UNITED STATES
SECURITIES AND EXCHANGE COMMISSION
Washington, D.C. 20549
FORM N-CSR
CERTIFIED SHAREHOLDER REPORT OF REGISTERED
MANAGEMENT INVESTMENT COMPANIES
Investment Company Act file number: 811-21295
JPMorgan Trust I
(Exact name of registrant as specified in charter)
270 Park Avenue
New York, NY 10017
(Address of principal executive offices) (Zip code)
Frank J. Nasta
270 Park Avenue
New York, NY 10017
(Name and Address of Agent for Service)
Registrant’s telephone number, including area code: (800) 480-4111
Date of fiscal year end: October 31
Date of reporting period: November 1, 2016 through April 30, 2017
Form N-CSR is to be used by management investment companies to file reports with the Commission not later than 10 days after the transmission to stockholders of any report that is required to be transmitted to stockholders under Rule 30e-1 under the Investment Company Act of 1940 (17 CFR 270.30e-1). The Commission may use the information provided on Form N-CSR in its regulatory, disclosure review, inspection, and policymaking roles.
A registrant is required to disclose the information specified by Form N-CSR, and the Commission will make this information public. A registrant is not required to respond to the collection of information contained in Form N-CSR unless the Form displays a currently valid Office of Management and Budget (“OMB”) control number. Please direct comments concerning the accuracy of the information collection burden estimate and any suggestions for reducing the burden to Secretary, Securities and Exchange Commission, 450 Fifth Street, NW, Washington, DC 20549-0609. The OMB has reviewed this collection of information under the clearance requirements of 44 U.S.C. Section 3507.
ITEM 1. REPORTS TO STOCKHOLDERS.
The following is a copy of the report transmitted to shareholders pursuant to Rule 30e-1 under the Investment Company Act of 1940 (17 CFR 270.30e-1).
Semi-Annual Report
J.P. Morgan Specialty Funds
April 30, 2017 (Unaudited)
JPMorgan Opportunistic Equity Long/Short Fund
JPMorgan Research Market Neutral Fund

CONTENTS
Investments in a Fund are not deposits or obligations of, or guaranteed or endorsed by, any bank and are not insured or guaranteed by the FDIC, the Federal Reserve Board or any other government agency. You could lose money if you sell when a Fund’s share price is lower than when you invested.
Past performance is no guarantee of future performance. The general market views expressed in this report are opinions based on market and other conditions through the end of the reporting period and are subject to change without notice. These views are not intended to predict the future performance of a Fund or the securities markets. References to specific securities and their issuers are for illustrative purposes only and are not intended to be, and should not be interpreted as, recommendations to purchase or sell such securities. Such views are not meant as investment advice and may not be relied on as an indication of trading intent on behalf of any Fund.
Prospective investors should refer to the Funds’ prospectus for a discussion of the Funds’ investment objective, strategies and risks. Call J.P. Morgan Funds Service Center at 1-800-480-4111 for a prospectus containing more complete information about a Fund, including management fees and other expenses. Please read it carefully before investing.
CEO’S LETTER
May 25, 2017 (Unaudited)
Dear Shareholder,
The world’s leading economies continued their upward trajectory over the six months ended April 30, 2017, bolstered by central bank policies, growth in corporate earnings and buoyant consumer and business sentiment.
| | |
 | | “While bond markets provided a mixed performance over the six months ended April 30, 2017, equity markets rewarded investors with solid returns.” — George C.W. Gatch |
While the U.S. and China had been leading drivers of growth for most of the current economic expansion, by late 2016 and into 2017 the world’s other leading economies began to strengthen. Each of the world’s 20 largest economies was forecast to increase output of goods and services through 2017 and the variation in growth rates among those economies was forecast to be the lowest since 1980, according to Bloomberg News.
The U.S. economy slowed somewhat in the first quarter of 2017, but unemployment dropped to 4.4% in April 2017 and the U.S. Federal Reserve reiterated its intent to raise interest rates amid continued economic growth and rising inflation. Throughout the six month reporting period, U.S. financial markets — particularly U.S. equities — generally outperformed other developed markets and emerging markets.
China’s economy continued to grow and posted a 6.9% rise in gross domestic product (GDP) in the first quarter of 2017, amid strength in housing, infrastructure investment, exports and retail sales. Notably, financial markets in China remained largely stable for the six month reporting period. For the 86 trading days through April 24, 2017, the Shanghai Stock Exchange Composite Index hadn’t fallen by more than 1%, thanks in large part to government efforts to prevent a recurrence of the sharp sell-offs that hit Chinese markets in mid-2015 and early 2016.
Meanwhile, Chinese officials sought to reduce financial system risk by tightening money-market rules and pushing to reduce the use of leverage and financial market speculation.
In the European Union (EU), rising consumer spending and manufacturing led to 0.6% growth in first quarter GDP. In particular, Germany’s economy continued to accelerate into 2017, with positive growth in factory orders and an estimated 14% increase in corporate earnings in the first quarter of 2017. Surveys of consumer sentiment across the EU were more upbeat than in recent years. At the end of March 2017, EU unemployment stood at 9.5%, the lowest level since April 2009.
In emerging markets, economic strength in China and a rebound in commodities prices, which began in the latter half of 2016, helped lift economic growth. Moreover, the economies of Brazil, Argentina, Russia, Turkey and South Africa — which were seen as weak links in the global economy — all showed positive growth by the end of April 2017.
While bond markets provided a mixed performance over the six months ended April 30, 2017, equity markets rewarded investors with solid returns. The Standard & Poor’s 500 Index returned 13.32% for the reporting period, while the Morgan Stanley Capital International (“MSCI”) Europe, Australasia and Far East Index (net of foreign withholding taxes) returned 11.73% and the MSCI Emerging Markets Index (net of foreign withholding taxes) returned 9.03%.
We look forward to managing your investment needs for years to come. Should you have any questions, please visit www.jpmorganfunds.com or contact the J.P. Morgan Funds Service Center at 1-800-480-4111.
Sincerely yours,

George C.W. Gatch
CEO, Investment Funds Management,
J.P. Morgan Asset Management
| | | | | | | | |
| | | |
| APRIL 30, 2017 | | J.P. MORGAN SPECIALTY FUNDS | | | | | 1 | |
J.P. Morgan Specialty Funds
MARKET OVERVIEW
SIX MONTHS ENDED APRIL 30, 2017 (Unaudited)
U.S. Global financial markets generally provided positive returns for the six month reporting period as the world’s leading economies continued to grow in a more uniform fashion and investors sought returns in both developed and emerging markets.
During the final quarter of 2016 and into 2017, leading U.S. equity indexes hit multiple record highs amid solid corporate earnings and expectations that the Republican majorities in the U.S. Congress and President’s Trumps’ administration would work to ease business regulations, reduce taxes and increase infrastructure spending.
The performance of fixed-income markets was mixed. High-yield bonds, also known as junk bonds, and U.S. Treasury bonds generally outperformed other debt securities during in the reporting period.
For the six months ended April 30, 2017, the Standard & Poor’s 500 returned 13.32%, while the BofA Merrill Lynch 3-Month U.S. Treasury Index returned 0.23%.
| | | | | | |
| | | |
| 2 | | | | J.P. MORGAN SPECIALTY FUNDS | | APRIL 30, 2017 |
JPMorgan Opportunistic Equity Long/Short Fund
FUND COMMENTARY
SIX MONTHS ENDED APRIL 30, 2017 (Unaudited)
| | | | |
| REPORTING PERIOD RETURN: | | | |
| Fund (Class I Shares)1* | | | 6.39% | |
| Standard & Poor’s 500 Index | | | 13.32% | |
| BofA Merrill Lynch 3-Month U.S. Treasury Bill Index | | | 0.23% | |
| |
| Net Assets as of 4/30/2017 (In Thousands) | | | $192,465 | |
INVESTMENT OBJECTIVE**
The JPMorgan Opportunistic Equity Long/Short Fund (the “Fund”) seeks capital appreciation.
WHAT WERE THE MAIN DRIVERS OF THE FUND’S PERFORMANCE?
The Fund’s Class I Shares underperformed the Standard & Poor’s 500 Index (the “Benchmark”) for the six months ended April 30, 2017. The Fund’s long positions in the industrials sector and its short positions in the real estate sector were leading detractors from performance relative to the Benchmark. The Fund’s short positions in the consumer discretionary sector and long positions in the information technology sector were leading contributors to relative performance.
Leading individual detractors from relative performance included the Fund’s long positions in Newell Brands Inc. and Canadian Pacific Railway Ltd., and its short position in Host Hotels & Resorts Inc. Shares of Newell Brands, a household products company, fell after the company reported lower-than-expected sales. Shares of Canadian Pacific Railway, a freight railroad operator, fell after the departure of the company’s chief executive. Shares of Host Hotels & Resorts, a real estate investment trust, rose after the company reported better-than-expected earnings and revenue.
Leading individual contributors to relative performance included the Fund’s long positions in Royal Caribbean Cruises Ltd. and Comcast Corp. and its short position in Alliance Data Systems Corp. Shares of Royal Caribbean Cruises, a cruise ship operator, rose after the company reported better-than-expected earnings and revenue, raised its earnings forecast and unveiled a share repurchase program. Shares of Comcast, a cable TV provider, rose on better-than-expected earnings. Shares of Alliance Data Systems, a provider of marketing and customer loyalty programs, fell on disappointing earnings results.
HOW WAS THE FUND POSITIONED?
During the six months ended April 30, 2017, the Fund invested an average of 107% of its assets under management in long and short positions in equity securities, selecting from a universe of equity securities with market capitalizations similar to those included in the Russell 1000 Index and/or S&P 500 Index. The Fund’s manager sought to achieve lower volatility than the Benchmark through a disciplined research process, security selection and risk management. For the six month reporting period, the Fund’s average gross exposure was 107% and its average net exposure was 49%.
| 1 | | Effective April 3, 2017, Select Class Shares were renamed Class I. |
| * | | The return shown is based on net asset values calculated for shareholder transactions and may differ from the return shown in the financial highlights, which reflects adjustments made to the net asset values in accordance with accounting principles generally accepted in the United States of America. |
| ** | | The adviser seeks to achieve the Fund’s objective. There can be no guarantee it will be achieved. |
| | | | | | | | |
| | | |
| APRIL 30, 2017 | | J.P. MORGAN SPECIALTY FUNDS | | | | | 3 | |
JPMorgan Opportunistic Equity Long/Short Fund
FUND COMMENTARY
SIX MONTHS ENDED APRIL 30, 2017 (Unaudited) (continued)
| | | | | | | | |
| TOP TEN LONG POSITIONS OF THE PORTFOLIO*** | |
| | 1. | | | Mohawk Industries, Inc. | | | 6.7 | % |
| | 2. | | | Canadian Pacific Railway Ltd., (Canada) | | | 6.0 | |
| | 3. | | | Harley-Davidson, Inc. | | | 5.5 | |
| | 4. | | | Thermo Fisher Scientific, Inc. | | | 5.5 | |
| | 5. | | | Alphabet, Inc., Class A | | | 5.3 | |
| | 6. | | | Fiserv, Inc. | | | 4.9 | |
| | 7. | | | 3M Co. | | | 4.8 | |
| | 8. | | | UnitedHealth Group, Inc. | | | 3.8 | |
| | 9. | | | Newell Brands, Inc. | | | 3.4 | |
| | 10. | | | Walt Disney Co. (The) | | | 3.3 | |
| | | | | | | | |
| TOP TEN SHORT POSITIONS OF THE PORTFOLIO**** | |
| | 1. | | | Kellogg Co. | | | 5.4 | % |
| | 2. | | | CVS Health Corp. | | | 4.4 | |
| | 3. | | | General Mills, Inc. | | | 4.2 | |
| | 4. | | | AutoZone, Inc. | | | 4.1 | |
| | 5. | | | Molson Coors Brewing Co., Class B | | | 3.6 | |
| | 6. | | | Enbridge, Inc., (Canada) | | | 3.4 | |
| | 7. | | | Sealed Air Corp. | | | 2.6 | |
| | 8. | | | General Motors Co. | | | 2.5 | |
| | 9. | | | O’Reilly Automotive, Inc. | | | 2.3 | |
| | 10. | | | United Parcel Service, Inc., Class B | | | 2.1 | |
| | | | |
LONG PORTFOLIO COMPOSITION BY SECTOR*** | |
| Consumer Discretionary | | | 33.2 | % |
| Industrials | | | 20.6 | |
| Information Technology | | | 18.0 | |
| Health Care | | | 12.3 | |
| Materials | | | 3.7 | |
| Financials | | | 3.7 | |
| Consumer Staples | | | 2.5 | |
| Utilities | | | 2.1 | |
| Energy | | | 0.1 | |
| Call Options Purchased | | | 0.1 | |
| Real Estate | | | 0.1 | |
| Short-Term Investment | | | 3.6 | |
| | | | |
SHORT PORTFOLIO COMPOSITION BY SECTOR**** | |
| Consumer Staples | | | 23.0 | % |
| Consumer Discretionary | | | 22.2 | |
| Financials | | | 9.9 | |
| Industrials | | | 9.1 | |
| Materials | | | 8.4 | |
| Energy | | | 7.6 | |
| Real Estate | | | 5.8 | |
| Health Care | | | 5.2 | |
| Information Technology | | | 4.7 | |
| Utilities | | | 4.1 | |
| *** | | Percentages indicated are based on total long investments as of April 30, 2017. The Fund’s portfolio composition is subject to change. |
| **** | | Percentages indicated are based on total short investments as of April 30, 2017. The Fund’s portfolio composition is subject to change. |
| | | | | | |
| | | |
| 4 | | | | J.P. MORGAN SPECIALTY FUNDS | | APRIL 30, 2017 |
| | | | | | | | | | | | | | |
AVERAGE ANNUAL TOTAL RETURNS AS OF APRIL 30, 2017 | |
| | | | |
| | | INCEPTION DATE OF
CLASS | | 6 MONTH* | | | 1 YEAR | | | SINCE
INCEPTION | |
CLASS A SHARES | | August 29, 2014 | | | | | | | | | | | | |
With Sales Charge** | | | | | 0.66 | % | | | 4.06 | % | | | 5.87 | % |
Without Sales Charge | | | | | 6.25 | | | | 9.84 | | | | 8.03 | |
CLASS C SHARES | | August 29, 2014 | | | | | | | | | | | | |
With CDSC*** | | | | | 4.96 | | | | 8.32 | | | | 7.50 | |
Without CDSC | | | | | 5.96 | | | | 9.32 | | | | 7.50 | |
CLASS I SHARES (FORMERLY SELECT CLASS SHARES) | | August 29, 2014 | | | 6.39 | | | | 10.10 | | | | 8.30 | |
CLASS R2 SHARES | | August 29, 2014 | | | 6.11 | | | | 9.58 | | | | 7.77 | |
CLASS R5 SHARES | | August 29, 2014 | | | 6.48 | | | | 10.31 | | | | 8.52 | |
CLASS R6 SHARES | | August 29, 2014 | | | 6.47 | | | | 10.36 | | | | 8.56 | |
| ** | | Sales Charge for Class A Shares is 5.25%. |
| *** | | Assumes a 1% CDSC (contingent deferred sales charge) for the 6 month and one year periods and 0% CDSC thereafter. |
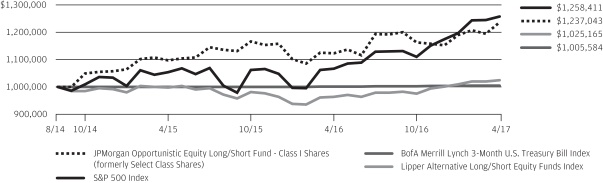
LIFE OF FUND PERFORMANCE (8/29/14 TO 4/30/17)
The performance quoted is past performance and is not a guarantee of future results. Mutual funds are subject to certain market risks. Investment returns and principal value of an investment will fluctuate so that an investor’s shares, when redeemed, may be worth more or less than their original cost. Current performance may be higher or lower than the performance data shown. For up-to-date month-end performance information please call 1-800-480-4111.
The Fund commenced operations on August 29, 2014.
The graph illustrates comparative performance for $1,000,000 invested in Class I Shares of the JPMorgan Opportunistic Equity Long/Short Fund, the S&P 500 Index, the BofA Merrill Lynch 3-Month U.S. Treasury Bill Index and Lipper Alternative Long/Short Equity Funds Index from August 29, 2014 to April 30, 2017. The performance of the Fund assumes reinvestment of all dividends and capital gain distributions, if any, and does not include a sales charge. The performance of the S&P 500 Index and BofA Merrill Lynch 3-Month U.S. Treasury Bill Index does not reflect the deduction of expenses or a sales charge associated with a mutual fund and has been adjusted to reflect reinvestment of all dividends and capital gain distributions of securities included in the benchmarks, if applicable. The performance of the Lipper Alternative Long/Short Equity Funds Index includes expenses associated with a mutual fund, such as investment management fees. These expenses are not identical to the expenses
incurred by the Fund. The S&P 500 Index is an unmanaged index generally representative of the performance of large companies in the U.S. stock market. The BofA Merrill Lynch 3-Month U.S. Treasury Bill Index is comprised of a single issue purchased at the beginning of the month and held for a full month. Each month the index is rebalanced and the issue selected is the outstanding Treasury Bill that matures closest to, but not beyond, 3 months from the rebalancing date. The Lipper Alternative Long/Short Equity Funds Index represents the total returns of the funds in the indicated category as defined by Lipper, Inc. Investors cannot invest directly in an index.
Class I Shares have a $1,000,000 minimum initial investment.
Fund performance may reflect the waiver of the Fund’s fees and reimbursement of expenses for certain periods since the inception date. Without these waivers and reimbursements, performance would have been lower. Also, performance shown in this section does not reflect the deduction of taxes that a shareholder would pay on Fund distributions or redemptions of Fund shares.
The returns shown are based on net asset values calculated for shareholder transactions and may differ from the returns shown in the financial highlights, which reflect adjustments made to the net asset values in accordance with accounting principles generally accepted in the United States of America.
| | | | | | | | |
| | | |
| APRIL 30, 2017 | | J.P. MORGAN SPECIALTY FUNDS | | | | | 5 | |
JPMorgan Research Market Neutral Fund
FUND COMMENTARY
SIX MONTHS ENDED APRIL 30, 2017 (Unaudited)
| | | | |
| REPORTING PERIOD RETURN: | | | |
| Fund (Class L Shares)1* | | | 4.18% | |
| BofA Merrill Lynch 3-Month U.S. Treasury Bill Index | | | 0.23% | |
| |
| Net Assets as of 4/30/2017 (In Thousands) | | $ | 235,760 | |
INVESTMENT OBJECTIVE**
The JPMorgan Research Market Neutral Fund (the “Fund”) seeks to provide long-term capital appreciation from a broadly diversified portfolio of U.S. stocks while neutralizing the general risks associated with stock market investing.
WHAT WERE THE MAIN DRIVERS OF THE FUND’S PERFORMANCE?
The Fund’s Class L Shares outperformed the BofA Merrill Lynch 3-Month U.S. Treasury Bill Index (the “Benchmark”) for the six months ended April 30, 2017.
The Fund’s security selection in the semiconductors and retail sectors was a leading contributor to performance relative to the Benchmark, while security selection in the financial services and insurance sectors was a leading detractor from relative performance.
Leading individual contributors to the Fund’s relative performance included its short positions in Mattel Inc. and Verizon Communications Inc., and its long position in Broadcom Ltd. Shares of Mattel, a toy maker, fell after the company reported a decline in sales and a wider-than-expected loss in the first quarter of 2017. Shares of Verizon Communications, a provider of telecommunications services, fell after the company reported a decline in customers for its wireless services. Shares of Broadcom, a semiconductor manufacturer, rose on sales growth following its merger with Avago Technologies Inc.
Leading individual detractors from relative performance included the Fund’s short positions in Boeing Co. and Whole Foods Market Inc., and its long position in Wex Inc. Shares of
Boeing, an aircraft manufacturer, rose amid growth in orders for new aircraft and investor expectations that the company’s military defense business would grow. Shares of Whole Foods Market, an upscale supermarket chain, rose on news reports than Albertsons Cos. was exploring a takeover offer for the company. Shares of Wex, a payment processing company, declined on news of the company’s $1.1 billion acquisition of Electronic Funds Source LLC.
HOW WAS THE FUND POSITIONED?
The Fund’s portfolio managers aimed to construct a portfolio of long and short positions with a low correlation to traditional investments such as stocks and bonds. The Fund’s portfolio managers used fundamental research to estimate companies’ long-term earnings forecasts, ranking approximately 600 large and mid cap stocks into five quintiles. The Fund’s portfolio managers looked to the top two quintiles for potential long positions in stocks that they believed were undervalued and the bottom two quintiles for potential short positions in stocks that they believed were overvalued.
| 1 | | Effective December 1, 2016, Institutional Class Shares were renamed Class L Shares. |
| * | | The return shown is based on net asset values calculated for shareholder transactions and may differ from the return shown in the financial highlights, which reflects adjustments made to the net asset values in accordance with accounting principles generally accepted in the United States of America. |
| ** | | The adviser seeks to achieve the Fund’s objective. There can be no guarantee it will be achieved. |
| | | | | | |
| | | |
| 6 | | | | J.P. MORGAN SPECIALTY FUNDS | | APRIL 30, 2017 |
| | | | | | | | |
| TOP TEN LONG POSITIONS OF THE PORTFOLIO*** | |
| | 1. | | | Alphabet, Inc., Class C | | | 3.0 | % |
| | 2. | | | Union Pacific Corp. | | | 2.9 | |
| | 3. | | | EOG Resources, Inc. | | | 2.1 | |
| | 4. | | | Walt Disney Co. (The) | | | 2.1 | |
| | 5. | | | Stanley Black & Decker, Inc. | | | 1.8 | |
| | 6. | | | Molson Coors Brewing Co., Class B | | | 1.8 | |
| | 7. | | | PepsiCo, Inc. | | | 1.7 | |
| | 8. | | | UnitedHealth Group, Inc. | | | 1.7 | |
| | 9. | | | Starbucks Corp. | | | 1.6 | |
| | 10. | | | Canadian Pacific Railway Ltd., (Canada) | | | 1.6 | |
| | | | | | | | |
| TOP TEN SHORT POSITIONS OF THE PORTFOLIO**** | |
| | 1. | | | Southern Co. (The), (United States) | | | 2.7 | % |
| | 2. | | | Exxon Mobil Corp., (United States) | | | 2.4 | |
| | 3. | | | Intel Corp., (United States) | | | 2.3 | |
| | 4. | | | Boeing Co. (The), (United States) | | | 1.9 | |
| | 5. | | | LyondellBasell Industries NV, Class A, (United States) | | | 1.7 | |
| | 6. | | | Coca-Cola Co. (The), (United States) | | | 1.6 | |
| | 7. | | | Verizon Communications, Inc., (United States) | | | 1.5 | |
| | 8. | | | Dominion Resources, Inc., (United States) | | | 1.5 | |
| | 9. | | | Procter & Gamble Co. (The), (United States) | | | 1.5 | |
| | 10. | | | US Bancorp, (United States) | | | 1.5 | |
| | | | |
LONG POSITION PORTFOLIO COMPOSITION BY SECTOR*** | |
| Consumer Discretionary | | | 16.9 | % |
| Information Technology | | | 15.1 | |
| Industrials | | | 13.0 | |
| Financials | | | 12.8 | |
| Consumer Staples | | | 9.0 | |
| Health Care | | | 7.8 | |
| Utilities | | | 6.3 | |
| Materials | | | 5.7 | |
| Energy | | | 5.5 | |
| Real Estate | | | 1.8 | |
| Others (each less than 1.0%) | | | 0.5 | |
| Short-Term Investments | | | 5.6 | |
| | | | |
SHORT POSITION PORTFOLIO COMPOSITION BY SECTOR**** | |
| Consumer Discretionary | | | 16.6 | % |
| Financials | | | 13.5 | |
| Industrials | | | 13.4 | |
| Information Technology | | | 12.5 | |
| Consumer Staples | | | 11.4 | |
| Health Care | | | 8.1 | |
| Utilities | | | 7.4 | |
| Energy | | | 6.2 | |
| Materials | | | 6.0 | |
| Telecommunication Services | | | 2.5 | |
| Real Estate | | | 2.4 | |
| *** | | Percentages indicated are based on total long investments as of April 30, 2017. The Fund’s portfolio composition is subject to change. |
| **** | | Percentages indicated are based on total short investments as of April 30, 2017. The Fund’s portfolio composition is subject to change. |
| | | | | | | | |
| | | |
| APRIL 30, 2017 | | J.P. MORGAN SPECIALTY FUNDS | | | | | 7 | |
JPMorgan Research Market Neutral Fund
FUND COMMENTARY
SIX MONTHS ENDED APRIL 30, 2017 (Unaudited) (continued)
| | | | | | | | | | | | | | | | | | |
AVERAGE ANNUAL TOTAL RETURNS AS OF APRIL 30, 2017 | |
| | | | | |
| | | INCEPTION DATE OF
CLASS | | 6 MONTH* | | | 1 YEAR | | | 5 YEAR | | | 10 YEAR | |
CLASS A SHARES | | February 28, 2002 | | | | | | | | | | | | | | | | |
With Sales Charge** | | | | | (1.44 | )% | | | (1.23 | )% | | | (0.51 | )% | | | 0.20 | % |
Without Sales Charge | | | | | 4.05 | | | | 4.27 | | | | 0.58 | | | | 0.74 | |
CLASS C SHARES | | November 2, 2009 | | | | | | | | | | | | | | | | |
With CDSC*** | | | | | 2.75 | | | | 2.75 | | | | 0.06 | | | | 0.24 | |
Without CDSC | | | | | 3.75 | | | | 3.75 | | | | 0.06 | | | | 0.24 | |
CLASS I SHARES (FORMERLY SELECT CLASS SHARES) | | November 2, 2009 | | | 4.18 | | | | 4.54 | | | | 0.83 | | | | 1.06 | |
CLASS L SHARES (FORMERLY INSTITUTIONAL CLASS SHARES) | | December 31, 1998 | | | 4.24 | | | | 4.67 | | | | 1.05 | | | | 1.23 | |
| ** | | Sales Charge for Class A Shares is 5.25%. |
| *** | | Assumes a 1% CDSC (contingent deferred sales charge) for the 6 month and one year periods and 0% CDSC thereafter. |
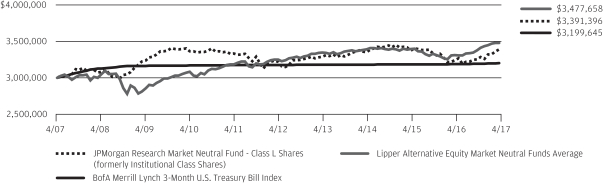
TEN YEAR FUND PERFORMANCE (4/30/07 to 4/30/17)
The performance quoted is past performance and is not a guarantee of future results. Mutual funds are subject to certain market risks. Investment returns and principal value of an investment will fluctuate so that an investor’s shares, when redeemed, may be worth more or less than their original cost. Current performance may be higher or lower than the performance data shown. For up-to-date month-end performance information please call 1-800-480-4111.
Returns for Class I (formerly Select Class) Shares prior to its inception date are based on the performance of Class L Shares. The actual returns for Class I Shares would have been lower than shown because Class I Shares have higher expenses than Class L Shares.
Returns for Class C Shares prior to its inception date are based on the performance of Class B Shares, all of which converted to Class A Shares on June 19, 2015. The actual returns of Class C Shares would have been similar to those shown because Class C Shares had similar expenses to Class B Shares.
The graph illustrates comparative performance for $3,000,000 invested in Class L Shares of the JPMorgan Research Market Neutral Fund, BofA Merrill Lynch 3-Month U.S. Treasury Bill Index and Lipper Alternative Equity Market Neutral Funds Average from April 30, 2007 to April 30, 2017. The performance of the Fund assumes reinvestment of all dividends and capital gain distributions, if any, and does not include a sales charge. The performance of the BofA Merrill Lynch 3-Month U.S. Treasury Bill Index does not reflect the deduction of expenses or a sales charge
associated with a mutual fund and has been adjusted to reflect reinvestment of all dividends and capital gain distributions of the securities included in the benchmark, if applicable. The performance of the Lipper Alternative Equity Market Neutral Funds Average includes expenses associated with a mutual fund, such as investment management fees. These expenses are not identical to the expenses incurred by the Fund. The BofA Merrill Lynch 3-Month U.S. Treasury Bill Index is comprised of a single issue purchased at the beginning of the month and held for a full month. Each month the index is rebalanced and the issue selected is the outstanding Treasury Bill that matures closest to, but not beyond, 3 months from the rebalancing date. Investors cannot invest directly in an index. The Lipper Alternative Equity Market Neutral Funds Average is an average based on the total returns of all mutual funds within the Fund’s designated category as determined by Lipper, Inc.
Class L Shares have a $3,000,000 minimum initial investment.
Fund performance may reflect the waiver of the Fund’s fees and reimbursement of expenses for certain periods since the inception date. Without these waivers and reimbursements, performance would have been lower. Also, performance shown in this section does not reflect the deduction of taxes that a shareholder would pay on Fund distributions or redemptions of Fund shares.
The returns shown are based on net asset values calculated for shareholder transactions and may differ from the returns shown in the financial highlights, which reflect adjustments made to the net asset values in accordance with accounting principles generally accepted in the United States of America.
| | | | | | |
| | | |
| 8 | | | | J.P. MORGAN SPECIALTY FUNDS | | APRIL 30, 2017 |
JPMorgan Opportunistic Equity Long/Short Fund
SCHEDULE OF PORTFOLIO INVESTMENTS
AS OF APRIL 30, 2017 (Unaudited)
(Amounts in thousands)
| | | | | | | | |
| SHARES | | | SECURITY DESCRIPTION | | VALUE($) | |
| | Long Positions — 99.1% | | | | |
| | Common Stocks — 95.4% | | | | |
| | | | Consumer Discretionary — 32.9% | | | | |
| | | | Auto Components — 0.0% (g) | | | | |
| | — | (h) | | Delphi Automotive plc | | | 20 | |
| | | | | | | | |
| | | | Automobiles — 5.6% | |
| | 185 | | | Harley-Davidson, Inc. | | | 10,507 | |
| | 1 | | | Tesla, Inc. (a) | | | 221 | |
| | | | | | | | |
| | | | | | | 10,728 | |
| | | | | | | | |
| | | | Hotels, Restaurants & Leisure — 3.2% | |
| | — | (h) | | Hilton Worldwide Holdings, Inc. | | | 19 | |
| | 34 | | | Royal Caribbean Cruises Ltd. | | | 3,586 | |
| | 26 | | | Wyndham Worldwide Corp. | | | 2,522 | |
| | | | | | | | |
| | | | | | | 6,127 | |
| | | | | | | | |
| | | | Household Durables — 10.1% | |
| | 1 | | | DR Horton, Inc. | | | 19 | |
| | 55 | | | Mohawk Industries, Inc. (a) | | | 12,806 | |
| | 137 | | | Newell Brands, Inc. (j) | | | 6,554 | |
| | | | | | | | |
| | | | | | | 19,379 | |
| | | | | | | | |
| | | | Internet & Direct Marketing Retail — 0.5% | |
| | 1 | | | Amazon.com, Inc. (a) | | | 806 | |
| | 1 | | | Netflix, Inc. (a) | | | 198 | |
| | | | | | | | |
| | | | | | | 1,004 | |
| | | | | | | | |
| | | | Media — 10.5% | |
| | — | (h) | | Charter Communications, Inc., Class A (a) | | | 20 | |
| | 51 | | | DISH Network Corp., Class A (a) | | | 3,279 | |
| | 59 | | | Time Warner, Inc. (j) | | | 5,852 | |
| | 161 | | | Twenty-First Century Fox, Inc., Class B | | | 4,809 | |
| | 54 | | | Walt Disney Co. (The) | | | 6,265 | |
| | | | | | | | |
| | | | | | | 20,225 | |
| | | | | | | | |
| | | | Multiline Retail — 0.0% (g) | |
| | — | (h) | | Dollar General Corp. | | | 19 | |
| | 1 | | | Macy’s, Inc. | | | 18 | |
| | | | | | | | |
| | | | | | | 37 | |
| | | | | | | | |
| | | | Specialty Retail — 1.6% | |
| | — | (h) | | Best Buy Co., Inc. | | | 22 | |
| | — | (h) | | Home Depot, Inc. (The) | | | 20 | |
| | 31 | | | Lithia Motors, Inc., Class A | | | 2,963 | |
| | — | (h) | | Lowe’s Cos., Inc. | | | 20 | |
| | — | (h) | | Ross Stores, Inc. | | | 18 | |
| | — | (h) | | TJX Cos., Inc. (The) | | | 19 | |
| | | | | | | | |
| | | | | | | 3,062 | |
| | | | | | | | |
| | | | | | | | |
| SHARES | | | SECURITY DESCRIPTION | | VALUE($) | |
| | | | | | | | |
| | | | | | | | |
| | | | Textiles, Apparel & Luxury Goods — 1.4% | |
| | 50 | | | NIKE, Inc., Class B | | | 2,781 | |
| | | | | | | | |
| | | | Total Consumer Discretionary | | | 63,363 | |
| | | | | | | | |
| | | | Consumer Staples — 2.5% | |
| | | | Beverages — 2.4% | |
| | 41 | | | PepsiCo, Inc. | | | 4,641 | |
| | | | | | | | |
| | | | Food & Staples Retailing — 0.1% | |
| | — | (h) | | Costco Wholesale Corp. | | | 20 | |
| | 1 | | | Kroger Co. (The) | | | 19 | |
| | — | (h) | | Walgreens Boots Alliance, Inc. | | | 19 | |
| | | | | | | | |
| | | | | | | 58 | |
| | | | | | | | |
| | | | Food Products — 0.0% (g) | |
| | — | (h) | | Kraft Heinz Co. (The) | | | 19 | |
| | — | (h) | | Mondelez International, Inc., Class A | | | 19 | |
| | | | | | | | |
| | | | | | | 38 | |
| | | | | | | | |
| | | | Personal Products — 0.0% (g) | |
| | — | (h) | | Estee Lauder Cos., Inc. (The), Class A | | | 19 | |
| | | | | | | | |
| | | | Total Consumer Staples | | | 4,756 | |
| | | | | | | | |
| | | | Energy — 0.1% | |
| | | | Oil, Gas & Consumable Fuels — 0.1% | |
| | — | (h) | | Anadarko Petroleum Corp. | | | 17 | |
| | 1 | | | Cabot Oil & Gas Corp. | | | 19 | |
| | — | (h) | | Chevron Corp. | | | 18 | |
| | — | (h) | | Concho Resources, Inc. (a) | | | 18 | |
| | — | (h) | | Continental Resources, Inc. (a) | | | 17 | |
| | — | (h) | | Diamondback Energy, Inc. (a) | | | 18 | |
| | — | (h) | | EOG Resources, Inc. | | | 17 | |
| | — | (h) | | EQT Corp. | | | 18 | |
| | 1 | | | Kinder Morgan, Inc. | | | 18 | |
| | — | (h) | | Pioneer Natural Resources Co. | | | 17 | |
| | 1 | | | Plains GP Holdings LP, Class A | | | 17 | |
| | — | (h) | | TransCanada Corp., (Canada) | | | 19 | |
| | | | | | | | |
| | | | Total Energy | | | 213 | |
| | | | | | | | |
| | | | Financials — 3.7% | |
| | | | Banks — 0.2% | |
| | 1 | | | Bank of America Corp. | | | 17 | |
| | — | (h) | | Citigroup, Inc. | | | 19 | |
| | — | (h) | | First Republic Bank | | | 18 | |
| | 1 | | | KeyCorp | | | 18 | |
| | 3 | | | PNC Financial Services Group, Inc. (The) | | | 357 | |
| | — | (h) | | SVB Financial Group (a) | | | 17 | |
| | — | (h) | | Wells Fargo & Co. | | | 17 | |
| | | | | | | | |
| | | | | | | 463 | |
| | | | | | | | |
SEE NOTES TO FINANCIAL STATEMENTS.
| | | | | | | | |
| | | |
| APRIL 30, 2017 | | J.P. MORGAN SPECIALTY FUNDS | | | | | 9 | |
JPMorgan Opportunistic Equity Long/Short Fund
SCHEDULE OF PORTFOLIO INVESTMENTS
AS OF APRIL 30, 2017 (Unaudited) (continued)
(Amounts in thousands)
| | | | | | | | |
| SHARES | | | SECURITY DESCRIPTION | | VALUE($) | |
| | Long Positions — continued | | | | |
| | Common Stocks — continued | | | | |
| | | | Capital Markets — 1.1% | |
| | — | (h) | | Ameriprise Financial, Inc. | | | 18 | |
| | — | (h) | | Bank of New York Mellon Corp. (The) | | | 18 | |
| | — | (h) | | BlackRock, Inc. | | | 19 | |
| | — | (h) | | Charles Schwab Corp. (The) | | | 17 | |
| | 9 | | | Goldman Sachs Group, Inc. (The) (j) | | | 2,010 | |
| | — | (h) | | Intercontinental Exchange, Inc. | | | 19 | |
| | — | (h) | | Morgan Stanley | | | 18 | |
| | | | | | | | |
| | | | | | | 2,119 | |
| | | | | | | | |
| | | | Consumer Finance — 2.3% | |
| | 1 | | | Ally Financial, Inc. | | | 17 | |
| | 54 | | | American Express Co. (j) | | | 4,304 | |
| | — | (h) | | Capital One Financial Corp. | | | 16 | |
| | 1 | | | Synchrony Financial | | | 14 | |
| | | | | | | | |
| | | | | | | 4,351 | |
| | | | | | | | |
| | | | Diversified Financial Services — 0.0% (g) | |
| | — | (h) | | Voya Financial, Inc. | | | 17 | |
| | | | | | | | |
| | | | Insurance — 0.1% | |
| | — | (h) | | American International Group, Inc. | | | 18 | |
| | — | (h) | | Arthur J Gallagher & Co. | | | 19 | |
| | — | (h) | | Chubb Ltd. | | | 19 | |
| | — | (h) | | Everest Re Group Ltd. | | | 20 | |
| | — | (h) | | Hartford Financial Services Group, Inc. (The) | | | 18 | |
| | — | (h) | | MetLife, Inc. | | | 18 | |
| | | | | | | | |
| | | | | | | 112 | |
| | | | | | | | |
| | | | Total Financials | | | 7,062 | |
| | | | | | | | |
| | | | Health Care — 12.1% | |
| | | | Biotechnology — 0.1% | |
| | — | (h) | | Biogen, Inc. (a) | | | 17 | |
| | — | (h) | | Celgene Corp. (a) | | | 19 | |
| | — | (h) | | Incyte Corp. (a) | | | 17 | |
| | — | (h) | | Vertex Pharmaceuticals, Inc. (a) | | | 24 | |
| | | | | | | | |
| | | | | | | 77 | |
| | | | | | | | |
| | | | Health Care Equipment & Supplies — 0.0% (g) | |
| | — | (h) | | Abbott Laboratories (j) | | | 18 | |
| | — | (h) | | Becton Dickinson and Co. | | | 19 | |
| | 1 | | | Boston Scientific Corp. (a) | | | 20 | |
| | — | (h) | | Zimmer Biomet Holdings, Inc. | | | 19 | |
| | | | | | | | |
| | | | | | | 76 | |
| | | | | | | | |
| | | | Health Care Providers & Services — 6.6% | |
| | — | (h) | | Aetna, Inc. | | | 19 | |
| | 25 | | | Humana, Inc. | | | 5,557 | |
| | | | | | | | |
| SHARES | | | SECURITY DESCRIPTION | | VALUE($) | |
| | | | | | | | |
| | | | | | | | |
| | | | Health Care Providers & Services — continued | | | | |
| | — | (h) | | McKesson Corp. | | | 17 | |
| | 41 | | | UnitedHealth Group, Inc. | | | 7,184 | |
| | | | | | | | |
| | | | | | | 12,777 | |
| | | | | | | | |
| | | | Life Sciences Tools & Services — 5.4% | |
| | 63 | | | Thermo Fisher Scientific, Inc. (j) | | | 10,419 | |
| | | | | | | | |
| | | | Pharmaceuticals — 0.0% (g) | |
| | — | (h) | | Allergan plc | | | 19 | |
| | — | (h) | | Bristol-Myers Squibb Co. | | | 19 | |
| | — | (h) | | Eli Lilly & Co. | | | 18 | |
| | | | | | | | |
| | | | | | | 56 | |
| | | | | | | | |
| | | | Total Health Care | | | 23,405 | |
| | | | | | | | |
| | | | Industrials — 20.4% | |
| | | | Aerospace & Defense — 2.0% | |
| | 8 | | | Northrop Grumman Corp. | | | 1,912 | |
| | 12 | | | Raytheon Co. | | | 1,910 | |
| | | | | | | | |
| | | | | | | 3,822 | |
| | | | | | | | |
| | | | Airlines — 0.0% (g) | |
| | — | (h) | | United Continental Holdings, Inc. (a) | | | 18 | |
| | | | | | | | |
| | | | Building Products — 0.0% (g) | |
| | — | (h) | | Johnson Controls International plc | | | 19 | |
| | 1 | | | Masco Corp. | | | 21 | |
| | | | | | | | |
| | | | | | | 40 | |
| | | | | | | | |
| | | | Commercial Services & Supplies — 0.0% (g) | |
| | — | (h) | | Waste Connections, Inc., (Canada) | | | 20 | |
| | | | | | | | |
| | | | Electrical Equipment — 2.2% | |
| | 56 | | | Eaton Corp. plc | | | 4,258 | |
| | | | | | | | |
| | | | Industrial Conglomerates — 4.8% | |
| | 47 | | | 3M Co. | | | 9,162 | |
| | 1 | | | General Electric Co. | | | 18 | |
| | — | (h) | | Honeywell International, Inc. | | | 19 | |
| | | | | | | | |
| | | | | | | 9,199 | |
| | | | | | | | |
| | | | Machinery — 2.0% | |
| | 37 | | | Caterpillar, Inc. | | | 3,741 | |
| | — | (h) | | Ingersoll-Rand plc | | | 21 | |
| | — | (h) | | PACCAR, Inc. | | | 18 | |
| | | | | | | | |
| | | | | | | 3,780 | |
| | | | | | | | |
| | | | Road & Rail — 9.4% | |
| | 75 | | | Canadian Pacific Railway Ltd., (Canada) (j) | | | 11,418 | |
| | 92 | | | CSX Corp. | | | 4,698 | |
| | — | (h) | | Kansas City Southern | | | 19 | |
SEE NOTES TO FINANCIAL STATEMENTS.
| | | | | | |
| | | |
| 10 | | | | J.P. MORGAN SPECIALTY FUNDS | | APRIL 30, 2017 |
| | | | | | | | |
| SHARES | | | SECURITY DESCRIPTION | | VALUE($) | |
| | Long Positions — continued | | | | |
| | Common Stocks — continued | | | | |
| | | | Road & Rail — continued | | | | |
| | 17 | | | Norfolk Southern Corp. | | | 1,957 | |
| | — | (h) | | Union Pacific Corp. | | | 19 | |
| | | | | | | | |
| | | | | | | 18,111 | |
| | | | | | | | |
| | | | Trading Companies & Distributors — 0.0% (g) | |
| | — | (h) | | AerCap Holdings NV, (Ireland) (a) | | | 19 | |
| | | | | | | | |
| | | | Total Industrials | | | 39,267 | |
| | | | | | | | |
| | | | Information Technology — 17.9% | |
| | | | Electronic Equipment, Instruments & Components — 0.0% (g) | |
| | — | (h) | | TE Connectivity Ltd. | | | 20 | |
| | | | | | | | |
| | | | Internet Software & Services — 5.6% | |
| | 11 | | | Alphabet, Inc., Class A (a) (j) | | | 10,115 | |
| | 4 | | | Facebook, Inc., Class A (a) | | | 611 | |
| | | | | | | | |
| | | | | | | 10,726 | |
| | | | | | | | |
| | | | IT Services — 11.1% | |
| | 46 | | | Fidelity National Information Services, Inc. | | | 3,835 | |
| | 79 | | | Fiserv, Inc. (a) (j) | | | 9,397 | |
| | 25 | | | Mastercard, Inc., Class A (j) | | | 2,894 | |
| | 58 | | | Visa, Inc., Class A (j) | | | 5,255 | |
| | — | (h) | | WEX, Inc. (a) | | | 18 | |
| | | | | | | | |
| | | | | | | 21,399 | |
| | | | | | | | |
| | | | Semiconductors & Semiconductor Equipment — 0.1% | |
| | — | (h) | | Broadcom Ltd. | | | 19 | |
| | — | (h) | | Maxim Integrated Products, Inc. | | | 19 | |
| | — | (h) | | Microchip Technology, Inc. | | | 19 | |
| | 1 | | | Micron Technology, Inc. (a) | | | 20 | |
| | 1 | | | ON Semiconductor Corp. (a) | | | 17 | |
| | — | (h) | | QUALCOMM, Inc. | | | 18 | |
| | — | (h) | | Texas Instruments, Inc. | | | 19 | |
| | | | | | | | |
| | | | | | | 131 | |
| | | | | | | | |
| | | | Software — 1.1% | |
| | — | (h) | | Mobileye NV (a) | | | 25 | |
| | 18 | | | ServiceNow, Inc. (a) | | | 1,729 | |
| | 17 | | | Snap, Inc., Class A (a) | | | 372 | |
| | — | (h) | | Workday, Inc., Class A (a) | | | 20 | |
| | | | | | | | |
| | | | | | | 2,146 | |
| | | | | | | | |
| | | | Technology Hardware, Storage & Peripherals — 0.0% (g) | |
| | 1 | | | Hewlett Packard Enterprise Co. | | | 19 | |
| | | | | | | | |
| | | | Total Information Technology | | | 34,441 | |
| | | | | | | | |
| | | | Materials — 3.7% | |
| | | | Chemicals — 1.1% | |
| | 17 | | | Ecolab, Inc. (j) | | | 2,157 | |
| | | | | | | | |
| SHARES | | | SECURITY DESCRIPTION | | VALUE($) | |
| | |
| | |
| | | | Chemicals — continued | |
| | — | (h) | | EI du Pont de Nemours & Co. | | | 19 | |
| | 1 | | | Mosaic Co. (The) | | | 17 | |
| | 1 | | | Olin Corp. | | | 19 | |
| | | | | | | | |
| | | | | | | 2,212 | |
| | | | | | | | |
| | | | Construction Materials — 0.0% (g) | |
| | — | (h) | | Vulcan Materials Co. | | | 19 | |
| | | | | | | | |
| | | | Containers & Packaging — 2.5% | |
| | — | (h) | | Ball Corp. | | | 19 | |
| | 95 | | | Berry Global Group, Inc. (a) | | | 4,759 | |
| | — | (h) | | WestRock Co. | | | 19 | |
| | | | | | | | |
| | | | | | | 4,797 | |
| | | | | | | | |
| | | | Metals & Mining — 0.1% | |
| | 1 | | | Alcoa Corp. | | | 17 | |
| | 6 | | | TimkenSteel Corp. (a) | | | 91 | |
| | | | | | | | |
| | | | | | | 108 | |
| | | | | | | | |
| | | | Total Materials | | | 7,136 | |
| | | | | | | | |
| | | | Real Estate — 0.1% | |
| | | | Equity Real Estate Investment Trusts (REITs) — 0.1% | |
| | — | (h) | | AvalonBay Communities, Inc. | | | 19 | |
| | 1 | | | HCP, Inc. | | | 19 | |
| | 1 | | | Kimco Realty Corp. | | | 16 | |
| | 1 | | | Omega Healthcare Investors, Inc. | | | 19 | |
| | 1 | | | Quality Care Properties, Inc. (a) | | | 17 | |
| | — | (h) | | SBA Communications Corp., Class A (a) | | | 21 | |
| | — | (h) | | SL Green Realty Corp. | | | 17 | |
| | 1 | | | STORE Capital Corp. | | | 19 | |
| | | | | | | | |
| | | | Total Real Estate | | | 147 | |
| | | | | | | | |
| | | | Utilities — 2.0% | |
| | | | Electric Utilities — 2.0% | |
| | — | (h) | | Edison International | | | 19 | |
| | 29 | | | NextEra Energy, Inc. | | | 3,832 | |
| | — | (h) | | PG&E Corp. | | | 19 | |
| | — | (h) | | Pinnacle West Capital Corp. | | | 19 | |
| | | | | | | | |
| | | | | | | 3,889 | |
| | | | | | | | |
| | | | Multi-Utilities — 0.0% (g) | |
| | 1 | | | NiSource, Inc. | | | 19 | |
| | | | | | | | |
| | | | Water Utilities — 0.0% (g) | |
| | — | (h) | | American Water Works Co., Inc. | | | 20 | |
| | | | | | | | |
| | | | Total Utilities | | | 3,928 | |
| | | | | | | | |
| | | | Total Common Stocks
(Cost $167,501) | | | 183,718 | |
| | | | | | | | |
SEE NOTES TO FINANCIAL STATEMENTS.
| | | | | | | | |
| | | |
| APRIL 30, 2017 | | J.P. MORGAN SPECIALTY FUNDS | | | | | 11 | |
JPMorgan Opportunistic Equity Long/Short Fund
SCHEDULE OF PORTFOLIO INVESTMENTS
AS OF APRIL 30, 2017 (Unaudited) (continued)
(Amounts in thousands, except number of Options contracts)
| | | | | | | | |
NUMBER OF
CONTRACTS | | | SECURITY DESCRIPTION | | VALUE($) | |
| | Long Positions — continued | | | | |
| | Options Purchased — 0.1% | | | | |
| | | | Call Options Purchased — 0.1% | | | | |
| | 701 | | | Newell Brands, Inc., expiring 01/19/18 at $50.00, American Style (a) (Cost $259) | | | 198 | |
| | | | | | | | |
| | |
| SHARES | | | | | | |
| | Short-Term Investment — 3.6% | | | | |
| | | | Investment Company — 3.6% | |
| | 6,842 | | | JPMorgan U.S. Government Money Market Fund, Institutional Class Shares, 0.620% (b) (l) (Cost $6,842) | | | 6,842 | |
| | | | | | | | |
| | | | Total Investments — 99.1%
(Cost $174,602) | | | 190,758 | |
| | | | Other Assets in Excess of
Liabilities — 0.9% | | | 1,707 | |
| | | | | | | | |
| | | | NET ASSETS — 100.0% | | $ | 192,465 | |
| | | | | | | | |
| | Short Positions — 34.3% | |
| | Common Stocks — 34.3% | |
| | | | Consumer Discretionary — 7.6% | |
| | | | Auto Components — 0.1% | |
| | 3 | | | Autoliv, Inc., (Sweden) | | | 305 | |
| | | | | | | | |
| | | | Automobiles — 1.6% | |
| | 120 | | | Ford Motor Co. | | | 1,375 | |
| | 47 | | | General Motors Co. | | | 1,626 | |
| | | | | | | | |
| | | | | | | 3,001 | |
| | | | | | | | |
| | | | Hotels, Restaurants & Leisure — 0.4% | |
| | 1 | | | Chipotle Mexican Grill, Inc. (a) | | | 374 | |
| | 4 | | | Darden Restaurants, Inc. | | | 382 | |
| | | | | | | | |
| | | | | | | 756 | |
| | | | | | | | |
| | | | Household Durables — 0.5% | |
| | 6 | | | Whirlpool Corp. | | | 1,025 | |
| | | | | | | | |
| | | | Leisure Products — 0.2% | |
| | 3 | | | Hasbro, Inc. | | | 331 | |
| | | | | | | | |
| | | | Media — 1.2% | |
| | 5 | | | CBS Corp. (Non-Voting), Class B | | | 301 | |
| | 13 | | | Interpublic Group of Cos., Inc. (The) | | | 310 | |
| | 16 | | | Omnicom Group, Inc. | | | 1,349 | |
| | 4 | | | Scripps Networks Interactive, Inc., Class A | | | 300 | |
| | | | | | | | |
| | | | | | | 2,260 | |
| | | | | | | | |
| | | | Multiline Retail — 0.5% | |
| | 8 | | | Kohl’s Corp. | | | 312 | |
| | 7 | | | Nordstrom, Inc. | | | 325 | |
| | 5 | | | Target Corp. | | | 289 | |
| | | | | | | | |
| | | | | | | 926 | |
| | | | | | | | |
| | | | | | | | |
SHARES | | | SECURITY DESCRIPTION | | VALUE($) | |
| | |
| | |
| | | | Specialty Retail — 2.8% | |
| | 4 | | | AutoZone, Inc. (a) | | | 2,698 | |
| | 7 | | | Bed Bath & Beyond, Inc. | | | 276 | |
| | 6 | | | O’Reilly Automotive, Inc. (a) | | | 1,544 | |
| | 45 | | | Sally Beauty Holdings, Inc. (a) | | | 862 | |
| | | | | | | | |
| | | | | | | 5,380 | |
| | | | | | | | |
| | | | Textiles, Apparel & Luxury Goods — 0.3% | |
| | 4 | | | Carter’s, Inc. | | | 342 | |
| | 4 | | | Ralph Lauren Corp. | | | 328 | |
| | | | | | | | |
| | | | | | | 670 | |
| | | | | | | | |
| | | | Total Consumer Discretionary | | | 14,654 | |
| | | | | | | | |
| | | | Consumer Staples — 7.9% | |
| | | | Beverages — 1.2% | |
| | 25 | | | Molson Coors Brewing Co., Class B | | | 2,356 | |
| | | | | | | | |
| | | | Food & Staples Retailing — 2.0% | |
| | 35 | | | CVS Health Corp. | | | 2,878 | |
| | 6 | | | Sysco Corp. | | | 325 | |
| | 5 | | | Wal-Mart Stores, Inc. | | | 341 | |
| | 11 | | | Whole Foods Market, Inc. | | | 404 | |
| | | | | | | | |
| | | | | | | 3,948 | |
| | | | | | | | |
| | | | Food Products — 3.5% | |
| | 49 | | | General Mills, Inc. | | | 2,799 | |
| | 3 | | | Hershey Co. (The) | | | 323 | |
| | 51 | | | Kellogg Co. | | | 3,599 | |
| | | | | | | | |
| | | | | | | 6,721 | |
| | | | | | | | |
| | | | Household Products — 0.4% | |
| | 7 | | | Church & Dwight Co., Inc. | | | 335 | |
| | 3 | | | Clorox Co. (The) | | | 357 | |
| | | | | | | | |
| | | | | | | 692 | |
| | | | | | | | |
| | | | Personal Products — 0.8% | |
| | 19 | | | Coty, Inc., Class A | | | 345 | |
| | 16 | | | Edgewell Personal Care Co. (a) | | | 1,123 | |
| | | | | | | | |
| | | | | | | 1,468 | |
| | | | | | | | |
| | | | Total Consumer Staples | | | 15,185 | |
| | | | | | | | |
| | | | Energy — 2.6% | |
| | | | Energy Equipment & Services — 0.5% | |
| | 5 | | | Helmerich & Payne, Inc. | | | 281 | |
| | 8 | | | National Oilwell Varco, Inc. | | | 286 | |
| | 4 | | | Schlumberger Ltd. | | | 311 | |
| | | | | | | | |
| | | | | | | 878 | |
| | | | | | | | |
| | | | Oil, Gas & Consumable Fuels — 2.1% | |
| | 54 | | | Enbridge, Inc., (Canada) | | | 2,256 | |
SEE NOTES TO FINANCIAL STATEMENTS.
| | | | | | |
| | | |
| 12 | | | | J.P. MORGAN SPECIALTY FUNDS | | APRIL 30, 2017 |
| | | | | | | | |
| SHARES | | | SECURITY DESCRIPTION | | VALUE($) | |
| | Short Positions — continued | |
| | Common Stocks — continued | |
| | | | Oil, Gas & Consumable Fuels — continued | |
| | 4 | | | Exxon Mobil Corp. | | | 306 | |
| | 7 | | | Hess Corp. | | | 331 | |
| | 20 | | | Marathon Oil Corp. | | | 296 | |
| | 12 | | | Murphy Oil Corp. | | | 312 | |
| | 9 | | | Noble Energy, Inc. | | | 304 | |
| | 6 | | | ONEOK, Inc. | | | 315 | |
| | | | | | | | |
| | | | | | | 4,120 | |
| | | | | | | | |
| | | | Total Energy | | | 4,998 | |
| | | | | | | | |
| | | | Financials — 3.4% | |
| | | | Banks — 1.2% | |
| | 11 | | | Fifth Third Bancorp | | | 281 | |
| | 15 | | | First Horizon National Corp. | | | 284 | |
| | 17 | | | Fulton Financial Corp. | | | 321 | |
| | 3 | | | M&T Bank Corp. | | | 533 | |
| | 17 | | | People’s United Financial, Inc. | | | 300 | |
| | 7 | | | US Bancorp | | | 345 | |
| | 6 | | | Webster Financial Corp. | | | 305 | |
| | | | | | | | |
| | | | | | | 2,369 | |
| | | | | | | | |
| | | | Capital Markets — 0.7% | |
| | 3 | | | CME Group, Inc. | | | 314 | |
| | 11 | | | Federated Investors, Inc., Class B | | | 299 | |
| | 8 | | | Franklin Resources, Inc. | | | 337 | |
| | 5 | | | Nasdaq, Inc. | | | 316 | |
| | | | | | | | |
| | | | | | | 1,266 | |
| | | | | | | | |
| | | | Insurance — 1.5% | |
| | 4 | | | Aflac, Inc. | | | 325 | |
| | 5 | | | Axis Capital Holdings Ltd. | | | 319 | |
| | 5 | | | Principal Financial Group, Inc. | | | 333 | |
| | 3 | | | Prudential Financial, Inc. | | | 325 | |
| | 2 | | | RenaissanceRe Holdings Ltd., (Bermuda) | | | 309 | |
| | 4 | | | Torchmark Corp. | | | 323 | |
| | 3 | | | Travelers Cos., Inc. (The) | | | 308 | |
| | 3 | | | Willis Towers Watson plc | | | 332 | |
| | 5 | | | WR Berkley Corp. | | | 358 | |
| | | | | | | | |
| | | | | | | 2,932 | |
| | | | | | | | |
| | | | Total Financials | | | 6,567 | |
| | | | | | | | |
| | | | Health Care — 1.8% | |
| | | | Biotechnology — 0.4% | |
| | 6 | | | AbbVie, Inc. | | | 370 | |
| | 2 | | | Amgen, Inc. | | | 327 | |
| | | | | | | | |
| | | | | | | 697 | |
| | | | | | | | |
| | | | | | | | |
| SHARES | | | SECURITY DESCRIPTION | | VALUE($) | |
| | | | | | | | |
| | | | | | | | |
| | | | Health Care Equipment & Supplies — 0.9% | |
| | 6 | | | Baxter International, Inc. | | | 338 | |
| | 1 | | | CR Bard, Inc. | | | 436 | |
| | 4 | | | Medtronic plc | | | 331 | |
| | 3 | | | Stryker Corp. | | | 368 | |
| | 4 | | | Varian Medical Systems, Inc. (a) | | | 365 | |
| | | | | | | | |
| | | | | | | 1,838 | |
| | | | | | | | |
| | | | Health Care Providers & Services — 0.3% | |
| | 4 | | | AmerisourceBergen Corp. | | | 305 | |
| | 4 | | | Cardinal Health, Inc. | | | 302 | |
| | | | | | | | |
| | | | | | | 607 | |
| | | | | | | | |
| | | | Pharmaceuticals — 0.2% | |
| | 3 | | | Johnson & Johnson | | | 326 | |
| | | | | | | | |
| | | | Total Health Care | | | 3,468 | |
| | | | | | | | |
| | | | Industrials — 3.1% | |
| | | | Aerospace & Defense — 0.3% | |
| | 2 | | | Boeing Co. (The) | | | 329 | |
| | 3 | | | United Technologies Corp. | | | 332 | |
| | | | | | | | |
| | | | | | | 661 | |
| | | | | | | | |
| | | | Air Freight & Logistics — 0.9% | |
| | 4 | | | CH Robinson Worldwide, Inc. | | | 287 | |
| | 13 | | | United Parcel Service, Inc., Class B | | | 1,403 | |
| | | | | | | | |
| | | | | | | 1,690 | |
| | | | | | | | |
| | | | Airlines — 0.2% | |
| | 7 | | | American Airlines Group, Inc. | | | 303 | |
| | | | | | | | |
| | | | Commercial Services & Supplies — 0.3% | |
| | 5 | | | Republic Services, Inc. | | | 337 | |
| | 5 | | | Waste Management, Inc. | | | 337 | |
| | | | | | | | |
| | | | | | | 674 | |
| | | | | | | | |
| | | | Electrical Equipment — 0.2% | |
| | 6 | | | Emerson Electric Co. | | | 347 | |
| | | | | | | | |
| | | | Machinery — 0.5% | |
| | 5 | | | AGCO Corp. | | | 345 | |
| | 8 | | | Donaldson Co., Inc. | | | 364 | |
| | 3 | | | Illinois Tool Works, Inc. | | | 348 | |
| | | | | | | | |
| | | | | | | 1,057 | |
| | | | | | | | |
| | | | Professional Services — 0.2% | |
| | 2 | | | Equifax, Inc. | | | 335 | |
| | | | | | | | |
| | | | Road & Rail — 0.2% | |
| | 4 | | | JB Hunt Transport Services, Inc. | | | 316 | |
| | | | | | | | |
SEE NOTES TO FINANCIAL STATEMENTS.
| | | | | | | | |
| | | |
| APRIL 30, 2017 | | J.P. MORGAN SPECIALTY FUNDS | | | | | 13 | |
JPMorgan Opportunistic Equity Long/Short Fund
SCHEDULE OF PORTFOLIO INVESTMENTS
AS OF APRIL 30, 2017 (Unaudited) (continued)
(Amounts in thousands)
| | | | | | | | |
| SHARES | | | SECURITY DESCRIPTION | | VALUE($) | |
| | Short Positions — continued | |
| | Common Stocks — continued | |
| | | | Trading Companies & Distributors — 0.3% | |
| | 8 | | | Air Lease Corp. | | | 313 | |
| | 7 | | | Fastenal Co. | | | 313 | |
| | | | | | | | |
| | | | | | | 626 | |
| | | | | | | | |
| | | | Total Industrials | | | 6,009 | |
| | | | | | | | |
| | | | Information Technology — 1.6% | |
| | | | Communications Equipment — 0.4% | |
| | 10 | | | Cisco Systems, Inc. | | | 352 | |
| | 12 | | | Juniper Networks, Inc. | | | 368 | |
| | | | | | | | |
| | | | | | | 720 | |
| | | | | | | | |
| | | | Electronic Equipment, Instruments & Components — 0.2% | |
| | 5 | | | Amphenol Corp., Class A | | | 349 | |
| | | | | | | | |
| | | | Internet Software & Services — 0.2% | |
| | 22 | | | Twitter, Inc. (a) | | | 361 | |
| | | | | | | | |
| | | | Semiconductors & Semiconductor Equipment — 0.3% | |
| | 9 | | | Intel Corp. | | | 319 | |
| | 6 | | | Xilinx, Inc. | | | 372 | |
| | | | | | | | |
| | | | | | | 691 | |
| | | | | | | | |
| | | | Software — 0.2% | |
| | 4 | | | salesforce.com, Inc. (a) | | | 349 | |
| | | | | | | | |
| | | | Technology Hardware, Storage & Peripherals — 0.3% | |
| | 8 | | | NetApp, Inc. | | | 324 | |
| | 7 | | | Seagate Technology plc | | | 296 | |
| | | | | | | | |
| | | | | | | 620 | |
| | | | | | | | |
| | | | Total Information Technology | | | 3,090 | |
| | | | | | | | |
| | | | Materials — 2.9% | |
| | | | Chemicals — 0.7% | |
| | 3 | | | Agrium, Inc., (Canada) | | | 313 | |
| | 2 | | | Air Products & Chemicals, Inc. | | | 348 | |
| | 4 | | | LyondellBasell Industries NV, Class A | | | 318 | |
| | 3 | | | Praxair, Inc. | | | 355 | |
| | | | | | | | |
| | | | | | | 1,334 | |
| | | | | | | | |
| | | | Containers & Packaging — 2.0% | |
| | 4 | | | AptarGroup, Inc. | | | 350 | |
| | 10 | | | Bemis Co., Inc. | | | 464 | |
| | 6 | | | Greif, Inc., Class A | | | 353 | |
| | 7 | | | International Paper Co. | | | 367 | |
| | 3 | | | Packaging Corp. of America | | | 338 | |
| | 39 | | | Sealed Air Corp. | | | 1,708 | |
| | 6 | | | Sonoco Products Co. | | | 315 | |
| | | | | | | | |
| | | | | | | 3,895 | |
| | | | | | | | |
| | | | | | | | |
| SHARES | | | SECURITY DESCRIPTION | | VALUE($) | |
| | | | | | | | |
| | | | | | | | |
| | | | Paper & Forest Products — 0.2% | |
| | 9 | | | Domtar Corp. | | | 338 | |
| | | | | | | | |
| | | | Total Materials | | | 5,567 | |
| | | | | | | | |
| | | | Real Estate — 2.0% | |
| | | | Equity Real Estate Investment Trusts (REITs) — 2.0% | |
| | 4 | | | Crown Castle International Corp. | | | 336 | |
| | 3 | | | Digital Realty Trust, Inc. | | | 365 | |
| | 2 | | | Federal Realty Investment Trust | | | 308 | |
| | 11 | | | Healthcare Realty Trust, Inc. | | | 348 | |
| | 10 | | | Healthcare Trust of America, Inc., Class A | | | 312 | |
| | 3 | | | Simon Property Group, Inc. | | | 480 | |
| | 20 | | | Tanger Factory Outlet Centers, Inc. | | | 611 | |
| | 9 | | | UDR, Inc. | | | 350 | |
| | 5 | | | Ventas, Inc. | | | 349 | |
| | 5 | | | Welltower, Inc. | | | 366 | |
| | | | | | | | |
| | | | Total Real Estate | | | 3,825 | |
| | | | | | | | |
| | | | Utilities — 1.4% | |
| | | | Electric Utilities — 0.5% | |
| | 4 | | | Duke Energy Corp. | | | 341 | |
| | 6 | | | Eversource Energy | | | 338 | |
| | 7 | | | Southern Co. (The) | | | 357 | |
| | | | | | | | |
| | | | | | | 1,036 | |
| | | | | | | | |
| | | | Gas Utilities — 0.2% | |
| | 6 | | | National Fuel Gas Co. | | | 312 | |
| | | | | | | | |
| | | | Multi-Utilities — 0.5% | |
| | 5 | | | Consolidated Edison, Inc. | | | 359 | |
| | 5 | | | Dominion Resources, Inc. | | | 358 | |
| | 5 | | | SCANA Corp. | | | 321 | |
| | | | | | | | |
| | | | | | | 1,038 | |
| | | | | | | | |
| | | | Water Utilities — 0.2% | |
| | 10 | | | Aqua America, Inc. | | | 338 | |
| | | | | | | | |
| | | | Total Utilities | | | 2,724 | |
| | | | | | | | |
| | | | Total Securities Sold Short
(Proceeds $67,053) | | $ | 66,087 | |
| | | | | | | | |
Percentages indicated are based on net assets.
SEE NOTES TO FINANCIAL STATEMENTS.
| | | | | | |
| | | |
| 14 | | | | J.P. MORGAN SPECIALTY FUNDS | | APRIL 30, 2017 |
JPMorgan Research Market Neutral Fund
SCHEDULE OF PORTFOLIO INVESTMENTS
AS OF APRIL 30, 2017 (Unaudited)
(Amounts in thousands)
| | | | | | | | |
| SHARES | | | SECURITY DESCRIPTION | | VALUE($) | |
| | Long Positions — 99.1% | |
| | Common Stocks — 93.5% | |
| | | | Consumer Discretionary — 16.8% | |
| | | | Auto Components — 0.4% | |
| | 12 | | | Delphi Automotive plc | | | 979 | |
| | | | | | | | |
| | | | Hotels, Restaurants & Leisure — 3.5% | |
| | 21 | | | Hilton Worldwide Holdings, Inc. | | | 1,220 | |
| | 3 | | | McDonald’s Corp. | | | 364 | |
| | 23 | | | Royal Caribbean Cruises Ltd. | | | 2,451 | |
| | 63 | | | Starbucks Corp. | | | 3,754 | |
| | 7 | | | Yum Brands, Inc. | | | 486 | |
| | | | | | | | |
| | | | | | | 8,275 | |
| | | | | | | | |
| | | | Household Durables — 1.0% | |
| | 11 | | | DR Horton, Inc. | | | 346 | |
| | 35 | | | MDC Holdings, Inc. | | | 1,093 | |
| | 37 | | | PulteGroup, Inc. | | | 838 | |
| | | | | | | | |
| | | | | | | 2,277 | |
| | | | | | | | |
| | | | Internet & Direct Marketing Retail — 1.1% | |
| | 3 | | | Amazon.com, Inc. (a) | | | 2,620 | |
| | | | | | | | |
| | | | Media — 5.6% | |
| | 5 | | | Charter Communications, Inc., Class A (a) | | | 1,719 | |
| | 48 | | | Comcast Corp., Class A | | | 1,881 | |
| | 17 | | | DISH Network Corp., Class A (a) | | | 1,117 | |
| | 141 | | | Sirius XM Holdings, Inc. | | | 697 | |
| | 94 | | | Twenty-First Century Fox, Inc., Class B | | | 2,807 | |
| | 43 | | | Walt Disney Co. (The) (j) | | | 4,960 | |
| | | | | | | | |
| | | | | | | 13,181 | |
| | | | | | | | |
| | | | Multiline Retail — 0.2% | |
| | 13 | | | Macy’s, Inc. | | | 372 | |
| | | | | | | | |
| | | | Specialty Retail — 4.3% | |
| | 11 | | | Best Buy Co., Inc. (j) | | | 551 | |
| | 19 | | | Home Depot, Inc. (The) | | | 2,910 | |
| | 32 | | | Lowe’s Cos., Inc. | | | 2,756 | |
| | 4 | | | O’Reilly Automotive, Inc. (a) | | | 1,096 | |
| | 37 | | | TJX Cos., Inc. (The) | | | 2,916 | |
| | | | | | | | |
| | | | | | | 10,229 | |
| | | | | | | | |
| | | | Textiles, Apparel & Luxury Goods — 0.7% | |
| | 30 | | | NIKE, Inc., Class B | | | 1,679 | |
| | | | | | | | |
| | | | Total Consumer Discretionary | | | 39,612 | |
| | | | | | | | |
| | | | Consumer Staples — 9.0% | |
| | | | Beverages — 5.1% | |
| | 8 | | | Brown-Forman Corp., Class B | | | 365 | |
| | 21 | | | Constellation Brands, Inc., Class A | | | 3,548 | |
| | 43 | | | Molson Coors Brewing Co., Class B | | | 4,131 | |
| | | | | | | | |
| SHARES | | | SECURITY DESCRIPTION | | VALUE($) | |
| | | | | | | | |
| | | | | | | | |
| | | | Beverages — continued | |
| | 35 | | | PepsiCo, Inc. | | | 3,981 | |
| | | | | | | | |
| | | | | | | 12,025 | |
| | | | | | | | |
| | | | Food & Staples Retailing — 1.4% | |
| | 9 | | | Costco Wholesale Corp. | | | 1,534 | |
| | 21 | | | Walgreens Boots Alliance, Inc. | | | 1,782 | |
| | | | | | | | |
| | | | | | | 3,316 | |
| | | | | | | | |
| | | | Food Products — 1.8% | |
| | 8 | | | Kraft Heinz Co. (The) | | | 694 | |
| | 51 | | | Mondelez International, Inc., Class A | | | 2,278 | |
| | 14 | | | Post Holdings, Inc. (a) | | | 1,152 | |
| | | | | | | | |
| | | | | | | 4,124 | |
| | | | | | | | |
| | | | Personal Products — 0.2% | |
| | 5 | | | Estee Lauder Cos., Inc. (The), Class A | | | 468 | |
| | | | | | | | |
| | | | Tobacco — 0.5% | |
| | 11 | | | Philip Morris International, Inc. (j) | | | 1,167 | |
| | | | | | | | |
| | | | Total Consumer Staples | | | 21,100 | |
| | | | | | | | |
| | | | Energy — 5.4% | |
| | | | Oil, Gas & Consumable Fuels — 5.4% | |
| | 5 | | | Concho Resources, Inc. (a) | | | 661 | |
| | 25 | | | Diamondback Energy, Inc. (a) | | | 2,494 | |
| | 54 | | | EOG Resources, Inc. | | | 5,011 | |
| | 13 | | | Marathon Petroleum Corp. | | | 672 | |
| | 19 | | | Pioneer Natural Resources Co. | | | 3,351 | |
| | 9 | | | Valero Energy Corp. | | | 604 | |
| | | | | | | | |
| | | | Total Energy | | | 12,793 | |
| | | | | | | | |
| | | | Financials — 12.6% | |
| | | | Banks — 3.9% | |
| | 99 | | | Bank of America Corp. (j) | | | 2,316 | |
| | 23 | | | Citigroup, Inc. | | | 1,344 | |
| | 11 | | | Comerica, Inc. | | | 764 | |
| | 10 | | | East West Bancorp, Inc. | | | 554 | |
| | 46 | | | KeyCorp | | | 835 | |
| | 19 | | | PNC Financial Services Group, Inc. (The) | | | 2,303 | |
| | 3 | | | SVB Financial Group (a) | | | 579 | |
| | 11 | | | Wells Fargo & Co. | | | 579 | |
| | | | | | | | |
| | | | | | | 9,274 | |
| | | | | | | | |
| | | | Capital Markets — 3.9% | |
| | 13 | | | Ameriprise Financial, Inc. | | | 1,693 | |
| | 14 | | | Bank of New York Mellon Corp. (The) | | | 635 | |
| | 55 | | | Charles Schwab Corp. (The) | | | 2,130 | |
| | 29 | | | Intercontinental Exchange, Inc. | | | 1,773 | |
SEE NOTES TO FINANCIAL STATEMENTS.
| | | | | | | | |
| | | |
| APRIL 30, 2017 | | J.P. MORGAN SPECIALTY FUNDS | | | | | 15 | |
JPMorgan Research Market Neutral Fund
SCHEDULE OF PORTFOLIO INVESTMENTS
AS OF APRIL 30, 2017 (Unaudited) (continued)
(Amounts in thousands)
| | | | | | | | |
| SHARES | | | SECURITY DESCRIPTION | | VALUE($) | |
| | Long Positions — continued | |
| | Common Stocks — continued | |
| | | | Capital Markets — continued | |
| | 61 | | | Morgan Stanley (j) | | | 2,655 | |
| | 5 | | | State Street Corp. | | | 394 | |
| | | | | | | | |
| | | | | | | 9,280 | |
| | | | | | | | |
| | | | Insurance — 4.8% | |
| | 13 | | | American International Group, Inc. | | | 766 | |
| | 39 | | | Arthur J Gallagher & Co. | | | 2,191 | |
| | 25 | | | Chubb Ltd. (j) | | | 3,429 | |
| | 50 | | | Hartford Financial Services Group, Inc. (The) | | | 2,427 | |
| | 15 | | | Lincoln National Corp. | | | 987 | |
| | 28 | | | MetLife, Inc. | | | 1,445 | |
| | | | | | | | |
| | | | | | | 11,245 | |
| | | | | | | | |
| | | | Total Financials | | | 29,799 | |
| | | | | | | | |
| | | | Health Care — 7.8% | |
| | | | Biotechnology — 2.0% | |
| | 5 | | | Alexion Pharmaceuticals, Inc. (a) | | | 634 | |
| | 6 | | | Biogen, Inc. (a) | | | 1,671 | |
| | 3 | | | BioMarin Pharmaceutical, Inc. (a) | | | 280 | |
| | 11 | | | Celgene Corp. (a) (j) | | | 1,345 | |
| | 7 | | | Vertex Pharmaceuticals, Inc. (a) | | | 779 | |
| | | | | | | | |
| | | | | | | 4,709 | |
| | | | | | | | |
| | | | Health Care Equipment & Supplies — 0.6% | |
| | 40 | | | Boston Scientific Corp. (a) | | | 1,044 | |
| | 3 | | | Zimmer Biomet Holdings, Inc. | | | 342 | |
| | | | | | | | |
| | | | | | | 1,386 | |
| | | | | | | | |
| | | | Health Care Providers & Services — 3.4% | |
| | 5 | | | Aetna, Inc. (j) | | | 686 | |
| | 15 | | | Humana, Inc. | | | 3,381 | |
| | 22 | | | UnitedHealth Group, Inc. | | | 3,911 | |
| | | | | | | | |
| | | | | | | 7,978 | |
| | | | | | | | |
| | | | Life Sciences Tools & Services — 0.2% | |
| | 7 | | | Agilent Technologies, Inc. | | | 366 | |
| | | | | | | | |
| | | | Pharmaceuticals — 1.6% | |
| | 4 | | | Allergan plc | | | 1,089 | |
| | 15 | | | Bristol-Myers Squibb Co. | | | 851 | |
| | 13 | | | Eli Lilly & Co. | | | 1,047 | |
| | 25 | | | Pfizer, Inc. | | | 841 | |
| | | | | | | | |
| | | | | | | 3,828 | |
| | | | | | | | |
| | | | Total Health Care | | | 18,267 | |
| | | | | | | | |
| | | | Industrials — 12.9% | |
| | | | Aerospace & Defense — 1.2% | |
| | 6 | | | General Dynamics Corp. | | | 1,241 | |
| | | | | | | | |
| SHARES | | | SECURITY DESCRIPTION | | VALUE($) | |
| | | | | | | | |
| | | | | | | | |
| | | | Aerospace & Defense — continued | |
| | 3 | | | Huntington Ingalls Industries, Inc. | | | 532 | |
| | 5 | | | L3 Technologies, Inc. | | | 934 | |
| | | | | | | | |
| | | | | | | 2,707 | |
| | | | | | | | |
| | | | Air Freight & Logistics — 0.2% | |
| | 3 | | | FedEx Corp. | | | 527 | |
| | | | | | | | |
| | | | Airlines — 1.2% | |
| | 10 | | | Alaska Air Group, Inc. | | | 890 | |
| | 18 | | | Delta Air Lines, Inc. | | | 796 | |
| | 16 | | | United Continental Holdings, Inc. (a) | | | 1,120 | |
| | | | | | | | |
| | | | | | | 2,806 | |
| | | | | | | | |
| | | | Building Products — 0.2% | |
| | 6 | | | Allegion plc (j) | | | 488 | |
| | | | | | | | |
| | | | Electrical Equipment — 1.3% | |
| | 16 | | | Eaton Corp. plc (j) | | | 1,194 | |
| | 12 | | | Rockwell Automation, Inc. | | | 1,960 | |
| | | | | | | | |
| | | | | | | 3,154 | |
| | | | | | | | |
| | | | Industrial Conglomerates — 1.0% | |
| | 18 | | | Honeywell International, Inc. | | | 2,333 | |
| | | | | | | | |
| | | | Machinery — 2.8% | |
| | 14 | | | Ingersoll-Rand plc | | | 1,270 | |
| | 12 | | | PACCAR, Inc. | | | 832 | |
| | 2 | | | Snap-on, Inc. | | | 311 | |
| | 31 | | | Stanley Black & Decker, Inc. (j) | | | 4,239 | |
| | | | | | | | |
| | | | | | | 6,652 | |
| | | | | | | | |
| | | | Road & Rail — 4.8% | |
| | 24 | | | Canadian Pacific Railway Ltd., (Canada) (j) | | | 3,666 | |
| | 8 | | | Norfolk Southern Corp. | | | 980 | |
| | 60 | | | Union Pacific Corp. | | | 6,770 | |
| | | | | | | | |
| | | | | | | 11,416 | |
| | | | | | | | |
| | | | Trading Companies & Distributors — 0.2% | |
| | 9 | | | HD Supply Holdings, Inc. (a) | | | 355 | |
| | | | | | | | |
| | | | Total Industrials | | | 30,438 | |
| | | | | | | | |
| | | | Information Technology — 14.9% | |
| | | | Electronic Equipment, Instruments & Components — 0.6% | |
| | 19 | | | TE Connectivity Ltd. | | | 1,456 | |
| | | | | | | | |
| | | | Internet Software & Services — 3.4% | |
| | 8 | | | Alphabet, Inc., Class C (a) (j) | | | 6,978 | |
| | 7 | | | Facebook, Inc., Class A (a) | | | 1,023 | |
| | | | | | | | |
| | | | | | | 8,001 | |
| | | | | | | | |
SEE NOTES TO FINANCIAL STATEMENTS.
| | | | | | |
| | | |
| 16 | | | | J.P. MORGAN SPECIALTY FUNDS | | APRIL 30, 2017 |
| | | | | | | | |
| SHARES | | | SECURITY DESCRIPTION | | VALUE($) | |
| | Long Positions — continued | |
| | Common Stocks — continued | |
| | | | IT Services — 3.0% | |
| | 20 | | | Accenture plc, Class A (j) | | | 2,471 | |
| | 17 | | | Fidelity National Information Services, Inc. (j) | | | 1,391 | |
| | 18 | | | Vantiv, Inc., Class A (a) (j) | | | 1,101 | |
| | 10 | | | Visa, Inc., Class A | | | 892 | |
| | 13 | | | WEX, Inc. (a) (j) | | | 1,340 | |
| | | | | | | | |
| | | | | | | 7,195 | |
| | | | | | | | |
| | | | Semiconductors & Semiconductor Equipment — 4.6% | |
| | 18 | | | Analog Devices, Inc. | | | 1,363 | |
| | 17 | | | Broadcom Ltd. (j) | | | 3,652 | |
| | 7 | | | Maxim Integrated Products, Inc. | | | 325 | |
| | 18 | | | Microchip Technology, Inc. | | | 1,383 | |
| | 47 | | | ON Semiconductor Corp. (a) | | | 661 | |
| | 43 | | | Texas Instruments, Inc. | | | 3,386 | |
| | | | | | | | |
| | | | | | | 10,770 | |
| | | | | | | | |
| | | | Software — 2.8% | |
| | 18 | | | Adobe Systems, Inc. (a) (j) | | | 2,395 | |
| | 36 | | | Microsoft Corp. | | | 2,484 | |
| | 4 | | | Mobileye NV (a) | | | 249 | |
| | 28 | | | Snap, Inc., Class A (a) | | | 640 | |
| | 9 | | | Workday, Inc., Class A (a) | | | 824 | |
| | | | | | | | |
| | | | | | | 6,592 | |
| | | | | | | | |
| | | | Technology Hardware, Storage & Peripherals — 0.5% | |
| | 8 | | | Apple, Inc. | | | 1,196 | |
| | | | | | | | |
| | | | Total Information Technology | | | 35,210 | |
| | | | | | | | |
| | | | Materials — 5.7% | |
| | | | Chemicals — 3.8% | |
| | 16 | | | Celanese Corp., Series A | | | 1,431 | |
| | 29 | | | Dow Chemical Co. (The) | | | 1,838 | |
| | 18 | | | Eastman Chemical Co. | | | 1,419 | |
| | 26 | | | EI du Pont de Nemours & Co. | | | 2,035 | |
| | 37 | | | Olin Corp. | | | 1,184 | |
| | 15 | | | Westlake Chemical Corp. | | | 917 | |
| | | | | | | | |
| | | | | | | 8,824 | |
| | | | | | | | |
| | | | Containers & Packaging — 1.5% | |
| | 9 | | | Avery Dennison Corp. | | | 760 | |
| | 18 | | | Crown Holdings, Inc. (a) | | | 996 | |
| | 33 | | | WestRock Co. | | | 1,760 | |
| | | | | | | | |
| | | | | | | 3,516 | |
| | | | | | | | |
| | | | Metals & Mining — 0.4% | |
| | 29 | | | Alcoa Corp. | | | 976 | |
| | | | | | | | |
| | | | Total Materials | | | 13,316 | |
| | | | | | | | |
| | | | | | | | |
| SHARES | | | SECURITY DESCRIPTION | | VALUE($) | |
| | | | | | | | |
| | | | | | | | |
| | | | Real Estate — 1.7% | |
| | | | Equity Real Estate Investment Trusts (REITs) — 1.7% | |
| | 5 | | | AvalonBay Communities, Inc. | | | 1,028 | |
| | 5 | | | Public Storage | | | 982 | |
| | 10 | | | SBA Communications Corp., Class A (a) | | | 1,251 | |
| | 5 | | | SL Green Realty Corp. | | | 506 | |
| | 14 | | | STORE Capital Corp. | | | 339 | |
| | | | | | | | |
| | | | Total Real Estate | | | 4,106 | |
| | | | | | | | |
| | | | Telecommunication Services — 0.5% | |
| | | | Wireless Telecommunication Services — 0.5% | |
| | 18 | | | T-Mobile US, Inc. (a) (j) | | | 1,182 | |
| | | | | | | | |
| | | | Utilities — 6.2% | |
| | | | Electric Utilities — 4.5% | |
| | 31 | | | Edison International | | | 2,441 | |
| | 15 | | | NextEra Energy, Inc. (j) | | | 2,034 | |
| | 45 | | | PG&E Corp. | | | 3,039 | |
| | 18 | | | Pinnacle West Capital Corp. | | | 1,493 | |
| | 33 | | | Xcel Energy, Inc. | | | 1,508 | |
| | | | | | | | |
| | | | | | | 10,515 | |
| | | | | | | | |
| | | | Multi-Utilities — 1.4% | |
| | 14 | | | Ameren Corp. | | | 750 | |
| | 32 | | | CMS Energy Corp. (j) | | | 1,474 | |
| | 45 | | | NiSource, Inc. | | | 1,100 | |
| | | | | | | | |
| | | | | | | 3,324 | |
| | | | | | | | |
| | | | Water Utilities — 0.3% | |
| | 11 | | | American Water Works Co., Inc. | | | 844 | |
| | | | | | | | |
| | | | Total Utilities | | | 14,683 | |
| | | | | | | | |
| | | | Total Common Stocks
(Cost $162,425) | | | 220,506 | |
| | | | | | | | |
| | Short-Term Investments — 5.6% | |
| | | | Investment Company — 5.5% | |
| | 12,873 | | | JPMorgan U.S. Government Money Market Fund, Institutional Class Shares, 0.620% (b) (l) | | | 12,873 | |
| | | | | | | | |
| | |
PRINCIPAL
AMOUNT($) | | | | | | |
| | | | U.S. Treasury Obligation — 0.1% | |
| | 318 | | | U.S. Treasury Bill, 0.970% 03/01/18 (k) (n) | | | 315 | |
| | | | | | | | |
| | | | Total Short-Term Investments
(Cost $13,188) | | | 13,188 | |
| | | | | | | | |
| | | | Total Investments — 99.1%
(Cost $175,613) | | | 233,694 | |
| | | | Other Assets in Excess of
Liabilities — 0.9% | | | 2,066 | |
| | | | | | | | |
| | | | NET ASSETS — 100.0% | | $ | 235,760 | |
| | | | | | | | |
SEE NOTES TO FINANCIAL STATEMENTS.
| | | | | | | | |
| | | |
| APRIL 30, 2017 | | J.P. MORGAN SPECIALTY FUNDS | | | | | 17 | |
JPMorgan Research Market Neutral Fund
SCHEDULE OF PORTFOLIO INVESTMENTS
AS OF APRIL 30, 2017 (Unaudited) (continued)
(Amounts in thousands)
| | | | | | | | |
| SHARES | | | SECURITY DESCRIPTION | | VALUE($) | |
| | Short Positions — 91.8% | |
| | Common Stocks — 91.8% | |
| | | | Consumer Discretionary — 15.3% | |
| | | | Auto Components — 0.6% | |
| | 8 | | | Autoliv, Inc., (Sweden) | | | 807 | |
| | 12 | | | BorgWarner, Inc. | | | 512 | |
| | | | | | | | |
| | | | | | | 1,319 | |
| | | | | | | | |
| | | | Automobiles — 0.7% | |
| | 40 | | | Ford Motor Co. | | | 461 | |
| | 27 | | | General Motors Co. | | | 946 | |
| | 2 | | | Harley-Davidson, Inc. | | | 131 | |
| | | | | | | | |
| | | | | | | 1,538 | |
| | | | | | | | |
| | | | Hotels, Restaurants & Leisure — 2.0% | |
| | 11 | | | Aramark | | | 391 | |
| | 18 | | | Bloomin’ Brands, Inc. | | | 395 | |
| | 8 | | | Brinker International, Inc. | | | 349 | |
| | 4 | | | Cheesecake Factory, Inc. (The) | | | 256 | |
| | 2 | | | Chipotle Mexican Grill, Inc. (a) | | | 1,044 | |
| | 9 | | | Darden Restaurants, Inc. | | | 756 | |
| | 13 | | | Dunkin’ Brands Group, Inc. | | | 737 | |
| | 15 | | | Hyatt Hotels Corp., Class A (a) | | | 838 | |
| | | | | | | | |
| | | | | | | 4,766 | |
| | | | | | | | |
| | | | Household Durables — 0.2% | |
| | 10 | | | Garmin Ltd. | | | 508 | |
| | | | | | | | |
| | | | Internet & Direct Marketing Retail — 1.2% | |
| | 11 | | | Netflix, Inc. (a) | | | 1,679 | |
| | 1 | | | Priceline Group, Inc. (The) (a) | | | 1,108 | |
| | | | | | | | |
| | | | | | | 2,787 | |
| | | | | | | | |
| | | | Leisure Products — 1.1% | |
| | 8 | | | Hasbro, Inc. | | | 763 | |
| | 80 | | | Mattel, Inc. | | | 1,797 | |
| | | | | | | | |
| | | | | | | 2,560 | |
| | | | | | | | |
| | | | Media — 4.6% | |
| | 31 | | | Discovery Communications, Inc., Class A (a) | | | 891 | |
| | 73 | | | Interpublic Group of Cos., Inc. (The) | | | 1,724 | |
| | 127 | | | News Corp., Class A | | | 1,610 | |
| | 40 | | | Omnicom Group, Inc. | | | 3,250 | |
| | 54 | | | Regal Entertainment Group, Class A | | | 1,192 | |
| | 29 | | | Scripps Networks Interactive, Inc., Class A | | | 2,172 | |
| | | | | | | | |
| | | | | | | 10,839 | |
| | | | | | | | |
| | | | Multiline Retail — 2.0% | |
| | 39 | | | Kohl’s Corp. | | | 1,532 | |
| | 18 | | | Nordstrom, Inc. | | | 859 | |
| | 44 | | | Target Corp. | | | 2,441 | |
| | | | | | | | |
| | | | | | | 4,832 | |
| | | | | | | | |
| | | | | | | | |
| SHARES | | | SECURITY DESCRIPTION | | VALUE($) | |
| | | | | | | | |
| | | | | | | | |
| | | | Specialty Retail — 2.0% | |
| | 17 | | | Abercrombie & Fitch Co., Class A | | | 204 | |
| | 107 | | | Ascena Retail Group, Inc. (a) | | | 418 | |
| | 6 | | | AutoNation, Inc. (a) | | | 239 | |
| | 56 | | | Bed Bath & Beyond, Inc. | | | 2,187 | |
| | 22 | | | DSW, Inc., Class A | | | 458 | |
| | 22 | | | Gap, Inc. (The) | | | 576 | |
| | 11 | | | L Brands, Inc. | | | 602 | |
| | | | | | | | |
| | | | | | | 4,684 | |
| | | | | | | | |
| | | | Textiles, Apparel & Luxury Goods — 0.9% | |
| | 7 | | | Lululemon Athletica, Inc. (a) | | | 374 | |
| | 12 | | | Michael Kors Holdings Ltd. (a) | | | 437 | |
| | 3 | | | Ralph Lauren Corp. | | | 234 | |
| | 31 | | | Under Armour, Inc., Class A (a) | | | 656 | |
| | 22 | | | Under Armour, Inc., Class C (a) | | | 435 | |
| | | | | | | | |
| | | | | | | 2,136 | |
| | | | | | | | |
| | | | Total Consumer Discretionary | | | 35,969 | |
| | | | | | | | |
| | | | Consumer Staples — 10.4% | |
| | | | Beverages — 1.5% | |
| | 83 | | | Coca-Cola Co. (The) | | | 3,564 | |
| | | | | | | | |
| | | | Food & Staples Retailing — 2.6% | |
| | 25 | | | CVS Health Corp. | | | 2,062 | |
| | 11 | | | Kroger Co. (The) | | | 338 | |
| | 4 | | | Sysco Corp. | | | 226 | |
| | 13 | | | Wal-Mart Stores, Inc. | | | 940 | |
| | 68 | | | Whole Foods Market, Inc. | | | 2,484 | |
| | | | | | | | |
| | | | | | | 6,050 | |
| | | | | | | | |
| | | | Food Products — 1.9% | |
| | 12 | | | Campbell Soup Co. | | | 685 | |
| | 39 | | | General Mills, Inc. | | | 2,248 | |
| | 24 | | | Kellogg Co. | | | 1,684 | |
| | | | | | | | |
| | | | | | | 4,617 | |
| | | | | | | | |
| | | | Household Products — 3.9% | |
| | 54 | | | Church & Dwight Co., Inc. | | | 2,661 | |
| | 22 | | | Clorox Co. (The) | | | 2,941 | |
| | 5 | | | Colgate-Palmolive Co. | | | 368 | |
| | 38 | | | Procter & Gamble Co. (The) | | | 3,284 | |
| | | | | | | | |
| | | | | | | 9,254 | |
| | | | | | | | |
| | | | Personal Products — 0.2% | |
| | 26 | | | Coty, Inc., Class A | | | 455 | |
| | | | | | | | |
| | | | Tobacco — 0.3% | |
| | 10 | | | Altria Group, Inc. | | | 704 | |
| | | | | | | | |
| | | | Total Consumer Staples | | | 24,644 | |
| | | | | | | | |
SEE NOTES TO FINANCIAL STATEMENTS.
| | | | | | |
| | | |
| 18 | | | | J.P. MORGAN SPECIALTY FUNDS | | APRIL 30, 2017 |
| | | | | | | | |
| SHARES | | | SECURITY DESCRIPTION | | VALUE($) | |
| | Short Positions — continued | |
| | Common Stocks — continued | |
| | | | Energy — 5.6% | |
| | | | Energy Equipment & Services — 1.1% | |
| | 12 | | | Helmerich & Payne, Inc. | | | 734 | |
| | 26 | | | Schlumberger Ltd. | | | 1,916 | |
| | | | | | | | |
| | | | | | | 2,650 | |
| | | | | | | | |
| | | | Oil, Gas & Consumable Fuels — 4.5% | |
| | 18 | | | Chevron Corp. | | | 1,889 | |
| | 16 | | | ConocoPhillips | | | 762 | |
| | 7 | | | Enbridge, Inc., (Canada) | | | 302 | |
| | 62 | | | Exxon Mobil Corp. | | | 5,087 | |
| | 30 | | | Hess Corp. | | | 1,465 | |
| | 37 | | | Marathon Oil Corp. | | | 547 | |
| | 9 | | | Murphy Oil Corp. | | | 241 | |
| | 12 | | | Noble Energy, Inc. | | | 388 | |
| | | | | | | | |
| | | | | | | 10,681 | |
| | | | | | | | |
| | | | Total Energy | | | 13,331 | |
| | | | | | | | |
| | | | Financials — 12.4% | |
| | | | Banks — 4.3% | |
| | 26 | | | Associated Banc-Corp. | | | 645 | |
| | 18 | | | Bank of Hawaii Corp. | | | 1,476 | |
| | 23 | | | First Hawaiian, Inc. | | | 685 | |
| | 48 | | | First Horizon National Corp. | | | 883 | |
| | 45 | | | Fulton Financial Corp. | | | 837 | |
| | 7 | | | M&T Bank Corp. | | | 1,027 | |
| | 71 | | | People’s United Financial, Inc. | | | 1,241 | |
| | 64 | | | US Bancorp | | | 3,281 | |
| | | | | | | | |
| | | | | | | 10,075 | |
| | | | | | | | |
| | | | Capital Markets — 2.6% | |
| | 2 | | | BlackRock, Inc. | | | 654 | |
| | 7 | | | CME Group, Inc. | | | 778 | |
| | 21 | | | Federated Investors, Inc., Class B | | | 553 | |
| | 31 | | | Franklin Resources, Inc. | | | 1,354 | |
| | 2 | | | Goldman Sachs Group, Inc. (The) | | | 358 | |
| | 9 | | | Nasdaq, Inc. | | | 606 | |
| | 13 | | | Northern Trust Corp. | | | 1,161 | |
| | 9 | | | T Rowe Price Group, Inc. | | | 645 | |
| | | | | | | | |
| | | | | | | 6,109 | |
| | | | | | | | |
| | | | Insurance — 5.5% | |
| | 27 | | | Aflac, Inc. | | | 2,007 | |
| | 8 | | | Allstate Corp. (The) | | | 618 | |
| | 3 | | | Aon plc | | | 395 | |
| | 13 | | | Arch Capital Group Ltd. (a) | | | 1,254 | |
| | 11 | | | Axis Capital Holdings Ltd. | | | 705 | |
| | | | | | | | |
| SHARES | | | SECURITY DESCRIPTION | | VALUE($) | |
| | | | | | | | |
| | | | | | | | |
| | | | Insurance — continued | |
| | 9 | | | Principal Financial Group, Inc. | | | 573 | |
| | 30 | | | Progressive Corp. (The) | | | 1,201 | |
| | 5 | | | RenaissanceRe Holdings Ltd., (Bermuda) | | | 697 | |
| | 18 | | | Torchmark Corp. | | | 1,408 | |
| | 16 | | | Travelers Cos., Inc. (The) | | | 1,934 | |
| | 6 | | | Willis Towers Watson plc | | | 849 | |
| | 21 | | | WR Berkley Corp. | | | 1,447 | |
| | | | | | | | |
| | | | | | | 13,088 | |
| | | | | | | | |
| | | | Total Financials | | | 29,272 | |
| | | | | | | | |
| | | | Health Care — 7.5% | |
| | | | Biotechnology — 2.2% | |
| | 39 | | | AbbVie, Inc. | | | 2,544 | |
| | 13 | | | Amgen, Inc. | | | 2,172 | |
| | 1 | | | Regeneron Pharmaceuticals, Inc. (a) | | | 350 | |
| | | | | | | | |
| | | | | | | 5,066 | |
| | | | | | | | |
| | | | Health Care Equipment & Supplies — 2.1% | |
| | 9 | | | Baxter International, Inc. | | | 524 | |
| | 6 | | | Becton Dickinson and Co. | | | 1,178 | |
| | 1 | | | CR Bard, Inc. | | | 338 | |
| | 20 | | | Medtronic plc | | | 1,684 | |
| | 13 | | | Varian Medical Systems, Inc. (a) | | | 1,134 | |
| | | | | | | | |
| | | | | | | 4,858 | |
| | | | | | | | |
| | | | Health Care Providers & Services — 1.9% | |
| | 7 | | | AmerisourceBergen Corp. | | | 566 | |
| | 20 | | | Cardinal Health, Inc. | | | 1,423 | |
| | 18 | | | DaVita, Inc. (a) | | | 1,259 | |
| | 11 | | | Express Scripts Holding Co. (a) | | | 662 | |
| | 2 | | | Laboratory Corp. of America Holdings (a) | | | 280 | |
| | 4 | | | Patterson Cos., Inc. | | | 165 | |
| | 2 | | | Quest Diagnostics, Inc. | | | 179 | |
| | | | | | | | |
| | | | | | | 4,534 | |
| | | | | | | | |
| | | | Pharmaceuticals — 1.3% | |
| | 25 | | | Johnson & Johnson | | | 3,140 | |
| | | | | | | | |
| | | | Total Health Care | | | 17,598 | |
| | | | | | | | |
| | | | Industrials — 12.3% | |
| | | | Aerospace & Defense — 3.5% | |
| | 19 | | | Arconic, Inc. | | | 515 | |
| | 23 | | | Boeing Co. (The) | | | 4,211 | |
| | 11 | | | Lockheed Martin Corp. | | | 2,903 | |
| | 4 | | | Raytheon Co. | | | 559 | |
| | | | | | | | |
| | | | | | | 8,188 | |
| | | | | | | | |
SEE NOTES TO FINANCIAL STATEMENTS.
| | | | | | | | |
| | | |
| APRIL 30, 2017 | | J.P. MORGAN SPECIALTY FUNDS | | | | | 19 | |
JPMorgan Research Market Neutral Fund
SCHEDULE OF PORTFOLIO INVESTMENTS
AS OF APRIL 30, 2017 (Unaudited) (continued)
(Amounts in thousands, except number of Futures contracts)
| | | | | | | | |
| SHARES | | | SECURITY DESCRIPTION | | VALUE($) | |
| | Short Positions — continued | |
| | Common Stocks — continued | |
| | | | Air Freight & Logistics — 1.3% | |
| | 19 | | | CH Robinson Worldwide, Inc. | | | 1,381 | |
| | 16 | | | Expeditors International of Washington, Inc. | | | 869 | |
| | 8 | | | United Parcel Service, Inc., Class B | | | 871 | |
| | | | | | | | |
| | | | | | | 3,121 | |
| | | | | | | | |
| | | | Electrical Equipment — 0.2% | |
| | 9 | | | Emerson Electric Co. | | | 530 | |
| | | | | | | | |
| | | | Industrial Conglomerates — 1.8% | |
| | 16 | | | 3M Co. | | | 3,133 | |
| | 42 | | | General Electric Co. | | | 1,212 | |
| | | | | | | | |
| | | | | | | 4,345 | |
| | | | | | | | |
| | | | Machinery — 1.4% | |
| | 7 | | | AGCO Corp. | | | 416 | |
| | 4 | | | Caterpillar, Inc. | | | 399 | |
| | 9 | | | Donaldson Co., Inc. | | | 421 | |
| | 14 | | | Flowserve Corp. | | | 717 | |
| | 10 | | | Illinois Tool Works, Inc. | | | 1,334 | |
| | | | | | | | |
| | | | | | | 3,287 | |
| | | | | | | | |
| | | | Professional Services — 0.9% | |
| | 11 | | | Equifax, Inc. | | | 1,529 | |
| | 12 | | | Nielsen Holdings plc | | | 506 | |
| | | | | | | | |
| | | | | | | 2,035 | |
| | | | | | | | |
| | | | Road & Rail — 2.4% | |
| | 6 | | | Canadian National Railway Co., (Canada) | | | 455 | |
| | 151 | | | Heartland Express, Inc. | | | 3,037 | |
| | 34 | | | Knight Transportation, Inc. | | | 1,154 | |
| | 33 | | | Werner Enterprises, Inc. | | | 897 | |
| | | | | | | | |
| | | | | | | 5,543 | |
| | | | | | | | |
| | | | Trading Companies & Distributors — 0.8% | |
| | 7 | | | Air Lease Corp. | | | 278 | |
| | 13 | | | Fastenal Co. | | | 565 | |
| | 5 | | | WW Grainger, Inc. | | | 1,041 | |
| | | | | | | | |
| | | | | | | 1,884 | |
| | | | | | | | |
| | | | Total Industrials | | | 28,933 | |
| | | | | | | | |
| | | | Information Technology — 11.5% | |
| | | | Communications Equipment — 1.8% | | | | |
| | 71 | | | Cisco Systems, Inc. | | | 2,428 | |
| | 59 | | | Juniper Networks, Inc. | | | 1,759 | |
| | | | | | | | |
| | | | | | | 4,187 | |
| | | | | | | | |
| | | | Electronic Equipment, Instruments & Components — 0.4% | |
| | 12 | | | Amphenol Corp., Class A | | | 889 | |
| | | | | | | | |
| | | | | | | | |
| SHARES | | | SECURITY DESCRIPTION | | VALUE($) | |
| | | | | | | | |
| | | | | | | | |
| | | | Internet Software & Services — 1.7% | |
| | 55 | | | eBay, Inc. (a) | | | 1,838 | |
| | 15 | | | GrubHub, Inc. (a) | | | 653 | |
| | 92 | | | Twitter, Inc. (a) | | | 1,518 | |
| | | | | | | | |
| | | | | | | 4,009 | |
| | | | | | | | |
| | | | IT Services — 0.8% | |
| | 3 | | | Alliance Data Systems Corp. | | | 749 | |
| | 3 | | | International Business Machines Corp. | | | 459 | |
| | 15 | | | PayPal Holdings, Inc. (a) | | | 692 | |
| | | | | | | | |
| | | | | | | 1,900 | |
| | | | | | | | |
| | | | Semiconductors & Semiconductor Equipment — 4.5% | |
| | 13 | | | Applied Materials, Inc. | | | 532 | |
| | 139 | | | Intel Corp. | | | 5,007 | |
| | 2 | | | KLA-Tencor Corp. | | | 197 | |
| | 2 | | | Lam Research Corp. | | | 319 | |
| | 7 | | | Qorvo, Inc. (a) | | | 469 | |
| | 19 | | | QUALCOMM, Inc. | | | 1,021 | |
| | 3 | | | Skyworks Solutions, Inc. | | | 249 | |
| | 55 | | | Taiwan Semiconductor Manufacturing Co. Ltd., (Taiwan), ADR | | | 1,829 | |
| | 17 | | | Xilinx, Inc. | | | 1,079 | |
| | | | | | | | |
| | | | | | | 10,702 | |
| | | | | | | | |
| | | | Software — 1.6% | |
| | 2 | | | Intuit, Inc. | | | 238 | |
| | 28 | | | Oracle Corp. | | | 1,264 | |
| | 17 | | | salesforce.com, Inc. (a) | | | 1,472 | |
| | 7 | | | SAP SE, (Germany), ADR | | | 672 | |
| | | | | | | | |
| | | | | | | 3,646 | |
| | | | | | | | |
| | | | Technology Hardware, Storage & Peripherals — 0.7% | |
| | 11 | | | NetApp, Inc. | | | 423 | |
| | 31 | | | Seagate Technology plc | | | 1,293 | |
| | | | | | | | |
| | | | | | | 1,716 | |
| | | | | | | | |
| | | | Total Information Technology | | | 27,049 | |
| | | | | | | | |
| | | | Materials — 5.5% | |
| | | | Chemicals — 3.9% | |
| | 10 | | | Air Products & Chemicals, Inc. | | | 1,405 | |
| | 11 | | | CF Industries Holdings, Inc. | | | 286 | |
| | 5 | | | Ecolab, Inc. | | | 594 | |
| | 44 | | | LyondellBasell Industries NV, Class A | | | 3,746 | |
| | 5 | | | PPG Industries, Inc. | | | 527 | |
| | 13 | | | Praxair, Inc. | | | 1,625 | |
| | 3 | | | Sherwin-Williams Co. (The) | | | 971 | |
| | | | | | | | |
| | | | | | | 9,154 | |
| | | | | | | | |
SEE NOTES TO FINANCIAL STATEMENTS.
| | | | | | |
| | | |
| 20 | | | | J.P. MORGAN SPECIALTY FUNDS | | APRIL 30, 2017 |
| | | | | | | | |
| SHARES | | | SECURITY DESCRIPTION | | VALUE($) | |
| | Short Positions — continued | |
| | Common Stocks — continued | |
| | | | Containers & Packaging — 0.7% | |
| | 10 | | | AptarGroup, Inc. | | | 795 | |
| | 5 | | | Bemis Co., Inc. | | | 243 | |
| | 12 | | | Sonoco Products Co. | | | 633 | |
| | | | | | | | |
| | | | | | | 1,671 | |
| | | | | | | | |
| | | | Metals & Mining — 0.4% | |
| | 15 | | | Compass Minerals International, Inc. | | | 990 | |
| | | | | | | | |
| | | | Paper & Forest Products — 0.5% | |
| | 27 | | | Domtar Corp. | | | 1,082 | |
| | | | | | | | |
| | | | Total Materials | | | 12,897 | |
| | | | | | | | |
| | | | Real Estate — 2.2% | |
| | | | Equity Real Estate Investment Trusts (REITs) — 2.2% | |
| | 68 | | | CBL & Associates Properties, Inc. | | | 627 | |
| | 8 | | | Crown Castle International Corp. | | | 766 | |
| | 3 | | | Federal Realty Investment Trust | | | 367 | |
| | 18 | | | Healthcare Trust of America, Inc., Class A | | | 564 | |
| | 26 | | | Pennsylvania REIT | | | 355 | |
| | 4 | | | Taubman Centers, Inc. | | | 231 | |
| | 7 | | | Ventas, Inc. | | | 468 | |
| | 47 | | | Washington Prime Group, Inc. | | | 411 | |
| | 21 | | | Welltower, Inc. | | | 1,481 | |
| | | | | | | | |
| | | | Total Real Estate | | | 5,270 | |
| | | | | | | | |
| | | | Telecommunication Services — 2.3% | |
| | | | Diversified Telecommunication Services — 2.3% | |
| | 52 | | | AT&T, Inc. | | | 2,064 | |
| | 73 | | | Verizon Communications, Inc. | | | 3,336 | |
| | | | | | | | |
| | | | Total Telecommunication Services | | | 5,400 | |
| | | | | | | | |
| | | | | | | | |
| SHARES | | | SECURITY DESCRIPTION | | VALUE($) | |
| | | | | | | | |
| | | | | | | | |
| | | | Utilities — 6.8% | |
| | | | Electric Utilities — 2.8% | |
| | 14 | | | Eversource Energy | | | 820 | |
| | 116 | | | Southern Co. (The) | | | 5,777 | |
| | | | | | | | |
| | | | | | | 6,597 | |
| | | | | | | | |
| | | | Gas Utilities — 0.3% | |
| | 4 | | | National Fuel Gas Co. | | | 222 | |
| | 9 | | | UGI Corp. | | | 446 | |
| | | | | | | | |
| | | | | | | 668 | |
| | | | | | | | |
| | | | Multi-Utilities — 3.6% | |
| | 20 | | | Consolidated Edison, Inc. | | | 1,617 | |
| | 43 | | | Dominion Resources, Inc. | | | 3,329 | |
| | 34 | | | SCANA Corp. | | | 2,255 | |
| | 21 | | | WEC Energy Group, Inc. | | | 1,283 | |
| | | | | | | | |
| | | | | | | 8,484 | |
| | | | | | | | |
| | | | Water Utilities — 0.1% | |
| | 9 | | | Aqua America, Inc. | | | 291 | |
| | | | | | | | |
| | | | Total Utilities | | | 16,040 | |
| | | | | | | | |
| | | | Total Securities Sold Short
(Proceeds $215,587) | | $ | 216,403 | |
| | | | | | | | |
Percentages indicated are based on net assets.
| | | | | | | | | | | | | | | | | | | | |
| Futures Contracts | |
NUMBER OF
CONTRACTS | | | DESCRIPTION | | EXPIRATION
DATE | | | TRADING
CURRENCY | | | NOTIONAL
VALUE AT
APRIL 30, 2017 | | | NET
UNREALIZED
APPRECIATION
(DEPRECIATION) | |
| | | | Short Futures Outstanding | |
| | (37 | ) | | E-mini S&P 500 | | | 06/16/17 | | | | USD | | | $ | (4,404 | ) | | $ | (18 | ) |
| | | | | | | | | | | | | | | | | | | | |
SEE NOTES TO FINANCIAL STATEMENTS.
| | | | | | | | |
| | | |
| APRIL 30, 2017 | | J.P. MORGAN SPECIALTY FUNDS | | | | | 21 | |
J.P. Morgan Specialty Funds
NOTES TO SCHEDULES OF PORTFOLIO INVESTMENTS
AS OF APRIL 30, 2017 (Unaudited)
| | |
| ADR | | — American Depositary Receipt |
| REIT | | — Real Estate Investment Trust |
| USD | | — United States Dollar |
| |
| (a) | | — Non-income producing security. |
| (b) | | — Investment in affiliate. Money market fund is registered under the Investment Company Act of 1940, as amended, and advised by J.P. Morgan Investment Management Inc. |
| (g) | | — Amount rounds to less than 0.05%. |
| (h) | | — Amount rounds to less than 500. |
| | |
| (j) | | — All or a portion of this security is segregated as collateral for short sales. The total values of securities segregated as collateral for JPMorgan Opportunistic Equity Long/Short Fund and JPMorgan Research Market Neutral Fund were approximately $34,302,000 and $39,842,000, respectively. |
| (k) | | — All or a portion of this security is deposited with the broker as initial margin for future contracts. |
| (l) | | — The rate shown is the current yield as of April 30, 2017. |
| (n) | | — The rate shown is the effective yield as of April 30, 2017. |
SEE NOTES TO FINANCIAL STATEMENTS.
| | | | | | |
| | | |
| 22 | | | | J.P. MORGAN SPECIALTY FUNDS | | APRIL 30, 2017 |
THIS PAGE IS INTENTIONALLY LEFT BLANK
| | | | | | | | |
| | | |
| APRIL 30, 2017 | | J.P. MORGAN SPECIALTY FUNDS | | | | | 23 | |
STATEMENTS OF ASSETS AND LIABILITIES
AS OF APRIL 30, 2017
(Amounts in thousands, except per share amounts)
| | | | | | | | |
| | | Opportunistic
Equity Long/Short
Fund | | | Research
Market
Neutral Fund | |
ASSETS: | | | | | | | | |
Investments in non-affiliates, at value | | $ | 183,916 | | | $ | 220,821 | |
Investments in affiliates, at value | | | 6,842 | | | | 12,873 | |
| | | | | | | | |
Total investment securities, at value | | | 190,758 | | | | 233,694 | |
Deposits at broker for securities sold short | | | 58,414 | | | | 216,740 | |
Restricted cash for securities sold short | | | — | | | | 3 | |
Receivables: | | | | | | | | |
Investment securities sold | | | 30,360 | | | | 5,396 | |
Fund shares sold | | | 152 | | | | 131 | |
Dividends from non-affiliates | | | 79 | | | | 258 | |
Dividends from affiliates | | | 12 | | | | 6 | |
Variation margin on futures contracts | | | — | | | | 10 | |
| | | | | | | | |
Total Assets | | | 279,775 | | | | 456,238 | |
| | | | | | | | |
| | |
LIABILITIES: | | | | | | | | |
Payables: | | | | | | | | |
Due to custodian | | | 35 | | | | 108 | |
Securities sold short, at value | | | 66,087 | | | | 216,403 | |
Dividend expense to non-affiliates on securities sold short | | | 87 | | | | 239 | |
Investment securities purchased | | | 20,767 | | | | 3,348 | |
Fund shares redeemed | | | 28 | | | | 108 | |
Accrued liabilities: | | | | | | | | |
Investment advisory fees | | | 170 | | | | 123 | |
Administration fees | | | 5 | | | | — | |
Distribution fees | | | 11 | | | | 12 | |
Service fees | | | 36 | | | | 28 | |
Custodian and accounting fees | | | 10 | | | | 11 | |
Trustees’ and Chief Compliance Officer’s fees | | | — | (a) | | | — | |
Other | | | 74 | | | | 98 | |
| | | | | | | | |
Total Liabilities | | | 87,310 | | | | 220,478 | |
| | | | | | | | |
Net Assets | | $ | 192,465 | | | $ | 235,760 | |
| | | | | | | | |
| (a) | Amount rounds to less than 500. |
SEE NOTES TO FINANCIAL STATEMENTS.
| | | | | | |
| | | |
| 24 | | | | J.P. MORGAN SPECIALTY FUNDS | | APRIL 30, 2017 |
| | | | | | | | |
| | | Opportunistic
Equity Long/Short
Fund | | | Research
Market
Neutral Fund | |
NET ASSETS: | | | | | | | | |
Paid-in-Capital | | $ | 175,591 | | | $ | 247,969 | |
Accumulated undistributed (distributions in excess of) net investment income | | | (2,084 | ) | | | (8,510 | ) |
Accumulated net realized gains (losses) | | | 1,836 | | | | (60,946 | ) |
Net unrealized appreciation (depreciation) | | | 17,122 | | | | 57,247 | |
| | | | | | | | |
Total Net Assets | | $ | 192,465 | | | $ | 235,760 | |
| | | | | | | | |
| | |
Net Assets: | | | | | | | | |
Class A | | $ | 46,697 | | | $ | 19,585 | |
Class C | | | 2,868 | | | | 12,419 | |
Class I (formerly Select Class) | | | 134,635 | | | | 43,948 | |
Class L (formerly Institutional Class) | | | — | | | | 159,808 | |
Class R2 | | | 22 | | | | — | |
Class R5 | | | 23 | | | | — | |
Class R6 | | | 8,220 | | | | — | |
| | | | | | | | |
Total | | $ | 192,465 | | | $ | 235,760 | |
| | | | | | | | |
| | |
Outstanding units of beneficial interest (shares) | | | | | | | | |
($0.0001 par value; unlimited number of shares authorized): | | | | | | | | |
Class A | | | 2,568 | | | | 1,360 | |
Class C | | | 160 | | | | 916 | |
Class I (formerly Select Class) | | | 7,353 | | | | 2,936 | |
Class L (formerly Institutional Class) | | | — | | | | 10,489 | |
Class R2 | | | 1 | | | | — | |
Class R5 | | | 1 | | | | — | |
Class R6 | | | 446 | | | | — | |
| | |
Net Asset Value (a): | | | | | | | | |
Class A — Redemption price per share | | $ | 18.19 | | | $ | 14.40 | |
Class C — Offering price per share (b) | | | 17.95 | | | | 13.55 | |
Class I (formerly Select Class) — Offering and redemption price per share | | | 18.31 | | | | 14.97 | |
Class L (formerly Institutional Class) — Offering and redemption price per share | | | — | | | | 15.24 | |
Class R2 — Offering and redemption price per share | | | 18.07 | | | | — | |
Class R5 — Offering and redemption price per share | | | 18.41 | | | | — | |
Class R6 — Offering and redemption price per share | | | 18.43 | | | | — | |
Class A maximum sales charge | | | 5.25 | % | | | 5.25 | % |
Class A maximum public offering price per share
[net asset value per share/(100% — maximum sales charge)] | | $ | 19.20 | | | $ | 15.20 | |
| | | | | | | | |
| | |
Cost of investments in non-affiliates | | $ | 167,760 | | | $ | 162,740 | |
Cost of investments in affiliates | | | 6,842 | | | | 12,873 | |
Proceeds from securities sold short | | | 67,053 | | | | 215,587 | |
| (a) | Per share amounts may not recalculate due to rounding of net assets and/or shares outstanding. |
| (b) | Redemption price for Class C Shares varies based upon length of time the shares are held. |
SEE NOTES TO FINANCIAL STATEMENTS.
| | | | | | | | |
| | | |
| APRIL 30, 2017 | | J.P. MORGAN SPECIALTY FUNDS | | | | | 25 | |
STATEMENTS OF OPERATIONS
For the Six Months Ended April 30, 2017 (Unaudited)
(Amounts in thousands)
| | | | | | | | |
| | | Opportunistic
Equity Long/Short
Fund | | | Research
Market
Neutral Fund | |
INVESTMENT INCOME: | | | | | | | | |
Interest income from non-affiliates | | $ | — | | | $ | 1 | |
Interest income from affiliates | | | — | (a) | | | — | (a) |
Interest income to non-affiliates on securities sold short | | | 136 | | | | 548 | |
Dividend income from non-affiliates | | | 928 | | | | 2,315 | |
Dividend income from affiliates | | | 90 | | | | 35 | |
Foreign taxes withheld | | | — | (a) | | | 1 | |
| | | | | | | | |
Total investment income | | | 1,154 | | | | 2,900 | |
| | | | | | | | |
| | |
EXPENSES: | | | | | | | | |
Investment advisory fees | | | 1,198 | | | | 1,169 | |
Administration fees | | | 82 | | | | 120 | |
Distribution fees: | | | | | | | | |
Class A | | | 55 | | | | 27 | |
Class C | | | 11 | | | | 50 | |
Class R2 | | | — | (a) | | | — | |
Service fees: | | | | | | | | |
Class A | | | 55 | | | | 27 | |
Class C | | | 3 | | | | 17 | |
Class I (formerly Select Class) | | | 181 | | | | 60 | |
Class L (formerly Institutional Class) | | | — | | | | 105 | |
Class R2 | | | — | (a) | | | — | |
Class R5 | | | — | (a) | | | — | |
Custodian and accounting fees | | | 29 | | | | 15 | |
Interest expense to affiliates | | | 1 | | | | 6 | |
Professional fees | | | 44 | | | | 31 | |
Interest expense to non-affiliates | | | — | | | | 1 | |
Trustees’ and Chief Compliance Officer’s fees | | | 13 | | | | 13 | |
Printing and mailing costs | | | 18 | | | | 32 | |
Registration and filing fees | | | 48 | | | | 22 | |
Transfer agency fees (See Note 2.F.) | | | 3 | | | | 9 | |
Sub-transfer agency fees (See Note 2.F.) | | | 28 | | | | 47 | |
Other | | | 6 | | | | 3 | |
Dividend expense to non-affiliates on securities sold short | | | 529 | | | | 3,560 | |
| | | | | | | | |
Total expenses | | | 2,304 | | | | 5,314 | |
| | | | | | | | |
Less fees waived | | | (164 | ) | | | (387 | ) |
Less expense reimbursements | | | — | (a) | | | — | |
| | | | | | | | |
Net expenses | | | 2,140 | | | | 4,927 | |
| | | | | | | | |
Net investment income (loss) | | | (986 | ) | | | (2,027 | ) |
| | | | | | | | |
| | |
REALIZED/UNREALIZED GAINS (LOSSES): | | | | | | | | |
Net realized gain (loss) on transactions from: | | | | | | | | |
Investments in non-affiliates | | | 10,611 | | | | 50,067 | |
Futures | | | — | | | | (457 | ) |
Securities sold short | | | (5,455 | ) | | | (19,759 | ) |
| | | | | | | | |
Net realized gain (loss) | | | 5,156 | | | | 29,851 | |
| | | | | | | | |
Change in net unrealized appreciation/depreciation on: | | | | | | | | |
Investments in non-affiliates | | | 7,966 | | | | (10,887 | ) |
Futures | | | — | | | | (66 | ) |
Securities sold short | | | (146 | ) | | | (5,150 | ) |
| | | | | | | | |
Change in net unrealized appreciation/depreciation | | | 7,820 | | | | (16,103 | ) |
| | | | | | | | |
Net realized/unrealized gains (losses) | | | 12,976 | | | | 13,748 | |
| | | | | | | | |
Change in net assets resulting from operations | | $ | 11,990 | | | $ | 11,721 | |
| | | | | | | | |
| (a) | Amount rounds to less than 500. |
SEE NOTES TO FINANCIAL STATEMENTS.
| | | | | | |
| | | |
| 26 | | | | J.P. MORGAN SPECIALTY FUNDS | | APRIL 30, 2017 |
STATEMENTS OF CHANGES IN NET ASSETS
FOR THE PERIODS INDICATED
(Amounts in thousands)
| | | | | | | | | | | | | | | | |
| | | Opportunistic Equity Long/Short Fund | | | Research Market Neutral Fund | |
| | | Six Months Ended
April 30, 2017
(Unaudited) | | | Year Ended
October 31, 2016 | | | Six Months Ended
April 30, 2017
(Unaudited) | | | Year Ended
October 31, 2016 | |
CHANGE IN NET ASSETS RESULTING FROM OPERATIONS: | | | | | | | | | | | | | | | | |
Net investment income (loss) | | $ | (986 | ) | | $ | (1,625 | ) | | $ | (2,027 | ) | | $ | (8,226 | ) |
Net realized gain (loss) | | | 5,156 | | | | (760 | ) | | | 29,851 | | | | 19,177 | |
Change in net unrealized appreciation/depreciation | | | 7,820 | | | | 2,877 | | | | (16,103 | ) | | | (27,397 | ) |
| | | | | | | | | | | | | | | | |
Change in net assets resulting from operations | | | 11,990 | | | | 492 | | | | 11,721 | | | | (16,446 | ) |
| | | | | | | | | | | | | | | | |
| | | | |
DISTRIBUTIONS TO SHAREHOLDERS: | | | | | | | | | | | | | | | | |
Class A | | | | | | | | | | | | | | | | |
From net realized gains | | | — | | | | (567 | ) | | | — | | | | — | |
Class C | | | | | | | | | | | | | | | | |
From net realized gains | | | — | | | | (18 | ) | | | — | | | | — | |
Class I (formerly Select Class) | | | | | | | | | | | | | | | | |
From net realized gains | | | — | | | | (1,173 | ) | | | — | | | | — | |
Class R2 | | | | | | | | | | | | | | | | |
From net realized gains | | | — | | | | — | (a) | | | — | | | | — | |
Class R5 | | | | | | | | | | | | | | | | |
From net realized gains | | | — | | | | — | (a) | | | — | | | | — | |
Class R6 | | | | | | | | | | | | | | | | |
From net realized gains | | | — | | | | — | (a) | | | — | | | | — | |
| | | | | | | | | | | | | | | | |
Total distributions to shareholders | | | — | | | | (1,758 | ) | | | — | | | | — | |
| | | | | | | | | | | | | | | | |
| | | | |
CAPITAL TRANSACTIONS: | | | | | | | | | | | | | | | | |
Change in net assets resulting from capital transactions | | | (33,159 | ) | | | 67,443 | | | | (123,312 | ) | | | (293,232 | ) |
| | | | | | | | | | | | | | | | |
| | | | |
NET ASSETS: | | | | | | | | | | | | | | | | |
Change in net assets | | | (21,169 | ) | | | 66,177 | | | | (111,591 | ) | | | (309,678 | ) |
Beginning of period | | | 213,634 | | | | 147,457 | | | | 347,351 | | | | 657,029 | |
| | | | | | | | | | | | | | | | |
End of period | | $ | 192,465 | | | $ | 213,634 | | | $ | 235,760 | | | $ | 347,351 | |
| | | | | | | | | | | | | | | | |
Accumulated undistributed (distributions in excess of) net investment income | | $ | (2,084 | ) | | $ | (1,098 | ) | | $ | (8,510 | ) | | $ | (6,483 | ) |
| | | | | | | | | | | | | | | | |
| (a) | Amount rounds to less than 500. |
SEE NOTES TO FINANCIAL STATEMENTS.
| | | | | | | | |
| | | |
| APRIL 30, 2017 | | J.P. MORGAN SPECIALTY FUNDS | | | | | 27 | |
STATEMENTS OF CHANGES IN NET ASSETS
FOR THE PERIODS INDICATED (continued)
(Amounts in thousands)
| | | | | | | | | | | | | | | | |
| | | Opportunistic Equity Long/Short Fund | | | Research Market Neutral Fund | |
| | | Six Months Ended
April 30, 2017
(Unaudited) | | | Year Ended
October 31, 2016 | | | Six Months Ended
April 30, 2017
(Unaudited) | | | Year Ended
October 31, 2016 | |
CAPITAL TRANSACTIONS: | | | | | | | | | | | | | | | | |
Class A | | | | | | | | | | | | | | | | |
Proceeds from shares issued | | $ | 10,030 | | | $ | 64,846 | | | $ | 971 | | | $ | 11,078 | |
Distributions reinvested | | | — | | | | 567 | | | | — | | | | — | |
Cost of shares redeemed | | | (9,365 | ) | | | (51,340 | ) | | | (7,621 | ) | | | (46,582 | ) |
| | | | | | | | | | | | | | | | |
Change in net assets resulting from Class A capital transactions | | $ | 665 | | | $ | 14,073 | | | $ | (6,650 | ) | | $ | (35,504 | ) |
| | | | | | | | | | | | | | | | |
Class C | | | | | | | | | | | | | | | | |
Proceeds from shares issued | | $ | 196 | | | $ | 3,353 | | | $ | 154 | | | $ | 674 | |
Distributions reinvested | | | — | | | | 18 | | | | — | | | | — | |
Cost of shares redeemed | | | (766 | ) | | | (916 | ) | | | (3,232 | ) | | | (8,689 | ) |
| | | | | | | | | | | | | | | | |
Change in net assets resulting from Class C capital transactions | | $ | (570 | ) | | $ | 2,455 | | | $ | (3,078 | ) | | $ | (8,015 | ) |
| | | | | | | | | | | | | | | | |
Class I (formerly Select Class) | | | | | | | | | | | | | | | | |
Proceeds from shares issued | | $ | 11,492 | | | $ | 101,558 | | | $ | 2,834 | | | $ | 8,216 | |
Distributions reinvested | | | — | | | | 1,148 | | | | — | | | | — | |
Cost of shares redeemed | | | (44,013 | ) | | | (59,796 | ) | | | (14,064 | ) | | | (288,879 | ) |
| | | | | | | | | | | | | | | | |
Change in net assets resulting from Class I capital transactions | | $ | (32,521 | ) | | $ | 42,910 | | | $ | (11,230 | ) | | $ | (280,663 | ) |
| | | | | | | | | | | | | | | | |
Class L (formerly Institutional Class) | | | | | | | | | | | | | | | | |
Proceeds from shares issued | | $ | — | | | $ | — | | | $ | 9,424 | | | $ | 303,966 | |
Cost of shares redeemed | | | — | | | | — | | | | (111,778 | ) | | | (273,016 | ) |
| | | | | | | | | | | | | | | | |
Change in net assets resulting from Class L capital transactions | | $ | — | | | $ | — | | | $ | (102,354 | ) | | $ | 30,950 | |
| | | | | | | | | | | | | | | | |
Class R2 | | | | | | | | | | | | | | | | |
Distributions reinvested | | $ | — | | | $ | — | (a) | | $ | — | | | $ | — | |
| | | | | | | | | | | | | | | | |
Change in net assets resulting from Class R2 capital transactions | | $ | — | | | $ | — | (a) | | $ | — | | | $ | — | |
| | | | | | | | | | | | | | | | |
Class R5 | | | | | | | | | | | | | | | | |
Distributions reinvested | | $ | — | | | $ | — | (a) | | $ | — | | | $ | — | |
| | | | | | | | | | | | | | | | |
Change in net assets resulting from Class R5 capital transactions | | $ | — | | | $ | — | (a) | | $ | — | | | $ | — | |
| | | | | | | | | | | | | | | | |
Class R6 | | | | | | | | | | | | | | | | |
Proceeds from shares issued | | $ | 227 | | | $ | 9,490 | | | $ | — | | | $ | — | |
Distributions reinvested | | | — | | | | — | (a) | | | — | | | | — | |
Cost of shares redeemed | | | (960 | ) | | | (1,485 | ) | | | — | | | | — | |
| | | | | | | | | | | | | | | | |
Change in net assets resulting from Class R6 capital transactions | | $ | (733 | ) | | $ | 8,005 | | | $ | — | | | $ | — | |
| | | | | | | | | | | | | | | | |
Total change in net assets resulting from capital transactions | | $ | (33,159 | ) | | $ | 67,443 | | | $ | (123,312 | ) | | $ | (293,232 | ) |
| | | | | | | | | | | | | | | | |
| (a) | Amount rounds to less than 500. |
SEE NOTES TO FINANCIAL STATEMENTS.
| | | | | | |
| | | |
| 28 | | | | J.P. MORGAN SPECIALTY FUNDS | | APRIL 30, 2017 |
| | | | | | | | | | | | | | | | |
| | | Opportunistic Equity Long/Short Fund | | | Research Market Neutral Fund | |
| | | Six Months Ended
April 30, 2017
(Unaudited) | | | Year Ended
October 31, 2016 | | | Six Months Ended
April 30, 2017
(Unaudited) | | | Year Ended
October 31, 2016 | |
SHARE TRANSACTIONS: | | | | | | | | | | | | | | | | |
Class A | | | | | | | | | | | | | | | | |
Issued | | | 577 | | | | 3,830 | | | | 68 | | | | 789 | |
Reinvested | | | — | | | | 34 | | | | — | | | | — | |
Redeemed | | | (538 | ) | | | (3,089 | ) | | | (543 | ) | | | (3,369 | ) |
| | | | | | | | | | | | | | | | |
Change in Class A Shares | | | 39 | | | | 775 | | | | (475 | ) | | | (2,580 | ) |
| | | | | | | | | | | | | | | | |
Class C | | | | | | | | | | | | | | | | |
Issued | | | 12 | | | | 199 | | | | 11 | | | | 51 | |
Reinvested | | | — | | | | 1 | | | | — | | | | — | |
Redeemed | | | (45 | ) | | | (55 | ) | | | (244 | ) | | | (663 | ) |
| | | | | | | | | | | | | | | | |
Change in Class C Shares | | | (33 | ) | | | 145 | | | | (233 | ) | | | (612 | ) |
| | | | | | | | | | | | | | | | |
Class I (formerly Select Class) | | | | | | | | | | | | | | | | |
Issued | | | 655 | | | | 6,047 | | | | 194 | | | | 570 | |
Reinvested | | | — | | | | 68 | | | | — | | | | — | |
Redeemed | | | (2,515 | ) | | | (3,566 | ) | | | (961 | ) | | | (19,768 | ) |
| | | | | | | | | | | | | | | | |
Change in Class I Shares | | | (1,860 | ) | | | 2,549 | | | | (767 | ) | | | (19,198 | ) |
| | | | | | | | | | | | | | | | |
Class L (formerly Institutional Class) | | | | | | | | | | | | | | | | |
Issued | | | — | | | | — | | | | 634 | | | | 20,509 | |
Redeemed | | | — | | | | — | | | | (7,505 | ) | | | (18,650 | ) |
| | | | | | | | | | | | | | | | |
Change in Class L Shares | | | — | | | | — | | | | (6,871 | ) | | | 1,859 | |
| | | | | | | | | | | | | | | | |
Class R2 | | | | | | | | | | | | | | | | |
Reinvested | | | — | | | | — | (a) | | | — | | | | — | |
| | | | | | | | | | | | | | | | |
Change in Class R2 Shares | | | — | | | | — | (a) | | | — | | | | — | |
| | | | | | | | | | | | | | | | |
Class R5 | | | | | | | | | | | | | | | | |
Reinvested | | | — | | | | — | (a) | | | — | | | | — | |
| | | | | | | | | | | | | | | | |
Change in Class R5 Shares | | | — | | | | — | (a) | | | — | | | | — | |
| | | | | | | | | | | | | | | | |
Class R6 | | | | | | | | | | | | | | | | |
Issued | | | 13 | | | | 571 | | | | — | | | | — | |
Reinvested | | | — | | | | — | (a) | | | — | | | | — | |
Redeemed | | | (54 | ) | | | (85 | ) | | | — | | | | — | |
| | | | | | | | | | | | | | | | |
Change in Class R6 Shares | | | (41 | ) | | | 486 | | | | — | | | | — | |
| | | | | | | | | | | | | | | | |
| (a) | Amount rounds to less than 500. |
SEE NOTES TO FINANCIAL STATEMENTS.
| | | | | | | | |
| | | |
| APRIL 30, 2017 | | J.P. MORGAN SPECIALTY FUNDS | | | | | 29 | |
FINANCIAL HIGHLIGHTS
FOR THE PERIODS INDICATED
| | | | | | | | | | | | | | | | | | | | |
| | | Per share operating performance | |
| | | | | | Investment operations | | | Distributions | |
| | | Net asset
value,
beginning
of period | | | Net
investment
income
(loss) (b) | | | Net realized
and unrealized
gains
(losses) on
investments | | | Total from
investment
operations | | | Net
realized
gain | |
Opportunistic Equity Long/Short Fund | |
Class A | |
Six Months Ended April 30, 2017 (Unaudited) | | $ | 17.12 | | | $ | (0.10 | ) | | $ | 1.17 | | | $ | 1.07 | | | $ | — | |
Year Ended October 31, 2016 | | | 17.37 | | | | (0.16 | ) | | | 0.07 | | | | (0.09 | ) | | | (0.16 | ) |
Year Ended October 31, 2015 | | | 15.75 | | | | (0.25 | ) | | | 1.93 | | | | 1.68 | | | | (0.06 | ) |
August 29, 2014 (h) through October 31, 2014 | | | 15.00 | | | | (0.06 | ) | | | 0.81 | | | | 0.75 | | | | — | |
| | | | | |
Class C | | | | | | | | | | | | | | | | | | | | |
Six Months Ended April 30, 2017 (Unaudited) | | | 16.94 | | | | (0.14 | ) | | | 1.15 | | | | 1.01 | | | | — | |
Year Ended October 31, 2016 | | | 17.27 | | | | (0.24 | ) | | | 0.07 | | | | (0.17 | ) | | | (0.16 | ) |
Year Ended October 31, 2015 | | | 15.73 | | | | (0.37 | ) | | | 1.97 | | | | 1.60 | | | | (0.06 | ) |
August 29, 2014 (h) through October 31, 2014 | | | 15.00 | | | | (0.07 | ) | | | 0.80 | | | | 0.73 | | | | — | |
| | | | | |
Class I (formerly Select Class) | | | | | | | | | | | | | | | | | | | | |
Six Months Ended April 30, 2017 (Unaudited) | | | 17.21 | | | | (0.08 | ) | | | 1.18 | | | | 1.10 | | | | — | |
Year Ended October 31, 2016 | | | 17.42 | | | | (0.12 | ) | | | 0.07 | | | | (0.05 | ) | | | (0.16 | ) |
Year Ended October 31, 2015 | | | 15.75 | | | | (0.26 | ) | | | 1.99 | | | | 1.73 | | | | (0.06 | ) |
August 29, 2014 (h) through October 31, 2014 | | | 15.00 | | | | (0.05 | ) | | | 0.80 | | | | 0.75 | | | | — | |
| | | | | |
Class R2 | | | | | | | | | | | | | | | | | | | | |
Six Months Ended April 30, 2017 (Unaudited) | | | 17.03 | | | | (0.12 | ) | | | 1.16 | | | | 1.04 | | | | — | |
Year Ended October 31, 2016 | | | 17.32 | | | | (0.20 | ) | | | 0.07 | | | | (0.13 | ) | | | (0.16 | ) |
Year Ended October 31, 2015 | | | 15.74 | | | | (0.35 | ) | | | 1.99 | | | | 1.64 | | | | (0.06 | ) |
August 29, 2014 (h) through October 31, 2014 | | | 15.00 | | | | (0.06 | ) | | | 0.80 | | | | 0.74 | | | | — | |
| | | | | |
Class R5 | | | | | | | | | | | | | | | | | | | | |
Six Months Ended April 30, 2017 (Unaudited) | | | 17.29 | | | | (0.07 | ) | | | 1.19 | | | | 1.12 | | | | — | |
Year Ended October 31, 2016 | | | 17.47 | | | | (0.08 | ) | | | 0.06 | | | | (0.02 | ) | | | (0.16 | ) |
Year Ended October 31, 2015 | | | 15.76 | | | | (0.23 | ) | | | 2.00 | | | | 1.77 | | | | (0.06 | ) |
August 29, 2014 (h) through October 31, 2014 | | | 15.00 | | | | (0.04 | ) | | | 0.80 | | | | 0.76 | | | | — | |
| | | | | |
Class R6 | | | | | | | | | | | | | | | | | | | | |
Six Months Ended April 30, 2017 (Unaudited) | | | 17.31 | | | | (0.06 | ) | | | 1.18 | | | | 1.12 | | | | — | |
Year Ended October 31, 2016 | | | 17.48 | | | | (0.08 | ) | | | 0.07 | | | | (0.01 | ) | | | (0.16 | ) |
Year Ended October 31, 2015 | | | 15.76 | | | | (0.23 | ) | | | 2.01 | | | | 1.78 | | | | (0.06 | ) |
August 29, 2014 (h) through October 31, 2014 | | | 15.00 | | | | (0.04 | ) | | | 0.80 | | | | 0.76 | | | | — | |
| (a) | Annualized for periods less than one year, unless otherwise noted. |
| (b) | Calculated based upon average shares outstanding. |
| (c) | Not annualized for periods less than one year. |
| (d) | Includes adjustments in accordance with accounting principles generally accepted in the United States of America and as such, the net asset values for financial reporting purposes and the returns based upon those net asset values may differ from the net asset values and returns for shareholder transactions. |
| (e) | The net expenses and expenses without waivers, reimbursements and earnings credits (excluding dividend expense and interest expense for securities sold short) for Class A are 1.80% and 2.00% for the period ended April 30, 2017, 1.80% and 2.07% for the year ended October 31, 2016, 1.81% and 2.20% for the year ended October 31, 2015 and 2.00% and 11.67% for the period ended October 31, 2014; for Class C are 2.31% and 2.50% for the period ended April 30, 2017, 2.29% and 2.52% for the year ended October 31, 2016, 2.39% and 3.18% for the year ended October 31. 2015 and 2.50% and 12.17% for the period ended October 31, 2014; for Class I (formerly Select Class) are 1.55% and 1.71% for the period ended April 30, 2017, 1.54% and 1.71% for the year ended October 31, 2016, 1.66% and 2.20% for the year ended October 31, 2015 and 1.75% and 11.42% for the period ended October 31, 2014; for Class R2 are 2.05% and 2.36% for the period ended April 30, 2017, 2.05% and 4.35% for the year ended October 31, 2016, 2.21% and 4.13% for the year ended October 31, 2015 and 2.25% and 11.92% for the period ended October 31, 2014; for Class R5 are 1.36% and 1.67% for the period ended April 30, 2017, 1.35% and 3.70% for the year ended October 31, 2016, 1.52% and 3.43% for the year ended October 31, 2015 and 1.55% and 11.22% for the period ended October 31, 2014; for Class R6 are 1.31% and 1.44% for the period ended April 30, 2017, 1.29% and 1.60% for the year ended October 31, 2016, 1.47% and 3.39% for the year ended October 31, 2015 and 1.50% and 11.17% for the period ended October 31, 2014, respectively. |
| (f) | Includes earnings credits and interest expense, if applicable, each of which is less than 0.005% unless otherwise noted. |
| (g) | Certain non-recurring expenses incurred by the Fund were not annualized for the year ended October 31, 2015 and period ended October 31, 2014. |
| (h) | Commencement of offering of class of shares. |
SEE NOTES TO FINANCIAL STATEMENTS.
| | | | | | |
| | | |
| 30 | | | | J.P. MORGAN SPECIALTY FUNDS | | APRIL 30, 2017 |
| | | | | | | | | | | | | | | | | | | | | | | | | | | | | | |
| | | Ratios/Supplemental data | |
| | | | | | | | | | Ratios to average net assets (a) | | | | | | | |
Net asset
value,
end of
period | | | Total return
(excludes
sales charge) (c)(d) | | | Net assets,
end of
period
(000’s) | | | Net expenses
(including
dividend and
interest
expense for
securities sold
short) (e)(f) | | | Net
investment
income
(loss) | | | Expenses
without waivers,
reimbursements and
earnings credits
including dividend
and interest expense
for securities sold
short) (e) | | | Portfolio
turnover rate
(excluding
securities sold
short) (c) | | | Portfolio
turnover rate
(including
securities sold
short) (c) | |
| | | | | | | | | | | | | | | | | | | | | | | | | | | | | | |
| | | | | | | | | | | | | | | | | | | | | | | | | | | | | | |
| $ | 18.19 | | | | 6.25 | % | | $ | 46,697 | | | | 2.33 | % | | | (1.19 | )% | | | 2.53 | % | | | 214 | % | | | 351 | % |
| | 17.12 | | | | (0.53 | ) | | | 43,298 | | | | 2.26 | | | | (0.96 | ) | | | 2.53 | | | | 463 | | | | 749 | |
| | 17.37 | | | | 10.74 | | | | 30,480 | | | | 2.38 | (g) | | | (1.70 | )(g) | | | 2.77 | (g) | | | 347 | | | | 734 | |
| | 15.75 | | | | 5.00 | | | | 52 | | | | 2.65 | (g) | | | (2.24 | )(g) | | | 12.33 | (g) | | | 94 | | | | 178 | |
| | | | | | | |
| | | | | | | | | | | | | | | | | | | | | | | | | | | | | | |
| | 17.95 | | | | 5.96 | | | | 2,868 | | | | 2.84 | | | | (1.66 | ) | | | 3.03 | | | | 214 | | | | 351 | |
| | 16.94 | | | | (1.00 | ) | | | 3,273 | | | | 2.75 | | | | (1.46 | ) | | | 2.98 | | | | 463 | | | | 749 | |
| | 17.27 | | | | 10.25 | | | | 823 | | | | 2.96 | (g) | | | (2.17 | )(g) | | | 3.75 | (g) | | | 347 | | | | 734 | |
| | 15.73 | | | | 4.87 | | | | 52 | | | | 3.15 | (g) | | | (2.74 | )(g) | | | 12.82 | (g) | | | 94 | | | | 178 | |
| | | | | | | |
| | | | | | | | | | | | | | | | | | | | | | | | | | | | | | |
| | 18.31 | | | | 6.39 | | | | 134,635 | | | | 2.08 | | | | (0.92 | ) | | | 2.24 | | | | 214 | | | | 351 | |
| | 17.21 | | | | (0.29 | ) | | | 158,589 | | | | 2.00 | | | | (0.69 | ) | | | 2.17 | | | | 463 | | | | 749 | |
| | 17.42 | | | | 11.06 | | | | 116,091 | | | | 2.23 | (g) | | | (1.53 | )(g) | | | 2.77 | (g) | | | 347 | | | | 734 | |
| | 15.75 | | | | 5.00 | | | | 4,989 | | | | 2.40 | (g) | | | (1.99 | )(g) | | | 12.07 | (g) | | | 94 | | | | 178 | |
| | | | | | | |
| | | | | | | | | | | | | | | | | | | | | | | | | | | | | | |
| | 18.07 | | | | 6.11 | | | | 22 | | | | 2.58 | | | | (1.44 | ) | | | 2.89 | | | | 214 | | | | 351 | |
| | 17.03 | | | | (0.76 | ) | | | 21 | | | | 2.51 | | | | (1.18 | ) | | | 4.81 | | | | 463 | | | | 749 | |
| | 17.32 | | | | 10.49 | | | | 21 | | | | 2.78 | (g) | | | (2.01 | )(g) | | | 4.70 | (g) | | | 347 | | | | 734 | |
| | 15.74 | | | | 4.93 | | | | 52 | | | | 2.90 | (g) | | | (2.49 | )(g) | | | 12.57 | (g) | | | 94 | | | | 178 | |
| | | | | | | |
| | | | | | | | | | | | | | | | | | | | | | | | | | | | | | |
| | 18.41 | | | | 6.48 | | | | 23 | | | | 1.89 | | | | (0.75 | ) | | | 2.20 | | | | 214 | | | | 351 | |
| | 17.29 | | | | (0.12 | ) | | | 21 | | | | 1.81 | | | | (0.48 | ) | | | 4.16 | | | | 463 | | | | 749 | |
| | 17.47 | | | | 11.31 | | | | 21 | | | | 2.09 | (g) | | | (1.32 | )(g) | | | 4.00 | (g) | | | 347 | | | | 734 | |
| | 15.76 | | | | 5.07 | | | | 53 | | | | 2.20 | (g) | | | (1.79 | )(g) | | | 11.88 | (g) | | | 94 | | | | 178 | |
| | | | | | | |
| | | | | | | | | | | | | | | | | | | | | | | | | | | | | | |
| | 18.43 | | | | 6.47 | | | | 8,220 | | | | 1.84 | | | | (0.71 | ) | | | 1.97 | | | | 214 | | | | 351 | |
| | 17.31 | | | | (0.06 | ) | | | 8,432 | | | | 1.75 | | | | (0.45 | ) | | | 2.06 | | | | 463 | | | | 749 | |
| | 17.48 | | | | 11.37 | | | | 21 | | | | 2.04 | (g) | | | (1.27 | )(g) | | | 3.96 | (g) | | | 347 | | | | 734 | |
| | 15.76 | | | | 5.07 | | | | 53 | | | | 2.15 | (g) | | | (1.74 | )(g) | | | 11.82 | (g) | | | 94 | | | | 178 | |
SEE NOTES TO FINANCIAL STATEMENTS.
| | | | | | | | |
| | | |
| APRIL 30, 2017 | | J.P. MORGAN SPECIALTY FUNDS | | | | | 31 | |
FINANCIAL HIGHLIGHTS
FOR THE PERIODS INDICATED
| | | | | | | | | | | | | | | | | | | | |
| | | Per share operating performance | |
| | | | | | Investment operations | | | Distributions | |
| | | Net asset
value,
beginning
of period | | | Net
investment
income
(loss) (b) | | | Net realized
and unrealized
gains
(losses) on
investments | | | Total from
investment
operations | | | Net
realized
gain | |
Research Market Neutral Fund | |
Class A | |
Six Months Ended April 30, 2017 (Unaudited) | | $ | 13.84 | | | $ | (0.12 | ) | | $ | 0.68 | | | $ | 0.56 | | | $ | — | |
Year Ended October 31, 2016 | | | 14.25 | | | | (0.28 | ) | | | (0.13 | ) | | | (0.41 | ) | | | — | |
Year Ended October 31, 2015 | | | 15.17 | | | | (0.31 | ) | | | (0.22 | ) | | | (0.53 | ) | | | (0.39 | ) |
Year Ended October 31, 2014 | | | 14.58 | | | | (0.34 | ) | | | 0.93 | | | | 0.59 | | | | — | |
Year Ended October 31, 2013 | | | 14.44 | | | | (0.35 | ) | | | 0.49 | | | | 0.14 | | | | — | |
Year Ended October 31, 2012 | | | 14.71 | | | | (0.35 | ) | | | 0.08 | | | | (0.27 | ) | | | — | |
| | | | | |
Class C | | | | | | | | | | | | | | | | | | | | |
Six Months Ended April 30, 2017 (Unaudited) | | | 13.06 | | | | (0.14 | ) | | | 0.63 | | | | 0.49 | | | | — | |
Year Ended October 31, 2016 | | | 13.51 | | | | (0.32 | ) | | | (0.13 | ) | | | (0.45 | ) | | | — | |
Year Ended October 31, 2015 | | | 14.48 | | | | (0.35 | ) | | | (0.23 | ) | | | (0.58 | ) | | | (0.39 | ) |
Year Ended October 31, 2014 | | | 13.99 | | | | (0.39 | ) | | | 0.88 | | | | 0.49 | | | | — | |
Year Ended October 31, 2013 | | | 13.91 | | | | (0.41 | ) | | | 0.49 | | | | 0.08 | | | | — | |
Year Ended October 31, 2012 | | | 14.25 | | | | (0.41 | ) | | | 0.07 | | | | (0.34 | ) | | | — | |
| | | | | |
Class I (formerly Select Class) | | | | | | | | | | | | | | | | | | | | |
Six Months Ended April 30, 2017 (Unaudited) | | | 14.37 | | | | (0.10 | ) | | | 0.70 | | | | 0.60 | | | | — | |
Year Ended October 31, 2016 | | | 14.76 | | | | (0.25 | ) | | | (0.14 | ) | | | (0.39 | ) | | | — | |
Year Ended October 31, 2015 | | | 15.66 | | | | (0.26 | ) | | | (0.25 | ) | | | (0.51 | ) | | | (0.39 | ) |
Year Ended October 31, 2014 | | | 15.02 | | | | (0.31 | ) | | | 0.95 | | | | 0.64 | | | | — | |
Year Ended October 31, 2013 | | | 14.83 | | | | (0.32 | ) | | | 0.51 | | | | 0.19 | | | | — | |
Year Ended October 31, 2012 | | | 15.08 | | | | (0.32 | ) | | | 0.07 | | | | (0.25 | ) | | | — | |
| | | | | |
Class L (formerly Institutional Class) | | | | | | | | | | | | | | | | | | | | |
Six Months Ended April 30, 2017 (Unaudited) | | | 14.62 | | | | (0.10 | ) | | | 0.72 | | | | 0.62 | | | | — | |
Year Ended October 31, 2016 | | | 14.99 | | | | (0.23 | ) | | | (0.14 | ) | | | (0.37 | ) | | | — | |
Year Ended October 31, 2015 | | | 15.87 | | | | (0.23 | ) | | | (0.26 | ) | | | (0.49 | ) | | | (0.39 | ) |
Year Ended October 31, 2014 | | | 15.17 | | | | (0.27 | ) | | | 0.97 | | | | 0.70 | | | | — | |
Year Ended October 31, 2013 | | | 14.95 | | | | (0.29 | ) | | | 0.51 | | | | 0.22 | | | | — | |
Year Ended October 31, 2012 | | | 15.16 | | | | (0.29 | ) | | | 0.08 | | | | (0.21 | ) | | | — | |
| (a) | Annualized for periods less than one year, unless otherwise noted. |
| (b) | Calculated based upon average shares outstanding. |
| (c) | Not annualized for periods less than one year. |
| (d) | Includes adjustments in accordance with accounting principles generally accepted in the United States of America and as such, the net asset values for financial reporting purposes and the returns based upon those net asset values may differ from the net asset values and returns for shareholder transactions. |
| (e) | Includes earnings credits and interest expense, if applicable, each of which is less than 0.005% or unless otherwise noted. |
| (f) | The net expenses and expenses without waivers, reimbursements and earnings credits (excluding dividend expense and interest expense for securities sold short) for Class A are 1.23% and 1.50% for the period ended April 30, 2017, 1.22% and 1.53% for the year ended October 31, 2016, 1.43% and 1.89% for the year ended October 31, 2015, 1.49% and 1.91% for the year ended October 31, 2014, 1.49% and 1.93% for the year ended October 31, 2013 and 1.49% and 1.99% for the year ended October 31, 2012; for Class C 1.74% and 2.11% for the period ended April 30, 2017, 1.72% and 2.02% for the year ended October 31, 2016, 1.90% and 2.32% for the year ended October 31, 2015, 1.99% and 2.41% for the year ended October 31, 2014, 1.99% and 2.43% for the year ended October 31, 2013 and 1.99% and 2.49% for the year ended October 31, 2012; for Class I (formerly Select Class) are 0.97% and 1.29% for the period ended April 30, 2017, 0.96% and 1.27% for the year ended October 31, 2016, 1.18% and 1.57% for the year ended October 31, 2015, 1.25% and 1.66% for the year ended October 31, 2014, 1.24% and 1.66% for the year ended October 31, 2013 and 1.24% and 1.74% for the year ended October 31, 2012; for Class L (formerly Institutional Class) 0.83% and 1.08% for the period ended April 30, 2017, 0.81% and 1.06% for the year ended October 31, 2016, 0.95% and 1.44% for the year ended October 31, 2015, 0.99% and 1.51% for the year ended October 31, 2014, 0.99% and 1.53% for the year ended October 31, 2013 and 0.99% and 1.59% for the year ended October 31, 2012, respectively. |
SEE NOTES TO FINANCIAL STATEMENTS.
| | | | | | |
| | | |
| 32 | | | | J.P. MORGAN SPECIALTY FUNDS | | APRIL 30, 2017 |
| | | | | | | | | | | | | | | | | | | | | | | | | | | | | | |
| | | Ratios/Supplemental data | |
| | | | | | | | | | Ratios to average net assets (a) | | | | | | | |
Net asset
value,
end of
period | | | Total return
(excludes
sales charge) (c)(d) | | | Net assets,
end of
period
(000’s) | | | Net expenses
(including
dividend and
interest
expense for
securities sold
short)(e)(f) | | | Net
investment
income
(loss) | | | Expenses
without waivers,
reimbursements and
earnings credits
(including dividend
and interest expense
for securities sold
short) (f) | | | Portfolio
turnover rate
(Excluding
short sales) (c) | | | Portfolio
turnover rate
(including
short sales) (c) | |
| | | | | | | | | | | | | | | | | | | | | | | | | | | | | | |
| | | | | | | | | | | | | | | | | | | | | | | | | | | | | | |
| $ | 14.40 | | | | 4.05 | % | | $ | 19,585 | | | | 3.66 | % | | | (1.68 | )% | | | 3.93 | % | | | 59 | % | | | 154 | % |
| | 13.84 | | | | (2.88 | ) | | | 25,393 | | | | 3.33 | | | | (2.07 | ) | | | 3.64 | | | | 133 | | | | 298 | |
| | 14.25 | | | | (3.59 | ) | | | 62,910 | | | | 3.57 | | | | (1.94 | ) | | | 4.03 | | | | 163 | | | | 370 | |
| | 15.17 | | | | 4.05 | | | | 82,477 | | | | 3.82 | | | | (2.26 | ) | | | 4.24 | | | | 90 | | | | 192 | |
| | 14.58 | | | | 0.97 | | | | 88,944 | | | | 4.24 | | | | (2.42 | ) | | | 4.68 | | | | 75 | | | | 149 | |
| | 14.44 | | | | (1.84 | ) | | | 116,146 | | | | 4.46 | | | | (2.47 | ) | | | 4.96 | | | | 82 | | | | 186 | |
| | | | | | | |
| | | | | | | | | | | | | | | | | | | | | | | | | | | | | | |
| | 13.55 | | | | 3.75 | | | | 12,419 | | | | 4.17 | | | | (2.19 | ) | | | 4.54 | | | | 59 | | | | 154 | |
| | 13.06 | | | | (3.33 | ) | | | 15,003 | | | | 3.83 | | | | (2.53 | ) | | | 4.13 | | | | 133 | | | | 298 | |
| | 13.51 | | | | (4.12 | ) | | | 23,790 | | | | 4.04 | | | | (2.63 | ) | | | 4.46 | | | | 163 | | | | 370 | |
| | 14.48 | | | | 3.50 | | | | 10,933 | | | | 4.32 | | | | (2.76 | ) | | | 4.74 | | | | 90 | | | | 192 | |
| | 13.99 | | | | 0.58 | | | | 14,209 | | | | 4.74 | | | | (2.92 | ) | | | 5.18 | | | | 75 | | | | 149 | |
| | 13.91 | | | | (2.39 | ) | | | 19,275 | | | | 4.96 | | | | (2.97 | ) | | | 5.46 | | | | 82 | | | | 186 | |
| | | | | | | |
| | | | | | | | | | | | | | | | | | | | | | | | | | | | | | |
| | 14.97 | | | | 4.18 | | | | 43,948 | | | | 3.40 | | | | (1.43 | ) | | | 3.72 | | | | 59 | | | | 154 | |
| | 14.37 | | | | (2.64 | ) | | | 53,221 | | | | 3.07 | | | | (1.82 | ) | | | 3.38 | | | | 133 | | | | 298 | |
| | 14.76 | | | | (3.34 | ) | | | 337,990 | | | | 3.32 | | | | (1.74 | ) | | | 3.71 | | | | 163 | | | | 370 | |
| | 15.66 | | | | 4.26 | | | | 348,525 | | | | 3.57 | | | | (2.01 | ) | | | 3.99 | | | | 90 | | | | 192 | |
| | 15.02 | | | | 1.28 | | | | 292,993 | | | | 3.99 | | | | (2.15 | ) | | | 4.43 | | | | 75 | | | | 149 | |
| | 14.83 | | | | (1.66 | ) | | | 290,794 | | | | 4.17 | | | | (2.19 | ) | | | 4.67 | | | | 82 | | | | 186 | |
| | | | | | | |
| | | | | | | | | | | | | | | | | | | | | | | | | | | | | | |
| | 15.24 | | | | 4.24 | | | | 159,808 | | | | 3.26 | | | | (1.28 | ) | | | 3.51 | | | | 59 | | | | 154 | |
| | 14.62 | | | | (2.47 | ) | | | 253,734 | | | | 2.92 | | | | (1.61 | ) | | | 3.17 | | | | 133 | | | | 298 | |
| | 14.99 | | | | (3.17 | ) | | | 232,339 | | | | 3.09 | | | | (1.48 | ) | | | 3.58 | | | | 163 | | | | 370 | |
| | 15.87 | | | | 4.61 | | | | 271,595 | | | | 3.32 | | | | (1.76 | ) | | | 3.84 | | | | 90 | | | | 192 | |
| | 15.17 | | | | 1.47 | | | | 316,843 | | | | 3.74 | | | | (1.91 | ) | | | 4.28 | | | | 75 | | | | 149 | |
| | 14.95 | | | | (1.39 | ) | | | 337,565 | | | | 3.99 | | | | (1.98 | ) | | | 4.59 | | | | 82 | | | | 186 | |
SEE NOTES TO FINANCIAL STATEMENTS.
| | | | | | | | |
| | | |
| APRIL 30, 2017 | | J.P. MORGAN SPECIALTY FUNDS | | | | | 33 | |
NOTES TO FINANCIAL STATEMENTS
AS OF APRIL 30, 2017
1. Organization
JPMorgan Trust I (the “Trust”) was formed on November 12, 2004, as a Delaware statutory trust, pursuant to a Declaration of Trust dated November 5, 2004 and is registered under the Investment Company Act of 1940, as amended (the “1940 Act”), as an open-end management investment company.
The following are 2 separate funds of the Trust (collectively, the “Funds”) covered by this report:
| | | | |
| | | Classes Offered | | Diversified/Non-Diversified |
| Opportunistic Equity Long/Short Fund | | Class A, Class C, Class R2, Class R5, Class R6 and Class I^ | | Non-Diversified |
| Research Market Neutral Fund | | Class A, Class C, Class L* and Class I^ | | Diversified |
| ^ | Effective April 3, 2017, Select Class was renamed Class I. |
| * | Effective December 1, 2016, Institutional Class was renamed Class L and is publicly offered on a limited basis. |
The investment objective of Opportunistic Equity Long/Short Fund is to seek capital appreciation.
The investment objective of Research Market Neutral Fund is to seek to provide long-term capital appreciation from a broadly diversified portfolio of U.S. stocks while neutralizing the general risks associated with stock market investing.
Opportunistic Equity Long/Short Fund commenced operations on August 29, 2014. Prior to January 23, 2015, the Fund was not publicly offered for investment.
Class A Shares generally provide for a front-end sales charge while Class C Shares provide for a contingent deferred sales charge (“CDSC”). No sales charges are assessed with respect to Class R2, Class R5, Class R6, Class L and Class I Shares. All classes of shares have equal rights as to earnings, assets and voting privileges, except that each class may bear different transfer agency, sub-transfer agency (through April 2, 2017), distribution and service fees and each class has exclusive voting rights with respect to its distribution plan and shareholder servicing agreements. Effective April 3, 2017 sub-transfer agency and shareholder servicing fees were consolidated into a single service fee. Certain Class A Shares, for which front-end sales charges have been waived, may be subject to a CDSC as described in the Funds’ prospectus. Beginning on November 14, 2017, Class C Shares will automatically convert to Class A Shares after ten years.
J.P. Morgan Investment Management Inc. (“JPMIM”) an indirect, wholly-owned subsidiary of JPMorgan Chase & Co. (“JPMorgan”) acts as Adviser (the “Adviser”) and Administrator (the “Administrator”) to the Funds.
2. Significant Accounting Policies
The following is a summary of significant accounting policies followed by the Funds in the preparation of their financial statements. The Funds are investment companies and, accordingly, follow the investment company accounting and reporting guidance of the Financial Accounting Standards Board Accounting Standards Codification Topic 946 — Investment Companies, which is part of U.S. generally accepted accounting principles (“GAAP”). The preparation of financial statements in conformity with GAAP requires management to make estimates and assumptions that affect the reported amounts of assets and liabilities and disclosure of contingent assets and liabilities at the date of the financial statements and the reported amounts of increases and decreases in net assets from operations during the reporting period. Actual results could differ from those estimates.
A. Valuation of Investments — The valuation of investments is in accordance with GAAP and the Funds’ valuation policies set forth by and under the supervision and responsibility of the Board of Trustees (the “Board”), which established the following approach to valuation, as described more fully below: (i) investments for which market quotations are readily available shall be valued at such unadjusted quoted prices and (ii) all other investments for which market quotations are not readily available shall be valued at their fair value as determined in good faith by the Board.
The Administrator has established the J.P. Morgan Investment Management Americas Valuation Committee (“AVC”) to assist the Board with the oversight and monitoring of the valuation of the Funds’ investments. The Administrator implements the valuation policies of the Funds’ investments, as directed by the Board. The AVC oversees and carries out the policies for the valuation of investments held in the Funds. This includes monitoring the appropriateness of fair values based on results of ongoing valuation oversight, including but not limited to consideration of macro or security specific events, market events and pricing vendor and broker due diligence. The Administrator is responsible for discussing and assessing the potential impacts to the fair values on an ongoing basis, and at least on a quarterly basis with the AVC and the Board.
Equities and other exchange-traded instruments are valued at the last sale price or official market closing price on the primary exchange on which the instrument is traded before the net asset values (“NAV”) of the Funds are calculated on a valuation date.
Investments in open-end investment companies excluding exchange traded funds (“ETFs) (the “Underlying Funds”) are valued at each Underlying Fund’s NAV per share as of the report date.
Futures and options are generally valued on the basis of available market quotations.
Valuations reflected in this report are as of the report date. As a result, changes in valuation due to market events and/or issuer related events after the report date and prior to issuance of the report are not reflected herein.
The various inputs that are used in determining the valuation of the Funds’ investments are summarized into the three broad levels listed below.
| • | | Level 1 — Unadjusted inputs using quoted prices in active markets for identical investments. |
| | | | | | |
| | | |
| 34 | | | | J.P. MORGAN SPECIALTY FUNDS | | APRIL 30, 2017 |
| • | | Level 2 — Other significant observable inputs including, but not limited to, quoted prices for similar investments, inputs other than quoted prices that are observable for investments (such as interest rates, prepayment speeds, credit risk, etc.) or other market corroborated inputs. |
| • | | Level 3 — Significant inputs based on the best information available in the circumstances, to the extent observable inputs are not available (including the Funds’ assumptions in determining the fair value of investments). |
A financial instrument’s level within the fair value hierarchy is based on the lowest level of any input, both individually and in the aggregate, that is significant to the fair value measurement. The inputs or methodology used for valuing instruments are not necessarily an indication of the risk associated with investing in those instruments.
The following tables represent each valuation input as presented on the Schedules of Portfolio Investments (“SOIs”) (amounts in thousands):
Opportunistic Equity Long/Short Fund
| | | | | | | | | | | | | | | | |
| | | Level 1
Quoted prices | | | Level 2
Other significant
observable inputs | | | Level 3
Significant
unobservable inputs | | | Total | |
Total Investments in Securities (a) | | $ | 190,758 | | | $ | — | | | $ | — | | | $ | 190,758 | |
| | | | | | | | | | | | | | | | |
Total Liabilities for Securities Sold Short (a) | | $ | (66,087 | ) | | $ | — | | | $ | — | | | $ | (66,087 | ) |
| | | | | | | | | | | | | | | | |
| | | | |
| Research Market Neutral Fund | | | | | | | | | | | | | | | | |
| | | Level 1
Quoted prices | | | Level 2
Other significant
observable inputs | | | Level 3
Significant
unobservable inputs | | | Total | |
Total Investments in Securities (b) | | $ | 233,379 | | | $ | 315 | | | $ | — | | | $ | 233,694 | |
| | | | | | | | | | | | | | | | |
Total Liabilities for Securities Sold Short (a) | | $ | (216,403 | ) | | $ | — | | | $ | — | | | $ | (216,403 | ) |
| | | | | | | | | | | | | | | | |
Depreciation in Other Financial Instruments | | | | | | | | | | | | | | | | |
Futures Contracts | | $ | (18 | ) | | $ | — | | | $ | — | | | $ | (18 | ) |
| | | | | | | | | | | | | | | | |
| (a) | All portfolio holdings designated as level 1 are disclosed individually on the SOIs. Please refer to the SOIs for industry specifics of portfolio holdings. |
| (b) | All portfolio holdings designated as level 1 and level 2 are disclosed individually on the SOIs. Level 2 consists of a U.S. Treasury Bill that is held as initial margin for futures contracts. Please refer to the SOIs for industry specifics of portfolio holdings. |
There were no transfers among any levels during the six months end April 30, 2017.
B. Options — Opportunistic Equity Long/Short Fund purchased put and call options on various instruments including futures, securities, currencies and interest rate swaps (“swaptions”) to manage and hedge interest rate risks within its portfolio and also to gain long or short exposure to the underlying instrument, index, currency or rate. A purchaser of a put option has the right, but not the obligation, to sell the underlying instrument at an agreed upon price (“strike price”) to the option seller. A purchaser of a call option has the right, but not the obligation, to purchase the underlying instrument at the strike price from the option seller. Swaptions and Eurodollar options are settled for cash.
Options Purchased — Premiums paid by the Fund for options purchased are included on the Statements of Assets and Liabilities as an investment. The option is adjusted daily to reflect the current market value of the option and the change is recorded as Change in net unrealized appreciation/ depreciation of investments in non-affiliates on the Statements of Operations. If the option is allowed to expire, the Fund will lose the entire premium it paid and record a realized loss for the premium amount. Premiums paid for options purchased which are exercised or closed are added to the amounts paid or offset against the proceeds on the underlying investment transaction to determine the realized gain (loss) or cost basis of the underlying investment.
The table below discloses the volume of the Fund’s options contracts activity during the six months ended April 30, 2017:
| | | | |
| | | Opportunistic
Equity
Long/Short
Fund | |
Exchange-Traded Options: | | | | |
Average Number of Contracts Purchased | | $ | 698 | (a) |
Ending Number of Contracts Purchased | | | 701 | |
| (a) | For the period January 1, 2017 through April 30, 2017. |
| | | | | | | | |
| | | |
| APRIL 30, 2017 | | J.P. MORGAN SPECIALTY FUNDS | | | | | 35 | |
NOTES TO FINANCIAL STATEMENTS
AS OF APRIL 30, 2017 (continued)
The Fund’s exchange traded option contracts are not subject to master netting arrangements (the right to close out all transactions traded with a counterparty and net amounts owed or due across transactions).
C. Short Sales — The Funds engaged in short sales as part of their normal investment activities. In a short sale, the Funds sell securities they do not own in anticipation of a decline in the market value of those securities. In order to deliver securities to the purchaser, the Funds borrow securities from a broker. To close out a short position, the Funds deliver the same securities to the broker.
The Funds are required to pledge cash or securities to the broker as collateral for the securities sold short. Collateral requirements are calculated daily based on the current market value of the short positions. Cash collateral deposited with the broker is recorded as an asset on the Statements of Assets and Liabilities. Securities segregated as collateral are denoted on the SOIs. The Funds may receive or pay the net of the following amounts: (i) a portion of the income from the investment of cash collateral; (ii) the broker’s fee on the borrowed securities (calculated daily based upon the market value of each borrowed security and a variable rate that is dependent on availability of the security); and (iii) a financing charge for the difference between the market value of the short position and cash collateral deposited with the broker. The net amounts of income or fees are included as interest income or interest expense on securities sold short on the Statements of Operations.
The Funds are obligated to pay the broker dividends declared on short positions when a position is open on the record date. Dividends on short positions are reported on ex-dividend date on the Statements of Operations as dividend expense on securities sold short.
Liabilities for securities sold short are reported at market value on the Statements of Assets and Liabilities and the change in market value is recorded as Change in net unrealized appreciation/depreciation on the Statements of Operations. Short sale transactions may result in unlimited losses as the security’s price increases and the short position loses value. There is no upward limit on the price a borrowed security could attain. The Funds are also subject to risk of loss if the broker were to fail to perform its obligations under the contractual terms.
The Funds will record a realized loss if the price of the borrowed security increases between the date of the short sale and the date on which the Funds replace the borrowed security. The Funds will record a realized gain if the price of the borrowed security declines between those dates.
As of April 30, 2017, the Funds had outstanding short sales as listed on their SOIs.
D. Futures Contracts — Research Market Neutral Fund used index futures contracts to more effectively manage the long and short equity exposures in the portfolio. The use of futures contracts exposes the Fund to equity price risk.
Futures contracts provide for the delayed delivery of the underlying instrument at a fixed price or are settled for a cash amount based on the change in the value of the underlying instrument at a specific date in the future. Upon entering into a futures contract, the Fund is required to deposit with the broker, cash or securities in an amount equal to a certain percentage of the contract amount, which is referred to as the initial margin deposit. Subsequent payments, referred to as variation margin, are made or received by the Fund periodically and are based on changes in the market value of open futures contracts. Changes in the market value of open futures contracts are recorded as Change in net unrealized appreciation/depreciation on the Statements of Operations. Realized gains or losses, representing the difference between the value of the contract at the time it was opened and the value at the time it was closed, are reported on the Statements of Operations at the closing or expiration of the futures contract. Securities deposited as initial margin are designated on the SOI and cash deposited is recorded on the Statements of Assets and Liabilities. A receivable from and/or a payable to brokers for the daily variation margin is also recorded on the Statements of Assets and Liabilities.
The Fund may be subject to the risk that the change in the value of the futures contract may not correlate perfectly with the underlying instrument. Use of long futures contracts subjects the Fund to risk of loss in excess of the amounts shown on the Statements of Assets and Liabilities, up to the notional amount of the futures contracts. Use of short futures contracts subjects the Fund to unlimited risk of loss. The Fund may enter into futures contracts only on exchanges or boards of trade. The exchange or board of trade acts as the counterparty to each futures transaction; therefore, the Fund’s credit risk is limited to failure of the exchange or board of trade. Under some circumstances, futures exchanges may establish daily limits on the amount that the price of a futures contract can vary from the previous day’s settlement price, which could effectively prevent liquidation of positions.
The table below discloses the volume of the Fund’s futures contracts activity during the six months ended April 30, 2017 (amounts in thousands):
| | | | |
| | | Research Market
Neutral Fund | |
Futures Contracts: | | | | |
Average Notional Balance Short | | $ | 4,537 | |
Ending Notional Balance Short | | | 4,404 | |
The Fund’s futures contracts are not subject to master netting arrangements (the right to close out all transactions traded with a counterparty and net amounts owed or due across transactions).
E. Security Transactions and Investment Income — Investment transactions are accounted for on the trade date (the date the order to buy or sell is executed). Securities gains and losses are calculated on a specifically identified cost basis. Interest income is determined on the basis of coupon interest accrued using the effective interest method which adjusts for amortization of premiums and accretion of discounts. Dividend income net of foreign taxes withheld, if any, and dividend expense on securities sold short, are recorded on the ex-dividend date or when a Fund first learns of the dividend.
| | | | | | |
| | | |
| 36 | | | | J.P. MORGAN SPECIALTY FUNDS | | APRIL 30, 2017 |
To the extent such information is publicly available, the Funds record distributions received in excess of income earned from underlying investments as a reduction of cost of investments and/or realized gain. Such amounts are based on estimates if actual amounts are not available and actual amounts of income, realized gain and return of capital may differ from the estimated amounts. The Funds adjust the estimated amounts of the components of distributions (and consequently their net investment income) as necessary once the issuers provide information about the actual composition of the Distributions.
F. Allocation of Income and Expenses — Expenses directly attributable to a fund are charged directly to that fund, while the expenses attributable to more than one fund of the Trust are allocated among the respective funds. In calculating the NAV of each class, investment income, realized and unrealized gains and losses and expenses, other than class specific expenses, are allocated daily to each class of shares based upon the proportion of net assets of each class at the beginning of each day.
Transfer agency fees are class-specific expenses and sub-transfer agency fees were class specific expenses up through April 2, 2017. Effective April 3, 2017, the Funds ceased making direct payments to financial intermediaries for any applicable sub-transfer agency services. Payments to financial intermediaries for sub-transfer agency services are made by JPMorgan Distribution Services, Inc. from the Shareholder Servicing Fee, which has been renamed as the Service Fee.
The amount of the transfer agency and sub-transfer agency fees charged to each class of the Funds for the six months ended April 30, 2017 are as follows (amounts in thousands):
| | | | | | | | | | | | | | | | | | | | | | | | | | | | | | | | |
| | | Class A | | | Class C | | | Class I | | | Class L | | | R2 | | | R5 | | | R6 | | | Total | |
Opportunistic Equity Long/Short Fund | | | | | | | | | | | | | | | | | | | | | | | | | | | | | | | | |
Transfer agency fees | | $ | 1 | | | $ | — | (a) | | $ | 2 | | | | n/a | | | $ | — | (a) | | $ | — | (a) | | | n/a | | | $ | 3 | |
Sub-transfer agency fees | | | 13 | | | | 1 | | | | 14 | | | | n/a | | | | — | | | | — | | | | n/a | | | | 28 | |
Research Market Neutral Fund | | | | | | | | | | | | | | | | | | | | | | | | | | | | | | | | |
Transfer agency fees | | | 4 | | | | 1 | | | | 2 | | | $ | 2 | | | | n/a | | | | n/a | | | | n/a | | | | 9 | |
Sub-transfer agency fees | | | — | | | | 9 | | | | 18 | | | | 20 | | | | n/a | | | | n/a | | | | n/a | | | | 47 | |
| (a) | Amount rounds to less than 500. |
G. Federal Income Taxes — Each Fund is treated as a separate taxable entity for Federal income tax purposes. Each Fund’s policy is to comply with the provisions of the Internal Revenue Code of 1986, as amended (the “Code”), applicable to regulated investment companies and to distribute to shareholders all of its distributable net investment income and net realized capital gains on investments. Accordingly, no provision for Federal income tax is necessary. Management has reviewed the Funds’ tax positions for all open tax years and has determined that as of April 30, 2017 no liability for income tax is required in the Funds’ financial statements for net unrecognized tax benefits. However, management’s conclusions may be subject to future review based on changes in, or the interpretation of, the accounting standards or tax laws and regulations. Each of the Funds’ Federal tax returns for the prior three fiscal years, or since inception if shorter, remains subject to examination by the Internal Revenue Service.
H. Distributions to Shareholders — Distributions from net investment income are generally declared and paid annually for the Opportunistic Equity Long/Short Fund, and are generally declared and paid quarterly for the Research Market Neutral Fund and are declared separately for each class. No class has preferential dividend rights; differences in per share rates are due to differences in separate class expenses. Net realized capital gains, if any, are distributed by each Fund at least annually. The amount of distributions from net investment income and net realized capital gains is determined in accordance with Federal income tax regulations, which may differ from GAAP. To the extent these “book/tax” differences are permanent in nature (i.e., that they result from other than timing of recognition — “temporary differences”), such amounts are reclassified within the capital accounts based on their Federal tax-basis treatment.
The reclassifications for the Funds relate primarily to dividend expense for securities sold short and net operating loss.
3. Fees and Other Transactions with Affiliates
A. Investment Advisory Fee — Pursuant to an Investment Advisory Agreement, the Adviser supervises the investments of each Fund and for such services is paid a fee. The fee is accrued daily and paid monthly at an annual rate of each Fund’s respective average daily net assets as follows:
| | | | |
Opportunistic Equity Long/Short Fund | | | 1.20 | % |
Research Market Neutral Fund | | | 0.80 | |
The Adviser waived Investment Advisory fees and/or reimbursed expenses as outlined in Note 3.F.
B. Administration Fee — Pursuant to an Administration Agreement, the Administrator provides certain administration services to the Funds. In consideration of these services, the Administrator receives a fee accrued daily and paid monthly at an annual rate of 0.15% of the first $25 billion of the average daily net assets of all funds in the J.P. Morgan Funds Complex covered by the Administration Agreement (excluding certain funds of funds and money market funds) and 0.075% of the average daily net assets in excess of $25 billion of all such funds. For the six months ended April 30, 2017 the effective annualized rate was 0.08% of each Fund’s average daily net assets, notwithstanding any fee waivers and/or expense reimbursements.
The Administrator waived Administration fees as outlined in Note 3.F.
| | | | | | | | |
| | | |
| APRIL 30, 2017 | | J.P. MORGAN SPECIALTY FUNDS | | | | | 37 | |
NOTES TO FINANCIAL STATEMENTS
AS OF APRIL 30, 2017 (continued)
JPMorgan Chase Bank, N.A. (“JPMCB”), a wholly-owned subsidiary of JPMorgan, serves as the Funds’ sub-administrator (the “Sub-administrator”). For its services as Sub-administrator, JPMCB receives a portion of the fees payable to the Administrator.
C. Distribution Fees — Pursuant to a Distribution Agreement, JPMorgan Distribution Services, Inc. (“JPMDS”), a wholly-owned subsidiary of JPMorgan, serves as the Trust’s principal underwriter and promotes and arranges for the sale of each Fund’s shares.
The Board has adopted a Distribution Plan (the “Distribution Plan”) for Class A, Class C and Class R2 Shares of the Funds, as applicable, in accordance with Rule 12b-1 under the 1940 Act. The Class R5, Class R6, Class L and Class I Shares do not charge a distribution fee. The Distribution Plan provides that each Fund shall pay distribution fees, including payments to the JPMDS, at annual rates of the average daily net assets as shown in the table below:
| | | | | | | | | | | | |
| | | Class A | | | Class C | | | Class R2 | |
Opportunistic Equity Long/Short Fund | | | 0.25 | % | | | 0.75 | % | | | 0.50 | % |
Research Market Neutral Fund | | | 0.25 | | | | 0.75 | | | | n/a | |
In addition, the JPMDS is entitled to receive the front-end sales charges from purchases of Class A Shares and the CDSC from redemptions of Class C Shares and certain Class A Shares for which front-end sales charges have been waived. For the six months ended April 30, 2017, the JPMDS retained the following (amounts in thousands):
| | | | | | | | |
| | | Front-End Sales Charge | | | CDSC | |
Opportunistic Equity Long/Short Fund | | $ | — | (a) | | $ | — | |
Research Market Neutral Fund | | | — | (a) | | | — | (a) |
| (a) | Amount rounds to less than 500. |
D. Service Fees — The Trust, on behalf of the Funds, has entered into a Shareholder Servicing Agreement with the JPMDS under which the JPMDS provides certain support services to the shareholders. The Class R6 Shares do not charge a service fee. For performing these services, the JPMDS receives a fee that is accrued daily and paid monthly equal to a percentage of the average daily net assets as shown in the table below:
| | | | | | | | | | | | | | | | | | | | | | | | |
| | | Class A | | | Class C | | | Class R2 | | | Class R5 | | | Class L | | | Class I | |
Opportunistic Equity Long/Short Fund | | | 0.25 | % | | | 0.25 | % | | | 0.25 | % | | | 0.10 | % | | | n/a | | | | 0.25 | % |
Research Market Neutral Fund | | | 0.25 | | | | 0.25 | | | | n/a | | | | n/a | | | | 0.10 | % | | | 0.25 | |
The JPMDS has entered into shareholder services contracts with affiliated and unaffiliated financial intermediaries who provide shareholder services and other related services to their clients or customers who invest in the Funds under which the JPMDS will pay all or a portion of such fees earned to financial intermediaries for performing such services.
The JPMDS waived service fees as outlined in Note 3.F.
E. Custodian and Accounting Fees — JPMCB provides portfolio custody and accounting services to the Funds. For performing these services, the Funds pay JPMCB transaction and asset-based fees that vary according to the number of transactions and positions, plus out-of-pocket expense. The amounts paid directly to JPMCB by the Funds for custody and accounting services are included in Custodian and accounting fees on the Statements of Operations. Payments to the custodian may be reduced by credits earned by each Fund, based on uninvested cash balances held by the custodian. Such earnings credits, if any, are presented separately on the Statements of Operations.
Interest income earned on cash balances at the custodian, if any, is included in Interest income from affiliates on the Statements of Operations.
Interest expense paid to the custodian related to cash overdrafts, if any, is included in Interest expense to affiliates on the Statements of Operations.
F. Waivers and Reimbursements — The Adviser, Administrator and JPMDS have contractually agreed to waive fees and/or reimburse the Funds to the extent that total annual operating expenses (excluding acquired fund fees and expenses other than certain money market fund fees as described below, dividend and interest expenses related to short sales, interest, taxes, expenses related to litigation and potential litigation and extraordinary expenses) exceed the percentages of the Funds’ respective average daily net assets as shown in the table below:
| | | | | | | | | | | | | | | | | | | | | | | | | | | | |
| | | Class A | | | Class C | | | Class R2 | | | Class R5 | | | Class R6 | | | Class L | | | Class I | |
Opportunistic Equity Long/Short Fund | | | 1.85 | % | | | 2.35 | % | | | 2.10 | % | | | 1.40 | % | | | 1.35 | % | | | n/a | | | | 1.60 | % |
Research Market Neutral Fund | | | 1.25 | | | | 1.75 | | | | n/a | | | | n/a | | | | n/a | | | | 0.85 | % | | | 0.99 | |
The expense limitation agreements were in effect for the six months ended April 30, 2017 and are in place until at least February 28, 2018.
| | | | | | |
| | | |
| 38 | | | | J.P. MORGAN SPECIALTY FUNDS | | APRIL 30, 2017 |
For the six months ended April 30, 2017 the Funds’ service providers waived fees and/or reimbursed expenses for each of the Funds as follows (amounts in thousands). None of these parties expect the Funds to repay any such waived fees and/or reimbursed expenses in future years.
| | | | | | | | | | | | | | | | | | | | |
| | | Contractual Waivers | | | | |
| | | Investment
Advisory
Fees | | | Administration
Fees | | | Service
Fees | | | Total | | | Contractual
Reimbursements | |
Opportunistic Equity Long/Short Fund | | $ | 54 | | | $ | 36 | | | $ | 30 | | | $ | 120 | | | $ | — | (a) |
Research Market Neutral Fund | | | 223 | | | | 120 | | | | 27 | | | | 370 | | | | — | |
| (a) | Amount rounds to less than 500. |
Additionally, the Funds may invest in one or more money market funds advised by the Adviser or its affiliates (affiliated money market funds). The Adviser, Administrator and/or JPMDS, as shareholder servicing agent, have contractually agreed to waive fees and/or reimburse expenses in an amount sufficient to offset the respective net fees each collects from the affiliated money market fund on the applicable Funds’ investment in such affiliated money market fund.
The amounts of these waivers resulting from investments in these money market funds for the six months ended April 30, 2017 were as follows (amounts in thousands):
| | | | |
Opportunistic Equity Long/Short Fund | | $ | 44 | |
Research Market Neutral Fund | | | 17 | |
G. Other — Certain officers of the Trust are affiliated with the Adviser, the Administrator and the JPMDS. Such officers, with the exception of the Chief Compliance Officer, receive no compensation from the Funds for serving in their respective roles.
The Board appointed a Chief Compliance Officer to the Funds in accordance with Federal securities regulations. Each Fund, along with other affiliated funds, makes reimbursement payments, on a pro-rata basis, to the Administrator for a portion of the fees associated with the Office of the Chief Compliance Officer. Such fees are included in Trustees’ and Chief Compliance Officer’s fees on the Statements of Operations.
The Trust adopted a Trustee Deferred Compensation Plan (the “Plan”) which allows the Independent Trustees to defer the receipt of all or a portion of compensation related to performance of their duties as Trustees. The deferred fees are invested in various J.P. Morgan Funds until distribution in accordance with the Plan.
During the six months ended April 30, 2017 Research Market Neutral Fund purchased securities from an underwriting syndicate in which the principal underwriter or members of the syndicate are affiliated with the Adviser.
The Funds may use related party broker-dealers. For the six months ended April 30, 2017, the Funds did not incur any brokerage commissions with broker dealers affiliated with the Adviser.
The Securities and Exchange Commission (“SEC”) has granted an exemptive order permitting the Funds to engage in principal transactions with J.P. Morgan Securities, Inc., an affiliated broker, involving taxable money market instruments, subject to certain conditions.
4. Investment Transactions
During the six months ended April 30, 2017, purchases and sales of investments (excluding short-term investments) were as follows (amounts in thousands):
| | | | | | | | | | | | | | | | |
| | | Purchases
(excluding U.S.
Government) | | | Sales
(excluding U.S.
Government) | | | Securities
Sold Short | | | Covers on
Securities
Sold Short | |
Opportunistic Equity Long/Short Fund | | $ | 371,312 | | | $ | 332,095 | | | $ | 211,753 | | | $ | 199,252 | |
Research Market Neutral Fund | | | 161,500 | | | | 303,562 | | | | 130,481 | | | | 261,641 | |
5. Federal Income Tax Matters
For Federal income tax purposes, the estimated cost and unrealized appreciation (depreciation) in value of investment securities held at April 30, 2017 were as follows (amounts in thousands):
| | | | | | | | | | | | | | | | |
| | | Aggregate
Cost | | | Gross
Unrealized
Appreciation | | | Gross
Unrealized
Depreciation | | | Net Unrealized
Appreciation
(Depreciation) | |
Opportunistic Equity Long/Short Fund | | $ | 174,602 | | | $ | 16,437 | | | $ | 281 | | | $ | 16,156 | |
Research Market Neutral Fund | | | 175,613 | | | | 58,589 | | | | 508 | | | | 58,081 | |
| | | | | | | | |
| | | |
| APRIL 30, 2017 | | J.P. MORGAN SPECIALTY FUNDS | | | | | 39 | |
NOTES TO FINANCIAL STATEMENTS
AS OF APRIL 30, 2017 (continued)
At October 31, 2016, the following Funds had net capital loss carryforwards (amounts in thousands):
| | | | | | | | |
| | | Capital Loss
Carryforward
Character Short-Term | | | Long-Term | |
Research Market Neutral Fund | | | 68,342 | * | | $ | — | |
| * | Amount includes capital loss carryforwards from business combinations, which are limited in future years under Internal Revenue Code Sections 381-384. |
6. Borrowings
The Funds rely upon an exemptive order granted by the SEC (the “Order”) permitting the establishment and operation of an Interfund Lending Facility (the “Facility”). The Facility allows the Funds to directly lend and borrow money to or from any other fund relying upon the Order at rates beneficial to both the borrowing and lending funds. Advances under the Facility are taken primarily for temporary or emergency purposes, including the meeting of redemption requests that otherwise might require the untimely disposition of securities, and are subject to each Fund’s borrowing restrictions. The Interfund loan rate is determined, as specified in the Order, by averaging the current repurchase agreement rate and the current bank loan rate. The Order was granted to JPMorgan Trust II and may be relied upon by the Funds because the Funds and the series of JPMorgan Trust II are all investment companies in the same “group of investment companies” (as defined in Section 12(d)(1)(G) of the 1940 Act).
The Trust and JPMCB have entered into a financing arrangement. Under this arrangement, JPMCB provides an unsecured, uncommitted credit facility in the aggregate amount of $100 million to certain of the J.P. Morgan Funds, including the Funds. Advances under the arrangement are taken primarily for temporary or emergency purposes, including the meeting of redemption requests that otherwise might require the untimely disposition of securities, and are subject to each Fund’s borrowing restrictions. Interest on borrowings is payable at a rate determined by JPMCB at the time of borrowing. This agreement has been extended until November 6, 2017.
The Funds had no borrowings outstanding from another fund or from the unsecured, uncommitted credit facility during the six months ended April 30, 2017.
In addition, effective August 16, 2016, the Trust along with certain other trusts (“Borrowers”) entered into a joint syndicated senior unsecured revolving credit facility totaling $1.5 billion (“Credit Facility”) with various lenders and The Bank of New York Mellon, as administrative agent for the lenders. This Credit Facility provides a source of funds to the Borrowers for temporary and emergency purposes, including the meeting of redemption requests that otherwise might require the untimely disposition of securities. Under the terms of the Credit Facility, a borrowing fund must have a minimum of $25,000,000 in adjusted net asset value and not exceed certain adjusted net asset coverage ratios prior to and during the time in which any borrowings are outstanding. If a fund does not comply with the aforementioned requirements, the fund must remediate within three business days with respect to the $25,000,000 minimum adjusted net asset value or within one business day with respect to certain asset coverage ratios or the administrative agent at the request of, or with the consent of, the lenders may terminate the Credit Facility and declare any outstanding borrowings to be due and payable immediately.
Interest associated with any borrowing under the Credit Facility is charged to the borrowing fund at a rate of interest equal to 1.00% plus the greater of the federal funds effective rate or one month LIBOR. The annual commitment fee to maintain the Credit Facility is 0.15% and is incurred on the unused portion of the Credit Facility and is allocated to all participating funds pro rata based on their respective net assets. The initial term of the Credit Facility is 364 days, unless extended.
The Funds did not utilize the Credit Facility during the six months ended April 30, 2017.
7. Risks, Concentrations and Indemnifications
In the normal course of business, the Funds enter into contracts that contain a variety of representations which provide general indemnifications. Each Fund’s maximum exposure under these arrangements is unknown. The amount of exposure would depend on future claims that may be made against each Fund that have not yet occurred. However, based on experience, the Funds expect the risk of loss to be remote.
As of April 30, 2017, the Fund had individual shareholder accounts and/or omnibus accounts which owned more than 10% of the Funds outstanding shares as follows:
| | | | | | | | | | | | | | | | |
| | | Number of
Individual Affiliated
Shareholder
Accounts and/or
Affiliated Omnibus
Accounts | | | % of the
Fund | | | Number of Individual Non- affiliated
Shareholder Accounts and/or
Non-affiliated
Omnibus Accounts | | | % of the
Fund | |
Opportunistic Equity Long/Short Fund | | | 1 | | | | 35.3 | % | | | 2 | | | | 24.3 | % |
| | | | | | |
| | | |
| 40 | | | | J.P. MORGAN SPECIALTY FUNDS | | APRIL 30, 2017 |
The J.P. Morgan Investor Funds, which are affiliated funds of funds, owned in the aggregate 48.8% of the net assets of the Research Market Neutral Fund.
Significant shareholder transactions by these shareholders may impact the Funds’ performance.
Because Opportunistic Equity Long/Short Fund may invest a substantial portion of its assets in REITs, the Fund may be subject to certain risks similar to those associated with direct investments in real estate. REITs may be affected by changes in the value of their underlying properties and by defaults by tenants. REITs depend generally on their ability to generate cash flow to make distributions to shareholders, and certain REITs have self-liquidation provisions by which mortgages held may be paid in full and distributions of capital returns may be made at any time.
Since Opportunistic Equity Long/Short Fund is non-diversified, it may invest a greater percentage of its assets in a particular issuer or group of issuers than a diversified fund would. This increased investment in fewer issuers may result in the Fund’s shares being more sensitive to economic results of those issuing the securities.
As of April 30, 2017, the Research Market Neutral Fund pledged substantially all of its assets to Citibank for securities sold short. For the Research Market Neutral Fund, deposits at broker for securities sold short, as noted on the Statements of Assets and Liabilities, are held at Citibank. The Opportunistic Equity Long/Short Fund pledged substantially all of its assets to Citigroup Global Markets, Inc. for securities sold short. For the Opportunistic Equity Long/Short Fund, deposits at broker for securities sold short, as noted on the Statements of Assets and Liabilities, are held at Citigroup Global Markets, Inc.
8. Investment Company Reporting Modernization
In October 2016, the U.S. Securities and Exchange Commission adopted new rules and forms, and amendments to certain current rules and forms, to modernize the reporting and disclosure of information by registered investment companies. In part, the final rules amend Regulation S-X and will require standardized, enhanced disclosures about derivatives in investment company financial statements, as well as other amendments. The com-pliance date for the amendments to Regulation S-X is August 1, 2017. At this time, management is currently assessing the anticipated impact of the Regulation S-X amendments on the Funds’ financial statements and related disclosures.
| | | | | | | | |
| | | |
| APRIL 30, 2017 | | J.P. MORGAN SPECIALTY FUNDS | | | | | 41 | |
SCHEDULE OF SHAREHOLDER EXPENSES
(Unaudited)
Hypothetical $1,000 Investment
As a shareholder of the Funds, you incur two types of costs: (1) transaction costs, including sales charges (loads) on purchase payments and (2) ongoing costs, including investment advisory fees, administration fees, distribution fees and other Fund expenses. The examples below are intended to help you understand your ongoing costs (in dollars) of investing in the Funds and to compare these ongoing costs with the ongoing costs of investing in other mutual funds. The examples assume that you had a $1,000 investment in each Class at the beginning of the reporting period, November 1, 2016, and continued to hold your shares at the end of the reporting period, April 30, 2017.
Actual Expenses
For each Class of each Fund in the table below, the first line provides information about actual account values and actual expenses. You may use the information in this line, together with the amount you invested, to estimate the expenses that you paid over the period. Simply divide your account value by $1,000 (for example, an $8,600 account value divided by $1,000 = 8.6), then multiply the result by the number in the first line of each Class under the heading entitled “Expenses Paid During the Period” to estimate the expenses you paid on your account during this period.
Hypothetical Example for Comparison Purposes
The second line of each Class in the table below provides information about hypothetical account values and hypothetical expenses based on the Class’ actual expense ratio and an assumed rate of return of 5% per year before expenses, which is not the Class’ actual return. The hypothetical account values and expenses may not be used to estimate the actual ending account balance or expenses you paid for the period. You may use this information to compare the ongoing costs of investing in the Class of the Fund and other funds. To do so, compare this 5% hypothetical example with the 5% hypothetical examples that appear in the shareholder reports of the other funds. Please note that the expenses shown in the table are meant to highlight your ongoing costs only and do not reflect any transaction costs, such as sales charges (loads) or redemption fees. Therefore, the second line for each Class in the table is useful in comparing ongoing costs only, and will not help you determine the relative total costs of owning different funds. In addition, if these transaction costs were included, your costs would have been higher. The examples also assume all dividends and distributions have been reinvested.
| | | | | | | | | | | | | | | | |
| | | Beginning
Account Value
November 1, 2016 | | | Ending
Account Value
April 30, 2017 | | | Expenses
Paid During the
Period* | | | Annualized
Expense
Ratio | |
Opportunistic Equity Long/Short Fund | | | | | | | | | | | | | | | | |
Class A | | | | | | | | | | | | | | | | |
Actual | | $ | 1,000.00 | | | $ | 1,062.50 | | | $ | 11.92 | | | | 2.33 | % |
Hypothetical | | | 1,000.00 | | | | 1,013.19 | | | | 11.63 | | | | 2.33 | |
Class C | | | | | | | | | | | | | | | | |
Actual | | | 1,000.00 | | | | 1,059.60 | | | | 14.50 | | | | 2.84 | |
Hypothetical | | | 1,000.00 | | | | 1,010.76 | | | | 14.16 | | | | 2.84 | |
Class I (formerly Select Class) | | | | | | | | | | | | | | | | |
Actual | | | 1,000.00 | | | | 1,063.90 | | | | 10.64 | | | | 2.08 | |
Hypothetical | | | 1,000.00 | | | | 1,014.48 | | | | 10.39 | | | | 2.08 | |
Class R2 | | | | | | | | | | | | | | | | |
Actual | | | 1,000.00 | | | | 1,061.10 | | | | 13.18 | | | | 2.58 | |
Hypothetical | | | 1,000.00 | | | | 1,011.95 | | | | 12.87 | | | | 2.58 | |
Class R5 | | | | | | | | | | | | | | | | |
Actual | | | 1,000.00 | | | | 1,064.80 | | | | 9.68 | | | | 1.89 | |
Hypothetical | | | 1,000.00 | | | | 1,015.42 | | | | 9.44 | | | | 1.89 | |
Class R6 | | | | | | | | | | | | | | | | |
Actual | | | 1,000.00 | | | | 1,064.70 | | | | 9.42 | | | | 1.84 | |
Hypothetical | | | 1,000.00 | | | | 1,015.72 | | | | 9.20 | | | | 1.84 | |
| | | | |
Research Market Neutral Fund | | | | | | | | | | | | | | | | |
Class A | | | | | | | | | | | | | | | | |
Actual | | | 1,000.00 | | | | 1,040.50 | | | | 18.52 | | | | 3.66 | |
Hypothetical | | | 1,000.00 | | | | 1,006.60 | | | | 18.21 | | | | 3.66 | |
Class C | | | | | | | | | | | | | | | | |
Actual | | | 1,000.00 | | | | 1,037.50 | | | | 21.07 | | | | 4.17 | |
Hypothetical | | | 1,000.00 | | | | 1,004.17 | | | | 20.72 | | | | 4.17 | |
Class I (formerly Select Class) | | | | | | | | | | | | | | | | |
Actual | | | 1,000.00 | | | | 1,041.80 | | | | 17.21 | | | | 3.40 | |
Hypothetical | | | 1,000.00 | | | | 1,007.98 | | | | 16.93 | | | | 3.40 | |
Class L (formerly Institutional Class) | | | | | | | | | | | | | | | | |
Actual | | | 1,000.00 | | | | 1,042.40 | | | | 16.51 | | | | 3.26 | |
Hypothetical | | | 1,000.00 | | | | 1,008.53 | | | | 16.24 | | | | 3.26 | |
| * | Expenses are equal to each Class’ respective annualized expense ratio, multiplied by the average account value over the period, multiplied by 181/365 (to reflect the one-half year period). |
| | | | | | |
| | | |
| 42 | | | | J.P. MORGAN SPECIALTY FUNDS | | APRIL 30, 2017 |
J.P. Morgan Funds are distributed by JPMorgan Distribution Services, Inc., which is an affiliate of JPMorgan Chase & Co. Affiliates of JPMorgan Chase & Co. receive fees for providing various services to the funds.
Contact JPMorgan Distribution Services, Inc. at 1-800-480-4111 for a fund prospectus. You can also visit us at www.jpmorganfunds.com. Investors should carefully consider the investment objectives and risk as well as charges and expenses of the mutual fund before investing. The prospectus contains this and other information about the mutual fund. Read the prospectus carefully before investing.
Investors may obtain information about the Securities Investor Protection Corporation (SIPC), including the SIPC brochure by visiting www.sipc.org or by calling SIPC at 202-371-8300.
Each Fund files a complete schedule of its fund holdings for the first and third quarters of its fiscal year with the SEC on Form N-Q. The Funds’ Forms N-Q are available on the SEC’s website at http://www.sec.gov and may be reviewed and copied at the SEC’s Public Reference Room in Washington, DC. Information on the operation of the SEC’s Public Reference Room may be obtained by calling 1-800-SEC-0330. Shareholders may request the Form N-Q without charge by calling 1-800-480-4111 or by visiting the J.P. Morgan Funds’ website at www.jpmorganfunds.com.
A description of each Fund’s policies and procedures with respect to the disclosure of each Fund’s holdings is available in the prospectus and Statement of Additional Information.
A copy of proxy policies and procedures is available without charge upon request by calling 1-800-480-4111 and on the Funds’ website at www.jpmorganfunds.com. A description of such policies and procedures is on the SEC’s website at www.sec.gov. The Trustees have delegated the authority to vote proxies for securities owned by the Funds to the Adviser. A copy of the Funds’ voting record for the most recent 12-month period ended June 30 is available on the SEC’s website at www.sec.gov or at the Funds’ website at www.jpmorganfunds.com no later than August 31 of each year. The Funds’ proxy voting record will include, among other things, a brief description of the matter voted on for each fund security, and will state how each vote was cast, for example, for or against the proposal.


J.P. Morgan Asset Management is the marketing name for the asset management business of JPMorgan Chase & Co. Those businesses include, but are not limited to, J.P. Morgan Investment Management Inc., Security Capital Research & Management Incorporated and J.P. Morgan Alternative Asset Management, Inc.
| | | | |
| | © JPMorgan Chase & Co., 2017. All rights reserved. April 2017. | | SAN-SPEC-417 |
Semi-Annual Report
J.P. Morgan International Equity Funds
April 30, 2017 (Unaudited)
JPMorgan Emerging Economies Fund
JPMorgan Emerging Markets Equity Fund
JPMorgan Emerging Markets Equity Income Fund
JPMorgan Global Research Enhanced Index Fund
JPMorgan Global Unconstrained Equity Fund
JPMorgan International Discovery Fund
JPMorgan International Equity Fund
JPMorgan International Equity Income Fund
JPMorgan International Opportunities Fund
JPMorgan International Research Enhanced Equity Fund
JPMorgan International Unconstrained Equity Fund
JPMorgan International Value Fund
JPMorgan Intrepid International Fund

CONTENTS
Investments in a Fund are not deposits or obligations of, or guaranteed or endorsed by, any bank and are not insured or guaranteed by the FDIC, the Federal Reserve Board or any other government agency. You could lose money if you sell when a Fund’s share price is lower than when you invested.
Past performance is no guarantee of future performance. The general market views expressed in this report are opinions based on market and other conditions through the end of the reporting period and are subject to change without notice. These views are not intended to predict the future performance of a Fund or the securities markets. References to specific securities and their issuers are for illustrative purposes only and are not intended to be, and should not be interpreted as, recommendations to purchase or sell such securities. Such views are not meant as investment advice and may not be relied on as an indication of trading intent on behalf of any Fund.
Prospective investors should refer to the Funds’ prospectus for a discussion of the Funds’ investment objectives, strategies and risks. Call J.P. Morgan Funds Service Center at 1-800-480-4111 for a prospectus containing more complete information about a Fund, including management fees and other expenses. Please read it carefully before investing.
CEO’S LETTER
May 25, 2017 (Unaudited)
Dear Shareholder,
The world’s leading economies continued their upward trajectory over the six months ended April 30, 2017, bolstered by central bank policies, growth in corporate earnings and buoyant consumer and business sentiment.
| | |
 | | “While bond markets provided a mixed performance over the six months ended April 30, 2017, equity markets rewarded investors with solid returns.” — George C.W. Gatch |
While the U.S. and China had been leading drivers of growth for most of the current economic expansion, by late 2016 and into 2017 the world’s other leading economies began to strengthen. Each of the world’s 20 largest economies was forecast to increase output of goods and services through 2017 and the variation in growth rates among those economies was forecast to be the lowest since 1980, according to Bloomberg News.
The U.S. economy slowed somewhat in the first quarter of 2017, but unemployment dropped to 4.4% in April 2017 and the U.S. Federal Reserve reiterated its intent to raise interest rates amid continued economic growth and rising inflation. Throughout the six month reporting period, U.S. financial markets — particularly U.S. equities — generally outperformed other developed markets and emerging markets.
China’s economy continued to grow and posted a 6.9% rise in gross domestic product (GDP) in the first quarter of 2017, amid strength in housing, infrastructure investment, exports and retail sales. Notably, financial markets in China remained largely stable for the six month reporting period. For the 86 trading days through April 24, 2017, the Shanghai Stock Exchange Composite Index hadn’t fallen by more than 1%, thanks in large part to government efforts to prevent a recurrence of the sharp sell-offs that hit Chinese markets in mid-2015 and early 2016.
Meanwhile, Chinese officials sought to reduce financial system risk by tightening money-market rules and pushing to reduce the use of leverage and financial market speculation.
In the European Union (EU), rising consumer spending and manufacturing led to 0.6% growth in first quarter GDP. In particular, Germany’s economy continued to accelerate into 2017, with positive growth in factory orders and an estimated 14% increase in corporate earnings in the first quarter of 2017. Surveys of consumer sentiment across the EU were more upbeat than in recent years. At the end of March 2017, EU unemployment stood at 9.5%, the lowest level since April 2009.
In emerging markets, economic strength in China and a rebound in commodities prices, which began in the latter half of 2016, helped lift economic growth. Moreover, the economies of Brazil, Argentina, Russia, Turkey and South Africa — which were seen as weak links in the global economy — all showed positive growth by the end of April 2017.
While bond markets provided a mixed performance over the six months ended April 30, 2017, equity markets rewarded investors with solid returns. The Standard & Poor’s 500 Index returned 13.32% for the reporting period, while the Morgan Stanley Capital International (“MSCI”) Europe, Australasia and Far East Index (net of foreign withholding taxes) returned 11.73% and the MSCI Emerging Markets Index (net of foreign withholding taxes) returned 9.03%.
We look forward to managing your investment needs for years to come. Should you have any questions, please visit www.jpmorganfunds.com or contact the J.P. Morgan Funds Service Center at 1-800-480-4111.
Sincerely yours,

George C.W. Gatch
CEO, Investment Funds Management,
J.P. Morgan Asset Management
J.P. Morgan International Equity Funds
MARKET OVERVIEW
SIX MONTHS ENDED APRIL 30, 2017 (Unaudited)
Global financial markets generally provided positive returns for the six month reporting period as the world’s leading economies continued to grow in a more uniform fashion and investors sought returns in many developed and emerging markets.
During the final quarter of 2016 and into 2017, certain leading U.S. equity indexes hit multiple record highs amid solid corporate earnings and expectations that the Republican majorities in the U.S. Congress and President Trump’s administration would work to ease business regulations, reduce taxes and increase infrastructure spending.
In Europe, a pickup in corporate earnings and improvements in consumer sentiment also proved attractive to investors during the reporting period. Electoral defeats of anti-European Union (EU) politicians in Austria and the Netherlands also helped lift investor sentiment across the EU and other developed markets.
Emerging markets also saw investment inflows during the six month reporting period amid economic and financial market stability in China. Notably, the Chinese government’s efforts to curb excessive leverage in its financial markets appeared to adversely impact the Shanghai Stock Exchange Composite Index in April 2017. Meanwhile, several previously underperforming economies – particularly Brazil, Argentina, Russia, Turkey and South Africa – showed signs of improvement toward the end of the reporting period.
Commodities prices showed signs of stabilization during the reporting period and global oil prices reached 15-month highs in October 2016. Oil prices were further bolstered by the December 2016 decision by the Organization of Petroleum Exporting Countries’ to curb production. However, by the end of the reporting period, overproduction pushed global oil prices lower.
For the six months ended April 30, 2017, the MSCI Europe Australasia and Far East Index (net of foreign withholding taxes) returned 11.47% and the MSCI Emerging Markets Index (net of foreign withholding taxes) returned 8.88%.
| | | | | | |
| | | |
| 2 | | | | J.P. MORGAN INTERNATIONAL EQUITY FUNDS | | APRIL 30, 2017 |
JPMorgan Emerging Economies Fund
FUND COMMENTARY
SIX MONTHS ENDED APRIL 30, 2017 (Unaudited)
| | | | |
| REPORTING PERIOD RETURN: | |
| Fund (Class I Shares)1* | | | 11.03% | |
| Morgan Stanley Capital International (“MSCI”) Emerging Markets Index (net of foreign withholding taxes) | | | 8.88% | |
| |
| Net Assets as of 4/30/2017 (In Thousands) | | $ | 1,881,826 | |
INVESTMENT OBJECTIVE**
The JPMorgan Emerging Economies Fund (the “Fund”) seeks long-term capital growth.
WHAT WERE THE MAIN DRIVERS OF THE FUND’S PERFORMANCE?
The Fund’s Class I Shares outperformed the MSCI Emerging Markets Index (net of foreign withholding taxes) (the “Benchmark”) for the six months ended April 30, 2017.
The Fund’s security selection in the energy sector and its security selection and overweight position in the materials sector were leading contributors to performance relative to the Benchmark. The Fund’s security selection in the utilities sector and its security selection and overweight position in the consumer staples sector were leading detractors from relative performance.
Leading individual contributors to relative performance included the Fund’s overweight positions in Polski Koncern Naftowy SA, KGHM Polska Miedz SA and AAC Technologies Holdings Inc. Shares of Polski Koncern Naftowy, a Polish crude oil processor, benefitted from rising oil prices during most of the reporting period. Shares of KGHM Polska Miedz, a Polish metals mining and smelting company, rose amid investor expectations for higher demand for base metals. Shares of AAC Technologies Holdings, a Chinese maker of acoustical components for consumer electronics, rose on expectations for continued growth in smartphone sales.
Leading individual detractors from relative performance included the Fund’s underweight position in Samsung Electronics Co. and its overweight positions in Micro-Star International Co. and Emlak Konut Gayrimenkul Yatiri
Ortakligi AS. Shares of Samsung Electronics, a South Korean consumer electronics manufacturer, rose after the company reported strong earnings growth. Shares of Micro-Star International, a Taiwanese maker of computer hardware, declined as the company transitioned to new products, which reduced sales. Shares of Emlak Konus Gayrimenkul, a Turkish real estate investment trust, fell after the company announced it would eliminate regular dividend payments.
HOW WAS THE FUND POSITIONED?
The Fund’s portfolio managers used a combination of top-down and bottom-up research, seeking what they believed to be attractively priced countries, sectors and securities with positive catalysts. As a result of this process, the Fund’s largest average country exposures during the six months ended April 30, 2017, were to China, South Korea and Taiwan and its smallest average country exposures were to Chile, Singapore and Vietnam. From a sector perspective, the Fund’s largest average weightings were in the financials, information technology and energy sectors, while its smallest average weightings were in the telecommunication services, health care and real estate sectors.
| 1 | | On April 3, 2017, the Fund’s Select Class Shares were renamed Class I Shares. |
| * | | The return shown is based on net asset values calculated for shareholder transactions and may differ from the return shown in the financial highlights, which reflects adjustments made to the net asset values in accordance with accounting principles generally accepted in the United States of America. |
| ** | | The adviser seeks to achieve the Fund’s objective. There can be no guarantee it will be achieved. |
| | | | | | | | |
| | | |
| APRIL 30, 2017 | | J.P. MORGAN INTERNATIONAL EQUITY FUNDS | | | | | 3 | |
JPMorgan Emerging Economies Fund
FUND COMMENTARY
SIX MONTHS ENDED APRIL 30, 2017 (Unaudited) (continued)
| | | | | | | | |
| TOP TEN EQUITY HOLDINGS OF THE PORTFOLIO*** | |
| | 1. | | | Samsung Electronics Co. Ltd. (South Korea) | | | 2.3 | % |
| | 2. | | | Industrial & Commercial Bank of China Ltd., Class H (China) | | | 2.2 | |
| | 3. | | | Itau Unibanco Holding SA, ADR (Brazil) | | | 1.9 | |
| | 4. | | | Tencent Holdings Ltd. (China) | | | 1.7 | |
| | 5. | | | Alibaba Group Holding Ltd., ADR (China) | | | 1.6 | |
| | 6. | | | Polski Koncern Naftowy ORLEN SA (Poland) | | | 1.5 | |
| | 7. | | | NetEase, Inc., ADR (China) | | | 1.5 | |
| | 8. | | | China Construction Bank Corp., Class H (China) | | | 1.5 | |
| | 9. | | | Bank of China Ltd., Class H (China) | | | 1.4 | |
| | 10. | | | Copa Holdings SA, Class A (Panama) | | | 1.4 | |
| | | | |
PORTFOLIO COMPOSITION BY COUNTRY*** | |
| China | | | 21.9 | % |
| South Korea | | | 17.0 | |
| Taiwan | | | 14.1 | |
| Brazil | | | 9.4 | |
| Russia | | | 8.6 | |
| Thailand | | | 4.6 | |
| Turkey | | | 4.3 | |
| India | | | 3.1 | |
| Hong Kong | | | 2.8 | |
| Poland | | | 2.5 | |
| South Africa | | | 2.5 | |
| Hungary | | | 1.5 | |
| Panama | | | 1.4 | |
| Malaysia | | | 1.3 | |
| United Arab Emirates | | | 1.2 | |
| Others (each less than 1.0%) | | | 2.1 | |
| Short-Term Investment | | | 1.7 | |
| *** | | Percentages indicated are based on total investments as of April 30, 2017. The Fund’s portfolio composition is subject to change. |
| | | | | | |
| | | |
| 4 | | | | J.P. MORGAN INTERNATIONAL EQUITY FUNDS | | APRIL 30, 2017 |
| | | | | | | | | | | | | | | | | | |
AVERAGE ANNUAL TOTAL RETURNS AS OF APRIL 30, 2017 | |
| | | | | |
| | | INCEPTION DATE OF
CLASS | | 6 MONTH* | | | 1 YEAR | | | 5 YEAR | | | SINCE
INCEPTION | |
CLASS A SHARES | | February 28, 2008 | | | | | | | | | | | | | | | | |
With Sales Charge** | | | | | 5.03 | % | | | 14.62 | % | | | (1.33 | )% | | | (0.97 | )% |
Without Sales Charge | | | | | 10.85 | | | | 21.01 | | | | (0.26 | ) | | | (0.39 | ) |
CLASS C SHARES | | February 28, 2008 | | | | | | | | | | | | | | | | |
With CDSC*** | | | | | 9.64 | | | | 19.45 | | | | (0.74 | ) | | | (0.88 | ) |
Without CDSC | | | | | 10.64 | | | | 20.45 | | | | (0.74 | ) | | | (0.88 | ) |
CLASS I SHARES (FORMERLY SELECT CLASS SHARES) | | February 28, 2008 | | | 11.03 | | | | 21.31 | | | | 0.00 | (a) | | | (0.13 | ) |
CLASS R5 SHARES | | February 28, 2008 | | | 11.10 | | | | 21.52 | | | | 0.20 | | | | 0.06 | |
CLASS R6 SHARES | | September 1, 2015 | | | 11.10 | | | | 21.54 | | | | 0.22 | | | | 0.07 | |
| ** | | Sales Charge for Class A Shares is 5.25%. |
| *** | | Assumes a 1% CDSC (contingent deferred sales charge) for the 6 month and one year periods and 0% CDSC thereafter. |
| (a) | | Amount rounds to less than 0.005%. |
LIFE OF FUND PERFORMANCE (2/28/08 TO 4/30/17)
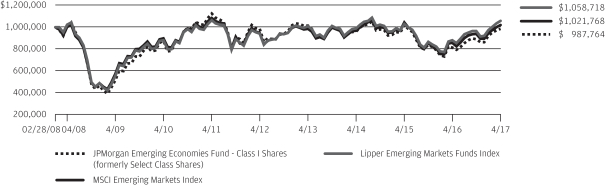
The performance quoted is past performance and is not a guarantee of future results. Mutual funds are subject to certain market risks. Investment returns and principal value of an investment will fluctuate so that an investor’s shares, when redeemed, may be worth more or less than their original cost. Current performance may be higher or lower than the performance data shown. For up-to-date month-end performance information please call 1-800-480-4111.
The Fund commenced operations on February 28, 2008.
Returns for Class R6 Shares prior to its inception date are based on the performance of Class R5 Shares. The actual returns for Class R6 Shares would have been different than those shown because Class R6 Shares have different expenses than Class R5 Shares.
The graph illustrates comparative performance for $1,000,000 invested in Class I Shares of the JPMorgan Emerging Economies Fund, the MSCI Emerging Markets Index and the Lipper Emerging Markets Funds Index from February 28, 2008 to April 30, 2017. The performance of the Fund assumes reinvestment of all dividends and capital gain distributions, if any, and does not include a sales charge. The performance of the MSCI Emerging Markets Index does not reflect the deduction of expenses or a sales charge associated with a mutual fund and approximates the minimum possible dividend reinvestment of the securities included in the benchmark, if applicable. The dividend is reinvested after deduction of withholding tax, applying the maximum rate to non-resident individual investors who do not benefit from double taxation treaties. The performance of the Lipper Emerging Markets Funds Index includes
expenses associated with a mutual fund, such as investment management fees. These expenses are not identical to the expenses incurred by the Fund. The MSCI Emerging Markets Index is a free float-adjusted market capitalization weighted index that is designed to measure the equity market performance of emerging markets. The Lipper Emerging Markets Funds Index is an index based on the total returns of certain mutual funds within the Fund’s designated category as determined by Lipper, Inc. Investors cannot invest directly in an index.
Class I Shares have a $1,000,000 minimum initial investment.
Fund performance may reflect the waiver of the Fund’s fees and reimbursement of expenses for certain periods since the inception date. Without these waivers and reimbursements, performance would have been lower. Also, performance shown in this section does not reflect the deduction of taxes that a shareholder would pay on Fund distributions or redemptions of Fund shares.
International investing involves a greater degree of risk and increased volatility. Changes in currency exchange rates and differences in accounting and taxation policies outside the United States can raise or lower returns. Also, some overseas markets may not be as politically and economically stable as the U.S. and other nations.
The returns shown are based on net asset values calculated for shareholder transactions and may differ from the returns shown in the financial highlights, which reflect adjustments made to the net asset values in accordance with accounting principles generally accepted in the United States of America.
| | | | | | | | |
| | | |
| APRIL 30, 2017 | | J.P. MORGAN INTERNATIONAL EQUITY FUNDS | | | | | 5 | |
JPMorgan Emerging Markets Equity Fund
FUND COMMENTARY
SIX MONTHS ENDED APRIL 30, 2017 (Unaudited)
| | | | |
| REPORTING PERIOD RETURN: | |
| Fund (Class L Shares)1* | | | 10.00% | |
| Morgan Stanley Capital International (“MSCI”) Emerging Markets Index (net of foreign withholding taxes) | | | 8.88% | |
| |
| Net Assets as of 4/30/2017 (In Thousands) | | $ | 3,562,217 | |
INVESTMENT OBJECTIVE**
The JPMorgan Emerging Markets Equity Fund (the “Fund”) seeks to provide high total return from a portfolio of equity securities from emerging markets issuers.
WHAT WERE THE MAIN DRIVERS OF THE FUND’S PERFORMANCE?
The Fund’s Class L Shares outperformed the MSCI Emerging Markets Index (net of foreign withholding taxes) (the “Benchmark”) for the six months ended April 30, 2017.
The Fund’s security selection in the financials and consumer staples sectors was a leading contributor to performance relative to the Benchmark, while the Fund’s security selection in the information technology and energy sectors was a leading detractor from relative performance.
Leading individual contributors to relative performance included the Fund’s overweight positions in Sberbank of Russia OJSC, JD.com Inc. and AAC Technologies Holdings Inc. Shares of Sberbank, a Russian bank, rose along with a general rebound in Russian equities during the reporting period. Shares of JD.com, a Chinese retailer of consumer electronics, rose on revenue growth and expanding profit margins. Shares of AAC Technologies Holdings, a Chinese maker of acoustical components for consumer electronics, rose on expectations for continued growth in smartphone sales.
Leading individual detractors from relative performance included the Fund’s underweight position in Samsung Electronics Co. and its overweight positions in Magnit PJSC and BB Seguridade Participacoes SA. Shares of Samsung Electronics, a South Korean consumer electronics manufacturer, rose after
the company reported strong earnings growth. Shares of Magnit, a Russian operator of retail stores, fell on weak sales growth. Shares of BB Seguridade Participacoes, a Brazilian insurance company, fell after the company forecast slower profit growth.
HOW WAS THE FUND POSITIONED?
The Fund’s portfolio managers employed an active strategy in which portfolio construction was focused on the highest-conviction ideas found at the security level. The Fund’s portfolio managers used bottom-up fundamental research to determine the Fund’s security weightings, researching companies in an attempt to determine their underlying value and potential for future earnings growth. As a result of this process, the Fund’s largest average sector positions during the reporting period were in the financials, information technology and consumer discretionary sectors, while the Fund’s smallest average sector positions were in the utilities, materials and health care sectors. The Fund’s largest average country positions were in China, India and South Africa and its smallest average positions were in Turkey, Egypt and Papua New Guinea.
| 1 | | Effective December 1, 2016, the Fund’s Institutional Class Shares were renamed Class L Shares. |
| * | | The return shown is based on net asset values calculated for shareholder transactions and may differ from the return shown in the financial highlights, which reflects adjustments made to the net asset values in accordance with accounting principles generally accepted in the United States of America. |
| ** | | The adviser seeks to achieve the Fund’s objective. There can be no guarantee it will be achieved. |
| | | | | | |
| | | |
| 6 | | | | J.P. MORGAN INTERNATIONAL EQUITY FUNDS | | APRIL 30, 2017 |
| | | | | | | | |
| TOP TEN EQUITY HOLDINGS OF THE PORTFOLIO*** | |
| | 1. | | | Tencent Holdings Ltd. (China) | | | 6.5 | % |
| | 2. | | | Alibaba Group Holding Ltd., ADR (China) | | | 4.0 | |
| | 3. | | | Taiwan Semiconductor Manufacturing Co. Ltd., ADR (Taiwan) | | | 4.0 | |
| | 4. | | | AIA Group Ltd. (Hong Kong) | | | 3.7 | |
| | 5. | | | Housing Development Finance Corp. Ltd. (India) | | | 3.5 | |
| | 6. | | | Samsung Electronics Co. Ltd. (South Korea) | | | 3.2 | |
| | 7. | | | Bid Corp. Ltd. (South Africa) | | | 2.6 | |
| | 8. | | | Tata Consultancy Services Ltd. (India) | | | 2.3 | |
| | 9. | | | JD.com, Inc., ADR (China) | | | 2.2 | |
| | 10. | | | HDFC Bank Ltd., ADR (India) | | | 2.0 | |
| | | | |
PORTFOLIO COMPOSITION BY COUNTRY*** | |
| India | | | 18.6 | % |
| China | | | 18.5 | |
| South Africa | | | 11.1 | |
| Brazil | | | 10.1 | |
| Taiwan | | | 7.7 | |
| Hong Kong | | | 6.6 | |
| South Korea | | | 5.1 | |
| Russia | | | 4.1 | |
| United States | | | 3.4 | |
| Indonesia | | | 3.1 | |
| Mexico | | | 2.6 | |
| Argentina | | | 1.6 | |
| Panama | | | 1.3 | |
| Peru | | | 1.2 | |
| Switzerland | | | 1.0 | |
| Others (each less than 1.0%) | | | 2.7 | |
| Short-Term Investment | | | 1.3 | |
| *** | | Percentages indicated are based on total investments as of April 30, 2017. The Fund’s portfolio composition is subject to change. |
| | | | | | | | |
| | | |
| APRIL 30, 2017 | | J.P. MORGAN INTERNATIONAL EQUITY FUNDS | | | | | 7 | |
JPMorgan Emerging Markets Equity Fund
FUND COMMENTARY
SIX MONTHS ENDED APRIL 30, 2017 (Unaudited) (continued)
| | | | | | | | | | | | | | | | | | |
AVERAGE ANNUAL TOTAL RETURNS AS OF APRIL 30, 2017 | |
| | | | | |
| | | INCEPTION DATE OF
CLASS | | 6 MONTH* | | | 1 YEAR | | | 5 YEAR | | | 10 YEAR | |
CLASS A SHARES | | September 28, 2001 | | | | | | | | | | | | | | | | |
With Sales Charge** | | | | | 4.14 | % | | | 15.38 | % | | | 0.86 | % | | | 1.90 | % |
Without Sales Charge | | | | | 9.92 | | | | 21.77 | | | | 1.95 | | | | 2.45 | |
CLASS C SHARES | | February 28, 2006 | | | | | | | | | | | | | | | | |
With CDSC*** | | | | | 8.62 | | | | 20.12 | | | | 1.44 | | | | 1.94 | |
Without CDSC | | | | | 9.62 | | | | 21.12 | | | | 1.44 | | | | 1.94 | |
CLASS I SHARES (FORMERLY SELECT CLASS SHARES) | | September 10, 2001 | | | 10.00 | | | | 22.02 | | | | 2.20 | | | | 2.70 | |
CLASS L SHARES (FORMERLY INSTITUTIONAL CLASS SHARES) | | November 15, 1993 | | | 10.06 | | | | 22.17 | | | | 2.35 | | | | 2.87 | |
CLASS R5 SHARES | | September 9, 2016 | | | 10.09 | | | | 22.20 | | | | 2.36 | | | | 2.87 | |
CLASS R6 SHARES | | December 23, 2013 | | | 10.16 | | | | 22.37 | | | | 2.43 | | | | 2.90 | |
| ** | | Sales Charge for Class A Shares is 5.25%. |
| *** | | Assumes a 1% CDSC (contingent deferred sales charge) for the 6 month and one year periods and 0% CDSC thereafter. |
TEN YEAR PERFORMANCE (4/30/07 TO 4/30/17)
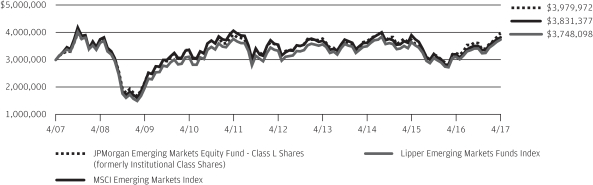
The performance quoted is past performance and is not a guarantee of future results. Mutual funds are subject to certain market risks. Investment returns and principal value of an investment will fluctuate so that an investor’s shares, when redeemed, may be worth more or less than their original cost. Current performance may be higher or lower than the performance data shown. For up-to-date month-end performance information please call 1-800-480-4111.
Returns for Class R6 Shares prior to its inception date are based on the performance of Class L Shares. The actual returns of R6 Shares would have been different than those shown because R6 Shares have different expenses than Class L Shares.
Returns for Class R5 Shares prior to its inception date are based on the performance of Class L Shares. The actual returns of Class R5 Shares would have been different than those shown because Class R5 Shares have different expenses than Class L Shares.
The graph illustrates comparative performance for $3,000,000 invested in Class L Shares of the JPMorgan Emerging Markets Equity Fund, the MSCI Emerging Markets Index and the Lipper Emerging Markets Funds Index from April 30, 2007 to April 30, 2017. The performance of the Fund assumes reinvestment of all dividends and capital gain distributions, if any, and does not include a sales charge. The performance of the MSCI Emerging Markets Index does not reflect the deduction of expenses or a sales charge associated with a mutual fund and approximates the minimum possible dividend reinvestment of the securities included in the benchmark, if applicable. The dividend is reinvested after deduction of withholding tax, applying the maximum rate to non-resident individual investors who do not benefit from double taxation treaties. The
performance of the Lipper Emerging Markets Funds Index includes expenses associated with a mutual fund, such as investment management fees. These expenses are not identical to the expenses incurred by the Fund. The MSCI Emerging Markets Index is a free float-adjusted market capitalization weighted index that is designed to measure the equity market performance of emerging markets. The Lipper Emerging Markets Funds Index is an index based on the total returns of certain mutual funds within the Fund’s designated category, as determined by Lipper, Inc. Investors cannot invest directly in an index.
Class L Shares have a $3,000,000 minimum initial investment.
Fund performance may reflect the waiver of the Fund’s fees and reimbursement of expenses for certain periods since the inception date. Without these waivers and reimbursements, performance would have been lower. Also, performance shown in this section does not reflect the deduction of taxes that a shareholder would pay on Fund distributions or redemptions of Fund shares.
International investing involves a greater degree of risk and increased volatility. Changes in currency exchange rates and differences in accounting and taxation policies outside the U.S. can raise or lower returns. Also, some overseas markets may not be as politically and economically stable as the United States and other nations.
The returns shown are based on net asset values calculated for shareholder transactions and may differ from the returns shown in the financial highlights, which reflect adjustments made to the net asset values in accordance with accounting principles generally accepted in the United States of America.
| | | | | | |
| | | |
| 8 | | | | J.P. MORGAN INTERNATIONAL EQUITY FUNDS | | APRIL 30, 2017 |
JPMorgan Emerging Markets Equity Income Fund
FUND COMMENTARY
SIX MONTHS ENDED APRIL 30, 2017 (Unaudited)
| | | | |
| Reporting Period Return: | | | |
| Fund (Class I Shares)(1)* | | | 5.55% | |
| Morgan Stanley Capital International (“MSCI”) Emerging Markets Index (net of foreign withholding taxes) | | | 8.88% | |
| |
| Net Assets as of 4/30/2017 (In Thousands) | | $ | 16,087 | |
INVESTMENT OBJECTIVE**
The JPMorgan Emerging Markets Equity Income Fund (the “Fund”) seeks to provide both current income and long-term capital appreciation.
WHAT WERE THE MAIN DRIVERS OF THE FUND’S PERFORMANCE?
The Fund’s Class I Shares underperformed the MSCI Emerging Markets Index (net of foreign withholding taxes) (the “Benchmark”) for the six months ended April 30, 2017.
The Fund’s security selection and underweight position in the information technology sector and its security selection in the financials sector were leading detractors from performance relative to the Benchmark. The Fund’s security selection in the consumer discretionary and energy sectors was a leading contributor to relative performance.
Leading individual detractors from relative performance included the Fund’s underweight position in Samsung Electronics Co. and its overweight positions in Engie Brasil Energia SA and BB Seguridade Participacoes SA. Shares of Samsung Electronics, a South Korean consumer electronics manufacturer that was not held in the Fund, rose after the company reported strong earnings growth. Shares of Engie Brasil Energia, a Brazilian electricity generator, fell amid investor concerns about the company’s transition toward renewable energy and electricity transmission. Shares of BB Seguridade Participacoes, a Brazilian insurance company, fell after the company forecast slower profit growth.
Leading individual contributors to relative performance included the Fund’s overweight positions in Fuyao Glass Industry Group Co. and GD Midea Holding Co. and its underweight position in Petroleo Brasiliero SA. Shares of Fuyao Glass Industry Group, a Chinese maker of glass for the automobile industry, rose on investor expectations for growing auto sales. Shares of GD Midea Holding, a Chinese appliance manufacturer not held in the Benchmark, rose on investor expectations for growth in the retail market for home appliances. Shares of Petroleo Brasiliero, Brazil’s state-controlled petroleum company, which was not held in the Fund, fell amid a global oversupply of oil at the end of the reporting period.
HOW THE FUND WAS MANAGED?
The Fund’s portfolio managers employed a bottom-up fundamental approach to security selection, rigorously researching companies in an attempt to determine their underlying value and potential for future growth. The Fund’s portfolio managers looked for dividend yielding equity securities that they believed were undervalued and possessed the long-term earnings power and strong cash flow generation that would enable them to grow their dividends.
| (1) | | On April 3, 2017, the Fund’s Select Class Shares were renamed Class I Shares. |
| * | | The return shown is based on net asset values calculated for shareholder transactions and may differ from the return shown in the financial highlights, which reflects adjustments made to the net asset values in accordance with accounting principles generally accepted in the United States of America. |
| ** | | The adviser seeks to achieve the Fund’s objective. There can be no guarantee it will be achieved. |
| | | | | | | | |
| | | |
| APRIL 30, 2017 | | J.P. MORGAN INTERNATIONAL EQUITY FUNDS | | | | | 9 | |
JPMorgan Emerging Markets Equity Income Fund
FUND COMMENTARY
SIX MONTHS ENDED APRIL 30, 2017 (Unaudited) (continued)
| | | | | | | | |
| TOP TEN EQUITY HOLDINGS OF THE PORTFOLIO*** | |
| | 1. | | | Taiwan Semiconductor Manufacturing Co. Ltd., ADR (Taiwan) | | | 5.0 | % |
| | 2. | | | Kimberly-Clark de Mexico SAB de CV, Class A (Mexico) | | | 3.0 | |
| | 3. | | | Banco Santander Chile, ADR (Chile) | | | 3.0 | |
| | 4. | | | Moscow Exchange MICEX-RTS PJSC (Russia) | | | 2.7 | |
| | 5. | | | Fuyao Glass Industry Group Co. Ltd., Class A (China) | | | 2.7 | |
| | 6. | | | China Mobile Ltd. (China) | | | 2.7 | |
| | 7. | | | Ambev SA, ADR (Brazil) | | | 2.7 | |
| | 8. | | | Samsung Electronics Co. Ltd. (South Korea) | | | 2.5 | |
| | 9. | | | BB Seguridade Participacoes SA (Brazil) | | | 2.5 | |
| | 10. | | | China Resources Power Holdings Co. Ltd. (China) | | | 2.4 | |
| | | | |
SUMMARY OF INVESTMENTS BY COUNTRY*** | |
| Taiwan | | | 19.5 | % |
| China | | | 13.1 | |
| South Africa | | | 12.2 | |
| Brazil | | | 7.4 | |
| Russia | | | 7.4 | |
| South Korea | | | 6.6 | |
| Mexico | | | 6.3 | |
| Hong Kong | | | 6.0 | |
| Thailand | | | 4.3 | |
| Turkey | | | 3.4 | |
| Czech Republic | | | 3.0 | |
| Chile | | | 3.0 | |
| Indonesia | | | 2.1 | |
| Hungary | | | 1.7 | |
| United Arab Emirates | | | 1.5 | |
| United States | | | 1.4 | |
| France | | | 0.9 | |
| Short-Term Investment | | | 0.2 | |
| *** | | Percentages indicated are based on total investments as of April 30, 2017. The Fund’s portfolio composition is subject to change. |
| | | | | | |
| | | |
| 10 | | | | J.P. MORGAN INTERNATIONAL EQUITY FUNDS | | APRIL 30, 2017 |
| | | | | | | | | | | | | | |
AVERAGE ANNUAL TOTAL RETURNS AS OF APRIL 30, 2017 | |
| | | | |
| | | INCEPTION DATE OF
CLASS | | 6 MONTH* | | | 1 YEAR | | | SINCE
INCEPTION | |
CLASS A SHARES | | December 12, 2014 | | | | | | | | | | | | |
With Sales Charge** | | | | | (0.17 | )% | | | 7.99 | % | | | (2.42 | )% |
Without Sales Charge | | | | | 5.39 | | | | 13.98 | | | | (0.18 | ) |
CLASS C SHARES | | December 12, 2014 | | | | | | | | | | | | |
With CDSC*** | | | | | 4.18 | | | | 12.33 | | | | (0.68 | ) |
Without CDSC | | | | | 5.18 | | | | 13.33 | | | | (0.68 | ) |
CLASS I SHARES (FORMERLY SELECT CLASS SHARES) | | December 12, 2014 | | | 5.55 | | | | 14.18 | | | | 0.07 | |
CLASS R5 SHARES | | December 12, 2014 | | | 5.72 | | | | 14.47 | | | | 0.28 | |
CLASS R6 SHARES | | December 12, 2014 | | | 5.67 | | | | 14.52 | | | | 0.32 | |
| ** | | Sales Charge for Class A Shares is 5.25%. |
| *** | | Assumes a 1% CDSC (contingent deferred sales charge) for the 6 month and one year periods and 0% CDSC thereafter. |
LIFE OF FUND PERFORMANCE (12/12/14 TO 4/30/17)
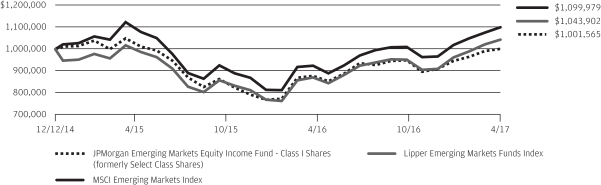
The performance quoted is past performance and is not a guarantee of future results. Mutual funds are subject to certain market risks. Investment returns and principal value of an investment will fluctuate so that an investor’s shares, when redeemed, may be worth more or less than their original cost. Current performance may be higher or lower than the performance data shown. For up-to-date month-end performance information please call 1-800-480-4111.
The Fund commenced operations on December 12, 2014.
The graph illustrates comparative performance for $1,000,000 invested in Class I Shares of the JPMorgan Emerging Markets Equity Income Fund, the MSCI Emerging Markets Index and the Lipper Emerging Markets Funds Index from December 12, 2014 to April 30, 2017. The performance of the Fund assumes reinvestment of all dividends and capital gain distributions, if any, and does not include a sales charge. The performance of the MSCI Emerging Markets Index does not reflect the deduction of expenses or a sales charge associated with a mutual fund and approximates the minimum possible dividend reinvestment of the securities included in the benchmark, if applicable. The dividend is reinvested after deduction of withholding tax, applying the maximum rate to non-resident individual investors who do not benefit from double taxation treaties. The performance of the Lipper Emerging Markets Funds Index includes expenses associated with a mutual fund, such as investment management fees. These expenses are not identical to the expenses incurred by the Fund. The
MSCI Emerging Markets Index is a free float-adjusted market capitalization weighted index that is designed to measure the equity market performance of emerging markets. The Lipper Emerging Markets Funds Index is an index based on the total returns of certain mutual funds within the Fund’s designated category, as determined by Lipper, Inc. Investors cannot invest directly in an index.
Class I Shares have a $1,000,000 minimum initial investment.
Fund performance may reflect the waiver of the Fund’s fees and reimbursement of expenses for certain periods since the inception date. Without these waivers and reimbursements, performance would have been lower. Also, performance shown in this section does not reflect the deduction of taxes that a shareholder would pay on Fund distributions or redemptions of Fund shares.
International investing involves a greater degree of risk and increased volatility. Changes in currency exchange rates and differences in accounting and taxation policies outside the U.S. can raise or lower returns. Also, some overseas markets may not be as politically and economically stable as the United States and other nations.
The returns shown are based on net asset values calculated for shareholder transactions and may differ from the returns shown in the financial highlights, which reflect adjustments made to the net asset values in accordance with accounting principles generally accepted in the United States of America.
| | | | | | | | |
| | | |
| APRIL 30, 2017 | | J.P. MORGAN INTERNATIONAL EQUITY FUNDS | | | | | 11 | |
JPMorgan Global Research Enhanced Index Fund
FUND COMMENTARY
SIX MONTHS ENDED APRIL 30, 2017 (Unaudited)
| | | | |
| REPORTING PERIOD RETURN: | |
| Fund (Class I Shares)1* | | | 12.78% | |
| Morgan Stanley Capital International (“MSCI”) World Index (net of foreign withholding taxes)2 | | | 12.12% | |
| |
| Net Assets as of 4/30/2017 (In Thousands) | | $ | 7,716,152 | |
INVESTMENT OBJECTIVE**
The JPMorgan Global Research Enhanced Index Fund (the “Fund”) seeks to provide long-term capital appreciation.
WHAT WERE THE MAIN DRIVERS OF THE FUND’S PERFORMANCE?
The Fund’s Class I Shares outperformed the MSCI World Index (net of foreign withholding taxes) (the “Benchmark”) for the six months ended April 30, 2017.
By sector, the Fund’s security selection in the telecommunications and banks-finance sectors was a leading contributor to performance relative to the Benchmark, while the Fund’s security selection in the banks-capital markets and basic industries sectors was a leading detractor from relative performance. By region, the Fund’s security selection in North America was the leading contributor to relative performance, while the Fund’s underweight allocation to Europe and its overweight allocation to Japan detracted from relative performance.
Due to the Fund holding a relatively large number of securities during the period, the impact of individual holdings on the Fund’s relative performance tended to be small.
HOW WAS THE FUND POSITIONED?
The Fund sought to outperform the Benchmark over time, while seeking to achieve sector, geographic and risk characteristics similar to that of the Benchmark. Using the fundamental equity insights generated by JPMorgan’s team of analysts, the Fund’s portfolio managers took marginally overweight positions in securities that they considered undervalued, while being marginally underweight in or not holding securities in the Benchmark that they considered overvalued. During the reporting period, the Fund’s portfolio managers used exchange-traded funds and futures to help manage cash flows.
| | | | | | | | |
| TOP TEN EQUITY HOLDINGS OF THE PORTFOLIO*** | |
| | 1. | | | Apple, Inc. (United States) | | | 2.3 | % |
| | 2. | | | Microsoft Corp. (United States) | | | 1.7 | |
| | 3. | | | Amazon.com, Inc. (United States) | | | 1.2 | |
| | 4. | | | Facebook, Inc., Class A (United States) | | | 1.2 | |
| | 5. | | | Alphabet, Inc., Class C (United States) | | | 1.0 | |
| | 6. | | | Wells Fargo & Co. (United States) | | | 0.9 | |
| | 7. | | | Bank of America Corp. (United States) | | | 0.9 | |
| | 8. | | | Alphabet, Inc., Class A (United States) | | | 0.8 | |
| | 9. | | | Exxon Mobil Corp. (United States) | | | 0.8 | |
| | 10. | | | General Electric Co. (United States) | | | 0.8 | |
| | | | |
PORTFOLIO COMPOSITION BY COUNTRY*** | |
| United States | | | 59.8 | % |
| Japan | | | 8.7 | |
| United Kingdom | | | 5.6 | |
| France | | | 4.1 | |
| Germany | | | 3.7 | |
| Canada | | | 3.4 | |
| Switzerland | | | 2.9 | |
| Australia | | | 2.6 | |
| Netherlands | | | 2.0 | |
| Spain | | | 1.4 | |
| Hong Kong | | | 1.2 | |
| Others (each less than 1.0%) | | | 4.0 | |
| Short-Term Investment | | | 0.6 | |
| 1 | | On April 3, 2017, the Fund’s Select Class Shares were renamed Class I Shares. |
| 2 | | MSCI World Index is a registered service mark of Morgan Stanley Capital International, which does not sponsor and is in no way affiliated with the Fund. |
| * | | The return shown is based on net asset values calculated for shareholder transactions and may differ from the return shown in the financial highlights, which reflects adjustments made to the net asset values in accordance with accounting principles generally accepted in the United States of America. |
| ** | | The adviser seeks to achieve the Fund’s objective. There can be no guarantee it will be achieved. |
| *** | | Percentages indicated are based on total investments as of April 30, 2017. The Fund’s portfolio composition is subject to change. |
| | | | | | |
| | | |
| 12 | | | | J.P. MORGAN INTERNATIONAL EQUITY FUNDS | | APRIL 30, 2017 |
| | | | | | | | | | | | | | | | | | |
AVERAGE ANNUAL TOTAL RETURNS AS OF APRIL 30, 2017 | |
| | | | | |
| | | INCEPTION DATE OF
CLASS | | 6 MONTH* | | | 1 YEAR | | | 3 YEAR | | | SINCE
INCEPTION | |
CLASS A SHARES | | February 28, 2013 | | | | | | | | | | | | | | | | |
With Sales Charge** | | | | | 6.72 | % | | | 9.36 | % | | | 3.84 | % | | | 8.05 | % |
Without Sales Charge | | | | | 12.62 | | | | 15.44 | | | | 5.72 | | | | 9.46 | |
CLASS C SHARES | | February 28, 2013 | | | | | | | | | | | | | | | | |
With CDSC*** | | | | | 11.36 | | | | 13.84 | | | | 5.20 | | | | 8.91 | |
Without CDSC | | | | | 12.36 | | | | 14.84 | | | | 5.20 | | | | 8.91 | |
CLASS I SHARES (FORMERLY SELECT CLASS SHARES) | | February 28, 2013 | | | 12.78 | | | | 15.74 | | | | 5.99 | | | | 9.73 | |
CLASS R2 SHARES | | February 28, 2013 | | | 12.46 | | | | 15.14 | | | | 5.45 | | | | 9.18 | |
| ** | | Sales Charge for Class A Shares is 5.25%. |
| *** | | Assumes a 1% CDSC (contingent deferred sales charge) for the 6 month and one year periods and 0% CDSC thereafter. |
LIFE OF FUND PERFORMANCE (2/28/13 TO 4/30/17)
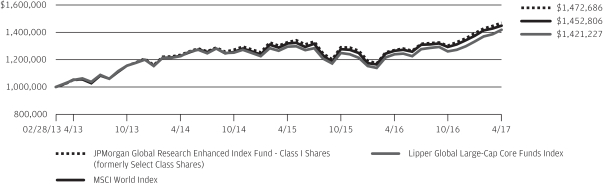
The performance quoted is past performance and is not a guarantee of future results. Mutual funds are subject to certain market risks. Investment returns and principal value of an investment will fluctuate so that an investor’s shares, when redeemed, may be worth more or less than their original cost. Current performance may be higher or lower than the performance data shown. For up-to-date, month-end performance information please call 1-800-480-4111.
The Fund commenced operations on February 28, 2013.
The graph illustrates comparative performance for $1,000,000 invested in Class I Shares of the JPMorgan Global Research Enhanced Index Fund, the MSCI World Index and the Lipper Global Large-Cap Core Funds Index from February 28, 2013 to April 30, 2017. The performance of the Fund assumes reinvestment of all dividends and capital gain distributions, if any, and does not include a sales charge. The performance of the MSCI World Index does not reflect the deduction of expenses or a sales charge associated with a mutual fund and has been adjusted to reflect reinvestment of all dividends and capital gain distributions of the securities included in the benchmark, if applicable. The performance of the Lipper Global Large-Cap Core Funds Index includes expenses associated with a mutual fund, such as investment management fees. These expenses are not identical to the expenses incurred by the Fund. The MSCI World Index is a free float-adjusted market capitalization weighted index that is designed to measure the equity market performance of developed markets. The Lipper Global Large-Cap Core Funds Index is an index based on the total returns of certain mutuals funds within the Fund’s designated category, as determined by Lipper, Inc. Investors cannot invest directly in an index.
Class I Shares have a $1,000,000 minimum initial investment.
Fund performance may reflect the waiver of the Fund’s fees and reimbursement of expenses for certain periods since the inception date. Without these waivers and reimbursements, performance would have been lower. Also,
performance shown in this section does not reflect the deduction of taxes that a shareholder would pay on Fund distributions or redemptions of Fund shares.
International investing involves a greater degree of risk and increased volatility. Changes in currency exchange rates and differences in accounting and taxation policies outside the U.S. can raise or lower returns. Also, some overseas markets may not be as politically and economically stable as the United States and other nations.
The returns shown are based on net asset values calculated for shareholder transactions and may differ from the returns shown in the financial highlights, which reflect adjustments made to the net asset values in accordance with accounting principles generally accepted in the United States of America.
The MSCI information may only be used for your internal use, may not be reproduced or redisseminated in any form and may not be used as a basis for or a component of any financial instruments or products or indices. None of the MSCI information is intended to constitute investment advice or a recommendation to make (or refrain from making) any kind of investment decision and may not be relied on as such. Historical data and analysis should not be taken as an indication or guarantee of any future performance analysis, forecast or prediction. The MSCI information is provided on an “as is” basis and the user of this information assumes the entire risk of any use made of this information. MSCI, each of its affiliates and each other person involved in or related to compiling, computing or creating any MSCI information (collectively, the “MSCI Parties”) expressly disclaims all warranties (including, without limitation, any warranties of originality, accuracy, completeness, timeliness, non-infringement, merchantability and fitness for a particular purpose) with respect to this information. Without limiting any of the foregoing, in no event shall any MSCI Party have any liability for any direct, indirect, special, incidental, punitive, consequential (including, without limitation, lost profits) or any other damages. (www.msci.com)
| | | | | | | | |
| | | |
| APRIL 30, 2017 | | J.P. MORGAN INTERNATIONAL EQUITY FUNDS | | | | | 13 | |
JPMorgan Global Unconstrained Equity Fund
FUND COMMENTARY
SIX MONTHS ENDED APRIL 30, 2017 (Unaudited)
| | | | |
| REPORTING PERIOD RETURN: | |
| Fund (Class I Shares)1* | | | 14.34% | |
| Morgan Stanley Capital International (“MSCI”) All Country World Index (net of foreign withholding taxes) | | | 11.76% | |
| |
| Net Assets as of 4/30/2017 (In Thousands) | | | $2,125 | |
INVESTMENT OBJECTIVE**
The JPMorgan Global Unconstrained Equity Fund (the “Fund”) seeks to provide long-term capital appreciation.
WHAT WERE THE MAIN DRIVERS OF THE FUND’S PERFORMANCE?
The Fund’s Class I Shares outperformed the MSCI All Country World Index (net of foreign withholding taxes) (the “Benchmark”) for the six months ended April 30, 2017.
By sector, the Fund’s security selection in the consumer discretionary and financials sectors was a leading contributor to performance relative to the Benchmark. The Fund’s security selection in the health care and energy sectors was a leading detractor from relative performance.
By region, the Fund’s security selection in North America and its security selection and underweight position in Japan were leading contributors to relative performance, while the Fund’s security selection in Europe, including the U.K., was a leading detractor from relative performance.
Leading individual contributors to the Fund’s relative performance included its overweight positions in Time Inc., Harman International Industries Inc. and Vertex Pharmaceuticals Inc. Shares of Time, a magazine publisher not held in the Benchmark, rose on news that the company was soliciting takeover offers. Shares of Harman International, an auto parts manufacturer, rose ahead of its takeover by Samsung Electronics Co. Shares of Vertex Pharmaceuticals, a drug maker, rose following positive results from clinical trials of its treatment for cystic fibrosis.
Leading individual detractors from the Fund’s relative performance included its overweight positions in Teva Pharmaceutical Industries Ltd., Alexion Pharmaceuticals Inc. and BT Group PLC. Shares of Teva Pharmaceutical, an Israel-based maker of generic and specialty drugs, fell amid investor concerns about the company’s patent on a key drug and general concerns about pricing pressure on generic drugs. Shares of Alexion Pharmaceuticals, a drug maker, fell amid management changes and investor concerns about increased competition for the company’s drugs. Share of BT Group, a telecommunications provider, fell after the company significantly reduced its earnings forecast.
HOW WAS THE FUND POSITIONED?
The Fund’s portfolio managers combined a contrarian approach with bottom-up fundamental research to construct a global portfolio of what they believed were undervalued companies, characterized by sustainability of earnings, strong free cash flow and the ability to increase earnings faster than their sector peers.
| | | | | | | | |
| TOP TEN EQUITY HOLDINGS OF THE PORTFOLIO*** | |
| | 1. | | | Alphabet, Inc., Class C (United States) | | | 5.0 | % |
| | 2. | | | Citigroup, Inc. (United States) | | | 3.3 | |
| | 3. | | | Molson Coors Brewing Co., Class B (United States) | | | 3.1 | |
| | 4. | | | Vodafone Group plc (United Kingdom) | | | 3.1 | |
| | 5. | | | Amazon.com, Inc. (United States) | | | 2.7 | |
| | 6. | | | Teva Pharmaceutical Industries Ltd., ADR (Israel) | | | 2.6 | |
| | 7. | | | Shire plc, ADR (United States) | | | 2.5 | |
| | 8. | | | Novartis AG (Registered) (Switzerland) | | | 2.4 | |
| | 9. | | | AXA SA (France) | | | 2.4 | |
| | 10. | | | Kroger Co. (The) (United States) | | | 2.4 | |
| | | | |
PORTFOLIO COMPOSITION BY COUNTRY*** | |
| United States | | | 49.4 | % |
| United Kingdom | | | 10.1 | |
| China | | | 8.9 | |
| France | | | 7.8 | |
| Japan | | | 5.7 | |
| Switzerland | | | 3.9 | |
| Israel | | | 2.6 | |
| Denmark | | | 1.8 | |
| Hong Kong | | | 1.6 | |
| Canada | | | 1.5 | |
| Luxembourg | | | 1.5 | |
| Netherlands | | | 1.4 | |
| India | | | 1.1 | |
| Others (each less than 1.0%) | | | 0.8 | |
| Short-Term Investment | | | 1.9 | |
| 1 | | On April 3, 2017, the Fund’s Select Class Shares were renamed Class I Shares. |
| * | | The return shown is based on net asset values calculated for shareholder transactions and may differ from the return shown in the financial highlights, which reflects adjustments made to the net asset values in accordance with accounting principles generally accepted in the United States of America. |
| ** | | The adviser seeks to achieve the Fund’s objective. There can be no guarantee it will be achieved. |
| *** | | Percentages indicated are based on total investments as of April 30, 2017. The Fund’s portfolio composition is subject to change. |
| | | | | | |
| | | |
| 14 | | | | J.P. MORGAN INTERNATIONAL EQUITY FUNDS | | APRIL 30, 2017 |
| | | | | | | | | | | | | | | | | | | | | | |
AVERAGE ANNUAL TOTAL RETURNS AS OF APRIL 30, 2017 | |
| | | | | | |
| | | INCEPTION DATE OF
CLASS | | 6 MONTH* | | | 1 YEAR | | | 3 YEAR | | | 5 YEAR | | | SINCE
INCEPTION | |
CLASS A SHARES | | November 30, 2011 | | | | | | | | | | | | | | | | | | | | |
With Sales Charge** | | | | | 8.12 | % | | | 11.26 | % | | | 3.67 | % | | | 8.24 | % | | | 9.55 | % |
Without Sales Charge | | | | | 14.09 | | | | 17.42 | | | | 5.55 | | | | 9.42 | | | | 10.65 | |
CLASS C SHARES | | November 30, 2011 | | | | | | | | | | | | | | | | | | | | |
With CDSC*** | | | | | 12.84 | | | | 15.84 | | | | 5.04 | | | | 8.88 | | | | 10.10 | |
Without CDSC | | | | | 13.84 | | | | 16.84 | | | | 5.04 | | | | 8.88 | | | | 10.10 | |
CLASS I SHARES (FORMERLY SELECT CLASS SHARES) | | November 30, 2011 | | | 14.34 | | | | 17.82 | | | | 5.90 | | | | 9.75 | | | | 10.98 | |
CLASS R2 SHARES | | November 30, 2011 | | | 14.05 | | | | 17.18 | | | | 5.30 | | | | 9.15 | | | | 10.38 | |
CLASS R5 SHARES | | November 30, 2011 | | | 14.35 | | | | 18.00 | | | | 6.03 | | | | 9.92 | | | | 11.15 | |
CLASS R6 SHARES | | November 30, 2011 | | | 14.41 | | | | 18.07 | | | | 6.09 | | | | 9.97 | | | | 11.21 | |
| ** | | Sales Charge for Class A Shares is 5.25%. |
| *** | | Assumes a 1% CDSC (contingent deferred sales charge) for the 6 month and one year periods and 0% CDSC thereafter. |
LIFE OF FUND PERFORMANCE (11/30/11 TO 4/30/17)
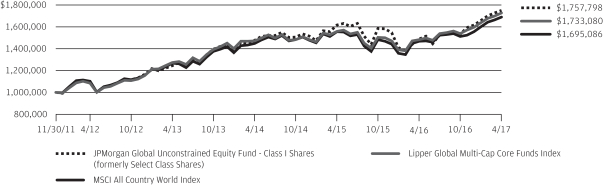
The performance quoted is past performance and is not a guarantee of future results. Mutual funds are subject to certain market risks. Investment returns and principal value of an investment will fluctuate so that an investor’s shares, when redeemed, may be worth more or less than their original cost. Current performance may be higher or lower than the performance data shown. For up-to-date month-end performance information please call 1-800-480-4111.
The Fund commenced operations on November 30, 2011.
The graph illustrates comparative performance for $1,000,000 invested in Class I Shares of the JPMorgan Global Unconstrained Equity Fund, the MSCI All Country World Index and the Lipper Global Multi-Cap Core Funds Index from November 30, 2011 to April 30, 2017. The performance of the Fund assumes reinvestment of all dividends and capital gain distributions, if any, and does not include a sales charge. The performance of the MSCI All Country World Index does not reflect the deduction of expenses or a sales charge associated with a mutual fund and approximates the minimum possible dividend reinvestment of the securities included in the benchmark, if applicable. The dividend is reinvested after deduction of withholding tax, applying the maximum rate to non-resident institutional investors who do not benefit from double taxation treaties. The MSCI All Country World Index is a free float-adjusted market capitalization weighted index that is designed to measure the equity market performance of developed and emerging markets. The Lipper Global Multi-Cap Core Funds Index is an index based on the total returns of certain mutual funds
within the Fund’s designated category, as determined by Lipper, Inc. Investors cannot invest directly in an index.
Class I Shares have a $1,000,000 minimum initial investment.
Subsequent to the inception date of the Fund and through January 5, 2015, the Fund did not experience any shareholder activity. If such shareholder activity had occurred, the Fund’s performance may have been impacted.
Fund performance may reflect the waiver of the Fund’s fees and reimbursement of expenses for certain periods since the inception date. Without these waivers and reimbursements, performance would have been lower. Also, performance shown in this section does not reflect the deduction of taxes that a shareholder would pay on Fund distributions or redemptions of Fund shares.
International investing involves a greater degree of risk and increased volatility. Changes in currency exchange rates and differences in accounting and taxation policies outside the U.S. can raise or lower returns. Also, some overseas markets may not be as politically and economically stable as the U.S. and other nations.
The returns shown are based on net asset values calculated for shareholder transactions and may differ from the returns shown in the financial highlights, which reflect adjustments made to the net asset values in accordance with accounting principles generally accepted in the United States of America.
| | | | | | | | |
| | | |
| APRIL 30, 2017 | | J.P. MORGAN INTERNATIONAL EQUITY FUNDS | | | | | 15 | |
JPMorgan International Discovery Fund
FUND COMMENTARY
SIX MONTHS ENDED APRIL 30, 2017 (Unaudited)
| | | | |
| REPORTING PERIOD RETURN: | |
| Fund (Class I Shares)1* | | | 12.11% | |
| MSCI Europe, Australasia and Far East Small and Mid Cap Index (“MSCI EAFE SMID Cap Index”) | | | 12.29% | |
| |
| Net Assets as of 4/30/2017 (In Thousands) | | | $6,762 | |
INVESTMENT OBJECTIVE**
The JPMorgan International Discovery Fund (the “Fund”) seeks to provide long-term capital appreciation.
WHAT WERE THE MAIN DRIVERS OF THE FUND’S PERFORMANCE?
The Fund’s Class I Shares underperformed the MSCI EAFE SMID Cap Index (net of foreign withholding taxes) (the “Benchmark”) for the six months ended April 30, 2017.
Relative to the Benchmark, the Fund’s security selection in the materials and diversified financials sectors was a leading detractor from performance, while the Fund’s overweight position and security selection in the capital goods sector and its security selection in the retailing sector were leading contributors to relative performance.
By region, the Fund’s security selection in the Pacific, excluding Japan, was a leading detractor from relative performance, while its security selection in emerging markets was a leading contributor to relative performance.
Leading individual detractors included the Fund’s underweight positions in Plus500 Ltd., Noble Group Ltd. and M3 Inc. Shares of Plus500, a U.K. online securities trading platform operator, rose after the company named a new chairwoman and reached a settlement in a dispute with Belgian regulators. Shares of Noble Group, a Chinese commodities supply chain operator, rose on news reports that Sinochem was seeking to buy a stake in the company. Shares of M3, a Japanese provider of online
health care services, rose after Sony Corp. announced plans to sell its stake in the company.
Leading individual contributors to relative performance included the Fund’s positions in JD Sports Fashion PLC, Ashtead Group PLC and Ipsen. Shares of JD Sports Fashion, a U.K.
apparel retailer, rose after the company reported better-than-expected earnings. Shares of Ashtead Group, a U.K. equipment rental company, rose after the company reported strong earnings growth. Shares of Ipsen, a French drug maker, rose amid the company’s successful launch of two new drugs.
HOW WAS THE FUND POSITIONED?
The Fund’s assets were primarily invested in equity and equity-like securities of foreign companies, including foreign subsidiaries of U.S. companies. At April 30, 2017, the Fund’s largest sector holdings were in the industrials, consumer discretionary and materials sectors, while the Fund’s smallest sector holdings were in the utilities, telecommunications services and energy sectors. By region, the Fund’s largest positions were in Europe and Japan.
| 1 | | On April 3, 2017, the Fund’s Select Class Shares were renamed Class I Shares. |
| * | | The return shown is based on net asset values calculated for shareholder transactions and may differ from the return shown in the financial highlights, which reflects adjustments made to the net asset values in accordance with accounting principles generally accepted in the United States of America. |
| ** | | The adviser seeks to achieve the Fund’s objective. There can be no guarantee it will be achieved. |
| | | | | | |
| | | |
| 16 | | | | J.P. MORGAN INTERNATIONAL EQUITY FUNDS | | APRIL 30, 2017 |
| | | | | | | | |
| TOP TEN EQUITY HOLDINGS OF THE PORTFOLIO*** | |
| | 1. | | | Ashtead Group plc (United Kingdom) | | | 1.8 | % |
| | 2. | | | JD Sports Fashion plc (United Kingdom) | | | 1.7 | |
| | 3. | | | Micro Focus International plc (United Kingdom) | | | 1.4 | |
| | 4. | | | Aristocrat Leisure Ltd. (Australia) | | | 1.4 | |
| | 5. | | | AAC Technologies Holdings, Inc. (China) | | | 1.4 | |
| | 6. | | | Electrocomponents plc (United Kingdom) | | | 1.4 | |
| | 7. | | | Treasury Wine Estates Ltd. (Australia) | | | 1.3 | |
| | 8. | | | Challenger Ltd. (Australia) | | | 1.3 | |
| | 9. | | | Mitsubishi Motors Corp. (Japan) | | | 1.2 | |
| | 10. | | | Domino’s Pizza Enterprises Ltd. (Australia) | | | 1.2 | |
| | | | |
PORTFOLIO COMPOSITION BY COUNTRY*** | |
| Japan | | | 24.9 | % |
| United Kingdom | | | 16.4 | |
| France | | | 8.5 | |
| Australia | | | 8.4 | |
| Switzerland | | | 7.1 | |
| Italy | | | 6.8 | |
| Hong Kong | | | 4.7 | |
| Germany | | | 4.1 | |
| China | | | 3.5 | |
| Sweden | | | 3.2 | |
| Finland | | | 2.2 | |
| Norway | | | 2.1 | |
| United States | | | 1.4 | |
| Denmark | | | 1.3 | |
| Georgia | | | 1.1 | |
| Others (each less than 1.0%) | | | 4.3 | |
| *** | | Percentages indicated are based upon total investments as of April 30, 2017. The Fund’s composition is subject to change. |
| | | | | | | | |
| | | |
| APRIL 30, 2017 | | J.P. MORGAN INTERNATIONAL EQUITY FUNDS | | | | | 17 | |
JPMorgan International Discovery Fund
FUND COMMENTARY
SIX MONTHS ENDED APRIL 30, 2017 (Unaudited) (continued)
| | | | | | | | | | |
AVERAGE ANNUAL TOTAL RETURNS AS OF APRIL 30, 2017 | |
| | | | |
| | | INCEPTION DATE OF
CLASS | | 6 MONTH* | | 1 YEAR | | SINCE
INCEPTION | |
CLASS A SHARES | | December 21, 2015 | | | | | | | | |
With Sales Charge** | | | | 6.06% | | 9.55% | | | 3.84 | % |
Without Sales Charge | | | | 11.91 | | 15.64 | | | 8.04 | |
CLASS C SHARES | | December 21, 2015 | | | | | | | | |
With CDSC*** | | | | 10.62 | | 14.12 | | | 7.50 | |
Without CDSC | | | | 11.62 | | 15.12 | | | 7.50 | |
CLASS I SHARES (FORMERLY SELECT CLASS SHARES) | | December 21, 2015 | | 12.11 | | 16.08 | | | 8.40 | |
CLASS R5 SHARES | | December 21, 2015 | | 12.15 | | 16.19 | | | 8.54 | |
CLASS R6 SHARES | | December 21, 2015 | | 12.19 | | 16.31 | | | 8.62 | |
| ** | | Sales Charge for Class A Shares is 5.25%. |
| *** | | Assumes a 1% CDSC (contingent deferred sales charge) for the 6 month and one year periods and 0% CDSC thereafter. |
LIFE OF FUND PERFORMANCE (12/21/15 TO 04/30/17)
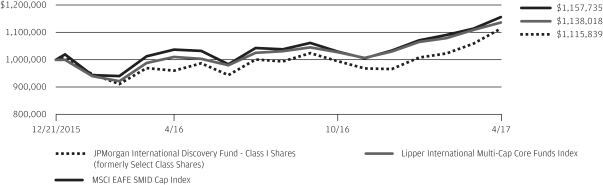
The performance quoted is past performance and is not a guarantee of future results. Mutual funds are subject to certain market risks. Investment returns and principal value of an investment will fluctuate so that an investor’s shares, when redeemed, may be worth more or less than their original cost. Current performance may be higher or lower than the performance data shown. For up-to-date, month-end performance information please call 1-800-480-4111.
The Fund commenced operations on December 21, 2015.
The graph illustrates comparative performance for $1,000,000 invested in Class I Shares of the JPMorgan International Discovery Fund, the MSCI EAFE SMID Cap Index (net of foreign withholding taxes) and the Lipper international Multi-Cap Core Funds Index from December 21, 2015 to April 30, 2017. The performance of the Fund assumes reinvestment of all dividends and capital gain distributions, if any, and does not include a sales charge. The performance of the MSCI EAFE SMID Cap Index (net of foreign withholding taxes) does not reflect the deduction of expenses or a sales charge associated with a mutual fund and approximates the minimum possible dividend reinvestment of the securities included in the benchmark, if applicable. The dividend is reinvested after deduction of withholding tax, applying the maximum rate to non-resident institutional investors who do not benefit from double taxation treaties. The performance of the Lipper international Multi-Cap Core Funds Index includes expenses associated with a mutual fund, such as investment management fees. These expenses are not identical to the expenses incurred by the Fund. The MSCI EAFE SMID Cap Index captures mid and small cap representation across Developed Markets countries around the world, excluding the U.S. and Canada. The Lipper International Multi-Cap Core Funds Index is an index based on the
total returns of certain mutual funds within the Fund’s designated category, as determined by Lipper, Inc. Investors cannot invest directly in an index.
The MSCI information may only be used for your internal use, may not be reproduced or redisseminated in any form and may not be used as a basis for or a component of any financial instruments or products or indices. None of the MSCI information is intended to constitute investment advice or a recommendation to make (or refrain from making) any kind of investment decision and may not be relied on as such. Historical data and analysis should not be taken as an indication or guarantee of any future performance analysis, forecast or prediction. The MSCI information is provided on an “as is” basis and the user of this information assumes the entire risk of any use made of this information. MSCI, each of its affiliates and each other person involved in or related to compiling, computing or creating any MSCI information (collectively, the “MSCI Parties”) expressly disclaims all warranties (including, without limitation, any warranties of originality, accuracy, completeness, timeliness, noninfringement, merchantability and fitness for a particular purpose) with respect to this information. Without limiting any of the foregoing, in no event shall any MSCI Party have any liability for any direct, indirect, special, incidental, punitive, consequential (including, without limitation, lost profits) or any other damages. (www.msci.com)
Class I Shares have a $1,000,000 minimum initial investment.
Fund performance may reflect the waiver of the Fund’s fees and reimbursement of expenses for certain periods since the inception date. Without these waivers and reimbursements, performance would have been lower. Also, performance shown in this section does not reflect the deduction of taxes that a shareholder would pay on Fund distributions or redemptions of Fund shares.
| | | | | | |
| | | |
| 18 | | | | J.P. MORGAN INTERNATIONAL EQUITY FUNDS | | APRIL 30, 2017 |
International investing involves a greater degree of risk and increased volatility. Changes in currency exchange rates and differences in accounting and taxation policies outside the U.S. can raise or lower returns. Also, some overseas markets may not be as politically and economically stable as the U.S. and other nations.
The returns shown are based on net asset values calculated for shareholder transactions and may differ from the returns shown in the financial highlights, which reflect adjustments made to the net asset values in accordance with accounting principles generally accepted in the United States of America.
| | | | | | | | |
| | | |
| APRIL 30, 2017 | | J.P. MORGAN INTERNATIONAL EQUITY FUNDS | | | | | 19 | |
JPMorgan International Equity Fund
FUND COMMENTARY
SIX MONTHS ENDED APRIL 30, 2017 (Unaudited)
| | | | |
| REPORTING PERIOD RETURN: | |
| Fund (Class I Shares)1* | | | 11.03% | |
| Morgan Stanley Capital International (“MSCI”) Europe, Australasia and Far East (“EAFE”) Index (net of foreign withholding taxes) | | | 11.47% | |
| |
| Net Assets as of 4/30/2017 (In Thousands) | | $ | 3,688,410 | |
INVESTMENT OBJECTIVE**
The JPMorgan International Equity Fund (the “Fund”) seeks total return from long-term capital growth and income. Total return consists of capital growth and current income.
WHAT WERE THE MAIN DRIVERS OF THE FUND’S PERFORMANCE?
The Fund’s Class I Shares underperformed the MSCI EAFE Index (net of foreign withholding taxes) (the “Benchmark”) for the six months ended April 30, 2017.
The Fund’s security selection in the industrials and energy sectors was a leading detractor from performance relative to the Benchmark, while the Fund’s security selection in the information technology and consumer discretionary sectors was a leading contributor to relative performance.
Leading individual detractors from the Fund’s relative performance included its overweight positions in Japan Tobacco Inc., CNOOC Ltd. and Vodafone Group PLC. Shares of Japan Tobacco, a maker of tobacco products, fell amid investor concerns about the company’s domestic sales volume and competition for its next-generation products. Shares of CNOOC, a Chinese offshore petroleum company that was not held in the Benchmark, fell after the company issued a lower-than-expected forecast for production and capital expenditures. Shares of Vodafone, a U.K. telecommunications company, fell after the company reported slower revenue growth, driven by low cost competition in its Indian business.
Leading individual contributors to the Fund’s relative performance included the Fund’s overweight positions in Samsung Electronics Co., Prudential PLC and Akzo Nobel NV.
Shares of Samsung Electronics, a South Korean consumer electronics manufacturer not held in the Benchmark, rose after the company reported strong earnings growth. Shares of Prudential, a U.K. insurance and financial services company, rose after the company reported better-than-expected results from its U.S. and Asia businesses. Shares of Akzo Nobel, a Dutch paint and coatings manufacturer, rose following news reports that PPG Industries Inc. was seeking to acquire the company.
HOW WAS THE FUND POSITIONED?
The Fund’s portfolio managers continued to focus on security selection to build a portfolio of international equities. They used bottom-up fundamental research to identify what they
believed were attractively priced securities of companies with solid financial positions that possessed the potential to increase their earnings faster than their industry peers.
| | | | | | | | |
| TOP TEN EQUITY HOLDINGS OF THE PORTFOLIO*** | |
| | 1. | | | Samsung Electronics Co. Ltd., GDR (South Korea) | | | 2.2 | % |
| | 2. | | | HSBC Holdings plc (United Kingdom) | | | 2.1 | |
| | 3. | | | Roche Holding AG (Switzerland) | | | 2.1 | |
| | 4. | | | Prudential plc (United Kingdom) | | | 2.1 | |
| | 5. | | | Novartis AG (Registered) (Switzerland) | | | 2.0 | |
| | 6. | | | SAP SE (Germany) | | | 1.9 | |
| | 7. | | | UBS Group AG (Registered) (Switzerland) | | | 1.8 | |
| | 8. | | | Vodafone Group plc (United Kingdom) | | | 1.7 | |
| | 9. | | | Sumitomo Mitsui Financial Group, Inc. (Japan) | | | 1.7 | |
| | 10. | | | Royal Dutch Shell plc, Class A (Netherlands) | | | 1.7 | |
| | | | |
PORTFOLIO COMPOSITION BY COUNTRY*** | |
| Japan | | | 20.8 | % |
| United Kingdom | | | 19.1 | |
| France | | | 12.2 | |
| Switzerland | | | 10.5 | |
| Germany | | | 8.0 | |
| Netherlands | | | 5.6 | |
| Hong Kong | | | 4.5 | |
| China | | | 3.1 | |
| South Korea | | | 2.7 | |
| Belgium | | | 1.6 | |
| Spain | | | 1.2 | |
| Taiwan | | | 1.2 | |
| Australia | | | 1.2 | |
| India | | | 1.1 | |
| South Africa | | | 1.1 | |
| Denmark | | | 1.0 | |
| United States | | | 1.0 | |
| Others (each less than 1.0%) | | | 2.0 | |
| Short-Term Investment | | | 2.1 | |
| 1 | | On April 3, 2017, the Fund’s Select Class Shares were renamed Class I Shares. |
| * | | The return shown is based on net asset values calculated for shareholder transactions and may differ from the return shown in the financial highlights, which reflects adjustments made to the net asset values in accordance with accounting principles generally accepted in the United States of America. |
| ** | | The adviser seeks to achieve the Fund’s objective. There can be no guarantee it will be achieved. |
| *** | | Percentages indicated are based on total investments as of April 30, 2017. The Fund’s portfolio composition is subject to change. |
| | | | | | |
| | | |
| 20 | | | | J.P. MORGAN INTERNATIONAL EQUITY FUNDS | | APRIL 30, 2017 |
| | | | | | | | | | | | | | | | | | |
AVERAGE ANNUAL TOTAL RETURNS AS OF APRIL 30, 2017 | |
| | | | | |
| | | INCEPTION DATE OF
CLASS | | 6 MONTH* | | | 1 YEAR | | | 5 YEAR | | | 10 YEAR | |
CLASS A SHARES | | February 28, 2002 | | | | | | | | | | | | | | | | |
With Sales Charge** | | | | | 5.16 | % | | | 8.78 | % | | | 3.99 | % | | | 0.54 | % |
Without Sales Charge | | | | | 10.99 | | | | 14.78 | | | | 5.12 | | | | 1.08 | |
CLASS C SHARES | | January 31, 2003 | | | | | | | | | | | | | | | | |
With CDSC*** | | | | | 9.70 | | | | 13.22 | | | | 4.59 | | | | 0.56 | |
Without CDSC | | | | | 10.70 | | | | 14.22 | | | | 4.59 | | | | 0.56 | |
CLASS I SHARES (FORMERLY SELECT CLASS SHARES) | | January 1, 1997 | | | 11.03 | | | | 15.01 | | | | 5.37 | | | | 1.33 | |
CLASS R2 SHARES | | November 3, 2008 | | | 10.84 | | | | 14.45 | | | | 4.85 | | | | 0.85 | |
CLASS R5 SHARES | | May 15, 2006 | | | 11.09 | | | | 15.19 | | | | 5.57 | | | | 1.52 | |
CLASS R6 SHARES | | November 30, 2010 | | | 11.23 | | | | 15.28 | | | | 5.63 | | | | 1.55 | |
| ** | | Sales Charge for Class A Shares is 5.25%. |
| *** | | Assumes a 1% CDSC (contingent deferred sales charge) for the 6 month and one year periods and 0% CDSC thereafter. |
TEN YEAR PERFORMANCE (4/30/07 TO 4/30/17)
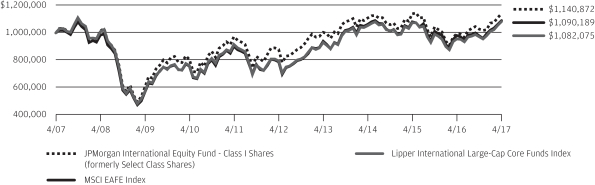
The performance quoted is past performance and is not a guarantee of future results. Mutual funds are subject to certain market risks. Investment returns and principal value of an investment will fluctuate so that an investor’s shares, when redeemed, may be worth more or less than their original cost. Current performance may be higher or lower than the performance data shown. For up-to-date month-end performance information please call 1-800-480-4111.
Returns for Class R2 Shares prior to its inception date are based on the performance of Class A Shares. The actual returns of R2 Shares would have been lower than those shown because R2 Shares have higher expenses than Class A Shares.
Returns for Class R6 Shares prior to its inception date are based on the performance of Class R5 Shares. The actual returns of Class R6 Shares would have been different than those shown because Class R6 Shares have different expenses than Class R5 Shares.
The graph illustrates comparative performance for $1,000,000 invested in Class I Shares of the JPMorgan International Equity Fund, the MSCI EAFE Index and the Lipper International Large-Cap Core Funds Index from April 30, 2007 to April 30, 2017. The performance of the Fund assumes reinvestment of all dividends and capital gain distributions, if any, and does not include a sales charge. The performance of the MSCI EAFE Index does not reflect the deduction of expenses or a sales charge associated with a mutual fund and approximates the minimum possible dividend reinvestment of the securities included in the benchmark, if applicable. The dividend is reinvested after deduction of withholding tax, applying the maximum rate to non-resident institutional investors who do not benefit from double taxation treaties. The performance of the
Lipper International Large-Cap Core Funds Index includes expenses associated with a mutual fund, such as investment management fees. These expenses are not identical to the expenses incurred by the Fund. The MSCI EAFE Index is a free float-adjusted market capitalization weighted index that is designed to measure the equity market performance of developed markets, excluding the U.S. and Canada. The Lipper International Large-Cap Core Funds Index is an index based on the total returns of certain mutual funds within the Fund’s designated category, as determined by Lipper, Inc. Investors cannot invest directly in an index.
Class I Shares have a $1,000,000 minimum initial investment.
Fund performance may reflect the waiver of the Fund’s fees and reimbursement of expenses for certain periods since the inception date. Without these waivers and reimbursements, performance would have been lower. Also, performance shown in this section does not reflect the deduction of taxes that a shareholder would pay on Fund distributions or redemptions of Fund shares.
International investing involves a greater degree of risk and increased volatility. Changes in currency exchange rates and differences in accounting and taxation policies outside the U.S. can raise or lower returns. Also, some overseas markets may not be as politically and economically stable as the United States and other nations.
The returns shown are based on net asset values calculated for shareholder transactions and may differ from the returns shown in the financial highlights, which reflect adjustments made to the net asset values in accordance with accounting principles generally accepted in the United States of America.
| | | | | | | | |
| | | |
| APRIL 30, 2017 | | J.P. MORGAN INTERNATIONAL EQUITY FUNDS | | | | | 21 | |
JPMorgan International Equity Income Fund
FUND COMMENTARY
SIX MONTHS ENDED APRIL 30, 2017 (Unaudited)
| | | | |
| REPORTING PERIOD RETURN: | |
| Fund (Class I Shares)1* | | | 8.87% | |
| Morgan Stanley Capital International (“MSCI”) Europe, Australasia and Far East (“EAFE”) Index (net of foreign withholding taxes) | |
| 11.47%
|
|
| |
| Net Assets as of 4/30/2017 (In Thousands) | | $ | 175,872 | |
INVESTMENT OBJECTIVE**
The JPMorgan International Equity Income Fund (the “Fund”) seeks to provide both current income and long-term capital appreciation.
WHAT WERE THE MAIN DRIVERS OF THE FUND’S PERFORMANCE?
The Fund’s Class I Shares underperformed the MSCI EAFE Index (net of foreign withholding taxes) (the “Benchmark”) for the six months ended April 30, 2017.
By sector, the Fund’s security selection in the banks and insurance sectors was a leading detractor from performance relative to the Benchmark. The Fund’s security selection in the industrial cyclical sector and its underweight position in the utilities sector, where the Fund had no holdings, were leading positive contributors to relative performance.
By region, the Fund’s underweight positions and security selection in the Pacific and in Japan detracted from relative performance, while the Fund’s holdings in emerging markets, where the Benchmark had no exposure, and its security selection and underweight position in Continental Europe made positive contributions to relative performance.
Leading individual detractors from relative performance included the Fund’s overweight positions in Royal Ahold Delhaize NV, Daiwa Securities Group Inc. and Severstal PAO. Shares of Royal Ahold Delhaize, a Netherlands grocery chain, fell after the company reported a decline in earnings. Shares of Daiwa Securities Group, a Japanese financial services company, fell amid investor expectations for low returns in Japanese financial markets. Shares of Severstal, a Russian an iron ore producer and steelmaker, fell amid a decline in global prices for iron ore.
Leading individual contributors to relative performance included the Fund’s underweight position in Toyota Motor Corp. and its overweight positions in Michelin SCA and Samsung Electronics Co. Shares of Toyota, a Japanese automaker, fell amid a slowdown in U.S. auto sales and ongoing litigation related to faulty air bags. Shares of Michelin, a French maker of automotive tires and maps and guides, rose amid investor expectations for increased auto sales. Shares of Samsung Electronics, a South Korean consumer electronics manufacturer not held in the Benchmark, rose after the company reported strong earnings growth.
HOW THE FUND WAS MANAGED?
The Fund’s portfolio managers employed a bottom-up fundamental approach to security selection, rigorously researching companies in an attempt to determine their underlying value and potential for future growth. The Fund’s portfolio managers looked for dividend yielding equity securities that they believed were undervalued and possessed the long-term earnings power and strong cash flow generation that would enable them to grow their dividends.
| 1 | | On April 3, 2017, the Fund’s Select Class Shares were renamed Class I Shares. |
| * | | The return shown is based on net asset values calculated for shareholder transactions and may differ from the return shown in the financial highlights, which reflects adjustments made to the net asset values in accordance with accounting principles generally accepted in the United States of America. |
| ** | | The adviser seeks to achieve the Fund’s objective. There can be no guarantee it will be achieved. |
| | | | | | |
| | | |
| 22 | | | | J.P. MORGAN INTERNATIONAL EQUITY FUNDS | | APRIL 30, 2017 |
| | | | | | | | |
| TOP TEN EQUITY HOLDINGS OF THE PORTFOLIO*** | |
| | 1. | | | GlaxoSmithKline plc (United Kingdom) | | | 3.5 | % |
| | 2. | | | British American Tobacco plc (United Kingdom) | | | 3.0 | |
| | 3. | | | Anheuser-Busch InBev SA/NV (Belgium) | | | 3.0 | |
| | 4. | | | Danske Bank A/S (Denmark) | | | 2.7 | |
| | 5. | | | HSBC Holdings plc, ADR (United Kingdom) | | | 2.4 | |
| | 6. | | | WPP plc (United Kingdom) | | | 2.3 | |
| | 7. | | | Siemens AG (Registered) (Germany) | | | 2.3 | |
| | 8. | | | Cie Generale des Etablissements Michelin (France) | | | 2.2 | |
| | 9. | | | Mitsubishi UFJ Financial Group, Inc., ADR (Japan) | | | 2.2 | |
| | 10. | | | Bridgestone Corp. (Japan) | | | 2.2 | |
| | | | |
PORTFOLIO COMPOSITION BY COUNTRY*** | |
| United Kingdom | | | 24.4 | % |
| Germany | | | 12.2 | |
| Japan | | | 10.8 | |
| Switzerland | | | 7.6 | |
| France | | | 7.5 | |
| Netherlands | | | 5.7 | |
| Russia | | | 4.9 | |
| Finland | | | 3.9 | |
| Belgium | | | 3.0 | |
| Denmark | | | 2.7 | |
| South Korea | | | 2.0 | |
| Canada | | | 1.9 | |
| Czech Republic | | | 1.8 | |
| China | | | 1.6 | |
| Norway | | | 1.5 | |
| New Zealand | | | 1.3 | |
| Hong Kong | | | 1.1 | |
| Spain | | | 1.0 | |
| Others (each less than 1.0%) | | | 3.2 | |
| Short-Term Investment | | | 1.9 | |
| *** | | Percentages indicated are based on total investments as of April 30, 2017. The Fund’s portfolio composition is subject to change. |
| | | | | | | | |
| | | |
| APRIL 30, 2017 | | J.P. MORGAN INTERNATIONAL EQUITY FUNDS | | | | | 23 | |
JPMorgan International Equity Income Fund
FUND COMMENTARY
SIX MONTHS ENDED APRIL 30, 2017 (Unaudited) (continued)
| | | | | | | | | | | | | | | | | | |
AVERAGE ANNUAL TOTAL RETURNS AS OF APRIL 30, 2017 | |
| | | | | |
| | | INCEPTION DATE OF
CLASS | | 6 MONTH* | | | 1 YEAR | | | 5 YEAR | | | SINCE
INCEPTION | |
CLASS A SHARES | | February 28, 2011 | | | | | | | | | | | | | | | | |
With Sales Charge** | | | | | 2.96 | % | | | 1.71 | % | | | 5.29 | % | | | 3.57 | % |
Without Sales Charge | | | | | 8.69 | | | | 7.33 | | | | 6.43 | | | | 4.48 | |
CLASS C SHARES | | February 28, 2011 | | | | | | | | | | | | | | | | |
With CDSC*** | | | | | 7.42 | | | | 5.87 | | | | 5.91 | | | | 3.95 | |
Without CDSC | | | | | 8.42 | | | | 6.87 | | | | 5.91 | | | | 3.95 | |
CLASS I SHARES (FORMERLY SELECT CLASS SHARES) | | February 28, 2011 | | | 8.87 | | | | 7.70 | | | | 6.74 | | | | 4.77 | |
CLASS R2 SHARES | | February 28, 2011 | | | 8.56 | | | | 7.10 | | | | 6.16 | | | | 4.21 | |
CLASS R5 SHARES | | February 28, 2011 | | | 8.91 | | | | 7.81 | | | | 6.90 | | | | 4.94 | |
CLASS R6 SHARES | | January 30, 2015 | | | 8.95 | | | | 7.86 | | | | 6.91 | | | | 4.94 | |
| ** | | Sales Charge for Class A Shares is 5.25%. |
| *** | | Assumes a 1% CDSC (contingent deferred sales charge) for the 6 month and one year periods and 0% CDSC thereafter. |
LIFE OF FUND PERFORMANCE (2/28/11 TO 4/30/17)
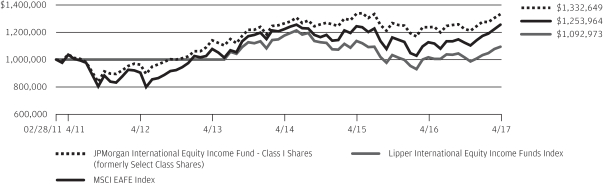
The performance quoted is past performance and is not a guarantee of future results. Mutual funds are subject to certain market risks. Investment returns and principal value of an investment will fluctuate so that an investor’s shares, when redeemed, may be worth more or less than their original cost. Current performance may be higher or lower than the performance data shown. For up-to-date, month-end performance information please call 1-800-480-4111.
The Fund commenced operations on February 28, 2011.
Returns for Class R6 Shares prior to its inception date are based on the performance of Class R5 Shares. The actual returns for Class R6 Shares would have been different than those shown because Class R6 Shares have different expenses than Class R5 Shares.
The graph illustrates comparative performance for $1,000,000 invested in Class I Shares of the JPMorgan International Equity Income Fund, the MSCI EAFE Index and the Lipper International Equity Income Funds Index from February 28, 2011 to April 30, 2017. Return information prior to July 31, 2013 for the Lipper International Equity Income Funds Index is not provided by Lipper, Inc. The performance of the Fund assumes reinvestment of all dividends and capital gain distributions, if any, and does not include a sales charge. The performance of the MSCI EAFE Index does not reflect the deduction of expenses or a sales charge associated with a mutual fund and approximates the minimum possible dividend reinvestment of the securities included in the benchmarks, if applicable. The dividend is reinvested after deduction of withholding tax, applying the maximum rate to non-resident institutional investors who do not benefit from double taxation treaties. The performance of the Lipper Inter-
national Equity Income Funds Index includes expenses associated with a mutual fund, such as investment management fees. These expenses are not identical to the expenses incurred by the Fund. The MSCI EAFE Index is a free float-adjusted market capitalization weighted index that is designed to measure the equity market performance of developed markets, excluding the U.S. and Canada. The Lipper International Equity Income Funds Index is an index based on the total returns of certain mutual funds within the Fund’s designated category as determined by Lipper, Inc. Investors cannot invest directly in an index.
Class I Shares have a $1,000,000 minimum initial investment.
Fund performance may reflect the waiver of the Fund’s fees and reimbursement of expenses for certain periods since the inception date. Without these waivers and reimbursements, performance would have been lower. Also, performance shown in this section does not reflect the deduction of taxes that a shareholder would pay on Fund distributions or redemptions of Fund shares.
International investing involves a greater degree of risk and increased volatility. Changes in currency exchange rates and differences in accounting and taxation policies outside the United States can raise or lower returns. Also, some overseas markets may not be as politically and economically stable as the United States and other nations.
The returns shown are based on net asset values calculated for shareholder transactions and may differ from the returns shown in the financial highlights, which reflect adjustments made to the net asset values in accordance with accounting principles generally accepted in the United States of America.
The MSCI information may only be used for your internal use, may not be
| | | | | | |
| | | |
| 24 | | | | J.P. MORGAN INTERNATIONAL EQUITY FUNDS | | APRIL 30, 2017 |
reproduced or redisseminated in any form and may not be used as a basis for or a component of any financial instruments or products or indices. None of the MSCI information is intended to constitute investment advice or a recommendation to make (or refrain from making) any kind of investment decision and may not be relied on as such. Historical data and analysis should not be taken as an indication or guarantee of any future performance analysis, forecast or prediction. The MSCI information is provided on an “as is” basis and the user of this information assumes the entire risk of any use made of this information. MSCI, each of its affiliates and each other person involved in or
related to compiling, computing or creating any MSCI information (collectively, the “MSCI Parties”) expressly disclaims all warranties (including, without limitation, any warranties of originality, accuracy, completeness, timeliness, non-infringement, merchantability and fitness for a particular purpose) with respect to this information. Without limiting any of the foregoing, in no event shall any MSCI Party have any liability for any direct, indirect, special, incidental, punitive, consequential (including, without limitation, lost profits) or any other damages. (www.msci.com)
| | | | | | | | |
| | | |
| APRIL 30, 2017 | | J.P. MORGAN INTERNATIONAL EQUITY FUNDS | | | | | 25 | |
JPMorgan International Opportunities Fund
FUND COMMENTARY
SIX MONTHS ENDED APRIL 30, 2017 (Unaudited)
| | | | |
| REPORTING PERIOD RETURN: | |
| Fund (Class A Shares, without a sales charge)* | | | 12.51% | |
| Morgan Stanley Capital International (“MSCI”) Europe, Australasia and Far East (“EAFE”) Index (net of foreign withholding taxes) | | | 11.47% | |
| |
| Net Assets as of 4/30/2017 (In Thousands) | | $ | 2,971,751 | |
INVESTMENT OBJECTIVE**
The JPMorgan International Opportunities Fund (the “Fund”) seeks to provide high total return from a portfolio of equity securities of foreign companies in developed and, to a lesser extent, emerging markets.
WHAT WERE THE MAIN DRIVERS OF THE FUND’S PERFORMANCE?
The Fund’s Class A Shares, without a sales charge, outperformed the MSCI EAFE Index (net of foreign withholding taxes) (the “Benchmark”) for the six months ended April 30, 2017.
By sector, the Fund’s security selection in the industrial cyclical and basic industries sectors was a leading contributor to performance relative to the Benchmark. The Fund’s security selection in the transportation services and consumer cyclical sector and the banks sector was a leading detractor from relative performance.
The Fund’s regional allocations made positive contributions to relative performance, with the Fund’s security selection in Europe, excluding the U.K., and Japan providing the leading contributions and the Fund’s security selection in the U.K. and emerging markets providing the smallest contribution. The Benchmark had no allocation to emerging markets.
Leading individual contributors to relative performance included the Fund’s overweight positions in DMG Mori Co., Norsk Hydro ASA and Goodman Group. Shares of DMG Mori, a Japanese maker of industrial cutting machine tools that was not held in the Benchmark, rose on investor expectations for increased demand from the robotics sector. Shares of Norsk Hydro, a Norwegian aluminum and renewable energy company, rose on increased aluminum prices and weakness in Norway’s
currency. Shares of Goodman Group, an Australian real estate company, rose amid strong tenant demand and the company’s reduced debt obligations.
Leading individual detractors from relative performance included the Fund’s overweight positions in Orix Corp. and Yamato Holdings Co. and its underweight position in LMH Moet Hennessy Louis Vuitton SE. Shares of Orix, a Japanese financial services company, fell amid a slowdown in the company’s growth. Shares of Yamato Holdings, a Japanese parcel delivery and logistics company, fell after the company reported lower-than-expected earnings and higher-than-expected costs. Shares of LVMH Moet Hennessy, a luxury goods manufacturer that was not held in the Fund, rose on increased sales and improved consumer sentiment.
HOW WAS THE FUND POSITIONED?
The Fund’s portfolio managers employed a bottom-up fundamental approach to security selection, seeking to identify what they believed were the most attractive investment opportunities within each sector. The Fund’s portfolio managers looked for securities that they believed possessed an attractive valuation signal (as measured by a proprietary dividend discount model) and a timely catalyst that would enable the security to realize its inherent value. In addition, the Fund employed futures and currency forwards to help manage cash flows and the Fund’s currency exposure.
| * | | The return shown is based on net asset values calculated for shareholder transactions and may differ from the return shown in the financial highlights, which reflects adjustments made to the net asset values in accordance with accounting principles generally accepted in the United States of America. |
| ** | | The adviser seeks to achieve the Fund’s objective. There can be no guarantee it will be achieved. |
| | | | | | |
| | | |
| 26 | | | | J.P. MORGAN INTERNATIONAL EQUITY FUNDS | | APRIL 30, 2017 |
| | | | | | | | |
| TOP TEN EQUITY HOLDINGS OF THE PORTFOLIO*** | |
| | 1. | | | Royal Dutch Shell plc, Class A (Netherlands) | | | 2.6 | % |
| | 2. | | | Roche Holding AG (Switzerland) | | | 2.4 | |
| | 3. | | | British American Tobacco plc (United Kingdom) | | | 2.2 | |
| | 4. | | | Siemens AG (Registered) (Germany) | | | 2.1 | |
| | 5. | | | Mitsubishi UFJ Financial Group, Inc. (Japan) | | | 1.7 | |
| | 6. | | | ING Groep NV (Netherlands) | | | 1.7 | |
| | 7. | | | TOTAL SA (France) | | | 1.7 | |
| | 8. | | | BNP Paribas SA (France) | | | 1.7 | |
| | 9. | | | Unilever NV, CVA (United Kingdom) | | | 1.6 | |
| | 10. | | | Anheuser-Busch InBev SA/NV (Belgium) | | | 1.6 | |
| | | | |
PORTFOLIO COMPOSITION BY COUNTRY*** | |
Japan | | | 23.6 | % |
United Kingdom | | | 16.5 | |
France | | | 13.9 | |
Germany | | | 9.0 | |
Netherlands | | | 6.9 | |
Switzerland | | | 5.3 | |
Australia | | | 3.8 | |
China | | | 2.8 | |
Italy | | | 2.4 | |
Denmark | | | 2.4 | |
Finland | | | 2.2 | |
Spain | | | 1.6 | |
Belgium | | | 1.6 | |
India | | | 1.5 | |
United States | | | 1.4 | |
Norway | | | 1.4 | |
Sweden | | | 1.3 | |
Chile | | | 1.1 | |
Short-Term Investment | | | 1.3 | |
| *** | | Percentages indicated are based on total investments as of April 30, 2017. The Fund’s portfolio composition is subject to change. |
| | | | | | | | |
| | | |
| APRIL 30, 2017 | | J.P. MORGAN INTERNATIONAL EQUITY FUNDS | | | | | 27 | |
JPMorgan International Opportunities Fund
FUND COMMENTARY
SIX MONTHS ENDED APRIL 30, 2017 (Unaudited) (continued)
| | | | | | | | | | | | | | | | | | |
AVERAGE ANNUAL TOTAL RETURNS AS OF APRIL 30, 2017 | |
| | | | | |
| | | INCEPTION DATE OF
CLASS | | 6 MONTH* | | | 1 YEAR | | | 5 YEAR | | | 10 YEAR | |
CLASS A SHARES | | September 10, 2001 | | | | | | | | | | | | | | | | |
With Sales Charge** | | | | | 6.63 | % | | | 5.61 | % | | | 4.45 | % | | | 0.09 | % |
Without Sales Charge | | | | | 12.51 | | | | 11.46 | | | | 5.58 | | | | 0.64 | |
CLASS C SHARES | | July 31, 2007 | | | | | | | | | | | | | | | | |
With CDSC*** | | | | | 11.21 | | | | 9.88 | | | | 5.03 | | | | 0.12 | |
Without CDSC | | | | | 12.21 | | | | 10.88 | | | | 5.03 | | | | 0.12 | |
CLASS I SHARES (FORMERLY SELECT CLASS SHARES) | | September 10, 2001 | | | 12.52 | | | | 11.65 | | | | 5.85 | | | | 0.88 | |
CLASS R6 SHARES | | November 30, 2010 | | | 12.74 | | | | 12.02 | | | | 6.16 | | | | 1.14 | |
| ** | | Sales Charge for Class A Shares is 5.25%. |
| *** | | Assumes a 1% CDSC (contingent deferred sales charge) for the 6 month and one year periods and 0% CDSC thereafter. |
TEN YEAR PERFORMANCE (4/30/07 TO 4/30/17)
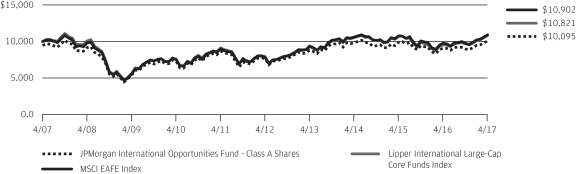
The performance quoted is past performance and is not a guarantee of future results. Mutual funds are subject to certain market risks. Investment returns and principal value of an investment will fluctuate so that an investor’s shares, when redeemed, may be worth more or less than their original cost. Current performance may be higher or lower than the performance data shown. For up-to-date month-end performance information please call 1-800-480-4111.
Returns for Class C Shares prior to its inception date are based on the performance of Class B Shares, all of which converted to Class A Shares on June 19, 2015. The actual returns of Class C Shares would have been similar to those shown because Class C Shares had similar expenses to Class B Shares.
Returns for Class R6 Shares prior to its inception date are based on the performance of Institutional Class Shares. The actual returns of Class R6 Shares would have been different than those shown because Class R6 Shares have different expenses than Institutional Class Shares.
The graph illustrates comparative performance for $10,000 invested in Class A Shares of the JPMorgan International Opportunities Fund, the MSCI EAFE Index and the Lipper International Large-Cap Core Funds Index from April 30, 2007 to April 30, 2017. The performance of the Fund assumes reinvestment of all dividends and capital gain distributions, if any, and does not include a sales charge. The performance of the MSCI EAFE Index does not reflect the deduction of expenses or a sales charge associated with a mutual fund and approximates the minimum possible dividend reinvestment of the securities included in the benchmark, if applicable. The dividend is reinvested after deduction of withholding tax, applying the maximum rate to non-resident institutional investors who do not benefit from double taxation treaties. The performance of the
Lipper International Large-Cap Core Funds Index includes expenses associated with a mutual fund, such as investment management fees. These expenses are not identical to the expenses incurred by the Fund. The MSCI EAFE Index is a free float-adjusted market capitalization weighted index that is designed to measure the equity market performance of developed markets, excluding the U.S. and Canada. The Lipper International Large-Cap Core Funds Index is an index based on the total returns of certain mutual funds within the Fund’s designated category, as determined by Lipper, Inc. Investors cannot invest directly in an index.
Class A Shares have a $1,000 minimum initial investment.
Fund performance may reflect the waiver of the Fund’s fees and reimbursement of expenses for certain periods since the inception date. Without these waivers and reimbursements, performance would have been lower. Also, performance shown in this section does not reflect the deduction of taxes that a shareholder would pay on Fund distributions or redemptions of Fund shares.
International investing involves a greater degree of risk and increased volatility. Changes in currency exchange rates and differences in accounting and taxation policies outside the U.S. can raise or lower returns. Also, some overseas markets may not be as politically and economically stable as the United States and other nations.
The returns shown are based on net asset values calculated for shareholder transactions and may differ from the returns shown in the financial highlights, which reflect adjustments made to the net asset values in accordance with accounting principles generally accepted in the United States of America.
| | | | | | |
| | | |
| 28 | | | | J.P. MORGAN INTERNATIONAL EQUITY FUNDS | | APRIL 30, 2017 |
JPMorgan International Research Enhanced Equity Fund
FUND COMMENTARY
SIX MONTHS ENDED APRIL 30, 2017 (Unaudited)
| | | | |
| REPORTING PERIOD RETURN: | | | |
| Fund (Class I Shares)1* | | | 12.66% | |
| Morgan Stanley Capital International (“MSCI”) Europe, Australasia and Far East (“EAFE”) Index (net of foreign withholding taxes) | | | 11.47% | |
| |
| Net Assets as of 4/30/2017 (In Thousands) | | $ | 1,715,944 | |
INVESTMENT OBJECTIVE**
The JPMorgan International Research Enhanced Equity Fund (the “Fund”) seeks to provide long-term capital appreciation.
WHAT WERE THE MAIN DRIVERS OF THE FUND’S PERFORMANCE?
The Fund’s Class I Shares outperformed the MSCI EAFE Index (net of foreign withholding taxes) (the “Benchmark”) for the six months ended April 30, 2017.
By sector, the Fund’s security selection in the industrial cyclical and banks sectors was a leading positive contributor to relative performance. The Fund’s security selection in the automobiles sector and overweight position in the telecommunications sector were leading detractors from relative performance.
Each of the Fund’s regional allocations made a positive contribution to relative performance. The Fund’s security selection in Europe, excluding the U.K., was a leading contributor to relative performance, while the Fund’s security selection in the Pacific, excluding Japan, was the smallest contributor to relative performance.
Due to the Fund holding a relatively large number of securities during the period, the impact of individual holdings on the Fund’s relative performance tended to be small.
HOW WAS THE FUND POSITIONED?
The Fund sought to outperform the Benchmark over time, while seeking to achieve sector, geographic and risk characteristics similar to that of the Benchmark. Using the fundamental equity insights generated by analysts, the Fund’s portfolio managers took a marginally overweight position in securities included within the universe of the Benchmark that they considered undervalued, while marginally underweighting or not holding securities in the Benchmark that they considered overvalued.
| | | | | | | | |
| TOP TEN EQUITY HOLDINGS OF THE PORTFOLIO*** | |
| | 1. | | | Nestle SA (Registered) (Switzerland) | | | 2.6 | % |
| | 2. | | | Roche Holding AG (Switzerland) | | | 1.9 | |
| | 3. | | | British American Tobacco plc (United Kingdom) | | | 1.6 | |
| | 4. | | | Siemens AG (Registered) (Germany) | | | 1.4 | |
| | 5. | | | Bayer AG (Registered) (Germany) | | | 1.4 | |
| | 6. | | | SAP SE (Germany) | | | 1.2 | |
| | 7. | | | HSBC Holdings plc (United Kingdom) | | | 1.2 | |
| | 8. | | | Toyota Motor Corp. (Japan) | | | 1.2 | |
| | 9. | | | Commonwealth Bank of Australia (Australia) | | | 1.2 | |
| | 10. | | | Anheuser-Busch InBev SA/NV (Belgium) | | | 1.2 | |
| | | | |
PORTFOLIO COMPOSITION BY COUNTRY*** | |
Japan | | | 21.4 | % |
United Kingdom | | | 15.7 | |
Germany | | | 10.9 | |
France | | | 10.1 | |
Switzerland | | | 9.7 | |
Australia | | | 6.6 | |
Netherlands | | | 5.2 | |
Italy | | | 3.1 | |
Hong Kong | | | 2.6 | |
Spain | | | 2.4 | |
Finland | | | 2.0 | |
Belgium | | | 1.2 | |
United States | | | 1.1 | |
Denmark | | | 1.1 | |
Others (each less than 1.0%) | | | 4.7 | |
| Short-Term Investment | | | 2.2 | |
| 1 | | On April 3, 2017, the Fund’s Select Class Shares were renamed Class I Shares. |
| * | | The return shown is based on net asset values calculated for shareholder transactions and may differ from the return shown in the financial highlights, which reflects adjustments made to the net asset values in accordance with accounting principles generally accepted in the United States of America. |
| ** | | The adviser seeks to achieve the Fund’s objective. There can be no guarantee it will be achieved. |
| *** | | Percentages indicated are based on total investments as of April 30, 2017. The Fund’s portfolio composition is subject to change. |
| | | | | | | | |
| | | |
| APRIL 30, 2017 | | J.P. MORGAN INTERNATIONAL EQUITY FUNDS | | | | | 29 | |
JPMorgan International Research Enhanced Equity Fund
FUND COMMENTARY
SIX MONTHS ENDED APRIL 30, 2017 (Unaudited) (continued)
| | | | | | | | | | | | | | | | | | |
AVERAGE ANNUAL TOTAL RETURNS AS OF APRIL 30, 2017 | |
| | | | | |
| | | INCEPTION DATE OF
CLASS | | 6 MONTH* | | | 1 YEAR | | | 5 YEAR | | | 10 YEAR | |
CLASS A SHARES | | April 23, 1993 | | | | | | | | | | | | | | | | |
With Sales Charge** | | | | | 6.59 | % | | | 7.38 | % | | | 5.90 | % | | | (0.09 | )% |
Without Sales Charge | | | | | 12.49 | | | | 13.30 | | | | 7.05 | | | | 0.45 | |
CLASS C SHARES | | November 4, 1997 | | | | | | | | | | | | | | | | |
With CDSC*** | | | | | 11.20 | | | | 11.66 | | | | 6.48 | | | | (0.18 | ) |
Without CDSC | | | | | 12.20 | | | | 12.66 | | | | 6.48 | | | | (0.18 | ) |
CLASS I SHARES (FORMERLY SELECT CLASS SHARES) | | October 28, 1992 | | | 12.66 | | | | 13.60 | | | | 7.33 | | | | 0.70 | |
CLASS R2 SHARES | | November 3, 2008 | | | 12.40 | | | | 12.99 | | | | 6.79 | | | | 0.19 | |
| ** | | Sales Charge for Class A Shares is 5.25%. |
| *** | | Assumes a 1% CDSC (contingent deferred sales charge) for the 6 month and one year periods and 0% CDSC thereafter. |
TEN YEAR PERFORMANCE (4/30/07 to 4/30/17)
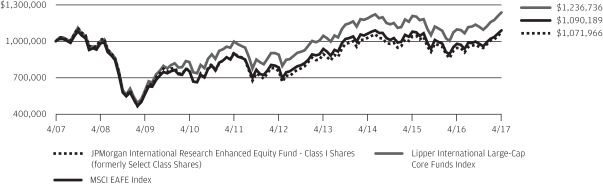
The performance quoted is past performance and is not a guarantee of future results. Mutual funds are subject to certain market risks. Investment returns and principal value of an investment will fluctuate so that an investor’s shares, when redeemed, may be worth more or less than their original cost. Current performance may be higher or lower than the performance data shown. For up-to-date month-end performance information please call 1-800-480-4111.
Returns for Class R2 Shares prior to its inception date are based on the performance of Class I Shares. Class R2 Shares performance has been adjusted to reflect the difference in expenses between classes.
The graph illustrates comparative performance for $1,000,000 invested in Class I Shares of the JPMorgan International Research Enhanced Equity Fund, the MSCI EAFE Index and the Lipper International Large-Cap Core Funds Index from April 30, 2007 to April 30, 2017. The performance of the Fund assumes reinvestment of all dividends and capital gain distributions, if any, and does not include a sales charge. The performance of the MSCI EAFE Index does not reflect the deduction of expenses or a sales charge associated with a mutual fund and approximates the minimum possible dividend reinvestment of the securities included in the benchmark, if applicable. The dividend is reinvested after deduction of withholding tax, applying the maximum rate to non-resident institutional investors who do not benefit from double taxation treaties. The performance of the Lipper International Large-Cap Core Funds Index includes expenses associated with a mutual fund, such as investment management fees. These expenses are not identical to the expenses incurred by the Fund. The MSCI EAFE Index is a free float-adjusted market capitalization weighted index that is designed to measure the equity market performance of developed markets, excluding the U.S. and Canada. The Lipper International Large-Cap Core Funds Index is an index based on the total returns of certain mutual funds within the Fund’s designated category as determined by Lipper, Inc. Investors cannot invest directly in an index.
Class I Shares have a $1,000,000 minimum initial investment.
Fund performance may reflect the waiver of the Fund’s fees and reimbursement of expenses for certain periods since the inception date. Without these waivers and reimbursements, performance would have been lower. Also, performance shown in this section does not reflect the deduction of taxes that a shareholder would pay on Fund distributions or redemptions of Fund shares.
International investing involves a greater degree of risk and increased volatility. Changes in currency exchange rates and differences in accounting and taxation policies outside of the U.S. can raise or lower returns. Also, some overseas markets may not be as politically and economically stable as the United States and other nations.
The returns shown are based on net asset values calculated for shareholder transactions and may differ from the returns shown in the financial highlights, which reflect adjustments made to the net asset values in accordance with accounting principles generally accepted in the United States of America.
The MSCI information may only be used for your internal use, may not be reproduced or redisseminated in any form and may not be used as a basis for or a component of any financial instruments or products or indices. None of the MSCI information is intended to constitute investment advice or a recommendation to make (or refrain from making) any kind of investment decision and may not be relied on as such. Historical data and analysis should not be taken as an indication or guarantee of any future performance analysis, forecast or prediction. The MSCI information is provided on an “as is” basis and the user of this information assumes the entire risk of any use made of this information. MSCI, each of its affiliates and each other person involved in or related to compiling, computing or creating any MSCI information (collectively, the “MSCI Parties”) expressly disclaims all warranties (including, without limitation, any warranties of originality, accuracy, completeness, timeliness, non-infringement, merchantability and fitness for a particular purpose) with respect to this information. Without limiting any of the foregoing, in no event shall any MSCI Party have any liability for any direct, indirect, special, incidental, punitive, consequential (including, without limitation, lost profits) or any other damages. (www.msci.com)
| | | | | | |
| | | |
| 30 | | | | J.P. MORGAN INTERNATIONAL EQUITY FUNDS | | APRIL 30, 2017 |
JPMorgan International Unconstrained Equity Fund
FUND COMMENTARY
SIX MONTHS ENDED APRIL 30, 2017 (Unaudited)
| | | | |
| REPORTING PERIOD RETURN: | | | |
| Fund (Class I Shares)1* | | | 11.76% | |
| Morgan Stanley Capital International (“MSCI”) All Country World Index, Ex-U.S. (net of foreign withholding taxes) | | | 10.37% | |
| |
| Net Assets as of 4/30/2017 (In Thousands) | | $ | 174,359 | |
INVESTMENT OBJECTIVE**
The JPMorgan International Unconstrained Equity Fund (the “Fund”) seeks to provide long-term capital appreciation.
WHAT WERE THE MAIN DRIVERS OF THE FUND’S PERFORMANCE?
The Fund’s Class I Shares outperformed the MSCI All Country World Index, ex-U.S. (net of foreign withholding taxes) (the “Benchmark”) for the six months ended April 30, 2017.
By sector, the Fund’s security selection in the consumer discretionary and materials sectors was a leading contributor to performance relative to the Benchmark, while the Fund’s security selection in the energy and telecommunication services sectors was a leading detractor from relative performance.
By region, the Fund’s security selection in Europe and the U.K. was a leading contributor to performance relative to the Benchmark, while the Fund’s security selection in the Pacific, excluding Japan, and in North America was a leading detractor from relative performance.
Leading individual contributors to the relative performance included the Fund’s overweight positions in Altice NV, Actelion Ltd. and Wartsila Oyj. Shares of Altice, a Dutch telecommunications and media company, rose on news reports that it would sell a minority interest in its U.S. operations through an initial public offering. Shares of Actelion, a Swiss drug maker, rose on news reports of a $30 billion takeover offer by Johnson & Johnson. Shares of Wartsila, a Finnish maker of engines and generators, rose after the company won several large contracts for supply and maintenance.
Leading individual detractors from the Fund’s relative performance included its overweight positions in Teva Pharmaceutical Industries Ltd., CNOOC Ltd and Alimentation Couche-Tard Inc. Shares of Teva Pharmaceutical, an Israel-based maker of generic and specialty drugs, fell amid investor concerns about the company’s patent on a key drug and general concerns about pricing pressure on generic drugs. Shares of CNOOC, a Chinese offshore petroleum company, fell after the company reported a decline in earnings and revenue. Shares of Alimentation Couche-Tard, a Canadian operator of convenience stores, rose after the company reported growth in sales and earnings.
HOW WAS THE FUND POSITIONED?
By harnessing their team’s global sector specialists, the Fund’s portfolio managers sought to build a high-conviction, benchmark-agnostic portfolio of growth, value and unique companies, whose future prospects, the managers believed, were under-appreciated by the market and thus possessed the potential to deliver higher-than-expected earnings that could have a positive effect on the share price.
| 1 | | On April 3, 2017, the Fund’s Select Class Shares were renamed Class I Shares. |
| * | | The return shown is based on net asset values calculated for shareholder transactions and may differ from the return shown in the financial highlights, which reflects adjustments made to the net asset values in accordance with accounting principles generally accepted in the United States of America. |
| ** | | The adviser seeks to achieve the Fund’s objective. There can be no guarantee it will be achieved. |
| | | | | | | | |
| | | |
| APRIL 30, 2017 | | J.P. MORGAN INTERNATIONAL EQUITY FUNDS | | | | | 31 | |
JPMorgan International Unconstrained Equity Fund
FUND COMMENTARY
SIX MONTHS ENDED APRIL 30, 2017 (Unaudited) (continued)
| | | | | | | | |
| TOP TEN EQUITY HOLDINGS OF THE PORTFOLIO*** | |
| | 1. | | | Altice NV, Class A (Netherlands) | | | 4.1 | % |
| | 2. | | | British American Tobacco plc (United Kingdom) | | | 3.5 | |
| | 3. | | | Continental AG (Germany) | | | 2.8 | |
| | 4. | | | Nokia OYJ (Finland) | | | 2.7 | |
| | 5. | | | Banco Bilbao Vizcaya Argentaria SA (Spain) | | | 2.7 | |
| | 6. | | | Samsung Electronics Co. Ltd., GDR (South Korea) | | | 2.6 | |
| | 7. | | | NN Group NV (Netherlands) | | | 2.6 | |
| | 8. | | | Vodafone Group plc (United Kingdom) | | | 2.6 | |
| | 9. | | | CNOOC Ltd. (China) | | | 2.6 | |
| | 10. | | | LafargeHolcim Ltd. (Registered) (Switzerland) | | | 2.5 | |
| | | | |
PORTFOLIO COMPOSITION BY COUNTRY*** | |
United Kingdom | | | 18.4 | % |
Netherlands | | | 10.8 | |
Japan | | | 10.2 | |
China | | | 7.8 | |
Switzerland | | | 7.8 | |
South Korea | | | 6.4 | |
Hong Kong | | | 5.9 | |
Finland | | | 4.8 | |
Germany | | | 4.6 | |
Canada | | | 4.0 | |
Spain | | | 2.7 | |
India | | | 2.3 | |
Belgium | | | 2.0 | |
Israel | | | 2.0 | |
Denmark | | | 1.6 | |
Macau | | | 1.5 | |
Italy | | | 1.5 | |
South Africa | | | 1.3 | |
United States | | | 1.2 | |
Short-Term Investment | | | 3.2 | |
| *** | | Percentages indicated are based on total investments as of April 30, 2017. The Fund’s portfolio composition is subject to change. |
| | | | | | |
| | | |
| 32 | | | | J.P. MORGAN INTERNATIONAL EQUITY FUNDS | | APRIL 30, 2017 |
| | | | | | | | | | | | | | | | | | | | | | |
AVERAGE ANNUAL TOTAL RETURNS AS OF APRIL 30, 2017 | |
| | | | | | |
| | | INCEPTION DATE OF
CLASS | | | 6 MONTH* | | 1 YEAR | | | 3 YEAR | | | 5 YEAR | | | SINCE
INCEPTION | |
CLASS A SHARES | | | November 30, 2011 | | | | | | | | | | | | | | | | | | | |
With Sales Charge** | | | | | | 5.66% | | | 7.49 | % | | | 1.45 | % | | | 5.38 | % | | | 7.34 | % |
Without Sales Charge | | | | | | 11.54 | | | 13.45 | | | | 3.29 | | | | 6.52 | | | | 8.41 | |
CLASS C SHARES | | | November 30, 2011 | | | | | | | | | | | | | | | | | | | |
With CDSC*** | | | | | | 10.29 | | | 11.95 | | | | 2.78 | | | | 6.00 | | | | 7.87 | |
Without CDSC | | | | | | 11.29 | | | 12.95 | | | | 2.78 | | | | 6.00 | | | | 7.87 | |
CLASS I SHARES (FORMERLY SELECT CLASS SHARES) | | | November 30, 2011 | | | 11.76 | | | 13.85 | | | | 3.63 | | | | 6.84 | | | | 8.73 | |
CLASS R2 SHARES | | | November 30, 2011 | | | 11.43 | | | 13.20 | | | | 3.04 | | | | 6.26 | | | | 8.14 | |
CLASS R5 SHARES | | | November 30, 2011 | | | 11.81 | | | 13.96 | | | | 3.76 | | | | 7.00 | | | | 8.90 | |
CLASS R6 SHARES | | | November 30, 2011 | | | 11.80 | | | 14.02 | | | | 3.81 | | | | 7.06 | | | | 8.96 | |
| ** | | Sales Charge for Class A Shares is 5.25%. |
| *** | | Assumes a 1% CDSC (contingent deferred sales charge) for the one year period and 0% CDSC thereafter. |
LIFE OF FUND PERFORMANCE (11/30/11 TO 4/30/17)
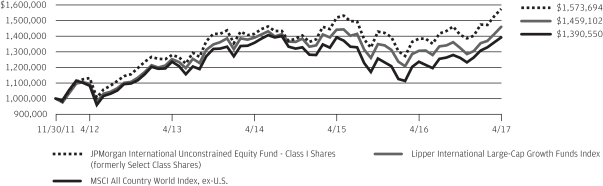
The performance quoted is past performance and is not a guarantee of future results. Mutual funds are subject to certain market risks. Investment returns and principal value of an investment will fluctuate so that an investor’s shares, when redeemed, may be worth more or less than their original cost. Current performance may be higher or lower than the performance data shown. For up-to-date, month-end performance information please call 1-800-480-4111.
The Fund commenced operations on November 30, 2011.
The graph illustrates comparative performance for $1,000,000 invested in Class I Shares of the JPMorgan International Unconstrained Equity Fund, the MSCI All Country World Index, ex-U.S. and the Lipper International Large-Cap Growth Funds Index from November 30, 2011 to April 30, 2017. The performance of the Fund assumes reinvestment of all dividends and capital gain distributions, if any, and does not include a sales charge. The performance of the MSCI All Country World Index, ex-U.S. does not reflect the deduction of expenses or a sales charge associated with a mutual fund and approximates the minimum possible dividend reinvestment of the securities included in the benchmark, if applicable. The dividend is reinvested after deduction of withholding tax, applying the maximum rate to non-resident institutional investors who do not benefit from double taxation treaties. The performance of the Lipper International Large-Cap Growth Funds Index includes expenses associated with a mutual fund, such as investment management fees. These expenses are not identical to the expenses incurred by the Fund. The MSCI All Country World Index, ex-U.S. is a free float-adjusted market capitalization weighted index that is designed to measure the equity market performance of developed and
emerging markets, excluding the United States. The Lipper International Large-Cap Growth Funds Index is an index based on the total returns of certain mutual funds within the Fund’s designated category, as determined by Lipper, Inc. Investors cannot invest directly in an index.
Class I Shares have a $1,000,000 minimum initial investment.
Subsequent to the inception date of the Fund and through May 30, 2013, the Fund did not experience any shareholder activity. If such shareholder activity had occurred, the Fund’s performance may have been impacted.
Fund performance may reflect the waiver of the Fund’s fees and reimbursement of expenses for certain periods since the inception date. Without these waivers and reimbursements, performance would have been lower. Also, performance shown in this section does not reflect the deduction of taxes that a shareholder would pay on Fund distributions or redemptions of Fund shares.
International investing involves a greater degree of risk and increased volatility. Changes in currency exchange rates and differences in accounting and taxation policies outside the U.S. can raise or lower returns. Also, some overseas markets may not be as politically and economically stable as the United States and other nations.
The returns shown are based on net asset values calculated for shareholder transactions and may differ from the returns shown in the financial highlights, which reflect adjustments made to the net asset values in accordance with accounting principles generally accepted in the United States of America.
| | | | | | | | |
| | | |
| APRIL 30, 2017 | | J.P. MORGAN INTERNATIONAL EQUITY FUNDS | | | | | 33 | |
JPMorgan International Value Fund
FUND COMMENTARY
SIX MONTHS ENDED APRIL 30, 2017 (Unaudited)
| | | | |
| REPORTING PERIOD RETURN: | |
| Fund (Class L Shares)1* | | | 12.89% | |
| Morgan Stanley Capital International (“MSCI”) Europe, Australasia and Far East (“EAFE”) Value Index (net of foreign withholding taxes) | | | 12.53% | |
| |
| Net Assets as of 4/30/2017 (In Thousands) | | $ | 824,857 | |
INVESTMENT OBJECTIVE**
The JPMorgan International Value Fund (the “Fund”) seeks to provide high total return from a portfolio of foreign company equity securities.
WHAT WERE THE MAIN DRIVERS OF THE FUND’S PERFORMANCE?
The Fund’s Class L Shares outperformed the MSCI EAFE Value Index (net of foreign withholding taxes) (the “Benchmark”) for the six months ended April 30, 2017.
By sector, the Fund’s security selection in the insurance and utilities sectors was a leading contributor to performance relative to the Benchmark, while the Fund’s security selection in the energy and health care sectors was a leading detractor from relative performance.
By region, the Fund’s security selection in Japan, Europe and the U.K. was a leading contributor to relative performance, while the Fund’s underweight allocation to the Pacific, excluding Japan, and its security selection in emerging markets and North America were leading detractors from relative performance.
Leading individual contributors to relative performance included the Fund’s overweight positions in Prudential PLC and Bankia SA and its underweight position in Toyota Motor Corp.
Shares of Prudential, a U.K. insurance and financial services company that was not held in the Benchmark, rose after the company’s chief executive said there were “significant” growth opportunities for the company’s business abroad. Shares of Bankia, a Spanish financial services company, rose on better-than-expected earnings. Shares of Toyota, a Japanese automaker, fell amid a slowdown in U.S. auto sales and ongoing litigation related to faulty air bags.
Leading individual detractors from relative performance included the Fund’s overweight positions in Teva Pharmaceutical Industries Ltd., Daikin Industries Ltd. and CNOOC Ltd. Shares of Teva Pharmaceuticals, an Israeli maker of generic and specialty drugs, fell amid investor concerns about the company’s patent on a key drug and general concerns about pricing pressure on generic drugs. Shares of Daikin Industries, a maker of air conditioning systems that was not held in the Benchmark, fell after the company reported a decline in revenue. Shares of CNOOC, a Chinese offshore petroleum company that was not held in the Benchmark, fell after the company reported a decline in earnings and revenue.
HOW WAS THE FUND POSITIONED?
The Fund’s portfolio managers employed a bottom-up fundamental approach to security selection, seeking to identify what they believed were the most attractive value investment opportunities within each sector. The Fund’s portfolio managers looked for securities that they believed possessed an attractive valuation signal (as measured by a proprietary dividend discount model) and a timely catalyst that would enable the securities to realize their inherent value. In addition, the Fund employed futures and currency forwards to help manage cash flows and currency exposure.
| 1 | | Effective December 1, 2016, the Fund’s Institutional Class Shares were renamed Class L Shares. |
| * | | The return shown is based on net asset values calculated for shareholder transactions and may differ from the return shown in the financial highlights, which reflects adjustments made to the net asset values in accordance with accounting principles generally accepted in the United States of America. |
| ** | | The adviser seeks to achieve the Fund’s objective. There can be no guarantee it will be achieved. |
| | | | | | |
| | | |
| 34 | | | | J.P. MORGAN INTERNATIONAL EQUITY FUNDS | | APRIL 30, 2017 |
| | | | | | | | |
| TOP TEN HOLDINGS OF THE PORTFOLIO*** | |
| | 1. | | | Royal Dutch Shell plc, Class A (Netherlands) | | | 3.9 | % |
| | 2. | | | TOTAL SA (France) | | | 3.4 | |
| | 3. | | | Siemens AG (Registered) (Germany) | | | 2.8 | |
| | 4. | | | Australia & New Zealand Banking Group Ltd. (Australia) | | | 2.8 | |
| | 5. | | | Mitsubishi UFJ Financial Group, Inc. (Japan) | | | 2.8 | |
| | 6. | | | BNP Paribas SA (France) | | | 2.2 | |
| | 7. | | | AXA SA (France) | | | 2.2 | |
| | 8. | | | ING Groep NV (Netherlands) | | | 2.0 | |
| | 9. | | | Zurich Insurance Group AG (Switzerland) | | | 1.9 | |
| | 10. | | | Rio Tinto plc (United Kingdom) | | | 1.8 | |
| | | | |
PORTFOLIO COMPOSITION BY COUNTRY*** | |
| Japan | | | 22.7 | % |
| France | | | 15.9 | |
| United Kingdom | | | 10.1 | |
| Germany | | | 8.4 | |
| Netherlands | | | 7.7 | |
| Switzerland | | | 4.5 | |
| Australia | | | 3.9 | |
| Italy | | | 3.3 | |
| Spain | | | 3.0 | |
| Belgium | | | 2.2 | |
| Sweden | | | 1.8 | |
| United States | | | 1.5 | |
| Hong Kong | | | 1.3 | |
| Israel | | | 1.3 | |
| Singapore | | | 1.2 | |
| Austria | | | 1.1 | |
| South Korea | | | 1.1 | |
| Canada | | | 1.0 | |
| Norway | | | 1.0 | |
| Finland | | | 1.0 | |
| Luxembourg | | | 1.0 | |
| Others (each less than 1.0%) | | | 2.3 | |
| Short-Term Investment | | | 2.7 | |
| *** | | Percentages indicated are based on total investments as of April 30, 2017. The Fund’s portfolio composition is subject to change. |
| | | | | | | | |
| | | |
| APRIL 30, 2017 | | J.P. MORGAN INTERNATIONAL EQUITY FUNDS | | | | | 35 | |
JPMorgan International Value Fund
FUND COMMENTARY
SIX MONTHS ENDED APRIL 30, 2017 (Unaudited) (continued)
| | | | | | | | | | | | | | | | | | |
AVERAGE ANNUAL TOTAL RETURNS AS OF APRIL 30, 2017 | |
| | | | | |
| | | INCEPTION DATE
OF CLASS | | 6 MONTH* | | | 1 YEAR | | | 5 YEAR | | | 10 YEAR | |
CLASS A SHARES | | September 28, 2001 | | | | | | | | | | | | | | | | |
With Sales Charge** | | | | | 6.73 | % | | | 7.56 | % | | | 3.39 | % | | | (0.99 | )% |
Without Sales Charge | | | | | 12.66 | | | | 13.50 | | | | 4.51 | | | | (0.46 | ) |
CLASS C SHARES | | July 11, 2006 | | | | | | | | | | | | | | | | |
With CDSC*** | | | | | 11.35 | | | | 11.82 | | | | 4.00 | | | | (0.95 | ) |
Without CDSC | | | | | 12.35 | | | | 12.82 | | | | 4.00 | | | | (0.95 | ) |
CLASS I SHARES (FORMERLY SELECT CLASS SHARES) | | September 10, 2001 | | | 12.75 | | | | 13.75 | | | | 4.80 | | | | (0.20 | ) |
CLASS L SHARES (FORMERLY INSTITUTIONAL CLASS SHARES) | | November 4, 1993 | | | 12.89 | | | | 13.89 | | | | 4.95 | | | | (0.05 | ) |
CLASS R2 SHARES | | November 3, 2008 | | | 12.48 | | | | 13.14 | | | | 4.25 | | | | (0.68 | ) |
CLASS R5 SHARES | | September 9, 2016 | | | 12.80 | | | | 13.89 | | | | 4.95 | | | | (0.05 | ) |
CLASS R6 SHARES | | November 30, 2010 | | | 12.90 | | | | 14.08 | | | | 5.07 | | | | 0.03 | |
| ** | | Sales Charge for Class A Shares is 5.25%. |
| *** | | Assumes a 1% CDSC (contingent deferred sales charge) for the 6 month and one year period and 0% CDSC thereafter. |
TEN YEAR PERFORMANCE (4/30/07 TO 4/30/17)
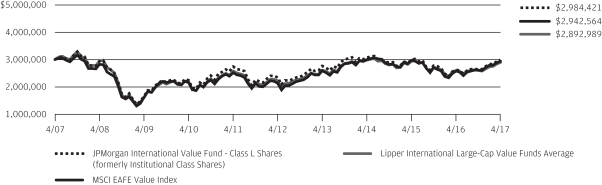
The performance quoted is past performance and is not a guarantee of future results. Mutual funds are subject to certain market risks. Investment returns and principal value of an investment will fluctuate so that an investor’s shares, when redeemed, may be worth more or less than their original cost. Current performance may be higher or lower than the performance data shown. For up-to-date month-end performance information please call 1-800-480-4111.
Returns for Class R2 Shares prior to its inception date are based on the performance of Class A Shares. The actual returns of R2 Shares would have been lower than those shown because R2 Shares have higher expenses than Class A Shares.
Returns for Class R5 Shares prior to its inception date are based on the performance of Class L Shares. The actual returns of Class R5 shares would have been different than those shown because Class R5 Shares have different expenses than Class L Shares.
Returns for Class R6 Shares prior to its inception date are based on the performance of Class L Shares. The actual returns of Class R6 Shares would have been different than those shown because Class R6 Shares have different expenses than Class L Shares.
The graph illustrates comparative performance for $3,000,000 invested in Class L Shares of the JPMorgan International Value Fund, the MSCI EAFE Value Index and the Lipper International Large-Cap Value Funds Average from April 30, 2007 to April 30, 2017. The performance of the Fund assumes reinvestment of all dividends and capital gain distributions, if any, and does not include a sales charge. The performance of the MSCI EAFE Value Index does not reflect the deduction of expenses or a sales charge associated with a mutual fund and approximates the minimum possible dividend reinvestment of the securities included in the benchmark, if
applicable. The dividend is reinvested after deduction of withholding tax, applying the maximum rate to non-resident institutional investors who do not benefit from double taxation treaties. The performance of the Lipper International Large-Cap Value Funds Average includes expenses associated with a mutual fund, such as investment management fees. These expenses are not identical to the expenses incurred by the Fund. The MSCI EAFE Value Index is a free float-adjusted market capitalization weighted index that is designed to measure the performance of value-oriented stocks in the world’s equity markets, excluding the U.S. and Canada. Investors cannot invest directly in an index. The Lipper International Large-Cap Value Funds Average is an average based on the total returns of all mutual funds within the Fund’s designated category as determined by Lipper, Inc.
Class L Shares have a $3,000,000 minimum initial investment.
Fund performance may reflect the waiver of the Fund’s fees and reimbursement of expenses for certain periods since the inception date. Without these waivers and reimbursements, performance would have been lower. Also, performance shown in this section does not reflect the deduction of taxes that a shareholder would pay on Fund distributions or redemptions of Fund shares.
International investing involves a greater degree of risk and increased volatility. Changes in currency exchange rates and differences in accounting and taxation policies outside the U.S. can raise or lower returns. Also, some overseas markets may not be as politically and economically stable as the United States and other nations.
The returns shown are based on net asset values calculated for shareholder transactions and may differ from the returns shown in the financial highlights, which reflect adjustments made to the net asset values in accordance with accounting principles generally accepted in the United States of America.
| | | | | | |
| | | |
| 36 | | | | J.P. MORGAN INTERNATIONAL EQUITY FUNDS | | APRIL 30, 2017 |
JPMorgan Intrepid International Fund
FUND COMMENTARY
SIX MONTHS ENDED APRIL 30, 2017 (Unaudited)
| | | | |
| REPORTING PERIOD RETURN: | |
| Fund (Class A Shares, without a sales charge)* | | | 11.08% | |
| Morgan Stanley Capital International (“MSCI”) Europe, Australasia and Far East (“EAFE”) Index (net of foreign withholding taxes) | | | 11.47% | |
| |
| Net Assets as of 4/30/2017 (In Thousands) | | $ | 2,922,753 | |
INVESTMENT OBJECTIVE**
The JPMorgan Intrepid International Fund (the “Fund”) seeks to maximize long-term capital growth by investing primarily in equity securities in developed markets outside the U.S.
WHAT WERE THE MAIN DRIVERS OF THE FUND’S PERFORMANCE?
The Fund’s Class A Shares, without a sales charge, underperformed the MSCI EAFE Index (net of foreign withholding taxes) (the “Benchmark”) for the six months ended April 30, 2017. The Fund’s portfolio managers attempted to construct the Fund so that security selection and style factors (i.e., growth, value and quality characteristics) would be the primary drivers of returns.
The Fund’s security selection in the consumer discretionary and telecommunication services sectors was a leading detractor from performance relative to the Benchmark, while the Fund’s security selection in the materials and health care sectors was a leading contributor to relative performance.
The Fund targeted investments in companies that exhibited specific growth, value and quality characteristics during the
period. The Fund held a range of 150 to 250 securities. Consequently, the impact of any individual security on the Fund’s overall performance tended to be small.
HOW WAS THE FUND POSITIONED?
The Fund’s portfolio managers believe that attractively valued, high quality securities with positive momentum have the potential to outperform the market. During the reporting period, the Fund’s portfolio managers invested in securities that they believed were attractive based on their proprietary multifactor model.
| * | | The return shown is based on net asset values calculated for shareholder transactions and may differ from the return shown in the financial highlights, which reflects adjustments made to the net asset values in accordance with accounting principles generally accepted in the United States of America. |
| ** | | The adviser seeks to achieve the Fund’s objective. There can be no guarantee it will be achieved. |
| | | | | | | | |
| | | |
| APRIL 30, 2017 | | J.P. MORGAN INTERNATIONAL EQUITY FUNDS | | | | | 37 | |
JPMorgan Intrepid International Fund
FUND COMMENTARY
SIX MONTHS ENDED APRIL 30, 2017 (Unaudited) (continued)
| | | | | | | | |
| TOP TEN EQUITY HOLDINGS OF THE PORTFOLIO*** | |
| | 1. | | | Roche Holding AG (Switzerland) | | | 1.8 | % |
| | 2. | | | Unilever NV, CVA (United Kingdom) | | | 1.5 | |
| | 3. | | | Nestle SA (Registered) (Switzerland) | | | 1.5 | |
| | 4. | | | British American Tobacco plc (United Kingdom) | | | 1.4 | |
| | 5. | | | Siemens AG (Registered) (Germany) | | | 1.2 | |
| | 6. | | | Sanofi (France) | | | 1.2 | |
| | 7. | | | Bayer AG (Registered) (Germany) | | | 1.0 | |
| | 8. | | | BHP Billiton Ltd. (Australia) | | | 1.0 | |
| | 9. | | | ING Groep NV (Netherlands) | | | 1.0 | |
| | 10. | | | Banco Santander SA (Spain) | | | 1.0 | |
| | | | |
PORTFOLIO COMPOSITION BY COUNTRY*** | |
| Japan | | | 23.6 | % |
| United Kingdom | | | 16.0 | |
| Switzerland | | | 11.3 | |
| France | | | 10.2 | |
| Germany | | | 7.4 | |
| Australia | | | 6.9 | |
| Netherlands | | | 3.2 | |
| Denmark | | | 3.0 | |
| Spain | | | 2.9 | |
| Sweden | | | 2.8 | |
| Hong Kong | | | 2.3 | |
| Italy | | | 1.1 | |
| Norway | | | 1.1 | |
| United States | | | 1.0 | |
| Others (each less than 1.0%) | | | 4.6 | |
| Short-Term Investment | | | 2.6 | |
| *** | | Percentages indicated are based on total investments as of April 30, 2017. The Fund’s portfolio composition is subject to change. |
| | | | | | |
| | | |
| 38 | | | | J.P. MORGAN INTERNATIONAL EQUITY FUNDS | | APRIL 30, 2017 |
| | | | | | | | | | | | | | | | | | |
AVERAGE ANNUAL TOTAL RETURNS AS OF APRIL 30, 2017 | |
| | | | | |
| | | INCEPTION DATE OF
CLASS | | 6 MONTH* | | | 1 YEAR | | | 5 YEAR | | | 10 YEAR | |
CLASS A SHARES | | April 30, 2001 | | | | | | | | | | | | | | | | |
With Sales Charge** | | | | | 5.26 | % | | | 6.85 | % | | | 5.34 | % | | | (0.30 | )% |
Without Sales Charge | | | | | 11.08 | | | | 12.79 | | | | 6.49 | | | | 0.24 | |
CLASS C SHARES | | February 28, 2006 | | | | | | | | | | | | | | | | |
With CDSC*** | | | | | 9.83 | | | | 11.28 | | | | 5.96 | | | | (0.26 | ) |
Without CDSC | | | | | 10.83 | | | | 12.28 | | | | 5.96 | | | | (0.26 | ) |
CLASS I SHARES (FORMERLY SELECT CLASS SHARES) | | February 28, 2006 | | | 11.33 | | | | 13.21 | | | | 6.80 | | | | 0.51 | |
CLASS R2 SHARES | | November 3, 2008 | | | 10.99 | | | | 12.53 | | | | 6.22 | | | | 0.02 | |
CLASS R6 SHARES | | May 29, 2015 | | | 11.39 | | | | 13.42 | | | | 7.03 | | | | 0.74 | |
| ** | | Sales Charge for Class A Shares is 5.25%. |
| *** | | Assumes a 1% CDSC (contingent deferred sales charge) for the 6 month and one year periods and 0% CDSC thereafter. |
TEN YEAR PERFORMANCE (4/30/07/ TO 4/30/17)
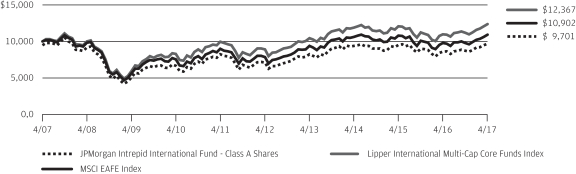
The performance quoted is past performance and is not a guarantee of future results. Mutual funds are subject to certain market risks. Investment returns and principal value of an investment will fluctuate so that an investor’s shares, when redeemed, may be worth more or less than their original cost. Current performance may be higher or lower than the performance data shown. For up-to-date month-end performance information please call 1-800-480-4111.
Returns for Class R2 Shares prior to its inception date are based on the performance of Class A Shares. The actual returns for Class R2 Shares would have been lower than those shown because Class R2 Shares have higher expenses than Class A Shares.
Returns for Class R6 Shares prior to its inception date are based on the performance of Institutional Class Shares. The actual returns of R6 Shares would have been different than those shown because R6 Shares have different expenses than Class A Shares.
The graph illustrates comparative performance for $10,000 invested in Class A Shares of the JPMorgan Intrepid International Fund, the MSCI EAFE Index and the Lipper International Multi-Cap Core Funds Index from April 30, 2007 to April 30, 2017. The performance of the Fund assumes reinvestment of all dividends and capital gain distributions, if any, and does not include a sales charge. The performance of the MSCI EAFE Index does not reflect the deduction of expenses or a sales charge associated with a mutual fund and approximates the minimum possible dividend reinvestment of the securities included in the benchmark, if applicable. The dividend is reinvested after deduction of withholding tax, applying the maximum rate to non-resident institutional investors who do not benefit from double taxation
treaties. The performance of the Lipper International Multi-Cap Core Funds Index includes expenses associated with a mutual fund, such as investment management fees. These expenses are not identical to the expenses incurred by the Fund. The MSCI EAFE Index is a free float-adjusted market capitalization weighted index that is designed to measure the equity market performance of developed markets, excluding the U.S. and Canada. The Lipper International Multi-Cap Core Funds Index is an index based on the total returns of certain mutual funds within the Fund’s designated category, as determined by Lipper, Inc. Investors cannot invest directly in an index.
Class A Shares have a $1,000 minimum initial investment.
Fund performance may reflect the waiver of the Fund’s fees and reimbursement of expenses for certain periods since the inception date. Without these waivers and reimbursements, performance would have been lower. Also, performance shown in this section does not reflect the deduction of taxes that a shareholder would pay on Fund distributions or redemptions of Fund shares.
International investing involves a greater degree of risk and increased volatility. Changes in currency exchange rates and differences in accounting and taxation policies outside the U.S. can raise or lower returns. Also, some overseas markets may not be as politically and economically stable as the United States and other nations.
The returns shown are based on net asset values calculated for shareholder transactions and may differ from the returns shown in the financial highlights, which reflect adjustments made to the net asset values in accordance with accounting principles generally accepted in the United States of America.
| | | | | | | | |
| | | |
| APRIL 30, 2017 | | J.P. MORGAN INTERNATIONAL EQUITY FUNDS | | | | | 39 | |
JPMorgan Emerging Economies Fund
SCHEDULE OF PORTFOLIO INVESTMENTS
AS OF APRIL 30, 2017 (Unaudited)
(Amounts in thousands)
| | | | | | | | |
| SHARES | | | SECURITY DESCRIPTION | | VALUE($) | |
| | Common Stocks — 95.6% | |
| | | | Brazil — 7.7% | |
| | 1,984 | | | Banco Bradesco SA, ADR (a) | | | 20,930 | |
| | 2,275 | | | Banco do Brasil SA (a) | | | 23,496 | |
| | 1,278 | | | Cia de Saneamento Basico do Estado de Sao Paulo, ADR (a) | | | 11,759 | |
| | 249 | | | Cia de Saneamento de Minas Gerais-COPASA (a) | | | 2,820 | |
| | 766 | | | Cosan SA Industria e Comercio | | | 8,901 | |
| | 1,773 | | | EDP — Energias do Brasil SA (a) | | | 7,534 | |
| | 2,839 | | | Itau Unibanco Holding SA, ADR | | | 34,917 | |
| | 307 | | | M Dias Branco SA (a) | | | 4,721 | |
| | 2,270 | | | MRV Engenharia e Participacoes SA | | | 11,345 | |
| | 763 | | | Qualicorp SA | | | 5,408 | |
| | 782 | | | Transmissora Alianca de Energia Eletrica SA | | | 5,783 | |
| | 908 | | | Vale SA, ADR (a) | | | 7,792 | |
| | | | | | | | |
| | | | | | | 145,406 | |
| | | | | | | | |
| | | | China — 21.8% | |
| | 1,582 | | | AAC Technologies Holdings, Inc. | | | 23,191 | |
| | 261 | | | Alibaba Group Holding Ltd., ADR (a) | | | 30,095 | |
| | 4,921 | | | Anhui Conch Cement Co. Ltd., Class H | | | 17,209 | |
| | 54,916 | | | Bank of China Ltd., Class H | | | 26,564 | |
| | 6,007 | | | BYD Electronic International Co. Ltd. | | | 9,168 | |
| | 9,726 | | | China CITIC Bank Corp. Ltd., Class H | | | 6,157 | |
| | 34,451 | | | China Construction Bank Corp., Class H | | | 27,963 | |
| | 6,498 | | | China Lesso Group Holdings Ltd. | | | 5,174 | |
| | 4,600 | | | China Mengniu Dairy Co. Ltd. | | | 8,887 | |
| | 7,860 | | | China Merchants Bank Co. Ltd., Class H | | | 20,365 | |
| | 3,092 | | | China Overseas Land & Investment Ltd. | | | 8,969 | |
| | 17,654 | | | China Power International Development Ltd. | | | 6,577 | |
| | 479 | | | Chlitina Holding Ltd. | | | 2,299 | |
| | 3,812 | | | COSCO SHIPPING Ports Ltd. | | | 4,173 | |
| | 9,925 | | | Geely Automobile Holdings Ltd. | | | 13,372 | |
| | 5,646 | | | Guangzhou Automobile Group Co. Ltd., Class H | | | 8,774 | |
| | 15,346 | | | Huadian Power International Corp. Ltd., Class H | | | 6,465 | |
| | 15,510 | | | Huaneng Power International, Inc., Class H | | | 10,691 | |
| | 63,095 | | | Industrial & Commercial Bank of China Ltd., Class H | | | 41,129 | |
| | 107 | | | NetEase, Inc., ADR | | | 28,374 | |
| | 11,070 | | | PICC Property & Casualty Co. Ltd., Class H | | | 17,795 | |
| | 3,280 | | | Ping An Insurance Group Co. of China Ltd., Class H | | | 18,438 | |
| | 5,888 | | | Shenzhen Expressway Co. Ltd., Class H | | | 5,362 | |
| | 3,027 | | | Sinopharm Group Co. Ltd., Class H | | | 13,567 | |
| | 1,034 | | | Tencent Holdings Ltd. | | | 32,386 | |
| | 2,996 | | | TravelSky Technology Ltd., Class H | | | 7,886 | |
| | 11,252 | | | Xinyi Solar Holdings Ltd. (a) | | | 3,512 | |
| | 4,944 | | | Zhejiang Expressway Co. Ltd., Class H | | | 6,150 | |
| | | | | | | | |
| | | | | | | 410,692 | |
| | | | | | | | |
| | | | | | | | |
| SHARES | | | SECURITY DESCRIPTION | | VALUE($) | |
| | | | | | | | |
| | | | Hong Kong — 2.7% | |
| | 4,387 | | | China High Speed Transmission Equipment Group Co. Ltd. | | | 4,261 | |
| | 1,628 | | | Haier Electronics Group Co. Ltd. | | | 3,775 | |
| | 2,198 | | | Kingboard Chemical Holdings Ltd. | | | 7,916 | |
| | 2,759 | | | Kingboard Laminates Holdings Ltd. | | | 3,325 | |
| | 6,136 | | | Lee & Man Paper Manufacturing Ltd. | | | 4,805 | |
| | 4,680 | | | Nine Dragons Paper Holdings Ltd. | | | 5,047 | |
| | 19,207 | | | WH Group Ltd. (e) | | | 17,136 | |
| | 6,160 | | | Xinyi Glass Holdings Ltd. (a) | | | 5,459 | |
| | | | | | | | |
| | | | | | | 51,724 | |
| | | | | | | | |
| | | | Hungary — 1.5% | |
| | 127 | | | MOL Hungarian Oil & Gas plc | | | 9,550 | |
| | 644 | | | OTP Bank plc | | | 18,119 | |
| | | | | | | | |
| | | | | | | 27,669 | |
| | | | | | | | |
| | | | India — 3.1% | |
| | 1,782 | | | Apollo Tyres Ltd. | | | 6,758 | |
| | 921 | | | Bharat Petroleum Corp. Ltd. | | | 10,298 | |
| | 1,127 | | | Hindustan Petroleum Corp. Ltd. | | | 9,395 | |
| | 7,703 | | | Oil & Natural Gas Corp. Ltd. | | | 22,319 | |
| | 2,937 | | | Rural Electrification Corp. Ltd. | | | 9,241 | |
| | | | | | | | |
| | | | | | | 58,011 | |
| | | | | | | | |
| | | | Indonesia — 0.7% | |
| | 14,292 | | | Bank Rakyat Indonesia Persero Tbk. PT | | | 13,805 | |
| | | | | | | | |
| | | | Malaysia — 1.3% | |
| | 13,704 | | | AirAsia Bhd. | | | 10,570 | |
| | 4,031 | | | Tenaga Nasional Bhd. | | | 12,940 | |
| | | | | | | | |
| | | | | | | 23,510 | |
| | | | | | | | |
| | | | Mexico — 0.6% | |
| | 3,736 | | | Grupo Mexico SAB de CV, Series B | | | 10,989 | |
| | | | | | | | |
| | | | Panama — 1.4% | |
| | 228 | | | Copa Holdings SA, Class A | | | 26,498 | |
| | | | | | | | |
| | | | Poland — 2.5% | |
| | 344 | | | KGHM Polska Miedz SA | | | 10,911 | |
| | 971 | | | Polski Koncern Naftowy ORLEN SA | | | 29,030 | |
| | 4,582 | | | Polskie Gornictwo Naftowe i Gazownictwo SA | | | 7,813 | |
| | | | | | | | |
| | | | | | | 47,754 | |
| | | | | | | | |
| | | | Qatar — 0.5% | |
| | 223 | | | Qatar National Bank QPSC | | | 8,821 | |
| | | | | | | | |
| | | | Russia — 8.0% | |
| | 8,222 | | | Alrosa PJSC | | | 14,174 | |
| | 297 | | | LUKOIL PJSC, ADR | | | 14,738 | |
| | 11,250 | | | Magnitogorsk Iron & Steel OJSC | | | 6,697 | |
SEE NOTES TO FINANCIAL STATEMENTS.
| | | | | | |
| | | |
| 40 | | | | J.P. MORGAN INTERNATIONAL EQUITY FUNDS | | APRIL 30, 2017 |
| | | | | | | | |
| SHARES | | | SECURITY DESCRIPTION | | VALUE($) | |
| | Common Stocks — continued | |
| | | | Russia — continued | | | | |
| | 1,163 | | | MMC Norilsk Nickel PJSC, ADR | | | 17,869 | |
| | 1,450 | | | Mobile TeleSystems PJSC, ADR | | | 14,965 | |
| | 3,187 | | | Moscow Exchange MICEX-RTS PJSC | | | 6,445 | |
| | 180 | | | Ros Agro plc, GDR | | | 2,211 | |
| | 2,530 | | | Rosneft Oil Co. PJSC, GDR | | | 13,996 | |
| | 344,413 | | | RusHydro PJSC | | | 5,416 | |
| | 1,449 | | | Sberbank of Russia PJSC, ADR | | | 17,280 | |
| | 361 | | | Sberbank of Russia PJSC, ADR | | | 4,288 | |
| | 978 | | | Severstal PJSC, GDR | | | 13,356 | |
| | 157 | | | Tatneft PJSC, ADR | | | 6,163 | |
| | 150 | | | Tatneft PJSC, ADR | | | 5,898 | |
| | 163 | | | X5 Retail Group NV, GDR (a) | | | 5,750 | |
| | | | | | | | |
| | | | | | | 149,246 | |
| | | | | | | | |
| | | | South Africa — 2.5% | |
| | 648 | | | Barloworld Ltd. | | | 5,839 | |
| | 404 | | | Imperial Holdings Ltd. | | | 5,111 | |
| | 672 | | | Nedbank Group Ltd. | | | 11,326 | |
| | 514 | | | Sappi Ltd. | | | 3,820 | |
| | 1,923 | | | Standard Bank Group Ltd. | | | 21,351 | |
| | | | | | | | |
| | | | | | | 47,447 | |
| | | | | | | | |
| | | | South Korea — 16.9% | |
| | 696 | | | Hana Financial Group, Inc. | | | 23,914 | |
| | 103 | | | Hyosung Corp. | | | 13,013 | |
| | 254 | | | Hyundai Engineering & Construction Co. Ltd. | | | 10,814 | |
| | 262 | | | Hyundai Marine & Fire Insurance Co. Ltd. | | | 8,450 | |
| | 66 | | | Hyundai Mobis Co. Ltd. | | | 12,858 | |
| | 512 | | | Korea Electric Power Corp. | | | 20,409 | |
| | 27 | | | KT Corp. | | | 751 | |
| | 175 | | | KT&G Corp. | | | 15,583 | |
| | 454 | | | LG Uplus Corp. | | | 5,764 | |
| | 42 | | | Mando Corp. | | | 8,579 | |
| | 70 | | | NCSoft Corp. | | | 22,067 | |
| | 310 | | | Partron Co. Ltd. | | | 2,963 | |
| | 90 | | | POSCO | | | 21,255 | |
| | 22 | | | Samsung Electronics Co. Ltd. | | | 42,569 | |
| | 411 | | | Shinhan Financial Group Co. Ltd. | | | 17,139 | |
| | 490 | | | SK Hynix, Inc. | | | 23,203 | |
| | 148 | | | SK Innovation Co. Ltd. | | | 22,234 | |
| | 34 | | | SK Materials Co. Ltd. | | | 5,331 | |
| | 191 | | | S-Oil Corp. | | | 16,706 | |
| | 1,859 | | | Woori Bank | | | 24,370 | |
| | | | | | | | |
| | | | | | | 317,972 | |
| | | | | | | | |
| | | | | | | | |
| SHARES | | | SECURITY DESCRIPTION | | VALUE($) | |
| | | | | | | | |
| | | | Taiwan — 14.0% | |
| | 5,653 | | | Accton Technology Corp. | | | 12,823 | |
| | 37,792 | | | CTBC Financial Holding Co. Ltd. | | | 23,600 | |
| | 1,921 | | | Elite Material Co. Ltd. | | | 7,662 | |
| | 2,703 | | | FLEXium Interconnect, Inc. (a) | | | 10,032 | |
| | 12,721 | | | Fubon Financial Holding Co. Ltd. | | | 19,914 | |
| | 1,687 | | | General Interface Solution Holding Ltd. | | | 9,406 | |
| | 665 | | | Grape King Bio Ltd. | | | 4,284 | |
| | 7,991 | | | Hon Hai Precision Industry Co. Ltd. | | | 26,154 | |
| | 7,938 | | | King Yuan Electronics Co. Ltd. (a) | | | 7,166 | |
| | 148 | | | Largan Precision Co. Ltd. | | | 24,578 | |
| | 2,051 | | | Merry Electronics Co. Ltd. | | | 12,141 | |
| | 7,104 | | | Micro-Star International Co. Ltd. | | | 14,229 | |
| | 3,497 | | | Pegatron Corp. | | | 10,299 | |
| | 3,549 | | | Powertech Technology, Inc. | | | 11,134 | |
| | 1,468 | | | Realtek Semiconductor Corp. | | | 4,964 | |
| | 369 | | | Silicon Motion Technology Corp., ADR | | | 17,923 | |
| | 266 | | | St Shine Optical Co. Ltd. | | | 5,149 | |
| | 593 | | | Taiwan Semiconductor Manufacturing Co. Ltd., ADR | | | 19,619 | |
| | 2,515 | | | Tong Yang Industry Co. Ltd. | | | 4,268 | |
| | 1,690 | | | Wistron NeWeb Corp. | | | 4,848 | |
| | 22,560 | | | Yuanta Financial Holding Co. Ltd. | | | 9,646 | |
| | 1,900 | | | Zhen Ding Technology Holding Ltd. | | | 4,443 | |
| | | | | | | | |
| | | | | | | 264,282 | |
| | | | | | | | |
| | | | Thailand — 4.6% | |
| | 11,586 | | | Charoen Pokphand Foods PCL, NVDR | | | 8,949 | |
| | 3,512 | | | Kiatnakin Bank PCL, NVDR | | | 6,921 | |
| | 34,101 | | | Krung Thai Bank PCL, NVDR | | | 19,497 | |
| | 1,781 | | | PTT PCL, NVDR | | | 19,989 | |
| | 19,213 | | | Star Petroleum Refining PCL, NVDR | | | 7,324 | |
| | 3,487 | | | Thai Oil PCL, NVDR | | | 7,857 | |
| | 6,681 | | | Thanachart Capital PCL, NVDR | | | 9,118 | |
| | 3,005 | | | Tisco Financial Group PCL, NVDR | | | 6,620 | |
| | | | | | | | |
| | | | | | | 86,275 | |
| | | | | | | | |
| | | | Turkey — 4.3% | |
| | 6,367 | | | Akbank TAS | | | 17,042 | |
| | 18,162 | | | Emlak Konut Gayrimenkul Yatirim Ortakligi A/S | | | 15,079 | |
| | 5,476 | | | Eregli Demir ve Celik Fabrikalari TAS | | | 10,031 | |
| | 940 | | | KOC Holding A/S | | | 4,418 | |
| | 3,513 | | | Tekfen Holding A/S | | | 9,054 | |
| | 253 | | | Tupras Turkiye Petrol Rafinerileri A/S | | | 6,376 | |
| | 4,207 | | | Turkiye Halk Bankasi A/S | | | 13,949 | |
| | 3,687 | | | Turkiye Sise ve Cam Fabrikalari A/S | | | 4,628 | |
| | | | | | | | |
| | | | | | | 80,577 | |
| | | | | | | | |
SEE NOTES TO FINANCIAL STATEMENTS.
| | | | | | | | |
| | | |
| APRIL 30, 2017 | | J.P. MORGAN INTERNATIONAL EQUITY FUNDS | | | | | 41 | |
JPMorgan Emerging Economies Fund
SCHEDULE OF PORTFOLIO INVESTMENTS
AS OF APRIL 30, 2017 (Unaudited) (continued)
(Amounts in thousands, except number of Futures contracts)
| | | | | | | | |
| SHARES | | | SECURITY DESCRIPTION | | VALUE($) | |
| | Common Stocks — continued | |
| | | | United Arab Emirates — 1.2% | |
| | 9,836 | | | Aldar Properties PJSC | | | 5,726 | |
| | 8,804 | | | Emaar Properties PJSC | | | 17,192 | |
| | | | | | | | |
| | | | | | | 22,918 | |
| | | | | | | | |
| | | | Vietnam — 0.3% | |
| | 4,185 | | | Hoa Phat Group JSC | | | 5,407 | |
| | | | | | | | |
| | | | Total Common Stocks
(Cost $1,560,658) | | | 1,799,003 | |
| | | | | | | | |
| | Preferred Stocks — 2.3% | |
| | | | Brazil — 1.7% | |
| | 644 | | | Braskem SA (Preference), Class A | | | 6,918 | |
| | 2,586 | | | Cia de Saneamento do Parana (Preference) | | | 8,311 | |
| | 2,824 | | | Cia Energetica de Minas Gerais (Preference) | | | 7,866 | |
| | 5,510 | | | Metalurgica Gerdau SA (Preference) | | | 7,933 | |
| | | | | | | | |
| | | | | | | 31,028 | |
| | | | | | | | |
| | | | Russia — 0.6% | |
| | 22,079 | | | Surgutneftegas OJSC (Preference) | | | 11,831 | |
| | | | | | | | |
| | | | Total Preferred Stocks
(Cost $46,046) | | | 42,859 | |
| | | | | | | | |
| | Short-Term Investment — 1.7% | |
| | | | Investment Company — 1.7% | |
| | 32,084 | | | JPMorgan U.S. Government Money Market Fund, Institutional Class Shares,
0.620% (b) (l)
(Cost $32,084) | | | 32,084 | |
| | | | | | | | |
| | | | Total Investments — 99.6%
(Cost $1,638,788) | | | 1,873,946 | |
| | | | Other Assets in Excess of
Liabilities — 0.4% | | | 7,880 | |
| | | | | | | | |
| | | | NET ASSETS — 100.0% | | $ | 1,881,826 | |
| | | | | | | | |
Percentages indicated are based on net assets.
Summary of Investments by Industry, April 30, 2017
The following table represents the portfolio investments of the Fund by industry classifications as a percentage of total investments:
| | | | |
| INDUSTRY | | PERCENTAGE | |
Banks | | | 24.5 | % |
Oil, Gas & Consumable Fuels | | | 12.3 | |
Electronic Equipment, Instruments & Components | | | 7.0 | |
Metals & Mining | | | 6.7 | |
Internet Software & Services | | | 4.8 | |
Semiconductors & Semiconductor Equipment | | | 4.7 | |
Technology Hardware, Storage & Peripherals | | | 3.6 | |
Electric Utilities | | | 3.2 | |
Insurance | | | 2.4 | |
Food Products | | | 2.2 | |
Auto Components | | | 2.0 | |
Airlines | | | 2.0 | |
Real Estate Management & Development | | | 1.7 | |
Diversified Financial Services | | | 1.6 | |
Communications Equipment | | | 1.4 | |
Chemicals | | | 1.3 | |
Independent Power & Renewable Electricity Producers | | | 1.3 | |
Water Utilities | | | 1.2 | |
Automobiles | | | 1.2 | |
Software | | | 1.2 | |
Construction & Engineering | | | 1.1 | |
Health Care Providers & Services | | | 1.0 | |
Others (each less than 1.0%) | | | 9.9 | |
Short-Term Investment | | | 1.7 | |
| | | | | | | | | | | | | | | | | | | | |
| Futures Contracts | | | | | | | | | | | | |
NUMBER OF
CONTRACTS | | | DESCRIPTION | | EXPIRATION
DATE | | | TRADING
CURRENCY | | | NOTIONAL
VALUE AT
APRIL 30, 2017 | | | NET
UNREALIZED
APPRECIATION
(DEPRECIATION) | |
| | | | Long Futures Outstanding | | | | | | | | | | | | | | | | |
| | 154 | | | Mini MSCI Emerging Markets Mini Index | | | 06/16/17 | | | | USD | | | $ | 7,538 | | | $ | 42 | |
| | | | | | | | | | | | | | | | | | | | |
SEE NOTES TO FINANCIAL STATEMENTS.
| | | | | | |
| | | |
| 42 | | | | J.P. MORGAN INTERNATIONAL EQUITY FUNDS | | APRIL 30, 2017 |
JPMorgan Emerging Markets Equity Fund
SCHEDULE OF PORTFOLIO INVESTMENTS
AS OF APRIL 30, 2017 (Unaudited)
(Amounts in thousands)
| | | | | | | | |
| SHARES | | | SECURITY DESCRIPTION | | VALUE($) | |
| | Common Stocks — 96.6% | |
| | | | Argentina — 1.7% | |
| | 257 | | | MercadoLibre, Inc. | | | 58,887 | |
| | | | | | | | |
| | | | Australia — 0.6% | |
| | 4,119 | | | Oil Search Ltd. | | | 22,225 | |
| | | | | | | | |
| | | | Brazil — 9.5% | |
| | 6,193 | | | Ambev SA, ADR | | | 35,487 | |
| | 3,895 | | | BB Seguridade Participacoes SA | | | 36,568 | |
| | 5,596 | | | CCR SA | | | 31,100 | |
| | 3,273 | | | Cielo SA | | | 24,853 | |
| | 3,647 | | | Itau Unibanco Holding SA, ADR | | | 44,857 | |
| | 4,759 | | | Kroton Educacional SA | | | 22,519 | |
| | 5,578 | | | Lojas Renner SA | | | 51,841 | |
| | 846 | | | Marcopolo SA (a) | | | 554 | |
| | 1,313 | | | Raia Drogasil SA (a) | | | 27,793 | |
| | 2,258 | | | Ultrapar Participacoes SA | | | 50,447 | |
| | 2,451 | | | WEG SA | | | 13,653 | |
| | | | | | | | |
| | | | | | | 339,672 | |
| | | | | | | | |
| | | | China — 18.5% | |
| | 3,047 | | | AAC Technologies Holdings, Inc. | | | 44,659 | |
| | 1,242 | | | Alibaba Group Holding Ltd., ADR (a) | | | 143,431 | |
| | 150 | | | Baidu, Inc., ADR (a) | | | 27,098 | |
| | 5,271 | | | CNOOC Ltd. | | | 6,145 | |
| | 2,222 | | | JD.com, Inc., ADR (a) | | | 77,936 | |
| | 11,165 | | | Ping An Insurance Group Co. of China Ltd., Class H | | | 62,770 | |
| | 4,527 | | | Shenzhou International Group Holdings Ltd. | | | 29,787 | |
| | 7,358 | | | Tencent Holdings Ltd. | | | 230,541 | |
| | 2,710 | | | Vipshop Holdings Ltd., ADR (a) | | | 37,591 | |
| | | | | | | | |
| | | | | | | 659,958 | |
| | | | | | | | |
| | | | Cyprus — 0.3% | |
| | 1,207 | | | Globaltrans Investment plc, GDR | | | 9,140 | |
| | | | | | | | |
| | | | Egypt — 0.7% | |
| | 5,592 | | | Commercial International Bank Egypt SAE, GDR | | | 23,906 | |
| | | | | | | | |
| | | | Hong Kong — 6.6% | |
| | 19,196 | | | AIA Group Ltd. | | | 132,864 | |
| | 517 | | | Jardine Matheson Holdings Ltd. | | | 33,277 | |
| | 8,783 | | | Sands China Ltd. | | | 39,780 | |
| | 7,133 | | | Techtronic Industries Co. Ltd. | | | 30,603 | |
| | | | | | | | |
| | | | | | | 236,524 | |
| | | | | | | | |
| | | | India — 18.6% | |
| | 1,756 | | | Asian Paints Ltd. | | | 30,610 | |
| | 2,198 | | | HDFC Bank Ltd. | | | 53,697 | |
| | 903 | | | HDFC Bank Ltd., ADR | | | 71,917 | |
| | 5,303 | | | Housing Development Finance Corp. Ltd. | | | 126,621 | |
| | | | | | | | |
| SHARES | | | SECURITY DESCRIPTION | | VALUE($) | |
| | | | | | | | |
| | | | India — continued | | | | |
| | 2,002 | | | IndusInd Bank Ltd. | | | 44,956 | |
| | 2,686 | | | Infosys Ltd., ADR | | | 39,112 | |
| | 15,007 | | | ITC Ltd. | | | 64,796 | |
| | 2,407 | | | Kotak Mahindra Bank Ltd. | | | 33,742 | |
| | 1,676 | | | Lupin Ltd. | | | 34,832 | |
| | 2,334 | | | Tata Consultancy Services Ltd. | | | 82,417 | |
| | 754 | | | Tata Motors Ltd., ADR | | | 26,879 | |
| | 801 | | | UltraTech Cement Ltd. | | | 52,904 | |
| | | | | | | | |
| | | | | | | 662,483 | |
| | | | | | | | |
| | | | Indonesia — 3.2% | |
| | 71,609 | | | Astra International Tbk. PT | | | 47,992 | |
| | 31,120 | | | Bank Central Asia Tbk. PT | | | 41,388 | |
| | 23,468 | | | Bank Rakyat Indonesia Persero Tbk. PT | | | 22,667 | |
| | | | | | | | |
| | | | | | | 112,047 | |
| | | | | | | | |
| | | | Mexico — 2.6% | |
| | 9,980 | | | Becle SAB de CV (a) | | | 16,699 | |
| | 9,928 | | | Grupo Financiero Banorte SAB de CV, Class O | | | 57,458 | |
| | 3,708 | | | Infraestructura Energetica Nova SAB de CV | | | 17,323 | |
| | | | | | | | |
| | | | | | | 91,480 | |
| | | | | | | | |
| | | | Panama — 1.3% | |
| | 406 | | | Copa Holdings SA, Class A | | | 47,278 | |
| | | | | | | | |
| | | | Peru — 1.2% | |
| | 278 | | | Credicorp Ltd. | | | 42,716 | |
| | | | | | | | |
| | | | Russia — 4.1% | |
| | 412 | | | LUKOIL PJSC, ADR | | | 20,448 | |
| | 408 | | | Magnit PJSC | | | 62,916 | |
| | 181 | | | Magnit PJSC, GDR | | | 6,328 | |
| | 19,497 | | | Sberbank of Russia PJSC | | | 56,630 | |
| | | | | | | | |
| | | | | | | 146,322 | |
| | | | | | | | |
| | | | South Africa — 11.1% | |
| | 1,755 | | | Aspen Pharmacare Holdings Ltd. | | | 36,393 | |
| | 4,360 | | | Bid Corp. Ltd. | | | 92,360 | |
| | 3,907 | | | Bidvest Group Ltd. (The) | | | 46,629 | |
| | 331 | | | Capitec Bank Holdings Ltd. | | | 18,897 | |
| | 9,183 | | | FirstRand Ltd. | | | 34,259 | |
| | 1,738 | | | Mr Price Group Ltd. | | | 20,435 | |
| | 3,174 | | | Remgro Ltd. | | | 52,691 | |
| | 9,054 | | | Sanlam Ltd. | | | 48,083 | |
| | 8,592 | | | Woolworths Holdings Ltd. | | | 46,574 | |
| | | | | | | | |
| | | | | | | 396,321 | |
| | | | | | | | |
| | | | South Korea — 5.1% | |
| | 164 | | | Hyundai Motor Co. | | | 20,702 | |
| | 127 | | | Netmarble Games Corp. (a) (e) | | | 17,540 | |
SEE NOTES TO FINANCIAL STATEMENTS.
| | | | | | | | |
| | | |
| APRIL 30, 2017 | | J.P. MORGAN INTERNATIONAL EQUITY FUNDS | | | | | 43 | |
JPMorgan Emerging Markets Equity Fund
SCHEDULE OF PORTFOLIO INVESTMENTS
AS OF APRIL 30, 2017 (Unaudited) (continued)
(Amounts in thousands)
| | | | | | | | |
| SHARES | | | SECURITY DESCRIPTION | | VALUE($) | |
| | Common Stocks — continued | |
| | | | South Korea — continued | |
| | 194 | | | Samsung Biologics Co. Ltd. (a) | | | 29,764 | |
| | 58 | | | Samsung Electronics Co. Ltd. | | | 113,225 | |
| | | | | | | | |
| | | | | | | 181,231 | |
| | | | | | | | |
| | | | Taiwan — 7.7% | |
| | 5,115 | | | Delta Electronics, Inc. | | | 28,790 | |
| | 1,732 | | | Eclat Textile Co. Ltd. | | | 18,943 | |
| | 239 | | | Largan Precision Co. Ltd. | | | 39,691 | |
| | 5,095 | | | President Chain Store Corp. | | | 44,338 | |
| | 4,294 | | | Taiwan Semiconductor Manufacturing Co. Ltd., ADR | | | 142,012 | |
| | | | | | | | |
| | | | | | | 273,774 | |
| | | | | | | | |
| | | | Thailand — 0.8% | |
| | 5,060 | | | Kasikornbank PCL, NVDR | | | 27,038 | |
| | | | | | | | |
| | | | Turkey — 0.3% | |
| | 1,022 | | | Ford Otomotiv Sanayi A/S | | | 11,363 | |
| | | | | | | | |
| | | | United States — 2.7% | |
| | 493 | | | EPAM Systems, Inc. (a) | | | 37,986 | |
| | 443 | | | Luxoft Holding, Inc. (a) | | | 27,298 | |
| | 947 | | | Yum China Holdings, Inc. (a) | | | 32,326 | |
| | | | | | | | |
| | | | | | | 97,610 | |
| | | | | | | | |
| | | | Total Common Stocks
(Cost $2,724,226) | | | 3,439,975 | |
| | | | | | | | |
| | Preferred Stocks — 0.5% | |
| | | | Brazil — 0.5% | |
| | 1,178 | | | Itau Unibanco Holding SA (Preference) | | | 14,561 | |
| | 6,706 | | | Marcopolo SA (Preference) | | | 5,049 | |
| | | | | | | | |
| | | | Total Preferred Stocks
(Cost $18,886) | | | 19,610 | |
| | | | | | | | |
| | Structured Instrument — 0.9% | |
| | | | China — 0.9% | | | | |
| | | | Low Exercise Cash Settled Call Warrant — 0.9% | |
| | 4,302 | | | Hangzhou Robam Appliances Co. Ltd., expiring 10/27/17 (Strike Price $0.00) (issued through UBS AG) (a) (Cost $23,518) | | | 33,989 | |
| | | | | | | | |
| | |
NUMBER OF
WARRANTS | | | | | | |
| | Warrants — 0.7% | | | | |
| | | | United States — 0.7% | |
| | 1,278 | | | Almarai Co., expiring 07/24/17
(Strike Price $1.00) (a)
(Cost $17,678) | | | 24,753 | |
| | | | | | | | |
| | | | | | | | |
| SHARES | | | SECURITY DESCRIPTION | | VALUE($) | |
| | Short-Term Investment — 1.3% | |
| | | | Investment Company — 1.3% | |
| | 45,041 | | | JPMorgan U.S. Government Money Market Fund, Institutional Class Shares, 0.620% (b) (l)
(Cost $45,041) | | | 45,041 | |
| | | | | | | | |
| | | | Total Investments — 100.0%
(Cost $2,829,349) | | | 3,563,368 | |
| | | | Liabilities in Excess of
Other Assets — 0.0% (g) | | | (1,151 | ) |
| | | | | | | | |
| | | | NET ASSETS — 100.0% | | $ | 3,562,217 | |
| | | | | | | | |
Percentages indicated are based on net assets.
Summary of Investments by Industry, April 30, 2017
The following table represents the portfolio investments of the Fund by industry classifications as a percentage of total investments:
| | | | |
| INDUSTRY | | PERCENTAGE | |
Banks | | | 15.5 | % |
Internet Software & Services | | | 12.9 | |
Insurance | | | 7.9 | |
Food & Staples Retailing | | | 7.3 | |
IT Services | | | 5.9 | |
Semiconductors & Semiconductor Equipment | | | 4.0 | |
Thrifts & Mortgage Finance | | | 3.5 | |
Internet & Direct Marketing Retail | | | 3.2 | |
Technology Hardware, Storage & Peripherals | | | 3.2 | |
Electronic Equipment, Instruments & Components | | | 3.2 | |
Automobiles | | | 3.0 | |
Oil, Gas & Consumable Fuels | | | 2.8 | |
Multiline Retail | | | 2.8 | |
Diversified Financial Services | | | 2.4 | |
Industrial Conglomerates | | | 2.2 | |
Hotels, Restaurants & Leisure | | | 2.0 | |
Pharmaceuticals | | | 2.0 | |
Tobacco | | | 1.8 | |
Construction Materials | | | 1.5 | |
Beverages | | | 1.5 | |
Textiles, Apparel & Luxury Goods | | | 1.4 | |
Airlines | | | 1.3 | |
Capital Markets | | | 1.0 | |
Others (each less than 1.0%) | | | 6.4 | |
Short-Term Investment | | | 1.3 | |
SEE NOTES TO FINANCIAL STATEMENTS.
| | | | | | |
| | | |
| 44 | | | | J.P. MORGAN INTERNATIONAL EQUITY FUNDS | | APRIL 30, 2017 |
JPMorgan Emerging Markets Equity Income Fund
SCHEDULE OF PORTFOLIO INVESTMENTS
AS OF APRIL 30, 2017 (Unaudited)
(Amounts in thousands)
| | | | | | | | |
| SHARES | | | SECURITY DESCRIPTION | | VALUE($) | |
| | Common Stocks — 96.2% | | | | |
| | | | Brazil — 7.3% | |
| | 74 | | | Ambev SA, ADR | | | 423 | |
| | 43 | | | BB Seguridade Participacoes SA | | | 399 | |
| | 24 | | | Engie Brasil Energia SA | | | 260 | |
| | 4 | | | Smiles SA | | | 94 | |
| | | | | | | | |
| | | | | | | 1,176 | |
| | | | | | | | |
| | | | Chile — 2.9% | |
| | 20 | | | Banco Santander Chile, ADR | | | 470 | |
| | | | | | | | |
| | | | China — 13.0% | |
| | 41 | | | China Mobile Ltd. | | | 431 | |
| | 214 | | | China Resources Power Holdings Co. Ltd. | | | 385 | |
| | 204 | | | CNOOC Ltd. | | | 238 | |
| | 132 | | | Fuyao Glass Industry Group Co. Ltd., Class A | | | 431 | |
| | 16 | | | Fuyao Glass Industry Group Co. Ltd., Class H (e) | | | 58 | |
| | 192 | | | Lenovo Group Ltd. | | | 123 | |
| | 52 | | | Midea Group Co. Ltd., Class A | | | 255 | |
| | 56 | | | Zhengzhou Yutong Bus Co. Ltd., Class A | | | 164 | |
| | | | | | | | |
| | | | | | | 2,085 | |
| | | | | | | | |
| | | | Czech Republic — 3.0% | |
| | 9 | | | Komercni banka A/S | | | 349 | |
| | 40 | | | Moneta Money Bank A/S (e) | | | 130 | |
| | | | | | | | |
| | | | | | | 479 | |
| | | | | | | | |
| | | | Hong Kong — 5.9% | |
| | 14 | | | Hang Seng Bank Ltd. | | | 292 | |
| | 231 | | | HKT Trust & HKT Ltd. | | | 295 | |
| | 62 | | | Sands China Ltd. | | | 282 | |
| | 6 | | | VTech Holdings Ltd. | | | 75 | |
| | | | | | | | |
| | | | | | | 944 | |
| | | | | | | | |
| | | | Hungary — 1.7% | |
| | 10 | | | OTP Bank plc | | | 272 | |
| | | | | | | | |
| | | | Indonesia — 2.1% | |
| | 1,002 | | | Telekomunikasi Indonesia Persero Tbk. PT | | | 331 | |
| | | | | | | | |
| | | | Mexico — 6.2% | |
| | 71 | | | Bolsa Mexicana de Valores SAB de CV (a) | | | 123 | |
| | 137 | | | Fibra Uno Administracion SA de CV | | | 239 | |
| | 221 | | | Kimberly-Clark de Mexico SAB de CV, Class A | | | 472 | |
| | 74 | | | Wal-Mart de Mexico SAB de CV | | | 168 | |
| | | | | | | | |
| | | | | | | 1,002 | |
| | | | | | | | |
| | | | Russia — 7.3% | |
| | 5 | | | LUKOIL PJSC, ADR | | | 236 | |
| | 6 | | | MegaFon PJSC, GDR | | | 61 | |
| | 9 | | | MMC Norilsk Nickel PJSC, ADR | | | 131 | |
| | 7 | | | Mobile TeleSystems PJSC, ADR | | | 77 | |
| | | | | | | | |
| SHARES | | | SECURITY DESCRIPTION | | VALUE($) | |
| | | | | | | | |
| | | | Russia — continued | |
| | 214 | | | Moscow Exchange MICEX-RTS PJSC | | | 433 | |
| | 9 | | | PhosAgro PJSC, GDR | | | 128 | |
| | 8 | | | Severstal PJSC, GDR | | | 108 | |
| | | | | | | | |
| | | | | | | 1,174 | |
| | | | | | | | |
| | | | South Africa — 12.1% | |
| | 46 | | | AVI Ltd. | | | 339 | |
| | 26 | | | Barclays Africa Group Ltd. | | | 283 | |
| | 9 | | | Bid Corp. Ltd. | | | 196 | |
| | 97 | | | FirstRand Ltd. | | | 361 | |
| | 118 | | | MMI Holdings Ltd. | | | 205 | |
| | 25 | | | Vodacom Group Ltd. | | | 278 | |
| | 52 | | | Woolworths Holdings Ltd. | | | 280 | |
| | | | | | | | |
| | | | | | | 1,942 | |
| | | | | | | | |
| | | | South Korea — 6.5% | |
| | 3 | | | Kangwon Land, Inc. | | | 103 | |
| | 4 | | | KT&G Corp. | | | 345 | |
| | — | (h) | | Samsung Electronics Co. Ltd. | | | 400 | |
| | 9 | | | SK Telecom Co. Ltd., ADR | | | 203 | |
| | | | | | | | |
| | | | | | | 1,051 | |
| | | | | | | | |
| | | | Taiwan — 19.2% | |
| | 23 | | | Asustek Computer, Inc. | | | 230 | |
| | 41 | | | Chicony Electronics Co. Ltd. | | | 108 | |
| | 42 | | | Delta Electronics, Inc. | | | 235 | |
| | 44 | | | Far EasTone Telecommunications Co. Ltd. | | | 108 | |
| | 35 | | | MediaTek, Inc. | | | 252 | |
| | 102 | | | Mega Financial Holding Co. Ltd. | | | 82 | |
| | 53 | | | Novatek Microelectronics Corp. | | | 204 | |
| | 32 | | | President Chain Store Corp. | | | 278 | |
| | 96 | | | Quanta Computer, Inc. | | | 199 | |
| | 97 | | | Taiwan Mobile Co. Ltd. | | | 358 | |
| | 24 | | | Taiwan Semiconductor Manufacturing Co. Ltd., ADR | | | 802 | |
| | 122 | | | Vanguard International Semiconductor Corp. | | | 233 | |
| | | | | | | | |
| | | | | | | 3,089 | |
| | | | | | | | |
| | | | Thailand — 4.2% | |
| | 21 | | | Siam Cement PCL (The) (Registered) | | | 327 | |
| | 13 | | | Siam Commercial Bank PCL (The) | | | 60 | |
| | 38 | | | Siam Commercial Bank PCL (The), NVDR | | | 169 | |
| | 36 | | | Thai Oil PCL | | | 81 | |
| | 19 | | | Thai Oil PCL, NVDR | | | 43 | |
| | | | | | | | |
| | | | | | | 680 | |
| | | | | | | | |
SEE NOTES TO FINANCIAL STATEMENTS.
| | | | | | | | |
| | | |
| APRIL 30, 2017 | | J.P. MORGAN INTERNATIONAL EQUITY FUNDS | | | | | 45 | |
JPMorgan Emerging Markets Equity Income Fund
SCHEDULE OF PORTFOLIO INVESTMENTS
AS OF APRIL 30, 2017 (Unaudited) (continued)
(Amounts in thousands)
| | | | | | | | |
| SHARES | | | SECURITY DESCRIPTION | | VALUE($) | |
| | Common Stocks — continued | |
| | | | Turkey — 3.3% | |
| | 8 | | | Ford Otomotiv Sanayi A/S | | | 88 | |
| | 32 | | | Tofas Turk Otomobil Fabrikasi A/S | | | 265 | |
| | 7 | | | Tupras Turkiye Petrol Rafinerileri A/S | | | 183 | |
| | | | | | | | |
| | | | | | | 536 | |
| | | | | | | | |
| | | | United Arab Emirates — 1.5% | |
| | 82 | | | National Bank of Abu Dhabi PJSC | | | 245 | |
| | | | | | | | |
| | | | Total Common Stocks
(Cost $14,489) | | | 15,476 | |
| | | | | | | | |
| | Structured Instrument — 0.9% | |
| | 29 | | | Midea Group Co. Ltd., expiring 10/13/2017 (issued through BNP Paribas) (a)
(Cost $115) | | | 141 | |
| | | | | | | | |
| | |
NUMBER OF
WARRANTS | | | | | | |
| | Warrant — 1.4% | |
| | | | United States — 1.4% | |
| | 13 | | | Al Rajhi Bank, expiring 01/22/18 (Strike Price $ 1.00) (a)
(Cost $207) | | | 225 | |
| | | | | | | | |
| | |
| SHARES | | | | | | |
| | Short-Term Investment — 0.1% | |
| | | | Investment Company — 0.1% | |
| | 24 | | | JPMorgan U.S. Government Money Market Fund, Institutional Class Shares, 0.620% (b) (l) (Cost $24) | | | 24 | |
| | | | | | | | |
| | | | Total Investments — 98.6%
(Cost $14,835) | | | 15,866 | |
| | | | Other Assets in Excess of
Liabilities — 1.4% | | | 221 | |
| | | | | | | | |
| | | | NET ASSETS — 100.0% | | $ | 16,087 | |
| | | | | | | | |
Percentages indicated are based on net assets.
Summary of Investments by Industry, April 30, 2017
The following table represents the portfolio investments of the Fund by industry classifications as a percentage of total investments:
| | | | |
| INDUSTRY | | PERCENTAGE | |
Banks | | | 17.1 | % |
Wireless Telecommunication Services | | | 9.5 | |
Semiconductors & Semiconductor Equipment | | | 9.4 | |
Technology Hardware, Storage & Peripherals | | | 6.7 | |
Oil, Gas & Consumable Fuels | | | 4.9 | |
Independent Power & Renewable Electricity Producers | | | 4.1 | |
Food & Staples Retailing | | | 4.0 | |
Diversified Telecommunication Services | | | 3.9 | |
Insurance | | | 3.8 | |
Capital Markets | | | 3.5 | |
Auto Components | | | 3.1 | |
Household Products | | | 3.0 | |
Beverages | | | 2.7 | |
Hotels, Restaurants & Leisure | | | 2.4 | |
Diversified Financial Services | | | 2.3 | |
Automobiles | | | 2.2 | |
Tobacco | | | 2.2 | |
Food Products | | | 2.1 | |
Construction Materials | | | 2.1 | |
Multiline Retail | | | 1.8 | |
Household Durables | | | 1.6 | |
Metals & Mining | | | 1.5 | |
Equity Real Estate Investment Trusts (REITs) | | | 1.5 | |
Electronic Equipment, Instruments & Components | | | 1.5 | |
Machinery | | | 1.0 | |
Others (each less than 1.0%) | | | 1.9 | |
Short-Term Investment | | | 0.2 | |
SEE NOTES TO FINANCIAL STATEMENTS.
| | | | | | |
| | | |
| 46 | | | | J.P. MORGAN INTERNATIONAL EQUITY FUNDS | | APRIL 30, 2017 |
JPMorgan Global Research Enhanced Index Fund
SCHEDULE OF PORTFOLIO INVESTMENTS
AS OF APRIL 30, 2017 (Unaudited)
(Amounts in thousands)
| | | | | | | | |
| SHARES | | | SECURITY DESCRIPTION | | VALUE($) | |
| | Common Stocks — 98.6% | |
| | | | Australia — 2.6% | |
| | 119 | | | AGL Energy Ltd. | | | 2,388 | |
| | 987 | | | Alumina Ltd. | | | 1,355 | |
| | 299 | | | Amcor Ltd. | | | 3,515 | |
| | 531 | | | AMP Ltd. | | | 2,128 | |
| | 306 | | | APA Group | | | 2,099 | |
| | 60 | | | Aristocrat Leisure Ltd. | | | 887 | |
| | 19 | | | ASX Ltd. | | | 702 | |
| | 637 | | | Aurizon Holdings Ltd. | | | 2,457 | |
| | 683 | | | Australia & New Zealand Banking Group Ltd. | | | 16,722 | |
| | 61 | | | Bendigo & Adelaide Bank Ltd. | | | 563 | |
| | 649 | | | BHP Billiton Ltd. | | | 11,551 | |
| | 131 | | | BHP Billiton plc | | | 1,993 | |
| | 237 | | | Boral Ltd. | | | 1,093 | |
| | 297 | | | Brambles Ltd. | | | 2,301 | |
| | 71 | | | Caltex Australia Ltd. | | | 1,581 | |
| | 71 | | | Challenger Ltd. | | | 701 | |
| | 209 | | | Coca-Cola Amatil Ltd. | | | 1,464 | |
| | 19 | | | Cochlear Ltd. | | | 1,945 | |
| | 349 | | | Commonwealth Bank of Australia | | | 22,811 | |
| | 166 | | | Computershare Ltd. | | | 1,835 | |
| | 23 | | | Crown Resorts Ltd. | | | 217 | |
| | 92 | | | CSL Ltd. | | | 9,102 | |
| | 341 | | | Dexus Property Group | | | 2,606 | |
| | 266 | | | DUET Group | | | 601 | |
| | 127 | | | Fortescue Metals Group Ltd. | | | 504 | |
| | 449 | | | Goodman Group | | | 2,727 | |
| | 211 | | | GPT Group (The) | | | 831 | |
| | 184 | | | Incitec Pivot Ltd. | | | 522 | |
| | 352 | | | Insurance Australia Group Ltd. | | | 1,636 | |
| | 175 | | | LendLease Group | | | 2,102 | |
| | 72 | | | Macquarie Group Ltd. | | | 5,013 | |
| | 487 | | | Medibank Pvt Ltd. | | | 1,059 | |
| | 1,368 | | | Mirvac Group | | | 2,324 | |
| | 521 | | | National Australia Bank Ltd. | | | 13,229 | |
| | 148 | | | Newcrest Mining Ltd. | | | 2,375 | |
| | 339 | | | Oil Search Ltd. | | | 1,829 | |
| | 112 | | | Orica Ltd. | | | 1,555 | |
| | 267 | | | Origin Energy Ltd. | | | 1,439 | |
| | 341 | | | Qantas Airways Ltd. | | | 1,082 | |
| | 357 | | | QBE Insurance Group Ltd. | | | 3,427 | |
| | 40 | | | Ramsay Health Care Ltd. | | | 2,168 | |
| | 25 | | | REA Group Ltd. | | | 1,131 | |
| | 317 | | | Santos Ltd. (a) | | | 822 | |
| | 958 | | | Scentre Group | | | 3,090 | |
| | 15 | | | SEEK Ltd. | | | 186 | |
| | | | | | | | |
| SHARES | | | SECURITY DESCRIPTION | | VALUE($) | |
| | | | | | | | |
| | | | Australia — continued | |
| | 44 | | | Sonic Healthcare Ltd. | | | 733 | |
| | 1,438 | | | South32 Ltd. | | | 2,980 | |
| | 490 | | | Stockland | | | 1,779 | |
| | 338 | | | Suncorp Group Ltd. | | | 3,486 | |
| | 319 | | | Sydney Airport | | | 1,648 | |
| | 341 | | | Tabcorp Holdings Ltd. | | | 1,211 | |
| | 166 | | | Tatts Group Ltd. | | | 533 | |
| | 869 | | | Telstra Corp. Ltd. | | | 2,746 | |
| | 131 | | | TPG Telecom Ltd. | | | 578 | |
| | 499 | | | Transurban Group | | | 4,558 | |
| | 110 | | | Treasury Wine Estates Ltd. | | | 985 | |
| | 1,285 | | | Vicinity Centres | | | 2,769 | |
| | 215 | | | Wesfarmers Ltd. | | | 6,914 | |
| | 342 | | | Westfield Corp. | | | 2,326 | |
| | 675 | | | Westpac Banking Corp. | | | 17,694 | |
| | 156 | | | Woodside Petroleum Ltd. | | | 3,763 | |
| | 293 | | | Woolworths Ltd. | | | 5,888 | |
| | | | | | | | |
| | | | | | | 202,259 | |
| | | | | | | | |
| | | | Austria — 0.1% | |
| | 317 | | | Erste Group Bank AG (a) | | | 11,337 | |
| | — | (h) | | Telekom Austria AG (a) | | | — | (h) |
| | | | | | | | |
| | | | | | | 11,337 | |
| | | | | | | | |
| | | | Belgium — 0.5% | |
| | 207 | | | Anheuser-Busch InBev SA/NV | | | 23,305 | |
| | 166 | | | KBC Group NV | | | 11,993 | |
| | | | | | | | |
| | | | | | | 35,298 | |
| | | | | | | | |
| | | | Bermuda — 0.1% | |
| | 90 | | | Marvell Technology Group Ltd. | | | 1,349 | |
| | 91 | | | XL Group Ltd. | | | 3,789 | |
| | | | | | | | |
| | | | | | | 5,138 | |
| | | | | | | | |
| | | | Canada — 3.4% | |
| | 52 | | | Agnico Eagle Mines Ltd. | | | 2,489 | |
| | 33 | | | Agrium, Inc. | | | 3,056 | |
| | 104 | | | Alimentation Couche-Tard, Inc., Class B | | | 4,792 | |
| | 85 | | | ARC Resources Ltd. | | | 1,110 | |
| | 155 | | | Bank of Montreal | | | 10,971 | |
| | 280 | | | Bank of Nova Scotia (The) | | | 15,583 | |
| | 275 | | | Barrick Gold Corp. | | | 4,605 | |
| | 36 | | | BCE, Inc. | | | 1,655 | |
| | 221 | | | Brookfield Asset Management, Inc., Class A | | | 8,162 | |
| | 98 | | | Canadian Imperial Bank of Commerce | | | 7,914 | |
| | 188 | | | Canadian National Railway Co. | | | 13,569 | |
| | 270 | | | Canadian Natural Resources Ltd. | | | 8,608 | |
SEE NOTES TO FINANCIAL STATEMENTS.
| | | | | | | | |
| | | |
| APRIL 30, 2017 | | J.P. MORGAN INTERNATIONAL EQUITY FUNDS | | | | | 47 | |
JPMorgan Global Research Enhanced Index Fund
SCHEDULE OF PORTFOLIO INVESTMENTS
AS OF APRIL 30, 2017 (Unaudited) (continued)
(Amounts in thousands)
| | | | | | | | |
| SHARES | | | SECURITY DESCRIPTION | | VALUE($) | |
| | Common Stocks — continued | |
| | | | Canada — continued | |
| | 98 | | | Canadian Pacific Railway Ltd. | | | 15,045 | |
| | 17 | | | Canadian Tire Corp. Ltd., Class A | | | 2,097 | |
| | 209 | | | Cenovus Energy, Inc. | | | 2,083 | |
| | 55 | | | CGI Group, Inc., Class A (a) | | | 2,643 | |
| | 5 | | | Constellation Software, Inc. | | | 2,153 | |
| | 126 | | | Crescent Point Energy Corp. | | | 1,243 | |
| | 29 | | | Dollarama, Inc. | | | 2,514 | |
| | 194 | | | Enbridge, Inc. | | | 8,042 | |
| | 211 | | | Encana Corp. | | | 2,261 | |
| | 6 | | | Fairfax Financial Holdings Ltd. | | | 2,525 | |
| | 69 | | | Fortis, Inc. | | | 2,246 | |
| | 43 | | | Franco-Nevada Corp. | | | 2,896 | |
| | 57 | | | Gildan Activewear, Inc. | | | 1,594 | |
| | 198 | | | Goldcorp, Inc. | | | 2,756 | |
| | 73 | | | Great-West Lifeco, Inc. | | | 1,969 | |
| | 73 | | | Imperial Oil Ltd. | | | 2,133 | |
| | 32 | | | Intact Financial Corp. | | | 2,218 | |
| | 84 | | | Inter Pipeline Ltd. | | | 1,705 | |
| | 294 | | | Kinross Gold Corp. (a) | | | 1,023 | |
| | 56 | | | Loblaw Cos. Ltd. | | | 3,140 | |
| | 98 | | | Magna International, Inc. | | | 4,106 | |
| | 486 | | | Manulife Financial Corp. | | | 8,521 | |
| | 59 | | | Metro, Inc. | | | 2,034 | |
| | 82 | | | National Bank of Canada | | | 3,193 | |
| | 60 | | | Open Text Corp. | | | 2,072 | |
| | 93 | | | Pembina Pipeline Corp. | | | 2,972 | |
| | 207 | | | Potash Corp. of Saskatchewan, Inc. | | | 3,486 | |
| | 92 | | | Power Corp. of Canada | | | 2,141 | |
| | 62 | | | Power Financial Corp. | | | 1,567 | |
| | 54 | | | Restaurant Brands International, Inc. | | | 3,038 | |
| | 89 | | | Rogers Communications, Inc., Class B | | | 4,097 | |
| | 336 | | | Royal Bank of Canada | | | 22,990 | |
| | 63 | | | Saputo, Inc. | | | 2,077 | |
| | 101 | | | Shaw Communications, Inc., Class B | | | 2,133 | |
| | 103 | | | Silver Wheaton Corp. | | | 2,058 | |
| | 37 | | | SNC-Lavalin Group, Inc. | | | 1,480 | |
| | 152 | | | Sun Life Financial, Inc. | | | 5,365 | |
| | 383 | | | Suncor Energy, Inc. | | | 11,994 | |
| | 133 | | | Teck Resources Ltd., Class B | | | 2,755 | |
| | 423 | | | Toronto-Dominion Bank (The) | | | 19,917 | |
| | 175 | | | TransCanada Corp. | | | 8,116 | |
| | 40 | | | Waste Connections, Inc. | | | 3,648 | |
| | | | | | | | |
| | | | | | | 264,560 | |
| | | | | | | | |
| | | | | | | | |
| SHARES | | | SECURITY DESCRIPTION | | VALUE($) | |
| | | | | | | | |
| | | | China — 0.0% (g) | |
| | 925 | | | BOC Hong Kong Holdings Ltd. | | | 3,799 | |
| | 412 | | | Yangzijiang Shipbuilding Holdings Ltd. | | | 339 | |
| | | | | | | | |
| | | | | | | 4,138 | |
| | | | | | | | |
| | | | Denmark — 0.7% | |
| | 131 | | | Chr Hansen Holding A/S | | | 8,854 | |
| | 241 | | | Danske Bank A/S | | | 8,777 | |
| | 631 | | | Novo Nordisk A/S, Class B | | | 24,587 | |
| | 75 | | | Pandora A/S | | | 8,058 | |
| | 1,274 | | | TDC A/S | | | 6,836 | |
| | | | | | | | |
| | | | | | | 57,112 | |
| | | | | | | | |
| | | | Finland — 0.2% | |
| | 153 | | | Cargotec OYJ, Class B | | | 9,135 | |
| | — | (h) | | Nokian Renkaat OYJ | | | — | (h) |
| | 131 | | | UPM-Kymmene OYJ | | | 3,454 | |
| | 2 | | | Wartsila OYJ Abp | | | 105 | |
| | | | | | | | |
| | | | | | | 12,694 | |
| | | | | | | | |
| | | | France — 4.1% | |
| | 194 | | | Air Liquide SA | | | 23,409 | |
| | 256 | | | Airbus SE | | | 20,702 | |
| | 102 | | | Arkema SA | | | 10,825 | |
| | 896 | | | AXA SA | | | 23,912 | |
| | 345 | | | BNP Paribas SA | | | 24,361 | |
| | 51 | | | Bouygues SA | | | 2,134 | |
| | 109 | | | Cap Gemini SA | | | 10,890 | |
| | 98 | | | Cie Generale des Etablissements Michelin | | | 12,866 | |
| | 45 | | | Kering | | | 14,054 | |
| | 23 | | | L’Oreal SA | | | 4,509 | |
| | 29 | | | LVMH Moet Hennessy Louis Vuitton SE | | | 7,198 | |
| | 1,735 | | | Natixis SA | | | 12,072 | |
| | 69 | | | Nexans SA (a) | | | 3,833 | |
| | 105 | | | Pernod Ricard SA | | | 13,174 | |
| | 128 | | | Renault SA | | | 11,977 | |
| | 252 | | | Sanofi | | | 23,798 | |
| | 256 | | | Schneider Electric SE | | | 20,257 | |
| | 75 | | | Societe Generale SA | | | 4,098 | |
| | 110 | | | Sodexo SA | | | 13,944 | |
| | 41 | | | Thales SA | | | 4,313 | |
| | 592 | | | TOTAL SA | | | 30,379 | |
| | 6 | | | Unibail-Rodamco SE | | | 1,563 | |
| | 243 | | | Vinci SA | | | 20,729 | |
| | | | | | | | |
| | | | | | | 314,997 | |
| | | | | | | | |
SEE NOTES TO FINANCIAL STATEMENTS.
| | | | | | |
| | | |
| 48 | | | | J.P. MORGAN INTERNATIONAL EQUITY FUNDS | | APRIL 30, 2017 |
| | | | | | | | |
| SHARES | | | SECURITY DESCRIPTION | | VALUE($) | |
| | Common Stocks — continued | |
| | | | Germany — 3.2% | |
| | 80 | | | adidas AG | | | 15,947 | |
| | 65 | | | Allianz SE (Registered) | | | 12,379 | |
| | 140 | | | BASF SE | | | 13,687 | |
| | 232 | | | Bayer AG (Registered) | | | 28,753 | |
| | 38 | | | Bayerische Motoren Werke AG | | | 3,628 | |
| | 64 | | | Continental AG | | | 14,389 | |
| | 115 | | | Daimler AG (Registered) | | | 8,551 | |
| | 285 | | | Deutsche Post AG (Registered) | | | 10,233 | |
| | 691 | | | Deutsche Telekom AG (Registered) | | | 12,124 | |
| | 153 | | | Evonik Industries AG | | | 5,093 | |
| | 165 | | | Fresenius SE & Co. KGaA | | | 13,351 | |
| | 519 | | | Infineon Technologies AG | | | 10,721 | |
| | 32 | | | Linde AG | | | 5,736 | |
| | 73 | | | Muenchener Rueckversicherungs-Gesellschaft AG in Muenchen (Registered) | | | 14,060 | |
| | 297 | | | SAP SE | | | 29,796 | |
| | 247 | | | Siemens AG (Registered) | | | 35,367 | |
| | 1,335 | | | Telefonica Deutschland Holding AG | | | 6,472 | |
| | 97 | | | Uniper SE (a) | | | 1,592 | |
| | 198 | | | Vonovia SE | | | 7,183 | |
| | | | | | | | |
| | | | | | | 249,062 | |
| | | | | | | | |
| | | | Hong Kong — 1.1% | |
| | 2,496 | | | AIA Group Ltd. | | | 17,279 | |
| | 53 | | | ASM Pacific Technology Ltd. | | | 794 | |
| | 85 | | | Bank of East Asia Ltd. (The) | | | 353 | |
| | 572 | | | Cathay Pacific Airways Ltd. | | | 823 | |
| | 176 | | | Cheung Kong Infrastructure Holdings Ltd. | | | 1,541 | |
| | 464 | | | Cheung Kong Property Holdings Ltd. | | | 3,320 | |
| | 650 | | | CK Hutchison Holdings Ltd. | | | 8,114 | |
| | 446 | | | CLP Holdings Ltd. | | | 4,704 | |
| | 409 | | | Galaxy Entertainment Group Ltd. | | | 2,272 | |
| | 153 | | | Hang Lung Properties Ltd. | | | 401 | |
| | 192 | | | Hang Seng Bank Ltd. | | | 3,895 | |
| | 350 | | | Henderson Land Development Co. Ltd. | | | 2,217 | |
| | 322 | | | HKT Trust & HKT Ltd. | | | 412 | |
| | 1,806 | | | Hong Kong & China Gas Co. Ltd. | | | 3,607 | |
| | 229 | | | Hong Kong Exchanges & Clearing Ltd. | | | 5,620 | |
| | 49 | | | Hong kong Land Holdings Ltd. | | | 376 | |
| | 2,431 | | | Hutchison Port Holdings Trust, Class U | | | 984 | |
| | 38 | | | Jardine Matheson Holdings Ltd. | | | 2,465 | |
| | 342 | | | Kerry Properties Ltd. | | | 1,278 | |
| | 908 | | | Li & Fung Ltd. | | | 380 | |
| | 349 | | | Link REIT | | | 2,505 | |
| | 240 | | | MTR Corp. Ltd. | | | 1,381 | |
| | 499 | | | New World Development Co. Ltd. | | | 621 | |
| | | | | | | | |
| SHARES | | | SECURITY DESCRIPTION | | VALUE($) | |
| | | | | | | | |
| | | | Hong Kong — continued | | | | |
| | 311 | | | NWS Holdings Ltd. | | | 584 | |
| | 293 | | | Power Assets Holdings Ltd. | | | 2,631 | |
| | 653 | | | Sands China Ltd. | | | 2,958 | |
| | 1,068 | | | Sino Land Co. Ltd. | | | 1,807 | |
| | 330 | | | Sun Hung Kai Properties Ltd. | | | 4,945 | |
| | 204 | | | Swire Pacific Ltd., Class A | | | 1,962 | |
| | 99 | | | Techtronic Industries Co. Ltd. | | | 423 | |
| | 699 | | | WH Group Ltd. (e) | | | 623 | |
| | 412 | | | Wharf Holdings Ltd. (The) | | | 3,513 | |
| | 388 | | | Wheelock & Co. Ltd. | | | 3,022 | |
| | 223 | | | Yue Yuen Industrial Holdings Ltd. | | | 880 | |
| | | | | | | | |
| | | | | | | 88,690 | |
| | | | | | | | |
| | | | Ireland — 0.2% | |
| | 148 | | | James Hardie Industries plc, CDI | | | 2,505 | |
| | 104 | | | Ryanair Holdings plc, ADR (a) | | | 9,586 | |
| | | | | | | | |
| | | | | | | 12,091 | |
| | | | | | | | |
| | | | Israel — 0.1% | |
| | 155 | | | Teva Pharmaceutical Industries Ltd., ADR | | | 4,887 | |
| | | | | | | | |
| | | | Italy — 0.7% | |
| | 382 | | | Atlantia SpA | | | 9,689 | |
| | 3,226 | | | Enel SpA | | | 15,337 | |
| | 48 | | | Eni SpA | | | 743 | |
| | 1,239 | | | Intesa Sanpaolo SpA | | | 3,616 | |
| | 197 | | | Italgas SpA (a) | | | 890 | |
| | 8,659 | | | Telecom Italia SpA (a) | | | 7,685 | |
| | 834 | | | UniCredit SpA (a) | | | 13,581 | |
| | | | | | | | |
| | | | | | | 51,541 | |
| | | | | | | | |
| | | | Japan — 8.7% | |
| | 208 | | | Air Water, Inc. | | | 4,010 | |
| | 227 | | | Ajinomoto Co., Inc. | | | 4,421 | |
| | 61 | | | Alfresa Holdings Corp. | | | 1,092 | |
| | 245 | | | Amada Holdings Co. Ltd. | | | 2,918 | |
| | 32 | | | Asahi Group Holdings Ltd. | | | 1,220 | |
| | 400 | | | Asahi Kasei Corp. | | | 3,814 | |
| | 243 | | | Astellas Pharma, Inc. | | | 3,204 | |
| | 123 | | | Bandai Namco Holdings, Inc. | | | 3,857 | |
| | 217 | | | Bridgestone Corp. | | | 9,064 | |
| | 128 | | | Canon, Inc. | | | 4,255 | |
| | 131 | | | Casio Computer Co. Ltd. | | | 1,845 | |
| | 13 | | | Central Japan Railway Co. | | | 2,247 | |
| | 141 | | | Chubu Electric Power Co., Inc. | | | 1,896 | |
| | 54 | | | Chugai Pharmaceutical Co. Ltd. | | | 1,912 | |
| | 619 | | | Concordia Financial Group Ltd. | | | 2,849 | |
SEE NOTES TO FINANCIAL STATEMENTS.
| | | | | | | | |
| | | |
| APRIL 30, 2017 | | J.P. MORGAN INTERNATIONAL EQUITY FUNDS | | | | | 49 | |
JPMorgan Global Research Enhanced Index Fund
SCHEDULE OF PORTFOLIO INVESTMENTS
AS OF APRIL 30, 2017 (Unaudited) (continued)
(Amounts in thousands)
| | | | | | | | |
| SHARES | | | SECURITY DESCRIPTION | | VALUE($) | |
| | Common Stocks — continued | |
| | | | Japan — continued | |
| | 67 | | | Dai Nippon Printing Co. Ltd. | | | 746 | |
| | 318 | | | Daicel Corp. | | | 3,647 | |
| | 336 | | | Dai-ichi Life Holdings, Inc. | | | 5,732 | |
| | 272 | | | Daiichi Sankyo Co. Ltd. | | | 6,052 | |
| | 84 | | | Daikin Industries Ltd. | | | 8,157 | |
| | 40 | | | Daito Trust Construction Co. Ltd. | | | 5,886 | |
| | 226 | | | Daiwa House Industry Co. Ltd. | | | 6,719 | |
| | — | (h) | | Daiwa House REIT Investment Corp. | | | 817 | |
| | 104 | | | DeNA Co. Ltd. | | | 2,232 | |
| | 61 | | | Denso Corp. | | | 2,611 | |
| | 52 | | | Dentsu, Inc. | | | 2,918 | |
| | 58 | | | DIC Corp. | | | 2,072 | |
| | 78 | | | East Japan Railway Co. | | | 6,955 | |
| | 3 | | | Eisai Co. Ltd. | | | 142 | |
| | 155 | | | Electric Power Development Co. Ltd. | | | 3,593 | |
| | 32 | | | FANUC Corp. | | | 6,556 | |
| | 8 | | | Fast Retailing Co. Ltd. | | | 2,646 | |
| | 267 | | | Fuji Electric Co. Ltd. | | | 1,463 | |
| | 171 | | | FUJIFILM Holdings Corp. | | | 6,343 | |
| | 427 | | | Fujitsu Ltd. | | | 2,665 | |
| | 72 | | | Hankyu Hanshin Holdings, Inc. | | | 2,382 | |
| | 27 | | | Hisamitsu Pharmaceutical Co., Inc. | | | 1,367 | |
| | 1,575 | | | Hitachi Ltd. | | | 8,701 | |
| | 11 | | | Hokuriku Electric Power Co. | | | 99 | |
| | 452 | | | Honda Motor Co. Ltd. | | | 13,153 | |
| | 104 | | | Hoya Corp. | | | 4,966 | |
| | 318 | | | Hulic Co. Ltd. | | | 2,996 | |
| | 521 | | | Inpex Corp. | | | 4,989 | |
| | 510 | | | ITOCHU Corp. | | | 7,216 | |
| | 207 | | | J Front Retailing Co. Ltd. | | | 2,978 | |
| | 123 | | | Japan Airlines Co. Ltd. | | | 3,875 | |
| | 58 | | | Japan Exchange Group, Inc. | | | 816 | |
| | — | (h) | | Japan Prime Realty Investment Corp. | | | 728 | |
| | — | (h) | | Japan Real Estate Investment Corp. | | | 1,675 | |
| | 1 | | | Japan Retail Fund Investment Corp. | | | 1,303 | |
| | 339 | | | Japan Tobacco, Inc. | | | 11,280 | |
| | 152 | | | JFE Holdings, Inc. | | | 2,596 | |
| | 155 | | | JGC Corp. | | | 2,703 | |
| | 54 | | | JTEKT Corp. | | | 849 | |
| | 1,100 | | | JXTG Holdings, Inc. | | | 4,963 | |
| | 588 | | | Kajima Corp. | | | 3,993 | |
| | 296 | | | Kansai Electric Power Co., Inc. (The) | | | 3,999 | |
| | 62 | | | Kao Corp. | | | 3,394 | |
| | 961 | | | Kawasaki Heavy Industries Ltd. | | | 2,910 | |
| | 307 | | | KDDI Corp. | | | 8,142 | |
| | 67 | | | Keikyu Corp. | | | 769 | |
| | | | | | | | |
| SHARES | | | SECURITY DESCRIPTION | | VALUE($) | |
| | | | | | | | |
| | | | Japan — continued | |
| | 78 | | | Kewpie Corp. | | | 1,980 | |
| | 27 | | | Keyence Corp. | | | 10,734 | |
| | 214 | | | Kintetsu Group Holdings Co. Ltd. | | | 781 | |
| | 310 | | | Kirin Holdings Co. Ltd. | | | 6,029 | |
| | 128 | | | Komatsu Ltd. | | | 3,426 | |
| | 43 | | | Kubota Corp. | | | 674 | |
| | 13 | | | Kyocera Corp. | | | 759 | |
| | 275 | | | Kyowa Hakko Kirin Co. Ltd. | | | 4,725 | |
| | 155 | | | Kyushu Electric Power Co., Inc. | | | 1,669 | |
| | 3 | | | Lawson, Inc. | | | 226 | |
| | 126 | | | M3, Inc. | | | 3,208 | |
| | 45 | | | Mabuchi Motor Co. Ltd. | | | 2,552 | |
| | 296 | | | Marubeni Corp. | | | 1,827 | |
| | 235 | | | Marui Group Co. Ltd. | | | 3,217 | |
| | 334 | | | Mazda Motor Corp. | | | 4,929 | |
| | 809 | | | Mebuki Financial Group, Inc. | | | 3,174 | |
| | 24 | | | Mitsubishi Chemical Holdings Corp. | | | 189 | |
| | 457 | | | Mitsubishi Corp. | | | 9,851 | |
| | 609 | | | Mitsubishi Electric Corp. | | | 8,495 | |
| | 107 | | | Mitsubishi Estate Co. Ltd. | | | 2,049 | |
| | 115 | | | Mitsubishi Tanabe Pharma Corp. | | | 2,332 | |
| | 3,201 | | | Mitsubishi UFJ Financial Group, Inc. | | | 20,283 | |
| | 633 | | | Mitsubishi UFJ Lease & Finance Co. Ltd. | | | 3,307 | |
| | 216 | | | Mitsui & Co. Ltd. | | | 3,053 | |
| | 646 | | | Mitsui Chemicals, Inc. | | | 3,305 | |
| | 81 | | | Mitsui Fudosan Co. Ltd. | | | 1,782 | |
| | 3,513 | | | Mizuho Financial Group, Inc. | | | 6,422 | |
| | 38 | | | MS&AD Insurance Group Holdings, Inc. | | | 1,232 | |
| | 26 | | | Murata Manufacturing Co. Ltd. | | | 3,425 | |
| | 139 | | | NGK Insulators Ltd. | | | 2,972 | |
| | 136 | | | NGK Spark Plug Co. Ltd. | | | 2,945 | |
| | 135 | | | NH Foods Ltd. | | | 3,848 | |
| | 85 | | | Nidec Corp. | | | 7,836 | |
| | 27 | | | Nintendo Co. Ltd. | | | 6,757 | |
| | — | (h) | | Nippon Building Fund, Inc. | | | 1,708 | |
| | — | (h) | | Nippon Prologis REIT, Inc. | | | 543 | |
| | 265 | | | Nippon Steel & Sumitomo Metal Corp. | | | 5,961 | |
| | 219 | | | Nippon Telegraph & Telephone Corp. | | | 9,385 | |
| | 258 | | | Nippon Yusen KK | | | 519 | |
| | 641 | | | Nissan Motor Co. Ltd. | | | 6,103 | |
| | 206 | | | Nisshin Seifun Group, Inc. | | | 3,159 | |
| | 32 | | | Nitori Holdings Co. Ltd. | | | 4,216 | |
| | 45 | | | Nitto Denko Corp. | | | 3,419 | |
| | 633 | | | Nomura Holdings, Inc. | | | 3,802 | |
| | 1 | | | Nomura Real Estate Master Fund, Inc. | | | 1,067 | |
| | 118 | | | NSK Ltd. | | | 1,607 | |
SEE NOTES TO FINANCIAL STATEMENTS.
| | | | | | |
| | | |
| 50 | | | | J.P. MORGAN INTERNATIONAL EQUITY FUNDS | | APRIL 30, 2017 |
| | | | | | | | |
| SHARES | | | SECURITY DESCRIPTION | | VALUE($) | |
| | Common Stocks — continued | |
| | | | Japan — continued | |
| | 359 | | | NTT DOCOMO, Inc. | | | 8,675 | |
| | 65 | | | Obayashi Corp. | | | 627 | |
| | 33 | | | Obic Co. Ltd. | | | 1,756 | |
| | 110 | | | Olympus Corp. | | | 4,230 | |
| | 37 | | | Omron Corp. | | | 1,566 | |
| | 84 | | | Oriental Land Co. Ltd. | | | 4,801 | |
| | 475 | | | ORIX Corp. | | | 7,262 | |
| | 75 | | | Otsuka Corp. | | | 4,007 | |
| | 149 | | | Otsuka Holdings Co. Ltd. | | | 6,840 | |
| | 478 | | | Panasonic Corp. | | | 5,714 | |
| | 194 | | | Rakuten, Inc. | | | 1,989 | |
| | 19 | | | Recruit Holdings Co. Ltd. | | | 955 | |
| | 363 | | | Resona Holdings, Inc. | | | 2,019 | |
| | 65 | | | Rohm Co. Ltd. | | | 4,537 | |
| | 5 | | | Ryohin Keikaku Co. Ltd. | | | 1,218 | |
| | 61 | | | Santen Pharmaceutical Co. Ltd. | | | 851 | |
| | 7 | | | Secom Co. Ltd. | | | 472 | |
| | 147 | | | Seibu Holdings, Inc. | | | 2,565 | |
| | 86 | | | Sekisui House Ltd. | | | 1,422 | |
| | 149 | | | Seven & i Holdings Co. Ltd. | | | 6,272 | |
| | 53 | | | Shimadzu Corp. | | | 906 | |
| | 19 | | | Shimamura Co. Ltd. | | | 2,600 | |
| | 11 | | | Shimano, Inc. | | | 1,638 | |
| | 80 | | | Shimizu Corp. | | | 767 | |
| | 102 | | | Shin-Etsu Chemical Co. Ltd. | | | 8,822 | |
| | 65 | | | Shionogi & Co. Ltd. | | | 3,342 | |
| | 267 | | | Shizuoka Bank Ltd. (The) | | | 2,254 | |
| | 13 | | | SMC Corp. | | | 3,749 | |
| | 222 | | | SoftBank Group Corp. | | | 16,809 | |
| | 64 | | | Sompo Holdings, Inc. | | | 2,422 | |
| | 326 | | | Sony Corp. | | | 11,176 | |
| | 27 | | | Stanley Electric Co. Ltd. | | | 788 | |
| | 86 | | | Subaru Corp. | | | 3,241 | |
| | 214 | | | Sumitomo Chemical Co. Ltd. | | | 1,208 | |
| | 35 | | | Sumitomo Corp. | | | 464 | |
| | 216 | | | Sumitomo Electric Industries Ltd. | | | 3,533 | |
| | 107 | | | Sumitomo Metal Mining Co. Ltd. | | | 1,449 | |
| | 368 | | | Sumitomo Mitsui Financial Group, Inc. | | | 13,679 | |
| | 152 | | | Sumitomo Mitsui Trust Holdings, Inc. | | | 5,214 | |
| | 187 | | | Sumitomo Realty & Development Co. Ltd. | | | 5,052 | |
| | 101 | | | Suntory Beverage & Food Ltd. | | | 4,568 | |
| | 33 | | | Suruga Bank Ltd. | | | 686 | |
| | 70 | | | Suzuken Co. Ltd. | | | 2,300 | |
| | 144 | | | Suzuki Motor Corp. | | | 6,028 | |
| | 59 | | | Sysmex Corp. | | | 3,575 | |
| | | | | | | | |
| SHARES | | | SECURITY DESCRIPTION | | VALUE($) | |
| | | | | | | | |
| | | | Japan — continued | |
| | 45 | | | T&D Holdings, Inc. | | | 675 | |
| | 90 | | | Takeda Pharmaceutical Co. Ltd. | | | 4,337 | |
| | 61 | | | Tohoku Electric Power Co., Inc. | | | 807 | |
| | 208 | | | Tokio Marine Holdings, Inc. | | | 8,778 | |
| | 282 | | | Tokyo Electric Power Co. Holdings, Inc. (a) | | | 1,097 | |
| | 48 | | | Tokyo Electron Ltd. | | | 5,839 | |
| | 259 | | | Tokyo Gas Co. Ltd. | | | 1,202 | |
| | 262 | | | Tokyo Tatemono Co. Ltd. | | | 3,574 | |
| | 641 | | | Tokyu Corp. | | | 4,591 | |
| | 387 | | | Toppan Printing Co. Ltd. | | | 3,896 | |
| | 19 | | | Toyo Suisan Kaisha Ltd. | | | 729 | |
| | 67 | | | Toyota Industries Corp. | | | 3,347 | |
| | 579 | | | Toyota Motor Corp. | | | 31,352 | |
| | 27 | | | Toyota Tsusho Corp. | | | 849 | |
| | 45 | | | Trend Micro, Inc. | | | 1,998 | |
| | 1 | | | United Urban Investment Corp. | | | 813 | |
| | 84 | | | West Japan Railway Co. | | | 5,606 | |
| | 192 | | | Yahoo Japan Corp. | | | 823 | |
| | 630 | | | Yamada Denki Co. Ltd. | | | 3,308 | |
| | 116 | | | Yamato Holdings Co. Ltd. | | | 2,513 | |
| | | | | | | | |
| | | | | | | 671,062 | |
| | | | | | | | |
| | | | Jersey — 0.1% | |
| | 49 | | | Randgold Resources Ltd. | | | 4,307 | |
| | | | | | | | |
| | | | Luxembourg — 0.1% | |
| | 1,102 | | | ArcelorMittal (a) | | | 8,664 | |
| | | | | | | | |
| | | | Netherlands — 1.9% | |
| | 136 | | | ASML Holding NV | | | 18,040 | |
| | 130 | | | Heineken Holding NV | | | 10,921 | |
| | 39 | | | Heineken NV | | | 3,464 | |
| | 1,354 | | | ING Groep NV | | | 22,073 | |
| | 701 | | | Koninklijke Ahold Delhaize NV | | | 14,516 | |
| | 3,643 | | | Koninklijke KPN NV | | | 10,531 | |
| | 97 | | | Koninklijke Philips NV | | | 3,356 | |
| | 342 | | | NN Group NV | | | 11,354 | |
| | 1,343 | | | Royal Dutch Shell plc, Class A | | | 34,872 | |
| | 805 | | | Royal Dutch Shell plc, Class B | | | 21,426 | |
| | | | | | | | |
| | | | | | | 150,553 | |
| | | | | | | | |
| | | | New Zealand — 0.1% | |
| | 291 | | | Auckland International Airport Ltd. | | | 1,380 | |
| | 192 | | | Contact Energy Ltd. | | | 686 | |
| | 262 | | | Fletcher Building Ltd. | | | 1,539 | |
| | 102 | | | Ryman Healthcare Ltd. | | | 605 | |
| | 579 | | | Spark New Zealand Ltd. | | | 1,467 | |
| | | | | | | | |
| | | | | | | 5,677 | |
| | | | | | | | |
SEE NOTES TO FINANCIAL STATEMENTS.
| | | | | | | | |
| | | |
| APRIL 30, 2017 | | J.P. MORGAN INTERNATIONAL EQUITY FUNDS | | | | | 51 | |
JPMorgan Global Research Enhanced Index Fund
SCHEDULE OF PORTFOLIO INVESTMENTS
AS OF APRIL 30, 2017 (Unaudited) (continued)
(Amounts in thousands)
| | | | | | | | |
| SHARES | | | SECURITY DESCRIPTION | | VALUE($) | |
| | Common Stocks — continued | |
| | | | Norway — 0.1% | |
| | 942 | | | Norsk Hydro ASA | | | 5,366 | |
| | | | | | | | |
| | | | Portugal — 0.1% | |
| | 677 | | | Galp Energia SGPS SA | | | 10,524 | |
| | | | | | | | |
| | | | Singapore — 0.4% | |
| | 169 | | | Ascendas REIT | | | 310 | |
| | 335 | | | CapitaLand Ltd. | | | 901 | |
| | 379 | | | CapitaLand Mall Trust | | | 534 | |
| | 390 | | | ComfortDelGro Corp. Ltd. | | | 764 | |
| | 472 | | | DBS Group Holdings Ltd. | | | 6,524 | |
| | 771 | | | Genting Singapore plc | | | 614 | |
| | 866 | | | Global Logistic Properties Ltd. | | | 1,785 | |
| | 17 | | | Jardine Cycle & Carriage Ltd. | | | 565 | |
| | 449 | | | Keppel Corp. Ltd. | | | 2,089 | |
| | 796 | | | Oversea-Chinese Banking Corp. Ltd. | | | 5,576 | |
| | 79 | | | Singapore Exchange Ltd. | | | 421 | |
| | 153 | | | Singapore Press Holdings Ltd. | | | 380 | |
| | 1,756 | | | Singapore Telecommunications Ltd. | | | 4,702 | |
| | 304 | | | United Overseas Bank Ltd. | | | 4,728 | |
| | 618 | | | Wilmar International Ltd. | | | 1,570 | |
| | | | | | | | |
| | | | | | | 31,463 | |
| | | | | | | | |
| | | | Spain — 1.3% | |
| | 762 | | | Banco Bilbao Vizcaya Argentaria SA | | | 6,104 | |
| | 2,517 | | | Banco Santander SA | | | 16,400 | |
| | 9,046 | | | Bankia SA | | | 10,983 | |
| | 1,157 | | | Distribuidora Internacional de Alimentacion SA | | | 6,877 | |
| | 2,486 | | | Iberdrola SA | | | 17,875 | |
| | 487 | | | Industria de Diseno Textil SA | | | 18,651 | |
| | 446 | | | Red Electrica Corp. SA | | | 8,702 | |
| | 444 | | | Repsol SA | | | 7,003 | |
| | 1,020 | | | Telefonica SA | | | 11,286 | |
| | | | | | | | |
| | | | | | | 103,881 | |
| | | | | | | | |
| | | | Sweden — 0.7% | |
| | 63 | | | Assa Abloy AB, Class B | | | 1,371 | |
| | 265 | | | Atlas Copco AB, Class A | | | 9,908 | |
| | 1,431 | | | Nordea Bank AB | | | 17,599 | |
| | 748 | | | Sandvik AB | | | 11,992 | |
| | 978 | | | Skandinaviska Enskilda Banken AB, Class A | | | 11,259 | |
| | | | | | | | |
| | | | | | | 52,129 | |
| | | | | | | | |
| | | | Switzerland — 2.9% | |
| | 186 | | | ABB Ltd. (Registered) | | | 4,556 | |
| | 19 | | | Actelion Ltd. (a) | | | 5,517 | |
| | 125 | | | Adecco Group AG (Registered) | | | 9,251 | |
| | 91 | | | Cie Financiere Richemont SA (Registered) | | | 7,604 | |
| | | | | | | | |
| SHARES | | | SECURITY DESCRIPTION | | VALUE($) | |
| | | | | | | | |
| | | | Switzerland — continued | |
| | 266 | | | Credit Suisse Group AG (Registered) (a) | | | 4,057 | |
| | 657 | | | Glencore plc (a) | | | 2,584 | |
| | 291 | | | LafargeHolcim Ltd. (Registered) (a) | | | 16,501 | |
| | 754 | | | Nestle SA (Registered) | | | 58,074 | |
| | 453 | | | Novartis AG (Registered) | | | 34,850 | |
| | 180 | | | Roche Holding AG | | | 47,023 | |
| | 10 | | | Syngenta AG (a) | | | 4,605 | |
| | 485 | | | UBS Group AG (Registered) (a) | | | 8,275 | |
| | 151 | | | Wolseley plc | | | 9,573 | |
| | 47 | | | Zurich Insurance Group AG | | | 13,064 | |
| | | | | | | | |
| | | | | | | 225,534 | |
| | | | | | | | |
| | | | United Kingdom — 5.6% | |
| | 1,116 | | | 3i Group plc | | | 11,473 | |
| | 82 | | | Anglo American plc (a) | | | 1,177 | |
| | 191 | | | Associated British Foods plc | | | 6,946 | |
| | 191 | | | AstraZeneca plc | | | 11,441 | |
| | 515 | | | BAE Systems plc | | | 4,187 | |
| | 1,804 | | | Barclays plc | | | 4,941 | |
| | 852 | | | Barratt Developments plc | | | 6,391 | |
| | 2,539 | | | BP plc | | | 14,537 | |
| | 589 | | | British American Tobacco plc | | | 39,767 | |
| | 615 | | | BT Group plc | | | 2,425 | |
| | 11 | | | Capita plc | | | 76 | |
| | 3,957 | | | Centrica plc | | | 10,140 | |
| | 586 | | | Compass Group plc | | | 11,830 | |
| | 281 | | | Diageo plc | | | 8,178 | |
| | 1,175 | | | Dixons Carphone plc | | | 5,103 | |
| | 1,292 | | | GlaxoSmithKline plc | | | 26,008 | |
| | 3,121 | | | HSBC Holdings plc | | | 25,736 | |
| | 157 | | | Imperial Brands plc | | | 7,672 | |
| | 228 | | | InterContinental Hotels Group plc | | | 12,094 | |
| | 2,138 | | | ITV plc | | | 5,815 | |
| | 52 | | | Liberty Global plc, Class A (a) | | | 1,855 | |
| | 1 | | | Liberty Global plc, Class C (a) | | | 28 | |
| | 119 | | | Liberty Global plc, Series C (a) | | | 4,110 | |
| | 2,000 | | | Lloyds Banking Group plc | | | 1,797 | |
| | 275 | | | London Stock Exchange Group plc | | | 12,028 | |
| | 450 | | | National Grid plc | | | 5,829 | |
| | 1,115 | | | Prudential plc | | | 24,739 | |
| | 99 | | | Reckitt Benckiser Group plc | | | 9,111 | |
| | 446 | | | RELX plc | | | 9,048 | |
| | 98 | | | Rio Tinto Ltd. | | | 4,459 | |
| | 377 | | | Rio Tinto plc | | | 14,854 | |
| | 1,401 | | | RSA Insurance Group plc | | | 10,807 | |
| | 906 | | | Sage Group plc (The) | | | 7,860 | |
SEE NOTES TO FINANCIAL STATEMENTS.
| | | | | | |
| | | |
| 52 | | | | J.P. MORGAN INTERNATIONAL EQUITY FUNDS | | APRIL 30, 2017 |
| | | | | | | | |
| SHARES | | | SECURITY DESCRIPTION | | VALUE($) | |
| | Common Stocks — continued | |
| | | | United Kingdom — continued | |
| | 1,517 | | | Standard Chartered plc (a) | | | 14,173 | |
| | 4,085 | | | Taylor Wimpey plc | | | 10,582 | |
| | 533 | | | Unilever NV, CVA | | | 27,910 | |
| | 8,726 | | | Vodafone Group plc | | | 22,475 | |
| | 273 | | | Whitbread plc | | | 14,266 | |
| | 797 | | | WPP plc | | | 17,056 | |
| | | | | | | | |
| | | | | | | 428,924 | |
| | | | | | | | |
| | | | United States — 59.6% | |
| | 19 | | | 3M Co. | | | 3,754 | |
| | 524 | | | Abbott Laboratories | | | 22,851 | |
| | 35 | | | AbbVie, Inc. | | | 2,283 | |
| | 319 | | | Accenture plc, Class A | | | 38,659 | |
| | 46 | | | Activision Blizzard, Inc. | | | 2,425 | |
| | 9 | | | Acuity Brands, Inc. | | | 1,507 | |
| | 283 | | | Adobe Systems, Inc. (a) | | | 37,851 | |
| | 175 | | | Aetna, Inc. | | | 23,648 | |
| | 242 | | | Agilent Technologies, Inc. | | | 13,345 | |
| | 108 | | | Alexion Pharmaceuticals, Inc. (a) | | | 13,756 | |
| | 209 | | | Allegion plc | | | 16,404 | |
| | 135 | | | Allergan plc | | | 32,856 | |
| | 69 | | | Alphabet, Inc., Class A (a) | | | 63,726 | |
| | 88 | | | Alphabet, Inc., Class C (a) | | | 80,165 | |
| | 411 | | | Altria Group, Inc. | | | 29,511 | |
| | 101 | | | Amazon.com, Inc. (a) | | | 93,493 | |
| | 261 | | | Ameren Corp. | | | 14,264 | |
| | 46 | | | American Express Co. | | | 3,637 | |
| | 289 | | | American International Group, Inc. | | | 17,596 | |
| | 38 | | | American Water Works Co., Inc. | | | 3,021 | |
| | 71 | | | Ameriprise Financial, Inc. | | | 9,059 | |
| | 37 | | | Amgen, Inc. | | | 6,058 | |
| | 263 | | | Anadarko Petroleum Corp. | | | 14,982 | |
| | 339 | | | Analog Devices, Inc. | | | 25,849 | |
| | 32 | | | Antero Resources Corp. (a) | | | 675 | |
| | 1,222 | | | Apple, Inc. | | | 175,536 | |
| | 38 | | | Aramark | | | 1,393 | |
| | 123 | | | Archer-Daniels-Midland Co. | | | 5,635 | |
| | 20 | | | Arrow Electronics, Inc. (a) | | | 1,405 | |
| | 256 | | | Arthur J Gallagher & Co. | | | 14,275 | |
| | 1,132 | | | AT&T, Inc. | | | 44,872 | |
| | 138 | | | Automatic Data Processing, Inc. | | | 14,445 | |
| | 13 | | | AutoZone, Inc. (a) | | | 9,040 | |
| | 82 | | | AvalonBay Communities, Inc. | | | 15,552 | |
| | 29 | | | Avery Dennison Corp. | | | 2,383 | |
| | 37 | | | Ball Corp. | | | 2,873 | |
| | 3,061 | | | Bank of America Corp. | | | 71,435 | |
| | | | | | | | |
| SHARES | | | SECURITY DESCRIPTION | | VALUE($) | |
| | | | | | | | |
| | | | United States — continued | |
| | 370 | | | Bank of New York Mellon Corp. (The) | | | 17,397 | |
| | 44 | | | Becton Dickinson and Co. | | | 8,307 | |
| | 263 | | | Berkshire Hathaway, Inc., Class B (a) | | | 43,377 | |
| | 60 | | | Best Buy Co., Inc. | | | 3,126 | |
| | 100 | | | Biogen, Inc. (a) | | | 27,149 | |
| | 59 | | | BioMarin Pharmaceutical, Inc. (a) | | | 5,678 | |
| | 49 | | | BlackRock, Inc. | | | 18,709 | |
| | 41 | | | Boston Properties, Inc. | | | 5,146 | |
| | 900 | | | Boston Scientific Corp. (a) | | | 23,750 | |
| | 559 | | | Bristol-Myers Squibb Co. | | | 31,353 | |
| | 66 | | | Brixmor Property Group, Inc. | | | 1,312 | |
| | 171 | | | Broadcom Ltd. | | | 37,777 | |
| | 26 | | | Broadridge Financial Solutions, Inc. | | | 1,825 | |
| | 96 | | | Brown-Forman Corp., Class B | | | 4,565 | |
| | 71 | | | CA, Inc. | | | 2,320 | |
| | 166 | | | Cabot Oil & Gas Corp. | | | 3,860 | |
| | 61 | | | Cadence Design Systems, Inc. (a) | | | 1,993 | |
| | 16 | | | Camden Property Trust | | | 1,339 | |
| | 252 | | | Capital One Financial Corp. | | | 20,240 | |
| | 88 | | | Carnival Corp. | | | 5,428 | |
| | 24 | | | Caterpillar, Inc. | | | 2,435 | |
| | 67 | | | CBRE Group, Inc., Class A (a) | | | 2,390 | |
| | 29 | | | CDK Global, Inc. | | | 1,890 | |
| | 32 | | | CDW Corp. | | | 1,894 | |
| | 56 | | | Celanese Corp., Series A | | | 4,917 | |
| | 293 | | | Celgene Corp. (a) | | | 36,338 | |
| | 37 | | | Centene Corp. (a) | | | 2,759 | |
| | 621 | | | Charles Schwab Corp. (The) | | | 24,132 | |
| | 1 | | | Charter Communications, Inc. (a) | | | 290 | |
| | 98 | | | Charter Communications, Inc., Class A (a) | | | 33,868 | |
| | 342 | | | Chevron Corp. | | | 36,502 | |
| | 187 | | | Chubb Ltd. | | | 25,644 | |
| | 36 | | | Cigna Corp. | | | 5,661 | |
| | 19 | | | Cintas Corp. | | | 2,371 | |
| | 713 | | | Cisco Systems, Inc. | | | 24,291 | |
| | 912 | | | Citigroup, Inc. | | | 53,894 | |
| | 89 | | | Citizens Financial Group, Inc. | | | 3,253 | |
| | 354 | | | CMS Energy Corp. | | | 16,070 | |
| | 510 | | | Coca-Cola Co. (The) | | | 22,007 | |
| | 128 | | | Cognizant Technology Solutions Corp., Class A (a) | | | 7,715 | |
| | 62 | | | Colgate-Palmolive Co. | | | 4,446 | |
| | 1,365 | | | Comcast Corp., Class A | | | 53,479 | |
| | 140 | | | Concho Resources, Inc. (a) | | | 17,731 | |
| | 142 | | | Constellation Brands, Inc., Class A | | | 24,566 | |
| | 10 | | | Cooper Cos., Inc. (The) | | | 2,053 | |
SEE NOTES TO FINANCIAL STATEMENTS.
| | | | | | | | |
| | | |
| APRIL 30, 2017 | | J.P. MORGAN INTERNATIONAL EQUITY FUNDS | | | | | 53 | |
JPMorgan Global Research Enhanced Index Fund
SCHEDULE OF PORTFOLIO INVESTMENTS
AS OF APRIL 30, 2017 (Unaudited) (continued)
(Amounts in thousands)
| | | | | | | | |
| SHARES | | | SECURITY DESCRIPTION | | VALUE($) | |
| | Common Stocks — continued | |
| | | | United States — continued | |
| | 7 | | | Core Laboratories NV | | | 826 | |
| | 206 | | | Corning, Inc. | | | 5,943 | |
| | 162 | | | Costco Wholesale Corp. | | | 28,771 | |
| | 198 | | | Crown Holdings, Inc. (a) | | | 11,121 | |
| | 47 | | | Cummins, Inc. | | | 7,127 | |
| | 94 | | | CVS Health Corp. | | | 7,710 | |
| | 134 | | | Danaher Corp. | | | 11,150 | |
| | 53 | | | Deere & Co. | | | 5,957 | |
| | 141 | | | Delphi Automotive plc | | | 11,361 | |
| | 221 | | | Delta Air Lines, Inc. | | | 10,030 | |
| | 125 | | | Diamondback Energy, Inc. (a) | | | 12,451 | |
| | 21 | | | Dick’s Sporting Goods, Inc. | | | 1,055 | |
| | 279 | | | Discover Financial Services | | | 17,451 | |
| | 238 | | | DISH Network Corp., Class A (a) | | | 15,311 | |
| | 92 | | | Dollar General Corp. | | | 6,673 | |
| | 332 | | | Dow Chemical Co. (The) | | | 20,825 | |
| | 415 | | | DR Horton, Inc. | | | 13,662 | |
| | 66 | | | Dr Pepper Snapple Group, Inc. | | | 6,016 | |
| | 63 | | | DXC Technology Co. (a) | | | 4,768 | |
| | 60 | | | E*TRADE Financial Corp. (a) | | | 2,061 | |
| | 261 | | | Eastman Chemical Co. | | | 20,811 | |
| | 308 | | | Eaton Corp. plc | | | 23,331 | |
| | 11 | | | Edgewell Personal Care Co. (a) | | | 772 | |
| | 243 | | | Edison International | | | 19,448 | |
| | 393 | | | EI du Pont de Nemours & Co. | | | 31,358 | |
| | 399 | | | Eli Lilly & Co. | | | 32,741 | |
| | 319 | | | EOG Resources, Inc. | | | 29,498 | |
| | 145 | | | EQT Corp. | | | 8,452 | |
| | 26 | | | Equinix, Inc. | | | 11,039 | |
| | 81 | | | Equity Residential | | | 5,227 | |
| | 8 | | | Essex Property Trust, Inc. | | | 1,956 | |
| | 18 | | | Everest Re Group Ltd. | | | 4,579 | |
| | 137 | | | Exelon Corp. | | | 4,746 | |
| | 37 | | | Extra Space Storage, Inc. | | | 2,776 | |
| | 756 | | | Exxon Mobil Corp. | | | 61,694 | |
| | 14 | | | F5 Networks, Inc. (a) | | | 1,747 | |
| | 636 | | | Facebook, Inc., Class A (a) | | | 95,539 | |
| | 55 | | | FedEx Corp. | | | 10,343 | |
| | 279 | | | Fidelity National Information Services, Inc. | | | 23,507 | |
| | 60 | | | First Data Corp., Class A (a) | | | 935 | |
| | 24 | | | FLIR Systems, Inc. | | | 869 | |
| | 31 | | | Foot Locker, Inc. | | | 2,382 | |
| | 806 | | | Ford Motor Co. | | | 9,250 | |
| | 65 | | | Fortive Corp. | | | 4,125 | |
| | 116 | | | General Dynamics Corp. | | | 22,551 | |
| | | | | | | | |
| SHARES | | | SECURITY DESCRIPTION | | VALUE($) | |
| | | | | | | | |
| | | | United States — continued | |
| | 2,107 | | | General Electric Co. | | | 61,080 | |
| | 113 | | | General Motors Co. | | | 3,910 | |
| | 347 | | | Gilead Sciences, Inc. | | | 23,772 | |
| | 120 | | | Goldman Sachs Group, Inc. (The) | | | 26,824 | |
| | 44 | | | H&R Block, Inc. | | | 1,085 | |
| | 184 | | | Halliburton Co. | | | 8,421 | |
| | 333 | | | Hartford Financial Services Group, Inc. (The) | | | 16,125 | |
| | 391 | | | HCP, Inc. | | | 12,262 | |
| | 115 | | | HD Supply Holdings, Inc. (a) | | | 4,647 | |
| | 353 | | | Hewlett Packard Enterprise Co. | | | 6,584 | |
| | 38 | | | Hilton Worldwide Holdings, Inc. | | | 2,218 | |
| | 40 | | | Hologic, Inc. (a) | | | 1,807 | |
| | 371 | | | Home Depot, Inc. (The) | | | 57,850 | |
| | 333 | | | Honeywell International, Inc. | | | 43,614 | |
| | 996 | | | HP, Inc. | | | 18,751 | |
| | 96 | | | Humana, Inc. | | | 21,379 | |
| | 9 | | | Huntington Ingalls Industries, Inc. | | | 1,872 | |
| | 18 | | | IDEXX Laboratories, Inc. (a) | | | 2,999 | |
| | 66 | | | Illumina, Inc. (a) | | | 12,156 | |
| | 35 | | | Incyte Corp. (a) | | | 4,331 | |
| | 225 | | | Ingersoll-Rand plc | | | 19,971 | |
| | 14 | | | Ingredion, Inc. | | | 1,731 | |
| | 411 | | | Intel Corp. | | | 14,866 | |
| | 323 | | | Intercontinental Exchange, Inc. | | | 19,431 | |
| | 143 | | | International Business Machines Corp. | | | 22,989 | |
| | 457 | | | Johnson & Johnson | | | 56,400 | |
| | 192 | | | Johnson Controls International plc | | | 7,988 | |
| | 8 | | | Jones Lang LaSalle, Inc. | | | 964 | |
| | 716 | | | KeyCorp | | | 13,064 | |
| | 112 | | | Kimberly-Clark Corp. | | | 14,468 | |
| | 420 | | | Kimco Realty Corp. | | | 8,520 | |
| | 254 | | | Kinder Morgan, Inc. | | | 5,233 | |
| | 253 | | | Kraft Heinz Co. (The) | | | 22,897 | |
| | 71 | | | L3 Technologies, Inc. | | | 12,206 | |
| | 23 | | | Laboratory Corp. of America Holdings (a) | | | 3,229 | |
| | 56 | | | Lam Research Corp. | | | 8,045 | |
| | 16 | | | Lear Corp. | | | 2,287 | |
| | — | (h) | | Lennox International, Inc. | | | 23 | |
| | 24 | | | Liberty Broadband Corp., Class C (a) | | | 2,174 | |
| | 24 | | | Liberty Media Corp.-Liberty SiriusXM, Class A (a) | | | 930 | |
| | 30 | | | Liberty Property Trust | | | 1,202 | |
| | 47 | | | Lincoln National Corp. | | | 3,128 | |
| | 443 | | | Lowe’s Cos., Inc. | | | 37,595 | |
| | 25 | | | Macerich Co. (The) | | | 1,551 | |
| | 207 | | | Macy’s, Inc. | | | 6,056 | |
| | 16 | | | ManpowerGroup, Inc. | | | 1,592 | |
SEE NOTES TO FINANCIAL STATEMENTS.
| | | | | | |
| | | |
| 54 | | | | J.P. MORGAN INTERNATIONAL EQUITY FUNDS | | APRIL 30, 2017 |
| | | | | | | | |
| SHARES | | | SECURITY DESCRIPTION | | VALUE($) | |
| | Common Stocks — continued | |
| | | | United States — continued | |
| | 113 | | | Marathon Petroleum Corp. | | | 5,760 | |
| | 393 | | | Masco Corp. | | | 14,553 | |
| | 1 | | | Mastercard, Inc. | | | 73 | |
| | 73 | | | Mastercard, Inc., Class A | | | 8,547 | |
| | 41 | | | McDonald’s Corp. | | | 5,678 | |
| | 35 | | | McKesson Corp. | | | 4,792 | |
| | 101 | | | Medtronic plc | | | 8,410 | |
| | 553 | | | Merck & Co., Inc. | | | 34,473 | |
| | 452 | | | MetLife, Inc. | | | 23,434 | |
| | 170 | | | Microchip Technology, Inc. | | | 12,851 | |
| | 1,939 | | | Microsoft Corp. | | | 132,755 | |
| | 217 | | | Molson Coors Brewing Co., Class B | | | 20,802 | |
| | 686 | | | Mondelez International, Inc., Class A | | | 30,884 | |
| | 739 | | | Morgan Stanley | | | 32,037 | |
| | 377 | | | Mosaic Co. (The) | | | 10,163 | |
| | 14 | | | Mylan NV (a) | | | 522 | |
| | 30 | | | National Retail Properties, Inc. | | | 1,259 | |
| | 143 | | | Newell Brands, Inc. | | | 6,831 | |
| | 45 | | | Newfield Exploration Co. (a) | | | 1,555 | |
| | 110 | | | Newmont Mining Corp. | | | 3,705 | |
| | 233 | | | NextEra Energy, Inc. | | | 31,139 | |
| | 408 | | | NIKE, Inc., Class B | | | 22,581 | |
| | 77 | | | Norfolk Southern Corp. | | | 9,004 | |
| | 73 | | | Northrop Grumman Corp. | | | 18,002 | |
| | 53 | | | Nuance Communications, Inc. (a) | | | 950 | |
| | 72 | | | NVIDIA Corp. | | | 7,537 | |
| | 321 | | | Occidental Petroleum Corp. | | | 19,733 | |
| | 339 | | | Oracle Corp. | | | 15,235 | |
| | 71 | | | O’Reilly Automotive, Inc. (a) | | | 17,703 | |
| | 191 | | | PACCAR, Inc. | | | 12,778 | |
| | 53 | | | Parsley Energy, Inc., Class A (a) | | | 1,569 | |
| | 69 | | | Paychex, Inc. | | | 4,109 | |
| | 491 | | | PepsiCo, Inc. | | | 55,645 | |
| | 1,752 | | | Pfizer, Inc. | | | 59,418 | |
| | 355 | | | PG&E Corp. | | | 23,784 | |
| | 414 | | | Philip Morris International, Inc. | | | 45,864 | |
| | 150 | | | Phillips 66 | | | 11,926 | |
| | 165 | | | Pinnacle West Capital Corp. | | | 14,067 | |
| | 138 | | | Pioneer Natural Resources Co. | | | 23,845 | |
| | 25 | | | Plains GP Holdings LP, Class A | | | 749 | |
| | 122 | | | PNC Financial Services Group, Inc. (The) | | | 14,563 | |
| | 1 | | | Priceline Group, Inc. (The) (a) | | | 2,733 | |
| | 398 | | | Procter & Gamble Co. (The) | | | 34,769 | |
| | 283 | | | Prologis, Inc. | | | 15,411 | |
| | 91 | | | Prudential Financial, Inc. | | | 9,756 | |
| | 53 | | | Public Storage | | | 11,068 | |
| | 500 | | | PulteGroup, Inc. | | | 11,341 | |
| | 16 | | | PVH Corp. | | | 1,620 | |
| | | | | | | | |
| SHARES | | | SECURITY DESCRIPTION | | VALUE($) | |
| | | | | | | | |
| | | | United States — continued | |
| | 83 | | | QUALCOMM, Inc. (a) | | | 4,440 | |
| | 29 | | | Quest Diagnostics, Inc. | | | 3,023 | |
| | 29 | | | Raymond James Financial, Inc. | | | 2,153 | |
| | 53 | | | Realty Income Corp. | | | 3,107 | |
| | 33 | | | Regency Centers Corp. | | | 2,116 | |
| | 3 | | | Regeneron Pharmaceuticals, Inc. (a) | | | 1,057 | |
| | 574 | | | Regions Financial Corp. | | | 7,891 | |
| | 14 | | | Reinsurance Group of America, Inc. | | | 1,724 | |
| | 27 | | | Robert Half International, Inc. | | | 1,251 | |
| | 7 | | | Rockwell Collins, Inc. | | | 692 | |
| | 146 | | | Ross Stores, Inc. | | | 9,481 | |
| | 150 | | | Royal Caribbean Cruises Ltd. | | | 16,040 | |
| | 33 | | | Sabre Corp. | | | 781 | |
| | – | (h) | | SBA Communications Corp. (a) | | | 49 | |
| | 26 | | | SBA Communications Corp., Class A (a) | | | 3,251 | |
| | 213 | | | Schlumberger Ltd. | | | 15,489 | |
| | 89 | | | Sealed Air Corp. | | | 3,909 | |
| | 33 | | | Sensata Technologies Holding NV (a) | | | 1,365 | |
| | 37 | | | ServiceNow, Inc. (a) | | | 3,513 | |
| | 5 | | | Sherwin-Williams Co. (The) | | | 1,777 | |
| | 330 | | | Shire plc | | | 19,465 | |
| | 55 | | | Simon Property Group, Inc. | | | 9,055 | |
| | 861 | | | Sirius XM Holdings, Inc. | | | 4,263 | |
| | 51 | | | SL Green Realty Corp. | | | 5,376 | |
| | 81 | | | Snap, Inc., Class A (a) | | | 1,836 | |
| | 76 | | | Snap-on, Inc. | | | 12,776 | |
| | 7 | | | Spectrum Brands Holdings, Inc. | | | 1,045 | |
| | 200 | | | Stanley Black & Decker, Inc. | | | 27,180 | |
| | 568 | | | Starbucks Corp. | | | 34,123 | |
| | 172 | | | State Street Corp. | | | 14,415 | |
| | 190 | | | SunTrust Banks, Inc. | | | 10,793 | |
| | 26 | | | SVB Financial Group (a) | | | 4,493 | |
| | 63 | | | Symantec Corp. | | | 1,990 | |
| | 32 | | | Synopsys, Inc. (a) | | | 2,350 | |
| | 51 | | | TD Ameritrade Holding Corp. | | | 1,956 | |
| | 311 | | | TE Connectivity Ltd. | | | 24,066 | |
| | 37 | | | TEGNA, Inc. | | | 950 | |
| | 8 | | | Teleflex, Inc. | | | 1,696 | |
| | 509 | | | Texas Instruments, Inc. | | | 40,322 | |
| | 66 | | | Textron, Inc. | | | 3,085 | |
| | 127 | | | Thermo Fisher Scientific, Inc. | | | 20,936 | |
| | 85 | | | Thomson Reuters Corp. | | | 3,857 | |
| | 164 | | | Time Warner, Inc. | | | 16,242 | |
| | 349 | | | TJX Cos., Inc. (The) | | | 27,452 | |
| | 171 | | | T-Mobile US, Inc. (a) | | | 11,527 | |
| | 65 | | | Toll Brothers, Inc. | | | 2,356 | |
| | 884 | | | Twenty-First Century Fox, Inc., Class A | | | 26,997 | |
| | 90 | | | Twenty-First Century Fox, Inc., Class B | | | 2,694 | |
| | 372 | | | Union Pacific Corp. | | | 41,650 | |
SEE NOTES TO FINANCIAL STATEMENTS.
| | | | | | | | |
| | | |
| APRIL 30, 2017 | | J.P. MORGAN INTERNATIONAL EQUITY FUNDS | | | | | 55 | |
JPMorgan Global Research Enhanced Index Fund
SCHEDULE OF PORTFOLIO INVESTMENTS
AS OF APRIL 30, 2017 (Unaudited) (continued)
(Amounts in thousands, except number of Futures contracts)
| | | | | | | | |
| SHARES | | | SECURITY DESCRIPTION | | VALUE($) | |
| | Common Stocks — continued | |
| | | | United States — continued | |
| | 210 | | | United Continental Holdings, Inc. (a) | | | 14,778 | |
| | 37 | | | United Parcel Service, Inc., Class B | | | 4,016 | |
| | 129 | | | United Technologies Corp. | | | 15,301 | |
| | 10 | | | United Therapeutics Corp. (a) | | | 1,217 | |
| | 340 | | | UnitedHealth Group, Inc. | | | 59,425 | |
| | 49 | | | Unum Group | | | 2,288 | |
| | 52 | | | US Bancorp | | | 2,657 | |
| | 96 | | | Valero Energy Corp. | | | 6,216 | |
| | 174 | | | Vantiv, Inc., Class A (a) | | | 10,788 | |
| | 260 | | | VEREIT, Inc. | | | 2,175 | |
| | 21 | | | VeriSign, Inc. (a) | | | 1,889 | |
| | 564 | | | Verizon Communications, Inc. | | | 25,895 | |
| | 102 | | | Vertex Pharmaceuticals, Inc. (a) | | | 12,106 | |
| | 610 | | | Visa, Inc., Class A | | | 55,619 | |
| | 35 | | | Voya Financial, Inc. | | | 1,293 | |
| | 28 | | | Vulcan Materials Co. | | | 3,365 | |
| | 351 | | | Walgreens Boots Alliance, Inc. | | | 30,399 | |
| | 81 | | | Wal-Mart Stores, Inc. | | | 6,085 | |
| | 447 | | | Walt Disney Co. (The) | | | 51,682 | |
| | 1,328 | | | Wells Fargo & Co. | | | 71,520 | |
| | 199 | | | WestRock Co. | | | 10,660 | |
| | 71 | | | WEX, Inc. (a) | | | 7,185 | |
| | 93 | | | Workday, Inc., Class A (a) | | | 8,140 | |
| | 423 | | | Xcel Energy, Inc. | | | 19,075 | |
| | 187 | | | Xerox Corp. | | | 1,345 | |
| | 40 | | | Zimmer Biomet Holdings, Inc. | | | 4,803 | |
| | | | | | | | |
| | | | | | | 4,599,598 | |
| | | | | | | | |
| | | | Total Common Stocks
(Cost $6,295,356) | | | 7,611,486 | |
| | | | | | | | |
| | Preferred Stocks — 0.5% | |
| | | | Germany — 0.5% | |
| | 139 | | | Henkel AG & Co. KGaA (Preference) | | | 18,855 | |
| | 104 | | | Volkswagen AG (Preference) | | | 16,484 | |
| | | | | | | | |
| | | | Total Preferred Stocks
(Cost $31,296) | | | 35,339 | |
| | | | | | | | |
| | |
NUMBER OF
RIGHTS | | | | | | |
| | Rights — 0.0% (g) | |
| | | | Australia — 0.0% (g) | |
| | 12 | | | TPG Telecom Ltd., expiring 05/12/17 (Strike Price $1.00) (a)
(Cost $—) | | | 6 | |
| | | | | | | | |
| | | | | | | | |
| SHARES | | | SECURITY DESCRIPTION | | VALUE($) | |
| | Short-Term Investment — 0.6% | |
| | | | Investment Company — 0.6% | |
| | 46,476 | | | JPMorgan U.S. Government Money Market Fund, Institutional Class Shares, 0.620% (b) (l)
(Cost $46,476) | | | 46,476 | |
| | | | | | | | |
| | | | Total Investments — 99.7%
(Cost $6,373,128) | | | 7,693,307 | |
| | | | Other Assets in Excess of
Liabilities — 0.3% | | | 22,845 | |
| | | | | | | | |
| | | | NET ASSETS — 100.0% | | $ | 7,716,152 | |
| | | | | | | | |
Percentages indicated are based on net assets.
SEE NOTES TO FINANCIAL STATEMENTS.
| | | | | | |
| | | |
| 56 | | | | J.P. MORGAN INTERNATIONAL EQUITY FUNDS | | APRIL 30, 2017 |
Summary of Investments by Industry, April 30, 2017
The following table represents the portfolio investments of the Fund by industry classifications as a percentage of total investments:
| | | | |
| INDUSTRY | | PERCENTAGE | |
Banks | | | 9.2 | % |
Pharmaceuticals | | | 6.3 | |
Oil, Gas & Consumable Fuels | | | 5.9 | |
Insurance | | | 3.9 | |
Software | | | 3.4 | |
Internet Software & Services | | | 3.2 | |
Media | | | 3.2 | |
Capital Markets | | | 3.0 | |
IT Services | | | 2.9 | |
Technology Hardware, Storage & Peripherals | | | 2.8 | |
Beverages | | | 2.7 | |
Specialty Retail | | | 2.6 | |
Chemicals | | | 2.6 | |
Semiconductors & Semiconductor Equipment | | | 2.5 | |
Electric Utilities | | | 2.3 | |
Biotechnology | | | 2.2 | |
Industrial Conglomerates | | | 2.1 | |
Equity Real Estate Investment Trusts (REITs) | | | 2.0 | |
Machinery | | | 2.0 | |
| | | | |
| INDUSTRY | | PERCENTAGE | |
Diversified Telecommunication Services | | | 1.9 | % |
Food Products | | | 1.9 | |
Health Care Providers & Services | | | 1.9 | |
Tobacco | | | 1.7 | |
Hotels, Restaurants & Leisure | | | 1.7 | |
Food & Staples Retailing | | | 1.6 | |
Automobiles | | | 1.5 | |
Road & Rail | | | 1.4 | |
Aerospace & Defense | | | 1.3 | |
Health Care Equipment & Supplies | | | 1.3 | |
Internet & Direct Marketing Retail | | | 1.3 | |
Metals & Mining | | | 1.2 | |
Household Products | | | 1.1 | |
Textiles, Apparel & Luxury Goods | | | 1.1 | |
Electrical Equipment | | | 1.0 | |
Others (each less than 1.0%) | | | 12.7 | |
Short-Term Investment | | | 0.6 | |
| | | | | | | | | | | | | | | | | | | | |
| Futures Contracts | | | | | | | | | | | | |
NUMBER OF
CONTRACTS | | | DESCRIPTION | | EXPIRATION
DATE | | | TRADING
CURRENCY | | | NOTIONAL
VALUE AT
APRIL 30, 2017 | | | NET
UNREALIZED
APPRECIATION
(DEPRECIATION) | |
| | | | Long Futures Outstanding | | | | | | | | | | | | | | | | |
| | 442 | | | Euro STOXX 50 Index | | | 06/16/17 | | | | EUR | | | $ | 16,892 | | | $ | 646 | |
| | | | | | | | | | | | | | | | | | | | |
SEE NOTES TO FINANCIAL STATEMENTS.
| | | | | | | | |
| | | |
| APRIL 30, 2017 | | J.P. MORGAN INTERNATIONAL EQUITY FUNDS | | | | | 57 | |
JPMorgan Global Unconstrained Equity Fund
SCHEDULE OF PORTFOLIO INVESTMENTS
AS OF APRIL 30, 2017 (Unaudited)
(Amounts in thousands)
| | | | | | | | |
| SHARES | | | SECURITY DESCRIPTION | | VALUE($) | |
| | Common Stocks — 93.4% | |
| | | | Canada — 1.4% | | | | |
| | — | (h) | | Canadian Pacific Railway Ltd. | | | 30 | |
| | | | | | | | |
| | | | China — 8.5% | | | | |
| | — | (h) | | Baidu, Inc., ADR (a) | | | 30 | |
| | 6 | | | China Overseas Land & Investment Ltd. | | | 17 | |
| | 18 | | | China Unicom Hong Kong Ltd. | | | 23 | |
| | — | (h) | | CNOOC Ltd., ADR | | | 37 | |
| | 1 | | | JD.com, Inc., ADR (a) | | | 27 | |
| | 4 | | | Ping An Insurance Group Co. of China Ltd., Class H | | | 23 | |
| | 2 | | | Vipshop Holdings Ltd., ADR (a) | | | 23 | |
| | | | | | | | |
| | | | | | | 180 | |
| | | | | | | | |
| | | | Denmark — 1.7% | |
| | 1 | | | Novo Nordisk A/S, Class B | | | 36 | |
| | | | | | | | |
| | | | France — 7.4% | | | | |
| | — | (h) | | Airbus SE | | | 36 | |
| | 2 | | | AXA SA | | | 48 | |
| | — | (h) | | Sanofi | | | 38 | |
| | — | (h) | | Schneider Electric SE | | | 35 | |
| | | | | | | | |
| | | | | | | 157 | |
| | | | | | | | |
| | | | Hong Kong — 1.5% | |
| | 5 | | | AIA Group Ltd. | | | 32 | |
| | | | | | | | |
| | | | India — 1.0% | |
| | 3 | | | ICICI Bank Ltd., ADR | | | 22 | |
| | | | | | | | |
| | | | Israel — 2.5% | |
| | 2 | | | Teva Pharmaceutical Industries Ltd., ADR | | | 53 | |
| | | | | | | | |
| | | | Italy — 0.8% | |
| | 1 | | | UniCredit SpA (a) | | | 17 | |
| | | | | | | | |
| | | | Japan — 5.4% | | | | |
| | 2 | | | Inpex Corp. | | | 16 | |
| | 1 | | | Japan Airlines Co. Ltd. | | | 31 | |
| | 1 | | | Japan Tobacco, Inc. | | | 27 | |
| | 1 | | | Sumitomo Mitsui Financial Group, Inc. | | | 41 | |
| | | | | | | | |
| | | | | | | 115 | |
| | | | | | | | |
| | | | Luxembourg — 1.4% | | | | |
| | 4 | | | ArcelorMittal (a) | | | 30 | |
| | | | | | | | |
| | | | Netherlands — 1.3% | | | | |
| | — | (h) | | NXP Semiconductors NV (a) | | | 28 | |
| | | | | | | | |
| | | | Switzerland — 3.7% | | | | |
| | 1 | | | LafargeHolcim Ltd. (Registered) (a) | | | 30 | |
| | 1 | | | Novartis AG (Registered) | | | 49 | |
| | | | | | | | |
| | | | | | | 79 | |
| | | | | | | | |
| | | | United Kingdom — 9.7% | | | | |
| | 1 | | | British American Tobacco plc | | | 40 | |
| | 12 | | | BT Group plc | | | 47 | |
| | | | | | | | |
| SHARES | | | SECURITY DESCRIPTION | | VALUE($) | |
| | | | | | | | |
| | | | United Kingdom — continued | | | | |
| | 9 | | | ITV plc | | | 25 | |
| | 1 | | | Liberty Global plc, Class A (a) | | | 31 | |
| | 24 | | | Vodafone Group plc | | | 62 | |
| | | | | | | | |
| | | | | | | 205 | |
| | | | | | | | |
| | | | United States — 47.1% | |
| | — | (h) | | Activision Blizzard, Inc. | | | 23 | |
| | — | (h) | | Aetna, Inc. | | | 25 | |
| | — | (h) | | Affiliated Managers Group, Inc. | | | 23 | |
| | — | (h) | | Alexion Pharmaceuticals, Inc. (a) | | | 34 | |
| | — | (h) | | Allergan plc | | | 44 | |
| | — | (h) | | Alphabet, Inc., Class C (a) | | | 101 | |
| | — | (h) | | Amazon.com, Inc. (a) | | | 55 | |
| | — | (h) | | Broadcom Ltd. | | | 32 | |
| | 1 | | | CBRE Group, Inc., Class A (a) | | | 29 | |
| | 1 | | | Citigroup, Inc. | | | 68 | |
| | 1 | | | DISH Network Corp., Class A (a) | | | 38 | |
| | — | (h) | | Eastman Chemical Co. | | | 33 | |
| | — | (h) | | EQT Corp. | | | 20 | |
| | 1 | | | Globant SA (a) | | | 24 | |
| | — | (h) | | Honeywell International, Inc. | | | 30 | |
| | 2 | | | Kroger Co. (The) | | | 48 | |
| | 1 | | | MetLife, Inc. | | | 31 | |
| | 1 | | | Molson Coors Brewing Co., Class B | | | 64 | |
| | 1 | | | Morgan Stanley | | | 30 | |
| | — | (h) | | Occidental Petroleum Corp. | | | 29 | |
| | — | (h) | | Pioneer Natural Resources Co. | | | 40 | |
| | — | (h) | | Shire plc, ADR | | | 50 | |
| | 1 | | | Snap, Inc., Class A (a) | | | 23 | |
| | 1 | | | Time, Inc. | | | 12 | |
| | 1 | | | TripAdvisor, Inc. (a) | | | 28 | |
| | 1 | | | Twenty-First Century Fox, Inc., Class A | | | 39 | |
| | — | (h) | | Vertex Pharmaceuticals, Inc. (a) | | | 27 | |
| | | | | | | | |
| | | | | | | 1,000 | |
| | | | | | | | |
| | | | Total Common Stocks
(Cost $1,857) | | | 1,984 | |
| | | | | | | | |
| | Short-Term Investment — 1.8% | |
| | | | Investment Company — 1.8% | | | | |
| | 39 | | | JPMorgan U.S. Government Money Market Fund, Institutional Class Shares, 0.620% (b) (l)
(Cost $39) | | | 39 | |
| | | | | | | | |
| | | | Total Investments — 95.2%
(Cost $1,896) | | | 2,023 | |
| | | | Other Assets in Excess of
Liabilities — 4.8% | | | 102 | |
| | | | | | | | |
| | | | NET ASSETS — 100.0% | | $ | 2,125 | |
| | | | | | | | |
Percentages indicated are based on net assets.
SEE NOTES TO FINANCIAL STATEMENTS.
| | | | | | |
| | | |
| 58 | | | | J.P. MORGAN INTERNATIONAL EQUITY FUNDS | | APRIL 30, 2017 |
Summary of Investments by Industry, April 30, 2017
The following table represents the portfolio investments of the Fund by industry classifications as a percentage of total investments:
| | | | |
| INDUSTRY | | PERCENTAGE | |
Pharmaceuticals | | | 10.9 | % |
Banks | | | 7.2 | |
Media | | | 7.2 | |
Oil, Gas & Consumable Fuels | | | 7.0 | |
Insurance | | | 6.6 | |
Internet & Direct Marketing Retail | | | 6.6 | |
Internet Software & Services | | | 6.5 | |
Biotechnology | | | 5.5 | |
Diversified Telecommunication Services | | | 3.5 | |
Software | | | 3.5 | |
Tobacco | | | 3.3 | |
Beverages | | | 3.1 | |
Wireless Telecommunication Services | | | 3.1 | |
Semiconductors & Semiconductor Equipment | | | 2.9 | |
| | | | |
| INDUSTRY | | PERCENTAGE | |
Capital Markets | | | 2.6 | % |
Food & Staples Retailing | | | 2.4 | |
Real Estate Management & Development | | | 2.3 | |
Aerospace & Defense | | | 1.8 | |
Electrical Equipment | | | 1.7 | |
Chemicals | | | 1.6 | |
Airlines | | | 1.6 | |
Construction Materials | | | 1.5 | |
Road & Rail | | | 1.5 | |
Industrial Conglomerates | | | 1.5 | |
Metals & Mining | | | 1.5 | |
Health Care Providers & Services | | | 1.2 | |
Short-Term Investment | | | 1.9 | |
SEE NOTES TO FINANCIAL STATEMENTS.
| | | | | | | | |
| | | |
| APRIL 30, 2017 | | J.P. MORGAN INTERNATIONAL EQUITY FUNDS | | | | | 59 | |
JPMorgan International Discovery Fund
SCHEDULE OF PORTFOLIO INVESTMENTS
AS OF APRIL 30, 2017 (Unaudited)
(Amounts in thousands)
| | | | | | | | |
| SHARES | | | SECURITY DESCRIPTION | | VALUE($) | |
| | Common Stocks — 98.8% | |
| | | | Australia — 8.3% | |
| | 3 | | | ALS Ltd. | | | 15 | |
| | 11 | | | Alumina Ltd. | | | 16 | |
| | 7 | | | Aristocrat Leisure Ltd. | | | 96 | |
| | 42 | | | Ausdrill Ltd. | | | 43 | |
| | 6 | | | BlueScope Steel Ltd. | | | 53 | |
| | 9 | | | Challenger Ltd. | | | 85 | |
| | 2 | | | Domino’s Pizza Enterprises Ltd. | | | 82 | |
| | 10 | | | Fortescue Metals Group Ltd. | | | 38 | |
| | 23 | | | South32 Ltd. | | | 48 | |
| | 10 | | | Treasury Wine Estates Ltd. | | | 87 | |
| | | | | | | | |
| | | | | | | 563 | |
| | | | | | | | |
| | | | Austria — 0.9% | |
| | 1 | | | ams AG | | | 63 | |
| | | | | | | | |
| | | | China — 3.4% | |
| | 7 | | | AAC Technologies Holdings, Inc. | | | 95 | |
| | 153 | | | Lonking Holdings Ltd. | | | 43 | |
| | 40 | | | MMG Ltd. (a) | | | 14 | |
| | 52 | | | Nexteer Automotive Group Ltd. | | | 81 | |
| | | | | | | | |
| | | | | | | 233 | |
| | | | | | | | |
| | | | Denmark — 1.3% | |
| | 1 | | | FLSmidth & Co. A/S | | | 56 | |
| | — | (h) | | Royal Unibrew A/S | | | 17 | |
| | 1 | | | Spar Nord Bank A/S | | | 12 | |
| | | | | | | | |
| | | | | | | 85 | |
| | | | | | | | |
| | | | Finland — 2.1% | |
| | 1 | | | Huhtamaki OYJ | | | 29 | |
| | 2 | | | Metso OYJ | | | 59 | |
| | 1 | | | Nokian Renkaat OYJ | | | 55 | |
| | | | | | | | |
| | | | | | | 143 | |
| | | | | | | | |
| | | | France — 8.4% | |
| | 1 | | | Alten SA | | | 59 | |
| | 1 | | | Ipsen SA | | | 58 | |
| | 1 | | | IPSOS | | | 47 | |
| | 1 | | | Remy Cointreau SA | | | 55 | |
| | 3 | | | Rexel SA | | | 52 | |
| | — | (h) | | SEB SA | | | 63 | |
| | — | (h) | | Sopra Steria Group | | | 57 | |
| | 1 | | | Tarkett SA | | | 54 | |
| | 1 | | | Trigano SA | | | 60 | |
| | 1 | | | Ubisoft Entertainment SA (a) | | | 61 | |
| | | | | | | | |
| | | | | | | 566 | |
| | | | | | | | |
| | | | Georgia — 1.1% | |
| | 2 | | | BGEO Group plc | | | 75 | |
| | | | | | | | |
| | | | | | | | |
| SHARES | | | SECURITY DESCRIPTION | | VALUE($) | |
| | | | | | | | |
| | | | Germany — 4.1% | |
| | 1 | | | Covestro AG (e) | | | 53 | |
| | 1 | | | HUGO BOSS AG | | | 55 | |
| | — | (h) | | MTU Aero Engines AG | | | 60 | |
| | 1 | | | Stabilus SA | | | 56 | |
| | 2 | | | Wacker Neuson SE | | | 51 | |
| | | | | | | | |
| | | | | | | 275 | |
| | | | | | | | |
| | | | Hong Kong — 4.7% | |
| | 43 | | | HKT Trust & HKT Ltd. | | | 55 | |
| | 15 | | | Kerry Properties Ltd. | | | 54 | |
| | 23 | | | New World Development Co. Ltd. | | | 29 | |
| | 50 | | | Nine Dragons Paper Holdings Ltd. | | | 54 | |
| | 482 | | | Noble Group Ltd. (a) | | | 49 | |
| | 20 | | | SJM Holdings Ltd. | | | 19 | |
| | 13 | | | Techtronic Industries Co. Ltd. | | | 54 | |
| | | | | | | | |
| | | | | | | 314 | |
| | | | | | | | |
| | | | Ireland — 0.5% | |
| | — | (h) | | Paddy Power Betfair plc | | | 33 | |
| | | | | | | | |
| | | | Israel — 0.6% | | | | |
| | 7 | | | Plus500 Ltd. | | | 40 | |
| | | | | | | | |
| | | | Italy — 6.7% | |
| | 4 | | | Amplifon SpA | | | 57 | |
| | 1 | | | Brembo SpA | | | 57 | |
| | 2 | | | De’ Longhi SpA | | | 55 | |
| | 8 | | | FinecoBank Banca Fineco SpA | | | 57 | |
| | 1 | | | Industria Macchine Automatiche SpA | | | 54 | |
| | 2 | | | Recordati SpA | | | 58 | |
| | 2 | | | Salvatore Ferragamo SpA | | | 58 | |
| | 1 | | | Tod’s SpA | | | 59 | |
| | | | | | | | |
| | | | | | | 455 | |
| | | | | | | | |
| | | | Japan — 24.6% | |
| | 3 | | | Alpine Electronics, Inc. | | | 49 | |
| | 3 | | | Alps Electric Co. Ltd. | | | 73 | |
| | 4 | | | Chiba Bank Ltd. (The) | | | 27 | |
| | 2 | | | Ebara Corp. | | | 55 | |
| | 2 | | | Electric Power Development Co. Ltd. | | | 44 | |
| | 3 | | | en-japan, Inc. | | | 60 | |
| | 17 | | | Fukuoka Financial Group, Inc. | | | 78 | |
| | 3 | | | Hitachi Metals Ltd. | | | 39 | |
| | 2 | | | Japan Exchange Group, Inc. | | | 21 | |
| | 4 | | | Lifull Co. Ltd. | | | 27 | |
| | 3 | | | LIXIL Group Corp. | | | 67 | |
| | 3 | | | M3, Inc. | | | 69 | |
| | 2 | | | MINEBEA MITSUMI, Inc. | | | 22 | |
SEE NOTES TO FINANCIAL STATEMENTS.
| | | | | | |
| | | |
| 60 | | | | J.P. MORGAN INTERNATIONAL EQUITY FUNDS | | APRIL 30, 2017 |
| | | | | | | | |
| SHARES | | | SECURITY DESCRIPTION | | VALUE($) | |
| | Common Stocks — continued | |
| | | | Japan — continued | |
| | 4 | | | Mitsubishi Chemical Holdings Corp. | | | 32 | |
| | 13 | | | Mitsubishi Motors Corp. | | | 82 | |
| | 9 | | | Mitsubishi UFJ Lease & Finance Co. Ltd. | | | 46 | |
| | 13 | | | Mitsui Chemicals, Inc. | | | 67 | |
| | 1 | | | Nihon M&A Center, Inc. | | | 48 | |
| | 1 | | | Nitori Holdings Co. Ltd. | | | 78 | |
| | 6 | | | NSK Ltd. | | | 75 | |
| | 12 | | | NTN Corp. | | | 61 | |
| | 1 | | | Rohm Co. Ltd. | | | 77 | |
| | 2 | | | Sekisui Chemical Co. Ltd. | | | 32 | |
| | 3 | | | Shizuoka Bank Ltd. (The) | | | 25 | |
| | 5 | | | Sumco Corp. | | | 79 | |
| | 2 | | | Suruga Bank Ltd. | | | 38 | |
| | 5 | | | Tadano Ltd. | | | 61 | |
| | 1 | | | TDK Corp. | | | 56 | |
| | 4 | | | Temp Holdings Co. Ltd. | | | 66 | |
| | 2 | | | Toridoll Holdings Corp. | | | 55 | |
| | 1 | | | Ulvac, Inc. | | | 56 | |
| | | | | | | | |
| | | | | | | 1,665 | |
| | | | | | | | |
| | | | Netherlands — 0.8% | |
| | 1 | | | Aalberts Industries NV | | | 57 | |
| | | | | | | | |
| | | | Norway — 2.1% | |
| | 3 | | | Salmar ASA | | | 60 | |
| | 5 | | | Skandiabanken ASA (a) (e) | | | 47 | |
| | 2 | | | TGS Nopec Geophysical Co. ASA | | | 36 | |
| | | | | | | | |
| | | | | | | 143 | |
| | | | | | | | |
| | | | South Africa — 0.7% | |
| | 2 | | | Mondi plc | | | 45 | |
| | | | | | | | |
| | | | Spain — 0.8% | |
| | 15 | | | Mapfre SA | | | 53 | |
| | | | | | | | |
| | | | Sweden — 3.2% | |
| | 6 | | | Husqvarna AB, Class B | | | 60 | |
| | 4 | | | Sandvik AB | | | 60 | |
| | 2 | | | Thule Group AB (e) | | | 37 | |
| | 2 | | | Trelleborg AB, Class B, | | | 57 | |
| | | | | | | | |
| | | | | | | 214 | |
| | | | | | | | |
| | | | Switzerland — 7.0% | |
| | — | (h) | | Baloise Holding AG (Registered) | | | 54 | |
| | — | (h) | | Bucher Industries AG (Registered) | | | 60 | |
| | — | (h) | | dormakaba Holding AG (a) | | | 54 | |
| | — | (h) | | Forbo Holding AG (Registered) | | | 57 | |
| | 1 | | | Oriflame Holding AG (a) | | | 51 | |
| | — | (h) | | Sika AG | | | 58 | |
| | | | | | | | |
| SHARES | | | SECURITY DESCRIPTION | | VALUE($) | |
| | | | | | | | |
| | | | Switzerland — continued | |
| | — | (h) | | Sulzer AG (Registered) | | | 55 | |
| | 1 | | | Temenos Group AG (Registered) (a) | | | 54 | |
| | — | (h) | | Wolseley plc | | | 29 | |
| | | | | | | | |
| | | | | | | 472 | |
| | | | | | | | |
| | | | United Kingdom — 16.2% | |
| | 5 | | | 3i Group plc | | | 49 | |
| | 7 | | | 888 Holdings plc | | | 25 | |
| | 3 | | | Anglo American plc (a) | | | 41 | |
| | 6 | | | Ashtead Group plc | | | 122 | |
| | 3 | | | Barratt Developments plc | | | 26 | |
| | 6 | | | BBA Aviation plc | | | 24 | |
| | 5 | | | CNH Industrial NV | | | 59 | |
| | — | (h) | | DCC plc | | | 18 | |
| | 14 | | | Electrocomponents plc | | | 95 | |
| | 1 | | | Fevertree Drinks plc | | | 21 | |
| | 6 | | | G4S plc | | | 23 | |
| | 6 | | | GKN plc | | | 27 | |
| | 1 | | | Intermediate Capital Group plc | | | 14 | |
| | 14 | | | ITV plc | | | 37 | |
| | 19 | | | JD Sports Fashion plc | | | 112 | |
| | 4 | | | Just Eat plc (a) | | | 31 | |
| | 25 | | | Melrose Industries plc | | | 77 | |
| | 3 | | | Micro Focus International plc | | | 97 | |
| | 11 | | | OneSavings Bank plc | | | 65 | |
| | 2 | | | RPC Group plc | | | 17 | |
| | 2 | | | Smiths Group plc | | | 34 | |
| | 3 | | | Subsea 7 SA | | | 56 | |
| | 4 | | | Vesuvius plc | | | 25 | |
| | | | | | | | |
| | | | | | | 1,095 | |
| | | | | | | | |
| | | | United States — 1.3% | |
| | 1 | | | Carnival plc | | | 34 | |
| | 2 | | | Yum China Holdings, Inc. (a) | | | 57 | |
| | | | | | | | |
| | | | | | | 91 | |
| | | | | | | | |
| | | | Total Investments — 98.8%
(Cost $5,564) | | | 6,680 | |
| | | | Other Assets in Excess of
Liabilities — 1.2% | | | 82 | |
| | | | | | | | |
| | | | NET ASSETS — 100.0% | | $ | 6,762 | |
| | | | | | | | |
Percentages indicated are based on net assets.
SEE NOTES TO FINANCIAL STATEMENTS.
| | | | | | | | |
| | | |
| APRIL 30, 2017 | | J.P. MORGAN INTERNATIONAL EQUITY FUNDS | | | | | 61 | |
JPMorgan International Discovery Fund
SCHEDULE OF PORTFOLIO INVESTMENTS
AS OF APRIL 30, 2017 (Unaudited) (continued)
Summary of Investments by Industry, April 30, 2017
The following table represents the portfolio investments of the Fund by industry classifications as a percentage of total investments:
| | | | |
| INDUSTRY | | PERCENTAGE | |
Machinery | | | 13.6 | % |
Hotels, Restaurants & Leisure | | | 6.0 | |
Household Durables | | | 5.9 | |
Banks | | | 5.4 | |
Electronic Equipment, Instruments & Components | | | 4.8 | |
Semiconductors & Semiconductor Equipment | | | 4.1 | |
Trading Companies & Distributors | | | 3.8 | |
Metals & Mining | | | 3.7 | |
Auto Components | | | 3.3 | |
Software | | | 3.1 | |
Chemicals | | | 3.1 | |
Specialty Retail | | | 2.8 | |
Professional Services | | | 2.8 | |
Beverages | | | 2.7 | |
Textiles, Apparel & Luxury Goods | | | 2.6 | |
Diversified Financial Services | | | 2.6 | |
Building Products | | | 1.8 | |
| | | | |
| INDUSTRY | | PERCENTAGE | |
IT Services | | | 1.7 | % |
Pharmaceuticals | | | 1.7 | |
Media | | | 1.7 | |
Insurance | | | 1.6 | |
Paper & Forest Products | | | 1.5 | |
Construction & Engineering | | | 1.5 | |
Leisure Products | | | 1.5 | |
Energy Equipment & Services | | | 1.4 | |
Capital Markets | | | 1.3 | |
Real Estate Management & Development | | | 1.2 | |
Automobiles | | | 1.2 | |
Commercial Services & Supplies | | | 1.2 | |
Electrical Equipment | | | 1.2 | |
Health Care Technology | | | 1.0 | |
Thrifts & Mortgage Finance | | | 1.0 | |
Others (each less than 1.0%) | | | 7.2 | |
SEE NOTES TO FINANCIAL STATEMENTS.
| | | | | | |
| | | |
| 62 | | | | J.P. MORGAN INTERNATIONAL EQUITY FUNDS | | APRIL 30, 2017 |
JPMorgan International Equity Fund
SCHEDULE OF PORTFOLIO INVESTMENTS
AS OF APRIL 30, 2017 (Unaudited)
(Amounts in thousands)
| | | | | | | | |
| SHARES | | | SECURITY DESCRIPTION | | VALUE($) | |
| | | | | | | | |
| | Common Stocks — 97.0% | | | | |
| | | | Australia — 1.2% | | | | |
| | 1,574 | | | BHP Billiton Ltd. | | | 28,029 | |
| | 768 | | | BHP Billiton plc | | | 11,716 | |
| | 1,794 | | | South32 Ltd. | | | 3,717 | |
| | | | | | | | |
| | | | | | | 43,462 | |
| | | | | | | | |
| | | | Belgium — 1.6% | | | | |
| | 511 | | | Anheuser-Busch InBev SA/NV | | | 57,669 | |
| | | | | | | | |
| | | | China — 3.1% | | | | |
| | 181 | | | Baidu, Inc., ADR (a) | | | 32,538 | |
| | 5,578 | | | China Overseas Land & Investment Ltd. | | | 16,179 | |
| | 30,300 | | | CNOOC Ltd. | | | 35,348 | |
| | 5,321 | | | Ping An Insurance Group Co. of China Ltd., Class H | | | 29,913 | |
| | | | | | | | |
| | | | | | | 113,978 | |
| | | | | | | | |
| | | | Denmark — 1.0% | | | | |
| | 974 | | | Novo Nordisk A/S, Class B | | | 37,917 | |
| | | | | | | | |
| | | | France — 12.2% | | | | |
| | 855 | | | Accor SA | | | 38,988 | |
| | 1,834 | | | AXA SA | | | 48,919 | |
| | 681 | | | BNP Paribas SA | | | 48,035 | |
| | 243 | | | Essilor International SA | | | 31,448 | |
| | 305 | | | Imerys SA | | | 26,202 | |
| | 66 | | | Kering | | | 20,404 | |
| | 203 | | | LVMH Moet Hennessy Louis Vuitton SE | | | 50,046 | |
| | 273 | | | Pernod Ricard SA | | | 34,105 | |
| | 490 | | | Safran SA | | | 40,588 | |
| | 570 | | | Sanofi | | | 53,829 | |
| | 733 | | | Schneider Electric SE | | | 58,067 | |
| | | | | | | | |
| | | | | | | 450,631 | |
| | | | | | | | |
| | | | Germany — 6.9% | | | | |
| | 327 | | | Allianz SE (Registered) | | | 62,328 | |
| | 405 | | | Bayer AG (Registered) | | | 50,164 | |
| | 249 | | | Continental AG | | | 55,862 | |
| | 165 | | | Fresenius Medical Care AG & Co. KGaA | | | 14,642 | |
| | 700 | | | SAP SE | | | 70,098 | |
| | | | | | | | |
| | | | | | | 253,094 | |
| | | | | | | | |
| | | | Hong Kong — 4.5% | | | | |
| | 6,716 | | | AIA Group Ltd. | | | 46,483 | |
| | 5,301 | | | Cheung Kong Property Holdings Ltd. | | | 37,951 | |
| | 4,030 | | | CK Hutchison Holdings Ltd. | | | 50,318 | |
| | 7,070 | | | Sands China Ltd. | | | 32,021 | |
| | | | | | | | |
| | | | | | | 166,773 | |
| | | | | | | | |
| | | | | | | | |
| SHARES | | | SECURITY DESCRIPTION | | VALUE($) | |
| | | | | | | | |
| | | | India — 1.1% | | | | |
| | 520 | | | HDFC Bank Ltd., ADR | | | 41,364 | |
| | | | | | | | |
| | | | | | | | |
| | | | Indonesia — 0.7% | | | | |
| | 40,823 | | | Astra International Tbk. PT | | | 27,359 | |
| | | | | | | | |
| | | | Israel — 0.6% | | | | |
| | 699 | | | Teva Pharmaceutical Industries Ltd., ADR | | | 22,073 | |
| | | | | | | | |
| | | | Japan — 20.8% | | | | |
| | 2,593 | | | Astellas Pharma, Inc. | | | 34,189 | |
| | 328 | | | Daikin Industries Ltd. | | | 31,880 | |
| | 214 | | | FANUC Corp. | | | 43,590 | |
| | 1,490 | | | Honda Motor Co. Ltd. | | | 43,373 | |
| | 3,680 | | | Inpex Corp. | | | 35,259 | |
| | 1,625 | | | Japan Tobacco, Inc. | | | 54,076 | |
| | 1,311 | | | KDDI Corp. | | | 34,752 | |
| | 93 | | | Keyence Corp. | | | 37,226 | |
| | 1,346 | | | Komatsu Ltd. | | | 35,954 | |
| | 3,232 | | | Kubota Corp. | | | 50,915 | |
| | 1,108 | | | Makita Corp. | | | 39,519 | |
| | 1,362 | | | Mitsui Fudosan Co. Ltd. | | | 29,967 | |
| | 397 | | | Nidec Corp. | | | 36,463 | |
| | 235 | | | Nitto Denko Corp. | | | 17,673 | |
| | 581 | | | Shin-Etsu Chemical Co. Ltd. | | | 50,456 | |
| | 149 | | | SMC Corp. | | | 42,026 | |
| | 1,692 | | | Sumitomo Mitsui Financial Group, Inc. | | | 62,821 | |
| | 315 | | | Tokyo Electron Ltd. | | | 38,239 | |
| | 912 | | | Toyota Motor Corp. | | | 49,374 | |
| | | | | | | | |
| | | | | | | 767,752 | |
| | | | | | | | |
| | | | Macau — 0.8% | | | | |
| | 12,614 | | | Wynn Macau Ltd. | | | 27,651 | |
| | | | | | | | |
| | | | Netherlands — 5.6% | | | | |
| | 463 | | | Akzo Nobel NV | | | 40,490 | |
| | 332 | | | ASML Holding NV | | | 43,844 | |
| | 3,621 | | | ING Groep NV | | | 59,025 | |
| | 2,413 | | | Royal Dutch Shell plc, Class A | | | 62,673 | |
| | | | | | | | |
| | | | | | | 206,032 | |
| | | | | | | | |
| | | | South Africa — 1.1% | | | | |
| | 216 | | | Naspers Ltd., Class N | | | 41,151 | |
| | | | | | | | |
| | | | South Korea — 2.7% | | | | |
| | 95 | | | Hyundai Mobis Co. Ltd. | | | 18,455 | |
| | 83 | | | Samsung Electronics Co. Ltd., GDR | | | 80,965 | |
| | | | | | | | |
| | | | | | | 99,420 | |
| | | | | | | | |
| | | | Spain — 1.2% | | | | |
| | 5,649 | | | Banco Bilbao Vizcaya Argentaria SA | | | 45,257 | |
| | | | | | | | |
SEE NOTES TO FINANCIAL STATEMENTS.
| | | | | | | | |
| | | |
| APRIL 30, 2017 | | J.P. MORGAN INTERNATIONAL EQUITY FUNDS | | | | | 63 | |
JPMorgan International Equity Fund
SCHEDULE OF PORTFOLIO INVESTMENTS
AS OF APRIL 30, 2017 (Unaudited) (continued)
(Amounts in thousands)
| | | | | | | | |
| SHARES | | | SECURITY DESCRIPTION | | VALUE($) | |
| | Common Stocks — continued | | | | |
| | | | Switzerland — 10.6% | | | | |
| | 505 | | | Cie Financiere Richemont SA (Registered) | | | 42,161 | |
| | 9,313 | | | Glencore plc (a) | | | 36,603 | |
| | 835 | | | LafargeHolcim Ltd. (Registered) (a) | | | 47,388 | |
| | 945 | | | Novartis AG (Registered) | | | 72,759 | |
| | 298 | | | Roche Holding AG | | | 78,098 | |
| | 3,814 | | | UBS Group AG (Registered) (a) | | | 65,108 | |
| | 170 | | | Zurich Insurance Group AG | | | 47,053 | |
| | | | | | | | |
| | | | | | | 389,170 | |
| | | | | | | | |
| | | | Taiwan — 1.2% | | | | |
| | 1,335 | | | Taiwan Semiconductor Manufacturing Co. Ltd., ADR | | | 44,155 | |
| | | | | | | | |
| | | | United Kingdom — 19.1% | | | | |
| | 890 | | | British American Tobacco plc | | | 60,120 | |
| | 2,137 | | | Burberry Group plc | | | 44,651 | |
| | 9,626 | | | HSBC Holdings plc | | | 79,325 | |
| | 717 | | | Imperial Brands plc | | | 35,107 | |
| | 32,579 | | | Lloyds Banking Group plc | | | 29,273 | |
| | 4,681 | | | Meggitt plc | | | 28,033 | |
| | 890 | | | Persimmon plc | | | 26,868 | |
| | 3,465 | | | Prudential plc | | | 76,895 | |
| | 1,467 | | | RELX NV | | | 28,341 | |
| | 703 | | | Rio Tinto Ltd. | | | 31,804 | |
| | 543 | | | Rio Tinto plc | | | 21,415 | |
| | 4,743 | | | Standard Chartered plc (a) | | | 44,324 | |
| | 975 | | | TechnipFMC plc (a) | | | 29,320 | |
| | 865 | | | Travis Perkins plc | | | 18,048 | |
| | 949 | | | Unilever plc | | | 48,843 | |
| | 24,977 | | | Vodafone Group plc | | | 64,332 | |
| | 1,839 | | | WPP plc | | | 39,370 | |
| | | | | | | | |
| | | | | | | 706,069 | |
| | | | | | | | |
| | | | United States — 1.0% | | | | |
| | 600 | | | Shire plc | | | 35,393 | |
| | | | | | | | |
| | | | Total Common Stocks
(Cost $$3,044,043) | | | 3,576,370 | |
| | | | | | | | |
| | Preferred Stocks — 1.1% | |
| | | | Germany — 1.1% | | | | |
| | 315 | | | Henkel AG & Co. KGaA (Preference)
(Cost $27,580) | | | 42,841 | |
| | | | | | | | |
| | | | | | | | |
| SHARES | | | SECURITY DESCRIPTION | | VALUE($) | |
| | Short-Term Investment — 2.1% | |
| | | | Investment Company — 2.1% | | | | |
| | 76,383 | | | JPMorgan U.S. Government Money Market Fund, Institutional Class Shares, 0.620% (b) (l)
(Cost $76,383) | | | 76,383 | |
| | | | | | | | |
| | | | Total Investments — 100.2%
(Cost $3,148,006) | | | 3,695,594 | |
| | | | Liabilities in Excess of
Other Assets — (0.2)% | | | (7,184 | ) |
| | | | | | | | |
| | | | NET ASSETS — 100.0% | | $ | 3,688,410 | |
| | | | | | | | |
Percentages indicated are based on net assets.
SEE NOTES TO FINANCIAL STATEMENTS.
| | | | | | |
| | | |
| 64 | | | | J.P. MORGAN INTERNATIONAL EQUITY FUNDS | | APRIL 30, 2017 |
Summary of Investments by Industry, April 30, 2017
The following table represents the portfolio investments of the Fund by industry classifications as a percentage of total investments:
| | | | |
| INDUSTRY | | PERCENTAGE | |
Banks | | | 11.1 | % |
Pharmaceuticals | | | 9.4 | |
Insurance | | | 8.4 | |
Machinery | | | 5.7 | |
Textiles, Apparel & Luxury Goods | | | 4.3 | |
Tobacco | | | 4.0 | |
Metals & Mining | | | 3.6 | |
Oil, Gas & Consumable Fuels | | | 3.6 | |
Semiconductors & Semiconductor Equipment | | | 3.4 | |
Automobiles | | | 3.2 | |
Chemicals | | | 2.9 | |
Wireless Telecommunication Services | | | 2.7 | |
Hotels, Restaurants & Leisure | | | 2.7 | |
Electrical Equipment | | | 2.5 | |
Beverages | | | 2.5 | |
| | | | |
| INDUSTRY | | PERCENTAGE | |
Real Estate Management & Development | | | 2.3 | % |
Technology Hardware, Storage & Peripherals | | | 2.2 | |
Media | | | 2.2 | |
Auto Components | | | 2.0 | |
Construction Materials | | | 2.0 | |
Software | | | 1.9 | |
Aerospace & Defense | | | 1.9 | |
Capital Markets | | | 1.8 | |
Industrial Conglomerates | | | 1.4 | |
Personal Products | | | 1.3 | |
Household Products | | | 1.2 | |
Electronic Equipment, Instruments & Components | | | 1.0 | |
Biotechnology | | | 1.0 | |
Others (each less than 1.0%) | | | 5.7 | |
Short-Term Investment | | | 2.1 | |
| | | | | | | | | | | | | | | | | | | | | | | | |
| Forward Foreign Currency Exchange Contracts | |
CONTRACTS
TO BUY | | CURRENCY | | | COUNTERPARTY | | | SETTLEMENT
DATE | | | SETTLEMENT
VALUE | | | VALUE AT
APRIL 30, 2017 | | | NET UNREALIZED
APPRECIATION
(DEPRECIATION) | |
| 14,635 | | | EUR | | | | BNP Paribas | | | | 05/03/17 | | | $ | 15,947 | | | $ | 15,942 | | | $ | (5 | ) |
SEE NOTES TO FINANCIAL STATEMENTS.
| | | | | | | | |
| | | |
| APRIL 30, 2017 | | J.P. MORGAN INTERNATIONAL EQUITY FUNDS | | | | | 65 | |
JPMorgan International Equity Income Fund
SCHEDULE OF PORTFOLIO INVESTMENTS
AS OF APRIL 30, 2017 (Unaudited)
(Amounts in thousands)
| | | | | | | | |
| SHARES | | | SECURITY DESCRIPTION | | VALUE($) | |
| | | | | | | | |
| | Common Stocks — 97.0% | |
| | | | Belgium — 2.9% | | | | |
| | 46 | | | Anheuser-Busch InBev SA/NV | | | 5,177 | |
| | | | | | | | |
| | | | Brazil — 0.7% | | | | |
| | 149 | | | Vale SA, ADR (a) | | | 1,279 | |
| | | | | | | | |
| | | | Canada — 1.9% | | | | |
| | 29 | | | Toronto-Dominion Bank (The) | | | 1,353 | |
| | 43 | | | TransCanada Corp. | | | 1,976 | |
| | | | | | | | |
| | | | | | | 3,329 | |
| | | | | | | | |
| | | | China — 1.6% | | | | |
| | 2,343 | | | CNOOC Ltd. | | | 2,733 | |
| | | | | | | | |
| | | | Czech Republic — 1.8% | | | | |
| | 962 | | | Moneta Money Bank A/S (e) | | | 3,110 | |
| | | | | | | | |
| | | | Denmark — 2.7% | | | | |
| | 131 | | | Danske Bank A/S | | | 4,749 | |
| | | | | | | | |
| | | | Finland — 3.9% | | | | |
| | 31 | | | Cargotec OYJ, Class B | | | 1,860 | |
| | 231 | | | Nokia OYJ, ADR | | | 1,325 | |
| | 139 | | | UPM-Kymmene OYJ | | | 3,660 | |
| | | | | | | | |
| | | | | | | 6,845 | |
| | | | | | | | |
| | | | France — 7.5% | | | | |
| | 11 | | | Airbus SE | | | 862 | |
| | 30 | | | Cie Generale des Etablissements Michelin | | | 3,889 | |
| | 36 | | | Sanofi | | | 3,400 | |
| | 7 | | | Unibail-Rodamco SE | | | 1,746 | |
| | 38 | | | Vinci SA | | | 3,244 | |
| | | | | | | | |
| | | | | | | 13,141 | |
| | | | | | | | |
| | | | Germany — 12.1% | | | | |
| | 17 | | | Allianz SE (Registered) | | | 3,180 | |
| | 25 | | | BASF SE | | | 2,450 | |
| | 11 | | | Continental AG | | | 2,573 | |
| | 46 | | | Daimler AG (Registered) | | | 3,420 | |
| | 22 | | | Deutsche Boerse AG | | | 2,156 | |
| | 76 | | | Deutsche Wohnen AG | | | 2,607 | |
| | 25 | | | Evonik Industries AG | | | 848 | |
| | 28 | | | Siemens AG (Registered) | | | 3,974 | |
| | | | | | | | |
| | | | | | | 21,208 | |
| | | | | | | | |
| | | | Hong Kong — 1.0% | | | | |
| | 406 | | | Sands China Ltd. | | | 1,841 | |
| | | | | | | | |
| | | | Israel — 0.7% | | | | |
| | 38 | | | Teva Pharmaceutical Industries Ltd., ADR | | | 1,201 | |
| | | | | | | | |
| | | | Japan — 10.7% | | | | |
| | 90 | | | Bridgestone Corp. | | | 3,754 | |
| | 104 | | | Daiwa House Industry Co. Ltd. | | | 3,095 | |
| | | | | | | | |
| SHARES | | | SECURITY DESCRIPTION | | VALUE($) | |
| | | | | | | | |
| | | | | | | | |
| | | | Japan — continued | | | | |
| | 535 | | | Daiwa Securities Group, Inc. | | | 3,255 | |
| | 128 | | | Mitsubishi Corp. | | | 2,771 | |
| | 592 | | | Mitsubishi UFJ Financial Group, Inc., ADR | | | 3,755 | |
| | 52 | | | Nippon Telegraph & Telephone Corp. | | | 2,237 | |
| | | | | | | | |
| | | | | | | 18,867 | |
| | | | | | | | |
| | | | Netherlands — 5.6% | | | | |
| | 192 | | | ING Groep NV | | | 3,128 | |
| | 165 | | | Koninklijke Ahold Delhaize NV | | | 3,417 | |
| | 99 | | | NN Group NV | | | 3,293 | |
| | | | | | | | |
| | | | | | | 9,838 | |
| | | | | | | | |
| | | | New Zealand — 1.3% | | | | |
| | 879 | | | Spark New Zealand Ltd. | | | 2,229 | |
| | | | | | | | |
| | | | Norway — 1.5% | | | | |
| | 172 | | | DNB ASA | | | 2,692 | |
| | | | | | | | |
| | | | Russia — 4.8% | | | | |
| | 63 | | | LUKOIL PJSC, ADR | | | 3,130 | |
| | 164 | | | MMC Norilsk Nickel PJSC, ADR | | | 2,512 | |
| | 210 | | | Severstal PJSC, GDR | | | 2,864 | |
| | | | | | | | |
| | | | | | | 8,506 | |
| | | | | | | | |
| | | | South Korea — 1.9% | | | | |
| | 2 | | | Samsung Electronics Co. Ltd. | | | 3,433 | |
| | | | | | | | |
| | | | Spain — 1.0% | | | | |
| | 152 | | | Telefonica SA | | | 1,681 | |
| | | | | | | | |
| | | | Sweden — 0.9% | | | | |
| | 68 | | | Skandinaviska Enskilda Banken AB, Class A | | | 779 | |
| | 121 | | | Telefonaktiebolaget LM Ericsson, Class B | | | 788 | |
| | | | | | | | |
| | | | | | | 1,567 | |
| | | | | | | | |
| | | | Switzerland — 7.5% | | | | |
| | 27 | | | Galenica Sante Ltd. (a) (e) | | | 1,193 | |
| | 522 | | | Glencore plc (a) | | | 2,052 | |
| | 30 | | | LafargeHolcim Ltd. (Registered) (a) | | | 1,682 | |
| | 23 | | | Novartis AG (Registered) | | | 1,781 | |
| | 34 | | | Swiss Re AG | | | 2,924 | |
| | 56 | | | Wolseley plc | | | 3,533 | |
| | | | | | | | |
| | | | | | | 13,165 | |
| | | | | | | | |
| | | | Taiwan — 0.9% | | | | |
| | 47 | | | Taiwan Semiconductor Manufacturing Co. Ltd., ADR | | | 1,562 | |
| | | | | | | | |
| | | | United Kingdom — 24.1% | | | | |
| | 190 | | | 3i Group plc | | | 1,956 | |
| | 351 | | | BAE Systems plc | | | 2,850 | |
| | 275 | | | Beazley plc | | | 1,566 | |
SEE NOTES TO FINANCIAL STATEMENTS.
| | | | | | |
| | | |
| 66 | | | | J.P. MORGAN INTERNATIONAL EQUITY FUNDS | | APRIL 30, 2017 |
| | | | | | | | |
| SHARES | | | SECURITY DESCRIPTION | | VALUE($) | |
| | | | | | | | |
| | Common Stocks — continued | | | | |
| | | | United Kingdom — continued | | | | |
| | 67 | | | Berkeley Group Holdings plc | | | 2,844 | |
| | 78 | | | British American Tobacco plc | | | 5,262 | |
| | 695 | | | Direct Line Insurance Group plc | | | 3,141 | |
| | 300 | | | GlaxoSmithKline plc | | | 6,033 | |
| | 100 | | | HSBC Holdings plc, ADR | | | 4,102 | |
| | 62 | | | Imperial Brands plc | | | 3,032 | |
| | 32 | | | InterContinental Hotels Group plc | | | 1,683 | |
| | 628 | | | ITV plc | | | 1,708 | |
| | 31 | | | Persimmon plc | | | 927 | |
| | 73 | | | Prudential plc | | | 1,630 | |
| | 219 | | | RSA Insurance Group plc | | | 1,693 | |
| | 187 | | | WPP plc | | | 4,012 | |
| | | | | | | | |
| | | | | | | 42,439 | |
| | | | | | | | |
| | | | Total Common Stocks
(Cost $155,245) | | | 170,592 | |
| | | | | | | | |
| | Short-Term Investment — 1.9% | |
| | | | Investment Company — 1.9% | | | | |
| | 3,386 | | | JPMorgan U.S. Government Money Market Fund, Institutional Class Shares, 0.620% (b) (l)
(Cost $3,386) | | | 3,386 | |
| | | | | | | | |
| | | | Total Investments — 98.9%
(Cost $158,631) | | | 173,978 | |
| | | | Other Assets in Excess of
Liabilities — 1.1% | | | 1,894 | |
| | | | | | | | |
| | | | NET ASSETS — 100.0% | | $ | 175,872 | |
| | | | | | | | |
Percentages indicated are based on net assets.
Summary of Investments by Industry, April 30, 2017
The following table represents the portfolio investments of the Fund by industry classifications as a percentage of total investments:
| | | | |
| INDUSTRY | | PERCENTAGE | |
Banks | | | 13.6 | % |
Insurance | | | 10.0 | |
Pharmaceuticals | | | 7.8 | |
Auto Components | | | 5.9 | |
Metals & Mining | | | 5.0 | |
Tobacco | | | 4.8 | |
Oil, Gas & Consumable Fuels | | | 4.5 | |
Capital Markets | | | 4.2 | |
Trading Companies & Distributors | | | 3.6 | |
Diversified Telecommunication Services | | | 3.5 | |
Media | | | 3.3 | |
Real Estate Management & Development | | | 3.3 | |
Beverages | | | 3.0 | |
Industrial Conglomerates | | | 2.3 | |
Household Durables | | | 2.2 | |
Aerospace & Defense | | | 2.1 | |
Paper & Forest Products | | | 2.1 | |
Hotels, Restaurants & Leisure | | | 2.0 | |
Technology Hardware, Storage & Peripherals | | | 2.0 | |
Automobiles | | | 2.0 | |
Food & Staples Retailing | | | 2.0 | |
Chemicals | | | 1.9 | |
Construction & Engineering | | | 1.9 | |
Communications Equipment | | | 1.2 | |
Machinery | | | 1.1 | |
Equity Real Estate Investment Trusts (REITs) | | | 1.0 | |
Construction Materials | | | 1.0 | |
Others (each less than 1.0%) | | | 0.8 | |
Short-Term Investment | | | 1.9 | |
SEE NOTES TO FINANCIAL STATEMENTS.
| | | | | | | | |
| | | |
| APRIL 30, 2017 | | J.P. MORGAN INTERNATIONAL EQUITY FUNDS | | | | | 67 | |
JPMorgan International Opportunities Fund
SCHEDULE OF PORTFOLIO INVESTMENTS
AS OF APRIL 30, 2017 (Unaudited)
(Amounts in thousands)
| | | | | | | | |
| SHARES | | | SECURITY DESCRIPTION | | VALUE($) | |
| | | | | | | | |
| | Common Stocks — 97.7% | |
| | | | Australia — 3.8% | | | | |
| | 1,372 | | | Australia & New Zealand Banking Group Ltd. | | | 33,592 | |
| | 260 | | | Commonwealth Bank of Australia | | | 17,009 | |
| | 7,729 | | | Goodman Group | | | 46,928 | |
| | 2,832 | | | Oil Search Ltd. | | | 15,280 | |
| | | | | | | | |
| | | | | | | 112,809 | |
| | | | | | | | |
| | | | Belgium — 1.6% | | | | |
| | 416 | | | Anheuser-Busch InBev SA/NV | | | 46,945 | |
| | | | | | | | |
| | | | Chile — 1.1% | | | | |
| | 3,018 | | | Antofagasta plc | | | 32,747 | |
| | | | | | | | |
| | | | China — 2.8% | | | | |
| | 8,276 | | | China Resources Gas Group Ltd. | | | 27,891 | |
| | 12,100 | | | China Resources Land Ltd. | | | 33,529 | |
| | 663 | | | Tencent Holdings Ltd. | | | 20,768 | |
| | | | | | | | |
| | | | | | | 82,188 | |
| | | | | | | | |
| | | | Denmark — 2.4% | | | | |
| | 436 | | | Chr Hansen Holding A/S | | | 29,388 | |
| | 205 | | | Genmab A/S (a) | | | 40,740 | |
| | | | | | | | |
| | | | | | | 70,128 | |
| | | | | | | | |
| | | | Finland — 2.2% | | | | |
| | 1,300 | | | UPM-Kymmene OYJ | | | 34,254 | |
| | 491 | | | Wartsila OYJ Abp | | | 29,835 | |
| | | | | | | | |
| | | | | | | 64,089 | |
| | | | | | | | |
| | | | France — 13.9% | | | | |
| | 535 | | | Airbus SE | | | 43,244 | |
| | 1,353 | | | AXA SA | | | 36,106 | |
| | 709 | | | BNP Paribas SA | | | 50,050 | |
| | 393 | | | Cap Gemini SA | | | 39,319 | |
| | 102 | | | Kering | | | 31,718 | |
| | 1,044 | | | Klepierre | | | 40,982 | |
| | 252 | | | Pernod Ricard SA | | | 31,563 | |
| | 301 | | | Renault SA | | | 28,086 | |
| | 252 | | | Sanofi | | | 23,843 | |
| | 370 | | | Thales SA | | | 38,866 | |
| | 979 | | | TOTAL SA | | | 50,266 | |
| | | | | | | | |
| | | | | | | 414,043 | |
| | | | | | | | |
| | | | Germany — 7.8% | | | | |
| | 197 | | | adidas AG | | | 39,582 | |
| | 140 | | | Continental AG | | | 31,400 | |
| | 271 | | | Deutsche Boerse AG | | | 26,534 | |
| | 406 | | | Fresenius SE & Co. KGaA | | | 32,950 | |
| | 1,962 | | | Infineon Technologies AG | | | 40,555 | |
| | 434 | | | Siemens AG (Registered) | | | 62,267 | |
| | | | | | | | |
| | | | | | | 233,288 | |
| | | | | | | | |
| | | | | | | | |
| SHARES | | | SECURITY DESCRIPTION | | VALUE($) | |
| | | | | | | | |
| | |
| | | | India — 1.5% | | | | |
| | 566 | | | HDFC Bank Ltd., ADR | | | 45,077 | |
| | | | | | | | |
| | | | Italy — 2.4% | | | | |
| | 8,724 | | | Enel SpA | | | 41,475 | |
| | 35,094 | | | Telecom Italia SpA (a) | | | 31,150 | |
| | | | | | | | |
| | | | | | | 72,625 | |
| | | | | | | | |
| | | | Japan — 23.7% | | | | |
| | 384 | | | Daikin Industries Ltd. | | | 37,373 | |
| | 295 | | | Dentsu, Inc. | | | 16,641 | |
| | 1,815 | | | DMG Mori Co. Ltd. | | | 29,971 | |
| | 978 | | | Honda Motor Co. Ltd. | | | 28,457 | |
| | 468 | | | Izumi Co. Ltd. | | | 23,402 | |
| | 1,135 | | | Japan Airlines Co. Ltd. | | | 35,829 | |
| | 2,405 | | | Kajima Corp. | | | 16,330 | |
| | 108 | | | Keyence Corp. | | | 43,578 | |
| | 1,574 | | | Marui Group Co. Ltd. | | | 21,561 | |
| | 1,773 | | | Mitsubishi Corp. | | | 38,255 | |
| | 8,201 | | | Mitsubishi UFJ Financial Group, Inc. | | | 51,963 | |
| | 1,596 | | | Mitsui Fudosan Co. Ltd. | | | 35,116 | |
| | 1,332 | | | Nippon Steel & Sumitomo Metal Corp. | | | 30,000 | |
| | 898 | | | Nippon Telegraph & Telephone Corp. | | | 38,467 | |
| | 428 | | | Oriental Land Co. Ltd. | | | 24,599 | |
| | 2,633 | | | ORIX Corp. | | | 40,235 | |
| | 453 | | | Sompo Holdings, Inc. | | | 17,108 | |
| | 1,102 | | | Sumitomo Mitsui Financial Group, Inc. | | | 40,922 | |
| | 455 | | | Suntory Beverage & Food Ltd. | | | 20,495 | |
| | 1,028 | | | Suzuki Motor Corp. | | | 42,952 | |
| | 961 | | | Tokio Marine Holdings, Inc. | | | 40,502 | |
| | 1,386 | | | Yamato Holdings Co. Ltd. | | | 29,959 | |
| | | | | | | | |
| | | | | | | 703,715 | |
| | | | | | | | |
| | | | Netherlands — 6.9% | | | | |
| | 278 | | | ASML Holding NV | | | 36,744 | |
| | 3,085 | | | ING Groep NV | | | 50,291 | |
| | 1,885 | | | Koninklijke Ahold Delhaize NV | | | 39,050 | |
| | 2,990 | | | Royal Dutch Shell plc, Class A | | | 77,952 | |
| | | | | | | | |
| | | | | | | 204,037 | |
| | | | | | | | |
| | | | Norway — 1.4% | | | | |
| | 7,211 | | | Norsk Hydro ASA | | | 41,096 | |
| | | | | | | | |
| | | | Spain — 1.6% | | | | |
| | 3,774 | | | Distribuidora Internacional de Alimentacion SA | | | 22,439 | |
| | 674 | | | Industria de Diseno Textil SA | | | 25,821 | |
| | | | | | | | |
| | | | | | | 48,260 | |
| | | | | | | | |
SEE NOTES TO FINANCIAL STATEMENTS.
| | | | | | |
| | | |
| 68 | | | | J.P. MORGAN INTERNATIONAL EQUITY FUNDS | | APRIL 30, 2017 |
| | | | | | | | |
| SHARES | | | SECURITY DESCRIPTION | | VALUE($) | |
| | | | | | | | |
| | Common Stocks — continued | | | | |
| | | | Sweden — 1.3% | | | | |
| | 2,753 | | | Svenska Handelsbanken AB, Class A | | | 39,055 | |
| | | | | | | | |
| | | | Switzerland — 5.4% | | | | |
| | 269 | | | Roche Holding AG | | | 70,321 | |
| | 2,541 | | | UBS Group AG (Registered) (a) | | | 43,384 | |
| | 718 | | | Wolseley plc | | | 45,607 | |
| | | | | | | | |
| | | | | | | 159,312 | |
| | | | | | | | |
| | | | United Kingdom — 16.5% | | | | |
| | 789 | | | Associated British Foods plc | | | 28,730 | |
| | 554 | | | AstraZeneca plc | | | 33,156 | |
| | 948 | | | British American Tobacco plc | | | 64,030 | |
| | 7,012 | | | Dixons Carphone plc | | | 30,460 | |
| | 1,727 | | | GlaxoSmithKline plc | | | 34,762 | |
| | 5,276 | | | Kingfisher plc | | | 23,343 | |
| | 2,061 | | | Prudential plc | | | 45,732 | |
| | 1,174 | | | Rio Tinto plc | | | 46,310 | |
| | 4,741 | | | Standard Chartered plc (a) | | | 44,307 | |
| | 8,587 | | | Taylor Wimpey plc | | | 22,242 | |
| | 930 | | | TechnipFMC plc (a) | | | 27,948 | |
| | 906 | | | Unilever NV, CVA | | | 47,460 | |
| | 16,568 | | | Vodafone Group plc | | | 42,674 | |
| | | | | | | | |
| | | | | | | 491,154 | |
| | | | | | | | |
| | | | United States — 1.4% | | | | |
| | 699 | | | Shire plc | | | 41,186 | |
| | | | | | | | |
| | | | Total Common Stocks
(Cost $2,514,603) | | | 2,901,754 | |
| | | | | | | | |
| | Preferred Stock — 1.2% | |
| | | | Germany — 1.2% | | | | |
| | 265 | | | Henkel AG & Co. KGaA (Preference)
(Cost $23,526) | | | 36,068 | |
| | | | | | | | |
| | Short-Term Investment — 1.3% | |
| | | | Investment Company — 1.3% | | | | |
| | 38,835 | | | JPMorgan U.S. Government Money Market Fund, Institutional Class Shares, 0.620% (b) (l)
(Cost $38,835) | | | 38,835 | |
| | | | | | | | |
| | | | Total Investments — 100.2%
(Cost $2,576,964) | | | 2,976,657 | |
| | | | Liabilities in Excess of
Other Assets — (0.2)% | | | (4,906 | ) |
| | | | | | | | |
| | | | NET ASSETS — 100.0% | | $ | 2,971,751 | |
| | | | | | | | |
Percentages indicated are based on net assets.
Summary of Investments by Industry, April 30, 2017
The following table represents the portfolio investments of the Fund by industry classifications as a percentage of total investments:
| | | | |
| INDUSTRY | | PERCENTAGE | |
Banks | | | 12.5 | % |
Pharmaceuticals | | | 5.4 | |
Metals & Mining | | | 5.0 | |
Oil, Gas & Consumable Fuels | | | 4.8 | |
Insurance | | | 4.6 | |
Automobiles | | | 3.3 | |
Beverages | | | 3.3 | |
Equity Real Estate Investment Trusts (REITs) | | | 3.0 | |
Trading Companies & Distributors | | | 2.8 | |
Aerospace & Defense | | | 2.8 | |
Biotechnology | | | 2.7 | |
Specialty Retail | | | 2.7 | |
Semiconductors & Semiconductor Equipment | | | 2.6 | |
Textiles, Apparel & Luxury Goods | | | 2.4 | |
Capital Markets | | | 2.3 | |
Diversified Telecommunication Services | | | 2.3 | |
Real Estate Management & Development | | | 2.3 | |
Tobacco | | | 2.2 | |
Industrial Conglomerates | | | 2.1 | |
Food & Staples Retailing | | | 2.1 | |
Machinery | | | 2.0 | |
Personal Products | | | 1.6 | |
Multiline Retail | | | 1.5 | |
Electronic Equipment, Instruments & Components | | | 1.5 | |
Wireless Telecommunication Services | | | 1.4 | |
Electric Utilities | | | 1.4 | |
Diversified Financial Services | | | 1.4 | |
IT Services | | | 1.3 | |
Building Products | | | 1.3 | |
Household Products | | | 1.2 | |
Airlines | | | 1.2 | |
Paper & Forest Products | | | 1.2 | |
Health Care Providers & Services | | | 1.1 | |
Auto Components | | | 1.1 | |
Air Freight & Logistics | | | 1.0 | |
Chemicals | | | 1.0 | |
Food Products | | | 1.0 | |
Others (each less than 1.0%) | | | 5.3 | |
Short-Term Investment | | | 1.3 | |
SEE NOTES TO FINANCIAL STATEMENTS.
| | | | | | | | |
| | | |
| APRIL 30, 2017 | | J.P. MORGAN INTERNATIONAL EQUITY FUNDS | | | | | 69 | |
JPMorgan International Opportunities Fund
SCHEDULE OF PORTFOLIO INVESTMENTS
AS OF APRIL 30, 2017 (Unaudited) (continued)
(Amounts in thousands)
| | | | | | | | | | | | | | | | | | | | | | | | |
| Forward Foreign Currency Exchange Contracts | |
CONTRACTS
TO BUY | | | CURRENCY | | | COUNTERPARTY | | SETTLEMENT
DATE | | | SETTLEMENT
VALUE | | | VALUE AT
APRIL 30, 2017 | | | NET
UNREALIZED
APPRECIATION
(DEPRECIATION) | |
| 13,310
11,312 |
| |
| EUR
for GBP |
| | BNP Paribas | | | 05/10/17 | | | $ | 14,655 | # | | $ | 14,504 | # | | $ | (151 | ) |
| 1,058,538
7,664 |
| |
| JPY
for GBP |
| | Goldman Sachs International | | | 05/10/17 | | | | 9,928 | # | | | 9,498 | # | | | (430 | ) |
| | 141,926 | | | | AUD | | | Australia & New Zealand Banking Group Ltd. | | | 05/10/17 | | | | 108,010 | | | | 106,259 | | | | (1,751 | ) |
| | 15,086 | | | | CHF | | | HSBC Bank, NA | | | 05/10/17 | | | | 15,148 | | | | 15,169 | | | | 21 | |
| | 21,459 | | | | CHF | | | Standard Chartered Bank | | | 05/10/17 | | | | 21,343 | | | | 21,577 | | | | 234 | |
| | 104,016 | | | | CHF | | | TD Bank Financial Group | | | 05/10/17 | | | | 105,119 | | | | 104,590 | | | | (529 | ) |
| | 37,812 | | | | EUR | | | HSBC Bank, NA | | | 05/10/17 | | | | 40,080 | | | | 41,204 | | | | 1,124 | |
| | 29,473 | | | | EUR | | | State Street Corp. | | | 05/10/17 | | | | 31,467 | | | | 32,117 | | | | 650 | |
| | 44,592 | | | | EUR | | | Union Bank of Switzerland AG | | | 05/10/17 | | | | 47,852 | | | | 48,593 | | | | 741 | |
| | 36,687 | | | | GBP | | | Barclays Bank plc | | | 05/10/17 | | | | 46,161 | | | | 47,528 | | | | 1,367 | |
| | 7,952 | | | | GBP | | | Goldman Sachs International | | | 05/10/17 | | | | 9,899 | | | | 10,302 | | | | 403 | |
| | 24,590 | | | | GBP | | | HSBC Bank, NA | | | 05/10/17 | | | | 30,512 | | | | 31,856 | | | | 1,344 | |
| | 10,844 | | | | GBP | | | National Australia Bank | | | 05/10/17 | | | | 13,585 | | | | 14,048 | | | | 463 | |
| | 160,969 | | | | HKD | | | HSBC Bank, NA | | | 05/10/17 | | | | 20,771 | | | | 20,698 | | | | (73 | ) |
| | 2,659,164 | | | | JPY | | | HSBC Bank, NA | | | 05/10/17 | | | | 23,294 | | | | 23,862 | | | | 568 | |
| | 2,210,477 | | | | JPY | | | Merrill Lynch International | | | 05/10/17 | | | | 19,749 | | | | 19,835 | | | | 86 | |
| | 3,796,863 | | | | JPY | | | National Australia Bank | | | 05/10/17 | | | | 34,101 | | | | 34,070 | | | | (31 | ) |
| | 1,696,022 | | | | JPY | | | Societe Generale | | | 05/10/17 | | | | 14,961 | | | | 15,219 | | | | 258 | |
| | 1,963,262 | | | | JPY | | | State Street Corp. | | | 05/10/17 | | | | 17,713 | | | | 17,617 | | | | (96 | ) |
| | 118,421 | | | | SEK | | | Barclays Bank plc | | | 05/10/17 | | | | 13,102 | | | | 13,375 | | | | 273 | |
| | 59,817 | | | | SEK | | | National Australia Bank | | | 05/10/17 | | | | 6,651 | | | | 6,756 | | | | 105 | |
| | 306,528 | | | | SEK | | | Union Bank of Switzerland AG | | | 05/10/17 | | | | 34,839 | | | | 34,622 | | | | (217 | ) |
| | 48,233 | | | | SGD | | | HSBC Bank, NA | | | 05/11/17 | | | | 34,092 | | | | 34,526 | | | | 434 | |
| | | | | | | | | | | | | | $ | 713,032 | | | $ | 717,825 | | | $ | 4,793 | |
| | |
| | | | | | | | | | | | | | | | | | | | | | |
CONTRACTS
TO SELL | | | CURRENCY | | COUNTERPARTY | | SETTLEMENT
DATE | | | SETTLEMENT
VALUE | | | VALUE AT
APRIL 30, 2017 | | | NET
UNREALIZED
APPRECIATION
(DEPRECIATION) | |
| | 185,329 | | | DKK | | Merrill Lynch International | | | 05/10/17 | | | $ | 26,807 | | | $ | 27,152 | | | $ | (345 | ) |
| | 7,156 | | | EUR | | Australia & New Zealand Banking Group Ltd. | | | 05/10/17 | | | | 7,604 | | | | 7,797 | | | | (193 | ) |
| | 195,316 | | | EUR | | Barclays Bank plc | | | 05/10/17 | | | | 209,803 | | | | 212,840 | | | | (3,037 | ) |
| | 6,788 | | | EUR | | Citibank, NA | | | 05/10/17 | | | | 7,341 | | | | 7,397 | | | | (56 | ) |
| | 29,693 | | | EUR | | Goldman Sachs International | | | 05/10/17 | | | | 31,390 | | | | 32,358 | | | | (968 | ) |
| | 37,740 | | | EUR | | Merrill Lynch International | | | 05/10/17 | | | | 40,289 | | | | 41,126 | | | | (837 | ) |
| | 5,440 | | | EUR | | National Australia Bank | | | 05/10/17 | | | | 5,775 | | | | 5,928 | | | | (153 | ) |
| | 46,665 | | | EUR | | State Street Corp. | | | 05/10/17 | | | | 49,276 | | | | 50,853 | | | | (1,577 | ) |
| | 10,821 | | | EUR | | TD Bank Financial Group | | | 05/10/17 | | | | 11,453 | | | | 11,792 | | | | (339 | ) |
| | 10,617 | | | GBP | | Australia & New Zealand Banking Group Ltd. | | | 05/10/17 | | | | 13,119 | | | | 13,754 | | | | (635 | ) |
| | 5,801 | | | GBP | | BNP Paribas | | | 05/10/17 | | | | 7,252 | | | | 7,515 | | | | (263 | ) |
| | 6,868 | | | GBP | | Goldman Sachs International | | | 05/10/17 | | | | 8,541 | | | | 8,897 | | | | (356 | ) |
| | 42,591 | | | GBP | | HSBC Bank, NA | | | 05/10/17 | | | | 52,982 | | | | 55,176 | | | | (2,194 | ) |
| | 85,561 | | | HKD | | Union Bank of Switzerland AG | | | 05/10/17 | | | | 11,041 | | | | 11,002 | | | | 39 | |
SEE NOTES TO FINANCIAL STATEMENTS.
| | | | | | |
| | | |
| 70 | | | | J.P. MORGAN INTERNATIONAL EQUITY FUNDS | | APRIL 30, 2017 |
| | | | | | | | | | | | | | | | | | | | | | | | |
CONTRACTS
TO SELL | | | CURRENCY | | | COUNTERPARTY | | SETTLEMENT
DATE | | | SETTLEMENT
VALUE | | | VALUE AT
APRIL 30, 2017 | | | NET
UNREALIZED
APPRECIATION
(DEPRECIATION) | |
| | 8,401,047 | | | | JPY | | | Barclays Bank plc | | | 05/10/17 | | | $ | 75,054 | | | $ | 75,385 | | | $ | (331 | ) |
| | 2,878,121 | | | | JPY | | | BNP Paribas | | | 05/10/17 | | | | 25,949 | | | | 25,826 | | | | 123 | |
| | 2,509,034 | | | | JPY | | | Royal Bank of Canada | | | 05/10/17 | | | | 22,420 | | | | 22,515 | | | | (95 | ) |
| | 978,456 | | | | JPY | | | Standard Chartered Bank | | | 05/10/17 | | | | 8,881 | | | | 8,780 | | | | 101 | |
| | 1,786,001 | | | | JPY | | | State Street Corp. | | | 05/10/17 | | | | 15,671 | | | | 16,026 | | | | (355 | ) |
| | 190,241 | | | | NOK | | | TD Bank Financial Group | | | 05/10/17 | | | | 22,941 | | | | 22,160 | | | | 781 | |
| | | | | | | | | | | | | | $ | 653,589 | | | $ | 664,279 | | | $ | (10,690 | ) |
| | |
| # | For cross-currency exchange contracts, the settlement value is the U.S. Dollar market value at April 30, 2017 of the currency being sold, and the value at April 30, 2017 is the U.S. dollar market value of the currency being purchased. |
SEE NOTES TO FINANCIAL STATEMENTS.
| | | | | | | | |
| | | |
| APRIL 30, 2017 | | J.P. MORGAN INTERNATIONAL EQUITY FUNDS | | | | | 71 | |
JPMorgan International Research Enhanced Equity Fund
SCHEDULE OF PORTFOLIO INVESTMENTS
AS OF APRIL 30, 2017 (Unaudited)
(Amounts in U.S. Dollars, unless otherwise noted)
(Amounts in thousands)
| | | | | | | | |
| SHARES | | | SECURITY DESCRIPTION | | VALUE($) | |
| | | | | | | | |
| | Common Stocks — 93.4% | |
| | | | Australia — 6.4% | | | | |
| | 1,039 | | | AMP Ltd. | | | 4,164 | |
| | 761 | | | Australia & New Zealand Banking Group Ltd. | | | 18,622 | |
| | 449 | | | BGP Holdings Beneficial (a) | | | 6 | |
| | 924 | | | BHP Billiton Ltd. | | | 16,453 | |
| | 298 | | | Commonwealth Bank of Australia | | | 19,461 | |
| | 52 | | | CSL Ltd. | | | 5,118 | |
| | 998 | | | Dexus Property Group | | | 7,619 | |
| | 1,794 | | | Goodman Group | | | 10,891 | |
| | 132 | | | Macquarie Group Ltd. | | | 9,194 | |
| | 52 | | | National Australia Bank Ltd. | | | 1,324 | |
| | 394 | | | Wesfarmers Ltd. | | | 12,694 | |
| | 168 | | | Westpac Banking Corp. | | | 4,406 | |
| | | | | | | | |
| | | | | | | 109,952 | |
| | | | | | | | |
| | | | Austria — 0.4% | | | | |
| | 212 | | | Erste Group Bank AG (a) | | | 7,574 | |
| | | | | | | | |
| | | | Belgium — 1.1% | | | | |
| | 171 | | | Anheuser-Busch InBev SA/NV | | | 19,309 | |
| | | | | | | | |
| | | | Denmark — 1.0% | | | | |
| | 77 | | | Chr Hansen Holding A/S | | | 5,207 | |
| | 318 | | | Novo Nordisk A/S, Class B | | | 12,375 | |
| | | | | | | | |
| | | | | | | 17,582 | |
| | | | | | | | |
| | | | Finland — 2.0% | | | | |
| | 117 | | | Cargotec OYJ, Class B | | | 6,964 | |
| | 2,145 | | | Nokia OYJ | | | 12,264 | |
| | 668 | | | Outokumpu OYJ | | | 6,399 | |
| | 135 | | | Wartsila OYJ Abp | | | 8,205 | |
| | | | | | | | |
| | | | | | | 33,832 | |
| | | | | | | | |
| | | | France — 9.7% | | | | |
| | 156 | | | Air Liquide SA | | | 18,774 | |
| | 198 | | | Airbus SE | | | 15,996 | |
| | 619 | | | AXA SA | | | 16,521 | |
| | 215 | | | BNP Paribas SA | | | 15,206 | |
| | 68 | | | Cap Gemini SA | | | 6,834 | |
| | 745 | | | Natixis SA | | | 5,183 | |
| | 80 | | | Pernod Ricard SA | | | 9,962 | |
| | 112 | | | Renault SA | | | 10,484 | |
| | 201 | | | Sanofi | | | 19,011 | |
| | 191 | | | Schneider Electric SE | | | 15,094 | |
| | 69 | | | Sodexo SA | | | 8,706 | |
| | 313 | | | TOTAL SA | | | 16,043 | |
| | 466 | | | Vivendi SA | | | 9,239 | |
| | | | | | | | |
| | | | | | | 167,053 | |
| | | | | | | | |
| | | | | | | | |
| SHARES | | | SECURITY DESCRIPTION | | VALUE($) | |
| | | | | | | | |
| | |
| | | | Germany — 9.5% | | | | |
| | 51 | | | adidas AG | | | 10,215 | |
| | 15 | | | Allianz SE (Registered) | | | 2,915 | |
| | 26 | | | BASF SE | | | 2,542 | |
| | 183 | | | Bayer AG (Registered) | | | 22,653 | |
| | 160 | | | Brenntag AG | | | 9,463 | |
| | 238 | | | Daimler AG (Registered) | | | 17,731 | |
| | 85 | | | Deutsche Bank AG (Registered) (a) | | | 1,531 | |
| | 103 | | | Deutsche Boerse AG | | | 10,056 | |
| | 317 | | | Deutsche Post AG (Registered) | | | 11,408 | |
| | 612 | | | Deutsche Telekom AG (Registered) | | | 10,738 | |
| | 45 | | | HeidelbergCement AG | | | 4,143 | |
| | 431 | | | Infineon Technologies AG | | | 8,904 | |
| | 40 | | | Linde AG | | | 7,187 | |
| | 205 | | | SAP SE | | | 20,561 | |
| | 160 | | | Siemens AG (Registered) | | | 22,890 | |
| | | | | | | | |
| | | | | | | 162,937 | |
| | | | | | | | |
| | | | Hong Kong — 2.5% | | | | |
| | 778 | | | AIA Group Ltd. | | | 5,382 | |
| | 701 | | | Cheung Kong Property Holdings Ltd. | | | 5,020 | |
| | 960 | | | CK Hutchison Holdings Ltd. | | | 11,990 | |
| | 153 | | | Hang Seng Bank Ltd. | | | 3,092 | |
| | 858 | | | Power Assets Holdings Ltd. | | | 7,717 | |
| | 766 | | | Sands China Ltd. | | | 3,468 | |
| | 811 | | | Wharf Holdings Ltd. (The) | | | 6,917 | |
| | | | | | | | |
| | | | | | | 43,586 | |
| | | | | | | | |
| | | | Ireland — 0.4% | | | | |
| | 81 | | | Ryanair Holdings plc, ADR (a) | | | 7,417 | |
| | | | | | | | |
| | | | Israel — 0.6% | | | | |
| | 318 | | | Teva Pharmaceutical Industries Ltd., ADR | | | 10,056 | |
| | | | | | | | |
| | | | Italy — 3.0% | | | | |
| | 486 | | | Assicurazioni Generali SpA | | | 7,703 | |
| | 315 | | | Atlantia SpA | | | 7,981 | |
| | 2,544 | | | Enel SpA | | | 12,096 | |
| | 1,244 | | | Intesa Sanpaolo SpA | | | 3,631 | |
| | 9,768 | | | Telecom Italia SpA (a) | | | 8,670 | |
| | 708 | | | UniCredit SpA (a) | | | 11,524 | |
| | | | | | | | |
| | | | | | | 51,605 | |
| | | | | | | | |
| | | | Japan — 20.6% | | | | |
| | 238 | | | Bridgestone Corp. | | | 9,923 | |
| | 54 | | | Central Japan Railway Co. | | | 9,056 | |
| | 97 | | | Daikin Industries Ltd. | | | 9,391 | |
| | 93 | | | Dentsu, Inc. | | | 5,266 | |
| | 355 | | | DMG Mori Co. Ltd. | | | 5,867 | |
SEE NOTES TO FINANCIAL STATEMENTS.
| | | | | | |
| | | |
| 72 | | | | J.P. MORGAN INTERNATIONAL EQUITY FUNDS | | APRIL 30, 2017 |
| | | | | | | | |
| SHARES | | | SECURITY DESCRIPTION | | VALUE($) | |
| | | | | | | | |
| | Common Stocks — continued | |
| | | | Japan — continued | | | | |
| | 129 | | | East Japan Railway Co. | | | 11,550 | |
| | 112 | | | Electric Power Development Co. Ltd. | | | 2,594 | |
| | 1,205 | | | Fujitsu Ltd. | | | 7,523 | |
| | 1,698 | | | Hitachi Ltd. | | | 9,380 | |
| | 374 | | | Honda Motor Co. Ltd. | | | 10,888 | |
| | 438 | | | J Front Retailing Co. Ltd. | | | 6,311 | |
| | 241 | | | Japan Airlines Co. Ltd. | | | 7,621 | |
| | 73 | | | Japan Tobacco, Inc. | | | 2,412 | |
| | 254 | | | JFE Holdings, Inc. | | | 4,338 | |
| | 1,290 | | | JXTG Holdings, Inc. | | | 5,820 | |
| | 987 | | | Kajima Corp. | | | 6,702 | |
| | 213 | | | KDDI Corp. | | | 5,658 | |
| | 10 | | | Keyence Corp. | | | 3,899 | |
| | 561 | | | Kirin Holdings Co. Ltd. | | | 10,913 | |
| | 378 | | | Kyowa Hakko Kirin Co. Ltd. | | | 6,498 | |
| | 322 | | | Kyushu Electric Power Co., Inc. | | | 3,478 | |
| | 144 | | | Mabuchi Motor Co. Ltd. | | | 8,129 | |
| | 495 | | | Mazda Motor Corp. | | | 7,314 | |
| | 318 | | | Medipal Holdings Corp. | | | 5,267 | |
| | 2,332 | | | Mitsubishi UFJ Financial Group, Inc. | | | 14,775 | |
| | 410 | | | Mitsui Fudosan Co. Ltd. | | | 9,013 | |
| | 188 | | | MS&AD Insurance Group Holdings, Inc. | | | 6,120 | |
| | 413 | | | NGK Spark Plug Co. Ltd. | | | 8,963 | |
| | 85 | | | Nidec Corp. | | | 7,836 | |
| | 203 | | | Nippon Steel & Sumitomo Metal Corp. | | | 4,569 | |
| | 279 | | | Nippon Telegraph & Telephone Corp. | | | 11,944 | |
| | 47 | | | Nishi-Nippon Financial Holdings, Inc. | | | 443 | |
| | — | (h) | | Nitori Holdings Co. Ltd. | | | 11 | |
| | 325 | | | ORIX Corp. | | | 4,964 | |
| | 129 | | | Otsuka Corp. | | | 6,883 | |
| | 110 | | | Otsuka Holdings Co. Ltd. | | | 5,062 | |
| | 293 | | | Seiko Epson Corp. | | | 5,999 | |
| | 313 | | | Seven & i Holdings Co. Ltd. | | | 13,207 | |
| | 88 | | | Shin-Etsu Chemical Co. Ltd. | | | 7,666 | |
| | 323 | | | Sony Corp. | | | 11,069 | |
| | 1,053 | | | Sumitomo Bakelite Co. Ltd. | | | 6,767 | |
| | 347 | | | Sumitomo Mitsui Financial Group, Inc. | | | 12,892 | |
| | 214 | | | Sumitomo Realty & Development Co. Ltd. | | | 5,781 | |
| | 170 | | | Suntory Beverage & Food Ltd. | | | 7,637 | |
| | 423 | | | Takashimaya Co. Ltd. | | | 3,895 | |
| | 990 | | | Tokyo Gas Co. Ltd. | | | 4,596 | |
| | 371 | | | Toyota Motor Corp. | | | 20,068 | |
| | 380 | | | Yamato Holdings Co. Ltd. | | | 8,216 | |
| | | | | | | | |
| | | | | | | 354,174 | |
| | | | | | | | |
| | | | | | | | |
| SHARES | | | SECURITY DESCRIPTION | | VALUE($) | |
| | | | | | | | |
| | | | | | | | |
| | | | Luxembourg — 0.5% | | | | |
| | 1,128 | | | ArcelorMittal (a) | | | 8,867 | |
| | | | | | | | |
| | | | Netherlands — 5.0% | | | | |
| | 68 | | | ASML Holding NV | | | 8,963 | |
| | 127 | | | Heineken NV | | | 11,336 | |
| | 888 | | | ING Groep NV | | | 14,473 | |
| | 354 | | | Koninklijke Philips NV | | | 12,225 | |
| | 187 | | | NN Group NV | | | 6,210 | |
| | 519 | | | Royal Dutch Shell plc, Class A | | | 13,465 | |
| | 704 | | | Royal Dutch Shell plc, Class B | | | 18,720 | |
| | | | | | | | |
| | | | | | | 85,392 | |
| | | | | | | | |
| | | | New Zealand — 0.3% | | | | |
| | 2,237 | | | Spark New Zealand Ltd. | | | 5,669 | |
| | | | | | | | |
| | | | Norway — 0.4% | | | | |
| | 1,088 | | | Norsk Hydro ASA | | | 6,199 | |
| | | | | | | | |
| | | | Portugal — 0.3% | | | | |
| | 330 | | | Galp Energia SGPS SA | | | 5,127 | |
| | | | | | | | |
| | | | Singapore — 0.9% | | | | |
| | 942 | | | DBS Group Holdings Ltd. | | | 13,003 | |
| | 371 | | | Singapore Exchange Ltd. | | | 1,966 | |
| | | | | | | | |
| | | | | | | 14,969 | |
| | | | | | | | |
| | | | Spain — 2.3% | | | | |
| | 1,361 | | | Banco Santander SA | | | 8,873 | |
| | 7,584 | | | Bankia SA | | | 9,208 | |
| | 1,364 | | | Iberdrola SA | | | 9,804 | |
| | 302 | | | Repsol SA | | | 4,768 | |
| | 654 | | | Telefonica SA | | | 7,233 | |
| | | | | | | | |
| | | | | | | 39,886 | |
| | | | | | | | |
| | | | Sweden — 0.8% | | | | |
| | 1,086 | | | Nordea Bank AB | | | 13,358 | |
| | | | | | | | |
| | | | Switzerland — 9.4% | | | | |
| | 172 | | | Cie Financiere Richemont SA (Registered) | | | 14,382 | |
| | 166 | | | Credit Suisse Group AG (Registered) (a) | | | 2,532 | |
| | 164 | | | LafargeHolcim Ltd. (Registered) (a) | | | 9,318 | |
| | 36 | | | LafargeHolcim Ltd. (Registered) (a) | | | 2,041 | |
| | 550 | | | Nestle SA (Registered) | | | 42,338 | |
| | 213 | | | Novartis AG (Registered) | | | 16,405 | |
| | 121 | | | Roche Holding AG | | | 31,593 | |
| | 13 | | | Syngenta AG (a) | | | 5,826 | |
| | 754 | | | UBS Group AG (Registered) (a) | | | 12,875 | |
| | 203 | | | Wolseley plc | | | 12,899 | |
| | 38 | | | Zurich Insurance Group AG | | | 10,386 | |
| | | | | | | | |
| | | | | | | 160,595 | |
| | | | | | | | |
SEE NOTES TO FINANCIAL STATEMENTS.
| | | | | | | | |
| | | |
| APRIL 30, 2017 | | J.P. MORGAN INTERNATIONAL EQUITY FUNDS | | | | | 73 | |
JPMorgan International Research Enhanced Equity Fund
SCHEDULE OF PORTFOLIO INVESTMENTS
AS OF APRIL 30, 2017 (Unaudited) (continued)
(Amounts in U.S. Dollars, unless otherwise noted)
(Amounts in thousands, except number of Futures contracts)
| | | | | | | | |
| SHARES | | | SECURITY DESCRIPTION | | VALUE($) | |
| | | | | | | | |
| | Common Stocks — continued | |
| | | | United Kingdom — 15.2% | | | | |
| | 692 | | | 3i Group plc | | | 7,112 | |
| | 185 | | | Associated British Foods plc | | | 6,746 | |
| | 206 | | | AstraZeneca plc | | | 12,309 | |
| | 1,421 | | | Aviva plc | | | 9,665 | |
| | 791 | | | Barratt Developments plc | | | 5,939 | |
| | 2,108 | | | BP plc | | | 12,069 | |
| | 400 | | | British American Tobacco plc | | | 27,006 | |
| | 3,632 | | | Centrica plc | | | 9,308 | |
| | 1,574 | | | Debenhams plc | | | 1,044 | |
| | 1,288 | | | Dixons Carphone plc | | | 5,596 | |
| | 756 | | | GlaxoSmithKline plc | | | 15,211 | |
| | 2,475 | | | HSBC Holdings plc | | | 20,412 | |
| | 249 | | | HSBC Holdings plc | | | 2,050 | |
| | 224 | | | InterContinental Hotels Group plc | | | 11,880 | |
| | 2,738 | | | ITV plc | | | 7,446 | |
| | 11,115 | | | Lloyds Banking Group plc | | | 9,987 | |
| | 623 | | | Prudential plc | | | 13,819 | |
| | 99 | | | Reckitt Benckiser Group plc | | | 9,136 | |
| | 143 | | | Rio Tinto Ltd. | | | 6,489 | |
| | 76 | | | Rio Tinto plc | | | 2,979 | |
| | 1,298 | | | Standard Chartered plc (a) | | | 12,131 | |
| | 2,396 | | | Taylor Wimpey plc | | | 6,205 | |
| | 180 | | | TechnipFMC plc (a) | | | 5,422 | |
| | 174 | | | Unilever NV, CVA | | | 9,094 | |
| | 6,783 | | | Vodafone Group plc | | | 17,471 | |
| | 81 | | | Whitbread plc | | | 4,226 | |
| | 435 | | | WPP plc | | | 9,320 | |
| | | | | | | | |
| | | | | | | 260,072 | |
| | | | | | | | |
| | | | United States — 1.1% | | | | |
| | 304 | | | Shire plc | | | 17,928 | |
| | | | | | | | |
| | | | Total Common Stocks
(Cost $1,438,943) | | | 1,603,139 | |
| | | | | | | | |
| | |
PRINCIPAL
AMOUNT($) | | | | | | |
| | Corporate Bond — 0.0% (g) | |
| | | | Materials — 0.0% (g) | | | | |
| | | | Metals & Mining — 0.0% (g) | | | | |
| | BRL 11 | | | Vale SA, Series A6, VAR, 0.000% (x) (y)
(Cost $—) | | | — | (h) |
| | | | | | | | |
| | |
| SHARES | | | | | | |
| | Preferred Stocks — 1.0% | |
| | | | Germany — 1.0% | | | | |
| | 98 | | | Henkel AG & Co. KGaA (Preference) | | | 13,270 | |
| | 24 | | | Volkswagen AG (Preference) | | | 3,828 | |
| | | | | | | | |
| | | | Total Preferred Stocks
(Cost $12,862) | | | 17,098 | |
| | | | | | | | |
| | | | | | | | |
| SHARES | | | SECURITY DESCRIPTION | | VALUE($) | |
| | | | | | | | |
| | Short-Term Investment — 2.1% | |
| | | | Investment Company — 2.1% | | | | |
| | 36,122 | | | JPMorgan U.S. Government Money Market Fund, Institutional Class Shares, 0.620% (b) (l)
(Cost $36,122) | | | 36,122 | |
| | | | | | | | |
| | | | Total Investments — 96.5%
(Cost $1,487,927) | | | 1,656,359 | |
| | | | Other Assets in Excess of
Liabilities — 3.5% | | | 59,585 | |
| | | | | | | | |
| | | | NET ASSETS — 100.0% | | $ | 1,715,944 | |
| | | | | | | | |
Percentages indicated are based on net assets.
SEE NOTES TO FINANCIAL STATEMENTS.
| | | | | | |
| | | |
| 74 | | | | J.P. MORGAN INTERNATIONAL EQUITY FUNDS | | APRIL 30, 2017 |
Summary of Investments by Industry, April 30, 2017
The following table represents the portfolio investments of the Fund by industry classifications as a percentage of total investments:
| | | | |
| INDUSTRY | | PERCENTAGE | |
Banks | | | 13.4 | % |
Pharmaceuticals | | | 9.1 | |
Insurance | | | 4.7 | |
Oil, Gas & Consumable Fuels | | | 4.6 | |
Automobiles | | | 4.2 | |
Beverages | | | 3.6 | |
Metals & Mining | | | 3.4 | |
Chemicals | | | 3.3 | |
Diversified Telecommunication Services | | | 3.2 | |
Food Products | | | 3.0 | |
Industrial Conglomerates | | | 2.8 | |
Capital Markets | | | 2.7 | |
Electric Utilities | | | 2.0 | |
Electrical Equipment | | | 1.9 | |
Tobacco | | | 1.8 | |
Hotels, Restaurants & Leisure | | | 1.7 | |
Real Estate Management & Development | | | 1.6 | |
Food & Staples Retailing | | | 1.6 | |
| | | | |
| INDUSTRY | | PERCENTAGE | |
Textiles, Apparel & Luxury Goods | | | 1.5 | % |
Household Durables | | | 1.4 | |
Wireless Telecommunication Services | | | 1.4 | |
Biotechnology | | | 1.4 | |
Household Products | | | 1.4 | |
Trading Companies & Distributors | | | 1.3 | |
Media | | | 1.3 | |
IT Services | | | 1.3 | |
Machinery | | | 1.3 | |
Road & Rail | | | 1.2 | |
Software | | | 1.2 | |
Air Freight & Logistics | | | 1.2 | |
Auto Components | | | 1.1 | |
Equity Real Estate Investment Trusts (REITs) | | | 1.1 | |
Semiconductors & Semiconductor Equipment | | | 1.1 | |
Aerospace & Defense | | | 1.0 | |
Others (each less than 1.0%) | | | 9.0 | |
Short-Term Investment | | | 2.2 | |
| | | | | | | | | | | | | | | | | | | | |
| Futures Contracts | | | | | | | | | | |
NUMBER OF
CONTRACTS | | | DESCRIPTION | | EXPIRATION
DATE | | | TRADING
CURRENCY | | | NOTIONAL
VALUE AT
APRIL 30, 2017 | | | NET
UNREALIZED
APPRECIATION
(DEPRECIATION) | |
| | | | Long Futures Outstanding | | | | | | | | | | | | | | | | |
| | 41 | | | TOPIX Index | | | 06/08/17 | | | | JPY | | | $ | 5,636 | | | $ | 157 | |
| | 195 | | | Euro STOXX 50 Index | | | 06/16/17 | | | | USD | | | | 7,452 | | | | 396 | |
| | 72 | | | FTSE 100 Index | | | 06/16/17 | | | | USD | | | | 6,681 | | | | (67 | ) |
| | | | | | | | | | | | | | | | | | | | |
| | | | | | | | | | | | | | | | | | $ | 486 | |
| | | | | | | | | | | | | | | | | | | | |
| | | | | | | | | | | | | | | | | | | | | | |
| Forward Foreign Currency Exchange Contracts | |
CONTRACTS
TO BUY | | | CURRENCY | | COUNTERPARTY | | SETTLEMENT
DATE | | | SETTLEMENT
VALUE | | | VALUE AT
APRIL 30, 2017 | | | NET
UNREALIZED
APPRECIATION
(DEPRECIATION) | |
| | 1,260 | | | EUR | | Goldman Sachs International | | | 05/02/17 | | | $ | 1,370 | | | $ | 1,373 | | | $ | 3 | |
SEE NOTES TO FINANCIAL STATEMENTS.
| | | | | | | | |
| | | |
| APRIL 30, 2017 | | J.P. MORGAN INTERNATIONAL EQUITY FUNDS | | | | | 75 | |
JPMorgan International Unconstrained Equity Fund
SCHEDULE OF PORTFOLIO INVESTMENTS
AS OF APRIL 30, 2017 (Unaudited)
(Amounts in thousands)
| | | | | | | | |
| SHARES | | | SECURITY DESCRIPTION | | VALUE($) | |
| | Common Stocks — 95.8% | |
| | | | Belgium — 2.0% | |
| | 31 | | | Anheuser-Busch InBev SA/NV | | | 3,492 | |
| | | | | | | | |
| | | | Canada — 3.9% | |
| | 76 | | | Alimentation Couche-Tard, Inc., Class B | | | 3,476 | |
| | 47 | | | Canadian National Railway Co. | | | 3,375 | |
| | | | | | | | |
| | | | | | | 6,851 | |
| | | | | | | | |
| | | | China — 7.7% | |
| | 20 | | | Baidu, Inc., ADR (a) | | | 3,545 | |
| | 2,298 | | | China Unicom Hong Kong Ltd. | | | 2,974 | |
| | 3,785 | | | CNOOC Ltd. | | | 4,413 | |
| | 72 | | | JD.com, Inc., ADR (a) | | | 2,516 | |
| | | | | | | | |
| | | | | | | 13,448 | |
| | | | | | | | |
| | | | Denmark — 1.5% | |
| | 69 | | | Novo Nordisk A/S, Class B | | | 2,701 | |
| | | | | | | | |
| | | | Finland — 4.8% | |
| | 812 | | | Nokia OYJ | | | 4,641 | |
| | 61 | | | Wartsila OYJ Abp | | | 3,685 | |
| | | | | | | | |
| | | | | | | 8,326 | |
| | | | | | | | |
| | | | Germany — 4.6% | |
| | 22 | | | Continental AG | | | 4,843 | |
| | 71 | | | Zalando SE (a) (e) | | | 3,113 | |
| | | | | | | | |
| | | | | | | 7,956 | |
| | | | | | | | |
| | | | Hong Kong — 5.8% | |
| | 605 | | | AIA Group Ltd. | | | 4,186 | |
| | 355 | | | Cheung Kong Property Holdings Ltd. | | | 2,538 | |
| | 273 | | | CK Hutchison Holdings Ltd. | | | 3,403 | |
| | | | | | | | |
| | | | | | | 10,127 | |
| | | | | | | | |
| | | | India — 2.3% | |
| | 51 | | | HDFC Bank Ltd., ADR | | | 4,054 | |
| | | | | | | | |
| | | | Israel — 2.0% | |
| | 109 | | | Teva Pharmaceutical Industries Ltd., ADR | | | 3,433 | |
| | | | | | | | |
| | | | Italy — 1.5% | |
| | 157 | | | UniCredit SpA (a) | | | 2,560 | |
| | | | | | | | |
| | | | Japan — 10.1% | |
| | 4 | | | Keyence Corp. | | | 1,608 | |
| | 159 | | | Komatsu Ltd. | | | 4,257 | |
| | 248 | | | Kubota Corp. | | | 3,903 | |
| | 263 | | | ORIX Corp. | | | 4,024 | |
| | 44 | | | Shin-Etsu Chemical Co. Ltd. | | | 3,790 | |
| | | | | | | | |
| | | | | | | 17,582 | |
| | | | | | | | |
| | | | | | | | |
| SHARES | | | SECURITY DESCRIPTION | | VALUE($) | |
| | | | | | | | |
| | | | Macau — 1.5% | |
| | 1,196 | | | Wynn Macau Ltd. | | | 2,623 | |
| | | | | | | | |
| | | | Netherlands — 10.7% | |
| | 41 | | | Akzo Nobel NV | | | 3,570 | |
| | 284 | | | Altice NV, Class A (a) | | | 7,052 | |
| | 218 | | | ING Groep NV | | | 3,554 | |
| | 135 | | | NN Group NV | | | 4,484 | |
| | | | | | | | |
| | | | | | | 18,660 | |
| | | | | | | | |
| | | | South Africa — 1.3% | |
| | 12 | | | Naspers Ltd., Class N | | | 2,245 | |
| | | | | | | | |
| | | | South Korea — 6.3% | |
| | 20 | | | Hyundai Motor Co. | | | 2,514 | |
| | 17 | | | LG Chem Ltd. | | | 4,021 | |
| | 5 | | | Samsung Electronics Co. Ltd., GDR | | | 4,504 | |
| | | | | | | | |
| | | | | | | 11,039 | |
| | | | | | | | |
| | | | Spain — 2.6% | |
| | 573 | | | Banco Bilbao Vizcaya Argentaria SA | | | 4,591 | |
| | | | | | | | |
| | | | Switzerland — 7.7% | |
| | 41 | | | Cie Financiere Richemont SA (Registered) | | | 3,461 | |
| | 638 | | | Glencore plc (a) | | | 2,506 | |
| | 77 | | | LafargeHolcim Ltd. (Registered) (a) | | | 4,363 | |
| | 180 | | | UBS Group AG (Registered) (a) | | | 3,072 | |
| | | | | | | | |
| | | | | | | 13,402 | |
| | | | | | | | |
| | | | United Kingdom — 18.3% | |
| | 88 | | | British American Tobacco plc | | | 5,978 | |
| | 1,099 | | | ITV plc | | | 2,990 | |
| | 480 | | | Meggitt plc | | | 2,876 | |
| | 180 | | | RELX NV | | | 3,476 | |
| | 69 | | | Rio Tinto plc | | | 2,740 | |
| | 162 | | | Smith & Nephew plc | | | 2,662 | |
| | 432 | | | Standard Chartered plc (a) | | | 4,040 | |
| | 88 | | | TechnipFMC plc (a) | | | 2,648 | |
| | 1,722 | | | Vodafone Group plc | | | 4,434 | |
| | | | | | | | |
| | | | | | | 31,844 | |
| | | | | | | | |
| | | | United States — 1.2% | |
| | 35 | | | Shire plc | | | 2,066 | |
| | | | | | | | |
| | | | Total Common Stocks
(Cost $152,822) | | | 167,000 | |
| | | | | | | | |
SEE NOTES TO FINANCIAL STATEMENTS.
| | | | | | |
| | | |
| 76 | | | | J.P. MORGAN INTERNATIONAL EQUITY FUNDS | | APRIL 30, 2017 |
| | | | | | | | |
| SHARES | | | SECURITY DESCRIPTION | | VALUE($) | |
| | Short-Term Investment — 3.2% | | | | |
| | | | Investment Company — 3.2% | |
| | 5,532 | | | JPMorgan U.S. Government Money Market Fund, Institutional Class Shares, 0.620% (b) (l) (Cost $5,532) | | | 5,532 | |
| | | | | | | | |
| | | | Total Investments — 99.0%
(Cost $158,354) | | | 172,532 | |
| | | | Other Assets in Excess of
Liabilities — 1.0% | | | 1,827 | |
| | | | | | | | |
| | | | NET ASSETS — 100.0% | | $ | 174,359 | |
| | | | | | | | |
Percentages indicated are based on net assets.
Summary of Investments by Industry, April 30, 2017
The following table represents the portfolio investments of the Fund by industry classifications as a percentage of total investments:
| | | | |
| INDUSTRY | | PERCENTAGE | |
Banks | | | 10.9 | % |
Media | | | 7.0 | |
Machinery | | | 6.9 | |
Chemicals | | | 6.6 | |
Insurance | | | 5.0 | |
Pharmaceuticals | | | 3.6 | |
Tobacco | | | 3.5 | |
Internet & Direct Marketing Retail | | | 3.3 | |
Metals & Mining | | | 3.0 | |
Auto Components | | | 2.8 | |
Communications Equipment | | | 2.7 | |
Technology Hardware, Storage & Peripherals | | | 2.6 | |
Wireless Telecommunication Services | | | 2.6 | |
Oil, Gas & Consumable Fuels | | | 2.6 | |
Construction Materials | | | 2.5 | |
Diversified Financial Services | | | 2.3 | |
Internet Software & Services | | | 2.1 | |
Beverages | | | 2.0 | |
Professional Services | | | 2.0 | |
Food & Staples Retailing | | | 2.0 | |
Textiles, Apparel & Luxury Goods | | | 2.0 | |
Industrial Conglomerates | | | 2.0 | |
Road & Rail | | | 2.0 | |
Capital Markets | | | 1.8 | |
Diversified Telecommunication Services | | | 1.7 | |
Aerospace & Defense | | | 1.7 | |
Health Care Equipment & Supplies | | | 1.5 | |
Energy Equipment & Services | | | 1.5 | |
Hotels, Restaurants & Leisure | | | 1.5 | |
Real Estate Management & Development | | | 1.5 | |
Automobiles | | | 1.5 | |
Biotechnology | | | 1.2 | |
Others (each less than 1.0%) | | | 0.9 | |
Short-Term Investment | | | 3.2 | |
SEE NOTES TO FINANCIAL STATEMENTS.
| | | | | | | | |
| | | |
| APRIL 30, 2017 | | J.P. MORGAN INTERNATIONAL EQUITY FUNDS | | | | | 77 | |
JPMorgan International Value Fund
SCHEDULE OF PORTFOLIO INVESTMENTS
AS OF APRIL 30, 2017 (Unaudited)
(Amounts in thousands)
| | | | | | | | |
| SHARES | | | SECURITY DESCRIPTION | | VALUE($) | |
| | Common Stocks — 97.1% | | | | |
| | | | Australia — 3.9% | | | | |
| | 935 | | | Australia & New Zealand Banking Group Ltd. | | | 22,888 | |
| | 1,529 | | | Goodman Group | | | 9,282 | |
| | | | | | | | |
| | | | | | | 32,170 | |
| | | | | | | | |
| | | | Austria — 1.1% | | | | |
| | 258 | | | Erste Group Bank AG (a) | | | 9,249 | |
| | | | | | | | |
| | | | Belgium — 2.2% | | | | |
| | 79 | | | Anheuser-Busch InBev SA/NV | | | 8,965 | |
| | 125 | | | KBC Group NV | | | 9,024 | |
| | | | | | | | |
| | | | | | | 17,989 | |
| | | | | | | | |
| | | | Canada — 1.0% | | | | |
| | 185 | | | TransCanada Corp. | | | 8,589 | |
| | | | | | | | |
| | | | Chile — 0.6% | | | | |
| | 200 | | | Banco Santander Chile, ADR | | | 4,722 | |
| | | | | | | | |
| | | | China — 0.8% | | | | |
| | 5,684 | | | CNOOC Ltd. | | | 6,631 | |
| | | | | | | | |
| | | | Finland — 1.0% | | | | |
| | 855 | | | Outokumpu OYJ | | | 8,183 | |
| | | | | | | | |
| | | | France — 15.9% | | | | |
| | 104 | | | Air Liquide SA | | | 12,494 | |
| | 123 | | | Airbus SE | | | 9,912 | |
| | 667 | | | AXA SA | | | 17,792 | |
| | 260 | | | BNP Paribas SA | | | 18,347 | |
| | 1,270 | | | Natixis SA | | | 8,840 | |
| | 126 | | | Renault SA | | | 11,766 | |
| | 145 | | | Sanofi | | | 13,730 | |
| | 129 | | | Schneider Electric SE | | | 10,243 | |
| | 545 | | | TOTAL SA | | | 27,984 | |
| | | | | | | | |
| | | | | | | 131,108 | |
| | | | | | | | |
| | | | Germany — 8.3% | |
| | 59 | | | Bayer AG (Registered) | | | 7,250 | |
| | 120 | | | Brenntag AG | | | 7,135 | |
| | 184 | | | Daimler AG (Registered) | | | 13,726 | |
| | 94 | | | Deutsche Boerse AG | | | 9,208 | |
| | 33 | | | HeidelbergCement AG | | | 3,070 | |
| | 235 | | | Infineon Technologies AG | | | 4,858 | |
| | 164 | | | Siemens AG (Registered) | | | 23,490 | |
| | | | | | | | |
| | | | | | | 68,737 | |
| | | | | | | | |
| | | | Hong Kong — 1.3% | |
| | 863 | | | CK Hutchison Holdings Ltd. | | | 10,772 | |
| | | | | | | | |
| | | | Ireland — 0.9% | |
| | 78 | | | Ryanair Holdings plc, ADR (a) | | | 7,138 | |
| | | | | | | | |
| | | | | | | | |
| SHARES | | | SECURITY DESCRIPTION | | VALUE($) | |
| | | | | | | | |
| | | | Israel — 1.3% | |
| | 327 | | | Teva Pharmaceutical Industries Ltd., ADR | | | 10,338 | |
| | | | | | | | |
| | | | Italy — 3.3% | |
| | 2,970 | | | Enel SpA | | | 14,121 | |
| | 2,497 | | | Intesa Sanpaolo SpA | | | 7,290 | |
| | 6,452 | | | Telecom Italia SpA (a) | | | 5,726 | |
| | | | | | | | |
| | | | | | | 27,137 | |
| | | | | | | | |
| | | | Japan — 22.7% | |
| | 298 | | | Bridgestone Corp. | | | 12,434 | |
| | 98 | | | Daikin Industries Ltd. | | | 9,567 | |
| | 65 | | | Dentsu, Inc. | | | 3,669 | |
| | 351 | | | DMG Mori Co. Ltd. | | | 5,788 | |
| | 455 | | | Honda Motor Co. Ltd. | | | 13,255 | |
| | 275 | | | Japan Airlines Co. Ltd. | | | 8,675 | |
| | 178 | | | Mabuchi Motor Co. Ltd. | | | 10,020 | |
| | 497 | | | Mitsubishi Corp. | | | 10,715 | |
| | 3,604 | | | Mitsubishi UFJ Financial Group, Inc. | | | 22,836 | |
| | 265 | | | Mitsui Fudosan Co. Ltd. | | | 5,831 | |
| | 458 | | | NGK Spark Plug Co. Ltd. | | | 9,928 | |
| | 325 | | | Nippon Telegraph & Telephone Corp. | | | 13,945 | |
| | 177 | | | Otsuka Corp. | | | 9,481 | |
| | 74 | | | Sompo Holdings, Inc. | | | 2,804 | |
| | 171 | | | Sony Corp. | | | 5,881 | |
| | 716 | | | Sumitomo Electric Industries Ltd. | | | 11,697 | |
| | 180 | | | Sumitomo Mitsui Financial Group, Inc. | | | 6,695 | |
| | 233 | | | Sumitomo Mitsui Trust Holdings, Inc. | | | 7,964 | |
| | 158 | | | Suzuki Motor Corp. | | | 6,605 | |
| | 71 | | | Toyota Motor Corp. | | | 3,864 | |
| | 262 | | | Yamato Holdings Co. Ltd. | | | 5,662 | |
| | | | | | | | |
| | | | | | | 187,316 | |
| | | | | | | | |
| | | | Luxembourg — 1.0% | |
| | 1,038 | | | ArcelorMittal (a) | | | 8,154 | |
| | | | | | | | |
| | | | Netherlands — 7.7% | |
| | 267 | | | ASR Nederland NV (a) | | | 7,908 | |
| | 1,007 | | | ING Groep NV | | | 16,413 | |
| | 212 | | | NN Group NV | | | 7,031 | |
| | 1,248 | | | Royal Dutch Shell plc, Class A | | | 32,398 | |
| | | | | | | | |
| | | | | | | 63,750 | |
| | | | | | | | |
| | | | Norway — 1.0% | |
| | 1,497 | | | Norsk Hydro ASA | | | 8,529 | |
| | | | | | | | |
| | | | Singapore — 1.2% | |
| | 741 | | | DBS Group Holdings Ltd. | | | 10,235 | |
| | | | | | | | |
| | | | South Korea — 1.1% | |
| | 5 | | | Samsung Electronics Co. Ltd. | | | 9,202 | |
| | | | | | | | |
SEE NOTES TO FINANCIAL STATEMENTS.
| | | | | | |
| | | |
| 78 | | | | J.P. MORGAN INTERNATIONAL EQUITY FUNDS | | APRIL 30, 2017 |
| | | | | | | | |
| SHARES | | | SECURITY DESCRIPTION | | VALUE($) | |
| | Common Stocks — continued | | | | |
| | | | Spain — 3.0% | |
| | 10,323 | | | Bankia SA | | | 12,534 | |
| | 1,698 | | | Iberdrola SA | | | 12,203 | |
| | | | | | | | |
| | | | | | | 24,737 | |
| | | | | | | | |
| | | | Sweden — 1.8% | |
| | 1,179 | | | Nordea Bank AB | | | 14,499 | |
| | | | | | | | |
| | | | Switzerland — 4.5% | |
| | 102 | | | LafargeHolcim Ltd. (Registered) (a) | | | 5,810 | |
| | 29 | | | Roche Holding AG | | | 7,577 | |
| | 127 | | | Wolseley plc | | | 8,097 | |
| | 57 | | | Zurich Insurance Group AG | | | 15,675 | |
| | | | | | | | |
| | | | | | | 37,159 | |
| | | | | | | | |
| | | | United Kingdom — 10.1% | |
| | 752 | | | Barratt Developments plc | | | 5,642 | |
| | 98 | | | InterContinental Hotels Group plc | | | 5,184 | |
| | 2,550 | | | ITV plc | | | 6,936 | |
| | 3,889 | | | Lloyds Banking Group plc | | | 3,495 | |
| | 268 | | | National Grid plc | | | 3,466 | |
| | 606 | | | Prudential plc | | | 13,453 | |
| | 371 | | | Rio Tinto plc | | | 14,618 | |
| | 1,457 | | | Standard Chartered plc (a) | | | 13,621 | |
| | 162 | | | TechnipFMC plc (a) | | | 4,880 | |
| | 4,639 | | | Vodafone Group plc | | | 11,949 | |
| | | | | | | | |
| | | | | | | 83,244 | |
| | | | | | | | |
| | | | United States — 1.4% | |
| | 203 | | | Shire plc | | | 11,982 | |
| | | | | | | | |
| | | | Total Common Stocks
(Cost $762,383) | | | 801,570 | |
| | | | | | | | |
| | Short-Term Investment — 2.7% | | | | |
| | | | Investment Company — 2.7% | |
| | 22,045 | | | JPMorgan U.S. Government Money Market Fund, Institutional Class Shares, 0.620% (b) (l) (Cost $22,045) | | | 22,045 | |
| | | | | | | | |
| | | | Total Investments — 99.8%
(Cost $784,428) | | | 823,615 | |
| | | | Other Assets in Excess of
Liabilities — 0.2% | | | 1,242 | |
| | | | | | | | |
| | | | NET ASSETS — 100.0% | | $ | 824,857 | |
| | | | | | | | |
Percentages indicated are based on net assets.
Summary of Investments by Industry, April 30, 2017
The following table represents the portfolio investments of the Fund by industry classifications as a percentage of total investments:
| | | | |
| INDUSTRY | | PERCENTAGE | |
Banks | | | 22.9 | % |
Oil, Gas & Consumable Fuels | | | 9.2 | |
Insurance | | | 7.8 | |
Automobiles | | | 6.0 | |
Metals & Mining | | | 4.8 | |
Pharmaceuticals | | | 4.7 | |
Industrial Conglomerates | | | 4.2 | |
Auto Components | | | 4.1 | |
Electric Utilities | | | 3.2 | |
Trading Companies & Distributors | | | 3.1 | |
Electrical Equipment | | | 2.5 | |
Diversified Telecommunication Services | | | 2.4 | |
Airlines | | | 1.9 | |
Chemicals | | | 1.5 | |
Biotechnology | | | 1.5 | |
Wireless Telecommunication Services | | | 1.4 | |
Household Durables | | | 1.4 | |
Media | | | 1.3 | |
Aerospace & Defense | | | 1.2 | |
Building Products | | | 1.2 | |
IT Services | | | 1.2 | |
Equity Real Estate Investment Trusts (REITs) | | | 1.1 | |
Capital Markets | | | 1.1 | |
Technology Hardware, Storage & Peripherals | | | 1.1 | |
Beverages | | | 1.1 | |
Construction Materials | | | 1.1 | |
Others (each less than 1.0%) | | | 4.3 | |
Short-Term Investment | | | 2.7 | |
SEE NOTES TO FINANCIAL STATEMENTS.
| | | | | | | | |
| | | |
| APRIL 30, 2017 | | J.P. MORGAN INTERNATIONAL EQUITY FUNDS | | | | | 79 | |
JPMorgan International Value Fund
SCHEDULE OF PORTFOLIO INVESTMENTS
AS OF APRIL 30, 2017 (Unaudited) (continued)
(Amounts in thousands)
| | | | | | | | | | | | | | | | | | | | | | |
| Forward Foreign Currency Exchange Contracts | |
CONTRACTS
TO BUY | | | CURRENCY | | COUNTERPARTY | | SETTLEMENT
DATE | | | SETTLEMENT
VALUE | | | VALUE AT
APRIL 30, 2017 | | | NET
UNREALIZED
APPRECIATION
(DEPRECIATION) | |
| | 2,442 | | | EUR | | | | | | | | | | | | | | | | | | |
| | 2,106 | | | for GBP | | Goldman Sachs International | | | 05/26/17 | | | $ | 2,729 | # | | $ | 2,663 | # | | $ | (66 | ) |
| | 4,401 | | | EUR | | | | | | | | | | | | | | | | | | |
| | 512,473 | | | for JPY | | Australia and New Zealand Banking Group Ltd. | | | 05/26/17 | | | | 4,601 | # | | | 4,799 | # | | | 198 | |
| | 4,067 | | | EUR | | | | | | | | | | | | | | | | | | |
| | 6,100 | | | for SGD | | Standard Chartered Bank | | | 05/26/17 | | | | 4,367 | # | | | 4,436 | # | | | 69 | |
| | 12,622 | | | AUD | | Australia and New Zealand Banking Group Ltd. | | | 05/26/17 | | | | 9,595 | | | | 9,448 | | | | (147 | ) |
| | 52,319 | | | AUD | | HSBC Bank, N.A. | | | 05/26/17 | | | | 40,101 | | | | 39,159 | | | | (942 | ) |
| | 3,489 | | | CAD | | Australia and New Zealand Banking Group Ltd. | | | 05/26/17 | | | | 2,616 | | | | 2,557 | | | | (59 | ) |
| | 24,284 | | | CHF | | National Australia Bank | | | 05/26/17 | | | | 24,543 | | | | 24,446 | | | | (97 | ) |
| | 40,063 | | | DKK | | Societe Generale | | | 05/30/17 | | | | 5,769 | | | | 5,876 | | | | 107 | |
| | 8,154 | | | EUR | | BNP Paribas | | | 05/26/17 | | | | 8,895 | | | | 8,893 | | | | (2 | ) |
| | 3,924 | | | EUR | | Citibank, NA | | | 05/26/17 | | | | 4,166 | | | | 4,280 | | | | 114 | |
| | 5,562 | | | EUR | | Goldman Sachs International | | | 05/26/17 | | | | 6,052 | | | | 6,066 | | | | 14 | |
| | 2,251 | | | EUR | | National Australia Bank | | | 05/26/17 | | | | 2,435 | | | | 2,455 | | | | 20 | |
| | 7,642 | | | EUR | | Standard Chartered Bank | | | 05/26/17 | | | | 8,320 | | | | 8,335 | | | | 15 | |
| | 81,124 | | | EUR | | State Street Corp. | | | 05/26/17 | | | | 88,388 | | | | 88,479 | | | | 91 | |
| | 2,910 | | | EUR | | TD Bank Financial Group | | | 05/26/17 | | | | 3,123 | | | | 3,173 | | | | 50 | |
| | 11,128 | | | GBP | | Citibank, NA | | | 05/26/17 | | | | 13,826 | | | | 14,424 | | | | 598 | |
| | 4,653 | | | GBP | | Goldman Sachs International | | | 05/26/17 | | | | 5,950 | | | | 6,030 | | | | 80 | |
| | 8,146 | | | GBP | | Standard Chartered Bank | | | 05/26/17 | | | | 10,124 | | | | 10,558 | | | | 434 | |
| | 30,752 | | | GBP | | TD Bank Financial Group | | | 05/26/17 | | | | 38,773 | | | | 39,858 | | | | 1,085 | |
| | 54,356 | | | HKD | | Standard Chartered Bank | | | 05/26/17 | | | | 7,011 | | | | 6,992 | | | | (19 | ) |
| | 41,308 | | | HKD | | State Street Corp. | | | 05/26/17 | | | | 5,324 | | | | 5,313 | | | | (11 | ) |
| | 514,464 | | | JPY | | National Australia Bank | | | 05/26/17 | | | | 4,676 | | | | 4,619 | | | | (57 | ) |
| | 6,291,513 | | | JPY | | Standard Chartered Bank | | | 05/26/17 | | | | 57,006 | | | | 56,490 | | | | (516 | ) |
| | 308,285 | | | JPY | | TD Bank Financial Group | | | 05/26/17 | | | | 2,741 | | | | 2,768 | | | | 27 | |
| | 26,567 | | | NOK | | Goldman Sachs International | | | 05/26/17 | | | | 3,123 | | | | 3,095 | | | | (28 | ) |
| | 14,489 | | | NOK | | National Australia Bank | | | 05/26/17 | | | | 1,690 | | | | 1,688 | | | | (2 | ) |
| | 35,516 | | | SEK | | Merrill Lynch International | | | 05/26/17 | | | | 4,058 | | | | 4,015 | | | | (43 | ) |
| | 102,553 | | | SEK | | National Australia Bank | | | 05/26/17 | | | | 11,582 | | | | 11,594 | | | | 12 | |
| | 4,167 | | | SGD | | Australia and New Zealand Banking Group Ltd. | | | 05/26/17 | | | | 2,989 | | | | 2,983 | | | | (6 | ) |
| | 1,933 | | | SGD | | Societe Generale | | | 05/26/17 | | | | 1,366 | | | | 1,384 | | | | 18 | |
| | | | | | | | | | | | $ | 385,939 | | | $ | 386,876 | | | $ | 937 | |
| | |
| | | | | | | | | | | | | | | | | | | | | | |
CONTRACTS
TO SELL | | | CURRENCY | | COUNTERPARTY | | SETTLEMENT
DATE | | | SETTLEMENT
VALUE | | | VALUE AT
APRIL 30, 2017 | | | NET
UNREALIZED
APPRECIATION
(DEPRECIATION) | |
| | 8,278 | | | AUD | | BNP Paribas | | | 05/26/17 | | | $ | 6,213 | | | $ | 6,195 | | | $ | 18 | |
| | 17,405 | | | AUD | | Royal Bank of Canada | | | 05/26/17 | | | | 13,316 | | | | 13,027 | | | | 289 | |
| | 4,652 | | | CAD | | National Australia Bank | | | 05/26/17 | | | | 3,482 | | | | 3,409 | | | | 73 | |
| | 10,497 | | | CAD | | State Street Corp. | | | 05/26/17 | | | | 8,029 | | | | 7,692 | | | | 337 | |
| | 3,655 | | | CHF | | National Australia Bank | | | 05/26/17 | | | | 3,639 | | | | 3,679 | | | | (40 | ) |
| | 10,087 | | | CHF | | TD Bank Financial Group | | | 05/26/17 | | | | 10,150 | | | | 10,154 | | | | (4 | ) |
SEE NOTES TO FINANCIAL STATEMENTS.
| | | | | | |
| | | |
| 80 | | | | J.P. MORGAN INTERNATIONAL EQUITY FUNDS | | APRIL 30, 2017 |
| | | | | | | | | | | | | | | | | | | | | | |
CONTRACTS
TO SELL | | | CURRENCY | | COUNTERPARTY | | SETTLEMENT
DATE | | | SETTLEMENT
VALUE | | | VALUE AT
APRIL 30, 2017 | | | NET
UNREALIZED
APPRECIATION
(DEPRECIATION) | |
| | 4,160 | | | EUR | | Australia and New Zealand Banking Group Ltd. | | | 05/26/17 | | | $ | 4,414 | | | $ | 4,537 | | | $ | (123 | ) |
| | 38,842 | | | EUR | | BNP Paribas | | | 05/26/17 | | | | 41,534 | | | | 42,364 | | | | (830 | ) |
| | 64,804 | | | EUR | | Citibank, NA | | | 05/26/17 | | | | 69,859 | | | | 70,679 | | | | (820 | ) |
| | 55,565 | | | EUR | | Goldman Sachs International | | | 05/26/17 | | | | 59,373 | | | | 60,602 | | | | (1,229 | ) |
| | 9,616 | | | EUR | | State Street Corp. | | | 05/26/17 | | | | 10,202 | | | | 10,488 | | | | (286 | ) |
| | 38,433 | | | GBP | | HSBC Bank, N.A. | | | 05/26/17 | | | | 47,897 | | | | 49,814 | | | | (1,917 | ) |
| | 7,281,631 | | | JPY | | Credit Suisse International | | | 05/26/17 | | | | 65,594 | | | | 65,381 | | | | 213 | |
| | 40,565 | | | NOK | | Goldman Sachs International | | | 05/26/17 | | | | 4,878 | | | | 4,727 | | | | 151 | |
| | 27,968 | | | NOK | | TD Bank Financial Group | | | 05/26/17 | | | | 3,244 | | | | 3,258 | | | | (14 | ) |
| | 35,719 | | | SEK | | Merrill Lynch International | | | 05/26/17 | | | | 3,956 | | | | 4,038 | | | | (82 | ) |
| | | | | | | | | | | | $ | 355,780 | | | $ | 360,044 | | | $ | (4,264 | ) |
| | |
| # | For cross-currency exchange contracts, the settlement value is the U.S. Dollar market value at April 30, 2017 of the currency being sold, and the value at April 30, 2017 is the U.S. Dollar market value of the currency being purchased. |
SEE NOTES TO FINANCIAL STATEMENTS.
| | | | | | | | |
| | | |
| APRIL 30, 2017 | | J.P. MORGAN INTERNATIONAL EQUITY FUNDS | | | | | 81 | |
JPMorgan Intrepid International Fund
SCHEDULE OF PORTFOLIO INVESTMENTS
AS OF APRIL 30, 2017 (Unaudited)
(Amounts in thousands)
| | | | | | | | |
| SHARES | | | SECURITY DESCRIPTION | | VALUE($) | |
| | Common Stocks — 95.3% | |
| | | | Australia — 6.8% | |
| | 1,209 | | | AGL Energy Ltd. | | | 24,204 | |
| | 954 | | | Australia & New Zealand Banking Group Ltd. | | | 23,360 | |
| | 1,162 | | | Bendigo & Adelaide Bank Ltd. | | | 10,696 | |
| | 1,589 | | | BHP Billiton Ltd. | | | 28,290 | |
| | 1,219 | | | Challenger Ltd. | | | 12,044 | |
| | 39 | | | Commonwealth Bank of Australia | | | 2,567 | |
| | 1,170 | | | Computershare Ltd. | | | 12,897 | |
| | 1,401 | | | CSR Ltd. | | | 5,136 | |
| | 208 | | | Flight Centre Travel Group Ltd. | | | 4,882 | |
| | 2,155 | | | Fortescue Metals Group Ltd. | | | 8,540 | |
| | 2,569 | | | GPT Group (The) | | | 10,090 | |
| | 157 | | | LendLease Group | | | 1,881 | |
| | 2,294 | | | Metcash Ltd. (a) | | | 3,693 | |
| | 4,858 | | | South32 Ltd. | | | 10,067 | |
| | 1,035 | | | Westpac Banking Corp. | | | 27,131 | |
| | 535 | | | Woodside Petroleum Ltd. | | | 12,874 | |
| | | | | | | | |
| | | | | | | 198,352 | |
| | | | | | | | |
| | | | Austria — 0.4% | |
| | 254 | | | Erste Group Bank AG (a) | | | 9,080 | |
| | 14 | | | Lenzing AG | | | 2,648 | |
| | | | | | | | |
| | | | | | | 11,728 | |
| | | | | | | | |
| | | | Belgium — 0.8% | |
| | 334 | | | bpost SA | | | 7,998 | |
| | 223 | | | KBC Group NV | | | 16,115 | |
| | | | | | | | |
| | | | | | | 24,113 | |
| | | | | | | | |
| | | | China — 0.8% | |
| | 5,289 | | | BOC Hong Kong Holdings Ltd. | | | 21,735 | |
| | 806 | | | China Overseas Land & Investment Ltd. | | | 2,338 | |
| | | | | | | | |
| | | | | | | 24,073 | |
| | | | | | | | |
| | | | Denmark — 2.9% | |
| | 754 | | | Danske Bank A/S | | | 27,405 | |
| | 9 | | | Dfds A/S | | | 538 | |
| | 598 | | | Novo Nordisk A/S, Class B | | | 23,270 | |
| | 62 | | | Pandora A/S | | | 6,661 | |
| | 3 | | | Schouw & Co. AB | | | 314 | |
| | 234 | | | Sydbank A/S | | | 8,509 | |
| | 1,794 | | | TDC A/S | | | 9,626 | |
| | 105 | | | Vestas Wind Systems A/S | | | 9,077 | |
| | | | | | | | |
| | | | | | | 85,400 | |
| | | | | | | | |
| | | | Finland — 0.4% | |
| | 429 | | | UPM-Kymmene OYJ | | | 11,298 | |
| | | | | | | | |
| | | | | | | | |
| SHARES | | | SECURITY DESCRIPTION | | VALUE($) | |
| | |
| | | | France — 10.0% | |
| | 105 | | | Arkema SA | | | 11,115 | |
| | 655 | | | AXA SA | | | 17,467 | |
| | 371 | | | BNP Paribas SA | | | 26,210 | |
| | 107 | | | Cap Gemini SA | | | 10,716 | |
| | 148 | | | Cie Generale des Etablissements Michelin | | | 19,311 | |
| | 224 | | | Faurecia | | | 10,923 | |
| | 64 | | | LVMH Moet Hennessy Louis Vuitton SE | | | 15,884 | |
| | 174 | | | Metropole Television S.A. | | | 3,953 | |
| | 1,546 | | | Natixis SA | | | 10,762 | |
| | 10 | | | Nexans SA (a) | | | 561 | |
| | 881 | | | Orange SA | | | 13,636 | |
| | 526 | | | Peugeot SA (a) | | | 11,031 | |
| | 349 | | | Sanofi | | | 33,017 | |
| | 243 | | | Schneider Electric SE | | | 19,238 | |
| | 349 | | | Societe Generale SA | | | 19,120 | |
| | 83 | | | Sodexo SA | | | 10,551 | |
| | 12 | | | Sopra Steria Group | | | 1,806 | |
| | 104 | | | Thales SA | | | 10,975 | |
| | 241 | | | TOTAL SA | | | 12,356 | |
| | 207 | | | Valeo SA | | | 14,882 | |
| | 221 | | | Vinci SA | | | 18,859 | |
| | | | | | | | |
| | | | | | | 292,373 | |
| | | | | | | | |
| | | | Germany — 7.2% | |
| | 144 | | | Allianz SE (Registered) | | | 27,416 | |
| | 234 | | | Bayer AG (Registered) | | | 28,904 | |
| | 17 | | | Bayerische Motoren Werke AG | | | 1,666 | |
| | 136 | | | Covestro AG (e) | | | 10,626 | |
| | 275 | | | Evonik Industries AG | | | 9,185 | |
| | 233 | | | Freenet AG | | | 7,306 | |
| | 168 | | | Fresenius SE & Co. KGaA | | | 13,618 | |
| | 93 | | | Hannover Rueck SE | | | 11,147 | |
| | 54 | | | HeidelbergCement AG | | | 5,022 | |
| | 514 | | | Infineon Technologies AG | | | 10,634 | |
| | 603 | | | Innogy SE (e) | | | 22,182 | |
| | 19 | | | Jenoptik AG | | | 504 | |
| | 96 | | | Merck KGaA | | | 11,245 | |
| | 154 | | | OSRAM Licht AG | | | 10,300 | |
| | 235 | | | Siemens AG (Registered) | | | 33,683 | |
| | 376 | | | Uniper SE (a) | | | 6,174 | |
| | | | | | | | |
| | | | | | | 209,612 | |
| | | | | | | | |
| | | | Hong Kong — 2.3% | |
| | 1,375 | | | Cheung Kong Property Holdings Ltd. | | | 9,840 | |
| | 1,087 | | | Chow Tai Fook Jewellery Group Ltd. | | | 1,195 | |
| | 1,151 | | | CK Hutchison Holdings Ltd. | | | 14,373 | |
SEE NOTES TO FINANCIAL STATEMENTS.
| | | | | | |
| | | |
| 82 | | | | J.P. MORGAN INTERNATIONAL EQUITY FUNDS | | APRIL 30, 2017 |
| | | | | | | | |
| SHARES | | | SECURITY DESCRIPTION | | VALUE($) | |
| | Common Stocks — continued | |
| | | | Hong Kong — continued | |
| | 573 | | | Hongkong Land Holdings Ltd. | | | 4,417 | |
| | 6,862 | | | New World Development Co. Ltd. | | | 8,533 | |
| | 1,123 | | | Wharf Holdings Ltd. (The) | | | 9,575 | |
| | 1,055 | | | Wheelock & Co. Ltd. | | | 8,218 | |
| | 11,166 | | | Xinyi Glass Holdings Ltd. (a) | | | 9,895 | |
| | | | | | | | |
| | | | | | | 66,046 | |
| | | | | | | | |
| | | | Indonesia — 0.2% | |
| | 220 | | | Telekomunikasi Indonesia Persero Tbk. PT, ADR | | | 7,195 | |
| | | | | | | | |
| | | | Italy — 1.1% | |
| | 621 | | | Enel SpA | | | 2,954 | |
| | 2,997 | | | Intesa Sanpaolo SpA | | | 8,749 | |
| | 1,159 | | | Mediobanca SpA | | | 11,148 | |
| | 343 | | | Prysmian SpA | | | 9,897 | |
| | | | | | | | |
| | | | | | | 32,748 | |
| | | | | | | | |
| | | | Japan — 23.1% | |
| | 741 | | | Amada Holdings Co. Ltd. | | | 8,805 | |
| | 1,498 | | | Asahi Glass Co. Ltd. | | | 12,979 | |
| | 918 | | | Astellas Pharma, Inc. | | | 12,100 | |
| | 347 | | | Bandai Namco Holdings, Inc. | | | 10,897 | |
| | 323 | | | Bridgestone Corp. | | | 13,460 | |
| | 98 | | | Central Japan Railway Co. | | | 16,402 | |
| | 1,998 | | | Concordia Financial Group Ltd. | | | 9,189 | |
| | 97 | | | Daikin Industries Ltd. | | | 9,421 | |
| | 56 | | | Family Mart UNY Holdings Co. Ltd. | | | 3,177 | |
| | 1,911 | | | Fuji Electric Co. Ltd. | | | 10,475 | |
| | 196 | | | Hazama Ando Corp. | | | 1,396 | |
| | 98 | | | Hikari Tsushin, Inc. | | | 9,422 | |
| | 391 | | | Hitachi Chemical Co. Ltd. | | | 11,192 | |
| | 2,151 | | | Hitachi Ltd. | | | 11,883 | |
| | 821 | | | Hitachi Metals Ltd. | | | 11,499 | |
| | 606 | | | Honda Motor Co. Ltd. | | | 17,641 | |
| | 240 | | | Hoya Corp. | | | 11,465 | |
| | 375 | | | Idemitsu Kosan Co. Ltd. | | | 11,977 | |
| | 429 | | | ITOCHU Corp. | | | 6,069 | |
| | 1,028 | | | Kansai Electric Power Co., Inc. (The) | | | 13,894 | |
| | 617 | | | KDDI Corp. | | | 16,357 | |
| | 205 | | | Koito Manufacturing Co. Ltd. | | | 10,598 | |
| | 717 | | | Kuraray Co. Ltd. | | | 11,570 | |
| | 344 | | | LIXIL Group Corp. | | | 8,605 | |
| | 192 | | | Matsumotokiyoshi Holdings Co. Ltd. | | | 9,634 | |
| | 717 | | | Mazda Motor Corp. | | | 10,586 | |
| | 17 | | | Meitec Corp. | | | 722 | |
| | 631 | | | Mitsubishi Corp. | | | 13,624 | |
| | | | | | | | |
| SHARES | | | SECURITY DESCRIPTION | | VALUE($) | |
| | |
| | | | Japan — continued | |
| | 865 | | | Mitsubishi Electric Corp. | | | 12,071 | |
| | 4,239 | | | Mitsubishi UFJ Financial Group, Inc. | | | 26,858 | |
| | 1,920 | | | Mitsubishi UFJ Lease & Finance Co. Ltd. | | | 10,032 | |
| | 225 | | | Mitsui Fudosan Co. Ltd. | | | 4,951 | �� |
| | 309 | | | NH Foods Ltd. | | | 8,807 | |
| | 82 | | | Nichias Corp. | | | 837 | |
| | 94 | | | Nichirei Corp. | | | 2,350 | |
| | 310 | | | Nippon Telegraph & Telephone Corp. | | | 13,294 | |
| | 18 | | | Nitori Holdings Co. Ltd. | | | 2,368 | |
| | 108 | | | Nitto Denko Corp. | | | 8,110 | |
| | 791 | | | NTT DOCOMO, Inc. | | | 19,147 | |
| | 1,326 | | | Obayashi Corp. | | | 12,871 | |
| | 753 | | | ORIX Corp. | | | 11,502 | |
| | 113 | | | Otsuka Holdings Co. Ltd. | | | 5,191 | |
| | 269 | | | Penta-Ocean Construction Co. Ltd. | | | 1,363 | |
| | 336 | | | Pola Orbis Holdings, Inc. | | | 7,748 | |
| | 148 | | | SCREEN Holdings Co. Ltd. | | | 10,757 | |
| | 608 | | | Sekisui Chemical Co. Ltd. | | | 10,196 | |
| | 51 | | | Shin-Etsu Chemical Co. Ltd. | | | 4,450 | |
| | 209 | | | Shionogi & Co. Ltd. | | | 10,758 | |
| | 237 | | | SoftBank Group Corp. | | | 17,947 | |
| | 348 | | | Sompo Holdings, Inc. | | | 13,162 | |
| | 569 | | | Sony Corp. | | | 19,518 | |
| | 280 | | | Subaro Corp. | | | 10,631 | |
| | 203 | | | Sumitomo Bakelite Co. Ltd. | | | 1,305 | |
| | 2,050 | | | Sumitomo Chemical Co. Ltd. | | | 11,569 | |
| | 683 | | | Sumitomo Electric Industries Ltd. | | | 11,148 | |
| | 1,300 | | | Sumitomo Heavy Industries Ltd. | | | 9,069 | |
| | 477 | | | Sumitomo Mitsui Financial Group, Inc. | | | 17,696 | |
| | 260 | | | Sumitomo Mitsui Trust Holdings, Inc. | | | 8,917 | |
| | 720 | | | T&D Holdings, Inc. | | | 10,702 | |
| | 2,376 | | | Taiheiyo Cement Corp. | | | 7,896 | |
| | 1,724 | | | Taisei Corp. | | | 13,146 | |
| | 106 | | | Tokyo Electron Ltd. | | | 12,807 | |
| | 799 | | | Tokyo Tatemono Co. Ltd. | | | 10,917 | |
| | 351 | | | Toyota Motor Corp. | | | 19,007 | |
| | 32 | | | TS Tech Co., Ltd. | | | 830 | |
| | | | | | | | |
| | | | | | | 674,967 | |
| | | | | | | | |
| | | | Luxembourg — 0.6% | |
| | 218 | | | APERAM SA | | | 10,944 | |
| | 1,022 | | | ArcelorMittal (a) | | | 8,034 | |
| | | | | | | | |
| | | | | | | 18,978 | |
| | | | | | | | |
| | | | Netherlands — 3.2% | |
| | 1,500 | | | Aegon NV | | | 7,655 | |
SEE NOTES TO FINANCIAL STATEMENTS.
| | | | | | | | |
| | | |
| APRIL 30, 2017 | | J.P. MORGAN INTERNATIONAL EQUITY FUNDS | | | | | 83 | |
JPMorgan Intrepid International Fund
SCHEDULE OF PORTFOLIO INVESTMENTS
AS OF APRIL 30, 2017 (Unaudited) (continued)
(Amounts in thousands)
| | | | | | | | |
| SHARES | | | SECURITY DESCRIPTION | | VALUE($) | |
| | Common Stocks — continued | |
| | | | Netherlands — continued | |
| | 274 | | | ASR Nederland NV (a) | | | 8,116 | |
| | 1,707 | | | ING Groep NV | | | 27,829 | |
| | 587 | | | Koninklijke Ahold Delhaize NV | | | 12,157 | |
| | 16 | | | NN Group NV | | | 524 | |
| | 280 | | | Philips Lighting NV (a) (e) | | | 9,461 | |
| | 1,026 | | | Royal Dutch Shell plc, Class B | | | 27,300 | |
| | | | | | | | |
| | | | | | | 93,042 | |
| | | | | | | | |
| | | | Norway — 1.1% | |
| | 740 | | | DNB ASA | | | 11,551 | |
| | 1,638 | | | Norsk Hydro ASA | | | 9,336 | |
| | 614 | | | Telenor ASA | | | 9,917 | |
| | | | | | | | |
| | | | | | | 30,804 | |
| | | | | | | | |
| | | | Portugal — 0.1% | |
| | 842 | | | EDP — Energias de Portugal SA | | | 2,779 | |
| | | | | | | | |
| | | | Singapore — 0.6% | |
| | 786 | | | DBS Group Holdings Ltd. | | | 10,861 | |
| | 209 | | | Jardine Cycle & Carriage Ltd. | | | 7,086 | |
| | 130 | | | Venture Corp., Ltd. | | | 1,136 | |
| | | | | | | | |
| | | | | | | 19,083 | |
| | | | | | | | |
| | | | South Africa — 0.3% | |
| | 1,556 | | | Steinhoff International Holdings NV | | | 7,916 | |
| | | | | | | | |
| | | | South Korea — 0.1% | |
| | 51 | | | POSCO, ADR | | | 2,983 | |
| | | | | | | | |
| | | | Spain — 2.8% | |
| | 336 | | | ACS Actividades de Construccion y Servicios SA | | | 12,440 | |
| | 242 | | | Amadeus IT Group SA | | | 13,035 | |
| | 4,248 | | | Banco Santander SA | | | 27,685 | |
| | 2,191 | | | Iberdrola SA | | | 15,750 | |
| | 874 | | | Repsol SA | | | 13,798 | |
| | | | | | | | |
| | | | | | | 82,708 | |
| | | | | | | | |
| | | | Sweden — 2.7% | |
| | 373 | | | Atlas Copco AB, Class A | | | 13,941 | |
| | 377 | | | Boliden AB | | | 10,778 | |
| | 463 | | | Castellum AB | | | 6,344 | |
| | 182 | | | JM AB | | | 6,405 | |
| | 410 | | | Skanska AB, Class B | | | 9,800 | |
| | 1,095 | | | Swedbank AB, Class A | | | 25,961 | |
| | 236 | | | Trelleborg AB, Class B, | | | 5,541 | |
| | | | | | | | |
| | | | | | | 78,770 | |
| | | | | | | | |
| | | | Switzerland — 11.1% | |
| | 607 | | | ABB Ltd. (Registered) | | | 14,875 | |
| | 319 | | | Adecco Group AG (Registered) | | | 23,683 | |
| | | | | | | | |
| SHARES | | | SECURITY DESCRIPTION | | VALUE($) | |
| | |
| | | | Switzerland — continued | |
| | 207 | | | Cie Financiere Richemont SA (Registered) | | | 17,259 | |
| | 356 | | | Coca-Cola HBC AG (a) | | | 9,885 | |
| | 10 | | | Flughafen Zuerich AG (Registered) | | | 2,184 | |
| | – | (h) | | Forbo Holding AG (Registered) | | | 586 | |
| | 11 | | | Georg Fischer AG (Registered) | | | 10,012 | |
| | 4,075 | | | Glencore plc (a) | | | 16,014 | |
| | 269 | | | Logitech International SA (Registered) | | | 8,993 | |
| | 49 | | | Lonza Group AG (Registered) (a) | | | 10,091 | |
| | 546 | | | Nestle SA (Registered) | | | 42,046 | |
| | 345 | | | Novartis AG (Registered) | | | 26,559 | |
| | 197 | | | Roche Holding AG | | | 51,524 | |
| | 52 | | | Schindler Holding AG | | | 10,638 | |
| | 4 | | | Sika AG | | | 24,285 | |
| | 36 | | | Swiss Life Holding AG (Registered) (a) | | | 11,624 | |
| | 151 | | | Swiss Re AG | | | 13,134 | |
| | 1,258 | | | UBS Group AG (Registered) (a) | | | 21,483 | |
| | 133 | | | Wolseley plc | | | 8,442 | |
| | | | | | | | |
| | | | | | | 323,317 | |
| | | | | | | | |
| | | | United Kingdom — 15.7% | |
| | 1,161 | | | 3i Group plc | | | 11,935 | |
| | 646 | | | Anglo American plc (a) | | | 9,243 | |
| | 1,688 | | | Aviva plc | | | 11,477 | |
| | 1,672 | | | Barratt Developments plc | | | 12,544 | |
| | 464 | | | Beazley plc | | | 2,646 | |
| | 2,450 | | | BP plc | | | 14,024 | |
| | 603 | | | British American Tobacco plc | | | 40,709 | |
| | 1,033 | | | BT Group plc | | | 4,074 | |
| | 515 | | | Burberry Group plc | | | 10,772 | |
| | 3,265 | | | Centrica plc | | | 8,366 | |
| | 3,362 | | | ConvaTec Group plc (a) (e) | | | 13,371 | |
| | 61 | | | DCC plc | | | 5,654 | |
| | 715 | | | Diageo plc | | | 20,822 | |
| | 233 | | | Dialog Semiconductor plc (a) | | | 10,909 | |
| | 2,123 | | | GKN plc | | | 9,864 | |
| | 510 | | | GlaxoSmithKline plc | | | 10,256 | |
| | 66 | | | Hiscox Ltd. | | | 970 | |
| | 2,174 | | | HSBC Holdings plc | | | 17,928 | |
| | 393 | | | Imperial Brands plc | | | 19,223 | |
| | 100 | | | InterContinental Hotels Group plc | | | 5,296 | |
| | 1,930 | | | International Consolidated Airlines Group SA | | | 13,994 | |
| | 1,127 | | | JD Sports Fashion plc | | | 6,497 | |
| | 477 | | | John Wood Group plc | | | 4,693 | |
| | 22,714 | | | Lloyds Banking Group plc | | | 20,410 | |
| | 398 | | | Pagegroup plc | | | 2,581 | |
SEE NOTES TO FINANCIAL STATEMENTS.
| | | | | | |
| | | |
| 84 | | | | J.P. MORGAN INTERNATIONAL EQUITY FUNDS | | APRIL 30, 2017 |
| | | | | | | | |
| SHARES | | | SECURITY DESCRIPTION | | VALUE($) | |
| | Common Stocks — continued | |
| | | | United Kingdom — continued | |
| | 709 | | | Persimmon plc | | | 21,396 | |
| | 997 | | | Prudential plc | | | 22,131 | |
| | 58 | | | Reckitt Benckiser Group plc | | | 5,306 | |
| | 297 | | | Redrow plc | | | 2,215 | |
| | 643 | | | Rio Tinto plc | | | 25,369 | |
| | 96 | | | Savills plc | | | 1,160 | |
| | 260 | | | Schroders plc | | | 10,729 | |
| | 54 | | | Segro plc | | | 342 | |
| | 802 | | | Subsea 7 SA | | | 13,221 | |
| | 21 | | | TechnipFMC plc (a) | | | 628 | |
| | 976 | | | UBM plc | | | 8,972 | |
| | 812 | | | Unilever NV, CVA | | | 42,545 | |
| | 1,408 | | | Vodafone Group plc | | | 3,627 | |
| | 608 | | | WPP plc | | | 13,017 | |
| | | | | | | | |
| | | | | | | 458,916 | |
| | | | | | | | |
| | | | United States — 1.0% | |
| | 399 | | | Carnival plc | | | 24,599 | |
| | 84 | | | Shire plc | | | 4,974 | |
| | | | | | | | |
| | | | | | | 29,573 | |
| | | | | | | | |
| | | | Total Common Stocks
(Cost $2,601,672) | | | 2,786,774 | |
| | | | | | | | |
| | Preferred Stock — 0.1% | |
| | | | Germany — 0.1% | |
| | 15 | | | Henkel AG & Co. KGaA (Preference)
(Cost $1,833) | | | 2,052 | |
| | | | | | | | |
| | Short-Term Investment — 2.5% | |
| | | | Investment Company — 2.5% | |
| | 73,458 | | | JPMorgan U.S. Government Money Market Fund, Institutional Class Shares, 0.620% (b) (l)
(Cost $73,458) | | | 73,458 | |
| | | | | | | | |
| | | | Total Investments — 97.9%
(Cost $2,676,963) | | | 2,862,284 | |
| | | | Other Assets in Excess of
Liabilities — 2.1% | | | 60,469 | |
| | | | | | | | |
| | | | NET ASSETS — 100.0% | | $ | 2,922,753 | |
| | | | | | | | |
Percentages indicated are based on net assets.
Summary of Investments by Industry, April 30, 2017
The following table represents the portfolio investments of the Fund by industry classifications as a percentage of total investments:
| | | | |
| INDUSTRY | | PERCENTAGE | |
Banks | | | 14.9 | % |
Pharmaceuticals | | | 7.4 | |
Insurance | | | 5.5 | |
Metals & Mining | | | 5.3 | |
Chemicals | | | 3.7 | |
Auto Components | | | 3.5 | |
Electrical Equipment | | | 3.4 | |
Oil, Gas & Consumable Fuels | | | 3.2 | |
Household Durables | | | 2.8 | |
Automobiles | | | 2.5 | |
Construction & Engineering | | | 2.4 | |
Real Estate Management & Development | | | 2.4 | |
Wireless Telecommunication Services | | | 2.3 | |
Tobacco | | | 2.1 | |
Machinery | | | 2.0 | |
Diversified Telecommunication Services | | | 2.0 | |
Multi-Utilities | | | 1.9 | |
Industrial Conglomerates | | | 1.9 | |
Food Products | | | 1.9 | |
Textiles, Apparel & Luxury Goods | | | 1.8 | |
Personal Products | | | 1.8 | |
Hotels, Restaurants & Leisure | | | 1.6 | |
Semiconductors & Semiconductor Equipment | | | 1.6 | |
Capital Markets | | | 1.5 | |
IT Services | | | 1.3 | |
Electric Utilities | | | 1.2 | |
Diversified Financial Services | | | 1.2 | |
Building Products | | | 1.1 | |
Beverages | | | 1.1 | |
Food & Staples Retailing | | | 1.0 | |
Trading Companies & Distributors | | | 1.0 | |
Others (each less than 1.0%) | | | 10.1 | |
Short-Term Investment | | | 2.6 | |
SEE NOTES TO FINANCIAL STATEMENTS.
| | | | | | | | |
| | | |
| APRIL 30, 2017 | | J.P. MORGAN INTERNATIONAL EQUITY FUNDS | | | | | 85 | |
JPMorgan Intrepid International Fund
SCHEDULE OF PORTFOLIO INVESTMENTS
AS OF APRIL 30, 2017 (Unaudited) (continued)
(Amounts in thousands, except number of Futures contracts)
| | | | | | | | | | | | | | | | | | | | | | |
| Futures Contracts | | | | |
| | | | NUMBER OF
CONTRACTS | | DESCRIPTION | | EXPIRATION
DATE | | | TRADING
CURRENCY | | | NOTIONAL
VALUE AT
APRIL 30, 2017 | | | NET
UNREALIZED
APPRECIATION
(DEPRECIATION) | |
| | | | | | Long Futures Outstanding | | | | | |
| | | | 568 | | Euro STOXX 50 Index | | | 06/16/17 | | | | USD | | | $ | 21,707 | | | $ | 51 | |
| | | | 175 | | FTSE 100 Index | | | 06/16/17 | | | | USD | | | | 16,239 | | | | 34 | |
| | | | | | | | | | | | | | | | | | | | | | |
| | | | | | | | $ | 85 | |
| | | | | | | | | | | | | | | | | | | | | | |
SEE NOTES TO FINANCIAL STATEMENTS.
| | | | | | |
| | | |
| 86 | | | | J.P. MORGAN INTERNATIONAL EQUITY FUNDS | | APRIL 30, 2017 |
J.P. Morgan International Equity Funds
NOTES TO SCHEDULE OF PORTFOLIO INVESTMENTS
AS OF APRIL 30, 2017 (Unaudited)
| | |
| ADR | | — American Depositary Receipt |
| AUD | | — Australian Dollar |
| BRL | | — Brazilian Real |
| CAD | | — Canadian Dollar |
| CDI | | — CHESS Depository Interest |
| CHF | | — Swiss Franc |
| CVA | | — Dutch Certification |
| DKK | | — Danish Krone |
| EUR | | — Euro |
| FTSE | | — Financial Times Stock Exchange |
| GBP | | — British Pound |
| GDR | | — Global Depositary Receipt |
| HKD | | — Hong Kong Dollar |
| JPY | | — Japanese Yen |
| MSCI | | — Morgan Stanley Capital International |
| NOK | | — Norwegian Krone |
| NVDR | | — Non Voting Depositary Receipt |
| REIT | | — Real Estate Investment Trust |
| SEK | | — Swedish Krona |
| SGD | | — Singapore Dollar |
| TOPIX | | — Tokyo Stock Price Index |
| USD | | — United States Dollar |
| | |
| VAR | | — Variable Rate Security. The interest rate shown is the rate in effect as of April 30, 2017. |
| |
| (a) | | — Non-income producing security. |
| (b) | | — Investment in affiliate. Money market fund is registered under the Investment Company Act of 1940, as amended, and advised by J.P. Morgan Investment Management Inc. |
| (e) | | — Security is exempt from registration under Rule 144A of the Securities Act of 1933, as amended. Unless otherwise indicated, this security has been determined to be liquid under procedures established by the Board of Trustees and may be resold in transactions exempt from registration, normally to qualified institutional buyers. |
| (g) | | — Amount rounds to less than 0.05%. |
| (h) | | — Amount rounds to less than 500. |
| (l) | | — The rate shown is the current yield as of April 30, 2017. |
| (x) | | — Securities are perpetual and thus, do not have a predetermined maturity date. The coupon rates for these securities are fixed for a period of time and may be structured to adjust thereafter. The dates shown, if applicable, reflect the next call date. The coupon rates shown are the rates in effect as of April 30, 2017. |
| (y) | | — Preferred Security. |
SEE NOTES TO FINANCIAL STATEMENTS.
| | | | | | | | |
| | | |
| APRIL 30, 2017 | | J.P. MORGAN INTERNATIONAL EQUITY FUNDS | | | | | 87 | |
STATEMENTS OF ASSETS AND LIABILITIES
AS OF APRIL 30, 2017 (Unaudited)
(Amounts in thousands, except per share amounts)
| | | | | | | | | | | | |
| | | Emerging
Economies
Fund | | | Emerging
Markets
Equity Fund | | |
Emerging
Markets
Equity
Income Fund | |
ASSETS: | |
Investments in non-affiliates, at value | | $ | 1,841,862 | | | $ | 3,518,327 | | | $ | 15,842 | |
Investments in affiliates, at value | | | 32,084 | | | | 45,041 | | | | 24 | |
| | | | | | | | | | | | |
Total investment securities, at value | | | 1,873,946 | | | | 3,563,368 | | | | 15,866 | |
Cash | | | 1,151 | | | | 1,496 | | | | 159 | |
Foreign currency, at value | | | 573 | | | | 18,233 | | | | 28 | |
Deposits at broker for futures contracts | | | 339 | | | | — | | | | — | |
Receivables: | | | | | | | | | | | | |
Investment securities sold | | | 17,358 | | | | — | | | | 51 | |
Fund shares sold | | | 1,996 | | | | 7,315 | | | | 38 | |
Dividends from non-affiliates | | | 4,324 | | | | 2,993 | | | | 49 | |
Dividends from affiliates | | | 14 | | | | 32 | | | | — | (a) |
Tax reclaims | | | 65 | | | | 279 | | | | 2 | |
Variation margin on futures contracts | | | 25 | | | | — | | | | — | (a) |
Due from adviser | | | — | | | | — | | | | 28 | |
Other assets | | | — | | | | — | | | | 30 | |
| | | | | | | | | | | | |
Total Assets | | | 1,899,791 | | | | 3,593,716 | | | | 16,251 | |
| | | | | | | | | | | | |
| | | |
LIABILITIES: | | | | | | | | | | | | |
Payables: | | | | | | | | | | | | |
Investment securities purchased | | | 8,195 | | | | 17,717 | | | | 80 | |
Fund shares redeemed | | | 6,312 | | | | 5,845 | | | | 11 | |
Accrued liabilities: | | | | | | | | | | | | |
Investment advisory fees | | | 1,009 | | | | 2,146 | | | | — | |
Administration fees | | | 4 | | | | 55 | | | | — | |
Distribution fees | | | 33 | | | | 113 | | | | 2 | |
Service fees | | | 41 | | | | 201 | | | | 3 | |
Custodian and accounting fees | | | 82 | | | | 276 | | | | 12 | |
Trustees’ and Chief Compliance Officer’s fees | | | 2 | | | | 2 | | | | 1 | |
Deferred India capital gains tax | | | 2,193 | | | | 4,937 | | | | — | |
Audit fees | | | 51 | | | | 49 | | | | 53 | |
Printing and mailing cost | | | 16 | | | | 86 | | | | — | |
Other | | | 27 | | | | 72 | | | | 2 | |
| | | | | | | | | | | | |
Total Liabilities | | | 17,965 | | | | 31,499 | | | | 164 | |
| | | | | | | | | | | | |
Net Assets | | $ | 1,881,826 | | | $ | 3,562,217 | | | $ | 16,087 | |
| | | | | | | | | | | | |
| (a) | Amount rounds to less than 500. |
SEE NOTES TO FINANCIAL STATEMENTS.
| | | | | | |
| | | |
| 88 | | | | J.P. MORGAN INTERNATIONAL EQUITY FUNDS | | APRIL 30, 2017 |
| | | | | | | | | | | | |
| | | Emerging
Economies
Fund | | | Emerging
Markets
Equity Fund | | |
Emerging
Markets
Equity
Income Fund | |
NET ASSETS: | |
Paid-in-Capital | | $ | 1,832,468 | | | $ | 2,956,136 | | | $ | 15,489 | |
Accumulated undistributed (distributions in excess of) net investment income | | | 6,320 | | | | 2,227 | | | | 111 | |
Accumulated net realized gains (losses) | | | (190,011 | ) | | | (125,223 | ) | | | (544 | ) |
Net unrealized appreciation (depreciation) | | | 233,049 | | | | 729,077 | | | | 1,031 | |
| | | | | | | | | | | | |
Total Net Assets | | $ | 1,881,826 | | �� | $ | 3,562,217 | | | $ | 16,087 | |
| | | | | | | | | | | | |
| | | |
Net Assets: | | | | | | | | | | | | |
Class A | | $ | 152,637 | | | $ | 454,739 | | | $ | 10,671 | |
Class C | | | 2,723 | | | | 37,694 | | | | 113 | |
Class I (formerly Select Class) | | | 59,491 | | | | 402,793 | | | | 5,227 | |
Class L (formerly Institutional Class) | | | — | | | | 511,475 | | | | — | |
Class R5 | | | 1,356 | | | | 22 | | | | 20 | |
Class R6 | | | 1,665,619 | | | | 2,155,494 | | | | 56 | |
| | | | | | | | | | | | |
Total | | $ | 1,881,826 | | | $ | 3,562,217 | | | $ | 16,087 | |
| | | | | | | | | | | | |
| | | |
Outstanding units of beneficial interest (shares) | | | | | | | | | | | | |
($0.0001 par value; unlimited number of shares authorized): | | | | | | | | | | | | |
Class A | | | 12,083 | | | | 19,089 | | | | 755 | |
Class C | | | 217 | | | | 1,624 | | | | 8 | |
Class I (formerly Select Class) | | | 4,651 | | | | 16,510 | | | | 368 | |
Class L (formerly Institutional Class) | | | — | | | | 20,834 | | | | — | |
Class R5 | | | 105 | | | | 1 | | | | 1 | |
Class R6 | | | 130,910 | | | | 87,931 | | | | 4 | |
| | | |
Net Asset Value (a): | | | | | | | | | | | | |
Class A — Redemption price per share | | $ | 12.63 | | | $ | 23.82 | | | $ | 14.13 | |
Class C — Offering price per share (b) | | | 12.55 | | | | 23.20 | | | | 14.10 | |
Class I (formerly Select Class) — Offering and redemption price per share | | | 12.79 | | | | 24.40 | | | | 14.19 | |
Class L (formerly Institutional Class) — Offering and redemption price per share | | | — | | | | 24.55 | | | | — | |
Class R5 — Offering and redemption price per share | | | 12.90 | | | | 24.54 | | | | 14.20 | |
Class R6 — Offering and redemption price per share | | | 12.72 | | | | 24.51 | | | | 14.20 | |
Class A maximum sales charge | | | 5.25 | % | | | 5.25 | % | | | 5.25 | % |
Class A maximum public offering price per share | | | | | | | | | | | | |
[net asset value per share/(100% — maximum sales charge)] | | $ | 13.33 | | | $ | 25.14 | | | $ | 14.91 | |
| | | | | | | | | | | | |
| | | |
Cost of investments in non-affiliates | | $ | 1,606,704 | | | $ | 2,784,308 | | | $ | 14,811 | |
Cost of investments in affiliates | | | 32,084 | | | | 45,041 | | | | 24 | |
Cost of foreign currency | | | 579 | | | | 18,237 | | | | 28 | |
| (a) | Per share amounts may not recalculate due to rounding of net assets and/or shares outstanding. |
| (b) | Redemption price for Class C Shares varies based upon length of time the shares are held. |
SEE NOTES TO FINANCIAL STATEMENTS.
| | | | | | | | |
| | | |
| APRIL 30, 2017 | | J.P. MORGAN INTERNATIONAL EQUITY FUNDS | | | | | 89 | |
STATEMENTS OF ASSETS AND LIABILITIES
AS OF APRIL 30, 2017 (Unaudited) (continued)
(Amounts in thousands, except per share amounts)
| | | | | | | | | | | | |
| | |
Global
Research
Enhanced
Index Fund | | | Global
Unconstrained
Equity Fund | | | International
Discovery
Fund | |
ASSETS: | |
Investments in non-affiliates, at value | | $ | 7,646,831 | | | $ | 1,984 | | | $ | 6,680 | |
Investments in affiliates, at value | | | 46,476 | | | | 39 | | | | — | |
| | | | | | | | | | | | |
Total investment securities, at value | | | 7,693,307 | | | | 2,023 | | | | 6,680 | |
Cash | | | 2,392 | | | | 70 | | | | 186 | |
Foreign currency, at value | | | 3,446 | | | | 11 | | | | 5 | |
Deposits at broker for futures contracts | | | 1,296 | | | | — | | | | — | |
Receivables: | | | | | | | | | | | | |
Investment securities sold | | | 1,604 | | | | 24 | | | | 119 | |
Fund shares sold | | | 7,554 | | | | 22 | | | | — | |
Dividends from non-affiliates | | | 13,789 | | | | 4 | | | | 29 | |
Dividends from affiliates | | | 27 | | | | — | (a) | | | — | |
Tax reclaims | | | 6,358 | | | | 14 | | | | 2 | |
Due from adviser | | | — | | | | 24 | | | | 33 | |
Other assets | | | — | | | | 22 | | | | — | |
| | | | | | | | | | | | |
Total Assets | | | 7,729,773 | | | | 2,214 | | | | 7,054 | |
| | | | | | | | | | | | |
| | | |
LIABILITIES: | | | | | | | | | | | | |
Payables: | | | | | | | | | | | | |
Investment securities purchased | | | 6,021 | | | | 20 | | | | 214 | |
Fund shares redeemed | | | 5,332 | | | | — | | | | — | |
Variation margin on futures contracts | | | 32 | | | | — | | | | — | |
Accrued liabilities: | | | | | | | | | | | | |
Investment advisory fees | | | 465 | | | | — | | | | — | |
Distribution fees | | | — | (a) | | | — | (a) | | | — | (a) |
Service fees | | | 1,543 | | | | — | (a) | | | 1 | |
Custodian and accounting fees | | | 99 | | | | 7 | | | | 18 | |
Trustees’ and Chief Compliance Officer’s fees | | | 18 | | | | — | (a) | | | — | (a) |
Audit fees | | | 46 | | | | 54 | | | | 53 | |
Printing and mailing cost | | | 65 | | | | 5 | | | | 4 | |
Other | | | — | | | | 3 | | | | 2 | |
| | | | | | | | | | | | |
Total Liabilities | | | 13,621 | | | | 89 | | | | 292 | |
| | | | | | | | | | | | |
Net Assets | | $ | 7,716,152 | | | $ | 2,125 | | | $ | 6,762 | |
| | | | | | | | | | | | |
| (a) | Amount rounds to less than 500. |
SEE NOTES TO FINANCIAL STATEMENTS.
| | | | | | |
| | | |
| 90 | | | | J.P. MORGAN INTERNATIONAL EQUITY FUNDS | | APRIL 30, 2017 |
| | | | | | | | | | | | |
| | |
Global
Research
Enhanced
Index Fund | | | Global
Unconstrained
Equity Fund | | | International
Discovery
Fund | |
NET ASSETS: | |
Paid-in-Capital | | $ | 6,649,649 | | | $ | 1,944 | | | $ | 6,041 | |
Accumulated undistributed (distributions in excess of) net investment income | | | 39,651 | | | | (1 | ) | | | 31 | |
Accumulated net realized gains (losses) | | | (293,804 | ) | | | 55 | | | | (426 | ) |
Net unrealized appreciation (depreciation) | | | 1,320,656 | | | | 127 | | | | 1,116 | |
| | | | | | | | | | | | |
Total Net Assets | | $ | 7,716,152 | | | $ | 2,125 | | | $ | 6,762 | |
| | | | | | | | | | | | |
| | | |
Net Assets: | | | | | | | | | | | | |
Class A | | $ | 23 | | | $ | 679 | | | $ | 133 | |
Class C | | | 22 | | | | 263 | | | | 22 | |
Class I (formerly Select Class) | | | 7,716,084 | | | | 1,123 | | | | 6,563 | |
Class R2 | | | 23 | | | | 20 | | | | — | |
Class R5 | | | — | | | | 20 | | | | 22 | |
Class R6 | | | — | | | | 20 | | | | 22 | |
| | | | | | | | | | | | |
Total | | $ | 7,716,152 | | | $ | 2,125 | | | $ | 6,762 | |
| | | | | | | | | | | | |
| | | |
Outstanding units of beneficial interest (shares) | | | | | | | | | | | | |
($0.0001 par value; unlimited number of shares authorized): | | | | | | | | | | | | |
Class A | | | 1 | | | | 42 | | | | 8 | |
Class C | | | 1 | | | | 17 | | | | 1 | |
Class I (formerly Select Class) | | | 380,697 | | | | 69 | | | | 397 | |
Class R2 | | | 1 | | | | 1 | | | | — | |
Class R5 | | | — | | | | 1 | | | | 1 | |
Class R6 | | | — | | | | 1 | | | | 1 | |
| | | |
Net Asset Value (a): | | | | | | | | | | | | |
Class A — Redemption price per share | | $ | 20.38 | | | $ | 16.12 | | | $ | 16.52 | |
Class C — Offering price per share (b) | | | 20.44 | | | | 15.96 | | | | 16.48 | |
Class I (formerly Select Class) — Offering and redemption price per share | | | 20.27 | | | | 16.24 | | | | 16.55 | |
Class R2 — Offering and redemption price per share | | | 20.41 | | | | 16.23 | | | | — | |
Class R5 — Offering and redemption price per share | | | — | | | | 16.18 | | | | 16.56 | |
Class R6 — Offering and redemption price per share | | | — | | | | 16.17 | | | | 16.56 | |
Class A maximum sales charge | | | 5.25 | % | | | 5.25 | % | | | 5.25 | % |
Class A maximum public offering price per share | | | | | | | | | | | | |
[net asset value per share/(100% — maximum sales charge)] | | $ | 21.51 | | | $ | 17.01 | | | $ | 17.44 | |
| | | | | | | | | | | | |
| | | |
Cost of investments in non-affiliates | | $ | 6,326,652 | | | $ | 1,857 | | | $ | 5,564 | |
Cost of investments in affiliates | | | 46,476 | | | | 39 | | | | — | |
Cost of foreign currency | | | 3,430 | | | | 11 | | | | 5 | |
| (a) | Per share amounts may not recalculate due to rounding of net assets and/or shares outstanding. |
| (b) | Redemption price for Class C Shares varies based upon length of time the shares are held. |
SEE NOTES TO FINANCIAL STATEMENTS.
| | | | | | | | |
| | | |
| APRIL 30, 2017 | | J.P. MORGAN INTERNATIONAL EQUITY FUNDS | | | | | 91 | |
STATEMENTS OF ASSETS AND LIABILITIES
AS OF APRIL 30, 2017 (Unaudited) (continued)
(Amounts in thousands, except per share amounts)
| | | | | | | | | | | | |
| | | International
Equity Fund | | |
International
Equity
Income Fund | | | International
Opportunities
Fund | |
ASSETS: | |
Investments in non-affiliates, at value | | $ | 3,619,211 | | | $ | 170,592 | | | $ | 2,937,822 | |
Investments in affiliates, at value | | | 76,383 | | | | 3,386 | | | | 38,835 | |
| | | | | | | | | | | | |
Total investment securities, at value | | | 3,695,594 | | | | 173,978 | | | | 2,976,657 | |
Cash | | | 132 | | | | 111 | | | | 50 | |
Foreign currency, at value | | | 722 | | | | 444 | | | | 17 | |
Receivables: | | | | | | | | | | | | |
Investment securities sold | | | — | | | | — | | | | — | (a) |
Fund shares sold | | | 693 | | | | 751 | | | | 491 | |
Interest and dividends from non-affiliates | | | 12,468 | | | | 1,017 | | | | 10,286 | |
Dividends from affiliates | | | 31 | | | | 3 | | | | 28 | |
Tax reclaims | | | 5,167 | | | | 247 | | | | 2,944 | |
Unrealized appreciation on forward foreign currency exchange contracts | | | — | | | | — | | | | 9,115 | |
| | | | | | | | | | | | |
Total Assets | | | 3,714,807 | | | | 176,551 | | | | 2,999,588 | |
| | | | | | | | | | | | |
| | | |
LIABILITIES: | | | | | | | | | | | | |
Payables: | | | | | | | | | | | | |
Investment securities purchased | | | 16,564 | | | | — | | | | — | |
Fund shares redeemed | | | 7,326 | | | | 473 | | | | 10,990 | |
Unrealized depreciation on forward foreign currency exchange contracts | | | 5 | | | | — | | | | 15,012 | |
Accrued liabilities: | | | | | | | | | | | | |
Investment advisory fees | | | 1,929 | | | | 68 | | | | 1,423 | |
Administration fees | | | 154 | | | | — | | | | 194 | |
Distribution fees | | | 66 | | | | 23 | | | | 42 | |
Service fees | | | 75 | | | | 27 | | | | 50 | |
Custodian and accounting fees | | | 75 | | | | 16 | | | | 60 | |
Trustees’ and Chief Compliance Officer’s fees | | | 6 | | | | 1 | | | | 2 | |
Audit fees | | | 58 | | | | 57 | | | | 19 | |
Printing and mailing cost | | | 67 | | | | 10 | | | | 18 | |
Other | | | 72 | | | | 4 | | | | 27 | |
| | | | | | | | | | | | |
Total Liabilities | | | 26,397 | | | | 679 | | | | 27,837 | |
| | | | | | | | | | | | |
Net Assets | | $ | 3,688,410 | | | $ | 175,872 | | | $ | 2,971,751 | |
| | | | | | | | | | | | |
| (a) | Amount rounds to less than 500. |
SEE NOTES TO FINANCIAL STATEMENTS.
| | | | | | |
| | | |
| 92 | | �� | | J.P. MORGAN INTERNATIONAL EQUITY FUNDS | | APRIL 30, 2017 |
| | | | | | | | | | | | |
| | | International
Equity Fund | | |
International
Equity
Income Fund | | | International
Opportunities
Fund | |
NET ASSETS: | |
Paid-in-Capital | | $ | 3,196,752 | | | $ | 171,876 | | | $ | 2,693,240 | |
Accumulated undistributed (distributions in excess of) net investment income | | | 10,013 | | | | (57 | ) | | | 11,077 | |
Accumulated net realized gains (losses) | | | (65,934 | ) | | | (11,305 | ) | | | (126,303 | ) |
Net unrealized appreciation (depreciation) | | | 547,579 | | | | 15,358 | | | | 393,737 | |
| | | | | | | | | | | | |
Total Net Assets | | $ | 3,688,410 | | | $ | 175,872 | | | $ | 2,971,751 | |
| | | | | | | | | | | | |
| | | |
Net Assets: | | | | | | | | | | | | |
Class A | | $ | 257,057 | | | $ | 74,610 | | | $ | 204,929 | |
Class C | | | 23,139 | | | | 13,128 | | | | 1,484 | |
Class I (formerly Select Class) | | | 112,377 | | | | 85,893 | | | | 47,653 | |
Class R2 | | | 1,533 | | | | 472 | | | | — | |
Class R5 | | | 19,619 | | | | 1,637 | | | | — | |
Class R6 | | | 3,274,685 | | | | 132 | | | | 2,717,685 | |
| | | | | | | | | | | | |
Total | | $ | 3,688,410 | | | $ | 175,872 | | | $ | 2,971,751 | |
| | | | | | | | | | | | |
| | | |
Outstanding units of beneficial interest (shares) | | | | | | | | | | | | |
($0.0001 par value; unlimited number of shares authorized): | | | | | | | | | | | | |
Class A | | | 16,316 | | | | 4,857 | | | | 13,637 | |
Class C | | | 1,551 | | | | 860 | | | | 102 | |
Class I (formerly Select Class) | | | 7,031 | | | | 5,576 | | | | 3,128 | |
Class R2 | | | 98 | | | | 31 | | | | — | |
Class R5 | | | 1,226 | | | | 106 | | | | — | |
Class R6 | | | 204,657 | | | | 9 | | | | 177,853 | |
| | | |
Net Asset Value (a): | | | | | | | | | | | | |
Class A — Redemption price per share | | $ | 15.75 | | | $ | 15.36 | | | $ | 15.03 | |
Class C — Offering price per share (b) | | | 14.93 | | | | 15.26 | | | | 14.54 | |
Class I (formerly Select Class) — Offering and redemption price per share | | | 15.98 | | | | 15.40 | | | | 15.23 | |
Class R2 — Offering and redemption price per share | | | 15.68 | | | | 15.33 | | | | — | |
Class R5 — Offering and redemption price per share | | | 16.00 | | | | 15.41 | | | | — | |
Class R6 — Offering and redemption price per share | | | 16.00 | | | | 15.40 | | | | 15.28 | |
Class A maximum sales charge | | | 5.25 | % | | | 5.25 | % | | | 5.25 | % |
Class A maximum public offering price per share | | | | | | | | | | | | |
[net asset value per share/(100% — maximum sales charge)] | | $ | 16.62 | | | $ | 16.21 | | | $ | 15.86 | |
| | | | | | | | | | | | |
| | | |
Cost of investments in non-affiliates | | $ | 3,071,623 | | | $ | 155,245 | | | $ | 2,538,129 | |
Cost of investments in affiliates | | | 76,383 | | | | 3,386 | | | | 38,835 | |
Cost of foreign currency | | | 722 | | | | 444 | | | | 19 | |
| (a) | Per share amounts may not recalculate due to rounding of net assets and/or shares outstanding. |
| (b) | Redemption price for Class C Shares varies based upon length of time the shares are held. |
SEE NOTES TO FINANCIAL STATEMENTS.
| | | | | | | | |
| | | |
| APRIL 30, 2017 | | J.P. MORGAN INTERNATIONAL EQUITY FUNDS | | | | | 93 | |
STATEMENTS OF ASSETS AND LIABILITIES
AS OF APRIL 30, 2017 (Unaudited) (continued)
(Amounts in thousands, except per share amounts)
| | | | | | | | | | | | | | | | |
| | |
International
Research
Enhanced
Equity Fund | | | International
Unconstrained
Equity Fund | | | International
Value Fund | | | Intrepid
International
Fund | |
ASSETS: | |
Investments in non-affiliates, at value | | $ | 1,620,237 | | | $ | 167,000 | | | $ | 801,570 | | | $ | 2,788,826 | |
Investments in affiliates, at value | | | 36,122 | | | | 5,532 | | | | 22,045 | | | | 73,458 | |
| | | | | | | | | | | | | | | | |
Total investment securities, at value | | | 1,656,359 | | | | 172,532 | | | | 823,615 | | | | 2,862,284 | |
Cash | | | 7,961 | | | | 510 | | | | 181 | | | | — | |
Foreign currency, at value | | | 1,923 | | | | 48 | | | | 85 | | | | 2,108 | |
Deposits at broker for futures contracts | | | 1,598 | | | | — | | | | — | | | | — | |
Due from custodian | | | 2,015 | | | | — | | | | 2,464 | | | | — | |
Receivables: | | | | | | | | | | | | | | | | |
Investment securities sold | | | 13,153 | | | | — | (a) | | | — | | | | 428,136 | |
Fund shares sold | | | 62,845 | | | | 1,906 | | | | 2,050 | | | | 445 | |
Interest and dividends from non-affiliates | | | 4,664 | | | | 541 | | | | 2,424 | | | | 11,787 | |
Dividends from affiliates | | | 26 | | | | 2 | | | | 7 | | | | 38 | |
Tax reclaims | | | 2,361 | | | | 63 | | | | 2,418 | | | | 4,171 | |
Variation margin on futures contracts | | | — | | | | — | | | | — | | | | 85 | |
Unrealized appreciation on forward foreign currency exchange contracts | | | 3 | | | | — | | | | 4,013 | | | | — | |
Other assets | | | 71 | | | | 25 | | | | — | | | | — | |
| | | | | | | | | | | | | | | | |
Total Assets | | | 1,752,979 | | | | 175,627 | | | | 837,257 | | | | 3,309,054 | |
| | | | | | | | | | | | | | | | |
| | | | |
LIABILITIES: | | | | | | | | | | | | | | | | |
Payables: | | | | | | | | | | | | | | | | |
Due to custodian | | | — | | | | — | | | | — | | | | 11 | |
Investment securities purchased | | | 35,854 | | | | 1,088 | | | | 2,464 | | | | 378,560 | |
Fund shares redeemed | | | 656 | | | | 7 | | | | 1,457 | | | | 5,916 | |
Variation margin on futures contracts | | | 19 | | | | — | | | | — | | | | — | |
Unrealized depreciation on forward foreign currency exchange contracts | | | — | | | | — | | | | 7,340 | | | | — | |
Accrued liabilities: | | | | | | | | | | | | | | | | |
Investment advisory fees | | | 54 | | | | 78 | | | | 388 | | | | 1,396 | |
Administration fees | | | — | | | | 1 | | | | 53 | | | | 191 | |
Distribution fees | | | 27 | | | | 8 | | | | 73 | | | | 41 | |
Service fees | | | 308 | | | | 8 | | | | 118 | | | | 48 | |
Custodian and accounting fees | | | 37 | | | | 11 | | | | 54 | | | | 75 | |
Trustees’ and Chief Compliance Officer’s fees | | | 1 | | | | 1 | | | | — | (a) | | | 1 | |
Audit fees | | | 45 | | | | 56 | | | | 1 | | | | 31 | |
Printing and mailing cost | | | 17 | | | | 1 | | | | 183 | | | | 16 | |
Other | | | 17 | | | | 9 | | | | 269 | | | | 15 | |
| | | | | | | | | | | | | | | | |
Total Liabilities | | | 37,035 | | | | 1,268 | | | | 12,400 | | | | 386,301 | |
| | | | | | | | | | | | | | | | |
Net Assets | | $ | 1,715,944 | | | $ | 174,359 | | | $ | 824,857 | | | $ | 2,922,753 | |
| | | | | | | | | | | | | | | | |
| (a) | Amount rounds to less than 500. |
SEE NOTES TO FINANCIAL STATEMENTS.
| | | | | | |
| | | |
| 94 | | | | J.P. MORGAN INTERNATIONAL EQUITY FUNDS | | APRIL 30, 2017 |
| | | | | | | | | | | | | | | | |
| | |
International
Research
Enhanced
Equity Fund | | | International
Unconstrained
Equity Fund | | | International
Value Fund | | | Intrepid
International
Fund | |
NET ASSETS: | |
Paid-in-Capital | | $ | 1,536,841 | | | $ | 163,452 | | | $ | 1,124,355 | | | $ | 2,939,893 | |
Accumulated undistributed (distributions in excess of) net investment income | | | 11,227 | | | | 496 | | | | 3,696 | | | | 20,112 | |
Accumulated net realized gains (losses) | | | (1,026 | ) | | | (3,772 | ) | | | (338,806 | ) | | | (222,672 | ) |
Net unrealized appreciation (depreciation) | | | 168,902 | | | | 14,183 | | | | 35,612 | | | | 185,420 | |
| | | | | | | | | | | | | | | | |
Total Net Assets | | $ | 1,715,944 | | | $ | 174,359 | | | $ | 824,857 | | | $ | 2,922,753 | |
| | | | | | | | | | | | | | | | |
| | | | |
Net Assets: | | | | | | | | | | | | | | | | |
Class A | | $ | 71,210 | | | $ | 26,032 | | | $ | 294,864 | | | $ | 199,735 | |
Class C | | | 12,585 | | | | 5,735 | | | | 22,320 | | | | 1,914 | |
Class I (formerly Select Class) | | | 1,619,251 | | | | 30,034 | | | | 151,737 | | | | 49,895 | |
Class L (formerly Institutional Class) | | | — | | | | — | | | | 323,408 | | | | — | |
Class R2 | | | 12,898 | | | | 22 | | | | 1,276 | | | | 536 | |
Class R5 | | | — | | | | 22 | | | | 23 | | | | — | |
Class R6 | | | — | | | | 112,514 | | | | 31,229 | | | | 2,670,673 | |
| | | | | | | | | | | | | | | | |
Total | | $ | 1,715,944 | | | $ | 174,359 | | | $ | 824,857 | | | $ | 2,922,753 | |
| | | | | | | | | | | | | | | | |
| | | | |
Outstanding units of beneficial interest (shares) ($0.0001 par value; unlimited number of shares authorized): | | | | | | | | | | | | | | | | |
Class A | | | 4,163 | | | | 1,381 | | | | 22,637 | | | | 9,948 | |
Class C | | | 767 | | | | 307 | | | | 1,769 | | | | 94 | |
Class I (formerly Select Class) | | | 93,996 | | | | 1,577 | | | | 11,380 | | | | 2,392 | |
Class L (formerly Institutional Class) | | | — | | | | — | | | | 24,393 | | | | — | |
Class R2 | | | 773 | | | | 1 | | | | 100 | | | | 27 | |
Class R5 | | | — | | | | 1 | | | | 2 | | | | — | |
Class R6 | | | — | | | | 5,913 | | | | 2,360 | | | | 130,041 | |
| | | | |
Net Asset Value (a): | | | | | | | | | | | | | | | | |
Class A — Redemption price per share | | $ | 17.10 | | | $ | 18.84 | | | $ | 13.03 | | | $ | 20.08 | |
Class C — Offering price per share (b) | | | 16.41 | | | | 18.68 | | | | 12.62 | | | | 20.30 | |
Class I (formerly Select Class) — Offering and redemption price per share | | | 17.23 | | | | 19.05 | | | | 13.33 | | | | 20.86 | |
Class L (formerly Institutional Class) — Offering and redemption price per share | | | — | | | | — | | | | 13.26 | | | | — | |
Class R2 — Offering and redemption price per share | | | 16.68 | | | | 18.84 | | | | 12.81 | | | | 19.91 | |
Class R5 — Offering and redemption price per share | | | — | | | | 19.03 | | | | 13.22 | | | | — | |
Class R6 — Offering and redemption price per share | | | — | | | | 19.03 | | | | 13.23 | | | | 20.54 | |
Class A maximum sales charge | | | 5.25 | % | | | 5.25 | % | | | 5.25 | % | | | 5.25 | % |
Class A maximum public offering price per share | | | | | | | | | | | | | | | | |
[net asset value per share/(100% — maximum sales charge)] | | $ | 18.05 | | | $ | 19.88 | | | $ | 13.75 | | | $ | 21.19 | |
| | | | | | | | | | | | | | | | |
| | | | |
Cost of investments in non-affiliates | | $ | 1,451,805 | | | $ | 152,822 | | | $ | 762,383 | | | $ | 2,603,505 | |
Cost of investments in affiliates | | | 36,122 | | | | 5,532 | | | | 22,045 | | | | 73,458 | |
Cost of foreign currency | | | 1,933 | | | | 48 | | | | 85 | | | | 2,108 | |
| (a) | Per share amounts may not recalculate due to rounding of net assets and/or shares outstanding. |
| (b) | Redemption price for Class C Shares varies based upon length of time the shares are held. |
SEE NOTES TO FINANCIAL STATEMENTS.
| | | | | | | | |
| | | |
| APRIL 30, 2017 | | J.P. MORGAN INTERNATIONAL EQUITY FUNDS | | | | | 95 | |
STATEMENTS OF OPERATIONS
FOR THE SIX MONTHS ENDED APRIL 30, 2017 (Unaudited)
(Amounts in thousands)
| | | | | | | | | | | | |
| | | Emerging
Economies
Fund | | | Emerging
Markets
Equity Fund | | |
Emerging
Markets
Equity
Income Fund | |
INVESTMENT INCOME: | | | | | | | | | | | | |
Interest income from non-affiliates | | $ | — | | | $ | — | | | $ | — | (a) |
Interest income from affiliates | | | 1 | | | | 6 | | | | — | (a) |
Dividend income from non-affiliates | | | 21,984 | | | | 23,912 | | | | 256 | |
Dividend income from affiliates | | | 71 | | | | 135 | | | | — | (a) |
Foreign taxes withheld | | | (1,911 | ) | | | (1,674 | ) | | | (19 | ) |
| | | | | | | | | | | | |
Total investment income | | | 20,145 | | | | 22,379 | | | | 237 | |
| | | | | | | | | | | | |
| | | |
EXPENSES: | | | | | | | | | | | | |
Investment advisory fees | | | 7,646 | | | | 13,500 | | | | 64 | |
Administration fees | | | 736 | | | | 1,299 | | | | 5 | |
Distribution fees: | | | | | | | | | | | | |
Class A | | | 182 | | | | 504 | | | | 11 | |
Class C | | | 9 | | | | 133 | | | | — | (a) |
Service fees: | | | | | | | | | | | | |
Class A | | | 182 | | | | 504 | | | | 11 | |
Class C | | | 3 | | | | 44 | | | | — | (a) |
Class I (formerly Select Class) | | | 68 | | | | 402 | | | | 5 | |
Class L (formerly Institutional Class) | | | — | | | | 214 | | | | — | |
Class R5 | | | 1 | | | | — | (a) | | | — | (a) |
Custodian and accounting fees | | | 796 | | | | 901 | | | | 39 | |
Interest expense to affiliates | | | 8 | | | | 2 | | | | — | (a) |
Professional fees | | | 62 | | | | 50 | | | | 46 | |
Trustees’ and Chief Compliance Officer’s fees | | | 18 | | | | 19 | | | | 13 | |
Printing and mailing costs | | | 26 | | | | 115 | | | | 1 | |
Registration and filing fees | | | 32 | | | | 56 | | | | 39 | |
Transfer agency fees (See Note 2.J.) | | | 12 | | | | 58 | | | | — | (a) |
Sub-transfer agency fees (See Note 2.J.) | | | 61 | | | | 503 | | | | 2 | |
Other | | | 20 | | | | 27 | | | | 4 | |
| | | | | | | | | | | | |
Total expenses | | | 9,862 | | | | 18,331 | | | | 240 | |
| | | | | | | | | | | | |
Less fees waived | | | (1,784 | ) | | | (3,080 | ) | | | (72 | ) |
Less expense reimbursements | | | (4 | ) | | | (3 | ) | | | (75 | ) |
| | | | | | | | | | | | |
Net expenses | | | 8,074 | | | | 15,248 | | | | 93 | |
| | | | | | | | | | | | |
Net investment income (loss) | | | 12,071 | | | | 7,131 | | | | 144 | |
| | | | | | | | | | | | |
| | | |
REALIZED/UNREALIZED GAINS (LOSSES): | | | | | | | | | | | | |
Net realized gain (loss) on transactions from: | | | | | | | | | | | | |
Investments in non-affiliates | | | 55,131 | | | | (12,964 | ) | | | (16 | ) |
Futures | | | (195 | ) | | | — | | | | (1 | ) |
Foreign currency transactions | | | 82 | | | | 199 | | | | (3 | ) |
| | | | | | | | | | | | |
Net realized gain (loss) | | | 55,018 | | | | (12,765 | ) | | | (20 | ) |
| | | | | | | | | | | | |
Change in net unrealized appreciation/depreciation on: | | | | | | | | | | | | |
Investments in non-affiliates | | | 128,449 | (b) | | | 336,523 | (c) | | | 614 | |
Futures | | | 324 | | | | — | | | | — | |
Foreign currency translations | | | 5 | | | | (15 | ) | | | — | (a) |
| | | | | | | | | | | | |
Change in net unrealized appreciation/depreciation | | | 128,778 | | | | 336,508 | | | | 614 | |
| | | | | | | | | | | | |
Net realized/unrealized gains (losses) | | | 183,796 | | | | 323,743 | | | | 594 | |
| | | | | | | | | | | | |
Change in net assets resulting from operations | | $ | 195,867 | | | $ | 330,874 | | | $ | 738 | |
| | | | | | | | | | | | |
| (a) | Amount rounds to less than 500. |
| (b) | Net of change in India capital gains tax of approximately $(1,356,000) for Emerging Economies Fund. |
| (c) | Net of change in India capital gains tax of approximately $(309,000) for Emerging Markets Equity Fund. |
SEE NOTES TO FINANCIAL STATEMENTS.
| | | | | | |
| | | |
| 96 | | | | J.P. MORGAN INTERNATIONAL EQUITY FUNDS | | APRIL 30, 2017 |
| | | | | | | | | | | | |
| | |
Global
Research
Enhanced
Index Fund | | | Global
Unconstrained
Equity Fund | | | International
Discovery
Fund | |
INVESTMENT INCOME: | |
Interest income from non-affiliates | | $ | — | (a) | | $ | — | (a) | | $ | — | (a) |
Interest income from affiliates | | | 6 | | | | — | (a) | | | — | |
Dividend income from non-affiliates | | | 85,954 | | | | 14 | | | | 70 | |
Dividend income from affiliates | | | 102 | | | | — | (a) | | | — | |
Foreign taxes withheld | | | (4,017 | ) | | | (1 | ) | | | (7 | ) |
| | | | | | | | | | | | |
Total investment income | | | 82,045 | | | | 13 | | | | 63 | |
| | | | | | | | | | | | |
| | | |
EXPENSES: | | | | | | | | | | | | |
Investment advisory fees | | | 7,237 | | | | 6 | | | | 21 | |
Administration fees | | | 2,960 | | | | 1 | | | | 2 | |
Distribution fees: | | | | | | | | | | | | |
Class A | | | — | (a) | | | 1 | | | | — | (a) |
Class C | | | — | (a) | | | 1 | | | | — | (a) |
Class R2 | | | — | (a) | | | — | (a) | | | — | |
Service fees: | | | | | | | | | | | | |
Class A | | | — | (a) | | | 1 | | | | — | (a) |
Class C | | | — | (a) | | | — | (a) | | | — | (a) |
Class I (formerly Select Class) | | | 9,046 | | | | 1 | | | | 7 | |
Class R2 | | | — | (a) | | | — | (a) | | | — | |
Class R5 | | | — | | | | — | (a) | | | — | (a) |
Custodian and accounting fees | | | 281 | | | | 19 | | | | 49 | |
Interest expense to affiliates | | | 13 | | | | — | (a) | | | — | (a) |
Professional fees | | | 80 | | | | 38 | | | | 36 | |
Trustees’ and Chief Compliance Officer’s fees | | | 6 | | | | 13 | | | | 13 | |
Printing and mailing costs | | | 87 | | | | 7 | | | | 13 | |
Registration and filing fees | | | 19 | | | | 50 | | | | 7 | |
Transfer agency fees (See Note 2.J.) | | | 27 | | | | 1 | | | | — | (a) |
Sub-transfer agency fees (See Note 2.J.) | | | 115 | | | | 1 | | | | — | (a) |
Offering costs | | | — | | | | — | | | | 93 | |
Other | | | 42 | | | | 4 | | | | 3 | |
| | | | | | | | | | | | |
Total expenses | | | 19,913 | | | | 144 | | | | 244 | |
| | | | | | | | | | | | |
Less fees waived | | | (7,632 | ) | | | (9 | ) | | | (25 | ) |
Less expense reimbursements | | | — | (a) | | | (129 | ) | | | (192 | ) |
| | | | | | | | | | | | |
Net expenses | | | 12,281 | | | | 6 | | | | 27 | |
| | | | | | | | | | | | |
Net investment income (loss) | | | 69,764 | | | | 7 | | | | 36 | |
| | | | | | | | | | | | |
| | | |
REALIZED/UNREALIZED GAINS (LOSSES): | | | | | | | | | | | | |
Net realized gain (loss) on transactions from: | | | | | | | | | | | | |
Investments in non-affiliates | | | 29,869 | | | | 108 | | | | 2 | |
Foreign currency transactions | | | (222 | ) | | | (1 | ) | | | (2 | ) |
| | | | | | | | | | | | |
Net realized gain (loss) | | | 29,647 | | | | 107 | | | | — | (a) |
| | | | | | | | | | | | |
Change in net unrealized appreciation/depreciation on: | | | | | | | | | | | | |
Investments in non-affiliates | | | 773,038 | | | | 128 | | | | 687 | |
Futures | | | 646 | | | | — | | | | — | |
Foreign currency translations | | | 378 | | | | — | (a) | | | — | (a) |
| | | | | | | | | | | | |
Change in net unrealized appreciation/depreciation | | | 774,062 | | | | 128 | | | | 687 | |
| | | | | | | | | | | | |
Net realized/unrealized gains (losses) | | | 803,709 | | | | 235 | | | | 687 | |
| | | | | | | | | | | | |
Change in net assets resulting from operations | | $ | 873,473 | | | $ | 242 | | | $ | 723 | |
| | | | | | | | | | | | |
| (a) | Amount rounds to less than 500. |
SEE NOTES TO FINANCIAL STATEMENTS.
| | | | | | | | |
| | | |
| APRIL 30, 2017 | | J.P. MORGAN INTERNATIONAL EQUITY FUNDS | | | | | 97 | |
STATEMENTS OF OPERATIONS
FOR THE SIX MONTHS ENDED APRIL 30, 2017 (Unaudited) (continued)
(Amounts in thousands)
| | | | | | | | | | | | |
| | | International
Equity Fund | | |
International
Equity
Income Fund | | | International
Opportunities
Fund | |
INVESTMENT INCOME: | |
Interest income from non-affiliates | | $ | — | (a) | | $ | — | (a) | | $ | 1 | |
Interest income from affiliates | | | 3 | | | | 1 | | | | 1 | |
Dividend income from non-affiliates | | | 39,480 | | | | 3,760 | | | | 39,139 | |
Dividend income from affiliates | | | 123 | | | | 8 | | | | 118 | |
Foreign taxes withheld | | | (3,067 | ) | | | (349 | ) | | | (3,674 | ) |
| | | | | | | | | | | | |
Total investment income | | | 36,539 | | | | 3,420 | | | | 35,585 | |
| | | | | | | | | | | | |
| | | |
EXPENSES: | | | | | | | | | | | | |
Investment advisory fees | | | 12,172 | | | | 524 | | | | 8,457 | |
Administration fees | | | 1,423 | | | | 61 | | | | 1,153 | |
Distribution fees: | | | | | | | | | | | | |
Class A | | | 275 | | | | 88 | | | | 218 | |
Class C | | | 81 | | | | 45 | | | | 6 | |
Class R2 | | | 4 | | | | 1 | | | | — | |
Service fees: | | | | | | | | | | | | |
Class A | | | 275 | | | | 88 | | | | 218 | |
Class C | | | 27 | | | | 15 | | | | 2 | |
Class I (formerly Select Class) | | | 123 | | | | 82 | | | | 47 | |
Class R2 | | | 2 | | | | 1 | | | | — | |
Class R5 | | | 9 | | | | — | (a) | | | — | |
Institutional Class | | | — | | | | — | | | | 5 | |
Custodian and accounting fees | | | 256 | | | | 44 | | | | 211 | |
Interest expense to affiliates | | | 7 | | | | — | (a) | | | 10 | |
Professional fees | | | 75 | | | | 43 | | | | 74 | |
Trustees’ and Chief Compliance Officer’s fees | | | 17 | | | | 14 | | | | 15 | |
Printing and mailing costs | | | 58 | | | | 4 | | | | 32 | |
Registration and filing fees | | | 34 | | | | 54 | | | | 41 | |
Transfer agency fees (See Note 2.J.) | | | 35 | | | | 6 | | | | 20 | |
Sub-transfer agency fees (See Note 2.J.) | | | 136 | | | | 50 | | | | 34 | |
Other | | | 30 | | | | 6 | | | | 22 | |
| | | | | | | | | | | | |
Total expenses | | | 15,039 | | | | 1,126 | | | | 10,565 | |
| | | | | | | | | | | | |
Less fees waived | | | (1,402 | ) | | | (279 | ) | | | (66 | ) |
Less expense reimbursements | | | (3 | ) | | | — | (a) | | | — | |
| | | | | | | | | | | | |
Net expenses | | | 13,634 | | | | 847 | | | | 10,499 | |
| | | | | | | | | | | | |
Net investment income (loss) | | | 22,905 | | | | 2,573 | | | | 25,086 | |
| | | | | | | | | | | | |
| | | |
REALIZED/UNREALIZED GAINS (LOSSES): | | | | | | | | | | | | |
Net realized gain (loss) on transactions from: | | | | | | | | | | | | |
Investments in non-affiliates | | | (20,107 | ) | | | (425 | ) | | | (17,182 | ) |
Futures | | | — | | | | — | | | | (151 | ) |
Foreign currency transactions | | | (325 | ) | | | (341 | ) | | | 10,453 | |
| | | | | | | | | | | | |
Net realized gain (loss) | | | (20,432 | ) | | | (766 | ) | | | (6,880 | ) |
| | | | | | | | | | | | |
Change in net unrealized appreciation/depreciation on: | | | | | | | | | | | | |
Investments in non-affiliates | | | 375,260 | | | | 11,038 | | | | 336,470 | |
Futures | | | — | | | | — | | | | (386 | ) |
Foreign currency translations | | | 362 | | | | 135 | | | | (8,981 | ) |
| | | | | | | | | | | | |
Change in net unrealized appreciation/depreciation | | | 375,622 | | | | 11,173 | | | | 327,103 | |
| | | | | | | | | | | | |
Net realized/unrealized gains (losses) | | | 355,190 | | | | 10,407 | | | | 320,223 | |
| | | | | | | | | | | | |
Change in net assets resulting from operations | | $ | 378,095 | | | $ | 12,980 | | | $ | 345,309 | |
| | | | | | | | | | | | |
| (a) | Amount rounds to less than 500. |
SEE NOTES TO FINANCIAL STATEMENTS.
| | | | | | |
| | | |
| 98 | | | | J.P. MORGAN INTERNATIONAL EQUITY FUNDS | | APRIL 30, 2017 |
| | | | | | | | | | | | | | | | |
| | |
International
Research
Enhanced
Equity Fund | | | International
Unconstrained
Equity Fund | | | International
Value Fund | | | Intrepid
International
Fund | |
INVESTMENT INCOME: | |
Interest income from non-affiliates | | $ | 5 | | | $ | — | (a) | | $ | — | (a) | | $ | — | |
Interest income from affiliates | | | 4 | | | | — | (a) | | | 3 | | | | 1 | |
Dividend income from non-affiliates | | | 21,140 | | | | 1,123 | | | | 14,329 | | | | 43,589 | |
Dividend income from affiliates | | | 92 | | | | 7 | | | | 42 | | | | 117 | |
Foreign taxes withheld | | | (1,707 | ) | | | (66 | ) | | | (1,471 | ) | | | (3,354 | ) |
| | | | | | | | | | | | | | | | |
Total investment income | | | 19,534 | | | | 1,064 | | | | 12,903 | | | | 40,353 | |
| | | | | | | | | | | | | | | | |
| | | | |
EXPENSES: | | | | | | | | | | | | | | | | |
Investment advisory fees | | | 1,439 | | | | 449 | | | | 3,020 | | | | 8,362 | |
Administration fees | | | 589 | | | | 52 | | | | 412 | | | | 1,140 | |
Distribution fees: | | | | | | | | | | | | | | | | |
Class A | | | 87 | | | | 21 | | | | 410 | | | | 212 | |
Class C | | | 48 | | | | 17 | | | | 87 | | | | 8 | |
Class R2 | | | 29 | | | | — | (a) | | | 3 | | | | 1 | |
Service fees: | | | | | | | | | | | | | | | | |
Class A | | | 87 | | | | 21 | | | | 410 | | | | 212 | |
Class C | | | 16 | | | | 6 | | | | 29 | | | | 2 | |
Class I (formerly Select Class) | | | 1,682 | | | | 20 | | | | 186 | | | | 50 | |
Class L (formerly Institutional Class) | | | — | | | | — | | | | 238 | | | | — | |
Class R2 | | | 14 | | | | — | (a) | | | 2 | | | | 1 | |
Class R5 | | | — | | | | — | (a) | | | — | (a) | | | — | |
Institutional Class | | | — | | | | — | | | | — | | | | 2 | |
Custodian and accounting fees | | | 116 | | | | 32 | | | | 102 | | | | 217 | |
Interest expense to affiliates | | | 3 | | | | — | (a) | | | 5 | | | | 11 | |
Professional fees | | | 70 | | | | 40 | | | | 59 | | | | 74 | |
Trustees’ and Chief Compliance Officer’s fees | | | 16 | | | | 14 | | | | 13 | | | | 15 | |
Printing and mailing costs | | | 38 | | | | 4 | | | | 155 | | | | 26 | |
Registration and filing fees | | | 58 | | | | 38 | | | | 92 | | | | 42 | |
Transfer agency fees (See Note 2.J.) | | | 42 | | | | 5 | | | | 21 | | | | 14 | |
Sub-transfer agency fees (See Note 2.J.) | | | 172 | | | | 8 | | | | 272 | | | | 18 | |
Other | | | 11 | | | | 4 | | | | 16 | | | | 27 | |
| | | | | | | | | | | | | | | | |
Total expenses | | | 4,517 | | | | 731 | | | | 5,532 | | | | 10,434 | |
| | | | | | | | | | | | | | | | |
Less fees waived | | | (1,862 | ) | | | (176 | ) | | | (156 | ) | | | (61 | ) |
Less expense reimbursements | | | (4 | ) | | | — | (a) | | | — | (a) | | | — | |
| | | | | | | | | | | | | | | | |
Net expenses | | | 2,651 | | | | 555 | | | | 5,376 | | | | 10,373 | |
| | | | | | | | | | | | | | | | |
Net investment income (loss) | | | 16,883 | | | | 509 | | | | 7,527 | | | | 29,980 | |
| | | | | | | | | | | | | | | | |
| | | | |
REALIZED/UNREALIZED GAINS (LOSSES): | | | | | | | | | | | | | | | | |
Net realized gain (loss) on transactions from: | | | | | | | | | | | | | | | | |
Investments in non-affiliates | | | 7,712 | | | | 1,311 | | | | 39,322 | | | | 80,285 | |
Futures | | | 4,772 | | | | — | | | | 825 | | | | — | |
Foreign currency transactions | | | (174 | ) | | | 12 | | | | 4,435 | | | | (84 | ) |
| | | | | | | | | | | | | | | | |
Net realized gain (loss) | | | 12,310 | | | | 1,323 | | | | 44,582 | | | | 80,201 | |
| | | | | | | | | | | | | | | | |
Change in net unrealized appreciation/depreciation on: | | | | | | | | | | | | | | | | |
Investments in non-affiliates | | | 146,693 | | | | 13,724 | | | | 73,859 | | | | 198,759 | |
Futures | | | (212 | ) | | | — | | | | — | | | | 85 | |
Foreign currency translations | | | 257 | | | | 7 | | | | (2,787 | ) | | | 367 | |
| | | | | | | | | | | | | | | | |
Change in net unrealized appreciation/depreciation | | | 146,738 | | | | 13,731 | | | | 71,072 | | | | 199,211 | |
| | | | | | | | | | | | | | | | |
Net realized/unrealized gains (losses) | | | 159,048 | | | | 15,054 | | | | 115,654 | | | | 279,412 | |
| | | | | | | | | | | | | | | | |
Change in net assets resulting from operations | | $ | 175,931 | | | $ | 15,563 | | | $ | 123,181 | | | $ | 309,392 | |
| | | | | | | | | | | | | | | | |
| (a) | Amount rounds to less than 500. |
SEE NOTES TO FINANCIAL STATEMENTS.
| | | | | | | | |
| | | |
| APRIL 30, 2017 | | J.P. MORGAN INTERNATIONAL EQUITY FUNDS | | | | | 99 | |
STATEMENTS OF CHANGES IN NET ASSETS
FOR THE PERIODS INDICATED
(Amounts in thousands)
| | | | | | | | | | | | | | | | |
| | |
Emerging Economies Fund | | | Emerging Markets Equity Fund | |
| | | Six Months Ended
April 30, 2017
(Unaudited) | | | Year Ended
October 31, 2016 | | | Six Months Ended
April 30, 2017
(Unaudited) | | | Year Ended
October 31, 2016 | |
CHANGE IN NET ASSETS RESULTING FROM OPERATIONS: | | | | | | | | | | | | | | | | |
Net investment income (loss) | | $ | 12,071 | | | $ | 24,658 | | | $ | 7,131 | | | $ | 20,045 | |
Net realized gain (loss) | | | 55,018 | | | | (59,529 | ) | | | (12,765 | ) | | | (68,841 | ) |
Change in net unrealized appreciation/depreciation | | | 128,778 | | | | 133,106 | | | | 336,508 | | | | 346,979 | |
| | | | | | | | | | | | | | | | |
Change in net assets resulting from operations | | | 195,867 | | | | 98,235 | | | | 330,874 | | | | 298,183 | |
| | | | | | | | | | | | | | | | |
|
DISTRIBUTIONS TO SHAREHOLDERS: | |
Class A | | | | | | | | | | | | | | | | |
From net investment income | | | (1,900 | ) | | | (378 | ) | | | (1,930 | ) | | | (1,590 | ) |
Class C | | | | | | | | | | | | | | | | |
From net investment income | | | (14 | ) | | | (1 | ) | | | (12 | ) | | | — | |
Class I (formerly Select Class) | | | | | | | | | | | | | | | | |
From net investment income | | | (709 | ) | | | (168 | ) | | | (1,895 | ) | | | (1,894 | ) |
Class L (formerly Institutional Class) | | | | | | | | | | | | | | | | |
From net investment income | | | — | | | | — | | | | (3,193 | ) | | | (2,796 | ) |
Class R5 (b) | | | | | | | | | | | | | | | | |
From net investment income | | | (23 | ) | | | — | | | | — | (a) | | | — | |
Class R6 | | | | | | | | | | | | | | | | |
From net investment income | | | (24,949 | ) | | | (12,736 | ) | | | (16,962 | ) | | | (13,982 | ) |
| | | | | | | | | | | | | | | | |
Total distributions to shareholders | | | (27,595 | ) | | | (13,283 | ) | | | (23,992 | ) | | | (20,262 | ) |
| | | | | | | | | | | | | | | | |
|
CAPITAL TRANSACTIONS: | |
Change in net assets resulting from capital transactions | | | (66,158 | ) | | | 593,917 | | | | 130,757 | | | | 580,806 | |
| | | | | | | | | | | | | | | | |
|
NET ASSETS: | |
Change in net assets | | | 102,114 | | | | 678,869 | | | | 437,639 | | | | 858,727 | |
Beginning of period | | | 1,779,712 | | | | 1,100,843 | | | | 3,124,578 | | | | 2,265,851 | |
| | | | | | | | | | | | | | | | |
End of period | | $ | 1,881,826 | | | $ | 1,779,712 | | | $ | 3,562,217 | | | $ | 3,124,578 | |
| | | | | | | | | | | | | | | | |
Accumulated undistributed (distributions in excess of) net investment income | | $ | 6,320 | | | $ | 21,844 | | | $ | 2,227 | | | $ | 19,088 | |
| | | | | | | | | | | | | | | | |
| (a) | Amount rounds to less than 500. |
| (b) | Commencement of offering of class of shares effective September 9, 2016, for Emerging Markets Equity Fund. |
SEE NOTES TO FINANCIAL STATEMENTS.
| | | | | | |
| | | |
| 100 | | | | J.P. MORGAN INTERNATIONAL EQUITY FUNDS | | APRIL 30, 2017 |
| | | | | | | | | | | | | | | | |
| | |
Emerging Markets Equity Income Fund | | | Global Research Enhanced Index Fund | |
| | | Six Months Ended
April 30, 2017
(Unaudited) | | | Year Ended
October 31, 2016 | | | Six Months Ended
April 30, 2017
(Unaudited) | | | Year Ended
October 31, 2016 | |
CHANGE IN NET ASSETS RESULTING FROM OPERATIONS: | | | | | | | | | | | | | | | | |
Net investment income (loss) | | $ | 144 | | | $ | 151 | | | $ | 69,764 | | | $ | 152,165 | |
Net realized gain (loss) | | | (20 | ) | | | (403 | ) | | | 29,647 | | | | (222,262 | ) |
Change in net unrealized appreciation/depreciation | | | 614 | | | | 811 | | | | 774,062 | | | | 116,394 | |
| | | | | | | | | | | | | | | | |
Change in net assets resulting from operations | | | 738 | | | | 559 | | | | 873,473 | | | | 46,297 | |
| | | | | | | | | | | | | | | | |
|
DISTRIBUTIONS TO SHAREHOLDERS: | |
Class A | | | | | | | | | | | | | | | | |
From net investment income | | | (32 | ) | | | (85 | ) | | | (1 | ) | | | — | (a) |
Class C | | | | | | | | | | | | | | | | |
From net investment income | | | — | (a) | | | (1 | ) | | | — | (a) | | | — | |
Class I (formerly Select Class) | | | | | | | | | | | | | | | | |
From net investment income | | | (16 | ) | | | (54 | ) | | | (155,975 | ) | | | (138,054 | ) |
Class R2 | | | | | | | | | | | | | | | | |
From net investment income | | | — | | | | — | | | | — | (a) | | | — | (a) |
Class R5 | | | | | | | | | | | | | | | | |
From net investment income | | | — | (a) | | | — | (a) | | | — | | | | — | |
Class R6 | | | | | | | | | | | | | | | | |
From net investment income | | | — | (a) | | | (1 | ) | | | — | | | | — | |
| | | | | | | | | | | | | | | | |
Total distributions to shareholders | | | (48 | ) | | | (141 | ) | | | (155,976 | ) | | | (138,054 | ) |
| | | | | | | | | | | | | | | | |
|
CAPITAL TRANSACTIONS: | |
Change in net assets resulting from capital transactions | | | 3,821 | | | | 8,465 | | | | 91,349 | | | | (416,215 | ) |
| | | | | | | | | | | | | | | | |
|
NET ASSETS: | |
Change in net assets | | | 4,511 | | | | 8,883 | | | | 808,846 | | | | (507,972 | ) |
Beginning of period | | | 11,576 | | | | 2,693 | | | | 6,907,306 | | | | 7,415,278 | |
| | | | | | | | | | | | | | | | |
End of period | | $ | 16,087 | | | $ | 11,576 | | | $ | 7,716,152 | | | $ | 6,907,306 | |
| | | | | | | | | | | | | | | | |
Accumulated undistributed (distributions in excess of) net investment income | | $ | 111 | | | $ | 15 | | | $ | 39,651 | | | $ | 125,863 | |
| | | | | | | | | | | | | | | | |
| (a) | Amount rounds to less than 500. |
SEE NOTES TO FINANCIAL STATEMENTS.
| | | | | | | | |
| | | |
| APRIL 30, 2017 | | J.P. MORGAN INTERNATIONAL EQUITY FUNDS | | | | | 101 | |
STATEMENTS OF CHANGES IN NET ASSETS
FOR THE PERIODS INDICATED (continued)
(Amounts in thousands)
| | | | | | | | | | | | | | | | |
| | |
Global Unconstrained Equity Fund | | | International Discovery Fund | |
| | | Six Months Ended
April 30, 2017
(Unaudited) | | | Year Ended
October 31, 2016 | | | Six Months Ended
April 30, 2017
(Unaudited) | | | Period Ended
October 31, 2016 (a) | |
CHANGE IN NET ASSETS RESULTING FROM OPERATIONS: | | | | | | | | | | | | | | | | |
Net investment income (loss) | | $ | 7 | | | $ | 334 | | | $ | 36 | | | $ | 60 | |
Net realized gain (loss) | | | 107 | | | | 5,782 | | | | — | (b) | | | (427 | ) |
Change in net unrealized appreciation/depreciation | | | 128 | | | | (108 | ) | | | 687 | | | | 429 | |
| | | | | | | | | | | | | | | | |
Change in net assets resulting from operations | | | 242 | | | | 6,008 | | | | 723 | | | | 62 | |
| | | | | | | | | | | | | | | | |
|
DISTRIBUTIONS TO SHAREHOLDERS: | |
Class A | | | | | | | | | | | | | | | | |
From net investment income | | | — | | | | (443 | ) | | | — | (b) | | | — | (b) |
From net realized gains | | | — | | | | (5,070 | ) | | | — | | | | — | |
Return of capital | | | — | | | | (841 | ) | | | — | | | | — | |
Class C | | | | | | | | | | | | | | | | |
From net investment income | | | — | | | | (4 | ) | | | — | (b) | | | — | (b) |
From net realized gains | | | — | | | | (7 | ) | | | — | | | | — | |
Return of capital | | | — | | | | (17 | ) | | | — | | | | — | |
Class I (formerly Select Class) | | | | | | | | | | | | | | | | |
From net investment income | | | (3 | ) | | | (78 | ) | | | (60 | ) | | | (3 | ) |
From net realized gains | | | — | | | | (590 | ) | | | — | | | | — | |
Return of capital | | | — | | | | (169 | ) | | | — | | | | — | |
Class R2 | | | | | | | | | | | | | | | | |
From net investment income | | | — | | | | — | (b) | | | — | | | | — | |
From net realized gains | | | — | | | | (1 | ) | | | — | | | | — | |
Return of capital | | | — | | | | (1 | ) | | | — | | | | — | |
Class R5 | | | | | | | | | | | | | | | | |
From net investment income | | | — | (b) | | | — | (b) | | | — | (b) | | | — | (b) |
From net realized gains | | | — | | | | — | (b) | | | — | | | | — | |
Return of capital | | | — | | | | (1 | ) | | | — | | | | — | |
Class R6 | | | | | | | | | | | | | | | | |
From net investment income | | | — | (b) | | | — | (b) | | | — | (b) | | | — | (b) |
From net realized gains | | | — | | | | — | (b) | | | — | | | | — | |
Return of capital | | | — | | | | (1 | ) | | | — | | | | — | |
| | | | | | | | | | | | | | | | |
Total distributions to shareholders | | | (3 | ) | | | (7,223 | ) | | | (60 | ) | | | (3 | ) |
| | | | | | | | | | | | | | | | |
|
CAPITAL TRANSACTIONS: | |
Change in net assets resulting from capital transactions | | | 214 | | | | 1,246 | | | | 205 | | | | 5,835 | |
| | | | | | | | | | | | | | | | |
|
NET ASSETS: | |
Change in net assets | | | 453 | | | | 31 | | | | 868 | | | | 5,894 | |
Beginning of period | | | 1,672 | | | | 1,641 | | | | 5,894 | | | | — | |
| | | | | | | | | | | | | | | | |
End of period | | $ | 2,125 | | | $ | 1,672 | | | $ | 6,762 | | | $ | 5,894 | |
| | | | | | | | | | | | | | | | |
Accumulated undistributed (distributions in excess of) net investment income | | $ | (1 | ) | | $ | (5 | ) | | $ | 31 | | | $ | 55 | |
| | | | | | | | | | | | | | | | |
| (a) | Commencement of operations was December 21, 2015. |
| (b) | Amount rounds to less than 500. |
SEE NOTES TO FINANCIAL STATEMENTS.
| | | | | | |
| | | |
| 102 | | | | J.P. MORGAN INTERNATIONAL EQUITY FUNDS | | APRIL 30, 2017 |
| | | | | | | | | | | | | | | | |
| | |
International Equity Fund | | | International Equity Income Fund | |
| | | Six Months Ended
April 30, 2017
(Unaudited) | | | Year Ended
October 31, 2016 | | | Six Months Ended
April 30, 2017
(Unaudited) | | | Year Ended
October 31, 2016 | |
CHANGE IN NET ASSETS RESULTING FROM OPERATIONS: | | | | | | | | | | | | | | | | |
Net investment income (loss) | | $ | 22,905 | | | $ | 64,099 | | | $ | 2,573 | | | $ | 3,443 | |
Net realized gain (loss) | | | (20,432 | ) | | | (22,289 | ) | | | (766 | ) | | | (9,171 | ) |
Change in net unrealized appreciation/depreciation | | | 375,622 | | | | (25,645 | ) | | | 11,173 | | | | 1,423 | |
| | | | | | | | | | | | | | | | |
Change in net assets resulting from operations | | | 378,095 | | | | 16,165 | | | | 12,980 | | | | (4,305 | ) |
| | | | | | | | | | | | | | | | |
|
DISTRIBUTIONS TO SHAREHOLDERS: | |
Class A | | | | | | | | | | | | | | | | |
From net investment income | | | (611 | ) | | | (3,550 | ) | | | (1,252 | ) | | | (2,121 | ) |
From net realized gains | | | — | | | | — | | | | — | | | | (1,055 | ) |
Class C | | | | | | | | | | | | | | | | |
From net investment income | | | (22 | ) | | | (328 | ) | | | (200 | ) | | | (297 | ) |
From net realized gains | | | — | | | | — | | | | — | | | | (151 | ) |
Class I (formerly Select Class) | | | | | | | | | | | | | | | | |
From net investment income | | | (394 | ) | | | (2,129 | ) | | | (1,392 | ) | | | (1,237 | ) |
From net realized gains | | | — | | | | — | | | | — | | | | (534 | ) |
Class R2 | | | | | | | | | | | | | | | | |
From net investment income | | | (2 | ) | | | (21 | ) | | | (7 | ) | | | (4 | ) |
From net realized gains | | | — | | | | — | | | | — | | | | (1 | ) |
Class R5 | | | | | | | | | | | | | | | | |
From net investment income | | | (165 | ) | | | (1,103 | ) | | | (24 | ) | | | (14 | ) |
From net realized gains | | | — | | | | — | | | | — | | | | — | (a) |
Class R6 | | | | | | | | | | | | | | | | |
From net investment income | | | (16,643 | ) | | | (57,230 | ) | | | (3 | ) | | | (1 | ) |
From net realized gains | | | — | | | | — | | | | — | | | | (1 | ) |
| | | | | | | | | | | | | | | | |
Total distributions to shareholders | | | (17,837 | ) | | | (64,361 | ) | | | (2,878 | ) | | | (5,416 | ) |
| | | | | | | | | | | | | | | | |
|
CAPITAL TRANSACTIONS: | |
Change in net assets resulting from capital transactions | | | (96,314 | ) | | | 550,039 | | | | 31,615 | | | | 33,459 | |
| | | | | | | | | | | | | | | | |
|
NET ASSETS: | |
Change in net assets | | | 263,944 | | | | 501,843 | | | | 41,717 | | | | 23,738 | |
Beginning of period | | | 3,424,466 | | | | 2,922,623 | | | | 134,155 | | | | 110,417 | |
| | | | | | | | | | | | | | | | |
End of period | | $ | 3,688,410 | | | $ | 3,424,466 | | | $ | 175,872 | | | $ | 134,155 | |
| | | | | | | | | | | | | | | | |
Accumulated undistributed (distributions in excess of) net investment income | | $ | 10,013 | | | $ | 4,945 | | | $ | (57 | ) | | $ | 248 | |
| | | | | | | | | | | | | | | | |
| (a) | Amount rounds to less than 500. |
SEE NOTES TO FINANCIAL STATEMENTS.
| | | | | | | | |
| | | |
| APRIL 30, 2017 | | J.P. MORGAN INTERNATIONAL EQUITY FUNDS | | | | | 103 | |
STATEMENTS OF CHANGES IN NET ASSETS
FOR THE PERIODS INDICATED (continued)
(Amounts in thousands)
| | | | | | | | | | | | | | | | |
| | | International Opportunities Fund | | | International Research Enhanced
Equity Fund | |
| | | Six Months Ended
April 30, 2017
(Unaudited) | | | Year Ended
October 31, 2016 | | | Six Months Ended
April 30, 2017
(Unaudited) | | | Year Ended
October 31, 2016 | |
CHANGE IN NET ASSETS RESULTING FROM OPERATIONS: | | | | | | | | | | | | | | | | |
Net investment income (loss) | | $ | 25,086 | | | $ | 58,073 | | | $ | 16,883 | | | $ | 31,541 | |
Net realized gain (loss) | | | (6,880 | ) | | | (47,823 | ) | | | 12,310 | | | | (7,725 | ) |
Change in net unrealized appreciation/depreciation | | | 327,103 | | | | (77,418 | ) | | | 146,738 | | | | (35,894 | ) |
| | | | | | | | | | | | | | | | |
Change in net assets resulting from operations | | | 345,309 | | | | (67,168 | ) | | | 175,931 | | | | (12,078 | ) |
| | | | | | | | | | | | | | | | |
|
DISTRIBUTIONS TO SHAREHOLDERS: | |
Class A | | | | | | | | | | | | | | | | |
From net investment income | | | (4,762 | ) | | | (362 | ) | | | (1,511 | ) | | | (1,772 | ) |
From net realized gains | | | — | | | | — | | | | — | | | | (738 | ) |
Class C | | | | | | | | | | | | | | | | |
From net investment income | | | (39 | ) | | | — | (a) | | | (227 | ) | | | (316 | ) |
From net realized gains | | | — | | | | — | | | | — | | | | (169 | ) |
Class I (formerly Select Class) | | | | | | | | | | | | | | | | |
From net investment income | | | (1,226 | ) | | | (55 | ) | | | (32,213 | ) | | | (19,237 | ) |
From net realized gains | | | — | | | | — | | | | — | | | | (7,017 | ) |
Class R2 | | | | | | | | | | | | | | | | |
From net investment income | | | — | | | | — | | | | (254 | ) | | | (80 | ) |
From net realized gains | | | — | | | | — | | | | — | | | | (35 | ) |
Class R6 | | | | | | | | | | | | | | | | |
From net investment income | | | (92,823 | ) | | | (13,758 | ) | | | — | | | | — | |
Institutional Class | | | | | | | | | | | | | | | | |
From net investment income | | | — | | | | (312 | ) | | | — | | | | — | |
| | | | | | | | | | | | | | | | |
Total distributions to shareholders | | | (98,850 | ) | | | (14,487 | ) | | | (34,205 | ) | | | (29,364 | ) |
| | | | | | | | | | | | | | | | |
|
CAPITAL TRANSACTIONS: | |
Change in net assets resulting from capital transactions | | | (44,578 | ) | | | 611,155 | | | | 239,007 | | | | 492,324 | |
| | | | | | | | | | | | | | | | |
|
NET ASSETS: | |
Change in net assets | | | 201,881 | | | | 529,500 | | | | 380,733 | | | | 450,882 | |
Beginning of period | | | 2,769,870 | | | | 2,240,370 | | | | 1,335,211 | | | | 884,329 | |
| | | | | | | | | | | | | | | | |
End of period | | $ | 2,971,751 | | | $ | 2,769,870 | | | $ | 1,715,944 | | | $ | 1,335,211 | |
| | | | | | | | | | | | | | | | |
Accumulated undistributed (distributions in excess of) net investment income | | $ | 11,077 | | | $ | 84,841 | | | $ | 11,227 | | | $ | 28,549 | |
| | | | | | | | | | | | | | | | |
| (a) | Amount rounds to less than 500. |
SEE NOTES TO FINANCIAL STATEMENTS.
| | | | | | |
| | | |
| 104 | | | | J.P. MORGAN INTERNATIONAL EQUITY FUNDS | | APRIL 30, 2017 |
| | | | | | | | | | | | | | | | |
| | | International Unconstrained
Equity Fund | | | International Value Fund | |
| | | Six Months Ended
April 30, 2017
(Unaudited) | | | Year Ended
October 31, 2016 | | | Six Months Ended
April 30, 2017
(Unaudited) | | | Year Ended
October 31, 2016 | |
CHANGE IN NET ASSETS RESULTING FROM OPERATIONS: | | | | | | | | | | | | | | | | |
Net investment income (loss) | | $ | 509 | | | $ | 1,438 | | | $ | 7,527 | | | $ | 42,906 | |
Net realized gain (loss) | | | 1,323 | | | | (3,109 | ) | | | 44,582 | | | | (34,758 | ) |
Change in net unrealized appreciation/depreciation | | | 13,731 | | | | 2,169 | | | | 71,072 | | | | (142,738 | ) |
| | | | | | | | | | | | | | | | |
Change in net assets resulting from operations | | | 15,563 | | | | 498 | | | | 123,181 | | | | (134,590 | ) |
| | | | | | | | | | | | | | | | |
|
DISTRIBUTIONS TO SHAREHOLDERS: | |
Class A | | | | | | | | | | | | | | | | |
From net investment income | | | (259 | ) | | | (18 | ) | | | (18,922 | ) | | | (7,469 | ) |
Class C | | | | | | | | | | | | | | | | |
From net investment income | | | (67 | ) | | | (3 | ) | | | (1,312 | ) | | | (176 | ) |
Class I (formerly Select Class) | | | | | | | | | | | | | | | | |
From net investment income | | | (257 | ) | | | — | | | | (8,933 | ) | | | (2,865 | ) |
Class L (formerly Institutional Class) | | | | | | | | | | | | | | | | |
From net investment income | | | — | | | | — | | | | (30,468 | ) | | | (19,068 | ) |
Class R2 | | | | | | | | | | | | | | | | |
From net investment income | | | — | (a) | | | — | | | | (59 | ) | | | (18 | ) |
Class R5 (b) | | | | | | | | | | | | | | | | |
From net investment income | | | — | (a) | | | — | (a) | | | (1 | ) | | | — | |
Class R6 | | | | | | | | | | | | | | | | |
From net investment income | | | (1,980 | ) | | | (253 | ) | | | (1,834 | ) | | | (61 | ) |
| | | | | | | | | | | | | | | | |
Total distributions to shareholders | | | (2,563 | ) | | | (274 | ) | | | (61,529 | ) | | | (29,657 | ) |
| | | | | | | | | | | | | | | | |
|
CAPITAL TRANSACTIONS: | |
Change in net assets resulting from capital transactions | | | 51,584 | | | | 35,055 | | | | (545,015 | ) | | | (971,729 | ) |
| | | | | | | | | | | | | | | | |
|
NET ASSETS: | |
Change in net assets | | | 64,584 | | | | 35,279 | | | | (483,363 | ) | | | (1,135,976 | ) |
Beginning of period | | | 109,775 | | | | 74,496 | | | | 1,308,220 | | | | 2,444,196 | |
| | | | | | | | | | | | | | | | |
End of period | | $ | 174,359 | | | $ | 109,775 | | | $ | 824,857 | | | $ | 1,308,220 | |
| | | | | | | | | | | | | | | | |
Accumulated undistributed (distributions in excess of) net investment income | | $ | 496 | | | $ | 2,550 | | | $ | 3,696 | | | $ | 57,698 | |
| | | | | | | | | | | | | | | | |
| (a) | Amount rounds to less than 500. |
| (b) | Commencement of offering of class shares effective September 9, 2016, for International Value Fund. |
SEE NOTES TO FINANCIAL STATEMENTS.
| | | | | | | | |
| | | |
| APRIL 30, 2017 | | J.P. MORGAN INTERNATIONAL EQUITY FUNDS | | | | | 105 | |
STATEMENTS OF CHANGES IN NET ASSETS
FOR THE PERIODS INDICATED (continued)
(Amounts in thousands)
| | | | | | | | |
| | |
Intrepid International Fund | |
| | | Six Months Ended
April 30, 2017
(Unaudited) | | | Year Ended
October 31, 2016 | |
CHANGE IN NET ASSETS RESULTING FROM OPERATIONS: | | | | | | | | |
Net investment income (loss) | | $ | 29,980 | | | $ | 63,699 | |
Net realized gain (loss) | | | 80,201 | | | | (12,289 | ) |
Change in net unrealized appreciation/depreciation | | | 199,211 | | | | (67,747 | ) |
| | | | | | | | |
Change in net assets resulting from operations | | | 309,392 | | | | (16,337 | ) |
| | | | | | | | |
|
DISTRIBUTIONS TO SHAREHOLDERS: | |
Class A | | | | | | | | |
From net investment income | | | (3,117 | ) | | | (2,746 | ) |
Class C | | | | | | | | |
From net investment income | | | (28 | ) | | | (35 | ) |
Class I (formerly Select Class) | | | | | | | | |
From net investment income | | | (1,014 | ) | | | (365 | ) |
Class R2 | | | | | | | | |
From net investment income | | | (9 | ) | | | (3 | ) |
Class R6 | | | | | | | | |
From net investment income | | | (66,113 | ) | | | (39,523 | ) |
Institutional Class | | | | | | | | |
From net investment income | | | — | | | | (210 | ) |
| | | | | | | | |
Total distributions to shareholders | | | (70,281 | ) | | | (42,882 | ) |
| | | | | | | | |
|
CAPITAL TRANSACTIONS: | |
Change in net assets resulting from capital transactions | | | (10,672 | ) | | | 671,617 | |
| | | | | | | | |
|
NET ASSETS: | |
Change in net assets | | | 228,439 | | | | 612,398 | |
Beginning of period | | | 2,694,314 | | | | 2,081,916 | |
| | | | | | | | |
End of period | | $ | 2,922,753 | | | $ | 2,694,314 | |
| | | | | | | | |
Accumulated undistributed (distributions in excess of) net investment income | | $ | 20,112 | | | $ | 60,413 | |
| | | | | | | | |
SEE NOTES TO FINANCIAL STATEMENTS.
| | | | | | |
| | | |
| 106 | | | | J.P. MORGAN INTERNATIONAL EQUITY FUNDS | | APRIL 30, 2017 |
| | | | | | | | | | | | | | | | |
| | | Emerging Economies Fund | | |
Emerging Markets Equity Fund | |
| | | Six Months Ended
April 30, 2017
(Unaudited) | | | Year Ended
October 31, 2016 | | | Six Months Ended
April 30, 2017
(Unaudited) | | | Year Ended
October 31, 2016 | |
CAPITAL TRANSACTIONS: | | | | | | | | | | | | | | | | |
Class A | | | | | | | | | | | | | | | | |
Proceeds from shares issued | | $ | 24,140 | | | $ | 124,070 | | | $ | 83,490 | | | $ | 206,821 | |
Distributions reinvested | | | 1,899 | | | | 378 | | | | 1,872 | | | | 1,541 | |
Cost of shares redeemed | | | (35,200 | ) | | | (24,840 | ) | | | (80,108 | ) | | | (105,922 | ) |
| | | | | | | | | | | | | | | | |
Change in net assets resulting from Class A capital transactions | | $ | (9,161 | ) | | $ | 99,608 | | | $ | 5,254 | | | $ | 102,440 | |
| | | | | | | | | | | | | | | | |
Class C | | | | | | | | | | | | | | | | |
Proceeds from shares issued | | $ | 303 | | | $ | 283 | | | $ | 4,172 | | | $ | 7,659 | |
Distributions reinvested | | | 14 | | | | 1 | | | | 12 | | | | — | |
Cost of shares redeemed | | | (284 | ) | | | (1,482 | ) | | | (9,137 | ) | | | (15,484 | ) |
| | | | | | | | | | | | | | | | |
Change in net assets resulting from Class C capital transactions | | $ | 33 | | | $ | (1,198 | ) | | $ | (4,953 | ) | | $ | (7,825 | ) |
| | | | | | | | | | | | | | | | |
Class I (formerly Select Class) | | | | | | | | | | | | | | | | |
Proceeds from shares issued | | $ | 9,733 | | | $ | 21,815 | | | $ | 115,722 | | | $ | 115,950 | |
Distributions reinvested | | | 360 | | | | 86 | | | | 1,623 | | | | 1,651 | |
Cost of shares redeemed | | | (9,262 | ) | | | (216,425 | ) | | | (49,421 | ) | | | (350,209 | ) |
| | | | | | | | | | | | | | | | |
Change in net assets resulting from Class I capital transactions | | $ | 831 | | | $ | (194,524 | ) | | $ | 67,924 | | | $ | (232,608 | ) |
| | | | | | | | | | | | | | | | |
Class L (formerly Institutional Class) | | | | | | | | | | | | | | | | |
Proceeds from shares issued | | $ | — | | | $ | — | | | $ | 179,479 | | | $ | 177,616 | |
Distributions reinvested | | | — | | | | — | | | | 2,481 | | | | 1,936 | |
Cost of shares redeemed | | | — | | | | — | | | | (104,952 | ) | | | (138,231 | ) |
| | | | | | | | | | | | | | | | |
Change in net assets resulting from Class L capital transactions | | $ | — | | | $ | — | | | $ | 77,008 | | | $ | 41,321 | |
| | | | | | | | | | | | | | | | |
Class R5 (b) | | | | | | | | | | | | | | | | |
Proceeds from shares issued | | $ | 183 | | | $ | 79,836 | | | $ | — | | | $ | 20 | |
Distributions reinvested | | | 23 | | | | — | | | | — | (a) | | | — | |
Cost of shares redeemed | | | (562 | ) | | | (158,991 | ) | | | — | | | | — | |
| | | | | | | | | | | | | | | | |
Change in net assets resulting from Class R5 capital transactions | | $ | (356 | ) | | $ | (79,155 | ) | | $ | — | (a) | | $ | 20 | |
| | | | | | | | | | | | | | | | |
Class R6 | | | | | | | | | | | | | | | | |
Proceeds from shares issued | | $ | 69,557 | | | $ | 962,670 | | | $ | 103,294 | | | $ | 895,741 | |
Distributions reinvested | | | 24,949 | | | | 12,736 | | | | 16,658 | | | | 13,982 | |
Cost of shares redeemed | | | (152,011 | ) | | | (206,220 | ) | | | (134,428 | ) | | | (232,265 | ) |
| | | | | | | | | | | | | | | | |
Change in net assets resulting from Class R6 capital transactions | | $ | (57,505 | ) | | $ | 769,186 | | | $ | (14,476 | ) | | $ | 677,458 | |
| | | | | | | | | | | | | | | | |
Total change in net assets resulting from capital transactions | | $ | (66,158 | ) | | $ | 593,917 | | | $ | 130,757 | | | $ | 580,806 | |
| | | | | | | | | | | | | | | | |
| (a) | Amount rounds to less than 500. |
| (b) | Commencement of offering of class of shares effective September 9, 2016, for Emerging Markets Equity Fund. |
SEE NOTES TO FINANCIAL STATEMENTS.
| | | | | | | | |
| | | |
| APRIL 30, 2017 | | J.P. MORGAN INTERNATIONAL EQUITY FUNDS | | | | | 107 | |
STATEMENTS OF CHANGES IN NET ASSETS
FOR THE PERIODS INDICATED (continued)
(Amounts in thousands)
| | | | | | | | | | | | | | | | |
| | |
| | | Emerging Economies Fund | | | Emerging Markets Equity Fund | |
| | | Six Months Ended
April 30, 2017
(Unaudited) | | | Year Ended
October 31, 2016 | | | Six Months Ended
April 30, 2017
(Unaudited) | | | Year Ended
October 31, 2016 | |
SHARE TRANSACTIONS: | |
Class A | |
Issued | | | 2,060 | | | | 11,197 | | | | 3,827 | | | | 10,198 | |
Reinvested | | | 173 | | | | 36 | | | | 93 | | | | 84 | |
Redeemed | | | (2,994 | ) | | | (2,309 | ) | | | (3,722 | ) | | | (5,454 | ) |
| | | | | | | | | | | | | | | | |
Change in Class A Shares | | | (761 | ) | | | 8,924 | | | | 198 | | | | 4,828 | |
| | | | | | | | | | | | | | | | |
Class C | |
Issued | | | 26 | | | | 28 | | | | 193 | | | | 402 | |
Reinvested | | | 1 | | | | — | (a) | | | 1 | | | | — | |
Redeemed | | | (25 | ) | | | (145 | ) | | | (438 | ) | | | (822 | ) |
| | | | | | | | | | | | | | | | |
Change in Class C Shares | | | 2 | | | | (117 | ) | | | (244 | ) | | | (420 | ) |
| | | | | | | | | | | | | | | | |
Class I (formerly Select Class) | |
Issued | | | 808 | | | | 2,004 | | | | 5,133 | | | | 5,865 | |
Reinvested | | | 32 | | | | 8 | | | | 79 | | | | 88 | |
Redeemed | | | (770 | ) | | | (19,109 | ) | | | (2,226 | ) | | | (17,594 | ) |
| | | | | | | | | | | | | | | | |
Change in Class I Shares | | | 70 | | | | (17,097 | ) | | | 2,986 | | | | (11,641 | ) |
| | | | | | | | | | | | | | | | |
Class L (formerly Institutional Class) | |
Issued | | | — | | | | — | | | | 8,038 | | | | 8,547 | |
Reinvested | | | — | | | | — | | | | 119 | | | | 103 | |
Redeemed | | | — | | | | — | | | | (4,697 | ) | | | (6,992 | ) |
| | | | | | | | | | | | | | | | |
Change in Class L Shares | | | — | | | | — | | | | 3,460 | | | | 1,658 | |
| | | | | | | | | | | | | | | | |
Class R5 (b) | |
Issued | | | 15 | | | | 7,225 | | | | — | | | | 1 | |
Reinvested | | | 2 | | | | — | | | | — | (a) | | | — | |
Redeemed | | | (48 | ) | | | (14,428 | ) | | | — | | | | — | |
| | | | | | | | | | | | | | | | |
Change in Class R5 Shares | | | (31 | ) | | | (7,203 | ) | | | — | (a) | | | 1 | |
| | | | | | | | | | | | | | | | |
Class R6 | |
Issued | | | 5,811 | | | | 87,032 | | | | 4,719 | | | | 42,972 | |
Reinvested | | | 2,258 | | | | 1,219 | | | | 804 | | | | 745 | |
Redeemed | | | (12,419 | ) | | | (18,962 | ) | | | (5,782 | ) | | | (11,576 | ) |
| | | | | | | | | | | | | | | | |
Change in Class R6 Shares | | | (4,350 | ) | | | 69,289 | | | | (259 | ) | | | 32,141 | |
| | | | | | | | | | | | | | | | |
| (a) | Amount rounds to less than 500. |
| (b) | Commencement of offering of class of shares effective September 9, 2016, for Emerging Markets Equity Fund. |
SEE NOTES TO FINANCIAL STATEMENTS.
| | | | | | |
| | | |
| 108 | | | | J.P. MORGAN INTERNATIONAL EQUITY FUNDS | | APRIL 30, 2017 |
| | | | | | | | | | | | | | | | |
| | | Emerging Markets
Equity Income Fund | | | Global Research
Enhanced Index Fund | |
| | | Six Months Ended
April 30, 2017
(Unaudited) | | | Year Ended
October 31, 2016 | | | Six Months Ended
April 30, 2017
(Unaudited) | | | Year Ended
October 31, 2016 | |
CAPITAL TRANSACTIONS: | | | | | | | | | | | | | | | | |
Class A | | | | | | | | | | | | | | | | |
Proceeds from shares issued | | $ | 3,743 | | | $ | 8,578 | | | $ | — | | | $ | — | (a) |
Distributions reinvested | | | 32 | | | | 85 | | | | 1 | | | | — | (a) |
Cost of shares redeemed | | | (1,829 | ) | | | (653 | ) | | | — | | | | — | |
| | | | | | | | | | | | | | | | |
Change in net assets resulting from Class A capital transactions | | $ | 1,946 | | | $ | 8,010 | | | $ | 1 | | | $ | — | (a) |
| | | | | | | | | | | | | | | | |
Class C | | | | | | | | | | | | | | | | |
Proceeds from shares issued | | $ | 14 | | | $ | 57 | | | $ | — | | | $ | — | |
Distributions reinvested | | | — | (a) | | | 1 | | | | — | (a) | | | — | |
Cost of shares redeemed | | | — | (a) | | | — | (a) | | | — | | | | — | |
| | | | | | | | | | | | | | | | |
Change in net assets resulting from Class C capital transactions | | $ | 14 | | | $ | 58 | | | $ | — | (a) | | $ | — | |
| | | | | | | | | | | | | | | | |
Class I (formerly Select Class) | | | | | | | | | | | | | | | | |
Proceeds from shares issued | | $ | 1,877 | | | $ | 397 | | | $ | 728,946 | | | $ | 1,314,724 | |
Distributions reinvested | | | 16 | | | | 54 | | | | 19,299 | | | | 9,477 | |
Cost of shares redeemed | | | (62 | ) | | | (59 | ) | | | (656,897 | ) | | | (1,740,416 | ) |
| | | | | | | | | | | | | | | | |
Change in net assets resulting from Class I capital transactions | | $ | 1,831 | | | $ | 392 | | | $ | 91,348 | | | $ | (416,215 | ) |
| | | | | | | | | | | | | | | | |
Class R2 | | | | | | | | | | | | | | | | |
Distributions reinvested | | | — | | | | — | | | | — | (a) | | | — | (a) |
| | | | | | | | | | | | | | | | |
Change in net assets resulting from Class R2 capital transactions | | $ | — | | | $ | — | | | $ | — | (a) | | $ | — | (a) |
| | | | | | | | | | | | | | | | |
Class R5 | | | | | | | | | | | | | | | | |
Proceeds from shares issued | | $ | — | | | $ | — | (a) | | $ | — | | | $ | — | |
Distributions reinvested | | | — | (a) | | | — | (a) | | | — | | | | — | |
Cost of shares redeemed | | | — | | | | — | (a) | | | — | | | | — | |
| | | | | | | | | | | | | | | | |
Change in net assets resulting from Class R5 capital transactions | | $ | — | (a) | | $ | — | (a) | | $ | — | | | $ | — | |
| | | | | | | | | | | | | | | | |
Class R6 | | | | | | | | | | | | | | | | |
Proceeds from shares issued | | $ | 30 | | | $ | 8 | | | $ | — | | | $ | — | |
Distributions reinvested | | | — | (a) | | | 1 | | | | — | | | | — | |
Cost of shares redeemed | | | — | (a) | | | (4 | ) | | | — | | | | — | |
| | | | | | | | | | | | | | | | |
Change in net assets resulting from Class R6 capital transactions | | $ | 30 | | | $ | 5 | | | $ | — | | | $ | — | |
| | | | | | | | | | | | | | | | |
Total change in net assets resulting from capital transactions | | $ | 3,821 | | | $ | 8,465 | | | $ | 91,349 | | | $ | (416,215 | ) |
| | | | | | | | | | | | | | | | |
| (a) | Amount rounds to less than 500. |
SEE NOTES TO FINANCIAL STATEMENTS.
| | | | | | | | |
| | | |
| APRIL 30, 2017 | | J.P. MORGAN INTERNATIONAL EQUITY FUNDS | | | | | 109 | |
STATEMENTS OF CHANGES IN NET ASSETS
FOR THE PERIODS INDICATED (continued)
(Amounts in thousands)
| | | | | | | | | | | | | | | | |
| | | Emerging Markets
Equity Income Fund | | | Global Research
Enhanced Index Fund | |
| | | Six Months Ended
April 30, 2017
(Unaudited) | | | Year Ended
October 31, 2016 | | | Six Months Ended
April 30, 2017
(Unaudited) | | | Year Ended
October 31, 2016 | |
SHARE TRANSACTIONS: | |
Class A | |
Issued | | | 273 | | | | 652 | | | | — | | | | — | |
Reinvested | | | 3 | | | | 7 | | | | — | (a) | | | — | (a) |
Redeemed | | | (137 | ) | | | (50 | ) | | | — | | | | — | |
| | | | | | | | | | | | | | | | |
Change in Class A Shares | | | 139 | | | | 609 | | | | — | (a) | | | — | (a) |
| | | | | | | | | | | | | | | | |
Class C | |
Issued | | | 1 | | | | 4 | | | | — | | | | — | |
Reinvested | | | — | (a) | | | — | (a) | | | — | (a) | | | — | |
Redeemed | | | — | (a) | | | — | | | | — | | | | — | |
| | | | | | | | | | | | | | | | |
Change in Class C Shares | | | 1 | | | | 4 | | | | — | (a) | | | — | |
| | | | | | | | | | | | | | | | |
Class I (formerly Select Class) | |
Issued | | | 139 | | | | 30 | | | | 37,667 | | | | 74,956 | |
Reinvested | | | 1 | | | | 4 | | | | 1,023 | | | | 538 | |
Redeemed | | | (5 | ) | | | (4 | ) | | | (33,996 | ) | | | (99,095 | ) |
| | | | | | | | | | | | | | | | |
Change in Class I Shares | | | 135 | | | | 30 | | | | 4,694 | | | | (23,601 | ) |
| | | | | | | | | | | | | | | | |
Class R2 | |
Reinvested | | | — | | | | — | | | | — | (a) | | | — | (a) |
| | | | | | | | | | | | | | | | |
Change in Class R2 Shares | | | — | | | | — | | | | — | (a) | | | — | (a) |
| | | | | | | | | | | | | | | | |
Class R5 | |
Reinvested | | | — | (a) | | | — | (a) | | | — | | | | — | |
| | | | | | | | | | | | | | | | |
Change in Class R5 Shares | | | — | (a) | | | — | (a) | | | — | | | | — | |
| | | | | | | | | | | | | | | | |
Class R6 | |
Issued | | | 2 | | | | 1 | | | | — | | | | — | |
Reinvested | | | — | (a) | | | — | (a) | | | — | | | | — | |
Redeemed | | | — | (a) | | | — | (a) | | | — | | | | — | |
| | | | | | | | | | | | | | | | |
Change in Class R6 Shares | | | 2 | | | | 1 | | | | — | | | | — | |
| | | | | | | | | | | | | | | | |
| (a) | Amount rounds to less than 500. |
SEE NOTES TO FINANCIAL STATEMENTS.
| | | | | | |
| | | |
| 110 | | | | J.P. MORGAN INTERNATIONAL EQUITY FUNDS | | APRIL 30, 2017 |
| | | | | | | | | | | | | | | | |
| | | Global Unconstrained Equity Fund | | |
International Discovery Fund | |
| | | Six Months Ended
April 30, 2017
(Unaudited) | | | Year Ended
October 31, 2016 | | | Six Months Ended
April 30, 2017
(Unaudited) | | | Period Ended
October 31, 2016 (a) | |
CAPITAL TRANSACTIONS: | | | | | | | | | | | | | | | | |
Class A | | | | | | | | | | | | | | | | |
Proceeds from shares issued | | $ | 278 | | | $ | 121,461 | | | $ | 106 | | | $ | 20 | |
Distributions reinvested | | | — | | | | 6,351 | | | | — | (b) | | | — | (b) |
Cost of shares redeemed | | | (81 | ) | | | (126,936 | ) | | | (2 | ) | | | — | |
| | | | | | | | | | | | | | | | |
Change in net assets resulting from Class A capital transactions | | $ | 197 | | | $ | 876 | | | $ | 104 | | | $ | 20 | |
| | | | | | | | | | | | | | | | |
Class C | | | | | | | | | | | | | | | | |
Proceeds from shares issued | | $ | 112 | | | $ | 50 | | | $ | — | (b) | | $ | 20 | |
Distributions reinvested | | | — | | | | 26 | | | | — | (b) | | | — | (b) |
Cost of shares redeemed | | | (89 | ) | | | (146 | ) | | | — | | | | — | |
| | | | | | | | | | | | | | | | |
Change in net assets resulting from Class C capital transactions | | $ | 23 | | | $ | (70 | ) | | $ | — | (b) | | $ | 20 | |
| | | | | | | | | | | | | | | | |
Class I (formerly Select Class) | | | | | | | | | | | | | | | | |
Proceeds from shares issued | | $ | 167 | | | $ | 15,051 | | | $ | 764 | | | $ | 5,752 | |
Distributions reinvested | | | 2 | | | | 803 | | | | 60 | | | | 3 | |
Cost of shares redeemed | | | (175 | ) | | | (15,414 | ) | | | (723 | ) | | | — | |
| | | | | | | | | | | | | | | | |
Change in net assets resulting from Class I capital transactions | | $ | (6 | ) | | $ | 440 | | | $ | 101 | | | $ | 5,755 | |
| | | | | | | | | | | | | | | | |
Class R2 | | | | | | | | | | | | | | | | |
Proceeds from shares issued | | $ | — | | | $ | — | (b) | | $ | — | | | $ | — | |
Cost of shares redeemed | | | — | | | | — | (b) | | | — | | | | — | |
| | | | | | | | | | | | | | | | |
Change in net assets resulting from Class R2 capital transactions | | $ | — | | | $ | — | (b) | | $ | — | | | $ | — | |
| | | | | | | | | | | | | | | | |
Class R5 | | | | | | | | | | | | | | | | |
Proceeds from shares issued | | $ | — | | | $ | — | (b) | | $ | — | (b) | | $ | 20 | |
Distributions reinvested | | | — | | | | — | | | | — | (b) | | | — | (b) |
Cost of shares redeemed | | | — | | | | — | (b) | | | — | | | | — | |
| | | | | | | | | | | | | | | | |
Change in net assets resulting from Class R5 capital transactions | | $ | — | | | $ | — | (b) | | $ | — | (b) | | $ | 20 | |
| | | | | | | | | | | | | | | | |
Class R6 | | | | | | | | | | | | | | | | |
Proceeds from shares issued | | $ | — | | | $ | — | | | $ | — | (b) | | $ | 20 | |
Distributions reinvested | | | — | | | | — | | | | — | (b) | | | — | (b) |
Cost of shares redeemed | | | — | | | | — | (b) | | | — | | | | — | |
| | | | | | | | | | | | | | | | |
Change in net assets resulting from Class R6 capital transactions | | $ | — | | | $ | — | (b) | | $ | — | (b) | | $ | 20 | |
| | | | | | | | | | | | | | | | |
Total change in net assets resulting from capital transactions | | $ | 214 | | | $ | 1,246 | | | $ | 205 | | | $ | 5,835 | |
| | | | | | | | | | | | | | | | |
| (a) | Commencement of operations was December 21, 2015. |
| (b) | Amount rounds to less than 500. |
SEE NOTES TO FINANCIAL STATEMENTS.
| | | | | | | | |
| | | |
| APRIL 30, 2017 | | J.P. MORGAN INTERNATIONAL EQUITY FUNDS | | | | | 111 | |
STATEMENTS OF CHANGES IN NET ASSETS
FOR THE PERIODS INDICATED (continued)
(Amounts in thousands)
| | | | | | | | | | | | | | | | |
| | |
Global Unconstrained Equity Fund | | | International Discovery Fund | |
| | | Six Months Ended
April 30, 2017
(Unaudited) | | | Year Ended
October 31, 2016 | | | Six Months Ended
April 30, 2017
(Unaudited) | | | Period Ended
October 31, 2016 (a) | |
SHARE TRANSACTIONS: | |
Class A | |
Issued | | | 17 | | | | 9,129 | | | | 7 | | | | 1 | |
Reinvested | | | — | | | | 478 | | | | — | (b) | | | — | (b) |
Redeemed | | | (5 | ) | | | (9,592 | ) | | | — | (b) | | | — | |
| | | | | | | | | | | | | | | | |
Change in Class A Shares | | | 12 | | | | 15 | | | | 7 | | | | 1 | |
| | | | | | | | | | | | | | | | |
Class C | |
Issued | | | 8 | | | | 3 | | | | — | | | | 1 | |
Reinvested | | | — | | | | 2 | | | | — | (b) | | | — | (b) |
Redeemed | | | (6 | ) | | | (10 | ) | | | — | | | | — | |
| | | | | | | | | | | | | | | | |
Change in Class C Shares | | | 2 | | | | (5 | ) | | | — | (b) | | | 1 | |
| | | | | | | | | | | | | | | | |
Class I (formerly Select Class) | |
Issued | | | 10 | | | | 1,096 | | | | 51 | | | | 390 | |
Reinvested | | | — | (b) | | | 60 | | | | 4 | | | | — | (b) |
Redeemed | | | (11 | ) | | | (1,149 | ) | | | (48 | ) | | | — | |
| | | | | | | | | | | | | | | | |
Change in Class I Shares | | | (1 | ) | | | 7 | | | | 7 | | | | 390 | |
| | | | | | | | | | | | | | | | |
Class R5 | |
Issued | | | — | | | | — | | | | — | | | | 1 | |
Reinvested | | | — | | | | — | | | | — | (b) | | | — | (b) |
| | | | | | | | | | | | | | | | |
Change in Class R5 Shares | | | — | | | | — | | | | — | (b) | | | 1 | |
| | | | | | | | | | | | | | | | |
Class R6 | |
Issued | | | — | | | | — | | | | — | | | | 2 | |
Reinvested | | | — | | | | — | | | | — | (b) | | | — | (b) |
| | | | | | | | | | | | | | | | |
Change in Class R6 Shares | | | — | | | | — | | | | — | (b) | | | 2 | |
| | | | | | | | | | | | | | | | |
| (a) | Commencement of operations was December 21, 2015. |
| (b) | Amount rounds to less than 500. |
SEE NOTES TO FINANCIAL STATEMENTS.
| | | | | | |
| | | |
| 112 | | | | J.P. MORGAN INTERNATIONAL EQUITY FUNDS | | APRIL 30, 2017 |
| | | | | | | | | | | | | | | | |
| | |
International Equity Fund | | | International Equity Income Fund | |
| | | Six Months Ended
April 30, 2017
(Unaudited) | | | Year Ended
October 31, 2016 | | | Six Months Ended
April 30, 2017
(Unaudited) | | | Year Ended
October 31, 2016 | |
CAPITAL TRANSACTIONS: | | | | | | | | | | | | | | | | |
Class A | | | | | | | | | | | | | | | | |
Proceeds from shares issued | | $ | 66,057 | | | $ | 110,321 | | | $ | 24,036 | | | $ | 47,652 | |
Distributions reinvested | | | 605 | | | | 3,515 | | | | 1,250 | | | | 3,171 | |
Cost of shares redeemed | | | (49,431 | ) | | | (113,970 | ) | | | (21,979 | ) | | | (45,371 | ) |
| | | | | | | | | | | | | | | | |
Change in net assets resulting from Class A capital transactions | | $ | 17,231 | | | $ | (134 | ) | | $ | 3,307 | | | $ | 5,452 | |
| | | | | | | | | | | | | | | | |
Class C | | | | | | | | | | | | | | | | |
Proceeds from shares issued | | $ | 2,194 | | | $ | 2,485 | | | $ | 2,698 | | | $ | 7,012 | |
Distributions reinvested | | | 19 | | | | 272 | | | | 199 | | | | 445 | |
Cost of shares redeemed | | | (3,510 | ) | | | (7,667 | ) | | | (2,327 | ) | | | (3,519 | ) |
| | | | | | | | | | | | | | | | |
Change in net assets resulting from Class C capital transactions | | $ | (1,297 | ) | | $ | (4,910 | ) | | $ | 570 | | | $ | 3,938 | |
| | | | | | | | | | | | | | | | |
Class I (formerly Select Class) | | | | | | | | | | | | | | | | |
Proceeds from shares issued | | $ | 22,843 | | | $ | 32,905 | | | $ | 40,951 | | | $ | 54,317 | |
Distributions reinvested | | | 321 | | | | 1,578 | | | | 1,262 | | | | 1,598 | |
Cost of shares redeemed | | | (15,539 | ) | | | (460,051 | ) | | | (15,559 | ) | | | (32,820 | ) |
| | | | | | | | | | | | | | | | |
Change in net assets resulting from Class I capital transactions | | $ | 7,625 | | | $ | (425,568 | ) | | $ | 26,654 | | | $ | 23,095 | |
| | | | | | | | | | | | | | | | |
Class R2 | | | | | | | | | | | | | | | | |
Proceeds from shares issued | | $ | 197 | | | $ | 883 | | | $ | 148 | | | $ | 282 | |
Distributions reinvested | | | 1 | | | | 10 | | | | 7 | | | | 5 | |
Cost of shares redeemed | | | (277 | ) | | | (596 | ) | | | (28 | ) | | | (12 | ) |
| | | | | | | | | | | | | | | | |
Change in net assets resulting from Class R2 capital transactions | | $ | (79 | ) | | $ | 297 | | | $ | 127 | | | $ | 275 | |
| | | | | | | | | | | | | | | | |
Class R5 | | | | | | | | | | | | | | | | |
Proceeds from shares issued | | $ | 1,285 | | | $ | 6,787 | | | $ | 905 | | | $ | 696 | |
Distributions reinvested | | | 165 | | | | 1,103 | | | | 24 | | | | 14 | |
Cost of shares redeemed | | | (43,203 | ) | | | (4,763 | ) | | | (74 | ) | | | (14 | ) |
| | | | | | | | | | | | | | | | |
Change in net assets resulting from Class R5 capital transactions | | $ | (41,753 | ) | | $ | 3,127 | | | $ | 855 | | | $ | 696 | |
| | | | | | | | | | | | | | | | |
Class R6 | | | | | | | | | | | | | | | | |
Proceeds from shares issued | | $ | 255,711 | | | $ | 1,159,108 | | | $ | 112 | | | $ | 1 | |
Distributions reinvested | | | 16,643 | | | | 57,229 | | | | 3 | | | | 2 | |
Cost of shares redeemed | | | (350,395 | ) | | | (239,110 | ) | | | (13 | ) | | | — | (a) |
| | | | | | | | | | | | | | | | |
Change in net assets resulting from Class R6 capital transactions | | $ | (78,041 | ) | | $ | 977,227 | | | $ | 102 | | | $ | 3 | |
| | | | | | | | | | | | | | | | |
Total change in net assets resulting from capital transactions | | $ | (96,314 | ) | | $ | 550,039 | | | $ | 31,615 | | | $ | 33,459 | |
| | | | | | | | | | | | | | | | |
| (a) | Amount rounds to less than 500. |
SEE NOTES TO FINANCIAL STATEMENTS.
| | | | | | | | |
| | | |
| APRIL 30, 2017 | | J.P. MORGAN INTERNATIONAL EQUITY FUNDS | | | | | 113 | |
STATEMENTS OF CHANGES IN NET ASSETS
FOR THE PERIODS INDICATED (continued)
(Amounts in thousands)
| | | | | | | | | | | | | | | | |
| | |
International Equity Fund | | | International Equity Income Fund | |
| | | Six Months Ended
April 30, 2017
(Unaudited) | | | Year Ended
October 31, 2016 | | | Six Months Ended
April 30, 2017
(Unaudited) | | | Year Ended
October 31, 2016 | |
SHARE TRANSACTIONS: | |
Class A | |
Issued | | | 4,424 | | | | 8,046 | | | | 1,620 | | | | 3,246 | |
Reinvested | | | 42 | | | | 265 | | | | 84 | | | | 216 | |
Redeemed | | | (3,380 | ) | | | (8,294 | ) | | | (1,486 | ) | | | (3,069 | ) |
| | | | | | | | | | | | | | | | |
Change in Class A Shares | | | 1,086 | | | | 17 | | | | 218 | | | | 393 | |
| | | | | | | | | | | | | | | | |
Class C | |
Issued | | | 155 | | | | 189 | | | | 183 | | | | 479 | |
Reinvested | | | 1 | | | | 22 | | | | 13 | | | | 31 | |
Redeemed | | | (252 | ) | | | (584 | ) | | | (158 | ) | | | (243 | ) |
| | | | | | | | | | | | | | | | |
Change in Class C Shares | | | (96 | ) | | | (373 | ) | | | 38 | | | | 267 | |
| | | | | | | | | | | | | | | | |
Class I (formerly Select Class) | |
Issued | | | 1,520 | | | | 2,347 | | | | 2,755 | | | | 3,700 | |
Reinvested | | | 22 | | | | 117 | | | | 84 | | | | 108 | |
Redeemed | | | (1,043 | ) | | | (30,864 | ) | | | (1,054 | ) | | | (2,258 | ) |
| | | | | | | | | | | | | | | | |
Change in Class I Shares | | | 499 | | | | (28,400 | ) | | | 1,785 | | | | 1,550 | |
| | | | | | | | | | | | | | | | |
Class R2 | |
Issued | | | 14 | | | | 64 | | | | 10 | | | | 19 | |
Reinvested | | | — | (a) | | | 1 | | | | 1 | | | | — | (a) |
Redeemed | | | (19 | ) | | | (44 | ) | | | (2 | ) | | | (1 | ) |
| | | | | | | | | | | | | | | | |
Change in Class R2 Shares | | | (5 | ) | | | 21 | | | | 9 | | | | 18 | |
| | | | | | | | | | | | | | | | |
Class R5 | |
Issued | | | 89 | | | | 483 | | | | 60 | | | | 48 | |
Reinvested | | | 11 | | | | 81 | | | | 2 | | | | 1 | |
Redeemed | | | (2,941 | ) | | | (338 | ) | | | (5 | ) | | | (1 | ) |
| | | | | | | | | | | | | | | | |
Change in Class R5 Shares | | | (2,841 | ) | | | 226 | | | | 57 | | | | 48 | |
| | | | | | | | | | | | | | | | |
Class R6 | |
Issued | | | 17,337 | | | | 82,405 | | | | 9 | | | | — | (a) |
Reinvested | | | 1,123 | | | | 4,227 | | | | — | (a) | | | — | (a) |
Redeemed | | | (23,335 | ) | | | (16,681 | ) | | | (1 | ) | | | — | (a) |
| | | | | | | | | | | | | | | | |
Change in Class R6 Shares | | | (4,875 | ) | | | 69,951 | | | | 8 | | | | — | (a) |
| | | | | | | | | | | | | | | | |
| (a) | Amount rounds to less than 500. |
SEE NOTES TO FINANCIAL STATEMENTS.
| | | | | | |
| | | |
| 114 | | | | J.P. MORGAN INTERNATIONAL EQUITY FUNDS | | APRIL 30, 2017 |
| | | | | | | | | | | | | | | | |
| | | International Opportunities Fund | | | International Research Enhanced
Equity Fund | |
| | | Six Months Ended
April 30, 2017
(Unaudited) | | | Year Ended
October 31, 2016 | | | Six Months Ended
April 30, 2017
(Unaudited) | | | Year Ended
October 31, 2016 | |
CAPITAL TRANSACTIONS: | | | | | | | | | | | | | | | | |
Class A | | | | | | | | | | | | | | | | |
Proceeds from shares issued | | $ | 58,284 | | | $ | 107,477 | | | $ | 6,125 | | | $ | 9,158 | |
Distributions reinvested | | | 4,754 | | | | 362 | | | | 1,449 | | | | 2,436 | |
Cost of shares redeemed | | | (46,279 | ) | | | (84,187 | ) | | | (12,722 | ) | | | (19,422 | ) |
| | | | | | | | | | | | | | | | |
Change in net assets resulting from Class A capital transactions | | $ | 16,759 | | | $ | 23,652 | | | $ | (5,148 | ) | | $ | (7,828 | ) |
| | | | | | | | | | | | | | | | |
Class C | | | | | | | | | | | | | | | | |
Proceeds from shares issued | | $ | 70 | | | $ | 469 | | | $ | 429 | | | $ | 998 | |
Distributions reinvested | | | 36 | | | | — | (a) | | | 221 | | | | 467 | |
Cost of shares redeemed | | | (321 | ) | | | (554 | ) | | | (2,825 | ) | | | (5,171 | ) |
| | | | | | | | | | | | | | | | |
Change in net assets resulting from Class C capital transactions | | $ | (215 | ) | | $ | (85 | ) | | $ | (2,175 | ) | | $ | (3,706 | ) |
| | | | | | | | | | | | | | | | |
Class I (formerly Select Class) | | | | | | | | | | | | | | | | |
Proceeds from shares issued | | $ | 25,843 | | | $ | 8,676 | | | $ | 364,310 | | | $ | 568,584 | |
Distributions reinvested | | | 933 | | | | 35 | | | | 31,067 | | | | 25,196 | |
Cost of shares redeemed | | | (6,778 | ) | | | (8,351 | ) | | | (150,603 | ) | | | (96,905 | ) |
| | | | | | | | | | | | | | | | |
Change in net assets resulting from Class I capital transactions | | $ | 19,998 | | | $ | 360 | | | $ | 244,774 | | | $ | 496,875 | |
| | | | | | | | | | | | | | | | |
Class R2 | | | | | | | | | | | | | | | | |
Proceeds from shares issued | | $ | — | | | $ | — | | | $ | 4,057 | | | $ | 8,693 | |
Distributions reinvested | | | — | | | | — | | | | 189 | | | | 28 | |
Cost of shares redeemed | | | — | | | | — | | | | (2,690 | ) | | | (1,738 | ) |
| | | | | | | | | | | | | | | | |
Change in net assets resulting from Class R2 capital transactions | | $ | — | | | $ | — | | | $ | 1,556 | | | $ | 6,983 | |
| | | | | | | | | | | | | | | | |
Class R6 | | | | | | | | | | | | | | | | |
Proceeds from shares issued | | $ | 157,755 | | | $ | 871,518 | | | $ | — | | | $ | — | |
Distributions reinvested | | | 92,823 | | | | 13,758 | | | | — | | | | — | |
Cost of shares redeemed | | | (281,444 | ) | | | (295,100 | ) | | | — | | | | — | |
| | | | | | | | | | | | | | | | |
Change in net assets resulting from Class R6 capital transactions | | $ | (30,866 | ) | | $ | 590,176 | | | $ | — | | | $ | — | |
| | | | | | | | | | | | | | | | |
Institutional Class | | | | | | | | | | | | | | | | |
Proceeds from shares issued | | $ | 207 | | | $ | 11,992 | | | $ | — | | | $ | — | |
Distributions reinvested | | | — | | | | 243 | | | | — | | | | — | |
Cost of shares redeemed | | | (50,461 | ) | | | (15,183 | ) | | | — | | | | — | |
| | | | | | | | | | | | | | | | |
Change in net assets resulting from Institutional Class capital transactions | | $ | (50,254 | ) | | $ | (2,948 | ) | | $ | — | | | $ | — | |
| | | | | | | | | | | | | | | | |
Total change in net assets resulting from capital transactions | | $ | (44,578 | ) | | $ | 611,155 | | | $ | 239,007 | | | $ | 492,324 | |
| | | | | | | | | | | | | | | | |
| (a) | Amount rounds to less than 500. |
SEE NOTES TO FINANCIAL STATEMENTS.
| | | | | | | | |
| | | |
| APRIL 30, 2017 | | J.P. MORGAN INTERNATIONAL EQUITY FUNDS | | | | | 115 | |
STATEMENTS OF CHANGES IN NET ASSETS
FOR THE PERIODS INDICATED (continued)
(Amounts in thousands)
| | | | | | | | | | | | | | | | |
| | | International Opportunities Fund | | | International Research Enhanced
Equity Fund | |
| | | Six Months Ended
April 30, 2017
(Unaudited) | | | Year Ended
October 31, 2016 | | | Six Months Ended
April 30, 2017
(Unaudited) | | | Year Ended
October 31, 2016 | |
SHARE TRANSACTIONS: | |
Class A | |
Issued | | | 4,083 | | | | 7,900 | | | | 380 | | | | 600 | |
Reinvested | | | 349 | | | | 26 | | | | 93 | | | | 157 | |
Redeemed | | | (3,277 | ) | | | (6,175 | ) | | | (789 | ) | | | (1,276 | ) |
| | | | | | | | | | | | | | | | |
Change in Class A Shares | | | 1,155 | | | | 1,751 | | | | (316 | ) | | | (519 | ) |
| | | | | | | | | | | | | | | | |
Class C | |
Issued | | | 4 | | | | 36 | | | | 27 | | | | 67 | |
Reinvested | | | 3 | | | | — | (a) | | | 15 | | | | 32 | |
Redeemed | | | (23 | ) | | | (42 | ) | | | (183 | ) | | | (353 | ) |
| | | | | | | | | | | | | | | | |
Change in Class C Shares | | | (16 | ) | | | (6 | ) | | | (141 | ) | | | (254 | ) |
| | | | | | | | | | | | | | | | |
Class I (formerly Select Class) | |
Issued | | | 1,820 | | | | 636 | | | | 22,174 | | | | 37,181 | |
Reinvested | | | 67 | | | | 3 | | | | 1,983 | | | | 1,614 | |
Redeemed | | | (474 | ) | | | (596 | ) | | | (9,356 | ) | | | (6,312 | ) |
| | | | | | | | | | | | | | | | |
Change in Class I Shares | | | 1,413 | | | | 43 | | | | 14,801 | | | | 32,483 | |
| | | | | | | | | | | | | | | | |
Class R2 | |
Issued | | | — | | | | — | | | | 259 | | | | 581 | |
Reinvested | | | — | | | | — | | | | 12 | | | | 2 | |
Redeemed | | | — | | | | — | | | | (171 | ) | | | (115 | ) |
| | | | | | | | | | | | | | | | |
Change in Class R2 Shares | | | — | | | | — | | | | 100 | | | | 468 | |
| | | | | | | | | | | | | | | | |
Class R6 | |
Issued | | | 10,976 | | | | 63,733 | | | | — | | | | — | |
Reinvested | | | 6,707 | | | | 975 | | | | — | | | | — | |
Redeemed | | | (19,419 | ) | | | (20,913 | ) | | | — | | | | — | |
| | | | | | | | | | | | | | | | |
Change in Class R6 Shares | | | (1,736 | ) | | | 43,795 | | | | — | | | | — | |
| | | | | | | | | | | | | | | | |
Institutional Class | |
Issued | | | 15 | | | | 861 | | | | — | | | | — | |
Reinvested | | | — | | | | 17 | | | | — | | | | — | |
Redeemed | | | (3,536 | ) | | | (1,102 | ) | | | — | | | | — | |
| | | | | | | | | | | | | | | | |
Change in Institutional Class Shares | | | (3,521 | ) | | | (224 | ) | | | — | | | | — | |
| | | | | | | | | | | | | | | | |
| (a) | Amount rounds to less than 500. |
SEE NOTES TO FINANCIAL STATEMENTS.
| | | | | | |
| | | |
| 116 | | | | J.P. MORGAN INTERNATIONAL EQUITY FUNDS | | APRIL 30, 2017 |
| | | | | | | | | | | | | | | | |
| | | International Unconstrained
Equity Fund | | | International Value Fund | |
| | | Six Months Ended
April 30, 2017
(Unaudited) | | | Year Ended
October 31, 2016 | | | Six Months Ended
April 30, 2017
(Unaudited) | | | Year Ended
October 31, 2016 | |
CAPITAL TRANSACTIONS: | | | | | | | | | | | | | | | | |
Class A | | | | | | | | | | | | | | | | |
Proceeds from shares issued | | $ | 15,302 | | | $ | 11,592 | | | $ | 41,862 | | | $ | 205,683 | |
Distributions reinvested | | | 257 | | | | 18 | | | | 18,745 | | | | 7,392 | |
Cost of shares redeemed | | | (5,248 | ) | | | (3,467 | ) | | | (359,972 | ) | | | (291,409 | ) |
| | | | | | | | | | | | | | | | |
Change in net assets resulting from Class A capital transactions | | $ | 10,311 | | | $ | 8,143 | | | $ | (299,365 | ) | | $ | (78,334 | ) |
| | | | | | | | | | | | | | | | |
Class C | | | | | | | | | | | | | | | | |
Proceeds from shares issued | | $ | 1,733 | | | $ | 2,759 | | | $ | 1,199 | | | $ | 5,220 | |
Distributions reinvested | | | 66 | | | | 3 | | | | 1,151 | | | | 154 | |
Cost of shares redeemed | | | (1,128 | ) | | | (1,551 | ) | | | (5,890 | ) | | | (10,150 | ) |
| | | | | | | | | | | | | | | | |
Change in net assets resulting from Class C capital transactions | | $ | 671 | | | $ | 1,211 | | | $ | (3,540 | ) | | $ | (4,776 | ) |
| | | | | | | | | | | | | | | | |
Class I (formerly Select Class) | | | | | | | | | | | | | | | | |
Proceeds from shares issued | | $ | 21,514 | | | $ | 7,331 | | | $ | 16,866 | | | $ | 57,659 | |
Distributions reinvested | | | 198 | | | | — | | | | 4,900 | | | | 1,701 | |
Cost of shares redeemed | | | (3,561 | ) | | | (57,428 | ) | | | (37,031 | ) | | | (119,752 | ) |
| | | | | | | | | | | | | | | | |
Change in net assets resulting from Class I capital transactions | | $ | 18,151 | | | $ | (50,097 | ) | | $ | (15,265 | ) | | $ | (60,392 | ) |
| | | | | | | | | | | | | | | | |
Class L (formerly Institutional Class) | | | | | | | | | | | | | | | | |
Proceeds from shares issued | | $ | — | | | $ | — | | | $ | 133,242 | | | $ | 320,955 | |
Distributions reinvested | | | — | | | | — | | | | 20,403 | | | | 13,888 | |
Cost of shares redeemed | | | — | | | | — | | | | (381,988 | ) | | | (1,188,471 | ) |
| | | | | | | | | | | | | | | | |
Change in net assets resulting from Class L capital transactions | | $ | — | | | $ | — | | | $ | (228,343 | ) | | $ | (853,628 | ) |
| | | | | | | | | | | | | | | | |
Class R2 | | | | | | | | | | | | | | | | |
Proceeds from shares issued | | $ | — | | | $ | — | | | $ | 225 | | | $ | 765 | |
Distributions reinvested | | | — | (a) | | | — | | | | 24 | | | | 8 | |
Cost of shares redeemed | | | — | | | | — | (a) | | | (234 | ) | | | (1,410 | ) |
| | | | | | | | | | | | | | | | |
Change in net assets resulting from Class R2 capital transactions | | $ | — | (a) | | $ | — | (a) | | $ | 15 | | | $ | (637 | ) |
| | | | | | | | | | | | | | | | |
Class R5 (b) | | | | | | | | | | | | | | | | |
Proceeds from shares issued | | $ | — | | | $ | — | | | $ | — | (a) | | $ | 20 | |
Distributions reinvested | | | — | (a) | | | — | (a) | | | 1 | | | | — | |
Cost of shares redeemed | | | — | | | | — | (a) | | | — | | | | — | |
| | | | | | | | | | | | | | | | |
Change in net assets resulting from Class R5 capital transactions | | $ | — | (a) | | $ | — | (a) | | $ | 1 | | | $ | 20 | |
| | | | | | | | | | | | | | | | |
Class R6 | | | | | | | | | | | | | | | | |
Proceeds from shares issued | | $ | 20,478 | | | $ | 75,541 | | | $ | 219 | | | $ | 28,014 | |
Distributions reinvested | | | 1,980 | | | | 253 | | | | 1,834 | | | | 61 | |
Cost of shares redeemed | | | (7 | ) | | | 4 | | | | (571 | ) | | | (2,057 | ) |
| | | | | | | | | | | | | | | | |
Change in net assets resulting from Class R6 capital transactions | | $ | 22,451 | | | $ | 75,798 | | | $ | 1,482 | | �� | $ | 26,018 | |
| | | | | | | | | | | | | | | | |
Total change in net assets resulting from capital transactions | | $ | 51,584 | | | $ | 35,055 | | | $ | (545,015 | ) | | $ | (971,729 | ) |
| | | | | | | | | | | | | | | | |
| (a) | Amount rounds to less than 500. |
| (b) | Commencement of offering of class shares effective September 9, 2016, for International Value Fund. |
SEE NOTES TO FINANCIAL STATEMENTS.
| | | | | | | | |
| | | |
| APRIL 30, 2017 | | J.P. MORGAN INTERNATIONAL EQUITY FUNDS | | | | | 117 | |
STATEMENTS OF CHANGES IN NET ASSETS
FOR THE PERIODS INDICATED (continued)
(Amounts in thousands)
| | | | | | | | | | | | | | | | |
| | | International Unconstrained
Equity Fund | | | International Value Fund | |
| | | Six Months Ended
April 30, 2017
(Unaudited) | | | Year Ended
October 31, 2016 | | | Six Months Ended
April 30, 2017
(Unaudited) | | | Year Ended
October 31, 2016 | |
SHARE TRANSACTIONS: | |
Class A | |
Issued | | | 855 | | | | 688 | | | | 3,342 | | | | 17,288 | |
Reinvested | | | 15 | | | | 1 | | | | 1,558 | | | | 600 | |
Redeemed | | | (303 | ) | | | (206 | ) | | | (29,149 | ) | | | (24,382 | ) |
| | | | | | | | | | | | | | | | |
Change in Class A Shares | | | 567 | | | | 483 | | | | (24,249 | ) | | | (6,494 | ) |
| | | | | | | | | | | | | | | | |
Class C | |
Issued | | | 96 | | | | 167 | | | | 99 | | | | 445 | |
Reinvested | | | 4 | | | | — | (a) | | | 99 | | | | 13 | |
Redeemed | | | (65 | ) | | | (92 | ) | | | (488 | ) | | | (874 | ) |
| | | | | | | | | | | | | | | | |
Change in Class C Shares | | | 35 | | | | 75 | | | | (290 | ) | | | (416 | ) |
| | | | | | | | | | | | | | | | |
Class I (formerly Select Class) | |
Issued | | | 1,198 | | | | 438 | | | | 1,337 | | | | 4,708 | |
Reinvested | | | 12 | | | | — | | | | 399 | | | | 135 | |
Redeemed | | | (202 | ) | | | (3,248 | ) | | | (2,912 | ) | | | (9,716 | ) |
| | | | | | | | | | | | | | | | |
Change in Class I Shares | | | 1,008 | | | | (2,810 | ) | | | (1,176 | ) | | | (4,873 | ) |
| | | | | | | | | | | | | | | | |
Class L (formerly Institutional Class) | |
Issued | | | — | | | | — | | | | 10,486 | | | | 26,460 | |
Reinvested | | | — | | | | — | | | | 1,668 | | | | 1,108 | |
Redeemed | | | — | | | | — | | | | (29,609 | ) | | | (97,097 | ) |
| | | | | | | | | | | | | | | | |
Change in Class L Shares | | | — | | | | — | | | | (17,455 | ) | | | (69,529 | ) |
| | | | | | | | | | | | | | | | |
Class R2 | |
Issued | | | — | | | | — | | | | 19 | | | | 65 | |
Reinvested | | | — | (a) | | | — | | | | 2 | | | | 1 | |
Redeemed | | | — | | | | — | | | | (19 | ) | | | (118 | ) |
| | | | | | | | | | | | | | | | |
Change in Class R2 Shares | | | — | (a) | | | — | | | | 2 | | | | (52 | ) |
| | | | | | | | | | | | | | | | |
Class R5 (b) | |
Issued | | | — | | | | — | | | | — | | | | 2 | |
Reinvested | | | — | (a) | | | — | (a) | | | — | (a) | | | — | |
| | | | | | | | | | | | | | | | |
Change in Class R5 Shares | | | — | (a) | | | — | (a) | | | — | (a) | | | 2 | |
| | | | | | | | | | | | | | | | |
Class R6 | |
Issued | | | 1,145 | | | | 4,336 | | | | 18 | | | | 2,230 | |
Reinvested | | | 117 | | | | 15 | | | | 150 | | | | 5 | |
Redeemed | | | — | (a) | | | (1 | ) | | | (46 | ) | | | (174 | ) |
| | | | | | | | | | | | | | | | |
Change in Class R6 Shares | | | 1,262 | | | | 4,350 | | | | 122 | | | | 2,061 | |
| | | | | | | | | | | | | | | | |
| (a) | Amount rounds to less than 500. |
| (b) | Commencement of offering of class shares effective September 9, 2016, for International Value Fund. |
SEE NOTES TO FINANCIAL STATEMENTS.
| | | | | | |
| | | |
| 118 | | | | J.P. MORGAN INTERNATIONAL EQUITY FUNDS | | APRIL 30, 2017 |
| | | | | | | | |
| | |
Intrepid International Fund | |
| | | Six Months Ended
April 30, 2017
(Unaudited) | | | Year Ended
October 31, 2016 | |
CAPITAL TRANSACTIONS: | | | | | | | | |
Class A | | | | | | | | |
Proceeds from shares issued | | $ | 56,818 | | | $ | 102,499 | |
Distributions reinvested | | | 3,114 | | | | 2,734 | |
Cost of shares redeemed | | | (39,731 | ) | | | (87,263 | ) |
| | | | | | | | |
Change in net assets resulting from Class A capital transactions | | $ | 20,201 | | | $ | 17,970 | |
| | | | | | | | |
Class C | | | | | | | | |
Proceeds from shares issued | | $ | 126 | | | $ | 651 | |
Distributions reinvested | | | 27 | | | | 32 | |
Cost of shares redeemed | | | (699 | ) | | | (1,054 | ) |
| | | | | | | | |
Change in net assets resulting from Class C capital transactions | | $ | (546 | ) | | $ | (371 | ) |
| | | | | | | | |
Class I (formerly Select Class) | | | | | | | | |
Proceeds from shares issued | | $ | 32,967 | | | $ | 6,578 | |
Distributions reinvested | | | 451 | | | | 221 | |
Cost of shares redeemed | | | (3,756 | ) | | | (8,803 | ) |
| | | | | | | | |
Change in net assets resulting from Class I capital transactions | | $ | 29,662 | | | $ | (2,004 | ) |
| | | | | | | | |
Class R2 | | | | | | | | |
Proceeds from shares issued | | $ | 45 | | | $ | 318 | |
Distributions reinvested | | | 4 | | | | 3 | |
Cost of shares redeemed | | | (59 | ) | | | (41 | ) |
| | | | | | | | |
Change in net assets resulting from Class R2 capital transactions | | $ | (10 | ) | | $ | 280 | |
| | | | | | | | |
Class R6 | | | | | | | | |
Proceeds from shares issued | | $ | 199,247 | | | $ | 900,498 | |
Distributions reinvested | | | 66,113 | | | | 39,523 | |
Cost of shares redeemed | | | (301,583 | ) | | | (259,983 | ) |
| | | | | | | | |
Change in net assets resulting from Class R6 capital transactions | | $ | (36,223 | ) | | $ | 680,038 | |
| | | | | | | | |
Institutional Class | | | | | | | | |
Proceeds from shares issued | | $ | 39 | | | $ | 3,104 | |
Distributions reinvested | | | — | | | | 50 | |
Cost of shares redeemed | | | (23,795 | ) | | | (27,450 | ) |
| | | | | | | | |
Change in net assets resulting from Institutional Class capital transactions | | $ | (23,756 | ) | | $ | (24,296 | ) |
| | | | | | | | |
Total change in net assets resulting from capital transactions | | $ | (10,672 | ) | | $ | 671,617 | |
| | | | | | | | |
SEE NOTES TO FINANCIAL STATEMENTS.
| | | | | | | | |
| | | |
| APRIL 30, 2017 | | J.P. MORGAN INTERNATIONAL EQUITY FUNDS | | | | | 119 | |
STATEMENTS OF CHANGES IN NET ASSETS
FOR THE PERIODS INDICATED (continued)
(Amounts in thousands)
| | | | | | | | |
| | |
Intrepid International Fund | |
| | | Six Months Ended
April 30, 2017
(Unaudited) | | | Year Ended
October 31, 2016 | |
SHARE TRANSACTIONS: | |
Class A | |
Issued | | | 2,971 | | | | 5,754 | |
Reinvested | | | 171 | | | | 148 | |
Redeemed | | | (2,106 | ) | | | (4,883 | ) |
| | | | | | | | |
Change in Class A Shares | | | 1,036 | | | | 1,019 | |
| | | | | | | | |
Class C | | | | | | | | |
Issued | | | 7 | | | | 35 | |
Reinvested | | | 1 | | | | 2 | |
Redeemed | | | (37 | ) | | | (57 | ) |
| | | | | | | | |
Change in Class C Shares | | | (29 | ) | | | (20 | ) |
| | | | | | | | |
Class I (formerly Select Class) | | | | | | | | |
Issued | | | 1,707 | | | | 354 | |
Reinvested | | | 24 | | | | 12 | |
Redeemed | | | (191 | ) | | | (472 | ) |
| | | | | | | | |
Change in Class I Shares | | | 1,540 | | | | (106 | ) |
| | | | | | | | |
Class R2 | | | | | | | | |
Issued | | | 2 | | | | 18 | |
Reinvested | | | — | (a) | | | — | (a) |
Redeemed | | | (3 | ) | | | (2 | ) |
| | | | | | | | |
Change in Class R2 Shares | | | (1 | ) | | | 16 | |
| | | | | | | | |
Class R6 | | | | | | | | |
Issued | | | 10,410 | | | | 49,855 | |
Reinvested | | | 3,555 | | | | 2,101 | |
Redeemed | | | (15,445 | ) | | | (13,945 | ) |
| | | | | | | | |
Change in Class R6 Shares | | | (1,480 | ) | | | 38,011 | |
| | | | | | | | |
Institutional Class | | | | | | | | |
Issued | | | 2 | | | | 170 | |
Reinvested | | | — | | | | 3 | |
Redeemed | | | (1,238 | ) | | | (1,551 | ) |
| | | | | | | | |
Change in Institutional Class Shares | | | (1,236 | ) | | | (1,378 | ) |
| | | | | | | | |
| (a) | Amount rounds to less than 500. |
SEE NOTES TO FINANCIAL STATEMENTS.
| | | | | | |
| | | |
| 120 | | | | J.P. MORGAN INTERNATIONAL EQUITY FUNDS | | APRIL 30, 2017 |
THIS PAGE IS INTENTIONALLY LEFT BLANK
| | | | | | | | |
| | | |
| APRIL 30, 2017 | | J.P. MORGAN INTERNATIONAL EQUITY FUNDS | | | | | 121 | |
FINANCIAL HIGHLIGHTS
FOR THE PERIODS INDICATED
| | | | | | | | | | | | | | | | | | | | |
| | | Per share operating performance | |
| | | | | | Investment operations | | | Distributions | |
| | | Net asset
value,
beginning
of period | | | Net
investment
income
(loss) (b) | | | Net realized
and unrealized
gains
(losses) on
investments | | | Total from
investment
operations | | | Net
investment
income | |
Emerging Economies Fund | |
Class A | |
Six Months Ended April 30, 2017 (Unaudited) | | $ | 11.55 | | | $ | 0.05 | | | $ | 1.18 | | | $ | 1.23 | | | $ | (0.15 | ) |
Year Ended October 31, 2016 | | | 11.03 | | | | 0.15 | | | | 0.46 | | | | 0.61 | | | | (0.09 | ) |
Year Ended October 31, 2015 | | | 13.13 | | | | 0.13 | (f) | | | (2.03 | ) | | | (1.90 | ) | | | (0.20 | ) |
Year Ended October 31, 2014 | | | 13.63 | | | | 0.22 | | | | (0.57 | ) | | | (0.35 | ) | | | (0.15 | ) |
Year Ended October 31, 2013 | | | 12.88 | | | | 0.19 | | | | 0.67 | | | | 0.86 | | | | (0.11 | ) |
Year Ended October 31, 2012 | | | 12.65 | | | | 0.17 | | | | 0.21 | | | | 0.38 | | | | (0.15 | ) |
|
Class C | |
Six Months Ended April 30, 2017 (Unaudited) | | | 11.41 | | | | 0.02 | | | | 1.18 | | | | 1.20 | | | | (0.06 | ) |
Year Ended October 31, 2016 | | | 10.86 | | | | 0.09 | | | | 0.46 | | | | 0.55 | | | | — | (g) |
Year Ended October 31, 2015 | | | 12.92 | | | | 0.10 | (f) | | | (2.03 | ) | | | (1.93 | ) | | | (0.13 | ) |
Year Ended October 31, 2014 | | | 13.44 | | | | 0.15 | | | | (0.57 | ) | | | (0.42 | ) | | | (0.10 | ) |
Year Ended October 31, 2013 | | | 12.72 | | | | 0.13 | | | | 0.66 | | | | 0.79 | | | | (0.07 | ) |
Year Ended October 31, 2012 | | | 12.58 | | | | 0.15 | | | | 0.15 | | | | 0.30 | | | | (0.16 | ) |
|
Class I (formerly Select Class) | |
Six Months Ended April 30, 2017 (Unaudited) | | | 11.68 | | | | 0.07 | | | | 1.20 | | | | 1.27 | | | | (0.16 | ) |
Year Ended October 31, 2016 | | | 11.06 | | | | 0.18 | | | | 0.47 | | | | 0.65 | | | | (0.03 | ) |
Year Ended October 31, 2015 | | | 13.17 | | | | 0.18 | (f) | | | (2.06 | ) | | | (1.88 | ) | | | (0.23 | ) |
Year Ended October 31, 2014 | | | 13.67 | | | | 0.26 | | | | (0.58 | ) | | | (0.32 | ) | | | (0.18 | ) |
Year Ended October 31, 2013 | | | 12.91 | | | | 0.21 | | | | 0.70 | | | | 0.91 | | | | (0.15 | ) |
Year Ended October 31, 2012 | | | 12.68 | | | | 0.22 | | | | 0.18 | | | | 0.40 | | | | (0.17 | ) |
|
Class R5 | |
Six Months Ended April 30, 2017 (Unaudited) | | | 11.78 | | | | 0.08 | | | | 1.21 | | | | 1.29 | | | | (0.17 | ) |
Year Ended October 31, 2016 | | | 11.11 | | | | 0.05 | | | | 0.62 | | | | 0.67 | | | | — | |
Year Ended October 31, 2015 | | | 13.22 | | | | 0.20 | (f) | | | (2.06 | ) | | | (1.86 | ) | | | (0.25 | ) |
Year Ended October 31, 2014 | | | 13.71 | | | | 0.29 | | | | (0.58 | ) | | | (0.29 | ) | | | (0.20 | ) |
Year Ended October 31, 2013 | | | 12.94 | | | | 0.25 | | | | 0.68 | | | | 0.93 | | | | (0.16 | ) |
Year Ended October 31, 2012 | | | 12.71 | | | | 0.25 | | | | 0.18 | | | | 0.43 | | | | (0.20 | ) |
|
Class R6 | |
Six Months Ended April 30, 2017 (Unaudited) | | | 11.64 | | | | 0.08 | | | | 1.18 | | | | 1.26 | | | | (0.18 | ) |
Year Ended October 31, 2016 | | | 11.11 | | | | 0.21 | | | | 0.46 | | | | 0.67 | | | | (0.14 | ) |
September 1, 2015 (h) through October 31, 2015 | | | 10.46 | | | | (0.02 | )(f) | | | 0.67 | | | | 0.65 | | | | — | |
| (a) | Annualized for periods less than one year, unless otherwise noted. |
| (b) | Calculated based upon average shares outstanding. |
| (c) | Not annualized for periods less than one year. |
| (d) | Includes adjustments in accordance with accounting principles generally accepted in the United States of America and as such, the net asset values for financial reporting purposes and the returns based upon those net asset values may differ from the net asset values and returns for shareholder transactions. |
| (e) | Includes interest expense, if applicable, which is less than 0.005% unless otherwise noted. |
| (f) | Net investment income (loss) may appear disproportionate among the classes due to the timing of recognition of income and changes in the relative size of the classes. |
| (g) | Amount rounds to less than $0.005. |
| (h) | Commencement of offering of class of shares. |
SEE NOTES TO FINANCIAL STATEMENTS.
| | | | | | |
| | | |
| 122 | | | | J.P. MORGAN INTERNATIONAL EQUITY FUNDS | | APRIL 30, 2017 |
| | | | | | | | | | | | | | | | | | | | | | | | | | |
| | | Ratios/Supplemental data | |
| | | | | | | | | | Ratios to average net assets (a) | | | | |
Net asset
value,
end of
period | | | Total return
(excludes
sales charge) (c)(d) | | | Net assets,
end of
period
(000’s) | | | Net
expenses (e) | | | Net
investment
income
(loss) | | | Expenses
without waivers
and reimbursements | | | Portfolio
turnover
rate (c) | |
| | | | | | | | | | | | | | | | | | | | | | | | | | |
| | | | | | | | | | | | | | | | | | | | | | | | | | |
| $ | 12.63 | | | | 10.85 | % | | $ | 152,637 | | | | 1.35 | % | | | 0.88 | % | | | 1.62 | % | | | 33 | % |
| | 11.55 | | | | 5.62 | | | | 148,331 | | | | 1.42 | | | | 1.42 | | | | 1.70 | | | | 72 | |
| | 11.03 | | | | (14.60 | ) | | | 43,220 | | | | 1.58 | | | | 1.06 | (f) | | | 1.99 | | | | 118 | |
| | 13.13 | | | | (2.56 | ) | | | 80,806 | | | | 1.60 | | | | 1.71 | | | | 1.73 | | | | 79 | |
| | 13.63 | | | | 6.67 | | | | 69,690 | | | | 1.60 | | | | 1.45 | | | | 1.72 | | | | 43 | |
| | 12.88 | | | | 3.15 | | | | 30,356 | | | | 1.65 | | | | 1.37 | | | | 1.76 | | | | 72 | |
| | | | | | |
| | | | | | | | | | | | | | | | | | | | | | | | | | |
| | 12.55 | | | | 10.64 | | | | 2,723 | | | | 1.85 | | | | 0.40 | | | | 2.25 | | | | 33 | |
| | 11.41 | | | | 5.11 | | | | 2,448 | | | | 1.96 | | | | 0.82 | | | | 2.37 | | | | 72 | |
| | 10.86 | | | | (15.02 | ) | | | 3,614 | | | | 2.09 | | | | 0.80 | (f) | | | 2.36 | | | | 118 | |
| | 12.92 | | | | (3.12 | ) | | | 5,331 | | | | 2.10 | | | | 1.13 | | | | 2.23 | | | | 79 | |
| | 13.44 | | | | 6.25 | | | | 5,089 | | | | 2.10 | | | | 1.02 | | | | 2.22 | | | | 43 | |
| | 12.72 | | | | 2.54 | | | | 2,088 | | | | 2.12 | | | | 1.21 | | | | 2.27 | | | | 72 | |
| | | | | | |
| | | | | | | | | | | | | | | | | | | | | | | | | | |
| | 12.79 | | | | 11.03 | | | | 59,491 | | | | 1.10 | | | | 1.14 | | | | 1.30 | | | | 33 | |
| | 11.68 | | | | 5.93 | | | | 53,509 | | | | 1.21 | | | | 1.67 | | | | 1.40 | | | | 72 | |
| | 11.06 | | | | (14.45 | ) | | | 239,866 | | | | 1.34 | | | | 1.51 | (f) | | | 1.46 | | | | 118 | |
| | 13.17 | | | | (2.35 | ) | | | 288,059 | | | | 1.35 | | | | 1.96 | | | | 1.48 | | | | 79 | |
| | 13.67 | | | | 7.04 | | | | 277,822 | | | | 1.35 | | | | 1.61 | | | | 1.47 | | | | 43 | |
| | 12.91 | | | | 3.34 | | | | 82,457 | | | | 1.39 | | | | 1.70 | | | | 1.51 | | | | 72 | |
| | | | | | |
| | | | | | | | | | | | | | | | | | | | | | | | | | |
| | 12.90 | | | | 11.18 | | | | 1,356 | | | | 0.92 | | | | 1.37 | | | | 1.17 | | | | 33 | |
| | 11.78 | | | | 6.03 | | | | 1,602 | | | | 1.08 | | | | 0.49 | | | | 1.25 | | | | 72 | |
| | 11.11 | | | | (14.20 | ) | | | 81,516 | | | | 1.14 | | | | 1.65 | (f) | | | 1.25 | | | | 118 | |
| | 13.22 | | | | (2.12 | ) | | | 852,477 | | | | 1.15 | | | | 2.19 | | | | 1.28 | | | | 79 | |
| | 13.71 | | | | 7.21 | | | | 676,985 | | | | 1.15 | | | | 1.84 | | | | 1.27 | | | | 43 | |
| | 12.94 | | | | 3.53 | | | | 331,032 | | | | 1.19 | | | | 1.99 | | | | 1.31 | | | | 72 | |
| | | | | | |
| | | | | | | | | | | | | | | | | | | | | | | | | | |
| | 12.72 | | | | 11.10 | | | | 1,665,619 | | | | 0.85 | | | | 1.39 | | | | 1.04 | | | | 33 | |
| | 11.64 | | | | 6.16 | | | | 1,573,822 | | | | 0.94 | | | | 1.99 | | | | 1.09 | | | | 72 | |
| | 11.11 | | | | 6.21 | | | | 732,627 | | | | 1.07 | | | | (0.92 | )(f) | | | 1.17 | | | | 118 | |
SEE NOTES TO FINANCIAL STATEMENTS.
| | | | | | | | |
| | | |
| APRIL 30, 2017 | | J.P. MORGAN INTERNATIONAL EQUITY FUNDS | | | | | 123 | |
FINANCIAL HIGHLIGHTS
FOR THE PERIODS INDICATED (continued)
| | | | | | | | | | | | | | | | | | | | |
| | | Per share operating performance | |
| | | | | | Investment operations | | | Distributions | |
| | | Net asset
value,
beginning
of period | | | Net
investment
income
(loss) (b) | | | Net realized
and unrealized
gains
(losses) on
investments | | | Total from
investment
operations | | | Net
investment
income | |
Emerging Markets Equity Fund | |
Class A | |
Six Months Ended April 30, 2017 (Unaudited) | | $ | 21.79 | | | $ | 0.01 | | | $ | 2.12 | | | $ | 2.13 | | | $ | (0.10 | ) |
Year Ended October 31, 2016 | | | 19.53 | | | | 0.09 | | | | 2.28 | | | | 2.37 | | | | (0.11 | ) |
Year Ended October 31, 2015 | | | 23.72 | | | | 0.12 | (f) | | | (4.12 | ) | | | (4.00 | ) | | | (0.19 | ) |
Year Ended October 31, 2014 | | | 23.05 | | | | 0.16 | (f) | | | 0.59 | | | | 0.75 | | | | (0.08 | ) |
Year Ended October 31, 2013 | | | 22.01 | | | | 0.10 | | | | 1.02 | | | | 1.12 | | | | (0.08 | ) |
Year Ended October 31, 2012 | | | 21.09 | | | | 0.07 | | | | 0.85 | | | | 0.92 | | | | — | |
|
Class C | |
Six Months Ended April 30, 2017 (Unaudited) | | | 21.18 | | | | (0.05 | ) | | | 2.08 | | | | 2.03 | | | | (0.01 | ) |
Year Ended October 31, 2016 | | | 18.96 | | | | (0.01 | ) | | | 2.23 | | | | 2.22 | | | | — | |
Year Ended October 31, 2015 | | | 23.03 | | | | 0.03 | (f) | | | (4.02 | ) | | | (3.99 | ) | | | (0.08 | ) |
Year Ended October 31, 2014 | | | 22.41 | | | | 0.05 | (f) | | | 0.57 | | | | 0.62 | | | | — | |
Year Ended October 31, 2013 | | | 21.44 | | | | (0.01 | ) | | | 0.99 | | | | 0.98 | | | | (0.01 | ) |
Year Ended October 31, 2012 | | | 20.65 | | | | (0.04 | ) | | | 0.83 | | | | 0.79 | | | | — | |
|
Class I (formerly Select Class) | |
Six Months Ended April 30, 2017 (Unaudited) | | | 22.33 | | | | 0.04 | | | | 2.17 | | | | 2.21 | | | | (0.14 | ) |
Year Ended October 31, 2016 | | | 19.98 | | | | 0.13 | | | | 2.35 | | | | 2.48 | | | | (0.13 | ) |
Year Ended October 31, 2015 | | | 24.24 | | | | 0.19 | (f) | | | (4.21 | ) | | | (4.02 | ) | | | (0.24 | ) |
Year Ended October 31, 2014 | | | 23.47 | | | | 0.18 | (f) | | | 0.64 | | | | 0.82 | | | | (0.05 | ) |
Year Ended October 31, 2013 | | | 22.40 | | | | 0.17 | | | | 1.03 | | | | 1.20 | | | | (0.13 | ) |
Year Ended October 31, 2012 | | | 21.42 | | | | 0.13 | | | | 0.86 | | | | 0.99 | | | | (0.01 | ) |
|
Class L (formerly Institutional Class) | |
Six Months Ended April 30, 2017 (Unaudited) | | | 22.49 | | | | 0.05 | | | | 2.18 | | | | 2.23 | | | | (0.17 | ) |
Year Ended October 31, 2016 | | | 20.15 | | | | 0.17 | | | | 2.35 | | | | 2.52 | | | | (0.18 | ) |
Year Ended October 31, 2015 | | | 24.42 | | | | 0.23 | (f) | | | (4.26 | ) | | | (4.03 | ) | | | (0.24 | ) |
Year Ended October 31, 2014 | | | 23.73 | | | | 0.17 | (f) | | | 0.70 | | | | 0.87 | | | | (0.18 | ) |
Year Ended October 31, 2013 | | | 22.65 | | | | 0.20 | | | | 1.04 | | | | 1.24 | | | | (0.16 | ) |
Year Ended October 31, 2012 | | | 21.66 | | | | 0.16 | | | | 0.87 | | | | 1.03 | | | | (0.04 | ) |
|
Class R5 | |
Six Months Ended April 30, 2017 (Unaudited) | | | 22.49 | | | | 0.05 | | | | 2.18 | | | | 2.23 | | | | (0.18 | ) |
September 9, 2016 (g) through October 31, 2016 | | | 22.40 | | | | 0.01 | | | | 0.08 | | | | 0.09 | | | | — | |
|
Class R6 | |
Six Months Ended April 30, 2017 (Unaudited) | | | 22.46 | | | | 0.06 | | | | 2.18 | | | | 2.24 | | | | (0.19 | ) |
Year Ended October 31, 2016 | | | 20.13 | | | | 0.19 | | | | 2.35 | | | | 2.54 | | | | (0.21 | ) |
Year Ended October 31, 2015 | | | 24.44 | | | | 0.22 | (f) | | | (4.23 | ) | | | (4.01 | ) | | | (0.30 | ) |
December 23, 2013 (g) through October 31, 2014 | | | 22.47 | | | | 0.38 | (f) | | | 1.59 | | | | 1.97 | | | | — | |
| (a) | Annualized for periods less than one year, unless otherwise noted. |
| (b) | Calculated based upon average shares outstanding. |
| (c) | Not annualized for periods less than one year. |
| (d) | Includes adjustments in accordance with accounting principles generally accepted in the United States of America and as such, the net asset values for financial reporting purposes and the returns based upon those net asset values may differ from the net asset values and returns for shareholder transactions. |
| (e) | Includes interest expense, if applicable, which is less than 0.005% unless otherwise noted. |
| (f) | Net investment income (loss) may appear disproportionate among the classes due to the timing of recognition of income and changes in the relative size of the classes. |
| (g) | Commencement of offering of class of shares. |
SEE NOTES TO FINANCIAL STATEMENTS.
| | | | | | |
| | | |
| 124 | | | | J.P. MORGAN INTERNATIONAL EQUITY FUNDS | | APRIL 30, 2017 |
| | | | | | | | | | | | | | | | | | | | | | | | | | |
| | | Ratios/Supplemental data | |
| | | | | | | | | | Ratios to average net assets (a) | | | | |
Net asset
value,
end of
period | | | Total return
(excludes
sales charge) (c)(d) | | | Net assets,
end of
period
(000’s) | | | Net
expenses (e) | | | Net
investment
income
(loss) | | | Expenses
without waivers
and reimbursements | | | Portfolio
turnover
rate (c) | |
| | | | | | | | | | | | | | | | | | | | | | | | | | |
| | | | | | | | | | | | | | | | | | | | | | | | | | |
| $ | 23.82 | | | | 9.88 | % | | $ | 454,739 | | | | 1.34 | % | | | 0.06 | % | | | 1.65 | % | | | 8 | % |
| | 21.79 | | | | 12.25 | | | | 411,713 | | | | 1.44 | | | | 0.44 | | | | 1.76 | | | | 23 | |
| | 19.53 | | | | (16.95 | ) | | | 274,710 | | | | 1.61 | | | | 0.57 | (f) | | | 1.88 | | | | 35 | |
| | 23.72 | | | | 3.26 | | | | 350,555 | | | | 1.70 | | | | 0.72 | (f) | | | 1.81 | | | | 33 | |
| | 23.05 | | | | 5.08 | | | | 327,090 | | | | 1.76 | | | | 0.46 | | | | 1.79 | | | | 34 | |
| | 22.01 | | | | 4.36 | | | | 281,194 | | | | 1.82 | | | | 0.33 | | | | 1.82 | | | | 20 | |
| | | | | | |
| | | | | | | | | | | | | | | | | | | | | | | | | | |
| | 23.20 | | | | 9.58 | | | | 37,694 | | | | 1.84 | | | | (0.46 | ) | | | 2.16 | | | | 8 | |
| | 21.18 | | | | 11.71 | | | | 39,568 | | | | 1.95 | | | | (0.06 | ) | | | 2.26 | | | | 23 | |
| | 18.96 | | | | (17.38 | ) | | | 43,387 | | | | 2.10 | | | | 0.13 | (f) | | | 2.33 | | | | 35 | |
| | 23.03 | | | | 2.77 | | | | 56,732 | | | | 2.20 | | | | 0.22 | (f) | | | 2.31 | | | | 33 | |
| | 22.41 | | | | 4.56 | | | | 56,119 | | | | 2.26 | | | | (0.06 | ) | | | 2.29 | | | | 34 | |
| | 21.44 | | | | 3.83 | | | | 44,643 | | | | 2.32 | | | | (0.17 | ) | | | 2.32 | | | | 20 | |
| | | | | | |
| | | | | | | | | | | | | | | | | | | | | | | | | | |
| | 24.40 | | | | 10.00 | | | | 402,793 | | | | 1.10 | | | | 0.33 | | | | 1.32 | | | | 8 | |
| | 22.33 | | | | 12.51 | | | | 301,959 | | | | 1.20 | | | | 0.66 | | | | 1.43 | | | | 23 | |
| | 19.98 | | | | (16.70 | ) | | | 502,729 | | | | 1.35 | | | | 0.88 | (f) | | | 1.48 | | | | 35 | |
| | 24.24 | | | | 3.51 | | | | 583,501 | | | | 1.45 | | | | 0.78 | (f) | | | 1.56 | | | | 33 | |
| | 23.47 | | | | 5.34 | | | | 1,900,639 | | | | 1.51 | | | | 0.74 | | | | 1.54 | | | | 34 | |
| | 22.40 | | | | 4.65 | | | | 1,291,326 | | | | 1.57 | | | | 0.60 | | | | 1.57 | | | | 20 | |
| | | | | | |
| | | | | | | | | | | | | | | | | | | | | | | | | | |
| | 24.55 | | | | 10.06 | | | | 511,475 | | | | 0.95 | | | | 0.48 | | | | 1.16 | | | | 8 | |
| | 22.49 | | | | 12.71 | | | | 390,647 | | | | 1.04 | | | | 0.84 | | | | 1.22 | | | | 23 | |
| | 20.15 | | | | (16.60 | ) | | | 316,635 | | | | 1.21 | | | | 1.05 | (f) | | | 1.31 | | | | 35 | |
| | 24.42 | | | | 3.72 | | | | 411,449 | | | | 1.30 | | | | 0.72 | (f) | | | 1.40 | | | | 33 | |
| | 23.73 | | | | 5.47 | | | | 1,123,600 | | | | 1.36 | | | | 0.88 | | | | 1.39 | | | | 34 | |
| | 22.65 | | | | 4.80 | | | | 629,223 | | | | 1.41 | | | | 0.73 | | | | 1.42 | | | | 20 | |
| | | | | | |
| | | | | | | | | | | | | | | | | | | | | | | | | | |
| | 24.54 | | | | 10.09 | | | | 22 | | | | 0.94 | | | | 0.46 | | | | 1.16 | | | | 8 | |
| | 22.49 | | | | 0.40 | | | | 20 | | | | 0.90 | | | | 0.28 | | | | 1.08 | | | | 23 | |
| | | | | | |
| | | | | | | | | | | | | | | | | | | | | | | | | | |
| | 24.51 | | | | 10.12 | | | | 2,155,494 | | | | 0.85 | | | | 0.56 | | | | 1.00 | | | | 8 | |
| | 22.46 | | | | 12.83 | | | | 1,980,671 | | | | 0.94 | | | | 0.96 | | | | 1.08 | | | | 23 | |
| | 20.13 | | | | (16.54 | ) | | | 1,128,390 | | | | 1.10 | | | | 0.99 | (f) | | | 1.16 | | | | 35 | |
| | 24.44 | | | | 8.77 | | | | 1,130,050 | | | | 1.20 | | | | 1.85 | (f) | | | 1.33 | | | | 33 | |
SEE NOTES TO FINANCIAL STATEMENTS.
| | | | | | | | |
| | | |
| APRIL 30, 2017 | | J.P. MORGAN INTERNATIONAL EQUITY FUNDS | | | | | 125 | |
FINANCIAL HIGHLIGHTS
FOR THE PERIODS INDICATED (continued)
| | | | | | | | | | | | | | | | | | | | |
| | | Per share operating performance | |
| | | | | | Investment operations | | | Distributions | |
| | | Net asset
value,
beginning
of period | | | Net
investment
income
(loss) (b) | | | Net realized
and unrealized
gains
(losses) on
investments | | | Total from
investment
operations | | | Net
investment
income | |
Emerging Markets Equity Income Fund | |
Class A | |
Six Months Ended April 30, 2017 (Unaudited) | | $ | 13.46 | | | $ | 0.14 | | | $ | 0.58 | | | $ | 0.72 | | | $ | (0.05 | ) |
Year Ended October 31, 2016 | | | 12.50 | | | | 0.44 | | | | 0.76 | | | | 1.20 | | | | (0.24 | ) |
December 12, 2014 (g) through October 31, 2015 | | | 15.00 | | | | 0.45 | | | | (2.52 | ) | | | (2.07 | ) | | | (0.43 | ) |
|
Class C | |
Six Months Ended April 30, 2017 (Unaudited) | | | 13.44 | | | | 0.10 | | | | 0.59 | | | | 0.69 | | | | (0.03 | ) |
Year Ended October 31, 2016 | | | 12.51 | | | | 0.27 | | | | 0.85 | | | | 1.12 | | | | (0.19 | ) |
December 12, 2014 (g) through October 31, 2015 | | | 15.00 | | | | 0.42 | | | | (2.55 | ) | | | (2.13 | ) | | | (0.36 | ) |
|
Class I (formerly Select Class) | |
Six Months Ended April 30, 2017 (Unaudited) | | | 13.51 | | | | 0.17 | | | | 0.57 | | | | 0.74 | | | | (0.06 | ) |
Year Ended October 31, 2016 | | | 12.53 | | | | 0.38 | | | | 0.85 | | | | 1.23 | | | | (0.25 | ) |
December 12, 2014 (g) through October 31, 2015 | | | 15.00 | | | | 0.49 | | | | (2.53 | ) | | | (2.04 | ) | | | (0.43 | ) |
|
Class R5 | |
Six Months Ended April 30, 2017 (Unaudited) | | | 13.51 | | | | 0.16 | | | | 0.60 | | | | 0.76 | | | | (0.07 | ) |
Year Ended October 31, 2016 | | | 12.53 | | | | 0.40 | | | | 0.85 | | | | 1.25 | | | | (0.27 | ) |
December 12, 2014 (g) through October 31, 2015 | | | 15.00 | | | | 0.51 | | | | (2.53 | ) | | | (2.02 | ) | | | (0.45 | ) |
|
Class R6 | |
Six Months Ended April 30, 2017 (Unaudited) | | | 13.52 | | | | 0.22 | | | | 0.54 | | | | 0.76 | | | | (0.08 | ) |
Year Ended October 31, 2016 | | | 12.53 | | | | 0.41 | | | | 0.85 | | | | 1.26 | | | | (0.27 | ) |
December 12, 2014 (g) through October 31, 2015 | | | 15.00 | | | | 0.52 | | | | (2.53 | ) | | | (2.01 | ) | | | (0.46 | ) |
| (a) | Annualized for periods less than one year, unless otherwise noted. |
| (b) | Calculated based upon average shares outstanding. |
| (c) | Not annualized for periods less than one year. |
| (d) | Includes adjustments in accordance with accounting principles generally accepted in the United States of America and as such, the net asset values for financial reporting purposes and the returns based upon those net asset values may differ from the net asset values and returns for shareholder transactions. |
| (e) | Includes interest expense, if applicable, which is less than 0.005% unless otherwise noted. |
| (f) | Certain non-recurring expenses incurred by the Fund were not annualized for the year ended October 31, 2016 and for the period ended October 31, 2015. |
| (g) | Commencement of operations. |
SEE NOTES TO FINANCIAL STATEMENTS.
| | | | | | |
| | | |
| 126 | | | | J.P. MORGAN INTERNATIONAL EQUITY FUNDS | | APRIL 30, 2017 |
| | | | | | | | | | | | | | | | | | | | | | | | | | |
| | | Ratios/Supplemental data (a) | |
| | | | | | | | | | Ratios to average net assets | | | | |
Net asset
value,
end of
period | | | Total return
(excludes
sales charge) (c)(d) | | | Net assets,
end of
period
(000’s) | | | Net
expenses (e) | | | Net
investment
income
(loss) | | | Expenses
without waivers
and reimbursements | | | Portfolio
turnover
rate (c) | |
| | | | | | | | | | | | | | | | | | | | | | | | | | |
| | | | | | | | | | | | | | | | | | | | | | | | | | |
| $ | 14.13 | | | | 5.39 | % | | $ | 10,671 | | | | 1.55 | % | | | 2.07 | % | | | 3.81 | % | | | 12 | % |
| | 13.46 | | | | 9.76 | | | | 8,291 | | | | 1.54 | (f) | | | 3.36 | (f) | | | 3.29 | (f) | | | 21 | |
| | 12.50 | | | | (13.93 | ) | | | 86 | | | | 1.57 | (f) | | | 3.72 | (f) | | | 10.55 | (f) | | | 25 | |
| | | | | | |
| | | | | | | | | | | | | | | | | | | | | | | | | | |
| | 14.10 | | | | 5.18 | | | | 113 | | | | 2.05 | | | | 1.55 | | | | 4.43 | | | | 12 | |
| | 13.44 | | | | 9.10 | | | | 94 | | | | 2.05 | (f) | | | 2.15 | (f) | | | 8.18 | (f) | | | 21 | |
| | 12.51 | | | | (14.26 | ) | | | 32 | | | | 2.08 | (f) | | | 3.32 | (f) | | | 12.02 | (f) | | | 25 | |
| | | | | | |
| | | | | | | | | | | | | | | | | | | | | | | | | | |
| | 14.19 | | | | 5.55 | | | | 5,227 | | | | 1.30 | | | | 2.50 | | | | 3.61 | | | | 12 | |
| | 13.51 | | | | 9.96 | | | | 3,148 | | | | 1.30 | (f) | | | 3.05 | (f) | | | 8.02 | (f) | | | 21 | |
| | 12.53 | | | | (13.70 | ) | | | 2,541 | | | | 1.33 | (f) | | | 3.85 | (f) | | | 10.36 | (f) | | | 25 | |
| | | | | | |
| | | | | | | | | | | | | | | | | | | | | | | | | | |
| | 14.20 | | | | 5.72 | | | | 20 | | | | 1.10 | | | | 2.40 | | | | 3.49 | | | | 12 | |
| | 13.51 | | | | 10.15 | | | | 19 | | | | 1.10 | (f) | | | 3.22 | (f) | | | 9.72 | (f) | | | 21 | |
| | 12.53 | | | | (13.55 | ) | | | 17 | | | | 1.14 | (f) | | | 4.05 | (f) | | | 10.84 | (f) | | | 25 | |
| | | | | | |
| | | | | | | | | | | | | | | | | | | | | | | | | | |
| | 14.20 | | | | 5.67 | | | | 56 | | | | 1.05 | | | | 3.31 | | | | 3.62 | | | | 12 | |
| | 13.52 | | | | 10.26 | | | | 24 | | | | 1.05 | (f) | | | 3.32 | (f) | | | 9.33 | (f) | | | 21 | |
| | 12.53 | | | | (13.51 | ) | | | 17 | | | | 1.08 | (f) | | | 4.10 | (f) | | | 10.82 | (f) | | | 25 | |
SEE NOTES TO FINANCIAL STATEMENTS.
| | | | | | | | |
| | | |
| APRIL 30, 2017 | | J.P. MORGAN INTERNATIONAL EQUITY FUNDS | | | | | 127 | |
FINANCIAL HIGHLIGHTS
FOR THE PERIODS INDICATED (continued)
| | | | | | | | | | | | | | | | | | | | | | | | | | | | |
| | | Per share operating performance | |
| | | | | | Investment operations | | | Distributions | |
| | | Net asset
value,
beginning
of period | | | Net
investment
income
(loss) (b) | | | Net realized
and unrealized
gains
(losses) on
investments | | | Total from
investment
operations | | | Net
investment
income | | | Net
realized
gain | | | Total
distributions | |
Global Research Enhanced Index Fund | | | | | | | | | | | | | | | | | | | | | |
Class A | | | | | | | | | | | | | | | | | | | | | | | | | | | | |
Six Months Ended April 30, 2017 (Unaudited) | | $ | 18.45 | | | $ | 0.16 | | | $ | 2.14 | | | $ | 2.30 | | | $ | (0.37 | ) | | $ | — | | | $ | (0.37 | ) |
Year Ended October 31, 2016 | | | 18.52 | | | | 0.35 | | | | (0.23 | ) | | | 0.12 | | | | (0.19 | ) | | | — | | | | (0.19 | ) |
Year Ended October 31, 2015 | | | 18.77 | | | | 0.37 | | | | (0.15 | ) | | | 0.22 | | | | (0.22 | ) | | | (0.25 | ) | | | (0.47 | ) |
Year Ended October 31, 2014 | | | 17.33 | | | | 0.34 | | | | 1.35 | | | | 1.69 | | | | (0.15 | ) | | | (0.10 | ) | | | (0.25 | ) |
February 28, 2013 (f) through October 31, 2013 | | | 15.00 | | | | 0.19 | | | | 2.14 | | | | 2.33 | | | | — | | | | — | | | | — | |
| | | | | | | |
Class C | | | | | | | | | | | | | | | | | | | | | | | | | | | | |
Six Months Ended April 30, 2017 (Unaudited) | | | 18.46 | | | | 0.11 | | | | 2.15 | | | | 2.26 | | | | (0.28 | ) | | | — | | | | (0.28 | ) |
Year Ended October 31, 2016 | | | 18.43 | | | | 0.26 | | | | (0.23 | ) | | | 0.03 | | | | — | | | | — | | | | — | |
Year Ended October 31, 2015 | | | 18.68 | | | | 0.28 | | | | (0.15 | ) | | | 0.13 | | | | (0.13 | ) | | | (0.25 | ) | | | (0.38 | ) |
Year Ended October 31, 2014 | | | 17.28 | | | | 0.25 | | | | 1.33 | | | | 1.58 | | | | (0.08 | ) | | | (0.10 | ) | | | (0.18 | ) |
February 28, 2013 (f) through October 31, 2013 | | | 15.00 | | | | 0.14 | | | | 2.14 | | | | 2.28 | | | | — | | | | — | | | | — | |
| | | | | | | |
Class I (formerly Select Class) | | | | | | | | | | | | | | | | | | | | | | | | | | | | |
Six Months Ended April 30, 2017 (Unaudited) | | | 18.37 | | | | 0.18 | | | | 2.14 | | | | 2.32 | | | | (0.42 | ) | | | — | | | | (0.42 | ) |
Year Ended October 31, 2016 | | | 18.56 | | | | 0.39 | | | | (0.24 | ) | | | 0.15 | | | | (0.34 | ) | | | — | | | | (0.34 | ) |
Year Ended October 31, 2015 | | | 18.81 | | | | 0.39 | | | | (0.12 | ) | | | 0.27 | | | | (0.27 | ) | | | (0.25 | ) | | | (0.52 | ) |
Year Ended October 31, 2014 | | | 17.37 | | | | 0.39 | | | | 1.33 | | | | 1.72 | | | | (0.18 | ) | | | (0.10 | ) | | | (0.28 | ) |
February 28, 2013 (f) through October 31, 2013 | | | 15.00 | | | | 0.19 | | | | 2.18 | | | | 2.37 | | | | — | | | | — | | | | — | |
| | | | | | | |
Class R2 | | | | | | | | | | | | | | | | | | | | | | | | | | | | |
Six Months Ended April 30, 2017 (Unaudited) | | | 18.46 | | | | 0.14 | | | | 2.14 | | | | 2.28 | | | | (0.33 | ) | | | — | | | | (0.33 | ) |
Year Ended October 31, 2016 | | | 18.47 | | | | 0.30 | | | | (0.22 | ) | | | 0.08 | | | | (0.09 | ) | | | — | | | | (0.09 | ) |
Year Ended October 31, 2015 | | | 18.72 | | | | 0.32 | | | | (0.15 | ) | | | 0.17 | | | | (0.17 | ) | | | (0.25 | ) | | | (0.42 | ) |
Year Ended October 31, 2014 | | | 17.30 | | | | 0.29 | | | | 1.35 | | | | 1.64 | | | | (0.12 | ) | | | (0.10 | ) | | | (0.22 | ) |
February 28, 2013 (f) through October 31, 2013 | | | 15.00 | | | | 0.17 | | | | 2.13 | | | | 2.30 | | | | — | | | | — | | | | — | |
| (a) | Annualized for periods less than one year, unless otherwise noted. |
| (b) | Calculated based upon average shares outstanding. |
| (c) | Not annualized for periods less than one year. |
| (d) | Includes adjustments in accordance with accounting principles generally accepted in the United States of America and as such, the net asset values for financial reporting purposes and the returns based upon those net asset values may differ from the net asset values and returns for shareholder transactions. |
| (e) | Includes interest expense, if applicable, which is less than 0.005% unless otherwise noted. |
| (f) | Commencement of operations. |
| (g) | Certain non-recurring expenses incurred by the Fund were not annualized for the period ended October 31, 2013. |
| (h) | Ratios are disproportionate among classes due to the size of net assets and fixed expenses. |
SEE NOTES TO FINANCIAL STATEMENTS.
| | | | | | |
| | | |
| 128 | | | | J.P. MORGAN INTERNATIONAL EQUITY FUNDS | | APRIL 30, 2017 |
| | | | | | | | | | | | | | | | | | | | | | | | | | |
| | | Ratios/Supplemental data | |
| | | | | | | | | | Ratios to average net assets (a) | | | | |
Net asset
value,
end of
period | | | Total return
(excludes
sales charge) (c)(d) | | | Net assets,
end of
period
(000’s) | | | Net
expenses (e) | | |
Net
investment
income
(loss) | | | Expenses
without waivers
and reimbursements | | | Portfolio
turnover
rate (c) | |
| | | | | | | | | | | | | | | | | | | | | | | | | | |
| | | | | | | | | | | | | | | | | | | | | | | | | | |
| $ | 20.38 | | | | 12.62 | % | | $ | 23 | | | | 0.59 | % | | | 1.68 | % | | | 0.98 | % | | | 17 | % |
| | 18.45 | | | | 0.68 | | | | 20 | | | | 0.59 | | | | 1.95 | | | | 3.30 | | | | 35 | |
| | 18.52 | | | | 1.22 | | | | 20 | | | | 0.58 | | | | 1.98 | | | | 0.99 | | | | 44 | |
| | 18.77 | | | | 9.90 | | | | 64 | | | | 0.58 | | | | 1.87 | | | | 0.81 | | | | 40 | |
| | 17.33 | | | | 15.53 | | | | 58 | | | | 0.58 | (g) | | | 1.79 | (g) | | | 1.62 | (g)(h) | | | 25 | |
| | | | | | |
| | | | | | | | | | | | | | | | | | | | | | | | | | |
| | 20.44 | | | | 12.36 | | | | 22 | | | | 1.09 | | | | 1.17 | | | | 1.48 | | | | 17 | |
| | 18.46 | | | | 0.16 | | | | 20 | | | | 1.09 | | | | 1.44 | | | | 3.81 | | | | 35 | |
| | 18.43 | | | | 0.73 | | | | 20 | | | | 1.08 | | | | 1.48 | | | | 1.50 | | | | 44 | |
| | 18.68 | | | | 9.27 | | | | 63 | | | | 1.08 | | | | 1.37 | | | | 1.31 | | | | 40 | |
| | 17.28 | | | | 15.20 | | | | 58 | | | | 1.08 | (g) | | | 1.29 | (g) | | | 2.12 | (g)(h) | | | 25 | |
| | | | | | |
| | | | | | | | | | | | | | | | | | | | | | | | | | |
| | 20.27 | | | | 12.78 | | | | 7,716,084 | | | | 0.34 | | | | 1.93 | | | | 0.55 | | | | 17 | |
| | 18.37 | | | | 0.91 | | | | 6,907,246 | | | | 0.34 | | | | 2.19 | | | | 0.55 | | | | 35 | |
| | 18.56 | | | | 1.51 | | | | 7,415,218 | | | | 0.33 | | | | 2.06 | | | | 0.56 | | | | 44 | |
| | 18.81 | | | | 10.09 | | | | 3,577,523 | | | | 0.33 | | | | 2.16 | | | | 0.56 | | | | 40 | |
| | 17.37 | | | | 15.80 | | | | 1,895,025 | | | | 0.33 | (g) | | | 1.73 | (g) | | | 0.60 | (g)(h) | | | 25 | |
| | | | | | |
| | | | | | | | | | | | | | | | | | | | | | | | | | |
| | 20.41 | | | | 12.46 | | | | 23 | | | | 0.83 | | | | 1.42 | | | | 1.23 | | | | 17 | |
| | 18.46 | | | | 0.46 | | | | 20 | | | | 0.84 | | | | 1.70 | | | | 3.55 | | | | 35 | |
| | 18.47 | | | | 0.98 | | | | 20 | | | | 0.83 | | | | 1.73 | | | | 1.25 | | | | 44 | |
| | 18.72 | | | | 9.58 | | | | 63 | | | | 0.83 | | | | 1.62 | | | | 1.06 | | | | 40 | |
| | 17.30 | | | | 15.33 | | | | 58 | | | | 0.83 | (g) | | | 1.54 | (g) | | | 1.87 | (g)(h) | | | 25 | |
SEE NOTES TO FINANCIAL STATEMENTS.
| | | | | | | | |
| | | |
| APRIL 30, 2017 | | J.P. MORGAN INTERNATIONAL EQUITY FUNDS | | | | | 129 | |
FINANCIAL HIGHLIGHTS
FOR THE PERIODS INDICATED (continued)
| | | | | | | | | | | | | | | | | | | | | | | | | | | | | | | | |
| | | Per share operating performance | |
| | | | | | Investment operations | | | Distributions | |
| | | Net asset
value,
beginning
of period | | | Net
investment
income
(loss) | | | Net realized
and unrealized
gains
(losses) on
investments | | | Total from
investment
operations | | | Net
investment
income | | | Net
realized
gain | | | Return
of
capital | | | Total
distributions | |
Global Unconstrained Equity Fund | |
Class A | |
Six Months Ended April 30, 2017 (Unaudited) | | $ | 14.12 | | | $ | 0.05 | (e) | | $ | 1.95 | | | $ | 2.00 | | | $ | — | | | $ | — | | | $ | — | | | $ | — | |
Year Ended October 31, 2016 | | | 16.12 | | | | 0.27 | (e) | | | (0.88 | ) | | | (0.61 | ) | | | (0.30 | ) | | | (0.27 | ) | | | (0.82 | ) | | | (1.39 | ) |
Year Ended October 31, 2015 | | | 19.55 | | | | 0.11 | (e) | | | 0.66 | | | | 0.77 | | | | (0.31 | ) | | | (3.89 | ) | | | — | | | | (4.20 | ) |
Year Ended October 31, 2014 | | | 20.11 | | | | 0.23 | | | | 1.17 | | | | 1.40 | | | | (0.17 | ) | | | (1.79 | ) | | | — | | | | (1.96 | ) |
Year Ended October 31, 2013 | | | 16.73 | | | | 0.24 | | | | 3.77 | | | | 4.01 | | | | (0.22 | ) | | | (0.41 | ) | | | — | | | | (0.63 | ) |
November 30, 2011 (g) through October 31, 2012 | | | 15.00 | | | | 0.17 | | | | 1.56 | | | | 1.73 | | | | — | (h) | | | — | | | | — | | | | — | (h) |
| | | | | | | | |
Class C | | | | | | | | | | | | | | | | | | | | | | | | | | | | | | | | |
Six Months Ended April 30, 2017 (Unaudited) | | | 14.02 | | | | 0.02 | (e) | | | 1.92 | | | | 1.94 | | | | — | | | | — | | | | — | | | | — | |
Year Ended October 31, 2016 | | | 16.01 | | | | 0.11 | (e) | | | (0.79 | ) | | | (0.68 | ) | | | (0.22 | ) | | | (0.27 | ) | | | (0.82 | ) | | | (1.31 | ) |
Year Ended October 31, 2015 | | | 19.43 | | | | 0.04 | (e) | | | 0.64 | | | | 0.68 | | | | (0.21 | ) | | | (3.89 | ) | | | — | | | | (4.10 | ) |
Year Ended October 31, 2014 | | | 20.01 | | | | 0.14 | | | | 1.16 | | | | 1.30 | | | | (0.09 | ) | | | (1.79 | ) | | | — | | | | (1.88 | ) |
Year Ended October 31, 2013 | | | 16.65 | | | | 0.16 | | | | 3.76 | | | | 3.92 | | | | (0.15 | ) | | | (0.41 | ) | | | — | | | | (0.56 | ) |
November 30, 2011 (g) through October 31, 2012 | | | 15.00 | | | | 0.09 | | | | 1.56 | | | | 1.65 | | | | — | | | | — | | | | — | | | | — | |
| | | | | | | | |
Class I (formerly Select Class) | | | | | | | | | | | | | | | | | | | | | | | | | | | | | | | | |
Six Months Ended April 30, 2017 (Unaudited) | | | 14.23 | | | | 0.08 | (e) | | | 1.97 | | | | 2.05 | | | | (0.04 | ) | | | — | | | | — | | | | (0.04 | ) |
Year Ended October 31, 2016 | | | 16.18 | | | | 0.26 | (e) | | | (0.83 | ) | | | (0.57 | ) | | | (0.29 | ) | | | (0.27 | ) | | | (0.82 | ) | | | (1.38 | ) |
Year Ended October 31, 2015 | | | 19.60 | | | | 0.19 | (e) | | | 0.64 | | | | 0.83 | | | | (0.36 | ) | | | (3.89 | ) | | | — | | | | (4.25 | ) |
Year Ended October 31, 2014 | | | 20.15 | | | | 0.27 | | | | 1.19 | | | | 1.46 | | | | (0.22 | ) | | | (1.79 | ) | | | — | | | | (2.01 | ) |
Year Ended October 31, 2013 | | | 16.76 | | | | 0.29 | | | | 3.77 | | | | 4.06 | | | | (0.26 | ) | | | (0.41 | ) | | | — | | | | (0.67 | ) |
November 30, 2011 (g) through October 31, 2012 | | | 15.00 | | | | 0.20 | | | | 1.57 | | | | 1.77 | | | | (0.01 | ) | | | — | | | | — | | | | (0.01 | ) |
| | | | | | | | |
Class R2 | | | | | | | | | | | | | | | | | | | | | | | | | | | | | | | | |
Six Months Ended April 30, 2017 (Unaudited) | | | 14.24 | | | | 0.03 | (e) | | | 1.96 | | | | 1.99 | | | | — | | | | — | | | | — | | | | — | |
Year Ended October 31, 2016 | | | 16.11 | | | | 0.14 | (e) | | | (0.79 | ) | | | (0.65 | ) | | | (0.13 | ) | | | (0.27 | ) | | | (0.82 | ) | | | (1.22 | ) |
Year Ended October 31, 2015 | | | 19.49 | | | | 0.08 | (e) | | | 0.65 | | | | 0.73 | | | | (0.22 | ) | | | (3.89 | ) | | | — | | | | (4.11 | ) |
Year Ended October 31, 2014 | | | 20.06 | | | | 0.18 | | | | 1.17 | | | | 1.35 | | | | (0.13 | ) | | | (1.79 | ) | | | — | | | | (1.92 | ) |
Year Ended October 31, 2013 | | | 16.69 | | | | 0.20 | | | | 3.77 | | | | 3.97 | | | | (0.19 | ) | | | (0.41 | ) | | | — | | | | (0.60 | ) |
November 30, 2011 (g) through October 31, 2012 | | | 15.00 | | | | 0.13 | | | | 1.56 | | | | 1.69 | | | | — | | | | — | | | | — | | | | — | |
| | | | | | | | |
Class R5 | | | | | | | | | | | | | | | | | | | | | | | | | | | | | | | | |
Six Months Ended April 30, 2017 (Unaudited) | | | 14.24 | | | | 0.08 | (e) | | | 1.96 | | | | 2.04 | | | | (0.10 | ) | | | — | | | | — | | | | (0.10 | ) |
Year Ended October 31, 2016 | | | 16.21 | | | | 0.24 | (e) | | | (0.80 | ) | | | (0.56 | ) | | | (0.32 | ) | | | (0.27 | ) | | | (0.82 | ) | | | (1.41 | ) |
Year Ended October 31, 2015 | | | 19.65 | | | | 0.21 | (e) | | | 0.64 | | | | 0.85 | | | | (0.40 | ) | | | (3.89 | ) | | | — | | | | (4.29 | ) |
Year Ended October 31, 2014 | | | 20.19 | | | | 0.31 | | | | 1.19 | | | | 1.50 | | | | (0.25 | ) | | | (1.79 | ) | | | — | | | | (2.04 | ) |
Year Ended October 31, 2013 | | | 16.79 | | | | 0.32 | | | | 3.79 | | | | 4.11 | | | | (0.30 | ) | | | (0.41 | ) | | | — | | | | (0.71 | ) |
November 30, 2011 (g) through October 31, 2012 | | | 15.00 | | | | 0.23 | | | | 1.57 | | | | 1.80 | | | | (0.01 | ) | | | — | | | | — | | | | (0.01 | ) |
| | | | | | | | |
Class R6 | | | | | | | | | | | | | | | | | | | | | | | | | | | | | | | | |
Six Months Ended April 30, 2017 (Unaudited) | | | 14.23 | | | | 0.09 | (e) | | | 1.95 | | | | 2.04 | | | | (0.10 | ) | | | — | | | | — | | | | (0.10 | ) |
Year Ended October 31, 2016 | | | 16.22 | | | | 0.25 | (e) | | | (0.80 | ) | | | (0.55 | ) | | | (0.35 | ) | | | (0.27 | ) | | | (0.82 | ) | | | (1.44 | ) |
Year Ended October 31, 2015 | | | 19.66 | | | | 0.21 | (e) | | | 0.66 | | | | 0.87 | | | | (0.42 | ) | | | (3.89 | ) | | | — | | | | (4.31 | ) |
Year Ended October 31, 2014 | | | 20.20 | | | | 0.32 | | | | 1.19 | | | | 1.51 | | | | (0.26 | ) | | | (1.79 | ) | | | — | | | | (2.05 | ) |
Year Ended October 31, 2013 | | | 16.80 | | | | 0.33 | | | | 3.78 | | | | 4.11 | | | | (0.30 | ) | | | (0.41 | ) | | | — | | | | (0.71 | ) |
November 30, 2011 (g) through October 31, 2012 | | | 15.00 | | | | 0.24 | | | | 1.57 | | | | 1.81 | | | | (0.01 | ) | | | — | | | | — | | | | (0.01 | ) |
| (a) | Annualized for periods less than one year, unless otherwise noted. |
| (b) | Not annualized for periods less than one year. |
| (c) | Includes adjustments in accordance with accounting principles generally accepted in the United States of America and as such, the net asset values for financial reporting purposes and the returns based upon those net asset values may differ from the net asset values and returns for shareholder transactions. |
| (d) | Includes interest expense, if applicable, which is less than 0.005% unless otherwise noted. |
| (e) | Calculated based upon average shares outstanding. |
| (f) | Certain non-recurring expenses incurred by the Fund were not annualized for the year ended October 31, 2013 and for the period ended October 31, 2012. |
| (g) | Commencement of operations. |
| (h) | Amount rounds to less than $0.005. |
SEE NOTES TO FINANCIAL STATEMENTS.
| | | | | | |
| | | |
| 130 | | | | J.P. MORGAN INTERNATIONAL EQUITY FUNDS | | APRIL 30, 2017 |
| | | | | | | | | | | | | | | | | | | | | | | | | | |
| | | Ratios/Supplemental data | |
| | | | | | | | | | Ratios to average net assets (a) | | | | |
Net asset
value,
end of
period | | | Total return
(excludes
sales charge) (b)(c) | | | Net assets,
end of
period
(000’s) | | | Net
expenses (d) | | | Net
investment
income
(loss) | | | Expenses
without waivers
and reimbursements | | | Portfolio
turnover
rate (b) | |
| | | | | | | | | | | | | | | | | | | | | | | | | | |
| | | | | | | | | | | | | | | | | | | | | | | | | | |
| $ | 16.12 | | | | 14.16 | % | | $ | 679 | | | | 0.74 | % | | | 0.70 | % | | | 15.87 | % | | | 51 | % |
| | 14.12 | | | | (3.53 | ) | | | 417 | | | | 0.74 | | | | 1.95 | | | | 1.90 | | | | 1256 | |
| | 16.12 | | | | 4.76 | | | | 244 | | | | 1.00 | | | | 0.67 | | | | 7.57 | | | | 132 | |
| | 19.55 | | | | 7.83 | | | | 75 | | | | 1.35 | | | | 1.27 | | | | 4.32 | | | | 97 | |
| | 20.11 | | | | 24.74 | | | | 70 | | | | 1.35 | (f) | | | 1.37 | (f) | | | 5.36 | (f) | | | 71 | |
| | 16.73 | | | | 11.55 | | | | 56 | | | | 1.35 | (f) | | | 1.14 | (f) | | | 6.89 | (f) | | | 49 | |
| | | | | | |
| | | | | | | | | | | | | | | | | | | | | | | | | | |
| | 15.96 | | | | 13.84 | | | | 263 | | | | 1.24 | | | | 0.21 | | | | 16.30 | | | | 51 | |
| | 14.02 | | | | (4.02 | ) | | | 210 | | | | 1.17 | | | | 0.78 | | | | 11.83 | | | | 1256 | |
| | 16.01 | | | | 4.26 | | | | 317 | | | | 1.48 | | | | 0.21 | | | | 9.92 | | | | 132 | |
| | 19.43 | | | | 7.28 | | | | 74 | | | | 1.85 | | | | 0.77 | | | | 4.82 | | | | 97 | |
| | 20.01 | | | | 24.16 | | | | 69 | | | | 1.85 | (f) | | | 0.87 | (f) | | | 5.85 | (f) | | | 71 | |
| | 16.65 | | | | 11.00 | | | | 56 | | | | 1.85 | (f) | | | 0.65 | (f) | | | 7.38 | (f) | | | 49 | |
| | | | | | |
| | | | | | | | | | | | | | | | | | | | | | | | | | |
| | 16.24 | | | | 14.41 | | | | 1,123 | | | | 0.40 | | | | 1.02 | | | | 15.35 | | | | 51 | |
| | 14.23 | | | | (3.23 | ) | | | 991 | | | | 0.36 | | | | 1.86 | | | | 5.37 | | | | 1256 | |
| | 16.18 | | | | 5.13 | | | | 1,020 | | | | 0.88 | | | | 1.06 | | | | 7.34 | | | | 132 | |
| | 19.60 | | | | 8.11 | | | | 4,156 | | | | 1.10 | | | | 1.52 | | | | 4.06 | | | | 97 | |
| | 20.15 | | | | 25.04 | | | | 3,844 | | | | 1.10 | (f) | | | 1.62 | (f) | | | 5.10 | (f) | | | 71 | |
| | 16.76 | | | | 11.77 | | | | 3,075 | | | | 1.10 | (f) | | | 1.40 | (f) | | | 6.64 | (f) | | | 49 | |
| | | | | | |
| | | | | | | | | | | | | | | | | | | | | | | | | | |
| | 16.23 | | | | 13.97 | | | | 20 | | | | 1.00 | | | | 0.41 | | | | 15.92 | | | | 51 | |
| | 14.24 | | | | (3.79 | ) | | | 18 | | | | 0.92 | | | | 1.00 | | | | 13.46 | | | | 1256 | |
| | 16.11 | | | | 4.55 | | | | 20 | | | | 1.46 | | | | 0.45 | | | | 8.67 | | | | 132 | |
| | 19.49 | | | | 7.55 | | | | 75 | | | | 1.60 | | | | 1.02 | | | | 4.56 | | | | 97 | |
| | 20.06 | | | | 24.45 | | | | 69 | | | | 1.60 | (f) | | | 1.12 | (f) | | | 5.60 | (f) | | | 71 | |
| | 16.69 | | | | 11.27 | | | | 56 | | | | 1.60 | (f) | | | 0.90 | (f) | | | 7.14 | (f) | | | 49 | |
| | | | | | |
| | | | | | | | | | | | | | | | | | | | | | | | | | |
| | 16.18 | | | | 14.35 | | | | 20 | | | | 0.30 | | | | 1.11 | | | | 15.23 | | | | 51 | |
| | 14.24 | | | | (3.12 | ) | | | 18 | | | | 0.22 | | | | 1.70 | | | | 12.77 | | | | 1256 | |
| | 16.21 | | | | 5.26 | | | | 20 | | | | 0.76 | | | | 1.15 | | | | 7.97 | | | | 132 | |
| | 19.65 | | | | 8.34 | | | | 76 | | | | 0.90 | | | | 1.72 | | | | 3.86 | | | | 97 | |
| | 20.19 | | | | 25.29 | | | | 70 | | | | 0.90 | (f) | | | 1.82 | (f) | | | 4.89 | (f) | | | 71 | |
| | 16.79 | | | | 11.99 | | | | 56 | | | | 0.90 | (f) | | | 1.60 | (f) | | | 6.45 | (f) | | | 49 | |
| | | | | | |
| | | | | | | | | | | | | | | | | | | | | | | | | | |
| | 16.17 | | | | 14.41 | | | | 20 | | | | 0.24 | | | | 1.16 | | | | 15.18 | | | | 51 | |
| | 14.23 | | | | (3.10 | ) | | | 18 | | | | 0.17 | | | | 1.75 | | | | 12.75 | | | | 1256 | |
| | 16.22 | | | | 5.34 | | | | 20 | | | | 0.71 | | | | 1.20 | | | | 7.91 | | | | 132 | |
| | 19.66 | | | | 8.39 | | | | 76 | | | | 0.85 | | | | 1.77 | | | | 3.81 | | | | 97 | |
| | 20.20 | | | | 25.33 | | | | 70 | | | | 0.85 | (f) | | | 1.87 | (f) | | | 4.85 | (f) | | | 71 | |
| | 16.80 | | | | 12.06 | | | | 56 | | | | 0.85 | (f) | | | 1.65 | (f) | | | 6.40 | (f) | | | 49 | |
SEE NOTES TO FINANCIAL STATEMENTS.
| | | | | | | | |
| | | |
| APRIL 30, 2017 | | J.P. MORGAN INTERNATIONAL EQUITY FUNDS | | | | | 131 | |
FINANCIAL HIGHLIGHTS
FOR THE PERIODS INDICATED (continued)
| | | | | | | | | | | | | | | | | | | | |
| | | Per share operating performance | |
| | | | | | Investment operations | | | Distributions | |
| | | Net asset
value,
beginning
of period | | | Net
investment
income
(loss) (b) | | | Net realized
and unrealized
gains
(losses) on
investments | | | Total from
investment
operations | | | Net
investment
income | |
International Discovery Fund | |
Class A | |
Six Months Ended April 30, 2017 (Unaudited) | | $ | 14.88 | | | $ | 0.13 | | | $ | 1.62 | | | $ | 1.75 | | | $ | (0.11 | ) |
December 21, 2015 (g) through October 31, 2016 | | | 15.00 | | | | 0.13 | | | | (0.24 | )(h)(i) | | | (0.11 | ) | | | (0.01 | ) |
|
Class C | |
Six Months Ended April 30, 2017 (Unaudited) | | | 14.82 | | | | 0.03 | | | | 1.68 | | | | 1.71 | | | | (0.05 | ) |
December 21, 2015 (g) through October 31, 2016 | | | 15.00 | | | | 0.07 | | | | (0.24 | )(h)(i) | | | (0.17 | ) | | | (0.01 | ) |
|
Class I (formerly Select Class) | |
Six Months Ended April 30, 2017 (Unaudited) | | | 14.92 | | | | 0.09 | | | | 1.69 | | | | 1.78 | | | | (0.15 | ) |
December 21, 2015 (g) through October 31, 2016 | | | 15.00 | | | | 0.17 | | | | (0.24 | )(h)(i) | | | (0.07 | ) | | | (0.01 | ) |
|
Class R5 | |
Six Months Ended April 30, 2017 (Unaudited) | | | 14.94 | | | | 0.10 | | | | 1.69 | | | | 1.79 | | | | (0.17 | ) |
December 21, 2015 (g) through October 31, 2016 | | | 15.00 | | | | 0.19 | | | | (0.24 | )(h)(i) | | | (0.05 | ) | | | (0.01 | ) |
|
Class R6 | |
Six Months Ended April 30, 2017 (Unaudited) | | | 14.94 | | | | 0.10 | | | | 1.69 | | | | 1.79 | | | | (0.17 | ) |
December 21, 2015 (g) through October 31, 2016 | | | 15.00 | | | | 0.20 | | | | (0.25 | )(h)(i) | | | (0.05 | ) | | | (0.01 | ) |
| (a) | Annualized for periods less than one year, unless otherwise noted. |
| (b) | Calculated based upon average shares outstanding. |
| (c) | Not annualized for periods less than one year. |
| (d) | Includes adjustments in accordance with accounting principles generally accepted in the United States of America and as such, the net asset values for financial reporting purposes and the returns based upon those net asset values may differ from the net asset values and returns for shareholder transactions. |
| (e) | Includes interest expense, if applicable, which is less than 0.005% unless otherwise noted. |
| (f) | Certain non-recurring expenses incurred by the Fund were not annualized for the period ended April 30, 2017 and for the period ended October 31, 2016. |
| (g) | Commencement of operations. |
| (h) | An affiliate of JPMorgan Chase & Co. reimbursed the Fund for losses incurred from an operational error. Without the reimbursement, the net realized and unrealized gains (losses) on investments per share would have been $(0.26), $(0.27), $(0.27), $(0.27) and $(0.28), and the total return would have been (0.88)%, (1.36)%, (0.67)%, (0.53)% and (0.53)% for Class A, Class C, Class I, Class R5 and Class R6, respectively. |
| (i) | Calculation of the net realized and unrealized gains (losses) per share do not correlate with the Fund’s net realized and unrealized gains (losses) presented in the Statement of Operations due to the timing of capital transactions in relation to the fluctuating market values of the Fund’s investments. |
SEE NOTES TO FINANCIAL STATEMENTS.
| | | | | | |
| | | |
| 132 | | | | J.P. MORGAN INTERNATIONAL EQUITY FUNDS | | APRIL 30, 2017 |
| | | | | | | | | | | | | | | | | | | | | | | | | | |
| | | Ratios/Supplemental data | |
| | | | | | | | | | Ratios to average net assets (a) | | | | |
Net asset
value,
end of
period | | | Total return
(excludes
sales charge) (c)(d) | | | Net assets,
end of
period
(000’s) | | | Net
expenses (e)(f) | | | Net
investment
income
(loss) (b)(f) | | | Expenses
without waivers
and reimbursements | | | Portfolio
turnover
rate (c) | |
| | | | | | | | | | | | | | | | | | | | | | | | | | |
| | | | | | | | | | | | | | | | | | | | | | | | | | |
| $ | 16.52 | | | | 11.91 | % | | $ | 133 | | | | 1.25 | % | | | 1.67 | % | | | 7.53 | % | | | 76 | % |
| | 14.88 | | | | (0.75 | )(i) | | | 20 | | | | 1.25 | | | | 1.07 | | | | 9.33 | | | | 200 | |
| | | | | | |
| | | | | | | | | | | | | | | | | | | | | | | | | | |
| | 16.48 | | | | 11.62 | | | | 22 | | | | 1.75 | | | | 0.36 | | | | 8.70 | | | | 76 | |
| | 14.82 | | | | (1.16 | )(i) | | | 20 | | | | 1.75 | | | | 0.57 | | | | 9.78 | | | | 200 | |
| | | | | | |
| | | | | | | | | | | | | | | | | | | | | | | | | | |
| | 16.55 | | | | 12.11 | | | | 6,563 | | | | 0.95 | | | | 1.16 | | | | 7.91 | | | | 76 | |
| | 14.92 | | | | (0.47 | )(i) | | | 5,815 | | | | 0.95 | | | | 1.34 | | | | 5.54 | | | | 200 | |
| | | | | | |
| | | | | | | | | | | | | | | | | | | | | | | | | | |
| | 16.56 | | | | 12.15 | | | | 22 | | | | 0.80 | | | | 1.30 | | | | 7.77 | | | | 76 | |
| | 14.94 | | | | (0.33 | )(i) | | | 20 | | | | 0.80 | | | | 1.52 | | | | 8.83 | | | | 200 | |
| | | | | | |
| | | | | | | | | | | | | | | | | | | | | | | | | | |
| | 16.56 | | | | 12.20 | | | | 22 | | | | 0.75 | | | | 1.36 | | | | 7.71 | | | | 76 | |
| | 14.94 | | | | (0.33 | )(i) | | | 19 | | | | 0.75 | | | | 1.57 | | | | 8.77 | | | | 200 | |
SEE NOTES TO FINANCIAL STATEMENTS.
| | | | | | | | |
| | | |
| APRIL 30, 2017 | | J.P. MORGAN INTERNATIONAL EQUITY FUNDS | | | | | 133 | |
FINANCIAL HIGHLIGHTS
FOR THE PERIODS INDICATED (continued)
| | | | | | | | | | | | | | | | | | | | |
| | | Per share operating performance | |
| | | | | | Investment operations | | | Distributions | |
| | | Net asset
value,
beginning
of period | | | Net
investment
income
(loss) (b) | | | Net realized
and unrealized
gains
(losses) on
investments | | | Total from
investment
operations | | | Net
investment
income | |
International Equity Fund | |
Class A | |
Six Months Ended April 30, 2017 (Unaudited) | | $ | 14.24 | | | $ | 0.07 | | | $ | 1.48 | | | $ | 1.55 | | | $ | (0.04 | ) |
Year Ended October 31, 2016 | | | 14.75 | | | | 0.22 | | | | (0.51 | ) | | | (0.29 | ) | | | (0.22 | ) |
Year Ended October 31, 2015 | | | 15.25 | | | | 0.23 | | | | (0.50 | ) | | | (0.27 | ) | | | (0.23 | ) |
Year Ended October 31, 2014 | | | 15.92 | | | | 0.37 | (f) | | | (0.68 | ) | | | (0.31 | ) | | | (0.36 | ) |
Year Ended October 31, 2013 | | | 13.36 | | | | 0.20 | | | | 2.56 | | | | 2.76 | | | | (0.20 | ) |
Year Ended October 31, 2012 | | | 12.61 | | | | 0.22 | | | | 0.74 | | | | 0.96 | | | | (0.21 | ) |
|
Class C | |
Six Months Ended April 30, 2017 (Unaudited) | | | 13.50 | | | | 0.02 | | | | 1.42 | | | | 1.44 | | | | (0.01 | ) |
Year Ended October 31, 2016 | | | 14.02 | | | | 0.13 | | | | (0.47 | ) | | | (0.34 | ) | | | (0.18 | ) |
Year Ended October 31, 2015 | | | 14.52 | | | | 0.15 | | | | (0.48 | ) | | | (0.33 | ) | | | (0.17 | ) |
Year Ended October 31, 2014 | | | 15.20 | | | | 0.26 | (f) | | | (0.64 | ) | | | (0.38 | ) | | | (0.30 | ) |
Year Ended October 31, 2013 | | | 12.78 | | | | 0.12 | | | | 2.45 | | | | 2.57 | | | | (0.15 | ) |
Year Ended October 31, 2012 | | | 12.08 | | | | 0.16 | | | | 0.69 | | | | 0.85 | | | | (0.15 | ) |
|
Class I (formerly Select Class) | |
Six Months Ended April 30, 2017 (Unaudited) | | | 14.45 | | | | 0.08 | | | | 1.51 | | | | 1.59 | | | | (0.06 | ) |
Year Ended October 31, 2016 | | | 14.95 | | | | 0.24 | | | | (0.48 | ) | | | (0.24 | ) | | | (0.26 | ) |
Year Ended October 31, 2015 | | | 15.45 | | | | 0.29 | | | | (0.53 | ) | | | (0.24 | ) | | | (0.26 | ) |
Year Ended October 31, 2014 | | | 16.13 | | | | 0.39 | (f) | | | (0.67 | ) | | | (0.28 | ) | | | (0.40 | ) |
Year Ended October 31, 2013 | | | 13.52 | | | | 0.23 | | | | 2.61 | | | | 2.84 | | | | (0.23 | ) |
Year Ended October 31, 2012 | | | 12.76 | | | | 0.26 | | | | 0.74 | | | | 1.00 | | | | (0.24 | ) |
|
Class R2 | |
Six Months Ended April 30, 2017 (Unaudited) | | | 14.17 | | | | 0.04 | | | | 1.49 | | | | 1.53 | | | | (0.02 | ) |
Year Ended October 31, 2016 | | | 14.69 | | | | 0.18 | | | | (0.50 | ) | | | (0.32 | ) | | | (0.20 | ) |
Year Ended October 31, 2015 | | | 15.19 | | | | 0.20 | | | | (0.51 | ) | | | (0.31 | ) | | | (0.19 | ) |
Year Ended October 31, 2014 | | | 15.87 | | | | 0.30 | (f) | | | (0.65 | ) | �� | | (0.35 | ) | | | (0.33 | ) |
Year Ended October 31, 2013 | | | 13.31 | | | | 0.11 | | | | 2.61 | | | | 2.72 | | | | (0.16 | ) |
Year Ended October 31, 2012 | | | 12.58 | | | | 0.15 | | | | 0.77 | | | | 0.92 | | | | (0.19 | ) |
|
Class R5 | |
Six Months Ended April 30, 2017 (Unaudited) | | | 14.47 | | | | 0.06 | | | | 1.54 | | | | 1.60 | | | | (0.07 | ) |
Year Ended October 31, 2016 | | | 14.97 | | | | 0.27 | | | | (0.49 | ) | | | (0.22 | ) | | | (0.28 | ) |
Year Ended October 31, 2015 | | | 15.46 | | | | 0.29 | | | | (0.49 | ) | | | (0.20 | ) | | | (0.29 | ) |
Year Ended October 31, 2014 | | | 16.13 | | | | 0.44 | (f) | | | (0.69 | ) | | | (0.25 | ) | | | (0.42 | ) |
Year Ended October 31, 2013 | | | 13.52 | | | | 0.27 | | | | 2.60 | | | | 2.87 | | | | (0.26 | ) |
Year Ended October 31, 2012 | | | 12.75 | | | | 0.29 | | | | 0.74 | | | | 1.03 | | | | (0.26 | ) |
|
Class R6 | |
Six Months Ended April 30, 2017 (Unaudited) | | | 14.46 | | | | 0.10 | | | | 1.52 | | | | 1.62 | | | | (0.08 | ) |
Year Ended October 31, 2016 | | | 14.97 | | | | 0.29 | | | | (0.51 | ) | | | (0.22 | ) | | | (0.29 | ) |
Year Ended October 31, 2015 | | | 15.46 | | | | 0.32 | | | | (0.52 | ) | | | (0.20 | ) | | | (0.29 | ) |
Year Ended October 31, 2014 | | | 16.13 | | | | 0.45 | (f) | | | (0.69 | ) | | | (0.24 | ) | | | (0.43 | ) |
Year Ended October 31, 2013 | | | 13.52 | | | | 0.28 | | | | 2.59 | | | | 2.87 | | | | (0.26 | ) |
Year Ended October 31, 2012 | | | 12.75 | | | | 0.29 | | | | 0.74 | | | | 1.03 | | | | (0.26 | ) |
| (a) | Annualized for periods less than one year, unless otherwise noted. |
| (b) | Calculated based upon average shares outstanding. |
| (c) | Not annualized for periods less than one year. |
| (d) | Includes adjustments in accordance with accounting principles generally accepted in the United States of America and as such, the net asset values for financial reporting purposes and the returns based upon those net asset values may differ from the net asset values and returns for shareholder transactions. |
| (e) | Includes interest expense, if applicable, which is less than 0.005% unless otherwise noted. |
| (f) | Reflects special dividends paid out during the period by several of the Fund’s holdings. Had the Fund not received the special dividends, the net investment income (loss) per share would have been $0.32, $0.21, $0.34, $0.25, $0.39 and $0.40 for Class A, Class C, Class I, Class R2, Class R5 and Class R6, respectively, and the net investment income (loss) ratio would have been 2.01%, 1.40%, 2.08%, 1.59%, 2.40% and 2.48% for Class A, Class C, Class I, Class R2, Class R5 and Class R6, respectively. |
SEE NOTES TO FINANCIAL STATEMENTS.
| | | | | | |
| | | |
| 134 | | | | J.P. MORGAN INTERNATIONAL EQUITY FUNDS | | APRIL 30, 2017 |
| | | | | | | | | | | | | | | | | | | | | | | | | | |
| | | Ratios/Supplemental data | |
| | | | | | | | | | Ratios to average net assets (a) | | | | |
Net asset
value,
end of
period | | | Total return
(excludes
sales charge) (c)(d) | | | Net assets,
end of
period
(000’s) | | | Net
expenses (e) | | |
Net
investment
income
(loss) | | | Expenses
without waivers
and reimbursements | | | Portfolio
turnover
rate (c) | |
| | | | | | | | | | | | | | | | | | | | | | | | | | |
| | | | | | | | | | | | | | | | | | | | | | | | | | |
| $ | 15.75 | | | | 10.92 | % | | $ | 257,057 | | | | 1.24 | % | | | 0.93 | % | | | 1.39 | % | | | 5 | % |
| | 14.24 | | | | (1.83 | ) | | | 216,932 | | | | 1.31 | | | | 1.62 | | | | 1.49 | | | | 11 | |
| | 14.75 | | | | (1.89 | ) | | | 224,370 | | | | 1.31 | | | | 1.50 | | | | 1.59 | | | | 13 | |
| | 15.25 | | | | (2.06 | ) | | | 186,242 | | | | 1.31 | | | | 2.34 | (f) | | | 1.45 | | | | 6 | |
| | 15.92 | | | | 20.85 | | | | 188,590 | | | | 1.30 | | | | 1.33 | | | | 1.47 | | | | 8 | |
| | 13.36 | | | | 7.70 | | | | 98,274 | | | | 1.30 | | | | 1.72 | | | | 1.51 | | | | 5 | |
| | | | | | |
| | | | | | | | | | | | | | | | | | | | | | | | | | |
| | 14.93 | | | | 10.70 | | | | 23,139 | | | | 1.74 | | | | 0.33 | | | | 1.94 | | | | 5 | |
| | 13.50 | | | | (2.31 | ) | | | 22,235 | | | | 1.81 | | | | 0.97 | | | | 2.06 | | | | 11 | |
| | 14.02 | | | | (2.36 | ) | | | 28,313 | | | | 1.81 | | | | 1.02 | | | | 2.05 | | | | 13 | |
| | 14.52 | | | | (2.59 | ) | | | 26,299 | | | | 1.81 | | | | 1.73 | (f) | | | 1.95 | | | | 6 | |
| | 15.20 | | | | 20.25 | | | | 23,655 | | | | 1.80 | | | | 0.83 | | | | 1.97 | | | | 8 | |
| | 12.78 | | | | 7.16 | | | | 17,873 | | | | 1.80 | | | | 1.31 | | | | 2.01 | | | | 5 | |
| | | | | | |
| | | | | | | | | | | | | | | | | | | | | | | | | | |
| | 15.98 | | | | 11.03 | | | | 112,377 | | | | 0.99 | | | | 1.14 | | | | 1.15 | | | | 5 | |
| | 14.45 | | | | (1.50 | ) | | | 94,362 | | | | 1.06 | | | | 1.69 | | | | 1.24 | | | | 11 | |
| | 14.95 | | | | (1.66 | ) | | | 522,402 | | | | 1.06 | | | | 1.84 | | | | 1.19 | | | | 13 | |
| | 15.45 | | | | (1.88 | ) | | | 494,344 | | | | 1.06 | | | | 2.41 | (f) | | | 1.20 | | | | 6 | |
| | 16.13 | | | | 21.23 | | | | 434,316 | | | | 1.05 | | | | 1.51 | | | | 1.22 | | | | 8 | |
| | 13.52 | | | | 7.91 | | | | 210,375 | | | | 1.05 | | | | 2.02 | | | | 1.25 | | | | 5 | |
| | | | | | |
| | | | | | | | | | | | | | | | | | | | | | | | | | |
| | 15.68 | | | | 10.84 | | | | 1,533 | | | | 1.49 | | | | 0.61 | | | | 1.84 | | | | 5 | |
| | 14.17 | | | | (2.08 | ) | | | 1,461 | | | | 1.56 | | | | 1.28 | | | | 1.95 | | | | 11 | |
| | 14.69 | | | | (2.14 | ) | | | 1,203 | | | | 1.56 | | | | 1.28 | | | | 1.92 | | | | 13 | |
| | 15.19 | | | | (2.33 | ) | | | 1,405 | | | | 1.56 | | | | 1.92 | (f) | | | 1.70 | | | | 6 | |
| | 15.87 | | | | 20.58 | | | | 1,230 | | | | 1.55 | | | | 0.78 | | | | 1.72 | | | | 8 | |
| | 13.31 | | | | 7.45 | | | | 721 | | | | 1.55 | | | | 1.16 | | | | 1.74 | | | | 5 | |
| | | | | | |
| | | | | | | | | | | | | | | | | | | | | | | | | | |
| | 16.00 | | | | 11.09 | | | | 19,619 | | | | 0.84 | | | | 0.84 | | | | 0.94 | | | | 5 | |
| | 14.47 | | | | (1.34 | ) | | | 58,836 | | | | 0.86 | | | | 1.93 | | | | 1.02 | | | | 11 | |
| | 14.97 | | | | (1.42 | ) | | | 57,500 | | | | 0.86 | | | | 1.88 | | | | 1.06 | | | | 13 | |
| | 15.46 | | | | (1.65 | ) | | | 95,749 | | | | 0.86 | | | | 2.73 | (f) | | | 1.00 | | | | 6 | |
| | 16.13 | | | | 21.42 | | | | 106,963 | | | | 0.85 | | | | 1.79 | | | | 1.02 | | | | 8 | |
| | 13.52 | | | | 8.19 | | | | 63,767 | | | | 0.85 | | | | 2.24 | | | | 1.05 | | | | 5 | |
| | | | | | |
| | | | | | | | | | | | | | | | | | | | | | | | | | |
| | 16.00 | | | | 11.23 | | | | 3,274,685 | | | | 0.74 | | | | 1.36 | | | | 0.81 | | | | 5 | |
| | 14.46 | | | | (1.36 | ) | | | 3,030,640 | | | | 0.81 | | | | 2.05 | | | | 0.91 | | | | 11 | |
| | 14.97 | | | | (1.37 | ) | | | 2,088,835 | | | | 0.80 | | | | 2.03 | | | | 0.91 | | | | 13 | |
| | 15.46 | | | | (1.60 | ) | | | 1,681,788 | | | | 0.81 | | | | 2.81 | (f) | | | 0.95 | | | | 6 | |
| | 16.13 | | | | 21.47 | | | | 1,248,489 | | | | 0.80 | | | | 1.85 | | | | 0.97 | | | | 8 | |
| | 13.52 | | | | 8.23 | | | | 682,861 | | | | 0.80 | | | | 2.26 | | | | 1.00 | | | | 5 | |
SEE NOTES TO FINANCIAL STATEMENTS.
| | | | | | | | |
| | | |
| APRIL 30, 2017 | | J.P. MORGAN INTERNATIONAL EQUITY FUNDS | | | | | 135 | |
FINANCIAL HIGHLIGHTS
FOR THE PERIODS INDICATED (continued)
| | | | | | | | | | | | | | | | | | | | | | | | | | | | |
| | | Per share operating performance | |
| | | | | | Investment operations | | | Distributions | |
| | | Net asset
value,
beginning
of period | | | Net
investment
income
(loss) (b) | | | Net realized
and unrealized
gains
(losses) on
investments | | | Total from
investment
operations | | | Net
investment
income | | | Net
realized
gain | | | Total
distributions | |
International Equity Income Fund | |
Class A | |
Six Months Ended April 30, 2017 (Unaudited) | | $ | 14.38 | | | $ | 0.23 | | | $ | 1.01 | | | $ | 1.24 | | | $ | (0.26 | ) | | $ | — | | | $ | (0.26 | ) |
Year Ended October 31, 2016 | | | 15.66 | | | | 0.45 | (f) | | | (1.01 | ) | | | (0.56 | ) | | | (0.46 | ) | | | (0.26 | ) | | | (0.72 | ) |
Year Ended October 31, 2015 | | | 16.41 | | | | 0.39 | (f) | | | (0.33 | ) | | | 0.06 | | | | (0.65 | ) | | | (0.16 | ) | | | (0.81 | ) |
Year Ended October 31, 2014 | | | 16.67 | | | | 0.91 | (g) | | | (0.38 | ) | | | 0.53 | | | | (0.66 | ) | | | (0.13 | ) | | | (0.79 | ) |
Year Ended October 31, 2013 | | | 14.12 | | | | 0.43 | | | | 2.55 | | | | 2.98 | | | | (0.41 | ) | | | (0.02 | ) | | | (0.43 | ) |
Year Ended October 31, 2012 | | | 13.37 | | | | 0.31 | | | | 0.88 | | | | 1.19 | | | | (0.44 | ) | | | — | | | | (0.44 | ) |
|
Class C | |
Six Months Ended April 30, 2017 (Unaudited) | | | 14.30 | | | | 0.20 | | | | 1.00 | | | | 1.20 | | | | (0.24 | ) | | | — | | | | (0.24 | ) |
Year Ended October 31, 2016 | | | 15.59 | | | | 0.38 | (f) | | | (1.01 | ) | | | (0.63 | ) | | | (0.40 | ) | | | (0.26 | ) | | | (0.66 | ) |
Year Ended October 31, 2015 | | | 16.36 | | | | 0.39 | (f) | | | (0.42 | ) | | | (0.03 | ) | | | (0.58 | ) | | | (0.16 | ) | | | (0.74 | ) |
Year Ended October 31, 2014 | | | 16.63 | | | | 0.84 | (g) | | | (0.40 | ) | | | 0.44 | | | | (0.58 | ) | | | (0.13 | ) | | | (0.71 | ) |
Year Ended October 31, 2013 | | | 14.11 | | | | 0.34 | | | | 2.55 | | | | 2.89 | | | | (0.35 | ) | | | (0.02 | ) | | | (0.37 | ) |
Year Ended October 31, 2012 | | | 13.35 | | | | 0.36 | | | | 0.77 | | | | 1.13 | | | | (0.37 | ) | | | — | | | | (0.37 | ) |
|
Class I (formerly Select Class) | |
Six Months Ended April 30, 2017 (Unaudited) | | | 14.41 | | | | 0.29 | | | | 0.98 | | | | 1.27 | | | | (0.28 | ) | | | — | | | | (0.28 | ) |
Year Ended October 31, 2016 | | | 15.70 | | | | 0.46 | (f) | | | (0.98 | ) | | | (0.52 | ) | | | (0.51 | ) | | | (0.26 | ) | | | (0.77 | ) |
Year Ended October 31, 2015 | | | 16.45 | | | | 0.49 | (f) | | | (0.37 | ) | | | 0.12 | | | | (0.71 | ) | | | (0.16 | ) | | | (0.87 | ) |
Year Ended October 31, 2014 | | | 16.71 | | | | 0.96 | (g) | | | (0.40 | ) | | | 0.56 | | | | (0.69 | ) | | | (0.13 | ) | | | (0.82 | ) |
Year Ended October 31, 2013 | | | 14.14 | | | | 0.47 | | | | 2.55 | | | | 3.02 | | | | (0.43 | ) | | | (0.02 | ) | | | (0.45 | ) |
Year Ended October 31, 2012 | | | 13.37 | | | | 0.47 | | | | 0.76 | | | | 1.23 | | | | (0.46 | ) | | | — | | | | (0.46 | ) |
|
Class R2 | |
Six Months Ended April 30, 2017 (Unaudited) | | | 14.36 | | | | 0.22 | | | | 1.00 | | | | 1.22 | | | | (0.25 | ) | | | — | | | | (0.25 | ) |
Year Ended October 31, 2016 | | | 15.65 | | | | 0.39 | (f) | | | (0.98 | ) | | | (0.59 | ) | | | (0.44 | ) | | | (0.26 | ) | | | (0.70 | ) |
Year Ended October 31, 2015 | | | 16.41 | | | | 0.61 | (f) | | | (0.60 | ) | | | 0.01 | | | | (0.61 | ) | | | (0.16 | ) | | | (0.77 | ) |
Year Ended October 31, 2014 | | | 16.67 | | | | 0.87 | (g) | | | (0.39 | ) | | | 0.48 | | | | (0.61 | ) | | | (0.13 | ) | | | (0.74 | ) |
Year Ended October 31, 2013 | | | 14.12 | | | | 0.40 | | | | 2.54 | | | | 2.94 | | | | (0.37 | ) | | | (0.02 | ) | | | (0.39 | ) |
Year Ended October 31, 2012 | | | 13.36 | | | | 0.40 | | | | 0.76 | | | | 1.16 | | | | (0.40 | ) | | | — | | | | (0.40 | ) |
|
Class R5 | |
Six Months Ended April 30, 2017 (Unaudited) | | | 14.42 | | | | 0.30 | | | | 0.97 | | | | 1.27 | | | | (0.28 | ) | | | — | | | | (0.28 | ) |
Year Ended October 31, 2016 | | | 15.70 | | | | 0.49 | (f) | | | (0.98 | ) | | | (0.49 | ) | | | (0.53 | ) | | | (0.26 | ) | | | (0.79 | ) |
Year Ended October 31, 2015 | | | 16.46 | | | | 0.76 | (f) | | | (0.63 | ) | | | 0.13 | | | | (0.73 | ) | | | (0.16 | ) | | | (0.89 | ) |
Year Ended October 31, 2014 | | | 16.72 | | | | 0.99 | (g) | | | (0.39 | ) | | | 0.60 | | | | (0.73 | ) | | | (0.13 | ) | | | (0.86 | ) |
Year Ended October 31, 2013 | | | 14.15 | | | | 0.51 | | | | 2.54 | | | | 3.05 | | | | (0.46 | ) | | | (0.02 | ) | | | (0.48 | ) |
Year Ended October 31, 2012 | | | 13.38 | | | | 0.50 | | | | 0.76 | | | | 1.26 | | | | (0.49 | ) | | | — | | | | (0.49 | ) |
|
Class R6 | |
Six Months Ended April 30, 2017 (Unaudited) | | | 14.41 | | | | 0.28 | | | | 1.00 | | | | 1.28 | | | | (0.29 | ) | | | — | | | | (0.29 | ) |
Year Ended October 31, 2016 | | | 15.69 | | | | 0.51 | (f) | | | (0.99 | ) | | | (0.48 | ) | | | (0.54 | ) | | | (0.26 | ) | | | (0.80 | ) |
January 30, 2015 (h) through October 31, 2015 | | | 15.82 | | | | 0.69 | (f) | | | (0.41 | ) | | | 0.28 | | | | (0.41 | ) | | | — | | | | (0.41 | ) |
| (a) | Annualized for periods less than one year, unless otherwise noted. |
| (b) | Calculated based upon average shares outstanding. |
| (c) | Not annualized for periods less than one year. |
| (d) | Includes adjustments in accordance with accounting principles generally accepted in the United States of America and as such, the net asset values for financial reporting purposes and the returns based upon those net asset values may differ from the net asset values and returns for shareholder transactions. |
| (e) | Includes interest expense, if applicable, which is less than 0.005% unless otherwise noted. |
| (f) | Net investment income (loss) may appear disproportionate among the classes due to the timing of recognition of income and changes in the relative size of the classes. |
| (g) | Reflects special dividends paid out during the period by several of the Fund’s holdings. Had the Fund not received the special dividends, the net investment income (loss) per share would have been $0.66, $0.59, $0.71, $0.62 and $0.74 for Class A, Class C, Class I, Class R2 and Class R5, respectively, and the net investment income (loss) ratio would have been 3.94%, 3.53%, 4.25%, 3.74% and 4.44% for Class A, Class C, Class I, Class R2 and Class R5, respectively. |
| (h) | Commencement of offering of class of shares. |
SEE NOTES TO FINANCIAL STATEMENTS.
| | | | | | |
| | | |
| 136 | | | | J.P. MORGAN INTERNATIONAL EQUITY FUNDS | | APRIL 30, 2017 |
| | | | | | | | | | | | | | | | | | | | | | | | | | |
| | | Ratios/Supplemental data | |
| | | | | | | | | | Ratios to average net assets (a) | | | | |
Net asset
value,
end of
period | | | Total return
(excludes
sales charge) (c)(d) | | | Net assets,
end of
period
(000’s) | | | Net
expenses (e) | | |
Net
investment
income
(loss) | | | Expenses
without waivers
and reimbursements | | | Portfolio
turnover
rate (c) | |
| | | | | | | | | | | | | | | | | | | | | | | | | | |
| | | | | | | | | | | | | | | | | | | | | | | | | | |
| $ | 15.36 | | | | 8.69 | % | | $ | 74,610 | | | | 1.25 | % | | | 3.13 | % | | | 1.57 | % | | | 42 | % |
| | 14.38 | | | | (3.60 | ) | | | 66,722 | | | | 1.24 | | | | 3.06 | (f) | | | 1.57 | | | | 162 | |
| | 15.66 | | | | 0.29 | | | | 66,499 | | | | 1.25 | | | | 2.42 | (f) | | | 1.67 | | | | 238 | |
| | 16.41 | | | | 3.18 | | | | 74,652 | | | | 1.25 | | | | 5.44 | (g) | | | 1.67 | | | | 138 | |
| | 16.67 | | | | 21.40 | | | | 49,118 | | | | 1.24 | | | | 2.77 | | | | 1.82 | | | | 63 | |
| | 14.12 | | | | 9.09 | | | | 9,003 | | | | 1.25 | | | | 2.21 | | | | 2.31 | | | | 52 | |
| | | | | | |
| | | | | | | | | | | | | | | | | | | | | | | | | | |
| | 15.26 | | | | 8.42 | | | | 13,128 | | | | 1.74 | | | | 2.70 | | | | 2.10 | | | | 42 | |
| | 14.30 | | | | (4.09 | ) | | | 11,754 | | | | 1.75 | | | | 2.59 | (f) | | | 2.12 | | | | 162 | |
| | 15.59 | | | | (0.23 | ) | | | 8,649 | | | | 1.75 | | | | 2.45 | (f) | | | 2.20 | | | | 238 | |
| | 16.36 | | | | 2.67 | | | | 3,530 | | | | 1.75 | | | | 5.03 | (g) | | | 2.17 | | | | 138 | |
| | 16.63 | | | | 20.74 | | | | 1,957 | | | | 1.74 | | | | 2.16 | | | | 2.32 | | | | 63 | |
| | 14.11 | | | | 8.66 | | | | 646 | | | | 1.75 | | | | 2.69 | | | | 2.95 | | | | 52 | |
| | | | | | |
| | | | | | | | | | | | | | | | | | | | | | | | | | |
| | 15.40 | | | | 8.87 | | | | 85,893 | | | | 0.90 | | | | 3.89 | | | | 1.32 | | | | 42 | |
| | 14.41 | | | | (3.31 | ) | | | 54,642 | | | | 0.89 | | | | 3.13 | (f) | | | 1.31 | | | | 162 | |
| | 15.70 | | | | 0.66 | | | | 35,177 | | | | 0.91 | | | | 3.00 | (f) | | | 1.41 | | | | 238 | |
| | 16.45 | | | | 3.39 | | | | 34,719 | | | | 1.00 | | | | 5.75 | (g) | | | 1.42 | | | | 138 | |
| | 16.71 | | | | 21.73 | | | | 55,485 | | | | 0.99 | | | | 3.04 | | | | 1.59 | | | | 63 | |
| | 14.14 | | | | 9.43 | | | | 27,292 | | | | 1.00 | | | | 3.44 | | | | 2.20 | | | | 52 | |
| | | | | | |
| | | | | | | | | | | | | | | | | | | | | | | | | | |
| | 15.33 | | | | 8.56 | | | | 472 | | | | 1.49 | | | | 3.05 | | | | 1.85 | | | | 42 | |
| | 14.36 | | | | (3.84 | ) | | | 316 | | | | 1.49 | | | | 2.66 | (f) | | | 2.39 | | | | 162 | |
| | 15.65 | | | | (0.01 | ) | | | 52 | | | | 1.50 | | | | 3.74 | (f) | | | 1.89 | | | | 238 | |
| | 16.41 | | | | 2.90 | | | | 574 | | | | 1.50 | | | | 5.24 | (g) | | | 1.92 | | | | 138 | |
| | 16.67 | | | | 21.12 | | | | 558 | | | | 1.49 | | | | 2.60 | | | | 2.11 | | | | 63 | |
| | 14.12 | | | | 8.87 | | | | 461 | | | | 1.50 | | | | 2.95 | | | | 2.70 | | | | 52 | |
| | | | | | |
| | | | | | | | | | | | | | | | | | | | | | | | | | |
| | 15.41 | | | | 8.91 | | | | 1,637 | | | | 0.80 | | | | 4.09 | | | | 1.09 | | | | 42 | |
| | 14.42 | | | | (3.14 | ) | | | 700 | | | | 0.79 | | | | 3.33 | (f) | | | 1.29 | | | | 162 | |
| | 15.70 | | | | 0.71 | | | | 19 | | | | 0.80 | | | | 4.59 | (f) | | | 1.16 | | | | 238 | |
| | 16.46 | | | | 3.60 | | | | 587 | | | | 0.80 | | | | 5.94 | (g) | | | 1.22 | | | | 138 | |
| | 16.72 | | | | 21.94 | | | | 566 | | | | 0.79 | | | | 3.31 | | | | 1.41 | | | | 63 | |
| | 14.15 | | | | 9.62 | | | | 465 | | | | 0.80 | | | | 3.65 | | | | 2.00 | | | | 52 | |
| | | | | | |
| | | | | | | | | | | | | | | | | | | | | | | | | | |
| | 15.40 | | | | 8.95 | | | | 132 | | | | 0.75 | | | | 3.76 | | | | 1.10 | | | | 42 | |
| | 14.41 | | | | (3.09 | ) | | | 21 | | | | 0.75 | | | | 3.48 | (f) | | | 3.06 | | | | 162 | |
| | 15.69 | | | | 1.66 | | | | 21 | | | | 0.75 | | | | 5.70 | (f) | | | 1.15 | | | | 238 | |
SEE NOTES TO FINANCIAL STATEMENTS.
| | | | | | | | |
| | | |
| APRIL 30, 2017 | | J.P. MORGAN INTERNATIONAL EQUITY FUNDS | | | | | 137 | |
FINANCIAL HIGHLIGHTS
FOR THE PERIODS INDICATED (continued)
| | | | | | | | | | | | | | | | | | | | |
| | | Per share operating performance | |
| | | | | | Investment operations | | | Distributions | |
| | | Net asset
value,
beginning
of period | | | Net
investment
income
(loss) (b) | | | Net realized
and unrealized
gains
(losses) on
investments | | | Total from
investment
operations | | | Net
investment
income | |
International Opportunities Fund | |
Class A | |
Six Months Ended April 30, 2017 (Unaudited) | | $ | 13.77 | | | $ | 0.10 | | | $ | 1.58 | | | $ | 1.68 | | | $ | (0.42 | ) |
Year Ended October 31, 2016 | | | 14.48 | | | | 0.25 | | | | (0.93 | ) | | | (0.68 | ) | | | (0.03 | ) |
Year Ended October 31, 2015 | | | 14.80 | | | | 0.20 | | | | (0.23 | ) | | | (0.03 | ) | | | (0.29 | ) |
Year Ended October 31, 2014 | | | 15.25 | | | | 0.36 | | | | (0.69 | ) | | | (0.33 | ) | | | (0.12 | ) |
Year Ended October 31, 2013 | | | 12.45 | | | | 0.25 | | | | 2.83 | | | | 3.08 | | | | (0.28 | ) |
Year Ended October 31, 2012 | | | 12.00 | | | | 0.23 | | | | 0.56 | | | | 0.79 | | | | (0.34 | ) |
|
Class C | |
Six Months Ended April 30, 2017 (Unaudited) | | | 13.30 | | | | 0.05 | | | | 1.54 | | | | 1.59 | | | | (0.35 | ) |
Year Ended October 31, 2016 | | | 14.04 | | | | 0.14 | | | | (0.88 | ) | | | (0.74 | ) | | | — | (f) |
Year Ended October 31, 2015 | | | 14.41 | | | | 0.10 | | | | (0.19 | ) | | | (0.09 | ) | | | (0.28 | ) |
Year Ended October 31, 2014 | | | 14.88 | | | | 0.27 | | | | (0.66 | ) | | | (0.39 | ) | | | (0.08 | ) |
Year Ended October 31, 2013 | | | 12.15 | | | | 0.16 | | | | 2.77 | | | | 2.93 | | | | (0.20 | ) |
Year Ended October 31, 2012 | | | 11.65 | | | | 0.18 | | | | 0.55 | | | | 0.73 | | | | (0.23 | ) |
|
Class I (formerly Select Class) | |
Six Months Ended April 30, 2017 (Unaudited) | | | 14.00 | | | | 0.12 | | | | 1.58 | | | | 1.70 | | | | (0.47 | ) |
Year Ended October 31, 2016 | | | 14.68 | | | | 0.28 | | | | (0.93 | ) | | | (0.65 | ) | | | (0.03 | ) |
Year Ended October 31, 2015 | | | 15.06 | | | | 0.25 | | | | (0.24 | ) | | | 0.01 | | | | (0.39 | ) |
Year Ended October 31, 2014 | | | 15.50 | | | | 0.40 | | | | (0.69 | ) | | | (0.29 | ) | | | (0.15 | ) |
Year Ended October 31, 2013 | | | 12.64 | | | | 0.29 | | | | 2.87 | | | | 3.16 | | | | (0.30 | ) |
Year Ended October 31, 2012 | | | 12.15 | | | | 0.28 | | | | 0.56 | | | | 0.84 | | | | (0.35 | ) |
|
Class R6 | |
Six Months Ended April 30, 2017 (Unaudited) | | | 14.05 | | | | 0.13 | | | | 1.61 | | | | 1.74 | | | | (0.51 | ) |
Year Ended October 31, 2016 | | | 14.75 | | | | 0.32 | | | | (0.92 | ) | | | (0.60 | ) | | | (0.10 | ) |
Year Ended October 31, 2015 | | | 15.13 | | | | 0.26 | | | | (0.21 | ) | | | 0.05 | | | | (0.43 | ) |
Year Ended October 31, 2014 | | | 15.57 | | | | 0.44 | | | | (0.70 | ) | | | (0.26 | ) | | | (0.18 | ) |
Year Ended October 31, 2013 | | | 12.69 | | | | 0.32 | | | | 2.88 | | | | 3.20 | | | | (0.32 | ) |
Year Ended October 31, 2012 | | | 12.20 | | | | 0.31 | | | | 0.56 | | | | 0.87 | | | | (0.38 | ) |
| (a) | Annualized for periods less than one year, unless otherwise noted. |
| (b) | Calculated based upon average shares outstanding. |
| (c) | Not annualized for periods less than one year. |
| (d) | Includes adjustments in accordance with accounting principles generally accepted in the United States of America and as such, the net asset values for financial reporting purposes and the returns based upon those net asset values may differ from the net asset values and returns for shareholder transactions. |
| (e) | Includes interest expense, if applicable, which is less than 0.005% unless otherwise noted. |
| (f) | Amount rounds to less than $0.005. |
SEE NOTES TO FINANCIAL STATEMENTS.
| | | | | | |
| | | |
| 138 | | | | J.P. MORGAN INTERNATIONAL EQUITY FUNDS | | APRIL 30, 2017 |
| | | | | | | | | | | | | | | | | | | | | | | | | | |
| | | Ratios/Supplemental data | |
| | | | | | | | | | Ratios to average net assets (a) | | | | |
Net asset
value,
end of
period | | | Total return
(excludes
sales charge) (c)(d) | | | Net assets,
end of
period
(000’s) | | | Net
expenses (e) | | |
Net
investment
income
(loss) | | | Expenses
without waivers
and reimbursements | | | Portfolio
turnover
rate (c) | |
| | | | | | | | | | | | | | | | | | | | | | | | | | |
| | | | | | | | | | | | | | | | | | | | | | | | | | |
| $ | 15.03 | | | | 12.51 | % | | $ | 204,929 | | | | 1.23 | % | | | 1.39 | % | | | 1.25 | % | | | 29 | % |
| | 13.77 | | | | (4.69 | ) | | | 171,940 | | | | 1.29 | | | | 1.83 | | | | 1.29 | | | | 48 | |
| | 14.48 | | | | (0.15 | ) | | | 155,397 | | | | 1.31 | | | | 1.34 | | | | 1.43 | | | | 43 | |
| | 14.80 | | | | (2.18 | ) | | | 110,667 | | | | 1.23 | | | | 2.39 | | | | 1.24 | | | | 55 | |
| | 15.25 | | | | 25.09 | | | | 123,807 | | | | 1.25 | | | | 1.78 | | | | 1.26 | | | | 36 | |
| | 12.45 | | | | 6.95 | | | | 67,472 | | | | 1.29 | | | | 1.91 | | | | 1.30 | | | | 45 | |
| | | | | | |
| | | | | | | | | | | | | | | | | | | | | | | | | | |
| | 14.54 | | | | 12.21 | | | | 1,484 | | | | 1.73 | | | | 0.75 | | | | 1.87 | | | | 29 | |
| | 13.30 | | | | (5.26 | ) | | | 1,565 | | | | 1.89 | | | | 1.06 | | | | 1.91 | | | | 48 | |
| | 14.04 | | | | (0.63 | ) | | | 1,743 | | | | 1.83 | | | | 0.70 | | | | 1.83 | | | | 43 | |
| | 14.41 | | | | (2.65 | ) | | | 1,441 | | | | 1.73 | | | | 1.80 | | | | 1.74 | | | | 55 | |
| | 14.88 | | | | 24.41 | | | | 1,109 | | | | 1.75 | | | | 1.19 | | | | 1.76 | | | | 36 | |
| | 12.15 | | | | 6.47 | | | | 531 | | | | 1.79 | | | | 1.55 | | | | 1.80 | | | | 45 | |
| | | | | | |
| | | | | | | | | | | | | | | | | | | | | | | | | | |
| | 15.23 | | | | 12.52 | | | | 47,653 | | | | 0.98 | | | | 1.64 | | | | 1.02 | | | | 29 | |
| | 14.00 | | | | (4.40 | ) | | | 23,999 | | | | 1.05 | | | | 1.99 | | | | 1.05 | | | | 48 | |
| | 14.68 | | | | 0.13 | | | | 24,548 | | | | 1.00 | | | | 1.71 | | | | 1.01 | | | | 43 | |
| | 15.06 | | | | (1.91 | ) | | | 47,581 | | | | 0.98 | | | | 2.55 | | | | 0.99 | | | | 55 | |
| | 15.50 | | | | 25.38 | | | | 47,743 | | | | 0.99 | | | | 2.04 | | | | 1.01 | | | | 36 | |
| | 12.64 | | | | 7.28 | | | | 33,029 | | | | 1.04 | | | | 2.35 | | | | 1.05 | | | | 45 | |
| | | | | | |
| | | | | | | | | | | | | | | | | | | | | | | | | | |
| | 15.28 | | | | 12.74 | | | | 2,717,685 | | | | 0.71 | | | | 1.81 | | | | 0.71 | | | | 29 | |
| | 14.05 | | | | (4.09 | ) | | | 2,522,883 | | | | 0.71 | | | | 2.29 | | | | 0.71 | | | | 48 | |
| | 14.75 | | | | 0.41 | | | | 2,003,409 | | | | 0.71 | | | | 1.75 | | | | 0.72 | | | | 43 | |
| | 15.13 | | | | (1.67 | ) | | | 1,539,613 | | | | 0.73 | | | | 2.82 | | | | 0.74 | | | | 55 | |
| | 15.57 | | | | 25.71 | | | | 1,204,314 | | | | 0.75 | | | | 2.27 | | | | 0.76 | | | | 36 | |
| | 12.69 | | | | 7.59 | | | | 692,117 | | | | 0.79 | | | | 2.58 | | | | 0.79 | | | | 45 | |
SEE NOTES TO FINANCIAL STATEMENTS.
| | | | | | | | |
| | | |
| APRIL 30, 2017 | | J.P. MORGAN INTERNATIONAL EQUITY FUNDS | | | | | 139 | |
FINANCIAL HIGHLIGHTS
FOR THE PERIODS INDICATED (continued)
| | | | | | | | | | | | | | | | | | | | | | | | | | | | |
| | | Per share operating performance | |
| | | | | | Investment operations | | | Distributions | |
| | | Net asset
value,
beginning
of period | | | Net
investment
income
(loss) (b) | | | Net realized
and unrealized
gains
(losses) on
investments | | | Total from
investment
operations | | | Net
investment
income | | | Net
realized
gain | | | Total
distributions | |
International Research Enhanced Equity Fund | |
Class A | |
Six Months Ended April 30, 2017 (Unaudited) | | $ | 15.54 | | | $ | 0.16 | | | $ | 1.75 | | | $ | 1.91 | | | $ | (0.35 | ) | | $ | — | | | $ | (0.35 | ) |
Year Ended October 31, 2016 | | | 16.54 | | | | 0.40 | (f) | | | (0.89 | ) | | | (0.49 | ) | | | (0.36 | ) | | | (0.15 | ) | | | (0.51 | ) |
Year Ended October 31, 2015 | | | 20.38 | | | | 0.43 | | | | (0.60 | ) | | | (0.17 | ) | | | (0.40 | ) | | | (3.27 | ) | | | (3.67 | ) |
Year Ended October 31, 2014 | | | 21.20 | | | | 0.47 | | | | (0.56 | ) | | | (0.09 | ) | | | (0.39 | ) | | | (0.34 | ) | | | (0.73 | ) |
Year Ended October 31, 2013 | | | 17.24 | | | | 0.38 | | | | 4.00 | | | | 4.38 | | | | (0.42 | ) | | | — | | | | (0.42 | ) |
Year Ended October 31, 2012 | | | 16.83 | | | | 0.37 | | | | 0.45 | | | | 0.82 | | | | (0.41 | ) | | | — | | | | (0.41 | ) |
|
Class C | |
Six Months Ended April 30, 2017 (Unaudited) | | | 14.88 | | | | 0.12 | | | | 1.67 | | | | 1.79 | | | | (0.26 | ) | | | — | | | | (0.26 | ) |
Year Ended October 31, 2016 | | | 15.85 | | | | 0.31 | (f) | | | (0.85 | ) | | | (0.54 | ) | | | (0.28 | ) | | | (0.15 | ) | | | (0.43 | ) |
Year Ended October 31, 2015 | | | 19.68 | | | | 0.33 | | | | (0.58 | ) | | | (0.25 | ) | | | (0.31 | ) | | | (3.27 | ) | | | (3.58 | ) |
Year Ended October 31, 2014 | | | 20.51 | | | | 0.36 | | | | (0.56 | ) | | | (0.20 | ) | | | (0.29 | ) | | | (0.34 | ) | | | (0.63 | ) |
Year Ended October 31, 2013 | | | 16.68 | | | | 0.27 | | | | 3.86 | | | | 4.13 | | | | (0.30 | ) | | | — | | | | (0.30 | ) |
Year Ended October 31, 2012 | | | 16.27 | | | | 0.25 | | | | 0.44 | | | | 0.69 | | | | (0.28 | ) | | | — | | | | (0.28 | ) |
|
Class I (formerly Select Class) | |
Six Months Ended April 30, 2017 (Unaudited) | | | 15.68 | | | | 0.19 | | | | 1.76 | | | | 1.95 | | | | (0.40 | ) | | | — | | | | (0.40 | ) |
Year Ended October 31, 2016 | | | 16.70 | | | | 0.46 | (f) | | | (0.92 | ) | | | (0.46 | ) | | | (0.41 | ) | | | (0.15 | ) | | | (0.56 | ) |
Year Ended October 31, 2015 | | | 20.54 | | | | 0.48 | | | | (0.60 | ) | | | (0.12 | ) | | | (0.45 | ) | | | (3.27 | ) | | | (3.72 | ) |
Year Ended October 31, 2014 | | | 21.36 | | | | 0.52 | | | | (0.56 | ) | | | (0.04 | ) | | | (0.44 | ) | | | (0.34 | ) | | | (0.78 | ) |
Year Ended October 31, 2013 | | | 17.36 | | | | 0.40 | | | | 4.06 | | | | 4.46 | | | | (0.46 | ) | | | — | | | | (0.46 | ) |
Year Ended October 31, 2012 | | | 16.96 | | | | 0.41 | | | | 0.45 | | | | 0.86 | | | | (0.46 | ) | | | — | | | | (0.46 | ) |
|
Class R2 | |
Six Months Ended April 30, 2017 (Unaudited) | | | 15.19 | | | | 0.14 | | | | 1.71 | | | | 1.85 | | | | (0.36 | ) | | | — | | | | (0.36 | ) |
Year Ended October 31, 2016 | | | 16.21 | | | | 0.31 | (f) | | | (0.84 | ) | | | (0.53 | ) | | | (0.34 | ) | | | (0.15 | ) | | | (0.49 | ) |
Year Ended October 31, 2015 | | | 20.07 | | | | 0.37 | | | | (0.58 | ) | | | (0.21 | ) | | | (0.38 | ) | | | (3.27 | ) | | | (3.65 | ) |
Year Ended October 31, 2014 | | | 20.91 | | | | 0.40 | | | | (0.54 | ) | | | (0.14 | ) | | | (0.36 | ) | | | (0.34 | ) | | | (0.70 | ) |
Year Ended October 31, 2013 | | | 17.03 | | | | 0.35 | | | | 3.92 | | | | 4.27 | | | | (0.39 | ) | | | — | | | | (0.39 | ) |
Year Ended October 31, 2012 | | | 16.66 | | | | 0.32 | | | | 0.45 | | | | 0.77 | | | | (0.40 | ) | | | — | | | | (0.40 | ) |
| (a) | Annualized for periods less than one year, unless otherwise noted. |
| (b) | Calculated based upon average shares outstanding. |
| (c) | Not annualized for periods less than one year. |
| (d) | Includes adjustments in accordance with accounting principles generally accepted in the United States of America and as such, the net asset values for financial reporting purposes and the returns based upon those net asset values may differ from the net asset values and returns for shareholder transactions. |
| (e) | Includes interest expense, if applicable, which is less than 0.005% unless otherwise noted. |
| (f) | Net investment income may appear disproportionate among the classes due to the timing of recognition of income and changes in the relative size of the classes. |
| (g) | Amount rounds to less than 0.005%. |
SEE NOTES TO FINANCIAL STATEMENTS.
| | | | | | |
| | | |
| 140 | | | | J.P. MORGAN INTERNATIONAL EQUITY FUNDS | | APRIL 30, 2017 |
| | | | | | | | | | | | | | | | | | | | | | | | | | |
| | | Ratios/Supplemental data | |
| | | | | | | | | | Ratios to average net assets (a) | | | | |
Net asset
value,
end of
period | | | Total return
(excludes
sales charge) (c)(d) | | | Net assets,
end of
period
(000’s) | | | Net
expenses (e) | | |
Net
investment
income
(loss) | | | Expenses
without waivers
and reimbursements | | | Portfolio
turnover
rate | |
| | | | | | | | | | | | | | | | | | | | | | | | | | |
| | | | | | | | | | | | | | | | | | | | | | | | | | |
| $ | 17.10 | | | | 12.49 | % | | $ | 71,210 | | | | 0.59 | % | | | 2.06 | % | | | 0.98 | % | | | 9 | % |
| | 15.54 | | | | (2.94 | ) | | | 69,626 | | | | 0.60 | | | | 2.60 | (f) | | | 1.02 | | | | 24 | |
| | 16.54 | | | | (0.29 | ) | | | 82,667 | | | | 0.60 | | | | 2.51 | | | | 0.99 | | | | 39 | |
| | 20.38 | | | | (0.40 | ) | | | 96,325 | | | | 0.59 | | | | 2.23 | | | | 1.10 | | | | 63 | |
| | 21.20 | | | | 25.84 | | | | 108,193 | | | | 0.75 | | | | 2.04 | | | | 1.35 | | | | 51 | |
| | 17.24 | | | | 5.16 | | | | 96,191 | | | | 1.07 | | | | 2.27 | | | | 1.31 | | | | 19 | |
| | | | | | |
| | | | | | | | | | | | | | | | | | | | | | | | | | |
| | 16.41 | | | | 12.20 | | | | 12,585 | | | | 1.09 | | | | 1.53 | | | | 1.47 | | | | 9 | |
| | 14.88 | | | | (3.41 | ) | | | 13,507 | | | | 1.10 | | | | 2.14 | (f) | | | 1.55 | | | | 24 | |
| | 15.85 | | | | (0.77 | ) | | | 18,423 | | | | 1.10 | | | | 2.01 | | | | 1.52 | | | | 39 | |
| | 19.68 | | | | (0.93 | ) | | | 20,724 | | | | 1.09 | | | | 1.75 | | | | 1.60 | | | | 63 | |
| | 20.51 | | | | 25.09 | | | | 21,802 | | | | 1.30 | | | | 1.49 | | | | 1.85 | | | | 51 | |
| | 16.68 | | | | 4.43 | | | | 16,291 | | | | 1.79 | | | | 1.57 | | | | 1.81 | | | | 19 | |
| | | | | | |
| | | | | | | | | | | | | | | | | | | | | | | | | | |
| | 17.23 | | | | 12.66 | | | | 1,619,251 | | | | 0.35 | | | | 2.37 | | | | 0.59 | | | | 9 | |
| | 15.68 | | | | (2.72 | ) | | | 1,241,856 | | | | 0.34 | | | | 2.98 | (f) | | | 0.59 | | | | 24 | |
| | 16.70 | | | | 0.00 | (g) | | | 779,908 | | | | 0.35 | | | | 2.79 | | | | 0.60 | | | | 39 | |
| | 20.54 | | | | (0.16 | ) | | | 562,180 | | | | 0.34 | | | | 2.45 | | | | 0.84 | | | | 63 | |
| | 21.36 | | | | 26.18 | | | | 464,273 | | | | 0.53 | | | | 2.10 | | | | 1.09 | | | | 51 | |
| | 17.36 | | | | 5.40 | | | | 469,065 | | | | 0.82 | | | | 2.51 | | | | 1.06 | | | | 19 | |
| | | | | | |
| | | | | | | | | | | | | | | | | | | | | | | | | | |
| | 16.68 | | | | 12.40 | | | | 12,898 | | | | 0.84 | | | | 1.86 | | | | 1.37 | | | | 9 | |
| | 15.19 | | | | (3.22 | ) | | | 10,222 | | | | 0.84 | | | | 2.08 | (f) | | | 1.34 | | | | 24 | |
| | 16.21 | | | | (0.50 | ) | | | 3,331 | | | | 0.85 | | | | 2.22 | | | | 1.41 | | | | 39 | |
| | 20.07 | | | | (0.66 | ) | | | 2,521 | | | | 0.84 | | | | 1.95 | | | | 1.33 | | | | 63 | |
| | 20.91 | | | | 25.52 | | | | 1,957 | | | | 0.95 | | | | 1.88 | | | | 1.61 | | | | 51 | |
| | 17.03 | | | | 4.94 | | | | 786 | | | | 1.32 | | | | 1.97 | | | | 1.56 | | | | 19 | |
SEE NOTES TO FINANCIAL STATEMENTS.
| | | | | | | | |
| | | |
| APRIL 30, 2017 | | J.P. MORGAN INTERNATIONAL EQUITY FUNDS | | | | | 141 | |
FINANCIAL HIGHLIGHTS
FOR THE PERIODS INDICATED (continued)
| | | | | | | | | | | | | | | | | | | | | | | | | | | | |
| | | Per share operating performance | |
| | | | | | Investment operations | | | Distributions | |
| | | Net asset
value,
beginning
of period | | | Net
investment
income
(loss) | | | Net realized
and unrealized
gains
(losses) on
investments | | | Total from
investment
operations | | | Net
investment
income | | | Net
realized
gain | | | Total
distributions | |
International Unconstrained Equity Fund | |
Class A | |
Six Months Ended April 30, 2017 (Unaudited) | | $ | 17.24 | | | $ | 0.04 | (e) | | $ | 1.91 | | | $ | 1.95 | | | $ | (0.35 | ) | | $ | — | | | $ | (0.35 | ) |
Year Ended October 31, 2016 | | | 17.61 | | | | 0.22 | (e)(f) | | | (0.55 | ) | | | (0.33 | ) | | | (0.04 | ) | | | — | | | | (0.04 | ) |
Year Ended October 31, 2015 | | | 18.59 | | | | 0.09 | (e)(f) | | | 0.39 | | | | 0.48 | | | | (0.17 | ) | | | (1.29 | ) | | | (1.46 | ) |
Year Ended October 31, 2014 | | | 20.59 | | | | 0.13 | (g) | | | (0.65 | ) | | | (0.52 | ) | | | (0.17 | ) | | | (1.31 | ) | | | (1.48 | ) |
Year Ended October 31, 2013 | | | 17.28 | | | | 0.15 | | | | 3.62 | | | | 3.77 | | | | (0.11 | ) | | | (0.35 | ) | | | (0.46 | ) |
November 30, 2011 (i) through October 31, 2012 | | | 15.00 | | | | 0.17 | | | | 2.11 | | | | 2.28 | | | | — | | | | — | | | | — | |
|
Class C | |
Six Months Ended April 30, 2017 (Unaudited) | | | 17.04 | | | | (0.02 | )(e) | | | 1.91 | | | | 1.89 | | | | (0.25 | ) | | | — | | | | (0.25 | ) |
Year Ended October 31, 2016 | | | 17.45 | | | | 0.13 | (e)(f) | | | (0.53 | ) | | | (0.40 | ) | | | (0.01 | ) | | | — | | | | (0.01 | ) |
Year Ended October 31, 2015 | | | 18.44 | | | | (0.02 | )(e)(f) | | | 0.39 | | | | 0.37 | | | | (0.07 | ) | | | (1.29 | ) | | | (1.36 | ) |
Year Ended October 31, 2014 | | | 20.47 | | | | 0.09 | (g) | | | (0.69 | ) | | | (0.60 | ) | | | (0.12 | ) | | | (1.31 | ) | | | (1.43 | ) |
Year Ended October 31, 2013 | | | 17.20 | | | | 0.07 | | | | 3.59 | | | | 3.66 | | | | (0.04 | ) | | | (0.35 | ) | | | (0.39 | ) |
November 30, 2011 (i) through October 31, 2012 | | | 15.00 | | | | 0.10 | | | | 2.10 | | | | 2.20 | | | | — | | | | — | | | | — | |
|
Class I (formerly Select Class) | |
Six Months Ended April 30, 2017 (Unaudited) | | | 17.45 | | | | 0.08 | (e) | | | 1.92 | | | | 2.00 | | | | (0.40 | ) | | | — | | | | (0.40 | ) |
Year Ended October 31, 2016 | | | 17.71 | | | | 0.24 | (e)(f) | | | (0.50 | ) | | | (0.26 | ) | | | — | | | | — | | | | — | |
Year Ended October 31, 2015 | | | 18.67 | | | | 0.15 | (e)(f) | | | 0.38 | | | | 0.53 | | | | (0.20 | ) | | | (1.29 | ) | | | (1.49 | ) |
Year Ended October 31, 2014 | | | 20.64 | | | | 0.21 | (g) | | | (0.67 | ) | | | (0.46 | ) | | | (0.20 | ) | | | (1.31 | ) | | | (1.51 | ) |
Year Ended October 31, 2013 | | | 17.32 | | | | 0.21 | | | | 3.60 | | | | 3.81 | | | | (0.14 | ) | | | (0.35 | ) | | | (0.49 | ) |
November 30, 2011 (i) through October 31, 2012 | | | 15.00 | | | | 0.21 | | | | 2.11 | | | | 2.32 | | | | — | | | | — | | | | — | |
|
Class R2 | |
Six Months Ended April 30, 2017 (Unaudited) | | | 17.21 | | | | — | (e)(j) | | | 1.93 | | | | 1.93 | | | | (0.30 | ) | | | — | | | | (0.30 | ) |
Year Ended October 31, 2016 | | | 17.57 | | | | 0.15 | (e)(f) | | | (0.51 | ) | | | (0.36 | ) | | | — | | | | — | | | | — | |
Year Ended October 31, 2015 | | | 18.55 | | | | 0.03 | (e)(f) | | | 0.39 | | | | 0.42 | | | | (0.11 | ) | | | (1.29 | ) | | | (1.40 | ) |
Year Ended October 31, 2014 | | | 20.53 | | | | 0.12 | (g) | | | (0.68 | ) | | | (0.56 | ) | | | (0.11 | ) | | | (1.31 | ) | | | (1.42 | ) |
Year Ended October 31, 2013 | | | 17.24 | | | | 0.12 | | | | 3.59 | | | | 3.71 | | | | (0.07 | ) | | | (0.35 | ) | | | (0.42 | ) |
November 30, 2011 (i) through October 31, 2012 | | | 15.00 | | | | 0.14 | | | | 2.10 | | | | 2.24 | | | | — | | | | — | | | | — | |
|
Class R5 | |
Six Months Ended April 30, 2017 (Unaudited) | | | 17.44 | | | | 0.06 | (e) | | | 1.95 | | | | 2.01 | | | | (0.42 | ) | | | — | | | | (0.42 | ) |
Year Ended October 31, 2016 | | | 17.75 | | | | 0.27 | (e)(f) | | | (0.52 | ) | | | (0.25 | ) | | | (0.06 | ) | | | — | | | | (0.06 | ) |
Year Ended October 31, 2015 | | | 18.72 | | | | 0.16 | (e)(f) | | | 0.39 | | | | 0.55 | | | | (0.23 | ) | | | (1.29 | ) | | | (1.52 | ) |
Year Ended October 31, 2014 | | | 20.69 | | | | 0.24 | (g) | | | (0.67 | ) | | | (0.43 | ) | | | (0.23 | ) | | | (1.31 | ) | | | (1.54 | ) |
Year Ended October 31, 2013 | | | 17.35 | | | | 0.25 | | | | 3.61 | | | | 3.86 | | | | (0.17 | ) | | | (0.35 | ) | | | (0.52 | ) |
November 30, 2011 (i) through October 31, 2012 | | | 15.00 | | | | 0.24 | | | | 2.11 | | | | 2.35 | | | | — | | | | — | | | | — | |
|
Class R6 | |
Six Months Ended April 30, 2017 (Unaudited) | | | 17.45 | | | | 0.08 | (e) | | | 1.93 | | | | 2.01 | | | | (0.43 | ) | | | — | | | | (0.43 | ) |
Year Ended October 31, 2016 | | | 17.76 | | | | 0.29 | (e)(f) | | | (0.52 | ) | | | (0.23 | ) | | | (0.08 | ) | | | — | | | | (0.08 | ) |
Year Ended October 31, 2015 | | | 18.73 | | | | (0.01 | )(e)(f) | | | 0.57 | | | | 0.56 | | | | (0.24 | ) | | | (1.29 | ) | | | (1.53 | ) |
Year Ended October 31, 2014 | | | 20.70 | | | | 0.25 | (g) | | | (0.67 | ) | | | (0.42 | ) | | | (0.24 | ) | | | (1.31 | ) | | | (1.55 | ) |
Year Ended October 31, 2013 | | | 17.36 | | | | 0.26 | | | | 3.61 | | | | 3.87 | | | | (0.18 | ) | | | (0.35 | ) | | | (0.53 | ) |
November 30, 2011 (i) through October 31, 2012 | | | 15.00 | | | | 0.25 | | | | 2.11 | | | | 2.36 | | | | — | | | | — | | | | — | |
| (a) | Annualized for periods less than one year, unless otherwise noted. |
| (b) | Not annualized for periods less than one year. |
| (c) | Includes adjustments in accordance with accounting principles generally accepted in the United States of America and as such, the net asset values for financial reporting purposes and the returns based upon those net asset values may differ from the net asset values and returns for shareholder transactions. |
| (d) | Includes interest expense, if applicable, which is less than 0.005% unless otherwise noted. |
| (e) | Calculated based upon average shares outstanding. |
| (f) | Net investment income (loss) may appear disproportionate among the classes due to the timing of recognition of income and changes in the relative size of the classes. |
| (g) | Reflects special dividends paid out during the period by one of the Fund’s holdings. Had the Fund not received the special dividend, the net investment income (loss) per share would have been $0.10, $0.06, $0.17, $0.08, $0.20 and $0.22 for Class A, Class C, Class I, Class R2, Class R5 and Class R6, respectively and the net investment income (loss) ratio would have been 0.80%, 0.37%, 0.99%, 0.48%, 1.18% and 1.23% for Class A, Class C, Class I, Class R2, Class R5 and Class R6, respectively. |
| (h) | Certain non-recurring expenses incurred by the Fund were not annualized for the year ended October 31, 2013 and for the period ended October 31, 2012. |
| (i) | Commencement of operations. |
| (j) | Amount rounds to less than $0.005. |
SEE NOTES TO FINANCIAL STATEMENTS.
| | | | | | |
| | | |
| 142 | | | | J.P. MORGAN INTERNATIONAL EQUITY FUNDS | | APRIL 30, 2017 |
| | | | | | | | | | | | | | | | | | | | | | | | | | |
| | | Ratios/Supplemental data | |
| | | | | | | | | | Ratios to average net assets (a) | | | | |
Net asset
value,
end of
period | | | Total return
(excludes
sales charge) (b)(c) | | | Net assets,
end of
period
(000’s) | | | Net
expenses (d) | | |
Net
investment
income
(loss) | | | Expenses
without waivers
and reimbursements | | | Portfolio
turnover
rate (b) | |
| | | | | | | | | | | | | | | | | | | | | | | | | | |
| | | | | | | | | | | | | | | | | | | | | | | | | | |
| $ | 18.84 | | | | 11.54 | % | | $ | 26,032 | | | | 1.24 | % | | | 0.48 | % | | | 1.57 | % | | | 24 | % |
| | 17.24 | | | | (1.86 | ) | | | 14,034 | | | | 1.24 | | | | 1.28 | (f) | | | 1.61 | | | | 51 | |
| | 17.61 | | | | 3.04 | | | | 5,824 | | | | 1.24 | | | | 0.49 | (f) | | | 2.31 | | | | 42 | |
| | 18.59 | | | | (2.47 | ) | | | 351 | | | | 1.32 | | | | 0.98 | (g) | | | 5.09 | | | | 63 | |
| | 20.59 | | | | 22.23 | | | | 83 | | | | 1.32 | (h) | | | 0.89 | (h) | | | 7.99 | (h) | | | 65 | |
| | 17.28 | | | | 15.20 | | | | 58 | | | | 1.32 | (h) | | | 1.17 | (h) | | | 6.99 | (h) | | | 40 | |
| | | | | | |
| | | | | | | | | | | | | | | | | | | | | | | | | | |
| | 18.68 | | | | 11.29 | | | | 5,735 | | | | 1.74 | | | | (0.20 | ) | | | 2.09 | | | | 24 | |
| | 17.04 | | | | (2.28 | ) | | | 4,626 | | | | 1.74 | | | | 0.75 | (f) | | | 2.14 | | | | 51 | |
| | 17.45 | | | | 2.39 | | | | 3,439 | | | | 1.74 | | | | (0.12 | )(f) | | | 2.79 | | | | 42 | |
| | 18.44 | | | | (2.91 | ) | | | 137 | | | | 1.82 | | | | 0.55 | (g) | | | 6.19 | | | | 63 | |
| | 20.47 | | | | 21.61 | | | | 76 | | | | 1.82 | (h) | | | 0.40 | (h) | | | 8.35 | (h) | | | 65 | |
| | 17.20 | | | | 14.67 | | | | 57 | | | | 1.82 | (h) | | | 0.67 | (h) | | | 7.47 | (h) | | | 40 | |
| | | | | | |
| | | | | | | | | | | | | | | | | | | | | | | | | | |
| | 19.05 | | | | 11.76 | | | | 30,034 | | | | 0.89 | | | | 0.94 | | | | 1.28 | | | | 24 | |
| | 17.45 | | | | (1.47 | ) | | | 9,929 | | | | 0.89 | | | | 1.41 | (f) | | | 1.35 | | | | 51 | |
| | 17.71 | | | | 3.29 | | | | 59,858 | | | | 0.89 | | | | 0.83 | (f) | | | 1.84 | | | | 42 | |
| | 18.67 | | | | (2.18 | ) | | | 3,868 | | | | 1.07 | | | | 1.17 | (g) | | | 5.55 | | | | 63 | |
| | 20.64 | | | | 22.49 | | | | 3,925 | | | | 1.07 | (h) | | | 1.17 | (h) | | | 7.52 | (h) | | | 65 | |
| | 17.32 | | | | 15.47 | | | | 3,175 | | | | 1.07 | (h) | | | 1.42 | (h) | | | 6.74 | (h) | | | 40 | |
| | | | | | |
| | | | | | | | | | | | | | | | | | | | | | | | | | |
| | 18.84 | | | | 11.43 | | | | 22 | | | | 1.49 | | | | 0.02 | | | | 1.95 | | | | 24 | |
| | 17.21 | | | | (2.05 | ) | | | 20 | | | | 1.49 | | | | 0.87 | (f) | | | 4.37 | | | | 51 | |
| | 17.57 | | | | 2.67 | | | | 20 | | | | 1.51 | | | | 0.19 | (f) | | | 5.11 | | | | 42 | |
| | 18.55 | | | | (2.68 | ) | | | 68 | | | | 1.57 | | | | 0.66 | (g) | | | 6.05 | | | | 63 | |
| | 20.53 | | | | 21.92 | | | | 70 | | | | 1.57 | (h) | | | 0.67 | (h) | | | 8.01 | (h) | | | 65 | |
| | 17.24 | | | | 14.93 | | | | 57 | | | | 1.57 | (h) | | | 0.92 | (h) | | | 7.23 | (h) | | | 40 | |
| | | | | | |
| | | | | | | | | | | | | | | | | | | | | | | | | | |
| | 19.03 | | | | 11.81 | | | | 22 | | | | 0.80 | | | | 0.72 | | | | 1.24 | | | | 24 | |
| | 17.44 | | | | (1.38 | ) | | | 20 | | | | 0.80 | | | | 1.57 | (f) | | | 3.59 | | | | 51 | |
| | 17.75 | | | | 3.43 | | | | 20 | | | | 0.81 | | | | 0.89 | (f) | | | 4.43 | | | | 42 | |
| | 18.72 | | | | (1.99 | ) | | | 70 | | | | 0.87 | | | | 1.36 | (g) | | | 5.34 | | | | 63 | |
| | 20.69 | | | | 22.76 | | | | 71 | | | | 0.87 | (h) | | | 1.37 | (h) | | | 7.31 | (h) | | | 65 | |
| | 17.35 | | | | 15.67 | | | | 58 | | | | 0.87 | (h) | | | 1.62 | (h) | | | 6.54 | (h) | | | 40 | |
| | | | | | |
| | | | | | | | | | | | | | | | | | | | | | | | | | |
| | 19.03 | | | | 11.80 | | | | 112,514 | | | | 0.75 | | | | 0.88 | | | | 0.99 | | | | 24 | |
| | 17.45 | | | | (1.29 | ) | | | 81,146 | | | | 0.74 | | | | 1.70 | (f) | | | 1.02 | | | | 51 | |
| | 17.76 | | | | 3.48 | | | | 5,335 | | | | 0.74 | | | | (0.05 | )(f) | | | 2.87 | | | | 42 | |
| | 18.73 | | | | (1.95 | ) | | | 70 | | | | 0.82 | | | | 1.41 | (g) | | | 5.29 | | | | 63 | |
| | 20.70 | | | | 22.80 | | | | 71 | | | | 0.82 | (h) | | | 1.42 | (h) | | | 7.26 | (h) | | | 65 | |
| | 17.36 | | | | 15.73 | | | | 58 | | | | 0.82 | (h) | | | 1.67 | (h) | | | 6.49 | (h) | | | 40 | |
SEE NOTES TO FINANCIAL STATEMENTS.
| | | | | | | | |
| | | |
| APRIL 30, 2017 | | J.P. MORGAN INTERNATIONAL EQUITY FUNDS | | | | | 143 | |
FINANCIAL HIGHLIGHTS
FOR THE PERIODS INDICATED (continued)
| | | | | | | | | | | | | | | | | | | | |
| | | Per share operating performance | |
| | | Investment operations | | | Distributions | |
| | | Net asset
value,
beginning of period | | | Net
investment
income
(loss) (b) | | | Net realized and unrealized
gains
(losses) on
investments | | | Total from
investment
operations | | | Net
investment
income | |
International Value Fund | |
Class A | |
Six Months Ended April 30, 2017 (Unaudited) | | $ | 12.23 | | | $ | 0.08 | | | $ | 1.41 | | | $ | 1.49 | | | $ | (0.69 | ) |
Year Ended October 31, 2016 | | | 13.02 | | | | 0.23 | | | | (0.88 | ) | | | (0.65 | ) | | | (0.14 | ) |
Year Ended October 31, 2015 | | | 14.14 | | | | 0.18 | (f) | | | (0.83 | ) | | | (0.65 | ) | | | (0.47 | ) |
Year Ended October 31, 2014 | | | 15.02 | | | | 0.47 | (f)(g) | | | (1.07 | ) | | | (0.60 | ) | | | (0.28 | ) |
Year Ended October 31, 2013 | | | 12.18 | | | | 0.22 | | | | 2.91 | | | | 3.13 | | | | (0.29 | ) |
Year Ended October 31, 2012 | | | 12.05 | | | | 0.31 | | | | 0.21 | | | | 0.52 | | | | (0.39 | ) |
|
Class C | |
Six Months Ended April 30, 2017 (Unaudited) | | | 11.88 | | | | 0.05 | | | | 1.36 | | | | 1.41 | | | | (0.67 | ) |
Year Ended October 31, 2016 | | | 12.65 | | | | 0.17 | | | | (0.87 | ) | | | (0.70 | ) | | | (0.07 | ) |
Year Ended October 31, 2015 | | | 13.72 | | | | 0.10 | (f) | | | (0.78 | ) | | | (0.68 | ) | | | (0.39 | ) |
Year Ended October 31, 2014 | | | 14.61 | | | | 0.38 | (f)(g) | | | (1.05 | ) | | | (0.67 | ) | | | (0.22 | ) |
Year Ended October 31, 2013 | | | 11.84 | | | | 0.16 | | | | 2.83 | | | | 2.99 | | | | (0.22 | ) |
Year Ended October 31, 2012 | | | 11.72 | | | | 0.25 | | | | 0.19 | | | | 0.44 | | | | (0.32 | ) |
|
Class I (formerly Select Class) | |
Six Months Ended April 30, 2017 (Unaudited) | | | 12.57 | | | | 0.10 | | | | 1.44 | | | | 1.54 | | | | (0.78 | ) |
Year Ended October 31, 2016 | | | 13.37 | | | | 0.28 | | | | (0.91 | ) | | | (0.63 | ) | | | (0.17 | ) |
Year Ended October 31, 2015 | | | 14.48 | | | | 0.23 | (f) | | | (0.84 | ) | | | (0.61 | ) | | | (0.50 | ) |
Year Ended October 31, 2014 | | | 15.19 | | | | 0.45 | (f)(g) | | | (1.04 | ) | | | (0.59 | ) | | | (0.12 | ) |
Year Ended October 31, 2013 | | | 12.31 | | | | 0.27 | | | | 2.93 | | | | 3.20 | | | | (0.32 | ) |
Year Ended October 31, 2012 | | | 12.19 | | | | 0.34 | | | | 0.21 | | | | 0.55 | | | | (0.43 | ) |
|
Class L (formerly Institutional Class) | |
Six Months Ended April 30, 2017 (Unaudited) | | | 12.50 | | | | 0.10 | | | | 1.45 | | | | 1.55 | | | | (0.79 | ) |
Year Ended October 31, 2016 | | | 13.29 | | | | 0.31 | | | | (0.93 | ) | | | (0.62 | ) | | | (0.17 | ) |
Year Ended October 31, 2015 | | | 14.41 | | | | 0.23 | (f) | | | (0.83 | ) | | | (0.60 | ) | | | (0.52 | ) |
Year Ended October 31, 2014 | | | 15.29 | | | | 0.53 | (f)(g) | | | (1.09 | ) | | | (0.56 | ) | | | (0.32 | ) |
Year Ended October 31, 2013 | | | 12.38 | | | | 0.29 | | | | 2.95 | | | | 3.24 | | | | (0.33 | ) |
Year Ended October 31, 2012 | | | 12.26 | | | | 0.36 | | | | 0.20 | | | | 0.56 | | | | (0.44 | ) |
|
Class R2 | |
Six Months Ended April 30, 2017 (Unaudited) | | | 12.04 | | | | 0.07 | | | | 1.38 | | | | 1.45 | | | | (0.68 | ) |
Year Ended October 31, 2016 | | | 12.83 | | | | 0.19 | | | | (0.87 | ) | | | (0.68 | ) | | | (0.11 | ) |
Year Ended October 31, 2015 | | | 13.93 | | | | 0.14 | (f) | | | (0.81 | ) | | | (0.67 | ) | | | (0.43 | ) |
Year Ended October 31, 2014 | | | 14.78 | | | | 0.42 | (f)(g) | | | (1.05 | ) | | | (0.63 | ) | | | (0.22 | ) |
Year Ended October 31, 2013 | | | 11.99 | | | | 0.18 | | | | 2.88 | | | | 3.06 | | | | (0.27 | ) |
Year Ended October 31, 2012 | | | 11.86 | | | | 0.28 | | | | 0.19 | | | | 0.47 | | | | (0.34 | ) |
|
Class R5 | |
Six Months Ended April 30, 2017 (Unaudited) | | | 12.51 | | | | 0.11 | | | | 1.42 | | | | 1.53 | | | | (0.82 | ) |
September 9, 2016 (h) through October 31, 2016 | | | 12.55 | | | | 0.03 | | | | (0.07 | ) | | | (0.04 | ) | | | — | |
|
Class R6 | |
Six Months Ended April 30, 2017 (Unaudited) | | | 12.51 | | | | 0.12 | | | | 1.42 | | | | 1.54 | | | | (0.82 | ) |
Year Ended October 31, 2016 | | | 13.31 | | | | 0.37 | | | | (0.96 | ) | | | (0.59 | ) | | | (0.21 | ) |
Year Ended October 31, 2015 | | | 14.42 | | | | 0.18 | (f) | | | (0.76 | ) | | | (0.58 | ) | | | (0.53 | ) |
Year Ended October 31, 2014 | | | 15.29 | | | | 0.54 | (f)(g) | | | (1.09 | ) | | | (0.55 | ) | | | (0.32 | ) |
Year Ended October 31, 2013 | | | 12.38 | | | | 0.30 | | | | 2.96 | | | | 3.26 | | | | (0.35 | ) |
Year Ended October 31, 2012 | | | 12.26 | | | | 0.37 | | | | 0.21 | | | | 0.58 | | | | (0.46 | ) |
| (a) | Annualized for periods less than one year, unless otherwise noted. |
| (b) | Calculated based upon average shares outstanding. |
| (c) | Not annualized for periods less than one year. |
| (d) | Includes adjustments in accordance with accounting principles generally accepted in the United States of America and as such, the net asset values for financial reporting purposes and the returns based upon those net asset values may differ from the net asset values and returns for shareholder transactions. |
| (e) | Includes interest expense, if applicable, which is less than 0.005% unless otherwise noted. |
| (f) | Net investment income (loss) may appear disproportionate among the classes due to the timing of recognition of income and changes in the relative size of the classes. |
| (g) | Reflects special dividends paid out during the period by several of the Fund’s holdings. Had the Fund not received the special dividends, the net investment income (loss) per share would have been $0.39, $0.30, $0.37, $0.45, $0.34 and $0.46 for Class A, Class C, Class I, Class L, Class R2 and Class R6, respectively and the net investment income (loss) ratio would have been 2.67%, 2.13%, 2.44%, 2.99%, 2.39% and 3.06% for Class A, Class C, Class I, Class L, Class R2 and Class R6, respectively. |
| (h) | Commencement of offering of class of shares. |
SEE NOTES TO FINANCIAL STATEMENTS.
| | | | | | |
| | | |
| 144 | | | | J.P. MORGAN INTERNATIONAL EQUITY FUNDS | | APRIL 30, 2017 |
| | | | | | | | | | | | | | | | | | | | | | | | | | |
| | | Ratios/Supplemental data | |
| | | | | | | | | | Ratios to average net assets (a) | | | | |
Net asset
value,
end of
period | | | Total return
(excludes
sales charge) (c)(d) | | | Net assets,
end of
period
(000’s) | | | Net
expenses (e) | | |
Net
investment
income
(loss) | | | Expenses
without waivers
and reimbursements | | | Portfolio
turnover
rate (c) | |
| | | | | | | | | | | | | | | | | | | | | | | | | | |
| | | | | | | | | | | | | | | | | | | | | | | | | | |
| $ | 13.03 | | | | 12.66 | % | | $ | 294,864 | | | | 1.33 | % | | | 1.34 | % | | | 1.42 | % | | | 16 | % |
| | 12.23 | | | | (5.01 | ) | | | 573,449 | | | | 1.35 | | | | 1.91 | | | | 1.43 | | | | 61 | |
| | 13.02 | | | | (4.63 | ) | | | 695,251 | | | | 1.35 | | | | 1.31 | (f) | | | 1.45 | | | | 74 | |
| | 14.14 | | | | (4.09 | ) | | | 491,010 | | | | 1.33 | | | | 3.19 | (f)(g) | | | 1.36 | | | | 59 | |
| | 15.02 | | | | 26.13 | | | | 221,077 | | | | 1.33 | | | | 1.66 | | | | 1.35 | | | | 66 | |
| | 12.18 | | | | 4.64 | | | | 124,691 | | | | 1.35 | | | | 2.66 | | | | 1.37 | | | | 62 | |
| | | | | | |
| | | | | | | | | | | | | | | | | | | | | | | | | | |
| | 12.62 | | | | 12.35 | | | | 22,320 | | | | 1.83 | | | | 0.79 | | | | 1.93 | | | | 16 | |
| | 11.88 | | | | (5.54 | ) | | | 24,453 | | | | 1.85 | | | | 1.43 | | | | 1.91 | | | | 61 | |
| | 12.65 | | | | (5.01 | ) | | | 31,296 | | | | 1.85 | | | | 0.79 | (f) | | | 1.90 | | | | 74 | |
| | 13.72 | | | | (4.64 | ) | | | 31,176 | | | | 1.83 | | | | 2.65 | (f)(g) | | | 1.86 | | | | 59 | |
| | 14.61 | | | | 25.58 | | | | 22,682 | | | | 1.83 | | | | 1.19 | | | | 1.85 | | | | 66 | |
| | 11.84 | | | | 4.04 | | | | 14,311 | | | | 1.85 | | | | 2.23 | | | | 1.87 | | | | 62 | |
| | | | | | |
| | | | | | | | | | | | | | | | | | | | | | | | | | |
| | 13.33 | | | | 12.75 | | | | 151,737 | | | | 1.04 | | | | 1.62 | | | | 1.05 | | | | 16 | |
| | 12.57 | | | | (4.74 | ) | | | 157,867 | | | | 1.01 | | | | 2.28 | | | | 1.02 | | | | 61 | |
| | 13.37 | | | | (4.28 | ) | | | 233,045 | | | | 1.03 | | | | 1.62 | (f) | | | 1.03 | | | | 74 | |
| | 14.48 | | | | (3.90 | ) | | | 300,712 | | | | 1.08 | | | | 2.96 | (f)(g) | | | 1.10 | | | | 59 | |
| | 15.19 | | | | 26.46 | | | | 1,634,392 | | | | 1.09 | | | | 1.99 | | | | 1.10 | | | | 66 | |
| | 12.31 | | | | 4.87 | | | | 1,458,864 | | | | 1.10 | | | | 2.92 | | | | 1.12 | | | | 62 | |
| | | | | | |
| | | | | | | | | | | | | | | | | | | | | | | | | | |
| | 13.26 | | | | 12.89 | | | | 323,408 | | | | 0.87 | | | | 1.57 | | | | 0.87 | | | | 16 | |
| | 12.50 | | | | (4.63 | ) | | | 523,251 | | | | 0.90 | | | | 2.53 | | | | 0.91 | | | | 61 | |
| | 13.29 | | | | (4.23 | ) | | | 1,480,321 | | | | 0.95 | | | | 1.63 | (f) | | | 0.99 | | | | 74 | |
| | 14.41 | | | | (3.75 | ) | | | 2,932,420 | | | | 0.93 | | | | 3.51 | (f)(g) | | | 0.96 | | | | 59 | |
| | 15.29 | | | | 26.72 | | | | 1,087,334 | | | | 0.94 | | | | 2.08 | | | | 0.95 | | | | 66 | |
| | 12.38 | | | | 5.00 | | | | 639,798 | | | | 0.94 | | | | 3.03 | | | | 0.97 | | | | 62 | |
| | | | | | |
| | | | | | | | | | | | | | | | | | | | | | | | | | |
| | 12.81 | | | | 12.48 | | | | 1,276 | | | | 1.59 | | | | 1.11 | | | | 1.85 | | | | 16 | |
| | 12.04 | | | | (5.28 | ) | | | 1,182 | | | | 1.59 | | | | 1.65 | | | | 1.91 | | | | 61 | |
| | 12.83 | | | | (4.84 | ) | | | 1,929 | | | | 1.60 | | | | 1.01 | (f) | | | 2.01 | | | | 74 | |
| | 13.93 | | | | (4.33 | ) | | | 1,768 | | | | 1.58 | | | | 2.91 | (f)(g) | | | 1.61 | | | | 59 | |
| | 14.78 | | | | 25.91 | | | | 1,249 | | | | 1.59 | | | | 1.39 | | | | 1.60 | | | | 66 | |
| | 11.99 | | | | 4.27 | | | | 881 | | | | 1.60 | | | | 2.43 | | | | 1.62 | | | | 62 | |
| | | | | | |
| | | | | | | | | | | | | | | | | | | | | | | | | | |
| | 13.22 | | | | 12.80 | | | | 23 | | | | 0.91 | | | | 1.77 | | | | 0.92 | | | | 16 | |
| | 12.51 | | | | (0.32 | ) | | | 20 | | | | 0.79 | | | | 1.52 | | | | 0.79 | | | | 61 | |
| | | | | | |
| | | | | | | | | | | | | | | | | | | | | | | | | | |
| | 13.23 | | | | 12.90 | | | | 31,229 | | | | 0.77 | | | | 1.91 | | | | 0.77 | | | | 16 | |
| | 12.51 | | | | (4.45 | ) | | | 27,998 | | | | 0.72 | | | | 3.00 | | | | 0.73 | | | | 61 | |
| | 13.31 | | | | (4.04 | ) | | | 2,354 | | | | 0.73 | | | | 1.32 | (f) | | | 0.73 | | | | 74 | |
| | 14.42 | | | | (3.64 | ) | | | 30,992 | | | | 0.83 | | | | 3.58 | (f)(g) | | | 0.84 | | | | 59 | |
| | 15.29 | | | | 26.84 | | | | 107,313 | | | | 0.84 | | | | 2.12 | | | | 0.85 | | | | 66 | |
| | 12.38 | | | | 5.11 | | | | 25,945 | | | | 0.84 | | | | 3.06 | | | | 0.87 | | | | 62 | |
SEE NOTES TO FINANCIAL STATEMENTS.
| | | | | | | | |
| | | |
| APRIL 30, 2017 | | J.P. MORGAN INTERNATIONAL EQUITY FUNDS | | | | | 145 | |
FINANCIAL HIGHLIGHTS
FOR THE PERIODS INDICATED (continued)
| | | | | | | | | | | | | | | | | | | | |
| | | Per share operating performance | |
| | | | | | Investment operations | | | Distributions | |
| | | Net asset
value,
beginning
of period | | | Net
investment
income
(loss) (b) | | | Net realized
and unrealized
gains
(losses) on
investments | | | Total from
investment
operations | | | Net
investment
income | |
Intrepid International Fund | |
Class A | |
Six Months Ended April 30, 2017 (Unaudited) | | $ | 18.44 | | | $ | 0.17 | | | $ | 1.85 | | | $ | 2.02 | | | $ | (0.38 | ) |
Year Ended October 31, 2016 | | | 19.36 | | | | 0.40 | (f) | | | (0.99 | ) | | | (0.59 | ) | | | (0.33 | ) |
Year Ended October 31, 2015 | | | 19.49 | | | | 0.34 | (f) | | | (0.26 | ) | | | 0.08 | | | | (0.21 | ) |
Year Ended October 31, 2014 | | | 19.79 | | | | 0.39 | (f) | | | (0.45 | ) | | | (0.06 | ) | | | (0.24 | ) |
Year Ended October 31, 2013 | | | 15.90 | | | | 0.25 | | | | 3.88 | | | | 4.13 | | | | (0.24 | ) |
Year Ended October 31, 2012 | | | 15.32 | | | | 0.25 | | | | 0.49 | | | | 0.74 | | | | (0.16 | ) |
|
Class C | |
Six Months Ended April 30, 2017 (Unaudited) | | | 18.57 | | | | 0.10 | | | | 1.89 | | | | 1.99 | | | | (0.26 | ) |
Year Ended October 31, 2016 | | | 19.52 | | | | 0.28 | (f) | | | (0.97 | ) | | | (0.69 | ) | | | (0.26 | ) |
Year Ended October 31, 2015 | | | 19.63 | | | | 0.23 | (f) | | | (0.24 | ) | | | (0.01 | ) | | | (0.10 | ) |
Year Ended October 31, 2014 | | | 19.92 | | | | 0.36 | (f) | | | (0.52 | ) | | | (0.16 | ) | | | (0.13 | ) |
Year Ended October 31, 2013 | | | 16.00 | | | | 0.17 | | | | 3.90 | | | | 4.07 | | | | (0.15 | ) |
Year Ended October 31, 2012 | | | 15.36 | | | | 0.18 | | | | 0.50 | | | | 0.68 | | | | (0.04 | ) |
|
Class I (formerly Select Class) | |
Six Months Ended April 30, 2017 (Unaudited) | | | 19.20 | | | | 0.21 | | | | 1.92 | | | | 2.13 | | | | (0.47 | ) |
Year Ended October 31, 2016 | | | 20.13 | | | | 0.46 | (f) | | | (1.01 | ) | | | (0.55 | ) | | | (0.38 | ) |
Year Ended October 31, 2015 | | | 20.22 | | | | 0.42 | (f) | | | (0.26 | ) | | | 0.16 | | | | (0.25 | ) |
Year Ended October 31, 2014 | | | 20.51 | | | | 0.51 | (f) | | | (0.53 | ) | | | (0.02 | ) | | | (0.27 | ) |
Year Ended October 31, 2013 | | | 16.46 | | | | 0.31 | | | | 4.01 | | | | 4.32 | | | | (0.27 | ) |
Year Ended October 31, 2012 | | | 15.85 | | | | 0.30 | | | | 0.51 | | | | 0.81 | | | | (0.20 | ) |
|
Class R2 | |
Six Months Ended April 30, 2017 (Unaudited) | | | 18.29 | | | | 0.13 | | | | 1.85 | | | | 1.98 | | | | (0.36 | ) |
Year Ended October 31, 2016 | | | 19.21 | | | | 0.36 | (f) | | | (1.01 | ) | | | (0.65 | ) | | | (0.27 | ) |
Year Ended October 31, 2015 | | | 19.31 | | | | 0.38 | (f) | | | (0.34 | ) | | | 0.04 | | | | (0.14 | ) |
Year Ended October 31, 2014 | | | 19.61 | | | | 0.40 | (f) | | | (0.53 | ) | | | (0.13 | ) | | | (0.17 | ) |
Year Ended October 31, 2013 | | | 15.74 | | | | 0.20 | | | | 3.86 | | | | 4.06 | | | | (0.19 | ) |
Year Ended October 31, 2012 | | | 15.21 | | | | 0.19 | | | | 0.50 | | | | 0.69 | | | | (0.16 | ) |
|
Class R6 | |
Six Months Ended April 30, 2017 (Unaudited) | | | 18.91 | | | | 0.21 | | | | 1.90 | | | | 2.11 | | | | (0.48 | ) |
Year Ended October 31, 2016 | | | 19.84 | | | | 0.49 | (f) | | | (1.01 | ) | | | (0.52 | ) | | | (0.41 | ) |
May 29, 2015 (g) through October 31, 2015 | | | 21.08 | | | | 0.12 | (f) | | | (1.36 | ) | | | (1.24 | ) | | | — | |
| (a) | Annualized for periods less than one year, unless otherwise noted. |
| (b) | Calculated based upon average shares outstanding. |
| (c) | Not annualized for periods less than one year. |
| (d) | Includes adjustments in accordance with accounting principles generally accepted in the United States of America and as such, the net asset values for financial reporting purposes and the returns based upon those net asset values may differ from the net asset values and returns for shareholder transactions. |
| (e) | Includes interest expense, if applicable, which is less than 0.005% unless otherwise noted. |
| (f) | Net investment income (loss) may appear disproportionate among the classes due to the timing of recognition of income and changes in the relative size of the classes. |
| (g) | Commencement of offering of class of shares. |
SEE NOTES TO FINANCIAL STATEMENTS.
| | | | | | |
| | | |
| 146 | | | | J.P. MORGAN INTERNATIONAL EQUITY FUNDS | | APRIL 30, 2017 |
| | | | | | | | | | | | | | | | | | | | | | | | | | |
| | | Ratios/Supplemental data | |
| | | | | | | | | | Ratios to average net assets (a) | | | | |
Net asset
value,
end of
period | | | Total return
(excludes
sales charge) (c)(d) | | | Net assets,
end of
period
(000’s) | | | Net
expenses (e) | | |
Net
investment
income
(loss) | | | Expenses
without waivers
and reimbursements | | | Portfolio
turnover
rate (c) | |
| | | | | | | | | | | | | | | | | | | | | | | | | | |
| | | | | | | | | | | | | | | | | | | | | | | | | | |
| $ | 20.08 | | | | 11.14 | % | | $ | 199,735 | | | | 1.21 | % | | | 1.80 | % | | | 1.22 | % | | | 30 | % |
| | 18.44 | | | | (3.07 | ) | | | 164,327 | | | | 1.25 | | | | 2.21 | (f) | | | 1.29 | | | | 38 | |
| | 19.36 | | | | 0.45 | | | | 152,834 | | | | 1.29 | | | | 1.75 | (f) | | | 1.49 | | | | 33 | |
| | 19.49 | | | | (0.33 | ) | | | 101,114 | | | | 1.39 | | | | 1.96 | (f) | | | 1.46 | | | | 48 | |
| | 19.79 | | | | 26.25 | | | | 60,135 | | | | 1.47 | | | | 1.42 | | | | 1.54 | | | | 49 | |
| | 15.90 | | | | 4.97 | | | | 32,231 | | | | 1.50 | | | | 1.65 | | | | 1.62 | | | | 46 | |
| | | | | | |
| | | | | | | | | | | | | | | | | | | | | | | | | | |
| | 20.30 | | | | 10.83 | | | | 1,914 | | | | 1.75 | | | | 1.07 | | | | 1.83 | | | | 30 | |
| | 18.57 | | | | (3.56 | ) | | | 2,287 | | | | 1.75 | | | | 1.52 | (f) | | | 1.87 | | | | 38 | |
| | 19.52 | | | | (0.05 | ) | | | 2,789 | | | | 1.78 | | | | 1.17 | (f) | | | 1.91 | | | | 33 | |
| | 19.63 | | | | (0.84 | ) | | | 1,318 | | | | 1.89 | | | | 1.79 | (f) | | | 1.96 | | | | 48 | |
| | 19.92 | | | | 25.60 | | | | 1,131 | | | | 1.98 | | | | 0.94 | | | | 2.04 | | | | 49 | |
| | 16.00 | | | | 4.45 | | | | 875 | | | | 2.00 | | | | 1.18 | | | | 2.12 | | | | 46 | |
| | | | | | |
| | | | | | | | | | | | | | | | | | | | | | | | | | |
| | 20.86 | | | | 11.33 | | | | 49,895 | | | | 0.90 | | | | 2.10 | | | | 1.00 | | | | 30 | |
| | 19.20 | | | | (2.73 | ) | | | 16,363 | | | | 0.90 | | | | 2.44 | (f) | | | 1.08 | | | | 38 | |
| | 20.13 | | | | 0.80 | | | | 19,292 | | | | 0.97 | | | | 2.04 | (f) | | | 1.12 | | | | 33 | |
| | 20.22 | | | | (0.13 | ) | | | 15,963 | | | | 1.14 | | | | 2.47 | (f) | | | 1.21 | | | | 48 | |
| | 20.51 | | | | 26.56 | | | | 13,916 | | | | 1.23 | | | | 1.68 | | | | 1.29 | | | | 49 | |
| | 16.46 | | | | 5.24 | | | | 9,467 | | | | 1.25 | | | | 1.94 | | | | 1.37 | | | | 46 | |
| | | | | | |
| | | | | | | | | | | | | | | | | | | | | | | | | | |
| | 19.91 | | | | 10.99 | | | | 536 | | | | 1.49 | | | | 1.41 | | | | 1.59 | | | | 30 | |
| | 18.29 | | | | (3.36 | ) | | | 503 | | | | 1.50 | | | | 2.02 | (f) | | | 1.75 | | | | 38 | |
| | 19.21 | | | | 0.24 | | | | 227 | | | | 1.52 | | | | 1.91 | (f) | | | 1.69 | | | | 33 | |
| | 19.31 | | | | (0.66 | ) | | | 98 | | | | 1.64 | | | | 2.03 | (f) | | | 1.71 | | | | 48 | |
| | 19.61 | | | | 26.02 | | | | 98 | | | | 1.72 | | | | 1.16 | | | | 1.79 | | | | 49 | |
| | 15.74 | | | | 4.64 | | | | 81 | | | | 1.75 | | | | 1.29 | | | | 1.87 | | | | 46 | |
| | | | | | |
| | | | | | | | | | | | | | | | | | | | | | | | | | |
| | 20.54 | | | | 11.44 | | | | 2,670,673 | | | | 0.71 | | | | 2.17 | | | | 0.71 | | | | 30 | |
| | 18.91 | | | | (2.59 | ) | | | 2,487,086 | | | | 0.71 | | | | 2.65 | (f) | | | 0.72 | | | | 38 | |
| | 19.84 | | | | (5.88 | ) | | | 1,854,941 | | | | 0.73 | | | | 1.47 | (f) | | | 0.74 | | | | 33 | |
SEE NOTES TO FINANCIAL STATEMENTS.
| | | | | | | | |
| | | |
| APRIL 30, 2017 | | J.P. MORGAN INTERNATIONAL EQUITY FUNDS | | | | | 147 | |
NOTES TO FINANCIAL STATEMENTS
AS OF APRIL 30, 2017 (Unaudited)
1. Organization
JPMorgan Trust I (“JPM I”) and JPMorgan Trust II (“JPM II”) (collectively, the “Trusts”) were formed on November 12, 2004, as Delaware statutory trusts, pursuant to Declarations of Trust dated November 5, 2004 and are registered under the Investment Company Act of 1940, as amended (the “1940 Act”), as open-end management investment companies.
The following are 13 separate funds of the Trusts (collectively, the “Funds”) covered by this report:
| | | | | | |
| | | Classes Offered | | Trust | | Diversified/Non-Diversified |
| Emerging Economies Fund | | Class A, Class C, Class I*, Class R5 and Class R6 | | JPM I | | Diversified |
| Emerging Markets Equity Fund | | Class A, Class C, Class I*, Class L**, Class R5*** and Class R6 | | JPM I | | Diversified |
| Emerging Markets Equity Income Fund | | Class A, Class C, Class I*, Class R5 and Class R6 | | JPM I | | Diversified |
| Global Research Enhanced Index Fund | | Class A, Class C, Class I* and Class R2 | | JPM I | | Diversified |
| Global Unconstrained Equity Fund | | Class A, Class C, Class I*, Class R2, Class R5 and Class R6 | | JPM I | | Diversified |
| International Discovery Fund | | Class A, Class C, Class I*, Class R5 and Class R6 | | JPM I | | Diversified |
| International Equity Fund | | Class A, Class C, Class I*, Class R2, Class R5 and Class R6 | | JPM I | | Diversified |
| International Equity Income Fund | | Class A, Class C, Class I*, Class R2, Class R5 and Class R6 | | JPM I | | Diversified |
| International Opportunities Fund | | Class A, Class C, Class I*, Class R6 and Institutional**** | | JPM I | | Diversified |
| International Research Enhanced Equity Fund | | Class A, Class C, Class I* and Class R2 | | JPM II | | Diversified |
| International Unconstrained Equity Fund | | Class A, Class C, Class I*, Class R2, Class R5 and Class R6 | | JPM I | | Diversified |
| International Value Fund | | Class A, Class C, Class I*, Class L**, Class R2, Class R5*** and Class R6 | | JPM I | | Diversified |
| Intrepid International Fund | | Class A, Class C, Class I*, Class R2, Class R6 and Institutional**** | | JPM I | | Diversified |
| * | Effective April 3, 2017, Select Class was renamed Class I. |
| ** | Effective December 1, 2016, Institutional Class was renamed Class L and is publicly offered on a limited basis. |
| *** | Class R5 Shares commenced operations on September 9, 2016, for Emerging Markets Equity Fund and International Value Fund. |
| **** | Effective December 1, 2016, Institutional Class was renamed Class L and subsequently liquidated on December 8, 2016. |
As of April 30, 2017, Class A, Class C and Class R2 Shares of Global Research Enhanced Index Fund and Class R2 shares of the Global Unconstrained Equity Fund were not publicly offered for investment.
The investment objective of Emerging Economies Fund is to seek long-term capital growth.
The investment objective of Emerging Markets Equity Fund is to seek to provide high total return from a portfolio of equity securities from emerging markets issuers.
The investment objective of Emerging Markets Equity Income Fund and the International Equity Income Fund is to seek to provide both current income and long-term capital appreciation.
The investment objective of Global Research Enhanced Index Fund, Global Unconstrained Equity Fund, International Discovery Fund, International Research Enhanced Equity Fund and International Unconstrained Equity Fund is to seek to provide long-term capital appreciation.
The investment objective of International Equity Fund is to seek total return from long-term capital growth and income. Total return consists of capital growth and current income.
The investment objective of International Opportunities Fund is to seek to provide high total return from a portfolio of equity securities of foreign companies in developed and, to a lesser extent, emerging markets.
The investment objective of International Value Fund is to seek to provide high total return from a portfolio of foreign company equity securities.
The investment objective of Intrepid International Fund is to seek to maximize long-term capital growth by investing primarily in equity securities in developed markets outside the U.S.
Class A Shares generally provide for a front-end sales charge while Class C Shares provide for a contingent deferred sales charge (“CDSC”). No sales charges are assessed with respect to Class I, Class L, Class R2, Class R5 and Class R6 Shares. All classes of shares have equal rights as to earnings, assets and voting privileges, except that each class may bear different transfer agency, sub-transfer agency (through April 2, 2017), distribution and service fees and each class has exclusive voting rights with respect to its distribution plan and shareholder servicing agreements. Effective April 3, 2017 sub-transfer agency and shareholder servicing fees were consolidated in to a single service fee. Certain Class A Shares, for which front-end sales charges have been waived, may be subject to a CDSC as described in the Funds’ prospectus. Beginning on November 14, 2017, Class C Shares will automatically convert to Class A Shares after ten years.
| | | | | | |
| | | |
| 148 | | | | J.P. MORGAN INTERNATIONAL EQUITY FUNDS | | APRIL 30, 2017 |
J.P. Morgan Investment Management Inc. (“JPMIM”) an indirect, wholly owned subsidiary of JPMorgan Chase & Co. (“JPMorgan”) acts as Adviser (the “Adviser”) and Administrator (the “Administrator”) to the Funds.
2. Significant Accounting Policies
The following is a summary of significant accounting policies followed by the Funds in the preparation of their financial statements. The Funds are investment companies and, accordingly, follow the investment company accounting and reporting guidance of the Financial Accounting Standards Board Accounting Standards Codification Topic 946 — Investment Companies, which is part of U.S. generally accepted accounting principles (“GAAP”). The preparation of financial statements in conformity with GAAP requires management to make estimates and assumptions that affect the reported amounts of assets and liabilities and disclosure of contingent assets and liabilities at the date of the financial statements and the reported amounts of increases and decreases in net assets from operations during the reporting period. Actual results could differ from those estimates.
A. Valuation of Investments — The valuation of investments is in accordance with GAAP and the Funds’ valuation policies set forth by and under the supervision and responsibility of the Board of Trustees (the “Board”), which established the following approach to valuation, as described more fully below: (i) investments for which market quotations are readily available shall be valued at such unadjusted quoted prices and (ii) all other investments for which market quotations are not readily available shall be valued at their fair value as determined in good faith by the Board.
The Administrator has established the J.P. Morgan Investment Management Americas Valuation Committee (“AVC”) to assist the Board with the oversight and monitoring of the valuation of the Funds’ investments. The Administrator implements the valuation policies of the Funds’ investments, as directed by the Board. The AVC oversees and carries out the policies for the valuation of investments held in the Funds. This includes monitoring the appropriateness of fair values based on results of ongoing valuation oversight, including but not limited to consideration of macro or security specific events, market events and pricing vendor and broker due diligence. The Administrator is responsible for discussing and assessing the potential impacts to the fair values on an ongoing basis, and at least on a quarterly basis with the AVC and the Board.
A market-based approach is primarily used to value the Funds’ investments. Investments for which market quotations are not readily available are fair valued by approved affiliated and unaffiliated pricing vendors or third party broker-dealers (collectively referred to as “Pricing Services”) or may be internally fair valued using methods set forth by the valuation policies approved by the Board. This may include related or comparable assets or liabilities, recent transactions, market multiples, book values, and other relevant information for the investment to determine the fair value of the investment. An income-based valuation approach may be used in which the anticipated future cash flows of the investment are discounted to calculate the fair value. Discounts may also be applied due to the nature or duration of any restrictions on the disposition of the investments. Valuations may be based upon current market prices of securities that are comparable in coupon, rating, maturity and industry. It is possible that the estimated values may differ significantly from the values that would have been used, had a ready market for the investments existed, and such differences could be material.
Equities and other exchange-traded instruments are valued at the last sale price or official market closing price on the primary exchange on which the instrument is traded before the net asset values (“NAV”) of the Funds are calculated on a valuation date. Certain foreign equity instruments, as well as certain derivatives with equity reference obligations, are valued by applying international fair value factors provided by approved Pricing Services. The factors seek to adjust the local closing price for movements of local markets post closing, but prior to the time the NAVs are calculated. Investments in open-end investment companies (the “Underlying Funds”) are valued at each Underlying Fund’s NAV per share as of the report date.
Futures are generally valued on the basis of available market quotations. Forward foreign currency exchange contracts are valued utilizing market quotations from approved Pricing Services.
Valuations reflected in this report are as of the report date. As a result, changes in valuation due to market events and/or issuer related events after the report date and prior to issuance of the report are not reflected herein.
The various inputs that are used in determining the valuation of the Funds’ investments are summarized into the three broad levels listed below.
| • | | Level 1 — Unadjusted inputs using quoted prices in active markets for identical investments. |
| • | | Level 2 — Other significant observable inputs including, but not limited to, quoted prices for similar investments, inputs other than quoted prices that are observable for investments (such as interest rates, prepayment speeds, credit risk, etc.) or other market corroborated inputs. |
| • | | Level 3 — Significant inputs based on the best information available in the circumstances, to the extent observable inputs are not available (including the Funds’ assumptions in determining the fair value of investments). |
A financial instrument’s level within the fair value hierarchy is based on the lowest level of any input, both individually and in the aggregate, that is significant to the fair value measurement. The inputs or methodology used for valuing instruments are not necessarily an indication of the risk associated with investing in those instruments.
| | | | | | | | |
| | | |
| APRIL 30, 2017 | | J.P. MORGAN INTERNATIONAL EQUITY FUNDS | | | | | 149 | |
NOTES TO FINANCIAL STATEMENTS
AS OF APRIL 30, 2017 (Unaudited) (continued)
The following tables represent each valuation input as presented on the Schedules of Portfolio Investments (“SOIs”) (amounts in thousands):
Emerging Economies Fund
| | | | | | | | | | | | | | | | |
| | | Level 1
Quoted prices | | | Level 2
Other significant
observable inputs | | | Level 3
Significant
unobservable inputs | | | Total | |
Investments in Securities | | | | | | | | | | | | | | | | |
Common Stocks | | | | | | | | | | | | | | | | |
Brazil | | $ | 145,406 | | | $ | — | | | $ | — | | | $ | 145,406 | |
China | | | 58,469 | | | | 352,223 | | | | — | | | | 410,692 | |
Hong Kong | | | — | | | | 51,724 | | | | — | | | | 51,724 | |
Hungary | | | — | | | | 27,669 | | | | — | | | | 27,669 | |
India | | | — | | | | 58,011 | | | | — | | | | 58,011 | |
Indonesia | | | — | | | | 13,805 | | | | — | | | | 13,805 | |
Malaysia | | | — | | | | 23,510 | | | | — | | | | 23,510 | |
Mexico | | | 10,989 | | | | — | | | | — | | | | 10,989 | |
Panama | | | 26,498 | | | | — | | | | — | | | | 26,498 | |
Poland | | | — | | | | 47,754 | | | | — | | | | 47,754 | |
Qatar | | | — | | | | 8,821 | | | | — | | | | 8,821 | |
Russia | | | 52,717 | | | | 96,529 | | | | — | | | | 149,246 | |
South Africa | | | 5,839 | | | | 41,608 | | | | — | | | | 47,447 | |
South Korea | | | — | | | | 317,972 | | | | — | | | | 317,972 | |
Taiwan | | | 37,542 | | | | 226,740 | | | | — | | | | 264,282 | |
Thailand | | | — | | | | 86,275 | | | | — | | | | 86,275 | |
Turkey | | | — | | | | 80,577 | | | | — | | | | 80,577 | |
United Arab Emirates | | | — | | | | 22,918 | | | | — | | | | 22,918 | |
Vietnam | | | — | | | | 5,407 | | | | — | | | | 5,407 | |
| | | | | | | | | | | | | | | | |
Total Common Stocks | | | 337,460 | | | | 1,461,543 | | | | — | | | | 1,799,003 | |
| | | | | | | | | | | | | | | | |
Preferred Stocks | | | | | | | | | | | | | | | | |
Brazil | | | 31,028 | | | | — | | | | — | | | | 31,028 | |
Russia | | | 11,831 | | | | — | | | | — | | | | 11,831 | |
| | | | | | | | | | | | | | | | |
Total Preferred Stocks | | | 42,859 | | | | — | | | | — | | | | 42,859 | |
| | | | | | | | | | | | | | | | |
Short-Term Investment | | | | | | | | | | | | | | | | |
Investment Company | | | 32,084 | | | | — | | | | — | | | | 32,084 | |
| | | | | | | | | | | | | | | | |
Total Investments in Securities | | $ | 412,403 | | | $ | 1,461,543 | | | $ | — | | | $ | 1,873,946 | |
| | | | | | | | | | | | | | | | |
Appreciation in Other Financial Instruments | | | | | | | | | | | | | | | | |
Futures Contracts | | $ | 42 | | | $ | — | | | $ | — | | | $ | 42 | |
| | | | | | | | | | | | | | | | |
| | | | | | |
| | | |
| 150 | | | | J.P. MORGAN INTERNATIONAL EQUITY FUNDS | | APRIL 30, 2017 |
Emerging Markets Equity Fund
| | | | | | | | | | | | | | | | |
| | | Level 1
Quoted prices | | | Level 2
Other significant
observable inputs | | | Level 3
Significant
unobservable inputs | | | Total | |
Investments in Securities | | | | | | | | | | | | | | | | |
Common Stocks | | | | | | | | | | | | | | | | |
Argentina | | $ | 58,887 | | | $ | — | | | $ | — | | | $ | 58,887 | |
Australia | | | — | | | | 22,225 | | | | — | | | | 22,225 | |
Brazil | | | 339,672 | | | | — | | | | — | | | | 339,672 | |
China | | | 286,056 | | | | 373,902 | | | | — | | | | 659,958 | |
Cyprus | | | 9,140 | | | | — | | | | — | | | | 9,140 | |
Egypt | | | 23,906 | | | | — | | | | — | | | | 23,906 | |
Hong Kong | | | — | | | | 236,524 | | | | — | | | | 236,524 | |
India | | | 137,908 | | | | 524,575 | | | | — | | | | 662,483 | |
Indonesia | | | — | | | | 112,047 | | | | — | | | | 112,047 | |
Mexico | | | 91,480 | | | | — | | | | — | | | | 91,480 | |
Panama | | | 47,278 | | | | — | | | | — | | | | 47,278 | |
Peru | | | 42,716 | | | | — | | | | — | | | | 42,716 | |
Russia | | | — | | | | 146,322 | | | | — | | | | 146,322 | |
South Africa | | | — | | | | 396,321 | | | | — | | | | 396,321 | |
South Korea | | | — | | | | 163,691 | | | | 17,540 | | | | 181,231 | |
Taiwan | | | 142,012 | | | | 131,762 | | | | — | | | | 273,774 | |
Thailand | | | — | | | | 27,038 | | | | — | | | | 27,038 | |
Turkey | | | — | | | | 11,363 | | | | — | | | | 11,363 | |
United States | | | 97,610 | | | | — | | | | — | | | | 97,610 | |
| | | | | | | | | | | | | | | | |
Total Common Stocks | | | 1,276,665 | | | | 2,145,770 | | | | 17,540 | | | | 3,439,975 | |
| | | | | | | | | | | | | | | | |
Preferred Stocks | | | | | | | | | | | | | | | | |
Brazil | | | 19,610 | | | | — | | | | — | | | | 19,610 | |
Structured Instruments | | | | | | | | | | | | | | | | |
China | | | — | | | | 33,989 | | | | — | | | | 33,989 | |
Warrants | | | | | | | | | | | | | | | | |
United States | | | — | | | | 24,753 | | | | — | | | | 24,753 | |
Short-Term Investment | | | | | | | | | | | | | | | | |
Investment Company | | | 45,041 | | | | — | | | | — | | | | 45,041 | |
| | | | | | | | | | | | | | | | |
Total Investments in Securities | | $ | 1,341,316 | | | $ | 2,204,512 | | | $ | 17,540 | * | | $ | 3,563,368 | |
| | | | | | | | | | | | | | | | |
| * | Level 3 securities are valued by brokers and pricing services. At April 30, 2017, the value of these securities was approximately $17,540,000. The inputs for these securities are not readily available or cannot be reasonably estimated and are generally those inputs described in Note 2.A. The appropriateness of fair values for these securities is monitored on an ongoing basis which may include results of back testing, results of broker and vendor due diligence, unchanged price review and consideration of macro or security specific events. |
| | | | | | | | | | | | | | | | |
| | | |
| Emerging Markets Equity Income Fund | | | | | | | | | | | | | |
| | | | |
| | | Level 1
Quoted prices | | | Level 2
Other significant observable inputs | | | Level 3
Significant unobservable inputs | | | Total | |
Investments in Securities | | | | | | | | | | | | | | | | |
Common Stocks | | | | | | | | | | | | | | | | |
Brazil | | $ | 1,176 | | | $ | — | | | $ | — | | | $ | 1,176 | |
Chile | | | 470 | | | | — | | | | — | | | | 470 | |
China | | | — | | | | 2,085 | | | | — | | | | 2,085 | |
Czech Republic | | | 349 | | | | 130 | | | | — | | | | 479 | |
Hong Kong | | | 295 | | | | 649 | | | | — | | | | 944 | |
Hungary | | | — | | | | 272 | | | | — | | | | 272 | |
Indonesia | | | — | | | | 331 | | | | — | | | | 331 | |
Mexico | | | 1,002 | | | | — | | | | — | | | | 1,002 | |
Russia | | | 571 | | | | 603 | | | | — | | | | 1,174 | |
South Africa | | | 544 | | | | 1,398 | | | | — | | | | 1,942 | |
South Korea | | | 203 | | | | 848 | | | | — | | | | 1,051 | |
| | | | | | | | |
| | | |
| APRIL 30, 2017 | | J.P. MORGAN INTERNATIONAL EQUITY FUNDS | | | | | 151 | |
NOTES TO FINANCIAL STATEMENTS
AS OF APRIL 30, 2017 (Unaudited) (continued)
Emerging Markets Equity Income Fund (continued)
| | | | | | | | | | | | | | | | |
| | | | |
| | | Level 1
Quoted prices | | | Level 2
Other significant observable inputs | | | Level 3
Significant unobservable inputs | | | Total | |
Taiwan | | $ | 802 | | | $ | 2,287 | | | $ | — | | | $ | 3,089 | |
Thailand | | | 141 | | | | 539 | | | | — | | | | 680 | |
Turkey | | | — | | | | 536 | | | | — | | | | 536 | |
United Arab Emirates | | | 245 | | | | — | | | | — | | | | 245 | |
| | | | | | | | | | | | | | | | |
Total Common Stocks | | | 5,798 | | | | 9,678 | | | | — | | | | 15,476 | |
| | | | | | | | | | | | | | | | |
Structured Instruments | | | | | | | | | | | | | | | | |
France | | | — | | | | 141 | | | | — | | | | 141 | |
Warrant | | | | | | | | | | | | | | | | |
United States | | | — | | | | 225 | | | | — | | | | 225 | |
Short-Term Investment | | | | | | | | | | | | | | | | |
Investment Company | | | 24 | | | | — | | | | — | | | | 24 | |
| | | | | | | | | | | | | | | | |
Total Investments in Securities | | $ | 5,822 | | | $ | 10,044 | | | $ | — | | | $ | 15,866 | |
| | | | | | | | | | | | | | | | |
| | | |
| Global Research Enhanced Index Fund | | | | | | | | | | | | | |
| | | | |
| | | Level 1
Quoted prices | | | Level 2
Other significant
observable inputs | | | Level 3
Significant
unobservable inputs | | | Total | |
Investments in Securities | | | | | | | | | | | | | | | | |
Common Stocks | | | | | | | | | | | | | | | | |
Australia | | $ | — | | | $ | 202,259 | | | $ | — | | | $ | 202,259 | |
Austria | | | — | (a) | | | 11,337 | | | | — | | | | 11,337 | |
Belgium | | | — | | | | 35,298 | | | | — | | | | 35,298 | |
Bermuda | | | 5,138 | | | | — | | | | — | | | | 5,138 | |
Canada | | | 264,560 | | | | — | | | | — | | | | 264,560 | |
China | | | — | | | | 4,138 | | | | — | | | | 4,138 | |
Denmark | | | — | | | | 57,112 | | | | — | | | | 57,112 | |
Finland | | | — | | | | 12,694 | | | | — | | | | 12,694 | |
France | | | — | | | | 314,997 | | | | — | | | | 314,997 | |
Germany | | | — | | | | 249,062 | | | | — | | | | 249,062 | |
Hong Kong | | | 2,086 | | | | 86,604 | | | | — | | | | 88,690 | |
Ireland | | | 9,586 | | | | 2,505 | | | | — | | | | 12,091 | |
Israel | | | 4,887 | | | | — | | | | — | | | | 4,887 | |
Italy | | | 890 | | | | 50,651 | | | | — | | | | 51,541 | |
Japan | | | 2,521 | | | | 668,541 | | | | — | | | | 671,062 | |
Jersey | | | — | | | | 4,307 | | | | — | | | | 4,307 | |
Luxembourg | | | — | | | | 8,664 | | | | — | | | | 8,664 | |
Netherlands | | | — | | | | 150,553 | | | | — | | | | 150,553 | |
New Zealand | | | — | | | | 5,677 | | | | — | | | | 5,677 | |
Norway | | | — | | | | 5,366 | | | | — | | | | 5,366 | |
Portugal | | | — | | | | 10,524 | | | | — | | | | 10,524 | |
Singapore | | | — | | | | 31,463 | | | | — | | | | 31,463 | |
Spain | | | — | | | | 103,881 | | | | — | | | | 103,881 | |
Sweden | | | — | | | | 52,129 | | | | — | | | | 52,129 | |
Switzerland | | | 5,517 | | | | 220,017 | | | | — | | | | 225,534 | |
United Kingdom | | | 5,993 | | | | 422,931 | | | | — | | | | 428,924 | |
United States | | | 4,580,133 | | | | 19,465 | | | | — | | | | 4,599,598 | |
| | | | | | | | | | | | | | | | |
Total Common Stocks | | | 4,881,311 | | | | 2,730,175 | | | | — | | | | 7,611,486 | |
| | | | | | | | | | | | | | | | |
Preferred Stocks | | | | | | | | | | | | | | | | |
Germany | | | — | | | | 35,339 | | | | — | | | | 35,339 | |
Rights | | | | | | | | | | | | | | | | |
Australia | | | — | | | | 6 | | | | — | | | | 6 | |
Short-Term Investment | | | | | | | | | | | | | | | | |
Investment Company | | | 46,476 | | | | — | | | | — | | | | 46,476 | |
| | | | | | | | | | | | | | | | |
Total Investments in Securities | | $ | 4,927,787 | | | $ | 2,765,520 | | | $ | — | | | $ | 7,693,307 | |
| | | | | | | | | | | | | | | | |
Appreciation in Other Financial Instruments | | | | | | | | | | | | | | | | |
Futures Contracts | | $ | — | | | $ | 646 | | | $ | — | | | $ | 646 | |
| | | | | | | | | | | | | | | | |
| | | | | | |
| | | |
| 152 | | | | J.P. MORGAN INTERNATIONAL EQUITY FUNDS | | APRIL 30, 2017 |
Global Unconstrained Equity Fund
| | | | | | | | | | | | | | | | |
| | | Level 1
Quoted prices | | | Level 2
Other significant
observable inputs | | | Level 3
Significant
unobservable inputs | | | Total | |
Investments in Securities | | | | | | | | | | | | | | | | |
Common Stocks | | | | | | | | | | | | | | | | |
Canada | | $ | 30 | | | $ | — | | | $ | — | | | $ | 30 | |
China | | | 117 | | | | 63 | | | | — | | | | 180 | |
Denmark | | | — | | | | 36 | | | | — | | | | 36 | |
France | | | — | | | | 157 | | | | — | | | | 157 | |
Hong Kong | | | — | | | | 32 | | | | — | | | | 32 | |
India | | | 22 | | | | — | | | | — | | | | 22 | |
Israel | | | 53 | | | | — | | | | — | | | | 53 | |
Italy | | | — | | | | 17 | | | | — | | | | 17 | |
Japan | | | — | | | | 115 | | | | — | | | | 115 | |
Luxembourg | | | — | | | | 30 | | | | — | | | | 30 | |
Netherlands | | | 28 | | | | — | | | | — | | | | 28 | |
Switzerland | | | — | | | | 79 | | | | — | | | | 79 | |
United Kingdom | | | 31 | | | | 174 | | | | — | | | | 205 | |
United States | | | 1,000 | | | | — | | | | — | | | | 1,000 | |
| | | | | | | | | | | | | | | | |
Total Common Stocks | | | 1,281 | | | | 703 | | | | — | | | | 1,984 | |
| | | | | | | | | | | | | | | | |
Short-Term Investment | | | | | | | | | | | | | | | | |
Investment Company | | | 39 | | | | — | | | | — | | | | 39 | |
| | | | | | | | | | | | | | | | |
Total Investments in Securities | | $ | 1,320 | | | $ | 703 | | | $ | — | | | $ | 2,023 | |
| | | | | | | | | | | | | | | | |
| | | |
| International Discovery Fund | | | | | | | | | | | | | |
| | | | |
| | | Level 1
Quoted prices | | | Level 2
Other significant
observable inputs | | | Level 3
Significant
unobservable inputs | | | Total | |
Investments in Securities | | | | | | | | | | | | | | | | |
Common Stocks | | | | | | | | | | | | | | | | |
Australia | | $ | — | | | $ | 563 | | | $ | — | | | $ | 563 | |
Austria | | | — | | | | 63 | | | | — | | | | 63 | |
China | | | — | | | | 233 | | | | — | | | | 233 | |
Denmark | | | 17 | | | | 68 | | | | — | | | | 85 | |
Finland | | | — | | | | 143 | | | | — | | | | 143 | |
France | | | 106 | | | | 460 | | | | — | | | | 566 | |
Georgia | | | — | | | | 75 | | | | — | | | | 75 | |
Germany | | | 56 | | | | 219 | | | | — | | | | 275 | |
Hong Kong | | | 55 | | | | 259 | | | | — | | | | 314 | |
Ireland | | | — | | | | 33 | | | | — | | | | 33 | |
Israel | | | 40 | | | | — | | | | — | | | | 40 | |
Italy | | | 117 | | | | 338 | | | | — | | | | 455 | |
Japan | | | — | | | | 1,665 | | | | — | | | | 1,665 | |
Netherlands | | | — | | | | 57 | | | | — | | | | 57 | |
Norway | | | — | | | | 143 | | | | — | | | | 143 | |
South Africa | | | — | | | | 45 | | | | — | | | | 45 | |
Spain | | | — | | | | 53 | | | | — | | | | 53 | |
Sweden | | | — | | | | 214 | | | | — | | | | 214 | |
Switzerland | | | 106 | | | | 366 | | | | — | | | | 472 | |
United Kingdom | | | 167 | | | | 928 | | | | — | | | | 1,095 | |
United States | | | 56 | | | | 35 | | | | — | | | | 91 | |
| | | | | | | | | | | | | | | | |
Total Investments in Securities | | $ | 720 | | | $ | 5,960 | | | $ | — | | | $ | 6,680 | |
| | | | | | | | | | | | | | | | |
| | | | | | | | |
| | | |
| APRIL 30, 2017 | | J.P. MORGAN INTERNATIONAL EQUITY FUNDS | | | | | 153 | |
NOTES TO FINANCIAL STATEMENTS
AS OF APRIL 30, 2017 (Unaudited) (continued)
International Equity Fund
| | | | | | | | | | | | | | | | |
| | | Level 1
Quoted prices | | | Level 2
Other significant
observable inputs | | | Level 3
Significant
unobservable inputs | | | Total | |
Investments in Securities | | | | | | | | | | | | | | | | |
Common Stocks | | | | | | | | | | | | | | | | |
Australia | | $ | — | | | $ | 43,462 | | | $ | — | | | $ | 43,462 | |
Belgium | | | — | | | | 57,669 | | | | — | | | | 57,669 | |
China | | | 32,538 | | | | 81,440 | | | | — | | | | 113,978 | |
Denmark | | | — | | | | 37,917 | | | | — | | | | 37,917 | |
France | | | — | | | | 450,631 | | | | — | | | | 450,631 | |
Germany | | | — | | | | 253,094 | | | | — | | | | 253,094 | |
Hong Kong | | | — | | | | 166,773 | | | | — | | | | 166,773 | |
India | | | 41,364 | | | | — | | | | — | | | | 41,364 | |
Indonesia | | | — | | | | 27,359 | | | | — | | | | 27,359 | |
Israel | | | 22,073 | | | | — | | | | — | | | | 22,073 | |
Japan | | | — | | | | 767,752 | | | | — | | | | 767,752 | |
Macau | | | — | | | | 27,651 | | | | — | | | | 27,651 | |
Netherlands | | | — | | | | 206,032 | | | | — | | | | 206,032 | |
South Africa | | | — | | | | 41,151 | | | | — | | | | 41,151 | |
South Korea | | | — | | | | 99,420 | | | | — | | | | 99,420 | |
Spain | | | — | | | | 45,257 | | | | — | | | | 45,257 | |
Switzerland | | | — | | | | 389,170 | | | | — | | | | 389,170 | |
Taiwan | | | 44,155 | | | | — | | | | — | | | | 44,155 | |
United Kingdom | | | — | | | | 706,069 | | | | — | | | | 706,069 | |
United States | | | — | | | | 35,393 | | | | — | | | | 35,393 | |
| | | | | | | | | | | | | | | | |
Total Common Stocks | | | 140,130 | | | | 3,436,240 | | | | — | | | | 3,576,370 | |
| | | | | | | | | | | | | | | | |
Preferred Stocks | | | | | | | | | | | | | | | | |
Germany | | | — | | | | 42,841 | | | | — | | | | 42,841 | |
Short-Term Investment | | | | | | | | | | | | | | | | |
Investment Company | | | 76,383 | | | | — | | | | — | | | | 76,383 | |
| | | | | | | | | | | | | | | | |
Total Investments in Securities | | $ | 216,513 | | | $ | 3,479,081 | | | $ | — | | | $ | 3,695,594 | |
| | | | | | | | | | | | | | | | |
Depreciation in Other Financial Instruments | | | | | | | | | | | | | | | | |
Forward Foreign Currency Exchange Contracts | | $ | — | | | $ | (5 | ) | | $ | — | | | $ | (5 | ) |
| | | | | | | | | | | | | | | | |
| | | | | | |
| | | |
| 154 | | | | J.P. MORGAN INTERNATIONAL EQUITY FUNDS | | APRIL 30, 2017 |
| | | | | | | | | | | | | | | | |
| International Equity Income Fund | |
| | | | |
| | | Level 1
Quoted prices | | | Level 2
Other significant
observable inputs | | | Level 3
Significant
unobservable inputs | | | Total | |
Investments in Securities | |
Common Stocks | | | | | | | | | | | | | | | | |
Belgium | | $ | — | | | $ | 5,177 | | | $ | — | | | $ | 5,177 | |
Brazil | | | 1,279 | | | | — | | | | — | | | | 1,279 | |
Canada | | | 3,329 | | | | — | | | | — | | | | 3,329 | |
China | | | — | | | | 2,733 | | | | — | | | | 2,733 | |
Czech Republic | | | — | | | | 3,110 | | | | — | | | | 3,110 | |
Denmark | | | — | | | | 4,749 | | | | — | | | | 4,749 | |
Finland | | | 1,325 | | | | 5,520 | | | | — | | | | 6,845 | |
France | | | — | | | | 13,141 | | | | — | | | | 13,141 | |
Germany | | | — | | | | 21,208 | | | | — | | | | 21,208 | |
Hong Kong | | | — | | | | 1,841 | | | | — | | | | 1,841 | |
Israel | | | 1,201 | | | | — | | | | — | | | | 1,201 | |
Japan | | | 3,755 | | | | 15,112 | | | | — | | | | 18,867 | |
Netherlands | | | — | | | | 9,838 | | | | — | | | | 9,838 | |
New Zealand | | | — | | | | 2,229 | | | | — | | | | 2,229 | |
Norway | | | — | | | | 2,692 | | | | — | | | | 2,692 | |
Russia | | | — | | | | 8,506 | | | | — | | | | 8,506 | |
South Korea | | | — | | | | 3,433 | | | | — | | | | 3,433 | |
Spain | | | — | | | | 1,681 | | | | — | | | | 1,681 | |
Sweden | | | — | | | | 1,567 | | | | — | | | | 1,567 | |
Switzerland | | | 1,193 | | | | 11,972 | | | | — | | | | 13,165 | |
Taiwan | | | 1,562 | | | | — | | | | — | | | | 1,562 | |
United Kingdom | | | 4,102 | | | | 38,337 | | | | — | | | | 42,439 | |
| | | | | | | | | | | | | | | | |
Total Common Stocks | | | 17,746 | | | | 152,846 | | | | — | | | | 170,592 | |
| | | | | | | | | | | | | | | | |
Short-Term Investment | | | | | | | | | | | | | | | | |
Investment Company | | | 3,386 | | | | — | | | | — | | | | 3,386 | |
| | | | | | | | | | | | | | | | |
Total Investments in Securities | | $ | 21,132 | | | $ | 152,846 | | | $ | — | | | $ | 173,978 | |
| | | | | | | | | | | | | | | | |
| International Opportunities Fund | |
| | | | |
| | | Level 1
Quoted prices | | | Level 2
Other significant
observable inputs | | | Level 3
Significant
unobservable inputs | | | Total | |
Investments in Securities | | | | | | | | | | | | | | | | |
Common Stocks | | | | | | | | | | | | | | | | |
Australia | | $ | — | | | $ | 112,809 | | | $ | — | | | $ | 112,809 | |
Belgium | | | — | | | | 46,945 | | | | — | | | | 46,945 | |
Chile | | | — | | | | 32,747 | | | | — | | | | 32,747 | |
China | | | — | | | | 82,188 | | | | — | | | | 82,188 | |
Denmark | | | — | | | | 70,128 | | | | — | | | | 70,128 | |
Finland | | | — | | | | 64,089 | | | | — | | | | 64,089 | |
France | | | — | | | | 414,043 | | | | — | | | | 414,043 | |
Germany | | | — | | | | 233,288 | | | | — | | | | 233,288 | |
India | | | 45,077 | | | | — | | | | — | | | | 45,077 | |
Italy | | | — | | | | 72,625 | | | | — | | | | 72,625 | |
Japan | | | — | | | | 703,715 | | | | — | | | | 703,715 | |
Netherlands | | | — | | | | 204,037 | | | | — | | | | 204,037 | |
Norway | | | — | | | | 41,096 | | | | — | | | | 41,096 | |
Spain | | | — | | | | 48,260 | | | | — | | | | 48,260 | |
Sweden | | | — | | | | 39,055 | | | | — | | | | 39,055 | |
Switzerland | | | — | | | | 159,312 | | | | — | | | | 159,312 | |
United Kingdom | | | — | | | | 491,154 | | | | — | | | | 491,154 | |
United States | | | — | | | | 41,186 | | | | — | | | | 41,186 | |
| | | | | | | | | | | | | | | | |
Total Common Stocks | | | 45,077 | | | | 2,856,677 | | | | — | | | | 2,901,754 | |
| | | | | | | | | | | | | | | | |
| | | | | | | | |
| | | |
| APRIL 30, 2017 | | J.P. MORGAN INTERNATIONAL EQUITY FUNDS | | | | | 155 | |
NOTES TO FINANCIAL STATEMENTS
AS OF APRIL 30, 2017 (Unaudited) (continued)
| | | | | | | | | | | | | | | | |
| International Opportunities Fund (continued) | |
| | | Level 1
Quoted prices | | | Level 2
Other significant
observable inputs | | | Level 3
Significant
unobservable inputs | | | Total | |
Preferred Stocks | | | | | | | | | | | | | | | | |
Germany | | $ | — | | | $ | 36,068 | | | $ | — | | | $ | 36,068 | |
Short-Term Investment | | | | | | | | | | | | | | | | |
Investment Company | | | 38,835 | | | | — | | | | — | | | | 38,835 | |
| | | | | | | | | | | | | | | | |
Total Investments in Securities | | $ | 83,912 | | | $ | 2,892,745 | | | $ | — | | | $ | 2,976,657 | |
| | | | | | | | | | | | | | | | |
Appreciation in Other Financial Instruments | | | | | | | | | | | | | | | | |
Forward Foreign Currency Exchange Contracts | | $ | — | | | $ | 9,115 | | | $ | — | | | $ | 9,115 | |
| | | | | | | | | | | | | | | | |
Depreciation in Other Financial Instruments | | | | | | | | | | | | | | | | |
Forward Foreign Currency Exchange Contracts | | $ | — | | | $ | (15,012 | ) | | $ | — | | | $ | (15,012 | ) |
| | | | | | | | | | | | | | | | |
| | | |
| International Research Enhanced Equity Fund | | | | | | | | | | | | | |
| | | | |
| | | Level 1
Quoted prices | | | Level 2
Other significant
observable inputs | | | Level 3
Significant
unobservable inputs | | | Total | |
Investments in Securities | | | | | | | | | | | | | | | | |
Common Stocks | | | | | | | | | | | | | | | | |
Australia | | $ | — | | | $ | 109,946 | | | $ | 6 | | | $ | 109,952 | |
Austria | | | — | | | | 7,574 | | | | — | | | | 7,574 | |
Belgium | | | — | | | | 19,309 | | | | — | | | | 19,309 | |
Denmark | | | — | | | | 17,582 | | | | — | | | | 17,582 | |
Finland | | | — | | | | 33,832 | | | | — | | | | 33,832 | |
France | | | — | | | | 167,053 | | | | — | | | | 167,053 | |
Germany | | | — | | | | 162,937 | | | | — | | | | 162,937 | |
Hong Kong | | | — | | | | 43,586 | | | | — | | | | 43,586 | |
Ireland | | | 7,417 | | | | — | | | | — | | | | 7,417 | |
Israel | | | 10,056 | | | | — | | | | — | | | | 10,056 | |
Italy | | | — | | | | 51,605 | | | | — | | | | 51,605 | |
Japan | | | — | | | | 354,174 | | | | — | | | | 354,174 | |
Luxembourg | | | — | | | | 8,867 | | | | — | | | | 8,867 | |
Netherlands | | | — | | | | 85,392 | | | | — | | | | 85,392 | |
New Zealand | | | — | | | | 5,669 | | | | — | | | | 5,669 | |
Norway | | | — | | | | 6,199 | | | | — | | | | 6,199 | |
Portugal | | | — | | | | 5,127 | | | | — | | | | 5,127 | |
Singapore | | | — | | | | 14,969 | | | | — | | | | 14,969 | |
Spain | | | — | | | | 39,886 | | | | — | | | | 39,886 | |
Sweden | | | — | | | | 13,358 | | | | — | | | | 13,358 | |
Switzerland | | | — | | | | 160,595 | | | | — | | | | 160,595 | |
United Kingdom | | | 1,044 | | | | 259,028 | | | | — | | | | 260,072 | |
United States | | | — | | | | 17,928 | | | | — | | | | 17,928 | |
| | | | | | | | | | | | | | | | |
Total Common Stocks | | | 18,517 | | | | 1,584,616 | | | | 6 | | | | 1,603,139 | |
| | | | | | | | | | | | | | | | |
Preferred Stocks | | | | | | | | | | | | | | | | |
Germany | | | — | | | | 17,098 | | | | — | | | | 17,098 | |
Debt Securities | | | | | | | | | | | | | | | | |
Corporate Bonds | | | | | | | | | | | | | | | | |
Brazil | | | — | | | | — | | | | — | (b) | | | — | (b) |
Short-Term Investment | | | | | | | | | | | | | | | | |
Investment Company | | | 36,122 | | | | — | | | | — | | | | 36,122 | |
| | | | | | | | | | | | | | | | |
Total Investments in Securities | | $ | 54,639 | | | $ | 1,601,714 | | | $ | 6 | | | $ | 1,656,359 | |
| | | | | | | | | | | | | | | | |
| | | | | | |
| | | |
| 156 | | | | J.P. MORGAN INTERNATIONAL EQUITY FUNDS | | APRIL 30, 2017 |
| | | | | | | | | | | | | | | | |
| International Research Enhanced Equity Fund (continued) | |
| | | Level 1
Quoted prices | | | Level 2
Other significant
observable inputs | | | Level 3
Significant
unobservable inputs | | | Total | |
Appreciation in Other Financial Instruments | | | | | | | | | | | | | | | | |
Forward Foreign Currency Exchange Contracts | | $ | — | | | $ | 3 | | | $ | — | | | $ | 3 | |
Futures Contracts | | | — | | | | 553 | | | | — | | | | 553 | |
| | | | | | | | | | | | | | | | |
Total Appreciation in Other Financial Instruments | | $ | — | | | $ | 556 | | | $ | — | | | $ | 556 | |
| | | | | | | | | | | | | | | | |
Depreciation in Other Financial Instruments | | | | | | | | | | | | | | | | |
Futures Contracts | | $ | — | | | $ | (67 | ) | | $ | — | | | $ | (67 | ) |
| | | | | | | | | | | | | | | | |
| | | |
| International Unconstrained Equity Fund | | | | | | | | | | | | | |
| | | | |
| | | Level 1
Quoted prices | | | Level 2
Other significant
observable inputs | | | Level 3
Significant
unobservable inputs | | | Total | |
Investments in Securities | | | | | | | | | | | | | | | | |
Common Stocks | | | | | | | | | | | | | | | | |
Belgium | | $ | — | | | $ | 3,492 | | | $ | — | | | $ | 3,492 | |
Canada | | | 6,851 | | | | — | | | | — | | | | 6,851 | |
China | | | 6,061 | | | | 7,387 | | | | — | | | | 13,448 | |
Denmark | | | — | | | | 2,701 | | | | — | | | | 2,701 | |
Finland | | | — | | | | 8,326 | | | | — | | | | 8,326 | |
Germany | | | — | | | | 7,956 | | | | — | | | | 7,956 | |
Hong Kong | | | — | | | | 10,127 | | | | — | | | | 10,127 | |
India | | | 4,054 | | | | — | | | | — | | | | 4,054 | |
Israel | | | 3,433 | | | | — | | | | — | | | | 3,433 | |
Italy | | | — | | | | 2,560 | | | | — | | | | 2,560 | |
Japan | | | — | | | | 17,582 | | | | — | | | | 17,582 | |
Macau | | | — | | | | 2,623 | | | | — | | | | 2,623 | |
Netherlands | | | — | | | | 18,660 | | | | — | | | | 18,660 | |
South Africa | | | — | | | | 2,245 | | | | — | | | | 2,245 | |
South Korea | | | — | | | | 11,039 | | | | — | | | | 11,039 | |
Spain | | | — | | | | 4,591 | | | | — | | | | 4,591 | |
Switzerland | | | — | | | | 13,402 | | | | — | | | | 13,402 | |
United Kingdom | | | — | | | | 31,844 | | | | — | | | | 31,844 | |
United States | | | — | | | | 2,066 | | | | — | | | | 2,066 | |
| | | | | | | | | | | | | | | | |
Total Common Stocks | | | 20,399 | | | | 146,601 | | | | — | | | | 167,000 | |
| | | | | | | | | | | | | | | | |
Short-Term Investment | | | | | | | | | | | | | | | | |
Investment Company | | | 5,532 | | | | — | | | | — | | | | 5,532 | |
| | | | | | | | | | | | | | | | |
Total Investments in Securities | | $ | 25,931 | | | $ | 146,601 | | | $ | — | | | $ | 172,532 | |
| | | | | | | | | | | | | | | | |
| | | | | | | | |
| | | |
| APRIL 30, 2017 | | J.P. MORGAN INTERNATIONAL EQUITY FUNDS | | | | | 157 | |
NOTES TO FINANCIAL STATEMENTS
AS OF APRIL 30, 2017 (Unaudited) (continued)
International Value Fund
| | | | | | | | | | | | | | | | |
| | | Level 1
Quoted prices | | | Level 2
Other significant
observable inputs | | | Level 3
Significant
unobservable inputs | | | Total | |
Investments in Securities | | | | | | | | | | | | | | | | |
Common Stocks | | | | | | | | | | | | | | | | |
Australia | | $ | — | | | $ | 32,170 | | | $ | — | | | $ | 32,170 | |
Austria | | | — | | | | 9,249 | | | | — | | | | 9,249 | |
Belgium | | | — | | | | 17,989 | | | | — | | | | 17,989 | |
Canada | | | 8,589 | | | | — | | | | — | | | | 8,589 | |
Chile | | | 4,722 | | | | — | | | | — | | | | 4,722 | |
China | | | — | | | | 6,631 | | | | — | | | | 6,631 | |
Finland | | | — | | | | 8,183 | | | | — | | | | 8,183 | |
France | | | — | | | | 131,108 | | | | — | | | | 131,108 | |
Germany | | | — | | | | 68,737 | | | | — | | | | 68,737 | |
Hong Kong | | | — | | | | 10,772 | | | | — | | | | 10,772 | |
Ireland | | | 7,138 | | | | — | | | | — | | | | 7,138 | |
Israel | | | 10,338 | | | | — | | | | — | | | | 10,338 | |
Italy | | | — | | | | 27,137 | | | | — | | | | 27,137 | |
Japan | | | — | | | | 187,316 | | | | — | | | | 187,316 | |
Luxembourg | | | — | | | | 8,154 | | | | — | | | | 8,154 | |
Netherlands | | | — | | | | 63,750 | | | | — | | | | 63,750 | |
Norway | | | — | | | | 8,529 | | | | — | | | | 8,529 | |
Singapore | | | — | | | | 10,235 | | | | — | | | | 10,235 | |
South Korea | | | — | | | | 9,202 | | | | — | | | | 9,202 | |
Spain | | | — | | | | 24,737 | | | | — | | | | 24,737 | |
Sweden | | | — | | | | 14,499 | | | | — | | | | 14,499 | |
Switzerland | | | — | | | | 37,159 | | | | — | | | | 37,159 | |
United Kingdom | | | — | | | | 83,244 | | | | — | | | | 83,244 | |
United States | | | — | | | | 11,982 | | | | — | | | | 11,982 | |
| | | | | | | | | | | | | | | | |
Total Common Stocks | | | 30,787 | | | | 770,783 | | | | — | | | | 801,570 | |
| | | | | | | | | | | | | | | | |
Short-Term Investment | | | | | | | | | | | | | | | | |
Investment Company | | | 22,045 | | | | — | | | | — | | | | 22,045 | |
| | | | | | | | | | | | | | | | |
Total Investments in Securities | | $ | 52,832 | | | $ | 770,783 | | | $ | — | | | $ | 823,615 | |
| | | | | | | | | | | | | | | | |
Appreciation in Other Financial Instruments | | | | | | | | | | | | | | | | |
Forward Foreign Currency Exchange Contracts | | $ | — | | | $ | 4,013 | | | $ | — | | | $ | 4,013 | |
| | | | | | | | | | | | | | | | |
Depreciation in Other Financial Instruments | | | | | | | | | | | | | | | | |
Forward Foreign Currency Exchange Contracts | | $ | — | | | $ | (7,340 | ) | | $ | — | | | $ | (7,340 | ) |
| | | | | | | | | | | | | | | | |
| | | | | | |
| | | |
| 158 | | | | J.P. MORGAN INTERNATIONAL EQUITY FUNDS | | APRIL 30, 2017 |
Intrepid International Fund
| | | | | | | | | | | | | | | | |
| | | Level 1
Quoted prices | | | Level 2
Other significant
observable inputs | | | Level 3
Significant
unobservable inputs | | | Total | |
Investments in Securities | | | | | | | | | | | | | | | | |
Common Stocks | | | | | | | | | | | | | | | | |
Australia | | $ | — | | | $ | 198,352 | | | $ | — | | | $ | 198,352 | |
Austria | | | 2,648 | | | | 9,080 | | | | — | | | | 11,728 | |
Belgium | | | — | | | | 24,113 | | | | — | | | | 24,113 | |
China | | | — | | | | 24,073 | | | | — | | | | 24,073 | |
Denmark | | | — | | | | 85,400 | | | | — | | | | 85,400 | |
Finland | | | — | | | | 11,298 | | | | — | | | | 11,298 | |
France | | | — | | | | 292,373 | | | | — | | | | 292,373 | |
Germany | | | 22,182 | | | | 187,430 | | | | — | | | | 209,612 | |
Hong Kong | | | 4,417 | | | | 61,629 | | | | — | | | | 66,046 | |
Indonesia | | | 7,195 | | | | — | | | | — | | | | 7,195 | |
Italy | | | — | | | | 32,748 | | | | — | | | | 32,748 | |
Japan | | | — | | | | 674,967 | | | | — | | | | 674,967 | |
Luxembourg | | | — | | | | 18,978 | | | | — | | | | 18,978 | |
Netherlands | | | 9,461 | | | | 83,581 | | | | — | | | | 93,042 | |
Norway | | | — | | | | 30,804 | | | | — | | | | 30,804 | |
Portugal | | | — | | | | 2,779 | | | | — | | | | 2,779 | |
Singapore | | | — | | | | 19,083 | | | | — | | | | 19,083 | |
South Africa | | | — | | | | 7,916 | | | | — | | | | 7,916 | |
South Korea | | | 2,983 | | | | — | | | | — | | | | 2,983 | |
Spain | | | — | | | | 82,708 | | | | — | | | | 82,708 | |
Sweden | | | — | | | | 78,770 | | | | — | | | | 78,770 | |
Switzerland | | | — | | | | 323,317 | | | | — | | | | 323,317 | |
United Kingdom | | | 16,746 | | | | 442,170 | | | | — | | | | 458,916 | |
United States | | | — | | | | 29,573 | | | | — | | | | 29,573 | |
| | | | | | | | | | | | | | | | |
Total Common Stocks | | | 65,632 | | | | 2,721,142 | | | | — | | | | 2,786,774 | |
| | | | | | | | | | | | | | | | |
Preferred Stock | | | | | | | | | | | | | | | | |
Germany | | | — | | | | 2,052 | | | | — | | | | 2,052 | |
Short-Term Investment | | | | | | | | | | | | | | | | |
Investment Company | | | 73,458 | | | | — | | | | — | | | | 73,458 | |
| | | | | | | | | | | | | | | | |
Total Investments in Securities | | $ | 139,090 | | | $ | 2,723,194 | | | $ | — | | | $ | 2,862,284 | |
| | | | | | | | | | | | | | | | |
Appreciation in Other Financial Instruments | | | | | | | | | | | | | | | | |
Futures Contracts | | $ | — | | | $ | 85 | | | $ | — | | | $ | 85 | |
| | | | | | | | | | | | | | | | |
| (b) | Amount rounds to less than 500. |
For the Emerging Economies Fund, Emerging Markets Equity Fund, International Equity Fund, International Equity Income Fund, International Opportunities Fund, International Research Enhanced Equity Fund, International Unconstrained Equity Fund, International Value Fund and Intrepid International Fund the transfers from level 1 to level 2 in the amounts of approximately $14,600,000, $31,497,000, $60,798,000, $4,725,000, $56,617,000, $15,755,000, $2,901,000, $13,046,000 and $15,844,000, respectively, are due to applying the fair value factors to certain securities during the six months ended April 30, 2017.
For the Emerging Markets Equity Income Fund the transfers from level 2 to level 1 in the amount of approximately $412,000 are due to the non-application of the fair value factors to certain securities during the six months ended April 30, 2017.
For the International Discovery Fund the transfers from level 2 to level 1 in the amount of approximately $71,000 and the transfers from level 2 to level 1 in the amount of approximately $268,000 are due to the application and non-application of the fair value factors to certain securities during the six months ended April 30, 2017.
For the Global Research Enhanced Index Fund there were no significant transfers among any levels during the six months ended April 30, 2017.
For the Global Unconstrained Equity Fund there were no transfers among any levels during the six months ended April 30, 2017.
| | | | | | | | |
| | | |
| APRIL 30, 2017 | | J.P. MORGAN INTERNATIONAL EQUITY FUNDS | | | | | 159 | |
NOTES TO FINANCIAL STATEMENTS
AS OF APRIL 30, 2017 (Unaudited) (continued)
The following is a summary of investments for which significant unobservable inputs (level 3) were used in determining fair value (amounts in thousands):
Emerging Markets Equity Fund
| | | | | | | | | | | | | | | | | | | | | | | | | | | | | | | | | | | | |
| | | Balance as
of October 31, 2016 | | | Realized
gain (loss) | | | Change in net
unrealized
appreciation
(depreciation) | | | Net accretion
(amortization) | | | Purchases1 | | | Sales2 | | | Transfers
into Level 3 | | | Transfers
out of Level 3 | | | Balance as
of April 30, 2017 | |
Common Stock — Information Technology | | $ | — | | | $ | — | | | $ | (231 | ) | | $ | — | | | $ | 17,771 | | | $ | — | | | $ | — | | | $ | — | | | $ | 17,540 | |
| | | | | | | | | | | | | | | | | | | | | | | | | | | | | | | | | | | | |
| 1 | Purchases include all purchases of securities and securities received in corporate actions. |
| 2 | Sales include all sales of securities, maturities, paydowns and securities tendered in corporate actions. |
The changes in net unrealized appreciation (depreciation) attributable to securities owned at April 30, 2017, which were valued using significant unobservable inputs (level 3) amounted to approximately $(231,000).
B. Restricted Securities — Certain securities held by the Funds may be subject to legal or contractual restrictions on resale. Restricted securities generally are resold in transactions exempt from registration under the Securities Act of 1933 (the “Securities Act”). Disposal of these securities may involve time-consuming negotiations and expense. Prompt sale at the current valuation may be difficult and could adversely affect the net asset value of the Funds.
As of April 30, 2017, the Funds had no investments in restricted securities other than securities sold to the Funds under Rule 144A or Regulation S under the Securities Act.
C. Futures Contracts — Emerging Economies Fund, Emerging Markets Equity Income Fund, Global Research Enhanced Index Fund, International Opportunities Fund, International Research Enhanced Equity Fund, International Value Fund and Intrepid International Fund used index futures contracts to gain or reduce exposure to the stock market, maintain liquidity or minimize transaction costs. The Funds also bought futures contracts to invest incoming cash in the market or sold futures in response to cash outflows, thereby simulating an invested position in the underlying index.
Futures contracts provide for the delayed delivery of the underlying instrument at a fixed price or are settled for a cash amount based on the change in the value of the underlying instrument at a specific date in the future. Upon entering into a futures contract, the Funds are required to deposit with the broker, cash or securities in an amount equal to a certain percentage of the contract amount, which is referred to as the initial margin deposit. Subsequent payments, referred to as variation margin, are made or received by the Funds periodically and are based on changes in the market value of open futures contracts. Changes in the market value of open futures contracts are recorded as Change in net unrealized appreciation/depreciation on the Statements of Operations. Realized gains or losses, representing the difference between the value of the contract at the time it was opened and the value at the time it was closed, are reported on the Statements of Operations at the closing or expiration of the futures contract. Securities deposited as initial margin are designated on the SOIs and cash deposited is recorded on the Statements of Assets and Liabilities. A receivable from and/or a payable to brokers for the daily variation margin is also recorded on the Statements of Assets and Liabilities.
The Funds may be subject to the risk that the change in the value of the futures contract may not correlate perfectly with the underlying instrument. Use of long futures contracts subjects the Funds to risk of loss in excess of the amounts shown on the Statements of Assets and Liabilities, up to the notional amount of the futures contracts. Use of short futures contracts subjects the Funds to unlimited risk of loss. The Funds may enter into futures contracts only on exchanges or boards of trade. The exchange or board of trade acts as the counterparty to each futures transaction; therefore, the Funds’ credit risk is limited to failure of the exchange or board of trade. Under some circumstances, futures exchanges may establish daily limits on the amount that the price of a futures contract can vary from the previous day’s settlement price, which could effectively prevent liquidation of positions.
The Funds’ futures contracts are not subject to master netting arrangements (the right to close out all transactions traded with a counterparty and net amounts owed or due across transactions).
The table below discloses the volume of the Funds’ futures contracts activity during the six months ended April 30, 2017 (amounts in thousands):
| | | | | | | | | | | | | | | | | | | | | | | | | | | | |
| | | Emerging
Economies
Fund | | | Emerging
Markets Equity
Income Fund | | | Global Research
Enhanced Index
Fund | | | International
Opportunities
Fund | | | International
Research Enhanced
Equity Fund | | | International
Value Fund | | | Intrepid
International
Fund | |
Futures Contracts: | | | | | | | | | | | | | | | | | | | | | | | | | | | | |
Average Notional Balance Long | | $ | 14,011 | | | $ | 320 | (a) | | $ | 16,522 | (b) | | $ | 77,007 | (c) | | $ | 26,083 | | | $ | 15,417 | (d) | | $ | 37,946 | (e) |
Ending Notional Balance Long | | | 7,538 | | | | — | | | | 16,892 | | | | — | | | | 19,769 | | | | — | | | | 37,946 | |
| (a) | For the period from January 1, 2017 to January 31, 2017. |
| (b) | For the period from March 1, 2017 to April 30, 2017. |
| | | | | | |
| | | |
| 160 | | | | J.P. MORGAN INTERNATIONAL EQUITY FUNDS | | APRIL 30, 2017 |
| (c) | For the period from October 1, 2016 to November 30, 2016. |
| (d) | For the period January 1, 2017 to March 31, 2017. |
| (e) | For the period April 1, 2017 to April 30, 2017. |
D. Forward Foreign Currency Exchange Contracts — Emerging Economies Fund, Emerging Markets Equity Income Fund, International Equity Fund, International Equity Income Fund, International Opportunities Fund, International Research Enhanced Equity Fund and International Value Fund may be exposed to foreign currency risks associated with some or all of their portfolio investments and used forward foreign currency exchange contracts to hedge or manage certain of these exposures as part of an investment strategy. Emerging Economies Fund, Emerging Markets Equity Income Fund, International Equity Fund, International Equity Income Fund, International Opportunities Fund, International Research Enhanced Equity Fund and International Value Fund also bought forward currency exchange contracts to gain exposure to currencies. Forward foreign currency exchange contracts represent obligations to purchase or sell foreign currency on a specified future date at a price fixed at the time the contracts are entered into. Non-deliverable forward foreign currency exchange contracts are settled with the counterparty in U.S. dollars without the delivery of foreign currency.
The values of the forward foreign currency exchange contracts are adjusted daily based on the applicable exchange rate of the underlying currency. Changes in the value of these contracts are recorded as unrealized appreciation or depreciation until the contract settlement date. When the forward foreign currency exchange contract is closed, the Funds record a realized gain or loss equal to the difference between the value at the time the contract was opened and the value at the time it was closed. The Funds also record a realized gain or loss when a forward foreign currency exchange contract offsets another forward foreign currency exchange contract with the same counterparty upon settlement.
The Funds may be required to post or receive collateral for Non-Deliverable forward foreign currency exchange contracts.
The table below discloses the volume of the Funds’ forward foreign currency exchange contracts activity during the six months ended April 30, 2017 (amounts in thousands):
| | | | | | | | | | | | | | | | | | | | | | | | | | | | |
| | | Emerging
Economies
Fund | | | Emerging
Markets Equity
Income Fund | | | International
Equity Fund | | | International
Equity
Income Fund | | | International
Opportunities
Fund | | | International
Research Enhanced
Equity Fund | | | International
Value Fund | |
Forward Foreign Currency Exchange Contracts: | | | | | | | | | | | | | | | | | |
Average Settlement Value Purchased | | $ | 3,175 | (a) | | $ | 83 | (a) | | $ | 15,947 | (b) | | $ | 6,494 | (c) | | $ | 542,166 | | | $ | 1,370 | (b) | | $ | 286,215 | |
Average Settlement Value Sold | | | — | | | | — | | | | — | | | | 5,898 | (c) | | | 477,851 | | | | — | | | | 248,963 | |
Ending Settlement Value Purchased | | | — | | | | — | | | | 15,947 | | | | — | | | | 713,032 | | | | 1,370 | | | | 385,939 | |
Ending Settlement Value Sold | | | — | | | | — | | | | — | | | | — | | | | 653,589 | | | | — | | | | 355,780 | |
| (a) | For the period from January 1, 2017 to January 31, 2017. |
| (b) | For the period from April 1, 2017 to April 30, 2017. |
| (c) | For the period from October 1, 2016 to November 30, 2016. |
E. Summary of Derivatives Information
The following table presents the value of derivatives held as of April 30, 2017, by their primary underlying risk exposure and respective location on the Statements of Assets and Liabilities (amounts in thousands):
Emerging Economies Fund
| | | | | | |
| Derivative Contracts | | Statements of Assets and Liabilities Location | | | |
| Gross Assets: | | | | Futures Contracts (a) | |
Equity contracts | | Receivables, Net Assets — Unrealized Appreciation | | $ | 42 | |
| | | | | | |
| (a) | This amount represents the cumulative appreciation (depreciation) of futures contracts as reported on the SOIs. The Statements of Assets and Liabilities only reflect the current day variation margin receivable/payable from/to brokers. |
The following table presents the value of derivatives held as of April 30, 2017, by their primary underlying risk exposure and respective location on the Statements of Assets and Liabilities (amounts in thousands):
Global Research Enhanced Index Fund
| | | | | | |
| Derivative Contracts | | Statements of Assets and Liabilities Location | | | |
| Gross Assets: | | | | Futures Contracts (a) | |
Equity contracts | | Receivables, Net Assets — Unrealized Appreciation | | $ | 646 | |
| | | | | | |
| (a) | This amount represents the cumulative appreciation (depreciation) of futures contracts as reported on the SOIs. The Statements of Assets and Liabilities only reflect the current day variation margin receivable/payable from/to brokers. |
| | | | | | | | |
| | | |
| APRIL 30, 2017 | | J.P. MORGAN INTERNATIONAL EQUITY FUNDS | | | | | 161 | |
NOTES TO FINANCIAL STATEMENTS
AS OF APRIL 30, 2017 (Unaudited) (continued)
The following table presents the value of derivatives held as of April 30, 2017, by their primary underlying risk exposure and respective location on the Statements of Assets and Liabilities (amounts in thousands):
International Equity Fund
| | | | | | |
| Derivative Contracts | | Statements of Assets and Liabilities Location | | | |
| Gross Liabilities: | | | | Forward Foreign
Currency Exchange
Contracts | |
Foreign exchange contracts | | Payables | | $ | (5 | ) |
| | | | | | |
The following table presents the value of derivatives held as of April 30, 2017, by their primary underlying risk exposure and respective location on the Statements of Assets and Liabilities (amounts in thousands):
International Opportunities Fund
| | | | | | |
| Derivative Contracts | | Statements of Assets and Liabilities Location | | | |
| Gross Assets: | | | | Forward Foreign
Currency Exchange
Contracts | |
Foreign exchange contracts | | Receivables | | $ | 9,115 | |
| | | | | | |
| | |
Gross Liabilities: | | | | | |
Foreign exchange contracts | | Payables | | $ | (15,012 | ) |
| | | | | | |
| (a) | This amount represents the cumulative appreciation (depreciation) of futures contracts as reported on the SOIs. The Statements of Assets and Liabilities only reflect the current day variation margin receivable/payable from/to brokers. |
The following table presents the Fund’s gross derivative assets and liabilities by counterparty net of amounts available for offset under netting arrangements and any related collateral received or posted by the Fund as of April 30, 2017:
International Opportunities Fund
| | | | | | | | | | | | | | | | |
| Counterparty | | Gross Amount of
Derivative Assets
Presented on the
Statement of Assets
and Liabilities (a) | | | Derivatives
Available
for offset | | | Collateral
Received | | | Net Amount Due
From Counterparty
(Not less than zero) | |
Barclays Bank plc | | $ | 1,640 | | | $ | (1,640 | ) | | $ | — | | | $ | — | |
BNP Paribas | | | 123 | | | | (123 | ) | | | — | | | | — | |
Goldman Sachs International | | | 403 | | | | (403 | ) | | | — | | | | — | |
HSBC Bank N.A. | | | 3,491 | | | | (2,267 | ) | | | — | | | | 1,224 | |
Merrill Lynch International | | | 86 | | | | (86 | ) | | | — | | | | — | |
National Australia Bank | | | 568 | | | | (184 | ) | | | — | | | | 384 | |
Societe Generale | | | 258 | | | | — | | | | — | | | | 258 | |
Standard Chartered Bank | | | 335 | | | | — | | | | — | | | | 335 | |
State Street Corp. | | | 650 | | | | (650 | ) | | | — | | | | — | |
TD Bank Financial Group | | | 781 | | | | (781 | ) | | | — | | | | — | |
Union Bank of Switzerland AG | | | 780 | | | | (217 | ) | | | — | | | | 563 | |
| | | | | | | | | | | | | | | | |
| | $ | 9,115 | | | $ | (6,351 | ) | | $ | — | | | $ | 2,764 | |
| | | | | | | | | | | | | | | | |
| | | | | | |
| | | |
| 162 | | | | J.P. MORGAN INTERNATIONAL EQUITY FUNDS | | APRIL 30, 2017 |
| | | | | | | | | | | | | | | | |
| Counterparty | | Gross Amount of Derivative Liabilities
Presented on the
Statement of Assets
and Liabilities (a) | | | Derivatives
Available
for offset | | | Collateral
Posted | | | Net Amount Due
To Counterparty
(Not less than zero) | |
Australia and New Zealand Banking Group Limited | | $ | 2,579 | | | $ | — | | | $ | — | | | $ | 2,579 | |
Barclays Bank plc | | | 3,368 | | | | (1,640 | ) | | | — | | | | 1,728 | |
BNP Paribas | | | 414 | | | | (123 | ) | | | — | | | | 291 | |
Citibank, N.A. | | | 56 | | | | — | | | | — | | | | 56 | |
Goldman Sachs International | | | 1,754 | | | | (403 | ) | | | — | | | | 1,351 | |
HSBC Bank N.A. | | | 2,267 | | | | (2,267 | ) | | | — | | | | — | |
Merrill Lynch International | | | 1,182 | | | | (86 | ) | | | — | | | | 1,096 | |
National Australia Bank | | | 184 | | | | (184 | ) | | | — | | | | — | |
Royal Bank of Canada | | | 95 | | | | — | | | | — | | | | 95 | |
State Street Corp. | | | 2,028 | | | | (650 | ) | | | — | | | | 1,378 | |
TD Bank Financial Group | | | 868 | | | | (781 | ) | | | — | | | | 87 | |
Union Bank of Switzerland AG | | | 217 | | | | (217 | ) | | | — | | | | — | |
| | | | | | | | | | | | | | | | |
| | $ | 15,012 | | | $ | (6,351 | ) | | $ | — | | | $ | 8,661 | |
| | | | | | | | | | | | | | | | |
| (a) | For financial reporting purposes, the Fund does not offset derivative assets and derivative liabilities subject to master netting arrangements on the Statements of Assets and Liabilities. |
The following table presents the value of derivatives held as of April 30, 2017, by their primary underlying risk exposure and respective location on the Statements of Assets and Liabilities (amounts in thousands):
International Research Enhanced Equity Fund
| | | | | | | | | | | | | | |
| Derivative Contracts | | Statements of Assets and Liabilities Location | | | | | | | | | |
| Gross Assets: | | | | Futures
Contracts (a) | | | Forward Foreign
Currency Exchange
Contracts | | | Total | |
Equity contracts | | Receivables, Net Assets — Unrealized Appreciation | | $ | 553 | | | $ | — | | | $ | 553 | |
Foreign exchange contracts | | Receivables | | | — | | | | 3 | | | | 3 | |
| | | | | | | | | | | | | | |
Total | | | | $ | 553 | | | $ | 3 | | | $ | 556 | |
| | | | | | | | | | | | | | |
| | | | |
Gross Liabilities: | | | | | | | | | | | |
Equity contracts | | Payables, Net Assets — Unrealized Depreciation | | $ | (67 | ) | | $ | — | | | $ | (67 | ) |
| | | | | | | | | | | | | | |
| (a) | This amount represents the cumulative appreciation (depreciation) of futures contracts as reported on the SOIs. The Statements of Assets and Liabilities only reflect the current day variation margin receivable/payable from/to brokers. |
The following table presents the value of derivatives held as of April 30, 2017, by their primary underlying risk exposure and respective location on the Statements of Assets and Liabilities (amounts in thousands):
International Value Fund
| | | | | | |
| Derivative Contracts | | Statements of Assets and Liabilities Location | | | |
| Gross Assets: | | | | Forward Foreign
Currency Exchange
Contracts | |
Foreign exchange contracts | | Receivables | | $ | 4,013 | |
| | | | | | |
| | |
Gross Liabilities: | | | | | |
Foreign exchange contracts | | Payables | | $ | (7,340 | ) |
| | | | | | |
| | | | | | | | |
| | | |
| APRIL 30, 2017 | | J.P. MORGAN INTERNATIONAL EQUITY FUNDS | | | | | 163 | |
NOTES TO FINANCIAL STATEMENTS
AS OF APRIL 30, 2017 (Unaudited) (continued)
The following table presents the Fund’s gross derivative assets and liabilities by counterparty net of amounts available for offset under netting arrangements and any related collateral received or posted by the Fund as of April 30, 2017:
International Value Fund
| | | | | | | | | | | | | | | | |
| Counterparty | | Gross Amount of Derivative Assets
Presented on the
Statement of Assets
and Liabilities (a) | | | Derivatives
Available
for offset | | | Collateral
Received | | | Net Amount Due
From Counterparty
(Not less than zero) | |
Australia and New Zealand Banking Group Limited | | $ | 198 | | | $ | (198 | ) | | $ | — | | | $ | — | |
BNP Paribas | | | 18 | | | | (18 | ) | | | — | | | | — | |
Citibank, N.A. | | | 712 | | | | (712 | ) | | | — | | | | — | |
Credit Suisse International | | | 213 | | | | — | | | | — | | | | 213 | |
Goldman Sachs International | | | 245 | | | | (245 | ) | | | — | | | | — | |
National Australia Bank | | | 105 | | | | (105 | ) | | | — | | | | — | |
Royal Bank of Canada | | | 289 | | | | — | | | | — | | | | 289 | |
Societe Generale | | | 125 | | | | — | | | | — | | | | 125 | |
Standard Chartered Bank | | | 518 | | | | (518 | ) | | | — | | | | — | |
State Street Corp. | | | 428 | | | | (297 | ) | | | — | | | | 131 | |
TD Bank Financial Group | | | 1,162 | | | | (18 | ) | | | — | | | | 1,144 | |
| | | | | | | | | | | | | | | | |
| | $ | 4,013 | | | $ | (2,111 | ) | | $ | — | | | $ | 1,902 | |
| | | | | | | | | | | | | | | | |
| | | | |
| Counterparty | | Gross Amount of
Derivative Liabilities
Presented on the
Statement of Assets
and Liabilities (a) | | | Derivatives
Available
for offset | | | Collateral
Posted | | | Net Amount Due
To Counterparty
(Not less than zero) | |
Australia and New Zealand Banking Group Limited | | $ | 335 | | | $ | (198 | ) | | $ | — | | | $ | 137 | |
BNP Paribas | | | 832 | | | | (18 | ) | | | | | | | 814 | |
Citibank, N.A. | | | 820 | | | | (712 | ) | | | — | | | | 108 | |
Goldman Sachs International | | | 1,323 | | | | (245 | ) | | | — | | | | 1,078 | |
HSBC Bank, N.A. | | | 2,859 | | | | — | | | | — | | | | 2,859 | |
Merrill Lynch International | | | 125 | | | | — | | | | — | | | | 125 | |
National Australia Bank | | | 196 | | | | (105 | ) | | | | | | | 91 | |
Standard Chartered Bank | | | 535 | | | | (518 | ) | | | — | | | | 17 | |
State Street Corp. | | | 297 | | | | (297 | ) | | | — | | | | — | |
TD Bank Financial Group | | | 18 | | | | (18 | ) | | | — | | | | — | |
| | | | | | | | | | | | | | | | |
| | $ | 7,340 | | | $ | (2,111 | ) | | $ | — | | | $ | 5,229 | |
| | | | | | | | | | | | | | | | |
| (a) | For financial reporting purposes, the Fund does not offset derivative assets and derivative liabilities subject to master netting arrangements on the Statements of Assets and Liabilities. |
The following table presents the value of derivatives held at April 30, 2017, by their primary underlying risk exposure and respective location on the Statements of Assets and Liabilities (amounts in thousands):
Intrepid International Fund
| | | | | | |
| Derivative Contracts | | Statements of Assets and Liabilities Location | | | |
| Gross Assets: | | | | Futures Contracts (a) | |
Equity contracts | | Receivables, Net Assets — Unrealized Appreciation | | $ | 85 | |
| | | | | | |
| (a) | This amount represents the cumulative appreciation (depreciation) of futures contracts as reported on the SOIs. The Statements of Assets and Liabilities only reflect the current day variation margin receivable/payable from/to brokers. |
The Funds are party to various derivative contracts governed by International Swaps and Derivatives Association master agreements (“ISDA agreements”). The Funds’ ISDA agreements, which are separately negotiated with each dealer counterparty, may contain provisions allowing, absent other considerations, a counterparty to exercise rights, to the extent not otherwise waived, against the Funds in the event the Funds’ net assets decline over time by a pre-determined percentage or fall below a pre-determined floor. The ISDA agreements may also contain provisions allowing, absent other conditions, the Funds to exercise rights, to the extent not otherwise waived, against the counterparty (e.g., decline in a counterparty’s
| | | | | | |
| | | |
| 164 | | | | J.P. MORGAN INTERNATIONAL EQUITY FUNDS | | APRIL 30, 2017 |
credit rating below a specified level). Such rights for both the counterparty and Funds often include the ability to terminate (i.e., close out) open contracts at prices which may favor the counterparty, which could have an adverse effect on the Funds. The ISDA agreements give the Funds and counterparty the right, upon an event of default, to close out all transactions traded under such agreements and to net amounts owed or due across all transactions and offset such net payable or receivable with collateral posted to a segregated account by one party to the other.
The following tables present the effect of derivatives on the Statements of Operations for the six months ended April 30, 2017, by primary underlying risk exposure (amounts in thousands):
Emerging Economies Fund
| | | | | | | | | | | | |
| Amount of Realized Gain (Loss) on Derivatives Recognized on the Statements of Operations | |
| Derviative Contracts | | Futures Contracts | | | Forward Foreign
Currency Exchange
Contracts | | | Total | |
Equity contracts | | $ | (195 | ) | | $ | — | | | $ | (195 | ) |
Foreign exchange contracts | | | — | | | | 180 | | | | 180 | |
| | | | | | | | | | | | |
| | $ | (195 | ) | | $ | 180 | | | $ | (15 | ) |
| | | | | | | | | | | | |
| | | | |
| Amount of Change in Unrealized Appreciation (Depreciation) on Derivatives Recognized on the Statements of Operations | |
| Derviative Contracts | | Futures Contracts | |
Equity contracts | | $ | 324 | |
| | | | |
Emerging Markets Equity Income Fund
| | | | | | | | | | | | |
| Amount of Realized Gain (Loss) on Derivatives Recognized on the Statements of Operations | |
| Derviative Contracts | | Futures Contracts | | | Forward Foreign
Currency Exchange
Contracts | | | Total | |
Equity contracts | | $ | (1 | ) | | $ | — | | | $ | (1 | ) |
Foreign exchange contracts | | | — | | | | — | (a) | | | — | (a) |
| | | | | | | | | | | | |
| | $ | (1 | ) | | $ | — | (a) | | $ | (1 | ) |
| | | | | | | | | | | | |
| (a) | Amount rounds to less than 500. |
Global Research Enhanced Index Fund
| | | | |
| Amount of Change in Unrealized Appreciation (Depreciation) on Derivatives Recognized on the Statements of Operations | |
| Derviative Contracts | | Futures Contracts | |
Equity contracts | | $ | 646 | |
| | | | |
International Equity Fund
| | | | |
| Amount of Realized Gain (Loss) on Derivatives Recognized on the Statements of Operations | |
| Derviative Contracts | | Forward Foreign
Currency Exchange Contracts | |
Foreign exchange contracts | | $ | (320 | ) |
| | | | |
| | | | |
| Amount of Change in Unrealized Appreciation (Depreciation) on Derivatives Recognized on the Statements of Operations | |
| Derviative Contracts | | Forward Foreign
Currency Exchange
Contracts | |
Foreign exchange contracts | | $ | (5 | ) |
| | | | |
International Equity Income Fund
| | | | |
| Amount of Realized Gain (Loss) on Derivatives Recognized on the Statements of Operations | |
| Derviative Contracts | | Forward Foreign
Currency Exchange
Contracts | |
Foreign exchange contracts | | $ | (393 | ) |
| | | | |
| | | | | | | | |
| | | |
| APRIL 30, 2017 | | J.P. MORGAN INTERNATIONAL EQUITY FUNDS | | | | | 165 | |
NOTES TO FINANCIAL STATEMENTS
AS OF APRIL 30, 2017 (Unaudited) (continued)
| | | | |
| Amount of Change in Unrealized Appreciation (Depreciation) on Derivatives Recognized on the Statements of Operations | |
| Derviative Contracts | | Forward Foreign
Currency Exchange
Contracts | |
Foreign exchange contracts | | $ | 113 | |
| | | | |
International Opportunities Fund
| | | | | | | | | | | | |
| Amount of Realized Gain (Loss) on Derivatives Recognized on the Statements of Operations | |
| Derviative Contracts | | Futures Contracts | | | Forward Foreign
Currency Exchange
Contracts | | | Total | |
Equity contracts | | $ | (151 | ) | | $ | — | | | $ | (151 | ) |
Foreign exchange contracts | | | — | | | | 10,449 | | | | 10,449 | |
| | | | | | | | | | | | |
| | $ | (151 | ) | | $ | 10,449 | | | $ | 10,298 | |
| | | | | | | | | | | | |
| | | | | | | | | | | | |
| Amount of Change in Unrealized Appreciation (Depreciation) on Derivatives Recognized on the Statements of Operations | |
| Derviative Contracts | | Futures Contracts | | | Forward Foreign
Currency Exchange
Contracts | | | Total | |
Equity contracts | | $ | (386 | ) | | $ | — | | | $ | (386 | ) |
Foreign exchange contracts | | | — | | | | (9,236 | ) | | | (9,236 | ) |
| | | | | | | | | | | | |
| | $ | (386 | ) | | $ | (9,236 | ) | | $ | (9,622 | ) |
| | | | | | | | | | | | |
International Research Enhanced Equity Fund
| | | | |
| Amount of Realized Gain (Loss) on Derivatives Recognized on the Statements of Operations | |
| Derviative Contracts | | Futures Contracts | |
Equity contracts | | $ | 4,772 | |
| | | | |
| | | | | | | | | | | | |
| Amount of Change in Unrealized Appreciation (Depreciation) on Derivatives Recognized on the Statements of Operations | |
| Derviative Contracts | | Futures Contracts | | | Forward Foreign
Currency Exchange
Contracts | | | Total | |
Equity contracts | | $ | (212 | ) | | $ | — | | | $ | (212 | ) |
Foreign exchange contracts | | | — | | | | 3 | | | | 3 | |
| | | | | | | | | | | | |
| | $ | (212 | ) | | $ | 3 | | | $ | (209 | ) |
| | | | | | | | | | | | |
International Unconstrained Equity Fund
| | | | |
| Amount of Realized Gain (Loss) on Derivatives Recognized on the Statements of Operations | |
| Derviative Contracts | | Forward Foreign
Currency Exchange
Contracts | |
Foreign exchange contracts | | $ | (18 | ) |
| | | | |
International Value Fund
| | | | | | | | | | | | |
| Amount of Realized Gain (Loss) on Derivatives Recognized on the Statements of Operations | |
| Derviative Contracts | | Futures Contracts | | | Forward Foreign
Currency Exchange Contracts | | | Total | |
Equity contracts | | $ | 825 | | | $ | — | | | $ | 825 | |
Foreign exchange contracts | | | — | | | | 4,157 | | | | 4,157 | |
| | | | | | | | | | | | |
| | $ | 825 | | | $ | 4,157 | | | $ | 4,982 | |
| | | | | | | | | | | | |
| | | | | | |
| | | |
| 166 | | | | J.P. MORGAN INTERNATIONAL EQUITY FUNDS | | APRIL 30, 2017 |
| | | | |
| Amount of Change in Unrealized Appreciation (Depreciation) on Derivatives Recognized on the Statements of Operations | |
| Derviative Contracts | | Forward Foreign
Currency Exchange
Contracts | |
Foreign exchange contracts | | $ | (2,888 | ) |
| | | | |
Intrepid International Fund
| | | | |
| Amount of Change in Unrealized Appreciation (Depreciation) on Derivatives Recognized on the Statements of Operations | |
| Derviative Contracts | | Futures Contracts | |
Equity contracts | | $ | 85 | |
| | | | |
The Funds’ derivatives contracts held at April 30, 2017 are not accounted for as hedging instruments under GAAP.
F. Structured Instruments — Emerging Markets Equity Fund and Emerging Markets Equity Income Fund invested in structured instruments that have similar economic characteristics to equity securities. These instruments often seek to replicate the performance of an underlying reference asset such as an equity security or market (“reference asset”). The value of these instruments is generally derived from the price movements of the reference asset. If the Fund holds the structured instrument to maturity, the Fund will be entitled to receive payment from the instrument’s issuing entity based on the value of the reference asset with any necessary adjustments, and record a realized gain or loss. The instrument may receive dividends paid in connection with the reference asset which are reported as Net realized gain (loss) on investment transactions on the Statements of Operations.
Structured instruments may be issued by banks, broker dealers or their affiliates or other entities and typically constitute unsecured contractual obligations of the issuing entity. In addition to credit risk, investments in structured instruments generally have the same risks associated with a direct investment in the reference asset. However, there can be no assurance that structured instruments will trade at the same price or have the same value as the reference asset. In addition, structured instruments may be subject to transfer restrictions and a liquid market may not exist for these instruments.
The lack of a liquid market may make it difficult to sell the structured instruments or accurately value them. Investments in structured instruments subject the Funds to counterparty risk.
G. Foreign Currency Translation — The books and records of the Funds are maintained in U.S. dollars. Foreign currency amounts are translated into U.S. dollars at the prevailing exchange rates of such currencies against the U.S. dollar. The market value of investment securities and other assets and liabilities are translated at the exchange rate as of the valuation date. Purchases and sales of investment securities, income and expenses are translated at the exchange rate prevailing on the respective dates of such transactions.
The Funds do not isolate the effect of changes in foreign exchange rates from changes in market prices on securities held. Accordingly, such changes are included within Change in net unrealized appreciation/depreciation on investments on the Statements of Operations.
Reported realized foreign currency gains and losses arise from the disposition of foreign currency, currency gains or losses realized between the trade and settlement dates on securities transactions, and the difference between the amounts of dividends, interest and foreign withholding taxes recorded on each Fund’s books on the transaction date and the U.S. dollar equivalent of the amounts actually received or paid. These reported realized foreign currency gains and losses are included in Net realized gain (loss) on foreign currency transactions on the Statements of Operations. Unrealized foreign currency gains and losses arise from changes (due to changes in exchange rates) in the value of foreign currency and other assets and liabilities denominated in foreign currencies, which are held at period end and are included in Change in net unrealized appreciation/depreciation on foreign currency translations on the Statements of Operations.
H. Offering and Organizational Costs — Total offering costs of approximately $112,000 incurred in connection with the offering of shares of International Discovery Fund were amortized on a straight line basis over 12 months from the date the Fund commenced operations. For the six months ended April 30, 2017, total offering costs amortized were approximately $93,000.
I. Security Transactions and Investment Income — Investment transactions are accounted for on the trade date (the date the order to buy or sell is executed). Securities gains and losses are calculated on a specifically identified cost basis. Interest income is determined on the basis of coupon interest accrued using the effective interest method which adjusts for amortization of premiums and accretion of discounts. Dividend income net of foreign taxes withheld, if any, is recorded on the ex-dividend date or when a fund first learns of the dividend. Certain Funds may receive other income from investments in loan assignments and/or unfunded commitments, including amendment fees, consent fees and commitment fees. These fees are recorded as income when received by the Fund. These amounts are included in Interest Income in the Statement of Operations.
J. Allocation of Income and Expenses — Expenses directly attributable to a fund are charged directly to that fund, while the expenses attributable to more than one fund of the Trusts are allocated among the respective funds. In calculating the NAV of each class, investment income, realized and unrealized gains and losses and expenses, other than class specific expenses, are allocated daily to each class of shares based upon the proportion of net assets of each class at the beginning of each day.
| | | | | | | | |
| | | |
| APRIL 30, 2017 | | J.P. MORGAN INTERNATIONAL EQUITY FUNDS | | | | | 167 | |
NOTES TO FINANCIAL STATEMENTS
AS OF APRIL 30, 2017 (Unaudited) (continued)
Transfer agency fees are class-specific expenses and sub-transfer agency fees were class specific expenses up through April 2, 2017. Effective April 3, 2017, the Funds ceased making direct payments to financial intermediaries for any applicable sub-transfer agency services. Payments to financial intermediaries for sub-transfer agency services are made by JPMorgan Distribution Services, Inc. from the Shareholder Servicing Fee which has been renamed as the Service Fee.
The amount of the transfer agency fees and sub-transfer agency fees charged to each class of the Funds for the six months ended April 30, 2017 are as follows (amounts in thousands):
| | | | | | | | | | | | | | | | | | | | | | | | | | | | | | | | |
| | | Class A | | | Class C | | | Class I | | | Class L | | | Class R2 | | | Class R5 | | | Class R6 | | | Total | |
Emerging Economies Fund | | | | | | | | | | | | | | | | | | | | | | | | | | | | | | | | |
Transfer agency fees | | $ | 4 | | | $ | 1 | | | $ | 2 | | | | n/a | | | | n/a | | | $ | — | (a) | | $ | 5 | | | $ | 12 | |
Sub-transfer agency fees | | | 57 | | | | 2 | | | | 1 | | | | n/a | | | | n/a | | | | 1 | | | | — | | | | 61 | |
| | | | | | | |
Emerging Markets Equity Fund | | | | | | | | | | | | | | | | | | | | | | | | | | | | | |
Transfer agency fees | | | 30 | | | | 5 | | | | 9 | | | $ | 8 | | | | n/a | | | | — | (a) | | | 6 | | | | 58 | |
Sub-transfer agency fees | | | 269 | | | | 24 | | | | 96 | | | | 114 | | | | n/a | | | | — | | | | — | | | | 503 | |
| | | | | | | |
Emerging Markets Equity Income Fund | | | | | | | | | | | | | | | | | | | | | | | | | | | | | |
Transfer agency fees | | | — | (a) | | | — | (a) | | | — | (a) | | | n/a | | | | n/a | | | | — | (a) | | | — | (a) | | | — | (a) |
Sub-transfer agency fees | | | 2 | | | | — | (a) | | | — | (a) | | | n/a | | | | n/a | | | | — | | | | — | | | | 2 | |
| | | | | | | |
Global Research Enhanced Index Fund | | | | | | | | | | | | | | | | | | | | | | | | | | | | | |
Transfer agency fees | | | — | (a) | | | — | (a) | | | 27 | | | | n/a | | | $ | — | (a) | | | n/a | | | | n/a | | | | 27 | |
Sub-transfer agency fees | | | — | | | | — | | | | 115 | | | | n/a | | | | — | | | | n/a | | | | n/a | | | | 115 | |
| | | | | | | |
Global Unconstrained Equity Fund | | | | | | | | | | | | | | | | | | | | | | | | | | | | | |
Transfer agency fees | | | 1 | | | | — | (a) | | | — | (a) | | | n/a | | | | — | (a) | | | — | (a) | | | — | (a) | | | 1 | |
Sub-transfer agency fees | | | 1 | | | | — | (a) | | | — | (a) | | | n/a | | | | — | | | | — | | | | — | | | | 1 | |
| | | | | | | |
International Discovery Fund | | | | | | | | | | | | | | | | | | | | | | | | | | | | | |
Transfer agency fees | | | — | (a) | | | — | (a) | | | — | (a) | | | n/a | | | | n/a | | | | — | (a) | | | — | (a) | | | — | (a) |
Sub-transfer agency fees | | | — | (a) | | | — | | | | — | (a) | | | n/a | | | | n/a | | | | — | | | | — | | | | — | (a) |
| | | | | | | |
International Equity Fund | | | | | | | | | | | | | | | | | | | | | | | | | | | | | |
Transfer agency fees | | | 16 | | | | 3 | | | | 5 | | | | n/a | | | | — | (a) | | | 1 | | | | 10 | | | | 35 | |
Sub-transfer agency fees | | | 69 | | | | 11 | | | | 41 | | | | n/a | | | | 2 | | | | 13 | | | | — | | | | 136 | |
| | | | | | | |
International Equity Income Fund | | | | | | | | | | | | | | | | | | | | | | | | | | | | | |
Transfer agency fees | | | 2 | | | | 1 | | | | 3 | | | | n/a | | | | — | (a) | | | — | (a) | | | — | (a) | | | 6 | |
Sub-transfer agency fees | | | 23 | | | | 5 | | | | 22 | | | | n/a | | | | — | | | | — | (a) | | | — | | | | 50 | |
| | | | | | | |
International Opportunities Fund | | | | | | | | | | | | | | | | | | | | | | | | | | | | | |
Transfer agency fees | | | 9 | | | | — | (a) | | | 4 | | | | — | (a) | | | n/a | | | | n/a | | | | 7 | | | | 20 | |
Sub-transfer agency fees | | | 24 | | | | 1 | | | | 7 | | | | 2 | | | | n/a | | | | n/a | | | | — | | | | 34 | |
| | | | | | | |
International Research Enhanced Equity Fund | | | | | | | | | | | | | | | | | | | | | | | | | | | | | |
Transfer agency fees | | | 20 | | | | 2 | | | | 6 | | | | n/a | | | | 14 | | | | n/a | | | | n/a | | | | 42 | |
Sub-transfer agency fees | | | 35 | | | | 9 | | | | 125 | | | | n/a | | | | 3 | | | | n/a | | | | n/a | | | | 172 | |
International Unconstrained Equity Fund | | | | | | | | | | | | | | | | | | | | | | | | | | | | | |
Transfer agency fees | | | 2 | | | | 1 | | | | 2 | | | | n/a | | | | — | (a) | | | — | (a) | | | — | | | | 5 | |
Sub-transfer agency fees | | | 5 | | | | 1 | | | | 2 | | | | n/a | | | | — | | | | — | | | | — | | | | 8 | |
| | | | | | | |
International Value Fund | | | | | | | | | | | | | | | | | | | | | | | | | | | | | |
Transfer agency fees | | | 11 | | | | 2 | | | | 4 | | | | 4 | | | | — | (a) | | | — | (a) | | | — | (a) | | | 21 | |
Sub-transfer agency fees | | | 235 | | | | 17 | | | | 18 | | | | — | | | | 2 | | | | — | | | | — | | | | 272 | |
| | | | | | | |
Intrepid International Fund | | | | | | | | | | | | | | | | | | | | | | | | | | | | | |
Transfer agency fees | | | 5 | | | | — | (a) | | | 1 | | | | — | | | | — | (a) | | | n/a | | | | 8 | | | | 14 | |
Sub-transfer agency fees | | | 10 | | | | 1 | | | | 7 | | | | — | (a) | | | — | (a) | | | n/a | | | | — | | | | 18 | |
| (a) | Amount rounds to less than 500. |
K. Federal Income Taxes — Each Fund is treated as a separate taxable entity for Federal income tax purposes. Each Fund’s policy is to comply with the provisions of the Internal Revenue Code of 1986, as amended (the “Code”), applicable to regulated investment companies and to distribute to shareholders all of its distributable net investment income and net realized capital gains on investments. Accordingly, no provision for Federal
| | | | | | |
| | | |
| 168 | | | | J.P. MORGAN INTERNATIONAL EQUITY FUNDS | | APRIL 30, 2017 |
income tax is necessary. Management has reviewed the Funds’ tax positions for all open tax years and has determined that as of April 30, 2017, no liability for income tax is required in the Funds’ financial statements for net unrecognized tax benefits. However, management’s conclusions may be subject to future review based on changes in, or the interpretation of, the accounting standards or tax laws and regulations. Each of the Funds’ Federal tax returns for the prior three fiscal years, or since inception if shorter, remains subject to examination by the Internal Revenue Service.
L. Foreign Taxes — The Funds may be subject to foreign taxes on income, gains on investments or currency purchases/repatriation, a portion of which may be recoverable. The Funds will accrue such taxes and recoveries as applicable, based upon their current interpretation of tax rules and regulations that exist in the markets in which they invest. Certain Funds are subject to a tax imposed on short-term capital gains on securities of issuers domiciled in India. The Funds record an estimated deferred tax liability for these securities that have been held for less than one year at the end of the reporting period, assuming those positions were disposed of at the end of the period. This amount, if any, is reported as Deferred India capital gains tax in the accompanying Statements of Assets and Liabilities. Short-term realized capital losses on the sale of securities of issuers domiciled in India can be carried forward for eight years to offset potential future short-term realized capital gains.
India has enacted rules imposing a tax on the indirect transfers of Indian shares. Based upon current guidance from the Indian tax authorities, management does not believe that such tax will be applicable to the Funds. However, management’s conclusion, regarding this and other foreign tax matters, may be subject to future review based on changes in, or the interpretation of, the accounting standards and the tax laws and regulations.
M. Distributions to Shareholders — Distributions from net investment income if any, are generally declared and paid annually, except for International Equity Income Fund, which are declared and paid monthly. Distributions are declared separately for each class. No class has preferential dividend rights; differences in per share rates are due to differences in separate class expenses. Net realized capital gains, if any, are distributed by each Fund at least annually. The amount of distributions from net investment income and net realized capital gains is determined in accordance with Federal income tax regulations, which may differ from GAAP. To the extent these “book/tax” differences are permanent in nature (i.e., that they result from other than timing of recognition — “temporary differences”), such amounts are reclassified within the capital accounts based on their Federal tax-basis treatment.
3. Fees and Other Transactions with Affiliates
A. Investment Advisory Fee — Pursuant to Investment Advisory Agreements, the Adviser supervises the investments of each Fund and for such services is paid a fee. The fee is accrued daily and paid monthly based on each Fund’s respective average daily net assets.
The annual rate for each Fund is as follows:
| | | | |
Emerging Economies Fund | | | 0.85 | % |
Emerging Markets Equity Fund | | | 0.85 | |
Emerging Markets Equity Income Fund | | | 1.00 | |
Global Research Enhanced Index Fund | | | 0.20 | |
Global Unconstrained Equity Fund | | | 0.70 | |
International Discovery Fund | | | 0.70 | |
International Equity Fund* | | | 0.70 | |
International Equity Income Fund | | | 0.70 | |
International Opportunities Fund | | | 0.60 | |
International Research Enhanced Equity Fund | | | 0.20 | |
International Unconstrained Equity Fund | | | 0.70 | |
International Value Fund | | | 0.60 | |
Intrepid International Fund | | | 0.60 | |
| * | Prior to November 1, 2016, the annual rate was 0.80%. |
The Adviser waived Investment Advisory fees and/or reimbursed expenses as outlined in Note 3.F.
B. Administration Fee — Pursuant to Administration Agreements, the Administrator provides certain administration services to the Funds. In consideration of these services, the Administrator receives a fee accrued daily and paid monthly at an annual rate of 0.15% of the first $25 billion of the average daily net assets of all funds in the J.P. Morgan Funds Complex covered by the Administration Agreement (excluding certain funds of funds and money market funds) and 0.075% of the average daily net assets in excess of $25 billion of all such funds. For the six months ended April 30, 2017, the effective rate was 0.08% of each Fund’s average daily net assets, notwithstanding any fee waivers and/or expense reimbursements.
The Administrator waived Administration fees as outlined in Note 3.F.
JPMorgan Chase Bank, N.A. (“JPMCB”), a wholly-owned subsidiary of JPMorgan, serves as the Funds’ sub-administrator (the “Sub-administrator”). For its services as Sub-administrator, JPMCB receives a portion of the fees payable to the Administrator.
| | | | | | | | |
| | | |
| APRIL 30, 2017 | | J.P. MORGAN INTERNATIONAL EQUITY FUNDS | | | | | 169 | |
NOTES TO FINANCIAL STATEMENTS
AS OF APRIL 30, 2017 (Unaudited) (continued)
C. Distribution Fees — Pursuant to a Distribution Agreement, JPMorgan Distribution Services, Inc. (“JPMDS”), a wholly-owned subsidiary of JPMorgan, serves as the Trusts’ principal underwriter and promotes and arranges for the sale of each Fund’s shares. The Board has adopted a Distribution Plan (the “Distribution Plan”) for Class A, Class C and Class R2 Shares of the Funds, as applicable, in accordance with Rule 12b-1 under the 1940 Act. The Class R5, Class R6, Class I and Institutional Class Shares do not charge a distribution fee. The Distribution Plan provides that each Fund shall pay distribution fees, including payments to JPMDS, at annual rates of the average daily net assets as shown in the table below:
| | | | | | | | | | | | |
| | | Class A | | | Class C | | | Class R2 | |
Emerging Economies Fund | | | 0.25 | % | | | 0.75 | % | | | n/a | |
Emerging Markets Equity Fund | | | 0.25 | | | | 0.75 | | | | n/a | |
Emerging Markets Equity Income Fund | | | 0.25 | | | | 0.75 | | | | n/a | |
Global Research Enhanced Index Fund | | | 0.25 | | | | 0.75 | | | | 0.50 | % |
Global Unconstrained Equity Fund | | | 0.25 | | | | 0.75 | | | | 0.50 | |
International Discovery Fund | | | 0.25 | | | | 0.75 | | | | n/a | |
International Equity Fund | | | 0.25 | | | | 0.75 | | | | 0.50 | |
International Equity Income Fund | | | 0.25 | | | | 0.75 | | | | 0.50 | |
International Opportunities Fund | | | 0.25 | | | | 0.75 | | | | n/a | |
International Research Enhanced Equity Fund | | | 0.25 | | | | 0.75 | | | | 0.50 | |
International Unconstrained Equity Fund | | | 0.25 | | | | 0.75 | | | | 0.50 | |
International Value Fund | | | 0.25 | | | | 0.75 | | | | 0.50 | |
Intrepid International Fund | | | 0.25 | | | | 0.75 | | | | 0.50 | |
In addition, JPMDS is entitled to receive the front-end sales charges from purchases of Class A Shares and the CDSC from redemptions of Class C Shares and certain Class A Shares for which front-end sales charges have been waived. For the six months ended April 30, 2017, JPMDS retained the following amounts (in thousands):
| | | | | | | | |
| | | Front-End
Sales Charge | | | CDSC | |
Emerging Economies Fund | | $ | 1 | | | $ | — | |
Emerging Markets Equity Fund | | | 37 | | | | — | (a) |
Emerging Markets Equity Income Fund | | | — | (a) | | | — | |
Global Unconstrained Equity Fund | | | — | (a) | | | — | |
International Equity Fund | | | 4 | | | | — | (a) |
International Equity Income Fund | | | 14 | | | | — | (a) |
International Opportunities Fund | | | 1 | | | | — | (a) |
International Research Enhanced Equity Fund | | | 2 | | | | — | |
International Unconstrained Equity Fund | | | 11 | | | | — | (a) |
International Value Fund | | | 66 | | | | — | |
Intrepid International Fund | | | 1 | | | | — | |
| (a) | Amount rounds to less than 500. |
D. Service Fees — The Trusts, on behalf of the Funds, have entered into a Shareholder Servicing Agreement with JPMDS under which JPMDS provides certain support services to the shareholders. The Class R6 Shares do not charge service fees. For performing these services, JPMDS receives a fee that is accrued daily and paid monthly equal to a percentage of the average daily net assets as shown in the table below:
| | | | | | | | | | | | | | | | | | | | | | | | |
| | | Class A | | | Class C | | | Class I | | | Class L | | | Class R2 | | | Class R5 | |
Emerging Economies Fund | | | 0.25 | % | | | 0.25 | % | | | 0.25 | % | | | n/a | | | | n/a | | | | 0.10 | % |
Emerging Markets Equity Fund | | | 0.25 | | | | 0.25 | | | | 0.25 | | | | 0.10 | % | | | n/a | | | | 0.10 | |
Emerging Markets Equity Income Fund | | | 0.25 | | | | 0.25 | | | | 0.25 | | | | n/a | | | | n/a | | | | 0.10 | |
Global Research Enhanced Index Fund | | | 0.25 | | | | 0.25 | | | | 0.25 | | | | n/a | | | | 0.25 | % | | | n/a | |
Global Unconstrained Equity Fund | | | 0.25 | | | | 0.25 | | | | 0.25 | | | | n/a | | | | 0.25 | | | | 0.10 | |
International Discovery Fund | | | 0.25 | | | | 0.25 | | | | 0.25 | | | | n/a | | | | n/a | | | | 0.10 | |
International Equity Fund | | | 0.25 | | | | 0.25 | | | | 0.25 | | | | n/a | | | | 0.25 | | | | 0.10 | |
International Equity Income Fund | | | 0.25 | | | | 0.25 | | | | 0.25 | | | | n/a | | | | 0.25 | | | | 0.10 | |
International Opportunities Fund | | | 0.25 | | | | 0.25 | | | | 0.25 | | | | 0.10 | * | | | n/a | | | | n/a | |
International Research Enhanced Equity Fund | | | 0.25 | | | | 0.25 | | | | 0.25 | | | | n/a | | | | 0.25 | | | | n/a | |
International Unconstrained Equity Fund | | | 0.25 | | | | 0.25 | | | | 0.25 | | | | n/a | | | | 0.25 | | | | 0.10 | |
International Value Fund | | | 0.25 | | | | 0.25 | | | | 0.25 | | | | 0.10 | | | | 0.25 | | | | 0.10 | |
Intrepid International Fund | | | 0.25 | | | | 0.25 | | | | 0.25 | | | | 0.10 | * | | | 0.25 | | | | n/a | |
| * | Liquidated on December 8, 2016. |
| | | | | | |
| | | |
| 170 | | | | J.P. MORGAN INTERNATIONAL EQUITY FUNDS | | APRIL 30, 2017 |
JPMDS has entered into shareholder services contracts with affiliated and unaffiliated financial intermediaries who provide shareholder services and other related services to their clients or customers who invest in the Funds under which JPMDS will pay all or a portion of such fees earned to financial intermediaries for performing such services.
JPMDS waived service fees as outlined in Note 3.F.
E. Custodian and Accounting Fees — JPMCB provides portfolio and accounting services to the Funds. For performing these services, the Funds pay JPMCB transaction and asset-based fees that vary according to the number of transactions and positions, plus out-of-pocket expenses. The amounts paid directly to JPMCB by the Funds for custody and accounting services are included in Custodian and accounting fees on the Statements of Operations.
Interest income earned on cash balances at the custodian, if any, is included as Interest income from affiliates on the Statements of Operations.
Interest expense paid to the custodian related to cash overdrafts, if any, is included in Interest expense to affiliates on the Statements of Operations.
F. Waivers and Reimbursements — The Adviser, Administrator and/or JPMDS have contractually agreed to waive fees and/or reimburse the Funds to the extent that total annual operating expenses (excluding acquired fund fees and expenses other than certain money market fund fees as described below, dividend and interest expenses related to short sales, interest, taxes, expenses related to litigation and potential litigation and extraordinary expenses) exceed the percentages of the Funds’ respective average daily net assets as shown in the table below:
| | | | | | | | | | | | | | | | | | | | | | | | | | | | |
| | | Class A | | | Class C | | | Class I | | | Class L | | | Class R2 | | | Class R5 | | | Class R6 | |
Emerging Economies Fund* | | | 1.35 | % | | | 1.85 | % | | | 1.10 | % | | | n/a | | | | n/a | | | | 0.95 | % | | | 0.85 | % |
Emerging Markets Equity Fund** | | | 1.35 | | | | 1.85 | | | | 1.10 | | | | 0.95 | % | | | n/a | | | | 0.95 | | | | 0.85 | |
Emerging Markets Equity Income Fund | | | 1.55 | | | | 2.05 | | | | 1.30 | | | | n/a | | | | n/a | | | | 1.10 | | | | 1.05 | |
Global Research Enhanced Index Fund | | | 0.59 | | | | 1.09 | | | | 0.34 | | | | n/a | | | | 0.84 | % | | | n/a | | | | n/a | |
Global Unconstrained Equity Fund*** | | | 1.25 | | | | 1.75 | | | | 0.90 | | | | n/a | | | | 1.50 | | | | 0.80 | | | | 0.75 | |
International Discovery Fund | | | 1.25 | | | | 1.75 | | | | 0.95 | | | | n/a | | | | n/a | | | | 0.80 | | | | 0.75 | |
International Equity Fund**** | | | 1.24 | | | | 1.74 | | | | 0.99 | | | | n/a | | | | 1.49 | | | | 0.84 | | | | 0.74 | |
International Equity Income Fund | | | 1.25 | | | | 1.75 | | | | 0.90 | | | | n/a | | | | 1.50 | | | | 0.80 | | | | 0.75 | |
International Opportunities Fund***** | | | 1.24 | | | | 1.74 | | | | 0.99 | | | | n/a | | | | n/a | | | | n/a | | | | 0.74 | |
International Research Enhanced Equity Fund | | | 0.60 | | | | 1.10 | | | | 0.35 | | | | n/a | | | | 0.85 | | | | n/a | | | | n/a | |
International Unconstrained Equity Fund | | | 1.25 | | | | 1.75 | | | | 0.90 | | | | n/a | | | | 1.50 | | | | 0.80 | | | | 0.75 | |
International Value Fund | | | 1.35 | | | | 1.85 | | | | 1.10 | | | | 0.95 | | | | 1.60 | | | | 0.95 | | | | 0.85 | |
Intrepid International Fund | | | 1.25 | | | | 1.75 | | | | 0.90 | | | | 0.85 | | | | 1.50 | | | | n/a | | | | 0.75 | |
| * | Prior to May 20, 2016, the contractual expense limitations for Emerging Economies Fund were 1.55%, 2.05%, 1.10%, 1.05% and 1.30% for Class A, Class C, Class I, Class R5 and Class R6, respectively. |
| ** | Prior to May 20, 2016, the contractual expense limitations for Emerging Markets Equity Fund were 1.55%, 2.05%, 1.05%, 1.15% and 1.30% for Class A, Class C, Class I, Class L and Class R6, respectively. |
| *** | Prior to February 27, 2017, the contractual expense limitations for Global Unconstrained Equity Fund were 0.75%, 1.25%, 0.40%, 1.00%, 0.30% and 0.25% for Class A, Class C, Class I, Class R2, Class R5 and Class R6, respectively. |
| **** | Prior to November 1, 2016, the contractual expense limitations for International Equity Fund were 1.31%, 1.81%, 1.06%, 1.56%, 0.86% and 0.81% for Class A, Class C, Class I, Class R2, Class R5 and Class R6, respectively. |
| ***** | Prior to November 1, 2016, the contractual expense limitations for International Opportunities Fund were 1.31%, 1.92%, 1.06% and 0.81% for Class A, Class C, Class I and Class R6, respectively. |
Except as noted above, the expense limitation agreements were in effect for the six months ended April 30, 2017 and are in place until February 28, 2018.
| | | | | | | | |
| | | |
| APRIL 30, 2017 | | J.P. MORGAN INTERNATIONAL EQUITY FUNDS | | | | | 171 | |
NOTES TO FINANCIAL STATEMENTS
AS OF APRIL 30, 2017 (Unaudited) (continued)
For the six months ended April 30, 2017, the Funds’ service providers waived fees and/or reimbursed expenses for each of the Funds as follows (amounts in thousands). None of these parties expect the Funds to repay any such waived fees and/or reimbursed expenses in future years.
| | | | | | | | | | | | | | | | | | | | |
| | | Contractual Waivers | | | | |
| | | Investment
Advisory Fees | | | Administration Fees | | | Service Fees | | | Total | | | Contractual
Reimbursements | |
Emerging Economies Fund | | $ | 1,052 | | | $ | 635 | | | $ | 67 | | | $ | 1,754 | | | $ | 4 | |
Emerging Markets Equity Fund | | | 1,483 | | | | 989 | | | | 552 | | | | 3,024 | | | | 3 | |
Emerging Markets Equity Income Fund | | | 65 | | | | 5 | | | | 2 | | | | 72 | | | | 75 | |
Global Research Enhanced Index Fund | | | 4,561 | | | | 2,960 | | | | 76 | | | | 7,597 | | | | — | (a) |
Global Unconstrained Equity Fund | | | 2 | | | | — | (a) | | | 2 | | | | 4 | | | | 129 | |
International Discovery Fund | | | 21 | | | | 3 | | | | 1 | | | | 25 | | | | 192 | |
International Equity Fund | | | 727 | | | | 482 | | | | 149 | | | | 1,358 | | | | 3 | |
International Equity Income Fund | | | 158 | | | | 61 | | | | 57 | | | | 276 | | | | — | (a) |
International Opportunities Fund | | | — | | | | — | | | | 17 | | | | 17 | | | | — | |
International Research Enhanced Equity Fund | | | 1,157 | | | | 588 | | | | 83 | | | | 1,828 | | | | 4 | |
International Unconstrained Equity Fund | | | 101 | | | | 51 | | | | 22 | | | | 174 | | | | — | (a) |
International Value Fund | | | — | | | | — | | | | 141 | | | | 141 | | | | — | (a) |
Intrepid International Fund | | | — | | | | — | | | | 21 | | | | 21 | | | | — | |
| (a) | Amount rounds to less than 500. |
| | | | |
| | | Voluntary
Waivers | |
| | | Investment
Advisory | |
Global Unconstrained Equity Fund | | $ | 5 | |
Additionally, the Funds may invest in one or more money market funds advised by the Adviser or its affiliates (affiliated money market funds). The Adviser, Administrator and/or JPMDS, as shareholder servicing agent, have contractually agreed to waive fees and/or reimburse expenses in an amount sufficient to offset the respective net fees each collects from the affiliated money market fund on the applicable Funds’ investment in such affiliated money market fund.
The amounts of these waivers resulting from investments in these money market funds for the six months ended April 30, 2017 were as follows (amounts in thousands):
| | | | |
Emerging Economies Fund | | $ | 30 | |
Emerging Markets Equity Fund | | | 56 | |
Emerging Markets Equity Income Fund | | | — | (a) |
Global Research Enhanced Index Fund | | | 35 | |
Global Unconstrained Equity Fund | | | — | (a) |
International Discovery Fund | | | — | |
International Equity Fund | | | 44 | |
International Equity Income Fund | | | 3 | |
International Opportunities Fund | | | 49 | |
International Research Enhanced Equity Fund | | | 34 | |
International Unconstrained Equity Fund | | | 2 | |
International Value Fund | | | 15 | |
Intrepid International Fund | | | 40 | |
| (a) | Amount rounds to less than 500. |
G. Other — Certain officers of the Trusts are affiliated with the Adviser, the Administrator and JPMDS. Such officers, with the exception of the Chief Compliance Officer, receive no compensation from the Funds for serving in their respective roles.
The Board appointed a Chief Compliance Officer to the Funds in accordance with Federal securities regulations. Each Fund, along with other affiliated funds, makes reimbursement payments, on a pro-rata basis, to the Administrator for a portion of the fees associated with the Office of the Chief Compliance Officer. Such fees are included in Trustees’ and Chief Compliance Officer’s fees on the Statements of Operations.
The Trusts adopted a Trustee Deferred Compensation Plan (the “Plan”) which allows the Independent Trustees to defer the receipt of all or a portion of compensation related to performance of their duties as Trustees. The deferred fees are invested in various J.P. Morgan Funds until distribution in accordance with the Plan.
| | | | | | |
| | | |
| 172 | | | | J.P. MORGAN INTERNATIONAL EQUITY FUNDS | | APRIL 30, 2017 |
During the six months ended April 30, 2017, Emerging Markets Equity Fund, Global Unconstrained Equity Fund, International Discovery Fund and International Equity Income Fund purchased securities from an underwriting syndicate in which the principal underwriter or members of the syndicate were affiliated with the Adviser.
The Funds may use related party broker-dealers. For the six months ended April 30, 2017, the Funds incurred brokerage commissions with broker-dealers affiliated with the Adviser as follows (amounts in thousands):
| | | | |
Emerging Markets Equity Fund | | $ | 1 | |
Global Research Enhanced Index Fund | | | 1 | |
Global Unconstrained Equity Fund | | | — | (a) |
| (a) | Amount rounds to less than 500. |
The Securities and Exchange Commission (“SEC”) has granted an exemptive order permitting the Funds to engage in principal transactions with J.P. Morgan Securities, Inc., an affiliated broker, involving taxable money market instruments, subject to certain conditions.
4. Investment Transactions
During the six months ended April 30, 2017, purchases and sales of investments (excluding short-term investments) were as follows (amounts in thousands):
| | | | | | | | |
| | | Purchases (excluding U.S.
Government) | | | Sales (excluding U.S.
Government) | |
Emerging Economies Fund | | $ | 586,459 | | | $ | 658,704 | |
Emerging Markets Equity Fund | | | 394,248 | | | | 246,989 | |
Emerging Markets Equity Income Fund | | | 5,471 | | | | 1,593 | |
Global Research Enhanced Index Fund | | | 1,214,594 | | | | 1,238,842 | |
Global Unconstrained Equity Fund | | | 989 | | | | 887 | |
International Discovery Fund | | | 4,816 | | | | 4,533 | |
International Equity Fund | | | 165,569 | | | | 276,433 | |
International Equity Income Fund | | | 91,253 | | | | 62,287 | |
International Opportunities Fund | | | 800,224 | | | | 862,938 | |
International Research Enhanced Equity Fund | | | 295,891 | | | | 123,461 | |
International Unconstrained Equity Fund | | | 75,184 | | | | 31,049 | |
International Value Fund | | | 154,768 | | | | 765,288 | |
Intrepid International Fund | | | 835,022 | | | | 955,486 | |
During the six months ended April 30, 2017, there were no purchases or sales of U.S. Government securities.
5. Federal Income Tax Matters
For Federal income tax purposes, the estimated cost and unrealized appreciation (depreciation) in value of investment securities held at April 30, 2017 were as follows (amounts in thousands):
| | | | | | | | | | | | | | | | |
| | | Aggregate Cost | | | Gross Unrealized Appreciation | | | Gross Unrealized Depreciation | | | Net Unrealized Appreciation (Depreciation) | |
Emerging Economies Fund | | $ | 1,638,788 | | | $ | 285,743 | | | $ | 50,585 | | | $ | 235,158 | |
Emerging Markets Equity Fund | | | 2,829,349 | | | | 834,561 | | | | 100,542 | | | | 734,019 | |
Emerging Markets Equity Income Fund | | | 14,835 | | | | 1,202 | | | | 171 | | | | 1,031 | |
Global Research Enhanced Index Fund | | | 6,373,128 | | | | 1,439,204 | | | | 119,025 | | | | 1,320,179 | |
Global Unconstrained Equity Fund | | | 1,896 | | | | 192 | | | | 65 | | | | 127 | |
International Discovery Fund | | | 5,564 | | | | 1,197 | | | | 81 | | | | 1,116 | |
International Equity Fund | | | 3,148,006 | | | | 691,992 | | | | 144,404 | | | | 547,588 | |
International Equity Income Fund | | | 158,631 | | | | 17,492 | | | | 2,145 | | | | 15,347 | |
International Opportunities Fund | | | 2,576,964 | | | | 447,151 | | | | 47,458 | | | | 399,693 | |
International Research Enhanced Equity Fund | | | 1,487,927 | | | | 201,700 | | | | 33,268 | | | | 168,432 | |
International Unconstrained Equity Fund | | | 158,354 | | | | 18,515 | | | | 4,337 | | | | 14,178 | |
International Value Fund | | | 784,428 | | | | 80,678 | | | | 41,491 | | | | 39,187 | |
Intrepid International Fund | | | 2,676,963 | | | | 281,364 | | | | 96,043 | | | | 185,321 | |
Under the Regulated Investment Company Modernization Act of 2010 (the “Act”), net capital losses recognized by the Funds after October 31, 2011, are carried forward indefinitely, and retain their character as short-term and/or long-term losses. Prior to the Act, net capital losses incurred by the Funds were carried forward for eight years and treated as short-term losses. The Act requires that post-enactment net capital losses be used before pre-enactment net capital losses.
| | | | | | | | |
| | | |
| APRIL 30, 2017 | | J.P. MORGAN INTERNATIONAL EQUITY FUNDS | | | | | 173 | |
NOTES TO FINANCIAL STATEMENTS
AS OF APRIL 30, 2017 (Unaudited) (continued)
At October 31, 2016, the Funds had the following pre-enactment net capital loss carryforwards, expiring during the years indicated, which are available to offset future realized gains as follows (amounts in thousands):
| | | | | | | | | | | | | | | | |
| | | 2017 | | | 2018 | | | 2019 | | | Total | |
Emerging Economies Fund | | $ | 1,890 | | | $ | — | | | $ | 16,730 | | | $ | 18,620 | |
Emerging Markets Equity Fund | | | 4,903 | | | | — | | | | — | | | | 4,903 | |
International Equity Fund | | | — | | | | 4,532 | | | | 3,312 | | | | 7,844 | |
International Opportunities Fund | | | — | | | | — | | | | 5,449 | | | | 5,449 | |
International Value Fund | | | 241,545 | | | | 63,767 | | | | — | | | | 305,312 | |
Intrepid International Fund | | | 250,971 | | | | — | | | | — | | | | 250,971 | |
At October 31, 2016, the following Funds had post-enactment net capital loss carryforwards as follows (amounts in thousands):
| | | | | | | | |
| | | Capital Loss Carryforward Character | |
| | | Short-Term | | | Long-Term | |
Emerging Economies Fund | | $ | 146,542 | | | $ | 75,520 | |
Emerging Markets Equity Fund | | | 10,629 | | | | 82,340 | |
Emerging Markets Equity Income Fund | | | 183 | * | | | 318 | * |
Global Research Enhanced Index Fund | | | 104,492 | | | | 132,136 | |
International Discovery Fund | | | 392 | | | | — | |
International Equity Fund | | | — | | | | 33,563 | |
International Equity Income Fund | | | 8,624 | | | | 718 | |
International Opportunities Fund | | | 82,645 | | | | 21,877 | |
International Research Enhanced Equity Fund | | | 2,467 | | | | 686 | |
International Unconstrained Equity Fund | | | 3,639 | | | | 1,080 | |
International Value Fund | | | 71,243 | | | | — | |
Intrepid International Fund | | | 46,299 | | | | — | |
| * | Amount includes capital loss carryforwards from business combinations, which are limited in future years under Internal Revenue Code Sections 381-384. |
6. Borrowings
The Funds rely upon an exemptive order granted by the SEC (the “Order”) permitting the establishment and operation of an Interfund Lending Facility (the “Facility”). The Facility allows the Funds to directly lend and borrow money to or from any other fund relying upon the Order at rates beneficial to both the borrowing and lending funds. Advances under the Facility are taken primarily for temporary or emergency purposes, including the meeting of redemption requests that otherwise might require the untimely disposition of securities, and are subject to each Fund’s borrowing restrictions. The Interfund loan rate is determined, as specified in the Order, by averaging the current repurchase agreement rate and the current bank loan rate. The Order was granted to JPMorgan Trust II and may be relied upon by the Funds because the Funds and the series of JPMorgan Trust II are all investment companies in the same “group of investment companies” (as defined in Section 12(d)(1)(G) of the 1940 Act).
The Trusts and JPMCB have entered into a financing arrangement. Under this arrangement, JPMCB provides an unsecured, uncommitted credit facility in the aggregate amount of $100 million to certain of the J.P. Morgan Funds, including the Funds. Advances under the arrangement are taken primarily for temporary or emergency purposes, including the meeting of redemption requests that otherwise might require the untimely disposition of securities, and are subject to each Fund’s borrowing restrictions. Interest on borrowings is payable at a rate determined by JPMCB at the time of borrowing. This agreement has been extended until November 6, 2017.
The Funds had no borrowings outstanding from another fund or from the unsecured, uncommitted credit facility at April 30, 2017. Average borrowings from the Facility for the six months ended April 30, 2017, were as follows (amounts in thousands):
| | | | | | | | | | | | | | | | |
| | | Average Borrowings | | | Average
Interest Rate Paid | | | Number of Days
Outstanding | | | Interest Paid | |
Emerging Economies Fund | | $ | 24,077 | | | | 1.35 | % | | | 8 | | | $ | 8 | |
Emerging Markets Equity Fund | | | 16,088 | | | | 1.45 | | | | 3 | | | | 2 | |
International Equity Fund | | | 30,293 | | | | 1.33 | | | | 6 | | | | 7 | |
International Opportunities Fund | | | 26,795 | | | | 1.03 | | | | 9 | | | | 8 | |
International Value Fund | | | 22,457 | | | | 0.61 | | | | 7 | | | | 3 | |
Intrepid International Fund | | | 43,082 | | | | 1.38 | | | | 6 | | | | 10 | |
In addition, effective August 16, 2016, the Trusts along with certain other trusts (“Borrowers”) entered into a joint syndicated senior unsecured revolving credit facility totaling $1.5 billion (“Credit Facility”) with various lenders and The Bank of New York Mellon, as administrative agent for the lenders. This Credit Facility provides a source of funds to the Borrowers for temporary and emergency purposes, including the meeting of
| | | | | | |
| | | |
| 174 | | | | J.P. MORGAN INTERNATIONAL EQUITY FUNDS | | APRIL 30, 2017 |
redemption requests that otherwise might require the untimely disposition of securities. Under the terms of the Credit Facility, a borrowing fund must have a minimum of $25,000,000 in adjusted net asset value and not exceed certain adjusted net asset coverage ratios prior to and during the time in which and any borrowings are outstanding. If a fund does not comply with the aforementioned requirements, the Fund must remediate within three business days with respect to the $25,000,000 minimum adjusted net asset value or within one business day with respect to certain asset coverage ratios or the administrative agent at the request of, or with the consent of, the lenders may terminate the Credit Facility and declare any outstanding borrowings to be due and payable immediately.
Interest associated with any borrowing under the Credit Facility is charged to the borrowing fund at a rate of interest equal to 1.00% plus the greater of the federal funds effective rate or one month LIBOR. The annual commitment fee to maintain the Credit Facility is 0.15% and is incurred on the unused portion of the Credit Facility and is allocated to all participating funds pro rata based on their respective net assets. The initial term of the Credit Facility is 364 days, unless extended.
The Funds had no borrowings outstanding from the Credit Facility at April 30, 2017. Average borrowings from the Credit Facility for, or at any time during the six months ended April 30, 2017, were as follows (amounts in thousands):
| | | | | | | | | | | | | | | | |
| | | Average
Borrowings | | | Average
Interest Rate Paid | | | Number of
Days
Outstanding | | | Interest
Paid | |
Intrepid International Fund | | $ | 5,700 | | | | 1.77 | % | | | 4 | | | $ | 1 | |
7. Risks, Concentrations and Indemnifications
In the normal course of business, the Funds enter into contracts that contain a variety of representations which provide general indemnifications. Each Fund’s maximum exposure under these arrangements is unknown. The amount of exposure would depend on future claims that may be made against each Fund that have not yet occurred. However, based on experience, the Funds expect the risk of loss to be remote.
Derivatives may be riskier than other types of investments because they may be more sensitive to changes in economic and market conditions and could result in losses that significantly exceed the Funds’ original investment. Many derivatives create leverage thereby causing the Funds to be more volatile than they would have been if they had not used derivatives. Derivatives also expose the Funds to counterparty risk (the risk that the derivative counterparty will not fulfill its contractual obligations), including credit risk of the derivative counterparty.
As of April 30, 2017, the J.P. Morgan Access Funds, J.P. Morgan Investor Funds and the JPMorgan SmartRetirement Funds, which are affiliated funds of funds, owned in the aggregate, shares representing more than 10% of the net assets of certain Funds as follows:
| | | | | | | | | | | | |
| | | JPMorgan
Access
Funds | | | J.P.
Morgan Investor Funds | | | JPMorgan SmartRetirement Funds | |
Emerging Economies Fund | | | — | | | | 10.2 | % | | | 70.6 | % |
Emerging Markets Equity Fund | | | — | | | | — | | | | 47.0 | |
International Equity Fund | | | — | | | | — | | | | 71.2 | |
International Opportunities Fund | | | — | | | | — | | | | 88.1 | |
International Research Enhanced Equity Fund | | | 17.3 | % | | | 45.5 | | | | — | |
International Unconstrained Equity Fund | | | — | | | | 61.4 | | | | — | |
Intrepid International Fund | | | — | | | | — | | | | 90.8 | |
As of April 30, 2017, the following Funds had individual shareholder accounts and/or omnibus accounts each owning more than 10% of the Fund’s outstanding shares as follows:
| | | | | | | | | | | | | | | | |
| | | Number of Individual Affiliated Shareholder Accounts and/or Affiliated Omnibus Accounts | | | % of the Fund | | | Number of Individual
Nonaffiliated Shareholder Accounts and/or Non-affiliated Omnibus Accounts | | | % of the Fund | |
Emerging Markets Equity Income Fund | | | 1 | | | | 18.7 | % | | | 2 | | | | 67.7 | % |
Global Research Enhanced Index Fund | | | 1 | | | | 84.0 | | | | — | | | | — | |
Global Unconstrained Equity Fund | | | 2 | | | | 25.6 | | | | 2 | | | | 23.1 | |
International Discovery Fund | | | 3 | | | | 97.7 | | | | — | | | | — | |
International Equity Income Fund | | | — | | | | — | | | | 3 | | | | 50.8 | |
International Research Enhanced Equity Fund | | | 1 | | | | 27.8 | | | | 1 | | | | 17.3 | |
International Value Fund | | | — | | | | — | | | | 2 | | | | 55.8 | |
Significant shareholder transactions by these shareholders may impact the Funds’ performance.
| | | | | | | | |
| | | |
| APRIL 30, 2017 | | J.P. MORGAN INTERNATIONAL EQUITY FUNDS | | | | | 175 | |
NOTES TO FINANCIAL STATEMENTS
AS OF APRIL 30, 2017 (Unaudited) (continued)
The Funds may have elements of risk not typically associated with investments in the United States of America due to concentrated investments in a limited number of countries or regions, which may vary throughout the year depending on the Fund. Such concentrations may subject the Funds to additional risks resulting from political or economic conditions in such countries or regions and the possible imposition of adverse governmental laws or currency exchange restrictions could cause the securities and their markets to be less liquid and their prices to be more volatile than those of comparable U.S. securities.
As of April 30, 2017, the following Funds had non-U.S. country allocations representing greater than 10% of total investments as follows:
| | | | | | | | | | | | | | | | | | | | | | | | | | | | |
| | | Brazil | | | China | | | France | | | Germany | | | Hong-Kong | | | India | | | Japan | |
Emerging Economies Fund | | | — | % | | | 21.9 | % | | | — | % | | | — | % | | | — | % | | | — | % | | | — | % |
Emerging Markets Equity Fund | | | 10.1 | | | | 18.5 | | | | — | | | | — | | | | — | | | | 18.6 | | | | — | |
Emerging Markets Equity Income Fund | | | — | | | | 13.1 | | | | — | | | | — | | | | — | | | | — | | | | — | |
International Discovery Fund | | | — | | | | — | | | | — | | | | — | | | | — | | | | — | | | | 24.9 | |
International Equity Fund | | | — | | | | — | | | | 12.2 | | | | — | | | | — | | | | — | | | | 20.8 | |
International Equity Income Fund | | | — | | | | — | | | | — | | | | 12.2 | | | | — | | | | — | | | | 10.8 | |
International Opportunities Fund | | | — | | | | — | | | | 13.9 | | | | — | | | | — | | | | — | | | | 23.6 | |
International Research Enhanced Equity Fund | | | — | | | | — | | | | 10.1 | | | | 10.9 | | | | — | | | | — | | | | 21.4 | |
International Unconstrained Equity Fund | | | — | | | | — | | | | — | | | | — | | | | — | | | | — | | | | 10.2 | |
International Value Fund | | | — | | | | — | | | | 15.9 | | | | — | | | | — | | | | — | | | | 22.7 | |
Intrepid International Fund | | | — | | | | — | | | | 10.2 | | | | — | | | | — | | | | — | | | | 23.6 | |
| | | | | | | | | | | | | | | | | | | | | | | | |
| | | Netherlands | | | South Africa | | | South Korea | | | Switzerland | | | Taiwan | | | United Kingdom | |
Emerging Economies Fund | | | — | % | | | — | % | | | 17.0 | % | | | — | % | | | 14.1 | % | | | — | % |
Emerging Markets Equity Fund | | | — | | | | 11.1 | | | | — | | | | — | | | | — | | | | — | |
Emerging Markets Equity Income Fund | | | — | | | | 12.2 | | | | — | | | | — | | | | 19.5 | | | | — | |
Global Unconstrained Equity Fund | | | — | | | | — | | | | — | | | | — | | | | — | | | | 10.1 | |
International Discovery Fund | | | — | | | | — | | | | — | | | | — | | | | — | | | | 16.4 | |
International Equity Fund | | | — | | | | — | | | | — | | | | 10.5 | | | | — | | | | 19.1 | |
International Equity Income Fund | | | — | | | | — | | | | — | | | | — | | | | — | | | | 24.4 | |
International Opportunities Fund | | | — | | | | — | | | | — | | | | — | | | | — | | | | 16.5 | |
International Research Enhanced Equity Fund | | | — | | | | — | | | | — | | | | — | | | | — | | | | 15.7 | |
International Unconstrained Equity Fund | | | 10.8 | | | | — | | | | — | | | | — | | | | — | | | | 18.4 | |
International Value Fund | | | — | | | | — | | | | — | | | | — | | | | — | | | | 10.1 | |
Intrepid International Fund | | | — | | | | — | | | | — | | | | 11.3 | | | | — | | | | 16.0 | |
As of April 30, 2017, a significant portion of each Fund’s investments consisted of securities that were denominated in foreign currencies. Changes in currency exchange rates will affect the value of, and investment income from, such securities.
8. Investment Company Reporting Modernization
In October 2016, the U.S. Securities and Exchange Commission adopted new rules and forms, and amendments to certain current rules and forms, to modernize the reporting and disclosure of information by registered investment companies. In part, the final rules amend Regulation S-X and will require standardized, enhanced disclosures about derivatives in investment company financial statements, as well as other amendments. The compliance date for the amendments to Regulation S-X is August 1, 2017. At this time, management is currently assessing the anticipated impact of the Regulation S-X amendments on the Fund’s financial statements and related disclosures.
| | | | | | |
| | | |
| 176 | | | | J.P. MORGAN INTERNATIONAL EQUITY FUNDS | | APRIL 30, 2017 |
SCHEDULE OF SHAREHOLDER EXPENSES
(Unaudited)
Hypothetical $1,000 Investment
As a shareholder of the Funds, you incur two types of costs: (1) transaction costs, including sales charges (loads) on purchase payments and redemption fees and (2) ongoing costs, including investment advisory fees, administration fees, distribution fees and other Fund expenses. The examples below are intended to help you understand your ongoing costs (in dollars) of investing in the Funds and to compare these ongoing costs with the ongoing costs of investing in other mutual funds. The examples assume that you had a $1,000 investment in each Class at the beginning of the reporting period, November 1, 2016, and continued to hold your shares at the end of the reporting period, April 30, 2017.
Actual Expenses
For each Class of each Fund in the table below, the first line provides information about actual account values and actual expenses. You may use the information in this line, together with the amount you invested, to estimate the expenses that you paid over the period. Simply divide your account value by $1,000 (for example, an $8,600 account value divided by $1,000 = 8.6), then multiply the result by the number in the first line of each Class under the heading entitled “Expenses Paid During the Period” to estimate the expenses you paid on your account during this period.
Hypothetical Example for Comparison Purposes
The second line of each Class in the table below provides information about hypothetical account values and hypothetical expenses based on the Class’ actual expense ratio and an assumed rate of return of 5% per year before expenses, which is not the Class’ actual return. The hypothetical account values and expenses may not be used to estimate the actual ending account balance or expenses you paid for the period. You may use this information to compare the ongoing costs of investing in the Class of the Funds and other funds. To do so, compare this 5% hypothetical example with the 5% hypothetical examples that appear in the shareholder reports of the other funds. Please note that the expenses shown in the table are meant to highlight your ongoing costs only and do not reflect any transaction costs, such as sales charges (loads) or redemption fees. Therefore, the second line for each Class in the table is useful in comparing ongoing costs only, and will not help you determine the relative total costs of owning different funds. In addition, if these transaction costs were included, your costs would have been higher. The examples also assume all dividends and distributions have been reinvested.
| | | | | | | | | | | | | | | | |
| | | Beginning
Account Value
November 1, 2016 | | | Ending
Account Value
April 30, 2017 | | | Expenses
Paid During
the Period* | | | Annualized
Expense
Ratio | |
Emerging Economies Fund | | | | | | | | | | | | | | | | |
Class A | | | | | | | | | | | | | | | | |
Actual | | $ | 1,000.00 | | | $ | 1,108.50 | | | $ | 7.06 | | | | 1.35 | % |
Hypothetical | | | 1,000.00 | | | | 1,018.10 | | | | 6.76 | | | | 1.35 | |
Class C | | | | | | | | | | | | | | | | |
Actual | | | 1,000.00 | | | | 1,106.40 | | | | 9.66 | | | | 1.85 | |
Hypothetical | | | 1,000.00 | | | | 1,015.62 | | | | 9.25 | | | | 1.85 | |
Class I (formerly Select Class) | | | | | | | | | | | | | | | | |
Actual | | | 1,000.00 | | | | 1,110.30 | | | | 5.76 | | | | 1.10 | |
Hypothetical | | | 1,000.00 | | | | 1,019.34 | | | | 5.51 | | | | 1.10 | |
Class R5 | | | | | | | | | | | | | | | | |
Actual | | | 1,000.00 | | | | 1,111.80 | | | | 4.82 | | | | 0.92 | |
Hypothetical | | | 1,000.00 | | | | 1,020.23 | | | | 4.61 | | | | 0.92 | |
Class R6 | | | | | | | | | | | | | | | | |
Actual | | | 1,000.00 | | | | 1,111.00 | | | | 4.45 | | | | 0.85 | |
Hypothetical | | | 1,000.00 | | | | 1,020.58 | | | | 4.26 | | | | 0.85 | |
| | | | |
Emerging Markets Equity Fund | | | | | | | | | | | | | | | | |
Class A | | | | | | | | | | | | | | | | |
Actual | | | 1,000.00 | | | | 1,098.80 | | | | 6.97 | | | | 1.34 | |
Hypothetical | | | 1,000.00 | | | | 1,018.15 | | | | 6.71 | | | | 1.34 | |
Class C | | | | | | | | | | | | | | | | |
Actual | | | 1,000.00 | | | | 1,095.80 | | | | 9.56 | | | | 1.84 | |
Hypothetical | | | 1,000.00 | | | | 1,015.67 | | | | 9.20 | | | | 1.84 | |
Class I (formerly Select Class) | | | | | | | | | | | | | | | | |
Actual | | | 1,000.00 | | | | 1,100.00 | | | | 5.73 | | | | 1.10 | |
Hypothetical | | | 1,000.00 | | | | 1,019.34 | | | | 5.51 | | | | 1.10 | |
Class L (formerly Institutional Class) | | | | | | | | | | | | | | | | |
Actual | | | 1,000.00 | | | | 1,100.60 | | | | 4.95 | | | | 0.95 | |
Hypothetical | | | 1,000.00 | | | | 1,020.08 | | | | 4.76 | | | | 0.95 | |
| | | | | | | | |
| | | |
| APRIL 30, 2017 | | J.P. MORGAN INTERNATIONAL EQUITY FUNDS | | | | | 177 | |
SCHEDULE OF SHAREHOLDER EXPENSES
(Unaudited) (continued)
Hypothetical $1,000 Investment
| | | | | | | | | | | | | | | | |
| | | Beginning
Account Value
November 1, 2016 | | | Ending
Account Value
April 30, 2017 | | | Expenses
Paid During
the Period* | | | Annualized
Expense
Ratio | |
Emerging Markets Equity Fund (continued) | | | | | | | | | | | | | | | | |
Class R5 | | | | | | | | | | | | | | | | |
Actual | | $ | 1,000.00 | | | $ | 1,100.90 | | | $ | 4.90 | | | | 0.94 | % |
Hypothetical | | | 1,000.00 | | | | 1,020.13 | | | | 4.71 | | | | 0.94 | |
Class R6 | | | | | | | | | | | | | | | | |
Actual | | | 1,000.00 | | | | 1,101.20 | | | | 4.43 | | | | 0.85 | |
Hypothetical | | | 1,000.00 | | | | 1,020.58 | | | | 4.26 | | | | 0.85 | |
| | | | |
Emerging Markets Equity Income Fund | | | | | | | | | | | | | | | | |
Class A | | | | | | | | | | | | | | | | |
Actual | | | 1,000.00 | | | | 1,053.90 | | | | 7.89 | | | | 1.55 | |
Hypothetical | | | 1,000.00 | | | | 1,017.11 | | | | 7.75 | | | | 1.55 | |
Class C | | | | | | | | | | | | | | | | |
Actual | | | 1,000.00 | | | | 1,051.80 | | | | 10.43 | | | | 2.05 | |
Hypothetical | | | 1,000.00 | | | | 1,014.63 | | | | 10.24 | | | | 2.05 | |
Class I (formerly Select Class) | | | | | | | | | | | | | | | | |
Actual | | | 1,000.00 | | | | 1,055.50 | | | | 6.63 | | | | 1.30 | |
Hypothetical | | | 1,000.00 | | | | 1,018.35 | | | | 6.51 | | | | 1.30 | |
Class R5 | | | | | | | | | | | | | | | | |
Actual | | | 1,000.00 | | | | 1,057.20 | | | | 5.61 | | | | 1.10 | |
Hypothetical | | | 1,000.00 | | | | 1,019.34 | | | | 5.51 | | | | 1.10 | |
Class R6 | | | | | | | | | | | | | | | | |
Actual | | | 1,000.00 | | | | 1,056.70 | | | | 5.35 | | | | 1.05 | |
Hypothetical | | | 1,000.00 | | | | 1,019.59 | | | | 5.26 | | | | 1.05 | |
| | | | |
Global Research Enhanced Index Fund | | | | | | | | | | | | | | | | |
Class A | | | | | | | | | | | | | | | | |
Actual | | | 1,000.00 | | | | 1,126.20 | | | | 3.11 | | | | 0.59 | |
Hypothetical | | | 1,000.00 | | | | 1,021.87 | | | | 2.96 | | | | 0.59 | |
Class C | | | | | | | | | | | | | | | | |
Actual | | | 1,000.00 | | | | 1,123.60 | | | | 5.74 | | | | 1.09 | |
Hypothetical | | | 1,000.00 | | | | 1,019.39 | | | | 5.46 | | | | 1.09 | |
Class I (formerly Select Class) | | | | | | | | | | | | | | | | |
Actual | | | 1,000.00 | | | | 1,127.80 | | | | 1.79 | | | | 0.34 | |
Hypothetical | | | 1,000.00 | | | | 1,023.11 | | | | 1.71 | | | | 0.34 | |
Class R2 | | | | | | | | | | | | | | | | |
Actual | | | 1,000.00 | | | | 1,124.60 | | | | 4.37 | | | | 0.83 | |
Hypothetical | | | 1,000.00 | | | | 1,020.68 | | | | 4.16 | | | | 0.83 | |
| | | | |
Global Unconstrained Equity Fund | | | | | | | | | | | | | | | | |
Class A | | | | | | | | | | | | | | | | |
Actual | | | 1,000.00 | | | | 1,141.60 | | | | 3.93 | | | | 0.74 | |
Hypothetical | | | 1,000.00 | | | | 1,021.12 | | | | 3.71 | | | | 0.74 | |
Class C | | | | | | | | | | | | | | | | |
Actual | | | 1,000.00 | | | | 1,138.40 | | | | 6.57 | | | | 1.24 | |
Hypothetical | | | 1,000.00 | | | | 1,018.65 | | | | 6.21 | | | | 1.24 | |
Class I (formerly Select Class) | | | | | | | | | | | | | | | | |
Actual | | | 1,000.00 | | | | 1,144.10 | | | | 2.13 | | | | 0.40 | |
Hypothetical | | | 1,000.00 | | | | 1,022.81 | | | | 2.01 | | | | 0.40 | |
Class R2 | | | | | | | | | | | | | | | | |
Actual | | | 1,000.00 | | | | 1,140.50 | | | | 5.31 | | | | 1.00 | |
Hypothetical | | | 1,000.00 | | | | 1,019.84 | | | | 5.01 | | | | 1.00 | |
Class R5 | | | | | | | | | | | | | | | | |
Actual | | | 1,000.00 | | | | 1,143.50 | | | | 1.59 | | | | 0.30 | |
Hypothetical | | | 1,000.00 | | | | 1,023.31 | | | | 1.51 | | | | 0.30 | |
Class R6 | | | | | | | | | | | | | | | | |
Actual | | | 1,000.00 | | | | 1,144.10 | | | | 1.28 | | | | 0.24 | |
Hypothetical | | | 1,000.00 | | | | 1,023.60 | | | | 1.20 | | | | 0.24 | |
| | | | | | |
| | | |
| 178 | | | | J.P. MORGAN INTERNATIONAL EQUITY FUNDS | | APRIL 30, 2017 |
| | | | | | | | | | | | | | | | |
| | | Beginning
Account Value
November 1, 2016 | | | Ending
Account Value
April 30, 2017 | | | Expenses
Paid During
the Period* | | | Annualized
Expense
Ratio | |
International Discovery Fund | | | | | | | | | | | | | | | | |
Class A | | | | | | | | | | | | | | | | |
Actual | | $ | 1,000.00 | | | $ | 1,119.10 | | | $ | 6.57 | | | | 1.25 | % |
Hypothetical | | | 1,000.00 | | | | 1,018.60 | | | | 6.26 | | | | 1.25 | |
Class C | | | | | | | | | | | | | | | | |
Actual | | | 1,000.00 | | | | 1,116.20 | | | | 9.18 | | | | 1.75 | |
Hypothetical | | | 1,000.00 | | | | 1,016.12 | | | | 8.75 | | | | 1.75 | |
Class I (formerly Select Class) | | | | | | | | | | | | | | | | |
Actual | | | 1,000.00 | | | | 1,121.10 | | | | 5.00 | | | | 0.95 | |
Hypothetical | | | 1,000.00 | | | | 1,020.08 | | | | 4.76 | | | | 0.95 | |
Class R5 | | | | | | | | | | | | | | | | |
Actual | | | 1,000.00 | | | | 1,121.50 | | | | 4.21 | | | | 0.80 | |
Hypothetical | | | 1,000.00 | | | | 1,020.83 | | | | 4.01 | | | | 0.80 | |
Class R6 | | | | | | | | | | | | | | | | |
Actual | | | 1,000.00 | | | | 1,121.90 | | | | 3.95 | | | | 0.75 | |
Hypothetical | | | 1,000.00 | | | | 1,021.08 | | | | 3.76 | | | | 0.75 | |
| | | | |
International Equity Fund | | | | | | | | | | | | | | | | |
Class A | | | | | | | | | | | | | | | | |
Actual | | | 1,000.00 | | | | 1,109.20 | | | | 6.48 | | | | 1.24 | |
Hypothetical | | | 1,000.00 | | | | 1,018.65 | | | | 6.21 | | | | 1.24 | |
Class C | | | | | | | | | | | | | | | | |
Actual | | | 1,000.00 | | | | 1,107.00 | | | | 9.09 | | | | 1.74 | |
Hypothetical | | | 1,000.00 | | | | 1,016.17 | | | | 8.70 | | | | 1.74 | |
Class I (formerly Select Class) | | | | | | | | | | | | | | | | |
Actual | | | 1,000.00 | | | | 1,110.30 | | | | 5.18 | | | | 0.99 | |
Hypothetical | | | 1,000.00 | | | | 1,019.89 | | | | 4.96 | | | | 0.99 | |
Class R2 | | | | | | | | | | | | | | | | |
Actual | | | 1,000.00 | | | | 1,108.40 | | | | 7.79 | | | | 1.49 | |
Hypothetical | | | 1,000.00 | | | | 1,017.41 | | | | 7.45 | | | | 1.49 | |
Class R5 | | | | | | | | | | | | | | | | |
Actual | | | 1,000.00 | | | | 1,110.90 | | | | 4.40 | | | | 0.84 | |
Hypothetical | | | 1,000.00 | | | | 1,020.63 | | | | 4.21 | | | | 0.84 | |
Class R6 | | | | | | | | | | | | | | | | |
Actual | | | 1,000.00 | | | | 1,112.30 | | | | 3.88 | | | | 0.74 | |
Hypothetical | | | 1,000.00 | | | | 1,021.12 | | | | 3.71 | | | | 0.74 | |
| | | | |
International Equity Income Fund | | | | | | | | | | | | | | | | |
Class A | | | | | | | | | | | | | | | | |
Actual | | | 1,000.00 | | | | 1,086.90 | | | | 6.47 | | | | 1.25 | |
Hypothetical | | | 1,000.00 | | | | 1,018.60 | | | | 6.26 | | | | 1.25 | |
Class C | | | | | | | | | | | | | | | | |
Actual | | | 1,000.00 | | | | 1,084.20 | | | | 8.99 | | | | 1.74 | |
Hypothetical | | | 1,000.00 | | | | 1,016.17 | | | | 8.70 | | | | 1.74 | |
Class I (formerly Select Class) | | | | | | | | | | | | | | | | |
Actual | | | 1,000.00 | | | | 1,088.70 | | | | 4.66 | | | | 0.90 | |
Hypothetical | | | 1,000.00 | | | | 1,020.33 | | | | 4.51 | | | | 0.90 | |
Class R2 | | | | | | | | | | | | | | | | |
Actual | | | 1,000.00 | | | | 1,085.60 | | | | 7.71 | | | | 1.49 | |
Hypothetical | | | 1,000.00 | | | | 1,017.41 | | | | 7.45 | | | | 1.49 | |
Class R5 | | | | | | | | | | | | | | | | |
Actual | | | 1,000.00 | | | | 1,089.10 | | | | 4.14 | | | | 0.80 | |
Hypothetical | | | 1,000.00 | | | | 1,020.83 | | | | 4.01 | | | | 0.80 | |
Class R6 | | | | | | | | | | | | | | | | |
Actual | | | 1,000.00 | | | | 1,089.50 | | | | 3.89 | | | | 0.75 | |
Hypothetical | | | 1,000.00 | | | | 1,021.08 | | | | 3.76 | | | | 0.75 | |
| | | | | | | | |
| | | |
| APRIL 30, 2017 | | J.P. MORGAN INTERNATIONAL EQUITY FUNDS | | | | | 179 | |
SCHEDULE OF SHAREHOLDER EXPENSES
(Unaudited) (continued)
Hypothetical $1,000 Investment
| | | | | | | | | | | | | | | | |
| | | Beginning
Account Value
November 1, 2016 | | | Ending
Account Value
April 30, 2017 | | | Expenses
Paid During
the Period* | | | Annualized
Expense
Ratio | |
International Opportunities Fund | | | | | | | | | | | | | | | | |
Class A | | | | | | | | | | | | | | | | |
Actual | | $ | 1,000.00 | | | $ | 1,125.10 | | | $ | 6.48 | | | | 1.23 | % |
Hypothetical | | | 1,000.00 | | | | 1,018.70 | | | | 6.16 | | | | 1.23 | |
Class C | | | | | | | | | | | | | | | | |
Actual | | | 1,000.00 | | | | 1,122.10 | | | | 9.10 | | | | 1.73 | |
Hypothetical | | | 1,000.00 | | | | 1,016.22 | | | | 8.65 | | | | 1.73 | |
Class I (formerly Select Class) | | | | | | | | | | | | | | | | |
Actual | | | 1,000.00 | | | | 1,125.20 | | | | 5.16 | | | | 0.98 | |
Hypothetical | | | 1,000.00 | | | | 1,019.93 | | | | 4.91 | | | | 0.98 | |
Class R6 | | | | | | | | | | | | | | | | |
Actual | | | 1,000.00 | | | | 1,127.40 | | | | 3.75 | | | | 0.71 | |
Hypothetical | | | 1,000.00 | | | | 1,021.27 | | | | 3.56 | | | | 0.71 | |
| | | | |
International Research Enhanced Equity Fund | | | | | | | | | | | | | | | | |
Class A | | | | | | | | | | | | | | | | |
Actual | | | 1,000.00 | | | | 1,124.90 | | | | 3.11 | | | | 0.59 | |
Hypothetical | | | 1,000.00 | | | | 1,021.87 | | | | 2.96 | | | | 0.59 | |
Class C | | | | | | | | | | | | | | | | |
Actual | | | 1,000.00 | | | | 1,122.00 | | | | 5.73 | | | | 1.09 | |
Hypothetical | | | 1,000.00 | | | | 1,019.39 | | | | 5.46 | | | | 1.09 | |
Class I (formerly Select Class) | | | | | | | | | | | | | | | | |
Actual | | | 1,000.00 | | | | 1,126.60 | | | | 1.85 | | | | 0.35 | |
Hypothetical | | | 1,000.00 | | | | 1,023.06 | | | | 1.76 | | | | 0.35 | |
Class R2 | | | | | | | | | | | | | | | | |
Actual | | | 1,000.00 | | | | 1,124.00 | | | | 4.42 | | | | 0.84 | |
Hypothetical | | | 1,000.00 | | | | 1,020.63 | | | | 4.21 | | | | 0.84 | |
| | | | |
International Unconstrained Equity Fund | | | | | | | | | | | | | | | | |
Class A | | | | | | | | | | | | | | | | |
Actual | | | 1,000.00 | | | | 1,115.40 | | | | 6.50 | | | | 1.24 | |
Hypothetical | | | 1,000.00 | | | | 1,018.65 | | | | 6.21 | | | | 1.24 | |
Class C | | | | | | | | | | | | | | | | |
Actual | | | 1,000.00 | | | | 1,112.90 | | | | 9.12 | | | | 1.74 | |
Hypothetical | | | 1,000.00 | | | | 1,016.17 | | | | 8.70 | | | | 1.74 | |
Class I (formerly Select Class) | | | | | | | | | | | | | | | | |
Actual | | | 1,000.00 | | | | 1,117.60 | | | | 4.67 | | | | 0.89 | |
Hypothetical | | | 1,000.00 | | | | 1,020.38 | | | | 4.46 | | | | 0.89 | |
Class R2 | | | | | | | | | | | | | | | | |
Actual | | | 1,000.00 | | | | 1,114.30 | | | | 7.81 | | | | 1.49 | |
Hypothetical | | | 1,000.00 | | | | 1,017.41 | | | | 7.45 | | | | 1.49 | |
Class R5 | | | | | | | | | | | | | | | | |
Actual | | | 1,000.00 | | | | 1,118.10 | | | | 4.20 | | | | 0.80 | |
Hypothetical | | | 1,000.00 | | | | 1,020.83 | | | | 4.01 | | | | 0.80 | |
Class R6 | | | | | | | | | | | | | | | | |
Actual | | | 1,000.00 | | | | 1,118.00 | | | | 3.94 | | | | 0.75 | |
Hypothetical | | | 1,000.00 | | | | 1,021.08 | | | | 3.76 | | | | 0.75 | |
| | | | |
International Value Fund | | | | | | | | | | | | | | | | |
Class A | | | | | | | | | | | | | | | | |
Actual | | | 1,000.00 | | | | 1,126.60 | | | | 7.01 | | | | 1.33 | |
Hypothetical | | | 1,000.00 | | | | 1,018.20 | | | | 6.66 | | | | 1.33 | |
Class C | | | | | | | | | | | | | | | | |
Actual | | | 1,000.00 | | | | 1,123.50 | | | | 9.64 | | | | 1.83 | |
Hypothetical | | | 1,000.00 | | | | 1,015.72 | | | | 9.15 | | | | 1.83 | |
Class I (formerly Select Class) | | | | | | | | | | | | | | | | |
Actual | | | 1,000.00 | | | | 1,127.50 | | | | 5.49 | | | | 1.04 | |
Hypothetical | | | 1,000.00 | | | | 1,019.64 | | | | 5.21 | | | | 1.04 | |
| | | | | | |
| | | |
| 180 | | | | J.P. MORGAN INTERNATIONAL EQUITY FUNDS | | APRIL 30, 2017 |
| | | | | | | | | | | | | | | | |
| | | Beginning
Account Value
November 1, 2016 | | | Ending
Account Value
April 30, 2017 | | | Expenses
Paid During
the Period* | | | Annualized
Expense
Ratio | |
International Value Fund (continued) | | | | | | | | | | | | | | | | |
Class L (formerly Institutional Class) | | | | | | | | | | | | | | | | |
Actual | | $ | 1,000.00 | | | $ | 1,128.90 | | | $ | 4.59 | | | | 0.87 | % |
Hypothetical | | | 1,000.00 | | | | 1,020.48 | | | | 4.36 | | | | 0.87 | |
Class R2 | | | | | | | | | | | | | | | | |
Actual | | | 1,000.00 | | | | 1,124.80 | | | | 8.38 | | | | 1.59 | |
Hypothetical | | | 1,000.00 | | | | 1,016.91 | | | | 7.95 | | | | 1.59 | |
Class R5 | | | | | | | | | | | | | | | | |
Actual | | | 1,000.00 | | | | 1,128.00 | | | | 4.80 | | | | 0.91 | |
Hypothetical | | | 1,000.00 | | | | 1,020.28 | | | | 4.56 | | | | 0.91 | |
Class R6 | | | | | | | | | | | | | | | | |
Actual | | | 1,000.00 | | | | 1,129.00 | | | | 4.06 | | | | 0.77 | |
Hypothetical | | | 1,000.00 | | | | 1,020.98 | | | | 3.86 | | | | 0.77 | |
| | | | |
Intrepid International Fund | | | | | | | | | | | | | | | | |
Class A | | | | | | | | | | | | | | | | |
Actual | | | 1,000.00 | | | | 1,111.40 | | | | 6.33 | | | | 1.21 | |
Hypothetical | | | 1,000.00 | | | | 1,018.79 | | | | 6.06 | | | | 1.21 | |
Class C | | | | | | | | | | | | | | | | |
Actual | | | 1,000.00 | | | | 1,108.30 | | | | 9.15 | | | | 1.75 | |
Hypothetical | | | 1,000.00 | | | | 1,016.12 | | | | 8.75 | | | | 1.75 | |
Class I (formerly Select Class) | | | | | | | | | | | | | | | | |
Actual | | | 1,000.00 | | | | 1,113.30 | | | | 4.72 | | | | 0.90 | |
Hypothetical | | | 1,000.00 | | | | 1,020.33 | | | | 4.51 | | | | 0.90 | |
Class R2 | | | | | | | | | | | | | | | | |
Actual | | | 1,000.00 | | | | 1,109.90 | | | | 7.79 | | | | 1.49 | |
Hypothetical | | | 1,000.00 | | | | 1,017.41 | | | | 7.45 | | | | 1.49 | |
Class R6 | | | | | | | | | | | | | | | | |
Actual | | | 1,000.00 | | | | 1,114.40 | | | | 3.72 | | | | 0.71 | |
Hypothetical | | | 1,000.00 | | | | 1,021.27 | | | | 3.56 | | | | 0.71 | |
| * | Expenses are equal to each Class’ respective annualized expense ratio, multiplied by the average account value over the period, multiplied by 181/365 (to reflect the one-half year period). |
| | | | | | | | |
| | | |
| APRIL 30, 2017 | | J.P. MORGAN INTERNATIONAL EQUITY FUNDS | | | | | 181 | |
J.P. Morgan Funds are distributed by JPMorgan Distribution Services, Inc., which is an affiliate of JPMorgan Chase & Co. Affiliates of JPMorgan Chase & Co. receive fees for providing various services to the funds.
Contact JPMorgan Distribution Services, Inc. at 1-800-480-4111 for a fund prospectus. You can also visit us at www.jpmorganfunds.com. Investors should carefully consider the investment objectives and risk as well as charges and expenses of the mutual fund before investing. The prospectus contains this and other information about the mutual fund. Read the prospectus carefully before investing.
Investors may obtain information about the Securities Investor Protection Corporation (SIPC), including the SIPC brochure by visiting www.sipc.org or by calling SIPC at 202-371-8300.
Each Fund files a complete schedule of its fund holdings for the first and third quarters of its fiscal year with the SEC on Form N-Q. The Funds’ Forms N-Q are available on the SEC’s website at http://www.sec.gov and may be reviewed and copied at the SEC’s Public Reference Room in Washington, DC. Information on the operation of the SEC’s Public Reference Room may be obtained by calling 1-800-SEC-0330. Shareholders may request the Form N-Q without charge by calling 1-800-480-4111 or by visiting the J.P. Morgan Funds’ website at www.jpmorganfunds.com.
A description of each Fund’s policies and procedures with respect to the disclosure of each Fund’s holdings is available in the prospectus and Statement of Additional Information.
A copy of proxy policies and procedures is available without charge upon request by calling 1-800-480-4111 and on the Funds’ website at www.jpmorganfunds.com. A description of such policies and procedures is on the SEC’s website at www.sec.gov. The Trustees have delegated the authority to vote proxies for securities owned by the Funds to the Adviser. A copy of the Funds’ voting record for the most recent 12-month period ended June 30 is available on the SEC’s website at www.sec.gov or at the Funds’ website at www.jpmorganfunds.com no later than August 31 of each year. The Funds’ proxy voting record will include, among other things, a brief description of the matter voted on for each fund security, and will state how each vote was cast, for example, for or against the proposal.

J.P. Morgan Asset Management is the marketing name for the asset management business of JPMorgan Chase & Co. Those businesses include, but are not limited to, J.P. Morgan Investment Management Inc., Security Capital Research & Management Incorporated and J.P. Morgan Alternative Asset Management, Inc.
| | | | |
| | © JPMorgan Chase & Co., 2017. All rights reserved. April 2017. | | SAN-INTEQ-417 |
Semi-Annual Report
J.P. Morgan Tax Aware Funds
April 30, 2017 (Unaudited)
JPMorgan Tax Aware Equity Fund
JPMorgan Tax Aware Real Return Fund

CONTENTS
Investments in a Fund are not deposits or obligations of, or guaranteed or endorsed by, any bank and are not insured or guaranteed by the FDIC, the Federal Reserve Board or any other government agency. You could lose money if you sell when a Fund’s share price is lower than when you invested.
Past performance is no guarantee of future performance. The general market views expressed in this report are opinions based on market and other conditions through the end of the reporting period and are subject to change without notice. These views are not intended to predict the future performance of a Fund or the securities markets. References to specific securities and their issuers are for illustrative purposes only and are not intended to be, and should not be interpreted as, recommendations to purchase or sell such securities. Such views are not meant as investment advice and may not be relied on as an indication of trading intent on behalf of any Fund.
Prospective investors should refer to the Funds’ prospectus for a discussion of the Funds’ investment objectives, strategies and risks. Call J.P. Morgan Funds Service Center at 1-800-480-4111 for a prospectus containing more complete information about a Fund, including management fees and other expenses. Please read it carefully before investing.
CEO’S LETTER
May 25, 2017 (Unaudited)
Dear Shareholder,
The world’s leading economies continued their upward trajectory over the six months ended April 30, 2017, bolstered by central bank policies, growth in corporate earnings and buoyant consumer and business sentiment.
| | |
 | | “While bond markets provided a mixed performance over the six months ended April 30, 2017, equity markets rewarded investors with solid returns.” — George C.W. Gatch |
While the U.S. and China had been leading drivers of growth for most of the current economic expansion, by late 2016 and into 2017 the world’s other leading economies began to strengthen. Each of the world’s 20 largest economies was forecast to increase output of goods and services through 2017 and the variation in growth rates among those economies was forecast to be the lowest since 1980, according to Bloomberg News.
The U.S. economy slowed somewhat in the first quarter of 2017, but unemployment dropped to 4.4% in April 2017 and the U.S. Federal Reserve reiterated its intent to raise interest rates amid continued economic growth and rising inflation. Throughout the six month reporting period, U.S. financial markets — particularly U.S. equities — generally outperformed other developed markets and emerging markets.
China’s economy continued to grow and posted a 6.9% rise in gross domestic product (GDP) in the first quarter of 2017, amid strength in housing, infrastructure investment, exports and retail sales. Notably, financial markets in China remained largely stable for the six month reporting period. For the 86 trading days through April 24, 2017, the Shanghai Stock Exchange Composite Index hadn’t fallen by more than 1%, thanks in large part to government efforts to prevent a recurrence of the sharp sell-offs that hit Chinese markets in mid-2015 and early 2016.
Meanwhile, Chinese officials sought to reduce financial system risk by tightening money-market rules and pushing to reduce the use of leverage and financial market speculation.
In the European Union (EU), rising consumer spending and manufacturing led to 0.6% growth in first quarter GDP. In particular, Germany’s economy continued to accelerate into 2017, with positive growth in factory orders and an estimated 14% increase in corporate earnings in the first quarter of 2017. Surveys of consumer sentiment across the EU were more upbeat than in recent years. At the end of March 2017, EU unemployment stood at 9.5%, the lowest level since April 2009.
In emerging markets, economic strength in China and a rebound in commodities prices, which began in the latter half of 2016, helped lift economic growth. Moreover, the economies of Brazil, Argentina, Russia, Turkey and South Africa — which were seen as weak links in the global economy — all showed positive growth by the end of April 2017.
While bond markets provided a mixed performance over the six months ended April 30, 2017, equity markets rewarded investors with solid returns. The Standard & Poor’s 500 Index returned 13.32% for the reporting period, while the Morgan Stanley Capital International (“MSCI”) Europe, Australasia and Far East Index (net of foreign withholding taxes) returned 11.73% and the MSCI Emerging Markets Index (net of foreign withholding taxes) returned 9.03%.
We look forward to managing your investment needs for years to come. Should you have any questions, please visit www.jpmorganfunds.com or contact the J.P. Morgan Funds Service Center at 1-800-480-4111.
Sincerely yours,

George C.W. Gatch
CEO, Investment Funds Management,
J.P. Morgan Asset Management
| | | | | | | | |
| | | |
| APRIL 30, 2017 | | J.P. MORGAN TAX AWARE FUNDS | | | | | 1 | |
J.P. Morgan Tax Aware Funds
MARKET OVERVIEW
SIX MONTHS ENDED APRIL 30, 2017 (Unaudited)
U.S. Global financial markets generally provided positive returns for the six month reporting period as the world’s leading economies continued to grow in a more uniform fashion and investors sought returns in both developed and emerging markets.
During the final quarter of 2016 and into 2017, leading U.S. equity indexes hit multiple record highs amid solid corporate earnings and expectations that the Republican majorities in the U.S. Congress and President’s Trumps’ administration would work to ease business regulations, reduce taxes and increase infrastructure spending.
The performance of fixed-income markets was mixed. High-yield bonds, also known as junk bonds, and U.S. Treasury bonds generally outperformed other debt securities during in the reporting period.
For the six months ended April 30, 2017, the S&P 500 returned 13.32%, while the Bloomberg Barclays U.S. 1-15 Year Blend (1-17) Municipal Bond Index returned -0.06%.
| | | | | | |
| | | |
| 2 | | | | J.P. MORGAN TAX AWARE FUNDS | | APRIL 30, 2017 |
JPMorgan Tax Aware Equity Fund
FUND COMMENTARY
SIX MONTHS ENDED APRIL 30, 2017 (Unaudited)
| | | | |
| REPORTING PERIOD RETURN: | |
| Fund (Class I Shares)1* | | | 15.25% | |
| S&P 500 Index | | | 13.32% | |
| |
| Net Assets as of 4/30/2017 (In Thousands) | | $ | 1,201,796 | |
INVESTMENT OBJECTIVE**
The JPMorgan Tax Aware Equity Fund (the “Fund”) seeks to provide high after-tax total return from a portfolio of selected equity securities.
WHAT WERE THE MAIN DRIVERS OF THE FUND’S PERFORMANCE?
The Fund’s Class I Shares outperformed the S&P 500 Index (the “Benchmark”) for the six months ended April 30, 2017. The Fund’s security selection in the retail and semiconductors & hardware sectors was a leading contributor to performance relative to the Benchmark, while the Fund’s security selection in the insurance and financial services sectors was a leading detractor from relative performance.
Leading individual contributors to the Fund’s relative performance included its overweight positions in Broadcom Ltd., Home Depot Inc. and Lowe’s Cos. Shares of Broadcom, a semiconductor manufacturer, rose on sales growth following its merger with Avago Technologies Inc. Shares of home improvement retail chains Home Depot and Lowe’s rose on better-than-expected sales and earnings.
Leading individual detractors from the Fund’s relative performance included its overweight positions in Molson Coors Brewing Co., Walt Disney Productions Inc. and AutoZone Inc. Shares of Molson Coors Brewing, a beer maker, fell after the company reported a drop in sales and lower-than-expected earnings. Shares of Walt Disney Productions, an entertainment and media company, fell on declining subscribers for its cable TV programming, including its ESPN channel. Shares of AutoZone, a retail auto parts chain, fell amid a slowdown in overall sales of U.S. cars and trucks.
HOW WAS THE FUND POSITIONED?
During the reporting period, the Fund’s portfolio managers employed a bottom-up fundamental approach to security selection, researching companies to determine what they believed to be their underlying value and potential for future earnings growth.
| | | | | | | | |
| TOP TEN EQUITY HOLDINGS OF THE PORTFOLIO*** | |
| | 1. | | | Broadcom Ltd. | | | 4.0 | % |
| | 2. | | | Apple, Inc. | | | 3.7 | |
| | 3. | | | UnitedHealth Group, Inc. | | | 3.6 | |
| | 4. | | | Microsoft Corp. | | | 3.6 | |
| | 5. | | | Amazon.com, Inc. | | | 3.2 | |
| | 6. | | | Honeywell International, Inc. | | | 2.9 | |
| | 7. | | | Bank of America Corp. | | | 2.8 | |
| | 8. | | | Alphabet, Inc., Class C | | | 2.5 | |
| | 9. | | | Wells Fargo & Co. | | | 2.5 | |
| | 10. | | | Alphabet, Inc., Class A | | | 2.3 | |
| | | | |
PORTFOLIO COMPOSITION BY SECTOR*** | |
| Information Technology | | | 26.0 | % |
| Financials | | | 18.1 | |
| Consumer Discretionary | | | 15.3 | |
| Health Care | | | 14.5 | |
| Industrials | | | 10.0 | |
| Energy | | | 6.7 | |
| Consumer Staples | | | 4.5 | |
| Materials | | | 3.0 | |
| Utilities | | | 1.3 | |
| Short-Term Investment | | | 0.6 | |
| 1 | | On April 3, 2017, the Fund’s Institutional Class Shares were renamed Class I Shares. |
| * | | The return shown is based on net asset values calculated for shareholder transactions and may differ from the return shown in the financial highlights, which reflects adjustments made to the net asset values in accordance with accounting principles generally accepted in the United States of America. |
| ** | | The adviser seeks to achieve the Fund’s objective. There can be no guarantee it will be achieved. |
| *** | | Percentages indicated are based on total investments as of April 30, 2017. The Fund’s portfolio composition is subject to change. |
| | | | | | | | |
| | | |
| APRIL 30, 2017 | | J.P. MORGAN TAX AWARE FUNDS | | | | | 3 | |
JPMorgan Tax Aware Equity Fund
FUND COMMENTARY
SIX MONTHS ENDED APRIL 30, 2017 (Unaudited) (continued)
| | | | | | | | | | | | | | | | | | | | | | | | | | | | | | | | | | | | | | | | | | | | | | | | | | |
AVERAGE ANNUAL TOTAL RETURNS AS OF APRIL 30, 2017 | |
| | | | | 6 MONTHS* | | | 1 YEAR | | | 5 YEAR | | | 10 YEAR | |
| | | Inception Date
of Class | | Before
Taxes | | | After Taxes
on
Distributions | | | After Taxes
on
Distributions
and Sale of
Fund Shares | | | Before
Taxes | | | After Taxes
on
Distributions | | | After Taxes
on
Distributions
and Sale of
Fund Shares | | | Before
Taxes | | | After Taxes
on
Distributions | | | After Taxes
on
Distributions
and Sale of
Fund Shares | | | Before
Taxes | | | After Taxes
on
Distributions | | | After Taxes
on
Distributions
and Sale of
Fund Shares | |
CLASS A SHARES | | March 22,
2011 | | | | | | | | | | | | | | | | | | | | | | | | | | | | | | | | | | | | | | | | | | | | | | | | |
With Sales Charge** | | | | | 8.93 | % | | | 7.78 | % | | | 5.89 | % | | | 14.04 | % | | | 12.75 | % | | | 8.87 | % | | | 12.52 | % | | | 11.71 | % | | | 9.91 | % | | | 6.46 | % | | | 5.96 | % | | | 5.14 | % |
Without Sales Charge | | | | | 14.97 | | | | 13.76 | | | | 9.36 | | | | 20.36 | | | | 19.00 | | | | 12.50 | | | | 13.74 | | | | 12.93 | | | | 10.93 | | | | 7.04 | | | | 6.53 | | | | 5.63 | |
CLASS C SHARES | | March 22,
2011 | | | | | | | | | | | | | | | | | | | | | | | | | | | | | | | | | | | | | | | | | | | | | | | | |
With CDSC*** | | | | | 13.70 | | | | 12.52 | | | | 8.61 | | | | 18.79 | | | | 17.53 | | | | 11.55 | | | | 13.18 | | | | 12.47 | | | | 10.48 | | | | 6.71 | | | | 6.26 | | | | 5.36 | |
Without CDSC | | | | | 14.70 | | | | 13.52 | | | | 9.18 | | | | 19.79 | | | | 18.53 | | | | 12.11 | | | | 13.18 | | | | 12.47 | | | | 10.48 | | | | 6.71 | | | | 6.26 | | | | 5.36 | |
CLASS I SHARES (FORMERLY INSTITUTIONAL CLASS SHARES) | | January 30,
1997 | | | 15.25 | | | | 13.97 | | | | 9.56 | | | | 20.92 | | | | 19.42 | | | | 12.91 | | | | 14.23 | | | | 13.23 | | | | 11.32 | | | | 7.32 | | | | 6.77 | | | | 5.86 | |
| ** | | Sales Charge for Class A Shares is 5.25%. |
| *** | | Assumes a 1% CDSC (contingent deferred sales charge) for the 6 month and one year periods and 0% CDSC thereafter. |
After-tax returns are calculated using the historical highest individual federal marginal income tax rates and do not reflect the impact of state and local taxes. Actual after-tax returns depend on the investor’s tax situation and may differ from those shown, and the after-tax returns shown are not relevant to investors who hold their shares through tax-deferred arrangements such as 401(k) plans or individual retirement accounts.
TEN YEAR FUND PERFORMANCE (4/30/07 TO 4/30/17)
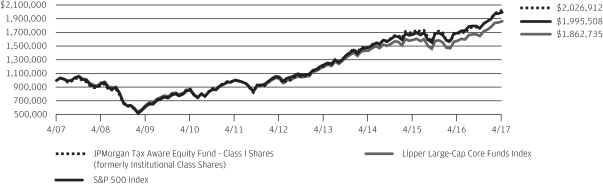
The performance quoted is past performance and is not a guarantee of future results. Mutual funds are subject to certain market risks. Investment returns and principal value of an investment will fluctuate so that an investor’s shares, when redeemed, may be worth more or less than their original cost. Current performance may be higher or lower than the performance data shown. For up-to-date month-end performance information please call 1-800-480-4111.
Returns for Class A and Class C Shares prior to their inception date are based on the performance of Class I Shares (formerly Institutional Class Shares). The actual returns of Class A and Class C Shares would have been lower than those shown because Class A and Class C Shares have higher expenses than Class I Shares (formerly Institutional Class Shares).
The graph illustrates comparative performance for $1,000,000 invested in Class I Shares (formerly Institutional Class Shares) of the JPMorgan Tax Aware Equity Fund, the S&P 500 Index and the Lipper Large-Cap Core Funds Index from April 30, 2007 to April 30, 2017. The performance of the Fund assumes reinvestment of all dividends and capital gain distributions, if any, and does not
include a sales charge. The performance of the S&P 500 Index does not reflect the deduction of expenses or a sales charge associated with a mutual fund and has been adjusted to reflect reinvestment of all dividends and capital gain distributions of the securities included in the benchmark, if applicable. The performance of the Lipper Large-Cap Core Funds Index includes expenses associated with a mutual fund, such as investment management fees. These expenses are not identical to the expenses incurred by the Fund. The S&P 500 Index is an unmanaged index generally representative of the performance of large companies in the U.S. stock market. The Lipper Large-Cap Core Funds Index is an index based on total returns of certain mutual funds within the Fund’s designated category as determined by Lipper, Inc. Investors cannot invest directly in an index.
Class I Shares (formerly Institutional Class Shares) have a $1,000,000 minimum initial investment.
The Tax Aware strategy seeks to minimize shareholders’ tax liability in connection with the Fund’s distribution of realized capital gains. There can be no guarantee the strategy will minimize or eliminate such tax liability.
| | | | | | |
| | | |
| 4 | | | | J.P. MORGAN TAX AWARE FUNDS | | APRIL 30, 2017 |
Fund performance may reflect the waiver of the Fund’s fees and reimbursement of expenses for certain periods since the inception date. Without these waivers and reimbursements, performance would have been lower. Also, performance shown in this section does not reflect the deduction of taxes that a shareholder would pay on Fund distributions or redemptions of Fund shares, with the exception of returns noted above as after taxes.
The returns shown are based on net asset values calculated for shareholder transactions and may differ from the returns shown in the financial highlights, which reflect adjustments made to the net asset values in accordance with accounting principles generally accepted in the United States of America.
| | | | | | | | |
| | | |
| APRIL 30, 2017 | | J.P. MORGAN TAX AWARE FUNDS | | | | | 5 | |
JPMorgan Tax Aware Real Return Fund
FUND COMMENTARY
SIX MONTHS ENDED APRIL 30, 2017 (Unaudited)
| | | | |
| REPORTING PERIOD RETURN: | |
| Fund (Class I Shares)(1)* | | | 0.46% | |
Bloomberg Barclays U.S. 1-15 Year Blend (1-17) Municipal Bond Index | | | -0.06% | |
| Composite Benchmark** | | | 1.28% | |
| |
| Net Assets as of 4/30/2017 (In Thousands) | | | $1,461,267 | |
INVESTMENT OBJECTIVE***
The JPMorgan Tax Aware Real Return Fund (the “Fund”) seeks to maximize after-tax inflation protected return.
WHAT WERE THE MAIN DRIVERS OF THE FUND’S PERFORMANCE?
The Fund’s Class I Shares had a positive absolute return and outperformed the Bloomberg Barclays U.S. 1-15 Year Blend (1-17) Municipal Bond Index (the “Benchmark”) but underperformed the Composite Benchmark for the six months ended April 30, 2017.
The Fund’s hedge against inflation, which was implemented through the use of swaps contracts, made a positive contribution to absolute performance and performance relative to the Benchmark. During the six month period, the two, five, ten and thirty year Barclays inflation swap indexes returned 0.37%, 1.31%, 2.23% and 4.58% respectively. Returns for inflation swaps were pulled higher by increased realized inflation. During the reporting period, the U.S. Consumer Price Index rose to 2.2% from 1.6%.
Amid rising interest rates during the reporting period, the Fund’s shorter duration profile in cash bonds contributed to both absolute performance and performance relative to the Benchmark. Generally, bonds with longer duration will experience a larger increase or decrease in price as interest rates fall or rise, respectively, versus bonds with shorter duration. The Fund’s shorter duration profile in water & sewer bonds also contributed to both absolute and relative performance.
The Fund’s underweight position in the industrial development revenue/pollution control revenue bonds and hospital sector bonds detracted from both absolute and relative performance. The Fund’s overweight allocation to AAA-rated bonds, which underperformed lower rated bonds, also detracted from absolute and relative performance.
The Fund was not fully hedged during the reporting period, which detracted from performance relative to the Composite Benchmark. The Fund’s overweight allocation to the short end of the yield curve, which underperformed other parts of the curve, also detracted from performance relative to the Composite Benchmark. The yield curve shows the relationship between yields and maturity dates for a set of similar bonds at a given point in time.
HOW WAS THE FUND POSITIONED?
Among the Fund’s tax-exempt fixed income investments, the Fund employed a bottom-up, security-selection-based investment approach and sought to take advantage of opportunities stemming from increased volatility, supply pressures and headline credit risk. The Fund maintained its bias to high quality debt securities, as the Fund’s portfolio managers preferred higher-quality issuances. The Fund’s portfolio managers also maintained an inflation-overlay hedging strategy, using zero-coupon inflation-linked swaps to purchase protection against inflation along the yield curve.
During the period, the Fund’s portfolio managers increased the hedge ratio to 94% from 90% in the face of volatility in inflation-linked securities.
INVESTMENT APPROACH
The Fund uses zero-coupon inflation-linked swaps (“inflation swaps”) in combination with tax-exempt municipal bonds to seek to replicate a portfolio of inflation protected securities. The Fund is designed to protect the total return generated by its tax-exempt fixed income holdings from inflation risk. The inflation swaps used by the Fund are based on cumulative percentage movements in the Consumer Price Index for All Urban Consumers (“CPI-U”). The inflation swaps are structured so that one counterparty agrees to pay the cumulative percentage change in the CPI-U over the duration of the swap. The other counterparty (the Fund) pays a compounded fixed rate (zero coupon inflation-swap rate), which is based on the “breakeven inflation rate,” calculated as the yield difference between a nominal U.S. Treasury security and a U.S. Treasury Inflation Protected Security of equal maturity.
The Fund’s portfolio managers aim to protect the portfolio from inflation risk across maturities. Therefore, the yield curve positioning of the underlying bonds is used as the general basis for the Fund’s inflation swap positioning. The yield curve shows the relationship between yields and maturity dates for a set of similar bonds at a given point in time. The Fund’s portfolio managers believe that matching the duration of the inflation protection to the duration of the underlying bonds is the most effective and efficient way to protect the portfolio from both actual realized inflation as well as the loss of value that results from an increase in inflation expectations. Duration measures the price sensitivity of a bond or a portfolio of bonds to relative
| | | | | | |
| | | |
| 6 | | | | J.P. MORGAN TAX AWARE FUNDS | | APRIL 30, 2017 |
changes in interest rates. However, the inflation protection is actively managed, and the Fund’s portfolio managers may elect to deviate from the curve positioning of the underlying bonds as a result of opportunities that may result from macroeconomic or technical factors.
| | | | |
PORTFOLIO COMPOSITION**** | |
| Municipal Bonds | | | 90.5 | % |
| Daily Demand Notes | | | 1.7 | |
| Quarterly Demand Note | | | 0.2 | |
| Short-Term Investment | | | 7.6 | |
| (1) | | On April 3, 2017, the Fund’s Institutional Class Shares were renamed Class I Shares. |
| * | | The return shown is based on net asset values calculated for shareholder transactions and may differ from the return shown in the financial highlights, which reflects adjustments made to the net asset values in accordance with accounting principles generally accepted in the United States of America. |
| ** | | The Fund’s Composite Benchmark is determined by adding the return of the Bloomberg Barclays U.S. 1-15 Year Blend (1-17) Municipal Bond Index and the Bloomberg Barclays Inflation Swap 5 Year Zero Coupon Index. |
| *** | | The adviser seeks to achieve the Fund’s objective. There can be no guarantee it will be achieved. |
| **** | | Percentages indicated are based on total investments as of April 30, 2017. The Fund’s portfolio composition is subject to change. |
| | | | | | | | |
| | | |
| APRIL 30, 2017 | | J.P. MORGAN TAX AWARE FUNDS | | | | | 7 | |
JPMorgan Tax Aware Real Return Fund
FUND COMMENTARY
SIX MONTHS ENDED APRIL 30, 2017 (Unaudited)
| | | | | | | | | | | | | | | | | | | | | | | | | | | | | | | | | | | | | | | | | | | | | | | | | | |
AVERAGE ANNUAL TOTAL RETURNS AS OF APRIL 30, 2017 | |
| | | | | 6 MONTHS* | | | 1 YEAR | | | 5 YEAR | | | 10 YEAR | |
| | | Inception Date
of Class | | Before
Taxes | | | After Taxes
on
Distributions | | | After Taxes
on
Distributions
and Sale of
Fund Shares | | | Before
Taxes | | | After Taxes
on
Distributions | | | After Taxes
on
Distributions
and Sale of
Fund Shares | | | Before
Taxes | | | After Taxes
on
Distributions | | | After Taxes
on
Distributions
and Sale of
Fund Shares | | | Before
Taxes | | | After Taxes
on
Distributions | | | After Taxes
on
Distributions
and Sale of
Fund Shares | |
CLASS A SHARES | | August 31,
2005 | | | | | | | | | | | | | | | | | | | | | | | | | | | | | | | | | | | | | | | | | | | | | | | | |
With Sales Charge** | | | | | (3.39 | )% | | | (3.39 | )% | | | (1.39 | )% | | | (2.88 | )% | | | (2.88 | )% | | | (0.58 | )% | | | (0.20 | )% | | | (0.20 | )% | | | 0.41 | % | | | 1.77 | % | | | 1.77 | % | | | 1.95 | % |
Without Sales Charge | | | | | 0.34 | | | | 0.34 | | | | 0.74 | | | | 0.94 | | | | 0.94 | | | | 1.62 | | | | 0.57 | | | | 0.57 | | | | 1.01 | | | | 2.16 | | | | 2.16 | | | | 2.27 | |
CLASS C SHARES | | August 31,
2005 | | | | | | | | | | | | | | | | | | | | | | | | | | | | | | | | | | | | | | | | | | | | | | | | |
With CDSC*** | | | | | (0.91 | ) | | | (0.91 | ) | | | (0.07 | ) | | | (0.51 | ) | | | (0.52 | ) | | | 0.55 | | | | (0.07 | ) | | | (0.07 | ) | | | 0.38 | | | | 1.52 | | | | 1.52 | | | | 1.63 | |
Without CDSC | | | | | 0.09 | | | | 0.09 | | | | 0.49 | | | | 0.49 | | | | 0.48 | | | | 1.12 | | | | (0.07 | ) | | | (0.07 | ) | | | 0.38 | | | | 1.52 | | | | 1.52 | | | | 1.63 | |
CLASS I SHARES (FORMERLY INSTITUTIONAL CLASS SHARES) | | August 31,
2005 | | | 0.46 | | | | 0.46 | | | | 0.86 | | | | 1.30 | | | | 1.30 | | | | 1.93 | | | | 0.82 | | | | 0.82 | | | | 1.26 | | | | 2.43 | | | | 2.43 | | | | 2.53 | |
CLASS R6 SHARES | | August 16,
2013 | | | 0.51 | | | | 0.51 | | | | 0.92 | | | | 1.30 | | | | 1.30 | | | | 1.97 | | | | 0.90 | | | | 0.90 | | | | 1.33 | | | | 2.47 | | | | 2.47 | | | | 2.57 | |
| ** | | Sales Charge for Class A Shares is 3.75%. |
| *** | | Assumes a 1% CDSC (contingent deferred sales charge) for the 6 month and one year periods and 0% CDSC thereafter. |
After-tax returns are calculated using the historical highest individual federal marginal income tax rates and do not reflect the impact of state and local taxes. Actual after-tax returns depend on the investor’s tax situation and may differ from those shown, and the after-tax returns shown are not relevant to investors who hold their shares through tax-deferred arrangements such as 401(k) plans or individual retirement accounts.
TEN YEAR FUND PERFORMANCE (4/30/07 TO 4/30/17)
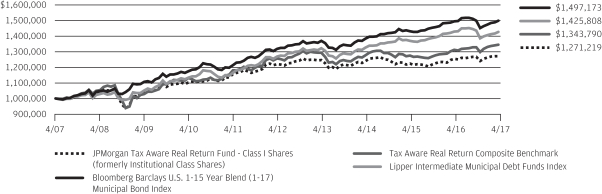
The performance quoted is past performance and is not a guarantee of future results. Mutual funds are subject to certain market risks. Investment returns and principal value of an investment will fluctuate so that an investor’s shares, when redeemed, may be worth more or less than their original cost. Current performance may be higher or lower than the performance data shown. For up-to-date month-end performance information please call 1-800-480-4111.
Returns for Class R6 Shares prior to its inception date are based on the performance of Class I Shares (formerly Institutional Class Shares). The actual returns of Class R6 Shares would have been different than those shown because Class R6 Shares have different expenses than Class I Shares (formerly Institutional Class Shares).
The graph illustrates comparative performance for $1,000,000 invested in Class I Shares (formerly Institutional Class Shares) of the JPMorgan Tax Aware Real Return Fund, the Bloomberg Barclays U.S. 1-15 Year Blend (1-17) Municipal Bond Index, the
Tax Aware Real Return Composite Benchmark and the Lipper Intermediate Municipal Debt Funds Index April 30, 2007 to April 30, 2017. The performance of the Fund assumes reinvestment of all dividends and capital gain distributions, if any, and does not include a sales charge. The performance of the Bloomberg Barclays U.S. 1-15 Year Blend (1-17) Municipal Bond Index and the Tax Aware Real Return Composite Benchmark does not reflect the deduction of expenses or a sales charge associated with a mutual fund and has been adjusted to reflect reinvestment of all dividends and capital gain distributions of the securities included in the benchmarks, if applicable. The performance of the Lipper Intermediate Municipal Debt Funds Index includes expenses associated with a mutual fund, such as investment management fees. These expenses are not identical to the expenses incurred by the Fund.
The Bloomberg Barclays U.S. 1-15 Year Blend (1-17) Municipal Bond Index represents the performance of municipal bonds with maturities from 1 to 17 years. The Tax Aware Real Return Composite Benchmark is determined by adding the return of the Bloomberg Barclays U.S. 1-15 Year Blend (1-17) Municipal Bond Index and the
| | | | | | |
| | | |
| 8 | | | | J.P. MORGAN TAX AWARE FUNDS | | APRIL 30, 2017 |
Bloomberg Barclays Inflation Swap 5 Year Zero Coupon Index. The Lipper Intermediate Municipal Debt Funds Index is an index based on total returns of certain mutual funds within the Fund’s designated category as determined by Lipper, Inc. Investors cannot invest directly in an index.
Class I Shares (formerly Institutional Class Shares) have a $1,000,000 minimum initial investment.
For some investors, income from municipal bonds may be subject to the Alternative Minimum Tax. Capital gains, if any, are federally taxable. Income may be subject to state and local taxes.
The Tax Aware strategy seeks to minimize shareholders’ tax liability in connection with the Fund’s distribution of realized capital gains. There can be no guarantee the strategy will minimize or eliminate such tax liability.
Fund performance may reflect the waiver of the Fund’s fees and reimbursement of expenses for certain periods since the inception date. Without these waivers and reimbursements, performance would have been lower. Also, performance shown in this section does not reflect the deduction of taxes that a shareholder would pay on Fund distributions or redemptions of Fund shares, with the exception of returns noted above as after taxes.
The returns shown are based on net asset values calculated for shareholder transactions and may differ from the returns shown in the financial highlights, which reflect adjustments made to the net asset values in accordance with accounting principles generally accepted in the United States of America.
| | | | | | | | |
| | | |
| APRIL 30, 2017 | | J.P. MORGAN TAX AWARE FUNDS | | | | | 9 | |
JPMorgan Tax Aware Equity Fund
SCHEDULE OF PORTFOLIO INVESTMENTS
AS OF APRIL 30, 2017 (Unaudited)
(Amounts in thousands)
| | | | | | | | |
| SHARES | | | SECURITY DESCRIPTION | | VALUE($) | |
| | Common Stocks — 99.3% | |
| | | | Consumer Discretionary — 15.3% | |
| | | | Auto Components — 0.4% | |
| | 60 | | | Delphi Automotive plc | | | 4,792 | |
| | | | | | | | |
| | | | Automobiles — 0.7% | |
| | 231 | | | General Motors Co. | | | 8,006 | |
| | | | | | | | |
| | | | Hotels, Restaurants & Leisure — 1.1% | |
| | 150 | | | Starbucks Corp. | | | 9,015 | |
| | 64 | | | Yum Brands, Inc. | | | 4,182 | |
| | | | | | | | |
| | | | | | | 13,197 | |
| | | | | | | | |
| | | | Internet & Direct Marketing Retail — 3.2% | | | | |
| | 42 | | | Amazon.com, Inc. (a) | | | 38,909 | |
| | | | | | | | |
| | | | Media — 4.9% | |
| | 40 | | | Charter Communications, Inc., Class A (a) | | | 13,864 | |
| | 345 | | | Comcast Corp., Class A | | | 13,522 | |
| | 110 | | | DISH Network Corp., Class A (a) | | | 7,069 | |
| | 216 | | | Walt Disney Co. (The) | | | 24,946 | |
| | | | | | | | |
| | | | | | | 59,401 | |
| | | | | | | | |
| | | | Specialty Retail — 4.5% | | | | |
| | 11 | | | AutoZone, Inc. (a) | | | 7,317 | |
| | 151 | | | Home Depot, Inc. (The) | | | 23,608 | |
| | 195 | | | Lowe’s Cos., Inc. | | | 16,535 | |
| | 78 | | | TJX Cos., Inc. (The) | | | 6,126 | |
| | | | | | | | |
| | | | | | | 53,586 | |
| | | | | | | | |
| | | | Textiles, Apparel & Luxury Goods — 0.5% | | | | |
| | 102 | | | NIKE, Inc., Class B | | | 5,674 | |
| | | | | | | | |
| | | | Total Consumer Discretionary | | | 183,565 | |
| | | | | | | | |
| | | | Consumer Staples — 4.4% | | | | |
| | | | Beverages — 2.6% | | | | |
| | 34 | | | Constellation Brands, Inc., Class A | | | 5,815 | |
| | 131 | | | Molson Coors Brewing Co., Class B | | | 12,567 | |
| | 112 | | | PepsiCo, Inc. | | | 12,683 | |
| | | | | | | | |
| | | | | | | 31,065 | |
| | | | | | | | |
| | | | Food & Staples Retailing — 0.5% | | | | |
| | 32 | | | Costco Wholesale Corp. | | | 5,695 | |
| | | | | | | | |
| | | | Food Products — 0.8% | |
| | 220 | | | Mondelez International, Inc., Class A | | | 9,925 | |
| | | | | | | | |
| | | | Tobacco — 0.5% | |
| | 61 | | | Philip Morris International, Inc. | | | 6,806 | |
| | | | | | | | |
| | | | Total Consumer Staples | | | 53,491 | |
| | | | | | | | |
| | | | Energy — 6.7% | | | | |
| | | | Oil, Gas & Consumable Fuels — 6.7% | | | | |
| | 545 | | | Cabot Oil & Gas Corp. | | | 12,659 | |
| | 81 | | | Concho Resources, Inc. (a) | | | 10,196 | |
| | | | | | | | |
| SHARES | | | SECURITY DESCRIPTION | | VALUE($) | |
| | | | | | | | |
| | | | Oil, Gas & Consumable Fuels — continued | |
| | 52 | | | Diamondback Energy, Inc. (a) | | | 5,162 | |
| | 216 | | | EOG Resources, Inc. | | | 19,948 | |
| | 135 | | | Occidental Petroleum Corp. | | | 8,284 | |
| | 105 | | | Pioneer Natural Resources Co. | | | 18,129 | |
| | 124 | | | TransCanada Corp., (Canada) | | | 5,740 | |
| | | | | | | | |
| | | | Total Energy | | | 80,118 | |
| | | | | | | | |
| | | | Financials — 18.1% | | | | |
| | | | Banks — 8.1% | | | | |
| | 1,464 | | | Bank of America Corp. | | | 34,171 | |
| | 457 | | | Citigroup, Inc. | | | 27,043 | |
| | 65 | | | First Republic Bank | | | 6,010 | |
| | 552 | | | Wells Fargo & Co. | | | 29,701 | |
| | | | | | | | |
| | | | | | | 96,925 | |
| | | | | | | | |
| | | | Capital Markets — 4.6% | | | | |
| | 33 | | | BlackRock, Inc. | | | 12,774 | |
| | 23 | | | Goldman Sachs Group, Inc. (The) | | | 5,125 | |
| | 234 | | | Intercontinental Exchange, Inc. | | | 14,105 | |
| | 527 | | | Morgan Stanley | | | 22,863 | |
| | | | | | | | |
| | | | | | | 54,867 | |
| | | | | | | | |
| | | | Consumer Finance — 1.2% | | | | |
| | 53 | | | Capital One Financial Corp. | | | 4,221 | |
| | 167 | | | Discover Financial Services | | | 10,433 | |
| | | | | | | | |
| | | | | | | 14,654 | |
| | | | | | | | |
| | | | Insurance — 4.2% | | | | |
| | 154 | | | American International Group, Inc. | | | 9,362 | |
| | 190 | | | Chubb Ltd. | | | 26,142 | |
| | 110 | | | Hartford Financial Services Group, Inc. (The) | | | 5,305 | |
| | 192 | | | MetLife, Inc. | | | 9,958 | |
| | | | | | | | |
| | | | | | | 50,767 | |
| | | | | | | | |
| | | | Total Financials | | | 217,213 | |
| | | | | | | | |
| | | | Health Care — 14.5% | |
| | | | Biotechnology — 2.9% | |
| | 25 | | | Alexion Pharmaceuticals, Inc. (a) | | | 3,212 | |
| | 44 | | | Biogen, Inc. (a) | | | 12,006 | |
| | 22 | | | Bioverativ, Inc. (a) | | | 1,302 | |
| | 97 | | | Celgene Corp. (a) | | | 12,003 | |
| | 55 | | | Vertex Pharmaceuticals, Inc. (a) | | | 6,492 | |
| | | | | | | | |
| | | | | | | 35,015 | |
| | | | | | | | |
| | | | Health Care Equipment & Supplies — 0.8% | | | | |
| | 375 | | | Boston Scientific Corp. (a) | | | 9,884 | |
| | | | | | | | |
SEE NOTES TO FINANCIAL STATEMENTS.
| | | | | | |
| | | |
| 10 | | | | J.P. MORGAN TAX AWARE FUNDS | | APRIL 30, 2017 |
| | | | | | | | |
| SHARES | | | SECURITY DESCRIPTION | | VALUE($) | |
| | Common Stocks — continued | |
| | | | Health Care Providers & Services — 4.1% | |
| | 23 | | | Humana, Inc. | | | 5,178 | |
| | 249 | | | UnitedHealth Group, Inc. | | | 43,603 | |
| | | | | | | | |
| | | | | | | 48,781 | |
| | | | | | | | |
| | | | Life Sciences Tools & Services — 0.6% | | | | |
| | 124 | | | Agilent Technologies, Inc. | | | 6,799 | |
| | | | | | | | |
| | | | Pharmaceuticals — 6.1% | |
| | 70 | | | Allergan plc | | | 17,136 | |
| | 247 | | | Bristol-Myers Squibb Co. | | | 13,852 | |
| | 152 | | | Eli Lilly & Co. | | | 12,498 | |
| | 87 | | | Merck & Co., Inc. | | | 5,410 | |
| | 724 | | | Pfizer, Inc. | | | 24,551 | |
| | | | | | | | |
| | | | | | | 73,447 | |
| | | | | | | | |
| | | | Total Health Care | | | 173,926 | |
| | | | | | | | |
| | | | Industrials — 10.0% | |
| | | | Aerospace & Defense — 0.3% | |
| | 19 | | | General Dynamics Corp. | | | 3,604 | |
| | | | | | | | |
| | | | Airlines — 1.2% | |
| | 102 | | | Southwest Airlines Co. | | | 5,712 | |
| | 123 | | | United Continental Holdings, Inc. (a) | | | 8,637 | |
| | | | | | | | |
| | | | | | | 14,349 | |
| | | | | | | | |
| | | | Building Products — 1.4% | | | | |
| | 92 | | | Allegion plc | | | 7,235 | |
| | 265 | | | Masco Corp. | | | 9,811 | |
| | | | | | | | |
| | | | | | | 17,046 | |
| | | | | | | | |
| | | | Commercial Services & Supplies — 0.7% | | | | |
| | 98 | | | Waste Connections, Inc., (Canada) | | | 9,055 | |
| | | | | | | | |
| | | | Industrial Conglomerates — 4.6% | |
| | 688 | | | General Electric Co. | | | 19,950 | |
| | 268 | | | Honeywell International, Inc. | | | 35,191 | |
| | | | | | | | |
| | | | | | | 55,141 | |
| | | | | | | | |
| | | | Machinery — 1.4% | | | | |
| | 121 | | | Stanley Black & Decker, Inc. | | | 16,529 | |
| | | | | | | | |
| | | | Road & Rail — 0.4% | |
| | 44 | | | Union Pacific Corp. | | | 4,949 | |
| | | | | | | | |
| | | | Total Industrials | | | 120,673 | |
| | | | | | | | |
| | | | Information Technology — 26.0% | | | | |
| | | | Internet Software & Services — 6.8% | | | | |
| | 30 | | | Alphabet, Inc., Class A (a) | | | 28,134 | |
| | 33 | | | Alphabet, Inc., Class C (a) | | | 30,119 | |
| | 157 | | | Facebook, Inc., Class A (a) | | | 23,568 | |
| | | | | | | | |
| | | | | | | 81,821 | |
| | | | | | | | |
| | | | | | | | |
| SHARES | | | SECURITY DESCRIPTION | | VALUE($) | |
| | | | | | | | |
| | | | IT Services — 4.9% | | | | |
| | 65 | | | Accenture plc, Class A | | | 7,912 | |
| | 192 | | | Fidelity National Information Services, Inc. | | | 16,180 | |
| | 157 | | | Mastercard, Inc., Class A | | | 18,319 | |
| | 119 | | | Visa, Inc., Class A | | | 10,892 | |
| | 57 | | | WEX, Inc. (a) | | | 5,804 | |
| | | | | | | | |
| | | | | | | 59,107 | |
| | | | | | | | |
| | | | Semiconductors & Semiconductor Equipment — 5.6% | |
| | 73 | | | Analog Devices, Inc. | | | 5,540 | |
| | 219 | | | Broadcom Ltd. | | | 48,413 | |
| | 56 | | | Microchip Technology, Inc. | | | 4,235 | |
| | 111 | | | Texas Instruments, Inc. | | | 8,805 | |
| | | | | | | | |
| | | | | | | 66,993 | |
| | | | | | | | |
| | | | Software — 5.0% | | | | |
| | 122 | | | Adobe Systems, Inc. (a) | | | 16,362 | |
| | 630 | | | Microsoft Corp. | | | 43,103 | |
| | 49 | | | Snap, Inc., Class A (a) | | | 1,105 | |
| | | | | | | | |
| | | | | | | 60,570 | |
| | | | | | | | |
| | | | Technology Hardware, Storage & Peripherals — 3.7% | |
| | 308 | | | Apple, Inc. | | | 44,316 | |
| | | | | | | | |
| | | | Total Information Technology | | | 312,807 | |
| | | | | | | | |
| | | | Materials — 3.0% | |
| | | | Chemicals — 2.3% | |
| | 70 | | | Celanese Corp., Series A | | | 6,075 | |
| | 221 | | | Dow Chemical Co. (The) | | | 13,901 | |
| | 92 | | | EI du Pont de Nemours & Co. | | | 7,305 | |
| | | | | | | | |
| | | | | | | 27,281 | |
| | | | | | | | |
| | | | Construction Materials — 0.7% | | | | |
| | 39 | | | Martin Marietta Materials, Inc. | | | 8,479 | |
| | | | | | | | |
| | | | Total Materials | | | 35,760 | |
| | | | | | | | |
| | | | Utilities — 1.3% | | | | |
| | | | Multi-Utilities — 1.3% | | | | |
| | 156 | | | CMS Energy Corp. | | | 7,064 | |
| | 354 | | | NiSource, Inc. | | | 8,588 | |
| | | | | | | | |
| | | | Total Utilities | | | 15,652 | |
| | | | | | | | |
| | | | Total Common Stocks
(Cost $661,778) | | | 1,193,205 | |
| | | | | | | | |
SEE NOTES TO FINANCIAL STATEMENTS.
| | | | | | | | |
| | | |
| APRIL 30, 2017 | | J.P. MORGAN TAX AWARE FUNDS | | | | | 11 | |
JPMorgan Tax Aware Equity Fund
SCHEDULE OF PORTFOLIO INVESTMENTS
AS OF APRIL 30, 2017 (Unaudited) (continued)
(Amounts in thousands)
| | | | | | | | |
| SHARES | | | SECURITY DESCRIPTION | | VALUE($) | |
| | Short-Term Investment — 0.6% | | | | |
| | | | Investment Company — 0.6% | |
| | 7,499 | | | JPMorgan U.S. Government Money Market Fund, Institutional Class Shares, 0.620% (b) (l) (Cost $7,499) | | | 7,499 | |
| | | | | | | | |
| | | | Total Investments — 99.9%
(Cost $669,277) | | | 1,200,704 | |
| | | | Other Assets in Excess of
Liabilities — 0.1% | | | 1,092 | |
| | | | | | | | |
| | | | NET ASSETS — 100.0% | | $ | 1,201,796 | |
| | | | | | | | |
Percentages indicated are based on net assets.
SEE NOTES TO FINANCIAL STATEMENTS.
| | | | | | |
| | | |
| 12 | | | | J.P. MORGAN TAX AWARE FUNDS | | APRIL 30, 2017 |
JPMorgan Tax Aware Real Return Fund
SCHEDULE OF PORTFOLIO INVESTMENTS
AS OF APRIL 30, 2017 (Unaudited)
(Amounts in thousands)
| | | | | | | | |
PRINCIPAL
AMOUNT($) | | | SECURITY DESCRIPTION | | VALUE($) | |
| | Daily Demand Notes — 1.8% | |
| | | | New York — 0.9% | | | | |
| | | | General Obligation — 0.9% | | | | |
| | 12,500 | | | City of New York, Fiscal Year 2006, Series I, Sub Series I-4, GO, VRDO, LOC: TD Bank NA, 0.700%, 05/01/17 | | | 12,500 | |
| | | | | | | | |
| | | | Texas — 0.9% | |
| | | | Industrial Development Revenue/Pollution Control Revenue — 0.9% | |
| | 12,500 | | | Lower Neches Valley Authority Industrial Development Corp., ExxonMobil Project, Rev., VRDO, 0.720%, 05/01/17 | | | 12,500 | |
| | | | | | | | |
| | | | Total Daily Demand Notes
(Cost $25,000) | | | 25,000 | |
| | | | | | | | |
| | Municipal Bonds — 90.1% (t) | |
| | | | Alaska — 1.1% | | | | |
| | | | Other Revenue — 1.1% | | | | |
| | 13,490 | | | Borough of Matanuska-Susitna, Goose Creek Correctional Center Project, Rev., 5.250%, 09/01/29 | | | 15,568 | |
| | | | | | | | |
| | | | Arizona — 3.2% | |
| | | | General Obligation — 0.1% | |
| | 1,400 | | | City of Goodyear, GO, AGM, 6.000%, 07/01/19 | | | 1,483 | |
| | | | | | | | |
| | | | Other Revenue — 0.2% | | | | |
| | | | Phoenix Civic Improvement Corp., Senior Lien, | | | | |
| | 1,085 | | | Series C, Rev., 5.000%, 07/01/22 | | | 1,231 | |
| | 1,000 | | | Series C, Rev., 5.000%, 07/01/24 | | | 1,135 | |
| | | | | | | | |
| | | | | | | 2,366 | |
| | | | | | | | |
| | | | Prerefunded — 2.8% | |
| | 33,840 | | | Arizona State Transportation Board, Series A, Rev., GAN, 5.250%, 07/01/20 (p) | | | 38,085 | |
| | 3,000 | | | Arizona State Transportation Board, Maricopa County Regional Area Road, Rev., 5.000%, 07/01/20 (p) | | | 3,353 | |
| | | | | | | | |
| | | | | | | 41,438 | |
| | | | | | | | |
| | | | Utility — 0.1% | |
| | 1,500 | | | Salt River Project Agricultural Improvement & Power District, Electric System, Series A, Rev., 5.000%, 01/01/22 | | | 1,604 | |
| | | | | | | | |
| | | | Total Arizona | | | 46,891 | |
| | | | | | | | |
| | | | Arkansas — 0.1% | | | | |
| | | | Prerefunded — 0.0% (g) | |
| | 710 | | | City of Fort Smith, Water & Sewer, Rev., AGM, 5.000%, 10/01/18 (p) | | | 751 | |
| | | | | | | | |
| | | | | | | | |
PRINCIPAL
AMOUNT($) | | | SECURITY DESCRIPTION | | VALUE($) | |
| | | | | | | | |
| | | | Water & Sewer — 0.1% | |
| | 1,105 | | | City of Fort Smith, Water & Sewer, Rev., AGM, 5.000%, 10/01/22 | | | 1,164 | |
| | | | | | | | |
| | | | Total Arkansas | | | 1,915 | |
| | | | | | | | |
| | | | California — 17.6% | |
| | | | Certificate of Participation/Lease — 0.0% (g) | |
| | 80 | | | Los Angeles Unified School District, Headquarters Building Projects, Series B, COP, 5.000%, 10/01/31 | | | 91 | |
| | | | | | | | |
| | | | Education — 1.1% | |
| | 3,000 | | | California State University, Systemwide, Series A, Rev., 5.000%, 11/01/24 | | | 3,657 | |
| | 2,475 | | | Golden West Schools Financing Authority, Placentia-Yorba Linda University, Rev., AMBAC, 5.500%, 08/01/20 | | | 2,800 | |
| | 2,910 | | | Simi Valley School Financing Authority, Unified School District, Rev., AGM, 5.000%, 08/01/21 | | | 2,998 | |
| | 5,000 | | | University of California, Series AF, Rev., 5.000%, 05/15/27 | | | 5,903 | |
| | | | | | | | |
| | | | | | | 15,358 | |
| | | | | | | | |
| | | | General Obligation — 6.3% | | | | |
| | 5,775 | | | Arcadia Unified School District, County of Los Angeles, GO, 4.000%, 08/01/41 | | | 5,973 | |
| | 1,490 | | | Carlsbad Unified School District, Series B, GO, Zero Coupon, 05/01/19 | | | 1,452 | |
| | 750 | | | Center Unified School District, Election of 1991, Series D, GO, NATL-RE, Zero Coupon, 08/01/26 | | | 487 | |
| | | | Contra Costa Community College District, | | | | |
| | 2,115 | | | GO, 5.000%, 08/01/21 | | | 2,438 | |
| | 1,000 | | | GO, 5.000%, 08/01/22 | | | 1,145 | |
| | 1,000 | | | GO, 5.000%, 08/01/24 | | | 1,141 | |
| | 145 | | | Los Angeles Community College District, Election of 2008, Series G, GO, 4.000%, 08/01/39 | | | 150 | |
| | | | Los Angeles Unified School District, | | | | |
| | 1,000 | | | Series A-1, GO, AGM, 5.000%, 07/01/19 | | | 1,007 | |
| | 10,010 | | | Series B, GO, 5.000%, 07/01/26 | | | 12,459 | |
| | 9,000 | | | Series C, GO, 5.000%, 07/01/26 | | | 10,823 | |
| | 5,000 | | | Series D, GO, 5.250%, 07/01/24 | | | 5,447 | |
| | | | Murrieta Valley Unified School District, | | | | |
| | 550 | | | GO, AGM, 5.000%, 09/01/22 | | | 642 | |
| | 725 | | | GO, AGM, 5.000%, 09/01/23 | | | 861 | |
| | | | San Diego Unified School District, Election of 1998, | | | | |
| | 3,800 | | | Series C-2, GO, AGM, 5.500%, 07/01/24 | | | 4,739 | |
| | 1,000 | | | Series F-1, GO, AGM, 5.250%, 07/01/28 | | | 1,259 | |
SEE NOTES TO FINANCIAL STATEMENTS.
| | | | | | | | |
| | | |
| APRIL 30, 2017 | | J.P. MORGAN TAX AWARE FUNDS | | | | | 13 | |
JPMorgan Tax Aware Real Return Fund
SCHEDULE OF PORTFOLIO INVESTMENTS
AS OF APRIL 30, 2017 (Unaudited) (continued)
(Amounts in thousands)
| | | | | | | | |
PRINCIPAL
AMOUNT($) | | | SECURITY DESCRIPTION | | VALUE($) | |
| | Municipal Bonds — continued | |
| | | | General Obligation — continued | | | | |
| | 1,000 | | | State Center Community College District, GO, 5.000%, 08/01/24 | | | 1,169 | |
| | | | State of California, Various Purpose, | | | | |
| | 5,000 | | | GO, 5.000%, 04/01/20 | | | 5,387 | |
| | 10,370 | | | GO, 5.000%, 08/01/30 | | | 12,083 | |
| | 5,000 | | | GO, 5.500%, 04/01/18 | | | 5,212 | |
| | 5,000 | | | GO, 5.500%, 04/01/21 | | | 5,437 | |
| | 5,000 | | | GO, 5.625%, 04/01/26 | | | 5,446 | |
| | 6,600 | | | GO, 6.500%, 04/01/33 | | | 7,285 | |
| | | | | | | | |
| | | | | | | 92,042 | |
| | | | | | | | |
| | | | Hospital — 0.3% | |
| | 1,000 | | | California Health Facilities Financing Authority, Kaiser Permanente, Series A, Sub Series A-2, Rev., 4.000%, 11/01/38 | | | 1,018 | |
| | | | California Municipal Finance Authority, Community Medical Centers, | | | | |
| | 1,750 | | | Series A, Rev., 5.000%, 02/01/31 | | | 2,001 | |
| | 1,500 | | | Series A, Rev., 5.000%, 02/01/32 | | | 1,700 | |
| | | | | | | | |
| | | | | | | 4,719 | |
| | | | | | | | |
| | | | Other Revenue — 0.4% | |
| | 4,950 | | | Golden State Tobacco Securitization Corp., Tobacco Settlement, Series A, Rev., 5.000%, 06/01/34 | | | 5,588 | |
| | | | San Francisco Bay Area Rapid Transit District, Sales Tax, | | | | |
| | 175 | | | Series A, Rev., 5.000%, 07/01/24 | | | 213 | |
| | 395 | | | Series A, Rev., 5.000%, 07/01/25 | | | 485 | |
| | 225 | | | Series A, Rev., 5.000%, 07/01/26 | | | 274 | |
| | | | | | | | |
| | | | | | | 6,560 | |
| | | | | | | | |
| | | | Prerefunded — 2.2% | |
| | 2,000 | | | California Educational Facilities Authority, University of Southern California, Series A, Rev., 5.000%, 10/01/18 (p) | | | 2,119 | |
| | 3,500 | | | California Health Facilities Financing Authority, Providence Health & Services, Series C, Rev., 6.250%, 10/01/18 (p) | | | 3,766 | |
| | 2,070 | | | California State Department of Water Resources, Power Supply, Series H, Rev., AGM-CR, 5.000%, 05/01/18 (p) | | | 2,157 | |
| | 8,700 | | | California State Public Works Board, University of California, Series H, Rev., 5.000%, 09/01/23 (p) | | | 10,479 | |
| | 2,695 | | | Center Unified School District, Election of 1991, GO, NATL-RE, Zero Coupon, 08/01/17 (p) | | | 1,751 | |
| | 15 | | | City of Los Angeles, Department of Water & Power, Power System, Series A, Rev., 5.000%, 01/01/23 (p) | | | 18 | |
| | | | | | | | |
PRINCIPAL
AMOUNT($) | | | SECURITY DESCRIPTION | | VALUE($) | |
| | | | | | | | |
| | | | Prerefunded — continued | | | | |
| | 200 | | | Simi Valley School Financing Authority, Unified School District, Rev., AGM, 5.000%, 08/01/17 (p) | | | 206 | |
| | 10,285 | | | University of California, Series O, Rev., 5.750%, 05/15/19 (p) | | | 11,267 | |
| | | | | | | | |
| | | | | | | 31,763 | |
| | | | | | | | |
| | | | Transportation — 0.6% | |
| | | | California Infrastructure & Economic Development Bank, Bay Area Toll Bridges, First Lien, | | | | |
| | 340 | | | Series A, Rev., AGM, 5.000%, 07/01/22 (p) | | | 400 | |
| | 2,315 | | | Series A, Rev., FGIC, 5.000%, 07/01/25 (p) | | | 2,859 | |
| | | | San Joaquin County Transportation Authority, Measure K, | | | | |
| | 2,285 | | | Rev., 5.000%, 03/01/29 | | | 2,778 | |
| | 2,000 | | | Rev., 5.000%, 03/01/30 | | | 2,412 | |
| | | | | | | | |
| | | | | | | 8,449 | |
| | | | | | | | |
| | | | Utility — 5.7% | |
| | | | City of Los Angeles, Department of Water & Power, Power System, | | | | |
| | 2,500 | | | Series A, Rev., 5.000%, 07/01/23 | | | 3,019 | |
| | 1,010 | | | Series A, Rev., 5.000%, 07/01/30 | | | 1,167 | |
| | 2,050 | | | Series A, Rev., 5.000%, 07/01/31 | | | 2,455 | |
| | 2,550 | | | Series A, Rev., 5.000%, 07/01/32 | | | 3,034 | |
| | 5,000 | | | Series A, Rev., 5.000%, 07/01/33 | | | 5,917 | |
| | 10,710 | | | Series A, Rev., 5.000%, 07/01/34 | | | 12,605 | |
| | 25,385 | | | Series B, Rev., 5.000%, 07/01/28 | | | 29,893 | |
| | 8,580 | | | Series B, Rev., 5.000%, 07/01/29 | | | 10,409 | |
| | 2,100 | | | Series B, Rev., 5.000%, 07/01/31 | | | 2,429 | |
| | 1,925 | | | Series B, Rev., 5.000%, 07/01/32 | | | 2,217 | |
| | 3,300 | | | Series D, Rev., 5.000%, 07/01/32 | | | 3,834 | |
| | 5,000 | | | Long Beach Bond Finance Authority, Natural Gas, Series A, Rev., 5.250%, 11/15/21 | | | 5,594 | |
| | 1,290 | | | Sacramento Municipal Utility District Financing Authority, Cosumnes Project, Rev., 5.000%, 07/01/28 | | | 1,538 | |
| | | | | | | | |
| | | | | | | 84,111 | |
| | | | | | | | |
| | | | Water & Sewer — 1.0% | |
| | 450 | | | City of Los Angeles, Wastewater System, Series B, Rev., 5.000%, 06/01/19 | | | 487 | |
| | 4,750 | | | City of Santa Rosa, Wastewater, Capital Appreciation, Series B, Rev., AGM-CR, AMBAC, Zero Coupon, 09/01/23 | | | 4,154 | |
| | 2,545 | | | Metropolitan Water District Southern Water Works, Series A, Rev., 5.000%, 10/01/25 | | | 2,980 | |
SEE NOTES TO FINANCIAL STATEMENTS.
| | | | | | |
| | | |
| 14 | | | | J.P. MORGAN TAX AWARE FUNDS | | APRIL 30, 2017 |
| | | | | | | | |
PRINCIPAL
AMOUNT($) | | | SECURITY DESCRIPTION | | VALUE($) | |
| | Municipal Bonds — continued | |
| | | | Water & Sewer — continued | | | | |
| | 6,000 | | | San Diego County Water Authority, Series A, Rev., 5.000%, 05/01/30 | | | 7,014 | |
| | | | | | | | |
| | | | | | | 14,635 | |
| | | | | | | | |
| | | | Total California | | | 257,728 | |
| | | | | | | | |
| | | | Colorado — 2.1% | |
| | | | General Obligation — 1.8% | |
| | 4,250 | | | Dawson Ridge Metropolitan District No.1, Series A, GO, Zero Coupon, 10/01/22 (p) | | | 3,860 | |
| | | | Douglas County School District No. Re-1, Douglas & Elbert Counties, | | | | |
| | 6,950 | | | GO, 5.250%, 12/15/23 | | | 8,421 | |
| | 2,345 | | | GO, 5.250%, 12/15/25 | | | 2,901 | |
| | 10,000 | | | Jefferson County School District No. R-1, GO, 5.000%, 12/15/22 | | | 11,786 | |
| | | | | | | | |
| | | | | | | 26,968 | |
| | | | | | | | |
| | | | Prerefunded — 0.3% | |
| | 2,170 | | | Colorado Higher Education, COP, 5.500%, 11/01/18 (p) | | | 2,316 | |
| | 1,225 | | | Platte River Power Authority, Series HH, Rev., 5.000%, 06/01/19 (p) | | | 1,325 | |
| | | | | | | | |
| | | | | | | 3,641 | |
| | | | | | | | |
| | | | Total Colorado | | | 30,609 | |
| | | | | | | | |
| | | | Connecticut — 0.8% | |
| | | | General Obligation — 0.6% | |
| | 200 | | | City of Greenwich, GO, 5.000%, 06/01/20 | | | 209 | |
| | 8,200 | | | State of Connecticut, Series E, GO, 5.000%, 08/15/30 | | | 9,294 | |
| | | | | | | | |
| | | | | | | 9,503 | |
| | | | | | | | |
| | | | Prerefunded — 0.1% | |
| | 1,000 | | | Connecticut State Health & Educational Facility Authority, Quinnipiac University, Series I, Rev., NATL-RE, 5.000%, 07/01/17 (p) | | | 1,007 | |
| | | | | | | | |
| | | | Water & Sewer — 0.1% | |
| | | | South Central Regional Water Authority, Water System Revenue, | | | | |
| | 250 | | | Series A, Rev., NATL-RE, 5.250%, 08/01/19 | | | 273 | |
| | 1,290 | | | Series A, Rev., NATL-RE, 5.250%, 08/01/20 | | | 1,451 | |
| | | | | | | | |
| | | | | | | 1,724 | |
| | | | | | | | |
| | | | Total Connecticut | | | 12,234 | |
| | | | | | | | |
| | | | Delaware — 0.2% | |
| | | | Education — 0.1% | |
| | 1,000 | | | University of Delaware, Series B, Rev., 5.000%, 11/01/21 | | | 1,093 | |
| | | | | | | | |
| | | | | | | | |
PRINCIPAL
AMOUNT($) | | | SECURITY DESCRIPTION | | VALUE($) | |
| | | | | | | | |
| | | | General Obligation — 0.1% | |
| | 1,000 | | | State of Delaware, Series C, GO, 5.000%, 03/01/21 | | | 1,141 | |
| | | | | | | | |
| | | | Total Delaware | | | 2,234 | |
| | | | | | | | |
| | | | District of Columbia — 0.9% | |
| | | | Special Tax — 0.1% | |
| | 2,000 | | | District of Columbia, Income Tax, Series A, Rev., 5.000%, 12/01/20 | | | 2,264 | |
| | | | | | | | |
| | | | Water & Sewer — 0.8% | |
| | | | District of Columbia Water & Sewer Authority, Sub Lien, | | | | |
| | 5,000 | | | Series C, Rev., 5.000%, 10/01/25 | | | 5,766 | |
| | 5,000 | | | Series C, Rev., 5.000%, 10/01/29 | | | 5,654 | |
| | | | | | | | |
| | | | | | | 11,420 | |
| | | | | | | | |
| | | | Total District of Columbia | | | 13,684 | |
| | | | | | | | |
| | | | Florida — 2.9% | |
| | | | General Obligation — 2.9% | |
| | | | Florida State Board of Education, Public Education Capital Outlay, | | | | |
| | 5,090 | | | Series A, GO, 5.000%, 06/01/24 | | | 5,710 | |
| | 32,375 | | | Series D, GO, 5.000%, 06/01/25 | | | 36,898 | |
| | | | | | | | |
| | | | Total Florida | | | 42,608 | |
| | | | | | | | |
| | | | Georgia — 1.8% | |
| | | | General Obligation — 0.4% | |
| | | | State of Georgia, | | | | |
| | 300 | | | Series B, GO, 5.000%, 07/01/20 | | | 336 | |
| | 1,000 | | | Series B, GO, 5.750%, 08/01/17 | | | 1,013 | |
| | 3,960 | | | Series E, GO, 5.000%, 12/01/25 | | | 4,903 | |
| | | | | | | | |
| | | | | | | 6,252 | |
| | | | | | | | |
| | | | Transportation — 0.5% | |
| | 6,000 | | | City of Atlanta, Airport, Series A, Rev., 5.000%, 01/01/21 | | | 6,773 | |
| | | | | | | | |
| | | | Water & Sewer — 0.9% | |
| | 6,895 | | | Cobb County, Water & Sewer, Rev., 5.000%, 07/01/22 | | | 7,456 | |
| | 5,000 | | | Fulton County, Water & Sewerage, Rev., 5.000%, 01/01/23 | | | 5,645 | |
| | 125 | | | Henry County Water & Sewerage Authority, Rev., 5.000%, 02/01/29 | | | 142 | |
| | | | | | | | |
| | | | | | | 13,243 | |
| | | | | | | | |
| | | | Total Georgia | | | 26,268 | |
| | | | | | | | |
SEE NOTES TO FINANCIAL STATEMENTS.
| | | | | | | | |
| | | |
| APRIL 30, 2017 | | J.P. MORGAN TAX AWARE FUNDS | | | | | 15 | |
JPMorgan Tax Aware Real Return Fund
SCHEDULE OF PORTFOLIO INVESTMENTS
AS OF APRIL 30, 2017 (Unaudited) (continued)
(Amounts in thousands)
| | | | | | | | |
PRINCIPAL
AMOUNT($) | | | SECURITY DESCRIPTION | | VALUE($) | |
| | Municipal Bonds — continued | |
| | | | Idaho — 0.6% | |
| | | | Prerefunded — 0.6% | |
| | 8,000 | | | Idaho Health Facilities Authority, Trinity Health Group, Series B, Rev., 6.000%, 12/01/18 (p) | | | 8,628 | |
| | | | | | | | |
| | | | Illinois — 0.9% | |
| | | | General Obligation — 0.1% | |
| | 140 | | | Du Page & Will Counties Community School District No. 204 Indian Prairie, School Building, Series F, GO, AGM-CR, FGIC, 6.250%, 12/30/21 | | | 169 | |
| | 625 | | | Village of Schaumburg, Series A, GO, 4.000%, 12/01/20 | | | 681 | |
| | | | | | | | |
| | | | | | | 850 | |
| | | | | | | | |
| | | | Other Revenue — 0.2% | |
| | | | City of Chicago, Motor Fuel Tax, | | | | |
| | 75 | | | Rev., 5.000%, 01/01/20 | | | 79 | |
| | 200 | | | Rev., 5.000%, 01/01/21 | | | 213 | |
| | 105 | | | Rev., 5.000%, 01/01/22 | | | 112 | |
| | 3,000 | | | City of Chicago, Sales Tax, Rev., AGM, 5.000%, 01/01/18 | | | 3,040 | |
| | | | | | | | |
| | | | | | | 3,444 | |
| | | | | | | | |
| | | | Transportation — 0.3% | |
| | 3,000 | | | Illinois State Toll Highway Authority, Series A, Rev., 5.000%, 12/01/22 | | | 3,502 | |
| | 750 | | | Regional Transportation Authority, Series A, Rev., NATL-RE, 6.000%, 07/01/24 | | | 936 | |
| | | | | | | | |
| | | | | | | 4,438 | |
| | | | | | | | |
| | | | Water & Sewer — 0.3% | |
| | 1,125 | | | City of Chicago, Wastewater Transmission, Series A, Rev., BHAC-CR, 5.250%, 01/01/30 | | | 1,151 | |
| | | | City of Chicago, Water Revenue, Second Lien Project, | | | | |
| | 1,000 | | | Rev., 5.000%, 11/01/21 | | | 1,117 | |
| | 400 | | | Rev., 5.000%, 11/01/22 | | | 453 | |
| | 1,000 | | | Rev., 5.000%, 11/01/29 | | | 1,099 | |
| | | | | | | | |
| | | | | | | 3,820 | |
| | | | | | | | |
| | | | Total Illinois | | | 12,552 | |
| | | | | | | | |
| | | | Indiana — 1.4% | |
| | | | Education — 0.1% | |
| | 1,030 | | | South Bend Community School Corp., First Mortgage, Rev., AGM, 5.000%, 07/05/17 | | | 1,038 | |
| | | | | | | | |
| | | | Other Revenue — 1.0% | |
| | 1,110 | | | Fort Wayne Redevelopment Authority, Lease Rental, Harrison Square Project, Rev., 5.000%, 02/01/26 | | | 1,302 | |
| | | | | | | | |
PRINCIPAL
AMOUNT($) | | | SECURITY DESCRIPTION | | VALUE($) | |
| | |
| | | | Other Revenue — continued | |
| | 9,870 | | | Indiana Finance Authority, Revolving Fund, Series A, Rev., 5.000%, 02/01/26 | | | 11,245 | |
| | 1,750 | | | Indianapolis Local Public Improvement Bond Bank, Pilot Infrastructure Project, Series F, Rev., AGM, 5.000%, 01/01/22 | | | 1,926 | |
| | | | | | | | |
| | | | | | | 14,473 | |
| | | | | | | | |
| | | | Utility — 0.3% | |
| | 4,050 | | | Indianapolis Local Public Improvement Bond Bank, Stormwater Project, Series D, Rev., 5.000%, 01/01/26 | | | 4,666 | |
| | | | | | | | |
| | | | Water & Sewer — 0.0% (g) | |
| | | | City of Evansville, Waterworks District, | | | | |
| | 325 | | | Series B, Rev., 5.000%, 01/01/22 | | | 369 | |
| | 375 | | | Series B, Rev., 5.000%, 01/01/23 | | | 426 | |
| | | | | | | | |
| | | | | | | 795 | |
| | | | | | | | |
| | | | Total Indiana | | | 20,972 | |
| | | | | | | | |
| | | | Iowa — 0.4% | |
| | | | Other Revenue — 0.4% | |
| | 5,440 | | | Iowa Finance Authority, State Revolving Fund, Rev., 5.000%, 08/01/26 | | | 6,221 | |
| | | | | | | | |
| | | | Kentucky — 1.5% | |
| | | | Education — 0.6% | |
| | 1,190 | | | Meade Country School District Finance Corp., School Building, Rev., 5.000%, 09/01/26 | | | 1,415 | |
| | 6,000 | | | Oldham County, School District Finance Corp., School Building, Rev., 5.000%, 06/01/26 | | | 7,150 | |
| | | | | | | | |
| | | | | | | 8,565 | |
| | | | | | | | |
| | | | Prerefunded — 0.5% | |
| | 7,145 | | | Kentucky State Property & Buildings Commission, Project No. 89, Rev., AGM, 5.000%, 11/01/18 (p) | | | 7,580 | |
| | | | | | | | |
| | | | Transportation — 0.4% | |
| | 5,185 | | | Kentucky Turnpike Authority, Revitalization Projects, Series A, Rev., 5.000%, 07/01/28 | | | 5,849 | |
| | | | | | | | |
| | | | Total Kentucky | | | 21,994 | |
| | | | | | | | |
| | | | Louisiana — 0.8% | |
| | | | Housing — 0.2% | |
| | 3,270 | | | Louisiana Public Facilities Authority, Multi-Family Housing, CR, Series A, Rev., Zero Coupon, 02/01/20 (p) | | | 3,151 | |
| | | | | | | | |
| | | | Other Revenue — 0.5% | |
| | 3,000 | | | Louisiana Local Government Environmental Facilities & Community Development Authority, LCTCS Act 360 Project, Rev., 5.000%, 10/01/32 | | | 3,435 | |
SEE NOTES TO FINANCIAL STATEMENTS.
| | | | | | |
| | | |
| 16 | | | | J.P. MORGAN TAX AWARE FUNDS | | APRIL 30, 2017 |
| | | | | | | | |
PRINCIPAL
AMOUNT($) | | | SECURITY DESCRIPTION | | VALUE($) | |
| | Municipal Bonds — continued | |
| | | | Other Revenue — continued | |
| | 4,375 | | | Louisiana Public Facilities Authority, CR, Series B, Rev., Zero Coupon, 12/01/19 (p) | | | 4,230 | |
| | | | | | | | |
| | | | | | | 7,665 | |
| | | | | | | | |
| | | | Utility — 0.1% | |
| | 1,250 | | | City of Alexandria, Utilities, Series A, Rev., 5.000%, 05/01/43 | | | 1,384 | |
| | | | | | | | |
| | | | Total Louisiana | | | 12,200 | |
| | | | | | | | |
| | | | Massachusetts — 5.0% | |
| | | | General Obligation — 1.8% | |
| | | | Commonwealth of Massachusetts, | | | | |
| | 9,000 | | | Series A, GO, 5.250%, 08/01/19 | | | 9,845 | |
| | 200 | | | Series C, GO, AGM, 5.500%, 12/01/22 | | | 242 | |
| | | | Commonwealth of Massachusetts, Consolidated Loan of 2014, | | | | |
| | 5,000 | | | Series C, GO, 4.000%, 07/01/31 | | | 5,287 | |
| | 2,500 | | | Series C, GO, 5.000%, 07/01/23 | | | 2,932 | |
| | 6,875 | | | Series F, GO, 5.000%, 11/01/26 | | | 8,057 | |
| | | | | | | | |
| | | | | | | 26,363 | |
| | | | | | | | |
| | | | Other Revenue — 0.6% | |
| | 7,420 | | | Massachusetts School Building Authority, Dedicated Sales Tax, Series B, Rev., 5.000%, 08/15/30 | | | 8,565 | |
| | | | | | | | |
| | | | Prerefunded — 1.1% | |
| | 13,300 | | | Commonwealth of Massachusetts, Consolidated Loan of 2014, Series F, GO, 5.000%, 11/01/22 (p) | | | 15,685 | |
| | | | | | | | |
| | | | Transportation — 0.9% | |
| | 10,000 | | | Massachusetts Bay Transportation Authority, Series A, Rev., 5.250%, 07/01/27 | | | 12,503 | |
| | | | | | | | |
| | | | Water & Sewer — 0.6% | |
| | 8,280 | | | Massachusetts Clean Water Trust (The), Green Bond, Series 20, Rev., 5.000%, 02/01/36 | | | 9,523 | |
| | | | | | | | |
| | | | Total Massachusetts | | | 72,639 | |
| | | | | | | | |
| | | | Michigan — 1.2% | |
| | | | General Obligation — 0.2% | |
| | 2,000 | | | Huron Valley School District, GO, Q-SBLF, 5.000%, 05/01/24 | | | 2,243 | |
| | | | | | | | |
| | | | Other Revenue — 0.1% | |
| | 1,240 | | | State of Michigan, Trunk Line Fund, Rev., 5.000%, 11/15/28 | | | 1,404 | |
| | | | | | | | |
| | | | Prerefunded — 0.3% | |
| | 4,170 | | | University of Michigan, Series A, Rev., 5.000%, 04/01/19 (p) | | | 4,483 | |
| | | | | | | | |
| | | | | | | | |
PRINCIPAL
AMOUNT($) | | | SECURITY DESCRIPTION | | VALUE($) | |
| | | | | | | | |
| | | | Water & Sewer — 0.6% | |
| | 8,545 | | | City of Grand Rapids, Sanitary Sewer System, Series A, Rev., AGM-CR, BHAC-CR, FGIC, 5.500%, 01/01/22 | | | 9,528 | |
| | | | | | | | |
| | | | Total Michigan | | | 17,658 | |
| | | | | | | | |
| | | | Minnesota — 1.5% | |
| | | | General Obligation — 0.7% | |
| | 775 | | | Olmsted County, Crossover, Series A, GO, 5.000%, 02/01/21 | | | 881 | |
| | 8,275 | | | State of Minnesota, Various Purpose, Series F, GO, 5.000%, 08/01/20 | | | 9,280 | |
| | | | | | | | |
| | | | | | | 10,161 | |
| | | | | | | | |
| | | | Other Revenue — 0.8% | |
| | 9,705 | | | State of Minnesota, General Fund Refunding Appropriation, Series B, Rev., 5.000%, 03/01/25 | | | 11,156 | |
| | | | | | | | |
| | | | Total Minnesota | | | 21,317 | |
| | | | | | | | |
| | | | Missouri — 0.8% | |
| | | | Industrial Development Revenue/Pollution Control Revenue — 0.0% (g) | |
| | | | Missouri Environmental Improvement & Energy Resources Authority, Water Pollution Control & Drinking Water, | | | | |
| | 15 | | | Series A, Rev., 5.000%, 01/01/19 (p) | | | 16 | |
| | 365 | | | Series B, Rev., 5.000%, 07/01/25 | | | 411 | |
| | | | | | | | |
| | | | | | | 427 | |
| | | | | | | | |
| | | | Other Revenue — 0.5% | |
| | 6,620 | | | Kansas City Industrial Development Authority, Downtown Redevelopment District, Series A, Rev., 5.000%, 09/01/21 | | | 7,453 | |
| | | | | | | | |
| | | | Prerefunded — 0.0% (g) | |
| | 20 | | | Missouri Environmental Improvement & Energy Resources Authority, Water Pollution Control & Drinking Water, Series A, Rev., 5.000%, 01/01/20 (p) | | | 22 | |
| | | | | | | | |
| | | | Transportation — 0.3% | |
| | 4,060 | | | Missouri Highways & Transportation Commission, Federal Reimbursement, Series A, Rev., 5.000%, 05/01/20 | | | 4,384 | |
| | | | | | | | |
| | | | Total Missouri | | | 12,286 | |
| | | | | | | | |
| | | | Nebraska — 0.4% | |
| | | | Prerefunded — 0.0% (g) | |
| | 155 | | | Nebraska Public Power District, Series B, Rev., AGM, 5.000%, 07/01/17 (p) | | | 156 | |
| | | | | | | | |
SEE NOTES TO FINANCIAL STATEMENTS.
| | | | | | | | |
| | | |
| APRIL 30, 2017 | | J.P. MORGAN TAX AWARE FUNDS | | | | | 17 | |
JPMorgan Tax Aware Real Return Fund
SCHEDULE OF PORTFOLIO INVESTMENTS
AS OF APRIL 30, 2017 (Unaudited) (continued)
(Amounts in thousands)
| | | | | | | | |
PRINCIPAL
AMOUNT($) | | | SECURITY DESCRIPTION | | VALUE($) | |
| | Municipal Bonds — continued | |
| | | | Utility — 0.4% | |
| | 445 | | | Nebraska Public Power District, Series B, Rev., AGM, 5.000%, 01/01/18 | | | 448 | |
| | 5,000 | | | Omaha Public Power District, Electric System, Series A, Rev., 4.000%, 02/01/32 | | | 5,289 | |
| | | | | | | | |
| | | | | | | 5,737 | |
| | | | | | | | |
| | | | Total Nebraska | | | 5,893 | |
| | | | | | | | |
| | | | New Hampshire — 0.3% | |
| | | | Prerefunded — 0.3% | |
| | 4,505 | | | New Hampshire Municipal Bond Bank, Series E, Rev., 5.000%, 01/15/20 (p) | | | 4,957 | |
| | | | | | | | |
| | | | New Jersey — 2.2% | |
| | | | Education — 1.3% | |
| | | | New Jersey Economic Development Authority, School Facilities Construction, | | | | |
| | 10,000 | | | Series PP, Rev., 5.000%, 06/15/29 | | | 10,257 | |
| | 3,500 | | | Series XX, Rev., 5.000%, 06/15/19 | | | 3,675 | |
| | 5,145 | | | Series XX, Rev., 5.000%, 06/15/21 | | | 5,478 | |
| | | | | | | | |
| | | | | | | 19,410 | |
| | | | | | | | |
| | | | General Obligation — 0.2% | |
| | 850 | | | North Brunswick Township Board of Education, GO, 5.000%, 07/15/22 | | | 953 | |
| | | | Township of Woodbridge, | | | | |
| | 1,100 | | | GO, 5.000%, 07/15/22 | | | 1,223 | |
| | 1,200 | | | GO, 5.000%, 07/15/23 | | | 1,333 | |
| | | | | | | | |
| | | | | | | 3,509 | |
| | | | | | | | |
| | | | Transportation — 0.6% | |
| | 2,500 | | | New Jersey Transportation Trust Fund Authority, Transportation Program, Series AA, Rev., 5.000%, 06/15/36 | | | 2,517 | |
| | 5,000 | | | New Jersey Transportation Trust Fund Authority, Transportation System, Series B, Rev., AMBAC, 5.250%, 12/15/22 | | | 5,482 | |
| | | | | | | | |
| | | | | | | 7,999 | |
| | | | | | | | |
| | | | Water & Sewer — 0.1% | |
| | 1,995 | | | Sussex County Municipal Utilities Authority, Wastewater Facilities, Capital Appreciation, Series B, Rev., AGM, Zero Coupon, 12/01/20 | | | 1,869 | |
| | | | | | | | |
| | | | Total New Jersey | | | 32,787 | |
| | | | | | | | |
| | | | New Mexico — 0.9% | |
| | | | Other Revenue — 0.8% | |
| | | | New Mexico Finance Authority, Senior Lien Public Project, | | | | |
| | 1,625 | | | Series B, Rev., 5.000%, 06/01/22 | | | 1,693 | |
| | 1,690 | | | Series B, Rev., 5.000%, 06/01/23 | | | 1,760 | |
| | | | | | | | |
PRINCIPAL
AMOUNT($) | | | SECURITY DESCRIPTION | | VALUE($) | |
| | | | | | | | |
| | | | Other Revenue — continued | |
| | 1,820 | | | Series B, Rev., 5.000%, 06/01/25 | | | 1,894 | |
| | 1,965 | | | Series B, Rev., 5.000%, 06/01/27 | | | 2,043 | |
| | 4,200 | | | Series C, Rev., 5.000%, 06/01/22 | | | 4,778 | |
| | | | | | | | |
| | | | | | | 12,168 | |
| | | | | | | | |
| | | | Transportation — 0.1% | |
| | 1,385 | | | New Mexico Finance Authority, State Transportation, Sub Lien, Series A-2, Rev., 5.000%, 12/15/21 | | | 1,559 | |
| | | | | | | | |
| | | | Total New Mexico | | | 13,727 | |
| | | | | | | | |
| | | | New York — 20.9% | |
| | | | General Obligation — 1.2% | |
| | 5,000 | | | City of New York, Fiscal Year 2010, Series E, GO, 5.000%, 08/01/23 | | | 5,435 | |
| | | | City of New York, Fiscal Year 2013, | | | | |
| | 6,085 | | | Series D, GO, 5.000%, 08/01/28 | | | 7,040 | |
| | 4,050 | | | Series F, Sub Series F-1, GO, 5.000%, 03/01/30 | | | 4,639 | |
| | | | | | | | |
| | | | | | | 17,114 | |
| | | | | | | | |
| | | | Hospital — 0.0% (g) | |
| | 510 | | | New York State Dormitory Authority, Mental Health Services Facilities Improvement, Series D, Rev., AGM, 5.000%, 02/15/18 | | | 512 | |
| | | | | | | | |
| | | | Industrial Development Revenue/Pollution Control Revenue — 0.7% | |
| | 9,475 | | | New York Liberty Development Corp., World Trade Centrer Projects, Class 1, Rev., 5.000%, 09/15/30 | | | 10,847 | |
| | | | | | | | |
| | | | Other Revenue — 7.0% | |
| | 6,750 | | | New York City Transitional Finance Authority, Building Aid, Fiscal Year 2007, Series S-2, Rev., NATL-RE, 5.000%, 01/15/22 | | | 6,772 | |
| | 3,745 | | | New York City Transitional Finance Authority, Future Tax Secured, Fiscal Year 2010, Series B, Rev., 5.000%, 11/01/21 | | | 4,121 | |
| | 9,000 | | | New York City Transitional Finance Authority, Future Tax Secured, Fiscal Year 2012, Series D, Sub Series D-1, Rev., 5.000%, 11/01/31 | | | 10,215 | |
| | 10,000 | | | New York City Transitional Finance Authority, Future Tax Secured, Fiscal Year 2013, Sub Series F-1, Rev., 5.000%, 02/01/31 | | | 11,466 | |
| | 10,000 | | | New York Convention Center Development Corp., Hotel Unit Fee Secured, Rev., AGM-CR, Zero Coupon, 11/15/52 | | | 2,156 | |
| | 7,875 | | | New York Local Government Assistance Corp., Sub Lien, Series A-5/6, Rev., 5.500%, 04/01/19 | | | 8,548 | |
SEE NOTES TO FINANCIAL STATEMENTS.
| | | | | | |
| | | |
| 18 | | | | J.P. MORGAN TAX AWARE FUNDS | | APRIL 30, 2017 |
| | | | | | | | |
PRINCIPAL
AMOUNT($) | | | SECURITY DESCRIPTION | | VALUE($) | |
| | Municipal Bonds — continued | |
| | | | Other Revenue — continued | |
| | 8,500 | | | New York State Dormitory Authority, Consolidated Services Contract, Series A, Rev., 5.000%, 07/01/23 | | | 9,224 | |
| | | | New York State Dormitory Authority, State Sales Tax, | | | | |
| | 3,000 | | | Series A, Rev., 5.000%, 03/15/28 | | | 3,559 | |
| | 5,000 | | | Series A, Rev., 5.000%, 03/15/29 | | | 5,891 | |
| | 1,000 | | | Series A, Rev., 5.000%, 03/15/33 | | | 1,150 | |
| | 4,225 | | | Series A, Rev., 5.000%, 03/15/34 | | | 4,834 | |
| | | | New York State Urban Development Corp., Service Contract, | | | | |
| | 15,000 | | | Series B, Rev., 5.250%, 01/01/25 | | | 15,747 | |
| | 5,000 | | | Series D, Rev., 5.500%, 01/01/19 | | | 5,371 | |
| | | | Sales Tax Asset Receivable Corp., Fiscal Year 2015, | | | | |
| | 1,800 | | | Series A, Rev., 5.000%, 10/15/28 | | | 2,150 | |
| | 7,500 | | | Series A, Rev., 5.000%, 10/15/29 | | | 8,895 | |
| | 1,850 | | | Series A, Rev., 5.000%, 10/15/31 | | | 2,177 | |
| | | | | | | | |
| | | | | | | 102,276 | |
| | | | | | | | |
| | | | Prerefunded — 1.3% | |
| | 805 | | | Metropolitan Transportation Authority, | | | | |
| | | | Series C, Rev., 6.500%, 11/15/18 (p) | | | 874 | |
| | 350 | | | New York City Municipal Water Finance Authority, Water & Sewer System, Second General Resolution, Series CC, Rev., 5.000%, 06/15/18 (p) | | | 366 | |
| | 5 | | | New York City Transitional Finance Authority, Future Tax Secured, Fiscal Year 2010, Series B, Rev., 5.000%, 11/01/19 (p) | | | 6 | |
| | 10,000 | | | New York State Dormitory Authority, State Personal Income Tax, Education, Series A, Rev., 5.000%, 03/15/18 (p) | | | 10,363 | |
| | 4,395 | | | New York State Dormitory Authority, University Dormitory Facilities, Series A, Rev., 5.000%, 07/01/18 (p) | | | 4,607 | |
| | 1,000 | | | New York State Environmental Facilities Corp., State Personal Income Tax, Series A, Rev., 5.000%, 12/15/17 (p) | | | 1,026 | |
| | 1,865 | | | Triborough Bridge & Tunnel Authority, Series A-2, Rev., 5.000%, 11/15/18 (p) | | | 1,981 | |
| | | | | | | | |
| | | | | | | 19,223 | |
| | | | | | | | |
| | | | Special Tax — 2.9% | |
| | 7,250 | | | New York State Dormitory Authority, State Personal Income Tax, Series C, Rev., 5.000%, 03/15/31 | | | 8,399 | |
| | 4,000 | | | New York State Dormitory Authority, State Personal Income Tax, Education, Series A, Rev., 5.000%, 03/15/23 | | | 4,292 | |
| | | | | | | | |
PRINCIPAL
AMOUNT($) | | | SECURITY DESCRIPTION | | VALUE($) | |
| | | | | | | | |
| | | | Special Tax — continued | |
| | | | New York State Dormitory Authority, State Personal Income Tax, General Purpose, | | | | |
| | 12,500 | | | Series C, Rev., 5.000%, 03/15/33 | | | 14,404 | |
| | 3,500 | | | Series C, Rev., 5.000%, 03/15/41 | | | 3,863 | |
| | 10,000 | | | New York State Thruway Authority, State Personal Income Tax, Transportation, Series A, Rev., 5.000%, 03/15/26 | | | 11,211 | |
| | | | | | | | |
| | | | | | | 42,169 | |
| | | | | | | | |
| | | | Transportation — 3.9% | |
| | | | Metropolitan Transportation Authority, | | | | |
| | 1,500 | | | Series A, Rev., 5.000%, 11/15/41 | | | 1,680 | |
| | 195 | | | Series C, Rev., 6.500%, 11/15/28 | | | 212 | |
| | 5,000 | | | Subseries C-1, Rev., 5.250%, 11/15/28 | | | 6,005 | |
| | 2,530 | | | New York Transportation Development Corp., Special Facilities, Laguardia Airport Terminal B Redevelopment Project, Series A, Rev., AMT, 4.000%, 07/01/31 | | | 2,609 | |
| | | | Port Authority of New York & New Jersey, Consolidated, | | | | |
| | 2,965 | | | Rev., 5.000%, 05/01/34 | | | 3,247 | |
| | 2,000 | | | Rev., 5.000%, 05/01/35 | | | 2,187 | |
| | 6,500 | | | Rev., 5.000%, 10/15/41 | | | 7,382 | |
| | 3,105 | | | Triborough Bridge & Tunnel Authority, Series A-2, Rev., 5.000%, 11/15/28 | | | 3,291 | |
| | | | Triborough Bridge & Tunnel Authority, MTA Bridges & Tunnels, | | | | |
| | 25,000 | | | Series A, Rev., 5.000%, 01/01/26 | | | 28,801 | |
| | 1,250 | | | Series B, Rev., 5.000%, 11/15/31 | | | 1,440 | |
| | | | | | | | |
| | | | | | | 56,854 | |
| | | | | | | | |
| | | | Utility — 0.7% | |
| | | | Utility Debt Securitization Authority, | | | | |
| | 4,000 | | | Series TE, Rev., 5.000%, 12/15/28 | | | 4,729 | |
| | 4,250 | | | Series TE, Rev., 5.000%, 12/15/41 | | | 4,853 | |
| | | | | | | | |
| | | | | | | 9,582 | |
| | | | | | | | |
| | | | Water & Sewer — 3.2% | |
| | 380 | | | New York City Municipal Water Finance Authority, Water & Sewer System Second General Resolution, Fiscal Year 2009, Series AA, Rev., 5.000%, 06/15/17 (p) | | | 382 | |
| | 2,150 | | | New York City Municipal Water Finance Authority, Water & Sewer System, Second General Resolution, Series CC, Rev., 5.000%, 06/15/29 | | | 2,255 | |
| | 16,335 | | | New York City Municipal Water Finance Authority, Water & Sewer System, Second General Resolution, Fiscal Year 2010, Series FF, Rev., 5.000%, 06/15/24 | | | 18,272 | |
SEE NOTES TO FINANCIAL STATEMENTS.
| | | | | | | | |
| | | |
| APRIL 30, 2017 | | J.P. MORGAN TAX AWARE FUNDS | | | | | 19 | |
JPMorgan Tax Aware Real Return Fund
SCHEDULE OF PORTFOLIO INVESTMENTS
AS OF APRIL 30, 2017 (Unaudited) (continued)
(Amounts in thousands)
| | | | | | | | |
PRINCIPAL
AMOUNT($) | | | SECURITY DESCRIPTION | | VALUE($) | |
| | Municipal Bonds — continued | |
| | | | Water & Sewer — continued | |
| | 3,000 | | | New York City Municipal Water Finance Authority, Water & Sewer System, Second General Resolution, Fiscal Year 2015, Series FF, Rev., 5.000%, 06/15/31 | | | 3,525 | |
| | 10,225 | | | New York State Environmental Facilities Corp., State Clean Water & Drinking Water, Series C, Rev., 5.000%, 06/15/21 | | | 10,281 | |
| | | | New York State Environmental Facilities Corp., State Clean Water & Drinking Water Revolving Funds, New York City Municipal Water Finance Authority Projects — Second Resolution, | | | | |
| | 2,750 | | | Series A, Rev., 5.000%, 06/15/26 | | | 3,426 | |
| | 3,500 | | | Series A, Rev., 5.000%, 06/15/27 | | | 4,388 | |
| | 3,000 | | | Series A, Rev., 5.000%, 06/15/28 | | | 3,723 | |
| | | | | | | | |
| | | | | | | 46,252 | |
| | | | | | | | |
| | | | Total New York | | | 304,829 | |
| | | | | | | | |
| | | | North Carolina — 0.7% | |
| | | | Prerefunded — 0.6% | |
| | 2,170 | | | City of High Point, Combined Enterprise System, Rev., AGM, 5.000%, 11/01/18 (p) | | | 2,301 | |
| | 5,950 | | | Wake County, Hammond Road Detention Center, Limited Obligation, Rev., 5.000%, 06/01/19 (p) | | | 6,437 | |
| | | | | | | | |
| | | | | | | 8,738 | |
| | | | | | | | |
| | | | Transportation — 0.1% | |
| | 700 | | | North Carolina Turnpike Authority, Triangle Expressway System, Senior Lien, Rev., AGM, 5.000%, 01/01/29 | | | 826 | |
| | | | | | | | |
| | | | Total North Carolina | | | 9,564 | |
| | | | | | | | |
| | | | Ohio — 0.8% | |
| | | | Other Revenue — 0.2% | |
| | 550 | | | City of Cleveland, Parking Facilities, Rev., AGM, 5.250%, 09/15/18 (p) | | | 583 | |
| | 2,235 | | | Ohio State Building Authority, State Facilities, Adult Correctional Building Fund Projects, Series B, Rev., 5.000%, 10/01/22 | | | 2,449 | |
| | | | | | | | |
| | | | | | | 3,032 | |
| | | | | | | | |
| | | | Prerefunded — 0.4% | |
| | 4,750 | | | City of Columbus, Series 1, GO, 5.000%, 07/01/23 (p) | | | 5,676 | |
| | 670 | | | State of Ohio, Higher Educational Facility, Denison University 2007 Project, Rev., 5.000%, 11/01/17 (p) | | | 684 | |
| | | | | | | | |
| | | | | | | 6,360 | |
| | | | | | | | |
| | | | | | | | |
PRINCIPAL
AMOUNT($) | | | SECURITY DESCRIPTION | | VALUE($) | |
| | | | | | | | |
| | | | Water & Sewer — 0.2% | |
| | | | Northeast Ohio Regional Sewer District, Wastewater Improvement, | | | | |
| | 555 | | | Rev., 5.000%, 11/15/25 | | | 666 | |
| | 1,500 | | | Rev., 5.000%, 11/15/27 | | | 1,782 | |
| | | | | | | | |
| | | | | | | 2,448 | |
| | | | | | | | |
| | | | Total Ohio | | | 11,840 | |
| | | | | | | | |
| | | | Oklahoma — 0.7% | |
| | | | Transportation — 0.6% | |
| | | | Oklahoma Turnpike Authority, Turnpike System, Second Senior, | | | | |
| | 3,000 | | | Series A, Rev., 5.000%, 01/01/22 | | | 3,379 | |
| | 2,000 | | | Series A, Rev., 5.000%, 01/01/24 | | | 2,251 | |
| | 2,000 | | | Series A, Rev., 5.000%, 01/01/38 | | | 2,285 | |
| | | | | | | | |
| | | | | | | 7,915 | |
| | | | | | | | |
| | | | Water & Sewer — 0.1% | |
| | 1,380 | | | Oklahoma City Water Utilities Trust, Water & Sewer System, Rev., 5.000%, 07/01/27 | | | 1,630 | |
| | | | | | | | |
| | | | Total Oklahoma | | | 9,545 | |
| | | | | | | | |
| | | | Oregon — 1.1% | |
| | | | General Obligation — 0.0% (g) | |
| | 100 | | | Marion County, GO, AMBAC, 5.500%, 06/01/23 | | | 122 | |
| | | | | | | | |
| | | | Other Revenue — 0.1% | |
| | 1,500 | | | Oregon State Department of Administrative Services, Lottery, Series A, Rev., 5.000%, 04/01/27 | | | 1,744 | |
| | | | | | | | |
| | | | Prerefunded — 0.8% | |
| | | | Oregon State Department of Administrative Services, | | | | |
| | 6,965 | | | Series A, COP, 5.000%, 05/01/19 (p) | | | 7,504 | |
| | 3,425 | | | Series A, COP, 5.000%, 05/01/19 (p) | | | 3,695 | |
| | | | | | | | |
| | | | | | | 11,199 | |
| | | | | | | | |
| | | | Water & Sewer — 0.2% | |
| | 2,180 | | | City of Portland, Sewer System, Second Lien, Series B, Rev., 4.000%, 10/01/36 | | | 2,287 | |
| | | | | | | | |
| | | | Total Oregon | | | 15,352 | |
| | | | | | | | |
| | | | Pennsylvania — 0.7% | |
| | | | General Obligation — 0.3% | |
| | 4,195 | | | Commonwealth of Pennsylvania, Third Series, GO, 5.375%, 07/01/21 | | | 4,826 | |
| | | | | | | | |
| | | | Prerefunded — 0.4% | |
| | 3,225 | | | Pennsylvania State University, | | | | |
| | | | Series A, Rev., 5.000%, 03/01/19 (p) | | | 3,457 | |
SEE NOTES TO FINANCIAL STATEMENTS.
| | | | | | |
| | | |
| 20 | | | | J.P. MORGAN TAX AWARE FUNDS | | APRIL 30, 2017 |
| | | | | | | | |
PRINCIPAL
AMOUNT($) | | | SECURITY DESCRIPTION | | VALUE($) | |
| | Municipal Bonds — continued | |
| | | | Prerefunded — continued | |
| | 1,860 | | | Red Lion Area School District, GO, AGM, 5.000%, 05/01/18 (p) | | | 1,937 | |
| | | | | | | | |
| | | | | | | 5,394 | |
| | | | | | | | |
| | | | Total Pennsylvania | | | 10,220 | |
| | | | | | | | |
| | | | Rhode Island — 0.1% | |
| | | | Education — 0.0% (g) | |
| | 655 | | | Rhode Island Health & Educational Building Corp., Brown University, Series A, Rev., 5.000%, 09/01/25 | | | 744 | |
| | | | | | | | |
| | | | General Obligation — 0.1% | |
| | 1,000 | | | State of Rhode Island & Providence Plantations, Consolidated Capital Development Loan of 2014, Series A, GO, 5.000%, 11/01/24 | | | 1,190 | |
| | | | | | | | |
| | | | Total Rhode Island | | | 1,934 | |
| | | | | | | | |
| | | | South Carolina — 0.8% | |
| | | | Prerefunded — 0.2% | |
| | 2,220 | | | City of Charleston, Waterworks & Sewer System, Series A, Rev., 5.000%, 01/01/19 (p) | | | 2,367 | |
| | | | | | | | |
| | | | Utility — 0.5% | |
| | 7,000 | | | Piedmont Municipal Power Agency, Series A-3, Rev., AGC, 5.000%, 01/01/18 | | | 7,188 | |
| | | | | | | | |
| | | | Water & Sewer — 0.1% | |
| | 1,500 | | | City of Columbia, Rev., 5.000%, 02/01/26 | | | 1,729 | |
| | | | | | | | |
| | | | Total South Carolina | | | 11,284 | |
| | | | | | | | |
| | | | Tennessee — 0.1% | |
| | | | General Obligation — 0.1% | |
| | 835 | | | Metropolitan Government of Nashville & Davidson County, GO, 5.000%, 07/01/24 | | | 972 | |
| | | | | | | | |
| | | | Prerefunded — 0.0% (g) | |
| | 195 | | | Metropolitan Government of Nashville & Davidson County, GO, 5.000%, 07/01/22 (p) | | | 228 | |
| | | | | | | | |
| | | | Total Tennessee | | | 1,200 | |
| | | | | | | | |
| | | | Texas — 9.3% | |
| | | | Education — 0.3% | |
| | 500 | | | University of Texas, Financing System, Series C, Rev., 5.000%, 08/15/18 | | | 526 | |
| | | | Waco Educational Finance Corp., Baylor University, | | | | |
| | 2,275 | | | Series C, Rev., 5.000%, 03/01/21 | | | 2,352 | |
| | 1,215 | | | Series C, Rev., 5.000%, 03/01/22 | | | 1,256 | |
| | | | | | | | |
| | | | | | | 4,134 | |
| | | | | | | | |
| | | | | | | | |
PRINCIPAL
AMOUNT($) | | | SECURITY DESCRIPTION | | VALUE($) | |
| | | | | | | | |
| | | | General Obligation — 4.1% | |
| | | | Carroll Independent School District, | | | | |
| | 1,000 | | | Series C, GO, 5.000%, 02/15/20 | | | 1,070 | |
| | 945 | | | Series C, GO, 5.000%, 02/15/22 | | | 1,012 | |
| | 325 | | | Series C, GO, 5.000%, 02/15/23 | | | 348 | |
| | 4,485 | | | City of Garland, Series A, GO, 5.000%, 02/15/23 | | | 4,624 | |
| | 4,000 | | | City of Houston, Public Improvement, Series A, GO, 5.000%, 03/01/30 | | | 4,595 | |
| | 3,150 | | | City of Lubbock, GO, 5.000%, 02/15/25 | | | 3,725 | |
| | 680 | | | City of Pflugerville, Limited Tax, GO, 5.000%, 08/01/23 | | | 789 | |
| | | | City of San Antonio, General Improvement, | | | | |
| | 700 | | | GO, 5.000%, 08/01/23 | | | 799 | |
| | 3,500 | | | GO, 5.000%, 08/01/24 | | | 3,993 | |
| | 4,735 | | | GO, 5.000%, 08/01/26 | | | 5,396 | |
| | 2,735 | | | GO, 5.000%, 08/01/27 | | | 3,115 | |
| | 4,000 | | | Counties of Dallas, Denton, Collin and Rockwall, City of Dallas, GO, 5.000%, 02/15/29 | | | 4,442 | |
| | | | Crandall Independent School District, | | | | |
| | 1,150 | | | Series A, GO, PSF-GTD, Zero Coupon, 08/15/25 | | | 926 | |
| | 2,140 | | | Series A, GO, PSF-GTD, Zero Coupon, 08/15/26 | | | 1,666 | |
| | 2,145 | | | Series A, GO, PSF-GTD, Zero Coupon, 08/15/27 | | | 1,610 | |
| | 2,105 | | | Series A, GO, PSF-GTD, Zero Coupon, 08/15/28 | | | 1,523 | |
| | 1,965 | | | Dallas County Community College District, GO, 5.000%, 02/15/24 | | | 2,099 | |
| | 1,000 | | | Hays County, GO, 5.000%, 02/15/23 | | | 1,099 | |
| | | | Hays County, Pass-Through Toll, | | | | |
| | 1,500 | | | GO, 5.000%, 02/15/23 | | | 1,648 | |
| | 1,785 | | | GO, 5.000%, 02/15/24 | | | 1,957 | |
| | 2,410 | | | GO, 5.000%, 02/15/25 | | | 2,636 | |
| | | | San Jacinto Community College District, | | | | |
| | 390 | | | GO, AMBAC, 5.000%, 02/15/20 | | | 391 | |
| | 2,600 | | | GO, 5.000%, 02/15/40 | | | 2,874 | |
| | | | State of Texas, Water Financial Assistance, | | | | |
| | 2,500 | | | Series A, GO, 5.000%, 08/01/20 | | | 2,632 | |
| | 4,340 | | | Series A, GO, 5.000%, 08/01/21 | | | 4,567 | |
| | | | | | | | |
| | | | | | | 59,536 | |
| | | | | | | | |
| | | | Prerefunded — 2.7% | |
| | | | Dallas Area Rapid Transit, Senior Lien, | | | | |
| | 3,000 | | | Rev., 5.250%, 12/01/18 (p) | | | 3,202 | |
| | 7,660 | | | Series A, Rev., 5.000%, 06/01/19 (p) | | | 8,281 | |
SEE NOTES TO FINANCIAL STATEMENTS.
| | | | | | | | |
| | | |
| APRIL 30, 2017 | | J.P. MORGAN TAX AWARE FUNDS | | | | | 21 | |
JPMorgan Tax Aware Real Return Fund
SCHEDULE OF PORTFOLIO INVESTMENTS
AS OF APRIL 30, 2017 (Unaudited) (continued)
(Amounts in thousands)
| | | | | | | | |
PRINCIPAL
AMOUNT($) | | | SECURITY DESCRIPTION | | VALUE($) | |
| | Municipal Bonds — continued | |
| | | | Prerefunded — continued | |
| | 1,830 | | | Harlandale Independent School District, GO, AGC, 5.000%, 08/01/19 (p) | | | 1,989 | |
| | 9,055 | | | North Texas Municipal Water District, | | | | |
| | | | Rev., 5.000%, 06/01/18 (p) | | | 9,457 | |
| | 5,000 | | | San Jacinto Community College District, GO, 5.000%, 02/15/19 (p) | | | 5,353 | |
| | 5,000 | | | Southwest Higher Education Authority, Inc., Southern Methodist University Project, Rev., 5.000%, 10/01/19 (p) | | | 5,467 | |
| | 1,800 | | | Tarrant County, Limited Tax, GO, 5.000%, 07/15/18 (p) | | | 1,889 | |
| | 3,755 | | | University of North Texas, Financing System, Series A, Rev., 5.000%, 04/15/19 (p) | | | 4,044 | |
| | | | | | | | |
| | | | | | | 39,682 | |
| | | | | | | | |
| | | | Transportation — 0.8% | |
| | 3,000 | | | City of Houston, Airport System, Sub Lien, Series B, Rev., 5.000%, 07/01/26 | | | 3,384 | |
| | 7,660 | | | Grand Parkway Transportation Corp., Series B, Rev., 5.250%, 10/01/51 | | | 8,810 | |
| | | | | | | | |
| | | | | | | 12,194 | |
| | | | | | | | |
| | | | Utility — 0.2% | |
| | 3,000 | | | City of San Antonio, Electric and Gas System, Rev., 5.000%, 02/01/26 | | | 3,666 | |
| | | | | | | | |
| | | | Water & Sewer — 1.2% | |
| | 5,550 | | | City of Houston, Water & Sewer System, Junior Lien, Series A, Rev., AGM, 5.750%, 12/01/32 (p) | | | 7,632 | |
| | 1,250 | | | City of San Antonio, Water System Junior Lien, Series E, Rev., 5.000%, 05/15/24 | | | 1,480 | |
| | | | Coastal Water Authority, City of Houston Projects, | | | | |
| | 100 | | | Rev., 4.000%, 12/15/18 | | | 105 | |
| | 3,315 | | | Rev., 5.000%, 12/15/23 | | | 3,713 | |
| | 3,820 | | | Texas Water Development Board, State Revolving Fund, Series A, Sub Series A-1, Rev., 5.000%, 07/15/20 | | | 4,155 | |
| | | | | | | | |
| | | | | | | 17,085 | |
| | | | | | | | |
| | | | Total Texas | | | 136,297 | |
| | | | | | | | |
| | | | Utah — 0.6% | |
| | | | Prerefunded — 0.6% | |
| | 7,455 | | | Metropolitan Water District of Salt Lake & Sandy, Series A, Rev., 5.000%, 07/01/19 (p) | | | 8,086 | |
| | 1,150 | | | Utah State University of Agriculture & Applied Science, Rev., 5.000%, 06/01/19 (p) | | | 1,244 | |
| | | | | | | | |
| | | | Total Utah | | | 9,330 | |
| | | | | | | | |
| | | | | | | | |
PRINCIPAL
AMOUNT($) | | | SECURITY DESCRIPTION | | VALUE($) | |
| | |
| | | | Vermont — 0.5% | |
| | | | Education — 0.2% | |
| | | | University of Vermont & State Agricultural College, | | | | |
| | 2,115 | | | Rev., AMBAC, 5.000%, 10/01/21 | | | 2,150 | |
| | 1,175 | | | Rev., AMBAC, 5.000%, 10/01/22 | | | 1,195 | |
| | | | | | | | |
| | | | | | | 3,345 | |
| | | | | | | | |
| | | | Prerefunded — 0.3% | |
| | 3,295 | | | University of Vermont & State Agricultural College, Rev., AMBAC, 5.000%, 10/01/17 (p) | | | 3,352 | |
| | | | | | | | |
| | | | Total Vermont | | | 6,697 | |
| | | | | | | | |
| | | | Virginia — 2.5% | |
| | | | Education — 0.8% | |
| | 10,050 | | | Virginia College Building Authority, Public Higher Education Financing Program, Series B, Rev., 5.000%, 09/01/19 | | | 10,965 | |
| | | | | | | | |
| | | | General Obligation — 1.3% | |
| | 205 | | | City of Richmond, Public Improvement, Series D, GO, 5.000%, 07/15/26 | | | 228 | |
| | 17,575 | | | Commonwealth of Virginia, Series D, GO, 5.000%, 06/01/20 | | | 19,077 | |
| | | | | | | | |
| | | | | | | 19,305 | |
| | | | | | | | |
| | | | Other Revenue — 0.0% (g) | |
| | 25 | | | Virginia Public Building Authority, Public Facilities, Series B-1, Rev., 5.000%, 08/01/18 (p) | | | 27 | |
| | 405 | | | Virginia Resources Authority, Pooled Financing Program, Infrastructure, Rev., 5.000%, 11/01/23 | | | 445 | |
| | | | | | | | |
| | | | | | | 472 | |
| | | | | | | | |
| | | | Prerefunded — 0.1% | |
| | 560 | | | Virginia Resources Authority, Pooled Financing Program, Infrastructure, Series A,
Rev., 5.000%, 11/01/19 (p) | | | 614 | |
| | | | | | | | |
| | | | Utility — 0.3% | |
| | 4,090 | | | City of Richmond, Public Utility Revenue, Series A, Rev., 5.000%, 01/15/28 | | | 4,913 | |
| | | | | | | | |
| | | | Total Virginia | | | 36,269 | |
| | | | | | | | |
| | | | Washington — 2.7% | |
| | | | General Obligation — 0.2% | |
| | 1,100 | | | Snohomish County, Edmonds School District No. 15, GO, 5.000%, 12/01/33 | | | 1,249 | |
| | 2,000 | | | State of Washington, Various Purpose, Series D, GO, 5.000%, 02/01/24 | | | 2,354 | |
SEE NOTES TO FINANCIAL STATEMENTS.
| | | | | | |
| | | |
| 22 | | | | J.P. MORGAN TAX AWARE FUNDS | | APRIL 30, 2017 |
| | | | | | | | |
PRINCIPAL
AMOUNT($) | | | SECURITY DESCRIPTION | | VALUE($) | |
| | Municipal Bonds — continued | |
| | | | General Obligation — continued | |
| | 275 | | | Yakima County School District No. 7, GO, 5.500%, 12/01/23 | | | 304 | |
| | | | | | | | |
| | | | | | | 3,907 | |
| | | | | | | | |
| | | | Prerefunded — 2.0% | |
| | | | State of Washington, Various Purpose, | | | | |
| | 10,000 | | | Series 2010C, GO, 5.000%, 08/01/19 (p) | | | 10,871 | |
| | 12,400 | | | Series R-2010A, GO, 5.000%, 01/01/19 (p) | | | 13,224 | |
| | 4,415 | | | Yakima County School District No. 7, GO, 5.500%, 12/01/19 (p) | | | 4,907 | |
| | | | | | | | |
| | | | | | | 29,002 | |
| | | | | | | | |
| | | | Transportation — 0.4% | |
| | | | Port of Seattle, Intermediate Lien, | | | | |
| | 3,750 | | | Series B, Rev., 5.000%, 03/01/33 | | | 4,251 | |
| | 1,000 | | | Series B, Rev., 5.000%, 03/01/34 | | | 1,129 | |
| | | | | | | | |
| | | | | | | 5,380 | |
| | | | | | | | |
| | | | Water & Sewer — 0.1% | |
| | 1,325 | | | City of Seattle, Drainage & Wastewater Improvement, Rev., 5.000%, 09/01/26 | | | 1,526 | |
| | | | | | | | |
| | | | Total Washington | | | 39,815 | |
| | | | | | | | |
| | | | Total Municipal Bonds
(Cost $1,246,171) | | | 1,317,746 | |
| | | | | | | | |
| | | | | | | | |
PRINCIPAL
AMOUNT($) | | | SECURITY DESCRIPTION | | VALUE($) | |
| | Quarterly Demand Note — 0.2% | |
| | | | Pennsylvania — 0.2% | |
| | | | Hospital — 0.2% | |
| | 3,000 | | | Sayre Health Care Facilities Authority, Guthrie Health Issue, Rev., VAR, 1.487%, 06/01/17
(Cost $3000) | | | 2,901 | |
| | | | | | | | |
| | |
| SHARES | | | | | | |
| | Short-Term Investment — 7.5% | | | | |
| | | | Investment Company — 7.5% | |
| | 110,133 | | | JPMorgan U.S. Government Money Market Fund, Institutional Class Shares, 0.620% (b) (l) †
(Cost $110,133) | | | 110,133 | |
| | | | | | | | |
| | | | Total Investments — 99.6%
(Cost $1,384,304) | | | 1,455,780 | |
| | | | Other Assets in Excess of
Liabilities — 0.4% | | | 5,487 | |
| | | | | | | | |
| | | | NET ASSETS — 100.0% | | $ | 1,461,267 | |
| | | | | | | | |
Percentages indicated are based on net assets.
| | | | | | | | | | | | | | |
| Inflation-Linked Swaps | | | | | | | | | | | | |
| | | RATE TYPE (r) | | | | | | | | |
| SWAP COUNTERPARTY | | PAYMENTS MADE
BY THE FUND | | PAYMENTS RECEIVED
BY THE FUND | | TERMINATION
DATE | | NOTIONAL
AMOUNT | | | VALUE | |
Barclays Bank plc | | 2.812% at termination | | CPI-U at termination | | 10/12/19 | | | 25,000 | | | $ | (3,957 | ) |
Barclays Bank plc | | 2.590% at termination | | CPI-U at termination | | 12/31/19 | | | 35,000 | | | | (2,894 | ) |
Barclays Bank plc | | 1.823% at termination | | CPI-U at termination | | 11/08/21 | | | 25,000 | | | | 397 | |
Barclays Bank plc | | 2.439% at termination | | CPI-U at termination | | 05/15/24 | | | 18,000 | | | | (1,156 | ) |
Barclays Bank plc | | 2.700% at termination | | CPI-U at termination | | 09/03/44 | | | 5,000 | | | | (889 | ) |
BNP Paribas | | 2.100% at termination | | CPI-U at termination | | 08/26/18 | | | 25,000 | | | | (910 | ) |
BNP Paribas | | 2.105% at termination | | CPI-U at termination | | 08/26/18 | | | 12,000 | | | | (440 | ) |
BNP Paribas | | 2.190% at termination | | CPI-U at termination | | 09/03/19 | | | 13,000 | | | | (515 | ) |
BNP Paribas | | 2.350% at termination | | CPI-U at termination | | 07/06/20 | | | 25,000 | | | | (1,603 | ) |
BNP Paribas | | 2.265% at termination | | CPI-U at termination | | 02/06/24 | | | 25,000 | | | | (220 | ) |
BNP Paribas | | 2.165% at termination | | CPI-U at termination | | 04/04/24 | | | 24,000 | | | | (115 | ) |
BNP Paribas | | 1.997% at termination | | CPI-U at termination | | 11/07/26 | | | 25,000 | | | | 629 | |
Citibank NA | | 2.190% at termination | | CPI-U at termination | | 09/02/19 | | | 9,000 | | | | (357 | ) |
Citibank NA | | 2.420% at termination | | CPI-U at termination | | 05/24/20 | | | 25,000 | | | | (1,867 | ) |
Citibank NA | | 2.420% at termination | | CPI-U at termination | | 06/30/20 | | | 50,000 | | | | (3,637 | ) |
Citibank NA | | 2.410% at termination | | CPI-U at termination | | 07/01/20 | | | 50,000 | | | | (3,574 | ) |
Citibank NA | | 2.330% at termination | | CPI-U at termination | | 07/06/20 | | | 50,000 | | | | (3,088 | ) |
Citibank NA | | 2.492% at termination | | CPI-U at termination | | 08/27/24 | | | 22,000 | | | | (1,569 | ) |
Citibank NA | | 2.477% at termination | | CPI-U at termination | | 09/02/24 | | | 15,000 | | | | (1,045 | ) |
Citibank NA | | 2.623% at termination | | CPI-U at termination | | 10/07/24 | | | 14,000 | | | | (273 | ) |
Credit Suisse International | | 2.250% at termination | | CPI-U at termination | | 05/09/17 | | | 50,000 | | | | (2,475 | ) |
SEE NOTES TO FINANCIAL STATEMENTS.
| | | | | | | | |
| | | |
| APRIL 30, 2017 | | J.P. MORGAN TAX AWARE FUNDS | | | | | 23 | |
JPMorgan Tax Aware Real Return Fund
SCHEDULE OF PORTFOLIO INVESTMENTS
AS OF APRIL 30, 2017 (Unaudited) (continued)
(Amounts in thousands)
| | | | | | | | | | | | | | |
| | | | | | | | | | | | | |
| | | RATE TYPE (r) | | | | | | | | |
| SWAP COUNTERPARTY | | PAYMENTS MADE
BY THE FUND | | PAYMENTS RECEIVED
BY THE FUND | | TERMINATION
DATE | | NOTIONAL
AMOUNT | | | VALUE | |
Credit Suisse International | | 2.178% at termination | | CPI-U at termination | | 05/28/18 | | | 65,000 | | | $ | (2,972 | ) |
Deutsche Bank AG, New York | | 2.500% at termination | | CPI-U at termination | | 02/25/18 | | | 50,000 | | | | (3,017 | ) |
Deutsche Bank AG, New York | | 2.140% at termination | | CPI-U at termination | | 09/10/19 | | | 55,000 | | | | (2,014 | ) |
Deutsche Bank AG, New York | | 2.410% at termination | | CPI-U at termination | | 06/30/20 | | | 20,000 | | | | (1,431 | ) |
Deutsche Bank AG, New York | | 1.823% at termination | | CPI-U at termination | | 11/08/21 | | | 25,000 | | | | 397 | |
Deutsche Bank AG, New York | | 2.477% at termination | | CPI-U at termination | | 02/21/24 | | | 40,000 | | | | (2,706 | ) |
Deutsche Bank AG, New York | | 2.415% at termination | | CPI-U at termination | | 12/15/24 | | | 54,000 | | | | (491 | ) |
Deutsche Bank AG, New York | | 2.003% at termination | | CPI-U at termination | | 11/07/26 | | | 25,000 | | | | 614 | |
Deutsche Bank AG, New York | | 2.708% at termination | | CPI-U at termination | | 02/25/44 | | | 5,000 | | | | (900 | ) |
Deutsche Bank AG, New York | | 2.498% at termination | | CPI-U at termination | | 10/10/44 | | | 8,000 | | | | (836 | ) |
Deutsche Bank AG, New York | | 2.000% at termination | | CPI-U at termination | | 10/13/45 | | | 5,000 | | | | 371 | |
Goldman Sachs International | | 2.211% at termination | | CPI-U at termination | | 08/29/19 | | | 20,000 | | | | (817 | ) |
Goldman Sachs International | | 2.185% at termination | | CPI-U at termination | | 09/02/19 | | | 12,000 | | | | (473 | ) |
Goldman Sachs International | | 2.194% at termination | | CPI-U at termination | | 09/02/19 | | | 19,000 | | | | (758 | ) |
Morgan Stanley Capital Services | | 2.175% at termination | | CPI-U at termination | | 10/01/18 | | | 20,000 | | | | (798 | ) |
Morgan Stanley Capital Services | | 2.323% at termination | | CPI-U at termination | | 06/23/19 | | | 20,000 | | | | (909 | ) |
Morgan Stanley Capital Services | | 2.525% at termination | | CPI-U at termination | | 01/27/24 | | | 30,000 | | | | (2,191 | ) |
Morgan Stanley Capital Services | | 2.500% at termination | | CPI-U at termination | | 02/04/24 | | | 34,000 | | | | (2,379 | ) |
Morgan Stanley Capital Services | | 2.673% at termination | | CPI-U at termination | | 09/12/44 | | | 3,000 | | | | (502 | ) |
Royal Bank of Scotland | | 2.430% at termination | | CPI-U at termination | | 06/28/20 | | | 25,000 | | | | (1,848 | ) |
Royal Bank of Scotland | | 2.423% at termination | | CPI-U at termination | | 06/30/20 | | | 75,000 | | | | (5,485 | ) |
Royal Bank of Scotland | | 2.475% at termination | | CPI-U at termination | | 03/17/24 | | | 7,000 | | | | (473 | ) |
Royal Bank of Scotland | | 3.556% at termination | | CPI-U at termination | | 07/31/29 | | | 49,000 | | | | (19,005 | ) |
Royal Bank of Scotland | | 2.733% at termination | | CPI-U at termination | | 02/10/44 | | | 9,000 | | | | (1,701 | ) |
Union Bank of Switzerland AG | | 2.170% at termination | | CPI-U at termination | | 04/22/18 | | | 50,000 | | | | (2,268 | ) |
Union Bank of Switzerland AG | | 2.200% at termination | | CPI-U at termination | | 03/09/22 | | | 10,000 | | | | (63 | ) |
| | | | | | | | | | | | | | |
| | | | | | | | | | | | $ | (82,213 | ) |
| | | | | | | | | | | | | | |
SEE NOTES TO FINANCIAL STATEMENTS.
| | | | | | |
| | | |
| 24 | | | | J.P. MORGAN TAX AWARE FUNDS | | APRIL 30, 2017 |
J.P. Morgan Tax Aware Funds
NOTES TO SCHEDULE OF PORTFOLIO INVESTMENTS
AS OF APRIL 30, 2017 (Unaudited)
| | |
| AGC | | — Insured by Assured Guaranty Corp. |
| AGM | | — Insured by Assured Guaranty Municipal Corp. |
| AMBAC | | — Insured by American Municipal Bond Assurance Corp. |
| AMT | | — Alternative Minimum Tax |
| BHAC | | — Insured by Berkshire Hathaway Assurance Corp. |
| COP | | — Certificate of Participation |
| CPI-U | | — Consumer Price Index for All Urban Consumers |
| CR | | — Custodial Receipts |
| FGIC | | — Insured by Financial Guaranty Insurance Co. |
| GAN | | — Grant Anticipation Notes |
| GO | | — General Obligation |
| GTD | | — Guaranteed |
| LOC | | — Letter of Credit |
| MTA | | — Metropolitan Transportation Authority |
| NATL | | — Insured by National Public Finance Guarantee Corp. |
| PSF | | — Permanent School Fund |
| Q-SBLF | | — Qualified School Bond Loan Fund |
| RE | | — Reinsured |
| Rev. | | — Revenue |
| VAR | | — Variable Rate Security. The interest rate shown is the rate in effect as of April 30, 2017. |
| VRDO | | — Variable Rate Demand Obligation. The interest rate shown is the rate in effect as of April 30, 2017. |
| | |
| (a) | | — Non-income producing security. |
| (b) | | — Investment in affiliate. Money market fund is registered under the Investment Company Act of 1940, as amended, and advised by J.P. Morgan Investment Management Inc. |
| (g) | | — Amount rounds to less than 0.05%. |
| (l) | | — The rate shown is the current yield as of April 30, 2017. |
| (p) | | — Security is prerefunded or escrowed to maturity. |
| (r) | | — Rates shown are per annum and payments are as described. |
| (t) | | — The date shown represents the earliest of the prerefunded date, next put date, or final maturity date. |
| † | | — Approximately $2,040,000 of this investment is restricted as collateral for certain derivatives to various brokers. |
SEE NOTES TO FINANCIAL STATEMENTS.
| | | | | | | | |
| | | |
| APRIL 30, 2017 | | J.P. MORGAN TAX AWARE FUNDS | | | | | 25 | |
STATEMENTS OF ASSETS AND LIABILITIES
AS OF APRIL 30, 2017 (Unaudited)
(Amounts in thousands, except per share amounts)
| | | | | | | | |
| | | Tax Aware
Equity Fund | | |
Tax Aware
Real Return
Fund | |
ASSETS: | | | | | | | | |
Investments in non-affiliates, at value | | $ | 1,193,205 | | | $ | 1,345,647 | |
Investments in affiliates, at value | | | 7,499 | | | | 108,093 | |
Investments in affiliates — restricted, at value | | | — | | | | 2,040 | |
| | | | | | | | |
Total investment securities, at value | | | 1,200,704 | | | | 1,455,780 | |
Restricted cash | | | ��� | | | | 79,330 | |
Cash | | | 7 | | | | — | (a) |
Receivables: | | | | | | | | |
Investment securities sold | | | — | | | | 3,792 | |
Fund shares sold | | | 1,665 | | | | 957 | |
Interest and dividends from non-affiliates | | | 670 | | | | 16,838 | |
Dividends from affiliates | | | 4 | | | | 57 | |
Outstanding swap contracts, at value | | | — | | | | 2,408 | |
| | | | | | | | |
Total Assets | | | 1,203,050 | | | | 1,559,162 | |
| | | | | | | | |
| | |
LIABILITIES: | | | | | | | | |
Payables: | | | | | | | | |
Investment securities purchased | | | — | | | | 10,836 | |
Fund shares redeemed | | | 677 | | | | 1,747 | |
Outstanding swap contracts, at value | | | — | | | | 84,621 | |
Accrued liabilities: | | | | | | | | |
Investment advisory fees | | | 339 | | | | 350 | |
Administration fees | | | 79 | | | | 67 | |
Distribution fees | | | 8 | | | | 29 | |
Service fees | | | 95 | | | | 109 | |
Custodian and accounting fees | | | 7 | | | | 20 | |
Collateral management fees | | | — | | | | 6 | |
Trustees’ and Chief Compliance Officer’s fees | | | — | (a) | | | — | (a) |
Other | | | 49 | | | | 110 | |
| | | | | | | | |
Total Liabilities | | | 1,254 | | | | 97,895 | |
| | | | | | | | |
Net Assets | | $ | 1,201,796 | | | $ | 1,461,267 | |
| | | | | | | | |
| (a) | Amount rounds to less than 500. |
SEE NOTES TO FINANCIAL STATEMENTS.
| | | | | | |
| | | |
| 26 | | | | J.P. MORGAN TAX AWARE FUNDS | | APRIL 30, 2017 |
| | | | | | | | |
| | | Tax Aware
Equity Fund | | |
Tax Aware
Real Return
Fund | |
NET ASSETS: | | | | | | | | |
Paid-in-Capital | | $ | 562,063 | | | $ | 1,549,406 | |
Accumulated undistributed (distributions in excess of) net investment income | | | 533 | | | | (24 | ) |
Accumulated net realized gains (losses) | | | 107,773 | | | | (77,378 | ) |
Net unrealized appreciation (depreciation) | | | 531,427 | | | | (10,737 | ) |
| | | | | | | | |
Total Net Assets | | $ | 1,201,796 | | | $ | 1,461,267 | |
| | | | | | | | |
| | |
Net Assets: | | | | | | | | |
Class A | | $ | 17,549 | | | $ | 49,703 | |
Class C | | | 7,611 | | | | 29,350 | |
Class I (formerly Institutional Class) | | | 1,176,636 | | | | 1,261,038 | |
Class R6 | | | — | | | | 121,176 | |
| | | | | | | | |
Total | | $ | 1,201,796 | | | $ | 1,461,267 | |
| | | | | | | | |
| | |
Outstanding units of beneficial interest (shares) | | | | | | | | |
($0.0001 par value; unlimited number of shares authorized): | | | | | | | | |
Class A | | | 554 | | | | 5,231 | |
Class C | | | 243 | | | | 3,097 | |
Class I (formerly Institutional Class) | | | 36,991 | | | | 132,495 | |
Class R6 | | | — | | | | 12,728 | |
| | |
Net Asset Value (a): | | | | | | | | |
Class A — Redemption price per share | | $ | 31.67 | | | $ | 9.50 | |
Class C — Offering price per share (b) | | | 31.41 | | | | 9.48 | |
Class I (formerly Institutional Class) — Offering and redemption price per share | | | 31.81 | | | | 9.52 | |
Class R6 — Offering and redemption price per share | | | — | | | | 9.52 | |
Class A maximum sales charge | | | 5.25 | % | | | 3.75 | % |
Class A maximum public offering price per share
[net asset value per share/(100% — maximum sales charge)] | | $ | 33.42 | | | $ | 9.87 | |
| | | | | | | | |
Cost of investments in non-affiliates | | $ | 661,778 | | | $ | 1,274,171 | |
Cost of investments in affiliates | | | 7,499 | | | | 108,093 | |
Cost of investments in affiliates—restricted | | | — | | | | 2,040 | |
| (a) | Per share amounts may not recalculate due to rounding of net assets and/or shares outstanding. |
| (b) | Redemption price for Class C Shares varies based upon length of time the shares are held. |
SEE NOTES TO FINANCIAL STATEMENTS.
| | | | | | | | |
| | | |
| APRIL 30, 2017 | | J.P. MORGAN TAX AWARE FUNDS | | | | | 27 | |
STATEMENTS OF OPERATIONS
FOR THE SIX MONTHS ENDED APRIL 30, 2017 (Unaudited)
(Amounts in thousands)
| | | | | | | | |
| | | Tax Aware
Equity Fund | | |
Tax Aware
Real Return
Fund | |
INVESTMENT INCOME: | | | | | | | | |
Interest income from non-affiliates | | $ | — | | | $ | 22,938 | |
Interest income from affiliates | | | 1 | | | | 2 | |
Dividend income from non-affiliates | | | 9,172 | | | | — | |
Dividend income from affiliates | | | 10 | | | | 212 | |
| | | | | | | | |
Total investment income | | | 9,183 | | | | 23,152 | |
| | | | | | | | |
| | |
EXPENSES: | | | | | | | | |
Investment advisory fees | | | 2,043 | | | | 2,473 | |
Administration fees | | | 478 | | | | 578 | |
Distribution fees: | | | | | | | | |
Class A | | | 19 | | | | 62 | |
Class C | | | 25 | | | | 113 | |
Service fees: | | | | | | | | |
Class A | | | 19 | | | | 62 | |
Class C | | | 8 | | | | 38 | |
Class I (formerly Institutional Class) | | | 665 | | | | 694 | |
Select Class (a) | | | 102 | | | | 121 | |
Custodian and accounting fees | | | 18 | | | | 52 | |
Professional fees | | | 30 | | | | 53 | |
Collateral management fees | | | — | | | | 18 | |
Trustees’ and Chief Compliance Officer’s fees | | | 15 | | | | 15 | |
Printing and mailing costs | | | 24 | | | | 25 | |
Registration and filing fees | | | 35 | | | | 54 | |
Transfer agency fees (See Note 2.E.) | | | 10 | | | | 9 | |
Sub-transfer agency fees (See Note 2.E.) | | | 40 | | | | 35 | |
Other | | | 11 | | | | 11 | |
| | | | | | | | |
Total expenses | | | 3,542 | | | | 4,413 | |
| | | | | | | | |
Less fees waived | | | (265 | ) | | | (843 | ) |
| | | | | | | | |
Net expenses | | | 3,277 | | | | 3,570 | |
| | | | | | | | |
Net investment income (loss) | | | 5,906 | | | | 19,582 | |
| | | | | | | | |
| | |
REALIZED/UNREALIZED GAINS (LOSSES): | | | | | | | | |
Net realized gain (loss) on transactions from: | | | | | | | | |
Investments in non-affiliates | | | 113,884 | | | | (7,074 | ) |
Swaps | | | — | | | | (10,183 | ) |
| | | | | | | | |
Net realized gain (loss) | | | 113,884 | | | | (17,257 | ) |
| | | | | | | | |
Change in net unrealized appreciation/depreciation on: | | | | | | | | |
Investments in non-affiliates | | | 48,280 | | | | (27,969 | ) |
Swaps | | | — | | | | 29,310 | |
| | | | | | | | |
Change in net unrealized appreciation/depreciation | | | 48,280 | | | | 1,341 | |
| | | | | | | | |
Net realized/unrealized gains (losses) | | | 162,164 | | | | (15,916 | ) |
| | | | | | | | |
Change in net assets resulting from operations | | $ | 168,070 | | | $ | 3,666 | |
| | | | | | | | |
| (a) | All remaining Select Class Shares exchanged into Institutional Class Shares and the Institutional Class Shares were then renamed to Class I Shares on April 3, 2017. Additionally, on April 3, 2017, Select Class Shares were no longer offered. |
SEE NOTES TO FINANCIAL STATEMENTS.
| | | | | | |
| | | |
| 28 | | | | J.P. MORGAN TAX AWARE FUNDS | | APRIL 30, 2017 |
STATEMENTS OF CHANGES IN NET ASSETS
FOR THE PERIODS INDICATED
(Amounts in thousands)
| | | | | | | | | | | | | | | | |
| | | Tax Aware Equity Fund | | | Tax Aware Real Return Fund | |
| | | Six Months Ended
April 30, 2017
(Unaudited) | | | Year Ended
October 31, 2016 | | | Six Months Ended
April 30, 2017
(Unaudited) | | | Year Ended
October 31, 2016 | |
CHANGE IN NET ASSETS RESULTING FROM OPERATIONS: | | | | | | | | | | | | | | | | |
Net investment income (loss) | | $ | 5,906 | | | $ | 14,629 | | | $ | 19,582 | | | $ | 43,339 | |
Net realized gain (loss) | | | 113,884 | | | | 50,563 | | | | (17,257 | ) | | | (12,693 | ) |
Distributions of capital gains received from investment company affiliates | | | — | | | | — | | | | — | | | | 1 | |
Change in net unrealized appreciation/depreciation | | | 48,280 | | | | (30,737 | ) | | | 1,341 | | | | 29,871 | |
| | | | | | | | | | | | | | | | |
Change in net assets resulting from operations | | | 168,070 | | | | 34,455 | | | | 3,666 | | | | 60,518 | |
| | | | | | | | | | | | | | | | |
| | | | |
DISTRIBUTIONS TO SHAREHOLDERS: | | | | | | | | | | | | | | | | |
Class A | | | | | | | | | | | | | | | | |
From net investment income | | | (53 | ) | | | (108 | ) | | | (640 | ) | | | (1,249 | ) |
From net realized gains | | | (616 | ) | | | (526 | ) | | | — | | | | — | |
Class C | | | | | | | | | | | | | | | | |
From net investment income | | | (13 | ) | | | (18 | ) | | | (311 | ) | | | (691 | ) |
From net realized gains | | | (255 | ) | | | (198 | ) | | | — | | | | — | |
Class I (formerly Institutional Class) | | | | | | | | | | | | | | | | |
From net investment income | | | (6,197 | ) | | | (13,182 | ) | | | (15,556 | ) | | | (32,988 | ) |
From net realized gains | | | (44,856 | ) | | | (51,885 | ) | | | — | | | | — | |
Class R6 | | | | | | | | | | | | | | | | |
From net investment income | | | — | | | | — | | | | (1,872 | ) | | | (5,423 | ) |
Select Class (a) | | | | | | | | | | | | | | | | |
From net investment income | | | (547 | ) | | | (925 | ) | | | (1,354 | ) | | | (3,204 | ) |
From net realized gains | | | (3,890 | ) | | | (3,533 | ) | | | — | | | | — | |
| | | | | | | | | | | | | | | | |
Total distributions to shareholders | | | (56,427 | ) | | | (70,375 | ) | | | (19,733 | ) | | | (43,555 | ) |
| | | | | | | | | | | | | | | | |
| | | | |
CAPITAL TRANSACTIONS: | | | | | | | | | | | | | | | | |
Change in net assets resulting from capital transactions | | | (91,652 | ) | | | (149,342 | ) | | | (58,421 | ) | | | (211,512 | ) |
| | | | | | | | | | | | | | | | |
| | | | |
NET ASSETS: | | | | | | | | | | | | | | | | |
Change in net assets | | | 19,991 | | | | (185,262 | ) | | | (74,488 | ) | | | (194,549 | ) |
Beginning of period | | | 1,181,805 | | | | 1,367,067 | | | | 1,535,755 | | | | 1,730,304 | |
| | | | | | | | | | | | | | | | |
End of period | | $ | 1,201,796 | | | $ | 1,181,805 | | | $ | 1,461,267 | | | $ | 1,535,755 | |
| | | | | | | | | | | | | | | | |
Accumulated undistributed (distributions in excess of) net investment income | | $ | 533 | | | $ | 1,437 | | | $ | (24 | ) | | $ | 127 | |
| | | | | | | | | | | | | | | | |
Class A | | | | | | | | | | | | | | | | |
Proceeds from shares issued | | $ | 2,900 | | | $ | 5,639 | | | $ | 15,394 | | | $ | 5,823 | |
Distributions reinvested | | | 587 | | | | 505 | | | | 595 | | | | 1,131 | |
Cost of shares redeemed | | | (1,374 | ) | | | (4,291 | ) | | | (13,042 | ) | | | (16,887 | ) |
| | | | | | | | | | | | | | | | |
Change in net assets resulting from Class A capital transactions | | $ | 2,113 | | | $ | 1,853 | | | $ | 2,947 | | | $ | (9,933 | ) |
| | | | | | | | | | | | | | | | |
Class C | | | | | | | | | | | | | | | | |
Proceeds from shares issued | | $ | 1,731 | | | $ | 1,806 | | | $ | 1,518 | | | $ | 2,704 | |
Distributions reinvested | | | 268 | | | | 216 | | | | 236 | | | | 508 | |
Cost of shares redeemed | | | (739 | ) | | | (913 | ) | | | (5,103 | ) | | | (13,442 | ) |
| | | | | | | | | | | | | | | | |
Change in net assets resulting from Class C capital transactions | | $ | 1,260 | | | $ | 1,109 | | | $ | (3,349 | ) | | $ | (10,230 | ) |
| | | | | | | | | | | | | | | | |
| (a) | All remaining Select Class Shares exchanged into Institutional Class Shares and the Institutional Class Shares were then renamed to Class I Shares on April 3, 2017. Additionally, on April 3, 2017, Select Class Shares were no longer offered. |
SEE NOTES TO FINANCIAL STATEMENTS.
| | | | | | | | |
| | | |
| APRIL 30, 2017 | | J.P. MORGAN TAX AWARE FUNDS | | | | | 29 | |
STATEMENTS OF CHANGES IN NET ASSETS
FOR THE PERIODS INDICATED (continued)
(Amounts in thousands)
| | | | | | | | | | | | | | | | |
| | | Tax Aware Equity Fund | | | Tax Aware Real Return Fund | |
| | | Six Months Ended
April 30, 2017
(Unaudited) | | | Year Ended
October 31, 2016 | | | Six Months Ended
April 30, 2017
(Unaudited) | | | Year Ended
October 31, 2016 | |
CAPITAL TRANSACTIONS: (continued) | | | | | | | | | | | | | | | | |
Class I (formerly Institutional Class) | | | | | | | | | | | | | | | | |
Proceeds from shares issued | | $ | 67,286 | | | $ | 151,339 | | | $ | 249,592 | | | $ | 390,021 | |
Distributions reinvested | | | 6,215 | | | | 4,570 | | | | 1,783 | | | | 5,007 | |
Cost of shares redeemed | | | (165,385 | ) | | | (317,844 | ) | | | (239,640 | ) | | | (565,755 | ) |
Exchanged from Select Class Shares | | | 97,920 | | | | — | | | | 116,476 | | | | — | |
| | | | | | | | | | | | | | | | |
Change in net assets resulting from Class I capital transactions | | $ | 6,036 | | | $ | (161,935 | ) | | $ | 128,211 | | | $ | (170,727 | ) |
| | | | | | | | | | | | | | | | |
Class R6 | | | | | | | | | | | | | | | | |
Proceeds from shares issued | | $ | — | | | $ | — | | | $ | 6,269 | | | $ | 9,612 | |
Distributions reinvested | | | — | | | | — | | | | 1,486 | | | | 3,012 | |
Cost of shares redeemed | | | — | | | | — | | | | (82,062 | ) | | | — | (a) |
| | | | | | | | | | | | | | | | |
Change in net assets resulting from Class R6 capital transactions | | $ | — | | | $ | — | | | $ | (74,307 | ) | | $ | 12,624 | |
| | | | | | | | | | | | | | | | |
Select Class (b) | | | | | | | | | | | | | | | | |
Proceeds from shares issued | | $ | 5,686 | | | $ | 23,060 | | | $ | 32,949 | | | $ | 27,567 | |
Distributions reinvested | | | 1,452 | | | | 1,414 | | | | 606 | | | | 1,312 | |
Cost of shares redeemed | | | (10,279 | ) | | | (14,843 | ) | | | (29,002 | ) | | | (62,125 | ) |
Exchanged to Class I Shares | | | (97,920 | ) | | | — | | | | (116,476 | ) | | | — | |
| | | | | | | | | | | | | | | | |
Change in net assets resulting from Select Class capital transactions | | $ | (101,061 | ) | | $ | 9,631 | | | $ | (111,923 | ) | | $ | (33,246 | ) |
| | | | | | | | | | | | | | | | |
Total change in net assets resulting from capital transactions | | $ | (91,652 | ) | | $ | (149,342 | ) | | $ | (58,421 | ) | | $ | (211,512 | ) |
| | | | | | | | | | | | | | | | |
| | | | |
SHARE TRANSACTIONS: | | | | | | | | | | | | | | | | |
Class A | | | | | | | | | | | | | | | | |
Issued | | | 94 | | | | 210 | | | | 1,617 | | | | 608 | |
Reinvested | | | 20 | | | | 18 | | | | 63 | | | | 118 | |
Redeemed | | | (45 | ) | | | (154 | ) | | | (1,377 | ) | | | (1,766 | ) |
| | | | | | | | | | | | | | | | |
Change in Class A Shares | | | 69 | | | | 74 | | | | 303 | | | | (1,040 | ) |
| | | | | | | | | | | | | | | | |
Class C | | | | | | | | | | | | | | | | |
Issued | | | 58 | | | | 65 | | | | 160 | | | | 283 | |
Reinvested | | | 9 | | | | 8 | | | | 25 | | | | 53 | |
Redeemed | | | (24 | ) | | | (32 | ) | | | (539 | ) | | | (1,410 | ) |
| | | | | | | | | | | | | | | | |
Change in Class C Shares | | | 43 | | | | 41 | | | | (354 | ) | | | (1,074 | ) |
| | | | | | | | | | | | | | | | |
Class I (formerly Institutional Class) | | | | | | | | | | | | | | | | |
Issued | | | 2,185 | | | | 5,539 | | | | 26,228 | | | | 40,712 | |
Reinvested | | | 209 | | | | 164 | | | | 188 | | | | 523 | |
Redeemed | | | (5,456 | ) | | | (11,397 | ) | | | (25,272 | ) | | | (59,079 | ) |
Exchanged from Select Class Shares | | | 3,131 | | | | — | | | | 12,222 | | | | — | |
| | | | | | | | | | | | | | | | |
Change in Class I Shares | | | 69 | | | | (5,694 | ) | | | 13,366 | | | | (17,844 | ) |
| | | | | | | | | | | | | | | | |
Class R6 | | | | | | | | | | | | | | | | |
Issued | | | — | | | | — | | | | 658 | | | | 996 | |
Reinvested | | | — | | | | — | | | | 156 | | | | 314 | |
Redeemed | | | — | | | | — | | | | (8,682 | ) | | | — | (a) |
| | | | | | | | | | | | | | | | |
Change in Class R6 Shares | | | — | | | | — | | | | (7,868 | ) | | | 1,310 | |
| | | | | | | | | | | | | | | | |
Select Class (b) | | | | | | | | | | | | | | | | |
Issued | | | 189 | | | | 867 | | | | 3,465 | | | | 2,886 | |
Reinvested | | | 49 | | | | 51 | | | | 64 | | | | 137 | |
Redeemed | | | (340 | ) | | | (534 | ) | | | (3,056 | ) | | | (6,513 | ) |
Exchanged to Class I Shares | | | (3,134 | ) | | | — | | | | (12,235 | ) | | | — | |
| | | | | | | | | | | | | | | | |
Change in Select Class Shares | | | (3,236 | ) | | | 384 | | | | (11,762 | ) | | | (3,490 | ) |
| | | | | | | | | | | | | | | | |
| (a) | Amount rounds to less than 500. |
| (b) | All remaining Select Class Shares exchanged into Institutional Class Shares and the Institutional Class Shares were then renamed to Class I Shares on April 3, 2017. Additionally, on April 3, 2017, Select Class Shares were no longer offered. |
SEE NOTES TO FINANCIAL STATEMENTS.
| | | | | | |
| | | |
| 30 | | | | J.P. MORGAN TAX AWARE FUNDS | | APRIL 30, 2017 |
THIS PAGE IS INTENTIONALLY LEFT BLANK
| | | | | | | | |
| | | |
| APRIL 30, 2017 | | J.P. MORGAN TAX AWARE FUNDS | | | | | 31 | |
FINANCIAL HIGHLIGHTS
FOR THE PERIODS INDICATED
| | | | | | | | | | | | | | | | | | | | | | | | | | | | |
| | | Per share operating performance | |
| | | | | | Investment operations | | | Distributions | |
| | | Net asset
value,
beginning
of period | | | Net
investment
income
(loss) (b) | | | Net realized
and unrealized gains (losses) on
investments | | | Total from
investment
operations | | | Net
investment
income | | | Net
realized
gain | | | Total
distributions | |
Tax Aware Equity Fund | | | | | | | | | | | | | | | | | | | | | | | | | | | | |
Class A | | | | | | | | | | | | | | | | | | | | | | | | | | | | |
Six Months Ended April 30, 2017 (Unaudited) | | $ | 28.82 | | | $ | 0.08 | | | $ | 4.13 | | | $ | 4.21 | | | $ | (0.10 | ) | | $ | (1.26 | ) | | $ | (1.36 | ) |
Year Ended October 31, 2016 | | | 29.60 | | | | 0.20 | | | | 0.47 | | | | 0.67 | | | | (0.22 | ) | | | (1.23 | ) | | | (1.45 | ) |
Year Ended October 31, 2015 | | | 29.01 | | | | 0.20 | | | | 1.41 | | | | 1.61 | | | | (0.21 | ) | | | (0.81 | ) | | | (1.02 | ) |
Year Ended October 31, 2014 | | | 24.87 | | | | 0.19 | | | | 4.15 | | | | 4.34 | | | | (0.20 | ) | | | — | | | | (0.20 | ) |
Year Ended October 31, 2013 | | | 19.60 | | | | 0.23 | (f) | | | 5.33 | | | | 5.56 | | | | (0.29 | ) | | | — | | | | (0.29 | ) |
Year Ended October 31, 2012 | | | 17.43 | | | | 0.18 | | | | 2.18 | | | | 2.36 | | | | (0.19 | ) | | | — | | | | (0.19 | ) |
| | | | | | | |
Class C | | | | | | | | | | | | | | | | | | | | | | | | | | | | |
Six Months Ended April 30, 2017 (Unaudited) | | | 28.62 | | | | 0.01 | | | | 4.10 | | | | 4.11 | | | | (0.06 | ) | | | (1.26 | ) | | | (1.32 | ) |
Year Ended October 31, 2016 | | | 29.43 | | | | 0.06 | | | | 0.46 | | | | 0.52 | | | | (0.10 | ) | | | (1.23 | ) | | | (1.33 | ) |
Year Ended October 31, 2015 | | | 28.88 | | | | 0.05 | | | | 1.40 | | | | 1.45 | | | | (0.09 | ) | | | (0.81 | ) | | | (0.90 | ) |
Year Ended October 31, 2014 | | | 24.78 | | | | 0.06 | | | | 4.12 | | | | 4.18 | | | | (0.08 | ) | | | — | | | | (0.08 | ) |
Year Ended October 31, 2013 | | | 19.54 | | | | 0.12 | (f) | | | 5.32 | | | | 5.44 | | | | (0.20 | ) | | | — | | | | (0.20 | ) |
Year Ended October 31, 2012 | | | 17.42 | | | | 0.08 | | | | 2.19 | | | | 2.27 | | | | (0.15 | ) | | | — | | | | (0.15 | ) |
| | | | | | | |
Class I (formerly Institutional Class) | | | | | | | | | | | | | | | | | | | | | | | | | | | | |
Six Months Ended April 30, 2017 (Unaudited) | | | 28.94 | | | | 0.15 | | | | 4.16 | | | | 4.31 | | | | (0.18 | ) | | | (1.26 | ) | | | (1.44 | ) |
Year Ended October 31, 2016 | | | 29.70 | | | | 0.34 | | | | 0.46 | | | | 0.80 | | | | (0.33 | ) | | | (1.23 | ) | | | (1.56 | ) |
Year Ended October 31, 2015 | | | 29.10 | | | | 0.34 | | | | 1.39 | | | | 1.73 | | | | (0.32 | ) | | | (0.81 | ) | | | (1.13 | ) |
Year Ended October 31, 2014 | | | 24.92 | | | | 0.30 | | | | 4.18 | | | | 4.48 | | | | (0.30 | ) | | | — | | | | (0.30 | ) |
Year Ended October 31, 2013 | | | 19.63 | | | | 0.34 | (f) | | | 5.32 | | | | 5.66 | | | | (0.37 | ) | | | — | | | | (0.37 | ) |
Year Ended October 31, 2012 | | | 17.43 | | | | 0.28 | | | | 2.17 | | | | 2.45 | | | | (0.25 | ) | | | — | | | | (0.25 | ) |
| (a) | Annualized for periods less than one year, unless otherwise noted. |
| (b) | Calculated based upon average shares outstanding. |
| (c) | Not annualized for periods less than one year. |
| (d) | Includes adjustments in accordance with accounting principles generally accepted in the United States of America and as such, the net asset values for financial reporting purposes and the returns based upon those net asset values may differ from the net asset values and returns for shareholder transactions. |
| (e) | Includes earnings credits and interest expense, if applicable, each of which is less than 0.005% unless otherwise noted. |
| (f) | Reflects special dividends paid out during the period by several of the Fund’s holdings. Had the Fund not received the special dividends, the net investment income (loss) per share would have been $0.20, $0.09 and $0.31 for Class A, Class C and Class I Shares, respectively, and the net investment income (loss) ratio would have been 0.88%, 0.41% and 1.41% for Class A, Class C and Class I Shares, respectively. |
SEE NOTES TO FINANCIAL STATEMENTS.
| | | | | | |
| | | |
| 32 | | | | J.P. MORGAN TAX AWARE FUNDS | | APRIL 30, 2017 |
| | | | | | | | | | | | | | | | | | | | | | | | | | |
| | | Ratios/Supplemental data | |
| | | | | | | | | | Ratios to average net assets (a) | | | | |
Net asset
value,
end of
period | | | Total return
(excludes sales charge) (c)(d) | | | Net assets,
end of
period
(000’s) | | | Net
expenses (e) | | | Net
investment
income
(loss) | | | Expenses
without waivers,
reimbursements and
earnings credits | | | Portfolio
turnover
rate (c) | |
| | | | | | | | | | | | | | | | | | | | | | | | | | |
| | | | | | | | | | | | | | | | | | | | | | | | | | |
| $ | 31.67 | | | | 14.97 | % | | $ | 17,549 | | | | 1.02 | % | | | 0.53 | % | | | 1.02 | % | | | 16 | % |
| | 28.82 | | | | 2.47 | | | | 13,971 | | | | 1.03 | | | | 0.71 | | | | 1.03 | | | | 41 | |
| | 29.60 | | | | 5.71 | | | | 12,164 | | | | 0.99 | | | | 0.70 | | | | 0.99 | | | | 59 | |
| | 29.01 | | | | 17.50 | | | | 10,667 | | | | 0.96 | | | | 0.71 | | | | 0.96 | | | | 59 | |
| | 24.87 | | | | 28.65 | | | | 7,944 | | | | 0.96 | | | | 1.03 | (f) | | | 0.96 | | | | 67 | |
| | 19.60 | | | | 13.64 | | | | 4,902 | | | | 0.96 | | | | 0.95 | | | | 0.96 | | | | 55 | |
| | | | | | |
| | | | | | | | | | | | | | | | | | | | | | | | | | |
| | 31.41 | | | | 14.70 | | | | 7,611 | | | | 1.50 | | | | 0.04 | | | | 1.50 | | | | 16 | |
| | 28.62 | | | | 1.95 | | | | 5,729 | | | | 1.52 | | | | 0.21 | | | | 1.52 | | | | 41 | |
| | 29.43 | | | | 5.18 | | | | 4,680 | | | | 1.50 | | | | 0.16 | | | | 1.50 | | | | 59 | |
| | 28.88 | | | | 16.92 | | | | 2,700 | | | | 1.46 | | | | 0.21 | | | | 1.46 | | | | 59 | |
| | 24.78 | | | | 28.03 | | | | 1,950 | | | | 1.46 | | | | 0.56 | (f) | | | 1.46 | | | | 67 | |
| | 19.54 | | | | 13.10 | | | | 1,432 | | | | 1.46 | | | | 0.43 | | | | 1.46 | | | | 55 | |
| | | | | | |
| | | | | | | | | | | | | | | | | | | | | | | | | | |
| | 31.81 | | | | 15.25 | | | | 1,176,636 | | | | 0.55 | | | | 1.01 | | | | 0.59 | | | | 16 | |
| | 28.94 | | | | 2.94 | | | | 1,068,546 | | | | 0.55 | | | | 1.19 | | | | 0.56 | | | | 41 | |
| | 29.70 | | | | 6.16 | | | | 1,265,581 | | | | 0.55 | | | | 1.16 | | | | 0.55 | | | | 59 | |
| | 29.10 | | | | 18.04 | | | | 1,293,555 | | | | 0.55 | | | | 1.10 | | | | 0.56 | | | | 59 | |
| | 24.92 | | | | 29.13 | | | | 120,302 | | | | 0.55 | | | | 1.56 | (f) | | | 0.56 | | | | 67 | |
| | 19.63 | | | | 14.19 | | | | 148,369 | | | | 0.55 | | | | 1.53 | | | | 0.56 | | | | 55 | |
SEE NOTES TO FINANCIAL STATEMENTS.
| | | | | | | | |
| | | |
| APRIL 30, 2017 | | J.P. MORGAN TAX AWARE FUNDS | | | | | 33 | |
FINANCIAL HIGHLIGHTS
FOR THE PERIODS INDICATED (continued)
| | | | | | | | | | | | | | | | | | | | |
| | | Per share operating performance | |
| | | | | | Investment operations | | | Distributions | |
| | | Net asset
value,
beginning
of period | | | Net
investment
income
(loss) | | | Net realized
and unrealized
gains
(losses) on
investments | | | Total from
investment
operations | | | Net
investment
income | |
Tax Aware Real Return Fund | | | | | | | | | | | | | | | | | | | | |
Class A | | | | | | | | | | | | | | | | | | | | |
Six Months Ended April 30, 2017 (Unaudited) | | $ | 9.59 | | | $ | 0.12 | (e) | | $ | (0.09 | ) | | $ | 0.03 | | | $ | (0.12 | ) |
Year Ended October 31, 2016 | | | 9.49 | | | | 0.24 | (e) | | | 0.10 | | | | 0.34 | | | | (0.24 | ) |
Year Ended October 31, 2015 | | | 10.01 | | | | 0.25 | (e) | | | (0.51 | ) | | | (0.26 | ) | | | (0.26 | ) |
Year Ended October 31, 2014 | | | 10.06 | | | | 0.26 | (e) | | | (0.04 | ) | | | 0.22 | | | | (0.27 | ) |
Year Ended October 31, 2013 | | | 10.51 | | | | 0.25 | | | | (0.48 | ) | | | (0.23 | ) | | | (0.22 | ) |
Year Ended October 31, 2012 | | | 10.19 | | | | 0.24 | | | | 0.32 | | | | 0.56 | | | | (0.24 | ) |
| | | | | |
Class C | | | | | | | | | | | | | | | | | | | | |
Six Months Ended April 30, 2017 (Unaudited) | | | 9.57 | | | | 0.10 | (e) | | | (0.09 | ) | | | 0.01 | | | | (0.10 | ) |
Year Ended October 31, 2016 | | | 9.47 | | | | 0.18 | (e) | | | 0.10 | | | | 0.28 | | | | (0.18 | ) |
Year Ended October 31, 2015 | | | 9.98 | | | | 0.19 | (e) | | | (0.50 | ) | | | (0.31 | ) | | | (0.20 | ) |
Year Ended October 31, 2014 | | | 10.03 | | | | 0.19 | (e) | | | (0.04 | ) | | | 0.15 | | | | (0.20 | ) |
Year Ended October 31, 2013 | | | 10.48 | | | | 0.17 | | | | (0.47 | ) | | | (0.30 | ) | | | (0.15 | ) |
Year Ended October 31, 2012 | | | 10.16 | | | | 0.18 | | | | 0.32 | | | | 0.50 | | | | (0.18 | ) |
| | | | | |
Class I (formerly Institutional Class) | | | | | | | | | | | | | | | | | | | | |
Six Months Ended April 30, 2017 (Unaudited) | | | 9.61 | | | | 0.13 | (e) | | | (0.09 | ) | | | 0.04 | | | | (0.13 | ) |
Year Ended October 31, 2016 | | | 9.51 | | | | 0.26 | (e) | | | 0.11 | | | | 0.37 | | | | (0.27 | ) |
Year Ended October 31, 2015 | | | 10.03 | | | | 0.27 | (e) | | | (0.50 | ) | | | (0.23 | ) | | | (0.29 | ) |
Year Ended October 31, 2014 | | | 10.08 | | | | 0.29 | (e) | | | (0.05 | ) | | | 0.24 | | | | (0.29 | ) |
Year Ended October 31, 2013 | | | 10.53 | | | | 0.27 | | | | (0.48 | ) | | | (0.21 | ) | | | (0.24 | ) |
Year Ended October 31, 2012 | | | 10.20 | | | | 0.27 | | | | 0.33 | | | | 0.60 | | | | (0.27 | ) |
| | | | | |
Class R6 | | | | | | | | | | | | | | | | | | | | |
Six Months Ended April 30, 2017 (Unaudited) | | | 9.61 | | | | 0.14 | (e) | | | (0.09 | ) | | | 0.05 | | | | (0.14 | ) |
Year Ended October 31, 2016 | | | 9.51 | | | | 0.27 | (e) | | | 0.11 | | | | 0.38 | | | | (0.28 | ) |
Year Ended October 31, 2015 | | | 10.03 | | | | 0.28 | (e) | | | (0.50 | ) | | | (0.22 | ) | | | (0.30 | ) |
Year Ended October 31, 2014 | | | 10.08 | | | | 0.30 | (e) | | | (0.05 | ) | | | 0.25 | | | | (0.30 | ) |
August 16, 2013 (f) through October 31, 2013 | | | 9.92 | | | | 0.05 | | | | 0.18 | | | | 0.23 | | | | (0.07 | ) |
| (a) | Annualized for periods less than one year, unless otherwise noted. |
| (b) | Not annualized for periods less than one year. |
| (c) | Includes adjustments in accordance with accounting principles generally accepted in the United States of America and as such, the net asset values for financial reporting purposes and the returns based upon those net asset values may differ from the net asset values and returns for shareholder transactions. |
| (d) | Includes earnings credits and interest expense, if applicable, each of which is less than 0.005% unless otherwise noted. |
| (e) | Calculated based upon average shares outstanding. |
| (f) | Commencement of offering of class of shares. |
SEE NOTES TO FINANCIAL STATEMENTS.
| | | | | | |
| | | |
| 34 | | | | J.P. MORGAN TAX AWARE FUNDS | | APRIL 30, 2017 |
| | | | | | | | | | | | | | | | | | | | | | | | | | |
| | | Ratios/Supplemental data | |
| | | | | | | | | | Ratios to average net assets (a) | | | | |
Net asset
value,
end of
period | | | Total return
(excludes
sales charge) (b)(c) | | | Net assets,
end of
period
(000’s) | | | Net
expenses (d) | | | Net
investment
income
(loss) | | | Expenses
without waivers,
reimbursements and
earnings credits | | | Portfolio
turnover
rate (b) | |
| | | | | | | | | | | | | | | | | | | | | | | | | | |
| | | | | | | | | | | | | | | | | | | | | | | | | | |
| $ | 9.50 | | | | 0.34 | % | | $ | 49,703 | | | | 0.74 | % | | | 2.53 | % | | | 0.98 | % | | | 10 | % |
| | 9.59 | | | | 3.64 | | | | 47,268 | | | | 0.75 | | | | 2.50 | | | | 0.98 | | | | 7 | |
| | 9.49 | | | | (2.59 | ) | | | 56,660 | | | | 0.75 | | | | 2.58 | | | | 0.97 | | | | 18 | |
| | 10.01 | | | | 2.15 | | | | 95,153 | | | | 0.75 | | | | 2.58 | | | | 0.97 | | | | 11 | |
| | 10.06 | | | | (2.22 | ) | | | 153,819 | | | | 0.75 | | | | 2.31 | | | | 0.97 | | | | 16 | |
| | 10.51 | | | | 5.55 | | | | 222,694 | | | | 0.75 | | | | 2.34 | | | | 0.97 | | | | 8 | |
| | | | | | |
| | | | | | | | | | | | | | | | | | | | | | | | | | |
| | 9.48 | | | | 0.09 | | | | 29,350 | | | | 1.24 | | | | 2.03 | | | | 1.51 | | | | 10 | |
| | 9.57 | | | | 2.98 | | | | 33,016 | | | | 1.40 | | | | 1.85 | | | | 1.50 | | | | 7 | |
| | 9.47 | | | | (3.16 | ) | | | 42,843 | | | | 1.40 | | | | 1.93 | | | | 1.49 | | | | 18 | |
| | 9.98 | | | | 1.48 | | | | 59,850 | | | | 1.40 | | | | 1.93 | | | | 1.46 | | | | 11 | |
| | 10.03 | | | | (2.85 | ) | | | 83,639 | | | | 1.40 | | | | 1.67 | | | | 1.47 | | | | 16 | |
| | 10.48 | | | | 4.92 | | | | 108,755 | | | | 1.40 | | | | 1.70 | | | | 1.47 | | | | 8 | |
| | | | | | |
| | | | | | | | | | | | | | | | | | | | | | | | | | |
| | 9.52 | | | | 0.46 | | | | 1,261,038 | | | | 0.49 | | | | 2.78 | | | | 0.59 | | | | 10 | |
| | 9.61 | | | | 3.89 | | | | 1,144,534 | | | | 0.50 | | | | 2.75 | | | | 0.57 | | | | 7 | |
| | 9.51 | | | | (2.33 | ) | | | 1,302,381 | | | | 0.50 | | | | 2.83 | | | | 0.56 | | | | 18 | |
| | 10.03 | | | | 2.41 | | | | 1,682,468 | | | | 0.50 | | | | 2.83 | | | | 0.56 | | | | 11 | |
| | 10.08 | | | | (1.97 | ) | | | 960,451 | | | | 0.50 | | | | 2.57 | | | | 0.57 | | | | 16 | |
| | 10.53 | | | | 5.91 | | | | 944,652 | | | | 0.50 | | | | 2.58 | | | | 0.57 | | | | 8 | |
| | | | | | |
| | | | | | | | | | | | | | | | | | | | | | | | | | |
| | 9.52 | | | | 0.51 | | | | 121,176 | | | | 0.39 | | | | 2.89 | | | | 0.46 | | | | 10 | |
| | 9.61 | | | | 3.99 | | | | 197,981 | | | | 0.40 | | | | 2.84 | | | | 0.46 | | | | 7 | |
| | 9.51 | | | | (2.24 | ) | | | 183,464 | | | | 0.40 | | | | 2.93 | | | | 0.45 | | | | 18 | |
| | 10.03 | | | | 2.52 | | | | 253,993 | | | | 0.40 | | | | 2.94 | | | | 0.46 | | | | 11 | |
| | 10.08 | | | | 2.33 | | | | 102,671 | | | | 0.38 | | | | 2.69 | | | | 0.47 | | | | 16 | |
SEE NOTES TO FINANCIAL STATEMENTS.
| | | | | | | | |
| | | |
| APRIL 30, 2017 | | J.P. MORGAN TAX AWARE FUNDS | | | | | 35 | |
NOTES TO FINANCIAL STATEMENTS
AS OF APRIL 30, 2017 (Unaudited)
1. Organization
JPMorgan Trust I (the “Trust”) was formed on November 12, 2004, as a Delaware statutory trust, pursuant to a Declaration of Trust dated November 5, 2004 and is registered under the Investment Company Act of 1940, as amended (the “1940 Act”), as an open-end management investment company.
The following are 2 separate funds of the Trust (collectively, the “Funds”) covered by this report:
| | | | |
| | | Classes Offered | | Diversified/Non-Diversified |
| Tax Aware Equity Fund | | Class A, Class C and Class I^ | | Diversified |
| Tax Aware Real Return Fund | | Class A, Class C, Class R6 and Class I^ | | Diversified |
| ^ | On April 3, 2017, the Funds’ Select Class Shares were exchanged into Institutional Class Shares and the Institutional Class Shares were then renamed Class I Shares. Additionally, on April 3, 2017, Select Class Shares were no longer offered. |
The investment objective of Tax Aware Equity Fund is to seek to provide high after-tax total return from a portfolio of selected equity securities.
The investment objective of Tax Aware Real Return Fund is to seek to maximize after-tax inflation protected return.
Class A Shares generally provide for a front-end sales charge while Class C Shares provide for a contingent deferred sales charge (“CDSC”). No sales charges are assessed with respect to Class R6 and Class I Shares. All classes of shares have equal rights as to earnings, assets and voting privileges, except that each class may bear different transfer agency, sub-transfer agency (through April 2, 2017), distribution and service fees and each class has exclusive voting rights with respect to its distribution plan and shareholder servicing agreements. Effective April 3, 2017 subtransfer agency and shareholder servicing fees were consolidated into a single service fee. Certain Class A Shares, for which front-end sales charges have been waived, may be subject to a CDSC as described in the Funds’ prospectus. Beginning on November 14, 2017, Class C Shares will automatically convert to Class A Shares after ten years.
J.P. Morgan Investment Management Inc. (“JPMIM”) an indirect, wholly-owned subsidiary of JPMorgan Chase & Co. (“JPMorgan”) acts as Adviser (the “Adviser”) and Administrator (the “Administrator”) to the Funds.
2. Significant Accounting Policies
The following is a summary of significant accounting policies followed by the Funds in the preparation of their financial statements. The Funds are investment companies and, accordingly, follow the investment company accounting and reporting guidance of the Financial Accounting Standards Board Accounting Standards Codification Topic 946 — Investment Companies, which is part of U.S. generally accepted accounting principles (“GAAP”). The preparation of financial statements in conformity with GAAP requires management to make estimates and assumptions that affect the reported amounts of assets and liabilities and disclosure of contingent assets and liabilities at the date of the financial statements and the reported amounts of increases and decreases in net assets from operations during the reporting period. Actual results could differ from those estimates.
A. Valuation of Investments — The valuation of investments is in accordance with GAAP and the Funds’ valuation policies set forth by and under the supervision and responsibility of the Board of Trustees (the “Board”), which established the following approach to valuation, as described more fully below: (i) investments for which market quotations are readily available shall be valued at such unadjusted quoted prices and (ii) all other investments for which market quotations are not readily available shall be valued at their fair value as determined in good faith by the Board.
The Administrator has established the J.P. Morgan Asset Investment Americas Valuation Committee (“AVC”) to assist the Board with the oversight and monitoring of the valuation of the Funds’ investments. The Administrator implements the valuation policies of the Funds’ investments, as directed by the Board. The AVC oversees and carries out the policies for the valuation of investments held in the Funds. This includes monitoring the appropriateness of fair values based on results of ongoing valuation oversight, including but not limited to consideration of macro or security specific events, market events and pricing vendor and broker due diligence. The Administrator is responsible for discussing and assessing the potential impacts to the fair values on an ongoing basis, and at least on a quarterly basis with the AVC and the Board.
Fixed income instruments are valued based on prices received from approved affiliated and unaffiliated pricing vendors or third party broker-dealers (collectively referred to as “Pricing Services”). The Pricing Services use multiple valuation techniques to determine the valuation of fixed income instruments. In instances where sufficient market activity exists, the Pricing Services may utilize a market-based approach through which trades or quotes from market makers are used to determine the valuation of these instruments. In instances where sufficient market activity may not exist, the Pricing Services also utilize proprietary valuation models which may consider market transactions in comparable securities and the various relationships between securities in determining fair value and/or market characteristics in order to estimate the relevant cash flows, which are then discounted to calculate the fair values.
Equities and other exchange-traded instruments are valued at the last sale price or official market closing price on the primary exchange on which the instrument is traded before the net asset values (“NAV”) of the Funds are calculated on a valuation date. Investments in open-end investment companies (the “Underlying Funds”) are valued at each Underlying Fund’s NAV per share as of the report date.
Swaps are valued utilizing market quotations from approved Pricing Services.
| | | | | | |
| | | |
| 36 | | | | J.P. MORGAN TAX AWARE FUNDS | | APRIL 30, 2017 |
Valuations reflected in this report are as of the report date. As a result, changes in valuation due to market events and/or issuer related events after the report date and prior to issuance of the report are not reflected herein.
The various inputs that are used in determining the valuation of the Funds’ investments are summarized into the three broad levels listed below.
| • | | Level 1 — Unadjusted inputs using quoted prices in active markets for identical investments. |
| • | | Level 2 — Other significant observable inputs including, but not limited to, quoted prices for similar investments, inputs other than quoted prices that are observable for investments (such as interest rates, prepayment speeds, credit risk, etc.) or other market corroborated inputs. |
| • | | Level 3 — Significant inputs based on the best information available in the circumstances, to the extent observable inputs are not available (including the Funds’ assumptions in determining the fair value of investments). |
A financial instrument’s level within the fair value hierarchy is based on the lowest level of any input, both individually and in the aggregate, that is significant to the fair value measurement. The inputs or methodology used for valuing instruments are not necessarily an indication of the risk associated with investing in those instruments.
The following tables represent each valuation input as presented on the Schedules of Portfolio Investments (“SOIs”) (amounts in thousands):
Tax Aware Equity Fund
| | | | | | | | | | | | | | | | |
| | | Level 1
Quoted prices | | | Level 2
Other significant
observable inputs | | | Level 3
Significant
unobservable inputs | | | Total | |
Total Investments in Securities (a) | | $ | 1,200,704 | | | $ | — | | | $ | — | | | $ | 1,200,704 | |
| | | | | | | | | | | | | | | | |
Tax Aware Real Return Fund
| | | | | | | | | | | | | | | | |
| | | Level 1
Quoted prices | | | Level 2
Other significant
observable inputs | | | Level 3
Significant
unobservable inputs | | | Total | |
Total Investments in Securities (b) | | $ | 110,133 | | | $ | 1,345,647 | | | $ | — | | | $ | 1,455,780 | |
| | | | | | | | | | | | | | | | |
Appreciation in Other Financial Instruments | | | | | | | | | | | | | | | | |
Inflation-Linked Swaps | | $ | — | | | $ | 2,408 | | | $ | — | | | $ | 2,408 | |
| | | | | | | | | | | | | | | | |
Depreciation in Other Financial Instruments | | | | | | | | | | | | | | | | |
Inflation-Linked Swaps | | $ | — | | | $ | (84,621 | ) | | $ | — | | | $ | (84,621 | ) |
| | | | | | | | | | | | | | | | |
| (a) | All portfolio holdings designated as level 1 are disclosed individually on the SOIs. Please refer to the SOIs for industry specifics of portfolio holdings. |
| (b) | All portfolio holdings designated as level 1 and level 2 are disclosed individually on the SOIs. Level 1 consists of a money market mutual fund that is held for daily investments of cash and as an investment of cash collateral for swaps. Please refer to the SOIs for state specifics of portfolio holdings. |
There were no transfers among any levels during the six months ended April 30, 2017.
B. Swaps — Tax Aware Real Return Fund engaged in inflation-linked swaps to provide inflation protection within its portfolio. Swap transactions are negotiated contracts over the counter (“OTC swaps”) between the Fund and a counterparty or centrally cleared (“centrally cleared swaps”) with a central clearinghouse through a Futures Commission Merchant (“FCM”), to exchange investment cash flows, assets, foreign currencies or market-linked returns at specified, future intervals.
Upfront payments made and/or received by the Fund are recorded as assets or liabilities, respectively in the Statements of Assets and Liabilities and amortized over the term of the swap. The value of an OTC swap agreement is recorded as either an asset or a liability on the Statements of Assets and Liabilities at the beginning of the measurement period. Upon entering into a centrally cleared swap, the Fund is required to deposit with the FCM cash or securities, which is referred to as initial margin deposit. Securities deposited as initial margin are designated on the SOIs and cash deposited is recorded on the Statements of Assets and Liabilities. Daily changes in valuation of centrally cleared swaps, if any, are recorded as a variation margin receivable or payable on the Statements of Assets and Liabilities. The change in the value of swaps, including accruals of periodic amounts of interest to be paid or received on swaps, is reported as Change in net unrealized appreciation/depreciation on the Statements of Operations. A realized gain or loss is recorded upon payment or receipt of a periodic payment or payment made upon termination of a swap agreement.
The Fund may be required to post or receive collateral based on the net value of the Fund’s outstanding OTC swap contracts with the counterparty in the form of cash or securities. Daily movement of cash collateral is subject to minimum threshold amounts. Collateral posted by the Fund is held in a segregated account at the Fund’s custodian bank. For certain counterparties cash collateral posted by the Fund is invested in an affiliated money market fund (See Note 3.F.), otherwise the cash collateral is included on the Statements of Assets and Liabilities as Restricted cash. Collateral received by the Fund is held in escrow in segregated accounts maintained by JPMorgan Chase Bank, N.A. (“JPMCB”), an affiliate of the Fund, which provides collateral management services to the Fund (See Note 3.G.). These amounts are not reflected on the Fund’s Statements of Assets and Liabilities and are disclosed in the table below.
| | | | | | | | |
| | | |
| APRIL 30, 2017 | | J.P. MORGAN TAX AWARE FUNDS | | | | | 37 | |
NOTES TO FINANCIAL STATEMENTS
AS OF APRIL 30, 2017 (Unaudited) (continued)
Tax Aware Real Return Fund’s swap contracts at net value and collateral posted or received by counterparty as of April 30, 2017 are as follows (amounts in thousands):
| | | | | | | | | | |
| Fund Counterparty | | | | Value of Swap contracts | | | Collateral
amount | |
Barclays Bank plc | | Collateral Posted | | $ | (8,499 | ) | | $ | 8,430 | |
BNP Paribas | | | | | (3,174 | ) | | | 3,570 | |
Citibank, NA | | | | | (15,410 | ) | | | 15,500 | |
Credit Suisse International | | | | | (5,447 | ) | | | 5,490 | |
Deutsche Bank AG, New York | | | | | (10,013 | ) | | | 9,020 | |
Goldman Sachs International | | | | | (2,048 | ) | | | 2,040 | |
Morgan Stanley Capital Services | | | | | (6,779 | ) | | | 6,800 | |
Royal Bank of Scotland | | | | | (28,512 | ) | | | 28,460 | |
Insert Tax Matters | | | | | (2,331 | ) | | | 2,060 | |
The use of swaps exposes the Fund to interest rate risk. The Fund also may be subject to various risks from the use of swaps including: (i) the risk that changes in the value of the swap may not correlate perfectly with the underlying rate; (ii) counterparty credit risk related to the failure, by the counterparty to the swap, to perform under the terms of the contract; (iii) liquidity risk related to the lack of a liquid market for these contracts allowing the Fund to close out its position(s); and, (iv) documentation risk relating to disagreement over contract terms.
Tax Aware Real Return Fund is party to various derivative contracts governed by International Swaps and Derivatives Association master agreements (“ISDA agreements”). The Fund’s ISDA agreements, which are separately negotiated with each dealer counterparty, may contain provisions allowing, absent other considerations, a counterparty to exercise rights, to the extent not otherwise waived, against the Fund in the event the Fund’s net assets decline over time by a pre-determined percentage or fall below a pre-determined floor. The ISDA agreements may also contain provisions allowing, absent other conditions, the Fund to exercise rights, to the extent not otherwise waived, against the counterparty (e.g., decline in a counterparty’s credit rating below a specified level). Such rights for both the counterparty and Fund often include the ability to terminate (i.e., close out) open contracts at prices which may favor the counterparty, which could have an adverse effect on the Fund. The ISDA agreements give the Fund and counterparty the right, upon an event of default, to close out all transactions traded under such agreements and to net amounts owed or due across all transactions and offset such net payable or receivable with collateral posted to a segregated account by one party to the other.
The Fund’s swap contracts are subject to master netting arrangements.
The table below discloses the volume of the Fund’s swap activity during the six months ended April 30, 2017 (amounts in thousands):
| | | | |
| Interest Rate-Related Swaps (Inflation-Linked Swaps) | | Tax Aware
Real Return Fund | |
Average Notional Balance — Pays Fixed Rate | | $ | 1,280,143 | |
Ending Notional Balance — Pays Fixed Rate | | | 1,277,000 | |
C. Summary of Derivatives Information
The following table presents the Fund’s gross derivative assets and liabilities by counterparty net of amounts available for offset under netting arrangements and net of any related collateral received or posted by the Fund as of April 30, 2017 (amounts in thousands):
Tax Aware Real Return Fund
| | | | | | | | | | | | | | | | |
| Counterparty | | Gross Amount of
Derivative Assets
Subject to Netting
Arrangements
Presented on the
Statements of Assets
and Liabilities (a) | | | Derivatives
Available
for offset | | | Collateral
Received (b) | | | Net Amount Due
From Counterparty
(Not less than zero) | |
Barclays Bank plc | | $ | 397 | | | $ | (397 | ) | | $ | — | | | $ | — | |
BNP Paribas | | | 629 | | | | (629 | ) | | | — | | | | — | |
Deutsche Bank AG, New York | | | 1,382 | | | | (1,382 | ) | | | — | | | | — | |
| | | | | | | | | | | | | | | | |
| | $ | 2,408 | | | $ | (2,408 | ) | | $ | — | | | $ | — | |
| | | | | | | | | | | | | | | | |
| | | | | | |
| | | |
| 38 | | | | J.P. MORGAN TAX AWARE FUNDS | | APRIL 30, 2017 |
| | | | | | | | | | | | | | | | |
| Counterparty | | Gross Amount of
Derivative Liabilities
Subject to Netting
Arrangements
Presented on the
Statements of Assets
and Liabilities (a) | | | Derivatives
Available
for offset | | | Collateral
Posted (b) | | | Net Amount Due
From Counterparty
(Not less than zero) | |
Barclays Bank plc | | $ | 8,896 | | | $ | (397 | ) | | $ | (8,430 | ) | | $ | 69 | |
BNP Paribas | | | 3,803 | | | | (629 | ) | | | (3,174 | ) | | | — | |
Insert Tax Matters | | | 15,410 | | | | — | | | | (15,410 | ) | | | — | |
Credit Suisse International | | | 5,447 | | | | — | | | | (5,447 | ) | | | — | |
Deutsche Bank AG, New York | | | 11,395 | | | | (1,382 | ) | | | (9,020 | ) | | | 993 | |
Goldman Sachs International | | | 2,048 | | | | — | | | | (2,040 | ) | | | 8 | |
Morgan Stanley Capital Services | | | 6,779 | | | | — | | | | (6,779 | ) | | | — | |
Royal Bank of Scotland | | | 28,512 | | | | — | | | | (28,460 | ) | | | 52 | |
Union Bank of Switzerland AG | | | 2,331 | | | | — | | | | (2,060 | ) | | | 271 | |
| | | | | | | | | | | | | | | | |
| | $ | 84,621 | | | $ | (2,408 | ) | | $ | (80,820 | ) | | $ | 1,393 | |
| | | | | | | | | | | | | | | | |
| (a) | For financial reporting purposes, the Fund does not offset derivative assets and derivative liabilities subject to master netting arrangements on the Statements of Assets and Liabilities. |
| (b) | Collateral received or posted is limited to the net derivative asset or net derivative liability amounts. See Note 2.B. for actual swap collateral received or posted. |
The Fund’s derivatives contracts held at April 30, 2017 are not accounted for as hedging instruments under GAAP.
D. Security Transactions and Investment Income — Investment transactions are accounted for on the trade date (the date the order to buy or sell is executed). Securities gains and losses are calculated on a specifically identified cost basis. Interest income is determined on the basis of coupon interest accrued using the effective interest method which adjusts for amortization of premiums and accretion of discounts. Dividend income net of foreign taxes withheld, if any, is recorded on the ex-dividend date or when a Fund first learns of the dividend.
E. Allocation of Income and Expenses — Expenses directly attributable to a fund are charged directly to that fund, while the expenses attributable to more than one fund of the Trust are allocated among the respective funds. In calculating the NAV of each class, investment income, realized and unrealized gains and losses and expenses, other than class specific expenses, are allocated daily to each class of shares based upon the proportion of net assets of each class at the beginning of each day.
Transfer agency fees are class-specific expenses and sub-transfer agency fees were class specific expenses up through April 2, 2017. Effective April 3, 2017, the Funds ceased making direct payments to financial intermediaries for any applicable sub-transfer agency services. Payments to financial intermediaries for sub-transfer agency services are made by JPMorgan Distribution Services, Inc. from the Shareholder Servicing Fee which has been renamed as the Service Fee. The amount of the transfer agency and sub-transfer agency fees charged to each class of the Funds for the six months ended April 30, 2017 are as follows (amounts in thousands):
| | | | | | | | | | | | | | | | | | | | | | | | |
| | | Class A | | | Class C | | | Class I | | | Class R6 | | | Select Class | | | Total | |
Tax Aware Equity Fund | | | | | | | | | | | | | | | | | | | | | | | | |
Transfer agency fees | | $ | 1 | | | $ | — | (a) | | $ | 7 | | | | n/a | | | $ | 2 | | | $ | 10 | |
Sub-transfer agency fees | | | 4 | | | | 1 | | | | 31 | | | | n/a | | | | 4 | | | | 40 | |
Tax Aware Real Return Fund | | | | | | | | | | | | | | | | | | | | | | | | |
Transfer agency fees | | | 1 | | | | 1 | | | | 5 | | | $ | 1 | | | | 1 | | | | 9 | |
Sub-transfer agency fees | | | 4 | | | | 6 | | | | 10 | | | | — | | | | 15 | | | | 35 | |
| (a) | Amount rounds to less than 500. |
F. Federal Income Taxes — Each Fund is treated as a separate taxable entity for Federal income tax purposes. Each Fund’s policy is to comply with the provisions of the Internal Revenue Code of 1986, as amended (the “Code”), applicable to regulated investment companies and to distribute to shareholders all of its distributable net investment income and net realized capital gains on investments. Accordingly, no provision for Federal income tax is necessary. Management has reviewed the Funds’ tax positions for all open tax years and has determined that as of April 30, 2017, no liability for income tax is required in the Funds’ financial statements for net unrecognized tax benefits. However, management’s conclusions may be subject to future review based on changes in, or the interpretation of, the accounting standards or tax laws and regulations. Each of the Funds’ Federal tax returns for the prior three fiscal years remains subject to examination by the Internal Revenue Service.
G. Distributions to Shareholders — Tax Aware Equity Fund generally declares and pays distributions from net investment income quarterly. Tax Aware Real Return Fund generally declares and pays distributions from net investment income monthly. Distributions are declared separately for each class. No class has preferential dividend rights; differences in per share rates are due to differences in separate class expenses. Net realized
| | | | | | | | |
| | | |
| APRIL 30, 2017 | | J.P. MORGAN TAX AWARE FUNDS | | | | | 39 | |
NOTES TO FINANCIAL STATEMENTS
AS OF APRIL 30, 2017 (Unaudited) (continued)
capital gains, if any, are distributed by each Fund at least annually. The amount of distributions from net investment income and net realized capital gains is determined in accordance with Federal income tax regulations, which may differ from GAAP. To the extent these “book/tax” differences are permanent in nature (i.e., that they result from other than timing of recognition — “temporary differences”), such amounts are reclassified within the capital accounts based on their Federal tax-basis treatment.
3. Fees and Other Transactions with Affiliates
A. Investment Advisory Fee — Pursuant to an Investment Advisory Agreement, the Adviser supervises the investments of each Fund and for such services is paid a fee. The fee is accrued daily and paid monthly based on each Fund’s respective average daily net assets. The annual rate for each Fund is as follows:
| | | | |
Tax Aware Equity Fund | | | 0.35 | % |
Tax Aware Real Return Fund | | | 0.35 | |
The Adviser waived Investment Advisory fees and/or reimbursed expenses as outlined in Note 3.F.
B. Administration Fee — Pursuant to an Administration Agreement, the Administrator provides certain administration services to the Funds. In consideration of these services, the Administrator receives a fee accrued daily and paid monthly at an annual rate of 0.15% of the first $25 billion of the average daily net assets of all funds in the J.P. Morgan Funds Complex covered by the Administration Agreement (excluding certain funds of funds and money market funds) and 0.075% of the average daily net assets in excess of $25 billion of all such funds. For the six months ended April 30, 2017, the effective annualized rate was 0.08% of each Fund’s average daily net assets, notwithstanding any fee waivers and/or expense reimbursements.
JPMCB serves as the Funds’ sub-administrator (the “Sub-administrator”). For its services as Sub-administrator, JPMCB receives a portion of the fees payable to the Administrator.
C. Distribution Fees — Pursuant to a Distribution Agreement, JPMorgan Distribution Services, Inc. (“JPMDS”), a wholly-owned subsidiary of JPMorgan, serves as the Trust’s principal underwriter and promotes and arranges for the sale of each Fund’s shares. The Board has adopted a Distribution Plan (the “Distribution Plan”) for Class A and Class C Shares of the Funds in accordance with Rule 12b-1 under the 1940 Act. The Class R6 and Class I Shares do not charge a distribution fee. The Distribution Plan provides that each Fund shall pay distribution fees, including payments to the JPMDS, at annual rates of the average daily net assets as shown in the table below:
| | | | | | | | |
| | | Class A | | | Class C | |
Tax Aware Equity Fund | | | 0.25 | % | | | 0.75 | % |
Tax Aware Real Return Fund | | | 0.25 | | | | 0.75 | |
In addition, the JPMDS is entitled to receive the front-end sales charges from purchases of Class A Shares and the CDSC from redemptions of Class C Shares and certain Class A Shares for which front-end sales charges have been waived. For the six months ended April 30, 2017, the JPMDS retained the following (amounts in thousands):
| | | | | | | | |
| | | Front-End Sales Charge | | | CDSC | |
Tax Aware Equity Fund | | | $3 | | | $ | — | |
Tax Aware Real Return Fund | | | 2 | | | | (1 | ) |
D. Service Fees — The Trust, on behalf of the Funds, has entered into a Shareholder Servicing Agreement with the JPMDS under which the JPMDS provides certain support services to the shareholders. The Class R6 Shares do not charge a service fee. For performing these services, the JPMDS receives a fee that is accrued daily and paid monthly equal to a percentage of the average daily net assets as shown in the table below:
| | | | | | | | | | | | |
| | | Class A | | | Class C | | | Class I* | |
Tax Aware Equity Fund | | | 0.25 | % | | | 0.25 | % | | | 0.25 | % |
Tax Aware Real Return Fund | | | 0.25 | | | | 0.25 | | | | 0.25 | |
| * | Prior to April 3, 2017, the rates were 0.10%. |
The JPMDS has entered into shareholder services contracts with affiliated and unaffiliated financial intermediaries who provide shareholder services and other related services to their clients or customers who invest in the Funds under which the JPMDS will pay all or a portion of such fees earned to financial intermediaries for performing such services.
The JPMDS waived service fees as outlined in Note 3.F.
E. Custodian and Accounting Fees — JPMCB provides portfolio custody and accounting services to the Funds. For performing these services, the Funds pay JPMCB transaction and asset-based fees that vary according to the number of transactions and positions, plus out-of-pocket expenses. The amounts paid directly to JPMCB by the Funds for custody and accounting services are included in Custodian and accounting fees on the Statements of Operations. Payments to the custodian may be reduced by credits earned by each Fund, based on uninvested cash balances held by the custodian. Such earnings credits, if any, are presented separately on the Statements of Operations.
| | | | | | |
| | | |
| 40 | | | | J.P. MORGAN TAX AWARE FUNDS | | APRIL 30, 2017 |
Interest expense paid to the custodian related to cash overdrafts, if any, is included in Interest expense to affiliates on the Statements of Operations.
F. Waivers and Reimbursements — The Adviser, Administrator and JPMDS have contractually agreed to waive fees and/or reimburse the Funds to the extent that total annual operating expenses (excluding acquired fund fees and expenses other than certain money market fund fees as described below, dividend expenses related to short sales, interest expenses related to short sales, interest, taxes, expenses related to litigation and potential litigation and extraordinary expenses) exceed the percentages of the Funds’ respective average daily net assets as shown in the table below:
| | | | | | | | | | | | | | | | |
| | | Class A | | | Class C | | | Class R6 | | | Class I | |
Tax Aware Equity Fund | | | 1.05 | % | | | 1.55 | % | | | n/a | | | | 0.55 | % |
Tax Aware Real Return Fund | | | 0.75 | | | | 1.25 | | | | 0.40 | % | | | 0.50 | |
The expense limitation agreements were in effect for the six months ended April 30, 2017 and are in place until at least October 31, 2018.
For the six months ended April 30, 2017, the Funds’ service providers waived fees and/or reimbursed expenses for each of the Funds as follows (amounts in thousands). None of these parties expect the Funds to repay any such waived fees and/or reimbursed expenses in future years.
| | | | | | | | | | | | | | | | |
| | | Contractual Waivers | |
| | | Investment
Advisory
Fees | | | Administration
Fees | | | Service
Fees | | | Total | |
Tax Aware Equity Fund | | $ | — | | | $ | — | | | $ | 262 | | | $ | 262 | |
Tax Aware Real Return Fund | | | 277 | | | | 185 | | | | 312 | | | | 774 | |
Additionally, the Funds may invest in one or more money market funds advised by the Adviser or its affiliates (affiliated money market funds). The Adviser, Administrator and/or JPMDS, as shareholder servicing agent, have contractually agreed to waive fees and/or reimburse expenses in an amount sufficient to offset the respective net fees each collects from the affiliated money market fund on the applicable Funds’ investment in such affiliated money market fund.
The amounts of these waivers resulting from investments in these money market funds for the six months ended April 31, 2017 were as follows (amounts in thousands):
| | | | |
Tax Aware Equity Fund | | $ | 3 | |
Tax Aware Real Return Fund | | | 69 | |
G. Collateral Management Fees — JPMCB provides derivatives collateral management services for Tax Aware Real Return Fund. The amounts paid directly to JPMCB by the Fund for these services are included in Collateral Management fees on the Statements of Operations.
H. Other — Certain officers of the Trust are affiliated with the Adviser, the Administrator and the JPMDS. Such officers, with the exception of the Chief Compliance Officer, receive no compensation from the Funds for serving in their respective roles.
The Board appointed a Chief Compliance Officer to the Funds in accordance with Federal securities regulations. Each Fund, along with other affiliated funds, makes reimbursement payments, on a pro-rata basis, to the Administrator for a portion of the fees associated with the Office of the Chief Compliance Officer. Such fees are included in Trustees’ and Chief Compliance Officer’s fees on the Statements of Operations.
The Trust adopted a Trustee Deferred Compensation Plan (the “Plan”) which allows the Independent Trustees to defer the receipt of all or a portion of compensation related to performance of their duties as Trustees. The deferred fees are invested in various J.P. Morgan Funds until distribution in accordance with the Plan.
During the six months ended April 30, 2017, the Tax Aware Real Return Fund purchased securities from an underwriting syndicate in which the principal underwriter or members of the syndicate were affiliated with the Adviser.
The Funds may use related party broker-dealers. For the six months ended April 30, 2017, the Funds did not incur any brokerage commissions with broker-dealers affiliated with the Adviser.
The Securities and Exchange Commission (“SEC”) has granted an exemptive order permitting the Funds to engage in principal transactions with J.P. Morgan Securities, Inc., an affiliated broker, involving taxable money market instruments, subject to certain conditions.
4. Investment Transactions
During the six months ended April 30, 2017, purchases and sales of investments (excluding short-term investments) were as follows (amounts in thousands):
| | | | | | | | |
| | | Purchases
(excluding U.S.
Government) | | | Sales
(excluding U.S.
Government) | |
Tax Aware Equity Fund | | $ | 182,153 | | | $ | 328,304 | |
Tax Aware Real Return Fund | | | 133,775 | | | | 229,453 | |
| | | | | | | | |
| | | |
| APRIL 30, 2017 | | J.P. MORGAN TAX AWARE FUNDS | | | | | 41 | |
NOTES TO FINANCIAL STATEMENTS
AS OF APRIL 30, 2017 (Unaudited) (continued)
During the six months ended April 30, 2017, there were no purchases or sales of U.S. Government securities.
5. Federal Income Tax Matters
For Federal income tax purposes, the estimated cost and unrealized appreciation (depreciation) in value of investment securities held at April 30, 2017 were as follows (amounts in thousands):
| | | | | | | | | | | | | | | | |
| | | Aggregate
Cost | | | Gross
Unrealized
Appreciation | | | Gross
Unrealized
Depreciation | | | Net Unrealized
Appreciation
(Depreciation) | |
Tax Aware Equity Fund | | $ | 669,277 | | | $ | 532,350 | | | $ | 923 | | | $ | 531,427 | |
Tax Aware Real Return Fund | | | 1,384,304 | | | | 72,850 | | | | 1,374 | | | | 71,476 | |
Under the Regulated Investment Company Modernization Act of 2010 (the “Act”), net capital losses recognized by the Funds after October 31, 2011, are carried forward indefinitely, and retain their character as short-term and/or long-term losses. Prior to the Act, net capital losses incurred by the Funds were carried forward for eight years and treated as short-term losses. The Act requires that post-enactment net capital losses be used before pre-enactment net capital losses.
At October 31, 2016, the following Fund had post-enactment net capital loss carryforwards which are available to offset future realized gains (amounts in thousands):
| | | | | | | | |
| | | Capital Loss Carryforward Character | |
| | | Short-Term | | | Long-Term | |
Tax Aware Real Return Fund | | $ | 30,936 | | | $ | — | |
6. Borrowings
The Funds rely upon an exemptive order granted by the SEC (the “Order”) permitting the establishment and operation of an Interfund Lending Facility (the “Facility”). The Facility allows the Funds to directly lend and borrow money to or from any other fund relying upon the Order at rates beneficial to both the borrowing and lending funds. Advances under the Facility are taken primarily for temporary or emergency purposes, including the meeting of redemption requests that otherwise might require the untimely disposition of securities, and are subject to each Fund’s borrowing restrictions. The Interfund loan rate is determined, as specified in the Order, by averaging the current repurchase agreement rate and the current bank loan rate. The Order was granted to JPMorgan Trust II and may be relied upon by the Funds because the Funds and the series of JPMorgan Trust II are all investment companies in the same “group of investment companies” (as defined in Section 12(d)(1)(G) of the 1940 Act).
The Trust and JPMCB have entered into a financing arrangement. Under this arrangement, JPMCB provides an unsecured, uncommitted credit facility in the aggregate amount of $100 million to certain of the J.P. Morgan Funds, including the Funds. Advances under the arrangement are taken primarily for temporary or emergency purposes, including the meeting of redemption requests that otherwise might require the untimely disposition of securities, and are subject to each Fund’s borrowing restrictions. Interest on borrowings is payable at a rate determined by JPMCB at the time of borrowing. This agreement has been extended until November 6, 2017.
The Funds had no borrowings outstanding from another fund or from the unsecured, uncommitted credit facility during the six months ended April 30, 2017.
In addition, effective August 16, 2016, the Trust along with certain other trusts (“Borrowers”) entered into a joint syndicated senior unsecured revolving credit facility totaling $1.5 billion (“Credit Facility”) with various lenders and The Bank of New York Mellon, as administrative agent for the lenders. This Credit Facility provides a source of funds to the Borrowers for temporary and emergency purposes, including the meeting of redemption requests that otherwise might require the untimely disposition of securities. Under the terms of the Credit Facility, a borrowing fund must have a minimum of $25,000,000 in adjusted net asset value and not exceed certain adjusted net asset coverage ratios prior to and during the time in which any borrowings are outstanding. If a fund does not comply with the aforementioned requirements, the fund must remediate within three business days with respect to the $25,000,000 minimum adjusted net asset value or within one business day with respect to certain asset coverage ratios or the administrative agent at the request of, or with the consent of, the lenders may terminate the Credit Facility and declare any outstanding borrowings to be due and payable immediately.
Interest associated with any borrowing under the Credit Facility is charged to the borrowing fund at a rate of interest equal to 1.00% plus the greater of the federal funds effective rate or one month LIBOR. The annual commitment fee to maintain the Credit Facility is 0.15% and is incurred on the unused portion of the Credit Facility and is allocated to all participating funds pro rata based on their respective net assets. The initial term of the Credit Facility is 364 days, unless extended.
The Funds did not utilize the Credit Facility during the six months ended April 30, 2017.
7. Risks, Concentrations and Indemnifications
In the normal course of business, the Funds enter into contracts that contain a variety of representations which provide general indemnifications. Each Fund’s maximum exposure under these arrangements is unknown. The amount of exposure would depend on future claims that may be made against each Fund that have not yet occurred. However, based on experience, the Funds expect the risk of loss to be remote.
| | | | | | |
| | | |
| 42 | | | | J.P. MORGAN TAX AWARE FUNDS | | APRIL 30, 2017 |
As of April 30, 2017, the Funds had affiliated omnibus accounts which owed more than 10% of the Fund’s outstanding shares as follows:
| | | | | | | | |
| | | Number of
Affiliated
Omnibus Accounts | | | % of the Fund | |
Tax Aware Equity Fund | | | 1 | | | | 79.6 | % |
Tax Aware Real Return Fund | | | 1 | | | | 70.4 | % |
Significant shareholder transactions by these shareholders may impact the Funds’ performance.
Derivatives may be riskier than other types of investments because they may be more sensitive to changes in economic and market conditions and could result in losses that significantly exceed the Funds’ original investment. Many derivatives create leverage thereby causing the Funds to be more volatile than they would have been if they had not used derivatives. Derivatives also expose the Funds to counterparty risk (the risk that the derivative counterparty will not fulfill its contractual obligations), including credit risk of the derivative counterparty.
Tax Aware Real Return Fund invests primarily in a portfolio of municipal debt obligations issued by states, territories and possessions of the United States and by the District of Columbia, and by their political subdivisions and duly constituted authorities. An issuer’s ability to meet its payment obligations may be affected by economic or political developments in a specific state or region. These debt obligations may be insured by private insurers who guarantee the payment of principal and interest in the event of issuer default. The value of these investments may be impacted by changes to bond insurers’ ratings and the Fund’s ability to collect principal and interest, in the event of an issuer’s default, may be limited if the private insurer does not have the wherewithal to satisfy its obligation.
The Fund is subject to interest rate and credit risk. The value of debt securities may decline as interest rates increase. The Fund could lose money if the issuer of a fixed income security is unable to pay interest or repay principal when it is due. The Fund invests in floating rate loans and other floating rate debt securities. Although these investments are generally less sensitive to interest rate changes than other fixed rate instruments, the value of floating rate loans and other floating rate investments may decline if their interest rates do not rise as quickly, or as much, as general interest rates. Many factors can cause interest rates to rise. Some examples include central bank monetary policy, rising inflation rates and general economic conditions. Given that the Federal Reserve has recently raised interest rates and may continue to do so, the Funds may face a heightened level of interest rate risk. The ability of the issuers of debt to meet their obligations may be affected by the economic and political developments in a specific industry or region.
8. Investment Company Reporting Modernization
In October 2016, the U.S. Securities and Exchange Commission adopted new rules and forms, and amendments to certain current rules and forms, to modernize the reporting and disclosure of information by registered investment companies. In part, the final rules amend Regulation S-X and will require standardized, enhanced disclosures about derivatives in investment company financial statements, as well as other amendments. The compliance date for the amendments to Regulation S-X is August 1, 2017. At this time, management is currently assessing the anticipated impact of the Regulation S-X amendments on the Fund’s financial statements and related disclosures.
| | | | | | | | |
| | | |
| APRIL 30, 2017 | | J.P. MORGAN TAX AWARE FUNDS | | | | | 43 | |
SCHEDULE OF SHAREHOLDER EXPENSES
(Unaudited)
Hypothetical $1,000 Investment
As a shareholder of the Funds, you incur two types of costs: (1) transaction costs, including sales charges (loads) on purchase payments and (2) ongoing costs, including investment advisory fees, administration fees, distribution fees and other Fund expenses. The examples below are intended to help you understand your ongoing costs (in dollars) of investing in the Funds and to compare these ongoing costs with the ongoing costs of investing in other mutual funds. The examples assume that you had a $1,000 investment in each Class at the beginning of the reporting period, November 1, 2016, and continued to hold your shares at the end of the reporting period, April 30, 2017.
Actual Expenses
For each Class of each Fund in the table below, the first line provides information about actual account values and actual expenses. You may use the information in this line, together with the amount you invested, to estimate the expenses that you paid over the period. Simply divide your account value by $1,000 (for example, an $8,600 account value divided by $1,000 = 8.6), then multiply the result by the number in the first line of each Class under the heading entitled “Expenses Paid During the Period” to estimate the expenses you paid on your account during this period.
Hypothetical Example for Comparison Purposes
The second line of each Class in the table below provides information about hypothetical account values and hypothetical expenses based on the Class’ actual expense ratio and an assumed rate of return of 5% per year before expenses, which is not the Class’ actual return. The hypothetical account values and expenses may not be used to estimate the actual ending account balance or expenses you paid for the period. You may use this information to compare the ongoing costs of investing in the Class of the Fund and other funds. To do so, compare this 5% hypothetical example with the 5% hypothetical examples that appear in the shareholder reports of the other funds. Please note that the expenses shown in the table are meant to highlight your ongoing costs only and do not reflect any transaction costs, such as sales charges (loads) or redemption fees. Therefore, the second line for each Class in the table is useful in comparing ongoing costs only, and will not help you determine the relative total costs of owning different funds. In addition, if these transaction costs were included, your costs would have been higher. The examples also assume all dividends and distributions have been reinvested.
| | | | | | | | | | | | | | | | |
| | | Beginning
Account Value
November 1, 2016 | | | Ending
Account Value
April 30, 2017 | | | Expenses
Paid During
the Period* | | | Annualized
Expense
Ratio | |
Tax Aware Equity Fund | | | | | | | | | | | | | | | | |
Class A | | | | | | | | | | | | | | | | |
Actual | | $ | 1,000.00 | | | $ | 1,149.70 | | | $ | 5.44 | | | | 1.02 | % |
Hypothetical | | | 1,000.00 | | | | 1,019.74 | | | | 5.11 | | | | 1.02 | |
Class C | | | | | | | | | | | | | | | | |
Actual | | | 1,000.00 | | | | 1,147.00 | | | | 7.99 | | | | 1.50 | |
Hypothetical | | | 1,000.00 | | | | 1,017.36 | | | | 7.50 | | | | 1.50 | |
Class I (formerly Institutional Class) | | | | | | | | | | | | | | | | |
Actual | | | 1,000.00 | | | | 1,152.50 | | | | 2.94 | | | | 0.55 | |
Hypothetical | | | 1,000.00 | | | | 1,022.07 | | | | 2.76 | | | | 0.55 | |
| | | | |
Tax Aware Real Return Fund | | | | | | | | | | | | | | | | |
Class A | | | | | | | | | | | | | | | | |
Actual | | $ | 1,000.00 | | | $ | 1,003.40 | | | $ | 3.68 | | | | 0.74 | % |
Hypothetical | | | 1,000.00 | | | | 1,021.12 | | | | 3.71 | | | | 0.74 | |
Class C | | | | | | | | | | | | | | | | |
Actual | | | 1,000.00 | | | | 1,000.90 | | | | 6.15 | | | | 1.24 | |
Hypothetical | | | 1,000.00 | | | | 1,018.65 | | | | 6.21 | | | | 1.24 | |
Class I (formerly Institutional Class) | | | | | | | | | | | | | | | | |
Actual | | | 1,000.00 | | | | 1,004.60 | | | | 2.44 | | | | 0.49 | |
Hypothetical | | | 1,000.00 | | | | 1,022.36 | | | | 2.46 | | | | 0.49 | |
Class R6 | | | | | | | | | | | | | | | | |
Actual | | | 1,000.00 | | | | 1,005.10 | | | | 1.94 | | | | 0.39 | |
Hypothetical | | | 1,000.00 | | | | 1,022.86 | | | | 1.96 | | | | 0.39 | |
| * | Expenses are equal to each Class’ respective annualized expense ratio, multiplied by the average account value over the period, multiplied by 181/365 (to reflect the one-half year period). |
| | | | | | |
| | | |
| 44 | | | | J.P. MORGAN TAX AWARE FUNDS | | APRIL 30, 2017 |
J.P. Morgan Funds are distributed by JPMorgan Distribution Services, Inc., which is an affiliate of JPMorgan Chase & Co. Affiliates of JPMorgan Chase & Co. receive fees for providing various services to the funds.
Contact JPMorgan Distribution Services, Inc. at 1-800-480-4111 for a fund prospectus. You can also visit us at www.jpmorganfunds.com. Investors should carefully consider the investment objectives and risk as well as charges and expenses of the mutual fund before investing. The prospectus contains this and other information about the mutual fund. Read the prospectus carefully before investing.
Investors may obtain information about the Securities Investor Protection Corporation (SIPC), including the SIPC brochure by visiting www.sipc.org or by calling SIPC at 202-371-8300.
Each Fund files a complete schedule of its fund holdings for the first and third quarters of its fiscal year with the SEC on Form N-Q. The Funds’ Forms N-Q are available on the SEC’s website at http://www.sec.gov and may be reviewed and copied at the SEC’s Public Reference Room in Washington, DC. Information on the operation of the SEC’s Public Reference Room may be obtained by calling 1-800-SEC-0330. Shareholders may request the Form N-Q without charge by calling 1-800-480-4111 or by visiting the J.P. Morgan Funds’ website at www.jpmorganfunds.com.
A description of each Fund’s policies and procedures with respect to the disclosure of each Fund’s holdings is available in the prospectus and Statement of Additional Information.
A copy of proxy policies and procedures is available without charge upon request by calling 1-800-480-4111 and on the Funds’ website at www.jpmorganfunds.com. A description of such policies and procedures is on the SEC’s website at www.sec.gov. The Trustees have delegated the authority to vote proxies for securities owned by the Funds to the Adviser. A copy of the Funds’ voting record for the most recent 12-month period ended June 30 is available on the SEC’s website at www.sec.gov or at the Funds’ website at www.jpmorganfunds.com no later than August 31 of each year. The Funds’ proxy voting record will include, among other things, a brief description of the matter voted on for each fund security, and will state how each vote was cast, for example, for or against the proposal.

J.P. Morgan Asset Management is the marketing name for the asset management business of JPMorgan Chase & Co. Those businesses include, but are not limited to, J.P. Morgan Investment Management Inc., Security Capital Research & Management Incorporated and J.P. Morgan Alternative Asset Management, Inc.
| | | | |
| | © JPMorgan Chase & Co., 2017. All rights reserved. April 2017. | | SAN-TA-417 |
Semi-Annual Report
J.P. Morgan Country/Region Funds
April 30, 2017 (Unaudited)
JPMorgan China Region Fund
JPMorgan Intrepid European Fund
JPMorgan Latin America Fund

CONTENTS
Investments in a Fund are not deposits or obligations of, or guaranteed or endorsed by, any bank and are not insured or guaranteed by the FDIC, the Federal Reserve Board or any other government agency. You could lose money if you sell when a Fund’s share price is lower than when you invested.
Past performance is no guarantee of future performance. The general market views expressed in this report are opinions based on market and other conditions through the end of the reporting period and are subject to change without notice. These views are not intended to predict the future performance of a Fund or the securities markets. References to specific securities and their issuers are for illustrative purposes only and are not intended to be, and should not be interpreted as, recommendations to purchase or sell such securities. Such views are not meant as investment advice and may not be relied on as an indication of trading intent on behalf of any Fund.
Prospective investors should refer to the Funds’ prospectus for a discussion of the Funds’ investment objectives, strategies and risks. Call J.P. Morgan Funds Service Center at 1-800-480-4111 for a prospectus containing more complete information about a Fund, including management fees and other expenses. Please read it carefully before investing.
CEO’S LETTER
May 25, 2017 (Unaudited)
Dear Shareholder,
The world’s leading economies continued their upward trajectory over the six months ended April 30, 2017, bolstered by central bank policies, growth in corporate earnings and buoyant consumer and business sentiment.
| | |
 | | “While bond markets provided a mixed performance over the six months ended April 30, 2017, equity markets rewarded investors with solid returns.” — George C.W. Gatch |
While the U.S. and China had been leading drivers of growth for most of the current economic expansion, by late 2016 and into 2017 the world’s other leading economies began to strengthen. Each of the world’s 20 largest economies was forecast to increase output of goods and services through 2017 and the variation in growth rates among those economies was forecast to be the lowest since 1980, according to Bloomberg News.
The U.S. economy slowed somewhat in the first quarter of 2017, but unemployment dropped to 4.4% in April 2017 and the U.S. Federal Reserve reiterated its intent to raise interest rates amid continued economic growth and rising inflation. Throughout the six month reporting period, U.S. financial markets — particularly U.S. equities — generally outperformed other developed markets and emerging markets.
China’s economy continued to grow and posted a 6.9% rise in gross domestic product (GDP) in the first quarter of 2017, amid strength in housing, infrastructure investment, exports and retail sales. Notably, financial markets in China remained largely stable for the six month reporting period. For the 86 trading days through April 24, 2017, the Shanghai Stock Exchange Composite Index hadn’t fallen by more than 1%, thanks in large part to government efforts to prevent a recurrence of the sharp sell-offs that hit Chinese markets in mid-2015 and early 2016.
Meanwhile, Chinese officials sought to reduce financial system risk by tightening money-market rules and pushing to reduce the use of leverage and financial market speculation.
In the European Union (EU), rising consumer spending and manufacturing led to 0.6% growth in first quarter GDP. In particular, Germany’s economy continued to accelerate into 2017, with positive growth in factory orders and an estimated 14% increase in corporate earnings in the first quarter of 2017. Surveys of consumer sentiment across the EU were more upbeat than in recent years. At the end of March 2017, EU unemployment stood at 9.5%, the lowest level since April 2009.
In emerging markets, economic strength in China and a rebound in commodities prices, which began in the latter half of 2016, helped lift economic growth. Moreover, the economies of Brazil, Argentina, Russia, Turkey and South Africa — which were seen as weak links in the global economy — all showed positive growth by the end of April 2017.
While bond markets provided a mixed performance over the six months ended April 30, 2017, equity markets rewarded investors with solid returns. The Standard & Poor’s 500 Index returned 13.32% for the reporting period, while the Morgan Stanley Capital International (“MSCI”) Europe, Australasia and Far East Index (net of foreign withholding taxes) returned 11.73% and the MSCI Emerging Markets Index (net of foreign withholding taxes) returned 9.03%.
We look forward to managing your investment needs for years to come. Should you have any questions, please visit www.jpmorganfunds.com or contact the J.P. Morgan Funds Service Center at 1-800-480-4111.
Sincerely yours,

George C.W. Gatch
CEO, Investment Funds Management,
J.P. Morgan Asset Management
| | | | | | | | |
| | | |
| APRIL 30, 2017 | | J.P. MORGAN COUNTRY/REGION FUNDS | | | | | 1 | |
J.P. Morgan Country/Region Funds
MARKET OVERVIEW
SIX MONTHS ENDED APRIL 30, 2017 (Unaudited)
Global financial markets generally provided positive returns for the six month reporting period as the world’s leading economies continued to grow in a more uniform fashion and investors sought returns in many developed and emerging markets.
In Europe, a pickup in corporate earnings and improvements in consumer sentiment also proved attractive to investors during the reporting period. Electoral defeats of anti-European Union (EU) politicians in Austria and the Netherlands also helped lift investor sentiment across the EU and other developed markets.
Emerging markets also saw investment inflows during the six month reporting period amid economic and financial market stability in China. Notably, the Chinese government’s efforts to curb excessive leverage in its financial markets appeared to adversely impact the Shanghai Stock Exchange Composite Index in April 2017. Meanwhile, several previously underperforming economies — particularly Brazil, Argentina, Russia, Turkey and South Africa — showed signs of improvement toward the end of the reporting period.
Commodities prices showed signs of stabilization during the reporting period and global oil prices reached 15-month highs in October 2016. Oil prices were further bolstered by the December 2016 decision of the Organization of Petroleum Exporting Countries’ to curb production. However, by the end of the reporting period, overproduction pushed global oil prices lower.
For the six month ended April 30, 2017, the MSCI World Index (net of foreign withholding taxes) returned 12.12% and the MSCI Emerging Markets Index (net of foreign withholding taxes) returned 8.88%.
| | | | | | |
| | | |
| 2 | | | | J.P. MORGAN COUNTRY/REGION FUNDS | | APRIL 30, 2017 |
JPMorgan China Region Fund
FUND COMMENTARY
SIX MONTHS ENDED APRIL 30, 2017 (Unaudited)
| | | | |
| REPORTING PERIOD RETURN: | | | |
| Fund (Class I Shares)1* | | | 10.14% | |
| Morgan Stanley Capital International (“MSCI”) Golden Dragon Index (net of foreign withholding taxes) | | | 9.43% | |
| |
| Net Assets as of 4/30/2017 (In Thousands) | | $ | 19,512 | |
INVESTMENT OBJECTIVE**
The JPMorgan China Region Fund (the “Fund”) will seek long-term capital growth.
WHAT WERE THE MAIN DRIVERS OF THE FUND’S PERFORMANCE?
The Fund’s Class I Shares outperformed the MSCI Golden Dragon Index (net of foreign withholding taxes) (the “Benchmark”) for the six months ended April 30, 2017.
By sector, the Fund’s security selection in the information technology sector and its underweight position in the telecommunications services sector were leading contributors to performance relative to the Benchmark. The Fund’s security selection in the financials and energy sectors was a leading detractor from relative performance.
By region, the Fund’s security selection and overweight positon in China contributed to relative performance, while the Fund’s security selection in Hong Kong and Taiwan detracted from relative performance.
Leading individual contributors to the Fund’s relative performance included its overweight positions in AAC Technologies Holdings Inc. and Largan Precision Co., and its underweight position in China Mobile Ltd. Shares of AAC Technologies, a Chinese maker of smartphone components, rose on earnings growth and strong demand for its products. Shares of Largan Precision, a Taiwanese maker of optical components used in mobile devices, rose on investor expectations that the company would benefit from Apple Inc.’s iPhone 7 upgrade. Shares of China Mobile, a provider of telecommunications services that was not held by the Fund, fell amid a decline in demand for its mobile services.
Leading individual detractors from relative performance included the Fund’s overweight positions in Bank of China Ltd., CNOOC Ltd. and China Resources Phoenix Healthcare Holdings Co. Shares of Bank of China, a banking and financial services company, fell on weak earnings among China’s large banks. Shares of CNOOC, China’s national petroleum company, fell amid a decline in global oil prices at the end of the reporting period. Shares of China Resources, a hospital management and supply company, fell amid a re-organization of company management.
HOW WAS THE FUND POSITIONED?
The Fund targets quality and growth in securities and its portfolio managers seek to invest in high-conviction investment ideas that they believe have attractive prospects. The portfolio managers employed a bottom-up fundamental approach to security selection, rigorously researching companies in an attempt to determine their underlying value and potential for future earnings growth. During the period, the portfolio managers sought to invest in opportunities in the consumer, health care, technology, Internet and environmental sectors.
| | | | | | | | |
| TOP TEN EQUITY HOLDINGS OF THE PORTFOLIO*** | |
| | 1. | | | Tencent Holdings Ltd. (China) | | | 10.0 | % |
| | 2. | | | Taiwan Semiconductor Manufacturing Co. Ltd., ADR (Taiwan) | | | 8.2 | |
| | 3. | | | Alibaba Group Holding Ltd., ADR (China) | | | 7.5 | |
| | 4. | | | AIA Group Ltd. (Hong Kong) | | | 4.7 | |
| | 5. | | | Ping An Insurance Group Co. of China Ltd., Class H (China) | | | 4.0 | |
| | 6. | | | Bank of China Ltd., Class H (China) | | | 3.5 | |
| | 7. | | | JD.com, Inc., ADR (China) | | | 3.1 | |
| | 8. | | | Largan Precision Co. Ltd. (Taiwan) | | | 3.1 | |
| | 9. | | | AAC Technologies Holdings, Inc. (China) | | | 2.8 | |
| | 10. | | | China Merchants Bank Co. Ltd., Class H (China) | | | 2.8 | |
| | | | |
PORTFOLIO COMPOSITION BY COUNTRY*** | |
| China | | | 64.7 | % |
| Taiwan | | | 18.7 | |
| Hong Kong | | | 14.6 | |
| Macau | | | 1.2 | |
Others (each less than 1.0%) | | | 0.8 | |
| 1 | | On April 3, 2017, the Fund’s Select Class Shares were renamed Class I Shares. |
| * | | The return shown is based on net asset values calculated for shareholder transactions and may differ from the return shown in the financial highlights, which reflects adjustments made to the net asset values in accordance with accounting principles generally accepted in the United States of America. |
| ** | | The adviser seeks to achieve the Fund’s objective. There can be no guarantee it will be achieved. |
| *** | | Percentages indicated are based on total investments as of April 30, 2017. The Fund’s portfolio composition is subject to change. |
| | | | | | | | |
| | | |
| APRIL 30, 2017 | | J.P. MORGAN COUNTRY/REGION FUNDS | | | | | 3 | |
JPMorgan China Region Fund
FUND COMMENTARY
SIX MONTHS ENDED APRIL 30, 2017 (Unaudited) (continued)
| | | | | | | | | | | | | | | | | | |
AVERAGE ANNUAL TOTAL RETURNS AS OF APRIL 30, 2017 | |
| | | | | |
| | | INCEPTION DATE OF
CLASS | | 6 MONTH* | | | 1 YEAR | | | 5 YEAR | | | 10 YEAR | |
CLASS A SHARES | | February 28, 2007 | | | | | | | | | | | | | | | | |
With Sales Charge** | | | | | 4.27 | % | | | 16.97 | % | | | 6.03 | % | | | 4.43 | % |
Without Sales Charge | | | | | 10.02 | | | | 23.43 | | | | 7.17 | | | | 5.00 | |
CLASS C SHARES | | February 28, 2007 | | | | | | | | | | | | | | | | |
With CDSC*** | | | | | 8.79 | | | | 21.80 | | | | 6.63 | | | | 4.48 | |
Without CDSC | | | | | 9.79 | | | | 22.80 | | | | 6.63 | | | | 4.48 | |
CLASS I SHARES (FORMERLY SELECT CLASS SHARES) | | February 28, 2007 | | | 10.14 | | | | 23.64 | | | | 7.43 | | | | 5.26 | |
| ** | | Sales Charge for Class A Shares is 5.25%. |
| *** | | Assumes a 1% CDSC (contingent deferred sales charge) for the 6 month and one year periods and 0% CDSC thereafter. |
TEN YEAR PERFORMANCE (4/30/07 TO 4/30/17)
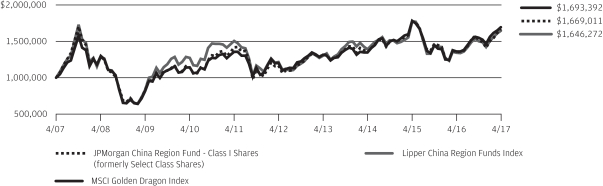
The performance quoted is past performance and is not a guarantee of future results. Mutual funds are subject to certain market risks. Investment returns and principal value of an investment will fluctuate so that an investor’s shares, when redeemed, may be worth more or less than their original cost. Current performance may be higher or lower than the performance data shown. For up-to-date month-end performance information please call 1-800-480-4111.
The graph illustrates comparative performance for $1,000,000 invested in Class I Shares of the JPMorgan China Region Fund, the MSCI Golden Dragon Index and the Lipper China Region Funds Index from April 30, 2007 to April 30, 2017. The performance of the Fund assumes reinvestment of all dividends and capital gain distributions, if any, and does not include a sales charge. The performance of the MSCI Golden Dragon Index does not reflect the deduction of expenses or a sales charge associated with a mutual fund and approximates the minimum possible dividend reinvestment of the securities included in the benchmark, if applicable. The dividend is reinvested after deduction of withholding tax, applying the maximum rate to non-resident individual investors who do not benefit from double taxation treaties. The performance of the Lipper China Region Funds Index includes expenses associated with a mutual fund, such as investment management fees. These expenses are not identical to the expenses incurred by the Fund. The MSCI Golden Dragon Index is a free float-adjusted market capitalization index that is designed to measure equity market
performance in the China region. The Lipper China Region Funds Index represents the total returns of certain mutual funds within the Fund’s designated category as determined by Lipper, Inc. Investors cannot invest directly in an index.
Class I Shares have a $1,000,000 minimum initial investment.
Fund performance may reflect the waiver of the Fund’s fees and reimbursement of expenses for certain periods since the inception date. Without these waivers and reimbursements, performance would have been lower. Also, performance shown in this section does not reflect the deduction of taxes that a shareholder would pay on Fund distributions or redemptions of Fund shares.
International investing involves a greater degree of risk and increased volatility. Changes in currency exchange rates and differences in accounting and taxation policies outside the U.S. can raise or lower returns. Also, some overseas markets may not be as politically and economically stable as the U.S. and other nations. The Fund is also subject to the additional risk of non-diversified “regional” fund investing.
The returns shown are based on net asset values calculated for shareholder transactions and may differ from the returns shown in the financial highlights, which reflect adjustments made to the net asset values in accordance with accounting principles generally accepted in the United States of America.
| | | | | | |
| | | |
| 4 | | | | J.P. MORGAN COUNTRY/REGION FUNDS | | APRIL 30, 2017 |
JPMorgan Intrepid European Fund
FUND COMMENTARY
SIX MONTHS ENDED APRIL 30, 2017 (Unaudited)
| | | | |
| REPORTING PERIOD RETURN: | |
| Fund (Class A Shares, without a sales charge)* | | | 15.52% | |
| Morgan Stanley Capital International (“MSCI”) Europe Index (net of foreign withholding taxes) | | | 14.52% | |
| |
| Net Assets as of 4/30/2017 (In Thousands) | | $ | 873,463 | |
INVESTMENT OBJECTIVE**
The JPMorgan Intrepid European Fund (the “Fund”) seeks total return from long-term capital growth. Total return consists of capital growth and current income.
WHAT WERE THE MAIN DRIVERS OF THE FUND’S PERFORMANCE?
The Fund’s Class A Shares, without a sales charge, outperformed the MSCI Europe Index (net of foreign withholding taxes) (the “Benchmark”) for the six months ended April 30, 2017.
The Fund’s security selection in the information technology and consumer discretionary sectors was a leading contributor to performance relative to the Benchmark, while the Fund’s security selection in the consumer staples sector and its underweight position in the financials sector were leading detractors from relative performance.
Leading individual contributors to relative performance included the Fund’s overweight positions in STMicroelectronics NV, Actelion Ltd. and Glencore PLC. Shares of STMicroelectronics, a maker of semiconductors, rose on investor expectations for growth in sales and earnings. Shares of Actelion, a drug maker, rose ahead of its acquisition by Johnson & Johnson. Shares of Glencore, a mining company, rose amid a rebound in commodities prices in the latter part of the reporting period.
Leading individual detractors from relative performance included the Fund’s overweight positions in ArcelorMittal SA, Marine Harvest ASA and Leroy Seafood Group ASA. Shares of ArcelorMittal, a steelmaker, fell after the company warned of weakness in steel prices. Shares of Marine Harvest, a provider of farm-raised salmon and processed seafood products, fell as investor expectations for higher salmon prices receded. Shares of Leroy Seafood Group, a seafood products company not held in the Benchmark, fell after the company reported a drop in harvest volume and higher costs for feed and environmental compliance.
HOW WAS THE FUND POSITIONED?
The Fund’s portfolio managers believe that attractively valued, high quality securities with positive momentum have the potential to outperform the market. During the reporting period, the Fund’s portfolio managers invested in securities that they believed had these style characteristics.
Portfolio positions were based on bottom-up security selection rather than top-down asset allocation decisions.
| | | | | | | | |
| TOP TEN EQUITY HOLDINGS OF THE PORTFOLIO*** | |
| | 1. | | | Sanofi (France) | | | 3.4 | % |
| | 2. | | | Siemens AG (Registered) (Germany) | | | 3.2 | |
| | 3. | | | Allianz SE (Registered) (Germany) | | | 2.9 | |
| | 4. | | | Kering (France) | | | 2.8 | |
| | 5. | | | TOTAL SA (France) | | | 2.6 | |
| | 6. | | | ING Groep NV (Netherlands) | | | 2.4 | |
| | 7. | | | KBC Group NV (Belgium) | | | 2.3 | |
| | 8. | | | Volvo AB, Class B (Sweden) | | | 2.2 | |
| | 9. | | | Lloyds Banking Group plc (United Kingdom) | | | 2.2 | |
| | 10. | | | adidas AG (Germany) | | | 2.0 | |
| | | | |
PORTFOLIO COMPOSITION BY COUNTRY*** | |
| United Kingdom | | | 18.6 | % |
| France | | | 16.3 | |
| Germany | | | 15.1 | |
| Switzerland | | | 9.3 | |
| Spain | | | 8.1 | |
| Sweden | | | 5.2 | |
| Italy | | | 4.6 | |
| Finland | | | 3.7 | |
| Netherlands | | | 3.5 | |
| Denmark | | | 2.5 | |
| Belgium | | | 2.3 | |
| Luxembourg | | | 2.1 | |
| Ireland | | | 1.5 | |
| South Africa | | | 1.4 | |
| Norway | | | 1.3 | |
| Austria | | | 1.2 | |
| Short-Term Investment | | | 3.3 | |
| * | | The return shown is based on net asset values calculated for shareholder transactions and may differ from the return shown in the financial highlights, which reflects adjustments made to the net asset values in accordance with accounting principles generally accepted in the United States of America. |
| ** | | The adviser seeks to achieve the Fund’s objective. There can be no guarantee it will be achieved. |
| *** | | Percentages indicated are based on total investments as of April 30, 2017. The Fund’s portfolio composition is subject to change. |
| | | | | | | | |
| | | |
| APRIL 30, 2017 | | J.P. MORGAN COUNTRY/REGION FUNDS | | | | | 5 | |
JPMorgan Intrepid European Fund
FUND COMMENTARY
SIX MONTHS ENDED APRIL 30, 2017 (Unaudited) (continued)
| | | | | | | | | | | | | | | | | | |
AVERAGE ANNUAL TOTAL RETURNS AS OF APRIL 30, 2017 | |
| | | | | |
| | | INCEPTION DATE OF
CLASS | | 6 MONTH* | | | 1 YEAR | | | 5 YEAR | | | 10 YEAR | |
CLASS A SHARES | | November 2, 1995 | | | | | | | | | | | | | | | | |
With Sales Charge** | | | | | 9.43 | % | | | 6.53 | % | | | 7.82 | % | | | 0.70 | % |
Without Sales Charge | | | | | 15.52 | | | | 12.44 | | | | 8.99 | | | | 1.24 | |
CLASS C SHARES | | November 1, 1998 | | | | | | | | | | | | | | | | |
With CDSC*** | | | | | 14.23 | | | | 10.90 | | | | 8.44 | | | | 0.74 | |
Without CDSC | | | | | 15.23 | | | | 11.90 | | | | 8.44 | | | | 0.74 | |
CLASS I SHARES (FORMERLY SELECT CLASS SHARES) | | September 10, 2001 | | | 15.68 | | | | 12.81 | | | | 9.30 | | | | 1.52 | |
CLASS L SHARES (FORMERLY INSTITUTIONAL CLASS SHARES) | | September 10, 2001 | | | 15.79 | | | | 13.04 | | | | 9.52 | | | | 1.73 | |
| ** | | Sales Charge for Class A Shares is 5.25%. |
| *** | | Assumes a 1% CDSC (contingent deferred sales charge) for the 6 month and one year periods and 0% CDSC thereafter. |
TEN YEAR PERFORMANCE (4/30/07 TO 4/30/17)
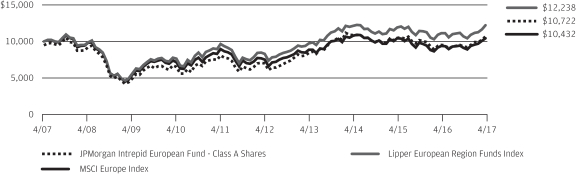
The performance quoted is past performance and is not a guarantee of future results. Mutual funds are subject to certain market risks. Investment returns and principal value of an investment will fluctuate so that an investor’s shares, when redeemed, may be worth more or less than their original cost. Current performance may be higher or lower than the performance data shown. For up-to-date month-end performance information please call 1-800-480-4111.
The graph illustrates comparative performance for $10,000 invested in Class A Shares of the JPMorgan Intrepid European Fund, the MSCI Europe Index and the Lipper European Region Funds Index from April 30, 2007 to April 30, 2017. The performance of the Fund assumes reinvestment of all dividends and capital gain distributions, if any, and includes a sales charge. The performance of the MSCI Europe Index does not reflect the deduction of expenses or a sales charge associated with a mutual fund and approximates the minimum possible dividend reinvestment of the securities included in the benchmark, if applicable. The dividend is reinvested after deduction of withholding tax, applying the maximum rate to non-resident individual investors who do not benefit from double taxation treaties. The performance of the Lipper European Region Funds Index includes expenses associated with a mutual fund, such as investment management fees. These expenses are not identical to the expenses incurred by the Fund. The MSCI Europe Index is a free float-adjusted market capitalization weighted index that is designed to measure the equity market
performance of the developed markets in Europe. The Lipper European Region Funds Index represents the total returns of certain mutual funds within the Fund’s designated category as determined by Lipper, Inc. Investors cannot invest directly in an index.
Class A Shares have a $1,000 minimum initial investment and carry a 5.25% sales charge.
Fund performance may reflect the waiver of the Fund’s fees and reimbursement of expenses for certain periods since the inception date. Without these waivers and reimbursements, performance would have been lower. Also, performance shown in this section does not reflect the deduction of taxes that a shareholder would pay on Fund distributions or redemptions of Fund shares.
International investing involves a greater degree of risk and increased volatility. Changes in currency exchange rates and differences in accounting and taxation policies outside the U.S. can raise or lower returns. Also, some overseas markets may not be as politically and economically stable as the U.S. and other nations.
The returns shown are based on net asset values calculated for shareholder transactions and may differ from the returns shown in the financial highlights, which reflect adjustments made to the net asset values in accordance with accounting principles generally accepted in the United States of America.
| | | | | | |
| | | |
| 6 | | | | J.P. MORGAN COUNTRY/REGION FUNDS | | APRIL 30, 2017 |
JPMorgan Latin America Fund
FUND COMMENTARY
SIX MONTHS ENDED APRIL 30, 2017 (Unaudited)
| | | | |
| REPORTING PERIOD RETURN: | | | |
| Fund (Class A Shares, without a sales charge)* | | | 1.89% | |
Morgan Stanley Capital International (“MSCI”) Emerging Markets
(“EM”) Latin America Index (net of foreign withholding taxes) | | | 1.04% | |
| |
| Net Assets as of 4/30/2017 (In Thousands) | | $ | 46,833 | |
INVESTMENT OBJECTIVE**
The JPMorgan Latin America Fund (the “Fund”) will seek long-term capital growth.
WHAT WERE THE MAIN DRIVERS OF THE FUND’S PERFORMANCE?
The Fund’s Class A Shares, without a sales charge, outperformed the MSCI EM Latin America Index (net of foreign withholding taxes) (the “Benchmark”) for the six months ended April 30, 2017.
By sector, the Fund’s security selection in the consumer discretionary sector and its security selection and overweight position in the health care sector were leading contributors to performance relative to the Benchmark. The Fund’s underweight position and security selection in the materials sector and its underweight position in the telecommunication services sector were leading detractors from relative performance.
By region, the Fund’s security selection in Brazil and overweight position in Argentina, which was not held in the Benchmark, were leading contributors to relative performance, while the Fund’s security selection in Mexico and its underweight position in Chile were leading detractors from relative performance.
Leading individual contributors to the Fund’s relative performance included its overweight positions in Fleury SA and Pampa Energia SA and its underweight position in BRF SA. Shares of Fleury, a Brazilian provider of medical diagnostics that was not held in the Benchmark, rose on sales and margins growth. Shares of Pampa Energia, an Argentine electricity provider not held in the Benchmark, rose on better-than-expected earnings. Shares of BRF, a Brazilian food processing company, fell after the company reported lower-than-expected sales and earnings following an investigation related to tainted meat.
Leading individual detractors from the Fund’s relative performance included its underweight positions in Vale SA and America Movil SAB and its overweight position in Globant SA. Shares of Vale, a Brazilian metals and mining company, rose on rising prices for global commodities. Shares of America Movil, a Mexican telecommunications provider, benefitted from investor demand for defensive sector stocks amid an uncertain environment for equities in Mexico. Shares of Globant, an Argentina-based provider of software applications, fell on lower-than-expected earnings.
HOW WAS THE FUND POSITIONED?
During the reporting period, the Fund employed a strategy in which portfolio construction was focused on the opportunities at the security level. The Fund’s portfolio managers used bottom-up fundamental research to determine the Fund’s security weightings, rigorously researching companies in an attempt to determine their underlying value and potential for future growth. As a result of this process, the Fund’s largest average overweight positions versus the Benchmark were in the industrials and health care sectors and the Fund’s largest average underweight positions were in the telecommunication services and materials sectors.
| | | | | | | | |
| TOP TEN EQUITY HOLDINGS OF THE PORTFOLIO*** | |
| | 1. | | | Itau Unibanco Holding SA, ADR (Brazil) | | | 5.0 | % |
| | 2. | | | Fleury SA (Brazil) | | | 4.4 | |
| | 3. | | | Banco Bradesco SA, ADR (Brazil) | | | 4.4 | |
| | 4. | | | Credicorp Ltd. (Peru) | | | 3.4 | |
| | 5. | | | Lojas Renner SA (Brazil) | | | 3.3 | |
| | 6. | | | Fomento Economico Mexicano SAB de CV, ADR (Mexico) | | | 3.2 | |
| | 7. | | | Itausa - Investimentos Itau SA (Preference) (Brazil) | | | 3.2 | |
| | 8. | | | Ambev SA, ADR (Brazil) | | | 3.1 | |
| | 9. | | | Globant SA (United States) | | | 3.0 | |
| | 10. | | | BM&FBovespa SA - Bolsa de Valores Mercadorias e Futuros (Brazil) | | | 2.8 | |
| | | | |
PORTFOLIO COMPOSITION BY COUNTRY*** | |
| Brazil | | | 57.2 | % |
| Mexico | | | 26.4 | |
| United States | | | 4.9 | |
| Peru | | | 4.5 | |
| Argentina | | | 3.9 | |
| Panama | | | 1.6 | |
| Chile | | | 1.0 | |
| Others (each less than 1.0%) | | | 0.5 | |
| * | | The return shown is based on net asset values calculated for shareholder transactions and may differ from the return shown in the financial highlights, which reflects adjustments made to the net asset values in accordance with accounting principles generally accepted in the United States of America. |
| ** | | The adviser seeks to achieve the Fund’s objective. There can be no guarantee it will be achieved. |
| *** | | Percentages indicated are based on total investments as of April 30, 2017. The Fund’s portfolio composition is subject to change. |
| | | | | | | | |
| | | |
| APRIL 30, 2017 | | J.P. MORGAN COUNTRY/REGION FUNDS | | | | | 7 | |
JPMorgan Latin America Fund
FUND COMMENTARY
SIX MONTHS ENDED APRIL 30, 2017 (Unaudited) (continued)
| | | | | | | | | | | | | | | | | | | | |
AVERAGE ANNUAL TOTAL RETURNS AS OF APRIL 30, 2017 | |
| | | | | |
| | | INCEPTION DATE OF
CLASS | | | 6 MONTH* | | | 1 YEAR | | | 5 YEAR | | | 10 YEAR | |
CLASS A SHARES | | | February 28, 2007 | | | | | | | | | | | | | | | | | |
With Sales Charge** | | | | | | | (3.45 | )% | | | 11.63 | % | | | (5.75 | )% | | | (0.64 | )% |
Without Sales Charge | | | | | | | 1.89 | | | | 17.80 | | | | (4.73 | ) | | | (0.10 | ) |
CLASS C SHARES | | | February 28, 2007 | | | | | | | | | | | | | | | | | |
With CDSC*** | | | | | | | 0.69 | | | | 16.28 | | | | (5.20 | ) | | | (0.60 | ) |
Without CDSC | | | | | | | 1.69 | | | | 17.28 | | | | (5.20 | ) | | | (0.60 | ) |
CLASS I SHARES (FORMERLY SELECT CLASS SHARES) | | | February 28, 2007 | | | | 2.06 | | | | 18.17 | | | | (4.48 | ) | | | 0.15 | |
CLASS R6 SHARES | | | November 2, 2015 | | | | 2.19 | | | | 18.45 | | | | (4.41 | ) | | | 0.18 | |
| ** | | Sales Charge for Class A Shares is 5.25%. |
| *** | | Assumes a 1% CDSC (contingent deferred sales charge) for the 6 month and one year periods and 0% CDSC thereafter. |
TEN YEAR PERFORMANCE (4/30/07 TO 4/30/17)
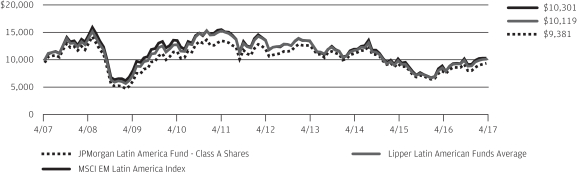
The performance quoted is past performance and is not a guarantee of future results. Mutual funds are subject to certain market risks. Investment returns and principal value of an investment will fluctuate so that an investor’s shares, when redeemed, may be worth more or less than their original cost. Current performance may be higher or lower than the performance data shown. For up-to-date month-end performance information please call 1-800-480-4111.
Returns for Class R6 Shares prior to its inception date are based on the performance of the Class I Shares (formerly Select Class Shares). The actual return of Class R6 Shares would have been different than those shown because Class I Shares (formerly Select Class Shares) have different expenses than Class R6 Shares.
The graph illustrates comparative performance for $10,000 invested in Class A Shares of the JPMorgan Latin America Fund, the MSCI EM Latin America Index and the Lipper Latin American Funds Average from April 30, 2007 to April 30, 2017. The performance of the Fund assumes reinvestment of all dividends and capital gain distributions, if any, and includes a sales charge. The performance of the MSCI EM Latin America Index does not reflect the deduction of expenses or a sales charge associated with a mutual fund and approximates the minimum possible dividend reinvestment of the securities included in the benchmark, if applicable. The dividend is reinvested after deduction of withholding tax, applying the maximum rate to non-resident individual investors who do not benefit from double taxation treaties. The performance of the Lipper Latin American Funds Average includes expenses associated with a mutual fund, such as investment management fees. These expenses are not identical to
the expenses incurred by the Fund. The MSCI EM Latin America Index is a free float-adjusted market capitalization index that is designed to measure equity
market performance of emerging markets in Latin America. Investors cannot invest directly in an index. The Lipper Latin American Funds Average is an average based on the total returns of all mutual funds within the Fund’s designated category as determined by Lipper, Inc.
Class A Shares have a $1,000 minimum initial investment and carry a 5.25% sales charge.
Fund performance may reflect the waiver of the Fund’s fees and reimbursement of expenses for certain periods since the inception date. Without these waivers and reimbursements, performance would have been lower. Also, performance shown in this section does not reflect the deduction of taxes that a shareholder would pay on Fund distributions or redemptions of Fund shares.
International investing involves a greater degree of risk and increased volatility. Changes in currency exchange rates and differences in accounting and taxation policies outside the U.S. can raise or lower returns. Also, some overseas markets may not be as politically and economically stable as the U.S. and other nations.
The returns shown are based on net asset values calculated for shareholder transactions and may differ from the returns shown in the financial highlights, which reflect adjustments made to the net asset values in accordance with accounting principles generally accepted in the United States of America.
| | | | | | |
| | | |
| 8 | | | | J.P. MORGAN COUNTRY/REGION FUNDS | | APRIL 30, 2017 |
JPMorgan China Region Fund
SCHEDULE OF PORTFOLIO INVESTMENTS
AS OF APRIL 30, 2017 (Unaudited)
(Amounts in thousands)
| | | | | | | | |
| SHARES | | | SECURITY DESCRIPTION | | VALUE($) | |
| | Common Stocks — 104.9% | |
| | | | China — 66.1% | |
| | 41 | | | AAC Technologies Holdings, Inc. | | | 601 | |
| | 14 | | | Alibaba Group Holding Ltd., ADR (a) | | | 1,615 | |
| | 354 | | | Aluminum Corp. of China Ltd., Class H (a) | | | 174 | |
| | 1,534 | | | Bank of China Ltd., Class H | | | 742 | |
| | 182 | | | Brilliance China Automotive Holdings Ltd. | | | 305 | |
| | 790 | | | CGN Power Co. Ltd., Class H (e) | | | 238 | |
| | 91 | | | China Conch Venture Holdings Ltd. | | | 180 | |
| | 195 | | | China Everbright International Ltd. | | | 263 | |
| | 99 | | | China Medical System Holdings Ltd. | | | 171 | |
| | 230 | | | China Merchants Bank Co. Ltd., Class H | | | 596 | |
| | 98 | | | China Resources Gas Group Ltd. | | | 330 | |
| | 78 | | | China Resources Land Ltd. | | | 216 | |
| | 78 | | | China Resources Phoenix Healthcare Holdings Co. Ltd. (a) | | | 100 | |
| | 140 | | | China State Construction International Holdings Ltd. | | | 254 | |
| | 84 | | | China Taiping Insurance Holdings Co. Ltd. (a) | | | 208 | |
| | 440 | | | CNOOC Ltd. | | | 513 | |
| | 198 | | | CSPC Pharmaceutical Group Ltd. | | | 275 | |
| | 8 | | | Ctrip.com International Ltd., ADR (a) | | | 385 | |
| | 17 | | | Dong-E-E-Jiao Co. Ltd., Class A | | | 165 | |
| | 7 | | | Hangzhou Robam Appliances Co. Ltd., Class A | | | 56 | |
| | 16 | | | Han’s Laser Technology Industry Group Co. Ltd., Class A | | | 67 | |
| | 19 | | | JD.com, Inc., ADR (a) | | | 676 | |
| | 32 | | | Jiangsu Hengrui Medicine Co. Ltd., Class A | | | 245 | |
| | 2 | | | Kweichow Moutai Co. Ltd., Class A | | | 108 | |
| | 233 | | | Nexteer Automotive Group Ltd. | | | 363 | |
| | 27 | | | Ningbo Joyson Electronic Corp., Class A (a) | | | 119 | |
| | 154 | | | Ping An Insurance Group Co. of China Ltd., Class H | | | 863 | |
| | 36 | | | SAIC Motor Corp. Ltd., Class A | | | 141 | |
| | 28 | | | Shenzhen Sunway Communication Co. Ltd., Class A | | | 143 | |
| | 10 | | | Silergy Corp. | | | 181 | |
| | 19 | | | Spring Airlines Co. Ltd., Class A | | | 88 | |
| | 35 | | | Suofeiya Home Collection Co. Ltd., Class A | | | 176 | |
| | 69 | | | Tencent Holdings Ltd. | | | 2,146 | |
| | 14 | | | Vipshop Holdings Ltd., ADR (a) | | | 188 | |
| | | | | | | | |
| | | | | | | 12,891 | |
| | | | | | | | |
| | | | Hong Kong — 16.0% | |
| | 144 | | | AIA Group Ltd. | | | 1,000 | |
| | 36 | | | Cafe de Coral Holdings Ltd. | | | 117 | |
| | 61 | | | Cheung Kong Property Holdings Ltd. | | | 438 | |
| | | | | | | | |
| SHARES | | | SECURITY DESCRIPTION | | VALUE($) | |
| | | | | | | | |
| | | | Hong Kong — continued | | | | |
| | 17 | | | Hong Kong Exchanges & Clearing Ltd. | | | 410 | |
| | 36 | | | IMAX China Holding, Inc. (a) (e) | | | 170 | |
| | 27 | | | Orient Overseas International Ltd. | | | 141 | |
| | 135 | | | Regina Miracle International Holdings Ltd. (e) | | | 105 | |
| | 62 | | | Sands China Ltd. | | | 281 | |
| | 203 | | | Sino Biopharmaceutical Ltd. | | | 167 | |
| | 341 | | | WH Group Ltd. (e) | | | 304 | |
| | | | | | | | |
| | | | | | | 3,133 | |
| | | | | | | | |
| | | | Macau — 1.3% | |
| | 111 | | | MGM China Holdings Ltd. | | | 252 | |
| | | | | | | | |
| | | | Singapore — 0.9% | |
| | 33 | | | BOC Aviation Ltd. (e) | | | 173 | |
| | | | | | | | |
| | | | Taiwan — 20.6% | |
| | 180 | | | Advanced Semiconductor Engineering, Inc. | | | 226 | |
| | 315 | | | China Life Insurance Co. Ltd. | | | 293 | |
| | 16 | | | Eclat Textile Co. Ltd. | | | 175 | |
| | 4 | | | Largan Precision Co. Ltd. | | | 664 | |
| | 29 | | | President Chain Store Corp. | | | 253 | |
| | 5 | | | Silicon Motion Technology Corp., ADR | | | 237 | |
| | 50 | | | Taiwan Paiho Ltd. | | | 167 | |
| | 53 | | | Taiwan Semiconductor Manufacturing Co. Ltd., ADR | | | 1,764 | |
| | 12 | | | Tung Thih Electronic Co. Ltd. | | | 82 | |
| | 356 | | | Yuanta Financial Holding Co. Ltd. | | | 152 | |
| | | | | | | | |
| | | | | | | 4,013 | |
| | | | | | | | |
| | | | Total Common Stocks
(Cost $13,404) | | | 20,462 | |
| | | | | | | | |
| | Structured Instruments — 5.0% | |
| | | | China — 5.0% | |
| | | | Low Exercise Cash Settled Call Warrants — 5.0% | |
| | 69 | | | GoerTek, Inc., expiring 07/17/17 (Strike Price $1.00) (issued through UBS AG) (a) | | | 174 | |
| | 53 | | | Hangzhou Hikvision Digital Technology Co. Ltd., expiring 10/27/17 (Strike Price $0.00) (issued through UBS AG) (a) | | | 279 | |
| | 28 | | | Hangzhou Robam Appliances Co. Ltd., expiring 10/27/17 (Strike Price $0.00) (issued through UBS AG) (a) | | | 222 | |
| | 38 | | | Han’s Laser Technology Industry Group Co. Ltd., expiring 11/06/17 (Strike Price $0.00) (issued through Morgan Stanley) (a) (e) | | | 160 | |
SEE NOTES TO FINANCIAL STATEMENTS.
| | | | | | | | |
| | | |
| APRIL 30, 2017 | | J.P. MORGAN COUNTRY/REGION FUNDS | | | | | 9 | |
JPMorgan China Region Fund
SCHEDULE OF PORTFOLIO INVESTMENTS
AS OF APRIL 30, 2017 (Unaudited) (continued)
(Amounts in thousands)
| | | | | | | | |
| SHARES | | | SECURITY DESCRIPTION | | VALUE($) | |
| | Structured Instruments — continued | | | | |
| | | | Low Exercise Cash Settled Call Warrants — continued | |
| | 37 | | | Luxshare Precision Industry Co. Ltd., expiring 06/26/17 (Strike Price $0.00) (issued through UBS AG) (a) | | | 145 | |
| | | | | | | | |
| | | | Total Structured Instruments
(Cost $747) | | | 980 | |
| | | | | | | | |
| | | | Total Investments — 109.9%
(Cost $14,151) | | | 21,442 | |
| | | | Liabilities in Excess of
Other Assets — (9.9)% | | | (1,930 | ) |
| | | | | | | | |
| | | | NET ASSETS — 100.0% | | $ | 19,512 | |
| | | | | | | | |
Percentages indicated are based on net assets.
Summary of Investments by Industry, April 30, 2017
The following table represents the portfolio investments of the Fund by industry classifications as a percentage of total investments:
| | | | |
| INDUSTRY | | PERCENTAGE | |
Internet Software & Services | | | 17.5 | % |
Semiconductors & Semiconductor Equipment | | | 11.2 | |
Insurance | | | 11.0 | |
Capital Markets | | | 7.2 | |
Banks | | | 6.3 | |
Electronic Equipment, Instruments & Components | | | 5.9 | |
Internet & Direct Marketing Retail | | | 5.8 | |
Pharmaceuticals | | | 4.8 | |
Real Estate Management & Development | | | 3.1 | |
Hotels, Restaurants & Leisure | | | 3.0 | |
Auto Components | | | 2.6 | |
Oil, Gas & Consumable Fuels | | | 2.4 | |
| | | | |
| INDUSTRY | | PERCENTAGE | |
Textiles, Apparel & Luxury Goods | | | 2.1 | % |
Automobiles | | | 2.1 | |
Gas Utilities | | | 1.5 | |
Food Products | | | 1.4 | |
Commercial Services & Supplies | | | 1.2 | |
Construction & Engineering | | | 1.2 | |
Food & Staples Retailing | | | 1.2 | |
Machinery | | | 1.2 | |
Independent Power & Renewable Electricity Producers | | | 1.1 | |
Household Durables | | | 1.1 | |
Others (each less than 1.0%) | | | 5.1 | |
SEE NOTES TO FINANCIAL STATEMENTS.
| | | | | | |
| | | |
| 10 | | | | J.P. MORGAN COUNTRY/REGION FUNDS | | APRIL 30, 2017 |
JPMorgan Intrepid European Fund
SCHEDULE OF PORTFOLIO INVESTMENTS
AS OF APRIL 30, 2017 (Unaudited)
(Amounts in thousands)
| | | | | | | | |
| SHARES | | | SECURITY DESCRIPTION | | VALUE($) | |
| | Common Stocks — 95.2% | | | | |
| | | | Austria — 1.2% | | | | |
| | 157 | | | ams AG | | | 10,111 | |
| | | | | | | | |
| | | | Belgium — 2.3% | | | | |
| | 274 | | | KBC Group NV | | | 19,821 | |
| | | | | | | | |
| | | | Denmark — 2.5% | | | | |
| | 248 | | | Danske Bank A/S | | | 9,034 | |
| | 147 | | | Vestas Wind Systems A/S | | | 12,635 | |
| | | | | | | | |
| | | | | | | 21,669 | |
| | | | | | | | |
| | | | Finland — 3.6% | | | | |
| | 294 | | | Metso OYJ | | | 10,519 | |
| | 614 | | | Outokumpu OYJ | | | 5,880 | |
| | 355 | | | Stora Enso OYJ, Class R | | | 4,209 | |
| | 427 | | | UPM-Kymmene OYJ | | | 11,244 | |
| | | | | | | | |
| | | | | | | 31,852 | |
| | | | | | | | |
| | | | France — 16.1% | | | | |
| | 548 | | | AXA SA | | | 14,626 | |
| | 731 | | | Engie SA | | | 10,311 | |
| | 79 | | | Kering | | | 24,521 | |
| | 76 | | | Renault SA | | | 7,097 | |
| | 306 | | | Sanofi | | | 28,930 | |
| | 200 | | | Societe Generale SA | | | 10,967 | |
| | 65 | | | Sodexo SA | | | 8,273 | |
| | 444 | | | TOTAL SA | | | 22,805 | |
| | 149 | | | Vinci SA | | | 12,722 | |
| | | | | | | | |
| | | | | | | 140,252 | |
| | | | | | | | |
| | | | Germany — 14.9% | | | | |
| | 87 | | | adidas AG | | | 17,406 | |
| | 130 | | | Allianz SE (Registered) | | | 24,821 | |
| | 243 | | | Deutsche Wohnen AG | | | 8,304 | |
| | 405 | | | Evonik Industries AG | | | 13,508 | |
| | 63 | | | Hannover Rueck SE | | | 7,519 | |
| | 48 | | | HOCHTIEF AG | | | 8,566 | |
| | 577 | | | Infineon Technologies AG | | | 11,929 | |
| | 142 | | | LANXESS AG | | | 10,227 | |
| | 194 | | | Siemens AG (Registered) | | | 27,788 | |
| | | | | | | | |
| | | | | | | 130,068 | |
| | | | | | | | |
| | | | Ireland — 1.4% | | | | |
| | 474 | | | Smurfit Kappa Group plc | | | 12,686 | |
| | | | | | | | |
| | | | Italy — 4.5% | | | | |
| | 1,638 | | | Enav SpA (a) (e) | | | 6,707 | |
| | 218 | | | Ferrari NV | | | 16,414 | |
| | 476 | | | Moncler SpA | | | 11,735 | |
| | 164 | | | Prysmian SpA | | | 4,730 | |
| | | | | | | | |
| | | | | | | 39,586 | |
| | | | | | | | |
| | | | | | | | |
| SHARES | | | SECURITY DESCRIPTION | | VALUE($) | |
| | | | | | | | |
| | | | Luxembourg — 2.1% | | | | |
| | 174 | | | APERAM SA | | | 8,744 | |
| | 1,181 | | | ArcelorMittal (a) | | | 9,283 | |
| | | | | | | | |
| | | | | | | 18,027 | |
| | | | | | | | |
| | | | Netherlands — 3.4% | | | | |
| | 1,286 | | | ING Groep NV | | | 20,955 | |
| | 153 | | | Randstad Holding NV | | | 9,144 | |
| | | | | | | | |
| | | | | | | 30,099 | |
| | | | | | | | |
| | | | Norway — 1.2% | | | | |
| | 436 | | | Marine Harvest ASA (a) | | | 7,246 | |
| | 641 | | | Norsk Hydro ASA | | | 3,652 | |
| | | | | | | | |
| | | | | | | 10,898 | |
| | | | | | | | |
| | | | South Africa — 1.4% | | | | |
| | 474 | | | Mondi plc | | | 12,251 | |
| | | | | | | | |
| | | | Spain — 8.0% | | | | |
| | 317 | | | ACS Actividades de Construccion y Servicios SA | | | 11,730 | |
| | 69 | | | Aena SA (e) | | | 12,164 | |
| | 2,293 | | | Banco Santander SA | | | 14,944 | |
| | 465 | | | Endesa SA | | | 10,947 | |
| | 686 | | | Gamesa Corp. Tecnologica SA | | | 14,805 | |
| | 456 | | | Telefonica SA | | | 5,048 | |
| | | | | | | | |
| | | | | | | 69,638 | |
| | | | | | | | |
| | | | Sweden — 5.2% | | | | |
| | 563 | | | Electrolux AB, Series B | | | 16,722 | |
| | 749 | | | Nordea Bank AB | | | 9,216 | |
| | 1,185 | | | Volvo AB, Class B | | | 19,357 | |
| | | | | | | | |
| | | | | | | 45,295 | |
| | | | | | | | |
| | | | Switzerland — 9.1% | | | | |
| | 178 | | | Adecco Group AG (Registered) | | | 13,248 | |
| | 15 | | | Galenica Sante Ltd. (a) (e) | | | 671 | |
| | 2,765 | | | Glencore plc (a) | | | 10,868 | |
| | 460 | | | Logitech International SA (Registered) | | | 15,375 | |
| | 162 | | | Nestle SA (Registered) | | | 12,493 | |
| | 493 | | | STMicroelectronics NV | | | 7,907 | |
| | 35 | | | Swiss Life Holding AG (Registered) (a) | | | 11,463 | |
| | 462 | | | UBS Group AG (Registered) (a) | | | 7,888 | |
| | | | | | | | |
| | | | | | | 79,913 | |
| | | | | | | | |
| | | | United Kingdom — 18.3% | | | | |
| | 393 | | | Ashtead Group plc | | | 8,293 | |
| | 1,599 | | | Aviva plc | | | 10,871 | |
| | 188 | | | British American Tobacco plc | | | 12,679 | |
| | 215 | | | Dialog Semiconductor plc (a) | | | 10,075 | |
| | 2,854 | | | GKN plc | | | 13,265 | |
SEE NOTES TO FINANCIAL STATEMENTS.
| | | | | | | | |
| | | |
| APRIL 30, 2017 | | J.P. MORGAN COUNTRY/REGION FUNDS | | | | | 11 | |
JPMorgan Intrepid European Fund
SCHEDULE OF PORTFOLIO INVESTMENTS
AS OF APRIL 30, 2017 (Unaudited) (continued)
(Amounts in thousands, except number of Futures contracts)
| | | | | | | | |
| SHARES | | | SECURITY DESCRIPTION | | VALUE($) | |
| | Common Stocks — continued | | | | |
| | | | United Kingdom — continued | | | | |
| | 199 | | | InterContinental Hotels Group plc | | | 10,547 | |
| | 1,282 | | | International Consolidated Airlines Group SA | | | 9,289 | |
| | 21,490 | | | Lloyds Banking Group plc | | | 19,310 | |
| | 1,931 | | | Melrose Industries plc | | | 5,914 | |
| | 438 | | | Persimmon plc | | | 13,222 | |
| | 315 | | | Rio Tinto plc | | | 12,421 | |
| | 985 | | | Tate & Lyle plc | | | 9,658 | |
| | 3,789 | | | Taylor Wimpey plc | | | 9,816 | |
| | 279 | | | Unilever NV, CVA | | | 14,614 | |
| | | | | | | | |
| | | | | | | 159,974 | |
| | | | | | | | |
| | | | Total Common Stocks
(Cost $754,683) | | | 832,140 | |
| | | | | | | | |
| | Short-Term Investment — 3.3% | | | | |
| | | | Investment Company — 3.3% | | | | |
| | 28,641 | | | JPMorgan U.S. Government Money Market Fund, Institutional Class Shares, 0.620% (b) (l)
(Cost $28,641) | | | 28,641 | |
| | | | | | | | |
| | | | Total Investments — 98.5%
(Cost $783,324) | | | 860,781 | |
| | | | Other Assets in Excess of
Liabilities — 1.5% | | | 12,682 | |
| | | | | | | | |
| | | | NET ASSETS — 100.0% | | $ | 873,463 | |
| | | | | | | | |
Percentages indicated are based on net assets.
Summary of Investments by Industry, April 30, 2017
The following table represents the portfolio investments of the Fund by industry classifications as a percentage of total investments:
| | | | |
| INDUSTRY | | PERCENTAGE | |
Banks | | | 12.1 | % |
Insurance | | | 8.1 | |
Textiles, Apparel & Luxury Goods | | | 6.2 | |
Metals & Mining | | | 5.9 | |
Semiconductors & Semiconductor Equipment | | | 4.6 | |
Household Durables | | | 4.6 | |
Electrical Equipment | | | 4.4 | |
Construction & Engineering | | | 3.8 | |
Machinery | | | 3.5 | |
Pharmaceuticals | | | 3.4 | |
Food Products | | | 3.4 | |
Industrial Conglomerates | | | 3.2 | |
Paper & Forest Products | | | 3.2 | |
Chemicals | | | 2.8 | |
Automobiles | | | 2.7 | |
Oil, Gas & Consumable Fuels | | | 2.7 | |
Professional Services | | | 2.6 | |
Transportation Infrastructure | | | 2.2 | |
Hotels, Restaurants & Leisure | | | 2.2 | |
Technology Hardware, Storage & Peripherals | | | 1.8 | |
Personal Products | | | 1.7 | |
Auto Components | | | 1.5 | |
Containers & Packaging | | | 1.5 | |
Tobacco | | | 1.5 | |
Electric Utilities | | | 1.3 | |
Multi-Utilities | | | 1.2 | |
Airlines | | | 1.1 | |
Real Estate Management & Development | | | 1.0 | |
Trading Companies & Distributors | | | 1.0 | |
Others (each less than 1.0%) | | | 1.5 | |
Short-Term Investment | | | 3.3 | |
| | | | | | | | | | | | | | | | | | | | |
| Futures Contracts | |
NUMBER OF
CONTRACTS | | | DESCRIPTION | | EXPIRATION
DATE | | | TRADING
CURRENCY | | | NOTIONAL
VALUE AT APRIL 30, 2017 | | | NET UNREALIZED
APPRECIATION
(DEPRECIATION) | |
| | | | Long Futures Outstanding | | | | | | | | | | | | | | | | |
| | 387 | | | Euro STOXX 50 Index | | | 06/16/17 | | | | EUR | | | $ | 14,790 | | | $ | 260 | |
| | 77 | | | FTSE 100 Index | | | 06/16/17 | | | | GBP | | | | 7,145 | | | | (61 | ) |
| | | | | | | | | | | | | | | | | | | | |
| | | | | | | | | | | | | | | | | | $ | 199 | |
| | | | | | | | | | | | | | | | | | | | |
SEE NOTES TO FINANCIAL STATEMENTS.
| | | | | | |
| | | |
| 12 | | | | J.P. MORGAN COUNTRY/REGION FUNDS | | APRIL 30, 2017 |
JPMorgan Latin America Fund
SCHEDULE OF PORTFOLIO INVESTMENTS
AS OF APRIL 30, 2017 (Unaudited)
(Amounts in thousands)
| | | | | | | | |
| SHARES | | | SECURITY DESCRIPTION | | VALUE($) | |
| | Common Stocks — 94.5% | | | | |
| | | | Argentina — 3.8% | | | | |
| | 3 | | | MercadoLibre, Inc. | | | 706 | |
| | 20 | | | Pampa Energia SA, ADR (a) | | | 1,096 | |
| | | | | | | | |
| | | | | | | 1,802 | |
| | | | | | | | |
| | | | Brazil — 52.2% | | | | |
| | 45 | | | AES Tiete SA | | | 192 | |
| | 251 | | | Ambev SA, ADR | | | 1,436 | |
| | 26 | | | Arezzo Industria e Comercio SA | | | 272 | |
| | 193 | | | Banco Bradesco SA, ADR (a) | | | 2,036 | |
| | 90 | | | BB Seguridade Participacoes SA | | | 841 | |
| | 218 | | | BM&FBovespa SA — Bolsa de Valores Mercadorias e Futuros (a) | | | 1,303 | |
| | 20 | | | BRF SA (a) | | | 250 | |
| | 197 | | | CCR SA | | | 1,093 | |
| | 44 | | | Cia de Saneamento Basico do Estado de Sao Paulo (a) | | | 405 | |
| | 5 | | | CVC Brasil Operadora e Agencia de Viagens SA | | | 50 | |
| | 80 | | | Engie Brasil Energia SA | | | 861 | |
| | 122 | | | Fleury SA | | | 2,045 | |
| | 77 | | | Gerdau SA, ADR | | | 234 | |
| | 47 | | | Iguatemi Empresa de Shopping Centers SA | | | 493 | |
| | 121 | | | Iochpe Maxion SA | | | 630 | |
| | 190 | | | Itau Unibanco Holding SA, ADR | | | 2,332 | |
| | 9 | | | Itausa — Investimentos Itau SA (a) | | | 29 | |
| | 207 | | | Kroton Educacional SA | | | 980 | |
| | 69 | | | Linx SA | | | 389 | |
| | 55 | | | Localiza Rent a Car SA | | | 814 | |
| | 167 | | | Lojas Renner SA | | | 1,549 | |
| | 43 | | | M Dias Branco SA (a) | | | 666 | |
| | 16 | | | Ouro Fino Saude Animal Participacoes SA | | | 123 | |
| | 127 | | | Petroleo Brasileiro SA, ADR (a) | | | 1,111 | |
| | 49 | | | Raia Drogasil SA (a) | | | 1,042 | |
| | 24 | | | Smiles SA | | | 523 | |
| | 37 | | | Transmissora Alianca de Energia Eletrica SA | | | 273 | |
| | 30 | | | Ultrapar Participacoes SA | | | 678 | |
| | 60 | | | Valid Solucoes e Servicos de Seguranca em Meios de Pagamento e Identificacao SA | | | 430 | |
| | 201 | | | WEG SA | | | 1,122 | |
| | 21 | | | Wilson Sons Ltd., BDR | | | 247 | |
| | | | | | | | |
| | | | | | | 24,449 | |
| | | | | | | | |
| | | | Chile — 1.0% | | | | |
| | 56 | | | SACI Falabella | | | 448 | |
| | | | | | | | |
| | | | Luxembourg — 0.5% | | | | |
| | 10 | | | Ternium SA, ADR | | | 253 | |
| | | | | | | | |
| | | | Mexico — 26.1% | | | | |
| | 254 | | | Alfa SAB de CV, Class A | | | 350 | |
| | 58 | | | Alsea SAB de CV | | | 208 | |
| | | | | | | | |
| SHARES | | | SECURITY DESCRIPTION | | VALUE($) | |
| | | | | | | | |
| | | | Mexico — continued | | | | |
| | 169 | | | Becle SAB de CV (a) | | | 283 | |
| | 188 | | | Bolsa Mexicana de Valores SAB de CV (a) | | | 328 | |
| | 293 | | | Corp. Inmobiliaria Vesta SAB de CV | | | 412 | |
| | 17 | | | Fomento Economico Mexicano SAB de CV, ADR | | | 1,490 | |
| | 497 | | | Gentera SAB de CV | | | 833 | |
| | 53 | | | Gruma SAB de CV, Class B | | | 710 | |
| | 83 | | | Grupo Aeroportuario del Centro Norte SAB de CV (a) | | | 459 | |
| | 106 | | | Grupo Aeroportuario del Pacifico SAB de CV, Class B | | | 1,088 | |
| | 6 | | | Grupo Aeroportuario del Sureste SAB de CV, ADR | | | 1,193 | |
| | 169 | | | Grupo Financiero Banorte SAB de CV, Class O | | | 979 | |
| | 147 | | | Infraestructura Energetica Nova SAB de CV | | | 687 | |
| | 389 | | | Kimberly-Clark de Mexico SAB de CV, Class A | | | 830 | |
| | 396 | | | Mexichem SAB de CV | | | 1,083 | |
| | 100 | | | Organizacion Soriana SAB de CV, Class B (a) | | | 229 | |
| | 297 | | | Qualitas Controladora SAB de CV | | | 486 | |
| | 212 | | | Unifin Financiera SAB de CV SOFOM ENR | | | 555 | |
| | | | | | | | |
| | | | | | | 12,203 | |
| | | | | | | | |
| | | | Panama — 1.6% | | | | |
| | 6 | | | Copa Holdings SA, Class A | | | 740 | |
| | | | | | | | |
| | | | Peru — 4.5% | | | | |
| | 10 | | | Credicorp Ltd. | | | 1,592 | |
| | 15 | | | Intercorp Financial Services, Inc. | | | 495 | |
| | | | | | | | |
| | | | | | | 2,087 | |
| | | | | | | | |
| | | | United States — 4.8% | | | | |
| | 17 | | | FirstCash, Inc. | | | 871 | |
| | 37 | | | Globant SA (a) | | | 1,393 | |
| | | | | | | | |
| | | | | | | 2,264 | |
| | | | | | | | |
| | | | Total Common Stocks
(Cost $38,021) | | | 44,246 | |
| | | | | | | | |
| | Preferred Stocks — 4.3% | | | | |
| | | | Brazil — 4.3% | | | | |
| | 12 | | | Cia Paranaense de Energia (Preference) | | | 113 | |
| | 475 | | | Itausa — Investimentos Itau SA (Preference) | | | 1,472 | |
| | 107 | | | Suzano Papel e Celulose SA (Preference), Class A | | | 449 | |
| | | | | | | | |
| | | | | | | 2,034 | |
| | | | | | | | |
| | | | Total Preferred Stocks
(Cost $2,047) | | | 2,034 | |
| | | | | | | | |
| | | | Total Investments — 98.8%
(Cost $40,068) | | | 46,280 | |
| | | | Other Assets in Excess of
Liabilities — 1.2% | | | 553 | |
| | | | | | | | |
| | | | NET ASSETS — 100.0% | | $ | 46,833 | |
| | | | | | | | |
Percentages indicated are based on net assets.
SEE NOTES TO FINANCIAL STATEMENTS.
| | | | | | | | |
| | | |
| APRIL 30, 2017 | | J.P. MORGAN COUNTRY/REGION FUNDS | | | | | 13 | |
JPMorgan Latin America Fund
SCHEDULE OF PORTFOLIO INVESTMENTS
AS OF APRIL 30, 2017 (Unaudited) (continued)
Summary of Investments by Industry, April 30, 2017
The following table represents the portfolio investments of the Fund by industry classifications as a percentage of total investments:
| | | | |
| INDUSTRY | | PERCENTAGE | |
Banks | | | 19.3 | % |
Transportation Infrastructure | | | 8.8 | |
Beverages | | | 6.9 | |
Consumer Finance | | | 4.9 | |
Health Care Providers & Services | | | 4.4 | |
Multiline Retail | | | 4.3 | |
Oil, Gas & Consumable Fuels | | | 3.9 | |
Software | | | 3.9 | |
Machinery | | | 3.8 | |
Capital Markets | | | 3.5 | |
Food Products | | | 3.5 | |
Electric Utilities | | | 3.2 | |
Insurance | | | 2.9 | |
Food & Staples Retailing | | | 2.7 | |
Chemicals | | | 2.3 | |
Independent Power & Renewable Electricity Producers | | | 2.3 | |
Diversified Consumer Services | | | 2.1 | |
Real Estate Management & Development | | | 2.0 | |
Household Products | | | 1.8 | |
Road & Rail | | | 1.8 | |
Airlines | | | 1.6 | |
Internet Software & Services | | | 1.5 | |
Gas Utilities | | | 1.5 | |
Media | | | 1.1 | |
Metals & Mining | | | 1.0 | |
Paper & Forest Products | | | 1.0 | |
Others (each less than 1.0%) | | | 4.0 | |
SEE NOTES TO FINANCIAL STATEMENTS.
| | | | | | |
| | | |
| 14 | | | | J.P. MORGAN COUNTRY/REGION FUNDS | | APRIL 30, 2017 |
J.P. Morgan Country/Region Funds
NOTES TO SCHEDULES OF PORTFOLIO INVESTMENTS
AS OF APRIL 30, 2017 (Unaudited)
| | |
| ADR | | — American Depositary Receipt |
| BDR | | — Brazilian Depositary Receipt |
| CVA | | — Dutch Certification |
| EUR | | — Euro |
| FTSE | | — Financial Times Stock Exchange |
| GBP | | — British Pound |
| |
| (a) | | — Non-income producing security. |
| (b) | | — Investment in affiliate. Money market fund is registered under the Investment Company Act of 1940, as amended, and advised by J.P. Morgan Investment Management Inc. |
| | |
| (e) | | — Security is exempt from registration under Rule 144A of the Securities Act of 1933, as amended. Unless otherwise indicated, this security has been determined to be liquid under procedures established by the Board of Trustees and may be resold in transactions exempt from registration, normally to qualified institutional buyers. |
| (l) | | — The rate shown is the current yield as of April 30, 2017. |
SEE NOTES TO FINANCIAL STATEMENTS.
| | | | | | | | |
| | | |
| APRIL 30, 2017 | | J.P. MORGAN COUNTRY/REGION FUNDS | | | | | 15 | |
STATEMENTS OF ASSETS AND LIABILITIES
AS OF APRIL 30, 2017 (Unaudited)
(Amounts in thousands, except per share amounts)
| | | | | | | | | | | | |
| | | China
Region Fund | | |
Intrepid
European
Fund | | | Latin
America
Fund | |
ASSETS: | |
Investments in non-affiliates, at value | | $ | 21,442 | | | $ | 832,140 | | | $ | 46,280 | |
Investments in affiliates, at value | | | — | | | | 28,641 | | | | — | |
| | | | | �� | | | | | | | |
Total investment securities, at value | | | 21,442 | | | | 860,781 | | | | 46,280 | |
Cash | | | 71 | | | | 100 | | | | 297 | |
Foreign currency, at value | | | 103 | | | | 312 | | | | 11 | |
Deposits at broker for futures contracts | | | — | | | | 825 | | | | — | |
Receivables: | | | | | | | | | | | | |
Due from custodian | | | — | | | | 1,605 | | | | — | |
Investment securities sold | | | 161 | | | | 15,018 | | | | 186 | |
Fund shares sold | | | 10 | | | | 958 | | | | 10 | |
Dividends from non-affiliates | | | 6 | | | | 2,846 | | | | 121 | |
Dividends from affiliates | | | — | | | | 24 | | | | — | (a) |
Tax reclaims | | | — | | | | 2,646 | | | | — | |
Due from adviser | | | 30 | | | | — | | | | — | |
Other assets | | | 2 | | | | — | | | | 15 | |
| | | | | | | | | | | | |
Total Assets | | | 21,825 | | | | 885,115 | | | | 46,920 | |
| | | | | | | | | | | | |
|
LIABILITIES: | |
Payables: | | | | | | | | | | | | |
Investment securities purchased | | | 134 | | | | 10,304 | | | | — | |
Fund shares redeemed | | | 2,094 | | | | 501 | | | | 10 | |
Variation margin on futures contracts | | | — | | | | 31 | | | | — | |
Accrued liabilities: | | | | | | | | | | | | |
Investment advisory fees | | | — | | | | 426 | | | | 2 | |
Administration fees | | | — | | | | 54 | | | | — | |
Distribution fees | | | 2 | | | | 58 | | | | 3 | |
Service fees | | | — | (a) | | | 107 | | | | 3 | |
Custodian and accounting fees | | | 22 | | | | 15 | | | | 7 | |
Trustees’ and Chief Compliance Officer’s fees | | | — | (a) | | | — | | | | — | |
Audit fees | | | 48 | | | | 36 | | | | 49 | |
Printing and mailing cost | | | 12 | | | | 40 | | | | 6 | |
Other | | | 1 | | | | 80 | | | | 7 | |
| | | | | | | | | | | | |
Total Liabilities | | | 2,313 | | | | 11,652 | | | | 87 | |
| | | | | | | | | | | | |
Net Assets | | $ | 19,512 | | | $ | 873,463 | | | $ | 46,833 | |
| | | | | | | | | | | | |
| (a) | Amount rounds to less than 500. |
SEE NOTES TO FINANCIAL STATEMENTS.
| | | | | | |
| | | |
| 16 | | | | J.P. MORGAN COUNTRY/REGION FUNDS | | APRIL 30, 2017 |
| | | | | | | | | | | | |
| | | China
Region Fund | | |
Intrepid
European
Fund | | | Latin
America
Fund | |
NET ASSETS: | |
Paid-in-Capital | | $ | 11,981 | | | $ | 996,596 | | | $ | 84,346 | |
Accumulated undistributed (distributions in excess of) net investment income | | | (139 | ) | | | 6,482 | | | | 143 | |
Accumulated net realized gains (losses) | | | 379 | | | | (207,167 | ) | | | (43,869 | ) |
Net unrealized appreciation (depreciation) | | | 7,291 | | | | 77,552 | | | | 6,213 | |
| | | | | | | | | | | | |
Total Net Assets | | $ | 19,512 | | | $ | 873,463 | | | $ | 46,833 | |
| | | | | | | | | | | | |
|
Net Assets: | |
Class A | | $ | 3,922 | | | $ | 149,937 | | | $ | 10,185 | |
Class C | | | 1,868 | | | | 46,939 | | | | 1,849 | |
Class I (formerly Select Class) | | | 13,722 | | | | 147,976 | | | | 6,641 | |
Class L (formerly Institutional Class) | | | — | | | | 528,611 | | | | — | |
Class R6 | | | — | | | | — | | | | 28,158 | |
| | | | | | | | | | | | |
Total | | $ | 19,512 | | | $ | 873,463 | | | $ | 46,833 | |
| | | | | | | | | | | | |
|
Outstanding units of beneficial interest (shares)
($0.0001 par value; unlimited number of shares authorized): | |
Class A | | | 230 | | | | 6,031 | | | | 705 | |
Class C | | | 114 | | | | 2,122 | | | | 131 | |
Class I (formerly Select Class) | | | 779 | | | | 5,839 | | | | 451 | |
Class L (formerly Institutional Class) | | | — | | | | 20,686 | | | | — | |
Class R6 | | | — | | | | — | | | | 1,947 | |
| | | |
Net Asset Value (a): | | | | | | | | | | | | |
Class A — Redemption price per share | | $ | 17.02 | | | $ | 24.86 | | | $ | 14.44 | |
Class C — Offering price per share (b) | | | 16.40 | | | | 22.12 | | | | 14.12 | |
Class I (formerly Select Class) — Offering and redemption price per share | | | 17.61 | | | | 25.34 | | | | 14.73 | |
Class L (formerly Institutional Class) — Offering and redemption price per share | | | — | | | | 25.55 | | | | — | |
Class R6 — Offering and redemption price per share | | | — | | | | — | | | | 14.46 | |
Class A maximum sales charge | | | 5.25 | % | | | 5.25 | % | | | 5.25 | % |
Class A maximum public offering price per share
[net asset value per share/(100% — maximum sales charge)] | | $ | 17.96 | | | $ | 26.24 | | | $ | 15.24 | |
| | | | | | | | | | | | |
| | | |
Cost of investments in non-affiliates | | $ | 14,151 | | | $ | 754,683 | | | $ | 40,068 | |
Cost of investments in affiliates | | | — | | | | 28,641 | | | | — | |
Cost of foreign currency | | | 103 | | | | 312 | | | | 11 | |
| (a) | Per share amounts may not recalculate due to rounding of net assets and/or shares outstanding. |
| (b) | Redemption price for Class C Shares varies based upon length of time the shares are held. |
SEE NOTES TO FINANCIAL STATEMENTS.
| | | | | | | | |
| | | |
| APRIL 30, 2017 | | J.P. MORGAN COUNTRY/REGION FUNDS | | | | | 17 | |
STATEMENTS OF OPERATIONS
FOR THE SIX MONTHS ENDED APRIL 30, 2017 (Unaudited)
(Amounts in thousands)
| | | | | | | | | | | | |
| | | China
Region Fund | | |
Intrepid
European
Fund | | | Latin
America
Fund | |
INVESTMENT INCOME: | |
Interest income from non-affiliates | | $ | — | (a) | | $ | 1 | | | $ | — | |
Interest income from affiliates | | | — | (a) | | | 1 | | | | — | |
Dividend income from non-affiliates | | | 18 | | | | 11,671 | | | | 850 | |
Dividend income from affiliates | | | — | | | | 63 | | | | 1 | |
Foreign taxes withheld | | | — | (a) | | | (1,034 | ) | | | (4 | ) |
| | | | | | | | | | | | |
Total investment income | | | 18 | | | | 10,702 | | | | 847 | |
| | | | | | | | | | | | |
|
EXPENSES: | |
Investment advisory fees | | | 103 | | | | 2,492 | | | | 269 | |
Administration fees | | | 8 | | | | 314 | | | | 22 | |
Distribution fees: | | | | | | | | | | | | |
Class A | | | 5 | | | | 189 | | | | 13 | |
Class C | | | 7 | | | | 172 | | | | 7 | |
Service fees: | | | | | | | | | | | | |
Class A | | | 5 | | | | 189 | | | | 13 | |
Class C | | | 2 | | | | 57 | | | | 3 | |
Class I (formerly Select Class) | | | 19 | | | | 167 | | | | 18 | |
Class L (formerly Institutional Class) | | | — | | | | 218 | | | | — | |
Custodian and accounting fees | | | 61 | | | | 84 | | | | 52 | |
Interest expense to affiliates | | | — | (a) | | | 4 | | | | 3 | |
Professional fees | | | 34 | | | | 71 | | | | 34 | |
Trustees’ and Chief Compliance Officer’s fees | | | 13 | | | | 14 | | | | 12 | |
Printing and mailing costs | | | — | (a) | | | 39 | | | | 8 | |
Registration and filing fees | | | 19 | | | | 34 | | | | 22 | |
Transfer agency fees (See Note 2.G.) | | | 3 | | | | 26 | | | | 3 | |
Sub-transfer agency fees (See Note 2.G.) | | | 3 | | | | 138 | | | | 14 | |
Other | | | 3 | | | | 11 | | | | 3 | |
| | | | | | | | | | | | |
Total expenses | | | 285 | | | | 4,219 | | | | 496 | |
| | | | | | | | | | | | |
Less fees waived | | | (109 | ) | | | (18 | ) | | | (158 | ) |
Less expense reimbursements | | | (30 | ) | | | — | | | | — | |
| | | | | | | | | | | | |
Net expenses | | | 146 | | | | 4,201 | | | | 338 | |
| | | | | | | | | | | | |
Net investment income (loss) | | | (128 | ) | | | 6,501 | | | | 509 | |
| | | | | | | | | | | | |
| | | |
REALIZED/UNREALIZED GAINS (LOSSES): | | | | | | | | | | | | |
Net realized gain (loss) on transactions from: | |
Investments in non-affiliates | | | 1,072 | | | | 35,780 | | | | (358 | ) |
Futures | | | — | | | | 1,328 | | | | — | |
Foreign currency transactions | | | (1 | ) | | | (599 | ) | | | 22 | |
| | | | | | | | | | | | |
Net realized gain (loss) | | | 1,071 | | | | 36,509 | | | | (336 | ) |
| | | | | | | | | | | | |
Change in net unrealized appreciation/depreciation on: | |
Investments in non-affiliates | | | 932 | | | | 72,585 | | | | (3,069 | ) |
Futures | | | — | | | | 194 | | | | — | |
Foreign currency translations | | | — | (a) | | | 85 | | | | (1 | ) |
| | | | | | | | | | | | |
Change in net unrealized appreciation/depreciation | | | 932 | | | | 72,864 | | | | (3,070 | ) |
| | | | | | | | | | | | |
Net realized/unrealized gains (losses) | | | 2,003 | | | | 109,373 | | | | (3,406 | ) |
| | | | | | | | | | | | |
Change in net assets resulting from operations | | $ | 1,875 | | | $ | 115,874 | | | $ | (2,897 | ) |
| | | | | | | | | | | | |
| (a) | Amount rounds to less than 500. |
SEE NOTES TO FINANCIAL STATEMENTS.
| | | | | | |
| | | |
| 18 | | | | J.P. MORGAN COUNTRY/REGION FUNDS | | APRIL 30, 2017 |
STATEMENTS OF CHANGES IN NET ASSETS
FOR THE PERIODS INDICATED
(Amounts in thousands)
| | | | | | | | | | | | | | | | |
| | | China Region Fund | | | Intrepid European Fund | |
| | | Six Months Ended
April 30, 2017
(Unaudited) | | | Year Ended
October 31, 2016 | | | Six Months Ended
April 30, 2017
(Unaudited) | | | Year Ended
October 31, 2016 | |
CHANGE IN NET ASSETS RESULTING FROM OPERATIONS: | | | | | | | | | | | | | | | | |
Net investment income (loss) | | $ | (128 | ) | | $ | 107 | | | $ | 6,501 | | | $ | 18,013 | |
Net realized gain (loss) | | | 1,071 | | | | 2,147 | | | | 36,509 | | | | (96,679 | ) |
Change in net unrealized appreciation/depreciation | | | 932 | | | | (2,002 | ) | | | 72,864 | | | | (18,236 | ) |
| | | | | | | | | | | | | | | | |
Change in net assets resulting from operations | | | 1,875 | | | | 252 | | | | 115,874 | | | | (96,902 | ) |
| | | | | | | | | | | | | | | | |
|
DISTRIBUTIONS TO SHAREHOLDERS: | |
Class A | | | | | | | | | | | | | | | | |
From net investment income | | | (18 | ) | | | (422 | ) | | | (2,962 | ) | | | (2,758 | ) |
From net realized gains | | | (333 | ) | | | — | | | | — | | | | — | |
Class C | | | | | | | | | | | | | | | | |
From net investment income | | | — | | | | (206 | ) | | | (764 | ) | | | (733 | ) |
From net realized gains | | | (153 | ) | | | — | | | | — | | | | — | |
Class I (formerly Select Class) | | | | | | | | | | | | | | | | |
From net investment income | | | (97 | ) | | | (1,223 | ) | | | (2,896 | ) | | | (3,259 | ) |
From net realized gains | | | (1,119 | ) | | | — | | | | — | | | | — | |
Class L (formerly Institutional Class) | | | | | | | | | | | | | | | | |
From net investment income | | | — | | | | — | | | | (10,351 | ) | | | (8,098 | ) |
| | | | | | | | | | | | | | | | |
Total distributions to shareholders | | | (1,720 | ) | | | (1,851 | ) | | | (16,973 | ) | | | (14,848 | ) |
| | | | | | | | | | | | | | | | |
|
CAPITAL TRANSACTIONS: | |
Change in net assets resulting from capital transactions | | | (3,756 | ) | | | (10,477 | ) | | | (7,825 | ) | | | (174,875 | ) |
| | | | | | | | | | | | | | | | |
|
NET ASSETS: | |
Change in net assets | | | (3,601 | ) | | | (12,076 | ) | | | 91,076 | | | | (286,625 | ) |
Beginning of period | | | 23,113 | | | | 35,189 | | | | 782,387 | | | | 1,069,012 | |
| | | | | | | | | | | | | | | | |
End of period | | $ | 19,512 | | | $ | 23,113 | | | $ | 873,463 | | | $ | 782,387 | |
| | | | | | | | | | | | | | | | |
Accumulated undistributed (distributions in excess of) net investment income | | $ | (139 | ) | | $ | 104 | | | $ | 6,482 | | | $ | 16,954 | |
| | | | | | | | | | | | | | | | |
SEE NOTES TO FINANCIAL STATEMENTS.
| | | | | | | | |
| | | |
| APRIL 30, 2017 | | J.P. MORGAN COUNTRY/REGION FUNDS | | | | | 19 | |
STATEMENTS OF CHANGES IN NET ASSETS
FOR THE PERIODS INDICATED (continued)
(Amounts in thousands)
| | | | | | | | |
| | | Latin America Fund | |
| | | Six Months Ended
April 30, 2017
(Unaudited) | | | Year Ended
October 31, 2016 | |
CHANGE IN NET ASSETS RESULTING FROM OPERATIONS: | |
Net investment income (loss) | | $ | 509 | | | $ | 1,121 | |
Net realized gain (loss) | | | (336 | ) | | | (2,580 | ) |
Change in net unrealized appreciation/depreciation | | | (3,070 | ) | | | 22,434 | |
| | | | | | | | |
Change in net assets resulting from operations | | | (2,897 | ) | | | 20,975 | |
| | | | | | | | |
|
DISTRIBUTIONS TO SHAREHOLDERS: | |
Class A | | | | | | | | |
From net investment income | | | (169 | ) | | | (111 | ) |
Class C | | | | | | | | |
From net investment income | | | (26 | ) | | | (24 | ) |
Class I (formerly Select Class) | | | | | | | | |
From net investment income | | | (539 | ) | | | (9 | ) |
Class R6 (a) | | | | | | | | |
From net investment income | | | (640 | ) | | | (804 | ) |
| | | | | | | | |
Total distributions to shareholders | | | (1,374 | ) | | | (948 | ) |
| | | | | | | | |
|
CAPITAL TRANSACTIONS: | |
Change in net assets resulting from capital transactions | | | (28,352 | ) | | | (4,641 | ) |
| | | | | | | | |
|
NET ASSETS: | |
Change in net assets | | | (32,623 | ) | | | 15,386 | |
Beginning of period | | | 79,456 | | | | 64,070 | |
| | | | | | | | |
End of period | | $ | 46,833 | | | $ | 79,456 | |
| | | | | | | | |
Accumulated undistributed (distributions in excess of) net investment income | | $ | 143 | | | $ | 1,008 | |
| | | | | | | | |
| (a) | Commencement of offering of class of shares effective November 2, 2015. |
SEE NOTES TO FINANCIAL STATEMENTS.
| | | | | | |
| | | |
| 20 | | | | J.P. MORGAN COUNTRY/REGION FUNDS | | APRIL 30, 2017 |
| | | | | | | | | | | | | | | | |
| | | China Region Fund | | | Intrepid European Fund | |
| | | Six Months Ended
April 30, 2017
(Unaudited) | | | Year Ended
October 31, 2016 | | | Six Months Ended
April 30, 2017
(Unaudited) | | | Year Ended
October 31, 2016 | |
CAPITAL TRANSACTIONS: | | | | | | | | | | | | | | | | |
Class A | | | | | | | | | | | | | | | | |
Proceeds from shares issued | | $ | 369 | | | $ | 550 | | | $ | 11,829 | | | $ | 62,580 | |
Distributions reinvested | | | 347 | | | | 418 | | | | 2,847 | | | | 2,662 | |
Cost of shares redeemed | | | (1,478 | ) | | | (1,591 | ) | | | (46,301 | ) | | | (97,769 | ) |
| | | | | | | | | | | | | | | | |
Change in net assets resulting from Class A capital transactions | | $ | (762 | ) | | $ | (623 | ) | | $ | (31,625 | ) | | $ | (32,527 | ) |
| | | | | | | | | | | | | | | | |
Class C | | | | | | | | | | | | | | | | |
Proceeds from shares issued | | $ | 174 | | | $ | 324 | | | $ | 3,652 | | | $ | 9,072 | |
Distributions reinvested | | | 110 | | | | 155 | | | | 683 | | | | 641 | |
Cost of shares redeemed | | | (458 | ) | | | (861 | ) | | | (13,284 | ) | | | (26,738 | ) |
| | | | | | | | | | | | | | | | |
Change in net assets resulting from Class C capital transactions | | $ | (174 | ) | | $ | (382 | ) | | $ | (8,949 | ) | | $ | (17,025 | ) |
| | | | | | | | | | | | | | | | |
Class I (formerly Select Class) | | | | | | | | | | | | | | | | |
Proceeds from shares issued | | $ | 1,216 | | | $ | 1,403 | | | $ | 32,104 | | | $ | 72,289 | |
Distributions reinvested | | | 175 | | | | 217 | | | | 1,243 | | | | 1,756 | |
Cost of shares redeemed | | | (4,211 | ) | | | (11,092 | ) | | | (47,116 | ) | | | (481,537 | ) |
| | | | | | | | | | | | | | | | |
Change in net assets resulting from Class I capital transactions | | $ | (2,820 | ) | | $ | (9,472 | ) | | $ | (13,769 | ) | | $ | (407,492 | ) |
| | | | | | | | | | | | | | | | |
Class L (formerly Institutional Class) | | | | | | | | | | | | | | | | |
Proceeds from shares issued | | $ | — | | | $ | — | | | $ | 80,365 | | | $ | 371,399 | |
Distributions reinvested | | | — | | | | — | | | | 9,412 | | | | 6,847 | |
Cost of shares redeemed | | | — | | | | — | | | | (43,259 | ) | | | (96,077 | ) |
| | | | | | | | | | | | | | | | |
Change in net assets resulting from Class L capital transactions | | $ | — | | | $ | — | | | $ | 46,518 | | | $ | 282,169 | |
| | | | | | | | | | | | | | | | |
Total change in net assets resulting from capital transactions | | $ | (3,756 | ) | | $ | (10,477 | ) | | $ | (7,825 | ) | | $ | (174,875 | ) |
| | | | | | | | | | | | | | | | |
SEE NOTES TO FINANCIAL STATEMENTS.
| | | | | | | | |
| | | |
| APRIL 30, 2017 | | J.P. MORGAN COUNTRY/REGION FUNDS | | | | | 21 | |
STATEMENTS OF CHANGES IN NET ASSETS
FOR THE PERIODS INDICATED (continued)
(Amounts in thousands)
| | | | | | | | | | | | | | | | |
| | | China Region Fund | | | Intrepid European Fund | |
| | | Six Months Ended
April 30, 2017
(Unaudited) | | | Year Ended
October 31, 2016 | | | Six Months Ended
April 30, 2017
(Unaudited) | | | Year Ended
October 31, 2016 | |
SHARE TRANSACTIONS: | |
Class A | |
Issued | | | 22 | | | | 35 | | | | 517 | | | | 2,755 | |
Reinvested | | | 24 | | | | 26 | | | | 130 | | | | 115 | |
Redeemed | | | (95 | ) | | | (100 | ) | | | (2,035 | ) | | | (4,445 | ) |
| | | | | | | | | | | | | | | | |
Change in Class A Shares | | | (49 | ) | | | (39 | ) | | | (1,388 | ) | | | (1,575 | ) |
| | | | | | | | | | | | | | | | |
Class C | |
Issued | | | 11 | | | | 21 | | | | 176 | | | | 449 | |
Reinvested | | | 8 | | | | 10 | | | | 35 | | | | 31 | |
Redeemed | | | (31 | ) | | | (57 | ) | | | (659 | ) | | | (1,362 | ) |
| | | | | | | | | | | | | | | | |
Change in Class C Shares | | | (12 | ) | | | (26 | ) | | | (448 | ) | | | (882 | ) |
| | | | | | | | | | | | | | | | |
Class I (formerly Select Class) | |
Issued | | | 78 | | | | 86 | | | | 1,364 | | | | 3,181 | |
Reinvested | | | 11 | | | | 13 | | | | 56 | | | | 74 | |
Redeemed | | | (250 | ) | | | (666 | ) | | | (2,065 | ) | | | (20,109 | ) |
| | | | | | | | | | | | | | | | |
Change in Class I Shares | | | (161 | ) | | | (567 | ) | | | (645 | ) | | | (16,854 | ) |
| | | | | | | | | | | | | | | | |
Class L (formerly Institutional Class) | |
Issued | | | — | | | | — | | | | 3,351 | | | | 14,948 | |
Reinvested | | | — | | | | — | | | | 421 | | | | 288 | |
Redeemed | | | — | | | | — | | | | (1,859 | ) | | | (4,219 | ) |
| | | | | | | | | | | | | | | | |
Change in Class L Shares | | | — | | | | — | | | | 1,913 | | | | 11,017 | |
| | | | | | | | | | | | | | | | |
SEE NOTES TO FINANCIAL STATEMENTS.
| | | | | | |
| | | |
| 22 | | | | J.P. MORGAN COUNTRY/REGION FUNDS | | APRIL 30, 2017 |
| | | | | | | | |
| | | Latin America Fund | |
| | | Six Months Ended
April 30, 2017
(Unaudited) | | | Year Ended
October 31, 2016 | |
CAPITAL TRANSACTIONS: | | | | | | | | |
Class A | | | | | | | | |
Proceeds from shares issued | | $ | 1,771 | | | $ | 3,759 | |
Distributions reinvested | | | 159 | | | | 105 | |
Cost of shares redeemed | | | (3,497 | ) | | | (6,671 | ) |
| | | | | | | | |
Change in net assets resulting from Class A capital transactions | | $ | (1,567 | ) | | $ | (2,807 | ) |
| | | | | | | | |
Class C | | | | | | | | |
Proceeds from shares issued | | $ | 179 | | | $ | 643 | |
Distributions reinvested | | | 25 | | | | 24 | |
Cost of shares redeemed | | | (940 | ) | | | (664 | ) |
| | | | | | | | |
Change in net assets resulting from Class C capital transactions | | $ | (736 | ) | | $ | 3 | |
| | | | | | | | |
Class I (formerly Select Class) | | | | | | | | |
Proceeds from shares issued | | $ | 2,524 | | | $ | 25,228 | |
Distributions reinvested | | | 528 | | | | 9 | |
Cost of shares redeemed | | | (26,248 | ) | | | (48,971 | ) |
| | | | | | | | |
Change in net assets resulting from Class I capital transactions | | $ | (23,196 | ) | | $ | (23,734 | ) |
| | | | | | | | |
Class R6 (a) | | | | | | | | |
Proceeds from shares issued | | $ | 6,212 | | | $ | 43,650 | |
Distributions reinvested | | | 640 | | | | 804 | |
Cost of shares redeemed | | | (9,705 | ) | | | (22,557 | ) |
| | | | | | | | |
Change in net assets resulting from Class R6 capital transactions | | $ | (2,853 | ) | | $ | 21,897 | |
| | | | | | | | |
Total change in net assets resulting from capital transactions | | $ | (28,352 | ) | | $ | (4,641 | ) |
| | | | | | | | |
|
SHARE TRANSACTIONS: | |
Class A | |
Issued | | | 133 | | | | 317 | |
Reinvested | | | 13 | | | | 10 | |
Redeemed | | | (264 | ) | | | (569 | ) |
| | | | | | | | |
Change in Class A Shares | | | (118 | ) | | | (242 | ) |
| | | | | | | | |
Class C | |
Issued | | | 14 | | | | 58 | |
Reinvested | | | 2 | | | | 2 | |
Redeemed | | | (77 | ) | | | (58 | ) |
| | | | | | | | |
Change in Class C Shares | | | (61 | ) | | | 2 | |
| | | | | | | | |
Class I (formerly Select Class) | |
Issued | | | 188 | | | | 2,048 | |
Reinvested | | | 43 | | | | 1 | |
Redeemed | | | (2,065 | ) | | | (4,143 | ) |
| | | | | | | | |
Change in Class I Shares | | | (1,834 | ) | | | (2,094 | ) |
| | | | | | | | |
Class R6 (a) | |
Issued | | | 464 | | | | 3,690 | |
Reinvested | | | 53 | | | | 77 | |
Redeemed | | | (721 | ) | | | (1,616 | ) |
| | | | | | | | |
Change in Class R6 Shares | | | (204 | ) | | | 2,151 | |
| | | | | | | | |
| (a) | Commencement of offering of class of shares effective November 2, 2015. |
SEE NOTES TO FINANCIAL STATEMENTS.
| | | | | | | | |
| | | |
| APRIL 30, 2017 | | J.P. MORGAN COUNTRY/REGION FUNDS | | | | | 23 | |
FINANCIAL HIGHLIGHTS
FOR THE PERIODS INDICATED
| | | | | | | | | | | | | | | | | | | | | | | | | | | | |
| | | | | | Per share operating performance | |
| | | | | | Investment operations | | | Distributions | |
| | | Net asset
value,
beginning
of period | | | Net
investment
income
(loss) (b) | | | Net realized
and unrealized
gains
(losses) on
investments | | | Total from
investment
operations | | | Net
investment
income | | | Net
realized
gain | | | Total
distributions | |
China Region Fund | | | | | | | | | | | | | | | | | | | | | | | | | | | | |
Class A | | | | | | | | | | | | | | | | | | | | | | | | | | | | |
Six Months Ended April 30, 2017 (Unaudited) | | $ | 16.85 | | | $ | (0.11 | ) | | $ | 1.59 | | | $ | 1.48 | | | $ | (0.06 | ) | | $ | (1.25 | ) | | $ | (1.31 | ) |
Year Ended October 31, 2016 | | | 17.73 | | | | 0.06 | | | | 0.44 | | | | 0.50 | | | | (1.38 | ) | | | — | | | | (1.38 | ) |
Year Ended October 31, 2015 | | | 22.02 | | | | 0.25 | (f) | | | (0.57 | ) | | | (0.32 | ) | | | (0.08 | ) | | | (3.89 | ) | | | (3.97 | ) |
Year Ended October 31, 2014 | | | 20.62 | | | | 0.09 | (g) | | | 1.37 | | | | 1.46 | | | | (0.06 | ) | | | — | | | | (0.06 | ) |
Year Ended October 31, 2013 | | | 17.73 | | | | 0.08 | | | | 2.81 | | | | 2.89 | | | | — | | | | — | | | | — | |
Year Ended October 31, 2012 | | | 16.64 | | | | 0.10 | | | | 1.13 | | | | 1.23 | | | | (0.14 | ) | | | — | | | | (0.14 | ) |
| | | | | | | |
Class C | | | | | | | | | | | | | | | | | | | | | | | | | | | | |
Six Months Ended April 30, 2017 (Unaudited) | | | 16.26 | | | | (0.14 | ) | | | 1.53 | | | | 1.39 | | | | — | | | | (1.25 | ) | | | (1.25 | ) |
Year Ended October 31, 2016 | | | 17.20 | | | | (0.03 | ) | | | 0.43 | | | | 0.40 | | | | (1.34 | ) | | | — | | | | (1.34 | ) |
Year Ended October 31, 2015 | | | 21.50 | | | | 0.08 | (f) | | | (0.48 | ) | | | (0.40 | ) | | | (0.01 | ) | | | (3.89 | ) | | | (3.90 | ) |
Year Ended October 31, 2014 | | | 20.18 | | | | 0.03 | (g) | | | 1.29 | | | | 1.32 | | | | — | | | | — | | | | — | |
Year Ended October 31, 2013 | | | 17.43 | | | | 0.01 | | | | 2.74 | | | | 2.75 | | | | — | | | | — | | | | — | |
Year Ended October 31, 2012 | | | 16.31 | | | | — | (h) | | | 1.13 | | | | 1.13 | | | | (0.01 | ) | | | — | | | | (0.01 | ) |
| | | | | | | |
Class I (formerly Select Class) | | | | | | | | | | | | | | | | | | | | | | | | | | | | |
Six Months Ended April 30, 2017 (Unaudited) | | | 17.41 | | | | (0.09 | ) | | | 1.64 | | | | 1.55 | | | | (0.10 | ) | | | (1.25 | ) | | | (1.35 | ) |
Year Ended October 31, 2016 | | | 17.87 | | | | 0.09 | | | | 0.48 | | | | 0.57 | | | | (1.03 | ) | | | — | | | | (1.03 | ) |
Year Ended October 31, 2015 | | | 22.17 | | | | 0.16 | (f) | | | (0.43 | ) | | | (0.27 | ) | | | (0.14 | ) | | | (3.89 | ) | | | (4.03 | ) |
Year Ended October 31, 2014 | | | 20.75 | | | | 0.09 | (g) | | | 1.44 | | | | 1.53 | | | | (0.11 | ) | | | — | | | | (0.11 | ) |
Year Ended October 31, 2013 | | | 17.84 | | | | 0.22 | | | | 2.74 | | | | 2.96 | | | | (0.05 | ) | | | — | | | | (0.05 | ) |
Year Ended October 31, 2012 | | | 16.75 | | | | 0.12 | | | | 1.15 | | | | 1.27 | | | | (0.18 | ) | | | — | | | | (0.18 | ) |
| (a) | Annualized for periods less than one year, unless otherwise noted. |
| (b) | Calculated based upon average shares outstanding. |
| (c) | Not annualized for periods less than one year. |
| (d) | Includes adjustments in accordance with accounting principles generally accepted in the United States of America and as such, the net asset values for financial reporting purposes and the returns based upon those net asset values may differ from the net asset values and returns for shareholder transactions. |
| (e) | Includes interest expense, if applicable, each of which is less than 0.005% unless otherwise noted. |
| (f) | Net investment income (loss) may appear disproportionate among the classes due to the timing of recognition of income and changes in the relative size of the classes. |
| (g) | Reflects special dividends paid out during the period by several of the Fund’s holdings. Had the Fund not received the special dividends, the net investment income (loss) per share would have been $0.04, $(0.02) and $0.04 for Class A, Class C and Class I Shares, respectively, and the net investment income (loss) ratio would have been 0.19%, (0.08)% and 0.21% for Class A, Class C and Class I Shares, respectively. |
| (h) | Amount rounds to less than $0.005. |
SEE NOTES TO FINANCIAL STATEMENTS.
| | | | | | |
| | | |
| 24 | | | | J.P. MORGAN COUNTRY/REGION FUNDS | | APRIL 30, 2017 |
| | | | | | | | | | | | | | | | | | | | | | | | | | |
| | | Ratios/Supplemental data | |
| | | | | | | | | | Ratios to average net assets (a) | | | | |
Net asset
value,
end of
period | | | Total return
(excludes
sales charge) (c)(d) | | | Net assets,
end of
period
(000’s) | | | Net
expenses (e) | | | Net
investment
income
(loss) | | | Expenses
without waivers
and reimbursements | | | Portfolio
turnover
rate (c) | |
| | | | | | | | | | | | | | | | | | | | | | | | | | |
| | | | | | | | | | | | | | | | | | | | | | | | | | |
| $ | 17.02 | | | | 10.02 | % | | $ | 3,922 | | | | 1.55 | % | | | (1.38 | )% | | | 2.99 | % | | | 27 | % |
| | 16.85 | | | | 3.29 | | | | 4,697 | | | | 1.55 | | | | 0.38 | | | | 2.65 | | | | 61 | |
| | 17.73 | | | | (2.04 | ) | | | 5,651 | | | | 1.75 | | | | 1.15 | (f) | | | 2.10 | | | | 176 | |
| | 22.02 | | | | 7.12 | | | | 4,237 | | | | 1.85 | | | | 0.42 | (g) | | | 2.02 | | | | 72 | |
| | 20.62 | | | | 16.30 | | | | 6,079 | | | | 1.85 | | | | 0.44 | | | | 2.29 | | | | 72 | |
| | 17.73 | | | | 7.51 | | | | 3,138 | | | | 1.98 | | | | 0.61 | | | | 5.40 | | | | 85 | |
| | | | | | |
| | | | | | | | | | | | | | | | | | | | | | | | | | |
| | 16.40 | | | | 9.72 | | | | 1,868 | | | | 2.05 | | | | (1.87 | ) | | | 3.47 | | | | 27 | |
| | 16.26 | | | | 2.76 | | | | 2,044 | | | | 2.05 | | | | (0.22 | ) | | | 3.11 | | | | 61 | |
| | 17.20 | | | | (2.49 | ) | | | 2,610 | | | | 2.24 | | | | 0.37 | (f) | | | 2.62 | | | | 176 | |
| | 21.50 | | | | 6.54 | | | | 1,857 | | | | 2.35 | | | | 0.15 | (g) | | | 2.52 | | | | 72 | |
| | 20.18 | | | | 15.78 | | | | 1,550 | | | | 2.35 | | | | 0.03 | | | | 2.82 | | | | 72 | |
| | 17.43 | | | | 6.97 | | | | 1,441 | | | | 2.48 | | | | (0.01 | ) | | | 5.89 | | | | 85 | |
| | | | | | |
| | | | | | | | | | | | | | | | | | | | | | | | | | |
| | 17.61 | | | | 10.14 | | | | 13,722 | | | | 1.30 | | | | (1.13 | ) | | | 2.63 | | | | 27 | |
| | 17.41 | | | | 3.51 | | | | 16,372 | | | | 1.30 | | | | 0.53 | | | | 2.27 | | | | 61 | |
| | 17.87 | | | | (1.81 | ) | | | 26,928 | | | | 1.56 | | | | 0.69 | (f) | | | 1.69 | | | | 176 | |
| | 22.17 | | | | 7.39 | | | | 332,071 | | | | 1.60 | | | | 0.43 | (g) | | | 1.76 | | | | 72 | |
| | 20.75 | | | | 16.62 | | | | 640,511 | | | | 1.60 | | | | 1.13 | | | | 1.82 | | | | 72 | |
| | 17.84 | | | | 7.78 | | | | 4,483 | | | | 1.73 | | | | 0.70 | | | | 5.15 | | | | 85 | |
SEE NOTES TO FINANCIAL STATEMENTS.
| | | | | | | | |
| | | |
| APRIL 30, 2017 | | J.P. MORGAN COUNTRY/REGION FUNDS | | | | | 25 | |
FINANCIAL HIGHLIGHTS
FOR THE PERIODS INDICATED (continued)
| | | | | | | | | | | | | | | | | | | | |
| | | Per share operating performance | |
| | | | | | Investment operations | | | Distributions | |
| | | Net asset
value,
beginning
of period | | | Net
investment
income
(loss) (b) | | | Net realized
and unrealized
gains
(losses) on
investments | | | Total from
investment
operations | | | Net
investment
income | |
Intrepid European Fund | | | | | | | | | | | | | | | | | | | | |
Class A | | | | | | | | | | | | | | | | | | | | |
Six Months Ended April 30, 2017 (Unaudited) | | $ | 21.94 | | | $ | 0.14 | | | $ | 3.20 | | | $ | 3.34 | | | $ | (0.42 | ) |
Year Ended October 31, 2016 | | | 24.41 | | | | 0.37 | | | | (2.55 | ) | | | (2.18 | ) | | | (0.29 | ) |
Year Ended October 31, 2015 | | | 24.54 | | | | 0.36 | | | | 0.32 | | | | 0.68 | | | | (0.81 | ) |
Year Ended October 31, 2014 | | | 24.79 | | | | 0.66 | | | | (0.90 | ) | | | (0.24 | ) | | | (0.01 | ) |
Year Ended October 31, 2013 | | | 17.89 | | | | 0.27 | | | | 6.87 | | | | 7.14 | | | | (0.24 | ) |
Year Ended October 31, 2012 | | | 16.98 | | | | 0.26 | (f) | | | 1.19 | | | | 1.45 | | | | (0.54 | ) |
| | | | | |
Class C | | | | | | | | | | | | | | | | | | | | |
Six Months Ended April 30, 2017 (Unaudited) | | | 19.52 | | | | 0.08 | | | | 2.85 | | | | 2.93 | | | | (0.33 | ) |
Year Ended October 31, 2016 | | | 21.77 | | | | 0.23 | | | | (2.27 | ) | | | (2.04 | ) | | | (0.21 | ) |
Year Ended October 31, 2015 | | | 21.99 | | | | 0.21 | | | | 0.29 | | | | 0.50 | | | | (0.72 | ) |
Year Ended October 31, 2014 | | | 22.32 | | | | 0.47 | | | | (0.79 | ) | | | (0.32 | ) | | | (0.01 | ) |
Year Ended October 31, 2013 | | | 16.11 | | | | 0.18 | | | | 6.16 | | | | 6.34 | | | | (0.13 | ) |
Year Ended October 31, 2012 | | | 15.33 | | | | 0.22 | (f) | | | 1.01 | | | | 1.23 | | | | (0.45 | ) |
| | | | | |
Class I (formerly Select Class) | | | | | | | | | | | | | | | | | | | | |
Six Months Ended April 30, 2017 (Unaudited) | | | 22.37 | | | | 0.20 | | | | 3.25 | | | | 3.45 | | | | (0.48 | ) |
Year Ended October 31, 2016 | | | 24.83 | | | | 0.44 | | | | (2.59 | ) | | | (2.15 | ) | | | (0.31 | ) |
Year Ended October 31, 2015 | | | 24.95 | | | | 0.45 | | | | 0.32 | | | | 0.77 | | | | (0.89 | ) |
Year Ended October 31, 2014 | | | 25.18 | | | | 0.71 | | | | (0.88 | ) | | | (0.17 | ) | | | (0.06 | ) |
Year Ended October 31, 2013 | | | 18.15 | | | | 0.22 | | | | 7.07 | | | | 7.29 | | | | (0.26 | ) |
Year Ended October 31, 2012 | | | 17.24 | | | | 0.38 | (f) | | | 1.12 | | | | 1.50 | | | | (0.59 | ) |
| | | | | |
Class L (formerly Institutional Class) | | | | | | | | | | | | | | | | | | | | |
Six Months Ended April 30, 2017 (Unaudited) | | | 22.61 | | | | 0.22 | | | | 3.27 | | | | 3.49 | | | | (0.55 | ) |
Year Ended October 31, 2016 | | | 25.13 | | | | 0.49 | | | | (2.60 | ) | | | (2.11 | ) | | | (0.41 | ) |
Year Ended October 31, 2015 | | | 25.23 | | | | 0.54 | | | | 0.28 | | | | 0.82 | | | | (0.92 | ) |
Year Ended October 31, 2014 | | | 25.46 | | | | 0.79 | | | | (0.93 | ) | | | (0.14 | ) | | | (0.09 | ) |
Year Ended October 31, 2013 | | | 18.35 | | | | 0.22 | | | | 7.20 | | | | 7.42 | | | | (0.31 | ) |
Year Ended October 31, 2012 | | | 17.42 | | | | 0.40 | (f) | | | 1.17 | | | | 1.57 | | | | (0.64 | ) |
| (a) | Annualized for periods less than one year, unless otherwise noted. |
| (b) | Calculated based upon average shares outstanding. |
| (c) | Not annualized for periods less than one year. |
| (d) | Includes adjustments in accordance with accounting principles generally accepted in the United States of America and as such, the net asset values for financial reporting purposes and the returns based upon those net asset values may differ from the net asset values and returns for shareholder transactions. |
| (e) | Includes interest expense, if applicable, each of which is less than 0.005% unless otherwise noted. |
| (f) | Reflects special dividends paid out during the period by several of the Fund’s holdings. Had the Fund not received the special dividends, the net investment income (loss) per share would have been $0.24, $0.21, $0.37 and $0.39 for Class A, Class C, Class I and Class L Shares, respectively, and the net investment income (loss) ratio would have been 1.44%, 1.39%, 2.20% and 2.28% for Class A, Class C, Class I and Class L Shares, respectively. |
SEE NOTES TO FINANCIAL STATEMENTS.
| | | | | | |
| | | |
| 26 | | | | J.P. MORGAN COUNTRY/REGION FUNDS | | APRIL 30, 2017 |
| | | | | | | | | | | | | | | | | | | | | | | | | | |
| | | Ratios/Supplemental data | |
| | | | | | | | | | Ratios to average net assets (a) | | | | |
Net asset
value,
end of
period | | | Total return
(excludes
sales charge) (c)(d) | | | Net assets,
end of
period
(000’s) | | | Net
expenses (e) | | | Net
investment
income
(loss) | | | Expenses
without waivers
and reimbursements | | | Portfolio
turnover
rate (c) | |
| | | | | | | | | | | | | | | | | | | | | | | | | | |
| | | | | | | | | | | | | | | | | | | | | | | | | | |
| $ | 24.86 | | | | 15.52 | % | | $ | 149,937 | | | | 1.41 | % | | | 1.26 | % | | | 1.41 | % | | | 104 | % |
| | 21.94 | | | | (8.98 | ) | | | 162,767 | | | | 1.42 | | | | 1.66 | | | | 1.43 | | | | 142 | |
| | 24.41 | | | | 2.86 | | | | 219,548 | | | | 1.41 | | | | 1.48 | | | | 1.41 | | | | 167 | |
| | 24.54 | | | | (0.95 | ) | | | 192,865 | | | | 1.30 | | | | 2.55 | | | | 1.31 | | | | 197 | |
| | 24.79 | | | | 40.30 | | | | 98,202 | | | | 1.47 | | | | 1.30 | | | | 1.76 | | | | 253 | |
| | 17.89 | | | | 9.04 | | | | 94,840 | | | | 1.50 | | | | 1.54 | (f) | | | 1.74 | | | | 297 | |
| | | | | | |
| | | | | | | | | | | | | | | | | | | | | | | | | | |
| | 22.12 | | | | 15.23 | | | | 46,939 | | | | 1.90 | | | | 0.81 | | | | 1.91 | | | | 104 | |
| | 19.52 | | | | (9.42 | ) | | | 50,152 | | | | 1.91 | | | | 1.16 | | | | 1.92 | | | | 142 | |
| | 21.77 | | | | 2.37 | | | | 75,145 | | | | 1.91 | | | | 0.98 | | | | 1.91 | | | | 167 | |
| | 21.99 | | | | (1.46 | ) | | | 61,814 | | | | 1.80 | | | | 2.00 | | | | 1.81 | | | | 197 | |
| | 22.32 | | | | 39.62 | | | | 21,663 | | | | 1.95 | | | | 0.94 | | | | 2.27 | | | | 253 | |
| | 16.11 | | | | 8.47 | | | | 8,953 | | | | 2.00 | | | | 1.48 | (f) | | | 2.26 | | | | 297 | |
| | | | | | |
| | | | | | | | | | | | | | | | | | | | | | | | | | |
| | 25.34 | | | | 15.73 | | | | 147,976 | | | | 1.09 | | | | 1.72 | | | | 1.09 | | | | 104 | |
| | 22.37 | | | | (8.73 | ) | | | 145,080 | | | | 1.10 | | | | 1.95 | | | | 1.10 | | | | 142 | |
| | 24.83 | | | | 3.22 | | | | 579,389 | | | | 1.07 | | | | 1.81 | | | | 1.07 | | | | 167 | |
| | 24.95 | | | | (0.68 | ) | | | 409,675 | | | | 1.05 | | | | 2.69 | | | | 1.06 | | | | 197 | |
| | 25.18 | | | | 40.63 | | | | 328,979 | | | | 1.18 | | | | 0.94 | | | | 1.33 | | | | 253 | |
| | 18.15 | | | | 9.27 | | | | 15,469 | | | | 1.25 | | | | 2.29 | (f) | | | 1.51 | | | | 297 | |
| | | | | | |
| | | | | | | | | | | | | | | | | | | | | | | | | | |
| | 25.55 | | | | 15.79 | | | | 528,611 | | | | 0.90 | | | | 1.93 | | | | 0.91 | | | | 104 | |
| | 22.61 | | | | (8.48 | ) | | | 424,388 | | | | 0.90 | | | | 2.16 | | | | 0.90 | | | | 142 | |
| | 25.13 | | | | 3.36 | | | | 194,930 | | | | 0.90 | | | | 2.16 | | | | 0.91 | | | | 167 | |
| | 25.23 | | | | (0.56 | ) | | | 375,683 | | | | 0.90 | | | | 2.93 | | | | 0.91 | | | | 197 | |
| | 25.46 | | | | 40.95 | | | | 249,744 | | | | 0.98 | | | | 0.96 | | | | 1.18 | | | | 253 | |
| | 18.35 | | | | 9.63 | | | | 16,151 | | | | 1.00 | | | | 2.37 | (f) | | | 1.35 | | | | 297 | |
SEE NOTES TO FINANCIAL STATEMENTS.
| | | | | | | | |
| | | |
| APRIL 30, 2017 | | J.P. MORGAN COUNTRY/REGION FUNDS | | | | | 27 | |
FINANCIAL HIGHLIGHTS
FOR THE PERIODS INDICATED (continued)
| | | | | | | | | | | | | | | | | | | | |
| | | Per share operating performance | |
| | | | | | Investment operations | | | Distributions | |
| | | Net asset
value,
beginning
of period | | | Net
investment
income
(loss) (b) | | | Net realized
and unrealized
gains
(losses) on
investments | | | Total from
investment
operations | | | Net
investment
income | |
Latin America Fund | | | | | | | | | | | | | | | | | | | | |
Class A | | | | | | | | | | | | | | | | | | | | |
Six Months Ended April 30, 2017 (Unaudited) | | $ | 14.43 | | | $ | 0.10 | (f) | | $ | 0.14 | | | $ | 0.24 | | | $ | (0.23 | ) |
Year Ended October 31, 2016 | | | 11.31 | | | | 0.14 | | | | 3.11 | | | | 3.25 | | | | (0.13 | ) |
Year Ended October 31, 2015 | | | 17.43 | | | | 0.14 | | | | (6.23 | ) | | | (6.09 | ) | | | (0.03 | ) |
Year Ended October 31, 2014 | | | 18.47 | | | | 0.10 | | | | (1.02 | ) | | | (0.92 | ) | | | (0.12 | ) |
Year Ended October 31, 2013 | | | 18.46 | | | | 0.10 | | | | (0.05 | ) | | | 0.05 | | | | (0.04 | ) |
Year Ended October 31, 2012 | | | 18.88 | | | | 0.10 | | | | (0.49 | ) | | | (0.39 | ) | | | (0.03 | ) |
| | | | | |
Class C | | | | | | | | | | | | | | | | | | | | |
Six Months Ended April 30, 2017 (Unaudited) | | | 14.07 | | | | 0.08 | (f) | | | 0.13 | | | | 0.21 | | | | (0.16 | ) |
Year Ended October 31, 2016 | | | 11.06 | | | | 0.08 | | | | 3.04 | | | | 3.12 | | | | (0.11 | ) |
Year Ended October 31, 2015 | | | 17.11 | | | | 0.06 | | | | (6.10 | ) | | | (6.04 | ) | | | (0.01 | ) |
Year Ended October 31, 2014 | | | 18.12 | | | | 0.02 | | | | (1.00 | ) | | | (0.98 | ) | | | (0.03 | ) |
Year Ended October 31, 2013 | | | 18.21 | | | | 0.01 | | | | (0.06 | ) | | | (0.05 | ) | | | (0.04 | ) |
Year Ended October 31, 2012 | | | 18.72 | | | | 0.01 | | | | (0.49 | ) | | | (0.48 | ) | | | (0.03 | ) |
| | | | | |
Class I (formerly Select Class) | | | | | | | | | | | | | | | | | | | | |
Six Months Ended April 30, 2017 (Unaudited) | | | 14.74 | | | | 0.13 | (f) | | | 0.13 | | | | 0.26 | | | | (0.27 | ) |
Year Ended October 31, 2016 | | | 11.40 | | | | 0.15 | | | | 3.20 | | | | 3.35 | | | | (0.01 | ) |
Year Ended October 31, 2015 | | | 17.58 | | | | 0.17 | | | | (6.27 | ) | | | (6.10 | ) | | | (0.08 | ) |
Year Ended October 31, 2014 | | | 18.63 | | | | 0.16 | | | | (1.04 | ) | | | (0.88 | ) | | | (0.17 | ) |
Year Ended October 31, 2013 | | | 18.59 | | | | 0.15 | | | | (0.05 | ) | | | 0.10 | | | | (0.06 | ) |
Year Ended October 31, 2012 | | | 18.98 | | | | 0.13 | | | | (0.48 | ) | | | (0.35 | ) | | | (0.04 | ) |
| | | | | |
Class R6 | | | | | | | | | | | | | | | | | | | | |
Six Months Ended April 30, 2017 (Unaudited) | | | 14.50 | | | | 0.13 | (f) | | | 0.13 | | | | 0.26 | | | | (0.30 | ) |
November 2, 2015 (h) through October 31, 2016 | | | 11.46 | | | | 0.21 | | | | 3.05 | | | | 3.26 | | | | (0.22 | ) |
| (a) | Annualized for periods less than one year, unless otherwise noted. |
| (b) | Calculated based upon average shares outstanding. |
| (c) | Not annualized for periods less than one year. |
| (d) | Includes adjustments in accordance with accounting principles generally accepted in the United States of America and as such, the net asset values for financial reporting purposes and the returns based upon those net asset values may differ from the net asset values and returns for shareholder transactions. |
| (e) | Includes interest expense, if applicable, each of which is less than 0.005% unless otherwise noted. |
| (f) | Net investment income (loss) may appear disproportionate among the classes due to the timing of recognition of income and changes in the relative size of the classes. |
| (g) | The net expenses and expenses without waivers and reimbursements (excluding interest expense) for Class A are 1.55% and 2.28%, Class C are 2.05% and 2.74%, Class R5 are 1.30% and 1.85% and Class I are 1.05% and 1.60%, respectively, for the six months ended April 30, 2017. |
| (h) | Commencement of offering of class of shares. |
SEE NOTES TO FINANCIAL STATEMENTS.
| | | | | | |
| | | |
| 28 | | | | J.P. MORGAN COUNTRY/REGION FUNDS | | APRIL 30, 2017 |
| | | | | | | | | | | | | | | | | | | | | | | | | | |
| | | Ratios/Supplemental data | |
| | | | | | | | | | Ratios to average net assets (a) | | | | |
Net asset
value,
end of
period | | | Total return
(excludes
sales charge) (c)(d) | | |
Net assets,
end of
period
(000’s) | | | Net
expenses (e) | | | Net
investment
income
(loss) | | | Expenses
without waivers
and reimbursements | | | Portfolio
turnover
rate (c) | |
| | | | | | | | | | | | | | | | | | | | | | | | | | |
| | | | | | | | | | | | | | | | | | | | | | | | | | |
| $ | 14.44 | | | | 1.96 | % | | $ | 10,185 | | | | 1.56 | %(g) | | | 1.49 | %(f) | | | 2.29 | %(g) | | | 31 | % |
| | 14.43 | | | | 29.13 | | | | 11,878 | | | | 1.55 | | | | 1.20 | | | | 2.15 | | | | 61 | |
| | 11.31 | | | | (34.97 | ) | | | 12,044 | | | | 1.66 | | | | 0.97 | | | | 2.08 | | | | 25 | |
| | 17.43 | | | | (4.98 | ) | | | 26,591 | | | | 1.70 | | | | 0.55 | | | | 1.89 | | | | 58 | |
| | 18.47 | | | | 0.25 | | | | 24,688 | | | | 1.70 | | | | 0.54 | | | | 1.91 | | | | 37 | |
| | 18.46 | | | | (2.04 | ) | | | 17,490 | | | | 1.86 | | | | 0.52 | | | | 2.03 | | | | 49 | |
| | | | | | |
| | | | | | | | | | | | | | | | | | | | | | | | | | |
| | 14.12 | | | | 1.69 | | | | 1,849 | | | | 2.06 | (g) | | | 1.19 | (f) | | | 2.75 | (g) | | | 31 | |
| | 14.07 | | | | 28.57 | | | | 2,700 | | | | 2.05 | | | | 0.72 | | | | 2.65 | | | | 61 | |
| | 11.06 | | | | (35.30 | ) | | | 2,108 | | | | 2.16 | | | | 0.45 | | | | 2.58 | | | | 25 | |
| | 17.11 | | | | (5.42 | ) | | | 3,778 | | | | 2.20 | | | | 0.11 | | | | 2.39 | | | | 58 | |
| | 18.12 | | | | (0.30 | ) | | | 4,292 | | | | 2.20 | | | | 0.07 | | | | 2.42 | | | | 37 | |
| | 18.21 | | | | (2.54 | ) | | | 3,370 | | | | 2.37 | | | | 0.05 | | | | 2.52 | | | | 49 | |
| | | | | | |
| | | | | | | | | | | | | | | | | | | | | | | | | | |
| | 14.73 | | | | 2.13 | | | | 6,641 | | | | 1.31 | (g) | | | 2.06 | (f) | | | 1.86 | (g) | | | 31 | |
| | 14.74 | | | | 29.46 | | | | 33,691 | | | | 1.29 | | | | 1.19 | | | | 1.77 | | | | 61 | |
| | 11.40 | | | | (34.80 | ) | | | 49,918 | | | | 1.41 | | | | 1.22 | | | | 1.65 | | | | 25 | |
| | 17.58 | | | | (4.72 | ) | | | 79,367 | | | | 1.45 | | | | 0.88 | | | | 1.64 | | | | 58 | |
| | 18.63 | | | | 0.50 | | | | 109,334 | | | | 1.45 | | | | 0.79 | | | | 1.67 | | | | 37 | |
| | 18.59 | | | | (1.85 | ) | | | 60,487 | | | | 1.61 | | | | 0.69 | | | | 1.78 | | | | 49 | |
| | | | | | |
| | | | | | | | | | | | | | | | | | | | | | | | | | |
| | 14.46 | | | | 2.19 | | | | 28,158 | | | | 1.06 | (g) | | | 2.00 | (f) | | | 1.60 | (g) | | | 31 | |
| | 14.50 | | | | 29.18 | | | | 31,187 | | | | 1.05 | | | | 1.77 | | | | 1.46 | | | | 61 | |
SEE NOTES TO FINANCIAL STATEMENTS.
| | | | | | | | |
| | | |
| APRIL 30, 2017 | | J.P. MORGAN COUNTRY/REGION FUNDS | | | | | 29 | |
NOTES TO FINANCIAL STATEMENTS
AS OF APRIL 30, 2017 (Unaudited)
1. Organization
JPMorgan Trust I (the “Trust”) was formed on November 12, 2004, as a Delaware statutory trust, pursuant to a Declaration of Trust dated November 5, 2004 and is registered under the Investment Company Act of 1940, as amended (the “1940 Act”), as an open-end management investment company.
The following are 3 separate funds of the Trust (collectively, the “Funds”) covered by this report:
| | | | |
| | | Classes Offered | | Diversified/Non-Diversified |
| China Region Fund | | Class A, Class C and Class I^ | | Non-Diversified |
| Intrepid European Fund | | Class A, Class C, Class I^ and Class L^^ | | Diversified |
| Latin America Fund | | Class A, Class C, Class I^ and Class R6 | | Diversified |
| ^ | Effective April 3, 2017, the Select Class was renamed Class I. |
| ^^ | Effective December 1, 2016, the Institutional Class was renamed Class L and is publicly offered on a limited basis. |
The investment objectives of the Funds are as follows:
The China Region Fund and Latin America Fund will seek long-term capital growth.
The Intrepid European Fund seeks total return from long-term capital growth. Total return consists of capital growth and current income.
Effective April 14, 2017, Latin America Fund changed from operating as a non-diversified fund to operating as a diversified fund.
Class A Shares generally provide for a front-end sales charge while Class C Shares provide for a contingent deferred sales charge (“CDSC”). No sales charges are assessed with respect to Class I, Class L and Class R6 Shares. All classes of shares have equal rights as to earnings, assets and voting privileges, except that each class may bear different transfer agency, sub-transfer agency (through April 2, 2017) , distribution and service fees and each class has exclusive voting rights with respect to its distribution plan and shareholder servicing agreements. Effective April 3, 2017 sub-transfer agency and shareholder servicing fees were consolidated into a single service fee. Certain Class A Shares, for which front-end sales charges have been waived, may be subject to a CDSC as described in the Funds’ prospectus. Beginning on November 14, 2017 Class C Shares will automatically convert to Class A Shares after ten years.
J.P. Morgan Investment Management Inc. (“JPMIM”) an indirect, wholly owned subsidiary of JPMorgan Chase & Co. (“JPMorgan”) acts as Adviser (the “Adviser”) and Administrator (the “Administrator”) to the Funds.
2. Significant Accounting Policies
The following is a summary of significant accounting policies followed by the Funds in the preparation of their financial statements. The Funds are investment companies and, accordingly, follow the investment company accounting and reporting guidance of the Financial Accounting Standards Board Accounting Standards Codification Topic 946 — Investment Companies, which is part of U.S. generally accepted accounting principles (“GAAP”). The preparation of financial statements in conformity with GAAP requires management to make estimates and assumptions that affect the reported amounts of assets and liabilities and disclosure of contingent assets and liabilities at the date of the financial statements and the reported amounts of increases and decreases in net assets from operations during the reporting period. Actual results could differ from those estimates.
A. Valuation of Investments — The valuation of investments is in accordance with GAAP and the Funds’ valuation policies set forth by and under the supervision and responsibility of the Board of Trustees (the “Board”), which established the following approach to valuation, as described more fully below: (i) investments for which market quotations are readily available shall be valued at such unadjusted quoted prices and (ii) all other investments for which market quotations are not readily available shall be valued at their fair value as determined in good faith by the Board.
The Administrator has established the J.P. Morgan Investment Management Americas Valuation Committee (“AVC”) to assist the Board with the oversight and monitoring of the valuation of the Funds’ investments. The Administrator implements the valuation policies of the Funds’ investments, as directed by the Board. The AVC oversees and carries out the policies for the valuation of investments held in the Funds. This includes monitoring the appropriateness of fair values based on results of ongoing valuation oversight, including but not limited to consideration of macro or security specific events, market events and pricing vendor and broker due diligence. The Administrator is responsible for discussing and assessing the potential impacts to the fair values on an ongoing basis, and at least on a quarterly basis with the AVC and the Board.
A market-based approach is primarily used to value the Funds’ investments. Investments for which market quotations are not readily available are fair valued by approved affiliated and unaffiliated pricing vendors or third party broker-dealers (collectively referred to as “Pricing Services”) or may be internally fair valued using methods set forth by the valuation policies approved by the Board. This may include related or comparable assets or liabilities, recent transactions, market multiples, book values, and other relevant information for the investment to determine the fair value of the investment. An income-based valuation approach may be used in which the anticipated future cash flows of the investment are discounted to calculate the fair value. Discounts may also be applied due to the nature or duration of any restrictions on the disposition of the investments. Valuations may be based upon current market prices of securities that are comparable in coupon, rating, maturity and industry. It is possible that the estimated values may differ significantly from the values that would have been used, had a ready market for the investments existed, and such differences could be material.
| | | | | | |
| | | |
| 30 | | | | J.P. MORGAN COUNTRY/REGION FUNDS | | APRIL 30, 2017 |
Equities and other exchange-traded instruments are valued at the last sale price or official market closing price on the primary exchange on which the instrument is traded before the net asset values (“NAV”) of the Funds are calculated on a valuation date. Certain foreign equity instruments, as well as certain derivatives with equity reference obligations, are valued by applying international fair value factors provided by approved Pricing Services. The factors seek to adjust the local closing price for movements of local markets post closing, but prior to the time the NAVs are calculated. Investments in open-end investment companies (the “Underlying Funds”) are valued at each Underlying Fund’s NAV per share as of the report date.
Futures are generally valued on the basis of available market quotations.
Valuations reflected in this report are as of the report date. As a result, changes in valuation due to market events and/or issuer related events after the report date and prior to issuance of the report are not reflected herein.
The various inputs that are used in determining the valuation of the Funds’ investments are summarized into the three broad levels listed below.
| • | | Level 1 — Unadjusted inputs using quoted prices in active markets for identical investments. |
| • | | Level 2 — Other significant observable inputs including, but not limited to, quoted prices for similar investments, inputs other than quoted prices that are observable for investments (such as interest rates, prepayment speeds, credit risk, etc.) or other market corroborated inputs. |
| • | | Level 3 — Significant inputs based on the best information available in the circumstances, to the extent observable for inputs are not available (including the Funds’ assumptions in determining the fair value of investments). |
A financial instrument’s level within the fair value hierarchy is based on the lowest level of any input, both individually and in the aggregate, that is significant to the fair value measurement. The inputs or methodology used for valuing instruments are not necessarily an indication of the risk associated with investing in those instruments.
The following tables represent each valuation input as presented on the Schedules of Portfolio Investments (“SOIs”) (amounts in thousands):
China Region Fund
| | | | | | | | | | | | | | | | |
| | | Level 1
Quoted prices | | | Level 2
Other significant observable inputs | | | Level 3
Significant unobservable inputs | | | Total | |
Investments in Securities | | | | | | | | | | | | | | | | |
Common Stocks | | | | | | | | | | | | | | | | |
China | | $ | 3,748 | | | $ | 9,143 | | | $ | — | | | $ | 12,891 | |
Hong Kong | | | — | | | | 3,133 | | | | — | | | | 3,133 | |
Macau | | | — | | | | 252 | | | | — | | | | 252 | |
Singapore | | | 27 | | | | 146 | | | | — | | | | 173 | |
Taiwan | | | 2,001 | | | | 2,012 | | | | — | | | | 4,013 | |
| | | | | | | | | | | | | | | | |
Total Common Stocks | | | 5,776 | | | | 14,686 | | | | — | | | | 20,462 | |
| | | | | | | | | | | | | | | | |
Structured Instruments | | | | | | | | | | | | | | | | |
China | | | — | | | | 980 | | | | — | | | | 980 | |
| | | | | | | | | | | | | | | | |
Total Investments in Securities | | $ | 5,776 | | | $ | 15,666 | | | $ | — | | | $ | 21,442 | |
| | | | | | | | | | | | | | | | |
| | | | |
| Intrepid European Fund | | | | | | | | | | | | | | | | |
| | | Level 1
Quoted prices | | | Level 2
Other significant observable inputs | | | Level 3
Significant unobservable inputs | | | Total | |
Investments in Securities | | | | | | | | | | | | | | | | |
Common Stocks | | | | | | | | | | | | | | | | |
Austria | | $ | — | | | $ | 10,111 | | | $ | — | | | $ | 10,111 | |
Belgium | | | — | | | | 19,821 | | | | — | | | | 19,821 | |
Denmark | | | — | | | | 21,669 | | | | — | | | | 21,669 | |
Finland | | | — | | | | 31,852 | | | | — | | | | 31,852 | |
France | | | — | | | | 140,252 | | | | — | | | | 140,252 | |
Germany | | | — | | | | 130,068 | | | | — | | | | 130,068 | |
Ireland | | | 12,686 | | | | — | | | | — | | | | 12,686 | |
Italy | | | — | | | | 39,586 | | | | — | | | | 39,586 | |
Luxembourg | | | — | | | | 18,027 | | | | — | | | | 18,027 | |
Netherlands | | | — | | | | 30,099 | | | | — | | | | 30,099 | |
Norway | | | — | | | | 10,898 | | | | — | | | | 10,898 | |
South Africa | | | — | | | | 12,251 | | | | — | | | | 12,251 | |
Spain | | | — | | | | 69,638 | | | | — | | | | 69,638 | |
Sweden | | | — | | | | 45,295 | | | | — | | | | 45,295 | |
| | | | | | | | |
| | | |
| APRIL 30, 2017 | | J.P. MORGAN COUNTRY/REGION FUNDS | | | | | 31 | |
NOTES TO FINANCIAL STATEMENTS
AS OF APRIL 30, 2017 (Unaudited) (continued)
| | | | | | | | | | | | | | | | |
| Intrepid European Fund (continued) | | | | | | | | | | | | | | | | |
| | | Level 1
Quoted prices | | | Level 2
Other significant observable inputs | | | Level 3
Significant unobservable inputs | | | Total | |
Switzerland | | $ | 671 | | | $ | 79,242 | | | $ | — | | | $ | 79,913 | |
United Kingdom | | | 5,914 | | | | 154,060 | | | | — | | | | 159,974 | |
| | | | | | | | | | | | | | | | |
Total Common Stocks | | | 19,271 | | | | 812,869 | | | | — | | | | 832,140 | |
| | | | | | | | | | | | | | | | |
Short-Term Investment | | | | | | | | | | | | | | | | |
Investment Company | | | 28,641 | | | | — | | | | — | | | | 28,641 | |
| | | | | | | | | | | | | | | | |
Total Investments in Securities | | | 47,912 | | | | 812,869 | | | | — | | | | 860,781 | |
| | | | | | | | | | | | | | | | |
Appreciation in Other Financial Instruments | | | | | | | | | | | | | | | | |
Futures Contracts | | $ | — | | | $ | 260 | | | $ | — | | | $ | 260 | |
| | | | | | | | | | | | | | | | |
Depreciation in Other Financial Instruments | | | | | | | | | | | | | | | | |
Futures Contracts | | $ | — | | | $ | (61 | ) | | $ | — | | | $ | (61 | ) |
| | | | | | | | | | | | | | | | |
| | | | |
Latin America Fund | | | | | | | | | | | | | | | | |
| | | Level 1
Quoted prices | | | Level 2
Other significant observable inputs | | | Level 3
Significant unobservable inputs | | | Total | |
Total Investments in Securities (a) | | $ | 46,280 | | | $ | — | | | $ | — | | | $ | 46,280 | |
| | | | | | | | | | | | | | | | |
| (a) | All portfolio holdings designated as level 1 are disclosed individually on the SOIs. Please refer to the SOIs for country specifics of portfolio holdings. |
For China Region Fund, transfers from level 2 to level 1 in the amount of approximately $590,000 are due to the non-application of the fair value factors to certain securities during the period ended April 30, 2017.
For Intrepid European Fund, transfers from level 1 to level 2 in the amount of approximately $6,265,000 are due to applying the fair value factors to certain securities during the period ended April 30, 2017.
For Latin America Fund there were no transfers among any levels during the six months ended April 30, 2017.
B. Restricted Securities — Certain securities held by the Funds may be subject to legal or contractual restrictions on resale. Restricted securities generally are resold in transactions exempt from registration under the Securities Act of 1933 (the “Securities Act”). Disposal of these securities may involve time-consuming negotiations and expense. Prompt sale at the current valuation may be difficult and could adversely affect the net asset value of the Funds.
As of April 30, 2017, the Funds had no investments in restricted securities other than securities sold to the Funds under Rule 144A and/or Regulation S under the Securities Act.
C. Futures Contracts — Intrepid European Fund used index futures contracts to gain or reduce exposure to the stock market, maintain liquidity or minimize transaction costs. The Fund also bought futures contracts to invest incoming cash in the market or sold futures in response to cash outflows, thereby simulating an invested position in the underlying index. The use of futures contracts exposes the Fund to equity price risk.
Futures contracts provide for the delayed delivery of the underlying instrument at a fixed price or are settled for a cash amount based on the change in the value of the underlying instrument at a specific date in the future. Upon entering into a futures contract, the Fund is required to deposit with the broker, cash or securities in an amount equal to a certain percentage of the contract amount, which is referred to as the initial margin deposit. Subsequent payments, referred to as variation margin, are made or received by the Fund periodically and are based on changes in the market value of open futures contracts. Changes in the market value of open futures contracts are recorded as Change in net unrealized appreciation/depreciation on the Statements of Operations. Realized gains or losses, representing the difference between the value of the contract at the time it was opened and the value at the time it was closed, are reported on the Statements of Operations at the closing or expiration of the futures contract. Securities deposited as initial margin are designated on the SOIs and cash deposited is recorded on the Statements of Assets and Liabilities. A receivable from and/or a payable to brokers for the daily variation margin is also recorded on the Statements of Assets and Liabilities.
The Fund may be subject to the risk that the change in the value of the futures contract may not correlate perfectly with the underlying instrument. Use of long futures contracts subjects the Fund to risk of loss in excess of the amounts shown on the Statements of Assets and Liabilities, up to the notional amount of the futures contracts. Use of short futures contracts subjects the Fund to unlimited risk of loss. The Fund may enter into futures contracts only on exchanges or boards of trade. The exchange or board of trade acts as the counterparty to each futures transaction; therefore, the Fund’s credit risk is limited to failure of the exchange or board of trade. Under some circumstances, futures exchanges may establish daily limits on the amount that the price of a futures contract can vary from the previous day’s settlement price, which could effectively prevent liquidation of positions.
| | | | | | |
| | | |
| 32 | | | | J.P. MORGAN COUNTRY/REGION FUNDS | | APRIL 30, 2017 |
The table below discloses the volume of the Fund’s futures contracts activity during the six months ended April 30, 2017 (amounts in thousands):
| | | | |
| | | Intrepid European
Fund | |
Futures Contracts: | | | | |
Average Notional Balance Long | | $ | 17,286 | |
Ending Notional Balance Long | | | 21,935 | |
The Fund’s futures contracts are not subject to master netting arrangements (the right to close out all transactions traded with a counterparty and net amounts owed or due across transactions).
D. Structured Instruments — China Region Fund invested in structured instruments that have similar economic characteristics to equity securities. These instruments often seek to replicate the performance of an underlying reference asset such as an equity security or market (“reference asset”). The value of these instruments is generally derived from the price movements of the reference asset. If the Fund holds the structured instrument to maturity, the Fund will be entitled to receive payment from the instrument’s issuing entity based on the value of the reference asset with any necessary adjustments, and record a realized gain or loss. The instrument may receive dividends paid in connection with the reference asset which are reported as Net realized gain (loss) on investment transactions on the Statements of Operations.
Structured instruments may be issued by banks, broker dealers or their affiliates or other entities and typically constitute unsecured contractual obligations of the issuing entity. In addition to credit risk, investments in structured instruments generally have the same risks associated with a direct investment in the reference asset. However, there can be no assurance that structured instruments will trade at the same price or have the same value as the reference asset. In addition, structured instruments may be subject to transfer restrictions and a liquid market may not exist for these instruments. The lack of a liquid market may make it difficult to sell the structured instruments or accurately value them. Investments in structured instruments subject the Fund to counterparty risk.
E. Foreign Currency Translation — The books and records of the Funds are maintained in U.S. dollars. Foreign currency amounts are translated into U.S. dollars at the prevailing exchange rates of such currencies against the U.S. dollar. The market value of investment securities and other assets and liabilities are translated at the exchange rate as of the valuation date. Purchases and sales of investment securities, income and expenses are translated at the exchange rate prevailing on the respective dates of such transactions.
The Funds do not isolate the effect of changes in foreign exchange rates from changes in market prices on securities held. Accordingly, such changes are included within Change in net unrealized appreciation/depreciation on investments on the Statements of Operations.
Reported realized foreign currency gains and losses arise from the disposition of foreign currency, currency gains or losses realized between the trade and settlement dates on securities transactions, and the difference between the amounts of dividends, interest and foreign withholding taxes recorded on each Fund’s books on the transaction date and the U.S. dollar equivalent of the amounts actually received or paid. These reported realized foreign currency gains and losses are included in Net realized gain or loss on foreign currency transactions on the Statements of Operations. Unrealized foreign currency gains and losses arise from changes (due to changes in exchange rates) in the value of foreign currency and other assets and liabilities denominated in foreign currencies, which are held at period end and are included in Change in net unrealized appreciation/depreciation on foreign currency translations on the Statements of Operations.
F. Security Transactions and Investment Income — Investment transactions are accounted for on the trade date (the date the order to buy or sell is executed). Securities gains and losses are calculated on a specifically identified cost basis. Interest income is determined on the basis of coupon interest accrued using the effective interest method which adjusts for amortization of premiums and accretion of discounts. Dividend income net of foreign taxes withheld, if any, is recorded on the ex-dividend date or when a Fund first learns of the dividend. Certain Funds may receive other income from investment in loan assignments and/or unfunded commitments, including amendment fees, consent fees and commitment fees. These fees are recorded as income when received by the Fund. These amounts are included in Interest Income in the Statement of Operations.
G. Allocation of Income and Expenses — Expenses directly attributable to a fund are charged directly to that fund, while the expenses attributable to more than one fund of the Trust are allocated among the respective funds. In calculating the NAV of each class, investment income, realized and unrealized gains and losses and expenses, other than class specific expenses, are allocated daily to each class of shares based upon the proportion of net assets of each class at the beginning of each day.
Transfer agency fees are class-specific expenses and sub-transfer agency fees were class specific expenses up through April 2, 2017. Effective April 3, 2017, the Funds ceased making direct payments to financial intermediaries for any applicable sub-transfer agency services. Payments to financial intermediaries for sub-transfer agency services are made by JPMorgan Distribution Services, Inc. from the Shareholder Servicing Fee which has been renamed as the Service Fee.
| | | | | | | | |
| | | |
| APRIL 30, 2017 | | J.P. MORGAN COUNTRY/REGION FUNDS | | | | | 33 | |
NOTES TO FINANCIAL STATEMENTS
AS OF APRIL 30, 2017 (Unaudited) (continued)
The amount of the transfer agency fees and sub-transfer agency fees charged to each class of the Funds for the six months ended April 30, 2017 are as follows (amounts in thousands):
| | | | | | | | | | | | | | | | | | | | | | | | |
| | | Class A | | | Class C | | | Class I | | | Class L | | | Class R6 | | | Total | |
China Region Fund | | | | | | | | | | | | | | | | | | | | | | | | |
Transfer agency fees | | $ | 1 | | | $ | 1 | | | $ | 1 | | | | n/a | | | | n/a | | | $ | 3 | |
Sub-transfer agency fees | | | 2 | | | | 1 | | | | — | (a) | | | n/a | | | | n/a | | | | 3 | |
Intrepid European Fund | | | | | | | | | | | | | | | | | | | | | | | | |
Transfer agency fees | | | 15 | | | | 3 | | | | 6 | | | $ | 2 | | | | n/a | | | | 26 | |
Sub-transfer agency fees | | | 73 | | | | 22 | | | | 23 | | | | 20 | | | | n/a | | | | 138 | |
Latin America Fund | | | | | | | | | | | | | | | | | | | | | | | | |
Transfer agency fees | | | 1 | | | | 1 | | | | 1 | | | | n/a | | | $ | — | (a) | | | 3 | |
Sub-transfer agency fees | | | 8 | | | | 1 | | | | 5 | | | | n/a | | | | — | | | | 14 | |
| (a) | Amount rounds to less than 500. |
H. Federal Income Taxes — Each Fund is treated as a separate taxable entity for Federal income tax purposes. Each Fund’s policy is to comply with the provisions of the Internal Revenue Code of 1986, as amended (the “Code”), applicable to regulated investment companies and to distribute to shareholders all of its distributable net investment income and net realized capital gains on investments. Accordingly, no provision for Federal income tax is necessary. Management has reviewed the Funds’ tax positions for all open tax years and has determined that as of April 30, 2017, no liability for income tax is required on the Funds’ financial statements for net unrecognized tax benefits. However, management’s conclusions may be subject to future review based on changes in, or the interpretation of, the accounting standards or tax laws and regulations. Each of the Funds’ Federal tax returns for the prior three fiscal years remain subject to examination by the Internal Revenue Service.
I. Foreign Taxes — The Funds may be subject to foreign taxes on income, gains on investments or currency purchases/repatriation, a portion of which may be recoverable. The Funds will accrue such taxes and recoveries as applicable, based upon their current interpretation of tax rules and regulations that exist in the markets in which they invest.
J. Distributions to Shareholders — Distributions from net investment income are generally declared and paid at least annually. Distributions are declared separately for each class. No class has preferential dividend rights; differences in per share rates are due to differences in separate class expenses. Net realized capital gains, if any, are distributed by each Fund at least annually. The amount of distributions from net investment income and net realized capital gains is determined in accordance with Federal income tax regulations, which may differ from GAAP. To the extent these “book/tax” differences are permanent in nature (i.e., that they result from other than timing of recognition — “temporary differences”), such amounts are reclassified within the capital accounts based on their Federal tax-basis treatment.
3. Fees and Other Transactions with Affiliates
A. Investment Advisory Fee — Pursuant to an Investment Advisory Agreement, the Adviser supervises the investments of each Fund and for such services is paid a fee. The fee is accrued daily and paid monthly based on each Fund’s respective average daily net assets. The annual rate for each Fund is as follows:
| | | | |
China Region Fund | | | 1.00 | % |
Intrepid European Fund | | | 0.65 | |
Latin America Fund | | | 1.00 | |
The Adviser, on behalf of China Region Fund, has entered into an investment sub-advisory agreement with JF International Management, Inc. (“JFIMI”), a wholly-owned subsidiary of JPMorgan Asset Management (Asia) Inc., which is wholly-owned by J.P. Morgan Asset Management Holdings Inc. For performing its services as sub-adviser, JFIMI receives a portion of the fees payable to the Adviser. The fee is accrued daily and paid monthly at an annual rate of 0.48% of the Fund’s average daily net assets. The Adviser waived Investment Advisory fees and/or reimbursed expenses as outlined in Note 3.F.
B. Administration Fee — Pursuant to an Administration Agreement, the Administrator provides certain administration services to the Funds. In consideration of these services, the Administrator receives a fee accrued daily and paid monthly at an annual rate of 0.15% of the first $25 billion of the average daily net assets of all funds in the J.P. Morgan Funds Complex covered by the Administration Agreement (excluding certain funds of funds and money market funds) and 0.075% of the average daily net assets in excess of $25 billion of all such funds. For the six months ended April 30, 2017, the effective annual rate was 0.08% of each Fund’s average daily net assets, notwithstanding any fee waivers and/or expense reimbursements.
The Administrator waived Administration fees as outlined in Note 3.F.
JPMorgan Chase Bank, N.A. (“JPMCB”), a wholly-owned subsidiary of JPMorgan, serves as the Funds’ sub-administrator (the “Sub-administrator”). For its services as Sub-administrator, JPMCB receives a portion of the fees payable to the Administrator.
| | | | | | |
| | | |
| 34 | | | | J.P. MORGAN COUNTRY/REGION FUNDS | | APRIL 30, 2017 |
C. Distribution Fees — Pursuant to a Distribution Agreement, JPMorgan Distribution Services, Inc. ( “JPMDS”), a wholly-owned subsidiary of JPMorgan, serves as the Trust’s principal underwriter and promotes and arranges for the sale of each Fund’s shares.
The Board has adopted a Distribution Plan (the “Distribution Plan”) for Class A and Class C Shares of the Funds, as applicable, in accordance with Rule 12b-1 under the 1940 Act. Class I, Class L and Class R6 Shares do not participate in the Distribution Plan. The Distribution Plan provides that each Fund shall pay distribution fees, including payments to JPMDS, at annual rates of the average daily net assets as shown in the table below:
| | | | | | | | |
| | | Class A | | | Class C | |
China Region Fund | | | 0.25 | % | | | 0.75 | % |
Intrepid European Fund | | | 0.25 | | | | 0.75 | |
Latin America Fund | | | 0.25 | | | | 0.75 | |
In addition, JPMDS is entitled to receive the front-end sales charges from purchases of Class A Shares and the CDSC from redemptions of Class C Shares and certain Class A Shares for which front-end sales charges have been waived. For the six months ended April 30, 2017, JPMDS retained the following (amounts in thousands):
| | | | | | | | |
| | | Front-End Sales Charge | | | CDSC | |
China Region Fund | | $ | — | (a) | | $ | — | |
Intrepid European Fund | | | 13 | | | | 1 | |
Latin America Fund | | | — | (a) | | | — | |
| (a) | Amount rounds to less than 500. |
D. Service Fees — The Trust, on behalf of the Funds, has entered into a Shareholder Servicing Agreement with JPMDS under which JPMDS provides certain support services to the shareholders. The Class R6 Shares do not charge a service fee. For performing these services, JPMDS receives a fee that is accrued daily and paid monthly equal to a percentage of the average daily net assets as shown in the table below:
| | | | | | | | | | | | | | | | |
| | | Class A | | | Class C | | | Class I | | | Class L | |
China Region Fund | | | 0.25 | % | | | 0.25 | % | | | 0.25 | % | | | n/a | |
Intrepid European Fund | | | 0.25 | | | | 0.25 | | | | 0.25 | | | | 0.10 | % |
Latin America Fund | | | 0.25 | | | | 0.25 | | | | 0.25 | | | | n/a | |
JPMDS has entered into shareholder services contracts with affiliated and unaffiliated financial intermediaries who provide shareholder services and other related services to their clients or customers who invest in the Funds under which JPMDS will pay all or a portion of such fees earned to financial intermediaries for performing such services.
JPMDS waived service fees as outlined in Note 3.F.
E. Custodian and Accounting Fees — JPMCB provides portfolio custody and accounting services to the Funds. For performing these services, the Funds pay JPMCB transaction and asset-based fees that vary according to the number of transactions and positions, plus out-of-pocket expenses. The amounts paid directly to JPMCB by the Funds for custody and accounting services are included in Custodian and accounting fees on the Statements of Operations.
Interest expense paid to the custodian related to cash overdraft, if any, is included in Interest expense to affiliates on the Statements of Operations.
F. Waivers and Reimbursements — The Adviser, Administrator and/or JPMDS have contractually agreed to waive fees and/or reimburse the Funds to the extent that total annual operating expenses (excluding acquired fund fees and expenses other than certain money market fund fees as described below, dividend and interest expenses related to short sales, interest, taxes, expenses related to litigation and potential litigation and extraordinary expenses) exceed the percentages of the Funds’ respective average daily net assets as shown in the table below:
| | | | | | | | | | | | | | | | | | | | |
| | | Class A | | | Class C | | | Class I | | | Class L | | | Class R6 | |
China Region Fund | | | 1.55 | % | | | 2.05 | % | | | 1.30 | % | | | n/a | | | | n/a | |
Intrepid European Fund | | | 1.50 | | | | 2.00 | | | | 1.25 | | | | 1.00 | % | | | n/a | |
Latin America Fund | | | 1.55 | | | | 2.05 | | | | 1.30 | | | | n/a | | | | 1.05 | % |
The expense limitation agreements were in effect for the six months ended April 30, 2017 and are in place until at least February 28, 2017.
For the six months ended April 30, 2017, the Funds’ service providers waived fees and/or reimbursed expenses for each of the Funds as follows (amounts in thousands). None of these parties expect the Funds to repay any such waived fees and/or reimbursed expenses in future years.
| | | | | | | | | | | | | | | | | | | | |
| | | Contractual Waivers | | | | |
| | | Investment
Advisory
Fees | | | Administration
Fees | | | Service
Fees | | | Total | | | Reimbursements | |
China Region Fund | | $ | 93 | | | $ | 8 | | | $ | 8 | | | $ | 109 | | | $ | 30 | |
Latin America Fund | | | 119 | | | | 22 | | | | 17 | | | | 158 | | | | — | |
| | | | | | | | |
| | | |
| APRIL 30, 2017 | | J.P. MORGAN COUNTRY/REGION FUNDS | | | | | 35 | |
NOTES TO FINANCIAL STATEMENTS
AS OF APRIL 30, 2017 (Unaudited) (continued)
Additionally, the Funds may invest in one or more money market funds advised by the Adviser or its affiliates (affiliated money market funds). The Adviser, Administrator and/or JPMDS, as shareholder servicing agent, have contractually agreed to waive fees and/or reimburse expenses in an amount sufficient to offset the respective net fees each collects from the affiliated money market fund on the applicable Funds’ investment in such affiliated money market fund.
The amounts of these waivers resulting from investments in these money market funds for the six months ended April 30, 2017 were as follows (amounts in thousands):
| | | | |
Intrepid European Fund | | $ | 18 | |
Latin America Fund | | | — | (a) |
| (a) | Amount rounds to less than 500. |
G. Other — Certain officers of the Trust are affiliated with the Adviser, the Administrator and JPMDS. Such officers, with the exception of the Chief Compliance Officer, receive no compensation from the Funds for serving in their respective roles.
The Board appointed a Chief Compliance Officer to the Funds in accordance with Federal securities regulations. Each Fund, along with other affiliated funds, makes reimbursement payments, on a pro-rata basis, to the Administrator for a portion of the fees associated with the Office of the Chief Compliance Officer. Such fees are included in Trustees’ and Chief Compliance Officer’s fees on the Statements of Operations.
The Trust adopted a Trustee Deferred Compensation Plan (the “Plan”) which allows the Independent Trustees to defer the receipt of all or a portion of compensation related to performance of their duties as Trustees. The deferred fees are invested in various J.P. Morgan Funds until distribution in accordance with the Plan.
During the six months ended April 30, 2017, the Latin America Fund purchased securities from an underwriting syndicate in which the principal underwriter or members of the syndicate were affiliated with the Adviser.
The Funds may use related party broker-dealers. For the six months ended April 30, 2017, the Funds incurred brokerage commissions with broker-dealers affiliated with the Adviser as follows (amounts in thousands):
| (a) | Amount rounds to less than 500. |
The Securities and Exchange Commission (“SEC”) has granted an exemptive order permitting the Funds to engage in principal transactions with J.P. Morgan Securities, Inc., an affiliated broker, involving taxable money market instruments, subject to certain conditions.
4. Investment Transactions
During the six months ended April 30, 2017, purchases and sales of investments (excluding short-term investments) were as follows (amounts in thousands):
| | | | | | | | |
| | | Purchases
(excluding U.S.
Government) | | | Sales
(excluding U.S.
Government) | |
China Region Fund | | $ | 5,522 | | | $ | 9,383 | |
Intrepid European Fund | | | 774,721 | | | | 801,538 | |
Latin America Fund | | | 17,231 | | | | 47,283 | |
During the six months ended April 30, 2017, there were no purchases or sales of U.S. Government securities.
5. Federal Income Tax Matters
For Federal income tax purposes, the estimated cost and unrealized appreciation (depreciation) in value of investment securities held at April 30, 2017 were as follows (amounts in thousands):
| | | | | | | | | | | | | | | | |
| | | Aggregate
Cost | | | Gross
Unrealized
Appreciation | | | Gross
Unrealized
Depreciation | | | Net Unrealized
Appreciation
(Depreciation) | |
China Region Fund | | $ | 14,151 | | | $ | 7,417 | | | $ | 126 | | | $ | 7,291 | |
Intrepid European Fund | | | 783,324 | | | | 84,905 | | | | 7,448 | | | | 77,457 | |
Latin America Fund | | | 40,068 | | | | 8,075 | | | | 1,863 | | | | 6,212 | |
Under the Regulated Investment Company Modernization Act of 2010 (the “Act”), net capital losses recognized by the Funds after October 31, 2011, are carried forward indefinitely, and retain their character as short-term and/or long-term losses. Prior to the Act, net capital losses incurred by the Funds were carried forward for eight years and treated as short-term losses. The Act requires that post-enactment net capital losses be used before pre-enactment net capital losses.
| | | | | | |
| | | |
| 36 | | | | J.P. MORGAN COUNTRY/REGION FUNDS | | APRIL 30, 2017 |
As of October 31, 2016, the following Funds had post-enactment net capital loss carryforwards (amounts in thousands):
| | | | | | | | |
| | | Capital Loss Carryforward Character | |
| | | Short-
Term | | | Long-Term | |
Intrepid European Fund | | $ | 129,417 | | | $ | 9,863 | |
Latin America Fund | | | 15,689 | | | | 21,582 | |
As of October 31, 2016, the Funds had the following pre-enactment net capital loss carryforwards, expiring during the year indicated, which are available to offset future realized gains (amounts in thousands):
| | | | | | | | | | | | |
| | | 2017 | | | 2019 | | | Total | |
Intrepid European Fund | | $ | 98,908 | | | | — | | | $ | 98,908 | |
Latin America Fund | | | 2,277 | | | | 3,482 | | | | 5,759 | |
6. Borrowings
The Funds rely upon an exemptive order granted by the SEC (the “Order”) permitting the establishment and operation of an Interfund Lending Facility (the “Facility”). The Facility allows the Funds to directly lend and borrow money to or from any other fund relying upon the Order at rates beneficial to both the borrowing and lending funds. Advances under the Facility are taken primarily for temporary or emergency purposes, including the meeting of redemption requests that otherwise might require the untimely disposition of securities, and are subject to each Fund’s borrowing restrictions. The Interfund loan rate is determined, as specified in the Order, by averaging the current repurchase agreement rate and the current bank loan rate. The Order was granted to JPMorgan Trust II and may be relied upon by the Funds because the Funds and the series of JPMorgan Trust II are all investment companies in the same “group of investment companies” (as defined in Section 12(d)(1)(G) of the 1940 Act).
The Trust and JPMCB have entered into a financing arrangement. Under this arrangement, JPMCB provides an unsecured, uncommitted credit facility in the aggregate amount of $100 million to certain of the J.P. Morgan Funds, including the Funds. Advances under the arrangement are taken primarily for temporary or emergency purposes, including the meeting of redemption requests that otherwise might require the untimely disposition of securities, and are subject to each Fund’s borrowing restrictions. Interest on borrowings is payable at a rate determined by JPMCB at the time of borrowing. This agreement has been extended until November 6, 2017.
The Funds had no borrowings outstanding from another fund or from the unsecured, uncommitted credit facility during the six months ended April 30, 2017. Average borrowings from the Facility for the six months ended April 30, 2017, were as follows (amounts in thousands):
| | | | | | | | | | | | | | | | |
| | | Average
Borrowings | | | Average Interest
Rate Paid | | | Number of
Days
Outstanding | | | Interest
Paid | |
Latin America Fund | | $ | 7,598 | | | | 0.94 | % | | | 10 | | | $ | 2 | |
Interest expense paid as a result of borrowings from another fund or from the unsecured, uncommitted credit facility is included in Interest expense to affiliates on the Statements of Operations.
In addition, effective August 16, 2016, the Trust along with certain other trusts (“Borrowers”) entered into a joint syndicated senior unsecured revolving credit facility totaling $1.5 billion (“Credit Facility”) with various lenders and The Bank of New York Mellon, as administrative agent for the lenders. This Credit Facility provides a source of funds to the Borrowers for temporary and emergency purposes, including the meeting of redemption requests that otherwise might require the untimely disposition of securities. Under the terms of the Credit Facility, a borrowing fund must have a minimum of $25,000,000 in adjusted net asset value and not exceed certain adjusted net asset coverage ratios prior to and during the time in which any borrowings are outstanding. If a fund does not comply with the aforementioned requirements, the Fund must remediate within three business days with respect to the $25,000,000 minimum adjusted net asset value or within one business day with respect to certain asset coverage ratios or the administrative agent at the request of, or with the consent of, the lenders may terminate the Credit Facility and declare any outstanding borrowings to be due and payable immediately.
Interest associated with any borrowing under the Credit Facility is charged to the borrowing fund at a rate of interest equal to 1.00% plus the greater of the federal funds effective rate or one month LIBOR. The annual commitment fee to maintain the Credit Facility is 0.15% and is incurred on the unused portion of the Credit Facility and is allocated to all participating funds pro rata based on their respective net assets. The initial term of the Credit Facility is 364 days, unless extended.
The Funds had no borrowings outstanding from Credit Facility at April 30, 2017, or at any time during the six months then ended.
7. Risks, Concentrations and Indemnifications
In the normal course of business, the Funds enter into contracts that contain a variety of representations which provide general indemnifications. Each Fund’s maximum exposure under these arrangements is unknown. The amount of exposure would depend on future claims that may be made against each Fund that have not yet occurred. However, based on experience, the Funds expect the risk of loss to be remote.
| | | | | | | | |
| | | |
| APRIL 30, 2017 | | J.P. MORGAN COUNTRY/REGION FUNDS | | | | | 37 | |
NOTES TO FINANCIAL STATEMENTS
AS OF APRIL 30, 2017 (Unaudited) (continued)
As of April 30, 2017, the Fund had omnibus accounts owning more than 10% of the Fund’s out-standing shares as follows:
| | | | | | | | | | | | | | | | |
| | | Number of
Affiliated
Omnibus
Accounts | | | % of the
Fund | | | Number of
Unaffiliated
Omnibus
Accounts | | | % of the
Fund | |
China Region Fund | | | 1 | | | | 48.1 | % | | | 1 | | | | 12.8 | % |
The J.P. Morgan Investor Funds, which are affiliated and/or non-affiliated funds of funds, owned in the aggregate, shares representing more than 10% of the net assets of certain Funds as follows:
| | | | |
| | | J.P. Morgan
Investor Funds | |
Intrepid European Fund | | | 39.5 | % |
Latin America Fund | | | 60.1 | |
Significant shareholder transactions by these shareholders may impact the Funds’ performance.
The Funds may have elements of risk not typically associated with investments in the United States of America due to concentrated investments in a limited number of countries or regions, which may vary throughout the year depending on the Fund. Such concentrations may subject the Funds to additional risks resulting from political or economic conditions in such countries or regions and the possible imposition of adverse governmental laws or currency exchange restrictions could cause the securities and their markets to be less liquid and their prices to be more volatile than those of comparable U.S. securities.
As of April 30, 2017, the Funds had non-U.S. country allocations representing greater than 10% of total investments as follows:
| | | | | | | | | | | | | | | | | | | | | | | | | | | | | | | | |
| | | Brazil | | | China | | | France | | | Germany | | | Hong
Kong | | | Mexico | | | Taiwan | | | United
Kingdom | |
China Region Fund | | | — | | | | 64.7 | % | | | — | | | | — | | | | 14.6 | % | | | — | | | | 18.7 | % | | | — | |
Intrepid European Fund | | | — | | | | — | | | | 16.3 | % | | | 15.1 | % | | | — | | | | — | | | | — | | | | 18.6 | % |
Latin America Fund | | | 57.2 | % | | | — | | | | — | | | | — | | | | — | | | | 26.4 | % | | | — | | | | — | |
As of April 30, 2017, substantially all of the Funds’ investments consisted of securities that were denominated in foreign currencies. Changes in currency exchange rates will affect the value of, and investment income from, such securities.
The China Region Fund invests primarily in equity securities of companies in the China Region. In general, China Region companies are those that are organized under the laws of, or have a principal office in, the People’s Republic of China (including Hong Kong and Macau) (“China”), or Taiwan; or the principal securities market for which is China or Taiwan. The Latin America Fund invests primarily in equity securities of Latin America issuers or other investments economically tied to Latin America.
A company of a specific country or region is one that is organized under the laws of, or has a principal office in that country or region; the principal securities market for which is that country or region; that derives at least 50% of its total revenues or profits from goods that are produced or sold, investments made, or services performed in that country or region; or at least 50% of the assets of which are located in that country or region.
Because these Funds may invest a significant portion of their assets in these markets, they are subject to greater risks of adverse events that occur in those markets and may experience greater volatility than a Fund that is more broadly diversified geographically.
The Funds invest in Preferred Securities. These securities are typically issued by corporations, generally in the form of interest bearing notes with preferred security characteristics and may include provisions that permit the issuer, in its discretion, to defer or omit distributions for a certain period of time.
8. Investment Company Reporting Modernization
In October 2016, the U.S. Securities and Exchange Commission adopted new rules and forms, and amendments to certain current rules and forms, to modernize the reporting and disclosure of information by registered investment companies. In part, the final rules amend Regulation S-X and will require standardized, enhanced disclosures about derivatives in investment company financial statements, as well as other amendments. The compliance date for the amendments to Regulation S-X is August 1, 2017. At this time, management is currently assessing the anticipated impact of the Regulation S-X amendments on the Funds’ financial statements and related disclosures.
| | | | | | |
| | | |
| 38 | | | | J.P. MORGAN COUNTRY/REGION FUNDS | | APRIL 30, 2017 |
SCHEDULE OF SHAREHOLDER EXPENSES
(Unaudited)
Hypothetical $1,000 Investment
As a shareholder of the Funds, you incur two types of costs: (1) transaction costs including sales charges (loads) on purchase payments and redemption fees and (2) ongoing costs, including investment advisory fees, administration fees, distribution fees and other Fund expenses. The examples below are intended to help you understand your ongoing costs (in dollars) of investing in the Funds and to compare these ongoing costs with the ongoing costs of investing in other mutual funds. The examples assume that you had a $1,000 investment in each Class at the beginning of the reporting period, November 1, 2016, and continued to hold your shares at the end of the reporting period, April 30, 2017.
Actual Expenses
For each Class of each Fund in the table below, the first line provides information about actual account values and actual expenses. You may use the information in this line, together with the amount you invested, to estimate the expenses that you paid over the period. Simply divide your account value by $1,000 (for example, an $8,600 account value divided by $1,000 = 8.6), then multiply the result by the number in the first line of each Class under the heading entitled “Expenses Paid During the Period” to estimate the expenses you paid on your account during this period.
Hypothetical Example for Comparison Purposes
The second line of each Class in the table below provides information about hypothetical account values and hypothetical expenses based on the Class’ actual expense ratio and an assumed rate of return of 5% per year before expenses, which is not the Class’ actual return. The hypothetical account values and expenses may not be used to estimate the actual ending account balance or expenses you paid for the period. You may use this information to compare the ongoing costs of investing in the Class of the Fund and other funds. To do so, compare this 5% hypothetical example with the 5% hypothetical examples that appear in the shareholder reports of the other funds. Please note that the expenses shown in the table are meant to highlight your ongoing costs only and do not reflect any transaction costs, such as sales charges (loads) or redemption fees. Therefore, the second line for each Class in the table is useful in comparing ongoing costs only, and will not help you determine the relative total costs of owning different funds. In addition, if these transaction costs were included, your costs would have been higher. The examples also assume all dividends and distributions have been reinvested.
| | | | | | | | | | | | | | | | |
| | | Beginning
Account Value
November 1, 2016 | | | Ending
Account Value
April 30, 2017 | | | Expenses
Paid During
the Period* | | | Annualized
Expense
Ratio | |
China Region Fund | | | | | | | | | | | | | | | | |
Class A | | | | | | | | | | | | | | | | |
Actual | | $ | 1,000.00 | | | $ | 1,100.20 | | | $ | 8.07 | | | | 1.55 | % |
Hypothetical | | | 1,000.00 | | | | 1,017.11 | | | | 7.75 | | | | 1.55 | |
Class C | | | | | | | | | | | | | | | | |
Actual | | | 1,000.00 | | | | 1,097.20 | | | | 10.66 | | | | 2.05 | |
Hypothetical | | | 1,000.00 | | | | 1,014.63 | | | | 10.24 | | | | 2.05 | |
Class I (formerly Select Class) | | | | | | | | | | | | | | | | |
Actual | | | 1,000.00 | | | | 1,101.40 | | | | 6.77 | | | | 1.30 | |
Hypothetical | | | 1,000.00 | | | | 1,018.35 | | | | 6.51 | | | | 1.30 | |
| | | | |
Intrepid European Fund | | | | | | | | | | | | | | | | |
Class A | | | | | | | | | | | | | | | | |
Actual | | | 1,000.00 | | | | 1,155.20 | | | | 7.53 | | | | 1.41 | |
Hypothetical | | | 1,000.00 | | | | 1,017.80 | | | | 7.05 | | | | 1.41 | |
Class C | | | | | | | | | | | | | | | | |
Actual | | | 1,000.00 | | | | 1,152.30 | | | | 10.14 | | | | 1.90 | |
Hypothetical | | | 1,000.00 | | | | 1,015.37 | | | | 9.49 | | | | 1.90 | |
Class I (formerly Select Class) | | | | | | | | | | | | | | | | |
Actual | | | 1,000.00 | | | | 1,157.30 | | | | 5.83 | | | | 1.09 | |
Hypothetical | | | 1,000.00 | | | | 1,019.39 | | | | 5.46 | | | | 1.09 | |
Class L (formerly Institutional Class) | | | | | | | | | | | | | | | | |
Actual | | | 1,000.00 | | | | 1,157.90 | | | | 4.82 | | | | 0.90 | |
Hypothetical | | | 1,000.00 | | | | 1,020.33 | | | | 4.51 | | | | 0.90 | |
| | | | |
Latin America Fund | | | | | | | | | | | | | | | | |
Class A | | | | | | | | | | | | | | | | |
Actual | | | 1,000.00 | | | | 1,019.60 | | | | 7.81 | | | | 1.56 | |
Hypothetical | | | 1,000.00 | | | | 1,017.06 | | | | 7.80 | | | | 1.56 | |
| | | | | | | | |
| | | |
| APRIL 30, 2017 | | J.P. MORGAN COUNTRY/REGION FUNDS | | | | | 39 | |
SCHEDULE OF SHAREHOLDER EXPENSES
(Unaudited) (continued)
Hypothetical $1,000 Investment
| | | | | | | | | | | | | | | | |
| | | Beginning
Account Value
November 1, 2016 | | | Ending
Account Value
April 30, 2017 | | | Expenses
Paid During
the Period* | | | Annualized
Expense
Ratio | |
Latin America Fund (continued) | | | | | | | | | | | | | | | | |
Class C | | | | | | | | | | | | | | | | |
Actual | | $ | 1,000.00 | | | $ | 1,016.90 | | | $ | 10.30 | | | | 2.06 | % |
Hypothetical | | | 1,000.00 | | | | 1,014.58 | | | | 10.29 | | | | 2.06 | |
Class I (formerly Select Class) | | | | | | | | | | | | | | | | |
Actual | | | 1,000.00 | | | | 1,021.30 | | | | 6.57 | | | | 1.31 | |
Hypothetical | | | 1,000.00 | | | | 1,018.30 | | | | 6.56 | | | | 1.31 | |
Class R6 | | | | | | | | | | | | | | | | |
Actual | | | 1,000.00 | | | | 1,021.90 | | | | 5.31 | | | | 1.06 | |
Hypothetical | | | 1,000.00 | | | | 1,019.54 | | | | 5.31 | | | | 1.06 | |
| * | Expenses are equal to each Class’ respective annualized expense ratio, multiplied by the average account value over the period, multiplied by 181/365 (to reflect the one-half year period). |
| | | | | | |
| | | |
| 40 | | | | J.P. MORGAN COUNTRY/REGION FUNDS | | APRIL 30, 2017 |
J.P. Morgan Funds are distributed by JPMorgan Distribution Services, Inc., which is an affiliate of JPMorgan Chase & Co. Affiliates of JPMorgan Chase & Co. receive fees for providing various services to the funds.
Contact JPMorgan Distribution Services, Inc. at 1-800-480-4111 for a fund prospectus. You can also visit us at www.jpmorganfunds.com. Investors should carefully consider the investment objectives and risk as well as charges and expenses of the mutual fund before investing. The prospectus contains this and other information about the mutual fund. Read the prospectus carefully before investing.
Investors may obtain information about the Securities Investor Protection Corporation (SIPC), including the SIPC brochure by visiting www.sipc.org or by calling SIPC at 202-371-8300.
Each Fund files a complete schedule of its fund holdings for the first and third quarters of its fiscal year with the SEC on Form N-Q. The Funds’ Forms N-Q are available on the SEC’s website at http://www.sec.gov and may be reviewed and copied at the SEC’s Public Reference Room in Washington, DC. Information on the operation of the SEC’s Public Reference Room may be obtained by calling 1-800-SEC-0330. Shareholders may request the Form N-Q without charge by calling 1-800-480-4111 or by visiting the J.P. Morgan Funds’ website at www.jpmorganfunds.com.
A description of each Fund’s policies and procedures with respect to the disclosure of each Fund’s holdings is available in the prospectus and Statement of Additional Information.
A copy of proxy policies and procedures is available without charge upon request by calling 1-800-480-4111 and on the Funds’ website at www.jpmorganfunds.com. A description of such policies and procedures is on the SEC’s website at www.sec.gov. The Trustees have delegated the authority to vote proxies for securities owned by the Funds to the Adviser. A copy of the Funds’ voting record for the most recent 12-month period ended June 30 is available on the SEC’s website at www.sec.gov or at the Funds’ website at www.jpmorganfunds.com no later than August 31 of each year. The Funds’ proxy voting record will include, among other things, a brief description of the matter voted on for each fund security, and will state how each vote was cast, for example, for or against the proposal.

J.P. Morgan Asset Management is the marketing name for the asset management business of JPMorgan Chase & Co. Those businesses include, but are not limited to, J.P. Morgan Investment Management Inc., Security Capital Research & Management Incorporated and J.P. Morgan Alternative Asset Management, Inc.
| | | | |
| | © JPMorgan Chase & Co., 2017. All rights reserved. April 2017. | | SAN-INTEQ-CO-417 |
Semi-Annual Report
J.P. Morgan SMA Funds
April 30, 2017 (Unaudited)
JPMorgan International Value SMA Fund
JPMorgan Tax Aware Real Return SMA Fund

CONTENTS
Investments in a Fund are not deposits or obligations of, or guaranteed or endorsed by, any bank and are not insured or guaranteed by the FDIC, the Federal Reserve Board or any other government agency. You could lose money if you sell when a Fund’s share price is lower than when you invested.
Past performance is no guarantee of future performance. The general market views expressed in this report are opinions based on market and other conditions through the end of the reporting period and are subject to change without notice. These views are not intended to predict the future performance of a Fund or the securities markets. References to specific securities and their issuers are for illustrative purposes only and are not intended to be, and should not be interpreted as, recommendations to purchase or sell such securities. Such views are not meant as investment advice and may not be relied on as an indication of trading intent on behalf of any Fund.
Prospective investors should refer to the Funds’ prospectus for a discussion of the Funds’ investment objectives, strategies and risks. Call J.P. Morgan Funds Service Center at 1-800-480-4111 for a prospectus containing more complete information about a Fund, including management fees and other expenses. Please read it carefully before investing.
CEO’S LETTER
May 25, 2017 (Unaudited)
Dear Shareholder,
The world’s leading economies continued their upward trajectory over the six months ended April 30, 2017, bolstered by central bank policies, growth in corporate earnings and buoyant consumer and business sentiment.
| | |
 | | “While bond markets provided a mixed performance over the six months ended April 30, 2017, equity markets rewarded investors with solid returns.” — George C.W. Gatch |
While the U.S. and China had been leading drivers of growth for most of the current economic expansion, by late 2016 and into 2017 the world’s other leading economies began to strengthen. Each of the world’s 20 largest economies was forecast to increase output of goods and services through 2017 and the variation in growth rates among those economies was forecast to be the lowest since 1980, according to Bloomberg News.
The U.S. economy slowed somewhat in the first quarter of 2017, but unemployment dropped to 4.4% in April 2017 and the U.S. Federal Reserve reiterated its intent to raise interest rates amid continued economic growth and rising inflation. Throughout the six month reporting period, U.S. financial markets — particularly U.S. equities — generally outperformed other developed markets and emerging markets.
China’s economy continued to grow and posted a 6.9% rise in gross domestic product (GDP) in the first quarter of 2017, amid strength in housing, infrastructure investment, exports and retail sales. Notably, financial markets in China remained largely stable for the six month reporting period. For the 86 trading days through April 24, 2017, the Shanghai Stock Exchange Composite Index hadn’t fallen by more than 1%, thanks in large part to government efforts to prevent a recurrence of the sharp sell-offs that hit Chinese markets in mid-2015 and early 2016.
Meanwhile, Chinese officials sought to reduce financial system risk by tightening money-market rules and pushing to reduce the use of leverage and financial market speculation.
In the European Union (EU), rising consumer spending and manufacturing led to 0.6% growth in first quarter GDP. In particular, Germany’s economy continued to accelerate into 2017, with positive growth in factory orders and an estimated 14% increase in corporate earnings in the first quarter of 2017. Surveys of consumer sentiment across the EU were more upbeat than in recent years. At the end of March 2017, EU unemployment stood at 9.5%, the lowest level since April 2009.
In emerging markets, economic strength in China and a rebound in commodities prices, which began in the latter half of 2016, helped lift economic growth. Moreover, the economies of Brazil, Argentina, Russia, Turkey and South Africa — which were seen as weak links in the global economy — all showed positive growth by the end of April 2017.
While bond markets provided a mixed performance over the six months ended April 30, 2017, equity markets rewarded investors with solid returns. The Standard & Poor’s 500 Index returned 13.32% for the reporting period, while the Morgan Stanley Capital International (“MSCI”) Europe, Australasia and Far East Index (net of foreign withholding taxes) returned 11.73% and the MSCI Emerging Markets Index (net of foreign withholding taxes) returned 9.03%.
We look forward to managing your investment needs for years to come. Should you have any questions, please visit www.jpmorganfunds.com or contact the J.P. Morgan Funds Service Center at 1-800-480-4111.
Sincerely yours,

George C.W. Gatch
CEO, Investment Funds Management,
J.P. Morgan Asset Management
| | | | | | | | |
| | | |
| APRIL 30, 2017 | | J.P. MORGAN SMA FUNDS | | | | | 1 | |
J.P. Morgan Funds
MARKET OVERVIEW
SIX MONTHS ENDED APRIL 30, 2017 (Unaudited)
Global financial markets generally provided positive returns for the six month reporting period as the world’s leading economies continued to grow in a more uniform fashion and investors sought returns in many developed and emerging markets.
During the final quarter of 2016 and into 2017, certain leading U.S. equity indexes hit multiple record highs amid solid corporate earnings and expectations that the Republican majorities in the U.S. Congress and President Trump’s administration would work to ease business regulations, reduce taxes and increase infrastructure spending.
In Europe, a pickup in corporate earnings and improvements in consumer sentiment also proved attractive to investors during the reporting period. Electoral defeats of anti-European Union (EU) politicians in Austria and the Netherlands also helped lift investor sentiment across the EU and other developed markets.
Emerging markets also saw investment inflows during the six month reporting period amid economic and financial market stability in China. Notably, the Chinese government’s efforts to curb excessive leverage in its financial markets appeared to adversely impact the Shanghai Stock Exchange Composite Index in April 2017. Meanwhile, several previously underperforming economies — particularly Brazil, Argentina, Russia, Turkey and South Africa showed signs of improvement toward the end of the reporting period.
The performance of fixed-income markets was mixed. High-yield bonds, also known as junk bonds, and U.S. Treasury bonds generally outperformed other debt securities during in the reporting period.
Commodities prices showed signs of stabilization during the reporting period and global oil prices reached 15-month highs in October 2016. Oil prices were further bolstered by the December 2016 decision by the Organization of Petroleum Exporting Countries to curb production. However, by the end of the reporting period, overproduction pushed global oil prices lower.
For the six months ended April 30, 2017, the MSCI Europe Australasia and Far East Index (net of foreign withholding taxes) returned 12.53%, while the Bloomberg Barclays U.S. 1-15 Year Blend (1-17) Municipal Bond Index returned -0.06%.
| | | | | | |
| | | |
| 2 | | | | J.P. MORGAN SMA FUNDS | | APRIL 30, 2017 |
JPMorgan International Value SMA Fund
FUND COMMENTARY
SIX MONTHS ENDED APRIL 30, 2017 (Unaudited)
| | | | |
| REPORTING PERIOD RETURN: | | | |
| Fund* | | | 13.93% | |
| Morgan Stanley Capital International (“MSCI”) Europe, Australasia and Far East (“EAFE”) Value Index (net of foreign withholding taxes) | | | 12.53% | |
| |
| Net Assets as of 4/30/2017 (In Thousands) | | $ | 68,003 | |
INVESTMENT OBJECTIVE**
The JPMorgan International Value SMA Fund (the “Fund”) seeks to provide high total return from a portfolio of foreign company equity securities. The Fund was established to implement the International Value separately managed account strategy, and to hold common shares of companies that were deemed attractive by the Fund’s portfolio managers but were not accessible as American Depositary Receipts (ADRs).
WHAT WERE THE MAIN DRIVERS OF THE FUND’S PERFORMANCE?
The Fund’s shares outperformed the MSCI EAFE Value Index (net of foreign withholding taxes) (the “Benchmark”) for the six months ended April 30, 2017.
By sector, the Fund’s overweight position and security selection in the technology-semiconductors sector and its underweight position in the telecommunications sector, where the Fund had no holdings, were leading contributors to performance relative to the Benchmark. The Fund’s security selection in the technology-hardware and industrial cyclical sectors was a leading detractor from relative performance.
By region, the Fund’s security selection in Europe and the U.K. was a leading contributor to relative performance, while the Fund’s overweight position in Japan was a leading detractor from relative performance.
Leading individual contributors to the Fund’s relative performance included the Fund’s overweight positions in Bankia SA and Outokumpu Oyj and its underweight position in Toyota Motor Corp. Shares of Bankia, a Spanish financial services company, rose on better-than-expected earnings. Shares of Outokumpu, a Finnish maker of stainless steel, rose after the company reported a rebound in earnings and proposed to pay its first dividend since 2007. Shares of Toyota, a Japanese automaker not held by the Fund, fell amid a slowdown in U.S. auto sales and ongoing litigation related to faulty air bags.
Leading individual detractors from relative performance included the Fund’s overweight positions in Daikin Industries Ltd., Chartered Standard PLC and HeidelbergCement AG.
Shares of Daikin Industries, a maker of air conditioning systems that was not held in the Benchmark, fell after the company reported a decline in revenue. Shares of Standard Chartered, a U.K. bank, fell early in the reporting period after the company reported lower-than-expected earnings. Share of HeidelbergCement, a German building materials manufacturer, fell after the company abandoned its bid to acquire assets from rivals Holcim Ltd. and Lafarge SA.
HOW WAS THE FUND POSITIONED?
The Fund’s portfolio managers employed a bottom-up fundamental approach to security selection, seeking to identify what they believed were the most attractive value investment opportunities within each sector. The Fund’s portfolio managers looked for securities that they believed possessed an attractive valuation signal (as measured by a proprietary dividend discount model) and a timely catalyst that would enable the securities to realize their inherent value.
The Fund is offered as a component of the JPMorgan International Value SMA Managed Account Strategy (“SMA Strategy”) to participants in separately managed account programs. As a result, the Fund’s holdings depend on whether a particular security or instrument can be purchased directly on behalf of the participants in the separately managed account programs investing in the SMA Strategy.
| * | | The return shown is based on net asset values calculated for shareholder transactions and may differ from the return shown in the financial highlights which reflects adjustments made to the net asset values in accordance with accounting principles generally accepted in the United States of America. |
| ** | | The adviser seeks to achieve the Fund’s objective. There can be no guarantee it will be achieved. |
| | | | | | | | |
| | | |
| APRIL 30, 2017 | | J.P. MORGAN SMA FUNDS | | | | | 3 | |
JPMorgan International Value SMA Fund
FUND COMMENTARY
SIX MONTHS ENDED APRIL 30, 2017 (Unaudited) (continued)
| | | | | | | | |
| TOP TEN EQUITY HOLDINGS OF THE PORTFOLIO* | |
| | 1. | | | Daimler AG (Registered) (Germany) | | | 6.1 | % |
| | 2. | | | Bankia SA (Spain) | | | 5.3 | |
| | 3. | | | Renault SA (France) | | | 5.2 | |
| | 4. | | | Sumitomo Electric Industries Ltd. (Japan) | | | 5.1 | |
| | 5. | | | Standard Chartered plc (United Kingdom) | | | 4.7 | |
| | 6. | | | Mitsubishi Corp. (Japan) | | | 4.7 | |
| | 7. | | | Daikin Industries Ltd. (Japan) | | | 4.3 | |
| | 8. | | | Mabuchi Motor Co. Ltd. (Japan) | | | 4.2 | |
| | 9. | | | Goodman Group (Australia) | | | 4.2 | |
| | 10. | | | NGK Spark Plug Co. Ltd. (Japan) | | | 4.2 | |
| | | | |
PORTFOLIO COMPOSITION BY COUNTRY* | |
| Japan | | | 42.5 | % |
| Germany | | | 14.6 | |
| France | | | 8.6 | |
| United Kingdom | | | 7.1 | |
| Netherlands | | | 6.4 | |
| Spain | | | 5.3 | |
| Australia | | | 4.2 | |
| South Korea | | | 4.0 | |
| Austria | | | 3.8 | |
| Finland | | | 3.5 | |
| * | | Percentages indicated are based on total investments as of April 30, 2017. The Fund’s portfolio composition is subject to change. |
| | | | | | |
| | | |
| 4 | | | | J.P. MORGAN SMA FUNDS | | APRIL 30, 2017 |
| | | | | | | | | | |
AVERAGE ANNUAL TOTAL RETURNS AS OF APRIL 30, 2017 |
| | | | | | | | | | | | | | | | | | | | | | | | |
| | | | | | |
| | | INCEPTION DATE OF
CLASS | | | 6 MONTH* | | | 1 YEAR | | | 3 YEAR | | | 5 YEAR | | | SINCE INCEPTION | |
JPMorgan International Value SMA Fund | | | August 17, 2007 | | | | 13.93 | % | | | 17.84 | % | | | (0.03 | )% | | | 4.82 | % | | | 0.89 | % |
LIFE OF FUND PERFORMANCE (8/17/07 TO 4/30/17)
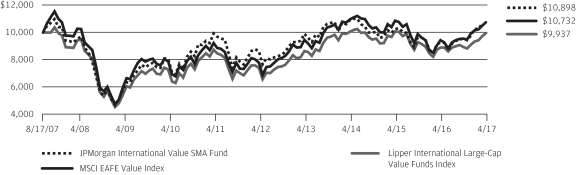
The performance quoted is past performance and is not a guarantee of future results. Mutual funds are subject to certain market risks. Investment returns and principal value of an investment will fluctuate so that an investor’s shares, when redeemed, may be worth more or less than their original cost. Current performance may be higher or lower than the performance data shown. For up-to-date, month-end performance information please call 1-800-480-4111.
The Fund commenced operations on August 17, 2007.
The graph illustrates comparative performance for $10,000 invested in the JPMorgan International Value SMA Fund, the MSCI EAFE Value Index and the Lipper International Large-Cap Value Funds Index from August 17, 2007 to April 30, 2017. The performance of the Fund assumes reinvestment of all dividends and capital gain distributions, if any, and does not include a sales charge. The performance of the Lipper International Large-Cap Value Funds Index reflects an initial investment at the end of the month closest to the Fund’s inception. The performance of the MSCI EAFE Value Index does not reflect the deduction of expenses associated with a mutual fund and approximates the minimum possible dividend reinvestment of the securities included in the benchmark, if applicable. The dividend is reinvested after deduction of withholding tax, applying the maximum rate to nonresident institutional investors who do not benefit from double taxation treaties. The performance of the Lipper International Large-Cap Value Funds Index includes expenses associated with a mutual fund, such as investment management fees. These expenses are
not identical to the expenses incurred by the Fund. The MSCI EAFE Value Index is a free float-adjusted market capitalization weighted index that is designed to measure the performance of value-oriented stocks in developed markets, excluding the U.S. and Canada. The Lipper International Large-Cap Value Funds Index is an index based on total returns of certain mutual funds within the Fund’s designated category as determined by Lipper, Inc. Investors cannot invest directly in an index.
Fund performance may reflect the waiver of the Fund’s fees and reimbursement of expenses for certain periods since the inception date. Without these waivers and reimbursements, performance would have been lower. Also, performance shown in this section does not reflect the deduction of taxes that a shareholder would pay on Fund distributions or redemptions of Fund shares.
International investing involves a greater degree of risk and increased volatility. Changes in currency exchange rates and differences in accounting and taxation policies outside the U.S. can raise or lower returns. Also, some overseas markets may not be as politically and economically stable as the U.S. and other nations.
The returns shown are based on net asset values calculated for shareholder transactions and may differ from the returns shown in the financial highlights, which reflect adjustments made to the net asset values in accordance with accounting principles generally accepted in the United States of America.
| | | | | | | | |
| | | |
| APRIL 30, 2017 | | J.P. MORGAN SMA FUNDS | | | | | 5 | |
JPMorgan Tax Aware Real Return SMA Fund
FUND COMMENTARY
SIX MONTHS ENDED APRIL 30, 2017 (Unaudited)
| | | | |
| REPORTING PERIOD RETURN: | | | |
| Fund* | | | 1.11% | |
| Bloomberg Barclays U.S. 1-15 Year Blend (1-17) Municipal Bond Index | | | (0.06)% | |
| Tax Aware Real Return Composite Benchmark** | | | 1.28% | |
| |
| Net Assets as of 4/30/2017 (In Thousands) | | $ | 11,448 | |
INVESTMENT OBJECTIVE***
The JPMorgan Tax Aware Real Return SMA Fund (the “Fund”) seeks to maximize after-tax inflation protected return.
WHAT WERE THE MAIN DRIVERS OF THE FUND’S PERFORMANCE?
The Fund’s shares had a positive absolute return and outperformed the Bloomberg Barclays U.S. 1-15 Year Blend (1-17) Municipal Bond Index (the “Benchmark”) but underperformed the Composite Benchmark for the six months ended April 30, 2017.
The Fund’s hedge against inflation, which was implemented through the use of swaps contracts, made a positive contribution to absolute performance and performance relative to the Benchmark. During the six month period, the two, five, ten and thirty year Bloomberg Barclays inflation swap indexes returned 0.37%, 1.31%, 2.23% and 4.58% respectively. Returns for inflation swaps were pulled higher by increased realized inflation. During the reporting period, the U.S. Consumer Price Index rose to 2.2% from 1.6%.
Amid rising interest rates during the reporting period, the Fund’s shorter duration profile in cash bonds contributed to both absolute performance and performance relative to the Benchmark. Generally, bonds with longer duration will experience a larger increase or decrease in price as interest rates fall or rise, respectively, versus bonds with shorter duration. The Fund’s shorter duration profile in water & sewer bonds also contributed to both absolute and relative performance.
The Fund’s underweight position in industrial development revenue/pollution control revenue bonds and hospital sector bonds detracted from both absolute and relative performance. The Fund’s overweight allocation to AAA-rated bonds, which underperformed lower rated bonds, also detracted from absolute and relative performance.
The Fund was not fully hedged during the reporting period, which detracted from performance relative to the Composite Benchmark. The Fund’s overweight allocation to the short end of the yield curve, which underperformed other parts of the yield curve, also detracted from performance relative to the Composite Benchmark. The yield curve shows the relationship between yields and maturity dates for a set of similar bonds at a given point in time.
HOW WAS THE FUND POSITIONED?
Among the Fund’s tax-exempt fixed income investments, the Fund employed a bottom-up, security-selection-based investment approach and sought to take advantage of opportunities stemming from increased volatility, supply pressures and headline credit risk. The Fund maintained its bias to high quality debt securities, as the Fund’s portfolio managers preferred higher-quality issuances. The Fund’s portfolio managers also maintained an inflation-overlay hedging strategy, using zero-coupon inflation-linked swaps to purchase protection against inflation along the yield curve.
During the period, the Fund’s portfolio managers increased the hedge ratio to 94% from 90% in the face of volatility in inflation-linked securities.
INVESTMENT APPROACH
The Fund uses zero-coupon inflation-linked swaps (“inflation swaps”) in combination with tax-exempt municipal bonds to seek to replicate a portfolio of inflation protected securities. The Fund is designed to protect the total return generated by its tax-exempt fixed income holdings from inflation risk. The inflation swaps used by the Fund are based on cumulative percentage movements in the Consumer Price Index for All Urban Consumers (“CPI-U”). The inflation swaps are structured so that one counterparty agrees to pay the cumulative percentage change in the CPI-U over the duration of the swap. The other counterparty (the Fund) pays a compounded fixed rate (zero coupon inflation-swap rate), which is based on the “breakeven inflation rate,” calculated as the yield difference between a nominal U.S. Treasury security and a U.S. Treasury Inflation Protected Security (TIPS) of equal maturity.
The Fund’s portfolio managers aim to protect the portfolio from inflation risk across maturities. Therefore, the yield curve positioning of the underlying bonds is used as the general basis for the Fund’s inflation swap positioning. The yield curve shows the relationship between yields and maturity dates for a set of similar bonds at a given point in time. The Fund’s portfolio managers believe that matching the duration of the inflation protection to the duration of the underlying bonds is the most effective and efficient way to protect the portfolio from both actual realized inflation as well as the loss of value that results from an increase in inflation expectations. Duration measures the price sensitivity of a bond or a portfolio of bonds to relative
| | | | | | |
| | | |
| 6 | | | | J.P. MORGAN SMA FUNDS | | APRIL 30, 2017 |
changes in interest rates. However, the inflation protection is actively managed, and the Fund’s portfolio managers may elect to deviate from the curve positioning of the underlying bonds as a result of opportunities that may result from macroeconomic or technical factors.
| | | | |
PORTFOLIO COMPOSITION**** | |
| Municipal Bonds | | | 92.4 | % |
| Short-Term Investment | | | 7.6 | |
| * | | The return shown is based on net asset values calculated for shareholder transactions and may differ from the return shown in the financial highlights which reflects adjustments made to the net asset values in accordance with accounting principles generally accepted in the United States of America. |
| ** | | The return of the Fund’s Composite Benchmark is determined by adding the return of the Bloomberg Barclays U.S. 1-15 Year Blend (1-17) Municipal Bond Index and the Bloomberg Barclays Inflation Swap 5 Year Zero Coupon Index. |
| *** | | The adviser seeks to achieve the Fund’s objective. There can be no guarantee it will be achieved. |
| **** | | Percentages indicated are based on total investments as of April 30, 2017. The Fund’s portfolio composition is subject to change. |
| | | | | | | | |
| | | |
| APRIL 30, 2017 | | J.P. MORGAN SMA FUNDS | | | | | 7 | |
JPMorgan Tax Aware Real Return SMA Fund
FUND COMMENTARY
SIX MONTHS ENDED APRIL 30, 2017 (Unaudited) (continued)
| | | | | | | | | | |
AVERAGE ANNUAL TOTAL RETURNS AS OF APRIL 30, 2017 |
| | | | | | | | | | | | | | | | | | | | | | | | |
| | | | | | |
| | | INCEPTION DATE OF
FUND | | | 6 MONTH* | | | 1 YEAR | | | 3 YEAR | | | 5 YEAR | | | SINCE INCEPTION | |
Tax Aware Real Return SMA Fund | | | May 31, 2007 | | | | | | | | | | | | | | | | | | | | | |
Before Taxes | | | | | | | 1.11 | % | | | 2.03 | % | | | 1.09 | % | | | 0.88 | % | | | 3.11 | % |
After Taxes on Distributions | | | | | | | 1.11 | | | | 2.02 | | | | 1.09 | | | | 0.88 | | | | 3.11 | |
After Taxes on Distributions and Sale of Fund Shares | | | | | | | 1.19 | | | | 2.28 | | | | 1.52 | | | | 1.32 | | | | 3.12 | |
LIFE OF FUND PERFORMANCE (5/31/07 TO 4/30/17)
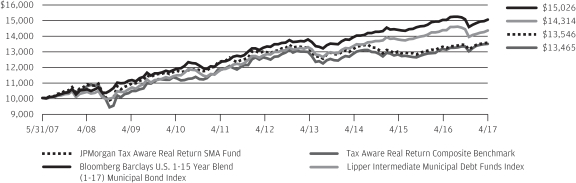
The performance quoted is past performance and is not a guarantee of future results. Mutual funds are subject to certain market risks. Investment returns and principal value of an investment will fluctuate so that an investor’s shares, when redeemed, may be worth more or less than their original cost. Current performance may be higher or lower than the performance data shown. For up-to-date, month-end performance information please call 1-800-480-4111.
The Fund commenced operations on May 31, 2007.
The graph illustrates comparative performance for $10,000 invested in the JPMorgan Tax Aware Real Return SMA Fund, the Bloomberg Barclays U.S. 1-15 Year Blend (1-17) Municipal Bond Index, the Tax Aware Real Return Composite Benchmark and the Lipper Intermediate Municipal Debt Funds Index from May 31, 2007 to April 30, 2017. The performance of the Fund assumes reinvestment of all dividends and capital gain distributions, if any, and does not include a sales charge. The performance of the Bloomberg Barclays U.S. 1-15 Year Blend (1-17) Municipal Bond Index and the Tax Aware Real Return Composite Benchmark does not reflect the deduction of expenses associated with a mutual fund and has been adjusted to reflect reinvestment of all dividends and capital gain distributions of the securities included in the benchmarks, if applicable. The performance of the Lipper Intermediate Municipal Debt Funds Index includes expenses associated with a mutual fund, such as investment management fees. These expenses are not identical to the expenses incurred by the Fund. The Bloomberg Barclays U.S. 1-15 Year Blend (1-17) Municipal Bond Index represents the performance of municipal bonds with maturities from 1 to 17 years. The Tax
Aware Real Return Composite Benchmark is determined by adding the Bloomberg Barclays U.S. 1-15 Year Blend (1-17) Municipal Bond Index and the Bloomberg Barclays Inflation Swap 5 Year Zero Coupon Index. The Lipper Intermediate Municipal Debt Funds Index is an index based on total returns of certain mutual funds within the Fund’s designated category as determined by Lipper, Inc. Investors cannot invest directly in an index.
For some investors, income from municipal bonds may be subject to the Alternative Minimum Tax. Capital gains, if any, are federally taxable. Income may be subject to state and local taxes.
The Tax Aware strategy seeks to minimize shareholders’ tax liability in connection with the Fund’s distribution of realized capital gains. There can be no guarantee the strategy will minimize or eliminate tax liability.
Fund performance may reflect the waiver of the Fund’s fees and reimbursement of expenses for certain periods since the inception date. Without these waivers and reimbursements, performance would have been lower. Also, performance shown in this section does not reflect the deduction of taxes that a shareholder would pay on Fund distributions or redemptions of Fund shares, with the exception of returns noted above as after taxes.
The returns shown are based on net asset values calculated for shareholder transactions and may differ from the returns shown in the financial highlights, which reflect adjustments made to the net asset values in accordance with accounting principles generally accepted in the United States of America.
| | | | | | |
| | | |
| 8 | | | | J.P. MORGAN SMA FUNDS | | APRIL 30, 2017 |
JPMorgan International Value SMA Fund
SCHEDULE OF PORTFOLIO INVESTMENTS
AS OF APRIL 30, 2017 (Unaudited)
(Amounts in thousands)
| | | | | | | | |
| SHARES | | | SECURITY DESCRIPTION | | VALUE($) | |
| | Common Stocks — 96.5% | |
| | | | Australia — 4.0% | |
| | 450 | | | Goodman Group | | | 2,735 | |
| | | | | | | | |
| | | | Austria — 3.7% | |
| | 70 | | | Erste Group Bank AG (a) | | | 2,506 | |
| | | | | | | | |
| | | | Finland — 3.4% | |
| | 238 | | | Outokumpu OYJ | | | 2,278 | |
| | | | | | | | |
| | | | France — 8.4% | |
| | 329 | | | Natixis SA | | | 2,287 | |
| | 36 | | | Renault SA | | | 3,391 | |
| | | | | | | | |
| | | | | | | 5,678 | |
| | | | | | | | |
| | | | Germany — 14.1% | |
| | 35 | | | Brenntag AG | | | 2,102 | |
| | 54 | | | Daimler AG (Registered) | | | 4,001 | |
| | 27 | | | Deutsche Boerse AG | | | 2,678 | |
| | 9 | | | HeidelbergCement AG | | | 815 | |
| | | | | | | | |
| | | | | | | 9,596 | |
| | | | | | | | |
| | | | Japan — 41.0% | |
| | 29 | | | Daikin Industries Ltd. | | | 2,790 | |
| | 18 | | | Dentsu, Inc. | | | 1,010 | |
| | 80 | | | DMG Mori Co. Ltd. | | | 1,328 | |
| | 75 | | | Japan Airlines Co. Ltd. | | | 2,372 | |
| | 49 | | | Mabuchi Motor Co. Ltd. | | | 2,755 | |
| | 142 | | | Mitsubishi Corp. | | | 3,056 | |
| | 75 | | | Mitsui Fudosan Co. Ltd. | | | 1,639 | |
| | 126 | | | NGK Spark Plug Co. Ltd. | | | 2,728 | |
| | 49 | | | Otsuka Corp. | | | 2,609 | |
| | | | | | | | |
| SHARES | | | SECURITY DESCRIPTION | | VALUE($) | |
| | | | | | | | |
| | | | Japan — continued | |
| | 20 | | | Sompo Holdings, Inc. | | | 771 | |
| | 207 | | | Sumitomo Electric Industries Ltd. | | | 3,374 | |
| | 43 | | | Suzuki Motor Corp. | | | 1,814 | |
| | 76 | | | Yamato Holdings Co. Ltd. | | | 1,651 | |
| | | | | | | | |
| | | | | | | 27,897 | |
| | | | | | | | |
| | | | Netherlands — 6.2% | |
| | 72 | | | ASR Nederland NV (a) | | | 2,116 | |
| | 62 | | | NN Group NV | | | 2,072 | |
| | | | | | | | |
| | | | | | | 4,188 | |
| | | | | | | | |
| | | | South Korea — 3.8% | |
| | 1 | | | Samsung Electronics Co. Ltd. | | | 2,605 | |
| | | | | | | | |
| | | | Spain — 5.1% | |
| | 2,875 | | | Bankia SA | | | 3,490 | |
| | | | | | | | |
| | | | United Kingdom — 6.8% | |
| | 207 | | | Barratt Developments plc | | | 1,551 | |
| | 330 | | | Standard Chartered plc (a) | | | 3,080 | |
| | | | | | | | |
| | | | | | | 4,631 | |
| | | | | | | | |
| | | | Total Investments — 96.5%
(Cost $53,568) | | | 65,604 | |
| | | | Other Assets in Excess of
Liabilities — 3.5% | | | 2,399 | |
| | | | | | | | |
| | | | NET ASSETS — 100.0% | | $ | 68,003 | |
| | | | | | | | |
Percentages indicated are based on net assets.
SEE NOTES TO FINANCIAL STATEMENTS.
| | | | | | | | |
| | | |
| APRIL 30, 2017 | | J.P. MORGAN SMA FUNDS | | | | | 9 | |
JPMorgan International Value SMA Fund
SCHEDULE OF PORTFOLIO INVESTMENTS
AS OF APRIL 30, 2017 (Unaudited) (continued)
Summary of Investments by Industry, April 30, 2017
The following table represents the portfolio investments of the Fund by industry classifications as a percentage of total investments:
| | | | |
| INDUSTRY | | PERCENTAGE | |
Banks | | | 17.3 | % |
Automobiles | | | 14.0 | |
Auto Components | | | 9.3 | |
Trading Companies & Distributors | | | 7.9 | |
Insurance | | | 7.6 | |
Building Products | | | 4.2 | |
Electrical Equipment | | | 4.2 | |
Equity Real Estate Investment Trusts (REITs) | | | 4.2 | |
Capital Markets | | | 4.1 | |
IT Services | | | 4.0 | |
| | | | |
| INDUSTRY | | PERCENTAGE | |
Technology Hardware, Storage & Peripherals | | | 4.0 | % |
Airlines | | | 3.6 | |
Metals & Mining | | | 3.5 | |
Air Freight & Logistics | | | 2.5 | |
Real Estate Management & Development | | | 2.5 | |
Household Durables | | | 2.4 | |
Machinery | | | 2.0 | |
Media | | | 1.5 | |
Construction Materials | | | 1.2 | |
SEE NOTES TO FINANCIAL STATEMENTS.
| | | | | | |
| | | |
| 10 | | | | J.P. MORGAN SMA FUNDS | | APRIL 30, 2017 |
JPMorgan Tax Aware Real Return SMA Fund
SCHEDULE OF PORTFOLIO INVESTMENTS
AS OF APRIL 30, 2017 (Unaudited)
(Amounts in thousands)
| | | | | | | | |
PRINCIPAL AMOUNT($) | | | SECURITY DESCRIPTION | | VALUE($) | |
| | Municipal Bonds — 90.9% (t) | |
| | | | Arizona — 0.2% | |
| | | | Water & Sewer — 0.2% | |
| | 25 | | | City of Phoenix Civic Improvement Corp., Wastewater System, Rev., NATL, 5.000%, 07/01/17 | | | 25 | |
| | | | | | | | |
| | | | California — 6.9% | |
| | | | Education — 1.5% | |
| | 60 | | | California Educational Facilities Authority, Pomona College, Series A, Rev., 5.000%, 01/01/18 | | | 62 | |
| | 75 | | | Golden West Schools Financing Authority, Series A, Rev., NATL-RE, 5.800%, 02/01/20 | | | 84 | |
| | 25 | | | Golden West Schools Financing Authority, Beverly Hills Unified School District, Rev., NATL-RE, FGIC, 5.250%, 08/01/23 | | | 30 | |
| | | | | | | | |
| | | | | | | 176 | |
| | | | | | | | |
| | | | General Obligation — 2.2% | |
| | 55 | | | County of Los Angeles, GO, TRAN, 3.000%, 06/30/17 | | | 55 | |
| | 165 | | | Tustin Unified School District, School Facilities Improvement District No. 2002-1, GO, 5.000%, 08/01/31 | | | 196 | |
| | | | | | | | |
| | | | | | | 251 | |
| | | | | | | | |
| | | | Utility — 3.2% | |
| | 300 | | | City of Los Angeles, Department of Water & Power, Power System, Series B, Rev., 5.000%, 07/01/29 | | | 364 | |
| | | | | | | | |
| | | | Total California | | | 791 | |
| | | | | | | | |
| | | | Colorado — 0.2% | |
| | | | Utility — 0.2% | |
| | 25 | | | Platte River Power Authority, Series II, Rev., 4.000%, 06/01/17 | | | 25 | |
| | | | | | | | |
| | | | Connecticut — 3.7% | |
| | | | Water & Sewer — 3.7% | |
| | | | City of Stamford, Water Pollution Control System & Facility, | | | | |
| | 100 | | | Series A, Rev., 6.000%, 08/15/20 | | | 116 | |
| | 150 | | | Series A, Rev., 6.000%, 08/15/21 | | | 180 | |
| | 100 | | | Series A, Rev., 6.000%, 08/15/22 | | | 124 | |
| | | | | | | | |
| | | | Total Connecticut | | | 420 | |
| | | | | | | | |
| | | | District of Columbia — 1.0% | |
| | | | Water & Sewer — 1.0% | |
| | 100 | | | District of Columbia Water & Sewer Authority, Public Utility Subordinate Lien, Series C, Rev., 5.000%, 10/01/24 | | | 116 | |
| | | | | | | | |
| | | | | | | | |
PRINCIPAL AMOUNT($) | | | SECURITY DESCRIPTION | | VALUE($) | |
| | | | | | | | |
| | | | Florida — 8.2% | |
| | | | General Obligation — 2.5% | |
| | 250 | | | Florida State Board of Education, Public Education Capital Outlay, Series D, GO, 5.000%, 06/01/25 | | | 285 | |
| | | | | | | | |
| | | | Utility — 5.0% | |
| | 200 | | | Florida Municipal Power Agency, Stanton Project, Rev., 5.250%, 10/01/18 | | | 212 | |
| | 300 | | | Sarasota County, Florida Utility System, Series B, Rev., 5.000%, 10/01/25 | | | 367 | |
| | | | | | | | |
| | | | | | | 579 | |
| | | | | | | | |
| | | | Water & Sewer — 0.7% | |
| | 75 | | | City of Auburndale, Water & Sewer, Rev., AGC-ICC, AMBAC, 5.250%, 12/01/18 | | | 80 | |
| | | | | | | | |
| | | | Total Florida | | | 944 | |
| | | | | | | | |
| | | | Georgia — 6.5% | |
| | | | General Obligation — 3.2% | |
| | 300 | | | Dekalb County, Georgia Special Transportation, Parks and Greenspace and Libraries, GO, 5.000%, 12/01/26 | | | 369 | |
| | | | | | | | |
| | | | Water & Sewer — 3.3% | | | | |
| | 250 | | | DeKalb County, Water & Sewerage, Series B, Rev., 5.250%, 10/01/26 | | | 313 | |
| | 60 | | | Jackson County Water & Sewer Authority, Series A, Rev., XLCA, 5.250%, 09/01/21 | | | 67 | |
| | | | | | | | |
| | | | | | | 380 | |
| | | | | | | | |
| | | | Total Georgia | | | 749 | |
| | | | | | | | |
| | | | Illinois — 0.6% | |
| | | | General Obligation — 0.6% | |
| | 60 | | | City of Chicago, Series A, GO, AGM, 5.500%, 01/01/19 | | | 64 | |
| | | | | | | | |
| | | | Indiana — 2.1% | |
| | | | Certificate of Participation/Lease — 1.1% | |
| | 115 | | | Indiana University, Series A, COP, 4.000%, 06/01/18 | | | 119 | |
| | | | | | | | |
| | | | Education — 1.0% | |
| | 100 | | | Purdue University, Student Fee, Series U, Rev., 5.250%, 07/01/21 | | | 116 | |
| | | | | | | | |
| | | | Total Indiana | | | 235 | |
| | | | | | | | |
| | | | Kansas — 0.5% | |
| | | | Prerefunded — 0.5% | |
| | 50 | | | Sedgwick County Unified School District No. 259 Wichita, School Building, Series A, GO, 4.500%, 10/01/18 (p) | | | 52 | |
| | | | | | | | |
SEE NOTES TO FINANCIAL STATEMENTS.
| | | | | | | | |
| | | |
| APRIL 30, 2017 | | J.P. MORGAN SMA FUNDS | | | | | 11 | |
JPMorgan Tax Aware Real Return SMA Fund
SCHEDULE OF PORTFOLIO INVESTMENTS
AS OF APRIL 30, 2017 (Unaudited) (continued)
(Amounts in thousands)
| | | | | | | | |
PRINCIPAL AMOUNT($) | | | SECURITY DESCRIPTION | | VALUE($) | |
| | Municipal Bonds — continued | |
| | | | Louisiana — 0.2% | |
| | | | Water & Sewer — 0.2% | |
| | 25 | | | Tangipahoa Water District, Series A, Rev., AGM, 3.000%, 11/01/18 | | | 26 | |
| | | | | | | | |
| | | | Massachusetts — 4.9% | |
| | | | Prerefunded — 0.6% | |
| | 75 | | | Massachusetts Development Finance Agency, College of Pharmacy and Allied Health Sciences, Series E, Rev., AGC, 5.000%, 07/01/17 (p) | | | 76 | |
| | | | | | | | |
| | | | Transportation — 4.3% | |
| | | | Massachusetts Bay Transportation Authority, | | | | |
| | 150 | | | Series A, Rev., 5.250%, 07/01/27 | | | 187 | |
| | 250 | | | Series B, Rev., 5.250%, 07/01/23 | | | 302 | |
| | | | | | | | |
| | | | | | | 489 | |
| | | | | | | | |
| | | | Total Massachusetts | | | 565 | |
| | | | | | | | |
| | | | Nevada — 2.1% | |
| | | | Water & Sewer — 2.1% | |
| | 200 | | | Truckee Meadows Water Authority, Rev., 5.000%, 07/01/31 | | | 237 | |
| | | | | | | | |
| | | | New Jersey — 1.3% | |
| | | | Transportation — 1.3% | |
| | | | New Jersey Transportation Trust Fund Authority, Transportation System, | | | | |
| | 80 | | | Series A, Rev., 5.250%, 12/15/20 | | | 86 | |
| | 60 | | | Series A, Rev., 5.500%, 12/15/21 | | | 66 | |
| | | | | | | | |
| | | | Total New Jersey | | | 152 | |
| | | | | | | | |
| | | | New Mexico — 8.5% | |
| | | | Other Revenue — 3.7% | |
| | 340 | | | New Mexico Finance Authority, Senior Lien Public Project, Series C, Rev., 5.000%, 06/01/22 | | | 387 | |
| | 30 | | | New Mexico Finance Authority, Subordinate Lien Public Project Revolving Fund, Series B, Rev., NATL-RE, 5.000%, 06/15/17 | | | 30 | |
| | | | | | | | |
| | | | | | | 417 | |
| | | | | | | | |
| | | | Transportation — 4.8% | |
| | 250 | | | New Mexico Finance Authority, State Transportation, Senior Lien, Series B, Rev., 5.000%, 06/15/24 | | | 278 | |
| | 250 | | | New Mexico Finance Authority, State Transportation, Sub Lien, Series A-2, Rev., 5.000%, 12/15/21 | | | 281 | |
| | | | | | | | |
| | | | | | | 559 | |
| | | | | | | | |
| | | | Total New Mexico | | | 976 | |
| | | | | | | | |
| | | | | | | | |
PRINCIPAL AMOUNT($) | | | SECURITY DESCRIPTION | | VALUE($) | |
| | | | | | | | |
| | | | New York — 9.5% | |
| | | | Education — 0.8% | |
| | | | New York State Dormitory Authority, The New School | | | | |
| | 30 | | | Rev., 5.000%, 07/01/18 | | | 31 | |
| | 55 | | | Series A, Rev., 5.000%, 07/01/17 | | | 56 | |
| | | | | | | | |
| | | | | | | 87 | |
| | | | | | | | |
| | | | General Obligation — 1.0% | |
| | | | City of New York, | | | | |
| | 25 | | | Sub Series E-1, GO, 5.375%, 10/15/18 | | | 27 | |
| | 10 | | | Sub Series E-1, GO, 6.250%, 10/15/28 | | | 11 | |
| | 20 | | | County of Tompkins, Public Improvement, Series A, GO, 4.000%, 03/01/21 | | | 22 | |
| | 50 | | | Eastport South Manor Central School District, GO, 4.000%, 08/01/17 | | | 50 | |
| | | | | | | | |
| | | | | | | 110 | |
| | | | | | | | |
| | | | Other Revenue — 1.0% | |
| | 110 | | | New York City Transitional Finance Authority, Building Aid, Fiscal Year 2009, Series S-5, Rev., 5.000%, 01/15/26 | | | 117 | |
| | | | | | | | |
| | | | Prerefunded — 1.1% | |
| | 85 | | | City of New York, Sub Series E-1, GO, 6.250%, 10/15/18 (p) | | | 91 | |
| | 30 | | | New York State Thruway Authority, 2nd General Highway & Bridge Trust Fund, Series B, Rev., 5.000%, 10/01/18 (p) | | | 32 | |
| | | | | | | | |
| | | | | | | 123 | |
| | | | | | | | |
| | | | Special Tax — 1.5% | |
| | 150 | | | New York State Dormitory Authority, State Personal Income Tax, General Purpose, Series C, Rev., 5.000%, 03/15/33 | | | 173 | |
| | | | | | | | |
| | | | Transportation — 4.1% | |
| | 410 | | | Triborough Bridge & Tunnel Authority, MTA Bridges & Tunnels, Series A, Rev., 5.000%, 01/01/26 | | | 472 | |
| | | | | | | | |
| | | | Total New York | | | 1,082 | |
| | | | | | | | |
| | | | Ohio — 5.3% | |
| | | | General Obligation — 2.3% | |
| | 100 | | | Franklin County, Various Purpose, GO, 5.000%, 12/01/19 | | | 106 | |
| | 125 | | | State of Ohio, Common Schools, Series A, GO, 5.000%, 09/15/26 | | | 155 | |
| | | | | | | | |
| | | | | | | 261 | |
| | | | | | | | |
| | | | Prerefunded — 3.0% | |
| | 25 | | | Barberton City School District, GO, 5.250%, 06/01/18 (p) | | | 26 | |
SEE NOTES TO FINANCIAL STATEMENTS.
| | | | | | |
| | | |
| 12 | | | | J.P. MORGAN SMA FUNDS | | APRIL 30, 2017 |
| | | | | | | | |
PRINCIPAL AMOUNT($) | | | SECURITY DESCRIPTION | | VALUE($) | |
| | Municipal Bonds — continued | |
| | | | Prerefunded — continued | |
| | 250 | | | City of Columbus, Series 1, GO, 5.000%, 07/01/23 (p) | | | 299 | |
| | 20 | | | Village of New Albany, GO, AMBAC, 5.000%, 12/01/17 (p) | | | 21 | |
| | | | | | | | |
| | | | | | | 346 | |
| | | | | | | | |
| | | | Total Ohio | | | 607 | |
| | | | | | | | |
| | | | Oregon — 2.4% | |
| | | | General Obligation — 2.4% | |
| | 5 | | | Clackamas County School District No 115, Gladstone School District, GO, 2.000%, 06/15/17 | | | 5 | |
| | 215 | | | Clackamas County School District No. 7J, Lake Oswego, GO, AGM, 5.250%, 06/01/25 | | | 266 | |
| | | | | | | | |
| | | | Total Oregon | | | 271 | |
| | | | | | | | |
| | | | Pennsylvania — 0.4% | |
| | | | General Obligation — 0.4% | |
| | 25 | | | Bethel Park School District, GO, 4.000%, 08/01/17 | | | 25 | |
| | 15 | | | Central Bucks School District, Series A, GO, 5.000%, 05/15/23 | | | 17 | |
| | | | | | | | |
| | | | Total Pennsylvania | | | 42 | |
| | | | | | | | |
| | | | South Carolina — 3.0% | |
| | | | General Obligation — 3.0% | |
| | 300 | | | State of South Carolina, Series C, GO, 5.000%, 03/01/22 | | | 341 | |
| | | | | | | | |
| | | | Tennessee — 0.7% | |
| | | | Prerefunded — 0.4% | |
| | 50 | | | Metropolitan Government of Nashville & Davidson County, GO, 5.000%, 01/01/18 (p) | | | 52 | |
| | | | | | | | |
| | | | Water & Sewer — 0.3% | |
| | 30 | | | City of Knoxville, Water System, Series BB, Rev., 5.000%, 03/01/19 | | | 32 | |
| | | | | | | | |
| | | | Total Tennessee | | | 84 | |
| | | | | | | | |
| | | | Texas — 11.6% | |
| | | | Education — 3.1% | |
| | 30 | | | Harris County, Cultural Education Facilities Finance Corp., Methodist Hospital System, Series B, Rev., 5.500%, 12/01/18 | | | 32 | |
| | 250 | | | Permanent University Fund — University of Texas System, Series B, Rev., 5.250%, 07/01/28 | | | 318 | |
| | | | | | | | |
| | | | | | | 350 | |
| | | | | | | | |
| | | | General Obligation — 2.4% | |
| | 250 | | | Hays County, Pass-Through Toll, GO, 5.000%, 02/15/23 | | | 275 | |
| | | | | | | | |
| | | | | | | | |
PRINCIPAL AMOUNT($) | | | SECURITY DESCRIPTION | | VALUE($) | |
| | | | | | | | |
| | | | Prerefunded — 5.8% | |
| | 355 | | | City of Houston, Combined Utility System, First Lien, Series D, Rev., 5.000%, 11/15/21 (p) | | | 411 | |
| | 30 | | | City of Rockwall, GO, AMBAC, 5.000%, 08/01/17 (p) | | | 30 | |
| | 210 | | | Harris County, Series C, Rev., 5.000%, 08/15/19 (p) | | | 228 | |
| | | | | | | | |
| | | | | | | 669 | |
| | | | | | | | |
| | | | Water & Sewer — 0.3% | |
| | 30 | | | North Texas Municipal Water District, Water System, Rev., 5.250%, 09/01/20 | | | 34 | |
| | | | | | | | |
| | | | Total Texas | | | 1,328 | |
| | | | | | | | |
| | | | Utah — 2.1% | |
| | | | Other Revenue — 2.1% | |
| | 200 | | | Utah Transit Authority Sales Tax, Subordinate Sales Tax, Series A, Rev., 5.000%, 06/15/29 | | | 238 | |
| | | | | | | | |
| | | | Virginia — 7.5% | |
| | | | Education — 1.0% | |
| | 50 | | | University of Virginia, Rev., 4.000%, 09/01/21 | | | 56 | |
| | 50 | | | Virginia College Building Authority, 21st Century College & Equipment Programs, Educational Facilities, Series E-2, Rev., 5.000%, 02/01/23 | | | 59 | |
| | | | | | | | |
| | | | | | | 115 | |
| | | | | | | | |
| | | | General Obligation — 3.7% | |
| | 50 | | | City of Alexandria, Series A, GO, 4.500%, 06/15/20 | | | 55 | |
| | 300 | | | County of Chesterfield, Public Improvement, GO, 5.000%, 01/01/24 | | | 362 | |
| | | | | | | | |
| | | | | | | 417 | |
| | | | | | | | |
| | | | Utility — 2.6% | |
| | 250 | | | City of Richmond, Public Utility Revenue, Series A, Rev., 5.000%, 01/15/25 | | | 302 | |
| | | | | | | | |
| | | | Water & Sewer — 0.2% | |
| | 25 | | | County of Henrico, Water & Sewer System, Rev., 3.000%, 05/01/17 | | | 25 | |
| | | | | | | | |
| | | | Total Virginia | | | 859 | |
| | | | | | | | |
| | | | Washington — 1.5% | |
| | | | Transportation — 1.5% | |
| | 150 | | | Central Puget Sound Regional Transportation Authority, Sales Tax & Motor Vehicle Excise Tax, Series P-1, Rev., 5.000%, 02/01/25 | | | 174 | |
| | | | | | | | |
| | | | Total Municipal Bonds
(Cost $9,983) | | | 10,403 | |
| | | | | | | | |
SEE NOTES TO FINANCIAL STATEMENTS.
| | | | | | | | |
| | | |
| APRIL 30, 2017 | | J.P. MORGAN SMA FUNDS | | | | | 13 | |
JPMorgan Tax Aware Real Return SMA Fund
SCHEDULE OF PORTFOLIO INVESTMENTS
AS OF APRIL 30, 2017 (Unaudited) (continued)
(Amounts in thousands)
| | | | | | | | |
SHARES | | | SECURITY DESCRIPTION | | VALUE($) | |
| | Short-Term Investment — 7.5% | |
| | | | Investment Company — 7.5% | |
| | 862 | | | JPMorgan U.S. Government Money Market Fund, Institutional Class Shares, 0.620% (b) (l)
(Cost $862) | | | 862 | |
| | | | | | | | |
| | | | Total Investments — 98.4%
(Cost $10,845) | | | 11,265 | |
| | | | Other Assets in Excess of
Liabilities — 1.6% | | | 183 | |
| | | | | | | | |
| | | | NET ASSETS — 100.0% | | $ | 11,448 | |
| | | | | | | | |
Percentages indicated are based on net assets.
| | | | | | | | | | | | | | | | |
| Inflation-Linked Swaps | | | | | | | | | | | | | |
| | | RATE TYPE (r) | | | | | | | | | |
| SWAP COUNTERPARTY | | PAYMENTS MADE
BY THE FUND | | PAYMENTS RECEIVED
BY THE FUND | | TERMINATION
DATE | | | NOTIONAL
AMOUNT | | | VALUE | |
Bank of America NA | | 1.700% at termination | | CPI-U at termination | | | 04/04/18 | | | $ | 500 | | | $ | 3 | |
BNP Paribas | | 1.695% at termination | | CPI-U at termination | | | 06/02/19 | | | | 1,250 | | | | 18 | |
BNP Paribas | | 2.720% at termination | | CPI-U at termination | | | 04/01/21 | | | | 6,000 | | | | (639 | ) |
BNP Paribas | | 2.165% at termination | | CPI-U at termination | | | 04/04/24 | | | | 600 | | | | (3 | ) |
Royal Bank of Scotland | | 2.620% at termination | | CPI-U at termination | | | 06/28/25 | | | | 1,000 | | | | (119 | ) |
Union Bank of Switzerland AG | | 2.275% at termination | | CPI-U at termination | | | 03/16/27 | | | | 700 | | | | (3 | ) |
| | | | | | | | | | | | | | | | |
| | | | | | | | | | | | | | $ | (743 | ) |
| | | | | | | | | | | | | | | | |
SEE NOTES TO FINANCIAL STATEMENTS.
| | | | | | |
| | | |
| 14 | | | | J.P. MORGAN SMA FUNDS | | APRIL 30, 2017 |
J.P. Morgan SMA Funds
NOTES TO SCHEDULE OF PORTFOLIO INVESTMENTS
AS OF APRIL 30, 2017 (Unaudited)
| | |
| AGC | | — Insured by Assured Guaranty Corp. |
| AGM | | — Insured by Assured Guaranty Municipal Corp. |
| AMBAC | | — Insured by American Municipal Bond Assurance Corp. |
| COP | | — Certificate of Participation |
| CPI-U | | — Consumer Price Index for All Urban Consumers |
| FGIC | | — Insured by Financial Guaranty Insurance Co. |
| GO | | — General Obligation |
| ICC | | — Insured Custody Certificates |
| MTA | | — Metropolitan Transportation Authority |
| NATL | | — Insured by National Public Finance Guarantee Corp. |
| RE | | — Reinsured |
| Rev. | | — Revenue |
| TRAN | | — Tax & Revenue Anticipation Note |
| XLCA | | — Insured by XL Capital Assurance |
| | |
| (a) | | — Non-income producing security. |
| (b) | | — Investment in affiliate. Money market fund is registered under the Investment Company Act of 1940, as amended, and advised by J.P. Morgan Investment Management Inc. |
| (l) | | — The rate shown is the current yield as of April 30, 2017. |
| (p) | | — Security is prerefunded or escrowed to maturity. |
| (r) | | — Rates shown are per annum and payments are as described. |
| (t) | | — The date shown represents the earliest of the prerefunded date, next put date, or final maturity date. |
SEE NOTES TO FINANCIAL STATEMENTS.
| | | | | | | | |
| | | |
| APRIL 30, 2017 | | J.P. MORGAN SMA FUNDS | | | | | 15 | |
STATEMENTS OF ASSETS AND LIABILITIES
AS OF APRIL 30, 2017 (Unaudited)
(Amounts in thousands, except per share amounts)
| | | | | | | | |
| | | International
Value SMA
Fund | | | Tax Aware
Real Return
SMA Fund | |
ASSETS: | | | | | | | | |
Investments in non-affiliates, at value | | $ | 65,604 | | | $ | 10,403 | |
Investments in affiliates, at value | | | — | | | | 862 | |
| | | | | | | | |
Total investment securities, at value | | | 65,604 | | | | 11,265 | |
Restricted cash | | | — | | | | 830 | |
Cash | | | 1,921 | | | | — | |
Foreign currency, at value | | | 4 | | | | — | |
Receivables: | | | | | | | | |
Fund shares sold | | | 20 | | | | — | |
Interest and dividends from non-affiliates | | | 243 | | | | 130 | |
Dividends from affiliates | | | — | | | | 1 | |
Tax reclaims | | | 237 | | | | — | |
Outstanding swap contracts, at value | | | — | | | | 21 | |
Due from adviser | | | 26 | | | | 22 | |
| | | | | | | | |
Total Assets | | | 68,055 | | | | 12,269 | |
| | | | | | | | |
| | |
LIABILITIES: | | | | | | | | |
Payables: | | | | | | | | |
Fund shares redeemed | | | 8 | | | | — | |
Outstanding swap contracts, at value | | | — | | | | 764 | |
Accrued liabilities: | | | | | | | | |
Custodian and accounting fees | | | 7 | | | | — | |
Collateral management fees | | | — | | |
| 5
|
|
Trustees’ and Chief Compliance Officer’s fees | | | — | (a) | | | — | (a) |
Audit fees | | | 19 | | | | 50 | |
Printing and mailing cost | | | 6 | | | | 2 | |
Registration fee | | | 7 | | | | — | |
Other | | | 5 | | | | — | |
| | | | | | | | |
Total Liabilities | | | 52 | | | | 821 | |
| | | | | | | | |
Net Assets | | $ | 68,003 | | | $ | 11,448 | |
| | | | | | | | |
NET ASSETS: | | | | | | | | |
Paid-in-Capital | | $ | 67,994 | | | $ | 11,925 | |
Accumulated undistributed (distributions in excess of) net investment income | | | 203 | | | | (4 | ) |
Accumulated net realized gains (losses) | | | (12,198 | ) | | | (150 | ) |
Net unrealized appreciation (depreciation) | | | 12,004 | | | | (323 | ) |
| | | | | | | | |
Total Net Assets | | $ | 68,003 | | | $ | 11,448 | |
| | | | | | | | |
| | |
Outstanding units of beneficial interest (shares) ($0.0001 par value; unlimited number of shares authorized): | | | 5,371 | | | | 1,143 | |
Net asset value, offering and redemption price per share (b) | | $ | 12.66 | | | $ | 10.02 | |
| | | | | | | | |
Cost of investments in non-affiliates | | $ | 53,568 | | | $ | 9,983 | |
Cost of investments in affiliates | | | — | | | | 862 | |
Cost of foreign currency | | | 4 | | | | — | |
| (a) | Amount rounds to less than 500. |
| (b) | Per share amounts may not recalculate due to rounding of net assets and/or shares outstanding. |
SEE NOTES TO FINANCIAL STATEMENTS.
| | | | | | |
| | | |
| 16 | | | | J.P. MORGAN SMA FUNDS | | APRIL 30, 2017 |
STATEMENTS OF OPERATIONS
FOR THE SIX MONTHS ENDED APRIL 30, 2017 (Unaudited)
(Amounts in thousands)
| | | | | | | | |
| | | International
Value SMA
Fund | | | Tax Aware
Real Return
SMA Fund | |
INVESTMENT INCOME: | | | | | | | | |
Interest income from non-affiliates | | $ | — | | | $ | 129 | |
Interest income from affiliates | | | — | (a) | | | 1 | |
Dividend income from non-affiliates | | | 739 | | | | — | |
Dividend income from affiliates | | | — | | | | 2 | |
Foreign taxes withheld | | | (102 | ) | | | — | |
| | | | | | | | |
Total investment income | | | 637 | | | | 132 | |
| | | | | | | | |
| | |
EXPENSES: | | | | | | | | |
Administration fees | | | 28 | | | | 4 | |
Custodian and accounting fees | | | 23 | | | | 10 | |
Interest expense to affiliates | | | 1 | | | | — | |
Professional fees | | | 55 | | | | 44 | |
Collateral management fees | | | — | | | | 15 | |
Trustees’ and Chief Compliance Officer’s fees | | | 13 | | | | 13 | |
Printing and mailing costs | | | 7 | | | | 3 | |
Registration and filing fees | | | 10 | | | | 17 | |
Transfer agency fees | | | — | (a) | | | — | (a) |
Sub-transfer agency fees | | | 2 | | | | — | (a) |
Other | | | 5 | | | | 1 | |
| | | | | | | | |
Total expenses | | | 144 | | | | 107 | |
| | | | | | | | |
Less fees waived | | | (28 | ) | | | (4 | ) |
Less expense reimbursements | | | (115 | ) | | | (103 | ) |
| | | | | | | | |
Net expenses | | | 1 | | | | — | |
| | | | | | | | |
Net investment income (loss) | | | 636 | | | | 132 | |
| | | | | | | | |
| | |
REALIZED/UNREALIZED GAINS (LOSSES): | | | | | | | | |
Net realized gain (loss) on transactions from: | | | | | | | | |
Investments in non-affiliates | | | 3,946 | | | | 2 | |
Futures | | | 21 | | | | — | |
Foreign currency transactions | | | (38 | ) | | | — | |
| | | | | | | | |
Net realized gain (loss) | | | 3,929 | | | | 2 | |
| | | | | | | | |
Change in net unrealized appreciation/depreciation on: | | | | | | | | |
Investments in non-affiliates | | | 4,336 | | | | (133 | ) |
Foreign currency translations | | | (8 | ) | | | — | |
Swaps | | | — | | | | 114 | |
| | | | | | | | |
Change in net unrealized appreciation/depreciation | | | 4,328 | | | | (19 | ) |
| | | | | | | | |
Net realized/unrealized gains (losses) | | | 8,257 | | | | (17 | ) |
| | | | | | | | |
Change in net assets resulting from operations | | $ | 8,893 | | | $ | 115 | |
| | | | | | | | |
| (a) | Amount rounds to less than 500. |
SEE NOTES TO FINANCIAL STATEMENTS.
| | | | | | | | |
| | | |
| APRIL 30, 2017 | | J.P. MORGAN SMA FUNDS | | | | | 17 | |
STATEMENTS OF CHANGES IN NET ASSETS
FOR THE PERIODS INDICATED
(Amounts in thousands)
| | | | | | | | | | | | | | | | |
| | | International Value SMA Fund | | | Tax Aware Real Return SMA Fund | |
| | | Six Months Ended
April 30, 2017
(Unaudited) | | | Year Ended
October 31, 2016 | | | Six Months Ended
April 30, 2017
(Unaudited) | | | Year Ended
October 31, 2016 | |
CHANGE IN NET ASSETS RESULTING FROM OPERATIONS: | |
Net investment income (loss) | | $ | 636 | | | $ | 1,934 | | | $ | 132 | | | $ | 289 | |
Net realized gain (loss) | | | 3,929 | | | | (4,971 | ) | | | 2 | | | | 164 | |
Change in net unrealized appreciation/depreciation | | | 4,328 | | | | 1,947 | | | | (19 | ) | | | (61 | ) |
| | | | | | | | | | | | | | | | |
Change in net assets resulting from operations | | | 8,893 | | | | (1,090 | ) | | | 115 | | | | 392 | |
| | | | | | | | | | | | | | | | |
| | | | |
DISTRIBUTIONS TO SHAREHOLDERS: | | | | | | | | | | | | | | | | |
From net investment income | | | (2,258 | ) | | | (3,412 | ) | | | (137 | ) | | | (290 | ) |
| | | | | | | | | | | | | | | | |
| | | | |
CAPITAL TRANSACTIONS: | | | | | | | | | | | | | | | | |
Proceeds from shares issued | | | 11,344 | | | | 24,016 | | | | 2,840 | | | | 3,956 | |
Distributions reinvested | | | 1,413 | | | | 1,944 | | | | — | | | | — | |
Cost of shares redeemed | | | (28,137 | ) | | | (50,767 | ) | | | (1,567 | ) | | | (4,944 | ) |
| | | | | | | | | | | | | | | | |
Change in net assets resulting from capital transactions | | | (15,380 | ) | | | (24,807 | ) | | | 1,273 | | | | (988 | ) |
| | | | | | | | | | | | | | | | |
| | | | |
NET ASSETS: | | | | | | | | | | | | | | | | |
Change in net assets | | | (8,745 | ) | | | (29,309 | ) | | | 1,251 | | | | (886 | ) |
Beginning of period | | | 76,748 | | | | 106,057 | | | | 10,197 | | | | 11,083 | |
| | | | | | | | | | | | | | | | |
End of period | | $ | 68,003 | | | $ | 76,748 | | | $ | 11,448 | | | $ | 10,197 | |
| | | | | | | | | | | | | | | | |
Accumulated undistributed (distributions in excess of) net investment income | | $ | 203 | | | $ | 1,825 | | | $ | (4 | ) | | $ | 1 | |
| | | | | | | | | | | | | | | | |
SHARE TRANSACTIONS: | | | | | | | | | | | | | | | | |
Issued | | | 977 | | | | 2,260 | | | | 286 | | | | 394 | |
Reinvested | | | 124 | | | | 173 | | | | — | | | | — | |
Redeemed | | | (2,421 | ) | | | (4,564 | ) | | | (158 | ) | | | (493 | ) |
| | | | | | | | | | | | | | | | |
Change in Shares | | | (1,320 | ) | | | (2,131 | ) | | | 128 | | | | (99 | ) |
| | | | | | | | | | | | | | | | |
SEE NOTES TO FINANCIAL STATEMENTS.
| | | | | | |
| | | |
| 18 | | | | J.P. MORGAN SMA FUNDS | | APRIL 30, 2017 |
THIS PAGE IS INTENTIONALLY LEFT BLANK
| | | | | | | | |
| | | |
| APRIL 30, 2017 | | J.P. MORGAN SMA FUNDS | | | | | 19 | |
FINANCIAL HIGHLIGHTS
FOR THE PERIODS INDICATED
| | | | | | | | | | | | | | | | | | | | | | | | |
| | | Per share operating performance | |
| | | | | | Investment operations | | | Distributions | | | | |
| | | Net asset
value,
beginning
of period | | | Net
investment
income
(loss) | | | Net realized
and unrealized
gains
(losses) on
investments | | | Total from
investment
operations | | | Net
investment
income | | | | |
| | | |
International Value SMA Fund | | | | | | | | | | | | | |
Six Months Ended April 30, 2017 (Unaudited) | | $ | 11.47 | | | $ | 0.11 | (f) | | $ | 1.45 | | | $ | 1.56 | | | $ | (0.37 | ) | | | | |
Year Ended October 31, 2016 | | | 12.02 | | | | 0.25 | (f) | | | (0.36 | ) | | | (0.11 | ) | | | (0.44 | ) | | | | |
Year Ended October 31, 2015 | | | 12.78 | | | | 0.26 | (f) | | | (0.69 | ) | | | (0.43 | ) | | | (0.33 | ) | | | | |
Year Ended October 31, 2014 | | | 13.87 | | | | 0.30 | | | | (1.12 | ) | | | (0.82 | ) | | | (0.27 | ) | | | | |
Year Ended October 31, 2013 | | | 11.31 | | | | 0.31 | | | | 2.69 | | | | 3.00 | | | | (0.44 | ) | | | | |
Year Ended October 31, 2012 | | | 11.47 | | | | 0.43 | | | | (0.21 | ) | | | 0.22 | | | | (0.38 | ) | | | | |
| (a) | Annualized for periods less than one year, unless otherwise noted. |
| (b) | Not annualized for periods less than one year. |
| (c) | Includes adjustments in accordance with accounting principles generally accepted in the United States of America and as such, the net asset values for financial reporting purposes and the returns based upon those net asset values may differ from the net asset values and returns for shareholder transactions. |
| (d) | Includes interest expense, if applicable, which is less than 0.005% unless otherwise noted. |
| (e) | The Fund’s expenses have been contractually capped at 0.00%. See Note 3.E. in the Notes to Financial Statements. The Fund is an integral part of “separately managed accounts” programs sponsored by investment advisors and/or broker-dealers, some of which are unaffiliated with the Funds and the Investment Advisor. Participants in these programs pay a fee to the sponsor of the program. |
| (f) | Calculated based upon average shares outstanding. |
SEE NOTES TO FINANCIAL STATEMENTS.
| | | | | | |
| | | |
| 20 | | | | J.P. MORGAN SMA FUNDS | | APRIL 30, 2017 |
| | | | | | | | | | | | | | | | | | | | | | | | | | |
| | | | | | Ratios/Supplemental data | |
| | | | | | | | | | Ratios to average net assets (a) | | | | |
| | | | | | |
Net asset
value,
end of
period | | | Total
return (b)(c) | | | Net assets,
end of
period
(000’s) | | | Net
expenses (d)(e) | | | Net investment income (loss) | | | Expenses without waivers and reimbursements | | | Portfolio
turnover
rate (b) | |
| | | | | | |
| | | | | | | | | | | | | | | | | | | | | | | | | | |
| $ | 12.66 | | | | 13.93 | % | | $ | 68,003 | | | | — | % | | | 1.83 | % | | | 0.42 | % | | | 30 | % |
| | 11.47 | | | | (0.83 | ) | | | 76,748 | | | | — | | | | 2.31 | | | | 0.33 | | | | 70 | |
| | 12.02 | | | | (3.42 | ) | | | 106,057 | | | | — | | | | 2.11 | | | | 0.20 | | | | 113 | |
| | 12.78 | | | | (6.04 | ) | | | 316,962 | | | | — | | | | 2.22 | | | | 0.17 | | | | 85 | |
| | 13.87 | | | | 27.33 | | | | 325,158 | | | | — | | | | 2.66 | | | | 0.22 | | | | 72 | |
| | 11.31 | | | | 2.28 | | | | 201,942 | | | | — | | | | 3.58 | | | | 0.21 | | | | 81 | |
SEE NOTES TO FINANCIAL STATEMENTS.
| | | | | | | | |
| | | |
| APRIL 30, 2017 | | J.P. MORGAN SMA FUNDS | | | | | 21 | |
FINANCIAL HIGHLIGHTS
FOR THE PERIODS INDICATED
| | | | | | | | | | | | | | | | | | | | |
| | | Per share operating performance | |
| | | | | | Investment operations | | | Distributions | |
| | | Net asset
value,
beginning
of period | | | Net
investment
income
(loss) | | | Net realized
and unrealized
gains
(losses) on
investments | | | Total from
investment
operations | | | Net
investment
income | |
| | |
Tax Aware Real Return SMA Fund | | | | | | | | | |
Six Months Ended April 30, 2017 (Unaudited) | | $ | 10.04 | | | $ | 0.13 | (f) | | $ | (0.02 | ) | | $ | 0.11 | | | $ | (0.13 | ) |
Year Ended October 31, 2016 | | | 9.95 | | | | 0.28 | (f) | | | 0.09 | | | | 0.37 | | | | (0.28 | ) |
Year Ended October 31, 2015 | | | 10.52 | | | | 0.31 | (f) | | | (0.55 | ) | | | (0.24 | ) | | | (0.33 | ) |
Year Ended October 31, 2014 | | | 10.58 | | | | 0.30 | | | | (0.05 | ) | | | 0.25 | | | | (0.31 | ) |
Year Ended October 31, 2013 | | | 11.11 | | | | 0.29 | | | | (0.54 | ) | | | (0.25 | ) | | | (0.28 | ) |
Year Ended October 31, 2012 | | | 10.71 | | | | 0.27 | | | | 0.39 | | | | 0.66 | | | | (0.26 | ) |
| (a) | Annualized for periods less than one year, unless otherwise noted. |
| (b) | Not annualized for periods less than one year. |
| (c) | Includes adjustments in accordance with accounting principles generally accepted in the United States of America and as such, the net asset values for financial reporting purposes and the returns based upon those net asset values may differ from the net asset values and returns for shareholder transactions. |
| (d) | Includes earnings credits and interest expense, if applicable, each of which is less than 0.005% unless otherwise noted. |
| (e) | The Fund’s expenses have been contractually capped at 0.00%. See Note 3.E. in the Notes to Financial Statements. The Fund is an integral part of “separately managed accounts” programs sponsored by investment advisors and/or broker-dealers, some of which are unaffiliated with the Funds and the Investment Advisor. Participants in these programs pay a fee to the sponsor of the program. |
| (f) | Calculated based upon average shares outstanding. |
| (g) | Amount rounds to less than 0.005. |
SEE NOTES TO FINANCIAL STATEMENTS.
| | | | | | |
| | | |
| 22 | | | | J.P. MORGAN SMA FUNDS | | APRIL 30, 2017 |
| | | | | | | | | | | | | | | | | | | | | | | | | | |
| | | Ratios/Supplemental data | |
| | | | | | | | | | Ratios to average net assets (a) | | | | |
| | | | | | |
Net asset
value,
end of
period | | | Total return (b)(c) | | | Net assets,
end of
period
(000’s) | | | Net
expenses (d)(e) | | | Net
investment
income
(loss) | | | Expenses
without waivers
and
reimbursements | | | Portfolio
turnover
rate (b) | |
| | | | | | |
| | | | | | | | | | | | | | | | | | | | | | | | | | |
| $ | 10.02 | | | | 1.11 | % | | $ | 11,448 | | | | — | % | | | 2.53 | % | | | 2.06 | % | | | 4 | % |
| | 10.04 | | | | 3.80 | | | | 10,197 | | | | — | | | | 2.82 | | | | 1.97 | | | | 32 | |
| | 9.95 | | | | (2.27 | ) | | | 11,083 | | | | — | | | | 3.07 | | | | 1.01 | | | | — | (g) |
| | 10.52 | | | | 2.38 | | | | 20,947 | | | | — | | | | 2.85 | | | | 0.78 | | | | 6 | |
| | 10.58 | | | | (2.29 | ) | | | 27,244 | | | | — | | | | 2.58 | | | | 0.60 | | | | 16 | |
| | 11.11 | | | | 6.24 | | | | 39,681 | | | | — | | | | 2.45 | | | | 0.51 | | | | 4 | |
SEE NOTES TO FINANCIAL STATEMENTS.
| | | | | | | | |
| | | |
| APRIL 30, 2017 | | J.P. MORGAN SMA FUNDS | | | | | 23 | |
NOTES TO FINANCIAL STATEMENTS
AS OF APRIL 30, 2017 (Unaudited)
1. Organization
JPMorgan Trust I (the “Trust”) was formed on November 12, 2004, as a Delaware statutory trust, pursuant to a Declaration of Trust dated November 5, 2004 and is registered under the Investment Company Act of 1940, as amended (the “1940 Act”), as an open-end management investment company.
The following are 2 separate funds of the Trust (collectively, the “Funds”) covered by this report:
| | |
| | | Diversified/Non-Diversified |
| International Value SMA Fund | | Diversified |
| Tax Aware Real Return SMA Fund | | Diversified |
The investment objective of International Value SMA Fund is to seek to provide high total return from a portfolio of foreign company equity securities.
The investment objective of Tax Aware Real Return SMA Fund is to seek to maximize after-tax inflation protected return.
Shares of the Funds may be purchased only by or on behalf of separately managed accounts where J.P. Morgan Investment Management Inc. (the “Adviser” or “JPMIM”), an indirect, wholly-owned subsidiary of JPMorgan Chase & Co. (“JPMorgan”), serves as the investment adviser, sub-adviser or model portfolio provider for the account with the separately managed account sponsor or directly with the client. The Funds’ shares may not be purchased directly by individuals.
2. Significant Accounting Policies
The following is a summary of significant accounting policies followed by the Funds in the preparation of their financial statements. The Funds are investment companies and, accordingly, follow the investment company accounting and reporting guidance of the Financial Accounting Standards Board Accounting Standards Codification Topic 946 — Investment Companies, which is part of U.S. generally accepted accounting principles (“GAAP”). The preparation of financial statements in conformity with GAAP requires management to make estimates and assumptions that affect the reported amounts of assets and liabilities and disclosure of contingent assets and liabilities at the date of the financial statements and the reported amounts of increases and decreases in net assets from operations during the reporting period. Actual results could differ from those estimates.
A. Valuation of Investments — The valuation of investments is in accordance with GAAP and the Funds’ valuation policies set forth by and under the supervision and responsibility of the Board of Trustees (the “Board”), which established the following approach to valuation, as described more fully below: (i) investments for which market quotations are readily available shall be valued at such unadjusted quoted prices and (ii) all other investments for which market quotations are not readily available shall be valued at their fair value as determined in good faith by the Board.
The Administrator has established the J.P. Morgan Investment Management Americas Valuation Committee (“AVC”) to assist the Board with the oversight and monitoring of the valuation of the Funds’ investments. The Administrator implements the valuation policies of the Funds’ investments, as directed by the Board. The AVC oversees and carries out the policies for the valuation of investments held in the Funds. This includes monitoring the appropriateness of fair values based on results of ongoing valuation oversight, including but not limited to consideration of macro or security specific events, market events and pricing vendor and broker due diligence. The Administrator is responsible for discussing and assessing the potential impacts to the fair values on an ongoing basis, and at least on a quarterly basis with the AVC and the Board.
Fixed income instruments are valued based on prices received from approved affiliated and unaffiliated pricing vendors or third party broker-dealers (collectively referred to as “Pricing Services”). The Pricing Services use multiple valuation techniques to determine the valuation of fixed income instruments. In instances where sufficient market activity exists, the Pricing Services may utilize a market-based approach through which trades or quotes from market makers are used to determine the valuation of these instruments. In instances where sufficient market activity may not exist, the Pricing Services also utilize proprietary valuation models which may consider market transactions in comparable securities and the various relationships between securities in determining fair value and/or market characteristics in order to estimate the relevant cash flows, which are then discounted to calculate the fair values.
Equities and other exchange-traded instruments are valued at the last sale price or official market closing price on the primary exchange on which the instrument is traded before the net asset values (“NAV”) of the Funds are calculated on a valuation date. Certain foreign equity instruments, including investments with equity reference obligations, are valued by applying an international fair value factor provided by approved Pricing Services. The factors seek to adjust the local closing price for movements of local markets post-closing, but prior to the time the NAVs are calculated.
Investments in open-end investment companies (the “Underlying Funds”) are valued at each Underlying Fund’s NAV per share as of the report date.
Futures are generally valued on the basis of available market quotations. Swaps are valued utilizing market quotations from approved Pricing Services.
Valuations reflected in this report are as of the report date. As a result, changes in valuation due to market events and/or issuer related events after the report date and prior to issuance of the report are not reflected herein.
The various inputs that are used in determining the valuation of the Funds’ investments are summarized into the three broad levels listed below.
| • | | Level 1 — Unadjusted inputs using quoted prices in active markets for identical investments. |
| • | | Level 2 — Other significant observable inputs including, but not limited to, quoted prices for similar investments, inputs other than quoted prices that are observable for investments (such as interest rates, prepayment speeds, credit risk, etc.) or other market corroborated inputs. |
| | | | | | |
| | | |
| 24 | | | | J.P. MORGAN SMA FUNDS | | APRIL 30, 2017 |
| • | | Level 3 — Significant inputs based on the best information available in the circumstances, to the extent observable inputs are not available (including the Funds’ assumptions in determining the fair value of investments). |
A financial instrument’s level within the fair value hierarchy is based on the lowest level of any input, both individually and in the aggregate, that is significant to the fair value measurement. The inputs or methodology used for valuing instruments are not necessarily an indication of the risk associated with investing in those instruments.
The following tables represent each valuation input as presented on the Schedules of Portfolio Investments (“SOIs”) (amounts in thousands):
International Value SMA Fund
| | | | | | | | | | | | | | | | |
| | | Level 1
Quoted prices | | | Level 2
Other significant
observable inputs | | | Level 3
Significant
unobservable inputs | | | Total | |
Total Investments in Securities (a) | | $ | — | | | $ | 65,604 | | | $ | — | | | $ | 65,604 | |
| | | | | | | | | | | | | | | | |
Tax Aware Real Return SMA Fund
| | | | | | | | | | | | | | | | |
| | | Level 1
Quoted prices | | | Level 2
Other significant
observable inputs | | | Level 3
Significant
unobservable inputs | | | Total | |
Total Investments in Securities (b) | | $ | 862 | | | $ | 10,403 | | | $ | — | | | $ | 11,265 | |
| | | | | | | | | | | | | | | | |
Appreciation in Other Financial Instruments | | | | | | | | | | | | | | | | |
Inflation-Linked Swaps | | $ | — | | | $ | 21 | | | $ | — | | | $ | 21 | |
| | | | | | | | | | | | | | | | |
Depreciation in Other Financial Instruments | | | | | | | | | | | | | | | | |
Inflation-Linked Swaps | | $ | — | | | $ | (764 | ) | | $ | — | | | $ | (764 | ) |
| | | | | | | | | | | | | | | | |
| (a) | All portfolio holdings designated as level 2 are disclosed individually on the SOIs. Please refer to the SOIs for country specifics of portfolio holdings. |
| (b) | All portfolio holdings designated as level 1 and level 2 are disclosed individually on the SOIs. Level 1 consists of a money market mutual fund that is held for daily investments of cash. Please refer to the SOIs for state specifics of portfolio holdings. |
There were no transfers among any levels during the six months ended April 30, 2017.
B. Restricted Securities — Certain securities held by International Value SMA Fund may be subject to legal or contractual restrictions on resale. Restricted securities generally are resold in transactions exempt from registration under the Securities Act of 1933 (the “Securities Act”). Disposal of these securities may involve time-consuming negotiations and expense. Prompt sale at the current valuation may be difficult and could adversely affect the net asset value of the Fund.
As of April 30, 2017, International Value SMA Fund had no investments in restricted securities under the Securities Act.
C. Futures Contracts — International Value SMA Fund used index futures contracts to gain or reduce exposure to the market, maintain liquidity or minimize transaction costs. The Fund also bought futures contracts to invest incoming cash in the market or sold futures in response to cash outflows, thereby simulating an invested position in the underlying index. The use of futures contracts exposes the Fund to equity price risk.
Futures contracts provide for the delayed delivery of the underlying instrument at a fixed price or are settled for a cash amount based on the change in the value of the underlying instrument at a specific date in the future. Upon entering into a futures contract, the Fund is required to deposit with the broker, cash or securities in an amount equal to a certain percentage of the contract amount, which is referred to as the initial margin deposit. Subsequent payments, referred to as variation margin, are made or received by the Fund periodically and are based on changes in the market value of open futures contracts. Changes in the market value of open futures contracts are recorded as change in net unrealized appreciation/depreciation on the Statements of Operations. Realized gains or losses, representing the difference between the value of the contract at the time it was opened and the value at the time it was closed, are reported on the Statements of Operations at the closing or expiration of the futures contract. Securities deposited as initial margin are designated on the SOI and cash deposited is recorded on the Statements of Assets and Liabilities. A receivable from and/or a payable to brokers for the daily variation margin is also recorded on the Statements of Assets and Liabilities.
The Fund may be subject to the risk that the change in the value of the futures contract may not correlate perfectly with the underlying instrument. Use of long futures contracts subjects the Fund to risk of loss in excess of the amounts shown on the Statements of Assets and Liabilities, up to the notional amount of the futures contracts. Use of short futures contracts subjects the Fund to unlimited risk of loss. The Fund may enter into futures contracts only on exchanges or boards of trade. The exchange or board of trade acts as the counterparty to each futures transaction; therefore, the Fund’s credit risk is limited to failure of the exchange or board of trade. Under some circumstances, futures exchanges may establish daily limits on the amount that the price of a futures contract can vary from the previous day’s settlement price, which could effectively prevent liquidation of positions.
The Fund’s futures contracts are not subject to master netting arrangements (the right to close out all transactions traded with a counterparty and net amounts owed or due across transactions).
| | | | | | | | |
| | | |
| APRIL 30, 2017 | | J.P. MORGAN SMA FUNDS | | | | | 25 | |
NOTES TO FINANCIAL STATEMENTS
AS OF APRIL 30, 2017 (unaudited) (continued)
As of April 30, 2017, the Fund did not hold futures contracts.
The table below discloses the volume of the Fund’s futures contracts activity during the six months ended April 30, 2017 (amounts in thousands):
| | | | |
| | | International
Value SMA
Fund | |
Futures Contracts | | | | |
Average Notional Balance Long | | $ | 2,542 | (a) |
| (a) | For the period January 1, 2017 through January 31, 2017. |
D. Swaps — Tax Aware Real Return SMA Fund engaged in inflation-linked swaps to provide inflation protection within its portfolio. Swap transactions are negotiated contracts over the counter (“OTC swaps”) between a fund and a counterparty or centrally cleared (“centrally cleared swaps”) with a central clearinghouse through a Futures Commission Merchant (“FCM”), to exchange investment cash flows, assets, foreign currencies or market-linked returns at specified, future intervals.
Upfront payments made and/or received by the Fund are recorded as assets or liabilities, respectively in the Statements of Assets and Liabilities and amortized over the term of the swap. The value of an OTC swap agreement is recorded as either an asset or a liability on the Statements of Assets and Liabilities at the beginning of the measurement period. Upon entering into a centrally cleared swap, the Fund is required to deposit with the FCM cash or securities, which is referred to as initial margin deposit. Securities deposited as initial margin are designated on the SOI and cash deposited is recorded on the Statements of Assets and Liabilities. Daily changes in valuation of centrally cleared swaps, if any, are recorded as a variation margin receivable or payable on the Statements of Assets and Liabilities. The change in the value of swaps, including accruals of periodic amounts of interest to be paid or received on swaps, is reported as change in net unrealized appreciation/depreciation on the Statements of Operations. A realized gain or loss is recorded upon payment or receipt of a periodic payment or payment made upon termination of a swap agreement.
The use of swaps exposes the Fund to interest rate risk. The Fund also may be subject to various risks from the use of swaps including: (i) the risk that changes in the value of the swap may not correlate perfectly with the underlying rate; (ii) counterparty credit risk related to the failure, by the counterparty to the swap, to perform under the terms of the contract; (iii) liquidity risk related to the lack of a liquid market for these contracts allowing the Fund to close out its position(s); and, (iv) documentation risk relating to disagreement over contract terms.
The Fund is party to various derivative contracts governed by International Swaps and Derivatives Association master agreements (“ISDA agreements”). The Fund’s ISDA agreements, which are separately negotiated with each dealer counterparty, may contain provisions allowing, absent other considerations, a counterparty to exercise rights, to the extent not otherwise waived, against the Fund in the event the Fund’s net assets decline over time by a pre-determined percentage or fall below a pre-determined floor. The ISDA agreements may also contain provisions allowing, absent other conditions, the Fund to exercise rights, to the extent not otherwise waived, against the counterparty (e.g., decline in a counterparty’s credit rating below a specified level). Such rights for both the counterparty and Funds often include the ability to terminate (i.e., close out) open contracts at prices which may favor the counterparty, which could have an adverse effect on the Funds. The ISDA agreements gives the Fund and counterparty the right, upon an event of default, to close out all transactions traded under such agreements and to net amounts owed or due across all transactions and offset such net payable or receivable with collateral posted to a segregated account by one party to the other.
The Fund may be required to post or receive collateral for over the counter swaps.
The Fund’s swap contracts are subject to master netting arrangements.
The table below discloses the volume of the Fund’s swap activity during the six months ended April 30, 2017 (amounts in thousands):
| | | | |
| | | Tax Aware
Real Return SMA Fund | |
Interest Rate-Related Swaps (Inflation-Linked Swaps): | | | | |
Average Notional Balance — Pays Fixed Rate | | $ | 9,036 | |
Ending Notional Balance — Pays Fixed Rate | | | 10,050 | |
The Fund may be required to post or receive collateral based on the net value of the Fund’s outstanding OTC swap contracts, non-deliverable forward foreign currency contracts and/or OTC options with the counterparty in the form of cash or securities. Daily movement of collateral is subject to minimum threshold amounts. Collateral posted by the Fund is held in a segregated account at the Fund’s custodian bank. For certain counterparties cash collateral posted by the Fund is invested in an affiliated money market fund. Otherwise the cash collateral is included on the Statements of Assets and Liabilities as Restricted cash. Collateral received by the Fund is held in escrow in segregated accounts maintained by JPMorgan Chase Bank, N.A. (“JPMCB”), an affiliate of the Fund, which provides collateral management services to the Fund (See Note 3.F.). These amounts are not reflected on the Fund’s Statements of Assets and Liabilities and are disclosed in the table below.
| | | | | | |
| | | |
| 26 | | | | J.P. MORGAN SMA FUNDS | | APRIL 30, 2017 |
The Fund’s derivative contracts collateral requirements and collateral posted or received by counterparty as of April 30, 2017 are as follows (amounts in thousands):
| | | | | | | | | | | | | | |
| Fund | | | | | Fund Counterparty | | Value of
derivative
contracts | | | Collateral
amount | |
Tax Aware Real Return SMA Fund | | | Collateral Posted | | | BNP Paribas | | $ | (624 | ) | | $ | 570 | |
| | | | | | Royal Bank of Scotland | | | (119 | ) | | | 260 | |
E. Summary of Derivatives Information
The following table presents the value of derivatives held as of April 30, 2017, by their primary underlying risk exposure and respective location on the Statements of Assets and Liabilities (amounts in thousands):
Tax Aware Real Return SMA Fund
| | | | | | |
| Derivative Contracts | | Statements of Assets and Liabilities Location | | | |
| Gross Assets: | | | | Swaps | |
Interest rate contracts | | Receivables | | $ | 21 | |
| | | | | | |
| Gross Liabilities: | | | | Swaps | |
Interest rate contracts | | Payables | | $ | (764 | ) |
| | | | | | |
The following tables present the Fund’s gross derivative assets and liabilities by counterparty net of amounts available for offset under netting arrangements and net of any related collateral received or posted by the Fund as of April 30, 2017 (amounts in thousands):
Tax Aware Real Return SMA Fund
| | | | | | | | | | | | | | | | |
| Counterparty | | Gross Amount of
Derivative Assets
Subject to Netting
Arrangements
Presented on the
Statement of Assets
and Liabilities (a) | | | Derivatives
Available
for Offset | | | Collateral
Received | | | Net Amount Due
From Counterparty
(Not less than zero) | |
Bank of America N.A. | | $ | 3 | | | $ | — | | | $ | — | | | $ | 3 | |
BNP Paribas | | | 18 | | | | (18 | ) | | | — | | | | — | |
| | | | | | | | | | | | | | | | |
| | $ | 21 | | | $ | (18 | ) | | $ | — | | | $ | 3 | |
| | | | | | | | | | | | | | | | |
| | | | | | | | | | | | | | | | |
| Counterparty | | Gross Amount of
Derivative Liabilities
Subject to Netting
Arrangements
Presented on the
Statement of Assets
and Liabilities (a) | | | Derivatives
Available
for Offset | | | Collateral
Posted | | | Net Amount Due To Counterparty
(Not less than zero) | |
BNP Paribas | | $ | 642 | | | $ | (18 | ) | | $ | (570 | )(b) | | $ | 54 | |
Royal Bank of Scotland | | | 119 | | | | — | | | | (119 | )(b) | | | — | |
Union Bank of Switzerland AG | | | 3 | | | | — | | | | — | | | | 3 | |
| | | | | | | | | | | | | | | | |
| | $ | 764 | | | $ | (18 | ) | | $ | (689 | ) | | $ | 57 | |
| | | | | | | | | | | | | | | | |
| (a) | For financial reporting purposes, the Fund does not offset derivative assets and derivative liabilities subject to master netting arrangements on the Statements of Assets and Liabilities. |
| (b) | Collateral received or posted is limited to the net derivative asset or net derivative liability amounts. See Note 2.D. for actual swap collateral received or posted. |
The following tables present the effect of derivatives on the Statements of Operations for the six months ended April 30, 2017, by primary underlying risk exposure (amounts in thousands):
International Value SMA Fund
| | | | |
| Amount of Realized Gain (Loss) on Derivatives Recognized on the Statements of Operations | |
| Derivative Contracts | | Futures Contracts | |
Equity contracts | | $ | 21 | |
| | | | |
| | | | | | | | |
| | | |
| APRIL 30, 2017 | | J.P. MORGAN SMA FUNDS | | | | | 27 | |
NOTES TO FINANCIAL STATEMENTS
AS OF APRIL 30, 2017 (Unaudited) (continued)
Tax Aware Real Return SMA Fund
| | | | |
| Amount of Change in Unrealized Appreciation (Depreciation) on Derivatives Recognized on the Statements of Operations | |
| Derivative Contracts | | Swaps | |
Interest rate contracts | | $ | 114 | |
| | | | |
F. Foreign Currency Translation — The books and records of the Funds are maintained in U.S. dollars. Foreign currency amounts are translated into U.S. dollars at the prevailing exchange rates of such currencies against the U.S. dollar. The market value of investment securities and other assets and liabilities are translated at the exchange rate as of the valuation date. Purchases and sales of investment securities, income and expenses are translated at the exchange rate prevailing on the respective dates of such transactions.
The Funds do not isolate the effect of changes in foreign exchange rates from changes in market prices on securities held. Accordingly, such changes are included within Change in net unrealized appreciation/depreciation on investments on the Statements of Operations.
Reported realized foreign currency gains and losses arise from the disposition of foreign currency, currency gains or losses realized between the trade and settlement dates on securities transactions, and the difference between the amounts of dividends, interest and foreign withholding taxes recorded on the Fund’s books on the transaction date and the U.S. dollar equivalent of the amounts actually received or paid. These reported realized foreign currency gains and losses are included in Net realized gain (loss) on foreign currency transactions on the Statements of Operations. Unrealized foreign currency gains and losses arise from changes (due to changes in exchange rates) in the value of foreign currency and other assets and liabilities denominated in foreign currencies, which are held at period end and are included in Change in net unrealized appreciation/depreciation on foreign currency translations on the Statements of Operations.
G. Security Transactions and Investment Income — Investment transactions are accounted for on the trade date (the date the order to buy or sell is executed). Securities gains and losses are calculated on a specifically identified cost basis. Interest income is determined on the basis of coupon interest accrued using the effective interest method which adjusts for amortization of premiums and accretion of discounts. Dividend income, net of foreign taxes withheld, if any, is recorded on the ex-dividend date or when a Fund first learns of the dividend.
H. Allocation of Expenses — Expenses directly attributable to a fund are charged directly to that fund, while the expenses attributable to more than one fund of the Trust are allocated among the respective funds.
I. Federal Income Taxes — Each Fund is treated as a separate taxable entity for Federal income tax purposes. Each Fund’s policy is to comply with the provisions of the Internal Revenue Code of 1986, as amended (the “Code”), applicable to regulated investment companies and to distribute to shareholders all of its distributable net investment income and net realized capital gains on investments. Accordingly, no provision for Federal income tax is necessary. Management has reviewed the Funds’ tax positions for all open tax years and has determined that as of April 30, 2017, no liability for income tax is required in the Funds’ financial statements for net unrecognized tax benefits. However, management’s conclusions may be subject to future review based on changes in, or the interpretation of, the accounting standards or tax laws and regulations. Each of the Funds’ Federal tax returns for the prior three fiscal years remains subject to examination by the Internal Revenue Service.
J. Foreign Taxes — International Value SMA Fund may be subject to foreign taxes on income, gains on investments or currency purchases/repatriation, a portion of which may be recoverable. The Fund will accrue such taxes and recoveries as applicable, based upon its current interpretation of tax rules and regulations that exist in the markets in which it invests.
K. Distributions to Shareholders — Distributions from net investment income are generally declared and paid annually for International Value SMA Fund and monthly for Tax Aware Real Return SMA Fund. Net realized capital gains, if any, are distributed by each Fund at least annually. The amount of distributions from net investment income and net realized capital gains is determined in accordance with Federal income tax regulations, which may differ from GAAP. To the extent these “book/tax” differences are permanent in nature (i.e., that they result from other than timing of recognition — “temporary differences”), such amounts are reclassified within the capital accounts based on their Federal tax-basis treatment.
3. Fees and Other Transactions with Affiliates
A. Investment Advisory Fee — Pursuant to an Investment Advisory Agreement, the Adviser does not charge an advisory fee to the Funds. It should be understood, however, that the Funds are an integral part of separately managed account programs. Participants in these programs pay a fee to the sponsor of the program. The Adviser is compensated directly or indirectly by the separately managed account sponsors.
B. Administration Fee — Pursuant to an Administration Agreement, the Administrator provides certain administration services to the Funds. In consideration of these services, the Administrator receives a fee accrued daily and paid monthly at an annual rate of 0.15% of the first $25 billion of the average daily net assets of all funds in the J.P. Morgan Funds Complex covered by the Administration Agreement (excluding certain funds of funds and money market funds) and 0.075% of the average daily net assets in excess of $25 billion of all such funds. For the six months ended April 30, 2017, the effective annualized rate was 0.08% of each Fund’s average daily net assets, notwithstanding any fee waivers and/or expense reimbursements.
The Administrator waived Administration fees as outlined in Note 3.E.
JPMCB serves as the Funds’ sub-administrator (the “Sub-administrator”). For its services as Sub-administrator, JPMCB receives a portion of the fees payable to the Administrator.
| | | | | | |
| | | |
| 28 | | | | J.P. MORGAN SMA FUNDS | | APRIL 30, 2017 |
C. Distribution Fees — Pursuant to a Distribution Agreement, JPMorgan Distribution Services, Inc. (“JPMDS”), a wholly-owned subsidiary of JPMorgan, serves as the Trust’s principal underwriter and promotes and arranges for the sale of the Funds’ shares. JPMDS receives no compensation in its capacity as the Funds’ underwriter.
D. Custodian and Accounting Fees — JPMCB provides portfolio custody and accounting services to the Funds. For performing these services, the Funds pay JPMCB transaction and asset-based fees that vary according to the number of transactions and positions, plus out-of-pocket expenses. The amounts paid directly to JPMCB by the Funds for custody and accounting services are included in Custodian and accounting fees on the Statements of Operations. International Value SMA Fund earns interest on uninvested cash balances held by the custodian. Such interest amounts are presented separately on the Statements of Operations. For Tax Aware Real Return SMA Fund, payments to the custodian may be reduced by credits earned, if any, by the Fund, based on uninvested cash balances held by the custodian. Such earnings credits, if any, are presented separately on the Statements of Operations.
Interest expense paid to the custodian related to cash overdrafts, if any, is included in Interest expense to affiliates on the Statements of Operations.
E. Waivers and Reimbursements — No expenses or fees (excluding acquired fund fees and expenses, dividend expenses related to short sales, interest expenses related to short sales, interest, taxes, expenses related to litigation and potential litigation and extraordinary expenses) are borne by the Funds pursuant to contractual arrangements with the Adviser through February 28, 2018.
For the six months ended April 30, 2017, the Funds’ Adviser and the Administrator waived fees and/or reimbursed expenses for each of the Funds as follows (amounts in thousands). None of these parties expect the Funds to repay any such waived fees and/or reimbursed expenses in future years.
| | | | | | | | |
| | | Contractual
Waivers | | | Contractual
Reimbursements | |
International Value SMA Fund | | $ | 28 | | | $ | 115 | |
Tax Aware Real Return SMA Fund | | | 4 | | | | 103 | |
Additionally, the Funds may invest in one or more money market funds advised by the Adviser or its affiliates (affiliated money market funds). The Adviser, Administrator and/or JPMDS, as shareholder servicing agent, have contractually agreed to waive fees and/or reimburse expenses in an amount sufficient to offset the respective net fees each collects from the affiliated money market fund on the applicable Funds’ investment in such affiliated money market fund.
The amounts of these waivers/reimbursements resulting from investments in these money market funds for the six months ended April 30, 2017 was as follows (amounts in thousands):
| | | | |
Tax Aware Real Return SMA Fund | | $ | 1 | |
F. Collateral Management Fees — JPMCB provides derivatives collateral management services for Tax Aware Real Return SMA Fund. The amounts paid directly to JPMCB by the Fund for these services are included in Collateral Management fees on the Statements of Operations.
G. Other — The Funds may invest in affiliated J.P. Morgan money market funds. The Funds’ Adviser and its affiliates provide services to and receive fees from the J.P. Morgan money market funds; therefore, the Adviser and its affiliates may indirectly receive fees, including advisory fees, from the Funds.
Certain officers of the Trust are affiliated with the Adviser, the Administrator and JPMDS. Such officers, with the exception of the Chief Compliance Officer, receive no compensation from the Funds for serving in their respective roles.
The Board appointed a Chief Compliance Officer to the Funds in accordance with Federal securities regulations. Each Fund, along with other affiliated funds, makes reimbursement payments, on a pro-rata basis, to the Administrator for a portion of the fees associated with the Office of the Chief Compliance Officer. Such fees are included in Trustees’ and Chief Compliance Officer’s fees on the Statements of Operations.
The Trust adopted a Trustee Deferred Compensation Plan (the “Plan”) which allows the Independent Trustees to defer the receipt of all or a portion of compensation related to performance of their duties as Trustees. The deferred fees are invested in various J.P. Morgan Funds until distribution in accordance with the Plan.
The Funds may use related party broker-dealers. For the six months ended April 30, 2017, the Funds did not incur any brokerage commissions with broker-dealers affiliated with the Adviser.
The Securities and Exchange Commission (“SEC”) has granted an exemptive order permitting the Funds to engage in principal transactions with J.P. Morgan Securities, Inc., an affiliated broker, involving taxable money market instruments, subject to certain conditions.
| | | | | | | | |
| | | |
| APRIL 30, 2017 | | J.P. MORGAN SMA FUNDS | | | | | 29 | |
NOTES TO FINANCIAL STATEMENTS
AS OF APRIL 30, 2017 (Unaudited) (continued)
4. Investment Transactions
During the six months ended April 30, 2017, purchases and sales of investments (excluding short-term investments) were as follows (amounts in thousands):
| | | | | | | | |
| | | Purchases
(excluding U.S.
Government) | | | Sales
(excluding U.S.
Government) | |
International Value SMA Fund | | $ | 20,215 | | | $ | 37,681 | |
Tax Aware Real Return SMA Fund | | | 1,895 | | | | 329 | |
During the six months ended April 30, 2017, there were no purchases or sales of U.S. Government securities.
5. Federal Income Tax Matters
For Federal income tax purposes, the estimated cost and unrealized appreciation (depreciation) in value of investment securities held at April 30, 2017 were as follows (amounts in thousands):
| | | | | | | | | | | | | | | | |
| | | Aggregate
Cost | | | Gross
Unrealized
Appreciation | | | Gross
Unrealized
Depreciation | | | Net
Unrealized
Appreciation
(Depreciation) | |
| | $ | 53,568 | | | $ | 12,623 | | | $ | 587 | | | $ | 12,036 | |
| | | 10,845 | | | | 466 | | | | 46 | | | | 420 | |
Under the Regulated Investment Company Modernization Act of 2010 (the “Act”), net capital losses recognized by the Funds after October 31, 2011 are carried forward indefinitely, and retain their character as short-term and/or long-term losses. Prior to the Act, net capital losses incurred by the Funds were carried forward for eight years and treated as short-term losses. The Act requires that post-enactment net capital losses be used before pre-enactment net capital losses.
At October 31, 2016, the Funds had pre-enactment net capital loss carryforwards, expiring during the years indicated, which are available to offset future realized gains (amounts in thousands):
| | | | | | | | | | | | | | | | |
| | | 2017 | | | 2018 | | | 2019 | | | Total | |
International Value SMA Fund | | $ | 10,125 | | | $ | — | | | $ | — | | | $ | 10,125 | |
Tax Aware Real Return SMA Fund | | | — | | | | 9 | | | | 4 | | | | 13 | |
At October 31, 2016, the following Funds had post-enactment net capital loss carryforwards (amounts in thousands):
| | | | |
| | | Capital Loss Carryforward Character | |
| | | Short-Term | |
International Value SMA Fund | | $ | 5,384 | |
Tax Aware Real Return SMA Fund | | | 140 | |
During the year ended October 31, 2016, the following Fund utilized capital loss carryforwards as follows (amounts in thousands):
| | | | |
Tax Aware Real Return SMA Fund | | $ | 162 | |
6. Borrowings
The Funds rely upon an exemptive order granted by the SEC (the “Order”) permitting the establishment and operation of an Interfund Lending Facility (the “Facility”). The Facility allows the Funds to directly lend and borrow money to or from any other fund relying upon the Order at rates beneficial to both the borrowing and lending funds. Advances under the Facility are taken primarily for temporary or emergency purposes, including the meeting of redemption requests that otherwise might require the untimely disposition of securities, and are subject to each Fund’s borrowing restrictions. The Interfund loan rate is determined, as specified in the Order, by averaging the current repurchase agreement rate and the current bank loan rate. The Order was granted to JPMorgan Trust II and may be relied upon by the Funds because the Funds and the series of JPMorgan Trust II are all investment companies in the same “group of investment companies” (as defined in Section 12(d)(1)(G) of the 1940 Act).
The Trust and JPMCB have entered into a financing arrangement. Under this arrangement, JPMCB provides an unsecured, uncommitted credit facility in the aggregate amount of $100 million to certain of the J.P. Morgan Funds, including the Funds. Advances under the arrangement are taken primarily for temporary or emergency purposes, including the meeting of redemption requests that otherwise might require the untimely disposition of securities, and are subject to each Fund’s borrowing restrictions. Interest on borrowings is payable at a rate determined by JPMCB at the time of borrowing. This agreement has been extended until November 6, 2017.
| | | | | | |
| | | |
| 30 | | | | J.P. MORGAN SMA FUNDS | | APRIL 30, 2017 |
The Funds had no borrowings outstanding from another fund or from the unsecured, uncommitted credit facility during the six months ended April 30, 2017. Average borrowings from the Facility for, or at any time during the six months ended April 30, 2017, were as follows (amounts in thousands):
| | | | | | | | | | | | | | | | |
| | | Average
Borrowings | | | Average Interest
Rate Paid | | | Number of
Days
Outstanding | | | Interest
Paid | |
International Value SMA Fund | | $ | 2,393 | | | | 1.59 | % | | | 4 | | | $ | — | (a) |
| (a) | Amount rounds to less than 500. |
In addition, effective August 16, 2016, the Trust along with certain other trusts (“Borrowers”) entered into a joint syndicated senior unsecured revolving credit facility totaling $1.5 billion (“Credit Facility”) with various lenders and The Bank of New York Mellon, as administrative agent for the lenders. This Credit Facility provides a source of funds to the Borrowers for temporary and emergency purposes, including the meeting of redemption requests that otherwise might require the untimely disposition of securities. Under the terms of the Credit Facility, a borrowing fund must have a minimum of $25,000,000 in adjusted net asset value and not exceed certain adjusted net asset coverage ratios prior to and during the time in which any borrowings are outstanding. If a fund does not comply with the aforementioned requirements, the fund must remediate within three business days with respect to the $25,000,000 minimum adjusted net asset value or within one business day with respect to certain asset coverage ratios or the administrative agent at the request of, or with the consent of, the lenders may terminate the Credit Facility and declare any outstanding borrowings to be due and payable immediately.
Interest associated with any borrowing under the Credit Facility is charged to the borrowing fund at a rate of interest equal to 1.00% plus the greater of the federal funds effective rate or one month LIBOR. The annual commitment fee to maintain the Credit Facility is 0.15% and is incurred on the unused portion of the Credit Facility and is allocated to all participating funds pro rata based on their respective net assets. The initial term of the Credit Facility is 364 days, unless extended. The Funds did not utilize the Credit Facility during the six months ended April 30, 2017.
7. Risks, Concentrations and Indemnifications
In the normal course of business, the Funds enter into contracts that contain a variety of representations which provide general indemnifications. Each Fund’s maximum exposure under these arrangements is unknown. The amount of exposure would depend on future claims that may be made against each Fund that have not yet occurred. However, based on experience, the Funds expect the risk of loss to be remote.
As of April 30, 2017, International Value SMA Fund had three shareholders, which are accounts maintained by separately managed account sponsors on behalf of their clients, that owned 91.3% of the Fund’s outstanding shares. Tax Aware Real Return SMA Fund had a shareholder, which is an account maintained by a separately managed account sponsor on behalf of its clients, that owned 100.0% of the Fund’s outstanding shares. Significant shareholder transactions by these shareholders may impact the Funds’ performance.
International Value SMA Fund may have elements of risk not typically associated with investments in the United States of America due to concentrated investments in a limited number of countries or regions, which may vary throughout the year. Such concentrations may subject the Fund to additional risks resulting from political or economic conditions in such countries or regions and the possible imposition of adverse governmental laws, or currency exchange restrictions could cause the securities and their markets to be less liquid and their prices to be more volatile than those of comparable U.S. securities.
As of April 30, 2017, International Value SMA Fund had non-U.S. country allocations representing greater than 10% of total investments as follows:
| | | | | | | | |
| | | Germany | | | Japan | |
International Value SMA Fund | | | 14.6 | % | | | 42.5 | % |
As of April 30, 2017, substantially all of the International Value SMA Fund’s investments consisted of securities that were denominated in foreign currencies. Changes in currency exchange rates will affect the value of, and investment income from, such securities.
Derivatives may be riskier than other types of investments because they may be more sensitive to changes in economic and market conditions and could result in losses that significantly exceed the Funds’ original investment. Many derivatives create leverage thereby causing the Funds to be more volatile than they would have been if it had not used derivatives. Derivatives also expose the Funds to counterparty risk (the risk that the derivative counterparty will not fulfill its contractual obligations), including credit risk of the derivative counterparty.
Tax Aware Real Return SMA Fund invests primarily in a portfolio of municipal debt obligations issued by states, territories and possessions of the United States and by the District of Columbia, and by their political subdivisions and duly constituted authorities. An issuer’s ability to meet its payment obligations may be affected by economic or political developments in a specific state or region. These debt obligations may be insured by private insurers who guarantee the payment of principal and interest in the event of issuer default. The value of these investments may be impacted by changes to bond insurers’ ratings and the Fund’s ability to collect principal and interest, in the event of an issuer’s default, may be limited if the private insurer does not have the wherewithal to satisfy its obligation.
Tax Aware Real Return SMA Fund is subject to interest rate and credit risk. The value of debt securities may decline as interest rates increase. The Fund could lose money if the issuer of a fixed income security is unable to pay interest or repay principal when it is due. The Fund invests in floating
| | | | | | | | |
| | | |
| APRIL 30, 2017 | | J.P. MORGAN SMA FUNDS | | | | | 31 | |
NOTES TO FINANCIAL STATEMENTS
AS OF APRIL 30, 2017 (Unaudited) (continued)
rate loans and other floating rate debt securities. Although these investments are generally less sensitive to interest rate changes than other fixed rate instruments, the value of floating rate loans and other floating rate investments may decline if their interest rates do not rise as quickly, or as much, as general interest rates. Many factors can cause interest rates to rise. Some examples include central bank monetary policy, rising inflation rates and general economic conditions. Given that the Federal Reserve has recently raised interest rates and may continue to do so, the Fund may face a heightened level of interest rate risk. The ability of the issuers of debt to meet their obligations may be affected by the economic and political developments in a specific industry or region.
8. Investment Company Reporting Modernization
In October 2016, the U.S. Securities and Exchange Commission adopted new rules and forms, and amendments to certain current rules and forms, to modernize the reporting and disclosure of information by registered investment companies. In part, the final rules amend Regulation S-X and will require standardized, enhanced disclosures about derivatives in investment company financial statements, as well as other amendments. The compliance date for the amendments to Regulation S-X is August 1, 2017. At this time, management is currently assessing the anticipated impact of the Regulation S-X amendments on the Funds’ financial statements and related disclosures.
| | | | | | |
| | | |
| 32 | | | | J.P. MORGAN SMA FUNDS | | APRIL 30, 2017 |
SCHEDULE OF SHAREHOLDER EXPENSES
(Unaudited)
Hypothetical $1,000 Investment
As a shareholder of the Funds, you incur two types of costs: (1) transaction costs and (2) ongoing costs, including administration fees and other Fund expenses. The examples below are intended to help you understand your ongoing costs (in dollars) of investing in the Funds and to compare these ongoing costs with the ongoing costs of investing in other mutual funds. The examples assume that you had a $1,000 investment in each Fund at the beginning of the reporting period, November 1, 2016, and continued to hold your shares at the end of the reporting period, April 30, 2017.
Actual Expenses
For each Fund in the table below, the first line provides information about actual account values and actual expenses. You may use the information in this line, together with the amount you invested, to estimate the expenses that you paid over the period. Simply divide your account value by $1,000 (for example, an $8,600 account value divided by $1,000 = 8.6), then multiply the result by the number in the first line of each Fund under the heading entitled “Expenses Paid During the Period” to estimate the expenses you paid on your account during this period.
Hypothetical Example for Comparison Purposes
The second line of each Fund in the table below provides information about hypothetical account values and hypothetical expenses based on the Fund’s actual expense ratio and an assumed rate of return of 5% per year before expenses, which is not the Fund’s actual return. The hypothetical account values and expenses may not be used to estimate the actual ending account balance or expenses you paid for the period. You may use this information to compare the ongoing costs of investing in the Funds and other funds. To do so, compare this 5% hypothetical example with the 5% hypothetical examples that appear in the shareholder reports of the other funds. Please note that the expenses shown in the table are meant to highlight your ongoing costs only and do not reflect any transaction costs, such as sales charges (loads) or redemption fees. Therefore, the second line for each Fund in the table is useful in comparing ongoing costs only, and will not help you determine the relative total costs of owning different funds. In addition, if these transaction costs were included, your costs would have been higher. The examples also assume all dividends and distributions have been reinvested.
| | | | | | | | | | | | | | | | |
| | | Beginning Account Value November 1, 2016 | | | Ending Account Value April 30, 2017 | | | Expenses Paid During
the Period†* | | | Annualized Expense Ratio† | |
International Value SMA Fund | | | | | | | | | | | | | | | | |
Actual | | $ | 1,000.00 | | | $ | 1,139.30 | | | $ | 0.00 | | | | 0.00 | % |
Hypothetical | | | 1,000.00 | | | | 1,024.79 | | | | 0.00 | | | | 0.00 | |
| | | | |
Tax Aware Real Return SMA Fund | | | | | | | | | | | | | | | | |
Actual | | | 1,000.00 | | | | 1,011.10 | | | | 0.00 | | | | 0.00 | |
Hypothetical | | | 1,000.00 | | | | 1,024.79 | | | | 0.00 | | | | 0.00 | |
| † | Reflects the fact that no fees or expenses are borne by the Funds. The Funds are an integral part of “separately managed accounts” programs sponsored by investment advisers and/or broker-dealers unaffiliated with the Funds and the Adviser. Participants in these programs pay a fee to the sponsor of the program. |
| * | Expenses are equal to each Fund’s respective annualized expense ratio, multiplied by the average account value over the period, multiplied by 181/365 (to reflect the one-half year period). |
| | | | | | | | |
| | | |
| APRIL 30, 2017 | | J.P. MORGAN SMA FUNDS | | | | | 33 | |
J.P. Morgan Funds are distributed by JPMorgan Distribution Services, Inc., which is an affiliate of JPMorgan Chase & Co. Affiliates of JPMorgan Chase & Co. receive fees for providing various services to the funds.
Contact JPMorgan Distribution Services, Inc. at 1-800-480-4111 for a fund prospectus. Investors should carefully consider the investment objectives and risk as well as charges and expenses of the mutual fund before investing. The prospectus contains this and other information about the mutual fund. Read the prospectus carefully before investing.
Investors may obtain information about the Securities Investor Protection Corporation (SIPC), including the SIPC brochure by visiting www.sipc.org or by calling SIPC at 202-371-8300.
Each Fund files a complete schedule of its fund holdings for the first and third quarters of its fiscal year with the SEC on Form N-Q. The Funds’ Forms N-Q are available on the SEC’s website at http://www.sec.gov and may be reviewed and copied at the SEC’s Public Reference Room in Washington, DC. Information on the operation of the SEC’s Public Reference Room may be obtained by calling 1-800-SEC-0330. Shareholders may request the Form N-Q without charge by calling 1-800-480-4111.
A description of each Fund’s policies and procedures with respect to the disclosure of each Fund’s holdings is available in the prospectus and Statement of Additional Information.
A copy of proxy policies and procedures is available without charge upon request by calling 1-800-480-4111 and a description of such policies and procedures is on the SEC’s website at www.sec.gov. The Trustees have delegated the authority to vote proxies for securities owned by the Funds to the Adviser. A copy of the Funds’ voting record for the most recent 12-month period ended June 30 is available on the SEC’s website at www.sec.gov no later than August 31 of each year. The Funds’ proxy voting record will include, among other things, a brief description of the matter voted on for each fund security, and will state how each vote was cast, for example, for or against the proposal.

J.P. Morgan Asset Management is the marketing name for the asset management business of JPMorgan Chase & Co. Those businesses include, but are not limited to, J.P. Morgan Investment Management Inc., Security Capital Research & Management Incorporated and J.P. Morgan Alternative Asset Management, Inc.
| | | | |
| | © JPMorgan Chase & Co., 2017. All rights reserved. April 2017. | | SAN-SMA-417 |
Semi-Annual Report
J.P. Morgan Funds
April 30, 2017 (Unaudited)
JPMorgan Global Allocation Fund
JPMorgan Income Builder Fund

CONTENTS
Investments in a Fund are not deposits or obligations of, or guaranteed or endorsed by, any bank and are not insured or guaranteed by the FDIC, the Federal Reserve Board or any other government agency. You could lose money if you sell when a Fund’s share price is lower than when you invested.
Past performance is no guarantee of future performance. The general market views expressed in this report are opinions based on market and other conditions through the end of the reporting period and are subject to change without notice. These views are not intended to predict the future performance of a Fund or the securities markets. References to specific securities and their issuers are for illustrative purposes only and are not intended to be, and should not be interpreted as, recommendations to purchase or sell such securities. Such views are not meant as investment advice and may not be relied on as an indication of trading intent on behalf of any Fund.
Prospective investors should refer to the Funds’ prospectus for a discussion of the Funds’ investment objectives, strategies and risks. Call J.P. Morgan Funds Service Center at 1-800-480-4111 for a prospectus containing more complete information about a Fund, including management fees and other expenses. Please read it carefully before investing.
CEO’S LETTER
May 25, 2017 (Unaudited)
Dear Shareholder,
The world’s leading economies continued their upward trajectory over the six months ended April 30, 2017, bolstered by central bank policies, growth in corporate earnings and buoyant consumer and business sentiment.
| | |
 | | “While bond markets provided a mixed performance over the six months ended April 30, 2017, equity markets rewarded investors with solid returns.” — George C.W. Gatch |
While the U.S. and China had been leading drivers of growth for most of the current economic expansion, by late 2016 and into 2017 the world’s other leading economies began to strengthen. Each of the world’s 20 largest economies was forecast to increase output of goods and services through 2017 and the variation in growth rates among those economies was forecast to be the lowest since 1980, according to Bloomberg News.
The U.S. economy slowed somewhat in the first quarter of 2017, but unemployment dropped to 4.4% in April 2017 and the U.S. Federal Reserve reiterated its intent to raise interest rates amid continued economic growth and rising inflation. Throughout the six month reporting period, U.S. financial markets — particularly U.S. equities — generally outperformed other developed markets and emerging markets.
China’s economy continued to grow and posted a 6.9% rise in gross domestic product (GDP) in the first quarter of 2017, amid strength in housing, infrastructure investment, exports and retail sales. Notably, financial markets in China remained largely stable for the six month reporting period. For the 86 trading days through April 24, 2017, the Shanghai Stock Exchange Composite Index hadn’t fallen by more than 1%, thanks in large part to government efforts to prevent a recurrence of the sharp sell-offs that hit Chinese markets in mid-2015 and early 2016.
Meanwhile, Chinese officials sought to reduce financial system risk by tightening money-market rules and pushing to reduce the use of leverage and financial market speculation.
In the European Union (EU), rising consumer spending and manufacturing led to 0.6% growth in first quarter GDP. In particular, Germany’s economy continued to accelerate into 2017, with positive growth in factory orders and an estimated 14% increase in corporate earnings in the first quarter of 2017. Surveys of consumer sentiment across the EU were more upbeat than in recent years. At the end of March 2017, EU unemployment stood at 9.5%, the lowest level since April 2009.
In emerging markets, economic strength in China and a rebound in commodities prices, which began in the latter half of 2016, helped lift economic growth. Moreover, the economies of Brazil, Argentina, Russia, Turkey and South Africa — which were seen as weak links in the global economy — all showed positive growth by the end of April 2017.
While bond markets provided a mixed performance over the six months ended April 30, 2017, equity markets rewarded investors with solid returns. The Standard & Poor’s 500 Index returned 13.32% for the reporting period, while the Morgan Stanley Capital International (“MSCI”) Europe, Australasia and Far East Index (net of foreign withholding taxes) returned 11.73% and the MSCI Emerging Markets Index (net of foreign withholding taxes) returned 9.03%.
We look forward to managing your investment needs for years to come. Should you have any questions, please visit www.jpmorganfunds.com or contact the J.P. Morgan Funds Service Center at 1-800-480-4111.
Sincerely yours,

George C.W. Gatch
CEO, Investment Funds Management,
J.P. Morgan Asset Management
| | | | | | | | |
| | | |
| APRIL 30, 2017 | | J.P. MORGAN FUNDS | | | | | 1 | |
J.P. Morgan Funds
MARKET OVERVIEW
SIX MONTHS ENDED APRIL 30, 2017 (Unaudited)
Global financial markets generally provided positive returns for the six month reporting period as the world’s leading economies continued to grow in a more uniform fashion and investors sought returns in both developed and emerging markets.
During the final quarter of 2016 and into 2017, leading U.S. equity indexes hit multiple record highs amid solid corporate earnings and expectations that the Republican majorities in the U.S. Congress and President’s Trumps’ administration would work to ease business regulations, reduce taxes and increase infrastructure spending.
In Europe, a pickup in corporate earnings and improvements in consumer sentiment also proved attractive to investors. Electoral defeats of anti-European Union (EU) politicians in Austria, the Netherlands and France also helped lift investor sentiment across the EU and other developed markets.
Emerging markets also saw investment inflows during the six month reporting period amid economic and financial market stability in China. Notably, the Chinese government’s efforts to curb excessive leverage in its financial markets put a damper on the Shanghai Composite Index in April 2017. Meanwhile, several previously underperforming economies — particularly Brazil, Argentina, Russia, Turkey and South Africa — were growing by the end of the reporting period.
Commodities prices stabilized during the reporting period and global oil prices reached 15-month highs in October 2016. Oil prices were further bolstered by the Organization of Petroleum Exporting Countries’ decision to curb production. However, by the end of the reporting period, overproduction pushed global oil prices lower.
For the six months ended April 30, 2017, the MSCI World Index (net of foreign withholding taxes) returned 12.12% and the Bloomberg Barclays U.S. Aggregate Index (formerly the Barclays U.S. Aggregate Index) returned –0.67%.
| | | | | | |
| | | |
| 2 | | | | J.P. MORGAN FUNDS | | APRIL 30, 2017 |
JPMorgan Global Allocation Fund
FUND COMMENTARY
SIX MONTHS ENDED APRIL 30, 2017 (Unaudited)
| | | | |
| REPORTING PERIOD RETURN: | |
| Fund (Class I Shares)1* | | | 7.95% | |
| Morgan Stanley Capital International (“MSCI”) World Index (net of foreign withholding taxes) | | | 12.12% | |
| Bloomberg Barclays Global Aggregate Index (Unhedged USD)2 | | | (1.63)% | |
| Bloomberg Barclays U.S. Aggregate Index2 | | | (0.67)% | |
| Global Allocation Composite Benchmark | | | 6.46% | |
| |
| Net Assets as of 4/30/2017 (In Thousands) | | | $1,648,649 | |
INVESTMENT OBJECTIVE**
The JPMorgan Global Allocation Fund (the “Fund”) seeks to maximize long-term total return.
WHAT WERE THE MAIN DRIVERS OF THE FUND’S PERFORMANCE?
For the six months ended April 30, 2017, the Fund’s Class I Shares underperformed the MSCI World Index (net of foreign withholding taxes) (the “Benchmark”) and outperformed the Bloomberg Barclays Global Aggregate Index (Unhedged USD), the Bloomberg Barclays U.S. Aggregate Index and the Global Allocation Composite Benchmark, which consists of 60% MSCI World Index (net of foreign withholding taxes) and 40% Bloomberg Barclays Global Aggregate Index (Unhedged USD).
Relative to the Benchmark, the Fund’s increased allocation to global bonds was a leading detractor from performance. However, the Fund’s increased allocation to U.S. equities contributed positively to performance as U.S. equities outperformed international equities during the reporting period.
HOW WAS THE FUND POSITIONED?
The Fund’s portfolio managers continued to maintain a positive view on global equities and higher yielding credit relative to government bonds. However, the Fund’s domestic equity market exposure was decreased in favor of more exposure to both international developed and emerging market equities given the portfolio managers’ view on positive global growth. In late April, the portfolio managers added a dedicated European Dynamic Hedged Equity strategy as a way to gain additional exposure to European equities with less volatility. Given the expectation for continued market volatility, the portfolio managers held some of the Fund’s global equity exposure in call options as a way to manage risk, but still capture potential market gains. In fixed income assets, the portfolio managers maintained a positive view on credit as expressed through high yield bonds in the U.S. and Europe, as well as non-agency mortgages. Within core fixed income, the Fund maintains exposure to government bonds as a way to further diversify its fixed income exposure.
| | | | | | | | |
| | | |
| APRIL 30, 2017 | | J.P. MORGAN FUNDS | | | | | 3 | |
JPMorgan Global Allocation Fund
FUND COMMENTARY
SIX MONTHS ENDED APRIL 30, 2017 (Unaudited) (continued)
| | | | | | | | |
| TOP TEN LONG HOLDINGS OF THE PORTFOLIO*** | |
| | 1. | | | JPMorgan Emerging Markets Debt Fund, Class R6 Shares, (United States) | | | 2.8 | % |
| | 2. | | | Government of Japan, Series 343, 0.100%, 06/20/26, (Japan) | | | 1.0 | |
| | 3. | | | Republic of Australia, Reg. S, Series 122, 5.250%, 03/15/19, (Australia) | | | 0.8 | |
| | 4. | | | U.S. Treasury Note, 0.750%, 01/31/18, (United States) | | | 0.7 | |
| | 5. | | | Alphabet, Inc., Class C, (United States) | | | 0.7 | |
| | 6. | | | UnitedHealth Group, Inc., (United States) | | | 0.6 | |
| | 7. | | | Nestle SA (Registered), (Switzerland) | | | 0.6 | |
| | 8. | | | Republic of Canada, 1.750%, 03/01/19, (Canada) | | | 0.5 | |
| | 9. | | | Mohawk Industries, Inc., (United States) | | | 0.5 | |
| | 10. | | | Apple, Inc., (United States) | | | 0.5 | |
| | | | | | | | |
| TOP TEN SHORT HOLDINGS OF THE PORTFOLIO**** | |
| | 1. | | | Kellogg Co., (United States) | | | 5.5 | % |
| | 2. | | | CVS Health Corp., (United States) | | | 4.3 | |
| | 3. | | | General Mills, Inc., (United States) | | | 4.2 | |
| | 4. | | | AutoZone, Inc., (United States) | | | 4.1 | |
| | 5. | | | Molson Coors Brewing Co., Class B, (United States) | | | 3.6 | |
| | 6. | | | Enbridge, Inc., (Canada) | | | 3.4 | |
| | 7. | | | Sealed Air Corp., (United States) | | | 2.6 | |
| | 8. | | | General Motors Co., (United States) | | | 2.5 | |
| | 9. | | | O’Reilly Automotive, Inc., (United States) | | | 2.3 | |
| | 10. | | | United Parcel Service, Inc., Class B, (United States) | | | 2.1 | |
| | | | |
LONG POSITION PORTFOLIO COMPOSITION*** | |
| Common Stocks | | | 48.3 | % |
| Corporate Bonds | | | 21.1 | |
| Foreign Government Securities | | | 4.0 | |
| Investment Company | | | 2.8 | |
| Asset-Backed Securities | | | 2.7 | |
| Collateralized Mortgage Obligations | | | 2.1 | |
| U.S. Treasury Obligations | | | 1.5 | |
| Others (each less than 1.0%) | | | 1.7 | |
| Short-Term Investments | | | 15.8 | |
| | | | |
SHORT POSITION PORTFOLIO COMPOSITION**** | |
| Common Stocks | | | 100.0 | % |
| 1 | | Effective April 3, 2017, Select Class Shares were renamed Class I Shares. |
| 2 | | Effective November 30, 2016, the Fund’s benchmark changed from the Bloomberg Barclays U.S. Aggregate Index to the Bloomberg Barclays Global Aggregate Index (Unhedged USD) after determining that the investment universe of the new benchmark better reflects the investment universe of the Fund’s investment strategies. |
| * | | The return shown is based on the net asset values calculated for shareholder transactions and may differ from the return shown in the financial highlights, which reflects adjustments made to the net asset values in accordance with accounting principles generally accepted in the United States of America. |
| ** | | The adviser seeks to achieve the Fund’s objective. There can be no guarantee it will be achieved. |
| *** | | Percentages indicated are based on total investments as of April 30, 2017. The Fund’s portfolio composition is subject to change. |
| **** | | Percentages indicated are based on total short investments as of April 30, 2017. The Fund’s portfolio composition is subject to change. |
| | | | | | |
| | | |
| 4 | | | | J.P. MORGAN FUNDS | | APRIL 30, 2017 |
| | | | | | | | | | | | | | | | | | |
AVERAGE ANNUAL TOTAL RETURNS AS OF APRIL 30, 2017 | |
| | | | | |
| | | INCEPTION DATE OF
CLASS | | 6 MONTH* | | | 1 YEAR | | | 5 YEAR | | | SINCE
INCEPTION | |
CLASS A SHARES | | May 31, 2011 | | | | | | | | | | | | | | | | |
With Sales Charge** | | | | | 3.04 | % | | | 5.82 | % | | | 6.19 | % | | | 4.83 | % |
Without Sales Charge | | | | | 7.88 | | | | 10.81 | | | | 7.17 | | | | 5.65 | |
CLASS C SHARES | | May 31, 2011 | | | | | | | | | | | | | | | | |
With CDSC*** | | | | | 6.61 | | | | 9.30 | | | | 6.64 | | | | 5.13 | |
Without CDSC | | | | | 7.61 | | | | 10.30 | | | | 6.64 | | | | 5.13 | |
CLASS I SHARES (FORMERLY SELECT CLASS SHARES) | | May 31, 2011 | | | 7.95 | | | | 11.08 | | | | 7.43 | | | | 5.91 | |
CLASS R2 SHARES | | May 31, 2011 | | | 7.69 | | | | 10.57 | | | | 6.89 | | | | 5.39 | |
| ** | | Sales Charge for Class A Shares is 4.50%. |
| *** | | Assumes a 1% CDSC (contingent deferred sales charge) for the 6 month and one year periods and 0% CDSC thereafter. |
LIFE OF FUND PERFORMANCE (5/31/11 TO 4/30/17)
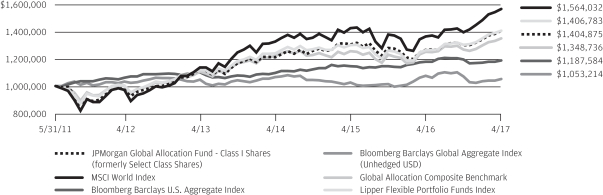
The performance quoted is past performance and is not a guarantee of future results. Mutual funds are subject to certain market risks. Investment returns and principal value of an investment will fluctuate so that an investor’s shares, when redeemed, may be worth more or less than their original cost. Current performance may be higher or lower than the performance data shown. For up-to-date, month-end performance information please call 1-800-480-4111.
The Fund commenced operations on May 31, 2011.
The graph illustrates comparative performance for $1,000,000 invested in Class I Shares of the JPMorgan Global Allocation Fund, the MSCI World Index, the Bloomberg Barclays U.S. Aggregate Index, the Bloomberg Barclays Global Aggregate Index, the Global Allocation Composite Benchmark and the Lipper Flexible Portfolio Funds Index from May 31, 2011 to April 30, 2017. The performance of the Fund assumes reinvestment of all dividends and capital gain distributions, if any, and does not include a sales charge. The performance of the MSCI World Index, the Bloomberg Barclays Global Aggregate Index – (Unhedged USD), the Bloomberg Barclays U.S. Aggregate Index and the Global Allocation Composite Benchmark do not reflect the deduction of expenses or a sales charge associated with a mutual fund and approximates the minimum possible dividend reinvestment of the securities included in the benchmark, if applicable. The dividend is reinvested after deduction of withholding tax, applying the maximum rate to non-resident institutional investors who do not benefit from double taxation treaties. The performance of the Global Allocation Composite Benchmark does not reflect the deduction of expenses associated with a mutual fund, such as investment management fees and has been adjusted to reflect reinvestment of all dividends and capital gain distributions of securities included in the benchmark, if applicable. The performance of the Lipper Flexible Portfolio Funds Index includes expenses associated with a mutual fund, such as investment management fees. These expenses are not identical to the expenses incurred by the Fund. The MSCI World Index is a free float-adjusted market capitalization weighted index that is designed to measure the equity market performance of developed markets. The Global Allocation
Composite Benchmark is a composite benchmark comprised of unmanaged indexes that includes 60% MSCI World Index (net of foreign withholding taxes) and 40% Bloomberg Barclays Global Aggregate Index (Unhedged USD). The Bloomberg Barclays U.S. Aggregate Index is an unmanaged index that represents securities that are SEC-registered, taxable, and dollar denominated. The index covers the U.S. investment grade fixed rate bond market, with index components for government and corporate securities, mortgage pass-through securities, and asset-backed securities. The Bloomberg Barclays Global Aggregate Index provides a broad-based measure of the global investment-grade fixed income markets. The Lipper Flexible Portfolio Funds Index is an index based on the total returns of certain mutual funds within the Fund’s designated category as defined by Lipper, Inc. Investors cannot invest directly in an index.
Subsequent to the inception date of the Fund through May 30, 2013, the Fund did not experience any shareholder activity. If such shareholder activity had occurred, the Fund’s performance may have been impacted.
Class I Shares have a $1,000,000 minimum initial investment.
Fund performance may reflect the waiver of the Fund’s fees and reimbursement of expenses for certain periods since the inception date. Without these waivers and reimbursements, performance would have been lower. Also, performance shown in this section does not reflect the deduction of taxes that a shareholder would pay on Fund distributions or redemptions of Fund shares.
International investing involves a greater degree of risk and increased volatility. Changes in currency exchange rates and differences in accounting and taxation policies outside the U.S. can raise or lower returns. Also, some overseas markets may not be as politically and economically stable as the U.S. and other nations.
The returns shown are based on net asset values calculated for shareholder transactions and may differ from the returns shown in the financial highlights, which reflect adjustments made to the net asset values in accordance with accounting principles generally accepted in the United States of America.
| | | | | | | | |
| | | |
| APRIL 30, 2017 | | J.P. MORGAN FUNDS | | | | | 5 | |
JPMorgan Income Builder Fund
FUND COMMENTARY
SIX MONTHS ENDED APRIL 30, 2017 (Unaudited)
| | | | |
| REPORTING PERIOD RETURN: | |
| Fund (Class A Shares, without a sales charge)* | | | 5.43% | |
| Morgan Stanley Capital International (“MSCI”) World Index (net of foreign withholding taxes) | | | 12.12% | |
| Bloomberg Barclays U.S. Aggregate Index | | | (0.67)% | |
| Income Builder Composite Benchmark | | | 6.86% | |
| |
| Net Assets as of 4/30/2017 (In Thousands) | | | $12,275,684 | |
INVESTMENT OBJECTIVE**
The JPMorgan Income Builder Fund (the “Fund”) seeks to maximize income while maintaining prospects for capital appreciation.
INVESTMENT APPROACH
J.P. Morgan’s Multi-Asset Solutions Team (the “Team”) combined capital markets research and asset allocation with the insights of specialist asset class teams to construct a broadly diversified portfolio of income producing securities that the Team believed would perform well given the Team’s market views. The underlying specialist teams built portfolios of their highest conviction securities that they believed to be the best opportunities for yield and total return on a risk-adjusted basis.
WHAT WERE THE MAIN DRIVERS OF THE FUND’S PERFORMANCE?
For the six months ended April 30, 2017, the Fund’s Class A Shares, without a sales charge, underperformed both the MSCI World Index (net of foreign withholding taxes) and the Income Builder Composite Benchmark (the “Composite Benchmark”), which is comprised of 60% MSCI World Index (net of foreign withholding taxes) and 40% Bloomberg Barclays U.S. Aggregate Index. The Fund outperformed the Bloomberg Barclays U.S. Aggregate Index.
During the reporting period, equities generally outperformed other asset classes and the Fund’s lower allocation to equities detracted from performance relative to both MSCI World Index (net of foreign withholding taxes) and the Composite Benchmark. The Fund’s allocation to equities was a positive contributor to performance relative to the Bloomberg Barclays U.S. Aggregate Index, which does not hold equities.
HOW WAS THE FUND POSITIONED?
The Fund’s portfolio managers positioned the Fund to tactically pursue income. The portfolio managers believed that the long decline in U.S. interest rates appeared to have ended, and absent a severe economic shock, the U.S. economy is in a reflationary environment with upward pressure on interest rates. During the reporting period, the portfolio managers’ conviction in their pro-risk positioning increased in light of the pick-up and broadening out in the global economic growth outlook. They reduced the Fund’s allocation to bonds in favor of equity. As global growth continued to broaden out, they became more regionally diversified across equity regions. While they preferred equity over bonds, corporate credit remained their most favored asset class within fixed income.
| | | | | | |
| | | |
| 6 | | | | J.P. MORGAN FUNDS | | APRIL 30, 2017 |
| | | | | | | | |
| TOP TEN HOLDINGS OF THE PORTFOLIO*** | |
| | 1. | | | Johnson & Johnson | | | 0.8 | % |
| | 2. | | | Microsoft Corp. | | | 0.8 | |
| | 3. | | | Pfizer, Inc. | | | 0.7 | |
| | 4. | | | Occidental Petroleum Corp. | | | 0.7 | |
| | 5. | | | Wells Fargo & Co. | | | 0.7 | |
| | 6. | | | GlaxoSmithKline plc, (United Kingdom) | | | 0.7 | |
| | 7. | | | Unibail-Rodamco SE, (France) | | | 0.6 | |
| | 8. | | | Siemens AG (Registered), (Germany) | | | 0.6 | |
| | 9. | | | CME Group, Inc. | | | 0.5 | |
| | 10. | | | Comcast Corp., Class A. | | | 0.5 | |
| | | | |
PORTFOLIO COMPOSITION*** | |
| Corporate Bonds | | | 43.6 | % |
| Common Stocks | | | 41.9 | |
| Asset-Backed Securities | | | 4.4 | |
| Collateralized Mortgage Obligations | | | 3.2 | |
| Foreign Government Securities | | | 1.2 | |
| Commercial Mortgage-Backed Securities | | | 1.2 | |
| Others (each less than 1.0%) | | | 2.9 | |
| Short-Term Investments | | | 1.6 | |
| * | | The return shown is based on net asset values calculated for shareholder transactions and may differ from the return shown in the financial highlights, which reflects adjustments made to the net asset values in accordance with accounting principles generally accepted in the United States of America. |
| ** | | The adviser seeks to achieve the Fund’s objective. There can be no guarantee it will be achieved. |
| *** | | Percentages indicated are based on total investments as of April 30, 2017. The Fund’s portfolio composition is subject to change. |
| | | | | | | | |
| | | |
APRIL 30, 2017 | | J.P. MORGAN FUNDS | | | | | 7 | |
JPMorgan Income Builder Fund
FUND COMMENTARY
SIX MONTHS ENDED APRIL 30, 2017 (Unaudited) (continued)
| | | | | | | | | | | | | | | | | | | | |
AVERAGE ANNUAL TOTAL RETURNS AS OF APRIL 30, 2017 | |
| | | | | |
| | | INCEPTION DATE OF
CLASS | | | 6 MONTH* | | | 1 YEAR | | | 5 YEAR | | | SINCE
INCEPTION | |
CLASS A SHARES | | | May 31, 2007 | | | | | | | | | | | | | | | | | |
With Sales Charge** | | | | | | | 0.67 | % | | | 4.27 | % | | | 5.46 | % | | | 4.92 | % |
Without Sales Charge | | | | | | | 5.43 | | | | 9.16 | | | | 6.42 | | | | 5.41 | |
CLASS C SHARES | | | May 31, 2007 | | | | | | | | | | | | | | | | | |
With CDSC*** | | | | | | | 4.28 | | | | 7.72 | | | | 5.92 | | | | 4.89 | |
Without CDSC | | | | | | | 5.28 | | | | 8.72 | | | | 5.92 | | | | 4.89 | |
CLASS I SHARES (FORMERLY SELECT CLASS SHARES) | | | May 31, 2007 | | | | 5.60 | | | | 9.41 | | | | 6.61 | | | | 5.60 | |
| ** | | Sales Charge for Class A Shares is 4.50%. |
| *** | | Assumes a 1% CDSC (contingent deferred sales charge) for the 6 month one year periods and 0% CDSC thereafter. |
LIFE OF FUND PERFORMANCE (5/31/07 TO 4/30/17)
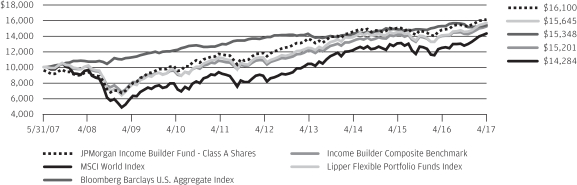
The performance quoted is past performance and is not a guarantee of future results. Mutual funds are subject to certain market risks. Investment returns and principal value of an investment will fluctuate so that an investor’s shares, when redeemed, may be worth more or less than their original cost. Current performance may be higher or lower than the performance data shown. For up-to-date month-end performance information please call 1-800-480-4111.
The Fund commenced operations on May 31, 2007.
The graph illustrates comparative performance for $10,000 invested in Class A Shares of the JPMorgan Income Builder Fund, the MSCI World Index, the Bloomberg Barclays U.S. Aggregate Index, the Income Builder Composite Benchmark and the Lipper Flexible Portfolio Funds Index from May 31, 2007 to April 30, 2017. The performance of the Fund assumes reinvestment of all dividends and capital gain distributions, if any, and includes a sales charge. The performance of the MSCI World Index, the Bloomberg Barclays U.S. Aggregate Index and the Income Builder Composite Benchmark do not reflect the deduction of expenses or a sales charge associated with a mutual fund and have been adjusted to reflect reinvestment of all dividends and capital gain distributions of securities included in the benchmarks, if applicable. The MSCI World Index assumes the dividend is reinvested after deduction of withholding tax, applying the maximum rate to non-resident institutional investors who do not benefit from double taxation treaties. The performance of the Lipper Flexible Portfolio Funds Index includes expenses associated with a mutual fund, such as investment management fees. These expenses are not identical to the expenses incurred by the Fund. The MSCI World Index is a free float-adjusted market capitalization weighted index that is designed to measure the equity market performance of developed markets. The Bloomberg Barclays U.S. Aggregate Index is an unmanaged index that represents securities that are SEC-registered, taxable, and dollar denominated. The index covers the U.S. investment
grade fixed rate bond market, with index components for government and corporate securities, mortgage pass-through securities, and asset-backed securities. The Income Builder Composite Benchmark is a composite benchmark comprised of unmanaged indexes that includes 60% MSCI World Index and 40% Bloomberg Barclays U.S. Aggregate Index. The Lipper Flexible Portfolio Funds Index is an index based on total returns of certain mutual funds within the Fund’s designated category as determined by Lipper, Inc. Investors cannot invest directly in an index.
From the inception of the Fund through December 18, 2009, the Fund did not experience any shareholder purchase and sale activity. If such shareholder activity had occurred, the Fund’s performance may have been impacted. Class A Shares have a $1,000 minimum initial investment and carry a 4.50% sales charge.
Fund performance may reflect the waiver of the Fund’s fees and reimbursement of expenses for certain periods since the inception date. Without these waivers and reimbursements, performance would have been lower. Also, performance shown in this section does not reflect the deduction of taxes that a shareholder would pay on Fund distributions or redemptions of Fund shares.
International investing involves a greater degree of risk and increased volatility. Changes in currency exchange rates and differences in accounting and taxation policies outside the U.S. can raise or lower returns. Also, some overseas markets may not be as politically and economically stable as the U.S. and other nations.
The returns shown are based on net asset values calculated for shareholder transactions and may differ from the returns shown in the financial highlights, which reflect adjustments made to the net asset values in accordance with accounting principles generally accepted in the United States of America.
| | | | | | |
| | | |
| 8 | | | | J.P. MORGAN FUNDS | | APRIL 30, 2017 |
JPMorgan Global Allocation Fund
SCHEDULE OF PORTFOLIO INVESTMENTS
AS OF APRIL 30, 2017 (Unaudited)
(Amounts in U.S. Dollars, unless otherwise noted)
(Amounts in thousands)
| | | | | | | | |
PRINCIPAL
AMOUNT | | | SECURITY DESCRIPTION | | VALUE | |
| | | | | | | | |
| | Long Positions — 99.6% | | | | |
| | Asset-Backed Securities — 2.6% | | | | |
| | | | United States — 2.6% | | | | |
| | 500 | | | ABFC Trust, Series 2004-HE1, Class M1, VAR, 1.891%, 03/25/34 | | | 485 | |
| | | | ACE Securities Corp. Home Equity Loan Trust, | | | | |
| | 555 | | | Series 2002-HE3, Class M1, VAR, 2.791%, 10/25/32 | | | 542 | |
| | 371 | | | Series 2003-NC1, Class M1, VAR, 2.161%, 07/25/33 | | | 355 | |
| | 450 | | | Series 2003-OP1, Class M1, VAR, 2.041%, 12/25/33 | | | 430 | |
| | 162 | | | Series 2004-HE4, Class M2, VAR, 1.966%, 12/25/34 | | | 158 | |
| | 550 | | | Series 2004-OP1, Class M3, VAR, 2.866%, 04/25/34 | | | 507 | |
| | 431 | | | Ameriquest Mortgage Securities, Inc., Series 2004-FR1W, Class A6, VAR, 4.622%, 05/25/34 | | | 428 | |
| | | | Ameriquest Mortgage Securities, Inc. Asset-Backed Pass-Through Certificates, | | | | |
| | 620 | | | Series 2003-10, Class M1, VAR, 2.041%, 12/25/33 | | | 588 | |
| | 272 | | | Series 2003-10, Class M2, VAR, 3.541%, 12/25/33 | | | 265 | |
| | 66 | | | Series 2003-11, Class M3, VAR, 3.781%, 12/25/33 | | | 64 | |
| | 373 | | | Amortizing Residential Collateral Trust, Series 2004-1, Class M5, VAR, 2.866%, 10/25/34 | | | 365 | |
| | | | Argent Securities, Inc. Asset-Backed Pass-Through Certificates, | | | | |
| | 918 | | | Series 2003-W5, Class M2, VAR, 3.766%, 10/25/33 | | | 878 | |
| | 1,580 | | | Series 2003-W9, Class M2, VAR, 3.571%, 01/25/34 | | | 1,544 | |
| | 936 | | | Series 2004-W4, Class A, VAR, 1.511%, 03/25/34 | | | 848 | |
| | 241 | | | Series 2004-W5, Class M1, VAR, 1.891%, 04/25/34 | | | 230 | |
| | | | Asset-Backed Securities Corp. Home Equity Loan Trust, | | | | |
| | 670 | | | Series 2004-HE2, Class M2, VAR, 2.866%, 04/25/34 | | | 615 | |
| | 1,205 | | | Series 2004-HE3, Class M2, VAR, 2.671%, 06/25/34 | | | 1,088 | |
| | | | Bear Stearns Asset-Backed Securities I Trust, | | | | |
| | 620 | | | Series 2004-FR2, Class M3, VAR, 2.791%, 06/25/34 | | | 605 | |
| | 894 | | | Series 2004-HE6, Class M2, VAR, 2.866%, 08/25/34 | | | 855 | |
| | | | | | | | |
PRINCIPAL
AMOUNT | | | SECURITY DESCRIPTION | | VALUE | |
| | | | | | | | |
| | | | | | | | |
| | | | | | | | |
| | | | United States — continued | |
| | | | Bear Stearns Asset-Backed Securities Trust, | | | | |
| | 609 | | | Series 2004-1, Class M1, VAR, 1.966%, 06/25/34 | | | 564 | |
| | 238 | | | Series 2004-2, Class M1, VAR, 2.191%, 08/25/34 | | | 223 | |
| | | | Countrywide Asset-Backed Certificates, | | | | |
| | 33 | | | Series 2002-3, Class M1, VAR, 2.116%, 03/25/32 | | | 33 | |
| | 53 | | | Series 2002-4, Class M1, VAR, 2.116%, 12/25/32 | | | 49 | |
| | 127 | | | Series 2003-BC4, Class M2, VAR, 2.341%, 06/25/33 | | | 121 | |
| | 100 | | | Series 2003-BC6, Class M2, VAR, 2.716%, 10/25/33 | | | 99 | |
| | 105 | | | Series 2004-2, Class M1, VAR, 1.741%, 05/25/34 | | | 100 | |
| | 407 | | | Series 2004-3, Class M1, VAR, 1.741%, 06/25/34 | | | 380 | |
| | 1,000 | | | Series 2005-12, Class M2, VAR, 1.481%, 02/25/36 | | | 927 | |
| | 481 | | | Series 2005-AB3, Class 1A1, VAR, 1.241%, 02/25/36 | | | 427 | |
| | 913 | | | Countrywide Partnership Trust,
Series 2004-EC1, Class M2, VAR, 1.936%, 01/25/35 | | | 846 | |
| | | | Credit-Based Asset Servicing & Securitization LLC, | | | | |
| | 1,468 | | | Series 2004-CB4, Class A5, SUB, 6.780%, 05/25/35 | | | 1,469 | |
| | 173 | | | Series 2005-CB1, Class M2, VAR, 2.086%, 01/25/35 | | | 158 | |
| | | | CWABS, Inc. Asset-Backed Certificates Trust, | | | | |
| | 558 | | | Series 2003-BC1, Class A1, VAR, 1.791%, 03/25/33 | | | 530 | |
| | 100 | | | Series 2004-5, Class M3, VAR, 2.716%, 07/25/34 | | | 96 | |
| | 524 | | | Series 2004-6, Class M1, VAR, 1.891%, 10/25/34 | | | 504 | |
| | 84 | | | Series 2004-6, Class M2, VAR, 1.966%, 10/25/34 | | | 79 | |
| | 35 | | | Delta Air Lines Pass-Through Trust,
Series 2007-1, Class B, 8.021%, 08/10/22 | | | 40 | |
| | 307 | | | Equity One Mortgage Pass-Through Trust,
Series 2003-4, Class M1, SUB, 5.869%, 10/25/34 | | | 294 | |
| | 554 | | | First Franklin Mortgage Loan Trust,
Series 2005-FF10, Class A1, VAR, 1.291%, 11/25/35 | | | 504 | |
SEE NOTES TO FINANCIAL STATEMENTS.
| | | | | | | | |
| | | |
| APRIL 30, 2017 | | J.P. MORGAN FUNDS | | | | | 9 | |
JPMorgan Global Allocation Fund
SCHEDULE OF PORTFOLIO INVESTMENTS
AS OF APRIL 30, 2017 (Unaudited) (continued)
(Amounts in U.S. Dollars, unless otherwise noted)
(Amounts in thousands)
| | | | | | | | |
PRINCIPAL
AMOUNT | | | SECURITY DESCRIPTION | | VALUE | |
| | | | | | | | |
| | Long Positions — continued | |
| | Asset-Backed Securities — continued | |
| | | | United States — continued | |
| | | | Fremont Home Loan Trust, | | | | |
| | 39 | | | Series 2003-B, Class M2, VAR, 3.421%, 12/25/33 | | | 38 | |
| | 756 | | | Series 2004-2, Class M2, VAR, 1.921%, 07/25/34 | | | 732 | |
| | 174 | | | Series 2004-B, Class M7, VAR, 3.991%, 05/25/34 | | | 145 | |
| | | | GSAMP Trust, | | | | |
| | 687 | | | Series 2004-OPT, Class M1, VAR, 1.861%, 11/25/34 | | | 636 | |
| | 364 | | | Series 2006-HE3, Class A2C, VAR, 1.151%, 05/25/46 | | | 339 | |
| | 333 | | | Home Equity Asset Trust, Series 2004-7, Class M1, VAR, 1.921%, 01/25/35 | | | 321 | |
| | | | Home Equity Mortgage Loan Asset-Backed Trust, | | | | |
| | 284 | | | Series 2004-B, Class M3, VAR, 2.191%, 11/25/34 | | | 262 | |
| | 295 | | | Series 2004-B, Class M8, VAR, 4.291%, 11/25/34 | | | 267 | |
| | | | Long Beach Mortgage Loan Trust, | | | | |
| | 1,017 | | | Series 2004-3, Class M2, VAR, 1.891%, 07/25/34 | | | 962 | |
| | 584 | | | Series 2004-3, Class M4, VAR, 2.603%, 07/25/34 | | | 550 | |
| | | | Mastr Asset-Backed Securities Trust, | | | | |
| | 114 | | | Series 2003-NC1, Class M5, VAR, 5.162%, 04/25/33 | | | 95 | |
| | 751 | | | Series 2005-NC1, Class M2, VAR, 1.741%, 12/25/34 | | | 723 | |
| | | | Morgan Stanley ABS Capital I, Inc. Trust, | | | | |
| | 232 | | | Series 2003-HE2, Class M2, VAR, 3.466%, 08/25/33 | | | 226 | |
| | 701 | | | Series 2004-HE6, Class M1, VAR, 1.816%, 08/25/34 | | | 681 | |
| | 32 | | | Series 2004-HE8, Class M3, VAR, 2.116%, 09/25/34 | | | 31 | |
| | 402 | | | Series 2004-NC5, Class M1, VAR, 1.891%, 05/25/34 | | | 375 | |
| | 498 | | | Series 2004-NC6, Class M2, VAR, 2.866%, 07/25/34 | | | 469 | |
| | 408 | | | Series 2004-NC7, Class M2, VAR, 1.921%, 07/25/34 | | | 402 | |
| | 55 | | | Series 2005-HE1, Class M3, VAR, 1.771%, 12/25/34 | | | 46 | |
| | 345 | | | Morgan Stanley Dean Witter Capital I, Inc. Trust, Series 2002-AM3, Class A3, VAR, 1.971%, 02/25/33 | | | 327 | |
| | | | | | | | |
PRINCIPAL
AMOUNT | | | SECURITY DESCRIPTION | | VALUE | |
| | | | | | | | |
| | |
| | |
| | | | United States — continued | |
| | 554 | | | New Century Home Equity Loan Trust, Series 2004-2, Class M3, VAR, 1.996%, 08/25/34 | | | 519 | |
| | 510 | | | NovaStar Mortgage Funding Trust,
Series 2003-2, Class M3, VAR, 4.366%, 09/25/33 | | | 487 | |
| | 1,587 | | | Option One Mortgage Acceptance Corp. Asset-Backed Certificates, Series 2003-4, Class M1, VAR, 2.011%, 07/25/33 | | | 1,454 | |
| | | | Option One Mortgage Loan Trust, | | | | |
| | 741 | | | Series 2004-1, Class M1, VAR, 1.891%, 01/25/34 | | | 686 | |
| | 691 | | | Series 2004-1, Class M2, VAR, 2.641%, 01/25/34 | | | 617 | |
| | 35 | | | Series 2004-3, Class M2, VAR, 1.846%, 11/25/34 | | | 32 | |
| | 500 | | | Park Place Securities, Inc. Asset-Backed Pass-Through Certificates, Series 2005-WCH1, Class M4, VAR, 2.236%, 01/25/36 | | | 489 | |
| | | | Pretium Mortgage Credit Partners I LLC, | | | | |
| | 584 | | | Series 2016-NPL3, Class A1, SUB, 4.375%, 05/27/31 (e) | | | 584 | |
| | 924 | | | Series 2016-NPL6, Class A1, SUB, 3.500%, 10/27/31 (e) | | | 924 | |
| | | | Renaissance Home Equity Loan Trust, | | | | |
| | 421 | | | Series 2003-2, Class M1, VAR, 2.228%, 08/25/33 | | | 397 | |
| | 777 | | | Series 2004-1, Class M4, VAR, 3.691%, 05/25/34 | | | 644 | |
| | 131 | | | Series 2005-1, Class AF6, SUB, 4.970%, 05/25/35 | | | 133 | |
| | 418 | | | Saxon Asset Securities Trust, Series 2003-3, Class M1, VAR, 1.966%, 12/25/33 | | | 396 | |
| | 550 | | | Soundview Home Loan Trust, Series 2005-OPT1, Class M2, VAR, 1.666%, 06/25/35 | | | 511 | |
| | 845 | | | Specialty Underwriting & Residential Finance Trust, Series 2003-BC4, Class M1, VAR, 1.891%, 11/25/34 | | | 795 | |
| | | | Structured Asset Investment Loan Trust, | | | | |
| | 301 | | | Series 2003-BC11, Class M1, VAR, 1.966%, 10/25/33 | | | 296 | |
| | 418 | | | Series 2004-6, Class A3, VAR, 1.791%, 07/25/34 | | | 403 | |
| | 434 | | | Series 2004-7, Class M2, VAR, 2.116%, 08/25/34 | | | 405 | |
| | 644 | | | Series 2004-8, Class M9, VAR, 4.741%, 09/25/34 | | | 527 | |
| | 41 | | | Series 2004-BNC1, Class A5, VAR, 2.231%, 09/25/34 | | | 37 | |
SEE NOTES TO FINANCIAL STATEMENTS.
| | | | | | |
| | | |
| 10 | | | | J.P. MORGAN FUNDS | | APRIL 30, 2017 |
| | | | | | | | |
PRINCIPAL
AMOUNT | | | SECURITY DESCRIPTION | | VALUE | |
| | | | | | | | |
| | Long Positions — continued | |
| | Asset-Backed Securities — continued | |
| | | | United States — continued | |
| | 477 | | | Structured Asset Securities Corp. Mortgage Loan Trust, Series 2006-BC4, Class A4, VAR, 1.161%, 12/25/36 | | | 422 | |
| | 1,452 | | | VOLT LIV LLC, Series 2017-NPL1, Class A1, SUB, 3.625%, 02/25/47 (e) | | | 1,455 | |
| | 1,500 | | | VOLT LVII LLC, Series 2017-NPL4, Class A1, SUB, 3.375%, 04/25/47 (e) | | | 1,500 | |
| | 1,238 | | | VOLT XLIII LLC, Series 2016-NPL3, Class A1, SUB, 4.250%, 03/26/46 (e) | | | 1,249 | |
| | 1,069 | | | VOLT XLV LLC, Series 2016-NPL5, Class A1, SUB, 4.000%, 05/25/46 (e) | | | 1,077 | |
| | 1,139 | | | VOLT XLVII LLC, Series 2016-NPL7, Class A1, SUB, 3.750%, 06/25/46 (e) | | | 1,147 | |
| | | | Wells Fargo Home Equity Asset-Backed Securities Trust, | | | | |
| | 412 | | | Series 2004-2, Class M6, VAR, 3.811%, 10/25/34 | | | 399 | |
| | 97 | | | Series 2004-2, Class M8A, VAR, 5.491%, 10/25/34 (e) | | | 91 | |
| | | | | | | | |
| | | | Total Asset-Backed Securities
(Cost $43,091) | | | 43,596 | |
| | | | | | | | |
| | Collateralized Mortgage Obligations — 2.1% | |
| | | | United States — 2.1% | | | | |
| | | | Alternative Loan Trust | | | | |
| | 598 | | | Series 2004-27CB, Class A1, 6.000%, 12/25/34 | | | 586 | |
| | 144 | | | Series 2004-28CB, Class 6A1, 6.000%, 01/25/35 | | | 145 | |
| | 114 | | | Series 2005-11CB, Class 2A1, 5.500%, 06/25/35 | | | 111 | |
| | 27 | | | Series 2005-19CB, Class A2, IF, 14.761%, 06/25/35 | | | 33 | |
| | 1,430 | | | Series 2005-28CB, Class 2A6, 5.000%, 08/25/35 | | | 1,245 | |
| | 980 | | | Series 2006-14CB, Class A1, 6.000%, 06/25/36 | | | 841 | |
| | 97 | | | Banc of America Funding Trust, Series 2005-6, Class 1A2, 5.500%, 10/25/35 | | | 91 | |
| | | | Bear Stearns ALT-A Trust | | | | |
| | 105 | | | Series 2005-4, Class 23A1, VAR, 3.580%, 05/25/35 | | | 101 | |
| | 812 | | | Series 2005-4, Class 23A2, VAR, 3.580%, 05/25/35 | | | 796 | |
| | 258 | | | Series 2005-7, Class 12A3, VAR, 1.671%, 08/25/35 | | | 243 | |
| | | | Bear Stearns ARM Trust | | | | |
| | 744 | | | Series 2005-5, Class A2, VAR, 2.820%, 08/25/35 | | | 740 | |
| | | | | | | | |
PRINCIPAL
AMOUNT | | | SECURITY DESCRIPTION | | VALUE | |
| | | | | | | | |
| | |
| | |
| | | | United States – continued | |
| | 376 | | | Series 2005-9, Class A1, VAR, 2.830%, 10/25/35 | | | 361 | |
| | 683 | | | Series 2006-1, Class A1, VAR, 2.910%, 02/25/36 | | | 677 | |
| | 817 | | | Bear Stearns Asset-Backed Securities I Trust, Series 2004-AC3, Class M1, VAR, 1.816%, 06/25/34 | | | 648 | |
| | | | Chase Mortgage Finance Trust | | | | |
| | 338 | | | Series 2006-S4, Class A5, 6.000%, 12/25/36 | | | 275 | |
| | 167 | | | Series 2007-A1, Class 1A1, VAR, 3.360%, 02/25/37 | | | 168 | |
| | 223 | | | Series 2007-A1, Class 8A1, VAR, 3.240%, 02/25/37 | | | 226 | |
| | | | CHL Mortgage Pass-Through Trust | | | | |
| | 124 | | | Series 2004-9, Class A7, 5.250%, 06/25/34 | | | 126 | |
| | 627 | | | Series 2004-25, Class 2A1, VAR, 1.662%, 02/25/35 | | | 551 | |
| | 877 | | | Series 2005-26, Class 1A11, 5.500%, 11/25/35 | | | 804 | |
| | 721 | | | Series 2005-31, Class 2A1, VAR, 3.114%, 01/25/36 | | | 653 | |
| | 271 | | | Series 2006-21, Class A14, 6.000%, 02/25/37 | | | 236 | |
| | 309 | | | Series 2007-10, Class A4, 5.500%, 07/25/37 | | | 253 | |
| | | | Citigroup Mortgage Loan Trust | | | | |
| | 661 | | | Series 2005-3, Class 2A2A, VAR, 3.076%, 08/25/35 | | | 661 | |
| | 198 | | | Series 2005-11, Class A2A, VAR, 2.930%, 10/25/35 | | | 199 | |
| | 742 | | | Citigroup Mortgage Loan Trust, Inc.,
Series 2005-4, Class A, VAR, 3.050%, 08/25/35 | | | 729 | |
| | | | Credit Suisse First Boston Mortgage Securities Corp. | | | | |
| | 22 | | | Series 2003-25, Class 2A1, 4.500%, 10/25/18 | | | 22 | |
| | 564 | | | Series 2004-8, Class 5A1, 6.000%, 12/25/34 | | | 596 | |
| | 498 | | | GSR Mortgage Loan Trust, Series 2004-11, Class 2A2, VAR, 3.341%, 09/25/34 | | | 490 | |
| | | | Impac CMB Trust | | | | |
| | 122 | | | Series 2004-6, Class 1A2, VAR, 1.771%, 10/25/34 | | | 116 | |
| | 711 | | | Series 2005-2, Class 2A2, VAR, 1.791%, 04/25/35 | | | 658 | |
| | 401 | | | Series 2005-4, Class 2A2, VAR, 1.751%, 05/25/35 | | | 347 | |
SEE NOTES TO FINANCIAL STATEMENTS.
| | | | | | | | |
| | | |
| APRIL 30, 2017 | | J.P. MORGAN FUNDS | | | | | 11 | |
JPMorgan Global Allocation Fund
SCHEDULE OF PORTFOLIO INVESTMENTS
AS OF APRIL 30, 2017 (Unaudited) (continued)
(Amounts in U.S. Dollars, unless otherwise noted)
(Amounts in thousands)
| | | | | | | | |
PRINCIPAL
AMOUNT | | | SECURITY DESCRIPTION | | VALUE | |
| | | | | | | | |
| | Long Positions — continued | |
| | Collateralized Mortgage Obligations — continued | |
| | | | United States — continued | |
| | 283 | | | Series 2005-4, Class 2M2, VAR, 2.116%, 05/25/35 | | | 242 | |
| | 329 | | | JP Morgan Mortgage Trust, Series 2005-A8, Class 2A3, VAR, 2.987%, 11/25/35 | | | 308 | |
| | 401 | | | MASTR Adjustable Rate Mortgages Trust, Series 2004-13, Class 2A1, VAR, 3.111%, 04/21/34 | | | 412 | |
| | 172 | | | MASTR Alternative Loan Trust, Series 2004-6, Class 8A1, 5.500%, 07/25/34 | | | 176 | |
| | 85 | | | Merrill Lynch Mortgage Investors Trust, Series 2005-1, Class 2A1, VAR, 3.027%, 04/25/35 | | | 83 | |
| | | | Merrill Lynch Mortgage Investors Trust MLMI | | | | |
| | 124 | | | Series 2003-A4, Class 3A, VAR, 3.540%, 05/25/33 | | | 121 | |
| | 82 | | | Series 2005-A2, Class A3, VAR, 2.978%, 02/25/35 | | | 80 | |
| | | | Morgan Stanley Mortgage Loan Trust | | | | |
| | 197 | | | Series 2004-5AR, Class 4A, VAR, 3.266%, 07/25/34 | | | 192 | |
| | 479 | | | Series 2004-7AR, Class 2A6, VAR, 3.219%, 09/25/34 | | | 485 | |
| | 372 | | | Series 2004-11AR, Class 1A2A, VAR, 1.301%, 01/25/35 | | | 348 | |
| | 537 | | | MortgageIT Trust, Series 2005-1, Class 1B1, VAR, 2.491%, 02/25/35 | | | 498 | |
| | | | Opteum Mortgage Acceptance Corp. Asset-Backed Pass-Through Certificates | | | | |
| | 708 | | | Series 2005-4, Class 1A2, VAR, 1.381%, 11/25/35 | | | 673 | |
| | 997 | | | Series 2005-5, Class 1APT, VAR, 1.271%, 12/25/35 | | | 917 | |
| | | | Opteum Mortgage Acceptance Corp. Trust | | | | |
| | 804 | | | Series 2006-1, Class 1AC1, VAR, 1.291%, 04/25/36 | | | 744 | |
| | 1,123 | | | Series 2006-1, Class 1APT, VAR, 1.201%, 04/25/36 | | | 1,025 | |
| | — | (h) | | Prudential Home Mortgage Securities Co., Inc. (The), Series 1988-1, Class A, VAR, 0.000%, 04/25/18 | | | – (h) | |
| | | | RALI Trust | | | | |
| | 1,006 | | | Series 2006-QS3, Class 1A10, 6.000%, 03/25/36 | | | 926 | |
| | 99 | | | Series 2006-QS18, Class 3A1, 5.750%, 12/25/21 | | | 94 | |
| | 142 | | | Residential Asset Securitization Trust, Series 2004-A8, Class A1, 5.250%, 11/25/34 | | | 143 | |
| | | | | | | | |
PRINCIPAL
AMOUNT | | | SECURITY DESCRIPTION | | VALUE | |
| | | | | | | | |
| | |
| | |
| | | | United States — continued | |
| | | | RFMSI Trust | | | | |
| | 15 | | | Series 2003-S15, Class A1, 4.500%, 08/25/18 | | | 15 | |
| | 21 | | | Series 2003-S16, Class A2, 4.500%, 09/25/18 | | | 21 | |
| | 58 | | | Series 2003-S20, Class 2A1, 4.750%, 12/25/18 | | | 58 | |
| | 950 | | | Series 2006-S10, Class 1A1, 6.000%, 10/25/36 | | | 903 | |
| | 313 | | | Structured Adjustable Rate Mortgage Loan Trust, Series 2005-17, Class 4A3, VAR, 3.123%, 08/25/35 | | | 307 | |
| | | | WaMu Mortgage Pass-Through Certificates Trust | | | | |
| | 17 | | | Series 2003-S8, Class A2, 5.000%, 09/25/18 | | | 17 | |
| | 63 | | | Series 2004-CB2, Class 5A, 5.000%, 07/25/19 | | | 63 | |
| | 988 | | | Series 2005-AR3, Class A1, VAR, 3.011%, 03/25/35 | | | 962 | |
| | 664 | | | Series 2005-AR5, Class A6, VAR, 2.800%, 05/25/35 | | | 663 | |
| | 511 | | | Series 2005-AR7, Class A3, VAR, 2.814%, 08/25/35 | | | 512 | |
| | 353 | | | Series 2005-AR10, Class 1A3, VAR, 2.792%, 09/25/35 | | | 349 | |
| | 472 | | | Series 2005-AR14, Class 1A4, VAR, 2.814%, 12/25/35 | | | 455 | |
| | 43 | | | Washington Mutual MSC Mortgage Pass-Through Certificates Trust, Series 2003-MS3, Class 2A2, 4.500%, 03/25/18 | | | 43 | |
| | | | Wells Fargo Mortgage-Backed Securities Trust | | | | |
| | 243 | | | Series 2003-H, Class A1, VAR, 3.027%, 09/25/33 | | | 245 | |
| | 289 | | | Series 2003-K, Class 1A1, VAR, 2.901%, 11/25/33 | | | 290 | |
| | 315 | | | Series 2003-M, Class A1, VAR, 3.000%, 12/25/33 | | | 315 | |
| | 182 | | | Series 2004-H, Class A1, VAR, 3.058%, 06/25/34 | | | 184 | |
| | 101 | | | Series 2004-K, Class 1A2, VAR, 3.110%, 07/25/34 | | | 101 | |
| | 291 | | | Series 2004-Z, Class 2A2, VAR, 3.001%, 12/25/34 | | | 294 | |
| | 973 | | | Series 2004-CC, Class A1, VAR, 3.094%, 01/25/35 | | | 987 | |
| | 440 | | | Series 2004-DD, Class 1A1, VAR, 3.111%, 01/25/35 | | | 439 | |
SEE NOTES TO FINANCIAL STATEMENTS.
| | | | | | |
| | | |
| 12 | | | | J.P. MORGAN FUNDS | | APRIL 30, 2017 |
| | | | | | | | |
PRINCIPAL
AMOUNT | | | SECURITY DESCRIPTION | | VALUE | |
| | | | | | | | |
| | Long Positions — continued | |
| | Collateralized Mortgage Obligations — continued | |
| | | | United States — continued | |
| | 145 | | | Series 2004-EE, Class 2A2, VAR, 3.057%, 12/25/34 | | | 147 | |
| | 1,273 | | | Series 2005-AR1, Class 1A1, VAR, 3.116%, 02/25/35 | | | 1,292 | |
| | 372 | | | Series 2005-AR2, Class 2A2, VAR, 3.164%, 03/25/35 | | | 375 | |
| | 137 | | | Series 2005-AR2, Class 3A1, VAR, 3.148%, 03/25/35 | | | 138 | |
| | 523 | | | Series 2005-AR3, Class 1A1, VAR, 3.120%, 03/25/35 | | | 532 | |
| | 607 | | | Series 2005-AR10, Class 2A1, VAR, 3.092%, 06/25/35 | | | 617 | |
| | 681 | | | Series 2005-AR14, Class A1, VAR, 3.016%, 08/25/35 | | | 684 | |
| | 335 | | | Series 2005-AR16, Class 6A3, VAR, 3.137%, 10/25/35 | | | 334 | |
| | 66 | | | Series 2006-AR2, Class 2A3, VAR, 3.089%, 03/25/36 | | | 64 | |
| | 238 | | | Series 2006-AR3, Class A3, VAR, 3.255%, 03/25/36 | | | 233 | |
| | 657 | | | Series 2006-AR6, Class 7A1, VAR, 3.034%, 03/25/36 | | | 662 | |
| | 229 | | | Wells Fargo Mortgage-Backed Securities Trust, Series 2004-N, Class A7, VAR, 3.007%, 08/25/34 | | | 229 | |
| | | | | | | | |
| | | | Total Collateralized Mortgage Obligations
(Cost $33,259) | | | 33,725 | |
| | | | | | | | |
| | Commercial Mortgage-Backed Securities — 0.5% | |
| | | | United States — 0.5% | | | | |
| | | | JP Morgan Chase Commercial Mortgage Securities Trust, | | | | |
| | 1,500 | | | Series 2007-LD11, Class AM, VAR, 6.004%, 06/15/49 | | | 1,538 | |
| | 673 | | | Series 2007-LDPX, Class AM, VAR, 5.464%, 01/15/49 | | | 672 | |
| | 1,700 | | | LB Commercial Mortgage Trust,
Series 2007-C3, Class AJ, VAR, 6.206%, 07/15/44 | | | 1,681 | |
| | 1,542 | | | LB-UBS Commercial Mortgage Trust, Series 2006-C6, Class AJ, VAR, 5.452%, 09/15/39 | | | 1,326 | |
| | | | Morgan Stanley Capital I Trust, | | | | |
| | 167 | | | Series 2006-HQ8, Class AJ, VAR, 5.627%, 03/12/44 | | | 167 | |
| | 988 | | | Series 2006-HQ10, Class AJ, VAR, 5.389%, 11/12/41 | | | 991 | |
| | 551 | | | Series 2007-HQ11, Class AJ, VAR, 5.508%, 02/12/44 | | | 540 | |
| | | | | | | | |
PRINCIPAL
AMOUNT | | | SECURITY DESCRIPTION | | VALUE | |
| | | | | | | | |
| | | | | | | | |
| | | | | | | | |
| | | | United States — continued | |
| | 1,000 | | | Wachovia Bank Commercial Mortgage Trust, Series 2007-C31, Class C, VAR, 5.984%, 04/15/47 | | | 999 | |
| | | | | | | | |
| | | | Total Commercial Mortgage-Backed Securities
(Cost $8,030) | | | 7,914 | |
| | | | | | | | |
| | |
| SHARES | | | | | | |
| | Common Stocks — 48.4% | |
| | | | Australia — 1.5% | |
| | 253 | | | AMP Ltd. | | | 1,015 | |
| | 168 | | | Australia & New Zealand Banking Group Ltd. | | | 4,121 | |
| | 204 | | | BHP Billiton Ltd. | | | 3,640 | |
| | 66 | | | Commonwealth Bank of Australia | | | 4,291 | |
| | 12 | | | CSL Ltd. | | | 1,206 | |
| | 223 | | | Dexus Property Group | | | 1,702 | |
| | 399 | | | Goodman Group | | | 2,424 | |
| | 28 | | | Macquarie Group Ltd. | | | 1,959 | |
| | 12 | | | National Australia Bank Ltd. | | | 295 | |
| | 32 | | | Oil Search Ltd. | | | 170 | |
| | 85 | | | Wesfarmers Ltd. | | | 2,724 | |
| | 37 | | | Westpac Banking Corp. | | | 973 | |
| | | | | | | | |
| | | | | | | 24,520 | |
| | | | | | | | |
| | | | Austria — 0.1% | | | | |
| | 47 | | | Erste Group Bank AG (a) | | | 1,676 | |
| | | | | | | | |
| | | | Belgium — 0.3% | | | | |
| | 38 | | | Anheuser-Busch InBev SA/NV | | | 4,273 | |
| | | | | | | | |
| | | | Brazil — 0.4% | |
| | 160 | | | Ambev SA, ADR | | | 916 | |
| | 109 | | | CCR SA | | | 609 | |
| | 101 | | | Cielo SA | | | 766 | |
| | 104 | | | Itau Unibanco Holding SA (Preference) | | | 1,287 | |
| | 78 | | | Lojas Renner SA | | | 729 | |
| | 41 | | | Ultrapar Participacoes SA | | | 913 | |
| | 14 | | | Vale SA, ADR (a) | | | 117 | |
| | 110 | | | WEG SA | | | 610 | |
| | | | | | | | |
| | | | | | | 5,947 | |
| | | | | | | | |
| | | | Canada — 0.5% | | | | |
| | 25 | | | Canadian Pacific Railway Ltd. | | | 3,793 | |
| | — | (h) | | TransCanada Corp. | | | 6 | |
| | 50 | | | Waste Connections, Inc. | | | 4,638 | |
| | | | | | | | |
| | | | | | | 8,437 | |
| | | | | | | | |
| | | | Chile — 0.0% (g) | | | | |
| | 24 | | | Banco Santander Chile, ADR | | | 574 | |
| | | | | | | | |
SEE NOTES TO FINANCIAL STATEMENTS.
| | | | | | | | |
| | | |
| APRIL 30, 2017 | | J.P. MORGAN FUNDS | | | | | 13 | |
JPMorgan Global Allocation Fund
SCHEDULE OF PORTFOLIO INVESTMENTS
AS OF APRIL 30, 2017 (Unaudited) (continued)
(Amounts in U.S. Dollars, unless otherwise noted)
(Amounts in thousands)
| | | | | | | | |
SHARES | | | SECURITY DESCRIPTION | | VALUE | |
| | Long Positions — continued | |
| | Common Stocks — continued | |
| | | | China — 0.6% | |
| | 16 | | | Alibaba Group Holding Ltd., ADR (a) | | | 1,797 | |
| | 6 | | | Baidu, Inc., ADR (a) | | | 1,163 | |
| | 417 | | | CNOOC Ltd. | | | 486 | |
| | 580 | | | Geely Automobile Holdings Ltd. | | | 781 | |
| | 196 | | | Ping An Insurance Group Co. of China Ltd., Class H | | | 1,099 | |
| | 108 | | | Tencent Holdings Ltd. | | | 3,375 | |
| | 114 | | | Tsingtao Brewery Co. Ltd., Class H | | | 513 | |
| | | | | | | | |
| | | | | | | 9,214 | |
| | | | | | | | |
| | | | Denmark — 0.2% | | | | |
| | 18 | | | Chr Hansen Holding A/S | | | 1,203 | |
| | 70 | | | Novo Nordisk A/S, Class B | | | 2,739 | |
| | | | | | | | |
| | | | | | | 3,942 | |
| | | | | | | | |
| | | | Finland — 0.5% | | | | |
| | 26 | | | Cargotec OYJ, Class B | | | 1,548 | |
| | 457 | | | Nokia OYJ | | | 2,612 | |
| | 142 | | | Outokumpu OYJ | | | 1,363 | |
| | 32 | | | Wartsila OYJ Abp | | | 1,932 | |
| | | | | | | | |
| | | | | | | 7,455 | |
| | | | | | | | |
| | | | France — 2.2% | | | | |
| | 34 | | | Air Liquide SA | | | 4,155 | |
| | 44 | | | Airbus SE | | | 3,541 | |
| | 137 | | | AXA SA | | | 3,651 | |
| | 48 | | | BNP Paribas SA | | | 3,362 | |
| | 15 | | | Cap Gemini SA | | | 1,507 | |
| | — | (h) | | Kering | | | 3 | |
| | 167 | | | Natixis SA | | | 1,164 | |
| | 17 | | | Pernod Ricard SA | | | 2,089 | |
| | 25 | | | Renault SA | | | 2,320 | |
| | 43 | | | Sanofi | | | 4,100 | |
| | 41 | | | Schneider Electric SE | | | 3,208 | |
| | 14 | | | Sodexo SA | | | 1,837 | |
| | 69 | | | TOTAL SA | | | 3,551 | |
| | 96 | | | Vivendi SA | | | 1,911 | |
| | | | | | | | |
| | | | | | | 36,399 | |
| | | | | | | | |
| | | | Germany — 2.4% | | | | |
| | 11 | | | adidas AG | | | 2,168 | |
| | 4 | | | Allianz SE (Registered) | | | 783 | |
| | 6 | | | BASF SE | | | 554 | |
| | 41 | | | Bayer AG (Registered) | | | 5,015 | |
| | 33 | | | Brenntag AG | | | 1,984 | |
| | 53 | | | Daimler AG (Registered) | | | 3,922 | |
| | | | | | | | |
SHARES | | | SECURITY DESCRIPTION | | VALUE | |
| | | | | | | | |
| | | | | | | | |
| | | | Germany — continued | | | | |
| | 18 | | | Deutsche Bank AG (Registered) (a) | | | 327 | |
| | 22 | | | Deutsche Boerse AG | | | 2,109 | |
| | 69 | | | Deutsche Post AG (Registered) | | | 2,480 | |
| | 129 | | | Deutsche Telekom AG (Registered) | | | 2,262 | |
| | 10 | | | HeidelbergCement AG | | | 922 | |
| | 22 | | | Henkel AG & Co. KGaA (Preference) | | | 2,936 | |
| | 92 | | | Infineon Technologies AG | | | 1,898 | |
| | 9 | | | Linde AG | | | 1,596 | |
| | 46 | | | SAP SE | | | 4,570 | |
| | 35 | | | Siemens AG (Registered) | | | 5,065 | |
| | 5 | | | Volkswagen AG (Preference) | | | 844 | |
| | | | | | | | |
| | | | | | | 39,435 | |
| | | | | | | | |
| | | | Hong Kong — 0.9% | | | | |
| | 511 | | | AIA Group Ltd. | | | 3,535 | |
| | 154 | | | Cheung Kong Property Holdings Ltd. | | | 1,102 | |
| | 212 | | | CK Hutchison Holdings Ltd. | | | 2,652 | |
| | 34 | | | Hang Seng Bank Ltd. | | | 687 | |
| | 20 | | | Jardine Matheson Holdings Ltd. | | | 1,274 | |
| | 198 | | | Power Assets Holdings Ltd. | | | 1,776 | |
| | 355 | | | Sands China Ltd. | | | 1,607 | |
| | 501 | | | Sun Art Retail Group Ltd. | | | 516 | |
| | 181 | | | Wharf Holdings Ltd. (The) | | | 1,543 | |
| | | | | | | | |
| | | | | | | 14,692 | |
| | | | | | | | |
| | | | India — 0.5% | | | | |
| | 20 | | | Dr Reddy’s Laboratories Ltd., ADR | | | 799 | |
| | 54 | | | HDFC Bank Ltd., ADR | | | 4,297 | |
| | 140 | | | Infosys Ltd., ADR | | | 2,035 | |
| | 55 | | | Mahindra & Mahindra Ltd., GDR | | | 1,162 | |
| | | | | | | | |
| | | | | | | 8,293 | |
| | | | | | | | |
| | | | Indonesia — 0.2% | | | | |
| | 1,225 | | | Astra International Tbk. PT | | | 821 | |
| | 481 | | | Bank Central Asia Tbk. PT | | | 639 | |
| | 671 | | | Bank Rakyat Indonesia Persero Tbk. PT | | | 648 | |
| | 104 | | | Unilever Indonesia Tbk. PT | | | 349 | |
| | | | | | | | |
| | | | | | | 2,457 | |
| | | | | | | | |
| | | | Ireland — 0.1% | | | | |
| | — | (h) | | AerCap Holdings NV (a) | | | 6 | |
| | 17 | | | Ryanair Holdings plc, ADR (a) | | | 1,592 | |
| | | | | | | | |
| | | | | | | 1,598 | |
| | | | | | | | |
| | | | Israel — 0.1% | | | | |
| | 67 | | | Teva Pharmaceutical Industries Ltd., ADR | | | 2,131 | |
| | | | | | | | |
SEE NOTES TO FINANCIAL STATEMENTS.
| | | | | | |
| | | |
| 14 | | | | J.P. MORGAN FUNDS | | APRIL 30, 2017 |
| | | | | | | | |
SHARES | | | SECURITY DESCRIPTION | | VALUE | |
| | Long Positions — continued | |
| | Common Stocks — continued | |
| | | | Italy — 0.7% | | | | |
| | 102 | | | Assicurazioni Generali SpA | | | 1,618 | |
| | 68 | | | Atlantia SpA | | | 1,718 | |
| | 563 | | | Enel SpA | | | 2,675 | |
| | 276 | | | Intesa Sanpaolo SpA | | | 805 | |
| | 2,078 | | | Telecom Italia SpA (a) | | | 1,844 | |
| | 158 | | | UniCredit SpA (a) | | | 2,574 | |
| | | | | | | | |
| | | | | | | 11,234 | |
| | | | | | | | |
| | | | Japan — 4.7% | | | | |
| | 53 | | | Bridgestone Corp. | | | 2,190 | |
| | 12 | | | Central Japan Railway Co. | | | 1,945 | |
| | 20 | | | Daikin Industries Ltd. | | | 1,983 | |
| | 21 | | | Dentsu, Inc. | | | 1,174 | |
| | 77 | | | DMG Mori Co. Ltd. | | | 1,275 | |
| | 28 | | | East Japan Railway Co. | | | 2,549 | |
| | 20 | | | Electric Power Development Co. Ltd. | | | 462 | |
| | 257 | | | Fujitsu Ltd. | | | 1,604 | |
| | 369 | | | Hitachi Ltd. | | | 2,038 | |
| | 79 | | | Honda Motor Co. Ltd. | | | 2,308 | |
| | 92 | | | J Front Retailing Co. Ltd. | | | 1,328 | |
| | 51 | | | Japan Airlines Co. Ltd. | | | 1,604 | |
| | 16 | | | Japan Tobacco, Inc. | | | 539 | |
| | 57 | | | JFE Holdings, Inc. | | | 979 | |
| | 292 | | | JXTG Holdings, Inc. | | | 1,319 | |
| | 213 | | | Kajima Corp. | | | 1,446 | |
| | 45 | | | KDDI Corp. | | | 1,204 | |
| | 2 | | | Keyence Corp. | | | 965 | |
| | 124 | | | Kirin Holdings Co. Ltd. | | | 2,416 | |
| | 80 | | | Kyowa Hakko Kirin Co. Ltd. | | | 1,369 | |
| | 72 | | | Kyushu Electric Power Co., Inc. | | | 778 | |
| | 32 | | | Mabuchi Motor Co. Ltd. | | | 1,795 | |
| | 113 | | | Mazda Motor Corp. | | | 1,671 | |
| | 74 | | | Medipal Holdings Corp. | | | 1,224 | |
| | 516 | | | Mitsubishi UFJ Financial Group, Inc. | | | 3,270 | |
| | 86 | | | Mitsui Fudosan Co. Ltd. | | | 1,892 | |
| | 44 | | | MS&AD Insurance Group Holdings, Inc. | | | 1,444 | |
| | 92 | | | NGK Spark Plug Co. Ltd. | | | 1,989 | |
| | 18 | | | Nidec Corp. | | | 1,661 | |
| | 49 | | | Nippon Steel & Sumitomo Metal Corp. | | | 1,110 | |
| | 60 | | | Nippon Telegraph & Telephone Corp. | | | 2,580 | |
| | 5 | | | Nishi-Nippon Financial Holdings, Inc. | | | 51 | |
| | 75 | | | ORIX Corp. | | | 1,146 | |
| | 27 | | | Otsuka Corp. | | | 1,452 | |
| | 25 | | | Otsuka Holdings Co. Ltd. | | | 1,151 | |
| | 65 | | | Seiko Epson Corp. | | | 1,336 | |
| | | | | | | | |
SHARES | | | SECURITY DESCRIPTION | | VALUE | |
| | | | | | | | |
| | | | | | | | |
| | | | Japan — continued | | | | |
| | 69 | | | Seven & i Holdings Co. Ltd. | | | 2,923 | |
| | 19 | | | Shin-Etsu Chemical Co. Ltd. | | | 1,617 | |
| | 69 | | | Sony Corp. | | | 2,381 | |
| | 224 | | | Sumitomo Bakelite Co. Ltd. | | | 1,439 | |
| | 74 | | | Sumitomo Mitsui Financial Group, Inc. | | | 2,737 | |
| | 48 | | | Sumitomo Realty & Development Co. Ltd. | | | 1,297 | |
| | 39 | | | Suntory Beverage & Food Ltd. | | | 1,775 | |
| | 85 | | | Takashimaya Co. Ltd. | | | 783 | |
| | 229 | | | Tokyo Gas Co. Ltd. | | | 1,063 | |
| | 82 | | | Toyota Motor Corp. | | | 4,438 | |
| | 86 | | | Yamato Holdings Co. Ltd. | | | 1,863 | |
| | | | | | | | |
| | | | | | | 77,563 | |
| | | | | | | | |
| | | | Luxembourg — 0.1% | | | | |
| | 250 | | | ArcelorMittal (a) | | | 1,962 | |
| | | | | | | | |
| | | | Malaysia — 0.0% (g) | |
| | 82 | | | Public Bank Bhd. | | | 377 | |
| | | | | | | | |
| | | | Mexico — 0.1% | |
| | 83 | | | Grupo Financiero Banorte SAB de CV, Class O | | | 481 | |
| | 272 | | | Wal-Mart de Mexico SAB de CV | | | 613 | |
| | | | | | | | |
| | | | | | | 1,094 | |
| | | | | | | | |
| | | | Netherlands — 1.1% | | | | |
| | 15 | | | ASML Holding NV | | | 1,984 | |
| | 28 | | | Heineken NV | | | 2,509 | |
| | 197 | | | ING Groep NV | | | 3,204 | |
| | 78 | | | Koninklijke Philips NV | | | 2,703 | |
| | 40 | | | NN Group NV | | | 1,339 | |
| | 110 | | | Royal Dutch Shell plc, Class A | | | 2,844 | |
| | 156 | | | Royal Dutch Shell plc, Class B | | | 4,142 | |
| | | | | | | | |
| | | | | | | 18,725 | |
| | | | | | | | |
| | | | New Zealand — 0.1% | | | | |
| | 496 | | | Spark New Zealand Ltd. | | | 1,256 | |
| | | | | | | | |
| | | | Norway — 0.1% | |
| | 228 | | | Norsk Hydro ASA | | | 1,301 | |
| | | | | | | | |
| | | | Peru — 0.0% (g) | |
| | 4 | | | Credicorp Ltd. | | | 638 | |
| | | | | | | | |
| | | | Portugal — 0.1% | |
| | 77 | | | Galp Energia SGPS SA | | | 1,193 | |
| | | | | | | | |
| | | | Russia — 0.2% | |
| | 20 | | | LUKOIL PJSC, ADR | | | 1,012 | |
| | 24 | | | Magnit PJSC, GDR | | | 833 | |
| | 17 | | | Mobile TeleSystems PJSC, ADR | | | 176 | |
| | 104 | | | Sberbank of Russia PJSC, ADR | | | 1,232 | |
| | | | | | | | |
| | | | | | | 3,253 | |
| | | | | | | | |
SEE NOTES TO FINANCIAL STATEMENTS.
| | | | | | | | |
| | | |
| APRIL 30, 2017 | | J.P. MORGAN FUNDS | | | | | 15 | |
JPMorgan Global Allocation Fund
SCHEDULE OF PORTFOLIO INVESTMENTS
AS OF APRIL 30, 2017 (Unaudited) (continued)
(Amounts in U.S. Dollars, unless otherwise noted)
(Amounts in thousands)
| | | | | | | | |
SHARES | | | SECURITY DESCRIPTION | | VALUE | |
| | Long Positions — continued | |
| | Common Stocks — continued | |
| | | | Singapore — 0.2% | | | | |
| | 214 | | | DBS Group Holdings Ltd. | | | 2,953 | |
| | 83 | | | Singapore Exchange Ltd. | | | 440 | |
| | | | | | | | |
| | | | | | | 3,393 | |
| | | | | | | | |
| | | | South Africa — 0.4% | | | | |
| | 24 | | | Aspen Pharmacare Holdings Ltd. | | | 491 | |
| | 49 | | | Bid Corp. Ltd. | | | 1,036 | |
| | 47 | | | Bidvest Group Ltd. (The) | | | 566 | |
| | 7 | | | Capitec Bank Holdings Ltd. | | | 388 | |
| | 223 | | | FirstRand Ltd. | | | 832 | |
| | 25 | | | Mr Price Group Ltd. | | | 295 | |
| | 51 | | | MTN Group Ltd. | | | 486 | |
| | 56 | | | Remgro Ltd. | | | 936 | |
| | 56 | | | RMB Holdings Ltd. | | | 255 | |
| | 95 | | | Sanlam Ltd. | | | 503 | |
| | 38 | | | Shoprite Holdings Ltd. | | | 593 | |
| | 16 | | | Tiger Brands Ltd. | | | 495 | |
| | | | | | | | |
| | | | | | | 6,876 | |
| | | | | | | | |
| | | | South Korea — 0.2% | | | | |
| | 7 | | | Hyundai Motor Co. | | | 915 | |
| | 1 | | | Samsung Electronics Co. Ltd. | | | 2,921 | |
| | | | | | | | |
| | | | | | | 3,836 | |
| | | | | | | | |
| | | | Spain — 0.5% | | | | |
| | 305 | | | Banco Santander SA | | | 1,987 | |
| | 1,677 | | | Bankia SA | | | 2,036 | |
| | 301 | | | Iberdrola SA | | | 2,166 | |
| | 66 | | | Repsol SA | | | 1,049 | |
| | 146 | | | Telefonica SA | | | 1,609 | |
| | | | | | | | |
| | | | | | | 8,847 | |
| | | | | | | | |
| | | | Sweden — 0.2% | | | | |
| | 240 | | | Nordea Bank AB | | | 2,954 | |
| | | | | | | | |
| | | | Switzerland — 2.1% | |
| | 38 | | | Cie Financiere Richemont SA (Registered) | | | 3,183 | |
| | 37 | | | Credit Suisse Group AG (Registered) (a) | | | 558 | |
| | 44 | | | LafargeHolcim Ltd. (Registered) (a) | | | 2,522 | |
| | 122 | | | Nestle SA (Registered) | | | 9,369 | |
| | 47 | | | Novartis AG (Registered) | | | 3,630 | |
| | 27 | | | Roche Holding AG | | | 6,991 | |
| | 3 | | | Syngenta AG (a) | | | 1,294 | |
| | 167 | | | UBS Group AG (Registered) (a) | | | 2,842 | |
| | 45 | | | Wolseley plc | | | 2,854 | |
| | 8 | | | Zurich Insurance Group AG | | | 2,159 | |
| | | | | | | | |
| | | | | | | 35,402 | |
| | | | | | | | |
| | | | | | | | |
SHARES | | | SECURITY DESCRIPTION | | VALUE | |
| | | | | | | | |
| | | | | | | | |
| | | | Taiwan — 0.3% | | | | |
| | 143 | | | Delta Electronics, Inc. | | | 803 | |
| | 113 | | | President Chain Store Corp. | | | 983 | |
| | 101 | | | Taiwan Semiconductor Manufacturing Co. Ltd., ADR | | | 3,325 | |
| | | | | | | | |
| | | | | | | 5,111 | |
| | | | | | | | |
| | | | Thailand — 0.1% | | | | |
| | 47 | | | Siam Cement PCL (The) (Registered) | | | 721 | |
| | 176 | | | Siam Commercial Bank PCL (The) | | | 791 | |
| | | | | | | | |
| | | | | | | 1,512 | |
| | | | | | | | |
| | | | Turkey — 0.0% (g) | | | | |
| | 65 | | | KOC Holding A/S | | | 306 | |
| | | | | | | | |
| | | | United Kingdom — 3.4% | |
| | 152 | | | 3i Group plc | | | 1,564 | |
| | 40 | | | Associated British Foods plc | | | 1,450 | |
| | 44 | | | AstraZeneca plc | | | 2,614 | |
| | 298 | | | Aviva plc | | | 2,026 | |
| | 176 | | | Barratt Developments plc | | | 1,317 | |
| | 445 | | | BP plc | | | 2,549 | |
| | 88 | | | British American Tobacco plc | | | 5,976 | |
| | 806 | | | Centrica plc | | | 2,065 | |
| | 179 | | | Debenhams plc | | | 119 | |
| | 283 | | | Dixons Carphone plc | | | 1,229 | |
| | 161 | | | GlaxoSmithKline plc | | | 3,244 | |
| | 603 | | | HSBC Holdings plc | | | 4,975 | |
| | 49 | | | InterContinental Hotels Group plc | | | 2,572 | |
| | 607 | | | ITV plc | | | 1,651 | |
| | 2,345 | | | Lloyds Banking Group plc | | | 2,107 | |
| | 138 | | | Prudential plc | | | 3,059 | |
| | 22 | | | Reckitt Benckiser Group plc | | | 2,022 | |
| | 31 | | | Rio Tinto Ltd. | | | 1,409 | |
| | 18 | | | Rio Tinto plc | | | 724 | |
| | 287 | | | Standard Chartered plc (a) | | | 2,686 | |
| | 489 | | | Taylor Wimpey plc | | | 1,267 | |
| | 38 | | | TechnipFMC plc (a) | | | 1,156 | |
| | 37 | | | Unilever NV, CVA | | | 1,936 | |
| | 1,501 | | | Vodafone Group plc | | | 3,866 | |
| | 18 | | | Whitbread plc | | | 936 | |
| | 92 | | | WPP plc | | | 1,965 | |
| | | | | | | | |
| | | | | | | 56,484 | |
| | | | | | | | |
| | | | United States — 23.3% | | | | |
| | 16 | | | 3M Co. | | | 3,039 | |
| | — | (h) | | Abbott Laboratories | | | 6 | |
SEE NOTES TO FINANCIAL STATEMENTS.
| | | | | | |
| | | |
| 16 | | | | J.P. MORGAN FUNDS | | APRIL 30, 2017 |
| | | | | | | | |
SHARES | | | SECURITY DESCRIPTION | | VALUE | |
| | Long Positions — continued | |
| | Common Stocks — continued | |
| | | | United States — continued | | | | |
| | 52 | | | Acadia Healthcare Co., Inc. (a) | | | 2,266 | |
| | 8 | | | Acuity Brands, Inc. | | | 1,487 | |
| | 14 | | | Adobe Systems, Inc. (a) | | | 1,934 | |
| | 17 | | | AdvanSix, Inc. (a) | | | 471 | |
| | 14 | | | Aetna, Inc. | | | 1,889 | |
| | 10 | | | Affiliated Managers Group, Inc. | | | 1,640 | |
| | — | (h) | | Alcoa Corp. | | | 6 | |
| | 1 | | | Alleghany Corp. (a) | | | 406 | |
| | 4 | | | Allergan plc | | | 1,053 | |
| | 22 | | | Allied World Assurance Co. Holdings AG | | | 1,190 | |
| | — | (h) | | Ally Financial, Inc. | | | 4 | |
| | 4 | | | Alphabet, Inc., Class A (a) | | | 3,354 | |
| | 12 | | | Alphabet, Inc., Class C (a) | | | 11,007 | |
| | 8 | | | Amazon.com, Inc. (a) (j) | | | 7,412 | |
| | 26 | | | American Electric Power Co., Inc. | | | 1,733 | |
| | 18 | | | American Express Co. (j) | | | 1,430 | |
| | 53 | | | American Homes 4 Rent, Class A | | | 1,210 | |
| | 40 | | | American International Group, Inc. | | | 2,439 | |
| | — | (h) | | American Water Works Co., Inc. | | | 7 | |
| | — | (h) | | Ameriprise Financial, Inc. | | | 6 | |
| | 28 | | | Amphenol Corp., Class A | | | 2,013 | |
| | — | (h) | | Anadarko Petroleum Corp. | | | 6 | |
| | 25 | | | Apache Corp. | | | 1,218 | |
| | 55 | | | Apple, Inc. | | | 7,834 | |
| | 35 | | | Applied Materials, Inc. | | | 1,412 | |
| | 11 | | | Arista Networks, Inc. (a) | | | 1,496 | |
| | 16 | | | Arrow Electronics, Inc. (a) | | | 1,103 | |
| | — | (h) | | Arthur J Gallagher & Co. | | | 6 | |
| | 10 | | | Athene Holding Ltd., Class A (a) | | | 521 | |
| | 2 | | | AutoZone, Inc. (a) | | | 1,377 | |
| | — | (h) | | AvalonBay Communities, Inc. | | | 7 | |
| | 24 | | | Ball Corp. | | | 1,871 | |
| | 183 | | | Bank of America Corp. | | | 4,281 | |
| | — | (h) | | Bank of New York Mellon Corp. (The) | | | 6 | |
| | — | (h) | | Becton Dickinson and Co. | | | 6 | |
| | 22 | | | Bed Bath & Beyond, Inc. | | | 872 | |
| | 32 | | | Berry Global Group, Inc. (a) | | | 1,580 | |
| | 25 | | | Best Buy Co., Inc. | | | 1,295 | |
| | — | (h) | | Biogen, Inc. (a) | | | 6 | |
| | 4 | | | BlackRock, Inc. | | | 1,422 | |
| | — | (h) | | Boston Scientific Corp. (a) | | | 7 | |
| | 20 | | | Brinker International, Inc. | | | 889 | |
| | — | (h) | | Bristol-Myers Squibb Co. | | | 6 | |
| | 42 | | | Brixmor Property Group, Inc. | | | 833 | |
| | | | | | | | |
SHARES | | | SECURITY DESCRIPTION | | VALUE | |
| | | | | | | | |
| | | | | | | | |
| | | | United States — continued | | | | |
| | 9 | | | Broadcom Ltd. | | | 2,067 | |
| | — | (h) | | Cabot Oil & Gas Corp. | | | 7 | |
| | 43 | | | Capital One Financial Corp. (j) | | | 3,457 | |
| | 26 | | | Carlisle Cos., Inc. | | | 2,638 | |
| | 12 | | | Caterpillar, Inc. | | | 1,241 | |
| | 17 | | | Cavium, Inc. (a) | | | 1,190 | |
| | 78 | | | CBRE Group, Inc., Class A (a) | | | 2,782 | |
| | 20 | | | CBS Corp. (Non-Voting), Class B | | | 1,357 | |
| | 12 | | | Celgene Corp. (a) | | | 1,540 | |
| | 100 | | | Charles Schwab Corp. (The) | | | 3,876 | |
| | 4 | | | Charter Communications, Inc., Class A (a) | | | 1,426 | |
| | — | (h) | | Chevron Corp. | | | 6 | |
| | 10 | | | Chubb Ltd. | | | 1,432 | |
| | 4 | | | Cigna Corp. (j) | | | 663 | |
| | 58 | | | Cisco Systems, Inc. | | | 1,964 | |
| | 33 | | | Citigroup, Inc. | | | 1,968 | |
| | 52 | | | Citizens Financial Group, Inc. | | | 1,892 | |
| | 63 | | | Clear Channel Outdoor Holdings, Inc., Class A | | | 323 | |
| | 31 | | | CNO Financial Group, Inc. | | | 653 | |
| | 16 | | | Columbia Sportswear Co. | | | 928 | |
| | 15 | | | Comerica, Inc. | | | 1,053 | |
| | 10 | | | Concho Resources, Inc. (a) | | | 1,308 | |
| | 28 | | | ConocoPhillips | | | 1,356 | |
| | — | (h) | | Continental Resources, Inc. (a) | | | 6 | |
| | 64 | | | Corning, Inc. | | | 1,833 | |
| | — | (h) | | Costco Wholesale Corp. | | | 7 | |
| | 46 | | | Coty, Inc., Class A | | | 823 | |
| | 31 | | | CSX Corp. | | | 1,563 | |
| | 17 | | | CVS Health Corp. | | | 1,387 | |
| | — | (h) | | Delphi Automotive plc | | | 6 | |
| | 83 | | | Delta Air Lines, Inc. | | | 3,791 | |
| | — | (h) | | Diamondback Energy, Inc. (a) | | | 6 | |
| | 54 | | | DISH Network Corp., Class A (a) | | | 3,499 | |
| | — | (h) | | Dollar General Corp. | | | 6 | |
| | 16 | | | Dover Corp. | | | 1,238 | |
| | — | (h) | | DR Horton, Inc. | | | 6 | |
| | 12 | | | Dr Pepper Snapple Group, Inc. | | | 1,114 | |
| | 11 | | | Duke Energy Corp. | | | 892 | |
| | 16 | | | Eagle Materials, Inc. | | | 1,488 | |
| | 29 | | | East West Bancorp, Inc. | | | 1,587 | |
| | 10 | | | EastGroup Properties, Inc. | | | 813 | |
| | 19 | | | Eaton Corp. plc | | | 1,413 | |
| | 6 | | | Ecolab, Inc. | | | 717 | |
| | 17 | | | Edison International | | | 1,325 | |
SEE NOTES TO FINANCIAL STATEMENTS.
| | | | | | | | |
| | | |
| APRIL 30, 2017 | | J.P. MORGAN FUNDS | | | | | 17 | |
JPMorgan Global Allocation Fund
SCHEDULE OF PORTFOLIO INVESTMENTS
AS OF APRIL 30, 2017 (Unaudited) (continued)
(Amounts in U.S. Dollars, unless otherwise noted)
(Amounts in thousands)
| | | | | | | | |
SHARES | | | SECURITY DESCRIPTION | | VALUE | |
| | Long Positions — continued | |
| | Common Stocks — continued | |
| | | | United States — continued | | | | |
| | — | (h) | | EI du Pont de Nemours & Co. | | | 6 | |
| | 36 | | | Electronic Arts, Inc. (a) | | | 3,371 | |
| | — | (h) | | Eli Lilly & Co. (j) | | | 6 | |
| | 10 | | | Energizer Holdings, Inc. | | | 606 | |
| | 51 | | | Entercom Communications Corp., Class A (j) | | | 640 | |
| | 12 | | | EOG Resources, Inc. | | | 1,103 | |
| | 18 | | | EQT Corp. | | | 1,034 | |
| | 10 | | | Equifax, Inc. | | | 1,308 | |
| | — | (h) | | Estee Lauder Cos., Inc. (The), Class A | | | 6 | |
| | — | (h) | | Everest Re Group Ltd. | | | 7 | |
| | 16 | | | Eversource Energy | | | 978 | |
| | 32 | | | Evolent Health, Inc., Class A (a) | | | 738 | |
| | 33 | | | Exact Sciences Corp. (a) | | | 1,004 | |
| | 10 | | | Expedia, Inc. | | | 1,385 | |
| | 43 | | | Exxon Mobil Corp. | | | 3,544 | |
| | 46 | | | Facebook, Inc., Class A (a) | | | 6,964 | |
| | 15 | | | Fidelity National Information Services, Inc. | | | 1,275 | |
| | 41 | | | Fifth Third Bancorp | | | 1,005 | |
| | 21 | | | First Republic Bank | | | 1,978 | |
| | 26 | | | Fiserv, Inc. (a) | | | 3,117 | |
| | 28 | | | Fortune Brands Home & Security, Inc. | | | 1,756 | |
| | 31 | | | Gap, Inc. (The) | | | 821 | |
| | — | (h) | | General Electric Co. | | | 6 | |
| | 13 | | | Genuine Parts Co. | | | 1,227 | |
| | 21 | | | Gilead Sciences, Inc. | | | 1,454 | |
| | 48 | | | GoDaddy, Inc., Class A (a) | | | 1,876 | |
| | 3 | | | Goldman Sachs Group, Inc. (The) | | | 667 | |
| | 64 | | | Graphic Packaging Holding Co. | | | 873 | |
| | 14 | | | Guidewire Software, Inc. (a) | | | 871 | |
| | 35 | | | Hanesbrands, Inc. | | | 763 | |
| | 61 | | | Harley-Davidson, Inc. | | | 3,485 | |
| | 11 | | | Harris Corp. | | | 1,254 | |
| | 33 | | | Hartford Financial Services Group, Inc. (The) | | | 1,590 | |
| | 15 | | | HCA Holdings, Inc. (a) | | | 1,302 | |
| | — | (h) | | HCP, Inc. | | | 7 | |
| | 31 | | | HD Supply Holdings, Inc. (a) | | | 1,261 | |
| | 48 | | | Hewlett Packard Enterprise Co. | | | 903 | |
| | 28 | | | Hilton Grand Vacations, Inc. (a) | | | 927 | |
| | 49 | | | Hilton Worldwide Holdings, Inc. | | | 2,894 | |
| | 9 | | | Home Depot, Inc. (The) | | | 1,460 | |
| | 14 | | | Honeywell International, Inc. | | | 1,870 | |
| | 16 | | | Humana, Inc. | | | 3,571 | |
| | 7 | | | Illinois Tool Works, Inc. | | | 1,022 | |
| | 8 | | | Illumina, Inc. (a) | | | 1,560 | |
| | | | | | | | |
SHARES | | | SECURITY DESCRIPTION | | VALUE | |
| | | | | | | | |
| | | | | | | | |
| | | | United States — continued | | | | |
| | — | (h) | | Incyte Corp. (a) | | | 5 | |
| | — | (h) | | Ingersoll-Rand plc | | | 7 | |
| | — | (h) | | Intercontinental Exchange, Inc. | | | 6 | |
| | 26 | | | Invesco Ltd. | | | 850 | |
| | 9 | | | Jazz Pharmaceuticals plc (a) | | | 1,391 | |
| | 9 | | | John Bean Technologies Corp. | | | 817 | |
| | 22 | | | Johnson & Johnson | | | 2,688 | |
| | — | (h) | | Johnson Controls International plc | | | 6 | |
| | — | (h) | | Kansas City Southern | | | 6 | |
| | 28 | | | KapStone Paper and Packaging Corp. | | | 600 | |
| | — | (h) | | KeyCorp | | | 6 | |
| | 46 | | | Kimco Realty Corp. | | | 935 | |
| | 58 | | | Kinder Morgan, Inc. | | | 1,191 | |
| | 17 | | | Kite Pharma, Inc. (a) | | | 1,406 | |
| | 9 | | | KLA-Tencor Corp. | | | 887 | |
| | 34 | | | Kohl’s Corp. | | | 1,338 | |
| | — | (h) | | Kraft Heinz Co. (The) | | | 6 | |
| | 37 | | | Kroger Co. (The) | | | 1,088 | |
| | 61 | | | La Quinta Holdings, Inc. (a) | | | 867 | |
| | 10 | | | Lam Research Corp. | | | 1,440 | |
| | 17 | | | Lazard Ltd., Class A | | | 724 | |
| | 12 | | | Lennox International, Inc. | | | 2,027 | |
| | 10 | | | Lithia Motors, Inc., Class A | | | 983 | |
| | 43 | | | LKQ Corp. (a) | | | 1,330 | |
| | 71 | | | Loews Corp. (j) | | | 3,322 | |
| | — | (h) | | Lowe’s Cos., Inc. | | | 6 | |
| | 9 | | | M&T Bank Corp. | | | 1,362 | |
| | — | (h) | | Macy’s, Inc. | | | 6 | |
| | 29 | | | Marathon Petroleum Corp. | | | 1,476 | |
| | 7 | | | Marsh & McLennan Cos., Inc. | | | 516 | |
| | 6 | | | Martin Marietta Materials, Inc. | | | 1,296 | |
| | — | (h) | | Masco Corp. | | | 7 | |
| | 33 | | | Mastercard, Inc., Class A | | | 3,822 | |
| | — | (h) | | Maxim Integrated Products, Inc. | | | 6 | |
| | — | (h) | | McKesson Corp. | | | 6 | |
| | 39 | | | Merck & Co., Inc. | | | 2,432 | |
| | — | (h) | | MetLife, Inc. | | | 6 | |
| | — | (h) | | Microchip Technology, Inc. | | | 6 | |
| | — | (h) | | Micron Technology, Inc. (a) | | | 7 | |
| | 94 | | | Microsoft Corp. | | | 6,445 | |
| | 8 | | | Mid-America Apartment Communities, Inc. | | | 814 | |
| | 7 | | | Middleby Corp. (The) (a) | | | 982 | |
| | — | (h) | | Mobileye NV (a) | | | 6 | |
| | 35 | | | Mohawk Industries, Inc. (a) | | | 8,169 | |
SEE NOTES TO FINANCIAL STATEMENTS.
| | | | | | |
| | | |
| 18 | | | | J.P. MORGAN FUNDS | | APRIL 30, 2017 |
| | | | | | | | |
SHARES | | | SECURITY DESCRIPTION | | VALUE | |
| | Long Positions — continued | |
| | Common Stocks — continued | |
| | | | United States — continued | | | | |
| | 10 | | | Molson Coors Brewing Co., Class B | | | 987 | |
| | — | (h) | | Mondelez International, Inc., Class A | | | 6 | |
| | 20 | | | Monster Beverage Corp. (a) | | | 929 | |
| | 26 | | | Morgan Stanley | | | 1,141 | |
| | — | (h) | | Mosaic Co. (The) | | | 6 | |
| | 10 | | | Murphy USA, Inc. (a) | | | 662 | |
| | 16 | | | Nasdaq, Inc. | | | 1,070 | |
| | 11 | | | Netflix, Inc. (a) | | | 1,674 | |
| | 60 | | | Newell Brands, Inc. | | | 2,883 | |
| | 14 | | | Nexstar Media Group, Inc. | | | 993 | |
| | 23 | | | NextEra Energy, Inc. | | | 3,072 | |
| | 1 | | | NII Holdings, Inc. (a) | | | 1 | |
| | 17 | | | NIKE, Inc., Class B | | | 925 | |
| | — | (h) | | NiSource, Inc. | | | 6 | |
| | 20 | | | Nordstrom, Inc. | | | 962 | |
| | 6 | | | Norfolk Southern Corp. | | | 649 | |
| | 12 | | | Northern Trust Corp. | | | 1,122 | |
| | 3 | | | Northrop Grumman Corp. | | | 634 | |
| | 25 | | | Norwegian Cruise Line Holdings Ltd. (a) | | | 1,354 | |
| | 15 | | | NVIDIA Corp. (j) | | | 1,601 | |
| | 14 | | | Old Dominion Freight Line, Inc. | | | 1,238 | |
| | — | (h) | | Olin Corp. | | | 6 | |
| | — | (h) | | Omega Healthcare Investors, Inc. | | | 7 | |
| | — | (h) | | ON Semiconductor Corp. (a) | | | 6 | |
| | 38 | | | Outfront Media, Inc. | | | 1,001 | |
| | — | (h) | | PACCAR, Inc. | | | 6 | |
| | 7 | | | Palo Alto Networks, Inc. (a) | | | 775 | |
| | 12 | | | Park Hotels & Resorts, Inc. | | | 320 | |
| | 59 | | | PayPal Holdings, Inc. (a) | | | 2,828 | |
| | 38 | | | PBF Energy, Inc., Class A | | | 841 | |
| | 1 | | | Penn Virginia Corp. (a) | | | 23 | |
| | — | (h) | | Penn Virginia Corp. (a) | | | 18 | |
| | 14 | | | PepsiCo, Inc. | | | 1,541 | |
| | 118 | | | Pfizer, Inc. | | | 3,992 | |
| | — | (h) | | PG&E Corp. | | | 6 | |
| | 19 | | | Phillips 66 | | | 1,499 | |
| | — | (h) | | Pinnacle West Capital Corp. | | | 6 | |
| | — | (h) | | Pioneer Natural Resources Co. | | | 6 | |
| | — | (h) | | Plains GP Holdings LP, Class A | | | 6 | |
| | 22 | | | PNC Financial Services Group, Inc. (The) | | | 2,584 | |
| | 15 | | | Post Holdings, Inc. (a) | | | 1,229 | |
| | 2 | | | Priceline Group, Inc. (The) (a) (j) | | | 3,018 | |
| | 20 | | | Procter & Gamble Co. (The) | | | 1,703 | |
| | 7 | | | Prudential Financial, Inc. | | | 789 | |
| | | | | | | | |
SHARES | | | SECURITY DESCRIPTION | | VALUE | |
| | | | | | | | |
| | | | | | | | |
| | | | United States — continued | | | | |
| | 22 | | | QUALCOMM, Inc. | | | 1,176 | |
| | — | (h) | | Quality Care Properties, Inc. (a) | | | 6 | |
| | 50 | | | Rayonier, Inc. | | | 1,398 | |
| | 4 | | | Raytheon Co. | | | 633 | |
| | 14 | | | Red Rock Resorts, Inc., Class A | | | 320 | |
| | 25 | | | Revance Therapeutics, Inc. (a) | | | 537 | |
| | — | (h) | | Ross Stores, Inc. | | | 6 | |
| | 11 | | | Royal Caribbean Cruises Ltd. | | | 1,189 | |
| | 14 | | | S&P Global, Inc. | | | 1,930 | |
| | 2 | | | Sage Therapeutics, Inc. (a) | | | 149 | |
| | 17 | | | salesforce.com, Inc. (a) | | | 1,431 | |
| | — | (h) | | SBA Communications Corp., Class A (a) | | | 7 | |
| | 9 | | | Sempra Energy | | | 1,054 | |
| | 19 | | | ServiceNow, Inc. (a) | | | 1,828 | |
| | 67 | | | Shire plc | | | 3,967 | |
| | 4 | | | Signature Bank (a) | | | 507 | |
| | 17 | | | Sinclair Broadcast Group, Inc., Class A | | | 689 | |
| | — | (h) | | SL Green Realty Corp. | | | 6 | |
| | 45 | | | Snap, Inc., Class A (a) | | | 1,015 | |
| | 40 | | | Southwest Airlines Co. | | | 2,240 | |
| | 13 | | | Spark Therapeutics, Inc. (a) | | | 759 | |
| | 20 | | | Splunk, Inc. (a) | | | 1,299 | |
| | 15 | | | Stanley Black & Decker, Inc. | | | 2,108 | |
| | 28 | | | Starbucks Corp. | | | 1,695 | |
| | — | (h) | | Stone Energy Corp. (a) | | | 9 | |
| | — | (h) | | STORE Capital Corp. | | | 7 | |
| | 34 | | | SunTrust Banks, Inc. | | | 1,933 | |
| | — | (h) | | SVB Financial Group (a) | | | 6 | |
| | — | (h) | | Synchrony Financial | | | 5 | |
| | 27 | | | T Rowe Price Group, Inc. | | | 1,890 | |
| | 13 | | | Take-Two Interactive Software, Inc. (a) | | | 811 | |
| | — | (h) | | TE Connectivity Ltd. | | | 6 | |
| | 4 | | | Tesla, Inc. (a) | | | 1,351 | |
| | 26 | | | Texas Instruments, Inc. | | | 2,087 | |
| | 101 | | | TherapeuticsMD, Inc. (a) | | | 514 | |
| | 21 | | | Thermo Fisher Scientific, Inc. | | | 3,456 | |
| | 15 | | | Tiffany & Co. | | | 1,358 | |
| | 29 | | | Time Warner, Inc. | | | 2,866 | |
| | 2 | | | TimkenSteel Corp. (a) | | | 30 | |
| | — | (h) | | TJX Cos., Inc. (The) | | | 6 | |
| | 12 | | | T-Mobile US, Inc. (a) | | | 825 | |
| | 13 | | | Travelers Cos., Inc. (The) | | | 1,610 | |
| | 14 | | | TreeHouse Foods, Inc. (a) | | | 1,234 | |
| | 53 | | | Twenty-First Century Fox, Inc., Class B | | | 1,595 | |
SEE NOTES TO FINANCIAL STATEMENTS.
| | | | | | | | |
| | | |
| APRIL 30, 2017 | | J.P. MORGAN FUNDS | | | | | 19 | |
JPMorgan Global Allocation Fund
SCHEDULE OF PORTFOLIO INVESTMENTS
AS OF APRIL 30, 2017 (Unaudited) (continued)
(Amounts in U.S. Dollars, unless otherwise noted)
(Amounts in thousands)
| | | | | | | | |
SHARES | | | SECURITY DESCRIPTION | | VALUE | |
| | Long Positions — continued | |
| | Common Stocks — continued | |
| | | | United States — continued | | | | |
| | 4 | | | Ulta Beauty, Inc. (a) | | | 995 | |
| | — | (h) | | Union Pacific Corp. | | | 7 | |
| | — | (h) | | United Continental Holdings, Inc. (a) | | | 7 | |
| | 7 | | | United Rentals, Inc. (a) | | | 818 | |
| | 17 | | | United Technologies Corp. | | | 1,987 | |
| | 54 | | | UnitedHealth Group, Inc. | | | 9,493 | |
| | 21 | | | Unum Group | | | 952 | |
| | 35 | | | US Bancorp | | | 1,772 | |
| | 40 | | | Vantiv, Inc., Class A (a) | | | 2,512 | |
| | 17 | | | Veeva Systems, Inc., Class A (a) | | | 934 | |
| | 27 | | | Verizon Communications, Inc. | | | 1,243 | |
| | 14 | | | Vertex Pharmaceuticals, Inc. (a) | | | 1,703 | |
| | 53 | | | Visa, Inc., Class A | | | 4,821 | |
| | 17 | | | Vistra Energy Corp. | | | 256 | |
| | — | (h) | | Voya Financial, Inc. | | | 6 | |
| | 9 | | | Vulcan Materials Co. | | | 1,039 | |
| | 19 | | | VWR Corp. (a) | | | 546 | |
| | 13 | | | WABCO Holdings, Inc. (a) | | | 1,567 | |
| | 8 | | | Walgreens Boots Alliance, Inc. | | | 698 | |
| | 18 | | | Walt Disney Co. (The) | | | 2,077 | |
| | 21 | | | Wayfair, Inc., Class A (a) | | | 958 | |
| | 108 | | | Wells Fargo & Co. (j) | | | 5,825 | |
| | 27 | | | WestRock Co. | | | 1,459 | |
| | — | (h) | | WEX, Inc. (a) | | | 6 | |
| | 22 | | | Weyerhaeuser Co. | | | 735 | |
| | — | (h) | | Workday, Inc., Class A (a) | | | 6 | |
| | 9 | | | Wyndham Worldwide Corp. | | | 837 | |
| | 37 | | | Xcel Energy, Inc. | | | 1,688 | |
| | — | (h) | | Zimmer Biomet Holdings, Inc. | | | 6 | |
| | | | | | | | |
| | | | | | | 384,120 | |
| | | | | | | | |
| | | | Total Common Stocks
(Cost $689,239) | | | 798,480 | |
| | | | | | | | |
| | |
PRINCIPAL
AMOUNT/UNIT | | | | | | |
| | Convertible Bond — 0.0% (g) | |
| | | | United States — 0.0% (g) | | | | |
| | 60 | | | Liberty Interactive LLC, 3.750%, 02/15/30 (Cost $35) | | | 36 | |
| | | | | | | | |
| | Corporate Bonds — 21.1% | |
| | | | Belgium — 0.1% | | | | |
| | 485 | | | Anheuser-Busch InBev Finance, Inc., 3.650%, 02/01/26 | | | 496 | |
| | EUR 415 | | | Nyrstar Netherlands Holdings BV, 6.875%, 03/15/24 | | | 454 | |
| | | | | | | | |
PRINCIPAL
AMOUNT | | | SECURITY DESCRIPTION | | VALUE | |
| | | | | | | | |
| | | | | | | | |
| | | | Belgium — continued | | | | |
| | EUR 750 | | | Solvay Finance SA, Reg. S, VAR, 5.425%, 11/12/23 (x) (y) | | | 916 | |
| | | | | | | | |
| | | | | | | 1,866 | |
| | | | | | | | |
| | | | Bermuda — 0.0% (g) | | | | |
| | 780 | | | XLIT Ltd., Series E, VAR, 3.616%, 06/02/17 (x) (y) | | | 663 | |
| | | | | | | | |
| | | | | | | | |
| | | | Brazil — 0.1% | | | | |
| | | | JBS USA LUX SA, | | | | |
| | 585 | | | 5.750%, 06/15/25 (e) | | | 601 | |
| | 260 | | | 5.875%, 07/15/24 (e) | | | 272 | |
| | | | | | | | |
| | | | | | | 873 | |
| | | | | | | | |
| | | | Canada — 0.8% | | | | |
| | 285 | | | ATS Automation Tooling Systems, Inc., 6.500%, 06/15/23 (e) | | | 296 | |
| | 80 | | | Baytex Energy Corp., 5.625%, 06/01/24 (e) | | | 73 | |
| | | | Bombardier, Inc., | | | | |
| | 134 | | | 6.000%, 10/15/22 (e) | | | 134 | �� |
| | 192 | | | 6.125%, 01/15/23 (e) | | | 192 | |
| | 49 | | | 7.500%, 03/15/25 (e) | | | 51 | |
| | 1,337 | | | 8.750%, 12/01/21 (e) | | | 1,487 | |
| | 266 | | | Cascades, Inc., 5.750%, 07/15/23 (e) | | | 270 | |
| | | | Cenovus Energy, Inc., | | | | |
| | 92 | | | 4.250%, 04/15/27 (e) | | | 92 | |
| | 750 | | | 5.400%, 06/15/47 (e) | | | 735 | |
| | | | Concordia International Corp., | | | | |
| | 756 | | | 7.000%, 04/15/23 (e) | | | 121 | |
| | 74 | | | 9.000%, 04/01/22 (e) | | | 51 | |
| | 387 | | | Cott Holdings, Inc., 5.500%, 04/01/25 (e) | | | 394 | |
| | 250 | | | Emera US Finance LP, 4.750%, 06/15/46 | | | 253 | |
| | 554 | | | Garda World Security Corp., 7.250%, 11/15/21 (e) | | | 560 | |
| | 175 | | | Gateway Casinos & Entertainment Ltd., 8.250%, 03/01/24 (e) | | | 179 | |
| | 1,350 | | | GW Honos Security Corp., 8.750%, 05/15/25 (e) | | | 1,372 | |
| | 120 | | | Hudbay Minerals, Inc., 7.250%, 01/15/23 (e) | | | 128 | |
| | 579 | | | Kronos Acquisition Holdings, Inc., 9.000%, 08/15/23 (e) | | | 588 | |
| | | | Lundin Mining Corp., | | | | |
| | 215 | | | 7.500%, 11/01/20 (e) | | | 228 | |
| | 210 | | | 7.875%, 11/01/22 (e) | | | 231 | |
| | | | Mattamy Group Corp., | | | | |
| | 267 | | | 6.500%, 11/15/20 (e) | | | 274 | |
| | 76 | | | 6.875%, 12/15/23 (e) | | | 79 | |
SEE NOTES TO FINANCIAL STATEMENTS.
| | | | | | |
| | | |
| 20 | | | | J.P. MORGAN FUNDS | | APRIL 30, 2017 |
| | | | | | | | |
PRINCIPAL
AMOUNT | | | SECURITY DESCRIPTION | | VALUE | |
| | Long Positions — continued | |
| | Corporate Bonds — continued | |
| | | | Canada — continued | | | | |
| | | | MEG Energy Corp., | | | | |
| | 620 | | | 6.375%, 01/30/23 (e) | | | 546 | |
| | 25 | | | 7.000%, 03/31/24 (e) | | | 22 | |
| | | | NOVA Chemicals Corp., | | | | |
| | 97 | | | 5.000%, 05/01/25 (e) | | | 99 | |
| | 319 | | | 5.250%, 08/01/23 (e) | | | 328 | |
| | | | Open Text Corp., | | | | |
| | 323 | | | 5.625%, 01/15/23 (e) | | | 338 | |
| | 113 | | | 5.875%, 06/01/26 (e) | | | 121 | |
| | | | Precision Drilling Corp., | | | | |
| | 53 | | | 5.250%, 11/15/24 | | | 51 | |
| | 140 | | | 6.500%, 12/15/21 | | | 142 | |
| | 150 | | | Quebecor Media, Inc., 5.750%, 01/15/23 | | | 158 | |
| | | | Teck Resources Ltd., | | | | |
| | 160 | | | 3.000%, 03/01/19 | | | 162 | |
| | 233 | | | 4.750%, 01/15/22 | | | 241 | |
| | 180 | | | 5.400%, 02/01/43 | | | 175 | |
| | 330 | | | 6.000%, 08/15/40 | | | 340 | |
| | 630 | | | 6.125%, 10/01/35 | | | 666 | |
| | 45 | | | 8.000%, 06/01/21 (e) | | | 49 | |
| | 169 | | | 8.500%, 06/01/24 (e) | | | 196 | |
| | 625 | | | TransCanada PipeLines Ltd., 4.625%, 03/01/34 | | | 667 | |
| | 240 | | | Trinidad Drilling Ltd., 6.625%, 02/15/25 (e) | | | 242 | |
| | | | Videotron Ltd., | | | | |
| | 87 | | | 5.125%, 04/15/27 (e) | | | 89 | |
| | 455 | | | 5.375%, 06/15/24 (e) | | | 479 | |
| | | | | | | | |
| | | | | | | 12,899 | |
| | | | | | | | |
| | | | China — 0.0% (g) | | | | |
| | EUR 338 | | | BiSoho SAS, Reg. S, 5.875%, 05/01/23 | | | 396 | |
| | | | | | | | |
| | | | Finland — 0.0% (g) | |
| | 251 | | | Nokia OYJ, 6.625%, 05/15/39 | | | 274 | |
| | | | | | | | |
| | | | France — 0.9% | |
| | EUR 500 | | | Arkema SA, Reg. S, VAR, 4.750%, 10/29/20 (x) (y) | | | 589 | |
| | | | Autodis SA, | | | | |
| | EUR 200 | | | 4.375%, 05/01/22 | | | 227 | |
| | EUR 100 | | | Reg. S, 4.375%, 05/01/22 | | | 113 | |
| | EUR 1,200 | | | Casino Guichard Perrachon SA, Reg. S, 4.498%, 03/07/24 | | | 1,441 | |
| | 448 | | | Credit Agricole SA, VAR, 8.125%, 12/23/25 (e) (x) (y) | | | 494 | |
| | EUR 450 | | | Elis SA, Reg. S, 3.000%, 04/30/22 | | | 506 | |
| | | | | | | | |
PRINCIPAL
AMOUNT | | | SECURITY DESCRIPTION | | VALUE | |
| | | | | | | | |
| | | | | | | | |
| | | | France — continued | |
| | EUR 1,000 | | | Europcar Groupe SA, Reg. S, 5.750%, 06/15/22 | | | 1,143 | |
| | EUR 750 | | | Faurecia, Reg. S, 3.625%, 06/15/23 | | | 859 | |
| | EUR 400 | | | Groupe Fnac SA, Reg. S, 3.250%, 09/30/23 | | | 449 | |
| | EUR 250 | | | Horizon Holdings I SAS, Reg. S, 7.250%, 08/01/23 | | | 291 | |
| | EUR 300 | | | Labeyrie Fine Foods SAS, Reg. S, 5.625%, 03/15/21 | | | 336 | |
| | EUR 250 | | | Loxam SAS, Reg. S, 3.500%, 05/03/23 | | | 279 | |
| | EUR 1,200 | | | NEW Areva Holding SA, 4.875%, 09/23/24 | | | 1,362 | |
| | EUR 450 | | | Novafives SAS, Reg. S, 4.500%, 06/30/21 | | | 494 | |
| | EUR 1,000 | | | Peugeot SA, Reg. S, 2.375%, 04/14/23 | | | 1,139 | |
| | EUR 700 | | | Rexel SA, Reg. S, 3.500%, 06/15/23 | | | 796 | |
| | | | SFR Group SA, | | | | |
| | 600 | | | 6.000%, 05/15/22 (e) | | | 625 | |
| | 800 | | | 6.250%, 05/15/24 (e) | | | 828 | |
| | 334 | | | 7.375%, 05/01/26 (e) | | | 352 | |
| | EUR 500 | | | Reg. S, 5.375%, 05/15/22 | | | 567 | |
| | EUR 500 | | | Reg. S, 5.625%, 05/15/24 | | | 588 | |
| | 400 | | | Societe Generale SA, VAR, 7.375%, 09/13/21 (e) (x) (y) | | | 423 | |
| | EUR 300 | | | Vallourec SA, Reg. S, 2.250%, 09/30/24 | | | 264 | |
| | EUR 650 | | | Verallia Packaging SASU, Reg. S, 5.125%, 08/01/22 | | | 754 | |
| | | | | | | | |
| | | | | | | 14,919 | |
| | | | | | | | |
| | | | Germany — 0.5% | |
| | EUR 750 | | | CeramTec Group GmbH, Reg. S, 8.250%, 08/15/21 | | | 866 | |
| | EUR 300 | | | Douglas GmbH, Reg. S, 6.250%, 07/15/22 | | | 356 | |
| | | | Fresenius Medical Care US Finance II, Inc., | | | | |
| | 160 | | | 4.125%, 10/15/20 (e) | | | 164 | |
| | 220 | | | 4.750%, 10/15/24 (e) | | | 225 | |
| | 85 | | | 5.625%, 07/31/19 (e) | | | 91 | |
| | 25 | | | 6.500%, 09/15/18 (e) | | | 26 | |
| | 155 | | | Fresenius Medical Care US Finance, Inc., 5.750%, 02/15/21 (e) | | | 169 | |
| | EUR 220 | | | HP Pelzer Holding GmbH, 4.125%, 04/01/24 | | | 244 | |
| | EUR 900 | | | IHO Verwaltungs GmbH, 3.250% (cash), 09/15/23 (v) | | | 1,020 | |
| | EUR 400 | | | K+S AG, Reg. S, 3.000%, 06/20/22 | | | 461 | |
| | EUR 350 | | | ProGroup AG, Reg. S, 5.125%, 05/01/22 | | | 404 | |
| | EUR 600 | | | Schaeffler Finance BV, Reg. S, 3.250%, 05/15/25 | | | 707 | |
SEE NOTES TO FINANCIAL STATEMENTS.
| | | | | | | | |
| | | |
| APRIL 30, 2017 | | J.P. MORGAN FUNDS | | | | | 21 | |
JPMorgan Global Allocation Fund
SCHEDULE OF PORTFOLIO INVESTMENTS
AS OF APRIL 30, 2017 (Unaudited) (continued)
(Amounts in U.S. Dollars, unless otherwise noted)
(Amounts in thousands)
| | | | | | | | |
PRINCIPAL
AMOUNT | | | SECURITY DESCRIPTION | | VALUE | |
| | Long Positions — continued | |
| | Corporate Bonds — continued | |
| | | | Germany — continued | |
| | | | thyssenkrupp AG, | | | | |
| | EUR 400 | | | Reg. S, 1.750%, 11/25/20 | | | 446 | |
| | EUR 700 | | | Reg. S, 2.750%, 03/08/21 | | | 800 | |
| | | | Unitymedia GmbH, | | | | |
| | 255 | | | 6.125%, 01/15/25 (e) | | | 272 | |
| | EUR 250 | | | Reg. S, 3.750%, 01/15/27 | | | 276 | |
| | EUR 1,150 | | | Unitymedia Hessen GmbH & Co. KG, Reg. S, 4.000%, 01/15/25 | | | 1,318 | |
| | EUR 600 | | | WEPA Hygieneprodukte GmbH, Reg. S, 3.750%, 05/15/24 | | | 684 | |
| | | | | | | | |
| | | | | | | 8,529 | |
| | | | | | | | |
| | | | Greece — 0.0% (g) | |
| | EUR 400 | | | OTE plc, Reg. S, 7.875%, 02/07/18 | | | 458 | |
| | | | | | | | |
| | | | Ireland — 0.3% | |
| | EUR 300 | | | Allied Irish Banks plc, Reg. S, VAR, 4.125%, 11/26/25 | | | 345 | |
| | | | Ardagh Packaging Finance plc, | | | | |
| | 200 | | | 6.000%, 06/30/21 (e) | | | 207 | |
| | EUR 500 | | | Reg. S, 4.125%, 05/15/23 | | | 577 | |
| | EUR 814 | | | Reg. S, 6.750%, 05/15/24 | | | 974 | |
| | EUR 350 | | | Bank of Ireland, Reg. S, VAR, 4.250%, 06/11/24 | | | 401 | |
| | EUR 561 | | | eircom Finance DAC, Reg. S, 4.500%, 05/31/22 | | | 639 | |
| | | | Park Aerospace Holdings Ltd., | | | | |
| | 205 | | | 5.250%, 08/15/22 (e) | | | 217 | |
| | 213 | | | 5.500%, 02/15/24 (e) | | | 225 | |
| | EUR 900 | | | Smurfit Kappa Acquisitions Unltd Co., Reg. S, 3.250%, 06/01/21 | | | 1,059 | |
| | | | | | | | |
| | | | | | | 4,644 | |
| | | | | | | | |
| | | | Israel — 0.0% (g) | | | | |
| | 680 | | | Teva Pharmaceutical Finance Netherlands III BV, 4.100%, 10/01/46 | | | 579 | |
| | | | | | | | |
| | | | Italy — 0.6% | |
| | EUR 650 | | | Buzzi Unicem SpA, Reg. S, 2.125%, 04/28/23 | | | 733 | |
| | EUR 700 | | | Enel SpA, Reg. S, VAR, 5.000%, 01/15/75 | | | 823 | |
| | | | Leonardo SpA, | | | | |
| | EUR 1,000 | | | 4.500%, 01/19/21 | | | 1,231 | |
| | EUR 500 | | | 4.875%, 03/24/25 | | | 667 | |
| | EUR 450 | | | N&W Global Vending SpA, Reg. S, 7.000%, 10/15/23 | | | 514 | |
| | EUR 300 | | | Saipem Finance International BV, Reg. S, 3.750%, 09/08/23 | | | 342 | |
| | EUR 250 | | | Snaitech SpA, Reg. S, 6.375%, 11/07/21 | | | 290 | |
| | | | | | | | |
PRINCIPAL
AMOUNT | | | SECURITY DESCRIPTION | | VALUE | |
| | | | | | | | |
| | | | | | | | |
| | | | Italy — continued | |
| | | | Telecom Italia SpA, | | | | |
| | EUR 1,000 | | | Reg. S, 3.250%, 01/16/23 | | | 1,179 | |
| | EUR 1,500 | | | Reg. S, 3.625%, 05/25/26 | | | 1,745 | |
| | EUR 1,600 | | | Wind Acquisition Finance SA, Reg. S, 7.000%, 04/23/21 | | | 1,811 | |
| | | | | | | | |
| | | | | | | 9,335 | |
| | | | | | | | |
| | | | Japan — 0.1% | | | | |
| | | | SoftBank Group Corp., | | | | |
| | 200 | | | 4.500%, 04/15/20 (e) | | | 208 | |
| | EUR 400 | | | Reg. S, 4.000%, 07/30/22 | | | 478 | |
| | EUR 700 | | | Reg. S, 4.750%, 07/30/25 | | | 858 | |
| | | | | | | | |
| | | | | | | 1,544 | |
| | | | | | | | |
| | | | | | | | |
| | | | Luxembourg — 1.1% | |
| | | | Altice Financing SA, | | | | |
| | 400 | | | 6.500%, 01/15/22 (e) | | | 415 | |
| | 650 | | | 7.500%, 05/15/26 (e) | | | 702 | |
| | EUR 500 | | | Reg. S, 5.250%, 02/15/23 | | | 580 | |
| | | | Altice Luxembourg SA, | | | | |
| | 600 | | | 7.750%, 05/15/22 (e) | | | 637 | |
| | EUR 500 | | | Reg. S, 6.250%, 02/15/25 | | | 590 | |
| | EUR 1,000 | | | Reg. S, 7.250%, 05/15/22 | | | 1,151 | |
| | | | ArcelorMittal, | | | | |
| | 1,974 | | | 7.000%, 02/25/22 | | | 2,238 | |
| | 63 | | | 7.500%, 03/01/41 | | | 71 | |
| | 268 | | | 7.750%, 10/15/39 (w) | | | 306 | |
| | EUR 1,250 | | | Reg. S, 3.125%, 01/14/22 | | | 1,431 | |
| | EUR 700 | | | Auris Luxembourg II SA, Reg. S, 8.000%, 01/15/23 | | | 822 | |
| | EUR 200 | | | Galapagos SA, Reg. S, 5.375%, 06/15/21 | | | 219 | |
| | GBP 317 | | | Garfunkelux Holdco 2 SA, Reg. S, 11.000%, 11/01/23 | | | 442 | |
| | EUR 1,000 | | | INEOS Group Holdings SA, Reg. S, 5.375%, 08/01/24 | | | 1,157 | |
| | | | Intelsat Jackson Holdings SA, | | | | |
| | 355 | | | 5.500%, 08/01/23 | | | 303 | |
| | 223 | | | 7.250%, 04/01/19 | | | 215 | |
| | 407 | | | 7.250%, 10/15/20 | | | 381 | |
| | 425 | | | 7.500%, 04/01/21 | | | 389 | |
| | 762 | | | 8.000%, 02/15/24 (e) | | | 822 | |
| | EUR 550 | | | Kloeckner Pentaplast of America, Inc., Reg. S, 7.125%, 11/01/20 | | | 620 | |
| | EUR 500 | | | Matterhorn Telecom Holding SA, Reg. S, 4.875%, 05/01/23 | | | 548 | |
SEE NOTES TO FINANCIAL STATEMENTS.
| | | | | | |
| | | |
| 22 | | | | J.P. MORGAN FUNDS | | APRIL 30, 2017 |
| | | | | | | | |
PRINCIPAL
AMOUNT | | | SECURITY DESCRIPTION | | VALUE | |
| | Long Positions — continued | |
| | Corporate Bonds — continued | |
| | | | Luxembourg — continued | |
| | EUR 350 | | | Matterhorn Telecom SA, Reg. S, 3.875%, 05/01/22 | | | 391 | |
| | EUR 600 | | | SES SA, Reg. S, VAR, 4.625%, 01/02/22 (x) (y) | | | 698 | |
| | EUR 800 | | | SIG Combibloc Holdings SCA, Reg. S, 7.750%, 02/15/23 | | | 934 | |
| | EUR 500 | | | Swissport Investments SA, Reg. S, 6.750%, 12/15/21 | | | 596 | |
| | EUR 600 | | | Telenet Finance V Luxembourg SCA, Reg. S, 6.250%, 08/15/22 | | | 685 | |
| | EUR 400 | | | Telenet Finance VI Luxembourg SCA, Reg. S, 4.875%, 07/15/27 | | | 475 | |
| | | | | | | | |
| | | | | | | 17,818 | |
| | | | | | | | |
| | | | Mexico — 0.2% | | | | |
| | | | Cemex SAB de CV, | | | | |
| | 645 | | | 5.700%, 01/11/25 (e) | | | 677 | |
| | 1,760 | | | 6.125%, 05/05/25 (e) | | | 1,890 | |
| | 200 | | | 7.750%, 04/16/26 (e) | | | 227 | |
| | | | | | | | |
| | | | | | | 2,794 | |
| | | | | | | | |
| | | | Netherlands — 0.4% | | | | |
| | 400 | | | Bluewater Holding BV, Reg. S, 10.000%, 12/10/19 (e) | | | 338 | |
| | 250 | | | Constellium NV, 6.625%, 03/01/25 (e) | | | 246 | |
| | EUR 300 | | | Hema Bondco I BV, Reg. S, 6.250%, 06/15/19 | | | 331 | |
| | EUR 300 | | | Lincoln Finance Ltd., Reg. S, 6.875%, 04/15/21 | | | 351 | |
| | | | NXP BV, | | | | |
| | 355 | | | 4.125%, 06/01/21 (e) | | | 371 | |
| | 400 | | | 4.625%, 06/15/22 (e) | | | 430 | |
| | 565 | | | Shell International Finance BV, 3.750%, 09/12/46 | | | 526 | |
| | EUR 1,500 | | | UPC Holding BV, Reg. S, 6.375%, 09/15/22 | | | 1,716 | |
| | 170 | | | UPCB Finance IV Ltd., 5.375%, 01/15/25 (e) | | | 173 | |
| | | | Ziggo Bond Finance BV, | | | | |
| | 200 | | | 5.875%, 01/15/25 (e) | | | 205 | |
| | EUR 800 | | | Reg. S, 4.625%, 01/15/25 | | | 917 | |
| | 330 | | | Ziggo Secured Finance BV, 5.500%, 01/15/27 (e) | | | 339 | |
| | | | | | | | |
| | | | | | | 5,943 | |
| | | | | | | | |
| | | | New Zealand — 0.0% (g) | | | | |
| | | | Reynolds Group Issuer, Inc., | | | | |
| | 410 | | | 5.125%, 07/15/23 (e) | | | 427 | |
| | 210 | | | 5.750%, 10/15/20 | | | 216 | |
| | 65 | | | 6.875%, 02/15/21 | | | 67 | |
| | | | | | | | |
| | | | | | | 710 | |
| | | | | | | | |
| | | | | | | | |
PRINCIPAL
AMOUNT | | | SECURITY DESCRIPTION | | VALUE | |
| | | | | | | | |
| | | | | | | | |
| | | | Portugal — 0.0% (g) | | | | |
| | EUR 300 | | | EDP—Energias de Portugal SA, Reg. S, VAR, 5.375%, 09/16/75 | | | 354 | |
| | | | | | | | |
| | | | Spain — 0.5% | |
| | EUR 300 | | | CaixaBank SA, Reg. S, VAR, 3.500%, 02/15/27 | | | 339 | |
| | EUR 1,000 | | | Cirsa Funding Luxembourg SA, Reg. S, 5.750%, 05/15/21 | | | 1,161 | |
| | | | eDreams ODIGEO SA, | | | | |
| | EUR 483 | | | 8.500%, 08/01/21 | | | 573 | |
| | EUR 100 | | | Reg. S, 8.500%, 08/01/21 | | | 119 | |
| | EUR 800 | | | Gas Natural Fenosa Finance BV, Reg. S, VAR, 4.125%, 11/18/22 (x) (y) | | | 917 | |
| | EUR 500 | | | Gestamp Funding Luxembourg SA, Reg. S, 3.500%, 05/15/23 | | | 568 | |
| | EUR 500 | | | Repsol International Finance BV, Reg. S, VAR, 4.500%, 03/25/75 | | | 558 | |
| | 810 | | | Telefonica Emisiones SAU, 5.213%, 03/08/47 | | | 838 | |
| | | | Telefonica Europe BV, | | | | |
| | EUR 1,000 | | | Reg. S, VAR, 5.000%, 03/31/20 (x) (y) | | | 1,174 | |
| | EUR 1,000 | | | Reg. S, VAR, 7.625%, 09/18/21 (x) (y) | | | 1,291 | |
| | | | | | | | |
| | | | | | | 7,538 | |
| | | | | | | | |
| | | | Sweden — 0.2% | |
| | EUR 988 | | | Verisure Holding AB, Reg. S, 6.000%, 11/01/22 | | | 1,165 | |
| | EUR 450 | | | Volvo Car AB, Reg. S, 3.250%, 05/18/21 | | | 524 | |
| | EUR 700 | | | Volvo Treasury AB, Reg. S, VAR, 4.200%, 06/10/75 | | | 810 | |
| | | | | | | | |
| | | | | | | 2,499 | |
| | | | | | | | |
| | | | Switzerland — 0.1% | |
| | EUR 800 | | | Dufry Finance SCA, Reg. S, 4.500%, 08/01/23 | | | 935 | |
| | | | | | | | |
| | | | United Arab Emirates — 0.0% (g) | |
| | 703 | | | Shelf Drilling Holdings Ltd., 9.500%, 11/02/20 (e) | | | 700 | |
| | | | | | | | |
| | | | United Kingdom — 1.0% | |
| | | | Anglo American Capital plc, | | | | |
| | 554 | | | 4.125%, 09/27/22 (e) | | | 565 | |
| | 185 | | | 4.450%, 09/27/20 (e) | | | 192 | |
| | 200 | | | 4.750%, 04/10/27 (e) | | | 207 | |
| | 200 | | | 4.875%, 05/14/25 (e) | | | 208 | |
| | EUR 500 | | | Reg. S, 2.500%, 04/29/21 | | | 573 | |
| | EUR 1,100 | | | Reg. S, 3.250%, 04/03/23 | | | 1,301 | |
| | EUR 400 | | | Reg. S, 3.500%, 03/28/22 | | | 477 | |
| | 600 | | | Ashtead Capital, Inc., 5.625%, 10/01/24 (e) | | | 641 | |
| | 300 | | | Barclays plc, VAR, 8.250%, 12/15/18 (x) (y) | | | 319 | |
SEE NOTES TO FINANCIAL STATEMENTS.
| | | | | | | | |
| | | |
| APRIL 30, 2017 | | J.P. MORGAN FUNDS | | | | | 23 | |
JPMorgan Global Allocation Fund
SCHEDULE OF PORTFOLIO INVESTMENTS
AS OF APRIL 30, 2017 (Unaudited) (continued)
(Amounts in U.S. Dollars, unless otherwise noted)
(Amounts in thousands)
| | | | | | | | |
PRINCIPAL
AMOUNT | | | SECURITY DESCRIPTION | | VALUE | |
| | Long Positions — continued | |
| | Corporate Bonds — continued | |
| | | | United Kingdom — continued | |
| | GBP 650 | | | Boparan Finance plc, Reg. S, 5.250%, 07/15/19 | | | 850 | |
| | | | Fiat Chrysler Automobiles NV, | | | | |
| | 663 | | | 5.250%, 04/15/23 | | | 681 | |
| | EUR 800 | | | Reg. S, 3.750%, 03/29/24 | | | 919 | |
| | GBP 400 | | | Galaxy Bidco Ltd., Reg. S, 6.375%, 11/15/20 | | | 533 | |
| | GBP 400 | | | Iceland Bondco plc, Reg. S, 6.750%, 07/15/24 | | | 557 | |
| | GBP 400 | | | Jaguar Land Rover Automotive plc, Reg. S, 3.875%, 03/01/23 | | | 538 | |
| | | | KCA Deutag UK Finance plc, | | | | |
| | 282 | | | 7.250%, 05/15/21 (e) | | | 267 | |
| | 216 | | | 9.875%, 04/01/22 (e) | | | 222 | |
| | | | Noble Holding International Ltd., | | | | |
| | 24 | | | 5.250%, 03/15/42 | | | 16 | |
| | 160 | | | 6.200%, 08/01/40 | | | 113 | |
| | GBP 300 | | | Pizzaexpress Financing 1 plc, Reg. S, 8.625%, 08/01/22 | | | 388 | |
| | | | Royal Bank of Scotland Group plc, | | | | |
| | 1,147 | | | 6.100%, 06/10/23 | | | 1,233 | |
| | 475 | | | 6.125%, 12/15/22 | | | 512 | |
| | 200 | | | VAR, 7.500%, 08/10/20 (x) (y) | | | 207 | |
| | 200 | | | VAR, 8.625%, 08/15/21 (x) (y) | | | 216 | |
| | EUR 800 | | | Synlab Unsecured Bondco plc, Reg. S, 8.250%, 07/01/23 | | | 972 | |
| | EUR 1,500 | | | Tesco Corporate Treasury Services plc, Reg. S, 2.500%, 07/01/24 | | | 1,675 | |
| | | | Virgin Media Finance plc, | | | | |
| | 800 | | | 6.375%, 04/15/23 (e) | | | 839 | |
| | EUR 600 | | | Reg. S, 4.500%, 01/15/25 | | | 682 | |
| | EUR 500 | | | Worldpay Finance plc, Reg. S, 3.750%, 11/15/22 | | | 589 | |
| | | | | | | | |
| | | | | | | 16,492 | |
| | | | | | | | |
| | | | United States — 14.2% | |
| | 820 | | | 21st Century Fox America, Inc., 4.950%, 10/15/45 | | | 860 | |
| | | | Abbott Laboratories, | | | | |
| | 305 | | | 4.750%, 11/30/36 | | | 316 | |
| | 255 | | | 4.900%, 11/30/46 | | | 267 | |
| | 935 | | | AbbVie, Inc., 4.450%, 05/14/46 | | | 908 | |
| | | | Acadia Healthcare Co., Inc., | | | | |
| | 25 | | | 5.125%, 07/01/22 | | | 25 | |
| | 530 | | | 5.625%, 02/15/23 | | | 549 | |
| | 40 | | | 6.125%, 03/15/21 | | | 41 | |
| | 115 | | | 6.500%, 03/01/24 | | | 122 | |
| | | | | | | | |
PRINCIPAL
AMOUNT | | | SECURITY DESCRIPTION | | VALUE | |
| | | | | | | | |
| | |
| | | | United States — continued | |
| | 193 | | | ACCO Brands Corp., 5.250%, 12/15/24 (e) | | | 199 | |
| | 723 | | | ACE Cash Express, Inc., 11.000%, 02/01/19 (e) | | | 707 | |
| | | | Actavis Funding SCS, | | | | |
| | 310 | | | 4.550%, 03/15/35 | | | 313 | |
| | 310 | | | 4.750%, 03/15/45 | | | 315 | |
| | | | Adient Global Holdings Ltd., | | | | |
| | EUR 383 | | | 3.500%, 08/15/24 | | | 427 | |
| | EUR 200 | | | Reg. S, 3.500%, 08/15/24 | | | 223 | |
| | 1,090 | | | ADT Corp. (The), 4.125%, 06/15/23 | | | 1,063 | |
| | 153 | | | Advanced Micro Devices, Inc., 7.000%, 07/01/24 | | | 163 | |
| | | | AECOM, | | | | |
| | 548 | | | 5.125%, 03/15/27 (e) | | | 549 | |
| | 615 | | | 5.875%, 10/15/24 | | | 660 | |
| | 1,000 | | | AES Corp., 5.500%, 04/15/25 | | | 1,025 | |
| | 491 | | | Ahern Rentals, Inc., 7.375%, 05/15/23 (e) | | | 422 | |
| | 157 | | | Airxcel, Inc., 8.500%, 02/15/22 (e) | | | 162 | |
| | | | AK Steel Corp., | | | | |
| | 411 | | | 7.000%, 03/15/27 | | | 406 | |
| | 215 | | | 7.500%, 07/15/23 | | | 234 | |
| | | | Albertsons Cos. LLC, | | | | |
| | 475 | | | 5.750%, 03/15/25 (e) | | | 462 | |
| | 665 | | | 6.625%, 06/15/24 (e) | | | 680 | |
| | 257 | | | Alcoa Nederland Holding BV, 6.750%, 09/30/24 (e) | | | 281 | |
| | | | Alere, Inc., | | | | |
| | 190 | | | 6.375%, 07/01/23 (e) | | | 207 | |
| | 292 | | | 6.500%, 06/15/20 | | | 298 | |
| | | | Aleris International, Inc., | | | | |
| | 60 | | | 7.875%, 11/01/20 | | | 59 | |
| | 150 | | | 9.500%, 04/01/21 (e) | | | 161 | |
| | | | Alliance Data Systems Corp., | | | | |
| | 218 | | | 5.375%, 08/01/22 (e) | | | 220 | |
| | 170 | | | 5.875%, 11/01/21 (e) | | | 176 | |
| | | | Ally Financial, Inc., | | | | |
| | 891 | | | 4.125%, 02/13/22 | | | 897 | |
| | 25 | | | 4.625%, 03/30/25 | | | 25 | |
| | 710 | | | 5.125%, 09/30/24 | | | 725 | |
| | 400 | | | 5.750%, 11/20/25 | | | 409 | |
| | 328 | | | 8.000%, 11/01/31 | | | 390 | |
| | | | Altice US Finance I Corp., | | | | |
| | 790 | | | 5.375%, 07/15/23 (e) | | | 825 | |
| | 457 | | | 5.500%, 05/15/26 (e) | | | 472 | |
SEE NOTES TO FINANCIAL STATEMENTS.
| | | | | | |
| | | |
| 24 | | | | J.P. MORGAN FUNDS | | APRIL 30, 2017 |
| | | | | | | | |
PRINCIPAL
AMOUNT | | | SECURITY DESCRIPTION | | VALUE | |
| | Long Positions — continued | |
| | Corporate Bonds — continued | |
| | | | United States — continued | |
| | 670 | | | Altria Group, Inc., 3.875%, 09/16/46 | | | 628 | |
| | | | AMC Entertainment Holdings, Inc., | | | | |
| | 145 | | | 5.750%, 06/15/25 | | | 149 | |
| | 171 | | | 6.125%, 05/15/27 (e) | | | 175 | |
| | | | AMC Networks, Inc., | | | | |
| | 300 | | | 4.750%, 12/15/22 | | | 306 | |
| | 230 | | | 5.000%, 04/01/24 | | | 233 | |
| | | | American Axle & Manufacturing, Inc., | | | | |
| | 738 | | | 6.250%, 04/01/25 (e) | | | 734 | |
| | 618 | | | 6.500%, 04/01/27 (e) | | | 613 | |
| | 50 | | | 6.625%, 10/15/22 | | | 52 | |
| | 197 | | | American Greetings Corp., 7.875%, 02/15/25 (e) | | | 210 | |
| | | | American International Group, Inc., | | | | |
| | 540 | | | 3.875%, 01/15/35 | | | 503 | |
| | 525 | | | 4.800%, 07/10/45 | | | 541 | |
| | | | AmeriGas Partners LP, | | | | |
| | 252 | | | 5.625%, 05/20/24 | | | 256 | |
| | 193 | | | 5.750%, 05/20/27 | | | 194 | |
| | 127 | | | 5.875%, 08/20/26 | | | 129 | |
| | 525 | | | Amgen, Inc., 4.400%, 05/01/45 | | | 518 | |
| | 164 | | | AMN Healthcare, Inc., 5.125%, 10/01/24 (e) | | | 166 | |
| | 30 | | | Analog Devices, Inc., 4.500%, 12/05/36 | | | 30 | |
| | | | Antero Resources Corp., | | | | |
| | 186 | | | 5.000%, 03/01/25 (e) | | | 183 | |
| | 874 | | | 5.125%, 12/01/22 | | | 887 | �� |
| | 387 | | | 5.375%, 11/01/21 | | | 400 | |
| | 835 | | | Apple, Inc., 3.850%, 08/04/46 | | | 809 | |
| | 90 | | | Arch Capital Finance LLC, 5.031%, 12/15/46 | | | 98 | |
| | 45 | | | Archrock Partners LP, 6.000%, 10/01/22 | | | 45 | |
| | | | Arconic, Inc., | | | | |
| | 408 | | | 5.125%, 10/01/24 | | | 428 | |
| | 125 | | | 5.900%, 02/01/27 | | | 134 | |
| | 120 | | | 6.750%, 01/15/28 | | | 133 | |
| | | | AT&T, Inc., | | | | |
| | 600 | | | 4.350%, 06/15/45 | | | 532 | |
| | 850 | | | 4.500%, 03/09/48 | | | 767 | |
| | 305 | | | 5.250%, 03/01/37 | | | 313 | |
| | | | Avaya, Inc., | | | | |
| | 815 | | | 7.000%, 04/01/19 (d) (e) | | | 682 | |
| | 205 | | | 10.500%, 03/01/21 (d) (e) | | | 28 | |
| | | | Axalta Coating Systems LLC, | | | | |
| | 270 | | | 4.875%, 08/15/24 (e) | | | 280 | |
| | EUR 400 | | | Reg. S, 4.250%, 08/15/24 | | | 465 | |
| | | | | | | | |
PRINCIPAL
AMOUNT | | | SECURITY DESCRIPTION | | VALUE | |
| | | | | | | | |
| | |
| | | | United States — continued | |
| | 213 | | | B&G Foods, Inc., 5.250%, 04/01/25 | | | 218 | |
| | | | Ball Corp., | | | | |
| | 100 | | | 4.000%, 11/15/23 | | | 102 | |
| | EUR 600 | | | 4.375%, 12/15/23 | | | 730 | |
| | 210 | | | 5.250%, 07/01/25 | | | 227 | |
| | | | Bank of America Corp., | | | | |
| | 360 | | | 4.875%, 04/01/44 | | | 391 | |
| | 378 | | | Series AA, VAR, 6.100%, 03/17/25 (x) (y) | | | 405 | |
| | 720 | | | VAR, 3.824%, 01/20/28 | | | 725 | |
| | | | Berry Plastics Corp., | | | | |
| | 330 | | | 5.125%, 07/15/23 | | | 343 | |
| | 190 | | | 5.500%, 05/15/22 | | | 199 | |
| | 864 | | | Blue Cube Spinco, Inc., 10.000%, 10/15/25 | | | 1,065 | |
| | 115 | | | Blue Racer Midstream LLC, 6.125%, 11/15/22 (e) | | | 118 | |
| | 109 | | | Booz Allen Hamilton, Inc., 5.125%, 05/01/25 (e) | | | 110 | |
| | | | Boyd Gaming Corp., | | | | |
| | 120 | | | 6.375%, 04/01/26 | | | 129 | |
| | 212 | | | 6.875%, 05/15/23 | | | 228 | |
| | 923 | | | Bumble Bee Holdings, Inc., 9.000%, 12/15/17 (e) | | | 923 | |
| | 415 | | | BWAY Holding Co., 5.500%, 04/15/24 (e) | | | 420 | |
| | 623 | | | Cablevision Systems Corp., 8.000%, 04/15/20 | | | 696 | |
| | | | CalAtlantic Group, Inc., | | | | |
| | 83 | | | 5.250%, 06/01/26 | | | 85 | |
| | 524 | | | 5.875%, 11/15/24 | | | 563 | |
| | 302 | | | Caleres, Inc., 6.250%, 08/15/23 | | | 317 | |
| | 855 | | | California Resources Corp., 8.000%, 12/15/22 (e) | | | 658 | |
| | | | Calpine Corp., | | | | |
| | 370 | | | 5.250%, 06/01/26 (e) | | | 372 | |
| | 4 | | | 5.375%, 01/15/23 | | | 4 | |
| | 20 | | | 5.500%, 02/01/24 | | | 19 | |
| | 7 | | | 5.750%, 01/15/25 | | | 7 | |
| | 600 | | | 5.875%, 01/15/24 (e) | | | 630 | |
| | 376 | | | Camelot Finance SA, 7.875%, 10/15/24 (e) | | | 403 | |
| | 345 | | | CBS Corp., 4.600%, 01/15/45 | | | 345 | |
| | 103 | | | CCM Merger, Inc., 6.000%, 03/15/22 (e) | | | 106 | |
| | | | CCO Holdings LLC, | | | | |
| | 370 | | | 5.125%, 05/01/27 (e) | | | 377 | |
| | 480 | | | 5.500%, 05/01/26 (e) | | | 504 | |
| | 774 | | | 5.750%, 02/15/26 (e) | | | 822 | |
| | 1,224 | | | 5.875%, 04/01/24 (e) | | | 1,310 | |
SEE NOTES TO FINANCIAL STATEMENTS.
| | | | | | | | |
| | | |
| APRIL 30, 2017 | | J.P. MORGAN FUNDS | | | | | 25 | |
JPMorgan Global Allocation Fund
SCHEDULE OF PORTFOLIO INVESTMENTS
AS OF APRIL 30, 2017 (Unaudited) (continued)
(Amounts in U.S. Dollars, unless otherwise noted)
(Amounts in thousands)
| | | | | | | | |
PRINCIPAL
AMOUNT | | | SECURITY DESCRIPTION | | VALUE | |
| | Long Positions — continued | |
| | Corporate Bonds — continued | |
| | | | United States — continued | |
| | | | CDW LLC, | | | | |
| | 105 | | | 5.000%, 09/01/23 | | | 108 | |
| | 415 | | | 5.500%, 12/01/24 | | | 442 | |
| | | | Cedar Fair LP, | | | | |
| | 5 | | | 5.375%, 06/01/24 | | | 5 | |
| | 60 | | | 5.375%, 04/15/27 (e) | | | 62 | |
| | | | Centene Corp., | | | | |
| | 162 | | | 4.750%, 05/15/22 | | | 168 | |
| | 355 | | | 4.750%, 01/15/25 | | | 361 | |
| | 295 | | | 5.625%, 02/15/21 | | | 310 | |
| | 220 | | | 6.125%, 02/15/24 | | | 237 | |
| | | | CF Industries, Inc., | | | | |
| | 146 | | | 4.500%, 12/01/26 (e) | | | 149 | |
| | 430 | | | 5.150%, 03/15/34 | | | 389 | |
| | 77 | | | 5.375%, 03/15/44 | | | 67 | |
| | | | Charter Communications Operating LLC, | | | | |
| | 505 | | | 6.384%, 10/23/35 | | | 581 | |
| | 460 | | | 6.484%, 10/23/45 | | | 539 | |
| | 250 | | | Chemours Co. (The), 7.000%, 05/15/25 | | | 275 | |
| | | | Cheniere Corpus Christi Holdings LLC, | | | | |
| | 270 | | | 5.875%, 03/31/25 (e) | | | 287 | |
| | 270 | | | 7.000%, 06/30/24 (e) | | | 302 | |
| | | | Chesapeake Energy Corp., | | | | |
| | 387 | | | 4.875%, 04/15/22 | | | 355 | |
| | 220 | | | 6.125%, 02/15/21 | | | 216 | |
| | 268 | | | 8.000%, 01/15/25 (e) | | | 265 | |
| | 205 | | | Cincinnati Bell, Inc., 7.000%, 07/15/24 (e) | | | 217 | |
| | 288 | | | Cinemark USA, Inc., 5.125%, 12/15/22 | | | 297 | |
| | 680 | | | CIT Group, Inc., 5.000%, 08/15/22 | | | 732 | |
| | 362 | | | CITGO Petroleum Corp., 6.250%, 08/15/22 (e) | | | 368 | |
| | | | Citigroup, Inc., | | | | |
| | 308 | | | 4.650%, 07/30/45 | | | 321 | |
| | 540 | | | VAR, 3.887%, 01/10/28 | | | 548 | |
| | 280 | | | Series R, VAR, 6.125%, 11/15/20 (x) (y) | | | 299 | |
| | 240 | | | Series T, VAR, 6.250%, 08/15/26 (x) (y) | | | 261 | |
| | | | Claire’s Stores, Inc., | | | | |
| | 159 | | | 6.125%, 03/15/20 (e) | | | 64 | |
| | 26 | | | 9.000%, 03/15/19 (e) | | | 12 | |
| | | | Clear Channel Worldwide Holdings, Inc., | | | | |
| | 15 | | | Series A, 6.500%, 11/15/22 | | | 15 | |
| | 995 | | | Series B, 6.500%, 11/15/22 | | | 1,031 | |
| | 55 | | | Series A, 7.625%, 03/15/20 | | | 55 | |
| | 465 | | | Series B, 7.625%, 03/15/20 | | | 470 | |
| | 270 | | | Clearwater Paper Corp., 4.500%, 02/01/23 | | | 260 | |
| | | | | | | | |
PRINCIPAL
AMOUNT | | | SECURITY DESCRIPTION | | VALUE | |
| | | | | | | | |
| | | | | | | | |
| | | | United States — continued | |
| | 559 | | | CNG Holdings, Inc., 9.375%, 05/15/20 (e) | | | 509 | |
| | 229 | | | Coeur Mining, Inc., 7.875%, 02/01/21 | | | 237 | |
| | 235 | | | Columbia Pipeline Group, Inc., 5.800%, 06/01/45 | | | 275 | |
| | | | Comcast Corp., | | | | |
| | 270 | | | 3.400%, 07/15/46 | | | 234 | |
| | 115 | | | 4.600%, 08/15/45 | | | 120 | |
| | 180 | | | 4.750%, 03/01/44 | | | 192 | |
| | 479 | | | Commercial Metals Co., 4.875%, 05/15/23 | | | 481 | |
| | | | CommScope Technologies LLC, | | | | |
| | 237 | | | 5.000%, 03/15/27 (e) | | | 239 | |
| | 238 | | | 6.000%, 06/15/25 (e) | | | 254 | |
| | | | CommScope, Inc., | | | | |
| | 310 | | | 5.000%, 06/15/21 (e) | | | 319 | |
| | 85 | | | 5.500%, 06/15/24 (e) | | | 89 | |
| | | | Community Health Systems, Inc., | | | | |
| | 92 | | | 5.125%, 08/01/21 | | | 91 | |
| | 334 | | | 6.875%, 02/01/22 | | | 277 | |
| | 320 | | | 7.125%, 07/15/20 | | | 287 | |
| | 30 | | | CONSOL Energy, Inc., 5.875%, 04/15/22 | | | 29 | |
| | 306 | | | Consolidated Communications, Inc., 6.500%, 10/01/22 | | | 302 | |
| | | | Continental Resources, Inc., | | | | |
| | 152 | | | 4.500%, 04/15/23 | | | 150 | |
| | 760 | | | 5.000%, 09/15/22 | | | 766 | |
| | | | Covanta Holding Corp., | | | | |
| | 100 | | | 5.875%, 03/01/24 | | | 100 | |
| | 60 | | | 5.875%, 07/01/25 | | | 60 | |
| | 95 | | | 6.375%, 10/01/22 | | | 98 | |
| | | | Crestwood Midstream Partners LP, | | | | |
| | 116 | | | 5.750%, 04/01/25 (e) | | | 120 | |
| | 269 | | | 6.250%, 04/01/23 | | | 281 | |
| | 225 | | | Crown Americas LLC, 4.250%, 09/30/26 (e) | | | 220 | |
| | EUR 750 | | | Crown European Holdings SA, Reg. S, 4.000%, 07/15/22 | | | 912 | |
| | | | CSC Holdings LLC, | | | | |
| | 463 | | | 5.500%, 04/15/27 (e) | | | 479 | |
| | 564 | | | 6.750%, 11/15/21 | | | 620 | |
| | 205 | | | 10.125%, 01/15/23 (e) | | | 238 | |
| | 20 | | | CSI Compressco LP, 7.250%, 08/15/22 | | | 19 | |
| | 80 | | | Cumberland Farms, Inc., 6.750%, 05/01/25 (e) | | | 83 | |
| | 137 | | | CURO Financial Technologies Corp., 12.000%, 03/01/22 (e) | | | 145 | |
| | 921 | | | CVR Partners LP, 9.250%, 06/15/23 (e) | | | 941 | |
SEE NOTES TO FINANCIAL STATEMENTS.
| | | | | | |
| | | |
| 26 | | | | J.P. MORGAN FUNDS | | APRIL 30, 2017 |
| | | | | | | | |
PRINCIPAL
AMOUNT | | | SECURITY DESCRIPTION | | VALUE | |
| | Long Positions — continued | |
| | Corporate Bonds — continued | |
| | | | United States — continued | |
| | | | CyrusOne LP, | | | | |
| | 255 | | | 5.000%, 03/15/24 (e) | | | 262 | |
| | 157 | | | 5.375%, 03/15/27 (e) | | | 162 | |
| | 352 | | | Dana Financing Luxembourg SARL, 5.750%, 04/15/25 (e) | | | 361 | |
| | 71 | | | Dana, Inc., 5.500%, 12/15/24 | | | 72 | |
| | | | DaVita, Inc., | | | | |
| | 458 | | | 5.125%, 07/15/24 | | | 471 | |
| | 115 | | | 5.750%, 08/15/22 | | | 119 | |
| | | | DCP Midstream Operating LP, | | | | |
| | 430 | | | 3.875%, 03/15/23 | | | 419 | |
| | 87 | | | 4.950%, 04/01/22 | | | 89 | |
| | 270 | | | 6.750%, 09/15/37 (e) | | | 296 | |
| | 1,287 | | | Dean Foods Co., 6.500%, 03/15/23 (e) | | | 1,358 | |
| | | | Diamond 1 Finance Corp., | | | | |
| | 670 | | | 5.875%, 06/15/21 (e) | | | 710 | |
| | 464 | | | 6.020%, 06/15/26 (e) | | | 511 | |
| | 688 | | | 7.125%, 06/15/24 (e) | | | 760 | |
| | 400 | | | 8.350%, 07/15/46 (e) | | | 518 | |
| | 414 | | | Diebold Nixdorf, Inc., 8.500%, 04/15/24 | | | 462 | |
| | | | DISH DBS Corp., | | | | |
| | 145 | | | 5.875%, 07/15/22 | | | 154 | |
| | 305 | | | 5.875%, 11/15/24 | | | 320 | |
| | 2,229 | | | 6.750%, 06/01/21 | | | 2,424 | |
| | 275 | | | 7.750%, 07/01/26 | | | 322 | |
| | 399 | | | Dole Food Co., Inc., 7.250%, 06/15/25 (e) | | | 413 | |
| | 211 | | | Dollar Tree, Inc., 5.750%, 03/01/23 | | | 224 | |
| | 460 | | | Dominion Gas Holdings LLC, 4.600%, 12/15/44 | | | 464 | |
| | 316 | | | Downstream Development Authority of the Quapaw Tribe of Oklahoma, 10.500%, 07/01/19 (e) | | | 305 | |
| | 210 | | | DuPont Fabros Technology LP, 5.875%, 09/15/21 | | | 219 | |
| | | | Dynegy, Inc., | | | | |
| | 1,007 | | | 5.875%, 06/01/23 | | | 889 | |
| | 190 | | | 7.375%, 11/01/22 | | | 182 | |
| | 330 | | | 7.625%, 11/01/24 | | | 302 | |
| | 200 | | | 8.000%, 01/15/25 (e) | | | 183 | |
| | 66 | | | Eagle II Acquisition Co. LLC, 6.000%, 04/01/25 (e) | | | 68 | |
| | 65 | | | Eldorado Resorts, Inc., 7.000%, 08/01/23 | | | 70 | |
| | 3,322 | | | Embarq Corp., 7.995%, 06/01/36 | | | 3,384 | |
| | | | EMC Corp., | | | | |
| | 326 | | | 2.650%, 06/01/20 | | | 319 | |
| | | | | | | | |
PRINCIPAL
AMOUNT | | | SECURITY DESCRIPTION | | VALUE | |
| | | | | | | | |
| | | | | | | | |
| | | | United States — continued | |
| | 385 | | | 3.375%, 06/01/23 | | | 371 | |
| | 220 | | | EMI Music Publishing Group North America Holdings, Inc., 7.625%, 06/15/24 (e) | | | 243 | |
| | | | Endo Dac, | | | | |
| | 200 | | | 5.875%, 10/15/24 (e) | | | 203 | |
| | 600 | | | 6.000%, 07/15/23 (e) | | | 526 | |
| | | | Endo Finance LLC, | | | | |
| | 250 | | | 5.375%, 01/15/23 (e) | | | 214 | |
| | 546 | | | 5.750%, 01/15/22 (e) | | | 505 | |
| | 673 | | | Energy Transfer Equity LP, 5.875%, 01/15/24 | | | 725 | |
| | 205 | | | Energy Transfer Partners LP, 5.150%, 02/01/43 | | | 198 | |
| | 275 | | | EnerSys, 5.000%, 04/30/23 (e) | | | 280 | |
| | | | Ensco plc, | | | | |
| | 52 | | | 4.500%, 10/01/24 | | | 43 | |
| | 115 | | | 5.200%, 03/15/25 | | | 97 | |
| | 50 | | | 8.000%, 01/31/24 | | | 50 | |
| | 895 | | | Enterprise Products Operating LLC, 4.900%, 05/15/46 | | | 936 | |
| | | | Envision Healthcare Corp., | | | | |
| | 162 | | | 5.125%, 07/01/22 (e) | | | 164 | |
| | 524 | | | 5.625%, 07/15/22 | | | 541 | |
| | | | EP Energy LLC, | | | | |
| | 172 | | | 7.750%, 09/01/22 | | | 138 | |
| | 1,447 | | | 8.000%, 02/15/25 (e) | | | 1,288 | |
| | 1,158 | | | 9.375%, 05/01/20 | | | 1,097 | |
| | | | Equinix, Inc., | | | | |
| | 750 | | | 5.375%, 01/01/22 | | | 793 | |
| | 47 | | | 5.375%, 04/01/23 | | | 49 | |
| | 183 | | | 5.750%, 01/01/25 | | | 196 | |
| | 86 | | | 5.875%, 01/15/26 | | | 93 | |
| | 328 | | | ESH Hospitality, Inc., 5.250%, 05/01/25 (e) | | | 332 | |
| | 88 | | | EW Scripps Co. (The), 5.125%, 05/15/25 (e) | | | 90 | |
| | 520 | | | Exelon Corp., 4.450%, 04/15/46 | | | 522 | |
| | 540 | | | Express Scripts Holding Co., 4.800%, 07/15/46 (j) | | | 525 | |
| | 146 | | | Ferrellgas LP, 6.750%, 06/15/23 | | | 141 | |
| | 200 | | | Fidelity & Guaranty Life Holdings, Inc., 6.375%, 04/01/21 (e) | | | 205 | |
| | | | First Data Corp., | | | | |
| | 614 | | | 5.000%, 01/15/24 (e) | | | 628 | |
| | 116 | | | 5.375%, 08/15/23 (e) | | | 121 | |
| | 112 | | | 5.750%, 01/15/24 (e) | | | 116 | |
| | 803 | | | 7.000%, 12/01/23 (e) | | | 861 | |
SEE NOTES TO FINANCIAL STATEMENTS.
| | | | | | | | |
| | | |
| APRIL 30, 2017 | | J.P. MORGAN FUNDS | | | | | 27 | |
JPMorgan Global Allocation Fund
SCHEDULE OF PORTFOLIO INVESTMENTS
AS OF APRIL 30, 2017 (Unaudited) (continued)
(Amounts in U.S. Dollars, unless otherwise noted)
(Amounts in thousands)
| | | | | | | | |
PRINCIPAL
AMOUNT | | | SECURITY DESCRIPTION | | VALUE | |
| | Long Positions — continued | |
| | Corporate Bonds — continued | |
| | | | United States — continued | |
| | 97 | | | Flex Acquisition Co., Inc., 6.875%, 01/15/25 (e) | | | 100 | |
| | | | Ford Motor Co., | | | | |
| | 955 | | | 4.750%, 01/15/43 | | | 899 | |
| | 265 | | | 5.291%, 12/08/46 | | | 268 | |
| | | | Freeport-McMoRan, Inc., | | | | |
| | 620 | | | 3.550%, 03/01/22 | | | 583 | |
| | 955 | | | 3.875%, 03/15/23 | | | 886 | |
| | 392 | | | 5.400%, 11/14/34 | | | 349 | |
| | 528 | | | 5.450%, 03/15/43 | | | 450 | |
| | | | Frontier Communications Corp., | | | | |
| | 285 | | | 6.250%, 09/15/21 | | | 264 | |
| | 1,085 | | | 8.500%, 04/15/20 | | | 1,147 | |
| | 614 | | | 9.250%, 07/01/21 | | | 627 | |
| | 513 | | | 10.500%, 09/15/22 | | | 516 | |
| | 632 | | | 11.000%, 09/15/25 | | | 609 | |
| | 210 | | | FTI Consulting, Inc., 6.000%, 11/15/22 | | | 219 | |
| | 311 | | | Gartner, Inc., 5.125%, 04/01/25 (e) | | | 322 | |
| | 732 | | | Gates Global LLC, 6.000%, 07/15/22 (e) | | | 736 | |
| | 292 | | | GCP Applied Technologies, Inc., 9.500%, 02/01/23 (e) | | | 333 | |
| | | | General Motors Co., | | | | |
| | 385 | | | 5.000%, 04/01/35 | | | 381 | |
| | 830 | | | 5.200%, 04/01/45 | | | 808 | |
| | 497 | | | Genesis Energy LP, 5.625%, 06/15/24 | | | 488 | |
| | 595 | | | Genesys Telecommunications Laboratories, Inc., 10.000%, 11/30/24 (e) | | | 659 | |
| | 845 | | | GenOn Energy, Inc., 9.875%, 10/15/20 | | | 524 | |
| | | | Gilead Sciences, Inc., | | | | |
| | 550 | | | 4.150%, 03/01/47 | | | 519 | |
| | 370 | | | 4.600%, 09/01/35 | | | 384 | |
| | | | Global Partners LP, | | | | |
| | 165 | | | 6.250%, 07/15/22 | | | 163 | |
| | 210 | | | 7.000%, 06/15/23 | | | 208 | |
| | 650 | | | GLP Capital LP, 5.375%, 11/01/23 | | | 702 | |
| | 275 | | | Golden Nugget, Inc., 8.500%, 12/01/21 (e) | | | 294 | |
| | | | Goldman Sachs Group, Inc. (The), | | | | |
| | 275 | | | 3.500%, 11/16/26 | | | 273 | |
| | 460 | | | 3.850%, 01/26/27 | | | 467 | |
| | 375 | | | 4.750%, 10/21/45 | | | 401 | |
| | 120 | | | Goodman Networks, Inc., 12.225%, 07/01/18 (d) | | | 45 | |
| | 760 | | | Goodyear Tire & Rubber Co. (The), 4.875%, 03/15/27 | | | 760 | |
| | | | | | | | |
PRINCIPAL
AMOUNT | | | SECURITY DESCRIPTION | | VALUE | |
| | | | | | | | |
| | | | | | | | |
| | | | United States — continued | |
| | 100 | | | Graphic Packaging International, Inc., 4.125%, 08/15/24 | | | 100 | |
| | | | Gray Television, Inc., | | | | |
| | 285 | | | 5.125%, 10/15/24 (e) | | | 285 | |
| | 165 | | | 5.875%, 07/15/26 (e) | | | 171 | |
| | 385 | | | Great Plains Energy, Inc., 4.850%, 04/01/47 | | | 391 | |
| | 395 | | | Group 1 Automotive, Inc., 5.250%, 12/15/23 (e) | | | 398 | |
| | 9 | | | Guitar Center, Inc., 6.500%, 04/15/19 (e) | | | 8 | |
| | 520 | | | Halliburton Co., 5.000%, 11/15/45 | | | 556 | |
| | 463 | | | Hardwoods Acquisition, Inc., 7.500%, 08/01/21 (e) | | | 421 | |
| | | | Harland Clarke Holdings Corp., | | | | |
| | 200 | | | 6.875%, 03/01/20 (e) | | | 205 | |
| | 216 | | | 8.375%, 08/15/22 (e) | | | 222 | |
| | 430 | | | Harris Corp., 5.054%, 04/27/45 | | | 472 | |
| | 525 | | | HCA Holdings, Inc., 6.250%, 02/15/21 | | | 570 | |
| | | | HCA, Inc., | | | | |
| | 289 | | | 3.750%, 03/15/19 | | | 296 | |
| | 205 | | | 4.250%, 10/15/19 | | | 212 | |
| | 575 | | | 5.875%, 03/15/22 | | | 638 | |
| | 1,316 | | | 5.875%, 05/01/23 | | | 1,432 | |
| | 535 | | | 5.875%, 02/15/26 | | | 569 | |
| | 125 | | | 6.500%, 02/15/20 | | | 137 | |
| | 472 | | | 7.500%, 02/15/22 | | | 543 | |
| | 5 | | | 8.000%, 10/01/18 | | | 5 | |
| | | | HD Supply, Inc., | | | | |
| | 65 | | | 5.250%, 12/15/21 (e) | | | 68 | |
| | 330 | | | 5.750%, 04/15/24 (e) | | | 351 | |
| | 335 | | | Hecla Mining Co., 6.875%, 05/01/21 | | | 348 | |
| | 550 | | | Hess Corp., 5.800%, 04/01/47 | | | 568 | |
| | 1,187 | | | Hexion, Inc., 6.625%, 04/15/20 | | | 1,122 | |
| | 801 | | | Hilcorp Energy I LP, 5.000%, 12/01/24 (e) | | | 751 | |
| | 225 | | | Hilton Domestic Operating Co., Inc., 4.250%, 09/01/24 (e) | | | 227 | |
| | 250 | | | Hilton Grand Vacations Borrower LLC, 6.125%, 12/01/24 (e) | | | 266 | |
| | | | Hilton Worldwide Finance LLC, | | | | |
| | 216 | | | 4.625%, 04/01/25 (e) | | | 222 | |
| | 108 | | | 4.875%, 04/01/27 (e) | | | 111 | |
| | 224 | | | Holly Energy Partners LP, 6.000%, 08/01/24 (e) | | | 237 | |
| | 313 | | | Hologic, Inc., 5.250%, 07/15/22 (e) | | | 330 | |
| | | | Hughes Satellite Systems Corp., | | | | |
| | 484 | | | 5.250%, 08/01/26 (e) | | | 492 | |
| | 174 | | | 6.625%, 08/01/26 (e) | | | 179 | |
SEE NOTES TO FINANCIAL STATEMENTS.
| | | | | | |
| | | |
| 28 | | | | J.P. MORGAN FUNDS | | APRIL 30, 2017 |
| | | | | | | | |
PRINCIPAL
AMOUNT | | | SECURITY DESCRIPTION | | VALUE | |
| | Long Positions — continued | |
| | Corporate Bonds — continued | |
| | | | United States — continued | |
| | 990 | | | IASIS Healthcare LLC, 8.375%, 05/15/19 | | | 965 | |
| | | | Icahn Enterprises LP, | | | | |
| | 115 | | | 5.875%, 02/01/22 | | | 118 | |
| | 114 | | | 6.250%, 02/01/22 (e) | | | 119 | |
| | 114 | | | 6.750%, 02/01/24 (e) | | | 119 | |
| | 1,282 | | | iHeartCommunications, Inc., 9.000%, 12/15/19 | | | 1,058 | |
| | 204 | | | IHS Markit Ltd., 4.750%, 02/15/25 (e) | | | 213 | |
| | 1,015 | | | ILFC E-Capital Trust I, VAR, 4.660%, 12/21/65 (e) | | | 964 | |
| | 580 | | | ILFC E-Capital Trust II, VAR, 4.910%, 12/21/65 (e) | | | 557 | |
| | 303 | | | Infor Software Parent LLC, 7.125% (cash), 05/01/21 (e) (v) | | | 310 | |
| | | | Infor US, Inc., | | | | |
| | 324 | | | 5.750%, 08/15/20 (e) | | | 338 | |
| | 324 | | | 6.500%, 05/15/22 | | | 337 | |
| | 163 | | | Informatica LLC, 7.125%, 07/15/23 (e) | | | 160 | |
| | 110 | | | Intel Corp., 4.100%, 05/19/46 | | | 111 | |
| | | | International Game Technology plc, | | | | |
| | 375 | | | 6.250%, 02/15/22 (e) | | | 409 | |
| | 400 | | | 6.500%, 02/15/25 (e) | | | 438 | |
| | EUR 1,000 | | | Reg. S, 4.750%, 02/15/23 | | | 1,190 | |
| | | | Iron Mountain, Inc., | | | | |
| | 454 | | | 5.750%, 08/15/24 | | | 468 | |
| | 266 | | | 6.000%, 10/01/20 (e) | | | 278 | |
| | 212 | | | Isle of Capri Casinos, Inc., 5.875%, 03/15/21 | | | 219 | |
| | 340 | | | Jack Ohio Finance LLC, 6.750%, 11/15/21 (e) | | | 355 | |
| | 245 | | | Jaguar Holding Co. II, 6.375%, 08/01/23 (e) | | | 255 | |
| | | | JC Penney Corp., Inc., | | | | |
| | 450 | | | 5.875%, 07/01/23 (e) | | | 455 | |
| | 4 | | | 8.125%, 10/01/19 | | | 4 | |
| | 59 | | | Jo-Ann Stores LLC, 8.125%, 03/15/19 (e) | | | 59 | |
| | 45 | | | Johnson Controls International plc, 4.500%, 02/15/47 | | | 46 | |
| | 111 | | | Kaiser Aluminum Corp., 5.875%, 05/15/24 | | | 118 | |
| | 250 | | | KFC Holding Co., 5.250%, 06/01/26 (e) | | | 256 | |
| | 171 | | | Koppers, Inc., 6.000%, 02/15/25 (e) | | | 179 | |
| | | | Kraft Heinz Foods Co., | | | | |
| | 1,140 | | | 4.375%, 06/01/46 | | | 1,085 | |
| | 300 | | | 5.000%, 06/04/42 | | | 309 | |
| | 555 | | | Kroger Co. (The), 3.875%, 10/15/46 | | | 503 | |
| | | | L Brands, Inc., | | | | |
| | 250 | | | 6.750%, 07/01/36 | | | 242 | |
| | 325 | | | 6.875%, 11/01/35 | | | 321 | |
| | | | | | | | |
PRINCIPAL
AMOUNT | | | SECURITY DESCRIPTION | | VALUE | |
| | | | | | | | |
| | | | | | | | |
| | | | United States — continued | |
| | 45 | | | L3 Technologies, Inc., 3.850%, 12/15/26 | | | 46 | |
| | 239 | | | Ladder Capital Finance Holdings LLLP, 5.250%, 03/15/22 (e) | | | 245 | |
| | | | Lamar Media Corp., | | | | |
| | 64 | | | 5.000%, 05/01/23 | | | 67 | |
| | 432 | | | 5.375%, 01/15/24 | | | 456 | |
| | 434 | | | Landry’s, Inc., 6.750%, 10/15/24 (e) | | | 455 | |
| | | | Level 3 Financing, Inc., | | | | |
| | 268 | | | 5.125%, 05/01/23 | | | 275 | |
| | 132 | | | 5.250%, 03/15/26 | | | 136 | |
| | 197 | | | 5.375%, 01/15/24 | | | 205 | |
| | 306 | | | 5.375%, 05/01/25 | | | 319 | |
| | 312 | | | 5.625%, 02/01/23 | | | 324 | |
| | 5 | | | VAR, 4.762%, 01/15/18 | | | 5 | |
| | 5 | | | Levi Strauss & Co., 5.000%, 05/01/25 | | | 5 | |
| | 251 | | | Liberty Mutual Group, Inc., 7.800%, 03/15/37 (e) | | | 291 | |
| | 114 | | | LifePoint Health, Inc., 5.500%, 12/01/21 | | | 118 | |
| | | | Live Nation Entertainment, Inc., | | | | |
| | 300 | | | 4.875%, 11/01/24 (e) | | | 302 | |
| | 255 | | | 5.375%, 06/15/22 (e) | | | 265 | |
| | EUR 550 | | | LKQ Italia Bondco SpA, Reg. S, 3.875%, 04/01/24 | | | 639 | |
| | 350 | | | Lockheed Martin Corp., 3.800%, 03/01/45 | | | 334 | |
| | 258 | | | LPL Holdings, Inc., 5.750%, 09/15/25 (e) | | | 262 | |
| | | | Mallinckrodt International Finance SA, | | | | |
| | 63 | | | 4.750%, 04/15/23 | | | 54 | |
| | 90 | | | 5.500%, 04/15/25 (e) | | | 82 | |
| | 98 | | | 5.625%, 10/15/23 (e) | | | 93 | |
| | 183 | | | 5.750%, 08/01/22 (e) | | | 180 | |
| | 255 | | | Marathon Petroleum Corp., 4.750%, 09/15/44 | | | 236 | |
| | 158 | | | Martin Midstream Partners LP, 7.250%, 02/15/21 | | | 162 | |
| | 263 | | | Masonite International Corp., 5.625%, 03/15/23 (e) | | | 273 | |
| | 292 | | | MasTec, Inc., 4.875%, 03/15/23 | | | 292 | |
| | 249 | | | Mediacom Broadband LLC, 6.375%, 04/01/23 | | | 262 | |
| | 520 | | | MetLife, Inc., 4.600%, 05/13/46 | | | 559 | |
| | 95 | | | MGM Growth Properties Operating Partnership LP, 5.625%, 05/01/24 | | | 102 | |
| | | | MGM Resorts International, | | | | |
| | 296 | | | 4.625%, 09/01/26 | | | 295 | |
| | 260 | | | 6.000%, 03/15/23 | | | 284 | |
| | 250 | | | 6.625%, 12/15/21 | | | 281 | |
| | 280 | | | 7.750%, 03/15/22 | | | 326 | |
SEE NOTES TO FINANCIAL STATEMENTS.
| | | | | | | | |
| | | |
| APRIL 30, 2017 | | J.P. MORGAN FUNDS | | | | | 29 | |
JPMorgan Global Allocation Fund
SCHEDULE OF PORTFOLIO INVESTMENTS
AS OF APRIL 30, 2017 (Unaudited) (continued)
(Amounts in U.S. Dollars, unless otherwise noted)
(Amounts in thousands)
| | | | | | | | |
PRINCIPAL
AMOUNT | | | SECURITY DESCRIPTION | | VALUE | |
| | Long Positions — continued | |
| | Corporate Bonds — continued | |
| | | | United States — continued | |
| | | | Micron Technology, Inc., | | | | |
| | 660 | | | 5.250%, 08/01/23 (e) | | | 683 | |
| | 529 | | | 5.250%, 01/15/24 (e) | | | 545 | |
| | 60 | | | 5.500%, 02/01/25 | | | 63 | |
| | 216 | | | Microsemi Corp., 9.125%, 04/15/23 (e) | | | 248 | |
| | 300 | | | Microsoft Corp., 4.100%, 02/06/37 | | | 312 | |
| | 35 | | | Momentive Performance Materials USA, Inc., 8.875%, 10/15/20 (d) | | | – | |
| | 247 | | | Momentive Performance Materials, Inc., 3.880%, 10/24/21 | | | 245 | |
| | | | Morgan Stanley, | | | | |
| | 310 | | | 3.625%, 01/20/27 | | | 311 | |
| | 710 | | | 4.300%, 01/27/45 | | | 709 | |
| | 911 | | | MPH Acquisition Holdings LLC, 7.125%, 06/01/24 (e) | | | 979 | |
| | 155 | | | MPLX LP, 5.200%, 03/01/47 | | | 159 | |
| | 214 | | | MSCI, Inc., 5.250%, 11/15/24 (e) | | | 227 | |
| | 4 | | | Murphy Oil USA, Inc., 6.000%, 08/15/23 | | | 4 | |
| | 525 | | | Mylan NV, 5.250%, 06/15/46 | | | 539 | |
| | 264 | | | Nabors Industries, Inc., 5.500%, 01/15/23 (e) | | | 267 | |
| | | | Nationstar Mortgage LLC, | | | | |
| | 185 | | | 6.500%, 07/01/21 | | | 188 | |
| | 398 | | | 6.500%, 06/01/22 | | | 400 | |
| | 766 | | | Nature’s Bounty Co. (The), 7.625%, 05/15/21 (e) | | | 814 | |
| | 938 | | | Navistar International Corp., 8.250%, 11/01/21 | | | 950 | |
| | 210 | | | NCI Building Systems, Inc., 8.250%, 01/15/23 (e) | | | 229 | |
| | 265 | | | NCL Corp. Ltd., 4.750%, 12/15/21 (e) | | | 272 | |
| | 350 | | | Neiman Marcus Group Ltd. LLC, 8.000%, 10/15/21 (e) | | | 205 | |
| | | | Netflix, Inc., | | | | |
| | EUR 624 | | | 3.625%, 05/15/27 | | | 687 | |
| | 246 | | | 4.375%, 11/15/26 (e) | | | 242 | |
| | 115 | | | 5.750%, 03/01/24 | | | 124 | |
| | | | New Albertsons, Inc., | | | | |
| | 51 | | | 6.625%, 06/01/28 | | | 46 | |
| | 23 | | | 7.450%, 08/01/29 | | | 22 | |
| | 30 | | | 7.750%, 06/15/26 | | | 29 | |
| | 392 | | | 8.000%, 05/01/31 | | | 382 | |
| | 225 | | | 8.700%, 05/01/30 | | | 223 | |
| | 382 | | | New Home Co., Inc. (The), 7.250%, 04/01/22 (e) | | | 397 | |
| | 126 | | | Newfield Exploration Co., 5.625%, 07/01/24 | | | 133 | |
| | | | | | | | |
PRINCIPAL
AMOUNT | | | SECURITY DESCRIPTION | | VALUE | |
| | | | | | | | |
| | | | | | | | |
| | | | United States — continued | |
| | | | Nexstar Broadcasting, Inc., | | | | |
| | 245 | | | 5.625%, 08/01/24 (e) | | | 251 | |
| | 35 | | | 6.125%, 02/15/22 (e) | | | 37 | |
| | | | NGL Energy Partners LP, | | | | |
| | 2 | | | 5.125%, 07/15/19 | | | 2 | |
| | 301 | | | 6.125%, 03/01/25 (e) | | | 281 | |
| | 325 | | | Nielsen Co. Luxembourg SARL (The), 5.000%, 02/01/25 (e) | | | 325 | |
| | 783 | | | Nielsen Finance LLC, 5.000%, 04/15/22 (e) | | | 806 | |
| | 483 | | | Noble Energy, Inc., 5.050%, 11/15/44 | | | 499 | |
| | | | Novelis Corp., | | | | |
| | 509 | | | 5.875%, 09/30/26 (e) | | | 523 | |
| | 341 | | | 6.250%, 08/15/24 (e) | | | 361 | |
| | | | NRG Energy, Inc., | | | | |
| | 850 | | | 6.250%, 05/01/24 | | | 847 | |
| | 215 | | | 7.250%, 05/15/26 | | | 220 | |
| | | | NRG Yield Operating LLC, | | | | |
| | 180 | | | 5.000%, 09/15/26 (e) | | | 176 | |
| | 250 | | | 5.375%, 08/15/24 | | | 256 | |
| | 228 | | | Nuance Communications, Inc., 5.375%, 08/15/20 (e) | | | 233 | |
| | | | NuStar Logistics LP, | | | | |
| | 156 | | | 4.800%, 09/01/20 | | | 161 | |
| | 162 | | | 5.625%, 04/28/27 | | | 167 | |
| | 144 | | | 6.750%, 02/01/21 | | | 156 | |
| | 40 | | | NWH Escrow Corp., 7.500%, 08/01/21 (e) | | | 36 | |
| | 218 | | | Olin Corp., 5.125%, 09/15/27 | | | 227 | |
| | 505 | | | ONEOK Partners LP, 6.200%, 09/15/43 | | | 576 | |
| | 430 | | | Oracle Corp., 4.000%, 07/15/46 | | | 420 | |
| | | | Outfront Media Capital LLC, | | | | |
| | 33 | | | 5.250%, 02/15/22 | | | 34 | |
| | 195 | | | 5.625%, 02/15/24 | | | 205 | |
| | 405 | | | 5.875%, 03/15/25 | | | 428 | |
| | | | Owens-Brockway Glass Container, Inc., | | | | |
| | 80 | | | 5.000%, 01/15/22 (e) | | | 83 | |
| | 255 | | | 5.375%, 01/15/25 (e) | | | 266 | |
| | 117 | | | 6.375%, 08/15/25 (e) | | | 127 | |
| | 552 | | | Parker Drilling Co., 6.750%, 07/15/22 | | | 490 | |
| | 160 | | | Party City Holdings, Inc., 6.125%, 08/15/23 (e) | | | 165 | |
| | 268 | | | Pattern Energy Group, Inc., 5.875%, 02/01/24 (e) | | | 275 | |
| | 167 | | | PBF Holding Co. LLC, 7.000%, 11/15/23 | | | 170 | |
| | 157 | | | PBF Logistics LP, 6.875%, 05/15/23 | | | 161 | |
| | 92 | | | Peabody Energy Corp., 6.000%, 03/31/22 (e) | | | 94 | |
SEE NOTES TO FINANCIAL STATEMENTS.
| | | | | | |
| | | |
| 30 | | | | J.P. MORGAN FUNDS | | APRIL 30, 2017 |
| | | | | | | | |
PRINCIPAL
AMOUNT | | | SECURITY DESCRIPTION | | VALUE | |
| | Long Positions — continued | |
| | Corporate Bonds — continued | |
| | | | United States — continued | |
| | 75 | | | Penn Virginia Corp., 8.500%, 05/01/20 (d) | | | 1 | |
| | 293 | | | Penske Automotive Group, Inc., 5.500%, 05/15/26 | | | 292 | |
| | 80 | | | Performance Food Group, Inc., 5.500%, 06/01/24 (e) | | | 83 | |
| | 249 | | | PetSmart, Inc., 7.125%, 03/15/23 (e) | | | 227 | |
| | 290 | | | Philip Morris International, Inc., 4.875%, 11/15/43 | | | 316 | |
| | 725 | | | Phillips 66, 4.875%, 11/15/44 | | | 747 | |
| | 150 | | | Phillips 66 Partners LP, 4.900%, 10/01/46 | | | 147 | |
| | 329 | | | Pilgrim’s Pride Corp., 5.750%, 03/15/25 (e) | | | 342 | |
| | 111 | | | Plantronics, Inc., 5.500%, 05/31/23 (e) | | | 113 | |
| | 300 | | | PolyOne Corp., 5.250%, 03/15/23 | | | 308 | |
| | | | Post Holdings, Inc., | | | | |
| | 250 | | | 5.000%, 08/15/26 (e) | | | 249 | |
| | 265 | | | 5.500%, 03/01/25 (e) | | | 277 | |
| | 241 | | | 5.750%, 03/01/27 (e) | | | 249 | |
| | 90 | | | Prestige Brands, Inc., 6.375%, 03/01/24 (e) | | | 96 | |
| | 1,250 | | | Prime Security Services Borrower LLC, 9.250%, 05/15/23 (e) | | | 1,366 | |
| | 115 | | | Provident Funding Associates LP, 6.750%, 06/15/21 (e) | | | 118 | |
| | 525 | | | Prudential Financial, Inc., 4.600%, 05/15/44 | | | 560 | |
| | EUR 200 | | | PSPC Escrow Corp., Reg. S, 6.000%, 02/01/23 | | | 229 | |
| | 15 | | | PVH Corp., 4.500%, 12/15/22 | | | 15 | |
| | 291 | | | Qorvo, Inc., 6.750%, 12/01/23 | | | 316 | |
| | 10 | | | Quad/Graphics, Inc., 7.000%, 05/01/22 | | | 10 | |
| | 475 | | | Quicken Loans, Inc., 5.750%, 05/01/25 (e) | | | 480 | |
| | | | Quintiles IMS, Inc., | | | | |
| | EUR 500 | | | 3.250%, 03/15/25 (e) | | | 547 | |
| | 230 | | | 4.875%, 05/15/23 (e) | | | 236 | |
| | 345 | | | Qwest Capital Funding, Inc., 7.750%, 02/15/31 | | | 334 | |
| | 120 | | | Qwest Corp., 7.250%, 09/15/25 | | | 132 | |
| | 230 | | | Rackspace Hosting, Inc., 8.625%, 11/15/24 (e) | | | 244 | |
| | 211 | | | Radian Group, Inc., 7.000%, 03/15/21 | | | 235 | |
| | 25 | | | Radio Systems Corp., 8.375%, 11/01/19 (e) | | | 26 | |
| | | | Range Resources Corp., | | | | |
| | 305 | | | 4.875%, 05/15/25 | | | 293 | |
| | 171 | | | 5.000%, 03/15/23 (e) | | | 169 | |
| | | | Regal Entertainment Group, | | | | |
| | 230 | | | 5.750%, 03/15/22 | | | 240 | |
| | 50 | | | 5.750%, 06/15/23 | | | 53 | |
| | 160 | | | 5.750%, 02/01/25 | | | 166 | |
| | | | | | | | |
PRINCIPAL
AMOUNT | | | SECURITY DESCRIPTION | | VALUE | |
| | | | | | | | |
| | | | | | | | |
| | | | United States — continued | |
| | | | Revlon Consumer Products Corp., | | | | |
| | 110 | | | 5.750%, 02/15/21 | | | 109 | |
| | 924 | | | 6.250%, 08/01/24 | | | 899 | |
| | 555 | | | Reynolds American, Inc., 4.450%, 06/12/25 | | | 592 | |
| | | | Rite Aid Corp., | | | | |
| | 611 | | | 6.125%, 04/01/23 (e) | | | 605 | |
| | 5 | | | 6.750%, 06/15/21 | | | 5 | |
| | 172 | | | Rockies Express Pipeline LLC, 5.625%, 04/15/20 (e) | | | 184 | |
| | 1 | | | Royal Caribbean Cruises Ltd., 7.500%, 10/15/27 | | | 1 | |
| | | | RSP Permian, Inc., | | | | |
| | 150 | | | 5.250%, 01/15/25 (e) | | | 152 | |
| | 360 | | | 6.625%, 10/01/22 | | | 380 | |
| | | | Sabre GLBL, Inc., | | | | |
| | 40 | | | 5.250%, 11/15/23 (e) | | | 41 | |
| | 110 | | | 5.375%, 04/15/23 (e) | | | 115 | |
| | | | Sally Holdings LLC, | | | | |
| | 75 | | | 5.500%, 11/01/23 | | | 76 | |
| | 92 | | | 5.625%, 12/01/25 | | | 95 | |
| | | | SBA Communications Corp., | | | | |
| | 228 | | | 4.875%, 07/15/22 | | | 235 | |
| | 103 | | | 4.875%, 09/01/24 (e) | | | 104 | |
| | | | Scientific Games International, Inc., | | | | |
| | 510 | | | 7.000%, 01/01/22 (e) | | | 546 | |
| | 430 | | | 10.000%, 12/01/22 | | | 466 | |
| | 157 | | | Scotts Miracle-Gro Co. (The), 5.250%, 12/15/26 (e) | | | 162 | |
| | | | Sealed Air Corp., | | | | |
| | 105 | | | 4.875%, 12/01/22 (e) | | | 109 | |
| | 410 | | | 5.125%, 12/01/24 (e) | | | 430 | |
| | 100 | | | 5.250%, 04/01/23 (e) | | | 106 | |
| | 200 | | | 5.500%, 09/15/25 (e) | | | 214 | |
| | | | SemGroup Corp., | | | | |
| | 228 | | | 5.625%, 07/15/22 | | | 228 | |
| | 65 | | | 5.625%, 11/15/23 | | | 64 | |
| | 1,100 | | | Seminole Hard Rock Entertainment, Inc., 5.875%, 05/15/21 (e) | | | 1,116 | |
| | | | Sensata Technologies BV, | | | | |
| | 388 | | | 4.875%, 10/15/23 (e) | | | 392 | |
| | 38 | | | 5.000%, 10/01/25 (e) | | | 39 | |
| | 7 | | | 5.625%, 11/01/24 (e) | | | 7 | |
| | 200 | | | Sensata Technologies UK Financing Co. plc, 6.250%, 02/15/26 (e) | | | 216 | |
SEE NOTES TO FINANCIAL STATEMENTS.
| | | | | | | | |
| | | |
| APRIL 30, 2017 | | J.P. MORGAN FUNDS | | | | | 31 | |
JPMorgan Global Allocation Fund
SCHEDULE OF PORTFOLIO INVESTMENTS
AS OF APRIL 30, 2017 (Unaudited) (continued)
(Amounts in U.S. Dollars, unless otherwise noted)
(Amounts in thousands)
| | | | | | | | |
PRINCIPAL
AMOUNT | | | SECURITY DESCRIPTION | | VALUE | |
| | Long Positions — continued | |
| | Corporate Bonds — continued | |
| | | | United States — continued | |
| | | | Service Corp. International, | | | | |
| | 335 | | | 5.375%, 05/15/24 | | | 354 | |
| | 80 | | | 8.000%, 11/15/21 | | | 94 | |
| | EUR 300 | | | Silgan Holdings, Inc., Reg. S, 3.250%, 03/15/25 | | | 330 | |
| | | | Sinclair Television Group, Inc., | | | | |
| | 10 | | | 5.375%, 04/01/21 | | | 10 | |
| | 247 | | | 5.625%, 08/01/24 (e) | | | 257 | |
| | 115 | | | 6.125%, 10/01/22 | | | 120 | |
| | | | Sirius XM Radio, Inc., | | | | |
| | 148 | | | 4.625%, 05/15/23 (e) | | | 151 | |
| | 430 | | | 5.375%, 04/15/25 (e) | | | 441 | |
| | 431 | | | Six Flags Entertainment Corp., 4.875%, 07/31/24 (e) | | | 435 | |
| | | | SM Energy Co., | | | | |
| | 241 | | | 5.625%, 06/01/25 | | | 230 | |
| | 19 | | | 6.500%, 01/01/23 | | | 19 | |
| | 100 | | | 6.750%, 09/15/26 | | | 101 | |
| | 430 | | | Solera LLC, 10.500%, 03/01/24 (e) | | | 491 | |
| | 105 | | | Sonic Automotive, Inc., 6.125%, 03/15/27 (e) | | | 106 | |
| | 440 | | | Southern Power Co., Series F, 4.950%, 12/15/46 | | | 443 | |
| | 465 | | | Spectra Energy Partners LP, 4.500%, 03/15/45 | | | 449 | |
| | 10 | | | Speedway Motorsports, Inc., 5.125%, 02/01/23 | | | 10 | |
| | 398 | | | Springleaf Finance Corp., 7.750%, 10/01/21 | | | 425 | |
| | | | Sprint Capital Corp., | | | | |
| | 177 | | | 6.900%, 05/01/19 | | | 190 | |
| | 680 | | | 8.750%, 03/15/32 | | | 837 | |
| | | | Sprint Communications, Inc., | | | | |
| | 350 | | | 7.000%, 03/01/20 (e) | | | 383 | |
| | 255 | | | 7.000%, 08/15/20 | | | 276 | |
| | 102 | | | 8.375%, 08/15/17 | | | 104 | |
| | 750 | | | 9.000%, 11/15/18 (e) | | | 820 | |
| | | | Sprint Corp., | | | | |
| | 1,516 | | | 7.125%, 06/15/24 | | | 1,649 | |
| | 629 | | | 7.250%, 09/15/21 | | | 688 | |
| | 580 | | | 7.625%, 02/15/25 | | | 647 | |
| | 907 | | | 7.875%, 09/15/23 | | | 1,018 | |
| | 122 | | | SS&C Technologies Holdings, Inc., 5.875%, 07/15/23 | | | 130 | |
| | 508 | | | Standard Industries, Inc., 6.000%, 10/15/25 (e) | | | 542 | |
| | | | | | | | |
PRINCIPAL
AMOUNT | | | SECURITY DESCRIPTION | | VALUE | |
| | | | | | | | |
| | | | | | | | |
| | | | United States — continued | |
| | | | Steel Dynamics, Inc., | | | | |
| | 190 | | | 5.000%, 12/15/26 (e) | | | 194 | |
| | 301 | | | 5.500%, 10/01/24 | | | 318 | |
| | 285 | | | 6.375%, 08/15/22 | | | 296 | |
| | 255 | | | Sterigenics-Nordion Holdings LLC, 6.500%, 05/15/23 (e) | | | 263 | |
| | 5 | | | Stone Energy Corp., 7.500%, 05/31/22 | | | 5 | |
| | 675 | | | Summit Materials LLC, 6.125%, 07/15/23 | | | 707 | |
| | | | Summit Midstream Holdings LLC, | | | | |
| | 208 | | | 5.500%, 08/15/22 | | | 208 | |
| | 304 | | | 5.750%, 04/15/25 | | | 308 | |
| | 730 | | | Sunoco Logistics Partners Operations LP, 5.350%, 05/15/45 (j) | | | 729 | |
| | | | Sunoco LP, | | | | |
| | 229 | | | 6.250%, 04/15/21 | | | 242 | |
| | 320 | | | 6.375%, 04/01/23 | | | 340 | |
| | | | SUPERVALU, Inc., | | | | |
| | 630 | | | 6.750%, 06/01/21 | | | 644 | |
| | 1,185 | | | 7.750%, 11/15/22 | | | 1,214 | |
| | 364 | | | Symantec Corp., 5.000%, 04/15/25 (e) | | | 376 | |
| | | | Talen Energy Supply LLC, | | | | |
| | 150 | | | 4.600%, 12/15/21 | | | 116 | |
| | 3 | | | 4.625%, 07/15/19 (e) | | | 3 | |
| | 100 | | | 6.500%, 06/01/25 | | | 79 | |
| | 375 | | | 9.500%, 07/15/22 (e) | | | 351 | |
| | 310 | | | Tallgrass Energy Partners LP, 5.500%, 09/15/24 (e) | | | 312 | |
| | | | Targa Resources Partners LP, | | | | |
| | 431 | | | 4.250%, 11/15/23 | | | 427 | |
| | 422 | | | 5.125%, 02/01/25 (e) | | | 436 | |
| | 60 | | | 5.250%, 05/01/23 | | | 62 | |
| | 125 | | | 5.375%, 02/01/27 (e) | | | 130 | |
| | 100 | | | 6.750%, 03/15/24 | | | 109 | |
| | 553 | | | Team Health Holdings, Inc., 6.375%, 02/01/25 (e) | | | 540 | |
| | | | TEGNA, Inc., | | | | |
| | 30 | | | 5.125%, 07/15/20 | | | 31 | |
| | 200 | | | 5.500%, 09/15/24 (e) | | | 205 | |
| | 605 | | | 6.375%, 10/15/23 | | | 643 | |
| | 310 | | | Teleflex, Inc., 5.250%, 06/15/24 | | | 319 | |
| | 265 | | | Tempur Sealy International, Inc., 5.625%, 10/15/23 | | | 271 | |
| | | | Tenet Healthcare Corp., | | | | |
| | 420 | | | 4.375%, 10/01/21 | | | 419 | |
| | 267 | | | 4.500%, 04/01/21 | | | 267 | |
SEE NOTES TO FINANCIAL STATEMENTS.
| | | | | | |
| | | |
| 32 | | | | J.P. MORGAN FUNDS | | APRIL 30, 2017 |
| | | | | | | | |
PRINCIPAL
AMOUNT | | | SECURITY DESCRIPTION | | VALUE | |
| | Long Positions — continued | |
| | Corporate Bonds — continued | |
| | | | United States — continued | |
| | 90 | | | 4.750%, 06/01/20 | | | 91 | |
| | 130 | | | 5.500%, 03/01/19 | | | 131 | |
| | 49 | | | 6.000%, 10/01/20 | | | 52 | |
| | 5 | | | 6.250%, 11/01/18 | | | 5 | |
| | 18 | | | 6.750%, 02/01/20 | | | 18 | |
| | 175 | | | 6.750%, 06/15/23 | | | 167 | |
| | 115 | | | 7.500%, 01/01/22 (e) | | | 123 | |
| | 223 | | | 8.000%, 08/01/20 | | | 228 | |
| | 116 | | | 8.125%, 04/01/22 | | | 118 | |
| | 320 | | | VAR, 4.631%, 06/15/20 | | | 322 | |
| | 148 | | | Tennant Co., 5.625%, 05/01/25 (e) | | | 154 | |
| | 482 | | | Terex Corp., 5.625%, 02/01/25 (e) | | | 493 | |
| | 500 | | | Terraform Global Operating LLC, 9.750%, 08/15/22 (e) | | | 555 | |
| | | | TerraForm Power Operating LLC, | | | | |
| | 100 | | | SUB, 6.375%, 02/01/23 (e) | | | 103 | |
| | 487 | | | SUB, 6.625%, 06/15/25 (e) | | | 515 | |
| | 226 | | | Tesoro Corp., 5.125%, 12/15/26 (e) | | | 241 | |
| | | | Tesoro Logistics LP, | | | | |
| | 315 | | | 5.250%, 01/15/25 | | | 334 | |
| | 576 | | | 6.250%, 10/15/22 | | | 618 | |
| | 175 | | | 6.375%, 05/01/24 | | | 191 | |
| | 1,000 | | | TEXAS Co., 11.500%, 10/01/20 (d) | | | 3 | |
| | 261 | | | Titan International, Inc., 6.875%, 10/01/20 | | | 268 | |
| | | | T-Mobile USA, Inc., | | | | |
| | 326 | | | 5.125%, 04/15/25 | | | 343 | |
| | 217 | | | 5.375%, 04/15/27 | | | 232 | |
| | 121 | | | 6.000%, 03/01/23 | | | 129 | |
| | 862 | | | 6.000%, 04/15/24 | | | 934 | |
| | 696 | | | 6.375%, 03/01/25 | | | 761 | |
| | 400 | | | 6.500%, 01/15/26 | | | 443 | |
| | 346 | | | 6.625%, 04/01/23 | | | 370 | |
| | 442 | | | 6.836%, 04/28/23 | | | 474 | |
| | 175 | | | Toll Brothers Finance Corp., 5.625%, 01/15/24 | | | 188 | |
| | 247 | | | Tops Holding LLC, 8.000%, 06/15/22 (e) | | | 216 | |
| | | | TransDigm, Inc., | | | | |
| | 462 | | | 5.500%, 10/15/20 | | | 472 | |
| | 821 | | | 6.000%, 07/15/22 | | | 846 | |
| | 369 | | | 6.375%, 06/15/26 | | | 372 | |
| | 10 | | | 6.500%, 07/15/24 | | | 10 | |
| | 259 | | | 6.500%, 05/15/25 (e) | | | 265 | |
| | 464 | | | Transocean Proteus Ltd., 6.250%, 12/01/24 (e) | | | 473 | |
| | | | | | | | |
PRINCIPAL
AMOUNT | | | SECURITY DESCRIPTION | | VALUE | |
| | | | | |
| | |
| | | | United States — continued | |
| | | | Transocean, Inc., | | | | |
| | 223 | | | 5.800%, 10/15/22 | | | 207 | |
| | 984 | | | 6.800%, 03/15/38 | | | 787 | |
| | 251 | | | 7.500%, 04/15/31 | | | 224 | |
| | 798 | | | 9.000%, 07/15/23 (e) | | | 851 | |
| | 268 | | | 9.100%, 12/15/41 | | | 249 | |
| | EUR 600 | | | Trinseo Materials Operating SCA, Reg. S, 6.375%, 05/01/22 | | | 699 | |
| | 438 | | | Tutor Perini Corp., 6.875%, 05/01/25 (e) | | | 460 | |
| | | | Ultra Resources, Inc., | | | | |
| | 467 | | | 6.875%, 04/15/22 (e) | | | 472 | |
| | 167 | | | 7.125%, 04/15/25 (e) | | | 166 | |
| | 412 | | | Unifrax I LLC, 7.500%, 02/15/19 (e) | | | 412 | |
| | 131 | | | Unit Corp., 6.625%, 05/15/21 | | | 130 | |
| | 645 | | | United Continental Holdings, Inc., 5.000%, 02/01/24 | | | 648 | |
| | | | United Rentals North America, Inc., | | | | |
| | 700 | | | 5.500%, 07/15/25 | | | 731 | |
| | 90 | | | 5.500%, 05/15/27 | | | 93 | |
| | 550 | | | 5.750%, 11/15/24 | | | 580 | |
| | 121 | | | United States Steel Corp., 8.375%, 07/01/21 (e) | | | 133 | |
| | | | Uniti Group, Inc., | | | | |
| | 257 | | | 6.000%, 04/15/23 (e) | | | 267 | |
| | 186 | | | 7.125%, 12/15/24 (e) | | | 191 | |
| | 254 | | | Univar USA, Inc., 6.750%, 07/15/23 (e) | | | 265 | |
| | | | Univision Communications, Inc., | | | | |
| | 285 | | | 5.125%, 05/15/23 (e) | | | 290 | |
| | 982 | | | 5.125%, 02/15/25 (e) | | | 978 | |
| | 613 | | | 6.750%, 09/15/22 (e) | | | 642 | |
| | 215 | | | US Concrete, Inc., 6.375%, 06/01/24 | | | 225 | |
| | 196 | | | USIS Merger Sub, Inc., 6.875%, 05/01/25 (e) | | | 199 | |
| | | | Valeant Pharmaceuticals International, Inc., | | | | |
| | 603 | | | 5.875%, 05/15/23 (e) | | | 446 | |
| | 411 | | | 6.125%, 04/15/25 (e) | | | 303 | |
| | 564 | | | 6.375%, 10/15/20 (e) | | | 484 | |
| | 162 | | | 6.500%, 03/15/22 (e) | | | 166 | |
| | 236 | | | 6.750%, 08/15/18 (e) | | | 235 | |
| | 503 | | | 6.750%, 08/15/21 (e) | | | 415 | |
| | 492 | | | 7.000%, 10/01/20 (e) | | | 432 | |
| | 353 | | | 7.000%, 03/15/24 (e) | | | 360 | |
| | 259 | | | 7.250%, 07/15/22 (e) | | | 208 | |
| | 299 | | | 7.500%, 07/15/21 (e) | | | 248 | |
SEE NOTES TO FINANCIAL STATEMENTS.
| | | | | | | | |
| | | |
| APRIL 30, 2017 | | J.P. MORGAN FUNDS | | | | | 33 | |
JPMorgan Global Allocation Fund
SCHEDULE OF PORTFOLIO INVESTMENTS
AS OF APRIL 30, 2017 (Unaudited) (continued)
(Amounts in U.S. Dollars, unless otherwise noted)
(Amounts in thousands)
| | | | | | | | |
PRINCIPAL
AMOUNT | | | SECURITY DESCRIPTION | | VALUE | |
| | Long Positions — continued | |
| | Corporate Bonds — continued | |
| | | | United States — continued | |
| | | | Verizon Communications, Inc., | | | | |
| | 855 | | | 4.125%, 08/15/46 | | | 746 | |
| | 330 | | | 4.272%, 01/15/36 | | | 308 | |
| | 130 | | | 4.862%, 08/21/46 | | | 126 | |
| | 495 | | | 5.012%, 04/15/49 (e) | | | 486 | |
| | 290 | | | Versum Materials, Inc., 5.500%, 09/30/24 (e) | | | 301 | |
| | 1,246 | | | Vertiv Group Corp., 9.250%, 10/15/24 (e) | | | 1,338 | |
| | 290 | | | Viacom, Inc., 4.375%, 03/15/43 | | | 258 | |
| | 33 | | | Weatherford International LLC, 6.800%, 06/15/37 | | | 31 | |
| | | | Weatherford International Ltd., | | | | |
| | 269 | | | 4.500%, 04/15/22 | | | 254 | |
| | 120 | | | 5.950%, 04/15/42 | | | 105 | |
| | 432 | | | 6.500%, 08/01/36 | | | 408 | |
| | 77 | | | 6.750%, 09/15/40 | | | 73 | |
| | 273 | | | 7.000%, 03/15/38 | | | 262 | |
| | 214 | | | 8.250%, 06/15/23 | | | 232 | |
| | 2 | | | 9.875%, 02/15/24 (e) | | | 2 | |
| | 547 | | | West Corp., 5.375%, 07/15/22 (e) | | | 552 | |
| | | | Western Digital Corp., | | | | |
| | 246 | | | 7.375%, 04/01/23 (e) | | | 269 | |
| | 349 | | | 10.500%, 04/01/24 | | | 412 | |
| | 40 | | | Western Gas Partners LP, 5.450%, 04/01/44 | | | 42 | |
| | 221 | | | Western Refining Logistics LP, 7.500%, 02/15/23 | | | 239 | |
| | 1,149 | | | Whiting Petroleum Corp., 5.000%, 03/15/19 | | | 1,160 | |
| | | | Williams Cos., Inc. (The), | | | | |
| | 275 | | | 3.700%, 01/15/23 | | | 271 | |
| | 265 | | | 5.750%, 06/24/44 | | | 274 | |
| | 21 | | | Series A, 7.500%, 01/15/31 | | | 25 | |
| | 142 | | | 7.750%, 06/15/31 | | | 168 | |
| | | | Windstream Services LLC, | | | | |
| | 135 | | | 7.500%, 06/01/22 | | | 131 | |
| | 194 | | | 7.500%, 04/01/23 | | | 183 | |
| | 143 | | | 7.750%, 10/01/21 | | | 144 | |
| | | | WMG Acquisition Corp., | | | | |
| | EUR 400 | | | 4.125%, 11/01/24 (e) | | | 458 | |
| | 75 | | | 4.875%, 11/01/24 (e) | | | 76 | |
| | 55 | | | 5.000%, 08/01/23 (e) | | | 56 | |
| | 405 | | | 5.625%, 04/15/22 (e) | | | 422 | |
| | 380 | | | 6.750%, 04/15/22 (e) | | | 401 | |
| | EUR 150 | | | Reg. S, 4.125%, 11/01/24 | | | 171 | |
| | 240 | | | Wynn Las Vegas LLC, 5.375%, 03/15/22 | | | 248 | |
| | | | | | | | |
PRINCIPAL
AMOUNT | | | SECURITY DESCRIPTION | | VALUE | |
| | |
| | |
| | | | United States — continued | |
| | | | XPO Logistics, Inc., | | | | |
| | 245 | | | 6.125%, 09/01/23 (e) | | | 257 | |
| | 200 | | | 6.500%, 06/15/22 (e) | | | 212 | |
| | 20 | | | Xylem, Inc., 4.375%, 11/01/46 | | | 20 | |
| | | | Zayo Group LLC, | | | | |
| | 457 | | | 5.750%, 01/15/27 (e) | | | 485 | |
| | 196 | | | 6.000%, 04/01/23 | | | 208 | |
| | 245 | | | 6.375%, 05/15/25 | | | 265 | |
| | | | | | | | |
| | | | | | | 234,271 | |
| | | | | | | | |
| | | | Total Corporate Bonds
(Cost $336,800) | | | 347,033 | |
| | | | | | | | |
| | Foreign Government Securities — 4.0% | |
| | | | Australia — 0.8% | | | | |
| | AUD 17,000 | | | Republic of Australia, Reg. S, 5.250%, 03/15/19 | | | 13,567 | |
| | | | | | | | |
| | | | Canada — 0.5% | | | | |
| | CAD 11,600 | | | Republic of Canada, 1.750%, 03/01/19 | | | 8,661 | |
| | | | | | | | |
| | | | France — 0.1% | | | | |
| | EUR 1,700 | | | Republic of France, Reg. S, 3.250%, 05/25/45 | | | 2,438 | |
| | | | | | | | |
| | | | Italy — 0.4% | | | | |
| | | | Republic of Italy, | | | | |
| | EUR 4,000 | | | 0.450%, 06/01/21 | | | 4,327 | |
| | EUR 980 | | | Reg. S, 3.500%, 03/01/30 (e) | | | 1,181 | |
| | EUR 580 | | | Reg. S, 4.750%, 09/01/44 (e) | | | 791 | |
| | | | | | | | |
| | | | | | | 6,299 | |
| | | | | | | | |
| | | | Japan — 1.2% | | | | |
| | | | Government of Japan, | | | | |
| | JPY 1,830,000 | | | 0.100%, 06/20/26 | | | 16,589 | |
| | JPY 270,000 | | | 0.100%, 12/20/26 | | | 2,444 | |
| | | | | | | | |
| | | | | | | 19,033 | |
| | | | | | | | |
| | | | Spain — 0.2% | | | | |
| | EUR 3,300 | | | Kingdom of Spain, Reg. S, 4.000%, 04/30/20 (e) | | | 4,034 | |
| | | | | | | | |
| | | | United Kingdom — 0.8% | | | | |
| | | | United Kingdom Gilt, | | | | |
| | GBP 4,026 | | | Reg. S, 1.000%, 09/07/17 | | | 5,231 | |
| | GBP 5,300 | | | Reg. S, 1.500%, 07/22/26 | | | 7,155 | |
| | | | | | | | |
| | | | | | | 12,386 | |
| | | | | | | | |
| | | | Total Foreign Government Securities
(Cost $68,272) | | | 66,418 | |
| | | | | | | | |
SEE NOTES TO FINANCIAL STATEMENTS.
| | | | | | |
| | | |
| 34 | | | | J.P. MORGAN FUNDS | | APRIL 30, 2017 |
| | | | | | | | |
SHARES | | | SECURITY DESCRIPTION | | VALUE | |
| | Long Positions — continued | |
| | Investment Company — 2.8% | |
| | 5,593 | | | JPMorgan Emerging Markets Debt Fund, Class R6 Shares (b)
(Cost $46,487) | | | 46,198 | |
| | | | | | | | |
| | |
PRINCIPAL
AMOUNT | | | | | | |
| | Loan Assignments — 0.5% | |
| | | | Canada — 0.1% | | | | |
| | 288 | | | Concordia Healthcare Corp., Initial Dollar Term Loan, VAR, 5.250%, 10/21/21 | | | 193 | |
| | 834 | | | MEG Energy Corp., 1st Lien Term B Loan, VAR, 4.540%, 12/31/23 | | | 835 | |
| | | | | | | | |
| | | | | | | 1,028 | |
| | | | | | | | |
| | | | United States — 0.4% | |
| | 72 | | | Avaya, Inc., DIP Term Loan, VAR, 8.500%, 01/24/18 (d) | | | 74 | |
| | 145 | | | Avaya, Inc., Extending Tranche Term Loan B-3, VAR, 5.670%, 10/26/17 ^ | | | 121 | |
| | 185 | | | Avaya, Inc., Term Loan B-6, VAR, 6.532%, 03/31/18 (d) | | | 154 | |
| | 75 | | | Berry Plastics Corp., Term Loan L, VAR, 3.239%, 01/06/21 | | | 75 | |
| | 386 | | | California Resources Corp., 1st Lien Second Out Term Loan, VAR, 11.375%, 08/05/21 | | | 424 | |
| | 856 | | | Chesapeake Energy Corp., 1st Lien Last Out Term Loan, VAR, 8.553%, 08/23/21 ^ | | | 924 | |
| | 212 | | | Cincinnati Bell, Inc., Term Loan, VAR, 4.000%, 09/10/20 | | | 213 | |
| | 84 | | | Citgo Holding, Inc., Term Loan, VAR, 9.647%, 05/12/18 ^ | | | 85 | |
| | 211 | | | Consolidated Communications, Inc.,
Term Loan B-2, VAR, 4.000%, 10/05/23 ^ | | | 212 | |
| | 232 | | | Cortes NP Acquisition Corp., Term Loan B, VAR, 5.030%, 11/30/23 | | | 233 | |
| | 164 | | | Dell Software Group, Term Loan, VAR, 7.000%, 10/31/22 | | | 167 | |
| | 100 | | | Delta 2 Sarl, USD Facility B-3 Term Loan, VAR, 4.568%, 07/30/21 | | | 100 | |
| | 495 | | | First Data Corp., Term Loan B, VAR, 3.988%, 07/08/22 | | | 495 | |
| | 48 | | | FGI Operating Co. LLC, Term B Loan, VAR, 5.500%, 04/19/19 | | | 46 | |
| | 284 | | | Genesys Telecommunications Laboratories, Inc., Term Loan B, VAR, 5.158%, 12/01/23 | | | 286 | |
| | 213 | | | Graton Economic Development Authority, Incremental Term B Loan, VAR, 4.743%, 09/01/22 | | | 214 | |
| | 71 | | | Intrawest Operations Group LLC, Initial Term Loan, VAR, 4.500%, 12/09/20 | | | 72 | |
| | | | | | | | |
SHARES | | | SECURITY DESCRIPTION | | VALUE | |
| | |
| | |
| | | | United States — continued | |
| | 153 | | | Landry’s, Inc., 1st Lien Term Loan, VAR, 3.733%, 10/04/23 | | | 153 | |
| | 201 | | | Microsemi Corp., Closing Date Term B Loan, VAR, 3.226%, 01/15/23 | | | 202 | |
| | 574 | | | Moran Foods LLC, Term Loan B, VAR, 7.000%, 11/29/23 | | | 570 | |
| | 71 | | | MTL Publishing LLC, Term B-4 Loan, VAR, 3.736%, 08/22/22 | | | 71 | |
| | 107 | | | On Semiconductor Corp., 1st Lien Term Loan B, VAR, 3.243%, 03/31/23 | | | 108 | |
| | 205 | | | Petco Animal Supplies, Inc., 1st Lien
Term Loan B-1, VAR, 4.172%, 01/26/23 | | | 186 | |
| | 125 | | | PetSmart, Inc., Term Loan B, VAR, 4.020%, 03/11/22 ^ | | | 114 | |
| | 191 | | | Revlon Consumer Products Corp., Term Loan B, VAR, 4.493%, 09/07/23 | | | 191 | |
| | 5 | | | Rite Aid Corp., 2nd Lien Term Loan, VAR, 5.750%, 08/21/20 | | | 5 | |
| | 186 | | | Sears Roebuck Acceptance Corp., Term Loan, VAR, 5.500%, 06/30/18 | | | 183 | |
| | 165 | | | Syniverse Holdings, Inc., Initial Term Loan, VAR, 4.172%, 04/23/19 | | | 151 | |
| | 8 | | | Syniverse Holdings, Inc., Tranche B Term Loan, VAR, 4.147%, 04/23/19 | | | 7 | |
| | 410 | | | Ultra Resources, Inc., Term Loan, VAR, 4.000%, 04/12/24 ^ | | | 408 | |
| | 619 | | | Viskase Corp., Inc., Initial Term Loan, VAR, 4.397%, 01/30/21 | | | 591 | |
| | 448 | | | Western Refining, Inc., 1st Lien Term Loan B, VAR, 5.500%, 06/23/23 | | | 449 | |
| | 180 | | | XPO Logistics, Inc., Term loan B, VAR, 3.405%, 11/01/21 | | | 181 | |
| | | | | | | | |
| | | | | | | 7,465 | |
| | | | | | | | |
| | | | Total Loan Assignments
(Cost $8,475) | | | 8,493 | |
| | | | | | | | |
| | |
NUMBER OF
CONTRACTS | | | | | | |
| | Options Purchased — 0.4% | |
| | | | United States — 0.4% | | | | |
| | | | Call Options Purchased — 0.4% | | | | |
| | 1,928 | | | Euro STOXX 50 Index, expiring 06/16/17 at EUR 3,400.00, European Style (a) | | | 3,423 | |
| | 18,560 | | | iShares MSCI Emerging Markets Index, expiring 06/16/17 at $40.50, American Style (a) | | | 1,179 | |
| | 231 | | | Newell Brands, Inc., expiring 01/19/18 at $50.00, American Style (a) | | | 65 | |
SEE NOTES TO FINANCIAL STATEMENTS.
| | | | | | | | |
| | | |
| APRIL 30, 2017 | | J.P. MORGAN FUNDS | | | | | 35 | |
JPMorgan Global Allocation Fund
SCHEDULE OF PORTFOLIO INVESTMENTS
AS OF APRIL 30, 2017 (Unaudited) (continued)
(Amounts in U.S. Dollars, unless otherwise noted)
(Amounts in thousands)
| | | | | | | | |
NUMBER OF
CONTRACTS | | | SECURITY DESCRIPTION | | VALUE | |
| | Long Positions — continued | |
| | Options Purchased — continued | |
| | | | Call Options Purchased — continued | |
| | 437 | | | S&P 500 Index, expiring 06/16/17 at $2,375.00, European Style (a) | | | 1,523 | |
| | | | | | | | |
| | | | Total Options Purchased
(Cost $6,324) | | | 6,190 | |
| | | | | | | | |
SHARES | | | | | | |
| | Preferred Stocks — 0.0% (g) | |
| | | | Bermuda — 0.0% (g) | |
| | — | (h) | | XLIT Ltd., Series D, VAR, 3.354%, 06/13/17 ($1,000 par value) @ | | | 74 | |
| | | | | | | | |
| | | | United States — 0.0% (g) | |
| | 1 | | | GMAC Capital Trust I, Series 2, VAR, 6.824%, 02/15/40 ($25 par value) | | | 16 | |
| | | | | | | | |
| | | | Total Preferred Stocks
(Cost $88) | | | 90 | |
| | | | | | | | |
| | |
NUMBER OF
RIGHTS | | | | | | |
| | Rights — 0.0% (g) | |
| | | | United States — 0.0% (g) | | | | |
| | 44 | | | MEDIA GEN, Inc. CVR (a) | | | — | (h) |
| | 17 | | | Vistra Energy Corp. (a) | | | 20 | |
| | | | | | | | |
| | | | Total Rights
(Cost $—) | | | 20 | |
| | | | | | | | |
| | |
PRINCIPAL
AMOUNT | | | | | | |
| | U.S. Treasury Obligations — 1.5% | |
| | | | U.S. Treasury Bond, | | | | |
| | 3,100 | | | 3.625%, 08/15/43 | | | 3,495 | |
| | 4,000 | | | 3.750%, 08/15/41 | | | 4,597 | |
| | 800 | | | 5.375%, 02/15/31 | | | 1,079 | |
| | 870 | | | 6.125%, 08/15/29 | | | 1,216 | |
| | | | U.S. Treasury Note, | | | | |
| | 12,125 | | | 0.750%, 01/31/18 (k) | | | 12,097 | |
| | 2,448 | | | 2.125%, 05/15/25 | | | 2,433 | |
| | | | | | | | |
| | | | Total U.S. Treasury Obligations
(Cost $26,280) | | | 24,917 | |
| | | | | | | | |
| | |
| SHARES | | | | | | |
| | Short-Term Investments — 15.8% | |
| | | | Foreign Government Treasury Bills — 3.9% | | | | |
| | | | Canadian Treasury Bill, | | | | |
| | CAD 21,336 | | | 0.515%, 08/24/17 (n) | | | 15,604 | |
| | CAD 21,358 | | | 0.556%, 10/19/17 (n) | | | 15,605 | |
| | CAD 21,370 | | | 0.574%, 11/16/17 (n) | | | 15,608 | |
| | CAD 23,254 | | | 0.584%, 12/14/17 (n) | | | 16,976 | |
| | | | | | | | |
| | | | Total Foreign Government Treasury Bills
(Cost $65,950) | | | 63,793 | |
| | | | | | | | |
| | | | | | | | |
SHARES | | | SECURITY DESCRIPTION | | VALUE | |
| | | | | | | | |
| | | | | | | | |
| | | | Investment Company — 11.9% | |
| | 196,570 | | | JPMorgan U.S. Government Money Market Fund, Institutional Class Shares, 0.620% (b) (l) | | | 196,570 | |
| | | | | | | | |
| | | | Total Short-Term Investments
(Cost $262,520) | | | 260,363 | |
| | | | | | | | |
| | | | Total Investments — 99.7%
(Cost $1,528,900) | | | 1,643,473 | |
| | | | Other Assets in Excess of Liabilities — 0.3% | | | 5,176 | |
| | | | | | | | |
| | | | NET ASSETS — 100.0% | | $ | 1,648,649 | |
| | | | | | | | |
| | Short Positions — 1.3% | |
| | Common Stocks — 1.3% | |
| | | | Bermuda — 0.0% (g) | | | | |
| | 1 | | | RenaissanceRe Holdings Ltd. | | | 102 | |
| | | | | | | | |
| | | | Canada — 0.0% (g) | |
| | 1 | | | Agrium, Inc. | | | 104 | |
| | 18 | | | Enbridge, Inc. | | | 753 | |
| | | | | | | | |
| | | | | | | 857 | |
| | | | | | | | |
| | | | Sweden — 0.0% (g) | |
| | 1 | | | Autoliv, Inc. | | | 101 | |
| | | | | | | | |
| | | | United States — 1.3% | |
| | 2 | | | AbbVie, Inc. | | | 123 | |
| | 1 | | | Aflac, Inc. | | | 108 | |
| | 2 | | | AGCO Corp. | | | 114 | |
| | 3 | | | Air Lease Corp. | | | 104 | |
| | 1 | | | Air Products & Chemicals, Inc. | | | 115 | |
| | 2 | | | American Airlines Group, Inc. | | | 100 | |
| | 1 | | | AmerisourceBergen Corp. | | | 101 | |
| | 1 | | | Amgen, Inc. | | | 108 | |
| | 2 | | | Amphenol Corp., Class A | | | 116 | |
| | 1 | | | AptarGroup, Inc. | | | 116 | |
| | 3 | | | Aqua America, Inc. | | | 112 | |
| | 1 | | | AutoZone, Inc. (a) | | | 896 | |
| | 2 | | | Axis Capital Holdings Ltd. | | | 106 | |
| | 2 | | | Baxter International, Inc. | | | 112 | |
| | 2 | | | Bed Bath & Beyond, Inc. | | | 91 | |
| | 3 | | | Bemis Co., Inc. | | | 154 | |
| | 1 | | | Boeing Co. (The) | | | 109 | |
| | 1 | | | Cardinal Health, Inc. | | | 100 | |
| | 1 | | | Carter’s, Inc. | | | 113 | |
| | 1 | | | CBS Corp. (Non-Voting), Class B | | | 100 | |
| | 1 | | | CH Robinson Worldwide, Inc. | | | 95 | |
| | — | (h) | | Chipotle Mexican Grill, Inc. (a) | | | 124 | |
| | 2 | | | Church & Dwight Co., Inc. | | | 111 | |
SEE NOTES TO FINANCIAL STATEMENTS.
| | | | | | |
| | | |
| 36 | | | | J.P. MORGAN FUNDS | | APRIL 30, 2017 |
| | | | | | | | |
SHARES | | | SECURITY DESCRIPTION | | VALUE | |
| | Short Positions — continued | |
| | Common Stocks — continued | |
| | | | United States — continued | |
| | 3 | | | Cisco Systems, Inc. | | | 117 | |
| | 1 | | | Clorox Co. (The) | | | 118 | |
| | 1 | | | CME Group, Inc. | | | 104 | |
| | 2 | | | Consolidated Edison, Inc. | | | 119 | |
| | 6 | | | Coty, Inc., Class A | | | 114 | |
| | — | (h) | | CR Bard, Inc. | | | 145 | |
| | 1 | | | Crown Castle International Corp. | | | 112 | |
| | 12 | | | CVS Health Corp. | | | 954 | |
| | 1 | | | Darden Restaurants, Inc. | | | 127 | |
| | 1 | | | Digital Realty Trust, Inc. | | | 121 | |
| | 2 | | | Dominion Resources, Inc. | | | 119 | |
| | 3 | | | Domtar Corp. | | | 112 | |
| | 3 | | | Donaldson Co., Inc. | | | 121 | |
| | 1 | | | Duke Energy Corp. | | | 113 | |
| | 5 | | | Edgewell Personal Care Co. (a) | | | 375 | |
| | 2 | | | Emerson Electric Co. | | | 115 | |
| | 1 | | | Equifax, Inc. | | | 111 | |
| | 2 | | | Eversource Energy | | | 112 | |
| | 1 | | | Exxon Mobil Corp. | | | 101 | |
| | 2 | | | Fastenal Co. | | | 104 | |
| | 1 | | | Federal Realty Investment Trust | | | 102 | |
| | 4 | | | Federated Investors, Inc., Class B | | | 99 | |
| | 4 | | | Fifth Third Bancorp | | | 93 | |
| | 5 | | | First Horizon National Corp. | | | 94 | |
| | 40 | | | Ford Motor Co. | | | 458 | |
| | 3 | | | Franklin Resources, Inc. | | | 112 | |
| | 6 | | | Fulton Financial Corp. | | | 106 | |
| | 16 | | | General Mills, Inc. | | | 926 | |
| | 16 | | | General Motors Co. | | | 540 | |
| | 2 | | | Greif, Inc., Class A | | | 117 | |
| | 1 | | | Hasbro, Inc. | | | 110 | |
| | 4 | | | Healthcare Realty Trust, Inc. | | | 115 | |
| | 3 | | | Healthcare Trust of America, Inc., Class A | | | 104 | |
| | 2 | | | Helmerich & Payne, Inc. | | | 93 | |
| | 1 | | | Hershey Co. (The) | | | 107 | |
| | 2 | | | Hess Corp. | | | 110 | |
| | 1 | | | Illinois Tool Works, Inc. | | | 115 | |
| | 3 | | | Intel Corp. | | | 106 | |
| | 2 | | | International Paper Co. | | | 122 | |
| | 4 | | | Interpublic Group of Cos., Inc. (The) | | | 103 | |
| | 1 | | | JB Hunt Transport Services, Inc. | | | 105 | |
| | 1 | | | Johnson & Johnson | | | 108 | |
| | 4 | | | Juniper Networks, Inc. | | | 122 | |
| | 17 | | | Kellogg Co. | | | 1,199 | |
| | | | | | | | |
SHARES | | | SECURITY DESCRIPTION | | VALUE | |
| | |
| | |
| | | | United States — continued | |
| | 3 | | | Kohl’s Corp. | | | 104 | |
| | 1 | | | LyondellBasell Industries NV, Class A | | | 106 | |
| | 1 | | | M&T Bank Corp. | | | 177 | |
| | 7 | | | Marathon Oil Corp. | | | 98 | |
| | 1 | | | Medtronic plc | | | 110 | |
| | 8 | | | Molson Coors Brewing Co., Class B | | | 782 | |
| | 4 | | | Murphy Oil Corp. | | | 103 | |
| | 2 | | | Nasdaq, Inc. | | | 105 | |
| | 2 | | | National Fuel Gas Co. | | | 104 | |
| | 3 | | | National Oilwell Varco, Inc. | | | 95 | |
| | 3 | | | NetApp, Inc. | | | 107 | |
| | 3 | | | Noble Energy, Inc. | | | 101 | |
| | 2 | | | Nordstrom, Inc. | | | 108 | |
| | 5 | | | Omnicom Group, Inc. | | | 452 | |
| | 2 | | | ONEOK, Inc. | | | 105 | |
| | 2 | | | O’Reilly Automotive, Inc. (a) | | | 513 | |
| | 1 | | | Packaging Corp. of America | | | 112 | |
| | 6 | | | People’s United Financial, Inc. | | | 99 | |
| | 1 | | | Praxair, Inc. | | | 118 | |
| | 2 | | | Principal Financial Group, Inc. | | | 110 | |
| | 1 | | | Prudential Financial, Inc. | | | 108 | |
| | 1 | | | Ralph Lauren Corp. | | | 109 | |
| | 2 | | | Republic Services, Inc. | | | 112 | |
| | 1 | | | salesforce.com, Inc. (a) | | | 116 | |
| | 15 | | | Sally Beauty Holdings, Inc. (a) | | | 292 | |
| | 2 | | | SCANA Corp. | | | 107 | |
| | 1 | | | Schlumberger Ltd. | | | 103 | |
| | 1 | | | Scripps Networks Interactive, Inc., Class A | | | 100 | |
| | 2 | | | Seagate Technology plc | | | 98 | |
| | 13 | | | Sealed Air Corp. | | | 572 | |
| | 1 | | | Simon Property Group, Inc. | | | 161 | |
| | 2 | | | Sonoco Products Co. | | | 105 | |
| | 2 | | | Southern Co. (The) | | | 119 | |
| | 1 | | | Stryker Corp. | | | 122 | |
| | 2 | | | Sysco Corp. | | | 108 | |
| | 6 | | | Tanger Factory Outlet Centers, Inc. | | | 203 | |
| | 2 | | | Target Corp. | | | 96 | |
| | 1 | | | Torchmark Corp. | | | 107 | |
| | 1 | | | Travelers Cos., Inc. (The) | | | 102 | |
| | 7 | | | Twitter, Inc. (a) | | | 120 | |
| | 3 | | | UDR, Inc. | | | 116 | |
| | 4 | | | United Parcel Service, Inc., Class B | | | 470 | |
| | 1 | | | United Technologies Corp. | | | 110 | |
| | 2 | | | US Bancorp | | | 114 | |
SEE NOTES TO FINANCIAL STATEMENTS.
| | | | | | | | |
| | | |
| APRIL 30, 2017 | | J.P. MORGAN FUNDS | | | | | 37 | |
JPMorgan Global Allocation Fund
SCHEDULE OF PORTFOLIO INVESTMENTS
AS OF APRIL 30, 2017 (Unaudited) (continued)
(Amounts in U.S. Dollars, unless otherwise noted)
(Amounts in thousands, except number of Futures contracts)
| | | | | | | | |
SHARES | | | SECURITY DESCRIPTION | | VALUE | |
| | Short Positions — continued | |
| | Common Stocks — continued | |
| | | | United States — continued | |
| | 1 | | | Varian Medical Systems, Inc. (a) | | | 121 | |
| | 2 | | | Ventas, Inc. | | | 116 | |
| | 2 | | | Wal-Mart Stores, Inc. | | | 113 | |
| | 2 | | | Waste Management, Inc. | | | 112 | |
| | 2 | | | Webster Financial Corp. | | | 101 | |
| | 2 | | | Welltower, Inc. | | | 121 | |
| | 2 | | | Whirlpool Corp. | | | 340 | |
| | 4 | | | Whole Foods Market, Inc. | | | 134 | |
| | 1 | | | Willis Towers Watson plc | | | 110 | |
| | 2 | | | WR Berkley Corp. | | | 119 | |
| | 2 | | | Xilinx, Inc. | | | 123 | |
| | | | | | | | |
| | | | | | | 20,897 | |
| | | | | | | | |
| | | | Total Securities Sold Short
(Proceeds $22,278) | | | 21,957 | |
| | | | | | | | |
Summary of Investments by Industry, April 30, 2017
The following table represents the portfolio investments of the Fund by industry classifications as a percentage of total investments:
| | | | |
| INDUSTRY (LONG) | | PERCENTAGE | |
Banks | | | 5.9 | % |
Foreign Government Securities | | | 4.1 | |
Oil, Gas & Consumable Fuels | | | 4.1 | |
Media | | | 3.3 | |
Pharmaceuticals | | | 3.3 | |
Mutual Funds | | | 2.9 | |
Diversified Telecommunication Services | | | 2.7 | |
Asset-Backed Securities | | | 2.7 | |
Insurance | | | 2.5 | |
Health Care Providers & Services | | | 2.2 | |
Collateralized Mortgage Obligations | | | 2.1 | |
Hotels, Restaurants & Leisure | | | 1.9 | |
Internet Software & Services | | | 1.9 | |
Metals & Mining | | | 1.9 | |
Capital Markets | | | 1.8 | |
Automobiles | | | 1.8 | |
IT Services | | | 1.8 | |
Software | | | 1.7 | |
Chemicals | | | 1.5 | |
Semiconductors & Semiconductor Equipment | | | 1.4 | |
Food & Staples Retailing | | | 1.3 | |
Wireless Telecommunication Services | | | 1.3 | |
Electric Utilities | | | 1.3 | |
Industrial Conglomerates | | | 1.2 | |
Food Products | | | 1.2 | |
Beverages | | | 1.2 | |
Technology Hardware, Storage & Peripherals | | | 1.1 | |
Household Durables | | | 1.1 | |
Machinery | | | 1.1 | |
Internet & Direct Marketing Retail | | | 1.0 | |
Containers & Packaging | | | 1.0 | |
Others (each less than 1.0%) | | | 19.9 | |
Short-Term Investments | | | 15.8 | |
SEE NOTES TO FINANCIAL STATEMENTS.
| | | | | | |
| | | |
| 38 | | | | J.P. MORGAN FUNDS | | APRIL 30, 2017 |
| | | | |
| INDUSTRY (SHORT) | | PERCENTAGE | |
Food Products | | | 10.2 | % |
Specialty Retail | | | 8.2 | |
Oil, Gas & Consumable Fuels | | | 6.2 | |
Food & Staples Retailing | | | 6.0 | |
Containers & Packaging | | | 5.9 | |
Equity Real Estate Investment Trusts (REITs) | | | 5.8 | |
Automobiles | | | 4.5 | |
Insurance | | | 4.4 | |
Banks | | | 3.6 | |
Beverages | | | 3.6 | |
Media | | | 3.4 | |
Health Care Equipment & Supplies | | | 2.8 | |
Air Freight & Logistics | | | 2.6 | |
Personal Products | | | 2.2 | |
Chemicals | | | 2.0 | |
| | | | |
| INDUSTRY (SHORT) | | PERCENTAGE | |
Capital Markets | | | 1.9 | % |
Machinery | | | 1.6 | |
Multi-Utilities | | | 1.6 | |
Electric Utilities | | | 1.6 | |
Household Durables | | | 1.5 | |
Multiline Retail | | | 1.4 | |
Energy Equipment & Services | | | 1.3 | |
Hotels, Restaurants & Leisure | | | 1.1 | |
Communications Equipment | | | 1.1 | |
Biotechnology | | | 1.1 | |
Household Products | | | 1.0 | |
Semiconductors & Semiconductor Equipment | | | 1.0 | |
Commercial Services & Supplies | | | 1.0 | |
Textiles, Apparel & Luxury Goods | | | 1.0 | |
Others (each less than 1.0%) | | | 10.4 | |
| | | | | | | | | | | | | | | | | | | | |
| Futures Contracts | | | | | | | | | | |
NUMBER OF
CONTRACTS | | | DESCRIPTION | | EXPIRATION
DATE | | | TRADING
CURRENCY | | | NOTIONAL
VALUE AT
APRIL 30, 2017 | | | NET
UNREALIZED
APPRECIATION
(DEPRECIATION) | |
| | | | Long Futures Outstanding | | | | | | | | | | | | | | | | |
| | 357 | | | TOPIX Index | | | 06/08/17 | | | | JPY | | | | 49,073 | | | | (192 | ) |
| | 51 | | | Euro STOXX 50 Index | | | 06/16/17 | | | | USD | | | | 1,949 | | | | 103 | |
| | 19 | | | FTSE 100 Index | | | 06/16/17 | | | | USD | | | | 1,763 | | | | (26 | ) |
| | 1,674 | | | Mini MSCI Emerging Markets Index | | | 06/16/17 | | | | USD | | | | 81,942 | | | | 3,230 | |
| | 219 | | | Mini Russell 2000 | | | 06/16/17 | | | | USD | | | | 15,313 | | | | 143 | |
| | 349 | | | Euro FX | | | 06/19/17 | | | | USD | | | | 47,643 | | | | 333 | |
| | | | Short Futures Outstanding | | | | | | | | | | | | | | | | |
| | (22 | ) | | Euro-Buxl 30-Year Bond | | | 06/08/17 | | | | EUR | | | | (4,054 | ) | | | (41 | ) |
| | (81 | ) | | 10 Year Japanese Government Bond | | | 06/12/17 | | | | JPY | | | | (10,974 | ) | | | (70 | ) |
| | (13 | ) | | E-mini S&P 500 | | | 06/16/17 | | | | USD | | | | (1,547 | ) | | | (6 | ) |
| | (266 | ) | | Euro STOXX 50 Index | | | 06/16/17 | | | | USD | | | | (10,166 | ) | | | (19 | ) |
| | (44 | ) | | 10 Year U.S. Treasury Note | | | 06/21/17 | | | | USD | | | | (5,532 | ) | | | (12 | ) |
| | (17 | ) | | U.S. Treasury Long Bond | | | 06/21/17 | | | | USD | | | | (2,600 | ) | | | (49 | ) |
| | | | | | | | | | | | | | | | | | | | |
| | | | | | | | | | | | | | | | | | | 3,394 | |
| | | | | | | | | | | | | | | | | | | | |
SEE NOTES TO FINANCIAL STATEMENTS.
| | | | | | | | |
| | | |
| APRIL 30, 2017 | | J.P. MORGAN FUNDS | | | | | 39 | |
JPMorgan Global Allocation Fund
SCHEDULE OF PORTFOLIO INVESTMENTS
AS OF APRIL 30, 2017 (Unaudited) (continued)
(Amounts in U.S. Dollars, unless otherwise noted)
(Amounts in thousands)
| | | | | | | | | | | | | | | | | | | | | | |
| Forward Foreign Currency Exchange Contracts | |
CONTRACTS
TO BUY | | | CURRENCY | | COUNTERPARTY | | SETTLEMENT
DATE | | | SETTLEMENT
VALUE | | | VALUE AT
APRIL 30, 2017 | | | NET
UNREALIZED
APPRECIATION
(DEPRECIATION) | |
| | 469 | | | EUR | | National Australia Bank | | | 05/03/17 | | | | 511 | | | | 511 | | | | — | (h) |
| | 5,297 | | | EUR | | Australia and New Zealand Banking Group Ltd. | | | 06/30/17 | | | | 5,776 | | | | 5,788 | | | | 12 | |
| | 529 | | | EUR | | Morgan Stanley | | | 06/30/17 | | | | 563 | | | | 578 | | | | 15 | |
| | 2,648 | | | EUR | | National Australia Bank | | | 06/30/17 | | | | 2,853 | | | | 2,894 | | | | 41 | |
| | 165 | | | GBP | | National Australia Bank | | | 06/30/17 | | | | 206 | | | | 214 | | | | 8 | |
| | | | | | | | | | | | | 9,909 | | | | 9,985 | | | | 76 | |
| | |
| | | | | | | | | | | | | | | | | | | | | | | | |
CONTRACTS
TO SELL | | | CURRENCY | | | COUNTERPARTY | | SETTLEMENT
DATE | | | SETTLEMENT
VALUE | | | VALUE AT
APRIL 30, 2017 | | | NET
UNREALIZED
APPRECIATION
(DEPRECIATION) | |
| | 831 | | | | AUD | | | Australia and New Zealand Banking Group Ltd. | | | 06/30/17 | | | | 621 | | | | 621 | | | | — | (h) |
| | 17,217 | | | | AUD | | | National Australia Bank | | | 06/30/17 | | | | 13,071 | | | | 12,879 | | | | 192 | |
| | 85,069 | | | | CAD | | | Citibank, N.A. | | | 05/31/17 | | | | 62,780 | | | | 62,345 | | | | 435 | |
| | 1,861 | | | | CAD | | | State Street Corp. | | | 05/31/17 | | | | 1,372 | | | | 1,363 | | | | 9 | |
| | 11,904 | | | | CAD | | | National Australia Bank | | | 06/30/17 | | | | 8,886 | | | | 8,729 | | | | 157 | |
| | 1,032 | | | | EUR | | | Australia and New Zealand Banking Group Ltd. | | | 06/30/17 | | | | 1,129 | | | | 1,127 | | | | 2 | |
| | 503 | | | | EUR | | | Goldman Sachs International | | | 06/30/17 | | | | 549 | | | | 549 | | | | — | (h) |
| | 3,207 | | | | EUR | | | HSBC Bank, N.A. | | | 06/30/17 | | | | 3,497 | | | | 3,504 | | | | (7 | ) |
| | 3,680 | | | | EUR | | | Merrill Lynch International | | | 06/30/17 | | | | 3,922 | | | | 4,021 | | | | (99 | ) |
| | 469 | | | | EUR | | | National Australia Bank | | | 06/30/17 | | | | 513 | | | | 513 | | | | — | (h) |
| | 82,450 | | | | EUR | | | Societe Generale | | | 06/30/17 | | | | 89,921 | | | | 90,090 | | | | (169 | ) |
| | 129 | | | | EUR | | | Standard Chartered Bank | | | 06/30/17 | | | | 137 | | | | 141 | | | | (4 | ) |
| | 4,060 | | | | GBP | | | National Australia Bank | | | 05/31/17 | | | | 5,209 | | | | 5,264 | | | | (55 | ) |
| | 8,259 | | | | GBP | | | National Australia Bank | | | 06/30/17 | | | | 10,427 | | | | 10,716 | | | | (289 | ) |
| | 1,995,894 | | | | JPY | | | National Australia Bank | | | 06/30/17 | | | | 18,099 | | | | 17,948 | | | | 151 | |
| | | | | | | | | | | | | | | 220,133 | | | | 219,810 | | | | 323 | |
| | |
| | | | | | | | | | | | |
| Total Return Basket Swaps* Outstanding at April 30, 2017 | | | | |
| COUNTERPARTY | | | DESCRIPTION | | TERMINATION
DATE | | | VALUE** | |
| | Bank of America, NA | | | The Fund receives the total return on a portfolio of long and short positions and pays a specified LIBOR or Federal Funds floating rate, which is denominated in various foreign currencies based on the local currencies of the positions within the swap. | | | 10/31/18 | | | $ | — | (h) |
| | | | | | | | | | | | |
| * | See the accompanying “Additional Information — Total Return Basket Swaps” for further details. |
SEE NOTES TO FINANCIAL STATEMENTS.
| | | | | | |
| | | |
| 40 | | | | J.P. MORGAN FUNDS | | APRIL 30, 2017 |
JPMorgan Global Allocation Fund
ADDITIONAL INFORMATION — TOTAL RETURN BASKET SWAPS
AS OF APRIL 30, 2017 (Unaudited)
| | | | | | | | | | | | | | | | |
TOTAL RETURN BASKET
SWAP POSITIONS | | SHARES | | | NOTIONAL
VALUE($) (1) | | | CURRENT
VALUE($) (2) | | | VALUE($) (3) | |
Long Positions | | | | | | | | | | | | | | | | |
| | | | |
Common Stock | | | | | | | | | | | | | | | | |
United Kingdom — 0.0% (g) | | | | | | | | | | | | | | | | |
Persimmon plc. (a) | | | — | (h) | | | 3 | | | | 3 | | | | — | (h) |
| | | | | | | | | | | | | | | | |
Cash and Other Receivables/(Payables) (4) | | | | | | | | | | | | | | | — | |
| | | | | | | | | | | | | | | | |
Financing Costs | | | | | | | | | | | | | | | — | |
| | | | | | | | | | | | | | | | |
Net Dividends Receivable/(Payable) | | | | | | | | | | | | | | | — | |
Outstanding Swap Contract, at value | | | | | | | | | | | | | | | — | (h) |
| | | | | | | | | | | | | | | | |
Percentages indicated are based on net assets.
NOTES TO ADDITIONAL INFORMATION — TOTAL RETURN BASKET SWAPS:
| (1) | Notional value represents the market value (including any fees or commissions) of the long and short positions as of the reset date. |
| (2) | Current value represents market value as of April 30, 2017 of these positions based on the securities’ last sale or closing price on the principal exchange on which the securities are traded. |
| (3) | Value represents the unrealized gain(loss) of the positions subsequent to the swap reset. |
| (4) | Cash and other receivables/(payables) includes the gains (or losses) realized from purchases and sales within the swap. |
| (a) | Non-income producing security. |
| (g) | Amount rounds to less than 0.05%. |
| (h) | Amount rounds to less than 500. |
SEE NOTES TO FINANCIAL STATEMENTS.
| | | | | | | | |
| | | |
| APRIL 30, 2017 | | J.P. MORGAN FUNDS | | | | | 41 | |
JPMorgan Income Builder Fund
SCHEDULE OF PORTFOLIO INVESTMENTS
AS OF APRIL 30, 2017 (Unaudited)
(Amounts in U.S. Dollars, unless otherwise noted)
(Amounts in thousands)
| | | | | | | | |
PRINCIPAL
AMOUNT | | | SECURITY DESCRIPTION | | VALUE | |
| | Asset-Backed Securities — 4.4% | |
| | | | United States — 4.4% | |
| | | | ABFC Trust, | | | | |
| | 307 | | | Series 2003-OPT1, Class A1A, VAR, 1.811%, 04/25/33 | | | 298 | |
| | 1,840 | | | Series 2004-HE1, Class M1, VAR, 1.891%, 03/25/34 | | | 1,787 | |
| | 1,307 | | | Series 2004-OPT3, Class M1, VAR, 1.741%, 09/25/33 | | | 1,233 | |
| | 3,005 | | | Series 2004-OPT5, Class A1, VAR, 1.691%, 06/25/34 | | | 2,844 | |
| | 1,558 | | | Series 2005-WF1, Class M1, VAR, 1.531%, 11/25/34 | | | 1,512 | |
| | 1,099 | | | Accredited Mortgage Loan Trust, Series 2004-4, Class M1, VAR, 1.861%, 01/25/35 | | | 1,016 | |
| | | | ACE Securities Corp. Home Equity Loan Trust, | | | | |
| | 1,236 | | | Series 2003-FM1, Class M1, VAR, 2.281%, 11/25/32 | | | 1,122 | |
| | 1,397 | | | Series 2003-HE1, Class M1, VAR, 1.966%, 11/25/33 | | | 1,343 | |
| | 885 | | | Series 2003-NC1, Class M1, VAR, 2.161%, 07/25/33 | | | 849 | |
| | 4,090 | | | Series 2003-OP1, Class M1, VAR, 2.041%, 12/25/33 | | | 3,909 | |
| | 1,100 | | | Series 2004-HE2, Class M1, VAR, 2.026%, 10/25/34 | | | 1,045 | |
| | 1,753 | | | Series 2004-HE4, Class M2, VAR, 1.966%, 12/25/34 | | | 1,705 | |
| | 4,399 | | | Series 2004-OP1, Class M2, VAR, 2.556%, 04/25/34 | | | 4,183 | |
| | | | Ameriquest Mortgage Securities, Inc. Asset-Backed Pass-Through Certificates, | | | | |
| | 709 | | | Series 2002-AR1, Class M1, VAR, 2.056%, 09/25/32 | | | 654 | |
| | 1,347 | | | Series 2003-13, Class M1, VAR, 2.011%, 01/25/34 | | | 1,240 | |
| | 573 | | | Series 2003-13, Class M2, VAR, 3.541%, 01/25/34 | | | 545 | |
| | 916 | | | Series 2004-R1, Class A2, VAR, 1.591%, 02/25/34 | | | 817 | |
| | 4,444 | | | Series 2004-R1, Class M1, VAR, 1.786%, 02/25/34 | | | 4,127 | |
| | 514 | | | Series 2004-R1, Class M2, VAR, 1.861%, 02/25/34 | | | 475 | |
| | 42 | | | Series 2004-R3, Class A1B, VAR, 1.691%, 05/25/34 | | | 42 | |
| | 314 | | | Series 2004-R8, Class M1, VAR, 1.951%, 09/25/34 | | | 313 | |
| | | | | | | | |
PRINCIPAL
AMOUNT | | | SECURITY DESCRIPTION | | VALUE | |
| | | | | | | | |
| | | | United States — continued | | | | |
| | | | Argent Securities, Inc. Asset-Backed Pass-Through Certificates, | | | | |
| | 1,237 | | | Series 2003-W5, Class M2, VAR, 3.766%, 10/25/33 | | | 1,184 | |
| | 763 | | | Series 2004-W2, Class M2, VAR, 2.866%, 04/25/34 | | | 738 | |
| | 563 | | | Series 2004-W2, Class M3, VAR, 3.091%, 04/25/34 | | | 521 | |
| | 2,052 | | | Series 2004-W3, Class A3, VAR, 1.811%, 02/25/34 | | | 1,879 | |
| | 1,831 | | | Series 2004-W4, Class A, VAR, 1.511%, 03/25/34 | | | 1,659 | |
| | 1,352 | | | Series 2004-W6, Class M1, VAR, 1.816%, 05/25/34 | | | 1,298 | |
| | 551 | | | Series 2004-W7, Class M2, VAR, 1.891%, 05/25/34 | | | 513 | |
| | | | Asset-Backed Securities Corp. Home Equity Loan Trust, | | | | |
| | 2,306 | | | Series 2001-HE3, Class A1, VAR, 1.534%, 11/15/31 | | | 2,185 | |
| | 177 | | | Series 2003-HE3, Class M2, VAR, 3.994%, 06/15/33 | | | 170 | |
| | 1,717 | | | Series 2003-HE4, Class M1, VAR, 2.239%, 08/15/33 | | | 1,632 | |
| | 1,849 | | | Series 2004-HE2, Class M2, VAR, 2.866%, 04/25/34 | | | 1,697 | |
| | 1,279 | | | Series 2004-HE7, Class M2, VAR, 2.566%, 10/25/34 | | | 1,219 | |
| | 873 | | | Bayview Financial Acquisition Trust, Series 2006-D, Class 1A5, SUB, 5.668%, 12/28/36 | | | 855 | |
| | 394 | | | Bayview Financial Mortgage Pass-Through Trust, Series 2006-C, Class 1A2, SUB, 5.638%, 11/28/36 | | | 390 | |
| | | | Bear Stearns Asset-Backed Securities I Trust, | | | | |
| | 5,364 | | | Series 2004-HE6, Class M2, VAR, 2.866%, 08/25/34 | | | 5,131 | |
| | 2,286 | | | Series 2004-HE11, Class M2, VAR, 2.556%, 12/25/34 | | | 2,242 | |
| | | | Bear Stearns Asset-Backed Securities Trust, | | | | |
| | 879 | | | Series 2003-1, Class M1, VAR, 2.641%, 11/25/42 | | | 835 | |
| | 560 | | | Series 2003-SD1, Class A, VAR, 1.891%, 12/25/33 | | | 534 | |
| | 869 | | | Series 2003-SD1, Class M1, VAR, 2.266%, 12/25/33 | | | 829 | |
| | 1,588 | | | Series 2004-HE2, Class M2, VAR, 2.791%, 03/25/34 | | | 1,527 | |
SEE NOTES TO FINANCIAL STATEMENTS.
| | | | | | |
| | | |
| 42 | | | | J.P. MORGAN FUNDS | | APRIL 30, 2017 |
| | | | | | | | |
PRINCIPAL
AMOUNT | | | SECURITY DESCRIPTION | | VALUE | |
| | Asset-Backed Securities — continued | |
| | | | United States — continued | |
| | 2,142 | | | Series 2004-SD4, Class A1, VAR, 1.891%, 08/25/44 | | | 2,047 | |
| | 635 | | | CDC Mortgage Capital Trust, Series 2003-HE1, Class M1, VAR, 2.341%, 08/25/33 | | | 614 | |
| | | | Centex Home Equity Loan Trust, | | | | |
| | 5,991 | | | Series 2004-A, Class M1, VAR, 1.591%, 01/25/34 | | | 5,688 | |
| | 799 | | | Series 2004-C, Class M2, VAR, 1.786%, 06/25/34 | | | 693 | |
| | 603 | | | Series 2004-D, Class MF2, SUB, 5.560%, 09/25/34 | | | 579 | |
| | 1,640 | | | Series 2004-D, Class MF3, SUB, 5.760%, 09/25/34 | | | 1,175 | |
| | 258 | | | Series 2004-D, Class MV2, VAR, 1.681%, 09/25/34 | | | 234 | |
| | | | Chase Funding Loan Acquisition Trust, | | | | |
| | 1,263 | | | Series 2004-AQ1, Class M1, VAR, 2.086%, 05/25/34 | | | 1,156 | |
| | 1,892 | | | Series 2004-OPT1, Class M2, VAR, 2.491%, 06/25/34 | | | 1,829 | |
| | | | Chase Funding Trust, | | | | |
| | 1,423 | | | Series 2003-4, Class 1A5, SUB, 5.315%, 05/25/33 | | | 1,460 | |
| | 166 | | | Series 2003-4, Class 2M1, VAR, 1.891%, 03/25/33 | | | 159 | |
| | 422 | | | Series 2003-5, Class 1M2, VAR, 5.641%, 09/25/32 | | | 371 | |
| | 2,345 | | | Series 2003-6, Class 2A2, VAR, 1.571%, 11/25/34 | | | 2,091 | |
| | 2,458 | | | Series 2003-6, Class 2M1, VAR, 1.741%, 11/25/34 | | | 2,305 | |
| | 903 | | | Series 2004-1, Class 1M1, 4.725%, 05/25/33 | | | 871 | |
| | 1,051 | | | Series 2004-1, Class 2M1, VAR, 1.741%, 09/25/33 | | | 972 | |
| | 2,212 | | | Series 2004-2, Class 1M1, VAR, 5.700%, 02/26/35 | | | 2,068 | |
| | 1,487 | | | CHEC Loan Trust, Series 2004-1, Class M1, VAR, 1.891%, 07/25/34 | | | 1,335 | |
| | | | Citigroup Mortgage Loan Trust, Inc., | | | | |
| | 291 | | | Series 2005-OPT1, Class M4, VAR, 2.041%, 02/25/35 | | | 265 | |
| | 136 | | | Series 2005-WF2, Class AF7, SUB, 5.249%, 08/25/35 | | | 129 | |
| | 36 | | | Continental Airlines Pass Through Trust, Series 2004-ERJ1, 9.558%, 09/01/19 | | | 38 | |
| | | | Countrywide Asset-Backed Certificates, | | | | |
| | 276 | | | Series 2002-3, Class M1, VAR, 2.116%, 03/25/32 | | | 271 | |
| | | | | | | | |
PRINCIPAL
AMOUNT | | | SECURITY DESCRIPTION | | VALUE | |
| | | | | | | | |
| | | | United States — continued | | | | |
| | 1,003 | | | Series 2002-4, Class M1, VAR, 2.116%, 12/25/32 | | | 936 | |
| | 1,345 | | | Series 2003-3, Class 3A, VAR, 1.531%, 11/25/33 | | | 1,260 | |
| | 9,435 | | | Series 2004-2, Class M1, VAR, 1.741%, 05/25/34 | | | 8,996 | |
| | 3,060 | | | Series 2004-3, Class M1, VAR, 1.741%, 06/25/34 | | | 2,853 | |
| | 629 | | | Series 2004-3, Class M2, VAR, 1.816%, 06/25/34 | | | 591 | |
| | 1,234 | | | Series 2004-BC1, Class M1, VAR, 1.741%, 02/25/34 | | | 1,169 | |
| | 285 | | | Series 2004-BC4, Class M1, VAR, 2.041%, 11/25/34 | | | 274 | |
| | 908 | | | Series 2004-ECC2, Class M2, VAR, 1.966%, 12/25/34 | | | 875 | |
| | 3,000 | | | Series 2005-12, Class M2, VAR, 1.481%, 02/25/36 | | | 2,781 | |
| | 4,725 | | | Series 2005-AB3, Class 1A1, VAR, 1.241%, 02/25/36 | | | 4,192 | |
| | 9,401 | | | Series 2006-19, Class 2A2, VAR, 1.151%, 03/25/37 | | | 9,077 | |
| | 1,269 | | | Countrywide Partnership Trust, Series 2004-EC1, Class M2, VAR, 1.936%, 01/25/35 | | | 1,177 | |
| | | | Credit-Based Asset Servicing & Securitization LLC, | | | | |
| | 2,725 | | | Series 2003-CB6, Class M1, VAR, 2.041%, 12/25/33 | | | 2,539 | |
| | 1,477 | | | Series 2004-CB2, Class M1, VAR, 1.771%, 07/25/33 | | | 1,364 | |
| | 531 | | | Series 2005-CB8, Class AF2, SUB, 3.948%, 12/25/35 | | | 529 | |
| | | | CWABS, Inc. Asset-Backed Certificates Trust, | | | | |
| | 4,177 | | | Series 2003-BC1, Class A1, VAR, 1.791%, 03/25/33 | | | 3,964 | |
| | 737 | | | Series 2004-1, Class M2, VAR, 1.816%, 03/25/34 | | | 686 | |
| | 1,324 | | | Series 2004-1, Class M3, VAR, 1.966%, 02/25/34 | | | 1,239 | |
| | 1,965 | | | Series 2004-5, Class M2, VAR, 1.966%, 07/25/34 | | | 1,915 | |
| | 761 | | | Series 2004-6, Class M2, VAR, 1.966%, 10/25/34 | | | 717 | |
| | 264 | | | Series 2005-11, Class AF6, VAR, 4.685%, 02/25/36 | | | 273 | |
| | 452 | | | Equity One Mortgage Pass-Through Trust, Series 2003-4, Class M1, SUB, 5.869%, 10/25/34 | | | 433 | |
SEE NOTES TO FINANCIAL STATEMENTS.
| | | | | | | | |
| | | |
| APRIL 30, 2017 | | J.P. MORGAN FUNDS | | | | | 43 | |
JPMorgan Income Builder Fund
SCHEDULE OF PORTFOLIO INVESTMENTS
AS OF APRIL 30, 2017 (Unaudited) (continued)
(Amounts in U.S. Dollars, unless otherwise noted)
(Amounts in thousands)
| | | | | | | | |
PRINCIPAL
AMOUNT | | | SECURITY DESCRIPTION | | VALUE | |
| | Asset-Backed Securities — continued | |
| | | | United States — continued | |
| | 9,905 | | | FFMLT Trust, Series 2005-FF11, Class M1, VAR, 1.636%, 11/25/35 | | | 9,433 | |
| | 199 | | | Finance America Mortgage Loan Trust, Series 2004-3, Class M2, VAR, 1.936%, 11/25/34 | | | 154 | |
| | 930 | | | First Franklin Mortgage Loan Asset-Backed Certificates, Series 2004-FF3, Class M1, VAR, 1.816%, 05/25/34 | | | 869 | |
| | | | First Franklin Mortgage Loan Trust, | | | | |
| | 5,237 | | | Series 2003-FF5, Class M1, VAR, 1.891%, 03/25/34 | | | 4,912 | |
| | 2,307 | | | Series 2004-FF5, Class A1, VAR, 1.711%, 08/25/34 | | | 2,205 | |
| | 12,079 | | | Series 2005-FF10, Class A1, VAR, 1.291%, 11/25/35 | | | 10,977 | |
| | 1,507 | | | Series 2005-FF10, Class A4, VAR, 1.311%, 11/25/35 | | | 1,497 | |
| | 1,345 | | | Series 2006-FF8, Class IIA3, VAR, 1.141%, 07/25/36 | | | 1,295 | |
| | | | Fremont Home Loan Trust, | | | | |
| | 2,134 | | | Series 2003-A, Class M1, VAR, 1.966%, 08/25/33 | | | 2,005 | |
| | 1,967 | | | Series 2004-2, Class M2, VAR, 1.921%, 07/25/34 | | | 1,905 | |
| | 3,896 | | | Series 2004-A, Class M1, VAR, 1.816%, 01/25/34 | | | 3,608 | |
| | 537 | | | Series 2004-B, Class M2, VAR, 1.936%, 05/25/34 | | | 483 | |
| | 929 | | | Series 2004-C, Class M1, VAR, 1.966%, 08/25/34 | | | 878 | |
| | 1,799 | | | Series 2004-D, Class M1, VAR, 1.861%, 11/25/34 | | | 1,627 | |
| | 970 | | | Series 2004-D, Class M2, VAR, 1.891%, 11/25/34 | | | 925 | |
| | 1,132 | | | GSAA Trust, Series 2005-6, Class A3, VAR, 1.361%, 06/25/35 | | | 1,125 | |
| | | | GSAMP Trust, | | | | |
| | 2,257 | | | Series 2003-HE1, Class M1, VAR, 2.238%, 06/20/33 | | | 2,203 | |
| | 1,451 | | | Series 2003-SEA, Class A1, VAR, 1.391%, 02/25/33 | | | 1,366 | |
| | 724 | | | Series 2005-HE3, Class M2, VAR, 1.996%, 06/25/35 | | | 715 | |
| | 2,206 | | | Series 2005-NC1, Class M1, VAR, 1.666%, 02/25/35 | | | 2,097 | |
| | 3,218 | | | Series 2006-FM1, Class A2C, VAR, 1.151%, 04/25/36 | | | 2,059 | |
| | 6,835 | | | Series 2006-HE3, Class A2C, VAR, 1.151%, 05/25/46 | | | 6,371 | |
| | | | | | | | |
PRINCIPAL
AMOUNT | | | SECURITY DESCRIPTION | | VALUE | |
| | | | | | | | |
| | | | United States — continued | |
| | 2,274 | | | Series 2006-HE4, Class A2C, VAR, 1.141%, 06/25/36 | | | 2,232 | |
| | 6,655 | | | Series 2007-SEA1, Class A, VAR, 1.291%, 12/25/36 (e) | | | 6,172 | |
| | | | Home Equity Asset Trust, | | | | |
| | 3,988 | | | Series 2002-5, Class M1, VAR, 2.691%, 05/25/33 | | | 3,833 | |
| | 960 | | | Series 2003-3, Class M1, VAR, 2.281%, 08/25/33 | | | 941 | |
| | 443 | | | Series 2004-6, Class M2, VAR, 1.891%, 12/25/34 | | | 416 | |
| | 4,100 | | | Series 2005-7, Class M1, VAR, 1.441%, 01/25/36 | | | 3,966 | |
| | | | Home Equity Mortgage Loan Asset-Backed Trust, | | | | |
| | 567 | | | Series 2004-B, Class M2, VAR, 2.116%, 11/25/34 | | | 528 | |
| | 9,256 | | | Series 2004-C, Class M1, VAR, 1.831%, 03/25/35 | | | 8,630 | |
| | 990 | | | Series 2004-C, Class M2, VAR, 1.891%, 03/25/35 | | | 888 | |
| | 1,263 | | | Series 2006-B, Class 2A3, VAR, 1.181%, 06/25/36 | | | 1,215 | |
| | 307 | | | JP Morgan Mortgage Acquisition Trust, Series 2006-NC1, Class A4, VAR, 1.161%, 04/25/36 | | | 303 | |
| | | | Long Beach Mortgage Loan Trust, | | | | |
| | 896 | | | Series 2001-2, Class M1, VAR, 1.551%, 07/25/31 | | | 873 | |
| | 2,799 | | | Series 2002-5, Class M1, VAR, 2.236%, 11/25/32 | | | 2,712 | |
| | 388 | | | Series 2003-4, Class M1, VAR, 2.011%, 08/25/33 | | | 370 | |
| | 916 | | | Series 2004-3, Class M2, VAR, 1.891%, 07/25/34 | | | 867 | |
| | 598 | | | Series 2004-3, Class M4, VAR, 2.603%, 07/25/34 | | | 563 | |
| | 643 | | | Series 2004-3, Class M6, VAR, 3.128%, 07/25/34 | | | 604 | |
| | 1,981 | | | Series 2004-4, Class M1, VAR, 1.891%, 10/25/34 | | | 1,817 | |
| | 250 | | | Series 2005-WL2, Class M1, VAR, 1.696%, 08/25/35 | | | 249 | |
| | | | Mastr Asset-Backed Securities Trust, | | | | |
| | 1,461 | | | Series 2004-OPT2, Class M1, VAR, 1.891%, 09/25/34 | | | 1,367 | |
| | 933 | | | Series 2004-OPT2, Class M2, VAR, 1.966%, 09/25/34 | | | 825 | |
SEE NOTES TO FINANCIAL STATEMENTS.
| | | | | | |
| | | |
| 44 | | | | J.P. MORGAN FUNDS | | APRIL 30, 2017 |
| | | | | | | | |
PRINCIPAL
AMOUNT | | | SECURITY DESCRIPTION | | VALUE | |
| | Asset-Backed Securities — continued | |
| | | | United States — continued | |
| | 2,237 | | | Series 2005-NC1, Class M2, VAR, 1.741%, 12/25/34 | | | 2,152 | |
| | | | Merrill Lynch Mortgage Investors Trust, | | | | |
| | 476 | | | Series 2003-OPT1, Class M1, VAR, 1.966%, 07/25/34 | | | 442 | |
| | 389 | | | Series 2004-HE2, Class M1, VAR, 2.191%, 08/25/35 | | | 373 | |
| | 100 | | | Series 2004-WMC5, Class M5, VAR, 2.716%, 07/25/35 | | | 97 | |
| | 2,092 | | | Series 2005-FM1, Class M1, VAR, 1.471%, 05/25/36 | | | 1,938 | |
| | | | Morgan Stanley ABS Capital I, Inc. Trust, | | | | |
| | 1,108 | | | Series 2003-NC10, Class M1, VAR, 2.011%, 10/25/33 | | | 1,058 | |
| | 7,590 | | | Series 2004-HE1, Class M1, VAR, 1.846%, 01/25/34 | | | 7,240 | |
| | 533 | | | Series 2004-HE2, Class M2, VAR, 2.791%, 03/25/34 | | | 507 | |
| | 1,033 | | | Series 2004-HE2, Class M3, VAR, 3.166%, 03/25/34 | | | 626 | |
| | 4,101 | | | Series 2004-HE3, Class M1, VAR, 1.846%, 03/25/34 | | | 3,896 | |
| | 1,389 | | | Series 2004-HE3, Class M2, VAR, 2.866%, 03/25/34 | | | 1,335 | |
| | 1,228 | | | Series 2004-HE6, Class M1, VAR, 1.816%, 08/25/34 | | | 1,192 | |
| | 1,304 | | | Series 2004-HE6, Class M2, VAR, 1.891%, 08/25/34 | | | 1,238 | |
| | 863 | | | Series 2004-HE6, Class M3, VAR, 1.966%, 08/25/34 | | | 766 | |
| | 881 | | | Series 2004-HE7, Class M2, VAR, 1.936%, 08/25/34 | | | 872 | |
| | 84 | | | Series 2004-HE7, Class M3, VAR, 2.011%, 08/25/34 | | | 80 | |
| | 2,600 | | | Series 2004-HE8, Class M1, VAR, 1.951%, 09/25/34 | | | 2,466 | |
| | 995 | | | Series 2004-HE8, Class M2, VAR, 2.011%, 09/25/34 | | | 965 | |
| | 794 | | | Series 2004-HE8, Class M3, VAR, 2.116%, 09/25/34 | | | 750 | |
| | 2,679 | | | Series 2004-NC3, Class M1, VAR, 1.786%, 03/25/34 | | | 2,526 | |
| | 5,332 | | | Series 2004-NC5, Class M1, VAR, 1.891%, 05/25/34 | | | 4,972 | |
| | 721 | | | Series 2004-NC6, Class M2, VAR, 2.866%, 07/25/34 | | | 680 | |
| | 662 | | | Series 2004-NC8, Class M3, VAR, 2.101%, 09/25/34 | | | 625 | |
| | 1,517 | | | Series 2004-OP1, Class M2, VAR, 1.906%, 11/25/34 | | | 1,476 | |
| | | | | | | | |
PRINCIPAL
AMOUNT | | | SECURITY DESCRIPTION | | VALUE | |
| | |
| | | | United States — continued | |
| | 941 | | | Series 2004-OP1, Class M3, VAR, 2.011%, 11/25/34 | | | 866 | |
| | 2,149 | | | Series 2004-WMC2, Class M1, VAR, 1.906%, 07/25/34 | | | 2,058 | |
| | 1,034 | | | Series 2004-WMC2, Class M2, VAR, 2.791%, 07/25/34 | | | 1,010 | |
| | 3,341 | | | Series 2004-WMC3, Class M2, VAR, 1.786%, 01/25/35 | | | 3,021 | |
| | 456 | | | Series 2005-HE1, Class M2, VAR, 1.696%, 12/25/34 | | | 398 | |
| | 1,232 | | | Series 2005-HE1, Class M3, VAR, 1.771%, 12/25/34 | | | 1,021 | |
| | 291 | | | Series 2005-NC1, Class M3, VAR, 1.756%, 01/25/35 | | | 224 | |
| | | | New Century Home Equity Loan Trust, | | | | |
| | 497 | | | Series 2003-3, Class M1, VAR, 2.176%, 07/25/33 | | | 481 | |
| | 896 | | | Series 2003-B, Class M2, VAR, 3.466%, 11/25/33 | | | 878 | |
| | 3,174 | | | Series 2004-1, Class M1, VAR, 1.876%, 05/25/34 | | | 2,951 | |
| | 227 | | | Series 2004-2, Class M2, VAR, 1.921%, 08/25/34 | | | 212 | |
| | 1,057 | | | Series 2004-2, Class M4, VAR, 2.791%, 08/25/34 | | | 1,025 | |
| | 903 | | | Series 2004-2, Class M6, VAR, 3.241%, 08/25/34 | | | 878 | |
| | 2,083 | | | Series 2004-3, Class M2, VAR, 1.966%, 11/25/34 | | | 2,034 | |
| | 469 | | | Series 2004-3, Class M3, VAR, 2.056%, 11/25/34 | | | 435 | |
| | 5,305 | | | Series 2004-4, Class M1, VAR, 1.756%, 02/25/35 | | | 4,994 | |
| | 592 | | | Series 2004-4, Class M2, VAR, 1.786%, 02/25/35 | | | 553 | |
| | 292 | | | Series 2005-1, Class M3, VAR, 1.771%, 03/25/35 | | | 238 | |
| | 2,776 | | | Series 2006-2, Class A2B, VAR, 1.151%, 08/25/36 | | | 2,335 | |
| | | | NovaStar Mortgage Funding Trust, | | | | |
| | 1,191 | | | Series 2003-2, Class M2, VAR, 3.766%, 09/25/33 | | | 1,145 | |
| | 425 | | | Series 2003-3, Class M2, VAR, 2.641%, 12/25/33 | | | 422 | |
| | 4,395 | | | Series 2004-2, Class M4, VAR, 2.791%, 09/25/34 | | | 4,037 | |
| | | | Option One Mortgage Acceptance Corp. Asset-Backed Certificates, | | | | |
| | 1,465 | | | Series 2003-3, Class M1A, VAR, 2.551%, 06/25/33 | | | 1,401 | |
SEE NOTES TO FINANCIAL STATEMENTS.
| | | | | | | | |
| | | |
| APRIL 30, 2017 | | J.P. MORGAN FUNDS | | | | | 45 | |
JPMorgan Income Builder Fund
SCHEDULE OF PORTFOLIO INVESTMENTS
AS OF APRIL 30, 2017 (Unaudited) (continued)
(Amounts in U.S. Dollars, unless otherwise noted)
(Amounts in thousands)
| | | | | | | | |
PRINCIPAL
AMOUNT | | | SECURITY DESCRIPTION | | VALUE | |
| | Asset-Backed Securities — continued | |
| | | | United States — continued | |
| | 6,382 | | | Series 2003-5, Class A1, VAR, 1.631%, 08/25/33 | | | 6,077 | |
| | 506 | | | Series 2003-5, Class A2, VAR, 1.631%, 08/25/33 | | | 483 | |
| | 332 | | | Series 2003-5, Class M2, VAR, 3.316%, 08/25/33 | | | 297 | |
| | | | Option One Mortgage Loan Trust, | | | | |
| | 5,012 | | | Series 2002-3, Class A1, VAR, 1.491%, 08/25/32 | | | 4,767 | |
| | 885 | | | Series 2002-3, Class A2, VAR, 1.531%, 08/25/32 | | | 828 | |
| | 9,218 | | | Series 2004-2, Class M1, VAR, 1.786%, 05/25/34 | | | 8,626 | |
| | 715 | | | Series 2004-3, Class M2, VAR, 1.846%, 11/25/34 | | | 650 | |
| | 1,910 | | | People’s Choice Home Loan Securities Trust, Series 2004-2, Class M3, VAR, 2.716%, 10/25/34 | | | 1,723 | |
| | | | Pretium Mortgage Credit Partners I LLC, | | | | |
| | 9,090 | | | Series 2016-NPL3, Class A1, SUB, 4.375%, 05/27/31 (e) | | | 9,094 | |
| | 4,622 | | | Series 2016-NPL6, Class A1, SUB, 3.500%, 10/27/31 (e) | | | 4,621 | |
| | 10,848 | | | Series 2017-NPL1, Class A1, SUB, 3.500%, 04/29/32 (e) | | | 10,843 | |
| | 6,000 | | | Series 2017-NPL1, Class A2, SUB, 5.500%, 04/29/32 (e) | | | 5,866 | |
| | 2,039 | | | RAAC Trust, Series 2005-RP3, Class M1, VAR, 1.791%, 05/25/39 (e) | | | 1,999 | |
| | 646 | | | RAMP Trust, Series 2002-RS2, Class AI5, VAR, 6.030%, 03/25/32 | | | 659 | |
| | | | RASC Trust, | | | | |
| | 748 | | | Series 2001-KS3, Class AII, VAR, 1.451%, 09/25/31 | | | 718 | |
| | 3,499 | | | Series 2005-EMX1, Class M1, VAR, 1.636%, 03/25/35 | | | 3,401 | |
| | 1,788 | | | Series 2005-KS2, Class M1, VAR, 1.636%, 03/25/35 | | | 1,749 | |
| | 1,899 | | | Series 2006-KS5, Class A3, VAR, 1.151%, 07/25/36 | | | 1,871 | |
| | | | Renaissance Home Equity Loan Trust, | | | | |
| | 1,695 | | | Series 2002-3, Class M1, VAR, 2.491%, 12/25/32 | | | 1,662 | |
| | 471 | | | Series 2003-1, Class M1, VAR, 2.491%, 06/25/33 | | | 445 | |
| | 1,557 | | | Series 2003-3, Class M1, VAR, 1.721%, 12/25/33 | | | 1,420 | |
| | 1,417 | | | Series 2003-3, Class M2F, SUB, 5.681%, 12/25/33 | | | 1,378 | |
| | | | | | | | |
PRINCIPAL
AMOUNT | | | SECURITY DESCRIPTION | | VALUE | |
| | |
| | | | United States — continued | |
| | 2,950 | | | Series 2003-4, Class M1, VAR, 1.841%, 03/25/34 | | | 2,746 | |
| | 1,172 | | | Series 2003-4, Class M2F, SUB, 6.244%, 03/25/34 | | | 1,006 | |
| | 785 | | | Series 2004-1, Class M1, VAR, 1.861%, 05/25/34 | | | 724 | |
| | 566 | | | Series 2005-1, Class AF6, SUB, 4.970%, 05/25/35 | | | 579 | |
| | 1,098 | | | Series 2005-2, Class AV3, VAR, 1.361%, 08/25/35 | | | 961 | |
| | 1,022 | | | Series 2005-4, Class A3, SUB, 5.565%, 02/25/36 | | | 1,022 | |
| | 1,128 | | | SASCO Mortgage Loan Trust, Series 2004-GEL3, Class M1, VAR, 2.566%, 08/25/34 | | | 1,069 | |
| | | | Saxon Asset Securities Trust, | | | | |
| | 5,313 | | | Series 2003-3, Class M1, VAR, 1.966%, 12/25/33 | | | 5,026 | |
| | 288 | | | Series 2004-2, Class AF3, VAR, 4.519%, 08/25/35 | | | 290 | |
| | 1,629 | | | Series 2004-2, Class MV2, VAR, 2.791%, 08/25/35 | | | 1,595 | |
| | 3,766 | | | Series 2005-2, Class M2, VAR, 1.651%, 10/25/35 | | | 3,334 | |
| | | | Securitized Asset-Backed Receivables LLC Trust, | | | | |
| | 2,778 | | | Series 2004-NC1, Class M1, VAR, 1.771%, 02/25/34 | | | 2,618 | |
| | 933 | | | Series 2004-OP1, Class M2, VAR, 2.641%, 02/25/34 | | | 884 | |
| | 4,036 | | | Series 2004-OP2, Class M1, VAR, 1.966%, 08/25/34 | | | 3,930 | |
| | 1,505 | | | Series 2005-FR2, Class M2, VAR, 1.966%, 03/25/35 | | | 1,456 | |
| | 2,226 | | | Series 2005-OP1, Class M2, VAR, 1.666%, 01/25/35 | | | 2,118 | |
| | 2,807 | | | Soundview Home Loan Trust, Series 2006-OPT3, Class 2A3, VAR, 1.161%, 06/25/36 | | | 2,610 | |
| | | | Specialty Underwriting & Residential Finance Trust, | | | | |
| | 2,034 | | | Series 2004-BC1, Class M2, VAR, 2.596%, 02/25/35 | | | 1,966 | |
| | 1,470 | | | Series 2004-BC3, Class M1, VAR, 1.921%, 07/25/35 | | | 1,417 | |
| | | | Structured Asset Investment Loan Trust, | | | | |
| | 426 | | | Series 2003-BC3, Class M1, VAR, 2.416%, 04/25/33 | | | 421 | |
| | 877 | | | Series 2003-BC6, Class M1, VAR, 2.116%, 07/25/33 | | | 857 | |
SEE NOTES TO FINANCIAL STATEMENTS.
| | | | | | |
| | | |
| 46 | | | | J.P. MORGAN FUNDS | | APRIL 30, 2017 |
| | | | | | | | |
PRINCIPAL
AMOUNT | | | SECURITY DESCRIPTION | | VALUE | |
| | Asset-Backed Securities — continued | |
| | | | United States — continued | |
| | 1,821 | | | Series 2003-BC7, Class M1, VAR, 2.116%, 07/25/33 | | | 1,715 | |
| | 1,411 | | | Series 2003-BC11, Class M2, VAR, 3.541%, 10/25/33 | | | 1,411 | |
| | 1,449 | | | Series 2003-BC12, Class M1, VAR, 1.966%, 11/25/33 | | | 1,388 | |
| | 2,705 | | | Series 2004-1, Class M1, VAR, 1.966%, 02/25/34 | | | 2,612 | |
| | — | (h) | | Series 2004-1, Class M2, VAR, 3.691%, 02/25/34 | | | — | (h) |
| | 2,989 | | | Series 2004-5, Class M3, VAR, 1.921%, 05/25/34 | | | 2,869 | |
| | 13,215 | | | Series 2004-6, Class A3, VAR, 1.791%, 07/25/34 | | | 12,740 | |
| | 2,305 | | | Series 2004-6, Class M1, VAR, 1.891%, 07/25/34 | | | 2,169 | |
| | 1,485 | | | Series 2004-7, Class M1, VAR, 2.041%, 08/25/34 | | | 1,343 | |
| | 552 | | | Series 2004-8, Class M2, VAR, 1.921%, 09/25/34 | | | 499 | |
| | 262 | | | Series 2004-BNC1, Class A5, VAR, 2.231%, 09/25/34 | | | 241 | |
| | 2,449 | | | Series 2005-HE2, Class M1, VAR, 1.711%, 07/25/35 | | | 2,361 | |
| | | | Structured Asset Securities Corp. Mortgage Loan Trust, | | | | |
| | 5,187 | | | Series 2006-BC4, Class A4, VAR, 1.161%, 12/25/36 | | | 4,594 | |
| | 10,917 | | | Series 2006-BC6, Class A4, VAR, 1.161%, 01/25/37 | | | 10,276 | |
| | 4,697 | | | Structured Asset Securities Corp. Mortgage Pass-Through Certificates, Series 2002-AL1, Class A3, 3.450%, 02/25/32 | | | 4,614 | |
| | 2,956 | | | US Airways Pass Through Trust, Series 2013-1, Class B, 5.375%, 11/15/21 | | | 3,090 | |
| | 3,389 | | | VOLT LIV LLC, Series 2017-NPL1, Class A1, SUB, 3.625%, 02/25/47 (e) | | | 3,396 | |
| | 7,893 | | | VOLT LVI LLC, Series 2017-NPL3, Class A1, SUB, 3.500%, 03/25/47 (e) | | | 7,893 | |
| | 9,500 | | | VOLT LVII LLC, Series 2017-NPL4, Class A1, SUB, 3.375%, 04/25/47 (e) | | | 9,500 | |
| | 2,495 | | | VOLT XLII LLC, Series 2016-NPL2, Class A1, SUB, 4.250%, 03/26/46 (e) | | | 2,514 | |
| | 4,113 | | | VOLT XLIII LLC, Series 2016-NPL3, Class A1, SUB, 4.250%, 03/26/46 (e) | | | 4,149 | |
| | 1,425 | | | VOLT XLV LLC, Series 2016-NPL5, Class A1, SUB, 4.000%, 05/25/46 (e) | | | 1,436 | |
| | 4,177 | | | VOLT XLVII LLC, Series 2016-NPL7, Class A1, SUB, 3.750%, 06/25/46 (e) | | | 4,207 | |
| | | | | | | | |
PRINCIPAL
AMOUNT | | | SECURITY DESCRIPTION | | VALUE | |
| | |
| | | | United States — continued | |
| | 5,625 | | | VOLT XLVIII LLC, Series 2016-NPL8, Class A1, SUB, 3.500%, 07/25/46 (e) | | | 5,641 | |
| | 6,871 | | | VOLT XXII LLC, Series 2015-NPL4, Class A1, SUB, 3.500%, 02/25/55 (e) | | | 6,915 | |
| | 3,700 | | | VOLT XXV LLC, Series 2015-NPL8, Class A1, SUB, 3.500%, 06/26/45 (e) | | | 3,706 | |
| | 2,097 | | | VOLT XXXIII LLC, Series 2015-NPL5, Class A1, SUB, 3.500%, 03/25/55 (e) | | | 2,105 | |
| | 4,741 | | | VOLT XXXV, Series 2016-NPL9, Class A1, SUB, 3.500%, 09/25/46 (e) | | | 4,755 | |
| | 2,796 | | | VOLT XXXVI LLC, Series 2015-NP10, Class A1, SUB, 3.625%, 07/25/45 (e) | | | 2,805 | |
| | 6,179 | | | VOLT XXXVII LLC, Series 2015-NP11, Class A1, SUB, 3.625%, 07/25/45 (e) | | | 6,200 | |
| | 5,501 | | | VOLT XXXVIII LLC, Series 2015-NP12, Class A1, SUB, 3.875%, 09/25/45 (e) | | | 5,525 | |
| | | | Wells Fargo Home Equity Asset-Backed Securities Trust, | | | | |
| | 77 | | | Series 2004-2, Class A21B, VAR, 1.831%, 10/25/34 | | | 77 | |
| | 1,003 | | | Series 2004-2, Class M1, VAR, 1.891%, 10/25/34 | | | 975 | |
| | 1,550 | | | Series 2004-2, Class M4, VAR, 2.791%, 10/25/34 | | | 1,447 | |
| | 747 | | | Series 2004-2, Class M5, VAR, 2.866%, 10/25/34 | | | 699 | |
| | 290 | | | Series 2004-2, Class M8A, VAR, 5.491%, 10/25/34 (e) | | | 269 | |
| | 290 | | | Series 2004-2, Class M8B, VAR, 5.000%, 10/25/34 (e) | | | 244 | |
| | | | Wells Fargo Home Equity Trust Mortgage Pass-Through Certificates, | | | | |
| | 500 | | | Series 2004-1, Class M2, VAR, 1.621%, 04/25/34 | | | 458 | |
| | 717 | | | Series 2004-1, Class M4, VAR, 2.141%, 04/25/34 | | | 666 | |
| | | | | | | | |
| | | | Total Asset-Backed Securities
(Cost $519,376) | | | 534,566 | |
| | | | | | | | |
| | Collateralized Mortgage Obligations — 3.2% | |
| | | | United States — 3.2% | |
| | | | Adjustable Rate Mortgage Trust | | | | |
| | 4,945 | | | Series 2004-2, Class 6A1, VAR, 3.391%, 02/25/35 | | | 4,903 | |
| | 5,558 | | | Series 2004-4, Class 4A1, VAR, 3.264%, 03/25/35 | | | 5,502 | |
| | 1,864 | | | Series 2005-2, Class 3A1, VAR, 3.469%, 06/25/35 | | | 1,767 | |
SEE NOTES TO FINANCIAL STATEMENTS.
| | | | | | | | |
| | | |
| APRIL 30, 2017 | | J.P. MORGAN FUNDS | | | | | 47 | |
JPMorgan Income Builder Fund
SCHEDULE OF PORTFOLIO INVESTMENTS
AS OF APRIL 30, 2017 (Unaudited) (continued)
(Amounts in U.S. Dollars, unless otherwise noted)
(Amounts in thousands)
| | | | | | | | |
PRINCIPAL
AMOUNT | | | SECURITY DESCRIPTION | | VALUE | |
| | Collateralized Mortgage Obligations — continued | |
| | | | United States — continued | |
| | | | Alternative Loan Trust | | | | |
| | 1,032 | | | Series 2004-12CB, Class 2A1, 6.000%, 06/25/34 | | | 1,056 | |
| | 61 | | | Series 2004-16CB, Class 2A1, 5.000%, 08/25/19 | | | 61 | |
| | 512 | | | Series 2004-27CB, Class A1, 6.000%, 12/25/34 | | | 502 | |
| | 760 | | | Series 2004-28CB, Class 2A4, 5.750%, 01/25/35 | | | 740 | |
| | 110 | | | Series 2004-28CB, Class 4A1, 5.000%, 01/25/20 | | | 111 | |
| | 1,412 | | | Series 2004-28CB, Class 6A1, 6.000%, 01/25/35 | | | 1,422 | |
| | 5,164 | | | Series 2004-32CB, Class 2A5, 5.500%, 02/25/35 | | | 5,308 | |
| | 258 | | | Series 2005-3CB, Class 1A4, 5.250%, 03/25/35 | | | 256 | |
| | 12,520 | | | Series 2005-3CB, Class 1A13, 5.500%, 03/25/35 | | | 11,489 | |
| | 6,261 | | | Series 2005-6CB, Class 1A4, 5.500%, 04/25/35 | | | 6,056 | |
| | 702 | | | Series 2005-6CB, Class 1A6, 5.500%, 04/25/35 | | | 716 | |
| | 6,022 | | | Series 2005-10CB, Class 1A5, 5.500%, 05/25/35 | | | 5,729 | |
| | 3,462 | | | Series 2005-10CB, Class 1A8, 5.500%, 05/25/35 | | | 3,404 | |
| | 2,635 | | | Series 2005-13CB, Class A4, 5.500%, 05/25/35 | | | 2,571 | |
| | 314 | | | Series 2005-20CB, Class 1A1, 5.500%, 07/25/35 | | | 284 | |
| | 1,354 | | | Series 2005-21CB, Class A4, 5.250%, 06/25/35 | | | 1,292 | |
| | 6,024 | | | Series 2005-21CB, Class A17, 6.000%, 06/25/35 | | | 5,980 | |
| | 3,029 | | | Series 2005-23CB, Class A15, 5.500%, 07/25/35 | | | 2,836 | |
| | 55 | | | Series 2005-50CB, Class 4A1, 5.000%, 11/25/20 | | | 55 | |
| | 1,221 | | | Series 2005-64CB, Class 1A1, 5.500%, 12/25/35 | | | 1,162 | |
| | 3,091 | | | Series 2005-64CB, Class 1A15, 5.500%, 12/25/35 | | | 2,940 | |
| | 931 | | | Series 2005-85CB, Class 3A2, 5.250%, 02/25/21 | | | 898 | |
| | 660 | | | Series 2005-86CB, Class A4, 5.500%, 02/25/36 | | | 568 | |
| | 300 | | | Series 2005-J1, Class 3A1, 6.500%, 08/25/32 | | | 297 | |
| | | | | | | | |
PRINCIPAL
AMOUNT | | | SECURITY DESCRIPTION | | VALUE | |
| | |
| | | | United States — continued | |
| | 556 | | | Series 2005-J3, Class 3A1, 6.500%, 09/25/34 | | | 546 | |
| | 413 | | | Series 2005-J6, Class 2A1, 5.500%, 07/25/25 | | | 407 | |
| | 3 | | | Series 2005-J7, Class 2A1, 6.000%, 10/25/17 | | | 3 | |
| | 547 | | | Series 2005-J11, Class 5A1, 5.500%, 11/25/20 | | | 534 | |
| | 567 | | | Series 2005-J14, Class A3, 5.500%, 12/25/35 | | | 477 | |
| | 1,578 | | | Series 2006-4CB, Class 2A5, 5.500%, 04/25/36 | | | 1,479 | |
| | 2,334 | | | Series 2006-14CB, Class A1, 6.000%, 06/25/36 | | | 2,002 | |
| | 986 | | | Series 2006-19CB, Class A15, 6.000%, 08/25/36 | | | 859 | |
| | 441 | | | Series 2006-25CB, Class A2, 6.000%, 10/25/36 | | | 383 | |
| | 272 | | | Series 2006-J1, Class 1A13, 5.500%, 02/25/36 | | | 242 | |
| | 588 | | | Series 2006-J3, Class 4A1, 5.750%, 05/25/26 | | | 512 | |
| | 307 | | | Series 2007-8CB, Class A9, 6.000%, 05/25/37 | | | 269 | |
| | 253 | | | Series 2007-19, Class 1A8, 6.000%, 08/25/37 | | | 207 | |
| | 261 | | | Series 2007-25, Class 2A1, 6.000%, 11/25/22 | | | 255 | |
| | 114 | | | Series 2007-9T1, Class 3A1, 5.500%, 05/25/22 | | | 81 | |
| | 394 | | | American Home Mortgage Investment Trust, Series 2005-1, Class 6A, VAR, 3.428%, 06/25/45 | | | 391 | |
| | | | Banc of America Alternative Loan Trust | | | | |
| | 832 | | | Series 2004-12, Class 4A1, 5.500%, 01/25/20 | | | 839 | |
| | 189 | | | Series 2005-3, Class 2A1, 5.500%, 04/25/20 | | | 191 | |
| | 152 | | | Series 2005-4, Class 3A1, 5.500%, 05/25/20 | | | 150 | |
| | 88 | | | Series 2005-6, Class 5A4, 5.500%, 07/25/35 | | | 74 | |
| | 105 | | | Series 2005-6, Class 7A1, 5.500%, 07/25/20 | | | 100 | |
| | 1,004 | | | Series 2005-11, Class 4A5, 5.750%, 12/25/35 | | | 883 | |
| | 584 | | | Series 2005-12, Class 5A1, 5.250%, 01/25/21 | | | 567 | |
| | 15 | | | Series 2006-4, Class 2A1, 6.000%, 05/25/21 | | | 15 | |
SEE NOTES TO FINANCIAL STATEMENTS.
| | | | | | |
| | | |
| 48 | | | | J.P. MORGAN FUNDS | | APRIL 30, 2017 |
| | | | | | | | |
PRINCIPAL
AMOUNT | | | SECURITY DESCRIPTION | | VALUE | |
| | Collateralized Mortgage Obligations — continued | |
| | | | United States — continued | |
| | 1,166 | | | Series 2006-4, Class 3CB4, 6.000%, 05/25/46 | | | 1,058 | |
| | 796 | | | Series 2006-5, Class CB7, 6.000%, 06/25/46 | | | 705 | |
| | | | Banc of America Funding Trust | | | | |
| | 3,852 | | | Series 2005-6, Class 1A2, 5.500%, 10/25/35 | | | 3,617 | |
| | 962 | | | Series 2005-7, Class 4A7, 6.000%, 11/25/35 | | | 969 | |
| | 791 | | | Series 2006-2, Class 2A20, 5.750%, 03/25/36 | | | 744 | |
| | 2,188 | | | Series 2006-A, Class 1A1, VAR, 3.080%, 02/20/36 | | | 2,160 | |
| | 196 | | | Series 2007-4, Class 8A1, 5.500%, 11/25/34 | | | 184 | |
| | | | Banc of America Mortgage Trust | | | | |
| | 1,135 | | | Series 2004-A, Class 2A2, VAR, 3.593%, 02/25/34 | | | 1,120 | |
| | 557 | | | Series 2007-3, Class 1A1, 6.000%, 09/25/37 | | | 537 | |
| | 537 | | | Bear Stearns ALT-A Trust, Series 2006-8, Class 3A1, VAR, 1.151%, 02/25/34 | | | 491 | |
| | 694 | | | Bear Stearns ARM Trust, Series 2005-2, Class A2, VAR, 3.636%, 03/25/35 | | | 699 | |
| | 885 | | | Bear Stearns Asset-Backed Securities I Trust, Series 2004-AC5, Class M1, VAR, 1.661%, 10/25/34 | | | 331 | |
| | | | Chase Mortgage Finance Trust | | | | |
| | 1,848 | | | Series 2006-S3, Class 1A2, 6.000%, 11/25/36 | | | 1,492 | |
| | 1,304 | | | Series 2006-S4, Class A5, 6.000%, 12/25/36 | | | 1,063 | |
| | 12,109 | | | Series 2007-A2, Class 3A1, VAR, 3.381%, 07/25/37 | | | 12,078 | |
| | 346 | | | Series 2007-S2, Class 1A8, 6.000%, 03/25/37 | | | 292 | |
| | | | CHL Mortgage Pass-Through Trust | | | | |
| | 2,736 | | | Series 2003-21, Class A1, VAR, 3.333%, 05/25/33 | | | 2,730 | |
| | 240 | | | Series 2003-27, Class A1, VAR, 3.327%, 06/25/33 | | | 239 | |
| | 480 | | | Series 2003-37, Class 2A1, VAR, 3.171%, 09/25/33 | | | 460 | |
| | 5,229 | | | Series 2004-25, Class 2A1, VAR, 1.671%, 02/25/35 | | | 4,591 | |
| | 73 | | | Series 2005-5, Class A2, 5.500%, 03/25/35 | | | 73 | |
| | 261 | | | Series 2005-20, Class A7, 5.250%, 12/25/27 | | | 247 | |
| | | | | | | | |
PRINCIPAL
AMOUNT | | | SECURITY DESCRIPTION | | VALUE | |
| | |
| | | | United States — continued | |
| | 3,509 | | | Series 2005-26, Class 1A11, 5.500%, 11/25/35 | | | 3,215 | |
| | 334 | | | Series 2005-30, Class A5, 5.500%, 01/25/36 | | | 321 | |
| | 1,947 | | | Series 2005-31, Class 2A1, VAR, 3.114%, 01/25/36 | | | 1,763 | |
| | 2,310 | | | Series 2006-10, Class 1A16, 6.000%, 05/25/36 | | | 1,914 | |
| | 158 | | | Series 2006-15, Class A1, 6.250%, 10/25/36 | | | 133 | |
| | 707 | | | Series 2006-17, Class A2, 6.000%, 12/25/36 | | | 611 | |
| | 4,428 | | | Series 2006-18, Class 2A4, 6.000%, 12/25/36 | | | 4,027 | |
| | 5,297 | | | Series 2006-HYB1, Class 2A2C, VAR, 3.097%, 03/20/36 | | | 4,665 | |
| | 229 | | | Series 2006-J2, Class 1A1, 6.000%, 04/25/36 | | | 211 | |
| | 249 | | | Series 2007-2, Class A2, 6.000%, 03/25/37 | | | 216 | |
| | 1,992 | | | Series 2007-3, Class A18, 6.000%, 04/25/37 | | | 1,681 | |
| | 222 | | | Series 2007-10, Class A4, 5.500%, 07/25/37 | | | 182 | |
| | 568 | | | Series 2007-13, Class A4, 6.000%, 08/25/37 | | | 489 | |
| | 891 | | | Series 2007-18, Class 2A1, 6.500%, 11/25/37 | | | 720 | |
| | 1,325 | | | Citicorp Mortgage Securities Trust, Series 2007-4, Class 1A9, 6.000%, 05/25/37 | | | 1,271 | |
| | | | Citigroup Mortgage Loan Trust | | | | |
| | 458 | | | Series 2005-3, Class 2A2A, VAR, 3.076%, 08/25/35 | | | 458 | |
| | 848 | | | Series 2005-11, Class A2A, VAR, 2.930%, 10/25/35 | | | 850 | |
| | | | Citigroup Mortgage Loan Trust, Inc. | | | | |
| | 1,111 | | | Series 2005-4, Class A, VAR, 3.050%, 08/25/35 | | | 1,091 | |
| | 1,281 | | | Series 2005-6, Class A1, VAR, 2.690%, 09/25/35 | | | 1,318 | |
| | 1,243 | | | Series 2005-9, Class 2A2, 5.500%, 11/25/35 | | | 1,247 | |
| | 1,318 | | | Series 2006-8, Class A3, VAR, 1.341%, 10/25/35 (e) | | | 1,022 | |
| | 1,180 | | | COVPAR, 7.500%, 12/31/25 (e) | | | 1,180 | |
| | | | Credit Suisse First Boston Mortgage Securities Corp. | | | | |
| | 533 | | | Series 2003-29, Class 3A1, 5.500%, 12/25/33 | | | 564 | |
SEE NOTES TO FINANCIAL STATEMENTS.
| | | | | | | | |
| | | |
| APRIL 30, 2017 | | J.P. MORGAN FUNDS | | | | | 49 | |
JPMorgan Income Builder Fund
SCHEDULE OF PORTFOLIO INVESTMENTS
AS OF APRIL 30, 2017 (Unaudited) (continued)
(Amounts in U.S. Dollars, unless otherwise noted)
(Amounts in thousands)
| | | | | | | | |
PRINCIPAL
AMOUNT | | | SECURITY DESCRIPTION | | VALUE | |
| | Collateralized Mortgage Obligations — continued | |
| | | | United States — continued | |
| | 6,486 | | | Series 2004-4, Class 4A1, 5.500%, 08/25/34 | | | 6,628 | |
| | 206 | | | Series 2004-8, Class 4A3, 5.500%, 12/25/34 | | | 209 | |
| | 1,198 | | | Series 2004-AR5, Class 6A1, VAR, 3.394%, 06/25/34 | | | 1,203 | |
| | 116 | | | Series 2005-4, Class 3A17, 5.500%, 06/25/35 | | | 116 | |
| | 606 | | | Series 2005-10, Class 5A3, 5.500%, 11/25/35 | | | 576 | |
| | 2,603 | | | Series 2005-10, Class 11A1, 5.500%, 11/25/20 | | | 2,256 | |
| | 64 | | | Series 2005-10, Class 12A1, 5.250%, 11/25/20 | | | 58 | |
| | | | CSFB Mortgage-Backed Pass-Through Certificates | | | | |
| | 974 | | | Series 2004-AR4, Class 2A1, VAR, 3.405%, 05/25/34 | | | 962 | |
| | 4,933 | | | Series 2004-AR4, Class 4A1, VAR, 3.354%, 05/25/34 | | | 4,919 | |
| | 2,732 | | | CSFB Mortgage-Backed Trust, Series 2004-AR6, Class 7A1, VAR, 3.337%, 10/25/34 | | | 2,753 | |
| | | | CSMC Mortgage-Backed Trust | | | | |
| | 99 | | | Series 2006-8, Class 5A1, VAR, 5.779%, 10/25/26 | | | 94 | |
| | 915 | | | Series 2007-2, Class 3A13, 5.500%, 03/25/37 | | | 831 | |
| | 187 | | | Series 2007-3, Class 4A5, 5.000%, 04/25/37 | | | 179 | |
| | | | Deutsche Alt-A Securities, Inc. Mortgage Loan Trust | | | | |
| | 193 | | | Series 2005-1, Class 2A1, VAR, 5.853%, 02/25/20 | | | 194 | |
| | 66 | | | Series 2005-2, Class 2A1, VAR, 1.291%, 03/25/20 | | | 64 | |
| | 4,182 | | | DSLA Mortgage Loan Trust, Series 2005-AR4, Class 2A1A, VAR, 1.254%, 08/19/45 | | | 3,603 | |
| | | | FHLMC Structured Agency Credit Risk Debt Notes | | | | |
| | 880 | | | Series 2014-DN2, Class M3, VAR, 4.591%, 04/25/24 | | | 963 | |
| | 3,000 | | | Series 2017-DNA1, Class M2, VAR, 4.241%, 07/25/29 | | | 3,060 | |
| | 4,000 | | | Series 2017-DNA2, Class M2, VAR, 4.436%, 10/25/29 | | | 4,099 | |
| | | | First Horizon Alternative Mortgage Securities Trust | | | | |
| | 136 | | | Series 2005-FA1, Class 1A4, 5.500%, 03/25/35 | | | 131 | |
| | | | | | | | |
PRINCIPAL
AMOUNT | | | SECURITY DESCRIPTION | | VALUE | |
| | |
| | | | United States — continued | |
| | 835 | | | Series 2006-FA6, Class 3A1, 5.750%, 11/25/21 | | | 820 | |
| | | | First Horizon Mortgage Pass-Through Trust | | | | |
| | 387 | | | Series 2004-AR7, Class 4A1, VAR, 3.058%, 02/25/35 | | | 382 | |
| | 2,750 | | | Series 2005-5, Class 1A6, 5.500%, 10/25/35 | | | 2,648 | |
| | 673 | | | Series 2006-2, Class 1A3, 6.000%, 08/25/36 | | | 607 | |
| | 89 | | | Series 2006-2, Class 1A7, 6.000%, 08/25/36 | | | 80 | |
| | 631 | | | Series 2006-3, Class 1A13, 6.250%, 11/25/36 | | | 585 | |
| | 3,000 | | | Freddie Mac Structured Agency Credit Risk Debt Notes, Series 2016-DNA3, Class M2, VAR, 2.991%, 12/25/28 | | | 3,072 | |
| | | | GMACM Mortgage Loan Trust | | | | |
| | 1,044 | | | Series 2004-AR2, Class 3A, VAR, 3.633%, 08/19/34 | | | 1,003 | |
| | 657 | | | Series 2005-AR1, Class 3A, VAR, 3.796%, 03/18/35 | | | 642 | |
| | 1,617 | | | GSMSC Pass-Through Trust, Series 2008-2R, Class 2A1, VAR, 7.500%, 10/25/36 (e) | | | 1,206 | |
| | | | GSR Mortgage Loan Trust | | | | |
| | 382 | | | Series 2004-15F, Class 1A2, 5.500%, 12/25/34 | | | 409 | |
| | 466 | | | Series 2005-1F, Class 2A3, 6.000%, 02/25/35 | | | 456 | |
| | 2,210 | | | Series 2005-6F, Class 3A18, 5.500%, 07/25/35 | | | 2,274 | |
| | 216 | | | Series 2005-AR3, Class 6A1, VAR, 3.500%, 05/25/35 | | | 199 | |
| | 4,896 | | | Series 2005-AR4, Class 3A5, VAR, 3.129%, 07/25/35 | | | 4,555 | |
| | 2,221 | | | Series 2006-1F, Class 2A9, 6.000%, 02/25/36 | | | 1,951 | |
| | 1,371 | | | Series 2006-1F, Class 2A16, 6.000%, 02/25/36 | | | 1,208 | |
| | 340 | | | Series 2006-9F, Class 8A1, 5.500%, 08/25/21 | | | 315 | |
| | 719 | | | Series 2007-1F, Class 3A13, 6.000%, 01/25/37 | | | 673 | |
| | 445 | | | HarborView Mortgage Loan Trust, Series 2005-11, Class 2A1A, VAR, 1.304%, 08/19/45 | | | 423 | |
| | | | Impac CMB Trust | | | | |
| | 1,447 | | | Series 2004-5, Class 1A1, VAR, 1.711%, 10/25/34 | | | 1,382 | |
SEE NOTES TO FINANCIAL STATEMENTS.
| | | | | | |
| | | |
| 50 | | | | J.P. MORGAN FUNDS | | APRIL 30, 2017 |
| | | | | | | | |
PRINCIPAL
AMOUNT | | | SECURITY DESCRIPTION | | VALUE | |
| | Collateralized Mortgage Obligations — continued | |
| | | | United States — continued | |
| | 527 | | | Series 2004-5, Class 1M2, VAR, 1.861%, 10/25/34 | | | 482 | |
| | 3,182 | | | Series 2004-6, Class 1A2, VAR, 1.771%, 10/25/34 | | | 3,042 | |
| | 1,228 | | | Series 2004-7, Class 1A2, VAR, 1.911%, 11/25/34 | | | 1,139 | |
| | 4,900 | | | Series 2004-9, Class 1A1, VAR, 1.751%, 01/25/35 | | | 4,458 | |
| | 1,346 | | | Series 2004-10, Class 2A, VAR, 1.631%, 03/25/35 | | | 1,213 | |
| | 3,580 | | | Series 2004-10, Class 3A1, VAR, 1.691%, 03/25/35 | | | 3,225 | |
| | 732 | | | Series 2005-1, Class 1A1, VAR, 1.511%, 04/25/35 | | | 675 | |
| | 994 | | | Series 2005-1, Class 1A2, VAR, 1.611%, 04/25/35 | | | 865 | |
| | 945 | | | Series 2005-2, Class 1A2, VAR, 1.611%, 04/25/35 | | | 820 | |
| | 771 | | | Series 2005-4, Class 1A1A, VAR, 1.531%, 05/25/35 | | | 734 | |
| | 429 | | | Impac Secured Assets CMN Owner Trust, Series 2003-2, Class A4, 3.750%, 08/25/33 | | | 403 | |
| | | | IndyMac INDX Mortgage Loan Trust | | | | |
| | 627 | | | Series 2005-AR3, Class 3A1, VAR, 3.011%, 04/25/35 | | | 604 | |
| | 1,731 | | | Series 2005-AR14, Class 2A1A, VAR, 1.291%, 07/25/35 | | | 1,543 | |
| | | | JP Morgan Mortgage Trust | | | | |
| | 292 | | | Series 2004-A6, Class 1A1, VAR, 3.188%, 12/25/34 | | | 286 | |
| | 891 | | | Series 2005-A3, Class 6A6, VAR, 3.443%, 06/25/35 | | | 867 | |
| | 328 | | | Series 2005-A8, Class 1A1, VAR, 3.085%, 11/25/35 | | | 310 | |
| | 193 | | | Series 2006-S2, Class 2A1, 5.000%, 06/25/21 | | | 183 | |
| | 88 | | | Series 2006-S3, Class 2A4, 5.500%, 08/25/21 | | | 87 | |
| | 604 | | | Series 2007-A1, Class 2A2, VAR, 3.190%, 07/25/35 | | | 588 | |
| | 84 | | | Series 2007-S3, Class 2A3, 6.000%, 08/25/22 | | | 82 | |
| | 1,797 | | | Lehman Mortgage Trust, Series 2005-2, Class 2A5, 5.500%, 12/25/35 | | | 1,555 | |
| | | | Lehman XS Trust | | | | |
| | 11,020 | | | Series 2005-5N, Class 3A1A, VAR, 1.291%, 11/25/35 | | | 10,287 | |
| | | | | | | | |
PRINCIPAL
AMOUNT | | | SECURITY DESCRIPTION | | VALUE | |
| | |
| | | | United States — continued | |
| | 7,160 | | | Series 2005-7N, Class 1A1A, VAR, 1.261%, 12/25/35 | | | 6,817 | |
| | | | MASTR Alternative Loan Trust | | | | |
| | 747 | | | Series 2004-8, Class 1A1, 6.500%, 09/25/34 | | | 809 | |
| | 1,895 | | | Series 2004-12, Class 3A1, 6.000%, 12/25/34 | | | 1,970 | |
| | 666 | | | Series 2005-3, Class 1A1, 5.500%, 04/25/35 | | | 683 | |
| | 384 | | | Series 2005-5, Class 3A1, 5.750%, 08/25/35 | | | 322 | |
| | 1,108 | | | Series 2005-6, Class 1A2, 5.500%, 12/25/35 | | | 996 | |
| | 1,031 | | | Series 2006-3, Class 3A1, 5.500%, 06/25/21 | | | 972 | |
| | | | Merrill Lynch Mortgage Investors Trust | | | | |
| | 176 | | | Series 2005-1, Class 2A1, VAR, 3.027%, 04/25/35 | | | 170 | |
| | 555 | | | Series 2005-1, Class 2A2, VAR, 3.027%, 04/25/35 | | | 538 | |
| | 2,305 | | | Series 2006-1, Class 2A1, VAR, 2.975%, 02/25/36 | | | 2,283 | |
| | 460 | | | Series 2006-AF2, Class AF2, 6.250%, 10/25/36 | | | 372 | |
| | | | Morgan Stanley Mortgage Loan Trust | | | | |
| | 1,626 | | | Series 2004-8AR, Class 4A1, VAR, 3.211%, 10/25/34 | | | 1,630 | |
| | 977 | | | Series 2004-9, Class 1A, VAR, 5.413%, 11/25/34 | | | 1,023 | |
| | 126 | | | Series 2005-4, Class 1A, 5.000%, 08/25/35 | | | 126 | |
| | 1,745 | | | Series 2006-2, Class 1A, 5.250%, 02/25/21 | | | 1,676 | |
| | | | MortgageIT Trust | | | | |
| | 6,199 | | | Series 2005-3, Class A1, VAR, 1.291%, 08/25/35 | | | 5,844 | |
| | 851 | | | Series 2005-5, Class A1, VAR, 1.251%, 12/25/35 | | | 788 | |
| | 87 | | | Nomura Asset Acceptance Corp. Alternative Loan Trust, Series 2005-WF1, Class 2A5, SUB, 5.159%, 03/25/35 | | | 89 | |
| | | | Opteum Mortgage Acceptance Corp. Asset-Backed Pass-Through Certificates | | | | |
| | 804 | | | Series 2005-4, Class 1A2, VAR, 1.381%, 11/25/35 | | | 764 | |
| | 3,245 | | | Series 2005-5, Class 1APT, VAR, 1.271%, 12/25/35 | | | 2,983 | |
SEE NOTES TO FINANCIAL STATEMENTS.
| | | | | | | | |
| | | |
| APRIL 30, 2017 | | J.P. MORGAN FUNDS | | | | | 51 | |
JPMorgan Income Builder Fund
SCHEDULE OF PORTFOLIO INVESTMENTS
AS OF APRIL 30, 2017 (Unaudited) (continued)
(Amounts in U.S. Dollars, unless otherwise noted)
(Amounts in thousands)
| | | | | | | | |
PRINCIPAL
AMOUNT | | | SECURITY DESCRIPTION | | VALUE | |
| | Collateralized Mortgage Obligations — continued | |
| | | | United States — continued | |
| | | | Opteum Mortgage Acceptance Corp. Trust | | | | |
| | 3,559 | | | Series 2006-1, Class 1AC1, VAR, 1.291%, 04/25/36 | | | 3,290 | |
| | 992 | | | Series 2006-1, Class 1APT, VAR, 1.201%, 04/25/36 | | | 906 | |
| | 1,763 | | | Provident Funding Mortgage Loan Trust, Series 2005-1, Class 2A1, VAR, 3.406%, 05/25/35 | | | 1,705 | |
| | | | RALI Trust | | | | |
| | 43 | | | Series 2003-QS20, Class CB, 5.000%, 11/25/18 | | | 43 | |
| | 406 | | | Series 2004-QS15, Class A2, VAR, 1.391%, 11/25/34 | | | 396 | |
| | 3,101 | | | Series 2005-QA5, Class A2, VAR, 6.327%, 04/25/35 | | | 2,808 | |
| | 170 | | | Series 2005-QS2, Class A1, 5.500%, 02/25/35 | | | 168 | |
| | 3,132 | | | Series 2005-QS6, Class A1, 5.000%, 05/25/35 | | | 2,900 | |
| | 1,528 | | | Series 2005-QS17, Class A3, 6.000%, 12/25/35 | | | 1,412 | |
| | 2,744 | | | Series 2006-QS3, Class 1A10, 6.000%, 03/25/36 | | | 2,528 | |
| | 2,985 | | | Series 2006-QS4, Class A2, 6.000%, 04/25/36 | | | 2,566 | |
| | 99 | | | Series 2006-QS18, Class 3A1, 5.750%, 12/25/21 | | | 94 | |
| | | | Residential Asset Securitization Trust | | | | |
| | 167 | | | Series 2004-A6, Class A1, 5.000%, 08/25/19 | | | 167 | |
| | 121 | | | Series 2004-A8, Class A1, 5.250%, 11/25/34 | | | 122 | |
| | 4,830 | | | Series 2005-A3, Class A2, 5.500%, 04/25/35 | | | 4,234 | |
| | 2,829 | | | Series 2005-A8CB, Class A11, 6.000%, 07/25/35 | | | 2,637 | |
| | 221 | | | Series 2005-A14, Class A1, 5.500%, 12/25/35 | | | 191 | |
| | | | RFMSI Trust | | | | |
| | 429 | | | Series 2004-S9, Class 2A1, 4.750%, 12/25/19 | | | 430 | |
| | 199 | | | Series 2005-S7, Class A6, 5.500%, 11/25/35 | | | 194 | |
| | 1,055 | | | Series 2005-SA1, Class 3A, VAR, 3.131%, 03/25/35 | | | 1,037 | |
| | 3,868 | | | Series 2006-S10, Class 1A1, 6.000%, 10/25/36 | | | 3,676 | |
| | 1,559 | | | Sequoia Mortgage Trust, Series 2007-3, Class 1A1, VAR, 1.193%, 07/20/36 | | | 1,472 | |
| | | | | | | | |
PRINCIPAL
AMOUNT | | | SECURITY DESCRIPTION | | VALUE | |
| | |
| | | | United States — continued | |
| | | | Structured Adjustable Rate Mortgage Loan Trust | | | | |
| | 1,184 | | | Series 2004-16, Class 5A2, VAR, 3.237%, 11/25/34 | | | 1,184 | |
| | 680 | | | Series 2005-1, Class 1A1, VAR, 3.294%, 02/25/35 | | | 655 | |
| | 443 | | | Series 2005-17, Class 4A3, VAR, 3.123%, 08/25/35 | | | 435 | |
| | | | Structured Asset Securities Corp. Mortgage Pass-Through Certificates | | | | |
| | 919 | | | Series 2003-35, Class B1, VAR, 5.468%, 12/25/33 | | | 772 | |
| | 7,014 | | | Series 2004-10, Class 1A1, VAR, 5.386%, 06/25/34 | | | 7,133 | |
| | | | WaMu Mortgage Pass-Through Certificates Trust | | | | |
| | 1,919 | | | Series 2004-AR10, Class A1B, VAR, 1.411%, 07/25/44 | | | 1,838 | |
| | 2,361 | | | Series 2004-AR11, Class A, VAR, 2.816%, 10/25/34 | | | 2,356 | |
| | 6,214 | | | Series 2005-AR5, Class A6, VAR, 2.800%, 05/25/35 | | | 6,208 | |
| | 2,285 | | | Series 2005-AR7, Class A3, VAR, 2.814%, 08/25/35 | | | 2,290 | |
| | 3,589 | | | Series 2005-AR14, Class 1A3, VAR, 2.814%, 12/25/35 | | | 3,447 | |
| | 2,394 | | | Series 2005-AR14, Class 1A4, VAR, 2.814%, 12/25/35 | | | 2,306 | |
| | 74 | | | Series 2005-AR15, Class A1A1, VAR, 1.251%, 11/25/45 | | | 70 | |
| | 1,419 | | | Series 2005-AR16, Class 1A1, VAR, 2.879%, 12/25/35 | | | 1,363 | |
| | 166 | | | Series 2005-AR18, Class 1A3A, VAR, 2.860%, 01/25/36 | | | 165 | |
| | 621 | | | Series 2006-AR2, Class 1A1, VAR, 2.912%, 03/25/36 | | | 583 | |
| | | | Washington Mutual Mortgage Pass-Through Certificates WMALT Trust | | | | |
| | 1,621 | | | Series 2005-1, Class 1A3, 5.500%, 03/25/35 | | | 1,558 | |
| | 955 | | | Series 2005-4, Class CB7, 5.500%, 06/25/35 | | | 895 | |
| | 1,530 | | | Series 2005-10, Class 4CB1, 5.750%, 12/25/35 | | | 1,481 | |
| | 1,107 | | | Series 2006-3, Class 5A2, 5.500%, 03/25/21 | | | 1,045 | |
| | 332 | | | Series 2006-5, Class 2CB5, 6.500%, 07/25/36 | | | 283 | |
| | 1,792 | | | Series 2007-1, Class 2A1, 6.000%, 01/25/22 | | | 1,706 | |
SEE NOTES TO FINANCIAL STATEMENTS.
| | | | | | |
| | | |
| 52 | | | | J.P. MORGAN FUNDS | | APRIL 30, 2017 |
| | | | | | | | |
PRINCIPAL
AMOUNT | | | SECURITY DESCRIPTION | | VALUE | |
| | Collateralized Mortgage Obligations — continued | |
| | | | United States — continued | |
| | | | Wells Fargo Mortgage-Backed Securities Trust | | | | |
| | 3,965 | | | Series 2004-M, Class A1, VAR, 3.005%, 08/25/34 | | | 4,041 | |
| | 5,663 | | | Series 2004-N, Class A6, VAR, 3.007%, 08/25/34 | | | 5,661 | |
| | 5,378 | | | Series 2004-N, Class A7, VAR, 3.007%, 08/25/34 | | | 5,376 | |
| | 1,005 | | | Series 2004-Q, Class 1A1, VAR, 3.005%, 09/25/34 | | | 1,008 | |
| | 620 | | | Series 2004-Q, Class 1A2, VAR, 3.005%, 09/25/34 | | | 624 | |
| | 798 | | | Series 2004-BB, Class A5, VAR, 3.077%, 01/25/35 | | | 801 | |
| | 8,173 | | | Series 2004-DD, Class 1A1, VAR, 3.111%, 01/25/35 | | | 8,145 | |
| | 844 | | | Series 2004-DD, Class 2A6, VAR, 3.103%, 01/25/35 | | | 838 | |
| | 174 | | | Series 2005-AR2, Class 2A2, VAR, 3.164%, 03/25/35 | | | 176 | |
| | 799 | | | Series 2005-AR3, Class 2A1, VAR, 3.117%, 03/25/35 | | | 803 | |
| | 448 | | | Series 2005-AR4, Class 2A2, VAR, 3.313%, 04/25/35 | | | 448 | |
| | 2,196 | | | Series 2005-AR5, Class 1A1, VAR, 3.275%, 04/25/35 | | | 2,178 | |
| | 158 | | | Series 2005-AR7, Class 2A1, VAR, 3.269%, 05/25/35 | | | 156 | |
| | 4,137 | | | Series 2005-AR8, Class 1A1, VAR, 3.142%, 06/25/35 | | | 4,186 | |
| | 2,843 | | | Series 2005-AR10, Class 1A1, VAR, 3.090%, 06/25/35 | | | 2,955 | |
| | 1,232 | | | Series 2005-AR11, Class 1A1, VAR, 3.044%, 06/25/35 | | | 1,231 | |
| | 743 | | | Series 2005-AR15, Class 1A6, VAR, 2.983%, 09/25/35 | | | 702 | |
| | 2,659 | | | Series 2005-AR16, Class 6A3, VAR, 3.137%, 10/25/35 | | | 2,649 | |
| | 344 | | | Series 2005-AR16, Class 7A1, VAR, 3.081%, 10/25/35 | | | 335 | |
| | 832 | | | Series 2006-4, Class 1A9, 5.750%, 04/25/36 | | | 840 | |
| | 2,204 | | | Series 2006-AR2, Class 2A1, VAR, 3.089%, 03/25/36 | | | 2,208 | |
| | 388 | | | Series 2006-AR2, Class 2A3, VAR, 3.089%, 03/25/36 | | | 380 | |
| | 2,582 | | | Series 2006-AR6, Class 5A1, VAR, 3.098%, 03/25/36 | | | 2,566 | |
| | 506 | | | Series 2006-AR19, Class A3, VAR, 3.027%, 12/25/36 | | | 463 | |
| | | | | | | | |
PRINCIPAL
AMOUNT | | | SECURITY DESCRIPTION | | VALUE | |
| | |
| | | | United States — continued | |
| | 371 | | | Series 2007-2, Class 1A13, 6.000%, 03/25/37 | | | 368 | |
| | 728 | | | Series 2007-15, Class A1, 6.000%, 11/25/37 | | | 721 | |
| | | | | | | | |
| | | | Total Collateralized Mortgage Obligations
(Cost $383,588) | | | 387,099 | |
| | | | | | | | |
| | Commercial Mortgage-Backed Securities — 1.2% | |
| | | | United States — 1.2% | |
| | | | Banc of America Commercial Mortgage Trust, | | | | |
| | 711 | | | Series 2006-1, Class C, VAR, 5.509%, 09/10/45 | | | 710 | |
| | 2,007 | | | Series 2007-3, Class AJ, VAR, 5.850%, 06/10/49 | | | 2,019 | |
| | 5,000 | | | Series 2007-3, Class B, VAR, 5.850%, 06/10/49 | | | 5,099 | |
| | | | Bear Stearns Commercial Mortgage Securities Trust, | | | | |
| | 317 | | | Series 2006-PW13, Class AJ, VAR, 5.611%, 09/11/41 | | | 317 | |
| | 7,165 | | | Series 2006-PW13, Class C, VAR, 5.680%, 09/11/41 (e) | | | 6,910 | |
| | 11,480 | | | Series 2007-PW16, Class AJ, VAR, 5.867%, 06/11/40 | | | 11,509 | |
| | 5,790 | | | Series 2007-PW17, Class AJ, VAR, 6.087%, 06/11/50 | | | 5,909 | |
| | 2,283 | | | CD Commercial Mortgage Trust,
Series 2005-CD1, Class E, VAR, 5.420%, 07/15/44 | | | 2,280 | |
| | | | CD Mortgage Trust, | | | | |
| | 2,400 | | | Series 2007-CD5, Class B, VAR, 6.310%, 11/15/44 | | | 2,430 | |
| | 3,159 | | | Series 2007-CD5, Class D, VAR, 6.310%, 11/15/44 (e) | | | 3,176 | |
| | | | Commercial Mortgage Trust, | | | | |
| | 3,452 | | | Series 2006-C8, Class AJ, 5.377%, 12/10/46 | | | 3,460 | |
| | 2,275 | | | Series 2007-GG11, Class AJ, VAR, 6.236%, 12/10/49 | | | 2,309 | |
| | 5,400 | | | Series 2015-CR23, Class CMC, VAR, 3.807%, 05/10/48 (e) | | | 5,349 | |
| | 2,175 | | | Credit Suisse Commercial Mortgage Trust, Series 2007-C1, Class AM, 5.416%, 02/15/40 | | | 2,172 | |
| | 2,710 | | | GS Mortgage Securities Trust, Series 2006-GG8, Class AJ, 5.622%, 11/10/39 | | | 2,552 | |
| | | | JP Morgan Chase Commercial Mortgage Securities Trust, | | | | |
| | 1,500 | | | Series 2005-LDP2, Class E, VAR, 4.981%, 07/15/42 | | | 1,522 | |
SEE NOTES TO FINANCIAL STATEMENTS.
| | | | | | | | |
| | | |
| APRIL 30, 2017 | | J.P. MORGAN FUNDS | | | | | 53 | |
JPMorgan Income Builder Fund
SCHEDULE OF PORTFOLIO INVESTMENTS
AS OF APRIL 30, 2017 (Unaudited) (continued)
(Amounts in U.S. Dollars, unless otherwise noted)
(Amounts in thousands)
| | | | | | | | |
PRINCIPAL
AMOUNT | | | SECURITY DESCRIPTION | | VALUE | |
| | Commercial Mortgage-Backed Securities — continued | |
| | | | United States — continued | |
| | 4,900 | | | Series 2006-LDP8, Class D, VAR, 5.618%, 05/15/45 | | | 4,821 | |
| | 10,850 | | | Series 2007-LD11, Class AM, VAR, 6.004%, 06/15/49 | | | 11,126 | |
| | 3,363 | | | Series 2007-LDPX, Class AM, VAR, 5.464%, 01/15/49 | | | 3,361 | |
| | 2,000 | | | LB Commercial Mortgage Trust, Series 2007-C3, Class AJ, VAR, 6.206%, 07/15/44 | | | 1,977 | |
| | | | LB-UBS Commercial Mortgage Trust, | | | | |
| | 5,011 | | | Series 2006-C6, Class AJ, VAR, 5.452%, 09/15/39 | | | 4,309 | |
| | 2,410 | | | Series 2006-C6, Class B, VAR, 5.472%, 09/15/39 | | | 1,916 | |
| | 110 | | | Series 2007-C1, Class C, VAR, 5.533%, 02/15/40 | | | 110 | |
| | 9,200 | | | Series 2007-C6, Class AJ, VAR, 6.389%, 07/15/40 | | | 9,472 | |
| | | | Morgan Stanley Capital I Trust, | | | | |
| | 291 | | | Series 2006-HQ8, Class AJ, VAR, 5.627%, 03/12/44 | | | 292 | |
| | 3,480 | | | Series 2006-HQ8, Class C, VAR, 5.627%, 03/12/44 | | | 3,377 | |
| | 1,000 | | | Series 2006-HQ8, Class D, VAR, 5.627%, 03/12/44 | | | 425 | |
| | 3,584 | | | Series 2006-HQ9, Class D, VAR, 5.862%, 07/12/44 | | | 3,578 | |
| | 3,888 | | | Series 2006-HQ10, Class AJ, VAR, 5.389%, 11/12/41 | | | 3,902 | |
| | 4,257 | | | Series 2007-HQ11, Class AJ, VAR, 5.508%, 02/12/44 | | | 4,170 | |
| | 2,922 | | | Series 2007-HQ11, Class B, VAR, 5.538%, 02/12/44 | | | 2,731 | |
| | 3,255 | | | Series 2007-HQ12, Class B, VAR, 5.914%, 04/12/49 | | | 3,267 | |
| | | | Wachovia Bank Commercial Mortgage Trust, | | | | |
| | 2,022 | | | Series 2006-C29, Class AJ, VAR, 5.368%, 11/15/48 | | | 2,034 | |
| | 7,275 | | | Series 2007-C31, Class AJ, VAR, 5.660%, 04/15/47 | | | 7,367 | |
| | 1,200 | | | Series 2007-C31, Class C, VAR, 5.984%, 04/15/47 | | | 1,199 | |
| | 2,075 | | | Series 2007-C33, Class AJ, VAR, 6.179%, 02/15/51 | | | 2,113 | |
| | 2,650 | | | Series 2007-C33, Class B, VAR, 6.179%, 02/15/51 | | | 2,586 | |
| | 6,313 | | | Series 2007-C33, Class C, VAR, 6.179%, 02/15/51 | | | 5,893 | |
| | | | | | | | |
PRINCIPAL
AMOUNT | | | SECURITY DESCRIPTION | | VALUE | |
| | |
| | | | United States — continued | |
| | 2,500 | | | Series 2007-C34, Class AJ, VAR, 6.234%, 05/15/46 | | | 2,506 | |
| | 1,500 | | | Series 2007-C34, Class B, VAR, 6.309%, 05/15/46 | | | 1,496 | |
| | | | | | | | |
| | | | Total Commercial Mortgage-Backed Securities
(Cost $145,640) | | | 141,751 | |
| | | | | | | | |
| | |
| SHARES | | | | | | |
| | Common Stocks — 41.4% | |
| | | | Australia — 0.5% | |
| | 408 | | | BHP Billiton plc | | | 6,223 | |
| | 1,116 | | | Dexus Property Group | | | 8,518 | |
| | 2,108 | | | Goodman Group | | | 12,800 | |
| | 5,939 | | | Mirvac Group | | | 10,088 | |
| | 4,400 | | | Scentre Group | | | 14,195 | |
| | 2,096 | | | Westfield Corp. | | | 14,251 | |
| | | | | | | | |
| | | | | | | 66,075 | |
| | | | | | | | |
| | | | Belgium — 0.5% | | | | |
| | 448 | | | Anheuser-Busch InBev SA/NV | | | 50,474 | |
| | 82 | | | KBC Group NV | | | 5,945 | |
| | 95 | | | Proximus SADP | | | 2,904 | |
| | 37 | | | Warehouses De Pauw, CVA | | | 3,561 | |
| | | | | | | | |
| | | | | | | 62,884 | |
| | | | | | | | |
| | | | Brazil — 0.4% | | | | |
| | 3,514 | | | Ambev SA, ADR | | | 20,134 | |
| | 1,812 | | | BB Seguridade Participacoes SA | | | 17,012 | |
| | 1,090 | | | Engie Brasil Energia SA | | | 11,805 | |
| | 155 | | | Smiles SA | | | 3,384 | |
| | | | | | | | |
| | | | | | | 52,335 | |
| | | | | | | | |
| | | | Canada — 0.4% | | | | |
| | 369 | | | Allied Properties REIT | | | 9,901 | |
| | 340 | | | Canadian Apartment Properties REIT | | | 8,424 | |
| | 183 | | | RioCan REIT | | | 3,476 | |
| | 484 | | | TransCanada Corp. | | | 22,487 | |
| | | | | | | | |
| | | | | | | 44,288 | |
| | | | | | | | |
| | | | Chile — 0.2% | | | | |
| | 830 | | | Banco Santander Chile, ADR | | | 19,621 | |
| | | | | | | | |
| | | | China — 0.9% | |
| | 1,790 | | | China Mobile Ltd. | | | 19,057 | |
| | 8,790 | | | China Resources Power Holdings Co. Ltd. | | | 15,826 | |
| | 25,408 | | | CNOOC Ltd. | | | 29,641 | |
| | 3,383 | | | Fuyao Glass Industry Group Co. Ltd., Class A | | | 11,029 | |
| | 2,854 | | | Fuyao Glass Industry Group Co. Ltd., Class H (e) | | | 10,075 | |
SEE NOTES TO FINANCIAL STATEMENTS.
| | | | | | |
| | | |
| 54 | | | | J.P. MORGAN FUNDS | | APRIL 30, 2017 |
| | | | | | | | |
SHARES | | | SECURITY DESCRIPTION | | VALUE | |
| | Common Stocks — continued | |
| | | | China — continued | | | | |
| | 8,024 | | | Lenovo Group Ltd. | | | 5,130 | |
| | 2,761 | | | Midea Group Co. Ltd., Class A | | | 13,468 | |
| | 2,353 | | | Zhengzhou Yutong Bus Co. Ltd., Class A | | | 6,869 | |
| | | | | | | | |
| | | | | | | 111,095 | |
| | | | | | | | |
| | | | Colombia — 0.0% (g) | | | | |
| | 29 | | | Pacific Exploration and Production Corp. (a) | | | 866 | |
| | | | | | | | |
| | | | Czech Republic — 0.3% | |
| | 321 | | | Komercni banka A/S | | | 12,428 | |
| | 9,042 | | | Moneta Money Bank A/S (e) | | | 29,239 | |
| | | | | | | | |
| | | | | | | 41,667 | |
| | | | | | | | |
| | | | Denmark — 0.5% | | | | |
| | 1,524 | | | Danske Bank A/S | | | 55,409 | |
| | 40 | | | Pandora A/S | | | 4,267 | |
| | | | | | | | |
| | | | | | | 59,676 | |
| | | | | | | | |
| | | | Finland — 0.7% | | | | |
| | 132 | | | Elisa OYJ | | | 4,502 | |
| | 121 | | | Metso OYJ | | | 4,350 | |
| | 114 | | | Nokian Renkaat OYJ | | | 4,915 | |
| | 69 | | | Orion OYJ, Class B | | | 3,952 | |
| | 109 | | | Sampo OYJ, Class A | | | 5,206 | |
| | 434 | | | Stora Enso OYJ, Class R | | | 5,146 | |
| | 2,094 | | | UPM-Kymmene OYJ | | | 55,165 | |
| | | | | | | | |
| | | | | | | 83,236 | |
| | | | | | | | |
| | | | France — 1.8% | | | | |
| | 322 | | | AXA SA | | | 8,580 | |
| | 154 | | | BNP Paribas SA | | | 10,844 | |
| | 100 | | | Bouygues SA | | | 4,198 | |
| | 279 | | | Cie Generale des Etablissements Michelin | | | 36,506 | |
| | 238 | | | CNP Assurances | | | 4,966 | |
| | 361 | | | Credit Agricole SA | | | 5,375 | |
| | 153 | | | Edenred | | | 3,923 | |
| | 173 | | | Eutelsat Communications SA | | | 4,100 | |
| | 39 | | | Fonciere Des Regions | | | 3,495 | |
| | 190 | | | Klepierre | | | 7,447 | |
| | 114 | | | Mercialys SA | | | 2,225 | |
| | 597 | | | Natixis SA | | | 4,155 | |
| | 60 | | | Renault SA | | | 5,607 | |
| | 147 | | | Sanofi | | | 13,857 | |
| | 104 | | | SCOR SE | | | 4,111 | |
| | 141 | | | Societe Generale SA | | | 7,738 | |
| | 288 | | | TOTAL SA | | | 14,808 | |
| | 317 | | | Unibail-Rodamco SE | | | 77,922 | |
| | 88 | | | Vinci SA | | | 7,518 | |
| | | | | | | | |
| | | | | | | 227,375 | |
| | | | | | | | |
| | | | | | | | |
SHARES | | | SECURITY DESCRIPTION | | VALUE | |
| | | | | | | | |
| | | | Germany — 1.6% | |
| | 190 | | | Allianz SE (Registered) | | | 36,130 | |
| | 116 | | | BASF SE | | | 11,320 | |
| | 68 | | | Bayerische Motoren Werke AG | | | 6,494 | |
| | 145 | | | Daimler AG (Registered) | | | 10,827 | |
| | 497 | | | Deutsche Telekom AG (Registered) | | | 8,719 | |
| | 550 | | | Deutsche Wohnen AG | | | 18,815 | |
| | 595 | | | E.ON SE | | | 4,640 | |
| | 41 | | | Hannover Rueck SE | | | 4,959 | |
| | 49 | | | HUGO BOSS AG | | | 3,690 | |
| | 98 | | | Innogy SE (e) | | | 3,591 | |
| | 32 | | | Muenchener Rueckversicherungs-Gesellschaft AG in Muenchen (Registered) | | | 6,067 | |
| | 476 | | | Siemens AG (Registered) | | | 68,294 | |
| | 710 | | | Telefonica Deutschland Holding AG | | | 3,440 | |
| | 274 | | | TUI AG | | | 3,987 | |
| | | | | | | | |
| | | | | | | 190,973 | |
| | | | | | | | |
| | | | Hong Kong — 0.5% | |
| | 656 | | | Hang Seng Bank Ltd. | | | 13,286 | |
| | 7,644 | | | HKT Trust & HKT Ltd. | | | 9,778 | |
| | 1,136 | | | Hongkong Land Holdings Ltd. | | | 8,752 | |
| | 1,539 | | | Link REIT | | | 11,059 | |
| | 2,625 | | | Sands China Ltd. | | | 11,888 | |
| | 269 | | | VTech Holdings Ltd. | | | 3,403 | |
| | | | | | | | |
| | | | | | | 58,166 | |
| | | | | | | | |
| | | | Hungary — 0.1% | |
| | 438 | | | OTP Bank plc | | | 12,303 | |
| | | | | | | | |
| | | | India — 0.2% | |
| | 2,086 | | | Coal India Ltd. | | | 8,970 | |
| | 3,544 | | | ITC Ltd. | | | 15,301 | |
| | | | | | | | |
| | | | | | | 24,271 | |
| | | | | | | | |
| | | | Indonesia — 0.1% | |
| | 40,401 | | | Telekomunikasi Indonesia Persero Tbk. PT | | | 13,328 | |
| | | | | | | | |
| | | | Ireland — 0.0% (g) | |
| | 15,000 | | | Bank of Ireland (a) | | | 3,776 | |
| | | | | | | | |
| | | | Italy — 0.3% | |
| | 372 | | | Assicurazioni Generali SpA | | | 5,888 | |
| | 1,417 | | | Enel SpA | | | 6,735 | |
| | 440 | | | Eni SpA | | | 6,821 | |
| | 2,472 | | | Intesa Sanpaolo SpA | | | 7,215 | |
| | 147 | | | Italgas SpA (a) | | | 665 | |
| | 411 | | | Mediobanca SpA | | | 3,957 | |
| | 826 | | | Terna Rete Elettrica Nazionale SpA | | | 4,164 | |
| | | | | | | | |
| | | | | | | 35,445 | |
| | | | | | | | |
SEE NOTES TO FINANCIAL STATEMENTS.
| | | | | | | | |
| | | |
| APRIL 30, 2017 | | J.P. MORGAN FUNDS | | | | | 55 | |
JPMorgan Income Builder Fund
SCHEDULE OF PORTFOLIO INVESTMENTS
AS OF APRIL 30, 2017 (Unaudited) (continued)
(Amounts in U.S. Dollars, unless otherwise noted)
(Amounts in thousands)
| | | | | | | | |
SHARES | | | SECURITY DESCRIPTION | | VALUE | |
| | Common Stocks — continued | |
| | | | Japan — 1.4% | |
| | 2 | | | Activia Properties, Inc. | | | 10,937 | |
| | 750 | | | Bridgestone Corp. | | | 31,275 | |
| | 730 | | | Daiwa House Industry Co. Ltd. | | | 21,714 | |
| | 3 | | | Daiwa House REIT Investment Corp. | | | 7,187 | |
| | 15 | | | Japan Hotel REIT Investment Corp. | | | 10,290 | |
| | 930 | | | Mitsubishi Corp. | | | 20,059 | |
| | 3,359 | | | Mitsubishi UFJ Financial Group, Inc. | | | 21,283 | |
| | 7 | | | Nippon Prologis REIT, Inc. | | | 13,959 | |
| | 685 | | | Nippon Telegraph & Telephone Corp. | | | 29,356 | |
| | 4 | | | Orix JREIT, Inc. | | | 5,771 | |
| | | | | | | | |
| | | | | | | 171,831 | |
| | | | | | | | |
| | | | Mexico — 0.3% | |
| | 2,474 | | | Bolsa Mexicana de Valores SAB de CV (a) | | | 4,305 | |
| | 5,205 | | | Fibra Uno Administracion SA de CV | | | 9,091 | |
| | 8,874 | | | Kimberly-Clark de Mexico SAB de CV, Class A | | | 18,941 | |
| | 4,143 | | | Wal-Mart de Mexico SAB de CV | | | 9,354 | |
| | | | | | | | |
| | | | | | | 41,691 | |
| | | | | | | | |
| | | | Netherlands — 0.9% | |
| | 154 | | | ABN AMRO Group NV, CVA (e) | | | 4,034 | |
| | 728 | | | Aegon NV | | | 3,717 | |
| | 24 | | | Akzo Nobel NV | | | 2,128 | |
| | 61 | | | Eurocommercial Properties NV, CVA | | | 2,369 | |
| | 647 | | | ING Groep NV | | | 10,540 | |
| | 308 | | | Koninklijke Ahold Delhaize NV | | | 6,381 | |
| | 1,375 | | | Koninklijke KPN NV | | | 3,976 | |
| | 783 | | | NN Group NV | | | 25,973 | |
| | 62 | | | Randstad Holding NV | | | 3,683 | |
| | 763 | | | Royal Dutch Shell plc, Class A | | | 19,903 | |
| | 873 | | | Royal Dutch Shell plc, Class B | | | 23,226 | |
| | 164 | | | Vastned Retail NV | | | 6,131 | |
| | | | | | | | |
| | | | | | | 112,061 | |
| | | | | | | | |
| | | | Norway — 0.2% | |
| | 292 | | | DNB ASA | | | 4,555 | |
| | 251 | | | Marine Harvest ASA (a) | | | 4,175 | |
| | 328 | | | Statoil ASA | | | 5,397 | |
| | 257 | | | Telenor ASA | | | 4,157 | |
| | 103 | | | Yara International ASA | | | 3,839 | |
| | | | | | | | |
| | | | | | | 22,123 | |
| | | | | | | | |
| | | | Portugal — 0.1% | |
| | 1,492 | | | EDP — Energias de Portugal SA | | | 4,923 | |
| | 247 | | | Galp Energia SGPS SA | | | 3,832 | |
| | | | | | | | |
| | | | | | | 8,755 | |
| | | | | | | | |
| | | | | | | | |
SHARES | | | SECURITY DESCRIPTION | | VALUE | |
| | | | | | | | |
| | | | Russia — 0.4% | |
| | 194 | | | LUKOIL PJSC, ADR | | | 9,618 | |
| | 275 | | | MegaFon PJSC, GDR | | | 2,940 | |
| | 432 | | | MMC Norilsk Nickel PJSC, ADR | | | 6,640 | |
| | 321 | | | Mobile TeleSystems PJSC, ADR | | | 3,311 | |
| | 7,286 | | | Moscow Exchange MICEX-RTS PJSC | | | 14,731 | |
| | 301 | | | PhosAgro PJSC, GDR | | | 4,432 | |
| | 327 | | | Severstal PJSC, GDR | | | 4,460 | |
| | | | | | | | |
| | | | | | | 46,132 | |
| | | | | | | | |
| | | | Singapore — 0.0% (g) | |
| | 992 | | | Ascendas REIT | | | 1,819 | |
| | 1,584 | | | CapitaLand Commercial Trust | | | 1,841 | |
| | | | | | | | |
| | | | | | | 3,660 | |
| | | | | | | | |
| | | | South Africa — 0.7% | |
| | 1,708 | | | AVI Ltd. | | | 12,493 | |
| | 1,246 | | | Barclays Africa Group Ltd. | | | 13,682 | |
| | 445 | | | Bid Corp. Ltd. | | | 9,417 | |
| | 4,508 | | | FirstRand Ltd. | | | 16,819 | |
| | 617 | | | Investec plc | | | 4,573 | |
| | 4,195 | | | MMI Holdings Ltd. | | | 7,318 | |
| | 846 | | | Vodacom Group Ltd. | | | 9,563 | |
| | 1,795 | | | Woolworths Holdings Ltd. | | | 9,729 | |
| | | | | | | | |
| | | | | | | 83,594 | |
| | | | | | | | |
| | | | South Korea — 0.4% | |
| | 141 | | | Kangwon Land, Inc. | | | 4,469 | |
| | 148 | | | KT&G Corp. | | | 13,174 | |
| | 9 | | | Samsung Electronics Co. Ltd. | | | 16,703 | |
| | 417 | | | SK Telecom Co. Ltd., ADR | | | 9,829 | |
| | | | | | | | |
| | | | | | | 44,175 | |
| | | | | | | | |
| | | | Spain — 0.7% | |
| | 342 | | | Abertis Infraestructuras SA | | | 6,014 | |
| | 122 | | | ACS Actividades de Construccion y Servicios SA | | | 4,534 | |
| | 27 | | | Aena SA (e) | | | 4,838 | |
| | 1,116 | | | Banco Bilbao Vizcaya Argentaria SA | | | 8,939 | |
| | 2,917 | | | Banco de Sabadell SA | | | 5,610 | |
| | 2,094 | | | Banco Santander SA | | | 13,648 | |
| | 450 | | | Bankinter SA | | | 3,957 | |
| | 1,180 | | | CaixaBank SA | | | 5,356 | |
| | 625 | | | Distribuidora Internacional de Alimentacion SA | | | 3,718 | |
| | 140 | | | Enagas SA | | | 3,674 | |
| | 177 | | | Endesa SA | | | 4,164 | |
| | 1,026 | | | Iberdrola SA | | | 7,377 | |
| | 1,396 | | | Mapfre SA | | | 4,869 | |
| | 330 | | | Repsol SA | | | 5,214 | |
SEE NOTES TO FINANCIAL STATEMENTS.
| | | | | | |
| | | |
| 56 | | | | J.P. MORGAN FUNDS | | APRIL 30, 2017 |
| | | | | | | | |
SHARES | | | SECURITY DESCRIPTION | | VALUE | |
| | Common Stocks — continued | |
| | | | Spain — continued | |
| | 730 | | | Telefonica SA | | | 8,076 | |
| | | | | | | | |
| | | | | | | 89,988 | |
| | | | | | | | |
| | | | Sweden — 0.3% | |
| | 138 | | | Electrolux AB, Series B | | | 4,096 | |
| | 131 | | | ICA Gruppen AB | | | 4,484 | |
| | 607 | | | Nordea Bank AB | | | 7,468 | |
| | 427 | | | Skandinaviska Enskilda Banken AB, Class A | | | 4,916 | |
| | 164 | | | Skanska AB, Class B | | | 3,917 | |
| | 189 | | | SKF AB, Class B | | | 4,138 | |
| | 372 | | | Svenska Handelsbanken AB, Class A | | | 5,277 | |
| | 243 | | | Swedbank AB, Class A | | | 5,748 | |
| | | | | | | | |
| | | | | | | 40,044 | |
| | | | | | | | |
| | | | Switzerland — 0.8% | |
| | 303 | | | ABB Ltd. (Registered) | | | 7,431 | |
| | 1 | | | Banque Cantonale Vaudoise (Registered) (a) | | | 912 | |
| | 10 | | | Cembra Money Bank AG | | | 890 | |
| | 375 | | | Credit Suisse Group AG (Registered) (a) | | | 5,712 | |
| | 64 | | | Roche Holding AG | | | 16,631 | |
| | 346 | | | Swiss Re AG | | | 30,087 | |
| | 531 | | | UBS Group AG (Registered) (a) | | | 9,065 | |
| | 329 | | | Wolseley plc | | | 20,886 | |
| | 29 | | | Zurich Insurance Group AG | | | 7,891 | |
| | | | | | | | |
| | | | | | | 99,505 | |
| | | | | | | | |
| | | | Taiwan — 1.1% | |
| | 758 | | | Asustek Computer, Inc. | | | 7,447 | |
| | 1,269 | | | Chicony Electronics Co. Ltd. | | | 3,348 | |
| | 1,479 | | | Delta Electronics, Inc. | | | 8,327 | |
| | 1,903 | | | Far EasTone Telecommunications Co. Ltd. | | | 4,686 | |
| | 1,054 | | | MediaTek, Inc. | | | 7,576 | |
| | 4,301 | | | Mega Financial Holding Co. Ltd. | | | 3,453 | |
| | 2,450 | | | Novatek Microelectronics Corp. | | | 9,415 | |
| | 1,649 | | | President Chain Store Corp. | | | 14,350 | |
| | 6,308 | | | Quanta Computer, Inc. | | | 13,068 | |
| | 3,916 | | | Taiwan Mobile Co. Ltd. | | | 14,459 | |
| | 269 | | | Taiwan Semiconductor Manufacturing Co. Ltd., ADR | | | 8,882 | |
| | 737 | | | Taiwan Semiconductor Manufacturing Co. Ltd., ADR | | | 24,376 | |
| | 5,228 | | | Vanguard International Semiconductor Corp. | | | 9,971 | |
| | | | | | | | |
| | | | | | | 129,358 | |
| | | | | | | | |
| | | | Thailand — 0.2% | | | | |
| | 615 | | | Siam Cement PCL (The) (Registered) | | | 9,484 | |
| | 119 | | | Siam Cement PCL (The), NVDR | | | 1,840 | |
| | | | | | | | |
SHARES | | | SECURITY DESCRIPTION | | VALUE | |
| | |
| | | | Thailand — continued | | | | |
| | 563 | | | Siam Commercial Bank PCL (The) | | | 2,535 | |
| | 1,555 | | | Siam Commercial Bank PCL (The), NVDR | | | 7,001 | |
| | 808 | | | Thai Oil PCL | | | 1,820 | |
| | 1,026 | | | Thai Oil PCL, NVDR | | | 2,311 | |
| | | | | | | | |
| | | | | | | 24,991 | |
| | | | | | | | |
| | | | Turkey — 0.2% | | | | |
| | 323 | | | Ford Otomotiv Sanayi A/S | | | 3,594 | |
| | 1,139 | | | Tofas Turk Otomobil Fabrikasi A/S | | | 9,486 | |
| | 321 | | | Tupras Turkiye Petrol Rafinerileri A/S | | | 8,079 | |
| | | | | | | | |
| | | | | | | 21,159 | |
| | | | | | | | |
| | | | United Arab Emirates — 0.1% | | | | |
| | 3,230 | | | National Bank of Abu Dhabi PJSC | | | 9,673 | |
| | | | | | | | |
| | | | United Kingdom — 5.1% | |
| | 903 | | | Aviva plc | | | 6,143 | |
| | 5,011 | | | BAE Systems plc | | | 40,699 | |
| | 701 | | | Barratt Developments plc | | | 5,259 | |
| | 94 | | | Berkeley Group Holdings plc | | | 3,970 | |
| | 2,480 | | | BP plc | | | 14,198 | |
| | 831 | | | British American Tobacco plc | | | 56,161 | |
| | 1,834 | | | British Land Co. plc (The) | | | 15,592 | |
| | 1,854 | | | Centrica plc | | | 4,752 | |
| | 7,649 | | | Direct Line Insurance Group plc | | | 34,565 | |
| | 876 | | | Dixons Carphone plc | | | 3,806 | |
| | 1,380 | | | G4S plc | | | 5,450 | |
| | 4,313 | | | GlaxoSmithKline plc | | | 86,802 | |
| | 510 | | | Hammerson plc | | | 3,882 | |
| | 5,689 | | | HSBC Holdings plc | | | 46,896 | |
| | 220 | | | IMI plc | | | 3,641 | |
| | 246 | | | Imperial Brands plc | | | 12,065 | |
| | 101 | | | InterContinental Hotels Group plc | | | 5,366 | |
| | 585 | | | International Consolidated Airlines Group SA | | | 4,240 | |
| | 1,499 | | | ITV plc | | | 4,077 | |
| | 1,375 | | | J Sainsbury plc | | | 4,904 | |
| | 1,580 | | | Legal & General Group plc | | | 5,036 | |
| | 10,534 | | | Lloyds Banking Group plc | | | 9,465 | |
| | 574 | | | LondonMetric Property plc | | | 1,252 | |
| | 922 | | | Marks & Spencer Group plc | | | 4,375 | |
| | 552 | | | Meggitt plc | | | 3,308 | |
| | 1,948 | | | Old Mutual plc | | | 4,893 | |
| | 1,254 | | | Persimmon plc | | | 37,838 | |
| | 293 | | | Petrofac Ltd. | | | 3,084 | |
| | 940 | | | Rio Tinto plc | | | 37,097 | |
| | 525 | | | RSA Insurance Group plc | | | 4,050 | |
| | 1,856 | | | Safestore Holdings plc | | | 9,741 | |
SEE NOTES TO FINANCIAL STATEMENTS.
| | | | | | | | |
| | | |
| APRIL 30, 2017 | | J.P. MORGAN FUNDS | | | | | 57 | |
JPMorgan Income Builder Fund
SCHEDULE OF PORTFOLIO INVESTMENTS
AS OF APRIL 30, 2017 (Unaudited) (continued)
(Amounts in U.S. Dollars, unless otherwise noted)
(Amounts in thousands)
| | | | | | | | |
SHARES | | | SECURITY DESCRIPTION | | VALUE | |
| | Common Stocks — continued | |
| | | | United Kingdom — continued | | | | |
| | 1,601 | | | Segro plc | | | 10,069 | |
| | 141 | | | Severn Trent plc | | | 4,234 | |
| | 281 | | | St James’s Place plc | | | 4,179 | |
| | 891 | | | Standard Life plc | | | 4,191 | |
| | 388 | | | Tate & Lyle plc | | | 3,810 | |
| | 1,822 | | | Taylor Wimpey plc | | | 4,718 | |
| | 2,251 | | | Tritax Big Box REIT plc | | | 4,081 | |
| | 343 | | | Unilever plc | | | 17,658 | |
| | 16,094 | | | Vodafone Group plc | | | 41,453 | |
| | 2,249 | | | WPP plc | | | 48,158 | |
| | | | | | | | |
| | | | | | | 625,158 | |
| | | | | | | | |
| | | | United States — 19.5% | | | | |
| | 90 | | | 3M Co. | | | 17,528 | |
| | 56 | | | AbbVie, Inc. | | | 3,704 | |
| | 456 | | | Accenture plc, Class A | | | 55,302 | |
| | 111 | | | Alexandria Real Estate Equities, Inc. | | | 12,516 | |
| | 728 | | | Altria Group, Inc. | | | 52,254 | |
| | 118 | | | Analog Devices, Inc. | | | 9,012 | |
| | 310 | | | Apartment Investment & Management Co., Class A | | | 13,556 | |
| | 235 | | | Apple, Inc. | | | 33,809 | |
| | 68 | | | Arthur J Gallagher & Co. | | | 3,811 | |
| | 970 | | | AT&T, Inc. | | | 38,457 | |
| | 117 | | | Automatic Data Processing, Inc. | | | 12,250 | |
| | 172 | | | AvalonBay Communities, Inc. | | | 32,733 | |
| | 1,331 | | | Bank of America Corp. | | | 31,057 | |
| | 377 | | | BB&T Corp. | | | 16,290 | |
| | 636 | | | Brandywine Realty Trust | | | 10,794 | |
| | 176 | | | Bristol-Myers Squibb Co. | | | 9,838 | |
| | 592 | | | Brixmor Property Group, Inc. | | | 11,694 | |
| | 275 | | | Camden Property Trust | | | 22,634 | |
| | 206 | | | Chevron Corp. | | | 21,967 | |
| | 104 | | | Chubb Ltd. | | | 14,253 | |
| | 148 | | | Cincinnati Financial Corp. | | | 10,637 | |
| | 113 | | | Cinemark Holdings, Inc. | | | 4,862 | |
| | 529 | | | CME Group, Inc. | | | 61,483 | |
| | 229 | | | CMS Energy Corp. | | | 10,411 | |
| | 172 | | | Coca-Cola Co. (The) | | | 7,402 | |
| | 1,494 | | | Comcast Corp., Class A | | | 58,543 | |
| | 484 | | | ConocoPhillips | | | 23,198 | |
| | 35 | | | Cullen/Frost Bankers, Inc. | | | 3,279 | |
| | 257 | | | Digital Realty Trust, Inc. | | | 29,535 | |
| | 129 | | | Dr Pepper Snapple Group, Inc. | | | 11,804 | |
| | 27 | | | DTE Energy Co. | | | 2,787 | |
| | 186 | | | Duke Realty Corp. | | | 5,150 | |
| | | | | | | | |
SHARES | | | SECURITY DESCRIPTION | | VALUE | |
| | |
| | | | United States — continued | | | | |
| | 3 | | | Dynegy, Inc. (a) | | | 16 | |
| | 95 | | | Edison International | | | 7,611 | |
| | 423 | | | EI du Pont de Nemours & Co. | | | 33,702 | |
| | 105 | | | Eli Lilly & Co. | | | 8,652 | |
| | 107 | | | Extra Space Storage, Inc. | | | 8,109 | |
| | 248 | | | Exxon Mobil Corp. | | | 20,254 | |
| | 171 | | | Fidelity National Information Services, Inc. | | | 14,432 | |
| | 34 | | | General Dynamics Corp. | | | 6,540 | |
| | 1,476 | | | General Motors Co. | | | 51,127 | |
| | 56 | | | Gilead Sciences, Inc. | | | 3,813 | |
| | 279 | | | Halcon Resources Corp. (a) | | | 1,870 | |
| | 1,152 | | | HCP, Inc. | | | 36,102 | |
| | 249 | | | Highwoods Properties, Inc. | | | 12,651 | |
| | 557 | | | Home Depot, Inc. (The) | | | 87,005 | |
| | 173 | | | Honeywell International, Inc. | | | 22,684 | |
| | 1,140 | | | Host Hotels & Resorts, Inc. | | | 20,467 | |
| | 1,153 | | | HP, Inc. | | | 21,704 | |
| | 161 | | | Illinois Tool Works, Inc. | | | 22,183 | |
| | 129 | | | International Business Machines Corp. | | | 20,749 | |
| | 810 | | | Johnson & Johnson | | | 100,003 | |
| | 80 | | | Kimberly-Clark Corp. | | | 10,365 | |
| | 1,311 | | | Kimco Realty Corp. | | | 26,606 | |
| | 481 | | | KLA-Tencor Corp. | | | 47,256 | |
| | 253 | | | LaSalle Hotel Properties | | | 7,232 | |
| | 368 | | | Liberty Property Trust | | | 14,921 | |
| | 45 | | | M&T Bank Corp. | | | 7,021 | |
| | 224 | | | Macerich Co. (The) | | | 14,013 | |
| | 467 | | | Merck & Co., Inc. | | | 29,122 | |
| | 692 | | | MetLife, Inc. | | | 35,833 | |
| | 1,455 | | | Microsoft Corp. | | | 99,616 | |
| | 105 | | | Mid-America Apartment Communities, Inc. | | | 10,397 | |
| | 324 | | | Mondelez International, Inc., Class A | | | 14,589 | |
| | 886 | | | Morgan Stanley | | | 38,410 | |
| | 219 | | | National Health Investors, Inc. | | | 16,027 | |
| | 3 | | | Nebraska Book Holdings, Inc. (a) | | | — | (h) |
| | — | (h) | | New Cotai LLC, Class B (a) | | | — | (h) |
| | 395 | | | NextEra Energy, Inc. | | | 52,707 | |
| | 178 | | | NII Holdings, Inc. (a) | | | 153 | |
| | 302 | | | NiSource, Inc. | | | 7,327 | |
| | 170 | | | Northern Trust Corp. | | | 15,339 | |
| | 1,430 | | | Occidental Petroleum Corp. | | | 87,977 | |
| | 10 | | | Penn Virginia Corp. (a) | | | 393 | |
| | 12 | | | Penn Virginia Corp. (a) | | | 480 | |
| | 89 | | | PepsiCo, Inc. | | | 10,135 | |
| | 2,669 | | | Pfizer, Inc. | | | 90,537 | |
SEE NOTES TO FINANCIAL STATEMENTS.
| | | | | | |
| | | |
| 58 | | | | J.P. MORGAN FUNDS | | APRIL 30, 2017 |
| | | | | | | | |
SHARES | | | SECURITY DESCRIPTION | | VALUE | |
| | Common Stocks — continued | |
| | | | United States — continued | | | | |
| | 268 | | | Philip Morris International, Inc. | | | 29,724 | |
| | 195 | | | PNC Financial Services Group, Inc. (The) | | | 23,351 | |
| | 145 | | | PPG Industries, Inc. | | | 15,901 | |
| | 49 | | | Procter & Gamble Co. (The) | | | 4,244 | |
| | 760 | | | Prologis, Inc. | | | 41,338 | |
| | 178 | | | Prudential Financial, Inc. | | | 19,001 | |
| | 142 | | | Public Storage | | | 29,728 | |
| | 182 | | | Quality Care Properties, Inc. (a) | | | 3,158 | |
| | 120 | | | Realty Income Corp. | | | 6,986 | |
| | 115 | | | Regency Centers Corp. | | | 7,239 | |
| | 116 | | | Republic Services, Inc. | | | 7,331 | |
| | — | (h) | | Sabine Oil & Gas Holdings, Inc. (a) | | | 14 | |
| | 137 | | | Senior Housing Properties Trust | | | 2,944 | |
| | 157 | | | Simon Property Group, Inc. | | | 26,015 | |
| | 93 | | | SL Green Realty Corp. | | | 9,738 | |
| | 20 | | | Snap-on, Inc. | | | 3,302 | |
| | 2,072 | | | Spirit Realty Capital, Inc. | | | 19,518 | |
| | 17 | | | Stone Energy Corp. (a) | | | 346 | |
| | 154 | | | STORE Capital Corp. | | | 3,706 | |
| | 146 | | | Sunstone Hotel Investors, Inc. | | | 2,178 | |
| | 152 | | | T Rowe Price Group, Inc. | | | 10,766 | |
| | 628 | | | Texas Instruments, Inc. | | | 49,745 | |
| | 76 | | | Time Warner, Inc. | | | 7,516 | |
| | 233 | | | Travelers Cos., Inc. (The) | | | 28,289 | |
| | 267 | | | UnitedHealth Group, Inc. | | | 46,635 | |
| | 510 | | | US Bancorp | | | 26,162 | |
| | 383 | | | Valero Energy Corp. | | | 24,748 | |
| | 49 | | | Validus Holdings Ltd. | | | 2,711 | |
| | 120 | | | Ventas, Inc. | | | 7,709 | |
| | 434 | | | Verizon Communications, Inc. | | | 19,937 | |
| | 109 | | | VF Corp. | | | 5,942 | |
| | 483 | | | Vistra Energy Corp. | | | 7,219 | |
| | 207 | | | Vornado Realty Trust | | | 19,882 | |
| | 1,631 | | | Wells Fargo & Co. | | | 87,828 | |
| | 205 | | | Xcel Energy, Inc. | | | 9,241 | |
| | | | | | | | |
| | | | | | | 2,398,772 | |
| | | | | | | | |
| | | | Total Common Stocks
(Cost $4,412,757) | | | 5,080,050 | |
| | | | | | | | |
| | |
PRINCIPAL
AMOUNT/UNITS | | | | | | |
| | Convertible Bonds — 0.7% | |
| | | | Bermuda — 0.0% (g) | |
| | 384 | | | Golar LNG Ltd., 2.750%, 02/15/22 (e) | | | 374 | |
| | | | | | | | |
| | | | | | | | |
PRINCIPAL
AMOUNT/UNITS | | | SECURITY DESCRIPTION | | VALUE | |
| | | | | | | | |
| | | | China — 0.0% (g) | |
| | 800 | | | Baosteel Hong Kong Investment Co. Ltd., Reg. S, Zero Coupon, 12/01/18 | | | 824 | |
| | 600 | | | Cosmos Boom Investment Ltd., Reg. S, 0.500%, 06/23/20 | | | 586 | |
| | | | Ctrip.com International Ltd., | | | | |
| | 1,296 | | | 1.250%, 09/15/22 (e) | | | 1,354 | |
| | 345 | | | 1.990%, 07/01/25 | | | 406 | |
| | 500 | | | ENN Energy Holdings Ltd., Reg. S, Zero Coupon, 02/26/18 | | | 520 | |
| | | | | | | | |
| | | | | | | 3,690 | |
| | | | | | | | |
| | | | France — 0.0% (g) | |
| EUR 576
Units |
| | Rallye SA, Reg. S, 1.000%, 10/02/20 | | | 633 | |
| | 1,000 | | | TOTAL SA, Reg. S, Series FP, 0.500%, 12/02/22 | | | 1,020 | |
| | | | | | | | |
| | | | | | | 1,653 | |
| | | | | | | | |
| | | | Germany — 0.1% | |
| | EUR 3,100 | | | Bayer Capital Corp. BV, 5.625%,
11/22/19 (e) | | | 4,091 | |
| | 500 | | | Brenntag Finance BV, Reg. S, 1.875%, 12/02/22 | | | 521 | |
| | EUR 800 | | | Rocket Internet SE, Reg. S, 3.000%, 07/22/22 | | | 814 | |
| | | | | | | | |
| | | | | | | 5,426 | |
| | | | | | | | |
| | | | Hong Kong — 0.0% (g) | |
| | 2,000 | | | China Overseas Finance Investment Cayman V Ltd., Reg. S, Zero Coupon, 01/05/23 | | | 2,042 | |
| | HKD 8,000 | | | Shine Power International Ltd., Reg. S,
Zero Coupon, 07/28/19 | | | 1,034 | |
| | | | | | | | |
| | | | | | | 3,076 | |
| | | | | | | | |
| | | | Italy — 0.0% (g) | |
| | EUR 600 | | | Prysmian SpA, Reg. S, Zero Coupon, 01/17/22 | | | 673 | |
| | | | | | | | |
| | | | Malaysia — 0.0% (g) | |
| | 680 | | | Cahaya Capital Ltd., Reg. S, Zero Coupon, 09/18/21 | | | 657 | |
| | | | | | | | |
| | | | Mexico — 0.0% (g) | |
| | EUR 1,700 | | | America Movil BV, Reg. S, 5.500%, 09/17/18 | | | 1,555 | |
| | | | | | | | |
| | | | Netherlands — 0.0% (g) | |
| | EUR 600 | | | OCI NV, Reg. S, 3.875%, 09/25/18 | | | 654 | |
| | | | | | | | |
| | | | Portugal — 0.0% (g) | |
| | EUR 600 | | | Amorim Energia BV, Reg. S, 3.375%, 06/03/18 | | | 695 | |
| | | | | | | | |
SEE NOTES TO FINANCIAL STATEMENTS.
| | | | | | | | |
| | | |
| APRIL 30, 2017 | | J.P. MORGAN FUNDS | | | | | 59 | |
JPMorgan Income Builder Fund
SCHEDULE OF PORTFOLIO INVESTMENTS
AS OF APRIL 30, 2017 (Unaudited) (continued)
(Amounts in U.S. Dollars, unless otherwise noted)
(Amounts in thousands)
| | | | | | | | |
PRINCIPAL
AMOUNT/UNITS | | | SECURITY DESCRIPTION | | VALUE | |
| | Convertible Bonds — continued | |
| | | | Russia — 0.0% (g) | |
| | 1,368 | | | Yandex NV, 1.125%, 12/15/18 | | | 1,321 | |
| | | | | | | | |
| | | | Singapore — 0.0% (g) | |
| | | | CapitaLand Ltd., | | | | |
| | SGD 4,250 | | | Reg. S, 1.850%, 06/19/20 | | | 2,995 | |
| | SGD 750 | | | Reg. S, 1.950%, 10/17/23 | | | 555 | |
| | | | | | | | |
| | | | | | | 3,550 | |
| | | | | | | | |
| | | | South Africa — 0.0% (g) | |
| | GBP 900 | | | Brait SE, Reg. S, 2.750%, 09/18/20 | | | 1,104 | |
| | GBP 400 | | | Remgro Jersey GBP Ltd., Reg. S, 2.625%, 03/22/21 | | | 532 | |
| | | | Steinhoff Finance Holding GmbH, | | | | |
| | EUR 400 | | | Reg. S, Series SHF, 1.250%, 08/11/22 | | | 432 | |
| | EUR 1,800 | | | Reg. S, Series SNH, 1.250%, 10/21/23 | | | 1,902 | |
| | | | | | | | |
| | | | | | | 3,970 | |
| | | | | | | | |
| | | | Spain — 0.0% (g) | |
| | EUR 400 | | | OHL Investments SA, Reg. S, 4.000%, 04/25/18 | | | 422 | |
| | EUR 1,300 | | | Telefonica Participaciones SAU, Reg. S, 4.900%, 09/25/17 | | | 1,365 | |
| | EUR 500 | | | Telefonica SA, Reg. S, 6.000%, 07/24/17 | | | 508 | |
| | | | | | | | |
| | | | | | | 2,295 | |
| | | | | | | | |
| | | | Taiwan — 0.0% (g) | |
| | 600 | | | Nanya Technology Corp., Reg. S, Zero Coupon, 01/24/22 | | | 650 | |
| | 500 | | | TPK Holding Co. Ltd., Reg. S, Zero Coupon, 04/08/20 | | | 503 | |
| | 1,300 | | | Zhen Ding Technology Holding Ltd., Reg. S, Zero Coupon, 06/26/19 | | | 1,310 | |
| | | | | | | | |
| | | | | | | 2,463 | |
| | | | | | | | |
| | | | United Arab Emirates — 0.1% | |
| | | | Aabar Investments PJSC, | | | | |
| | EUR 2,000 | | | Reg. S, Series UCG, 0.500%, 03/27/20 | | | 1,944 | |
| | EUR 1,500 | | | Reg. S, Series UCG, 1.000%, 03/27/22 | | | 1,388 | |
| | 1,800 | | | DP World Ltd., Reg. S, 1.750%, 06/19/24 | | | 1,848 | |
| | 800 | | | National Bank of Abu Dhabi PJSC, Reg. S, 1.000%, 03/12/18 | | | 807 | |
| | | | | | | | |
| | | | | | | 5,987 | |
| | | | | | | | |
| | | | United Kingdom — 0.1% | |
| | GBP 400 | | | Balfour Beatty Finance No. 2 Ltd., Reg. S, 1.875%, 12/03/18 | | | 533 | |
| | GBP 1,300 | | | British Land White 2015 Ltd., Reg. S, Zero Coupon, 06/09/20 | | | 1,612 | |
| | 800 | | | Inmarsat plc, Reg. S, 3.875%, 09/09/23 | | | 918 | |
| | | | | | | | |
PRINCIPAL
AMOUNT/UNITS | | | SECURITY DESCRIPTION | | VALUE | |
| | | | | | | | |
| | | | United Kingdom — continued | |
| | | | International Consolidated Airlines Group SA, | | | | |
| | EUR 800 | | | Reg. S, 0.250%, 11/17/20 | | | 835 | |
| | EUR 1,000 | | | Reg. S, 0.625%, 11/17/22 | | | 1,030 | |
| | GBP 1,100 | | | Intu Jersey 2 Ltd., Reg. S, 2.875%, 11/01/22 | | | 1,380 | |
| | GBP 2,800 | | | Vodafone Group plc, Reg. S, 2.000%, 02/25/19 | | | 3,587 | |
| | | | | | | | |
| | | | | | | 9,895 | |
| | | | | | | | |
| | | | United States — 0.4% | |
| | | | Ares Capital Corp., | | | | |
| | 917 | | | 4.750%, 01/15/18 | | | 933 | |
| | 807 | | | Cheniere Energy, Inc., 4.250%, 03/15/45 | | | 549 | |
| | 1,686 | | | Chesapeake Energy Corp., 5.500%, 09/15/26 (e) | | | 1,659 | |
| | 826 | | | Colony NorthStar, Inc., 3.875%, 01/15/21 | | | 833 | |
| | 4,554 | | | DISH Network Corp., 2.375%, 03/15/24 (e) | | | 4,739 | |
| | 1,031 | | | Ensco Jersey Finance Ltd., 3.000%, 01/31/24 (e) | | | 954 | |
| | 1,226 | | | Extra Space Storage LP, 3.125%, 10/01/35 (e) | | | 1,279 | |
| | 671 | | | Finisar Corp., 0.500%, 12/15/36 (e) | | | 625 | |
| | 1,870 | | | FireEye, Inc., Series B, 1.625%, 06/01/35 | | | 1,681 | |
| | 873 | | | IAS Operating Partnership LP, 5.000%, 03/15/18 (e) | | | 885 | |
| | 908 | | | Illumina, Inc., Zero Coupon, 06/15/19 | | | 930 | |
| | 533 | | | Impax Laboratories, Inc., 2.000%, 06/15/22 | | | 449 | |
| | 1,486 | | | Intel Corp., 3.479%, 12/15/35 | | | 2,024 | |
| | 551 | | | Intercept Pharmaceuticals, Inc., 3.250%, 07/01/23 | | | 514 | |
| | 456 | | | Ionis Pharmaceuticals, Inc., 1.000%, 11/15/21 | | | 475 | |
| | | | Liberty Interactive LLC, | | | | |
| | 1,117 | | | 1.750%, 09/30/46 (e) | | | 1,312 | |
| | 1,384 | | | 4.000%, 11/15/29 | | | 857 | |
| | 798 | | | Macquarie Infrastructure Corp., 2.000%, 10/01/23 | | | 788 | |
| | | | Microchip Technology, Inc., | | | | |
| | 2,114 | | | 1.625%, 02/15/27 (e) | | | 2,164 | |
| | 755 | | | Micron Technology, Inc., Series G, 3.000%, 11/15/43 | | | 815 | |
| | 946 | | | Nabors Industries, Inc., 0.750%, 01/15/24 (e) | | | 814 | |
| | 67 | | | Nebraska Book Holdings, Inc., 2.000% (PIK), 04/01/26 (e) (v) | | | 7 | |
| | | | Nuance Communications, Inc., | | | | |
| | 561 | | | 1.000%, 12/15/35 | | | 542 | |
SEE NOTES TO FINANCIAL STATEMENTS.
| | | | | | |
| | | |
| 60 | | | | J.P. MORGAN FUNDS | | APRIL 30, 2017 |
| | | | | | | | |
PRINCIPAL
AMOUNT/UNITS | | | SECURITY DESCRIPTION | | VALUE | |
| | Convertible Bonds — continued | |
| | | | United States — continued | |
| | 488 | | | 2.750%, 11/01/31 | | | 490 | |
| | 650 | | | ON Semiconductor Corp., 1.625%, 10/15/23 (e) | | | 649 | |
| | 505 | | | Redwood Trust, Inc., 4.625%, 04/15/18 | | | 507 | |
| | 764 | | | Silicon Laboratories, Inc., 1.375%, 03/01/22 (e) | | | 802 | |
| | 546 | | | SolarCity Corp., 1.625%, 11/01/19 | | | 496 | |
| | 826 | | | SunPower Corp., 0.875%, 06/01/21 | | | 644 | |
| | 2,526 | | | Tesla, Inc., 1.250%, 03/01/21 | | | 2,618 | |
| | | | Twitter, Inc., | | | | |
| | 1,382 | | | 0.250%, 09/15/19 | | | 1,309 | |
| | 1,410 | | | 1.000%, 09/15/21 | | | 1,295 | |
| | | | VEREIT, Inc., | | | | |
| | 379 | | | 3.000%, 08/01/18 | | | 380 | |
| | 2,098 | | | 3.750%, 12/15/20 | | | 2,139 | |
| | 262 | | | Verint Systems, Inc., 1.500%, 06/01/21 | | | 252 | |
| | 1,322 | | | Viavi Solutions, Inc., 1.000%, 03/01/24 (e) | | | 1,344 | |
| | 1,129 | | | Weatherford International Ltd., 5.875%, 07/01/21 | | | 1,342 | |
| | 646 | | | Whiting Petroleum Corp., 1.250%, 04/01/20 | | | 571 | |
| | | | Yahoo!, Inc., | | | | |
| | 1,246 | | | Zero Coupon, 12/01/18 | | | 1,308 | |
| | | | | | | | |
| | | | | | | 41,974 | |
| | | | | | | | |
| | | | Total Convertible Bonds
(Cost $91,207) | | | 89,908 | |
| | | | | | | | |
| | |
SHARES | | | | | | |
| | Convertible Preferred Stocks — 0.3% | |
| | | | China — 0.0% (g) | |
| | 29 | | | Mandatory Exchangeable Trust, 5.750%, 06/03/19 ($100 par value) (e) | | | 4,026 | |
| | | | | | | | |
| | | | Israel — 0.0% (g) | |
| | 3 | | | Teva Pharmaceutical Industries Ltd., 7.000%, 12/15/18 ($1000 par value) | | | 1,851 | |
| | | | | | | | |
| | | | United States — 0.3% | |
| | 4 | | | Allergan plc, Series A, 5.500%, 03/01/18 ($1000 par value) | | | 3,735 | |
| | 20 | | | American Tower Corp., 5.500%, 02/15/18 ($100 par value) | | | 2,272 | |
| | 24 | | | Anthem, Inc., 5.250%, 05/01/18 ($50 par value) | | | 1,218 | |
| | 28 | | | Arconic, Inc., 5.375%, 10/01/17 ($50 par value) | | | 1,187 | |
| | | | | | | | |
SHARES | | | SECURITY DESCRIPTION | | VALUE | |
| | | | | | | | |
| | | | United States — continued | |
| | 3 | | | Bank of America Corp., Series L, 7.250% ($1000 par value) | | | 3,967 | |
| | 5 | | | Belden, Inc., 6.750%, 07/15/19($100 par value) | | | 516 | |
| | 8 | | | Bunge Ltd., 4.875% ($100 par value) | | | 835 | |
| | 52 | | | Dominion Resources, Inc., Series A, 6.750%, 08/15/19 ($50 par value) | | | 2,639 | |
| | 24 | | | DTE Energy Co., 6.500%, 10/01/19 ($50 par value) | | | 1,319 | |
| | 20 | | | Frontier Communications Corp., Series A, 11.125%, 06/29/18 ($100 par value) | | | 875 | |
| | 15 | | | Great Plains Energy, Inc., 7.000%, 09/15/19 ($50 par value) | | | 803 | |
| | 22 | | | Hess Corp., 8.000%, 02/01/19 ($50 par value) | | | 1,320 | |
| | 35 | | | Kinder Morgan, Inc., Series A, 9.750%, 10/26/18 ($49 par value) | | | 1,611 | |
| | 51 | | | NextEra Energy, Inc., 6.123%, 09/01/19 ($25 par value) | | | 2,652 | |
| | 35 | | | Southwestern Energy Co., Series B, 6.250%, 01/15/18 ($50 par value) | | | 640 | |
| | 5 | | | Stericycle, Inc., 5.250%, 09/15/18 ($100 par value) | | | 335 | |
| | 18 | | | T-Mobile US, Inc., 5.500%, 12/15/17 ($50 par value) | | | 1,969 | |
| | 4 | | | Wells Fargo & Co., Series L, 7.500% ($1000 par value) | | | 4,541 | |
| | 15 | | | Welltower, Inc., Series I, 6.500% ($50 par value) | | | 919 | |
| | | | | | | | |
| | | | | | | 33,353 | |
| | | | | | | | |
| | | | Total Convertible Preferred Stocks
(Cost $40,828) | | | 39,230 | |
| | | | | | | | |
PRINCIPAL
AMOUNT | | | | | | |
| | Corporate Bonds — 43.1% | |
| | | | Argentina — 0.0% (g) | |
| | 1,290 | | | Petrobras Argentina SA, 7.375%, 07/21/23 (e) | | | 1,374 | |
| | 650 | | | YPF SA, Reg. S, 8.750%, 04/04/24 | | | 749 | |
| | | | | | | | |
| | | | | | | 2,123 | |
| | | | | | | | |
| | | | Australia — 0.1% | |
| | 5,521 | | | Australia & New Zealand Banking Group Ltd., VAR, 6.750%, 06/15/26 (e) (x) (y) | | | 6,123 | |
| | 1,720 | | | BHP Billiton Finance USA Ltd., VAR, 6.750%, 10/19/75 (e) | | | 1,948 | |
| | 3,835 | | | FMG Resources August 2006 Pty. Ltd., 9.750%, 03/01/22 (e) | | | 4,412 | |
SEE NOTES TO FINANCIAL STATEMENTS.
| | | | | | | | |
| | | |
| APRIL 30, 2017 | | J.P. MORGAN FUNDS | | | | | 61 | |
JPMorgan Income Builder Fund
SCHEDULE OF PORTFOLIO INVESTMENTS
AS OF APRIL 30, 2017 (Unaudited) (continued)
(Amounts in U.S. Dollars, unless otherwise noted)
(Amounts in thousands)
| | | | | | | | |
PRINCIPAL
AMOUNT | | | SECURITY DESCRIPTION | | VALUE | |
| | Corporate Bonds — continued | |
| | | | Australia — continued | |
| | 1,560 | | | Nufarm Australia Ltd., 6.375%, 10/15/19 (e) | | | 1,601 | |
| | | | | | | | |
| | | | | | | 14,084 | |
| | | | | | | | |
| | | | Belgium — 0.1% | |
| | 2,025 | | | Anheuser-Busch InBev Finance, Inc., 4.900%, 02/01/46 | | | 2,212 | |
| | EUR 6,175 | | | KBC Group NV, Reg. S, VAR, 5.625%, 03/19/19 (x) (y) | | | 6,918 | |
| | | | | | | | |
| | | | | | | 9,130 | |
| | | | | | | | |
| | | | Bermuda — 0.0% (g) | |
| | 3,924 | | | XLIT Ltd., Series E, VAR, 3.616%, 06/02/17 (x) (y) | | | 3,335 | |
| | | | | | | | |
| | | | | | | – | |
| | | | Brazil — 0.2% | |
| | 1,653 | | | Banco Daycoval SA, Reg. S, 5.750%, 03/19/19 | | | 1,703 | |
| | 1,100 | | | GTL Trade Finance, Inc., Reg. S, 5.893%, 04/29/24 | | | 1,115 | |
| | | | JBS USA LUX SA, | | | | |
| | 4,689 | | | 5.750%, 06/15/25 (e) | | | 4,818 | |
| | 4,448 | | | 5.875%, 07/15/24 (e) | | | 4,648 | |
| | | | Petrobras Global Finance BV, | | | | |
| | 2,070 | | | 6.750%, 01/27/41 | | | 1,951 | |
| | 1,090 | | | 7.375%, 01/17/27 | | | 1,166 | |
| | 3,250 | | | 8.375%, 05/23/21 | | | 3,684 | |
| | 700 | | | Suzano Austria GmbH, Reg. S, 5.750%, 07/14/26 | | | 716 | |
| | 1,056 | | | Vale Overseas Ltd., 5.875%, 06/10/21 | | | 1,135 | |
| | 1,820 | | | Votorantim Cimentos SA, Reg. S, 7.250%, 04/05/41 | | | 1,861 | |
| | | | | | | | |
| | | | | | | 22,797 | |
| | | | | | | | |
| | | | Canada — 1.6% | |
| | 7,515 | | | 1011778 BC ULC, 6.000%, 04/01/22 (e) | | | 7,834 | |
| | 2,332 | | | ATS Automation Tooling Systems, Inc., 6.500%, 06/15/23 (e) | | | 2,425 | |
| | | | Baytex Energy Corp., | | | | |
| | 339 | | | 5.125%, 06/01/21 (e) | | | 317 | |
| | 364 | | | 5.625%, 06/01/24 (e) | | | 333 | |
| | | | Bombardier, Inc., | | | | |
| | 1,868 | | | 6.000%, 10/15/22 (e) | | | 1,868 | |
| | 3,228 | | | 6.125%, 01/15/23 (e) | | | 3,220 | |
| | 5,401 | | | 7.500%, 03/15/25 (e) | | | 5,617 | |
| | 188 | | | 7.750%, 03/15/20 (e) | | | 204 | |
| | 5,208 | | | 8.750%, 12/01/21 (e) | | | 5,794 | |
| | | | | | | | |
PRINCIPAL
AMOUNT | | | SECURITY DESCRIPTION | | VALUE | |
| | | | | | | | |
| | | | Canada — continued | |
| | | | Cascades, Inc., | | | | |
| | 1,420 | | | 5.500%, 07/15/22 (e) | | | 1,431 | |
| | 585 | | | 5.750%, 07/15/23 (e) | | | 594 | |
| | | | Cenovus Energy, Inc., | | | | |
| | 761 | | | 4.250%, 04/15/27 (e) | | | 756 | |
| | 8,290 | | | 5.400%, 06/15/47 (e) | | | 8,126 | |
| | 4,425 | | | 6.750%, 11/15/39 | | | 4,967 | |
| | | | Concordia International Corp., | | | | |
| | 6,381 | | | 7.000%, 04/15/23 (e) | | | 1,021 | |
| | 874 | | | 9.000%, 04/01/22 (e) | | | 607 | |
| | 2,468 | | | Cott Holdings, Inc., 5.500%, 04/01/25 (e) | | | 2,511 | |
| | 13,375 | | | Emera, Inc., Series 16-A, VAR, 6.750%, 06/15/76 | | | 14,729 | |
| | 4,369 | | | Garda World Security Corp., 7.250%, 11/15/21 (e) | | | 4,419 | |
| | 1,200 | | | Gateway Casinos & Entertainment Ltd., 8.250%, 03/01/24 (e) | | | 1,227 | |
| | 11,100 | | | GW Honos Security Corp., 8.750%, 05/15/25 (e) | | | 11,280 | |
| | 930 | | | Hudbay Minerals, Inc., 7.250%, 01/15/23 (e) | | | 989 | |
| | 3,382 | | | Kronos Acquisition Holdings, Inc., 9.000%, 08/15/23 (e) | | | 3,433 | |
| | | | Lundin Mining Corp., | | | | |
| | 1,800 | | | 7.500%, 11/01/20 (e) | | | 1,908 | |
| | 1,770 | | | 7.875%, 11/01/22 (e) | | | 1,945 | |
| | | | Mattamy Group Corp., | | | | |
| | 2,118 | | | 6.500%, 11/15/20 (e) | | | 2,176 | |
| | 532 | | | 6.875%, 12/15/23 (e) | | | 552 | |
| | | | MEG Energy Corp., | | | | |
| | 12,179 | | | 6.375%, 01/30/23 (e) | | | 10,718 | |
| | 7,290 | | | 6.500%, 01/15/25 (e) | | | 7,199 | |
| | 2,539 | | | 7.000%, 03/31/24 (e) | | | 2,266 | |
| | 3,276 | | | NOVA Chemicals Corp., 5.000%, 05/01/25 (e) | | | 3,354 | |
| | | | Open Text Corp., | | | | |
| | 1,957 | | | 5.625%, 01/15/23 (e) | | | 2,050 | |
| | 1,588 | | | 5.875%, 06/01/26 (e) | | | 1,695 | |
| | | | Precision Drilling Corp., | | | | |
| | 1,347 | | | 5.250%, 11/15/24 | | | 1,296 | |
| | 235 | | | 6.500%, 12/15/21 | | | 238 | |
| | 10,208 | | | Quebecor Media, Inc., 5.750%, 01/15/23 | | | 10,744 | |
| | 50 | | | Quebecor World Capital Corp., 6.125%, 01/15/16 (d) | | | — | |
| | 50 | | | Quebecor, Inc., 9.750%, 01/15/16 (d) | | | — | |
| | | | Teck Resources Ltd., | | | | |
| | 1,335 | | | 3.000%, 03/01/19 | | | 1,352 | |
SEE NOTES TO FINANCIAL STATEMENTS.
| | | | | | |
| | | |
| 62 | | | | J.P. MORGAN FUNDS | | APRIL 30, 2017 |
| | | | | | | | |
PRINCIPAL
AMOUNT | | | SECURITY DESCRIPTION | | VALUE | |
| | Corporate Bonds — continued | |
| | | | Canada — continued | |
| | 1,635 | | | 4.750%, 01/15/22 | | | 1,692 | |
| | 1,455 | | | 5.400%, 02/01/43 | | | 1,415 | |
| | 2,670 | | | 6.000%, 08/15/40 | | | 2,747 | |
| | 2,775 | | | 6.125%, 10/01/35 | | | 2,935 | |
| | 355 | | | 8.000%, 06/01/21 (e) | | | 387 | |
| | 1,383 | | | 8.500%, 06/01/24 (e) | | | 1,602 | |
| | 6,955 | | | TransCanada PipeLines Ltd., 4.625%, 03/01/34 | | | 7,423 | |
| | | | Transcanada Trust, | | | | |
| | 9,359 | | | Series 16-A, VAR, 5.875%, 08/15/76 | | | 10,061 | |
| | 13,375 | | | VAR, 5.300%, 03/15/77 | | | 13,459 | |
| | 9,855 | | | VAR, 5.625%, 05/20/75 | | | 10,298 | |
| | 1,631 | | | Trinidad Drilling Ltd., 6.625%, 02/15/25 (e) | | | 1,643 | |
| | | | Videotron Ltd., | | | | |
| | 1,365 | | | 5.000%, 07/15/22 | | | 1,447 | |
| | 2,495 | | | 5.125%, 04/15/27 (e) | | | 2,544 | |
| | 7,328 | | | 5.375%, 06/15/24 (e) | | | 7,722 | |
| | | | | | | | |
| | | | | | | 196,570 | |
| | | | | | | | |
| | | | Chile — 0.0% (g) | |
| | 2,140 | | | Cencosud SA, Reg. S, 5.500%, 01/20/21 | | | 2,319 | |
| | 1,350 | | | Empresa Electrica Angamos SA, Reg. S, 4.875%, 05/25/29 | | | 1,364 | |
| | | | | | | | |
| | | | | | | 3,683 | |
| | | | | | | | |
| | | | Colombia — 0.0% (g) | |
| | | | Ecopetrol SA, | | | | |
| | 2,182 | | | 7.375%, 09/18/43 | | | 2,351 | |
| | | | | | | | |
| | | | Croatia — 0.0% (g) | |
| | 1,340 | | | Hrvatska Elektroprivreda, 5.875%, 10/23/22 (e) | | | 1,437 | |
| | | | | | | | |
| | | | Finland — 0.0% (g) | |
| | | | Nokia OYJ, | | | | |
| | 904 | | | 5.375%, 05/15/19 | | | 958 | |
| | 1,452 | | | 6.625%, 05/15/39 | | | 1,588 | |
| | | | | | | | |
| | | | | | | 2,546 | |
| | | | | | | | |
| | | | France — 0.5% | |
| | | | Credit Agricole SA, | | | | |
| | 12,935 | | | VAR, 6.625%, 09/23/19 (e) (x) (y) | | | 13,207 | |
| | 4,435 | | | VAR, 8.125%, 12/23/25 (e) (x) (y) | | | 4,895 | |
| | | | SFR Group SA, | | | | |
| | 18,441 | | | 6.000%, 05/15/22 (e) | | | 19,225 | |
| | 3,730 | | | 6.250%, 05/15/24 (e) | | | 3,860 | |
| | 6,061 | | | 7.375%, 05/01/26 (e) | | | 6,379 | |
| | | | | | | | |
PRINCIPAL
AMOUNT | | | SECURITY DESCRIPTION | | VALUE | |
| | | | | | | | |
| | | | France — continued | |
| | 12,990 | | | Societe Generale SA, VAR, 7.375%, 09/13/21 (e) (x) (y) | | | 13,737 | |
| | | | | | | | |
| | | | | | | 61,303 | |
| | | | | | | | |
| | | | Georgia — 0.0% (g) | |
| | 988 | | | Georgian Railway JSC, Reg. S, 7.750%, 07/11/22 | | | 1,087 | |
| | | | | | | | |
| | | | Germany — 0.2% | |
| | | | Fresenius Medical Care US Finance II, Inc., | | | | |
| | 860 | | | 4.125%, 10/15/20 (e) | | | 884 | |
| | 1,160 | | | 4.750%, 10/15/24 (e) | | | 1,186 | |
| | 1,152 | | | 5.875%, 01/31/22 (e) | | | 1,263 | |
| | 400 | | | 6.500%, 09/15/18 (e) | | | 422 | |
| | 1,850 | | | Fresenius Medical Care US Finance, Inc., 5.750%, 02/15/21 (e) | | | 2,021 | |
| | 1,630 | | | IHO Verwaltungs GmbH, 4.500% (cash), 09/15/23 (e) (v) | | | 1,628 | |
| | | | Schaeffler Finance BV, | | | | |
| | 1,750 | | | 4.250%, 05/15/21 (e) | | | 1,789 | |
| | 2,755 | | | 4.750%, 05/15/23 (e) | | | 2,872 | |
| | 2,988 | | | Unitymedia GmbH, 6.125%, 01/15/25 (e) | | | 3,190 | |
| | 2,888 | | | Unitymedia Hessen GmbH & Co. KG, 5.500%, 01/15/23 (e) | | | 3,007 | |
| | | | ZF North America Capital, Inc., | | | | |
| | 8,445 | | | 4.500%, 04/29/22 (e) | | | 8,867 | |
| | 2,678 | | | 4.750%, 04/29/25 (e) | | | 2,785 | |
| | | | | | | | |
| | | | | | | 29,914 | |
| | | | | | | | |
| | | | Guatemala — 0.0% (g) | |
| | 1,470 | | | Comcel Trust via Comunicaciones Celulares SA, Reg. S, 6.875%, 02/06/24 | | | 1,565 | |
| | | | | | | | |
| | | | Hungary — 0.0% (g) | |
| | | | MFB Magyar Fejlesztesi Bank Zrt., | | | | |
| | 2,420 | | | 6.250%, 10/21/20 (e) | | | 2,665 | |
| | 2,250 | | | MOL Group Finance SA, Reg. S, 6.250%, 09/26/19 | | | 2,433 | |
| | | | | | | | |
| | | | | | | 5,098 | |
| | | | | | | | |
| | | | India — 0.0% (g) | |
| | 1,680 | | | Bharti Airtel International Netherlands BV, Reg. S, 5.125%, 03/11/23 | | | 1,770 | |
| | 1,030 | | | Reliance Holding USA, Inc., Reg. S, 5.400%, 02/14/22 | | | 1,127 | |
| | | | | | | | |
| | | | | | | 2,897 | |
| | | | | | | | |
| | | | Indonesia — 0.1% | |
| | 1,400 | | | Majapahit Holding BV, Reg. S, 7.750%, 01/20/20 | | | 1,570 | |
SEE NOTES TO FINANCIAL STATEMENTS.
| | | | | | | | |
| | | |
| APRIL 30, 2017 | | J.P. MORGAN FUNDS | | | | | 63 | |
JPMorgan Income Builder Fund
SCHEDULE OF PORTFOLIO INVESTMENTS
AS OF APRIL 30, 2017 (Unaudited) (continued)
(Amounts in U.S. Dollars, unless otherwise noted)
(Amounts in thousands)
| | | | | | | | |
PRINCIPAL
AMOUNT | | | SECURITY DESCRIPTION | | VALUE | |
| | Corporate Bonds — continued | |
| | | | Indonesia — continued | |
| | | | Pertamina Persero PT, | | | | |
| | 3,040 | | | Reg. S, 5.250%, 05/23/21 | | | 3,245 | |
| | 3,810 | | | Reg. S, 6.450%, 05/30/44 | | | 4,296 | |
| | | | | | | | |
| | | | | | | 9,111 | |
| | | | | | | | |
| | | | Ireland — 0.2% | |
| | | | Ardagh Packaging Finance plc, | | | | |
| | 6,560 | | | 6.000%, 02/15/25 (e) | | | 6,781 | |
| | 5,875 | | | 7.250%, 05/15/24 (e) | | | 6,397 | |
| | 425 | | | Fly Leasing Ltd., 6.750%, 12/15/20 | | | 446 | |
| | 4,095 | | | James Hardie International Finance Ltd., 5.875%, 02/15/23 (e) | | | 4,290 | |
| | | | Park Aerospace Holdings Ltd., | | | | |
| | 1,402 | | | 5.250%, 08/15/22 (e) | | | 1,481 | |
| | 1,454 | | | 5.500%, 02/15/24 (e) | | | 1,537 | |
| | | | | | | | |
| | | | | | | 20,932 | |
| | | | | | | | |
| | | | Israel — 0.1% | |
| | 10,210 | | | Teva Pharmaceutical Finance Netherlands III BV, 4.100%, 10/01/46 | | | 8,696 | |
| | | | | | | | |
| | | | Italy — 0.2% | |
| | 8,600 | | | Enel SpA, VAR, 8.750%, 09/24/73 (e) | | | 10,062 | |
| | 2,000 | | | Telecom Italia SpA, 5.303%, 05/30/24 (e) | | | 2,070 | |
| | | | Wind Acquisition Finance SA, | | | | |
| | 4,500 | | | 4.750%, 07/15/20 (e) | | | 4,573 | |
| | 4,500 | | | 7.375%, 04/23/21 (e) | | | 4,680 | |
| | | | | | | | |
| | | | | | | 21,385 | |
| | | | | | | | |
| | | | Jamaica — 0.0% (g) | |
| | 1,530 | | | Digicel Group Ltd., Reg. S, 7.125%, 04/01/22 | | | 1,276 | |
| | | | | | | | |
| | | | Japan — 0.0% (g) | |
| | 3,649 | | | SoftBank Group Corp., 4.500%, 04/15/20 (e) | | | 3,793 | |
| | | | | | | | |
| | | | Kazakhstan — 0.1% | |
| | 1,325 | | | Kazakhstan Temir Zholy Finance BV, Reg. S, 6.950%, 07/10/42 | | | 1,395 | |
| | | | KazMunayGas National Co. JSC, | | | | |
| | 3,396 | | | Reg. S, 6.375%, 04/09/21 | | | 3,727 | |
| | 1,100 | | | Reg. S, 9.125%, 07/02/18 | | | 1,181 | |
| | | | | | | | |
| | | | | | | 6,303 | |
| | | | | | | | |
| | | | Luxembourg — 1.0% | |
| | | | Altice Financing SA, | | | | |
| | 724 | | | 6.500%, 01/15/22 (e) | | | 750 | |
| | 8,062 | | | 6.625%, 02/15/23 (e) | | | 8,536 | |
| | 7,885 | | | 7.500%, 05/15/26 (e) | | | 8,516 | |
| | 200 | | | Altice Finco SA, 7.625%, 02/15/25 (e) | | | 205 | |
| | | | | | | | |
PRINCIPAL
AMOUNT | | | SECURITY DESCRIPTION | | VALUE | |
| | | | | | | | |
| | | | Luxembourg — continued | |
| | | | Altice Luxembourg SA, | | | | |
| | 415 | | | 7.625%, 02/15/25 (e) | | | 443 | |
| | 13,763 | | | 7.750%, 05/15/22 (e) | | | 14,623 | |
| | | | ArcelorMittal, | | | | |
| | 4,303 | | | 6.125%, 06/01/25 | | | 4,829 | |
| | 17,202 | | | 7.000%, 02/25/22 | | | 19,503 | |
| | 927 | | | 7.500%, 03/01/41 | | | 1,045 | |
| | 2,770 | | | 7.750%, 10/15/39 (w) | | | 3,165 | |
| | 6,920 | | | INEOS Group Holdings SA, 5.625%, 08/01/24 (e) | | | 7,041 | |
| | | | Intelsat Jackson Holdings SA, | | | | |
| | 9,453 | | | 5.500%, 08/01/23 | | | 8,070 | |
| | 1,772 | | | 7.250%, 04/01/19 | | | 1,708 | |
| | 27,267 | | | 7.250%, 10/15/20 | | | 25,527 | |
| | 9,475 | | | 7.500%, 04/01/21 | | | 8,670 | |
| | 6,115 | | | 8.000%, 02/15/24 (e) | | | 6,597 | |
| | | | | | | | |
| | | | | | | 119,228 | |
| | | | | | | | |
| | | | Malaysia — 0.0% (g) | |
| | 1,200 | | | Petronas Capital Ltd., Reg. S, 4.500%, 03/18/45 | | | 1,256 | |
| | | | | | | | |
| | | | Mexico — 0.4% | |
| | | | Alfa SAB de CV, | | | | |
| | 2,412 | | | 6.875%, 03/25/44 (e) | | | 2,521 | |
| | 2,700 | | | Reg. S, 5.250%, 03/25/24 | | | 2,865 | |
| | 600 | | | Banco Nacional de Comercio Exterior SNC, VAR, 3.800%, 08/11/26 (e) | | | 589 | |
| | 2,600 | | | BBVA Bancomer SA, Reg. S, 6.750%, 09/30/22 | | | 2,940 | |
| | | | Cemex Finance LLC, | | | | |
| | 995 | | | 6.000%, 04/01/24 (e) | | | 1,052 | |
| | 4,585 | | | 9.375%, 10/12/22 (e) | | | 4,910 | |
| | | | Cemex SAB de CV, | | | | |
| | 3,104 | | | 5.700%, 01/11/25 (e) | | | 3,261 | |
| | 8,730 | | | 6.125%, 05/05/25 (e) | | | 9,374 | |
| | 4,200 | | | 7.750%, 04/16/26 (e) | | | 4,764 | |
| | 1,200 | | | Grupo KUO SAB De CV, Reg. S, 6.250%, 12/04/22 | | | 1,229 | |
| | | | Petroleos Mexicanos, | | | | |
| | 2,749 | | | 5.625%, 01/23/46 | | | 2,444 | |
| | 1,250 | | | 6.375%, 02/04/21 | | | 1,367 | |
| | 5,050 | | | 6.625%, 06/15/35 | | | 5,233 | |
| | | | | | | | |
| | | | | | | 42,549 | |
| | | | | | | | |
SEE NOTES TO FINANCIAL STATEMENTS.
| | | | | | |
| | | |
| 64 | | | | J.P. MORGAN FUNDS | | APRIL 30, 2017 |
| | | | | | | | |
PRINCIPAL
AMOUNT | | | SECURITY DESCRIPTION | | VALUE | |
| | Corporate Bonds — continued | |
| | | | Morocco — 0.0% (g) | |
| | | | OCP SA, | | | | |
| | 1,720 | | | Reg. S, 5.625%, 04/25/24 | | | 1,842 | |
| | 1,171 | | | Reg. S, 6.875%, 04/25/44 | | | 1,265 | |
| | | | | | | | |
| | | | | | | 3,107 | |
| | | | | | | | |
| | | | Netherlands — 0.3% | |
| | 4,600 | | | Bluewater Holding BV, Reg. S, 10.000%, 12/10/19 (e) | | | 3,887 | |
| | 2,185 | | | Constellium NV, 6.625%, 03/01/25 (e) | | | 2,152 | |
| | | | NXP BV, | | | | |
| | 2,905 | | | 4.125%, 06/01/21 (e) | | | 3,039 | |
| | 2,665 | | | 4.625%, 06/15/22 (e) | | | 2,862 | �� |
| | 5,525 | | | 4.625%, 06/01/23 (e) | | | 5,946 | |
| | 6,874 | | | 5.750%, 03/15/23 (e) | | | 7,252 | |
| | 1,620 | | | Shell International Finance BV, 4.375%, 05/11/45 | | | 1,663 | |
| | 8,370 | | | UPCB Finance IV Ltd., 5.375%, 01/15/25 (e) | | | 8,517 | |
| | 1,425 | | | Ziggo Bond Finance BV, 5.875%, 01/15/25 (e) | | | 1,462 | |
| | 4,134 | | | Ziggo Secured Finance BV, 5.500%, 01/15/27 (e) | | | 4,248 | |
| | | | | | | | |
| | | | | | | 41,028 | |
| | | | | | | | |
| | | | New Zealand — 0.1% | |
| | | | Reynolds Group Issuer, Inc., | | | | |
| | 1,700 | | | 5.125%, 07/15/23 (e) | | | 1,772 | |
| | 7,885 | | | 5.750%, 10/15/20 | | | 8,122 | |
| | 3,079 | | | 6.875%, 02/15/21 | | | 3,163 | |
| | 1,745 | | | 7.000%, 07/15/24 (e) | | | 1,878 | |
| | | | | | | | |
| | | | | | | 14,935 | |
| | | | | | | | |
| | | | Nigeria — 0.0% (g) | |
| | 2,631 | | | Sea Trucks Group Ltd., Reg. S, 9.000%, 03/26/18 (d) (e) | | | 974 | |
| | | | | | | | |
| | | | Peru — 0.1% | |
| | 1,850 | | | Banco de Credito del Peru, Reg. S, 4.250%, 04/01/23 | | | 1,961 | |
| | 1,800 | | | BBVA Banco Continental SA, Reg. S, 5.000%, 08/26/22 | | | 1,943 | |
| | 1,124 | | | Consorcio Transmantaro SA, Reg. S, 4.375%, 05/07/23 | | | 1,141 | |
| | 1,700 | | | Southern Copper Corp., 5.875%, 04/23/45 | | | 1,784 | |
| | | | | | | | |
| | | | | | | 6,829 | |
| | | | | | | | |
| | | | Russia — 0.1% | |
| | 1,100 | | | Gazprom OAO Via Gaz Capital SA, Reg. S, 9.250%, 04/23/19 | | | 1,233 | |
| | | | | | | | |
PRINCIPAL
AMOUNT | | | SECURITY DESCRIPTION | | VALUE | |
| | | | | | | | |
| | | | Russia — continued | |
| | 550 | | | Russian Agricultural Bank OJSC Via RSHB Capital SA, Reg. S, 7.750%, 05/29/18 | | | 581 | |
| | 1,100 | | | Russian Railways via RZD Capital plc, Reg. S, 5.700%, 04/05/22 | | | 1,181 | |
| | 2,150 | | | Vnesheconombank Via VEB Finance plc, Reg. S, 5.942%, 11/21/23 | | | 2,306 | |
| | 1,081 | | | VTB Bank OJSC Via VTB Capital SA, Reg. S, 6.950%, 10/17/22 | | | 1,177 | |
| | | | | | | | |
| | | | | | | 6,478 | |
| | | | | | | | |
| | | | South Korea — 0.0% (g) | |
| | 3,805 | | | MagnaChip Semiconductor Corp., 6.625%, 07/15/21 | | | 3,482 | |
| | | | | | | | |
| | | | Spain — 0.2% | |
| | | | Banco Bilbao Vizcaya Argentaria SA, | | | | |
| | EUR 1,000 | | | Reg. S, VAR, 6.750%, 02/18/20 (x) (y) | | | 1,126 | |
| | EUR 1,800 | | | Reg. S, VAR, 7.000%, 02/19/19 (x) (y) | | | 2,019 | |
| | 2,000 | | | Reg. S, VAR, 9.000%, 05/09/18 (x) (y) | | | 2,109 | |
| | 11,870 | | | Telefonica Emisiones SAU, 5.213%, 03/08/47 | | | 12,276 | |
| | GBP 4,400 | | | Telefonica Europe BV, Reg. S, VAR, 6.750%, 11/26/20 (x) (y) | | | 6,170 | |
| | | | | | | | |
| | | | | | | 23,700 | |
| | | | | | | | |
| | | | Sweden — 0.1% | |
| | 5,000 | | | Skandinaviska Enskilda Banken AB, Reg. S, VAR, 5.750%, 05/13/20 (x) (y) | | | 5,150 | |
| | 5,000 | | | Svenska Handelsbanken AB, Reg. S, VAR, 5.250%, 03/01/21 (x) (y) | | | 5,082 | |
| | 5,000 | | | Swedbank AB, Reg. S, VAR, 5.500%, 03/17/20 (x) (y) | | | 5,106 | |
| | | | | | | | |
| | | | | | | 15,338 | |
| | | | | | | | |
| | | | Switzerland — 0.2% | |
| | | | Credit Suisse Group AG, | | | | |
| | 6,385 | | | VAR, 6.250%, 12/18/24 (e) (x) (y) | | | 6,656 | |
| | 2,646 | | | VAR, 7.500%, 12/11/23 (e) (x) (y) | | | 2,935 | |
| | | | UBS Group AG, | | | | |
| | 5,000 | | | Reg. S, VAR, 6.875%, 08/07/25 (x) (y) | | | 5,275 | |
| | 5,000 | | | Reg. S, VAR, 7.000%, 02/19/25 (x) (y) | | | 5,501 | |
| | 2,000 | | | Reg. S, VAR, 7.125%, 02/19/20 (x) (y) | | | 2,122 | |
| | | | | | | | |
| | | | | | | 22,489 | |
| | | | | | | | |
| | | | United Arab Emirates — 0.1% | |
| | 500 | | | DP World Ltd., Reg. S, 6.850%, 07/02/37 | | | 588 | |
| | 5,170 | | | Shelf Drilling Holdings Ltd., 9.500%, 11/02/20 (e) | | | 5,144 | |
| | | | | | | | |
| | | | | | | 5,732 | |
| | | | | | | | |
SEE NOTES TO FINANCIAL STATEMENTS.
| | | | | | | | |
| | | |
| APRIL 30, 2017 | | J.P. MORGAN FUNDS | | | | | 65 | |
JPMorgan Income Builder Fund
SCHEDULE OF PORTFOLIO INVESTMENTS
AS OF APRIL 30, 2017 (Unaudited) (continued)
(Amounts in U.S. Dollars, unless otherwise noted)
(Amounts in thousands)
| | | | | | | | |
PRINCIPAL
AMOUNT | | | SECURITY DESCRIPTION | | VALUE | |
| | Corporate Bonds — continued | |
| | | | United Kingdom — 0.8% | |
| | 3,075 | | | Afren plc, Reg. S, 6.625%, 12/09/20 (d) | | | 1 | |
| | | | Anglo American Capital plc, | | | | |
| | 775 | | | 3.625%, 05/14/20 (e) | | | 785 | |
| | 3,197 | | | 4.125%, 09/27/22 (e) | | | 3,261 | |
| | 739 | | | 4.450%, 09/27/20 (e) | | | 768 | |
| | 1,362 | | | 4.750%, 04/10/27 (e) | | | 1,408 | |
| | 3,646 | | | 4.875%, 05/14/25 (e) | | | 3,801 | |
| | | | Ashtead Capital, Inc., | | | | |
| | 3,560 | | | 5.625%, 10/01/24 (e) | | | 3,804 | |
| | 7,640 | | | 6.500%, 07/15/22 (e) | | | 7,936 | |
| | 11,384 | | | Fiat Chrysler Automobiles NV, 5.250%, 04/15/23 | | | 11,697 | |
| | | | HSBC Holdings plc, | | | | |
| | 4,840 | | | VAR, 6.375%, 09/17/24 (x) (y) | | | 5,009 | |
| | 6,000 | | | VAR, 6.375%, 03/30/25 (x) (y) | | | 6,270 | |
| | 6,852 | | | VAR, 6.875%, 06/01/21 (x) (y) | | | 7,421 | |
| | | | KCA Deutag UK Finance plc, | | | | |
| | 1,669 | | | 7.250%, 05/15/21 (e) | | | 1,581 | |
| | 2,560 | | | 9.875%, 04/01/22 (e) | | | 2,631 | |
| | 12,498 | | | Lloyds Banking Group plc, VAR, 7.500%, 06/27/24 (x) (y) | | | 13,467 | |
| | GBP 3,809 | | | Nationwide Building Society, Reg. S, VAR, 6.875%, 06/20/19 (x) (y) | | | 5,106 | |
| | | | Noble Holding International Ltd., | | | | |
| | 169 | | | 5.250%, 03/15/42 | | | 111 | |
| | 1,121 | | | 6.200%, 08/01/40 | | | 790 | |
| | 1,393 | | | 7.750%, 01/15/24 | | | 1,271 | |
| | | | Royal Bank of Scotland Group plc, | | | | |
| | 1,610 | | | 5.125%, 05/28/24 | | | 1,655 | |
| | 14,647 | | | 6.125%, 12/15/22 | | | 15,777 | |
| | | | Virgin Media Finance plc, | | | | |
| | 1,400 | | | 6.000%, 10/15/24 (e) | | | 1,467 | |
| | 2,548 | | | 6.375%, 04/15/23 (e) | | | 2,672 | |
| | | | Virgin Media Secured Finance plc, | | | | |
| | 975 | | | 5.250%, 01/15/26 (e) | | | 987 | |
| | 1,300 | | | 5.500%, 01/15/25 (e) | | | 1,334 | |
| | 1,100 | | | 5.500%, 08/15/26 (e) | | | 1,124 | |
| | | | | | | | |
| | | | | | | 102,134 | |
| | | | | | | | |
| | | | United States — 36.3% | |
| | | | 21st Century Fox America, Inc., | | | | |
| | 6,795 | | | 4.750%, 09/15/44 | | | 6,915 | |
| | 4,795 | | | 4.950%, 10/15/45 | | | 5,031 | |
| | 5,720 | | | Abbott Laboratories, 4.900%, 11/30/46 | | | 5,983 | |
| | | | | | | | |
PRINCIPAL
AMOUNT | | | SECURITY DESCRIPTION | | VALUE | |
| | | | | | | | |
| | | | United States — continued | |
| | | | AbbVie, Inc., | | | | |
| | 5,040 | | | 4.450%, 05/14/46 | | | 4,894 | |
| | 3,359 | | | 4.700%, 05/14/45 | | | 3,381 | |
| | | | Acadia Healthcare Co., Inc., | | | | |
| | 520 | | | 5.125%, 07/01/22 | | | 526 | |
| | 700 | | | 5.625%, 02/15/23 | | | 725 | |
| | 528 | | | 6.125%, 03/15/21 | | | 541 | |
| | 3,004 | | | 6.500%, 03/01/24 | | | 3,184 | |
| | 3,495 | | | ACCO Brands Corp., 5.250%, 12/15/24 (e) | | | 3,600 | |
| | 4,931 | | | ACE Cash Express, Inc., 11.000%,
02/01/19 (e) | | | 4,820 | |
| | 3,420 | | | ACI Worldwide, Inc., 6.375%, 08/15/20 (e) | | | 3,510 | |
| | 7,310 | | | Actavis Funding SCS, 4.850%, 06/15/44 | | | 7,445 | |
| | 3,720 | | | Adient Global Holdings Ltd., 4.875%, 08/15/26 (e) | | | 3,729 | |
| | | | ADT Corp. (The), | | | | |
| | 5,130 | | | 3.500%, 07/15/22 | | | 4,963 | |
| | 10,862 | | | 4.125%, 06/15/23 | | | 10,591 | |
| | 519 | | | Advanced Micro Devices, Inc., 7.000%, 07/01/24 | | | 552 | |
| | 870 | | | AdvancePierre Foods Holdings, Inc., 5.500%, 12/15/24 (e) | | | 970 | |
| | | | AECOM, | | | | |
| | 4,359 | | | 5.125%, 03/15/27 (e) | | | 4,364 | |
| | 9,398 | | | 5.875%, 10/15/24 | | | 10,084 | |
| | | | AES Corp., | | | | |
| | 1,900 | | | 4.875%, 05/15/23 | | | 1,919 | |
| | 770 | | | 5.500%, 03/15/24 | | | 791 | |
| | 5,125 | | | 5.500%, 04/15/25 | | | 5,253 | |
| | 555 | | | 6.000%, 05/15/26 | | | 585 | |
| | 3,731 | | | Ahern Rentals, Inc., 7.375%, 05/15/23 (e) | | | 3,209 | |
| | 4,805 | | | Air Medical Group Holdings, Inc., 6.375%, 05/15/23 (e) | | | 4,685 | |
| | 1,200 | | | Airxcel, Inc., 8.500%, 02/15/22 (e) | | | 1,236 | |
| | | | AK Steel Corp., | | | | |
| | 2,858 | | | 7.000%, 03/15/27 | | | 2,826 | |
| | 3,020 | | | 7.500%, 07/15/23 | | | 3,288 | |
| | | | Albertsons Cos. LLC, | | | | |
| | 5,637 | | | 5.750%, 03/15/25 (e) | | | 5,482 | |
| | 9,798 | | | 6.625%, 06/15/24 (e) | | | 10,018 | |
| | | | Alcoa Nederland Holding BV, | | | | |
| | 2,996 | | | 6.750%, 09/30/24 (e) | | | 3,278 | |
| | 900 | | | 7.000%, 09/30/26 (e) | | | 994 | |
| | | | Alere, Inc., | | | | |
| | 497 | | | 6.375%, 07/01/23 (e) | | | 541 | |
| | 3,955 | | | 6.500%, 06/15/20 | | | 4,044 | |
SEE NOTES TO FINANCIAL STATEMENTS.
| | | | | | |
| | | |
| 66 | | | | J.P. MORGAN FUNDS | | APRIL 30, 2017 |
| | | | | | | | |
PRINCIPAL
AMOUNT | | | SECURITY DESCRIPTION | | VALUE | |
| | Corporate Bonds — continued | |
| | | | United States — continued | |
| | | | Aleris International, Inc., | | | | |
| | 240 | | | 7.875%, 11/01/20 | | | 238 | |
| | 1,505 | | | 9.500%, 04/01/21 (e) | | | 1,614 | |
| | | | Alliance Data Systems Corp., | | | | |
| | 1,939 | | | 5.375%, 08/01/22 (e) | | | 1,958 | |
| | 970 | | | 5.875%, 11/01/21 (e) | | | 1,004 | |
| | 19,105 | | | Allstate Corp. (The), VAR, 5.750%, 08/15/53 | | | 20,777 | |
| | | | Ally Financial, Inc., | | | | |
| | 3,269 | | | 4.125%, 02/13/22 | | | 3,289 | |
| | 4,100 | | | 4.250%, 04/15/21 | | | 4,192 | |
| | 20,407 | | | 4.625%, 05/19/22 | | | 20,815 | |
| | 11,685 | | | 4.625%, 03/30/25 | | | 11,532 | |
| | 3,835 | | | 5.125%, 09/30/24 | | | 3,917 | |
| | 2,855 | | | 5.750%, 11/20/25 | | | 2,923 | |
| | 2,760 | | | 8.000%, 11/01/31 | | | 3,284 | |
| | 1,740 | | | Alta Mesa Holdings LP, 7.875%, 12/15/24 (e) | | | 1,827 | |
| | | | Altice US Finance I Corp., | | | | |
| | 5,715 | | | 5.375%, 07/15/23 (e) | | | 5,965 | |
| | 3,703 | | | 5.500%, 05/15/26 (e) | | | 3,828 | |
| | | | AMC Entertainment Holdings, Inc., | | | | |
| | 6,435 | | | 5.750%, 06/15/25 | | | 6,636 | |
| | 1,000 | | | 5.875%, 02/15/22 | | | 1,045 | |
| | 875 | | | 5.875%, 11/15/26 (e) | | | 891 | |
| | 1,079 | | | 6.125%, 05/15/27 (e) | | | 1,102 | |
| | | | AMC Networks, Inc., | | | | |
| | 2,100 | | | 4.750%, 12/15/22 | | | 2,142 | |
| | 9,150 | | | 5.000%, 04/01/24 | | | 9,270 | |
| | 1,620 | | | American Airlines Group, Inc., 5.500%, 10/01/19 (e) | | | 1,693 | |
| | | | American Axle & Manufacturing, Inc., | | | | |
| | 1,600 | | | 6.250%, 03/15/21 | | | 1,644 | |
| | 6,407 | | | 6.250%, 04/01/25 (e) | | | 6,375 | |
| | 6,261 | | | 6.500%, 04/01/27 (e) | | | 6,214 | |
| | 2,184 | | | 6.625%, 10/15/22 | | | 2,250 | |
| | 3,450 | | | 7.750%, 11/15/19 | | | 3,799 | |
| | | | American Express Co., | | | | |
| | 18,070 | | | Series C, VAR, 4.900%, 03/15/20 (x) (y) | | | 18,350 | |
| | 5,575 | | | VAR, 5.200%, 11/15/19 (x) (y) | | | 5,777 | |
| | 1,946 | | | American Greetings Corp., 7.875%, 02/15/25 (e) | | | 2,077 | |
| | | | American International Group, Inc., | | | | |
| | 4,240 | | | 4.500%, 07/16/44 | | | 4,147 | |
| | 8,805 | | | 4.800%, 07/10/45 | | | 9,070 | |
| | | | AmeriGas Partners LP, | | | | |
| | 4,278 | | | 5.500%, 05/20/25 | | | 4,321 | |
| | 1,314 | | | 5.625%, 05/20/24 | | | 1,337 | |
| | | | | | | | |
PRINCIPAL
AMOUNT | | | SECURITY DESCRIPTION | | VALUE | |
| | | | | | | | |
| | | | United States — continued | |
| | 1,309 | | | 5.750%, 05/20/27 | | | 1,312 | |
| | 1,039 | | | 5.875%, 08/20/26 | | | 1,055 | |
| | 4,850 | | | Amgen, Inc., 4.400%, 05/01/45 | | | 4,790 | |
| | | | Amkor Technology, Inc., | | | | |
| | 8,949 | | | 6.375%, 10/01/22 | | | 9,329 | |
| | 4,556 | | | 6.625%, 06/01/21 | | | 4,642 | |
| | 1,312 | | | AMN Healthcare, Inc., 5.125%, 10/01/24 (e) | | | 1,325 | |
| | 805 | | | Analog Devices, Inc., 4.500%, 12/05/36 | | | 814 | |
| | 5,026 | | | Anixter, Inc., 5.500%, 03/01/23 | | | 5,328 | |
| | 2,380 | | | Antero Midstream Partners LP, 5.375%, 09/15/24 (e) | | | 2,434 | |
| | | | Antero Resources Corp., | | | | |
| | 1,311 | | | 5.000%, 03/01/25 (e) | | | 1,291 | |
| | 9,240 | | | 5.125%, 12/01/22 | | | 9,379 | |
| | 3,548 | | | 5.375%, 11/01/21 | | | 3,663 | |
| | 4,205 | | | 5.625%, 06/01/23 | | | 4,326 | |
| | | | Anthem, Inc., | | | | |
| | 3,295 | | | 4.650%, 08/15/44 | | | 3,406 | |
| | 2,280 | | | 5.100%, 01/15/44 | | | 2,494 | |
| | 2,565 | | | Arch Capital Finance LLC, 5.031%, 12/15/46 | | | 2,802 | |
| | 930 | | | Archrock Partners LP, 6.000%, 10/01/22 | | | 928 | |
| | | | Arconic, Inc., | | | | |
| | 9,295 | | | 5.125%, 10/01/24 | | | 9,736 | |
| | 3,092 | | | 5.870%, 02/23/22 | | | 3,335 | |
| | 1,469 | | | 6.750%, 01/15/28 | | | 1,627 | |
| | 8,042 | | | Ashland LLC, 4.750%, 08/15/22 | | | 8,384 | |
| | | | AT&T, Inc., | | | | |
| | 5,380 | | | 4.350%, 06/15/45 | | | 4,773 | |
| | 8,215 | | | 4.750%, 05/15/46 | | | 7,712 | |
| | 1,175 | | | 5.150%, 03/15/42 | | | 1,164 | |
| | 2,680 | | | 5.450%, 03/01/47 | | | 2,761 | |
| | 4,210 | | | 5.650%, 02/15/47 | | | 4,447 | |
| | | | Avaya, Inc., | | | | |
| | 5,464 | | | 7.000%, 04/01/19 (d) (e) | | | 4,576 | |
| | 2,160 | | | 10.500%, 03/01/21 (d) (e) | | | 292 | |
| | | | Avis Budget Car Rental LLC, | | | | |
| | 6,050 | | | 5.500%, 04/01/23 | | | 5,959 | |
| | 5,730 | | | 6.375%, 04/01/24 (e) | | | 5,723 | |
| | 3,230 | | | Axalta Coating Systems LLC, 4.875%, 08/15/24 (e) | | | 3,345 | |
| | | | B&G Foods, Inc., | | | | |
| | 3,164 | | | 4.625%, 06/01/21 | | | 3,222 | |
| | 1,764 | | | 5.250%, 04/01/25 | | | 1,806 | |
| | | | Ball Corp., | | | | |
| | 905 | | | 5.000%, 03/15/22 | | | 966 | |
SEE NOTES TO FINANCIAL STATEMENTS.
| | | | | | | | |
| | | |
| APRIL 30, 2017 | | J.P. MORGAN FUNDS | | | | | 67 | |
JPMorgan Income Builder Fund
SCHEDULE OF PORTFOLIO INVESTMENTS
AS OF APRIL 30, 2017 (Unaudited) (continued)
(Amounts in U.S. Dollars, unless otherwise noted)
(Amounts in thousands)
| | | | | | | | |
PRINCIPAL
AMOUNT | | | SECURITY DESCRIPTION | | VALUE | |
| | Corporate Bonds — continued | |
| | | | United States — continued | |
| | 1,962 | | | 5.250%, 07/01/25 | | | 2,119 | |
| | | | Bank of America Corp., | | | | |
| | 13,619 | | | Series K, VAR, 8.000%, 01/30/18 (x) (y) | | | 14,130 | |
| | 14,315 | | | Series M, VAR, 8.125%, 05/15/18 (x) (y) | | | 14,995 | |
| | 23,045 | | | Series V, VAR, 5.125%, 06/17/19 (x) (y) | | | 23,160 | |
| | 7,015 | | | Series U, VAR, 5.200%, 06/01/23 (x) (y) | | | 7,024 | |
| | 11,220 | | | Series X, VAR, 6.250%, 09/05/24 (x) (y) | | | 12,034 | |
| | 13,130 | | | Series Z, VAR, 6.500%, 10/23/24 (x) (y) | | | 14,591 | |
| | 15,338 | | | Series AA, VAR, 6.100%, 03/17/25 (x) (y) | | | 16,431 | |
| | | | Bank of New York Mellon Corp. (The), | | | | |
| | 9,636 | | | Series D, VAR, 4.500%, 06/20/23 (x) (y) | | | 9,332 | |
| | 20,375 | | | Series E, VAR, 4.950%, 06/20/20 (x) (y) | | | 21,190 | |
| | 15,551 | | | Series F, VAR, 4.625%, 09/20/26 (x) (y) | | | 15,318 | |
| | 5,350 | | | Belden, Inc., 5.500%, 09/01/22 (e) | | | 5,484 | |
| | | | Berry Plastics Corp., | | | | |
| | 1,875 | | | 5.125%, 07/15/23 | | | 1,950 | |
| | 500 | | | 6.000%, 10/15/22 | | | 531 | |
| | 5,270 | | | Biogen, Inc., 5.200%, 09/15/45 | | | 5,717 | |
| | 6,262 | | | Blue Cube Spinco, Inc., 10.000%, 10/15/25 | | | 7,718 | |
| | 5,667 | | | Blue Racer Midstream LLC, 6.125%, 11/15/22 (e) | | | 5,802 | |
| | 3,185 | | | Boardwalk Pipelines LP, 5.950%, 06/01/26 | | | 3,561 | |
| | 920 | | | Boise Cascade Co., 5.625%, 09/01/24 (e) | | | 945 | |
| | 870 | | | Booz Allen Hamilton, Inc., 5.125%, 05/01/25 (e) | | | 882 | |
| | | | Boyd Gaming Corp., | | | | |
| | 970 | | | 6.375%, 04/01/26 | | | 1,045 | |
| | 6,460 | | | 6.875%, 05/15/23 | | | 6,953 | |
| | 3,379 | | | Bumble Bee Holdings, Inc., 9.000%, 12/15/17 (e) | | | 3,380 | |
| | 5,295 | | | BWAY Holding Co., 5.500%, 04/15/24 (e) | | | 5,355 | |
| | | | Cablevision Systems Corp., | | | | |
| | 4,472 | | | 8.000%, 04/15/20 | | | 4,995 | |
| | | | Caesars Entertainment Operating Co., Inc., | | | | |
| | 5,754 | | | 8.500%, 02/15/20 (d) | | | 7,020 | |
| | 10,622 | | | 9.125%, 02/15/20 (d) | | | 12,986 | |
| | 6,287 | | | 11.250%, 06/01/17 (d) | | | 7,497 | |
| | | | CalAtlantic Group, Inc., | | | | |
| | 682 | | | 5.250%, 06/01/26 | | | 696 | |
| | 1,240 | | | 5.375%, 10/01/22 | | | 1,324 | |
| | 2,247 | | | 5.875%, 11/15/24 | | | 2,416 | |
| | 840 | | | 8.375%, 01/15/21 | | | 987 | |
| | 1,759 | | | Caleres, Inc., 6.250%, 08/15/23 | | | 1,845 | |
| | 6,387 | | | California Resources Corp., 8.000%, 12/15/22 (e) | | | 4,918 | |
| | | | | | | | |
PRINCIPAL
AMOUNT | | | SECURITY DESCRIPTION | | VALUE | |
| | | | | | | | |
| | | | United States — continued | |
| | 2,133 | | | Callon Petroleum Co., 6.125%, 10/01/24 (e) | | | 2,234 | |
| | | | Calpine Corp., | | | | |
| | 3,015 | | | 5.250%, 06/01/26 (e) | | | 3,034 | |
| | 1,500 | | | 5.500%, 02/01/24 | | | 1,448 | |
| | 1,140 | | | 5.750%, 01/15/25 | | | 1,103 | |
| | 4,467 | | | 5.875%, 01/15/24 (e) | | | 4,690 | |
| | 2,720 | | | Camelot Finance SA, 7.875%, 10/15/24 (e) | | | 2,917 | |
| | 21,570 | | | Capital One Financial Corp., Series E, VAR, 5.550%, 06/01/20 (x) (y) | | | 22,433 | |
| | 788 | | | Capsugel SA, 7.000% (cash), 05/15/19 (e) (v) | | | 786 | |
| | 3,650 | | | CBS Corp., 4.600%, 01/15/45 | | | 3,648 | |
| | 1,090 | | | CBS Radio, Inc., 7.250%, 11/01/24 (e) | | | 1,185 | |
| | 662 | | | CCM Merger, Inc., 6.000%, 03/15/22 (e) | | | 684 | |
| | | | CCO Holdings LLC, | | | | |
| | 3,280 | | | 5.125%, 05/01/23 (e) | | | 3,424 | |
| | 2,687 | | | 5.125%, 05/01/27 (e) | | | 2,741 | |
| | 3,700 | | | 5.375%, 05/01/25 (e) | | | 3,857 | |
| | 10,530 | | | 5.500%, 05/01/26 (e) | | | 11,050 | |
| | 11,981 | | | 5.750%, 02/15/26 (e) | | | 12,726 | |
| | 33,461 | | | 5.875%, 04/01/24 (e) | | | 35,803 | |
| | | | CDW LLC, | | | | |
| | 2,242 | | | 5.000%, 09/01/23 | | | 2,304 | |
| | 875 | | | 5.500%, 12/01/24 | | | 932 | |
| | | | Cedar Fair LP, | | | | |
| | 575 | | | 5.375%, 06/01/24 | | | 595 | |
| | 490 | | | 5.375%, 04/15/27 (e) | | | 507 | |
| | 5,075 | | | Celgene Corp., 5.000%, 08/15/45 | | | 5,416 | |
| | | | Centene Corp., | | | | |
| | 100 | | | 4.750%, 05/15/22 | | | 104 | |
| | 2,850 | | | 4.750%, 01/15/25 | | | 2,896 | |
| | 2,570 | | | 5.625%, 02/15/21 | | | 2,702 | |
| | 1,745 | | | 6.125%, 02/15/24 | | | 1,880 | |
| | 2,600 | | | Central Garden & Pet Co., 6.125%, 11/15/23 | | | 2,776 | |
| | | | CenturyLink, Inc., | | | | |
| | 9,146 | | | Series T, 5.800%, 03/15/22 | | | 9,569 | |
| | 7,475 | | | Series W, 6.750%, 12/01/23 | | | 8,008 | |
| | | | CF Industries, Inc., | | | | |
| | 1,231 | | | 4.500%, 12/01/26 (e) | | | 1,251 | |
| | 2,835 | | | 4.950%, 06/01/43 | | | 2,388 | |
| | 3,705 | | | 5.150%, 03/15/34 | | | 3,353 | |
| | 8,153 | | | 5.375%, 03/15/44 | | | 7,103 | |
| | 15,945 | | | Charter Communications Operating LLC, 6.484%, 10/23/45 | | | 18,666 | |
SEE NOTES TO FINANCIAL STATEMENTS.
| | | | | | |
| | | |
| 68 | | | | J.P. MORGAN FUNDS | | APRIL 30, 2017 |
| | | | | | | | |
PRINCIPAL
AMOUNT | | | SECURITY DESCRIPTION | | VALUE | |
| | Corporate Bonds — continued | |
| | | | United States — continued | |
| | | | Chemours Co. (The), | | | | |
| | 4,500 | | | 6.625%, 05/15/23 | | | 4,815 | |
| | 1,930 | | | 7.000%, 05/15/25 | | | 2,121 | |
| | | | Cheniere Corpus Christi Holdings LLC, | | | | |
| | 4,945 | | | 5.875%, 03/31/25 (e) | | | 5,266 | |
| | 2,120 | | | 7.000%, 06/30/24 (e) | | | 2,369 | |
| | | | Chesapeake Energy Corp., | | | | |
| | 3,110 | | | 4.875%, 04/15/22 | | | 2,853 | |
| | 918 | | | 5.750%, 03/15/23 | | | 854 | |
| | 1,771 | | | 6.125%, 02/15/21 | | | 1,740 | |
| | 8,728 | | | 8.000%, 12/15/22 (e) | | | 9,197 | |
| | 2,135 | | | 8.000%, 01/15/25 (e) | | | 2,111 | |
| | 142 | | | Chukchansi Economic Development Authority, 9.750%, 05/30/20 (d) (e) | | | 58 | |
| | 2,239 | | | Cincinnati Bell, Inc., 7.000%, 07/15/24 (e) | | | 2,370 | |
| | 3,600 | | | Cinemark USA, Inc., 4.875%, 06/01/23 | | | 3,654 | |
| | | | CIT Group, Inc., | | | | |
| | 1,085 | | | 3.875%, 02/19/19 | | | 1,115 | |
| | 4,908 | | | 5.000%, 08/15/22 | | | 5,280 | |
| | 6,097 | | | 5.375%, 05/15/20 | | | 6,562 | |
| | 3,988 | | | 5.500%, 02/15/19 (e) | | | 4,212 | |
| | 1,908 | | | CITGO Petroleum Corp., 6.250%, 08/15/22 (e) | | | 1,941 | |
| | | | Citigroup, Inc., | | | | |
| | 14,725 | | | Series D, VAR, 5.350%, 05/15/23 (x) (y) | | | 14,891 | |
| | 10,670 | | | Series M, VAR, 6.300%, 05/15/24 (x) (y) | | | 11,260 | |
| | 21,330 | | | Series N, VAR, 5.800%, 11/15/19 (x) (y) | | | 22,290 | |
| | 10,010 | | | Series O, VAR, 5.875%, 03/27/20 (x) (y) | | | 10,437 | |
| | 20,570 | | | Series P, VAR, 5.950%, 05/15/25 (x) (y) | | | 21,611 | |
| | 7,020 | | | Series R, VAR, 6.125%, 11/15/20 (x) (y) | | | 7,480 | |
| | 5,475 | | | Series T, VAR, 6.250%, 08/15/26 (x) (y) | | | 5,961 | |
| | 15,330 | | | VAR, 5.950%, 01/30/23 (x) (y) | | | 16,135 | |
| | | | Claire’s Stores, Inc., | | | | |
| | 1,150 | | | 6.125%, 03/15/20 (e) | | | 466 | |
| | 11,608 | | | 9.000%, 03/15/19 (e) | | | 5,368 | |
| | | | Clean Harbors, Inc., | | | | |
| | 1,490 | | | 5.125%, 06/01/21 | | | 1,526 | |
| | 6,200 | | | 5.250%, 08/01/20 | | | 6,324 | |
| | | | Clear Channel Worldwide Holdings, Inc., | | | | |
| | 1,675 | | | Series A, 6.500%, 11/15/22 | | | 1,708 | |
| | 115 | | | Series A, 7.625%, 03/15/20 | | | 114 | |
| | 32,795 | | | Series B, 6.500%, 11/15/22 | | | 33,984 | |
| | 19,533 | | | Series B, 7.625%, 03/15/20 | | | 19,753 | |
| | | | Clearwater Paper Corp., | | | | |
| | 2,125 | | | 4.500%, 02/01/23 | | | 2,043 | |
| | 900 | | | 5.375%, 02/01/25 (e) | | | 882 | |
| | | | | | | | |
PRINCIPAL
AMOUNT | | | SECURITY DESCRIPTION | | VALUE | |
| | | | | | | | |
| | | | United States — continued | |
| | 4,235 | | | CNG Holdings, Inc., 9.375%, 05/15/20 (e) | | | 3,854 | |
| | | | CNH Industrial Capital LLC, | | | | |
| | 2,340 | | | 4.375%, 04/05/22 | | | 2,386 | |
| | 5,420 | | | 4.875%, 04/01/21 | | | 5,698 | |
| | 3,065 | | | CNO Financial Group, Inc., 5.250%, 05/30/25 | | | 3,165 | |
| | 1,434 | | | Coeur Mining, Inc., 7.875%, 02/01/21 | | | 1,484 | |
| | 2,669 | | | Cogent Communications Finance, Inc., 5.625%, 04/15/21 (e) | | | 2,749 | |
| | 5,075 | | | Cogent Communications Group, Inc., 5.375%, 03/01/22 (e) | | | 5,240 | |
| | 3,290 | | | Columbia Pipeline Group, Inc., 5.800%, 06/01/45 | | | 3,854 | |
| | | | Comcast Corp., | | | | |
| | 4,015 | | | 4.600%, 08/15/45 | | | 4,188 | |
| | 2,935 | | | 4.750%, 03/01/44 | | | 3,127 | |
| | 3,227 | | | Commercial Metals Co., 4.875%, 05/15/23 | | | 3,243 | |
| | | | CommScope Technologies LLC, | | | | |
| | 1,505 | | | 5.000%, 03/15/27 (e) | | | 1,518 | |
| | 9,502 | | | 6.000%, 06/15/25 (e) | | | 10,132 | |
| | | | CommScope, Inc., | | | | |
| | 2,355 | | | 5.000%, 06/15/21 (e) | | | 2,420 | |
| | 4,288 | | | 5.500%, 06/15/24 (e) | | | 4,499 | |
| | | | Community Health Systems, Inc., | | | | |
| | 1,089 | | | 5.125%, 08/01/21 | | | 1,079 | |
| | 2,082 | | | 6.875%, 02/01/22 | | | 1,723 | |
| | 2,575 | | | 7.125%, 07/15/20 | | | 2,311 | |
| | 2,172 | | | Concho Resources, Inc., 5.500%, 04/01/23 | | | 2,252 | |
| | 1,855 | | | CONSOL Energy, Inc., 5.875%, 04/15/22 | | | 1,809 | |
| | 2,232 | | | Consolidated Communications, Inc., 6.500%, 10/01/22 | | | 2,204 | |
| | | | Continental Resources, Inc., | | | | |
| | 673 | | | 3.800%, 06/01/24 | | | 633 | |
| | 7,296 | | | 4.500%, 04/15/23 | | | 7,186 | |
| | 6,317 | | | 5.000%, 09/15/22 | | | 6,372 | |
| | 2,195 | | | Cooper-Standard Automotive, Inc., 5.625%, 11/15/26 (e) | | | 2,225 | |
| | | | CoreCivic, Inc., | | | | |
| | 8,720 | | | 4.125%, 04/01/20 | | | 9,014 | |
| | 2,400 | | | 4.625%, 05/01/23 | | | 2,406 | |
| | | | Covanta Holding Corp., | | | | |
| | 240 | | | 5.875%, 03/01/24 | | | 241 | |
| | 379 | | | 5.875%, 07/01/25 | | | 378 | |
| | 577 | | | 6.375%, 10/01/22 | | | 594 | |
| | | | Crestwood Midstream Partners LP, | | | | |
| | 2,091 | | | 5.750%, 04/01/25 (e) | | | 2,169 | |
| | 1,409 | | | 6.250%, 04/01/23 | | | 1,471 | |
SEE NOTES TO FINANCIAL STATEMENTS.
| | | | | | | | |
| | | |
| APRIL 30, 2017 | | J.P. MORGAN FUNDS | | | | | 69 | |
JPMorgan Income Builder Fund
SCHEDULE OF PORTFOLIO INVESTMENTS
AS OF APRIL 30, 2017 (Unaudited) (continued)
(Amounts in U.S. Dollars, unless otherwise noted)
(Amounts in thousands)
| | | | | | | | |
PRINCIPAL
AMOUNT | | | SECURITY DESCRIPTION | | VALUE | |
| | Corporate Bonds — continued | |
| | | | United States — continued | |
| | | | Crown Americas LLC, | | | | |
| | 1,765 | | | 4.250%, 09/30/26 (e) | | | 1,730 | |
| | 770 | | | 4.500%, 01/15/23 | | | 795 | |
| | | | CSC Holdings LLC, | | | | |
| | 1,013 | | | 5.250%, 06/01/24 | | | 1,025 | |
| | 2,515 | | | 5.500%, 04/15/27 (e) | | | 2,600 | |
| | 1,400 | | | 6.625%, 10/15/25 (e) | | | 1,531 | |
| | 4,884 | | | 6.750%, 11/15/21 | | | 5,372 | |
| | 942 | | | 8.625%, 02/15/19 | | | 1,038 | |
| | 7,952 | | | 10.125%, 01/15/23 (e) | | | 9,224 | |
| | 1,390 | | | 10.875%, 10/15/25 (e) | | | 1,670 | |
| | 1,600 | | | CSI Compressco LP, 7.250%, 08/15/22 | | | 1,556 | |
| | 4,820 | | | CSX Corp., 4.250%, 11/01/66 | | | 4,517 | |
| | 640 | | | Cumberland Farms, Inc., 6.750%, 05/01/25 (e) | | | 664 | |
| | 936 | | | CURO Financial Technologies Corp., 12.000%, 03/01/22 (e) | | | 987 | |
| | 7,628 | | | CVR Partners LP, 9.250%, 06/15/23 (e) | | | 7,790 | |
| | | | CyrusOne LP, | | | | |
| | 1,625 | | | 5.000%, 03/15/24 (e) | | | 1,670 | |
| | 985 | | | 5.375%, 03/15/27 (e) | | | 1,014 | |
| | | | Dana Financing Luxembourg SARL, | | | | |
| | 4,089 | | | 5.750%, 04/15/25 (e) | | | 4,189 | |
| | 4,320 | | | 6.500%, 06/01/26 (e) | | | 4,525 | |
| | | | Dana, Inc., | | | | |
| | 2,750 | | | 5.500%, 12/15/24 | | | 2,798 | |
| | 6,125 | | | 6.000%, 09/15/23 | | | 6,401 | |
| | | | DaVita, Inc., | | | | |
| | 6,330 | | | 5.000%, 05/01/25 | | | 6,377 | |
| | 3,502 | | | 5.125%, 07/15/24 | | | 3,601 | |
| | 1,275 | | | 5.750%, 08/15/22 | | | 1,321 | |
| | | | DCP Midstream Operating LP, | | | | |
| | 4,359 | | | 3.875%, 03/15/23 | | | 4,250 | |
| | 686 | | | 4.750%, 09/30/21 (e) | | | 701 | |
| | 702 | | | 4.950%, 04/01/22 | | | 718 | |
| | 1,825 | | | 6.750%, 09/15/37 (e) | | | 2,000 | |
| | 6,738 | | | Dean Foods Co., 6.500%, 03/15/23 (e) | | | 7,109 | |
| | | | Denbury Resources, Inc., | | | | |
| | 3,495 | | | 4.625%, 07/15/23 | | | 2,394 | |
| | 570 | | | 5.500%, 05/01/22 | | | 425 | |
| | 5,145 | | | Devon Energy Corp., 5.000%, 06/15/45 | | | 5,227 | |
| | | | Diamond 1 Finance Corp., | | | | |
| | 25 | | | 3.480%, 06/01/19 (e) | | | 25 | |
| | 1,310 | | | 4.420%, 06/15/21 (e) | | | 1,375 | |
| | 7,581 | | | 5.450%, 06/15/23 (e) | | | 8,189 | |
| | | | | | | | |
PRINCIPAL
AMOUNT | | | SECURITY DESCRIPTION | | VALUE | |
| | | | | | | | |
| | | | United States — continued | |
| | 2,895 | | | 5.875%, 06/15/21 (e) | | | 3,069 | |
| | 9,141 | | | 6.020%, 06/15/26 (e) | | | 10,069 | |
| | 1,465 | | | 7.125%, 06/15/24 (e) | | | 1,619 | |
| | 6,310 | | | 8.350%, 07/15/46 (e) | | | 8,166 | |
| | 4,015 | | | Diebold Nixdorf, Inc., 8.500%, 04/15/24 | | | 4,477 | |
| | | | DISH DBS Corp., | | | | |
| | 7,460 | | | 5.000%, 03/15/23 | | | 7,479 | |
| | 21,800 | | | 5.875%, 07/15/22 | | | 23,093 | |
| | 14,963 | | | 5.875%, 11/15/24 | | | 15,692 | |
| | 23,384 | | | 6.750%, 06/01/21 | | | 25,430 | |
| | 4,279 | | | 7.750%, 07/01/26 | | | 5,012 | |
| | 6,950 | | | DJO Finco, Inc., 8.125%, 06/15/21 (e) | | | 6,186 | |
| | 2,774 | | | Dole Food Co., Inc., 7.250%, 06/15/25 (e) | | | 2,875 | |
| | 4,148 | | | Dollar Tree, Inc., 5.750%, 03/01/23 | | | 4,401 | |
| | 2,229 | | | Dominion Gas Holdings LLC, 4.600%, 12/15/44 | | | 2,248 | |
| | 17,485 | | | Dominion Resources, Inc., VAR, 5.750%, 10/01/54 | | | 18,337 | |
| | 2,164 | | | Downstream Development Authority of the Quapaw Tribe of Oklahoma, 10.500%, 07/01/19 (e) | | | 2,088 | |
| | 1,693 | | | DuPont Fabros Technology LP, 5.875%, 09/15/21 | | | 1,765 | |
| | | | Dynegy, Inc., | | | | |
| | 6,393 | | | 5.875%, 06/01/23 | | | 5,642 | |
| | 6,280 | | | 7.375%, 11/01/22 | | | 6,028 | |
| | 8,155 | | | 7.625%, 11/01/24 | | | 7,462 | |
| | 3,400 | | | 8.000%, 01/15/25 (e) | | | 3,111 | |
| | 366 | | | Eagle II Acquisition Co. LLC, 6.000%, 04/01/25 (e) | | | 378 | |
| | 560 | | | Eldorado Resorts, Inc., 7.000%, 08/01/23 | | | 605 | |
| | 25,041 | | | Embarq Corp., 7.995%, 06/01/36 | | | 25,511 | |
| | 1,129 | | | EMC Corp., 2.650%, 06/01/20 | | | 1,105 | |
| | 1,825 | | | EMI Music Publishing Group North America Holdings, Inc., 7.625%, 06/15/24 (e) | | | 2,017 | |
| | | | Endo Dac, | | | | |
| | 1,811 | | | 5.875%, 10/15/24 (e) | | | 1,845 | |
| | 10,650 | | | 6.000%, 07/15/23 (e) | | | 9,332 | |
| | 1,770 | | | 6.000%, 02/01/25 (e) | | | 1,495 | |
| | | | Endo Finance LLC, | | | | |
| | 3,026 | | | 5.750%, 01/15/22 (e) | | | 2,799 | |
| | 1,846 | | | 7.250%, 01/15/22 (e) | | | 1,818 | |
| | 6,565 | | | Energizer Holdings, Inc., 5.500%, 06/15/25 (e) | | | 6,844 | |
| | 6,302 | | | Energy Transfer Equity LP, 5.875%, 01/15/24 | | | 6,790 | |
SEE NOTES TO FINANCIAL STATEMENTS.
| | | | | | |
| | | |
| 70 | | | | J.P. MORGAN FUNDS | | APRIL 30, 2017 |
| | | | | | | | |
PRINCIPAL
AMOUNT | | | SECURITY DESCRIPTION | | VALUE | |
| | Corporate Bonds — continued | |
| | | | United States — continued | |
| | | | Energy Transfer Partners LP, | | | | |
| | 3,020 | | | 5.150%, 02/01/43 | | | 2,911 | |
| | 1,155 | | | 6.125%, 12/15/45 | | | 1,255 | |
| | 3,211 | | | EnerSys, 5.000%, 04/30/23 (e) | | | 3,271 | |
| | | | Ensco plc, | | | | |
| | 429 | | | 4.500%, 10/01/24 | | | 354 | |
| | 808 | | | 5.200%, 03/15/25 | | | 685 | |
| | 419 | | | 8.000%, 01/31/24 | | | 416 | |
| | 4,938 | | | Entegris, Inc., 6.000%, 04/01/22 (e) | | | 5,148 | |
| | | | Enterprise Products Operating LLC, | | | | |
| | 2,890 | | | 4.850%, 03/15/44 | | | 2,958 | |
| | 10,280 | | | 4.900%, 05/15/46 | | | 10,750 | |
| | | | Envision Healthcare Corp., | | | | |
| | 1,754 | | | 5.125%, 07/01/22 (e) | | | 1,780 | |
| | 1,075 | | | 5.625%, 07/15/22 | | | 1,109 | |
| | | | EP Energy LLC, | | | | |
| | 3,286 | | | 7.750%, 09/01/22 | | | 2,629 | |
| | 2,930 | | | 8.000%, 11/29/24 (e) | | | 3,066 | |
| | 23,134 | | | 8.000%, 02/15/25 (e) | | | 20,589 | |
| | 11,750 | | | 9.375%, 05/01/20 | | | 11,133 | |
| | | | Equinix, Inc., | | | | |
| | 1,320 | | | 4.875%, 04/01/20 | | | 1,353 | |
| | 3,098 | | | 5.375%, 01/01/22 | | | 3,276 | |
| | 950 | | | 5.375%, 04/01/23 | | | 989 | |
| | 948 | | | 5.750%, 01/01/25 | | | 1,014 | |
| | 3,555 | | | 5.875%, 01/15/26 | | | 3,831 | |
| | 8,015 | | | ERAC USA Finance LLC, 4.200%, 11/01/46 (e) | | | 7,327 | |
| | 5,852 | | | ESH Hospitality, Inc., 5.250%, 05/01/25 (e) | | | 5,925 | |
| | 720 | | | EW Scripps Co. (The), 5.125%, 05/15/25 (e) | | | 739 | |
| | | | Exelon Corp., | | | | |
| | 4,100 | | | 4.450%, 04/15/46 | | | 4,113 | |
| | 3,750 | | | 5.100%, 06/15/45 | | | 4,078 | |
| | | | Express Scripts Holding Co., | | | | |
| | 7,130 | | | 4.800%, 07/15/46 | | | 6,930 | |
| | 1,556 | | | 6.125%, 11/15/41 | | | 1,762 | |
| | | | FedEx Corp., | | | | |
| | 6,025 | | | 4.550%, 04/01/46 | | | 6,090 | |
| | 2,215 | | | 4.750%, 11/15/45 | | | 2,309 | |
| | 1,170 | | | Ferrellgas LP, 6.750%, 06/15/23 | | | 1,129 | |
| | 1,605 | | | Fidelity & Guaranty Life Holdings, Inc., 6.375%, 04/01/21 (e) | | | 1,645 | |
| | | | Fifth Third Bancorp, | | | | |
| | 2,385 | | | Series J, VAR, 4.900%, 09/30/19 (x) (y) | | | 2,385 | |
| | 17,625 | | | VAR, 5.100%, 06/30/23 (x) (y) | | | 17,537 | |
| | | | | | | | |
PRINCIPAL
AMOUNT | | | SECURITY DESCRIPTION | | VALUE | |
| | | | | | | | |
| | | | United States — continued | |
| | | | First Data Corp., | | | | |
| | 6,412 | | | 5.000%, 01/15/24 (e) | | | 6,558 | |
| | 13,853 | | | 5.375%, 08/15/23 (e) | | | 14,407 | |
| | 33,652 | | | 5.750%, 01/15/24 (e) | | | 34,914 | |
| | 5,643 | | | 7.000%, 12/01/23 (e) | | | 6,050 | |
| | 681 | | | Flex Acquisition Co., Inc., 6.875%, 01/15/25 (e) | | | 701 | |
| | 19,265 | | | Ford Motor Co., 4.750%, 01/15/43 | | | 18,141 | |
| | | | Freeport-McMoRan, Inc., | | | | |
| | 3,380 | | | 3.550%, 03/01/22 | | | 3,177 | |
| | 8,530 | | | 3.875%, 03/15/23 | | | 7,912 | |
| | 3,074 | | | 4.000%, 11/14/21 | | | 3,016 | |
| | 5,505 | | | 4.550%, 11/14/24 | | | 5,172 | |
| | 375 | | | 5.400%, 11/14/34 | | | 334 | |
| | 5,805 | | | 5.450%, 03/15/43 | | | 4,949 | |
| | | | Frontier Communications Corp., | | | | |
| | 6,760 | | | 6.250%, 09/15/21 | | | 6,270 | |
| | 7,180 | | | 6.875%, 01/15/25 | | | 6,013 | |
| | 6,801 | | | 8.500%, 04/15/20 | | | 7,192 | |
| | 5,281 | | | 9.250%, 07/01/21 | | | 5,388 | |
| | 3,111 | | | 10.500%, 09/15/22 | | | 3,130 | |
| | 19,452 | | | 11.000%, 09/15/25 | | | 18,747 | |
| | 3,849 | | | Gartner, Inc., 5.125%, 04/01/25 (e) | | | 3,984 | |
| | 5,143 | | | Gates Global LLC, 6.000%, 07/15/22 (e) | | | 5,169 | |
| | 4,460 | | | GCI, Inc., 6.750%, 06/01/21 | | | 4,622 | |
| | 3,552 | | | GCP Applied Technologies, Inc., 9.500%, 02/01/23 (e) | | | 4,049 | |
| | 5,100 | | | General Cable Corp., 5.750%, 10/01/22 | | | 5,049 | |
| | 48,057 | | | General Electric Co., Series D, VAR, 5.000%, 01/21/21 (x) (y) | | | 50,688 | |
| | | | General Motors Co., | | | | |
| | 7,250 | | | 4.875%, 10/02/23 | | | 7,734 | |
| | 6,370 | | | 6.250%, 10/02/43 | | | 6,958 | |
| | 8,720 | | | 6.750%, 04/01/46 | | | 10,210 | |
| | | | Genesis Energy LP, | | | | |
| | 2,418 | | | 5.625%, 06/15/24 | | | 2,376 | |
| | 1,054 | | | 6.000%, 05/15/23 | | | 1,054 | |
| | 780 | | | 6.750%, 08/01/22 | | | 802 | |
| | 4,440 | | | Genesys Telecommunications Laboratories, Inc., 10.000%, 11/30/24 (e) | | | 4,918 | |
| | 4,330 | | | GenOn Energy, Inc., 9.875%, 10/15/20 | | | 2,685 | |
| | | | GEO Group, Inc. (The), | | | | |
| | 8,165 | | | 5.875%, 01/15/22 | | | 8,492 | |
| | 2,215 | | | 6.000%, 04/15/26 | | | 2,276 | |
SEE NOTES TO FINANCIAL STATEMENTS.
| | | | | | | | |
| | | |
| APRIL 30, 2017 | | J.P. MORGAN FUNDS | | | | | 71 | |
JPMorgan Income Builder Fund
SCHEDULE OF PORTFOLIO INVESTMENTS
AS OF APRIL 30, 2017 (Unaudited) (continued)
(Amounts in U.S. Dollars, unless otherwise noted)
(Amounts in thousands)
| | | | | | | | |
PRINCIPAL
AMOUNT | | | SECURITY DESCRIPTION | | VALUE | |
| | Corporate Bonds — continued | |
| | | | United States — continued | |
| | | | Gilead Sciences, Inc., | | | | |
| | 755 | | | 4.150%, 03/01/47 | | | 712 | |
| | 8,795 | | | 4.750%, 03/01/46 | | | 9,069 | |
| | | | Global Partners LP, | | | | |
| | 1,085 | | | 6.250%, 07/15/22 | | | 1,074 | |
| | 1,995 | | | 7.000%, 06/15/23 | | | 1,975 | |
| | 4,035 | | | GLP Capital LP, 5.375%, 11/01/23 | | | 4,358 | |
| | 1,890 | | | Golden Nugget, Inc., 8.500%, 12/01/21 (e) | | | 2,018 | |
| | | | Goldman Sachs Group, Inc. (The), | | | | |
| | 16,295 | | | Series O, VAR, 5.300%, 11/10/26 (x) (y) | | | 16,916 | |
| | 21,703 | | | Series M, VAR, 5.375%, 05/10/20 (x) (y) | | | 22,501 | |
| | 25,078 | | | Series L, VAR, 5.700%, 05/10/19 (x) (y) | | | 25,893 | |
| | 2,585 | | | Goodman Networks, Inc., 12.225%, 07/01/18 (d) | | | 969 | |
| | | | Goodyear Tire & Rubber Co. (The), | | | | |
| | 5,526 | | | 4.875%, 03/15/27 | | | 5,526 | |
| | 4,150 | | | 5.000%, 05/31/26 | | | 4,259 | |
| | 2,085 | | | 5.125%, 11/15/23 | | | 2,193 | |
| | 570 | | | Graphic Packaging International, Inc., 4.875%, 11/15/22 | | | 596 | |
| | | | Gray Television, Inc., | | | | |
| | 2,285 | | | 5.125%, 10/15/24 (e) | | | 2,291 | |
| | 1,445 | | | 5.875%, 07/15/26 (e) | | | 1,495 | |
| | 3,425 | | | Great Lakes Dredge & Dock Corp., 7.375%, 02/01/19 | | | 3,412 | |
| | 5,340 | | | Great Plains Energy, Inc., 4.850%, 04/01/47 | | | 5,424 | |
| | 2,460 | | | Group 1 Automotive, Inc., 5.250%, 12/15/23 (e) | | | 2,478 | |
| | 293 | | | Guitar Center, Inc., 6.500%, 04/15/19 (e) | | | 251 | |
| | 1,045 | | | Gulfport Energy Corp., 6.000%, 10/15/24 (e) | | | 1,029 | |
| | 7,564 | | | H&E Equipment Services, Inc., 7.000%, 09/01/22 | | | 7,909 | |
| | 5,150 | | | Halcon Resources Corp., 6.750%, 02/15/25 (e) | | | 4,944 | |
| | 10,280 | | | Halliburton Co., 5.000%, 11/15/45 | | | 10,988 | |
| | 3,046 | | | Hardwoods Acquisition, Inc., 7.500%, 08/01/21 (e) | | | 2,772 | |
| | | | Harland Clarke Holdings Corp., | | | | |
| | 1,075 | | | 6.875%, 03/01/20 (e) | | | 1,102 | |
| | 1,466 | | | 8.375%, 08/15/22 (e) | | | 1,510 | |
| | 4,520 | | | Harris Corp., 5.054%, 04/27/45 | | | 4,965 | |
| | 3,847 | | | HCA Holdings, Inc., 6.250%, 02/15/21 | | | 4,174 | |
| | | | HCA, Inc., | | | | |
| | 2,318 | | | 3.750%, 03/15/19 | | | 2,370 | |
| | 1,410 | | | 4.250%, 10/15/19 | | | 1,461 | |
| | 2,330 | | | 4.500%, 02/15/27 | | | 2,352 | |
| | | | | | | | |
PRINCIPAL
AMOUNT | | | SECURITY DESCRIPTION | | VALUE | |
| | | | | | | | |
| | | | United States — continued | |
| | 1,976 | | | 5.000%, 03/15/24 | | | 2,097 | |
| | 2,175 | | | 5.250%, 04/15/25 | | | 2,337 | |
| | 400 | | | 5.250%, 06/15/26 | | | 427 | |
| | 34,831 | | | 5.375%, 02/01/25 | | | 36,268 | |
| | 15,079 | | | 5.875%, 03/15/22 | | | 16,719 | |
| | 2,040 | | | 5.875%, 05/01/23 | | | 2,220 | |
| | 6,435 | | | 5.875%, 02/15/26 | | | 6,837 | |
| | 2,977 | | | 6.500%, 02/15/20 | | | 3,267 | |
| | 26,168 | | | 7.500%, 02/15/22 | | | 30,104 | |
| | 1,400 | | | 8.000%, 10/01/18 | | | 1,507 | |
| | | | HD Supply, Inc., | | | | |
| | 10,360 | | | 5.250%, 12/15/21 (e) | | | 10,930 | |
| | 2,010 | | | 5.750%, 04/15/24 (e) | | | 2,135 | |
| | | | HealthSouth Corp., | | | | |
| | 3,470 | | | 5.750%, 11/01/24 | | | 3,535 | |
| | 3,650 | | | 5.750%, 09/15/25 | | | 3,691 | |
| | 2,986 | | | Hecla Mining Co., 6.875%, 05/01/21 | | | 3,098 | |
| | | | Herc Rentals, Inc., | | | | |
| | 3,474 | | | 7.500%, 06/01/22 (e) | | | 3,778 | |
| | 4,293 | | | 7.750%, 06/01/24 (e) | | | 4,685 | |
| | | | Hertz Corp. (The), | | | | |
| | 6,255 | | | 5.500%, 10/15/24 (e) | | | 5,364 | |
| | 4,891 | | | 6.250%, 10/15/22 | | | 4,512 | |
| | 7,435 | | | 7.375%, 01/15/21 | | | 7,119 | |
| | 5,595 | | | Hess Corp., 5.800%, 04/01/47 | | | 5,782 | |
| | 19,879 | | | Hexion, Inc., 6.625%, 04/15/20 | | | 18,786 | |
| | | | Hilcorp Energy I LP, | | | | |
| | 1,234 | | | 5.000%, 12/01/24 (e) | | | 1,157 | |
| | 921 | | | 5.750%, 10/01/25 (e) | | | 893 | |
| | 865 | | | Hillman Group, Inc. (The), 6.375%, 07/15/22 (e) | | | 824 | |
| | | | Hill-Rom Holdings, Inc., | | | | |
| | 685 | | | 5.000%, 02/15/25 (e) | | | 694 | |
| | 6,428 | | | 5.750%, 09/01/23 (e) | | | 6,717 | |
| | 2,940 | | | Hilton Domestic Operating Co., Inc., 4.250%, 09/01/24 (e) | | | 2,962 | |
| | 1,890 | | | Hilton Grand Vacations Borrower LLC, 6.125%, 12/01/24 (e) | | | 2,013 | |
| | | | Hilton Worldwide Finance LLC, | | | | |
| | 3,023 | | | 4.625%, 04/01/25 (e) | | | 3,106 | |
| | 1,512 | | | 4.875%, 04/01/27 (e) | | | 1,550 | |
| | 1,865 | | | Holly Energy Partners LP, 6.000%, 08/01/24 (e) | | | 1,972 | |
| | 4,617 | | | Hologic, Inc., 5.250%, 07/15/22 (e) | | | 4,865 | |
| | 1,000 | | | HRG Group, Inc., 7.875%, 07/15/19 | | | 1,040 | |
SEE NOTES TO FINANCIAL STATEMENTS.
| | | | | | |
| | | |
| 72 | | | | J.P. MORGAN FUNDS | | APRIL 30, 2017 |
| | | | | | | | |
PRINCIPAL
AMOUNT | | | SECURITY DESCRIPTION | | VALUE | |
| | Corporate Bonds — continued | |
| | | | United States — continued | |
| | | | Hughes Satellite Systems Corp., | | | | |
| | 7,205 | | | 5.250%, 08/01/26 (e) | | | 7,331 | |
| | 1,570 | | | 6.500%, 06/15/19 | | | 1,698 | |
| | 1,690 | | | 6.625%, 08/01/26 (e) | | | 1,736 | |
| | | | Huntsman International LLC, | | | | |
| | 560 | | | 4.875%, 11/15/20 | | | 589 | |
| | 8,665 | | | 5.125%, 11/15/22 | | | 9,109 | |
| | 6,110 | | | IASIS Healthcare LLC, 8.375%, 05/15/19 | | | 5,957 | |
| | | | Icahn Enterprises LP, | | | | |
| | 919 | | | 5.875%, 02/01/22 | | | 945 | |
| | 800 | | | 6.250%, 02/01/22 (e) | | | 832 | |
| | 800 | | | 6.750%, 02/01/24 (e) | | | 835 | |
| | | | iHeartCommunications, Inc., | | | | |
| | 2,116 | | | 9.000%, 12/15/19 | | | 1,746 | |
| | 2,067 | | | 9.000%, 03/01/21 | | | 1,571 | |
| | 1,400 | | | IHS Markit Ltd., 4.750%, 02/15/25 (e) | | | 1,465 | |
| | 8,163 | | | ILFC E-Capital Trust I, VAR, 4.660%, 12/21/65 (e) | | | 7,755 | |
| | 4,720 | | | ILFC E-Capital Trust II, VAR, 4.910%, 12/21/65 (e) | | | 4,531 | |
| | 8,769 | | | Infor Software Parent LLC, 7.125% (cash), 05/01/21 (e) (v) | | | 8,962 | |
| | | | Infor US, Inc., | | | | |
| | 1,248 | | | 5.750%, 08/15/20 (e) | | | 1,303 | |
| | 15,605 | | | 6.500%, 05/15/22 | | | 16,229 | |
| | 5,363 | | | Informatica LLC, 7.125%, 07/15/23 (e) | | | 5,276 | |
| | | | International Game Technology plc, | | | | |
| | 8,750 | | | 6.250%, 02/15/22 (e) | | | 9,537 | |
| | 8,640 | | | 6.500%, 02/15/25 (e) | | | 9,461 | |
| | 4,020 | | | Interval Acquisition Corp., 5.625%, 04/15/23 | | | 4,141 | |
| | | | Iron Mountain, Inc., | | | | |
| | 1,530 | | | 5.750%, 08/15/24 | | | 1,576 | |
| | 4,028 | | | 6.000%, 10/01/20 (e) | | | 4,214 | |
| | 1,250 | | | 6.000%, 08/15/23 | | | 1,328 | |
| | 1,957 | | | Isle of Capri Casinos, Inc., 5.875%, 03/15/21 | | | 2,021 | |
| | 1,915 | | | ITC Holdings Corp., 5.300%, 07/01/43 | | | 2,172 | |
| | 500 | | | Jack Cooper Holdings Corp., 9.250%, 06/01/20 | | | 185 | |
| | 8,360 | | | Jack Ohio Finance LLC, 6.750%, 11/15/21 (e) | | | 8,736 | |
| | 2,310 | | | Jaguar Holding Co. II, 6.375%, 08/01/23 (e) | | | 2,408 | |
| | 1,007 | | | JB Poindexter & Co., Inc., 9.000%, 04/01/22 (e) | | | 1,055 | |
| | | | JC Penney Corp., Inc., | | | | |
| | 3,200 | | | 5.875%, 07/01/23 (e) | | | 3,232 | |
| | 449 | | | 8.125%, 10/01/19 | | | 489 | |
| | | | | | | | |
PRINCIPAL
AMOUNT | | | SECURITY DESCRIPTION | | VALUE | |
| | | | | | | | |
| | | | United States — continued | |
| | 773 | | | Jo-Ann Stores LLC, 8.125%, 03/15/19 (e) | | | 772 | |
| | 955 | | | Johnson Controls International plc, 4.500%, 02/15/47 | | | 977 | |
| | 993 | | | Kaiser Aluminum Corp., 5.875%, 05/15/24 | | | 1,053 | |
| | 2,070 | | | KFC Holding Co., 5.000%, 06/01/24 (e) | | | 2,137 | |
| | 2,000 | | | Kinder Morgan Energy Partners LP, 5.625%, 09/01/41 | | | 2,070 | |
| | 7,460 | | | Kindred Healthcare, Inc., 8.750%, 01/15/23 | | | 7,656 | |
| | 3,075 | | | Kinetic Concepts, Inc., 7.875%, 02/15/21 (e) | | | 3,279 | |
| | 6,400 | | | KLX, Inc., 5.875%, 12/01/22 (e) | | | 6,728 | |
| | 2,065 | | | Kohl’s Corp., 5.550%, 07/17/45 | | | 1,869 | |
| | 1,160 | | | Koppers, Inc., 6.000%, 02/15/25 (e) | | | 1,215 | |
| | | | Kraft Heinz Foods Co., | | | | |
| | 7,495 | | | 4.375%, 06/01/46 | | | 7,133 | |
| | 1,045 | | | 5.000%, 06/04/42 | | | 1,077 | |
| | 8,927 | | | 5.200%, 07/15/45 | | | 9,426 | |
| | 3,574 | | | Kratos Defense & Security Solutions, Inc., 7.000%, 05/15/19 | | | 3,583 | |
| | 5,955 | | | Kroger Co. (The), 3.875%, 10/15/46 | | | 5,393 | |
| | | | L Brands, Inc., | | | | |
| | 400 | | | 5.625%, 10/15/23 | | | 420 | |
| | 6,385 | | | 6.750%, 07/01/36 | | | 6,185 | |
| | 1,606 | | | 6.875%, 11/01/35 | | | 1,584 | |
| | 1,514 | | | Ladder Capital Finance Holdings LLLP, 5.250%, 03/15/22 (e) | | | 1,554 | |
| | | | Lamar Media Corp., | | | | |
| | 363 | | | 5.000%, 05/01/23 | | | 380 | |
| | 258 | | | 5.375%, 01/15/24 | | | 272 | |
| | 2,652 | | | 5.750%, 02/01/26 | | | 2,887 | |
| | 2,340 | | | Landry’s, Inc., 6.750%, 10/15/24 (e) | | | 2,451 | |
| | 2,900 | | | Laredo Petroleum, Inc., 7.375%, 05/01/22 | | | 3,012 | |
| | | | Lear Corp., | | | | |
| | 3,400 | | | 5.250%, 01/15/25 | | | 3,606 | |
| | 2,000 | | | 5.375%, 03/15/24 | | | 2,114 | |
| | 1,000 | | | Level 3 Communications, Inc., 5.750%, 12/01/22 | | | 1,041 | |
| | | | Level 3 Financing, Inc., | | | | |
| | 5,636 | | | 5.125%, 05/01/23 | | | 5,784 | |
| | 3,308 | | | 5.250%, 03/15/26 | | | 3,411 | |
| | 4,086 | | | 5.375%, 01/15/24 | | | 4,247 | |
| | 10,230 | | | 5.375%, 05/01/25 | | | 10,665 | |
| | 561 | | | 5.625%, 02/01/23 | | | 582 | |
| | 75 | | | Levi Strauss & Co., 5.000%, 05/01/25 | | | 77 | |
| | 870 | | | Liberty Interactive LLC, 8.250%, 02/01/30 | | | 933 | |
| | 2,538 | | | Liberty Mutual Group, Inc., 7.800%, 03/15/37 (e) | | | 2,938 | |
SEE NOTES TO FINANCIAL STATEMENTS.
| | | | | | | | |
| | | |
| APRIL 30, 2017 | | J.P. MORGAN FUNDS | | | | | 73 | |
JPMorgan Income Builder Fund
SCHEDULE OF PORTFOLIO INVESTMENTS
AS OF APRIL 30, 2017 (Unaudited) (continued)
(Amounts in U.S. Dollars, unless otherwise noted)
(Amounts in thousands)
| | | | | | | | |
PRINCIPAL
AMOUNT | | | SECURITY DESCRIPTION | | VALUE | |
| | Corporate Bonds — continued | |
| | | | United States — continued | |
| | 1,335 | | | LifePoint Health, Inc., 5.500%, 12/01/21 | | | 1,378 | |
| | 1,887 | | | LIN Television Corp., 5.875%, 11/15/22 | | | 1,972 | |
| | 3,805 | | | Live Nation Entertainment, Inc., 4.875%, 11/01/24 (e) | | | 3,834 | |
| | 1,634 | | | LPL Holdings, Inc., 5.750%, 09/15/25 (e) | | | 1,659 | |
| | 3,265 | | | LSB Industries, Inc., SUB, 8.500%, 08/01/19 | | | 3,200 | |
| | 5,407 | | | LTF Merger Sub, Inc., 8.500%, 06/15/23 (e) | | | 5,745 | |
| | 4,372 | | | LYB International Finance BV, 4.875%, 03/15/44 | | | 4,526 | |
| | 1,320 | | | Magellan Midstream Partners LP, 4.250%, 09/15/46 | | | 1,260 | |
| | | | Mallinckrodt International Finance SA, | | | | |
| | 160 | | | 3.500%, 04/15/18 | | | 161 | |
| | 539 | | | 4.750%, 04/15/23 | | | 459 | |
| | 6,105 | | | 5.500%, 04/15/25 (e) | | | 5,556 | |
| | 5,243 | | | 5.625%, 10/15/23 (e) | | | 5,007 | |
| | 2,189 | | | 5.750%, 08/01/22 (e) | | | 2,151 | |
| | 5,645 | | | Marathon Petroleum Corp., 4.750%, 09/15/44 | | | 5,222 | |
| | 4,280 | | | Markel Corp., 5.000%, 04/05/46 | | | 4,497 | |
| | 1,117 | | | Martin Midstream Partners LP, 7.250%, 02/15/21 | | | 1,145 | |
| | 1,972 | | | Masonite International Corp., 5.625%, 03/15/23 (e) | | | 2,046 | |
| | 3,592 | | | MasTec, Inc., 4.875%, 03/15/23 | | | 3,592 | |
| | 890 | | | Match Group, Inc., 6.375%, 06/01/24 | | | 969 | |
| | 2,500 | | | Mediacom Broadband LLC, 6.375%, 04/01/23 | | | 2,631 | |
| | | | MetLife, Inc., | | | | |
| | 12,815 | | | 6.400%, 12/15/36 | | | 14,417 | |
| | 17,944 | | | Series C, VAR, 5.250%, 06/15/20 (x) (y) | | | 18,635 | |
| | | | MGM Growth Properties Operating Partnership LP, | | | | |
| | 995 | | | 4.500%, 09/01/26 | | | 991 | |
| | 2,630 | | | 5.625%, 05/01/24 | | | 2,837 | |
| | | | MGM Resorts International, | | | | |
| | 18,730 | | | 6.000%, 03/15/23 | | | 20,463 | |
| | 3,070 | | | 6.625%, 12/15/21 | | | 3,446 | |
| | 20,504 | | | 7.750%, 03/15/22 | | | 23,887 | |
| | 2,165 | | | Michaels Stores, Inc., 5.875%, 12/15/20 (e) | | | 2,222 | |
| | | | Micron Technology, Inc., | | | | |
| | 3,706 | | | 5.250%, 08/01/23 (e) | | | 3,836 | |
| | 8,287 | | | 5.250%, 01/15/24 (e) | | | 8,544 | |
| | 70 | | | 5.500%, 02/01/25 | | | 73 | |
| | 302 | | | 5.875%, 02/15/22 | | | 316 | |
| | 5,875 | | | 7.500%, 09/15/23 | | | 6,580 | |
| | | | | | | | |
PRINCIPAL
AMOUNT | | | SECURITY DESCRIPTION | | VALUE | |
| | |
| | | | United States — continued | |
| | 5,025 | | | Microsemi Corp., 9.125%, 04/15/23 (e) | | | 5,779 | |
| | 1,350 | | | Momentive Performance Materials USA, Inc., 8.875%, 10/15/20 (d) | | | — | (h) |
| | 1,900 | | | Momentive Performance Materials, Inc., 3.880%, 10/24/21 | | | 1,888 | |
| | | | Morgan Stanley, | | | | |
| | 29,170 | | | Series H, VAR, 5.450%, 07/15/19 (x) (y) | | | 29,863 | |
| | 26,955 | | | Series J, VAR, 5.550%, 07/15/20 (x) (y) | | | 28,218 | |
| | | | Motors Liquidation Co., | | | | |
| | 11 | | | 7.750%, 03/15/36 (d) | | | — | |
| | 115 | | | 8.375%, 07/15/33 (d) | | | — | |
| | 10 | | | VAR, 6.750%, 05/01/28 (d) | | | — | |
| | 5,316 | | | MPH Acquisition Holdings LLC, 7.125%, 06/01/24 (e) | | | 5,715 | |
| | | | MPLX LP, | | | | |
| | 5,720 | | | 4.875%, 12/01/24 | | | 6,116 | |
| | 3,485 | | | 5.200%, 03/01/47 | | | 3,568 | |
| | 1,900 | | | 5.500%, 02/15/23 | | | 1,969 | |
| | 1,851 | | | MSCI, Inc., 5.250%, 11/15/24 (e) | | | 1,962 | |
| | 10,774 | | | Mylan NV, 5.250%, 06/15/46 | | | 11,061 | |
| | 2,824 | | | Nabors Industries, Inc., 5.500%, 01/15/23 (e) | | | 2,859 | |
| | 2,473 | | | National Rural Utilities Cooperative Finance Corp., VAR, 5.250%, 04/20/46 | | | 2,576 | |
| | | | Nationstar Mortgage LLC, | | | | |
| | 1,372 | | | 6.500%, 07/01/21 | | | 1,393 | |
| | 1,028 | | | 6.500%, 06/01/22 | | | 1,033 | |
| | 3,280 | | | 7.875%, 10/01/20 | | | 3,411 | |
| | 3,087 | | | Nature’s Bounty Co. (The), 7.625%, 05/15/21 (e) | | | 3,280 | |
| | 6,992 | | | Navistar International Corp., 8.250%, 11/01/21 | | | 7,079 | |
| | 1,800 | | | NCI Building Systems, Inc., 8.250%, 01/15/23 (e) | | | 1,962 | |
| | 3,263 | | | NCL Corp. Ltd., 4.750%, 12/15/21 (e) | | | 3,345 | |
| | | | NCR Corp., | | | | |
| | 686 | | | 5.000%, 07/15/22 | | | 700 | |
| | 903 | | | 6.375%, 12/15/23 | | | 968 | |
| | | | Neiman Marcus Group Ltd. LLC, | | | | |
| | 4,962 | | | 9.500%, 10/15/21 (e) | | | 2,903 | |
| | 4,925 | | | 8.750% (PIK), 10/15/21 (e) (v) | | | 2,659 | |
| | | | Netflix, Inc., | | | | |
| | 1,786 | | | 4.375%, 11/15/26 (e) | | | 1,759 | |
| | 645 | | | 5.750%, 03/01/24 | | | 693 | |
| | 700 | | | 5.875%, 02/15/25 | | | 760 | |
SEE NOTES TO FINANCIAL STATEMENTS.
| | | | | | |
| | | |
| 74 | | | | J.P. MORGAN FUNDS | | APRIL 30, 2017 |
| | | | | | | | |
PRINCIPAL
AMOUNT | | | SECURITY DESCRIPTION | | VALUE | |
| | Corporate Bonds — continued | |
| | | | United States — continued | |
| | | | New Albertsons, Inc., | | | | |
| | 455 | | | 6.625%, 06/01/28 | | | 407 | |
| | 404 | | | 7.450%, 08/01/29 | | | 381 | |
| | 645 | | | 7.750%, 06/15/26 | | | 629 | |
| | 2,280 | | | 8.000%, 05/01/31 | | | 2,223 | |
| | 2,042 | | | 8.700%, 05/01/30 | | | 2,021 | |
| | 2,917 | | | New Home Co., Inc. (The), 7.250%, 04/01/22 (e) | | | 3,034 | |
| | | | Newfield Exploration Co., | | | | |
| | 2,010 | | | 5.625%, 07/01/24 | | | 2,124 | |
| | 3,808 | | | 5.750%, 01/30/22 | | | 4,046 | |
| | | | Nexstar Broadcasting, Inc., | | | | |
| | 2,020 | | | 5.625%, 08/01/24 (e) | | | 2,070 | |
| | 4,580 | | | 6.125%, 02/15/22 (e) | | | 4,789 | |
| | 1,985 | | | NFP Corp., 9.000%, 07/15/21 (e) | | | 2,099 | |
| | | | NGL Energy Partners LP, | | | | |
| | 445 | | | 5.125%, 07/15/19 | | | 444 | |
| | 1,977 | | | 6.125%, 03/01/25 (e) | | | 1,849 | |
| | 750 | | | 6.875%, 10/15/21 | | | 744 | |
| | 3,925 | | | Nielsen Co. Luxembourg SARL (The), 5.500%, 10/01/21 (e) | | | 4,077 | |
| | 12,144 | | | Nielsen Finance LLC, 5.000%, 04/15/22 (e) | | | 12,501 | |
| | 3,150 | | | Noble Energy, Inc., 5.250%, 11/15/43 | | | 3,295 | |
| | 9,480 | | | Northern Trust Corp., Series D, VAR, 4.600%, 10/01/26 (x) (y) | | | 9,433 | |
| | | | Novelis Corp., | | | | |
| | 5,165 | | | 5.875%, 09/30/26 (e) | | | 5,307 | |
| | 5,000 | | | 6.250%, 08/15/24 (e) | | | 5,288 | |
| | | | NRG Energy, Inc., | | | | |
| | 2,500 | | | 6.250%, 05/01/24 | | | 2,491 | |
| | 1,000 | | | 6.625%, 03/15/23 | | | 1,015 | |
| | 10,503 | | | 6.625%, 01/15/27 | | | 10,398 | |
| | | | NRG Yield Operating LLC, | | | | |
| | 2,465 | | | 5.000%, 09/15/26 (e) | | | 2,416 | |
| | 1,000 | | | 5.375%, 08/15/24 | | | 1,022 | |
| | 1,229 | | | Nuance Communications, Inc., 5.375%, 08/15/20 (e) | | | 1,255 | |
| | | | NuStar Logistics LP, | | | | |
| | 1,240 | | | 4.800%, 09/01/20 | | | 1,278 | |
| | 1,342 | | | 5.625%, 04/28/27 | | | 1,383 | |
| | 760 | | | 6.750%, 02/01/21 | | | 824 | |
| | 730 | | | NWH Escrow Corp., 7.500%, 08/01/21 (e) | | | 661 | |
| | | | Oasis Petroleum, Inc., | | | | |
| | 9,049 | | | 6.500%, 11/01/21 | | | 9,139 | |
| | 4,450 | | | 6.875%, 03/15/22 | | | 4,506 | |
| | 700 | | | 6.875%, 01/15/23 | | | 707 | |
| | | | | | | | |
PRINCIPAL
AMOUNT | | | SECURITY DESCRIPTION | | VALUE | |
| | | | | | | | |
| | | | United States — continued | |
| | 2,185 | | | Olin Corp., 5.125%, 09/15/27 | | | 2,275 | |
| | 3,600 | | | ONEOK Partners LP, 6.200%, 09/15/43 | | | 4,107 | |
| | 870 | | | Orbital ATK, Inc., 5.500%, 10/01/23 | | | 903 | |
| | | | Oshkosh Corp., | | | | |
| | 1,300 | | | 5.375%, 03/01/22 | | | 1,352 | |
| | 4,609 | | | 5.375%, 03/01/25 | | | 4,805 | |
| | | | Outfront Media Capital LLC, | | | | |
| | 748 | | | 5.250%, 02/15/22 | | | 777 | |
| | 1,650 | | | 5.625%, 02/15/24 | | | 1,733 | |
| | 750 | | | 5.875%, 03/15/25 | | | 793 | |
| | | | Owens-Brockway Glass Container, Inc., | | | | |
| | 810 | | | 5.000%, 01/15/22 (e) | | | 841 | |
| | 545 | | | 5.375%, 01/15/25 (e) | | | 568 | |
| | 584 | | | 5.875%, 08/15/23 (e) | | | 625 | |
| | 1,084 | | | 6.375%, 08/15/25 (e) | | | 1,179 | |
| | | | Parker Drilling Co., | | | | |
| | 3,266 | | | 6.750%, 07/15/22 | | | 2,898 | |
| | 660 | | | 7.500%, 08/01/20 | | | 614 | |
| | 1,235 | | | Parsley Energy LLC, 5.250%, 08/15/25 (e) | | | 1,244 | |
| | 2,540 | | | Party City Holdings, Inc., 6.125%, 08/15/23 (e) | | | 2,616 | |
| | 1,874 | | | Pattern Energy Group, Inc., 5.875%, 02/01/24 (e) | | | 1,923 | |
| | 1,588 | | | PBF Holding Co. LLC, 7.000%, 11/15/23 | | | 1,612 | |
| | 1,089 | | | PBF Logistics LP, 6.875%, 05/15/23 | | | 1,116 | |
| | 627 | | | Peabody Energy Corp., 6.000%, 03/31/22 (e) | | | 640 | |
| | | | Penn Virginia Corp., | | | | |
| | 500 | | | 7.250%, 04/15/19 (d) | | | 6 | |
| | 1,100 | | | 8.500%, 05/01/20 (d) | | | 14 | |
| | 2,399 | | | Penske Automotive Group, Inc., 5.500%, 05/15/26 | | | 2,387 | |
| | 660 | | | Performance Food Group, Inc., 5.500%, 06/01/24 (e) | | | 683 | |
| | 2,965 | | | Perrigo Finance Unlimited Co., 4.900%, 12/15/44 | | | 2,928 | |
| | 15,700 | | |
, Inc., 7.125%, 03/15/23 (e) | | | 14,326 | |
| | 11,806 | | | Phillips 66, 4.875%, 11/15/44 | | | 12,169 | |
| | 3,815 | | | Phillips 66 Partners LP, 4.900%, 10/01/46 | | | 3,732 | |
| | 2,096 | | | Pilgrim’s Pride Corp., 5.750%, 03/15/25 (e) | | | 2,180 | |
| | | | Plains All American Pipeline LP, | | | | |
| | 1,560 | | | 4.700%, 06/15/44 | | | 1,449 | |
| | 1,490 | | | 4.900%, 02/15/45 | | | 1,434 | |
| | 4,466 | | | Plantronics, Inc., 5.500%, 05/31/23 (e) | | | 4,544 | |
SEE NOTES TO FINANCIAL STATEMENTS.
| | | | | | | | |
| | | |
| APRIL 30, 2017 | | J.P. MORGAN FUNDS | | | | | 75 | |
JPMorgan Income Builder Fund
SCHEDULE OF PORTFOLIO INVESTMENTS
AS OF APRIL 30, 2017 (Unaudited) (continued)
(Amounts in U.S. Dollars, unless otherwise noted)
(Amounts in thousands)
| | | | | | | | |
PRINCIPAL
AMOUNT | | | SECURITY DESCRIPTION | | VALUE | |
| | Corporate Bonds — continued | |
| | | | United States — continued | |
| | | | PNC Financial Services Group, Inc. (The), | | | | |
| | 9,215 | | | Series R, VAR, 4.850%, 06/01/23 (x) (y) | | | 9,234 | |
| | 10,675 | | | Series S, VAR, 5.000%, 11/01/26 (x) (y) | | | 10,781 | |
| | 5,874 | | | VAR, 6.750%, 08/01/21 (x) (y) | | | 6,630 | |
| | 3,764 | | | PolyOne Corp., 5.250%, 03/15/23 | | | 3,868 | |
| | | | Post Holdings, Inc., | | | | |
| | 1,997 | | | 5.000%, 08/15/26 (e) | | | 1,987 | |
| | 3,954 | | | 5.500%, 03/01/25 (e) | | | 4,132 | |
| | 1,644 | | | 5.750%, 03/01/27 (e) | | | 1,703 | |
| | 6,595 | | | 7.750%, 03/15/24 (e) | | | 7,329 | |
| | 350 | | | 8.000%, 07/15/25 (e) | | | 398 | |
| | | | Prestige Brands, Inc., | | | | |
| | 1,725 | | | 5.375%, 12/15/21 (e) | | | 1,777 | |
| | 805 | | | 6.375%, 03/01/24 (e) | | | 861 | |
| | 10,635 | | | Prime Security Services Borrower LLC, 9.250%, 05/15/23 (e) | | | 11,619 | |
| | | | Prudential Financial, Inc., | | | | |
| | 7,920 | | | VAR, 5.200%, 03/15/44 | | | 8,237 | |
| | 5,006 | | | VAR, 5.375%, 05/15/45 | | | 5,281 | |
| | 23,245 | | | VAR, 5.625%, 06/15/43 | | | 25,366 | |
| | 20,685 | | | VAR, 5.875%, 09/15/42 | | | 22,853 | |
| | | | QEP Resources, Inc., | | | | |
| | 1,262 | | | 5.250%, 05/01/23 | | | 1,234 | |
| | 4,333 | | | 5.375%, 10/01/22 | | | 4,279 | |
| | 478 | | | 6.875%, 03/01/21 | | | 504 | |
| | 2,241 | | | Qorvo, Inc., 6.750%, 12/01/23 | | | 2,431 | |
| | 1,000 | | | Quad/Graphics, Inc., 7.000%, 05/01/22 | | | 1,010 | |
| | 4,374 | | | Quicken Loans, Inc., 5.750%, 05/01/25 (e) | | | 4,418 | |
| | | | Quintiles IMS, Inc., | | | | |
| | 1,255 | | | 4.875%, 05/15/23 (e) | | | 1,289 | |
| | 5,110 | | | 5.000%, 10/15/26 (e) | | | 5,251 | |
| | | | Qwest Capital Funding, Inc., | | | | |
| | 239 | | | 6.875%, 07/15/28 | | | 227 | |
| | 2,130 | | | 7.750%, 02/15/31 | | | 2,061 | |
| | 580 | | | Qwest Corp., 7.250%, 09/15/25 | | | 638 | |
| | 6,027 | | | Rackspace Hosting, Inc., 8.625%, 11/15/24 (e) | | | 6,381 | |
| | 1,123 | | | Radian Group, Inc., 7.000%, 03/15/21 | | | 1,252 | |
| | 3,655 | | | Radio Systems Corp., 8.375%, 11/01/19 (e) | | | 3,797 | |
| | 3,985 | | | Rain CII Carbon LLC, 7.250%, 04/01/25 (e) | | | 3,995 | |
| | | | Range Resources Corp., | | | | |
| | 6,244 | | | 4.875%, 05/15/25 | | | 5,994 | |
| | 2,947 | | | 5.000%, 03/15/23 (e) | | | 2,918 | |
| | 1,500 | | | Realogy Group LLC, 5.250%, 12/01/21 (e) | | | 1,579 | |
| | | | | | | | |
PRINCIPAL
AMOUNT | | | SECURITY DESCRIPTION | | VALUE | |
| | |
| | | | United States — continued | |
| | | | Regal Entertainment Group, | | | | |
| | 7,869 | | | 5.750%, 03/15/22 | | | 8,223 | |
| | 1,200 | | | 5.750%, 06/15/23 | | | 1,263 | |
| | 315 | | | 5.750%, 02/01/25 | | | 328 | |
| | 3,000 | | | Regency Energy Partners LP, 5.500%, 04/15/23 | | | 3,123 | |
| | | | Revlon Consumer Products Corp., | | | | |
| | 600 | | | 5.750%, 02/15/21 | | | 597 | |
| | 1,271 | | | 6.250%, 08/01/24 | | | 1,236 | |
| | 6,790 | | | Reynolds American, Inc., 5.850%, 08/15/45 | | | 8,022 | |
| | | | RHP Hotel Properties LP, | | | | |
| | 2,950 | | | 5.000%, 04/15/21 | | | 3,005 | |
| | 3,828 | | | 5.000%, 04/15/23 | | | 3,905 | |
| | | | Rite Aid Corp., | | | | |
| | 10,742 | | | 6.125%, 04/01/23 (e) | | | 10,634 | |
| | 910 | | | 6.750%, 06/15/21 | | | 917 | |
| | 6,175 | | | Riverbed Technology, Inc., 8.875%, 03/01/23 (e) | | | 6,360 | |
| | 1,192 | | | Rockies Express Pipeline LLC, 5.625%, 04/15/20 (e) | | | 1,274 | |
| | 3,104 | | | Rowan Cos., Inc., 7.375%, 06/15/25 | | | 3,065 | |
| | 58 | | | RR Donnelley & Sons Co., 7.000%, 02/15/22 | | | 59 | |
| | 7,778 | | | RSI Home Products, Inc., 6.500%, 03/15/23 (e) | | | 8,050 | |
| | | | RSP Permian, Inc., | | | | |
| | 2,200 | | | 5.250%, 01/15/25 (e) | | | 2,233 | |
| | 3,043 | | | 6.625%, 10/01/22 | | | 3,207 | |
| | | | Sabine Pass Liquefaction LLC, | | | | |
| | 285 | | | 5.000%, 03/15/27 (e) | | | 301 | |
| | 2,000 | | | 5.625%, 02/01/21 | | | 2,175 | |
| | 1,745 | | | 5.875%, 06/30/26 (e) | | | 1,946 | |
| | 900 | | | 6.250%, 03/15/22 | | | 1,009 | |
| | | | Sabre GLBL, Inc., | | | | |
| | 2,542 | | | 5.250%, 11/15/23 (e) | | | 2,631 | |
| | 8,087 | | | 5.375%, 04/15/23 (e) | | | 8,410 | |
| | | | Sally Holdings LLC, | | | | |
| | 575 | | | 5.500%, 11/01/23 | | | 586 | |
| | 325 | | | 5.625%, 12/01/25 | | | 336 | |
| | 3,905 | | | 5.750%, 06/01/22 | | | 4,022 | |
| | 495 | | | Sanchez Energy Corp., 6.125%, 01/15/23 | | | 455 | |
| | | | SBA Communications Corp., | | | | |
| | 2,791 | | | 4.875%, 07/15/22 | | | 2,875 | |
| | 3,930 | | | 4.875%, 09/01/24 (e) | | | 3,964 | |
| | | | Scientific Games International, Inc., | | | | |
| | 9,100 | | | 7.000%, 01/01/22 (e) | | | 9,742 | |
| | 6,795 | | | 10.000%, 12/01/22 | | | 7,361 | |
SEE NOTES TO FINANCIAL STATEMENTS.
| | | | | | |
| | | |
| 76 | | | | J.P. MORGAN FUNDS | | APRIL 30, 2017 |
| | | | | | | | |
PRINCIPAL
AMOUNT | | | SECURITY DESCRIPTION | | VALUE | |
| | Corporate Bonds — continued | |
| | | | United States — continued | |
| | | | Scotts Miracle-Gro Co. (The), | | | | |
| | 2,567 | | | 5.250%, 12/15/26 (e) | | | 2,651 | |
| | 7,683 | | | 6.000%, 10/15/23 | | | 8,211 | |
| | | | Sealed Air Corp., | | | | |
| | 1,400 | | | 4.875%, 12/01/22 (e) | | | 1,460 | |
| | 1,750 | | | 5.125%, 12/01/24 (e) | | | 1,833 | |
| | 1,233 | | | 5.250%, 04/01/23 (e) | | | 1,307 | |
| | | | SemGroup Corp., | | | | |
| | 1,146 | | | 5.625%, 07/15/22 | | | 1,143 | |
| | 1,070 | | | 5.625%, 11/15/23 | | | 1,057 | |
| | 4,456 | | | Seminole Hard Rock Entertainment, Inc., 5.875%, 05/15/21 (e) | | | 4,523 | |
| | | | Sensata Technologies BV, | | | | |
| | 4,678 | | | 4.875%, 10/15/23 (e) | | | 4,725 | |
| | 1,395 | | | 5.000%, 10/01/25 (e) | | | 1,424 | |
| | 2,034 | | | 5.625%, 11/01/24 (e) | | | 2,156 | |
| | 8,856 | | | Sensata Technologies UK Financing Co. plc, 6.250%, 02/15/26 (e) | | | 9,587 | |
| | | | Service Corp. International, | | | | |
| | 2,865 | | | 5.375%, 01/15/22 | | | 2,955 | |
| | 6,960 | | | 5.375%, 05/15/24 | | | 7,351 | |
| | 2,735 | | | 7.500%, 04/01/27 | | | 3,193 | |
| | 1,240 | | | 8.000%, 11/15/21 | | | 1,460 | |
| | 4,461 | | | SESI LLC, 7.125%, 12/15/21 | | | 4,506 | |
| | 408 | | | Shearer’s Foods LLC, 9.000%, 11/01/19 (e) | | | 427 | |
| | 2,664 | | | Shingle Springs Tribal Gaming Authority, 9.750%, 09/01/21 (e) | | | 2,837 | |
| | | | Sinclair Television Group, Inc., | | | | |
| | 2,835 | | | 5.125%, 02/15/27 (e) | | | 2,814 | |
| | 6,195 | | | 5.375%, 04/01/21 | | | 6,373 | |
| | 2,589 | | | 5.625%, 08/01/24 (e) | | | 2,692 | |
| | 4,230 | | | 6.125%, 10/01/22 | | | 4,415 | |
| | | | Sirius XM Radio, Inc., | | | | |
| | 2,871 | | | 4.625%, 05/15/23 (e) | | | 2,921 | |
| | 10,110 | | | 5.375%, 04/15/25 (e) | | | 10,375 | |
| | 2,855 | | | 5.375%, 07/15/26 (e) | | | 2,923 | |
| | 2,864 | | | 5.750%, 08/01/21 (e) | | | 2,972 | |
| | 7,571 | | | 6.000%, 07/15/24 (e) | | | 8,101 | |
| | | | Six Flags Entertainment Corp., | | | | |
| | 4,855 | | | 4.875%, 07/31/24 (e) | | | 4,897 | |
| | 1,205 | | | 5.250%, 01/15/21 | | | 1,237 | |
| | | | SM Energy Co., | | | | |
| | 1,760 | | | 5.000%, 01/15/24 | | | 1,659 | |
| | 845 | | | 5.625%, 06/01/25 | | | 807 | |
| | 1,248 | | | 6.500%, 11/15/21 | | | 1,276 | |
| | | | | | | | |
PRINCIPAL
AMOUNT | | | SECURITY DESCRIPTION | | VALUE | |
| | |
| | | | United States — continued | |
| | 1,081 | | | 6.500%, 01/01/23 | | | 1,097 | |
| | 945 | | | 6.750%, 09/15/26 | | | 952 | |
| | 2,030 | | | Solera LLC, 10.500%, 03/01/24 (e) | | | 2,317 | |
| | 671 | | | Sonic Automotive, Inc., 6.125%, 03/15/27 (e) | | | 676 | |
| | 1,915 | | | Southern Natural Gas Co. LLC, 4.800%, 03/15/47 (e) | | | 1,975 | |
| | 7,550 | | | Southern Power Co., Series F, 4.950%, 12/15/46 | | | 7,602 | |
| | | | Southwestern Energy Co., | | | | |
| | 1,510 | | | 4.100%, 03/15/22 | | | 1,412 | |
| | 3,615 | | | 6.700%, 01/23/25 | | | 3,597 | |
| | 1,605 | | | Spectra Energy Partners LP, 4.500%, 03/15/45 | | | 1,550 | |
| | | | Spectrum Brands, Inc., | | | | |
| | 5,594 | | | 5.750%, 07/15/25 | | | 5,996 | |
| | 2,159 | | | 6.125%, 12/15/24 | | | 2,301 | |
| | 3,202 | | | 6.625%, 11/15/22 | | | 3,370 | |
| | 1,075 | | | Speedway Motorsports, Inc., 5.125%, 02/01/23 | | | 1,086 | |
| | | | Springleaf Finance Corp., | | | | |
| | 1,304 | | | 7.750%, 10/01/21 | | | 1,394 | |
| | 1,688 | | | 8.250%, 12/15/20 | | | 1,849 | |
| | | | Sprint Capital Corp., | | | | |
| | 798 | | | 6.875%, 11/15/28 | | | 866 | |
| | 1,336 | | | 6.900%, 05/01/19 | | | 1,434 | |
| | 16,490 | | | 8.750%, 03/15/32 | | | 20,293 | |
| | | | Sprint Communications, Inc., | | | | |
| | 2,727 | | | 6.000%, 11/15/22 | | | 2,841 | |
| | 7,326 | | | 7.000%, 03/01/20 (e) | | | 8,004 | |
| | 5,125 | | | 7.000%, 08/15/20 | | | 5,554 | |
| | 8,460 | | | 9.000%, 11/15/18 (e) | | | 9,253 | |
| | 305 | | | 11.500%, 11/15/21 | | | 385 | |
| | | | Sprint Corp., | | | | |
| | 5,367 | | | 7.125%, 06/15/24 | | | 5,837 | |
| | 16,348 | | | 7.250%, 09/15/21 | | | 17,881 | |
| | 19,641 | | | 7.625%, 02/15/25 | | | 21,924 | |
| | 36,262 | | | 7.875%, 09/15/23 | | | 40,704 | |
| | | | SPX FLOW, Inc., | | | | |
| | 1,370 | | | 5.625%, 08/15/24 (e) | | | 1,387 | |
| | 2,175 | | | 5.875%, 08/15/26 (e) | | | 2,202 | |
| | 1,560 | | | SS&C Technologies Holdings, Inc., 5.875%, 07/15/23 | | | 1,658 | |
| | | | Standard Industries, Inc., | | | | |
| | 1,664 | | | 5.500%, 02/15/23 (e) | | | 1,730 | |
| | 2,351 | | | 6.000%, 10/15/25 (e) | | | 2,510 | |
SEE NOTES TO FINANCIAL STATEMENTS.
| | | | | | | | |
| | | |
| APRIL 30, 2017 | | J.P. MORGAN FUNDS | | | | | 77 | |
JPMorgan Income Builder Fund
SCHEDULE OF PORTFOLIO INVESTMENTS
AS OF APRIL 30, 2017 (Unaudited) (continued)
(Amounts in U.S. Dollars, unless otherwise noted)
(Amounts in thousands)
| | | | | | | | |
PRINCIPAL
AMOUNT | | | SECURITY DESCRIPTION | | VALUE | |
| | Corporate Bonds — continued | |
| | | | United States — continued | |
| | 1,650 | | | State Street Corp., Series F, VAR, 5.250%, 09/15/20 (x) (y) | | | 1,733 | |
| | | | Steel Dynamics, Inc., | | | | |
| | 1,085 | | | 5.000%, 12/15/26 (e) | | | 1,110 | |
| | 625 | | | 5.250%, 04/15/23 | | | 647 | |
| | 2,600 | | | 5.500%, 10/01/24 | | | 2,746 | |
| | 1,785 | | | 6.375%, 08/15/22 | | | 1,853 | |
| | 1,945 | | | Sterigenics-Nordion Holdings LLC, 6.500%, 05/15/23 (e) | | | 2,003 | |
| | 195 | | | Stone Energy Corp., 7.500%, 05/31/22 | | | 189 | |
| | 5,740 | | | Summit Materials LLC, 6.125%, 07/15/23 | | | 6,013 | |
| | | | Summit Midstream Holdings LLC, | | | | |
| | 1,559 | | | 5.500%, 08/15/22 | | | 1,563 | |
| | 4,125 | | | 5.750%, 04/15/25 | | | 4,176 | |
| | | | Sunoco Logistics Partners Operations LP, | | | | |
| | 5,150 | | | 5.300%, 04/01/44 | | | 5,103 | |
| | 7,420 | | | 5.350%, 05/15/45 | | | 7,406 | |
| | | | Sunoco LP, | | | | |
| | 1,288 | | | 5.500%, 08/01/20 | | | 1,332 | |
| | 3,029 | | | 6.250%, 04/15/21 | | | 3,199 | |
| | 1,055 | | | 6.375%, 04/01/23 | | | 1,121 | |
| | | | SunTrust Banks, Inc., | | | | |
| | 8,680 | | | Series G, VAR, 5.050%, 06/15/22 (x) (y) | | | 8,680 | |
| | 12,540 | | | VAR, 5.625%, 12/15/19 (x) (y) | | | 13,198 | |
| | | | SUPERVALU, Inc., | | | | |
| | 5,240 | | | 6.750%, 06/01/21 | | | 5,358 | |
| | 10,445 | | | 7.750%, 11/15/22 | | | 10,700 | |
| | 2,483 | | | Symantec Corp., 5.000%, 04/15/25 (e) | | | 2,567 | |
| | 4,815 | | | Sysco Corp., 4.500%, 04/01/46 | | | 4,869 | |
| | | | Talen Energy Supply LLC, | | | | |
| | 155 | | | 4.625%, 07/15/19(e) | | | 153 | |
| | 2,351 | | | 6.500%, 06/01/25 | | | 1,869 | |
| | 2,985 | | | 9.500%, 07/15/22(e) | | | 2,791 | |
| | 2,150 | | | Tallgrass Energy Partners LP, 5.500%, 09/15/24 (e) | | | 2,161 | |
| | | | Targa Resources Partners LP, | | | | |
| | 2,483 | | | 4.250%, 11/15/23 | | | 2,458 | |
| | 4,214 | | | 5.125%, 02/01/25(e) | | | 4,351 | |
| | 850 | | | 5.250%, 05/01/23 | | | 875 | |
| | 1,500 | | | 6.375%, 08/01/22 | | | 1,546 | |
| | 2,750 | | | 6.750%, 03/15/24 | | | 2,998 | |
| | 3,743 | | | Team Health Holdings, Inc., 6.375%, 02/01/25 (e) | | | 3,654 | |
| | | | TEGNA, Inc., | | | | |
| | 1,415 | | | 4.875%, 09/15/21(e) | | | 1,461 | |
| | | | | | | | |
PRINCIPAL
AMOUNT | | | SECURITY DESCRIPTION | | VALUE | |
| | |
| | | | United States — continued | |
| | 2,210 | | | 5.500%, 09/15/24(e) | | | 2,268 | |
| | 5,470 | | | 6.375%, 10/15/23 | | | 5,812 | |
| | | | Teleflex, Inc., | | | | |
| | 368 | | | 4.875%, 06/01/26 | | | 374 | |
| | 875 | | | 5.250%, 06/15/24 | | | 901 | |
| | | | Tempur Sealy International, Inc., | | | | |
| | 5,300 | | | 5.500%, 06/15/26 | | | 5,274 | |
| | 3,155 | | | 5.625%, 10/15/23 | | | 3,224 | |
| | | | Tenet Healthcare Corp., | | | | |
| | 3,935 | | | 4.375%, 10/01/21 | | | 3,930 | |
| | 10,946 | | | 4.500%, 04/01/21 | | | 10,932 | |
| | 1,220 | | | 4.750%, 06/01/20 | | | 1,238 | |
| | 2,995 | | | 5.500%, 03/01/19 | | | 3,025 | |
| | 4,629 | | | 6.000%, 10/01/20 | | | 4,872 | |
| | 510 | | | 6.250%, 11/01/18 | | | 535 | |
| | 6,205 | | | 6.750%, 02/01/20 | | | 6,267 | |
| | 9,620 | | | 6.750%, 06/15/23 | | | 9,187 | |
| | 1,980 | | | 7.500%, 01/01/22(e) | | | 2,119 | |
| | 10,318 | | | 8.000%, 08/01/20 | | | 10,528 | |
| | 13,423 | | | 8.125%, 04/01/22 | | | 13,624 | |
| | 1,223 | | | Tennant Co., 5.625%, 05/01/25 (e) | | | 1,270 | |
| | | | Tenneco, Inc., | | | | |
| | 2,225 | | | 5.000%, 07/15/26 | | | 2,242 | |
| | 1,097 | | | 5.375%, 12/15/24 | | | 1,132 | |
| | 6,463 | | | Terex Corp., 5.625%, 02/01/25 (e) | | | 6,608 | |
| | 4,767 | | | Terraform Global Operating LLC, 9.750%, 08/15/22 (e) | | | 5,291 | |
| | | | TerraForm Power Operating LLC, | | | | |
| | 1,000 | | | SUB, 6.375%, 02/01/23 (e) | | | 1,032 | |
| | 4,273 | | | SUB, 6.625%, 06/15/25 (e) | | | 4,519 | |
| | | | Tesoro Corp., | | | | |
| | 1,842 | | | 4.750%, 12/15/23 (e) | | | 1,929 | |
| | 1,872 | | | 5.125%, 12/15/26 (e) | | | 1,994 | |
| | | | Tesoro Logistics LP, | | | | |
| | 3,740 | | | 5.250%, 01/15/25 | | | 3,969 | |
| | 3,871 | | | 5.875%, 10/01/20 | | | 3,978 | |
| | 4,415 | | | 6.125%, 10/15/21 | | | 4,608 | |
| | 5,267 | | | 6.250%, 10/15/22 | | | 5,649 | |
| | 1,540 | | | 6.375%, 05/01/24 | | | 1,682 | |
| | | | Texas Competitive Electric Holdings Co. LLC, | | | | |
| | 29,250 | | | 8.500%, 05/01/20 (d) | | | 94 | |
| | 5,545 | | | TI Group Automotive Systems LLC, 8.750%, 07/15/23 (e) | | | 5,933 | |
| | 4,160 | | | Time, Inc., 5.750%, 04/15/22 (e) | | | 4,254 | |
SEE NOTES TO FINANCIAL STATEMENTS.
| | | | | | |
| | | |
| 78 | | | | J.P. MORGAN FUNDS | | APRIL 30, 2017 |
| | | | | | | | |
PRINCIPAL
AMOUNT | | | SECURITY DESCRIPTION | | VALUE | |
| | Corporate Bonds — continued | |
| | | | United States — continued | |
| | 1,887 | | | Titan International, Inc., 6.875%, 10/01/20 | | | 1,939 | |
| | | | T-Mobile USA, Inc., | | | | |
| | 2,066 | | | 5.125%, 04/15/25 | | | 2,177 | |
| | 1,375 | | | 5.375%, 04/15/27 | | | 1,471 | |
| | 3,110 | | | 6.000%, 03/01/23 | | | 3,311 | |
| | 944 | | | 6.000%, 04/15/24 | | | 1,023 | |
| | 1,485 | | | 6.125%, 01/15/22 | | | 1,569 | |
| | 4,162 | | | 6.375%, 03/01/25 | | | 4,548 | |
| | 2,440 | | | 6.500%, 01/15/24 | | | 2,641 | |
| | 11,360 | | | 6.500%, 01/15/26 | | | 12,595 | |
| | 5,243 | | | 6.625%, 04/01/23 | | | 5,604 | |
| | 4,532 | | | 6.836%, 04/28/23 | | | 4,861 | |
| | | | Toll Brothers Finance Corp., | | | | |
| | 670 | | | 4.875%, 11/15/25 | | | 688 | |
| | 935 | | | 5.625%, 01/15/24 | | | 1,003 | |
| | 2,076 | | | Tops Holding LLC, 8.000%, 06/15/22 (e) | | | 1,817 | |
| | | | TransDigm, Inc., | | | | |
| | 1,000 | | | 5.500%, 10/15/20 | | | 1,022 | |
| | 3,320 | | | 6.000%, 07/15/22 | | | 3,420 | |
| | 1,584 | | | 6.375%, 06/15/26 | | | 1,596 | |
| | 4,272 | | | 6.500%, 07/15/24 | | | 4,389 | |
| | 5,240 | | | 6.500%, 05/15/25 (e) | | | 5,358 | |
| | 4,690 | | | Transocean Proteus Ltd., 6.250%, 12/01/24 (e) | | | 4,784 | |
| | | | Transocean, Inc., | | | | |
| | 1,546 | | | 5.800%, 10/15/22 | | | 1,438 | |
| | 8,127 | | | 6.800%, 03/15/38 | | | 6,502 | |
| | 827 | | | 7.500%, 04/15/31 | | | 736 | |
| | 6,000 | | | 9.000%, 07/15/23 (e) | | | 6,397 | |
| | 1,247 | | | 9.100%, 12/15/41 | | | 1,160 | |
| | 3,465 | | | TreeHouse Foods, Inc., 6.000%, 02/15/24 (e) | | | 3,690 | |
| | 2,200 | | | Trinseo Materials Operating SCA, 6.750%, 05/01/22 (e) | | | 2,321 | |
| | | | Triumph Group, Inc., | | | | |
| | 4,545 | | | 4.875%, 04/01/21 | | | 4,454 | |
| | 1,686 | | | 5.250%, 06/01/22 | | | 1,644 | |
| | 3,623 | | | Tutor Perini Corp., 6.875%, 05/01/25 (e) | | | 3,804 | |
| | 2,950 | | | UCI International LLC, 8.625%, 02/15/19 (d) | | | 590 | |
| | | | Ultra Resources, Inc., | | | | |
| | 3,856 | | | 6.875%, 04/15/22 (e) | | | 3,899 | |
| | 1,376 | | | 7.125%, 04/15/25 (e) | | | 1,363 | |
| | 3,303 | | | Unifrax I LLC, 7.500%, 02/15/19 (e) | | | 3,303 | |
| | 3,616 | | | Unit Corp., 6.625%, 05/15/21 | | | 3,598 | |
| | | | | | | | |
PRINCIPAL
AMOUNT | | | SECURITY DESCRIPTION | | VALUE | |
| | |
| | | | United States — continued | |
| | 3,454 | | | United Continental Holdings, Inc., 5.000%, 02/01/24 | | | 3,471 | |
| | | | United Rentals North America, Inc., | | | | |
| | 3,281 | | | 5.500%, 07/15/25 | | | 3,429 | |
| | 4,235 | | | 5.500%, 05/15/27 | | | 4,357 | |
| | 4,880 | | | 5.750%, 11/15/24 | | | 5,142 | |
| | 1,845 | | | 5.875%, 09/15/26 | | | 1,946 | |
| | 6,478 | | | 6.125%, 06/15/23 | | | 6,769 | |
| | 3,148 | | | 7.625%, 04/15/22 | | | 3,286 | |
| | 988 | | | United States Steel Corp., 8.375%, 07/01/21 (e) | | | 1,088 | |
| | | | Uniti Group, Inc., | | | | |
| | 4,380 | | | 6.000%, 04/15/23 (e) | | | 4,558 | |
| | 2,764 | | | 7.125%, 12/15/24 (e) | | | 2,826 | |
| | 8,255 | | | 8.250%, 10/15/23 | | | 8,810 | |
| | 2,125 | | | Univar USA, Inc., 6.750%, 07/15/23 (e) | | | 2,215 | |
| | | | Univision Communications, Inc., | | | | |
| | 4,600 | | | 5.125%, 05/15/23 (e) | | | 4,675 | |
| | 4,492 | | | 5.125%, 02/15/25 (e) | | | 4,475 | |
| | 2,028 | | | 6.750%, 09/15/22 (e) | | | 2,124 | |
| | | | US Bancorp, | | | | |
| | 9,885 | | | Series I, VAR, 5.125%, 01/15/21 (x) (y) | | | 10,469 | |
| | 10,800 | | | Series J, VAR, 5.300%, 04/15/27 (x) (y) | | | 11,164 | |
| | 1,851 | | | US Concrete, Inc., 6.375%, 06/01/24 | | | 1,934 | |
| | 1,632 | | | USIS Merger Sub, Inc., 6.875%, 05/01/25 (e) | | | 1,661 | |
| | | | Valeant Pharmaceuticals International, Inc., | | | | |
| | 4,490 | | | 5.375%, 03/15/20 (e) | | | 3,845 | |
| | 383 | | | 5.500%, 03/01/23 (e) | | | 283 | |
| | 28,914 | | | 5.875%, 05/15/23 (e) | | | 21,360 | |
| | 5,988 | | | 6.125%, 04/15/25 (e) | | | 4,421 | |
| | 5,357 | | | 6.375%, 10/15/20 (e) | | | 4,600 | |
| | 2,551 | | | 6.500%, 03/15/22 (e) | | | 2,612 | |
| | 624 | | | 6.750%, 08/15/18 (e) | | | 622 | |
| | 9,817 | | | 6.750%, 08/15/21 (e) | | | 8,099 | |
| | 9,577 | | | 7.000%, 10/01/20 (e) | | | 8,404 | |
| | 6,372 | | | 7.000%, 03/15/24 (e) | | | 6,499 | |
| | 8,965 | | | 7.250%, 07/15/22 (e) | | | 7,194 | |
| | 21,192 | | | 7.500%, 07/15/21 (e) | | | 17,563 | |
| �� | 455 | | | Valvoline, Inc., 5.500%, 07/15/24 (e) | | | 481 | |
| | 3,475 | | | Veritas US, Inc., 7.500%, 02/01/23 (e) | | | 3,666 | |
| | | | Verizon Communications, Inc., | | | | |
| | 11,025 | | | 4.522%, 09/15/48 | | | 10,070 | |
| | 6,355 | | | 4.862%, 08/21/46 | | | 6,172 | |
| | 2,790 | | | 5.012%, 04/15/49 (e) | | | 2,738 | |
| | 2,375 | | | 5.500%, 03/16/47 | | | 2,504 | |
SEE NOTES TO FINANCIAL STATEMENTS.
| | | | | | | | |
| | | |
| APRIL 30, 2017 | | J.P. MORGAN FUNDS | | | | | 79 | |
JPMorgan Income Builder Fund
SCHEDULE OF PORTFOLIO INVESTMENTS
AS OF APRIL 30, 2017 (Unaudited) (continued)
(Amounts in U.S. Dollars, unless otherwise noted)
(Amounts in thousands)
| | | | | | | | |
PRINCIPAL
AMOUNT | | | SECURITY DESCRIPTION | | VALUE | |
| | Corporate Bonds — continued | |
| | | | United States — continued | |
| | 2,340 | | | Versum Materials, Inc., 5.500%,
09/30/24 (e) | | | 2,431 | |
| | 9,836 | | | Vertiv Group Corp., 9.250%, 10/15/24 (e) | | | 10,561 | |
| | | | Viacom, Inc., | | | | |
| | 6,675 | | | 4.375%, 03/15/43 | | | 5,938 | |
| | 4,865 | | | VAR, 5.875%, 02/28/57 | | | 5,023 | |
| | 4,385 | | | VAR, 6.250%, 02/28/57 | | | 4,500 | |
| | 7,330 | | | Vista Outdoor, Inc., 5.875%, 10/01/23 | | | 7,293 | |
| | | | Voya Financial, Inc., | | | | |
| | 3,660 | | | 4.800%, 06/15/46 | | | 3,669 | |
| | 13,110 | | | VAR, 5.650%, 05/15/53 | | | 13,536 | |
| | 1,567 | | | W&T Offshore, Inc., 8.500%, 06/15/19 | | | 1,293 | |
| | | | Wachovia Capital Trust III, | | | | |
| | 11,565 | | | VAR, 5.570%, 06/02/17 (x) (y) | | | 11,608 | |
| | 5,830 | | | Walgreens Boots Alliance, Inc., 4.800%, 11/18/44 | | | 6,024 | |
| | 268 | | | Weatherford International LLC, 6.800%, 06/15/37 | | | 253 | |
| | | | Weatherford International Ltd., | | | | |
| | 1,064 | | | 4.500%, 04/15/22 | | | 1,006 | |
| | 813 | | | 5.950%, 04/15/42 | | | 711 | |
| | 3,027 | | | 6.500%, 08/01/36 | | | 2,861 | |
| | 421 | | | 6.750%, 09/15/40 | | | 398 | |
| | 2,649 | | | 7.000%, 03/15/38 | | | 2,536 | |
| | 559 | | | 7.750%, 06/15/21 | | | 596 | |
| | 1,414 | | | 8.250%, 06/15/23 | | | 1,532 | |
| | 800 | | | 9.875%, 02/15/24 (e) | | | 932 | |
| | | | Wells Fargo & Co., | | | | |
| | 2,880 | | | Series K, VAR, 7.980%, 03/15/18 (x) (y) | | | 3,013 | |
| | 25,305 | | | Series S, VAR, 5.900%, 06/15/24 (x) (y) | | | 26,823 | |
| | 15,275 | | | Series U, VAR, 5.875%, 06/15/25 (x) (y) | | | 16,574 | |
| | | | West Corp., | | | | |
| | 864 | | | 4.750%, 07/15/21 (e) | | | 886 | |
| | 3,725 | | | 5.375%, 07/15/22 (e) | | | 3,762 | |
| | | | Western Digital Corp., | | | | |
| | 8,763 | | | 7.375%, 04/01/23 (e) | | | 9,595 | |
| | 14,250 | | | 10.500%, 04/01/24 | | | 16,815 | |
| | 770 | | | Western Gas Partners LP, 5.450%, 04/01/44 | | | 801 | |
| | 1,831 | | | Western Refining Logistics LP, 7.500%, 02/15/23 | | | 1,977 | |
| | | | Whiting Petroleum Corp., | | | | |
| | 10,148 | | | 5.000%, 03/15/19 | | | 10,250 | |
| | 3,935 | | | 5.750%, 03/15/21 | | | 3,915 | |
| | 3,500 | | | 6.250%, 04/01/23 | | | 3,500 | |
| | 2,125 | | | WildHorse Resource Development Corp., 6.875%, 02/01/25 (e) | | | 2,040 | |
| | | | | | | | |
PRINCIPAL
AMOUNT | | | SECURITY DESCRIPTION | | VALUE | |
| | |
| | | | United States — continued | |
| | | | Williams Cos., Inc. (The), | | | | |
| | 2,210 | | | 3.700%, 01/15/23 | | | 2,177 | |
| | 1,790 | | | 5.750%, 06/24/44 | | | 1,853 | |
| | 162 | | | Series A, 7.500%, 01/15/31 | | | 191 | |
| | 1,144 | | | 7.750%, 06/15/31 | | | 1,356 | |
| | 1,150 | | | Williams Partners LP, 4.875%, 05/15/23 | | | 1,185 | |
| | | | Windstream Services LLC, | | | | |
| | 3,370 | | | 6.375%, 08/01/23 | | | 2,974 | |
| | 15,459 | | | 7.500%, 06/01/22 | | | 15,034 | |
| | 1,384 | | | 7.500%, 04/01/23 | | | 1,308 | |
| | 7,262 | | | 7.750%, 10/01/21 | | | 7,298 | |
| | | | WMG Acquisition Corp., | | | | |
| | 865 | | | 4.875%, 11/01/24 (e) | | | 876 | |
| | 2,420 | | | 5.000%, 08/01/23 (e) | | | 2,459 | |
| | 3,823 | | | 5.625%, 04/15/22 (e) | | | 3,985 | |
| | 3,408 | | | 6.750%, 04/15/22 (e) | | | 3,596 | |
| | | | WPX Energy, Inc., | | | | |
| | 4,005 | | | 7.500%, 08/01/20 | | | 4,245 | |
| | 800 | | | 8.250%, 08/01/23 | | | 892 | |
| | | | Wynn Las Vegas LLC, | | | | |
| | 1,835 | | | 5.375%, 03/15/22 | | | 1,892 | |
| | 9,290 | | | 5.500%, 03/01/25 (e) | | | 9,662 | |
| | | | XPO Logistics, Inc., | | | | |
| | 1,865 | | | 6.125%, 09/01/23 (e) | | | 1,958 | |
| | 9,520 | | | 6.500%, 06/15/22 (e) | | | 10,080 | |
| | 540 | | | Xylem, Inc., 4.375%, 11/01/46 | | | 542 | |
| | | | Zayo Group LLC, | | | | |
| | 3,088 | | | 5.750%, 01/15/27 (e) | | | 3,277 | |
| | 12,312 | | | 6.000%, 04/01/23 | | | 13,081 | |
| | 1,348 | | | 6.375%, 05/15/25 | | | 1,458 | |
| | 11,510 | | | Zebra Technologies Corp., 7.250%, 10/15/22 | | | 12,445 | |
| | | | | | | | |
| | | | | | | 4,451,995 | |
| | | | | | | | |
| | | | Venezuela — 0.0% (g) | |
| | | | Petroleos de Venezuela SA, | | | | |
| | 1,871 | | | 6.000%, 11/15/26 | | | 710 | |
| | 1,890 | | | Reg. S, 5.375%, 04/12/27 | | | 723 | |
| | 900 | | | Reg. S, 12.750%, 02/17/22 | | | 555 | |
| | | | Venezuela Government Bond, | | | | |
| | 318 | | | Reg. S, 6.000%, 11/15/26 | | | 121 | |
| | 1,000 | | | Reg. S, 8.500%, 10/27/20 | | | 783 | |
| | 1,540 | | | Reg. S, 9.000%, 11/17/21 | | | 806 | |
| | | | | | | | |
| | | | | | | 3,698 | |
| | | | | | | | |
| | | | Total Corporate Bonds
(Cost $5,142,034) | | | 5,296,368 | |
| | | | | | | | |
SEE NOTES TO FINANCIAL STATEMENTS.
| | | | | | |
| | | |
| 80 | | | | J.P. MORGAN FUNDS | | APRIL 30, 2017 |
| | | | | | | | |
PRINCIPAL
AMOUNT | | | SECURITY DESCRIPTION | | VALUE | |
| | Foreign Government Securities — 1.2% | |
| | | | Angola — 0.0% (g) | |
| | 1,625 | | | Republic of Angola, Reg. S, 7.000%, 08/17/19 | | | 1,678 | |
| | | | | | | | |
| | | | Argentina — 0.1% | |
| | | | Provincia de Buenos Aires, | | | | |
| | 2,450 | | | Reg. S, 9.950%, 06/09/21 | | | 2,824 | |
| | 1,769 | | | Reg. S, 10.875%, 01/26/21 | | | 2,043 | |
| | | | Republic of Argentina, | | | | |
| | 1,910 | | | 6.250%, 04/22/19 | | | 2,020 | |
| | 890 | | | 7.500%, 04/22/26 | | | 980 | |
| | 1,682 | | | 8.280%, 12/31/33 | | | 1,884 | |
| | | | | | | | |
| | | | | | | 9,751 | |
| | | | | | | | |
| | | | Armenia — 0.0% (g) | |
| | 600 | | | Republic of Armenia, Reg. S, 7.150%, 03/26/25 | | | 654 | |
| | | | | | | | |
| | | | Aruba — 0.0% (g) | |
| | 1,620 | | | Government of Aruba, 4.625%, 09/14/23 (e) | | | 1,683 | |
| | | | | | | | |
| | | | Azerbaijan — 0.0% (g) | |
| | 1,700 | | | State Oil Co. of the Azerbaijan Republic, Reg. S, 6.950%, 03/18/30 | | | 1,840 | |
| | | | | | | | |
| | | | Belarus — 0.0% (g) | |
| | 2,200 | | | Republic of Belarus, Reg. S, 8.950%, 01/26/18 | | | 2,275 | |
| | | | | | | | |
| | | | Brazil — 0.1% | |
| | 4,630 | | | Federative Republic of Brazil, 8.250%, 01/20/34 | | | 5,880 | |
| | | | Republic of Brazil, | | | | |
| | 3,140 | | | 4.250%, 01/07/25 | | | 3,127 | |
| | 1,935 | | | 4.875%, 01/22/21 | | | 2,049 | |
| | | | | | | | |
| | | | | | | 11,056 | |
| | | | | | | | |
| | | | Cameroon — 0.0% (g) | |
| | 600 | | | Republic of Cameroon, 9.500%, 11/19/25 | | | 683 | |
| | | | | | | | |
| | | | Costa Rica — 0.0% (g) | |
| | 870 | | | Instituto Costarricense de Electricidad, Reg. S, 6.950%, 11/10/21 | | | 926 | |
| | | | Republic of Costa Rica, | | | | |
| | 1,270 | | | 7.158%, 03/12/45 (e) | | | 1,321 | |
| | 1,930 | | | Reg. S, 9.995%, 08/01/20 | | | 2,260 | |
| | | | | | | | |
| | | | | | | 4,507 | |
| | | | | | | | |
| | | | Croatia — 0.0% (g) | |
| | | | Republic of Croatia, | | | | |
| | 890 | | | Reg. S, 6.750%, 11/05/19 | | | 968 | |
| | | | | | | | |
| | | | | | | | |
PRINCIPAL
AMOUNT | | | SECURITY DESCRIPTION | | VALUE | |
| | | | | | | | |
| | | | Dominican Republic — 0.1% | |
| | | | Government of Dominican Republic, | | | | |
| | 4,090 | | | 6.875%, 01/29/26 (e) | | | 4,560 | |
| | 2,105 | | | 7.450%, 04/30/44 (e) | | | 2,384 | |
| | | | | | | | |
| | | | | | | 6,944 | |
| | | | | | | | |
| | | | Ecuador — 0.1% | |
| | | | Republic of Ecuador, | | | | |
| | 3,150 | | | Reg. S, 10.500%, 03/24/20 | | | 3,371 | |
| | 1,300 | | | Reg. S, 10.750%, 03/28/22 | | | 1,407 | |
| | | | | | | | |
| | | | | | | 4,778 | |
| | | | | | | | |
| | | | Egypt — 0.0% (g) | |
| | 1,200 | | | Republic of Egypt, 6.125%, 01/31/22 (e) | | | 1,249 | |
| | | | | | | | |
| | | | El Salvador — 0.0% (g) | |
| | | | Republic of El Salvador, | | | | |
| | 2,590 | | | Reg. S, 7.750%, 01/24/23 | | | 2,603 | |
| | | | | | | | |
| | | | Ethiopia — 0.0% (g) | |
| | 750 | | | Republic of Ethopia, 6.625%, 12/11/24 | | | 739 | |
| | | | | | | | |
| | | | Gabon — 0.0% (g) | |
| | 850 | | | Republic of Gabonese, 6.375%, 12/12/24 | | | 832 | |
| | | | | | | | |
| | | | Honduras — 0.0% (g) | |
| | | | Republic of Honduras, | | | | |
| | 1,380 | | | Reg. S, 8.750%, 12/16/20 | | | 1,571 | |
| | | | | | | | |
| | | | Hungary — 0.0% (g) | |
| | | | Republic of Hungary, | | | | |
| | 1,034 | | | 5.750%, 11/22/23 | | | 1,176 | |
| | 852 | | | 7.625%, 03/29/41 | | | 1,259 | |
| | | | | | | | |
| | | | | | | 2,435 | |
| | | | | | | | |
| | | | Indonesia — 0.1% | |
| | | | Republic of Indonesia, | | | | |
| | 2,480 | | | 6.750%, 01/15/44 (e) | | | 3,184 | |
| | 2,392 | | | Reg. S, 11.625%, 03/04/19 | | | 2,804 | |
| | | | | | | | |
| | | | | | | 5,988 | |
| | | | | | | | |
| | | | Iraq — 0.0% (g) | |
| | 3,785 | | | Republic of Iraq, Reg. S, 5.800%, 01/15/28 | | | 3,373 | |
| | | | | | | | |
| | | | Jamaica — 0.0% (g) | |
| | 2,250 | | | Government of Jamaica, 8.000%, 03/15/39 | | | 2,616 | |
| | | | | | | | |
| | | | Kenya — 0.0% (g) | |
| | | | Republic of Kenya, | | | | |
| | 820 | | | 6.875%, 06/24/24 | | | 829 | |
| | | | | | | | |
SEE NOTES TO FINANCIAL STATEMENTS.
| | | | | | | | |
| | | |
| APRIL 30, 2017 | | J.P. MORGAN FUNDS | | | | | 81 | |
JPMorgan Income Builder Fund
SCHEDULE OF PORTFOLIO INVESTMENTS
AS OF APRIL 30, 2017 (Unaudited) (continued)
(Amounts in U.S. Dollars, unless otherwise noted)
(Amounts in thousands)
| | | | | | | | |
PRINCIPAL
AMOUNT | | | SECURITY DESCRIPTION | | VALUE | |
| | Foreign Government Securities — continued | |
| | | | Lebanon — 0.1% | |
| | | | Republic of Lebanon, | | | | |
| | 842 | | | Reg. S, 5.450%, 11/28/19 | | | 859 | |
| | 2,500 | | | Reg. S, 6.600%, 11/27/26 | | | 2,525 | |
| | 4,550 | | | Reg. S, 8.250%, 04/12/21 | | | 5,039 | |
| | | | | | | | |
| | | | | | | 8,423 | |
| | | | | | | | |
| | | | Mexico — 0.0% (g) | |
| | 3,150 | | | United Mexican States, 4.600%, 01/23/46 | | | 3,056 | |
| | | | | | | | |
| | | | Morocco — 0.0% (g) | |
| | 1,050 | | | Kingdom of Morocco, Reg. S, 5.500%, 12/11/42 | | | 1,142 | |
| | | | | | | | |
| | | | Nigeria — 0.0% (g) | |
| | 700 | | | Republic of Nigeria, 7.875%, 02/16/32 | | | 759 | |
| | | | | | | | |
| | | | Oman — 0.0% (g) | |
| | 540 | | | Republic of Oman, 6.500%, 03/08/47 (e) | | | 580 | |
| | | | | | | | |
| | | | Pakistan — 0.0% (g) | |
| | 1,150 | | | Republic of Pakistan, Reg. S, 6.750%, 12/03/19 | | | 1,216 | |
| | | | | | | | |
| | | | Panama — 0.0% (g) | |
| | | | Republic of Panama, | | | | |
| | 1,100 | | | 3.750%, 03/16/25 | | | 1,133 | |
| | 1,450 | | | 4.300%, 04/29/53 | | | 1,428 | |
| | 700 | | | 6.700%, 01/26/36 | | | 905 | |
| | | | | | | | |
| | | | | | | 3,466 | |
| | | | | | | | |
| | | | Peru — 0.0% (g) | |
| | 1,500 | | | Republic of Peru, 5.625%, 11/18/50 | | | 1,811 | |
| | | | | | | | |
| | | | Philippines — 0.0% (g) | |
| | | | Republic of the Philippines, | | | | |
| | 1,560 | | | 10.625%, 03/16/25 | | | 2,385 | |
| | | | | | | | |
| | | | Romania — 0.0% (g) | |
| | | | Republic of Romania, | | | | |
| | 2,080 | | | Reg. S, 6.125%, 01/22/44 | | | 2,587 | |
| | | | | | | | |
| | | | Russia — 0.1% | |
| | | | Russian Federation, | | | | |
| | 3,000 | | | Reg. S, 5.875%, 09/16/43 | | | 3,462 | |
| | 3,340 | | | Reg. S, 12.750%, 06/24/28 | | | 5,924 | |
| | | | | | | | |
| | | | | | | 9,386 | |
| | | | | | | | |
| | | | Serbia — 0.0% (g) | |
| | | | Republic of Serbia, | | | | |
| | 3,280 | | | Reg. S, 7.250%, 09/28/21 | | | 3,776 | |
| | | | | | | | |
| | | | | | | | |
PRINCIPAL
AMOUNT | | | SECURITY DESCRIPTION | | VALUE | |
| | | | | | | | |
| | | | Slovenia — 0.0% (g) | |
| | 1,720 | | | Republic of Slovenia, Reg. S, 5.850%, 05/10/23 | | | 1,989 | |
| | | | | | | | |
| | | | South Africa — 0.1% | |
| | | | Republic of South Africa, | | | | |
| | 1,210 | | | 4.875%, 04/14/26 | | | 1,223 | |
| | 1,450 | | | 5.875%, 05/30/22 | | | 1,581 | |
| | 2,834 | | | 5.875%, 09/16/25 | | | 3,075 | |
| | | | | | | | |
| | | | | | | 5,879 | |
| | | | | | | | |
| | | | Sri Lanka — 0.1% | |
| | | | Republic of Sri Lanka, | | | | |
| | 3,050 | | | Reg. S, 5.875%, 07/25/22 | | | 3,153 | |
| | 1,890 | | | Reg. S, 6.250%, 10/04/20 | | | 2,001 | |
| | | | | | | | |
| | | | | | | 5,154 | |
| | | | | | | | |
| | | | Turkey — 0.1% | |
| | | | Republic of Turkey, | | | | |
| | 3,050 | | | 6.000%, 01/14/41 | | | 3,161 | |
| | 1,800 | | | 6.625%, 02/17/45 | | | 2,016 | |
| | 5,640 | | | 7.375%, 02/05/25 | | | 6,556 | |
| | | | | | | | |
| | | | | | | 11,733 | |
| | | | | | | | |
| | | | Ukraine — 0.1% | |
| | | | Republic of Ukraine, | | | | |
| | 2,300 | | | 7.750%, 09/01/19 | | | 2,353 | |
| | 3,800 | | | Reg. S, 7.750%, 09/01/20 | | | 3,840 | |
| | 1,000 | | | Reg. S, 7.750%, 09/01/27 | | | 940 | |
| | | | | | | | |
| | | | | | | 7,133 | |
| | | | | | | | |
| | | | Uruguay — 0.0% (g) | |
| | | | Republic of Uruguay, | | | | |
| | 1,260 | | | 5.100%, 06/18/50 | | | 1,247 | |
| | 880 | | | 7.625%, 03/21/36 | | | 1,162 | |
| | 430 | | | 8.000%, 11/18/22 | | | 525 | |
| | | | | | | | |
| | | | | | | 2,934 | |
| | | | | | | | |
| | | | Venezuela — 0.1% | |
| | | | Republic of Venezuela, | | | | |
| | 1,190 | | | 9.250%, 09/15/27 | | | 631 | |
| | 280 | | | Reg. S, 7.000%, 12/01/18 | | | 195 | |
| | 1,470 | | | Reg. S, 7.750%, 10/13/19 | | | 886 | |
| | 2,880 | | | Reg. S, 9.000%, 05/07/23 | | | 1,426 | |
| | 1,630 | | | Reg. S, 11.750%, 10/21/26 | | | 945 | |
| | 1,530 | | | Reg. S, 11.950%, 08/05/31 | | | 883 | |
| | | | | | | | |
| | | | | | | 4,966 | |
| | | | | | | | |
SEE NOTES TO FINANCIAL STATEMENTS.
| | | | | | |
| | | |
| 82 | | | | J.P. MORGAN FUNDS | | APRIL 30, 2017 |
| | | | | | | | |
PRINCIPAL
AMOUNT | | | SECURITY DESCRIPTION | | VALUE | |
| | Foreign Government Securities — continued | |
| | | | Zambia — 0.0% (g) | |
| | 1,910 | | | Republic of Zambia, Reg. S, 8.970%, 07/30/27 | | | 2,027 | |
| | | | | | | | |
| | | | Total Foreign Government Securities
(Cost $142,075) | | | 149,454 | |
| | | | | | | | |
| | Loan Assignments — 0.6% | |
| | | | Bermuda — 0.0% (g) | |
| | 1,997 | | | Floatel Delaware LLC, Initial Term Loan, VAR, 6.147%, 06/27/20 | | | 1,647 | |
| | | | | | | | |
| | | | Canada — 0.0% (g) | |
| | 2,402 | | | Concordia Healthcare Corp., Initial Dollar Term Loan, VAR, 5.250%, 10/21/21 | | | 1,607 | |
| | 4,392 | | | MEG Energy Corp., 1st Lien Term B Loan, VAR, 4.540%, 12/31/23 | | | 4,394 | |
| | | | | | | | |
| | | | | | | 6,001 | |
| | | | | | | | |
| | | | Luxembourg — 0.0% (g) | |
| | 956 | | | Onex Wizard Acquisition Co. II S.C.A., Initial Dollar Term Loan, VAR, 4.000%, 03/11/22 | | | 962 | |
| | | | | | | | |
| | | | United States — 0.6% | |
| | 181 | | | Alon USA Partners LP, MLP Term Loans, VAR, 9.250%, 11/26/18 | | | 181 | |
| | 829 | | | Avaya, Inc., DIP Term Loan, VAR, 8.500%, 01/24/18 (d) | | | 850 | |
| | 1,020 | | | Avaya, Inc., Extending Tranche Term Loan B-3, VAR, 5.670%, 10/26/17 ^ | | | 851 | |
| | 1,565 | | | Avaya, Inc., Term Loan B-6, VAR, 6.532%, 03/31/18 (d) | | | 1,301 | |
| | 1,260 | | | Avaya, Inc., Term Loan B-7, VAR, 6.417%, 05/29/20 (d) | | | 1,051 | |
| | 433 | | | Berry Plastics Corp., Term Loan I, VAR, 3.507%, 10/01/22 | | | 436 | |
| | 640 | | | Berry Plastics Corp., Term Loan L, VAR, 3.239%, 01/06/21 | | | 643 | |
| | 3,806 | | | California Resources Corp., 1st Lien Second Out Term Loan, VAR, 11.375%, 08/05/21 | | | 4,182 | |
| | 8,044 | | | Chesapeake Energy Corp., 1st Lien Last Out Term Loan, VAR, 8.553%, 08/23/21 ^ | | | 8,685 | |
| | 730 | | | Cincinnati Bell, Inc., Term Loan, VAR, 4.000%, 09/10/20 | | | 737 | |
| | 3,223 | | | Citgo Holding, Inc., Term B Loan, VAR, 4.647%, 07/29/21 | | | 3,240 | |
| | 686 | | | Citgo Holding, Inc., Term Loan, VAR, 9.647%, 05/12/18 ^ | | | 694 | |
| | 1,473 | | | Consolidated Communications, Inc.,
Term Loan B-2, VAR, 4.000%, 10/05/23 ^ | | | 1,480 | |
| | 1,869 | | | Cortes NP Acquisition Corp., Term Loan B, VAR, 5.030%, 11/30/23 | | | 1,880 | |
| | | | | | | | |
PRINCIPAL
AMOUNT | | | SECURITY DESCRIPTION | | VALUE | |
| | |
| | | | United States — continued | |
| | 1,298 | | | Dell Software Group, Term Loan, VAR, 7.000%, 10/31/22 | | | 1,320 | |
| | 1,190 | | | Delta 2 SARL, 2nd Lien Term Loan, VAR, 8.068%, 07/29/22 | | | 1,200 | |
| | 1,375 | | | Delta 2 Sarl, USD Facility B-3 Term Loan, VAR, 4.568%, 07/30/21 | | | 1,376 | |
| | 798 | | | FGI Operating Co. LLC, Term B Loan, VAR, 5.500%, 04/19/19 | | | 763 | |
| | 2,234 | | | First Data Corp., Term Loan B, VAR, 3.988%, 07/08/22 | | | 2,233 | |
| | 908 | | | Genesys Telecom Holdings, Term Loan B, VAR, 5.158%, 12/01/23 | | | 914 | |
| | 1,583 | | | Graton Economic Development Authority, Incremental Term B Loan, VAR, 4.743%, 09/01/22 | | | 1,589 | |
| | 2,245 | | | Gulf Finance LLC, 1st Lien Term Loan B, VAR, 6.250%, 07/27/23 | | | 2,240 | |
| | 5,407 | | | iHeartCommunications, Inc., Term Loan D, VAR, 7.743%, 01/30/19 | | | 4,600 | |
| | 1,873 | | | iHeartCommunications, Inc., Tranche E
Term Loan, VAR, 8.493%, 07/30/19 | | | 1,590 | |
| | 376 | | | Infor US, Inc., Tranche B-6 Term Loan, VAR, 3.897%, 02/01/22 | | | 375 | |
| | 1,076 | | | Intrawest Operations Group LLC, Initial Term Loan, VAR, 4.500%, 12/09/20 | | | 1,080 | |
| | 1,230 | | | Landry’s, Inc., 1st Lien Term Loan, VAR, 3.733%, 10/04/23 | | | 1,231 | |
| | 1,195 | | | Microsemi Corp., Closing Date Term B Loan, VAR, 3.226%, 01/15/23 | | | 1,200 | |
| | 4,893 | | | Moran Foods LLC, Term Loan B, VAR, 7.000%, 11/29/23 | | | 4,864 | |
| | 610 | | | MTL Publishing LLC, Term B-4 Loan, VAR, 3.736%, 08/22/22 | | | 610 | |
| | 943 | | | On Semiconductor, 1st Lien Term Loan B, VAR, 3.243%, 03/31/23 | | | 947 | |
| | 1,112 | | | PetSmart, Inc., Term Loan B, VAR, 4.020%, 03/11/22 ^ | | | 1,017 | |
| | 1,594 | | | Revlon Consumer Products Corp., Term Loan B, VAR, 4.493%, 09/07/23 | | | 1,596 | |
| | 395 | | | Rite Aid Corp., 2nd Lien Term Loan, VAR, 5.750%, 08/21/20 ^ | | | 396 | |
| | 555 | | | Scientific Games International, Inc, Term Loan, VAR, 4.994%, 10/01/21 | | | 563 | |
| | 1,189 | | | Sears Roebuck Acceptance Corp., Term Loan, VAR, 5.500%, 06/30/18 | | | 1,169 | |
| | 799 | | | Signode Industrial Group Lux SA, Initial Term B Loan, VAR, 3.923%, 05/01/21 | | | 802 | |
| | 1,034 | | | Syniverse Holdings, Inc., Initial Term Loan, VAR, 4.172%, 04/23/19 | | | 946 | |
SEE NOTES TO FINANCIAL STATEMENTS.
| | | | | | | | |
| | | |
| APRIL 30, 2017 | | J.P. MORGAN FUNDS | | | | | 83 | |
JPMorgan Income Builder Fund
SCHEDULE OF PORTFOLIO INVESTMENTS
AS OF APRIL 30, 2017 (Unaudited) (continued)
(Amounts in U.S. Dollars, unless otherwise noted)
(Amounts in thousands)
| | | | | | | | |
PRINCIPAL
AMOUNT | | | SECURITY DESCRIPTION | | VALUE | |
| | Loan Assignments — continued | |
| | | | United States — continued | |
| | 305 | | | Syniverse Holdings, Inc., Tranche B Term Loan, VAR, 4.147%, 04/23/19 | | | 280 | |
| | 845 | | | The Go Daddy Group, Inc., Term Loan B, VAR, 3.493%, 02/15/24 ^ | | | 848 | |
| | 253 | | | Tribune, Term Loan B, VAR, 3.993%, 12/27/20 | | | 255 | |
| | 2,847 | | | Ultra Resources, Inc., Term Loan, VAR, 4.000%, 04/12/24 ^ | | | 2,833 | |
| | 754 | | | Vertis, Inc., 1st Lien Term Loan, VAR, 0.000%, 12/20/15 (d) | | | — | (h) |
| | 2,130 | | | Viskase Cos., Inc., Initial Term Loan, VAR, 4.397%, 01/30/21 | | | 2,035 | |
| | 1,856 | | | Western Refining, Inc., 1st Lien Term Loan B, VAR, 5.500%, 06/23/23 | | | 1,859 | |
| | 1,499 | | | XPO Logistics, Inc., Term loan B, VAR, 3.405%, 11/01/21 | | | 1,508 | |
| | | | | | | | |
| | | | | | | 70,450 | |
| | | | | | | | |
| | | | Total Loan Assignments
(Cost $80821) | | | 79,060 | |
| | | | | | | | |
| | |
SHARES | | | | | | |
| | Preferred Stocks — 0.9% | |
| | | | Bermuda — 0.0% (g) | |
| | 3 | | | XLIT Ltd., Series D, VAR, 3.354%, 06/13/17 ($1,000 par value) @ | | | 2,907 | |
| | | | | | | | |
| | | | United States — 0.9% | |
| | 508 | | | BB&T Corp., Series F, 5.200%, 11/01/17 ($25 par value) @ | | | 12,747 | |
| | 52 | | | BB&T Corp., Series G, 5.200%, 06/01/18 ($25 par value) @ | | | 1,304 | |
| | 156 | | | Capital One Financial Corp., Series D, 6.700%, 12/01/19 ($25 par value) @ | | | 4,298 | |
| | 71 | | | Discover Financial Services, Series B, 6.500%, 12/01/17 ($25 par value) @ | | | 1,828 | |
| | 213 | | | Dominion Resources, Inc., Series A, 5.250%, 07/30/76 ($25 par value) | | | 5,236 | |
| | 12 | | | GMAC Capital Trust I, Series 2, VAR, 6.824%, 06/15/17 ($25 par value) | | | 305 | |
| | 460 | | | Goldman Sachs Group, Inc. (The), Series J, VAR, 5.500%, 05/10/23 ($25 par
value) @ | | | 12,388 | |
| | 23 | | | Hartford Financial Services Group, Inc. (The), VAR, 7.875%, 04/15/42 ($25 par value) | | | 700 | |
| | 310 | | | Morgan Stanley, Series I, VAR, 6.375%, 10/15/24 ($25 par value) @ | | | 8,609 | |
| | 508 | | | Morgan Stanley, Series K, VAR, 5.850%, 04/15/27 ($25 par value) @ | | | 13,396 | |
| | | | | | | | |
SHARES | | | SECURITY DESCRIPTION | | VALUE | |
| | | | | | | | |
| | | | United States — continued | |
| | 239 | | | SCE Trust II, 5.100%, 03/15/18 ($25 par value) @ | | | 5,973 | |
| | 281 | | | Southern Co. (The), 5.250%, 10/01/76 ($25 par value) | | | 6,890 | |
| | 301 | | | State Street Corp., Series D, VAR, 5.900%, 03/15/24 ($25 par value) @ | | | 8,476 | |
| | 315 | | | State Street Corp., Series E, 6.000%, 12/15/19 ($25 par value) @ | | | 8,442 | |
| | 128 | | | State Street Corp., Series G, VAR, 5.350%, 03/15/26 ($25 par value) @ | | | 3,420 | |
| | 6 | | | Tyson Foods, Inc., 4.750%, 07/15/17 ($50 par value) | | | 439 | |
| | 42 | | | Vornado Realty Trust, Series G, 6.625%, 06/15/17 ($25 par value) @ | | | 1,086 | |
| | 269 | | | Wells Fargo & Co., Series Y, 5.625%, 06/15/22 ($25 par value) @ | | | 6,733 | |
| | | | | | | | |
| | | | | | | 102,270 | |
| | | | | | | | |
| | | | Total Preferred Stocks
(Cost $98,565) | | | 105,177 | |
| | | | | | | | |
| | |
NUMBER OF
RIGHTS | | | | | | |
| | Rights — 0.0% (g) | |
| | | | United Kingdom — 0.0% (g) | |
| | 205 | | | Tritax Big Box REIT plc, expiring 05/10/17 (a) | | | 11 | |
| | | | | | | | |
| | | | United States — 0.0% (g) | |
| | 483 | | | Vistra Energy Corp., expiring 12/31/49 (a) | | | 579 | |
| | | | | | | | |
| | | | Total Rights
(Cost $—) | | | 590 | |
| | | | | | | | |
| | |
NUMBER OF
WARRANTS | | | | | | |
| | Warrants — 0.0% (g) | |
| | | | United States — 0.0% (g) | |
| | 1 | | | Nebraska Book Co., Inc., expiring 06/29/19 (Strike Price $1.00) (a) | | | — | |
| | — | (h) | | Nebraska Book Holdings, Inc., expiring 06/29/19 (Strike Price $1.00) (a) | | | — | |
| | | | Sabine Oil & Gas Holdings, Inc., | | | | |
| | — | (h) | | expiring 04/13/2026 (a) | | | 1 | |
| | 1 | | | expiring 04/13/2026
(Strike Price $1.00) (a) | | | 8 | |
| | | | | | | | |
| | | | Total Warrants
(Cost $9) | | | 9 | |
| | | | | | | | |
SEE NOTES TO FINANCIAL STATEMENTS.
| | | | | | |
| | | |
| 84 | | | | J.P. MORGAN FUNDS | | APRIL 30, 2017 |
| | | | | | | | |
PRINCIPAL
AMOUNT | | | SECURITY DESCRIPTION | | VALUE | |
| | U.S. Treasury Obligation — 0.3% | |
| | 35,374 | | | U.S. Treasury Note, 0.750%, 01/31/18 (k)
(Cost $35,340) | | | 35,291 | |
| | | | | | | | |
| | |
SHARES | | | | | | |
| | Short-Term Investments — 1.6% | |
| | | | Investment Company — 1.5% | |
| | 190,261 | | | JPMorgan U.S. Government Money Market Fund, Institutional Class Shares, 0.620% (b) (l) | | | 190,261 | |
| | | | | | | | |
| | | | Time Deposit — 0.1% | |
| | 9,500 | | | Credit Agricole Corporate & Investment Bank SA, 0.920%, 05/02/17 (n) | | | 9,500 | |
| | | | | | | | |
| | | | Total Short-Term Investments
(Cost $199,761) | | | 199,761 | |
| | | | | | | | |
| | | | Total Investments — 98.9%
(Cost $11,292,001) | | | 12,138,314 | |
| | | | Other Assets in Excess of Liabilities — 1.1% | | | 137,370 | |
| | | | | | | | |
| | | | NET ASSETS — 100.0% | | $ | 12,275,684 | |
| | | | | | | | |
Percentages indicated are based on net assets.
Summary of Investments by Industry, April 30, 2017
The following table represents the portfolio investments of the Fund by industry classifications as a percentage of total investments:
| | | | |
| INDUSTRY | | PERCENTAGE | |
Banks | | | 9.2 | % |
Oil, Gas & Consumable Fuels | | | 7.5 | |
Equity Real Estate Investment Trusts (REITs) | | | 7.2 | |
Media | | | 5.0 | |
Diversified Telecommunication Services | | | 4.6 | |
Asset-Backed Securities | | | 4.4 | |
Pharmaceuticals | | | 4.2 | |
Insurance | | | 4.2 | |
Capital Markets | | | 3.6 | |
Collateralized Mortgage Obligations | | | 3.2 | |
Health Care Providers & Services | | | 2.6 | |
Wireless Telecommunication Services | | | 2.4 | |
Semiconductors & Semiconductor Equipment | | | 2.1 | |
Hotels, Restaurants & Leisure | | | 2.1 | |
Chemicals | | | 1.7 | |
Tobacco | | | 1.5 | |
Auto Components | | | 1.5 | |
Metals & Mining | | | 1.5 | |
Foreign Government Securities | | | 1.4 | |
IT Services | | | 1.4 | |
Electric Utilities | | | 1.4 | |
Technology Hardware, Storage & Peripherals | | | 1.4 | |
Industrial Conglomerates | | | 1.4 | |
Software | | | 1.3 | |
Automobiles | | | 1.2 | |
Commercial Mortgage-Backed Securities | | | 1.2 | |
Specialty Retail | | | 1.1 | |
Food & Staples Retailing | | | 1.0 | |
Aerospace & Defense | | | 1.0 | |
Others (each less than 1.0%) | | | 16.1 | |
Short-Term Investments | | | 1.6 | |
SEE NOTES TO FINANCIAL STATEMENTS.
| | | | | | | | |
| | | |
| APRIL 30, 2017 | | J.P. MORGAN FUNDS | | | | | 85 | |
JPMorgan Income Builder Fund
SCHEDULE OF PORTFOLIO INVESTMENTS
AS OF APRIL 30, 2017 (Unaudited) (continued)
(Amounts in U.S. Dollars, unless otherwise noted)
(Amounts in thousands, except number of Futures contracts)
| | | | | | | | | | | | | | | | | | | | |
| Futures Contracts | | | | | | | | | | | | |
NUMBER OF
CONTRACTS | | | DESCRIPTION | | EXPIRATION
DATE | | | TRADING
CURRENCY | | | NOTIONAL
VALUE AT
APRIL 30, 2017 | | | NET
UNREALIZED
APPRECIATION
(DEPRECIATION) | |
| | | | Long Futures Outstanding | | | | | | | | | | | | | | | | |
| | 136 | | | Euro STOXX 50 Index | | | 06/16/17 | | | | EUR | | | | 5,197 | | | | 152 | |
| | | | Short Futures Outstanding | | | | | | | | | | | | | | | | |
| | (2,657 | ) | | Euro FX | | | 06/19/17 | | | | USD | | | | (362,714 | ) | | | (10,349 | ) |
| | (3,336 | ) | | GBP FX | | | 06/19/17 | | | | USD | | | | (270,299 | ) | | | (16,368 | ) |
| | (10,317 | ) | | 5 Year U.S. Treasury Note | | | 06/30/17 | | | | USD | | | | (1,221,597 | ) | | | (8,528 | ) |
| | | | | | | | | | | | | | | | | | | | |
| | | | | | | | | | | | | | | | | | | (35,093 | ) |
| | | | | | | | | | | | | | | | | | | | |
SEE NOTES TO FINANCIAL STATEMENTS.
| | | | | | |
| | | |
| 86 | | | | J.P. MORGAN FUNDS | | APRIL 30, 2017 |
J.P. Morgan Funds
NOTES TO SCHEDULE OF PORTFOLIO INVESTMENTS
AS OF APRIL 30, 2017 (Unaudited)
| | |
| ADR | | — American Depositary Receipt |
| ARM | | — Adjustable Rate Mortgage |
| AUD | | — Australian Dollar |
| CAD | | — Canadian Dollar |
| CSMC | | — Credit Suisse Mortgage Trust |
| CVA | | — Dutch Certification |
| CVR | | — Contingent Value Rights |
| DIP | | — Debtor-in-possession |
| EUR | | — Euro |
| FTSE | | — Financial Times and the London Stock Exchange |
| GBP | | — British Pound |
| GDR | | — Global Depositary Receipt |
| GMAC | | — General Motors Acceptance Corp. |
| HKD | | — Hong Kong Dollar |
| IF | | — Inverse Floaters represent securities that pay interest at a rate that increases (decreases) with a decline (incline) in a specified index. The interest rate shown is the rate in effect as of January 31, 2017. The rate may be subject to a cap and floor. |
| JPY | | — Japanese Yen |
| MSCI | | — Morgan Stanley Capital International |
| NVDR | | — Non Voting Depositary Receipt |
| PIK | | — Payment-in-kind |
| Reg. S | | — Security was purchased pursuant to Regulation S under the Securities Act of 1933, which exempts from registration securities offered and sold outside of the United States. Such a security cannot be sold in the United States without either an effective registration statement filed pursuant to the Securities Act of 1933, or pursuant to an exemption from registration. |
| REIT | | — Real Estate Investment Trust |
| SGD | | — Singapore Dollar |
| SUB | | — Step-Up Bond. The interest rate shown is the rate in effect as of April 30, 2017. |
| TOPIX | | — Tokyo Price Index |
| USD | | — United States Dollar |
| VAR | | — Variable Rate Security. The interest rate shown is the rate in effect as of April 30, 2017. |
| (a) | | — Non-income producing security. |
| (b) | | — Investment in affiliate. Fund is registered under the Investment Company Act of 1940, as amended, and advised by J.P. Morgan Investment Management Inc. |
| | |
| (d) | | — Defaulted Security. Security has not paid its last interest payment and/or interest is not being accrued. |
| (e) | | — Security is exempt from registration under Rule 144A of the Securities Act of 1933, as amended. Unless otherwise indicated, this security has been determined to be liquid under procedures established by the Board of Trustees and may be resold in transactions exempt from registration, normally to qualified institutional buyers. |
| (g) | | — Amount rounds to less than 0.05%. |
| (h) | | — Amount rounds to less than 500. |
| (j) | | — All or a portion of this security is segregated as collateral for short sales. The total value of securities segregated as collateral for JPMorgan Global Allocation Fund is approximately $24,706,000. |
| (k) | | — All or a portion of this security is deposited with the broker as initial margin for future contracts. |
| (l) | | — The rate shown is the current yield as of April 30, 2017. |
| (n) | | — The rate shown is the effective yield as of April 30, 2017. |
| (v) | | — Security has the ability to pay in kind (“PIK”) or pay income in cash. When applicable, separate rates of such payments are disclosed. |
| (w) | | — All or a portion of the security is a when-issued security, delayed delivery security, or forward commitment. |
| (x) | | — Security is perpetual and thus, does not have a predetermined maturity date. The coupon rate for this security is fixed for a period of time and may be structured to adjust thereafter. The date shown, if applicable, reflects the next call date. The coupon rate shown is the rate in effect as of April 30, 2017. |
| (y) | | — Preferred Security. |
| ^ | | — All or a portion of the security is unsettled as of April 30, 2017. Unless otherwise indicated, the coupon rate is undetermined. The coupon rate shown may not be accrued for the entire position. |
| @ | | — The date shown reflects the next call date on which the issuer may redeem the security. The coupon rate for this security is currently in effect as of April 30, 2017. |
SEE NOTES TO FINANCIAL STATEMENTS.
| | | | | | | | |
| | | |
| APRIL 30, 2017 | | J.P. MORGAN FUNDS | | | | | 87 | |
STATEMENTS OF ASSETS AND LIABILITIES
AS OF APRIL 30, 2017 (Unaudited)
(Amounts in thousands)
| | | | | | | | |
| | | Global
Allocation
Fund | | | Income
Builder Fund | |
ASSETS: | | | | | | | | |
Investments in non-affiliates, at value | | $ | 1,400,705 | | | $ | 11,948,053 | |
Investments in affiliates, at value | | | 242,768 | | | | 190,261 | |
| | | | | | | | |
Total investment securities, at value | | | 1,643,473 | | | | 12,138,314 | |
Cash | | | 1,624 | | | | 14,551 | |
Foreign currency, at value | | | 158 | | | | 1,519 | |
Deposits at broker for futures contracts | | | 770 | | | | 419 | |
Deposits at broker for securities sold short | | | 19,418 | | | | — | |
Receivables: | | | | | | | | |
Investment securities sold | | | 19,341 | | | | 66,854 | |
Fund shares sold | | | 5,681 | | | | 34,368 | |
Interest and dividends from non-affiliates | | | 7,215 | | | | 101,801 | |
Dividends from affiliates | | | 95 | | | | 75 | |
Tax reclaims | | | 382 | | | | 4,978 | |
Variation margin on futures contracts | | | 3,522 | | | | — | |
Unrealized appreciation on forward foreign currency exchange contracts | | | 1,022 | | | | — | |
| | | | | | | | |
Total Assets | | | 1,702,701 | | | | 12,362,879 | |
| | | | | | | | |
| | |
LIABILITIES: | | | | | | | | |
Payables: | | | | | | | | |
Securities sold short, at value | | | 21,957 | | | | — | |
Dividend expense to non-affiliates on securities sold short | | | 29 | | | | — | |
Investment securities purchased | | | 27,991 | | | | 53,515 | |
Fund shares redeemed | | | 1,986 | | | | 21,965 | |
Variation margin on futures contracts | | | — | | | | 1,420 | |
Unrealized depreciation on forward foreign currency exchange contracts | | | 623 | | | | — | |
Outstanding swap contracts, at value | | | — | (a) | | | — | |
Accrued liabilities: | | | | | | | | |
Investment advisory fees | | | 613 | | | | 3,178 | |
Administration fees | | | 3 | | | | — | |
Distribution fees | | | 278 | | | | 3,683 | |
Service fees | | | 328 | | | | 1,811 | |
Custodian and accounting fees | | | 57 | | | | 144 | |
Trustees’ and Chief Compliance Officer’s fees | | | 1 | | | | 55 | |
Deferred India capital gains tax | | | — | | | | 338 | |
Other | | | 186 | | | | 1,086 | |
| | | | | | | | |
Total Liabilities | | | 54,052 | | | | 87,195 | |
| | | | | | | | |
Net Assets | | $ | 1,648,649 | | | $ | 12,275,684 | |
| | | | | | | | |
| (a) | Amount rounds to less than 500. |
SEE NOTES TO FINANCIAL STATEMENTS.
| | | | | | |
| | | |
| 88 | | | | J.P. MORGAN FUNDS | | APRIL 30, 2017 |
| | | | | | | | |
| | | Global
Allocation
Fund | | | Income
Builder Fund | |
NET ASSETS: | |
Paid-in-Capital | | $ | 1,542,532 | | | $ | 11,919,328 | |
Accumulated undistributed (distributions in excess of) net investment income | | | 2,711 | | | | (12,124 | ) |
Accumulated net realized gains (losses) | | | (15,314 | ) | | | (442,330 | ) |
Net unrealized appreciation (depreciation) | | | 118,720 | | | | 810,810 | |
| | | | | | | | |
Total Net Assets | | $ | 1,648,649 | | | $ | 12,275,684 | |
| | | | | | | | |
| | |
Net Assets: | | | | | | | | |
Class A | | $ | 251,975 | | | $ | 3,602,173 | |
Class C | | | 372,486 | | | | 4,783,532 | |
Class I (formerly Select Class) | | | 1,022,833 | | | | 3,889,979 | |
Class R2 | | | 1,355 | | | | — | |
| | | | | | | | |
Total | | $ | 1,648,649 | | | $ | 12,275,684 | |
| | | | | | | | |
| | |
Outstanding units of beneficial interest (shares) | | | | | | | | |
($0.0001 par value; unlimited number of shares authorized): | | | | | | | | |
Class A | | | 14,442 | | | | 350,657 | |
Class C | | | 21,598 | | | | 466,881 | |
Class I (formerly Select Class) | | | 58,403 | | | | 378,166 | |
Class R2 | | | 78 | | | | — | |
| | |
Net Asset Value (a): | | | | | | | | |
Class A — Redemption price per share | | $ | 17.45 | | | $ | 10.27 | |
Class C — Offering price per share (b) | | | 17.25 | | | | 10.25 | |
Class I (formerly Select Class) — Offering and redemption price per share | | | 17.51 | | | | 10.29 | |
Class R2 — Offering and redemption price per share | | | 17.41 | | | | — | |
Class A maximum sales charge | | | 4.50 | % | | | 4.50 | % |
Class A maximum public offering price per share
[net asset value per share/(100% — maximum sales charge)] | | $ | 18.27 | | | $ | 10.75 | |
| | | | | | | | |
| | |
Cost of investments in non-affiliates | | $ | 1,285,843 | | | $ | 11,101,740 | |
Cost of investments in affiliates | | | 243,057 | | | | 190,261 | |
Cost of foreign currency | | | 157 | | | | 1,516 | |
Proceeds from securities sold short | | | 22,278 | | | | — | |
| (a) | Per share amounts may not recalculate due to rounding of net assets and/or shares outstanding. |
| (b) | Redemption price for Class C Shares varies based upon length of time the shares are held. |
SEE NOTES TO FINANCIAL STATEMENTS.
| | | | | | | | |
| | | |
| APRIL 30, 2017 | | J.P. MORGAN FUNDS | | | | | 89 | |
STATEMENTS OF OPERATIONS
FOR THE SIX MONTHS ENDED APRIL 30, 2017 (Unaudited)
(Amounts in thousands)
| | | | | | | | |
| | | Global
Allocation
Fund | | | Income
Builder Fund | |
INVESTMENT INCOME: | | | | | | | | |
Interest income from non-affiliates | | $ | 15,058 | | | $ | 208,886 | |
Interest income from affiliates | | | 6 | | | | 25 | |
Dividend income from non-affiliates | | | 7,632 | | | | 93,897 | |
Dividend income from affiliates | | | 1,769 | | | | 402 | |
Interest income to non-affiliates on securities sold short | | | 29 | | | | — | |
Foreign taxes withheld | | | (416 | ) | | | (4,666 | ) |
| | | | | | | | |
Total investment income | | | 24,078 | | | | 298,544 | |
| | | | | | | | |
| | |
EXPENSES: | | | | | | | | |
Investment advisory fees | | | 4,519 | | | | 26,993 | |
Administration fees | | | 616 | | | | 4,908 | |
Distribution fees: | | | | | | | | |
Class A | | | 346 | | | | 4,763 | |
Class C | | | 1,337 | | | | 17,982 | |
Class R2 | | | 2 | | | | — | |
Service fees: | | | | | | | | |
Class A | | | 346 | | | | 4,763 | |
Class C | | | 446 | | | | 5,994 | |
Class I (formerly Select Class) | | | 1,090 | | | | 4,239 | |
Class R2 | | | 1 | | | | — | |
Custodian and accounting fees | | | 174 | | | | 614 | |
Interest expense to affiliates | | | 1 | | | | 2 | |
Professional fees | | | 56 | | | | 142 | |
Interest expense to non-affiliates | | | 2 | | | | — | (a) |
Trustees’ and Chief Compliance Officer’s fees | | | 16 | | | | 51 | |
Printing and mailing costs | | | 59 | | | | 500 | |
Registration and filing fees | | | 70 | | | | 95 | |
Transfer agency fees (See Note 2.H.) | | | 29 | | | | 185 | |
Sub-transfer agency fees (See Note 2.H.) | | | 313 | | | | 2,619 | |
Other | | | 14 | | | | 90 | |
Dividend expense to non-affiliates on securities sold short | | | 109 | | | | — | |
| | | | | | | | |
Total expenses | | | 9,546 | | | | 73,940 | |
| | | | | | | | |
Less fees waived | | | (1,949 | ) | | | (19,685 | ) |
Less earnings credits | | | — | | | | — | (a) |
| | | | | | | | |
Net expenses | | | 7,597 | | | | 54,255 | |
| | | | | | | | |
Net investment income (loss) | | | 16,481 | | | | 244,289 | |
| | | | | | | | |
| | |
REALIZED/UNREALIZED GAINS (LOSSES): | | | | | | | | |
Net realized gain (loss) on transactions from: | | | | | | | | |
Investments in non-affiliates | | | 17,713 | | | | (1,765 | )(b) |
Investments in affiliates | | | (2,147 | ) | | | — | |
Futures | | | (10,954 | ) | | | 73,504 | |
Securities sold short | | | (589 | ) | | | — | |
Foreign currency transactions | | | 10,267 | | | | (14 | ) |
| | | | | | | | |
Net realized gain (loss) | | | 14,290 | | | | 71,725 | |
| | | | | | | | |
Change in net unrealized appreciation/depreciation on: | | | | | | | | |
Investments in non-affiliates | | | 81,841 | | | | 392,608 | (c) |
Investments in affiliates | | | 125 | | | | — | |
Futures | | | 7,557 | | | | (74,408 | ) |
Foreign currency translations | | | (4,502 | ) | | | 360 | |
Securities sold short | | | 321 | | | | — | |
Swaps | | | — | (a) | | | — | |
| | | | | | | | |
Change in net unrealized appreciation/depreciation | | | 85,342 | | | | 318,560 | |
| | | | | | | | |
Net realized/unrealized gains (losses) | | | 99,632 | | | | 390,285 | |
| | | | | | | | |
Change in net assets resulting from operations | | $ | 116,113 | | | $ | 634,574 | |
| | | | | | | | |
| (a) | Amount rounds to less than 500. |
| (b) | Net of India capital gains tax of $0 for Income Builder Fund. |
| (c) | Net of change in India capital gains tax of approximately $(90,000) for Income Builder Fund. |
SEE NOTES TO FINANCIAL STATEMENTS.
| | | | | | |
| | | |
| 90 | | | | J.P. MORGAN FUNDS | | APRIL 30, 2017 |
STATEMENTS OF CHANGES IN NET ASSETS
FOR THE PERIODS INDICATED
(Amounts in thousands)
| | | | | | | | | | | | | | | | |
| | | Global Allocation Fund | | | Income Builder Fund | |
| | | Six Months Ended
April 30, 2017
(Unaudited) | | | Year Ended
October 31, 2016 | | | Six Months Ended
April 30, 2017
(Unaudited) | | | Year Ended
October 31, 2016 | |
CHANGE IN NET ASSETS RESULTING FROM OPERATIONS: | | | | | | | | | | | | | | | | |
Net investment income (loss) | | $ | 16,481 | | | $ | 26,895 | | | $ | 244,289 | | | $ | 490,117 | |
Net realized gain (loss) | | | 14,290 | | | | (19,802 | ) | | | 71,725 | | | | (287,553 | ) |
Change in net unrealized appreciation/depreciation | | | 85,342 | | | | 28,891 | | | | 318,560 | | | | 256,068 | |
| | | | | | | | | | | | | | | | |
Change in net assets resulting from operations | | | 116,113 | | | | 35,984 | | | | 634,574 | | | | 458,632 | |
| | | | | | | | | | | | | | | | |
| | | | |
DISTRIBUTIONS TO SHAREHOLDERS: | | | | | | | | | | | | | | | | |
Class A | | | | | | | | | | | | | | | | |
From net investment income | | | (3,586 | ) | | | (5,458 | ) | | | (80,884 | ) | | | (170,221 | ) |
From net realized gains | | | — | | | | (294 | ) | | | — | | | | — | |
Class C | | | | | | | | | | | | | | | | |
From net investment income | | | (3,714 | ) | | | (4,931 | ) | | | (90,521 | ) | | | (186,131 | ) |
From net realized gains | | | — | | | | (305 | ) | | | — | | | | — | |
Class I (formerly Select Class) | | | | | | | | | | | | | | | | |
From net investment income | | | (11,844 | ) | | | (14,844 | ) | | | (76,268 | ) | | | (130,456 | ) |
From net realized gains | | | — | | | | (602 | ) | | | — | | | | — | |
Class R2 | | | | | | | | | | | | | | | | |
From net investment income | | | (9 | ) | | | (9 | ) | | | — | | | | — | |
From net realized gains | | | — | | | | — | (a) | | | — | | | | — | |
| | | | | | | | | | | | | | | | |
Total distributions to shareholders | | | (19,153 | ) | | | (26,443 | ) | | | (247,673 | ) | | | (486,808 | ) |
| | | | | | | | | | | | | | | | |
| | | | |
CAPITAL TRANSACTIONS: | | | | | | | | | | | | | | | | |
Change in net assets resulting from capital transactions | | | 120,907 | | | | 646,824 | | | | (269,811 | ) | | | (334,580 | ) |
| | | | | | | | | | | | | | | | |
| | | | |
NET ASSETS: | | | | | | | | | | | | | | | | |
Change in net assets | | | 217,867 | | | | 656,365 | | | | 117,090 | | | | (362,756 | ) |
Beginning of period | | | 1,430,782 | | | | 774,417 | | | | 12,158,594 | | | | 12,521,350 | |
| | | | | | | | | | | | | | | | |
End of period | | $ | 1,648,649 | | | $ | 1,430,782 | | | $ | 12,275,684 | | | $ | 12,158,594 | |
| | | | | | | | | | | | | | | | |
Accumulated undistributed (distributions in excess of) net investment income | | $ | 2,711 | | | $ | 5,383 | | | $ | (12,124 | ) | | $ | (8,740 | ) |
| | | | | | | | | | | | | | | | |
| (a) | Amount rounds to less than 500. |
SEE NOTES TO FINANCIAL STATEMENTS.
| | | | | | | | |
| | | |
| APRIL 30, 2017 | | J.P. MORGAN FUNDS | | | | | 91 | |
STATEMENTS OF CHANGES IN NET ASSETS
FOR THE PERIODS INDICATED (Continued)
(Amounts in thousands)
| | | | | | | | | | | | | | | | |
| | | Global Allocation Fund | | | Income Builder Fund | |
| | | Six Months Ended
April 30, 2017
(Unaudited) | | | Year Ended
October 31, 2016 | | | Six Months Ended
April 30, 2017
(Unaudited) | | | Year Ended
October 31, 2016 | |
CAPITAL TRANSACTIONS: | | | | | | | | | | | | | | | | |
Class A | | | | | | | | | | | | | | | | |
Proceeds from shares issued | | $ | 47,630 | | | $ | 181,480 | | | $ | 380,525 | | | $ | 915,563 | |
Distributions reinvested | | | 3,482 | | | | 5,561 | | | | 77,573 | | | | 163,299 | |
Cost of shares redeemed | | | (106,596 | ) | | | (108,810 | ) | | | (969,924 | ) | | | (1,338,823 | ) |
| | | | | | | | | | | | | | | | |
Change in net assets resulting from Class A capital transactions | | $ | (55,484 | ) | | $ | 78,231 | | | $ | (511,826 | ) | | $ | (259,961 | ) |
| | | | | | | | | | | | | | | | |
Class C | | | | | | | | | | | | | | | | |
Proceeds from shares issued | | $ | 53,639 | | | $ | 224,926 | | | $ | 296,892 | | | $ | 779,657 | |
Distributions reinvested | | | 3,097 | | | | 4,306 | | | | 78,484 | | | | 159,414 | |
Cost of shares redeemed | | | (64,558 | ) | | | (72,706 | ) | | | (714,301 | ) | | | (1,085,374 | ) |
| | | | | | | | | | | | | | | | |
Change in net assets resulting from Class C capital transactions | | $ | (7,822 | ) | | $ | 156,526 | | | $ | (338,925 | ) | | $ | (146,303 | ) |
| | | | | | | | | | | | | | | | |
Class I (formerly Select Class) | | | | | | | | | | | | | | | | |
Proceeds from shares issued | | $ | 279,810 | | | $ | 649,914 | | | $ | 1,051,398 | | | $ | 1,099,505 | |
Distributions reinvested | | | 9,336 | | | | 11,914 | | | | 59,911 | | | | 101,768 | |
Cost of shares redeemed | | | (105,472 | ) | | | (250,299 | ) | | | (530,369 | ) | | | (1,129,589 | ) |
| | | | | | | | | | | | | | | | |
Change in net assets resulting from Class I capital transactions | | $ | 183,674 | | | $ | 411,529 | | | $ | 580,940 | | | $ | 71,684 | |
| | | | | | | | | | | | | | | | |
Class R2 | | | | | | | | | | | | | | | | |
Proceeds from shares issued | | $ | 662 | | | $ | 613 | | | $ | — | | | $ | — | |
Distributions reinvested | | | 9 | | | | 9 | | | | — | | | | — | |
Cost of shares redeemed | | | (132 | ) | | | (84 | ) | | | — | | | | — | |
| | | | | | | | | | | | | | | | |
Change in net assets resulting from Class R2 capital transactions | | $ | 539 | | | $ | 538 | | | $ | — | | | $ | — | |
| | | | | | | | | | | | | | | | |
Total change in net assets resulting from capital transactions | | $ | 120,907 | | | $ | 646,824 | | | $ | (269,811 | ) | | $ | (334,580 | ) |
| | | | | | | | | | | | | | | | |
SHARE TRANSACTIONS: | | | | | | | | | | | | | | | | |
Class A | | | | | | | | | | | | | | | | |
Issued | | | 2,832 | | | | 11,294 | | | | 37,750 | | | | 93,520 | |
Reinvested | | | 211 | | | | 344 | | | | 7,685 | | | | 16,679 | |
Redeemed | | | (6,302 | ) | | | (6,755 | ) | | | (96,019 | ) | | | (137,075 | ) |
| | | | | | | | | | | | | | | | |
Change in Class A Shares | | | (3,259 | ) | | | 4,883 | | | | (50,584 | ) | | | (26,876 | ) |
| | | | | | | | | | | | | | | | |
Class C | | | | | | | | | | | | | | | | |
Issued | | | 3,221 | | | | 14,164 | | | | 29,491 | | | | 79,830 | |
Reinvested | | | 191 | | | | 269 | | | | 7,794 | | | | 16,325 | |
Redeemed | | | (3,893 | ) | | | (4,554 | ) | | | (71,093 | ) | | | (111,214 | ) |
| | | | | | | | | | | | | | | | |
Change in Class C Shares | | | (481 | ) | �� | | 9,879 | | | | (33,808 | ) | | | (15,059 | ) |
| | | | | | | | | | | | | | | | |
Class I (formerly Select Class) | | | | | | | | | | | | | | | | |
Issued | | | 16,534 | | | | 40,365 | | | | 103,825 | | | | 111,834 | |
Reinvested | | | 562 | | | | 734 | | | | 5,919 | | | | 10,378 | |
Redeemed | | | (6,262 | ) | | | (15,562 | ) | | | (52,639 | ) | | | (116,050 | ) |
| | | | | | | | | | | | | | | | |
Change in Class I Shares | | | 10,834 | | | | 25,537 | | | | 57,105 | | | | 6,162 | |
| | | | | | | | | | | | | | | | |
Class R2 | | | | | | | | | | | | | | | | |
Issued | | | 39 | | | | 38 | | | | — | | | | — | |
Reinvested | | | 1 | | | | 1 | | | | — | | | | — | |
Redeemed | | | (8 | ) | | | (5 | ) | | | — | | | | — | |
| | | | | | | | | | | | | | | | |
Change in Class R2 Shares | | | 32 | | | | 34 | | | | — | | | | — | |
| | | | | | | | | | | | | | | | |
SEE NOTES TO FINANCIAL STATEMENTS.
| | | | | | |
| | | |
| 92 | | | | J.P. MORGAN FUNDS | | APRIL 30, 2017 |
THIS PAGE IS INTENTIONALLY LEFT BLANK
| | | | | | | | |
| | | |
| APRIL 30, 2017 | | J.P. MORGAN FUNDS | | | | | 93 | |
FINANCIAL HIGHLIGHTS
FOR THE PERIODS INDICATED
| | | | | | | | | | | | | | | | | | | | | | | | | | | | |
| | | Per share operating performance | |
| | | Investment operations | | | Distributions | |
| | | Net asset
value,
beginning
of period | | | Net
investment
income
(loss) (b) | | |
Net realized
and unrealized
gains
(losses) on
investments | | | Total from
investment
operations | | | Net
investment
income | | | Net
realized
gain | | | Total
distributions | |
Global Allocation Fund | | | | | | | | | | | | | | | | | | | | | | | | | | | | |
Class A | | | | | | | | | | | | | | | | | | | | | | | | | | | | |
Six Months Ended April 30, 2017 (Unaudited) | | $ | 16.38 | | | $ | 0.18 | (g) | | $ | 1.10 | | | $ | 1.28 | | | $ | (0.21 | ) | | $ | — | | | $ | (0.21 | ) |
Year Ended October 31, 2016 | | | 16.47 | | | | 0.34 | (g) | | | (0.10 | )(i) | | | 0.24 | | | | (0.31 | ) | | | (0.02 | ) | | | (0.33 | ) |
Year Ended October 31, 2015 | | | 17.15 | | | | 0.23 | (g) | | | (0.01 | ) | | | 0.22 | | | | (0.34 | ) | | | (0.56 | ) | | | (0.90 | ) |
Year Ended October 31, 2014 | | | 16.45 | | | | 0.26 | (g) | | | 0.97 | | | | 1.23 | | | | (0.16 | ) | | | (0.37 | ) | | | (0.53 | ) |
Year Ended October 31, 2013 | | | 14.52 | | | | 0.19 | (g) | | | 2.15 | | | | 2.34 | | | | (0.41 | ) | | | — | | | | (0.41 | ) |
Year Ended October 31, 2012 | | | 13.53 | | | | 0.38 | | | | 0.98 | | | | 1.36 | | | | (0.37 | ) | | | — | | | | (0.37 | ) |
| | | | | | | |
Class C | | | | | | | | | | | | | | | | | | | | | | | | | | | | |
Six Months Ended April 30, 2017 (Unaudited) | | | 16.20 | | | | 0.14 | (g) | | | 1.08 | | | | 1.22 | | | | (0.17 | ) | | | — | | | | (0.17 | ) |
Year Ended October 31, 2016 | | | 16.30 | | | | 0.26 | (g) | | | (0.10 | )(i) | | | 0.16 | | | | (0.24 | ) | | | (0.02 | ) | | | (0.26 | ) |
Year Ended October 31, 2015 | | | 17.04 | | | | 0.15 | (g) | | | (0.02 | ) | | | 0.13 | | | | (0.31 | ) | | | (0.56 | ) | | | (0.87 | ) |
Year Ended October 31, 2014 | | | 16.39 | | | | 0.16 | (g) | | | 0.98 | | | | 1.14 | | | | (0.12 | ) | | | (0.37 | ) | | | (0.49 | ) |
Year Ended October 31, 2013 | | | 14.49 | | | | 0.16 | (g) | | | 2.09 | | | | 2.25 | | | | (0.35 | ) | | | — | | | | (0.35 | ) |
Year Ended October 31, 2012 | | | 13.52 | | | | 0.31 | | | | 0.99 | | | | 1.30 | | | | (0.33 | ) | | | — | | | | (0.33 | ) |
| | | | | | | |
Class I (formerly Select Class) | | | | | | | | | | | | | | | | | | | | | | | | | | | | |
Six Months Ended April 30, 2017 (Unaudited) | | | 16.45 | | | | 0.20 | (g) | | | 1.09 | | | | 1.29 | | | | (0.23 | ) | | | — | | | | (0.23 | ) |
Year Ended October 31, 2016 | | | 16.53 | | | | 0.39 | (g) | | | (0.10 | )(i) | | | 0.29 | | | | (0.35 | ) | | | (0.02 | ) | | | (0.37 | ) |
Year Ended October 31, 2015 | | | 17.19 | | | | 0.27 | (g) | | | (0.01 | ) | | | 0.26 | | | | (0.36 | ) | | | (0.56 | ) | | | (0.92 | ) |
Year Ended October 31, 2014 | | | 16.47 | | | | 0.30 | (g) | | | 0.97 | | | | 1.27 | | | | (0.18 | ) | | | (0.37 | ) | | | (0.55 | ) |
Year Ended October 31, 2013 | | | 14.53 | | | | 0.33 | (g) | | | 2.04 | | | | 2.37 | | | | (0.43 | ) | | | — | | | | (0.43 | ) |
Year Ended October 31, 2012 | | | 13.53 | | | | 0.41 | | | | 1.00 | | | | 1.41 | | | | (0.41 | ) | | | — | | | | (0.41 | ) |
| | | | | | | |
Class R2 | | | | | | | | | | | | | | | | | | | | | | | | | | | | |
Six Months Ended April 30, 2017 (Unaudited) | | | 16.36 | | | | 0.16 | (g) | | | 1.09 | | | | 1.25 | | | | (0.20 | ) | | | — | | | | (0.20 | ) |
Year Ended October 31, 2016 | | | 16.44 | | | | 0.31 | (g) | | | (0.10 | )(i) | | | 0.21 | | | | (0.27 | ) | | | (0.02 | ) | | | (0.29 | ) |
Year Ended October 31, 2015 | | | 17.13 | | | | 0.19 | (g) | | | (0.01 | ) | | | 0.18 | | | | (0.31 | ) | | | (0.56 | ) | | | (0.87 | ) |
Year Ended October 31, 2014 | | | 16.44 | | | | 0.22 | (g) | | | 0.96 | | | | 1.18 | | | | (0.12 | ) | | | (0.37 | ) | | | (0.49 | ) |
Year Ended October 31, 2013 | | | 14.51 | | | | 0.25 | (g) | | | 2.04 | | | | 2.29 | | | | (0.36 | ) | | | — | | | | (0.36 | ) |
Year Ended October 31, 2012 | | | 13.53 | | | | 0.34 | | | | 0.99 | | | | 1.33 | | | | (0.35 | ) | | | — | | | | (0.35 | ) |
| (a) | Annualized for periods less than one year, unless otherwise noted. |
| (b) | Net investment income (loss) is affected by timing of distributions from Underlying Funds. |
| (c) | Not annualized for periods less than one year. |
| (d) | Includes adjustments in accordance with accounting principles generally accepted in the United States of America and as such, the net asset values for financial reporting purposes and the returns based upon those net asset values may differ from the net asset values and returns for shareholder transactions. |
| (e) | Includes interest expense, if applicable, each of which is less than 0.005% unless otherwise noted. |
| (f) | Does not include expenses of Underlying Funds. |
| (g) | Calculated based upon average shares outstanding. |
| (h) | The net expenses and expenses without waivers (excluding dividend expense for securities sold short) for Class A are 1.01% and 1.29%, Class C are 1.52% and 1.79%, Class I are 0.77% and 1.02% and Class R2 are 1.27% and 1.65%, respectively, for the period ended April 30, 2017. |
| (i) | Calculation of the net realized and unrealized gains (losses) per share do not correlate with the Fund’s net realized and unrealized gains (losses) presented on the Statements of Operations due to the timing of capital transactions in relation to the fluctuating market values of the Fund’s investments. |
SEE NOTES TO FINANCIAL STATEMENTS.
| | | | | | |
| | | |
| 94 | | | | J.P. MORGAN FUNDS | | APRIL 30, 2017 |
| | | | | | | | | | | | | | | | | | | | | | | | | | | | | | |
| | | Ratios/Supplemental data | |
| | | | | | | | | | Ratios to average net assets (a) | | | | | | | |
Net asset
value,
end of
period | | | Total return
(excludes
sales charge) (c)(d) | | | Net assets,
end of
period
(000’s) | | | Net expenses
(including
dividend
expense for
securities sold
short) (e)(f) | | | Net
investment
income
(loss) (b) | | | Expenses
without waivers,
reimbursements
(including dividend
expense for
securities sold
short) (f) | | | Portfolio
turnover rate
(excluding
securities
sold short) (c) | | | Portfolio
turnover rate
(including short
sales) (c) | |
| | | | | | | | | | | | | | | | | | | | | | | | | | | | | | |
| | | | | | | | | | | | | | | | | | | | | | | | | | | | | | |
| $ | 17.45 | | | | 7.88 | % | | $ | 251,975 | | | | 1.03 | %(h) | | | 2.16 | % | | | 1.31 | %(h) | | | 35 | % | | | 38 | % |
| | 16.38 | | | | 1.50 | | | | 289,961 | | | | 1.02 | | | | 2.12 | | | | 1.32 | | | | 64 | | | | — | |
| | 16.47 | | | | 1.38 | | | | 211,120 | | | | 1.02 | | | | 1.40 | | | | 1.43 | | | | 44 | | | | — | |
| | 17.15 | | | | 7.58 | | | | 28,114 | | | | 1.03 | | | | 1.56 | | | | 1.74 | | | | 87 | | | | — | |
| | 16.45 | | | | 16.36 | | | | 2,253 | | | | 1.05 | | | | 1.18 | | | | 3.30 | | | | 120 | | | | — | |
| | 14.52 | | | | 10.26 | | | | 50 | | | | 1.05 | | | | 2.70 | | | | 2.54 | | | | 67 | | | | — | |
| | | | | | | |
| | | | | | | | | | | | | | | | | | | | | | | | | | | | | | |
| | 17.25 | | | | 7.61 | | | | 372,486 | | | | 1.53 | (h) | | | 1.66 | | | | 1.81 | (h) | | | 35 | | | | 38 | |
| | 16.20 | | | | 1.03 | | | | 357,682 | | | | 1.52 | | | | 1.63 | | | | 1.82 | | | | 64 | | | | — | |
| | 16.30 | | | | 0.84 | | | | 198,888 | | | | 1.51 | | | | 0.90 | | | | 1.92 | | | | 44 | | | | — | |
| | 17.04 | | | | 7.07 | | | | 14,308 | | | | 1.53 | | | | 0.97 | | | | 2.22 | | | | 87 | | | | — | |
| | 16.39 | | | | 15.74 | | | | 380 | | | | 1.55 | | | | 1.00 | | | | 3.41 | | | | 120 | | | | — | |
| | 14.49 | | | | 9.75 | | | | 49 | | | | 1.55 | | | | 2.19 | | | | 3.04 | | | | 67 | | | | — | |
| | | | | | | |
| | | | | | | | | | | | | | | | | | | | | | | | | | | | | | |
| | 17.51 | | | | 7.95 | | | | 1,022,833 | | | | 0.78 | (h) | | | 2.41 | | | | 1.03 | (h) | | | 35 | | | | 38 | |
| | 16.45 | | | | 1.79 | | | | 782,381 | | | | 0.77 | | | | 2.39 | | | | 1.04 | | | | 64 | | | | — | |
| | 16.53 | | | | 1.62 | | | | 364,206 | | | | 0.77 | | | | 1.61 | | | | 1.19 | | | | 44 | | | | — | |
| | 17.19 | | | | 7.88 | | | | 44,964 | | | | 0.78 | | | | 1.79 | | | | 1.55 | | | | 87 | | | | — | |
| | 16.47 | | | | 16.61 | | | | 27,636 | | | | 0.80 | | | | 2.10 | | | | 2.31 | | | | 120 | | | | — | |
| | 14.53 | | | | 10.58 | | | | 19,856 | | | | 0.80 | | | | 2.95 | | | | 2.29 | | | | 67 | | | | — | |
| | | | | | | |
| | | | | | | | | | | | | | | | | | | | | | | | | | | | | | |
| | 17.41 | | | | 7.69 | | | | 1,355 | | | | 1.28 | (h) | | | 1.87 | | | | 1.66 | (h) | | | 35 | | | | 38 | |
| | 16.36 | | | | 1.30 | | | | 758 | | | | 1.27 | | | | 1.93 | | | | 1.75 | | | | 64 | | | | — | |
| | 16.44 | | | | 1.14 | | | | 203 | | | | 1.27 | | | | 1.17 | | | | 1.77 | | | | 44 | | | | — | |
| | 17.13 | | | | 7.29 | | | | 62 | | | | 1.28 | | | | 1.31 | | | | 2.07 | | | | 87 | | | | — | |
| | 16.44 | | | | 16.06 | | | | 58 | | | | 1.30 | | | | 1.61 | | | | 2.79 | | | | 120 | | | | — | |
| | 14.51 | | | | 9.99 | | | | 50 | | | | 1.30 | | | | 2.44 | | | | 2.79 | | | | 67 | | | | — | |
SEE NOTES TO FINANCIAL STATEMENTS.
| | | | | | | | |
| | | |
| APRIL 30, 2017 | | J.P. MORGAN FUNDS | | | | | 95 | |
FINANCIAL HIGHLIGHTS
FOR THE PERIODS INDICATED (continued)
| | | | | | | | | | | | | | | | | | | | | | | | | | | | | | | | |
| | | | | | Per share operating performance | | | | |
| | | | | | Investment operations | | | Distributions | |
| | | Net asset
value,
beginning
of period | | | Net
investment
income
(loss) | | | Net realized
and unrealized
gains
(losses) on
investments | | | Total from
investment
operations | | | Net
investment
income | | | Net
realized
gain | | | Return
of
capital | | | Total
distributions | |
Income Builder Fund | | | | | | | | | | | | | | | | | | | | | | | | | | | | | | | | |
Class A | | | | | | | | | | | | | | | | | | | | | | | | | | | | | | | | |
Six Months Ended April 30, 2017 (Unaudited) | | $ | 9.95 | | | | 0.21 | (e) | | $ | 0.32 | | | $ | 0.53 | | | $ | (0.21 | ) | | $ | — | | | $ | — | | | $ | (0.21 | ) |
Year Ended October 31, 2016 | | | 9.96 | | | | 0.42 | (e) | | | (0.01 | ) | | | 0.41 | | | | (0.42 | ) | | | — | | | | — | | | | (0.42 | ) |
Year Ended October 31, 2015 | | | 10.41 | | | | 0.41 | (e) | | | (0.41 | ) | | | — | (f) | | | (0.41 | ) | | | (0.02 | ) | | | (0.02 | ) | | | (0.45 | ) |
Year Ended October 31, 2014 | | | 10.32 | | | | 0.47 | | | | 0.09 | | | | 0.56 | | | | (0.47 | ) | | | — | | | | — | | | | (0.47 | ) |
Year Ended October 31, 2013 | | | 9.70 | | | | 0.45 | | | | 0.64 | | | | 1.09 | | | | (0.47 | ) | | | — | | | | — | | | | (0.47 | ) |
Year Ended October 31, 2012 | | | 9.01 | | | | 0.50 | | | | 0.67 | | | | 1.17 | | | | (0.48 | ) | | | — | | | | — | | | | (0.48 | ) |
| | | | | | | | |
Class C | | | | | | | | | | | | | | | | | | | | | | | | | | | | | | | | |
Six Months Ended April 30, 2017 (Unaudited) | | | 9.92 | | | | 0.19 | (e) | | | 0.33 | | | | 0.52 | | | | (0.19 | ) | | | — | | | | — | | | | (0.19 | ) |
Year Ended October 31, 2016 | | | 9.93 | | | | 0.37 | (e) | | | (0.01 | ) | | | 0.36 | | | | (0.37 | ) | | | — | | | | — | | | | (0.37 | ) |
Year Ended October 31, 2015 | | | 10.38 | | | | 0.35 | (e) | | | (0.40 | ) | | | (0.05 | ) | | | (0.36 | ) | | | (0.02 | ) | | | (0.02 | ) | | | (0.40 | ) |
Year Ended October 31, 2014 | | | 10.29 | | | | 0.42 | | | | 0.10 | | | | 0.52 | | | | (0.43 | ) | | | — | | | | — | | | | (0.43 | ) |
Year Ended October 31, 2013 | | | 9.68 | | | | 0.40 | | | | 0.63 | | | | 1.03 | | | | (0.42 | ) | | | — | | | | — | | | | (0.42 | ) |
Year Ended October 31, 2012 | | | 9.00 | | | | 0.45 | | | | 0.67 | | | | 1.12 | | | | (0.44 | ) | | | — | | | | — | | | | (0.44 | ) |
| | | | | | | | |
Class I (formerly Select Class) | | | | | | | | | | | | | | | | | | | | | | | | | | | | | | | | |
Six Months Ended April 30, 2017 (Unaudited) | | | 9.96 | | | | 0.22 | (e) | | | 0.33 | | | | 0.55 | | | | (0.22 | ) | | | — | | | | — | | | | (0.22 | ) |
Year Ended October 31, 2016 | | | 9.97 | | | | 0.43 | (e) | | | (0.01 | ) | | | 0.42 | | | | (0.43 | ) | | | — | | | | — | | | | (0.43 | ) |
Year Ended October 31, 2015 | | | 10.42 | | | | 0.42 | (e) | | | (0.40 | ) | | | 0.02 | | | | (0.43 | ) | | | (0.02 | ) | | | (0.02 | ) | | | (0.47 | ) |
Year Ended October 31, 2014 | | | 10.33 | | | | 0.49 | | | | 0.09 | | | | 0.58 | | | | (0.49 | ) | | | — | | | | — | | | | (0.49 | ) |
Year Ended October 31, 2013 | | | 9.71 | | | | 0.46 | | | | 0.64 | | | | 1.10 | | | | (0.48 | ) | | | — | | | | — | | | | (0.48 | ) |
Year Ended October 31, 2012 | | | 9.02 | | | | 0.51 | | | | 0.67 | | | | 1.18 | | | | (0.49 | ) | | | — | | | | — | | | | (0.49 | ) |
| (a) | Annualized for periods less than one year, unless otherwise noted. |
| (b) | Not annualized for periods less than one year. |
| (c) | Includes adjustments in accordance with accounting principles generally accepted in the United States of America and as such, the net asset values for financial reporting purposes and the returns based upon those net asset values may differ from the net asset values and returns for shareholder transactions. |
| (d) | Includes earnings credits and interest expense, if applicable, each of which is less than 0.005% unless otherwise noted. |
| (e) | Calculated based upon average shares outstanding. |
| (f) | Amount rounds to less than $0.01. |
SEE NOTES TO FINANCIAL STATEMENTS.
| | | | | | |
| | | |
| 96 | | | | J.P. MORGAN FUNDS | | APRIL 30, 2017 |
| | | | | | | | | | | | | | | | | | | | | | | | | | |
| | | Ratios/Supplemental data | |
| | | | | | | | | | Ratios to average net assets (a) | | | | |
Net asset
value,
end of
period | | | Total return
(excludes
sales charge) (b)(c) | | |
Net assets,
end of
period
(000’s) | | | Net
expenses (d) | | | Net
investment
income
(loss) | | | Expenses
without waivers,
reimbursements and
earnings credits | | | Portfolio
turnover
rate (b) | |
| | | | | | | | | | | | | | | | | | | | | | | | | | |
| | | | | | | | | | | | | | | | | | | | | | | | | | |
| $ | 10.27 | | | | 5.43 | % | | $ | 3,602,173 | | | | 0.75 | % | | | 4.21 | % | | | 1.10 | % | | | 24 | % |
| | 9.95 | | | | 4.23 | | | | 3,991,877 | | | | 0.75 | | | | 4.25 | | | | 1.10 | | | | 52 | |
| | 9.96 | | | | (0.03 | ) | | | 4,262,148 | | | | 0.75 | | | | 3.97 | | | | 1.11 | | | | 48 | |
| | 10.41 | | | | 5.54 | | | | 4,024,646 | | | | 0.74 | | | | 4.60 | | | | 1.12 | | | | 41 | |
| | 10.32 | | | | 11.45 | | | | 3,223,725 | | | | 0.75 | | | | 4.55 | | | | 1.13 | | | | 41 | |
| | 9.70 | | | | 13.36 | | | | 1,502,366 | | | | 0.74 | | | | 5.48 | | | | 1.15 | | | | 40 | |
| | | | | | |
| | | | | | | | | | | | | | | | | | | | | | | | | | |
| | 10.25 | | | | 5.28 | | | | 4,783,532 | | | | 1.25 | | | | 3.72 | | | | 1.61 | | | | 24 | |
| | 9.92 | | | | 3.70 | | | | 4,968,359 | | | | 1.25 | | | | 3.76 | | | | 1.61 | | | | 52 | |
| | 9.93 | | | | (0.53 | ) | | | 5,120,797 | | | | 1.25 | | | | 3.47 | | | | 1.63 | | | | 48 | |
| | 10.38 | | | | 5.06 | | | | 4,676,332 | | | | 1.24 | | | | 4.08 | | | | 1.62 | | | | 41 | |
| | 10.29 | | | | 10.84 | | | | 3,476,814 | | | | 1.25 | | | | 4.05 | | | | 1.63 | | | | 41 | |
| | 9.68 | | | | 12.72 | | | | 1,665,862 | | | | 1.24 | | | | 4.98 | | | | 1.65 | | | | 40 | |
| | | | | | |
| | | | | | | | | | | | | | | | | | | | | | | | | | |
| | 10.29 | | | | 5.60 | | | | 3,889,979 | | | | 0.60 | | | | 4.39 | | | | 0.85 | | | | 24 | |
| | 9.96 | | | | 4.36 | | | | 3,198,358 | | | | 0.60 | | | | 4.39 | | | | 0.86 | | | | 52 | |
| | 9.97 | | | | 0.12 | | | | 3,138,405 | | | | 0.60 | | | | 4.12 | | | | 0.87 | | | | 48 | |
| | 10.42 | | | | 5.70 | | | | 2,852,404 | | | | 0.59 | | | | 4.68 | | | | 0.87 | | | | 41 | |
| | 10.33 | | | | 11.58 | | | | 1,585,506 | | | | 0.60 | | | | 4.70 | | | | 0.88 | | | | 41 | |
| | 9.71 | | | | 13.51 | | | | 817,404 | | | | 0.59 | | | | 5.63 | | | | 0.90 | | | | 40 | |
SEE NOTES TO FINANCIAL STATEMENTS.
| | | | | | | | |
| | | |
| APRIL 30, 2017 | | J.P. MORGAN FUNDS | | | | | 97 | |
NOTES TO FINANCIAL STATEMENTS
AS OF APRIL 30, 2017 (Unaudited)
1. Organization
JPMorgan Trust I (the “Trust”) was formed on November 12, 2004, as a Delaware statutory trust, pursuant to a Declaration of Trust dated November 5, 2004 and is registered under the Investment Company Act of 1940, as amended (the “1940 Act”), as an open-end management investment company.
The following are 2 separate funds of the Trust (collectively, the “Funds”) covered by this report:
| | | | |
| | | Classes Offered | | Diversified/Non-Diversified |
| Global Allocation Fund | | Class A, Class C, Class R2 and Class I^ | | Diversified |
| Income Builder Fund | | Class A, Class C and Class I^ | | Diversified |
| ^ | Effective April 3, 2017, Select Class was renamed Class I. |
The investment objective of Global Allocation Fund is to seek to maximize long-term total return.
The investment objective of Income Builder Fund is to seek to maximize income while maintaining prospects for capital appreciation.
Class A Shares generally provide for a front-end sales charge while Class C Shares provide for a contingent deferred sales charge (“CDSC”). No sales charges are assessed with respect to the Class R2 and Class I Shares. All classes of shares have equal rights as to earnings, assets and voting privileges, except that each class may bear different transfer agency, sub-transfer agency (through April 2, 2017), distribution and service fees and each class has exclusive voting rights with respect to its distribution plan and shareholder servicing agreements. Effective April 3, 2017 sub-transfer agency and shareholder servicing fees were consolidated into a single service fee. Certain Class A Shares, for which front-end sales charges have been waived, may be subject to a CDSC as described in the Funds’ prospectus. Beginning on November 14, 2017, Class C Shares will automatically convert to Class A Shares after ten years.
J.P. Morgan Investment Management Inc. (“JPMIM”) an indirect, wholly-owned subsidiary of JPMorgan Chase & Co. (“JPMorgan”) acts as Adviser (the “Adviser”) and Administrator (the “Administrator”) to the Funds.
2. Significant Accounting Policies
The following is a summary of significant accounting policies followed by the Funds in the preparation of their financial statements. The Funds are investment companies and, accordingly, follow the investment company accounting and reporting guidance of the Financial Accounting Standards Board Accounting Standards Codification Topic 946 —Investment Companies, which is part of U.S. generally accepted accounting principles (“GAAP”). The preparation of financial statements in conformity with GAAP requires management to make estimates and assumptions that affect the reported amounts of assets and liabilities and disclosure of contingent assets and liabilities at the date of the financial statements and the reported amounts of increases and decreases in net assets from operations during the reporting period. Actual results could differ from those estimates.
A. Valuation of Investments — The valuation of investments is in accordance with GAAP and the Funds’ valuation policies set forth by and under the supervision and responsibility of the Board of Trustees (the “Board”), which established the following approach to valuation, as described more fully below: (i) investments for which market quotations are readily available shall be valued at such unadjusted quoted prices and (ii) all other investments for which market quotations are not readily available shall be valued at their fair value as determined in good faith by the Board.
The Administrator has established the J.P. Morgan Investment Management Americas Valuation Committee (“AVC”) to assist the Board with the oversight and monitoring of the valuation of the Funds’ investments. The Administrator implements the valuation policies of the Funds’ investments, as directed by the Board. The AVC oversees and carries out the policies for the valuation of investments held in the Funds. This includes monitoring the appropriateness of fair values based on results of ongoing valuation oversight, including but not limited to consideration of macro or security specific events, market events and pricing vendor and broker due diligence. The Administrator is responsible for discussing and assessing the potential impacts to the fair values on an ongoing basis, and at least on a quarterly basis with the AVC and the Board.
A market-based approach is primarily used to value the Funds’ investments. Investments for which market quotations are not readily available are fair valued by approved affiliated and unaffiliated pricing vendors or third party broker-dealers (collectively referred to as “Pricing Services”) or may be internally fair valued using methods set forth by the valuation policies approved by the Board. This may include related or comparable assets or liabilities, recent transactions, market multiples, book values, and other relevant information for the investment to determine the fair value of the investment. An income-based valuation approach may be used in which the anticipated future cash flows of the investment are discounted to calculate the fair value. Discounts may also be applied due to the nature or duration of any restrictions on the disposition of the investments. Valuations may be based upon current market prices of securities that are comparable in coupon, rating, maturity and industry. It is possible that the estimated values may differ significantly from the values that would have been used, had a ready market for the investments existed, and such differences could be material.
Fixed income instruments are valued based on prices received from Pricing Services. The Pricing Services use multiple valuation techniques to determine the valuation of fixed income instruments. In instances where sufficient market activity exists, the Pricing Services may utilize a market-based approach through which trades or quotes from market makers are used to determine the valuation of these instruments. In instances where sufficient market activity may not exist, the Pricing Services also utilize proprietary valuation models which may consider market transactions in comparable securities and the various relationships between securities in determining fair value and/or market characteristics in order to estimate the relevant cash flows, which are then discounted to calculate the fair values.
| | | | | | |
| | | |
| 98 | | | | J.P. MORGAN FUNDS | | APRIL 30, 2017 |
Equities and other exchange-traded instruments are valued at the last sale price or official market closing price on the primary exchange on which the instrument is traded before the net asset values (“NAV”) of the Funds are calculated on a valuation date. Certain foreign equity instruments, as well as certain derivatives with equity reference obligations, are valued by applying international fair value factors provided by an approved Pricing Service. The factors seek to adjust the local closing price for movements of local markets post closing, but prior to the time the NAVs are calculated. Investments in open-end investment companies (the “Underlying Funds”) are valued at each Underlying Fund’s NAV per share as of the report date.
Futures and options are generally valued on the basis of available market quotations. Swaps and forward foreign currency exchange contracts are valued utilizing market quotations from approved Pricing Services.
See the table on “Quantitative Information about Level 3 Fair Value Measurements” for information on the valuation techniques and inputs used to value Level 3 securities held by the Funds at April 30, 2017.
Valuations reflected in this report are as of the report date. As a result, changes in valuation due to market events and/or issuer related events after the report date and prior to issuance of the report are not reflected herein.
The various inputs that are used in determining the valuation of the Funds’ investments are summarized into the three broad levels listed below.
| • | | Level 1 — Unadjusted inputs using quoted prices in active markets for identical investments. |
| • | | Level 2 — Other significant observable inputs including, but not limited to, quoted prices for similar investments, inputs other than quoted prices that are observable for investments (such as interest rates, prepayment speeds, credit risk, etc.) or other market corroborated inputs. |
| • | | Level 3 — Significant inputs based on the best information available in the circumstances, to the extent observable inputs are not available (including the Funds’ assumptions in determining the fair value of investments). |
A financial instrument’s level within the fair value hierarchy is based on the lowest level of any input, both individually and in the aggregate, that is significant to the fair value measurement. The inputs or methodology used for valuing instruments are not necessarily an indication of the risk associated with investing in those instruments.
The following tables represent each valuation input as presented on the Schedules of Portfolio Investments (“SOIs”) (amounts in thousands):
Global Allocation Fund
| | | | | | | | | | | | | | | | |
| | | Level 1
Quoted prices | | | Level 2
Other significant
observable inputs | | | Level 3
Significant
unobservable inputs | | | Total | |
Investments in Securities | | | | | | | | | | | | | | | | |
Common Stocks | | | | | | | | | | | | | | | | |
Australia | | $ | — | | | $ | 24,520 | | | $ | — | | | $ | 24,520 | |
Austria | | | — | | | | 1,676 | | | | — | | | | 1,676 | |
Belgium | | | — | | | | 4,273 | | | | — | | | | 4,273 | |
Brazil | | | 5,947 | | | | — | | | | — | | | | 5,947 | |
Canada | | | 8,437 | | | | — | | | | — | | | | 8,437 | |
Chile | | | 574 | | | | — | | | | — | | | | 574 | |
China | | | 2,960 | | | | 6,254 | | | | — | | | | 9,214 | |
Denmark | | | — | | | | 3,942 | | | | — | | | | 3,942 | |
Finland | | | — | | | | 7,455 | | | | — | | | | 7,455 | |
France | | | — | | | | 36,399 | | | | — | | | | 36,399 | |
Germany | | | — | | | | 39,435 | | | | — | | | | 39,435 | |
Hong Kong | | | — | | | | 14,692 | | | | — | | | | 14,692 | |
India | | | 7,131 | | | | 1,162 | | | | — | | | | 8,293 | |
Indonesia | | | 349 | | | | 2,108 | | | | — | | | | 2,457 | |
Ireland | | | 1,598 | | | | — | | | | — | | | | 1,598 | |
Israel | | | 2,131 | | | | — | | | | — | | | | 2,131 | |
Italy | | | — | | | | 11,234 | | | | — | | | | 11,234 | |
Japan | | | — | | | | 77,563 | | | | — | | | | 77,563 | |
Luxembourg | | | — | | | | 1,962 | | | | — | | | | 1,962 | |
Malaysia | | | — | | | | 377 | | | | — | | | | 377 | |
Mexico | | | 1,094 | | | | — | | | | — | | | | 1,094 | |
Netherlands | | | — | | | | 18,725 | | | | — | | | | 18,725 | |
New Zealand | | | — | | | | 1,256 | | | | — | | | | 1,256 | |
Norway | | | — | | | | 1,301 | | | | — | | | | 1,301 | |
Peru | | | 638 | | | | — | | | | — | | | | 638 | |
Portugal | | | — | | | | 1,193 | | | | — | | | | 1,193 | |
Russia | | | 176 | | | | 3,077 | | | | — | | | | 3,253 | |
| | | | | | | | |
| | | |
| APRIL 30, 2017 | | J.P. MORGAN FUNDS | | | | | 99 | |
NOTES TO FINANCIAL STATEMENTS
AS OF APRIL 30, 2017 (Unaudited) (continued)
| | | | | | | | | | | | | | | | |
| Global Allocation Fund (continued) | | | | | | | | | | | | | | | | |
| | | Level 1
Quoted prices | | | Level 2
Other significant
observable inputs | | | Level 3
Significant
unobservable inputs | | | Total | |
Singapore | | $ | — | | | $ | 3,393 | | | $ | — | | | $ | 3,393 | |
South Africa | | | — | | | | 6,876 | | | | — | | | | 6,876 | |
South Korea | | | — | | | | 3,836 | | | | — | | | | 3,836 | |
Spain | | | — | | | | 8,847 | | | | — | | | | 8,847 | |
Sweden | | | — | | | | 2,954 | | | | — | | | | 2,954 | |
Switzerland | | | — | | | | 35,402 | | | | — | | | | 35,402 | |
Taiwan | | | 3,325 | | | | 1,786 | | | | — | | | | 5,111 | |
Thailand | | | 791 | | | | 721 | | | | — | | | | 1,512 | |
Turkey | | | — | | | | 306 | | | | — | | | | 306 | |
United Kingdom | | | 119 | | | | 56,365 | | | | — | | | | 56,484 | |
United States | | | 380,153 | | | | 3,967 | | | | — | | | | 384,120 | |
| | | | | | | | | | | | | | | | |
Total Common Stocks | | | 415,423 | | | | 383,057 | | | | — | | | | 798,480 | |
| | | | | | | | | | | | | | | | |
Preferred Stocks | | | | | | | | | | | | | | | | |
Bermuda | | | — | | | | 74 | | | | — | | | | 74 | |
United States | | | 16 | | | | — | | | | — | | | | 16 | |
| | | | | | | | | | | | | | | | |
Total Preferred Stocks | | | 16 | | | | 74 | | | | — | | | | 90 | |
| | | | | | | | | | | | | | | | |
Investment Company | | | | | | | | | | | | | | | | |
United States | | | 46,198 | | | | — | | | | — | | | | 46,198 | |
Debt Securities | | | | | | | | | | | | | | | | |
Asset-Backed Securities | | | | | | | | | | | | | | | | |
United States | | | — | | | | 9,139 | | | | 34,457 | | | | 43,596 | |
Collateralized Mortgage Obligations | | | | | | | | | | | | | | | | |
United States | | | — | | | | 32,579 | | | | 1,146 | | | | 33,725 | |
Commercial Mortgage-Backed Securities | | | | | | | | | | | | | | | | |
United States | | | — | | | | 7,914 | | | | — | | | | 7,914 | |
Convertible Bonds | | | | | | | | | | | | | | | | |
United States | | | — | | | | 36 | | | | — | | | | 36 | |
Corporate Bonds | | | | | | | | | | | | | | | | |
Belgium | | | — | | | | 1,866 | | | | — | | | | 1,866 | |
Bermuda | | | — | | | | 663 | | | | — | | | | 663 | |
Brazil | | | — | | | | 873 | | | | — | | | | 873 | |
Canada | | | — | | | | 12,899 | | | | — | | | | 12,899 | |
China | | | — | | | | 396 | | | | — | | | | 396 | |
Finland | | | — | | | | 274 | | | | — | | | | 274 | |
France | | | — | | | | 14,919 | | | | — | | | | 14,919 | |
Germany | | | — | | | | 8,529 | | | | — | | | | 8,529 | |
Greece | | | — | | | | 458 | | | | — | | | | 458 | |
Ireland | | | — | | | | 4,644 | | | | — | | | | 4,644 | |
Israel | | | — | | | | 579 | | | | — | | | | 579 | |
Italy | | | — | | | | 9,335 | | | | — | | | | 9,335 | |
Japan | | | — | | | | 1,544 | | | | — | | | | 1,544 | |
Luxembourg | | | — | | | | 17,818 | | | | — | | | | 17,818 | |
Mexico | | | — | | | | 2,794 | | | | — | | | | 2,794 | |
Netherlands | | | — | | | | 5,943 | | | | — | | | | 5,943 | |
New Zealand | | | — | | | | 710 | | | | — | | | | 710 | |
Portugal | | | — | | | | 354 | | | | — | | | | 354 | |
Spain | | | — | | | | 7,538 | | | | — | | | | 7,538 | |
Sweden | | | — | | | | 2,499 | | | | — | | | | 2,499 | |
Switzerland | | | — | | | | 935 | | | | — | | | | 935 | |
United Arab Emirates | | | — | | | | 700 | | | | — | | | | 700 | |
United Kingdom | | | — | | | | 16,492 | | | | — | | | | 16,492 | |
United States | | | — | | | | 234,267 | | | | 4 | | | | 234,271 | |
| | | | | | | | | | | | | | | | |
Total Corporate Bonds | | | — | | | | 347,029 | | | | 4 | | | | 347,033 | |
| | | | | | | | | | | | | | | | |
| | | | | | |
| | | |
| 100 | | | | J.P. MORGAN FUNDS | | APRIL 30, 2017 |
| | | | | | | | | | | | | | | | |
| Global Allocation Fund (continued) | | | | | | | | | | | | | | | | |
| | | Level 1
Quoted prices | | | Level 2
Other significant
observable inputs | | | Level 3
Significant
unobservable inputs | | | Total | |
Loan Assignments | | | | | | | | | | | | | | | | |
Canada | | $ | — | | | $ | 1,028 | | | $ | — | | | $ | 1,028 | |
United States | | | — | | | | 7,465 | | | | — | | | | 7,465 | |
| | | | | | | | | | | | | | | | |
Total Loan Assignments | | | — | | | | 8,493 | | | | — | | | | 8,493 | |
| | | | | | | | | | | | | | | | |
Foreign Government Securities | | | — | | | | 66,418 | | | | — | | | | 66,418 | |
U.S. Treasury Obligations | | | — | | | | 24,917 | | | | — | | | | 24,917 | |
Options Purchased | | | | | | | | | | | | | | | | |
Call Options Purchased | | | 2,767 | | | | 3,423 | | | | — | | | | 6,190 | |
Rights | | | | | | | | | | | | | | | | |
United States | | | — | | | | — | | | | 20 | | | | 20 | |
Short-Term Investment | | | | | | | | | | | | | | | | |
Foreign Government Treasury Bills | | | — | | | | 63,793 | | | | — | | | | 63,793 | |
Investment Company | | | 196,570 | | | | — | | | | — | | | | 196,570 | |
| | | | | | | | | | | | | | | | |
Total Short-Term Investments | | | 196,570 | | | | 63,793 | | | | — | | | | 260,363 | |
| | | | | | | | | | | | | | | | |
Total Investments in Securities | | $ | 660,974 | | | $ | 946,872 | | | $ | 35,627 | | | $ | 1,643,473 | |
| | | | | | | | | | | | | | | | |
Liabilities | | | | | | | | | | | | | | | | |
Common Stocks | | | | | | | | | | | | | | | | |
Bermuda | | $ | (102 | ) | | $ | — | | | $ | — | | | $ | (102 | ) |
Canada | | | (857 | ) | | | — | | | | — | | | | (857 | ) |
Sweden | | | (101 | ) | | | — | | | | — | | | | (101 | ) |
United States | | | (20,897 | ) | | | — | | | | — | | | | (20,897 | ) |
| | | | | | | | | | | | | | | | |
Total Liabilities in Securities Sold Short | | $ | (21,957 | ) | | $ | — | | | $ | — | | | $ | (21,957 | ) |
| | | | | | | | | | | | | | | | |
Appreciation in Other Financial Instruments | | | | | | | | | | | | | | | | |
Forward Foreign Currency Exchange Contracts | | $ | — | | | $ | 1,022 | | | $ | — | | | $ | 1,022 | |
Futures Contracts | | | 3,706 | | | | 103 | | | | — | | | | 3,809 | |
| | | | | | | | | | | | | | | | |
Total Appreciation in Other Financial Instruments | | $ | 3,706 | | | $ | 1,125 | | | $ | — | | | $ | 4,831 | |
| | | | | | | | | | | | | | | | |
Depreciation in Other Financial Instruments | |
Forward Foreign Currency Exchange Contracts | | $ | — | | | $ | (623 | ) | | $ | — | | | $ | (623 | ) |
Futures Contracts | | | (178 | ) | | | (237 | ) | | | — | | | | (415 | ) |
Swaps | | | — | | | | — | (a) | | | — | | | | — | (a) |
| | | | | | | | | | | | | | | | |
Total Depreciation in Other Financial Instruments | | $ | (178 | ) | | $ | (860 | ) | | $ | — | | | $ | (1,038 | ) |
| | | | | | | | | | | | | | | | |
Income Builder Fund
| | | | | | | | | | | | | | | | |
| | | Level 1
Quoted prices | | | Level 2
Other significant
observable inputs | | | Level 3
Significant
unobservable inputs | | | Total | |
Investments in Securities | |
Common Stocks | | | | | | | | | | | | | | | | |
Australia | | $ | — | | | $ | 66,075 | | | $ | — | | | $ | 66,075 | |
Belgium | | | — | | | | 62,884 | | | | — | | | | 62,884 | |
Brazil | | | 52,335 | | | | — | | | | — | | | | 52,335 | |
Canada | | | 44,288 | | | | — | | | | — | | | | 44,288 | |
Chile | | | 19,621 | | | | — | | | | — | | | | 19,621 | |
China | | | — | | | | 111,095 | | | | — | | | | 111,095 | |
Colombia | | | 866 | | | | — | | | | — | | | | 866 | |
Czech Republic | | | 12,428 | | | | 29,239 | | | | — | | | | 41,667 | |
Denmark | | | — | | | | 59,676 | | | | — | | | | 59,676 | |
Finland | | | — | | | | 83,236 | | | | — | | | | 83,236 | |
France | | | 2,225 | | | | 225,150 | | | | — | | | | 227,375 | |
Germany | | | 3,591 | | | | 187,382 | | | | — | | | | 190,973 | |
Hong Kong | | | 9,778 | | | | 48,388 | | | | — | | | | 58,166 | |
| | | | | | | | |
| | | |
| APRIL 30, 2017 | | J.P. MORGAN FUNDS | | | | | 101 | |
NOTES TO FINANCIAL STATEMENTS
AS OF APRIL 30, 2017 (Unaudited) (continued)
| | | | | | | | | | | | | | | | |
| Income Builder Fund (continued) | | | | | | | | | | | | | | | | |
| | | Level 1
Quoted prices | | | Level 2
Other significant
observable inputs | | | Level 3
Significant
unobservable inputs | | | Total | |
Hungary | | $ | — | | | $ | 12,303 | | | $ | — | | | $ | 12,303 | |
India | | | — | | | | 24,271 | | | | — | | | | 24,271 | |
Indonesia | | | — | | | | 13,328 | | | | — | | | | 13,328 | |
Ireland | | | — | | | | 3,776 | | | | — | | | | 3,776 | |
Italy | | | 665 | | | | 34,780 | | | | — | | | | 35,445 | |
Japan | | | 10,937 | | | | 160,894 | | | | — | | | | 171,831 | |
Mexico | | | 41,691 | | | | — | | | | — | | | | 41,691 | |
Netherlands | | | 8,500 | | | | 103,561 | | | | — | | | | 112,061 | |
Norway | | | — | | | | 22,123 | | | | — | | | | 22,123 | |
Portugal | | | — | | | | 8,755 | | | | — | | | | 8,755 | |
Russia | | | 20,982 | | | | 25,150 | | | | — | | | | 46,132 | |
Singapore | | | — | | | | 3,660 | | | | — | | | | 3,660 | |
South Africa | | | 19,811 | | | | 63,783 | | | | — | | | | 83,594 | |
South Korea | | | 9,829 | | | | 34,346 | | | | — | | | | 44,175 | |
Spain | | | — | | | | 89,988 | | | | — | | | | 89,988 | |
Sweden | | | — | | | | 40,044 | | | | — | | | | 40,044 | |
Switzerland | | | — | | | | 99,505 | | | | — | | | | 99,505 | |
Taiwan | | | 33,258 | | | | 96,100 | | | | — | | | | 129,358 | |
Thailand | | | 4,355 | | | | 20,636 | | | | — | | | | 24,991 | |
Turkey | | | — | | | | 21,159 | | | | — | | | | 21,159 | |
United Arab Emirates | | | 9,673 | | | | — | | | | — | | | | 9,673 | |
United Kingdom | | | 5,333 | | | | 619,825 | | | | — | | | | 625,158 | |
United States | | | 2,398,758 | | | | 14 | | | | — | (a) | | | 2,398,772 | |
| | | | | | | | | | | | | | | | |
Total Common Stocks | | | 2,708,924 | | | | 2,371,126 | | | | — | (a) | | | 5,080,050 | |
| | | | | | | | | | | | | | | | |
Convertible Preferred Stocks | | | | | | | | | | | | | | | | |
China | | | — | | | | 4,026 | | | | — | | | | 4,026 | |
Israel | | | 1,851 | | | | — | | | | — | | | | 1,851 | |
United States | | | 33,353 | | | | — | | | | — | | | | 33,353 | |
| | | | | | | | | | | | | | | | |
Total Convertible Preferred Stocks | | | 35,204 | | | | 4,026 | | | | — | | | | 39,230 | |
| | | | | | | | | | | | | | | | |
Preferred Stocks | | | | | | | | | | | | | | | | |
Bermuda | | | — | | | | 2,907 | | | | — | | | | 2,907 | |
United States | | | 102,270 | | | | — | | | | — | | | | 102,270 | |
| | | | | | | | | | | | | | | | |
Total Preferred Stocks | | | 102,270 | | | | 2,907 | | | | — | | | | 105,177 | |
| | | | | | | | | | | | | | | | |
Debt Securities | | | | | | | | | | | | | | | | |
Asset-Backed Securities | | | | | | | | | | | | | | | | |
United States | | | — | | | | 101,725 | | | | 432,841 | | | | 534,566 | |
Collateralized Mortgage Obligations | | | | | | | | | | | | | | | | |
United States | | | — | | | | 384,551 | | | | 2,548 | | | | 387,099 | |
Commercial Mortgage-Backed Securities | | | | | | | | | | | | | | | | |
United States | | | — | | | | 89,424 | | | | 52,327 | | | | 141,751 | |
Convertible Bonds | | | | | | | | | | | | | | | | |
Bermuda | | | — | | | | 374 | | | | — | | | | 374 | |
China | | | — | | | | 3,690 | | | | — | | | | 3,690 | |
France | | | — | | | | 1,653 | | | | — | | | | 1,653 | |
Germany | | | — | | | | 5,426 | | | | — | | | | 5,426 | |
Hong Kong | | | — | | | | 3,076 | | | | — | | | | 3,076 | |
Italy | | | — | | | | 673 | | | | — | | | | 673 | |
Malaysia | | | — | | | | 657 | | | | — | | | | 657 | |
Mexico | | | — | | | | 1,555 | | | | — | | | | 1,555 | |
Netherlands | | | — | | | | 654 | | | | — | | | | 654 | |
Portugal | | | — | | | | 695 | | | | — | | | | 695 | |
Russia | | | — | | | | 1,321 | | | | — | | | | 1,321 | |
Singapore | | | — | | | | 3,550 | | | | — | | | | 3,550 | |
| | | | | | |
| | | |
| 102 | | | | J.P. MORGAN FUNDS | | APRIL 30, 2017 |
| | | | | | | | | | | | | | | | |
| Income Builder Fund (continued) | | | | | | | | | | | | | | | | |
| | | Level 1
Quoted prices | | | Level 2
Other significant
observable inputs | | | Level 3
Significant
unobservable inputs | | | Total | |
South Africa | | $ | — | | | $ | 3,970 | | | $ | — | | | $ | 3,970 | |
Spain | | | — | | | | 2,295 | | | | — | | | | 2,295 | |
Taiwan | | | — | | | | 2,463 | | | | — | | | | 2,463 | |
United Arab Emirates | | | — | | | | 5,987 | | | | — | | | | 5,987 | |
United Kingdom | | | — | | | | 9,895 | | | | — | | | | 9,895 | |
United States | | | — | | | | 41,967 | | | | 7 | | | | 41,974 | |
| | | | | | | | | | | | | | | | |
Total Convertible Bonds | | | — | | | | 89,901 | | | | 7 | | | | 89,908 | |
| | | | | | | | | | | | | | | | |
Corporate Bonds | | | | | | | | | | | | | | | | |
Argentina | | | — | | | | 2,123 | | | | — | | | | 2,123 | |
Australia | | | — | | | | 14,084 | | | | — | | | | 14,084 | |
Belgium | | | — | | | | 9,130 | | | | — | | | | 9,130 | |
Bermuda | | | — | | | | 3,335 | | | | — | | | | 3,335 | |
Brazil | | | — | | | | 22,797 | | | | — | | | | 22,797 | |
Canada | | | — | | | | 196,570 | | | | — | (b) | | | 196,570 | |
Chile | | | — | | | | 3,683 | | | | — | | | | 3,683 | |
Colombia | | | — | | | | 2,351 | | | | — | | | | 2,351 | |
Croatia | | | — | | | | 1,437 | | | | — | | | | 1,437 | |
Finland | | | — | | | | 2,546 | | | | — | | | | 2,546 | |
France | | | — | | | | 61,303 | | | | — | | | | 61,303 | |
Georgia | | | — | | | | 1,087 | | | | — | | | | 1,087 | |
Germany | | | — | | | | 29,914 | | | | — | | | | 29,914 | |
Guatemala | | | — | | | | 1,565 | | | | — | | | | 1,565 | |
Hungary | | | — | | | | 5,098 | | | | — | | | | 5,098 | |
India | | | — | | | | 2,897 | | | | — | | | | 2,897 | |
Indonesia | | | — | | | | 9,111 | | | | — | | | | 9,111 | |
Ireland | | | — | | | | 20,932 | | | | — | | | | 20,932 | |
Israel | | | — | | | | 8,696 | | | | — | | | | 8,696 | |
Italy | | | — | | | | 21,385 | | | | — | | | | 21,385 | |
Jamaica | | | — | | | | 1,276 | | | | — | | | | 1,276 | |
Japan | | | — | | | | 3,793 | | | | — | | | | 3,793 | |
Kazakhstan | | | — | | | | 6,303 | | | | — | | | | 6,303 | |
Luxembourg | | | — | | | | 119,228 | | | | — | | | | 119,228 | |
Malaysia | | | — | | | | 1,256 | | | | — | | | | 1,256 | |
Mexico | | | — | | | | 42,549 | | | | — | | | | 42,549 | |
Morocco | | | — | | | | 3,107 | | | | — | | | | 3,107 | |
Netherlands | | | — | | | | 41,028 | | | | — | | | | 41,028 | |
New Zealand | | | — | | | | 14,935 | | | | — | | | | 14,935 | |
Nigeria | | | — | | | | 974 | | | | — | | | | 974 | |
Peru | | | — | | | | 6,829 | | | | — | | | | 6,829 | |
Russia | | | — | | | | 6,478 | | | | — | | | | 6,478 | |
South Korea | | | — | | | | 3,482 | | | | — | | | | 3,482 | |
Spain | | | — | | | | 23,700 | | | | — | | | | 23,700 | |
Sweden | | | — | | | | 15,338 | | | | — | | | | 15,338 | |
Switzerland | | | — | | | | 22,489 | | | | — | | | | 22,489 | |
United Arab Emirates | | | — | | | | 5,732 | | | | — | | | | 5,732 | |
United Kingdom | | | — | | | | 102,134 | | | | — | | | | 102,134 | |
United States | | | — | | | | 4,451,048 | | | | 947 | | | | 4,451,995 | |
Venezuela | | | — | | | | 3,698 | | | | — | | | | 3,698 | |
| | | | | | | | | | | | | | | | |
Total Corporate Bonds | | | — | | | | 5,295,421 | | | | 947 | | | | 5,296,368 | |
| | | | | | | | | | | | | | | | |
Loan Assignments | | | | | | | | | | | | | | | | |
Bermuda | | | — | | | | 1,647 | | | | — | | | | 1,647 | |
Canada | | | — | | | | 6,001 | | | | — | | | | 6,001 | |
Luxembourg | | | — | | | | 962 | | | | — | | | | 962 | |
United States | | | — | | | | 70,450 | | | | — | (a) | | | 70,450 | |
| | | | | | | | | | | | | | | | |
Total Loan Assignments | | | — | | | | 79,060 | | | | — | (a) | | | 79,060 | |
| | | | | | | | | | | | | | | | |
| | | | | | | | |
| | | |
| APRIL 30, 2017 | | J.P. MORGAN FUNDS | | | | | 103 | |
NOTES TO FINANCIAL STATEMENTS
AS OF APRIL 30, 2017 (Unaudited) (continued)
| | | | | | | | | | | | | | | | |
| Income Builder Fund (continued) | | | | | | | | | | | | | | | | |
| | | Level 1
Quoted prices | | | Level 2
Other significant
observable inputs | | | Level 3
Significant
unobservable inputs | | | Total | |
Foreign Government Securities | | $ | — | | | $ | 149,454 | | | $ | — | | | $ | 149,454 | |
U.S. Treasury Obligation | | | — | | | | 35,291 | | | | — | | | | 35,291 | |
Rights | | | | | | | | | | | | | | | | |
United Kingdom | | | — | | | | 11 | | | | — | | | | 11 | |
United States | | | — | | | | — | | | | 579 | | | | 579 | |
| | | | | | | | | | | | | | | | |
Total Rights | | | — | | | | 11 | | | | 579 | | | | 590 | |
| | | | | | | | | | | | | | | | |
Warrants | | | | | | | | | | | | | | | | |
United States | | | 8 | | | | 1 | | | | — | (b) | | | 9 | |
Short-Term Investments | | | | | | | | | | | | | | | | |
Investment Company | | | 190,261 | | | | — | | | | — | | | | 190,261 | |
Time Deposit | | | — | | | | 9,500 | | | | — | | | | 9,500 | |
| | | | | | | | | | | | | | | | |
Total Investments in Securities | | $ | 3,036,667 | | | $ | 8,612,398 | | | $ | 489,249 | | | $ | 12,138,314 | |
| | | | | | | | | | | | | | | | |
Appreciation in Other Financial Instruments | | | | | | | | | | | | | | | | |
Futures Contracts | | $ | — | | | $ | 152 | | | $ | — | | | $ | 152 | |
| | | | | | | | | | | | | | | | |
Depreciation in Other Financial Instruments | | | | | | | | | | | | | | | | |
Futures Contracts | | $ | (35,245 | ) | | $ | — | | | $ | — | | | $ | (35,245 | ) |
| | | | | | | | | | | | | | | | |
| (a) | Amount rounds to less than 500. |
Transfers between fair value levels are valued utilizing values as of the beginning of the period.
For Global Allocation Fund, transfers from level 1 to level 2 in the amount of appoximately $9,610,000 are due to applying the fair value factors to certain securities during the period ended April 30, 2017.
For Income Builder Fund, there were no significant transfers between level 1 and level 2 during the period ended April 30, 2017.
There were no significant transfers among any other levels during the period ended April 30, 2017.
The following is a summary of investments for which significant unobservable inputs (level 3) were used in determining fair value (amounts in thousands):
| | | | | | | | | | | | | | | | | | | | | | | | | | | | | | | | | | | | |
| JPMorgan Global Allocation Fund | | Balance as of
October 31, 2016 | | | Realized
gain (loss) | | | Change in net
unrealized
appreciation
(depreciation) | | | Net
accretion
(amortization) | | | Purchases1 | | | Sales2 | | | Transfers
into Level 3 | | | Transfers
out
of Level 3 | | | Balance as of
April 30, 2017 | |
Asset-Backed Securities — United States | | $ | 30,046 | | | $ | 158 | | | $ | (36 | ) | | $ | 62 | | | $ | 3,587 | | | $ | (9,101 | ) | | $ | 9,962 | | | $ | (221 | ) | | $ | 34,457 | |
Collateralized Mortgage Obligations — United States | | | — | | | | — | | | | (19 | ) | | | 3 | | | | 687 | | | | (103 | ) | | | 578 | | | | — | | | | 1,146 | |
Common Stocks — United States | | | 42 | | | | — | | | | — | | | | — | | | | — | | | | — | | | | — | | | | (42 | ) | | | — | (a) |
Corporate Bonds — Bahamas | | | 50 | | | | (142 | ) | | | 166 | | | | — | | | | — | | | | (74 | ) | | | — | | | | — | | | | — | (a) |
Corporate Bonds — United States | | | 278 | | | | — | | | | (34 | ) | | | — | | | | — | | | | — | | | | — | | | | (240 | ) | | | 4 | |
Preferred Stock — Ireland | | | 67 | | | | — | | | | — | | | | — | | | | — | | | | — | | | | — | | | | (67 | ) | | | — | (a) |
Rights — United States | | | — | | | | — | | | | 20 | | | | — | | | | — | | | | — | | | | — | | | | — | | | | 20 | |
| | | | | | | | | | | | | | | | | | | | | | | | | | | | | | | | | | | | |
Total | | $ | 30,483 | | | $ | 16 | | | $ | 97 | | | $ | 65 | | | $ | 4,274 | | | $ | (9,278 | ) | | $ | 10,540 | | | $ | (570 | ) | | $ | 35,627 | |
| | | | | | | | | | | | | | | | | | | | | | | | | | | | | | | | | | | | |
| | | | | | |
| | | |
| 104 | | | | J.P. MORGAN FUNDS | | APRIL 30, 2017 |
| | | | | | | | | | | | | | | | | | | | | | | | | | | | | | | | | | | | |
| JPMorgan Income Builder Fund | | Balance as of
October 31, 2016 | | | Realized
gain (loss) | | | Change in net
unrealized
appreciation
(depreciation) | | | Net
accretion
(amortization) | | | Purchases1 | | | Sales2 | | | Transfers
into Level 3 | | | Transfers
out
of Level 3 | | | Balance as of
April 30, 2017 | |
Asset-Backed Securities | | $ | 382,859 | | | $ | (42 | ) | | $ | (557 | ) | | $ | 891 | | | $ | 29,022 | | | $ | (70,818 | ) | | $ | 98,500 | | | $ | (7,014 | ) | | $ | 432,841 | |
Collateralized Mortgage Obligations | | | 3,134 | | | | (5 | ) | | | 12 | | | | 9 | | | | — | | | | (602 | ) | | | — | | | | — | | | | 2,548 | |
Commercial Mortgage-Backed Securities | | | 59,561 | | | | — | | | | 861 | | | | (2 | ) | | | — | | | | (8,117 | ) | | | 5,498 | | | | (5,474 | ) | | | 52,327 | |
Common Stocks — United States | | | 963 | | | | — | | | | (73 | ) | | | — | | | | — | | | | — | | | | — | | | | (890 | ) | | | — | (a) |
Convertible Bond — United States | | | 10 | | | | — | | | | (4 | ) | | | — | | | | 1 | | | | — | | | | — | | | | — | | | | 7 | |
Corporate Bonds — Bahamas | | | 969 | | | | (3,363 | ) | | | 3,825 | | | | — | | | | — | | | | (1,431 | ) | | | — | | | | — | | | | — | (a) |
Corporate Bonds — Canada | | | — | (a) | | | — | | | | — | | | | — | | | | — | | | | — | | | | — | | | | — | | | | — | (a) |
Corporate Bonds — United States | | | 30,254 | | | | (25 | ) | | | (1,178 | ) | | | 10 | | | | — | | | | (5 | ) | | | — | | | | (28,109 | ) | | | 947 | |
Foreign Government Security | | | 558 | | | | (246 | ) | | | 193 | | | | — | | | | — | | | | (505 | ) | | | — | | | | — | | | | — | (a) |
Loan Assignment — United States | | | — | (b) | | | — | | | | — | | | | — | | | | — | | | | — | | | | — | | | | — | | | | — | (b) |
Preferred Stocks — Bermuda | | | 2,655 | | | | — | | | | — | | | | — | | | | — | | | | — | | | | — | | | | (2,655 | ) | | | — | (a) |
Preferred Stocks — United States | | | — | (a) | | | (12 | ) | | | 12 | | | | — | | | | — | | | | — | | | | — | | | | — | | | | — | (a) |
Right — United States | | | — | | | | — | | | | 579 | | | | — | | | | — | | | | — | | | | — | | | | — | | | | 579 | |
Warrants — United States | | | — | (a) | | | — | | | | — | | | | — | | | | — | | | | — | | | | — | | | | — | | | | — | (a) |
| | | | | | | | | | | | | | | | | | | | | | | | | | | | | | | | | | | | |
Total | | $ | 480,963 | | | $ | (3,693 | ) | | $ | 3,670 | | | $ | 908 | | | $ | 29,023 | | | $ | (81,478 | ) | | $ | 103,998 | | | $ | (44,142 | ) | | $ | 489,249 | |
| | | | | | | | | | | | | | | | | | | | | | | | | | | | | | | | | | | | |
| (1) | Purchases include all purchases of securities and securities received in corporate actions. |
| (2) | Sales include all sales of securities, maturities, paydowns and securities tendered in corporate actions. |
| (b) | Amount rounds to less than 500. |
The changes in net unrealized appreciation (depreciation) attributable to securities owned at April 30, 2017, which were valued using significant unobservable inputs (level 3) were as follows (amounts in thousands):
| | | | |
| | | Value | |
Global Allocation Fund | | $ | 22 | |
Income Builder Fund | | | (206 | ) |
These amounts are included in Change in net unrealized appreciation/depreciation of investments in non-affiliates on the Statements of Operations.
JPM Global Allocation
Quantitative Information about Level 3 Fair Value Measurements #
(Amounts in thousands)
| | | | | | | | | | | | |
| | | Fair Value at
April 30, 2017 | | | Valuation Technique(s) | | Unobservable Input | | Range (Weighted Average) | |
| | $ | 34,457 | | | Discounted Cash Flow | | Constant Prepayment Rate | | | 0.00% - 11.00% (4.72%) | |
| | | | | | | | Constant Default Rate | | | 0.00% - 25.00% (5.72%) | |
| | | | | | | | Yield (Discount Rate of Cash Flows) | | | 3.30% - 7.86% (4.68%) | |
| | | | | | | | | | | | |
| Asset-Backed Securities | | | 34,457 | | | | | | | | | |
| | | | | | | | | | | | |
| | | 1,146 | | | Discounted Cash Flow | | Constant Prepayment Rate | | | 5.77% -13.38% (10.07%) | |
| | | | | | | | Constant Default Rate | | | 3.00% - 4.13% (3.64%) | |
| | | | | | | | Yield (Discount Rate of Cash Flows) | | | 5.12% - 6.66% (5.99%) | |
| | | | | | | | | | | | |
| Collateralized Mortgage Backed Securities | | | 1,146 | | | | | | | | | |
| | | | | | | | | | | | |
| Corporate Bonds | | | — | (a) | | Pending Distribution | | Discount for Potential Outcome(b) | | | 100.00% (100.00%) | |
| | | | | | | | | | | | |
| Rights | | | — | (a) | | Pending Distribution | | Discount for Potential Outcome(b) | | | 100.00% (100.00%) | |
| | | | | | | | | | | | |
| Total | | $ | 35,602 | | | | | | | | | |
| | | | | | | | | | | | |
| # | The table above does not include level 3 investments that are valued by brokers and pricing services. At April 30, 2017, the value of these investments was approximately $25,000. The inputs for these investments are not readily available or cannot be reasonably estimated and are generally those inputs described in Note 2.A. |
| (b) | Represents amounts used when the reporting entity has determined that market participants would take into account discounts, as applicable, when pricing the investments. |
| | | | | | | | |
| | | |
| APRIL 30, 2017 | | J.P. MORGAN FUNDS | | | | | 105 | |
NOTES TO FINANCIAL STATEMENTS
AS OF APRIL 30, 2017 (Unaudited) (continued)
Income Builder Fund
Quantitative Information about Level 3 Fair Value Measurements #
(Amounts in thousands)
| | | | | | | | | | | | |
| | | Fair Value at
April 30, 2017 | | | Valuation Technique(s) | | Unobservable Input | | Range (Weighted Average) | |
| | $ | 7 | | | Comparable Transaction | | Transaction Price | | | $10.00 ($10.00) | |
| | | | | | | | | | | | |
| Convertible Bond | | | 7 | | | | | | | | | |
| | | | | | | | | | | | |
| | | 648 | | | Discounted Cash Flow | | Yield (Discount Rate of Cash Flows) | | | 0.00% (0.00%) | |
| | | 185 | | | Pending Distribution | | Expected Recovery | | | 0.49% of par | |
| | | | | | | | Discount for Potential Outcome (a) | | | 100% (100%) | |
| | | | | | | | | | | | |
| Corporate Bond | | | 833 | | | | | | | | | |
| | | | | | | | | | | | |
| | | 432,841 | | | Discounted Cash Flow | | Constant Prepayment Rate | | | 0.00% - 40.00% (5.58%) | |
| | | | | | | | Constant Default Rate | | | 0.00% - 38.00% (5.84%) | |
| | | | | | | | Yield (Discount Rate of Cash Flows) | | | 2.29% - 12.07% (4.23%) | |
| | | | | | | | | | | | |
| Asset-Backed Securities | | | 432,841 | | | | | | | | | |
| | | | | | | | | | | | |
| | | 2,548 | | | Discounted Cash Flow | | Constant Prepayment Rate | | | 4.00% - 21.26% (12.28%) | |
| | | | | | | | Constant Default Rate | | | 0.00% - 7.82% (2.14%) | |
| | | | | | | | Yield (Discount Rate of Cash Flows) | | | 2.96% - 10.41% (5.95%) | |
| | | | | | | | | | | | |
| Collateralized Mortgage Obligations | | | 2,548 | | | | | | | | | |
| | | | | | | | | | | | |
| | | 52,327 | | | Discounted Cash Flow | | Yield (Discount Rate of Cash Flows) | | | (49.75)% - 199.00% (40.25%) | |
| | | | | | | | | | | | |
| Commercial Mortgage-Backed Securities | | | 52,327 | | | | | | | | | |
| | | | | | | | | | | | |
| Loan Assignments | | | — | (b) | | Pending Distribution | | Projected Losses | | | 100% (100%) | |
| | | | | | | | | | | | |
| Warrants | | | — | (b) | | Intrinsic Value | | Issue Price vs. Stock Price | | | (N/A) | |
| | | | | | | | | | | | |
| Total | | $ | 488,556 | | | | | | | | | |
| | | | | | | | | | | | |
| # | The table above does not include level 3 investments that are valued by brokers and pricing services. At April 30, 2017, the value of these investments was approximately $693,000. The inputs for these investments are not readily available or cannot be reasonably estimated and are generally those inputs described in Note 2.A. |
| (a) | Represents amounts used when the reporting entity has determined that market participants would take into account discounts, as applicable, when pricing the investments. |
The significant unobservable inputs used in the fair value measurement of the Funds’ investments are listed above. Generally, a change in the assumptions used in any input in isolation may be accompanied by a change in another input. Significant changes in any of the unobservable inputs may significantly impact the fair value measurement. The impact is based on the relationship between each unobservable input and the fair value measurement. Significant increases (decreases) in the yield and default rate may decrease (increase) the fair value measurement. A significant change in the prepayment rate (Constant Prepayment Rate or PSA Prepayment Model) may decrease or increase the fair value measurement.
B. Restricted Securities — Certain securities held by the Funds may be subject to legal or contractual restrictions on resale. Restricted securities generally are resold in transactions exempt from registration under the Securities Act of 1933 (the “Securities Act”). Disposal of these securities may involve time-consuming negotiations and expense. Prompt sale at the current valuation may be difficult and could adversely affect the net asset value of the Funds.
As of April 30, 2017, the Funds had no investments in restricted securities other than securities sold to the Funds under Rule 144A and/or Regulation S under the Securities Act.
| | | | | | |
| | | |
| 106 | | | | J.P. MORGAN FUNDS | | APRIL 30, 2017 |
C. Investment Transactions with Affiliates — The Funds invest in certain Underlying Funds which are advised by JPMIM or their affiliates. An issuer which is under common control with the Funds may be considered an affiliate. For the purposes of the financial statements, the Funds assume the issuers listed below to be affiliated issuers. Underlying Funds’ distributions may be reinvested into the Underlying Funds. Reinvestment amounts are included in the purchase cost amounts in the table below. Included in the purchases and sales amounts in the table below are exchanges between certain share classes of the Underlying Funds. Such exchanges are not treated as purchases and sales for the purpose of recognizing realized gains (losses) or portfolio turnover. Included in the Realized Gain (Loss) amounts in the table below are distributions of realized capital gains, if any, received from the affiliated Underlying Funds (amounts in thousands):
| | | | | | | | | | | | | | | | | | | | | | | | | | | | |
| | | | | | For the six months ended April 30, 2017 | | | | | | | |
| Affiliate | | Value at
October 31,
2016 | | | Purchase
Cost | | | Sales
Proceeds | | | Realized
Gain/(Loss) | | | Dividend
Income | | | Shares at
April 30,
2017 | | | Value at
April 30,
2017 | |
JPMorgan Global Allocation Fund | | | | | | | | | | | | | | | | | | | | | | | | | | | | |
JPMorgan Emerging Markets Debt Fund, Class R6 Shares | | $ | 85,580 | | | $ | 2,940 | | | $ | 40,300 | | | $ | (2,147 | ) | | $ | 1,514 | | | | 5,593 | | | $ | 46,198 | |
JPMorgan U.S. Government Money Market Fund, Institutional Class Shares | | | 58,351 | | | | 516,798 | | | | 378,579 | | | | — | | | | 255 | | | | 196,570 | | | | 196,570 | |
| | | | | | | | | | | | | | | | | | | | | | | | | | | | |
| | $ | 143,931 | | | | | | | | | | | $ | (2,147 | ) | | $ | 1,769 | | | | | | | $ | 242,768 | |
| | | | | | | | | | | | | | | | | | | | | | | | | | | | |
| | | | |
| | | | | | For the six months ended April 30, 2017 | | | | | | | |
| Affiliate | | Value at
October 31,
2016 | | | Purchase
Cost | | | Sales
Proceeds | | | Realized
Gain/(Loss) | | | Dividend
Income | | | Shares at
April 30,
2017 | | | Value at
April 30,
2017 | |
JPMorgan Income Builder Fund | | | | | | | | | | | | | | | | | | | | | | | | | | | | |
JPMorgan U.S. Government Money Market Fund, Institutional Class Shares | | $ | 267,810 | | | $ | 1,306,504 | | | $ | 1,384,054 | | | $ | — | | | $ | 402 | | | | 190,261 | | | $ | 190,261 | |
| | | | | | | | | | | | | | | | | | | | | | | | | | | | |
D. Loan Assignments — The Funds invested in debt instruments that are interests in amounts owed to lenders or lending syndicates (a “Lender”) by corporate, governmental, or other borrowers (a “Borrower”). A loan is often administered by a bank or other financial institution (the “Agent”) that acts as Agent for all holders. The Agent administers the terms of the loan, as specified in the loan agreement. The Funds invest in loan assignments of all or a portion of the loans. When a fund purchases a loan assignment, the fund has direct rights against the Borrower on a loan, provided, however, the fund’s rights may be more limited than the Lender from which they acquired the assignment and the fund may be able to enforce its rights only through the Agent. As a result, the fund assumes the credit risk of the Borrower as well as any other persons interpositioned between the fund and the Borrower (“Intermediate Participants”). A fund may incur certain costs and delays in realizing payment on a loan assignment or suffer a loss of principal and/or interest if assets or interests held by the Agent or other Intermediate Participants are determined to be subject to the claims of the Agent’s or other Intermediate Participant’s creditors. In addition, it is unclear whether loan assignments and other forms of direct indebtedness offer securities law protections against fraud and misrepresentation. Also, because JPMIM may wish to invest in publicly traded securities of a Borrower, it may not have access to material non-public information regarding the Borrower to which other investors have access. Although certain loan assignments are secured by collateral, a fund could experience delays or limitations in realizing the value on such collateral or have their interest subordinated to other indebtedness of the Borrower. Loan assignments are vulnerable to market conditions such that economic conditions or other events may reduce the demand for assignments and certain assignments which were liquid, when purchased, may become illiquid and they may be difficult to value. In addition, the settlement period for loans is uncertain as there is no standardized settlement schedule applicable to such investments. Therefore, a fund may not receive the proceeds from a sale of such investments for a period after the sale.
Certain loan assignments are also subject to the risks associated with high yield securities described under Note 7.
E. Derivatives — The Funds used derivative instruments including futures, forward foreign currency exchange contracts options and swaps in connection with their investment strategy. Derivative instruments may be used as substitutes for securities in which the Funds can invest, to hedge portfolio investments or to generate income or gain to the Funds. Derivatives may also be used to manage duration, sector and yield curve exposures and credit and spread volatility.
The Funds may be subject to various risks from the use of derivatives including the risk that changes in the value of a derivative may not correlate perfectly with the underlying asset, rate or index; counterparty credit risk related to derivatives counterparties’ failure to perform under contract terms; liquidity risk related to the lack of a liquid market for these contracts allowing the Funds to close out their position(s); and, documentation risk relating to disagreement over contract terms. Investing in certain derivatives also results in a form of leverage and as such, the Funds’ risk of loss associated with these instruments may exceed their value, as recorded on the Statements of Assets and Liabilities.
The Funds are party to various derivative contracts governed by International Swaps and Derivatives Association master agreements (“ISDA agreements”). The Funds’ ISDA agreements, which are separately negotiated with each dealer counterparty, may contain provisions allowing, absent other considerations, a counterparty to exercise rights, to the extent not otherwise waived, against the Funds in the event the Funds’ net assets
| | | | | | | | |
| | | |
| APRIL 30, 2017 | | J.P. MORGAN FUNDS | | | | | 107 | |
NOTES TO FINANCIAL STATEMENTS
AS OF APRIL 30, 2017 (Unaudited) (continued)
decline over time by a pre-determined percentage or fall below a pre-determined floor. The ISDA agreements may also contain provisions allowing, absent other conditions, the Funds to exercise rights, to the extent not otherwise waived, against the counterparties (i.e., decline in a counterparty’s credit rating below a specified level). Such rights for both the counterparty and the Funds often include the ability to terminate (i.e., close out) open contracts at prices which may favor the counterparty, which could have an adverse effect on the Funds. The ISDA agreements give the Funds and counterparty the right, upon an event of default, to close out all transactions traded under such agreement and to net amounts owed or due across all transactions and offset such net payable or receivable with collateral posted to a segregated account by one party to the other.
Counterparty credit risk may be mitigated to the extent a counterparty posts collateral for mark to market gains to the Funds.
Notes E(1) — E(4) below describe the various derivatives used by the Funds.
(1). Options — Global Allocation Fund purchased put and call options on various instruments including futures, securities, currencies and interest rate swaps (“swaptions”) to manage and hedge interest rate risks within its portfolio and also to gain long or short exposure to the underlying instrument, index, currency or rate. A purchaser of a put option has the right, but not the obligation, to sell the underlying instrument at an agreed upon price (“strike price”) to the option seller. A purchaser of a call option has the right, but not the obligation, to purchase the underlying instrument at the strike price from the option seller. Swaptions and Eurodollar options are settled for cash.
Options Purchased — Premiums paid by the Fund for options purchased are included on the Statements of Assets and Liabilities as an investment. The option is adjusted daily to reflect the current market value of the option and the change is recorded as Change in net unrealized appreciation/depreciation of investments in non-affiliates on the Statements of Operations. If the option is allowed to expire, the Fund will lose the entire premium it paid and record a realized loss for the premium amount. Premiums paid for options purchased which are exercised or closed are added to the amounts paid or offset against the proceeds on the underlying investment transaction to determine the realized gain (loss) or cost basis of the underlying investment.
The Fund’s exchange traded option contracts are not subject to master netting arrangements (the right to close out all transactions traded with a counterparty and net amounts owed or due across transactions). The Fund’s over the counter (“OTC”) options are subject to master netting agreements. The Fund may be required to post or receive collateral for over the counter options.
(2). Futures Contracts — The Funds used index, treasury or other financial futures contracts to manage and hedge interest rate risk associated with portfolio investments and to gain or reduce exposure to particular countries or regions. The Funds also used futures contracts to lengthen or shorten the duration of the overall investment portfolio.
Futures contracts provide for the delayed delivery of the underlying instrument at a fixed price or are settled for a cash amount based on the change in the value of the underlying instrument at a specific date in the future. Upon entering into a futures contract, the Funds are required to deposit with the broker, cash or securities in an amount equal to a certain percentage of the contract amount, which is referred to as the initial margin deposit. Subsequent payments, referred to as variation margin, are made or received by the Funds periodically and are based on changes in the market value of open futures contracts. Changes in the market value of open futures contracts are recorded as Change in net unrealized appreciation/depreciation on the Statements of Operations. Realized gains or losses, representing the difference between the value of the contract at the time it was opened and the value at the time it was closed, are reported on the Statements of Operations at the closing or expiration of the futures contract. Securities deposited as initial margin are designated on the SOIs and cash deposited is recorded on the Statements of Assets and Liabilities. A receivable from and/or a payable to brokers for the daily variation margin is also recorded on the Statements of Assets and Liabilities.
The Funds may be subject to the risk that the change in the value of the futures contract may not correlate perfectly with the underlying instrument. Use of long futures contracts subjects the Funds to risk of loss in excess of the amounts shown on the Statements of Assets and Liabilities, up to the notional amount of the futures contracts. Use of short futures contracts subjects the Funds to unlimited risk of loss. The Funds may enter into futures contracts only on exchanges or boards of trade. The exchange or board of trade acts as the counterparty to each futures transaction; therefore, the Funds’ credit risk is limited to failure of the exchange or board of trade. Under some circumstances, futures exchanges may establish daily limits on the amount that the price of a futures contract can vary from the previous day’s settlement price, which could effectively prevent liquidation of positions.
The Funds’ futures contracts are not subject to master netting arrangements (the right to close out all transactions traded with a counterparty and net amounts owed or due across transactions).
(3). Forward Foreign Currency Exchange Contracts —The Funds may be exposed to foreign currency risks associated with some or all of their portfolio investments and use forward foreign currency exchange contracts to hedge or manage certain of these exposures as part of an investment strategy. The Funds also bought forward foreign currency exchange contracts to gain exposure to currencies. Forward foreign currency exchange contracts represent obligations to purchase or sell foreign currency on a specified future date at a price fixed at the time the contracts are entered into. Non-deliverable forward foreign currency exchange contracts are settled with the counterparty in U.S. dollars without the delivery of foreign currency.
The value of the forward foreign currency exchange contracts are adjusted daily based on the applicable exchange rate of the underlying currency. Changes in the value of these contracts are recorded as unrealized appreciation or depreciation until the contract settlement date. When the forward foreign currency exchange contract is closed, the Funds record a realized gain or loss equal to the difference between the value at the time the contract was opened and the value at the time it was closed. The Funds also record a realized gain or loss when a forward foreign currency exchange contract offsets another forward foreign currency exchange contract with the same counterparty upon settlement.
| | | | | | |
| | | |
| 108 | | | | J.P. MORGAN FUNDS | | APRIL 30, 2017 |
The Funds’ forward foreign currency exchange contracts are subject to master netting arrangements (the right to close out all transactions with a counterparty and net amounts owed or due across transactions). The Fund may be required to post or receive collateral for Non-deliverable forward foreign currency exchange contracts.
(4). Swaps — Global Allocation Fund engaged in swap transactions, total return basket swap, to manage total return risks within its portfolio. The Fund also used swap as alternatives to direct investments. Swap transactions are negotiated contracts over the counter (“OTC swaps”) between the Fund and a counterparty or centrally cleared (“centrally cleared swaps”) with a central clearinghouse through a Futures Commission Merchant (“FCM”), to exchange investment cash flows, assets, foreign currencies or market-linked returns at specified, future intervals.
Upfront payments made and/or received by the Fund are recorded as assets or liabilities, respectively on the Statements of Assets and Liabilities and amortized over the term of the swap. The value of an OTC swap agreement is recorded as either an asset or a liability on the Statements of Assets and Liabilities at the beginning of the measurement period. Upon entering into a centrally cleared swap, the Fund is required to deposit with the FCM cash or securities, which is referred to as initial margin deposit. Securities deposited as initial margin are designated on the SOIs and cash deposited is recorded on the Statements of Assets and Liabilities. Daily changes in valuation of centrally cleared swaps, if any, are recorded as a variation margin receivable or payable on the Statements of Assets and Liabilities. The change in the value of swaps, including accruals of periodic amounts of interest to be paid or received on swaps, is reported as Change in net unrealized appreciation/ depreciation on the Statements of Operations. A realized gain or loss is recorded upon payment or receipt of a periodic payment or payment made upon termination of a swap agreement.
The Fund may be required to post or receive collateral for over the counter swaps.
The Fund’s swap contracts are subject to master netting arrangements.
Total Return Basket Swaps
Global Allocation Fund entered into a total return basket swap agreement to obtain exposure to a portfolio of long and short securities. This is a highly specialized activity.
Under the terms of the agreements, the swap is designed to function as a portfolio of direct investments in long and short equity positions. This means that the Fund has the ability to trade in and out of long and short positions within the swap and will receive all of the economic benefits and risks equivalent to direct investments in these positions such as: capital appreciation (depreciation), corporate actions and dividends received and paid, all of which are reflected in the swap value. The swap value also includes interest charges and credits related to the notional values of the long and short positions and cash balances within the swap. These interest charges and credits are based on defined market rates plus or minus a specified spread and are referred to herein as “financing costs” and net dividends. Positions within the swap, accrued financing costs and net dividends, are part of the periodic reset. During a reset, any unrealized gains (losses) on positions and accrued financing costs become available for cash settlement between the Fund and the swap counterparty are recorded as Due from/to counterparty on swap contract on the Statements of Assets and Liabilities and as net realized gain (loss) on transactions from swap on the Statements of Operations.
Swap involves additional risks than if the Fund had invested in the underlying positions directly including: the risk that changes in the value of the swap may not correlate perfectly with the underlying long and short securities; counterparty risk related to the counterparty’s failure to perform under contract terms; liquidity risk related to the lack of a liquid market for the swap contract, which may limit the ability of the Fund to close out its positions; and, documentation risk relating to disagreement over contract terms. The total return basket swaps consist of securities that are denominated in foreign currencies. Changes in currency exchange rates will affect the value of, and investment income from, such securities. The Fund’s activities in the total return basket swap are concentrated with one counterparty. Investing in swaps results in a form of leverage (i.e., the Fund’s risk of loss associated with these instruments may exceed their value as recorded on the Statements of Assets and Liabilities).
The value of the swap is derived from a combination of (i) the net value of the underlying positions, which are valued daily using the last sale or closing prices on the principal exchange on which the underlying securities are traded; (ii) financing costs; (iii) the value of dividends; (iv) cash balances within the swap and/or other receivables (payables) from gains/(losses) realized when the swap resets; and (v) other factors, as applicable. The value of the swap is reflected on the Statements of Assets and Liabilities as Outstanding swap contracts, at value. Changes in the value of the swap are recognized as Change in net unrealized appreciation/depreciation of swaps on the Statements of Operations.
The total return basket swap contracts are subject to master netting arrangements. The fund may be required to post or receive collateral for total return basket swaps.
| | | | | | | | |
| | | |
| APRIL 30, 2017 | | J.P. MORGAN FUNDS | | | | | 109 | |
NOTES TO FINANCIAL STATEMENTS
AS OF APRIL 30, 2017 (Unaudited) (continued)
(5). Summary of Derivatives Information — The following table presents the value of derivatives held as of April 30, 2017, by their primary underlying risk exposure and respective location on the Statements of Assets and Liabilities (amounts in thousands):
Global Allocation Fund
| | | | | | | | | | | | | | | | | | | | | | |
| Derivative Contract | | Statements of Assets and Liabilities | | | | | | | |
| Gross Assets: | | | | Swaps | | | Options (a) | | | Futures Contracts (b) | | | Forward Foreign
Currency Exchange
Contracts | | | Total | |
Equity contracts | | Receivables, Net Assets —Unrealized Appreciation | | $ | — | | | $ | 6,190 | | | $ | 3,476 | | | $ | — | | | $ | 9,666 | |
Foreign exchange contracts | | Receivables | | | — | | | | — | | | | 333 | | | | 1,022 | | | | 1,355 | |
| | | | | | | | | | | | | | | | | | | | | | |
Total | | | | $ | — | | | $ | 6,190 | | | $ | 3,809 | | | $ | 1,022 | | | $ | 11,021 | |
| | | | | | | | | | | | | | | | | | | | | | |
| | | | | | |
Gross Liabilities: | | | | | | | | | | | | | | | | | |
Equity contracts | | Payables, Net Assets — Unrealized Depreciation | | $ | — | (c) | | $ | — | | | $ | (243 | ) | | $ | — | | | $ | (243 | ) |
Interest rate contracts | | Payables, Net Assets — Unrealized Depreciation | | | — | | | | — | | | | (172 | ) | | | — | | | | (172 | ) |
Foreign exchange contracts | | Payables | | | — | | | | — | | | | — | | | | (623 | ) | | | (623 | ) |
| | | | | | | | | | | | | | | | | | | | | | |
Total | | | | $ | — | (c) | | $ | — | | | $ | (415 | ) | | $ | (623 | ) | | $ | (1,038 | ) |
| | | | | | | | | | | | | | | | | | | | | | |
| (a) | The market value of options purchased is reported as an investment in non-affiliates, at value on the Statements of Assets and Liabilities. |
| (b) | This amount represents the cumulative appreciation (depreciation) of futures contracts as reported on the SOIs. The Statements of Assets and Liabilities only reflect the current day variation margin receivable/payable from/to brokers. |
| (c) | Amount rounds to less than 500. |
Income Builder Fund
| | | | | | |
| Derivative Contract | | Statements of Assets and Liabilities | | | |
| Gross Assets: | | | | Futures Contracts (a) | |
Equity contracts | | Receivables, Net Assets — Unrealized Appreciation | | $ | 152 | |
| | | | | | |
| | |
Gross Liabilities: | | | | | |
Interest rate contracts | | Payables, Net Assets — Unrealized Depreciation | | $ | (8,528 | ) |
Foreign exchange contracts | | | | | (26,717 | ) |
| | | | | | |
| | | | $ | (35,245 | ) |
| | | | | | |
| (a) | This amount represents the cumulative appreciation (depreciation) of futures contracts as reported on the SOIs. The Statements of Assets and Liabilities only reflect the current day variation margin receivable/payable from/to brokers. |
The following tables present the effect of derivatives on the Statements of Operations for the six months ended April 30, 2017, by primary underlying risk exposure (amounts in thousands):
Global Allocation Fund
| | | | | | | | | | | | | | | | | | | | |
| Amount of Realized Gain (Loss) on Derivatives Recognized on the Statements of Operations | | | | |
| Derviative Contracts | | | | | Options | | | Futures Contracts | | | Forward Foreign
Currency Exchange
Contracts | | | Total | |
Equity contracts | | | | | | $ | 12,025 | | | $ | (8,549 | ) | | $ | — | | | $ | 3,476 | |
Foreign exchange contracts | | | | | | | — | | | | (1,133 | ) | | | 10,451 | | | | 9,318 | |
Interest rate contracts | | | | | | | — | | | | (1,272 | ) | | | — | | | | (1,272 | ) |
| | | | | | | | | | | | | | | | | | | | |
Total | | | | | | $ | 12,025 | | | $ | (10,954 | ) | | $ | 10,451 | | | $ | 11,522 | |
| | | | | | | | | | | | | | | | | | | | |
| | | | | | |
| | | |
| 110 | | | | J.P. MORGAN FUNDS | | APRIL 30, 2017 |
| | | | | | | | | | | | | | | | | | | | |
| Amount of Change in Unrealized Appreciation (Depreciation) on Derivatives Recognized on the Statements of Operations | | | | |
| Derivative Contracts | | Swaps | | | Options | | | Futures
Contracts | | | Forward
Foreign
Currency
Exchange
Contracts | | | Total | |
Equity contracts | | $ | — | (a) | | $ | 4,121 | | | $ | 7,202 | | | $ | — | | | $ | 11,323 | |
Foreign exchange contracts | | | — | | | | — | | | | 333 | | | | (4,587 | ) | | | (4,254 | ) |
Interest rate contracts | | | — | | | | — | | | | 22 | | | | — | | | | 22 | |
| | | | | | | | | | | | | | | | | | | | |
Total | | $ | — | (a) | | $ | 4,121 | | | $ | 7,557 | | | $ | (4,587 | ) | | $ | 7,091 | |
| | | | | | | | | | | | | | | | | | | | |
| (a) | Amount rounds to less than 500. |
Income Builder Fund
| | | | | | | | | | | | |
| Amount of Realized Gain (Loss) on Derivatives Recognized on the Statements of the Operations | |
| Derivative Contracts | | Futures Contracts | | | Forward Foreign
Currency Exchange
Contracts | | | Total | |
Equity contracts | | $ | (166 | ) | | $ | — | | | $ | (166 | ) |
Foreign exchange contracts | | | 51,228 | | | | (136 | ) | | | 51,092 | |
Interest rate contracts | | | 22,442 | | | | — | | | | 22,442 | |
| | | | | | | | | | | | |
Total | | $ | 73,504 | | | $ | (136 | ) | | $ | 73,368 | |
| | | | | | | | | | | | |
| | | | |
| Amount of Change in Unrealized Appreciation (Depreciation) on Derivatives Recognized on the Statements of the Operations | |
| Derivative Contracts | | Futures Contracts | |
Equity contracts | | $ | 167 | |
Foreign exchange contracts | | | (59,593 | ) |
Interest rate contracts | | | (14,982 | ) |
| | | | |
Total | | $ | (74,408 | ) |
| | | | |
Derivatives Volume
The table below discloses the volume of the Funds’ futures contracts, forward foreign currency exchange contracts and options activity during the six months ended April 30, 2017. Please refer to the tables in the Summary of Derivatives Information for derivative-related gains and losses associated with volume activity (amounts in thousands).
| | | | | | | | |
| | | Global
Allocation
Fund | | | Income
Builder Fund | |
Futures Contracts: | | | | | | | | |
Equity | | | | | | | | |
Average Notional Balance Short | | $ | 132,849 | | | $ | 3,031 | |
Average Notional Balance Short | | | 61,194 | | | | — | |
Ending Notional Balance Long | | | 150,040 | | | | 5,197 | |
Ending Notional Balance Short | | | 11,713 | | | | — | |
Foreign Exchange | | | | | | | | |
Average Notional Balance Long | | | 47,209 | (a) | | | — | |
Average Notional Balance Short | | | 63,911 | (b) | | | 617,961 | |
Ending Notional Balance Long | | | 47,643 | | | | 633,013 | |
Interest Rate | | | | | | | | |
Average Notional Balance Long | | | 18,672 | (c) | | | — | |
Average Notional Balance Short | | | 88,097 | | | | 1,352,278 | |
Ending Notional Balance Long | | | — | | | | — | |
Ending Notional Balance Short | | | 23,160 | | | | 1,221,597 | |
| | | | | | | | |
| | | |
| APRIL 30, 2017 | | J.P. MORGAN FUNDS | | | | | 111 | |
NOTES TO FINANCIAL STATEMENTS
AS OF APRIL 30, 2017 (Unaudited) (continued)
| | | | | | | | |
| | | Global
Allocation
Fund | | | Income
Builder Fund | |
Forward Foreign Currency Exchange Contracts: | | | | | | | | |
Average Settlement Value Purchased | | $ | 28,109 | | | $ | — | |
Average Settlement Value Sold | | | 226,994 | | | | — | |
Ending Settlement Value Purchased | | | 9,909 | | | | — | |
Ending Settlement Value Sold | | | 220,133 | | | | — | |
| | |
Exchange-Traded Options: | | | | | | | | |
Average Number of Contracts Purchased | | | 22,260 | | | | — | |
Ending Number of Contracts Purchased | | | 21,156 | | | | — | |
| | |
Total Return Basket Swaps: | | | | | | | | |
Average Notional Balance Long | | | 3 | (d) | | | — | |
Ending Notional Balance Long | | | 3 | | | | — | |
| (a) | For the period March 1, 2017 through April 30, 2017. |
| (b) | For the period December 1, 2016 through January 31, 2017. |
| (c) | For the period October 1, 2016 through March 31, 2017. |
| (d) | For the period April 1, 2017 through April 30, 2017. |
The Funds may be required to post or receive collateral based on the net value of the Fund’s Non-deliverable Forward Foreign Currency Exchange Contracts and/or OTC options with the counterparty in the form of cash or securities. Daily movement of collateral is subject to minimum threshold amounts. Collateral posted by the Fund is held in a segregated account at the Fund’s custodian bank. Cash collateral posted by the Fund is reported on the Statements of Assets and Liabilities as Restricted cash. Collateral received by the Fund is held in escrow in segregated accounts maintained by JPMCB, an affiliate of the Fund.
F. Short Sales — Global Allocation Fund engaged in short sales as part of its normal investment activities. In a short sale, the Fund sells securities it does not own in anticipation of a decline in the market value of those securities. In order to deliver securities to the purchaser, the Fund borrows securities from a broker. To close out a short position, the Fund delivers the same securities to the broker.
The Fund is required to pledge cash or securities to the broker as collateral for the securities sold short. Collateral requirements are calculated daily based on the current market value of the short positions. Cash collateral deposited with the broker is recorded as an asset on the Statements of Assets and Liabilities. Securities segregated as collateral are denoted on the SOIs. The Fund may receive or pay the net of the following amounts:(i) a portion of the income from the investment of cash collateral; (ii) the broker’s fee on the borrowed securities (calculated daily based upon the market value of each borrowed security and a variable rate that is dependent on availability of the security); and (iii) a financing charge for the difference between the market value of the short position and cash collateral deposited with the broker. The net amounts of income or fees are included as interest income or interest expense on securities sold short on the Statements of Operations.
The Fund is obligated to pay the broker dividends declared on short positions when a position is open on the record date. Dividends on short positions are reported on ex-dividend date on the Statements of Operations as dividend expense on securities sold short.
Liabilities for securities sold short are reported at market value on the Statements of Assets and Liabilities and the change in market value is recorded as Change in net unrealized appreciation/depreciation on the Statements of Operations. Short sale transactions may result in unlimited losses as the security’s price increases and the short position loses value. There is no upward limit on the price a borrowed security could attain. The Fund is also subject to risk of loss if the broker were to fail to perform its obligations under the contractual terms. The Fund will record a realized loss if the price of the borrowed security increases between the date of the short sale and the date on which the Fund replaces the borrowed security. The Fund will record a realized gain if the price of the borrowed security declines between those dates. As of April 30, 2017, the Fund had outstanding short sales as listed on the SOI.
G. Foreign Currency Translation — The books and records of the Funds are maintained in U.S. dollars. Foreign currency amounts are translated into U.S. dollars at the prevailing exchange rates of such currencies against the U.S. dollar. The market value of investment securities and other assets and liabilities are translated at the exchange rate as of the valuation date. Purchases and sales of investment securities, income and expenses are translated at the exchange rate prevailing on the respective dates of such transactions.
The Funds do not isolate the effect of changes in foreign exchange rates from changes in market prices on securities held. Accordingly, such changes are included within Change in net unrealized appreciation/depreciation on investments on the Statements of Operations.
Reported realized foreign currency gains and losses arise from the disposition of foreign currency, currency gains or losses realized between the trade and settlement dates on securities transactions, and the difference between the amounts of dividends, interest and foreign withholding taxes recorded on each Fund’s books on the transaction date and the U.S. dollar equivalent of the amounts actually received or paid. These reported realized foreign currency gains and losses are included in Net realized gain (loss) on foreign currency transactions on the Statements of Operations.
| | | | | | |
| | | |
| 112 | | | | J.P. MORGAN FUNDS | | APRIL 30, 2017 |
Unrealized foreign currency gains and losses arise from changes (due to changes in exchange rates) in the value of foreign currency and other assets and liabilities denominated in foreign currencies, which are held at period end and are included in Change in net unrealized appreciation/depreciation on foreign currency translations on the Statements of Operations.
H. Security Transactions and Investment Income — Investment transactions are accounted for on the trade date (the date the order to buy or sell is executed). Securities gains and losses are calculated on a specifically identified cost basis. Interest income is determined on the basis of coupon interest accrued using the effective interest method which adjusts for amortization of premiums and accretion of discounts. Dividend income net of foreign taxes withheld, if any, is recorded on the ex-dividend date or when a fund first learns of the dividend. Certain Funds may receive other income from investment in loan assignments and/or unfunded commitments, including amendment fees, consent fees and commitment fees. These fees are recorded as income when received by the Fund. These amounts are included in Interest Income in the Statements of Operations.
I. Allocation of Income and Expenses — Expenses directly attributable to a fund are charged directly to that fund, while the expenses attributable to more than one fund of the Trust are allocated among the respective funds. In calculating the NAV of each class, investment income, realized and unrealized gains and losses and expenses, other than class specific expenses, are allocated daily to each class of shares based upon the proportion of net assets of each class at the beginning of each day.
Transfer agency fees are class-specific expenses and sub-transfer agency fees were class specific expenses up through April 2, 2017. Effective April 3, 2017, the Funds ceased making direct payments to financial intermediaries for any applicable sub-transfer agency services. Payments to financial intermediaries for sub-transfer agency services are made by JPMorgan Distribution Services, Inc. from the Shareholder Servicing Fee, which has been renamed as the Service Fee.
The amount of the transfer agency fees and sub-transfer agency fees charged to each class of the Funds for the six months ended April 30, 2017 are as follows (amounts in thousands):
| | | | | | | | | | | | | | | | | | | | |
| | | Class A | | | Class C | | | Class I | | | Class R2 | | | Total | |
Global Allocation Fund | | | | | | | | | | | | | | | | | | | | |
Transfer agency fees | | $ | 8 | | | $ | 10 | | | $ | 11 | | | $ | — | (a) | | $ | 29 | |
Sub-transfer agency fees | | | 78 | | | | 97 | | | | 138 | | | | — | (a) | | | 313 | |
Income Builder Fund | | | | | | | | | | | | | | | | | | | | |
Transfer agency fees | | | 67 | | | | 87 | | | | 31 | | | | n/a | | | | 185 | |
Sub-transfer agency fees | | | 689 | | | | 1,151 | | | | 779 | | | | n/a | | | | 2,619 | |
| (a) | Amount rounds to less than 500. |
J. Federal Income Taxes — Each Fund is treated as a separate taxable entity for Federal income tax purposes. Each Fund’s policy is to comply with the provisions of the Internal Revenue Code of 1986, as amended (the “Code”), applicable to regulated investment companies and to distribute to shareholders all of its distributable net investment income and net realized capital gains on investments. Accordingly, no provision for Federal income tax is necessary. Management has reviewed the Funds’ tax positions for all open tax years and has determined that as of April 30, 2017, no liability for income tax is required in the Funds’ financial statements for net unrecognized tax benefits. However, management’s conclusions may be subject to future review based on changes in, or the interpretation of, the accounting standards or tax laws and regulations. Each of the Funds’ Federal tax returns for the prior three fiscal years remains subject to examination by the Internal Revenue Service.
K. Foreign Taxes — The Funds may be subject to foreign taxes on income, gains on investments or currency purchases/repatriation, a portion of which may be recoverable. The Funds will accrue such taxes and recoveries as applicable, based upon its current interpretation of tax rules and regulations that exist in the markets in which it invests. Income Builder Fund is subject to a tax imposed on short-term capital gains on securities of issuers domiciled in India. The Fund records an estimated deferred tax liability for these securities that have been held for less than one year at the end of the reporting period, assuming those positions were disposed of at the end of the period. This amount, if any, is reported as Deferred India capital gains tax on the accompanying Statements of Assets and Liabilities. Short-term realized capital losses on the sale of securities of issuers domiciled in India can be carried forward for eight years to offset potential future short-term realized capital gains.
India has recently enacted rules imposing a tax on the indirect transfers of Indian shares. Based upon current guidance from Indian tax authorities, management does not believe that such tax will be applicable to the Funds. However, management’s conclusion, regarding this and other foreign tax matters, may be subject to future review based on changes in, or the interpretation of, the accounting standards and the tax laws and regulations.
L. Distributions to Shareholders — Distributions from net investment income are generally declared and paid monthly and are declared separately for each class. No class has preferential dividend rights; differences in per share rates are due to differences in separate class expenses. Net realized capital gains, if any, are distributed by each Fund at least annually. The amount of distributions from net investment income and net realized capital gains is determined in accordance with Federal income tax regulations, which may differ from GAAP. To the extent these “book/tax” differences are permanent in nature (i.e., that they result from other than timing of recognition — “temporary differences”), such amounts are reclassified within the capital accounts based on their Federal tax-basis treatment.
The reclassifications for the Funds relate primarily to foreign currency gains or losses and investments in passive foreign investment companies (“PFICs”).
| | | | | | | | |
| | | |
| APRIL 30, 2017 | | J.P. MORGAN FUNDS | | | | | 113 | |
NOTES TO FINANCIAL STATEMENTS
AS OF APRIL 30, 2017 (Unaudited) (continued)
3. Fees and Other Transactions with Affiliates
A. Investment Advisory Fee — Pursuant to an Investment Advisory Agreement, the Adviser supervises the investments of each Fund and for such services is paid a fee. The fee is accrued daily and paid monthly based on each Fund’s respective average daily net assets. The annual rate for each Fund is as follows:
| | | | |
Global Allocation Fund | | | 0.60 | % |
Income Builder Fund | | | 0.45 | |
The Adviser waived Investment Advisory fees and/or reimbursed expenses as outlined in Note 3.F.
B. Administration Fee —Pursuant to an Administration Agreement, the Administrator provides certain administration services to the Funds. In consideration of these services, the Administrator receives a fee accrued daily and paid monthly at an annual rate of 0.15% of the first $25 billion of the average daily net assets of all funds in the J.P. Morgan Funds Complex covered by the Administration Agreement (excluding certain funds of funds and money market funds) and 0.075% of the average daily net assets in excess of $25 billion of all such funds. For the six months ended April 30, 2017, the effective annualized rate was 0.08% of each Fund’s average daily net assets, notwithstanding any fee waivers and/or expense reimbursements.
The Administrator waived Administration fees as outlined in Note 3.F.
JPMorgan Chase Bank, N.A. (“JPMCB”), a wholly-owned subsidiary of JPMorgan, serves as the Funds’ sub-administrator (the “Sub-administrator”). For its services as Sub-administrator, JPMCB receives a portion of the fees payable to the Administrator.
C. Distribution Fees — Pursuant to a Distribution Agreement, JPMorgan Distribution Services, Inc. (“JPMDS”), a wholly-owned subsidiary of JPMorgan, serves as the Trust’s principal underwriter and promotes and arranges for the sale of each Fund’s shares.
The Board has adopted a Distribution Plan (the “Distribution Plan”) for Class A and Class C Shares of the Funds in accordance with Rule 12b-1 under the 1940 Act. The Class I Shares do not charge a distribution fee. The Distribution Plan provides that each Fund shall pay distribution fees, including payments to the JPMDS, at annual rates of the average daily net assets as shown in the table below:
| | | | | | | | | | | | |
| | | Class A | | | Class C | | | Class R2 | |
Global Allocation Fund | | | 0.25 | % | | | 0.75 | % | | | 0.50 | % |
Income Builder Fund | | | 0.25 | | | | 0.75 | | | | n/a | |
In addition, the JPMDS is entitled to receive the front-end sales charges from purchases of Class A Shares and the CDSC from redemptions of Class C Shares and certain Class A Shares for which front-end sales charges have been waived. For the six months ended April 30, 2017, the JPMDS retained the following (amounts in thousands):
| | | | | | | | |
| | | Front-End Sales Charge | | | CDSC | |
Global Allocation Fund | | $ | 50 | | | $ | 1 | |
Income Builder Fund | | | 447 | | | | 6 | |
D. Service Fees — The Trust, on behalf of the Funds, has entered into a Shareholder Servicing Agreement with the JPMDS under which the JPMDS provides certain support services to the shareholders. For performing these services, the JPMDS receives a fee that is accrued daily and paid monthly equal to a percentage of the average daily net assets as shown in the table below:
| | | | | | | | | | | | | | | | |
| | | Class A | | | Class C | | | Class I | | | Class R2 | |
Global Allocation Fund | | | 0.25 | % | | | 0.25 | % | | | 0.25 | % | | | 0.25 | % |
Income Builder Fund | | | 0.25 | | | | 0.25 | | | | 0.25 | | | | n/a | |
The JPMDS has entered into shareholder services contracts with affiliated and unaffiliated financial intermediaries who provide shareholder services and other related services to their clients or customers who invest in the Funds under which the JPMDS will pay all or a portion of such fees earned to financial intermediaries for performing such services.
The JPMDS waived service fees as outlined in Note 3.F.
E. Custodian and Accounting Fees — JPMCB provides portfolio custody and accounting services to the Funds. For performing these services, the Funds pay JPMCB transaction and asset-based fees that vary according to the number of transactions and positions, plus out-of-pocket expenses. The amounts paid directly to JPMCB by the Funds for custody and accounting services are included in Custodian and accounting fees on the Statements of Operations. Payments to the custodian may be reduced by credits earned by each Fund, based on uninvested cash balances held by the custodian. Such earnings credits, if any, are presented separately on the Statements of Operations.
Interest income earned on cash balances at the custodian, if any, is included in Interest income from affiliates on the Statements of Operations.
Interest expense paid to the custodian related to cash overdrafts, if any, is included in Interest expense to affiliates on the Statements of Operations.
| | | | | | |
| | | |
| 114 | | | | J.P. MORGAN FUNDS | | APRIL 30, 2017 |
F. Waivers and Reimbursements — The Adviser, Administrator and JPMDS have contractually agreed to waive fees and/or reimburse the Funds to the extent that total annual operating expenses (excluding acquired fund fees and expenses other than certain money market fund fees as described below, dividend expenses related to short sales, interest expenses related to short sales, interest, taxes, expenses related to litigation and potential litigation and extraordinary expenses) exceed the percentages of the Funds’ average daily net assets as shown in the table below:
| | | | | | | | | | | | | | | | |
| | | Class A | | | Class C | | | Class R2 | | | Class I | |
Global Allocation Fund | | | 1.03 | % | | | 1.53 | % | | | 1.28 | % | | | 0.78 | % |
Income Builder Fund | | | 0.75 | | | | 1.25 | | | | n/a | | | | 0.60 | |
The expense limitation agreements were in effect for the six months ended April 30, 2017 and are in place until at least February 28, 2018.
For the six months ended April 30, 2017, the Funds’ service providers waived fees and/or reimbursed expenses for each of the Funds as follows (amounts in thousands). None of these parties expect the Funds to repay any such waived fees and/or reimbursed expenses in future years.
| | | | | | | | | | | | | | | | | | | | |
| | | Contractual Waivers | | | | |
| | | Investment
Advisory
Fees | | | Administration
Fees | | | Service Fees | | | Total | | | Contractual
Reimbursements | |
Global Allocation Fund | | $ | 1,179 | | | $ | 613 | | | $ | 82 | | | $ | 1,874 | | | $ | — | |
Income Builder Fund | | | 10,406 | | | | 4,908 | | | | 4,190 | | | | 19,504 | | | | — | (a) |
| (a) | Amount rounds to less than 500. |
Additionally, the Funds may invest in one or more money market funds advised by the Adviser or its affiliates (affiliated money market funds). The Adviser, Administrator and/or JPMDS, as shareholder servicing agent, have contractually agreed to waive fees and/or reimburse expenses in an amount sufficient to offset the respective net fees each collects from the affiliated money market fund on the applicable Funds’ investment in such affiliated money market fund.
The amounts of these waivers resulting from investments in these money market funds for the six months ended April 30, 2017 was as follows (amounts in thousands):
| | | | |
Global Allocation Fund | | $ | 75 | |
Income Builder Fund | | | 181 | |
G. Other — Certain officers of the Trust are affiliated with the Adviser, the Administrator and the JPMDS. Such officers, with the exception of the Chief Compliance Officer, receive no compensation from the Funds for serving in their respective roles.
The Board appointed a Chief Compliance Officer to the Funds in accordance with Federal securities regulations. Each Fund, along with other affiliated funds, makes reimbursement payments, on a pro-rata basis, to the Administrator for a portion of the fees associated with the Office of the Chief Compliance Officer. Such fees are included in Trustees’ and Chief Compliance Officer’s fees on the Statements of Operations.
The Trust adopted a Trustee Deferred Compensation Plan (the “Plan”) which allows the Independent Trustees to defer the receipt of all or a portion of compensation related to performance of their duties as Trustees. The deferred fees are invested in various J.P. Morgan Funds until distribution in accordance with the Plan.
During the six months ended April 30, 2017, the Funds purchased securities from an underwriting syndicate in which the principal underwriter or members of the syndicate were affiliated with the Adviser.
The Funds may use related party broker-dealers. For the six months ended April 30, 2017, the Funds incurred brokerage commissions with broker-dealers affiliated with the Adviser as follows (amounts in thousands):
| | | | |
Global Allocation Fund | | $ | — | (a) |
Income Builder Fund | | | 6 | |
| (a) | Amount rounds to less than 500. |
The Securities and Exchange Commission (“SEC”) has granted an exemptive order permitting the Funds to engage in principal transactions with J.P. Morgan Securities, Inc., an affiliated broker, involving taxable money market instruments, subject to certain conditions.
| | | | | | | | |
| | | |
| APRIL 30, 2017 | | J.P. MORGAN FUNDS | | | | | 115 | |
NOTES TO FINANCIAL STATEMENTS
AS OF APRIL 30, 2017 (Unaudited) (continued)
4. Investment Transactions
During the six months ended April 30, 2017, purchases and sales of investments (excluding short-term investments) were as follows (amounts in thousands):
| | | | | | | | | | | | | | | | | | | | | | | | |
| | | Purchases
(excluding
U.S. Government) | | | Sales
(excluding
U.S. Government) | | | Purchases
of U.S.
Government | | | Sales
of U.S.
Government | | | Securities
Sold Short | | | Covers on
Securities
Sold Short | |
Global Allocation Fund | | $ | 456,858 | | | $ | 511,172 | | | $ | 13,098 | | | $ | 14,351 | | | $ | 63,929 | | | $ | 42,239 | |
Income Builder Fund | | | 2,848,663 | | | | 3,045,441 | | | | 35,328 | | | | 38,600 | | | | — | | | | — | |
5. Federal Income Tax Matters
For Federal income tax purposes, the estimated cost and unrealized appreciation (depreciation) in value of investment securities held at April 30, 2017 were as follows (amounts in thousands):
| | | | | | | | | | | | | | | | |
| | | Aggregate
Cost | | | Gross
Unrealized
Appreciation | | | Gross
Unrealized
Depreciation | | | Net Unrealized
Appreciation
(Depreciation) | |
Global Allocation Fund | | $ | 1,528,900 | | | $ | 137,935 | | | $ | 23,362 | | | $ | 114,573 | |
Income Builder Fund | | | 11,292,001 | | | | 1,031,101 | | | | 184,788 | | | | 846,313 | |
At October 31, 2016, the following Funds had net capital loss carryforwards available to offset future realized capital gains as follows (amounts in thousands):
| | | | | | | | |
| | | Capital Loss
Carryforward Character | |
| | | Short-Term | | | Long-Term | |
Global Allocation Fund | | $ | 7,562 | | | $ | 12,376 | |
Income Builder Fund | | | 328,141 | | | | 119,753 | |
6. Borrowings
The Funds rely upon an exemptive order granted by the SEC (the “Order”) permitting the establishment and operation of an Interfund Lending Facility (the “Facility”). The Facility allows the Funds to directly lend and borrow money to or from any other fund relying upon the Order at rates beneficial to both the borrowing and lending funds. Advances under the Facility are taken primarily for temporary or emergency purposes, including the meeting of redemption requests that otherwise might require the untimely disposition of securities, and are subject to each Fund’s borrowing restrictions. The Interfund loan rate is determined, as specified in the Order, by averaging the current repurchase agreement rate and the current bank loan rate. The Order was granted to JPMorgan Trust II and may be relied upon by the Funds because the Funds and the series of JPMorgan Trust II are both investment companies in the same “group of investment companies” (as defined in Section 12(d)(1)(G) of the 1940 Act).
The Trust and JPMCB have entered into a financing arrangement. Under this arrangement, JPMCB provides an unsecured, uncommitted credit facility in the aggregate amount of $100 million to certain of the J.P. Morgan Funds, including the Funds. Advances under the arrangement are taken primarily for temporary or emergency purposes, including the meeting of redemption requests that otherwise might require the untimely disposition of securities, and are subject to each Fund’s borrowing restrictions. Interest on borrowings is payable at a rate determined by JPMCB at the time of borrowing. This agreement has been extended until November 6, 2017.
The Funds had no borrowings outstanding from another fund or from the unsecured, uncommitted credit facility during the six months ended April 30, 2017.
In addition, effective August 16, 2016, the Trust along with certain other affiliated trusts (“Borrowers”) entered into a joint syndicated senior unsecured revolving credit facility totaling $1.5 billion (“Credit Facility”) with various lenders and The Bank of New York Mellon, as administrative agent for the lenders. This Credit Facility provides a source of funds to the Borrowers for temporary and emergency purposes, including the meeting of redemption requests that otherwise might require the untimely disposition of securities. Under the terms of the Credit Facility, a borrowing fund must have a minimum of $25,000,000 in adjusted net asset value and not exceed certain adjusted net asset coverage ratios prior to and during the time in which any borrowings are outstanding. If a fund does not comply with the aforementioned requirements, the fund must remediate within three business days with respect to the $25,000,000 minimum adjusted net asset value or within one business day with respect to certain asset coverage ratios or the administrative agent at the request of, or with the consent of, the lenders may terminate the Credit Facility and declare any outstanding borrowings to be due and payable immediately.
Interest associated with any borrowing under the Credit Facility is charged to the borrowing fund at a rate of interest equal to 1.00% plus the greater of the federal funds effective rate or one month LIBOR. The annual commitment fee to maintain the Credit Facility is 0.15% and is incurred on the unused portion of the Credit Facility and is allocated to all participating funds pro rata based on their respective net assets. The initial term of the Credit Facility is 364 days, unless extended.
The Funds did not utilize the Credit Facility during the six months ended April 30, 2017.
| | | | | | |
| | | |
| 116 | | | | J.P. MORGAN FUNDS | | APRIL 30, 2017 |
7. Risks, Concentrations and Indemnifications
In the normal course of business, the Funds enter into contracts that contain a variety of representations which provide general indemnifications. Each Fund’s maximum exposure under these arrangements is unknown. The amount of exposure would depend on future claims that may be made against each Fund that have not yet occurred. However, based on experience, the Funds expect the risk of loss to be remote.
As of April 30, 2017, the Funds had omnibus accounts which owned more than 10% of the Fund’s outstanding shares as follows:
| | | | | | | | | | | | | | | | |
| | | Number of Affiliated
Omnibus Accounts | | | % of the Fund | | | Number of Non-Affiliated
Omnibus Accounts | | | % of the Fund | |
Global Allocation Fund | | | 1 | | | | 10.7 | % | | | 2 | | | | 27.4 | % |
Income Builder Fund | | | 1 | | | | 14.5 | | | | 3 | | | | 36.8 | |
Significant shareholder transactions by these shareholders may impact the Funds’ performance.
The Funds may have elements of risk not typically associated with investments in the United States of America due to concentrated investments in a limited number of countries or regions, which may vary throughout the year. Such concentrations may subject each Fund to additional risks resulting from political or economic conditions in such countries or regions and the possible imposition of adverse governmental laws or currency exchange restrictions could cause the securities and their markets to be less liquid and their prices to be more volatile than those of comparable U.S. securities.
The Funds are subject to interest rate and credit risk. The value of debt securities may decline as interest rates increase. The Funds could lose money if the issuer of a fixed income security is unable to pay interest or repay principal when it is due. Many factors can cause interest rates to rise. Some examples include central bank monetary policy, rising inflation rates and general economic conditions. Given that the Federal Reserve has recently raised interest rates and may continue to do so, the Funds may face a heightened level of interest rate risk. The ability of the issuers of debt to meet their obligations may be affected by the economic and political developments in a specific industry or region. The Funds invest in floating rate loans and other floating rate debt securities. Although these investments are generally less sensitive to interest rate changes than other fixed rate instruments, the value of floating rate loans and other floating rate investments may decline if their interest rates do not rise as quickly, or as much, as general interest rates.
The Funds are also subject to counterparty credit risk, which is the risk that a counterparty fails to perform on agreements with the Funds such as swap and option contracts, credit linked notes, exchange-traded notes, forward foreign currency exchange contracts and To-Be-Announced securities.
The Funds are subject to risks associated with securities with contractual cash flows including asset-backed and mortgage-related securities such as collateralized mortgage obligations, mortgage pass-through securities and commercial mortgage-backed securities, including securities backed by sub-prime mortgage loans. The value, liquidity and related income of these securities are sensitive to changes in economic conditions, including real estate value, prepayments, delinquencies and/or defaults, and may be adversely affected by shifts in the market’s perception of the issuers and changes in interest rates.
8. Investment Company Reporting Modernization
In October 2016, the U.S. Securities and Exchange Commission adopted new rules and forms, and amendments to certain current rules and forms, to modernize the reporting and disclosure of information by registered investment companies. In part, the final rules amend Regulation S-X and will require standardized, enhanced disclosures about derivatives in investment company financial statements, as well as other amendments. The compliance date for the amendments to Regulation S-X is August 1, 2017. At this time, management is currently assessing the anticipated impact of the Regulation S-X amendments on the Fund’s (s) financial statements and related disclosures.
| | | | | | | | |
| | | |
| APRIL 30, 2017 | | J.P. MORGAN FUNDS | | | | | 117 | |
SCHEDULE OF SHAREHOLDER EXPENSES
(Unaudited)
Hypothetical $1,000 Investment
As a shareholder of the Funds, you incur two types of costs: (1) transaction costs, including sales charges (loads) on purchase payments and (2) ongoing costs, including investment advisory fees, administration fees, distribution fees and other Fund expenses. The examples below are intended to help you understand your ongoing costs (in dollars) of investing in the Funds and to compare these ongoing costs with the ongoing costs of investing in other mutual funds. The examples assume that you had a $1,000 investment in each Class at the beginning of the reporting period, November 1, 2016, and continued to hold your shares at the end of the reporting period, April 30, 2017
Actual Expenses
For each Class of each Fund in the table below, the first line provides information about actual account values and actual expenses. You may use the information in this line, together with the amount you invested, to estimate the expenses that you paid over the period. Simply divide your account value by $1,000 (for example, an $8,600 account value divided by $1,000 = 8.6), then multiply the result by the number in the first line of each Class under the heading entitled “Expenses Paid During the Period” to estimate the expenses you paid on your account during this period.
Hypothetical Example for Comparison Purposes
The second line of each Class in the table below provides information about hypothetical account values and hypothetical expenses based on the Class’ actual expense ratio and an assumed rate of return of 5% per year before expenses, which is not the Class’ actual return. The hypothetical account values and expenses may not be used to estimate the actual ending account balance or expenses you paid for the period. You may use this information to compare the ongoing costs of investing in the Class of the Funds and other funds. To do so, compare this 5% hypothetical example with the 5% hypothetical examples that appear in the shareholder reports of the other funds. Please note that the expenses shown in the table are meant to highlight your ongoing costs only and do not reflect any transaction costs, such as sales charges (loads) or redemption fees. Therefore, the second line for each Class in the table is useful in comparing ongoing costs only, and will not help you determine the relative total costs of owning different funds. In addition, if these transaction costs were included, your costs would have been higher. The examples also assume all dividends and distributions have been reinvested.
| | | | | | | | | | | | | | | | |
| | | Beginning
Account Value
November 1, 2016 | | | Ending
Account Value
April 30, 2017 | | | Expenses
Paid During
the Period* | | | Annualized
Expense
Ratio | |
Global Allocation Fund | | | | | | | | | | | | | | | | |
Class A | | | | | | | | | | | | | | | | |
Actual | | $ | 1,000.00 | | | $ | 1,078.80 | | | $ | 5.31 | | | | 1.03 | % |
Hypothetical | | | 1,000.00 | | | | 1,019.69 | | | | 5.16 | | | | 1.03 | |
Class C | | | | | | | | | | | | | | | | |
Actual | | | 1,000.00 | | | | 1,076.10 | | | | 7.88 | | | | 1.53 | |
Hypothetical | | | 1,000.00 | | | | 1,017.21 | | | | 7.65 | | | | 1.53 | |
Class I (formerly Select Class) | | | | | | | | | | | | | | | | |
Actual | | | 1,000.00 | | | | 1,079.50 | | | | 4.02 | | | | 0.78 | |
Hypothetical | | | 1,000.00 | | | | 1,020.93 | | | | 3.91 | | | | 0.78 | |
Class R2 | | | | | | | | | | | | | | | | |
Actual | | | 1,000.00 | | | | 1,076.90 | | | | 6.59 | | | | 1.28 | |
Hypothetical | | | 1,000.00 | | | | 1,018.45 | | | | 6.41 | | | | 1.28 | |
| | | | |
Income Builder Fund | | | | | | | | | | | | | | | | |
Class A | | | | | | | | | | | | | | | | |
Actual | | | 1,000.00 | | | | 1,054.30 | | | | 3.82 | | | | 0.75 | |
Hypothetical | | | 1,000.00 | | | | 1,021.08 | | | | 3.76 | | | | 0.75 | |
Class C | | | | | | | | | | | | | | | | |
Actual | | | 1,000.00 | | | | 1,052.80 | | | | 6.36 | | | | 1.25 | |
Hypothetical | | | 1,000.00 | | | | 1,018.60 | | | | 6.26 | | | | 1.25 | |
Class I (formerly Select Class) | | | | | | | | | | | | | | | | |
Actual | | | 1,000.00 | | | | 1,056.00 | | | | 3.06 | | | | 0.60 | |
Hypothetical | | | 1,000.00 | | | | 1,021.82 | | | | 3.01 | | | | 0.60 | |
| * | Expenses are equal to each Class’ respective annualized expense ratio, multiplied by the average account value over the period, multiplied by 181/365 (to reflect the one-half year period). |
| | | | | | |
| | | |
| 118 | | | | J.P. MORGAN FUNDS | | APRIL 30, 2017 |
J.P. Morgan Funds are distributed by JPMorgan Distribution Services, Inc., which is an affiliate of JPMorgan Chase & Co. Affiliates of JPMorgan Chase & Co. receive fees for providing various services to the funds.
Contact JPMorgan Distribution Services, Inc. at 1-800-480-4111 for a fund prospectus. You can also visit us at www.jpmorganfunds.com. Investors should carefully consider the investment objectives and risk as well as charges and expenses of the mutual fund before investing. The prospectus contains this and other information about the mutual fund. Read the prospectus carefully before investing.
Investors may obtain information about the Securities Investor Protection Corporation (SIPC), including the SIPC brochure by visiting www.sipc.org or by calling SIPC at 202-371-8300.
Each Fund files a complete schedule of its fund holdings for the first and third quarters of its fiscal year with the SEC on Form N-Q. The Funds’ Forms N-Q are available on the SEC’s website at http://www.sec.gov and may be reviewed and copied at the SEC’s Public Reference Room in Washington, DC. Information on the operation of the SEC’s Public Reference Room may be obtained by calling 1-800-SEC-0330. Shareholders may request the Form N-Q without charge by calling 1-800-480-4111 or by visiting the J.P. Morgan Funds’ website at www.jpmorganfunds.com.
A description of each Fund’s policies and procedures with respect to the disclosure of each Fund’s holdings is available in the prospectus and Statement of Additional Information.
A copy of proxy policies and procedures is available without charge upon request by calling 1-800-480-4111 and on the Funds’ website at www.jpmorganfunds.com. A description of such policies and procedures is on the SEC’s website at www.sec.gov. The Trustees have delegated the authority to vote proxies for securities owned by the Funds to the Adviser. A copy of the Funds’ voting record for the most recent 12-month period ended June 30 is available on the SEC’s website at www.sec.gov or at the Funds’ website at www.jpmorganfunds.com no later than August 31 of each year. The Funds’ proxy voting record will include, among other things, a brief description of the matter voted on for each fund security, and will state how each vote was cast, for example, for or against the proposal.

J.P. Morgan Asset Management is the marketing name for the asset management business of JPMorgan Chase & Co. Those businesses include, but are not limited to, J.P. Morgan Investment Management Inc., Security Capital Research & Management Incorporated and J.P. Morgan Alternative Asset Management, Inc.
| | | | |
| | © JPMorgan Chase & Co., 2017. All rights reserved. April 2017 | | SAN-IB-GAL-417 |
Semi-Annual Report
J.P. Morgan Funds
April 30, 2017 (Unaudited)
JPMorgan Emerging Markets Strategic Debt Fund

CONTENTS
Investments in a Fund are not deposits or obligations of, or guaranteed or endorsed by, any bank and are not insured or guaranteed by the FDIC, the Federal Reserve Board or any other government agency. You could lose money if you sell when the Fund’s share price is lower than when you invested.
Past performance is no guarantee of future performance. The general market views expressed in this report are opinions based on market and other conditions through the end of the reporting period and are subject to change without notice. These views are not intended to predict the future performance of the Fund or the securities markets. References to specific securities and their issuers are for illustrative purposes only and are not intended to be, and should not be interpreted as, recommendations to purchase or sell such securities. Such views are not meant as investment advice and may not be relied on as an indication of trading intent on behalf of the Fund.
Prospective investors should refer to the Fund’s prospectus for a discussion of the Fund’s investment objectives, strategies and risks. Call J.P. Morgan Funds Service Center at 1-800-480-4111 for a prospectus containing more complete information about a Fund, including management fees and other expenses. Please read it carefully before investing.
CEO’S LETTER
May 25, 2017 (Unaudited)
Dear Shareholder,
The world’s leading economies continued their upward trajectory over the six months ended April 30, 2017, bolstered by central bank policies, growth in corporate earnings and buoyant consumer and business sentiment.
| | |
 | | “While bond markets provided a mixed performance over the six months ended April 30, 2017, equity markets rewarded investors with solid returns.” — George C.W. Gatch |
While the U.S. and China had been leading drivers of growth for most of the current economic expansion, by late 2016 and into 2017 the world’s other leading economies began to strengthen. Each of the world’s 20 largest economies was forecast to increase output of goods and services through 2017 and the variation in growth rates among those economies was forecast to be the lowest since 1980, according to Bloomberg News.
The U.S. economy slowed somewhat in the first quarter of 2017, but unemployment dropped to 4.4% in April 2017 and the U.S. Federal Reserve reiterated its intent to raise interest rates amid continued economic growth and rising inflation. Throughout the six month reporting period, U.S. financial markets — particularly U.S. equities — generally outperformed other developed markets and emerging markets.
China’s economy continued to grow and posted a 6.9% rise in gross domestic product (GDP) in the first quarter of 2017, amid strength in housing, infrastructure investment, exports and retail sales. Notably, financial markets in China remained largely stable for the six month reporting period. For the 86 trading days through April 24, 2017, the Shanghai Stock Exchange Composite Index hadn’t fallen by more than 1%, thanks in large part to government efforts to prevent a recurrence of the sharp sell-offs that hit Chinese markets in mid-2015 and early 2016.
Meanwhile, Chinese officials sought to reduce financial system risk by tightening money-market rules and pushing to reduce the use of leverage and financial market speculation.
In the European Union (EU), rising consumer spending and manufacturing led to 0.6% growth in first quarter GDP. In particular, Germany’s economy continued to accelerate into 2017, with positive growth in factory orders and an estimated 14% increase in corporate earnings in the first quarter of 2017. Surveys of consumer sentiment across the EU were more upbeat than in recent years. At the end of March 2017, EU unemployment stood at 9.5%, the lowest level since April 2009.
In emerging markets, economic strength in China and a rebound in commodities prices, which began in the latter half of 2016, helped lift economic growth. Moreover, the economies of Brazil, Argentina, Russia, Turkey and South Africa — which were seen as weak links in the global economy — all showed positive growth by the end of April 2017.
While bond markets provided a mixed performance over the six months ended April 30, 2017, equity markets rewarded investors with solid returns. The Standard & Poor’s 500 Index returned 13.32% for the reporting period, while the Morgan Stanley Capital International (“MSCI”) Europe, Australasia and Far East Index (net of foreign withholding taxes) returned 11.73% and the MSCI Emerging Markets Index (net of foreign withholding taxes) returned 9.03%.
We look forward to managing your investment needs for years to come. Should you have any questions, please visit www.jpmorganfunds.com or contact the J.P. Morgan Funds Service Center at 1-800-480-4111.
Sincerely yours,

George C.W. Gatch
CEO, Investment Funds Management,
J.P. Morgan Asset Management
| | | | | | | | |
| | | |
| APRIL 30, 2017 | | J.P. MORGAN FUNDS | | | | | 1 | |
JPMorgan Emerging Markets Strategic Debt Fund
FUND COMMENTARY
SIX MONTHS ENDED APRIL 30, 2017 (Unaudited)
| | | | |
| REPORTING PERIOD RETURN: | |
| Fund (Class I Shares)1* | | | 2.26% | |
| J.P. Morgan Emerging Markets Bond Index Global Diversified | | | 2.45% | |
| JPMorgan Emerging Markets Strategic Debt Composite Benchmark | | | 2.45% | |
| |
| Net Assets as of 4/30/2017 (In Thousands) | | | $315,370 | |
| Duration as of 4/30/2017 | | | 5.4 years | |
INVESTMENT OBJECTIVE**
The JPMorgan Emerging Markets Strategic Debt Fund (the “Fund”) seeks to provide total return.
INVESTMENT STRATEGY
The Fund invests primarily in emerging markets corporate and sovereign debt securities denominated in U.S., developed or emerging market currencies. The Fund bases security selection on a combination of macroeconomic research and bottom-up fundamental country analysis and uses futures contracts, options, derivatives and currency options to manage the portfolio’s duration and foreign exchange volatility.
WHAT WERE THE MAIN DRIVERS OF THE FUND’S PERFORMANCE?
The Fund (Class I Shares) had a positive absolute performance but underperformed the J.P. Morgan Emerging Markets Bond Index Global Diversified (the “Index”) for the six months ended April 30, 2017.
During the reporting period, the Fund’s duration hedge in the U.S., implemented primarily through the use of U.S. Treasury futures and credit default swaps, was the leading detractor from absolute performance. Duration measures the price sensitivity of a bond or a portfolio of bonds to relative changes in interest rates. Generally, bonds with longer duration are more sensitive to increases or decreases in price as interest rates fall or rise, respectively. The Fund’s exposure to bonds in Malaysia and the Philippines also detracted from absolute performance as low yields failed to attract investors.
The Fund’s exposure to bonds in Argentina and Brazil was a leading contributor to absolute performance. During most of
the reporting period, economic fundamentals improved in Argentina. The Brazilian economy stabilized and Brazilian financial assets appreciated substantially amid investor expectations for economic reforms and monetary easing. The Fund’s exposure to bonds in Mexico also contributed to absolute performance as investor concerns about potential protectionist U.S. trade policies receded.
Relative to the Index, the Fund’s hedge against interest rate increases, implemented primarily through the use of futures on U.S. Treasury bonds and German government bonds, and its hedge against declines in bond prices, implemented primarily through credit default swaps/credit default indexes, detracted from performance. The Fund’s overall positioning in local currencies made a positive contribution to performance relative to the Index.
HOW WAS THE FUND POSITIONED?
The Fund invested primarily in debt securities from emerging market countries that the Fund’s portfolio managers believed had the potential to provide total return. At the end of the reporting period, the Fund’s foreign exchange positions were overweight in the currencies of Russia, Peru and India and underweight in the currencies of the U.S., Canada and China. In terms of sovereign debt, the Fund was overweight at the end of the reporting period in Brazil, the United Arab Emirates and Argentina and was underweight in Russia, the Philippines and Uruguay.
| 1 | | On April 3, 2017, the Fund’s Select Class Shares were renamed Class I Shares. |
| | | | | | |
| | | |
| 2 | | | | J.P. MORGAN FUNDS | | APRIL 30, 2017 |
| | | | |
PORTFOLIO COMPOSITION BY SECURITY TYPE*** | |
| Foreign Government Securities | | | 71.8 | % |
| Corporate Bonds | | | 25.5 | |
| U.S. Treasury Obligation | | | 0.3 | |
| Options Purchased | | | 0.1 | |
| Short-Term Investment | | | 2.3 | |
| | | | |
PORTFOLIO COMPOSITION BY COUNTRY*** | |
| Mexico | | | 8.2 | % |
| Brazil | | | 7.6 | |
| Argentina | | | 6.7 | |
| Russia | | | 5.0 | |
| Turkey | | | 3.9 | |
| Lebanon | | | 3.9 | |
| Ukraine | | | 3.9 | |
| Indonesia | | | 3.8 | |
| Colombia | | | 3.3 | |
| Dominican Republic | | | 3.1 | |
| Kazakhstan | | | 2.6 | |
| South Africa | | | 2.5 | |
| Sri Lanka | | | 2.4 | |
| Hungary | | | 2.4 | |
| Oman | | | 1.9 | |
| Peru | | | 1.6 | |
| Egypt | | | 1.5 | |
| Belarus | | | 1.5 | |
| China | | | 1.5 | |
| Uruguay | | | 1.5 | |
| El Salvador | | | 1.4 | |
| Ecuador | | | 1.4 | |
| Iraq | | | 1.3 | |
| Costa Rica | | | 1.3 | |
| Croatia | | | 1.2 | |
| Venezuela | | | 1.2 | |
| Pakistan | | | 1.2 | |
| Azerbaijan | | | 1.2 | |
| Philippines | | | 1.1 | |
| Paraguay | | | 1.1 | |
| Angola | | | 1.0 | |
| Nigeria | | | 1.0 | |
| Others (each less than 1.0%) | | | 14.5 | |
| Short-Term Investment | | | 2.3 | |
| * | | The return shown is based on net asset values calculated for shareholder transactions and may differ from the return shown in the financial highlights, which reflects adjustments made to the net asset values in accordance with accounting principles generally accepted in the United States of America. |
| ** | | The adviser seeks to achieve the Fund’s objective. There can be no guarantee it will be achieved. |
| *** | | Percentages indicated are based on total investments as of April 30, 2017. The Fund’s portfolio composition is subject to change. |
| | | | | | | | |
| | | |
| APRIL 30, 2017 | | J.P. MORGAN FUNDS | | | | | 3 | |
JPMorgan Emerging Markets Strategic Debt Fund
FUND COMMENTARY
SIX MONTHS ENDED APRIL 30, 2017 (Unaudited) (continued)
| | | | | | | | | | | | | | | | | | | | |
AVERAGE ANNUAL TOTAL RETURNS AS OF APRIL 30, 2017 | |
| | | INCEPTION DATE OF
CLASS | | | 6 MONTH* | | | 1 YEAR | | | 3 YEAR | | | SINCE
INCEPTION | |
CLASS A SHARES | | | June 29, 2012 | | | | | | | | | | | | | | | | | |
With Sales Charge** | | | | | | | (1.67 | )% | | | (1.32 | )% | | | (5.41 | )% | | | (4.00 | )% |
Without Sales Charge | | | | | | | 2.18 | | | | 2.55 | | | | (4.20 | ) | | | (3.24 | ) |
CLASS C SHARES | | | June 29, 2012 | | | | | | | | | | | | | | | | | |
With CDSC*** | | | | | | | 0.86 | | | | 0.98 | | | | (4.69 | ) | | | (3.72 | ) |
Without CDSC | | | | | | | 1.86 | | | | 1.98 | | | | (4.69 | ) | | | (3.72 | ) |
CLASS I SHARES (FORMERLY SELECT CLASS SHARES) | | | June 29, 2012 | | | | 2.26 | | | | 2.76 | | | | (3.99 | ) | | | (3.01 | ) |
CLASS R2 SHARES | | | June 29, 2012 | | | | 2.05 | | | | 2.30 | | | | (4.45 | ) | | | (3.47 | ) |
CLASS R5 SHARES | | | June 29, 2012 | | | | 2.34 | | | | 2.96 | | | | (3.79 | ) | | | (2.80 | ) |
CLASS R6 SHARES | | | June 29, 2012 | | | | 2.36 | | | | 2.98 | | | | (3.78 | ) | | | (2.76 | ) |
| ** | | Sales Charge for Class A Shares is 3.75%. |
| *** | | Assumes a 1% CDSC (contingent deferred sales charge) for the 6 month and one year periods and 0% CDSC thereafter. |
LIFE OF FUND PERFORMANCE (6/29/12 TO 4/30/17)
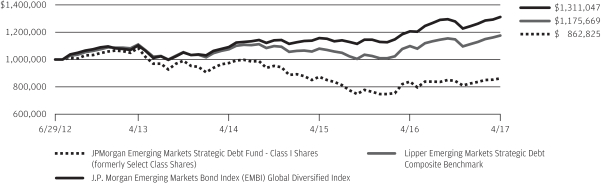
The performance quoted is past performance and is not a guarantee of future results. Mutual funds are subject to certain market risks. Investment returns and principal value of an investment will fluctuate so that an investor’s shares, when redeemed, may be worth more or less than their original cost. Current performance may be higher or lower than the performance data shown. For up-to-date, month-end performance information please call 1-800-480-4111. Effective September 30, 2016, some of the Fund’s investment strategies changed. The Fund’s past performance would have been different if the Fund was managed using the current strategies.
The Fund commenced operations on June 29, 2012.
The graph illustrates comparative performance for $1,000,000 invested in Class I Shares of the JPMorgan Emerging Markets Strategic Debt Fund, the J.P. Morgan Emerging Markets Bond Index (EMBI) Global Diversified and the Emerging Markets Strategic Debt Composite Benchmark from June 29, 2012 to April 30, 2017. The performance of the Fund assumes reinvestment of all dividends and capital gain distributions, if any, and does not include a sales charge. The performance of the J.P. Morgan Emerging Markets Bond Index (EMBI) Global Diversified does not reflect the deduction of expenses associated with a mutual fund, such as investment management fees. The Emerging Markets Strategic Debt Composite Benchmark does not reflect the deduction of expenses associated with a fund, such as investment management fees. By contrast, the performance of the Fund reflects the deduction of fund expenses, including sales charges if applicable. The J.P. Morgan Emerging Markets Bond Index (EMBI) Global Diversified tracks total returns for U.S. dollar-denominated
debt instruments issued by emerging market sovereign and quasi-sovereign entities: Brady bonds, loans, Eurobonds. The diversified index limits the exposure of some of the larger countries. The Emerging Markets Strategic Debt Composite Benchmark is comprised of unmanaged indices that include an equally weighted average of the J.P. Morgan Emerging Markets Bond Index (EMBI) Global Diversified, J.P. Morgan Government Bond Index-Emerging Markets (GBI-EM) Global Diversified and the J.P. Morgan Corporate Emerging Markets Bond Index (CEMBI) Broad Diversified. Investors cannot invest directly in an index.
Class I Shares have a $1,000,000 minimum initial investment.
Fund performance may reflect the waiver of the Fund’s fees and reimbursement of expenses for certain periods since the inception date. Without these waivers and reimbursements, performance would have been lower. Also, performance shown in this section does not reflect the deduction of taxes that a shareholder would pay on Fund distributions or redemptions of Fund shares.
International investing involves a greater degree of risk and increased volatility. Changes in currency exchange rates and differences in accounting and taxation policies outside the U.S. can raise or lower returns. Also, some overseas markets may not be as politically and economically stable as the U.S. and other nations.
The returns shown are based on net asset values calculated for shareholder transactions and may differ from the returns shown in the financial highlights, which reflect adjustments made to the net asset values in accordance with accounting principles generally accepted in the United States of America.
| | | | | | |
| | | |
| 4 | | | | J.P. MORGAN FUNDS | | APRIL 30, 2017 |
JPMorgan Emerging Markets Strategic Debt Fund
SCHEDULE OF PORTFOLIO INVESTMENTS
AS OF APRIL 30, 2017 (Unaudited)
(Amounts in U.S. Dollars, unless otherwise noted)
(Amounts in thousands)
| | | | | | | | |
PRINCIPAL
AMOUNT | | | SECURITY DESCRIPTION | | VALUE | |
| Corporate Bonds — 22.4% | | | | |
| | | | Argentina — 1.3% | | | | |
| | 270 | | | Pampa Energia SA, 7.500%, 01/24/27 (e) | | | 287 | |
| | 100 | | | Petrobras Argentina SA, Reg. S, 7.375%, 07/21/23 | | | 106 | |
| | | | YPF SA, | | | | |
| | 700 | | | Reg. S, 8.500%, 03/23/21 | | | 787 | |
| | 1,450 | | | Reg. S, 8.750%, 04/04/24 | | | 1,671 | |
| | 1,000 | | | Reg. S, 8.875%, 12/19/18 | | | 1,076 | |
| | | | | | | | |
| | | | | | | 3,927 | |
| | | | | | | | |
| | | | Brazil — 2.6% | | | | |
| | 400 | | | Banco do Brasil SA, Reg. S, VAR, 9.000%,
06/18/24 (x) (y) | | | 422 | |
| | 1,300 | | | Caixa Economica Federal, Reg. S, 4.500%, 10/03/18 | | | 1,322 | |
| | 330 | | | Centrais Eletricas Brasileiras SA, Reg. S, 6.875%, 07/30/19 | | | 349 | |
| | 600 | | | GTL Trade Finance, Inc., Reg. S, 5.893%, 04/29/24 | | | 608 | |
| | 810 | | | JBS Investments GmbH, Reg. S, 7.250%, 04/03/24 | | | 845 | |
| | | | Petrobras Global Finance BV, | | | | |
| | 1,000 | | | 5.375%, 01/27/21 | | | 1,028 | |
| | 1,538 | | | 8.375%, 05/23/21 | | | 1,743 | |
| | 850 | | | 8.750%, 05/23/26 | | | 991 | |
| | 200 | | | Raizen Fuels Finance SA, 5.300%, 01/20/27 (e) | | | 207 | |
| | 560 | | | Suzano Austria GmbH, 7.000%, 03/16/47 (e) | | | 554 | |
| | 200 | | | Votorantim Cimentos SA, Reg. S, 7.250%, 04/05/41 | | | 205 | |
| | | | | | | | |
| | | | | | | 8,274 | |
| | | | | | | | |
| | | | Chile — 0.5% | |
| | 800 | | | Corp. Nacional del Cobre de Chile, Reg. S, 4.500%, 09/16/25 | | | 845 | |
| | 290 | | | Empresa Electrica Angamos SA, Reg. S, 4.875%, 05/25/29 | | | 293 | |
| | 400 | | | Empresa Nacional del Petroleo, Reg. S, 3.750%, 08/05/26 | | | 392 | |
| | | | | | | | |
| | | | | | | 1,530 | |
| | | | | | | | |
| | | | China — 1.3% | |
| | 270 | | | Bluestar Finance Holdings Ltd., Reg. S, 3.125%, 09/30/19 | | | 271 | |
| | 270 | | | CCCI Treasure Ltd., Reg. S, VAR, 3.500%,
04/21/20 (x) (y) | | | 271 | |
| | 200 | | | Central Plaza Development Ltd., Reg. S, VAR, 7.125%, 12/02/19 (x) (y) | | | 214 | |
| | 200 | | | Greenland Hong Kong Holdings Ltd., Reg. S, 3.875%, 07/28/19 | | | 199 | |
| | | | | | | | |
PRINCIPAL
AMOUNT | | | SECURITY DESCRIPTION | | VALUE | |
| | | | | |
| | | | China — continued | | | | |
| | 200 | | | Guangxi Communications Investment Group Co. Ltd., Reg. S, 3.000%, 11/04/19 | | | 198 | |
| | 200 | | | Huarong Finance II Co. Ltd., Reg. S, 2.750%, 06/03/19 | | | 198 | |
| | 200 | | | Shui On Development Holding Ltd., Reg. S, 5.700%, 02/06/21 | | | 203 | |
| | 150 | | | Sinochem Overseas Capital Co. Ltd., Reg. S, 4.500%, 11/12/20 | | | 158 | |
| | 800 | | | Sinopec Group Overseas Development 2015 Ltd., Reg. S, 4.100%, 04/28/45 | | | 775 | |
| | 300 | | | Three Gorges Finance I Cayman Islands Ltd., Reg. S, 3.700%, 06/10/25 | | | 306 | |
| | 200 | | | Tianjin Infrastructure Construction & Investment Group Co. Ltd., Reg. S, 2.750%, 06/15/19 | | | 199 | |
| | 200 | | | Times Property Holdings Ltd., Reg. S, 6.250%, 01/23/20 | | | 206 | |
| | 200 | | | Vanke Real Estate Hong Kong Co. Ltd., Reg. S, 3.950%, 12/23/19 | | | 205 | |
| | 270 | | | Wealth Driven Ltd., Reg. S, 5.500%, 08/17/23 | | | 277 | |
| | 260 | | | West China Cement Ltd., Reg. S, 6.500%, 09/11/19 | | | 271 | |
| | 200 | | | Yuzhou Properties Co. Ltd., Reg. S, 6.000%, 01/25/22 | | | 206 | |
| | | | | | | | |
| | | | | | | 4,157 | |
| | | | | | | | |
| | | | Colombia — 1.3% | |
| | 300 | | | Banco GNB Sudameris SA, VAR, 6.500%,
04/03/27 (e) | | | 309 | |
| | | | Ecopetrol SA, | | | | |
| | 2,400 | | | 5.375%, 06/26/26 | | | 2,449 | |
| | 150 | | | 5.875%, 09/18/23 | | | 162 | |
| | 1,195 | | | 5.875%, 05/28/45 | | | 1,095 | |
| | | | | | | | |
| | | | | | | 4,015 | |
| | | | | | | | |
| | | | Congo — 0.1% | |
| | 309 | | | HTA Group Ltd., 9.125%, 03/08/22 (e) | | | 312 | |
| | | | | | | | |
| | | | El Salvador — 0.1% | |
| | 300 | | | Grupo Unicomer Co. Ltd., 7.875%, 04/01/24 (e) | | | 321 | |
| | | | | | | | |
| | | | Guatemala — 0.3% | |
| | 300 | | | Central American Bottling Corp., 5.750%,
01/31/27 (e) | | | 318 | |
| | 200 | | | Comcel Trust via Comunicaciones Celulares SA, Reg. S, 6.875%, 02/06/24 | | | 213 | |
| | 540 | | | Energuate Trust, 5.875%, 05/03/27 (e) | | | 548 | |
| | | | | | | | |
| | | | | | | 1,079 | |
| | | | | | | | |
SEE NOTES TO FINANCIAL STATEMENTS.
| | | | | | | | |
| | | |
| APRIL 30, 2017 | | J.P. MORGAN FUNDS | | | | | 5 | |
JPMorgan Emerging Markets Strategic Debt Fund
SCHEDULE OF PORTFOLIO INVESTMENTS
AS OF APRIL 30, 2017 (Unaudited) (continued)
(Amounts in U.S. Dollars, unless otherwise noted)
(Amounts in thousands)
| | | | | | | | |
PRINCIPAL
AMOUNT | | | SECURITY DESCRIPTION | | VALUE | |
| | Corporate Bonds — continued | | | | |
| | | | Hong Kong — 0.1% | | | | |
| | 200 | | | Shimao Property Holdings Ltd., Reg. S, 8.375%, 02/10/22 | | | 223 | |
| | | | | | | | |
| | | | Hungary — 0.1% | |
| | 300 | | | MFB Magyar Fejlesztesi Bank Zrt., Reg. S, 6.250%, 10/21/20 | | | 330 | |
| | | | | | | | |
| | | | India — 0.3% | |
| | 200 | | | Axis Bank Ltd., Reg. S, 2.875%, 06/01/21 | | | 198 | |
| | 200 | | | Neerg Energy Ltd., 6.000%, 02/13/22 (e) | | | 203 | |
| | 200 | | | UPL Corp. Ltd., 3.250%, 10/13/21 (e) | | | 199 | |
| | 240 | | | Vedanta Resources plc, 6.375%, 07/30/22 (e) | | | 243 | |
| | | | | | | | |
| | | | | | | 843 | |
| | | | | | | | |
| | | | Indonesia — 1.0% | |
| | 200 | | | Listrindo Capital BV, 4.950%, 09/14/26 (e) | | | 198 | |
| | 500 | | | Majapahit Holding BV, Reg. S, 7.750%, 01/20/20 | | | 561 | |
| | 1,500 | | | Pertamina Persero PT, Reg. S, 6.450%, 05/30/44 | | | 1,691 | |
| | 485 | | | Saka Energi Indonesia PT, 4.450%, 05/05/24 (e) | | | 486 | |
| | 200 | | | Theta Capital Pte. Ltd., Reg. S, 7.000%, 04/11/22 | | | 209 | |
| | | | | | | | |
| | | | | | | 3,145 | |
| | | | | | | | |
| | | | Jamaica — 0.1% | |
| | 200 | | | Digicel Group Ltd., Reg. S, 8.250%, 09/30/20 | | | 183 | |
| | | | | | | | |
| | | | Kazakhstan — 1.6% | |
| | 500 | | | Kazakhstan Temir Zholy Finance BV, Reg. S, 6.950%, 07/10/42 | | | 526 | |
| | | | KazMunayGas National Co. JSC, | | | | |
| | 700 | | | 5.750%, 04/19/47 (e) | | | 683 | |
| | 450 | | | Reg. S, 6.375%, 04/09/21 | | | 494 | |
| | 1,700 | | | Reg. S, 7.000%, 05/05/20 | | | 1,863 | |
| | 1,490 | | | Tengizchevroil Finance Co. International Ltd., Reg. S, 4.000%, 08/15/26 | | | 1,440 | |
| | | | | | | | |
| | | | | | | 5,006 | |
| | | | | | | | |
| | | | Kuwait — 0.5% | |
| | 340 | | | Equate Petrochemical BV, Reg. S, 3.000%, 03/03/22 | | | 338 | |
| | 1,300 | | | Kuwait Projects Co., Reg. S, 5.000%, 03/15/23 | | | 1,373 | |
| | | | | | | | |
| | | | | | | 1,711 | |
| | | | | | | | |
| | | | Mexico — 4.8% | |
| | 1,470 | | | Banco Inbursa SA Institucion de Banca Multiple, 4.375%, 04/11/27 (e) | | | 1,441 | |
| | | | | | | | |
PRINCIPAL
AMOUNT | | | SECURITY DESCRIPTION | | VALUE | |
| | | | | |
| | | | Mexico — continued | |
| | 200 | | | Banco Mercantil del Norte SA, VAR, 5.750%, 10/04/31 (e) | | | 196 | |
| | 500 | | | Banco Nacional de Comercio Exterior SNC, Reg. S, VAR, 3.800%, 08/11/26 | | | 491 | |
| | 670 | | | Grupo Kaltex SA de CV, 8.875%, 04/11/22 (e) | | | 662 | |
| | 1,490 | | | Mexichem SAB de CV, Reg. S, 5.875%, 09/17/44 | | | 1,467 | |
| | | | Petroleos Mexicanos, | | | | |
| | 90 | | | 5.375%, 03/13/22 (e) | | | 94 | |
| | 170 | | | 5.500%, 01/21/21 | | | 180 | |
| | 100 | | | 5.625%, 01/23/46 | | | 89 | |
| | 310 | | | 6.375%, 02/04/21 | | | 339 | |
| | 1,320 | | | 6.375%, 01/23/45 | | | 1,287 | |
| | 200 | | | 6.500%, 03/13/27 (e) | | | 216 | |
| | 250 | | | 6.625%, 06/15/35 | | | 259 | |
| | 1,650 | | | 6.750%, 09/21/47 | | | 1,669 | |
| | 2,250 | | | 6.875%, 08/04/26 | | | 2,514 | |
| | 2,400 | | | Reg. S, 5.375%, 03/13/22 | | | 2,514 | |
| | 1,000 | | | Reg. S, 6.500%, 03/13/27 | | | 1,079 | |
| | 500 | | | Reg. S, VAR, 4.770%, 03/11/22 | | | 542 | |
| | 149 | | | VAR, 4.770%, 03/11/22 (e) | | | 161 | |
| | | | | | | | |
| | | | | | | 15,200 | |
| | | | | | | | |
| | | | Morocco — 0.2% | |
| | 500 | | | OCP SA, Reg. S, 6.875%, 04/25/44 | | | 540 | |
| | | | | | | | |
| | | | Netherlands — 0.4% | |
| | 200 | | | VimpelCom Holdings BV, Reg. S, 5.950%, 02/13/23 | | | 213 | |
| | 1,200 | | | Zhaikmunai LLP, Reg. S, 7.125%, 11/13/19 | | | 1,176 | |
| | | | | | | | |
| | | | | | | 1,389 | |
| | | | | | | | |
| | | | Nigeria — 0.1% | |
| | 310 | | | IHS Netherlands Holdco BV, Reg. S, 9.500%, 10/27/21 | | | 322 | |
| | | | | | | | |
| | | | Peru — 0.3% | |
| | 800 | | | Fondo MIVIVIENDA SA, Reg. S, 3.500%, 01/31/23 | | | 806 | |
| | 150 | | | Union Andina de Cementos SAA, Reg. S, 5.875%, 10/30/21 | | | 156 | |
| | | | | | | | |
| | | | | | | 962 | |
| | | | | | | | |
| | | | Qatar — 0.1% | |
| | 200 | | | ABQ Finance Ltd., Reg. S, 3.625%, 04/13/21 | | | 202 | |
| | | | | | | | |
| | | | Russia — 2.3% | |
| | 1,560 | | | Alfa Bank AO Via Alfa Bond Issuance plc, Reg. S, 7.500%, 09/26/19 | | | 1,698 | |
SEE NOTES TO FINANCIAL STATEMENTS.
| | | | | | |
| | | |
| 6 | | | | J.P. MORGAN FUNDS | | APRIL 30, 2017 |
| | | | | | | | |
PRINCIPAL
AMOUNT | | | SECURITY DESCRIPTION | | VALUE | |
| | Corporate Bonds — continued | | | | |
| | | | Russia — continued | |
| | 700 | | | Gazprom OAO Via Gaz Capital SA, Reg. S, 4.950%, 02/06/28 | | | 704 | |
| | 1,486 | | | Metalloinvest Finance DAC, 4.850%, 05/02/24 (e) | | | 1,485 | |
| | 750 | | | Phosagro OAO via Phosagro Bond Funding DAC, 3.950%, 11/03/21 (e) | | | 751 | |
| | 400 | | | Sberbank of Russia Via SB Capital SA, Reg. S, 6.125%, 02/07/22 | | | 437 | |
| | 1,900 | | | Vnesheconombank Via VEB Finance plc, Reg. S, 6.025%, 07/05/22 | | | 2,040 | |
| | 200 | | | VTB Bank OJSC Via VTB Capital SA, Reg. S, 6.950%, 10/17/22 | | | 218 | |
| | | | | | | | |
| | | | | | | 7,333 | |
| | | | | | | | |
| | | | South Africa — 0.9% | |
| | | | Eskom Holdings SOC Ltd., | | | | |
| | 300 | | | Reg. S, 6.750%, 08/06/23 | | | 310 | |
| | 800 | | | Reg. S, 7.125%, 02/11/25 | | | 827 | |
| | 1,450 | | | MTN Mauritius Investment Ltd., Reg. S, 6.500%, 10/13/26 | | | 1,492 | |
| | 200 | | | Transnet SOC Ltd., Reg. S, 4.000%, 07/26/22 | | | 195 | |
| | | | | | | | |
| | | | | | | 2,824 | |
| | | | | | | | |
| | | | South Korea — 0.1% | |
| | 270 | | | Woori Bank, Reg. S, VAR, 4.500%, 09/27/21 (x) (y) | | | 265 | |
| | | | | | | | |
| | | | Sri Lanka — 0.1% | |
| | 400 | | | National Savings Bank, Reg. S, 8.875%, 09/18/18 | | | 425 | |
| | | | | | | | |
| | | | Trinidad and Tobago — 0.4% | |
| | 1,150 | | | Petroleum Co. of Trinidad & Tobago Ltd., Reg. S, 9.750%, 08/14/19 | | | 1,221 | |
| | | | | | | | |
| | | | Tunisia — 0.4% | |
| | 1,310 | | | Republic of Banque Centrale de Tunisie, Reg. S, 5.750%, 01/30/25 | | | 1,285 | |
| | | | | | | | |
| | | | Turkey — 0.1% | |
| | 200 | | | KOC Holding A/S, Reg. S, 5.250%, 03/15/23 | | | 206 | |
| | 200 | | | Turkiye Sise ve Cam Fabrikalari A/S, Reg. S, 4.250%, 05/09/20 | | | 200 | |
| | | | | | | | |
| | | | | | | 406 | |
| | | | | | | | |
| | | | Ukraine — 0.2% | |
| | 300 | | | Oschadbank Via SSB #1 plc, Reg. S, SUB, 9.375%, 03/10/23 | | | 306 | |
| | 400 | | | Ukreximbank Via Biz Finance plc, Reg. S, 9.750%, 01/22/25 | | | 402 | |
| | | | | | | | |
| | | | | | | 708 | |
| | | | | | | | |
| | | | | | | | |
PRINCIPAL
AMOUNT | | | SECURITY DESCRIPTION | | VALUE | |
| | | | | | | | |
| | | | United Arab Emirates — 0.6% | |
| | 930 | | | DP World Ltd., Reg. S, 6.850%, 07/02/37 | | | 1,093 | |
| | 200 | | | EA Partners I BV, Reg. S, 6.875%, 09/28/20 | | | 181 | |
| | 650 | | | MAF Global Securities Ltd., Reg. S, VAR, 7.125%, 10/29/18 (x) (y) | | | 685 | |
| | | | | | | | |
| | | | | | | 1,959 | |
| | | | | | | | |
| | | | United Kingdom — 0.1% | |
| | 200 | | | Genel Energy Finance plc, Reg. S, 7.500%, 05/14/19 (e) | | | 175 | |
| | | | | | | | |
| | | | Venezuela — 0.1% | |
| | | | Petroleos de Venezuela SA, | | | | |
| | 150 | | | Reg. S, 5.375%, 04/12/27 | | | 58 | |
| | 370 | | | Reg. S, 12.750%, 02/17/22 | | | 228 | |
| | | | | | | | |
| | | | | | | 286 | |
| | | | | | | | |
| | | | Total Corporate Bonds
(Cost $69,928) | | | 70,558 | |
| | | | | | | | |
| | Foreign Government Securities — 62.9% | | | | |
| | | | Angola — 0.9% | |
| | | | Republic of Angola, | | | | |
| | 1,070 | | | 9.500%, 11/12/25 | | | 1,120 | |
| | 563 | | | Reg. S, 7.000%, 08/17/19 | | | 581 | |
| | 1,130 | | | Reg. S, 9.500%, 11/12/25 | | | 1,184 | |
| | | | | | | | |
| | | | | | | 2,885 | |
| | | | | | | | |
| | | | Argentina — 4.6% | |
| | 1,600 | | | Provincia de Buenos Aires, Reg. S, 9.950%, 06/09/21 | | | 1,844 | |
| | | | Republic of Argentina, | | | | |
| | 3,470 | | | 6.875%, 04/22/21 | | | 3,777 | |
| | 750 | | | 7.450%, 09/01/24 (e) | | | 778 | |
| | 1,760 | | | 7.500%, 04/22/26 | | | 1,938 | |
| | 939 | | | 7.875%, 06/15/27 (e) | | | 979 | |
| ARS | 1,900 | | | 15.500%, 10/17/26 | | | 136 | |
| ARS | 4,300 | | | 16.000%, 10/17/23 | | | 299 | |
| ARS | 32,900 | | | 18.200%, 10/03/21 | | | 2,334 | |
| | 500 | | | Reg. S, 7.125%, 06/10/21 | | | 528 | |
| | 1,136 | | | Series NY, 8.280%, 12/31/33 | | | 1,272 | |
| | 900 | | | Series NY, SUB, 2.500%, 12/31/38 | | | 599 | |
| | | | | | | | |
| | | | | | | 14,484 | |
| | | | | | | | |
| | | | Armenia — 0.4% | |
| | 1,100 | | | Republic of Armenia, Reg. S, 7.150%, 03/26/25 | | | 1,199 | |
| | | | | | | | |
| | | | Azerbaijan — 1.0% | |
| | 800 | | | Republic of Azerbaijan, Reg. S, 4.750%, 03/18/24 | | | 816 | |
SEE NOTES TO FINANCIAL STATEMENTS.
| | | | | | | | |
| | | |
| APRIL 30, 2017 | | J.P. MORGAN FUNDS | | | | | 7 | |
JPMorgan Emerging Markets Strategic Debt Fund
SCHEDULE OF PORTFOLIO INVESTMENTS
AS OF APRIL 30, 2017 (Unaudited) (continued)
(Amounts in U.S. Dollars, unless otherwise noted)
(Amounts in thousands)
| | | | | | | | |
PRINCIPAL
AMOUNT | | | SECURITY DESCRIPTION | | VALUE | |
| | Foreign Government Securities — continued | | | | |
| | | | Azerbaijan — continued | |
| | | | State Oil Co. of the Azerbaijan Republic, | | | | |
| | 700 | | | Reg. S, 4.750%, 03/13/23 | | | 694 | |
| | 1,550 | | | Reg. S, 6.950%, 03/18/30 | | | 1,678 | |
| | | | | | | | |
| | | | | | | 3,188 | |
| | | | | | | | |
| | | | Belarus — 1.3% | |
| | 4,030 | | | Republic of Belarus, Reg. S, 8.950%, 01/26/18 | | | 4,167 | |
| | | | | | | | |
| | | | Bermuda — 0.2% | |
| | 600 | | | Republic of Bermuda, Reg. S, 4.854%, 02/06/24 | | | 636 | |
| | | | | | | | |
| | | | Bolivia — 0.1% | |
| | 280 | | | Plurinational State of Bolivia, 4.500%, 03/20/28 (e) | | | 273 | |
| | | | | | | | |
| | | | Brazil — 4.0% | |
| | | | Federative Republic of Brazil, | | | | |
| | 1,450 | | | 6.000%, 04/07/26 | | | 1,592 | |
| | 2,300 | | | 8.250%, 01/20/34 | | | 2,921 | |
| | BRL 8,020 | | | Series B, 6.000%, 08/15/22 | | | 7,768 | |
| | BRL 1,000 | | | Series F, 10.000%, 01/01/21 | | | 316 | |
| | | | | | | | |
| | | | | | | 12,597 | |
| | | | | | | | |
| | | | Cameroon — 0.4% | |
| | | | Republic of Cameroon, | | | | |
| | 700 | | | 9.500%, 11/19/25 | | | 797 | |
| | 300 | | | Reg. S, 9.500%, 11/19/25 | | | 341 | |
| | | | | | | | |
| | | | | | | 1,138 | |
| | | | | | | | |
| | | | Colombia — 1.6% | |
| | | | Republic of Colombia, | | | | |
| | 1,100 | | | 3.875%, 04/25/27 | | | 1,108 | |
| | 400 | | | 4.500%, 01/28/26 | | | 426 | |
| | 1,100 | | | 7.375%, 09/18/37 | | | 1,413 | |
| | COP 6,251,000 | | | Series B, 6.000%, 04/28/28 | | | 2,037 | |
| | | | | | | | |
| | | | | | | 4,984 | |
| | | | | | | | |
| | | | Costa Rica — 1.1% | |
| | | | Republic of Costa Rica, | | | | |
| | 500 | | | Reg. S, 4.250%, 01/26/23 | | | 486 | |
| | 500 | | | Reg. S, 5.875%, 04/25/21 | | | 516 | |
| | 800 | | | Reg. S, 6.375%, 05/15/43 | | | 691 | |
| | 300 | | | Reg. S, 7.000%, 04/04/44 | | | 309 | |
| | 1,400 | | | Reg. S, 7.158%, 03/12/45 | | | 1,456 | |
| | | | | | | | |
| | | | | | | 3,458 | |
| | | | | | | | |
| | | | Croatia — 1.1% | |
| | | | Republic of Croatia, | | | | |
| | 800 | | | Reg. S, 6.000%, 01/26/24 | | | 889 | |
| | | | | | | | |
PRINCIPAL
AMOUNT | | | SECURITY DESCRIPTION | | VALUE | |
| | | | | | | | |
| | | | Croatia — continued | |
| | 1,300 | | | Reg. S, 6.375%, 03/24/21 | | | 1,438 | |
| | 1,000 | | | Reg. S, 6.625%, 07/14/20 | | | 1,100 | |
| | | | | | | | |
| | | | | | | 3,427 | |
| | | | | | | | |
| | | | | |
| | | | Dominican Republic — 2.7% | |
| | | | Government of Dominican Republic, | | | | |
| | DOP 6,000 | | | 11.250%, 02/05/27 | | | 130 | |
| | 1,200 | | | Reg. S, 5.875%, 04/18/24 | | | 1,278 | |
| | 3,700 | | | Reg. S, 6.875%, 01/29/26 | | | 4,125 | |
| | 1,800 | | | Reg. S, 7.450%, 04/30/44 | | | 2,039 | |
| | 1,000 | | | Reg. S, 7.500%, 05/06/21 | | | 1,109 | |
| | | | | | | | |
| | | | | | | 8,681 | |
| | | | | | | | |
| | | | Ecuador — 1.2% | |
| | | | Republic of Ecuador, | | | | |
| | 1,600 | | | Reg. S, 7.950%, 06/20/24 | | | 1,528 | |
| | 300 | | | Reg. S, 10.500%, 03/24/20 | | | 321 | |
| | 1,850 | | | Reg. S, 10.750%, 03/28/22 | | | 2,003 | |
| | | | | | | | |
| | | | | | | 3,852 | |
| | | | | | | | |
| | | | Egypt — 1.3% | |
| | | | Republic of Egypt, | | | | |
| | 200 | | | 6.125%, 01/31/22 (e) | | | 208 | |
| | 1,200 | | | 8.500%, 01/31/47 (e) | | | 1,305 | |
| | 650 | | | Reg. S, 5.750%, 04/29/20 | | | 677 | |
| | 1,000 | | | Reg. S, 5.875%, 06/11/25 | | | 988 | |
| | 300 | | | Reg. S, 6.125%, 01/31/22 (e) | | | 312 | |
| | 700 | | | Reg. S, 7.500%, 01/31/27 | | | 754 | |
| | | | | | | | |
| | | | | | | 4,244 | |
| | | | | | | | |
| | | | El Salvador — 1.1% | |
| | | | Republic of El Salvador, | | | | |
| | 1,210 | | | Reg. S, 5.875%, 01/30/25 | | | 1,080 | |
| | 150 | | | Reg. S, 6.375%, 01/18/27 | | | 132 | |
| | 1,250 | | | Reg. S, 7.625%, 02/01/41 | | | 1,119 | |
| | 140 | | | Reg. S, 7.650%, 06/15/35 | | | 127 | |
| | 550 | | | Reg. S, 7.750%, 01/24/23 | | | 553 | |
| | 625 | | | Reg. S, 8.250%, 04/10/32 | | | 609 | |
| | | | | | | | |
| | | | | | | 3,620 | |
| | | | | | | | |
| | | | Ethiopia — 0.5% | |
| | | | Republic of Ethopia, | | | | |
| | 385 | | | 6.625%, 12/11/24 | | | 379 | |
| | 1,280 | | | Reg. S, 6.625%, 12/11/24 | | | 1,261 | |
| | | | | | | | |
| | | | | | | 1,640 | |
| | | | | | | | |
SEE NOTES TO FINANCIAL STATEMENTS.
| | | | | | |
| | | |
| 8 | | | | J.P. MORGAN FUNDS | | APRIL 30, 2017 |
| | | | | | | | |
PRINCIPAL
AMOUNT | | | SECURITY DESCRIPTION | | VALUE | |
| | Foreign Government Securities — continued | | | | |
| | | | Gabon — 0.3% | | | | |
| | 900 | | | Gabonese Republic, Reg. S, 6.375%, 12/12/24 | | | 881 | |
| | | | | | | | |
| | | | Ghana — 0.8% | | | | |
| | | | Republic of Ghana, | | | | |
| | 806 | | | 10.750%, 10/14/30 | | | 973 | |
| | 1,000 | | | Reg. S, 8.125%, 01/18/26 | | | 985 | |
| | 494 | | | Reg. S, 10.750%, 10/14/30 | | | 597 | |
| | | | | | | | |
| | | | | | | 2,555 | |
| | | | | | | | |
| | | | Honduras — 0.3% | | | | |
| | 800 | | | Republic of Honduras, Reg. S, 8.750%, 12/16/20 | | | 911 | |
| | | | | | | | |
| | | | Hungary — 2.0% | | | | |
| | | | Republic of Hungary, | | | | |
| | 300 | | | 5.375%, 03/25/24 | | | 337 | |
| | 3,724 | | | 5.750%, 11/22/23 | | | 4,236 | |
| HUF | 288,690 | | | Series 23-A, 6.000%, 11/24/23 | | | 1,211 | |
| HUF | 110,000 | | | Series 24-B, 3.000%, 06/26/24 | | | 386 | |
| | | | | | | | |
| | | | | | | 6,170 | |
| | | | | | | | |
| | | | India — 0.1% | | | | |
| | 200 | | | Export-Import Bank of India, Reg. S, 3.375%, 08/05/26 | | | 192 | |
| | | | | | | | |
| | | | Indonesia — 2.3% | | | | |
| | | | Republic of Indonesia, | | | | |
| | 1,000 | | | Reg. S, 4.125%, 01/15/25 | | | 1,030 | |
| | 300 | | | Reg. S, 5.875%, 01/15/24 | | | 342 | |
| | 300 | | | Reg. S, 5.950%, 01/08/46 | | | 353 | |
| | 1,600 | | | Reg. S, 6.625%, 02/17/37 | | | 1,962 | |
| IDR | 1,302,000 | | | Series FR70, 8.375%, 03/15/24 | | | 104 | |
| IDR | 41,010,000 | | | Series FR71, 9.000%, 03/15/29 | | | 3,433 | |
| | | | | | | | |
| | | | | | | 7,224 | |
| | | | | | | | |
| | | | Iraq — 1.2% | | | | |
| | 4,110 | | | Republic of Iraq, Reg. S, 5.800%, 01/15/28 | | | 3,663 | |
| | | | | | | | |
| | | | Ivory Coast — 0.3% | | | | |
| | | | Republic of Ivory Coast, | | | | |
| | 200 | | | Reg. S, 5.375%, 07/23/24 | | | 195 | |
| | 784 | | | Reg. S, SUB, 5.750%, 12/31/32 | | | 754 | |
| | | | | | | | |
| | | | | | | 949 | |
| | | | | | | | |
| | | | Jamaica — 0.5% | | | | |
| | | | Government of Jamaica, | | | | |
| | 300 | | | 6.750%, 04/28/28 | | | 335 | |
| | 300 | | | 8.000%, 06/24/19 | | | 316 | |
| | 800 | | | 8.000%, 03/15/39 | | | 930 | |
| | | | | | | | |
| | | | | | | 1,581 | |
| | | | | | | | |
| | | | | | | | |
PRINCIPAL
AMOUNT | | | SECURITY DESCRIPTION | | VALUE | |
| | | | | | | | |
| | | | Jordan — 0.4% | | | | |
| | | | Kingdom of Jordan, | | | | |
| | 700 | | | Reg. S, 5.750%, 01/31/27 | | | 691 | |
| | 700 | | | Reg. S, 6.125%, 01/29/26 | | | 715 | |
| | | | | | | | |
| | | | | | | 1,406 | |
| | | | | | | | |
| | | | Kazakhstan — 0.7% | | | | |
| | | | Republic of Kazakhstan, | | | | |
| | 1,100 | | | Reg. S, 5.125%, 07/21/25 | | | 1,203 | |
| | 800 | | | Reg. S, 6.500%, 07/21/45 | | | 953 | |
| | | | | | | | |
| | | | | | | 2,156 | |
| | | | | | | | |
| | | | | |
| | | | Kenya — 0.3% | | | | |
| | 1,000 | | | Republic of Kenya, Reg. S, 6.875%, 06/24/24 | | | 1,011 | |
| | | | | | | | |
| | | | Lebanon — 3.4% | | | | |
| | | | Republic of Lebanon, | | | | |
| | 1,000 | | | 6.250%, 05/27/22 | | | 1,032 | |
| | 760 | | | 6.375%, 03/09/20 | | | 790 | |
| | 2,632 | | | Reg. S, 5.450%, 11/28/19 | | | 2,685 | |
| | 1,125 | | | Reg. S, 6.600%, 11/27/26 | | | 1,136 | |
| | 3,800 | | | Reg. S, 6.650%, 02/26/30 | | | 3,795 | |
| | 1,200 | | | Reg. S, 8.250%, 04/12/21 | | | 1,329 | |
| | | | | | | | |
| | | | | | | 10,767 | |
| | | | | | | | |
| | | | Malaysia — 0.3% | | | | |
| | 1,000 | | | 1MDB Global Investments Ltd., Reg. S, 4.400%, 03/09/23 | | | 928 | |
| | | | | | | | |
| | | | Mexico — 2.3% | | | | |
| | | | United Mexican States, | | | | |
| | 800 | | | 4.150%, 03/28/27 | | | 824 | |
| | 1,950 | | | 5.550%, 01/21/45 | | | 2,150 | |
| | 100 | | | 5.750%, 10/12/10 | | | 102 | |
| MXN | 6,700 | | | Series M, 5.750%, 03/05/26 | | | 322 | |
| MXN | 31,800 | | | Series M, 6.500%, 06/09/22 | | | 1,645 | |
| MXN | 3,500 | | | Series M, 7.750%, 05/29/31 | | | 190 | |
| MXN | 37,000 | | | Series M, 7.750%, 11/23/34 | | | 2,001 | |
| MXN | 3,000 | | | Series M, 8.000%, 11/07/47 | | | 165 | |
| | | | | | | | |
| | | | | | | 7,399 | |
| | | | | | | | |
| | | | Mongolia — 0.3% | | | | |
| | | | Mongolia Government Bond, | | | | |
| | 200 | | | 8.750%, 03/09/24 (e) | | | 222 | |
| | 600 | | | Reg. S, 10.875%, 04/06/21 | | | 698 | |
| | | | | | | | |
| | | | | | | 920 | |
| | | | | | | | |
SEE NOTES TO FINANCIAL STATEMENTS.
| | | | | | | | |
| | | |
| APRIL 30, 2017 | | J.P. MORGAN FUNDS | | | | | 9 | |
JPMorgan Emerging Markets Strategic Debt Fund
SCHEDULE OF PORTFOLIO INVESTMENTS
AS OF APRIL 30, 2017 (Unaudited) (continued)
(Amounts in U.S. Dollars, unless otherwise noted)
(Amounts in thousands, except number of Options contracts)
| | | | | | | | |
PRINCIPAL
AMOUNT | | | SECURITY DESCRIPTION | | VALUE | |
| | Foreign Government Securities — continued | | | | |
| | | | Morocco — 0.1% | | | | |
| | 200 | | | Kingdom of Morocco, Reg. S, 5.500%, 12/11/42 | | | 218 | |
| | | | | | | | |
| | | | Namibia — 0.4% | |
| | 1,330 | | | Republic of Namibia, Reg. S, 5.250%, 10/29/25 | | | 1,345 | |
| | | | | | | | |
| | | | Nigeria — 0.8% | |
| | | | Republic of Nigeria, | | | | |
| | 2,330 | | | 7.875%, 02/16/32 (e) | | | 2,525 | |
| | | | | | | | |
| | | | Oman — 1.7% | |
| | | | Oman Government Bond, | | | | |
| | 3,140 | | | 6.500%, 03/08/47 (e) | | | 3,375 | |
| | 1,900 | | | Reg. S, 4.750%, 06/15/26 | | | 1,912 | |
| | | | | | | | |
| | | | | | | 5,287 | |
| | | | | | | | |
| | | | Pakistan — 1.1% | |
| | | | Republic of Pakistan, | | | | |
| | 1,620 | | | Reg. S, 6.875%, 06/01/17 | | | 1,627 | |
| | 1,000 | | | Reg. S, 7.250%, 04/15/19 | | | 1,057 | |
| | 600 | | | Reg. S, 8.250%, 04/15/24 | | | 668 | |
| | | | | | | | |
| | | | | | | 3,352 | |
| | | | | | | | |
| | | | Panama — 0.8% | |
| | | | Republic of Panama, | | | | |
| | 200 | | | 6.700%, 01/26/36 | | | 258 | |
| | 200 | | | 8.875%, 09/30/27 | | | 285 | |
| | 1,400 | | | 9.375%, 04/01/29 | | | 2,079 | |
| | | | | | | | |
| | | | | | | 2,622 | |
| | | | | | | | |
| | | | Paraguay — 0.9% | |
| | | | Republic of Paraguay, | | | | |
| | 470 | | | 4.700%, 03/27/27 (e) | | | 477 | |
| | 800 | | | Reg. S, 5.000%, 04/15/26 | | | 833 | |
| | 1,500 | | | Reg. S, 6.100%, 08/11/44 | | | 1,609 | |
| | | | | | | | |
| | | | | | | 2,919 | |
| | | | | | | | |
| | | | Peru — 1.1% | |
| | | | Republic of Peru, | | | | |
| | 100 | | | 4.125%, 08/25/27 | | | 109 | |
| | 450 | | | 5.625%, 11/18/50 | | | 543 | |
| | 1,300 | | | 8.750%, 11/21/33 | | | 1,989 | |
| | PEN 2,291 | | | Reg. S, 6.900%, 08/12/37 | | | 768 | |
| | | | | | | | |
| | | | | | | 3,409 | |
| | | | | | | | |
| | | | Philippines — 0.9% | |
| | 2,050 | | | Republic of Philippines, 7.750%, 01/14/31 | | | 2,929 | |
| | | | | | | | |
| | | | | | | | |
PRINCIPAL
AMOUNT | | | SECURITY DESCRIPTION | | VALUE | |
| | | | | | | | |
| | | | Romania — 0.5% | |
| | | | Republic of Romania, | | | | |
| | 1,200 | | | Reg. S, 4.375%, 08/22/23 | | | 1,270 | |
| | 300 | | | Reg. S, 4.875%, 01/22/24 | | | 327 | |
| | | | | | | | |
| | | | | | | 1,597 | |
| | | | | | | | |
| | | | Russia — 2.1% | |
| | | | Russian Federation, | | | | |
| | 800 | | | Reg. S, 4.875%, 09/16/23 | | | 868 | |
| | 200 | | | Reg. S, 5.000%, 04/29/20 | | | 214 | |
| RUB | 30,000 | | | Series 6211, 7.000%, 01/25/23 | | | 513 | |
| RUB | 18,000 | | | Series 6217, 7.500%, 08/18/21 | | | 314 | |
| RUB | 265,000 | | | Series 6219, 7.750%, 09/16/26 | | | 4,706 | |
| | | | | | | | |
| | | | | | | 6,615 | |
| | | | | | | | |
| | | | Senegal — 0.1% | |
| | 300 | | | Republic of Senegal, Reg. S, 6.250%, 07/30/24 | | | 306 | |
| | | | | | | | |
| | | | | |
| | | | Serbia — 0.6% | |
| | | | Republic of Serbia, | | | | |
| | 200 | | | Reg. S, 4.875%, 02/25/20 | | | 208 | |
| | 1,400 | | | Reg. S, 7.250%, 09/28/21 | | | 1,612 | |
| | | | | | | | |
| | | | | | | 1,820 | |
| | | | | | | | |
| | | | South Africa — 1.3% | |
| | | | Republic of South Africa, | | | | |
| | 1,200 | | | 4.300%, 10/12/28 | | | 1,135 | |
| | 600 | | | 5.000%, 10/12/46 | | | 567 | |
| | 1,000 | | | 5.500%, 03/09/20 | | | 1,063 | |
| | 300 | | | 5.875%, 09/16/25 | | | 325 | |
| | 100 | | | 6.250%, 03/08/41 | | | 111 | |
| ZAR | 10,879 | | | Series 2035, 8.875%, 02/28/35 | | | 773 | |
| | | | | | | | |
| | | | | | | 3,974 | |
| | | | | | | | |
| | | | Sri Lanka — 2.0% | |
| | | | Republic of Sri Lanka, | | | | |
| | 1,000 | | | Reg. S, 6.250%, 10/04/20 | | | 1,059 | |
| | 3,300 | | | Reg. S, 6.250%, 07/27/21 | | | 3,494 | |
| | 1,300 | | | Reg. S, 6.825%, 07/18/26 | | | 1,366 | |
| | 400 | | | Reg. S, 6.850%, 11/03/25 | | | 421 | |
| | | | | | | | |
| | | | | | | 6,340 | |
| | | | | | | | |
| | | | Turkey — 3.3% | |
| | | | Republic of Turkey, | | | | |
| | 1,000 | | | 4.875%, 04/16/43 | | | 905 | |
| | 300 | | | 5.625%, 03/30/21 | | | 318 | |
| | 1,700 | | | 6.000%, 01/14/41 | | | 1,762 | |
SEE NOTES TO FINANCIAL STATEMENTS.
| | | | | | |
| | | |
| 10 | | | | J.P. MORGAN FUNDS | | APRIL 30, 2017 |
| | | | | | | | |
PRINCIPAL
AMOUNT | | | SECURITY DESCRIPTION | | VALUE | |
| | Foreign Government Securities — continued | | | | |
| | | | Turkey — continued | |
| | 400 | | | 6.625%, 02/17/45 | | | 448 | |
| | 2,600 | | | 7.375%, 02/05/25 | | | 3,022 | |
| | 100 | | | 8.000%, 02/14/34 | | | 125 | |
| TRY | 2,341 | | | 10.500%, 01/15/20 | | | 654 | |
| TRY | 11,210 | | | 10.600%, 02/11/26 | | | 3,213 | |
| | | | | | | | |
| | | | | | | 10,447 | |
| | | | | | | | |
| | | | Ukraine — 3.2% | |
| | | | Republic of Ukraine, | | | | |
| | 810 | | | Reg. S, 0.000%, 05/31/40 | | | 285 | |
| | 4,200 | | | Reg. S, 7.750%, 09/01/19 | | | 4,297 | |
| | 500 | | | Reg. S, 7.750%, 09/01/20 | | | 505 | |
| | 1,300 | | | Reg. S, 7.750%, 09/01/21 | | | 1,297 | |
| | 1,700 | | | Reg. S, 7.750%, 09/01/24 | | | 1,625 | |
| | 2,165 | | | Reg. S, 7.750%, 09/01/27 | | | 2,035 | |
| | | | | | | | |
| | | | | | | 10,044 | |
| | | | | | | | |
| | | | Uruguay — 1.3% | |
| | | | Republic of Uruguay, | | | | |
| | 1,000 | | | 4.375%, 10/27/27 | | | 1,050 | |
| | 450 | | | 5.100%, 06/18/50 | | | 446 | |
| | 2,000 | | | 7.875%, 01/15/33 | | | 2,660 | |
| | | | | | | | |
| | | | | | | 4,156 | |
| | | | | | | | |
| | | | Venezuela — 1.0% | |
| | | | Republic of Venezuela, | | | | |
| | 440 | | | 9.250%, 09/15/27 | | | 233 | |
| | 20 | | | 9.375%, 01/13/34 | | | 10 | |
| | 1,470 | | | Reg. S, 6.000%, 11/15/26 | | | 558 | |
| | 120 | | | Reg. S, 7.000%, 12/01/18 | | | 84 | |
| | 400 | | | Reg. S, 7.000%, 03/31/38 | | | 178 | |
| | 150 | | | Reg. S, 7.650%, 04/21/25 | | | 70 | |
| | 360 | | | Reg. S, 7.750%, 10/13/19 | | | 217 | |
| | 400 | | | Reg. S, 8.500%, 10/27/20 | | | 313 | |
| | 280 | | | Reg. S, 9.000%, 11/17/21 | | | 146 | |
| | 90 | | | Reg. S, 9.000%, 05/07/23 | | | 44 | |
| | 800 | | | Reg. S, 9.250%, 05/07/28 | | | 380 | |
| | 350 | | | Reg. S, 9.750%, 05/17/35 | | | 166 | |
| | 170 | | | Reg. S, 11.750%, 10/21/26 | | | 99 | |
| | 630 | | | Reg. S, 11.950%, 08/05/31 | | | 364 | |
| | 350 | | | Reg. S, 12.750%, 08/23/22 | | | 217 | |
| | | | | | | | |
| | | | | | | 3,079 | |
| | | | | | | | |
| | | | Zambia — 0.7% | |
| | 2,000 | | | Republic of Zambia, Reg. S, 8.970%, 07/30/27 | | | 2,123 | |
| | | | | | | | |
| | | | Total Foreign Government Securities
(Cost $196,465) | | | 198,293 | |
| | | | | | | | |
| | | | | | | | |
NUMBER OF
CONTRACTS | | | SECURITY DESCRIPTION | | VALUE | |
| | Option Purchased — 0.0% (g) | |
| | | | Foreign Exchange Currency Options — 0.0% (g) | |
| | 4,848,315 | | | BRL Put/USD Call, Expiring 07/11/17 @ 3.44 BRL to 1 USD, Vanilla, European Style (a) | | | 39 | |
| | 702,653 | | | CLP Put/USD Call, Expiring 05/22/17 @ 675.58 CLP to 1 USD, Vanilla, European Style (a) | | | 4 | |
| | 982,521 | | | IDR Put/USD Call, Expiring 06/09/17 @ 13,901.00 IDR to 1 USD, Vanilla, European Style (a) | | | 1 | |
| | 704,125 | | | MXN Put/USD Call, Expiring 05/22/17 @ 21.58 MXN to 1 USD, Vanilla, European Style (a) | | | — | (h) |
| | 4,848,315 | | | PLN Put/USD Call, Expiring 06/09/17 @ 4.20 PLN to 1 USD, Vanilla, European Style (a) | | | 4 | |
| | 4,483,522 | | | ZAR Put/USD Call, Expiring 06/23/17 @ 13.65 ZAR to 1 USD, Vanilla, European Style (a) | | | 96 | |
| | | | | | | | |
| | | | Total Options Purchased
(Cost $144) | | | 144 | |
| | | | | | | | |
| | |
PRINCIPAL
AMOUNT | | | | | | |
| | U.S. Treasury Obligation — 0.3% | |
| | 900 | | | U.S. Treasury Inflation Linked Note, VAR, 0.125%, 07/15/26 (Cost $888) | | | 898 | |
| | | | | | | | |
| | |
| SHARES | | | | | | |
| | Short-Term Investment — 2.0% | |
| | | | Investment Company — 2.0% | |
| | 6,383 | | | JPMorgan Prime Money Market Fund, Institutional Class Shares, 1.000% (b) (l) (Cost $6,386) | | | 6,386 | |
| | | | | | | | |
| | | | Total Investments — 87.6%
(Cost $273,811) | | | 276,279 | |
| | | | Other Assets in Excess of
Liabilities — 12.4% | | | 39,091 | |
| | | | | | | | |
| | | | NET ASSETS — 100.0% | | $ | 315,370 | |
| | | | | | | | |
Percentages indicated are based on net assets.
SEE NOTES TO FINANCIAL STATEMENTS.
| | | | | | | | |
| | | |
| APRIL 30, 2017 | | J.P. MORGAN FUNDS | | | | | 11 | |
JPMorgan Emerging Markets Strategic Debt Fund
SCHEDULE OF PORTFOLIO INVESTMENTS
AS OF APRIL 30, 2017 (Unaudited) (continued)
(Amounts in U.S. Dollars, unless otherwise noted)
(Amounts in thousands, except number of Futures contracts)
| | | | | | | | | | | | | | | | | | | | |
| Futures Contracts | |
NUMBER OF
CONTRACTS | | | DESCRIPTION | | EXPIRATION
DATE | | | TRADING
CURRENCY | | | NOTIONAL
VALUE AT
APRIL 30, 2017 | | | NET
UNREALIZED
APPRECIATION
(DEPRECIATION) | |
| | | | Short Futures Outstanding | | | | | | | | | | | | | | | | |
| | (24 | ) | | Euro Bobl | | | 06/08/17 | | | | EUR | | | | (3,447 | ) | | | (12 | ) |
| | (32 | ) | | Euro Bund | | | 06/08/17 | | | | EUR | | | | (5,639 | ) | | | (44 | ) |
| | (13 | ) | | Euro OAT | | | 06/08/17 | | | | EUR | | | | (2,122 | ) | | | (33 | ) |
| | (18 | ) | | 10 Year U.S. Treasury Note | | | 06/21/17 | | | | USD | | | | (2,263 | ) | | | (4 | ) |
| | (92 | ) | | 5 Year U.S. Treasury Note | | | 06/30/17 | | | | USD | | | | (10,893 | ) | | | (103 | ) |
| | (22 | ) | | 90-Day Eurodollar | | | 12/18/17 | | | | USD | | | | (5,418 | ) | | | 21 | |
| | (270 | ) | | 90-Day Eurodollar | | | 12/17/18 | | | | USD | | | | (66,248 | ) | | | (103 | ) |
| | (35 | ) | | 90-Day Eurodollar | | | 12/16/19 | | | | USD | | | | (8,566 | ) | | | (4 | ) |
| | | | | | | | | | | | | | | | | | | | |
| | | | | (282 | ) |
| | | | | | | | | | | | | | | | | | | | |
| | | | | | | | | | | | | | | | | | | | | | |
| Forward Foreign Currency Exchange Contracts | | | | | | | | | | | | |
CONTRACTS
TO BUY | | | CURRENCY | | COUNTERPARTY | | SETTLEMENT
DATE | | | SETTLEMENT
VALUE | | | VALUE AT
APRIL 30, 2017 | | | NET
UNREALIZED
APPRECIATION
(DEPRECIATION) | |
| | 895 | | | EUR | | | | | | | | | | | | | | | | | | |
| | 18,635 | | | for MXN | | Barclays Bank plc | | | 06/14/17 | | | | 982 | # | | | 977 | # | | | (5 | ) |
| | 6,587 | | | ARS | | Goldman Sachs International† | | | 06/14/17 | | | | 416 | | | | 419 | | | | 3 | |
| | 5,463 | | | BRL | | Merrill Lynch International† | | | 06/14/17 | | | | 1,734 | | | | 1,703 | | | | (31 | ) |
| | 3,938 | | | BRL | | Goldman Sachs International† | | | 07/18/17 | | | | 1,230 | | | | 1,218 | | | | (12 | ) |
| | 645 | | | CHF | | National Australia Bank | | | 07/18/17 | | | | 642 | | | | 651 | | | | 9 | |
| | 6,151 | | | CNH | | HSBC Bank, NA | | | 06/14/17 | | | | 890 | | | | 888 | | | | (2 | ) |
| | 12,227,399 | | | COP | | Goldman Sachs International† | | | 06/14/17 | | | | 4,162 | | | | 4,127 | | | | (35 | ) |
| | 926,854 | | | COP | | Merrill Lynch International† | | | 06/14/17 | | | | 312 | | | | 313 | | | | 1 | |
| | 17,037 | | | CZK | | HSBC Bank, NA | | | 07/18/17 | | | | 696 | | | | 695 | | | | (1 | ) |
| | 185 | | | EUR | | National Australia Bank | | | 06/14/17 | | | | 199 | | | | 202 | | | | 3 | |
| | 523 | | | GBP | | HSBC Bank, NA | | | 07/18/17 | | | | 674 | | | | 679 | | | | 5 | |
| | 139,975 | | | HUF | | Barclays Bank plc | | | 06/14/17 | | | | 488 | | | | 488 | | | | — | (h) |
| | 142,098 | | | HUF | | Citibank, NA | | | 06/14/17 | | | | 487 | | | | 495 | | | | 8 | |
| | 22,746,750 | | | IDR | | HSBC Bank, NA† | | | 05/15/17 | | | | 1,704 | | | | 1,705 | | | | 1 | |
| | 36,630,075 | | | IDR | | Goldman Sachs International† | | | 06/14/17 | | | | 2,731 | | | | 2,736 | | | | 5 | |
| | 2,362 | | | ILS | | Societe Generale | | | 07/18/17 | | | | 649 | | | | 654 | | | | 5 | |
| | 57,936 | | | INR | | Merrill Lynch International† | | | 06/14/17 | | | | 878 | | | | 897 | | | | 19 | |
| | 3,777 | | | MXN | | Credit Suisse International | | | 06/14/17 | | | | 194 | | | | 199 | | | | 5 | |
| | 91,342 | | | MXN | | Goldman Sachs International | | | 06/14/17 | | | | 4,737 | | | | 4,816 | | | | 79 | |
| | 1,337 | | | MXN | | Societe Generale | | | 06/14/17 | | | | 68 | | | | 70 | | | | 2 | |
| | 24,386 | | | MXN | | Royal Bank of Canada | | | 07/18/17 | | | | 1,279 | | | | 1,279 | | | | — | (h) |
| | 8,470 | | | MYR | | Goldman Sachs International† | | | 06/14/17 | | | | 1,957 | | | | 1,953 | | | | (4 | ) |
| | 5,019 | | | PEN | | Goldman Sachs International† | | | 06/14/17 | | | | 1,532 | | | | 1,539 | | | | 7 | |
| | 2,092 | | | PEN | | Merrill Lynch International† | | | 06/14/17 | | | | 640 | | | | 642 | | | | 2 | |
SEE NOTES TO FINANCIAL STATEMENTS.
| | | | | | |
| | | |
| 12 | | | | J.P. MORGAN FUNDS | | APRIL 30, 2017 |
| | | | | | | | | | | | | | | | | | | | | | | | |
CONTRACTS
TO BUY | | | CURRENCY | | | COUNTERPARTY | | SETTLEMENT
DATE | | | SETTLEMENT
VALUE | | | VALUE AT
APRIL 30, 2017 | | | NET
UNREALIZED
APPRECIATION
(DEPRECIATION) | |
| | 8,328 | | | | PLN | | | Barclays Bank plc | | | 06/14/17 | | | | 2,105 | | | | 2,146 | | | | 41 | |
| | 1,781 | | | | PLN | | | Deutsche Bank AG | | | 06/14/17 | | | | 449 | | | | 459 | | | | 10 | |
| | 569 | | | | PLN | | | HSBC Bank, NA | | | 06/14/17 | | | | 139 | | | | 146 | | | | 7 | |
| | 2,697 | | | | PLN | | | Credit Suisse International | | | 07/18/17 | | | | 699 | | | | 695 | | | | (4 | ) |
| | 2,575 | | | | PLN | | | Deutsche Bank AG | | | 07/18/17 | | | | 655 | | | | 663 | | | | 8 | |
| | 5,939 | | | | RON | | | Barclays Bank plc | | | 06/14/17 | | | | 1,412 | | | | 1,427 | | | | 15 | |
| | 1,672 | | | | RON | | | Deutsche Bank AG | | | 06/14/17 | | | | 394 | | | | 401 | | | | 7 | |
| | 60,482 | | | | RUB | | | Citibank, NA† | | | 06/14/17 | | | | 1,026 | | | | 1,051 | | | | 25 | |
| | 20,598 | | | | RUB | | | Goldman Sachs International† | | | 06/14/17 | | | | 360 | | | | 358 | | | | (2 | ) |
| | 39,076 | | | | RUB | | | Citibank, NA† | | | 07/18/17 | | | | 671 | | | | 674 | | | | 3 | |
| | 79,403 | | | | RUB | | | Goldman Sachs International† | | | 07/18/17 | | | | 1,392 | | | | 1,371 | | | | (21 | ) |
| | 1,918 | | | | SGD | | | Societe Generale | | | 07/18/17 | | | | 1,365 | | | | 1,374 | | | | 9 | |
| | 70,224 | | | | THB | | | HSBC Bank, NA | | | 06/14/17 | | | | 2,042 | | | | 2,030 | | | | (12 | ) |
| | 6,854 | | | | THB | | | Standard Chartered Bank | | | 06/14/17 | | | | 194 | | | | 198 | | | | 4 | |
| | 4,210 | | | | TRY | | | HSBC Bank, NA | | | 06/14/17 | | | | 1,140 | | | | 1,170 | | | | 30 | |
| | 7,800 | | | | TRY | | | Merrill Lynch International | | | 06/14/17 | | | | 2,105 | | | | 2,168 | | | | 63 | |
| | 3,800 | | | | TRY | | | Societe Generale | | | 06/14/17 | | | | 1,041 | | | | 1,057 | | | | 16 | |
| | 766 | | | | TRY | | | TD Bank Financial Group | | | 06/14/17 | | | | 199 | | | | 213 | | | | 14 | |
| | 19,149 | | | | TWD | | | Citibank, NA† | | | 07/18/17 | | | | 637 | | | | 636 | | | | (1 | ) |
| | 14,303 | | | | ZAR | | | BNP Paribas | | | 06/14/17 | | | | 1,055 | | | | 1,062 | | | | 7 | |
| | 24,338 | | | | ZAR | | | Citibank, NA | | | 06/14/17 | | | | 1,870 | | | | 1,807 | | | | (63 | ) |
| | 17,948 | | | | ZAR | | | HSBC Bank, NA | | | 06/14/17 | | | | 1,382 | | | | 1,333 | | | | (49 | ) |
| | | | | | | | | | | | | | | 51,613 | | | | 51,784 | | | | 171 | |
| | |
| | | | | | | | | | | | | | | | | | | | | | |
CONTRACTS
TO SELL | | | CURRENCY | | COUNTERPARTY | | SETTLEMENT
DATE | | | SETTLEMENT
VALUE | | | VALUE AT
APRIL 30, 2017 | | | NET
UNREALIZED
APPRECIATION
(DEPRECIATION) | |
| | 916 | | | AUD | | HSBC Bank, NA | | | 07/18/17 | | | | 689 | | | | 685 | | | | 4 | |
| | 1,655 | | | AUD | | National Australia Bank | | | 07/18/17 | | | | 1,237 | | | | 1,237 | | | | — | (h) |
| | 24,344 | | | BRL | | Goldman Sachs International† | | | 06/14/17 | | | | 7,638 | | | | 7,587 | | | | 51 | |
| | 935 | | | CAD | | Goldman Sachs International | | | 07/18/17 | | | | 697 | | | | 685 | | | | 12 | |
| | 946 | | | CAD | | State Street Corp. | | | 07/18/17 | | | | 697 | | | | 694 | | | | 3 | |
| | 645 | | | CHF | | Union Bank of Switzerland AG | | | 07/18/17 | | | | 651 | | | | 652 | | | | (1 | ) |
| | 454,995 | | | CLP | | Goldman Sachs International† | | | 07/18/17 | | | | 692 | | | | 680 | | | | 12 | |
| | 7,439,108 | | | COP | | Citibank, NA† | | | 06/14/17 | | | | 2,530 | | | | 2,511 | | | | 19 | |
| | 2,631,170 | | | COP | | Goldman Sachs International† | | | 06/14/17 | | | | 897 | | | | 888 | | | | 9 | |
| | 2,297,785 | | | COP | | Merrill Lynch International† | | | 06/14/17 | | | | 780 | | | | 776 | | | | 4 | |
| | 4,151,401 | | | COP | | Goldman Sachs International† | | | 07/18/17 | | | | 1,397 | | | | 1,395 | | | | 2 | |
| | 185 | | | EUR | | State Street Corp. | | | 06/14/17 | | | | 199 | | | | 202 | | | | (3 | ) |
| | 643 | | | EUR | | Credit Suisse International | | | 07/18/17 | | | | 706 | | | | 704 | | | | 2 | |
| | 650 | | | EUR | | HSBC Bank, NA | | | 07/18/17 | | | | 709 | | | | 710 | | | | (1 | ) |
| | 107 | | | EUR | | National Australia Bank | | | 07/18/17 | | | | 114 | | | | 117 | | | | (3 | ) |
| | 523 | | | GBP | | National Australia Bank | | | 07/18/17 | | | | 650 | | | | 679 | | | | (29 | ) |
| | 69,450 | | | HUF | | Citibank, NA | | | 06/14/17 | | | | 237 | | | | 242 | | | | (5 | ) |
| | 72,115 | | | HUF | | Royal Bank of Canada | | | 06/14/17 | | | | 246 | | | | 251 | | | | (5 | ) |
| | 113,383 | | | HUF | | Standard Chartered Bank | | | 06/14/17 | | | | 394 | | | | 395 | | | | (1 | ) |
| | 212,650 | | | HUF | | State Street Corp. | | | 06/14/17 | | | | 740 | | | | 741 | | | | (1 | ) |
SEE NOTES TO FINANCIAL STATEMENTS.
| | | | | | | | |
| | | |
| APRIL 30, 2017 | | J.P. MORGAN FUNDS | | | | | 13 | |
JPMorgan Emerging Markets Strategic Debt Fund
SCHEDULE OF PORTFOLIO INVESTMENTS
AS OF APRIL 30, 2017 (Unaudited) (continued)
(Amounts in U.S. Dollars, unless otherwise noted)
(Amounts in thousands, except number of Options contracts)
| | | | | | | | | | | | | | | | | | | | | | | | |
CONTRACTS
TO SELL | | | CURRENCY | | | COUNTERPARTY | | SETTLEMENT
DATE | | | SETTLEMENT
VALUE | | | VALUE AT
APRIL 30, 2017 | | | NET
UNREALIZED
APPRECIATION
(DEPRECIATION) | |
| | 22,746,750 | | | | IDR | | | Deutsche Bank AG† | | | 05/15/17 | | | | 1,612 | | | | 1,705 | | | | (93 | ) |
| | 5,548,727 | | | | IDR | | | Goldman Sachs International† | | | 06/14/17 | | | | 411 | | | | 414 | | | | (3 | ) |
| | 41,013,150 | | | | IDR | | | Merrill Lynch International† | | | 06/14/17 | | | | 3,067 | | | | 3,063 | | | | 4 | |
| | 45,359 | | | | INR | | | Citibank, NA† | | | 07/18/17 | | | | 690 | | | | 699 | | | | (9 | ) |
| | 45,365 | | | | INR | | | Goldman Sachs International† | | | 07/18/17 | | | | 690 | | | | 700 | | | | (10 | ) |
| | 3,108 | | | | MXN | | | Goldman Sachs International | | | 06/14/17 | | | | 157 | | | | 164 | | | | (7 | ) |
| | 89,412 | | | | MXN | | | Societe Generale | | | 06/14/17 | | | | 4,627 | | | | 4,714 | | | | (87 | ) |
| | 6,383 | | | | PEN | | | Merrill Lynch International† | | | 06/14/17 | | | | 1,952 | | | | 1,958 | | | | (6 | ) |
| | 2,575 | | | | PLN | | | Standard Chartered Bank | | | 07/18/17 | | | | 643 | | | | 663 | | | | (20 | ) |
| | 4,125 | | | | RON | | | Credit Suisse International | | | 06/14/17 | | | | 970 | | | | 991 | | | | (21 | ) |
| | 61,217 | | | | RUB | | | Goldman Sachs International† | | | 06/14/17 | | | | 1,034 | | | | 1,065 | | | | (31 | ) |
| | 228,535 | | | | RUB | | | Merrill Lynch International† | | | 06/14/17 | | | | 3,894 | | | | 3,974 | | | | (80 | ) |
| | 39,076 | | | | RUB | | | Goldman Sachs International† | | | 07/18/17 | | | | 666 | | | | 674 | | | | (8 | ) |
| | 1,918 | | | | SGD | | | BNP Paribas | | | 07/18/17 | | | | 1,374 | | | | 1,374 | | | | — | (h) |
| | 10,512 | | | | THB | | | Australia & New Zealand Banking Group Limited | | | 06/14/17 | | | | 297 | | | | 304 | | | | (7 | ) |
| | 32,709 | | | | THB | | | Barclays Bank plc | | | 06/14/17 | | | | 945 | | | | 946 | | | | (1 | ) |
| | 33,858 | | | | THB | | | HSBC Bank, NA | | | 06/14/17 | | | | 978 | | | | 978 | | | | — | (h) |
| | 6,962 | | | | TRY | | | Citibank, NA | | | 06/14/17 | | | | 1,878 | | | | 1,935 | | | | (57 | ) |
| | 1,819 | | | | TRY | | | Merrill Lynch International | | | 06/14/17 | | | | 488 | | | | 506 | | | | (18 | ) |
| | 2,982 | | | | TRY | | | Societe Generale | | | 06/14/17 | | | | 808 | | | | 829 | | | | (21 | ) |
| | 1,225 | | | | TRY | | | TD Bank Financial Group | | | 06/14/17 | | | | 338 | | | | 341 | | | | (3 | ) |
| | 22,641 | | | | TWD | | | Goldman Sachs International† | | | 06/14/17 | | | | 746 | | | | 751 | | | | (5 | ) |
| | 4,366 | | | | TWD | | | Merrill Lynch International† | | | 06/14/17 | | | | 141 | | | | 144 | | | | (3 | ) |
| | 19,149 | | | | TWD | | | Merrill Lynch International† | | | 07/18/17 | | | | 628 | | | | 636 | | | | (8 | ) |
| | 4,374 | | | | ZAR | | | BNP Paribas | | | 06/14/17 | | | | 320 | | | | 324 | | | | (4 | ) |
| | 2,622 | | | | ZAR | | | Citibank, NA | | | 06/14/17 | | | | 194 | | | | 195 | | | | (1 | ) |
| | 5,887 | | | | ZAR | | | State Street Corp. | | | 06/14/17 | | | | 433 | | | | 437 | | | | (4 | ) |
| | | | | | | | | | | | | | | 51,881 | | | | 52,315 | | | | (434 | ) |
| | |
Credit Default Swaps — Buy Protection [1]
Credit indices:
| | | | | | | | | | | | | | | | | | | | | | |
SWAP COUNTERPARTY/
REFERENCE OBLIGATION | | FUND PAYS FIXED RATE (r) | | TERMINATION
DATE | | | IMPLIED CREDIT
SPREAD
AS OF
APRIL 30, 2017 [2] | | | NOTIONAL
AMOUNT [3] | | | VALUE | | | UPFRONT
PREMIUMS (PAID)/
RECEIVED [4] | |
Bank of America NA: | | | | | | | | | | | | | | | | | | | | | | |
CDX.EM.26-V1 | | 1.000% quarterly | | | 12/20/21 | | | | 1.815 | % | | | 2,100 | | | | 71 | | | | (118 | ) |
CDX.EM.26-V1 | | 1.000% quarterly | | | 12/20/21 | | | | 1.815 | | | | 3,200 | | | | 108 | | | | (184 | ) |
Citibank NA: | | | | | | | | | | | | | | | | | | | | | | |
CDX.EM.26-V1 | | 1.000% quarterly | | | 12/20/21 | | | | 1.815 | | | | 4,400 | | | | 148 | | | | (317 | ) |
CDX.EM.27-V1 | | 1.000% quarterly | | | 06/20/22 | | | | 1.964 | | | | 31,000 | | | | 1,358 | | | | (1,613 | ) |
| | | | | | | | | | | | | | | | | | | | | | |
| | | | | | | | | | | | | | | | | 1,685 | | | | (2,232 | ) |
| | | | | | | | | | | | | | | | | | | | | | |
| [1] | The Fund, as a buyer of credit protection, is generally obligated to make periodic payments and may also pay or receive an upfront premium to or from the protection seller, in exchange for the right to receive a contingent payment, upon occurrence of a credit event with respect to an underlying reference obligation, as defined under the terms of individual swap contracts. |
| [2] | Implied credit spreads are an indication of the seller’s performance risk, related to the likelihood of a credit event occurring that would require a seller to make payment to a buyer. Implied credit spreads are used to determine the value of swap contracts and reflect the cost of buying/selling protection, which may include upfront payments made to enter into the contract. Therefore, higher spreads would indicate a greater likelihood that a seller will be obligated to perform |
SEE NOTES TO FINANCIAL STATEMENTS.
| | | | | | |
| | | |
| 14 | | | | J.P. MORGAN FUNDS | | APRIL 30, 2017 |
| | (i.e.,make payment) under the swap contract. Increasing values, in absolute terms and relative to notional amounts, are also indicative of greater performance risk. Implied credit spreads for credit default swaps on credit indexes are linked to the weighted average spread across the underlying reference obligations included in a particular index. |
| [3] | The notional amount is the maximum amount that a seller of credit protection would be obligated to pay and a buyer of credit protection would receive, upon occurrence of a credit event. |
| [4] | Upfront premiums generally relate to payments made or received at the initiation of the agreement to compensate the differences between the stated terms of the swap agreement and current market conditions (credit spreads, interest rates and other relevant factors). |
| | | | | | | | | | | | | | | | |
| Interest Rate Swaps | | | | | | | | | | | | | |
| | | RATE TYPE (r) | | | | | | | | | |
| SWAP COUNTERPARTY | | PAYMENTS MADE BY THE FUND | | PAYMENTS RECEIVED BY THE FUND | | | TERMINATION
DATE | | NOTIONAL
AMOUNT | | | VALUE | |
Bank of America NA | | 3 month CD_KSDA quarterly | | | 1.525% quarterly | | | 11/29/18 | | | KRW 5,000,000 | | | | — | (h) |
Citibank NA | | 3 month CD_KSDA quarterly | | | 1.328% quarterly | | | 11/07/18 | | | KRW 2,700,000 | | | | (8 | ) |
Citibank NA | | 1.548 quarterly | | | 3 months CD_KSDA quarterly | | | 11/07/26 | | | KRW 500,000 | | | | 13 | |
Citibank NA | | 1.870 quarterly | | | 3 months CD_KSDA quarterly | | | 11/15/26 | | | KRW 1,010,000 | | | | — | (h) |
| | | | | | | | | | | | | | | | |
| | | | | | | | | | | | | | | 5 | |
| | | | | | | | | | | | | | | | |
FOREIGN EXCHANGE CURRENCY OPTIONS WRITTEN
| | | | | | | | | | | | | | | | |
| Call Options Written | | | | | | | | | | | | |
| DESCRIPTION | | EXERCISE
PRICE | | | EXPIRATION
DATE | | | NOTIONAL
AMOUNT | | | VALUE
| |
CLP Put/USD Call, Vanilla, European Style | | | CLP 675.580 | | | | 05/22/17 | | | | 702,653 | | | | (3 | ) |
| | | | | | | | | | | | | | | | |
(Premiums received of $3) | | | | | | | | | | | | | | | | |
SEE NOTES TO FINANCIAL STATEMENTS.
| | | | | | | | |
| | | |
| APRIL 30, 2017 | | J.P. MORGAN FUNDS | | | | | 15 | |
JPMorgan Emerging Markets Strategic Debt Fund
NOTES TO SCHEDULE OF PORTFOLIO INVESTMENTS
AS OF APRIL 30, 2017 (Unaudited)
| | |
| ARS | | — Argentine Peso |
| AUD | | — Australian Dollar |
| BRL | | — Brazilian Real |
| CAD | | — Canadian Dollar |
| CD | | — Certificate of Deposit |
| CDX | | — Credit Default Swap Index |
| CHF | | — Swiss Franc |
| CLP | | — Chilean Peso |
| CNH | | — China Renminbi |
| COP | | — Colombian Peso |
| CZK | | — Czech Republic Koruna |
| DOP | | — Dominican Republic Peso |
| EUR | | — Euro |
| GBP | | — British Pound |
| HUF | | — Hungarian Forint |
| IDR | | — Indonesian Rupiah |
| ILS | | — Israeli Shekel |
| INR | | — Indian Rupee |
| KRW | | — Korean Republic Won |
| KSDA | | — Korea Securities Depository Account |
| MXN | | — Mexican Peso |
| MYR | | — Malaysian Ringgit |
| PEN | | — Peruvian Nuevo Sol |
| PLN | | — Polish Zloty |
| Reg. S | | — Security was purchased pursuant to Regulation S under the Securities Act of 1933, which exempts from registration securities offered and sold outside of the United States. Such a security cannot be sold in the United States without either an effective registration statement filed pursuant to the Securities Act of 1933, or pursuant to an exemption from registration. |
| RON | | — Romanian Leu |
| RUB | | — Russian Ruble |
| SGD | | — Singapore Dollar |
| SUB | | — Step-Up Bond. The interest rate shown is the rate in effect as of April 30, 2017. |
| | |
| THB | | — Thai Baht |
| TRY | | — Turkish Lira |
| TWD | | — Taiwan Dollar |
| USD | | — United States Dollar |
| VAR | | — Variable Rate Security. The interest rate shown is the rate in effect as of April 30, 2017. |
| ZAR | | — South African Rand |
| |
| (a) | | — Non-income producing security. |
| (b) | | — Investment in affiliate. Money market fund is registered under the Investment Company Act of 1940, as amended, and advised by J.P. Morgan Investment Management Inc. |
| (e) | | — Security is exempt from registration under Rule 144A of the Securities Act of 1933, as amended. Unless otherwise indicated, this security has been determined to be liquid under procedures established by the Board of Trustees and may be resold in transactions exempt from registration, normally to qualified institutional buyers. |
| (g) | | — Amount rounds to less than 0.05%. |
| (h) | | — Amount rounds to less than 500. |
| (l) | | — The rate shown is the current yield as of April 30, 2017. |
| (r) | | — Rates shown are per annum and payments are as described. |
| (x) | | — Security is perpetual and thus, does not have a predetermined maturity date. The coupon rates for these securities are fixed for a period of time and may be structured to adjust thereafter. The dates shown, if applicable, reflects the next call date. The coupon rate shown is the rate in effect as of April 30, 2017. |
| (y) | | — Preferred Security. |
| # | | — For cross-currency exchange contracts, the settlement value is the U.S. Dollar market value at April 30, 2017 of the currency being sold, and the value at April 30, 2017 is the U.S. dollar market value of the currency being purchased. |
| † | | — Non-deliverable forward. Note 2.C. in the Notes to Financial Statements. |
SEE NOTES TO FINANCIAL STATEMENTS.
| | | | | | |
| | | |
| 16 | | | | J.P. MORGAN FUNDS | | APRIL 30, 2017 |
THIS PAGE IS INTENTIONALLY LEFT BLANK
| | | | | | | | |
| | | |
| APRIL 30, 2017 | | J.P. MORGAN FUNDS | | | | | 17 | |
STATEMENT OF ASSETS AND LIABILITIES
AS OF APRIL 30, 2017 (Unaudited)
(Amounts in thousands, except per share amounts)
| | | | |
| |
| | | Emerging Markets
Strategic Debt
Fund | |
ASSETS: | |
Investments in non-affiliates, at value | | $ | 269,893 | |
Investments in affiliates, at value | | | 6,386 | |
| | | | |
Total investment securities, at value | | | 276,279 | |
Cash | | | 1,340 | |
Foreign currency, at value | | | 413 | |
Deposits at broker for futures contracts | | | 521 | |
Receivables: | | | | |
Due from custodian | | | 645 | |
Investment securities sold | | | 2,908 | |
Fund shares sold | | | 35,658 | |
Interest and dividends from non-affiliates | | | 4,312 | |
Dividends from affiliates | | | 4 | |
Tax reclaims | | | 16 | |
Unrealized appreciation on forward foreign currency exchange contracts | | | 535 | |
Outstanding swap contracts, at value | | | 1,698 | |
Due from adviser | | | 47 | |
| | | | |
Total Assets | | | 324,376 | |
| | | | |
| |
LIABILITIES: | | | | |
Payables: | | | | |
Investment securities purchased | | | 7,837 | |
Fund shares redeemed | | | 26 | |
Variation margin on futures contracts | | | 30 | |
Unrealized depreciation on forward foreign currency exchange contracts | | | 798 | |
Outstanding options written, at fair value | | | 3 | |
Outstanding swap contracts, at value | | | 8 | |
Accrued liabilities: | | | | |
Distribution fees | | | 4 | |
Service fees | | | 5 | |
Custodian and accounting fees | | | 63 | |
Collateral management fees | | | 4 | |
Trustees’ and Chief Compliance Officer’s fees | | | 8 | |
Other | | | 220 | |
| | | | |
Total Liabilities | | | 9,006 | |
| | | | |
Net Assets | | $ | 315,370 | |
| | | | |
SEE NOTES TO FINANCIAL STATEMENTS.
| | | | | | |
| | | |
| 18 | | | | J.P. MORGAN FUNDS | | APRIL 30, 2017 |
| | | | |
| |
| | | Emerging Markets
Strategic Debt
Fund | |
NET ASSETS: | |
Paid-in-Capital | | $ | 330,886 | |
Accumulated undistributed (distributions in excess of) net investment income | | | 68 | |
Accumulated net realized gains (losses) | | | (16,967 | ) |
Net unrealized appreciation (depreciation) | | | 1,383 | |
| | | | |
Total Net Assets | | $ | 315,370 | |
| | | | |
| |
Net Assets: | | | | |
Class A | | $ | 17,984 | |
Class C | | | 62 | |
Class I (formerly Select Class) | | | 7,366 | |
Class R2 | | | 20 | |
Class R5 | | | 21 | |
Class R6 | | | 289,917 | |
| | | | |
Total | | $ | 315,370 | |
| | | | |
| |
Outstanding units of beneficial interest (shares) | | | | |
($0.0001 par value; unlimited number of shares authorized): | | | | |
Class A | | | 2,184 | |
Class C | | | 8 | |
Class I (formerly Select Class) | | | 888 | |
Class R2 | | | 2 | |
Class R5 | | | 2 | |
Class R6 | | | 34,646 | |
| |
Net Asset Value (a): | | | | |
Class A — Redemption price per share | | $ | 8.23 | |
Class C — Offering price per share (b) | | | 8.08 | |
Class I (formerly Select Class) — Offering and redemption price per share | | | 8.30 | |
Class R2 — Offering and redemption price per share | | | 8.16 | |
Class R5 — Offering and redemption price per share | | | 8.35 | |
Class R6 — Offering and redemption price per share | | | 8.37 | |
Class A maximum sales charge | | | 3.75 | % |
Class A maximum public offering price per share
[net asset value per share/(100% — maximum sales charge)] | | $ | 8.56 | |
| | | | |
| |
Cost of investments in non-affiliates | | $ | 267,425 | |
Cost of investments in affiliates | | | 6,386 | |
Cost of foreign currency | | | 413 | |
Premiums paid on swaps | | | 2,232 | |
Premiums received from options written | | | 3 | |
| (a) | Per share amounts may not recalculate due to rounding of net assets and/or shares outstanding. |
| (b) | Redemption price for Class C Shares varies based upon length of time the shares are held. |
SEE NOTES TO FINANCIAL STATEMENTS.
| | | | | | | | |
| | | |
| APRIL 30, 2017 | | J.P. MORGAN FUNDS | | | | | 19 | |
STATEMENT OF OPERATIONS
FOR THE SIX MONTHS ENDED APRIL 30, 2017 (Unaudited)
(Amounts in thousands)
| | | | |
| |
| | | Emerging Markets
Strategic
Debt Fund | |
INVESTMENT INCOME: | |
Interest income from non-affiliates | | $ | 3,041 | |
Interest income from affiliates | | | 1 | |
Dividend income from affiliates | | | 24 | |
Foreign taxes withheld | | | (27 | ) |
| | | | |
Total investment income | | | 3,039 | |
| | | | |
| |
EXPENSES: | | | | |
Investment advisory fees | | | 381 | |
Administration fees | | | 44 | |
Distribution fees: | | | | |
Class A | | | 6 | |
Class C | | | — | (a) |
Class R2 | | | — | (a) |
Service fees: | | | | |
Class A | | | 6 | |
Class C | | | — | (a) |
Class I (formerly Select Class) | | | 6 | |
Class R2 | | | — | (a) |
Class R5 | | | — | (a) |
Custodian and accounting fees | | | 75 | |
Interest expense to affiliates | | | — | (a) |
Professional fees | | | 136 | |
Collateral management fees | | | 13 | |
Trustees’ and Chief Compliance Officer’s fees | | | 21 | |
Printing and mailing costs | | | 37 | |
Registration and filing fees | | | 86 | |
Transfer agency fees (See Note 2.F.) | | | 1 | |
Sub-transfer agency fees (See Note 2.F.) | | | — | (a) |
Other | | | 7 | |
| | | | |
Total expenses | | | 819 | |
| | | | |
Less fees waived | | | (370 | ) |
Less expense reimbursements | | | (57 | ) |
| | | | |
Net expenses | | | 392 | |
| | | | |
Net investment income (loss) | | | 2,647 | |
| | | | |
| |
REALIZED/UNREALIZED GAINS (LOSSES): | | | | |
Net realized gain (loss) on transactions from: | | | | |
Investments in non-affiliates | | | (2,251 | ) |
Investments in affiliates | | | — | (a) |
Futures | | | 29 | |
Foreign currency transactions | | | 373 | |
Options written | | | 22 | |
Swaps | | | (297 | ) |
| | | | |
Net realized gain (loss) | | | (2,124 | ) |
| | | | |
Change in net unrealized appreciation/depreciation on: | | | | |
Investments in non-affiliates | | | 3,842 | |
Investments in affiliates | | | — | (a) |
Futures | | | (293 | ) |
Foreign currency translations | | | (253 | ) |
Swaps | | | (542 | ) |
| | | | |
Change in net unrealized appreciation/depreciation | | | 2,754 | |
| | | | |
Net realized/unrealized gains (losses) | | | 630 | |
| | | | |
Change in net assets resulting from operations | | $ | 3,277 | |
| | | | |
| (a) | Amount rounds to less than 500. |
SEE NOTES TO FINANCIAL STATEMENTS.
| | | | | | |
| | | |
| 20 | | | | J.P. MORGAN FUNDS | | APRIL 30, 2017 |
STATEMENT OF CHANGES IN NET ASSETS
FOR THE PERIODS INDICATED
(Amounts in thousands)
| | | | | | | | |
| | | Emerging Markets Strategic
Debt Fund | |
| | | Six Months Ended
April 30, 2017
(Unaudited) | | | Year Ended
October 31, 2016 | |
CHANGE IN NET ASSETS RESULTING FROM OPERATIONS: | |
Net investment income (loss) | | $ | 2,647 | | | $ | 3,816 | |
Net realized gain (loss) | | | (2,124 | ) | | | (30,132 | ) |
Change in net unrealized appreciation/depreciation | | | 2,754 | | | | 28,813 | |
| | | | | | | | |
Change in net assets resulting from operations | | | 3,277 | | | | 2,497 | |
| | | | | | | | |
| | |
DISTRIBUTIONS TO SHAREHOLDERS: | | | | | | | | |
Class A | | | | | | | | |
From net investment income | | | (94 | ) | | | — | |
Class C | | | | | | | | |
From net investment income | | | (1 | ) | | | — | |
Class I (formerly Select Class) | | | | | | | | |
From net investment income | | | (82 | ) | | | — | |
Class R2 | | | | | | | | |
From net investment income | | | — | (a) | | | — | |
Class R5 | | | | | | | | |
From net investment income | | | — | (a) | | | — | |
Class R6 | | | | | | | | |
From net investment income | | | (1,993 | ) | | | — | |
| | | | | | | | |
Total distributions to shareholders | | | (2,170 | ) | | | — | |
| | | | | | | | |
| | |
CAPITAL TRANSACTIONS: | | | | | | | | |
Change in net assets resulting from capital transactions | | | 233,137 | | | | (113,392 | ) |
| | | | | | | | |
| | |
NET ASSETS: | | | | | | | | |
Change in net assets | | | 234,244 | | | | (110,895 | ) |
Beginning of period | | | 81,126 | | | | 192,021 | |
| | | | | | | | |
End of period | | $ | 315,370 | | | $ | 81,126 | |
| | | | | | | | |
Accumulated undistributed (distributions in excess of) net investment income | | $ | 68 | | | $ | (409 | ) |
| | | | | | | | |
| (a) | Amount rounds to less than 500. |
SEE NOTES TO FINANCIAL STATEMENTS.
| | | | | | | | |
| | | |
| APRIL 30, 2017 | | J.P. MORGAN FUNDS | | | | | 21 | |
STATEMENT OF CHANGES IN NET ASSETS
FOR THE PERIODS INDICATED (continued)
(Amounts in thousands)
| | | | | | | | |
| | | Emerging Markets Strategic
Debt Fund | |
| | | Six Months Ended
April 30, 2017
(Unaudited) | | | Year Ended
October 31, 2016 | |
CAPITAL TRANSACTIONS: | | | | | | | | |
Class A | | | | | | | | |
Proceeds from shares issued | | $ | 18,073 | | | $ | 4,105 | |
Distributions reinvested | | | 94 | | | | — | |
Cost of shares redeemed | | | (1,324 | ) | | | (29,577 | ) |
| | | | | | | | |
Change in net assets resulting from Class A capital transactions | | $ | 16,843 | | | $ | (25,472 | ) |
| | | | | | | | |
| | |
Class C | | | | | | | | |
Proceeds from shares issued | | $ | 11 | | | $ | 31 | |
Distributions reinvested | | | 1 | | | | — | |
Cost of shares redeemed | | | (3 | ) | | | — | (a) |
| | | | | | | | |
Change in net assets resulting from Class C capital transactions | | $ | 9 | | | $ | 31 | |
| | | | | | | | |
| | |
Class I (formerly Select Class) | | | | | | | | |
Proceeds from shares issued | | $ | 4,199 | | | $ | 4,088 | |
Distributions reinvested | | | 81 | | | | — | |
Cost of shares redeemed | | | (693 | ) | | | (30,007 | ) |
| | | | | | | | |
Change in net assets resulting from Class I capital transactions | | $ | 3,587 | | | $ | (25,919 | ) |
| | | | | | | | |
| | |
Class R2 | | | | | | | | |
Proceeds from shares issued | | $ | — | (a) | | $ | — | (a) |
Distributions reinvested | | | — | (a) | | | — | |
Cost of shares redeemed | | | — | (a) | | | — | (a) |
| | | | | | | | |
Change in net assets resulting from Class R2 capital transactions | | $ | — | (a) | | $ | — | (a) |
| | | | | | | | |
| | |
Class R5 | | | | | | | | |
Proceeds from shares issued | | $ | — | (a) | | $ | — | (a) |
Distributions reinvested | | | — | (a) | | | — | |
Cost of shares redeemed | | | — | (a) | | | — | (a) |
| | | | | | | | |
Change in net assets resulting from Class R5 capital transactions | | $ | — | (a) | | $ | — | (a) |
| | | | | | | | |
| | |
Class R6 | | | | | | | | |
Proceeds from shares issued | | $ | 235,367 | | | $ | 21,768 | |
Distributions reinvested | | | 1,993 | | | | — | |
Cost of shares redeemed | | | (24,662 | ) | | | (83,800 | ) |
| | | | | | | | |
Change in net assets resulting from Class R6 capital transactions | | $ | 212,698 | | | $ | (62,032 | ) |
| | | | | | | | |
Total change in net assets resulting from capital transactions | | $ | 233,137 | | | $ | (113,392 | ) |
| | | | | | | | |
| (a) | Amount rounds to less than 500. |
SEE NOTES TO FINANCIAL STATEMENTS.
| | | | | | |
| | | |
| 22 | | | | J.P. MORGAN FUNDS | | APRIL 30, 2017 |
| | | | | | | | |
| | | Emerging Markets Strategic
Debt Fund | |
| | | Six Months Ended
April 30, 2017
(Unaudited) | | | Year Ended
October 31, 2016 | |
SHARE TRANSACTIONS: | |
Class A | |
Issued | | | 2,210 | | | | 544 | |
Reinvested | | | 12 | | | | — | |
Redeemed | | | (165 | ) | | | (4,056 | ) |
| | | | | | | | |
Change in Class A Shares | | | 2,057 | | | | (3,512 | ) |
| | | | | | | | |
Class C | | | | | | | | |
Issued | | | 1 | | | | 4 | |
Reinvested | | | — | (a) | | | — | |
Redeemed | | | — | (a) | | | — | |
| | | | | | | | |
Change in Class C Shares | | | 1 | | | | 4 | |
| | | | | | | | |
Class I (formerly Select Class) | | | | | | | | |
Issued | | | 512 | | | | 518 | |
Reinvested | | | 10 | | | | — | |
Redeemed | | | (85 | ) | | | (3,933 | ) |
| | | | | | | | |
Change in Class I Shares | | | 437 | | | | (3,415 | ) |
| | | | | | | | |
Class R2 | | | | | | | | |
Reinvested | | | — | (a) | | | — | |
| | | | | | | | |
Change in Class R2 Shares | | | — | (a) | | | — | |
| | | | | | | | |
Class R5 | | | | | | | | |
Reinvested | | | — | (a) | | | — | |
| | | | | | | | |
Change in Class R5 Shares | | | — | (a) | | | — | |
| | | | | | | | |
Class R6 | | | | | | | | |
Issued | | | 28,293 | | | | 2,815 | |
Reinvested | | | 240 | | | | — | |
Redeemed | | | (3,056 | ) | | | (11,296 | ) |
| | | | | | | | |
Change in Class R6 Shares | | | 25,477 | | | | (8,481 | ) |
| | | | | | | | |
| (a) | Amount rounds to less than 500. |
SEE NOTES TO FINANCIAL STATEMENTS.
| | | | | | | | |
| | | |
| APRIL 30, 2017 | | J.P. MORGAN FUNDS | | | | | 23 | |
FINANCIAL HIGHLIGHTS
FOR THE PERIODS INDICATED
| | | | | | | | | | | | | | | | | | | | | | | | | | | | | | | | |
| | | | | | Per share operating performance | |
| | | | | | Investment operations | | | Distributions | |
| | | Net asset
value,
beginning
of period | | | Net
investment
income
(loss) | | | Net realized
and unrealized
gains
(losses) on
investments | | | Total from
investment
operations | | | Net
investment
income | | | Net
realized
gain | | | Return of
capital | | | Total
distributions | |
Emerging Markets Strategic Debt Fund | | | | | | | | | | | | | | | | | | | | | | | | | | | | | | | | |
Class A | | | | | | | | | | | | | | | | | | | | | | | | | | | | | | | | |
Six Months Ended April 30, 2017 (Unaudited) | | $ | 8.18 | | | $ | 0.18 | (e) | | $ | (0.01 | ) | | $ | 0.17 | | | $ | (0.12 | ) | | $ | — | | | $ | — | | | $ | (0.12 | ) |
Year Ended October 31, 2016 | | | 7.56 | | | | 0.28 | (e) | | | 0.34 | (f) | | | 0.62 | | | | — | | | | — | | | | — | | | | — | |
Year Ended October 31, 2015 | | | 9.30 | | | | 0.31 | (e)(g) | | | (2.05 | ) | | | (1.74 | ) | | | — | | | | — | | | | — | (h) | | | — | (h) |
Year Ended October 31, 2014 | | | 9.69 | | | | 0.39 | (e) | | | (0.78 | ) | | | (0.39 | ) | | | — | | | | — | | | | — | | | | — | |
Year Ended October 31, 2013 | | | 10.27 | | | | 0.33 | (e) | | | (0.76 | ) | | | (0.43 | ) | | | (0.03 | ) | | | (0.01 | ) | | | (0.11 | ) | | | (0.15 | ) |
June 29, 2012 (j) through October 31, 2012 | | | 10.00 | | | | 0.11 | | | | 0.21 | | | | 0.32 | | | | (0.05 | ) | | | — | | | | — | | | | (0.05 | ) |
| | | | | | | | |
Class C | | | | | | | | | | | | | | | | | | | | | | | | | | | | | | | | |
Six Months Ended April 30, 2017 (Unaudited) | | | 8.05 | | | | 0.15 | (e) | | | (0.01 | ) | | | 0.14 | | | | (0.11 | ) | | | — | | | | — | | | | (0.11 | ) |
Year Ended October 31, 2016 | | | 7.47 | | | | 0.24 | (e) | | | 0.34 | (f) | | | 0.58 | | | | — | | | | — | | | | — | | | | — | |
Year Ended October 31, 2015 | | | 9.23 | | | | 0.28 | (e)(g) | | | (2.04 | ) | | | (1.76 | ) | | | — | | | | — | | | | — | | | | — | |
Year Ended October 31, 2014 | | | 9.67 | | | | 0.33 | (e) | | | (0.77 | ) | | | (0.44 | ) | | | — | | | | — | | | | — | | | | — | |
Year Ended October 31, 2013 | | | 10.27 | | | | 0.27 | (e) | | | (0.75 | ) | | | (0.48 | ) | | | (0.03 | ) | | | (0.01 | ) | | | (0.08 | ) | | | (0.12 | ) |
June 29, 2012 (j) through October 31, 2012 | | | 10.00 | | | | 0.09 | | | | 0.22 | | | | 0.31 | | | | (0.04 | ) | | | — | | | | — | | | | (0.04 | ) |
| | | | | | | | |
Class I (formerly Select Class) | | | | | | | | | | | | | | | | | | | | | | | | | | | | | | | | |
Six Months Ended April 30, 2017 (Unaudited) | | | 8.25 | | | | 0.18 | (e) | | | — | (h) | | | 0.18 | | | | (0.13 | ) | | | — | | | | — | | | | (0.13 | ) |
Year Ended October 31, 2016 | | | 7.61 | | | | 0.31 | (e) | | | 0.33 | (f) | | | 0.64 | | | | — | | | | — | | | | — | | | | — | |
Year Ended October 31, 2015 | | | 9.33 | | | | 0.34 | (e)(g) | | | (2.05 | ) | | | (1.71 | ) | | | — | (h) | | | — | | | | (0.01 | ) | | | (0.01 | ) |
Year Ended October 31, 2014 | | | 9.70 | | | | 0.40 | (e) | | | (0.77 | ) | | | (0.37 | ) | | | — | | | | — | | | | — | | | | — | |
Year Ended October 31, 2013 | | | 10.27 | | | | 0.36 | (e) | | | (0.76 | ) | | | (0.40 | ) | | | (0.04 | ) | | | (0.01 | ) | | | (0.12 | ) | | | (0.17 | ) |
June 29, 2012 (j) through October 31, 2012 | | | 10.00 | | | | 0.12 | | | | 0.21 | | | | 0.33 | | | | (0.06 | ) | | | — | | | | — | | | | (0.06 | ) |
| | | | | | | | |
Class R2 | | | | | | | | | | | | | | | | | | | | | | | | | | | | | | | | |
Six Months Ended April 30, 2017 (Unaudited) | | | 8.12 | | | | 0.16 | (e) | | | (0.01 | ) | | | 0.15 | | | | (0.11 | ) | | | — | | | | — | | | | (0.11 | ) |
Year Ended October 31, 2016 | | | 7.52 | | | | 0.26 | (e) | | | 0.34 | (f) | | | 0.60 | | | | — | | | | — | | | | — | | | | — | |
Year Ended October 31, 2015 | | | 9.27 | | | | 0.30 | (e)(g) | | | (2.05 | ) | | | (1.75 | ) | | | — | | | | — | | | | — | | | | — | |
Year Ended October 31, 2014 | | | 9.68 | | | | 0.35 | (e) | | | (0.76 | ) | | | (0.41 | ) | | | — | | | | — | | | | — | | | | — | |
Year Ended October 31, 2013 | | | 10.27 | | | | 0.30 | (e) | | | (0.75 | ) | | | (0.45 | ) | | | (0.04 | ) | | | (0.01 | ) | | | (0.09 | ) | | | (0.14 | ) |
June 29, 2012 (j) through October 31, 2012 | | | 10.00 | | | | 0.10 | | | | 0.21 | | | | 0.31 | | | | (0.04 | ) | | | — | | | | — | | | | (0.04 | ) |
| | | | | | | | |
Class R5 | | | | | | | | | | | | | | | | | | | | | | | | | | | | | | | | |
Six Months Ended April 30, 2017 (Unaudited) | | | 8.31 | | | | 0.19 | (e) | | | (0.01 | ) | | | 0.18 | | | | (0.14 | ) | | | — | | | | — | | | | (0.14 | ) |
Year Ended October 31, 2016 | | | 7.64 | | | | 0.32 | (e) | | | 0.35 | (f) | | | 0.67 | | | | — | | | | — | | | | — | | | | — | |
Year Ended October 31, 2015 | | | 9.36 | | | | 0.37 | (e)(g) | | | (2.08 | ) | | | (1.71 | ) | | | — | (h) | | | — | | | | (0.01 | ) | | | (0.01 | ) |
Year Ended October 31, 2014 | | | 9.71 | | | | 0.42 | (e) | | | (0.77 | ) | | | (0.35 | ) | | | — | | | | — | | | | — | | | | — | |
Year Ended October 31, 2013 | | | 10.27 | | | | 0.37 | (e) | | | (0.75 | ) | | | (0.38 | ) | | | (0.04 | ) | | | (0.01 | ) | | | (0.13 | ) | | | (0.18 | ) |
June 29, 2012 (j) through October 31, 2012 | | | 10.00 | | | | 0.12 | | | | 0.22 | | | | 0.34 | | | | (0.07 | ) | | | — | | | | — | | | | (0.07 | ) |
| | | | | | | | |
Class R6 | | | | | | | | | | | | | | | | | | | | | | | | | | | | | | | | |
Six Months Ended April 30, 2017 (Unaudited) | | | 8.32 | | | | 0.20 | (e) | | | (0.01 | ) | | | 0.19 | | | | (0.14 | ) | | | — | | | | — | | | | (0.14 | ) |
Year Ended October 31, 2016 | | | 7.65 | | | | 0.32 | (e) | | | 0.35 | (f) | | | 0.67 | | | | — | | | | — | | | | — | | | | — | |
Year Ended October 31, 2015 | | | 9.37 | | | | 0.36 | (e)(g) | | | (2.07 | ) | | | (1.71 | ) | | | — | (h) | | | — | | | | (0.01 | ) | | | (0.01 | ) |
Year Ended October 31, 2014 | | | 9.72 | | | | 0.43 | (e) | | | (0.78 | ) | | | (0.35 | ) | | | — | | | | — | | | | — | | | | — | |
Year Ended October 31, 2013 | | | 10.27 | | | | 0.38 | (e) | | | (0.75 | ) | | | (0.37 | ) | | | (0.04 | ) | | | (0.01 | ) | | | (0.13 | ) | | | (0.18 | ) |
June 29, 2012 (j) through October 31, 2012 | | | 10.00 | | | | 0.13 | | | | 0.21 | | | | 0.34 | | | | (0.07 | ) | | | — | | | | — | | | | (0.07 | ) |
| (a) | Annualized for periods less than one year, unless otherwise noted. |
| (b) | Not annualized for periods less than one year. |
| (c) | Includes adjustments in accordance with accounting principles generally accepted in the United States of America and as such, the net asset values for financial reporting purposes and the returns based upon those net asset values may differ from the net asset values and returns for shareholder transactions. |
| (d) | Includes earnings credits and interest expense, if applicable, each of which is less than 0.005% unless otherwise noted. |
| (e) | Calculated based upon average shares outstanding. |
| (f) | Calculation of the net realized and unrealized gains (losses) per share do not correlate with the Fund’s net realized and unrealized gains (losses) presented in the Statement of Operations due to the timing of capital transactions in relation to the fluctuating market values of the Fund’s investments. |
| (g) | Net investment income (loss) may appear disproportionate among the classes due to the timing of recognition of income and changes in the relative size of the classes. |
| (h) | Amount rounds to less than $0.005. |
| (i) | Certain non-recurring expenses incurred by the Fund were not annualized for the period ended October 31, 2012 and for the year ended October 31, 2013. |
| (j) | Commencement of operations. |
SEE NOTES TO FINANCIAL STATEMENTS.
| | | | | | |
| | | |
| 24 | | | | J.P. MORGAN FUNDS | | APRIL 30, 2017 |
| | | | | | | | | | | | | | | | | | | | | | | | | | |
| | | Ratios/Supplemental data | |
| | | | | | | | | | Ratios to average net assets (a) | | | | |
Net asset
value,
end of
period | | | Total return
(excludes
sales charge) (b)(c) | | |
Net assets,
end of
period
(000’s) | | | Net
expenses (d) | | | Net
investment
income
(loss) | | | Expenses
without waivers,
reimbursements and
earnings credits | | | Portfolio
turnover
rate (b) | |
| | | | | | | | | | | | | | | | | | | | | | | | | | |
| | | | | | | | | | | | | | | | | | | | | | | | | | |
| $ | 8.23 | | | | 2.05 | % | | $ | 17,984 | | | | 1.19 | % | | | 4.53 | % | | | 2.02 | % | | | 73 | % |
| | 8.18 | | | | 8.20 | | | | 1,036 | | | | 1.13 | | | | 3.70 | | | | 2.43 | | | | 189 | |
| | 7.56 | | | | (18.67 | ) | | | 27,511 | | | | 1.16 | | | | 3.75 | (g) | | | 1.91 | | | | 134 | |
| | 9.30 | | | | (4.02 | ) | | | 25,334 | | | | 1.21 | | | | 4.06 | | | | 1.41 | | | | 145 | |
| | 9.69 | | | | (4.26 | ) | | | 170 | | | | 1.21 | (i) | | | 3.33 | (i) | | | 1.59 | (i) | | | 221 | |
| | 10.27 | | | | 3.22 | | | | 52 | | | | 1.25 | (i) | | | 3.23 | (i) | | | 5.26 | (i) | | | 65 | |
| | | | | | |
| | | | | | | | | | | | | | | | | | | | | | | | | | |
| | 8.08 | | | | 1.73 | | | | 62 | | | | 1.69 | | | | 3.78 | | | | 2.71 | | | | 73 | |
| | 8.05 | | | | 7.76 | | | | 52 | | | | 1.63 | | | | 3.14 | | | | 3.65 | | | | 189 | |
| | 7.47 | | | | (19.07 | ) | | | 18 | | | | 1.67 | | | | 3.37 | (g) | | | 2.24 | | | | 134 | |
| | 9.23 | | | | (4.55 | ) | | | 54 | | | | 1.71 | | | | 3.48 | | | | 2.04 | | | | 145 | |
| | 9.67 | | | | (4.75 | ) | | | 49 | | | | 1.72 | (i) | | | 2.72 | (i) | | | 2.31 | (i) | | | 221 | |
| | 10.27 | | | | 3.06 | | | | 51 | | | | 1.75 | (i) | | | 2.73 | (i) | | | 5.75 | (i) | | | 65 | |
| | | | | | |
| | | | | | | | | | | | | | | | | | | | | | | | | | |
| | 8.30 | | | | 2.26 | | | | 7,366 | | | | 0.94 | | | | 4.56 | | | | 1.72 | | | | 73 | |
| | 8.25 | | | | 8.41 | | | | 3,723 | | | | 0.89 | | | | 3.99 | | | | 1.51 | | | | 189 | |
| | 7.61 | | | | (18.38 | ) | | | 29,405 | | | | 0.92 | | | | 4.04 | (g) | | | 1.21 | | | | 134 | |
| | 9.33 | | | | (3.81 | ) | | | 135,397 | | | | 0.96 | | | | 4.21 | | | | 1.30 | | | | 145 | |
| | 9.70 | | | | (4.03 | ) | | | 141,078 | | | | 0.97 | (i) | | | 3.63 | (i) | | | 1.46 | (i) | | | 221 | |
| | 10.27 | | | | 3.29 | | | | 10,069 | | | | 1.00 | (i) | | | 3.48 | (i) | | | 5.00 | (i) | | | 65 | |
| | | | | | |
| | | | | | | | | | | | | | | | | | | | | | | | | | |
| | 8.16 | | | | 1.92 | | | | 20 | | | | 1.44 | | | | 4.01 | | | | 2.42 | | | | 73 | |
| | 8.12 | | | | 7.98 | | | | 20 | | | | 1.38 | | | | 3.37 | | | | 4.61 | | | | 189 | |
| | 7.52 | | | | (18.88 | ) | | | 18 | | | | 1.41 | | | | 3.61 | (g) | | | 2.00 | | | | 134 | |
| | 9.27 | | | | (4.24 | ) | | | 47 | | | | 1.46 | | | | 3.71 | | | | 1.80 | | | | 145 | |
| | 9.68 | | | | (4.53 | ) | | | 49 | | | | 1.47 | (i) | | | 2.97 | (i) | | | 2.06 | (i) | | | 221 | |
| | 10.27 | | | | 3.14 | | | | 51 | | | | 1.50 | (i) | | | 2.98 | (i) | | | 5.50 | (i) | | | 65 | |
| | | | | | |
| | | | | | | | | | | | | | | | | | | | | | | | | | |
| | 8.35 | | | | 2.22 | | | | 21 | | | | 0.74 | | | | 4.71 | | | | 1.70 | | | | 73 | |
| | 8.31 | | | | 8.77 | | | | 20 | | | | 0.68 | | | | 4.07 | | | | 3.86 | | | | 189 | |
| | 7.64 | | | | (18.29 | ) | | | 19 | | | | 0.71 | | | | 4.31 | (g) | | | 1.29 | | | | 134 | |
| | 9.36 | | | | (3.60 | ) | | | 48 | | | | 0.76 | | | | 4.41 | | | | 1.10 | | | | 145 | |
| | 9.71 | | | | (3.82 | ) | | | 50 | | | | 0.77 | (i) | | | 3.67 | (i) | | | 1.36 | (i) | | | 221 | |
| | 10.27 | | | | 3.36 | | | | 52 | | | | 0.80 | (i) | | | 3.68 | (i) | | | 4.80 | (i) | | | 65 | |
| | | | | | |
| | | | | | | | | | | | | | | | | | | | | | | | | | |
| | 8.37 | | | | 2.36 | | | | 289,917 | | | | 0.69 | | | | 4.90 | | | | 1.47 | | | | 73 | |
| | 8.32 | | | | 8.76 | | | | 76,275 | | | | 0.63 | | | | 4.12 | | | | 1.25 | | | | 189 | |
| | 7.65 | | | | (18.26 | ) | | | 135,050 | | | | 0.66 | | | | 4.29 | (g) | | | 0.97 | | | | 134 | |
| | 9.37 | | | | (3.60 | ) | | | 153,222 | | | | 0.71 | | | | 4.51 | | | | 0.93 | | | | 145 | |
| | 9.72 | | | | (3.70 | ) | | | 9,086 | | | | 0.71 | (i) | | | 3.75 | (i) | | | 1.11 | (i) | | | 221 | |
| | 10.27 | | | | 3.38 | | | | 52 | | | | 0.75 | (i) | | | 3.73 | (i) | | | 4.75 | (i) | | | 65 | |
SEE NOTES TO FINANCIAL STATEMENTS.
| | | | | | | | |
| | | |
| APRIL 30, 2017 | | J.P. MORGAN FUNDS | | | | | 25 | |
NOTES TO FINANCIAL STATEMENTS
AS OF APRIL 30, 2017 (Unaudited)
1. Organization
JPMorgan Trust I (the “Trust”) was formed on November 12, 2004, as a Delaware statutory trust, pursuant to a Declaration of Trust dated November 5, 2004 and is registered under the Investment Company Act of 1940, as amended (the “1940 Act”), as an open-end management investment company.
The following is a separate fund of the Trust (the “Fund”) covered by this report:
| | | | |
| | | Classes Offered | | Diversified/Non-Diversified |
| Emerging Markets Strategic Debt Fund | | Class A, Class C, Class I*, Class R2, Class R5 and Class R6 | | Non-Diversified |
| * | Effective April 3, 2017, Select Class was renamed Class I. |
The investment objective of the Fund is to seek to provide total return.
Class A Shares generally provide for a front-end sales charge while Class C Shares provide for a contingent deferred sales charge (“CDSC”). No sales charges are assessed with respect to Class I, Class R2, Class R5 and Class R6 Shares. All classes of shares have equal rights as to earnings, assets and voting privileges, except that each class may bear different transfer agency, sub-transfer agency (through April 2, 2017), distribution and service fees and each class has exclusive voting rights with respect to its distribution plan and shareholder servicing agreements. Effective April 3, 2017 sub-transfer agency and shareholder servicing fees were consolidated into a single service fee. Certain Class A Shares, for which front-end sales charges have been waived, may be subject to a CDSC as described in the Fund’s prospectus. Beginning on November 14, 2017 Class C Shares will automatically convert to Class A Shares after ten years.
J.P. Morgan Investment Management Inc. (“JPMIM”) an indirect, wholly owned subsidiary of JPMorgan Chase & Co. (“JPMorgan”) acts as Adviser (the “Adviser”) and Administrator (the “Administrator”) to the Fund.
2. Significant Accounting Policies
The following is a summary of significant accounting policies followed by the Fund in the preparation of its financial statements. The Fund is an investment company and, accordingly, follows the investment company accounting and reporting guidance of the Financial Accounting Standards Board Accounting Standards Codification Topic 946 — Investment Companies, which is part of U.S. generally accepted accounting principles (“GAAP”). The preparation of financial statements in conformity with GAAP requires management to make estimates and assumptions that affect the reported amounts of assets and liabilities and disclosure of contingent assets and liabilities at the date of the financial statements and the reported amounts of increases and decreases in net assets from operations during the reporting period. Actual results could differ from those estimates.
A. Valuation of Investments — The valuation of investments is in accordance with GAAP and the Fund’s valuation policies set forth by and under the supervision and responsibility of the Board of Trustees (the “Board”), which established the following approach to valuation, as described more fully below: (i) investments for which market quotations are readily available shall be valued at such unadjusted quoted prices and (ii) all other investments for which market quotations are not readily available shall be valued at their fair value as determined in good faith by the Board.
The Administrator has established the J.P. Morgan Investment Management Americas Valuation Committee (“AVC”) to assist the Board with the oversight and monitoring of the valuation of the Fund’s investments. The Administrator implements the valuation policies of the Fund’s investments, as directed by the Board. The AVC oversees and carries out the policies for the valuation of investments held in the Fund. This includes monitoring the appropriateness of fair values based on results of ongoing valuation oversight, including but not limited to consideration of macro or security specific events, market events and pricing vendor and broker due diligence. The Administrator is responsible for discussing and assessing the potential impacts to the fair values on an ongoing basis, and at least on a quarterly basis with the AVC and the Board.
A market-based approach is primarily used to value the Fund’s investments. Investments for which market quotations are not readily available are fair valued by approved affiliated and unaffiliated pricing vendors or third party broker-dealers (collectively referred to as “Pricing Services”) or may be internally fair valued using methods set forth by the valuation policies approved by the Board. This may include related or comparable assets or liabilities, recent transactions, market multiples, book values, and other relevant information for the investment to determine the fair value of the investment. An income-based valuation approach may be used in which the anticipated future cash flows of the investment are discounted to calculate the fair value. Discounts may also be applied due to the nature or duration of any restrictions on the disposition of the investments. Valuations may be based upon current market prices of securities that are comparable in coupon, rating, maturity and industry. It is possible that the estimated values may differ significantly from the values that would have been used, had a ready market for the investments existed, and such differences could be material.
Fixed income instruments are valued based on prices received from Pricing Services. The Pricing Services use multiple valuation techniques to determine the valuation of fixed income instruments. In instances where sufficient market activity exists, the Pricing Services may utilize a market-based approach through which trades or quotes from market makers are used to determine the valuation of these instruments. In instances where sufficient market activity may not exist, the Pricing Services also utilize proprietary valuation models which may consider market transactions in comparable securities and the various relationships between securities in determining fair value and/or market characteristics in order to estimate the relevant cash flows, which are then discounted to calculate the fair values.
Investments in open-end investment companies (the “Underlying Funds”) are valued at each Underlying Fund’s net asset value per share (“NAV”) as of the report date.
| | | | | | |
| | | |
| 26 | | | | J.P. MORGAN FUNDS | | APRIL 30, 2017 |
Futures and options are generally valued on the basis of available market quotations. Swaps and forward foreign currency exchange contracts are valued utilizing market quotations from approved Pricing Services.
Valuations reflected in this report are as of the report date. As a result, changes in valuation due to market events and/or issuer related events after the report date and prior to issuance of the report are not reflected herein. The various inputs that are used in determining the valuation of the Fund’s investments are summarized into the three broad levels listed below.
| • | | Level 1 — Unadjusted inputs using quoted prices in active markets for identical investments. |
| • | | Level 2 — Other significant observable inputs including, but not limited to, quoted prices for similar investments, inputs other than quoted prices that are observable for investments (such as interest rates, prepayment speeds, credit risk, etc.) or other market corroborated inputs. |
| • | | Level 3 — Significant inputs based on the best information available in the circumstances, to the extent observable inputs are not available (including the Fund’s assumptions in determining the fair value of investments). |
A financial instrument’s level within the fair value hierarchy is based on the lowest level of any input, both individually and in the aggregate, that is significant to the fair value measurement. The inputs or methodology used for valuing instruments are not necessarily an indication of the risk associated with investing in those instruments.
The following tables represent each valuation input as presented on the Schedule of Portfolio Investments (“SOI”) (amounts in thousands):
| | | | | | | | | | | | | | | | |
| | | Level 1
Quoted prices | | | Level 2
Other significant
observable inputs | | | Level 3
Significant
unobservable inputs | | | Total | |
Investments in Securities | |
Debt Securities | | | | | | | | | | | | | | | | |
Corporate Bonds | | | | | | | | | | | | | | | | |
Argentina | | $ | — | | | $ | 3,927 | | | $ | — | | | $ | 3,927 | |
Brazil | | | — | | | | 8,274 | | | | — | | | | 8,274 | |
Chile | | | — | | | | 1,530 | | | | — | | | | 1,530 | |
China | | | — | | | | 4,157 | | | | — | | | | 4,157 | |
Colombia | | | — | | | | 4,015 | | | | — | | | | 4,015 | |
Congo | | | — | | | | 312 | | | | — | | | | 312 | |
El Salvador | | | — | | | | 321 | | | | — | | | | 321 | |
Guatemala | | | — | | | | 1,079 | | | | — | | | | 1,079 | |
Hong Kong | | | — | | | | 223 | | | | — | | | | 223 | |
Hungary | | | — | | | | 330 | | | | — | | | | 330 | |
India | | | — | | | | 843 | | | | — | | | | 843 | |
Indonesia | | | — | | | | 3,145 | | | | — | | | | 3,145 | |
Jamaica | | | — | | | | 183 | | | | — | | | | 183 | |
Kazakhstan | | | — | | | | 5,006 | | | | — | | | | 5,006 | |
Kuwait | | | — | | | | 1,711 | | | | — | | | | 1,711 | |
Mexico | | | — | | | | 15,200 | | | | — | | | | 15,200 | |
Morocco | | | — | | | | 540 | | | | — | | | | 540 | |
Netherlands | | | — | | | | 1,389 | | | | — | | | | 1,389 | |
Nigeria | | | — | | | | 322 | | | | — | | | | 322 | |
Peru | | | — | | | | 962 | | | | — | | | | 962 | |
Qatar | | | — | | | | 202 | | | | — | | | | 202 | |
Russia | | | — | | | | 7,333 | | | | — | | | | 7,333 | |
South Africa | | | — | | | | 2,824 | | | | — | | | | 2,824 | |
South Korea | | | — | | | | 265 | | | | — | | | | 265 | |
Sri Lanka | | | — | | | | 425 | | | | — | | | | 425 | |
Trinidad and Tobago | | | — | | | | 1,221 | | | | — | | | | 1,221 | |
Tunisia | | | — | | | | 1,285 | | | | — | | | | 1,285 | |
Turkey | | | — | | | | 406 | | | | — | | | | 406 | |
Ukraine | | | — | | | | 708 | | | | — | | | | 708 | |
United Arab Emirates | | | — | | | | 1,959 | | | | — | | | | 1,959 | |
United Kingdom | | | — | | | | 175 | | | | — | | | | 175 | |
Venezuela | | | — | | | | 286 | | | | — | | | | 286 | |
| | | | | | | | | | | | | | | | |
Total Corporate Bonds | | | — | | | | 70,558 | | | | — | | | | 70,558 | |
| | | | | | | | | | | | | | | | |
| | | | | | | | |
| | | |
| APRIL 30, 2017 | | J.P. MORGAN FUNDS | | | | | 27 | |
NOTES TO FINANCIAL STATEMENTS
AS OF APRIL 30, 2017 (Unaudited) (continued)
| | | | | | | | | | | | | | | | |
| | | Level 1
Quoted prices | | | Level 2
Other significant
observable inputs | | | Level 3
Significant
unobservable inputs | | | Total | |
Foreign Government Securities | | $ | — | | | $ | 198,293 | | | $ | — | | | $ | 198,293 | |
U.S. Treasury Obligation | | | — | | | | 898 | | | | — | | | | 898 | |
Options Purchased | | | | | | | | | | | | | | | | |
Foreign Exchange Currency Options | | | — | | | | 144 | | | | — | | | | 144 | |
Short-Term Investment | | | | | | | | | | | | | | | | |
Investment Company | | | 6,386 | | | | — | | | | — | | | | 6,386 | |
| | | | | | | | | | | | | | | | |
Total Investments in Securities | | $ | 6,386 | | | $ | 269,893 | | | $ | — | | | $ | 276,279 | |
| | | | | | | | | | | | | | | | |
Appreciation in Other Financial Instruments | | | | | | | | | | | | | | | | |
Forward Foreign Currency Exchange Contracts | | $ | — | | | $ | 535 | | | $ | — | | | $ | 535 | |
Futures Contracts | | | 21 | | | | — | | | | — | | | | 21 | |
Swaps | | | — | | | | 13 | | | | — | | | | 13 | |
| | | | | | | | | | | | | | | | |
Total Appreciation in Other Financial Instruments | | $ | 21 | | | $ | 548 | | | $ | — | | | $ | 569 | |
| | | | | | | | | | | | | | | | |
Depreciation in Other Financial Instruments | | | | | | | | | | | | | | | | |
Forward Foreign Currency Exchange Contracts | | $ | — | | | $ | (798 | ) | | $ | — | | | $ | (798 | ) |
Futures Contracts | | | (303 | ) | | | — | | | | — | | | | (303 | ) |
Options Written | | | | | | | | | | | | | | | | |
Foreign Exchange Currency Options Written | | | — | | | | (3 | ) | | | — | | | | (3 | ) |
Swaps | | | — | | | | (555 | ) | | | — | | | | (555 | ) |
| | | | | | | | | | | | | | | | |
Total Depreciation in Other Financial Instruments | | $ | (303 | ) | | $ | (1,356 | ) | | $ | — | | | $ | (1,659 | ) |
| | | | | | | | | | | | | | | | |
There were no transfers among any levels during the six months ended April 30, 2017.
The following is a summary of investments for which significant unobservable inputs (level 3) were used in determining fair value (amounts in thousands):
| | | | | | | | | | | | | | | | | | | | | | | | | | | | | | | | | | | | |
| | | Balance as
of October 31, 2016 | | | Realized
gain (loss) | | | Change in
net unrealized
appreciation
(depreciation) | | | Net
accretion
(amortization) | | | Purchases1 | | | Sales2 | | | Transfers
into Level 3 | | | Transfers
out of
Level 3 | | | Balance as
of April 30, 2017 | |
Debt Securities — Foreign Government Securities | | $ | 446 | | | $ | (197 | ) | | $ | 155 | | | $ | — | | | $ | — | | | $ | (404 | ) | | $ | — | | | $ | — | | | $ | — | |
| | | | | | | | | | | | | | | | | | | | | | | | | | | | | | | | | | | | |
Total | | $ | 446 | | | $ | (197 | ) | | $ | 155 | | | $ | — | | | $ | — | | | $ | (404 | ) | | $ | — | | | $ | — | | | $ | — | |
| | | | | | | | | | | | | | | | | | | | | | | | | | | | | | | | | | | | |
| (1) | Purchases include all purchases of securities and securities received in corporate actions. |
| (2) | Sales include all sales of securities, maturities, paydowns and securities tendered in corporate actions. |
B. Restricted Securities — Certain securities held by the Fund may be subject to legal or contractual restrictions on resale. Restricted securities generally are resold in transactions exempt from registration under the Securities Act of 1933 (the “Securities Act”). Disposal of these securities may involve time-consuming negotiations and expense. Prompt sale at the current valuation may be difficult and could adversely affect the net asset value of the Fund.
As of April 30, 2017, the Fund had no investments in restricted securities other than securities sold to the Fund under Rule 144A or Regulation S under the Securities Act.
C. Derivatives — The Fund used instruments including futures, forward foreign currency exchange contracts, options and swaps in connection with its investment strategy. Derivative instruments may be used as substitutes for securities in which the Fund can invest, to hedge portfolio investments or to generate income or gain to the Fund. Derivatives may also be used to manage duration, sector and yield curve exposures and credit and spread volatility.
The Fund may be subject to various risks from the use of derivatives including the risk that changes in the value of a derivative may not correlate perfectly with the underlying asset, rate or index; counterparty credit risk related to derivatives counterparties’ failure to perform under contract terms; liquidity risk related to the lack of a liquid market for these contracts allowing the Fund to close out its position(s); and, documentation risk relating to disagreement over contract terms. Investing in certain derivatives also results in a form of leverage and as such, the Fund’s risk of loss associated with these instruments may exceed its value, as recorded on the Statement of Assets and Liabilities.
The Fund is party to various derivative contracts governed by International Swaps and Derivatives Association master agreements (“ISDA agreements”). The Fund’s ISDA agreements, which are separately negotiated with each dealer counterparty, may contain provisions allowing, absent
| | | | | | |
| | | |
| 28 | | | | J.P. MORGAN FUNDS | | APRIL 30, 2017 |
other considerations, a counterparty to exercise rights, to the extent not otherwise waived, against the Fund in the event the Fund’s net assets decline over time by a pre-determined percentage or fall below a pre-determined floor. The ISDA agreements may also contain provisions allowing, absent other conditions, the Fund to exercise rights, to the extent not otherwise waived, against the counterparty (e.g., decline in a counterparty’s credit rating below a specified level). Such rights for both the counterparty and the Fund often include the ability to terminate (i.e., close out) open contracts at prices which may favor the counterparty, which could have an adverse effect on the Fund. The ISDA agreements give the Fund and counterparty the right, upon an event of default, to close out all transactions traded under such agreements and to net amounts owed or due across all transactions and offset such net payable or receivable with collateral posted to a segregated account by one party to the other.
Counterparty credit risk may be mitigated to the extent a counterparty posts collateral for mark to market gains to the Fund.
Notes C(1) — C(4) below describe the various derivatives used by the Fund.
(1). Options — The Fund purchased and sold (“wrote”) put and call options on various instruments including futures, securities, currencies and interest rate swaps (“swaptions”) to manage and hedge interest rate risks within its portfolio and also to gain long or short exposure to the underlying instrument, index, currency or rate. A purchaser of a put option has the right, but not the obligation, to sell the underlying instrument at an agreed upon price (“strike price”) to the option seller. A purchaser of a call option has the right, but not the obligation, to purchase the underlying instrument at the strike price from the option seller. Swaptions and Eurodollar options are settled for cash.
Options Purchased — Premiums paid by the Fund for options purchased are included on the Statement of Assets and Liabilities as an investment. The option is adjusted daily to reflect the current market value of the option and the change is recorded as Change in net unrealized appreciation/ depreciation of investments in non-affiliates on the Statement of Operations. If the option is allowed to expire, the Fund will lose the entire premium it paid and record a realized loss for the premium amount. Premiums paid for options purchased which are exercised or closed are added to the amounts paid or offset against the proceeds on the underlying investment transaction to determine the realized gain (loss) or cost basis of the underlying investment.
Options Written — Premiums received by the Fund for options written are included on the Statement of Assets and Liabilities as a liability. The amount of the liability is adjusted daily to reflect the current market value of the option written and the change in market value is recorded as Change in net unrealized appreciation/depreciation of Options written on the Statement of Operations. Premiums received from options written that expire are treated as realized gains. If a written option is closed, the Fund records a realized gain or loss on options written based on whether the cost of the closing transaction exceeds the premium received. If a call option is exercised by the option buyer, the premium received by the Fund is added to the proceeds from the sale of the underlying security to the option buyer and compared to the cost of the closing transaction to determine whether there has been a realized gain or loss. If a put option is exercised by an option buyer, the premium received by the option seller reduces the cost basis of the purchased security.
Written uncovered call options subject the Fund to unlimited risk of loss. Written covered call options limit the upside potential of a security above the strike price. Written put options subject the Fund to risk of loss if the value of the security declines below the exercise price minus the put premium.
The Fund is not subject to credit risk on options written as the counterparty has already performed its obligation by paying the premium at the inception of the contract.
Transactions in options written during the six months ended April 30, 2017 were as follows (amounts in thousands):
| | | | | | | | |
| | | Foreign Exchange Currency Options | |
| | | Notional
Amount | | | Premiums
Received | |
Options outstanding at October 31, 2016 | | $ | — | | | $ | — | |
Options written | | | 1,392 | | | | 25 | |
Options expired | | | — | | | | — | |
Options closed | | | (689 | ) | | | (22 | ) |
| | | | | | | | |
Options outstanding at April 30, 2017 | | $ | 703 | | | $ | 3 | |
| | | | | | | | |
The Fund’s exchange traded options contracts are not subject to master netting agreements (the right to close out all transactions traded with a counterparty and net amounts owed or due across transactions). The Fund’s over the counter (“OTC”) options are subject to master netting agreements. The Fund may be required to post or receive collateral for over the counter options.
(2). Futures Contracts — The Fund used treasury, index or other financial futures contracts to manage and hedge interest rate risk associated with portfolio investments. The Fund also used futures contracts to lengthen or shorten the duration of the overall investment portfolio.
Futures contracts provide for the delayed delivery of the underlying instrument at a fixed price or are settled for a cash amount based on the change in the value of the underlying instrument at a specific date in the future. Upon entering into a futures contract, the Fund is required to deposit with the broker, cash or securities in an amount equal to a certain percentage of the contract amount, which is referred to as the initial margin deposit. Subsequent payments, referred to as variation margin, are made or received by the Fund periodically and are based on changes in
| | | | | | | | |
| | | |
| APRIL 30, 2017 | | J.P. MORGAN FUNDS | | | | | 29 | |
NOTES TO FINANCIAL STATEMENTS
AS OF APRIL 30, 2017 (Unaudited) (continued)
the market value of open futures contracts. Changes in the market value of open futures contracts are recorded as Change in net unrealized appreciation/depreciation on the Statement of Operations. Realized gains or losses, representing the difference between the value of the contract at the time it was opened and the value at the time it was closed, are reported on the Statement of Operations at the closing or expiration of the futures contract. Securities deposited as initial margin are designated in the SOI and cash deposited is recorded on the Statement of Assets and Liabilities. A receivable from and/or a payable to brokers for the daily variation margin is also recorded on the Statement of Assets and Liabilities.
The use of futures contracts exposes the Fund to interest rate risk. The Fund may be subject to the risk that the change in the value of the futures contract may not correlate perfectly with the underlying instrument. Use of long futures contracts subjects the Fund to risk of loss in excess of the amounts shown on the Statement of Assets and Liabilities, up to the notional amount of the futures contracts. Use of short futures contracts subjects the Fund to unlimited risk of loss. The Fund may enter into futures contracts only on exchanges or boards of trade. The exchange or board of trade acts as the counterparty to each futures transaction; therefore, the Fund’s credit risk is limited to failure of the exchange or board of trade. Under some circumstances, futures exchanges may establish daily limits on the amount that the price of a futures contract can vary from the previous day’s settlement price, which could effectively prevent liquidation of positions.
The Fund’s futures contracts are not subject to master netting arrangements (the right to close out all transactions traded with a counterparty and net amounts owed or due across transactions).
(3). Forward Foreign Currency Exchange Contracts — The Fund may be exposed to foreign currency risks associated with some or all of the portfolio investments and used forward foreign currency exchange contracts to hedge or manage certain of these exposures as part of an investment strategy. The Fund also bought forward foreign currency exchange contracts to gain exposure to currencies. Forward foreign currency exchange contracts represent obligations to purchase or sell foreign currency on a specified future date at a price fixed at the time the contracts are entered into. Non-deliverable forward foreign currency exchange contracts are settled with the counterparty in U.S. Dollar without the delivery of foreign currency.
The values of the forward foreign currency exchange contracts are adjusted daily based on the applicable exchange rate of the underlying currency. Changes in the value of these contracts are recorded as unrealized appreciation or depreciation until the contract settlement date. When the forward foreign currency exchange contract is closed, the Fund records a realized gain or loss equal to the difference between the value at the time the contract was opened and the value at the time it was closed. The Fund also records a realized gain or loss when a forward foreign currency exchange contract offsets another forward foreign currency exchange contract with the same counterparty upon settlement.
The Fund’s forward foreign currency exchange contracts are subject to master netting arrangements (the right to close out all transactions with a counterparty and net amounts owed or due across transactions). The Fund may be required to post or receive collateral for non-deliverable forward foreign currency contracts.
(4). Swaps — The Fund engaged in various swap transactions, including credit default and interest rate swaps to manage credit and interest rate (e.g., duration, yield curve) risks within its portfolio. The Fund also used swaps as alternatives to direct investments. Swap transactions are negotiated contracts over the counter (“OTC swaps”) between the Fund and a counterparty or centrally cleared (“centrally cleared swaps”) with a central clearinghouse through a Futures Commission Merchant (“FCM”), to exchange investment cash flows, assets, foreign currencies or market-linked returns at specified, future intervals.
Upfront payments made and/or received by the Fund are recorded as assets or liabilities, respectively on the Statement of Assets and Liabilities and amortized over the term of the swap. The value of an OTC swap agreement is recorded as either an asset or a liability on the Statement of Assets and Liabilities at the beginning of the measurement period. Upon entering into a centrally cleared swap, the Fund is required to deposit with the FCM cash or securities, which is referred to as initial margin deposit. Securities deposited as initial margin are designated on the SOIs and cash deposited is recorded on the Statement of Assets and Liabilities. Daily changes in valuation of centrally cleared swaps, if any, are recorded as a variation margin receivable or payable on the Statement of Assets and Liabilities. The change in the value of swaps, including accruals of periodic amounts of interest to be paid or received on swaps, is reported as Change in net unrealized appreciation/ depreciation on the Statement of Operations. A realized gain or loss is recorded upon payment or receipt of a periodic payment or payment made upon termination of a swap agreement.
The Fund may be required to post or receive collateral for over the counter swaps.
The Fund’s swap contracts are subject to master netting arrangements.
Credit Default Swaps
The Fund entered into credit default swaps to simulate long and/or short bond positions or to take an active long and/or short position with respect to the likelihood of a default or credit event by the issuer of the underlying reference obligation.
The underlying reference obligation may be a single issuer of corporate or sovereign debt, a basket of issuers or a credit index. A credit index is a list of credit instruments or exposures that reference a fixed number of obligors with shared characteristics that represents some part of the credit market as a whole. Index credit default swaps have standardized terms including a fixed spread and standard maturity dates. The composition of the obligations within a particular index changes periodically.
Credit default swaps involve one party, the protection buyer, making a stream of payments to another party, the protection seller, in exchange for the right to receive a contingent payment if there is a credit event related to the underlying reference obligation. In the event that the reference
| | | | | | |
| | | |
| 30 | | | | J.P. MORGAN FUNDS | | APRIL 30, 2017 |
obligation matures prior to the termination date of the contract, a similar security will be substituted for the duration of the contract term. Credit events are defined under individual swap agreements and generally include bankruptcy, failure to pay, restructuring, repudiation/moratorium, obligation acceleration and obligation default.
If a credit event occurs, the Fund, as protection seller, would be obligated to make a payment, which may be either: (i) a net cash settlement equal to the notional amount of the swap less the auction value of the reference obligation or (ii) the notional amount of the swap in exchange for the delivery of the reference obligation. Selling protection effectively adds leverage to the Fund’s portfolio up to the notional amount of swap agreements. The notional amount represents the maximum potential liability under a contract and is not reflected on the Statement of Assets and Liabilities. Potential liabilities under these contracts may be reduced by: the auction rates of the underlying reference obligations; upfront payments received at the inception of a swap; and net amounts received from credit default swaps purchased with the identical reference obligation.
Interest Rate Swaps
The Fund entered into interest rate swap contracts to manage fund exposure to interest rates or to either preserve or generate a return on a particular investment or portion of its portfolio. These are agreements between counterparties to exchange periodic interest payments based on interest rates. One cash flow stream will typically be a floating rate payment based upon a specified interest rate while the other is typically a fixed interest rate.
(5). Summary of Derivatives Information — The following table presents the value of derivatives held as of April 30, 2017, by their primary underlying risk exposure and respective location on the Statement of Assets and Liabilities (amounts in thousands):
| | | | | | | | | | | | | | | | | | | | | | |
| Derivative Contracts | | Statements of Assets and Liabilities Location | | | | | | | | | | |
| Gross Assets: | | | | Options (a) | | | Futures
Contracts (b) | | | Forward Foreign
Currency Exchange
Contracts | | | OTC
Swaps | | | Total | |
Interest rate contracts | | Receivables, Net Assets — Unrealized Appreciation | | $ | — | | | $ | 21 | | | $ | — | | | $ | 13 | | | $ | 34 | |
Foreign exchange contracts | | Receivables | | | 144 | | | | — | | | | 535 | | | | — | | | | 679 | |
Credit contracts | | Receivables | | | — | | | | — | | | | — | | | | 1,685 | | | | 1,685 | |
| | | | | | | | | | | | | | | | | | | | | | |
Total | | | | $ | 144 | | | $ | 21 | | | $ | 535 | | | $ | 1,698 | | | $ | 2,398 | |
| | | | | | | | | | | | | | | | | | | | | | |
| | | | | | |
Gross Liabilities: | | | | | | | | | | | | | | | | | |
Interest rate contracts | | Payables, Net Assets — Unrealized Depreciation | | $ | — | | | $ | (303 | ) | | $ | — | | | $ | (8 | ) | | $ | (311 | ) |
Foreign exchange contracts | | Payables | | | (3 | ) | | | — | | | | (798 | ) | | | — | | | | (801 | ) |
Credit contracts | | Payables | | | — | | | | — | | | | — | | | | — | | | | — | |
| | | | | | | | | | | | | | | | | | | | | | |
Total | | | | $ | (3 | ) | | $ | (303 | ) | | $ | (798 | ) | | $ | (8 | ) | | $ | (1,112 | ) |
| | | | | | | | | | | | | | | | | | | | | | |
| (a) | The market value of options purchased is reported as Investments in non-affiliates, at value on the Statement of Assets and Liabilities. |
| (b) | This amount represents the cumulative appreciation (depreciation) of futures contracts as reported on the SOI. The Statement of Assets and Liabilities only reflect the current day variation margin receivable/payable from/to brokers. |
| | | | | | | | |
| | | |
| APRIL 30, 2017 | | J.P. MORGAN FUNDS | | | | | 31 | |
NOTES TO FINANCIAL STATEMENTS
AS OF APRIL 30, 2017 (Unaudited) (continued)
The following table presents the Fund’s gross derivative assets and liabilities by counterparty net of amounts available for offset under netting arrangements and any related collateral received or posted by the Fund as of April 30, 2017 (amounts in thousands):
| | | | | | | | | | | | | | | | |
| Counterparty | | Gross Amount of
Derivative Assets
Subject to Netting
Arrangements
Presented on the
Statement of Assets
and Liabilities (a) | | | Derivatives
Available
for offset | | | Collateral
Received | | | Net Amount Due
From Counterparty
(Not less than zero) | |
Bank of America NA | | $ | 179 | | | $ | — | | | $ | (179 | )(b) | | $ | — | |
Barclays Bank plc | | | 56 | | | | (6 | ) | | | — | | | | 50 | |
BNP Paribas | | | 7 | | | | (4 | ) | | | — | | | | 3 | |
Citibank, N.A. | | | 1,574 | | | | (144 | ) | | | — | | | | 1,430 | |
Credit Suisse International | | | 7 | | | | (7 | ) | | | — | | | | — | |
Deutsche Bank AG | | | 25 | | | | (25 | ) | | | — | | | | — | |
Goldman Sachs International | | | 180 | | | | (138 | ) | | | — | | | | 42 | |
HSBC Bank, N.A. | | | 47 | | | | (47 | ) | | | — | | | | — | |
Merrill Lynch International | | | 93 | | | | (93 | ) | | | — | | | | — | |
National Australia Bank | | | 12 | | | | (12 | ) | | | — | | | | — | |
Societe Generale | | | 32 | | | | (32 | ) | | | — | | | | — | |
Standard Chartered Bank | | | 4 | | | | (4 | ) | | | — | | | | — | |
State Street Corp. | | | 3 | | | | (3 | ) | | | — | | | | — | |
TD Bank Financial Group | | | 14 | | | | (3 | ) | | | — | | | | 11 | |
| | | | | | | | | | | | | | | | |
| | $ | 2,233 | | | $ | (518 | ) | | $ | (179 | ) | | $ | 1,536 | |
| | | | | | | | | | | | | | | | |
| | | | |
| Counterparty | | Gross Amount of
Derivative Liabilities
Subject to Netting
Arrangements
Presented on the
Statement of Assets
and Liabilities (a) | | | Derivatives
Available
for Offset | | | Collateral
Posted | | | Net Amount Due
To Counterparty
(Not less than zero) | |
Australia and New Zealand Banking Group Limited | | $ | 7 | | | $ | — | | | $ | — | | | $ | 7 | |
Barclays Bank plc | | | 6 | | | | (6 | ) | | | — | | | | — | |
BNP Paribas | | | 4 | | | | (4 | ) | | | — | | | | — | |
Citibank, N.A. | | | 144 | | | | (144 | ) | | | — | | | | — | |
Credit Suisse International | | | 25 | | | | (7 | ) | | | — | | | | 18 | |
Deutsche Bank AG | | | 93 | | | | (25 | ) | | | — | | | | 68 | |
Goldman Sachs International | | | 138 | | | | (138 | ) | | | — | | | | — | |
HSBC Bank, N.A. | | | 65 | | | | (47 | ) | | | — | | | | 18 | |
Merrill Lynch International | | | 146 | | | | (93 | ) | | | — | | | | 53 | |
National Australia Bank | | | 32 | | | | (12 | ) | | | — | | | | 20 | |
Royal Bank of Canada | | | 5 | | | | — | | | | — | | | | 5 | |
Societe Generale | | | 108 | | | | (32 | ) | | | — | | | | 76 | |
Standard Chartered Bank | | | 21 | | | | (4 | ) | | | — | | | | 17 | |
State Street Corp. | | | 8 | | | | (3 | ) | | | — | | | | 5 | |
TD Bank Financial Group | | | 3 | | | | (3 | ) | | | — | | | | — | |
Westpac Banking Corp. | | | 1 | | | | — | | | | — | | | | 1 | |
| | | | | | | | | | | | | | | | |
| | $ | 806 | | | $ | (518 | ) | | $ | — | | | $ | 288 | |
| | | | | | | | | | | | | | | | |
| (a) | For financial reporting purposes, the Fund does not offset derivative assets and derivative liabilities subject to master netting arrangements on the Statement of Assets and Liabilities. |
| (b) | Collateral received or posted is limited to the net derivative asset or net derivative liability amounts. See Note 2.C.(4). for actual swap collateral received or posted. |
| | | | | | |
| | | |
| 32 | | | | J.P. MORGAN FUNDS | | APRIL 30, 2017 |
The following table presents the effect of derivatives on the Statement of Operations for the six months ended April 30, 2017, by primary underlying risk exposure (amounts in thousands):
| | | | | | | | | | | | | | | | | | | | |
| Amount of Realized Gain (Loss) on Derivatives Recognized on the Statement of Operations | |
| Derivative Contracts | | Options | | | Futures Contracts | | | Forward Foreign
Currency Exchange
Contracts | | | OTC Swaps | | | Total | |
Interest rate contracts | | $ | — | | | $ | 29 | | | $ | — | | | $ | 9 | | | $ | 38 | |
Foreign exchange contracts | | | (10 | ) | | | — | | | | 246 | | | | (306 | ) | | | (70 | ) |
| | | | | | | | | | | | | | | | | | | | |
Total | | $ | (10 | ) | | $ | 29 | | | $ | 246 | | | $ | (297 | ) | | $ | (32 | ) |
| | | | | | | | | | | | | | | | | | | | |
|
| Amount of Change in Unrealized Appreciation (Depreciation) on Derivatives Recognized on the Statement of Operations | |
| Derivative Contracts | | Options | | | Futures Contracts | | | Forward Foreign
Currency Exchange
Contracts | | | OTC Swaps | | | Total | |
Interest rate contracts | | $ | — | | | $ | (293 | ) | | $ | — | | | $ | 5 | | | $ | (288 | ) |
Foreign exchange contracts | | | (27 | ) | | | — | | | | (257 | ) | | | — | | | | (284 | ) |
Credit contracts | | | — | | | | — | | | | — | | | | (547 | ) | | | (547 | ) |
| | | | | | | | | | | | | | | | | | | | |
Total | | $ | (27 | ) | | $ | (293 | ) | | $ | (257 | ) | | $ | (542 | ) | | $ | (1,119 | ) |
| | | | | | | | | | | | | | | | | | | | |
The Fund’s derivatives contracts held at April 30, 2017 are not accounted for as hedging instruments under GAAP.
Derivatives Volume
The tables below disclose the volume of the Fund’s forward foreign currency exchange contracts, options and swaps activity during the six months ended April 30, 2017 (amounts in thousands). Please refer to the tables in the Summary of Derivatives Information for derivative-related gains and losses associated with volume activity.
| | | | |
| | | | |
Futures Contracts: | | | | |
Average Notional Balance Long | | $ | 2,614 | (a) |
Average Notional Balance Short | | | 52,822 | |
Ending Notional Balance Short | | | 104,596 | |
| |
Forward Foreign Currency Exchange Contracts: | | | | |
Average Settlement Value Purchased | | $ | 31,491 | |
Average Settlement Value Sold | | | 32,383 | |
Ending Settlement Value Purchased | | | 52,602 | |
Ending Settlement Value Sold | | | 51,881 | |
| |
OTC Options: | �� | | | |
Average Notional Balance Purchased | | $ | 2,998 | (b) |
Average Notional Balance Written | | | 703 | (c) |
Ending Notional Balance Purchased | | | — | |
Ending Notional Balance Written | | | 703 | |
| |
Credit Default Swaps | | | | |
Average Notional Balance — Buy Protection | | $ | 19,957 | |
Average Notional Balance — Sell Protection | | | | |
Ending Notional Balance — Buy Protection | | | 40,700 | |
Ending Notional Balance — Sell Protection | | | | |
| |
Interest Rate-Related Swaps | | | | |
Average Notional Balance — Pays Fixed Rate | | $ | 2,115 | (d) |
Average Notional Balance — Receives Fixed Rate | | | 6,675 | (d) |
Ending Notional Balance — Pays Fixed Rate | | | 1,327 | |
Ending Notional Balance — Receives Fixed Rate | | | 6,767 | |
| (a) | For the period January 1, 2017 through January 31, 2017. |
| (b) | For the period November 1, 2016 through November 30, 2016. |
| (c) | For the period April 1, 2017 through April 30, 2017. |
| (d) | For the period November 1, 2016 through April 30, 2017. |
| | | | | | | | |
| | | |
| APRIL 30, 2017 | | J.P. MORGAN FUNDS | | | | | 33 | |
NOTES TO FINANCIAL STATEMENTS
AS OF APRIL 30, 2017 (Unaudited) (continued)
The Fund may be required to post or receive collateral based on the net value of the Fund’s outstanding OTC swap contracts, non-deliverable forward foreign currency contracts and/or OTC options with the counterparty in the form of cash or securities. Daily movement of cash collateral is subject to minimum threshold amounts. Collateral posted by the Fund is held in a segregated account at the Fund’s custodian bank. For certain counterparties, cash collateral posted by the Fund is invested in an affiliated money market fund. Otherwise the cash collateral is included on the Statement of Assets and Liabilities as Restricted cash. Collateral received by the Fund is held in escrow in accounts maintained by JPMorgan Chase Bank, N.A. (“JPMCB”), an affiliate of the Fund, which provides collateral management services to the Fund (See Note 3.G.). These amounts are not reflected on the Fund’s Statements of Assets and Liabilities and are disclosed in the table below.
The Fund’s derivative contracts collateral requirement and collateral posted or received by counterparty as of April 30, 2017 are as follows (amounts in thousands):
| | | | | | | | | | |
| | | Fund Counterparty | | Value of
derivative
contracts | | | Collateral
amount | |
Collateral Received | | Bank of America N.A | | $ | 179 | | | $ | (260 | ) |
D. Foreign Currency Translation —The books and records of the Fund are maintained in U.S. dollars. Foreign currency amounts are translated into U.S. dollars at the prevailing exchange rates of such currencies against the U.S. dollar. The market value of investment securities and other assets and liabilities are translated at the exchange rate as of the valuation date. Purchases and sales of investment securities, income and expenses are translated at the exchange rate prevailing on the respective dates of such transactions.
The Fund does not isolate the effect of changes in foreign exchange rates from changes in market prices on securities held. Accordingly, such changes are included within Change in net unrealized appreciation/depreciation on investments on the Statement of Operations.
Reported realized foreign currency gains and losses arise from the disposition of foreign currency, currency gains or losses realized between the trade and settlement dates on securities transactions, and the difference between the amounts of dividends, interest and foreign withholding taxes recorded on the Fund’s books on the transaction date and the U.S. dollar equivalent of the amounts actually received or paid. These reported realized foreign currency gains and losses are included in Net realized gain (loss) on foreign currency transactions on the Statement of Operations. Unrealized foreign currency gains and losses arise from changes (due to changes in exchange rates) in the value of foreign currency and other assets and liabilities denominated in foreign currencies, which are held at period end and are included in Change in net unrealized appreciation/depreciation on foreign currency translations on the Statement of Operations.
E. Security Transactions and Investment Income — Investment transactions are accounted for on the trade date (the date the order to buy or sell is executed). Securities gains and losses are calculated on a specifically identified cost basis. Interest income is determined on the basis of coupon interest accrued using the effective interest method which adjusts for amortization of premiums and accretion of discounts. Dividend income net of foreign taxes withheld, if any, is recorded on the ex-dividend date or when the Fund first learns of the dividend.
F. Allocation of Income and Expenses — Expenses directly attributable to a fund are charged directly to that fund, while the expenses attributable to more than one fund of the Trust are allocated among the respective funds. In calculating the NAV of each class, investment income, realized and unrealized gains and losses and expenses, other than class specific expenses, are allocated daily to each class of shares based upon the proportion of net assets of each class at the beginning of each day.
Transfer agency fees are class-specific expenses and sub-transfer agency fees were class specific expenses up through April 2, 2017. Effective April 3, 2017, the Funds ceased making direct payments to financial intermediaries for any applicable sub-transfer agency services. Payments to financial intermediaries for sub-transfer agency services are made by JPMorgan Distribution Services, Inc. from the Shareholder Servicing Fee which has been renamed as the Service Fee. The amount of the transfer agency fees and sub-transfer agency fees charged to each class of the Fund for the six months ended April 30, 2017 are as follows (amounts in thousands):
| | | | | | | | | | | | | | | | | | | | | | | | | | | | |
| | | Class A | | | Class C | | | Class I | | | R2 | | | R5 | | | R6 | | | Total | |
Transfer agency fees | | $ | — | (a) | | $ | — | (a) | | $ | — | (a) | | $ | — | (a) | | $ | — | (a) | | $ | 1 | | | $ | 1 | |
Sub-transfer agency fees | | | — | | | | — | (a) | | | — | | | | — | | | | — | | | | — | | | | — | (a) |
| (a) | Amount rounds to less than 500. |
G. Federal Income Taxes — The Fund is treated as a separate taxable entity for Federal income tax purposes. The Fund’s policy is to comply with the provisions of the Internal Revenue Code of 1986, as amended (the “Code”), applicable to regulated investment companies and to distribute to shareholders all of its distributable net investment income and net realized capital gains on investments. Accordingly, no provision for Federal income tax is necessary. Management has reviewed the Fund’s tax positions for all open tax years and has determined that as of April 30, 2017, no liability for income tax is required in the Fund’s financial statements for net unrecognized tax benefits. However, management’s conclusions may be subject to future review based on changes in, or the interpretation of, the accounting standards or tax laws and regulations. The Fund’s Federal tax returns for the prior three fiscal years remain subject to examination by the Internal Revenue Service.
H. Foreign Taxes — The Fund may be subject to foreign taxes on income, gains on investments or currency purchases/repatriation, a portion of which may be recoverable. The Fund will accrue such taxes and recoveries as applicable, based upon its current interpretation of tax rules and regulations that exist in the markets in which it invests.
| | | | | | |
| | | |
| 34 | | | | J.P. MORGAN FUNDS | | APRIL 30, 2017 |
I. Distributions to Shareholders — Distributions from net investment income are generally declared and paid monthly for the Fund and are declared separately for each class. No class has preferential dividend rights; differences in per share rates are due to differences in separate class expenses. Net realized capital gains, if any, are distributed by the Fund at least annually. The amount of distributions from net investment income and net realized capital gains is determined in accordance with Federal income tax regulations, which may differ from GAAP. To the extent these “book/tax” differences are permanent in nature (i.e., that they result from other than timing of recognition — “temporary differences”), such amounts are reclassified within the capital accounts based on their Federal tax-basis treatment.
3. Fees and Other Transactions with Affiliates
A. Investment Advisory Fee — Pursuant to an Investment Advisory Agreement, the Adviser supervises the investments of the Fund and for such services is paid a fee. The fee is accrued daily and paid monthly at an annual rate equal to 0.70% of the Fund’s average daily net assets.
The Adviser waived Investment Advisory fees and/or reimbursed expenses as outlined in Note 3.F.
B. Administration Fee — Pursuant to an Administration Agreement, the Administrator provides certain administration services to the Fund. In consideration of these services, the Administrator receives a fee accrued daily and paid monthly at an annual rate of 0.15% of the first $25 billion of the average daily net assets of all funds in the J.P. Morgan Funds Complex covered by the Administration Agreement (excluding certain funds of funds and money market funds) and 0.075% of the average daily net assets in excess of $25 billion of all such funds. For the six months ended April 30, 2017, the effective annualized rate was 0.08% of the Fund’s average daily net assets, notwithstanding any fee waivers and/or expense reimbursements.
The Administrator waived Administration fees as outlined in Note 3.F.
JPMCB, a wholly-owned subsidiary of JPMorgan, serves as the Fund’s sub-administrator (the “Sub-administrator”). For its services as Sub-administrator, JPMCB receives a portion of the fees payable to the Administrator.
C. Distribution Fees — Pursuant to a Distribution Agreement, JPMorgan Distribution Services, Inc. (“JPMDS”), a wholly-owned subsidiary of JPMorgan, serves as the Trust’s principal underwriter and promotes and arranges for the sale of the Fund’s shares.
The Board has adopted a Distribution Plan (the “Distribution Plan”) for Class A, Class C and Class R2 Shares of the Fund, as applicable, in accordance with Rule 12b-1 under the 1940 Act. Class I, Class R5 and Class R6 Shares do not charge a distribution fee. The Distribution Plan provides that the Fund shall pay distribution fees, including payments to JPMDS, at annual rates of the average daily net assets as shown in the table below:
| | | | | | | | | | |
| | | Class A | | Class C | | | Class R2 | |
| | 0.25% | | | 0.75 | % | | | 0.50 | % |
In addition, JPMDS is entitled to receive the front-end sales charges from purchases of Class A Shares and the CDSC from redemptions of Class C Shares and certain Class A Shares for which front-end sales charges have been waived. For the six months ended April 30, 2017, JPMDS retained the following (amounts in thousands):
| | |
| | | Front-End Sales Charge |
| | $—(a) |
| (a) | Amount rounds to less than 500. |
D. Service Fees —The Trust, on behalf of the Fund, has entered into a Shareholder Servicing Agreement with JPMDS under which JPMDS provides certain support services to the shareholders. The Class R6 Shares do not charge a service fee. For performing these services, JPMDS receives a fee that is accrued daily and paid monthly equal to a percentage of the average daily net assets as shown in the table below:
| | | | | | | | | | | | | | | | | | | | |
| | | Class A | | | Class C | | | Class I | | | Class R2 | | | Class R5 | |
| | | 0.25 | % | | | 0.25 | % | | | 0.25 | % | | | 0.25 | % | | | 0.10 | %* |
| * | Prior to April 3, 2017, the service fee for Class R5 Shares was 0.05%. |
JPMDS has entered into shareholder services contracts with affiliated and unaffiliated financial intermediaries who provide shareholder services and other related services to their clients or customers who invest in the Fund under which JPMDS will pay all or a portion of such fees earned to financial intermediaries for performing such services.
JPMDS waived service fees as outlined in Note 3.F.
E. Custodian and Accounting Fees — JPMCB provides portfolio custody and accounting services to the Fund. For performing these services, the Fund pays JPMCB transaction and asset based-fees that vary according to the number of transactions and positions, plus out-of-pocket expenses. The amounts paid directly to JPMCB by the Fund for custody and accounting services are included in Custodian and accounting fees on the Statement of Operations. The Fund earns interest on uninvested cash balances held by the custodian. Such interest amounts are presented separately on the Statement of Operations.
| | | | | | | | |
| | | |
| APRIL 30, 2017 | | J.P. MORGAN FUNDS | | | | | 35 | |
NOTES TO FINANCIAL STATEMENTS
AS OF APRIL 30, 2017 (Unaudited) (continued)
Interest income earned on cash balances at the custodian, if any, is included in Interest income from affiliates on the Statement of Operations.
Interest expense paid to the custodian related to cash overdrafts, if any, is included in Interest expense to affiliates on the Statement of Operations.
F. Waivers and Reimbursements — The Adviser, Administrator and/or JPMDS have contractually agreed to waive fees and/or reimburse the Fund to the extent that total annual operating expenses (excluding acquired fund fees and expenses other than certain money market fund fees as described below, dividend and interest expenses related to short sales, interest, taxes, expenses related to litigation and potential litigation and extraordinary expenses) exceed the percentages of the Fund’s respective average daily net assets as shown in the table below:
| | | | | | | | | | | | | | | | | | | | | | | | |
| | | Class A | | | Class C | | | Class I | | | Class R2 | | | Class R5 | | | Class R6 | |
| | | 1.20 | % | | | 1.70 | % | | | 0.95 | % | | | 1.45 | % | | | 0.75 | % | | | 0.70 | % |
The expense limitation agreements were in effect for the six months ended April 30, 2017 and are in place until at least February 28, 2018.
For the six months ended April 30, 2017, the Fund’s service providers waived fees and/or reimbursed expenses for the Fund as follows (amounts in thousands). None of these parties expect the Fund to repay any such waived fees and/or reimbursed expenses in future years.
| | | | | | | | | | | | | | | | | | | | |
| | | Contractual Waivers | | | | |
| | | Investment
Advisory
Fees | | | Administration
Fees | | | Service
Fees | | | Total | | | Reimbursements | |
| | $ | 319 | | | $ | 44 | | | $ | 1 | | | $ | 364 | | | $ | 57 | |
Additionally, the Fund may invest in one or more money market funds advised by the Adviser or its affiliates (affiliated money market funds). The Adviser, Administrator and/or JPMDS, as shareholder servicing agent, have contractually agreed to waive fees and/or reimburse expenses in an amount sufficient to offset the respective net fees each collects from the affiliated money market fund on the Fund’s investment in such affiliated money market fund.
The amount of these waivers resulting from investments in these money market funds for the six months ended April 30, 2017 was approximately $6,000.
G. Collateral Management Fees — JPMCB provides derivatives collateral management services for the Fund. The amounts paid directly to JPMCB by the Fund for these services are included in Collateral management fees on the Statement of Operations.
H. Other — Certain officers of the Trust are affiliated with the Adviser, the Administrator and JPMDS. Such officers, with the exception of the Chief Compliance Officer, receive no compensation from the Fund for serving in their respective roles.
The Board appointed a Chief Compliance Officer to the Fund in accordance with Federal securities regulations. The Fund, along with other affiliated funds, makes reimbursement payments, on a pro-rata basis, to the Administrator for a portion of the fees associated with the Office of the Chief Compliance Officer. Such fees are included in Trustees’ and Chief Compliance Officer’s fees on the Statement of Operations.
The Trust adopted a Trustee Deferred Compensation Plan (the “Plan”) which allows the Independent Trustees to defer the receipt of all or a portion of compensation related to performance of their duties as Trustees. The deferred fees are invested in various J.P. Morgan Funds until distribution in accordance with the Plan.
During the six months ended April 30, 2017, the Fund purchased securities from an underwriting syndicate in which the principal underwriter or members of the syndicate were affiliated with the Adviser.
The Fund may use related party broker-dealers. For the six months ended April 30, 2017, the Fund did not incur any brokerage commissions with broker-dealers affiliated with the Adviser.
The Securities and Exchange Commission (“SEC”) has granted an exemptive order permitting the Fund to engage in principal transactions with J.P. Morgan Securities, Inc., an affiliated broker, involving taxable money market instruments, subject to certain conditions.
4. Investment Transactions
During the six months ended April 30, 2017, purchases and sales of investments (excluding short-term investments) were as follows (amounts in thousands):
| | | | | | | | | | | | | | | | |
| | | Purchases
(excluding
U.S. Government) | | | Sales
(excluding
U.S. Government) | | | Purchases
of U.S.
Government | | | Sales
of U.S.
Government | |
| | $ | 270,659 | | | $ | 85,322 | | | $ | 879 | | | $ | — | |
| | | | | | |
| | | |
| 36 | | | | J.P. MORGAN FUNDS | | APRIL 30, 2017 |
5. Federal Income Tax Matters
For Federal income tax purposes, the estimated cost and unrealized appreciation (depreciation) in value of investment securities held at April 30, 2017 were as follows (amounts in thousands):
| | | | | | | | | | | | | | | | |
| | | Aggregate
Cost | | | Gross
Unrealized
Appreciation | | | Gross
Unrealized
Depreciation | | | Net Unrealized
Appreciation
(Depreciation) | |
| | $ | 273,811 | | | $ | 3,487 | | | $ | 1,019 | | | $ | 2,468 | |
At October 31, 2016, the Fund had net capital loss carryforwards which are available to offset future realized gains (amounts in thousands):
| | | | | | | | |
| | | Capital Loss Carryforward Character | |
| | | Short-Term | | | Long-Term | |
| | $ | 5,710 | | | $ | 9,024 | |
6. Borrowings
The Fund relies upon an exemptive order granted by the SEC (the “Order”) permitting the establishment and operation of an Interfund Lending Facility (the “Facility”). The Facility allows the Fund to directly lend and borrow money to or from any other fund relying upon the Order at rates beneficial to both the borrowing and lending funds. Advances under the Facility are taken primarily for temporary or emergency purposes, including the meeting of redemption requests that otherwise might require the untimely disposition of securities, and are subject to the Fund’s borrowing restrictions. The Interfund Loan Rate is determined, as specified in the Order, by averaging the current repurchase agreement rate and the current bank loan rate. The Order was granted to JPMorgan Trust II and may be relied upon by the Fund because the Fund and the series of JPMorgan Trust II are all investment companies in the same “group of investment companies” (as defined in Section 12(d)(1)(G) of the 1940 Act).
The Trust and JPMCB have entered into a financing arrangement. Under this arrangement, JPMCB provides an unsecured, uncommitted credit facility in the aggregate amount of $100 million to certain of the J.P. Morgan Funds, including the Fund. Advances under the arrangement are taken primarily for temporary or emergency purposes, including the meeting of redemption requests that otherwise might require the untimely disposition of securities, and are subject to the Fund’s borrowing restrictions. Interest on borrowings is payable at a rate determined by JPMCB at the time of borrowing. This agreement has been extended until November 6, 2017.
The Fund had no borrowings outstanding from another fund or from the unsecured, uncommitted credit facility during the six months ended April 30, 2017. Average borrowings from the Facility for, or at any time during the six months ended April 30, 2017, were as follows (amounts in thousands):
| | | | | | | | | | | | | | | | |
| | | Average
Borrowings | | | Average Interest
Rate Paid | | | Number of
Days
Outstanding | | | Interest
Paid | |
| | $ | 10,000 | | | | 0.34 | % | | | 1 | | | $ | — | (a) |
| (a) | Amount rounds to less than 500. |
Interest expense paid as a result of borrowing from another fund or from the unsecured, uncommited credit facility is included in Interest expense to affiliates on the Statements of Operations.
In addition, effective August 16, 2016, the Trust along with certain other trusts (“Borrowers”) entered into a joint syndicated senior unsecured revolving credit facility totaling $1.5 billion (“Credit Facility”) with various lenders and The Bank of New York Mellon, as administrative agent for the lenders. This Credit Facility provides a source of funds to the Borrowers for temporary and emergency purposes, including the meeting of redemption requests that otherwise might require the untimely disposition of securities. Under the terms of the Credit Facility, a borrowing fund must have a minimum of $25,000,000 in adjusted net asset value and not exceed certain adjusted net asset coverage ratios prior to and during the time in which any borrowings are outstanding. If a fund does not comply with the aforementioned requirements, the fund must remediate within three business days with respect to the $25,000,000 minimum adjusted net asset value or within one business day with respect to certain asset coverage ratios or the administrative agent at the request of, or with the consent of, the lenders may terminate the Credit Facility and declare any outstanding borrowings to be due and payable immediately.
Interest associated with any borrowing under the Credit Facility is charged to the borrowing fund at a rate of interest equal to 1.00% plus the greater of the federal funds effective rate or one month LIBOR. The annual commitment fee to maintain the Credit Facility is 0.15% and is incurred on the unused portion of the Credit Facility and is allocated to all participating funds pro rata based on their respective net assets. The initial term of the Credit Facility is 364 days, unless extended.
The Fund did not utilize the Credit Facility during the six months ended April 30, 2017.
| | | | | | | | |
| | | |
| APRIL 30, 2017 | | J.P. MORGAN FUNDS | | | | | 37 | |
NOTES TO FINANCIAL STATEMENTS
AS OF APRIL 30, 2017 (Unaudited) (continued)
7. Risks, Concentrations and Indemnifications
In the normal course of business, the Fund enters into contracts that contain a variety of representations which provide general indemnifications. The Fund’s maximum exposure under these arrangements is unknown. The amount of exposure would depend on future claims that may be made against the Fund that have not yet occurred. However, based on experience, the Fund expects the risk of loss to be remote.
As of April 30, 2017 the JPMorgan SmartRetirement Funds, which are affiliated funds of funds, owned in the aggregate, shares representing more than 10% of the net assets of the Fund as follows:
| | | | | | | | |
| | | | | | JPMorgan
SmartRetirement Funds | |
| | | | | | | 82.6 | % |
The Fund may have elements of risk not typically associated with investments in the United States of America due to concentrated investments in a limited number of countries or regions, which may vary throughout the year depending on the Fund. Such concentrations may subject the Fund to additional risks resulting from political or economic conditions in such countries or regions and the possible imposition of adverse governmental laws or currency exchange restrictions could cause the securities and their markets to be less liquid and their prices to be more volatile than those of comparable U.S. securities.
As of April 30, 2017, a significant portion of the Fund’s investments consisted of securities that are denominated in foreign currencies. Changes in currency exchange rates will affect the value of, and investment income from, such securities.
Derivatives may be riskier than other types of investments because they may be more sensitive to changes in economic and market conditions and could result in losses that significantly exceed the Funds’ original investment. Many derivatives create leverage thereby causing the Funds to be more volatile than they would have been if they had not used derivatives. Derivatives also expose the Funds to counterparty risk (the risk that the derivative counterparty will not fulfill its contractual obligations), including credit risk of the derivative counterparty.
The Fund is also subject to counterparty credit risk, which is the risk that a counterparty fails to perform on agreements with the Fund, such as swap and option contracts and credit linked notes.
The Fund is subject to interest rate and credit risk. The value of debt securities may decline as interest rates increase. The Fund could lose money if the issuer of a fixed income security is unable to pay interest or repay principal when it is due. Many factors can cause interest rates to rise. Some examples include central bank monetary policy, rising inflation rates and general economic conditions. Given that the Federal Reserve has recently raised interest rates and may continue to do so, the Fund may face a heightened level of interest rate risk. The ability of the issuers of debt to meet their obligations may be affected by the economic and political developments in a specific industry or region.
The Fund is subject to the risk that should the Fund decide to sell an illiquid investment when a ready buyer is not available at a price the Fund deems to be representative of its value, the value of the Fund’s net assets could be adversely affected.
The Fund’s investments in sovereign and corporate debt obligations within emerging market countries may be subject to potentially higher risks than investments in more developed markets and the prices of such investments may be volatile. The yields of emerging market debt obligations reflect, among other things, perceived credit risk. The consequences of political, social or economic instability in these markets may have disruptive effects on the market prices of the Fund’s investments and the income they generate, as well as the Fund’s ability to repatriate such amounts.
The Fund invests in preferred securities. These securities are typically issued by corporations, generally in the form of interest bearing notes with preferred security characteristics and may include provisions that permit the issuer, in its discretion, to defer or omit distributions for a certain period of time.
8. Investment Company Reporting Modernization
In October 2016, the U.S. Securities and Exchange Commission adopted new rules and forms, and amendments to certain current rules and forms, to modernize the reporting and disclosure of information by registered investment companies. In part, the final rules amend Regulation S-X and will require standardized, enhanced disclosures about derivatives in investment company financial statements, as well as other amendments. The compliance date for the amendments to Regulation S-X is August 1, 2017. At this time, management is currently assessing the anticipated impact of the Regulation S-X amendments on the Funds’ financial statements and related disclosures.
| | | | | | |
| | | |
| 38 | | | | J.P. MORGAN FUNDS | | APRIL 30, 2017 |
SCHEDULE OF SHAREHOLDER EXPENSES
(Unaudited)
Hypothetical $1,000 Investment
As a shareholder of the Fund you incur two types of costs: (1) transaction costs, including sales charges (loads) on purchase payments and (2) ongoing costs, including investment advisory fees, administration fees, distribution fees and other Fund expenses. The examples below are intended to help you understand your ongoing costs (in dollars) of investing in the Fund and to compare these ongoing costs with the ongoing costs of investing in other mutual funds. The examples assume that you had a $1,000 investment in each Class at the beginning of the reporting period, November 1, 2016, and continued to hold your shares at the end of the reporting period, April 30, 2017.
Actual Expenses
For each Class of the Fund in the table below, the first line provides information about actual account values and actual expenses. You may use the information in this line, together with the amount you invested, to estimate the expenses that you paid over the period. Simply divide your account value by $1,000 (for example, an $8,600 account value divided by $1,000 = 8.6), then multiply the result by the number in the first line of each Class under the heading entitled “Expenses Paid During the Period” to estimate the expenses you paid on your account during this period.
Hypothetical Example for Comparison Purposes
The second line of each Class in the table below provides information about hypothetical account values and hypothetical expenses based on the Class’ actual expense ratio and an assumed rate of return of 5% per year before expenses, which is not the Class’ actual return. The hypothetical account values and expenses may not be used to estimate the actual ending account balance or expenses you paid for the period. You may use this information to compare the ongoing costs of investing in the Class of the Fund and other funds. To do so, compare this 5% hypothetical example with the 5% hypothetical examples that appear in the shareholder reports of the other funds. Please note that the expenses shown in the table are meant to highlight your ongoing costs only and do not reflect any transaction costs, such as sales charges (loads) or redemption fees. Therefore, the second line for each Class in the table is useful in comparing ongoing costs only, and will not help you determine the relative total costs of owning different funds. In addition, if these transaction costs were included, your costs would have been higher. The examples also assume all dividends and distributions have been reinvested.
| | | | | | | | | | | | | | | | |
| | | Beginning Account Value November 1, 2016 | | | Ending Account Value April 30, 2017 | | | Expenses Paid During
the Period* | | | Annualized Expense Ratio | |
Emerging Markets Strategic Debt Fund | | | | | | | | | | | | | | | | |
Class A | | | | | | | | | | | | | | | | |
Actual | | $ | 1,000.00 | | | $ | 1,020.50 | | | $ | 5.96 | | | | 1.19 | % |
Hypothetical | | | 1,000.00 | | | | 1,018.89 | | | | 5.96 | | | | 1.19 | |
Class C | | | | | | | | | | | | | | | | |
Actual | | | 1,000.00 | | | | 1,017.30 | | | | 8.45 | | | | 1.69 | |
Hypothetical | | | 1,000.00 | | | | 1,016.41 | | | | 8.45 | | | | 1.69 | |
Class I (formerly Select Class) | | | | | | | | | | | | | | | | |
Actual | | | 1,000.00 | | | | 1,022.60 | | | | 4.71 | | | | 0.94 | |
Hypothetical | | | 1,000.00 | | | | 1,020.13 | | | | 4.71 | | | | 0.94 | |
Class R2 | | | | | | | | | | | | | | | | |
Actual | | | 1,000.00 | | | | 1,019.20 | | | | 7.21 | | | | 1.44 | |
Hypothetical | | | 1,000.00 | | | | 1,017.65 | | | | 7.20 | | | | 1.44 | |
Class R5 | | | | | | | | | | | | | | | | |
Actual | | | 1,000.00 | | | | 1,022.20 | | | | 3.71 | | | | 0.74 | |
Hypothetical | | | 1,000.00 | | | | 1,021.12 | | | | 3.71 | | | | 0.74 | |
Class R6 | | | | | | | | | | | | | | | | |
Actual | | | 1,000.00 | | | | 1,023.60 | | | | 3.46 | | | | 0.69 | |
Hypothetical | | | 1,000.00 | | | | 1,021.37 | | | | 3.46 | | | | 0.69 | |
| * | Expenses are equal to each Class’ respective annualized expense ratio, multiplied by the average account value over the period, multiplied by 181/365 (to reflect the one-half year period). |
| | | | | | | | |
| | | |
| APRIL 30, 2017 | | J.P. MORGAN FUNDS | | | | | 39 | |
J.P. Morgan Funds are distributed by JPMorgan Distribution Services, Inc., which is an affiliate of JPMorgan Chase & Co. Affiliates of JPMorgan Chase & Co. receive fees for providing various services to the funds.
Contact JPMorgan Distribution Services, Inc. at 1-800-480-4111 for a fund prospectus. You can also visit us at www.jpmorganfunds.com. Investors should carefully consider the investment objectives and risk as well as charges and expenses of the mutual fund before investing. The prospectus contains this and other information about the mutual fund. Read the prospectus carefully before investing.
Investors may obtain information about the Securities Investor Protection Corporation (SIPC), including the SIPC brochure by visiting www.sipc.org or by calling SIPC at 202-371-8300.
Each Fund files a complete schedule of its fund holdings for the first and third quarters of its fiscal year with the SEC on Form N-Q. The Funds’ Forms N-Q are available on the SEC’s website at http://www.sec.gov and may be reviewed and copied at the SEC’s Public Reference Room in Washington, DC. Information on the operation of the SEC’s Public Reference Room may be obtained by calling 1-800-SEC-0330. Shareholders may request the Form N-Q without charge by calling 1-800-480-4111 or by visiting the J.P. Morgan Funds’ website at www.jpmorganfunds.com.
A description of each Fund’s policies and procedures with respect to the disclosure of each Fund’s holdings is available in the prospectus and Statement of Additional Information.
A copy of proxy policies and procedures is available without charge upon request by calling 1-800-480-4111 and on the Funds’ website at www.jpmorganfunds.com. A description of such policies and procedures is on the SEC’s website at www.sec.gov. The Trustees have delegated the authority to vote proxies for securities owned by the Funds to the Adviser. A copy of the Funds’ voting record for the most recent 12-month period ended June 30 is available on the SEC’s website at www.sec.gov or at the Funds’ website at www.jpmorganfunds.com no later than August 31 of each year. The Funds’ proxy voting record will include, among other things, a brief description of the matter voted on for each fund security, and will state how each vote was cast, for example, for or against the proposal.

J.P. Morgan Asset Management is the marketing name for the asset management business of JPMorgan Chase & Co. Those businesses include, but are not limited to, J.P. Morgan Investment Management Inc., Security Capital Research & Management Incorporated and J.P. Morgan Alternative Asset Management, Inc.
| | | | |
| | © JPMorgan Chase & Co., 2017. All rights reserved. April 2017. | | SAN-EMSD-417 |
Semi-Annual Report
J.P. Morgan Funds
April 30, 2017 (Unaudited)
JPMorgan Commodities Strategy Fund

CONTENTS
Investments in the Fund are not deposits or obligations of, or guaranteed or endorsed by, any bank and are not insured or guaranteed by the FDIC, the Federal Reserve Board or any other government agency. You could lose money if you sell when the Fund’s share price is lower than when you invested.
Past performance is no guarantee of future performance. The general market views expressed in this report are opinions based on market and other conditions through the end of the reporting period and are subject to change without notice. These views are not intended to predict the future performance of the Fund or the securities markets. References to specific securities and their issuers are for illustrative purposes only and are not intended to be, and should not be interpreted as, recommendations to purchase or sell such securities. Such views are not meant as investment advice and may not be relied on as an indication of trading intent on behalf of the Fund.
Prospective investors should refer to the Fund’s prospectus for a discussion of the Fund’s investment objective, strategies and risks. Call J.P. Morgan Funds Service Center at 1-800-480-4111 for a prospectus containing more complete information about the Fund, including management fees and other expenses. Please read it carefully before investing.
CEO’S LETTER
May 25, 2017 (Unaudited)
Dear Shareholder,
The world’s leading economies continued their upward trajectory over the six months ended April 30, 2017, bolstered by central bank policies, growth in corporate earnings and buoyant consumer and business sentiment.
| | |
 | | “While bond markets provided a mixed performance over the six months ended April 30, 2017, equity markets rewarded investors with solid returns.” — George C.W. Gatch |
While the U.S. and China had been leading drivers of growth for most of the current economic expansion, by late 2016 and into 2017 the world’s other leading economies began to strengthen. Each of the world’s 20 largest economies was forecast to increase output of goods and services through 2017 and the variation in growth rates among those economies was forecast to be the lowest since 1980, according to Bloomberg News.
The U.S. economy slowed somewhat in the first quarter of 2017, but unemployment dropped to 4.4% in April 2017 and the U.S. Federal Reserve reiterated its intent to raise interest rates amid continued economic growth and rising inflation. Throughout the six month reporting period, U.S. financial markets — particularly U.S. equities — generally outperformed other developed markets and emerging markets.
China’s economy continued to grow and posted a 6.9% rise in gross domestic product (GDP) in the first quarter of 2017, amid strength in housing, infrastructure investment, exports and retail sales. Notably, financial markets in China remained largely stable for the six month reporting period. For the 86 trading days through April 24, 2017, the Shanghai Stock Exchange Composite Index hadn’t fallen by more than 1%, thanks in large part to government efforts to prevent a recurrence of the sharp sell-offs that hit Chinese markets in mid-2015 and early 2016.
Meanwhile, Chinese officials sought to reduce financial system risk by tightening money-market rules and pushing to reduce the use of leverage and financial market speculation.
In the European Union (EU), rising consumer spending and manufacturing led to 0.6% growth in first quarter GDP. In particular, Germany’s economy continued to accelerate into 2017, with positive growth in factory orders and an estimated 14% increase in corporate earnings in the first quarter of 2017. Surveys of consumer sentiment across the EU were more upbeat than in recent years. At the end of March 2017, EU unemployment stood at 9.5%, the lowest level since April 2009.
In emerging markets, economic strength in China and a rebound in commodities prices, which began in the latter half of 2016, helped lift economic growth. Moreover, the economies of Brazil, Argentina, Russia, Turkey and South Africa — which were seen as weak links in the global economy — all showed positive growth by the end of April 2017.
While bond markets provided a mixed performance over the six months ended April 30, 2017, equity markets rewarded investors with solid returns. The Standard & Poor’s 500 Index returned 13.32% for the reporting period, while the Morgan Stanley Capital International (“MSCI”) Europe, Australasia and Far East Index (net of foreign withholding taxes) returned 11.73% and the MSCI Emerging Markets Index (net of foreign withholding taxes) returned 9.03%.
We look forward to managing your investment needs for years to come. Should you have any questions, please visit www.jpmorganfunds.com or contact the J.P. Morgan Funds Service Center at 1-800-480-4111.
Sincerely yours,

George C.W. Gatch
CEO, Investment Funds Management,
J.P. Morgan Asset Management
| | | | | | | | |
| | | |
| APRIL 30, 2017 | | J.P. MORGAN FUNDS | | | | | 1 | |
JPMorgan Commodities Strategy Fund
FUND COMMENTARY
SIX MONTHS ENDED APRIL 30, 2017 (Unaudited)
| | | | |
| REPORTING PERIOD RETURN: | | | |
| Fund (Class I Shares)1* | | | (0.68 | )% |
| Bloomberg Commodity Index Total Return | | | (0.76 | )% |
| |
| Net Assets as of 4/30/2017 | | $ | 149,405,498 | |
INVESTMENT OBJECTIVE**
The JPMorgan Commodities Strategy Fund (the “Fund”) seeks total return.
HOW DID THE COMMODITIES MARKET PERFORM DURING THE REPORTING PERIOD?
Overall, commodities prices ended the six month reporting period lower. Prices for natural gas ended higher as market participants continued to expect tighter supplies in the summer of 2017 with increased liquefied natural gas exports and lagging U.S. production of natural gas.
Prices for petroleum products also ended the period higher. Despite higher-than-expected U.S. production, the Organization of Petroleum Exporting Countries’ curb on production and its commitment to market rebalancing helped support prices. At the end of the reporting period, inventories remained at elevated levels.
Prices for precious metals, including gold, were lower during the reporting period. Expectations of higher economic growth in the U.S. weighed on gold prices as the opportunity cost of holding non-yielding assets increased. Base metals as a whole ended the period higher as investor expectations of accommodative and pro-growth government policies helped support global metal demand. Stimulative policy measures from China — the world’s largest metal consumer — also helped boost demand.
Agricultural commodity prices were mixed with grains ending the reporting period lower amid positive crop production in the Southern Hemisphere. Soft commodity prices were lower as generally good weather led to increased production across the world, which weighed on prices. Livestock prices ended higher on greater-than-expected demand, and lower U.S. production.
WHAT WERE THE MAIN DRIVERS OF THE FUND’S PERFORMANCE?
The Fund’s Class I Shares outperformed the Bloomberg Commodity Index Total Return Index (the “Benchmark”) for the six months ended April 30, 2017. During the six month period, the Fund used swaps contracts to obtain exposure to different parts of the futures curve, which measures the price of contracts of different maturities for a specific commodity.
The Fund’s long position in lean hog futures contributed to performance relative to the Benchmark amid investor concerns about dwindling U.S. supplies. The Fund’s short positions in natural gas contributed to relative performance as the 2016-17 winter proved to be warmer than the market expected, leaving natural gas inventories elevated.
The Fund’s underweight position in gold detracted from relative performance as the Fund failed to capture returns from sporadic gold price spikes driven by discrete political or economic news. The Fund’s long positions in oil detracted from performance as inventories of crude oil remained relatively high, especially in the U.S.
HOW WAS THE FUND POSITIONED?
During the six month reporting period, the Fund invested in a wholly owned subsidiary that invested in commodity-linked derivative instruments and provided exposure to the investment returns of the commodities markets without investing directly in physical commodities. The Fund also invested in a portfolio of high-quality, fixed income securities, such as commercial paper or other short-term instruments that generally had a weighted average maturity of 90-days or less.
The Fund’s portfolio managers combined top-down research with fundamental and quantitative analysis to establish overweight and underweight positions in commodities. In addition, the Fund’s portfolio managers had the ability to adjust the Fund’s overall exposure to commodities relative to the Benchmark, based on their views of macroeconomic conditions.
| | | | | | |
| | | |
| 2 | | | | J.P. MORGAN FUNDS | | APRIL 30, 2017 |
| | | | |
CASH INVESTMENTS*** | |
| U.S. Treasury Obligations | | | 76.5 | % |
| U.S. Government Agency Securities | | | 2.5 | |
| Investment Company | | | 20.9 | |
|
PORTFOLIO COMPOSITION BY COUNTRY*** | |
| United States | | | 100 | % |
|
COMMODITY MATURITY*** | |
| 0 - 3 Months | | | 106.9 | % |
| 3 - 6 Months | | | (13.3 | ) |
| > 6 Months | | | 6.4 | |
|
COMMODITY-LINKED INVESTMENTS**** | |
| Energy | | | 28.8 | % |
| Brent Crude | | | 7.2 | |
| Unleaded Gas | | | 3.6 | |
| Heating Oil | | | 3.4 | |
| Natural Gas | | | 8.5 | |
| WTI Crude Oil | | | 6.1 | |
| Agricultural | | | 30.5 | |
| Coffee | | | 2.3 | |
| Corn | | | 7.7 | |
| Cotton | | | 1.6 | |
| Kansas Wheat | | | 1.2 | |
| Soybean Meal | | | 3.0 | |
| Soybean Oil | | | 2.7 | |
| Soybeans | | | 5.7 | |
| Sugar | | | 2.6 | |
| Wheat | | | 3.7 | |
| Industrial Metals | | | 17.3 | |
| Aluminum | | | 5.1 | |
| Copper | | | 7.2 | |
| Nickel | | | 2.3 | |
| Zinc | | | 2.7 | |
| Precious Metals | | | 16.5 | |
| Gold | | | 12.2 | |
| Silver | | | 4.3 | |
| Livestock | | | 7.1 | |
| Lean Hogs | | | 2.8 | |
| Live Cattle | | | 4.3 | |
| | | | |
FIXED INCOME MATURITY*** | |
| < One Month | | | 100.0 | % |
| | | | | | | | |
COMMODITY ALLOCATION | | Index | | | Fund**** | |
| Energy | | | 28.9 | % | | | 28.8 | % |
| Agricultural | | | 29.8 | | | | 30.5 | |
| Industrial Metals | | | 18.0 | | | | 17.3 | |
| Precious Metals | | | 16.5 | | | | 16.5 | |
| Livestock | | | 6.8 | | | | 7.1 | |
| 1 | | On April 3, 2017, the Fund’s Select Class Shares were renamed Class I Shares. |
| * | | The return shown is based on net asset values calculated for shareholder transactions and may differ from the return shown in the financial highlights, which reflects adjustments made to the net asset values in accordance with accounting principles generally accepted in the United States of America. |
| ** | | The adviser seeks to achieve the Fund’s objective. There can be no guarantee it will be achieved. |
| *** | | Percentages indicated are based on total investments as of April 30, 2017. The Fund’s portfolio composition is subject to change. |
| **** | | Exposures are calculated as the notional value, adjusted for net unrealized appreciation/depreciation, of the Fund’s derivative positions as a percentage of net assets. |
| | | | | | | | |
| | | |
| APRIL 30, 2017 | | J.P. MORGAN FUNDS | | | | | 3 | |
JPMorgan Commodities Strategy Fund
FUND COMMENTARY
SIX MONTHS ENDED APRIL 30, 2017 (Unaudited) (continued)
| | | | | | | | | | | | | | | | | | |
AVERAGE ANNUAL TOTAL RETURNS AS OF APRIL 30, 2017 | |
| | | | | |
| | | INCEPTION DATE OF
CLASS | | 6 MONTH* | | | 1 YEAR | | | 3 YEAR | | | SINCE
INCEPTION | |
CLASS A SHARES | | December 17, 2012 | | | | | | | | | | | | | | | | |
With Sales Charge** | | | | | (6.04 | )% | | | (6.44 | )% | | | (16.81 | )% | | | (12.79 | )% |
Without Sales Charge | | | | | (0.80 | ) | | | (1.25 | ) | | | (15.31 | ) | | | (11.70 | ) |
CLASS C SHARES | | December 17, 2012 | | | | | | | | | | | | | | | | |
With CDSC*** | | | | | (2.04 | ) | | | (2.73 | ) | | | (15.72 | ) | | | (12.12 | ) |
Without CDSC | | | | | (1.04 | ) | | | (1.73 | ) | | | (15.72 | ) | | | (12.12 | ) |
CLASS I SHARES (FORMERLY SELECT CLASS SHARES) | | December 17, 2012 | | | (0.68 | ) | | | (1.01 | ) | | | (15.09 | ) | | | (11.47 | ) |
CLASS R6 SHARES | | December 17, 2012 | | | (0.56 | ) | | | (0.78 | ) | | | (14.95 | ) | | | (11.33 | ) |
| ** | | Sales Charge for Class A Shares is 5.25%. |
| *** | | Assumes a 1% CDSC (contingent deferred sales charge) for the 6 month and one year periods and 0% CDSC thereafter. |
LIFE OF FUND PERFORMANCE (12/17/12 TO 4/30/2017)
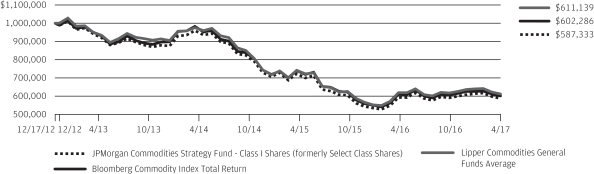
The performance quoted is past performance and is not a guarantee of future results. Mutual funds are subject to certain market risks. Investment returns and principal value of an investment will fluctuate so that an investor’s shares, when redeemed, may be worth more or less than their original cost. Current performance may be higher or lower than the performance data shown. For up-to-date, month-end performance information please call 1-800-480-4111.
The Fund commenced operations on December 17, 2012.
The graph illustrates comparative performance for $1,000,000 invested in the Class I Shares of the JPMorgan Commodities Strategy Fund, the Bloomberg Commodity Index Total Return and the Lipper Commodities General Funds Average from December 17, 2012 to April 30, 2017. The performance of the Lipper Commodities General Funds Average reflects an initial investment at the end of the month closest to the Fund’s inception. The performance of the Fund assumes reinvestment of all dividends and capital gain distributions, if any, and does not include a sales charge. The performance of the Bloomberg Commodity Index Total Return does not reflect the deduction of expenses or a sales charge associated with a mutual fund and has been adjusted to reflect reinvestment of all dividends and capital gain distributions of the securities included in the
benchmark, if applicable. The performance of the Lipper Commodities General Funds Average includes expenses associated with a mutual fund, such as investment management fees. These expenses are not identical to the expenses incurred by the Fund. The Bloomberg Commodity Index Total Return is composed of futures contracts on 22 physical commodities. Investors cannot invest directly in an index. The Lipper Commodities General Funds Average is an average based on the total returns of all mutual funds within the Fund’s designated category as determined by Lipper Inc.
Class I Shares have a $1,000,000 minimum initial investment.
Fund performance may reflect the waiver of the Fund’s fees and reimbursement of expenses for certain periods since the inception date. Without these waivers and reimbursements, performance would have been lower. Also, performance shown in this section does not reflect the deduction of taxes that a shareholder would pay on Fund distributions or redemptions of Fund shares.
The returns shown are based on net asset values calculated for shareholder transactions and may differ from the returns shown in the financial highlights, which reflect adjustments made to the net asset values in accordance with accounting principles generally accepted in the United States of America.
| | | | | | |
| | | |
| 4 | | | | J.P. MORGAN FUNDS | | APRIL 30, 2017 |
JPMorgan Commodities Strategy Fund
CONSOLIDATED SCHEDULE OF PORTFOLIO INVESTMENTS
AS OF APRIL 30, 2017 (Unaudited)
| | | | | | | | |
NUMBER OF
CONTRACTS | | | SECURITY DESCRIPTION | | VALUE($) | |
| | | | | | | | |
| | Options Purchased — 0.0% (g) | |
| | | | Put Options Purchased — 0.0% (g) | |
| | 52 | | | Henry Hub Natural Gas, Expiring 05/25/2017, at $3.00,
American Style, (a)
(Cost $23,517) | | | 14,560 | |
| | | | | | | | |
| | |
PRINCIPAL AMOUNT($) | | | | | | |
| | Short-Term Investments — 98.8% | |
| | | | U.S. Government Agency Security — 2.5% | |
| | 3,742,000 | | | FHLMC, DN, 0.700%, 05/01/17 (n) (Cost $3,742,000) | | | 3,742,000 | |
| | | | | | | | |
| | | | U.S. Treasury Obligations — 75.6% | |
| | | | U.S. Treasury Bill, | | | | |
| | 43,000,000 | | | 0.691%, 05/25/17 (n) | | | 42,980,779 | |
| | 48,000,000 | | | 0.720%, 05/18/17 (n) | | | 47,984,736 | |
| | 22,000,000 | | | 0.750%, 05/11/17 (n) | | | 21,995,930 | |
| | | | | | | | |
| | | | Total U.S. Treasury Obligations
(Cost $112,959,288) | | | 112,961,445 | |
| | | | | | | | |
| | | | | | | | |
SHARES | | | SECURITY DESCRIPTION | | VALUE($) | |
| | | | Investment Companies — 20.7% | |
| | 30,899,353 | | | JPMorgan Prime Money Market Fund, Institutional Class Shares,
1.000% (b) (l) ^ †
(Cost $30,908,217) | | | 30,913,184 | |
| | | | | | | | |
| | | | Total Short-Term Investments
(Cost $147,609,505) | | | 147,616,629 | |
| | | | | | | | |
| | | | Total Investments — 98.8%
(Cost $147,633,022) | | | 147,631,189 | |
| | | | Other Assets in Excess of
Liabilities — 1.2% | | | 1,774,309 | |
| | | | | | | | |
| | | | NET ASSETS — 100.0% | | $ | 149,405,498 | |
| | | | | | | | |
Percentages indicated are based on net assets.
| | | | | | | | | | | | | | | | | | | | |
| Futures Contracts ^ | |
NUMBER OF
CONTRACTS | | | DESCRIPTION | | EXPIRATION
DATE | | | TRADING
CURRENCY | | | NOTIONAL
VALUE AT APRIL 30, 2017 | | | NET UNREALIZED
APPRECIATION
(DEPRECIATION) | |
| | | | Long Futures Outstanding | |
| | 1 | | | LME Nickel Futures | | | 05/15/17 | | | | USD | | | $ | 56,436 | | | $ | (5,289 | ) |
| | 5 | | | LME Primary Aluminum Futures | | | 05/15/17 | | | | USD | | | | 238,000 | | | | 6,641 | |
| | 1 | | | LME Zinc Futures | | | 05/15/17 | | | | USD | | | | 65,363 | | | | (5,453 | ) |
| | 906 | | | Crude Oil Futures | | | 05/19/17 | | | | USD | | | | 44,692,980 | | | | (4,655,586 | ) |
| | 208 | | | Brent Crude Oil Futures | | | 05/31/17 | | | | USD | | | | 10,826,400 | | | | (901,040 | ) |
| | 196 | | | WTI Crude Oil Futures | | | 06/19/17 | | | | USD | | | | 9,725,520 | | | | (362,062 | ) |
| | 179 | | | Natural Gas Futures | | | 06/28/17 | | | | USD | | | | 6,001,870 | | | | 12,888 | |
| | 8 | | | LME Aluminum Futures | | | 07/17/17 | | | | USD | | | | 382,250 | | | | (3,474 | ) |
| | 3 | | | LME Nickel Futures | | | 07/17/17 | | | | USD | | | | 170,046 | | | | (13,320 | ) |
| | 3 | | | LME Zinc Futures | | | 07/17/17 | | | | USD | | | | 196,763 | | | | 385 | |
| | 139 | | | Lean Hogs Futures | | | 08/14/17 | | | | USD | | | | 4,193,630 | | | | (73,300 | ) |
| | 215 | | | Natural Gas Futures | | | 08/29/17 | | | | USD | | | | 7,232,600 | | | | (157,511 | ) |
| | | | Short Futures Outstanding | |
| | (1 | ) | | LME Nickel Futures | | | 05/15/17 | | | | USD | | | | (56,436 | ) | | | 4,692 | |
| | (5 | ) | | LME Primary Aluminum Futures | | | 05/15/17 | | | | USD | | | | (238,000 | ) | | | (3,609 | ) |
| | (1 | ) | | LME Zinc Futures | | | 05/15/17 | | | | USD | | | | (65,363 | ) | | | 2,347 | |
| | (1 | ) | | Gold 100 OZ Futures | | | 06/28/17 | | | | USD | | | | (126,830 | ) | | | 17 | |
| | (5 | ) | | Live Cattle Futures | | | 06/30/17 | | | | USD | | | | (248,050 | ) | | | (14,665 | ) |
| | (17 | ) | | NY Harbor ULSD Futures | | | 06/30/17 | | | | USD | | | | (1,081,924 | ) | | | 104,224 | |
| | (3 | ) | | Sugar No. 11 (World) Futures | | | 06/30/17 | | | | USD | | | | (54,197 | ) | | | 2,343 | |
| | (3 | ) | | LME Nickel Futures | | | 07/17/17 | | | | USD | | | | (170,046 | ) | | | 13,968 | |
| | (8 | ) | | LME Primary Aluminum Futures | | | 07/17/17 | | | | USD | | | | (382,250 | ) | | | (6,024 | ) |
SEE NOTES TO CONSOLIDATED FINANCIAL STATEMENTS.
| | | | | | | | |
| | | |
| APRIL 30, 2017 | | J.P. MORGAN FUNDS | | | | | 5 | |
JPMorgan Commodities Strategy Fund
CONSOLIDATED SCHEDULE OF PORTFOLIO INVESTMENTS
AS OF APRIL 30, 2017 (Unaudited) (continued)
| | | | | | | | | | | | | | | | | | | | |
| Futures Contracts ^ | |
NUMBER OF
CONTRACTS | | | DESCRIPTION | | EXPIRATION
DATE | | | TRADING
CURRENCY | | | NOTIONAL
VALUE AT APRIL 30, 2017 | | | NET UNREALIZED
APPRECIATION
(DEPRECIATION) | |
| | | | Short Futures Outstanding (continued) | |
| | (3 | ) | | LME Zinc Futures | | | 07/17/17 | | | | USD | | | | (196,763 | ) | | | 6,535 | |
| | (12 | ) | | Copper Futures | | | 07/27/17 | | | | USD | | | | (782,250 | ) | | | (5,981 | ) |
| | (3 | ) | | Silver Futures | | | 07/27/17 | | | | USD | | | | (258,930 | ) | | | 18,112 | |
| | (906 | ) | | Crude Oil Futures | | | 08/21/17 | | | | USD | | | | (45,372,480 | ) | | | 4,935,933 | |
| | (15 | ) | | Natural Gas Futures | | | 08/29/17 | | | | USD | | | | (504,600 | ) | | | 4,351 | |
| | (3 | ) | | LME Nickel Futures | | | 09/18/17 | | | | USD | | | | (170,757 | ) | | | 13,302 | |
| | (9 | ) | | LME Primary Aluminum Futures | | | 09/18/17 | | | | USD | | | | (431,606 | ) | | | 3,573 | |
| | (3 | ) | | LME Zinc Futures | | | 09/18/17 | | | | USD | | | | (197,213 | ) | | | (403 | ) |
| | (10 | ) | | Copper Futures | | | 09/27/17 | | | | USD | | | | (654,375 | ) | | | 3,949 | |
| | | | | | | | | | | | | | | | | | | | |
| | | | $ | (1,074,457 | ) |
| | | | | | | | | | | | | | | | | | | | |
| | | | | | | | | | | | | | |
| Return Swaps on Commodities ^ | |
| SWAP COUNTERPARTY | | UNDERLYING REFERENCE INSTRUMENT | | TERMINATION
DATE | | | NOTIONAL
VALUE | | | VALUE | |
Macquarie Bank Ltd. | | | | | | | | | | | | | | |
| | Long Positions | | | | | | | | | | | | |
| | COMEX Gold June 2017 Futures | | | 05/26/17 | | | $ | 8,880,740 | | | $ | 504,273 | |
| | COMEX Gold June 2017 Futures | | | 05/26/17 | | | | 8,340,500 | | | | 537,166 | |
| | CME Live Cattle June 2017 Futures | | | 06/01/17 | | | | 5,948,775 | | | | 747,856 | |
| | CBOT Corn July 2017 Futures | | | 06/28/17 | | | | 11,519,531 | | | | (66,296 | ) |
| | CBOT Soybean July 2017 Futures | | | 06/28/17 | | | | 8,503,744 | | | | (40,863 | ) |
| | CBOT Soybean Meal July 2017 Futures | | | 06/28/17 | | | | 4,446,435 | | | | 6,334 | |
| | CBOT Wheat July 2017 Futures | | | 06/28/17 | | | | 1,805,475 | | | | 30,924 | |
| | COMEX Silver July 2017 Futures | | | 06/28/17 | | | | 3,446,255 | | | | 92,302 | |
| | COMEX Silver July 2017 Futures | | | 06/28/17 | | | | 3,140,005 | | | | 53,376 | |
| | CBOT Soybean Oil December 2017 Futures | | | 11/28/17 | | | | 4,024,800 | | | | (8,680 | ) |
| | CBOT Wheat December 2017 Futures | | | 11/28/17 | | | | 5,650,500 | | | | (31,296 | ) |
| | | | | | | | | | | | | | |
| | | | | | | | | | | | $ | 1,825,096 | |
| | | | | | | | | | | | | | |
| | | | | | | | | | | | | | |
| Return Swaps on Commodities Indices ^ | |
| SWAP COUNTERPARTY | | UNDERLYING REFERENCE INSTRUMENT | | TERMINATION
DATE | | | NOTIONAL
VALUE | | | VALUE | |
Macquarie Bank Ltd. | | | | | | | | | | | | | | |
| | Long Positions | | | | | | | | | | | | |
| | BBG Industrial Metals Index | | | 06/22/17 | | | $ | 29,040,000 | | | $ | (900,447 | ) |
| | BBG Softs Index | | | 06/22/17 | | | | 10,365,000 | | | | (607,631 | ) |
| | BBG Heat Oil Index | | | 12/04/17 | | | | 6,800,000 | | | | (585,006 | ) |
| | BBG Unleaded Gasoline Index | | | 12/04/17 | | | | 6,200,000 | | | | (880,821 | ) |
| | | | | | | | | | | | | | |
| | | | | | | | | | | | $ | (2,973,905 | ) |
| | | | | | | | | | | | | | |
SEE NOTES TO CONSOLIDATED FINANCIAL STATEMENTS.
| | | | | | |
| | | |
| 6 | | | | J.P. MORGAN FUNDS | | APRIL 30, 2017 |
NOTES TO CONSOLIDATED SCHEDULE OF PORTFOLIO INVESTMENTS
AS OF APRIL 30, 2017 (Unaudited)
| | |
| Brent | | — Broom, Rannoch, Etieve, Ness, Tarbat |
| CBOT | | — Chicago Board of Trade |
| CME | | — Chicago Mercantile Exchange |
| COMEX | | — Commodity Exchange, Inc. |
| DN | | — Discount Notes |
| FHLMC | | — Federal Home Loan Mortgage Corp. |
| LME | | — London Metal Exchange |
| ULSD | | — Ultra Low Sulfur Diesel |
| USD | | — United States Dollar |
| WTI | | — West Texas Intermediate |
| | |
| (a) | | — Non-income producing security. |
| (b) | | — Investment in affiliate. Money market fund is registered under the Investment Company Act of 1940, as amended, and advised by J.P. Morgan Investment Management Inc. |
| (g) | | — Amount rounds to less than 0.05%. |
| (l) | | — The rate shown is the current yield as of April 30, 2017. |
| (n) | | — The rate shown is the effective yield as of April 30, 2017. |
| ^ | | — All or a portion of the position is held by the Subsidiary. |
| † | | — The value of investments restricted as collateral for swaps to the broker is $9,831,029. |
SEE NOTES TO CONSOLIDATED FINANCIAL STATEMENTS.
| | | | | | | | |
| | | |
| APRIL 30, 2017 | | J.P. MORGAN FUNDS | | | | | 7 | |
CONSOLIDATED STATEMENT OF ASSETS AND LIABILITIES
AS OF APRIL 30, 2017 (Unaudited)
| | | | |
| |
| | | Commodities
Strategy Fund | |
ASSETS: | | | | |
Investments in non-affiliates, at value | | $ | 116,718,005 | |
Investments in affiliates, at value | | | 21,082,155 | |
Investments in affiliates — restricted, at value | | | 9,831,029 | |
| | | | |
Total investment securities, at value | | | 147,631,189 | |
Deposits at broker for futures contracts | | | 3,080,000 | |
Receivables: | | | | |
Dividends from affiliates | | | 17,752 | |
Variation margin on futures contracts | | | 350,180 | |
Outstanding swap contracts, at value | | | 1,972,231 | |
| | | | |
Total Assets | | | 153,051,352 | |
| | | | |
| |
LIABILITIES: | | | | |
Payables: | | | | |
Investment securities purchased | | | 5 | |
Fund shares redeemed | | | 308,304 | |
Outstanding swap contracts, at value | | | 3,121,040 | |
Accrued liabilities: | | | | |
Investment advisory fees | | | 70,771 | |
Administration fees | | | 2,757 | |
Distribution fees | | | 501 | |
Service fees | | | 150 | |
Custodian and accounting fees | | | 36,112 | |
Collateral management fees | | | 1,676 | |
Other | | | 104,538 | |
| | | | |
Total Liabilities | | | 3,645,854 | |
| | | | |
Net Assets | | $ | 149,405,498 | |
| | | | |
SEE NOTES TO CONSOLIDATED FINANCIAL STATEMENTS.
| | | | | | |
| | | |
| 8 | | | | J.P. MORGAN FUNDS | | APRIL 30, 2017 |
| | | | |
| |
| | | Commodities
Strategy Fund | |
NET ASSETS: | | | | |
Paid-in-Capital | | $ | 153,973,761 | |
Accumulated undistributed (distributions in excess of) net investment income | | | (169,611 | ) |
Accumulated net realized gains (losses) | | | (2,173,553 | ) |
Net unrealized appreciation (depreciation) | | | (2,225,099 | ) |
| | | | |
Total Net Assets | | $ | 149,405,498 | |
| | | | |
| |
Net Assets: | | | | |
Class A | | $ | 1,121,462 | |
Class C | | | 417,789 | |
Class I (formerly Select Class) | | | 921,998 | |
Class R6 | | | 146,944,249 | |
| | | | |
Total | | $ | 149,405,498 | |
| | | | |
| |
Outstanding units of beneficial interest (shares)
($0.0001 par value; unlimited number of shares authorized): | | | | |
Class A | | | 128,693 | |
Class C | | | 48,979 | |
Class I (formerly Select Class) | | | 104,594 | |
Class R6 | | | 16,565,745 | |
| |
Net Asset Value (a): | | | | |
Class A — Redemption price per share | | $ | 8.71 | |
Class C — Offering price per share (b) | | | 8.53 | |
Class I (formerly Select Class) — Offering and redemption price per share | | | 8.82 | |
Class R6 — Offering and redemption price per share | | | 8.87 | |
Class A maximum sales charge | | | 5.25 | % |
Class A maximum public offering price per share
[net asset value per share/(100% — maximum sales charge)] | | $ | 9.19 | |
| | | | |
| |
Cost of investments in non-affiliates | | $ | 116,724,805 | |
Cost of investments in affiliates | | | 21,075,717 | |
Cost of investments in affiliates — restricted | | | 9,832,500 | |
| (a) | Per share amounts may not recalculate due to rounding of net assets and/or shares outstanding. |
| (b) | Redemption price for Class C Shares varies based upon length of time the shares are held. |
SEE NOTES TO CONSOLIDATED FINANCIAL STATEMENTS.
| | | | | | | | |
| | | |
| APRIL 30, 2017 | | J.P. MORGAN FUNDS | | | | | 9 | |
CONSOLIDATED STATEMENT OF OPERATIONS
FOR THE SIX MONTHS ENDED APRIL 30, 2017 (Unaudited)
| | | | |
| |
| | | Commodities
Strategy Fund | |
INVESTMENT INCOME: | | | | |
Interest income from non-affiliates | | $ | 251,391 | |
Interest income from affiliates | | | 6 | |
Dividend income from affiliates | | | 71,510 | |
| | | | |
Total investment income | | | 322,907 | |
| | | | |
| |
EXPENSES: | | | | |
Investment advisory fees | | | 664,152 | |
Administration fees | | | 66,469 | |
Distribution fees: | | | | |
Class A | | | 1,456 | |
Class C | | | 1,283 | |
Service fees: | | | | |
Class A | | | 1,456 | |
Class C | | | 428 | |
Class I (formerly Select Class) | | | 1,186 | |
Custodian and accounting fees | | | 32,168 | |
Collateral management fees | | | 5,205 | |
Professional fees | | | 63,814 | |
Trustees’ and Chief Compliance Officer’s fees | | | 20,533 | |
Printing and mailing costs | | | 8,205 | |
Registration and filing fees | | | 30,585 | |
Transfer agency fees (See Note 2.D) | | | 1,657 | |
Sub-transfer agency fees (See Note 2.D) | | | 13 | |
Other | | | 3,304 | |
| | | | |
Total expenses | | | 901,914 | |
| | | | |
Less fees waived | | | (370,009 | ) |
Less expense reimbursements | | | (1 | ) |
| | | | |
Net expenses | | | 531,904 | |
| | | | |
Net investment income (loss) | | | (208,997 | ) |
| | | | |
| |
REALIZED/UNREALIZED GAINS (LOSSES): | | | | |
Net realized gain (loss) on transactions from: | | | | |
Investments in non-affiliates | | | (56,463 | ) |
Investments in affiliates | | | 756 | |
Futures | | | 437,063 | |
Swaps | | | (2,552,749 | ) |
| | | | |
Net realized gain (loss) | | | (2,171,393 | ) |
| | | | |
Change in net unrealized appreciation/depreciation on: | | | | |
Investments in non-affiliates | | | 32,728 | |
Investments in affiliates | | | 2,819 | |
Futures | | | (859,681 | ) |
Swaps | | | 718,207 | |
| | | | |
Change in net unrealized appreciation/depreciation | | | (105,927 | ) |
| | | | |
Net realized/unrealized gains (losses) | | | (2,277,320 | ) |
| | | | |
Change in net assets resulting from operations | | $ | (2,486,317 | ) |
| | | | |
SEE NOTES TO CONSOLIDATED FINANCIAL STATEMENTS.
| | | | | | |
| | | |
| 10 | | | | J.P. MORGAN FUNDS | | APRIL 30, 2017 |
CONSOLIDATED STATEMENT OF CHANGES IN NET ASSETS
FOR THE PERIODS INDICATED
| | | | | | | | |
| | | Commodities Strategy Fund | |
| | | Six Months Ended
April 30, 2017
(Unaudited) | | | Year Ended
October 31, 2016 | |
CHANGE IN NET ASSETS RESULTING FROM OPERATIONS: | |
Net investment income (loss) | | $ | (208,997 | ) | | $ | (388,133 | ) |
Net realized gain (loss) | | | (2,171,393 | ) | | | (1,744,207 | ) |
Change in net unrealized appreciation/depreciation | | | (105,927 | ) | | | (713,251 | ) |
| | | | | | | | |
Change in net assets resulting from operations | | | (2,486,317 | ) | | | (2,845,591 | ) |
| | | | | | | | |
| | |
CAPITAL TRANSACTIONS: | | | | | | | | |
Change in net assets resulting from capital transactions | | | 67,422,788 | | | | 36,984,504 | |
| | | | | | | | |
| | |
NET ASSETS: | | | | | | | | |
Change in net assets | | | 64,936,471 | | | | 34,138,913 | |
Beginning of period | | | 84,469,027 | | | | 50,330,114 | |
| | | | | | | | |
End of period | | $ | 149,405,498 | | | $ | 84,469,027 | |
| | | | | | | | |
Accumulated undistributed (distributions in excess of) net investment income | | $ | (169,611 | ) | | $ | 39,386 | |
| | | | | | | | |
SEE NOTES TO CONSOLIDATED FINANCIAL STATEMENTS.
| | | | | | | | |
| | | |
| APRIL 30, 2017 | | J.P. MORGAN FUNDS | | | | | 11 | |
CONSOLIDATED STATEMENT OF CHANGES IN NET ASSETS
FOR THE PERIODS INDICATED (continued)
| | | | | | | | |
| | | Commodities Strategy Fund | |
| | | Six Months Ended
April 30, 2017
(Unaudited) | | | Year Ended
October 31, 2016 | |
CAPITAL TRANSACTIONS: | | | | | | | | |
Class A | | | | | | | | |
Proceeds from shares issued | | $ | 206,886 | | | $ | 757,403 | |
Cost of shares redeemed | | | (241,274 | ) | | | (393,348 | ) |
| | | | | | | | |
Change in net assets resulting from Class A capital transactions | | $ | (34,388 | ) | | $ | 364,055 | |
| | | | | | | | |
Class C | | | | | | | | |
Proceeds from shares issued | | $ | 174,453 | | | $ | 346,153 | |
Cost of shares redeemed | | | (54,315 | ) | | | (104,040 | ) |
| | | | | | | | |
Change in net assets resulting from Class C capital transactions | | $ | 120,138 | | | $ | 242,113 | |
| | | | | | | | |
Class I (formerly Select Class) | | | | | | | | |
Proceeds from shares issued | | $ | 380,298 | | | $ | 357,196 | |
Cost of shares redeemed | | | (389,292 | ) | | | (31,446,336 | ) |
| | | | | | | | |
Change in net assets resulting from Class I capital transactions | | $ | (8,994 | ) | | $ | (31,089,140 | ) |
| | | | | | | | |
Class R6 | | | | | | | | |
Proceeds from shares issued | | $ | 81,511,152 | | | $ | 75,257,628 | |
Cost of shares redeemed | | | (14,165,120 | ) | | | (7,790,152 | ) |
| | | | | | | | |
Change in net assets resulting from Class R6 capital transactions | | $ | 67,346,032 | | | $ | 67,467,476 | |
| | | | | | | | |
Total change in net assets resulting from capital transactions | | $ | 67,422,788 | | | $ | 36,984,504 | |
| | | | | | | | |
| | |
SHARE TRANSACTIONS: | | | | | | | | |
Class A | | | | | | | | |
Issued | | | 23,014 | | | | 87,935 | |
Redeemed | | | (27,561 | ) | | | (46,134 | ) |
| | | | | | | | |
Change in Class A Shares | | | (4,547 | ) | | | 41,801 | |
| | | | | | | | |
Class C | | | | | | | | |
Issued | | | 20,148 | | | | 39,759 | |
Redeemed | | | (6,197 | ) | | | (12,329 | ) |
| | | | | | | | |
Change in Class C Shares | | | 13,951 | | | | 27,430 | |
| | | | | | | | |
Class I (formerly Select Class) | | | | | | | | |
Issued | | | 41,356 | | | | 43,536 | |
Redeemed | | | (42,333 | ) | | | (3,490,837 | ) |
| | | | | | | | |
Change in Class I Shares | | | (977 | ) | | | (3,447,301 | ) |
| | | | | | | | |
Class R6 | | | | | | | | |
Issued | | | 8,894,927 | | | | 8,184,048 | |
Redeemed | | | (1,529,840 | ) | | | (869,295 | ) |
| | | | | | | | |
Change in Class R6 Shares | | | 7,365,087 | | | | 7,314,753 | |
| | | | | | | | |
SEE NOTES TO CONSOLIDATED FINANCIAL STATEMENTS.
| | | | | | |
| | | |
| 12 | | | | J.P. MORGAN FUNDS | | APRIL 30, 2017 |
THIS PAGE IS INTENTIONALLY LEFT BLANK
CONSOLIDATED FINANCIAL HIGHLIGHTS
FOR THE PERIODS INDICATED
| | | | | | | | | | | | | | | | | | | | | | | | |
| | | Per share operating performance | |
| | | | | | Investment operations | | | Distributions | | | | |
| | | Net asset
value,
beginning
of period | | | Net
investment
income
(loss) (b) | | | Net realized
and unrealized
gains
(losses) on
investments | | | Total from
investment
operations | | | Net
investment
income | | | Net asset
value,
end of
period | |
Commodities Strategy Fund | | | | | | | | | | | | | | | | | | | | | | | | |
Class A | | | | | | | | | | | | | | | | | | | | | | | | |
Six Months Ended April 30, 2017 (Unaudited) | | $ | 8.78 | | | $ | (0.03 | ) | | $ | (0.04 | ) | | $ | (0.07 | ) | | $ | — | | | $ | 8.71 | |
Year Ended October 31, 2016 | | | 9.01 | | | | (0.08 | ) | | | (0.15 | ) | | | (0.23 | ) | | | — | | | | 8.78 | |
Year Ended October 31, 2015 | | | 12.30 | | | | (0.11 | ) | | | (3.18 | ) | | | (3.29 | ) | | | — | | | | 9.01 | |
Year Ended October 31, 2014 | | | 13.18 | | | | (0.16 | ) | | | (0.72 | ) | | | (0.88 | ) | | | — | | | | 12.30 | |
December 17, 2012 (f) through October 31, 2013 | | | 15.00 | | | | (0.14 | ) | | | (1.68 | ) | | | (1.82 | ) | | | — | | | | 13.18 | |
| | | | | | |
Class C | | | | | | | | | | | | | | | | | | | | | | | | |
Six Months Ended April 30, 2017 (Unaudited) | | | 8.62 | | | | (0.05 | ) | | | (0.04 | ) | | | (0.09 | ) | | | — | | | | 8.53 | |
Year Ended October 31, 2016 | | | 8.88 | | | | (0.13 | ) | | | (0.13 | ) | | | (0.26 | ) | | | — | | | | 8.62 | |
Year Ended October 31, 2015 | | | 12.19 | | | | (0.17 | ) | | | (3.14 | ) | | | (3.31 | ) | | | — | | | | 8.88 | |
Year Ended October 31, 2014 | | | 13.12 | | | | (0.22 | ) | | | (0.71 | ) | | | (0.93 | ) | | | — | | | | 12.19 | |
December 17, 2012 (f) through October 31, 2013 | | | 15.00 | | | | (0.20 | ) | | | (1.68 | ) | | | (1.88 | ) | | | — | | | | 13.12 | |
| | | | | | |
Class I (formerly Select Class) | | | | | | | | | | | | | | | | | | | | | | | | |
Six Months Ended April 30, 2017 (Unaudited) | | | 8.87 | | | | (0.02 | ) | | | (0.03 | ) | | | (0.05 | ) | | | — | | | | 8.82 | |
Year Ended October 31, 2016 | | | 9.08 | | | | (0.06 | ) | | | (0.15 | ) | | | (0.21 | ) | | | — | | | | 8.87 | |
Year Ended October 31, 2015 | | | 12.36 | | | | (0.10 | ) | | | (3.18 | ) | | | (3.28 | ) | | | — | | | | 9.08 | |
Year Ended October 31, 2014 | | | 13.21 | | | | (0.13 | ) | | | (0.72 | ) | | | (0.85 | ) | | | — | | | | 12.36 | |
December 17, 2012 (f) through October 31, 2013 | | | 15.00 | | | | (0.11 | ) | | | (1.68 | ) | | | (1.79 | ) | | | — | | | | 13.21 | |
| | | | | | |
Class R6 | | | | | | | | | | | | | | | | | | | | | | | | |
Six Months Ended April 30, 2017 (Unaudited) | | | 8.92 | | | | (0.01 | ) | | | (0.04 | ) | | | (0.05 | ) | | | — | | | | 8.87 | |
Year Ended October 31, 2016 | | | 9.12 | | | | (0.05 | ) | | | (0.15 | ) | | | (0.20 | ) | | | — | | | | 8.92 | |
Year Ended October 31, 2015 | | | 12.40 | | | | (0.08 | ) | | | (3.20 | ) | | | (3.28 | ) | | | — | | | | 9.12 | |
Year Ended October 31, 2014 | | | 13.22 | | | | (0.10 | ) | | | (0.72 | ) | | | (0.82 | ) | | | — | (h) | | | 12.40 | |
December 17, 2012 (f) through October 31, 2013 | | | 15.00 | | | | (0.09 | ) | | | (1.69 | ) | | | (1.78 | ) | | | — | | | | 13.22 | |
| (a) | Annualized for periods less than one year, unless otherwise noted. |
| (b) | Calculated based upon average shares outstanding. |
| (c) | Not annualized for periods less than one year. |
| (d) | Includes adjustments in accordance with accounting principles generally accepted in the United States of America and as such, the net asset values for financial reporting purposes and the returns based upon those net asset values may differ from the net asset values and returns for shareholder transactions. |
| (e) | Includes earnings credits and interest expense, if applicable, each of which is less than 0.005% unless otherwise noted. |
| (f) | Commencement of operations. |
| (g) | Certain non-recurring expenses incurred by the Fund were not annualized for the period ended October 31, 2013. |
| (h) | Amount rounds to less than $0.005. |
SEE NOTES TO CONSOLIDATED FINANCIAL STATEMENTS.
| | | | | | |
| | | |
| 14 | | | | J.P. MORGAN FUNDS | | APRIL 30, 2017 |
| | | | | | | | | | | | | | | | | | | | | | |
| | | Ratios/Supplemental data | |
| | | | | | | Ratios to average net assets (a) | | | | |
Total return
(excludes
sales charge) (c)(d) | | | Net assets,
end of
period | | | Net
expenses (e) | | |
Net
investment
income
(loss) (e) | | | Expenses
without waivers,
reimbursements and
earnings credits | | | Portfolio
turnover
rate (c) | |
| | | | | | | | | | | | | | | | | | | | | | |
| | | | | | | | | | | | | | | | | | | | | | |
| | (0.80 | )% | | $ | 1,121,462 | | | | 1.22 | % | | | (0.74 | )% | | | 1.98 | % | | | 0 | % |
| | (2.55 | ) | | | 1,170,180 | | | | 1.21 | | | | (0.99 | ) | | | 2.53 | | | | 0 | |
| | (26.75 | ) | | | 823,931 | | | | 1.21 | | | | (1.14 | ) | | | 2.30 | | | | 0 | |
| | (6.68 | ) | | | 160,388 | | | | 1.20 | | | | (1.16 | ) | | | 2.03 | | | | 0 | |
| | (12.13 | ) | | | 43,924 | | | | 1.22 | (g) | | | (1.16 | )(g) | | | 2.74 | (g) | | | 0 | |
| | | | | |
| | | | | | | | | | | | | | | | | | | | | | |
| | (1.04 | ) | | | 417,789 | | | | 1.72 | | | | (1.22 | ) | | | 2.52 | | | | 0 | |
| | (2.93 | ) | | | 301,866 | | | | 1.73 | | | | (1.51 | ) | | | 3.25 | | | | 0 | |
| | (27.15 | ) | | | 67,492 | | | | 1.73 | | | | (1.68 | ) | | | 2.84 | | | | 0 | |
| | (7.09 | ) | | | 74,710 | | | | 1.71 | | | | (1.67 | ) | | | 2.53 | | | | 0 | |
| | (12.53 | ) | | | 43,733 | | | | 1.72 | (g) | | | (1.66 | )(g) | | | 3.24 | (g) | | | 0 | |
| | | | | |
| | | | | | | | | | | | | | | | | | | | | | |
| | (0.56 | ) | | | 921,998 | | | | 0.97 | | | | (0.49 | ) | | | 1.78 | | | | 0 | |
| | (2.31 | ) | | | 936,623 | | | | 0.92 | | | | (0.72 | ) | | | 2.14 | | | | 0 | |
| | (26.54 | ) | | | 32,246,991 | | | | 0.98 | | | | (0.92 | ) | | | 1.90 | | | | 0 | |
| | (6.43 | ) | | | 74,890,429 | | | | 0.97 | | | | (0.93 | ) | | | 1.79 | | | | 0 | |
| | (11.93 | ) | | | 92,256,260 | | | | 0.97 | (g) | | | (0.91 | )(g) | | | 2.10 | (g) | | | 0 | |
| | | | | |
| | | | | | | | | | | | | | | | | | | | | | |
| | (0.56 | ) | | | 146,944,249 | | | | 0.82 | | | | (0.32 | ) | | | 1.40 | | | | 0 | |
| | (2.19 | ) | | | 82,060,358 | | | | 0.83 | | | | (0.61 | ) | | | 1.85 | | | | 0 | |
| | (26.45 | ) | | | 17,191,700 | | | | 0.82 | | | | (0.77 | ) | | | 1.64 | | | | 0 | |
| | (6.19 | ) | | | 48,113,945 | | | | 0.82 | | | | (0.78 | ) | | | 1.53 | | | | 0 | |
| | (11.87 | ) | | | 38,913,194 | | | | 0.82 | (g) | | | (0.76 | )(g) | | | 1.86 | (g) | | | 0 | |
SEE NOTES TO CONSOLIDATED FINANCIAL STATEMENTS.
| | | | | | | | |
| | | |
| APRIL 30, 2017 | | J.P. MORGAN FUNDS | | | | | 15 | |
NOTES TO CONSOLIDATED FINANCIAL STATEMENTS
AS OF APRIL 30, 2017 (Unaudited)
1. Organization
JPMorgan Trust I (the “Trust”) was formed on November 12, 2004, as a Delaware statutory trust, pursuant to a Declaration of Trust dated November 5, 2004 and is registered under the Investment Company Act of 1940, as amended (the “1940 Act”), as an open-end management investment company.
The following is a separate fund of the Trust (the “Fund”) covered by this report:
| | | | |
| | | Classes Offered | | Diversified/Non-Diversified |
| Commodities Strategy Fund | | Class A, Class C, Class I* and Class R6 | | Non-diversified |
| * | Effective April 3, 2017, Select Class was renamed Class I. |
The investment objective of the Fund is to seek total return.
Class A Shares generally provide for a front-end sales charge while Class C Shares provide for a contingent deferred sales charge (“CDSC”). No sales charges are assessed with respect to Class I and Class R6 Shares. All classes of shares have equal rights as to earnings, assets and voting privileges, except that each class may bear different transfer agency, sub-transfer agency (through April 2, 2017), distribution and service fees and each class has exclusive voting rights with respect to its distribution plan and shareholder servicing agreements. Effective April 3, 2017 sub-transfer agency and shareholder servicing fees were consolidated into a single service fee. Certain Class A Shares, for which front-end sales charges have been waived, may be subject to a CDSC as described in the Fund’s prospectus. Beginning on November 14, 2017, Class C Shares will automatically convert to Class A Shares after ten years.
J.P. Morgan Investment Management Inc. (“JPMIM”) an indirect, wholly-owned subsidiary of JPMorgan Chase & Co. (“JPMorgan”) acts as Adviser (the “Adviser”) and Administrator (the “Administrator”) to the Fund.
Basis for Consolidation for the Fund
Commodities Strategy Fund CS Ltd. (the “Subsidiary”), a Cayman Islands exempted company, was incorporated on September 5, 2012 and is a wholly-owned subsidiary of the Fund. The Subsidiary acts as an investment vehicle for the Fund in order to effect certain investments on behalf of the Fund consistent with the Fund’s investment objective and policies as described in the Fund’s prospectus. As of April 30, 2017, net assets of the Fund were $149,405,498 of which $33,134,813, or approximately 22.2%, represented the Subsidiary’s net assets. Net realized losses in the Subsidiary amounted to $(2,171,397). The Consolidated Schedule of Portfolio Investments (“CSOI”) includes positions of the Fund and the Subsidiary. The consolidated financial statements include the accounts of the Fund and the Subsidiary. Subsequent references to the Fund within the Notes to Consolidated Financial Statements collectively refer to the Fund and the Subsidiary. All significant intercompany balances and transactions have been eliminated in consolidation.
2. Significant Accounting Policies
The following is a summary of significant accounting policies followed by the Fund in the preparation of its consolidated financial statements. The Fund is an investment company and, accordingly, follows the investment company accounting and reporting guidance of the Financial Accounting Standards Board Accounting Standards Codification Topic 946 — Investment Companies, which is part of U.S. generally accepted accounting principles (“GAAP”). The preparation of financial statements in conformity with GAAP requires management to make estimates and assumptions that affect the reported amounts of assets and liabilities and disclosure of contingent assets and liabilities at the date of the financial statements and the reported amounts of increases and decreases in net assets from operations during the reporting period. Actual results could differ from those estimates.
A. Valuation of Investments — The valuation of investments is in accordance with GAAP and the Fund’s valuation policies set forth by and under the supervision and responsibility of the Board of Trustees (the “Board”), which established the following approach to valuation, as described more fully below: (i) investments for which market quotations are readily available shall be valued at such unadjusted quoted prices and (ii) all other investments for which market quotations are not readily available shall be valued at their fair value as determined in good faith by the Board.
The Administrator has established the J.P. Morgan Investment Management Americas Valuation Committee (“AVC”) to assist the Board with the oversight and monitoring of the valuation of the Fund’s investments. The Administrator implements the valuation policies of the Fund’s investments, as directed by the Board. The AVC oversees and carries out the policies for the valuation of investments held in the Fund. This includes monitoring the appropriateness of fair values based on results of ongoing valuation oversight, including but not limited to consideration of macro or security specific events, market events and pricing vendor and broker due diligence. The Administrator is responsible for discussing and assessing the potential impacts to the fair values on an ongoing basis, and at least on a quarterly basis with the AVC and the Board.
Fixed income instruments are valued based on prices received from approved affiliated and unaffiliated pricing vendors or third party broker-dealers (collectively referred to as “Pricing Services”). The Pricing Services use multiple valuation techniques to determine fair value. In instances where sufficient market activity exists, the Pricing Services may utilize a market-based approach through which trades or quotes from market makers are used to determine the valuation of these instruments. In instances where sufficient market activity may not exist or is limited, the Pricing Services also utilize proprietary valuation models which may consider market transactions in comparable securities and the various relationships between securities in determining fair value and/or market characteristics in order to estimate the relevant cash flows, which are then discounted to calculate the fair values.
Investments in open-end investment companies (the “Underlying Funds”) are valued at each Underlying Fund’s net asset values (“NAV”) per share as of the report date.
| | | | | | |
| | | |
| 16 | | | | J.P. MORGAN FUNDS | | APRIL 30, 2017 |
Futures and options are generally valued on the basis of available market quotations. Swaps are valued utilizing market quotations from approved Pricing Services.
Valuations reflected in this report are as of the report date. As a result, changes in valuation due to market events and/or issuer related events after the report date and prior to issuance of the report are not reflected herein.
The various inputs that are used in determining the valuation of the Fund’s investments are summarized into the three broad levels listed below.
| • | | Level 1 — Unadjusted inputs using quoted prices in active markets for identical investments. |
| • | | Level 2 — Other significant observable inputs including, but not limited to, quoted prices for similar investments, inputs other than quoted prices that are observable for investments (such as interest rates, prepayment speeds, credit risk, etc.) or other market corroborated inputs. |
| • | | Level 3 — Significant inputs based on the best information available in the circumstances, to the extent observable inputs are not available (including the Fund’s assumptions in determining the fair value of investments). |
A financial instrument’s level within the fair value hierarchy is based on the lowest level of any input, both individually and in the aggregate, that is significant to the fair value measurement. The inputs or methodology used for valuing instruments are not necessarily an indication of the risk associated with investing in those instruments.
The following table represents each valuation input as presented on the CSOI:
| | | | | | | | | | | | | | | | |
| | | Level 1
Quoted prices | | | Level 2
Other significant
observable inputs | | | Level 3
Significant
unobservable inputs | | | Total | |
Total Investments in Securities (a) | | $ | 30,927,744 | | | $ | 116,703,445 | | | $ | — | | | $ | 147,631,189 | |
| | | | | | | | | | | | | | | | |
Appreciation in Other Financial Instruments | | | | | | | | | | | | | | | | |
Futures Contracts | | $ | 5,133,260 | | | $ | — | | | $ | — | | | $ | 5,133,260 | |
Return Swaps | | | — | | | | 1,972,231 | | | | — | | | | 1,972,231 | |
| | | | | | | | | | | | | | | | |
Total Appreciation in Other Financial Instruments | | $ | 5,133,260 | | | $ | 1,972,231 | | | $ | — | | | $ | 7,105,491 | |
| | | | | | | | | | | | | | | | |
Depreciation in Other Financial Instruments | | | | | | | | | | | | | | | | |
Futures Contracts | | $ | (6,207,717 | ) | | $ | — | | | $ | — | | | $ | (6,207,717 | ) |
Return Swaps | | | — | | | | (3,121,040 | ) | | | — | | | | (3,121,040 | ) |
| | | | | | | | | | | | | | | | |
Total Depreciation in Other Financial Instruments | | $ | (6,207,717 | ) | | $ | (3,121,040 | ) | | $ | — | | | $ | (9,328,757 | ) |
| | | | | | | | | | | | | | | | |
| (a) | Portfolio holdings designated as level 1 and level 2 are disclosed individually on the CSOI. Level 1 consists of a money market mutual fund that is held for daily investments of cash and options purchased. Please refer to the CSOI for industry specifics of portfolio holdings. |
There were no transfers among any levels during the six months ended April 30, 2017.
B. Derivatives — The Fund used instruments including futures, swaps and other derivatives in connection with its investment strategy. Derivative instruments may be used as substitutes for securities in which the Fund can invest for hedging and risk management purposes and to seek to enhance portfolio performance. Derivatives may also be used for the purpose of attempting to obtain or preserve a particular return or spread at a lower cost than obtaining that return or spread through purchases and/or sales of instruments in cash markets; to protect against currency fluctuations; to protect against any increase in the price of securities the Fund anticipates purchasing at a later date; and/or to gain exposure to certain markets in the most economical way possible.
The Fund may be subject to various risks from the use of derivatives including the risk that changes in the value of a derivative may not correlate perfectly with the underlying asset, rate or index; counterparty credit risk related to derivatives counterparties’ failure to perform under contract terms; liquidity risk related to the lack of a liquid market for these contracts allowing the Fund to close out its position(s); and, documentation risk relating to disagreement over contract terms. Investing in certain derivatives also results in a form of leverage and as such, the Fund’s risk of loss associated with these instruments may exceed their value, as recorded on the Consolidated Statement of Assets and Liabilities (“CSAL”).
The Fund is party to various derivative contracts governed by International Swaps and Derivatives Association master agreements (“ISDA agreements”). The Fund’s ISDA agreements, which are separately negotiated with each dealer counterparty, may contain provisions allowing, absent other considerations, a counterparty to exercise rights, to the extent not otherwise waived, against the Fund in the event the Fund’s net assets decline over time by a pre-determined percentage or fall below a pre-determined floor. The ISDA agreements also contain provisions allowing, absent other conditions, the Fund to exercise rights, to the extent not otherwise waived, against the counterparty (e.g., decline in a counterparty’s credit rating below a specified level). Such rights for both the counterparty and the Fund often include the ability to terminate (i.e., close out) open contracts at prices which may favor the counterparty, which could have an adverse effect on the Fund. The ISDA agreements give the Fund and counterparty the right, upon an event of default, to close out all transactions traded under such agreements and to net amounts owed or due across all transactions and offset such net payable or receivable with collateral posted to a segregated account by one party to the other.
Counterparty credit risk may be mitigated to the extent a counterparty posts collateral for mark to market gains to the Fund.
| | | | | | | | |
| | | |
| APRIL 30, 2017 | | J.P. MORGAN FUNDS | | | | | 17 | |
NOTES TO CONSOLIDATED FINANCIAL STATEMENTS
AS OF APRIL 30, 2017 (Unaudited) (continued)
Notes B(1) — B(3) below describe the various derivatives used by the Fund. These derivatives expose the Fund to commodity risk.
(1). Futures Contracts — The Fund used commodity futures contracts to obtain long and short exposure to the underlying commodities markets. The purchase of futures contracts will tend to increase the Fund’s exposure to positive and negative price fluctuations in the underlying instrument. The sales of futures contracts will tend to offset both positive and negative market price changes.
Futures contracts provide for the delayed delivery of the underlying instrument at a fixed price or are settled for a cash amount based on the change in the value of the underlying instrument at a specific date in the future. Upon entering into a futures contract, the Fund is required to deposit with the broker, cash or securities in an amount equal to a certain percentage of the contract amount, which is referred to as the initial margin deposit. Subsequent payments, referred to as variation margin, are made or received by the Fund periodically and are based on changes in the market value of open futures contracts. Changes in the market value of open futures contracts are recorded as change in net unrealized appreciation/depreciation on the Consolidated Statement of Operations (“CSOP”). Realized gains or losses, representing the difference between the value of the contract at the time it was opened and the derivatives value at the time it was closed, are reported on the CSOP at the closing or expiration of the futures contract. Securities deposited as initial margin are designated on the CSOI and cash deposited is recorded on the CSAL. A receivable from and/or a payable to brokers for the daily variation margin is also recorded on the CSAL.
The Fund may be subject to the risk that the change in the value of the futures contract may not correlate perfectly with the underlying instrument. Use of long futures contracts subjects the Fund to risk of loss in excess of the amounts shown on the CSAL, up to the notional amount of the futures contracts. Use of short futures contracts subjects the Fund to unlimited risk of loss. The Fund may enter into futures contracts only on exchanges (e.g., NYMEX), boards of trade or other platforms (e.g., Clearport). The exchange or board of trade acts as the counterparty to futures transactions; therefore, the Fund’s credit risk is limited to failure of the exchange or board of trade. For trades executed on other platforms, these futures contracts must be offset on the same platform in which they were executed; therefore liquidity risk exists to the extent there is a lack of a liquid market for these contracts allowing the Fund to close out its position. Under some circumstances, futures exchanges may establish daily limits on the amount that the price of a futures contract can vary from the previous day’s settlement price, which could effectively prevent liquidation of positions.
The Fund’s futures contracts are not subject to master netting arrangements (the right to close out all transactions traded with a counterparty and net amounts owed or due across transactions).
(2). Options — The Fund may purchase and/or sell (“write”) put and call options on various instruments including futures, securities, currencies and interest rate swaps (“swaptions”) to manage and hedge interest rate risks within its portfolio and also to gain long or short exposure to the underlying instrument, index, currency or rate. A purchaser of a put option has the right, but not the obligation, to sell the underlying instrument at an agreed upon price (“strike price”) to the option seller. A purchaser of a call option has the right, but not the obligation, to purchase the underlying instrument at the strike price from the option seller. Swaptions and Eurodollar options are settled for cash.
Options Purchased — Premiums paid by the Fund for options purchased are included on the CSAL as an investment. The option is adjusted daily to reflect the current market value of the option and the change is recorded as Change in net unrealized appreciation/depreciation of investments in non-affiliates on the CSOP. If the option is allowed to expire, the Fund will lose the entire premium it paid and record a realized loss for the premium amount. Premiums paid for options purchased which are exercised or closed are added to the amounts paid or offset against the proceeds on the underlying investment transaction to determine the realized gain (loss) or cost basis of the underlying investment.
The Fund’s exchange-traded option contracts are not subject to master netting arrangements (the right to close out all transactions traded with a counterparty and net amounts owed or due across transactions).
The Fund may be required to post or receive collateral for over the counter options.
(3). Return Swaps on Commodities and Commodity Indices — The Fund used return swaps on physical commodities, commodities futures and commodity futures indices to obtain long and short exposure to commodities markets. The value of a swap agreement is recorded at the beginning of the measurement period. Swaps on commodity futures and commodity indices values are based on the values of underlying commodity spot prices or futures contracts, using the last sale or closing price from the principal exchange on which the contract is traded. Under some circumstances, commodity futures exchanges may establish daily limits on the amount that the price of a commodity futures contract can vary from the previous day’s settlement price, which could effectively prevent liquidation of unfavorable positions. Change in swap values is recorded as Change in net unrealized appreciation/ depreciation — swaps on the CSOP. Realized gain or loss is recorded upon termination of a swap and is based on the difference between the contract price and market price of the underlying instrument or when an offsetting position is entered into. Return swaps on commodity indices are subject to monthly resets. Realized gain or loss is recorded on reset date of the swap and is based on the difference between contract and market price of underlying instrument.
Upon entering into a swap, the Fund may be required to post an initial collateral amount (referred to as “Independent Amount”), as defined in the swap agreement. Independent Amounts are posted to segregated accounts at the Fund’s custodian. The Fund may be required to post or receive collateral based on the net value of the Fund’s outstanding swap contracts with the counterparty in the form of cash or securities. Daily movement of cash collateral is subject to minimum threshold amounts. Collateral posted by the Fund is held in a segregated account at the Fund’s custodian bank. Cash collateral posted by the Fund is invested in an affiliated money market fund (See Note 3.G.) and is reported on the CSAL as Investments in affiliates — restricted. Collateral received by the Fund is held in escrow in segregated accounts maintained by JPMorgan Chase Bank, N.A. (“JPMCB”), an affiliate of the Fund, which provides collateral management services to the Fund (See Note 3.F.).
| | | | | | |
| | | |
| 18 | | | | J.P. MORGAN FUNDS | | APRIL 30, 2017 |
The Fund’s swap contracts at net value and collateral posted or received by counterparty as of April 30, 2017 is as follows:
| | | | | | | | | | |
| Counterparty | | | | Value of swap contracts | | | Collateral
amount | |
Macquarie Bank Ltd. | | Collateral Posted | | $ | (1,148,809 | ) | | $ | 9,831,029 | |
The Fund may be subject to various risks from the use of swaps including: (i) the risk that changes in the value of the swap may not correlate perfectly with the underlying instrument; (ii) counterparty credit risk related to the failure, by the counterparty to an over the counter derivative, to perform under the terms of the contract; (iii) liquidity risk related to the lack of a liquid market for these contracts allowing the Fund to close out its position(s); and, (iv) documentation risk relating to disagreement over contract terms. Investing in certain derivatives, including return swaps, also results in a form of leverage and, as such, the Fund’s risk of loss associated with these instruments may exceed their value as recorded on the CSAL.
The Fund’s activities in return swaps are concentrated with one counterparty. Counterparty credit risk may be mitigated to the extent a counterparty posts collateral for mark to market gains to the Fund.
The Fund’s swap contracts are subject to master netting arrangements.
(4). Summary of Derivatives Information — The following table presents the Fund’s gross derivative assets and liabilities by counterparty net of amounts available for offset under netting arrangements and net of any related collateral received or posted by the Fund as of April 30, 2017:
| | | | | | | | | | | | | | | | |
| Counterparty | | Gross Amount of Derivative Assets Presented on the CSAL (a) | | | Derivatives Available for Offset | | | Collateral Received | | | Net Amount Due
From Counterparty
(not less than zero) | |
Macquarie Bank Ltd. | | $ | 1,972,231 | | | $ | (1,972,231 | ) | | $ | — | | | $ | — | |
| | | | | | | | | | | | | | | | |
| | | | |
| Counterparty | | Gross Amount of Derivative Liabilities Presented on the CSAL (a) | | | Derivatives Available for Offset | | | Collateral Posted | | | Net Amount Due
To Counterparty
(not less than zero) | |
Macquarie Bank Ltd. | | $ | 3,121,040 | | | $ | (1,972,231 | ) | | $ | (1,148,809 | )(b) | | $ | — | |
| | | | | | | | | | | | | | | | |
| (a) | For financial reporting purposes, the Fund does not offset derivative assets and derivative liabilities subject to master netting arrangements on the CSAL. |
| (b) | Collateral received or posted is limited to the net derivative asset or net derivative liability amounts. See Note 2.B.(3) for actual swap collateral received or posted. |
Derivatives Volume — The table below discloses the volume of the Fund’s futures contracts, options and swap activity during the six months ended April 30, 2017.
| | | | |
Futures Contracts: | | | | |
Average Notional Balance Long | | $ | 115,231,732 | |
Average Notional Balance Short | | | 84,979,904 | |
Ending Notional Balance Long | | | 83,781,858 | |
Ending Notional Balance Short | | | 50,992,070 | |
| |
Exchange-Traded Options: | | | | |
Average Number of Contracts Purchased | | | 30 | |
Ending Number of Contracts Purchased | | | 52 | |
| |
Return Swaps on Commodities: | | | | |
Average Notional Balance Long | | $ | 49,321,758 | |
Average Notional Balance Short | | | 2,931,138 | (a) |
Ending Notional Balance Long | | | 65,706,760 | |
| |
Return Swaps on Commodity Indices: | | | | |
Average Notional Balance Long | | | 43,822,857 | |
Ending Notional Balance Long | | | 52,405,000 | |
| (a) | For the period November 1, 2016 through February 28, 2017. |
The Fund’s derivatives contracts held at April 30, 2017 are not accounted for as hedging instruments under GAAP.
| | | | | | | | |
| | | |
| APRIL 30, 2017 | | J.P. MORGAN FUNDS | | | | | 19 | |
NOTES TO CONSOLIDATED FINANCIAL STATEMENTS
AS OF APRIL 30, 2017 (Unaudited) (continued)
C. Security Transactions and Investment Income — Investment transactions are accounted for on the trade date (the date the order to buy or sell is executed). Securities gains and losses are calculated on a specifically identified cost basis. Interest income is determined on the basis of coupon interest accrued using the effective interest method which adjusts for amortization of premiums and accretion of discounts. Dividend income, net of foreign taxes withheld, if any, is recorded on the ex-dividend date or when the Fund first learns of the dividend.
D. Allocation of Income and Expenses — Expenses directly attributable to a fund are charged directly to that fund, while the expenses attributable to more than one fund of the Trust are allocated among the respective funds. In calculating the NAV of each class, investment income, realized and unrealized gains and losses and expenses, other than class specific expenses, are allocated daily to each class of shares based upon the proportion of net assets of each class at the beginning of each day.
Transfer agency fees are class-specific expenses and sub-transfer agency fees were class specific expenses up through April 2, 2017. Effective April 3, 2017, the Fund ceased making direct payments to financial intermediaries for any applicable sub-transfer agency services. Payments to financial intermediaries for sub-transfer agency services are made by JPMorgan Distribution Services, Inc. from the Shareholder Servicing Fee which has been renamed as the Service Fee.
The amount of the transfer agency fees and sub-transfer agency fees charged to each class of the Fund for the six months ended April 30, 2017 are as follows:
| | | | | | | | | | | | | | | | | | | | |
| | | Class A | | | Class C | | | Class I | | | Class R6 | | | Total | |
Transfer agency fees | | $ | 383 | | | $ | 193 | | | $ | 566 | | | $ | 515 | | | $ | 1,657 | |
Sub-transfer agency fees | | | — | | | | — | | | | 13 | | | | — | | | | 13 | |
E. Federal Income Taxes — The Fund is treated as a separate taxable entity for Federal income tax purposes. The Fund’s policy is to comply with the provisions of the Internal Revenue Code of 1986, as amended (the “Code”), applicable to regulated investment companies and to distribute to shareholders all of its distributable net investment income and net realized capital gains on investments. Accordingly, no provision for Federal income tax is necessary. Management has reviewed the Fund’s tax positions for all open tax years and has determined that as of April 30, 2017, no liability for income tax is required in the Fund’s consolidated financial statements for net unrecognized tax benefits. However, management’s conclusions may be subject to future review based on changes in, or the interpretation of, the accounting standards or tax laws and regulations. The Fund’s Federal tax returns for the prior three fiscal years remain subject to examination by the Internal Revenue Service.
For Federal income tax purposes, taxable income of the Fund and the Subsidiary are separately calculated. The Subsidiary is classified as a controlled foreign corporation under the Code and its taxable income, including net gains, is included as ordinary income in the calculation of the Fund’s taxable income. Net losses of the Subsidiary are not deductible by the Fund either in the current period or carried forward to future periods.
F. Distributions to Shareholders — Distributions from net investment income are generally declared and paid at least annually and are declared separately for each class. No class has preferential dividend rights; differences in per share rates are due to differences in separate class expenses. Net realized capital gains, if any, are distributed at least annually. The amount of distributions from net investment income and net realized capital gains is determined in accordance with Federal income tax regulations, which may differ from GAAP. To the extent these “book/tax” differences are permanent in nature (i.e., that they result from other than timing of recognition — “temporary differences”), such amounts are reclassified within the capital accounts based on their Federal tax-basis treatment.
3. Fees and Other Transactions with Affiliates
A. Investment Advisory Fee — Pursuant to an Investment Advisory Agreement, the Adviser supervises the investments of the Fund and the Subsidiary and for such services is paid a fee. The fee for services to the Fund is accrued daily and paid monthly at an annual rate of 0.85% of the Fund’s average daily net assets. The fee for services to the Subsidiary is accrued daily and paid monthly at an annual rate of 0.85% of the Subsidiary’s average daily net assets.
The Adviser waived Investment Advisory fees and/or reimbursed expenses as outlined in Note 3.G.
B. Administration Fees — Pursuant to an Administration Agreement, the Administrator provides certain administration services to the Fund and the Subsidiary. In consideration of these services for the Fund, the Administrator receives a fee accrued daily and paid monthly at the annual rate of 0.15% of the first $25 billion of the average daily net assets of all funds in the J.P. Morgan Funds Complex covered by the Administration Agreement (excluding certain funds of funds and money market funds) and 0.075% of the average daily net assets in excess of $25 billion of all such funds. For the six months ended April 30, 2017, the effective annualized rate was 0.10% of the Fund’s average daily net assets, notwithstanding any fee waivers and/or expense reimbursements. In consideration for services rendered to the Subsidiary, the Administrator receives a fee accrued daily and paid monthly at an annualized rate of 0.10% of the average daily net assets of the Subsidiary.
The Administrator waived Administration fees as outlined in Note 3.G.
JPMCB, a wholly-owned subsidiary of JPMorgan, serves as the Fund’s sub-administrator (the “Sub-administrator”). For its services as Sub-administrator, JPMCB receives a portion of the fees payable to the Administrator.
C. Distribution Fees — Pursuant to a Distribution Agreement, JPMorgan Distribution Services, Inc. (“JPMDS”), a wholly-owned subsidiary of JPMorgan, serves as the Trust’s principal underwriter and promotes and arranges for the sale of the Fund’s shares.
| | | | | | |
| | | |
| 20 | | | | J.P. MORGAN FUNDS | | APRIL 30, 2017 |
The Board has adopted a Distribution Plan (the “Distribution Plan”) for Class A and Class C Shares of the Fund in accordance with Rule 12b-1 under the 1940 Act. The Class I and Class R6 Shares do not charge a distribution fee. The Distribution Plan provides that the Fund shall pay distribution fees, including payments to JPMDS, at annual rates of 0.25% and 0.75% of the average daily net assets of Class A and Class C Shares, respectively.
In addition, JPMDS is entitled to receive the front-end sales charges from purchases of Class A Shares and the CDSC from redemptions of Class C Shares and certain Class A Shares for which front-end sales charges have been waived. For the six months ended April 30, 2017, JPMDS retained the following amounts:
| | | | | | |
| | | Front-End Sales Charge | | CDSC | |
| | $319 | | $ | 50 | |
D. Service Fees — The Trust, on behalf of the Fund, has entered into a Shareholder Servicing Agreement with JPMDS under which JPMDS provides certain support services to the shareholders. The Class R6 Shares do not charge a service fee. For performing these services, JPMDS receives a fee that is accrued daily and paid monthly at an annual rate of 0.25% for Class A, Class C and Class I Shares.
JPMDS has entered into shareholder services contracts with affiliated and unaffiliated financial intermediaries who provide shareholder services and other related services to their clients or customers who invest in the Fund under which JPMDS will pay all or a portion of such fees earned to financial intermediaries for performing such services.
JPMDS waived service fees as outlined in Note 3.G.
E. Custodian and Accounting Fees — JPMCB provides portfolio custody and accounting services to the Fund and Subsidiary. For performing these services, the Fund and Subsidiary pay JPMCB transaction and asset-based fees that vary according to the number of transactions and positions, plus out-of-pocket expenses. The amounts paid directly to JPMCB by the Fund and the Subsidiary for custody and accounting services are included in Custodian and accounting fees on the CSOP. Payments to the custodian may be reduced by credits earned by the Fund, based on uninvested cash balances held by the custodian. Such earnings credits, if any, are presented separately on the CSOP.
Interest expense paid to the custodian related to cash overdrafts, if any, is included in Interest expense to affiliates on the CSOP.
F. Collateral Management Fees — JPMCB provides derivatives collateral management services for the Fund. The amounts paid directly to JPMCB, if any, by the Fund for these services are included in Collateral management fees on the CSOP.
G. Waivers and Reimbursements — The Adviser, Administrator and/or JPMDS have contractually agreed to waive fees and/or reimburse expenses to the extent total annual operating expenses of the Fund, inclusive of the Subsidiary (excluding acquired fund fees and expenses other than certain money market fund fees as described below, dividend and interest expenses related to short sales, interest, taxes, expenses related to litigation and potential litigation and extraordinary expenses) exceed the percentages of the Fund’s average daily net assets as shown in the table below:
| | | | | | | | | | | | | | | | |
| | | Class A | | | Class C | | | Class I | | | Class R6 | |
| | | 1.25 | % | | | 1.75 | % | | | 1.00 | % | | | 0.85 | % |
The expense limitation agreement was in effect for the six months ended April 30, 2017 and is in place until at least February 28, 2018.
For the six months ended April 30, 2017, the Fund’s service providers waived fees and/or reimbursed expenses for the Fund as follows. None of these parties expect the Fund to repay any such waived fees and/or reimbursed expenses in future years.
| | | | | | | | | | | | | | | | | | | | |
| | | Contractual Waivers | | | | |
| | | Investment
Advisory Fees | | | Administration
Fees | | | Service
Fees | | | Total | | | Contractual
Reimbursements | |
| | $ | 299,420 | | | $ | 52,376 | | | $ | 2,371 | | | $ | 354,167 | | | $ | 1 | |
Additionally, the Fund may invest in one or more money market funds advised by the Adviser or its affiliates (affiliated money market funds). The Adviser, Administrator and/or JPMDS, as shareholder servicing agent, have contractually agreed to waive fees and/or reimburse expenses in an amount sufficient to offset the respective net fees each collects from the affiliated money market fund on the Fund’s investment in such affiliated money market fund.
Waivers resulting from investments in these money market funds for the six months ended April 30, 2017 were $15,842.
H. Other — Certain officers of the Trust are affiliated with the Adviser, the Administrator and JPMDS. Such officers, with the exception of the Chief Compliance Officer, receive no compensation from the Fund for serving in their respective roles.
The Board appointed a Chief Compliance Officer to the Fund in accordance with Federal securities regulations. The Fund, along with other affiliated funds, makes reimbursement payments, on a pro-rata basis, to the Administrator for a portion of the fees associated with the Office of the Chief Compliance Officer. Such fees are included in Trustees’ and Chief Compliance Officer’s fees on the CSOP.
The Trust adopted a Trustee Deferred Compensation Plan (the “Plan”) which allows the Independent Trustees to defer the receipt of all or a portion of compensation related to performance of their duties as Trustees. The deferred fees are invested in various J.P. Morgan Funds until distribution in accordance with the Plan.
| | | | | | | | |
| | | |
| APRIL 30, 2017 | | J.P. MORGAN FUNDS | | | | | 21 | |
NOTES TO CONSOLIDATED FINANCIAL STATEMENTS
AS OF APRIL 30, 2017 (Unaudited) (continued)
The Fund may use related party broker-dealers. For the six months ended April 30, 2017, the Fund did not incur any brokerage commissions with broker-dealers affiliated with the Adviser.
The Securities and Exchange Commission (“SEC”) has granted an exemptive order permitting the Fund to engage in principal transactions with J.P. Morgan Securities, Inc., an affiliated broker, involving taxable money market instruments, subject to certain conditions.
4. Investment Transactions
During the six months ended April 30, 2017, sales of long-term investments were $60,834. Additionally, during the six months ended April 30, 2017, there were no purchases or sales of long-term U.S. Government securities.
5. Federal Income Tax Matters
For Federal income tax purposes, the estimated cost and unrealized appreciation (depreciation) in value of investment securities, including the Subsidiary, held at April 30, 2017 were as follows:
| | | | | | | | | | | | | | | | |
| | | Aggregate
Cost | | | Gross
Unrealized
Appreciation | | | Gross
Unrealized
Depreciation | | | Net Unrealized
Appreciation
(Depreciation) | |
| | $ | 147,633,022 | | | $ | 7,124 | | | $ | 8,957 | | | $ | (1,833 | ) |
As of October 31, 2016, the Fund had net capital loss carryforwards as follows:
| | | | | | | | |
| | | Capital Loss Carryforward Character | |
| | | Short-Term | | | Long-Term | |
| | $ | 2,161 | | | $ | — | |
6. Borrowings
The Fund relies upon an exemptive order granted by the SEC (the “Order”) permitting the establishment and operation of an Interfund Lending Facility (the “Facility”). The Facility allows the Fund to directly lend and borrow money to or from any other fund relying upon the Order at rates beneficial to both the borrowing and lending funds. Advances under the Facility are taken primarily for temporary or emergency purposes, including the meeting of redemption requests that otherwise might require the untimely disposition of securities, and are subject to the Fund’s borrowing restrictions. The Interfund loan rate is determined, as specified in the Order, by averaging the current repurchase agreement rate and the current bank loan rate. The Order was granted to JPMorgan Trust II and may be relied upon by the Fund because the Fund and the series of JPMorgan Trust II are both investment companies in the same “group of investment companies” (as defined in Section 12(d)(1)(G) of the 1940 Act).
The Trust and JPMCB have entered into a financing arrangement. Under this arrangement, JPMCB provides an unsecured, uncommitted credit facility in the aggregate amount of $100 million to certain of the J.P. Morgan Funds, including the Fund. Advances under the arrangement are taken primarily for temporary or emergency purposes, including the meeting of redemption requests that otherwise might require the untimely disposition of securities, and are subject to the Fund’s borrowing restrictions. Interest on borrowings is payable at a rate determined by JPMCB at the time of borrowing. This agreement has been extended until November 6, 2017.
The Fund had no borrowings outstanding from another fund or from the unsecured, uncommitted credit facility during the six months ended April 30, 2017.
In addition, effective August 16, 2016, the Trust along with certain other trusts (“Borrowers”) entered into a joint syndicated senior unsecured revolving credit facility totaling $1.5 billion (“Credit Facility”) with various lenders and The Bank of New York Mellon, as administrative agent for the lenders. This Credit Facility provides a source of funds to the Borrowers for temporary and emergency purposes, including the meeting of redemption requests that otherwise might require the untimely disposition of securities. Under the terms of the Credit Facility, a borrowing fund must have a minimum of $25,000,000 in adjusted net asset value and not exceed certain adjusted net asset coverage ratios prior to and during the time in which any borrowings are outstanding. If a fund does not comply with the aforementioned requirements, the fund must remediate within three business days with respect to the $25,000,000 minimum adjusted net asset value or within one business day with respect to certain asset coverage ratios or the administrative agent at the request of, or with the consent of, the lenders may terminate the Credit Facility and declare any outstanding borrowings to be due and payable immediately.
Interest associated with any borrowing under the Credit Facility is charged to the borrowing fund at a rate of interest equal to 1.00% plus the greater of the federal funds effective rate or one month LIBOR. The annual commitment fee to maintain the Credit Facility is 0.15% and is incurred on the unused portion of the Credit Facility and is allocated to all participating funds pro rata based on their respective net assets. The initial term of the Credit Facility is 364 days, unless extended.
The Fund did not utilize the Credit Facility during the six months ended April 30, 2017.
7. Risks, Concentrations and Indemnifications
In the normal course of business, the Fund enters into contracts that contain a variety of representations which provide general indemnifications. The Fund’s maximum exposure under these arrangements is unknown. The amount of exposure would depend on future claims that may be made against the Fund that have not yet occurred. However, based on experience, the Fund expects the risk of loss to be remote.
| | | | | | |
| | | |
| 22 | | | | J.P. MORGAN FUNDS | | APRIL 30, 2017 |
As of April 30, 2017, the J.P. Morgan Investor Funds and JPMorgan SmartRetirement Funds, which are affiliated funds of funds, owned in the aggregate, shares representing more than 10% of the net assets of the Fund as follows:
| | | | | | | | |
| | | J.P. Morgan
Investor Funds | | | JPMorgan
SmartRetirement
Funds | |
| | | 13.0 | % | | | 81.7 | % |
Significant shareholder transactions by these shareholders may impact the Fund’s performance.
The Fund is also subject to counterparty credit risk, which is the risk that a counterparty fails to perform on agreements with the Fund such as swap contracts.
By investing in the Subsidiary, the Fund is indirectly exposed to the risks associated with the Subsidiary’s investments. The derivatives and other investments held by the Subsidiary are generally similar to those that are permitted to be held by the Fund and are subject to the same risks that apply to similar investments if held directly by the Fund.
Since the Fund is non-diversified, it may invest a greater percentage of its assets in a particular issuer or group of issuers than a diversified fund would. This increased investment in fewer issuers may result in the Fund’s shares being more sensitive to economic results of those issuing the securities.
Derivatives, including commodity-linked notes, swap agreements, commodity options, futures and options on futures, may be riskier than other types of investments because they may be more sensitive to changes in economic or market conditions than other types of investments and could result in losses that significantly exceed the Fund’s original investment. Many derivatives create leverage thereby causing the Fund to be more volatile than it would be if it had not used derivatives. Derivatives also expose the Fund to counterparty risk and to the credit risk of the derivative counterparty. Certain derivatives are synthetic instruments that attempt to replicate the performance of certain reference assets.
The Fund’s investment in commodity-linked derivative instruments may subject the Fund to greater volatility than investments in traditional securities, particularly if the instruments involve leverage. The value of commodity-linked derivative instruments may be affected by changes in overall market movements, commodity index volatility, changes in interest rates, or factors affecting a particular industry or commodity, such as drought, floods, weather, livestock disease, embargoes, tariffs and international economic, political and regulatory developments.
The Fund is subject to interest rate and credit risk. The value of debt securities may decline as interest rates increase. The Fund could lose money if the issuer of a fixed income security is unable to pay interest or repay principal when it is due. The Fund invests in floating rate loans and other floating rate debt securities. Although these investments are generally less sensitive to interest rate changes than other fixed rate instruments, the value of floating rate loans and other floating rate investments may decline if their interest rates do not rise as quickly, or as much, as general interest rates. Many factors can cause interest rates to rise. Some examples include central bank monetary policy, rising inflation rates and general economic conditions. Given that the Federal Reserve has recently raised interest rates and may continue to do so, the Fund may face a heightened level of interest rate risk. The ability of the issuers of debt to meet their obligations may be affected by the economic and political developments in a specific industry or region.
8. Investment Company Reporting Modernization
In October 2016, the U.S. Securities and Exchange Commission adopted new rules and forms, and amendments to certain current rules and forms, to modernize the reporting and disclosure of information by registered investment companies. In part, the final rules amend Regulation S-X and will require standardized, enhanced disclosures about derivatives in investment company financial statements, as well as other amendments. The compliance date for the amendments to Regulation S-X is August 1, 2017. At this time, management is currently assessing the anticipated impact of the Regulation S-X amendments on the Fund’s financial statements and related disclosures.
| | | | | | | | |
| | | |
| APRIL 30, 2017 | | J.P. MORGAN FUNDS | | | | | 23 | |
SCHEDULE OF SHAREHOLDER EXPENSES
(Unaudited)
Hypothetical $1,000 Investment
As a shareholder of the Fund, you incur two types of costs: (1) transaction costs, including sales charges (loads) on purchase payments and (2) ongoing costs, including investment advisory fees, administration fees, distribution fees and other Fund expenses. The examples below are intended to help you understand your ongoing costs (in dollars) of investing in the Fund and to compare these ongoing costs with the ongoing costs of investing in other mutual funds. The examples assume that you had a $1,000 investment in each Class at the beginning of the reporting period, November 1, 2016, and continued to hold your shares at the end of the reporting period, April 30, 2017.
Actual Expenses
For each Class of the Fund in the table below, the first line provides information about actual account values and actual expenses. You may use the information in this line, together with the amount you invested, to estimate the expenses that you paid over the period. Simply divide your account value by $1,000 (for example, an $8,600 account value divided by $1,000 = 8.6), then multiply the result by the number in the first line of each Class under the heading entitled “Expenses Paid During the Period” to estimate the expenses you paid on your account during this period.
Hypothetical Example for Comparison Purposes
The second line of each Class in the table below provides information about hypothetical account values and hypothetical expenses based on the Class’ actual expense ratio and an assumed rate of return of 5% per year before expenses, which is not the Class’ actual return. The hypothetical account values and expenses may not be used to estimate the actual ending account balance or expenses you paid for the period. You may use this information to compare the ongoing costs of investing in the Class of the Fund and other funds. To do so, compare this 5% hypothetical example with the 5% hypothetical examples that appear in the shareholder reports of the other funds. Please note that the expenses shown in the table are meant to highlight your ongoing costs only and do not reflect any transaction costs, such as sales charges (loads) or redemption fees. Therefore, the second line for each Class in the table is useful in comparing ongoing costs only, and will not help you determine the relative total costs of owning different funds. In addition, if these transaction costs were included, your costs would have been higher. The examples also assume all dividends and distributions have been reinvested.
| | | | | | | | | | | | | | | | |
| | | Beginning Account Value November 1, 2016 | | | Ending Account Value April 30, 2017 | | | Expenses Paid During the Period* | | | Annualized Expense Ratio | |
Commodities Strategy Fund | | | | | | | | | | | | | | | | |
Class A | | | | | | | | | | | | | | | | |
Actual | | $ | 1,000.00 | | | $ | 992.00 | | | $ | 6.03 | | | | 1.22 | % |
Hypothetical | | | 1,000.00 | | | | 1,018.74 | | | | 6.11 | | | | 1.22 | |
Class C | | | | | | | | | | | | | | | | |
Actual | | | 1,000.00 | | | | 989.60 | | | | 8.48 | | | | 1.72 | |
Hypothetical | | | 1,000.00 | | | | 1,016.27 | | | | 8.60 | | | | 1.72 | |
Class I (formerly Select Class) | | | | | | | | | | | | | | | | |
Actual | | | 1,000.00 | | | | 994.40 | | | | 4.80 | | | | 0.97 | |
Hypothetical | | | 1,000.00 | | | | 1,019.98 | | | | 4.86 | | | | 0.97 | |
Class R6 | | | | | | | | | | | | | | | | |
Actual | | | 1,000.00 | | | | 994.40 | | | | 4.05 | | | | 0.82 | |
Hypothetical | | | 1,000.00 | | | | 1,020.73 | | | | 4.11 | | | | 0.82 | |
| * | Expenses are equal to each Class’ respective annualized expense ratio, multiplied by the average account value over the period, multiplied by 181/365 (to reflect the one-half year period). |
| | | | | | |
| | | |
| 24 | | | | J.P. MORGAN FUNDS | | APRIL 30, 2017 |
J.P. Morgan Funds are distributed by JPMorgan Distribution Services, Inc., which is an affiliate of JPMorgan Chase & Co. Affiliates of JPMorgan Chase & Co. receive fees for providing various services to the funds.
Contact JPMorgan Distribution Services, Inc. at 1-800-480-4111 for a fund prospectus. You can also visit us at www.jpmorganfunds.com. Investors should carefully consider the investment objectives and risk as well as charges and expenses of the mutual fund before investing. The prospectus contains this and other information about the mutual fund. Read the prospectus carefully before investing.
Investors may obtain information about the Securities Investor Protection Corporation (SIPC), including the SIPC brochure by visiting www.sipc.org or by calling SIPC at 202-371-8300.
The Fund files a complete schedule of its fund holdings for the first and third quarters of its fiscal year with the SEC on Form N-Q. The Fund’s Forms N-Q are available on the SEC’s website at http://www.sec.gov and may be reviewed and copied at the SEC’s Public Reference Room in Washington, DC. Information on the operation of the SEC’s Public Reference Room may be obtained by calling 1-800-SEC-0330. Shareholders may request the Form N-Q without charge by calling 1-800-480-4111 or by visiting the J.P. Morgan Funds’ website at www.jpmorganfunds.com.
A description of the Fund’s policies and procedures with respect to the disclosure of the Fund’s holdings is available in the prospectus and Statement of Additional Information.
A copy of proxy policies and procedures is available without charge upon request by calling 1-800-480-4111 and on the Fund’s website at www.jpmorganfunds.com. A description of such policies and procedures is on the SEC’s website at www.sec.gov. The Trustees have delegated the authority to vote proxies for securities owned by the Fund to the Adviser. A copy of the Fund’s voting record for the most recent 12-month period ended June 30 is available on the SEC’s website at www.sec.gov or at the Fund’s website at www.jpmorganfunds.com no later than August 31 of each year. The Fund’s proxy voting record will include, among other things, a brief description of the matter voted on for each fund security, and will state how each vote was cast, for example, for or against the proposal.

J.P. Morgan Asset Management is the marketing name for the asset management business of JPMorgan Chase & Co. Those businesses include, but are not limited to, J.P. Morgan Investment Management Inc., Security Capital Research & Management Incorporated and J.P. Morgan Alternative Asset Management, Inc.
| | | | |
| | © JPMorgan Chase & Co., 2017. All rights reserved. April 2017. | | SAN-CSTRAT-417 |
Semi-Annual Report
J.P. Morgan Funds
April 30, 2017 (Unaudited)
JPMorgan Systematic Alpha Fund

CONTENTS
Investments in the Fund are not deposits or obligations of, or guaranteed or endorsed by, any bank and are not insured or guaranteed by the FDIC, the Federal Reserve Board or any other government agency. You could lose money if you sell when the Fund’s share price is lower than when you invested.
Past performance is no guarantee of future performance. The general market views expressed in this report are opinions based on market and other conditions through the end of the reporting period and are subject to change without notice. These views are not intended to predict the future performance of the Fund or the securities markets. References to specific securities and their issuers are for illustrative purposes only and are not intended to be, and should not be interpreted as, recommendations to purchase or sell such securities. Such views are not meant as investment advice and may not be relied on as an indication of trading intent on behalf of the Fund.
Prospective investors should refer to the Fund’s prospectus for a discussion of the Fund’s investment objective, strategies and risks. Call J.P. Morgan Funds Service Center at 1-800-480-4111 for a prospectus containing more complete information about the Fund, including management fees and other expenses. Please read it carefully before investing.
CEO’S LETTER
May 25, 2017 (Unaudited)
Dear Shareholder,
The world’s leading economies continued their upward trajectory over the six months ended April 30, 2017, bolstered by central bank policies, growth in corporate earnings and buoyant consumer and business sentiment.
| | |
 | | “While bond markets provided a mixed performance over the six months ended April 30, 2017, equity markets rewarded investors with solid returns.” — George C.W. Gatch |
While the U.S. and China had been leading drivers of growth for most of the current economic expansion, by late 2016 and into 2017 the world’s other leading economies began to strengthen. Each of the world’s 20 largest economies was forecast to increase output of goods and services through 2017 and the variation in growth rates among those economies was forecast to be the lowest since 1980, according to Bloomberg News.
The U.S. economy slowed somewhat in the first quarter of 2017, but unemployment dropped to 4.4% in April 2017 and the U.S. Federal Reserve reiterated its intent to raise interest rates amid continued economic growth and rising inflation. Throughout the six month reporting period, U.S. financial markets — particularly U.S. equities — generally outperformed other developed markets and emerging markets.
China’s economy continued to grow and posted a 6.9% rise in gross domestic product (GDP) in the first quarter of 2017, amid strength in housing, infrastructure investment, exports and retail sales. Notably, financial markets in China remained largely stable for the six month reporting period. For the 86 trading days through April 24, 2017, the Shanghai Stock Exchange Composite Index hadn’t fallen by more than 1%, thanks in large part to government efforts to prevent a recurrence of the sharp sell-offs that hit Chinese markets in mid-2015 and early 2016.
Meanwhile, Chinese officials sought to reduce financial system risk by tightening money-market rules and pushing to reduce the use of leverage and financial market speculation.
In the European Union (EU), rising consumer spending and manufacturing led to 0.6% growth in first quarter GDP. In particular, Germany’s economy continued to accelerate into 2017, with positive growth in factory orders and an estimated 14% increase in corporate earnings in the first quarter of 2017. Surveys of consumer sentiment across the EU were more upbeat than in recent years. At the end of March 2017, EU unemployment stood at 9.5%, the lowest level since April 2009.
In emerging markets, economic strength in China and a rebound in commodities prices, which began in the latter half of 2016, helped lift economic growth. Moreover, the economies of Brazil, Argentina, Russia, Turkey and South Africa — which were seen as weak links in the global economy — all showed positive growth by the end of April 2017.
While bond markets provided a mixed performance over the six months ended April 30, 2017, equity markets rewarded investors with solid returns. The Standard & Poor’s 500 Index returned 13.32% for the reporting period, while the Morgan Stanley Capital International (“MSCI”) Europe, Australasia and Far East Index (net of foreign withholding taxes) returned 11.73% and the MSCI Emerging Markets Index (net of foreign withholding taxes) returned 9.03%.
We look forward to managing your investment needs for years to come. Should you have any questions, please visit www.jpmorganfunds.com or contact the J.P. Morgan Funds Service Center at 1-800-480-4111.
Sincerely yours,

George C.W. Gatch
CEO, Investment Funds Management,
J.P. Morgan Asset Management
| | | | | | | | |
| | | |
| APRIL 30, 2017 | | J.P. MORGAN FUNDS | | | | | 1 | |
JPMorgan Systematic Alpha Fund
FUND COMMENTARY
SIX MONTHS ENDED APRIL 30, 2017 (Unaudited)
| | | | |
| REPORTING PERIOD RETURN: | |
| Fund (Class I Shares)1* | | | 2.49% | |
| BofA Merrill Lynch 3-Month U.S. Treasury Bill Index | | | 0.23% | |
| |
| Net Assets as of 4/30/2017 | | | $382,789,778 | |
INVESTMENT OBJECTIVE**
The JPMorgan Systematic Alpha Fund (the “Fund”) seeks to provide total return.
HOW DID THE MARKET PERFORM?
Global financial markets generally provided positive returns for the six month reporting period as the world’s leading economies continued to grow in a more uniform fashion and investors sought returns in both developed and emerging markets.
During the final quarter of 2016 and into 2017, leading U.S. equity indexes hit multiple record highs amid solid corporate earnings and expectations that the Republican majorities in the U.S. Congress and President Trump’s administration would work to ease business regulations, reduce taxes and increase infrastructure spending.
In Europe, a pickup in corporate earnings and improvements in consumer sentiment also proved attractive to investors. Electoral defeats of anti-European Union (EU) politicians in Austria and the Netherlands also helped lift investor sentiment across the EU and other developed markets.
Emerging markets also saw investment inflows during the six month reporting period amid economic and financial market stability in China. Notably, the Chinese government’s efforts to curb excessive leverage in its financial markets put a damper on the Shanghai Composite Index in April 2017. Meanwhile, several previously underperforming economies — particularly Brazil, Argentina, Russia, Turkey and South Africa — were growing by the end of the reporting period.
Commodities prices stabilized during the reporting period and global oil prices reached 15-month highs in October 2016. Oil prices were further bolstered by the Organization of Petroleum Exporting Countries’ decision to curb production. However, by the end of the reporting period, overproduction pushed global oil prices lower.
WHAT WERE THE MAIN DRIVERS OF THE FUND’S PERFORMANCE?
The Fund (Class I Shares) outperformed the BofA Merrill Lynch 3-Month U.S. Treasury Bill Index (the “Benchmark”) for the six months ended April 30, 2017. References to the Benchmark and to other indexes mentioned herein are for informational purposes and are not an indication of how the Fund is managed.
The use of the Benchmark does not imply the Fund is being managed like the Benchmark and does not imply low risk or low volatility, but rather is disclosed to allow for comparison of the Fund’s performance to that of a well-known and widely recognized index.
During the reporting period, the Fund’s alternative investment strategies experienced strong performance with gains from its equity market neutral, event driven, and global macro strategies outpacing minor losses from the Fund’s convertible bond arbitrage strategies.
The Fund’s equity market neutral strategy was the leading contributor to absolute returns. From a return perspective, value, size, and quality factors led the way, offsetting underperformance from the momentum factor. The value factor continued to perform well in the wake of a drawdown in the first half of 2016.
The Fund’s event-driven strategy generated a positive overall return. The merger arbitrage sub-strategy was the leading contributor within the event-driven strategy, benefiting from a high proportion of “friendly” mergers during the reporting period that were considered more likely to be completed. The Fund’s share repurchase and activism sub-strategies contributed to absolute performance, while the conglomerate discount arbitrage and index arbitrage sub-strategies detracted from absolute performance.
The Fund’s macro investment strategies also generated positive returns, with gains across momentum and foreign exchange-based return factors offsetting losses from commodity and fixed-income based return factors.
The convertible bond arbitrage strategy slightly detracted from absolute performance as long convertible bond positions slightly underperformed the related equity hedge positions.
HOW WAS THE FUND POSITIONED?
During the six month reporting period, the Fund’s risk was diversified across its investment strategies. Risk within the event-driven style remained below the historical average, reflecting slightly below average activity levels. In the equity market neutral style, aggregate factor dispersion was at the lower end of the typical range, however the global macro style was running near long-term target risk levels.
| | | | | | |
| | | |
| 2 | | | | J.P. MORGAN FUNDS | | APRIL 30, 2017 |
| | | | |
RISK ALLOCATION AS OF APRIL 30, 2017 | |
| Asset Class / Strategy | | % of Risk
Allocation*** | |
| Convertible Arbitrage (1) | | | 6.0 | % |
| Equity Market Neutral (2) | | | 42.5 | |
| Event Driven (3) | | | 28.9 | |
| Macro Based (4) | | | 22.6 | |
| | | | | | | | |
| TOP TEN HOLDINGS OF THE PORTFOLIO (a) | |
| | 1. | | | Akorn, Inc. | | | 1.1 | % |
| | 2. | | | Panera Bread Co., Class A | | | 1.1 | |
| | 3. | | | Mobileye NV | | | 1.1 | |
| | 4. | | | Syngenta AG (Switzerland) | | | 1.1 | |
| | 5. | | | Mead Johnson Nutrition Co. | | | 1.0 | |
| | 6. | | | VCA, Inc. | | | 1.0 | |
| | 7. | | | Brocade Communications Systems, Inc. | | | 1.0 | |
| | 8. | | | Valspar Corp. (The) | | | 1.0 | |
| | 9. | | | NXP Semiconductors NV (Netherlands) | | | 0.9 | |
| | 10. | | | Cabela’s, Inc. | | | 0.9 | |
| 1 | | On April 3, 2017, the Fund’s Select Class Shares were renamed Class I Shares. |
| * | | The return shown is based on net asset values calculated for shareholder transactions and may differ from the return shown in the financial highlights, which reflects adjustments made to the net asset values in accordance with accounting principles generally accepted in the United States of America. |
| ** | | The Adviser seeks to achieve the Fund’s objective. There can be no guarantee it will be achieved. |
| *** | | Risk allocations are calculated as the standard deviation (volatility of an asset class) divided by the overall volatility of the Fund. Risk, as measured by standard deviation, shows how widely a set of values varies from the mean. It is a historical measure of the volatility of returns earned by the Fund. The percentages above represent the current risk allocation based on the Fund’s holdings as of April 30, 2017 and are not representative of the targeted equal risk allocation across asset classes over the long-term. Holdings and allocations may vary over time. |
| (1) | | Convertible Arbitrage strategies seek to profit from the complexity of the pricing of convertible bonds (which contain elements of both a fixed income security and an equity option). |
| (2) | | Equity Market Neutral strategies involve simultaneous investing in equities (i.e. investing long) that the Adviser expects to increase in value and selling equities (i.e. selling short) that the Adviser expects to decrease in value. |
| (3) | | Event Driven strategies (e.g. merger arbitrage) seek to profit from investing in securities of companies on the basis that a specific event or catalyst will affect future pricing. |
| (4) | | Macro Based Strategies aim to exploit macro economic imbalances across the globe through a broad range of asset classes including, but not limited to fixed income, currency and commodities. |
| (a) | | Percentages indicated are based upon total market value of investments as of April 30, 2017. The Fund’s portfolio composition is subject to change. |
| | | | | | | | |
| | | |
| APRIL 30, 2017 | | J.P. MORGAN FUNDS | | | | | 3 | |
JPMorgan Systematic Alpha Fund
FUND COMMENTARY
SIX MONTHS ENDED APRIL 30, 2017 (Unaudited) (continued)
| | | | | | | | | | |
AVERAGE ANNUAL TOTAL RETURNS AS OF APRIL 30, 2017 |
| | | | | | | | | | | | | | | | | | | | |
| | | | | |
| | | INCEPTION DATE OF
CLASS | | | 6 MONTH* | | | 1 YEAR | | | 3 YEAR | | | SINCE
INCEPTION | |
CLASS A SHARES | | | February 12, 2013 | | | | | | | | | | | | | | | | | |
With Sales Charge** | | | | | | | (2.26 | )% | | | (1.11 | )% | | | 0.02 | % | | | 1.77 | % |
Without Sales Charge | | | | | | | 2.35 | | | | 3.53 | | | | 1.58 | | | | 2.89 | |
CLASS C SHARES | | | February 12, 2013 | | | | | | | | | | | | | | | | | |
With CDSC*** | | | | | | | 1.18 | | | | 2.09 | | | | 1.07 | | | | 2.39 | |
Without CDSC | | | | | | | 2.18 | | | | 3.09 | | | | 1.07 | | | | 2.39 | |
CLASS I SHARES (FORMERLY SELECT CLASS SHARES) | | | February 12, 2013 | | | | 2.49 | | | | 3.78 | | | | 1.80 | | | | 3.14 | |
CLASS R6 SHARES | | | February 12, 2013 | | | | 2.61 | | | | 4.05 | | | | 2.06 | | | | 3.35 | |
| ** | | Sales Charge for Class A Shares is 4.50%. |
| *** | | Assumes a 1% CDSC (contingent deferred sales charge) for the one year period and 0% CDSC thereafter. |
LIFE OF FUND PERFORMANCE (2/12/13 TO 4/30/17)
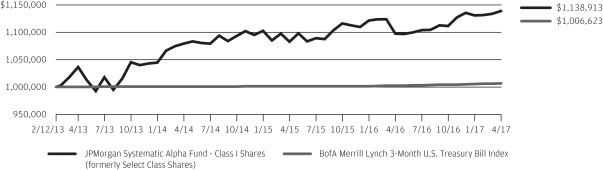
The performance quoted is past performance and is not a guarantee of future results. Mutual funds are subject to certain market risks. Investment returns and principal value of an investment will fluctuate so that an investor’s shares, when redeemed, may be worth more or less than their original cost. Current performance may be higher or lower than the performance data shown. For up-to-date, month-end performance information please call 1-800-480-4111.
The Fund commenced operations on February 12, 2013.
The graph illustrates comparative performance for $1,000,000 invested in Class I Shares (formerly Select Class Shares) of the JPMorgan Systematic Alpha Fund and the BofA Merrill Lynch 3-Month U.S. Treasury Bill Index from February 12, 2013 to April 30, 2017. The performance of the Fund assumes reinvestment of all dividends and capital gain distributions, if any, and does not include a sales charge. The performance of the BofA Merrill Lynch 3-Month U.S. Treasury Bill Index does not reflect the deduction of expenses or a sales charge associated with a mutual fund and has been adjusted to reflect reinvestment of all dividends and capital gain distributions of the securities included in the benchmark, if applicable. The BofA Merrill Lynch 3-Month U.S. Treasury Bill Index is comprised of a single issue purchased at the beginning of the month and held for a full month. Each month the index is rebalanced and the issue selected is the outstanding Treasury Bill that matures closest to, but not beyond, 3 months from the rebalancing date. Investors cannot invest directly in an index.
Class I Shares (formerly Select Class Shares) have a $1,000,000 minimum initial investment.
From the inception of the Fund through July 30, 2014, the Fund did not experience any shareholder activity. If such shareholder activity had occurred, the Fund’s performance may have been impacted.
Fund performance may reflect the waiver of the Fund’s fees and reimbursement of expenses for certain periods since the inception date. Without these waivers and reimbursements, performance would have been lower. Also, performance shown in this section does not reflect the deduction of taxes that a shareholder would pay on Fund distributions or redemptions of Fund shares.
International investing involves a greater degree of risk and increased volatility. Changes in currency exchange rates and differences in accounting and taxation policies outside the U.S. can raise or lower returns. Also, some overseas markets may not be as politically and economically stable as the U.S. and other nations.
The returns shown are based on net asset values calculated for shareholder transactions and may differ from the returns shown in the financial highlights, which reflect adjustments made to the net asset values in accordance with accounting principles generally accepted in the United States of America.
| | | | | | |
| | | |
| 4 | | | | J.P. MORGAN FUNDS | | APRIL 30, 2017 |
JPMorgan Systematic Alpha Fund
CONSOLIDATED SCHEDULE OF PORTFOLIO INVESTMENTS
AS OF APRIL 30, 2017 (Unaudited)
| | | | | | | | |
SHARES | | | SECURITY DESCRIPTION | | VALUE($) | |
| | Common Stocks — 54.1% | |
| | | | Consumer Discretionary — 8.9% | |
| | | | Auto Components — 0.2% | |
| | 29,486 | | | Gentex Corp. | | | 608,886 | |
| | 3,708 | | | Linamar Corp., (Canada) | | | 157,659 | |
| | | | | | | | |
| | | | | | | 766,545 | |
| | | | | | | | |
| | | | Automobiles — 0.1% | |
| | 14,300 | | | Subaru Corp., (Japan) | | | 542,143 | |
| | | | | | | | |
| | | | Diversified Consumer Services — 0.5% | |
| | 16,514 | | | DeVry Education Group, Inc. | | | 625,055 | |
| | 33,000 | | | H&R Block, Inc. | | | 818,070 | |
| | 10,974 | | | Nord Anglia Education, Inc., (Hong Kong) (a) | | | 353,363 | |
| | | | | | | | |
| | | | | | | 1,796,488 | |
| | | | | | | | |
| | | | Hotels, Restaurants & Leisure — 1.8% | |
| | 38,600 | | | Bloomin’ Brands, Inc. | | | 837,234 | |
| | 15,800 | | | Brinker International, Inc. | | | 698,202 | |
| | 50,800 | | | La Quinta Holdings, Inc. (a) | | | 716,788 | |
| | 12,213 | | | Panera Bread Co., Class A (a) | | | 3,818,761 | |
| | 1,972 | | | Wyndham Worldwide Corp. | | | 187,951 | |
| | 10,200 | | | Yum Brands, Inc. | | | 670,650 | |
| | | | | | | | |
| | | | | | | 6,929,586 | |
| | | | | | | | |
| | | | Household Durables — 0.8% | |
| | 46,500 | | | Haseko Corp., (Japan) | | | 530,785 | |
| | 30,200 | | | PulteGroup, Inc. | | | 684,634 | |
| | 39,300 | | | Sumitomo Forestry Co. Ltd., (Japan) | | | 601,730 | |
| | 27,059 | | | Taylor Morrison Home Corp., Class A (a) | | | 625,063 | |
| | 14,400 | | | Tempur Sealy International, Inc. (a) | | | 676,080 | |
| | | | | | | | |
| | | | | | | 3,118,292 | |
| | | | | | | | |
| | | | Leisure Products — 0.6% | |
| | 26,995 | | | American Outdoor Brands Corp. (a) | | | 597,939 | |
| | 18,700 | | | Bandai Namco Holdings, Inc., (Japan) | | | 586,929 | |
| | 25,300 | | | Heiwa Corp., (Japan) | | | 652,047 | |
| | 31,900 | | | Vista Outdoor, Inc. (a) | | | 623,964 | |
| | | | | | | | |
| | | | | | | 2,460,879 | |
| | | | | | | | |
| | | | Media — 1.7% | |
| | 11,000 | | | AMC Networks, Inc., Class A (a) | | | 656,480 | |
| | 10,100 | | | CBS Corp. (Non-Voting), Class B | | | 672,256 | |
| | 10,455 | | | Gannett Co., Inc. | | | 87,404 | |
| | 10,240 | | | John Wiley & Sons, Inc., Class A | | | 539,648 | |
| | 9,766 | | | Meredith Corp. | | | 571,799 | |
| | 6,247 | | | Omnicom Group, Inc. | | | 513,003 | |
| | 7,976 | | | Scripps Networks Interactive, Inc., Class A | | | 595,967 | |
| | 30,866 | | | Sinclair Broadcast Group, Inc., Class A | | | 1,217,664 | |
| | | | | | | | |
SHARES | | | SECURITY DESCRIPTION | | VALUE($) | |
| | | | | | | | |
| | | | Media — continued | | | | |
| | 31,100 | | | TEGNA, Inc. | | | 792,428 | |
| | 51,092 | | | Time, Inc. | | | 776,598 | |
| | | | | | | | |
| | | | | | | 6,423,247 | |
| | | | | | | | |
| | | | | | | | |
| | | | Multiline Retail — 0.1% | |
| | 2,675 | | | Dillard’s, Inc., Class A | | | 148,115 | |
| | 3,504 | | | Target Corp. | | | 195,698 | |
| | | | | | | | |
| | | | | | | 343,813 | |
| | | | | | | | |
| | | | Specialty Retail — 2.6% | |
| | 17,900 | | | Adastria Co. Ltd., (Japan) | | | 444,566 | |
| | 7,560 | | | American Eagle Outfitters, Inc. | | | 106,521 | |
| | 59,730 | | | Cabela’s, Inc. (a) | | | 3,261,258 | |
| | 41,378 | | | Chico’s FAS, Inc. | | | 571,844 | |
| | 58,707 | | | CST Brands, Inc. | | | 2,834,961 | |
| | 11,748 | | | Dick’s Sporting Goods, Inc. | | | 593,861 | |
| | 28,563 | | | JB Hi-Fi Ltd., (Australia) | | | 527,728 | |
| | 28,200 | | | Select Comfort Corp. (a) | | | 871,380 | |
| | 9,200 | | | Signet Jewelers Ltd. | | | 605,728 | |
| | | | | | | | |
| | | | | | | 9,817,847 | |
| | | | | | | | |
| | | | Textiles, Apparel & Luxury Goods — 0.5% | |
| | 3,400 | | | Deckers Outdoor Corp. (a) | | | 202,606 | |
| | 12,970 | | | Michael Kors Holdings Ltd. (a) | | | 484,170 | |
| | 6,246 | | | PVH Corp. | | | 631,033 | |
| | 22,877 | | | Wolverine World Wide, Inc. | | | 551,565 | |
| | | | | | | | |
| | | | | | | 1,869,374 | |
| | | | | | | | |
| | | | Total Consumer Discretionary | | | 34,068,214 | |
| | | | | | | | |
| | | | Consumer Staples — 5.2% | |
| | | | Beverages — 0.3% | |
| | 15,366 | | | Coca-Cola European Partners plc, (United Kingdom) | | | 593,435 | |
| | 4,844 | | | PepsiCo, Inc. | | | 548,728 | |
| | | | | | | | |
| | | | | | | 1,142,163 | |
| | | | | | | | |
| | | | Food & Staples Retailing — 1.2% | |
| | 10,600 | | | Matsumotokiyoshi Holdings Co. Ltd., (Japan) | | | 531,621 | |
| | 335,246 | | | Metcash Ltd., (Australia) (a) | | | 539,720 | |
| | 409,463 | | | Rite Aid Corp. (a) | | | 1,637,852 | |
| | 10,007 | | | Sysco Corp. | | | 529,070 | |
| | 6,305 | | | Walgreens Boots Alliance, Inc. | | | 545,635 | |
| | 8,266 | | | Wal-Mart Stores, Inc. | | | 621,438 | |
| | 5,500 | | | Whole Foods Market, Inc. | | | 200,035 | |
| | | | | | | | |
| | | | | | | 4,605,371 | |
| | | | | | | | |
SEE NOTES TO CONSOLIDATED FINANCIAL STATEMENTS.
| | | | | | | | |
| | | |
| APRIL 30, 2017 | | J.P. MORGAN FUNDS | | | | | 5 | |
JPMorgan Systematic Alpha Fund
CONSOLIDATED SCHEDULE OF PORTFOLIO INVESTMENTS
AS OF APRIL 30, 2017 (Unaudited) (continued)
| | | | | | | | |
SHARES | | | SECURITY DESCRIPTION | | VALUE($) | |
| | Common Stocks — continued | |
| | | | Food Products — 2.9% | |
| | 49,481 | | | AdvancePierre Foods Holdings, Inc. | | | 2,009,918 | |
| | 15,355 | | | Cal-Maine Foods, Inc. (a) | | | 579,651 | |
| | 9,692 | | | Campbell Soup Co. | | | 557,678 | |
| | 9,787 | | | General Mills, Inc. | | | 562,850 | |
| | 878 | | | Ingredion, Inc. | | | 108,714 | |
| | 4,377 | | | JM Smucker Co. (The) | | | 554,653 | |
| | 13,674 | | | Lamb Weston Holdings, Inc. | | | 570,889 | |
| | 40,843 | | | Mead Johnson Nutrition Co. | | | 3,623,591 | |
| | 13,500 | | | Morinaga & Co. Ltd., (Japan) | | | 637,951 | |
| | 23,600 | | | Nichirei Corp., (Japan) | | | 587,465 | |
| | 5,546 | | | Sanderson Farms, Inc. | | | 642,116 | |
| | 7,776 | | | Tyson Foods, Inc., Class A | | | 499,686 | |
| | | | | | | | |
| | | | | | | 10,935,162 | |
| | | | | | | | |
| | | | Household Products — 0.6% | |
| | 16,754 | | | Central Garden & Pet Co., Class A (a) | | | 590,243 | |
| | 6,342 | | | Procter & Gamble Co. (The) | | | 553,847 | |
| | 4,045 | | | Spectrum Brands Holdings, Inc. | | | 581,388 | |
| | 21,708 | | | Svenska Cellulosa AB SCA, (Sweden), Class B | | | 718,694 | |
| | | | | | | | |
| | | | | | | 2,444,172 | |
| | | | | | | | |
| | | | Personal Products — 0.2% | |
| | 13,300 | | | Nu Skin Enterprises, Inc., Class A | | | 734,559 | |
| | | | | | | | |
| | | | Total Consumer Staples | | | 19,861,427 | |
| | | | | | | | |
| | | | Energy — 2.3% | |
| | | | Energy Equipment & Services — 1.3% | |
| | 47,826 | | | Archrock, Inc. | | | 564,347 | |
| | 8,714 | | | Baker Hughes, Inc. | | | 517,350 | |
| | 4,800 | | | Basic Energy Services, Inc. (a) | | | 130,416 | |
| | 27,115 | | | Forum Energy Technologies, Inc. (a) | | | 458,244 | �� |
| | 8,304 | | | Helmerich & Payne, Inc. | | | 503,555 | |
| | 45,297 | | | Nabors Industries Ltd. | | | 468,371 | |
| | 14,474 | | | National Oilwell Varco, Inc. | | | 506,156 | |
| | 84,728 | | | Noble Corp. plc | | | 406,694 | |
| | 19,703 | | | Patterson-UTI Energy, Inc. | | | 426,471 | |
| | 26,982 | | | RPC, Inc. | | | 490,263 | |
| | 20,957 | | | Unit Corp. (a) | | | 450,366 | |
| | | | | | | | |
| | | | | | | 4,922,233 | |
| | | | | | | | |
| | | | Oil, Gas & Consumable Fuels — 1.0% | |
| | 29,867 | | | ARC Resources Ltd., (Canada) | | | 392,086 | |
| | 34,888 | | | CONSOL Energy, Inc. (a) | | | 529,600 | |
| | 24,165 | | | Delek US Holdings, Inc. | | | 581,651 | |
| | 11,596 | | | Halcon Resources Corp. (a) | | | 77,693 | |
| | 40,111 | | | Husky Energy, Inc., (Canada) (a) | | | 463,096 | |
| | | | | | | | |
SHARES | | | SECURITY DESCRIPTION | | VALUE($) | |
| | | | | | | | |
| | | | Oil, Gas & Consumable Fuels — continued | |
| | 17,100 | | | Idemitsu Kosan Co. Ltd., (Japan) | | | 546,720 | |
| | 12,516 | | | International Petroleum Corp., (Canada) (a) | | | 45,501 | |
| | 11,469 | | | Marathon Petroleum Corp. | | | 584,231 | |
| | 602 | | | PrairieSky Royalty Ltd., (Canada) | | | 13,120 | |
| | 3,800 | | | SandRidge Energy, Inc. (a) | | | 69,996 | |
| | 61,100 | | | Showa Shell Sekiyu KK, (Japan) | | | 590,090 | |
| | 1,500 | | | Southwestern Energy Co. (a) | | | 11,265 | |
| | 9,900 | | | Stone Energy Corp. (a) | | | 207,306 | |
| | | | | | | | |
| | | | | | | 4,112,355 | |
| | | | | | | | |
| | | | Total Energy | | | 9,034,588 | |
| | | | | | | | |
| | | | Financials — 5.0% | |
| | | | Banks — 1.1% | |
| | 7,880 | | | Bank of Montreal, (Canada) | | | 557,988 | |
| | 10,240 | | | Bank of Nova Scotia (The), (Canada) | | | 569,218 | |
| | 18,700 | | | CIT Group, Inc. | | | 865,997 | |
| | 30,280 | | | Old National Bancorp | | | 508,704 | |
| | 13,264 | | | Popular, Inc., (Puerto Rico) | | | 555,894 | |
| | 8,460 | | | Royal Bank of Canada, (Canada) | | | 579,287 | |
| | 10,446 | | | Toronto-Dominion Bank (The), (Canada) | | | 491,518 | |
| | | | | | | | |
| | | | | | | 4,128,606 | |
| | | | | | | | |
| | | | Capital Markets — 0.8% | |
| | 19,242 | | | IGM Financial, Inc., (Canada) | | | 578,085 | |
| | 54,027 | | | KCG Holdings, Inc., Class A (a) | | | 1,075,137 | |
| | 17,800 | | | Legg Mason, Inc. | | | 665,364 | |
| | 6,000 | | | Virtus Investment Partners, Inc. | | | 638,400 | |
| | | | | | | | |
| | | | | | | 2,956,986 | |
| | | | | | | | |
| | | | Consumer Finance — 0.2% | |
| | 7,100 | | | Capital One Financial Corp. | | | 570,698 | |
| | 21,155 | | | Navient Corp. | | | 321,556 | |
| | | | | | | | |
| | | | | | | 892,254 | |
| | | | | �� | | | |
| | | | Diversified Financial Services — 0.2% | |
| | 16,100 | | | Voya Financial, Inc. | | | 601,818 | |
| | | | | | | | |
| | | | Insurance — 2.2% | |
| | 10,400 | | | American International Group, Inc. | | | 633,464 | |
| | 6,800 | | | Assurant, Inc. | | | 654,432 | |
| | 30,234 | | | Assured Guaranty Ltd. | | | 1,152,822 | |
| | 11,545 | | | Athene Holding Ltd., Class A (a) | | | 615,464 | |
| | 9,267 | | | Axis Capital Holdings Ltd. | | | 610,695 | |
| | 2,356 | | | Everest Re Group Ltd. | | | 593,029 | |
| | 14,397 | | | Industrial Alliance Insurance & Financial Services, Inc., (Canada) | | | 607,394 | |
| | 31,833 | | | Maiden Holdings Ltd. | | | 393,138 | |
SEE NOTES TO CONSOLIDATED FINANCIAL STATEMENTS.
| | | | | | |
| | | |
| 6 | | | | J.P. MORGAN FUNDS | | APRIL 30, 2017 |
| | | | | | | | |
SHARES | | | SECURITY DESCRIPTION | | VALUE($) | |
| | Common Stocks — continued | |
| | | | Insurance — continued | | | | |
| | 14,400 | | | MetLife, Inc. | | | 746,064 | |
| | 9,430 | | | Principal Financial Group, Inc. | | | 614,176 | |
| | 5,405 | | | Prudential Financial, Inc. | | | 578,497 | |
| | 3,800 | | | Stewart Information Services Corp. | | | 180,272 | |
| | 12,834 | | | Unum Group | | | 594,599 | |
| | 700 | | | White Mountains Insurance Group Ltd. | | | 601,258 | |
| | | | | | | | |
| | | | | | | 8,575,304 | |
| | | | | | | | |
| | | | Thrifts & Mortgage Finance — 0.5% | |
| | 17,040 | | | Essent Group Ltd. (a) | | | 630,650 | |
| | 33,499 | | | EverBank Financial Corp. | | | 653,231 | |
| | 32,507 | | | Radian Group, Inc. | | | 548,718 | |
| | | | | | | | |
| | | | | | | 1,832,599 | |
| | | | | | | | |
| | | | Total Financials | | | 18,987,567 | |
| | | | | | | | |
| | | | Health Care — 5.9% | |
| | | | Biotechnology — 0.1% | |
| | 393 | | | AquaBounty Technologies, Inc. (a) | | | 3,053 | |
| | 3,800 | | | Bioverativ, Inc. (a) | | | 223,478 | |
| | | | | | | | |
| | | | | | | 226,531 | |
| | | | | | | | |
| | | | Health Care Equipment & Supplies — 1.2% | |
| | 31,092 | | | Ansell Ltd., (Australia) | | | 553,468 | |
| | 2,855 | | | Cooper Cos., Inc. (The) | | | 571,942 | |
| | 26,351 | | | Getinge AB, (Sweden), Class B | | | 514,715 | |
| | 15,264 | | | Halyard Health, Inc. (a) | | | 602,928 | |
| | 8,120 | | | Hill-Rom Holdings, Inc. | | | 614,197 | |
| | 13,430 | | | Hologic, Inc. (a) | | | 606,364 | |
| | 6,173 | | | Masimo Corp. (a) | | | 634,214 | |
| | 2,985 | | | Teleflex, Inc. | | | 617,567 | |
| | | | | | | | |
| | | | | | | 4,715,395 | |
| | | | | | | | |
| | | | Health Care Providers & Services — 2.2% | |
| | 7,300 | | | AmerisourceBergen Corp. | | | 598,965 | |
| | 3,822 | | | Cigna Corp. | | | 597,646 | |
| | 20,300 | | | Community Health Systems, Inc. (a) | | | 174,783 | |
| | 9,700 | | | DaVita, Inc. (a) | | | 669,397 | |
| | 2,166 | | | Express Scripts Holding Co. (a) | | | 132,863 | |
| | 13,041 | | | HealthSouth Corp. | | | 611,623 | |
| | 9,200 | | | LifePoint Health, Inc. (a) | | | 571,780 | |
| | 4,400 | | | McKesson Corp. | | | 608,476 | |
| | 3,899 | | | Owens & Minor, Inc. | | | 135,100 | |
| | 39,495 | | | VCA, Inc. (a) | | | 3,616,557 | |
| | 3,648 | | | WellCare Health Plans, Inc. (a) | | | 559,640 | |
| | | | | | | | |
| | | | | | | 8,276,830 | |
| | | | | | | | |
| | | | | | | | |
SHARES | | | SECURITY DESCRIPTION | | VALUE($) | |
| | | | | | | | |
| | | | Life Sciences Tools & Services — 0.6% | |
| | 11,282 | | | Agilent Technologies, Inc. | | | 621,074 | |
| | 2,877 | | | Bio-Rad Laboratories, Inc., Class A (a) | | | 627,934 | |
| | 10,530 | | | Cambrex Corp. (a) | | | 624,956 | |
| | 9,915 | | | PerkinElmer, Inc. | | | 589,050 | |
| | | | | | | | |
| | | | | | | 2,463,014 | |
| | | | | | | | |
| | | | Pharmaceuticals — 1.8% | |
| | 116,985 | | | Akorn, Inc. (a) | | | 3,913,149 | |
| | 2,400 | | | Allergan plc | | | 585,264 | |
| | 9,000 | | | Hisamitsu Pharmaceutical Co., Inc., (Japan) | | | 460,747 | |
| | 8,431 | | | Merck & Co., Inc. | | | 525,504 | |
| | 24,500 | | | Mitsubishi Tanabe Pharma Corp., (Japan) | | | 497,665 | |
| | 14,853 | | | Pfizer, Inc. | | | 503,814 | |
| | 57,817 | | | SciClone Pharmaceuticals, Inc. (a) | | | 557,934 | |
| | | | | | | | |
| | | | | | | 7,044,077 | |
| | | | | | | | |
| | | | Total Health Care | | | 22,725,847 | |
| | | | | | | | |
| | | | Industrials — 5.8% | |
| | | | Aerospace & Defense — 0.6% | |
| | 3,258 | | | Boeing Co. (The) | | | 602,176 | |
| | 39,463 | | | CAE, Inc., (Canada) | | | 602,765 | |
| | 18,965 | | | DigitalGlobe, Inc. (a) | | | 610,673 | |
| | 10,800 | | | Spirit AeroSystems Holdings, Inc., Class A | | | 617,328 | |
| | | | | | | | |
| | | | | | | 2,432,942 | |
| | | | | | | | |
| | | | Airlines — 0.3% | |
| | 11,099 | | | Delta Air Lines, Inc. | | | 504,339 | |
| | 10,984 | | | Hawaiian Holdings, Inc. (a) | | | 596,431 | |
| | | | | | | | |
| | | | | | | 1,100,770 | |
| | | | | | | | |
| | | | Commercial Services & Supplies — 0.8% | |
| | 48,306 | | | ACCO Brands Corp. (a) | | | 688,360 | |
| | 16,146 | | | Brady Corp., Class A | | | 628,887 | |
| | 104,948 | | | Downer EDI Ltd., (Australia) | | | 461,177 | |
| | 16,780 | | | Herman Miller, Inc. | | | 555,418 | |
| | 22,557 | | | Quad/Graphics, Inc. | | | 592,347 | |
| | | | | | �� | | |
| | | | | | | 2,926,189 | |
| | | | | | | | |
| | | | Construction & Engineering — 0.8% | |
| | 21,400 | | | COMSYS Holdings Corp., (Japan) | | | 407,091 | |
| | 894 | | | EMCOR Group, Inc. | | | 58,771 | |
| | 75,900 | | | Hazama Ando Corp., (Japan) | | | 540,535 | |
| | 9,105 | | | Jacobs Engineering Group, Inc. | | | 500,047 | |
| | 57,000 | | | Kandenko Co. Ltd., (Japan) | | | 566,596 | |
| | 92,700 | | | Penta-Ocean Construction Co. Ltd., (Japan) | | | 469,628 | |
| | 54,300 | | | Tokyu Construction Co. Ltd., (Japan) | | | 442,889 | |
| | | | | | | | |
| | | | | | | 2,985,557 | |
| | | | | | | | |
SEE NOTES TO CONSOLIDATED FINANCIAL STATEMENTS.
| | | | | | | | |
| | | |
| APRIL 30, 2017 | | J.P. MORGAN FUNDS | | | | | 7 | |
JPMorgan Systematic Alpha Fund
CONSOLIDATED SCHEDULE OF PORTFOLIO INVESTMENTS
AS OF APRIL 30, 2017 (Unaudited) (continued)
| | | | | | | | |
SHARES | | | SECURITY DESCRIPTION | | VALUE($) | |
| | Common Stocks — continued | |
| | | | Electrical Equipment — 0.9% | |
| | 8,378 | | | Eaton Corp. plc | | | 633,712 | |
| | 6,817 | | | EnerSys | | | 566,561 | |
| | 90,000 | | | Fuji Electric Co. Ltd., (Japan) | | | 493,315 | |
| | 17,200 | | | Furukawa Electric Co. Ltd., (Japan) | | | 696,286 | |
| | 46,800 | | | Nissin Electric Co. Ltd., (Japan) | | | 553,223 | |
| | 7,662 | | | Regal Beloit Corp. | | | 604,149 | |
| | | | | | | | |
| | | | | | | 3,547,246 | |
| | | | | | | | |
| | | | Machinery — 1.6% | |
| | 16,318 | | | Allison Transmission Holdings, Inc. | | | 631,180 | |
| | 46,800 | | | Amada Holdings Co. Ltd., (Japan) | | | 556,421 | |
| | 7,798 | | | Crane Co. | | | 623,138 | |
| | 3,855 | | | Cummins, Inc. | | | 581,874 | |
| | 12,268 | | | Greenbrier Cos., Inc. (The) | | | 533,044 | |
| | 7,088 | | | Ingersoll-Rand plc | | | 629,060 | |
| | 59,000 | | | OKUMA Corp., (Japan) | | | 618,843 | |
| | 7,738 | | | Oshkosh Corp. | | | 536,940 | |
| | 3,627 | | | Parker-Hannifin Corp. | | | 583,221 | |
| | 12,075 | | | Timken Co. (The) | | | 582,619 | |
| | 7,200 | | | Trinity Industries, Inc. | | | 193,680 | |
| | | | | | | | |
| | | | | | | 6,070,020 | |
| | | | | | | | |
| | | | Trading Companies & Distributors — 0.8% | |
| | 14,600 | | | AerCap Holdings NV, (Ireland) (a) | | | 671,746 | |
| | 9,117 | | | Applied Industrial Technologies, Inc. | | | 583,488 | |
| | 6,600 | | | MSC Industrial Direct Co., Inc., Class A | | | 590,898 | |
| | 34,020 | | | NOW, Inc. (a) | | | 578,680 | |
| | 17,626 | | | Rush Enterprises, Inc., Class A (a) | | | 665,382 | |
| | | | | | | | |
| | | | | | | 3,090,194 | |
| | | | | | | | |
| | | | Total Industrials | | | 22,152,918 | |
| | | | | | | | |
| | | | Information Technology — 10.8% | |
| | | | Communications Equipment — 1.7% | |
| | 285,755 | | | Brocade Communications Systems, Inc. | | | 3,591,940 | |
| | 4,292 | | | Cisco Systems, Inc. | | | 146,228 | |
| | 4,005 | | | F5 Networks, Inc. (a) | | | 517,166 | |
| | 17,332 | | | Finisar Corp. (a) | | | 395,863 | |
| | 6,743 | | | InterDigital, Inc. | | | 606,196 | |
| | 10,099 | | | NETGEAR, Inc. (a) | | | 476,168 | |
| | 10,392 | | | Plantronics, Inc. | | | 567,403 | |
| | | | | | | | |
| | | | | | | 6,300,964 | |
| | | | | | | | |
| | | | Electronic Equipment, Instruments & Components — 1.9% | |
| | 18,277 | | | Benchmark Electronics, Inc. (a) | | | 579,381 | |
| | 27,796 | | | Corning, Inc. | | | 801,915 | |
| | 11,548 | | | Dolby Laboratories, Inc., Class A | | | 608,926 | |
| | | | | | | | |
SHARES | | | SECURITY DESCRIPTION | | VALUE($) | |
| | | | | | | | |
| | | | Electronic Equipment, Instruments & Components — continued | |
| | 116,514 | | | InvenSense, Inc. (a) | | | 1,498,370 | |
| | 28,000 | | | Japan Aviation Electronics Industry Ltd., (Japan) | | | 382,994 | |
| | 15,335 | | | Orbotech Ltd., (Israel) (a) | | | 504,982 | |
| | 13,409 | | | Sanmina Corp. (a) | | | 499,485 | |
| | 5,219 | | | SYNNEX Corp. | | | 565,896 | |
| | 36,766 | | | TTM Technologies, Inc. (a) | | | 615,095 | |
| | 3,300 | | | V Technology Co. Ltd., (Japan) | | | 506,387 | |
| | 31,974 | | | Vishay Intertechnology, Inc. | | | 522,775 | |
| | | | | | | | |
| | | | | | | 7,086,206 | |
| | | | | | | | |
| | | | Internet Software & Services — 0.5% | |
| | 566 | | | Alphabet, Inc., Class A (a) | | | 523,278 | |
| | 6,980 | | | j2 Global, Inc. | | | 629,875 | |
| | 12,200 | | | Mixi, Inc., (Japan) | | | 676,786 | |
| | | | | | | | |
| | | | | | | 1,829,939 | |
| | | | | | | | |
| | | | IT Services — 0.8% | |
| | 2,040 | | | Amdocs Ltd. | | | 124,930 | |
| | 4,800 | | | Blackhawk Network Holdings, Inc. (a) | | | 194,160 | |
| | 12,213 | | | Convergys Corp. | | | 274,915 | |
| | 3,565 | | | DXC Technology Co. (a) | | | 268,587 | |
| | 3,421 | | | International Business Machines Corp. | | | 548,352 | |
| | 34,233 | | | NeuStar, Inc., Class A (a) | | | 1,136,535 | |
| | 22,100 | | | TIS, Inc., (Japan) | | | 557,048 | |
| | 6,130 | | | Western Union Co. (The) | | | 121,742 | |
| | | | | | | | |
| | | | | | | 3,226,269 | |
| | | | | | | | |
| | | | Semiconductors & Semiconductor Equipment — 3.3% | |
| | 7,092 | | | Analog Devices, Inc. | | | 540,410 | |
| | 15,750 | | | Applied Materials, Inc. | | | 639,607 | |
| | 10,456 | | | Cabot Microelectronics Corp. | | | 819,228 | |
| | 3,606 | | | Intel Corp. | | | 130,357 | |
| | 28,440 | | | Kulicke & Soffa Industries, Inc.,
(Singapore) (a) | | | 634,781 | |
| | 5,013 | | | Lam Research Corp. | | | 726,133 | |
| | 111,243 | | | Lattice Semiconductor Corp. (a) | | | 763,127 | |
| | 33,969 | | | Marvell Technology Group Ltd., (Bermuda) | | | 510,214 | |
| | 8,535 | | | Microchip Technology, Inc. | | | 645,075 | |
| | 31,725 | | | NXP Semiconductors NV, (Netherlands) (a) | | | 3,354,919 | |
| | 9,193 | | | Qorvo, Inc. (a) | | | 625,400 | |
| | 18,416 | | | Semtech Corp. (a) | | | 628,906 | |
| | 7,352 | | | Silicon Laboratories, Inc. (a) | | | 523,095 | |
| | 6,430 | | | Teradyne, Inc. | | | 226,786 | |
| | 7,601 | | | Texas Instruments, Inc. | | | 601,847 | |
SEE NOTES TO CONSOLIDATED FINANCIAL STATEMENTS.
| | | | | | |
| | | |
| 8 | | | | J.P. MORGAN FUNDS | | APRIL 30, 2017 |
| | | | | | | | |
SHARES | | | SECURITY DESCRIPTION | | VALUE($) | |
| | Common Stocks — continued | |
| | | | Semiconductors & Semiconductor Equipment — continued | |
| | 12,500 | | | Ulvac, Inc., (Japan) | | | 586,850 | |
| | 16,803 | | | XPERI Corp. | | | 564,581 | |
| | | | | | | | |
| | | | | | | 12,521,316 | |
| | | | | | | | |
| | | | Software — 2.3% | |
| | 6,927 | | | Citrix Systems, Inc. (a) | | | 560,671 | |
| | 63,000 | | | COLOPL, Inc., (Japan) | | | 581,707 | |
| | 12,100 | | | Konami Holdings Corp., (Japan) | | | 503,691 | |
| | 60,912 | | | Mobileye NV (a) | | | 3,771,671 | |
| | 17,400 | | | Nexon Co. Ltd., (Japan) | | | 296,137 | |
| | 14,926 | | | Open Text Corp., (Canada) | | | 517,525 | |
| | 3,228 | | | Oracle Corp. | | | 145,131 | |
| | 25,034 | | | Progress Software Corp. | | | 744,010 | |
| | 8,524 | | | Synopsys, Inc. (a) | | | 628,219 | |
| | 12,949 | | | VMware, Inc., Class A (a) | | | 1,218,760 | |
| | | | | | | | |
| | | | | | | 8,967,522 | |
| | | | | | | | |
| | | | Technology Hardware, Storage & Peripherals — 0.3% | |
| | 41,500 | | | Hewlett Packard Enterprise Co. | | | 773,145 | |
| | 12,992 | | | NCR Corp. (a) | | | 535,920 | |
| | | | | | | | |
| | | | | | | 1,309,065 | |
| | | | | | | | |
| | | | Total Information Technology | | | 41,241,281 | |
| | | | | | | | |
| | | | Materials — 7.3% | |
| | | | Chemicals — 4.2% | |
| | 9,373 | | | Cabot Corp. | | | 564,161 | |
| | 18,800 | | | Hitachi Chemical Co. Ltd., (Japan) | | | 538,416 | |
| | 81,745 | | | Huntsman Corp. | | | 2,024,824 | |
| | 9,993 | | | Innophos Holdings, Inc. | | | 479,064 | |
| | 39,200 | | | Kuraray Co. Ltd., (Japan) | | | 632,654 | |
| | 26,600 | | | Mitsubishi Gas Chemical Co., Inc., (Japan) | | | 568,792 | |
| | 14,715 | | | Monsanto Co. | | | 1,715,916 | |
| | 5,534 | | | Stepan Co. | | | 469,283 | |
| | 8,133 | | | Syngenta AG, (Switzerland) (a) | | | 3,770,771 | |
| | 27,800 | | | Teijin Ltd., (Japan) | | | 538,635 | |
| | 67,000 | | | Tosoh Corp., (Japan) | | | 629,706 | |
| | 240,000 | | | Ube Industries Ltd., (Japan) | | | 557,943 | |
| | 30,548 | | | Valspar Corp. (The) | | | 3,434,817 | |
| | | | | | | | |
| | | | | | | 15,924,982 | |
| | | | | | | | |
| | | | Construction Materials — 0.5% | |
| | 191,441 | | | CSR Ltd., (Australia) | | | 701,994 | |
| | 56,347 | | | Headwaters, Inc. (a) | | | 1,338,805 | |
| | | | | | | | |
| | | | | | | 2,040,799 | |
| | | | | | | | |
| | | | Containers & Packaging — 0.7% | |
| | 10,634 | | | Greif, Inc., Class A | | | 623,365 | |
| | | | | | | | |
SHARES | | | SECURITY DESCRIPTION | | VALUE($) | |
| | | | | | | | |
| | | | Containers & Packaging — continued | |
| | 15,534 | | | Multi Packaging Solutions International Ltd. (a) | | | 278,835 | |
| | 6,297 | | | Packaging Corp. of America | | | 622,018 | |
| | 14,900 | | | Sealed Air Corp. | | | 655,898 | |
| | 11,167 | | | WestRock Co. | | | 598,104 | |
| | | | | | | | |
| | | | | | | 2,778,220 | |
| | | | | | | | |
| | | | Metals & Mining — 1.9% | |
| | 62,558 | | | BlueScope Steel Ltd., (Australia) | | | 546,566 | |
| | 70,332 | | | Cliffs Natural Resources, Inc. (a) | | | 472,631 | |
| | 30,560 | | | Commercial Metals Co. | | | 569,638 | |
| | 106,376 | | | Fortescue Metals Group Ltd., (Australia) | | | 421,638 | |
| | 6,700 | | | Nisshin Steel Co. Ltd., (Japan) | | | 81,827 | |
| | 10,293 | | | Nucor Corp. | | | 631,270 | |
| | 196,410 | | | Regis Resources Ltd., (Australia) | | | 487,795 | |
| | 15,308 | | | Steel Dynamics, Inc. | | | 553,231 | |
| | 133,076 | | | Stillwater Mining Co. (a) | | | 2,392,706 | |
| | 70,278 | | | Westgold Resources Ltd., (Australia) (a) | | | 102,779 | |
| | 11,559 | | | Worthington Industries, Inc. | | | 502,817 | |
| | 17,400 | | | Yamato Kogyo Co. Ltd., (Japan) | | | 435,214 | |
| | | | | | | | |
| | | | | | | 7,198,112 | |
| | | | | | | | |
| | | | Total Materials | | | 27,942,113 | |
| | | | | | | | |
| | | | Real Estate — 0.5% | |
| | | | Real Estate Management & Development — 0.5% | |
| | 5,300 | | | CBRE Group, Inc., Class A (a) | | | 189,793 | |
| | 35,817 | | | First Capital Realty, Inc., (Canada) | | | 520,574 | |
| | 32,713 | | | Forestar Group, Inc. (a) | | | 462,889 | |
| | 18,932 | | | HFF, Inc., Class A | | | 594,465 | |
| | | | | | | | |
| | | | Total Real Estate | | | 1,767,721 | |
| | | | | | | | |
| | | | Telecommunication Services — 0.7% | |
| | | | Diversified Telecommunication Services — 0.5% | |
| | 1,237 | | | ATN International, Inc. | | | 85,588 | |
| | 9,310 | | | Straight Path Communications, Inc.,
Class B (a) | | | 1,199,686 | |
| | 79,987 | | | Vonage Holdings Corp. (a) | | | 536,713 | |
| | | | | | | | |
| | | | | | | 1,821,987 | |
| | | | | | | | |
| | | | Wireless Telecommunication Services — 0.2% | |
| | 17,000 | | | KDDI Corp., (Japan) | | | 450,739 | |
| | 19,700 | | | NTT DOCOMO, Inc., (Japan) | | | 476,683 | |
| | | | | | | | |
| | | | | | | 927,422 | |
| | | | | | | | |
| | | | Total Telecommunication Services | | | 2,749,409 | |
| | | | | | | | |
SEE NOTES TO CONSOLIDATED FINANCIAL STATEMENTS.
| | | | | | | | |
| | | |
| APRIL 30, 2017 | | J.P. MORGAN FUNDS | | | | | 9 | |
JPMorgan Systematic Alpha Fund
CONSOLIDATED SCHEDULE OF PORTFOLIO INVESTMENTS
AS OF APRIL 30, 2017 (Unaudited) (continued)
| | | | | | | | |
SHARES | | | SECURITY DESCRIPTION | | VALUE($) | |
| | Common Stocks — continued | |
| | | | Utilities — 1.7% | |
| | | | Electric Utilities — 0.3% | |
| | 8,558 | | | ALLETE, Inc. | | | 598,290 | |
| | 17,402 | | | Hawaiian Electric Industries, Inc. | | | 583,315 | |
| | | | | | | | |
| | | | | | | 1,181,605 | |
| | | | | | | | |
| | | | Gas Utilities — 1.0% | |
| | 141,000 | | | Osaka Gas Co. Ltd., (Japan) | | | 527,795 | |
| | 12,188 | | | UGI Corp. | | | 611,350 | |
| | 31,614 | | | WGL Holdings, Inc. | | | 2,606,891 | |
| | | | | | | | |
| | | | | | | 3,746,036 | |
| | | | | | | | |
| | | | Independent Power & Renewable Electricity Producers — 0.4% | |
| | 51,564 | | | AES Corp. | | | 583,189 | |
| | 33,174 | | | NRG Yield, Inc., Class C | | | 587,180 | |
| | 10,090 | | | Ormat Technologies, Inc. | | | 595,915 | |
| | | | | | | | |
| | | | | | | 1,766,284 | |
| | | | | | | | |
| | | | Total Utilities | | | 6,693,925 | |
| | | | | | | | |
| | | | Total Common Stocks
(Cost $194,131,931) | | | 207,225,010 | |
| | | | | | | | |
| | Convertible Preferred Stocks — 1.7% | |
| | | | Energy — 0.3% | |
| | | | Oil, Gas & Consumable Fuels — 0.3% | |
| | 7,617 | | | Hess Corp., 8.000%, 02/01/19
($50 par value) | | | 454,354 | |
| | 10,323 | | | Kinder Morgan, Inc., Series A, 9.750%, 10/26/18 ($49 par value) | | | 475,374 | |
| | 15,459 | | | Southwestern Energy Co., Series B, 6.250%, 01/15/18 ($50 par value) | | | 285,683 | |
| | | | | | | | |
| | | | Total Energy | | | 1,215,411 | |
| | | | | | | | |
| | | | Financials — 0.3% | |
| | | | Banks — 0.3% | |
| | 359 | | | Bank of America Corp., Series L, 7.250% ($1,000 par value) | | | 435,618 | |
| | 360 | | | Wells Fargo & Co., Series L, 7.500%
($1,000 par value) | | | 457,200 | |
| | | | | | | | |
| | | | Total Financials | | | 892,818 | |
| | | | | | | | |
| | | | Health Care — 0.3% | |
| | | | Health Care Providers & Services — 0.1% | |
| | 8,965 | | | Anthem, Inc., 5.250%, 05/01/18
($50 par value) | | | 460,622 | |
| | | | | | | | |
| | | | Pharmaceuticals — 0.2% | |
| | 875 | | | Allergan plc, Series A, 5.500%, 03/01/18 ($1,000 par value) | | | 757,557 | |
| | | | | | | | |
| | | | Total Health Care | | | 1,218,179 | |
| | | | | | | | |
| | | | | | | | |
SHARES | | | SECURITY DESCRIPTION | | VALUE($) | |
| | | | | | | | |
| | | | Industrials — 0.1% | |
| | | | Aerospace & Defense — 0.1% | |
| | 6,716 | | | Arconic, Inc., 5.375%, 10/01/17
($50 par value) | | | 285,161 | |
| | | | | | | | |
| | | | Real Estate — 0.1% | |
| | | | Equity Real Estate Investment Trusts (REITs) — 0.1% | |
| | 4,750 | | | Welltower, Inc., Series I, 6.500%
($50 par value) | | | 300,247 | |
| | | | | | | | |
| | | | Telecommunication Services — 0.3% | |
| | | | Diversified Telecommunication Services — 0.1% | |
| | 6,800 | | | Frontier Communications Corp., Series A, 11.125%, 06/29/18 ($100 par value) | | | 301,512 | |
| | | | | | | | |
| | | | Wireless Telecommunication Services — 0.2% | |
| | 8,800 | | | T-Mobile US, Inc., 5.500%, 12/15/17
($50 par value) | | | 965,536 | |
| | | | | | | | |
| | | | Total Telecommunication Services | | | 1,267,048 | |
| | | | | | | | |
| | | | Utilities — 0.3% | |
| | | | Electric Utilities — 0.2% | |
| | 10,125 | | | Exelon Corp., 6.500%, 06/01/17
($50 par value) | | | 500,074 | |
| | 6,900 | | | NextEra Energy, Inc., 6.371%, 09/01/18 ($50 par value) | | | 425,523 | |
| | | | | | | | |
| | | | | | | 925,597 | |
| | | | | | | | |
| | | | Multi-Utilities — 0.1% | |
| | 3,750 | | | Dominion Resources, Inc., 6.375%, 07/01/17 ($50 par value) | | | 188,850 | |
| | | | | | | | |
| | | | Total Utilities | | | 1,114,447 | |
| | | | | | | | |
| | | | Total Convertible Preferred Stocks
(Cost $6,417,403) | | | 6,293,311 | |
| | | | | | | | |
| | Preferred Stock — 0.1% | |
| | | | Consumer Staples — 0.1% | |
| | | | Food Products — 0.1% | |
| | 6,279 | | | Tyson Foods, Inc., 4.750%, 07/15/17
($50 par value) (Cost $314,911) | | | 435,449 | |
| | | | | | | | |
PRINCIPAL
AMOUNT($) | | | | | | |
| | Convertible Bonds — 6.5% | |
| | | | Consumer Discretionary — 0.7% | |
| | | | Internet & Direct Marketing Retail — 0.4% | |
| | | | Priceline Group, Inc. (The), | | | | |
| | 148,000 | | | 0.350%, 06/15/20 | | | 215,803 | |
| | 150,000 | | | 1.000%, 03/15/18 | | | 292,312 | |
| | 639,000 | | | Shutterfly, Inc., 0.250%, 05/15/18 | | | 645,789 | |
SEE NOTES TO CONSOLIDATED FINANCIAL STATEMENTS.
| | | | | | |
| | | |
| 10 | | | | J.P. MORGAN FUNDS | | APRIL 30, 2017 |
| | | | | | | | |
PRINCIPAL
AMOUNT($) | | | SECURITY DESCRIPTION | | VALUE($) | |
| | Convertible Bonds — continued | |
| | | | Internet & Direct Marketing Retail — continued | |
| | 538,000 | | | Vipshop Holdings Ltd., (China), 1.500%, 03/15/19 | | | 549,433 | |
| | | | | | | | |
| | | | | | | 1,703,337 | |
| | | | | | | | |
| | | | Media — 0.2% | |
| | 678,000 | | | Liberty Media Corp., 1.375%, 10/15/23 | | | 764,021 | |
| | | | | | | | |
| | | | Textiles, Apparel & Luxury Goods — 0.1% | |
| | 194,000 | | | Iconix Brand Group, Inc., 1.500%, 03/15/18 | | | 185,027 | |
| | | | | | | | |
| | | | Total Consumer Discretionary | | | 2,652,385 | |
| | | | | | | | |
| | | | Financials — 0.5% | |
| | | | Capital Markets — 0.3% | |
| | 478,000 | | | Jefferies Group LLC, 3.875%, 11/01/29 | | | 480,988 | |
| | 706,000 | | | Prospect Capital Corp., 4.750%, 04/15/20 | | | 703,352 | |
| | | | | | | | |
| | | | | | | 1,184,340 | |
| | | | | | | | |
| | | | Mortgage Real Estate Investment Trusts (REITs) — 0.2% | |
| | | | Starwood Property Trust, Inc., | | | | |
| | 387,000 | | | 4.000%, 01/15/19 | | | 441,664 | |
| | 266,000 | | | 4.550%, 03/01/18 | | | 288,942 | |
| | | | | | | | |
| | | | | | | 730,606 | |
| | | | | | | | |
| | | | Total Financials | | | 1,914,946 | |
| | | | | | | | |
| | | | Health Care — 1.8% | |
| | | | Biotechnology — 0.6% | |
| | 779,000 | | | Acorda Therapeutics, Inc., 1.750%, 06/15/21 | | | 611,515 | |
| | | | BioMarin Pharmaceutical, Inc., | | | | |
| | 412,000 | | | 0.750%, 10/15/18 | | | 485,387 | |
| | 373,000 | | | 1.500%, 10/15/20 | | | 462,287 | |
| | 661,000 | | | Ionis Pharmaceuticals, Inc., 1.000%, 11/15/21 | | | 689,093 | |
| | | | | | | | |
| | | | | | | 2,248,282 | |
| | | | | | | | |
| | | | Health Care Equipment & Supplies — 0.1% | |
| | | | Hologic, Inc., | | | | |
| | 168,000 | | | SUB, 0.000%, 12/15/43 | | | 211,995 | |
| | 174,000 | | | Series 2012, SUB, 2.000%, 03/01/42 | | | 253,931 | |
| | | | | | | | |
| | | | | | | 465,926 | |
| | | | | | | | |
| | | | Health Care Providers & Services — 0.6% | |
| | 133,000 | | | Anthem, Inc., 2.750%, 10/15/42 | | | 323,938 | |
| | 652,000 | | | Brookdale Senior Living, Inc., 2.750%, 06/15/18 | | | 643,850 | |
| | 408,000 | | | HealthSouth Corp., 2.000%, 12/01/43 | | | 534,735 | |
| | | | Molina Healthcare, Inc., | | | | |
| | 274,000 | | | 1.125%, 01/15/20 | | | 369,900 | |
| | 369,000 | | | 1.625%, 08/15/44 | | | 403,132 | |
| | | | | | | | |
| | | | | | | 2,275,555 | |
| | | | | | | | |
| | | | | | | | |
PRINCIPAL
AMOUNT($) | | | SECURITY DESCRIPTION | | VALUE($) | |
| | | | | | | | |
| | | | Health Care Technology — 0.2% | |
| | 593,000 | | | Allscripts Healthcare Solutions, Inc., 1.250%, 07/01/20 | | | 587,441 | |
| | | | | | | | |
| | | | Life Sciences Tools & Services — 0.0% (g) | |
| | 187,000 | | | Illumina, Inc., 0.500%, 06/15/21 | | | 199,272 | |
| | | | | | | | |
| | | | Pharmaceuticals — 0.3% | |
| | 142,000 | | | Impax Laboratories, Inc., 2.000%, 06/15/22 | | | 119,724 | |
| | 800,000 | | | Jazz Investments I Ltd., 1.875%, 08/15/21 | | | 886,000 | |
| | | | | | | | |
| | | | | | | 1,005,724 | |
| | | | | | | | |
| | | | Total Health Care | | | 6,782,200 | |
| | | | | | | | |
| | | | | | | | |
| | | | Industrials — 0.1% | |
| | | | Machinery — 0.1% | |
| | 465,000 | | | Trinity Industries, Inc., 3.875%, 06/01/36 | | | 571,369 | |
| | | | | | | | |
| | | | Information Technology — 2.8% | |
| | | | Communications Equipment — 0.2% | |
| | 520,000 | | | Brocade Communications Systems, Inc., 1.375%, 01/01/20 | | | 526,500 | |
| | 201,000 | | | Ciena Corp., 3.750%, 10/15/18 (e) | | | 257,406 | |
| | | | | | | | |
| | | | | | | 783,906 | |
| | | | | | | | |
| | | | Internet Software & Services — 0.5% | |
| | 643,000 | | | Akamai Technologies, Inc., Zero Coupon, 02/15/19 | | | 640,187 | |
| | 573,000 | | | j2 Global, Inc., 3.250%, 06/15/29 | | | 814,376 | |
| | 535,000 | | | Yandex NV, (Russia), 1.125%, 12/15/18 | | | 516,610 | |
| | | | | | | | |
| | | | | | | 1,971,173 | |
| | | | | | | | |
| | | | IT Services — 0.2% | |
| | 414,000 | | | Euronet Worldwide, Inc., 1.500%, 10/01/44 | | | 512,842 | |
| | | | | | | | |
| | | | Semiconductors & Semiconductor Equipment — 1.2% | |
| | | | Intel Corp., | | | | |
| | 210,000 | | | 3.250%, 08/01/39 | | | 367,238 | |
| | 221,000 | | | 3.479%, 12/15/35 | | | 300,974 | |
| | 273,000 | | | Lam Research Corp., 1.250%, 05/15/18 | | | 651,446 | |
| | 429,000 | | | Microchip Technology, Inc., 1.625%, 02/15/25 | | | 627,144 | |
| | 932,000 | | | Micron Technology, Inc., Series G, 3.000%, 11/15/43 | | | 1,006,560 | |
| | 101,000 | | | Novellus Systems, Inc., 2.625%, 05/15/41 | | | 432,217 | |
| | 600,000 | | | NXP Semiconductors NV, (Netherlands), 1.000%, 12/01/19 | | | 699,375 | |
| | 286,000 | | | Xilinx, Inc., 2.625%, 06/15/17 | | | 629,200 | |
| | | | | | | | |
| | | | | | | 4,714,154 | |
| | | | | | | | |
SEE NOTES TO CONSOLIDATED FINANCIAL STATEMENTS.
| | | | | | | | |
| | | |
| APRIL 30, 2017 | | J.P. MORGAN FUNDS | | | | | 11 | |
JPMorgan Systematic Alpha Fund
CONSOLIDATED SCHEDULE OF PORTFOLIO INVESTMENTS
AS OF APRIL 30, 2017 (Unaudited) (continued)
| | | | | | | | |
PRINCIPAL
AMOUNT($) | | | SECURITY DESCRIPTION | | VALUE($) | |
| | Convertible Bonds — continued | |
| | | | Software — 0.7% | |
| | 440,000 | | | Citrix Systems, Inc., 0.500%, 04/15/19 | | | 538,725 | |
| | 236,000 | | | Nuance Communications, Inc., 2.750%, 11/01/31 | | | 236,737 | |
| | 478,000 | | | Red Hat, Inc., 0.250%, 10/01/19 | | | 628,271 | |
| | 780,000 | | | Rovi Corp., 0.500%, 03/01/20 | | | 770,250 | |
| | 541,000 | | | Verint Systems, Inc., 1.500%, 06/01/21 | | | 521,051 | |
| | | | | | | | |
| | | | | | | 2,695,034 | |
| | | | | | | | |
| | | | Total Information Technology | | | 10,677,109 | |
| | | | | | | | |
| | | | Materials — 0.2% | |
| | | | Metals & Mining — 0.2% | |
| | 435,000 | | | Newmont Mining Corp., Series B, 1.625%, 07/15/17 | | | 435,000 | |
| | 438,000 | | | Royal Gold, Inc., 2.875%, 06/15/19 | | | 465,649 | |
| | | | | | | | |
| | | | Total Materials | | | 900,649 | |
| | | | | | | | |
| | | | Real Estate — 0.2% | |
| | | | Equity Real Estate Investment Trusts (REITs) — 0.2% | |
| | | | Spirit Realty Capital, Inc., | | | | |
| | 276,000 | | | 2.875%, 05/15/19 | | | 277,725 | |
| | 305,000 | | | 3.750%, 05/15/21 | | | 314,150 | |
| | | | | | | | |
| | | | Total Real Estate | | | 591,875 | |
| | | | | | | | |
| | | | | | | | |
PRINCIPAL
AMOUNT($) | | | SECURITY DESCRIPTION | | VALUE($) | |
| | | | | | | | |
| | | | Utilities — 0.2% | |
| | | | Independent Power & Renewable Electricity
Producers — 0.2% | |
| | 758,000 | | | NRG Yield, Inc., 3.500%, 02/01/19 (e) | | | 769,844 | |
| | | | | | | | |
| | | | Total Convertible Bonds
(Cost $23,335,937) | | | 24,860,377 | |
| | | | | | | | |
| | |
NUMBER OF
RIGHTS | | | | | | |
| | Right — 0.0% | |
| | | | Health Care — 0.0% | |
| | | | Biotechnology — 0.0% | |
| | 2,982 | | | Chelsea Therapeutics, Inc., (Denmark) (a) (Cost $—) | | | — | |
| | | | | | | | |
| | |
| SHARES | | | SECURITY DESCRIPTION | | | |
| | Short-Term Investment — 31.0% | |
| | | | Investment Company — 31.0% | |
| | 118,754,602 | | | JPMorgan U.S. Government Money Market Fund, Institutional Class Shares,
0.620% (b) (l) ^^
(Cost $118,754,602) | | | 118,754,602 | |
| | | | | | | | |
| | | | Total Investments — 93.4%
(Cost $342,954,784) | | | 357,568,749 | |
| | | | Other Assets in Excess of
Liabilities — 6.6% | | | 25,221,029 | |
| | | | | | | | |
| | | | NET ASSETS — 100.0% | | $ | 382,789,778 | |
| | | | | | | | |
Percentages indicated are based on net assets.
| | | | | | | | | | | | | | | | | | | | |
| Futures Contracts | |
NUMBER OF
CONTRACTS | | | DESCRIPTION | | EXPIRATION
DATE | | | TRADING
CURRENCY | | | NOTIONAL
VALUE AT
APRIL 30, 2017 | | | NET UNREALIZED
APPRECIATION
(DEPRECIATION) | |
| | | | Long Futures Outstanding | | | | | | | | | | | | | | | | |
| | 5 | | | LME Nickel Futures^ | | | 05/15/17 | | | | USD | | | $ | 282,180 | | | $ | (47,025 | ) |
| | 89 | | | LME Primary Aluminum Futures^ | | | 05/15/17 | | | | USD | | | | 4,236,400 | | | | (48,025 | ) |
| | 18 | | | LME Zinc Futures^ | | | 05/15/17 | | | | USD | | | | 1,176,525 | | | | (105,479 | ) |
| | 50 | | | CAC 40 Index | | | 05/19/17 | | | | EUR | | | | 2,841,021 | | | | 112,822 | |
| | 19 | | | IBEX 35 Index | | | 05/19/17 | | | | EUR | | | | 2,219,270 | | | | 79,319 | |
| | 6 | | | Feeder Cattle Futures^ | | | 05/25/17 | | | | USD | | | | 448,650 | | | | 83,370 | |
| | 72 | | | Euro Bobl | | | 06/08/17 | | | | EUR | | | | 10,341,727 | | | | (5,760 | ) |
| | 20 | | | Euro Bund | | | 06/08/17 | | | | EUR | | | | 3,524,539 | | | | 9,302 | |
| | 10 | | | TOPIX Index | | | 06/08/17 | | | | JPY | | | | 1,374,606 | | | | (15,634 | ) |
| | 26 | | | Lean Hogs Futures^ | | | 06/14/17 | | | | USD | | | | 769,600 | | | | (47,117 | ) |
| | 613 | | | 10 Year Australian Government Bond | | | 06/15/17 | | | | AUD | | | | 59,542,958 | | | | 1,690,360 | |
| | 22 | | | SPI 200 Index | | | 06/15/17 | | | | AUD | | | | 2,432,679 | | | | 74,660 | |
| | 8 | | | DAX Index | | | 06/16/17 | | | | EUR | | | | 2,716,099 | | | | 97,490 | |
| | 33 | | | E-mini S&P 500 | | | 06/16/17 | | | | USD | | | | 3,927,825 | | | | 36,170 | |
SEE NOTES TO CONSOLIDATED FINANCIAL STATEMENTS.
| | | | | | |
| | | |
| 12 | | | | J.P. MORGAN FUNDS | | APRIL 30, 2017 |
| | | | | | | | | | | | | | | | | | | | |
| Futures Contracts | |
NUMBER OF
CONTRACTS | | | DESCRIPTION | | EXPIRATION
DATE | | | TRADING
CURRENCY | | | NOTIONAL
VALUE AT
APRIL 30, 2017 | | | NET UNREALIZED
APPRECIATION
(DEPRECIATION) | |
| | 73 | | | Euro STOXX 50 Index | | | 06/16/17 | | | | EUR | | | $ | 2,789,844 | | | $ | 148,139 | |
| | 33 | | | FTSE 100 Index | | | 06/16/17 | | | | GBP | | | | 3,062,217 | | | | (47,032 | ) |
| | 16 | | | FTSE MIB Index | | | 06/16/17 | | | | EUR | | | | 1,767,457 | | | | 85,013 | |
| | 42 | | | LME Primary Aluminum Futures^ | | | 06/19/17 | | | | USD | | | | 2,002,613 | | | | 45,455 | |
| | 15 | | | LME Zinc Futures^ | | | 06/19/17 | | | | USD | | | | 982,594 | | | | (47,852 | ) |
| | 350 | | | 10 Year U.S. Treasury Note | | | 06/21/17 | | | | USD | | | | 44,001,563 | | | | 561,339 | |
| | 24 | | | Gold 100 OZ Futures^ | | | 06/28/17 | | | | USD | | | | 3,043,920 | | | | 26,846 | |
| | 16 | | | Long Gilt | | | 06/28/17 | | | | GBP | | | | 2,658,165 | | | | 25,701 | |
| | 14 | | | Hang Seng Index | | | 06/29/17 | | | | HKD | | | | 2,190,269 | | | | 44,253 | |
| | 95 | | | Live Cattle Futures^ | | | 06/30/17 | | | | USD | | | | 4,712,950 | | | | 659,850 | |
| | 104 | | | Cotton No. 2 Futures^ | | | 07/07/17 | | | | USD | | | | 4,101,240 | | | | 46,992 | |
| | 13 | | | Cocoa Futures^ | | | 07/14/17 | | | | USD | | | | 239,330 | | | | (35,289 | ) |
| | 29 | | | Copper Futures^ | | | 07/27/17 | | | | USD | | | | 1,890,438 | | | | (2,827 | ) |
| | 5 | | | Silver Futures^ | | | 07/27/17 | | | | USD | | | | 431,550 | | | | (15,588 | ) |
| | 15 | | | Gold 100 OZ Futures^ | | | 08/29/17 | | | | USD | | | | 1,907,550 | | | | 24,561 | |
| | 18 | | | Feeder Cattle Futures^ | | | 08/31/17 | | | | USD | | | | 1,392,300 | | | | 101,922 | |
| | 40 | | | Live Cattle Futures^ | | | 08/31/17 | | | | USD | | | | 1,920,800 | | | | 279,902 | |
| | 53 | | | Cocoa Futures^ | | | 09/14/17 | | | | USD | | | | 980,500 | | | | (141,460 | ) |
| | 7 | | | Silver Futures^ | | | 09/27/17 | | | | USD | | | | 606,760 | | | | (37,258 | ) |
| | | | Short Futures Outstanding | | | | | | | | | | | | | | | | |
| | (5 | ) | | LME Nickel Futures^ | | | 05/15/17 | | | | USD | | | | (282,180 | ) | | | 5,709 | |
| | (46 | ) | | LME Primary Aluminum Futures^ | | | 05/15/17 | | | | USD | | | | (2,189,600 | ) | | | (53,039 | ) |
| | (7 | ) | | WTI Crude Oil Futures^ | | | 05/22/17 | | | | USD | | | | (345,310 | ) | | | 13,911 | |
| | (58 | ) | | Natural Gas Futures^ | | | 05/26/17 | | | | USD | | | | (1,900,080 | ) | | | (63,714 | ) |
| | (259 | ) | | Euro Bund | | | 06/08/17 | | | | EUR | | | | (45,642,781 | ) | | | (97,895 | ) |
| | (3 | ) | | Euro-Buxl 30-Year Bond | | | 06/08/17 | | | | EUR | | | | (552,798 | ) | | | (3,279 | ) |
| | (66 | ) | | 10 Year Japanese Government Bond | | | 06/12/17 | | | | JPY | | | | (8,941,898 | ) | | | (56,581 | ) |
| | (174 | ) | | Lean Hogs Futures^ | | | 06/14/17 | | | | USD | | | | (5,150,400 | ) | | | 257,287 | |
| | (19 | ) | | 10 Year Australian Government Bond | | | 06/15/17 | | | | AUD | | | | (1,845,540 | ) | | | (56,694 | ) |
| | (60 | ) | | 3 Year Australian Government Bond | | | 06/15/17 | | | | AUD | | | | (5,037,280 | ) | | | (45,097 | ) |
| | (429 | ) | | E-mini S&P 500 | | | 06/16/17 | | | | USD | | | | (51,061,725 | ) | | | (419,146 | ) |
| | (5 | ) | | LME Zinc Futures^ | | | 06/19/17 | | | | USD | | | | (327,531 | ) | | | 2,672 | |
| | (297 | ) | | 10 Year Canadian Government Bond | | | 06/21/17 | | | | CAD | | | | (30,364,690 | ) | | | (643,452 | ) |
| | (25 | ) | | 10 Year U.S. Treasury Note | | | 06/21/17 | | | | USD | | | | (3,142,969 | ) | | | (38,547 | ) |
| | (3 | ) | | LME Primary Aluminum Futures^ | | | 06/21/17 | | | | USD | | | | (143,044 | ) | | | 3,647 | |
| | (12 | ) | | U.S. Treasury Long Bond | | | 06/21/17 | | | | USD | | | | (1,835,625 | ) | | | (32,129 | ) |
| | (63 | ) | | Long Gilt | | | 06/28/17 | | | | GBP | | | | (10,466,524 | ) | | | (82,342 | ) |
| | (29 | ) | | Natural Gas Futures^ | | | 06/28/17 | | | | USD | | | | (972,370 | ) | | | (18,427 | ) |
| | (41 | ) | | 5 Year U.S. Treasury Note | | | 06/30/17 | | | | USD | | | | (4,854,656 | ) | | | (41,610 | ) |
| | (42 | ) | | Sugar No. 11 (World Markets) Futures^ | | | 06/30/17 | | | | USD | | | | (758,755 | ) | | | 13,459 | |
| | (241 | ) | | CBOT Wheat Futures^ | | | 07/14/17 | | | | USD | | | | (5,208,613 | ) | | | 61,739 | |
| | (48 | ) | | Cocoa Futures^ | | | 07/14/17 | | | | USD | | | | (883,680 | ) | | | 27,166 | |
| | (179 | ) | | Corn Futures^ | | | 07/14/17 | | | | USD | | | | (3,280,175 | ) | | | 28,735 | |
| | (21 | ) | | Soybean Futures^ | | | 07/14/17 | | | | USD | | | | (1,004,063 | ) | | | 3,088 | |
| | (1 | ) | | LME Nickel Futures^ | | | 07/17/17 | | | | USD | | | | (56,682 | ) | | | 291 | |
| | (8 | ) | | Coffee ‘C’ Futures^ | | | 07/19/17 | | | | USD | | | | (400,200 | ) | | | 1,738 | |
| | (80 | ) | | CBOT Wheat Futures^ | | | 09/14/17 | | | | USD | | | | (1,783,000 | ) | | | 28,764 | |
| | (95 | ) | | Corn Futures^ | | | 09/14/17 | | | | USD | | | | (1,777,688 | ) | | | 22,282 | |
| | | | | | | | | | | | | | | | | | | | |
| | | | | | | | | | | | | | | | | | $ | 2,455,656 | |
| | | | | | | | | | | | | | | | | | | | |
| | | | | | | | | | | | | | | | | | | | |
SEE NOTES TO CONSOLIDATED FINANCIAL STATEMENTS.
| | | | | | | | |
| | | |
| APRIL 30, 2017 | | J.P. MORGAN FUNDS | | | | | 13 | |
JPMorgan Systematic Alpha Fund
CONSOLIDATED SCHEDULE OF PORTFOLIO INVESTMENTS
AS OF APRIL 30, 2017 (Unaudited) (continued)
| | | | | | | | | | | | | | | | | | | | | | |
| Forward Foreign Currency Exchange Contracts | |
CONTRACTS TO BUY | | | CURRENCY | | COUNTERPARTY | | SETTLEMENT
DATE | | | SETTLEMENT
VALUE | | | VALUE AT
APRIL 30, 2017 | | | NET UNREALIZED
APPRECIATION
(DEPRECIATION) | |
| | 16,845,116 | | | AUD | | Citibank, NA | | | 05/23/17 | | | $ | 12,763,096 | | | $ | 12,608,689 | | | $ | (154,407 | ) |
| | 9,140,220 | | | BRL | | Goldman Sachs International† | | | 05/23/17 | | | | 2,894,215 | | | | 2,863,221 | | | | (30,994 | ) |
| | 4,614,189 | | | EUR | | Goldman Sachs International | | | 05/23/17 | | | | 4,923,504 | | | | 5,031,711 | | | | 108,207 | |
| | 1,453,208 | | | EUR | | National Australia Bank | | | 05/23/17 | | | | 1,556,647 | | | | 1,584,704 | | | | 28,057 | |
| | 72,142,074 | | | JPY | | HSBC Bank, NA | | | 05/23/17 | | | | 664,412 | | | | 647,674 | | | | (16,738 | ) |
| | 527,991,706 | | | JPY | | Royal Bank of Canada | | | 05/23/17 | | | | 4,862,312 | | | | 4,740,184 | | | | (122,128 | ) |
| | 55,600,410 | | | MXN | | Merrill Lynch International | | | 05/23/17 | | | | 2,985,306 | | | | 2,942,059 | | | | (43,247 | ) |
| | 162,693,813 | | | RUB | | Goldman Sachs International† | | | 05/23/17 | | | | 2,877,922 | | | | 2,843,545 | | | | (34,377 | ) |
| | 53,339,114 | | | SEK | | Merrill Lynch International | | | 05/23/17 | | | | 5,944,020 | | | | 6,028,927 | | | | 84,907 | |
| | 10,087,208 | | | TRY | | Merrill Lynch International | | | 05/23/17 | | | | 2,707,013 | | | | 2,822,455 | | | | 115,442 | |
| | 36,426,326 | | | ZAR | | Goldman Sachs International | | | 05/23/17 | | | | 2,710,994 | | | | 2,715,040 | | | | 4,046 | |
| | 5,846,598 | | | ZAR | | Merrill Lynch International | | | 05/23/17 | | | | 420,482 | | | | 435,777 | | | | 15,295 | |
| | | | | | | | | | | | $ | 45,309,923 | | | $ | 45,263,986 | | | $ | (45,937 | ) |
| | |
| | | | | | | | | | | | | | | | | | | | | | |
CONTRACTS TO SELL | | | CURRENCY | | COUNTERPARTY | | SETTLEMENT
DATE | | | SETTLEMENT
VALUE | | | VALUE AT
APRIL 30, 2017 | | | NET UNREALIZED
APPRECIATION
(DEPRECIATION) | |
| | 2,607,060 | | | AUD | | Citibank, NA | | | 05/23/17 | | | $ | 1,975,300 | | | $ | 1,951,403 | | | $ | 23,897 | |
| | 5,606,666 | | | AUD | | HSBC Bank, NA | | | 05/23/17 | | | | 4,248,709 | | | | 4,196,629 | | | | 52,080 | |
| | 12,906,621 | | | CAD | | State Street Corp. | | | 05/23/17 | | | | 9,676,808 | | | | 9,457,879 | | | | 218,929 | |
| | 17,266,652 | | | CHF | | Citibank, NA | | | 05/23/17 | | | | 17,239,805 | | | | 17,377,761 | | | | (137,956 | ) |
| | 2,568,663 | | | EUR | | Goldman Sachs International | | | 05/23/17 | | | | 2,745,066 | | | | 2,801,093 | | | | (56,027 | ) |
| | 1,689,253 | | | GBP | | Goldman Sachs International | | | 05/23/17 | | | | 2,118,585 | | | | 2,189,271 | | | | (70,686 | ) |
| | 835,124,880 | | | HUF | | Merrill Lynch International | | | 05/23/17 | | | | 2,846,029 | | | | 2,906,700 | | | | (60,671 | ) |
| | 10,130,510 | | | ILS | | Citibank, NA | | | 05/23/17 | | | | 2,772,488 | | | | 2,799,006 | | | | (26,518 | ) |
| | 2,504,149,588 | | | JPY | | Morgan Stanley | | | 05/23/17 | | | | 23,056,656 | | | | 22,481,662 | | | | 574,994 | |
| | 58,570,254 | | | JPY | | Royal Bank of Canada | | | 05/23/17 | | | | 527,181 | | | | 525,830 | | | | 1,351 | |
| | 110,871,474 | | | NOK | | Merrill Lynch International | | | 05/23/17 | | | | 12,980,742 | | | | 12,916,665 | | | | 64,077 | |
| | 4,658,918 | | | NZD | | Australia and New Zealand Banking Group Ltd. | | | 05/23/17 | | | | 3,260,120 | | | | 3,197,058 | | | | 63,062 | |
| | 12,063,490 | | | PLN | | Merrill Lynch International | | | 05/23/17 | | | | 3,037,492 | | | | 3,108,935 | | | | (71,443 | ) |
| | 16,486,251 | | | SEK | | Merrill Lynch International | | | 05/23/17 | | | | 1,837,200 | | | | 1,863,444 | | | | (26,244 | ) |
| | 97,480,769 | | | THB | | Australia and New Zealand Banking Group Ltd. | | | 05/23/17 | | | | 2,836,109 | | | | 2,817,752 | | | | 18,357 | |
| | 90,003,825 | | | TWD | | Merrill Lynch International† | | | 05/23/17 | | | | 2,960,224 | | | | 2,981,411 | | | | (21,187 | ) |
| | | | | | | | | | | | $ | 94,118,514 | | | $ | 93,572,499 | | | $ | 546,015 | |
| | |
SEE NOTES TO CONSOLIDATED FINANCIAL STATEMENTS.
| | | | | | |
| | | |
| 14 | | | | J.P. MORGAN FUNDS | | APRIL 30, 2017 |
| | | | | | | | | | |
| Total Return Basket Swaps* Outstanding at April 30, 2017 | | | | |
| COUNTERPARTY | | DESCRIPTION | | TERMINATION
DATE | | | VALUE** | |
Bank of America NA | | The Fund receives the total return on a portfolio of long and short positions and pays a specified LIBOR or Federal Funds floating rate, which is denominated in various foreign currencies based on the local currencies of the positions within the swap. | | | 05/07/18 | | | $ | (4,178 | ) |
Bank of America NA | | The Fund receives the total return on a portfolio of long and short positions and pays a specified LIBOR or Federal Funds floating rate, which is denominated in various foreign currencies based on the local currencies of the positions within the swap. | | | 01/26/18 | | | | (2,227 | ) |
Union Bank Of Switzerland AG | | The Fund receives the total return on a portfolio of long and short positions and pays one month LIBOR plus a spread for long positions, with the exception of long positions denominated in HKD which pays one day LIBOR plus a spread, or one day Federal Funds floating rate for short positions, which is denominated in various foreign currencies based on the local currencies of the positions within the portfolio. | | | 12/03/19 | | | | (2,764 | ) |
Union Bank Of Switzerland AG | | The Fund receives the total return on a portfolio of long and short positions and pays one month LIBOR plus a spread for long positions, with the exception of long positions denominated in ZAR which pays one day LIBOR plus a spread, or one day Federal Funds floating rate for short positions, which is denominated in various foreign currencies based on the local currencies of the positions within the portfolio. | | | 03/20/18 | | | | (10,942 | ) |
| | | | | | | | | | |
| | | | | | | | $ | (20,111 | ) |
| | | | | | | | | | |
| * | | See the accompanying “Additional Information — Total Return Basket Swap” for further details |
| ** | | This represents the value of the swap subsequent to reset. |
NOTES TO CONSOLIDATED SCHEDULE OF PORTFOLIO INVESTMENTS
| | |
| AUD | | — Australian Dollar |
| BRL | | — Brazilian Real |
| CAC | | — Continuous Assisted Quotation |
| CAD | | — Canadian Dollar |
| CBOT | | — Chicago Board of Trade |
| CHF | | — Swiss Franc |
| DAX | | — Deutscher Aktien Index |
| EUR | | — Euro |
| FTSE | | — Financial Times and the London Stock Exchange |
| GBP | | — British Pound |
| HKD | | — Hong Kong Dollar |
| HUF | | — Hungarian Forint |
| IBEX | | — Spanish Exchange Index |
| ILS | | — Israeli Shekel |
| JPY | | — Japanese Yen |
| LIBOR | | — London Interbank Offered Rate |
| LME | | — London Metal Exchange |
| MIB | | — Milan, Italian Stock Exchange |
| MXN | | — Mexican Peso |
| NOK | | — Norwegian Krone |
| NZD | | — New Zealand Dollar |
| PLN | | — Polish Zloty |
| RUB | | — Russian Ruble |
| SEK | | — Swedish Krona |
| SPI | | — Australian Securities Exchange |
| | |
| SUB | | — Step-Up Bond. The interest rate shown is the rate in effect as of April 30, 2017. |
| THB | | — Thai Baht |
| TOPIX | | — Tokyo Stock Price Index |
| TRY | | — New Turkish Lira |
| TWD | | — Taiwan Dollar |
| USD | | — United States Dollar |
| WTI | | — West Texas Intermediate |
| ZAR | | — South African Rand |
| (a) | | — Non-income producing security. |
| (b) | | — Investment in affiliate. Money market fund is registered under the Investment Company Act of 1940, as amended, and advised by J.P. Morgan Investment Management Inc. |
| (e) | | — Security is exempt from registration under Rule 144A of the Securities Act of 1933, as amended. Unless otherwise indicated, this security has been determined to be liquid under procedures established by the Board of Trustees and may be resold in transactions exempt from registration, normally to qualified institutional buyers. |
| (g) | | — Amount rounds to less than 0.05%. |
| (l) | | — The rate shown is the current yield as of April 30, 2017. |
| † | | — Non-deliverable forward. See Note 2.C.(2) in the notes to consolidated financial statements. |
| ^ | | — Represents positions held in the Subsidiary. |
| ^^ | | — A portion of the position is held by the Subsidiary. |
SEE NOTES TO CONSOLIDATED FINANCIAL STATEMENTS.
| | | | | | | | |
| | | |
| APRIL 30, 2017 | | J.P. MORGAN FUNDS | | | | | 15 | |
JPMorgan Systematic Alpha Fund
ADDITIONAL INFORMATION — TOTAL RETURN BASKET SWAPS
AS OF APRIL 30, 2017 (Unaudited)
| | | | | | | | | | | | | | | | |
TOTAL RETURN BASKET
SWAP POSITIONS | | SHARES | | | NOTIONAL
VALUE($) (1) | | | CURRENT
VALUE($) (2) | | | VALUE($) (3) | |
| Long Positions | |
| | |
| Common Stocks | | | | | | | |
Consumer Discretionary — 1.7% | | | | | | | | | | | | | | | | |
Auto Components — 0.1% | | | | | | | | | | | | | | | | |
TS Tech Co. Ltd. (Japan) | | | 21,300 | | | | 558,510 | | | | 559,544 | | | | 1,034 | |
| | | | | | | | | | | | | | | | |
Automobiles — 0.1% | | | | | | | | | | | | | | | | |
Peugeot SA (France) (a) | | | 12,121 | | | | 253,968 | | | | 254,124 | | | | 156 | |
| | | | | | | | | | | | | | | | |
Hotels, Restaurants & Leisure — 0.3% | | | | | | | | | | | | | | | | |
GVC Holdings plc (Isle of Man) | | | 65,562 | | | | 634,322 | | | | 634,322 | | | | — | |
Ladbrokes Coral Group plc (United Kingdom) | | | 95,534 | | | | 161,970 | | | | 161,970 | | | | — | |
William Hill plc (United Kingdom) | | | 40,526 | | | | 154,056 | | | | 153,976 | | | | (80 | ) |
| | | | | | | | | | | | | | | | |
| | | 201,622 | | | | 950,348 | | | | 950,268 | | | | (80 | ) |
| | | | | | | | | | | | | | | | |
Household Durables — 0.5% | | | | | | | | | | | | | | | | |
Barratt Developments plc (United Kingdom) | | | 98,276 | | | | 737,629 | | | | 737,425 | | | | (204 | ) |
Crest Nicholson Holdings plc (United Kingdom) | | | 85,380 | | | | 667,375 | | | | 667,842 | | | | 467 | |
Persimmon plc (United Kingdom) | | | 22,030 | | | | 664,825 | | | | 664,714 | | | | (111 | ) |
| | | | | | | | | | | | | | | | |
| | | 205,686 | | | | 2,069,829 | | | | 2,069,981 | | | | 152 | |
| | | | | | | | | | | | | | | | |
Media — 0.2% | | | | | | | | | | | | | | | | |
Informa plc (United Kingdom) | | | 14,593 | | | | 121,343 | | | | 121,336 | | | | (7 | ) |
Mediaset Espana Comunicacion SA (Spain) (a) | | | 46,403 | | | | 639,670 | | | | 639,274 | | | | (396 | ) |
| | | | | | | | | | | | | | | | |
| | | 60,996 | | | | 761,013 | | | | 760,610 | | | | (403 | ) |
| | | | | | | | | | | | | | | | |
Specialty Retail — 0.3% | | | | | | | | | | | | | | | | |
Kingfisher plc (United Kingdom) | | | 142,804 | | | | 631,267 | | | | 631,757 | | | | 490 | |
K’s Holdings Corp. (Japan) | | | 31,200 | | | | 600,350 | | | | 600,179 | | | | (171 | ) |
| | | | | | | | | | | | | | | | |
| | | 174,004 | | | | 1,231,617 | | | | 1,231,936 | | | | 319 | |
| | | | | | | | | | | | | | | | |
Textiles, Apparel & Luxury Goods — 0.2% | | | | | | | | | | | | | | | | |
Burberry Group plc (United Kingdom) | | | 30,456 | | | | 636,668 | | | | 636,478 | | | | (190 | ) |
| | | | | | | | | | | | | | | | |
Total Consumer Discretionary | | | 706,185 | | | | 6,461,953 | | | | 6,462,941 | | | | 988 | |
| | | | | | | | | | | | | | | | |
Consumer Staples — 0.5% | | | | | | | | | | | | | | | | |
Beverages — 0.3% | | | | | | | | | | | | | | | | |
Coca-Cola HBC AG (Switzerland) (a) | | | 23,671 | | | | 656,709 | | | | 656,706 | | | | (3 | ) |
Diageo plc (United Kingdom) | | | 20,171 | | | | 586,909 | | | | 587,121 | | | | 212 | |
| | | | | | | | | | | | | | | | |
| | | 43,842 | | | | 1,243,618 | | | | 1,243,827 | | | | 209 | |
| | | | | | | | | | | | | | | | |
Food & Staples Retailing — 0.2% | | | | | | | | | | | | | | | | |
FamilyMart UNY Holdings Co. Ltd. (Japan) | | | 9,400 | | | | 531,240 | | | | 531,353 | | | | 113 | |
| | | | | | | | | | | | | | | | |
Total Consumer Staples | | | 53,242 | | | | 1,774,858 | | | | 1,775,180 | | | | 322 | |
| | | | | | | | | | | | | | | | |
Energy — 0.1% | | | | | | | | | | | | | | | | |
Oil, Gas & Consumable Fuels — 0.1% | | | | | | | | | | | | | | | | |
Woodside Petroleum Ltd. (Australia) | | | 23,487 | | | | 565,952 | | | | 565,367 | | | | (585 | ) |
| | | | | | | | | | | | | | | | |
Financials — 0.2% | | | | | | | | | | | | | | | | |
Banks — 0.2% | | | | | | | | | | | | | | | | |
Resona Holdings, Inc. (Japan) | | | 103,200 | | | | 573,791 | | | | 573,708 | | | | (83 | ) |
| | | | | | | | | | | | | | | | |
Health Care — 0.5% | | | | | | | | | | | | | | | | |
Pharmaceuticals — 0.5% | | | | | | | | | | | | | | | | |
Astellas Pharma, Inc. (Japan) | | | 39,600 | | | | 521,487 | | | | 522,210 | | | | 723 | |
Hisamitsu Pharmaceutical Co., Inc. (Japan) | | | 1,800 | | | | 92,038 | | | | 92,149 | | | | 111 | |
Kaken Pharmaceutical Co. Ltd. (Japan) | | | 10,300 | | | | 610,747 | | | | 611,753 | | | | 1,006 | |
Recordati SpA (Italy) | | | 17,366 | | | | 643,360 | | | | 643,360 | | | | — | |
Roche Holding AG (Switzerland) | | | 488 | | | | 127,763 | | | | 127,845 | | | | 82 | |
| | | | | | | | | | | | | | | | |
Total Health Care | | | 69,554 | | | | 1,995,395 | | | | 1,997,317 | | | | 1,922 | |
| | | | | | | | | | | | | | | | |
SEE NOTES TO CONSOLIDATED FINANCIAL STATEMENTS.
| | | | | | |
| | | |
| 16 | | | | J.P. MORGAN FUNDS | | APRIL 30, 2017 |
| | | | | | | | | | | | | | | | |
TOTAL RETURN BASKET
SWAP POSITIONS | | SHARES | | | NOTIONAL
VALUE($) (1) | | | CURRENT
VALUE($) (2) | | | VALUE($) (3) | |
| Long Positions — continued | |
| | |
| Common Stocks — continued | | | | | | | |
Industrials — 0.7% | | | | | | | | | | | | | | | | |
Commercial Services & Supplies — 0.0% (g) | | | | | | | | | | | | | | | | |
Downer EDI Ltd. (Australia) | | | 29,181 | | | | 128,482 | | | | 128,231 | | | | (251 | ) |
| | | | | | | | | | | | | | | | |
Construction & Engineering — 0.0% (g) | | | | | | | | | | | | | | | | |
Tokyu Construction Co. Ltd. (Japan) | | | 14,300 | | | | 116,606 | | | | 116,636 | | | | 30 | |
| | | | | | | | | | | | | | | | |
Electrical Equipment — 0.2% | | | | | | | | | | | | | | | | |
Schneider Electric SE (France) | | | 7,462 | | | | 589,306 | | | | 591,033 | | | | 1,727 | |
| | | | | | | | | | | | | | | | |
Professional Services — 0.3% | | | | | | | | | | | | | | | | |
Experian plc (United Kingdom) | | | 28,390 | | | | 610,026 | | | | 610,748 | | | | 722 | |
RELX plc (United Kingdom) | | | 28,462 | | | | 577,290 | | | | 577,059 | | | | (231 | ) |
| | | | | | | | | | | | | | | | |
| | | 56,852 | | | | 1,187,316 | | | | 1,187,807 | | | | 491 | |
| | | | | | | | | | | | | | | | |
Trading Companies & Distributors — 0.2% | | | | | | | | | | | | | | | | |
Sumitomo Corp. (Japan) | | | 42,800 | | | | 571,499 | | | | 571,951 | | | | 452 | |
| | | | | | | | | | | | | | | | |
Total Industrials | | | 150,595 | | | | 2,593,209 | | | | 2,595,658 | | | | 2,449 | |
| | | | | | | | | | | | | | | | |
Information Technology — 0.4% | | | | | | | | | | | | | | | | |
Electronic Equipment, Instruments & Components — 0.2% | | | | | | | | | | | | | | | | |
Japan Aviation Electronics Industry Ltd. (Japan) | | | 13,000 | | | | 177,726 | | | | 177,819 | | | | 93 | |
Spectris plc (United Kingdom) | | | 17,632 | | | | 630,300 | | | | 630,300 | | | | — | |
| | | | | | | | | | | | | | | | |
| | | 30,632 | | | | 808,026 | | | | 808,119 | | | | 93 | |
| | | | | | | | | | | | | | | | |
Internet Software & Services — 0.2% | | | | | | | | | | | | | | | | |
Moneysupermarket.com Group plc (United Kingdom) | | | 139,074 | | | | 623,065 | | | | 623,021 | | | | (44 | ) |
| | | | | | | | | | | | | | | | |
Total Information Technology | | | 169,706 | | | | 1,431,091 | | | | 1,431,140 | | | | 49 | |
| | | | | | | | | | | | | | | | |
Materials — 0.9% | | | | | | | | | | | | | | | | |
Chemicals — 0.3% | | | | | | | | | | | | | | | | |
Covestro AG (Germany) (e) | | | 7,169 | | | | 558,826 | | | | 558,691 | | | | (135 | ) |
Mitsui Chemicals, Inc. (Japan) | | | 121,000 | | | | 618,704 | | | | 619,120 | | | | 416 | |
| | | | | | | | | | | | | | | | |
| | | 128,169 | | | | 1,177,530 | | | | 1,177,811 | | | | 281 | |
| | | | | | | | | | | | | | | | |
Metals & Mining — 0.6% | | | | | | | | | | | | | | | | |
Mitsui Mining & Smelting Co. Ltd. (Japan) | | | 173,000 | | | | 583,521 | | | | 583,727 | | | | 206 | |
Rio Tinto plc (United Kingdom) | | | 12,484 | | | | 495,103 | | | | 492,497 | | | | (2,606 | ) |
South32 Ltd. (Australia) | | | 270,484 | | | | 563,057 | | | | 560,523 | | | | (2,534 | ) |
Vedanta Resources plc (India) | | | 57,489 | | | | 514,889 | | | | 514,515 | | | | (374 | ) |
| | | | | | | | | | | | | | | | |
| | | 513,457 | | | | 2,156,570 | | | | 2,151,262 | | | | (5,308 | ) |
| | | | | | | | | | | | | | | | |
Total Materials | | | 641,626 | | | | 3,334,100 | | | | 3,329,073 | | | | (5,027 | ) |
| | | | | | | | | | | | | | | | |
Real Estate — 0.1% | | | | | | | | | | | | | | | | |
Real Estate Management & Development — 0.1% | | | | | | | | | | | | | | | | |
Swiss Prime Site AG (Registered) (Switzerland) (a) | | | 5,989 | | | | 519,147 | | | | 519,208 | | | | 61 | |
| | | | | | | | | | | | | | | | |
Telecommunication Services — 0.0% (g) | | | | | | | | | | | | | | | | |
Wireless Telecommunication Services — 0.0% (g) | | | | | | | | | | | | | | | | |
KDDI Corp. (Japan) | | | 4,700 | | | | 124,610 | | | | 124,616 | | | | 6 | |
| | | | | | | | | | | | | | | | |
Utilities — 0.6% | | | | | | | | | | | | | | | | |
Electric Utilities — 0.5% | | | | | | | | | | | | | | | | |
Enel SpA (Italy) | | | 117,863 | | | | 560,286 | | | | 560,343 | | | | 57 | |
Kansai Electric Power Co., Inc. (The) (Japan) | | | 51,100 | | | | 690,807 | | | | 690,574 | | | | (233 | ) |
SSE plc (United Kingdom) | | | 31,111 | | | | 560,503 | | | | 560,445 | | | | (58 | ) |
| | | | | | | | | | | | | | | | |
| | | 200,074 | | | | 1,811,596 | | | | 1,811,362 | | | | (234 | ) |
| | | | | | | | | | | | | | | | |
Multi-Utilities — 0.1% | | | | | | | | | | | | | | | | |
Centrica plc (United Kingdom) | | | 173,041 | | | | 443,539 | | | | 443,409 | | | | (130 | ) |
SEE NOTES TO CONSOLIDATED FINANCIAL STATEMENTS.
| | | | | | | | |
| | | |
| APRIL 30, 2017 | | J.P. MORGAN FUNDS | | | | | 17 | |
JPMorgan Systematic Alpha Fund
ADDITIONAL INFORMATION — TOTAL RETURN BASKET SWAPS
AS OF APRIL 30, 2017 (Unaudited) (continued)
| | | | | | | | | | | | | | | | |
TOTAL RETURN BASKET
SWAP POSITIONS | | SHARES | | | NOTIONAL
VALUE($) (1) | | | CURRENT
VALUE($) (2) | | | VALUE($) (3) | |
| Long Positions — continued | |
| | |
| Common Stocks — continued | | | | | | | |
Multi-Utilities — continued | | | | | | | | | | | | | | | | |
National Grid plc (United Kingdom) | | | 12,917 | | | | 167,301 | | | | 167,253 | | | | (48 | ) |
| | | | | | | | | | | | | | | | |
| | | 185,958 | | | | 610,840 | | | | 610,662 | | | | (178 | ) |
| | | | | | | | | | | | | | | | |
Total Utilities | | | 386,032 | | | | 2,422,436 | | | | 2,422,024 | | | | (412 | ) |
| | | | | | | | | | | | | | | | |
Total Long Positions of Total Return Basket Swap | | | 2,314,316 | | | | 21,796,542 | | | | 21,796,232 | | | | (310 | ) |
| | | | | | | | | | | | | | | | |
Short Positions | | | | | | | | | | | | | | | | |
| | | | |
Common Stocks | | | | | | | | | | | | | | | | |
Consumer Discretionary — 4.5% | | | | | | | | | | | | | | | | |
Auto Components — 0.1% | | | | | | | | | | | | | | | | |
Visteon Corp. (a) | | | 5,378 | | | | 553,665 | | | | 553,665 | | | | — | |
| | | | | | | | | | | | | | | | |
Distributors — 0.2% | | | | | | | | | | | | | | | | |
Core-Mark Holding Co., Inc. | | | 16,918 | | | | 592,468 | | | | 592,468 | | | | — | |
| | | | | | | | | | | | | | | | |
Hotels, Restaurants & Leisure — 1.0% | | | | | | | | | | | | | | | | |
Buffalo Wild Wings, Inc. (a) | | | 541 | | | | 85,235 | | | | 85,235 | | | | — | |
Chipotle Mexican Grill, Inc. (a) | | | 530 | | | | 251,469 | | | | 251,469 | | | | — | |
ClubCorp Holdings, Inc. | | | 9,617 | | | | 129,349 | | | | 129,349 | | | | — | |
Domino’s Pizza Enterprises Ltd. (Australia) | | | 2,544 | | | | 116,430 | | | | 116,337 | | | | 93 | |
Greene King plc (United Kingdom) | | | 59,551 | | | | 579,250 | | | | 579,523 | | | | (273 | ) |
Merlin Entertainments plc (United Kingdom) (e) | | | 22,032 | | | | 144,249 | | | | 144,206 | | | | 43 | |
MGM Resorts International | | | 18,714 | | | | 574,707 | | | | 574,707 | | | | — | |
NH Hotel Group SA (Spain) (a) | | | 22,734 | | | | 117,754 | | | | 117,583 | | | | 171 | |
Norwegian Cruise Line Holdings Ltd. (a) | | | 10,116 | | | | 545,556 | | | | 545,556 | | | | — | |
Red Robin Gourmet Burgers, Inc. (a) | | | 8,879 | | | | 521,641 | | | | 521,641 | | | | — | |
Resorttrust, Inc. (Japan) | | | 12,300 | | | | 211,629 | | | | 211,715 | | | | (86 | ) |
Star Entertainment Grp Ltd. (The) (Australia) | | | 112,513 | | | | 469,271 | | | | 468,643 | | | | 628 | |
Whitbread plc (United Kingdom) | | | 3,392 | | | | 177,270 | | | | 177,222 | | | | 48 | |
| | | | | | | | | | | | | | | | |
| | | 283,463 | | | | 3,923,810 | | | | 3,923,186 | | | | 624 | |
| | | | | | | | | | | | | | | | |
Household Durables — 0.3% | | | | | | | | | | | | | | | | |
Meritage Homes Corp. (a) | | | 13,710 | | | | 534,005 | | | | 534,005 | | | | — | |
TomTom NV (Netherlands) (a) | | | 54,672 | | | | 555,879 | | | | 555,862 | | | | 17 | |
| | | | | | | | | | | | | | | | |
| | | 68,382 | | | | 1,089,884 | | | | 1,089,867 | | | | 17 | |
| | | | | | | | | | | | | | | | |
Internet & Direct Marketing Retail — 0.3% | | | | | | | | | | | | | | | | |
Groupon, Inc. (a) | | | 134,862 | | | | 528,659 | | | | 528,659 | | | | — | |
Netflix, Inc. (a) | | | 3,534 | | | | 537,875 | | | | 537,875 | | | | — | |
Rakuten, Inc. (Japan) | | | 11,000 | | | | 112,590 | | | | 112,685 | | | | (95 | ) |
TripAdvisor, Inc. (a) | | | 6,025 | | | | 271,185 | | | | 271,185 | | | | — | |
| | | | | | | | | | | | | | | | |
| | | 155,421 | | | | 1,450,309 | | | | 1,450,404 | | | | (95 | ) |
| | | | | | | | | | | | | | | | |
Leisure Products — 0.3% | | | | | | | | | | | | | | | | |
Mattel, Inc. | | | 20,145 | | | | 451,651 | | | | 451,651 | | | | — | |
Polaris Industries, Inc. | | | 5,986 | | | | 510,366 | | | | 510,366 | | | | — | |
| | | | | | | | | | | | | | | | |
| | | 26,131 | | | | 962,017 | | | | 962,017 | | | | — | |
| | | | | | | | | | | | | | | | |
Media — 0.7% | | | | | | | | | | | | | | | | |
Axel Springer SE (Germany) | | | 9,651 | | | | 541,516 | | | | 541,491 | | | | 25 | |
Dentsu, Inc. (Japan) | | | 9,100 | | | | 512,653 | | | | 513,669 | | | | (1,016 | ) |
JCDecaux SA (France) | | | 17,085 | | | | 602,707 | | | | 603,093 | | | | (386 | ) |
Lions Gate Entertainment Corp., Class A | | | 19,640 | | | | 513,979 | | | | 513,979 | | | | — | |
REA Group Ltd. (Australia) | | | 12,198 | | | | 561,641 | | | | 560,186 | | | | 1,455 | |
| | | | | | | | | | | | | | | | |
| | | 67,674 | | | | 2,732,496 | | | | 2,732,418 | | | | 78 | |
| | | | | | | | | | | | | | | | |
SEE NOTES TO CONSOLIDATED FINANCIAL STATEMENTS.
| | | | | | |
| | | |
| 18 | | | | J.P. MORGAN FUNDS | | APRIL 30, 2017 |
| | | | | | | | | | | | | | | | |
TOTAL RETURN BASKET
SWAP POSITIONS | | SHARES | | | NOTIONAL
VALUE($) (1) | | | CURRENT
VALUE($) (2) | | | VALUE($) (3) | |
| Short Positions — continued | |
| | |
| Common Stocks — continued | | | | | | | |
Multiline Retail — 0.5% | | | | | | | | | | | | | | | | |
B&M European Value Retail SA (Luxembourg) | | | 40,082 | | | | 174,951 | | | | 174,916 | | | | 35 | |
Dollar Tree, Inc. (a) | | | 6,242 | | | | 516,650 | | | | 516,650 | | | | — | |
Don Quijote Holdings Co. Ltd. (Japan) | | | 14,200 | | | | 517,811 | | | | 517,362 | | | | 449 | |
Marui Group Co. Ltd. (Japan) | | | 31,800 | | | | 435,316 | | | | 435,512 | | | | (196 | ) |
Next plc (United Kingdom) | | | 4,273 | | | | 238,256 | | | | 238,193 | | | | 63 | |
| | | | | | | | | | | | | | | | |
| | | 96,597 | | | | 1,882,984 | | | | 1,882,633 | | | | 351 | |
| | | | | | | | | | | | | | | | |
Specialty Retail — 0.6% | | | | | | | | | | | | | | | | |
CarMax, Inc. (a) | | | 7,405 | | | | 433,193 | | | | 433,193 | | | | — | |
Fast Retailing Co. Ltd. (Japan) | | | 1,500 | | | | 489,257 | | | | 489,927 | | | | (670 | ) |
L Brands, Inc. | | | 11,144 | | | | 588,515 | | | | 588,515 | | | | — | |
Murphy USA, Inc. (a) | | | 7,434 | | | | 517,183 | | | | 517,183 | | | | — | |
RH (a) | | | 6,033 | | | | 289,403 | | | | 289,403 | | | | — | |
| | | | | | | | | | | | | | | | |
| | | 33,516 | | | | 2,317,551 | | | | 2,318,221 | | | | (670 | ) |
| | | | | | | | | | | | | | | | |
Textiles, Apparel & Luxury Goods — 0.5% | | | | | | | | | | | | | | | | |
G-III Apparel Group Ltd. (a) | | | 9,655 | | | | 228,823 | | | | 228,823 | | | | — | |
Hanesbrands, Inc. | | | 21,944 | | | | 478,599 | | | | 478,599 | | | | — | |
NIKE, Inc., Class B | | | 9,345 | | | | 517,806 | | | | 517,806 | | | | — | |
Skechers U.S.A., Inc., Class A (a) | | | 21,214 | | | | 535,654 | | | | 535,654 | | | | — | |
| | | | | | | | | | | | | | | | |
| | | 62,158 | | | | 1,760,882 | | | | 1,760,882 | | | | — | |
| | | | | | | | | | | | | | | | |
Total Consumer Discretionary | | | 815,638 | | | | 17,266,066 | | | | 17,265,761 | | | | 305 | |
| | | | | | | | | | | | | | | | |
Consumer Staples — 2.9% | | | | | | | | | | | | | | | | |
Beverages — 0.8% | | | | | | | | | | | | | | | | |
Anheuser-Busch InBev SA/NV (Belgium) | | | 1,344 | | | | 151,379 | | | | 151,563 | | | | (184 | ) |
Britvic plc (United Kingdom) | | | 69,183 | | | | 595,879 | | | | 595,236 | | | | 643 | |
Brown-Forman Corp., Class B | | | 2,314 | | | | 109,498 | | | | 109,498 | | | | — | |
Coca-Cola Bottling Co. Consolidated | | | 2,794 | | | | 591,937 | | | | 591,937 | | | | — | |
Heineken NV (Netherlands) | | | 6,080 | | | | 542,088 | | | | 542,295 | | | | (207 | ) |
Remy Cointreau SA (France) | | | 5,514 | | | | 556,313 | | �� | | 556,235 | | | | 78 | |
Suntory Beverage & Food Ltd. (Japan) | | | 10,200 | | | | 456,129 | | | | 459,555 | | | | (3,426 | ) |
| | | | | | | | | | | | | | | | |
| | | 97,429 | | | | 3,003,223 | | | | 3,006,319 | | | | (3,096 | ) |
| | | | | | | | | | | | | | | | |
Food & Staples Retailing — 0.5% | | | | | | | | | | | | | | | | |
Aeon Co. Ltd. (Japan) | | | 34,000 | | | | 504,319 | | | | 503,910 | | | | 409 | |
Carrefour SA (France) | | | 20,059 | | | | 472,512 | | | | 472,415 | | | | 97 | |
Casey’s General Stores, Inc. | | | 3,866 | | | | 433,263 | | | | 433,263 | | | | — | |
Sugi Holdings Co. Ltd. (Japan) | | | 9,400 | | | | 466,311 | | | | 465,822 | | | | 489 | |
Woolworths Ltd. (Australia) | | | 151 | | | | 3,039 | | | | 3,035 | | | | 4 | |
| | | | | | | | | | | | | | | | |
| | | 67,476 | | | | 1,879,444 | | | | 1,878,445 | | | | 999 | |
| | | | | | | | | | | | | | | | |
Food Products — 0.9% | | | | | | | | | | | | | | | | |
Associated British Foods plc (United Kingdom) | | | 15,078 | | | | 548,766 | | | | 548,976 | | | | (210 | ) |
Calbee, Inc. (Japan) | | | 3,300 | | | | 115,156 | | | | 115,373 | | | | (217 | ) |
Chocoladefabriken Lindt & Spruengli AG (Registered) (Switzerland) | | | 8 | | | | 531,538 | | | | 531,853 | | | | (315 | ) |
Ezaki Glico Co. Ltd. (Japan) | | | 10,300 | | | | 542,373 | | | | 542,787 | | | | (414 | ) |
Kewpie Corp. (Japan) | | | 5,200 | | | | 132,198 | | | | 132,315 | | | | (117 | ) |
Nissin Foods Holdings Co. Ltd. (Japan) | | | 8,400 | | | | 480,753 | | | | 481,001 | | | | (248 | ) |
Pilgrim’s Pride Corp. | | | 24,214 | | | | 628,595 | | | | 628,595 | | | | — | |
Viscofan SA (Spain) | | | 10,122 | | | | 605,763 | | | | 605,010 | | | | 753 | |
| | | | | | | | | | | | | | | | |
| | | 76,622 | | | | 3,585,142 | | | | 3,585,910 | | | | (768 | ) |
| | | | | | | | | | | | | | | | |
SEE NOTES TO CONSOLIDATED FINANCIAL STATEMENTS.
| | | | | | | | |
| | | |
| APRIL 30, 2017 | | J.P. MORGAN FUNDS | | | | | 19 | |
JPMorgan Systematic Alpha Fund
ADDITIONAL INFORMATION — TOTAL RETURN BASKET SWAPS
AS OF APRIL 30, 2017 (Unaudited) (continued)
| | | | | | | | | | | | | | | | |
TOTAL RETURN BASKET
SWAP POSITIONS | | SHARES | | | NOTIONAL
VALUE($) (1) | | | CURRENT
VALUE($) (2) | | | VALUE($) (3) | |
| Short Positions — continued | |
| | |
| Common Stocks — continued | | | | | | | |
Household Products — 0.1% | | | | | | | | | | | | | | | | |
Clorox Co. (The) | | | 3,785 | | | | 506,017 | | | | 506,017 | | | | — | |
| | | | | | | | | | | | | | | | |
Personal Products — 0.6% | | | | | | | | | | | | | | | | |
Avon Products, Inc. (a) | | | 116,860 | | | | 566,771 | | | | 566,771 | | | | — | |
Coty, Inc., Class A | | | 29,339 | | | | 523,701 | | | | 523,701 | | | | — | |
Edgewell Personal Care Co. (a) | | | 1,349 | | | | 96,440 | | | | 96,440 | | | | — | |
elf Beauty, Inc. (a) | | | 17,107 | | | | 466,166 | | | | 466,166 | | | | — | |
Shiseido Co. Ltd. (Japan) | | | 19,300 | | | | 522,169 | | | | 522,848 | | | | (679 | ) |
| | | | | | | | | | | | | | | | |
| | | 183,955 | | | | 2,175,247 | | | | 2,175,926 | | | | (679 | ) |
| | | | | | | | | | | | | | | | |
Total Consumer Staples | | | 429,267 | | | | 11,149,073 | | | | 11,152,617 | | | | (3,544 | ) |
| | | | | | | | | | | | | | | | |
Energy — 1.9% | | | | | | | | | | | | | | | | |
Energy Equipment & Services — 0.3% | | | | | | | | | | | | | | | | |
Precision Drilling Corp. (Canada) (a) | | | 112,037 | | | | 445,669 | | | | 445,669 | | | | — | |
Vallourec SA (France) (a) | | | 70,796 | | | | 453,609 | | | | 452,843 | | | | 766 | |
| | | | | | | | | | | | | | | | |
| | | 182,833 | | | | 899,278 | | | | 898,512 | | | | 766 | |
| | | | | | | | | | | | | | | | |
Oil, Gas & Consumable Fuels — 1.6% | | | | | | | | | | | | | | | | |
Antero Resources Corp. (a) | | | 20,135 | | | | 426,661 | | | | 426,661 | | | | — | |
Carrizo Oil & Gas, Inc. (a) | | | 18,316 | | | | 460,647 | | | | 460,647 | | | | — | |
Chesapeake Energy Corp. (a) | | | 74,752 | | | | 393,196 | | | | 393,196 | | | | — | |
EQT Corp. | | | 2,062 | | | | 119,885 | | | | 119,885 | | | | — | |
Extraction Oil & Gas, Inc. (a) | | | 28,141 | | | | 440,407 | | | | 440,407 | | | | — | |
Gulfport Energy Corp. (a) | | | 14,952 | | | | 237,438 | | | | 237,438 | | | | — | |
Hess Corp. | | | 11,086 | | | | 541,329 | | | | 541,329 | | | | — | |
Inpex Corp. (Japan) | | | 50,400 | | | | 483,088 | | | | 482,953 | | | | 135 | |
Matador Resources Co. (a) | | | 22,312 | | | | 483,724 | | | | 483,724 | | | | — | |
MEG Energy Corp. (Canada) (a) | | | 18,346 | | | | 83,058 | | | | 83,058 | | | | — | |
Oasis Petroleum, Inc. (a) | | | 30,575 | | | | 365,066 | | | | 365,066 | | | | — | |
Occidental Petroleum Corp. | | | 8,204 | | | | 504,874 | | | | 504,874 | | | | — | |
Parsley Energy, Inc., Class A (a) | | | 16,126 | | | | 480,394 | | | | 480,394 | | | | — | |
PDC Energy, Inc. (a) | | | 1,803 | | | | 99,580 | | | | 99,580 | | | | — | |
QEP Resources, Inc. (a) | | | 40,912 | | | | 483,171 | | | | 483,171 | | | | — | |
Rice Energy, Inc. (a) | | | 7,175 | | | | 152,756 | | | | 152,756 | | | | — | |
Seven Generations Energy Ltd. (Canada), Class A (a) | | | 6,006 | | | | 106,344 | | | | 106,344 | | | | — | |
SM Energy Co. | | | 10,395 | | | | 234,823 | | | | 234,823 | | | | — | |
Tullow Oil plc (United Kingdom) (a) | | | 44,937 | | | | 122,166 | | | | 121,914 | | | | 252 | |
| | | | | | | | | | | | | | | | |
| | | 426,635 | | | | 6,218,607 | | | | 6,218,220 | | | | 387 | |
| | | | | | | | | | | | | | | | |
Total Energy | | | 609,468 | | | | 7,117,885 | | | | 7,116,732 | | | | 1,153 | |
| | | | | | | | | | | | | | | | |
Financials — 1.6% | | | | | | | | | | | | | | | | |
Banks — 0.4% | | | | | | | | | | | | | | | | |
Banco de Sabadell SA (Spain) | | | 295,041 | | | | 567,572 | | | | 567,483 | | | | 89 | |
Royal Bank of Scotland Group plc (United Kingdom) (a) | | | 57,533 | | | | 197,767 | | | | 197,522 | | | | 245 | |
Seven Bank Ltd. (Japan) | | | 30,600 | | | | 102,663 | | | | 102,775 | | | | (112 | ) |
UniCredit SpA (Italy) (a) | | | 34,394 | | | | 559,733 | | | | 560,020 | | | | (287 | ) |
| | | | | | | | | | | | | | | | |
| | | 417,568 | | | | 1,427,735 | | | | 1,427,800 | | | | (65 | ) |
| | | | | | | | | | | | | | | | |
Capital Markets — 0.8% | | | | | | | | | | | | | | | | |
Azimut Holding SpA (Italy) | | | 24,604 | | | | 480,276 | | | | 479,944 | | | | 332 | |
Deutsche Bank AG (Registered) (Germany) (a) | | | 30,899 | | | | 556,371 | | | | 555,589 | | | | 782 | |
Hargreaves Lansdown plc (United Kingdom) | | | 31,737 | | | | 566,438 | | | | 566,600 | | | | (162 | ) |
Interactive Brokers Group, Inc., Class A | | | 12,548 | | | | 437,047 | | | | 437,047 | | | | — | |
London Stock Exchange Group plc (United Kingdom) | | | 12,963 | | | | 567,995 | | | | 567,993 | | | | 2 | |
SEE NOTES TO CONSOLIDATED FINANCIAL STATEMENTS.
| | | | | | |
| | | |
| 20 | | | | J.P. MORGAN FUNDS | | APRIL 30, 2017 |
| | | | | | | | | | | | | | | | |
TOTAL RETURN BASKET
SWAP POSITIONS | | SHARES | | | NOTIONAL
VALUE($) (1) | | | CURRENT
VALUE($) (2) | | | VALUE($) (3) | |
| Short Positions — continued | |
| | |
| Common Stocks — continued | | | | | | | |
Capital Markets — continued | | | | | | | | | | | | | | | | |
NEX Group plc (United Kingdom) | | | 40,808 | | | | 325,320 | | | | 325,320 | | | | — | |
TP ICAP plc (United Kingdom) | | | 33,350 | | | | 197,876 | | | | 197,876 | | | | — | |
| | | | | | | | | | | | | | | | |
| | | 186,909 | | | | 3,131,323 | | | | 3,130,369 | | | | 954 | |
| | | | | | | | | | | | | | | | |
Consumer Finance — 0.1% | | | | | | | | | | | | | | | | |
Aiful Corp. (Japan) (a) | | | 29,400 | | | | 88,616 | | | | 88,661 | | | | (45 | ) |
LendingClub Corp. (a) | | | 44,112 | | | | 258,055 | | | | 258,055 | | | | — | |
| | | | | | | | | | | | | | | | |
| | | 73,512 | | | | 346,671 | | | | 346,716 | | | | (45 | ) |
| | | | | | | | | | | | | | | | |
Diversified Financial Services — 0.0% (g) | | | | | | | | | | | | | | | | |
Element Fleet Management Corp. (Canada) | | | 12,446 | | | | 109,320 | | | | 109,320 | | | | — | |
| | | | | | | | | | | | | | | | |
Insurance — 0.3% | | | | | | | | | | | | | | | | |
Markel Corp. (a) | | | 525 | | | | 509,040 | | | | 509,040 | | | | — | |
Sony Financial Holdings, Inc. (Japan) | | | 27,900 | | | | 463,519 | | | | 464,053 | | | | (534 | ) |
| | | | | | | | | | | | | | | | |
| | | 28,425 | | | | 972,559 | | | | 973,093 | | | | (534 | ) |
| | | | | | | | | | | | | | | | |
Thrifts & Mortgage Finance — 0.0% (g) | | | | | | | | | | | | | | | | |
PHH Corp. (a) | | | 9,038 | | | | 116,590 | | | | 116,590 | | | | — | |
| | | | | | | | | | | | | | | | |
Total Financials | | | 727,898 | | | | 6,104,198 | | | | 6,103,888 | | | | 310 | |
| | | | | | | | | | | | | | | | |
Health Care — 1.6% | | | | | | | | | | | | | | | | |
Health Care Equipment & Supplies — 0.5% | | | | | | | | | | | | | | | | |
DexCom, Inc. (a) | | | 3,359 | | | | 261,868 | | | | 261,868 | | | | — | |
Glaukos Corp. (a) | | | 10,932 | | | | 519,598 | | | | 519,598 | | | | — | |
Insulet Corp. (a) | | | 2,940 | | | | 127,625 | | | | 127,625 | | | | — | |
Penumbra, Inc. (a) | | | 6,865 | | | | 586,614 | | | | 586,614 | | | | — | |
Spectranetics Corp. (The) (a) | | | 19,997 | | | | 571,914 | | | | 571,914 | | | | — | |
| | | | | | | | | | | | | | | | |
| | | 44,093 | | | | 2,067,619 | | | | 2,067,619 | | | | — | |
| | | | | | | | | | | | | | | | |
Health Care Providers & Services — 0.4% | | | | | | | | | | | | | | | | |
Acadia Healthcare Co., Inc. (a) | | | 12,297 | | | | 535,903 | | | | 535,903 | | | | — | |
Diplomat Pharmacy, Inc. (a) | | | 24,203 | | | | 377,567 | | | | 377,567 | | | | — | |
Healthscope Ltd. (Australia) | | | 66,279 | | | | 109,682 | | | | 109,463 | | | | 219 | |
Tenet Healthcare Corp. (a) | | | 29,702 | | | | 465,430 | | | | 465,430 | | | | — | |
| | | | | | | | | | | | | | | | |
| | | 132,481 | | | | 1,488,582 | | | | 1,488,363 | | | | 219 | |
| | | | | | | | | | | | | | | | |
Health Care Technology — 0.1% | | | | | | | | | | | | | | | | |
athenahealth, Inc. (a) | | | 4,468 | | | | 437,909 | | | | 437,909 | | | | — | |
| | | | | | | | | | | | | | | | |
Life Sciences Tools & Services — 0.2% | | | | | | | | | | | | | | | | |
Eurofins Scientific SE (Luxembourg) | | | 1,140 | | | | 561,419 | | | | 561,481 | | | | (62 | ) |
| | | | | | | | | | | | | | | | |
Pharmaceuticals — 0.4% | | | | | | | | | | | | | | | | |
Dermira, Inc. (a) | | | 14,168 | | | | 482,562 | | | | 482,562 | | | | — | |
Medicines Co. (The) (a) | | | 2,953 | | | | 145,642 | | | | 145,642 | | | | — | |
Nektar Therapeutics (a) | | | 11,687 | | | | 221,702 | | | | 221,702 | | | | — | |
Ono Pharmaceutical Co. Ltd. (Japan) | | | 24,900 | | | | 513,077 | | | | 513,606 | | | | (529 | ) |
Pacira Pharmaceuticals, Inc. (a) | | | 2,240 | | | | 108,752 | | | | 108,752 | | | | — | |
TherapeuticsMD, Inc. (a) | | | 15,875 | | | | 80,963 | | | | 80,963 | | | | — | |
| | | | | | | | | | | | | | | | |
| | | 71,823 | | | | 1,552,698 | | | | 1,553,227 | | | | (529 | ) |
| | | | | | | | | | | | | | | | |
Total Health Care | | | 254,005 | | | | 6,108,227 | | | | 6,108,599 | | | | (372 | ) |
| | | | | | | | | | | | | | | | |
Industrials ��� 5.9% | | | | | | | | | | | | | | | | |
Aerospace & Defense — 0.6% | | | | | | | | | | | | | | | | |
Bombardier, Inc. (Canada), Class B (a) | | | 67,162 | | | | 103,814 | | | | 103,814 | | | | — | |
Cobham plc (United Kingdom) | | | 257,682 | | | | 442,218 | | | | 442,218 | | | | — | |
Cubic Corp. | | | 9,581 | | | | 497,254 | | | | 497,254 | | | | — | |
Mercury Systems, Inc. (a) | | | 14,591 | | | | 545,412 | | | | 545,412 | | | | — | |
SEE NOTES TO CONSOLIDATED FINANCIAL STATEMENTS.
| | | | | | | | |
| | | |
| APRIL 30, 2017 | | J.P. MORGAN FUNDS | | | | | 21 | |
JPMorgan Systematic Alpha Fund
ADDITIONAL INFORMATION — TOTAL RETURN BASKET SWAPS
AS OF APRIL 30, 2017 (Unaudited) (continued)
| | | | | | | | | | | | | | | | |
TOTAL RETURN BASKET
SWAP POSITIONS | | SHARES | | | NOTIONAL
VALUE($) (1) | | | CURRENT
VALUE($) (2) | | | VALUE($) (3) | |
| Short Positions — continued | |
| | |
| Common Stocks — continued | | | | | | | |
Aerospace & Defense — continued | | | | | | | | | | | | | | | | |
Rolls-Royce Holdings plc (United Kingdom) (a) | | | 17,060 | | | | 179,420 | | | | 179,326 | | | | 94 | |
Rolls-Royce Holdings plc (United Kingdom), Class C (a) | | | 1,211,260 | | | | 1,569 | | | | 1,569 | | | | — | |
TransDigm Group, Inc. | | | 1,968 | | | | 485,565 | | | | 485,565 | | | | — | |
| | | | | | | | | | | | | | | | |
| | | 1,579,304 | | | | 2,255,252 | | | | 2,255,158 | | | | 94 | |
| | | | | | | | | | | | | | | | |
Air Freight & Logistics — 0.2% | | | | | | | | | | | | | | | | |
Bollore SA (France) | | | 124,926 | | | | 508,266 | | | | 508,315 | | | | (49 | ) |
Yamato Holdings Co. Ltd. (Japan) | | | 5,000 | | | | 108,029 | | | | 108,045 | | | | (16 | ) |
| | | | | | | | | | | | | | | | |
| | | 129,926 | | | | 616,295 | | | | 616,360 | | | | (65 | ) |
| | | | | | | | | | | | | | | | |
Airlines — 0.3% | | | | | | | | | | | | | | | | |
American Airlines Group, Inc. | | | 12,333 | | | | 525,632 | | | | 525,632 | | | | — | |
easyJet plc (United Kingdom) | | | 41,817 | | | | 632,605 | | | | 632,539 | | | | 66 | |
| | | | | | | | | | | | | | | | |
| | | 54,150 | | | | 1,158,237 | | | | 1,158,171 | | | | 66 | |
| | | | | | | | | | | | | | | | |
Building Products — 0.1% | | | | | | | | | | | | | | | | |
Armstrong World Industries, Inc. (a) | | | 2,543 | | | | 118,885 | | | | 118,885 | | | | — | |
Nippon Sheet Glass Co. Ltd. (Japan) (a) | | | 14,600 | | | | 113,552 | | | | 113,590 | | | | (38 | ) |
| | | | | | | | | | | | | | | | |
| | | 17,143 | | | | 232,437 | | | | 232,475 | | | | (38 | ) |
| | | | | | | | | | | | | | | | |
Commercial Services & Supplies — 0.8% | | | | | | | | | | | | | | | | |
Brambles Ltd. (Australia) | | | 19,648 | | | | 152,126 | | | | 152,038 | | | | 88 | |
Clean Harbors, Inc. (a) | | | 9,361 | | | | 543,968 | | | | 543,968 | | | | — | |
Healthcare Services Group, Inc. | | | 12,176 | | | | 559,000 | | | | 559,000 | | | | — | |
Serco Group plc (United Kingdom) (a) | | | 361,096 | | | | 540,651 | | | | 540,370 | | | | 281 | |
Sohgo Security Services Co. Ltd. (Japan) | | | 12,600 | | | | 549,890 | | | | 550,094 | | | | (204 | ) |
Stericycle, Inc. (a) | | | 2,690 | | | | 229,565 | | | | 229,565 | | | | — | |
Team, Inc. (a) | | | 19,273 | | | | 518,444 | | | | 518,444 | | | | — | |
| | | | | | | | | | | | | | | | |
| | | 436,844 | | | | 3,093,644 | | | | 3,093,479 | | | | 165 | |
| | | | | | | | | | | | | | | | |
Construction & Engineering — 0.4% | | | | | | | | | | | | | | | | |
Ferrovial SA (Spain) | | | 26,562 | | | | 565,224 | | | | 565,042 | | | | 182 | |
Primoris Services Corp. | | | 21,450 | | | | 492,707 | | | | 492,707 | | | | — | |
SNC-Lavalin Group, Inc. (Canada) | | | 13,259 | | | | 533,255 | | | | 533,255 | | | | — | |
| | | | | | | | | | | | | | | | |
| | | 61,271 | | | | 1,591,186 | | | | 1,591,004 | | | | 182 | |
| | | | | | | | | | | | | | | | |
Electrical Equipment — 0.4% | | | | | | | | | | | | | | | | |
Acuity Brands, Inc. | | | 2,341 | | | | 412,250 | | | | 412,250 | | | | — | |
Melrose Industries plc (United Kingdom) | | | 184,959 | | | �� | 566,557 | | | | 566,557 | | | | — | |
OSRAM Licht AG (Germany) | | | 8,207 | | | | 549,713 | | | | 549,782 | | | | (69 | ) |
| | | | | | | | | | | | | | | | |
| | | 195,507 | | | | 1,528,520 | | | | 1,528,589 | | | | (69 | ) |
| | | | | | | | | | | | | | | | |
Industrial Conglomerates — 0.1% | | | | | | | | | | | | | | | | |
Roper Technologies, Inc. | | | 2,456 | | | | 537,127 | | | | 537,127 | | | | — | |
| | | | | | | | | | | | | | | | |
Machinery — 0.9% | | | | | | | | | | | | | | | | |
CIRCOR International, Inc. | | | 7,608 | | | | 507,530 | | | | 507,530 | | | | — | |
EnPro Industries, Inc. | | | 7,334 | | | | 518,147 | | | | 518,147 | | | | — | |
FANUC Corp. (Japan) | | | 2,700 | | | | 548,719 | | | | 549,709 | | | | (990 | ) |
GEA Group AG (Germany) | | | 11,666 | | | | 496,112 | | | | 495,950 | | | | 162 | |
Kone OYJ (Finland), Class B | | | 11,702 | | | | 536,138 | | | | 535,628 | | | | 510 | |
Proto Labs, Inc. (a) | | | 4,716 | | | | 273,528 | | | | 273,528 | | | | — | |
WELBILT, Inc. (a) | | | 27,029 | | | | 554,095 | | | | 554,095 | | | | — | |
| | | | | | | | | | | | | | | | |
| | | 72,755 | | | | 3,434,269 | | | | 3,434,587 | | | | (318 | ) |
| | | | | | | | | | | | | | | | |
Marine — 0.1% | | | | | | | | | | | | | | | | |
Matson, Inc. | | | 15,200 | | | | 481,840 | | | | 481,840 | | | | — | |
SEE NOTES TO CONSOLIDATED FINANCIAL STATEMENTS.
| | | | | | |
| | | |
| 22 | | | | J.P. MORGAN FUNDS | | APRIL 30, 2017 |
| | | | | | | | | | | | | | | | |
TOTAL RETURN BASKET
SWAP POSITIONS | | SHARES | | | NOTIONAL
VALUE($) (1) | | | CURRENT
VALUE($) (2) | | | VALUE($) (3) | |
| Short Positions — continued | |
| | |
| Common Stocks — continued | | | | | | | |
Professional Services — 0.6% | | | | | | | | | | | | | | | | |
Advisory Board Co. (The) (a) | | | 10,377 | | | | 530,265 | | | | 530,265 | | | | — | |
Bureau Veritas SA (France) | | | 24,548 | | | | 568,629 | | | | 568,786 | | | | (157 | ) |
Capita plc (United Kingdom) | | | 76,742 | | | | 552,643 | | | | 553,135 | | | | (492 | ) |
SGS SA (Registered) (Switzerland) | | | 243 | | | | 546,811 | | | | 547,190 | | | | (379 | ) |
| | | | | | | | | | | | | | | | |
| | | 111,910 | | | | 2,198,348 | | | | 2,199,376 | | | | (1,028 | ) |
| | | | | | | | | | | | | | | | |
Road & Rail — 0.7% | | | | | | | | | | | | | | | | |
AMERCO | | | 1,373 | | | | 514,134 | | | | 514,134 | | | | — | |
Avis Budget Group, Inc. (a) | | | 18,246 | | | | 556,503 | | | | 556,503 | | | | — | |
Hertz Global Holdings, Inc. (a) | | | 20,862 | | | | 344,014 | | | | 344,014 | | | | — | |
Keio Corp. (Japan) | | | 14,000 | | | | 112,025 | | | | 112,118 | | | | (93 | ) |
Kintetsu Group Holdings Co. Ltd. (Japan) | | | 128,000 | | | | 467,333 | | | | 467,429 | | | | (96 | ) |
Odakyu Electric Railway Co. Ltd. (Japan) | | | 6,400 | | | | 124,125 | | | | 124,242 | | | | (117 | ) |
Werner Enterprises, Inc. | | | 16,442 | | | | 448,867 | | | | 448,867 | | | | — | |
| | | | | | | | | | | | | | | | |
| | | 205,323 | | | | 2,567,001 | | | | 2,567,307 | | | | (306 | ) |
| | | | | | | | | | | | | | | | |
Trading Companies & Distributors — 0.5% | | | | | | | | | | | | | | | | |
Beacon Roofing Supply, Inc. (a) | | | 10,591 | | | | 524,996 | | | | 524,996 | | | | — | |
GMS, Inc. (a) | | | 11,400 | | | | 412,224 | | | | 412,224 | | | | — | |
Herc Holdings, Inc. (a) | | | 10,213 | | | | 464,385 | | | | 464,385 | | | | — | |
MISUMI Group, Inc. (Japan) | | | 5,800 | | | | 109,835 | | | | 109,881 | | | | (46 | ) |
SiteOne Landscape Supply, Inc. (a) | | | 10,742 | | | | 513,575 | | | | 513,575 | | | | — | |
| | | | | | | | | | | | | | | | |
| | | 48,746 | | | | 2,025,015 | | | | 2,025,061 | | | | (46 | ) |
| | | | | | | | | | | | | | | | |
Transportation Infrastructure — 0.2% | | | | | | | | | | | | | | | | |
Aeroports de Paris (France) | | | 4,544 | | | | 606,100 | | | | 606,100 | | | | — | |
Groupe Eurotunnel SE (Registered) (France) | | | 12,351 | | | | 135,683 | | | | 135,685 | | | | (2 | ) |
Mitsubishi Logistics Corp. (Japan) | | | 9,000 | | | | 116,260 | | | | 116,438 | | | | (178 | ) |
| | | | | | | | | | | | | | | | |
| | | 25,895 | | | | 858,043 | | | | 858,223 | | | | (180 | ) |
| | | | | | | | | | | | | | | | |
Total Industrials | | | 2,956,430 | | | | 22,577,214 | | | | 22,578,757 | | | | (1,543 | ) |
| | | | | | | | | | | | | | | | |
Information Technology — 3.9% | | | | | | | | | | | | | | | | |
Communications Equipment — 0.4% | | | | | | | | | | | | | | | | |
EchoStar Corp., Class A (a) | | | 8,818 | | | | 507,564 | | | | 507,564 | | | | — | |
Infinera Corp. (a) | | | 51,166 | | | | 507,567 | | | | 507,567 | | | | — | |
Nokia OYJ (Finland) | | | 47,570 | | | | 272,044 | | | | 271,950 | | | | 94 | |
ViaSat, Inc. (a) | | | 3,525 | | | | 225,706 | | | | 225,706 | | | | — | |
| | | | | | | | | | | | | | | | |
| | | 111,079 | | | | 1,512,881 | | | | 1,512,787 | | | | 94 | |
| | | | | | | | | | | | | | | | |
Internet Software & Services — 1.2% | | | | | | | | | | | | | | | | |
2U, Inc. (a) | | | 4,775 | | | | 216,785 | | | | 216,785 | | | | — | |
Benefitfocus, Inc. (a) | | | 9,038 | | | | 284,697 | | | | 284,697 | | | | — | |
Box, Inc., Class A (a) | | | 31,534 | | | | 543,646 | | | | 543,646 | | | | — | |
Cornerstone OnDemand, Inc. (a) | | | 13,557 | | | | 532,519 | | | | 532,519 | | | | — | |
CoStar Group, Inc. (a) | | | 791 | | | | 190,544 | | | | 190,544 | | | | — | |
GMO internet, Inc. (Japan) | | | 12,600 | | | | 149,537 | | | | 149,560 | | | | (23 | ) |
New Relic, Inc. (a) | | | 4,121 | | | | 164,758 | | | | 164,758 | | | | — | |
Pandora Media, Inc. (a) | | | 13,434 | | | | 145,759 | | | | 145,759 | | | | — | |
Q2 Holdings, Inc. (a) | | | 14,697 | | | | 560,691 | | | | 560,691 | | | | — | |
Quotient Technology, Inc. (a) | | | 55,095 | | | | 600,536 | | | | 600,536 | | | | — | |
Stamps.com, Inc. (a) | | | 3,851 | | | | 408,784 | | | | 408,784 | | | | — | |
WebMD Health Corp. (a) | | | 5,939 | | | | 322,072 | | | | 322,072 | | | | — | |
Zillow Group, Inc., Class C (a) | | | 15,341 | | | | 598,299 | | | | 598,299 | | | | — | |
| | | | | | | | | | | | | | | | |
| | | 184,773 | | | | 4,718,627 | | | | 4,718,650 | | | | (23 | ) |
| | | | | | | | | | | | | | | | |
SEE NOTES TO CONSOLIDATED FINANCIAL STATEMENTS.
| | | | | | | | |
| | | |
| APRIL 30, 2017 | | J.P. MORGAN FUNDS | | | | | 23 | |
JPMorgan Systematic Alpha Fund
ADDITIONAL INFORMATION — TOTAL RETURN BASKET SWAPS
AS OF APRIL 30, 2017 (Unaudited) (continued)
| | | | | | | | | | | | | | | | |
TOTAL RETURN BASKET
SWAP POSITIONS | | SHARES | | | NOTIONAL
VALUE($) (1) | | | CURRENT
VALUE($) (2) | | | VALUE($) (3) | |
| Short Positions — continued | |
| | |
| Common Stocks — continued | | | | | | | |
IT Services — 0.5% | | | | | | | | | | | | | | | | |
CSRA, Inc. | | | 16,333 | | | | 474,964 | | | | 474,964 | | | | — | |
InterXion Holding NV (Netherlands) (a) | | | 3,524 | | | | 146,810 | | | | 146,810 | | | | — | |
Syntel, Inc. | | | 30,929 | | | | 544,660 | | | | 544,660 | | | | — | |
Wirecard AG (Germany) | | | 9,014 | | | | 532,285 | | | | 533,002 | | | | (717 | ) |
Worldpay Group plc (United Kingdom) (e) | | | 41,614 | | | | 161,695 | | | | 161,610 | | | | 85 | |
| | | | | | | | | | | | | | | | |
| | | 101,414 | | | | 1,860,414 | | | | 1,861,046 | | | | (632 | ) |
| | | | | | | | | | | | | | | | |
Semiconductors & Semiconductor Equipment — 0.4% | | | | | | | | | | | | | | | | |
ams AG (Austria) | | | 9,467 | | | | 608,932 | | | | 609,045 | | | | (113 | ) |
Cavium, Inc. (a) | | | 7,355 | | | | 506,392 | | | | 506,392 | | | | — | |
First Solar, Inc. (a) | | | 19,367 | | | | 572,295 | | | | 572,295 | | | | — | |
| | | | | | | | | | | | | | | | |
| | | 36,189 | | | | 1,687,619 | | | | 1,687,732 | | | | (113 | ) |
| | | | | | | | | | | | | | | | |
Software — 1.2% | | | | | | | | | | | | | | | | |
FireEye, Inc. (a) | | | 24,873 | | | | 311,161 | | | | 311,161 | | | | — | |
Globant SA (a) | | | 6,269 | | | | 237,532 | | | | 237,532 | | | | — | |
Guidewire Software, Inc. (a) | | | 8,978 | | | | 552,057 | | | | 552,057 | | | | — | |
HubSpot, Inc. (a) | | | 2,262 | | | | 151,667 | | | | 151,667 | | | | — | |
Imperva, Inc. (a) | | | 6,404 | | | | 284,658 | | | | 284,658 | | | | — | |
Nintendo Co. Ltd. (Japan) | | | 1,200 | | | | 301,898 | | | | 303,679 | | | | (1,781 | ) |
Paylocity Holding Corp. (a) | | | 13,381 | | | | 527,747 | | | | 527,747 | | | | — | |
Pegasystems, Inc. | | | 12,378 | | | | 563,818 | | | | 563,818 | | | | — | |
RingCentral, Inc., Class A (a) | | | 5,937 | | | | 189,687 | | | | 189,687 | | | | — | |
salesforce.com, Inc. (a) | | | 5,578 | | | | 480,377 | | | | 480,377 | | | | — | |
Splunk, Inc. (a) | | | 1,983 | | | | 127,527 | | | | 127,527 | | | | — | |
Tableau Software, Inc., Class A (a) | | | 4,624 | | | | 248,216 | | | | 248,216 | | | | — | |
Workday, Inc., Class A (a) | | | 1,569 | | | | 137,131 | | | | 137,131 | | | | — | |
Zendesk, Inc. (a) | | | 9,211 | | | | 264,816 | | | | 264,816 | | | | — | |
| | | | | | | | | | | | | | | | |
| | | 104,647 | | | | 4,378,292 | | | | 4,380,073 | | | | (1,781 | ) |
| | | | | | | | | | | | | | | | |
Technology Hardware, Storage & Peripherals — 0.2% | | | | | | | | | | | | | | | | |
Pure Storage, Inc., Class A (a) | | | 13,055 | | | | 138,514 | | | | 138,514 | | | | — | |
Ricoh Co. Ltd. (Japan) | | | 62,800 | | | | 522,793 | | | | 523,463 | | | | (670 | ) |
Stratasys Ltd. (a) | | | 5,226 | | | | 129,396 | | | | 129,396 | | | | — | |
| | | | | | | | | | | | | | | | |
| | | 81,081 | | | | 790,703 | | | | 791,373 | | | | (670 | ) |
| | | | | | | | | | | | | | | | |
Total Information Technology | | | 619,183 | | | | 14,948,536 | | | | 14,951,661 | | | | (3,125 | ) |
| | | | | | | | | | | | | | | | |
Materials — 3.6% | | | | | | | | | | | | | | | | |
Chemicals — 1.3% | | | | | | | | | | | | | | | | |
Air Liquide SA (France) | | | 4,071 | | | | 490,460 | | | | 490,499 | | | | (39 | ) |
CF Industries Holdings, Inc. | | | 18,114 | | | | 484,368 | | | | 484,368 | | | | — | |
Clariant AG (Registered) (Switzerland) (a) | | | 27,417 | | | | 555,229 | | | | 555,242 | | | | (13 | ) |
DuluxGroup Ltd. (Australia) | | | 103,236 | | | | 523,342 | | | | 522,715 | | | | 627 | |
Essentra plc (United Kingdom) | | | 90,967 | | | | 637,998 | | | | 637,998 | | | | — | |
Ferro Corp. (a) | | | 31,951 | | | | 572,562 | | | | 572,562 | | | | — | |
Incitec Pivot Ltd. (Australia) | | | 185,286 | | | | 525,833 | | | | 524,944 | | | | 889 | |
Symrise AG (Germany) | | | 7,839 | | | | 548,803 | | | | 548,796 | | | | 7 | |
Umicore SA (Belgium) | | | 9,034 | | | | 528,940 | | | | 529,277 | | | | (337 | ) |
WR Grace & Co. | | | 1,777 | | | | 123,892 | | | | 123,892 | | | | — | |
| | | | | | | | | | | | | | | | |
| | | 479,692 | | | | 4,991,427 | | | | 4,990,293 | | | | 1,134 | |
| | | | | | | | | | | | | | | | |
Construction Materials — 0.3% | | | | | | | | | | | | | | | | |
Boral Ltd. (Australia) | | | 125,000 | | | | 576,575 | | | | 576,193 | | | | 382 | |
Vulcan Materials Co. | | | 4,378 | | | | 529,213 | | | | 529,213 | | | | — | |
| | | | | | | | | | | | | | | | |
| | | 129,378 | | | | 1,105,788 | | | | 1,105,406 | | | | 382 | |
| | | | | | | | | | | | | | | | |
SEE NOTES TO CONSOLIDATED FINANCIAL STATEMENTS.
| | | | | | |
| | | |
| 24 | | | | J.P. MORGAN FUNDS | | APRIL 30, 2017 |
| | | | | | | | | | | | | | | | |
TOTAL RETURN BASKET
SWAP POSITIONS | | SHARES | | | NOTIONAL
VALUE($) (1) | | | CURRENT
VALUE($) (2) | | | VALUE($) (3) | |
| Short Positions — continued | |
| | |
| Common Stocks — continued | | | | | | | |
Containers & Packaging — 0.5% | | | | | | | | | | | | | | | | |
Amcor Ltd. (Australia) | | | 45,039 | | | | 529,823 | | | | 529,581 | | | | 242 | |
Ball Corp. | | | 7,023 | | | | 539,998 | | | | 539,998 | | | | — | |
Huhtamaki OYJ (Finland) | | | 13,324 | | | | 516,402 | | | | 516,472 | | | | (70 | ) |
Toyo Seikan Group Holdings Ltd. (Japan) | | | 31,400 | | | | 525,329 | | | | 526,608 | | | | (1,279 | ) |
| | | | | | | | | | | | | | | | |
| | | 96,786 | | | | 2,111,552 | | | | 2,112,659 | | | | (1,107 | ) |
| | | | | | | | | | | | | | | | |
Metals & Mining — 1.5% | | | | | | | | | | | | | | | | |
Century Aluminum Co. (a) | | | 41,756 | | | | 569,552 | | | | 569,552 | | | | — | |
Compass Minerals International, Inc. | | | 6,278 | | | | 414,348 | | | | 414,348 | | | | — | |
Detour Gold Corp. (Canada) (a) | | | 44,476 | | | | 562,039 | | | | 562,039 | | | | — | |
Eldorado Gold Corp. (Canada) | | | 150,725 | | | | 550,982 | | | | 550,982 | | | | — | |
Franco-Nevada Corp. (Canada) | | | 1,827 | | | | 124,258 | | | | 124,258 | | | | — | |
Fresnillo plc (Mexico) | | | 9,420 | | | | 177,155 | | | | 177,116 | | | | 39 | |
Goldcorp, Inc. (Canada) | | | 35,226 | | | | 490,823 | | | | 490,823 | | | | — | |
Iluka Resources Ltd. (Australia) | | | 90,197 | | | | 567,332 | | | | 566,802 | | | | 530 | |
Independence Group NL (Australia) | | | 50,117 | | | | 122,340 | | | | 122,783 | | | | (443 | ) |
New Gold, Inc. (Canada) (a) | | | 172,872 | | | | 490,103 | | | | 490,103 | | | | — | |
Randgold Resources Ltd. (Jersey) | | | 6,214 | | | | 547,692 | | | | 546,623 | | | | 1,069 | |
Royal Gold, Inc. | | | 7,354 | | | | 519,781 | | | | 519,781 | | | | — | |
Silver Wheaton Corp. (Canada) | | | 24,673 | | | | 492,357 | | | | 492,357 | | | | — | |
| | | | | | | | | | | | | | | | |
| | | 641,135 | | | | 5,628,762 | | | | 5,627,567 | | | | 1,195 | |
| | | | | | | | | | | | | | | | |
Total Materials | | | 1,346,991 | | | | 13,837,529 | | | | 13,835,925 | | | | 1,604 | |
| | | | | | | | | | | | | | | | |
Real Estate — 0.2% | | | | | | | | | | | | | | | | |
Real Estate Management & Development — 0.2% | | | | | | | | | | | | | | | | |
Capital & Counties Properties plc (United Kingdom) | | | 26,205 | | | | 107,185 | | | | 107,167 | | | | 18 | |
Ichigo, Inc. (Japan) | | | 175,900 | | | | 511,250 | | | | 511,425 | | | | (175 | ) |
| | | | | | | | | | | | | | | | |
Total Real Estate | | | 202,105 | | | | 618,435 | | | | 618,592 | | | | (157 | ) |
| | | | | | | | | | | | | | | | |
Telecommunication Services — 0.5% | | | | | | | | | | | | | | | | |
Diversified Telecommunication Services — 0.4% | | | | | | | | | | | | | | | | |
Cellnex Telecom SA (Spain) (e) | | | 31,531 | | | | 557,275 | | | | 556,543 | | | | 732 | |
Iliad SA (France) | | | 607 | | | | 147,383 | | | | 147,334 | | | | 49 | |
SFR Group SA (France) (a) | | | 4,249 | | | | 139,131 | | | | 139,109 | | | | 22 | |
Vivendi SA (France) (a) | | | 27,138 | | | | 538,461 | | | | 538,288 | | | | 173 | |
| | | | | | | | | | | | | | | | |
| | | 63,525 | | | | 1,382,250 | | | | 1,381,274 | | | | 976 | |
| | | | | | | | | | | | | | | | |
Wireless Telecommunication Services — 0.1% | | | | | | | | | | | | | | | | |
Vodafone Group plc (United Kingdom) | | | 200,134 | | | | 515,965 | | | | 515,473 | | | | 492 | |
| | | | | | | | | | | | | | | | |
Total Telecommunication Services | | | 263,659 | | | | 1,898,215 | | | | 1,896,747 | | | | 1,468 | |
| | | | | | | | | | | | | | | | |
Utilities — 0.9% | | | | | | | | | | | | | | | | |
Electric Utilities — 0.1% | | | | | | | | | | | | | | | | |
Chugoku Electric Power Co., Inc. (The) (Japan) | | | 8,500 | | | | 92,644 | | | | 92,662 | | | | (18 | ) |
Hokkaido Electric Power Co., Inc. (Japan) | | | 14,700 | | | | 106,681 | | | | 106,712 | | | | (31 | ) |
Hokuriku Electric Power Co. (Japan) | | | 18,400 | | | | 170,011 | | | | 170,065 | | | | (54 | ) |
| | | | | | | | | | | | | | | | |
| | | 41,600 | | | | 369,336 | | | | 369,439 | | | | (103 | ) |
| | | | | | | | | | | | | | | | |
Gas Utilities — 0.1% | | | | | | | | | | | | | | | | |
New Jersey Resources Corp. | | | 13,970 | | | | 563,690 | | | | 563,690 | | | | — | |
| | | | | | | | | | | | | | | | |
Independent Power & Renewable Electricity Producers — 0.2% | | | | | | | | | | | | | | | | |
Calpine Corp. (a) | | | 18,672 | | | | 190,454 | | | | 190,454 | | | | — | |
NRG Energy, Inc. | | | 29,580 | | | | 499,902 | | | | 499,902 | | | | — | |
| | | | | | | | | | | | | | | | |
| | | 48,252 | | | | 690,356 | | | | 690,356 | | | | — | |
| | | | | | | | | | | | | | | | |
SEE NOTES TO CONSOLIDATED FINANCIAL STATEMENTS.
| | | | | | | | |
| | | |
| APRIL 30, 2017 | | J.P. MORGAN FUNDS | | | | | 25 | |
JPMorgan Systematic Alpha Fund
ADDITIONAL INFORMATION — TOTAL RETURN BASKET SWAPS
AS OF APRIL 30, 2017 (Unaudited) (continued)
| | | | | | | | | | | | | | | | |
TOTAL RETURN BASKET
SWAP POSITIONS | | SHARES | | | NOTIONAL
VALUE($) (1) | | | CURRENT
VALUE($) (2) | | | VALUE($) (3) | |
| Short Positions — continued | |
| | |
| Common Stocks — continued | | | | | | | |
Multi-Utilities — 0.1% | | | | | | | | | | | | | | | | |
NiSource, Inc. | | | 21,886 | | | | 530,736 | | | | 530,736 | | | | — | |
| | | | | | | | | | | | | | | | |
Water Utilities — 0.4% | | | | | | | | | | | | | | | | |
American Water Works Co., Inc. | | | 6,650 | | | | 530,404 | | | | 530,404 | | | | — | |
Aqua America, Inc. | | | 16,091 | | | | 532,451 | | | | 532,451 | | | | — | |
Pennon Group plc (United Kingdom) | | | 10,890 | | | | 120,877 | | | | 120,815 | | | | 62 | |
United Utilities Group plc (United Kingdom) | | | 11,337 | | | | 142,946 | | | | 142,872 | | | | 74 | |
| | | | | | | | | | | | | | | | |
| | | 44,968 | | | | 1,326,678 | | | | 1,326,542 | | | | 136 | |
| | | | | | | | | | | | | | | | |
Total Utilities | | | 170,676 | | | | 3,480,796 | | | | 3,480,763 | | | | 33 | |
| | | | | | | | | | | | | | | | |
Total Short Positions of Total Return Basket Swap | | | 8,395,320 | | | | 105,106,174 | | | | 105,110,042 | | | | (3,868 | ) |
| | | | | | | | | | | | | | | | |
Total of Long and Short Positions of Total Return Basket Swap | | | 6,081,004 | | | | (83,309,632 | ) | | | (83,313,810 | ) | | | (4,178 | ) |
| | | | | | | | | | | | | | | | |
Outstanding swap contract, at value | | | | | | | | | | | | | | $ | (4,178 | ) |
| | | | | | | | | | | | | | | | |
| | | | | | | | | | | | | | | | |
| | | | |
TOTAL RETURN BASKET
SWAP POSITIONS | | SHARES | | | NOTIONAL
VALUE($) (1) | | | CURRENT
VALUE($) (2) | | | VALUE($) (3) | |
| Long Positions | | | | | | | | | | | | |
| | | | |
| Common Stocks | | | | | | | | | | | | |
Consumer Discretionary — 2.0% | | | | | | | | | | | | | | | | |
Household Durables — 0.1% | | | | | | | | | | | | | | | | |
PanaHome Corp. (Japan) | | | 42,000 | | | | 466,059 | | | | 466,621 | | | | 562 | |
| | | | | | | | | | | | | | | | |
Media — 1.9% | | | | | | | | | | | | | | | | |
Sky plc (United Kingdom) | | | 281,985 | | | | 3,623,051 | | | | 3,622,466 | | | | (585 | ) |
Time Warner, Inc. | | | 36,254 | | | | 3,598,935 | | | | 3,598,935 | | | | — | |
| | | | | | | | | | | | | | | | |
| | | 318,239 | | | | 7,221,986 | | | | 7,221,401 | | | | (585 | ) |
| | | | | | | | | | | | | | | | |
Total Consumer Discretionary | | | 360,239 | | | | 7,688,045 | | | | 7,688,022 | | | | (23 | ) |
| | | | | | | | | | | | | | | | |
Consumer Staples — 1.3% | | | | | | | | | | | | | | | | |
Food & Staples Retailing — 0.2% | | | | | | | | | | | | | | | | |
Booker Group plc (United Kingdom) | | | 329,276 | | | | 827,368 | | | | 827,368 | | | | — | |
| | | | | | | | | | | | | | | | |
Tobacco — 1.1% | | | | | | | | | | | | | | | | |
Reynolds American, Inc. | | | 61,679 | | | | 3,978,295 | | | | 3,978,295 | | | | — | |
| | | | | | | | | | | | | | | | |
Total Consumer Staples | | | 390,955 | | | | 4,805,663 | | | | 4,805,663 | | | | — | |
| | | | | | | | | | | | | | | | |
Energy — 1.5% | | | | | | | | | | | | | | | | |
Energy Equipment & Services — 0.4% | | | | | | | | | | | | | | | | |
Amec Foster Wheeler plc (United Kingdom) | | | 237,022 | | | | 1,666,961 | | | | 1,664,065 | | | | (2,896 | ) |
| | | | | | | | | | | | | | | | |
Oil, Gas & Consumable Fuels — 1.1% | | | | | | | | | | | | | | | | |
Clayton Williams Energy, Inc. (a) | | | 16,261 | | | | 2,030,457 | | | | 2,030,457 | | | | — | |
Western Refining, Inc. | | | 70,607 | | | | 2,435,235 | | | | 2,435,235 | | | | — | |
| | | | | | | | | | | | | | | | |
| | | 86,868 | | | | 4,465,692 | | | | 4,465,692 | | | | — | |
| | | | | | | | | | | | | | | | |
Total Energy | | | 323,890 | | | | 6,132,653 | | | | 6,129,757 | | | | (2,896 | ) |
| | | | | | | | | | | | | | | | |
Financials — 2.2% | | | | | | | | | | | | | | | | |
Banks — 1.0% | | | | | | | | | | | | | | | | |
BNC Bancorp | | | 17,332 | | | | 579,755 | | | | 579,755 | | | | — | |
PrivateBancorp, Inc. | | | 57,788 | | | | 3,338,413 | | | | 3,338,413 | | | | — | |
| | | | | | | | | | | | | | | | |
| | | 75,120 | | | | 3,918,168 | | | | 3,918,168 | | | | — | |
| | | | | | | | | | | | | | | | |
Capital Markets — 0.0% (g) | | | | | | | | | | | | | | | | |
SVG Capital plc (United Kingdom) (a) | | | 5,123 | | | | 49,002 | | | | 49,002 | | | | — | |
| | | | | | | | | | | | | | | | |
SEE NOTES TO CONSOLIDATED FINANCIAL STATEMENTS.
| | | | | | |
| | | |
| 26 | | | | J.P. MORGAN FUNDS | | APRIL 30, 2017 |
| | | | | | | | | | | | | | | | |
| | | | |
TOTAL RETURN BASKET
SWAP POSITIONS | | SHARES | | | NOTIONAL
VALUE($) (1) | | | CURRENT
VALUE($) (2) | | | VALUE($) (3) | |
| Long Positions — continued | | | | | | | | | | | | |
| | | | |
| Common Stocks — continued | | | | | | | | | | | | |
Insurance — 0.8% | | | | | | | | | | | | | | | | |
Allied World Assurance Co. Holdings AG | | | 54,332 | | | | 2,884,486 | | | | 2,884,486 | | | | — | |
| | | | | | | | | | | | | | | | |
Thrifts & Mortgage Finance — 0.4% | | | | | | | | | | | | | | | | |
Astoria Financial Corp. | | | 81,540 | | | | 1,662,600 | | | | 1,662,600 | | | | — | |
| | | | | | | | | | | | | | | | |
Total Financials | | | 216,115 | | | | 8,514,256 | | | | 8,514,256 | | | | — | |
| | | | | | | | | | | | | | | | |
Health Care — 1.0% | | | | | | | | | | | | | | | | |
Health Care Equipment & Supplies — 1.0% | | | | | | | | | | | | | | | | |
CR Bard, Inc. | | | 12,568 | | | | 3,864,409 | | | | 3,864,409 | | | | — | |
| | | | | | | | | | | | | | | | |
Industrials — 1.5% | | | | | | | | | | | | | | | | |
Aerospace & Defense — 0.5% | | | | | | | | | | | | | | | | |
Rockwell Collins Inc. | | | 16,760 | | | | 1,744,549 | | | | 1,744,549 | | | | — | |
| | | | | | | | | | | | | | | | |
Road & Rail — 1.0% | | | | | | | | | | | | | | | | |
Swift Transportation Co. (a) | | | 155,161 | | | | 3,813,857 | | | | 3,813,857 | | | | — | |
| | | | | | | | | | | | | | | | |
Total Industrials | | | 171,921 | | | | 5,558,406 | | | | 5,558,406 | | | | — | |
| | | | | | | | | | | | | | | | |
Information Technology — 0.1% | | | | | | | | | | | | | | | | |
Semiconductors & Semiconductor Equipment — 0.1% | | | | | | | | | | | | | | | | |
Ultratech, Inc. (a) | | | 16,413 | | | | 500,925 | | | | 500,925 | | | | — | |
| | | | | | | | | | | | | | | | |
Telecommunication Services — 0.1% | | | | | | | | | | | | | | | | |
Diversified Telecommunication Services — 0.1% | | | | | | | | | | | | | | | | |
FairPoint Communications, Inc. (a) | | | 13,797 | | | | 235,239 | | | | 235,239 | | | | — | |
| | | | | | | | | | | | | | | | |
Total Long Positions of Total Return Basket Swap | | | 1,505,898 | | | | 37,299,596 | | | | 37,296,677 | | | | (2,919 | ) |
| | | | | | | | | | | | | | | | |
| Short Positions | | | | | | | | | | | | |
| | | | |
Common Stocks | | | | | | | | | | | | | | | | |
Consumer Staples — 0.7% | | | | | | | | | | | | | | | | |
Food & Staples Retailing — 0.2% | | | | | | | | | | | | | | | | |
Tesco plc (United Kingdom) (a) | | | 280,671 | | | | 666,160 | | | | 666,092 | | | | 68 | |
| | | | | | | | | | | | | | | | |
Tobacco — 0.5% | | | | | | | | | | | | | | | | |
British American Tobacco plc (United Kingdom) | | | 32,119 | | | | 2,169,467 | | | | 2,170,068 | | | | (601 | ) |
| | | | | | | | | | | | | | | | |
Total Consumer Staples | | | 312,790 | | | | 2,835,627 | | | | 2,836,160 | | | | (533 | ) |
| | | | | | | | | | | | | | | | |
Energy — 1.6% | | | | | | | | | | | | | | | | |
Energy Equipment & Services — 0.5% | | | | | | | | | | | | | | | | |
John Wood Group plc (United Kingdom) | | | 175,988 | | | | 1,731,202 | | | | 1,729,977 | | | | 1,225 | |
| | | | | | | | | | | | | | | | |
Oil, Gas & Consumable Fuels — 1.1% | | | | | | | | | | | | | | | | |
Noble Energy, Inc. | | | 44,733 | | | | 1,446,218 | | | | 1,446,218 | | | | — | |
Tesoro Corp. | | | 35,225 | | | | 2,807,785 | | | | 2,807,785 | | | | — | |
| | | | | | | | | | | | | | | | |
| | | 79,958 | | | | 4,254,003 | | | | 4,254,003 | | | | — | |
| | | | | | | | | | | | | | | | |
Total Energy | | | 255,946 | | | | 5,985,205 | | | | 5,983,980 | | | | 1,225 | |
| | | | | | | | | | | | | | | | |
Financials — 1.2% | | | | | | | | | | | | | | | | |
Banks — 1.0% | | | | | | | | | | | | | | | | |
Canadian Imperial Bank of Commerce (Canada) | | | 20,922 | | | | 1,689,792 | | | | 1,689,792 | | | | — | |
Pinnacle Financial Partners, Inc. | | | 8,982 | | | | 574,848 | | | | 574,848 | | | | — | |
Sterling Bancorp | | | 70,634 | | | | 1,642,241 | | | | 1,642,241 | | | | — | |
| | | | | | | | | | | | | | | | |
| | | 100,538 | | | | 3,906,881 | | | | 3,906,881 | | | | — | |
| | | | | | | | | | | | | | | | |
Insurance — 0.2% | | | | | | | | | | | | | | | | |
Fairfax Financial Holdings Ltd. (Canada) | | | 1,634 | | | | 746,944 | | | | 746,944 | | | | — | |
| | | | | | | | | | | | | | | | |
Total Financials | | | 102,172 | | | | 4,653,825 | | | | 4,653,825 | | | | — | |
| | | | | | | | | | | | | | | | |
SEE NOTES TO CONSOLIDATED FINANCIAL STATEMENTS.
| | | | | | | | |
| | | |
| APRIL 30, 2017 | | J.P. MORGAN FUNDS | | | | | 27 | |
JPMorgan Systematic Alpha Fund
ADDITIONAL INFORMATION — TOTAL RETURN BASKET SWAPS
AS OF APRIL 30, 2017 (Unaudited) (continued)
| | | | | | | | | | | | | | | | |
| | | | |
TOTAL RETURN BASKET
SWAP POSITIONS | | SHARES | | | NOTIONAL
VALUE($) (1) | | | CURRENT
VALUE($) (2) | | | VALUE($) (3) | |
| Short Positions — continued | | | | | | | | | | | | |
| | | | |
| Common Stocks — continued | | | | | | | | | | | | |
Health Care — 0.3% | | | | | | | | | | | | | | | | |
Health Care Equipment & Supplies — 0.3% | | | | | | | | | | | | | | | | |
Becton Dickinson and Co. | | | 6,316 | | | | 1,180,903 | | | | 1,180,903 | | | | — | |
| | | | | | | | | | | | | | | | |
Industrials — 1.0% | | | | | | | | | | | | | | | | |
Road & Rail — 1.0% | | | | | | | | | | | | | | | | |
Knight Transportation, Inc. | | | 110,598 | | | | 3,793,511 | | | | 3,793,511 | | | | — | |
| | | | | | | | | | | | | | | | |
Information Technology — 0.0% (g) | | | | | | | | | | | | | | | | |
Semiconductors & Semiconductor Equipment — 0.0% (g) | | | | | | | | | | | | | | | | |
Veeco Instruments, Inc. (a) | | | 4,346 | | | | 143,418 | | | | 143,418 | | | | — | |
| | | | | | | | | | | | | | | | |
Telecommunication Services — 0.6% | | | | | | | | | | | | | | | | |
Diversified Telecommunication Services — 0.6% | | | | | | | | | | | | | | | | |
AT&T, Inc. | | | 51,575 | | | | 2,043,917 | | | | 2,043,917 | | | | — | |
Consolidated Communications Holdings, Inc. | | | 9,970 | | | | 235,990 | | | | 235,990 | | | | — | |
| | | | | | | | | | | | | | | | |
Total Telecommunication Services | | | 61,545 | | | | 2,279,907 | | | | 2,279,907 | | | | — | |
| | | | | | | | | | | | | | | | |
Total Short Positions of Total Return Basket Swap | | | 853,713 | | | | 20,872,396 | | | | 20,871,704 | | | | 692 | |
| | | | | | | | | | | | | | | | |
Total of Long and Short Positions of Total Return Basket Swap | | | 652,185 | | | | 16,427,200 | | | | 16,424,973 | | | | (2,227 | ) |
| | | | | | | | | | | | | | | | |
Outstanding swap contract, at value | | | | | | | | | | | | | | $ | (2,227 | ) |
| | | | | | | | | | | | | | | | |
| | | | | | | | | | | | | | | | |
| | | | |
TOTAL RETURN BASKET
SWAP POSITIONS | | SHARES | | | NOTIONAL
VALUE($) (1) | | | CURRENT
VALUE($) (2) | | | VALUE($) (3) | |
| Long Positions | | | | | | | | | | | | |
| | | | |
| Common Stocks | | | | | | | | | | | | |
Consumer Discretionary — 0.7% | | | | | | | | | | | | | | | | |
Hotels, Restaurants & Leisure — 0.4% | | | | | | | | | | | | | | | | |
Tatts Group Ltd. (Australia) | | | 502,505 | | | | 1,617,986 | | | | 1,616,571 | | | | (1,415 | ) |
| | | | | | | | | | | | | | | | |
Textiles, Apparel & Luxury Goods — 0.3% | | | | | | | | | | | | | | | | |
Christian Dior SE (France) | | | 4,101 | | | | 1,125,516 | | | | 1,124,759 | | | | (757 | ) |
| | | | | | | | | | | | | | | | |
Total Consumer Discretionary | | | 506,606 | | | | 2,743,502 | | | | 2,741,330 | | | | (2,172 | ) |
| | | | | | | | | | | | | | | | |
Consumer Staples — 0.2% | | | | | | | | | | | | | | | | |
Food & Staples Retailing — 0.2% | | | | | | | | | | | | | | | | |
METRO AG (Germany) | | | 21,833 | | | | 718,475 | | | | 718,510 | | | | 35 | |
| | | | | | | | | | | | | | | | |
Energy — 0.1% | | | | | | | | | | | | | | | | |
Energy Equipment & Services — 0.1% | | | | | | | | | | | | | | | | |
Canyon Services Group, Inc. (Canada) (a) | | | 80,689 | | | | 374,170 | | | | 374,170 | | | | — | |
| | | | | | | | | | | | | | | | |
Health Care — 1.1% | | | | | | | | | | | | | | | | |
Biotechnology — 1.0% | | | | | | | | | | | | | | | | |
Actelion Ltd. (Switzerland) (a) | | | 13,208 | | | | 3,740,054 | | | | 3,740,054 | | | | — | |
| | | | | | | | | | | | | | | | |
Pharmaceuticals — 0.1% | | | | | | | | | | | | | | | | |
STADA Arzneimittel AG (Germany) | | | 3,900 | | | | 276,265 | | | | 276,356 | | | | 91 | |
| | | | | | | | | | | | | | | | |
Total Health Care | | | 17,108 | | | | 4,016,319 | | | | 4,016,410 | | | | 91 | |
| | | | | | | | | | | | | | | | |
Industrials — 1.4% | | | | | | | | | | | | | | | | |
Aerospace & Defense — 0.8% | | | | | | | | | | | | | | | | |
DigitalGlobe, Inc. (a) | | | 28,119 | | | | 905,432 | | | | 905,432 | | | | — | |
Zodiac Aerospace (France) | | | 89,698 | | | | 2,177,912 | | | | 2,177,466 | | | | (446 | ) |
| | | | | | | | | | | | | | | | |
| | | 117,817 | | | | 3,083,344 | | | | 3,082,898 | | | | (446 | ) |
| | | | | | | | | | | | | | | | |
Commercial Services & Supplies — 0.3% | | | | | | | | | | | | | | | | |
Spotless Group Holdings Ltd. (Australia) | | | 1,284,236 | | | | 1,038,567 | | | | 1,037,594 | | | | (973 | ) |
| | | | | | | | | | | | | | | | |
SEE NOTES TO CONSOLIDATED FINANCIAL STATEMENTS.
| | | | | | |
| | | |
| 28 | | | | J.P. MORGAN FUNDS | | APRIL 30, 2017 |
| | | | | | | | | | | | | | | | |
| | | | |
TOTAL RETURN BASKET
SWAP POSITIONS | | SHARES | | | NOTIONAL
VALUE($) (1) | | | CURRENT
VALUE($) (2) | | | VALUE($) (3) | |
| Long Positions — continued | | | | | | | | | | | | |
| | | | |
| Common Stocks — continued | | | | | | | | | | | | |
Machinery — 0.1% | | | | | | | | | | | | | | | | |
Pfeiffer Vacuum Technology AG (Germany) | | | 3,373 | | | | 437,965 | | | | 437,920 | | | | (45 | ) |
| | | | | | | | | | | | | | | | |
Professional Services — 0.2% | | | | | | | | | | | | | | | | |
WS Atkins plc (United Kingdom) | | | 22,374 | | | | 622,175 | | | | 622,414 | | | | 239 | |
| | | | | | | | | | | | | | | | |
Total Industrials | | | 1,427,800 | | | | 5,182,051 | | | | 5,180,826 | | | | (1,225 | ) |
| | | | | | | | | | | | | | | | |
Information Technology — 0.5% | | | | | | | | | | | | | | | | |
IT Services — 0.5% | | | | | | | | | | | | | | | | |
DH Corp. (Canada) | | | 112,717 | | | | 2,096,542 | | | | 2,096,542 | | | | — | |
| | | | | | | | | | | | | | | | |
Materials — 0.0% (g) | | | | | | | | | | | | | | | | |
Metals & Mining — 0.0% (g) | | | | | | | | | | | | | | | | |
Kirkland Lake Gold Ltd. (Canada) (a) | | | 314 | | | | 2,174 | | | | 2,174 | | | | — | |
| | | | | | | | | | | | | | | | |
Telecommunication Services — 0.9% | | | | | | | | | | | | | | | | |
Diversified Telecommunication Services — 0.9% | | | | | | | | | | | | | | | | |
Level 3 Communications, Inc. (a) | | | 55,963 | | | | 3,400,312 | | | | 3,400,312 | | | | — | |
| | | | | | | | | | | | | | | | |
Utilities — 0.1% | | | | | | | | | | | | | | | | |
Electric Utilities — 0.0% (g) | | | | | | | | | | | | | | | | |
Westar Energy, Inc. | | | 689 | | | | 35,849 | | | | 35,849 | | | | — | |
| | | | | | | | | | | | | | | | |
Independent Power & Renewable Electricity Producers — 0.1% | | | | | | | | | | | | | | | | |
EDP Renovaveis SA (Spain) | | | 51,860 | | | | 395,155 | | | | 395,205 | | | | 50 | |
| | | | | | | | | | | | | | | | |
Total Utilities | | | 52,549 | | | | 431,004 | | | | 431,054 | | | | 50 | |
| | | | | | | | | | | | | | | | |
Right | | | | | | | | | | | | | | | | |
Consumer Discretionary — 0.0% (g) | | | | | | | | | | | | | | | | |
Media — 0.0% (g) | | | | | | | | | | | | | | | | |
Media Gen, Inc., CVR | | | 48,548 | | | | — | | | | — | | | | — | |
| | | | | | | | | | | | | | | | |
Total Long Positions of Total Return Basket Swap | | | 2,324,127 | | | | 18,964,549 | | | | 18,961,328 | | | | (3,221 | ) |
| | | | | | | | | | | | | | | | |
| Short Positions | | | | | | | | | | | | |
| | | | |
| Common Stocks | | | | | | | | | | | | |
Consumer Discretionary — 0.2% | | | | | | | | | | | | | | | | |
Textiles, Apparel & Luxury Goods — 0.2% | | | | | | | | | | | | | | | | |
Hermes International (France) | | | 1,305 | | | | 624,339 | | | | 623,881 | | | | 458 | |
| | | | | | | | | | | | | | | | |
Energy — 0.1% | | | | | | | | | | | | | | | | |
Energy Equipment & Services — 0.1% | | | | | | | | | | | | | | | | |
Trican Well Service Ltd. (Canada) (a) | | | 135,799 | | | | 373,061 | | | | 373,061 | | | | — | |
| | | | | | | | | | | | | | | | |
Oil, Gas & Consumable Fuels — 0.0% (g) | | | | | | | | | | | | | | | | |
Royal Dutch Shell plc (Netherlands), Class A | | | 32 | | | | 829 | | | | 830 | | | | (1 | ) |
| | | | | | | | | | | | | | | | |
Total Energy | | | 135,831 | | | | 373,890 | | | | 373,891 | | | | (1 | ) |
| | | | | | | | | | | | | | | | |
Industrials — 0.2% | | | | | | | | | | | | | | | | |
Aerospace & Defense — 0.2% | | | | | | | | | | | | | | | | |
MacDonald Dettwiler & Associates Ltd. (Canada) | | | 14,599 | | | | 720,833 | | | | 720,833 | | | | — | |
| | | | | | | | | | | | | | | | |
Telecommunication Services — 0.5% | | | | | | | | | | | | | | | | |
Diversified Telecommunication Services — 0.5% | | | | | | | | | | | | | | | | |
CenturyLink, Inc. | | | 79,149 | | | | 2,031,755 | | | | 2,031,755 | | | | — | |
| | | | | | | | | | | | | | | | |
Total Short Positions of Total Return Basket Swap | | | 230,884 | | | | 3,750,817 | | | | 3,750,360 | | | | 457 | |
| | | | | | | | | | | | | | | | |
Total of Long and Short Positions of Total Return Basket Swap | | | 2,093,243 | | | | 15,213,732 | | | | 15,210,968 | | | | (2,764 | ) |
| | | | | | | | | | | | | | | | |
Outstanding swap contract, at value | | | | | | | | | | | | | | $ | (2,764 | ) |
| | | | | | | | | | | | | | | | |
SEE NOTES TO CONSOLIDATED FINANCIAL STATEMENTS.
| | | | | | | | |
| | | |
| APRIL 30, 2017 | | J.P. MORGAN FUNDS | | | | | 29 | |
JPMorgan Systematic Alpha Fund
ADDITIONAL INFORMATION — TOTAL RETURN BASKET SWAPS
AS OF APRIL 30, 2017 (Unaudited) (continued)
| | | | | | | | | | | | | | | | |
TOTAL RETURN BASKET
SWAP POSITIONS | | SHARES | | | NOTIONAL VALUE($) (1) | | | CURRENT VALUE($) (2) | | | VALUE($) (3) | |
Long Positions | | | | | | | | | | | | | | | | |
| | | | |
Common Stocks | | | | | | | | | | | | | | | | |
Consumer Discretionary — 3.2% | | | | | | | | | | | | | | | | |
Auto Components — 1.0% | | | | | | | | | | | | | | | | |
Cie Generale des Etablissements Michelin (France) | | | 4,831 | | | | 631,226 | | | | 631,900 | | | | 674 | |
Cooper-Standard Holdings, Inc. (a) | | | 5,373 | | | | 607,525 | | | | 607,525 | | | | — | |
GKN plc (United Kingdom) | | | 126,986 | | | | 590,291 | | | | 590,137 | | | | (154 | ) |
Lear Corp. | | | 4,108 | | | | 586,047 | | | | 586,047 | | | | — | |
Linamar Corp. (Canada) | | | 8,479 | | | | 360,515 | | | | 360,515 | | | | — | |
Magna International, Inc. (Canada) | | | 12,090 | | | | 505,016 | | | | 505,016 | | | | — | |
Valeo SA (France) | | | 10,158 | | | | 730,298 | | | | 730,971 | | | | 673 | |
| | | | | | | | | | | | | | | | |
| | | 172,025 | | | | 4,010,918 | | | | 4,012,111 | | | | 1,193 | |
| | | | | | | | | | | | | | | | |
Automobiles — 0.2% | | | | | | | | | | | | | | | | |
Peugeot SA (France) (a) | | | 17,280 | | | | 362,062 | | | | 362,286 | | | | 224 | |
Thor Industries, Inc. | | | 5,144 | | | | 494,750 | | | | 494,750 | | | | — | |
| | | | | | | | | | | | | | | | |
| | | 22,424 | | | | 856,812 | | | | 857,036 | | | | 224 | |
| | | | | | | | | | | | | | | | |
Hotels, Restaurants & Leisure — 0.5% | | | | | | | | | | | | | | | | |
Carnival plc | | | 9,120 | | | | 562,970 | | | | 562,088 | | | | (882 | ) |
Ladbrokes Coral Group plc (United Kingdom) | | | 255,321 | | | | 432,876 | | | | 432,876 | | | | — | |
William Hill plc (United Kingdom) | | | 110,440 | | | | 419,828 | | | | 419,610 | | | | (218 | ) |
Wyndham Worldwide Corp. | | | 4,687 | | | | 446,718 | | | | 446,718 | | | | — | |
| | | | | | | | | | | | | | | | |
| | | 379,568 | | | | 1,862,392 | | | | 1,861,292 | | | | (1,100 | ) |
| | | | | | | | | | | | | | | | |
Household Durables — 0.2% | | | | | | | | | | | | | | | | |
KB Home | | | 29,051 | | | | 598,451 | | | | 598,451 | | | | — | |
| | | | | | | | | | | | | | | | |
Media — 0.3% | | | | | | | | | | | | | | | | |
Informa plc (United Kingdom) | | | 52,567 | | | | 437,104 | | | | 437,078 | | | | (26 | ) |
Quebecor, Inc. (Canada), Class B | | | 18,708 | | | | 571,087 | | | | 571,087 | | | | — | |
| | | | | | | | | | | | | | | | |
| | | 71,275 | | | | 1,008,191 | | | | 1,008,165 | | | | (26 | ) |
| | | | | | | | | | | | | | | | |
Multiline Retail — 0.4% | | | | | | | | | | | | | | | | |
Big Lots, Inc. | | | 10,626 | | | | 536,507 | | | | 536,507 | | | | — | |
Dillard’s, Inc., Class A | | | 8,672 | | | | 480,168 | | | | 480,168 | | | | — | |
Target Corp. | | | 7,067 | | | | 394,692 | | | | 394,692 | | | | — | |
| | | | | | | | | | | | | | | | |
| | | 26,365 | | | | 1,411,367 | | | | 1,411,367 | | | | — | |
| | | | | | | | | | | | | | | | |
Specialty Retail — 0.4% | | | | | | | | | | | | | | | | |
Adastria Co. Ltd. (Japan) | | | 5,200 | | | | 129,166 | | | | 129,148 | | | | (18 | ) |
American Eagle Outfitters, Inc. | | | 28,514 | | | | 401,762 | | | | 401,762 | | | | — | |
Best Buy Co., Inc. | | | 11,821 | | | | 612,446 | | | | 612,446 | | | | — | |
Children’s Place, Inc. (The) | | | 4,841 | | | | 555,747 | | | | 555,747 | | | | — | |
| | | | | | | | | | | | | | | | |
| | | 50,376 | | | | 1,699,121 | | | | 1,699,103 | | | | (18 | ) |
| | | | | | | | | | | | | | | | |
Textiles, Apparel & Luxury Goods — 0.2% | | | | | | | | | | | | | | | | |
Christian Dior SE (France) | | | 2,767 | | | | 759,401 | | | | 758,890 | | | | (511 | ) |
| | | | | | | | | | | | | | | | |
Total Consumer Discretionary | | | 753,851 | | | | 12,206,653 | | | | 12,206,415 | | | | (238 | ) |
| | | | | | | | | | | | | | | | |
Consumer Staples — 1.4% | | | | | | | | | | | | | | | | |
Food & Staples Retailing — 0.5% | | | | | | | | | | | | | | | | |
SpartanNash Co. | | | 14,221 | | | | 523,333 | | | | 523,333 | | | | — | |
Tsuruha Holdings, Inc. (Japan) | | | 6,000 | | | | 608,208 | | | | 607,364 | | | | (844 | ) |
Wm Morrison Supermarkets plc (United Kingdom) | | | 176,035 | | | | 546,973 | | | | 546,835 | | | | (138 | ) |
| | | | | | | | | | | | | | | | |
| | | 196,256 | | | | 1,678,514 | | | | 1,677,532 | | | | (982 | ) |
| | | | | | | | | | | | | | | | |
Food Products — 0.6% | | | | | | | | | | | | | | | | |
Fresh Del Monte Produce, Inc. | | | 8,788 | | | | 538,704 | | | | 538,704 | | | | — | |
Ingredion, Inc. | | | 3,897 | | | | 482,527 | | | | 482,527 | | | | — | |
SEE NOTES TO CONSOLIDATED FINANCIAL STATEMENTS.
| | | | | | |
| | | |
| 30 | | | | J.P. MORGAN FUNDS | | APRIL 30, 2017 |
| | | | | | | | | | | | | | | | |
TOTAL RETURN BASKET
SWAP POSITIONS | | SHARES | | | NOTIONAL VALUE($) (1) | | | CURRENT VALUE($) (2) | | | VALUE($) (3) | |
| Long Positions — continued | | | | | | | | | | | | |
| | | | |
| Common Stocks — continued | | | | | | | | | | | | |
Food Products — continued | | | | | | | | | | | | | | | | |
Maple Leaf Foods, Inc. (Canada) | | | 24,226 | | | | 606,426 | | | | 606,426 | | | | — | |
Pinnacle Foods, Inc. | | | 11,039 | | | | 641,918 | | | | 641,918 | | | | — | |
| | | | | | | | | | | | | | | | |
| | | 47,950 | | | | 2,269,575 | | | | 2,269,575 | | | | — | |
| | | | | | | | | | | | | | | | |
Personal Products — 0.2% | | | | | | | | | | | | | | | | |
Ontex Group NV (Belgium) | | | 17,982 | | | | 599,974 | | | | 599,972 | | | | (2 | ) |
| | | | | | | | | | | | | | | | |
Tobacco — 0.1% | | | | | | | | | | | | | | | | |
Universal Corp. | | | 7,662 | | | | 562,774 | | | | 562,774 | | | | — | |
| | | | | | | | | | | | | | | | |
Total Consumer Staples | | | 269,850 | | | | 5,110,837 | | | | 5,109,853 | | | | (984 | ) |
| | | | | | | | | | | | | | | | |
Energy — 2.6% | | | | | | | | | | | | | | | | |
Energy Equipment & Services — 0.1% | | | | | | | | | | | | | | | | |
Petrofac Ltd. (United Kingdom) | | | 43,489 | | | | 458,783 | | | | 458,332 | | | | (451 | ) |
| | | | | | | | | | | | | | | | |
Oil, Gas & Consumable Fuels — 2.5% | | | | | | | | | | | | | | | | |
ARC Resources Ltd. (Canada) | | | 11,021 | | | | 144,681 | | | | 144,681 | | | | — | |
BP plc (United Kingdom) | | | 105,472 | | | | 604,487 | | | | 603,786 | | | | (701 | ) |
Clayton Williams Energy, Inc. (a) | | | 4,501 | | | | 562,025 | | | | 562,025 | | | | — | |
Enbridge Income Fund Holdings, Inc. (Canada) | | | 22,781 | | | | 559,074 | | | | 559,074 | | | | — | |
Enerplus Corp. (Canada) | | | 73,140 | | | | 527,767 | | | | 527,767 | | | | — | |
Galp Energia SGPS SA (Portugal) | | | 40,307 | | | | 626,545 | | | | 626,411 | | | | (134 | ) |
Husky Energy, Inc. (Canada) (a) | | | 11,811 | | | | 136,362 | | | | 136,362 | | | | — | |
Imperial Oil Ltd. (Canada) | | | 18,999 | | | | 552,691 | | | | 552,691 | | | | — | |
Neste OYJ (Finland) | | | 14,454 | | | | 590,270 | | | | 588,989 | | | | (1,281 | ) |
OMV AG (Austria) | | | 16,769 | | | | 772,215 | | | | 772,399 | | | | 184 | |
Repsol SA (Spain) | | | 38,510 | | | | 609,728 | | | | 607,816 | | | | (1,912 | ) |
Royal Dutch Shell plc (Netherlands), Class B | | | 21,561 | | | | 573,177 | | | | 573,673 | | | | 496 | |
Saras SpA (Italy) | | | 299,185 | | | | 625,080 | | | | 625,054 | | | | (26 | ) |
TOTAL SA (France) | | | 11,339 | | | | 582,624 | | | | 582,067 | | | | (557 | ) |
Valero Energy Corp. | | | 8,006 | | | | 517,268 | | | | 517,268 | | | | — | |
Veresen, Inc. (Canada) | | | 53,107 | | | | 592,520 | | | | 592,520 | | | | — | |
Western Refining, Inc. | | | 20,277 | | | | 699,354 | | | | 699,354 | | | | — | |
| | | | | | | | | | | | | | | | |
| | | 771,240 | | | | 9,275,868 | | | | 9,271,937 | | | | (3,931 | ) |
| | | | | | | | | | | | | | | | |
Total Energy | | | 814,729 | | | | 9,734,651 | | | | 9,730,269 | | | | (4,382 | ) |
| | | | | | | | | | | | | | | | |
Financials — 1.7% | | | | | | | | | | | | | | | | |
Banks — 0.5% | | | | | | | | | | | | | | | | |
BNP Paribas SA (France) | | | 8,782 | | | | 619,701 | | | | 619,809 | | | | 108 | |
ING Groep NV (Netherlands) | | | 38,709 | | | | 630,167 | | | | 630,939 | | | | 772 | |
National Bank of Canada (Canada) | | | 13,550 | | | | 526,594 | | | | 526,594 | | | | — | |
| | | | | | | | | | | | | | | | |
| | | 61,041 | | | | 1,776,462 | | | | 1,777,342 | | | | 880 | |
| | | | | | | | | | | | | | | | |
Capital Markets — 0.1% | | | | | | | | | | | | | | | | |
3i Group plc (United Kingdom) | | | 60,525 | | | | 622,040 | | | | 622,018 | | | | (22 | ) |
| | | | | | | | | | | | | | | | |
Insurance — 1.1% | | | | | | | | | | | | | | | | |
ASR Nederland NV (Netherlands) (a) | | | 20,410 | | | | 603,727 | | | | 603,849 | | | | 122 | |
CNP Assurances (France) | | | 31,160 | | | | 650,679 | | | | 650,894 | | | | 215 | |
Manulife Financial Corp. (Canada) | | | 32,991 | | | | 578,590 | | | | 578,590 | | | | — | |
Mapfre SA (Spain) | | | 170,529 | | | | 595,166 | | | | 594,817 | | | | (349 | ) |
Reinsurance Group of America, Inc. | | | 4,224 | | | | 528,169 | | | | 528,169 | | | | — | |
Swiss Life Holding AG (Registered) (Switzerland) (a) | | | 2,024 | | | | 658,665 | | | | 658,687 | | | | 22 | |
Validus Holdings Ltd. | | | 9,786 | | | | 540,970 | | | | 540,970 | | | | — | |
| | | | | | | | | | | | | | | | |
| | | 271,124 | | | | 4,155,966 | | | | 4,155,976 | | | | 10 | |
| | | | | | | | | | | | | | | | |
Total Financials | | | 392,690 | | | | 6,554,468 | | | | 6,555,336 | | | | 868 | |
| | | | | | | | | | | | | | | | |
SEE NOTES TO CONSOLIDATED FINANCIAL STATEMENTS.
| | | | | | | | |
| | | |
| APRIL 30, 2017 | | J.P. MORGAN FUNDS | | | | | 31 | |
JPMorgan Systematic Alpha Fund
ADDITIONAL INFORMATION — TOTAL RETURN BASKET SWAPS
AS OF APRIL 30, 2017 (Unaudited) (continued)
| | | | | | | | | | | | | | | | |
TOTAL RETURN BASKET
SWAP POSITIONS | | SHARES | | | NOTIONAL VALUE($) (1) | | | CURRENT VALUE($) (2) | | | VALUE($) (3) | |
| Long Positions — continued | | | | | | | | | | | | |
| | | | |
| Common Stocks — continued | | | | | | | | | | | | |
Health Care — 2.0% | | | | | | | | | | | | | | | | |
Health Care Providers & Services — 0.9% | | | | | | | | | | | | | | | | |
Aetna, Inc. | | | 4,594 | | | | 620,512 | | | | 620,512 | | | | — | |
Chemed Corp. | | | 3,218 | | | | 648,041 | | | | 648,041 | | | | — | |
Express Scripts Holding Co. (a) | | | 5,765 | | | | 353,625 | | | | 353,625 | | | | — | |
Owens & Minor, Inc. | | | 12,823 | | | | 444,317 | | | | 444,317 | | | | — | |
Quest Diagnostics, Inc. | | | 6,281 | | | | 662,708 | | | | 662,708 | | | | — | |
UnitedHealth Group, Inc. | | | 3,787 | | | | 662,270 | | | | 662,270 | | | | — | |
| | | | | | | | | | | | | | | | |
| | | 36,468 | | | | 3,391,473 | | | | 3,391,473 | | | | — | |
| | | | | | | | | | | | | | | | |
Life Sciences Tools & Services — 0.2% | | | | | | | | | | | | | | | | |
Lonza Group AG (Registered) (Switzerland) (a) | | | 3,254 | | | | 665,517 | | | | 665,801 | | | | 284 | |
| | | | | | | | | | | | | | | | |
Pharmaceuticals — 0.9% | | | | | | | | | | | | | | | | |
Bayer AG (Registered) (Germany) | | | 4,994 | | | | 617,980 | | | | 617,924 | | | | (56 | ) |
Johnson & Johnson | | | 4,790 | | | | 591,421 | | | | 591,421 | | | | — | |
Merck KGaA (Germany) | | | 5,085 | | | | 597,114 | | | | 597,344 | | | | 230 | |
Roche Holding AG (Switzerland) | | | 1,878 | | | | 491,677 | | | | 491,995 | | | | 318 | |
Sanofi (France) | | | 6,369 | | | | 600,879 | | | | 601,831 | | | | 952 | |
STADA Arzneimittel AG (Germany) | | | 10,892 | | | | 771,559 | | | | 771,811 | | | | 252 | |
| | | | | | | | | | | | | | | | |
| | | 34,008 | | | | 3,670,630 | | | | 3,672,326 | | | | 1,696 | |
| | | | | | | | | | | | | | | | |
Total Health Care | | | 73,730 | | | | 7,727,620 | | | | 7,729,600 | | | | 1,980 | |
| | | | | | | | | | | | | | | | |
Industrials — 3.6% | | | | | | | | | | | | | | | | |
Aerospace & Defense — 0.6% | | | | | | | | | | | | | | | | |
Huntington Ingalls Industries, Inc. | | | 2,987 | | | | 600,058 | | | | 600,058 | | | | — | |
Meggitt plc (United Kingdom) | | | 85,625 | | | | 512,920 | | | | 512,771 | | | | (149 | ) |
Safran SA (France) | | | 7,590 | | | | 628,517 | | | | 628,413 | | | | (104 | ) |
Thales SA (France) | | | 5,497 | | | | 577,950 | | | | 577,771 | | | | (179 | ) |
| | | | | | | | | | | | | | | | |
| | | 101,699 | | | | 2,319,445 | | | | 2,319,013 | | | | (432 | ) |
| | | | | | | | | | | | | | | | |
Airlines — 0.4% | | | | | | | | | | | | | | | | |
Alaska Air Group, Inc. | | | 5,694 | | | | 484,502 | | | | 484,502 | | | | — | |
Deutsche Lufthansa AG (Registered) (Germany) (a) | | | 35,403 | | | | 610,862 | | | | 610,782 | | | | (80 | ) |
WestJet Airlines Ltd. (Canada) | | | 31,621 | | | | 523,059 | | | | 523,059 | | | | — | |
| | | | | | | | | | | | | | | | |
| | | 72,718 | | | | 1,618,423 | | | | 1,618,343 | | | | (80 | ) |
| | | | | | | | | | | | | | | | |
Building Products — 0.2% | | | | | | | | | | | | | | | | |
Owens Corning | | | 10,963 | | | | 667,099 | | | | 667,099 | | | | — | |
| | | | | | | | | | | | | | | | |
Commercial Services & Supplies — 0.3% | | | | | | | | | | | | | | | | |
Deluxe Corp. | | | 7,781 | | | | 559,532 | | | | 559,532 | | | | — | |
Tetra Tech, Inc. | | | 12,571 | | | | 552,495 | | | | 552,495 | | | | — | |
| | | | | | | | | | | | | | | | |
| | | 20,352 | | | | 1,112,027 | | | | 1,112,027 | | | | — | |
| | | | | | | | | | | | | | | | |
Construction & Engineering — 0.4% | | | | | | | | | | | | | | | | |
ACS Actividades de Construccion y Servicios SA (Spain) | | | 17,618 | | | | 653,079 | | | | 652,757 | | | | (322 | ) |
HOCHTIEF AG (Germany) | | | 3,464 | | | | 624,110 | | | | 623,842 | | | | (268 | ) |
| | | | | | | | | | | | | | | | |
| | | 21,082 | | | | 1,277,189 | | | | 1,276,599 | | | | (590 | ) |
| | | | | | | | | | | | | | | | |
Electrical Equipment — 0.2% | | | | | | | | | | | | | | | | |
Prysmian SpA (Italy) | | | 21,564 | | | | 622,711 | | | | 622,309 | | | | (402 | ) |
| | | | | | | | | | | | | | | | |
Machinery — 1.0% | | | | | | | | | | | | | | | | |
Barnes Group, Inc. | | | 13,111 | | | | 720,712 | | | | 720,712 | | | | — | |
Georg Fischer AG (Registered) (Switzerland) | | | 621 | | | | 585,425 | | | | 585,583 | | | | 158 | |
Metso OYJ (Finland) | | | 19,501 | | | | 699,514 | | | | 698,409 | | | | (1,105 | ) |
New Flyer Industries, Inc. (Canada) | | | 15,786 | | | | 588,050 | | | | 588,050 | | | | — | |
SEE NOTES TO CONSOLIDATED FINANCIAL STATEMENTS.
| | | | | | |
| | | |
| 32 | | | | J.P. MORGAN FUNDS | | APRIL 30, 2017 |
| | | | | | | | | | | | | | | | |
TOTAL RETURN BASKET
SWAP POSITIONS | | SHARES | | | NOTIONAL VALUE($) (1) | | | CURRENT VALUE($) (2) | | | VALUE($) (3) | |
| Long Positions — continued | | | | | | | | | | | | |
| | | | |
| Common Stocks — continued | | | | | | | | | | | | |
Machinery — continued | | | | | | | | | | | | | | | | |
Valmet OYJ (Finland) | | | 36,831 | | | | 671,208 | | | | 670,874 | | | | (334 | ) |
Wabash National Corp. | | | 25,127 | | | | 572,393 | | | | 572,393 | | | | — | |
| | | | | | | | | | | | | | | | |
| | | 110,977 | | | | 3,837,302 | | | | 3,836,021 | | | | (1,281 | ) |
| | | | | | | | | | | | | | | | |
Road & Rail — 0.1% | | | | | | | | | | | | | | | | |
Canadian National Railway Co. (Canada) | | | 7,772 | | | | 561,784 | | | | 561,784 | | | | — | |
| | | | | | | | | | | | | | | | |
Trading Companies & Distributors — 0.1% | | | | | | | | | | | | | | | | |
Finning International, Inc. (Canada) | | | 27,337 | | | | 519,885 | | | | 519,885 | | | | — | |
| | | | | | | | | | | | | | | | |
Transportation Infrastructure — 0.3% | | | | | | | | | | | | | | | | |
Aena SA (Spain) (e) | | | 3,583 | | | | 632,280 | | | | 631,728 | | | | (552 | ) |
Flughafen Zuerich AG (Registered) (Switzerland) | | | 2,843 | | | | 626,317 | | | | 626,533 | | | | 216 | |
| | | | | | | | | | | | | | | | |
| | | 6,426 | | | | 1,258,597 | | | | 1,258,261 | | | | (336 | ) |
| | | | | | | | | | | | | | | | |
Total Industrials | | | 400,890 | | | | 13,794,462 | | | | 13,791,341 | | | | (3,121 | ) |
| | | | | | | | | | | | | | | | |
Information Technology — 2.8% | | | | | | | | | | | | | | | | |
Communications Equipment — 0.1% | | | | | | | | | | | | | | | | |
Cisco Systems, Inc. | | | 12,504 | | | | 426,011 | | | | 426,011 | | | | — | |
| | | | | | | | | | | | | | | | |
Electronic Equipment, Instruments & Components — 0.3% | | | | | | | | | | | | | | | | |
Corning, Inc. | | | 17,475 | | | | 504,154 | | | | 504,154 | | | | — | |
Methode Electronics, Inc. | | | 13,416 | | | | 597,683 | | | | 597,683 | | | | — | |
| | | | | | | | | | | | | | | | |
| | | 30,891 | | | | 1,101,837 | | | | 1,101,837 | | | | — | |
| | | | | | | | | | | | | | | | |
IT Services — 1.1% | | | | | | | | | | | | | | | | |
Amadeus IT Group SA (Spain) | | | 11,615 | | | | 626,285 | | | | 626,853 | | | | 568 | |
Amdocs Ltd. | | | 7,071 | | | | 433,028 | | | | 433,028 | | | | — | |
Atos SE (France) | | | 4,464 | | | | 584,975 | | | | 584,719 | | | | (256 | ) |
Cap Gemini SA (France) | | | 6,263 | | | | 626,968 | | | | 627,064 | | | | 96 | |
CGI Group, Inc. (Canada), Class A (a) | | | 11,193 | | | | 540,196 | | | | 540,196 | | | | — | |
Convergys Corp. | | | 15,234 | | | | 342,917 | | | | 342,917 | | | | — | |
NeuStar, Inc., Class A (a) | | | 17,379 | | | | 576,983 | | | | 576,983 | | | | — | |
Western Union Co. (The) | | | 20,236 | | | | 401,887 | | | | 401,887 | | | | — | |
| | | | | | | | | | | | | | | | |
| | | 93,455 | | | | 4,133,239 | | | | 4,133,647 | | | | 408 | |
| | | | | | | | | | | | | | | | |
Semiconductors & Semiconductor Equipment — 0.9% | | | | | | | | | | | | | | | | |
Advanced Energy Industries, Inc. (a) | | | 9,224 | | | | 680,731 | | | | 680,731 | | | | — | |
BE Semiconductor Industries NV (Netherlands) | | | 13,995 | | | | 731,138 | | | | 731,641 | | | | 503 | |
Infineon Technologies AG (Germany) | | | 28,390 | | | | 587,579 | | | | 586,809 | | | | (770 | ) |
Intel Corp. | | | 11,466 | | | | 414,496 | | | | 414,496 | | | | — | |
MKS Instruments, Inc. | | | 8,646 | | | | 676,550 | | | | 676,550 | | | | — | |
Teradyne, Inc. | | | 13,417 | | | | 473,218 | | | | 473,218 | | | | — | |
XPERI Corp. | | | 708 | | | | 23,789 | | | | 23,789 | | | | — | |
| | | | | | | | | | | | | | | | |
| | | 85,846 | | | | 3,587,501 | | | | 3,587,234 | | | | (267 | ) |
| | | | | | | | | | | | | | | | |
Software — 0.2% | | | | | | | | | | | | | | | | |
Nexon Co. Ltd. (Japan) | | | 21,800 | | | | 370,586 | | | | 371,022 | | | | 436 | |
Oracle Corp. | | | 10,113 | | | | 454,680 | | | | 454,680 | | | | — | |
| | | | | | | | | | | | | | | | |
| | | 31,913 | | | | 825,266 | | | | 825,702 | | | | 436 | |
| | | | | | | | | | | | | | | | |
Technology Hardware, Storage & Peripherals — 0.2% | | | | | | | | | | | | | | | | |
Apple, Inc. | | | 4,214 | | | | 605,341 | | | | 605,341 | | | | — | |
| | | | | | | | | | | | | | | | |
Total Information Technology | | | 258,823 | | | | 10,679,195 | | | | 10,679,772 | | | | 577 | |
| | | | | | | | | | | | | | | | |
Materials — 1.0% | | | | | | | | | | | | | | | | |
Chemicals — 0.3% | | | | | | | | | | | | | | | | |
LyondellBasell Industries NV, Class A | | | 5,521 | | | | 467,960 | | | | 467,960 | | | | — | |
SEE NOTES TO CONSOLIDATED FINANCIAL STATEMENTS.
| | | | | | | | |
| | | |
| APRIL 30, 2017 | | J.P. MORGAN FUNDS | | | | | 33 | |
JPMorgan Systematic Alpha Fund
ADDITIONAL INFORMATION — TOTAL RETURN BASKET SWAPS
AS OF APRIL 30, 2017 (Unaudited) (continued)
| | | | | | | | | | | | | | | | |
TOTAL RETURN BASKET
SWAP POSITIONS | | SHARES | | | NOTIONAL VALUE($) (1) | | | CURRENT VALUE($) (2) | | | VALUE($) (3) | |
| Long Positions — continued | | | | | | | | | | | | |
| | | | |
| Common Stocks — continued | | | | | | | | | | | | |
Chemicals — continued | | | | | | | | | | | | | | | | |
Trinseo SA | | | 7,762 | | | | 515,397 | | | | 515,397 | | | | — | |
| | | | | | | | | | | | | | | | |
| | | 13,283 | | | | 983,357 | | | | 983,357 | | | | — | |
| | | | | | | | | | | | | | | | |
Metals & Mining — 0.4% | | | | | | | | | | | | | | | | |
APERAM SA (Luxembourg) | | | 10,738 | | | | 540,631 | | | | 539,855 | | | | (776 | ) |
Centamin plc (Jersey) | | | 296,424 | | | | 679,169 | | | | 679,153 | | | | (16 | ) |
OZ Minerals Ltd. (Australia) | | | 91,845 | | | | 486,917 | | | | 487,682 | | | | 765 | |
Yamato Kogyo Co. Ltd. (Japan) | | | 4,900 | | | | 122,549 | | | | 122,560 | | | | 11 | |
| | | | | | | | | | | | | | | | |
| | | 403,907 | | | | 1,829,266 | | | | 1,829,250 | | | | (16 | ) |
| | | | | | | | | | | | | | | | |
Paper & Forest Products — 0.3% | | | | | | | | | | | | | | | | |
Schweitzer-Mauduit International, Inc. | | | 12,251 | | | | 527,406 | | | | 527,406 | | | | — | |
UPM-Kymmene OYJ (Finland) | | | 22,865 | | | | 603,492 | | | | 602,417 | | | | (1,075 | ) |
| | | | | | | | | | | | | | | | |
| | | 35,116 | | | | 1,130,898 | | | | 1,129,823 | | | | (1,075 | ) |
| | | | | | | | | | | | | | | | |
Total Materials | | | 452,306 | | | | 3,943,521 | | | | 3,942,430 | | | | (1,091 | ) |
| | | | | | | | | | | | | | | | |
Real Estate — 0.6% | | | | | | | | | | | | | | | | |
Real Estate Management & Development — 0.6% | | | | | | | | | | | | | | | | |
BUWOG AG (Austria) (a) | | | 24,424 | | | | 659,540 | | | | 659,540 | | | | — | |
Deutsche EuroShop AG (Germany) | | | 14,070 | | | | 571,140 | | | | 571,222 | | | | 82 | |
Nexity SA (France) (a) | | | 10,484 | | | | 570,040 | | | | 570,040 | | | | — | |
Vonovia SE (Germany) | | | 17,238 | | | | 624,065 | | | | 624,088 | | | | 23 | |
| | | | | | | | | | | | | | | | |
Total Real Estate | | | 66,216 | | | | 2,424,785 | | | | 2,424,890 | | | | 105 | |
| | | | | | | | | | | | | | | | |
Telecommunication Services — 0.5% | | | | | | | | | | | | | | | | |
Diversified Telecommunication Services — 0.3% | | | | | | | | | | | | | | | | |
Deutsche Telekom AG (Registered) (Germany) | | | 32,766 | | | | 574,642 | | | | 574,742 | | | | 100 | |
Telefonica SA (Spain) | | | 52,897 | | | | 585,138 | | | | 585,038 | | | | (100 | ) |
| | | | | | | | | | | | | | | | |
| | | 85,663 | | | | 1,159,780 | | | | 1,159,780 | | | | — | |
| | | | | | | | | | | | | | | | |
Wireless Telecommunication Services — 0.2% | | | | | | | | | | | | | | | | |
NTT DOCOMO, Inc. (Japan) | | | 4,600 | | | | 110,919 | | | | 111,306 | | | | 387 | |
Rogers Communications, Inc. (Canada), Class B | | | 14,369 | | | | 658,845 | | | | 658,845 | | | | — | |
| | | | | | | | | | | | | | | | |
| | | 18,969 | | | | 769,764 | | | | 770,151 | | | | 387 | |
| | | | | | | | | | | | | | | | |
Total Telecommunication Services | | | 104,632 | | | | 1,929,544 | | | | 1,929,931 | | | | 387 | |
| | | | | | | | | | | | | | | | |
Utilities — 1.0% | | | | | | | | | | | | | | | | |
Electric Utilities — 0.3% | | | | | | | | | | | | | | | | |
EDP — Energias de Portugal SA (Portugal) | | | 159,960 | | | | 527,961 | | | | 527,904 | | | | (57 | ) |
Endesa SA (Spain) | | | 24,051 | | | | 566,810 | | | | 566,477 | | | | (333 | ) |
| | | | | | | | | | | | | | | | |
| | | 184,011 | | | | 1,094,771 | | | | 1,094,381 | | | | (390 | ) |
| | | | | | | | | | | | | | | | |
Gas Utilities — 0.1% | | | | | | | | | | | | | | | | |
Gas Natural SDG SA (Spain) | | | 26,529 | | | | 599,923 | | | | 599,490 | | | | (433 | ) |
| | | | | | | | | | | | | | | | |
Multi-Utilities — 0.6% | | | | | | | | | | | | | | | | |
A2A SpA (Italy) | | | 359,557 | | | | 534,623 | | | | 534,423 | | | | (200 | ) |
CenterPoint Energy, Inc. | | | 20,509 | | | | 585,122 | | | | 585,122 | | | | – | |
E.ON SE (Germany) | | | 72,311 | | | | 563,745 | | | | 563,692 | | | | (53 | ) |
National Grid plc (United Kingdom) | | | 36,232 | | | | 469,277 | | | | 469,141 | | | | (136 | ) |
| | | | | | | | | | | | | | | | |
| | | 488,609 | | | | 2,152,767 | | | | 2,152,378 | | | | (389 | ) |
| | | | | | | | | | | | | | | | |
Total Utilities | | | 699,149 | | | | 3,847,461 | | | | 3,846,249 | | | | (1,212 | ) |
| | | | | | | | | | | | | | | | |
Total Long Positions of Total Return Basket Swap | | | 4,286,866 | | | | 77,953,197 | | | | 77,946,086 | | | | (7,111 | ) |
| | | | | | | | | | | | | | | | |
SEE NOTES TO CONSOLIDATED FINANCIAL STATEMENTS.
| | | | | | |
| | | |
| 34 | | | | J.P. MORGAN FUNDS | | APRIL 30, 2017 |
| | | | | | | | | | | | | | | | |
TOTAL RETURN BASKET
SWAP POSITIONS | | SHARES | | | NOTIONAL VALUE($) (1) | | | CURRENT VALUE($) (2) | | | VALUE($) (3) | |
| Short Positions | | | | | | | | | | | | |
| | | | |
| Common Stocks | | | | | | | | | | | | |
Consumer Discretionary — 3.4% | | | | | | | | | | | | | | | | |
Hotels, Restaurants & Leisure — 1.5% | | | | | | | | | | | | | | | | |
Accor SA (France) (a) | | | 10,446 | | | | 476,147 | | | | 476,329 | | | | (182 | ) |
Buffalo Wild Wings, Inc. (a) | | | 2,616 | | | | 412,151 | | | | 412,151 | | | | — | |
Chipotle Mexican Grill, Inc. (a) | | | 769 | | | | 364,867 | | | | 364,867 | | | | — | |
ClubCorp Holdings, Inc. | | | 19,050 | | | | 256,223 | | | | 256,223 | | | | — | |
Domino’s Pizza Enterprises Ltd. (Australia) | | | 9,130 | | | | 417,850 | | | | 417,514 | | | | 336 | |
Fiesta Restaurant Group, Inc. (a) | | | 17,915 | | | | 436,230 | | | | 436,230 | | | | — | |
Merlin Entertainments plc (United Kingdom) (e) | | | 66,575 | | | | 435,882 | | | | 435,753 | | | | 129 | |
NH Hotel Group SA (Spain) (a) | | | 95,810 | | | | 496,259 | | | | 495,542 | | | | 717 | |
Penn National Gaming, Inc. (a) | | | 28,816 | | | | 532,520 | | | | 532,520 | | | | — | |
Resorttrust, Inc. (Japan) | | | 17,000 | | | | 292,496 | | | | 292,614 | | | | (118 | ) |
Shake Shack, Inc., Class A (a) | | | 15,474 | | | | 525,188 | | | | 525,188 | | | | — | |
Whitbread plc (United Kingdom) | | | 7,190 | | | | 375,759 | | | | 375,657 | | | | 102 | |
Wynn Resorts Ltd. | | | 4,719 | | | | 580,484 | | | | 580,484 | | | | — | |
| | | | | | | | | | | | | | | | |
| | | 295,510 | | | | 5,602,056 | | | | 5,601,072 | | | | 984 | |
| | | | | | | | | | | | | | | | |
Internet & Direct Marketing Retail — 0.6% | | | | | | | | | | | | | | | | |
Ocado Group plc (United Kingdom) (a) | | | 171,502 | | | | 557,545 | | | | 557,545 | | | | — | |
Rakuten, Inc. (Japan) | | | 38,000 | | | | 388,948 | | | | 389,274 | | | | (326 | ) |
TripAdvisor, Inc. (a) | | | 6,157 | | | | 277,127 | | | | 277,127 | | | | — | |
Yoox Net-A-Porter Group SpA (Italy) (a) | | | 21,541 | | | | 572,537 | | | | 572,397 | | | | 140 | |
Zalando SE (Germany) (a) (e) | | | 11,509 | | | | 507,550 | | | | 507,687 | | | | (137 | ) |
| | | | | | | | | | | | | | | | |
| | | 248,709 | | | | 2,303,707 | | | | 2,304,030 | | | | (323 | ) |
| | | | | | | | | | | | | | | | |
Media — 0.3% | | | | | | | | | | | | | | | | |
Altice NV (Netherlands), Class A (a) | | | 24,977 | | | | 620,466 | | | | 620,584 | | | | (118 | ) |
Atresmedia Corp. de Medios de Comunicacion SA (Spain) | | | 40,503 | | | | 508,702 | | | | 507,971 | | | | 731 | |
| | | | | | | | | | | | | | | | |
| | | 65,480 | | | | 1,129,168 | | | | 1,128,555 | | | | 613 | |
| | | | | | | | | | | | | | | | |
Multiline Retail — 0.6% | | | | | | | | | | | | | | | | |
B&M European Value Retail SA (Luxembourg) | | | 86,622 | | | | 378,090 | | | | 378,014 | | | | 76 | |
Isetan Mitsukoshi Holdings Ltd. (Japan) | | | 47,800 | | | | 521,844 | | | | 522,320 | | | | (476 | ) |
Izumi Co. Ltd. (Japan) | | | 11,400 | | | | 570,639 | | | | 570,167 | | | | 472 | |
Next plc (United Kingdom) | | | 5,738 | | | | 319,941 | | | | 319,857 | | | | 84 | |
Ollie’s Bargain Outlet Holdings, Inc. (a) | | | 16,839 | | | | 644,934 | | | | 644,934 | | | | — | |
| | | | | | | | | | | | | | | | |
| | | 168,399 | | | | 2,435,448 | | | | 2,435,292 | | | | 156 | |
| | | | | | | | | | | | | | | | |
Specialty Retail — 0.2% | | | | | | | | | | | | | | | | |
Dufry AG (Registered) (Switzerland) (a) | | | 3,912 | | | | 640,861 | | | | 641,008 | | | | (147 | ) |
RH (a) | | | 5,056 | | | | 242,536 | | | | 242,536 | | | | — | |
| | | | | | | | | | | | | | | | |
| | | 8,968 | | | | 883,397 | | | | 883,544 | | | | (147 | ) |
| | | | | | | | | | | | | | | | |
Textiles, Apparel & Luxury Goods — 0.2% | | | | | | | | | | | | | | | | |
Cie Financiere Richemont SA (Registered) (Switzerland) | | | 6,420 | | | | 536,505 | | | | 536,446 | | | | 59 | |
G-III Apparel Group Ltd. (a) | | | 9,777 | | | | 231,715 | | | | 231,715 | | | | — | |
| | | | | | | | | | | | | | | | |
| | | 16,197 | | | | 768,220 | | | | 768,161 | | | | 59 | |
| | | | | | | | | | | | | | | | |
Total Consumer Discretionary | | | 803,263 | | | | 13,121,996 | | | | 13,120,654 | | | | 1,342 | |
| | | | | | | | | | | | | | | | |
Consumer Staples — 1.2% | | | | | | | | | | | | | | | | |
Beverages — 0.2% | | | | | | | | | | | | | | | | |
Anheuser-Busch InBev SA (Belgium) | | | 3,243 | | | | 365,271 | | | | 365,714 | | | | (443 | ) |
Brown-Forman Corp., Class B | | | 8,956 | | | | 423,798 | | | | 423,798 | | | | — | |
| | | | | | | | | | | | | | | | |
| | | 12,199 | | | | 789,069 | | | | 789,512 | | | | (443 | ) |
| | | | | | | | | | | | | | | | |
SEE NOTES TO CONSOLIDATED FINANCIAL STATEMENTS.
| | | | | | | | |
| | | |
| APRIL 30, 2017 | | J.P. MORGAN FUNDS | | | | | 35 | |
JPMorgan Systematic Alpha Fund
ADDITIONAL INFORMATION — TOTAL RETURN BASKET SWAPS
AS OF APRIL 30, 2017 (Unaudited) (continued)
| | | | | | | | | | | | | | | | |
TOTAL RETURN BASKET
SWAP POSITIONS | | SHARES | | | NOTIONAL VALUE($) (1) | | | CURRENT VALUE($) (2) | | | VALUE($) (3) | |
| Short Positions — continued | | | | | | | | | | | | |
| | | | |
| Common Stocks — continued | | | | | | | | | | | | |
Food & Staples Retailing — 0.1% | | | | | | | | | | | | | | | | |
Costco Wholesale Corp. | | | 2,534 | | | | 449,836 | | | | 449,836 | | | | — | |
| | | | | | | | | | | | | | | | |
Food Products — 0.7% | | | | | | | | | | | | | | | | |
Calbee, Inc. (Japan) | | | 12,200 | | | | 425,728 | | | | 426,530 | | | | (802 | ) |
Greencore Group plc (Ireland) | | | 164,891 | | | | 486,932 | | | | 486,764 | | | | 168 | |
Kerry Group plc (Ireland), Class A | | | 6,213 | | | | 507,722 | | | | 507,722 | | | | — | |
Kewpie Corp. (Japan) | | | 13,300 | | | | 338,122 | | | | 338,420 | | | | (298 | ) |
Yakult Honsha Co. Ltd. (Japan) | | | 10,200 | | | | 580,112 | | | | 581,361 | | | | (1,249 | ) |
| | | | | | | | | | | | | | | | |
| | | 206,804 | | | | 2,338,616 | | | | 2,340,797 | | | | (2,181 | ) |
| | | | | | | | | | | | | | | | |
Personal Products — 0.1% | | | | | | | | | | | | | | | | |
Edgewell Personal Care Co. (a) | | | 5,096 | | | | 364,313 | | | | 364,313 | | | | — | |
| | | | | | | | | | | | | | | | |
Tobacco — 0.1% | | | | | | | | | | | | | | | | |
Vector Group Ltd. | | | 22,216 | | | | 482,532 | | | | 482,532 | | | | — | |
| | | | | | | | | | | | | | | | |
Total Consumer Staples | | | 248,849 | | | | 4,424,366 | | | | 4,426,990 | | | | (2,624 | ) |
| | | | | | | | | | | | | | | | |
Energy — 1.8% | | | | | | | | | | | | | | | | |
Energy Equipment & Services — 0.1% | | | | | | | | | | | | | | | | |
Weatherford International plc (a) | | | 81,679 | | | | 471,288 | | | | 471,288 | | | | — | |
| | | | | | | | | | | | | | | | |
Oil, Gas & Consumable Fuels — 1.7% | | | | | | | | | | | | | | | | |
Cheniere Energy, Inc. (a) | | | 10,159 | | | | 460,711 | | | | 460,711 | | | | — | |
Concho Resources, Inc. (a) | | | 3,919 | | | | 496,381 | | | | 496,381 | | | | — | |
EQT Corp. | | | 6,555 | | | | 381,108 | | | | 381,108 | | �� | | — | |
Gulfport Energy Corp. (a) | | | 15,702 | | | | 249,348 | | | | 249,348 | | | | — | |
Kosmos Energy Ltd. (a) | | | 81,313 | | | | 488,691 | | | | 488,691 | | | | — | |
MEG Energy Corp. (Canada) (a) | | | 85,944 | | | | 389,095 | | | | 389,095 | | | | — | |
Noble Energy, Inc. | | | 12,559 | | | | 406,032 | | | | 406,032 | | | | — | |
PDC Energy, Inc. (a) | | | 6,742 | | | | 372,361 | | | | 372,361 | | | | — | |
PrairieSky Royalty Ltd. (Canada) | | | 602 | | | | 13,120 | | | | 13,120 | | | | — | |
Rice Energy, Inc. (a) | | | 16,610 | | | | 353,627 | | | | 353,627 | | | | — | |
RSP Permian, Inc. (a) | | | 10,783 | | | | 410,293 | | | | 410,293 | | | | — | |
Seven Generations Energy Ltd. (Canada), Class A (a) | | | 22,400 | | | | 396,621 | | | | 396,621 | | | | — | |
SM Energy Co. | | | 11,566 | | | | 261,276 | | | | 261,276 | | | | — | |
SRC ENERGY, Inc. (a) | | | 55,331 | | | | 417,196 | | | | 417,196 | | | | — | |
Teekay Corp. (Bermuda) | | | 48,891 | | | | 424,374 | | | | 424,374 | | | | — | |
Tullow Oil plc (United Kingdom) (a) | | | 136,574 | | | | 371,292 | | | | 370,526 | | | | 766 | |
WPX Energy, Inc. (a) | | | 32,498 | | | | 387,701 | | | | 387,701 | | | | — | |
| | | | | | | | | | | | | | | | |
| | | 558,148 | | | | 6,279,227 | | | | 6,278,461 | | | | 766 | |
| | | | | | | | | | | | | | | | |
Total Energy | | | 639,827 | | | | 6,750,515 | | | | 6,749,749 | | | | 766 | |
| | | | | | | | | | | | | | | | |
Financials — 2.3% | | | | | | | | | | | | | | | | |
Banks — 0.6% | | | | | | | | | | | | | | | | |
Banco Espirito Santo SA (Registered) (Portugal) (a) | | | 35,937 | | | | — | | | | — | | | | — | |
Bank of Ireland (Ireland) (a) | | | 2,054,485 | | | | 516,967 | | | | 517,193 | | | | (226 | ) |
Bank of Kyoto Ltd. (The) (Japan) | | | 65,000 | | | | 514,286 | | | | 514,777 | | | | (491 | ) |
Royal Bank of Scotland Group plc (United Kingdom) (a) | | | 137,970 | | | | 474,266 | | | | 473,676 | | | | 590 | |
Seven Bank Ltd. (Japan) | | | 136,400 | | | | 457,624 | | | | 458,122 | | | | (498 | ) |
Standard Chartered plc (United Kingdom) (a) | | | 51,531 | | | | 481,350 | | | | 481,578 | | | | (228 | ) |
| | | | | | | | | | | | | | | | |
| | | 2,481,323 | | | | 2,444,493 | | | | 2,445,346 | | | | (853 | ) |
| | | | | | | | | | | | | | | | |
Capital Markets — 0.7% | | | | | | | | | | | | | | | | |
Charles Schwab Corp. (The) | | | 14,132 | | | | 549,028 | | | | 549,028 | | | | — | |
Financial Engines, Inc. | | | 12,372 | | | | 525,810 | | | | 525,810 | | | | — | |
Julius Baer Group Ltd. (Switzerland) (a) | | | 10,842 | | | | 564,982 | | | | 565,374 | | | | (392 | ) |
Moody’s Corp. | | | 4,908 | | | | 580,715 | | | | 580,715 | | | | — | |
SEE NOTES TO CONSOLIDATED FINANCIAL STATEMENTS.
| | | | | | |
| | | |
| 36 | | | | J.P. MORGAN FUNDS | | APRIL 30, 2017 |
| | | | | | | | | | | | | | | | |
TOTAL RETURN BASKET
SWAP POSITIONS | | SHARES | | | NOTIONAL VALUE($) (1) | | | CURRENT VALUE($) (2) | | | VALUE($) (3) | |
| Short Positions — continued | | | | | | | | | | | | |
| | | | |
| Common Stocks — continued | | | | | | | | | | | | |
Capital Markets — continued | | | | | | | | | | | | | | | | |
TD Ameritrade Holding Corp. | | | 10,906 | | | | 417,373 | | | | 417,373 | | | | — | |
| | | | | | | | | | | | | | | | |
| | | 53,160 | | | | 2,637,908 | | | | 2,638,300 | | | | (392 | ) |
| | | | | | | | | | | | | | | | |
Consumer Finance — 0.2% | | | | | | | | | | | | | | | | |
Aiful Corp. (Japan) (a) | | | 135,200 | | | | 407,510 | | | | 407,720 | | | | (210 | ) |
LendingClub Corp. (a) | | | 53,253 | | | | 311,530 | | | | 311,530 | | | | — | |
| | | | | | | | | | | | | | | | |
| | | 188,453 | | | | 719,040 | | | | 719,250 | | | | (210 | ) |
| | | | | | | | | | | | | | | | |
Diversified Financial Services — 0.4% | | | | | | | | | | | | | | | | |
Ackermans & van Haaren NV (Belgium) | | | 3,472 | | | | 568,064 | | | | 568,253 | | | | (189 | ) |
Element Fleet Management Corp. (Canada) | | | 40,395 | | | | 354,812 | | | | 354,812 | | | | — | |
Wendel SA (France) | | | 3,938 | | | | 551,865 | | | | 552,032 | | | | (167 | ) |
| | | | | | | | | | | | | | | | |
| | | 47,805 | | | | 1,474,741 | | | | 1,475,097 | | | | (356 | ) |
| | | | | | | | | | | | | | | | |
Insurance — 0.3% | | | | | | | | | | | | | | | | |
Japan Post Holdings Co. Ltd. (Japan) | | | 38,600 | | | | 478,193 | | | | 478,954 | | | | (761 | ) |
St James’s Place plc (United Kingdom) | | | 40,765 | | | | 606,131 | | | | 605,905 | | | | 226 | |
| | | | | | | | | | | | | | | | |
| | | 79,365 | | | | 1,084,324 | | | | 1,084,859 | | | | (535 | ) |
| | | | | | | | | | | | | | | | |
Thrifts & Mortgage Finance — 0.1% | | | | | | | | | | | | | | | | |
PHH Corp. (a) | | | 31,891 | | | | 411,394 | | | | 411,394 | | | | — | |
| | | | | | | | | | | | | | | | |
Total Financials | | | 2,881,997 | | | | 8,771,900 | | | | 8,774,246 | | | | (2,346 | ) |
| | | | | | | | | | | | | | | | |
Health Care — 1.3% | | | | | | | | | | | | | | | | |
Health Care Equipment & Supplies — 0.6% | | | | | | | | | | | | | | | | |
DexCom, Inc. (a) | | | 2,669 | | | | 208,075 | | | | 208,075 | | | | — | |
Insulet Corp. (a) | | | 10,249 | | | | 444,909 | | | | 444,909 | | | | — | |
Neogen Corp. (a) | | | 8,534 | | | | 531,924 | | | | 531,924 | | | | — | |
Olympus Corp. (Japan) | | | 12,400 | | | | 477,201 | | | | 478,117 | | | | (916 | ) |
Wright Medical Group NV (a) | | | 16,743 | | | | 508,820 | | | | 508,820 | | | | — | |
| | | | | | | | | | | | | | | | |
| | | 50,595 | | | | 2,170,929 | | | | 2,171,845 | | | | (916 | ) |
| | | | | | | | | | | | | | | | |
Health Care Providers & Services — 0.1% | | | | | | | | | | | | | | | | |
Diplomat Pharmacy, Inc. (a) | | | 12,075 | | | | 188,370 | | | | 188,370 | | | | — | |
Healthscope Ltd. (Australia) | | | 221,778 | | | | 367,009 | | | | 366,275 | | | | 734 | |
| | | | | | | | | | | | | | | | |
| | | 233,853 | | | | 555,379 | | | | 554,645 | | | | 734 | |
| | | | | | | | | | | | | | | | |
Life Sciences Tools & Services — 0.1% | | | | | | | | | | | | | | | | |
MorphoSys AG (Germany) (a) | | | 8,841 | | | | 536,611 | | | | 536,754 | | | | (143 | ) |
| | | | | | | | | | | | | | | | |
Pharmaceuticals — 0.5% | | | | | | | | | | | | | | | | |
Medicines Co. (The) (a) | | | 7,434 | | | | 366,645 | | | | 366,645 | | | | — | |
Nektar Therapeutics (a) | | | 11,077 | | | | 210,131 | | | | 210,131 | | | | — | |
Pacira Pharmaceuticals, Inc. (a) | | | 9,247 | | | | 448,942 | | | | 448,942 | | | | — | |
Takeda Pharmaceutical Co. Ltd. (Japan) | | | 10,600 | | | | 507,963 | | | | 508,520 | | | | (557 | ) |
TherapeuticsMD, Inc. (a) | | | 50,459 | | | | 257,341 | | | | 257,341 | | | | — | |
| | | | | | | | | | | | | | | | |
| | | 88,817 | | | | 1,791,022 | | | | 1,791,579 | | | | (557 | ) |
| | | | | | | | | | | | | | | | |
Total Health Care | | | 382,106 | | | | 5,053,941 | | | | 5,054,823 | | | | (882 | ) |
| | | | | | | | | | | | | | | | |
Industrials — 3.8% | | | | | | | | | | | | | | | | |
Aerospace & Defense — 0.5% | | | | | | | | | | | | | | | | |
Airbus SE (France) | | | 6,848 | | | | 553,720 | | | | 553,953 | | | | (233 | ) |
Bombardier, Inc. (Canada), Class B (a) | | | 273,641 | | | | 422,975 | | | | 422,975 | | | | — | |
Hexcel Corp. | | | 10,087 | | | | 522,002 | | | | 522,002 | | | | — | |
Rolls-Royce Holdings plc (United Kingdom) (a) | | | 45,843 | | | | 482,132 | | | | 481,879 | | | | 253 | |
Rolls-Royce Holdings plc (United Kingdom), Class C (a) | | | 3,254,853 | | | | 4,216 | | | | 4,216 | | | | — | |
| | | | | | | | | | | | | | | | |
| | | 3,591,272 | | | | 1,985,045 | | | | 1,985,025 | | | | 20 | |
| | | | | | | | | | | | | | | | |
SEE NOTES TO CONSOLIDATED FINANCIAL STATEMENTS.
| | | | | | | | |
| | | |
| APRIL 30, 2017 | | J.P. MORGAN FUNDS | | | | | 37 | |
JPMorgan Systematic Alpha Fund
ADDITIONAL INFORMATION — TOTAL RETURN BASKET SWAPS
AS OF APRIL 30, 2017 (Unaudited) (continued)
| | | | | | | | | | | | | | | | |
TOTAL RETURN BASKET
SWAP POSITIONS | | SHARES | | | NOTIONAL VALUE($) (1) | | | CURRENT VALUE($) (2) | | | VALUE($) (3) | |
| Short Positions — continued | | | | | | | | | | | | |
| | | | |
| Common Stocks — continued | | | | | | | | | | | | |
Air Freight & Logistics — 0.1% | | | | | | | | | | | | | | | | |
Yamato Holdings Co. Ltd. (Japan) | | | 18,500 | | | | 399,706 | | | | 399,766 | | | | (60 | ) |
| | | | | | | | | | | | | | | | |
Airlines — 0.3% | | | | | | | | | | | | | | | | |
Air France-KLM (France) (a) | | | 68,207 | | | | 573,208 | | | | 573,015 | | | | 193 | |
Spirit Airlines, Inc. (a) | | | 9,599 | | | | 549,735 | | | | 549,735 | | | | — | |
| | | | | | | | | | | | | | | | |
| | | 77,806 | | | | 1,122,943 | | | | 1,122,750 | | | | 193 | |
| | | | | | | | | | | | | | | | |
Building Products — 0.4% | | | | | | | | | | | | | | | | |
Armstrong World Industries, Inc. (a) | | | 9,971 | | | | 466,144 | | | | 466,144 | | | | — | |
Nippon Sheet Glass Co. Ltd. (Japan) (a) | | | 56,900 | | | | 442,542 | | | | 442,688 | | | | (146 | ) |
Reliance Worldwide Corp. Ltd. (Australia) | | | 235,828 | | | | 538,593 | | | | 537,241 | | | | 1,352 | |
| | | | | | | | | | | | | | | | |
| | | 302,699 | | | | 1,447,279 | | | | 1,446,073 | | | | 1,206 | |
| | | | | | | | | | | | | | | | |
Commercial Services & Supplies — 0.4% | | | | | | | | | | | | | | | | |
Bilfinger SE (Germany) (a) | | | 12,095 | | | | 525,422 | | | | 525,093 | | | | 329 | |
Brambles Ltd. (Australia) | | | 52,653 | | | | 407,671 | | | | 407,433 | | | | 238 | |
Covanta Holding Corp. | | | 28,580 | | | | 415,839 | | | | 415,839 | | | | — | |
Stericycle, Inc. (a) | | | 3,755 | | | | 320,452 | | | | 320,452 | | | | — | |
| | | | | | | | | | | | | | | | |
| | | 97,083 | | | | 1,669,384 | | | | 1,668,817 | | | | 567 | |
| | | | | | | | | | | | | | | | |
Construction & Engineering — 0.1% | | | | | | | | | | | | | | | | |
OCI NV (Netherlands) (a) | | | 24,209 | | | | 470,984 | | | | 471,071 | | | | (87 | ) |
| | | | | | | | | | | | | | | | |
Electrical Equipment — 0.2% | | | | | | | | | | | | | | | | |
Mabuchi Motor Co. Ltd. (Japan) | | | 9,600 | | | | 541,682 | | | | 541,925 | | | | (243 | ) |
| | | | | | | | | | | | | | | | |
Machinery — 0.5% | | | | | | | | | | | | | | | | |
Alstom SA (France) (a) | | | 17,378 | | | | 551,805 | | | | 551,584 | | | | 221 | |
Flowserve Corp. | | | 9,928 | | | | 505,037 | | | | 505,037 | | | | — | |
Konecranes OYJ (Finland) | | | 12,826 | | | | 538,317 | | | | 537,889 | | | | 428 | |
Proto Labs, Inc. (a) | | | 5,719 | | | | 331,702 | | | | 331,702 | | | | — | |
| | | | | | | | | | | | | | | | |
| | | 45,851 | | | | 1,926,861 | | | | 1,926,212 | | | | 649 | |
| | | | | | | | | | | | | | | | |
Road & Rail — 0.4% | | | | | | | | | | | | | | | | |
Genesee & Wyoming, Inc., Class A (a) | | | 7,032 | | | | 476,488 | | | | 476,488 | | | | — | |
Hertz Global Holdings, Inc. (a) | | | 10,213 | | | | 168,402 | | | | 168,402 | | | | — | |
Keio Corp. (Japan) | | | 45,000 | | | | 360,081 | | | | 360,381 | | �� | | (300 | ) |
Odakyu Electric Railway Co. Ltd. (Japan) | | | 18,000 | | | | 349,101 | | | | 349,432 | | | | (331 | ) |
| | | | | | | | | | | | | | | | |
| | | 80,245 | | | | 1,354,072 | | | | 1,354,703 | | | | (631 | ) |
| | | | | | | | | | | | | | | | |
Trading Companies & Distributors — 0.4% | | | | | | | | | | | | | | | | |
Ashtead Group plc (United Kingdom) | | | 26,823 | | | | 566,628 | | | | 565,857 | | | | 771 | |
Brenntag AG (Germany) | | | 8,564 | | | | 507,858 | | | | 507,689 | | | | 169 | |
Herc Holdings, Inc. (a) | | | 3,404 | | | | 154,787 | | | | 154,787 | | | | — | |
MISUMI Group, Inc. (Japan) | | | 23,600 | | | | 446,913 | | | | 447,103 | | | | (190 | ) |
| | | | | | | | | | | | | | | | |
| | | 62,391 | | | | 1,676,186 | | | | 1,675,436 | | | | 750 | |
| | | | | | | | | | | | | | | | |
Transportation Infrastructure — 0.5% | | | | | | | | | | | | | | | | |
Abertis Infraestructuras SA (Spain) | | | 34,771 | | | | 611,698 | | | | 611,261 | | | | 437 | |
Groupe Eurotunnel SE (Registered) (France) | | | 37,649 | | | | 413,597 | | | | 413,601 | | | | (4 | ) |
Mitsubishi Logistics Corp. (Japan) | | | 29,000 | | | | 374,613 | | | | 375,190 | | | | (577 | ) |
Qube Holdings Ltd. (Australia) | | | 238,453 | | | | 469,596 | | | | 468,763 | | | | 833 | |
| | | | | | | | | | | | | | | | |
| | | 339,873 | | | | 1,869,504 | | | | 1,868,815 | | | | 689 | |
| | | | | | | | | | | | | | | | |
Total Industrials | | | 4,649,529 | | | | 14,463,646 | | | | 14,460,593 | | | | 3,053 | |
| | | | | | | | | | | | | | | | |
Information Technology — 2.6% | | | | | | | | | | | | | | | | |
Communications Equipment — 0.2% | | | | | | | | | | | | | | | | |
Nokia OYJ (Finland) | | | 56,159 | | | | 321,163 | | | | 321,052 | | | | 111 | |
SEE NOTES TO CONSOLIDATED FINANCIAL STATEMENTS.
| | | | | | |
| | | |
| 38 | | | | J.P. MORGAN FUNDS | | APRIL 30, 2017 |
| | | | | | | | | | | | | | | | |
TOTAL RETURN BASKET
SWAP POSITIONS | | SHARES | | | NOTIONAL VALUE($) (1) | | | CURRENT VALUE($) (2) | | | VALUE($) (3) | |
| Short Positions — continued | | | | | | | | | | | | |
| | | | |
| Common Stocks — continued | | | | | | | | | | | | |
Communications Equipment — continued | | | | | | | | | | | | | | | | |
ViaSat, Inc. (a) | | | 4,652 | | | | 297,868 | | | | 297,868 | | | | — | |
| | | | | | | | | | | | | | | | |
| | | 60,811 | | | | 619,031 | | | | 618,920 | | | | 111 | |
| | | | | | | | | | | | | | | | |
Electronic Equipment, Instruments & Components — 0.2% | | | | | | | | | | | | | | | | |
Japan Display, Inc. (Japan) (a) | | | 146,700 | | | | 331,629 | | | | 331,621 | | | | 8 | |
Topcon Corp. (Japan) | | | 32,400 | | | | 571,705 | | | | 572,449 | | | | (744 | ) |
| | | | | | | | | | | | | | | | |
| | | 179,100 | | | | 903,334 | | | | 904,070 | | | | (736 | ) |
| | | | | | | | | | | | | | | | |
Internet Software & Services — 0.7% | | | | | | | | | | | | | | | | |
2U, Inc. (a) | | | 10,054 | | | | 456,452 | | | | 456,452 | | | | — | |
Benefitfocus, Inc. (a) | | | 6,816 | | | | 214,704 | | | | 214,704 | | | | — | |
CoStar Group, Inc. (a) | | | 1,376 | | | | 331,465 | | | | 331,465 | | | | — | |
GMO internet, Inc. (Japan) | | | 31,400 | | | | 372,659 | | | | 372,716 | | | | (57 | ) |
New Relic, Inc. (a) | | | 10,155 | | | | 405,997 | | | | 405,997 | | | | — | |
Pandora Media, Inc. (a) | | | 26,645 | | | | 289,098 | | | | 289,098 | | | | — | |
Twilio, Inc., Class A (a) | | | 18,245 | | | | 602,997 | | | | 602,997 | | | | — | |
| | | | | | | | | | | | | | | | |
| | | 104,691 | | | | 2,673,372 | | | | 2,673,429 | | | | (57 | ) |
| | | | | | | | | | | | | | | | |
IT Services — 0.2% | | | | | | | | | | | | | | | | |
InterXion Holding NV (Netherlands) (a) | | | 8,440 | | | | 351,610 | | | | 351,610 | | | | — | |
Worldpay Group plc (United Kingdom) (e) | | | 91,306 | | | | 354,779 | | | | 354,593 | | | | 186 | |
| | | | | | | | | | | | | | | | |
| | | 99,746 | | | | 706,389 | | | | 706,203 | | | | 186 | |
| | | | | | | | | | | | | | | | |
Software — 1.1% | | | | | | | | | | | | | | | | |
Autodesk, Inc. (a) | | | 5,863 | | | | 528,080 | | | | 528,080 | | | | — | |
Blackline, Inc. (a) | | | 10,765 | | | | 353,846 | | | | 353,846 | | | | — | |
FireEye, Inc. (a) | | | 19,000 | | | | 237,690 | | | | 237,690 | | | | — | |
Globant SA (a) | | | 8,103 | | | | 307,023 | | | | 307,023 | | | | — | |
HubSpot, Inc. (a) | | | 5,593 | | | | 375,011 | | | | 375,011 | | | | — | |
Imperva, Inc. (a) | | | 6,397 | | | | 284,347 | | | | 284,347 | | | | — | |
Nintendo Co. Ltd. (Japan) | | | 1,000 | | | | 251,581 | | | | 253,065 | | | | (1,484 | ) |
RingCentral, Inc., Class A (a) | | | 12,811 | | | | 409,311 | | | | 409,311 | | | | — | |
Splunk, Inc. (a) | | | 5,520 | | | | 354,991 | | | | 354,991 | | | | — | |
Tableau Software, Inc., Class A (a) | | | 5,265 | | | | 282,625 | | | | 282,625 | | | | — | |
Workday, Inc., Class A (a) | | | 3,690 | | | | 322,506 | | | | 322,506 | | | | — | |
Zendesk, Inc. (a) | | | 11,256 | | | | 323,610 | | | | 323,610 | | | | — | |
| | | | | | | | | | | | | | | | |
| | | 95,263 | | | | 4,030,621 | | | | 4,032,105 | | | | (1,484 | ) |
| | | | | | | | | | | | | | | | |
Technology Hardware, Storage & Peripherals — 0.2% | | | | | | | | | | | | | | | | |
Pure Storage, Inc., Class A (a) | | | 37,729 | | | | 400,305 | | | | 400,305 | | | | — | |
Stratasys Ltd. (a) | | | 19,245 | | | | 476,506 | | | | 476,506 | | | | — | |
| | | | | | | | | | | | | | | | |
| | | 56,974 | | | | 876,811 | | | | 876,811 | | | | — | |
| | | | | | | | | | | | | | | | |
Total Information Technology | | | 596,585 | | | | 9,809,558 | | | | 9,811,538 | | | | (1,980 | ) |
| | | | | | | | | | | | | | | | |
Materials — 1.5% | | | | | | | | | | | | | | | | |
Chemicals — 0.5% | | | | | | | | | | | | | | | | |
Axalta Coating Systems Ltd. (a) | | | 15,100 | | | | 473,687 | | | | 473,687 | | | | — | |
K+S AG (Registered) (Germany) | | | 19,824 | | | | 473,022 | | | | 472,967 | | | | 55 | |
Potash Corp. of Saskatchewan, Inc. (Canada) | | | 25,969 | | | | 437,937 | | | | 437,937 | | | | — | |
WR Grace & Co. | | | 5,376 | | | | 374,815 | | | | 374,815 | | | | — | |
| | | | | | | | | | | | | | | | |
| | | 66,269 | | | | 1,759,461 | | | | 1,759,406 | | | | 55 | |
| | | | | | | | | | | | | | | | |
Construction Materials — 0.1% | | | | | | | | | | | | | | | | |
Summit Materials, Inc., Class A (a) | | | 22,163 | | | | 568,703 | | | | 568,703 | | | | — | |
SEE NOTES TO CONSOLIDATED FINANCIAL STATEMENTS.
| | | | | | | | |
| | | |
| APRIL 30, 2017 | | J.P. MORGAN FUNDS | | | | | 39 | |
JPMorgan Systematic Alpha Fund
ADDITIONAL INFORMATION — TOTAL RETURN BASKET SWAPS
AS OF APRIL 30, 2017 (Unaudited) (continued)
| | | | | | | | | | | | | | | | |
TOTAL RETURN BASKET
SWAP POSITIONS | | SHARES | | | NOTIONAL VALUE($) (1) | | | CURRENT VALUE($) (2) | | | VALUE($) (3) | |
| Short Positions — continued | | | | | | | | | | | | |
| | | | |
| Common Stocks — continued | | | | | | | | | | | | |
Metals & Mining — 0.9% | | | | | | | | | | | | | | | | |
Antofagasta plc (Chile) | | | 46,165 | | | | 501,065 | | | | 500,879 | | | | 186 | |
First Quantum Minerals Ltd. (Canada) | | | 40,717 | | | | 388,065 | | | | 388,065 | | | | — | |
Franco-Nevada Corp. (Canada) | | | 5,646 | | | | 383,997 | | | | 383,997 | | | | — | |
Fresnillo plc (Mexico) | | | 19,643 | | | | 369,412 | | | | 369,331 | | | | 81 | |
Hecla Mining Co. | | | 85,160 | | | | 464,122 | | | | 464,122 | | | | — | |
Independence Group NL (Australia) | | | 144,620 | | | | 353,030 | | | | 354,308 | | | | (1,278 | ) |
Kobe Steel Ltd. (Japan) (a) | | | 50,300 | | | | 446,710 | | | | 446,868 | | | | (158 | ) |
thyssenkrupp AG (Germany) | | | 20,024 | | | | 476,704 | | | | 477,183 | | | | (479 | ) |
| | | | | | | | | | | | | | | | |
| | | 412,275 | | | | 3,383,105 | | | | 3,384,753 | | | | (1,648 | ) |
| | | | | | | | | | | | | | | | |
Total Materials | | | 500,707 | | | | 5,711,269 | | | | 5,712,862 | | | | (1,593 | ) |
| | | | | | | | | | | | | | | | |
Real Estate — 0.1% | | | | | | | | | | | | | | | | |
Real Estate Management & Development — 0.1% | | | | | | | | | | | | | | | | |
Capital & Counties Properties plc (United Kingdom) | | | 91,190 | | | | 372,989 | | | | 372,926 | | | | 63 | |
| | | | | | | | | | | | | | | | |
Telecommunication Services — 0.6% | | | | | | | | | | | | | | | | |
Diversified Telecommunication Services — 0.5% | | | | | | | | | | | | | | | | |
Iliad SA (France) | | | 1,728 | | | | 419,567 | | | | 419,426 | | | | 141 | |
SFR Group SA (France) (a) | | | 14,157 | | | | 463,561 | | | | 463,489 | | | | 72 | |
TalkTalk Telecom Group plc (United Kingdom) | | | 229,335 | | | | 573,871 | | | | 573,871 | | | | — | |
Zayo Group Holdings, Inc. (a) | | | 14,493 | | | | 508,270 | | | | 508,270 | | | | — | |
| | | | | | | | | | | | | | | | |
| | | 259,713 | | | | 1,965,269 | | | | 1,965,056 | | | | 213 | |
| | | | | | | | | | | | | | | | |
Wireless Telecommunication Services — 0.1% | | | | | | | | | | | | | | | | |
Sprint Corp. (a) | | | 58,023 | | | | 523,948 | | | | 523,948 | | | | — | |
| | | | | | | | | | | | | | | | |
Total Telecommunication Services | | | 317,736 | | | | 2,489,217 | | | | 2,489,004 | | | | 213 | |
| | | | | | | | | | | | | | | | |
Utilities — 1.1% | | | | | | | | | | | | | | | | |
Electric Utilities — 0.3% | | | | | | | | | | | | | | | | |
Chugoku Electric Power Co., Inc. (The) (Japan) | | | 37,500 | | | | 408,724 | | | | 408,803 | | | | (79 | ) |
Hokkaido Electric Power Co., Inc. (Japan) | | | 52,400 | | | | 380,279 | | | | 380,391 | | | | (112 | ) |
Hokuriku Electric Power Co. (Japan) | | | 34,700 | | | | 320,619 | | | | 320,720 | | | | (101 | ) |
| | | | | | | | | | | | | | | | |
| | | 124,600 | | | | 1,109,622 | | | | 1,109,914 | | | | (292 | ) |
| | | | | | | | | | | | | | | | |
Independent Power & Renewable Electricity Producers — 0.2% | | | | | | | | | | | | | | | | |
Calpine Corp. (a) | | | 29,065 | | | | 296,463 | | | | 296,463 | | | | — | |
Northland Power, Inc. (Canada) | | | 27,332 | | | | 483,148 | | | | 483,148 | | | | — | |
| | | | | | | | | | | | | | | | |
| | | 56,397 | | | | 779,611 | | | | 779,611 | | | | — | |
| | | | | | | | | | | | | | | | |
Multi-Utilities — 0.2% | | | | | | | | | | | | | | | | |
Dominion Resources, Inc. | | | 5,869 | | | | 454,437 | | | | 454,437 | | | | — | |
Sempra Energy | | | 4,216 | | | | 476,492 | | | | 476,492 | | | | — | |
| | | | | | | | | | | | | | | | |
| | | 10,085 | | | | 930,929 | | | | 930,929 | | | | — | |
| | | | | | | | | | | | | | | | |
Water Utilities — 0.4% | | | | | | | | | | | | | | | | |
American States Water Co. | | | 11,202 | | | | 498,713 | | | | 498,713 | | | | — | |
Pennon Group plc (United Kingdom) | | | 39,236 | | | | 435,514 | | | | 435,289 | | | | 225 | |
United Utilities Group plc (United Kingdom) | | | 34,137 | | | | 430,426 | | | | 430,202 | | | | 224 | |
| | | | | | | | | | | | | | | | |
| | | 84,575 | | | | 1,364,653 | | | | 1,364,204 | | | | 449 | |
| | | | | | | | | | | | | | | | |
Total Utilities | | | 275,657 | | | | 4,184,815 | | | | 4,184,658 | | | | 157 | |
| | | | | | | | | | | | | | | | |
SEE NOTES TO CONSOLIDATED FINANCIAL STATEMENTS.
| | | | | | |
| | | |
| 40 | | | | J.P. MORGAN FUNDS | | APRIL 30, 2017 |
| | | | | | | | | | | | | | | | |
TOTAL RETURN BASKET
SWAP POSITIONS | | SHARES | | | NOTIONAL VALUE($) (1) | | | CURRENT VALUE($) (2) | | | VALUE($) (3) | |
| Short Positions — continued | | | | | | | | | | | | |
| | |
Preferred Stock | | | | | | | | | |
Industrials — 0.0% (g) | | | | | | | | | | | | | | | | |
Aerospace & Defense — 0.0% (g) | | | | | | | | | | | | | | | | |
Rolls-Royce Holdings plc (Preference) (United Kingdom), Class C (a) | | | 115,485 | | | | 150 | | | | 150 | | | | — | |
| | | | | | | | | | | | | | | | |
Total Short Positions of Total Return Basket Swap | | | 11,502,931 | | | | 75,154,362 | | | | 75,158,193 | | | | (3,831 | ) |
| | | | | | | | | | | | | | | | |
Total of Long and Short Positions of Total Return Basket Swap | | | 7,216,065 | | | | 2,798,835 | | | | 2,787,893 | | | | (10,942 | ) |
| | | | | | | | | | | | | | | | |
Outstanding swap contract, at value | | | | | | | | | | | | | | $ | (10,942 | ) |
| | | | | | | | | | | | | | | | |
Percentages indicated are based on net assets.
NOTES TO ADDITIONAL INFORMATION-TOTAL RETURN BASKET SWAPS:
CVR — Contingent Value Rights
| (1) | Notional value represents the market value (including any fees or commissions) of the long and short positions as of the reset date. |
| (2) | Current value represents market value as of April 30, 2017 of these positions based on the securities’ last sale or closing price on the principal exchange on which the securities are traded. |
| (3) | Value represents the unrealized gain (loss) of the positions subsequent to the swap reset. |
| (a) | Non-income producing security. |
| (g) | Amount rounds to less than 0.05%. |
SEE NOTES TO CONSOLIDATED FINANCIAL STATEMENTS.
| | | | | | | | |
| | | |
| APRIL 30, 2017 | | J.P. MORGAN FUNDS | | | | | 41 | |
CONSOLIDATED STATEMENT OF ASSETS AND LIABILITIES
AS OF APRIL 30, 2017 (Unaudited)
| | | | |
| | | Systematic
Alpha Fund | |
ASSETS: | |
Investments in non-affiliates, at value | | $ | 238,814,147 | |
Investments in affiliates, at value | | | 118,754,602 | |
| | | | |
Total investment securities, at value | | | 357,568,749 | |
Restricted cash | | | 2,040,000 | |
Cash | | | 4,007,506 | |
Foreign currency, at value | | | 5,550,767 | |
Deposits at broker for futures contracts | | | 10,495,000 | |
Receivables: | | | | |
Investment securities sold | | | 4,739,212 | |
Fund shares sold | | | 95,490 | |
Interest from non-affiliates | | | 437,918 | |
Dividends from affiliates | | | 61,498 | |
Tax reclaims | | | 28,864 | |
Unrealized appreciation on forward foreign currency exchange contracts | | | 1,372,701 | |
Due from counterparty for swap contracts | | | 657,203 | |
Other assets | | | 4,768 | |
| | | | |
Total Assets | | | 387,059,676 | |
| | | | |
| |
LIABILITIES: | | | | |
Payables: | | | | |
Investment securities purchased | | | 470,348 | |
Fund shares redeemed | | | 37,566 | |
Variation margin on futures contracts | | | 208,165 | |
Unrealized depreciation on forward foreign currency exchange contracts | | | 872,623 | |
Outstanding swap contracts, at value | | | 20,111 | |
Due to counterparty for swap contracts | | | 2,244,607 | |
Accrued liabilities: | | | | |
Investment advisory fees | | | 170,047 | |
Administration fees | | | 4,095 | |
Distribution fees | | | 11,979 | |
Service fees | | | 22,142 | |
Custodian and accounting fees | | | 38,770 | |
Other | | | 169,445 | |
| | | | |
Total Liabilities | | | 4,269,898 | |
| | | | |
Net Assets | | $ | 382,789,778 | |
| | | | |
SEE NOTES TO CONSOLIDATED FINANCIAL STATEMENTS.
| | | | | | |
| | | |
| 42 | | | | J.P. MORGAN FUNDS | | APRIL 30, 2017 |
| | | | |
| | | Systematic
Alpha Fund | |
NET ASSETS: | |
Paid-in-Capital | | $ | 376,896,548 | |
Accumulated undistributed (distributions in excess of) net investment income | | | (5,326,638 | ) |
Accumulated net realized gains (losses) | | | (6,444,731 | ) |
Net unrealized appreciation (depreciation) | | | 17,664,599 | |
| | | | |
Total Net Assets | | $ | 382,789,778 | |
| | | | |
|
Net Assets: | |
Class A | | $ | 56,198,887 | |
Class C | | | 444,753 | |
Class I (formerly Select Class) | | | 51,407,083 | |
Class R6 | | | 274,739,055 | |
| | | | |
Total | | $ | 382,789,778 | |
| | | | |
|
Outstanding units of beneficial interest (shares) | |
($0.0001 par value; unlimited number of shares authorized): | | | | |
Class A | | | 3,701,748 | |
Class C | | | 29,807 | |
Class I (formerly Select Class) | | | 3,294,121 | |
Class R6 | | | 17,765,426 | |
| |
Net Asset Value (a):
| | | | |
Class A — Redemption price per share | | $ | 15.18 | |
Class C — Offering price per share (b) | | | 14.92 | |
Class I (formerly Select Class) — Offering and redemption price per share | | | 15.61 | |
Class R6 — Offering and redemption price per share | | | 15.46 | |
Class A maximum sales charge | | | 4.50 | % |
Class A maximum public offering price per share
[net asset value per share/(100% — maximum sales charge)] | | $ | 15.90 | |
| | | | |
| |
Cost of investments in non-affiliates | | $ | 224,200,182 | |
Cost of investments in affiliates | | | 118,754,602 | |
Cost of foreign currency | | | 5,433,361 | |
| (a) | Per share amounts may not recalculate due to rounding of net assets and/or shares outstanding. |
| (b) | Redemption price for Class C Shares varies based upon length of time the shares are held. |
SEE NOTES TO CONSOLIDATED FINANCIAL STATEMENTS.
| | | | | | | | |
| | | |
| APRIL 30, 2017 | | J.P. MORGAN FUNDS | | | | | 43 | |
CONSOLIDATED STATEMENT OF OPERATIONS
FOR THE SIX MONTHS ENDED APRIL 30, 2017 (Unaudited)
| | | | |
| | | Systematic
Alpha Fund | |
INVESTMENT INCOME: | |
Dividend income from non-affiliates | | $ | 2,345,096 | |
Dividend income from affiliates | | | 242,052 | |
Interest income from non-affiliates | | | 315,384 | |
Interest income from affiliates | | | 2,631 | |
Foreign taxes withheld | | | (79,085 | ) |
| | | | |
Total investment income | | | 2,826,078 | |
| | | | |
|
EXPENSES: | |
Investment advisory fees | | | 1,519,677 | |
Administration fees | | | 169,981 | |
Distribution fees: | | | | |
Class A | | | 62,065 | |
Class C | | | 1,870 | |
Service fees: | | | | |
Class A | | | 62,065 | |
Class C | | | 623 | |
Class I (formerly Select Class) | | | 56,001 | |
Custodian and accounting fees | | | 112,468 | |
Interest expense to affiliates | | | 2,577 | |
Professional fees | | | 86,480 | |
Trustees’ and Chief Compliance Officer’s fees | | | 23,925 | |
Printing and mailing costs | | | 12,837 | |
Registration and filing fees | | | 43,075 | |
Transfer agency fees (See Note 2.F.) | | | 2,238 | |
Sub-transfer agency fees (See Note 2.F.) | | | 7,828 | |
Other | | | 5,800 | |
| | | | |
Total expenses | | | 2,169,510 | |
| | | | |
Less fees waived | | | (728,042 | ) |
Less earnings credits | | | (376 | ) |
| | | | |
Net expenses | | | 1,441,092 | |
| | | | |
Net investment income (loss) | | | 1,384,986 | |
| | | | |
| |
REALIZED/UNREALIZED GAINS (LOSSES): | | | | |
Net realized gain (loss) on transactions from: | |
Investments in non-affiliates | | | 7,149,993 | |
Futures | | | (8,329,259 | ) |
Foreign currency transactions | | | 3,654,587 | |
Swaps | | | (7,426,793 | ) |
| | | | |
Net realized gain (loss) | | | (4,951,472 | ) |
| | | | |
Change in net unrealized appreciation/depreciation on: | |
Investments in non-affiliates | | | 11,794,060 | |
Futures | | | 1,370,072 | |
Foreign currency translations | | | (483,723 | ) |
Swaps | | | (68,382 | ) |
| | | | |
Change in net unrealized appreciation/depreciation | | | 12,612,027 | |
| | | | |
Net realized/unrealized gains (losses) | | | 7,660,555 | |
| | | | |
Change in net assets resulting from operations | | $ | 9,045,541 | |
| | | | |
SEE NOTES TO CONSOLIDATED FINANCIAL STATEMENTS.
| | | | | | |
| | | |
| 44 | | | | J.P. MORGAN FUNDS | | APRIL 30, 2017 |
CONSOLIDATED STATEMENT OF CHANGES IN NET ASSETS
FOR THE PERIODS INDICATED
| | | | | | | | |
| | | Systematic Alpha Fund | |
| | | Six Months Ended
April 30, 2017
(Unaudited) | | | Year Ended
October 31, 2016 | |
CHANGE IN NET ASSETS RESULTING FROM OPERATIONS: | |
Net investment income (loss) | | $ | 1,384,986 | | | $ | 1,982,641 | |
Net realized gain (loss) | | | (4,951,472 | ) | | | (7,924,104 | ) |
Change in net unrealized appreciation/depreciation | | | 12,612,027 | | | | 4,956,512 | |
| | | | | | | | |
Change in net assets resulting from operations | | | 9,045,541 | | | | (984,951 | ) |
| | | | | | | | |
|
DISTRIBUTIONS TO SHAREHOLDERS: | |
Class A | | | | | | | | |
From net investment income | | | — | | | | (988,643 | ) |
From net realized gains | | | (83,124 | ) | | | — | |
Class C | | | | | | | | |
From net investment income | | | — | | | | (13,623 | ) |
From net realized gains | | | (1,193 | ) | | | — | |
Class I (formerly Select Class) | | | | | | | | |
From net investment income | | | (33,272 | ) | | | — | |
From net realized gains | | | (83,117 | ) | | | — | |
Class R6 | | | | | | | | |
From net investment income | | | (598,010 | ) | | | (6,365,412 | ) |
From net realized gains | | | (482,836 | ) | | | — | |
| | | | | | | | |
Total distributions to shareholders | | | (1,281,552 | ) | | | (7,367,678 | ) |
| | | | | | | | |
|
CAPITAL TRANSACTIONS: | |
Change in net assets resulting from capital transactions | | | 39,163,306 | | | | 23,949,299 | |
| | | | | | | | |
|
NET ASSETS: | |
Change in net assets | | | 46,927,295 | | | | 15,596,670 | |
Beginning of period | | | 335,862,483 | | | | 320,265,813 | |
| | | | | | | | |
End of period | | $ | 382,789,778 | | | $ | 335,862,483 | |
| | | | | | | | |
Accumulated undistributed (distributions in excess of) net investment income | | $ | (5,326,638 | ) | | $ | (6,080,342 | ) |
| | | | | | | | |
SEE NOTES TO CONSOLIDATED FINANCIAL STATEMENTS.
| | | | | | | | |
| | | |
| APRIL 30, 2017 | | J.P. MORGAN FUNDS | | | | | 45 | |
CONSOLIDATED STATEMENT OF CHANGES IN NET ASSETS
FOR THE PERIODS INDICATED (continued)
| | | | | | | | |
| | | Systematic Alpha Fund | |
| | | Six Months Ended
April 30, 2017
(Unaudited) | | | Year Ended
October 31, 2016 | |
CAPITAL TRANSACTIONS: | | | | | | | | |
Class A | | | | | | | | |
Proceeds from shares issued | | $ | 27,051,112 | | | $ | 34,490,135 | |
Distributions reinvested | | | 83,124 | | | | 988,643 | |
Cost of shares redeemed | | | (15,009,504 | ) | | | (39,177,739 | ) |
| | | | | | | | |
Change in net assets resulting from Class A capital transactions | | $ | 12,124,732 | | | $ | (3,698,961 | ) |
| | | | | | | | |
Class C | | | | | | | | |
Proceeds from shares issued | | $ | 308,997 | | | $ | 587,296 | |
Distributions reinvested | | | 1,193 | | | | 13,623 | |
Cost of shares redeemed | | | (645,377 | ) | | | (269,858 | ) |
| | | | | | | | |
Change in net assets resulting from Class C capital transactions | | $ | (335,187 | ) | | $ | 331,061 | |
| | | | | | | | |
Class I (formerly Select Class) | | | | | | | | |
Proceeds from shares issued | | $ | 24,581,741 | | | $ | 39,913,331 | |
Distributions reinvested | | | 76,067 | | | | — | |
Cost of shares redeemed | | | (7,197,351 | ) | | | (268,520,160 | ) |
| | | | | | | | |
Change in net assets resulting from Class I capital transactions | | $ | 17,460,457 | | | $ | (228,606,829 | ) |
| | | | | | | | |
Class R6 | | | | | | | | |
Proceeds from shares issued | | $ | 12,318,147 | | | $ | 271,927,080 | |
Distributions reinvested | | | 1,080,846 | | | | 6,365,412 | |
Cost of shares redeemed | | | (3,485,689 | ) | | | (22,368,464 | ) |
| | | | | | | | |
Change in net assets resulting from Class R6 capital transactions | | $ | 9,913,304 | | | $ | 255,924,028 | |
| | | | | | | | |
Total change in net assets resulting from capital transactions | | $ | 39,163,306 | | | $ | 23,949,299 | |
| | | | | | | | |
|
SHARE TRANSACTIONS: | |
Class A | |
Issued | | | 1,791,712 | | | | 2,319,369 | |
Reinvested | | | 5,508 | | | | 66,219 | |
Redeemed | | | (995,615 | ) | | | (2,633,244 | ) |
| | | | | | | | |
Change in Class A Shares | | | 801,605 | | | | (247,656 | ) |
| | | | | | | | |
Class C | |
Issued | | | 20,881 | | | | 39,656 | |
Reinvested | | | 80 | | | | 922 | |
Redeemed | | | (43,414 | ) | | | (18,540 | ) |
| | | | | | | | |
Change in Class C Shares | | | (22,453 | ) | | | 22,038 | |
| | | | | | | | |
Class I (formerly Select Class) | | | | | | | | |
Issued | | | 1,590,355 | | | | 2,616,027 | |
Reinvested | | | 4,900 | | | | — | |
Redeemed | | | (464,104 | ) | | | (17,537,819 | ) |
| | | | | | | | |
Change in Class I Shares | | | 1,131,151 | | | | (14,921,792 | ) |
| | | | | | | | |
Class R6 | |
Issued | | | 798,739 | | | | 17,544,824 | |
Reinvested | | | 70,226 | | | | 420,437 | |
Redeemed | | | (226,232 | ) | | | (1,470,170 | ) |
| | | | | | | | |
Change in Class R6 Shares | | | 642,733 | | | | 16,495,091 | |
| | | | | | | | |
SEE NOTES TO CONSOLIDATED FINANCIAL STATEMENTS.
| | | | | | |
| | | |
| 46 | | | | J.P. MORGAN FUNDS | | APRIL 30, 2017 |
THIS PAGE IS INTENTIONALLY LEFT BLANK
| | | | | | | | |
| | | |
| APRIL 30, 2017 | | J.P. MORGAN FUNDS | | | | | 47 | |
FINANCIAL HIGHLIGHTS
FOR THE PERIODS INDICATED
| | | | | | | | | | | | | | | | | | | | | | | | | | | | |
| | | Per share operating performance | |
| | | | | | Investment Operations | | | Distributions | |
| | | Net asset
value,
beginning
of period | | | Net
investment
income
(loss) | | | Net realized
and unrealized
gains
(losses) on
investments | | | Total from
investment
operations | | | Net
investment
income | | | Net
realized
gain | | | Total
distributions | |
Systematic Alpha Fund | | | | | | | | | | | | | | | | | | | | | | | | | | | | |
Class A | | | | | | | | | | | | | | | | | | | | | | | | | | | | |
Six Months Ended April 30, 2017 (Unaudited) | | $ | 14.85 | | | $ | 0.03 | (e) | | $ | 0.33 | | | $ | 0.36 | | | $ | — | | | $ | (0.03 | ) | | $ | (0.03 | ) |
Year Ended October 31, 2016 | | | 15.27 | | | | 0.03 | (e) | | | (0.14 | ) | | | (0.11 | ) | | | (0.31 | )(f) | | | — | | | | (0.31 | ) |
Year Ended October 31, 2015 | | | 15.16 | | | | (0.01 | )(e) | | | 0.29 | | | | 0.28 | | | | (0.15 | ) | | | (0.02 | ) | | | (0.17 | ) |
Year Ended October 31, 2014 | | | 15.60 | | | | (0.11 | )(e)(g) | | | 0.79 | | | | 0.68 | | | | (1.12 | ) | | | — | | | | (1.12 | ) |
February 12, 2013 (i) through October 31, 2013 | | | 15.00 | | | | 0.03 | | | | 0.57 | | | | 0.60 | | | | — | | | | — | | | | — | |
| | | | | | | |
Class C | | | | | | | | | | | | | | | | | | | | | | | | | | | | |
Six Months Ended April 30, 2017 (Unaudited) | | | 14.63 | | | | (0.01 | )(e)(g) | | | 0.33 | | | | 0.32 | | | | — | | | | (0.03 | ) | | | (0.03 | ) |
Year Ended October 31, 2016 | | | 15.14 | | | | (0.04 | )(e) | | | (0.14 | ) | | | (0.18 | ) | | | (0.33 | )(f) | | | — | | | | (0.33 | ) |
Year Ended October 31, 2015 | | | 15.10 | | | | (0.07 | )(e) | | | 0.27 | | | | 0.20 | | | | (0.14 | ) | | | (0.02 | ) | | | (0.16 | ) |
Year Ended October 31, 2014 | | | 15.55 | | | | (0.12 | )(e)(g) | | | 0.72 | | | | 0.60 | | | | (1.05 | ) | | | — | | | | (1.05 | ) |
February 12, 2013 (i) through October 31, 2013 | | | 15.00 | | | | (0.02 | ) | | | 0.57 | | | | 0.55 | | | | — | | | | — | | | | — | |
| | | | | | | |
Class I (formerly Selcet Class) | | | | | | | | | | | | | | | | | | | | | | | | | | | | |
Six Months Ended April 30, 2017 (Unaudited) | | | 15.26 | | | | 0.05 | (e) | | | 0.34 | | | | 0.39 | | | | (0.01 | ) | | | (0.03 | ) | | | (0.04 | ) |
Year Ended October 31, 2016 | | | 15.33 | | | | 0.06 | (e) | | | (0.13 | ) | | | (0.07 | ) | | | — | (f) | | | — | | | | — | |
Year Ended October 31, 2015 | | | 15.19 | | | | 0.04 | (e) | | | 0.28 | | | | 0.32 | | | | (0.16 | ) | | | (0.02 | ) | | | (0.18 | ) |
Year Ended October 31, 2014 | | | 15.63 | | | | (0.05 | )(e)(g) | | | 0.76 | | | | 0.71 | | | | (1.15 | ) | | | — | | | | (1.15 | ) |
February 12, 2013 (i) through October 31, 2013 | | | 15.00 | | | | 0.06 | | | | 0.57 | | | | 0.63 | | | | — | | | | — | | | | — | |
| | | | | | | |
Class R6 | | | | | | | | | | | | | | | | | | | | | | | | | | | | |
Six Months Ended April 30, 2017 (Unaudited) | | | 15.13 | | | | 0.07 | (e) | | | 0.33 | | | | 0.40 | | | | (0.04 | ) | | | (0.03 | ) | | | (0.07 | ) |
Year Ended October 31, 2016 | | | 15.56 | | | | 0.11 | (e) | | | (0.15 | ) | | | (0.04 | ) | | | (0.39 | )(f) | | | — | | | | (0.39 | ) |
Year Ended October 31, 2015 | | | 15.21 | | | | 0.09 | (e) | | | 0.28 | | | | 0.37 | | | | — | | | | (0.02 | ) | | | (0.02 | ) |
Year Ended October 31, 2014 | | | 15.64 | | | | 0.01 | (e)(g) | | | 0.73 | | | | 0.74 | | | | (1.17 | ) | | | — | | | | (1.17 | ) |
February 12, 2013 (i) through October 31, 2013 | | | 15.00 | | | | 0.07 | | | | 0.57 | | | | 0.64 | | | | — | | | | — | | | | — | |
| (a) | Annualized for periods less than one year, unless otherwise noted. |
| (b) | Not annualized for periods less than one year. |
| (c) | Includes adjustments in accordance with accounting principles generally accepted in the United States of America and as such, the net asset values for financial reporting purposes and the returns based upon those net asset values may differ from the net asset values and returns for shareholder transactions. |
| (d) | Includes earnings credits and interest expense, if applicable, each of which is less than 0.005% unless otherwise noted. |
| (e) | Calculated based upon average shares outstanding. |
| (f) | Distributions of Net investment income (loss) may appear disproportionate among classes due to the timing of recognition of income and changes in the relative size of the classes. |
| (g) | Net investment income (loss) may appear disproportionate among classes due to the timing of recognition of income and changes in the relative size of the classes. |
| (h) | Expenses without waivers, reimbursements and earnings credits may appear disproportionate among classes due to changes in the relative size of the classes. |
| (i) | Commencement of operations. |
| (j) | Certain non-recurring expenses incurred by the Fund were not annualized for the period ended October 31, 2013. |
SEE NOTES TO CONSOLIDATED FINANCIAL STATEMENTS.
| | | | | | |
| | | |
| 48 | | | | J.P. MORGAN FUNDS | | APRIL 30, 2017 |
| | | | | | | | | | | | | | | | | | | | | | | | | | |
| | | Ratios/Supplemental data | |
| | | | | | | | | | Ratios to average net assets (a) | |
Net asset
value,
end of
period | | | Total return
(excludes
sales charge) (b)(c) | | | Net assets,
end of
period | | | Net
expenses (d) | | | Net
investment
income
(loss) (d) | | | Expenses
without waivers,
reimbursements and
earnings credits | | | Portfolio
turnover
rate (b) | |
| | | | | | | | | | | | | | | | | | | | | | | | | | |
| | | | | | | | | | | | | | | | | | | | | | | | | | |
| $ | 15.18 | | | | 2.42 | % | | $ | 56,198,887 | | | | 1.20 | % | | | 0.37 | % | | | 1.60 | % | | | 72 | % |
| | 14.85 | | | | (0.74 | ) | | | 43,075,837 | | | | 1.18 | | | | 0.18 | | | | 1.66 | | | | 151 | |
| | 15.27 | | | | 1.87 | | | | 48,072,671 | | | | 1.16 | | | | (0.05 | ) | | | 1.69 | | | | 164 | |
| | 15.16 | | | | 4.68 | | | | 61,579,047 | | | | 1.24 | | | | (0.71 | )(g) | | | 1.66 | (h) | | | 113 | |
| | 15.60 | | | | 4.00 | | | | 52,013 | | | | 1.30 | (j) | | | 0.28 | (j) | | | 6.93 | (j) | | | 112 | |
| | | | | | |
| | | | | | | | | | | | | | | | | | | | | | | | | | |
| | 14.92 | | | | 2.18 | | | | 444,753 | | | | 1.71 | | | | (0.20 | )(g) | | | 2.24 | | | | 72 | |
| | 14.63 | | | | (1.23 | ) | | | 764,511 | | | | 1.69 | | | | (0.29 | ) | | | 2.26 | | | | 151 | |
| | 15.14 | | | | 1.34 | | | | 457,517 | | | | 1.62 | | | | (0.50 | ) | | | 2.26 | | | | 164 | |
| | 15.10 | | | | 4.16 | | | | 53,974 | | | | 1.77 | | | | (0.80 | )(g) | | | 5.85 | (h) | | | 113 | |
| | 15.55 | | | | 3.67 | | | | 51,827 | | | | 1.80 | (j) | | | (0.22 | )(j) | | | 7.43 | (j) | | | 112 | |
| | | | | | |
| | | | | | | | | | | | | | | | | | | | | | | | | | |
| | 15.61 | | | | 2.56 | | | | 51,407,083 | | | | 0.95 | | | | 0.61 | | | | 1.39 | | | | 72 | |
| | 15.26 | | | | (0.46 | ) | | | 33,006,202 | | | | 0.94 | | | | 0.42 | | | | 1.40 | | | | 151 | |
| | 15.33 | | | | 2.11 | | | | 261,973,042 | | | | 0.90 | | | | 0.24 | | | | 1.35 | | | | 164 | |
| | 15.19 | | | | 4.91 | | | | 131,267,018 | | | | 1.00 | | | | (0.31 | )(g) | | | 2.97 | (h) | | | 113 | |
| | 15.63 | | | | 4.20 | | | | 10,264,916 | | | | 1.05 | (j) | | | 0.54 | (j) | | | 6.68 | (j) | | | 112 | |
| | | | | | |
| | | | | | | | | | | | | | | | | | | | | | | | | | |
| | 15.46 | | | | 2.61 | | | | 274,739,055 | | | | 0.70 | | | | 0.88 | | | | 1.10 | | | | 72 | |
| | 15.13 | | | | (0.25 | ) | | | 259,015,933 | | | | 0.69 | | | | 0.70 | | | | 1.12 | | | | 151 | |
| | 15.56 | | | | 2.44 | | | | 9,762,583 | | | | 0.64 | | | | 0.59 | | | | 1.10 | | | | 164 | |
| | 15.21 | | | | 5.08 | | | | 54,788 | | | | 0.88 | | | | 0.09 | (g) | | | 4.84 | (h) | | | 113 | |
| | 15.64 | | | | 4.27 | | | | 52,144 | | | | 0.95 | (j) | | | 0.63 | (j) | | | 6.44 | (j) | | | 112 | |
SEE NOTES TO CONSOLIDATED FINANCIAL STATEMENTS.
| | | | | | | | |
| | | |
| APRIL 30, 2017 | | J.P. MORGAN FUNDS | | | | | 49 | |
NOTES TO CONSOLIDATED FINANCIAL STATEMENTS
AS OF APRIL 30, 2017 (Unaudited)
1. Organization
JPMorgan Trust I (the “Trust”) was formed on November 12, 2004, as a Delaware statutory trust, pursuant to a Declaration of Trust dated November 5, 2004 and is registered under the Investment Company Act of 1940, as amended (the “1940 Act”), as an open-end management investment company.
The following is a separate fund of the Trust (the “Fund”) covered by this report:
| | | | |
| | | Classes Offered | | Diversified/Non-Diversified |
| Systematic Alpha Fund | | Class A, Class C, Class I^ and Class R6 | | Diversified |
| ^ | Effective April 3, 2017, Select Class was renamed Class I. |
The investment objective of the Fund is to seek to provide total return.
Class A Shares generally provide for a front-end sales charge while Class C Shares provide for a contingent deferred sales charge (“CDSC”). No sales charges are assessed with respect to Class I and Class R6 Shares. All classes of shares have equal rights as to earnings, assets and voting privileges, except that each class may bear different transfer agency, sub-transfer agency (through April 2, 2017), distribution and service fees and each class has exclusive voting rights with respect to its distribution plan and shareholder servicing agreements. Effective April 3, 2017, sub-transfer agency and shareholder servicing fees were consolidated into a single service fee. Certain Class A Shares, for which front-end sales charges have been waived, may be subject to a CDSC as described in the Fund’s prospectus. Beginning on November 14, 2017, Class C Shares will automatically convert to Class A after ten years.
J.P. Morgan Investment Management Inc. (“JPMIM”) an indirect, wholly-owned subsidiary of JPMorgan Chase & Co. (“JPMorgan”) acts as Adviser (the “Adviser”) and Administrator (the “Administrator”) to the Fund.
Basis for Consolidation for the Fund
Systematic Alpha Fund CS Ltd. (the “Subsidiary”), a Cayman Islands exempted company, was incorporated on October 11, 2012 and is currently a wholly-owned subsidiary of the Fund. The Subsidiary acts as an investment vehicle for the Fund in order to effect certain investments on behalf of the Fund consistent with the Fund’s investment objectives and policies as described in the Fund’s prospectus. As of April 30, 2017, net assets of the Fund were $382,789,778 of which $51,949,464 or approximately 13.6% represented the Subsidiary’s net assets. The net realized loss in the Subsidiary amounted to $(1,563,953). The Consolidated Schedule of Portfolio Investments (“CSOI”) includes positions of the Fund and the Subsidiary. The consolidated financial statements include the accounts of the Fund and the Subsidiary. Subsequent references to the Fund within the Notes to Consolidated Financial Statements collectively refer to the Fund and the Subsidiary. All significant intercompany balances and transactions have been eliminated in consolidation.
2. Significant Accounting Policies
The following is a summary of significant accounting policies followed by the Fund in the preparation of its consolidated financial statements. The Fund is an investment company and, accordingly, follows the investment company accounting and reporting guidance of the Financial Accounting Standards Board Accounting Standards Codification Topic 946 — Investment Companies, which is part of U.S. generally accepted accounting principles (“GAAP”). The preparation of financial statements in conformity with GAAP requires management to make estimates and assumptions that affect the reported amounts of assets and liabilities and disclosure of contingent assets and liabilities at the date of the financial statements and the reported amounts of increases and decreases in net assets from operations during the reporting period. Actual results could differ from those estimates.
A. Valuation of Investments — The valuation of investments is in accordance with GAAP and the Fund’s valuation policies set forth by and under the supervision and responsibility of the Board of Trustees (the “Board”), which established the following approach to valuation, as described more fully below: (i) investments for which market quotations are readily available shall be valued at such unadjusted quoted prices and (ii) all other investments for which market quotations are not readily available shall be valued at their fair value as determined in good faith by the Board.
The Administrator has established the J.P. Morgan Investment Management Americas Valuation Committee (“AVC”) to assist the Board with the oversight and monitoring of the valuation of the Fund’s investments. The Administrator implements the valuation policies of the Fund’s investments, as directed by the Board. The AVC oversees and carries out the policies for the valuation of investments held in the Fund. This includes monitoring the appropriateness of fair values based on results of ongoing valuation oversight, including but not limited to consideration of macro or security specific events, market events and pricing vendor and broker due diligence. The Administrator is responsible for discussing and assessing the potential impacts to the fair values on an ongoing basis, and at least on a quarterly basis with the AVC and the Board.
A market-based approach is primarily used to value the Fund’s investments. Investments for which market quotations are not readily available are fair valued by approved affiliated and unaffiliated pricing vendors or third party broker-dealers (collectively referred to as “Pricing Services”) or may be internally fair valued using methods set forth by the valuation policies approved by the Board. This may include related or comparable assets or liabilities, recent transactions, market multiples, book values, and other relevant information for the investment to determine the fair value of the investment. An income-based valuation approach may be used in which the anticipated future cash flows of the investment are discounted to calculate the fair value. Discounts may also be applied due to the nature or duration of any restrictions on the disposition of the investments. Valuations may be based upon current market prices of securities that are comparable in coupon, rating, maturity and industry. It is possible that the estimated values may differ significantly from the values that would have been used, had a ready market for the investments existed, and such differences could be material.
| | | | | | |
| | | |
| 50 | | | | J.P. MORGAN FUNDS | | APRIL 30, 2017 |
Fixed income instruments are valued based on prices received from Pricing Services. The Pricing Services use multiple valuation techniques to determine the valuation of fixed income instruments. In instances where sufficient market activity exists, the Pricing Services may utilize a market-based approach through which trades or quotes from market makers are used to determine the valuation of fixed income instruments. In instances where sufficient market activity may not exist, the Pricing Services also utilize proprietary valuation models which may consider market transactions in comparable securities and the various relationships between securities in determining fair value and/or market characteristics in order to estimate the relevant cash flows, which are then discounted to calculate the fair values.
Equities and other exchange-traded instruments are valued at the last sale price or official market closing price on the primary exchange on which the instrument is traded before the net asset values (“NAV”) of the Fund are calculated on a valuation date. Certain foreign equity instruments, as well as certain derivatives with equity reference obligations, are valued by applying international fair value factors provided by approved Pricing Services. The factors seek to adjust the local closing price for movements of local markets post closing, but prior to the time the NAVs are calculated.
Investments in open-end investment companies (the “Underlying Funds”) are valued at each Underlying Fund’s NAV per share as of the report date.
Futures are generally valued on the basis of available market quotations. Swaps and forward foreign currency exchange contracts are valued utilizing market quotations from approved Pricing Services.
Valuations reflected in this report are as of the report date. As a result, changes in valuation due to market events and/or issuer related events after the report date and prior to issuance of the report are not reflected herein.
The various inputs that are used in determining the valuation of the Fund’s investments are summarized into the three broad levels listed below.
| • | | Level 1 — Unadjusted inputs using quoted prices in active markets for identical investments. |
| • | | Level 2 — Other significant observable inputs including, but not limited to, quoted prices for similar investments, inputs other than quoted prices that are observable for investments (such as interest rates, prepayment speeds, credit risk, etc.) or other market corroborated inputs. |
| • | | Level 3 — Significant inputs based on the best information available in the circumstances, to the extent observable inputs are not available (including the Fund’s assumptions in determining the fair value of investments). |
A financial instrument’s level within the fair value hierarchy is based on the lowest level of any input, both individually and in the aggregate, that is significant to the fair value measurement. The inputs or methodology used for valuing instruments are not necessarily an indication of the risk associated with investing in those instruments.
The following table represents each valuation input as presented on the CSOI:
| | | | | | | | | | | | | | | | |
| | | Level 1
Quoted prices | | | Level 2
Other significant
observable inputs | | | Level 3
Significant
unobservable inputs | | | Total | |
Investments in Securities | | | | | | | | | | | | | | | | |
Common Stocks | | | | | | | | | | | | | | | | |
Consumer Discretionary | | $ | 30,182,286 | | | $ | 3,885,928 | | | $ | — | | | $ | 34,068,214 | |
Consumer Staples | | | 16,845,976 | | | | 3,015,451 | | | | — | | | | 19,861,427 | |
Energy | | | 7,897,778 | | | | 1,136,810 | | | | — | | | | 9,034,588 | |
Financials | | | 18,987,567 | | | | — | | | | — | | | | 18,987,567 | |
Health Care | | | 20,699,252 | | | | 2,026,595 | | | | — | | | | 22,725,847 | |
Industrials | | | 16,346,914 | | | | 5,806,004 | | | | — | | | | 22,152,918 | |
Information Technology | | | 37,149,681 | | | | 4,091,600 | | | | — | | | | 41,241,281 | |
Materials | | | 17,927,383 | | | | 10,014,730 | | | | — | | | | 27,942,113 | |
Real Estate | | | 1,767,721 | | | | — | | | | — | | | | 1,767,721 | |
Telecommunication Services | | | 1,821,987 | | | | 927,422 | | | | — | | | | 2,749,409 | |
Utilities | | | 6,166,130 | | | | 527,795 | | | | — | | | | 6,693,925 | |
| | | | | | | | | | | | | | | | |
Total Common Stocks | | | 175,792,675 | | | | 31,432,335 | | | | — | | | | 207,225,010 | |
| | | | | | | | | | | | | | | | |
Convertible Preferred Stocks | | | | | | | | | | | | | | | | |
Energy | | | 1,215,411 | | | | — | | | | — | | | | 1,215,411 | |
Financials | | | 892,818 | | | | — | | | | — | | | | 892,818 | |
Health Care | | | 1,218,179 | | | | — | | | | — | | | | 1,218,179 | |
Industrials | | | 285,161 | | | | — | | | | — | | | | 285,161 | |
Real Estate | | | 300,247 | | | | — | | | | — | | | | 300,247 | |
Telecommunication Services | | | 1,267,048 | | | | — | | | | — | | | | 1,267,048 | |
Utilities | | | 1,114,447 | | | | — | | | | — | | | | 1,114,447 | |
| | | | | | | | | | | | | | | | |
Total Convertible Preferred Stocks | | | 6,293,311 | | | | — | | | | — | | | | 6,293,311 | |
| | | | | | | | | | | | | | | | |
| | | | | | | | |
| | | |
| APRIL 30, 2017 | | J.P. MORGAN FUNDS | | | | | 51 | |
NOTES TO CONSOLIDATED FINANCIAL STATEMENTS
AS OF APRIL 30, 2017 (continued)
| | | | | | | | | | | | | | | | |
| | | Level 1
Quoted prices | | | Level 2
Other significant
observable inputs | | | Level 3
Significant
unobservable inputs | | | Total | |
Preferred Stock | | | | | | | | | | | | | | | | |
Consumer Staples | | $ | 435,449 | | | $ | — | | | $ | — | | | $ | 435,449 | |
| | | | | | | | | | | | | | | | |
Debt Securities | | | | | | | | | | | | | | | | |
Convertible Bonds | | | | | | | | | | | | | | | | |
Consumer Discretionary | | | — | | | | 2,652,385 | | | | — | | | | 2,652,385 | |
Financials | | | — | | | | 1,914,946 | | | | — | | | | 1,914,946 | |
Health Care | | | — | | | | 6,782,200 | | | | — | | | | 6,782,200 | |
Industrials | | | — | | | | 571,369 | | | | — | | | | 571,369 | |
Information Technology | | | — | | | | 10,677,109 | | | | — | | | | 10,677,109 | |
Materials | | | — | | | | 900,649 | | | | — | | | | 900,649 | |
Real Estate | | | — | | | | 591,875 | | | | — | | | | 591,875 | |
Utilities | | | — | | | | 769,844 | | | | — | | | | 769,844 | |
| | | | | | | | | | | | | | | | |
Total Convertible Bonds | | | — | | | | 24,860,377 | | | | — | | | | 24,860,377 | |
| | | | | | | | | | | | | | | | |
Rights | | | | | | | | | | | | | | | | |
Health Care | | | — | | | | — | | | | — | (a) | | | — | (a) |
Short-Term Investments | | | | | | | | | | | | | | | | |
Investment Companies | | | 118,754,602 | | | | — | | | | — | | | | 118,754,602 | |
| | | | | | | | | | | | | | | | |
Total Investments in Securities | | $ | 301,276,037 | | | $ | 56,292,712 | | | $ | — | (a) | | $ | 357,568,749 | |
| | | | | | | | | | | | | | | | |
Appreciation in Other Financial Instruments | | | | | | | | | | | | | | | | |
Forward Foreign Currency Exchange Contracts | | $ | — | | | $ | 1,372,701 | | | $ | — | | | $ | 1,372,701 | |
Futures Contracts | | | 4,062,258 | | | | 641,696 | | | | — | | | | 4,703,954 | |
| | | | | | | | | | | | | | | | |
Total Appreciation in Other Financial Instruments | | $ | 4,062,258 | | | $ | 2,014,397 | | | $ | — | | | $ | 6,076,655 | |
| | | | | | | | | | | | | | | | |
Depreciation in Other Financial Instruments | | | | | | | | | | | | | | | | |
Forward Foreign Currency Exchange Contracts | | $ | — | | | $ | (872,623 | ) | | $ | — | | | $ | (872,623 | ) |
Futures Contracts | | | (2,185,632 | ) | | | (62,666 | ) | | | — | | | | (2,248,298 | ) |
Swaps | | | — | | | | (20,111 | ) | | | — | | | | (20,111 | ) |
| | | | | | | | | | | | | | | | |
Total Depreciation in Other Financial Instruments | | $ | (2,185,632 | ) | | $ | (955,400 | ) | | $ | — | | | $ | (3,141,032 | ) |
| | | | | | | | | | | | | | | | |
Transfers between fair value levels are valued utilizing values as of beginning of the period.
There were no significant transfers between Level 1 and Level 2 during the period ended April 30, 2017.
B. Restricted Securities — Certain securities held by the Fund may be subject to legal or contractual restrictions on resale. Restricted securities generally are resold in transactions exempt from registration under the Securities Act of 1933 (the “Securities Act”). Disposal of these securities may involve time-consuming negotiations and expense. Prompt sale at the current valuation may be difficult and could adversely affect the net asset value of the Fund.
As of April 30, 2017, the Fund had no investments in restricted securities other than securities sold to the Fund under Rule 144A and/or Regulation S under the Securities Act.
C. Derivatives — The Fund used derivative instruments including futures, forward foreign currency exchange contracts and swaps, in connection with its investment strategy. Derivative instruments may be used as substitutes for securities in which the Fund can invest, to hedge portfolio investments or to generate income or gains to the Fund. Derivatives may also be used to manage duration, sector and yield curve exposures and credit and spread volatility. Certain derivatives are synthetic instruments that attempt to replicate the performance of certain reference assets.
The Fund may be subject to various risks from the use of derivatives including the risk that changes in the value of a derivative may not correlate perfectly with the underlying asset, rate or index; counterparty credit risk related to derivatives counterparties’ failure to perform under contract terms; liquidity risk related to the lack of a liquid market for these contracts allowing the Fund to close out its position(s); and, documentation risk relating to disagreement over contract terms. Investing in certain derivatives also results in a form of leverage and as such, the Fund’s risk of loss associated with these instruments may exceed its value, as recorded in the Consolidated Statement of Assets and Liabilities (“CSAL”).
| | | | | | |
| | | |
| 52 | | | | J.P. MORGAN FUNDS | | APRIL 30, 2017 |
The Fund is party to various derivative contracts governed by International Swaps and Derivatives Association master agreements (“ISDA agreements”). The Fund’s ISDA agreements, which are separately negotiated with each dealer counterparty, may contain provisions allowing, absent other considerations, a counterparty to exercise rights, to the extent not otherwise waived, against the Fund in the event the Fund’s net assets decline over time by a pre-determined percentage or fall below a pre-determined floor. The ISDA agreements also contain provisions allowing, absent other conditions, the Fund to exercise rights, to the extent not otherwise waived, against the counterparty (i.e., decline in a counterparty’s credit rating below a specified level). Such rights for both the counterparty and Fund often include the ability to terminate (e.g., close out) open contracts at prices which may favor the counterparty, which could have an adverse effect on the Fund. The ISDA agreements give the Fund and counterparty the right, upon an event of default, to close out all transactions traded under such agreements and to net amounts owed or due across all transactions and offset such net payable or receivable with collateral posted to a segregated account by one party to the other.
Counterparty credit risk may be mitigated to the extent a counterparty posts collateral for mark-to-market gains to the Fund.
Notes C(1) — C(4) below describe the various derivatives used by the Fund.
(1). Futures Contracts — The Fund used index, treasury and commodity futures to obtain long and short exposure to the underlying commodities markets. The purchase of futures contracts will tend to increase the Fund’s exposure to positive and negative price fluctuations in the underlying instrument. The sale of futures contracts will tend to offset both positive and negative market price changes. The Fund also used index, equity or other financial futures contracts to manage and hedge interest rate risk associated with portfolio investments and to seek to enhance portfolio performance.
Futures contracts provide for the delayed delivery of the underlying instrument at a fixed price or are settled for a cash amount based on the change in the value of the underlying instrument at a specific date in the future. Upon entering into a futures contract, the Fund is required to deposit with the broker, cash or securities in an amount equal to a certain percentage of the contract amount, which is referred to as the initial margin deposit. Subsequent payments, referred to as variation margin, are made or received by the Fund periodically and are based on changes in the market value of open futures contracts. Changes in the market value of open futures contracts are recorded as Change in net unrealized appreciation/depreciation in the Consolidated Statement of Operations (“CSOP”). Realized gains or losses, representing the difference between the value of the contract at the time it was opened and the value at the time it was closed, are reported in the CSOP at the closing or expiration of the futures contract. Cash deposited is recorded on the CSAL. A receivable from and/or a payable to brokers for the daily variation margin is also recorded on the CSAL.
The use of futures contracts exposes the Fund to interest rate risk, commodities risk and equity price risk. The Fund may be subject to the risk that the change in the value of the futures contract may not correlate perfectly with the underlying instrument. Use of long futures contracts subjects the Fund to risk of loss in excess of the amounts shown on the CSAL, up to the notional amount of the futures contracts. Use of short futures contracts subjects the Fund to unlimited risk of loss. The Fund may enter into futures contracts only on exchanges or boards of trade. The exchange or board of trade acts as the counterparty to each futures transaction; therefore, the Fund’s credit risk is limited to failure of the exchange or board of trade. Under some circumstances, futures exchanges may establish daily limits on the amount that the price of a futures contract can vary from the previous day’s settlement price, which could effectively prevent liquidation of positions.
The Fund’s futures contracts are not subject to master netting arrangements (the right to close out all transactions traded with a counterparty and net amounts owed or due across transactions).
(2). Forward Foreign Currency Exchange Contracts — The Fund may be exposed to foreign currency risks associated with some or all of the portfolio investments and used forward foreign currency exchange contracts to hedge or manage certain of these exposures as part of an investment strategy. The Fund also bought forward foreign currency exchange contracts to gain exposure to currencies. Forward foreign currency exchange contracts represent obligations to purchase or sell foreign currency on a specified future date at a price fixed at the time the contracts are entered into. Non-deliverable forward foreign currency exchange contracts are settled with the counterparty in U.S. Dollar without the delivery of foreign currency.
The values of the forward foreign currency exchange contracts are adjusted daily based on the applicable exchange rate of the underlying currency. Changes in the value of these contracts are recorded as unrealized appreciation or depreciation until the contract settlement date. When the forward foreign currency exchange contract is closed, the Fund records a realized gain or loss equal to the difference between the value at the time the contract was opened and the value at the time it was closed. The Fund also records a realized gain or loss when a forward foreign currency exchange contract offsets another forward foreign currency exchange contract with the same counterparty upon settlement.
The Fund’s forward foreign currency exchange contracts are subject to master netting arrangements (the right to close out all transactions with a counterparty and net amounts owed or due across transactions). The Funds may be required to post or receive collateral for Non-Deliverable forward foreign currency exchange contracts.
(3). Total Return Basket Swaps — The Fund entered into total return basket swap agreements to obtain exposure to a portfolio of long and short securities. This is a highly specialized activity and a significant aspect of the Fund’s investment strategy.
Under the terms of the agreements, each swap is designed to function as a portfolio of direct investments in long and short equity positions. This means that the Fund has the ability to trade in and out of long and short positions within each swap and will receive all of the economic benefits and risks equivalent to direct investments in these positions such as: capital appreciation (depreciation), corporate actions and dividends received and paid, all of which are reflected in each swap value. Each swap value also includes interest charges and credits related to the notional values of the
| | | | | | | | |
| | | |
| APRIL 30, 2017 | | J.P. MORGAN FUNDS | | | | | 53 | |
NOTES TO CONSOLIDATED FINANCIAL STATEMENTS
AS OF APRIL 30, 2017 (continued)
long and short positions and cash balances within each swap. These interest charges and credits are based on defined market rates based on the local currencies of the positions in the portfolio plus or minus a specified spread and are referred to herein as “financing costs”. Positions within each swap, accrued financing costs and net dividends, are part of the monthly reset. During a reset, any unrealized gains (losses) on positions, accrued financing costs, and net dividends become available for cash settlement between the Fund and the swap counterparty are recorded as Due from/to counterparty for swap contract on the CSAL and as net realized gain (loss) on transactions from swaps on the CSOP.
The Fund may be required to post or receive collateral based on the net value of the Fund’s outstanding OTC swap contracts with the counterparty in the form of cash or securities. Daily movement of collateral is subject to minimum threshold amounts. Collateral posted by the Fund is held in a segregated account at the Fund’s custodian bank. For certain counterparties cash collateral posted or received by the Fund is reported on the CSAL as Restricted cash.
Each swap involves additional risks than if the Fund had invested in the underlying positions directly including: the risk that changes in the value of each swap may not correlate perfectly with the underlying long and short securities; counterparty risk related to the counterparty’s failure to perform under contract terms; liquidity risk related to the lack of a liquid market for each swap contract, which may limit the ability of the Fund to close out its positions; and, documentation risk relating to disagreement over contract terms. The total return basket swaps consist of securities that are denominated in foreign currencies. Changes in currency exchange rates will affect the value of, and investment income from, such securities. The Fund’s activities in each total return basket swap are concentrated with a single counterparty. Investing in swaps results in a form of leverage (i.e., the Fund’s risk of loss associated with these instruments may exceed their value as recorded on the CSAL).
The value of each swap is derived from a combination of (i) the net value of the underlying positions, which are valued daily using the last sale or closing prices on the principal exchange on which the underlying securities are traded; (ii) financing costs; (iii) the value of dividends; (iv) cash balances within the swap; and (v) other factors, as applicable. The value of each swap is reflected on the CSAL as Outstanding swap contracts, at value. Changes in the value of each swap are recognized as Change in net unrealized appreciation/depreciation of swaps on the CSOP.
The total return basket swaps contracts are subject to master netting arrangements. The Fund may be required to post or receive collateral for total return basket swaps.
(4). Summary of Derivatives Information — The following tables present the value of derivatives held as of April 30, 2017, by their primary underlying risk exposure and respective location on the CSAL:
| | | | | | | | | | | | | | | | | | |
| Derivative Contracts | | CSAL Location | | | | | | | | | | | | |
| Gross Assets: | | | | Futures
Contracts (a) | | | Forward Foreign
Currency Exchange
Contracts | | | Swaps | | | Total | |
Interest rate contracts | | Receivables, Net Assets — Unrealized Appreciation | | $ | 2,286,702 | | | $ | — | | | $ | — | | | $ | 2,286,702 | |
Equity contracts | | Receivables, Net Assets — Unrealized Appreciation | | | 677,866 | | | | — | | | | — | | | | 677,866 | |
Foreign exchange contracts | | Receivables | | | — | | | | 1,372,701 | | | | — | | | | 1,372,701 | |
Commodity contracts | | Receivables, Net Assets — Unrealized Appreciation | | | 1,739,386 | | | | — | | | | — | | | | 1,739,386 | |
| | | | | | | | | | | | | | | | | | |
Total | | | | $ | 4,703,954 | | | $ | 1,372,701 | | | $ | — | | | $ | 6,076,655 | |
| | | | | | | | | | | | | | | | | | |
| Gross Liabilities: | | | | | | | | | | | | | | |
Interest rate contracts | | Payables, Net Assets — Unrealized Depreciation | | $ | (1,103,386 | ) | | $ | — | | | $ | — | | | $ | (1,103,386 | ) |
Equity contracts | | Payables, Net Assets — Unrealized Depreciation | | | (481,812 | ) | | | — | | | | (20,111 | ) | | | (501,923 | ) |
Foreign exchange contracts | | Payables | | | — | | | | (872,623 | ) | | | — | | | | (872,623 | ) |
Commodity contracts | | Payables, Net Assets — Unrealized Depreciation | | | (663,100 | ) | | | — | | | | — | | | | (663,100 | ) |
| | | | | | | | | | | | | | | | | | |
Total | | | | $ | (2,248,298 | ) | | $ | (872,623 | ) | | $ | (20,111 | ) | | $ | (3,141,032 | ) |
| | | | | | | | | | | | | | | | | | |
| (a) | This amount represents the cumulative appreciation/depreciation of futures contracts as reported on the CSOI. The CSAL only reflects the current day variation margin receivable/payable from/to brokers. |
| | | | | | |
| | | |
| 54 | | | | J.P. MORGAN FUNDS | | APRIL 30, 2017 |
The following tables present the Fund’s gross derivative assets and liabilities by counterparty net of amounts available for offset under netting arrangements and any related collateral received or posted by the Fund as of April 30, 2017:
| | | | | | | | | | | | | | | | |
| Counterparty | | Gross Amount of
Derivative Assets
Presented on the
CSAL (a) | | | Derivatives
Available
for offset | | | Collateral
Received | | | Net Amount Due From Counterparty
(Not less than zero) | |
Australia and New Zealand Banking Group Ltd. | | $ | 81,419 | | | $ | — | | | $ | — | | | $ | 81,419 | |
Citibank, NA | | | 23,897 | | | | (23,897 | ) | | | — | | | | — | |
Goldman Sachs International | | | 112,253 | | | | (112,253 | ) | | | — | | | | — | |
HSBC Bank, NA | | | 52,080 | | | | (16,738 | ) | | | — | | | | 35,342 | |
Merrill Lynch International | | | 279,721 | | | | (222,792 | ) | | | (56,929 | )(b) | | | — | |
Morgan Stanley | | | 574,994 | | | | — | | | | — | | | | 574,994 | |
National Australia Bank | | | 28,057 | | | | — | | | | — | | | | 28,057 | |
Royal Bank of Canada | | | 1,351 | | | | (1,351 | ) | | | — | | | | — | |
State Street Corp. | | | 218,929 | | | | — | | | | — | | | | 218,929 | |
| | | | | | | | | | | | | | | | |
| | $ | 1,372,701 | | | $ | (377,031 | ) | | $ | (56,929 | ) | | $ | 938,741 | |
| | | | | | | | | | | | | | | | |
| | | | |
| Counterparty | | Gross Amount of
Derivative Liabilities
Presented on the
CSAL (a) | | | Derivatives
Available
for offset | | | Collateral
Posted | | | Net Amount Due To Counterparty (Not less than zero) | |
Bank of America, NA | | $ | 6,405 | | | $ | — | | | $ | — | | | $ | 6,405 | |
Citibank, NA | | | 318,881 | | | | (23,897 | ) | | | — | | | | 294,984 | |
Goldman Sachs International | | | 192,084 | | | | (112,253 | ) | | | — | | | | 79,831 | |
HSBC Bank, NA | | | 16,738 | | | | (16,738 | ) | | | — | | | | — | |
Merrill Lynch International | | | 222,792 | | | | (222,792 | ) | | | — | | | | — | |
Royal Bank of Canada | | | 122,128 | | | | (1,351 | ) | | | — | | | | 120,777 | |
Union Bank of Switzerland AG | | | 13,706 | | | | — | | | | — | | | | 13,706 | |
| | | | | | | | | | | | | | | | |
| | $ | 892,734 | | | $ | (377,031 | ) | | $ | — | | | $ | 515,703 | |
| | | | | | | | | | | | | | | | |
| (a) | For financial reporting purposes, the Fund does not offset derivative assets and derivative liabilities subject to master netting arrangements in the CSAL. |
| (b) | Collateral received or posted is limited to the net derivative asset or net derivative liability amounts. Collateral posted is presented as Restricted cash on the CSAL. |
The following tables present the effect of derivatives on the CSOP for the six months ended April 30, 2017, by primary underlying risk exposure:
| | | | | | | | | | | | | | | | |
| Amount of Realized Gain (Loss) on Derivatives Recognized on the CSOP | |
| Derivative Contracts | | Futures Contracts | | | Forward Foreign
Currency Exchange
Contracts | | | Swaps | | | Total | |
Interest rate contracts | | $ | (2,691,950 | ) | | $ | — | | | $ | — | | | $ | (2,691,950 | ) |
Equity contracts | | | (4,005,395 | ) | | | — | | | | (7,426,793 | ) | | | (11,432,188 | ) |
Foreign exchange contracts | | | — | | | | 3,758,736 | | | | — | | | | 3,758,736 | |
Commodity contracts | | | (1,631,914 | ) | | | — | | | | — | | | | (1,631,914 | ) |
| | | | | | | | | | | | | | | | |
Total | | $ | (8,329,259 | ) | | $ | 3,758,736 | | | $ | (7,426,793 | ) | | $ | (11,997,316 | ) |
| | | | | | | | | | | | | | | | |
|
| Amount of Change in Unrealized Appreciation (Depreciation) on Derivatives Recognized on the CSOP | |
| Derivative Contracts | | Futures Contracts | | | Forward Foreign
Currency Exchange
Contracts | | | Swaps | | | Total | |
Interest rate contracts | | $ | 1,710,023 | | | $ | — | | | $ | — | | | $ | 1,710,023 | |
Equity contracts | | | (1,098,477 | ) | | | — | | | | (68,382 | ) | | | (1,166,859 | ) |
Foreign exchange contracts | | | — | | | | (605,696 | ) | | | — | | | | (605,696 | ) |
Commodity contracts | | | 758,526 | | | | — | | | | — | | | | 758,526 | |
| | | | | | | | | | | | | | | | |
Total | | $ | 1,370,072 | | | $ | (605,696 | ) | | $ | (68,382 | ) | | $ | 695,994 | |
| | | | | | | | | | | | | | | | |
| | | | | | | | |
| | | |
| APRIL 30, 2017 | | J.P. MORGAN FUNDS | | | | | 55 | |
NOTES TO CONSOLIDATED FINANCIAL STATEMENTS
AS OF APRIL 30, 2017 (continued)
The Fund’s derivatives contracts held at April 30, 2017 are not accounted for as hedging instruments under GAAP.
Derivatives Volume
The table discloses the volume of the Fund’s futures contracts, forward foreign currency exchange contracts and swaps activity during the six months ended April 30, 2017. Please refer to the table in the Summary of Derivatives Information for derivative-related gains and losses associated with volume activity.
| | | | |
Futures Contracts: | | | | |
Commodity | | | | |
Average Notional Balance Long | | $ | 26,820,467 | |
Average Notional Balance Short | | | 23,226,790 | |
Ending Notional Balance Long | | | 31,125,900 | |
Ending Notional Balance Short | | | 26,463,371 | |
| |
Equity | | | | |
Average Notional Balance Long | | $ | 14,509,430 | |
Average Notional Balance Short | | | 52,861,104 | |
Ending Notional Balance Long | | | 25,321,287 | |
Ending Notional Balance Short | | | 51,061,725 | |
| |
Interest | | | | |
Average Notional Balance Long | | $ | 108,993,137 | |
Average Notional Balance Short | | | 102,636,349 | |
Ending Notional Balance Long | | | 120,068,952 | |
Ending Notional Balance Short | | | 112,684,761 | |
| |
Forward Foreign Currency Exchange Contracts: | | | | |
Average Settlement Value Purchased | | $ | 50,338,497 | |
Average Settlement Value Sold | | | 101,063,409 | |
Ending Settlement Value Purchased | | | 45,309,923 | |
Ending Settlement Value Sold | | | 94,118,514 | |
| |
Total Return Basket Swaps: | | | | |
Average Notional Balance Long | | $ | 140,317,724 | |
Average Notional Balance Short | | | 180,437,430 | |
Ending Notional Balance Long | | | 156,013,884 | |
Ending Notional Balance Short | | | 204,883,748 | |
D. Foreign Currency Translation — The books and records of the Fund are maintained in U.S. dollars. Foreign currency amounts are translated into U.S. dollars at the prevailing exchange rates of such currencies against the U.S. dollar. The market value of investment securities and other assets and liabilities are translated at the exchange rate as of the valuation date. Purchases and sales of investment securities, income and expenses are translated at the exchange rate prevailing on the respective dates of such transactions.
The Fund does not isolate the effect of changes in foreign exchange rates from changes in market prices on securities held. Accordingly, such changes are included within Change in net unrealized appreciation/depreciation on investments on the CSOP.
Reported realized foreign currency gains and losses arise from the disposition of foreign currency, currency gains or losses realized between the trade and settlement dates on securities transactions, and the difference between the amounts of dividends, interest and foreign withholding taxes recorded on the Fund’s books on the transaction date and the U.S. dollar equivalent of the amounts actually received or paid. These reported realized foreign currency gains and losses are included in Net realized gain (loss) on foreign currency transactions on the CSOP. Unrealized foreign currency gains and losses arise from changes (due to changes in exchange rates) in the value of foreign currency and other assets and liabilities denominated in foreign currencies, which are held at year end and are included in Change in net unrealized appreciation/depreciation on foreign currency translations on the CSOP.
E. Security Transactions and Investment Income — Investment transactions are accounted for on the trade date (the date the order to buy or sell is executed). Securities gains and losses are calculated on a specifically identified cost basis. Interest income is determined on the basis of coupon interest accrued using the effective interest method which adjusts for amortization of premiums and accretion of discounts. Dividend income, net of foreign taxes withheld, if any, is recorded on the ex-dividend date or when the Fund first learns of the dividend.
F. Allocation of Income and Expenses — Expenses directly attributable to a fund are charged directly to that fund, while the expenses attributable to more than one fund of the Trust are allocated among the respective funds. In calculating the NAV of each class, investment income, realized and unrealized gains and losses and expenses, other than class specific expenses, are allocated daily to each class of shares based upon the proportion of net assets of each class at the beginning of each day.
| | | | | | |
| | | |
| 56 | | | | J.P. MORGAN FUNDS | | APRIL 30, 2017 |
Transfer agency fees are class-specific expenses and sub-transfer agency fees were class specific expenses up through April 2, 2017. Effective April 3, 2017, the Fund ceased making direct payments to financial intermediaries for any applicable sub-transfer agency services. Payments to financial intermediaries for sub-transfer agency services are made by JPMorgan Distribution Services, Inc. from the Shareholder Servicing Fee which has been renamed as the Service Fee. The amount of the transfer agency fees and sub-transfer agency fees charged to each class of the Fund for the six months ended April 30, 2017 are as follows:
| | | | | | | | | | | | | | | | | | | | |
| | | Class A | | | Class C | | | Class I | | | Class R6 | | | Total | |
Transfer agency fees | | $ | 494 | | | $ | 79 | | | $ | 696 | | | $ | 969 | | | $ | 2,238 | |
Sub-transfer agency fees | | | — | | | | 259 | | | | 7,569 | | | | — | | | | 7,828 | |
G. Federal Income Taxes — The Fund is treated as a separate taxable entity for Federal income tax purposes. The Fund’s policy is to comply with the provisions of the Internal Revenue Code of 1986, as amended (the “Code”), applicable to regulated investment companies and to distribute to shareholders all of its distributable net investment income and net realized capital gains on investments. Accordingly, no provision for Federal income tax is necessary. Management has reviewed the Fund’s tax positions and has determined that as of April 30, 2017, no liability for income tax is required in the Fund’s consolidated financial statements for net unrecognized tax benefits. However, management’s conclusions may be subject to future review based on changes in, or the interpretation of, the accounting standards or tax laws and regulations. The Fund’s Federal tax returns for the prior three fiscal years remains subject to examination by the Internal Revenue Service.
For Federal income tax purposes, taxable income of the Fund and the Subsidiary are separately calculated. The Subsidiary is classified as a controlled foreign corporation under the Code and its taxable income, including net gains, is included as ordinary income in the calculation of the Fund’s taxable income. Net losses of the Subsidiary are not deductible by the Fund either in the current period or carried forward to future periods.
H. Foreign Taxes — The Fund may be subject to foreign taxes on income, gains on investments or currency purchases/repatriation, a portion of which may be recoverable. The Fund will accrue such taxes and recoveries as applicable, based upon its current interpretation of tax rules and regulations that exist in the markets in which it invests.
I. Distributions to Shareholders — Distributions from net investment income or net realized capital gains, if any, are generally declared and paid annually and are declared separately for each class. No class has preferential dividend rights; differences in per share rates are due to differences in separate class expenses. The amount of distributions from net investment income and net realized capital gains is determined in accordance with Federal income tax regulations, which may differ from GAAP. To the extent these “book/tax” differences are permanent in nature (i.e., that they result from other than timing of recognition — “temporary differences”), such amounts are reclassified within the capital accounts based on their Federal tax-basis treatment.
3. Fees and Other Transactions with Affiliates
A. Investment Advisory Fee — Pursuant to an Investment Advisory Agreement, the Adviser supervises the investments of the Fund and the Subsidiary and for such services is paid a fee. The fee for services to the Fund is accrued daily and paid monthly at an annual rate of 0.75% of the Fund’s average daily net assets.
The Subsidiary has entered into separate contracts with the Adviser and its affiliates to provide investment advisory and other services to the Subsidiary. The fee for services to the Subsidiary is accrued daily and paid monthly at an annual rate of 0.75% of the Subsidiary’s average daily net assets. The Adviser has agreed to waive the advisory fee that it receives from the Fund in an amount equal to the advisory fee paid to the Adviser by the Subsidiary. This waiver will continue in effect so long as the Fund invests in the Subsidiary and may not be terminated without approval by the Fund’s Board.
The Adviser waived Investment Advisory fees and/or reimbursed expenses as outlined in Note 3.F.
B. Administration Fees — Pursuant to an Administration Agreement, the Administrator provides certain administration services to the Fund and the Subsidiary. In consideration of these services for the Fund, the Administrator receives a fee accrued daily and paid monthly at the annual rate of 0.15% of the first $25 billion of the average daily net assets of all funds in the J.P. Morgan Funds Complex covered by the Administration Agreement (excluding certain funds of funds and money market funds) and 0.075% of the average daily net assets in excess of $25 billion of all such funds. For the six months ended April 30, 2017, the effective annualized rate was 0.09% of the Fund’s average daily net assets, notwithstanding any fee waivers and/or expense reimbursements. In consideration for services rendered to the Subsidiary, the Administrator receives a fee accrued daily and paid monthly at an annual rate of 0.10% of the average daily net assets of the Subsidiary.
The Administrator waived Administration fees as outlined in Note 3.F.
JPMCB, a wholly-owned subsidiary of JPMorgan, serves as the Fund’s sub-administrator (the “Sub-administrator”). For its services as Sub-administrator, JPMCB receives a portion of the fees payable to the Administrator.
C. Distribution Fees — Pursuant to a Distribution Agreement, JPMorgan Distribution Services, Inc. (“JPMDS”), a wholly-owned subsidiary of JPMorgan, serves as the Trust’s principal underwriter and promotes and arranges for the sale of the Fund’s shares.
The Board of Trustees has adopted a Distribution Plan (the “Distribution Plan”) for Class A and Class C Shares of the Fund in accordance with Rule 12b-1 under the 1940 Act. The Distribution Plan provides that the Fund shall pay distribution fees, including payments to JPMDS, at annual rates of 0.25% and 0.75% of the average daily net assets of Class A and Class C Shares, respectively.
| | | | | | | | |
| | | |
| APRIL 30, 2017 | | J.P. MORGAN FUNDS | | | | | 57 | |
NOTES TO CONSOLIDATED FINANCIAL STATEMENTS
AS OF APRIL 30, 2017 (continued)
In addition, JPMDS is entitled to receive the front-end sales charges from purchases of Class A Shares and the CDSC from redemptions of Class C Shares and certain Class A Shares for which front-end sales charges have been waived. For the six months ended April 30, 2017, JPMDS retained the following:
| | | | | | | | |
| | | Front-End Sales Charge | | | CDSC | |
| | $ | 243 | | | $ | — | |
D. Service Fees — The Trust, on behalf of the Fund, has entered into a Shareholder Servicing Agreement with JPMDS under which JPMDS provides certain support services to the shareholders. The Class R6 Shares do not participate in the shareholder servicing agreement. For performing these services, JPMDS receives a fee that is accrued daily and paid monthly at an annual rate of 0.25% of the average daily net assets for Class A, Class C and Class I Shares.
JPMDS has entered into shareholder services contracts with affiliated and unaffiliated financial intermediaries who provide shareholder services and other related services to their clients or customers who invest in the Fund under which JPMDS will pay all or a portion of such fees earned to financial intermediaries for performing such services.
JPMDS waived service fees as outlined in Note 3.F.
E. Custodian and Accounting Fees — JPMCB provides portfolio custody and accounting services to the Fund. For performing these services, the Fund pays JPMCB transaction and asset-based fees that vary according to the number of transactions and positions, plus out-of-pocket expenses. The amounts paid directly to JPMCB by the Fund for custody and accounting services are included in Custodian and accounting fees on the CSOP. Payments to the custodian may be reduced by credits earned by the Fund, based on uninvested cash balances held by the custodian. Such earnings credits, if any, are presented separately on the CSOP.
Interest income earned on cash balances at the custodian, if any, is included in Interest income from affiliates on the CSOP.
Interest expense paid to the custodian related to cash overdrafts, if any, is included in Interest expense to affiliates on the CSOP.
F. Waivers and Reimbursements — The Adviser, Administrator and/or JPMDS have contractually agreed to waive fees and/or reimburse the Fund to the extent total annual operating expenses of the Fund, inclusive of the Subsidiary (excluding acquired fund fees and expenses other than certain money market fund fees as described below, dividend and interest expenses related to short sales, interest, taxes, expenses related to litigation and potential litigation and extraordinary expenses) exceed the percentages of the Fund’s average daily net assets as shown in the table below:
| | | | | | | | | | | | | | | | |
| | | Class A | | | Class C | | | Class I | | | Class R6 | |
| | | 1.25 | % | | | 1.75 | % | | | 1.00 | % | | | 0.75 | % |
The expense limitation agreement was in effect for the six months ended April 30, 2017, and is in place until at least February 28, 2018.
For the six months ended April 30, 2017, the Fund’s service providers waived fees and/or reimbursed expenses for the Fund as follows. None of these parties expect the Fund to repay any such waived fees and reimbursed expenses in future years.
| | | | | | | | | | | | | | | | |
| | | Contractual Waivers | |
| | | Investment
Advisory
Fees | | | Administration
Fees | | | Service
Fees | | | Total | |
| | $ | 482,288 | | | $ | 146,813 | | | $ | 8,748 | | | $ | 637,849 | |
Additionally, the Fund may invest in one or more money market funds advised by the Adviser or its affiliates (affiliated money market funds). The Adviser, Administrator and/or JPMDS, as shareholder servicing agent, have contractually agreed to waive fees and/or reimburse expenses in an amount sufficient to offset the respective net fees each collects from the affiliated money market fund on the Fund’s investment in such affiliated money market fund.
The amount of these waivers resulting from investments in these money market funds for the six months ended April 30, 2017 was $90,193.
G. Other — Certain officers of the Trust are affiliated with the Adviser, the Administrator and JPMDS. Such officers, with the exception of the Chief Compliance Officer, receive no compensation from the Fund for serving in their respective roles.
The Board of Trustees appointed a Chief Compliance Officer to the Fund in accordance with Federal securities regulations. The Fund, along with other affiliated funds, makes reimbursement payments, on a pro-rata basis, to the Administrator for a portion of the fees associated with the Office of the Chief Compliance Officer. Such fees are included in Trustees’ and Chief Compliance Officer’s fees on the CSOP.
The Trust adopted a Trustee Deferred Compensation Plan (the “Plan”) which allows the Independent Trustees to defer the receipt of all or a portion of compensation related to performance of their duties as Trustees. The deferred fees are invested in various J.P. Morgan Funds until distribution in accordance with the Plan.
| | | | | | |
| | | |
| 58 | | | | J.P. MORGAN FUNDS | | APRIL 30, 2017 |
The Fund may use related party broker-dealers. For the six months ended April 30, 2017, the Fund did not incur any brokerage commissions with broker-dealers affiliated with the Adviser.
The Securities and Exchange Commission (“SEC”) has granted an exemptive order permitting the Fund to engage in principal transactions with J.P. Morgan Securities, Inc., an affiliated broker, involving taxable money market instruments, subject to certain conditions.
4. Investment Transactions
During the six months ended April 30, 2017, purchases and sales of investments (excluding short-term investments) were as follows:
| | | | | | | | |
| | | Purchases
(excluding U.S.
Government) | | | Sales
(excluding U.S.
Government) | |
| | $ | 170,010,976 | | | $ | 168,774,374 | |
During the six months ended April 30, 2017, there were no purchases or sales of U.S. Government securities.
5. Federal Income Tax Matters
For Federal income tax purposes, the estimated cost and unrealized appreciation (depreciation) in value of investment securities, including the Subsidiary, held at April 30, 2017 were as follows:
| | | | | | | | | | | | | | | | |
| | | Aggregate
Cost | | | Gross
Unrealized
Appreciation | | | Gross
Unrealized
Depreciation | | | Net Unrealized
Appreciation
(Depreciation) | |
| | $ | 342,954,784 | | | $ | 22,862,510 | | | $ | 8,248,545 | | | $ | 14,613,965 | |
The Federal income tax net unrealized appreciation (depreciation) in value of investment securities includes unrealized appreciation of the Fund’s investment in its Subsidiary of $1,076,286, which, if realized, is not deductible for income tax purposes.
During the year ended October 31, 2016 the Fund utilized capital loss carryforwards of $1,807,945.
Late year ordinary losses incurred after December 31 and within the taxable year are deemed to arise on the first business day of the Fund’s next taxable year. For the year ended October 31, 2016, the Fund deferred to November 1, 2016 late year ordinary losses of $5,240,144.
6. Borrowings
The Fund relies upon an exemptive order granted by the SEC (the “Order”) permitting the establishment and operation of an Interfund Lending Facility (the “Facility”). The Facility allows the Fund to directly lend and borrow money to or from any other fund relying upon the Order at rates beneficial to both the borrowing and lending funds. Advances under the Facility are taken primarily for temporary or emergency purposes, including the meeting of redemption requests that otherwise might require the untimely disposition of securities, and are subject to the Fund’s borrowing restrictions. The Interfund loan rate is determined, as specified in the Order, by averaging the current repurchase agreement rate and the current bank loan rate. The Order was granted to JPMorgan Trust II and may be relied upon by the Fund because the Fund and the series of JPMorgan Trust II are both investment companies in the same “group of investment companies” (as defined in Section 12(d)(1)(G) of the 1940 Act).
The Trust and JPMCB have entered into a financing arrangement. Under this arrangement, JPMCB provides an unsecured, uncommitted credit facility in the aggregate amount of $100 million to certain of the J.P. Morgan Funds, including the Fund. Advances under the arrangement are taken primarily for temporary or emergency purposes, including the meeting of redemption requests that otherwise might require the untimely disposition of securities, and are subject to the Fund’s borrowing restrictions. Interest on borrowings is payable at a rate determined by JPMCB at the time of borrowing. This agreement has been extended until November 6, 2017.
The Fund had no borrowings outstanding from another fund or from the unsecured, uncommitted credit facility during the six months ended April 30, 2017.
In addition, effective August 16, 2016, the Trust along with certain other trusts (“Borrowers”) entered into a joint syndicated senior unsecured revolving credit facility totaling $1.5 billion (“Credit Facility”) with various lenders and The Bank of New York Mellon, as administrative agent for the lenders. This Credit Facility provides a source of funds to the Borrowers for temporary and emergency purposes, including the meeting of redemption requests that otherwise might require the untimely disposition of securities. Under the terms of the Credit Facility, a borrowing fund must have a minimum of $25,000,000 in adjusted net asset value and not exceed certain adjusted net asset coverage ratios prior to and during the time in which any borrowings are outstanding. If a fund does not comply with the aforementioned requirements, the Fund must remediate within three business days with respect to the $25,000,000 minimum adjusted net asset value or within one business day with respect to certain asset coverage ratios or the administrative agent at the request of, or with the consent of, the lenders may terminate the Credit Facility and declare any outstanding borrowings to be due and payable immediately.
Interest associated with any borrowing under the Credit Facility is charged to the borrowing fund at a rate of interest equal to 1.00% plus the greater of the federal funds effective rate or one month LIBOR. The annual commitment fee to maintain the Credit Facility is 0.15% and is incurred
| | | | | | | | |
| | | |
| APRIL 30, 2017 | | J.P. MORGAN FUNDS | | | | | 59 | |
NOTES TO CONSOLIDATED FINANCIAL STATEMENTS
AS OF APRIL 30, 2017 (continued)
on the unused portion of the Credit Facility and is allocated to all participating funds pro rata based on their respective net assets. The initial term of the Credit Facility is 364 days, unless extended. The Fund did not utilize the Credit Facility during the six months ended April 30, 2017.
7. Risks, Concentrations and Indemnifications
In the normal course of business, the Fund enters into contracts that contain a variety of representations which provide general indemnifications. The Fund’s maximum exposure under these arrangements is unknown. The amount of exposure would depend on future claims that may be made against the Fund that have not yet occurred. However, based on experience, the Fund expects the risk of loss to be remote.
As of April 30, 2017, the J.P. Morgan Investor Funds, which are affiliated funds of funds, owned in the aggregate, 67.5% of the net assets of the Fund.
Significant shareholder transactions by these shareholders may impact the Fund’s performance.
By investing in the Subsidiary, the Fund is indirectly exposed to the risks associated with the Subsidiary’s investments. The derivatives and other investments held by the Subsidiary are generally similar to those that are permitted to be held by the Fund and are subject to the same risks that apply to similar investments if held directly by the Fund.
The Fund will employ various alternative investment strategies that involve the use of complicated investment techniques. There is no guarantee that these strategies will succeed and their use may subject the Fund to greater volatility and loss.
Derivatives, including swap agreements, commodity options, futures and options on futures, may be riskier than other types of investments because they may be more sensitive to changes in economic or market conditions than other types of investments and could result in losses that significantly exceed the Fund’s original investment. Many derivatives create leverage thereby causing the Fund to be more volatile than it would be if it had not used derivatives. Derivatives also expose the Fund to counterparty risk and to the credit risk of the derivative counterparty.
The Fund is also subject to counterparty credit risk, which is the risk that a counterparty fails to perform on agreements with the Fund such as swap and option contracts, credit linked notes, exchange-traded notes and forward foreign currency exchange contracts.
The Fund’s investment in commodity-linked derivative instruments may subject the Fund to greater volatility than investments in traditional securities, particularly if the instruments involve leverage. The value of commodity-linked derivative instruments may be affected by changes in overall market movements, commodity index volatility, changes in interest rates, or factors affecting a particular industry or commodity, such as drought, floods, weather, livestock disease, embargoes, tariffs and international economic, political and regulatory developments.
The Fund is subject to interest rate and credit risk. The value of debt securities may decline as interest rates increase. The Fund could lose money if the issuer of a fixed income security is unable to pay interest or repay principal when it is due. Many factors can cause interest rates to rise. Some examples include central bank monetary policy, rising inflation rates and general economic conditions. Given that the Federal Reserve has recently raised interest rates and may continue to do so, the Fund may face a heightened level of interest rate risk. The ability of the issuers of debt to meet their obligations may be affected by the economic and political developments in a specific industry or region.
The Fund’s investment in convertible bonds subjects the Fund to equity price risk. Due to their conversion feature, the value of convertible bonds tends to vary with fluctuations in the market value of the underlying security.
8. Investment Company Reporting Modernization
In October 2016, the U.S. Securities and Exchange Commission adopted new rules and forms, and amendments to certain current rules and forms, to modernize the reporting and disclosure of information by registered investment companies. In part, the final rules amend Regulation S-X and will require standardized, enhanced disclosures about derivatives in investment company financial statements, as well as other amendments. The compliance date for the amendments to Regulation S-X is August 1, 2017. At this time, management is currently assessing the anticipated impact of the Regulation S-X amendments on the Fund’s financial statements and related disclosures.
| | | | | | |
| | | |
| 60 | | | | J.P. MORGAN FUNDS | | APRIL 30, 2017 |
SCHEDULE OF SHAREHOLDER EXPENSES
(Unaudited)
Hypothetical $1,000 Investment
As a shareholder of the Fund, you incur two types of costs: (1) transaction costs, including sales charges (loads) on purchase payments and redemption fees and (2) ongoing costs, including investment advisory fees, administration fees, distribution fees and other Fund expenses. The examples below are intended to help you understand your ongoing costs (in dollars) of investing in the Fund and to compare these ongoing costs with the ongoing costs of investing in other mutual funds. The examples assume that you had a $1,000 investment in each Class at the beginning of the reporting period, November 1, 2016 and continued to hold your shares at the end of the reporting period, April 30, 2017.
Actual Expenses
For each Class of the Fund in the table below, the first line provides information about actual account values and actual expenses. You may use the information in this line, together with the amount you invested, to estimate the expenses that you paid over the period. Simply divide your account value by $1,000 (for example, an $8,600 account value divided by $1,000 = 8.6), then multiply the result by the number in the first line of each Class under the heading entitled “Expenses Paid During the Period” to estimate the expenses you paid on your account during this period.
Hypothetical Example for Comparison Purposes
The second line of each Class in the table below provides information about hypothetical account values and hypothetical expenses based on the Class’ actual expense ratio and an assumed rate of return of 5% per year before expenses, which is not the Class’ actual return. The hypothetical account values and expenses may not be used to estimate the actual ending account balance or expenses you paid for the period. You may use this information to compare the ongoing costs of investing in the Class of the Fund and other funds. To do so, compare this 5% hypothetical example with the 5% hypothetical examples that appear in the shareholder reports of the other funds. Please note that the expenses shown in the table are meant to highlight your ongoing costs only and do not reflect any transaction costs, such as sales charges (loads) or redemption fees. Therefore, the second line for each Class in the table is useful in comparing ongoing costs only, and will not help you determine the relative total costs of owning different funds. In addition, if these transaction costs were included, your costs would have been higher. The examples also assume all dividends and distributions have been reinvested.
| | | | | | | | | | | | | | | | |
| | | Beginning
Account Value November 1, 2016 | | | Ending
Account Value April 30, 2017 | | | Expenses Paid During the Period* | | | Annualized Expense
Ratio | |
Systematic Alpha Fund | | | | | | | | | | | | | | | | |
Class A | | | | | | | | | | | | | | | | |
Actual | | $ | 1,000.00 | | | $ | 1,024.20 | | | $ | 6.02 | | | | 1.20 | % |
Hypothetical | | | 1,000.00 | | | | 1,018.84 | | | | 6.01 | | | | 1.20 | |
Class C | | | | | | | | | | | | | | | | |
Actual | | | 1,000.00 | | | | 1,021.80 | | | | 8.57 | | | | 1.71 | |
Hypothetical | | | 1,000.00 | | | | 1,016.31 | | | | 8.55 | | | | 1.71 | |
Class I (formerly Select Class) | | | | | | | | | | | | | | | | |
Actual | | | 1,000.00 | | | | 1,025.60 | | | | 4.77 | | | | 0.95 | |
Hypothetical | | | 1,000.00 | | | | 1,020.08 | | | | 4.76 | | | | 0.95 | |
Class R6 | | | | | | | | | | | | | | | | |
Actual | | | 1,000.00 | | | | 1,026.10 | | | | 3.52 | | | | 0.70 | |
Hypothetical | | | 1,000.00 | | | | 1,021.32 | | | | 3.51 | | | | 0.70 | |
| * | Expenses are equal to each Class’ respective annualized expense ratio, multiplied by the average account value over the period, multiplied by 181/365 (to reflect the one-half year period). |
| | | | | | | | |
| | | |
| APRIL 30, 2017 | | J.P. MORGAN FUNDS | | | | | 61 | |
J.P. Morgan Funds are distributed by JPMorgan Distribution Services, Inc., which is an affiliate of JPMorgan Chase & Co. Affiliates of JPMorgan Chase & Co. receive fees for providing various services to the funds.
Contact JPMorgan Distribution Services, Inc. at 1-800-480-4111 for a fund prospectus. You can also visit us at www.jpmorganfunds.com. Investors should carefully consider the investment objectives and risk as well as charges and expenses of the mutual fund before investing. The prospectus contains this and other information about the mutual fund. Read the prospectus carefully before investing.
Investors may obtain information about the Securities Investor Protection Corporation (SIPC), including the SIPC brochure by visiting www.sipc.org or by calling SIPC at 202-371-8300.
The Fund files a complete schedule of its fund holdings for the first and third quarters of its fiscal year with the SEC on Form N-Q. The Fund’s Forms N-Q are available on the SEC’s website at http://www.sec.gov and may be reviewed and copied at the SEC’s Public Reference Room in Washington, DC. Information on the operation of the SEC’s Public Reference Room may be obtained by calling 1-800-SEC-0330. Shareholders may request the Form N-Q without charge by calling 1-800-480-4111 or by visiting the J.P. Morgan Funds’ website at www.jpmorganfunds.com.
A description of the Fund’s policies and procedures with respect to the disclosure of the Fund’s holdings is available in the prospectus and Statement of Additional Information.
A copy of proxy policies and procedures is available without charge upon request by calling 1-800-480-4111 and on the Fund’s website at www.jpmorganfunds.com. A description of such policies and procedures is on the SEC’s website at www.sec.gov. The Trustees have delegated the authority to vote proxies for securities owned by the Fund to the Adviser. A copy of the Fund’s voting record for the most recent 12-month period ended June 30 is available on the SEC’s website at www.sec.gov or at the Fund’s website at www.jpmorganfunds.com no later than August 31 of each year. The Fund’s proxy voting record will include, among other things, a brief description of the matter voted on for each fund security, and will state how each vote was cast, for example, for or against the proposal.

J.P. Morgan Asset Management is the marketing name for the asset management business of JPMorgan Chase & Co. Those businesses include, but are not limited to, J.P. Morgan Investment Management Inc., Security Capital Research & Management Incorporated and J.P. Morgan Alternative Asset Management, Inc.
| | | | |
| | © JPMorgan Chase & Co., 2017. All rights reserved. April 2017. | | SAN-SA-417 |
ITEM 2. CODE OF ETHICS.
Disclose whether, as of the end of the period covered by the report, the registrant has adopted a code of ethics that applies to the registrant’s principal executive officer, principal financial officer, principal accounting officer or controller, or persons performing similar functions, regardless of whether these individuals are employed by the registrant or a third party. If the registrant has not adopted such a code of ethics, explain why it has not done so.
The registrant must briefly describe the nature of any amendment, during the period covered by the report, to a provision of its code of ethics that applies to the registrant’s principal executive officer, principal financial officer, principal accounting officer or controller, or persons performing similar functions, regardless of whether these individuals are employed by the registrant or a third party, and that relates to any element of the code of ethics definition enumerated in paragraph (b) of this Item. The registrant must file a copy of any such amendment as an exhibit pursuant to Item 12(a)(1), unless the registrant has elected to satisfy paragraph (f) of this Item by positing its code of ethics on its website pursuant to paragraph (f)(2) of this Item, or by undertaking to provide its code of ethics to any person without charge, upon request, pursuant to paragraph (f)(3) of this Item.
If the registrant has, during the period covered by the report, granted a waiver, including an implicit waiver, from a provision of the code of ethics that applies to the registrant’s principal executive officer, principal financial officer, principal accounting officer or controller, or persons performing similar functions, regardless of whether these individuals are employed by the registrant or third party, that relates to one or more items set forth in paragraph (b) of this Item, the registrant must briefly describe the nature of the waiver, the name of the person to whom the waiver was granted, and the date of the waiver.
Not applicable to a semi-annual report.
ITEM 3. AUDIT COMMITTEE FINANCIAL EXPERT.
(a) (1) Disclose that the registrant’s board of directors has determined that the registrant either:
(i) Has at least one audit committee financial expert serving on its audit committee; or
(ii) Does not have an audit committee financial expert serving on its audit committee.
(2) If the registrant provides the disclosure required by paragraph (a)(1)(i) of this Item, it must disclose the name of the audit committee financial expert and whether that person is “independent.” In order to be considered “independent” for purposes of this Item, a member of an audit committee may not, other than in his or her capacity as a member of the audit committee, the board of directors, or any other board committee:
(i) Accept directly or indirectly any consulting, advisory, or other compensatory fee from the issuer; or
(ii) Be an “interested person” of the investment company as defined in Section 2(a)(19) of the Act (15 U.S.C. 80a-2(a)(19)).
(3) If the registrant provides the disclosure required by paragraph (a)(1)(ii) of this Item, it must explain why it does not have an audit committee financial expert.
Not applicable to a semi-annual report.
ITEM 4. PRINCIPAL ACCOUNTANT FEES AND SERVICES.
(a) Disclose, under the caption Audit Fees, the aggregate fees billed for each of the last two fiscal years for professional services rendered by the principal accountant for the audit of the registrant’s annual financial statements or services that are normally provided by the accountant in connection with statutory and regulatory filings or engagements for those fiscal years.
(b) Disclose, under the caption Audit-Related Fees, the aggregate fees billed in each of the last two fiscal years for assurance and related services by the principal accountant that are reasonably related to the performance of the audit of the registrant’s financial statements and are not reported under paragraph (a) of this Item. Registrants shall describe the nature of the services comprising the fees disclosed under this category.
(c) Disclose, under the caption Tax Fees, the aggregate fees billed in each of the last two fiscal years for professional services rendered by the principal accountant for tax compliance, tax advice, and tax planning. Registrants shall describe the nature of the services comprising the fees disclosed under this category.
(d) Disclose, under the caption All Other Fees, the aggregate fees billed in each of the last two fiscal years for products and services provided by the principal accountant, other than the services reported in paragraphs (a) through (c) of this Item. Registrants shall describe the nature of the services comprising the fees disclosed under this category.
(e) (1) Disclose the audit committee’s pre-approval policies and procedures described in paragraph (c)(7) of Rule 2-01 of Regulation S-X.
(2) Disclose the percentage of services described in each of paragraphs (b) through (d) of this Item that were approved by the audit committee pursuant to paragraph (c)(7)(i)(C) of Rule 2-01 of Regulation S-X.
(f) If greater than 50 percent, disclose the percentage of hours expended on the principal accountant’s engagement to audit the registrant’s financial statements for the most recent fiscal year that were attributed to work performed by persons other than the principal accountant’s full-time, permanent employees.
Not applicable to a semi-annual report.
(g) Disclose the aggregate non-audit fees billed by the registrant’s accountant for services rendered to the registrant, and rendered to the registrant’s investment adviser (not including any sub-adviser whose role is primarily portfolio management and is subcontracted with or overseen by another investment adviser), and any entity controlling, controlled by, or under common control with the adviser that provides ongoing services to the registrant for each of the last two fiscal years of the registrant.
(h) Disclose whether the registrant’s audit committee of the board of directors has considered whether the provision of non-audit services that were rendered to the registrant’s investment adviser (not including any subadviser whose role is primarily portfolio management and is subcontracted with or overseen by another investment adviser), and any entity controlling, controlled by, or under common control with the investment adviser that provides ongoing services to the registrant that were not pre-approved pursuant to paragraph (c)(7)(ii) of Rule 2-01 of Regulation S-X is compatible with maintaining the principal accountant’s independence.
Not applicable to a semi-annual report.
ITEM 5. AUDIT COMMITTEE OF LISTED REGISTRANTS.
(a) If the registrant is a listed issuer as defined in Rule 10A-3 under the Exchange Act (17CFR 240.10A-3), state whether or not the registrant has a separately-designated standing audit committee established in accordance with Section 3(a)(58)(A) of the Exchange Act (15 U.S.C. 78c(a)(58)(A)). If the registrant has such a committee, however designated, identify each committee member. If the entire board of directors is acting as the registrant’s audit committee as specified in Section 3(a)(58)(B) of the Exchange Act (15 U.S.C. 78c(a)(58)(B)), so state.
(b) If applicable, provide the disclosure required by Rule 10A-3(d) under the Exchange Act (17CFR 240.10A-3(d)) regarding an exemption from the listing standards for all audit committees.
Not applicable to a semi-annual report.
ITEM 6. SCHEDULE OF INVESTMENTS.
File Schedule I – Investments in securities of unaffiliated issuers as of the close of the reporting period as set forth in Section 210.12-12 of Regulation S-X, unless the schedule is included as part of the report to shareholders filed under Item 1 of this Form.
Included in Item 1.
ITEM 7. DISCLOSURE OF PROXY VOTING POLICIES AND PROCEDURES FOR CLOSED-END MANAGEMENT INVESTMENT COMPANIES.
A closed-end management investment company that is filing an annual report on this Form N-CSR must, unless it invests exclusively in non-voting securities, describe the policies and procedures that it uses to determine how to vote proxies relating to portfolio securities, including the procedures that the company uses when a vote presents a conflict between the interests of its shareholders, on the one hand, and those of the company’s investment adviser; principal underwriter; or any affiliated person (as defined in Section 2(a)(3) of the Investment Company Act of 1940 (15 U.S.C. 80a-2(a)(3)) and the rules thereunder) of the company, its investment adviser, or its principal underwriter, on the other. Include any policies and procedures of the company’s investment adviser, or any other third party, that the company uses, or that are used on the company’s behalf, to determine how to vote proxies relating to portfolio securities.
Not applicable.
ITEM 8. PORTFOLIO MANAGERS OF CLOSED-END MANAGEMENT INVESTMENT COMPANIES.
Not applicable.
ITEM 9. PURCHASE OF EQUITY SECURITIES BY CLOSED-END MANAGEMENT INVESTMENT COMPANY AND AFFILIATED PURCHASERS.
(a) If the registrant is a closed-end management investment company, provide the information specified in paragraph (b) of this Item with respect to any purchase made by or on behalf of the registrant or any “affiliated purchaser,” as defined in Rule 10b-18(a)(3) under the Exchange Act (17 CFR 240.10b-18(a)(3)), of shares or other units of any class of the registrant’s equity securities that is registered by the registrant pursuant to Section 12 of the Exchange Act (15 U.S.C. 781).
Not applicable.
ITEM 10. SUBMISSION OF MATTERS TO A VOTE OF SECURITY HOLDERS.
Describe any material changes to the procedures by which shareholders may recommend nominees to the registrant’s board of directors, where those changes were implemented after the registrant last provided disclosure in response to the requirements of Item 7(d)(2)(ii)(G) of Schedule 14A (17 CFR 240.14a-101), or this Item.
No material changes to report.
ITEM 11. CONTROLS AND PROCEDURES.
(a) Disclose the conclusions of the registrant’s principal executive and principal financial officers, or persons performing similar functions, regarding the effectiveness of the registrant’s disclosure controls and procedures (as defined in Rule 30a-3(c) under the Act (17 CFR 270.30a-3(c))) as of a date within 90 days of the filing date of the report that includes the disclosure required by this paragraph, based on the evaluation of these controls and procedures required by Rule 30a-3(b) under the Act (17 CFR 270.30a-3(b)) and Rules 13a-15(b) or 15d-15(b) under the Exchange Act (17 CFR 240.13a-15(b) or 240.15d-15(b)).
The Registrant’s principal executive and principal financial officers have concluded, based on their evaluation of the Registrant’s disclosure controls and procedures as of a date within 90 days of the filing date of this report, that the Registrant’s disclosure controls and procedures are reasonably designed to ensure that information required to be disclosed by the Registrant on Form N-CSR is recorded, processed, summarized and reported within the required time periods and that information required to be disclosed by the Registrant in the reports that it files or submits on Form N-CSR is accumulated and communicated to the Registrant’s management, including its principal executive and principal financial officers, as appropriate to allow timely decisions regarding required disclosure.
(b) Disclose any change in the registrant’s internal control over financial reporting (as defined in Rule 30a-3(d) under the Act (17 CFR 270.30a-3(d)) that occurred during the registrant’s second fiscal quarter of the period covered by this report that has materially affected, or is reasonably likely to materially affect, the registrant’s internal control over financial reporting.
There were no changes in the Registrant’s internal control over financial reporting that occurred during the last fiscal quarter covered by this report that have materially affected, or are reasonably likely to materially affect, the Registrant’s internal control over financial reporting.
ITEM 12. EXHIBITS.
(a) File the exhibits listed below as part of this Form. Letter or number the exhibits in the sequence indicated.
(a)(1) Any code of ethics, or amendment thereto, that is the subject of the disclosure required by Item 2, to the extent that the registrant intends to satisfy the Item 2 requirements through filing of an exhibit.
Not applicable.
(a)(2) A separate certification for each principal executive officer and principal financial officer of the registrant as required by Rule 30a-2(a) under the Act (17 CFR 270.30a-2).
Certifications pursuant to Rule 30a-2(a) under the Investment Company Act of 1940 are attached hereto.
(a)(3) Any written solicitation to purchase securities under Rule 23c-1 under the Act (17 CFR 270.23c-1) sent or given during the period covered by the report by or on behalf of the registrant to 10 or more persons.
Not applicable.
(b) A separate or combined certification for each principal executive officer and principal officer of the registrant as required by Rule 30a-2(b) under the Act of 1940.
Certifications pursuant to Rule 30a-2(b) under the Investment Company Act of 1940 are attached hereto.
SIGNATURES
Pursuant to the requirements of the Securities Exchange Act of 1934 and the Investment Company Act of 1940, the registrant has duly caused this report to be signed on its behalf by the undersigned, thereunto duly authorized.
| | |
| JPMorgan Trust I |
| |
| By: | | /s/ Brian S. Shlissel |
| | Brian S. Shlissel |
| | President and Principal Executive Office |
| | July 5, 2017 |
Pursuant to the requirements of the Securities Exchange Act of 1934 and the Investment Company Act of 1940, this report has been signed below by the following persons on behalf of the registrant and in the capacities and on the dates indicated.
| | |
| By: | | /s/ Brian S. Shlissel |
| | Brian S. Shlissel |
| | President and Principal Executive Officer |
| | July 5, 2017 |
| |
By: | | /s/ Laura M. Del Prato |
| | Laura M. Del Prato |
| | Treasurer and Principal Financial Officer |
| | July 5, 2017 |