UNITED STATES
SECURITIES AND EXCHANGE COMMISSION
Washington, D.C. 20549
FORM N-CSR
CERTIFIED SHAREHOLDER REPORT OF REGISTERED
MANAGEMENT INVESTMENT COMPANIES
Investment Company Act file number: 811-21295
JPMorgan Trust I
(Exact name of registrant as specified in charter)
270 Park Avenue
New York, NY 10017
(Address of principal executive offices) (Zip code)
Noah D. Greenhill, Esq.
270 Park Avenue
New York, NY 10017
(Name and Address of Agent for Service)
Registrant’s telephone number, including area code: (800) 480-4111
Date of fiscal year end: August 31
Date of reporting period: September 1, 2017 through August 31, 2018
Form N-CSR is to be used by management investment companies to file reports with the Commission not later than 10 days after the transmission to stockholders of any report that is required to be transmitted to stockholders under Rule 30e-1 under the Investment Company Act of 1940 (17 CFR 270.30e-1). The Commission may use the information provided on Form N-CSR in its regulatory, disclosure review, inspection, and policymaking roles.
A registrant is required to disclose the information specified by Form N-CSR, and the Commission will make this information public. A registrant is not required to respond to the collection of information contained in Form N-CSR unless the Form displays a currently valid Office of Management and Budget (“OMB”) control number. Please direct comments concerning the accuracy of the information collection burden estimate and any suggestions for reducing the burden to Secretary, Securities and Exchange Commission, 450 Fifth Street, NW, Washington, DC 20549-0609. The OMB has reviewed this collection of information under the clearance requirements of 44 U.S.C. Section 3507.
ITEM 1. REPORTS TO STOCKHOLDERS.
The following is a copy of the report transmitted to shareholders pursuant to Rule 30e-1 under the Investment Company Act of 1940 (17 CFR 270.30e-1).
Annual Report
J.P. Morgan Income Funds
August 31, 2018
JPMorgan Global Bond Opportunities Fund

CONTENTS
Investments in the Fund are not deposits or obligations of, or guaranteed or endorsed by, any bank and are not insured or guaranteed by the FDIC, the Federal Reserve Board or any other government agency. You could lose money if you sell when the Fund’s share price is lower than when you invested.
Past performance is no guarantee of future performance. The general market views expressed in this report are opinions based on market and other conditions through the end of the reporting period and are subject to change without notice. These views are not intended to predict the future performance of the Fund or the securities markets. References to specific securities and their issuers are for illustrative purposes only and are not intended to be, and should not be interpreted as, recommendations to purchase or sell such securities. Such views are not meant as investment advice and may not be relied on as an indication of trading intent on behalf of the Fund.
Prospective investors should refer to the Fund’s prospectuses for a discussion of the Fund’s investment objective, strategies and risks. Call J.P. Morgan Funds Service Center at 1-800-480-4111 for a prospectus containing more complete information about the Fund, including management fees and other expenses. Please read it carefully before investing.
CEO’S LETTER
October 9, 2018 (Unaudited)
Dear Shareholder,
The U.S. economy continued to outpace other developed markets, while geopolitical tensions and rising borrowing costs began to drag on emerging markets during the twelve months ended August 31, 2018.
| | |
 | | “While the impact of protectionist U.S. trade policies and currency devaluations in emerging markets loomed over financial markets, the underlying fundamentals of continued global economic growth remained in place at the end of August 2018.” — George C.W. Gatch |
Synchronized global economic growth helped the U.S. economy expand during the first half of the reporting period and U.S. equity prices reached record highs in every month from September 2017 through January 2018, a period also marked by low financial market volatility.
However, an early February sell-off in both equity and bond markets in the U.S. rapidly spread to other financial markets. The S&P 500 Index lost more than 10% of its value over several days and a spike in yields on benchmark 10-year U.S. Treasury bonds further roiled markets. U.S. equities recovered somewhat in subsequent months but it wasn’t until August 2018 that the S&P 500 returned to record highs.
In 2018, U.S. gross domestic product (GDP) rose 2.2% in the first quarter and 4.2% in the second quarter, the largest increase in nearly four years. Notably, U.S. corporate earnings and revenues in the first and second quarters of 2018 reached record levels and the U.S. unemployment rate fell to 3.9% in August 2018 from 4.2% in September 2017. The U.S. Federal Reserve responded to job growth and nascent inflationary pressure by raising interest rates in December 2017, and again in March and June. (Subsequent to the end of reporting period, the central bank raised rates in September 2018.)
In the European Union, political uncertainty clouded positive economic growth. While inflation remained below the European Central Bank’s (ECB) target rate, second quarter 2018 GDP grew by 2.1% and the unemployment rate in the 19-nation euro area fell to 8.1% in August, the lowest level since November 2008.
However, a new government in Italy threatened to challenge the European Commission’s stability and growth pact, raising investor fears that the commission would enact punitive measures. Also, negotiations over the U.K.’s exit from the European Union continued without resolution during the reporting period, raising political and economic uncertainty.
Against this backdrop, the ECB reiterated it would maintain interest rates at current levels until at least the summer of 2019.
China’s economy continued to drive emerging markets growth in late 2017, but U.S. tariffs on billions of dollars’ worth of Chinese goods in 2018 led to a decline in exports to the U.S. The Chinese government responded in kind to protectionist U.S. trade policies and moved to further stimulate domestic demand.
In other emerging markets, equities and bonds generally provided solid returns for the second half of 2017 but rising U.S. interest rates and a stronger U.S. dollar in 2018 raised borrowing costs and hurt select emerging markets, particularly petroleum importing nations with large current account deficits. Discrete political-economic factors in select nations also weighed on emerging markets debt.
While the impact of protectionist U.S. trade policies and currency devaluations in emerging markets loomed over financial markets, the underlying fundamentals of continued global economic growth remained in place at the end of August 2018.
We believe a long term outlook and a properly diversified portfolio should help investors navigate the changing market environment. We look forward to managing your investment needs for years to come. Should you have any questions, please visit www.jpmorganfunds.com or contact the J.P. Morgan Funds Service Center at 1-800-480-4111.
Sincerely yours,

George C.W. Gatch
CEO, Global Funds Management
J.P. Morgan Asset Management
| | | | | | | | |
| | | |
| AUGUST 31, 2018 | | J.P. MORGAN INCOME FUNDS | | | | | 1 | |
JPMorgan Global Bond Opportunities Fund
FUND COMMENTARY
TWELVE MONTHS ENDED AUGUST 31, 2018 (Unaudited)
| | | | |
| REPORTING PERIOD RETURN: | |
| Fund (Class I Shares)* | | | 0.85% | |
| Bloomberg Barclays Multiverse Index | | | (1.38)% | |
| |
| Net Assets as of 8/31/2018 (In Thousands) | | $ | 3,017,478 | |
| Duration as of 8/31/2018 | | | 3.0 Years | |
INVESTMENT OBJECTIVE**
The JPMorgan Global Bond Opportunities Fund (the “Fund”) seeks to provide total return.
HOW DID THE MARKET PERFORM?
During the reporting period, U.S. financial markets largely outperformed other developed markets and emerging markets. Positive economic data, record high corporate earnings and rising interest rates provided support for U.S. equities, while investor uncertainty about overseas markets bolstered U.S. Treasury bonds during the final months of the reporting period.
Within fixed income markets, high yield bonds (also known as “junk bonds”) outperformed investment grade corporate debt and U.S. Treasury bonds. Emerging markets debt was among the worst performers, as rising U.S. interest rates and a stronger U.S. dollar hurt those nations most reliant on foreign borrowing and/or oil imports. Discrete political issues also weighed on bonds issued by Turkey, Brazil, Russia and Italy.
WHAT WERE THE MAIN DRIVERS OF THE FUND’S PERFORMANCE?
The Fund is managed with an unconstrained orientation and is not managed to a benchmark. While the Fund is not managed to a benchmark, its performance is compared with the Bloomberg Barclays Multiverse Index (the “Index”). For the twelve months ended August 31, 2018, the Fund’s Class I shares outperformed the Index.
The Fund’s hedging of foreign currency positions through the use of forward contracts, was a leading contributor to performance relative to the unhedged Index.
The Fund’s allocations to corporate high yield bonds and securitized debt products were the leading contributors to absolute performance. During the reporting period, high yield returns were supported by robust corporate fundamentals, including low default rates, consistently strong earnings and prudent approaches to financing. The Fund’s security selection in shorter duration securitized debt products also helped absolute
performance as interest rates rose during the reporting period. Generally, bonds with shorter duration will experience a smaller decrease in price as interest rates rise versus bonds with longer duration.
The Fund’s allocation to emerging markets debt was the leading detractor from absolute performance. Emerging markets came under pressure in the second half of the reporting period due to rising U.S. interest rates, a stronger U.S. dollar and discrete political-economic issues in select nations. The Fund’s allocation to investment grade corporate credit also detracted from absolute performance amid slower demand and excess supply in the sector.
HOW WAS THE FUND POSITIONED?
During the reporting period, the Fund invested opportunistically across different markets and sectors. The Fund’s managers applied a flexible investment approach and did not manage to a benchmark. This allowed the Fund to shift its allocations based on changing market conditions. The Fund had exposure to a broad range of asset classes during the reporting period, including high yield and investment grade corporate bonds, agency and non-agency mortgage-backed securities, asset-backed securities, commercial mortgage-backed securities, emerging markets debt, convertible bonds and foreign government securities.
During the reporting period, the Fund’s managers increased their allocation to asset-backed securities in order to take advantage of a strong U.S. consumer and short duration positioning. The Fund also added an allocation to the European periphery (Italy, Spain, and Portugal). The managers decreased their allocations to investment grade and high yield corporate credit.
The managers modestly decreased the length of the Fund’s overall duration through a reduction in long end high yield and investment grade credit, as well as emerging markets local currency debt. The Fund’s duration decreased to 2.95 years at August 31, 2018 from 3.01 years at August 31, 2017.
| | | | | | |
| | | |
| 2 | | | | J.P. MORGAN INCOME FUNDS | | AUGUST 31, 2018 |
| | | | |
PORTFOLIO COMPOSITION*** | |
| Corporate Bonds | | | 51.3 | % |
| Foreign Government Securities | | | 16.7 | |
| Asset-Backed Securities | | | 10.2 | |
| Commercial Mortgage-Backed Securities | | | 5.3 | |
| Collateralized Mortgage Obligations | | | 3.7 | |
| Loan Assignments | | | 3.6 | |
| Convertible Bonds | | | 3.1 | |
| Others (each less than 1.0%) | | | 0.6 | |
| Short-Term Investments | | | 5.5 | |
| | | | |
PORTFOLIO COMPOSITION BY COUNTRY*** | |
| United States | | | 48.2 | % |
| Portugal | | | 4.2 | |
| Spain | | | 3.8 | |
| France | | | 3.1 | |
| United Kingdom | | | 3.0 | |
| Cayman Islands | | | 2.8 | |
| Indonesia | | | 2.4 | |
| Luxembourg | | | 2.3 | |
| Italy | | | 1.9 | |
| Germany | | | 1.8 | |
| Mexico | | | 1.6 | |
| Ireland | | | 1.5 | |
| Australia | | | 1.4 | |
| Netherlands | | | 1.4 | |
| South Africa | | | 1.2 | |
| Canada | | | 1.1 | |
| Switzerland | | | 1.1 | |
| Greece | | | 1.1 | |
| Others (each less than 1.0%) | | | 10.6 | |
| Short-Term Investments | | | 5.5 | |
| * | | The return shown is based on net asset values calculated for shareholder transactions and may differ from the return shown in the financial highlights, which reflects adjustments made to the net asset values in accordance with accounting principles generally accepted in the United States of America. |
| ** | | The adviser seeks to achieve the Fund’s objective. There can be no guarantee it will be achieved. |
| *** | | Percentages indicated are based on total investments as of August 31, 2018. The Fund’s portfolio composition is subject to change. |
| | | | | | | | |
| | | |
| AUGUST 31, 2018 | | J.P. MORGAN INCOME FUNDS | | | | | 3 | |
JPMorgan Global Bond Opportunities Fund
FUND COMMENTARY
TWELVE MONTHS ENDED AUGUST 31, 2018 (Unaudited) (continued)
| | | | | | | | | | | | | | |
AVERAGE ANNUAL TOTAL RETURNS AS OF AUGUST 31, 2018 | |
| | | | |
| | | INCEPTION DATE OF
CLASS | | 1 YEAR | | | 5 YEAR | | | SINCE
INCEPTION | |
CLASS A SHARES | | September 4, 2012 | | | | | | | | | | | | |
With Sales Charge* | | | | | (3.29 | )% | | | 2.96 | % | | | 3.51 | % |
Without Sales Charge | | | | | 0.50 | | | | 3.76 | | | | 4.17 | |
CLASS C SHARES | | September 4, 2012 | | | | | | | | | | | | |
With CDSC** | | | | | (0.80 | ) | | | 3.36 | | | | 3.77 | |
Without CDSC | | | | | 0.20 | | | | 3.36 | | | | 3.77 | |
CLASS I SHARES | | September 4, 2012 | | | 0.85 | | | | 4.03 | | | | 4.45 | |
CLASS R6 SHARES | | September 4, 2012 | | | 0.99 | | | | 4.17 | | | | 4.60 | |
| * | | Sales Charge for Class A Shares is 3.75%. |
| ** | | Assumes a 1% CDSC (contingent deferred sales charge) for the one year period and 0% CDSC thereafter. |
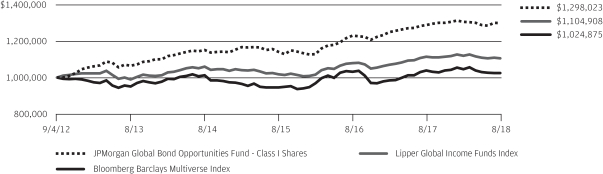
LIFE OF FUND PERFORMANCE (9/4/12 TO 8/31/18 )
The performance quoted is past performance and is not a guarantee of future results. Mutual funds are subject to certain market risks. Investment returns and principal value of an investment will fluctuate so that an investor’s shares, when redeemed, may be worth more or less than their original cost. Current performance may be higher or lower than the performance data shown. For up-to-date month-end performance information please call 1-800-480-4111.
The Fund commenced operations on September 4, 2012.
The graph illustrates comparative performance for $1,000,000 invested in Class I Shares of the JPMorgan Global Bond Opportunities Fund, the Bloomberg Barclays Multiverse Index and the Lipper Global Income Funds Index from September 4, 2012 to August 31, 2018. The performance of the Lipper Global Income Funds Index reflects an initial investment at the end of the month closest to the Fund’s inception. The performance of the Fund assumes reinvestment of all dividends and capital gain distributions, if any, and does not include a sales charge. The performance of the Bloomberg Barclays Multiverse Index does not reflect the deduction of expenses or a sales charge associated with a mutual fund, if applicable. The performance of the Lipper Global Income Funds Index includes expenses associated with a mutual fund, such as investment management fees. These expenses are not identical to the expenses incurred by the Fund. The Bloomberg Barclays Multiverse Index provides a broad-based measure of the international fixed income bond market. The Bloomberg Barclays Multiverse Index represents the union of the Bloomberg Barclays Global Aggregate Index and the Bloomberg Barclays Global High Yield Index. The Bloomberg Barclays Global Aggregate Index is a measure of global investment grade debt
from twenty-four different local currency markets. The Bloomberg Barclays Global High Yield Index provides a broad-based measure of the global high-yield fixed income markets. The Lipper Global Income Funds Index represents the total returns of certain mutual funds within the Fund’s designated category as determined by Lipper, Inc. Investors cannot invest directly in an index.
Class I Shares have a $1,000,000 minimum initial investment.
Subsequent to the inception of the Fund on September 4, 2012 until May 31, 2013, the Fund did not experience any shareholder purchase and sale activity. If such activity had occurred, the Fund’s performance may have been impacted.
Fund performance may reflect the waiver of the Fund’s fees and reimbursement of expenses for certain periods since the inception date. Without these waivers and reimbursements, performance would have been lower. Also, performance shown in this section does not reflect the deduction of taxes that a shareholder would pay on Fund distributions or redemptions of Fund shares.
International investing involves a greater degree of risk and increased volatility. Changes in currency exchange rates and differences in accounting and taxation policies outside the U.S. can raise or lower returns. Also, some overseas markets may not be as politically and economically stable as the United States and other nations.
The returns shown are based on net asset values calculated for shareholder transactions and may differ from the returns shown in the financial highlights, which reflect adjustments made to the net asset values in accordance with accounting principles generally accepted in the United States of America.
| | | | | | |
| | | |
| 4 | | | | J.P. MORGAN INCOME FUNDS | | AUGUST 31, 2018 |
JPMorgan Global Bond Opportunities Fund
SCHEDULE OF PORTFOLIO INVESTMENTS
AS OF AUGUST 31, 2018
(Amounts in U.S. Dollars, unless otherwise noted)
| | | | | | | | |
| INVESTMENTS | | PRINCIPAL AMOUNT (000) | | | VALUE
(000) | |
Corporate Bonds — 50.4% | | | | | | | | |
Argentina — 0.3% | | | | | | | | |
Pampa Energia SA | | | | | | | | |
7.38%, 7/21/2023 (a) | | | 2,768 | | | | 2,398 | |
7.50%, 1/24/2027 (b) | | | 3,090 | | | | 2,457 | |
YPF SA | | | | | | | | |
6.95%, 7/21/2027 (a) | | | 2,660 | | | | 2,128 | |
6.95%, 7/21/2027 (b) | | | 1,674 | | | | 1,339 | |
| | | | | | | | |
| | | | | | | 8,322 | |
| | | | | | | | |
Australia — 0.1% | | | | | | | | |
Australia & New Zealand Banking Group Ltd. (USD ICE Swap Rate 5 Year + 5.17%), 6.75%, 6/15/2026 (a) (c) (d) (e) | | | 1,076 | | | | 1,116 | |
FMG Resources August 2006 Pty. Ltd. | | | | | | | | |
4.75%, 5/15/2022 (a) | | | 265 | | | | 260 | |
5.13%, 5/15/2024 (a) | | | 265 | | | | 257 | |
Nufarm Australia Ltd. | | | | | | | | |
5.75%, 4/30/2026 (a) | | | 202 | | | | 188 | |
Origin Energy Finance Ltd. (EUR Swap Annual 5 Year + 3.67%), 4.00%, 9/16/2074 (b) (d) | | | EUR 1,800 | | | | 2,148 | |
| | | | | | | | |
| | | | | | | 3,969 | |
| | | | | | | | |
Azerbaijan — 0.2% | | | | | | | | |
State Oil Co. of the Azerbaijan Republic 4.75%, 3/13/2023 (b) | | | 4,590 | | | | 4,504 | |
| | | | | | | | |
Bahrain — 0.1% | | | | | | | | |
Batelco International Finance No. 1 Ltd. 4.25%, 5/1/2020 (b) | | | 1,600 | | | | 1,572 | |
| | | | | | | | |
Belgium — 0.5% | | | | | | | | |
Anheuser-Busch InBev Finance, Inc. | | | | | | | | |
3.65%, 2/1/2026 | | | 3,115 | | | | 3,047 | |
4.90%, 2/1/2046 | | | 3,305 | | | | 3,359 | |
Anheuser-Busch InBev SA/NV 2.00%, 3/17/2028 (b) | | | EUR 900 | | | | 1,091 | |
Nyrstar Netherlands Holdings BV 6.88%, 3/15/2024 (b) | | | EUR 1,600 | | | | 1,650 | |
Solvay Finance SA (EUR Swap Annual 5 Year + 3.70%), 5.42%, 11/12/2023 (b) (c) (d) (e) | | | EUR 3,400 | | | | 4,402 | |
Telenet Finance Luxembourg Notes SARL 3.50%, 3/1/2028 (b) | | | EUR 1,600 | | | | 1,796 | |
| | | | | | | | |
| | | | | | | 15,345 | |
| | | | | | | | |
Brazil — 0.4% | | | | | | | | |
Banco Daycoval SA 5.75%, 3/19/2019 (b) | | | 900 | | | | 900 | |
| | | | | | | | |
| INVESTMENTS | | PRINCIPAL AMOUNT (000) | | | VALUE
(000) | |
| | | | | | | | |
Brazil — continued | | | | | | | | |
Banco do Brasil SA (US Treasury Yield Curve Rate T Note Constant Maturity 10 Year + 4.40%), 6.25%, 4/15/2024 (b) (c) (d) (e) | | | 1,431 | | | | 1,072 | |
Banco Votorantim SA 7.38%, 1/21/2020 (b) | | | 700 | | | | 721 | |
Cemig Geracao e Transmissao SA 9.25%, 12/5/2024 (a) | | | 3,380 | | | | 3,375 | |
JSL Europe SA 7.75%, 7/26/2024 (b) | | | 3,950 | | | | 3,514 | |
Suzano Austria GmbH 5.75%, 7/14/2026 (a) | | | 1,430 | | | | 1,430 | |
Votorantim Cimentos SA 7.25%, 4/5/2041 (b) | | | 1,950 | | | | 1,914 | |
| | | | | | | | |
| | | | | | | 12,926 | |
| | | | | | | | |
Canada — 1.0% | | | | | | | | |
1011778 BC ULC 4.25%, 5/15/2024 (a) | | | 900 | | | | 859 | |
ATS Automation Tooling Systems, Inc. 6.50%, 6/15/2023 (a) | | | 188 | | | | 194 | |
Baytex Energy Corp. | | | | | | | | |
5.13%, 6/1/2021 (a) | | | 100 | | | | 97 | |
5.63%, 6/1/2024 (a) | | | 115 | | | | 109 | |
Bombardier, Inc. | | | | | | | | |
8.75%, 12/1/2021 (a) | | | 877 | | | | 969 | |
6.00%, 10/15/2022 (a) | | | 1,071 | | | | 1,076 | |
6.13%, 1/15/2023 (a) | | | 727 | | | | 733 | |
7.50%, 12/1/2024 (a) | | | 287 | | | | 302 | |
7.50%, 3/15/2025 (a) | | | 461 | | | | 476 | |
Calfrac Holdings LP 8.50%, 6/15/2026 (a) | | | 215 | | | | 205 | |
Cenovus Energy, Inc. | | | | | | | | |
4.25%, 4/15/2027 | | | 810 | | | | 782 | |
6.75%, 11/15/2039 | | | 1,596 | | | | 1,824 | |
5.20%, 9/15/2043 | | | 993 | | | | 967 | |
Concordia International Corp. | | | | | | | | |
9.00%, 4/1/2022 (a) | | | 630 | | | | 573 | |
7.00%, 4/15/2023 ‡ (a) (f) | | | 857 | | | | 52 | |
Cott Holdings, Inc. 5.50%, 4/1/2025 (a) | | | 241 | | | | 236 | |
Emera US Finance LP 3.55%, 6/15/2026 | | | 3,916 | | | | 3,721 | |
Encana Corp. | | | | | | | | |
6.50%, 8/15/2034 | | | 2,025 | | | | 2,380 | |
6.50%, 2/1/2038 | | | 552 | | | | 655 | |
Garda World Security Corp. 8.75%, 5/15/2025 (a) | | | 2,955 | | | | 2,911 | |
Hudbay Minerals, Inc. 7.25%, 1/15/2023 (a) | | | 250 | | | | 254 | |
SEE NOTES TO FINANCIAL STATEMENTS.
| | | | | | | | |
| | | |
| AUGUST 31, 2018 | | J.P. MORGAN INCOME FUNDS | | | | | 5 | |
JPMorgan Global Bond Opportunities Fund
SCHEDULE OF PORTFOLIO INVESTMENTS
AS OF AUGUST 31, 2018 (continued)
(Amounts in U.S. Dollars, unless otherwise noted)
| | | | | | | | |
| INVESTMENTS | | PRINCIPAL AMOUNT (000) | | | VALUE
(000) | |
Corporate Bonds — continued | | | | | | | | |
Canada — continued | | | | | | | | |
Kronos Acquisition Holdings, Inc. 9.00%, 8/15/2023 (a) | | | 321 | | | | 294 | |
Mattamy Group Corp. 6.88%, 12/15/2023 (a) | | | 560 | | | | 570 | |
MEG Energy Corp. | | | | | | | | |
6.38%, 1/30/2023 (a) | | | 800 | | | | 726 | |
6.50%, 1/15/2025 (a) | | | 2,467 | | | | 2,455 | |
NOVA Chemicals Corp. | | | | | | | | |
5.25%, 8/1/2023 (a) | | | 80 | | | | 80 | |
5.00%, 5/1/2025 (a) | | | 570 | | | | 550 | |
Open Text Corp. | | | | | | | | |
5.63%, 1/15/2023 (a) | | | 295 | | | | 304 | |
5.88%, 6/1/2026 (a) | | | 272 | | | | 281 | |
Precision Drilling Corp. | | | | | | | | |
7.75%, 12/15/2023 | | | 720 | | | | 762 | |
5.25%, 11/15/2024 | | | 350 | | | | 333 | |
7.13%, 1/15/2026 (a) | | | 391 | | | | 402 | |
Quebecor Media, Inc. 5.75%, 1/15/2023 | | | 975 | | | | 1,009 | |
Seven Generations Energy Ltd. 5.38%, 9/30/2025 (a) | | | 542 | | | | 526 | |
Stars Group Holdings BV 7.00%, 7/15/2026 (a) | | | 519 | | | | 540 | |
Transcanada Trust (ICE LIBOR USD 3 Month + 3.53%), 5.63%, 5/20/2075 (d) | | | 357 | | | | 355 | |
Videotron Ltd. | | | | | | | | |
5.38%, 6/15/2024 (a) | | | 1,300 | | | | 1,336 | |
5.13%, 4/15/2027 (a) | | | 100 | | | | 99 | |
| | | | | | | | |
| | | | | | | 29,997 | |
| | | | | | | | |
Chile — 0.0% (g) | | | | | | | | |
Empresa Electrica Guacolda SA 4.56%, 4/30/2025 (b) | | | 1,300 | | | | 1,207 | |
| | | | | | | | |
China — 0.5% | | | | | | | | |
Bluestar Finance Holdings Ltd. 3.13%, 9/30/2019 (b) | | | 1,400 | | | | 1,388 | |
Eagle Intermediate Global Holding BV 5.38%, 5/1/2023 (b) | | | EUR 1,300 | | | | 1,519 | |
GCL New Energy Holdings Ltd. 7.10%, 1/30/2021 (b) | | | 1,062 | | | | 935 | |
GOME Retail Holdings Ltd. 5.00%, 3/10/2020 (b) | | | 1,864 | | | | 1,755 | |
Guangxi Communications Investment Group Co. Ltd. 3.00%, 11/4/2019 (b) | | | 1,450 | | | | 1,414 | |
MCC Holding Hong Kong Corp. Ltd. 2.95%, 5/31/2020 (b) | | | 1,450 | | | | 1,423 | |
| | | | | | | | |
| INVESTMENTS | | PRINCIPAL AMOUNT (000) | | | VALUE
(000) | |
| | | | | | | | |
China — continued | | | | | | | | |
Moon Wise Global Ltd. (US Treasury Yield Curve Rate T Note Constant Maturity 5 Year + 12.37%), 9.00%, 1/28/2019 (b) (c) (d) (e) | | | 700 | | | | 709 | |
Overseas Chinese Town Asia Holdings Ltd. (US Treasury Yield Curve Rate T Note Constant Maturity 3 Year + 7.71%), 4.30%, 10/10/2020 (b) (c) (d) (e) | | | 1,400 | | | | 1,356 | |
Sino-Ocean Land Treasure III Ltd. (US Treasury Yield Curve Rate T Note Constant Maturity 5 Year + 3.26%), 4.90%, 9/21/2022 (b) (c) (d) (e) | | | 2,094 | | | | 1,740 | |
Tianjin Infrastructure Construction & Investment Group Co. Ltd. 2.75%, 6/15/2019 (b) | | | 900 | | | | 884 | |
Times China Holdings Ltd. 6.25%, 1/23/2020 (b) | | | 1,600 | | | | 1,582 | |
West China Cement Ltd. 6.50%, 9/11/2019 (b) | | | 700 | | | | 704 | |
| | | | | | | | |
| | | | | | | 15,409 | |
| | | | | | | | |
Denmark — 0.2% | | | | | | | | |
Danske Bank A/S (EUR Swap Annual 5 Year + 5.47%), 5.88%, 4/6/2022 (b) (c) (d) (e) | | | EUR 3,400 | | | | 4,252 | |
DKT Finance ApS 9.38%, 6/17/2023 (a) | | | 700 | | | | 740 | |
TDC A/S 3.75%, 3/2/2022 (h) | | | EUR 1,000 | | | | 1,271 | |
| | | | | | | | |
| | | | | | | 6,263 | |
| | | | | | | | |
Finland — 0.1% | | | | | | | | |
Nokia OYJ 4.38%, 6/12/2027 | | | 479 | | | | 460 | |
Stora Enso OYJ 2.50%, 6/7/2027 (b) | | | EUR 1,000 | | | | 1,212 | |
| | | | | | | | |
| | | | | | | 1,672 | |
| | | | | | | | |
France — 3.0% | | | | | | | | |
Accor SA (EUR Swap Annual 5 Year + 3.65%), 4.13%, 6/30/2020 (b) (c) (d) (e) | | | EUR 1,200 | | | | 1,461 | |
Altice France SA | | | | | | | | |
5.63%, 5/15/2024 (b) | | | EUR 4,650 | | | | 5,641 | |
6.25%, 5/15/2024 (a) | | | 618 | | | | 610 | |
7.38%, 5/1/2026 (a) | | | 760 | | | | 747 | |
8.13%, 2/1/2027 (a) | | | 367 | | | | 373 | |
Arkema SA (EUR Swap Annual 5 Year + 4.35%), 4.75%, 10/29/2020 (b) (c) (d) (e) | | | EUR 1,200 | | | | 1,490 | |
Autodis SA 4.38%, 5/1/2022 (b) | | | EUR 750 | | | | 883 | |
BPCE SA | | | | | | | | |
5.15%, 7/21/2024 (a) | | | 8,195 | | | | 8,383 | |
SEE NOTES TO FINANCIAL STATEMENTS.
| | | | | | |
| | | |
| 6 | | | | J.P. MORGAN INCOME FUNDS | | AUGUST 31, 2018 |
| | | | | | | | |
| INVESTMENTS | | PRINCIPAL AMOUNT (000) | | | VALUE
(000) | |
Corporate Bonds — continued | | | | | | | | |
France — continued | | | | | | | | |
(EUR Swap Annual 5 Year + 2.37%), 2.75%, 11/30/2027 (b) (d) | | | EUR 1,200 | | | | 1,463 | |
Casino Guichard Perrachon SA 3.58%, 2/7/2025 (b) (h) | | | EUR 2,900 | | | | 2,830 | |
CMA CGM SA 6.50%, 7/15/2022 (b) | | | EUR 800 | | | | 911 | |
Constantin Investissement 3 SASU 5.38%, 4/15/2025 (b) | | | EUR 1,700 | | | | 1,954 | |
Credit Agricole SA | | | | | | | | |
4.38%, 3/17/2025 (a) | | | 1,875 | | | | 1,846 | |
(USD Swap Semi 5 Year + 6.19%), 8.12%, 12/23/2025 (a) (c) (d) (e) | | | 2,740 | | | | 3,014 | |
Elis SA | | | | | | | | |
3.00%, 4/30/2022 (b) | | | EUR 1,300 | | | | 1,533 | |
1.88%, 2/15/2023 (b) | | | EUR 1,600 | | | | 1,868 | |
2.88%, 2/15/2026 (b) | | | EUR 1,400 | | | | 1,630 | |
Europcar Mobility Group 4.13%, 11/15/2024 (b) | | | EUR 2,800 | | | | 3,251 | |
Faurecia SA | | | | | | | | |
3.63%, 6/15/2023 (b) | | | EUR 1,000 | | | | 1,208 | |
2.63%, 6/15/2025 (b) | | | EUR 750 | | | | 892 | |
Fnac Darty SA 3.25%, 9/30/2023 (b) | | | EUR 1,000 | | | | 1,202 | |
Horizon Parent Holdings SARL 8.25% (cash), 2/15/2022 (b) (i) | | | EUR 1,500 | | | | 1,823 | |
La Financiere Atalian SASU | | | | | | | | |
4.00%, 5/15/2024 (b) | | | EUR 2,000 | | | | 2,253 | |
5.13%, 5/15/2025 (a) | | | EUR 265 | | | | 302 | |
5.13%, 5/15/2025 (b) | | | EUR 400 | | | | 457 | |
Loxam SAS 4.25%, 4/15/2024 (b) | | | EUR 3,500 | | | | 4,285 | |
Novafives SAS 5.00%, 6/15/2025 (a) | | | EUR 1,395 | | | | 1,549 | |
Orano SA | | | | | | | | |
4.38%, 11/6/2019 | | | EUR 1,800 | | | | 2,187 | |
3.25%, 9/4/2020 (b) | | | EUR 1,400 | | | | 1,694 | |
4.88%, 9/23/2024 | | | EUR 2,100 | | | | 2,590 | |
Paprec Holding SA | | | | | | | | |
4.00%, 3/31/2025 (a) | | | EUR 1,601 | | | | 1,877 | |
4.00%, 3/31/2025 (b) | | | EUR 500 | | | | 586 | |
Peugeot SA | | | | | | | | |
2.38%, 4/14/2023(b) | | | EUR 4,500 | | | | 5,522 | |
2.00%, 3/20/2025(b) | | | EUR 300 | | | | 348 | |
Picard Groupe SAS (EURIBOR 3 Month + 3.00%), 3.00%, 11/30/2023 (b)(d) | | | EUR 700 | | | | 800 | |
Rexel SA | | | | | | | | |
2.63%, 6/15/2024(b) | | | EUR 3,250 | | | | 3,849 | |
2.13%, 6/15/2025(b) | | | EUR 900 | | | | 1,021 | |
| | | | | | | | |
| INVESTMENTS | | PRINCIPAL AMOUNT (000) | | | VALUE
(000) | |
| | | | | | | | |
France — continued | | | | | | | | |
Societe Generale SA | | | | | | | | |
(EUR Swap Annual 5 Year + 5.54%), 6.75%, 4/7/2021(b)(c)(d)(e) | | | EUR 850 | | | | 1,069 | |
(USD ICE Swap Rate 5 Year + 5.87%), 8.00%, 9/29/2025 (a) (c) (d) (e) | | | 4,735 | | | | 5,049 | |
SPIE SA 3.13%, 3/22/2024 (b) | | | EUR 3,300 | | | | 3,849 | |
TOTAL SA (EUR Swap Annual 5 Year + 3.78%), 3.88%, 5/18/2022 (b) (c) (d) (e) | | | EUR 1,750 | | | | 2,188 | |
Vallourec SA | | | | | | | | |
6.63%, 10/15/2022 (b) | | | EUR 1,200 | | | | 1,457 | |
6.38%, 10/15/2023 (a) | | | EUR 620 | | | | 733 | |
6.38%, 10/15/2023 (b) | | | EUR 200 | | | | 236 | |
2.25%, 9/30/2024 (b) | | | EUR 2,000 | | | | 1,910 | |
| | | | | | | | |
| | | | | | | 90,824 | |
| | | | | | | | |
Germany — 1.8% | | | | | | | | |
Adler Pelzer Holding GmbH 4.13%, 4/1/2024 (b) | | | EUR 1,130 | | | | 1,317 | |
Allianz SE (EURIBOR 3 Month + 3.35%), 3.10%, 7/6/2047 (b) (d) | | | EUR 200 | | | | 241 | |
CBR Fashion Finance BV 5.13%, 10/1/2022 (b) | | | EUR 935 | | | | 955 | |
CTC BondCo GmbH | | | | | | | | |
5.25%, 12/15/2025 (a) | | | EUR 1,406 | | | | 1,612 | |
5.25%, 12/15/2025 (b) | | | EUR 1,050 | | | | 1,203 | |
Deutsche Bank AG 4.25%, 10/14/2021 | | | 3,065 | | | | 3,051 | |
Douglas GmbH 6.25%, 7/15/2022 (b) | | | EUR 650 | | | | 674 | |
Hapag-Lloyd AG 6.75%, 2/1/2022 (b) | | | EUR 500 | | | | 604 | |
IHO Verwaltungs GmbH | | | | | | | | |
3.25% (cash), 9/15/2023 (b) (i) | | | EUR 1,900 | | | | 2,260 | |
3.75% (cash), 9/15/2026 (b) (i) | | | EUR 1,400 | | | | 1,667 | |
Nidda BondCo GmbH 5.00%, 9/30/2025 (b) | | | EUR 2,100 | | | | 2,374 | |
Nidda Healthcare Holding GmbH 3.50%, 9/30/2024 (b) | | | EUR 2,309 | | | | 2,667 | |
ProGroup AG | | | | | | | | |
3.00%, 3/31/2026 (a) | | | EUR 987 | | | | 1,145 | |
3.00%, 3/31/2026 (b) | | | EUR 900 | | | | 1,045 | |
Schaeffler Finance BV 3.25%, 5/15/2025 (b) | | | EUR 5,300 | | | | 6,497 | |
Tele Columbus AG 3.88%, 5/2/2025 (b) | | | EUR 2,163 | | | | 2,223 | |
thyssenkrupp AG | | | | | | | | |
1.38%, 3/3/2022 (b) | | | EUR 5,500 | | | | 6,443 | |
2.50%, 2/25/2025 (b) | | | EUR 3,450 | | | | 4,206 | |
Unitymedia GmbH 3.75%, 1/15/2027 (b) | | | EUR 1,296 | | | | 1,588 | |
SEE NOTES TO FINANCIAL STATEMENTS.
| | | | | | | | |
| | | |
| AUGUST 31, 2018 | | J.P. MORGAN INCOME FUNDS | | | | | 7 | |
JPMorgan Global Bond Opportunities Fund
SCHEDULE OF PORTFOLIO INVESTMENTS
AS OF AUGUST 31, 2018 (continued)
(Amounts in U.S. Dollars, unless otherwise noted)
| | | | | | | | |
| INVESTMENTS | | PRINCIPAL AMOUNT (000) | | | VALUE
(000) | |
Corporate Bonds — continued | | | | | | | | |
Germany — continued | | | | | | | | |
Unitymedia Hessen GmbH & Co. KG | | | | | | | | |
4.00%, 1/15/2025 (b) | | | EUR 5,750 | | | | 7,009 | |
3.50%, 1/15/2027 (b) | | | EUR 1,550 | | | | 1,896 | |
WEPA Hygieneprodukte GmbH 3.75%, 5/15/2024 (b) | | | EUR 2,200 | | | | 2,517 | |
| | | | | | | | |
| | | | | | | 53,194 | |
| | | | | | | | |
Ghana — 0.0% (g) | | | | | | | | |
Tullow Oil plc 7.00%, 3/1/2025 (a) | | | 365 | | | | 352 | |
| | | | | | | | |
Greece — 0.5% | | | | | | | | |
Alpha Bank AE 2.50%, 2/5/2023 (b) | | | EUR 7,700 | | | | 9,053 | |
Crystal Almond SARL 10.00%, 11/1/2021 (b) | | | EUR 2,050 | | | | 2,570 | |
National Bank of Greece SA 2.75%, 10/19/2020 (b) | | | EUR 2,692 | | | | 3,226 | |
OTE plc 3.50%, 7/9/2020 (b) | | | EUR 1,350 | | | | 1,638 | |
| | | | | | | | |
| | | | | | | 16,487 | |
| | | | | | | | |
Guatemala — 0.1% | | | | | | | | |
Cementos Progreso Trust 7.13%, 11/6/2023 (b) | | | 700 | | | | 723 | |
Comunicaciones Celulares SA 6.88%, 2/6/2024 (b) | | | 700 | | | | 722 | |
| | | | | | | | |
| | | | | | | 1,445 | |
| | | | | | | | |
Hong Kong — 0.1% | | | | | | | | |
Studio City Co. Ltd. 7.25%, 11/30/2021 (b) | | | 700 | | | | 725 | |
WTT Investment Ltd. 5.50%, 11/21/2022 (a) | | | 3,700 | | | | 3,686 | |
| | | | | | | | |
| | | | | | | 4,411 | |
| | | | | | | | |
India — 0.3% | | | | | | | | |
ABJA Investment Co. Pte. Ltd. 5.45%, 1/24/2028 (b) | | | 4,930 | | | | 4,402 | |
JSW Steel Ltd. 5.25%, 4/13/2022 (b) | | | 3,444 | | | | 3,422 | |
| | | | | | | | |
| | | | | | | 7,824 | |
| | | | | | | | |
Indonesia — 0.1% | | | | | | | | |
Medco Platinum Road Pte. Ltd. 6.75%, 1/30/2025 (b) | | | 1,027 | | | | 940 | |
Theta Capital Pte. Ltd. 7.00%, 4/11/2022 (b) | | | 900 | | | | 741 | |
| | | | | | | | |
| | | | | | | 1,681 | |
| | | | | | | | |
Ireland — 1.4% | | | | | | | | |
AerCap Ireland Capital DAC | | | | | | | | |
4.63%, 10/30/2020 | | | 837 | | | | 856 | |
| | | | | | | | |
| INVESTMENTS | | PRINCIPAL AMOUNT (000) | | | VALUE
(000) | |
| | | | | | | | |
Ireland — continued | | | | | | | | |
5.00%, 10/1/2021 | | | 1,515 | | | | 1,566 | |
4.63%, 7/1/2022 | | | 3,765 | | | | 3,851 | |
3.65%, 7/21/2027 | | | 2,585 | | | | 2,394 | |
Allied Irish Banks plc | | | | | | | | |
(EUR Swap Annual 5 Year + 7.34%), 7.38%, 12/3/2020(b)(c)(d)(e) | | | EUR 1,650 | | | | 2,107 | |
(EUR Swap Annual 5 Year + 3.95%), 4.13%, 11/26/2025(b)(d) | | | EUR 3,100 | | | | 3,810 | |
Ardagh Packaging Finance plc | | | | | | | | |
4.13%, 5/15/2023 (b) | | | EUR 2,050 | | | | 2,483 | |
4.63%, 5/15/2023 (a) | | | 500 | | | | 496 | |
2.75%, 3/15/2024 (b) | | | EUR 1,900 | | | | 2,232 | |
6.75%, 5/15/2024 (b) | | | EUR 2,707 | | | | 3,395 | |
7.25%, 5/15/2024 (a) | | | 2,750 | | | | 2,891 | |
6.00%, 2/15/2025 (a) | | | 850 | | | | 831 | |
Avolon Holdings Funding Ltd. 5.50%, 1/15/2023 (a) | | | 450 | | | | 462 | |
Bank of Ireland | | | | | | | | |
(EUR Swap Annual 5 Year + 6.96%), 7.38%, 6/18/2020 (b) (c) (d) (e) | | | EUR 1,870 | | | | 2,343 | |
(EUR Swap Annual 5 Year + 3.55%), 4.25%, 6/11/2024 (b) (d) | | | EUR 2,587 | | | | 3,077 | |
eircom Finance DAC 4.50%, 5/31/2022 (b) | | | EUR 2,950 | | | | 3,500 | |
Park Aerospace Holdings Ltd. | | | | | | | | |
4.50%, 3/15/2023 (a) | | | 920 | | | | 910 | |
5.50%, 2/15/2024 (a) | | | 350 | | | | 359 | |
Smurfit Kappa Acquisitions ULC | | | | | | | | |
3.25%, 6/1/2021 (b) | | | EUR 3,250 | | | | 4,042 | |
2.75%, 2/1/2025 (b) | | | EUR 1,600 | | | | 1,939 | |
| | | | | | | | |
| | | | | | | 43,544 | |
| | | | | | | | |
Israel — 0.2% | | | | | | | | |
Teva Pharmaceutical Finance Netherlands II BV 1.13%, 10/15/2024 (b) | | | EUR 400 | | | | 408 | |
Teva Pharmaceutical Finance Netherlands III BV | | | | | | | | |
3.15%, 10/1/2026 | | | 4,790 | | | | 3,976 | |
6.75%, 3/1/2028 | | | 670 | | | | 698 | |
| | | | | | | | |
| | | | | | | 5,082 | |
| | | | | | | | |
Italy — 1.9% | | | | | | | | |
Buzzi Unicem SpA 2.13%, 4/28/2023 (b) | | | EUR 1,500 | | | | 1,781 | |
Enel Finance International NV | | | | | | | | |
3.63%, 5/25/2027 (a) | | | 3,570 | | | | 3,285 | |
3.50%, 4/6/2028 (a) | | | 4,365 | | | | 3,930 | |
SEE NOTES TO FINANCIAL STATEMENTS.
| | | | | | |
| | | |
| 8 | | | | J.P. MORGAN INCOME FUNDS | | AUGUST 31, 2018 |
| | | | | | | | |
| INVESTMENTS | | PRINCIPAL AMOUNT (000) | | | VALUE
(000) | |
Corporate Bonds — continued | | | | | | | | |
Italy — continued | | | | | | | | |
Enel SpA (GBP Swap 5 Year + 5.66%), 7.75%, 9/10/2075 (b) (d) | | | GBP 2,250 | | | | 3,199 | |
EVOCA SpA 7.00%, 10/15/2023 (b) | | | EUR 2,725 | | | | 3,367 | |
Intesa Sanpaolo SpA | | | | | | | | |
5.71%, 1/15/2026 (a) | | | 400 | | | | 363 | |
(EUR Swap Annual 5 Year + 7.19%), 7.75%, 1/11/2027 (b) (c) (d) (e) | | | EUR 1,800 | | | | 2,165 | |
3.88%, 7/14/2027 (a) | | | 5,880 | | | | 5,049 | |
Leonardo SpA | | | | | | | | |
4.50%, 1/19/2021 | | | EUR 4,700 | | | | 5,921 | |
4.88%, 3/24/2025 | | | EUR 2,675 | | | | 3,568 | |
Saipem Finance International BV 3.75%, 9/8/2023 (b) | | | EUR 2,250 | | | | 2,765 | |
Snaitech SpA 6.38%, 11/7/2021 (b) | | | EUR 500 | | | | 603 | |
Telecom Italia Capital SA | | | | | | | | |
6.38%, 11/15/2033 | | | 489 | | | | 496 | |
6.00%, 9/30/2034 | | | 282 | | | | 278 | |
7.20%, 7/18/2036 | | | 179 | | | | 191 | |
7.72%, 6/4/2038 | | | 85 | | | | 93 | |
Telecom Italia Finance SA 7.75%, 1/24/2033 | | | EUR 850 | | | | 1,343 | |
Telecom Italia SpA | | | | | | | | |
3.25%, 1/16/2023 (b) | | | EUR 4,250 | | | | 5,191 | |
3.00%, 9/30/2025 (b) | | | EUR 1,600 | | | | 1,877 | |
3.63%, 5/25/2026 (b) | | | EUR 4,350 | | | | 5,275 | |
Wind Tre SpA | | | | | | | | |
2.63%, 1/20/2023 (b) | | | EUR 3,523 | | | | 3,913 | |
3.13%, 1/20/2025 (b) | | | EUR 1,000 | | | | 1,084 | |
5.00%, 1/20/2026 (a) | | | 1,506 | | | | 1,347 | |
| | | | | | | | |
| | | | | | | 57,084 | |
| | | | | | | | |
Jamaica — 0.0% (g) | | | | | | | | |
Digicel Group Ltd. 7.13%, 4/1/2022 (b) | | | 1,574 | | | | 944 | |
| | | | | | | | |
Japan — 0.1% | | | | | | | | |
SoftBank Group Corp. 4.00%, 7/30/2022 (b) | | | EUR 2,995 | | | | 3,706 | |
| | | | | | | | |
Jordan — 0.0% (g) | | | | | | | | |
Hikma Pharmaceuticals plc 4.25%, 4/10/2020 (b) | | | 900 | | | | 899 | |
| | | | | | | | |
Kazakhstan — 0.2% | | | | | | | | |
KazMunayGas National Co. JSC 4.75%, 4/19/2027 (b) | | | 4,500 | | | | 4,489 | |
Nostrum Oil & Gas Finance BV 8.00%, 7/25/2022 (a) | | | 1,700 | | | | 1,625 | |
| | | | | | | | |
| | | | | | | 6,114 | |
| | | | | | | | |
| | | | | | | | |
| INVESTMENTS | | PRINCIPAL AMOUNT (000) | | | VALUE
(000) | |
| | | | | | | | |
Kuwait — 0.2% | | | | | | | | |
Kuwait Projects Co. SPC Ltd. | | | | | | | | |
5.00%, 3/15/2023 (b) | | | 2,400 | | | | 2,409 | |
4.50%, 2/23/2027 (b) | | | 3,226 | | | | 3,000 | |
| | | | | | | | |
| | | | | | | 5,409 | |
| | | | | | | | |
Luxembourg — 2.2% | | | | | | | | |
Altice Financing SA 5.25%, 2/15/2023 (b) | | | EUR 3,650 | | | | 4,409 | |
Altice Finco SA | | | | | | | | |
4.75%, 1/15/2028 (a) | | | EUR 800 | | | | 783 | |
4.75%, 1/15/2028 (b) | | | EUR 1,025 | | | | 1,004 | |
Altice Luxembourg SA | | | | | | | | |
7.25%, 5/15/2022 (b) | | | EUR 4,952 | | | | 5,785 | |
6.25%, 2/15/2025 (b) | | | EUR 2,550 | | | | 2,824 | |
ArcelorMittal | | | | | | | | |
2.88%, 7/6/2020 (b) | | | EUR 800 | | | | 974 | |
3.00%, 4/9/2021 (b) | | | EUR 550 | | | | 678 | |
0.95%, 1/17/2023 (b) | | | EUR 600 | | | | 689 | |
Auris Luxembourg II SA 8.00%, 1/15/2023 (b) | | | EUR 3,570 | | | | 4,311 | |
FAGE International SA 5.63%, 8/15/2026 (a) | | | 2,450 | | | | 2,150 | |
Galapagos SA 5.38%, 6/15/2021 ‡ (b) | | | EUR 975 | | | | 1,015 | |
Garfunkelux Holdco 2 SA 11.00%, 11/1/2023 (b) | | | GBP 700 | | | | 895 | |
Garfunkelux Holdco 3 SA 7.50%, 8/1/2022 (b) | | | EUR 495 | | | | 569 | |
INEOS Finance plc 4.00%, 5/1/2023 (b) | | | EUR 3,000 | | | | 3,552 | |
INEOS Group Holdings SA | | | | | | | | |
5.38%, 8/1/2024 (b) | | | EUR 1,150 | | | | 1,404 | |
5.63%, 8/1/2024 (a) | | | 500 | | | | 493 | |
Intelsat Connect Finance SA 9.50%, 2/15/2023 (a) | | | 948 | | | | 945 | |
Intelsat Jackson Holdings SA | | | | | | | | |
7.25%, 10/15/2020 | | | 597 | | | | 598 | |
7.50%, 4/1/2021 | | | 2,770 | | | | 2,787 | |
5.50%, 8/1/2023 | | | 1,227 | | | | 1,119 | |
8.00%, 2/15/2024 (a) | | | 1,177 | | | | 1,239 | |
9.75%, 7/15/2025 (a) | | | 80 | | | | 85 | |
Intelsat Luxembourg SA | | | | | | | | |
7.75%, 6/1/2021 | | | 435 | | | | 419 | |
8.13%, 6/1/2023 | | | 490 | | | | 425 | |
Matterhorn Telecom Holding SA 4.88%, 5/1/2023 (b) | | | EUR 1,600 | | | | 1,885 | |
Matterhorn Telecom SA 3.88%, 5/1/2022 (b) | | | EUR 3,900 | | | | 4,611 | |
SEE NOTES TO FINANCIAL STATEMENTS.
| | | | | | | | |
| | | |
| AUGUST 31, 2018 | | J.P. MORGAN INCOME FUNDS | | | | | 9 | |
JPMorgan Global Bond Opportunities Fund
SCHEDULE OF PORTFOLIO INVESTMENTS
AS OF AUGUST 31, 2018 (continued)
(Amounts in U.S. Dollars, unless otherwise noted)
| | | | | | | | |
| INVESTMENTS | | PRINCIPAL AMOUNT (000) | | | VALUE
(000) | |
Corporate Bonds — continued | | | | | | | | |
Luxembourg — continued | | | | | | | | |
Monitchem HoldCo 3 SA 5.25%, 6/15/2021 (b) | | | EUR 1,255 | | | | 1,418 | |
Picard Bondco SA 5.50%, 11/30/2024 (a) | | | EUR 1,300 | | | | 1,426 | |
Samsonite Finco SARL 3.50%, 5/15/2026 (a) | | | EUR 592 | | | | 676 | |
SES SA (EUR Swap Annual 5 Year + 4.66%), 4.62%, 1/2/2022 (b) (c) (d) (e) | | | EUR 4,150 | | | | 4,986 | |
SIG Combibloc Holdings SCA 7.75%, 2/15/2023 (b) | | | EUR 5,150 | | | | 6,224 | |
Telenet Finance VI Luxembourg SCA 4.88%, 7/15/2027 (b) | | | EUR 2,970 | | | | 3,696 | |
WFS Global Holding SAS 9.50%, 7/15/2022 (b) | | | EUR 1,000 | | | | 1,220 | |
| | | | | | | | |
| | | | | | | 65,294 | |
| | | | | | | | |
Mauritius — 0.0% (g) | | | | | | | | |
Liquid Telecommunications Financing plc 8.50%, 7/13/2022 (b) | | | 1,357 | | | | 1,396 | |
| | | | | | | | |
Mexico — 1.1% | | | | | | | | |
Banco Mercantil del Norte SA | | | | | | | | |
(US Treasury Yield Curve Rate T Note Constant Maturity 5 Year + 5.04%), 6.87%, 7/6/2022 (a) (c) (d) (e) | | | 2,670 | | | | 2,680 | |
(US Treasury Yield Curve Rate T Note Constant Maturity 5 Year + 4.45%), 5.75%, 10/4/2031 (a) (d) | | | 1,885 | | | | 1,787 | |
Banco Nacional de Comercio Exterior SNC (US Treasury Yield Curve Rate T Note Constant Maturity 5 Year + 3.00%), 3.80%, 8/11/2026 (a) (d) | | | 1,900 | | | | 1,850 | |
BBVA Bancomer SA (US Treasury Yield Curve Rate T Note Constant Maturity 5 Year + 2.65%), 5.13%, 1/18/2033 (a) (d) | | | 4,300 | | | | 3,931 | |
Cemex SAB de CV | | | | | | | | |
5.70%, 1/11/2025 (a) | | | 1,250 | | | | 1,258 | |
6.13%, 5/5/2025 (a) | | | 600 | | | | 617 | |
7.75%, 4/16/2026 (a) | | | 1,340 | | | | 1,462 | |
Comision Federal de Electricidad 4.75%, 2/23/2027 (b) | | | 900 | | | | 888 | |
Elementia SAB de CV 5.50%, 1/15/2025 (a) | | | 1,940 | | | | 1,848 | |
Nemak SAB de CV 4.75%, 1/23/2025 (a) | | | 4,300 | | | | 4,143 | |
Petroleos Mexicanos | | | | | | | | |
4.88%, 1/24/2022 | | | 3,020 | | | | 3,038 | |
5.35%, 2/12/2028 (b) | | | 5,697 | | | | 5,294 | |
| | | | | | | | |
| INVESTMENTS | | PRINCIPAL AMOUNT (000) | | | VALUE
(000) | |
| | | | | | | | |
Mexico — continued | | | | | | | | |
5.63%, 1/23/2046 | | | 3,510 | | | | 2,883 | |
| | | | | | | | |
| | | | | | | 31,679 | |
| | | | | | | | |
Morocco — 0.2% | | | | | | | | |
OCP SA | | | | | | | | |
5.63%, 4/25/2024 (b) | | | 1,200 | | | | 1,234 | |
4.50%, 10/22/2025 (b) | | | 3,360 | | | | 3,247 | |
| | | | | | | | |
| | | | | | | 4,481 | |
| | | | | | | | |
Netherlands — 1.1% | | | | | | | | |
ABN AMRO Bank NV | | | | | | | | |
(EUR Swap Annual 5 Year + 5.45%), 5.75%, 9/22/2020 (b) (c) (d) (e) | | | EUR 3,900 | | | | 4,826 | |
4.75%, 7/28/2025 (a) | | | 3,555 | | | | 3,599 | |
Hema Bondco I BV (EURIBOR 3 Month + 6.25%), 6.25%, 7/15/2022 (b) (d) | | | EUR 1,400 | | | | 1,550 | |
Hema Bondco II BV 8.50%, 1/15/2023 (b) | | | EUR 200 | | | | 218 | |
ING Groep NV (USD Swap Semi 5 Year + 5.12%), 6.87%, 4/16/2022 (b) (c) (d) (e) | | | 1,950 | | | | 1,984 | |
Lincoln Finance Ltd. 6.88%, 4/15/2021 (b) | | | EUR 1,600 | | | | 1,922 | |
Sigma Holdco BV 5.75%, 5/15/2026 (b) | | | EUR 1,993 | | | | 2,200 | |
Sunshine Mid BV | | | | | | | | |
6.50%, 5/15/2026 (a) | | | EUR 1,250 | | | | 1,393 | |
6.50%, 5/15/2026 (b) | | | EUR 750 | | | | 836 | |
UPC Holding BV 5.50%, 1/15/2028 (a) | | | 200 | | | | 186 | |
UPCB Finance IV Ltd. | | | | | | | | |
5.38%, 1/15/2025 (a) | | | 1,950 | | | | 1,926 | |
4.00%, 1/15/2027 (b) | | | EUR 1,935 | | | | 2,304 | |
UPCB Finance VII Ltd. 3.63%, 6/15/2029(b) | | | EUR 1,450 | | | | 1,673 | |
Ziggo Bond Finance BV | | | | | | | | |
4.63%, 1/15/2025 (b) | | | EUR 3,900 | | | | 4,504 | |
5.88%, 1/15/2025 (a) | | | 715 | | | | 668 | |
Ziggo BV | | | | | | | | |
3.75%, 1/15/2025 (b) | | | EUR 2,400 | | | | 2,785 | |
4.25%, 1/15/2027 (b) | | | EUR 1,000 | | | | 1,161 | |
5.50%, 1/15/2027 (a) | | | 435 | | | | 410 | |
| | | | | | | | |
| | | | | | | 34,145 | |
| | | | | | | | |
Nigeria — 0.1% | | | | | | | | |
IHS Netherlands Holdco BV 9.50%, 10/27/2021 (a) | | | 1,600 | | | | 1,606 | |
United Bank for Africa plc 7.75%, 6/8/2022 (b) | | | 1,200 | | | | 1,200 | |
| | | | | | | | |
| | | | | | | 2,806 | |
| | | | | | | | |
SEE NOTES TO FINANCIAL STATEMENTS.
| | | | | | |
| | | |
| 10 | | | | J.P. MORGAN INCOME FUNDS | | AUGUST 31, 2018 |
| | | | | | | | |
| INVESTMENTS | | PRINCIPAL AMOUNT (000) | | | VALUE
(000) | |
Corporate Bonds — continued | | | | | | | | |
Norway — 0.0% (g) | | | | | | | | |
Aker BP ASA 5.88%, 3/31/2025 (a) | | | 255 | | | | 265 | |
| | | | | | | | |
Panama — 0.0% (g) | | | | | | | | |
Global Bank Corp. 5.13%, 10/30/2019 (b) | | | 700 | | | | 706 | |
| | | | | | | | |
Peru — 0.3% | | | | | | | | |
Nexa Resources SA 5.38%, 5/4/2027 (b) | | | 5,950 | | | | 5,668 | |
Southern Copper Corp. 5.88%, 4/23/2045 | | | 3,070 | | | | 3,346 | |
| | | | | | | | |
| | | | | | | 9,014 | |
| | | | | | | | |
Portugal — 0.3% | | | | | | | | |
EDP — Energias de Portugal SA (EUR Swap Annual 5 Year + 5.04%), 5.38%, 9/16/2075 (b) (d) | | | EUR 2,800 | | | | 3,518 | |
EDP Finance BV | | | | | | | | |
5.25%, 1/14/2021 (a) | | | 400 | | | | 412 | |
2.38%, 3/23/2023 (b) | | | EUR 2,000 | | | | 2,480 | |
3.63%, 7/15/2024 (a) | | | 4,130 | | | | 3,983 | |
| | | | | | | | |
| | | | | | | 10,393 | |
| | | | | | | | |
Qatar — 0.1% | | | | | | | | |
ABQ Finance Ltd. 3.50%, 2/22/2022 (b) | | | 2,600 | | | | 2,525 | |
Ras Laffan Liquefied Natural Gas Co. Ltd. II 5.30%, 9/30/2020 (b) | | | 1,693 | | | | 1,727 | |
| | | | | | | | |
| | | | | | | 4,252 | |
| | | | | | | | |
Saudi Arabia — 0.1% | | | | | | | | |
Dar Al-Arkan Sukuk Co. Ltd. 6.88%, 4/10/2022 (b) | | | 2,431 | | | | 2,382 | |
| | | | | | | | |
South Korea—0.2% | | | | | | | | |
MagnaChip Semiconductor SA 5.00%, 3/1/2021 | | | 1,360 | | | | 2,033 | |
Woori Bank (US Treasury Yield Curve Rate T Note Constant Maturity 5 Year + 3.35%), 5.25%, 5/16/2022 (b) (c) (d) (e) | | | 4,150 | | | | 4,050 | |
| | | | | | | | |
| | | | | | | 6,083 | |
| | | | | | | | |
Spain — 1.4% | | | | | | | | |
Banco Bilbao Vizcaya Argentaria SA (EUR Swap Annual 5 Year + 9.18%), 8.88%, 4/14/2021 (b) (c) (d) (e) | | | EUR 2,400 | | | | 3,078 | |
Banco Santander SA 3.25%, 4/4/2026 (b) | | | EUR 800 | | | | 956 | |
CaixaBank SA | | | | | | | | |
(EUR Swap Annual 5 Year + 6.50%), 6.75%, 6/13/2024 (b) (c) (d) (e) | | | EUR 5,200 | | | | 6,498 | |
(EUR Swap Annual 5 Year + 3.35%), 3.50%, 2/15/2027 (b) (d) | | | EUR 3,200 | | | | 3,898 | |
Cellnex Telecom SA 2.88%, 4/18/2025 (b) | | | EUR 1,200 | | | | 1,423 | |
| | | | | | | | |
| INVESTMENTS | | PRINCIPAL AMOUNT (000) | | | VALUE
(000) | |
| | | | | | | | |
Spain — continued | | | | | | | | |
eDreams ODIGEO SA 8.50%, 8/1/2021 (b) | | | EUR 1,619 | | | | 1,959 | |
Gas Natural Fenosa Finance BV (EUR Swap Annual 8 Year + 3.35%), 4.13%, 11/18/2022 (b) (c) (d) (e) | | | EUR 1,800 | | | | 2,185 | |
Gestamp Funding Luxembourg SA 3.50%, 5/15/2023 (b) | | | EUR 1,646 | | | | 1,971 | |
Grifols SA 3.20%, 5/1/2025 (b) | | | EUR 1,800 | | | | 2,091 | |
Grupo-Antolin Irausa SA 3.25%, 4/30/2024 (b) | | | EUR 1,500 | | | | 1,727 | |
LHMC Finco SARL 6.25%, 12/20/2023 (a) | | | EUR 1,439 | | | | 1,720 | |
Telefonica Emisiones SAU 4.67%, 3/6/2038 | | | 930 | | | | 888 | |
Telefonica Europe BV | | | | | | | | |
(EUR Swap Annual 5 Year + 3.81%), 4.20%, 12/4/2019 (b) (c) (d) (e) | | | EUR 500 | | | | 599 | |
(EUR Swap Annual 5 Year + 2.33%), 2.63%, 6/7/2023 (b) (c) (d) (e) | | | EUR 2,900 | | | | 3,139 | |
Series NC5, (EUR Swap Annual 5 Year + 2.45%), 3.00%, 12/4/2023 (b) (c) (d) (e) | | | EUR 1,700 | | | | 1,857 | |
(EUR Swap Annual 10 Year + 4.30%), 5.88%, 3/31/2024 (b) (c) (d) (e) | | | EUR 5,700 | | | | 7,145 | |
| | | | | | | | |
| | | | | | | 41,134 | |
| | | | | | | | |
Sri Lanka — 0.1% | | | | | | | | |
National Savings Bank 8.88%, 9/18/2018 (b) | | | 2,950 | | | | 2,954 | |
| | | | | | | | |
Sweden — 0.4% | | | | | | | | |
Nordea Bank AB (USD Swap Semi 5 Year + 3.39%), 6.13%, 9/23/2024 (a) (c) (d) (e) | | | 1,674 | | | | 1,647 | |
Telefonaktiebolaget LM Ericsson 1.88%, 3/1/2024 (b) | | | EUR 1,150 | | | | 1,324 | |
Verisure Holding AB 6.00%, 11/1/2022 (b) | | | EUR 2,835 | | | | 3,419 | |
Verisure Midholding AB 5.75%, 12/1/2023 (b) | | | EUR 2,500 | | | | 2,921 | |
Volvo Car AB | | | | | | | | |
3.25%, 5/18/2021 (b) | | | EUR 1,000 | | | | 1,243 | |
2.00%, 1/24/2025 (b) | | | EUR 2,350 | | | | 2,700 | |
| | | | | | | | |
| | | | | | | 13,254 | |
| | | | | | | | |
Switzerland — 1.1% | | | | | | | | |
Credit Suisse AG 6.50%, 8/8/2023 (a) | | | 1,938 | | | | 2,072 | |
Credit Suisse Group AG | | | | | | | | |
(USD Swap Semi 5 Year + 4.60%), 7.50%, 12/11/2023 (a) (c) (d) (e) | | | 7,280 | | | | 7,735 | |
4.28%, 1/9/2028 (a) | | | 1,575 | | | | 1,549 | |
SEE NOTES TO FINANCIAL STATEMENTS.
| | | | | | | | |
| | | |
| AUGUST 31, 2018 | | J.P. MORGAN INCOME FUNDS | | | | | 11 | |
JPMorgan Global Bond Opportunities Fund
SCHEDULE OF PORTFOLIO INVESTMENTS
AS OF AUGUST 31, 2018 (continued)
(Amounts in U.S. Dollars, unless otherwise noted)
| | | | | | | | |
| INVESTMENTS | | PRINCIPAL AMOUNT (000) | | | VALUE
(000) | |
Corporate Bonds — continued | | | | | | | | |
Switzerland — continued | | | | | | | | |
(ICE LIBOR USD 3 Month + 1.41%), 3.87%, 1/12/2029 (a) (d) | | | 1,585 | | | | 1,513 | |
Dufry Finance SCA 4.50%, 8/1/2023 (b) | | | EUR 2,200 | | | | 2,645 | |
Dufry One BV 2.50%, 10/15/2024 (b) | | | EUR 2,550 | | | | 2,988 | |
Glencore Finance Europe Ltd. 1.63%, 1/18/2022 (b) | | | EUR 900 | | | | 1,064 | |
Kongsberg Actuation Systems BV 5.00%, 7/15/2025 (a) | | | EUR 820 | | | | 950 | |
UBS AG 5.13%, 5/15/2024 (b) | | | 1,404 | | | | 1,422 | |
UBS Group AG | | | | | | | | |
(USD Swap Semi 5 Year + 5.46%), 7.13%, 2/19/2020 (b) (c) (d) (e) | | | 723 | | | | 745 | |
(EUR Swap Annual 5 Year + 5.29%), 5.75%, 2/19/2022 (b) (c) (d) (e) | | | EUR 4,950 | | | | 6,377 | |
(USD Swap Semi 5 Year + 4.87%), 7.00%, 2/19/2025 (b) (c) (d) (e) | | | 2,750 | | | | 2,918 | |
| | | | | | | | |
| | | | | | | 31,978 | |
| | | | | | | | |
Turkey — 0.3% | | | | | | | | |
Akbank Turk A/S (USD Swap Semi 5 Year + 4.03%), 6.80%, 4/27/2028 (b) (d) | | | 4,050 | | | | 2,349 | |
Petkim Petrokimya Holding A/S 5.88%, 1/26/2023 (b) | | | 3,103 | | | | 2,641 | |
QNB Finansbank A/S 6.25%, 4/30/2019 (b) | | | 700 | | | | 691 | |
Turkiye Garanti Bankasi A/S 5.25%, 9/13/2022 (b) | | | 3,340 | | | | 2,739 | |
Turkiye Sise ve Cam Fabrikalari A/S 4.25%, 5/9/2020 (b) | | | 502 | | | | 462 | |
| | | | | | | | |
| | | | | | | 8,882 | |
| | | | | | | | |
United Arab Emirates — 0.1% | | | | | | | | |
DAE Funding LLC | | | | | | | | |
4.50%, 8/1/2022 (a) | | | 164 | | | | 162 | |
5.00%, 8/1/2024 (a) | | | 390 | | | | 383 | |
EMG SUKUK Ltd. 4.56%, 6/18/2024 (b) | | | 2,800 | | | | 2,807 | |
Shelf Drilling Holdings Ltd. 8.25%, 2/15/2025 (a) | | | 1,036 | | | | 1,053 | |
| | | | | | | | |
| | | | | | | 4,405 | |
| | | | | | | | |
United Kingdom — 3.0% | | | | | | | | |
Barclays plc | | | | | | | | |
(USD Swap Semi 5 Year + 4.84%), 7.75%, 9/15/2023 (c) (d) (e) | | | 294 | | | | 296 | |
4.38%, 9/11/2024 | | | 2,800 | | | | 2,718 | |
(EUR Swap Annual 5 Year + 2.45%), 2.63%, 11/11/2025 (b) (d) | | | EUR 2,400 | | | | 2,812 | |
5.20%, 5/12/2026 | | | 695 | | | | 687 | |
| | | | | | | | |
| INVESTMENTS | | PRINCIPAL AMOUNT (000) | | | VALUE
(000) | |
| | | | | | | | |
United Kingdom — continued | | | | | | | | |
4.84%, 5/9/2028 | | | 710 | | | | 674 | |
BAT Capital Corp. | | | | | | | | |
3.56%, 8/15/2027 (a) | | | 3,145 | | | | 2,946 | |
4.39%, 8/15/2037 (a) | | | 4,260 | | | | 3,964 | |
British Telecommunications plc 1.75%, 3/10/2026 (b) | | | EUR 2,500 | | | | 2,962 | |
CNH Industrial Finance Europe SA 2.88%, 5/17/2023 (b) | | | EUR 700 | | | | 871 | |
CPUK Finance Ltd. 4.25%, 8/28/2022 (b) | | | GBP 1,950 | | | | 2,524 | |
EC Finance plc 2.38%, 11/15/2022 (b) | | | EUR 400 | | | | 467 | |
Fiat Chrysler Automobiles NV | | | | | | | | |
4.50%, 4/15/2020 | | | 273 | | | | 274 | |
5.25%, 4/15/2023 | | | 1,360 | | | | 1,382 | |
3.75%, 3/29/2024 (b) | | | EUR 4,600 | | | | 5,765 | |
Galaxy Bidco Ltd. 6.38%, 11/15/2020 (b) | | | GBP 1,400 | | | | 1,805 | |
HSBC Holdings plc | | | | | | | | |
(EUR Swap Annual 5 Year + 5.34%), 6.00%, 9/29/2023 (b) (c) (d) (e) | | | EUR 2,700 | | | | 3,514 | |
4.25%, 3/14/2024 | | | 3,095 | | | | 3,104 | |
(ICE LIBOR USD 3 Month + 1.00%), 3.32%, 5/18/2024 (d) | | | 8,991 | | | | 9,016 | |
Iceland Bondco plc | | | | | | | | |
6.75%, 7/15/2024 (b) | | | GBP 1,400 | | | | 1,880 | |
4.63%, 3/15/2025 (b) | | | GBP 1,375 | | | | 1,624 | |
Jaguar Land Rover Automotive plc | | | | | | | | |
4.13%, 12/15/2018 (a) | | | 500 | | | | 500 | |
4.25%, 11/15/2019 (a) | | | 200 | | | | 200 | |
4.50%, 10/1/2027 (a) | | | 611 | | | | 517 | |
KCA Deutag UK Finance plc | | | | | | | | |
7.25%, 5/15/2021 (a) | | | 410 | | | | 383 | |
9.88%, 4/1/2022 (a) | | | 400 | | | | 399 | |
New Look Secured Issuer plc 6.50%, 7/1/2022 (b) | | | GBP 2,050 | | | | 1,609 | |
NGG Finance plc (GBP Swap 12 Year + 3.48%), 5.63%, 6/18/2073 (b) (d) | | | GBP 710 | | | | 1,008 | |
Nomad Foods Bondco plc 3.25%, 5/15/2024 (b) | | | EUR 1,600 | | | | 1,876 | |
Pizzaexpress Financing 2 plc 6.63%, 8/1/2021 (b) | | | GBP 880 | | | | 1,016 | |
Royal Bank of Scotland Group plc | | | | | | | | |
(USD Swap Semi 5 Year + 7.60%), 8.63%, 8/15/2021 (c) (d) (e) | | | 2,000 | | | | 2,141 | |
6.13%, 12/15/2022 | | | 1,645 | | | | 1,725 | |
(ICE LIBOR USD 3 Month + 1.48%), 3.50%, 5/15/2023 (d) | | | 3,185 | | | | 3,096 | |
6.00%, 12/19/2023 | | | 1,402 | | | | 1,462 | |
SEE NOTES TO FINANCIAL STATEMENTS.
| | | | | | |
| | | |
| 12 | | | | J.P. MORGAN INCOME FUNDS | | AUGUST 31, 2018 |
| | | | | | | | |
| INVESTMENTS | | PRINCIPAL AMOUNT (000) | | | VALUE
(000) | |
Corporate Bonds — continued | | | | | | | | |
United Kingdom — continued | | | | | | | | |
Santander UK Group Holdings plc 4.75%, 9/15/2025 (a) | | | 1,520 | | | | 1,498 | |
Standard Life Aberdeen plc (U.K. Government Bonds 5 Year Note Generic Bid Yield + 2.85%), 6.75%, 7/12/2027 (b) (c) (d) (e) | | | GBP 638 | | | | 1,100 | |
Synlab Unsecured Bondco plc 8.25%, 7/1/2023 (b) | | | EUR 2,750 | | | | 3,392 | |
Tesco Corporate Treasury Services plc 2.50%, 7/1/2024 (b) | | | EUR 7,700 | | | | 9,481 | |
Tesco plc 6.13%, 2/24/2022 | | | GBP 1,000 | | | | 1,463 | |
Virgin Media Finance plc | | | | | | | | |
4.50%, 1/15/2025 (b) | | | EUR 3,100 | | | | 3,657 | |
5.75%, 1/15/2025 (a) | | | 200 | | | | 193 | |
Virgin Media Secured Finance plc | | | | | | | | |
5.25%, 1/15/2026 (a) | | | 205 | | | | 199 | |
5.50%, 8/15/2026 (a) | | | 775 | | | | 762 | |
Worldpay Finance plc 3.75%, 11/15/2022 (b) | | | EUR 2,700 | | | | 3,385 | |
| | | | | | | | |
| | | | | | | 90,347 | |
| | | | | | | | |
United States — 25.0% | | | | | | | | |
21st Century Fox America, Inc. 4.95%, 10/15/2045 | | | 2,500 | | | | 2,734 | |
A10 Revolving Asset Financing LLC + 0.00%), 8.32%, 1/9/2020 ‡ (d) | | | 250 | | | | 250 | |
Acadia Healthcare Co., Inc. 6.50%, 3/1/2024 | | | 330 | | | | 342 | |
ACCO Brands Corp. 5.25%, 12/15/2024 (a) | | | 1,920 | | | | 1,910 | |
ACE Cash Express, Inc. 12.00%, 12/15/2022 (a) | | | 938 | | | | 1,003 | |
Adient Global Holdings Ltd. 3.50%, 8/15/2024 (b) | | | EUR 1,725 | | | | 1,871 | |
ADT Corp. (The) 4.13%, 6/15/2023 | | | 1,040 | | | | 989 | |
Advanced Micro Devices, Inc. 7.00%, 7/1/2024 | | | 186 | | | | 197 | |
Ahern Rentals, Inc. 7.38%, 5/15/2023 (a) | | | 846 | | | | 832 | |
Air Lease Corp. 3.00%, 9/15/2023 | | | 1,260 | | | | 1,201 | |
Air Medical Group Holdings, Inc. 6.38%, 5/15/2023 (a) | | | 1,275 | | | | 1,147 | |
AK Steel Corp. 7.00%, 3/15/2027 | | | 275 | | | | 261 | |
Albertsons Cos. LLC | | | | | | | | |
6.63%, 6/15/2024 | | | 1,581 | | | | 1,526 | |
5.75%, 3/15/2025 | | | 1,471 | | | | 1,331 | |
Alcoa Nederland Holding BV 6.75%, 9/30/2024 (a) | | | 350 | | | | 371 | |
| | | | | | | | |
| INVESTMENTS | | PRINCIPAL AMOUNT (000) | | | VALUE
(000) | |
| | | | | | | | |
United States — continued | | | | | | | | |
Alliance Data Systems Corp. | | | | | | | | |
5.88%, 11/1/2021 (a) | | | 509 | | | | 520 | |
5.38%, 8/1/2022 (a) | | | 543 | | | | 546 | |
Allison Transmission, Inc. 4.75%, 10/1/2027 (a) | | | 777 | | | | 730 | |
Ally Financial, Inc. | | | | | | | | |
4.75%, 9/10/2018 | | | 250 | | | | 250 | |
4.13%, 3/30/2020 | | | 1,000 | | | | 1,004 | |
4.25%, 4/15/2021 | | | 215 | | | | 215 | |
4.13%, 2/13/2022 | | | 805 | | | | 801 | |
4.63%, 5/19/2022 | | | 290 | | | | 292 | |
4.63%, 3/30/2025 | | | 2,530 | | | | 2,527 | |
8.00%, 11/1/2031 | | | 455 | | | | 556 | |
Altice US Finance I Corp. | | | | | | | | |
5.38%, 7/15/2023 (a) | | | 560 | | | | 564 | |
5.50%, 5/15/2026 (a) | | | 335 | | | | 329 | |
Altria Group, Inc. | | | | | | | | |
4.00%, 1/31/2024 | | | 1,500 | | | | 1,532 | |
4.25%, 8/9/2042 | | | 1,165 | | | | 1,086 | |
3.88%, 9/16/2046 | | | 965 | | | | 857 | |
AMC Entertainment Holdings, Inc. | | | | | | | | |
5.88%, 2/15/2022 | | | 320 | | | | 325 | |
5.75%, 6/15/2025 | | | 1,590 | | | | 1,543 | |
6.13%, 5/15/2027 | | | 107 | | | | 105 | |
AMC Networks, Inc. | | | | | | | | |
5.00%, 4/1/2024 | | | 258 | | | | 254 | |
4.75%, 8/1/2025 | | | 278 | | | | 268 | |
American Axle & Manufacturing, Inc. | | | | | | | | |
6.63%, 10/15/2022 | | | 1,185 | | | | 1,215 | |
6.25%, 4/1/2025 | | | 3,813 | | | | 3,794 | |
6.25%, 3/15/2026 | | | 288 | | | | 284 | |
6.50%, 4/1/2027 | | | 1,180 | | | | 1,168 | |
American International Group, Inc. 3.90%, 4/1/2026 | | | 1,750 | | | | 1,717 | |
American Tower Corp. REIT, 3.38%, 10/15/2026 | | | 2,390 | | | | 2,244 | |
American Tower Trust #1 REIT, 3.65%, 3/23/2028 (a) | | | 2,815 | | | | 2,774 | |
AmeriGas Partners LP 5.50%, 5/20/2025 | | | 575 | | | | 563 | |
Amkor Technology, Inc. 6.38%, 10/1/2022 | | | 1,000 | | | | 1,017 | |
AmWINS Group, Inc. 7.75%, 7/1/2026 (a) | | | 865 | | | | 911 | |
Analog Devices, Inc. 4.50%, 12/5/2036 | | | 190 | | | | 186 | |
Andeavor Logistics LP 6.25%, 10/15/2022 | | | 375 | | | | 388 | |
SEE NOTES TO FINANCIAL STATEMENTS.
| | | | | | | | |
| | | |
| AUGUST 31, 2018 | | J.P. MORGAN INCOME FUNDS | | | | | 13 | |
JPMorgan Global Bond Opportunities Fund
SCHEDULE OF PORTFOLIO INVESTMENTS
AS OF AUGUST 31, 2018 (continued)
(Amounts in U.S. Dollars, unless otherwise noted)
| | | | | | | | |
| INVESTMENTS | | PRINCIPAL AMOUNT (000) | | | VALUE
(000) | |
Corporate Bonds — continued | | | | | | | | |
United States — continued | | | | | | | | |
Anixter, Inc. 5.50%, 3/1/2023 | | | 320 | | | | 334 | |
Antero Resources Corp. | | | | | | | | |
5.38%, 11/1/2021 | | | 500 | | | | 508 | |
5.13%, 12/1/2022 | | | 1,850 | | | | 1,869 | |
Aramark International Finance SARL 3.13%, 4/1/2025 (b) | | | EUR 2,000 | | | | 2,406 | |
Archrock Partners LP 6.00%, 10/1/2022 | | | 78 | | | | 78 | |
Arconic, Inc. | | | | | | | | |
5.40%, 4/15/2021 | | | 250 | | | | 257 | |
5.13%, 10/1/2024 | | | 1,075 | | | | 1,080 | |
5.90%, 2/1/2027 | | | 754 | | | | 763 | |
6.75%, 1/15/2028 | | | 83 | | | | 85 | |
Ashland LLC 4.75%, 8/15/2022 (h) | | | 1,425 | | | | 1,440 | |
AT&T, Inc. | | | | | | | | |
3.15%, 9/4/2036 | | | EUR 900 | | | | 1,043 | |
4.30%, 12/15/2042 | | | 80 | | | | 68 | |
4.75%, 5/15/2046 | | | 880 | | | | 794 | |
Avaya, Inc. 7.00%, 4/1/2019 ‡ (f) | | | 1,120 | | | | — | (j) |
Avis Budget Car Rental LLC | | | | | | | | |
5.50%, 4/1/2023 | | | 1,830 | | | | 1,821 | |
6.38%, 4/1/2024 (a) | | | 925 | | | | 921 | |
5.25%, 3/15/2025 (a) | | | 459 | | | | 430 | |
Avis Budget Finance plc 4.13%, 11/15/2024 (b) | | | EUR 2,150 | | | | 2,558 | |
Axalta Coating Systems LLC | | | | | | | | |
4.25%, 8/15/2024 (b) | | | EUR 2,500 | | | | 3,047 | |
4.88%, 8/15/2024 (a) | | | 310 | | | | 308 | |
B&G Foods, Inc. 5.25%, 4/1/2025 | | | 269 | | | | 261 | |
Ball Corp. | | | | | | | | |
4.38%, 12/15/2023 | | | EUR 2,700 | | | | 3,555 | |
4.88%, 3/15/2026 | | | 133 | | | | 132 | |
Banff Merger Sub, Inc. 9.75%, 9/1/2026 (a) | | | 1,021 | | | | 1,024 | |
Bank of America Corp. | | | | | | | | |
(ICE LIBOR USD 3 Month + 1.16%), 3.12%, 1/20/2023 (d) | | | 2,620 | | | | 2,583 | |
(ICE LIBOR USD 3 Month + 0.79%), 3.00%, 12/20/2023 (d) | | | 12,205 | | | | 11,882 | |
Series X, (ICE LIBOR USD 3 Month + 3.71%), 6.25%, 9/5/2024 (c) (d) (e) | | | 466 | | | | 492 | |
Series AA, (ICE LIBOR USD 3 Month + 3.90%), 6.10%, 3/17/2025 (c) (d) (e) | | | 235 | | | | 247 | |
| | | | | | | | |
| INVESTMENTS | | PRINCIPAL AMOUNT (000) | | | VALUE
(000) | |
| | | | | | | | |
United States — continued | | | | | | | | |
Series DD, (ICE LIBOR USD 3 Month + 4.55%), 6.30%, 3/10/2026 (c) (d) (e) | | | 474 | | | | 507 | |
Series FF, (ICE LIBOR USD 3 Month + 2.93%), 5.87%, 3/15/2028 (c) (d) (e) | | | 6,630 | | | | 6,630 | |
(ICE LIBOR USD 3 Month + 1.07%), 3.97%, 3/5/2029 (d) | | | 1,875 | | | | 1,841 | |
Bausch Health Cos., Inc. | | | | | | | | |
7.50%, 7/15/2021 (a) | | | 100 | | | | 102 | |
5.63%, 12/1/2021 (a) | | | 85 | | | | 84 | |
6.50%, 3/15/2022 (a) | | | 123 | | | | 127 | |
5.50%, 3/1/2023 (a) | | | 114 | | | | 107 | |
4.50%, 5/15/2023 (b) | | | EUR 3,700 | | | | 4,187 | |
5.88%, 5/15/2023 (a) | | | 4,800 | | | | 4,589 | |
7.00%, 3/15/2024 (a) | | | 263 | | | | 278 | |
6.13%, 4/15/2025 (a) | | | 3,500 | | | | 3,255 | |
5.50%, 11/1/2025 (a) | | | 551 | | | | 550 | |
9.00%, 12/15/2025 (a) | | | 1,073 | | | | 1,135 | |
8.50%, 1/31/2027 (a) | | | 225 | | | | 231 | |
Becton Dickinson and Co. 1.40%, 5/24/2023 | | | EUR 471 | | | | 554 | |
Belden, Inc. 3.38%, 7/15/2027 (b) | | | EUR 2,500 | | | | 2,819 | |
Berry Global, Inc. 5.50%, 5/15/2022 | | | 400 | | | | 407 | |
Blue Cube Spinco LLC 10.00%, 10/15/2025 | | | 158 | | | | 183 | |
Blue Racer Midstream LLC 6.13%, 11/15/2022 (a) | | | 1,515 | | | | 1,545 | |
Booz Allen Hamilton, Inc. 5.13%, 5/1/2025 (a) | | | 175 | | | | 172 | |
Boyd Gaming Corp. | | | | | | | | |
6.88%, 5/15/2023 | | | 1,181 | | | | 1,241 | |
6.38%, 4/1/2026 | | | 545 | | | | 558 | |
Boyne USA, Inc. 7.25%, 5/1/2025 (a) | | | 427 | | | | 453 | |
Brink’s Co. (The) 4.63%, 10/15/2027 (a) | | | 290 | | | | 271 | |
Bristow Group, Inc. | | | | | | | | |
6.25%, 10/15/2022 | | | 125 | | | | 88 | |
8.75%, 3/1/2023 (a) | | | 247 | | | | 236 | |
Broadcom Corp. 3.63%, 1/15/2024 | | | 2,550 | | | | 2,469 | |
Buckeye Partners LP | | | | | | | | |
3.95%, 12/1/2026 | | | 1,970 | | | | 1,812 | |
(ICE LIBOR USD 3 Month + 4.02%), 6.38%, 1/22/2078 (d) | | | 423 | | | | 401 | |
Cablevision Systems Corp. 8.00%, 4/15/2020 | | | 582 | | | | 613 | |
SEE NOTES TO FINANCIAL STATEMENTS.
| | | | | | |
| | | |
| 14 | | | | J.P. MORGAN INCOME FUNDS | | AUGUST 31, 2018 |
| | | | | | | | |
| INVESTMENTS | | PRINCIPAL AMOUNT (000) | | | VALUE
(000) | |
Corporate Bonds — continued | | | | | | | | |
United States — continued | | | | | | | | |
California Resources Corp. 8.00%, 12/15/2022 (a) | | | 401 | | | | 359 | |
Callon Petroleum Co. 6.13%, 10/1/2024 | | | 244 | | | | 249 | |
Calpine Corp. 6.00%, 1/15/2022 (a) | | | 1,000 | | | | 1,017 | |
Camelot Finance SA 7.88%, 10/15/2024 (a) | | | 570 | | | | 568 | |
Capital One Financial Corp. | | | | | | | | |
3.50%, 6/15/2023 | | | 2,890 | | | | 2,858 | |
4.20%, 10/29/2025 | | | 3,000 | | | | 2,952 | |
3.80%, 1/31/2028 | | | 2,930 | | | | 2,788 | |
Carlyle Promissory Note 4.34%, 7/15/2019 ‡ | | | 8 | | | | 8 | |
Carrizo Oil & Gas, Inc. 6.25%, 4/15/2023 | | | 716 | | | | 732 | |
Catalent Pharma Solutions, Inc. 4.88%, 1/15/2026 (a) | | | 117 | | | | 112 | |
CBS Radio, Inc. 7.25%, 11/1/2024 (a) | | | 615 | | | | 589 | |
CCO Holdings LLC | | | | | | | | |
5.75%, 9/1/2023 | | | 405 | | | | 412 | |
5.75%, 1/15/2024 | | | 190 | | | | 193 | |
5.88%, 4/1/2024 (a) | | | 4,190 | | | | 4,274 | |
5.38%, 5/1/2025 (a) | | | 681 | | | | 677 | |
5.75%, 2/15/2026 (a) | | | 4,280 | | | | 4,280 | |
5.50%, 5/1/2026 (a) | | | 2,635 | | | | 2,602 | |
5.13%, 5/1/2027 (a) | | | 7,196 | | | | 6,863 | |
5.88%, 5/1/2027 (a) | | | 185 | | | | 184 | |
5.00%, 2/1/2028 (a) | | | 2,697 | | | | 2,526 | |
CDW LLC 5.00%, 9/1/2025 | | | 1,035 | | | | 1,029 | |
Central Garden & Pet Co. 6.13%, 11/15/2023 | | | 1,000 | | | | 1,031 | |
CenturyLink, Inc. | | | | | | | | |
Series S, 6.45%, 6/15/2021 | | | 315 | | | | 328 | |
Series T, 5.80%, 3/15/2022 | | | 360 | | | | 368 | |
Series W, 6.75%, 12/1/2023 | | | 1,380 | | | | 1,439 | |
Series Y, 7.50%, 4/1/2024 | | | 120 | | | | 128 | |
CF Industries, Inc. 4.50%, 12/1/2026 (a) | | | 2,360 | | | | 2,355 | |
Charter Communications Operating LLC 4.91%, 7/23/2025 | | | 2,868 | | | | 2,924 | |
Chemours Co. (The) | | | | | | | | |
6.63%, 5/15/2023 | | | 735 | | | | 770 | |
7.00%, 5/15/2025 | | | 195 | | | | 208 | |
Cheniere Corpus Christi Holdings LLC 5.88%, 3/31/2025 | | | 285 | | | | 303 | |
Cheniere Energy Partners LP 5.25%, 10/1/2025 | | | 265 | | | | 265 | |
| | | | | | | | |
| INVESTMENTS | | PRINCIPAL AMOUNT (000) | | | VALUE
(000) | |
| | | | | | | | |
United States — continued | | | | | | | | |
Chesapeake Energy Corp. | | | | | | | | |
4.88%, 4/15/2022 | | | 401 | | | | 387 | |
8.00%, 12/15/2022 (a) | | | 1,300 | | | | 1,367 | |
8.00%, 1/15/2025 | | | 1,054 | | | | 1,076 | |
8.00%, 6/15/2027 | | | 596 | | | | 603 | |
Cincinnati Bell, Inc. | | | | | | | | |
7.00%, 7/15/2024 (a) | | | 364 | | | | 320 | |
8.00%, 10/15/2025 (a) | | | 405 | | | | 360 | |
Cinemark USA, Inc. 5.13%, 12/15/2022 | | | 210 | | | | 211 | |
CIT Group, Inc. | | | | | | | | |
5.38%, 5/15/2020 | | | 26 | | | | 27 | |
5.00%, 8/15/2022 | | | 620 | | | | 632 | |
4.75%, 2/16/2024 | | | 262 | | | | 263 | |
5.25%, 3/7/2025 | | | 343 | | | | 349 | |
CITGO Petroleum Corp. 6.25%, 8/15/2022 (a) | | | 363 | | | | 366 | |
Citigroup, Inc. | | | | | | | | |
2.40%, 2/18/2020 | | | 2,690 | | | | 2,665 | |
Series O, (ICE LIBOR USD 3 Month + 4.06%), 5.87%, 3/27/2020 (c) (d) (e) | | | 3,488 | | | | 3,577 | |
2.65%, 10/26/2020 | | | 2,695 | | | | 2,664 | |
(ICE LIBOR USD 3 Month + 0.72%), 3.14%, 1/24/2023 (d) | | | 3,660 | | | | 3,607 | |
Claire’s Stores, Inc. | | | | | | | | |
9.00%, 3/15/2019 (a) (f) | | | 1,925 | | | | 1,237 | |
6.13%, 3/15/2020 (a) (f) | | | 250 | | | | 160 | |
Clean Harbors, Inc. 5.13%, 6/1/2021 | | | 880 | | | | 882 | |
Clear Channel Worldwide Holdings, Inc. | | | | | | | | |
Series B, 7.63%, 3/15/2020 | | | 4,045 | | | | 4,060 | |
Series B, 6.50%, 11/15/2022 | | | 8,483 | | | | 8,674 | |
Clearwater Paper Corp. 4.50%, 2/1/2023 | | | 620 | | | | 575 | |
CNG Holdings, Inc. 9.38%, 5/15/2020 (a) | | | 650 | | | | 647 | |
CNO Financial Group, Inc. 5.25%, 5/30/2025 | | | 670 | | | | 680 | |
CNX Midstream Partners LP 6.50%, 3/15/2026 (a) | | | 140 | | | | 139 | |
Cogent Communications Finance, Inc. 5.63%, 4/15/2021 (a) | | | 1,000 | | | | 1,005 | |
Cogent Communications Group, Inc. 5.38%, 3/1/2022 (a) | | | 535 | | | | 544 | |
Comcast Corp. | | | | | | | | |
4.60%, 8/15/2045 | | | 2,310 | | | | 2,271 | |
3.40%, 7/15/2046 | | | 2,000 | | | | 1,656 | |
Commercial Metals Co. 4.88%, 5/15/2023 | | | 405 | | | | 395 | |
SEE NOTES TO FINANCIAL STATEMENTS.
| | | | | | | | |
| | | |
| AUGUST 31, 2018 | | J.P. MORGAN INCOME FUNDS | | | | | 15 | |
JPMorgan Global Bond Opportunities Fund
SCHEDULE OF PORTFOLIO INVESTMENTS
AS OF AUGUST 31, 2018 (continued)
(Amounts in U.S. Dollars, unless otherwise noted)
| | | | | | | | |
| INVESTMENTS | | PRINCIPAL AMOUNT (000) | | | VALUE
(000) | |
Corporate Bonds — continued | | | | | | | | |
United States — continued | | | | | | | | |
CommScope Technologies LLC | | | | | | | | |
6.00%, 6/15/2025 (a) | | | 3,534 | | | | 3,658 | |
5.00%, 3/15/2027 (a) | | | 142 | | | | 138 | |
CommScope, Inc. 5.50%, 6/15/2024 (a) | | | 681 | | | | 690 | |
Community Health Systems, Inc. | | | | | | | | |
5.13%, 8/1/2021 | | | 563 | | | | 543 | |
6.88%, 2/1/2022 | | | 837 | | | | 427 | |
6.25%, 3/31/2023 | | | 441 | | | | 419 | |
8.63%, 1/15/2024 (a) | | | 777 | | | | 810 | |
8.13%, 6/30/2024 (a) | | | 1,138 | | | | 936 | |
Concho Resources, Inc. 3.75%, 10/1/2027 | | | 1,123 | | | | 1,074 | |
Constellation Merger Sub, Inc. 8.50%, 9/15/2025 (a) | | | 180 | | | | 170 | |
Constellium NV | | | | | | | | |
6.63%, 3/1/2025 (a) | | | 545 | | | | 554 | |
4.25%, 2/15/2026 (a) | | | EUR 541 | | | | 638 | |
4.25%, 2/15/2026 (b) | | | EUR 1,900 | | | | 2,240 | |
Cooper-Standard Automotive, Inc. 5.63%, 11/15/2026 (a) | | | 1,345 | | | | 1,325 | |
CoreCivic, Inc. REIT, 4.63%, 5/1/2023 | | | 800 | | | | 776 | |
Cornerstone Chemical Co. 6.75%, 8/15/2024 (a) | | | 217 | | | | 216 | |
Coty, Inc. | | | | | | | | |
4.00%, 4/15/2023 (a) | | | EUR 1,058 | | | | 1,217 | |
4.00%, 4/15/2023 (b) | | | EUR 1,050 | | | | 1,207 | |
6.50%, 4/15/2026 (a) | | | 1,190 | | | | 1,119 | |
Covanta Holding Corp. 5.88%, 3/1/2024 | | | 158 | | | | 159 | |
Crestwood Midstream Partners LP 6.25%, 4/1/2023 (h) | | | 555 | | | | 572 | |
Crown Americas LLC 4.75%, 2/1/2026 (a) | | | 274 | | | | 263 | |
Crown European Holdings SA | | | | | | | | |
4.00%, 7/15/2022 (b) | | | EUR 3,250 | | | | 4,140 | |
2.63%, 9/30/2024 (b) | | | EUR 2,400 | | | | 2,820 | |
CSC Holdings LLC | | | | | | | | |
8.63%, 2/15/2019 | | | 129 | | | | 132 | |
6.75%, 11/15/2021 | | | 242 | | | | 256 | |
10.13%, 1/15/2023 (a) | | | 1,200 | | | | 1,314 | |
5.25%, 6/1/2024 | | | 430 | | | | 417 | |
6.63%, 10/15/2025 (a) | | | 200 | | | | 208 | |
10.88%, 10/15/2025 (a) | | | 1,370 | | | | 1,594 | |
5.50%, 4/15/2027 (a) | | | 200 | | | | 195 | |
5.38%, 2/1/2028 (a) | | | 200 | | | | 192 | |
CSI Compressco LP 7.50%, 4/1/2025 (a) | | | 170 | | | | 171 | |
CURO Financial Technologies Corp. 12.00%, 3/1/2022 (a) | | | 282 | | | | 311 | |
| | | | | | | | |
| INVESTMENTS | | PRINCIPAL AMOUNT (000) | | | VALUE
(000) | |
| | | | | | | | |
United States — continued | | | | | | | | |
Curo Group Holdings Corp. 8.25%, 9/1/2025 (a) | | | 909 | | | | 900 | |
CVR Partners LP 9.25%, 6/15/2023 (a) | | | 885 | | | | 944 | |
CVS Health Corp. 4.30%, 3/25/2028 | | | 2,535 | | | | 2,516 | |
CyrusOne LP | | | | | | | | |
REIT, 5.00%, 3/15/2024 | | | 153 | | | | 155 | |
REIT, 5.38%, 3/15/2027 | | | 143 | | | | 144 | |
Dana, Inc. 5.50%, 12/15/2024 | | | 1,910 | | | | 1,893 | |
Darling Global Finance BV | | | | | | | | |
3.63%, 5/15/2026 (a) | | | EUR 1,428 | | | | 1,691 | |
3.63%, 5/15/2026 (b) | | | EUR 250 | | | | 296 | |
DaVita, Inc. | | | | | | | | |
5.13%, 7/15/2024 | | | 116 | | | | 112 | |
5.00%, 5/1/2025 | | | 800 | | | | 758 | |
DCP Midstream Operating LP | | | | | | | | |
3.88%, 3/15/2023 | | | 660 | | | | 644 | |
6.75%, 9/15/2037 (a) | | | 610 | | | | 657 | |
Dean Foods Co. 6.50%, 3/15/2023 (a) | | | 314 | | | | 299 | |
Dell International LLC | | | | | | | | |
5.88%, 6/15/2021 (a) | | | 470 | | | | 484 | |
7.13%, 6/15/2024 (a) | | | 637 | | | | 681 | |
6.02%, 6/15/2026 (a) | | | 5,145 | | | | 5,450 | |
Denbury Resources, Inc. 7.50%, 2/15/2024 (a) | | | 82 | | | | 83 | |
Diamond Offshore Drilling, Inc. 7.88%, 8/15/2025 | | | 286 | | | | 292 | |
Diamondback Energy, Inc. 4.75%, 11/1/2024 | | | 150 | | | | 151 | |
Diebold Nixdorf, Inc. 8.50%, 4/15/2024 | | | 620 | | | | 438 | |
DISH DBS Corp. | | | | | | | | |
6.75%, 6/1/2021 | | | 754 | | | | 766 | |
5.88%, 7/15/2022 | | | 2,595 | | | | 2,491 | |
5.00%, 3/15/2023 | | | 1,309 | | | | 1,165 | |
5.88%, 11/15/2024 | | | 6,021 | | | | 5,238 | |
7.75%, 7/1/2026 | | | 3,106 | | | | 2,803 | |
DJO Finance LLC 8.13%, 6/15/2021 (a) | | | 500 | | | | 516 | |
Dole Food Co., Inc. 7.25%, 6/15/2025 (a) | | | 283 | | | | 277 | |
Downstream Development Authority of the Quapaw Tribe of Oklahoma 10.50%, 2/15/2023 (a) | | | 993 | | | | 991 | |
Eldorado Resorts, Inc. 6.00%, 4/1/2025 | | | 643 | | | | 653 | |
Embarq Corp. 8.00%, 6/1/2036 | | | 2,789 | | | | 2,719 | |
EMC Corp. 2.65%, 6/1/2020 | | | 440 | | | | 430 | |
Encompass Health Corp. | | | | | | | | |
5.75%, 11/1/2024 | | | 1,070 | | | | 1,083 | |
SEE NOTES TO FINANCIAL STATEMENTS.
| | | | | | |
| | | |
| 16 | | | | J.P. MORGAN INCOME FUNDS | | AUGUST 31, 2018 |
| | | | | | | | |
| INVESTMENTS | | PRINCIPAL AMOUNT (000) | | | VALUE
(000) | |
Corporate Bonds — continued | | | | | | | | |
United States — continued | | | | | | | | |
5.75%, 9/15/2025 | | | 650 | | | | 655 | |
Endo Dac 6.00%, 2/1/2025 (a) (h) | | | 285 | | | | 236 | |
Endo Finance LLC 5.75%, 1/15/2022 (a) | | | 152 | | | | 141 | |
Energizer Gamma Acquisition BV 4.63%, 7/15/2026 (a) | | | EUR 1,417 | | | | 1,696 | |
Energizer Holdings, Inc. 5.50%, 6/15/2025 (a) | | | 1,400 | | | | 1,396 | |
EnerSys 5.00%, 4/30/2023 (a) | | | 495 | | | | 500 | |
EnLink Midstream Partners LP Series C, (ICE LIBOR USD 3 Month + 4.11%), 6.00%, 12/15/2022 (c) (d) (e) | | | 140 | | | | 129 | |
Ensco plc | | | | | | | | |
8.00%, 1/31/2024 | | | 156 | | | | 155 | |
5.20%, 3/15/2025 | | | 656 | | | | 549 | |
7.75%, 2/1/2026 | | | 211 | | | | 201 | |
Entegris, Inc. 4.63%, 2/10/2026 (a) | | | 1,210 | | | | 1,166 | |
Enterprise Development Authority (The) 12.00%, 7/15/2024 (a) | | | 1,530 | | | | 1,486 | |
Enterprise Products Operating LLC Series E, (ICE LIBOR USD 3 Month + 3.03%), 5.25%, 8/16/2077 (d) | | | 1,960 | | | | 1,852 | |
Envision Healthcare Corp. | | | | | | | | |
5.13%, 7/1/2022 (a) | | | 400 | | | | 406 | |
5.63%, 7/15/2022 | | | 677 | | | | 694 | |
EP Energy LLC | | | | | | | | |
9.38%, 5/1/2024 (a) | | | 1,755 | | | | 1,382 | |
8.00%, 11/29/2024 (a) | | | 938 | | | | 940 | |
8.00%, 2/15/2025 (a) | | | 760 | | | | 549 | |
7.75%, 5/15/2026 (a) | | | 617 | | | | 631 | |
Equinix, Inc. | | | | | | | | |
REIT, 5.38%, 4/1/2023 | | | 500 | | | | 511 | |
REIT, 5.75%, 1/1/2025 | | | 27 | | | | 28 | |
REIT, 2.88%, 10/1/2025 | | | EUR 5,275 | | | | 6,008 | |
REIT, 5.88%, 1/15/2026 | | | 2,076 | | | | 2,154 | |
REIT, 5.38%, 5/15/2027 | | | 485 | | | | 493 | |
ESH Hospitality, Inc. REIT, 5.25%, 5/1/2025 (a) | | | 951 | | | | 921 | |
Exela Intermediate LLC 10.00%, 7/15/2023 (a) | | | 905 | | | | 948 | |
Exelon Generation Co. LLC 4.25%, 6/15/2022 | | | 1,565 | | | | 1,597 | |
Fidelity & Guaranty Life Holdings, Inc. 5.50%, 5/1/2025 (a) | | | 650 | | | | 644 | |
First Data Corp. | | | | | | | | |
5.38%, 8/15/2023 (a) | | | 4,810 | | | | 4,895 | |
7.00%, 12/1/2023 (a) | | | 559 | | | | 581 | |
| | | | | | | | |
| INVESTMENTS | | PRINCIPAL AMOUNT (000) | | | VALUE
(000) | |
| | | | | | | | |
United States — continued | | | | | | | | |
5.00%, 1/15/2024 (a) | | | 45 | | | | 45 | |
5.75%, 1/15/2024 (a) | | | 3,639 | | | | 3,712 | |
FirstEnergy Corp. Series B, 3.90%, 7/15/2027 | | | 4,885 | | | | 4,797 | |
Ford Motor Credit Co. LLC 3.66%, 9/8/2024 | | | 3,000 | | | | 2,820 | |
Freeport-McMoRan, Inc. | | | | | | | | |
3.55%, 3/1/2022 | | | 1,190 | | | | 1,148 | |
3.88%, 3/15/2023 | | | 2,355 | | | | 2,267 | |
5.40%, 11/14/2034 | | | 600 | | | | 554 | |
Frontier Communications Corp. | | | | | | | | |
7.13%, 3/15/2019 | | | 355 | | | | 356 | |
10.50%, 9/15/2022 | | | 154 | | | | 135 | |
6.88%, 1/15/2025 | | | 1,150 | | | | 673 | |
11.00%, 9/15/2025 | | | 646 | | | | 494 | |
8.50%, 4/1/2026 (a) | | | 430 | | | | 405 | |
FXI Holdings, Inc. 7.88%, 11/1/2024 (a) | | | 733 | | | | 706 | |
Gartner, Inc. 5.13%, 4/1/2025 (a) | | | 84 | | | | 85 | |
GCI LLC 6.88%, 4/15/2025 | | | 500 | | | | 517 | |
GE Capital International Funding Co. Unlimited Co. 4.42%, 11/15/2035 | | | 2,975 | | | | 2,862 | |
General Electric Co. | | | | | | | | |
3.45%, 5/15/2024 | | | 748 | | | | 744 | |
2.13%, 5/17/2037 | | | EUR 400 | | | | 430 | |
4.50%, 3/11/2044 | | | 3,550 | | | | 3,435 | |
General Motors Co. | | | | | | | | |
5.15%, 4/1/2038 | | | 1,600 | | | | 1,518 | |
5.20%, 4/1/2045 | | | 2,035 | | | | 1,879 | |
Genesis Energy LP 6.00%, 5/15/2023 | | | 731 | | | | 719 | |
Genesys Telecommunications Laboratories, Inc. 10.00%, 11/30/2024 (a) | | | 801 | | | | 893 | |
GEO Group, Inc. (The) | | | | | | | | |
REIT, 5.13%, 4/1/2023 | | | 1,105 | | | | 1,066 | |
REIT, 5.88%, 10/15/2024 | | | 1,465 | | | | 1,429 | |
Global Partners LP 7.00%, 6/15/2023 ‡ | | | 676 | | | | 679 | |
Golden Nugget, Inc. 6.75%, 10/15/2024 (a) | | | 939 | | | | 954 | |
Goldman Sachs Group, Inc. (The) | | | | | | | | |
Series L, (ICE LIBOR USD 3 Month + 3.88%), 5.70%, 5/10/2019 (c) (d) (e) | | | 225 | | | | 228 | |
Series M, (ICE LIBOR USD 3 Month + 3.92%), 5.38%, 5/10/2020 (c) (d) (e) | | | 4,681 | | | | 4,792 | |
2.35%, 11/15/2021 | | | 2,575 | | | | 2,496 | |
SEE NOTES TO FINANCIAL STATEMENTS.
| | | | | | | | |
| | | |
| AUGUST 31, 2018 | | J.P. MORGAN INCOME FUNDS | | | | | 17 | |
JPMorgan Global Bond Opportunities Fund
SCHEDULE OF PORTFOLIO INVESTMENTS
AS OF AUGUST 31, 2018 (continued)
(Amounts in U.S. Dollars, unless otherwise noted)
| | | | | | | | |
| INVESTMENTS | | PRINCIPAL AMOUNT (000) | | | VALUE
(000) | |
Corporate Bonds — continued | | | | | | | | |
United States — continued | | | | | | | | |
1.38%, 7/26/2022 (b) | | | EUR 500 | | | | 598 | |
Series P, (ICE LIBOR USD 3 Month + 2.87%), 5.00%, 11/10/2022 (c) (d) (e) | | | 6,615 | | | | 6,258 | |
(ICE LIBOR USD 3 Month + 1.05%), 2.91%, 6/5/2023 (d) | | | 945 | | | | 919 | |
(ICE LIBOR USD 3 Month + 0.99%), 2.90%, 7/24/2023 (d) | | | 2,220 | | | | 2,155 | |
4.25%, 10/21/2025 | | | 1,815 | | | | 1,805 | |
(ICE LIBOR USD 3 Month + 1.17%), 3.48%, 5/15/2026 (d) | | | 3,806 | | | | 3,787 | |
Series O, (ICE LIBOR USD 3 Month + 3.83%), 5.30%, 11/10/2026 (c) (d) (e) | | | 484 | | | | 484 | |
(ICE LIBOR USD 3 Month + 1.16%), 3.81%, 4/23/2029 (d) | | | 3,824 | | | | 3,655 | |
Goodman Networks, Inc. 8.00%, 5/11/2022 ‡ | | | 9 | | | | 4 | |
Goodyear Tire & Rubber Co. (The) 4.88%, 3/15/2027 | | | 962 | | | | 883 | |
Graham Holdings Co. 5.75%, 6/1/2026 (a) | | | 188 | | | | 192 | |
Gray Television, Inc. | | | | | | | | |
5.13%, 10/15/2024 (a) | | | 26 | | | | 25 | |
5.88%, 7/15/2026 (a) | | | 400 | | | | 400 | |
Gulfport Energy Corp. | | | | | | | | |
6.00%, 10/15/2024 | | | 1,177 | | | | 1,162 | |
6.38%, 1/15/2026 | | | 126 | | | | 123 | |
H&E Equipment Services, Inc. 5.63%, 9/1/2025 | | | 330 | | | | 328 | |
Halcon Resources Corp. 6.75%, 2/15/2025 | | | 241 | | | | 225 | |
Hanesbrands, Inc. 4.88%, 5/15/2026 (a) | | | 699 | | | | 673 | |
Harris Corp. 4.85%, 4/27/2035 | | | 3,820 | | | | 3,924 | |
HCA, Inc. | | | | | | | | |
7.50%, 2/15/2022 | | | 1,275 | | | | 1,399 | |
5.88%, 5/1/2023 | | | 2,099 | | | | 2,204 | |
5.00%, 3/15/2024 | | | 300 | | | | 307 | |
5.38%, 2/1/2025 | | | 9,855 | | | | 9,968 | |
5.25%, 4/15/2025 | | | 500 | | | | 516 | |
5.88%, 2/15/2026 | | | 3,070 | | | | 3,173 | |
Hecla Mining Co. 6.88%, 5/1/2021 | | | 375 | | | | 378 | |
Herc Rentals, Inc. 7.75%, 6/1/2024 (a) | | | 1,019 | | | | 1,099 | |
Hertz Corp. (The) | | | | | | | | |
7.63%, 6/1/2022(a) | | | 2,230 | | | | 2,213 | |
6.25%, 10/15/2022 | | | 1,150 | | | | 1,073 | |
5.50%, 10/15/2024(a) | | | 1,475 | | | | 1,235 | |
| | | | | | | | |
| INVESTMENTS | | PRINCIPAL AMOUNT (000) | | | VALUE
(000) | |
| | | | | | | | |
United States — continued | | | | | | | | |
Hertz Holdings Netherlands BV | | | | | | | | |
4.13%, 10/15/2021 (b) | | | EUR 600 | | | | 711 | |
5.50%, 3/30/2023 (a) | | | EUR 1,724 | | | | 2,033 | |
Hexion, Inc. | | | | | | | | |
6.63%, 4/15/2020 | | | 1,095 | | | | 1,036 | |
9.00%, 11/15/2020 | | | 300 | | | | 254 | |
Hilcorp Energy I LP 5.00%, 12/1/2024 (a) | | | 1,485 | | | | 1,435 | |
Hill-Rom Holdings, Inc. 5.75%, 9/1/2023 (a) | | | 1,705 | | | | 1,756 | |
Hilton Domestic Operating Co., Inc. 5.13%, 5/1/2026 (a) | | | 200 | | | | 200 | |
Hilton Grand Vacations Borrower LLC 6.13%, 12/1/2024 | | | 122 | | | | 126 | |
Hilton Worldwide Finance LLC | | | | | | | | |
4.63%, 4/1/2025 | | | 130 | | | | 128 | |
4.88%, 4/1/2027 | | | 987 | | | | 971 | |
Hologic, Inc. 4.38%, 10/15/2025 (a) | | | 477 | | | | 459 | |
Hughes Satellite Systems Corp. | | | | | | | | |
5.25%, 8/1/2026 | | | 638 | | | | 610 | |
6.63%, 8/1/2026 | | | 348 | | | | 333 | |
Huntsman International LLC | | | | | | | | |
5.13%, 11/15/2022 | | | 1,105 | | | | 1,139 | |
4.25%, 4/1/2025 | | | EUR 2,800 | | | | 3,746 | |
Icahn Enterprises LP | | | | | | | | |
5.88%, 2/1/2022 | | | 776 | | | | 789 | |
6.25%, 2/1/2022 | | | 237 | | | | 244 | |
6.38%, 12/15/2025 | | | 713 | | | | 722 | |
iHeartCommunications, Inc. 9.00%, 12/15/2019 (f) | | | 3,270 | | | | 2,428 | |
IHS Markit Ltd. | | | | | | | | |
5.00%, 11/1/2022 (a) | | | 30 | | | | 31 | |
4.00%, 3/1/2026 (a) | | | 147 | | | | 141 | |
ILFC E-Capital Trust I (USD Constant Maturity 30 Year + 1.55%), 4.57%, 12/21/2065 (a) (d) | | | 500 | | | | 456 | |
ILFC E-Capital Trust II (US Treasury Yield Curve Rate T Note Constant Maturity 30 Year + 1.80%), 4.82%, 12/21/2065 (a) (d) | | | 535 | | | | 487 | |
Infor US, Inc. 6.50%, 5/15/2022 | | | 2,785 | | | | 2,821 | |
Informatica LLC 7.13%, 7/15/2023 (a) | | | 1,333 | | | | 1,356 | |
Ingevity Corp. 4.50%, 2/1/2026 (a) | | | 234 | | | | 219 | |
International Game Technology plc | | | | | | | | |
6.25%, 2/15/2022 (a) | | | 1,925 | | | | 1,986 | |
4.75%, 2/15/2023 (b) | | | EUR 4,250 | | | | 5,353 | |
SEE NOTES TO FINANCIAL STATEMENTS.
| | | | | | |
| | | |
| 18 | | | | J.P. MORGAN INCOME FUNDS | | AUGUST 31, 2018 |
| | | | | | | | |
| INVESTMENTS | | PRINCIPAL AMOUNT (000) | | | VALUE
(000) | |
Corporate Bonds — continued | | | | | | | | |
United States — continued | | | | | | | | |
inVentiv Group Holdings, Inc. 7.50%, 10/1/2024 (a) | | | 540 | | | | 571 | |
IQVIA, Inc. | | | | | | | | |
4.88%, 5/15/2023 (a) | | | 82 | | | | 82 | |
3.50%, 10/15/2024 (b) | | | EUR 5,250 | | | | 6,247 | |
3.25%, 3/15/2025 (b) | | | EUR 2,700 | | | | 3,166 | |
5.00%, 10/15/2026 (a) | | | 1,390 | | | | 1,373 | |
IRB Holding Corp. 6.75%, 2/15/2026 (a) | | | 186 | | | | 178 | |
Iron Mountain, Inc. | | | | | | | | |
REIT, 5.75%, 8/15/2024 | | | 645 | | | | 639 | |
REIT, 3.00%, 1/15/2025 (b) | | | EUR 2,350 | | | | 2,694 | |
REIT, 4.88%, 9/15/2027 (a) | | | 237 | | | | 220 | |
REIT, 5.25%, 3/15/2028 (a) | | | 297 | | | | 281 | |
ITC Holdings Corp. 3.35%, 11/15/2027 | | | 3,290 | | | | 3,116 | |
Jack Ohio Finance LLC 6.75%, 11/15/2021 (a) | | | 2,000 | | | | 2,070 | |
Jaguar Holding Co. II 6.38%, 8/1/2023 (a) | | | 44 | | | | 44 | |
JB Poindexter & Co., Inc. 7.13%, 4/15/2026 (a) | | | 36 | | | | 37 | |
JBS USA LUX SA | | | | | | | | |
7.25%, 6/1/2021 (a) | | | 1,188 | | | | 1,200 | |
5.75%, 6/15/2025 (a) | | | 1,247 | | | | 1,166 | |
6.75%, 2/15/2028 (a) | | | 467 | | | | 446 | |
JC Penney Corp., Inc. 5.88%, 7/1/2023 (a) | | | 48 | | | | 43 | |
Kennedy-Wilson, Inc. 5.88%, 4/1/2024 | | | 257 | | | | 255 | |
Kinetic Concepts, Inc. 7.88%, 2/15/2021 (a) | | | 1,205 | | | | 1,246 | |
KLX, Inc. 5.88%, 12/1/2022 (a) | | | 430 | | | | 445 | |
Kraft Heinz Foods Co. | | | | | | | | |
5.20%, 7/15/2045 | | | 1,655 | | | | 1,608 | |
4.38%, 6/1/2046 | | | 565 | | | | 494 | |
Kraton Polymers LLC 5.25%, 5/15/2026 (a) | | | EUR 705 | | | | 845 | |
Kratos Defense & Security Solutions, Inc. 6.50%, 11/30/2025 (a) | | | 505 | | | | 521 | |
Kronos International, Inc. 3.75%, 9/15/2025 (b) | | | EUR 1,180 | | | | 1,342 | |
L Brands, Inc. 5.25%, 2/1/2028 | | | 671 | | | | 577 | |
Ladder Capital Finance Holdings LLLP | | | | | | | | |
5.25%, 3/15/2022 (a) | | | 286 | | | | 287 | |
5.25%, 10/1/2025 (a) | | | 128 | | | | 120 | |
Lamar Media Corp. 5.75%, 2/1/2026 | | | 46 | | | | 48 | |
Lennar Corp. | | | | | | | | |
8.38%, 1/15/2021 | | | 210 | | | | 230 | |
5.88%, 11/15/2024 | | | 94 | | | | 98 | |
| | | | | | | | |
| INVESTMENTS | | PRINCIPAL AMOUNT (000) | | | VALUE
(000) | |
| | | | | | | | |
United States — continued | | | | | | | | |
4.75%, 11/29/2027 | | | 681 | | | | 650 | |
Level 3 Financing, Inc. | | | | | | | | |
5.63%, 2/1/2023 | | | 48 | | | | 49 | |
5.13%, 5/1/2023 | | | 198 | | | | 197 | |
5.38%, 1/15/2024 | | | 160 | | | | 160 | |
5.38%, 5/1/2025 | | | 592 | | | | 585 | |
5.25%, 3/15/2026 | | | 153 | | | | 150 | |
Level 3 Parent LLC 5.75%, 12/1/2022 | | | 1,175 | | | | 1,184 | |
LGI Homes, Inc. 6.88%, 7/15/2026 (a) | | | 414 | | | | 411 | |
LifePoint Health, Inc. 5.50%, 12/1/2021 | | | 20 | | | | 20 | |
LIN Television Corp. 5.88%, 11/15/2022 | | | 233 | | | | 238 | |
Live Nation Entertainment, Inc. 5.63%, 3/15/2026 (a) | | | 115 | | | | 116 | |
LKQ European Holdings BV 3.63%, 4/1/2026 (a) | | | EUR 1,599 | | | | 1,884 | |
LKQ Italia Bondco SpA 3.88%, 4/1/2024 (b) | | | EUR 1,800 | | | | 2,215 | |
LPL Holdings, Inc. 5.75%, 9/15/2025 (a) | | | 774 | | | | 757 | |
LTF Merger Sub, Inc. 8.50%, 6/15/2023 (a) | | | 770 | | | | 803 | |
Mallinckrodt International Finance SA | | | | | | | | |
5.75%, 8/1/2022 (a) | | | 381 | | | | 355 | |
5.50%, 4/15/2025 (a) | | | 1,135 | | | | 969 | |
Marathon Petroleum Corp. 4.75%, 9/15/2044 | | | 1,202 | | | | 1,167 | |
Marriott Ownership Resorts, Inc. 6.50%, 9/15/2026 (a) | | | 332 | | | | 339 | |
Martin Marietta Materials, Inc. 3.50%, 12/15/2027 | | | 2,770 | | | | 2,570 | |
Masco Corp. | | | | | | | | |
4.38%, 4/1/2026 | | | 3,780 | | | | 3,783 | |
3.50%, 11/15/2027 | | | 695 | | | | 644 | |
Masonite International Corp. 5.75%, 9/15/2026 (a) | | | 302 | | | | 305 | |
MasTec, Inc. 4.88%, 3/15/2023 | | | 650 | | | | 639 | |
Match Group, Inc. 5.00%, 12/15/2027 (a) | | | 58 | | | | 57 | |
Mattel, Inc. | | | | | | | | |
3.15%, 3/15/2023 | | | 243 | | | | 212 | |
6.75%, 12/31/2025 (a) | | | 214 | | | | 210 | |
MetLife, Inc. | | | | | | | | |
3.00%, 3/1/2025 | | | 1,920 | | | | 1,846 | |
6.40%, 12/15/2036 | | | 435 | | | | 464 | |
MGM Growth Properties Operating Partnership LP REIT, 5.63%, 5/1/2024 | | | 250 | | | | 257 | |
MGM Resorts International | | | | | | | | |
7.75%, 3/15/2022 | | | 1,545 | | | | 1,698 | |
SEE NOTES TO FINANCIAL STATEMENTS.
| | | | | | | | |
| | | |
| AUGUST 31, 2018 | | J.P. MORGAN INCOME FUNDS | | | | | 19 | |
JPMorgan Global Bond Opportunities Fund
SCHEDULE OF PORTFOLIO INVESTMENTS
AS OF AUGUST 31, 2018 (continued)
(Amounts in U.S. Dollars, unless otherwise noted)
| | | | | | | | |
| INVESTMENTS | | PRINCIPAL AMOUNT (000) | | | VALUE
(000) | |
Corporate Bonds — continued | | | | | | | | |
United States — continued | | | | | | | | |
6.00%, 3/15/2023 | | | 3,645 | | | | 3,784 | |
Mohawk Industries, Inc. 2.00%, 1/14/2022 | | | EUR 1,100 | | | | 1,336 | |
Momentive Performance Materials USA LLC 8.88%, 10/15/2020 ‡ (f) | | | 350 | | | | — | |
Momentive Performance Materials, Inc. 3.88%, 10/24/2021 | | | 350 | | | | 374 | |
Morgan Stanley | | | | | | | | |
Series H, (ICE LIBOR USD 3 Month + 3.61%), 5.45%, 7/15/2019 (c) (d) (e) | | | 2,670 | | | | 2,707 | |
Series J, (ICE LIBOR USD 3 Month + 3.81%), 5.55%, 7/15/2020 (c) (d) (e) | | | 2,470 | | | | 2,547 | |
3.70%, 10/23/2024 | | | 3,110 | | | | 3,083 | |
(ICE LIBOR USD 3 Month + 1.14%), 3.77%, 1/24/2029 (d) | | | 615 | | | | 593 | |
(ICE LIBOR USD 3 Month + 1.46%), 3.97%, 7/22/2038 (d) | | | 3,985 | | | | 3,730 | |
MPH Acquisition Holdings LLC 7.13%, 6/1/2024 (a) | | | 643 | | | | 666 | |
MSCI, Inc. | | | | | | | | |
5.25%, 11/15/2024 (a) | | | 155 | | | | 159 | |
5.38%, 5/15/2027 (a) | | | 189 | | | | 194 | |
Nabors Industries, Inc. 5.50%, 1/15/2023 | | | 325 | | | | 324 | |
Nationstar Mortgage Holdings, Inc. | | | | | | | | |
8.13%, 7/15/2023 (a) | | | 410 | | | | 426 | |
9.13%, 7/15/2026 (a) | | | 369 | | | | 384 | |
Navistar International Corp. 6.63%, 11/1/2025 (a) | | | 198 | | | | 206 | |
Neiman Marcus Group Ltd. LLC 8.00%, 10/15/2021 (a) | | | 2,604 | | | | 1,764 | |
Netflix, Inc. | | | | | | | | |
5.75%, 3/1/2024 | | | 200 | | | | 205 | |
4.38%, 11/15/2026 | | | 364 | | | | 343 | |
4.88%, 4/15/2028 (a) | | | 1,850 | | | | 1,753 | |
New Albertsons LP | | | | | | | | |
7.45%, 8/1/2029 | | | 197 | | | | 165 | |
8.70%, 5/1/2030 | | | 22 | | | | 19 | |
8.00%, 5/1/2031 | | | 665 | | | | 564 | |
New Home Co., Inc. (The) 7.25%, 4/1/2022 | | | 660 | | | | 670 | |
Newfield Exploration Co. 5.75%, 1/30/2022 | | | 190 | | | | 200 | |
NextEra Energy Operating Partners LP | | | | | | | | |
4.25%, 9/15/2024 (a) | | | 238 | | | | 232 | |
| | | | | | | | |
| INVESTMENTS | | PRINCIPAL AMOUNT (000) | | | VALUE
(000) | |
| | | | | | | | |
United States — continued | | | | | | | | |
4.50%, 9/15/2027 (a) | | | 161 | | | | 153 | |
NGPL PipeCo LLC 4.88%, 8/15/2027 (a) | | | 185 | | | | 186 | |
Nielsen Co. Luxembourg SARL (The) 5.00%, 2/1/2025 (a) | | | 250 | | | | 243 | |
Nielsen Finance LLC 5.00%, 4/15/2022 (a) | | | 2,089 | | | | 2,029 | |
Noble Energy, Inc. 3.85%, 1/15/2028 | | | 3,590 | | | | 3,424 | |
Noble Holding International Ltd. | | | | | | | | |
7.75%, 1/15/2024 | | | 369 | | | | 360 | |
7.88%, 2/1/2026 (a) | | | 352 | | | | 361 | |
Novelis Corp. | | | | | | | | |
6.25%, 8/15/2024 (a) | | | 440 | | | | 445 | |
5.88%, 9/30/2026 (a) | | | 890 | | | | 867 | |
NRG Energy, Inc. | | | | | | | | |
6.25%, 5/1/2024 | | | 690 | | | | 714 | |
6.63%, 1/15/2027 | | | 630 | | | | 659 | |
5.75%, 1/15/2028 (a) | | | 250 | | | | 253 | |
NRG Yield Operating LLC 5.38%, 8/15/2024 | | | 224 | | | | 225 | |
Nuance Communications, Inc. 5.63%, 12/15/2026 | | | 861 | | | | 858 | |
NuStar Logistics LP 5.63%, 4/28/2027 | | | 230 | | | | 229 | |
NVA Holdings, Inc. 6.88%, 4/1/2026 (a) | | | 240 | | | | 239 | |
Oasis Petroleum, Inc. | | | | | | | | |
6.88%, 3/15/2022 | | | 5 | | | | 5 | |
6.88%, 1/15/2023 | | | 2,020 | | | | 2,063 | |
OI European Group BV | | | | | | | | |
4.88%, 3/31/2021 (b) | | | EUR 1,000 | | | | 1,286 | |
4.00%, 3/15/2023 (a) | | | 190 | | | | 180 | |
3.13%, 11/15/2024 (b) | | | EUR 500 | | | | 596 | |
ONEOK, Inc. 4.00%, 7/13/2027 | | | 3,720 | | | | 3,632 | |
Outfront Media Capital LLC | | | | | | | | |
5.25%, 2/15/2022 | | | 5 | | | | 5 | |
5.63%, 2/15/2024 | | | 150 | | | | 151 | |
5.88%, 3/15/2025 | | | 546 | | | | 551 | |
Owens Corning 4.30%, 7/15/2047 | | | 3,295 | | | | 2,728 | |
Owens-Brockway Glass Container, Inc. 5.38%, 1/15/2025 (a) | | | 500 | | | | 494 | |
Party City Holdings, Inc. | | | | | | | | |
6.13%, 8/15/2023 (a) | | | 116 | | | | 118 | |
6.63%, 8/1/2026 (a) | | | 504 | | | | 508 | |
PBF Logistics LP 6.88%, 5/15/2023 | | | 185 | | | | 189 | |
Peabody Energy Corp. 6.00%, 3/31/2022 (a) | | | 190 | | | | 191 | |
Penn Virginia Corp. 8.50%, 5/1/2020 ‡ (f) | | | 300 | | | | 1 | |
SEE NOTES TO FINANCIAL STATEMENTS.
| | | | | | |
| | | |
| 20 | | | | J.P. MORGAN INCOME FUNDS | | AUGUST 31, 2018 |
| | | | | | | | |
| INVESTMENTS | | PRINCIPAL AMOUNT (000) | | | VALUE
(000) | |
Corporate Bonds — continued | | | | | | | | |
United States — continued | | | | | | | | |
Penske Automotive Group, Inc. 5.50%, 5/15/2026 | | | 681 | | | | 667 | |
PetSmart, Inc. | | | | | | | | |
7.13%, 3/15/2023 (a) | | | 1,833 | | | | 1,233 | |
5.88%, 6/1/2025 (a) | | | 1,843 | | | | 1,495 | |
8.88%, 6/1/2025 (a) | | | 370 | | | | 250 | |
PGT Escrow Issuer, Inc. 6.75%, 8/1/2026 (a) | | | 274 | | | | 281 | |
Pilgrim’s Pride Corp. | | | | | | | | |
5.75%, 3/15/2025 (a) | | | 702 | | | | 679 | |
5.88%, 9/30/2027 (a) | | | 305 | | | | 290 | |
Plantronics, Inc. 5.50%, 5/31/2023 (a) | | | 1,110 | | | | 1,102 | |
Polaris Intermediate Corp. 8.50% (cash), 12/1/2022 (a) (i) | | | 466 | | | | 481 | |
Post Holdings, Inc. | | | | | | | | |
5.50%, 3/1/2025 (a) | | | 915 | | | | 913 | |
5.00%, 8/15/2026 (a) | | | 18 | | | | 17 | |
5.75%, 3/1/2027 (a) | | | 825 | | | | 815 | |
PPL Capital Funding, Inc. 3.10%, 5/15/2026 | | | 3,860 | | | | 3,615 | |
PQ Corp. 5.75%, 12/15/2025 (a) | | | 99 | | | | 98 | |
Prime Security Services Borrower LLC 9.25%, 5/15/2023 (a) | | | 1,200 | | | | 1,286 | |
PSPC Escrow Corp. 6.00%, 2/1/2023(b) | | | EUR 2,150 | | | | 2,617 | |
PVH Corp. 3.13%, 12/15/2027 (b) | | | EUR 2,300 | | | | 2,653 | |
QEP Resources, Inc. | | | | | | | | |
6.88%, 3/1/2021 | | | 88 | | | | 92 | |
5.38%, 10/1/2022 | | | 515 | | | | 518 | |
5.63%, 3/1/2026 | | | 97 | | | | 93 | |
Quad/Graphics, Inc. 7.00%, 5/1/2022 | | | 15 | | | | 15 | |
Quicken Loans, Inc. | | | | | | | | |
5.75%, 5/1/2025 (a) | | | 1,095 | | | | 1,084 | |
5.25%, 1/15/2028 (a) | | | 330 | | | | 302 | |
Qwest Capital Funding, Inc. | | | | | | | | |
6.88%, 7/15/2028 | | | 119 | | | | 111 | |
7.75%, 2/15/2031 | | | 366 | | | | 339 | |
Qwest Corp. 7.25%, 9/15/2025 | | | 50 | | | | 54 | |
Rackspace Hosting, Inc. 8.63%, 11/15/2024 (a) | | | 2,003 | | | | 1,972 | |
Radian Group, Inc. | | | | | | | | |
7.00%, 3/15/2021 | | | 197 | | | | 210 | |
4.50%, 10/1/2024 | | | 483 | | | | 476 | |
Rain CII Carbon LLC 7.25%, 4/1/2025 (a) | | | 925 | | | | 948 | |
Range Resources Corp. 5.00%, 3/15/2023 | | | 208 | | | | 203 | |
| | | | | | | | |
| INVESTMENTS | | PRINCIPAL AMOUNT (000) | | | VALUE
(000) | |
| | | | | | | | |
United States — continued | | | | | | | | |
Realty Income Corp. REIT, 3.65%, 1/15/2028 | | | 1,570 | | | | 1,527 | |
Revlon Consumer Products Corp. 6.25%, 8/1/2024 | | | 400 | | | | 232 | |
Reynolds Group Issuer, Inc. | | | | | | | | |
5.75%, 10/15/2020 | | | 2,839 | | | | 2,843 | |
6.88%, 2/15/2021 (h) | | | 381 | | | | 386 | |
Rite Aid Corp. 6.13%, 4/1/2023 (a) | | | 1,260 | | | | 1,130 | |
Rockwell Collins, Inc. 3.50%, 3/15/2027 | | | 6,830 | | | | 6,542 | |
Roper Technologies, Inc. 3.80%, 12/15/2026 | | | 3,855 | | | | 3,770 | |
Rowan Cos., Inc. | | | | | | | | |
4.88%, 6/1/2022 | | | 379 | | | | 353 | |
7.38%, 6/15/2025 | | | 318 | | | | 305 | |
Sabre GLBL, Inc. 5.38%, 4/15/2023 (a) | | | 795 | | | | 801 | |
Sally Holdings LLC 5.63%, 12/1/2025 | | | 236 | | | | 217 | |
SBA Communications Corp. REIT, 4.88%, 9/1/2024 | | | 330 | | | | 326 | |
Scientific Games International, Inc. | | | | | | | | |
10.00%, 12/1/2022 | | | 504 | | | | 533 | |
5.00%, 10/15/2025 (a) | | | 732 | | | | 695 | |
Scotts Miracle-Gro Co. (The) | | | | | | | | |
6.00%, 10/15/2023 | | | 825 | | | | 838 | |
5.25%, 12/15/2026 | | | 1,695 | | | | 1,610 | |
Sealed Air Corp. 5.13%, 12/1/2024 (a) | | | 250 | | | | 253 | |
SemGroup Corp. | | | | | | | | |
5.63%, 11/15/2023 | | | 711 | | | | 688 | |
7.25%, 3/15/2026 | | | 680 | | | | 676 | |
Seminole Hard Rock Entertainment, Inc. 5.88%, 5/15/2021 (a) | | | 675 | | | | 675 | |
Sempra Energy 3.80%, 2/1/2038 | | | 3,420 | | | | 3,141 | |
Sensata Technologies BV | | | | | | | | |
4.88%, 10/15/2023 (a) | | | 1,250 | | | | 1,250 | |
5.63%, 11/1/2024 (a) | | | 600 | | | | 621 | |
5.00%, 10/1/2025 (a) | | | 129 | | | | 129 | |
Sensata Technologies UK Financing Co. plc 6.25%, 2/15/2026 (a) | | | 2,065 | | | | 2,171 | |
Service Corp. International 5.38%, 5/15/2024 | | | 162 | | | | 165 | |
Shire Acquisitions Investments Ireland DAC | | | | | | | | |
2.40%, 9/23/2021 | | | 2,915 | | | | 2,817 | |
3.20%, 9/23/2026 | | | 3,000 | | | | 2,794 | |
Silgan Holdings, Inc. 3.25%, 3/15/2025 | | | EUR 2,400 | | | | 2,860 | |
Sinclair Television Group, Inc. | | | | | | | | |
6.13%, 10/1/2022 | | | 2,000 | | | | 2,050 | |
SEE NOTES TO FINANCIAL STATEMENTS.
| | | | | | | | |
| | | |
| AUGUST 31, 2018 | | J.P. MORGAN INCOME FUNDS | | | | | 21 | |
JPMorgan Global Bond Opportunities Fund
SCHEDULE OF PORTFOLIO INVESTMENTS
AS OF AUGUST 31, 2018 (continued)
(Amounts in U.S. Dollars, unless otherwise noted)
| | | | | | | | |
| INVESTMENTS | | PRINCIPAL AMOUNT (000) | | | VALUE
(000) | |
Corporate Bonds — continued | | | | | | | | |
United States — continued | | | | | | | | |
5.63%, 8/1/2024 (a) | | | 900 | | | | 887 | |
Sirius XM Radio, Inc. | | | | | | | | |
4.63%, 5/15/2023 (a) | | | 355 | | | | 354 | |
6.00%, 7/15/2024 (a) | | | 3,785 | | | | 3,933 | |
5.38%, 4/15/2025 (a) | | | 540 | | | | 548 | |
5.00%, 8/1/2027 (a) | | | 477 | | | | 461 | |
SM Energy Co. 5.00%, 1/15/2024 | | | 56 | | | | 54 | |
Solera LLC 10.50%, 3/1/2024 (a) | | | 423 | | | | 464 | |
Sonic Automotive, Inc. 6.13%, 3/15/2027 | | | 63 | | | | 59 | |
Sotheby’s 4.88%, 12/15/2025 (a) | | | 505 | | | | 482 | |
Southwestern Energy Co. 6.20%, 1/23/2025 (h) | | | 1,313 | | | | 1,315 | |
Spectrum Brands Holdings, Inc. 7.75%, 1/15/2022 | | | 1,335 | | | | 1,372 | |
Springleaf Finance Corp. | | | | | | | | |
7.75%, 10/1/2021 | | | 465 | | | | 502 | |
5.63%, 3/15/2023 | | | 625 | | | | 624 | |
6.88%, 3/15/2025 | | | 545 | | | | 545 | |
7.13%, 3/15/2026 | | | 767 | | | | 763 | |
Sprint Capital Corp. 8.75%, 3/15/2032 | | | 1,520 | | | | 1,680 | |
Sprint Communications, Inc. 7.00%, 3/1/2020 (a) | | | 630 | | | | 655 | |
7.00%, 8/15/2020 | | | 321 | | | | 336 | |
9.25%, 4/15/2022 | | | 247 | | | | 280 | |
6.00%, 11/15/2022 | | | 1,131 | | | | 1,145 | |
Sprint Corp.
7.25%, 9/15/2021 | | | 22 | | | | 23 | |
7.88%, 9/15/2023 | | | 9,749 | | | | 10,493 | |
7.13%, 6/15/2024 | | | 942 | | | | 977 | |
7.63%, 2/15/2025 | | | 4,734 | | | | 5,024 | |
7.63%, 3/1/2026 | | | 1,756 | | | | 1,844 | |
SPX FLOW, Inc. 5.63%, 8/15/2024 (a) | | | 960 | | | | 962 | |
Standard Industries, Inc.
6.00%, 10/15/2025 (a) | | | 421 | | | | 430 | |
4.75%, 1/15/2028 (a) | | | 420 | | | | 391 | |
Staples, Inc. 8.50%, 9/15/2025 (a) | | | 2,656 | | | | 2,510 | |
Station Casinos LLC 5.00%, 10/1/2025 (a) | | | 235 | | | | 227 | |
Summit Materials LLC
6.13%, 7/15/2023 | | | 390 | | | | 395 | |
5.13%, 6/1/2025 (a) | | | 436 | | | | 412 | |
Summit Midstream Holdings LLC 5.50%, 8/15/2022 | | | 420 | | | | 418 | |
Sunoco Logistics Partners Operations LP 5.35%, 5/15/2045 | | | 2,010 | | | | 1,944 | |
5.40%, 10/1/2047 | | | 1,150 | | | | 1,124 | |
| | | | | | | | |
| INVESTMENTS | | PRINCIPAL AMOUNT (000) | | | VALUE
(000) | |
| | | | | | | | |
United States — continued | | | | | | | | |
SUPERVALU, Inc.
6.75%, 6/1/2021 | | | 281 | | | | 286 | |
7.75%, 11/15/2022 | | | 1,355 | | | | 1,406 | |
Synchrony Financial 3.95%, 12/1/2027 | | | 71 | | | | 65 | |
Talen Energy Supply LLC 6.50%, 6/1/2025 | | | 724 | | | | 539 | |
Tallgrass Energy Partners LP 5.50%, 9/15/2024 (a) | | | 370 | | | | 381 | |
Talos Production LLC 11.00%, 4/3/2022 (a) | | | 24 | | | | 25 | |
Targa Resources Partners LP
5.25%, 5/1/2023 | | | 695 | | | | 703 | |
4.25%, 11/15/2023 | | | 565 | | | | 548 | |
6.75%, 3/15/2024 | | | 2,495 | | | | 2,620 | |
5.00%, 1/15/2028 (a) | | | 490 | | | | 476 | |
Team Health Holdings, Inc. 6.38%, 2/1/2025 (a) | | | 587 | | | | 509 | |
TEGNA, Inc. 6.38%, 10/15/2023 | | | 1,548 | | | | 1,604 | |
Teleflex, Inc. 5.25%, 6/15/2024 | | | 60 | | | | 62 | |
Tempur Sealy International, Inc. 5.50%, 6/15/2026 | | | 1,520 | | | | 1,482 | |
Tenet Healthcare Corp. | | | | | |
4.50%, 4/1/2021 | | | 1,155 | | | | 1,154 | |
8.13%, 4/1/2022 | | | 5,263 | | | | 5,559 | |
6.75%, 6/15/2023 | | | 2,000 | | | | 2,000 | |
5.13%, 5/1/2025 | | | 400 | | | | 397 | |
Tennant Co. 5.63%, 5/1/2025 | | | 137 | | | | 138 | |
Terex Corp. 5.63%, 2/1/2025 (a) | | | 1,142 | | | | 1,133 | |
Terraform Global Operating LLC 6.13%, 3/1/2026 (a) | | | 287 | | | | 278 | |
TerraForm Power Operating LLC
4.25%, 1/31/2023 (a) | | | 344 | | | | 336 | |
6.62%, 6/15/2025 (a) (h) | | | 322 | | | | 343 | |
5.00%, 1/31/2028 (a) | | | 435 | | | | 407 | |
Texas Competitive Electric Holdings Co. LLC 8.50%, 5/1/2020‡ (f) | | | 375 | | | | — | (j) |
T-Mobile US, Inc.
6.38%, 3/1/2025 ‡ | | | 2,251 | | | | — | (j) |
6.50%, 1/15/2026 ‡ | | | 3,265 | | | | — | (j) |
4.50%, 2/1/2026 ‡ | | | 236 | | | | — | |
T-Mobile USA, Inc.
6.50%, 1/15/2024 | | | 1,055 | | | | 1,092 | |
6.50%, 1/15/2026 | | | 207 | | | | 219 | |
4.50%, 2/1/2026 | | | 113 | | | | 108 | |
4.75%, 2/1/2028 ‡ | | | 236 | | | | — | |
Toll Brothers Finance Corp.
4.88%, 11/15/2025 | | | 450 | | | | 438 | |
SEE NOTES TO FINANCIAL STATEMENTS.
| | | | | | |
| | | |
| 22 | | | | J.P. MORGAN INCOME FUNDS | | AUGUST 31, 2018 |
| | | | | | | | |
| INVESTMENTS | | PRINCIPAL AMOUNT (000) | | | VALUE
(000) | |
Corporate Bonds — continued | | | | | | | | |
United States — continued | | | | | | | | |
4.35%, 2/15/2028 | | | 360 | | | | 329 | |
TransDigm UK Holdings plc 6.88%, 5/15/2026 (a) | | | 269 | | | | 276 | |
TransDigm, Inc. 6.50%, 7/15/2024 | | | 478 | | | | 486 | |
6.50%, 5/15/2025 | | | 414 | | | | 421 | |
Transocean Guardian Ltd. 5.88%, 1/15/2024 (a) | | | 340 | | | | 342 | |
Transocean Pontus Ltd. 6.13%, 8/1/2025 (a) | | | 178 | | | | 182 | |
Transocean Proteus Ltd. 6.25%, 12/1/2024 (a) | | | 598 | | | | 612 | |
Transocean, Inc.
5.80%, 10/15/2022 (h) | | | 184 | | | | 182 | |
9.00%, 7/15/2023 (a) | | | 776 | | | | 837 | |
7.50%, 1/15/2026 (a) | | | 417 | | | | 425 | |
7.50%, 4/15/2031 | | | 220 | | | | 203 | |
6.80%, 3/15/2038 | | | 1,471 | | | | 1,212 | |
9.35%, 12/15/2041 (h) | | | 720 | | | | 714 | |
TreeHouse Foods, Inc. 6.00%, 2/15/2024 (a) | | | 1,695 | | | | 1,716 | |
Trinseo Materials Operating SCA 5.38%, 9/1/2025 (a) | | | 161 | | | | 158 | |
Tronox Finance plc 5.75%, 10/1/2025 (a) | | | 149 | | | | 143 | |
Tronox, Inc. 6.50%, 4/15/2026 (a) | | | 344 | | | | 337 | |
Tutor Perini Corp. 6.88%, 5/1/2025 (a) | | | 735 | | | | 748 | |
Ultra Resources, Inc. | | | | | |
6.88%, 4/15/2022 (a) | | | 1,826 | | | | 890 | |
7.13%, 4/15/2025 (a) | | | 1,095 | | | | 485 | |
Unit Corp. 6.63%, 5/15/2021 | | | 265 | | | | 265 | |
United Continental Holdings, Inc. 4.25%, 10/1/2022 | | | 283 | | | | 278 | |
United Rentals North America, Inc. | | | | | | | | |
5.75%, 11/15/2024 | | | 2,825 | | | | 2,916 | |
5.50%, 7/15/2025 | | | 385 | | | | 393 | |
5.88%, 9/15/2026 | | | 1,680 | | | | 1,730 | |
5.50%, 5/15/2027 | | | 2,695 | | | | 2,688 | |
4.88%, 1/15/2028 | | | 747 | | | | 712 | |
United States Steel Corp. | | | | | | | | |
6.88%, 8/15/2025 | | | 116 | | | | 118 | |
6.25%, 3/15/2026 | | | 560 | | | | 558 | |
United Technologies Corp. | | | | | | | | |
3.95%, 8/16/2025 | | | 2,660 | | | | 2,672 | |
4.13%, 11/16/2028 | | | 4,020 | | | | 4,018 | |
Uniti Group LP REIT, 6.00%, 4/15/2023 (a) | | | 2,389 | | | | 2,293 | |
Univar USA, Inc. 6.75%, 7/15/2023 (a) | | | 275 | | | | 284 | |
| | | | | | | | |
| INVESTMENTS | | PRINCIPAL AMOUNT (000) | | | VALUE
(000) | |
| | | | | | | | |
United States — continued | | | | | | | | |
Univision Communications, Inc. | | | | | | | | |
6.75%, 9/15/2022 (a) | | | 36 | | | | 37 | |
5.13%, 5/15/2023 (a) | | | 90 | | | | 85 | |
5.13%, 2/15/2025 (a) | | | 111 | | | | 102 | |
US Concrete, Inc. 6.38%, 6/1/2024 | | | 350 | | | | 353 | |
USA Compression Partners LP 6.88%, 4/1/2026 (a) | | | 157 | | | | 162 | |
USIS Merger Sub, Inc. 6.88%, 5/1/2025 (a) | | | 300 | | | | 299 | |
Vantiv LLC 3.88%, 11/15/2025 (b) | | | GBP 1,350 | | | | 1,702 | |
Venator Finance SARL 5.75%, 7/15/2025 (a) | | | 350 | | | | 326 | |
VEREIT Operating Partnership LP | | | | | | | | |
REIT, 4.60%, 2/6/2024 | | | 2,255 | | | | 2,275 | |
REIT, 3.95%, 8/15/2027 | | | 2,610 | | | | 2,486 | |
Verizon Communications, Inc. 3.85%, 11/1/2042 | | | 710 | | | | 610 | |
Verscend Escrow Corp. 9.75%, 8/15/2026 (a) | | | 84 | | | | 86 | |
Versum Materials, Inc. 5.50%, 9/30/2024 (a) | | | 150 | | | | 153 | |
Vertiv Group Corp. 9.25%, 10/15/2024 (a) | | | 2,295 | | | | 2,358 | |
Viacom, Inc. 4.38%, 3/15/2043 | | | 167 | | | | 144 | |
(ICE LIBOR USD 3 Month + 3.90%), 5.88%, 2/28/2057 (d) | | | 533 | | | | 520 | |
(ICE LIBOR USD 3 Month + 3.90%), 6.25%, 2/28/2057 (d) | | | 250 | | | | 248 | |
ViaSat, Inc. 5.63%, 9/15/2025 (a) | | | 5 | | | | 5 | |
VICI Properties 1 LLC REIT, 8.00%, 10/15/2023 | | | 1,246 | | | | 1,377 | |
Vista Outdoor, Inc. 5.88%, 10/1/2023 | | | 965 | | | | 946 | |
Vistra Energy Corp. | | | | | | | | |
7.38%, 11/1/2022 | | | 615 | | | | 640 | |
5.88%, 6/1/2023 | | | 653 | | | | 672 | |
7.63%, 11/1/2024 | | | 35 | | | | 38 | |
Vistra Operations Co. LLC 5.50%, 9/1/2026 (a) | | | 1,012 | | | | 1,030 | |
VOC Escrow Ltd. 5.00%, 2/15/2028 (a) | | | 408 | | | | 393 | |
Warner Media LLC 2.95%, 7/15/2026 | | | 824 | | | | 749 | |
Weatherford International LLC | | | | | | | | |
9.88%, 3/1/2025 (a) | | | 100 | | | | 94 | |
6.80%, 6/15/2037 | | | 3 | | | | 2 | |
Weatherford International Ltd. | | | | | | | | |
7.75%, 6/15/2021 | | | 237 | | | | 232 | |
4.50%, 4/15/2022 | | | 386 | | | | 336 | |
SEE NOTES TO FINANCIAL STATEMENTS.
| | | | | | | | |
| | | |
| AUGUST 31, 2018 | | J.P. MORGAN INCOME FUNDS | | | | | 23 | |
JPMorgan Global Bond Opportunities Fund
SCHEDULE OF PORTFOLIO INVESTMENTS
AS OF AUGUST 31, 2018 (continued)
(Amounts in U.S. Dollars, unless otherwise noted)
| | | | | | | | |
| INVESTMENTS | | PRINCIPAL AMOUNT (000) | | | VALUE
(000) | |
Corporate Bonds — continued | | | | | | | | |
United States — continued | | | | | | | | |
8.25%, 6/15/2023 | | | 120 | | | | 112 | |
9.88%, 2/15/2024 | | | 311 | | | | 294 | |
6.50%, 8/1/2036 | | | 394 | | | | 293 | |
7.00%, 3/15/2038 | | | 25 | | | | 19 | |
6.75%, 9/15/2040 | | | 10 | | | | 7 | |
5.95%, 4/15/2042 | | | 474 | | | | 333 | |
Welbilt, Inc. 9.50%, 2/15/2024 | | | 1,070 | | | | 1,172 | |
WellCare Health Plans, Inc. 5.25%, 4/1/2025 | | | 710 | | | | 726 | |
Wells Fargo & Co. 4.90%, 11/17/2045 | | | 1,210 | | | | 1,222 | |
WESCO Distribution, Inc. 5.38%, 6/15/2024 | | | 325 | | | | 323 | |
West Street Merger Sub, Inc. 6.38%, 9/1/2025 (a) | | | 64 | | | | 63 | |
Western Digital Corp. 4.75%, 2/15/2026 | | | 676 | | | | 663 | |
Western Gas Partners LP 4.75%, 8/15/2028 | | | 2,175 | | | | 2,164 | |
Whiting Petroleum Corp. | | | | | | | | |
5.75%, 3/15/2021 | | | 1,250 | | | | 1,281 | |
6.63%, 1/15/2026 | | | 286 | | | | 298 | |
Williams Cos., Inc. (The) 4.00%, 9/15/2025 | | | 5,660 | | | | 5,591 | |
Windstream Services LLC 9.00%, 6/30/2025 (a) | | | 2,488 | | | | 1,798 | |
WMG Acquisition Corp. | | | | | | | | |
5.63%, 4/15/2022 (a) | | | 351 | | | | 356 | |
4.13%, 11/1/2024 (b) | | | EUR 925 | | | | 1,110 | |
5.50%, 4/15/2026 (a) | | | 296 | | | | 291 | |
WPX Energy, Inc. | | | | | | | | |
6.00%, 1/15/2022 | | | 81 | | | | 83 | |
8.25%, 8/1/2023 | | | 1,020 | | | | 1,158 | |
5.75%, 6/1/2026 | | | 227 | | | | 229 | |
Wyndham Destinations, Inc. | | | | | | | | |
4.15%, 4/1/2024 (h) | | | 174 | | | | 172 | |
5.10%, 10/1/2025 (h) | | | 80 | | | | 81 | |
4.50%, 4/1/2027 (h) | | | 174 | | | | 166 | |
Wyndham Hotels & Resorts, Inc. 5.38%, 4/15/2026 (a) | | | 320 | | | | 318 | |
Wynn Las Vegas LLC 5.50%, 3/1/2025 (a) | | | 1,875 | | | | 1,855 | |
XPO Logistics, Inc. 6.50%, 6/15/2022 (a) | | | 1,196 | | | | 1,235 | |
Zayo Group LLC | | | | | | | | |
6.00%, 4/1/2023 | | | 370 | | | | 381 | |
6.38%, 5/15/2025 | | | 1,195 | | | | 1,249 | |
5.75%, 1/15/2027 (a) | | | 637 | | | | 639 | |
| | | | | | | | |
| | | | | | | 754,896 | |
| | | | | | | | |
Total Corporate Bonds
(Cost $1,551,485) | | | | 1,520,932 | |
| | | | | | | | |
| | | | | | | | |
| INVESTMENTS | | PRINCIPAL AMOUNT (000) | | | VALUE
(000) | |
Foreign Government Securities — 16.5% | |
Argentina — 0.3% | | | | | | | | |
Bonos de la Nacion Argentina con Ajuste por CER 4.00%, 3/6/2020 | | | ARS 151,238 | | | | 4,300 | |
Provincia de Buenos Aires | | | | | | | | |
9.95%, 6/9/2021 (b) | | | 2,170 | | | | 2,002 | |
5.38%, 1/20/2023 (b) | | | EUR 1,518 | | | | 1,427 | |
9.13%, 3/16/2024 (a) | | | 1,518 | | | | 1,290 | |
| | | | | | | | |
| | | | | | | 9,019 | |
| | | | | | | | |
Australia — 1.3% | | | | | | | | |
Republic of Australia 3.00%, 3/21/2047 (b) | | | AUD 53,900 | | | | 38,443 | |
| | | | | | | | |
Belarus — 0.2% | | | | | | | | |
Republic of Belarus | | | | | | | | |
6.88%, 2/28/2023 (a) | | | 497 | | | | 506 | |
7.63%, 6/29/2027 (a) | | | 1,950 | | | | 2,033 | |
6.20%, 2/28/2030 (b) | | | 3,473 | | | | 3,269 | |
| | | | | | | | |
| | | | | | | 5,808 | |
| | | | | | | | |
Colombia — 0.2% | | | | | | | | |
Republic of Colombia 5.00%, 6/15/2045 | | | 4,620 | | | | 4,620 | |
| | | | | | | | |
Costa Rica — 0.2% | | | | | | | | |
Republic of Costa Rica 7.00%, 4/4/2044 (b) | | | 4,691 | | | | 4,421 | |
| | | | | | | | |
Dominican Republic — 0.1% | | | | | | | | |
Government of Dominican Republic 6.88%, 1/29/2026 (a) | | | 4,060 | | | | 4,357 | |
| | | | | | | | |
Ecuador — 0.3% | | | | | | | | |
Republic of Ecuador | | | | | | | | |
10.50%, 3/24/2020 (b) | | | 6,600 | | | | 6,782 | |
10.75%, 3/28/2022 (a) | | | 2,730 | | | | 2,815 | |
| | | | | | | | |
| | | | | | | 9,597 | |
| | | | | | | | |
Egypt — 0.5% | | | | | | | | |
Arab Republic of Egypt | | | | | | | | |
5.75%, 4/29/2020 (b) | | | 5,700 | | | | 5,743 | |
6.13%, 1/31/2022 (a) | | | 1,700 | | | | 1,689 | |
4.75%, 4/16/2026 (a) | | | EUR 6,100 | | | | 6,603 | |
| | | | | | | | |
| | | | | | | 14,035 | |
| | | | | | | | |
El Salvador — 0.2% | | | | | | | | |
Republic of El Salvador | | | | | | | | |
7.75%, 1/24/2023 (b) | | | 6,760 | | | | 7,073 | |
7.63%, 2/1/2041 (b) | | | 355 | | | | 342 | |
| | | | | | | | |
| | | | | | | 7,415 | |
| | | | | | | | |
SEE NOTES TO FINANCIAL STATEMENTS.
| | | | | | |
| | | |
| 24 | | | | J.P. MORGAN INCOME FUNDS | | AUGUST 31, 2018 |
| | | | | | | | |
| INVESTMENTS | | PRINCIPAL AMOUNT (000) | | | VALUE
(000) | |
Foreign Government Securities — continued | | | | | |
Gabon — 0.1% | | | | | | | | |
Gabonese Republic 6.38%, 12/12/2024 (b) | | | 3,350 | | | | 3,044 | |
| | | | | | | | |
Greece — 0.5% | | | | | | | | |
Greece Government Bond 3.38%, 2/15/2025 (b) | | | EUR 13,084 | | | | 14,635 | |
| | | | | | | | |
Hungary — 0.1% | | | | | | | | |
Republic of Hungary 7.50%, 11/12/2020 | | | HUF 550,000 | | | | 2,215 | |
| | | | | | | | |
Indonesia — 2.3% | | | | | | | | |
Republic of Indonesia | | | | | | | | |
8.25%, 7/15/2021 | | | IDR 374,428,000 | | | | 25,775 | |
5.38%, 10/17/2023 (b) | | | 5,200 | | | | 5,518 | |
8.75%, 5/15/2031 | | | IDR 205,663,000 | | | | 14,377 | |
8.25%, 5/15/2036 | | | IDR 360,477,000 | | | | 23,708 | |
| | | | | | | | |
| | | | | | | 69,378 | |
| | | | | | | | |
Iraq — 0.1% | | | | | | | | |
Republic of Iraq 6.75%, 3/9/2023 (b) | | | 3,030 | | | | 2,939 | |
| | | | | | | | |
Ivory Coast — 0.2% | | | | | | | | |
Republic of Cote d’Ivoire 5.13%, 6/15/2025 (b) | | | EUR 4,680 | | | | 5,344 | |
| | | | | | | | |
| | | | | | | | |
Jamaica — 0.1% | | | | | | | | |
Jamaica Government International Bond 7.88%, 7/28/2045 | | | 1,490 | | | | 1,708 | |
| | | | | | | | |
Jordan — 0.1% | | | | | | | | |
Kingdom of Jordan 6.13%, 1/29/2026 (b) | | | 3,059 | | | | 2,967 | |
| | | | | | | | |
Lebanon — 0.2% | | | | | | | | |
Republic of Lebanon | | | | | | | | |
5.15%, 11/12/2018 (b) | | | 3,170 | | | | 3,166 | |
5.45%, 11/28/2019 (b) | | | 3,483 | | | | 3,331 | |
| | | | | | | | |
| | | | | | | 6,497 | |
| | | | | | | | |
Mexico — 0.5% | | | | | | | | |
United Mexican States 7.50%, 6/3/2027 | | | MXN 291,000 | | | | 14,804 | |
| | | | | | | | |
Morocco — 0.0% (g) | | | | | | | | |
Kingdom of Morocco 5.50%, 12/11/2042 (b) | | | 1,309 | | | | 1,384 | |
| | | | | | | | |
Nigeria — 0.2% | | | | | | | | |
Federal Republic of Nigeria 7.63%, 11/28/2047 (a) | | | 5,870 | | | | 5,320 | |
| | | | | | | | |
Oman — 0.2% | | | | | | | | |
Oman Government International Bond 4.75%, 6/15/2026 (a) | | | 6,200 | | | | 5,720 | |
| | | | | | | | |
| | | | | | | | |
| INVESTMENTS | | PRINCIPAL AMOUNT (000) | | | VALUE
(000) | |
| | | | | | | | |
Paraguay — 0.2% | | | | | | | | |
Republic of Paraguay | | | | | | | | |
5.00%, 4/15/2026 (a) | | | 560 | | | | 577 | |
5.00%, 4/15/2026 (b) | | | 6,650 | | | | 6,858 | |
| | | | | | | | |
| | | | | | | 7,435 | |
| | | | | | | | |
Portugal — 3.8% | | | | | | | | |
Portugal Obrigacoes do Tesouro | | | | | | | | |
5.13%, 10/15/2024 (b) | | | 14,610 | | | | 15,263 | |
2.88%, 10/15/2025 (b) | | | EUR 24,773 | | | | 31,616 | |
2.88%, 7/21/2026 (b) | | | EUR 14,486 | | | | 18,391 | |
4.13%, 4/14/2027 (b) | | | EUR 28,680 | | | | 39,548 | |
2.25%, 4/18/2034 (b) | | | EUR 7,400 | | | | 8,351 | |
| | | | | | | | |
| | | | | | | 113,169 | |
| | | | | | | | |
Qatar — 0.7% | | | | | | | | |
State of Qatar | | | | | | | | |
2.38%, 6/2/2021 (b) | | | 10,900 | | | | 10,592 | |
3.88%, 4/23/2023 (a) | | | 10,460 | | | | 10,510 | |
4.63%, 6/2/2046 (b) | | | 995 | | | | 991 | |
| | | | | | | | |
| | | | | | | 22,093 | |
| | | | | | | | |
Saudi Arabia — 0.1% | | | | | | | | |
Kingdom of Saudi Arabia | | | | | | | | |
4.63%, 10/4/2047 (b) | | | 2,275 | | | | 2,158 | |
5.00%, 4/17/2049 (b) | | | 2,239 | | | | 2,214 | |
| | | | | | | | |
| | | | | | | 4,372 | |
| | | | | | | | |
Serbia — 0.2% | | | | | | | | |
Republic of Serbia 4.88%, 2/25/2020 (b) | | | 6,000 | | | | 6,090 | |
| | | | | | | | |
South Africa — 1.2% | | | | | | | | |
Republic of South Africa 6.50%, 2/28/2041 | | | ZAR 772,145 | | | | 36,912 | |
| | | | | | | | |
Spain — 2.4% | | | | | | | | |
Kingdom of Spain | | | | | | | | |
2.90%, 10/31/2046 (b) | | | EUR 24,750 | | | | 30,709 | |
2.70%, 10/31/2048 (b) | | | EUR 34,650 | | | | 40,817 | |
| | | | | | | | |
| | | | | | | 71,526 | |
| | | | | | | | |
Zambia — 0.0% (g) | | | | | | | | |
Republic of Zambia 8.50%, 4/14/2024(b) | | | 1,592 | | | | 1,146 | |
| | | | | | | | |
Total Foreign Government Securities
(Cost $530,595) | | | | | | | 496,413 | |
| | | | | | | | |
Asset-Backed Securities — 10.0% | | | | | | | | |
Cayman Islands — 2.6% | | | | | | | | |
ACIS CLO Ltd. Series 2017-7A, Class A1, 3.69%, 5/1/2027 (a) (k) | | | 1,002 | | | | 1,004 | |
SEE NOTES TO FINANCIAL STATEMENTS.
| | | | | | | | |
| | | |
| AUGUST 31, 2018 | | J.P. MORGAN INCOME FUNDS | | | | | 25 | |
JPMorgan Global Bond Opportunities Fund
SCHEDULE OF PORTFOLIO INVESTMENTS
AS OF AUGUST 31, 2018 (continued)
(Amounts in U.S. Dollars, unless otherwise noted)
| | | | | | | | |
| INVESTMENTS | | PRINCIPAL AMOUNT (000) | | | VALUE
(000) | |
Asset-Backed Securities — continued | | | | | |
Cayman Islands — continued | | | | | | | | |
AIMCO CLO | | | | | | | | |
Series 2014-AA, Class AR, 3.45%, 7/20/2026 (a) (k) | | | 2,429 | | | | 2,429 | |
Series 2017-AA, Class A, 3.61%, 7/20/2029 (a) (k) | | | 1,125 | | | | 1,129 | |
Bain Capital Credit CLO Series 2017-1A, Class A1, 3.60%, 7/20/2030 (a) (k) | | | 2,282 | | | | 2,289 | |
Cedar Funding II CLO Ltd. Series 2013-1A, Class A1R, 3.56%, 6/9/2030 (a) (k) | | | 4,750 | | | | 4,751 | |
CFIP CLO Ltd. Series 2017-1A, Class A, 3.55%, 1/18/2030 (a) (k) | | | 5,200 | | | | 5,200 | |
CIFC Funding Ltd. | | | | | | | | |
Series 2017-1A, Class A, 3.71%, 4/23/2029 (a) (k) | | | 1,999 | | | | 2,001 | |
Series 2017-2A, Class A, 3.59%, 4/20/2030 (a) (k) | | | 2,997 | | | | 2,999 | |
Dryden 49 Senior Loan Fund Series 2017-49A, Class A, 3.54%, 7/18/2030 (a) (k) | | | 4,028 | | | | 4,030 | |
Flatiron CLO Ltd. Series 2013-1A, Class A1R, 3.50%, 1/17/2026 (a) (k) | | | 632 | | | | 632 | |
GoldentTree Loan Management US CLO 1 Ltd. Series 2017-1A, Class A, 3.57%, 4/20/2029 (a) (k) | | | 2,414 | | | | 2,419 | |
Grippen Park CLO Ltd. Series 2017-1A, Class A, 3.61%, 1/20/2030 (a) (k) | | | 2,167 | | | | 2,171 | |
LCM XV LP Series 15A, Class AR, 3.60%, 7/20/2030 (a) (k) | | | 2,073 | | | | 2,080 | |
LCM XVI LP Series 16A, Class AR, 3.37%, 7/15/2026 (a) (k) | | | 3,620 | | | | 3,618 | |
Nassau Ltd. Series 2017-IA, Class A1A, 3.66%, 10/15/2029 (a) (k) | | | 2,593 | | | | 2,599 | |
Neuberger Berman CLO XIV Ltd. Series 2013-14A, Class AR, 3.59%, 1/28/2030 (a) (k) | | | 4,130 | | | | 4,134 | |
Neuberger Berman Loan Advisers CLO 24 Ltd. Series 2017-24A, Class A, 3.57%, 4/19/2030 (a) (k) | | | 1,832 | | | | 1,833 | |
OCP CLO Ltd. Series 2017-13A, Class A1A, 3.60%, 7/15/2030 (a) (k) | | | 4,160 | | | | 4,171 | |
Octagon Investment Partners 30 Ltd. Series 2017-1A, Class A1, 3.67%, 3/17/2030 (a) (k) | | | 1,627 | | | | 1,635 | |
Race Point VIII CLO Ltd. Series 2013-8A, Class AR, 3.66%, 2/20/2030 (a) (k) | | | 3,161 | | | | 3,177 | |
Renew Series 2017-1A, Class B, 5.75%, 9/20/2052 ‡ (a) | | | 1,905 | | | | 1,937 | |
| | | | | | | | |
| INVESTMENTS | | PRINCIPAL AMOUNT (000) | | | VALUE
(000) | |
| | | | | | | | |
Cayman Islands — continued | | | | | | | | |
Shackleton CLO Ltd. Series 2014-6RA, Class B, 4.07%, 7/17/2028‡ (a) (k) | | | 890 | | | | 888 | |
TCI-Cent CLO Income Note Issuer Ltd. Series 2017-1A, Class A1, 3.61%, 7/25/2030 (a) (k) | | | 4,630 | | | | 4,632 | |
THL Credit Wind River CLO Ltd. | | | | | | | | |
Series 2017-1A, Class A, 3.67%, 4/18/2029 (a) (k) | | | 1,335 | | | | 1,339 | |
Series 2017-2A, Class A, 3.58%, 7/20/2030 (a) (k) | | | 4,680 | | | | 4,684 | |
TIAA CLO II Ltd. Series 2017-1A, Class A, 3.63%, 4/20/2029 (a) (k) | | | 2,456 | | | | 2,461 | |
TRESTLES CLO Ltd. Series 2017-1A, Class A1A, 3.65%, 7/25/2029 (a) (k) | | | 3,620 | | | | 3,631 | |
VOYA CLO Series 2017-2A, Class A1, 3.55%, 6/7/2030 (a) (k) | | | 4,335 | | | | 4,337 | |
| | | | | | | | |
| | | | | | | 78,210 | |
| | | | | | | | |
United States — 7.4% | | | | | | | | |
ABFC Trust Series 2004-OPT2, Class M2, 3.56%, 7/25/2033 ‡ (k) | | | 72 | | | | 69 | |
ACC Trust | | | | | | | | |
Series 2018-1, Class B, 4.82%, 5/20/2021 (a) | | | 310 | | | | 310 | |
Series 2018-1, Class C, 6.81%, 2/21/2023 (a) | | | 1,202 | | | | 1,203 | |
Accelerated Assets LLC Series 2018-1, Class C, 6.65%, 12/2/2033 ‡ (a) | | | 2,620 | | | | 2,624 | |
ACE Securities Corp. Home Equity Loan Trust Series 2004-OP1, Class M2, 3.64%, 4/25/2034 ‡ (k) | | | 86 | | | | 84 | |
American Airlines Pass-Through Trust Series 2015-1, Class B, 3.70%, 5/1/2023 | | | 798 | | | | 783 | |
American Credit Acceptance Receivables Trust | | | | | | | | |
Series 2018-2, Class A, 2.94%, 1/10/2022 (a) | | | 2,545 | | | | 2,545 | |
Series 2017-1, Class D, 3.54%, 3/13/2023 (a) | | | 680 | | | | 680 | |
Series 2016-4, Class D, 4.11%, 4/12/2023 (a) | | | 960 | | | | 966 | |
Series 2017-3, Class D, 3.43%, 10/10/2023 (a) | | | 1,380 | | | | 1,377 | |
Series 2018-1, Class F, 6.55%, 12/10/2024 (a) | | | 2,950 | | | | 2,966 | |
Apidos CLO XXX | | | | | | | | |
Class A2, 0.00%, 10/18/2031 (a) (k) | | | 2,360 | | | | 2,360 | |
SEE NOTES TO FINANCIAL STATEMENTS.
| | | | | | |
| | | |
| 26 | | | | J.P. MORGAN INCOME FUNDS | | AUGUST 31, 2018 |
| | | | | | | | |
| INVESTMENTS | | PRINCIPAL AMOUNT (000) | | | VALUE
(000) | |
Asset-Backed Securities — continued | | | | | | | | |
United States — continued | | | | | | | | |
Class C, 6.00%, 10/18/2031 (a) (k) | | | 1,613 | | | | 1,613 | |
Argent Securities, Inc. Asset-Backed Pass-Through Certificates | | | | | | | | |
Series 2004-W3, Class A3, 2.88%, 2/25/2034 ‡ (k) | | | 90 | | | | 88 | |
Series 2003-W7, Class M2, 4.69%, 3/25/2034 ‡ (k) | | | 85 | | | | 85 | |
Avis Budget Rental Car Funding AESOP LLC Series 2018-1A, Class C, 4.73%, 9/20/2024 (a) | | | 680 | | | | 680 | |
Bear Stearns Asset-Backed Securities Trust Series 2002-1, Class 1A5, 6.89%, 12/25/2034 ‡ (h) | | | 19 | | | | 20 | |
Benefit Street Partners CLO XI Series 2017-11, Class A2A, 4.09%, 4/15/2029 (a) (k) | | | 970 | | | | 971 | |
Business Jet Securities LLC | | | | | | | | |
Series 2018-1, Class A, 4.34%, 2/15/2033 (a) | | | 1,613 | | | | 1,622 | |
Series 2018-1, Class B, 6.05%, 2/15/2033 ‡ (a) | | | 3,034 | | | | 3,109 | |
Series 2018-2, Class C, 6.66%, 6/15/2033 (a) | | | 4,407 | | | | 4,434 | |
CIG Auto Receivables Trust Series 2017-1A, Class C, 5.33%, 12/16/2024 (a) | | | 400 | | | | 399 | |
Citi Held For Asset Issuance | | | | | | | | |
Series 2015-PM2, Class C, 5.96%, 3/15/2022 ‡ (a) | | | 1,517 | | | | 1,518 | |
Series 2015-PM3, Class C, 6.99%, 5/16/2022 ‡ (a) | | | 1,606 | | | | 1,612 | |
CLUB Credit Trust | | | | | | | | |
Series 2017-NP1, Class C, 5.13%, 4/17/2023 ‡ (a) | | | 3,410 | | | | 3,442 | |
Series 2017-P1, Class A, 2.42%, 9/15/2023 (a) | | | 652 | | | | 651 | |
Series 2017-P1, Class B, 3.56%, 9/15/2023 (a) | | | 3,285 | | | | 3,271 | |
Series 2017-P2, Class A, 2.61%, 1/15/2024 (a) | | | 1,008 | | | | 1,002 | |
Series 2018-NP1, Class C, 4.74%, 5/15/2024 ‡ (a) | | | 1,000 | | | | 999 | |
Continental Airlines Pass-Through Trust Series 2007-1, Class A, 5.98%, 4/19/2022 | | | 119 | | | | 126 | |
Countrywide Asset-Backed Certificates | | | | | | | | |
Series 2002-4, Class M1, 3.19%, 12/25/2032 ‡ (k) | | | 55 | | | | 55 | |
| | | | | | | | |
| INVESTMENTS | | PRINCIPAL AMOUNT (000) | | | VALUE
(000) | |
| | | | | | | | |
United States — continued | | | | | | | | |
Series 2004-BC1, Class M3, 4.16%, 10/25/2033 ‡ (k) | | | 12 | | | | 12 | |
Series 2004-2, Class M1, 2.81%, 5/25/2034 ‡ (k) | | | 99 | | | | 99 | |
Series 2004-ECC2, Class M2, 3.04%, 12/25/2034 ‡ (k) | | | 2,163 | | | | 2,165 | |
Credit Acceptance Auto Loan Trust | | | | | | | | |
Series 2018-2A, Class C, 4.16%, 9/15/2027 (a) | | | 4,350 | | | | 4,374 | |
Series 2018-3A, Class B, 3.89%, 10/15/2027 (a) | | | 930 | | | | 930 | |
Series 2018-3A, Class C, 4.04%, 12/15/2027 (a) | | | 1,060 | | | | 1,059 | |
Diamond Resorts Owner Trust Series 2018-1, Class C, 4.53%, 1/21/2031 (a) | | | 6,742 | | | | 6,742 | |
Drive Auto Receivables Trust Series 2018-3, Class D, 4.30%, 9/16/2024 | | | 4,432 | | | | 4,481 | |
DT Auto Owner Trust | | | | | | | | |
Series 2017-4A, Class D, 3.47%, 7/17/2023 (a) | | | 1,384 | | | | 1,374 | |
Series 2017-1A, Class E, 5.79%, 2/15/2024 (a) | | | 520 | | | | 528 | |
Series 2017-4A, Class E, 5.15%, 11/15/2024 (a) | | | 1,650 | | | | 1,651 | |
Series 2018-1A, Class E, 5.42%, 3/17/2025 (a) | | | 645 | | | | 650 | |
ENGS Commercial Finance Trust | | | | | | | | |
Series 2018-1A, Class C, 4.05%, 2/22/2023 ‡ (a) | | | 450 | | | | 449 | |
Series 2018-1A, Class D, 4.69%, 6/22/2023 ‡ (a) | | | 335 | | | | 334 | |
Exeter Automobile Receivables Trust | | | | | | | | |
Series 2018-3A, Class C, 3.71%, 6/15/2023 (a) | | | 1,647 | | | | 1,648 | |
Series 2018-2A, Class D, 4.04%, 3/15/2024 (a) | | | 3,300 | | | | 3,304 | |
Series 2018-3A, Class D, 4.35%, 6/17/2024 (a) | | | 3,650 | | | | 3,674 | |
Series 2018-3A, Class E, 5.43%, 8/15/2024 (a) | | | 900 | | | | 907 | |
Series 2018-1A, Class E, 4.64%, 10/15/2024 (a) | | | 1,880 | | | | 1,867 | |
Series 2018-2A, Class E, 5.33%, 5/15/2025 (a) | | | 1,790 | | | | 1,804 | |
Series 2018-3A, Class F, 6.55%, 8/25/2025 (a) | | | 880 | | | | 882 | |
SEE NOTES TO FINANCIAL STATEMENTS.
| | | | | | | | |
| | | |
| AUGUST 31, 2018 | | J.P. MORGAN INCOME FUNDS | | | | | 27 | |
JPMorgan Global Bond Opportunities Fund
SCHEDULE OF PORTFOLIO INVESTMENTS
AS OF AUGUST 31, 2018 (continued)
(Amounts in U.S. Dollars, unless otherwise noted)
| | | | | | | | |
| INVESTMENTS | | PRINCIPAL AMOUNT (000) | | | VALUE
(000) | |
Asset-Backed Securities — continued | | | | | | | | |
United States — continued | | | | | | | | |
First Franklin Mortgage Loan Trust Series 2004-FF5, Class A1, 2.78%, 8/25/2034 ‡ (k) | | | 109 | | | | 106 | |
FirstKey Lending Trust Series 2015-SFR1, Class D, 4.37%, 3/9/2047 ‡ (a) (k) | | | 860 | | | | 861 | |
Flagship Credit Auto Trust | | | | | | | | |
Series 2014-2, Class C, 3.95%, 12/15/2020 (a) | | | 198 | | | | 199 | |
Series 2018-3, Class A, 3.07%, 2/15/2023 (a) | | | 510 | | | | 510 | |
Series 2018-3, Class C, 3.79%, 12/16/2024 (a) | | | 1,090 | | | | 1,091 | |
Series 2018-3, Class D, 4.15%, 12/16/2024 (a) | | | 710 | | | | 711 | |
FREED ABS Trust | | | | | | | | |
Series 2018-1, Class A, 3.61%, 7/18/2024 (a) | | | 2,658 | | | | 2,655 | |
Series 2018-1, Class B, 4.56%, 7/18/2024 ‡ (a) | | | 600 | | | | 602 | |
Fremont Home Loan Trust Series 2004-2, Class M2, 2.99%, 7/25/2034 (k) | | | 23 | | | | 23 | |
GMAT Trust Series 2013-1A, Class M, 5.00%, 11/25/2043 ‡ (a) (k) | | | 340 | | | | 244 | |
Hertz Fleet Lease Funding LP Series 2018-1, Class E, 5.55%, 5/10/2032 (a) | | | 488 | | | | 489 | |
Home Equity Asset Trust Series 2004-6, Class M2, 2.96%, 12/25/2034 ‡ (k) | | | 39 | | | | 38 | |
Kabbage Asset Securitization LLC Series 2017-1, Class C, 8.00%, 3/15/2022 ‡ (a) | | | 2,000 | | | | 2,083 | |
LendingClub Issuance Trust Series 2016-NP2, Class B, 6.00%, 1/17/2023 ‡ (a) | | | 1,300 | | | | 1,314 | |
LendingPoint Funding Trust Series 2018-1, Class B, 8.06%, 11/15/2024 ‡ (a) (k) | | | 3,000 | | | | 3,000 | |
Lendmark Funding Trust | | | | | | | | |
Series 2017-1A, Class C, 5.41%, 12/22/2025 ‡ (a) | | | 2,330 | | | | 2,384 | |
Series 2017-2A, Class B, 3.38%, 5/20/2026 ‡ (a) | | | 685 | | | | 676 | |
Series 2017-2A, Class C, 4.33%, 5/20/2026 ‡ (a) | | | 515 | | | | 509 | |
Series 2018-1A, Class B, 4.09%, 12/21/2026 ‡ (a) | | | 730 | | | | 733 | |
Series 2018-1A, Class C, 5.03%, 12/21/2026 ‡ (a) | | | 1,700 | | | | 1,720 | |
LV Tower 52 Issuer Series 2013-1, Class M, 7.75%, 7/15/2019 ‡ (a) | | | 2,645 | | | | 2,645 | |
| | | | | | | | |
| INVESTMENTS | | PRINCIPAL AMOUNT (000) | | | VALUE
(000) | |
| | | | | | | | |
United States — continued | | | | | | | | |
Marlette Funding Trust | | | | | | | | |
Series 2017-3A, Class B, 3.01%, 12/15/2024 (a) | | | 740 | | | | 736 | |
Series 2017-3A, Class C, 4.01%, 12/15/2024 ‡ (a) | | | 1,180 | | | | 1,179 | |
Series 2018-1A, Class B, 3.19%, 3/15/2028 ‡ (a) | | | 1,050 | | | | 1,044 | |
Series 2018-1A, Class C, 3.69%, 3/15/2028 (a) | | | 1,815 | | | | 1,803 | |
Series 2018-1A, Class D, 4.85%, 3/15/2028 ‡ (a) | | | 450 | | | | 447 | |
Series 2018-2A, Class B, 3.61%, 7/17/2028 ‡ (a) | | | 3,970 | | | | 3,958 | |
Series 2018-2A, Class C, 4.37%, 7/17/2028 ‡ (a) | | | 2,580 | | | | 2,583 | |
Series 2018-3A, Class A, 3.20%, 9/15/2028 (a) | | | 1,550 | | | | 1,550 | |
Merrill Lynch Mortgage Investors Trust Series 2003-OPT1, Class M1, 3.04%, 7/25/2034 (k) | | | 75 | | | | 73 | |
MFA LLC Series 2018-NPL2, Class A1, 4.16%, 7/25/2048 (a) (h) | | | 3,294 | | | | 3,294 | |
MFA Trust Series 2017-NPL1, Class A1, 3.35%, 11/25/2047 ‡ (a) (h) | | | 5,897 | | | | 5,838 | |
Mid-State Capital Corp. Trust Series 2006-1, Class M2, 6.74%, 10/15/2040 ‡ (a) | | | 128 | | | | 145 | |
Morgan Stanley ABS Capital I, Inc. Trust Series 2004-HE1, Class M1, 2.92%, 1/25/2034 ‡ (k) | | | 47 | | | | 46 | |
New Century Home Equity Loan Trust Series 2003-4, Class M2, 4.79%, 10/25/2033 ‡ (k) | | | 50 | | | | 49 | |
OL SP LLC | | | | | | | | |
Series 2018, Class C, 4.25%, 2/9/2030 ‡ | | | 1,769 | | | | 1,651 | |
Series 2018, Class B, 4.61%, 2/9/2030 ‡ | | | 1,814 | | | | 1,809 | |
OnDeck Asset Securitization Trust LLC | | | | | | | | |
Series 2018-1A, Class B, 4.02%, 4/18/2022 ‡ (a) | | | 500 | | | | 499 | |
Series 2018-1A, Class C, 4.52%, 4/18/2022 ‡ (a) | | | 470 | | | | 470 | |
OneMain Direct Auto Receivables Trust | | | | | | | | |
Series 2018-1A, Class B, 3.71%, 4/14/2025 (a) | | | 1,493 | | | | 1,495 | |
Series 2018-1A, Class D, 4.40%, 1/14/2028 (a) | | | 2,840 | | | | 2,851 | |
SEE NOTES TO FINANCIAL STATEMENTS.
| | | | | | |
| | | |
| 28 | | | | J.P. MORGAN INCOME FUNDS | | AUGUST 31, 2018 |
| | | | | | | | |
| INVESTMENTS | | PRINCIPAL AMOUNT (000) | | | VALUE
(000) | |
Asset-Backed Securities — continued | | | | | | | | |
United States — continued | | | | | | | | |
Onemain Financial Issuance Trust Series 2018-1A, Class D, 4.08%, 3/14/2029 ‡ (a) | | | 1,250 | | | | 1,253 | |
OneMain Financial Issuance Trust | | | | | | | | |
Series 2014-2A, Class C, 4.33%, 9/18/2024 ‡ (a) | | | 9 | | | | 9 | |
Series 2014-2A, Class D, 5.31%, 9/18/2024 ‡ (a) | | | 151 | | | | 152 | |
Series 2015-1A, Class A, 3.19%, 3/18/2026 (a) | | | 536 | | | | 537 | |
Series 2015-1A, Class C, 5.12%, 3/18/2026 ‡ (a) | | | 608 | | | | 617 | |
Series 2017-1A, Class D, 4.52%, 9/14/2032 ‡ (a) | | | 1,100 | | | | 1,085 | |
Oportun Funding VI LLC Series 2017-A, Class B, 3.97%, 6/8/2023 ‡ (a) (k) | | | 1,170 | | | | 1,156 | |
Park Place Securities, Inc. Asset-Backed Pass-Through Certificates Series 2005-WCH1, Class M3, 2.90%, 1/25/2036 ‡ (k) | | | 202 | | | | 202 | |
People’s Choice Home Loan Securities Trust Series 2004-2, Class M1, 2.96%, 10/25/2034 ‡ (k) | | | 49 | | | | 49 | |
PNMAC FMSR Issuer Trust Series 2018-FT1, Class A, 4.41%, 4/25/2023 (a) (k) | | | 1,980 | | | | 1,986 | |
Pretium Mortgage Credit Partners I LLC | | | | | | | | |
Series 2017-NPL5, Class A1, 3.33%, 12/30/2032 (a) (k) | | | 4,287 | | | | 4,265 | |
Series 2018-NPL1, Class A1, 3.38%, 1/27/2033 ‡ (a) (h) | | | 2,765 | | | | 2,740 | |
Progress Residential Trust Series 2015-SFR2, Class D, 3.68%, 6/12/2032 ‡ (a) | | | 1,400 | | | | 1,392 | |
Prosper Marketplace Issuance Trust | | | | | | | | |
Series 2017-3A, Class A, 2.36%, 11/15/2023 (a) | | | 1,389 | | | | 1,385 | |
Series 2017-3A, Class B, 3.36%, 11/15/2023 (a) | | | 2,600 | | | | 2,583 | |
Series 2018-1A, Class B, 3.90%, 6/17/2024 (a) | | | 1,112 | | | | 1,112 | |
Series 2018-1A, Class C, 4.87%, 6/17/2024 (a) | | | 1,870 | | | | 1,867 | |
RASC Trust | | | | | | | | |
Series 2005-EMX1, Class M1, 2.71%, 3/25/2035 ‡ (k) | | | 1,631 | | | | 1,635 | |
Series 2005-KS2, Class M1, 2.71%, 3/25/2035 ‡ (k) | | | 59 | | | | 59 | |
| | | | | | | | |
| INVESTMENTS | | PRINCIPAL AMOUNT (000) | | | VALUE
(000) | |
| | | | | | | | |
United States — continued | | | | | | | | |
Renaissance Home Equity Loan Trust | | | | | | | | |
Series 2004-1, Class M1, 2.93%, 5/25/2034 ‡ (k) | | | 755 | | | | 727 | |
Series 2005-1, Class AF6, 4.97%, 5/25/2035 ‡ (h) | | | 363 | | | | 372 | |
Series 2005-2, Class M1, 5.05%, 8/25/2035 ‡ (h) | | | 910 | | | | 922 | |
Santander Drive Auto Receivables Trust | | | | | | | | |
Series 2015-5, Class E, 4.67%, 2/15/2023 (a) | | | 6,190 | | | | 6,252 | |
Series 2016-2, Class E, 4.38%, 9/15/2023 | | | 6,490 | | | | 6,565 | |
Series 2018-4, Class D, 3.98%, 12/15/2025 | | | 3,070 | | | | 3,070 | |
Santander Prime Auto Issuance Notes Trust | | | | | | | | |
Series 2018-A, Class F, 6.80%, 9/15/2025 ‡ (a) | | | 2,603 | | | | 2,616 | |
Series 2017-C, Class F, 6.68%, 10/15/2025 (a) | | | 2,850 | | | | 2,896 | |
Saxon Asset Securities Trust Series 2004-3, Class M1, 2.96%, 12/26/2034 ‡ (k) | | | 231 | | | | 229 | |
SoFi Consumer Loan Program LLC Series 2017-6, Class B, 3.52%, 11/25/2026 ‡ (a) | | | 1,584 | | | | 1,567 | |
SoFi Consumer Loan Program Trust | | | | | | | | |
Series 2018-1, Class A2, 3.14%, 2/25/2027 (a) | | | 459 | | | | 456 | |
Series 2018-1, Class B, 3.65%, 2/25/2027 ‡ (a) | | | 1,250 | | | | 1,240 | |
Series 2018-1, Class C, 3.97%, 2/25/2027 ‡ (a) | | | 730 | | | | 721 | |
Series 2018-2, Class B, 3.79%, 4/26/2027 ‡ (a) | | | 2,400 | | | | 2,394 | |
Springleaf Funding Trust Series 2016-AA, Class B, 3.80%, 11/15/2029 (a) | | | 700 | | | | 699 | |
Stanwich Mortgage Loan Trust
Series 2018-NPB1, Class A1, 4.02%, 5/16/2023 (a) (h) | | | 4,064 | | | | 4,062 | |
Structured Asset Investment Loan Trust Series 2003-BC10, Class A4, 3.06%, 10/25/2033 ‡ (k) | | | 129 | | | | 128 | |
T-Mobile USA, Inc. 6.00%, 4/15/2024 ‡ | | | 315 | | | | — | |
US Airways Pass-Through Trust Series 2013-1, Class B, 5.38%, 11/15/2021 | | | 594 | | | | 610 | |
Vantage Data Centers Issuer LLC Series 2018-1A, Class A2, 4.07%, 2/16/2043 (a) | | | 1,900 | | | | 1,916 | |
SEE NOTES TO FINANCIAL STATEMENTS.
| | | | | | | | |
| | | |
| AUGUST 31, 2018 | | J.P. MORGAN INCOME FUNDS | | | | | 29 | |
JPMorgan Global Bond Opportunities Fund
SCHEDULE OF PORTFOLIO INVESTMENTS
AS OF AUGUST 31, 2018 (continued)
(Amounts in U.S. Dollars, unless otherwise noted)
| | | | | | | | |
| INVESTMENTS | | PRINCIPAL AMOUNT (000) | | | VALUE
(000) | |
Asset-Backed Securities — continued | | | | | | | | |
United States — continued | | | | | | | | |
Veros Automobile Receivables Trust Series 2017-1, Class A, 2.84%, 4/17/2023 (a) | | | 1,514 | | | | 1,508 | |
VOLT LXII LLC Series 2017-NPL9, Class A1, 3.13%, 9/25/2047 ‡ (a) (h) | | | 1,171 | | | | 1,158 | |
VOLT LXIII LLC Series 2017-NP10, Class A1, 3.00%, 10/25/2047 (a) (h) | | | 2,214 | | | | 2,190 | |
VOLT LXIV LLC Series 2017-NP11, Class A1, 3.38%, 10/25/2047 ‡ (a) (h) | | | 1,827 | | | | 1,812 | |
VOLT LXIX LLC Series 2018-NPL5, Class A2, 5.80%, 8/25/2048 (a) (h) | | | 3,890 | | | | 3,885 | |
VOLT LXVIII LLC Series 2018-NPL4, Class A2, 5.93%, 7/27/2048 (a) (h) | | | 3,000 | | | | 2,998 | |
Westlake Automobile Receivables Trust | | | | | | | | |
Series 2018-3A, Class C, 3.61%, 10/16/2023 (a) | | | 2,210 | | | | 2,210 | |
Series 2018-3A, Class D, 4.00%, 10/16/2023 (a) | | | 1,420 | | | | 1,424 | |
Series 2018-3A, Class E, 4.90%, 12/15/2023 (a) | | | 780 | | | | 780 | |
Series 2018-2A, Class E, 4.86%, 1/16/2024 (a) | | | 1,220 | | | | 1,222 | |
Series 2018-1A, Class F, 5.60%, 7/15/2024 (a) | | | 5,470 | | | | 5,476 | |
Series 2018-2A, Class F, 6.04%, 1/15/2025 (a) | | | 1,701 | | | | 1,721 | |
Series 2018-3A, Class F, 6.02%, 2/18/2025 (a) | | | 1,060 | | | | 1,060 | |
| | | | | | | | |
| | | | | | | 223,681 | |
| | | | | | | | |
Total Asset-Backed Securities
(Cost $301,423) | | | | | | | 301,891 | |
| | | | | | | | |
Commercial Mortgage-Backed Securities — 5.2% | | | | | |
Cayman Islands — 0.2% | | | | | | | | |
GPMT Ltd. Series 2018-FL1, Class B, 3.62%, 11/21/2035 ‡ (a) (k) | | | 2,520 | | | | 2,521 | |
PFP Ltd. Series 2017-3, Class D, 5.56%, 1/14/2035 ‡ (a) (k) | | | 860 | | | | 865 | |
TPG Real Estate Finance Ltd. Series 2018-FL1, Class C, 3.96%, 2/15/2035 ‡ (a) (k) | | | 2,085 | | | | 2,099 | |
| | | | | | | | |
| | | | | | | 5,485 | |
| | | | | | | | |
United States — 5.0% | | | | | | | | |
BAMLL Re-REMIC Trust Series 2013-FRR3, Class A, PO, 6/26/2023 (a) | | | 4,375 | | | | 3,354 | |
| | | | | | | | |
| INVESTMENTS | | PRINCIPAL AMOUNT (000) | | | VALUE
(000) | |
| | | | | | | | |
United States — continued | | | | | | | | |
Banc of America Commercial Mortgage Trust | | | | | | | | |
Series 2006-1, Class E, 6.20%, 9/10/2045 ‡ (a) (k) | | | 501 | | | | 518 | |
Series 2007-5, Class AJ, 6.27%, 2/10/2051 (k) | | | 4,093 | | | | 4,190 | |
BANK | | | | | | | | |
Series 2017-BNK9, Class D, 2.80%, 11/15/2054 (a) | | | 2,255 | | | | 1,764 | |
Series 2017-BNK6, Class D, 3.10%, 7/15/2060 ‡ (a) | | | 2,644 | | | | 2,155 | |
Bear Stearns Commercial Mortgage Securities Trust Series 2006-PW13, Class B, 5.66%, 9/11/2041 ‡ (a) (k) | | | 372 | | | | 374 | |
BHMS ATLS Series 2018-ATLS, Class A, 3.31%, 7/15/2035 (a) (k) | | | 4,335 | | | | 4,335 | |
BX Commercial Mortgage Trust Series 2018-BIOA, Class D, 3.38%, 3/15/2037 ‡ (a) (k) | | | 9,450 | | | | 9,421 | |
BX Trust | | | | | | | | |
Series 2018-MCSF, Class B, 2.87%, 4/15/2035 ‡ (a) (k) | | | 1,500 | | | | 1,487 | |
Series 2018-MCSF, Class C, 3.07%, 4/15/2035 ‡ (a) (k) | | | 990 | | | | 983 | |
BXMT Ltd. Series 2017-FL1, Class D, 4.76%, 6/15/2035 ‡ (a) (k) | | | 4,650 | | | | 4,679 | |
Citigroup Commercial Mortgage Trust Series 2015-P1, Class D, 3.23%, 9/15/2048 ‡ (a) | | | 1,220 | | | | 1,060 | |
COBALT CMBS Commercial Mortgage Trust Series 2007-C3, Class B, 6.02%, 5/15/2046 ‡ (k) | | | 2,900 | | | | 2,890 | |
Commercial Mortgage Trust | | | | | | | | |
Series 2004-GG1, Class H, 6.60%, 6/10/2036 ‡ (a) (k) | | | 4,112 | | | | 4,148 | |
Series 2015-CR24, Class D, 3.46%, 8/10/2048 (k) | | | 1,070 | | | | 908 | |
Series 2015-CR24, Class A5, 3.70%, 8/10/2048 | | | 3,620 | | | | 3,654 | |
Credit Suisse Commercial Mortgage Trust Series 2007-C1, Class AM, 5.42%, 2/15/2040 | | | 1,569 | | | | 1,585 | |
CSAIL Commercial Mortgage Trust Series 2017-C8, Class C, 4.32%, 6/15/2050 ‡ | | | 1,390 | | | | 1,392 | |
FHLMC Multifamily Structured Pass-Through Certificates | | | | | | | | |
Series K033, Class X1, IO, 0.42%, 7/25/2023 (k) | | | 70,113 | | | | 945 | |
SEE NOTES TO FINANCIAL STATEMENTS.
| | | | | | |
| | | |
| 30 | | | | J.P. MORGAN INCOME FUNDS | | AUGUST 31, 2018 |
| | | | | | | | |
| INVESTMENTS | | PRINCIPAL AMOUNT (000) | | | VALUE
(000) | |
Commercial Mortgage-Backed Securities — continued | | | | | |
United States — continued | | | | | | | | |
Series K729, Class X1, IO, 0.49%, 10/25/2024 (k) | | | 28,932 | | | | 555 | |
Series K731, Class X3, IO, 2.16%, 5/25/2025 (k) | | | 3,460 | | | | 402 | |
Series K036, Class X3, IO, 2.18%, 12/25/2041 (k) | | | 31,545 | | | | 2,995 | |
Series K038, Class X3, IO, 2.57%, 6/25/2042 (k) | | | 17,000 | | | | 2,011 | |
Series K720, Class X3, IO, 1.38%, 8/25/2042 (k) | | | 39,172 | | | | 1,786 | |
Series K041, Class X3, IO, 1.70%, 11/25/2042 (k) | | | 30,520 | | | | 2,605 | |
Series K042, Class X3, IO, 1.66%, 1/25/2043 (k) | | | 21,950 | | | | 1,866 | |
Series K718, Class X3, IO, 1.49%, 2/25/2043 (k) | | | 112,228 | | | | 5,005 | |
Series K045, Class X3, IO, 1.55%, 4/25/2043 (k) | | | 39,625 | | | | 3,226 | |
Series K046, Class X3, IO, 1.56%, 4/25/2043 (k) | | | 38,350 | | | | 3,163 | |
Series K054, Class X3, IO, 1.65%, 4/25/2043 (k) | | | 66,098 | | | | 6,486 | |
Series K047, Class X3, IO, 1.55%, 6/25/2043 (k) | | | 28,400 | | | | 2,389 | |
Series K050, Class X3, IO, 1.61%, 10/25/2043 (k) | | | 21,110 | | | | 1,897 | |
Series K052, Class X3, IO, 1.67%, 1/25/2044 (k) | | | 15,770 | | | | 1,546 | |
Series K726, Class X3, IO, 2.20%, 7/25/2044 (k) | | | 6,381 | | | | 664 | |
Series K067, Class X3, IO, 2.19%, 9/25/2044 (k) | | | 19,640 | | | | 2,904 | |
Series K729, Class X3, IO, 2.04%, 11/25/2044 (k) | | | 7,055 | | | | 727 | |
Series K724, Class X3, IO, 1.93%, 12/25/2044 (k) | | | 10,996 | | | | 907 | |
Series K072, Class X3, IO, 2.21%, 12/25/2045 (k) | | | 12,354 | | | | 1,912 | |
Series K078, Class X3, IO, 2.29%, 6/25/2046 (k) | | | 10,990 | | | | 1,841 | |
FNMA ACES | | | | | | | | |
Series 2014-M3, Class X2, IO, 0.17%, 1/25/2024 (k) | | | 80,170 | | | | 246 | |
Series 2018-M3, Class X, IO, 0.10%, 7/25/2029 | | | 16,923 | | | | 112 | |
Series 2016-M4, Class X2, IO, 2.68%, 1/25/2039 (k) | | | 16,803 | | | | 1,693 | |
| | | | | | | | |
| INVESTMENTS | | PRINCIPAL AMOUNT (000) | | | VALUE
(000) | |
| | | | | | | | |
United States — continued | | | | | | | | |
FREMF Series 2018-KF46, Class B, 4.03%, 3/25/2028 ‡ (a) (k) | | | 1,635 | | | | 1,638 | |
FREMF Mortgage Trust | | | | | | | | |
Series 2017-KF29, Class B, 5.63%, 2/25/2024 (a) (k) | | | 2,501 | | | | 2,588 | |
Series 2017-KF31, Class B, 4.98%, 4/25/2024 (a) (k) | | | 1,450 | | | | 1,482 | |
Series 2017-KF36, Class B, 4.73%, 8/25/2024 (a) (k) | | | 1,704 | | | | 1,718 | |
Series 2017-KF38, Class B, 4.58%, 9/25/2024 (a) (k) | | | 1,252 | | | | 1,262 | |
Series 2017-KF41, Class B, 4.58%, 11/25/2024 (a) (k) | | | 950 | | | | 954 | |
Series 2018-KF42, Class B, 4.28%, 12/25/2024 (a) (k) | | | 2,874 | | | | 2,877 | |
Series 2018-KF45, Class B, 4.03%, 3/25/2025 (a) (k) | | | 1,000 | | | | 1,000 | |
Series 2016-KF24, Class B, 7.08%, 10/25/2026 (a) (k) | | | 562 | | | | 592 | |
Series 2017-KF40, Class B, 4.78%, 11/25/2027 ‡ (a) (k) | | | 1,707 | | | | 1,720 | |
Series 2017-K729, Class B, 3.80%, 11/25/2049 (a) (k) | | | 900 | | | | 879 | |
Series 2017-K728, Class B, 3.76%, 11/25/2050 (a) (k) | | | 4,200 | | | | 4,060 | |
Series 2017-K728, Class C, 3.76%, 11/25/2050 (a) (k) | | | 1,265 | | | | 1,187 | |
GNMA | | | | | | | | |
Series 2013-48, IO, 0.61%, 7/16/2054 (k) | | | 28,828 | | | | 1,252 | |
Series 2017-9, IO, 0.76%, 1/16/2057 (k) | | | 21,444 | | | | 1,395 | |
Series 2017-23, IO, 0.73%, 5/16/2059 (k) | | | 14,452 | | | | 882 | |
GRACE Mortgage Trust Series 2014-GRCE, Class B, 3.52%, 6/10/2028 (a) | | | 1,630 | | | | 1,634 | |
JP Morgan Chase Commercial Mortgage Securities Trust Series 2007-LD11, Class AM, 6.18%, 6/15/2049 (k) | | | 1,327 | | | | 1,348 | |
LB Commercial Mortgage Trust Series 2007-C3, Class AJ, 6.09%, 7/15/2044 (k) | | | 1,419 | | | | 1,441 | |
LB-UBS Commercial Mortgage Trust Series 2006-C6, Class AJ, 5.45%, 9/15/2039 ‡ (k) | | | 2,195 | | | | 1,767 | |
LMREC, Inc. Series 2016-CRE2, Class A, 3.77%, 11/24/2031 (a) (k) | | | 1,415 | | | | 1,423 | |
SEE NOTES TO FINANCIAL STATEMENTS.
| | | | | | | | |
| | | |
| AUGUST 31, 2018 | | J.P. MORGAN INCOME FUNDS | | | | | 31 | |
JPMorgan Global Bond Opportunities Fund
SCHEDULE OF PORTFOLIO INVESTMENTS
AS OF AUGUST 31, 2018 (continued)
(Amounts in U.S. Dollars, unless otherwise noted)
| | | | | | | | |
| INVESTMENTS | | PRINCIPAL AMOUNT (000) | | | VALUE
(000) | |
Commercial Mortgage-Backed Securities — continued | | | | | |
United States — continued | | | | | | | | |
Morgan Stanley Bank of America Merrill Lynch Trust Series 2014-C19, Class D, 3.25%, 12/15/2047 (a) | | | 540 | | | | 461 | |
Morgan Stanley Capital I Trust | | | | | | | | |
Series 2006-T23, Class D, 6.32%, 8/12/2041 ‡ (a) (k) | | | 2,800 | | | | 2,884 | |
Series 2006-HQ10, Class AJ, 5.39%, 11/12/2041 (k) | | | 985 | | | | 982 | |
Series 2005-HQ7, Class E, 5.55%, 11/14/2042 ‡ (k) | | | 1,868 | | | | 1,891 | |
Nationslink Funding Corp. Series 1999-LTL1, Class E, 5.00%, 1/22/2026 (a) | | | 400 | | | | 408 | |
UBS Commercial Mortgage Trust Series 2017-C6, Class D, 2.50%, 12/15/2050 (a) (k) | | | 1,205 | | | | 849 | |
Wachovia Bank Commercial Mortgage Trust | | | | | | | | |
Series 2007-C30, Class B, 5.46%, 12/15/2043 (k) | | | 2,510 | | | | 2,537 | |
Series 2007-C30, Class C, 5.48%, 12/15/2043 (k) | | | 2,790 | | | | 2,765 | |
Series 2005-C21, Class F, 5.41%, 10/15/2044 ‡ (a) (k) | | | 87 | | | | 29 | |
Series 2007-C34, Class AJ, 6.33%, 5/15/2046 (k) | | | 137 | | | | 139 | |
Series 2007-C31, Class C, 6.18%, 4/15/2047 ‡ (k) | | | 47 | | | | 47 | |
Series 2006-C29, Class B, 5.43%, 11/15/2048 (k) | | | 894 | | | | 898 | |
Series 2007-C33, Class AJ, 6.21%, 2/15/2051 (k) | | | 1,737 | | | | 1,715 | |
Series 2007-C33, Class B, 6.21%, 2/15/2051 ‡ (k) | | | 2,600 | | | | 2,026 | |
Series 2007-C33, Class C, 6.21%, 2/15/2051 ‡ (k) | | | 2,600 | | | | 832 | |
Wells Fargo Commercial Mortgage Trust | | | | | | | | |
Series 2010-C1, Class C, 5.78%, 11/15/2043 ‡ (a) (k) | | | 1,370 | | | | 1,408 | |
Series 2016-BNK1, Class D, 3.00%, 8/15/2049 ‡ (a) | | | 1,276 | | | | 1,054 | |
Series 2015-NXS2, Class A5, 3.77%, 7/15/2058 (k) | | | 1,250 | | | | 1,268 | |
| | | | | | | | |
| | | | | | | 152,072 | |
| | | | | | | | |
Total Commercial Mortgage-Backed Securities
(Cost $163,173) | | | | | | | 157,557 | |
| | | | | | | | |
| | | | | | | | |
| INVESTMENTS | | PRINCIPAL AMOUNT (000) | | | VALUE
(000) | |
Collateralized Mortgage Obligations — 3.7% | | | | | |
Bermuda — 0.1% | | | | | | | | |
Bellemeade Re Ltd. Series 2018-1A, Class M1B, 3.66%, 4/25/2028 ‡ (a) (k) | | | 2,300 | | | | 2,307 | |
| | | | | | | | |
Italy — 0.0% (g) | | | | | | | | |
Intesa Sec Srl Series 3, Class B, 0.00%, 10/30/2033 ‡ (b) (k) | | | EUR 120 | | | | 139 | |
| | | | | | | | |
Netherlands — 0.1% | | | | | | | | |
Permanent Master Issuer plc Series 2018-1A, Class 1A1, 2.75%, 7/15/2058 (a) (k) | | | 4,281 | | | | 4,274 | |
| | | | | | | | |
United States — 3.5% | | | | | | | | |
Acre Series 2017-B, 12/15/2020 ‡ | | | 3,000 | | | | 3,000 | |
Alternative Loan Trust | | | | | | | | |
Series 2004-25CB, Class A1, 6.00%, 12/25/2034 | | | 4,204 | | | | 4,243 | |
Series 2005-6CB, Class 1A6, 5.50%, 4/25/2035 | | | 88 | | | | 88 | |
Series 2005-21CB, Class A17, 6.00%, 6/25/2035 | | | 1,521 | | | | 1,475 | |
Series 2005-80CB, Class 5A1, 6.00%, 2/25/2036 | | | 3,921 | | | | 3,946 | |
Angel Oak Mortgage Trust I LLC Series 2018-PB1, Class A, 4.00%, 8/25/2021 (a) | | | 1,720 | | | | 1,725 | |
Chase Mortgage Finance Trust Series 2007-A1, Class 2A3, 4.47%, 2/25/2037 (k) | | | 94 | | | | 95 | |
CHL GMSR Issuer Trust Series 2018-GT1, Class A, 4.81%, 5/25/2023 (a) (k) | | | 1,210 | | | | 1,206 | |
CHL Mortgage Pass-Through Trust Series 2007-16, Class A1, 6.50%, 10/25/2037 | | | 1,708 | | | | 1,425 | |
Civic Mortgage LLC Series 2018-1, Class A1, 3.89%, 6/25/2022 (a) (h) | | | 1,373 | | | | 1,372 | |
DSLA Mortgage Loan Trust Series 2005-AR4, Class 2A1A, 2.34%, 8/19/2045 (k) | | | 1,053 | | | | 988 | |
FHLMC REMIC | | | | | | | | |
Series 4351, Class GI, IO, 5.00%, 11/15/2019 | | | 4 | | | | — | (j) |
Series 3775, Class LI, IO, 3.50%, 12/15/2020 | | | 470 | | | | 14 | |
Series 3110, Class SL, IF, IO, 4.09%, 2/15/2026 (k) | | | 149 | | | | 6 | |
Series 3907, Class SW, IF, IO, 4.59%, 7/15/2026 (k) | | | 2,347 | | | | 207 | |
SEE NOTES TO FINANCIAL STATEMENTS.
| | | | | | |
| | | |
| 32 | | | | J.P. MORGAN INCOME FUNDS | | AUGUST 31, 2018 |
| | | | | | | | |
| INVESTMENTS | | PRINCIPAL AMOUNT (000) | | | VALUE
(000) | |
Collateralized Mortgage Obligations — continued | | | | | |
United States — continued | | | | | | | | |
Series 3914, Class LS, IF, IO, 4.74%, 8/15/2026 (k) | | | 832 | | | | 75 | |
Series 4304, Class DI, IO, 2.50%, 1/15/2027 | | | 551 | | | | 34 | |
Series 4030, Class IL, IO, 3.50%, 4/15/2027 | | | 526 | | | | 50 | |
Series 4043, Class PI, IO, 2.50%, 5/15/2027 | | | 2,311 | | | | 165 | |
Series 4056, Class BI, IO, 3.00%, 5/15/2027 | | | 186 | | | | 16 | |
Series 4057, Class UI, IO, 3.00%, 5/15/2027 | | | 1,314 | | | | 106 | |
Series 4074, IO, 3.00%, 7/15/2027 | | | 4,009 | | | | 348 | |
Series 4120, Class UI, IO, 3.00%, 10/15/2027 | | | 1,011 | | | | 91 | |
Series 4136, Class IN, IO, 3.00%, 11/15/2027 | | | 199 | | | | 18 | |
Series 4323, Class IW, IO, 3.50%, 4/15/2028 | | | 344 | | | | 30 | |
Series 4311, Class QI, IO, 3.00%, 10/15/2028 | | | 1,722 | | | | 132 | |
Series 4324, Class AI, IO, 3.00%, 11/15/2028 | | | 937 | | | | 69 | |
Series 4313, Class UI, IO, 3.00%, 3/15/2029 | | | 1,668 | | | | 167 | |
Series 4280, Class KI, IO, 3.50%, 9/15/2031 | | | 1,209 | | | | 109 | |
Series 3716, Class PI, IO, 4.50%, 4/15/2038 | | | 157 | | | | 14 | |
Series 3459, Class JS, IF, IO, 4.19%, 6/15/2038 (k) | | | 538 | | | | 73 | |
Series 4119, Class LI, IO, 3.50%, 6/15/2039 | | | 458 | | | | 55 | |
Series 3907, Class AI, IO, 5.00%, 5/15/2040 | | | 504 | | | | 60 | |
Series 4018, Class HI, IO, 4.50%, 3/15/2041 | | | 402 | | | | 68 | |
Series 4215, Class LI, IO, 3.50%, 7/15/2041 | | | 691 | | | | 100 | |
Series 4073, Class IQ, IO, 4.00%, 7/15/2042 | | | 426 | | | | 94 | |
Series 4173, Class I, IO, 4.00%, 3/15/2043 | | | 1,014 | | | | 220 | |
Series 4372, Class SY, IF, IO, 4.04%, 8/15/2044 (k) | | | 1,532 | | | | 230 | |
Series 4585, Class JI, IO, 4.00%, 5/15/2045 | | | 2,774 | | | | 485 | |
| | | | | | | | |
| INVESTMENTS | | PRINCIPAL AMOUNT (000) | | | VALUE
(000) | |
| | | | | | | | |
United States — continued | | | | | | | | |
Series 4694, Class SA, IF, IO, 4.04%, 6/15/2047 (k) | | | 7,717 | | | | 1,424 | |
Series 4689, Class SD, IF, IO, 4.09%, 6/15/2047 (k) | | | 17,035 | | | | 3,026 | |
Series 4714, Class SA, IF, IO, 4.09%, 8/15/2047 (k) | | | 12,936 | | | | 2,469 | |
FHLMC STRIPS Series 305, IO, 3.50%, 3/15/2028 | | | 316 | | | | 30 | |
FHLMC Structured Agency Credit Risk Debt Notes Series 2018-HQA1, Class M2, 4.36%, 9/25/2030 (k) | | | 5,820 | | | | 5,885 | |
FNMA REMIC | | | | | | | | |
Series 2011-144, Class SA, IF, IO, 4.59%, 11/25/2025 (k) | | | 662 | | | | 42 | |
Series 2012-25, Class AI, IO, 3.50%, 3/25/2027 | | | 179 | | | | 18 | |
Series 2012-145, Class EI, IO, 3.00%, 1/25/2028 | | | 2,163 | | | | 186 | |
Series 2013-9, Class YI, IO, 3.50%, 2/25/2028 | | | 228 | | | | 21 | |
Series 2013-15, IO, 2.50%, 3/25/2028 | | | 3,223 | | | | 233 | |
Series 2013-18, Class AI, IO, 3.00%, 3/25/2028 | | | 988 | | | | 84 | |
Series 2013-31, Class DI, IO, 3.00%, 4/25/2028 | | | 1,083 | | | | 107 | |
Series 2013-31, Class YI, IO, 3.50%, 4/25/2028 | | | 200 | | | | 19 | |
Series 2014-35, Class KI, IO, 3.00%, 6/25/2029 | | | 2,186 | | | | 237 | |
Series 2014-44, Class QI, IO, 3.00%, 8/25/2029 | | | 1,355 | | | | 130 | |
Series 2012-120, Class DI, IO, 3.00%, 3/25/2031 | | | 878 | | | | 77 | |
Series 2013-66, Class IE, IO, 3.00%, 8/25/2032 | | | 9,999 | | | | 1,096 | |
Series 2013-61, Class HI, IO, 3.00%, 6/25/2033 | | | 6,883 | | | | 820 | |
Series 2013-64, Class LI, IO, 3.00%, 6/25/2033 | | | 1,381 | | | | 182 | |
Series 2012-148, Class JI, IO, 3.50%, 12/25/2039 | | | 244 | | | | 31 | |
Series 2009-101, Class SI, IF, IO, 3.69%, 12/25/2039 (k) | | | 625 | | | | 46 | |
Series 2010-102, Class IP, IO, 5.00%, 12/25/2039 | | | 138 | | | | 9 | |
Series 2012-118, Class DI, IO, 3.50%, 1/25/2040 | | | 232 | | | | 28 | |
SEE NOTES TO FINANCIAL STATEMENTS.
| | | | | | | | |
| | | |
| AUGUST 31, 2018 | | J.P. MORGAN INCOME FUNDS | | | | | 33 | |
JPMorgan Global Bond Opportunities Fund
SCHEDULE OF PORTFOLIO INVESTMENTS
AS OF AUGUST 31, 2018 (continued)
(Amounts in U.S. Dollars, unless otherwise noted)
| | | | | | | | |
| INVESTMENTS | | PRINCIPAL AMOUNT (000) | | | VALUE
(000) | |
Collateralized Mortgage Obligations — continued | | | | | |
United States — continued | | | | | | | | |
Series 2013-5, Class BI, IO, 3.50%, 3/25/2040 | | | 248 | | | | 30 | |
Series 2012-93, Class SE, IF, IO, 4.04%, 9/25/2042 (k) | | | 3,666 | | | | 602 | |
Series 2012-93, Class SG, IF, IO, 4.04%, 9/25/2042 (k) | | | 951 | | | | 157 | |
Series 2012-133, Class NS, IF, IO, 4.09%, 12/25/2042 (k) | | | 7,499 | | | | 1,325 | |
Series 2016-25, Class SL, IF, IO, 3.94%, 5/25/2046 (k) | | | 7,269 | | | | 1,295 | |
Series 2016-61, Class ST, IF, IO, 3.94%, 9/25/2046 (k) | | | 14,736 | | | | 2,523 | |
Series 2016-77, Class SA, IF, IO, 3.94%, 10/25/2046 (k) | | | 9,075 | | | | 1,763 | |
Series 2017-13, Class AS, IF, IO, 3.99%, 2/25/2047 (k) | | | 13,788 | | | | 2,549 | |
Series 2017-57, Class SA, IF, IO, 4.04%, 8/25/2057 (k) | | | 7,420 | | | | 1,173 | |
FNMA STRIPS | | | | | | | | |
Series 410, Class C12, IO, 5.50%, 7/25/2024 | | | 3,483 | | | | 197 | |
Series 409, Class 23, IO, 3.50%, 4/25/2027 (k) | | | 598 | | | | 50 | |
Series 401, Class C6, IO, 4.50%, 10/25/2029 | | | 1,396 | | | | 107 | |
FNMA, Connecticut Avenue Securities Series 2018-C05, Class 1M2, 4.41%, 1/25/2031 (k) | | | 2,008 | | | | 2,036 | |
GNMA | | | | | | | | |
Series 2002-24, Class AG, IF, IO, 5.89%, 4/16/2032 (k) | | | 1,232 | | | | 195 | |
Series 2003-69, Class SB, IF, IO, 4.54%, 8/16/2033 (k) | | | 1,106 | | | | 159 | |
Series 2011-13, Class S, IF, IO, 3.89%, 1/16/2041 (k) | | | 817 | | | | 110 | |
Series 2015-H13, Class GI, IO, 1.61%, 4/20/2065 (k) | | | 5,664 | | | | 292 | |
Series 2017-H14, Class FG, 3.53%, 6/20/2067 (k) | | | 2,012 | | | | 2,076 | |
Goodgreen Trust Series 2017-R1, 5.00%, 10/20/2051 ‡ | | | 4,112 | | | | 4,042 | |
GSMSC Pass-Through Trust Series 2008-2R, Class 2A1, 7.50%, 10/25/2036 (a) (k) | | | 159 | | | | 111 | |
HarborView Mortgage Loan Trust Series 2007-6, Class 2A1A, 2.27%, 8/19/2037 (k) | | | 205 | | | | 201 | |
Homeward Opportunities Fund I Trust Series 2018-1, Class A1, 3.77%, 6/25/2048 (a) (k) | | | 1,662 | | | | 1,663 | |
| | | | | | | | |
| INVESTMENTS | | PRINCIPAL AMOUNT (000) | | | VALUE
(000) | |
| | | | | | | | |
United States — continued | | | | | | | | |
JP Morgan Alternative Loan Trust Series 2006-A2, Class 1A1, 2.24%, 5/25/2036 (k) | | | 3,656 | | | | 3,493 | |
MASTR Alternative Loan Trust Series 2003-5, Class 30B1, 5.89%, 8/25/2033 ‡ (k) | | | 335 | | | | 327 | |
OBX Trust Series 2018-EXP1, Class 2A1, 2.91%, 4/25/2048 (a) (k) | | | 5,332 | | | | 5,332 | |
PNMAC GMSR Issuer Trust | | | | | | | | |
Series 2018-GT1, Class A, 4.91%, 2/25/2023 (a) (k) | | | 1,400 | | | | 1,412 | |
Series 2018-GT2, Class A, 4.71%, 8/25/2025 (a) (k) | | | 3,690 | | | | 3,707 | |
RALI Trust Series 2005-QO1, Class A1, 2.36%, 8/25/2035 (k) | | | 2,283 | | | | 2,004 | |
SART 7/15/2024 | | | 9,100 | | | | 9,117 | |
Structured Adjustable Rate Mortgage Loan Trust Series 2005-1, Class 5A1, 4.07%, 2/25/2035 (k) | | | 367 | | | | 368 | |
Toorak Mortgage Corp. Ltd. Series 2018-1, Class A1, 4.34%, 8/25/2021 (a) (h) | | | 4,190 | | | | 4,190 | |
Verus Securitization Trust Series 2018-2, Class A1, 3.68%, 6/1/2058 (a) (k) | | | 4,054 | | | | 4,055 | |
Wells Fargo Mortgage-Backed Securities Trust | | | | | | | | |
Series 2004-N, Class A6, 4.60%, 8/25/2034 (k) | | | 1,834 | | | | 1,860 | |
Series 2004-N, Class A7, 4.60%, 8/25/2034 (k) | | | 1,834 | | | | 1,859 | |
Series 2004-M, Class A1, 4.60%, 8/25/2034 (k) | | | 1,548 | | | | 1,598 | |
Series 2004-BB, Class A5, 3.76%, 1/25/2035 (k) | | | 907 | | | | 923 | |
Series 2005-AR2, Class 2A1, 3.93%, 3/25/2035 (k) | | | 1,323 | | | | 1,340 | |
Series 2005-AR2, Class 2A2, 3.93%, 3/25/2035 (k) | | | 304 | | | | 310 | |
Series 2005-AR16, Class 3A1, 4.03%, 3/25/2035 (k) | | | 444 | | | | 448 | |
Series 2005-AR4, Class 2A2, 4.00%, 4/25/2035 (k) | | | 249 | | | | 251 | |
Series 2007-2, Class 3A5, 5.25%, 3/25/2037 | | | 33 | | | | 33 | |
| | | | | | | | |
| | | | | | | 104,082 | |
| | | | | | | | |
Total Collateralized Mortgage Obligations
(Cost $114,395) | | | | 110,802 | |
| | | | | | | | |
SEE NOTES TO FINANCIAL STATEMENTS.
| | | | | | |
| | | |
| 34 | | | | J.P. MORGAN INCOME FUNDS | | AUGUST 31, 2018 |
| | | | | | | | |
| INVESTMENTS | | PRINCIPAL AMOUNT (000) | | | VALUE
(000) | |
Loan Assignments — 3.5% (l) | | | | | | | | |
Canada — 0.1% | | | | | | | | |
Bombardier Recreational Products, Inc., 1st Lien Term Loan B (ICE LIBOR USD 1 Month + 2.00%), 4.08%, 5/23/2025 (d) | | | 1,528 | | | | 1,524 | |
Celestica, Inc, 1st Lien Term Loan B (ICE LIBOR USD 1 Month + 2.00%), 4.06%, 6/27/2025 (d) | | | 394 | | | | 392 | |
Concordia Healthcare Corp., Initial Dollar Term Loan (ICE LIBOR USD 1 Month + 4.25%), 6.33%, 10/21/2021 (d) | | | 1,095 | | | | 987 | |
Garda World Security, 1st Lien Term Loan B (ICE LIBOR USD 3 Month + 2.50%; ICE LIBOR USD 3 Month + 3.50%), 5.80%, 5/24/2024 (d) | | | 85 | | | | 85 | |
Mastronardi Produce Ltd., 1st Lien Term Loan B (ICE LIBOR USD 1 Month + 3.25%), 5.33%, 5/1/2025 (d) | | | 179 | | | | 180 | |
MEG Energy Corp., 1st Lien Term B Loan (ICE LIBOR USD 1 Month + 3.50%), 5.58%, 12/31/2023 (d) | | | 143 | | | | 143 | |
| | | | | | | | |
| | | | | | | 3,311 | |
| | | | | | | | |
France — 0.0% (g) | | | | | | | | |
Altran Technologie, 1st Lien Term Loan B (ICE LIBOR USD 3 Month + 2.25%), 4.57%, 3/20/2025 (d) | | | 423 | | | | 422 | |
| | | | | | | | |
Luxembourg — 0.1% | | | | | | | | |
Auris Luxembourg III SARL, Term Loan B-7 (ICE LIBOR USD 3 Month + 3.00%), 5.33%, 1/17/2022 (d) | | | 1,006 | | | | 1,014 | |
Intelsat Jackson Holdings SA, 1st Lien Term Loan (ICE LIBOR USD 1 Month + 3.75%), 5.81%, 11/27/2023 (d) | | | 1,084 | | | | 1,088 | |
Onex Wizard Acquisition Co. II S.C.A., Initial Dollar Term Loan (ICE LIBOR USD 1 Month + 2.75%), 4.83%, 3/11/2022 (d) | | | 896 | | | | 899 | |
Samsonite IP Holdings Sarl, 1st Lien Term Loan B (ICE LIBOR USD 1 Month + 1.75%), 3.83%, 4/25/2025 (d) | | | 886 | | | | 881 | |
| | | | | | | | |
| | | | | | | 3,882 | |
| | | | | | | | |
Netherlands — 0.0% (g) | | | | | | | | |
Ziggo Secured Finance Partnership, 1st Lien Term Loan E (ICE LIBOR USD 1 Month + 2.50%), 4.56%, 4/15/2025 (d) | | | 1,230 | | | | 1,208 | |
| | | | | | | | |
| | | | | | | | |
| INVESTMENTS | | PRINCIPAL AMOUNT (000) | | | VALUE
(000) | |
| | | | | | | | |
United Kingdom — 0.1% | | | | | | | | |
Cineworld Finance US Inc., 1st Lien Term Loan B (ICE LIBOR USD 1 Month + 2.50%), 4.58%, 2/28/2025 (d) | | | 1,904 | | | | 1,897 | |
| | | | | | | | |
United States — 3.2% | | | | | | | | |
24 Hour Fitness Worldwide, Inc., 1st Lien Term Loan B (ICE LIBOR USD 1 Month + 3.50%), 5.58%, 5/30/2025 (d) | | | 580 | | | | 584 | |
A2Z Wireless Holdings, Inc., 1st Lien Term Loan B (ICE LIBOR USD 1 Month + 6.00%), 8.08%, 5/1/2023 (d) | | | 492 | | | | 470 | |
Acadia Healthcare Co., Inc., 1st Lien Term Loan B (ICE LIBOR USD 1 Month + 2.50%), 4.58%, 2/16/2023 (d) | | | 514 | | | | 516 | |
Albertson’s LLC, 1st Lien Term Loan | | | | | | | | |
(ICE LIBOR USD 3 Month + 3.00%), 5.34%, 12/21/2022 (d) (m) | | | 812 | | | | 809 | |
(ICE LIBOR USD 3 Month + 3.00%), 5.31%, 6/22/2023 (d) (m) | | | 719 | | | | 716 | |
Albertson’s LLC, 1st Lien Term Loan B-4 (ICE LIBOR USD 1 Month + 2.75%), 4.83%, 8/25/2021 (d) | | | 155 | | | | 155 | |
Altice US Finance I Corp., Term Loan (ICE LIBOR USD 1 Month + 2.25%), 4.33%, 7/28/2025 (d) (m) | | | 1,698 | | | | 1,695 | |
American Airlines, Inc., 1st Lien Term Loan B (ICE LIBOR USD 1 Month + 1.75%), 3.81%, 6/27/2025 (d) | | | 1,868 | | | | 1,828 | |
American Greetings Corp., Term Loan B (ICE LIBOR USD 1 Month + 4.50%), 6.58%, 4/6/2024 (d) | | | 279 | | | | 279 | |
Avaya, Inc., 1st Lien Term Loan B (ICE LIBOR USD 1 Month + 4.25%), 6.31%, 12/15/2024 (d) | | | 1,264 | | | | 1,271 | |
Barracuda Networks, Inc., 1st Lien Term Loan (ICE LIBOR USD 1 Month + 3.25%), 5.31%, 2/12/2025 (d) | | | 373 | | | | 373 | |
Barracuda Networks, Inc., 2nd Lien Term Loan (ICE LIBOR USD 1 Month + 7.25%), 9.31%, 2/12/2026 (d) | | | 82 | | | | 82 | |
Berry Plastics Corp., 1st Lien Term Loan | | | | | | | | |
(ICE LIBOR USD 1 Month + 1.75%), 3.94%, 2/8/2020 (d) | | | 294 | | | | 293 | |
(ICE LIBOR USD 2 Month + 1.75%), 3.94%, 1/6/2021 (d) | | | 205 | | | | 205 | |
BMC Software Finance, Inc., 1st Lien Term Loan B (ICE LIBOR USD 3 Month + 3.50%), 9/1/2025 (d) (m) | | | 725 | | | | 725 | |
Brookfield WEC Holdings, Inc., 1st Lien Term Loan (ICE LIBOR USD 1 Month + 3.75%), 5.83%, 8/1/2025 (d) | | | 1,725 | | | | 1,734 | |
SEE NOTES TO FINANCIAL STATEMENTS.
| | | | | | | | |
| | | |
| AUGUST 31, 2018 | | J.P. MORGAN INCOME FUNDS | | | | | 35 | |
JPMorgan Global Bond Opportunities Fund
SCHEDULE OF PORTFOLIO INVESTMENTS
AS OF AUGUST 31, 2018 (continued)
(Amounts in U.S. Dollars, unless otherwise noted)
| | | | | | | | |
| INVESTMENTS | | PRINCIPAL AMOUNT (000) | | | VALUE
(000) | |
Loan Assignments — continued | | | | | | | | |
United States — continued | | | | | | | | |
Brookfield WEC Holdings, Inc., 2nd Lien Term Loan (ICE LIBOR USD 3 Month + 6.75%), 8.83%, 8/3/2026 (d)(m) | | | 875 | | | | 887 | |
California Resources Corp., 1st Lien Second Out Term Loan (ICE LIBOR USD 1 Month + 10.38%), 12.44%, 12/31/2021 (d) | | | 792 | | | | 876 | |
California Resources Corp., Senior Secured First Out (ICE LIBOR USD 1 Month + 4.75%), 6.82%, 12/31/2022 (d) | | | 2,045 | | | | 2,073 | |
Calpine Corp., Term Loan (ICE LIBOR USD 3 Month + 2.50%), 4.84%, 1/15/2024 (d) | | | 970 | | | | 971 | |
CenturyLink, Inc., 1st Lien Term Loan B (ICE LIBOR USD 1 Month + 2.75%), 4.83%, 1/31/2025 (d) | | | 739 | | | | 730 | |
Chesapeake Energy, 1st Lien Last Out (ICE LIBOR USD 1 Month + 7.50%), 9.58%, 8/23/2021 (d) | | | 796 | | | | 830 | |
CHG Healthcare Services, 1st Lien Term Loan B (ICE LIBOR USD 1 Month + 3.00%; ICE LIBOR USD 3 Month + 3.00%), 5.34%, 6/7/2023 (d) | | | 2,415 | | | | 2,419 | |
Chrysler Group LLC, Tranche B Term Loan (ICE LIBOR USD 1 Month + 2.00%), 4.07%, 12/31/2018 (d) | | | 290 | | | | 290 | |
Cincinnati Bell, Term Loan B (ICE LIBOR USD 1 Month + 3.25%), 5.33%, 10/2/2024 (d) | | | 2,298 | | | | 2,291 | |
Citgo Holding, Inc., Term B Loan (ICE LIBOR USD 3 Month + 3.50%), 5.84%, 7/29/2021 (d) | | | 829 | | | | 829 | |
CityCenter Holdings LLC, Term Loan B (ICE LIBOR USD 1 Month + 2.25%), 4.33%, 4/18/2024 (d) | | | 1,348 | | | | 1,347 | |
Clear Channel Communications, Inc., Term Loan D (ICE LIBOR USD 1 Month + 6.75%), 8.83%, 1/30/2019 (d) | | | 550 | | | | 409 | |
Clear Channel Communications, Inc., Tranche E Term Loan (ICE LIBOR USD 1 Month + 7.50%), 9.58%, 7/30/2019 (d) | | | 24 | | | | 18 | |
Clover Merger Sub Inc, 1st Lien Term Loan (ICE LIBOR USD 1 Month + 3.50%), 5.58%, 9/26/2024 (d) | | | 1,057 | | | | 1,003 | |
Community Health Systems, Inc., Incremental 2021 Term H Loan (ICE LIBOR USD 3 Month + 3.25%), 5.54%, 1/27/2021 (d) | | | 763 | | | | 751 | |
| | | | | | | | |
| INVESTMENTS | | PRINCIPAL AMOUNT (000) | | | VALUE
(000) | |
| | | | | | | | |
United States — continued | | | | | | | | |
Consolidated Communications, Inc., Term Loan B (ICE LIBOR USD 1 Month + 3.00%), 5.08%, 10/5/2023 (d) | | | 148 | | | | 145 | |
Consolidated Container, 1st Lien Term Loan B (ICE LIBOR USD 1 Month + 2.75%), 4.83%, 5/22/2024 (d) | | | 382 | | | | 382 | |
Continental Building Products, 1st Lien Term Loan (ICE LIBOR USD 1 Month + 2.25%), 4.33%, 8/18/2023 (d) | | | 864 | | | | 865 | |
Crown Americas, 1st Lien Term Loan B (ICE LIBOR USD 1 Month + 2.00%), 4.08%, 4/3/2025 (d) | | | 565 | | | | 567 | |
CSC Holdings LLC, 1st Lien (ICE LIBOR USD 1 Month + 2.25%), 4.31%, 7/17/2025 (d) | | | 1,484 | | | | 1,477 | |
Culligan Holding, Inc., 1st Lien Term Loan B-1 (ICE LIBOR USD 1 Month + 3.25%), 5.33%, 12/13/2023 (d) | | | 298 | | | | 297 | |
Delta 2 Sarl, 1st Lien Term loan B (ICE LIBOR USD 1 Month + 2.50%), 4.58%, 2/1/2024 (d) | | | 747 | | | | 741 | |
Dole Food Co., 1st Lien Term Loan B (ICE LIBOR USD 1 Month + 2.75%; ICE LIBOR USD 3 Month + 2.75%), 4.83%, 4/6/2024 (d) | | | 1,452 | | | | 1,449 | |
Duff & Phelps Corp., 1st Lien Term Loan (ICE LIBOR USD 1 Month + 3.25%), 5.58%, 2/13/2025 (d) | | | 723 | | | | 724 | |
Dupont Performance (Axalta), Term Loan B (ICE LIBOR USD 3 Month + 1.75%), 4.08%, 6/1/2024 (d) | | | 648 | | | | 648 | |
EIF Channelview Cogeneration LLC, Term Loan (ICE LIBOR USD 1 Month + 4.25%), 6.33%, 5/3/2025 (d) | | | 400 | | | | 403 | |
FGI Operating Co. LLC, DIP Term Loan (ICE LIBOR USD 3 Month + 10.00%), 8.65%, 5/15/2022 (d) | | | 57 | | | | 57 | |
First Data Corp., 1st Lien Term Loan (ICE LIBOR USD 1 Month + 2.00%), 4.07%, 4/26/2024 (d) (m) | | | 695 | | | | 694 | |
Flex Acquisition Co., Inc., Term Loan (ICE LIBOR USD 3 Month + 3.00%), 5.34%, 12/29/2023 (d) | | | 1,578 | | | | 1,572 | |
Frontera Generation Holdings LLC, 1st Lien Senior Secured Term Loan B (ICE LIBOR USD 1 Month + 4.25%), 6.33%, 5/2/2025 (d) | | | 500 | | | | 501 | |
GGP, Inc., 1st Lien Term Loan B REIT, (ICE LIBOR USD 3 Month + 2.25%), 4.56%, 8/27/2025 (d) (m) | | | 2,850 | | | | 2,830 | |
SEE NOTES TO FINANCIAL STATEMENTS.
| | | | | | |
| | | |
| 36 | | | | J.P. MORGAN INCOME FUNDS | | AUGUST 31, 2018 |
| | | | | | | | |
| INVESTMENTS | | PRINCIPAL AMOUNT (000) | | | VALUE
(000) | |
Loan Assignments — continued | | | | | | | | |
United States — continued | | | | | | | | |
Go Daddy Group, Inc, 1st Lien Term Loan B (ICE LIBOR USD 1 Month + 2.25%), 4.33%, 2/15/2024 (d) | | | 396 | | | | 397 | |
Golden Nugget, Inc., 1st Lien Term Loan B (ICE LIBOR USD 1 Month + 2.75%), 4.82%, 10/4/2023 (d) | | | 1,228 | | | | 1,231 | |
Greeneden US Holdings II LLC, 1st Lien Term Loan B (ICE LIBOR USD 3 Month + 3.50%), 5.58%, 12/1/2023 (d) | | | 1,095 | | | | 1,096 | |
GTT Communications, 1st Lien Term Loan B (ICE LIBOR USD 3 Month + 2.75%), 4.83%, 5/31/2025 (d) | | | 1,023 | | | | 1,002 | |
Hargray Communications Group, Inc., Senior Secured Term Loan B (ICE LIBOR USD 1 Month + 3.00%), 5.08%, 5/16/2024 (d) | | | 2,499 | | | | 2,505 | |
HD Supply, Inc., 1st Lien Term Loan B-4 (ICE LIBOR USD 1 Month + 2.50%), 4.57%, 10/17/2023 (d) | | | 643 | | | | 647 | |
Hearthside Group Holdings, LLC, 1st Lien Term Loan (ICE LIBOR USD 1 Month + 3.00%), 5.06%, 5/23/2025 (d) | | | 153 | | | | 152 | |
Hub International, 1st Lien Term Loan B (ICE LIBOR USD 2 Month + 3.00%; ICE LIBOR USD 3 Month + 3.00%), 5.33%, 4/25/2025 (d) | | | 717 | | | | 716 | |
Impala Private Holdings II LLC, 1st Lien Term Loan (ICE LIBOR USD 1 Month + 4.00%), 6.08%, 11/14/2024 (d) | | | 391 | | | | 393 | |
Infor US, Inc., Tranche B-6 Term Loan (ICE LIBOR USD 1 Month + 2.75%), 4.83%, 2/1/2022 (d) | | | 842 | | | | 842 | |
Invenergy LLC, Term Loan (ICE LIBOR USD 3 Month + 3.75%), 5.81%, 8/28/2025 (d)(m) | | | 905 | | | | 912 | |
IRB Holding Corp., 1st Lien Term Loan B (ICE LIBOR USD 1 Month + 3.25%), 5.32%, 2/5/2025 (d) | | | 1,107 | | | | 1,112 | |
Janus International Group, 1st Lien Term Loan (ICE LIBOR USD 1 Month + 3.00%), 5.08%, 2/12/2025 (d) | | | 342 | | | | 337 | |
Keane Group Holdings LLC, 1st Lien Term Loan B (ICE LIBOR USD 1 Month + 3.75%), 5.88%, 5/25/2025 (d) | | | 514 | | | | 511 | |
Las Vegas Sands Corp., 1st Lien Senior Secured Term Loan (ICE LIBOR USD 1 Month + 1.75%), 3.83%, 3/27/2025 (d) | | | 643 | | | | 642 | |
Level 3 Financing, Tranche B Term Loan (ICE LIBOR USD 1 Month + 2.25%), 4.32%, 2/22/2024 (d) | | | 1,885 | | | | 1,887 | |
| | | | | | | | |
| INVESTMENTS | | PRINCIPAL AMOUNT (000) | | | VALUE
(000) | |
| | | | | | | | |
United States — continued | | | | | | | | |
Lightstone Holdco LLC, 1st Lien Term Loan B (ICE LIBOR USD 1 Month + 3.75%), 5.83%, 1/30/2024 (d) | | | 2,469 | | | | 2,455 | |
Lightstone Holdco LLC, 1st Lien Term Loan C (ICE LIBOR USD 1 Month + 3.75%), 5.83%, 1/30/2024 (d) | | | 133 | | | | 132 | |
Mallinckrodt International Finance SA, Term Loan (ICE LIBOR USD 3 Month + 3.00%), 5.52%, 2/24/2025 (d) | | | 1,127 | | | | 1,125 | |
Medrisk, Term Loan B (ICE LIBOR USD 1 Month + 2.75%), 4.83%, 12/27/2024 (d) | | | 239 | | | | 238 | |
Misys, Term Loan B (ICE LIBOR USD 1 Month + 3.50%), 5.58%, 6/13/2024 (d) | | | 1,061 | | | | 1,055 | |
Moran Foods LLC, Term Loan B (ICE LIBOR USD 1 Month + 6.00%), 8.08%, 12/5/2023 (d) | | | 419 | | | | 299 | |
MultiPlan, Inc., 1st Lien Term Loan B (ICE LIBOR USD 3 Month + 2.75%), 5.08%, 6/7/2023 (d) | | | 1,652 | | | | 1,650 | |
National Mentor Holdings, Inc., Tranche B Term Loan (ICE LIBOR USD 3 Month + 3.00%), 5.33%, 1/31/2021 (d) | | | 452 | | | | 454 | |
NCI Building Systems, 1st Lien Term Loan 4.08%, 2/7/2025 | | | 470 | | | | 469 | |
NVA Holdings, Inc., 1st Lien Term Loan B (ICE LIBOR USD 1 Month + 2.75%), 4.83%, 2/2/2025 (d) | | | 1,464 | | | | 1,458 | |
Party City Holdings Inc., 1st Lien Term Loan (ICE LIBOR USD 1 Month + 2.75%; ICE LIBOR USD 3 Month + 2.75%), 5.28%, 8/19/2022 (d) | | | 515 | | | | 517 | |
Pearl Intermediate Parent LLC, 1st Lien Term Loan (ICE LIBOR USD 1 Month + 2.75%), 4.83%, 2/14/2025 (d) | | | 667 | | | | 654 | |
Pearl Intermediate Parent LLC, Delayed Draw (ICE LIBOR USD 3 Month + 2.75%), 5.08%, 2/14/2025 (d) | | | 54 | | | | 53 | |
Pelican Products, Inc., 1st Lien Term Loan B (ICE LIBOR USD 1 Month + 3.50%), 5.58%, 5/1/2025 (d) | | | 1,287 | | | | 1,282 | |
Pelican Products, Inc., 2nd Lien Term Loan (ICE LIBOR USD 1 Month + 7.75%), 9.83%, 5/1/2026 (d) | | | 350 | | | | 352 | |
Penn National Gaming, Inc., 1st Lien Term Loan B (ICE LIBOR USD 3 Month + 2.50%), 2.50%, 8/14/2025 (d) (m) | | | 935 | | | | 936 | |
PetSmart, Inc., Term Loan B (ICE LIBOR USD 1 Month + 3.00%), 5.09%, 3/11/2022 (d) | | | 249 | | | | 214 | |
SEE NOTES TO FINANCIAL STATEMENTS.
| | | | | | | | |
| | | |
| AUGUST 31, 2018 | | J.P. MORGAN INCOME FUNDS | | | | | 37 | |
JPMorgan Global Bond Opportunities Fund
SCHEDULE OF PORTFOLIO INVESTMENTS
AS OF AUGUST 31, 2018 (continued)
(Amounts in U.S. Dollars, unless otherwise noted)
| | | | | | | | |
| INVESTMENTS | | PRINCIPAL AMOUNT (000) | | | VALUE
(000) | |
Loan Assignments — continued | | | | | | | | |
United States — continued | | | | | | | | |
Plantronics, Inc., 1st Lien Term Loan (ICE LIBOR USD 3 Month + 2.50%), 4.58%, 7/2/2025 (d) | | | 1,592 | | | | 1,588 | |
Prime Security Services Borrower LLC, Term B-1 Loan (ICE LIBOR USD 1 Month + 2.75%), 4.83%, 5/2/2022 (d) | | | 978 | | | | 980 | |
Quest Software US Holdings, Inc., 1st Lien Term Loan (ICE LIBOR USD 2 Month + 4.25%; ICE LIBOR USD 3 Month + 8.25%), 6.57%, 5/16/2025 (d) | | | 1,400 | | | | 1,393 | |
Quest Software US Holdings, Inc., 2nd Lien Term Loan (ICE LIBOR USD 3 Month + 8.25%), 10.57%, 5/18/2026 (d) | | | 360 | | | | 357 | |
Quidditch Acquisition, Inc., 1st Cov-Lite Lien Term Loan (ICE LIBOR USD 1 Month + 7.00%), 9.08%, 3/21/2025 (d) | | | 239 | | | | 242 | |
Rackspace Hosting, Inc., 1st Lien Term Loan B (ICE LIBOR USD 2 Month + 3.00%; ICE LIBOR USD 3 Month + 3.00%), 5.35%, 11/3/2023 (d) | | | 886 | | | | 880 | |
Red Ventures LLC, 1st Lien Term Loan (ICE LIBOR USD 1 Month + 4.00%), 6.08%, 11/8/2024 (d) | | | 335 | | | | 339 | |
Securus Technologies Holdings, Inc., 1st Lien Term Loan (ICE LIBOR USD 1 Month + 4.50%), 6.58%, 11/1/2024 (d) | | | 1,101 | | | | 1,099 | |
Sirva Worldwide, Inc., 1st Lien Term Loan (ICE LIBOR USD 3 Month + 5.00%), 7.69%, 8/4/2025 (d) (m) | | | 575 | | | | 574 | |
Sirva Worldwide, Inc., 2nd Lien Term Loan (ICE LIBOR USD 1 Month + 9.50%), 11.69%, 8/3/2026 (d) (m) | | | 200 | | | | 185 | |
SolarWinds Holdings, Inc., 1st Lien Term Loan (ICE LIBOR USD 1 Month + 3.00%), 5.08%, 2/5/2024 (d) | | | 796 | | | | 798 | |
Sonicwall, Inc., 1st Lien Term Loan (ICE LIBOR USD 3 Month + 3.50%), 5.82%, 5/16/2025 (d) (m) | | | 281 | | | | 281 | |
Sonicwall, Inc., 2nd Lien Term Loan (ICE LIBOR USD 3 Month + 3.50%; ICE LIBOR USD 3 Month + 7.50%), 9.82%, 5/18/2026 (d) (m) | | | 175 | | | | 174 | |
Spin Holdco, Inc., Term Loan B (ICE LIBOR USD 1 Month + 3.25%), 5.59%, 11/14/2022 (d) | | | 990 | | | | 992 | |
Staples, Inc., 1st Lien Term Loan (ICE LIBOR USD 3 Month + 4.00%), 6.34%, 9/12/2024 (d) | | | 2,680 | | | | 2,671 | |
| | | | | | | | |
| INVESTMENTS | | PRINCIPAL AMOUNT (000) | | | VALUE
(000) | |
| | | | | | | | |
United States — continued | | | | | | | | |
Summit Materials LLC, Term Loan (ICE LIBOR USD 1 Month + 2.00%), 4.08%, 11/21/2024 (d) | | | 1,317 | | | | 1,318 | |
Summit Midstream Partners Holdings LLC, Senior Secured Term Loan (ICE LIBOR USD 1 Month + 6.00%), 8.08%, 5/13/2022 (d) | | | 99 | | | | 101 | |
Supervalu Inc, Delayed Draw Term Loan (ICE LIBOR USD 1 Month + 3.50%), 5.58%, 6/8/2024 (d) | | | 203 | | | | 203 | |
Supervalu Inc, Term Loan B (ICE LIBOR USD 1 Month + 3.50%), 5.58%, 6/8/2024 (d) | | | 338 | | | | 338 | |
Syniverse Holdings, Inc., 1st Lien Term Loan (ICE LIBOR USD 1 Month + 5.00%), 7.07%, 3/9/2023 (d) | | | 2,713 | | | | 2,690 | |
Syniverse Holdings, Inc., 2nd Lien Term Loan (ICE LIBOR USD 1 Month + 9.00%), 11.07%, 3/11/2024 (d) | | | 385 | | | | 372 | |
Tennessee Merger Sub Inc., 1st Lien Term Loan B (ICE LIBOR USD 1 Month + 2.75%), 4.83%, 2/6/2024 (d) | | | 2,230 | | | | 2,128 | |
Tribune, Term Loan B (ICE LIBOR USD 1 Month + 3.00%), 5.08%, 12/27/2020 (d) | | | 470 | | | | 471 | |
UFC Holdings LLC, 2nd Lien Guaranteed Senior Secured Term Loan (ICE LIBOR USD 1 Month + 7.50%), 9.58%, 8/18/2024 (d) | | | 193 | | | | 195 | |
Ultra Resources, Inc., Term Loan (ICE LIBOR USD 1 Month + 3.00%), 5.08%, 4/12/2024 (d) | | | 791 | | | | 708 | |
Unitymedia Finance LLC, 1st Lien Term Loan B (ICE LIBOR USD 1 Month + 2.00%), 4.06%, 6/1/2023 (d) | | | 1,373 | | | | 1,371 | |
Univision Communications, Inc., 1st Lien Term Loan C-5 (ICE LIBOR USD 1 Month + 2.75%), 4.83%, 3/15/2024 (d) | | | 1,710 | | | | 1,640 | |
USI, Inc., Term Loan (ICE LIBOR USD 1 Month + 3.00%), 5.33%, 5/16/2024 (d) | | | 415 | | | | 414 | |
Verifone Systems, Inc., 1st Lien Term Loan B (ICE LIBOR USD 3 Month + 4.00%), 6.32%, 8/20/2025 (d) | | | 603 | | | | 604 | |
WMG Acquisition Corp., 1st Lien Term Loan F (ICE LIBOR USD 1 Month + 2.13%), 4.20%, 11/1/2023 (d) | | | 1,420 | | | | 1,413 | |
| | | | | | | | |
| | | | | | | 95,055 | |
| | | | | | | | |
Total Loan Assignments
(Cost $106,333) | | | | | | | 105,775 | |
| | | | | | | | |
SEE NOTES TO FINANCIAL STATEMENTS.
| | | | | | |
| | | |
| 38 | | | | J.P. MORGAN INCOME FUNDS | | AUGUST 31, 2018 |
| | | | | | | | |
| INVESTMENTS | | PRINCIPAL AMOUNT (000) | | | VALUE
(000) | |
Convertible Bonds — 3.1% | | | | | | | | |
China — 0.3% | | | | | | | | |
Ctrip.com International Ltd. 1.00%, 7/1/2020 | | | 4,645 | | | | 4,545 | |
Huazhu Group Ltd. 0.38%, 11/1/2022 (a) | | | 4,120 | | | | 4,202 | |
| | | | | | | | |
| | | | | | | 8,747 | |
| | | | | | | | |
Netherlands — 0.1% | | | | | | | | |
NXP Semiconductors NV 1.00%, 12/1/2019 | | | 1,565 | | | | 1,688 | |
| | | | | | | | |
United Arab Emirates — 0.0% (g) | | | | | | | | |
Aabar Investments PJSC 0.50%, 3/27/2020 (b) | | | EUR 800 | | | | 866 | |
| | | | | | | | |
United States — 2.7% | | | | | | | | |
Cree, Inc. 0.88%, 9/1/2023 (a) | | | 1,495 | | | | 1,535 | |
Cypress Semiconductor Corp. | | | | | | | | |
4.50%, 1/15/2022 | | | 3,590 | | | | 5,031 | |
2.00%, 2/1/2023 (a) | | | 265 | | | | 283 | |
DISH Network Corp. 3.38%, 8/15/2026 | | | 1,260 | | | | 1,185 | |
Envestnet, Inc. 1.75%, 12/15/2019 | | | 2,165 | | | | 2,441 | |
Etsy, Inc. Zero Coupon, 3/1/2023 (a) | | | 4,145 | | | | 6,047 | |
Finisar Corp. 0.50%, 12/15/2036 | | | 3,640 | | | | 3,354 | |
FireEye, Inc. 0.88%, 6/1/2024 (a) | | | 1,980 | | | | 1,935 | |
Horizon Global Corp. 2.75%, 7/1/2022 | | | 1,410 | | | | 1,021 | |
II-VI, Inc. 0.25%, 9/1/2022 (a) | | | 5,345 | | | | 6,467 | |
Knowles Corp. 3.25%, 11/1/2021 | | | 3,630 | | | | 4,325 | |
Liberty Expedia Holdings, Inc. 1.00%, 6/30/2047 (a) | | | 3,595 | | | | 3,606 | |
Live Nation Entertainment, Inc. 2.50%, 3/15/2023 (a) | | | 5,665 | | | | 5,867 | |
Nabors Industries, Inc. 0.75%, 1/15/2024 | | | 2,590 | | | | 2,039 | |
Nuance Communications, Inc. 1.50%, 11/1/2035 | | | 4,730 | | | | 4,688 | |
Nutanix, Inc. Zero Coupon, 1/15/2023 (a) | | | 3,420 | | | | 4,487 | |
Oasis Petroleum, Inc. 2.63%, 9/15/2023 | | | 3,385 | | | | 4,450 | |
ON Semiconductor Corp. 1.00%, 12/1/2020 | | | 3,410 | | | | 4,331 | |
Redfin Corp. 1.75%, 7/15/2023 | | | 1,820 | | | | 1,686 | |
SM Energy Co. 1.50%, 7/1/2021 | | | 3,880 | | | | 4,126 | |
Teradyne, Inc. 1.25%, 12/15/2023 | | | 4,055 | | | | 5,680 | |
Vocera Communications, Inc. 1.50%, 5/15/2023 (a) | | | 1,585 | | | | 1,859 | |
Zillow Group, Inc. 2.00%, 12/1/2021 | | | 4,075 | | | | 4,590 | |
| | | | | | | | |
| | | | | | | 81,033 | |
| | | | | | | | |
Total Convertible Bonds
(Cost $85,744) | | | | | | | 92,334 | |
| | | | | | | | |
| | | | | | | | |
| INVESTMENTS | | PRINCIPAL AMOUNT (000) | | | VALUE
(000) | |
Private Placements — 0.5% | | | | | | | | |
United States — 0.5% | | | | | | | | |
333-345 S.B Street | | | | | | | | |
6.08%, 11/1/2019 ‡
(Cost $15,000) | | | 15,000 | | | | 15,000 | |
| | | | | | | | |
| | |
| | | SHARES
(000) | | | | |
Common Stocks — 0.0% (g) | | | | | | | | |
New Zealand — 0.0% (g) | | | | | | | | |
UCI Holdings LLC * ‡ | | | 4 | | | | 72 | |
| | | | | | | | |
United States — 0.0% (g) | | | | | | | | |
Avaya Holdings Corp. * | | | 33 | | | | 782 | |
Caesars Entertainment Corp. * | | | 5 | | | | 50 | |
Goodman Private * ‡ | | | 1 | | | | — | |
NII Holdings, Inc. * | | | 3 | | | | 15 | |
Penn Virginia Corp. * | | | 1 | | | | 127 | |
Penn Virginia Corp. * | | | 1 | | | | 67 | |
Remington Outdoor Co., Inc. * ‡ | | | 5 | | | | 42 | |
VICI Properties, Inc., REIT ‡ | | | 7 | | | | 139 | |
VICI Properties, Inc., REIT * ‡ | | | 2 | | | | 37 | |
Vistra Energy Corp. * | | | 6 | | | | 146 | |
| | | | | | | | |
| | | | | | | 1,405 | |
| | | | | | | | |
Total Common Stocks
(Cost $1,054) | | | | | | | 1,477 | |
| | | | | | | | |
Preferred Stocks — 0.0% (g) | | | | | | | | |
Bermuda — 0.0% (g) | | | | | | | | |
XLIT Ltd., Series D, (ICE LIBOR USD 3 Month + 3.12%), 5.46%, 4/5/2018 ($1,000 par value)* (c) (d) (n) | | | — | (j) | | | 60 | |
| | | | | | | | |
United States — 0.0% (g) | | | | | | | | |
Goodman Private Preferred Shares * ‡ | | | 1 | | | | 1 | |
| | | | | | | | |
Total Preferred Stocks
(Cost $52) | | | | | | | 61 | |
| | | | | | | | |
| | |
| | | NO. OF RIGHTS
(000) | | | | |
Rights — 0.0% (g) | | | | | | | | |
United States — 0.0% (g) | | | | | | | | |
Vistra Energy Corp.,
expiring 12/31/2049 * ‡
(Cost $—) | | | 6 | | | | 4 | |
| | | | | | | | |
| | |
| | | SHARES
(000) | | | | |
Short-Term Investments — 5.4% | | | | | | | | |
Investment Companies — 5.4% | | | | | | | | |
JPMorgan Prime Money Market Fund Class Institutional Shares, 2.04% (o) (p)
(Cost $162,777) | | | 162,769 | | | | 162,818 | |
| | | | | | | | |
Total Investments — 98.3%
(Cost $3,032,031) | | | | | | | 2,965,064 | |
Other Assets Less Liabilities — 1.7% | | | | | | | 52,414 | |
| | | | | | | | |
NET ASSETS — 100.0% | | | | | | | 3,017,478 | |
| | | | | | | | |
Percentages indicated are based on net assets.
SEE NOTES TO FINANCIAL STATEMENTS.
| | | | | | | | |
| | | |
| AUGUST 31, 2018 | | J.P. MORGAN INCOME FUNDS | | | | | 39 | |
JPMorgan Global Bond Opportunities Fund
SCHEDULE OF PORTFOLIO INVESTMENTS
AS OF AUGUST 31, 2018 (continued)
| | | | | | | | | | | | | | | | | | | | |
| Futures contracts outstanding as of August 31, 2018 (amounts in thousands, except number of contracts): | |
| DESCRIPTION | | NUMBER OF
CONTRACTS | | | EXPIRATION
DATE | | | TRADING
CURRENCY | | | NOTIONAL
AMOUNT ($) | | | VALUE AND
UNREALIZED
APPRECIATION
(DEPRECIATION) ($) | |
Long Contracts | |
| Euro-BTP | | | 272 | | | | 12/2018 | | | | EUR | | | | 38,133 | | | | (39 | ) |
| Euro-Buxl | | | 49 | | | | 12/2018 | | | | EUR | | | | 10,086 | | | | 38 | |
| U.S. Treasury 10 Year Note | | | 253 | | | | 12/2018 | | | | USD | | | | 30,400 | | | | (82 | ) |
| U.S. Treasury 2 Year Note | | | 40 | | | | 12/2018 | | | | USD | | | | 8,454 | | | | (4 | ) |
| U.S. Treasury 5 Year Note | | | 841 | | | | 12/2018 | | | | USD | | | | 95,329 | | | | (146 | ) |
| U.S. Treasury Long Bond | | | 186 | | | | 12/2018 | | | | USD | | | | 26,784 | | | | (76 | ) |
| U.S. Treasury Ultra Bond | | | 195 | | | | 12/2018 | | | | USD | | | | 30,981 | | | | (273 | ) |
| | | | | | | | | | | | | | | | | | | | |
| | | | | | | | | | | | | | | | | | | (582 | ) |
| | | | | | | | | | | | | | | | | | | | |
Short Contracts | | | | | | | | | |
| Australia 10 Year Bond | | | (1,007 | ) | | | 09/2018 | | | | AUD | | | | (94,540 | ) | | | (977 | ) |
| Euro-Bobl | | | (1,886 | ) | | | 12/2018 | | | | EUR | | | | (288,117 | ) | | | (221 | ) |
| Euro-Bund | | | (596 | ) | | | 12/2018 | | | | EUR | | | | (111,229 | ) | | | (312 | ) |
| Euro-OAT | | | (273 | ) | | | 12/2018 | | | | EUR | | | | (48,341 | ) | | | (146 | ) |
| Euro-Schatz | | | (1,401 | ) | | | 12/2018 | | | | EUR | | | | (182,062 | ) | | | (26 | ) |
| U.S. Treasury 10 Year Ultra Note | | | (1,561 | ) | | | 12/2018 | | | | USD | | | | (199,686 | ) | | | 704 | |
| U.S. Treasury Ultra Bond | | | (92 | ) | | | 12/2018 | | | | USD | | | | (14,617 | ) | | | 100 | |
| 3 Month Eurodollar | | | (2,532 | ) | | | 12/2019 | | | | USD | | | | (614,295 | ) | | | 3,566 | |
| | | | | | | | | | | | | | | | | | | | |
| | | | | | | | | | | | | | | | | | | 2,688 | |
| | | | | | | | | | | | | | | | | | | | |
| | | | | | | | | | | | | | | | | | | 2,106 | |
| | | | | | | | | | | | | | | | | | | | |
| | | | | | | | | | | | | | | | | | |
| Forward foreign currency exchange contracts outstanding as of August 31, 2018 (amounts in thousands): | |
CURRENCY
PURCHASED | | | CURRENCY SOLD | | | COUNTERPARTY | | SETTLEMENT
DATE | | UNREALIZED
APPRECIATION
(DEPRECIATION) ($) | |
| EUR | | | 6,598 | | | USD | | | 7,583 | | | Barclays Bank plc | | 9/5/2018 | | | 75 | |
| EUR | | | 178,585 | | | USD | | | 206,821 | | | BNP Paribas | | 9/5/2018 | | | 471 | |
| EUR | | | 4,251 | | | USD | | | 4,847 | | | Goldman Sachs International | | 9/5/2018 | | | 87 | |
| EUR | | | 1,169 | | | USD | | | 1,333 | | | National Australia Bank Ltd. | | 9/5/2018 | | | 24 | |
| GBP | | | 837 | | | USD | | | 1,067 | | | Citibank, NA | | 9/5/2018 | | | 18 | |
| USD | | | 5,498 | | | ARS | | | 158,224 | | | Citibank, NA ** | | 9/5/2018 | | | 1,210 | |
| USD | | | 45,130 | | | AUD | | | 60,769 | | | Standard Chartered Bank | | 9/5/2018 | | | 1,443 | |
| USD | | | 9,517 | | | EUR | | | 8,123 | | | Australia & New Zealand Banking Group Ltd. | | 9/5/2018 | | | 89 | |
| USD | | | 1,621 | | | EUR | | | 1,382 | | | Barclays Bank plc | | 9/5/2018 | | | 17 | |
| USD | | | 390,048 | | | EUR | | | 331,890 | | | Citibank, NA | | 9/5/2018 | | | 4,806 | |
| USD | | | 331,398 | | | EUR | | | 281,965 | | | HSBC Bank, NA | | 9/5/2018 | | | 4,108 | |
| USD | | | 723 | | | EUR | | | 623 | | | National Australia Bank Ltd. | | 9/5/2018 | | | — | (j) |
| USD | | | 760 | | | EUR | | | 654 | | | Royal Bank of Canada | | 9/5/2018 | | | — | (j) |
| USD | | | 21,448 | | | GBP | | | 16,279 | | | Barclays Bank plc | | 9/5/2018 | | | 343 | |
| USD | | | 695 | | | GBP | | | 529 | | | Deutsche Bank AG | | 9/5/2018 | | | 9 | |
| USD | | | 3,010 | | | HUF | | | 832,385 | | | Merrill Lynch International | | 9/5/2018 | | | 52 | |
| USD | | | 70,028 | | | IDR | | | 1,015,756,959 | | | Goldman Sachs International ** | | 9/5/2018 | | | 1,070 | |
| USD | | | 67,210 | | | IDR | | | 980,039,944 | | | Standard Chartered Bank ** | | 9/5/2018 | | | 677 | |
SEE NOTES TO FINANCIAL STATEMENTS.
| | | | | | |
| | | |
| 40 | | | | J.P. MORGAN INCOME FUNDS | | AUGUST 31, 2018 |
| | | | | | | | | | | | | | | | | | | | |
CURRENCY
PURCHASED | | | CURRENCY SOLD | | | COUNTERPARTY | | SETTLEMENT
DATE | | | UNREALIZED
APPRECIATION
(DEPRECIATION) ($) | |
| USD | | | 43,156 | | | ZAR | | | 571,660 | | | Barclays Bank plc | | | 9/5/2018 | | | | 4,254 | |
| EUR | | | 652 | | | USD | | | 757 | | | Australia & New Zealand Banking Group Ltd. | | | 10/3/2018 | | | | 1 | |
| EUR | | | 3,090 | | | USD | | | 3,594 | | | TD Bank Financial Group | | | 10/3/2018 | | | | 1 | |
| USD | | | 5,041 | | | ARS | | | 158,224 | | | Goldman Sachs International ** | | | 10/3/2018 | | | | 889 | |
| USD | | | 44,295 | | | AUD | | | 60,769 | | | Goldman Sachs International | | | 10/3/2018 | | | | 609 | |
| USD | | | 181,878 | | | EUR | | | 155,293 | | | Goldman Sachs International | | | 10/3/2018 | | | | 1,247 | |
| USD | | | 203,464 | | | EUR | | | 173,530 | | | HSBC Bank, NA | | | 10/3/2018 | | | | 1,622 | |
| USD | | | 11,714 | | | EUR | | | 10,000 | | | National Australia Bank Ltd. | | | 10/3/2018 | | | | 82 | |
| USD | | | 892 | | | EUR | | | 763 | | | Royal Bank of Canada | | | 10/3/2018 | | | | 5 | |
| USD | | | 121,308 | | | EUR | | | 103,529 | | | Standard Chartered Bank | | | 10/3/2018 | | | | 888 | |
| USD | | | 20,037 | | | GBP | | | 15,385 | | | Barclays Bank plc | | | 10/3/2018 | | | | 70 | |
| USD | | | 2,979 | | | HUF | | | 832,385 | | | HSBC Bank, NA | | | 10/3/2018 | | | | 16 | |
| USD | | | 66,672 | | | IDR | | | 980,039,944 | | | Standard Chartered Bank ** | | | 10/3/2018 | | | | 1,610 | |
| USD | | | 39,863 | | | ZAR | | | 571,660 | | | Barclays Bank plc | | | 10/3/2018 | | | | 1,111 | |
| | | | | | | | | | | | | | | | | | | | |
| Total unrealized appreciation | | | | | | | 26,904 | |
| | | | | | | | |
| ARS | | | 158,224 | | | USD | | | 5,205 | | | Goldman Sachs International ** | | | 9/5/2018 | | | | (917 | ) |
| AUD | | | 60,769 | | | USD | | | 44,291 | | | Goldman Sachs International | | | 9/5/2018 | | | | (604 | ) |
| EUR | | | 3,557 | | | USD | | | 4,157 | | | Australia & New Zealand Banking Group Ltd. | | | 9/5/2018 | | | | (28 | ) |
| EUR | | | 155,293 | | | USD | | | 181,500 | | | Goldman Sachs International | | | 9/5/2018 | | | | (1,244 | ) |
| EUR | | | 173,530 | | | USD | | | 203,042 | | | HSBC Bank, NA | | | 9/5/2018 | | | | (1,618 | ) |
| EUR | | | 2,870 | | | USD | | | 3,354 | | | National Australia Bank Ltd. | | | 9/5/2018 | | | | (23 | ) |
| EUR | | | 103,529 | | | USD | | | 121,056 | | | Standard Chartered Bank | | | 9/5/2018 | | | | (885 | ) |
| GBP | | | 586 | | | USD | | | 769 | | | Australia & New Zealand Banking Group Ltd. | | | 9/5/2018 | | | | (10 | ) |
| GBP | | | 15,385 | | | USD | | | 20,014 | | | Barclays Bank plc | | | 9/5/2018 | | | | (70 | ) |
| HUF | | | 832,385 | | | USD | | | 2,972 | | | HSBC Bank, NA | | | 9/5/2018 | | | | (14 | ) |
| IDR | | | 1,995,796,902 | | | USD | | | 137,286 | | | Standard Chartered Bank ** | | | 9/5/2018 | | | | (1,794 | ) |
| USD | | | 5,485 | | | EUR | | | 4,745 | | | Barclays Bank plc | | | 9/5/2018 | | | | (22 | ) |
| ZAR | | | 571,660 | | | USD | | | 40,011 | | | Barclays Bank plc | | | 9/5/2018 | | | | (1,110 | ) |
| USD | | | 207,252 | | | EUR | | | 178,585 | | | BNP Paribas | | | 10/3/2018 | | | | (470 | ) |
| ZAR | | | 25,095 | | | USD | | | 1,738 | | | Royal Bank of Canada | | | 10/3/2018 | | | | (37 | ) |
| | | | | | | | | | | | | | | | | | | | |
| Total unrealized depreciation | | | | | | | (8,846 | ) |
| | | | | | | | |
| Net unrealized appreciation | | | | | | | 18,058 | |
| | | | | | | | |
| | | | | | | | | | | | | | | | | | | | | | | | | | | | | | |
| Centrally Cleared Credit default swap contracts outstanding — buy protection(1) as of August 31, 2018 (amounts in thousands): | |
| REFERENCE OBLIGATION/INDEX | | FINANCING RATE
PAID BY THE FUND (%) | | PAYMENT
FREQUENCY | | | MATURITY
DATE | | | IMPLIED
CREDIT
SPREAD
(%)(2) | | | NOTIONAL
AMOUNT(3) | | | UPFRONT
PAYMENTS
(RECEIPTS)
($)(4) | | | UNREALIZED
APPRECIATION
(DEPRECIATION)
($) | | | VALUE
($) | |
CDX.NA.HY.30-V1 | | 5.00 | | | Quarterly | | | | 6/20/2023 | | | | 3.31 | | | | USD 8,500 | | | | (568 | ) | | | (105 | ) | | | (673 | ) |
| | | | | | | | | | | | | | | | | | | | | | | | | | | | | | |
| | | | | | | | | | | | | | | | | | | | | (568 | ) | | | (105 | ) | | | (673 | ) |
| | | | | | | | | | | | | | | | | | | | | | | | | | | | | | |
| (1) | The Fund, as a buyer of credit protection, is generally obligated to make periodic payments and may also pay or receive an upfront premium to or from the protection seller, in exchange for the right to receive a contingent payment, upon occurrence of a credit event with respect to an underlying reference obligation, as defined under the terms of individual swap contracts. |
| (2) | Implied credit spreads are an indication of the seller’s performance risk, related to the likelihood of a credit event occurring that would require a seller to make payment to a buyer. Implied credit spreads are used to determine the value of swap contracts and reflect the cost of buying/selling protection, which may include upfront payments made to enter into the contract. Therefore, higher spreads would indicate a greater likelihood that a seller will be obligated to perform (i.e. |
SEE NOTES TO FINANCIAL STATEMENTS.
| | | | | | | | |
| | | |
| AUGUST 31, 2018 | | J.P. MORGAN INCOME FUNDS | | | | | 41 | |
JPMorgan Global Bond Opportunities Fund
SCHEDULE OF PORTFOLIO INVESTMENTS
AS OF AUGUST 31, 2018 (continued)
| | make payment) under the swap contract. Increasing values, in absolute terms and relative to notional amounts, are also indicative of greater performance risk. Implied credit spreads for credit default swaps on credit indexes are linked to the weighted average spread across the underlying reference obligations included in a particular index. |
| (3) | The notional amount is the maximum amount that a seller of credit protection would be obligated to pay and a buyer of credit protection would receive, upon occurrence of a credit event. |
| (4) | Upfront payments and receipts generally represent premiums paid or received at the initiation of the agreement to compensate the differences between the stated terms of the swap agreement and current market conditions (credit spreads, interest rates and other relevant factors). |
| | |
| Abbreviations |
| ABS | | Asset-backed securities |
| ACES | | Alternative Credit Enhancement Securities |
| ARS | | Argentine Peso |
| AUD | | Australian Dollar |
| CDX | | Credit Default Swap Index |
| CIFC | | Commercial Industrial Finance Corp. |
| CLO | | Collateralized Loan Obligations |
| CMBS | | Commercial Mortgage-Backed Security |
| DIP | | Debtor-in-Possession |
| EUR | | Euro |
| EURIBOR | | Euro Interbank Offered Rate |
| FHLMC | | Federal Home Loan Mortgage Corp. |
| FNMA | | Federal National Mortgage Association |
| GBP | | British Pound |
| GNMA | | Government National Mortgage Association |
| HUF | | Hungarian Forint |
| ICE | | Intercontinental Exchange |
| IDR | | Indonesian Rupiah |
| IF | | Inverse Floaters represent securities that pay interest at a rate that increases (decreases) with a decline (incline) in a specified index. The interest rate shown is the rate in effect as of August 31, 2018. The rate may be subject to a cap and floor. |
| IO | | Interest Only represents the right to receive the monthly interest payments on an underlying pool of mortgage loans. The principal amount shown represents the par value on the underlying pool. The yields on these securities are subject to accelerated principal paydowns as a result of prepayment or refinancing of the underlying pool of mortgage instruments. As a result, interest income may be reduced considerably. |
| LIBOR | | London Interbank Offered Rate |
| MXN | | Mexican Peso |
| OYJ | | Public Limited Company |
| PJSC | | Public Joint Stock Company |
| PO | | Principal Only represents the right to receive the principal portion only on an underlying pool of mortgage loans. The market value of these securities is extremely volatile in response to changes in market interest rates. As prepayments on the underlying mortgages of these securities increase, the yield on these securities increases. |
| REIT | | Real Estate Investment Trust |
| REMIC | | Real Estate Mortgage Investment Conduit |
| Re-REMIC | | Combined Real Estate Mortgage Investment Conduit |
| SCA | | Limited partnership with share capital |
| STRIPS | | Separate Trading of Registered Interest and Principal of Securities. The STRIPS Program lets investors hold and trade individual interest and principal components of eligible notes and bonds as separate securities. |
| USD | | United States Dollar |
| ZAR | | South African Rand |
| | |
| (a) | | Securities exempt from registration under Rule 144A or section 4(a)(2), of the Securities Act of 1933, as amended. Under procedures approved by the Board of Trustees, such securities have been determined to be liquid by the investment adviser and may be resold, normally to qualified institutional buyers in transactions exempt from registration. |
| (b) | | Security exempt from registration pursuant to Regulation S under the Securities Act of 1933, as amended. Regulation S applies to securities offerings that are made outside of the United States and do not involve direct selling efforts in the United States and as such may have restrictions on resale. |
| (c) | | Security is perpetual and thus, does not have a predetermined maturity date. The coupon rate for this security is fixed for a period of time and may be structured to adjust thereafter. The date shown, if applicable, reflects the next call date. The coupon rate shown is the rate in effect as of August 31, 2018. |
| (d) | | Variable or floating rate security, linked to the referenced benchmark. The interest rate shown is the current rate as of August 31, 2018. |
| (e) | | Security is an interest bearing note with preferred security characteristics. |
| (f) | | Defaulted security. |
| (g) | | Amount rounds to less than 0.1% of net assets. |
| (h) | | Step bond. Interest rate is a fixed rate for an initial period that either resets at a specific date or may reset in the future contingent upon a predetermined trigger. The interest rate shown is the current rate as of August 31, 2018. |
| (i) | | Security has the ability to pay in kind (“PIK”) or pay income in cash. When applicable, separate rates of such payments are disclosed. |
| (j) | | Amount rounds to less than one thousand. |
| (k) | | Variable or floating rate security, the interest rate of which adjusts periodically based on changes in current interest rates and prepayments on the underlying pool of assets. The interest rate shown is the current rate as of August 31, 2018. |
| (l) | | Loan assignments are presented by obligor. Each series or loan tranche underlying each obligor may have varying terms. |
| (m) | | All or a portion of this security is unsettled as of August 31, 2018. Unless otherwise indicated, the coupon rate is undetermined. The coupon rate shown may not be accrued for the entire position. |
| (n) | | The date shown reflects the next call date on which the issuer may redeem the security at par value. The coupon rate for this security is based on par value and is in effect as of August 31, 2018. |
| (o) | | Investment in affiliate. Fund is registered under the Investment Company Act of 1940, as amended, and advised by J.P. Morgan Investment Management Inc. |
| (p) | | The rate shown is the current yield as of August 31, 2018. |
| * | | Non-income producing security. |
| ** | | Non-deliverable forward. |
| ‡ | | Value determined using significant unobservable inputs. |
SEE NOTES TO FINANCIAL STATEMENTS.
| | | | | | |
| | | |
| 42 | | | | J.P. MORGAN INCOME FUNDS | | AUGUST 31, 2018 |
THIS PAGE IS INTENTIONALLY LEFT BLANK
| | | | | | | | |
| | | |
| AUGUST 31, 2018 | | J.P. MORGAN INCOME FUNDS | | | | | 43 | |
STATEMENT OF ASSETS AND LIABILITIES
AS OF AUGUST 31, 2018
(Amounts in thousands, except per share amounts)
| | | | |
| | | JPMorgan
Global Bond
Opportunities
Fund | |
ASSETS: | | | | |
Investments in non-affiliates, at value | | $ | 2,802,246 | |
Investments in affiliates, at value | | | 162,818 | |
Deposits at broker for OTC derivatives | | | 630 | |
Cash | | | 3,656 | |
Foreign currency, at value | | | 7,945 | |
Deposits at broker for futures contracts | | | 11,854 | |
Deposits at broker for centrally cleared swaps | | | 234 | |
Receivables: | | | | |
Investment securities sold | | | 9,939 | |
Fund shares sold | | | 4,695 | |
Interest and dividends from non-affiliates | | | 32,632 | |
Dividends from affiliates | | | 280 | |
Tax reclaims | | | 128 | |
Variation margin on centrally cleared swaps (net upfront receipts of $568) | | | 11 | |
Unrealized appreciation on forward foreign currency exchange contracts | | | 26,904 | |
Other assets | | | 149 | |
| | | | |
Total Assets | | | 3,064,121 | |
| | | | |
| |
LIABILITIES: | | | | |
Payables: | | | | |
Investment securities purchased | | | 28,339 | |
Fund shares redeemed | | | 5,228 | |
Variation margin on futures contracts | | | 2,429 | |
Unrealized depreciation on forward foreign currency exchange contracts | | | 8,846 | |
Unrealized depreciation on unfunded commitments | | | 3 | |
Accrued liabilities: | | | | |
Investment advisory fees | | | 924 | |
Distribution fees | | | 99 | |
Service fees | | | 321 | |
Custodian and accounting fees | | | 137 | |
Collateral management fees | | | 10 | |
Trustees’ and Chief Compliance Officer’s fees | | | — | (a) |
Other | | | 307 | |
| | | | |
Total Liabilities | | | 46,643 | |
| | | | |
Net Assets | | $ | 3,017,478 | |
| | | | |
| (a) | Amount rounds to less than one thousand. |
SEE NOTES TO FINANCIAL STATEMENTS.
| | | | | | |
| | | |
| 44 | | | | J.P. MORGAN INCOME FUNDS | | AUGUST 31, 2018 |
| | | | |
| | | JPMorgan
Global Bond
Opportunities
Fund | |
NET ASSETS: | | | | |
Paid-in-Capital | | $ | 3,111,940 | |
Accumulated undistributed (distributions in excess of) net investment income | | | (7,703 | ) |
Accumulated net realized gains (losses) | | | (39,525 | ) |
Net unrealized appreciation (depreciation) | | | (47,234 | ) |
| | | | |
Total Net Assets | | $ | 3,017,478 | |
| | | | |
| |
Net Assets: | | | | |
Class A | | $ | 216,740 | |
Class C | | | 81,916 | |
Class I | | | 2,245,011 | |
Class R6 | | | 473,811 | |
| | | | |
Total | | $ | 3,017,478 | |
| | | | |
| |
Outstanding units of beneficial interest (shares) | | | | |
($0.0001 par value; unlimited number of shares authorized): | | | | |
Class A | | | 21,758 | |
Class C | | | 8,252 | |
Class I | | | 224,912 | |
Class R6 | | | 47,446 | |
| |
Net Asset Value (a): | | | | |
Class A — Redemption price per share | | $ | 9.96 | |
Class C — Offering price per share (b) | | | 9.93 | |
Class I — Offering and redemption price per share | | | 9.98 | |
Class R6 — Offering and redemption price per share | | | 9.99 | |
Class A maximum sales charge | | | 3.75 | % |
Class A maximum public offering price per share
[net asset value per share/(100% — maximum sales charge)] | | $ | 10.35 | |
| | | | |
| |
Cost of investments in non-affiliates | | $ | 2,869,254 | |
Cost of investments in affiliates | | | 162,777 | |
Cost of foreign currency | | | 8,048 | |
| (a) | Per share amounts may not recalculate due to rounding of net assets and/or shares outstanding. |
| (b) | Redemption price for Class C Shares varies based upon length of time the shares are held. |
SEE NOTES TO FINANCIAL STATEMENTS.
| | | | | | | | |
| | | |
| AUGUST 31, 2018 | | J.P. MORGAN INCOME FUNDS | | | | | 45 | |
STATEMENT OF OPERATIONS
FOR THE YEAR ENDED AUGUST 31, 2018
(Amounts in thousands)
| | | | |
| | | JPMorgan
Global Bond
Opportunities
Fund | |
INVESTMENT INCOME: | | | | |
Interest income from non-affiliates | | $ | 131,011 | |
Interest income from affiliates | | | 18 | |
Dividend income from non-affiliates | | | 10 | |
Dividend income from affiliates | | | 1,526 | |
Foreign taxes withheld | | | (793 | ) |
| | | | |
Total investment income | | | 131,772 | |
| | | | |
| |
EXPENSES: | | | | |
Investment advisory fees | | | 15,614 | |
Administration fees | | | 2,304 | |
Distribution fees: | | | | |
Class A | | | 555 | |
Class C | | | 601 | |
Service fees: | | | | |
Class A | | | 555 | |
Class C | | | 200 | |
Class I | | | 5,094 | |
Custodian and accounting fees | | | 544 | |
Interest expense to affiliates | | | 24 | |
Professional fees | | | 140 | |
Collateral management fees | | | 41 | |
Trustees’ and Chief Compliance Officer’s fees | | | 35 | |
Printing and mailing costs | | | 198 | |
Registration and filing fees | | | 303 | |
Transfer agency fees (See Note 2.J.) | | | 70 | |
Other | | | 64 | |
| | | | |
Total expenses | | | 26,342 | |
| | | | |
Less fees waived | | | (7,747 | ) |
Less earnings credits | | | (1 | ) |
| | | | |
Net expenses | | | 18,594 | |
| | | | |
Net investment income (loss) | | | 113,178 | |
| | | | |
| |
REALIZED/UNREALIZED GAINS (LOSSES): | | | | |
Net realized gain (loss) on transactions from: | | | | |
Investments in non-affiliates | | | (10,395 | )(a) |
Investments in affiliates | | | (32 | ) |
Futures contracts | | | 3,638 | |
Foreign currency transactions | | | (1,854 | ) |
Forward foreign currency exchange contracts | | | 24,274 | |
Swaps | | | 17 | |
| | | | |
Net realized gain (loss) | | | 15,648 | |
| | | | |
Change in net unrealized appreciation/depreciation on: | | | | |
Investments in non-affiliates | | | (139,990 | )(b) |
Investments in affiliates | | | 40 | |
Futures contracts | | | 6,364 | |
Foreign currency translations | | | (715 | ) |
Forward foreign currency exchange contracts | | | 20,987 | |
Swaps | | | (105 | ) |
Unfunded commitments | | | (3 | ) |
| | | | |
Change in net unrealized appreciation/depreciation | | | (113,422 | ) |
| | | | |
Net realized/unrealized gains (losses) | | | (97,774 | ) |
| | | | |
Change in net assets resulting from operations | | $ | 15,404 | |
| | | | |
| (a) | Net of foreign capital gains tax of approximately $(208,000). |
| (b) | Net of change in foreign capital gains tax of approximately $313,000. |
SEE NOTES TO FINANCIAL STATEMENTS.
| | | | | | |
| | | |
| 46 | | | | J.P. MORGAN INCOME FUNDS | | AUGUST 31, 2018 |
STATEMENTS OF CHANGES IN NET ASSETS
FOR THE PERIODS INDICATED
(Amounts in thousands)
| | | | | | | | |
| | | JPMorgan Global Bond
Opportunities Fund | |
| | | Year Ended
August 31, 2018 | | | Year Ended
August 31, 2017 | |
CHANGE IN NET ASSETS RESULTING FROM OPERATIONS: | | | | | | | | |
Net investment income (loss) | | $ | 113,178 | | | $ | 69,258 | |
Net realized gain (loss) | | | 15,648 | | | | (44,881 | ) |
Change in net unrealized appreciation/depreciation | | | (113,422 | ) | | | 56,324 | |
| | | | | | | | |
Change in net assets resulting from operations | | | 15,404 | | | | 80,701 | |
| | | | | | | | |
| | |
DISTRIBUTIONS TO SHAREHOLDERS: | | | | | | | | |
Class A | | | | | | | | |
From net investment income | | | (6,946 | ) | | | (7,067 | ) |
Class C | | | | | | | | |
From net investment income | | | (2,209 | ) | | | (2,455 | ) |
Class I | | | | | | | | |
From net investment income | | | (70,366 | ) | | | (62,192 | ) |
Class R6 | | | | | | | | |
From net investment income | | | (17,145 | ) | | | (8,264 | ) |
| | | | | | | | |
Total distributions to shareholders | | | (96,666 | ) | | | (79,978 | ) |
| | | | | | | | |
| | |
CAPITAL TRANSACTIONS: | | | | | | | | |
Change in net assets resulting from capital transactions | | | 804,902 | | | | 892,443 | |
| | | | | | | | |
| | |
NET ASSETS: | | | | | | | | |
Change in net assets | | | 723,640 | | | | 893,166 | |
Beginning of period | | | 2,293,838 | | | | 1,400,672 | |
| | | | | | | | |
End of period | | $ | 3,017,478 | | | $ | 2,293,838 | |
| | | | | | | | |
Accumulated undistributed (distributions in excess of) net investment income | | $ | (7,703 | ) | | $ | (44,125 | ) |
| | | | | | | | |
| | |
CAPITAL TRANSACTIONS: | | | | | | | | |
Class A | | | | | | | | |
Proceeds from shares issued | | $ | 114,377 | | | $ | 153,426 | |
Distributions reinvested | | | 6,824 | | | | 6,865 | |
Cost of shares redeemed | | | (88,875 | ) | | | (95,125 | ) |
| | | | | | | | |
Change in net assets resulting from Class A capital transactions | | $ | 32,326 | | | $ | 65,166 | |
| | | | | | | | |
Class C | | | | | | | | |
Proceeds from shares issued | | $ | 34,282 | | | $ | 33,806 | |
Distributions reinvested | | | 2,104 | | | | 2,298 | |
Cost of shares redeemed | | | (23,081 | ) | | | (14,446 | ) |
| | | | | | | | |
Change in net assets resulting from Class C capital transactions | | $ | 13,305 | | | $ | 21,658 | |
| | | | | | | | |
Class I | | | | | | | | |
Proceeds from shares issued | | $ | 1,369,939 | | | $ | 1,121,913 | |
Distributions reinvested | | | 63,453 | | | | 28,367 | |
Cost of shares redeemed | | | (688,064 | ) | | | (660,897 | ) |
| | | | | | | | |
Change in net assets resulting from Class I capital transactions | | $ | 745,328 | | | $ | 489,383 | |
| | | | | | | | |
Class R6 | | | | | | | | |
Proceeds from shares issued | | $ | 283,898 | | | $ | 367,559 | |
Distributions reinvested | | | 15,329 | | | | 2,704 | |
Cost of shares redeemed | | | (285,284 | ) | | | (54,027 | ) |
| | | | | | | | |
Change in net assets resulting from Class R6 capital transactions | | $ | 13,943 | | | $ | 316,236 | |
| | | | | | | | |
Total change in net assets resulting from capital transactions | | $ | 804,902 | | | $ | 892,443 | |
| | | | | | | | |
SEE NOTES TO FINANCIAL STATEMENTS.
| | | | | | | | |
| | | |
| AUGUST 31, 2018 | | J.P. MORGAN INCOME FUNDS | | | | | 47 | |
STATEMENTS OF CHANGES IN NET ASSETS
FOR THE PERIODS INDICATED (continued)
(Amounts in thousands)
| | | | | | | | |
| | | JPMorgan Global Bond
Opportunities Fund | |
| | | Year Ended
August 31, 2018 | | | Year Ended
August 31, 2017 | |
SHARE TRANSACTIONS: | | | | | | | | |
Class A | | | | | | | | |
Issued | | | 11,219 | | | | 15,125 | |
Reinvested | | | 674 | | | | 679 | |
Redeemed | | | (8,779 | ) | | | (9,387 | ) |
| | | | | | | | |
Change in Class A Shares | | | 3,114 | | | | 6,417 | |
| | | | | | | | |
Class C | | | | | | | | |
Issued | | | 3,366 | | | | 3,338 | |
Reinvested | | | 208 | | | | 228 | |
Redeemed | | | (2,279 | ) | | | (1,429 | ) |
| | | | | | | | |
Change in Class C Shares | | | 1,295 | | | | 2,137 | |
| | | | | | | | |
Class I | | | | | | | | |
Issued | | | 133,947 | | | | 110,259 | |
Reinvested | | | 6,255 | | | | 2,800 | |
Redeemed | | | (67,733 | ) | | | (64,920 | ) |
| | | | | | | | |
Change in Class I Shares | | | 72,469 | | | | 48,139 | |
| | | | | | | | |
Class R6 | | | | | | | | |
Issued | | | 27,667 | | | | 35,939 | |
Reinvested | | | 1,509 | | | | 267 | |
Redeemed | | | (27,800 | ) | | | (5,297 | ) |
| | | | | | | | |
Change in Class R6 Shares | | | 1,376 | | | | 30,909 | |
| | | | | | | | |
SEE NOTES TO FINANCIAL STATEMENTS.
| | | | | | |
| | | |
| 48 | | | | J.P. MORGAN INCOME FUNDS | | AUGUST 31, 2018 |
THIS PAGE IS INTENTIONALLY LEFT BLANK
| | | | | | | | |
| | | |
| AUGUST 31, 2018 | | J.P. MORGAN INCOME FUNDS | | | | | 49 | |
FINANCIAL HIGHLIGHTS
FOR THE PERIODS INDICATED
| | | | | | | | | | | | | | | | | | | | | | | | | | | | |
| | | Per share operating performance | |
| | | | | | Investment operations | | | Distributions | |
| | | Net asset
value,
beginning
of period | | | Net
investment
income
(loss) (a) | | | Net realized
and unrealized
gains
(losses) on
investments | | | Total from
investment
operations | | | Net
investment
income | | | Net
realized
gain | | | Total
distributions | |
JPMorgan Global Bond Opportunities Fund | | | | | | | | | | | | | | | | | | | | | |
Class A | | | | | | | | | | | | | | | | | | | | | | | | | | | | |
Year Ended August 31, 2018 | | $ | 10.22 | | | $ | 0.38 | | | $ | (0.33 | ) | | $ | 0.05 | | | $ | (0.31 | ) | | $ | — | | | $ | (0.31 | ) |
Year Ended August 31, 2017 | | | 10.24 | | | | 0.39 | | | | 0.05 | | | | 0.44 | | | | (0.46 | ) | | | — | | | | (0.46 | ) |
Year Ended August 31, 2016 | | | 10.01 | | | | 0.38 | | | | 0.34 | | | | 0.72 | | | | (0.49 | ) | | | — | | | | (0.49 | ) |
Year Ended August 31, 2015 | | | 10.60 | | | | 0.40 | | | | (0.53 | ) | | | (0.13 | ) | | | (0.45 | ) | | | (0.01 | ) | | | (0.46 | ) |
Year Ended August 31, 2014 | | | 10.20 | | | | 0.42 | | | | 0.38 | | | | 0.80 | | | | (0.35 | ) | | | (0.05 | ) | | | (0.40 | ) |
| | | | | | | |
Class C | | | | | | | | | | | | | | | | | | | | | | | | | | | | |
Year Ended August 31, 2018 | | | 10.18 | | | | 0.34 | | | | (0.32 | ) | | | 0.02 | | | | (0.27 | ) | | | — | | | | (0.27 | ) |
Year Ended August 31, 2017 | | | 10.21 | | | | 0.35 | | | | 0.04 | | | | 0.39 | | | | (0.42 | ) | | | — | | | | (0.42 | ) |
Year Ended August 31, 2016 | | | 9.99 | | | | 0.34 | | | | 0.33 | | | | 0.67 | | | | (0.45 | ) | | | — | | | | (0.45 | ) |
Year Ended August 31, 2015 | | | 10.59 | | | | 0.35 | | | | (0.51 | ) | | | (0.16 | ) | | | (0.43 | ) | | | (0.01 | ) | | | (0.44 | ) |
Year Ended August 31, 2014 | | | 10.21 | | | | 0.37 | | | | 0.39 | | | | 0.76 | | | | (0.33 | ) | | | (0.05 | ) | | | (0.38 | ) |
| | | | | | | |
Class I | | | | | | | | | | | | | | | | | | | | | | | | | | | | |
Year Ended August 31, 2018 | | | 10.24 | | | | 0.41 | | | | (0.33 | ) | | | 0.08 | | | | (0.34 | ) | | | — | | | | (0.34 | ) |
Year Ended August 31, 2017 | | | 10.26 | | | | 0.42 | | | | 0.05 | | | | 0.47 | | | | (0.49 | ) | | | — | | | | (0.49 | ) |
Year Ended August 31, 2016 | | | 10.03 | | | | 0.40 | | | | 0.35 | | | | 0.75 | | | | (0.52 | ) | | | — | | | | (0.52 | ) |
Year Ended August 31, 2015 | | | 10.61 | | | | 0.42 | | | | (0.52 | ) | | | (0.10 | ) | | | (0.47 | ) | | | (0.01 | ) | | | (0.48 | ) |
Year Ended August 31, 2014 | | | 10.21 | | | | 0.45 | | | | 0.37 | | | | 0.82 | | | | (0.37 | ) | | | (0.05 | ) | | | (0.42 | ) |
| | | | | | | |
Class R6 | | | | | | | | | | | | | | | | | | | | | | | | | | | | |
Year Ended August 31, 2018 | | | 10.24 | | | | 0.43 | | | | (0.33 | ) | | | 0.10 | | | | (0.35 | ) | | | — | | | | (0.35 | ) |
Year Ended August 31, 2017 | | | 10.27 | | | | 0.43 | | | | 0.04 | | | | 0.47 | | | | (0.50 | ) | | | — | | | | (0.50 | ) |
Year Ended August 31, 2016 | | | 10.03 | | | | 0.42 | | | | 0.35 | | | | 0.77 | | | | (0.53 | ) | | | — | | | | (0.53 | ) |
Year Ended August 31, 2015 | | | 10.61 | | | | 0.44 | | | | (0.52 | ) | | | (0.08 | ) | | | (0.49 | ) | | | (0.01 | ) | | | (0.50 | ) |
Year Ended August 31, 2014 | | | 10.21 | | | | 0.48 | | | | 0.36 | | | | 0.84 | | | | (0.39 | ) | | | (0.05 | ) | | | (0.44 | ) |
| (a) | Calculated based upon average shares outstanding. |
| (b) | Includes adjustments in accordance with accounting principles generally accepted in the United States of America and as such, the net asset values for financial reporting purposes and the returns based upon those net asset values may differ from the net asset values and returns for shareholder transactions. |
| (c) | Includes earnings credits and interest expense, if applicable, each of which is less than 0.005% unless otherwise noted. |
| (d) | Commencing on August 31, 2017, the Fund presents portfolio turnover in two ways, one including securities sold short and the other excluding securities sold short. For periods prior to August 31, 2017 as well as for the year ended August 31, 2018, the Fund did not transact in securities sold short. |
| (e) | Certain non-recurring expenses incurred by the Fund were not annualized for the year ended August 31, 2014. |
SEE NOTES TO FINANCIAL STATEMENTS.
| | | | | | |
| | | |
| 50 | | | | J.P. MORGAN INCOME FUNDS | | AUGUST 31, 2018 |
| | | | | | | | | | | | | | | | | | | | | | | | | | | | | | |
| | | Ratios/Supplemental data | |
| | | | | | | | | | Ratios to average net assets | | | | | | | |
Net asset
value,
end of
period | | | Total return
(excludes
sales charge) (b) | | | Net assets,
end of
period
(000’s) | | | Net
expenses (c) | | | Net
investment
income
(loss) | | | Expenses
without waivers,
reimbursements and
earnings credits | | | Portfolio
turnover rate
(excluding
securities
sold short) (d) | | | Portfolio
turnover rate
(including
securities
sold short) (d) | |
| | | | | | | | | | | | | | | | | | | | | | | | | | | | | | |
| | | | | | | | | | | | | | | | | | | | | | | | | | | | | | |
| $ | 9.96 | | | | 0.50 | % | | $ | 216,740 | | | | 0.89 | % | | | 3.76 | % | | | 1.18 | % | | | 74 | % | | | — | % |
| | 10.22 | | | | 4.47 | | | | 190,488 | | | | 0.89 | | | | 3.87 | | | | 1.23 | | | | 61 | | | | 62 | |
| | 10.24 | | | | 7.51 | | | | 125,248 | | | | 0.89 | | | | 3.81 | | | | 1.27 | | | | 71 | | | | — | |
| | 10.01 | | | | (1.26 | ) | | | 64,383 | | | | 0.89 | | | | 3.85 | | | | 1.27 | | | | 90 | | | | — | |
| | 10.60 | | | | 8.01 | | | | 19,131 | | | | 0.89 | (e) | | | 4.01 | (e) | | | 1.49 | (e) | | | 77 | | | | — | |
| | | | | | | |
| | | | | | | | | | | | | | | | | | | | | | | | | | | | | | |
| | 9.93 | | | | 0.20 | | | | 81,916 | | | | 1.29 | | | | 3.35 | | | | 1.68 | | | | 74 | | | | — | |
| | 10.18 | | | | 3.97 | | | | 70,849 | | | | 1.29 | | | | 3.46 | | | | 1.72 | | | | 61 | | | | 62 | |
| | 10.21 | | | | 7.03 | | | | 49,223 | | | | 1.29 | | | | 3.40 | | | | 1.76 | | | | 71 | | | | — | |
| | 9.99 | | | | (1.63 | ) | | | 13,324 | | | | 1.29 | | | | 3.44 | | | | 1.79 | | | | 90 | | | | — | |
| | 10.59 | | | | 7.55 | | | | 4,727 | | | | 1.29 | (e) | | | 3.49 | (e) | | | 1.98 | (e) | | | 77 | | | | — | |
| | | | | | | |
| | | | | | | | | | | | | | | | | | | | | | | | | | | | | | |
| | 9.98 | | | | 0.74 | | | | 2,245,011 | | | | 0.64 | | | | 3.99 | | | | 0.93 | | | | 74 | | | | — | |
| | 10.24 | | | | 4.73 | | | | 1,560,658 | | | | 0.64 | | | | 4.12 | | | | 0.94 | | | | 61 | | | | 62 | |
| | 10.26 | | | | 7.76 | | | | 1,070,541 | | | | 0.64 | | | | 4.09 | | | | 0.95 | | | | 71 | | | | — | |
| | 10.03 | | | | (0.97 | ) | | | 942,467 | | | | 0.64 | | | | 4.08 | | | | 0.97 | | | | 90 | | | | — | |
| | 10.61 | | | | 8.22 | | | | 132,823 | | | | 0.64 | (e) | | | 4.30 | (e) | | | 1.26 | (e) | | | 77 | | | | — | |
| | | | | | | |
| | | | | | | | | | | | | | | | | | | | | | | | | | | | | | |
| | 9.99 | | | | 0.99 | | | | 473,811 | | | | 0.49 | | | | 4.17 | | | | 0.68 | | | | 74 | | | | — | |
| | 10.24 | | | | 4.78 | | | | 471,843 | | | | 0.49 | | | | 4.26 | | | | 0.68 | | | | 61 | | | | 62 | |
| | 10.27 | | | | 8.01 | | | | 155,660 | | | | 0.49 | | | | 4.23 | | | | 0.69 | | | | 71 | | | | — | |
| | 10.03 | | | | (0.86 | ) | | | 113,977 | | | | 0.49 | | | | 4.22 | | | | 0.71 | | | | 90 | | | | — | |
| | 10.61 | | | | 8.38 | | | | 47,277 | | | | 0.49 | (e) | | | 4.53 | (e) | | | 1.00 | (e) | | | 77 | | | | — | |
SEE NOTES TO FINANCIAL STATEMENTS.
| | | | | | | | |
| | | |
| AUGUST 31, 2018 | | J.P. MORGAN INCOME FUNDS | | | | | 51 | |
NOTES TO FINANCIAL STATEMENTS
AS OF AUGUST 31, 2018
1. Organization
JPMorgan Trust I (the “Trust”) was formed on November 12, 2004, as a Delaware statutory trust, pursuant to a Declaration of Trust dated November 5, 2004 and is registered under the Investment Company Act of 1940, as amended (the “1940 Act”), as an open-end management investment company.
The following is a separate fund of the Trust (the “Fund”) covered by this report:
| | | | |
| | | Classes Offered | | Diversified/Non-Diversified |
| JPMorgan Global Bond Opportunities Fund | | Class A, Class C, Class I and Class R6 | | Diversified |
The investment objective of the Fund is to seek to provide total return.
Class A Shares generally provide for a front-end sales charge while Class C Shares provide for a contingent deferred sales charge (“CDSC”). No sales charges are assessed with respect to Class I and Class R6 Shares. Certain Class A Shares, for which front-end sales charges have been waived, may be subject to a CDSC as described in the Fund’s prospectus. Beginning on November 14, 2017, Class C Shares automatically convert to Class A Shares after ten years. All classes of shares have equal rights as to earnings, assets and voting privileges, except that each class may bear different transfer agency, distribution and service fees and each class has exclusive voting rights with respect to its distribution plan and shareholder servicing agreements.
J.P. Morgan Investment Management Inc. (“JPMIM”), an indirect, wholly-owned subsidiary of JPMorgan Chase & Co. (“JPMorgan”), acts as Adviser (the “Adviser”) and Administrator (the “Administrator”) to the Fund.
2. Significant Accounting Policies
The following is a summary of significant accounting policies followed by the Fund in the preparation of its financial statements. The Fund is an investment company and, thus, follows the investment company accounting and reporting guidance of the Financial Accounting Standards Board Accounting Standards Codification Topic 946 — Investment Companies, which is part of U.S. generally accepted accounting principles (“GAAP”). The preparation of financial statements in conformity with GAAP requires management to make estimates and assumptions that affect the reported amounts of assets and liabilities and disclosure of contingent assets and liabilities at the date of the financial statements and the reported amounts of increases and decreases in net assets from operations during the reporting period. Actual results could differ from those estimates.
A. Valuation of Investments — The valuation of investments is in accordance with GAAP and the Fund’s valuation policies set forth by and under the supervision and responsibility of the Board of Trustees (the “Board”), which established the following approach to valuation, as described more fully below: (i) investments for which market quotations are readily available shall be valued at such unadjusted quoted prices and (ii) all other investments for which market quotations are not readily available shall be valued at their fair value as determined in good faith by the Board.
The Administrator has established the J.P. Morgan Asset Management Americas Valuation Committee (“AVC”) to assist the Board with the oversight and monitoring of the valuation of the Fund’s investments. The Administrator implements the valuation policies of the Fund’s investments, as directed by the Board. The AVC oversees and carries out the policies for the valuation of investments held in the Fund. This includes monitoring the appropriateness of fair values based on results of ongoing valuation oversight including, but not limited to, consideration of macro or security specific events, market events and pricing vendor and broker due diligence. The Administrator is responsible for discussing and assessing the potential impacts to the fair values on an ongoing basis, and at least on a quarterly basis with the AVC and the Board.
A market-based approach is primarily used to value the Fund’s investments. Investments for which market quotations are not readily available are fair valued by approved affiliated and unaffiliated pricing vendors or third party broker-dealers (collectively referred to as “Pricing Services”) or may be internally fair valued using methods set forth by the valuation policies approved by the Board. This may include related or comparable assets or liabilities, recent transactions, market multiples, book values and other relevant information for the investment to determine the fair value of the investment. An income-based valuation approach may be used in which the anticipated future cash flows of the investment are discounted to calculate the fair value. Discounts may also be applied due to the nature or duration of any restrictions on the disposition of the investments. Valuations may be based upon current market prices of securities that are comparable in coupon, rating, maturity and industry. It is possible that the estimated values may differ significantly from the values that would have been used, had a ready market for the investments existed, and such differences could be material.
Fixed income instruments are valued based on prices received from Pricing Services. The Pricing Services use multiple valuation techniques to determine the valuation of fixed income instruments. In instances where sufficient market activity exists, the Pricing Services may utilize a market-based approach through which trades or quotes from market makers are used to determine the valuation of these instruments. In instances where sufficient market activity may not exist, the Pricing Services also utilize proprietary valuation models which may consider market transactions in comparable securities and the various relationships between securities in determining fair value and/or market characteristics in order to estimate the relevant cash flows, which are then discounted to calculate the fair values.
Equities and other exchange-traded instruments are valued at the last sale price or official market closing price on the primary exchange on which the instrument is traded before the net asset values (“NAV”) of the Fund are calculated on a valuation date.
Investments in open-end investment companies (the “Underlying Funds”) are valued at each Underlying Fund’s NAV per share as of the report date.
| | | | | | |
| | | |
| 52 | | | | J.P. MORGAN INCOME FUNDS | | AUGUST 31, 2018 |
Futures contracts are generally valued on the basis of available market quotations. Forward foreign currency exchange contracts are valued utilizing market quotations from approved Pricing Services. Swap contracts are valued utilizing market quotations from approved Pricing Services.
See the table on “Quantitative Information about Level 3 Fair Value Measurements” for information on the valuation techniques and inputs used to value level 3 securities held by the Fund at August 31, 2018.
Valuations reflected in this report are as of the report date. As a result, changes in valuation due to market events and/or issuer related events after the report date and prior to issuance of the report are not reflected herein.
The various inputs that are used in determining the valuation of the Fund’s investments are summarized into the three broad levels listed below.
| • | | Level 1 — Unadjusted inputs using quoted prices in active markets for identical investments. |
| • | | Level 2 — Other significant observable inputs including, but not limited to, quoted prices for similar investments, inputs other than quoted prices that are observable for investments (such as interest rates, prepayment speeds, credit risk, etc.) or other market corroborated inputs. |
| • | | Level 3 — Significant inputs based on the best information available in the circumstances, to the extent observable inputs are not available (including the Fund’s assumptions in determining the fair value of investments). |
A financial instrument’s level within the fair value hierarchy is based on the lowest level of any input, both individually and in the aggregate, that is significant to the fair value measurement. The inputs or methodology used for valuing instruments are not necessarily an indication of the risk associated with investing in those instruments.
The following table represents each valuation input as presented on the Schedule of Portfolio Investments (“SOI”) (amounts in thousands):
| | | | | | | | | | | | | | | | |
| | | Level 1
Quoted prices | | | Level 2
Other significant
observable inputs | | | Level 3 Significant
unobservable inputs | | | Total | |
Investments in Securities | | | | | | | | | | | | | | | | |
Debt Securities | | | | | | | | | | | | | | | | |
Asset-Backed Securities | | | | | | | | | | | | | | | | |
Cayman Islands | | $ | — | | | $ | 75,385 | | | $ | 2,825 | | | $ | 78,210 | |
United States | | | — | | | | 146,049 | | | | 77,632 | | | | 223,681 | |
| | | | | | | | | | | | | | | | |
Total Asset-Backed Securities | | | — | | | | 221,434 | | | | 80,457 | | | | 301,891 | |
| | | | | | | | | | | | | | | | |
Collateralized Mortgage Obligations | | | | | | | | | | | | | | | | |
Bermuda | | | — | | | | — | | | | 2,307 | | | | 2,307 | |
Italy | | | — | | | | — | | | | 139 | | | | 139 | |
United States | | | — | | | | 96,713 | | | | 7,369 | | | | 104,082 | |
Other Collateralized Mortgage Obligations | | | — | | | | 4,274 | | | | — | | | | 4,274 | |
| | | | | | | | | | | | | | | | |
Total Collateralized Mortgage Obligations | | | — | | | | 100,987 | | | | 9,815 | | | | 110,802 | |
| | | | | | | | | | | | | | | | |
Commercial Mortgage-Backed Securities | | | | | | | | | | | | | | | | |
Cayman Islands | | | — | | | | — | | | | 5,485 | | | | 5,485 | |
United States | | | — | | | | 107,669 | | | | 44,403 | | | | 152,072 | |
| | | | | | | | | | | | | | | | |
Total Commercial Mortgage-Backed Securities | | | — | | | | 107,669 | | | | 49,888 | | | | 157,557 | |
| | | | | | | | | | | | | | | | |
Convertible Bonds | | | | | | | | | | | | | | | | |
Other Convertible Bonds | | | — | | | | 92,334 | | | | — | | | | 92,334 | |
Corporate Bonds | | | | | | | | | | | | | | | | |
Canada | | | — | | | | 29,945 | | | | 52 | | | | 29,997 | |
Luxembourg | | | — | | | | 64,279 | | | | 1,015 | | | | 65,294 | |
United States | | | — | | | | 753,954 | | | | 942 | | | | 754,896 | |
Other Corporate Bonds | | | — | | | | 670,745 | | | | — | | | | 670,745 | |
| | | | | | | | | | | | | | | | |
Total Corporate Bonds | | | — | | | | 1,518,923 | | | | 2,009 | | | | 1,520,932 | |
| | | | | | | | | | | | | | | | |
Foreign Government Securities | | | — | | | | 496,413 | | | | — | | | | 496,413 | |
Private Placements | | | | | | | | | | | | | | | | |
United States | | | — | | | | — | | | | 15,000 | | | | 15,000 | |
Preferred Stocks | | | | | | | | | | | | | | | | |
United States | | | — | | | | — | | | | 1 | | | | 1 | |
Other Preferred Stocks | | | — | | | | 60 | | | | — | | | | 60 | |
| | | | | | | | | | | | | | | | |
Total Preferred Stocks | | | — | | | | 60 | | | | 1 | | | | 61 | |
| | | | | | | | | | | | | | | | |
| | | | | | | | |
| | | |
| AUGUST 31, 2018 | | J.P. MORGAN INCOME FUNDS | | | | | 53 | |
NOTES TO FINANCIAL STATEMENTS
AS OF AUGUST 31, 2018 (continued)
| | | | | | | | | | | | | | | | |
| | | Level 1
Quoted prices | | | Level 2
Other significant
observable inputs | | | Level 3 Significant
unobservable inputs | | | Total | |
Common Stocks | | | | | | | | | | | | | | | | |
New Zealand | | $ | — | | | $ | — | | | $ | 72 | | | $ | 72 | |
United States | | | 1,187 | | | | — | | | | 218 | | | | 1,405 | |
| | | | | | | | | | | | | | | | |
Total Common Stocks | | | 1,187 | | | | — | | | | 290 | | | | 1,477 | |
| | | | | | | | | | | | | | | | |
Loan Assignments | | | | | | | | | | | | | | | | |
Other Loan Assignments | | | — | | | | 105,775 | | | | — | | | | 105,775 | |
Rights | | | | | | | | | | | | | | | | |
United States | | | — | | | | — | | | | 4 | | | | 4 | |
Short-Term Investments | | | | | | | | | | | | | | | | |
Investment Companies | | | 162,818 | | | | — | | | | — | | | | 162,818 | |
| | | | | | | | | | | | | | | | |
Total Investments in Securities | | $ | 164,005 | | | $ | 2,643,595 | | | $ | 157,464 | | | $ | 2,965,064 | |
| | | | | | | | | | | | | | | | |
Appreciation in Other Financial Instruments | | | | | | | | | | | | | | | | |
Forward Foreign Currency Exchange Contracts | | $ | — | | | $ | 26,904 | | | $ | — | | | $ | 26,904 | |
Futures Contracts | | | 4,408 | | | | — | | | | — | | | | 4,408 | |
| | | | | | | | | | | | | | | | |
Total Appreciation in Other Financial Instruments | | $ | 4,408 | | | $ | 26,904 | | | $ | — | | | $ | 31,312 | |
| | | | | | | | | | | | | | | | |
Depreciation in Other Financial Instruments | | | | | | | | | | | | | | | | |
Forward Foreign Currency Exchange Contracts | | $ | — | | | $ | (8,846 | ) | | $ | — | | | $ | (8,846 | ) |
Futures Contracts | | | (2,302 | ) | | | — | | | | — | | | | (2,302 | ) |
Swaps | | | — | | | | (105 | ) | | | — | | | | (105 | ) |
| | | | | | | | | | | | | | | | |
Total Depreciation in Other Financial Instruments | | $ | (2,302 | ) | | $ | (8,951 | ) | | $ | — | | | $ | (11,253 | ) |
| | | | | | | | | | | | | | | | |
Transfers between fair value levels are valued utilizing values as of the beginning of the period.
There were no transfers between level 1 and level 2 during the year ended August 31, 2018.
The following is a summary of investments for which significant unobservable inputs (level 3) were used in determining fair value (amounts in thousands):
| | | | | | | | | | | | | | | | | | | | | | | | | | | | | | | | | | | | |
| | | Balance as of
August 31, 2017 | | | Realized
gain (loss) | | | Change in net
unrealized
appreciation
(depreciation) | | | Net
accretion
(amortization) | | | Purchases1 | | | Sales2 | | | Transfers
into Level 3 | | | Transfers
out
of Level 3 | | | Balance as of
August 31, 2018 | |
Investments in Securities: | | | | | | | | | | | | | | | | | | | | | | | | | | | | | | | | | | | | |
Asset-Backed Securities — Cayman Islands | | $ | — | | | $ | (6 | ) | | $ | 4 | | | $ | — | (a) | | $ | 891 | | | $ | (295 | ) | | $ | 2,231 | | | $ | — | | | $ | 2,825 | |
Asset-Backed Securities — Ireland | | | 785 | | | | — | | | | — | (a) | | | — | | | | — | | | | (785 | ) | | | — | | | | — | | | | — | |
Asset-Backed Securities — United States | | | 21,828 | | | | 165 | | | | (409 | ) | | | (8 | ) | | | 65,565 | | | | (14,510 | ) | | | 5,084 | | | | (83 | ) | | | 77,632 | |
Collateralized Mortgage Obligations — Bermuda | | | — | | | | — | | | | 8 | | | | — | | | | 2,299 | | | | — | | | | — | | | | — | | | | 2,307 | |
Collateralized Mortgage Obligations — Italy | | | 142 | | | | — | | | | (4 | ) | | | 1 | | | | — | | | | — | | | | — | | | | — | | | | 139 | |
Collateralized Mortgage Obligations — United States | | | — | | | | 4 | | | | (24 | ) | | | — | (a) | | | 7,657 | | | | (268 | ) | | | — | | | | — | | | | 7,369 | |
Commercial Mortgage-Backed Securities — Cayman Islands | | | 864 | | | | — | | | | 16 | | | | — | | | | 4,605 | | | | — | | | | — | | | | — | | | | 5,485 | |
Commercial Mortgage-Backed Securities — United States | | | 35,746 | | | | (364 | ) | | | (2,140 | ) | | | 21 | | | | 38,229 | | | | (31,455 | ) | | | 6,071 | | | | (1,705 | ) | | | 44,403 | |
Common Stocks — New Zealand | | | 73 | | | | — | | | | (1 | ) | | | — | | | | — | | | | — | | | | — | | | | — | | | | 72 | |
Common Stocks — United States | | | — | (b) | | | — | (a) | | | 29 | | | | — | | | | 189 | | | | — | (a) | | | — | | | | — | | | | 218 | |
Corporate Bonds — Canada | | | — | | | | — | | | | (320 | ) | | | 3 | | | | 369 | | | | — | | | | — | | | | — | | | | 52 | |
Corporate Bonds — Luxembourg | | | — | | | | 4 | | | | (168 | ) | | | 1 | | | | 833 | | | | (470 | ) | | | 815 | | | | — | | | | 1,015 | |
Corporate Bonds — United States | | | 959 | | | | (13 | ) | | | 12 | | | | 7 | | | | 422 | | | | (444 | ) | | | — | | | | (1 | ) | | | 942 | |
Preferred Stocks — United States | | | 2 | | | | — | | | | (1 | ) | | | — | | | | — | | | | — | | | | — | | | | — | | | | 1 | |
Private Placements — Commercial Loans | | | — | | | | — | | | | — | | | | — | | | | 15,000 | | | | — | | | | — | | | | — | | | | 15,000 | |
Rights — United States | | | 7 | | | | — | | | | (3 | ) | | | — | | | | — | | | | — | | | | — | | | | — | | | | 4 | |
| | | | | | | | | | | | | | | | | | | | | | | | | | | | | | | | | | | | |
| | $ | 60,406 | | | $ | (210 | ) | | $ | (3,001 | ) | | $ | 25 | | | $ | 136,059 | | | $ | (48,227 | ) | | $ | 14,201 | | | $ | (1,789 | ) | | $ | 157,464 | |
| | | | | | | | | | | | | | | | | | | | | | | | | | | | | | | | | | | | |
| | | | | | |
| | | |
| 54 | | | | J.P. MORGAN INCOME FUNDS | | AUGUST 31, 2018 |
| 1 | Purchases include all purchases of securities and securities received in corporate actions. |
| 2 | Sales include all sales of securities, maturities, paydowns and securities tendered in corporate actions. |
| (a) | Amount rounds to less than one thousand. |
Transfers from level 2 to level 3 are due to a decline in market activity (e.g. frequency of trades), which resulted in a lack of available market inputs to determine the period ended August 31, 2018.
The changes in net unrealized appreciation (depreciation) attributable to securities owned at August 31, 2018, which were valued using significant unobservable inputs (level 3) amounted to approximately $(2,706,000). This amount is included in Change in net unrealized appreciation/ depreciation of investments in non-affiliates on the Statement of Operations.
Quantitative Information about Level 3 Fair Value Measurements #
(Amounts in thousands)
| | | | | | | | | | | | |
| | | Fair Value at
August 31, 2018 | | | Valuation Technique(s) | | Unobservable Input | | Range (Weighted Average) | |
| | $ | 42 | | | Terms of Exchange Offer / Restructuring | | Expected Recovery | | | $8.23 ($8.23) | |
| | | — | (a) | | Market Comparable Companies | | EBITDA Multiple (b) | | | 6.5x (6.5x) | |
| | | | | | | | | | | | |
| Common Stocks | | | 42 | | | | | | | | | |
| | | | | | | | | | | | |
| | | 1 | | | Market Comparable Companies | | EBITDA Multiple (b) | | | 6.5x (6.5x) | |
| | | | | | | | Discount for potential outcome (c) | | | 30.00% (30.00%) | |
| | | | | | | | | | | | |
| Preferred Stocks | | | 1 | | | | | | | | | |
| | | | | | | | | | | | |
| | | 67,604 | | | Discounted Cash Flow | | Constant Prepayment Rate | | | 0.00% - 35.00% (16.98%) | |
| | | | | | | | Constant Default Rate | | | 0.00% - 5.40% (0.34%) | |
| | | | | | | | Yield (Discount Rate of Cash Flows) | | | 2.37% - 6.68% (4.34%) | |
| | | | | | | | | | | | |
| Asset-Backed Securities | | | 67,604 | | | | | | | | | |
| | | | | | | | | | | | |
| | | 2,634 | | | Discounted Cash Flow | | Constant Prepayment Rate | | | 10.00% - 11.50% (10.19%) | |
| | | | | | | | Constant Default Rate | | | 0.00% - 2.41% (0.30%) | |
| | | | | | | | Yield (Discount Rate of Cash Flows) | | | 4.12% - 6.50% (4.42%) | |
| | | | | | | | | | | | |
| Collateralized Mortgage Obligations | | | 2,634 | | | | | | | | | |
| | | | | | | | | | | | |
| | | 38,119 | | | Discounted Cash Flow | | Yield (Discount Rate of Cash Flows) | | | (71.65)% - 199.00% (9.23%) | |
| | | | | | | | | | | | |
| Commercial Mortgage-Backed Securities | | | 38,119 | | | | | | | | | |
| | | | | | | | | | | | |
| | | 15,000 | | | Discounted Cash Flow | | Yield (Discount Rate of Cash Flows) | | | 6.11% (6.11%) | |
| | | | | | | | | | | | |
| Private Placements | | | 15,000 | | | | | | | | | |
| | | | | | | | | | | | |
| | | 64 | | | Discounted Cash Flow | | Yield (Discount Rate of Cash Flows) | | | 0.00% - 32.07% (2.67%) | |
| | | | | | | | Liquidity Discount | | | 0.50% (0.50%) | |
| | | | | | | | | | | | |
| Corporate Bonds | | | 64 | | | | | | | | | |
| | | | | | | | | | | | |
| Total | | $ | 123,464 | | | | | | | | | |
| | | | | | | | | | | | |
| # | The table above does not include level 3 securities that are valued by brokers and pricing services. At August 31, 2018, the value of these securities was approximately $34,000,000. The inputs for these securities are not readily available or cannot be reasonably estimated and generally are those inputs described in Note 2.A. |
| (a) | Securities senior in the issuing entity capital structure result in this security being valued at zero. |
| (b) | Represents amounts used when the reporting entity has determined that market participants would take into account such multiples when pricing the investments. |
| (c) | Represents amounts used when the reporting entity has determined that market participants would take into account discounts, as applicable, when pricing the investments. |
The significant unobservable inputs used in the fair value measurement of the Fund’s investments are listed above. Generally, a change in the assumptions used in any input in isolation may be accompanied by a change in another input. Significant changes in any of the unobservable inputs may significantly impact the fair value measurement. The impact is based on the relationship between each unobservable input and the fair value
| | | | | | | | |
| | | |
| AUGUST 31, 2018 | | J.P. MORGAN INCOME FUNDS | | | | | 55 | |
NOTES TO FINANCIAL STATEMENTS
AS OF AUGUST 31, 2018 (continued)
measurement. Significant increases (decreases) in the default rate may decrease (increase) the fair value measurement. A significant change in the discount rate or prepayment rate (Constant Prepayment Rate or PSA Prepayment Model) may decrease or increase the fair value measurement.
B. Restricted Securities — Certain securities held by the Fund may be subject to legal or contractual restrictions on resale. Restricted securities generally are resold in transactions exempt from registration under the Securities Act of 1933, as amended (the “Securities Act”). Disposal of these securities may involve time-consuming negotiations and expense. Prompt sale at the current valuation may be difficult and could adversely affect the net asset value of the Fund.
As of August 31, 2018, the Fund had no investments in restricted securities other than securities sold to the Fund under Rule 144A or Regulation S under the Securities Act.
C. Loan Assignments — The Fund may invest in debt instruments that are interests in amounts owed to lenders or lending syndicates (a “Lender”) by corporate, governmental or other borrowers (a “Borrower”). A loan is often administered by a bank or other financial institution (the “Agent”) that acts as Agent for all holders. The Agent administers the terms of the loan, as specified in the loan agreement. The Fund invests in loan assignments of all or a portion of the loans. When a fund purchases a loan assignment, the Fund has direct rights against the Borrower on a loan, provided, however, the Fund’s rights may be more limited than the Lender from which it acquired the assignment and the Fund may be able to enforce its rights only through the Agent. As a result, a fund assumes the credit risk of the Borrower as well as any other persons interpositioned between the Fund and the Borrower (“Intermediate Participants”). A fund may incur certain costs and delays in realizing payment on a loan assignment or suffer a loss of principal and/or interest if assets or interests held by the Agent or other Intermediate Participants are determined to be subject to the claims of the Agent’s or other Intermediate Participant’s creditors. In addition, it is unclear whether loan assignments and other forms of direct indebtedness offer securities law protections against fraud and misrepresentation. Also, because JPMIM may wish to invest in publicly traded securities of a Borrower, it may not have access to material non-public information regarding the Borrower to which other investors have access. Although certain loan assignments are secured by collateral, a fund could experience delays or limitations in realizing the value on such collateral or have its interest subordinated to other indebtedness of the Borrower. Loan assignments are vulnerable to market conditions such that economic conditions or other events may reduce the demand for assignments and certain assignments which were liquid, when purchased, may become illiquid and they may be difficult to value. In addition, the settlement period for loans is uncertain as there is no standardized settlement schedule applicable to such investments. Therefore, a fund may not receive the proceeds from a sale of such investments for a period after the sale.
Certain loan assignments are also subject to the risks associated with high yield securities described under Note 7.
D. Unfunded Commitments — The Fund has entered into commitments to buy and sell investments including commitments to buy loan assignments to settle on future dates as part of their normal investment activities. Unfunded commitments may include revolving loan facilities which may obligate the Funds to provide cash to the borrower on demand. Unfunded commitments are generally traded and priced as part of a related loan assignment (Note 2.C). The value of the unfunded portion of the investment is determined using a pro-rata allocation, based on its par value relative to the par value of the entire investment. The unrealized appreciation/depreciation from unfunded commitments is reported on the Statement of Assets and Liabilities. Credit risk exists on these commitments to the extent of any difference between the sales price and current value of the underlying securities sold. Market risk exists on these commitments to buy to the same extent as if the securities were owned on a settled basis and gains and losses are recorded and reported in the same manner. The Fund may receive an ongoing commitment fee based on the undrawn portion of the underlying loan facility, which is recorded as a component of Interest income from non-affiliates on the Statement of Operations.
At August 31, 2018, the Fund had the following loan commitment in which all or a portion of the commitment was unfunded which could be extended at the options of the borrower (amounts in thousands):
| | | | | | | | | | | | | | | | | | | | | | | | | | | | | | | | | | | | | | |
| | | | | Maturity
Date | | | Commitment
Fee Rate | | | Rate if
Funded | | | Unfunded
Commitment | | | Funded
Commitment | | | Total
Commitment | |
| Security Description | | Term | | Par
Amount | | | Value | | | Par
Amount | | | Value | | | Par
Amount | | | Value | |
Pearl Intermediate Parent LLC | | Delayed Draw Term Loan | | | 2/14/2025 | | | | 2.75 | % | | | 2.16 | % | | $ | 142 | | | $ | 139 | | | $ | 54 | | | $ | 53 | | | $ | 196 | | | $ | 192 | |
E. Investment Transactions with Affiliates — The Fund invested in Underlying Funds which are advised by the Adviser or its affiliates. An issuer which is under common control with the Fund may be considered an affiliate. For the purposes of the financial statements, the Fund assumes the issuers listed in the table below to be affiliated issuers. Underlying Funds’ distributions may be reinvested into the Underlying Funds. Reinvestment amounts are included in the purchase cost amounts in the table below. Amounts in the table below are in thousands.
| | | | | | | | | | | | | | | | | | | | | | | | | | | | | | | | | | | | |
| For the year ended August 31, 2018 | |
| Security Description | | Value at
August 31,
2017 | | | Purchases
at Cost | | | Proceeds
from Sales | | | Net
Realized
Gain
(Loss) | | | Change
in Unrealized
Appreciation/
(Depreciation) | | | Value at
August 31,
2018 | | | Shares at
August 31,
2018 | | | Dividend
Income | | | Capital Gain
Distributions | |
JPMorgan Prime Money Market Fund Class Institutional Shares, 2.04% (a) (b) | | $ | 86,406 | | | $ | 1,947,896 | | | $ | 1,871,492 | | | $ | (32 | ) | | $ | 40 | | | $ | 162,818 | | | | 162,769 | | | $ | 1,526 | | | $ | — | |
| | | | | | | | | | | | | | | | | | | | | | | | | | | | | | | | | | | | |
| | | | | | |
| | | |
| 56 | | | | J.P. MORGAN INCOME FUNDS | | AUGUST 31, 2018 |
| (a) | Investment in affiliate. Fund is registered under the Investment Company Act of 1940, as amended, and advised by J.P. Morgan Investment Management Inc. |
| (b) | The rate shown is the current yield as of August 31, 2018. |
F. Derivatives — The Fund used derivative instruments including futures, forward foreign currency exchange contracts and swaps in connection with its investment strategy. Derivative instruments may be used as substitutes for securities in which the Fund can invest, to hedge portfolio investments or to generate income or gain to the Fund. Derivatives may also be used to manage duration, sector and yield curve exposures and credit and spread volatility.
The Fund may be subject to various risks from the use of derivatives including the risk that changes in the value of a derivative may not correlate perfectly with the underlying asset, rate or index; counterparty credit risk related to derivatives counterparties’ failure to perform under contract terms; liquidity risk related to the lack of a liquid market for these contracts allowing the Fund to close out its position(s); and documentation risk relating to disagreement over contract terms. Investing in certain derivatives also results in a form of leverage and as such, the Fund’s risk of loss associated with these instruments may exceed its value, as recorded on the Statement of Assets and Liabilities.
The Fund is party to various derivative contracts governed by International Swaps and Derivatives Association master agreements (“ISDA agreements”). The Fund’s ISDA agreements, which are separately negotiated with each dealer counterparty, may contain provisions allowing, absent other considerations, a counterparty to exercise rights, to the extent not otherwise waived, against the Fund in the event the Fund’s net assets decline over time by a pre-determined percentage or fall below a pre-determined floor. The ISDA agreements may also contain provisions allowing, absent other conditions, the Fund to exercise rights, to the extent not otherwise waived, against a counterparty (e.g., decline in a counterparty’s credit rating below a specified level). Such rights for both a counterparty and the Fund often include the ability to terminate (i.e., close out) open contracts at prices which may favor a counterparty, which could have an adverse effect on the Fund. The ISDA agreements give the Fund and a counterparty the right, upon an event of default, to close out all transactions traded under such agreements and to net amounts owed or due across all transactions and will offset such net payable or receivable with collateral posted to a segregated account by one party to the other.
Counterparty credit risk may be mitigated to the extent a counterparty posts collateral for mark to market gains to the Fund.
Notes F(1) — F(3) below describe the various derivatives used by the Fund.
(1). Futures Contracts — The Fund used treasury, index or other financial futures contracts to gain or reduce exposure to the bond markets, maintain liquidity and minimize transaction costs. The Fund also bought futures contracts to immediately invest incoming cash in the market or sold futures in response to cash outflows, thereby simulating an invested position in the underlying index while maintaining a cash balance for liquidity.
Futures contracts provide for the delayed delivery of the underlying instrument at a fixed price or are settled for a cash amount based on the change in the value of the underlying instrument at a specific date in the future. Upon entering into a futures contract, the Fund is required to deposit with the broker, cash or securities in an amount equal to a certain percentage of the contract amount, which is referred to as the initial margin deposit. Subsequent payments, referred to as variation margin, are made or received by the Fund periodically and are based on changes in the market value of open futures contracts. Changes in the market value of open futures contracts are recorded as Change in net unrealized appreciation/depreciation on the Statement of Operations. Realized gains or losses, representing the difference between the value of the contract at the time it was opened and the value at the time it was closed, are reported on the Statement of Operations at the closing or expiration of the futures contract. Securities deposited as initial margin are designated on the SOI and cash deposited, which is considered restricted, is recorded on the Statement of Assets and Liabilities. A receivable from and/or a payable to brokers for the daily variation margin is also recorded on the Statement of Assets and Liabilities.
The use of futures contracts exposes the Fund to interest rate risk. The Fund may be subject to the risk that the change in the value of the futures contract may not correlate perfectly with the underlying instrument. Use of long futures contracts subjects the Fund to risk of loss in excess of the amounts shown on the Statement of Assets and Liabilities, up to the notional amount of the futures contracts. Use of short futures contracts subjects the Fund to unlimited risk of loss. The Fund may enter into futures contracts only on exchanges or boards of trade. The exchange or board of trade acts as the counterparty to each futures transaction; therefore, the Fund’s credit risk is limited to failure of the exchange or board of trade. Under some circumstances, futures exchanges may establish daily limits on the amount that the price of a futures contract can vary from the previous day’s settlement price, which could effectively prevent liquidation of positions.
The Fund’s futures contracts are not subject to master netting arrangements (the right to close out all transactions traded with a counterparty and net amounts owed or due across transactions).
(2). Forward Foreign Currency Exchange Contracts — The Fund may be exposed to foreign currency risks associated with some or all of the portfolio investments and used forward foreign currency exchange contracts to hedge or manage certain of these exposures as part of an investment strategy. The Fund also bought forward foreign currency exchange contracts to gain exposure to currencies. Forward foreign currency exchange contracts represent obligations to purchase or sell foreign currency on a specified future date at a price fixed at the time the contracts are entered into. Non-deliverable forward foreign currency exchange contracts are settled with the counterparty in U.S. dollar without the delivery of foreign currency.
| | | | | | | | |
| | | |
| AUGUST 31, 2018 | | J.P. MORGAN INCOME FUNDS | | | | | 57 | |
NOTES TO FINANCIAL STATEMENTS
AS OF AUGUST 31, 2018 (continued)
The values of the forward foreign currency exchange contracts are adjusted daily based on the applicable exchange rate of the underlying currency. Changes in the value of these contracts are recorded as unrealized appreciation or depreciation until the contract settlement date. When the forward foreign currency exchange contract is closed, the Fund records a realized gain or loss equal to the difference between the value at the time the contract was opened and the value at the time it was closed. The Fund also records a realized gain or loss when a forward foreign currency exchange contract offsets another forward foreign currency exchange contract with the same counterparty upon settlement.
The Fund’s forward foreign currency exchange contracts are subject to master netting arrangements (the right to close out all transactions with a counterparty and net amounts owed or due across transactions).
The Fund may be required to post or receive collateral for non-deliverable forward foreign currency exchange contracts.
(3). Swaps — The Fund engaged in various swap transactions, including credit default swaps, to manage credit risks within its portfolio. The Fund also used swaps as alternatives to direct investments. Swap transactions are negotiated contracts over the counter (“OTC swaps”) between the Fund and a counterparty or centrally cleared (“centrally cleared swaps”) with a central clearinghouse through a Futures Commission Merchant (“FCM”), to exchange investment cash flows, assets, foreign currencies or market-linked returns at specified, future intervals.
Upfront payments made and/or received are recorded as assets or liabilities, respectively, on the Statement of Assets and Liabilities and amortized over the term of the swap. The value of an OTC swap agreement is recorded as either an asset or a liability on the Statement of Assets and Liabilities at the beginning of the measurement period. Upon entering into a centrally cleared swap, the Fund is required to deposit with the FCM cash or securities, which is referred to as initial margin deposit. Securities deposited as initial margin are designated on the SOI and cash deposited, which is considered restricted, is recorded on the Statement of Assets and Liabilities. Daily changes in valuation of centrally cleared swaps, if any, are recorded as a variation margin receivable or payable on the Statement of Assets and Liabilities. The change in the value of swaps, including accruals of periodic amounts of interest to be paid or received on swaps, is reported as Change in net unrealized appreciation/depreciation on the Statement of Operations. A realized gain or loss is recorded upon payment or receipt of a periodic payment or payment made upon termination of a swap agreement.
The Fund may be required to post or receive collateral based on the net value of the Fund’s outstanding OTC swap contracts with the counterparty in the form of cash or securities. Daily movement of collateral is subject to minimum threshold amounts. Collateral posted by the Fund is held in a segregated account at the Fund’s custodian bank. For certain counterparties, cash collateral posted by the Fund is invested in an affiliated money market fund, otherwise the cash collateral is included on the Statement of Assets and Liabilities as Restricted cash.
Credit Default Swaps
The Fund entered into credit default swaps to simulate long and/or short bond positions or to take an active long and/or short position with respect to the likelihood of a default or credit event by the issuer of the underlying reference obligation.
The underlying reference obligation may be a single issuer of corporate or sovereign debt, a basket of issuers or a credit index. A credit index is a list of credit instruments or exposures that reference a fixed number of obligors with shared characteristics that represents some part of the credit market as a whole. Index credit default swaps have standardized terms including a fixed spread and standard maturity dates. The composition of the obligations within a particular index changes periodically.
Credit default swaps involve one party, the protection buyer, making a stream of payments to another party, the protection seller, in exchange for the right to receive a contingent payment if there is a credit event related to the underlying reference obligation. In the event that the reference obligation matures prior to the termination date of the contract, a similar security will be substituted for the duration of the contract term. Credit events are defined under individual swap agreements and generally include bankruptcy, failure to pay, restructuring, repudiation/moratorium, obligation acceleration and obligation default.
If a credit event occurs, the Fund, as protection seller, would be obligated to make a payment, which may be either: (i) a net cash settlement equal to the notional amount of the swap less the auction value of the reference obligation or (ii) the notional amount of the swap in exchange for the delivery of the reference obligation. Selling protection effectively adds leverage to the Fund’s portfolio up to the notional amount of swap agreements. The notional amount represents the maximum potential liability under a contract and is not reflected on the Statement of Assets and Liabilities. Potential liabilities under these contracts may be reduced by: the auction rates of the underlying reference obligations; upfront payments received at the inception of a swap; and net amounts received from credit default swaps purchased with the identical reference obligation.
| | | | | | |
| | | |
| 58 | | | | J.P. MORGAN INCOME FUNDS | | AUGUST 31, 2018 |
(5). Summary of Derivatives Information — The following table presents the value of derivatives held as of August 31, 2018, by their primary underlying risk exposure and respective location on the Statement of Assets and Liabilities (amounts in thousands):
| | | | | | | | | | | | | | | | | | |
| Derivative Contracts | | Statement of Assets and Liabilities Location | | | | | | | | | | | | |
| Gross Assets: | | | | Futures
Contracts (a) | | | Forward Foreign
Currency Exchange
Contracts | | | Centrally
Cleared
Swaps (b) | | | Total | |
Interest rate contracts | | Receivables, Net Assets — Unrealized Appreciation | | $ | 4,408 | | | $ | — | | | $ | — | | | $ | 4,408 | |
Foreign exchange contracts | | Receivables | | | — | | | | 26,904 | | | | — | | | | 26,904 | |
| | | | | | | | | | | | | | | | | | |
Total | | | | $ | 4,408 | | | $ | 26,904 | | | $ | — | | | $ | 31,312 | |
| | | | | | | | | | | | | | | | | | |
| | | | | |
Gross Liabilities: | | | | | | | | | | | | | | |
Interest rate contracts | | Payables, Net Assets — Unrealized Depreciation | | $ | (2,302 | ) | | $ | — | | | $ | — | | | $ | (2,302 | ) |
Credit contracts | | Payables | | | — | | | | — | | | | (673 | ) | | | (673 | ) |
Foreign exchange contracts | | Payables | | | — | | | | (8,846 | ) | | | — | | | | (8,846 | ) |
| | | | | | | | | | | | | | | | | | |
Total | | | | $ | (2,302 | ) | | $ | (8,846 | ) | | $ | (673 | ) | | $ | (11,821 | ) |
| | | | | | | | | | | | | | | | | | |
| (a) | This amount represents the cumulative appreciation (depreciation) of futures contracts as reported on the SOI. The Statement of Assets and Liabilities only reflects the current day variation margin receivable/payable from/to brokers. |
| (b) | This amount represents the value of centrally cleared swaps as reported on the SOI. The Statement of Assets and Liabilities only reflect the current day variation margin receivable/payable from/to brokers. |
The following table presents the Fund’s gross derivative assets and liabilities by counterparty net of amounts available for offset under netting arrangements and any related collateral received or posted by the Fund as of August 31, 2018 (amounts in thousands):
| | | | | | | | | | | | | | | | |
| Counterparty | | Gross Amount of
Derivative Assets
Subject to Netting
Agreement Presented
on the Statement of
Assets and Liabilities (a) | | | Derivatives
Available
for offset | | | Collateral
Received | | | Net Amount Due
From Counterparty
(Not less than zero) | |
Australia & New Zealand Banking Group Ltd. | | $ | 90 | | | $ | (38 | ) | | $ | — | | | $ | 52 | |
Barclays Bank plc | | | 5,870 | | | | (1,202 | ) | | | — | | | | 4,668 | |
BNP Paribas | | | 471 | | | | (470 | ) | | | — | | | | 1 | |
Citibank, NA | | | 6,034 | | | | — | | | | — | | | | 6,034 | |
Deutsche Bank AG | | | 9 | | | | — | | | | — | | | | 9 | |
Goldman Sachs International | | | 3,902 | | | | (2,765 | ) | | | — | | | | 1,137 | |
HSBC Bank, N.A. | | | 5,746 | | | | (1,632 | ) | | | — | | | | 4,114 | |
Merrill Lynch International | | | 52 | | | | — | | | | — | | | | 52 | |
National Australia Bank Ltd. | | | 106 | | | | (23 | ) | | | — | | | | 83 | |
Royal Bank of Canada | | | 5 | | | | (5 | ) | | | — | | | | — | |
Standard Chartered Bank | | | 4,618 | | | | (2,679 | ) | | | — | | | | 1,939 | |
TD Bank Financial Group | | | 1 | | | | — | | | | — | | | | 1 | |
| | | | | | | | | | | | | | | | |
| | $ | 26,904 | | | $ | (8,814 | ) | | $ | — | | | $ | 18,090 | |
| | | | | | | | | | | | | | | | |
| | | | |
| Counterparty | | Gross Amount of Derivative Liabilities Subject to Netting Agreement Presented on the Statement of Assets and Liabilities (a) | | | Derivatives Available for offset | | | Collateral Posted | | | Net Amount Due to Counterparty (Not less than zero) | |
Australia & New Zealand Banking Group Ltd. | | $ | 38 | | | $ | (38 | ) | | $ | — | | | $ | — | |
Barclays Bank plc | | | 1,202 | | | | (1,202 | ) | | | — | | | | — | |
BNP Paribas | | | 470 | | | | (470 | ) | | | — | | | | — | |
Goldman Sachs International | | | 2,765 | | | | (2,765 | ) | | | — | | | | — | |
HSBC Bank, N.A. | | | 1,632 | | | | (1,632 | ) | | | — | | | | — | |
National Australia Bank Ltd. | | | 23 | | | | (23 | ) | | | — | | | | — | |
Royal Bank of Canada | | | 37 | | | | (5 | ) | | | — | | | | 32 | |
Standard Chartered Bank | | | 2,679 | | | | (2,679 | ) | | | — | | | | — | |
| | | | | | | | | | | | | | | | |
| | $ | 8,846 | | | $ | (8,814 | ) | | $ | — | | | $ | 32 | |
| | | | | | | | | | | | | | | | |
| | | | | | | | |
| | | |
| AUGUST 31, 2018 | | J.P. MORGAN INCOME FUNDS | | | | | 59 | |
NOTES TO FINANCIAL STATEMENTS
AS OF AUGUST 31, 2018 (continued)
| (a) | For financial reporting purposes, the Fund does not offset derivative assets and derivative liabilities subject to master netting arrangements on the Statement of Assets and Liabilities. |
The following tables present the effect of derivatives on the Statement of Operations for the year ended August 31, 2018, by primary underlying risk exposure (amounts in thousands):
| | | | | | | | | | | | | | | | |
| Amount of Realized Gain (Loss) on Derivatives Recognized on the Statement of Operations | |
| Derivative Contracts | | Futures Contracts | | | Forward Foreign
Currency Exchange
Contracts | | | Swaps | | | Total | |
Interest rate contracts | | $ | 3,638 | | | $ | — | | | $ | — | | | $ | 3,638 | |
Credit contracts | | | — | | | | — | | | | 17 | | | | 17 | |
Foreign exchange contracts | | | — | | | | 24,274 | | | | — | | | | 24,274 | |
| | | | | | | | | | | | | | | | |
Total | | $ | 3,638 | | | $ | 24,274 | | | $ | 17 | | | $ | 27,929 | |
| | | | | | | | | | | | | | | | |
| | | | | | | | | | | | | | | | |
| Amount of Change in Unrealized Appreciation (Depreciation) on Derivatives Recognized on the Statement of Operations | |
| Derivative Contracts | | Futures Contracts | | | Forward Foreign
Currency Exchange
Contracts | | | Swaps | | | Total | |
Interest rate contracts | | $ | 6,364 | | | $ | — | | | $ | — | | | $ | 6,364 | |
Credit contracts | | | — | | | | — | | | | (105 | ) | | | (105 | ) |
Foreign exchange contracts | | | — | | | | 20,987 | | | | — | | | | 20,987 | |
| | | | | | | | | | | | | | | | |
Total | | $ | 6,364 | | | $ | 20,987 | | | $ | (105 | ) | | $ | 27,246 | |
| | | | | | | | | | | | | | | | |
The Fund’s derivatives contracts held at August 31, 2018 are not accounted for as hedging instruments under GAAP.
Derivatives Volume — The table below discloses the volume of the Fund’s futures contracts, forward foreign currency exchange contracts and swaps activity during the year ended August 31, 2018 (amounts in thousands, except number of contracts). Please refer to the tables in the Summary of Derivatives Information for derivative-related gains and losses associated with volume activity.
| | | | |
Futures Contracts — Interest: | | | | |
Average Notional Balance Long | | $ | 232,988 | |
Average Notional Balance Short | | | 1,600,008 | |
Ending Notional Balance Long | | | 240,167 | |
Ending Notional Balance Short | | | 1,552,887 | |
| |
Forward Foreign Currency Exchange Contracts: | | | | |
Average Settlement Value Purchased | | | 328,432 | |
Average Settlement Value Sold | | | 1,113,255 | |
Ending Settlement Value Purchased | | | 991,397 | |
Ending Settlement Value Sold | | | 1,901,122 | |
| |
Credit Default Swaps: | | | | |
Average Notional Balance — Buy Protection | | | 8,500 | (a) |
Ending Notional Balance — Buy Protection | | | 8,500 | |
| (a) | For the period July 1, 2018 through August 31, 2018. |
G. When-Issued Securities, Delayed Delivery Securities and Forward Commitments — The Fund purchased when-issued securities, including To Be Announced (“TBA”) securities, and entered into contracts to purchase or sell securities for a fixed price that may be settled a month or more after the trade date, or purchased delayed delivery securities which generally settle seven days after the trade date. When-issued securities are securities that have been authorized, but not issued in the market. A forward commitment involves entering into a contract to purchase or sell securities for a fixed price at a future date that may be settled a month or more after the trade date. A delayed delivery security is agreed upon in advance between the buyer and the seller of the security and is generally delivered beyond seven days of the agreed upon date. The purchase of securities on a when-issued, delayed delivery or forward commitment basis involves the risk that the value of the security to be purchased declines before settlement date. The sale of securities on a forward commitment basis involves the risk that the value of the securities sold may increase before the settlement date. The Fund may be exposed to credit risk if the counterparty fails to perform under the terms of the transaction. Interest income for securities purchased on a when-issued, delayed delivery or forward commitment basis is not accrued until settlement date.
H. Foreign Currency Translation — The books and records of the Fund are maintained in U.S. dollars. Foreign currency amounts are translated into U.S. dollars at the prevailing exchange rates of such currencies against the U.S. dollar. The market value of investment securities and other assets
| | | | | | |
| | | |
| 60 | | | | J.P. MORGAN INCOME FUNDS | | AUGUST 31, 2018 |
and liabilities are translated at the exchange rate as of the valuation date. Purchases and sales of investment securities, income and expenses are translated at the exchange rate prevailing on the respective dates of such transactions.
The Fund does not isolate the effect of changes in foreign exchange rates from changes in market prices on securities held. Accordingly, such changes are included within Change in net unrealized appreciation/depreciation on investments on the Statement of Operations.
Reported realized foreign currency gains and losses arise from the disposition of foreign currency, currency gains or losses realized between the trade and settlement dates on securities transactions, and the difference between the amounts of dividends, interest and foreign withholding taxes recorded on the Fund’s books on the transaction date and the U.S. dollar equivalent of the amounts actually received or paid. These reported realized foreign currency gains and losses are included in Net realized gain (loss) on foreign currency transactions on the Statement of Operations. Unrealized foreign currency gains and losses arise from changes (due to changes in exchange rates) in the value of foreign currency and other assets and liabilities denominated in foreign currencies, which are held at period end and are included in Change in net unrealized appreciation/depreciation on foreign currency translations on the Statement of Operations.
I. Security Transactions and Investment Income — Investment transactions are accounted for on the trade date (the date the order to buy or sell is executed). Securities gains and losses are calculated on a specifically identified cost basis. Interest income is determined on the basis of coupon interest accrued using the effective interest method which adjusts for amortization of premiums and accretion of discounts. Dividend income, net of foreign taxes withheld, if any, is recorded on the ex-dividend date or when the Fund first learns of the dividend. Certain Funds may receive other income from investment in loan assignments and/or unfunded commitments, including amendment fees, consent fees and commitment fees. These fees are recorded as income when received by the Fund. These amounts are included in Interest income from non-affiliates on the Statement of Operations.
J. Allocation of Income and Expenses — Expenses directly attributable to a fund are charged directly to that fund, while the expenses attributable to more than one fund of the Trust are allocated among the respective funds. In calculating the NAV of each class, investment income, realized and unrealized gains and losses and expenses, other than class-specific expenses, are allocated daily to each class of shares based upon the proportion of net assets of each class at the beginning of each day.
Transfer agency fees are class-specific expenses. The amount of the transfer agency fees charged to each class of the Fund for the year ended August 31, 2018 are as follows (amounts in thousands):
| | | | | | | | | | | | | | | | | | | | |
| | | Class A | | | Class C | | | Class I | | | Class R6 | | | Total | |
Transfer agency fees | | $ | 15 | | | $ | 5 | | | $ | 40 | | | $ | 10 | | | $ | 70 | |
K. Federal Income Taxes — The Fund is treated as a separate taxable entity for Federal income tax purposes. The Fund’s policy is to comply with the provisions of the Internal Revenue Code (the “Code”), applicable to regulated investment companies and to distribute to shareholders all of its distributable net investment income and net realized capital gains on investments. Accordingly, no provision for Federal income tax is necessary. Management has reviewed the Fund’s tax positions for all open tax years and has determined that as of August 31, 2018, no liability for income tax is required in the Fund’s financial statements for net unrecognized tax benefits. However, management’s conclusions may be subject to future review based on changes in, or the interpretation of, the accounting standards or tax laws and regulations. The Fund’s Federal tax returns for the prior three fiscal years remain subject to examination by the Internal Revenue Service.
L. Foreign Taxes — The Fund may be subject to foreign taxes on income, gains on investments or currency purchases/repatriation, a portion of which may be recoverable. The Fund will accrue such taxes and recoveries as applicable, based upon its current interpretation of tax rules and regulations that exist in the markets in which it invests.
M. Distributions to Shareholders — Distributions from net investment income, if any, are generally declared and paid monthly and are declared separately for each class. No class has preferential dividend rights; differences in per share rates are due to differences in separate class expenses. Net realized capital gains, if any, are distributed by the Fund at least annually. The amount of distributions from net investment income and net realized capital gains is determined in accordance with Federal income tax regulations, which may differ from GAAP. To the extent these “book/tax” differences are permanent in nature (i.e., that they result from other than timing of recognition — “temporary differences”), such amounts are reclassified within the capital accounts based on their Federal tax-basis treatment.
The following amounts were reclassified within the capital accounts (amounts in thousands):
| | | | | | | | | | |
| | | Paid-in-Capital | | Accumulated
undistributed
(distributions
in excess of)
net investment
income | | | Accumulated
net realized
gains (losses) | |
| | $14 | | $ | 19,910 | | | $ | (19,924 | ) |
The reclassifications for the Fund relate primarily to foreign currency gains or losses.
3. Fees and Other Transactions with Affiliates
A. Investment Advisory Fee — Pursuant to an Investment Advisory Agreement, the Adviser supervises the investments of the Fund and for such services is paid a fee. The fee is accrued daily and paid monthly at an annual rate of 0.55% of the Fund’s average daily net assets.
| | | | | | | | |
| | | |
| AUGUST 31, 2018 | | J.P. MORGAN INCOME FUNDS | | | | | 61 | |
NOTES TO FINANCIAL STATEMENTS
AS OF AUGUST 31, 2018 (continued)
The Adviser waived Investment Advisory fees and/or reimbursed expenses as outlined in Note 3.G.
B. Administration Fee — Pursuant to an Administration Agreement, the Administrator provides certain administration services to the Fund. In consideration of these services, the Administrator receives a fee accrued daily and paid monthly at an annual rate of 0.15% of the first $25 billion of the average daily net assets of all funds in the J.P. Morgan Funds Complex covered by the Administration Agreement (excluding certain funds of funds and money market funds) and 0.075% of the average daily net assets in excess of $25 billion of all such funds. For the year ended August 31, 2018, the effective annualized rate was 0.08% of the Fund’s average daily net assets, notwithstanding any fee waivers and/or expense reimbursements.
The Administrator waived Administration fees as outlined in Note 3.G.
JPMorgan Chase Bank, N.A. (“JPMCB”), a wholly-owned subsidiary of JPMorgan, serves as the Fund’s sub-administrator (the “Sub-administrator”). For its services as Sub-administrator, JPMCB receives a portion of the fees payable to the Administrator.
C. Distribution Fees — Pursuant to a Distribution Agreement, JPMorgan Distribution Services, Inc. (“JPMDS”), an indirect, wholly-owned subsidiary of JPMorgan, serves as the Trust’s principal underwriter and promotes and arranges for the sale of the Fund’s shares. The Board has adopted a Distribution Plan (the “Distribution Plan”) for Class A and Class C Shares of the Fund in accordance with Rule 12b-1 under the 1940 Act. Class I and Class R6 do not charge a distribution fee. The Distribution Plan provides that the Fund shall pay distribution fees, including payments to JPMDS, at annual rates of 0.25% and 0.75% of the average daily net assets of Class A and Class C Shares, respectively.
In addition, JPMDS is entitled to receive the front-end sales charges from purchases of Class A Shares and the CDSC from redemptions of Class C Shares and certain Class A Shares for which front-end sales charges have been waived. For the year ended August 31, 2018, JPMDS retained the following amounts (in thousands):
| | | | | | |
| | | Front-End Sales Charge | | CDSC | |
| | $29 | | $ | — | |
D. Service Fees — The Trust, on behalf of the Fund, has entered into a Shareholder Servicing Agreement with JPMDS under which JPMDS provides certain support services to the shareholders. For performing these services, JPMDS receives a fee, except for Class R6 Shares which do not charge a service fee, that is accrued daily and paid monthly at an annual rate of 0.25% of the average daily net assets of Class A, Class C and Class I Shares.
JPMDS has entered into shareholder services contracts with affiliated and unaffiliated financial intermediaries who provide shareholder services and other related services to their clients or customers who invest in the Fund under which JPMDS will pay all or a portion of such fees earned to financial intermediaries for performing such services.
JPMDS waived service fees as outlined in Note 3.G.
E. Custodian and Accounting Fees — JPMCB provides portfolio custody and accounting services to the Fund. For performing these services, the Fund pays JPMCB transaction and asset-based fees that vary according to the number of transactions and positions, plus out-of-pocket expenses. The amounts paid directly to JPMCB by the Fund for custody and accounting services are included in Custodian and accounting fees on the Statement of Operations. Interest income earned on cash balances at the custodian, if any, is included in Interest income from affiliates on the Statement of Operations. Prior to March 1, 2018, payments to the custodian were reduced by credits earned by the Fund, based on uninvested cash balances held by the custodian. Such earnings credits, if any, are presented separately on the Statement of Operations.
Interest income earned on cash balances at the custodian, if any, is included in Interest income from affiliates on the Statement of Operations.
Interest expense paid to the custodian related to cash overdrafts, if any, is included in Interest expense to affiliates on the Statement of Operations.
F. Collateral Management Fees — JPMCB provides derivatives collateral management services for the Fund. The amounts paid directly to JPMCB by the Fund for these services are included in Collateral management fees on the Statement of Operations.
G. Waivers and Reimbursements — The Adviser, Administrator and/or JPMDS have contractually agreed to waive fees and/or reimburse the Fund to the extent that total annual operating expenses (excluding acquired fund fees and expenses other than certain money market fund fees as described below, dividend expenses related to short sales, interest expenses related to short sales, interest, taxes, expenses related to litigation and potential litigation and extraordinary expenses) exceed the percentages of the Fund’s average daily net assets as shown in the table below:
| | | | | | | | | | | | | | | | |
| | | Class A | | | Class C | | | Class I | | | Class R6 | |
| | | 0.90 | % | | | 1.30 | % | | | 0.65 | % | | | 0.50 | % |
The expense limitation agreement was in effect for the year ended August 31, 2018 and is in place until at least December 31, 2018.
For the year ended August 31, 2018, the Fund’s service providers waived fees and/or reimbursed expenses for the Fund as follows (amounts in thousands). None of these parties expect the Fund to repay any such waived fees and/or reimbursed expenses in future years.
| | | | | | | | | | | | | | | | |
| | | Contractual Waivers | |
| | | Investment Advisory
Fees | | | Administration
Fees | | | Service
Fees | | | Total | |
| | $ | 3,110 | | | $ | 1,979 | | | $ | 2,429 | | | $ | 7,518 | |
| | | | | | |
| | | |
| 62 | | | | J.P. MORGAN INCOME FUNDS | | AUGUST 31, 2018 |
Additionally, the Fund may invest in one or more money market funds advised by the Adviser or its affiliates (affiliated money market funds). The Adviser, Administrator and/or JPMDS, as shareholder servicing agent, have contractually agreed to waive fees and/or reimburse expenses in an amount sufficient to offset the respective net fees each collects from the affiliated money market fund on the Fund’s investment in such affiliated money market fund.
The amount of waivers/reimbursements resulting from investments in these money market funds for the year ended August 31, 2018 was approximately $229,000.
H. Other — Certain officers of the Trust are affiliated with the Adviser, the Administrator and JPMDS. Such officers, with the exception of the Chief Compliance Officer, receive no compensation from the Fund for serving in their respective roles.
The Board appointed a Chief Compliance Officer to the Fund in accordance with Federal securities regulations. The Fund, along with other affiliated funds, makes reimbursement payments, on a pro-rata basis, to the Administrator for a portion of the fees associated with the Office of the Chief Compliance Officer. Such fees are included in Trustees’ and Chief Compliance Officer’s fees on the Statement of Operations.
The Trust adopted a Trustee Deferred Compensation Plan (the “Plan”) which allows the Independent Trustees to defer the receipt of all or a portion of compensation related to performance of their duties as Trustees. The deferred fees are invested in various J.P. Morgan Funds until distribution in accordance with the Plan.
During the year ended August 31, 2018, the Fund purchased securities from an underwriting syndicate in which the principal underwriter or members of the syndicate were affiliated with the Adviser.
The Fund may use related party broker-dealers. For the year ended August 31, 2018, the Fund did not incur any brokerage commissions with broker-dealers affiliated with the Adviser.
The Securities and Exchange Commission (“SEC”) has granted an exemptive order permitting the Fund to engage in principal transactions with J.P. Morgan Securities, Inc., an affiliated broker, involving taxable money market instruments, subject to certain conditions.
4. Investment Transactions
During the year ended August 31, 2018, purchases and sales of investments (excluding short-term investments) were as follows (amounts in thousands):
| | | | | | |
| | | Purchases
(excluding U.S.
Government) | | Sales
(excluding U.S.
Government) | |
| | $2,770,562 | | $ | 1,971,041 | |
During the year ended August 31, 2018, there were no purchases or sales of U.S. Government securities.
5. Federal Income Tax Matters
For Federal income tax purposes, the estimated cost and unrealized appreciation (depreciation) in value of investments held at August 31, 2018 were as follows (amounts in thousands):
| | | | | | | | | | | | | | | | |
| | | Aggregate
Cost | | | Gross
Unrealized
Appreciation | | | Gross
Unrealized
Depreciation | | | Net Unrealized
Appreciation
(Depreciation) | |
| | $ | 3,052,785 | | | $ | 57,488 | | | $ | 125,718 | | | $ | (68,230 | ) |
The difference between book and tax basis appreciation (depreciation) on investments is primarily attributed to wash sale loss deferrals, mark to market of futures contracts and forward foreign currency exchange contracts.
The tax character of distributions paid during the year ended August 31, 2018 was as follows (amounts in thousands):
| | | | | | | | | | | | |
| | | Ordinary
Income* | | | Net
Long-Term
Capital Gains | | | Total
Distributions Paid | |
| | $ | 96,666 | | | $ | — | | | $ | 96,666 | |
| * | Short-term gain distributions are treated as ordinary income for income tax purposes. |
The tax character of distributions paid during the year ended August 31, 2017 was as follows (amounts in thousands):
| | | | | | | | | | | | |
| | | Ordinary
Income* | | | Net
Long-Term
Capital Gains | | | Total
Distributions Paid | |
| | $ | 79,978 | | | $ | — | | | $ | 79,978 | |
| * | Short-term gain distributions are treated as ordinary income for income tax purposes. |
| | | | | | | | |
| | | |
| AUGUST 31, 2018 | | J.P. MORGAN INCOME FUNDS | | | | | 63 | |
NOTES TO FINANCIAL STATEMENTS
AS OF AUGUST 31, 2018 (continued)
As of August 31, 2018, the estimated components of net assets (excluding paid-in-capital) on a tax basis were as follows (amounts in thousands):
| | | | | | | | | | | | |
| | | Current
Distributable
Ordinary
Income | | | Current
Distributable
Long-Term
Capital Gain or
(Tax Basis Capital
Loss Carryover) | | | Unrealized
Appreciation
(Depreciation) | |
| | $ | 12,046 | | | $ | (24,878 | ) | | $ | (72,083 | ) |
The cumulative timing differences primarily consist of post-October capital loss deferrals, mark to market of forward foreign currency exchange contracts, mark to market of futures contracts, straddle loss deferrals and wash sale loss deferrals.
As of August 31, 2018, the Fund had net capital loss carryforwards as follows (amounts in thousands):
| | | | | | | | |
| | | Capital Loss Carryforward Character | |
| | | Short-Term | | | Long-Term | |
| | $ | 11,031 | | | $ | 13,847 | |
Net capital losses incurred after October 31, and within the taxable year are deemed to arise on the first business day of the Funds’ next taxable year. For the year ended August 31, 2018, the Fund deferred to September 1, 2018 the following net capital losses of (amounts in thousands):
| | | | | | | | |
| | | Net Capital Losses (Gains) | |
| | | Short-Term | | | Long-Term | |
| | $ | 10,000 | | | $ | (471 | ) |
During the year ended August 31, 2018, the Fund utilized capital loss carryforwards as follows (amounts in thousands):
| | | | |
| | | Capital Loss Utilized | |
| | | Short-Term | |
| | $ | 3,375 | |
6. Borrowings
The Fund relies upon an exemptive order granted by the SEC (the “Order”) permitting the establishment and operation of an Interfund Lending Facility (the “Facility”). The Facility allows the Fund to directly lend and borrow money to or from any other fund relying upon the Order at rates beneficial to both the borrowing and lending funds. Advances under the Facility are taken primarily for temporary or emergency purposes, including the meeting of redemption requests that otherwise might require the untimely disposition of securities, and are subject to the Fund’s borrowing restrictions. The Interfund loan rate is determined, as specified in the Order, by averaging the current repurchase agreement rate and the current bank loan rate. The Order was granted to JPMorgan Trust II and may be relied upon by the Fund because the Fund and the series of JPMorgan Trust II are both investment companies in the same “group of investment companies” (as defined in Section 12(d)(1)(G) of the 1940 Act).
The Trust and JPMCB have entered into a financing arrangement. Under this arrangement, JPMCB provides an unsecured, uncommitted credit facility in the aggregate amount of $100 million to certain of the J.P. Morgan Funds, including the Fund. Advances under the arrangement are taken primarily for temporary or emergency purposes, including the meeting of redemption requests that otherwise might require the untimely disposition of securities, and are subject to the Fund’s borrowing restrictions. Interest on borrowings is payable at a rate determined by JPMCB at the time of borrowing. This agreement has been extended until November 5, 2018.
The Fund had no borrowings outstanding from another fund or from the unsecured, uncommitted credit facility during the year ended August 31, 2018.
The Trust, along with certain other trusts (“Borrowers”), has entered into a joint syndicated senior unsecured revolving credit facility totaling $1.5 billion (“Credit Facility”) with various lenders and The Bank of New York Mellon, as administrative agent for the lenders. This Credit Facility provides a source of funds to the Borrowers for temporary and emergency purposes, including the meeting of redemption requests that otherwise might require the untimely disposition of securities. Under the terms of the Credit Facility, a borrowing fund must have a minimum of $25,000,000 in adjusted net asset value and not exceed certain adjusted net asset coverage ratios prior to and during the time in which any borrowings are outstanding. If a fund does not comply with the aforementioned requirements, the fund must remediate within three business days with respect to the $25,000,000 minimum adjusted net asset value or within one business day with respect to certain asset coverage ratios or the administrative agent at the request of, or with the consent of, the lenders may terminate the Credit Facility and declare any outstanding borrowings to be due and payable immediately.
Interest associated with any borrowing under the Credit Facility is charged to the borrowing fund at a rate of interest equal to 1.00% plus the greater of the federal funds effective rate or one month LIBOR. The annual commitment fee to maintain the Credit Facility is 0.15% and is incurred on the unused portion of the Credit Facility and is allocated to all participating funds pro rata based on their respective net assets. Effective August 14, 2018, this agreement has been amended and restated for a term of 364 days, unless extended.
The Fund did not utilize the Credit Facility during the year ended August 31, 2018.
| | | | | | |
| | | |
| 64 | | | | J.P. MORGAN INCOME FUNDS | | AUGUST 31, 2018 |
7. Risks, Concentrations and Indemnifications
In the normal course of business, the Fund enters into contracts that contain a variety of representations which provide general indemnifications. The Fund’s maximum exposure under these arrangements is unknown. The amount of exposure would depend on future claims that may be brought against the Fund. However, based on experience, the Fund expects the risk of loss to be remote.
As of August 31, 2018, the Fund had four affiliated omnibus accounts and three non-affiliated omnibus accounts, which owned 31.7% and 10.7% of the Fund’s outstanding shares, respectively.
The Fund may have elements of risk not typically associated with investments in the United States of America due to concentrated investments in a limited number of countries or regions, which may vary throughout the period. Such concentrations may subject the Fund to additional risks resulting from political or economic conditions in such countries or regions and the possible imposition of adverse governmental laws or currency exchange restrictions could cause the securities and their markets to be less liquid and their prices to be more volatile than those of comparable U.S. securities.
As of August 31, 2018, a significant portion of the Fund’s investments consisted of securities that were denominated in foreign currencies. Changes in currency exchange rates will affect the value of, and investment income from, such securities.
The Fund invests in debt securities that have preferred stock characteristics. These characteristics include provisions that permit the issuer, in its discretion, to defer or omit distributions for a certain period of time.
The Fund is subject to interest rate and credit risk. The value of debt securities may decline as interest rates increase. The Fund could lose money if the issuer of a fixed income security is unable to pay interest or repay principal when it is due. The Fund invests in floating rate loans and other floating rate debt securities. Although these investments are generally less sensitive to interest rate changes than other fixed rate instruments, the value of floating rate loans and other floating rate investments may decline if their interest rates do not rise as quickly, or as much, as general interest rates. Many factors can cause interest rates to rise. Some examples include central bank monetary policy, rising inflation rates and general economic conditions. Given that the Federal Reserve has been raising interest rates and may continue to do so, the Fund may face a heightened level of interest rate risk. The ability of the issuers of debt to meet their obligations may be affected by the economic and political developments in a specific industry or region.
Derivatives may be riskier than other types of investments because they may be more sensitive to changes in economic and market conditions and could result in losses that significantly exceed the Fund’s original investment. Many derivatives create leverage thereby causing the Fund to be more volatile than they would have been if it had not used derivatives. Derivatives also expose the Fund to counterparty risk (the risk that the derivative counterparty will not fulfill its contractual obligations), including credit risk of the derivative counterparty.
The Fund is also subject to counterparty credit risk, which is the risk that a counterparty fails to perform on agreements with the Fund such as forward foreign currency exchange contracts and TBA securities.
The Fund is subject to risks associated with securities with contractual cash flows including asset-backed and mortgage-related securities such as collateralized mortgage obligations, mortgage pass-through securities and commercial mortgage-backed securities, including securities backed by sub-prime mortgage loans. The value, liquidity and related income of these securities are sensitive to changes in economic conditions, including real estate value, prepayments, delinquencies and/or defaults, and may be adversely affected by shifts in the market’s perception of the issuers and changes in interest rates.
The Fund invests in high yield securities that are not rated or rated below investment grade (commonly known as “junk bonds”). These securities are considered to be high risk investments. Investments in lower-rated securities or unrated securities of comparable quality tend to be more sensitive to economic conditions than higher rated securities. Junk bonds involve a greater risk of default by the issuer because such securities are generally unsecured and are often subordinated to other creditors’ claims. The market price of these securities can change suddenly and unexpectedly. As a result, the Fund is intended for investors who are able and willing to assume a high degree of risk.
The Fund’s investments in sovereign and corporate debt obligations within emerging market countries may be subject to potentially higher risks than investments in more developed markets and the prices of such investments may be volatile. The yields of emerging market debt obligations reflect, among other things, perceived credit risk. The consequences of political, social or economic instability in these markets may have disruptive effects on the market prices of the Fund’s investments and the income they generate, as well as the Fund’s ability to repatriate such amounts.
8. New Accounting Pronouncements
In March 2017, the Financial Accounting Standards Board (“FASB”) issued Accounting Standards Update (“ASU”) 2017-08 (“ASU 2017-08”) Premium Amortization on Purchased Callable Debt Securities, which shortens the premium amortization period for purchased non-contingently callable debt securities. ASU 2017-08 requires that the premium be amortized to the earliest call date, for purchased non-contingently callable debt securities. ASU 2017-08 is effective for the fiscal years, and interim periods within those fiscal years, beginning after December 15, 2018. Management is currently evaluating the implications of these changes on the financial statements, if any.
In August 2018, the FASB issued ASU 2018-13 Fair Value Measurement (Topic 820): Disclosure Framework — Changes to the Disclosure Requirements for Fair Value Measurement, which adds, removes, and modifies certain aspects of the fair value disclosure. ASU 2018-13 amendments are the result of a broader disclosure project, FASB Concepts Statement Conceptual Framework for Financial Reporting — Chapter 8: Notes to Financial Statements, to improve the effectiveness of the fair value disclosure requirements. ASU 2018-13 is effective for the fiscal years, and interim periods within those fiscal years, beginning after December 15, 2019; early adoption is permitted. Management is currently evaluating the implications of these changes.
9. Subsequent Event
Effective October 5, 2018, the Fund may engage in securities lending to broker dealers or other financial institutions approved by the Fund. Citibank N.A. serves as lending agent for the Fund.
| | | | | | | | |
| | | |
| AUGUST 31, 2018 | | J.P. MORGAN INCOME FUNDS | | | | | 65 | |
REPORT OF INDEPENDENT REGISTERED PUBLIC ACCOUNTING FIRM
To the Board of Trustees of JPMorgan Trust I and Shareholders of JPMorgan Global Bond Opportunities Fund
Opinion on the Financial Statements
We have audited the accompanying statement of assets and liabilities, including the schedule of portfolio investments, of JPMorgan Global Bond Opportunities Fund (one of the funds constituting JPMorgan Trust I, referred to hereafter as the “Fund”) as of August 31, 2018, the related statement of operations for the year ended August 31, 2018, the statements of changes in net assets for each of the two years in the period ended August 31, 2018, including the related notes, and the financial highlights for each of the five years in the period ended August 31, 2018 (collectively referred to as the “financial statements”). In our opinion, the financial statements present fairly, in all material respects, the financial position of the Fund as of August 31, 2018, the results of its operations for the year then ended, the changes in its net assets for each of the two years in the period ended August 31, 2018 and the financial highlights for each of the five years in the period ended August 31, 2018 in conformity with accounting principles generally accepted in the United States of America.
Basis for Opinion
These financial statements are the responsibility of the Fund’s management. Our responsibility is to express an opinion on the Fund’s financial statements based on our audits. We are a public accounting firm registered with the Public Company Accounting Oversight Board (United States) (“PCAOB”) and are required to be independent with respect to the Fund in accordance with the U.S. federal securities laws and the applicable rules and regulations of the Securities and Exchange Commission and the PCAOB.
We conducted our audits of these financial statements in accordance with the standards of the PCAOB. Those standards require that we plan and perform the audit to obtain reasonable assurance about whether the financial statements are free of material misstatement, whether due to error or fraud.
Our audits included performing procedures to assess the risks of material misstatement of the financial statements, whether due to error or fraud, and performing procedures that respond to those risks. Such procedures included examining, on a test basis, evidence regarding the amounts and disclosures in the financial statements. Our audits also included evaluating the accounting principles used and significant estimates made by management, as well as evaluating the overall presentation of the financial statements. Our procedures included physical inspection of securities owned as of August 31, 2018 and held by the custodian and confirmation of securities owned as of August 31, 2018 by correspondence with the custodian, transfer agent, agent banks and brokers; when replies were not received from agent banks and brokers, we performed other auditing procedures. We believe that our audits provide a reasonable basis for our opinion.
/s/PricewaterhouseCoopers LLP
New York, New York
October 29, 2018
We have served as the auditor of one or more investment companies in JPMorgan Funds complex since 1993.
| | | | | | |
| | | |
| 66 | | | | J.P. MORGAN INCOME FUNDS | | AUGUST 31, 2018 |
TRUSTEES
(Unaudited)
The Fund’s Statement of Additional Information includes additional information about the Fund’s Trustees and is available, without charge, upon request by calling 1-800-480-4111 or on the J.P. Morgan Funds’ website at www.jpmorganfunds.com.
| | | | | | |
Name (Year of Birth); Positions With the Fund (1) | | Principal Occupation During Past 5 Years | | Number of
Funds in Fund
Complex Overseen
by Trustee (2) | | Other Directorships Held During the Past 5 Years |
Independent Trustees | | |
| | | |
| John F. Finn (1947); Trustee of Trust since 2005; Trustee of heritage One Group Mutual Funds since 1998. | | Chairman (1985-present), Chief Executive Officer, Gardner, Inc. (supply chain management company serving industrial and consumer markets) (1974-present). | | 136 | | Director, Greif, Inc. (GEF) (industrial package products and services) (2007-present); Trustee, Columbus Association for the Performing Arts (1988-present); Director, Cardinal Health, Inc. (CAH) (1994-2014). |
| | | |
| Stephen P. Fisher (1959); Trustee of Trust since 2018. | | Retired; Chairman and Chief Executive Officer (2014-2017), President and Chief Operating Officer, NYLIFE Distributors LLC (registered broker-dealer) (2008-2013); Chairman, NYLIM Service Company LLC (transfer agent) (2008-2017); President (2015-2017), Co-President (2014-2015) and Senior Managing Director, New York Life Investment Management LLC (registered investment adviser) (2005-2017); Chairman, IndexIQ Advisors LLC (registered investment adviser for ETFs) (2014-2017); President, MainStay VP Funds Trust (formerly MainStay VP Series Fund, Inc.) (registered investment companies) (2007-2017); President, MainStay DefinedTerm Municipal Opportunities Fund (registered investment company) (2011-2017); President, MainStay Funds Trust (registered investment companies) (2009-2017); President, The MainStay Funds (registered investment companies) (2007-2017). | | 136 | | Advisory Board Member, Scholarship Committee Member and Investment Committee Member, The First Tee of Plainfield (non-profit youth sports organization that provides need-based scholarships) (2014-present); Honors Program Advisory Board Member, The Zicklin School of Business, Baruch College, The City University of New York (2017-present). |
| | | |
| Dr. Matthew Goldstein (1941); Chairman since 2013; Trustee of Trust since 2005; Trustee of heritage J.P. Morgan Funds since 2003. | | Chancellor Emeritus, City University of New York (2015-present); Professor, City University of New York (2013-present); Chancellor, City University of New York (1999-2013); President, Adelphi University (New York) (1998-1999). | | 136 | | Trustee, Museum of Jewish Heritage (2011-present); Trustee, National Museum of Mathematics (present); Chair, Association of College and University Administrators (present). |
| | | |
| Dennis P. Harrington* (1950); Trustee of Trust since 2017. | | Retired; Partner, Deloitte LLP (1984-2012). | | 136 | | None |
| | | |
| Frankie D. Hughes (1952); Trustee of Trust since 2008. | | President, Ashland Hughes Properties (property management) (2014-present); President and Chief Investment Officer, Hughes Capital Management, Inc. (fixed income asset management) (1993-2014). | | 136 | | None |
| | | |
Raymond Kanner** (1953); Trustee of Trust since 2017. | | Retired; Managing Director & Chief Investment Officer, IBM Retirement Funds (2007-2016). | | 136 | | Director, Emerging Markets Growth Fund (1997-2016); Acting Executive Director, Committee on Investment of Employee Benefit Assets (CIEBA), 2016-2017; Advisory Board Member, Betterment for Business (2016-2017) (robo advisor); Advisory Board Member, Blue Star Indexes (2013-2017) (index creator); Member, Russell Index Client Advisory Board (2001-2015); Advisory Board Member, State Street Global Advisors’ OCIO Board (2017-present). |
| | | | | | | | |
| | | |
| AUGUST 31, 2018 | | J.P. MORGAN INCOME FUNDS | | | | | 67 | |
TRUSTEES
(Unaudited) (continued)
| | | | | | |
Name (Year of Birth); Positions With the Fund (1) | | Principal Occupation During Past 5 Years | | Number of
Funds in Fund
Complex Overseen
by Trustee (2) | | Other Directorships Held During the Past 5 Years |
Independent Trustees (continued) | | |
| | | |
| Peter C. Marshall (1942); Trustee of Trust since 2005; Trustee of heritage One Group Mutual Funds since 1985. | | Self-employed business consultant
(2002-present). | | 136 | | None |
| | | |
| Mary E. Martinez (1960); Trustee of Trust since 2013. | | Associate, Special Properties, a Christie’s International Real Estate Affiliate (2010-present); Managing Director, Bank of America (Asset Management) (2007-2008); Chief Operating Officer, U.S. Trust Asset Management, U.S. Trust Company (asset management) (2003-2007); President, Excelsior Funds (registered investment companies) (2004-2005). | | 136 | | None |
| | | |
| Marilyn McCoy (1948); Trustee of Trust since 2005; Trustee of heritage One Group Mutual Funds since 1999. | | Vice President of Administration and Planning, Northwestern University (1985-present). | | 136 | | None |
| | | |
| Mitchell M. Merin (1953); Trustee of Trust since 2013. | | Retired; President and Chief Operating Officer, Morgan Stanley Investment Management, Member Morgan Stanley & Co. Management Committee (registered investment adviser) (1985-2005). | | 136 | | Director, Sun Life Financial (SLF) (2007-2013) (financial services and insurance). |
| | | |
| Dr. Robert A. Oden, Jr. (1946); Trustee of Trust since 2005; Trustee of heritage One Group Mutual Funds since 1997. | | Retired; President, Carleton College (2002-2010); President, Kenyon College (1995-2002). | | 136 | | Vice Chair, Dartmouth-Hitchcock Medical Center (2011-present); Trustee, American University in Cairo (1999-2014); Trustee, American Museum of Fly Fishing (2013-present); Trustee, Trout Unlimited (2017-present). |
| | | |
| Marian U. Pardo*** (1946); Trustee of Trust since 2013. | | Managing Director and Founder, Virtual Capital Management LLC (Investment Consulting) (2007-present); Managing Director, Credit Suisse Asset Management (portfolio manager) (2003-2006). | | 136 | | Member, Board of Governors, Columbus Citizens Foundation (not-for-profit supporting philanthropic and cultural programs) (2006-present). |
| | | |
| James J. Schonbachler (1943); Trustee of Trust since 2005; Trustee of heritage J.P. Morgan Funds since 2001. | | Retired; Managing Director of Bankers Trust Company (financial services) (1968-1998). | | 136 | | None |
| (1) | The Trustees serve for an indefinite term, subject to the Trust’s current retirement policy, which is age 78 for all Trustees. |
| (2) | A Fund Complex means two or more registered investment companies that hold themselves out to investors as related companies for purposes of investment and investor services or have a common investment adviser or have an investment adviser that is an affiliated person of the investment adviser of any of the other registered investment companies. The J.P. Morgan Funds Complex for which the Board of Trustees serves currently includes eleven registered investment companies (136 funds). |
| | | | | | |
| | | |
| 68 | | | | J.P. MORGAN INCOME FUNDS | | AUGUST 31, 2018 |
| * | Two family members of Mr. Harrington are partner and managing director, respectively, of the Fund’s independent registered public accounting firm. Such firm has represented to the Board that those family members are not involved in the audit of the Fund’s financial statements and do not provide other services to the Fund. The Board has concluded that such association does not interfere with Mr. Harrington’s exercise of independent judgment as an Independent Trustee. |
| ** | A family member of Mr. Kanner is employed by JPMorgan Chase Bank, which is affiliated with JPMIM and JPMDS. In that capacity, this employee provides services to various JPMorgan affiliates including JPMIM and JPMDS and for which JPMIM and JPMDS bear some portion of the expense thereof. |
| *** | In connection with prior employment with JPMorgan Chase, Ms. Pardo was the recipient of non-qualified pension plan payments from JPMorgan Chase in the amount of approximately $2,055 per month, which she irrevocably waived effective January 1, 2013, and deferred compensation payments from JPMorgan Chase in the amount of approximately $7,294 per year, which ended in January 2013. In addition, Ms. Pardo receives payments from a fully-funded qualified plan, which is not an obligation of JPMorgan Chase. |
The contact address for each of the Trustees is 270 Park Avenue, New York, NY 10017.
| | | | | | | | |
| | | |
| AUGUST 31, 2018 | | J.P. MORGAN INCOME FUNDS | | | | | 69 | |
OFFICERS
(Unaudited)
| | |
Name (Year of Birth), Positions Held with the Trust (Since) | | Principal Occupations During Past 5 Years |
| |
Brian S. Shlissel (1964),
President and Principal Executive Officer (2016) | | Managing Director and Chief Administrative Officer for J.P. Morgan pooled vehicles, J.P. Morgan Investment Management Inc. (formerly JPMorgan Funds Management, Inc.) (2014 – present); Managing Director and Head of Mutual Fund Services, Allianz Global Investors; President and Chief Executive Officer, Allianz Global Investors Mutual Funds and PIMCO Closed-End Funds (1999-2014). |
| |
Timothy J. Clemens (1975), Treasurer and Principal Financial Officer (2018)* | | Executive Director, J.P. Morgan Investment Management Inc. (formerly JPMorgan Funds Management, Inc.) since February 2016; Vice President, JPMorgan Funds Management, Inc. from October 2013 to January 2016; Chief Financial Officer and Head of Valuation, Aberdeen Asset Management PLC (previously Artio Global Management) (2009 to September 2013). |
| |
Noah Greenhill (1969),
Secretary (2018) | | Managing Director and General Counsel, JPMorgan Asset Management (2015 – Present); Managing Director and General Counsel, JPMorgan Global Alternative Funds (2012-2015). |
| |
Stephen M. Ungerman (1953),
Chief Compliance Officer (2005) | | Managing Director, JPMorgan Chase & Co.; Mr. Ungerman has been with JPMorgan Chase & Co. since 2000. |
| |
Elizabeth A. Davin (1964), Assistant Secretary (2005)** | | Executive Director and Assistant General Counsel, JPMorgan Chase since February 2012; formerly Vice President and Assistant General Counsel, JPMorgan Chase from 2005 to February 2012; Senior Counsel, JPMorgan Chase (formerly Bank One Corporation) from 2004 to 2005. |
| |
Jessica K. Ditullio (1962),
Assistant Secretary (2005)** | | Executive Director and Assistant General Counsel, JPMorgan Chase. Ms. Ditullio has been with JPMorgan Chase (formerly Bank One Corporation) since 1990. |
| |
Carmine Lekstutis (1980),
Assistant Secretary (2011) | | Executive Director and Assistant General Counsel, JPMorgan Chase since February 2015; formerly Vice President and Assistant General Counsel, JPMorgan Chase from 2011 to February 2015. |
| |
Gregory S. Samuels (1980),
Assistant Secretary (2010) | | Executive Director and Assistant General Counsel, JPMorgan Chase since 2014; formerly Vice President and Assistant General Counsel, JPMorgan Chase from 2010 to February 2014. |
| |
Pamela L. Woodley (1971),
Assistant Secretary (2012) | | Vice President and Assistant General Counsel, JPMorgan Chase since November 2004. |
| |
Zachary E. Vonnegut-Gabovitch (1986), Assistant Secretary (2017) | | Vice President and Assistant General Counsel, JPMorgan Chase since September 2016; Associate, Morgan, Lewis & Bockius (law firm) from 2012 to 2016. |
| |
Michael M. D’Ambrosio (1969),
Assistant Treasurer (2012) | | Managing Director, J.P. Morgan Investment Management Inc. (formerly JPMorgan Funds Management, Inc.) since May 2014; formerly Executive Director, JPMorgan Funds Management, Inc. from 2012 to May 2014. |
| |
Jeffrey D. House (1972), Assistant Treasurer (2017)** | | Vice President, J.P. Morgan Investment Management Inc. (formerly JPMorgan Funds Management, Inc.) since July 2006. |
| |
Lauren A. Paino (1973), Assistant Treasurer (2014)* | | Executive Director, J.P. Morgan Investment Management Inc. (formerly JPMorgan Funds Management, Inc.) since August 2013; formerly Director, Credit Suisse Asset Management from 2000-2013. |
| |
Joseph Parascondola (1963),
Assistant Treasurer (2011)* | | Vice President, J.P. Morgan Investment Management Inc. (formerly JPMorgan Funds Management, Inc.) since August 2006. |
| |
Gillian I. Sands (1969),
Assistant Treasurer (2012)* | | Vice President, J.P. Morgan Investment Management Inc. (formerly JPMorgan Funds Management, Inc.) since September 2012. |
The contact address for each of the officers, unless otherwise noted, is 270 Park Avenue, New York, NY 10017.
| * | The contact address for the officer is 4 New York Plaza, New York, NY 10004. |
| ** | The contact address for the officer is 1111 Polaris Parkway, Columbus, OH 43240. |
| | | | | | |
| | | |
| 70 | | | | J.P. MORGAN INCOME FUNDS | | AUGUST 31, 2018 |
SCHEDULE OF SHAREHOLDER EXPENSES
(Unaudited)
Hypothetical $1,000 Investment
As a shareholder of the Fund, you incur two types of costs: (1) transaction costs, including sales charges (loads) on purchase payments and (2) ongoing costs, including investment advisory fees, administration fees, distribution fees and other Fund expenses. The examples below are intended to help you understand your ongoing costs (in dollars) of investing in the Fund and to compare these ongoing costs with the ongoing costs of investing in other mutual funds. The examples assume that you had a $1,000 investment in each Class at the beginning of the reporting period, March 1, 2018, and continued to hold your shares at the end of the reporting period, August 31, 2018.
Actual Expenses
For each Class of the Fund in the table below, the first line provides information about actual account values and actual expenses. You may use the information in this line, together with the amount you invested, to estimate the expenses that you paid over the period. Simply divide your account value by $1,000 (for example, an $8,600 account value divided by $1,000 = 8.6), then multiply the result by the number in the first line of each Class under the heading entitled “Expenses Paid During the Period” to estimate the expenses you paid on your account during this period.
Hypothetical Example for Comparison Purposes
The second line of each Class in the table below provides information about hypothetical account values and hypothetical expenses based on the Class’ actual expense ratio and an assumed rate of return of 5% per year before expenses, which is not the Class’ actual return. The hypothetical account values and expenses may not be used to estimate the actual ending account balance or expenses you paid for the period. You may use this information to compare the ongoing costs of investing in the Class of the Fund and other funds. To do so, compare this 5% hypothetical example with the 5% hypothetical examples that appear in the shareholder reports of the other funds. Please note that the expenses shown in the table are meant to highlight your ongoing costs only and do not reflect any transaction costs, such as sales charges (loads) or redemption fees. Therefore, the second line for each Class in the table is useful in comparing ongoing costs only, and will not help you determine the relative total costs of owning different funds. In addition, if these transaction costs were included, your costs would have been higher. The examples also assume all dividends and distributions have been reinvested.
| | | | | | | | | | | | | | | | |
| | | Beginning Account Value March 1, 2018 | | | Ending Account Value August 31, 2018 | | | Expenses Paid During
the Period* | | | Annualized Expense Ratio | |
JPMorgan Global Bond Opportunities Fund | | | | | | | | | | | | | | | | |
Class A | | | | | | | | | | | | | | | | |
Actual | | $ | 1,000.00 | | | $ | 992.60 | | | $ | 4.47 | | | | 0.89 | % |
Hypothetical | | | 1,000.00 | | | | 1,020.72 | | | | 4.53 | | | | 0.89 | |
Class C | | | | | | | | | | | | | | | | |
Actual | | | 1,000.00 | | | | 991.60 | | | | 6.48 | | | | 1.29 | |
Hypothetical | | | 1,000.00 | | | | 1,018.70 | | | | 6.56 | | | | 1.29 | |
Class I | | | | | | | | | | | | | | | | |
Actual | | | 1,000.00 | | | | 993.90 | | | | 3.22 | | | | 0.64 | |
Hypothetical | | | 1,000.00 | | | | 1,021.98 | | | | 3.26 | | | | 0.64 | |
Class R6 | | | | | | | | | | | | | | | | |
Actual | | | 1,000.00 | | | | 995.60 | | | | 2.46 | | | | 0.49 | |
Hypothetical | | | 1,000.00 | | | | 1,022.74 | | | | 2.50 | | | | 0.49 | |
| * | Expenses are equal to each Class’ respective annualized expense ratio, multiplied by the average account value over the period, multiplied by 184/365 (to reflect the one-half year period). |
| | | | | | | | |
| | | |
| AUGUST 31, 2018 | | J.P. MORGAN INCOME FUNDS | | | | | 71 | |
BOARD APPROVAL OF INVESTMENT ADVISORY AGREEMENT
(Unaudited)
The Board of Trustees has established various standing committees composed of Trustees with diverse backgrounds, to which the Board of Trustees has assigned specific subject matter responsibilities to further enhance the effectiveness of the Board’s oversight and decision making. The Board of Trustees and its investment committees (money market and alternative products, equity, and fixed income) meet regularly throughout the year and consider factors that are relevant to their annual consideration of investment advisory agreements at each meeting. They also meet for the specific purpose of considering investment advisory agreement annual renewals. The Board of Trustees held meetings in person in June and August 2018, at which the Trustees considered the continuation of the investment advisory agreement for the Fund whose annual report is contained herein (the “Advisory Agreement”). At the June meeting, the Board’s investment committees met to review and consider performance, expense and related information for the J.P. Morgan Funds. Each investment committee reported to the full Board, which then considered the investment committee’s preliminary findings. At the August meeting, the Trustees continued their review and consideration. The Trustees, including a majority of the Trustees who are not “interested persons” (as defined in the 1940 Act) of any party to the Advisory Agreement or any of their affiliates, approved the continuation of the Advisory Agreement on August 15, 2018.
As part of their review of the Advisory Agreement, the Trustees considered and reviewed performance and other information about the Fund received from the Adviser. This information includes the Fund’s performance as compared to the performance of its peers and benchmarks and analyses by the Adviser of the Fund’s performance. In addition, the Trustees have engaged an independent management consulting firm (“independent consultant”) to report on the performance of certain J.P. Morgan Funds at each of the Trustees’ regular meetings. The Adviser also periodically provides comparative information regarding the Fund’s expense ratios and those of its peer groups. In addition, in preparation for the June and August meetings, the Trustees requested, received and evaluated extensive materials from the Adviser, including performance and expense information compiled by Broadridge, using data from Lipper Inc., independent providers of investment company data (together, “Broadridge/Lipper”). The independent consultant also provided additional analyses of the performance of the Fund. Before voting on the Advisory Agreement, the Trustees reviewed the Advisory Agreement with representatives of the Adviser, counsel to the Trust and independent legal counsel and received a memorandum from independent legal counsel to the Trustees discussing the legal standards for their consideration of the proposed Advisory Agreement. The Trustees also discussed the Advisory Agreement in executive sessions with independent legal counsel at which no representatives of the Adviser were present.
A summary of the material factors evaluated by the Trustees in determining whether to approve the Advisory Agreement is provided below.
Each Trustee attributed different weights to the various factors and no factor alone was considered determinative. The Trustees considered information provided with respect to the Fund throughout the year, as well as materials furnished specifically in connection with the annual review process. From year to year, the Trustees consider and place emphasis on relevant information in light of changing circumstances in market and economic conditions. After considering and weighing the factors and information they received, the Trustees found that the compensation to be received by the Adviser from the Fund under the Advisory Agreement was fair and reasonable under the circumstances and determined that the continuance of the Advisory Agreement was in the best interests of the Fund and its shareholders.
Nature, Extent and Quality of Services Provided by the Adviser
The Trustees received and considered information regarding the nature, extent and quality of the services provided to the Fund under the applicable Advisory Agreement. The Trustees took into account information furnished throughout the year at Trustee meetings, as well as the materials furnished specifically in connection with this annual review process. The Trustees considered the background and experience of the Adviser’s senior management and the expertise of, and the amount of attention given to the Fund by, investment personnel of the Adviser. In addition, the Trustees reviewed the qualifications, backgrounds and responsibilities of the portfolio management team primarily responsible for the day-to-day management of the Fund and the infrastructure supporting the team, including personnel changes. The Trustees also considered information provided by the Adviser and JPMorgan Distribution Services, Inc. (“JPMDS”) about the structure and distribution strategy of the Fund. The Trustees reviewed information relating to the Adviser’s risk governance model and reports showing the Adviser’s compliance structure and ongoing compliance processes. The Trustees also considered the quality of administrative services provided by the Adviser in its role as administrator.
The Trustees also considered their knowledge of the nature and quality of the services provided by the Adviser and its affiliates to the Fund gained from their experience as Trustees of the J.P. Morgan Funds. In addition, they considered the overall reputation and capabilities of the Adviser and its affiliates, the commitment of the Adviser to provide high quality service to the Fund, their overall confidence in the Adviser’s integrity and the Adviser’s responsiveness to questions or concerns raised by them, including the Adviser’s willingness to consider and implement organizational and operational changes designed to improve investment results and the services provided to the Fund.
| | | | | | |
| | | |
| 72 | | | | J.P. MORGAN INCOME FUNDS | | AUGUST 31, 2018 |
Based upon these considerations and other factors, the Trustees concluded that they were satisfied with the nature, extent and quality of the investment advisory services provided to the Fund by the Adviser.
Costs of Services Provided and Profitability to the Adviser and its Affiliates
The Trustees received and considered information regarding the profitability to the Adviser and its affiliates in providing services to the Fund. The Trustees reviewed and discussed this information. The Trustees recognized that this information is not audited and represents the Adviser’s determination of its and its affiliates’ revenues from the contractual services provided to the Fund, less expenses of providing such services. Expenses include direct and indirect costs and are calculated using an allocation methodology developed by the Adviser. The Trustees also recognized that it is difficult to make comparisons of profitability from fund investment advisory contracts because comparative information is not generally publicly available and is affected by numerous factors, including the structure of the particular adviser, the types of funds it manages, its business mix, numerous assumptions regarding allocations and the fact that publicly-traded fund managers’ operating profits and net income are net of distribution and marketing expenses. Based upon their review, the Trustees concluded that the profitability to the Adviser under the Advisory Agreement was not unreasonable in light of the services and benefits provided to the Fund.
The Trustees also considered that JPMDS, an affiliate of the Adviser, and JPMIM earn fees from the Fund for providing shareholder and administrative services, respectively. These fees were shown separately in the profitability analysis presented to the Trustees. The Trustees also considered the payments of Rule 12b-1 fees to JPMDS, which also acts as the Fund’s distributor. The Trustees also considered the fees paid to JPMorgan Chase Bank, N.A. (“JPMCB”) for custody and fund accounting, and other related services.
Fall-Out Benefits
The Trustees reviewed information regarding potential “fallout” or ancillary benefits received by the Adviser and its affiliates as a result of their relationship with the Fund. The Trustees also reviewed the Adviser’s allocation of fund brokerage for the J.P. Morgan Funds complex, including allocations to brokers who provide research to the Adviser.
Economies of Scale
The Trustees considered the extent to which the Fund may benefit from economies of scale. The Trustees considered that there may not be a direct relationship between economies of scale realized by the Fund and those realized by the Adviser as assets increase. The Trustees considered the extent to which the Funds were priced to scale and whether it would be
appropriate to add advisory fee breakpoints, but noted that the Fund has implemented fee waivers and contractual expense limitations (“Fee Caps”) which allows the Fund’s shareholders to share potential economies of scale from the Fund’s inception and that the fees remain competitive with peer funds. The Trustees also considered that the Adviser has added or enhanced services to the Funds over time, noting the Adviser’s substantial investments in its business in support of the Fund, including investments in trading systems and technology (including cybersecurity improvements), attraction and retention of key talent, additions to analyst and portfolio management teams, and regulatory support enhancements. The Trustees concluded that the current fee structure was reasonable in light of the Fee Caps that the Adviser has in place that serve to limit the overall net expense ratios of the Fund at competitive levels. The Trustees concluded that the Fund’s shareholders received the benefits of potential economies of scale through the Fee Caps and the Adviser’s reinvestment in its operations to serve the Fund and its shareholders.
Independent Written Evaluation of the Fund’s Chief Compliance Officer
The Trustees noted that, upon their direction, the Chief Compliance Officer for the Fund had prepared an independent written evaluation in order to assist the Trustees in determining the reasonableness of the proposed management fees. The Trustees considered the written evaluation in determining whether to continue the Advisory Agreement.
Fees Relative to Adviser’s Other Clients
The Trustees received and considered information about the nature and extent of investment advisory services and fee rates offered to other clients of the Adviser, including institutional separate accounts and/or funds sub-advised by the Adviser, and for investment management styles substantially similar to that of the Fund. The Trustees considered the complexity of investment management for registered mutual funds relative to the Adviser’s other clients and noted differences in the regulatory, legal and other risks and responsibilities of providing services to the different clients. The Trustees considered that serving as an adviser to a registered mutual fund involves greater responsibilities and risks than acting as a sub-adviser and observed that sub-advisory fees may be lower than those charged by the Adviser to the Fund. The Trustees also noted that the adviser, not the mutual fund, pays the sub-advisory fee and that many responsibilities related to the advisory function are retained by the primary adviser. The Trustees concluded that the fee rates charged to the Fund in comparison to those charged to the Adviser’s other clients were reasonable.
Investment Performance
The Trustees received and considered absolute and/or relative performance for the Fund in a report prepared by Broadridge/Lipper. The Trustees considered the total return performance
| | | | | | | | |
| | | |
| AUGUST 31, 2018 | | J.P. MORGAN INCOME FUNDS | | | | | 73 | |
BOARD APPROVAL OF INVESTMENT ADVISORY AGREEMENT
(Unaudited) (continued)
information, which included the ranking of the Fund within a performance universe made up of funds with the same Broadridge/Lipper investment classification and objective (the “Universe”), and a sub-set of funds within the Universe (the “Peer Group”) by total return for the applicable one-year period. The Trustees reviewed a description of Broadridge/Lipper’s methodology for selecting mutual funds in the Fund’s Peer Group and Universe. The Broadridge/Lipper materials provided to the Trustees highlighted information with respect to certain representative classes to assist the Trustees in their review. As part of this review, the Trustees also reviewed the Fund’s performance against its benchmark and considered the performance information provided for the Fund at regular Board meetings by the Adviser and the Trustees’ independent consultant and also considered the special analysis prepared by the Trustees’ independent consultant. The Trustees also engaged with the Adviser to consider what steps might be taken to improve performance, as applicable. The Broadridge/Lipper performance data noted by the Trustees as part of their review and the determinations made by the Trustees with respect to the Fund’s performance for certain representative classes are summarized below:
The Trustees noted that the Global Bond Opportunities Fund’s performance for Class A and Class I shares was in the fourth, first and first quintiles based upon the Peer Group and in the third, first and first quintiles based upon Universe, for the one- and three-year periods ended December 31, 2017, respectively. The Trustees discussed the performance and investment strategy of the Fund with the Adviser and, reviewed the performance analysis and evaluation prepared by the independent consultant. Based upon these discussions and various other factors, the Trustees concluded that the Fund’s performance was satisfactory.
Advisory Fees and Expense Ratios
The Trustees considered the contractual advisory fee rate and administration fee rate paid by the Fund to the Adviser and compared the combined rate to the information prepared by Broadridge/Lipper concerning management fee rates paid by other funds in the same Broadridge/Lipper category as the Fund. The Trustees recognized that Broadridge/Lipper reported the Fund’s management fee rate as the combined contractual advisory fee and administration fee rates. The Trustees also reviewed information about other expenses and the expense ratios for the Fund. The Trustees considered the Fee Caps currently in place for the Fund and considered the net advisory fee rate after taking into account any waivers and/or reimbursements, and, where deemed appropriate by the Trustees, additional waivers and/or reimbursements. The Trustees recognized that it is difficult to make comparisons of advisory fees because there are variations in the services that are included in the fees paid by other funds. The Trustees’ determinations as a result of the review of the Fund’s advisory fees and expense ratios for certain representative classes are summarized below:
The Trustees noted that the Global Bond Opportunities Fund’s net advisory fee for Class A shares was in the second quintile based upon both the Peer Group and Universe, and that the actual total expenses were in the second and first quintiles based upon the Peer Group and Universe, respectively. The Trustees noted that the net advisory fee for Class I shares was in the second quintile based upon both the Peer Group and Universe, and that the actual total expenses for Class I shares were in the first and second quintiles based upon the Peer Group and Universe, respectively. After considering the factors identified above, in light of this information, the Trustees concluded that the advisory fees were satisfactory.
| | | | | | |
| | | |
| 74 | | | | J.P. MORGAN INCOME FUNDS | | AUGUST 31, 2018 |

Rev. January 2011
| | |
| FACTS | | WHAT DOES J.P. MORGAN FUNDS DO WITH YOUR PERSONAL INFORMATION? |
| | |
| Why? | | Financial companies choose how they share your personal information. Federal law gives consumers the right to limit some but not all sharing. Federal law also requires us to tell you how we collect, share, and protect your personal information. Please read this notice carefully to understand what we do. |
| | |
| What? | | The types of personal information we collect and share depend on the product or service you have with us. This information can include: ◾ Social Security number and account balances ◾ transaction history and account transactions ◾ checking account information and wire transfer instructions When you are no longer our customer, we continue to share your information as described in this notice. |
| | |
| How? | | All financial companies need to share customers’ personal information to run their everyday business. In the section below, we list the reasons financial companies can share their customers’ personal information; the reasons J.P. Morgan Funds chooses to share; and whether you can limit this sharing. |
| | | | |
| Reasons we can share your personal information | | Does J.P. Morgan
Funds share? | | Can you limit this
sharing? |
For our everyday business purposes — such as to process your transactions, maintain your account(s), respond to court orders and legal investigations, or report to credit bureaus | | Yes | | No |
For marketing purposes — to offer our products and services to you | | Yes | | No |
| For joint marketing with other financial companies | | No | | We don’t share |
For our affiliates’ everyday business purposes — information about your transactions and experiences | | No | | We don’t share |
For our affiliates’ everyday business purposes — information about your creditworthiness | | No | | We don’t share |
| For nonaffiliates to market to you | | No | | We don’t share |
| | |
| | |
| Questions? | | Call 1-800-480-4111 or go to www.jpmorganfunds.com |

| | |
| Who we are |
| Who is providing this notice? | | J.P. Morgan Funds |
| | |
| What we do |
| How does J.P. Morgan Funds protect my personal information? | | To protect your personal information from unauthorized access and use, we use security measures that comply with federal law. These measures include computer safeguards and secured files and buildings. We authorize our employees to access your information only when they need it to do their work and we require companies that work for us to protect your information. |
How does J.P. Morgan Funds collect my personal information? | | We collect your personal information, for example, when you: ◾ open an account or provide contact information ◾ give us your account information or pay us by check ◾ make a wire transfer We also collect your personal information from others, such as credit bureaus, affiliates and other companies. |
| Why can’t I limit all sharing? | | Federal law gives you the right to limit only ◾ sharing for affiliates’ everyday business purposes – information about your creditworthiness ◾ affiliates from using your information to market to you ◾ sharing for nonaffiliates to market to you State laws and individual companies may give you additional rights to limit sharing. |
| | |
| Definitions |
| Affiliates | | Companies related by common ownership or control. They can be financial and nonfinancial companies. ◾ J.P. Morgan Funds does not share with our affiliates. |
| Nonaffiliates | | Companies not related by common ownership or control. They can be financial and nonfinancial companies. ◾ J.P. Morgan Funds does not share with nonaffiliates so they can market to you. |
| Joint Marketing | | A formal agreement between nonaffiliated financial companies that together market financial products or services to you. ◾ J.P. Morgan Funds doesn’t jointly market. |
J.P. Morgan Funds are distributed by JPMorgan Distribution Services, Inc., which is an affiliate of JPMorgan Chase & Co. Affiliates of JPMorgan Chase & Co. receive fees for providing various services to the funds.
Contact JPMorgan Distribution Services, Inc. at 1-800-480-4111 for a fund prospectus. You can also visit us at www.jpmorganfunds.com. Investors should carefully consider the investment objectives and risk as well as charges and expenses of the mutual fund before investing. The prospectus contains this and other information about the mutual fund. Read the prospectus carefully before investing.
Investors may obtain information about the Securities Investor Protection Corporation (SIPC), including the SIPC brochure, by visiting www.sipc.org or by calling SIPC at 202-371-8300.
The Fund files a complete schedule of its fund holdings for the first and third quarters of its fiscal year with the SEC on Form N-Q. The Fund’s Forms N-Q are available on the SEC’s website at http://www.sec.gov and may be reviewed and copied at the SEC’s Public Reference Room in Washington, DC. Information on the operation of the SEC’s Public Reference Room may be obtained by calling 1-800-SEC-0330. Shareholders may request the Form N-Q without charge by calling 1-800-480-4111 or by visiting the J.P. Morgan Funds’ website at www.jpmorganfunds.com.
A description of the Fund’s policies and procedures with respect to the disclosure of the Fund’s holdings is available in the prospectuses and Statement of Additional Information.
A copy of proxy policies and procedures is available without charge upon request by calling 1-800-480-4111 and on the Fund’s website at www.jpmorganfunds.com. A description of such policies and procedures is on the SEC’s website at www.sec.gov. The Trustees have delegated the authority to vote proxies for securities owned by the Fund to the Adviser. A copy of the Fund’s voting record for the most recent 12-month period ended June 30 is available on the SEC’s website at www.sec.gov or at the Fund’s website at www.jpmorganfunds.com no later than August 31 of each year. The Fund’s proxy voting record will include, among other things, a brief description of the matter voted on for each fund security, and will state how each vote was cast, for example, for or against the proposal.


J.P. Morgan Asset Management is the marketing name for the asset management businesses of JPMorgan Chase & Co. Those businesses include, but are not limited to, J.P. Morgan Investment Management Inc., Security Capital Research & Management Incorporated and J.P. Morgan Alternative Asset Management, Inc.
| | | | |
| | © JPMorgan Chase & Co., 2018. All rights reserved. August 2018. | | AN-GBO-818 |
Annual Report
J.P. Morgan Income Funds
August 31, 2018
JPMorgan Floating Rate Income Fund

CONTENTS
Investments in the Fund are not deposits or obligations of, or guaranteed or endorsed by, any bank and are not insured or guaranteed by the FDIC, the Federal Reserve Board or any other government agency. You could lose money if you sell when the Fund’s share price is lower than when you invested.
Past performance is no guarantee of future performance. The general market views expressed in this report are opinions based on market and other conditions through the end of the reporting period and are subject to change without notice. These views are not intended to predict the future performance of the Fund or the securities markets. References to specific securities and their issuers are for illustrative purposes only and are not intended to be, and should not be interpreted as, recommendations to purchase or sell such securities. Such views are not meant as investment advice and may not be relied on as an indication of trading intent on behalf of the Fund.
Prospective investors should refer to the Fund’s prospectuses for a discussion of the Fund’s investment objective, strategies and risks. Call J.P. Morgan Funds Service Center at 1-800-480-4111 for a prospectus containing more complete information about the Fund, including management fees and other expenses. Please read it carefully before investing.
CEO’S LETTER
October 9, 2018 (Unaudited)
Dear Shareholder,
The U.S. economy continued to outpace other developed markets, while geopolitical tensions and rising borrowing costs began to drag on emerging markets during the twelve months ended August 31, 2018.
| | |
 | | “While the impact of protectionist U.S. trade policies and currency devaluations in emerging markets loomed over financial markets, the underlying fundamentals of continued global economic growth remained in place at the end of August 2018.” — George C.W. Gatch |
Synchronized global economic growth helped the U.S. economy expand during the first half of the reporting period and U.S. equity prices reached record highs in every month from September 2017 through January 2018, a period also marked by low financial market volatility.
However, an early February sell-off in both equity and bond markets in the U.S. rapidly spread to other financial markets. The S&P 500 Index lost more than 10% of its value over several days and a spike in yields on benchmark 10-year U.S. Treasury bonds further roiled markets. U.S. equities recovered somewhat in subsequent months but it wasn’t until August 2018 that the S&P 500 returned to record highs.
In 2018, U.S. gross domestic product (GDP) rose 2.2% in the first quarter and 4.2% in the second quarter, the largest increase in nearly four years. Notably, U.S. corporate earnings and revenues in the first and second quarters of 2018 reached record levels and the U.S. unemployment rate fell to 3.9% in August 2018 from 4.2% in September 2017. The U.S. Federal Reserve responded to job growth and nascent inflationary pressure by raising interest rates in December 2017, and again in March and June. (Subsequent to the end of reporting period, the central bank raised rates in September 2018.)
In the European Union, political uncertainty clouded positive economic growth. While inflation remained below the European Central Bank’s (ECB) target rate, second quarter 2018 GDP grew by 2.1% and the unemployment rate in the 19-nation euro area fell to 8.1% in August, the lowest level since November 2008.
However, a new government in Italy threatened to challenge the European Commission’s stability and growth pact, raising investor fears that the commission would enact punitive measures. Also, negotiations over the U.K.’s exit from the European Union continued without resolution during the reporting period, raising political and economic uncertainty.
Against this backdrop, the ECB reiterated it would maintain interest rates at current levels until at least the summer of 2019.
China’s economy continued to drive emerging markets growth in late 2017, but U.S. tariffs on billions of dollars’ worth of Chinese goods in 2018 led to a decline in exports to the U.S. The Chinese government responded in kind to protectionist U.S. trade policies and moved to further stimulate domestic demand.
In other emerging markets, equities and bonds generally provided solid returns for the second half of 2017 but rising U.S. interest rates and a stronger U.S. dollar in 2018 raised borrowing costs and hurt select emerging markets, particularly petroleum importing nations with large current account deficits. Discrete political-economic factors in select nations also weighed on emerging markets debt.
While the impact of protectionist U.S. trade policies and currency devaluations in emerging markets loomed over financial markets, the underlying fundamentals of continued global economic growth remained in place at the end of August 2018.
We believe a long term outlook and a properly diversified portfolio should help investors navigate the changing market environment. We look forward to managing your investment needs for years to come. Should you have any questions, please visit www.jpmorganfunds.com or contact the J.P. Morgan Funds Service Center at 1-800-480-4111.
Sincerely yours,

George C.W. Gatch
CEO, Global Funds Management
J.P. Morgan Asset Management
| | | | | | | | |
| | | |
| AUGUST 31, 2018 | | J.P. MORGAN INCOME FUNDS | | | | | 1 | |
JPMorgan Floating Rate Income Fund
FUND COMMENTARY
TWELVE MONTHS ENDED AUGUST 31, 2018 (Unaudited)
| | | | |
REPORTING PERIOD RETURN: | | | |
| Fund (Class I Shares)* | | | 3.63% | |
| Credit Suisse Leveraged Loan Index | | | 5.29% | |
| Bloomberg Barclays U.S. Aggregate Bond Index (formerly Bloomberg Barclays U.S. Aggregate Index) | | | (1.05)% | |
| |
| Net Assets as of 8/31/2018 (In Thousands) | | | $3,074,058 | |
INVESTMENT OBJECTIVE**
The JPMorgan Floating Rate Income Fund (the “Fund”) seeks to provide current income with a secondary objective of capital appreciation.
HOW DID THE MARKET PERFORM?
During the reporting period, U.S. equities largely outperformed fixed income securities as positive economic data, record high corporate earnings and rising interest rates provided support for equities. Within the fixed income markets, high yield bonds (also known as “junk bonds”) generally outperformed investment grade corporate debt and U.S. Treasury bonds. High yield bonds benefitted from continued investor appetite for higher risk in return for higher yield, as well as a low volume of new supply.
WHAT WERE THE MAIN DRIVERS OF THE FUND’S PERFORMANCE?
The Fund’s Class I Shares underperformed the Credit Suisse Leveraged Loan Index (the “Benchmark”) for the twelve months ended August 31, 2018.
The Fund’s investment selection — mostly in loan assignments — in the consumer durables sector was a leading detractor from performance relative to the Benchmark. The Fund’s overweight position in securities rated BB and its underweight position in securities rated CCC also detracted from relative performance as lower rated bonds generally performed better than higher rated bonds during the reporting period. The Fund’s investment selection, including loan assignments, in the health care and food/tobacco sectors was a leading positive contributor to relative performance.
Relative to the Bloomberg Barclays U.S. Aggregate Bond Index, which does not hold high yield bonds, the Fund’s allocation to
high yield bonds helped performance as high yield bonds generally outperformed other sectors of the bond market during the reporting period.
HOW WAS THE FUND POSITIONED?
Relative to the Benchmark during the twelve month reporting period, the Fund was overweight in securities rated AAA through BB and was underweight in securities rated B and CCC. The Fund’s portfolio managers generally upgraded the credit quality of the portfolio during the reporting period and gained exposure to higher quality loan assignments and bonds mainly by investing in floating rate loan facilities issued by corporations and, to a lesser extent, in fixed rate short duration corporate debt securities.
| | | | |
PORTFOLIO COMPOSITION*** | |
| Loan Assignments | | | 79.4 | % |
| Corporate Bonds | | | 11.8 | |
| Others (each less than 1.0%) | | | 1.3 | |
| Short-Term Investments | | | 7.5 | |
| * | | The return shown is based on net asset values calculated for shareholder transactions and may differ from the return shown in the financial highlights, which reflects adjustments made to the net asset values in accordance with accounting principles generally accepted in the United States of America. |
| ** | | The adviser seeks to achieve the Fund’s objective. There can be no guarantee it will be achieved. |
| *** | | Percentages indicated are based on total investments as of August 31, 2018. The Fund’s portfolio composition is subject to change. |
| | | | | | |
| | | |
| 2 | | | | J.P. MORGAN INCOME FUNDS | | AUGUST 31, 2018 |
| | | | | | | | | | | | | | | | |
AVERAGE ANNUAL TOTAL RETURNS AS OF AUGUST 31, 2018 | |
| | | | |
| | | INCEPTION DATE OF
CLASS | | | 1 YEAR | | | 5 YEAR | | | SINCE
INCEPTION | |
| | | | | | | | | | | | | | | | |
CLASS A SHARES | | | June 1, 2011 | | | | | | | | | | | | | |
With Sales Charge* | | | | | | | 1.02 | % | | | 1.85 | % | | | 2.61 | % |
Without Sales Charge | | | | | | | 3.38 | | | | 2.64 | | | | 3.16 | |
CLASS C SHARES | | | June 1, 2011 | | | | | | | | | | | | | |
With CDSC** | | | | | | | 1.87 | | | | 2.11 | | | | 2.64 | |
Without CDSC | | | | | | | 2.87 | | | | 2.11 | | | | 2.64 | |
CLASS I SHARES | | | June 1, 2011 | | | | 3.63 | | | | 2.88 | | | | 3.41 | |
CLASS R6 SHARES | | | October 31, 2013 | | | | 3.73 | | | | 2.98 | | | | 3.48 | |
| * | | Sales Charge for Class A Shares is 2.25%. |
| ** | | Assumes a 1% CDSC (contingent deferred sales charge) for the one year period and 0% CDSC thereafter. |
LIFE OF FUND PERFORMANCE (6/1/11 TO 8/31/18)
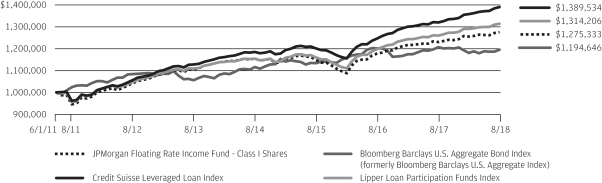
The performance quoted is past performance and is not a guarantee of future results. Mutual funds are subject to certain market risks. Investment returns and principal value of an investment will fluctuate so that an investor’s shares, when redeemed, may be worth more or less than their original cost. Current performance may be higher or lower than the performance data shown. For up-to-date, month-end performance information please call 1-800-480-4111.
The Fund commenced operations on June 1, 2011.
Returns for Class R6 Shares prior to their inception date are based on the performance of Class I Shares. The actual returns for Class R6 Shares would have been different than those shown because Class R6 Shares have different expenses than Class I Shares.
The graph illustrates comparative performance for $1,000,000 invested in the Class I Shares of JPMorgan Floating Rate Income Fund, the Credit Suisse Leveraged Loan Index, the Bloomberg Barclays U.S. Aggregate Bond Index and the Lipper Loan Participation Funds Index from June 1, 2011 to August 31, 2018. The performance of the Lipper Loan Participation Funds Index reflects an initial investment at the end of the month closest to the Fund’s inception. The performance of the Fund assumes reinvestment of all dividends and capital gain distributions, if any. The performance of the Credit Suisse Leveraged Loan Index and the Bloomberg Barclays U.S. Aggregate Bond Index does not reflect the deduction of expenses or a sales charge associated with a mutual fund and has been adjusted to reflect reinvestment of all dividends and capital gain distributions of the securities included in the indices, if applicable. The perform-
ance of the Lipper Loan Participation Funds Index includes expenses associated with a mutual fund, such as investment management fees. These expenses are not identical to the expenses incurred by the Fund. The Credit Suisse Leveraged Loan Index is an unmanaged market value-weighted index designed to represent the investable universe of the U.S. dollar-denominated leveraged loan market. The index reflects reinvestment of all distributions and changes in market prices. The Bloomberg Barclays U.S. Aggregate Bond Index is an unmanaged index that represents securities that are SEC-registered, taxable, and dollar denominated. The index covers the U.S. investment grade fixed rate bond market, with index components for government and corporate securities, mortgage pass-through securities, and asset-backed securities. The Lipper Loan Participation Funds Index is an index based on total returns of certain mutual funds within the Fund’s designated category as determined by Lipper, Inc. Investors cannot invest directly in an index.
Class I Shares have a $1,000,000 minimum initial investment.
Fund performance may reflect the waiver of the Fund’s fees and reimbursement of expenses for certain periods since the inception date. Without these waivers and reimbursements, performance would have been lower. Also, performance shown in this section does not reflect the deduction of taxes that a shareholder would pay on Fund distributions or redemptions of Fund shares.
The returns shown are based on net asset values calculated for shareholder transactions and may differ from the returns shown in the financial highlights, which reflect adjustments made to the net asset values in accordance with accounting principles generally accepted in the United States of America.
| | | | | | | | |
| | | |
| AUGUST 31, 2018 | | J.P. MORGAN INCOME FUNDS | | | | | 3 | |
JPMorgan Floating Rate Income Fund
SCHEDULE OF PORTFOLIO INVESTMENTS
AS OF AUGUST 31, 2018
| | | | | | | | |
| INVESTMENTS | | PRINCIPAL
AMOUNT
($000) | | | VALUE
($000) | |
Loan Assignments — 82.3% (a) | |
Aerospace & Defense — 1.6% | |
Bombardier Recreational Products, Inc., 1st Lien Term Loan B (Canada) (ICE LIBOR USD 1 Month + 2.00%), 4.08%, 5/23/2025 (b) | | | 11,600 | | | | 11,564 | |
MacDonald Dettwiler and Associates Ltd., Term Loan B (ICE LIBOR USD 1 Month + 2.75%), 4.83%, 10/4/2024 (b) | | | 16,150 | | | | 15,767 | |
TransDigm Group, Inc., 1st Lien Term Loan E (ICE LIBOR USD 1 Month + 2.50%), 4.58%, 5/30/2025 (b) | | | 6,684 | | | | 6,666 | |
TransDigm Group, Inc., 1st Lien Term Loan F (ICE LIBOR USD 1 Month + 2.50%), 4.58%, 6/9/2023 (b) | | | 15,473 | | | | 15,436 | |
TransDigm Group, Inc., Term Loan G (ICE LIBOR USD 1 Month + 2.50%), 4.58%, 8/22/2024 (b) | | | 997 | | | | 995 | |
| | | | | | | | |
| | | | | | | 50,428 | |
| | | | | | | | |
Air Freight & Logistics — 0.3% | | | | | | | | |
XPO Logistics, Inc., Term Loan (ICE LIBOR USD 1 Month + 2.00%), 4.06%, 2/24/2025 (b) | | | 9,523 | | | | 9,541 | |
| | | | | | | | |
Airlines — 1.0% | | | | | | | | |
American Airlines, Inc., 1st Lien Term Loan B | | | | | | | | |
(ICE LIBOR USD 1 Month + 2.00%), 4.06%, 12/14/2023 (b) | | | 19,057 | | | | 18,906 | |
(ICE LIBOR USD 1 Month + 1.75%), 3.81%, 6/27/2025 (b) | | | 12,739 | | | | 12,466 | |
| | | | | | | | |
| | | | | | | 31,372 | |
| | | | | | | | |
Auto Components — 0.2% | | | | | | | | |
USI, Inc., Term Loan (ICE LIBOR USD 1 Month + 3.00%), 5.33%, 5/16/2024 (b) | | | 6,454 | | | | 6,435 | |
| | | | | | | | |
Automobiles — 0.1% | | | | | | | | |
Scientific Games International, Inc., Term Loan (ICE LIBOR USD 2 Month + 2.75%), 4.83%, 8/14/2024 (b) (c) | | | 2,000 | | | | 1,994 | |
| | | | | | | | |
Building Products — 0.7% | | | | | | | | |
Continental Building Products, 1st Lien Term Loan (ICE LIBOR USD 1 Month + 2.25%), 4.33%, 8/18/2023 (b) | | | 7,970 | | | | 7,980 | |
Summit Materials Co. I LLC, Term Loan (ICE LIBOR USD 1 Month + 2.00%), 4.08%, 11/21/2024 (b) | | | 8,076 | | | | 8,079 | |
Unifrax LLC, Senior Secured Term Loan (ICE LIBOR USD 3 Month + 3.50%), 5.83%, 4/4/2024 (b) | | | 5,446 | | | | 5,466 | |
| | | | | | | | |
| | | | | | | 21,525 | |
| | | | | | | | |
| | | | | | | | |
| INVESTMENTS | | PRINCIPAL
AMOUNT
($000) | | | VALUE
($000) | |
| | | | | | | | |
Chemicals — 1.9% | | | | | | | | |
Chemours Co. (The), Term Loan B (ICE LIBOR USD 1 Month + 1.75%), 3.83%, 4/3/2025 (b) (c) | | | 14,972 | | | | 14,928 | |
Gemini HDPE LLC, Advance (ICE LIBOR USD 3 Month + 2.50%), 4.85%, 8/7/2024 (b) | | | 4,112 | | | | 4,113 | |
New Arclin US Holdings Corp., 1st Lien Senior Secured Term Loan (ICE LIBOR USD 3 Month + 3.50%), 5.83%, 2/14/2024 (b) | | | 4,024 | | | | 4,044 | |
Pelican Products, Inc., 1st Lien Term Loan B (ICE LIBOR USD 1 Month + 3.50%), 5.58%, 5/1/2025 (b) | | | 6,477 | | | | 6,449 | |
Pelican Products, Inc., 2nd Lien Term Loan (ICE LIBOR USD 1 Month + 7.75%), 9.83%, 5/1/2026 (b) | | | 2,205 | | | | 2,219 | |
PolyOne Corp., 1st Lien Term Loan B (ICE LIBOR USD 1 Month + 1.75%), 3.82%, 11/11/2022 (b) | | | 9,036 | | | | 9,032 | |
Trinseo Materials Operating SCA, 1st Lien Term Loan B (ICE LIBOR USD 1 Month + 2.00%), 4.08%, 9/6/2024 (b) | | | 8,957 | | | | 8,953 | |
Tronox Finance LLC, 1st Lien Term Loan B | | | | | | | | |
(ICE LIBOR USD 1 Month + 3.00%), 5.08%, 9/23/2024 (b) | | | 6,996 | | | | 7,017 | |
(ICE LIBOR USD 1 Month + 3.00%), 5.08%, 9/23/2024 (b) | | | 3,032 | | | | 3,041 | |
| | | | | | | | |
| | | | | | | 59,796 | |
| | | | | | | | |
Commercial Services & Supplies — 2.1% | | | | | | | | |
Advanced Disposal Services, Inc., Term Loan B (1 Week LIBOR + 2.25%), 4.21%, 11/10/2023 (b) | | | 3,180 | | | | 3,185 | |
Garda World Security, 1st Lien Term Loan B (Canada) (ICE LIBOR USD 3 Month + 2.50%; ICE LIBOR USD 3 Month + 3.50%), 5.80%, 5/24/2024 (b) | | | 18,728 | | | | 18,799 | |
Nielsen Finance LLC, 1st Lien Term Loan B-4 (ICE LIBOR USD 1 Month + 2.00%), 4.07%, 10/4/2023 (b) (c) | | | 5,000 | | | | 4,970 | |
Prime Security Services Borrower LLC, Term B-1 Loan | | | | | | | | |
(ICE LIBOR USD 1 Month + 2.75%), 4.83%, 5/2/2022 (b) | | | 33,970 | | | | 34,039 | |
Prometric Holdings, Inc., 1st Lien Term Loan (ICE LIBOR USD 1 Month + 3.00%), 5.08%, 1/29/2025 (b) | | | 2,584 | | | | 2,578 | |
| | | | | | | | |
| | | | | | | 63,571 | |
| | | | | | | | |
Communications Equipment — 0.9% | | | | | | | | |
Avaya, Inc., 1st Lien Term Loan B (ICE LIBOR USD 1 Month + 4.25%), 6.31%, 12/15/2024 (b) | | | 9,696 | | | | 9,756 | |
SEE NOTES TO FINANCIAL STATEMENTS.
| | | | | | |
| | | |
| 4 | | | | J.P. MORGAN INCOME FUNDS | | AUGUST 31, 2018 |
| | | | | | | | |
| INVESTMENTS | | PRINCIPAL
AMOUNT
($000) | | | VALUE
($000) | |
Loan Assignments — continued | |
Communications Equipment — continued | | | | | | | | |
Global Tel*Link Corp., 1st Lien Senior Secured Term Loan (ICE LIBOR USD 3 Month + 4.00%), 6.33%, 5/23/2020 (b) | | | 4,689 | | | | 4,711 | |
Lumentum Holdings, Inc., 1st Lien Term Loan (ICE LIBOR USD 3 Month + 2.50%), 2.50%, 8/8/2025 (b) (c) | | | 1,444 | | | | 1,447 | |
Plantronics, Inc., 1st Lien Term Loan (ICE LIBOR USD 3 Month + 2.50%), 4.58%, 7/2/2025 (b) | | | 11,732 | | | | 11,698 | |
| | | | | | | | |
| | | | | | | 27,612 | |
| | | | | | | | |
Containers & Packaging — 2.5% | | | | | | | | |
Berry Plastics Corp., 1st Lien Term Loan | | | | | | | | |
(ICE LIBOR USD 1 Month + 1.75%), 4.19%, 2/8/2020 (b) | | | 1,749 | | | | 1,748 | |
(ICE LIBOR USD 2 Month + 1.75%), 3.94%, 1/6/2021 (b) | | | 5,022 | | | | 5,018 | |
(ICE LIBOR USD 1 Month + 2.00%), 4.19%, 10/1/2022 (b) | | | 9,427 | | | | 9,429 | |
(ICE LIBOR USD 1 Month + 2.00%), 4.19%, 1/19/2024 (b) | | | 5,580 | | | | 5,576 | |
Bway Holding Co., 1st Lien Term Loan (ICE LIBOR USD 3 Month + 3.25%), 5.58%, 4/3/2024 (b) | | | 8,029 | | | | 7,994 | |
Consolidated Container, 1st Lien Term Loan B (ICE LIBOR USD 1 Month + 2.75%), 4.83%, 5/22/2024 (b) | | | 8,005 | | | | 8,011 | |
Flex Acquisition Co., Inc., Term Loan (ICE LIBOR USD 3 Month + 3.00%), 5.34%, 12/29/2023 (b) | | | 10,965 | | | | 10,921 | |
Reynolds Group Holdings, Inc., Term Loan (ICE LIBOR USD 1 Month + 2.75%), 4.83%, 2/5/2023 (b) | | | 9,442 | | | | 9,469 | |
Ring Container Technologies LLC, 1st Lien Term Loan (ICE LIBOR USD 1 Month + 2.75%), 4.83%, 10/31/2024 (b) | | | 7,442 | | | | 7,439 | |
Viskase Corp., Inc., Initial Term Loan (ICE LIBOR USD 3 Month + 3.25%), 5.58%, 1/30/2021 (b) | | | 11,868 | | | | 11,809 | |
| | | | | | | | |
| | | | | | | 77,414 | |
| | | | | | | | |
Diversified Consumer Services — 1.3% | | | | | | | | |
Altran Technologies SA, 1st Lien Term Loan B (France) (ICE LIBOR USD 3 Month + 2.25%), 4.57%, 3/20/2025 (b) | | | 2,936 | | | | 2,926 | |
Capital Vision Services Holdings, 1st Lien Term Loan (ICE LIBOR USD 1 Month + 3.00%), 5.08%, 2/6/2025 (b) | | | 5,726 | | | | 5,708 | |
Capital Vision Services Holdings, 2nd Lien Term Loan (ICE LIBOR USD 1 Month + 6.75%), 8.83%, 2/6/2026 (b) | | | 2,475 | | | | 2,455 | |
| | | | | | | | |
| INVESTMENTS | | PRINCIPAL
AMOUNT
($000) | | | VALUE
($000) | |
| | | | | | | | |
Diversified Consumer Services — continued | | | | | | | | |
PS Holdco LLC, 1st Lien Term Loan (ICE LIBOR USD 1 Month + 5.25%), 7.32%, 3/13/2025 (b) | | | 790 | | | | 793 | |
Spin Holdco, Inc., Term Loan B (ICE LIBOR USD 1 Month + 3.25%), 5.59%, 11/14/2022 (b) | | | 22,680 | | | | 22,730 | |
St George’s University Scholastic Services LLC, Term Loan B (ICE LIBOR USD 1 Month + 3.50%), 5.58%, 7/17/2025 (b) | | | 6,864 | | | | 6,933 | |
| | | | | | | | |
| | | | | | | 41,545 | |
| | | | | | | | |
Diversified Financial Services — 0.8% | | | | | | | | |
ABG Intermediate Holdings 2 LLC, First Lien Term Loan (ICE LIBOR USD 1 Month + 3.50%), 5.58%, 9/27/2024 (b) | | | 5,561 | | | | 5,567 | |
Advisor Group, Inc., 1st Lien Term Loan (ICE LIBOR USD 1 Month + 3.75%), 5.81%, 8/9/2025 (b) (c) | | | 4,055 | | | | 4,078 | |
Quidditch Acquisition, Inc., 1st Cov-Lite Lien Term Loan (ICE LIBOR USD 1 Month + 7.00%), 9.08%, 3/21/2025 (b) | | | 1,616 | | | | 1,632 | |
Telenet Financing LLC, 1st Lien Term Loan (ICE LIBOR USD 1 Month + 2.25%), 4.31%, 8/15/2026 (b) (c) | | | 13,690 | | | | 13,515 | |
| | | | | | | | |
| | | | | | | 24,792 | |
| | | | | | | | |
Diversified Telecommunication Services — 5.9% | |
Centurylink, Inc., 1st Lien Term Loan B (ICE LIBOR USD 1 Month + 2.75%), 4.83%, 1/31/2025 (b) | | | 43,998 | | | | 43,470 | |
Cincinnati Bell, Inc., Term Loan B (ICE LIBOR USD 1 Month + 3.25%), 5.33%, 10/2/2024 (b) | | | 18,430 | | | | 18,374 | |
Consolidated Communications, Inc., Term Loan B (ICE LIBOR USD 1 Month + 3.00%), 5.08%, 10/5/2023 (b) | | | 10,928 | | | | 10,742 | |
Frontier Communications Corp., Term Loan (ICE LIBOR USD 1 Month + 3.75%), 5.83%, 6/15/2024 (b) | | | 7,120 | | | | 6,871 | |
Hargray Communications Group, Inc., Senior Secured Term Loan B (ICE LIBOR USD 1 Month + 3.00%), 5.08%, 5/16/2024 (b) | | | 23,714 | | | | 23,774 | |
Intelsat Jackson Holdings SA, 1st Lien Term Loan (Luxembourg) (ICE LIBOR USD 1 Month + 3.75%), 5.81%, 11/27/2023 (b) | | | 30,096 | | | | 30,226 | |
Level 3 Financing, Inc., Tranche B Term Loan (ICE LIBOR USD 1 Month + 2.25%), 4.32%, 2/22/2024 (b) | | | 27,300 | | | | 27,326 | |
Securus Technologies Holdings, Inc., 1st Lien Term Loan (ICE LIBOR USD 1 Month + 4.50%), 6.58%, 11/1/2024 (b) | | | 9,586 | | | | 9,574 | |
SEE NOTES TO FINANCIAL STATEMENTS.
| | | | | | | | |
| | | |
| AUGUST 31, 2018 | | J.P. MORGAN INCOME FUNDS | | | | | 5 | |
JPMorgan Floating Rate Income Fund
SCHEDULE OF PORTFOLIO INVESTMENTS
AS OF AUGUST 31, 2018 (continued)
| | | | | | | | |
| INVESTMENTS | | PRINCIPAL
AMOUNT
($000) | | | VALUE
($000) | |
Loan Assignments — continued | |
Diversified Telecommunication Services — continued | |
Securus Technologies Holdings, Inc., 2nd Lien Term Loan (ICE LIBOR USD 1 Month + 8.25%), 10.33%, 11/1/2025 (b) | | | 1,153 | | | | 1,150 | |
Windstream Communications LLC, 1st Lien Term Loan B (ICE LIBOR USD 1 Month + 4.00%), 6.06%, 3/29/2021 (b) | | | 4,663 | | | | 4,336 | |
Zayo Group LLC, Term Loan B-2 (ICE LIBOR USD 1 Month + 2.25%), 4.33%, 1/19/2024 (b) | | | 6,123 | | | | 6,143 | |
| | | | | | | | |
| | | | | | | 181,986 | |
| | | | | | | | |
Electric Utilities — 2.3% | | | | | | | | |
Calpine Construction Finance Co. LP, 1st Lien Term Loan (ICE LIBOR USD 1 Month + 2.50%), 4.58%, 1/15/2025 (b) | | | 19,965 | | | | 19,977 | |
Frontera Generation Holdings LLC, 1st Lien Senior Secured Term Loan B (ICE LIBOR USD 1 Month + 4.25%), 6.33%, 5/2/2025 (b) | | | 3,100 | | | | 3,108 | |
Homer City Generation LP, 1st Lien Term Loan B (ICE LIBOR USD 1 Month + 11.00%), 13.08%, 4/5/2023 (b) | | | 4,296 | | | | 4,008 | |
Lightstone Holdco LLC, 1st Lien Term Loan B (ICE LIBOR USD 1 Month + 3.75%), 5.83%, 1/30/2024 (b) | | | 20,492 | | | | 20,377 | |
Lightstone Holdco LLC, 1st Lien Term Loan C (ICE LIBOR USD 1 Month + 3.75%), 5.83%, 1/30/2024 (b) | | | 1,164 | | | | 1,158 | |
Vistra Operations Co. LLC, Term Loan (ICE LIBOR USD 1 Month + 2.00%), 4.08%, 8/4/2023 (b) | | | 21,698 | | | | 21,655 | |
| | | | | | | | |
| | | | | | | 70,283 | |
| | | | | | | | |
Electrical Equipment — 1.3% | | | | | | | | |
Brookfield WEC Holdings, Inc., 1st Lien Term Loan (ICE LIBOR USD 1 Month + 3.75%), 5.83%, 8/1/2025 (b) | | | 15,183 | | | | 15,263 | |
Brookfield WEC Holdings, Inc., 2nd Lien Term Loan (ICE LIBOR USD 3 Month + 6.75%), 8.83%, 8/3/2026 (b) (c) | | | 8,080 | | | | 8,191 | |
Cortes NP Acquisition Corp., Term Loan B (ICE LIBOR USD 1 Month + 4.00%), 6.31%, 11/30/2023 (b) (c) | | | 15,000 | | | | 14,981 | |
| | | | | | | | |
| | | | | | | 38,435 | |
| | | | | | | | |
Electronic Equipment, Instruments & Components — 0.2% | |
TTM Technologies, Inc., Term Loan B (ICE LIBOR USD 1 Month + 2.50%), 4.58%, 9/28/2024 (b) | | | 3,351 | | | | 3,353 | |
VeriFone Systems, Inc., 1st Lien Term Loan (ICE LIBOR USD 3 Month + 4.00%), 6.32%, 8/20/2025 (b) | | | 4,350 | | | | 4,355 | |
| | | | | | | | |
| | | | | | | 7,708 | |
| | | | | | | | |
| | | | | | | | |
| INVESTMENTS | | PRINCIPAL
AMOUNT
($000) | | | VALUE
($000) | |
| | | | | | | | |
Energy Equipment & Services — 0.9% | |
EIF Channelview Cogeneration LLC, Term Loan (ICE LIBOR USD 1 Month + 4.25%), 6.33%, 5/3/2025 (b) | | | 2,600 | | | | 2,620 | |
Floatel International Ltd., Initial Term Loan (ICE LIBOR USD 3 Month + 5.00%), 7.33%, 6/27/2020 (b) | | | 2,922 | | | | 2,616 | |
KCA Deutag Alpha Ltd., 1st Lien Term Loan B (ICE LIBOR USD 3 Month + 6.75%), 9.08%, 2/28/2023 (b) | | | 6,789 | | | | 6,500 | |
Keane Group Holdings LLC, 1st Lien Term Loan B (ICE LIBOR USD 1 Month + 3.75%), 5.88%, 5/25/2025 (b) | | | 3,784 | | | | 3,765 | |
McDermott Technology Americas, Inc., 1st Lien Term Loan B (ICE LIBOR USD 1 Month + 5.00%), 7.08%, 5/12/2025 (b) | | | 8,408 | | | | 8,491 | |
Vistra Operations Co. LLC, 1st Lien Term Loan B-3 (ICE LIBOR USD 1 Month + 2.00%), 4.06%, 12/31/2025 (b) | | | 2,250 | | | | 2,244 | |
| | | | | | | | |
| | | | | | | 26,236 | |
| | | | | | | | |
Equity Real Estate Investment Trusts (REITs) — 0.8% | |
ESH Hospitality, Inc., 1st Lien Term Loan B (ICE LIBOR USD 1 Month + 2.00%), 4.08%, 8/30/2023 (b) | | | 6,640 | | | | 6,628 | |
GGP, Inc., 1st Lien Term Loan B (ICE LIBOR USD 3 Month + 2.25%), 4.56%, 8/27/2025 (b) (c) | | | 19,370 | | | | 19,236 | |
| | | | | | | | |
| | | | | | | 25,864 | |
| | | | | | | | |
Food & Staples Retailing — 3.7% | |
Albertson’s LLC, 1st Lien Term Loan | | | | | | | | |
(ICE LIBOR USD 3 Month + 3.00%), 5.34%, 12/21/2022 (b) (c) | | | 30,602 | | | | 30,510 | |
(ICE LIBOR USD 3 Month + 3.00%), 5.31%, 6/22/2023 (b) (c) | | | 14,203 | | | | 14,140 | |
Albertson’s LLC, 1st Lien Term Loan B-4 (ICE LIBOR USD 1 Month + 2.75%), 4.83%, 8/25/2021 (b) | | | 9,618 | | | | 9,598 | |
BJ’s Wholesale Club, Inc., 1st Lien Term Loan (ICE LIBOR USD 1 Month + 3.00%), 5.07%, 2/3/2024 (b) | | | 6,691 | | | | 6,700 | |
Moran Foods LLC, Term Loan B (ICE LIBOR USD 1 Month + 6.00%), 8.08%, 12/5/2023 (b) | | | 17,213 | | | | 12,293 | |
SUPERVALU, Inc., Delayed Draw Term Loan (ICE LIBOR USD 1 Month + 3.50%), 5.58%, 6/8/2024 (b) | | | 14,858 | | | | 14,874 | |
SUPERVALU, Inc., Term Loan B (ICE LIBOR USD 1 Month + 3.50%), 5.58%, 6/8/2024 (b) | | | 24,764 | | | | 24,789 | |
| | | | | | | | |
| | | | | | | 112,904 | |
| | | | | | | | |
SEE NOTES TO FINANCIAL STATEMENTS.
| | | | | | |
| | | |
| 6 | | | | J.P. MORGAN INCOME FUNDS | | AUGUST 31, 2018 |
| | | | | | | | |
| INVESTMENTS | | PRINCIPAL
AMOUNT
($000) | | | VALUE
($000) | |
Loan Assignments — continued | |
Food Products — 1.9% | |
Dole Food Co., 1st Lien Term Loan B (ICE LIBOR USD 1 Month + 2.75%; ICE LIBOR USD 3 Month + 2.75%; US Prime Rate + 5.00%), 4.83%, 4/6/2024 (b) | | | 15,194 | | | | 15,161 | |
Hearthside Group Holdings LLC, 1st Lien Term Loan (ICE LIBOR USD 1 Month + 3.00%), 5.06%, 5/23/2025 (b) | | | 11,687 | | | | 11,585 | |
JBS USA LLC, Term Loan B (ICE LIBOR USD 1 Month + 2.50%; ICE LIBOR USD 3 Month + 2.50%), 4.83%, 10/30/2022 (b) | | | 29,758 | | | | 29,729 | |
Mastronardi Produce Ltd., 1st Lien Term Loan B (Canada) (ICE LIBOR USD 1 Month + 3.25%), 5.33%, 5/1/2025 (b) | | | 944 | | | | 949 | |
| | | | | | | | |
| | | | | | | 57,424 | |
| | | | | | | | |
Health Care Equipment & Supplies — 1.1% | |
Auris Luxembourg III SARL, Term Loan B-7 (Luxembourg) (ICE LIBOR USD 3 Month + 3.00%), 5.33%, 1/17/2022 (b) | | | 8,607 | | | | 8,671 | |
Mallinckrodt International Finance SA, Term Loan (ICE LIBOR USD 3 Month + 3.00%), 5.52%, 2/24/2025 (b) | | | 5,270 | | | | 5,260 | |
Mallinckrodt International Finance SA, Term Loan B (ICE LIBOR USD 3 Month + 2.75%), 5.20%, 9/24/2024 (b) | | | 20,332 | | | | 20,154 | |
| | | | | | | | |
| | | | | | | 34,085 | |
| | | | | | | | |
Health Care Providers & Services — 5.4% | |
Acadia Healthcare Co., Inc., 1st Lien Term Loan B (ICE LIBOR USD 1 Month + 2.50%), 4.58%, 2/16/2023 (b) | | | 2,893 | | | | 2,906 | |
CHG Healthcare Services, 1st Lien Term Loan B (ICE LIBOR USD 1 Month + 3.00%; ICE LIBOR USD 3 Month + 3.00%), 5.34%, 6/7/2023 (b) | | | 20,971 | | | | 21,010 | |
Community Health Systems, Inc., Incremental 2021 Term H Loan (ICE LIBOR USD 3 Month + 3.25%), 5.54%, 1/27/2021 (b) (c) | | | 30,101 | | | | 29,647 | |
MedRisk, Inc., Term Loan B (ICE LIBOR USD 1 Month + 2.75%), 4.83%, 12/27/2024 (b) | | | 3,772 | | | | 3,757 | |
Midwest Physician Administrative Services LLC, 1st Lien Term Loan (ICE LIBOR USD 1 Month + 2.75%), 4.81%, 8/15/2024 (b) | | | 3,383 | | | | 3,330 | |
MultiPlan, Inc., 1st Lien Term Loan B (ICE LIBOR USD 3 Month + 2.75%), 5.08%, 6/7/2023 (b) | | | 26,240 | | | | 26,215 | |
National Mentor Holdings, Inc., Tranche B Term Loan (ICE LIBOR USD 3 Month + 3.00%), 5.33%, 1/31/2021 (b) | | | 21,132 | | | | 21,190 | |
| | | | | | | | |
| INVESTMENTS | | PRINCIPAL
AMOUNT
($000) | | | VALUE
($000) | |
| | | | | | | | |
Health Care Providers & Services — continued | |
Oryx Soutern Delaware Holdings LLC, 1st Lien Term Loan (ICE LIBOR USD 1 Month + 3.25%), 5.33%, 2/28/2025 (b) | | | 2,964 | | | | 2,899 | |
Pearl Intermediate Parent LLC, 1st Lien Term Loan (ICE LIBOR USD 1 Month + 2.75%), 4.83%, 2/14/2025 (b) | | | 10,598 | | | | 10,390 | |
Pearl Intermediate Parent LLC, Delayed Draw (ICE LIBOR USD 3 Month + 2.75%), 5.08%, 2/14/2025 (b) | | | 865 | | | | 848 | |
Pharmerica Corp., 1st Lien Term Loan (ICE LIBOR USD 1 Month + 3.50%), 5.57%, 12/6/2024 (b) | | | 8,219 | | | | 8,266 | |
Sound Inpatient Physicians Holdings LLC, 1st Lien Term Loan (ICE LIBOR USD 1 Month + 3.00%), 5.08%, 6/27/2025 (b) | | | 6,546 | | | | 6,557 | |
Sound Inpatient Physicians Holdings LLC, 2nd Lien Term Loan (ICE LIBOR USD 3 Month + 7.00%), 8.83%, 6/26/2026 (b) | | | 1,177 | | | | 1,179 | |
Tennessee Merger Sub, Inc., 1st Lien Term Loan B (ICE LIBOR USD 1 Month + 2.75%), 4.83%, 2/6/2024 (b) | | | 30,242 | | | | 28,856 | |
| | | | | | | | |
| | | | | | | 167,050 | |
| | | | | | | | |
Health Care Technology — 0.3% | |
Press Ganey Holdings, Inc., 1st Lien Term Loan (ICE LIBOR USD 1 Month + 2.75%), 4.83%, 10/23/2023 (b) | | | 8,673 | | | | 8,686 | |
| | | | | | | | |
Hotels, Restaurants & Leisure — 5.8% | |
1011778 BC ULC, 1st Lien Term Loan B (Canada) (ICE LIBOR USD 1 Month + 2.25%), 4.33%, 2/16/2024 (b) (c) | | | 28,304 | | | | 28,287 | |
24 Hour Fitness Worldwide, Inc., 1st Lien Term Loan B (ICE LIBOR USD 1 Month + 3.50%), 5.58%, 5/30/2025 (b) | | | 4,333 | | | | 4,366 | |
Aristocrat Leisure Ltd., 1st Lien Term Loan B (ICE LIBOR USD 3 Month + 1.75%), 4.10%, 10/19/2024 (b) | | | 30,144 | | | | 30,058 | |
CEOC LLC, 1st Lien Term Loan B (ICE LIBOR USD 1 Month + 2.00%), 4.58%, 10/7/2024 (b) (c) | | | 29,484 | | | | 29,447 | |
Gateway Casinos & Entertainment Ltd., 1st Lien Term Loan (ICE LIBOR USD 3 Month + 3.00%), 5.47%, 12/1/2023 (b) (c) | | | 10,696 | | | | 10,739 | |
Golden Nugget, Inc., 1st Lien Term Loan B (ICE LIBOR USD 1 Month + 2.75%), 4.82%, 10/4/2023 (b) | | | 3,144 | | | | 3,152 | |
Greektown Holdings LLC, Term Loan (ICE LIBOR USD 1 Month + 2.75%), 5.09%, 4/25/2024 (b) (c) | | | 15,002 | | | | 15,002 | |
SEE NOTES TO FINANCIAL STATEMENTS.
| | | | | | | | |
| | | |
| AUGUST 31, 2018 | | J.P. MORGAN INCOME FUNDS | | | | | 7 | |
JPMorgan Floating Rate Income Fund
SCHEDULE OF PORTFOLIO INVESTMENTS
AS OF AUGUST 31, 2018 (continued)
| | | | | | | | |
| INVESTMENTS | | PRINCIPAL
AMOUNT
($000) | | | VALUE
($000) | |
Loan Assignments — continued | |
Hotels, Restaurants & Leisure — continued | |
Hanjin International Corp., 1st Lien Term Loan (ICE LIBOR USD 3 Month + 2.50%), 4.83%, 10/19/2020 (b) | | | 8,687 | | | | 8,676 | |
Hilton Worldwide Finance LLC, Series B-2 Term Loan (ICE LIBOR USD 1 Month + 1.75%), 3.81%, 10/25/2023 (b) (c) | | | 5,197 | | | | 5,212 | |
IRB Holding Corp., 1st Lien Term Loan B (ICE LIBOR USD 1 Month + 3.25%), 5.32%, 2/5/2025 (b) | | | 7,642 | | | | 7,674 | |
Las Vegas Sands Corp., 1st Lien Senior Secured Term Loan (ICE LIBOR USD 1 Month + 1.75%), 3.83%, 3/27/2025 (b) | | | 29,999 | | | | 29,935 | |
Penn National Gaming, Inc., Term Loan (ICE LIBOR USD 1 Month + 2.50%), 4.58%, 1/19/2024 (b) | | | 5,010 | | | | 5,016 | |
| | | | | | | | |
| | | | | | | 177,564 | |
| | | | | | | | |
Household Durables — 0.2% | |
American Greetings Corp. Term Loan B (ICE LIBOR USD 1 Month + 4.50%), 6.58%, 4/6/2024 (b) | | | 1,936 | | | | 1,937 | |
Janus International Group LLC, 1st Lien Term Loan (ICE LIBOR USD 1 Month + 3.00%), 5.08%, 2/12/2025 (b) | | | 2,950 | | | | 2,904 | |
| | | | | | | | |
| | | | | | | 4,841 | |
| | | | | | | | |
Household Products — 0.4% | | | | | | | | |
Clover Merger Sub, Inc., 1st Lien Term Loan (ICE LIBOR USD 1 Month + 3.50%), 5.58%, 9/26/2024 (b) | | | 12,905 | | | | 12,244 | |
| | | | | | | | |
Independent Power and Renewable Electricity Producers — 2.8% | |
AES Corp., 1st Lien Term Loan B (ICE LIBOR USD 3 Month + 1.75%), 4.07%, 5/31/2022 (b) | | | 11,407 | | | | 11,393 | |
Calpine Corp., Term Loan (ICE LIBOR USD 3 Month + 2.50%), 4.84%, 1/15/2024 (b) | | | 9,324 | | | | 9,332 | |
ExGen Renewables I LLC, 1st Lien Term Loan (ICE LIBOR USD 3 Month + 3.00%), 5.32%, 11/28/2024 (b) | | | 9,102 | | | | 9,125 | |
Invenergy LLC, Term Loan (ICE LIBOR USD 3 Month + 3.75%), 5.81%, 8/28/2025 (b) (c) | | | 7,557 | | | | 7,613 | |
NRG Energy, Inc., Term Loan (ICE LIBOR USD 3 Month + 1.75%), 4.08%, 6/30/2023 (b) | | | 20,856 | | | | 20,833 | |
Talen Energy Supply, Term Loan B-1 (ICE LIBOR USD 1 Month + 4.00%), 6.08%, 7/15/2023 (b) | | | 3,506 | | | | 3,514 | |
Talen Energy Supply, Term Loan B-2 (ICE LIBOR USD 1 Month + 4.00%), 6.08%, 4/15/2024 (b) | | | 25,105 | | | | 25,163 | |
| | | | | | | | |
| | | | | | | 86,973 | |
| | | | | | | | |
| | | | | | | | |
| INVESTMENTS | | PRINCIPAL
AMOUNT
($000) | | | VALUE
($000) | |
| | | | | | | | |
Insurance — 1.0% | | | | | | | | |
Asurion LLC, 2nd Lien Term Loan (ICE LIBOR USD 1 Month + 6.50%), 8.58%, 8/4/2025 (b) | | | 4,275 | | | | 4,396 | |
Asurion LLC, Term Loan B-7 (ICE LIBOR USD 3 Month + 3.00%), 5.08%, 11/3/2024 (b) | | | 17,787 | | | | 17,831 | |
HUB International Ltd., 1st Lien Term Loan B (ICE LIBOR USD 2 Month + 3.00%; ICE LIBOR USD 3 Month + 3.00%), 5.33%, 4/25/2025 (b) | | | 7,757 | | | | 7,747 | |
| | | | | | | | |
| | | | | | | 29,974 | |
| | | | | | | | |
Internet & Direct Marketing Retail — 0.3% | | | | | | | | |
Shutterfly, Inc., Term Loan B-2 (ICE LIBOR USD 1 Month + 2.75%), 4.83%, 8/17/2024 (b) | | | 7,407 | | | | 7,426 | |
Travelport Finance, 1st Lien Term Loan B (ICE LIBOR USD 3 Month + 2.50%), 4.81%, 3/17/2025 (b) | | | 1,621 | | | | 1,619 | |
| | | | | | | | |
| | | | | | | 9,045 | |
| | | | | | | | |
Internet Software & Services — 0.8% | | | | | | | | |
GTT Communications, Inc., 1st Lien Term Loan B (ICE LIBOR USD 3 Month + 2.75%), 4.83%, 5/31/2025 (b) | | | 6,828 | | | | 6,690 | |
Impala Private Holdings II LLC, 1st Lien Term Loan (ICE LIBOR USD 1 Month + 4.00%), 6.08%, 11/14/2024 (b) | | | 3,120 | | | | 3,132 | |
Rackspace Hosting, Inc., 1st Lien Term Loan B (ICE LIBOR USD 2 Month + 3.00%; ICE LIBOR USD 3 Month + 3.00%), 5.35%, 11/3/2023 (b) | | | 13,661 | | | | 13,567 | |
| | | | | | | | |
| | | | | | | 23,389 | |
| | | | | | | | |
IT Services — 1.7% | | | | | | | | |
Ensono LP, 1st Lien Term Loan (ICE LIBOR USD 1 Month + 5.25%), 7.31%, 6/27/2025 (b) | | | 3,222 | | | | 3,230 | |
Exela Intermediate LLC, 1st Lien Term Loan B (ICE LIBOR USD 2 Month + 6.50%), 8.83%, 7/12/2023 (b) | | | 13,981 | | | | 14,139 | |
First Data Corp., 1st Lien Term Loan | | | | | | | | |
(ICE LIBOR USD 1 Month + 2.00%), 4.07%, 7/8/2022 (b) | | | 9,775 | | | | 9,768 | |
(ICE LIBOR USD 1 Month + 2.00%), 4.07%, 4/26/2024 (b) | | | 13,973 | | | | 13,949 | |
Optiv Security, Inc., 1st Lien Term Loan (ICE LIBOR USD 1 Month + 3.25%), 5.31%, 2/1/2024 (b) | | | 4,691 | | | | 4,538 | |
Optiv Security, Inc., 2nd Lien Term Loan (ICE LIBOR USD 1 Month + 7.25%), 9.31%, 1/31/2025 (b) | | | 4,000 | | | | 3,855 | |
SEE NOTES TO FINANCIAL STATEMENTS.
| | | | | | |
| | | |
| 8 | | | | J.P. MORGAN INCOME FUNDS | | AUGUST 31, 2018 |
| | | | | | | | |
| INVESTMENTS | | PRINCIPAL
AMOUNT
($000) | | | VALUE
($000) | |
Loan Assignments — continued | |
IT Services — continued | | | | | | | | |
SMS Systems Maintenance Services, Inc., Term Loan B (1 Week LIBOR + 5.00%; ICE LIBOR USD 1 Month + 5.00%), 7.08%, 10/30/2023 (b) | | | 5,147 | | | | 4,066 | |
| | | | | | | | |
| | | | | | | 53,545 | |
| | | | | | | | |
Leisure Products — 1.5% | | | | | | | | |
Delta 2 SARL, 1st Lien Term Loan B (ICE LIBOR USD 1 Month + 2.50%), 4.58%, 2/1/2024 (b) | | | 16,721 | | | | 16,588 | |
FGI Operating Co. LLC, 1st Lien Term Loan (ICE LIBOR USD 3 Month + 10.00%), 8.65%, 5/15/2022 (b) | | | 4,655 | | | | 4,655 | |
NVA Holdings, Inc., 1st Lien Term Loan B (ICE LIBOR USD 1 Month + 2.75%), 4.83%, 2/2/2025 (b) | | | 24,151 | | | | 24,045 | |
| | | | | | | | |
| | | | | | | 45,288 | |
| | | | | | | | |
Life Sciences Tools & Services — 0.1% | | | | | | | | |
Albany Molecular Research, Inc., 1st Lien Term Loan (ICE LIBOR USD 1 Month + 3.25%), 5.33%, 8/30/2024 (b) | | | 2,797 | | | | 2,793 | |
Syneos Health, Inc., 1st Lien Term Loan (ICE LIBOR USD 1 Month + 2.00%), 4.08%, 8/1/2024 (b) | | | 1,921 | | | | 1,921 | |
| | | | | | | | |
| | | | | | | 4,714 | |
| | | | | | | | |
Machinery — 0.7% | | | | | | | | |
Onex Wizard Acquisition Co. II SCA, Initial Dollar Term Loan (Luxembourg) (ICE LIBOR USD 1 Month + 2.75%), 4.83%, 3/11/2022 (b) (c) | | | 11,532 | | | | 11,566 | |
Rexnord LLC/RBS Global, Inc., 1st Lien Term Loan (ICE LIBOR USD 1 Month + 2.00%), 4.34%, 8/21/2024 (b) | | | 4,732 | | | | 4,746 | |
Zodiac Pool Solutions LLC, 1st Lien Term Loan (ICE LIBOR USD 1 Month + 2.25%), 4.33%, 7/2/2025 (b) | | | 5,189 | | | | 5,200 | |
| | | | | | | | |
| | | | | | | 21,512 | |
| | | | | | | | |
Materials — 0.4% | | | | | | | | |
Gates Global LLC, 1st Lien Term Loan B (ICE LIBOR USD 3 Month + 2.75%), 5.08%, 4/1/2024 (b) | | | 11,683 | | | | 11,736 | |
| | | | | | | | |
Media — 11.1% | | | | | | | | |
Altice Financing SA, 1st Lien Term Loan (ICE LIBOR USD 1 Month + 2.75%), 4.81%, 7/15/2025 (b) | | | 14,125 | | | | 13,666 | |
Altice Financing SA, 1st Lien Term Loan B (ICE LIBOR USD 1 Month + 2.75%), 4.81%, 1/31/2026 (b) | | | 1,067 | | | | 1,029 | |
| | | | | | | | |
| INVESTMENTS | | PRINCIPAL
AMOUNT
($000) | | | VALUE
($000) | |
| | | | | | | | |
Media — continued | | | | | | | | |
Altice US Finance I Corp., Term Loan (ICE LIBOR USD 1 Month + 2.25%), 4.33%, 7/28/2025 (b) | | | 37,687 | | | | 37,609 | |
AMC Entertainment, Inc., 1st Lien Term Loan (ICE LIBOR USD 1 Month + 2.25%), 4.31%, 12/15/2022 (b) | | | 6,548 | | | | 6,546 | |
AMC Entertainment, Inc., Term Loan B (ICE LIBOR USD 1 Month + 2.25%), 4.31%, 12/15/2023 (b) | | | 2,364 | | | | 2,365 | |
Charter Communications Operating, LLC, 1st Lien Term Loan (ICE LIBOR USD 1 Month + 2.00%), 4.08%, 4/30/2025 (b) | | | 9,122 | | | | 9,122 | |
Cineworld Finance US, Inc., 1st Lien Term Loan B (United Kingdom) (ICE LIBOR USD 1 Month + 2.50%), 4.58%, 2/28/2025 (b) | | | 15,617 | | | | 15,563 | |
CSC Holdings LLC, 1st Lien Term Loan (ICE LIBOR USD 1 Month + 2.25%), 4.31%, 7/17/2025 (b) (c) | | | 46,791 | | | | 46,582 | |
Gray Television, Inc., 1st Lien Term Loan B (ICE LIBOR USD 1 Month + 2.25%), 4.33%, 2/7/2024 (b) | | | 9,120 | | | | 9,126 | |
Hoya Midco LLC, 1st Lien Term Loan (ICE LIBOR USD 1 Month + 3.50%), 5.58%, 6/30/2024 (b) | | | 10,610 | | | | 10,522 | |
iHeartCommunications, Inc., Term Loan D (ICE LIBOR USD 1 Month + 6.75%), 8.83%, 1/30/2019 (b) (d) | | | 11,961 | | | | 8,901 | |
iHeartCommunications, Inc., Tranche E Term Loan (ICE LIBOR USD 1 Month + 7.50%), 9.58%, 7/30/2019 (b) (d) | | | 2,795 | | | | 2,078 | |
Live Nation Entertainment, Inc., 1st Lien Term Loan B-3 (ICE LIBOR USD 1 Month + 1.75%), 3.88%, 10/31/2023 (b) (c) | | | 8,700 | | | | 8,697 | |
Meredith Corp., 1st Lien Term Loan B (ICE LIBOR USD 1 Month + 3.00%), 5.08%, 1/31/2025 (b) | | | 8,972 | | | | 8,992 | |
Mission Broadcasting, Inc., Term Loan B-2 (ICE LIBOR USD 1 Month + 2.50%), 4.58%, 1/17/2024 (b) | | | 709 | | | | 711 | |
MTL Publishing LLC, 1st Lien Term Loan (ICE LIBOR USD 1 Month + 2.25%), 4.33%, 8/20/2023 (b) | | | 11,081 | | | | 11,053 | |
NAI Entertainment Holdings LLC, 1st Lien Term Loan B (ICE LIBOR USD 1 Month + 2.50%), 4.58%, 5/8/2025 (b) | | | 500 | | | | 499 | |
Nexstar Broadcasting, Inc., Term Loan B-2 (ICE LIBOR USD 1 Month + 2.50%), 4.58%, 1/17/2024 (b) | | | 5,208 | | | | 5,226 | |
SEE NOTES TO FINANCIAL STATEMENTS.
| | | | | | | | |
| | | |
| AUGUST 31, 2018 | | J.P. MORGAN INCOME FUNDS | | | | | 9 | |
JPMorgan Floating Rate Income Fund
SCHEDULE OF PORTFOLIO INVESTMENTS
AS OF AUGUST 31, 2018 (continued)
| | | | | | | | |
| INVESTMENTS | | PRINCIPAL
AMOUNT
($000) | | | VALUE
($000) | |
Loan Assignments — continued | | | | | | | | |
Media — continued | | | | | | | | |
Numericable US LLC, 1st Lien Term Loan B (ICE LIBOR USD 1 Month + 3.69%), 5.75%, 1/31/2026 (b) | | | 15,419 | | | | 14,795 | |
Red Ventures LLC, 1st Lien Term Loan (ICE LIBOR USD 1 Month + 4.00%), 6.08%, 11/8/2024 (b) | | | 9,810 | | | | 9,908 | |
Sinclair Broadcast Group, Inc., 1st Lien Term Loan B (ICE LIBOR USD 1 Month + 2.25%), 4.33%, 1/3/2024 (b) | | | 8,169 | | | | 8,165 | |
Tribune Media Co., 1st Lien Term Loan B (ICE LIBOR USD 1 Month + 3.00%), 5.08%, 1/26/2024 (b) | | | 6,389 | | | | 6,401 | |
Tribune Media Co., Term Loan B (ICE LIBOR USD 1 Month + 3.00%), 5.08%, 12/27/2020 (b) | | | 5,442 | | | | 5,446 | |
Unitymedia Finance LLC, 1st Lien Term Loan B (ICE LIBOR USD 1 Month + 2.00%), 4.06%, 6/1/2023 (b) (c) | | | 23,160 | | | | 23,121 | |
Univision Communications, Inc., 1st Lien Term Loan C-5 (ICE LIBOR USD 1 Month + 2.75%), 4.83%, 3/15/2024 (b) | | | 23,460 | | | | 22,498 | |
Vertis, Inc., 1st Lien Term Loan (ICE LIBOR USD 1 Month + 8.75%), 11.75%, 3/21/2018 ‡ (b) (d) | | | 1,967 | | | | — | (e) |
WMG Acquisition Corp., 1st Lien Term Loan F (ICE LIBOR USD 1 Month + 2.13%), 4.20%, 11/1/2023 (b) (c) | | | 22,896 | | | | 22,796 | |
Ziggo Secured Finance Partnership, 1st Lien Term Loan E (Netherlands) (ICE LIBOR USD 1 Month + 2.50%), 4.56%, 4/15/2025 (b) | | | 18,655 | | | | 18,330 | |
Zuffa LLC, 1st Lien Guaranteed Senior Secured Term Loan (ICE LIBOR USD 1 Month + 3.25%), 5.33%, 8/18/2023 (b) | | | 8,387 | | | | 8,417 | |
Zuffa LLC, 2nd Lien Guaranteed Senior Secured Term Loan (ICE LIBOR USD 1 Month + 7.50%), 9.58%, 8/18/2024 (b) | | | 2,121 | | | | 2,143 | |
| | | | | | | | |
| | | | | | | 340,307 | |
| | | | | | | | |
Metals & Mining — 0.2% | | | | | | | | |
Aleris International, Inc., 1st Lien Term Loan (ICE LIBOR USD 1 Month + 4.75%), 6.83%, 2/27/2023 (b) | | | 5,750 | | | | 5,827 | |
| | | | | | | | |
Multiline Retail — 0.3% | | | | | | | | |
Neiman Marcus Group, Inc., Other Term Loan (ICE LIBOR USD 1 Month + 3.25%), 5.33%, 10/25/2020 (b) | | | 9,234 | | | | 8,560 | |
| | | | | | | | |
Oil, Gas & Consumable Fuels — 5.6% | | | | | | | | |
California Resources Corp., 1st Lien Second Out Term Loan (ICE LIBOR USD 1 Month + 10.38%), 12.44%, 12/31/2021 (b) | | | 12,210 | | | | 13,500 | |
| | | | | | | | |
| INVESTMENTS | | PRINCIPAL
AMOUNT
($000) | | | VALUE
($000) | |
| | | | | | | | |
Oil, Gas & Consumable Fuels — continued | | | | | | | | |
California Resources Corp., Senior Secured First Out (ICE LIBOR USD 1 Month + 4.75%), 6.82%, 12/31/2022 (b) | | | 15,910 | | | | 16,129 | |
Chesapeake Energy Corp., 1st Lien Last Out (ICE LIBOR USD 1 Month + 7.50%), 9.58%, 8/23/2021 (b) | | | 8,047 | | | | 8,390 | |
CITGO Petroleum Corp., Term Loan B (ICE LIBOR USD 3 Month + 3.50%), 5.84%, 7/29/2021 (b) | | | 5,838 | | | | 5,835 | |
Delek US Holdings, Inc., 1st Lien Term Loan B (ICE LIBOR USD 1 Month + 2.50%), 4.58%, 3/31/2025 (b) | | | 4,888 | | | | 4,897 | |
EG Finco Ltd., 1st Lien Term Loan B (ICE LIBOR USD 3 Month + 4.00%), 6.27%, 2/7/2025 (b) | | | 8,180 | | | | 8,177 | |
EG Group Ltd., 1st Lien Term Loan B (ICE LIBOR USD 3 Month + 4.00%), 6.33%, 2/7/2025 (b) | | | 2,993 | | | | 2,991 | |
Energy Transfer Equity LP, 1st Lien Term Loan B (ICE LIBOR USD 1 Month + 2.00%), 4.06%, 2/2/2024 (b) | | | 19,956 | | | | 19,952 | |
Gulf Finance LLC, 1st Lien Term Loan B (ICE LIBOR USD 3 Month + 5.25%), 7.59%, 8/25/2023 (b) | | | 7,262 | | | | 6,023 | |
HFOTCO LLC, 1st Lien Term Loan B (ICE LIBOR USD 3 Month + 2.75%), 5.09%, 6/26/2025 (b) | | | 4,735 | | | | 4,728 | |
Kestrel Acquisition LLC, 1st Lien Term Loan B (ICE LIBOR USD 3 Month + 4.25%), 6.33%, 6/2/2025 (b) | | | 5,691 | | | | 5,734 | |
Medallion Midland Acquisition LLC, 1st Lien Term Loan B (ICE LIBOR USD 1 Month + 3.25%), 5.33%, 10/30/2024 (b) | | | 2,930 | | | | 2,900 | |
MEG Energy Corp., 1st Lien Term Loan B (Canada) (ICE LIBOR USD 1 Month + 3.50%), 5.58%, 12/31/2023 (b) | | | 6,219 | | | | 6,224 | |
Southcross Holdings Borrower LP, Tranche B Term Loan (ICE LIBOR USD 1 Month + 5.50%; ICE LIBOR USD 3 Month + 3.50%), 3.50%, 4/13/2023 (b) | | | 1,373 | | | | 1,157 | |
Stetson Midstream, 1st Lien Term Loan B (ICE LIBOR USD 3 Month + 3.75%), 6.58%, 7/18/2025 (b) | | | 29,150 | | | | 29,351 | |
Summit Midstream Partners Holdings LLC, Senior Secured Term Loan (ICE LIBOR USD 1 Month + 6.00%), 8.08%, 5/13/2022 (b) | | | 9,585 | | | | 9,705 | |
Terraform Power Operating LLC, 1st Lien Term Loan B (ICE LIBOR USD 1 Month + 2.00%), 4.08%, 11/8/2022 (b) | | | 5,094 | | | | 5,094 | |
SEE NOTES TO FINANCIAL STATEMENTS.
| | | | | | |
| | | |
| 10 | | | | J.P. MORGAN INCOME FUNDS | | AUGUST 31, 2018 |
| | | | | | | | |
| INVESTMENTS | | PRINCIPAL
AMOUNT
($000) | | | VALUE
($000) | |
Loan Assignments — continued | | | | | | | | |
Oil, Gas & Consumable Fuels — continued | | | | | | | | |
Ultra Resources, Inc., Term Loan (ICE LIBOR USD 1 Month + 3.00%), 5.08%, 4/12/2024 (b) | | | 25,590 | | | | 22,897 | |
| | | | | | | | |
| | | | | | | 173,684 | |
| | | | | | | | |
Personal Products — 0.2% | | | | | | | | |
Prestige Brands, Inc., 1st Lien Term Loan B-4 (ICE LIBOR USD 1 Month + 2.00%), 4.08%, 1/26/2024 (b) | | | 5,359 | | | | 5,349 | |
| | | | | | | | |
Pharmaceuticals — 2.1% | | | | | | | | |
Concordia Healthcare Corp., Initial Dollar Term Loan (Canada) (ICE LIBOR USD 1 Month + 4.25%), 6.33%, 10/21/2021 (b) | | | 20,174 | | | | 18,184 | |
Endo Pharmaceuticals, Inc., 1st Lien Term Loan B (ICE LIBOR USD 1 Month + 4.25%), 6.38%, 4/29/2024 (b) | | | 3,521 | | | | 3,539 | |
Grifols Worldwide Operations Ltd., Term Loan B (1 Week LIBOR + 2.25%), 4.21%, 1/31/2025 (b) | | | 14,813 | | | | 14,870 | |
Valeant Pharmaceuticals International, Inc., 1st Lien Term Loan B (ICE LIBOR USD 1 Month + 3.00%), 5.08%, 6/2/2025 (b) | | | 28,539 | | | | 28,629 | |
| | | | | | | | |
| | | | | | | 65,222 | |
| | | | | | | | |
Professional Services — 0.2% | | | | | | | | |
Trans Union LLC, 1st Lien Term Loan B-4 (ICE LIBOR USD 1 Month + 2.00%), 4.08%, 6/19/2025 (b) | | | 7,223 | | | | 7,246 | |
| | | | | | | | |
Real Estate Management & Development — 0.5% | |
CityCenter Holdings LLC, Term Loan B (ICE LIBOR USD 1 Month + 2.25%), 4.33%, 4/18/2024 (b) (c) | | | 14,313 | | | | 14,306 | |
| | | | | | | | |
Road & Rail — 1.1% | | | | | | | | |
Avolon Borrower 1 US LLC, Term Loan B-3 (Ireland) (ICE LIBOR USD 1 Month + 2.00%), 4.08%, 1/15/2025 (b) | | | 31,220 | | | | 31,178 | |
URS Merger Sub Corp., 1st Lien Term Loan (ICE LIBOR USD 1 Month + 5.25%), 7.33%, 9/1/2024 (b) | | | 2,264 | | | | 2,267 | |
| | | | | | | | |
| | | | | | | 33,445 | |
| | | | | | | | |
Semiconductors & Semiconductor Equipment — 0.4% | |
ON Semiconductor Corp., 1st Lien Term Loan B (ICE LIBOR USD 1 Month + 1.75%), 3.83%, 3/31/2023 (b) | | | 6,602 | | | | 6,608 | |
Versum Materials, Inc., Senior Secured Term Loan B (ICE LIBOR USD 3 Month + 2.00%), 4.33%, 9/29/2023 (b) | | | 5,197 | | | | 5,205 | |
| | | | | | | | |
| | | | | | | 11,813 | |
| | | | | | | | |
| | | | | | | | |
| INVESTMENTS | | PRINCIPAL
AMOUNT
($000) | | | VALUE
($000) | |
| | | | | | | | |
Software — 2.7% | | | | | | | | |
Barracuda Networks, Inc., 1st Lien Term Loan (ICE LIBOR USD 1 Month + 3.25%), 5.31%, 2/12/2025 (b) | | | 2,578 | | | | 2,578 | |
Barracuda Networks, Inc., 2nd Lien Term Loan (ICE LIBOR USD 1 Month + 7.25%), 9.31%, 2/12/2026 (b) | | | 563 | | | | 569 | |
Greeneden US Holdings II LLC, 1st Lien Term Loan B (ICE LIBOR USD 1 Month + 3.50%; ICE LIBOR USD 3 Month + 3.50%), 5.58%, 12/1/2023 (b) | | | 4,389 | | | | 4,396 | |
Infor US, Inc., Tranche B-6 Term Loan (ICE LIBOR USD 1 Month + 2.75%), 4.83%, 2/1/2022 (b) | | | 9,500 | | | | 9,506 | |
Landesk Software Group, Inc., 1st Lien Term Loan (ICE LIBOR USD 1 Month + 4.25%), 6.33%, 1/20/2024 (b) | | | 5,841 | | | | 5,853 | |
Landesk Software Group, Inc., 2nd Lien Term Loan (ICE LIBOR USD 1 Month + 9.00%), 11.08%, 1/20/2025 (b) | | | 1,885 | | | | 1,805 | |
Misys, Term Loan B (ICE LIBOR USD 1 Month + 3.50%), 5.58%, 6/13/2024 (b) | | | 13,618 | | | | 13,546 | |
Qlik Technologies, Inc., 1st Lien Term Loan B (ICE LIBOR USD 3 Month + 3.50%), 5.99%, 4/26/2024 (b) | | | 12,614 | | | | 12,608 | |
Salient CRGT, Inc., Term Loan B (ICE LIBOR USD 1 Month + 5.75%), 7.83%, 2/28/2022 (b) | | | 4,794 | | | | 4,854 | |
SolarWinds Holdings, Inc., 1st Lien Term Loan B (ICE LIBOR USD 1 Month + 3.00%), 5.08%, 2/5/2024 (b) | | | 13,433 | | | | 13,472 | |
Solera LLC, Dollar Term Loan (ICE LIBOR USD 1 Month + 2.75%), 4.83%, 3/3/2023 (b) | | | 4,497 | | | | 4,491 | |
Sonicwall, Inc., 1st Lien Term Loan (ICE LIBOR USD 3 Month + 3.50%), 5.82%, 5/16/2025 (b) (c) | | | 2,051 | | | | 2,046 | |
Sonicwall, Inc., 2nd Lien Term Loan (ICE LIBOR USD 3 Month + 7.50%), 9.82%, 5/18/2026 (b) (c) | | | 1,375 | | | | 1,365 | |
Vertafore, Inc., 1st Lien Term Loan B (ICE LIBOR USD 3 Month + 3.25%), 5.33%, 7/2/2025 (b) | | | 5,400 | | | | 5,386 | |
| | | | | | | | |
| | | | | | | 82,475 | |
| | | | | | | | |
Specialty Retail — 1.5% | | | | | | | | |
Culligan Holding, Inc., 1st Lien Term Loan B-1 (ICE LIBOR USD 1 Month + 3.25%), 5.33%, 12/13/2023 (b) | | | 4,296 | | | | 4,274 | |
Digicert Holdings, Inc., 1st Lien Term Loan (ICE LIBOR USD 1 Month + 5.25%), 7.33%, 10/31/2024 (b) | | | 3,463 | | | | 3,474 | |
SEE NOTES TO FINANCIAL STATEMENTS.
| | | | | | | | |
| | | |
| AUGUST 31, 2018 | | J.P. MORGAN INCOME FUNDS | | | | | 11 | |
JPMorgan Floating Rate Income Fund
SCHEDULE OF PORTFOLIO INVESTMENTS
AS OF AUGUST 31, 2018 (continued)
| | | | | | | | |
| INVESTMENTS | | PRINCIPAL
AMOUNT
($000) | | | VALUE
($000) | |
Loan Assignments — continued | | | | | | | | |
Specialty Retail — continued | |
Party City, 1st Lien Term Loan (ICE LIBOR USD 1 Month + 2.75%; ICE LIBOR USD 3 Month + 2.75%), 5.28%, 8/19/2022 (b) | | | 5,422 | | | | 5,442 | |
PetSmart, Inc., Term Loan B (ICE LIBOR USD 1 Month + 3.00%), 5.09%, 3/11/2022 (b) | | | 4,076 | | | | 3,506 | |
Staples, Inc., 1st Lien Term Loan (ICE LIBOR USD 3 Month + 4.00%), 6.34%, 9/12/2024 (b) | | | 29,205 | | | | 29,106 | |
| | | | | | | | |
| | | | | | | 45,802 | |
| | | | | | | | |
Technology Hardware, Storage & Peripherals — 1.3% | |
Dell International LLC, 1st Lien Term Loan B (ICE LIBOR USD 1 Month + 2.00%), 4.08%, 9/7/2023 (b) | | | 15,065 | | | | 15,058 | |
Mitel Networks, 1st Lien Term Loan (Canada) (ICE LIBOR USD 3 Month + 4.50%), 4.50%, 7/11/2025 (b) (c) | | | 574 | | | | 576 | |
Quest Software US Holdings, Inc., 1st Lien Term Loan (ICE LIBOR USD 2 Month + 4.25%), 6.57%, 5/16/2025 (b) | | | 10,125 | | | | 10,078 | |
Quest Software US Holdings, Inc., 2nd Lien Term Loan (ICE LIBOR USD 3 Month + 8.25%), 10.57%, 5/18/2026 (b) | | | 2,144 | | | | 2,126 | |
Radiate Holdco LLC, Term Loan (ICE LIBOR USD 1 Month + 3.00%), 5.08%, 2/1/2024 (b) | | | 7,347 | | | | 7,301 | |
Thoughtworks, Inc., 1st Lien Incremental Term Loan (ICE LIBOR USD 1 Month + 4.00%), 6.08%, 10/11/2024 (b) | | | 1,029 | | | | 1,032 | |
Thoughtworks, Inc., 1st Lien Term Loan
(ICE LIBOR USD 1 Month + 4.00%), 6.08%, 10/11/2024 (b) | | | 4,345 | | | | 4,364 | |
| | | | | | | | |
| | | | | | | 40,535 | |
| | | | | | | | |
Textiles, Apparel & Luxury Goods — 0.5% | | | | | | | | |
Cole Haan LLC, Term Loan B-1 (ICE LIBOR USD 1 Month + 4.00%), 6.08%, 1/31/2020 (b) | | | 4,279 | | | | 4,223 | |
Nine West Holdings, Inc., Initial Loan (US Prime Rate + 2.75%), 7.75%, 10/8/2019 (b) | | | 1,844 | | | | 1,809 | |
Samsonite IP Holdings SARL, 1st Lien Term Loan B (Luxembourg) (ICE LIBOR USD 1 Month + 1.75%), 3.83%, 4/25/2025 (b) | | | 8,866 | | | | 8,814 | |
| | | | | | | | |
| | | | | | | 14,846 | |
| | | | | | | | |
Transportation Infrastructure — 0.2% | | | | | | | | |
SIRVA Worldwide, Inc., 1st Lien Term Loan
(ICE LIBOR USD 3 Month + 5.00%), 7.69%, 8/4/2025 (b) (c) | | | 4,800 | | | | 4,788 | |
SIRVA Worldwide, Inc., 2nd Lien Term Loan
(ICE LIBOR USD 1 Month + 9.50%), 11.69%, 8/3/2026 (b) (c) | | | 1,650 | | | | 1,528 | |
| | | | | | | | |
| | | | | | | 6,316 | |
| | | | | | | | |
| | | | | | | | |
| INVESTMENTS | | PRINCIPAL
AMOUNT
($000) | | | VALUE
($000) | |
| | | | | | | | |
Wireless Telecommunication Services — 1.5% | | | | | | | | |
A2Z Wireless Holdings, Inc., 1st Lien Term Loan B (ICE LIBOR USD 1 Month + 6.00%), 8.08%, 5/1/2023 (b) | | | 13,214 | | | | 12,620 | |
Sprint Communications, Inc., 1st Lien Term Loan B (ICE LIBOR USD 1 Month + 2.50%), 4.63%, 2/2/2024 (b) | | | 13,440 | | | | 13,440 | |
Syniverse Holdings, Inc., 1st Lien Term Loan
(ICE LIBOR USD 1 Month + 5.00%), 7.07%, 3/9/2023 (b) | | | 17,966 | | | | 17,809 | |
Syniverse Holdings, Inc., 2nd Lien Term Loan
(ICE LIBOR USD 1 Month + 9.00%), 11.07%, 3/11/2024 (b) | | | 2,545 | | | | 2,456 | |
| | | | | | | | |
| | | | | | | 46,325 | |
| | | | | | | | |
Total Loan Assignments
(Cost $2,547,436) | | | | | | | 2,529,569 | |
| | | | | | | | |
Corporate Bonds — 12.3% | | | | | | | | |
Airlines — 0.4% | | | | | | | | |
Allegiant Travel Co. 5.50%, 7/15/2019 | | | 5,523 | | | | 5,578 | |
United Continental Holdings, Inc. 4.25%, 10/1/2022 | | | 8,078 | | | | 7,937 | |
| | | | | | | | |
| | | | | | | 13,515 | |
| | | | | | | | |
Auto Components — 0.1% | | | | | | | | |
Icahn Enterprises LP 5.88%, 2/1/2022 | | | 4,250 | | | | 4,322 | |
| | | | | | | | |
Automobiles — 0.1% | | | | | | | | |
Jaguar Land Rover Automotive plc (United Kingdom) 4.13%, 12/15/2018 (f) | | | 3,417 | | | | 3,417 | |
| | | | | | | | |
Banks — 0.4% | | | | | | | | |
Barclays Bank plc (United Kingdom) 7.63%, 11/21/2022 | | | 3,381 | | | | 3,666 | |
CIT Group, Inc. 4.13%, 3/9/2021 | | | 8,090 | | | | 8,121 | |
| | | | | | | | |
| | | | | | | 11,787 | |
| | | | | | | | |
Chemicals — 0.4% | | | | | | | | |
CF Industries, Inc. 3.40%, 12/1/2021 (f) | | | 9,000 | | | | 8,889 | |
FXI Holdings, Inc. 7.88%, 11/1/2024 (f) | | | 2,552 | | | | 2,459 | |
| | | | | | | | |
| | | | | | | 11,348 | |
| | | | | | | | |
Commercial Services & Supplies — 0.4% | | | | | | | | |
ILFC E-Capital Trust I (USD Constant Maturity 30 Year + 1.55%), 4.57%, 12/21/2065 (b) (f) | | | 11,745 | | | | 10,709 | |
Nielsen Finance LLC 4.50%, 10/1/2020 | | | 1,500 | | | | 1,496 | |
| | | | | | | | |
| | | | | | | 12,205 | |
| | | | | | | | |
Construction & Engineering — 0.2% | | | | | | | | |
MasTec, Inc. 4.88%, 3/15/2023 | | | 7,000 | | | | 6,878 | |
| | | | | | | | |
SEE NOTES TO FINANCIAL STATEMENTS.
| | | | | | |
| | | |
| 12 | | | | J.P. MORGAN INCOME FUNDS | | AUGUST 31, 2018 |
| | | | | | | | |
| INVESTMENTS | | PRINCIPAL
AMOUNT
($000) | | | VALUE
($000) | |
Corporate Bonds — continued | | | | | | | | |
Consumer Finance — 0.4% | | | | | | | | |
Ally Financial, Inc. 8.00%, 3/15/2020 | | | 12,050 | | | | 12,788 | |
| | | | | | | | |
Containers & Packaging — 0.4% | | | | | | | | |
Ardagh Packaging Finance plc (Ireland) 4.25%, 9/15/2022 (f) | | | 5,000 | | | | 4,931 | |
Reynolds Group Issuer, Inc. | | | | | | | | |
5.75%, 10/15/2020 | | | 3,876 | | | | 3,882 | |
(ICE LIBOR USD 3 Month + 3.50%), 5.84%, 7/15/2021 (b) (f) | | | 4,195 | | | | 4,242 | |
| | | | | | | | |
| | | | | | | 13,055 | |
| | | | | | | | |
Diversified Telecommunication Services — 0.1% | | | | | |
CCO Holdings LLC 5.25%, 9/30/2022 | | | 2,500 | | | | 2,517 | |
Level 3 Financing, Inc. 5.63%, 2/1/2023 | | | 1,535 | | | | 1,554 | |
| | | | | | | | |
| | | | | | | 4,071 | |
| | | | | | | | |
Electric Utilities — 0.0% (g) | | | | | | | | |
Texas Competitive Electric Holdings Co. LLC 8.50%, 5/1/2020 (d) | | | 75,000 | | | | 75 | |
| | | | | | | | |
Electronic Equipment, Instruments & Components — 0.2% | |
Anixter, Inc. 5.63%, 5/1/2019 | | | 3,400 | | | | 3,451 | |
Ingram Micro, Inc. 5.00%, 8/10/2022 | | | 1,400 | | | | 1,384 | |
| | | | | | | | |
| | | | | | | 4,835 | |
| | | | | | | | |
Energy Equipment & Services — 0.2% | | | | | | | | |
Nabors Industries, Inc. | | | | | | | | |
5.00%, 9/15/2020 | | | 3,623 | | | | 3,636 | |
5.10%, 9/15/2023 | | | 2,500 | | | | 2,414 | |
Shelf Drilling Holdings Ltd. (United Arab Emirates) 8.25%, 2/15/2025 (f) | | | 1,335 | | | | 1,357 | |
| | | | | | | | |
| | | | | | | 7,407 | |
| | | | | | | | |
Equity Real Estate Investment Trusts (REITs) — 0.1% | |
Equinix, Inc. 5.38%, 1/1/2022 | | | 3,000 | | | | 3,089 | |
| | | | | | | | |
Food Products — 0.1% | | | | | | | | |
JBS USA LUX SA 7.25%, 6/1/2021 (f) | | | 3,100 | | | | 3,131 | |
| | | | | | | | |
Health Care Equipment & Supplies — 0.1% | | | | | | | | |
Mallinckrodt International Finance SA 4.88%, 4/15/2020 (f) | | | 3,785 | | | | 3,771 | |
| | | | | | | | |
Health Care Providers & Services — 1.6% | | | | | | | | |
Centene Corp. 5.63%, 2/15/2021 | | | 7,250 | | | | 7,395 | |
DaVita, Inc. 5.75%, 8/15/2022 | | | 4,800 | | | | 4,866 | |
HCA, Inc. | | | | | | | | |
4.25%, 10/15/2019 | | | 7,000 | | | | 7,078 | |
6.50%, 2/15/2020 | | | 6,000 | | | | 6,228 | |
Tenet Healthcare Corp. | | | | | | | | |
4.75%, 6/1/2020 | | | 2,480 | | | | 2,505 | |
| | | | | | | | |
| INVESTMENTS | | PRINCIPAL
AMOUNT
($000) | | | VALUE
($000) | |
| | | | | | | | |
Health Care Providers & Services — continued | | | | | | | | |
6.00%, 10/1/2020 | | | 520 | | | | 540 | |
4.50%, 4/1/2021 | | | 5,000 | | | | 4,994 | |
4.38%, 10/1/2021 | | | 4,000 | | | | 3,990 | |
4.63%, 7/15/2024 | | | 11,841 | | | | 11,598 | |
| | | | | | | | |
| | | | | | | 49,194 | |
| | | | | | | | |
Hotels, Restaurants & Leisure — 1.3% | | | | | | | | |
Downstream Development Authority of the Quapaw Tribe of Oklahoma 10.50%, 2/15/2023 (f) | | | 1,511 | | | | 1,507 | |
International Game Technology plc 5.63%, 2/15/2020 (f) | | | 5,000 | | | | 5,088 | |
MGM Resorts International 5.25%, 3/31/2020 | | | 4,780 | | | | 4,876 | |
NCL Corp. Ltd. 4.75%, 12/15/2021 (f) | | | 6,154 | | | | 6,192 | |
Scientific Games International, Inc., 5.00%, 10/15/2025 (f) | | | 12,185 | | | | 11,576 | |
Seminole Hard Rock Entertainment, Inc. 5.88%, 5/15/2021 (f) | | | 11,645 | | | | 11,645 | |
| | | | | | | | |
| | | | | | | 40,884 | |
| | | | | | | | |
Independent Power and Renewable Electricity Producers — 0.2% | |
Calpine Corp. 6.00%, 1/15/2022 (f) | | | 5,000 | | | | 5,087 | |
| | | | | | | | |
IT Services — 0.3% | | | | | | | | |
Alliance Data Systems Corp. 5.88%, 11/1/2021 (f) | | | 5,000 | | | | 5,112 | |
Cardtronics, Inc. 5.13%, 8/1/2022 | | | 2,610 | | | | 2,562 | |
| | | | | | | | |
| | | | | | | 7,674 | |
| | | | | | | | |
Machinery — 0.1% | |
ATS Automation Tooling Systems, Inc. (Canada) 6.50%, 6/15/2023 (f) | | | 1,500 | | | | 1,549 | |
| | | | | | | | |
Media — 0.5% | | | | | | | | |
Cablevision Systems Corp. 8.00%, 4/15/2020 | | | 4,628 | | | | 4,871 | |
CSC Holdings LLC | | | | | | | | |
8.63%, 2/15/2019 | | | 1,486 | | | | 1,520 | |
5.25%, 6/1/2024 | | | 614 | | | | 596 | |
DISH DBS Corp. 7.88%, 9/1/2019 | | | 7,755 | | | | 8,017 | |
| | | | | | | | |
| | | | | | | 15,004 | |
| | | | | | | | |
Metals & Mining — 0.6% | |
FMG Resources August 2006 Pty. Ltd. (Australia) 4.75%, 5/15/2022 (f) | | | 5,000 | | | | 4,906 | |
Freeport-McMoRan, Inc. 3.10%, 3/15/2020 | | | 12,100 | | | | 11,999 | |
| | | | | | | | |
| | | | | | | 16,905 | |
| | | | | | | | |
SEE NOTES TO FINANCIAL STATEMENTS.
| | | | | | | | |
| | | |
| AUGUST 31, 2018 | | J.P. MORGAN INCOME FUNDS | | | | | 13 | |
JPMorgan Floating Rate Income Fund
SCHEDULE OF PORTFOLIO INVESTMENTS
AS OF AUGUST 31, 2018 (continued)
| | | | | | | | |
| INVESTMENTS | | PRINCIPAL
AMOUNT
($000) | | | VALUE
($000) | |
Corporate Bonds — continued | | | | | | | | |
Oil, Gas & Consumable Fuels — 1.8% | | | | | | | | |
Antero Resources Corp. | | | | | | | | |
5.38%, 11/1/2021 | | | 5,100 | | | | 5,183 | |
5.13%, 12/1/2022 | | | 8,363 | | | | 8,446 | |
Carrizo Oil & Gas, Inc. 6.25%, 4/15/2023 | | | 2,512 | | | | 2,569 | |
DCP Midstream Operating LP 4.75%, 9/30/2021 (f) | | | 4,750 | | | | 4,821 | |
NGL Energy Partners LP 5.13%, 7/15/2019 | | | 4,250 | | | | 4,257 | |
PBF Holding Co. LLC 7.00%, 11/15/2023 | | | 3,636 | | | | 3,800 | |
QEP Resources, Inc. 5.25%, 5/1/2023 | | | 3,000 | | | | 2,925 | |
Range Resources Corp. 5.88%, 7/1/2022 | | | 5,200 | | | | 5,252 | |
Southwestern Energy Co. 4.10%, 3/15/2022 | | | 5,200 | | | | 5,070 | |
Sunoco LP 4.88%, 1/15/2023 (f) | | | 1,840 | | | | 1,815 | |
Targa Resources Partners LP 4.25%, 11/15/2023 | | | 6,245 | | | | 6,058 | |
TerraForm Power Operating LLC 4.25%, 1/31/2023 (f) | | | 6,709 | | | | 6,541 | |
| | | | | | | | |
| | | | | | | 56,737 | |
| | | | | | | | |
Pharmaceuticals — 0.2% | | | | | | | | |
Bausch Health Cos., Inc. 6.50%, 3/15/2022 (f) | | | 6,000 | | | | 6,210 | |
| | | | | | | | |
| | | | | | | | |
Road & Rail — 0.5% | | | | | | | | |
Avis Budget Car Rental LLC 5.50%, 4/1/2023 | | | 7,500 | | | | 7,462 | |
DAE Funding LLC (United Arab Emirates) 4.00%, 8/1/2020 (f) | | | 8,358 | | | | 8,307 | |
| | | | | | | | |
| | | | | | | 15,769 | |
| | | | | | | | |
Software — 0.3% | |
Infor US, Inc. 5.75%, 8/15/2020 (f) | | | 4,350 | | | | 4,415 | |
Nuance Communications, Inc. 5.38%, 8/15/2020 (f) | | | 1,428 | | | | 1,428 | |
Symantec Corp. 4.20%, 9/15/2020 | | | 1,860 | | | | 1,872 | |
| | | | | | | | |
| | | | | | | 7,715 | |
| | | | | | | | |
Specialty Retail — 0.1% | |
Claire’s Stores, Inc. | | | | | | | | |
9.00%, 3/15/2019 (d) (f) | | | 4,000 | | | | 2,570 | |
6.13%, 3/15/2020 (d) (f) | | | 1,872 | | | | 1,203 | |
| | | | | | | | |
| | | | | | | 3,773 | |
| | | | | | | | |
Technology Hardware, Storage & Peripherals — 0.4% | |
Dell International LLC | | | | | | | | |
4.42%, 6/15/2021 (f) | | | 5,838 | | | | 5,937 | |
5.88%, 6/15/2021 (f) | | | 5,000 | | | | 5,144 | |
| | | | | | | | |
| | | | | | | 11,081 | |
| | | | | | | | |
| | | | | | | | |
| INVESTMENTS | | PRINCIPAL
AMOUNT
($000) | | | VALUE
($000) | |
| | | | | | | | |
Thrifts & Mortgage Finance — 0.1% | |
Radian Group, Inc. 5.25%, 6/15/2020 | | | 4,039 | | | | 4,120 | |
| | | | | | | | |
Wireless Telecommunication Services — 0.7% | | | | | | | | |
Inmarsat Finance plc (United Kingdom) 4.88%, 5/15/2022 (f) | | | 5,285 | | | | 5,298 | |
Sprint Communications, Inc. 6.00%, 11/15/2022 | | | 5,000 | | | | 5,061 | |
Sprint Corp. 7.25%, 9/15/2021 | | | 5,000 | | | | 5,242 | |
Sprint Spectrum Co. LLC 3.36%, 9/20/2021 (f) (h) | | | 1,838 | | | | 1,828 | |
T-Mobile USA, Inc. | | | | | | | | |
4.00%, 4/15/2022‡ | | | 3,334 | | | | — | (e) |
4.00%, 4/15/2022 | | | 3,334 | | | | 3,313 | |
| | | | | | | | |
| | | | | | | 20,742 | |
| | | | | | | | |
Total Corporate Bonds
(Cost $379,604) | | | | | | | 378,138 | |
| | | | | | | | |
| | |
| | | SHARES
(000) | | | | |
Common Stocks — 0.8% | | | | | | | | |
Aerospace & Defense — 0.1% | | | | | | | | |
Remington Outdoor Co., Inc.* ‡ | | | 419 | | | | 3,445 | |
| | | | | | | | |
Independent Power and Renewable Electricity Producers — 0.3% | |
Vistra Energy Corp.* | | | 330 | | | | 7,768 | |
| | | | | | | | |
Oil, Gas & Consumable Fuels — 0.0% (g) | | | | | | | | |
Southcross Holdco Equity* ‡ | | | 1 | | | | 334 | |
| | | | | | | | |
Software — 0.4% | | | | | | | | |
Avaya Holdings Corp.* | | | 500 | | | | 11,680 | |
| | | | | | | | |
Total Common Stocks
(Cost $19,055) | | | | | | | 23,227 | |
| | | | | | | | |
Preferred Stocks — 0.5% | | | | | | | | |
Insurance — 0.5% | | | | | | | | |
XLIT Ltd. (Bermuda), Series D, (ICE LIBOR USD 3 Month + 3.12%), 5.46%, 10/25/2018 ($1,000 par value) (b) (i)
(Cost $13,587) | | | 16 | | | | 16,543 | |
| | | | | | | | |
| | |
| | | PRINCIPAL
AMOUNT
($000) | | | | |
Asset-Backed Securities — 0.1% | | | | | | | | |
Continental Airlines Pass-Through Trust Series 2004-ERJ1, 9.56%, 9/1/2019 (Cost $1,228) | | | 1,187 | | | | 1,217 | |
| | | | | | | | |
SEE NOTES TO FINANCIAL STATEMENTS.
| | | | | | |
| | | |
| 14 | | | | J.P. MORGAN INCOME FUNDS | | AUGUST 31, 2018 |
| | | | | | | | |
| INVESTMENTS | | NO. OF
RIGHTS
(000) | | | VALUE
($000) | |
Rights — 0.0% (g) | | | | | | | | |
Independent Power and Renewable Electricity Producers — 0.0% (g) | |
Vistra Energy Corp., expiring 12/31/2049* ‡ (Cost $—) | | | 1,250 | | | | 882 | |
| | | | | | | | |
| | |
| | | SHARES
(000) | | | | |
Short-Term Investments — 7.7% | | | | | | | | |
Investment Companies — 7.7% | | | | | | | | |
JPMorgan U.S. Government Money Market Fund Class Institutional Shares, 1.82% (j) (k)
(Cost $238,030) | | | 238,030 | | | | 238,030 | |
| | | | | | | | |
Total Investments — 103.7%
(Cost $3,198,940) | | | | | | | 3,187,606 | |
Liabilities in Excess of
Other Assets — (3.7%) | | | | | | | (113,548 | ) |
| | | | | | | | |
Net Assets — 100.0% | | | | | | | 3,074,058 | |
| | | | | | | | |
Percentages indicated are based on net assets.
Abbreviations
| | |
| ICE | | Intercontinental Exchange |
| LIBOR | | London Interbank Offered Rate |
| SCA | | Limited partnership with share capital |
| USD | | United States Dollar |
| | |
| (a) | | Loan assignments are presented by obligor. Each series or loan tranche underlying each obligor may have varying terms. |
| (b) | | Variable or floating rate security, linked to the referenced benchmark. The interest rate shown is the current rate as of August 31, 2018. |
| (c) | | All or a portion of this security is unsettled as of August 31, 2018. Unless otherwise indicated, the coupon rate is undetermined. The coupon rate shown may not be accrued for the entire position. |
| (d) | | Defaulted security. |
| (e) | | Amount rounds to less than one thousand. |
| (f) | | Securities exempt from registration under Rule 144A or section 4(a)(2), of the Securities Act of 1933, as amended. Under procedures approved by the Board of Trustees, such securities have been determined to be liquid by the investment adviser and may be resold, normally to qualified institutional buyers in transactions exempt from registration. |
| (g) | | Amount rounds to less than 0.1% of net assets. |
| (h) | | Step bond. Interest rate is a fixed rate for an initial period that either resets at a specific date or may reset in the future contingent upon a predetermined trigger. The interest rate shown is the current rate as of August 31, 2018. |
| (i) | | The date shown reflects the next call date on which the issuer may redeem the security at par value. The coupon rate for this security is based on par value and is in effect as of August 31, 2018. |
| (j) | | Investment in affiliate. Fund is registered under the Investment Company Act of 1940, as amended, and advised by J.P. Morgan Investment Management Inc. |
| (k) | | The rate shown is the current yield as of August 31, 2018. |
| * | | Non-income producing security. |
| ‡ | | Value determined using significant unobservable inputs. |
SEE NOTES TO FINANCIAL STATEMENTS.
| | | | | | | | |
| | | |
| AUGUST 31, 2018 | | J.P. MORGAN INCOME FUNDS | | | | | 15 | |
STATEMENT OF ASSETS AND LIABILITIES
AS OF AUGUST 31, 2018
(Amounts in thousands, except per share amounts)
| | | | |
| | | JPMorgan
Floating Rate
Income Fund | |
ASSETS: | |
Investments in non-affiliates, at value | | $ | 2,949,576 | |
Investments in affiliates, at value | | | 238,030 | |
Cash | | | 6,427 | |
Foreign currency, at value | | | 1 | |
Receivables: | | | | |
Investment securities sold | | | 28,876 | |
Investment securities sold — delayed delivery securities | | | 244 | |
Fund shares sold | | | 4,023 | |
Interest from non-affiliates | | | 12,075 | |
Dividends from affiliates | | | 426 | |
Tax reclaims | | | 109 | |
Unrealized appreciation on unfunded commitments | | | 24 | |
| | | | |
Total Assets | | | 3,239,811 | |
| | | | |
|
LIABILITIES: | |
Payables: | | | | |
Investment securities purchased | | | 163,415 | |
Fund shares redeemed | | | 364 | |
Unrealized depreciation on unfunded commitments | | | 41 | |
Accrued liabilities: | | | | |
Investment advisory fees | | | 1,277 | |
Administration fees | | | 161 | |
Distribution fees | | | 51 | |
Service fees | | | 139 | |
Custodian and accounting fees | | | 37 | |
Trustees’ and Chief Compliance Officer’s fees | | | — | (a) |
Other | | | 268 | |
| | | | |
Total Liabilities | | | 165,753 | |
| | | | |
Net Assets | | $ | 3,074,058 | |
| | | | |
| (a) | Amount rounds to less than one thousand. |
SEE NOTES TO FINANCIAL STATEMENTS.
| | | | | | |
| | | |
| 16 | | | | J.P. MORGAN INCOME FUNDS | | AUGUST 31, 2018 |
| | | | |
| | | JPMorgan
Floating Rate
Income Fund | |
NET ASSETS: | |
Paid-in-Capital | | $ | 3,279,387 | |
Accumulated undistributed (distributions in excess of) net investment income | | | 2,253 | |
Accumulated net realized gains (losses) | | | (196,231 | ) |
Net unrealized appreciation (depreciation) | | | (11,351 | ) |
| | | | |
Total Net Assets | | $ | 3,074,058 | |
| | | | |
|
Net Assets: | |
Class A | | $ | 170,374 | |
Class C | | | 22,641 | |
Class I | | | 1,460,764 | |
Class R6 | | | 1,420,279 | |
| | | | |
Total | | $ | 3,074,058 | |
| | | | |
|
Outstanding units of beneficial interest (shares) | |
($0.0001 par value; unlimited number of shares authorized): | | | | |
Class A | | | 18,192 | |
Class C | | | 2,425 | |
Class I | | | 155,949 | |
Class R6 | | | 151,605 | |
| |
Net Asset Value (a): | | | | |
Class A — Redemption price per share | | $ | 9.37 | |
Class C — Offering price per share (b) | | | 9.34 | |
Class I — Offering and redemption price per share | | | 9.37 | |
Class R6 — Offering and redemption price per share | | | 9.37 | |
Class A maximum sales charge | | | 2.25 | % |
Class A maximum public offering price per share
[net asset value per share/(100% — maximum sales charge)] | | $ | 9.59 | |
| | | | |
| |
Cost of investments in non-affiliates | | $ | 2,960,910 | |
Cost of investments in affiliates | | | 238,030 | |
Cost of foreign currency | | | 2 | |
| (a) | Per share amounts may not recalculate due to rounding of net assets and/or shares outstanding. |
| (b) | Redemption price for Class C Shares varies based upon length of time the shares are held. |
SEE NOTES TO FINANCIAL STATEMENTS.
| | | | | | | | |
| | | |
| AUGUST 31, 2018 | | J.P. MORGAN INCOME FUNDS | | | | | 17 | |
STATEMENT OF OPERATIONS
FOR THE YEAR ENDED AUGUST 31, 2018
(Amounts in thousands)
| | | | |
| | | JPMorgan
Floating Rate
Income Fund | |
INVESTMENT INCOME: | |
Interest income from non-affiliates | | $ | 120,173 | |
Interest income from affiliates | | | 2 | |
Dividend income from non-affiliates | | | 803 | |
Dividend income from affiliates | | | 3,048 | |
| | | | |
Total investment income | | | 124,026 | |
| | | | |
|
EXPENSES: | |
Investment advisory fees | | | 14,082 | |
Administration fees | | | 2,078 | |
Distribution fees: | | | | |
Class A | | | 277 | |
Class C | | | 170 | |
Service fees: | | | | |
Class A | | | 277 | |
Class C | | | 57 | |
Class I | | | 3,427 | |
Custodian and accounting fees | | | 120 | |
Interest expense to affiliates | | | 1 | |
Professional fees | | | 144 | |
Trustees’ and Chief Compliance Officer’s fees | | | 33 | |
Printing and mailing costs | | | 63 | |
Registration and filing fees | | | 219 | |
Transfer agency fees (See Note 2.I.) | | | 31 | |
Other | | | 45 | |
| | | | |
Total expenses | | | 21,024 | |
| | | | |
Less fees waived | | | (2,861 | ) |
Less earnings credits | | | (1 | ) |
| | | | |
Net expenses | | | 18,162 | |
| | | | |
Net investment income (loss) | | | 105,864 | |
| | | | |
| |
REALIZED/UNREALIZED GAINS (LOSSES): | | | | |
Net realized gain (loss) on transactions from: | | | | |
Investments in non-affiliates | | | (22,950 | ) |
Foreign currency transactions | | | (17 | ) |
| | | | |
Net realized gain (loss) | | | (22,967 | ) |
| | | | |
Change in net unrealized appreciation/depreciation on: | |
Investments in non-affiliates | | | 7,924 | |
Foreign currency translations | | | — | (a) |
Unfunded commitments | | | (17 | ) |
| | | | |
Change in net unrealized appreciation/depreciation | | | 7,907 | |
| | | | |
Net realized/unrealized gains (losses) | | | (15,060 | ) |
| | | | |
Change in net assets resulting from operations | | $ | 90,804 | |
| | | | |
| (a) | Amount rounds to less than one thousand. |
SEE NOTES TO FINANCIAL STATEMENTS.
| | | | | | |
| | | |
| 18 | | | | J.P. MORGAN INCOME FUNDS | | AUGUST 31, 2018 |
STATEMENTS OF CHANGES IN NET ASSETS
FOR THE PERIODS INDICATED
(Amounts in thousands)
| | | | | | | | |
| | | JPMorgan Floating Rate Income Fund | |
| | | Year Ended
August 31, 2018 | | | Year Ended
August 31, 2017 | |
CHANGE IN NET ASSETS RESULTING FROM OPERATIONS: | |
Net investment income (loss) | | $ | 105,864 | | | $ | 84,603 | |
Net realized gain (loss) | | | (22,967 | ) | | | (56,181 | ) |
Change in net unrealized appreciation/depreciation | | | 7,907 | | | | 59,824 | |
| | | | | | | | |
Change in net assets resulting from operations | | | 90,804 | | | | 88,246 | |
| | | | | | | | |
|
DISTRIBUTIONS TO SHAREHOLDERS: | |
Class A | | | | | | | | |
From net investment income | | | (4,238 | ) | | | (3,599 | ) |
Class C | | | | | | | | |
From net investment income | | | (733 | ) | | | (856 | ) |
Class I | | | | | | | | |
From net investment income | | | (54,644 | ) | | | (43,924 | ) |
Class R6 | | | | | | | | |
From net investment income | | | (43,768 | ) | | | (35,871 | ) |
| | | | | | | | |
Total distributions to shareholders | | | (103,383 | ) | | | (84,250 | ) |
| | | | | | | | |
|
CAPITAL TRANSACTIONS: | |
Change in net assets resulting from capital transactions | | | 670,828 | | | | 600,514 | |
| | | | | | | | |
|
NET ASSETS: | |
Change in net assets | | | 658,249 | | | | 604,510 | |
Beginning of period | | | 2,415,809 | | | | 1,811,299 | |
| | | | | | | | |
End of period | | $ | 3,074,058 | | | $ | 2,415,809 | |
| | | | | | | | |
Accumulated undistributed (distributions in excess of) net investment income | | $ | 2,253 | | | $ | (35 | ) |
| | | | | | | | |
| | |
CAPITAL TRANSACTIONS: | | | | | | | | |
Class A | | | | | | | | |
Proceeds from shares issued | | $ | 117,372 | | | $ | 58,312 | |
Distributions reinvested | | | 4,234 | | | | 3,597 | |
Cost of shares redeemed | | | (38,974 | ) | | | (57,237 | ) |
| | | | | | | | |
Change in net assets resulting from Class A capital transactions | | $ | 82,632 | | | $ | 4,672 | |
| | | | | | | | |
Class C | | | | | | | | |
Proceeds from shares issued | | $ | 5,590 | | | $ | 12,519 | |
Distributions reinvested | | | 721 | | | | 838 | |
Cost of shares redeemed | | | (9,694 | ) | | | (9,264 | ) |
| | | | | | | | |
Change in net assets resulting from Class C capital transactions | | $ | (3,383 | ) | | $ | 4,093 | |
| | | | | | | | |
Class I | | | | | | | | |
Proceeds from shares issued | | $ | 747,849 | | | $ | 803,860 | |
Distributions reinvested | | | 46,643 | | | | 3,528 | |
Cost of shares redeemed | | | (657,234 | ) | | | (346,605 | ) |
| | | | | | | | |
Change in net assets resulting from Class I capital transactions | | $ | 137,258 | | | $ | 460,783 | |
| | | | | | | | |
Class R6 | | | | | | | | |
Proceeds from shares issued | | $ | 746,143 | | | $ | 265,017 | |
Distributions reinvested | | | 42,249 | | | | 30,602 | |
Cost of shares redeemed | | | (334,071 | ) | | | (164,653 | ) |
| | | | | | | | |
Change in net assets resulting from Class R6 capital transactions | | $ | 454,321 | | | $ | 130,966 | |
| | | | | | | | |
Total change in net assets resulting from capital transactions | | $ | 670,828 | | | $ | 600,514 | |
| | | | | | | | |
SEE NOTES TO FINANCIAL STATEMENTS.
| | | | | | | | |
| | | |
| AUGUST 31, 2018 | | J.P. MORGAN INCOME FUNDS | | | | | 19 | |
STATEMENTS OF CHANGES IN NET ASSETS
FOR THE PERIODS INDICATED (continued)
(Amounts in thousands)
| | | | | | | | |
| | | JPMorgan Floating Rate Income Fund | |
| | | Year Ended
August 31, 2018 | | | Year Ended
August 31, 2017 | |
SHARE TRANSACTIONS: | | | | | | | | |
Class A | | | | | | | | |
Issued | | | 12,492 | | | | 6,188 | |
Reinvested | | | 451 | | | | 381 | |
Redeemed | | | (4,149 | ) | | | (6,061 | ) |
| | | | | | | | |
Change in Class A Shares | | | 8,794 | | | | 508 | |
| | | | | | | | |
Class C | | | | | | | | |
Issued | | | 597 | | | | 1,330 | |
Reinvested | | | 77 | | | | 89 | |
Redeemed | | | (1,034 | ) | | | (984 | ) |
| | | | | | | | |
Change in Class C Shares | | | (360 | ) | | | 435 | |
| | | | | | | | |
Class I | | | | | | | | |
Issued | | | 79,502 | | | | 84,956 | |
Reinvested | | | 4,971 | | | | 374 | |
Redeemed | | | (69,898 | ) | | | (36,680 | ) |
| | | | | | | | |
Change in Class I Shares | | | 14,575 | | | | 48,650 | |
| | | | | | | | |
Class R6 | | | | | | | | |
Issued | | | 79,377 | | | | 28,012 | |
Reinvested | | | 4,500 | | | | 3,246 | |
Redeemed | | | (35,534 | ) | | | (17,424 | ) |
| | | | | | | | |
Change in Class R6 Shares | | | 48,343 | | | | 13,834 | |
| | | | | | | | |
SEE NOTES TO FINANCIAL STATEMENTS.
| | | | | | |
| | | |
| 20 | | | | J.P. MORGAN INCOME FUNDS | | AUGUST 31, 2018 |
THIS PAGE IS INTENTIONALLY LEFT BLANK
| | | | | | | | |
| | | |
| AUGUST 31, 2018 | | J.P. MORGAN INCOME FUNDS | | | | | 21 | |
FINANCIAL HIGHLIGHTS
FOR THE PERIODS INDICATED
| | | | | | | | | | | | | | | | | | | | | | | | | | | | |
| | | | | | Per share operating performance | |
| | | | | | Investment operations | | | Distributions | |
| | | Net asset
value,
beginning
of period | | | Net
investment
income
(loss) | | | Net realized
and unrealized
gains
(losses) on
investments | | | Total from
investment
operations | | | Net
investment
income | | | Net
realized
gain | | | Total
distributions | |
JPMorgan Floating Rate Income Fund | | | | | | | | | | | | | | | | | | | | | | | | | | | | |
Class A | | | | | | | | | | | | | | | | | | | | | | | | | | | | |
Year Ended August 31, 2018 | | $ | 9.41 | | | $ | 0.36 | (e) | | $ | (0.05 | ) | | $ | 0.31 | | | $ | (0.35 | ) | | $ | — | | | $ | (0.35 | ) |
Year Ended August 31, 2017 | | | 9.36 | | | | 0.35 | (e) | | | 0.05 | | | | 0.40 | | | | (0.35 | ) | | | — | | | | (0.35 | ) |
Year Ended August 31, 2016 | | | 9.56 | | | | 0.40 | (e) | | | (0.20 | ) | | | 0.20 | | | | (0.40 | ) | | | — | | | | (0.40 | ) |
Year Ended August 31, 2015 | | | 10.04 | | | | 0.38 | (e) | | | (0.47 | ) | | | (0.09 | ) | | | (0.39 | ) | | | — | (f) | | | (0.39 | ) |
Year Ended August 31, 2014 | | | 10.02 | | | | 0.39 | (g) | | | 0.02 | | | | 0.41 | | | | (0.38 | ) | | | (0.01 | ) | | | (0.39 | ) |
| | | | | | | |
Class C | | | | | | | | | | | | | | | | | | | | | | | | | | | | |
Year Ended August 31, 2018 | | | 9.38 | | | | 0.31 | (e) | | | (0.05 | ) | | | 0.26 | | | | (0.30 | ) | | | — | | | | (0.30 | ) |
Year Ended August 31, 2017 | | | 9.34 | | | | 0.31 | (e) | | | 0.04 | | | | 0.35 | | | | (0.31 | ) | | | — | | | | (0.31 | ) |
Year Ended August 31, 2016 | | | 9.54 | | | | 0.35 | (e) | | | (0.19 | ) | | | 0.16 | | | | (0.36 | ) | | | — | | | | (0.36 | ) |
Year Ended August 31, 2015 | | | 10.02 | | | | 0.33 | (e) | | | (0.46 | ) | | | (0.13 | ) | | | (0.35 | ) | | | — | (f) | | | (0.35 | ) |
Year Ended August 31, 2014 | | | 10.01 | | | | 0.34 | (g) | | | 0.02 | | | | 0.36 | | | | (0.34 | ) | | | (0.01 | ) | | | (0.35 | ) |
| | | | | | | |
Class I | | | | | | | | | | | | | | | | | | | | | | | | | | | | |
Year Ended August 31, 2018 | | | 9.41 | | | | 0.39 | (e) | | | (0.05 | ) | | | 0.34 | | | | (0.38 | ) | | | — | | | | (0.38 | ) |
Year Ended August 31, 2017 | | | 9.37 | | | | 0.37 | (e) | | | 0.05 | | | | 0.42 | | | | (0.38 | ) | | | — | | | | (0.38 | ) |
Year Ended August 31, 2016 | | | 9.57 | | | | 0.42 | (e) | | | (0.19 | ) | | | 0.23 | | | | (0.43 | ) | | | — | | | | (0.43 | ) |
Year Ended August 31, 2015 | | | 10.05 | | | | 0.40 | (e) | | | (0.46 | ) | | | (0.06 | ) | | | (0.42 | ) | | | — | (f) | | | (0.42 | ) |
Year Ended August 31, 2014 | | | 10.03 | | | | 0.42 | (g) | | | 0.02 | | | | 0.44 | | | | (0.41 | ) | | | (0.01 | ) | | | (0.42 | ) |
| | | | | | | |
Class R6 | | | | | | | | | | | | | | | | | | | | | | | | | | | | |
Year Ended August 31, 2018 | | | 9.41 | | | | 0.40 | (e) | | | (0.06 | ) | | | 0.34 | | | | (0.38 | ) | | | — | | | | (0.38 | ) |
Year Ended August 31, 2017 | | | 9.37 | | | | 0.39 | (e) | | | 0.04 | | | | 0.43 | | | | (0.39 | ) | | | — | | | | (0.39 | ) |
Year Ended August 31, 2016 | | | 9.57 | | | | 0.43 | (e) | | | (0.19 | ) | | | 0.24 | | | | (0.44 | ) | | | — | | | | (0.44 | ) |
Year Ended August 31, 2015 | | | 10.05 | | | | 0.41 | (e) | | | (0.46 | ) | | | (0.05 | ) | | | (0.43 | ) | | | — | (f) | | | (0.43 | ) |
October 31, 2013 (h) through August 31, 2014 | | | 10.10 | | | | 0.34 | (g) | | | (0.03 | ) | | | 0.31 | | | | (0.35 | ) | | | (0.01 | ) | | | (0.36 | ) |
| (a) | Annualized for periods less than one year, unless otherwise noted. |
| (b) | Not annualized for periods less than one year. |
| (c) | Includes adjustments in accordance with accounting principles generally accepted in the United States of America and as such, the net asset values for financial reporting purposes and the returns based upon those net asset values may differ from the net asset values and returns for shareholder transactions. |
| (d) | Includes earnings credits and interest expense, if applicable, each of which is less than 0.005% unless otherwise noted. |
| (e) | Calculated based upon average shares outstanding. |
| (f) | Amount rounds to less than $0.005. |
| (g) | Net investment income (loss) may appear disproportionate among the classes due to the timing of recognition of income and changes in the relative size of the classes. |
| (h) | Commencement of offering of class of shares. |
SEE NOTES TO FINANCIAL STATEMENTS.
| | | | | | |
| | | |
| 22 | | | | J.P. MORGAN INCOME FUNDS | | AUGUST 31, 2018 |
| | | | | | | | | | | | | | | | | | | | | | | | | | |
| | | Ratios/Supplemental data | |
| | | | | | | | | | Ratios to average net assets (a) | | | | |
Net asset
value,
end of
period | | | Total return
(excludes
sales charge) (b)(c) | | |
Net assets,
end of
period
(000’s) | | | Net
expenses (d) | | | Net
investment
income
(loss) | | | Expenses
without waivers,
reimbursements and
earnings credits | | | Portfolio
turnover
rate (b) | |
| | | | | | | | | | | | | | | | | | | | | | | | | | |
| | | | | | | | | | | | | | | | | | | | | | | | | | |
| $ | 9.37 | | | | 3.38 | % | | $ | 170,374 | | | | 0.98 | % | | | 3.88 | % | | | 1.16 | % | | | 38 | % |
| | 9.41 | | | | 4.36 | | | | 88,390 | | | | 0.98 | | | | 3.76 | | | | 1.18 | | | | 51 | |
| | 9.36 | | | | 2.30 | | | | 83,254 | | | | 0.99 | | | | 4.29 | | | | 1.22 | | | | 41 | |
| | 9.56 | | | | (0.92 | ) | | | 85,854 | | | | 0.99 | | | | 3.85 | | | | 1.25 | | | | 16 | |
| | 10.04 | | | | 4.15 | | | | 168,575 | | | | 0.98 | | | | 3.85 | (g) | | | 1.15 | | | | 61 | |
| | | | | | |
| | | | | | | | | | | | | | | | | | | | | | | | | | |
| | 9.34 | | | | 2.87 | | | | 22,641 | | | | 1.48 | | | | 3.35 | | | | 1.67 | | | | 38 | |
| | 9.38 | | | | 3.74 | | | | 26,114 | | | | 1.48 | | | | 3.25 | | | | 1.69 | | | | 51 | |
| | 9.34 | | | | 1.78 | | | | 21,937 | | | | 1.49 | | | | 3.79 | | | | 1.73 | | | | 41 | |
| | 9.54 | | | | (1.37 | ) | | | 26,637 | | | | 1.49 | | | | 3.35 | | | | 1.73 | | | | 16 | |
| | 10.02 | | | | 3.59 | | | | 22,738 | | | | 1.48 | | | | 3.35 | (g) | | | 1.65 | | | | 61 | |
| | | | | | |
| | | | | | | | | | | | | | | | | | | | | | | | | | |
| | 9.37 | | | | 3.63 | | | | 1,460,764 | | | | 0.73 | | | | 4.11 | | | | 0.91 | | | | 38 | |
| | 9.41 | | | | 4.51 | | | | 1,329,888 | | | | 0.73 | | | | 3.96 | | | | 0.91 | | | | 51 | |
| | 9.37 | | | | 2.55 | | | | 868,497 | | | | 0.74 | | | | 4.51 | | | | 0.91 | | | | 41 | |
| | 9.57 | | | | (0.61 | ) | | | 1,946,646 | | | | 0.74 | | | | 4.09 | | | | 0.92 | | | | 16 | |
| | 10.05 | | | | 4.40 | | | | 2,930,115 | | | | 0.73 | | | | 4.10 | (g) | | | 0.90 | | | | 61 | |
| | | | | | |
| | | | | | | | | | | | | | | | | | | | | | | | | | |
| | 9.37 | | | | 3.73 | | | | 1,420,279 | | | | 0.63 | | | | 4.21 | | | | 0.66 | | | | 38 | |
| | 9.41 | | | | 4.61 | | | | 971,417 | | | | 0.63 | | | | 4.10 | | | | 0.66 | | | | 51 | |
| | 9.37 | | | | 2.65 | | | | 837,611 | | | | 0.64 | | | | 4.67 | | | | 0.66 | | | | 41 | |
| | 9.57 | | | | (0.49 | ) | | | 391,548 | | | | 0.64 | | | | 4.18 | | | | 0.67 | | | | 16 | |
| | 10.05 | | | | 3.05 | | | | 916,404 | | | | 0.63 | | | | 4.11 | (g) | | | 0.66 | | | | 61 | |
SEE NOTES TO FINANCIAL STATEMENTS.
| | | | | | | | |
| | | |
| AUGUST 31, 2018 | | J.P. MORGAN INCOME FUNDS | | | | | 23 | |
NOTES TO FINANCIAL STATEMENTS
AS OF AUGUST 31, 2018
1. Organization
JPMorgan Trust I (the “Trust”) was formed on November 12, 2004, as a Delaware statutory trust, pursuant to a Declaration of Trust dated November 5, 2004 and is registered under the Investment Company Act of 1940, as amended (the “1940 Act”), as an open-end management investment company.
The following is a separate fund of the Trust (the “Fund”) covered by this report:
| | | | |
| | | Classes Offered | | Diversified/Non-Diversified |
| JPMorgan Floating Rate Income Fund | | Class A, Class C, Class I and Class R6 | | Diversified |
The investment objective of the Fund is to seek to provide current income with a secondary objective of capital appreciation.
Class A Shares generally provide for a front-end sales charge while Class C Shares provide for a contingent deferred sales charge (“CDSC”). No sales charges are assessed with respect to Class I and Class R6 Shares. Certain Class A Shares, for which front-end sales charges have been waived, may be subject to a CDSC as described in the Fund’s prospectus. Beginning on November 14, 2017, Class C Shares automatically convert to Class A Shares after ten years. All classes of shares have equal rights as to earnings, assets and voting privileges, except that each class may bear different transfer agency, distribution and service fees and each class has exclusive voting rights with respect to its distribution plan and shareholder servicing agreements.
J.P. Morgan Investment Management Inc. (“JPMIM”), an indirect, wholly-owned subsidiary of JPMorgan Chase & Co. (“JPMorgan”), acts as Adviser (the “Adviser”) and Administrator (the “Administrator”) to the Fund.
2. Significant Accounting Policies
The following is a summary of significant accounting policies followed by the Fund in the preparation of its financial statements. The Fund is an investment company and, thus, follows the investment company accounting and reporting guidance of the Financial Accounting Standards Board Accounting Standards Codification Topic 946 — Investment Companies, which is part of U.S. generally accepted accounting principles (“GAAP”). The preparation of financial statements in conformity with GAAP requires management to make estimates and assumptions that affect the reported amounts of assets and liabilities and disclosure of contingent assets and liabilities at the date of the financial statements and the reported amounts of increases and decreases in net assets from operations during the reporting period. Actual results could differ from those estimates.
A. Valuation of Investments — The valuation of investments is in accordance with GAAP and the Fund’s valuation policies set forth by and under the supervision and responsibility of the Board of Trustees (the “Board”), which established the following approach to valuation, as described more fully below: (i) investments for which market quotations are readily available shall be valued at such unadjusted quoted prices and (ii) all other investments for which market quotations are not readily available shall be valued at their fair value as determined in good faith by the Board.
The Administrator has established the J.P. Morgan Asset Management Americas Valuation Committee (“AVC”) to assist the Board with the oversight and monitoring of the valuation of the Fund’s investments. The Administrator implements the valuation policies of the Fund’s investments, as directed by the Board. The AVC oversees and carries out the policies for the valuation of investments held in the Fund. This includes monitoring the appropriateness of fair values based on results of ongoing valuation oversight including, but not limited to, consideration of macro or security specific events, market events and pricing vendor and broker due diligence. The Administrator is responsible for discussing and assessing the potential impacts to the fair values on an ongoing basis, and at least on a quarterly basis with the AVC and the Board.
A market-based approach is primarily used to value the Fund’s investments. Investments for which market quotations are not readily available are fair valued by approved affiliated and unaffiliated pricing vendors or third party broker-dealers (collectively referred to as “Pricing Services”) or may be internally fair valued using methods set forth by the valuation policies approved by the Board. This may include related or comparable assets or liabilities, recent transactions, market multiples, book values and other relevant information for the investment to determine the fair value of the investment. An income-based valuation approach may be used in which the anticipated future cash flows of the investment are discounted to calculate the fair value. Discounts may also be applied due to the nature or duration of any restrictions on the disposition of the investments. Valuations may be based upon current market prices of securities that are comparable in coupon, rating, maturity and industry. It is possible that the estimated values may differ significantly from the values that would have been used, had a ready market for the investments existed, and such differences could be material.
Fixed income instruments are valued based on prices received from Pricing Services. The Pricing Services use multiple valuation techniques to determine the valuation of fixed income instruments. In instances where sufficient market activity exists, the Pricing Services may utilize a market-based approach through which trades or quotes from market makers are used to determine the valuation of these instruments. In instances where sufficient market activity may not exist, the Pricing Services also utilize proprietary valuation models which may consider market transactions in comparable securities and the various relationships between securities in determining fair value and/or market characteristics in order to estimate the relevant cash flows, which are then discounted to calculate the fair values.
Equities and other exchange-traded instruments are valued at the last sale price or official market closing price on the primary exchange on which the instrument is traded before the net asset values (“NAV”) of the Fund are calculated on a valuation date. Investments in open-end investment companies, including J.P. Morgan Funds (the “Underlying Funds”), are valued at each Underlying Fund’s NAV per share as of the report date.
| | | | | | |
| | | |
| 24 | | | | J.P. MORGAN INCOME FUNDS | | AUGUST 31, 2018 |
Valuations reflected in this report are as of the report date. As a result, changes in valuation due to market events and/or issuer related events after the report date and prior to issuance of the report are not reflected herein.
The various inputs that are used in determining the valuation of the Fund’s investments are summarized into the three broad levels listed below.
| • | | Level 1 — Unadjusted inputs using quoted prices in active markets for identical investments. |
| • | | Level 2 — Other significant observable inputs including, but not limited to, quoted prices for similar investments, inputs other than quoted prices that are observable for investments (such as interest rates, prepayment speeds, credit risk, etc.) or other market corroborated inputs. |
| • | | Level 3 — Significant inputs based on the best information available in the circumstances, to the extent observable inputs are not available (including the Fund’s assumptions in determining the fair value of investments). |
A financial instrument’s level within the fair value hierarchy is based on the lowest level of any input, both individually and in the aggregate, that is significant to the fair value measurement. The inputs or methodology used for valuing instruments are not necessarily an indication of the risk associated with investing in those instruments.
The following table represents each valuation input as presented on the Schedule of Portfolio Investments (“SOI”) (amounts in thousands):
| | | | | | | | | | | | | | | | |
| | | Level 1 Quoted prices | | | Level 2 Other significant
observable inputs | | | Level 3 Significant
unobservable inputs | | | Total | |
Investments in Securities | | | | | | | | | |
Debt Securities | | | | | | | | | |
Asset-Backed Securities | | $ | — | | | $ | 1,217 | | | $ | — | | | $ | 1,217 | |
Corporate Bonds | | | | | | | | | |
Wireless Telecommunication Services | | | — | | | | 20,742 | | | | — | (a) | | | 20,742 | |
Other Corporate Bonds | | | — | | | | 357,396 | | | | — | | | | 357,396 | |
| | | | | | | | | | | | | | | | |
Total Corporate Bonds | | | — | | | | 378,138 | | | | — | (a) | | | 378,138 | |
| | | | | | | | | | | | | | | | |
Common Stocks | | | | | | | | | |
Aerospace & Defense | | | — | | | | — | | | | 3,445 | | | | 3,445 | |
Oil, Gas & Consumable Fuels | | | — | | | | — | | | | 334 | | | | 334 | |
Other Common Stocks | | | 19,448 | | | | — | | | | — | | | | 19,448 | |
| | | | | | | | | | | | | | | | |
Total Common Stocks | | | 19,448 | | | | — | | | | 3,779 | | | | 23,227 | |
| | | | | | | | | | | | | | | | |
Preferred Stocks | | | | | | | | | |
Other Preferred Stocks | | | — | | | | 16,543 | | | | — | | | | 16,543 | |
Loan Assignments | | | | | | | | | |
Media | | | — | | | | 340,307 | | | | — | (a) | | | 340,307 | |
Other Loan Assignments | | | — | | | | 2,189,262 | | | | — | | | | 2,189,262 | |
| | | | | | | | | | | | | | | | |
Total Loan Assignments | | | — | | | | 2,529,569 | | | | — | (a) | | | 2,529,569 | |
| | | | | | | | | | | | | | | | |
Rights | | | | | | | | | |
Independent Power and Renewable Electricity Producers | | | — | | | | — | | | | 882 | | | | 882 | |
Short-Term Investments | | | | | | | | | |
Investment Companies | | | 238,030 | | | | — | | | | — | | | | 238,030 | |
| | | | | | | | | | | | | | | | |
Total Investments in Securities | | $ | 257,478 | | | $ | 2,925,467 | | | $ | 4,661 | | | $ | 3,187,606 | |
| | | | | | | | | | | | | | | | |
| (a) | Amount rounds to less than one thousand. |
There were no significant transfers among any levels during the year ended August 31, 2018.
B. Foreign Currency Translation — The books and records of the Fund are maintained in U.S. dollars. Foreign currency amounts are translated into U.S. dollars at the prevailing exchange rates of such currencies against the U.S. dollar. The market value of investment securities and other assets and liabilities are translated at the exchange rate as of the valuation date. Purchases and sales of investment securities, income and expenses are translated at the exchange rate prevailing on the respective dates of such transactions.
The Fund does not isolate the effect of changes in foreign exchange rates from changes in market prices on securities held. Accordingly, such changes are included within Change in net unrealized appreciation/depreciation on investments on the Statement of Operations.
Reported realized foreign currency gains and losses arise from the disposition of foreign currency, currency gains or losses realized between the trade and settlement dates on securities transactions, and the difference between the amounts of dividends, interest and foreign withholding taxes recorded on the Fund’s books on the transaction date and the U.S. dollar equivalent of the amounts actually received or paid. These reported realized foreign currency gains and losses are included in Net realized gain (loss) on foreign currency transactions on the Statement of Operations. Unrealized foreign currency gains and losses arise from changes (due to changes in exchange rates) in the value of foreign currency and other
| | | | | | | | |
| | | |
| AUGUST 31, 2018 | | J.P. MORGAN INCOME FUNDS | | | | | 25 | |
NOTES TO FINANCIAL STATEMENTS
AS OF AUGUST 31, 2018 (continued)
assets and liabilities denominated in foreign currencies, which are held at period end and are included in Change in net unrealized appreciation/depreciation on foreign currency translations on the Statement of Operations.
C. Restricted Securities — Certain securities held by the Fund may be subject to legal or contractual restrictions on resale. Restricted securities generally are resold in transactions exempt from registration under the Securities Act of 1933, as amended (the “Securities Act”). Disposal of these securities may involve time-consuming negotiations and expense. Prompt sale at the current valuation may be difficult and could adversely affect the net asset value of the Fund.
As of August 31, 2018, the Fund had no investments in restricted securities other than securities sold to the Fund under Rule 144A or Regulation S under the Securities Act.
D. Loan Assignments — The Fund may invest in debt instruments that are interests in amounts owed to lenders or lending syndicates (a “Lender”) by corporate, governmental or other borrowers (a “Borrower”). A loan is often administered by a bank or other financial institution (the “Agent”) that acts as agent for all holders. The Agent administers the terms of the loan, as specified in the loan agreement. The fund invests in loan assignments of all or a portion of the loans. When a fund purchases a loan assignment, the fund has direct rights against the Borrower on a loan, provided, however, the Fund’s rights may be more limited than the Lender from which they acquired the assignment and the fund may be able to enforce its rights only through the Agent. As a result, a fund assumes the credit risk of the Borrower as well as any other persons interpositioned between the Fund and the Borrower (“Intermediate Participants”). A fund may incur certain costs and delays in realizing payment on a loan assignment or suffer a loss of principal and/or interest if assets or interests held by the Agent or other Intermediate Participants are determined to be subject to the claims of the Agent’s or other Intermediate Participant’s creditors. In addition, it is unclear whether loan assignments and other forms of direct indebtedness offer securities law protections against fraud and misrepresentation. Also, because JPMIM may wish to invest in publicly traded securities of a Borrower, it may not have access to material non-public information regarding the Borrower to which other investors have access. Although certain loan assignments are secured by collateral, a fund could experience delays or limitations in realizing the value on such collateral or have its interest subordinated to other indebtedness of the Borrower. Loan assignments are vulnerable to market conditions such that economic conditions or other events may reduce the demand for assignments and certain assignments which were liquid, when purchased, may become illiquid and they may be difficult to value. In addition, the settlement period for loans is uncertain as there is no standardized settlement schedule applicable to such investments. Therefore, a fund may not receive the proceeds from a sale of such investments for a period after the sale.
Certain loan assignments are also subject to the risks associated with high yield securities described under Note 7.
At August 31, 2018, the Fund had investments in loan assignments that amounted to more than 5% of the Fund’s net assets, by agent bank as follows:
| | | | |
| Agent Bank | | Percentage | |
Credit Suisse International | | | 16.9 | % |
Barclays Bank plc | | | 11.0 | |
JPMorgan Chase Bank, N.A. | | | 6.8 | |
Bank of America, N.A. | | | 8.2 | |
Morgan Stanley | | | 7.3 | |
Deutsche Bank AG | | | 7.6 | |
Goldman Sachs International | | | 6.7 | |
E. Unfunded Commitments — The Fund has entered into commitments to buy and sell investments including commitments to buy loan assignments to settle on future dates as part of their normal investment activities. Unfunded commitments may include revolving loan facilities which may obligate the Fund to provide cash to the borrower on demand. Unfunded commitments are generally traded and priced as part of a related loan assignment (Note 2.D). The value of the unfunded portion of the investment is determined using a pro-rata allocation, based on its par value relative to the par value of the entire investment. The unrealized appreciation/depreciation from unfunded commitments is reported on the Statement of Assets and Liabilities. Credit risk exists on these commitments to the extent of any difference between the sales price and current value of the underlying securities sold. Market risk exists on these commitments to buy to the same extent as if the securities were owned on a settled basis and gains and losses are recorded and reported in the same manner. The Fund may receive an ongoing commitment fee based on the undrawn portion of the underlying loan facility, which is recorded as a component of Interest income from non-affiliates on the Statement of Operations.
At August 31, 2018, the Fund had the following loan commitments in which all or a portion of the commitment was unfunded which could be extended at the options of the borrower (amounts in thousands):
| | | | | | | | | | | | | | | | | | | | | | | | | | | | | | | | | | | | | | |
| | | | | | | | | | | | | | Unfunded
Commitment | | | Funded
Commitment | | | Total
Commitment | |
| Security Description | | Term | | Maturity Date | | | Commitment Fee Rate | | | Rate if Funded | | | Par Amount | | | Value | | | Par Amount | | | Value | | | Par Amount | | | Value | |
Pearl Intermediate Parent LLC | | Delayed Draw Term Loan | | | 2/14/2025 | | | | 2.75 | % | | | 2.16 | % | | $ | 2,260 | | | $ | 2,215 | | | $ | 865 | | | $ | 848 | | | $ | 3,125 | | | $ | 3,063 | |
St. George’s University Scholastic Services LLC | | Delayed Draw Term Loan | | | 7/17/2025 | | | | 1.75 | | | | 0.00 | | | | 2,136 | | | | 2,157 | | | | — | | | | — | | | | 2,136 | | | | 2,157 | |
Thoughtworks, Inc. | | Delayed Draw Term Loan | | | 10/11/2024 | | | | 2.00 | | | | 0.00 | | | | 771 | | | | 774 | | | | — | | | | — | | | | 771 | | | | 774 | |
| | | | | | |
| | | |
| 26 | | | | J.P. MORGAN INCOME FUNDS | | AUGUST 31, 2018 |
F. When-Issued Securities, Delayed Delivery Securities and Forward Commitments — The Fund purchased when-issued securities, including To Be Announced (“TBA”) securities, and entered into contracts to purchase or sell securities for a fixed price that may be settled a month or more after the trade date, or purchased delayed delivery securities which generally settle seven days after the trade date. When-issued securities are securities that have been authorized, but not issued in the market. A forward commitment involves entering into a contract to purchase or sell securities for a fixed price at a future date that may be settled a month or more after the trade date. A delayed delivery security is agreed upon in advance between the buyer and the seller of the security and are generally delivered beyond seven days of the agreed upon date. The purchase of securities on a when-issued, delayed delivery or forward commitment basis involves the risk that the value of the security to be purchased declines before the settlement date. The sale of securities on a forward commitment basis involves the risk that the value of the securities sold may increase before the settlement date. The Fund may be exposed to credit risk if the counterparty fails to perform under the terms of the transaction. Interest income for securities purchased on a when-issued, delayed delivery or forward commitment basis is not accrued until the settlement date.
The Fund had delayed delivery securities outstanding as of August 31, 2018, which are shown as a Receivable for investment securities sold - delayed delivery securities on the Statement of Assets and Liabilities.
G. Investment Transactions with Affiliates — The Fund invested in Underlying Funds which are advised by the Adviser or its affiliates. An issuer which is under common control with the Fund may be considered an affiliate. For the purposes of the financial statements, the Fund assumes the issuers listed in the table below to be affiliated issuers. Underlying Funds’ distributions may be reinvested into the Underlying Funds. Reinvestment amounts are included in the purchase cost amounts in the table below.
| | | | | | | | | | | | | | | | | | | | | | | | | | | | | | | | | | | | |
| For the year ended August 31, 2018 | |
| Security Description | | Value at
August 31,
2017 | | | Purchases at
Cost | | | Proceeds
from Sales | | | Net
Realized
Gain
(Loss) | | | Change
in Unrealized
Appreciation/
(Depreciation) | | | Value at
August 31,
2018 | | | Shares at
August 31,
2018 | | | Dividend
Income | | | Capital Gain
Distributions | |
JPMorgan U.S. Government Money Market Fund Class Institutional Shares, 1.82% (a)(b) | | $ | 166,805 | | | $ | 1,428,652 | | | $ | 1,357,427 | | | $ | — | | | $ | — | | | $ | 238,030 | | | | 238,030 | | | $ | 3,048 | | | $ | — | |
| | | | | | | | | | | | | | | | | | | | | | | | | | | | | | | | | | | | |
| (a) | Investment in affiliate. Fund is registered under the Investment Company Act of 1940, as amended, and advised by J.P. Morgan Investment Management Inc. |
| (b) | The rate shown is the current yield as of August 31, 2018. |
H. Security Transactions and Investment Income — Investment transactions are accounted for on the trade date (the date the order to buy or sell is executed). Securities gains and losses are calculated on a specifically identified cost basis. Interest income is determined on the basis of coupon interest accrued using the effective interest method which adjusts for amortization of premiums and accretion of discounts. Dividend income, net of foreign taxes withheld, if any, is recorded on the ex-dividend date or when the Fund first learns of the dividend. Certain Funds may receive other income from investment in loan assignments and/or unfunded commitments, including amendment fees, consent fees and commitment fees. These fees are recorded as income when received by the Fund. These amounts are included in Interest income from non-affiliates on the Statement of Operations.
I. Allocation of Income and Expenses — Expenses directly attributable to a fund are charged directly to that fund, while the expenses attributable to more than one fund of the Trust are allocated among the respective funds. In calculating the NAV of each class, investment income, realized and unrealized gains and losses and expenses, other than class specific expenses, are allocated daily to each class of shares based upon the proportion of net assets of each class at the beginning of each day.
Transfer agency fees are class-specific expenses. The amount of the transfer agency fees charged to each class of the Fund for the year ended August 31, 2018 are as follows (amounts in thousands):
| | | | | | | | | | | | | | | | | | | | |
| | | Class A | | | Class C | | | Class I | | | Class R6 | | | Total | |
Transfer agency fees | | $ | 9 | | | $ | 4 | | | $ | 12 | | | $ | 6 | | | $ | 31 | |
J. Federal Income Taxes — The Fund is treated as a separate taxable entity for Federal income tax purposes. The Fund’s policy is to comply with the provisions of the Internal Revenue Code (the “Code”), applicable to regulated investment companies and to distribute to shareholders all of its distributable net investment income and net realized capital gains on investments. Accordingly, no provision for Federal income tax is necessary. Management has reviewed the Fund’s tax positions for all open tax years and has determined that as of August 31, 2018, no liability for income tax is required in the Fund’s financial statements for net unrecognized tax benefits. However, management’s conclusions may be subject to future review based on changes in, or the interpretation of, the accounting standards or tax laws and regulations. The Fund’s Federal tax returns for the prior three fiscal years remain subject to examination by the Internal Revenue Service.
K. Foreign Taxes — The Fund may be subject to foreign taxes on income, gains on investments or currency purchases/repatriation, a portion of which may be recoverable. The Fund will accrue such taxes and recoveries as applicable, based upon its current interpretation of tax rules and regulations that exist in the markets in which it invests.
| | | | | | | | |
| | | |
| AUGUST 31, 2018 | | J.P. MORGAN INCOME FUNDS | | | | | 27 | |
NOTES TO FINANCIAL STATEMENTS
AS OF AUGUST 31, 2018 (continued)
L. Distributions to Shareholders — Distributions from net investment income, if any, are generally declared and paid monthly and are declared separately for each class. No class has preferential dividend rights; differences in per share rates are due to differences in separate class expenses. Net realized capital gains, if any, are distributed by the Fund at least annually. The amount of distributions from net investment income and net realized capital gains is determined in accordance with Federal income tax regulations, which may differ from GAAP. To the extent these “book/tax” differences are permanent in nature (i.e., that they result from other than timing of recognition — “temporary differences”), such amounts are reclassified within the capital accounts based on their Federal tax-basis treatment.
The following amounts were reclassified within the capital accounts (amounts in thousands):
| | | | | | | | | | | | |
| | | Paid-in-Capital | | | Accumulated undistributed (distributions in excess of)
net investment
income | | | Accumulated net realized gains (losses) | |
| | $ | (24 | ) | | $ | (193 | ) | | $ | 217 | |
The reclassifications for the Fund relate primarily to debt modifications.
3. Fees and Other Transactions with Affiliates
A. Investment Advisory Fee — Pursuant to an Investment Advisory Agreement, the Adviser supervises the investments of the Fund and for such services is paid a fee. The fee is accrued daily and paid monthly at an annual rate of 0.55% of the Fund’s average daily net assets.
The Adviser waived Investment Advisory fees and/or reimbursed expenses as outlined in Note 3.F.
B. Administration Fee — Pursuant to an Administration Agreement, the Administrator provides certain administration services to the Fund. In consideration of these services, the Administrator receives a fee accrued daily and paid monthly at an annual rate of 0.15% of the first $25 billion of the average daily net assets of all funds in the J.P. Morgan Funds Complex covered by the Administration Agreement (excluding certain funds of funds and money market funds) and 0.075% of the average daily net assets in excess of $25 billion of all such funds. For the year ended August 31, 2018, the effective rate was 0.08% of the Fund’s average daily net assets, notwithstanding any fee waivers and/or expense reimbursements.
The Administrator waived Administration fees as outlined in Note 3.F.
JPMorgan Chase Bank, N.A. (“JPMCB”), a wholly-owned subsidiary of JPMorgan, serves as the Fund’s sub-administrator (the “Sub-administrator”). For its services as Sub-administrator, JPMCB receives a portion of the fees payable to the Administrator.
C. Distribution Fees — Pursuant to a Distribution Agreement, JPMorgan Distribution Services, Inc. (“JPMDS”), an indirect, wholly-owned subsidiary of JPMorgan, serves as the Trust’s principal underwriter and promotes and arranges for the sale of the Fund’s shares.
The Board has adopted a Distribution Plan (the “Distribution Plan”) for Class A and Class C Shares of the Fund in accordance with Rule 12b-1 under the 1940 Act. Class I and Class R6 do not charge a distribution fee. The Distribution Plan provides that the Fund shall pay distribution fees, including payments to JPMDS, at annual rates of 0.25% and 0.75% of the average daily net assets of Class A and Class C Shares, respectively.
In addition, JPMDS is entitled to receive the front-end sales charges from purchases of Class A Shares and the CDSC from redemptions of Class C Shares and certain Class A Shares for which front-end sales charges have been waived. For the year ended August 31, 2018, JPMDS retained the following (amounts in thousands):
| | | | | | | | |
| | | Front-End Sales Charge | | | CDSC | |
| | $ | 2 | | | $ | — | |
D. Service Fees — The Trust, on behalf of the Fund, has entered into a Shareholder Servicing Agreement with JPMDS under which JPMDS provides certain support services to the shareholders. For performing these services, JPMDS receives a fee, except for Class R6 Shares which do not charge a service fee, that is accrued daily and paid monthly at an annual rate of 0.25% of the average daily net assets of Class A, Class C and Class I Shares, respectively.
JPMDS has entered into shareholder services contracts with affiliated and unaffiliated financial intermediaries who provide shareholder services and other related services to their clients or customers who invest in the Fund under which JPMDS will pay all or a portion of such fees earned to financial intermediaries for performing such services.
JPMDS waived service fees as outlined in Note 3.F.
E. Custodian and Accounting Fees — JPMCB provides portfolio custody and accounting services to the Fund. For performing these services, the Fund pays JPMCB transaction and asset-based fees that vary according to the number of transactions and positions, plus out-of-pocket expenses. The amounts paid directly to JPMCB by the Fund for custody and accounting services are included in Custodian and accounting fees on the Statement of Operations. Interest income earned on cash balances at the custodian, if any, is included in Interest income from affiliates on the Statement of Operations. Prior to March 1, 2018, payments to the custodian were reduced by credits earned by the Fund, based on uninvested cash balances held by the custodian. Such earnings credits, if any, are presented separately on the Statement of Operations.
| | | | | | |
| | | |
| 28 | | | | J.P. MORGAN INCOME FUNDS | | AUGUST 31, 2018 |
Interest expense paid to the custodian related to cash overdrafts, if any, is included in Interest expense to affiliates on the Statement of Operations.
F. Waivers and Reimbursements — The Adviser, Administrator and/or JPMDS have contractually agreed to waive fees and/or reimburse the Fund to the extent that total annual operating expenses (excluding acquired fund fees and expenses other than certain money market fund fees as described below, dividend expenses related to short sales, interest expenses related to short sales, interest, taxes, expenses related to litigation and potential litigation and extraordinary expenses) exceed the percentages of the Fund’s respective average daily net assets as shown in the table below:
| | | | | | | | | | | | | | | | |
| | | Class A | | | Class C | | | Class I | | | Class R6 | |
| | | 1.00 | % | | | 1.50 | % | | | 0.75 | % | | | 0.65 | % |
The expense limitation agreement was in effect for the year ended August 31, 2018 and is in place until at least December 31, 2018.
For the year ended August 31, 2018, the Fund’s service providers waived fees and/or reimbursed expenses for the Fund as follows (amounts in thousands). None of these parties expect the Fund to repay any such waived fees and/or reimbursed expenses in future years.
| | | | | | | | | | | | | | | | |
| | | Contractual Waivers | |
| | | Investment Advisory Fees | | | Administration Fees | | | Service Fees | | | Total | |
| | $ | 107 | | | $ | 71 | | | $ | 2,259 | | | $ | 2,437 | |
Additionally, the Fund may invest in one or more money market funds advised by the Adviser or its affiliates (affiliated money market funds). The Adviser, Administrator and/or JPMDS, as shareholder servicing agent, have contractually agreed to waive fees and/or reimburse expenses in an amount sufficient to offset the respective net fees each collects from the affiliated money market fund on the Fund’s investment in such affiliated money market fund.
The amount of these waivers/reimbursements resulting from investments in these money market funds for the year ended August 31, 2018 was approximately $424,000.
G. Other — Certain officers of the Trust are affiliated with the Adviser, the Administrator and JPMDS. Such officers, with the exception of the Chief Compliance Officer, receive no compensation from the Fund for serving in their respective roles.
The Board appointed a Chief Compliance Officer to the Fund in accordance with Federal securities regulations. The Fund, along with other affiliated funds, makes reimbursement payments, on a pro-rata basis, to the Administrator for a portion of the fees associated with the Office of the Chief Compliance Officer. Such fees are included in Trustees’ and Chief Compliance Officer’s fees on the Statement of Operations.
The Trust adopted a Trustee Deferred Compensation Plan (the “Plan”) which allows the Independent Trustees to defer the receipt of all or a portion of compensation related to performance of their duties as Trustees. The deferred fees are invested in various J.P. Morgan Funds until distribution in accordance with the Plan.
During the year ended August 31, 2018, the Fund purchased securities from an underwriting syndicate in which the principal underwriter or members of the syndicate were affiliated with the Adviser.
The Fund may use related party broker-dealers. For the year ended August 31, 2018, the Fund did not incur any brokerage commissions with broker-dealers affiliated with the Adviser.
The Securities and Exchange Commission (“SEC”) has granted an exemptive order permitting the Fund to engage in principal transactions with J.P. Morgan Securities, Inc., an affiliated broker, involving taxable money market instruments, subject to certain conditions.
4. Investment Transactions
During the year ended August 31, 2018, purchases and sales of investments (excluding short-term investments) were as follows (amounts in thousands):
| | | | | | | | |
| | | Purchases (excluding U.S. Government) | | | Sales (excluding U.S. Government) | |
| | $ | 1,615,809 | | | $ | 938,537 | |
During the year ended August 31, 2018, there were no purchases or sales of U.S. Government securities.
5. Federal Income Tax Matters
For Federal income tax purposes, the estimated cost and unrealized appreciation (depreciation) in value of investments held at August 31, 2018 were as follows (amounts in thousands):
| | | | | | | | | | | | | | | | |
| | | Aggregate Cost | | | Gross Unrealized Appreciation | | | Gross Unrealized Depreciation | | | Gross Unrealized (Depreciation) | |
| | $ | 3,199,074 | | | $ | 21,475 | | | $ | 32,943 | | | $ | (11,468 | ) |
| | | | | | | | |
| | | |
| AUGUST 31, 2018 | | J.P. MORGAN INCOME FUNDS | | | | | 29 | |
NOTES TO FINANCIAL STATEMENTS
AS OF AUGUST 31, 2018 (continued)
The difference between book and tax basis appreciation (depreciation) on investments is primarily attributed to debt modifications.
The tax character of distributions paid during the year ended August 31, 2018 was as follows (amounts in thousands):
| | | | | | | | | | | | |
| | | Ordinary
Income* | | | Net
Long-Term
Capital Gains | | | Total
Distributions
Paid | |
| | $ | 103,383 | | | $ | — | | | $ | 103,383 | |
The tax character of distributions paid during the year ended August 31, 2017 was as follows (amounts in thousands):
| | | | | | | | | | | | |
| | | Ordinary
Income* | | | Net
Long-Term
Capital Gains | | | Total
Distributions
Paid | |
| | $ | 84,250 | | | $ | — | | | $ | 84,250 | |
| * | Short-term gain distributions are treated as ordinary income for income tax purposes. |
As of August 31, 2018, the estimated components of net assets (excluding paid-in-capital) on a tax basis were as follows (amounts in thousands):
| | | | | | | | | | | | |
| | | Current
Distributable
Ordinary
Income | | | Current
Distributable
Long-Term
Capital Gain or
(Tax Basis Capital
Loss Carryover) | | | Unrealized
Appreciation
(Depreciation) | |
| | $ | 2,313 | | | $ | (176,066 | ) | | $ | (11,486 | ) |
The cumulative timing differences primarily consist of post-October capital loss deferrals.
As of August 31, 2018, the Fund had the following post-enactment net capital loss carryforwards (amounts in thousands):
| | | | | | | | |
| | | Capital Loss Carryforward Character | |
| | | Short-Term | | | Long-Term | |
| | $ | 21,336 | | | $ | 154,730 | |
Specified ordinary losses and net capital losses and other late year losses incurred after October 31, and within the taxable year are deemed to arise on the first business day of the Fund’s next taxable year. For the year ended August 31, 2018 the Fund deferred to September 1, 2018 the following specified ordinary losses and net capital losses (gains) (amounts in thousands):
| | | | | | | | | | | | |
| | | Specified
Ordinary Losses | | | Net Capital Losses (Gains) | |
| | | Short-Term | | | Long-Term | |
| | $ | 19 | | | $ | (745 | ) | | $ | 20,779 | |
6. Borrowings
The Fund relies upon an exemptive order granted by the SEC (the “Order”) permitting the establishment and operation of an Interfund Lending Facility (the “Facility”). The Facility allows the Fund to directly lend and borrow money to or from any other fund relying upon the Order at rates beneficial to both the borrowing and lending funds. Advances under the Facility are taken primarily for temporary or emergency purposes, including the meeting of redemption requests that otherwise might require the untimely disposition of securities, and are subject to the Fund’s borrowing restrictions. The Interfund loan rate is determined, as specified in the Order, by averaging the current repurchase agreement rate and the current bank loan rate. The Order was granted to JPMorgan Trust II and may be relied upon by the Fund because the Fund and the series of JPMorgan Trust II are both investment companies in the same “group of investment companies” (as defined in Section 12(d)(1)(G) of the 1940 Act).
The Trust and JPMCB have entered into a financing arrangement. Under this arrangement, JPMCB provides an unsecured, uncommitted credit facility in the aggregate amount of $100 million to certain of the J.P. Morgan Funds, including the Fund. Advances under the arrangement are taken primarily for temporary or emergency purposes, including the meeting of redemption requests that otherwise might require the untimely disposition of securities, and are subject to the Fund’s borrowing restrictions. Interest on borrowings is payable at a rate determined by JPMCB at the time of borrowing. This agreement has been extended until November 5, 2018.
The Fund had no borrowings outstanding from another fund or from the unsecured, uncommitted credit facility during the year ended August 31, 2018.
| | | | | | |
| | | |
| 30 | | | | J.P. MORGAN INCOME FUNDS | | AUGUST 31, 2018 |
The Trust, along with certain other trusts (“Borrowers”), has entered into a joint syndicated senior unsecured revolving credit facility totaling $1.5 billion (“Credit Facility”) with various lenders and The Bank of New York Mellon, as administrative agent for the lenders. This Credit Facility provides a source of funds to the Borrowers for temporary and emergency purposes, including the meeting of redemption requests that otherwise might require the untimely disposition of securities. Under the terms of the Credit Facility, a borrowing fund must have a minimum of $25,000,000 in adjusted net asset value and not exceed certain adjusted net asset coverage ratios prior to and during the time in which any borrowings are outstanding. If a fund does not comply with the aforementioned requirements, the fund must remediate within three business days with respect to the $25,000,000 minimum adjusted net asset value or within one business day with respect to certain asset coverage ratios or the administrative agent at the request of, or with the consent of, the lenders may terminate the Credit Facility and declare any outstanding borrowings to be due and payable immediately.
Interest associated with any borrowing under the Credit Facility is charged to the borrowing fund at a rate of interest equal to 1.00% plus the greater of the federal funds effective rate or one month LIBOR. The annual commitment fee to maintain the Credit Facility is 0.15% and is incurred on the unused portion of the Credit Facility and is allocated to all participating funds pro rata based on their respective net assets. Effective August 14, 2018, this agreement has been amended and restated for a term of 364 days, unless extended.
The Fund did not utilize the Credit Facility during the year ended August 31, 2018.
7. Risks, Concentrations and Indemnifications
In the normal course of business, the Fund enters into contracts that contain a variety of representations which provide general indemnifications. The Fund’s maximum exposure under these arrangements is unknown. The amount of exposure would depend on future claims that may be brought against the Fund. However, based on experience, the Fund expects the risk of loss to be remote.
As of August 31, 2018, the Fund had four affiliated omnibus accounts, which represented 52.7% of the Fund’s outstanding shares.
As of August 31, 2018, the JPMorgan Investor Funds and JPMorgan SmartRetirement Funds, which are affiliated funds of funds, owned in the aggregate, shares representing more than 10% of the net assets of the Fund as follows:
| | | | | | | | |
| | | J.P. Morgan Investor Funds | | | JPMorgan SmartRetirement Funds | |
| | | 13.3 | % | | | 16.9 | % |
Significant shareholder transactions by these shareholders may impact the Fund’s performance.
The Fund is subject to interest rate and credit risk. The value of debt securities may decline as interest rates increase. The Fund could lose money if the issuer of a fixed income security is unable to pay interest or repay principal when it is due. The Fund invests in floating rate loans and other floating rate debt securities. Although these investments are generally less sensitive to interest rate changes than other fixed rate instruments, the value of floating rate loans and other floating rate investments may decline if their interest rates do not rise as quickly, or as much, as general interest rates. Many factors can cause interest rates to rise. Some examples include central bank monetary policy, rising inflation rates and general economic conditions. Given that the Federal Reserve has been raising interest rates and may continue to do so, the Fund may face a heightened level of interest rate risk. The ability of the issuers of debt to meet their obligations may be affected by the economic and political developments in a specific industry or region.
The Fund invests in high yield securities that are not rated or rated below investment grade (commonly known as “junk bonds”). These securities are considered to be high risk investments. Investments in lower-rated securities or unrated securities of comparable quality tend to be more sensitive to economic conditions than higher rated securities. Junk bonds involve a greater risk of default by the issuer because such securities are generally unsecured and are often subordinated to other creditors’ claims. The market price of these securities can change suddenly and unexpectedly. As a result, the Fund is intended for investors who are able and willing to assume a high degree of risk.
The Fund is subject to the risk that, should the Fund decide to sell an illiquid investment when a ready buyer is not available at a price the Fund deems to be representative of its value, the value of the Fund’s net assets could be adversely affected.
8. New Accounting Pronouncements
In March 2017, the Financial Accounting Standards Board (“FASB”) issued Accounting Standards Update (“ASU”) 2017-08 (“ASU 2017-08”) Premium Amortization on Purchased Callable Debt Securities, which shortens the premium amortization period for purchased non-contingently callable debt securities. ASU 2017-08 requires that the premium be amortized to the earliest call date, for purchased non-contingently callable debt securities. ASU 2017-08 is effective for the fiscal years, and interim periods within those fiscal years, beginning after December 15, 2018. Management is currently evaluating the implications of these changes on the financial statements, if any.
In August 2018, the FASB issued ASU 2018-13 Fair Value Measurement (Topic 820): Disclosure Framework — Changes to the Disclosure Requirements for Fair Value Measurement, which adds, removes, and modifies certain aspects of the fair value disclosure. ASU 2018-13 amendments are the result of a broader disclosure project, FASB Concepts Statement Conceptual Framework for Financial Reporting — Chapter 8: Notes to Financial Statements, to improve the effectiveness of the fair value disclosure requirements. ASU 2018-13 is effective for the fiscal years, and interim periods within those fiscal years, beginning after December 15, 2019; early adoption is permitted. Management is currently evaluating the implications of these changes.
| | | | | | | | |
| | | |
| AUGUST 31, 2018 | | J.P. MORGAN INCOME FUNDS | | | | | 31 | |
NOTES TO FINANCIAL STATEMENTS
AS OF AUGUST 31, 2018 (continued)
9. Subsequent Event
Effective October 5, 2018, the Fund may engage in securities lending to broker dealers or other financial institutions approved by the Fund. Citibank N. A. serves as lending agent for the Fund.
| | | | | | |
| | | |
| 32 | | | | J.P. MORGAN INCOME FUNDS | | AUGUST 31, 2018 |
REPORT OF INDEPENDENT REGISTERED PUBLIC ACCOUNTING FIRM
To the Board of Trustees of JPMorgan Trust I and Shareholders of JPMorgan Floating Rate Income Fund
Opinion on the Financial Statements
We have audited the accompanying statement of assets and liabilities, including the schedule of portfolio investments, of JPMorgan Floating Rate Income Fund (one of the funds constituting JPMorgan Trust I, referred to hereafter as the “Fund”) as of August 31, 2018, the related statement of operations for the year ended August 31, 2018, the statements of changes in net assets for each of the two years in the period ended August 31, 2018, including the related notes, and the financial highlights for each of the periods indicated therein (collectively referred to as the “financial statements”). In our opinion, the financial statements present fairly, in all material respects, the financial position of the Fund as of August 31, 2018, the results of its operations for the year then ended, the changes in its net assets for each of the two years in the period ended August 31, 2018 and the financial highlights for each of the periods indicated therein in conformity with accounting principles generally accepted in the United States of America.
Basis for Opinion
These financial statements are the responsibility of the Fund’s management. Our responsibility is to express an opinion on the Fund’s financial statements based on our audits. We are a public accounting firm registered with the Public Company Accounting Oversight Board (United States) (“PCAOB”) and are required to be independent with respect to the Fund in accordance with the U.S. federal securities laws and the applicable rules and regulations of the Securities and Exchange Commission and the PCAOB.
We conducted our audits of these financial statements in accordance with the standards of the PCAOB. Those standards require that we plan and perform the audit to obtain reasonable assurance about whether the financial statements are free of material misstatement, whether due to error or fraud.
Our audits included performing procedures to assess the risks of material misstatement of the financial statements, whether due to error or fraud, and performing procedures that respond to those risks. Such procedures included examining, on a test basis, evidence regarding the amounts and disclosures in the financial statements. Our audits also included evaluating the accounting principles used and significant estimates made by management, as well as evaluating the overall presentation of the financial statements. Our procedures included confirmation of securities owned as of August 31, 2018 by correspondence with the custodian, transfer agent, agent banks and brokers; when replies were not received from agent banks and brokers, we performed other auditing procedures. We believe that our audits provide a reasonable basis for our opinion.
/s/ PricewaterhouseCoopers LLP
New York, New York
October 29, 2018
We have served as the auditor of one or more investment companies in JPMorgan Funds complex since 1993.
| | | | | | | | |
| | | |
| AUGUST 31, 2018 | | J.P. MORGAN INCOME FUNDS | | | | | 33 | |
TRUSTEES
(Unaudited)
The Fund’s Statement of Additional Information includes additional information about the Fund’s Trustees and is available, without charge, upon request by calling 1-800-480-4111 or on the J.P. Morgan Funds’ website at www.jpmorganfunds.com.
| | | | | | |
Name (Year of Birth); Positions With the Fund (1) | | Principal Occupation During Past 5 Years | | Number of
Funds in Fund
Complex Overseen
by Trustee (2) | | Other Directorships Held During the Past 5 Years |
Independent Trustees | | |
| | | |
| John F. Finn (1947); Trustee of Trust since 2005; Trustee of heritage One Group Mutual Funds since 1998. | | Chairman (1985-present), Chief Executive Officer, Gardner, Inc. (supply chain management company serving industrial and consumer markets) (1974-present). | | 136 | | Director, Greif, Inc. (GEF) (industrial package products and services) (2007-present); Trustee, Columbus Association for the Performing Arts (1988-present); Director, Cardinal Health, Inc. (CAH) (1994-2014). |
| | | |
| Stephen P. Fisher (1959); Trustee of Trust since 2018. | | Retired; Chairman and Chief Executive Officer (2014-2017), President and Chief Operating Officer, NYLIFE Distributors LLC (registered broker-dealer) (2008-2013); Chairman, NYLIM Service Company LLC (transfer agent) (2008-2017); President (2015-2017), Co-President (2014-2015) and Senior Managing Director, New York Life Investment Management LLC (registered investment adviser) (2005-2017); Chairman, IndexIQ Advisors LLC (registered investment adviser for ETFs) (2014-2017); President, MainStay VP Funds Trust (formerly MainStay VP Series Fund, Inc.) (registered investment companies) (2007-2017); President, MainStay DefinedTerm Municipal Opportunities Fund (registered investment company) (2011-2017); President, MainStay Funds Trust (registered investment companies) (2009-2017); President, The MainStay Funds (registered investment companies) (2007-2017). | | 136 | | Advisory Board Member, Scholarship Committee Member and Investment Committee Member, The First Tee of Plainfield (non-profit youth sports organization that provides need-based scholarships) (2014-present); Honors Program Advisory Board Member, The Zicklin School of Business, Baruch College, The City University of New York (2017-present). |
| | | |
| Dr. Matthew Goldstein (1941); Chairman since 2013; Trustee of Trust since 2005; Trustee of heritage J.P. Morgan Funds since 2003. | | Chancellor Emeritus, City University of New York (2015-present); Professor, City University of New York (2013-present); Chancellor, City University of New York (1999-2013); President, Adelphi University (New York) (1998-1999). | | 136 | | Trustee, Museum of Jewish Heritage (2011-present); Trustee, National Museum of Mathematics (present); Chair, Association of College and University Administrators (present). |
| | | |
| Dennis P. Harrington* (1950); Trustee of Trust since 2017. | | Retired; Partner, Deloitte LLP (1984-2012). | | 136 | | None |
| | | |
| Frankie D. Hughes (1952); Trustee of Trust since 2008. | | President, Ashland Hughes Properties (property management) (2014-present); President and Chief Investment Officer, Hughes Capital Management, Inc. (fixed income asset management) (1993-2014). | | 136 | | None |
| | | |
Raymond Kanner** (1953); Trustee of Trust since 2017. | �� | Retired; Managing Director & Chief Investment Officer, IBM Retirement Funds (2007-2016). | | 136 | | Director, Emerging Markets Growth Fund (1997-2016); Acting Executive Director, Committee on Investment of Employee Benefit Assets (CIEBA), 2016-2017; Advisory Board Member, Betterment for Business (2016-2017) (robo advisor); Advisory Board Member, Blue Star Indexes (2013-2017) (index creator); Member, Russell Index Client Advisory Board (2001-2015); Advisory Board Member, State Street Global Advisors’ OCIO Board (2017-present). |
| | | | | | |
| | | |
| 34 | | | | J.P. MORGAN INCOME FUNDS | | AUGUST 31, 2018 |
| | | | | | |
Name (Year of Birth); Positions With the Fund (1) | | Principal Occupation During Past 5 Years | | Number of
Funds in Fund
Complex Overseen
by Trustee (2) | | Other Directorships Held During the Past 5 Years |
Independent Trustees (continued) | | |
| | | |
| Peter C. Marshall (1942); Trustee of Trust since 2005; Trustee of heritage One Group Mutual Funds since 1985. | | Self-employed business consultant
(2002-present). | | 136 | | None |
| | | |
| Mary E. Martinez (1960); Trustee of Trust since 2013. | | Associate, Special Properties, a Christie’s International Real Estate Affiliate (2010-present); Managing Director, Bank of America (Asset Management) (2007-2008); Chief Operating Officer, U.S. Trust Asset Management, U.S. Trust Company (asset management) (2003-2007); President, Excelsior Funds (registered investment companies) (2004-2005). | | 136 | | None |
| | | |
| Marilyn McCoy (1948); Trustee of Trust since 2005; Trustee of heritage One Group Mutual Funds since 1999. | | Vice President of Administration and Planning, Northwestern University (1985-present). | | 136 | | None |
| | | |
| Mitchell M. Merin (1953); Trustee of Trust since 2013. | | Retired; President and Chief Operating Officer, Morgan Stanley Investment Management, Member Morgan Stanley & Co. Management Committee (registered investment adviser) (1985-2005). | | 136 | | Director, Sun Life Financial (SLF) (2007-2013) (financial services and insurance). |
| | | |
| Dr. Robert A. Oden, Jr. (1946); Trustee of Trust since 2005; Trustee of heritage One Group Mutual Funds since 1997. | | Retired; President, Carleton College (2002-2010); President, Kenyon College (1995-2002). | | 136 | | Vice Chair, Dartmouth-Hitchcock Medical Center (2011-present); Trustee, American University in Cairo (1999-2014); Trustee, American Museum of Fly Fishing (2013-present); Trustee, Trout Unlimited (2017-present). |
| | | |
| Marian U. Pardo*** (1946); Trustee of Trust since 2013. | | Managing Director and Founder, Virtual Capital Management LLC (Investment Consulting) (2007-present); Managing Director, Credit Suisse Asset Management (portfolio manager) (2003-2006). | | 136 | | Member, Board of Governors, Columbus Citizens Foundation (not-for-profit supporting philanthropic and cultural programs) (2006-present). |
| | | |
| James J. Schonbachler (1943); Trustee of Trust since 2005; Trustee of heritage J.P. Morgan Funds since 2001. | | Retired; Managing Director of Bankers Trust Company (financial services) (1968-1998). | | 136 | | None |
| (1) | The Trustees serve for an indefinite term, subject to the Trust’s current retirement policy, which is age 78 for all Trustees. |
| (2) | A Fund Complex means two or more registered investment companies that hold themselves out to investors as related companies for purposes of investment and investor services or have a common investment adviser or have an investment adviser that is an affiliated person of the investment adviser of any of the other registered investment companies. The J.P. Morgan Funds Complex for which the Board of Trustees serves currently includes eleven registered investment companies (136 funds). |
| | | | | | | | |
| | | |
| AUGUST 31, 2018 | | J.P. MORGAN INCOME FUNDS | | | | | 35 | |
TRUSTEES
(Unaudited) (continued)
| * | Two family members of Mr. Harrington are partner and managing director, respectively, of the Fund’s independent registered public accounting firm. Such firm has represented to the Board that those family members are not involved in the audit of the Fund’s financial statements and do not provide other services to the Fund. The Board has concluded that such association does not interfere with Mr. Harrington’s exercise of independent judgment as an Independent Trustee. |
| ** | A family member of Mr. Kanner is employed by JPMorgan Chase Bank, which is affiliated with JPMIM and JPMDS. In that capacity, this employee provides services to various JPMorgan affiliates including JPMIM and JPMDS and for which JPMIM and JPMDS bear some portion of the expense thereof. |
| *** | In connection with prior employment with JPMorgan Chase, Ms. Pardo was the recipient of non-qualified pension plan payments from JPMorgan Chase in the amount of approximately $2,055 per month, which she irrevocably waived effective January 1, 2013, and deferred compensation payments from JPMorgan Chase in the amount of approximately $7,294 per year, which ended in January 2013. In addition, Ms. Pardo receives payments from a fully-funded qualified plan, which is not an obligation of JPMorgan Chase. |
The contact address for each of the Trustees is 270 Park Avenue, New York, NY 10017.
| | | | | | |
| | | |
| 36 | | | | J.P. MORGAN INCOME FUNDS | | AUGUST 31, 2018 |
OFFICERS
(Unaudited)
| | |
Name (Year of Birth), Positions Held with the Trust (Since) | | Principal Occupations During Past 5 Years |
| |
Brian S. Shlissel (1964),
President and Principal Executive Officer (2016) | | Managing Director and Chief Administrative Officer for J.P. Morgan pooled vehicles, J.P. Morgan Investment Management Inc. (formerly JPMorgan Funds Management, Inc.) (2014 – present); Managing Director and Head of Mutual Fund Services, Allianz Global Investors; President and Chief Executive Officer, Allianz Global Investors Mutual Funds and PIMCO Closed-End Funds (1999-2014). |
| |
Timothy J. Clemens (1975), Treasurer and Principal Financial Officer (2018)* | | Executive Director, J.P. Morgan Investment Management Inc. (formerly JPMorgan Funds Management, Inc.) since February 2016; Vice President, JPMorgan Funds Management, Inc. from October 2013 to January 2016; Chief Financial Officer and Head of Valuation, Aberdeen Asset Management PLC (previously Artio Global Management) (2009 to September 2013). |
| |
Noah Greenhill (1969),
Secretary (2018) | | Managing Director and General Counsel, JPMorgan Asset Management (2015 – Present); Managing Director and General Counsel, JPMorgan Global Alternative Funds (2012-2015). |
| |
Stephen M. Ungerman (1953),
Chief Compliance Officer (2005) | | Managing Director, JPMorgan Chase & Co.; Mr. Ungerman has been with JPMorgan Chase & Co. since 2000. |
| |
Elizabeth A. Davin (1964), Assistant Secretary (2005)** | | Executive Director and Assistant General Counsel, JPMorgan Chase since February 2012; formerly Vice President and Assistant General Counsel, JPMorgan Chase from 2005 to February 2012; Senior Counsel, JPMorgan Chase (formerly Bank One Corporation) from 2004 to 2005. |
| |
Jessica K. Ditullio (1962),
Assistant Secretary (2005)** | | Executive Director and Assistant General Counsel, JPMorgan Chase. Ms. Ditullio has been with JPMorgan Chase (formerly Bank One Corporation) since 1990. |
| |
Carmine Lekstutis (1980),
Assistant Secretary (2011) | | Executive Director and Assistant General Counsel, JPMorgan Chase since February 2015; formerly Vice President and Assistant General Counsel, JPMorgan Chase from 2011 to February 2015. |
| |
Gregory S. Samuels (1980),
Assistant Secretary (2010) | | Executive Director and Assistant General Counsel, JPMorgan Chase since 2014; formerly Vice President and Assistant General Counsel, JPMorgan Chase from 2010 to February 2014. |
| |
Pamela L. Woodley (1971),
Assistant Secretary (2012) | | Vice President and Assistant General Counsel, JPMorgan Chase since November 2004. |
| |
Zachary E. Vonnegut-Gabovitch (1986), Assistant Secretary (2017) | | Vice President and Assistant General Counsel, JPMorgan Chase since September 2016; Associate, Morgan, Lewis & Bockius (law firm) from 2012 to 2016. |
| |
Michael M. D’Ambrosio (1969),
Assistant Treasurer (2012) | | Managing Director, J.P. Morgan Investment Management Inc. (formerly JPMorgan Funds Management, Inc.) since May 2014; formerly Executive Director, JPMorgan Funds Management, Inc. from 2012 to May 2014. |
| |
Jeffrey D. House (1972), Assistant Treasurer (2017)** | | Vice President, J.P. Morgan Investment Management Inc. (formerly JPMorgan Funds Management, Inc.) since July 2006. |
| |
Lauren A. Paino (1973), Assistant Treasurer (2014)* | | Executive Director, J.P. Morgan Investment Management Inc. (formerly JPMorgan Funds Management, Inc.) since August 2013; formerly Director, Credit Suisse Asset Management from 2000-2013. |
| |
Joseph Parascondola (1963),
Assistant Treasurer (2011)* | | Vice President, J.P. Morgan Investment Management Inc. (formerly JPMorgan Funds Management, Inc.) since August 2006. |
| |
Gillian I. Sands (1969),
Assistant Treasurer (2012)* | | Vice President, J.P. Morgan Investment Management Inc. (formerly JPMorgan Funds Management, Inc.) since September 2012. |
The contact address for each of the officers, unless otherwise noted, is 270 Park Avenue, New York, NY 10017.
| * | The contact address for the officer is 4 New York Plaza, New York, NY 10004. |
| ** | The contact address for the officer is 1111 Polaris Parkway, Columbus, OH 43240. |
| | | | | | | | |
| | | |
| AUGUST 31, 2018 | | J.P. MORGAN INCOME FUNDS | | | | | 37 | |
SCHEDULE OF SHAREHOLDER EXPENSES
(Unaudited)
Hypothetical $1,000 Investment
As a shareholder of the Fund, you incur two types of costs: (1) transaction costs, including sales charges (loads) on purchase payments and (2) ongoing costs, including investment advisory fees, administration fees, distribution fees and other Fund expenses. The examples below are intended to help you understand your ongoing costs (in dollars) of investing in the Fund and to compare these ongoing costs with the ongoing costs of investing in other mutual funds. The examples assume that you had a $1,000 investment in each Class at the beginning of the reporting period, March 1, 2018, and continued to hold your shares at the end of the reporting period, August 31, 2018.
Actual Expenses
For each Class of the Fund in the table below, the first line provides information about actual account values and actual expenses. You may use the information in this line, together with the amount you invested, to estimate the expenses that you paid over the period. Simply divide your account value by $1,000 (for example, an $8,600 account value divided by $1,000 = 8.6), then multiply the result by the number in the first line of each Class under the heading entitled “Expenses Paid During the Period” to estimate the expenses you paid on your account during this period.
Hypothetical Example for Comparison Purposes
The second line of each Class in the table below provides information about hypothetical account values and hypothetical expenses based on the Class’ actual expense ratio and an assumed rate of return of 5% per year before expenses, which is not the Class’ actual return. The hypothetical account values and expenses may not be used to estimate the actual ending account balance or expenses you paid for the period. You may use this information to compare the ongoing costs of investing in the Class of the Fund and other funds. To do so, compare this 5% hypothetical example with the 5% hypothetical examples that appear in the shareholder reports of the other funds. Please note that the expenses shown in the table are meant to highlight your ongoing costs only and do not reflect any transaction costs, such as sales charges (loads) or redemption fees. Therefore, the second line for each Class in the table is useful in comparing ongoing costs only, and will not help you determine the relative total costs of owning different funds. In addition, if these transaction costs were included, your costs would have been higher. The examples also assume all dividends and distributions have been reinvested.
| | | | | | | | | | | | | | | | |
| | | Beginning
Account Value
March 1, 2018 | | | Ending
Account Value
August 31, 2018 | | | Expenses
Paid During
the Period* | | | Annualized
Expense
Ratio | |
JPMorgan Floating Rate Income Fund | | | | | | | | | | | | | | | | |
Class A | | | | | | | | | | | | | | | | |
Actual | | $ | 1,000.00 | | | $ | 1,014.90 | | | $ | 4.98 | | | | 0.98 | % |
Hypothetical | | | 1,000.00 | | | | 1,020.27 | | | | 4.99 | | | | 0.98 | |
Class C | | | | | | | | | | | | | | | | |
Actual | | | 1,000.00 | | | | 1,012.30 | | | | 7.51 | | | | 1.48 | |
Hypothetical | | | 1,000.00 | | | | 1,017.74 | | | | 7.53 | | | | 1.48 | |
Class I | | | | | | | | | | | | | | | | |
Actual | | | 1,000.00 | | | | 1,016.10 | | | | 3.71 | | | | 0.73 | |
Hypothetical | | | 1,000.00 | | | | 1,021.53 | | | | 3.72 | | | | 0.73 | |
Class R6 | | | | | | | | | | | | | | | | |
Actual | | | 1,000.00 | | | | 1,016.60 | | | | 3.20 | | | | 0.63 | |
Hypothetical | | | 1,000.00 | | | | 1,022.03 | | | | 3.21 | | | | 0.63 | |
| * | Expenses are equal to each Class’ respective annualized expense ratio, multiplied by the average account value over the period, multiplied by 184/365 (to reflect the one-half year period). |
| | | | | | |
| | | |
| 38 | | | | J.P. MORGAN INCOME FUNDS | | AUGUST 31, 2018 |
BOARD APPROVAL OF INVESTMENT ADVISORY AGREEMENT
(Unaudited)
The Board of Trustees has established various standing committees composed of Trustees with diverse backgrounds, to which the Board of Trustees has assigned specific subject matter responsibilities to further enhance the effectiveness of the Board’s oversight and decision making. The Board of Trustees and its investment committees (money market and alternative products, equity, and fixed income) meet regularly throughout the year and consider factors that are relevant to their annual consideration of investment advisory agreements at each meeting. They also meet for the specific purpose of considering investment advisory agreement annual renewals. The Board of Trustees held meetings in person in June and August 2018, at which the Trustees considered the continuation of the investment advisory agreement for the Fund whose annual report is contained herein (the “Advisory Agreement”). At the June meeting, the Board’s investment committees met to review and consider performance, expense and related information for the J.P. Morgan Funds. Each investment committee reported to the full Board, which then considered the investment committee’s preliminary findings. At the August meeting, the Trustees continued their review and consideration. The Trustees, including a majority of the Trustees who are not “interested persons” (as defined in the 1940 Act) of any party to the Advisory Agreement or any of their affiliates, approved the continuation of the Advisory Agreement on August 15, 2018.
As part of their review of the Advisory Agreement, the Trustees considered and reviewed performance and other information about the Fund received from the Adviser. This information includes the Fund’s performance compared to the performance of its peers and benchmarks and analyses by the Adviser of the Fund’s performance. In addition, the Trustees have engaged an independent management consulting firm (“independent consultant”) to report on the performance of certain J.P. Morgan Funds at each of the Trustees’ regular meetings. The Adviser also periodically provides comparative information regarding the Fund’s expense ratios and those of its peer groups. In addition, in preparation for the June and August meetings, the Trustees requested, received and evaluated extensive materials from the Adviser, including performance and expense analyses compiled by Broadridge, using data from Lipper Inc., independent providers of investment company data (together, “Broadridge/Lipper”). The Trustees’ independent consultant also provided additional analyses of the performance of the Fund as compared to the Fund’s objectives and peers. Before voting on the Advisory Agreement, the Trustees reviewed the Advisory Agreement with representatives of the Adviser, counsel to the Trust, and independent legal counsel and received a memorandum from independent legal counsel to the Trustees discussing the legal standards for their consideration of the Advisory Agreement. The Trustees also discussed the proposed Advisory Agreement in executive sessions with independent legal counsel at which no representatives of the Adviser were present.
A summary of the material factors evaluated by the Trustees in determining whether to approve the Advisory Agreement is provided below.
Each Trustee attributed different weights to the various factors and no factor alone was considered determinative. The Trustees considered information provided with respect to the Fund throughout the year, as well as materials furnished specifically in connection with the annual review process. From year to year, the Trustees consider and place emphasis on relevant information in light of changing circumstances in market and economic conditions. After considering and weighing the factors and information they had received, the Trustees found that the compensation to be received by the Adviser from the Fund under the Advisory Agreement was fair and reasonable under the circumstances and determined that the continuance of the Advisory Agreement was in the best interests of the Fund and its shareholders.
Nature, Extent and Quality of Services Provided by the Adviser
The Trustees received and considered information regarding the nature, extent and quality of the services provided to the Fund under the applicable Advisory Agreement. The Trustees took into account information furnished throughout the year at Trustee meetings, as well as the materials furnished specifically in connection with this annual review process. The Trustees considered the background and experience of the Adviser’s senior management and the expertise of, and the amount of attention given to the Fund by, investment personnel of the Adviser. In addition, the Trustees reviewed the qualifications, backgrounds and responsibilities of the portfolio management team primarily responsible for the day-to-day management of the Fund and the infrastructure supporting the team, including personnel changes. The Trustees also considered information provided by the Adviser and JPMorgan Distribution Services, Inc. (“JPMDS”) about the structure and distribution strategy of the Fund. The Trustees reviewed information relating to the Adviser’s risk governance model and reports showing the Adviser’s compliance structure and ongoing compliance processes. The Trustees also considered the quality of administrative services provided by the Adviser in its role as administrator.
The Trustees also considered their knowledge of the nature and quality of the services provided by the Adviser and its affiliates to the Fund gained from their experience as Trustees of the J.P. Morgan Funds. In addition, they considered the overall reputation and capabilities of the Adviser and its affiliates, the commitment of the Adviser to provide high quality service to the Fund, their overall confidence in the Adviser’s integrity and the Adviser’s responsiveness to questions or concerns raised by them, including the Adviser’s willingness to consider and implement organizational and operational changes designed to improve investment results and the services provided to the Fund.
| | | | | | | | |
| | | |
| AUGUST 31, 2018 | | J.P. MORGAN INCOME FUNDS | | | | | 39 | |
BOARD APPROVAL OF INVESTMENT ADVISORY AGREEMENT
(Unaudited) (continued)
Based upon these considerations and other factors, the Trustees concluded that they were satisfied with the nature, extent and quality of the investment advisory services provided to the Fund by the Adviser.
Costs of Services Provided and Profitability to the Adviser and its Affiliates
The Trustees received and considered information regarding the profitability to the Adviser and its affiliates in providing services to the Fund. The Trustees reviewed and discussed this information. The Trustees recognized that this information is not audited and represents the Adviser’s determination of its and its affiliates’ revenues from the contractual services provided to the Fund, less expenses of providing such services. Expenses include direct and indirect costs and are calculated using an allocation methodology developed by the Adviser. The Trustees also recognized that it is difficult to make comparisons of profitability from fund investment advisory contracts because comparative information is not generally publicly available and is affected by numerous factors, including the structure of the particular adviser, the types of funds it manages, its business mix, numerous assumptions regarding allocations and the fact that publicly-traded fund managers’ operating profits and net income are net of distribution and marketing expenses. Based upon their review, the Trustees concluded that the profitability to the Adviser under the Advisory Agreement was not unreasonable in light of the services and benefits provided to the Fund.
The Trustees also considered that JPMDS, an affiliate of the Adviser, and JPMIM earn fees from the Fund for providing shareholder and administrative services, respectively. These fees were shown separately in the profitability analysis presented to the Trustees. The Trustees also considered the payments of Rule 12b-1 fees to JPMDS, which also acts as the Fund’s distributor. The Trustees also considered the fees paid to JPMorgan Chase Bank, N.A. (“JPMCB”) for custody and fund accounting, and other related services.
Fall-Out Benefits
The Trustees reviewed information regarding potential “fallout” or ancillary benefits received by the Adviser and its affiliates as a result of their relationship with the Fund. The Trustees also reviewed the Adviser’s allocation of fund brokerage for the J.P. Morgan Funds complex, including allocations to brokers who provide research to the Adviser.
Economies of Scale
The Trustees considered the extent to which the Fund may benefit from economies of scale. The Trustees considered that there may not be a direct relationship between economies of scale realized by the Fund and those realized by the Adviser as assets increase. The Trustees considered the extent to which the Funds were priced to scale and whether it would be
appropriate to add advisory fee breakpoints, but noted that each Fund has implemented fee waivers and contractual expense limitations (“Fee Caps”) which allow each Fund’s shareholders to share potential economies of scale from a Fund’s inception and that the fees remain competitive with peer funds. The Trustees also considered that the Adviser has added or enhanced services to the Fund over time, noting the Adviser’s substantial investments in its business in support of the Fund, including investments in trading systems and technology (including cybersecurity improvements), attraction and retention of key talent, additions to analyst and portfolio management teams, and regulatory support enhancements. The Trustees also considered whether it would be appropriate to add advisory fee breakpoints and the Trustees concluded that the current fee structure was reasonable in light of the Fee Caps that the Adviser has in place that serve to limit the overall net expense ratios of the Fund at competitive levels. The Trustees concluded that the Fund’s shareholders received the benefits of potential economies of scale through the Fee Caps and the Adviser’s reinvestment in its operations to serve the Fund and its shareholders.
Independent Written Evaluation of the Fund’s Chief Compliance Officer
The Trustees noted that, upon their direction, the Chief Compliance Officer for the Fund had prepared an independent written evaluation in order to assist the Trustees in determining the reasonableness of the proposed management fees. The Trustees considered the written evaluation in determining whether to continue the Advisory Agreement.
Fees Relative to Adviser’s Other Clients
The Trustees received and considered information about the nature and extent of investment advisory services and fee rates offered to other clients of the Adviser, including institutional separate accounts and/or funds sub-advised by the Adviser, and for investment management styles substantially similar to that of the Fund. The Trustees considered the complexity of investment management for registered mutual funds relative to the Adviser’s other clients and noted differences in the regulatory, legal and other risks and responsibilities of providing services to the different clients. The Trustees considered that serving as an adviser to a registered mutual fund involves greater responsibilities and risks than acting as a sub-adviser and observed that sub-advisory fees may be lower than those charged by the Adviser to the Fund. The Trustees also noted that the adviser, not the mutual fund, pays the sub-advisory fee and that many responsibilities related to the advisory function are retained by the primary adviser. The Trustees concluded that the fee rates charged to the Fund in comparison to those charged to the Adviser’s other clients were reasonable.
| | | | | | |
| | | |
| 40 | | | | J.P. MORGAN INCOME FUNDS | | AUGUST 31, 2018 |
Investment Performance
The Trustees received and considered absolute and/or relative performance for the Fund in a report prepared by Broadridge/Lipper. The Trustees considered the total return performance information, which included the ranking of the Fund within a performance universe made up of funds with the same Broadridge/Lipper investment classification and objective (the “Universe”) as well as a sub-set of funds within the Universe (the “Peer Group”), by total return for the applicable one- and three-year periods. The Trustees reviewed a description of Broadridge/Lipper’s methodology for selecting mutual funds in the Fund’s Peer Group and Universe. The Broadridge/Lipper materials provided to the Trustees highlighted information with respect to certain representative classes to assist the Trustees in their review. As part of this review, the Trustees also reviewed the Fund’s performance against its benchmark and considered the performance information provided for the Fund at regular Board meetings by the Adviser and the Trustees’ independent consultant and also considered the special analysis prepared by the Trustees’ independent consultant. The Trustees also engaged with the Adviser to consider what steps might be taken to improve performance, as applicable. The Broadridge/Lipper performance data noted by the Trustees as part of their review and the determinations made by the Trustees with respect to the Fund’s performance for certain representative classes are summarized below:
The Trustees noted that the Fund’s performance for Class A shares was in the fourth, fifth and fifth quintiles based upon the Peer Group and in the fifth quintile based upon Universe, for the one-, three- and five-year periods ended December 31, 2017, respectively. The Trustees noted that the Fund’s performance for Class I shares was in the fourth, fifth and fourth quintiles based upon the Universe for the one-, three- and five-year periods ended December 31, 2017, respectively. The Trustees discussed the performance and investment strategy of the Fund with the Adviser and reviewed the performance analysis and evaluation prepared by the independent consultant. Based upon these discussions, and various other
factors, the Trustees concluded that the Fund’s performance was satisfactory, under the circumstances. They requested, however, that the Fund’s Adviser provide additional Fund performance information to be reviewed with the members of the Board’s fixed income committee at each of their regularly scheduled meetings over the course of the next year.
Advisory Fees and Expense Ratios
The Trustees considered the contractual advisory fee rate and administration fee rate paid by the Fund to the Adviser and compared the combined rate to the information prepared by Broadridge/Lipper concerning management fee rates paid by other funds in the same Broadridge/Lipper category as the Fund. The Trustees recognized that Broadridge/Lipper reported the Fund’s management fee rate as the combined contractual advisory fee and administration fee rates. The Trustees also reviewed information about other expenses and the expense ratios for the Fund. The Trustees considered the Fee Caps currently in place for the Fund, the net advisory fee rate after taking into account any waivers and/or reimbursements, and, where deemed appropriate by the Trustees, additional waivers and/or reimbursements. The Trustees recognized that it is difficult to make comparisons of advisory fees because there are variations in the services that are included in the fees paid by other funds. The Trustees’ determinations as a result of the review of the Fund’s advisory fees and expense ratios for certain representative classes are summarized below:
The Trustees noted that the Fund’s net advisory fee and actual total expenses for Class A shares were in the fourth and third quintiles based upon the Peer Group and in the fourth and second quintiles based upon Universe, respectively. The Trustees noted that the Fund’s net advisory fee and actual total expenses for the Class I shares were in the fourth and second quintiles based upon the Universe, respectively. After considering the factors identified above, in light of this information, the Trustees concluded that the advisory fee was satisfactory in light of the services provided to the Fund.
| | | | | | | | |
| | | |
| AUGUST 31, 2018 | | J.P. MORGAN INCOME FUNDS | | | | | 41 | |
TAX LETTER
(Unaudited)
Certain tax information for the J.P. Morgan Funds is required to be provided to shareholders based upon the Fund’s income and distributions for the taxable year ended August 31, 2018. The information and distributions reported in this letter may differ from the information and taxable distributions reported to the shareholders for the calendar year ending December 31, 2018. The information necessary to complete your income tax returns for the calendar year ending December 31, 2018 will be provided under separate cover.
Qualified Dividend Income (QDI)
The Fund had approximately $797,000, or maximum allowable amount, of ordinary income distributions treated as qualified dividends for the fiscal year ended August 31, 2018.
| | | | | | |
| | | |
| 42 | | | | J.P. MORGAN INCOME FUNDS | | AUGUST 31, 2018 |

Rev. January 2011
| | |
| FACTS | | WHAT DOES J.P. MORGAN FUNDS DO WITH YOUR PERSONAL INFORMATION? |
| | |
| Why? | | Financial companies choose how they share your personal information. Federal law gives consumers the right to limit some but not all sharing. Federal law also requires us to tell you how we collect, share, and protect your personal information. Please read this notice carefully to understand what we do. |
| | |
| What? | | The types of personal information we collect and share depend on the product or service you have with us. This information can include: ◾ Social Security number and account balances ◾ transaction history and account transactions ◾ checking account information and wire transfer instructions When you are no longer our customer, we continue to share your information as described in this notice. |
| | |
| How? | | All financial companies need to share customers’ personal information to run their everyday business. In the section below, we list the reasons financial companies can share their customers’ personal information; the reasons J.P. Morgan Funds chooses to share; and whether you can limit this sharing. |
| | | | |
| Reasons we can share your personal information | | Does J.P. Morgan
Funds share? | | Can you limit this
sharing? |
For our everyday business purposes — such as to process your transactions, maintain your account(s), respond to court orders and legal investigations, or report to credit bureaus | | Yes | | No |
For marketing purposes — to offer our products and services to you | | Yes | | No |
| For joint marketing with other financial companies | | No | | We don’t share |
For our affiliates’ everyday business purposes — information about your transactions and experiences | | No | | We don’t share |
For our affiliates’ everyday business purposes — information about your creditworthiness | | No | | We don’t share |
| For nonaffiliates to market to you | | No | | We don’t share |
| | |
| | |
| Questions? | | Call 1-800-480-4111 or go to www.jpmorganfunds.com |

| | |
| Who we are |
| Who is providing this notice? | | J.P. Morgan Funds |
| | |
| What we do |
| How does J.P. Morgan Funds protect my personal information? | | To protect your personal information from unauthorized access and use, we use security measures that comply with federal law. These measures include computer safeguards and secured files and buildings. We authorize our employees to access your information only when they need it to do their work and we require companies that work for us to protect your information. |
How does J.P. Morgan Funds collect my personal information? | | We collect your personal information, for example, when you: ◾ open an account or provide contact information ◾ give us your account information or pay us by check ◾ make a wire transfer We also collect your personal information from others, such as credit bureaus, affiliates and other companies. |
| Why can’t I limit all sharing? | | Federal law gives you the right to limit only ◾ sharing for affiliates’ everyday business purposes – information about your creditworthiness ◾ affiliates from using your information to market to you ◾ sharing for nonaffiliates to market to you State laws and individual companies may give you additional rights to limit sharing. |
| | |
| Definitions |
| Affiliates | | Companies related by common ownership or control. They can be financial and nonfinancial companies. ◾ J.P. Morgan Funds does not share with our affiliates. |
| Nonaffiliates | | Companies not related by common ownership or control. They can be financial and nonfinancial companies. ◾ J.P. Morgan Funds does not share with nonaffiliates so they can market to you. |
| Joint Marketing | | A formal agreement between nonaffiliated financial companies that together market financial products or services to you. ◾ J.P. Morgan Funds doesn’t jointly market. |
J.P. Morgan Funds are distributed by JPMorgan Distribution Services, Inc., which is an affiliate of JPMorgan Chase & Co. Affiliates of JPMorgan Chase & Co. receive fees for providing various services to the funds.
Contact JPMorgan Distribution Services, Inc. at 1-800-480-4111 for a fund prospectus. You can also visit us at www.jpmorganfunds.com. Investors should carefully consider the investment objectives and risk as well as charges and expenses of the mutual fund before investing. The prospectus contains this and other information about the mutual fund. Read the prospectus carefully before investing.
Investors may obtain information about the Securities Investor Protection Corporation (SIPC), including the SIPC brochure, by visiting www.sipc.org or by calling SIPC at 202-371-8300.
The Fund files a complete schedule of its fund holdings for the first and third quarters of its fiscal year with the SEC on Form N-Q. The Fund’s Forms N-Q are available on the SEC’s website at http://www.sec.gov and may be reviewed and copied at the SEC’s Public Reference Room in Washington, DC. Information on the operation of the SEC’s Public Reference Room may be obtained by calling 1-800-SEC-0330. Shareholders may request the Form N-Q without charge by calling 1-800-480-4111 or by visiting the J.P. Morgan Funds’ website at www.jpmorganfunds.com.
A description of the Fund’s policies and procedures with respect to the disclosure of the Fund’s holdings is available in the prospectuses and Statement of Additional Information.
A copy of proxy policies and procedures is available without charge upon request by calling 1-800-480-4111 and on the Fund’s website at www.jpmorganfunds.com. A description of such policies and procedures is on the SEC’s website at www.sec.gov. The Trustees have delegated the authority to vote proxies for securities owned by the Fund to the Adviser. A copy of the Fund’s voting record for the most recent 12-month period ended June 30 is available on the SEC’s website at www.sec.gov or at the Fund’s website at www.jpmorganfunds.com no later than August 31 of each year. The Fund’s proxy voting record will include, among other things, a brief description of the matter voted on for each fund security, and will state how each vote was cast, for example, for or against the proposal.

J.P. Morgan Asset Management is the marketing name for the asset management businesses of JPMorgan Chase & Co. Those businesses include, but are not limited to, J.P. Morgan Investment Management Inc., Security Capital Research & Management Incorporated and J.P. Morgan Alternative Asset Management, Inc.
| | | | |
| | © JPMorgan Chase & Co., 2018. All rights reserved. August 2018. | | AN-FRI-818 |
ITEM 2. CODE OF ETHICS.
Disclose whether, as of the end of the period covered by the report, the registrant has adopted a code of ethics that applies to the registrant’s principal executive officer, principal financial officer, principal accounting officer or controller, or persons performing similar functions, regardless of whether these individuals are employed by the registrant or a third party. If the registrant has not adopted such a code of ethics, explain why it has not done so.
The registrant must briefly describe the nature of any amendment, during the period covered by the report, to a provision of its code of ethics that applies to the registrant’s principal executive officer, principal financial officer, principal accounting officer or controller, or persons performing similar functions, regardless of whether these individuals are employed by the registrant or a third party, and that relates to any element of the code of ethics definition enumerated in paragraph (b) of this Item. The registrant must file a copy of any such amendment as an exhibit pursuant to Item 13(a)(1), unless the registrant has elected to satisfy paragraph (f) of this Item by positing its code of ethics on its website pursuant to paragraph (f)(2) of this Item, or by undertaking to provide its code of ethics to any person without charge, upon request, pursuant to paragraph (f)(3) of this Item.
If the registrant has, during the period covered by the report, granted a waiver, including an implicit waiver, from a provision of the code of ethics that applies to the registrant’s principal executive officer, principal financial officer, principal accounting officer or controller, or persons performing similar functions, regardless of whether these individuals are employed by the registrant or third party, that relates to one or more items set forth in paragraph (b) of this Item, the registrant must briefly describe the nature of the waiver, the name of the person to whom the waiver was granted, and the date of the waiver.
The Registrant has adopted a code of ethics that applies to the Registrant’s principal executive officer and principal financial officer. There were no amendments to the code of ethics or waivers granted with respect to the code of ethics in the period covered by the report.
ITEM 3. AUDIT COMMITTEE FINANCIAL EXPERT.
(a) (1) Disclose that the registrant’s board of directors has determined that the registrant either:
(i) Has at least one audit committee financial expert serving on its audit committee; or
(ii) Does not have an audit committee financial expert serving on its audit committee.
The Registrant’s Board of Trustees has determined that the Registrant has at least one audit committee financial expert serving on its audit committee. The Securities and Exchange Commission has stated that the designation or identification of a person as an audit committee financial expert pursuant to this Item 3 of Form N-CSR does not impose on such person any duties, obligations or liabilities that are greater than the duties, obligations and liabilities imposed on such person as a member of the Audit Committee and the Board of Trustees in the absence of such designation or identification.
(2) If the registrant provides the disclosure required by paragraph (a)(1)(i) of this Item, it must disclose the name of the audit committee financial expert and whether that person is “independent.” In order to be considered “independent” for purposes of this Item, a member of an audit committee may not, other than in his or her capacity as a member of the audit committee, the board of directors, or any other board committee:
(i) Accept directly or indirectly any consulting, advisory, or other compensatory fee from the issuer; or
(ii) Be an “interested person” of the investment company as defined in Section 2(a)(19) of the Act (15 U.S.C. 80a-2(a)(19)).
Effective October 31, 2017, Dennis P. Harrington replaced James Schonbachler as the audit committee financial expert. He is not an “interested person” of the Registrant and is also “independent” as defined by the U.S. Securities and Exchange Commission for purposes of audit committee financial expert determinations.
(3) If the registrant provides the disclosure required by paragraph (a)(1)(ii) of this Item, it must explain why it does not have an audit committee financial expert.
Not applicable.
ITEM 4. PRINCIPAL ACCOUNTANT FEES AND SERVICES.
(a) Disclose, under the caption Audit Fees, the aggregate fees billed for each of the last two fiscal years for professional services rendered by the principal accountant for the audit of the registrant’s annual financial statements or services that are normally provided by the accountant in connection with statutory and regulatory filings or engagements for those fiscal years.
AUDIT FEES
2018 – $213,414
2017 – $298,713
(b) Disclose, under the caption Audit-Related Fees, the aggregate fees billed in each of the last two fiscal years for assurance and related services by the principal accountant that are reasonably related to the performance of the audit of the registrant’s financial statements and are not reported under paragraph (a) of this Item. Registrants shall describe the nature of the services comprising the fees disclosed under this category.
AUDIT-RELATED FEES
2018 – $18,780
2017 – $31,320
Audit-related fees consists of semi-annual financial statement reviews and security count procedures performed as required under Rule 17f-2 of the Investment Company Act of 1940 during the Registrant’s fiscal year.
(c) Disclose, under the caption Tax Fees, the aggregate fees billed in each of the last two fiscal years for professional services rendered by the principal accountant for tax compliance, tax advice, and tax planning. Registrants shall describe the nature of the services comprising the fees disclosed under this category.
TAX FEES
2018 – $37,233
2017 – $58,174
The tax fees consist of fees billed in connection with preparing the federal regulated investment company income tax returns for the Registrant for the tax years ended August 31, 2018 and 2017, respectively.
For the last fiscal year, no tax fees were required to be approved pursuant to paragraph (c)(7)(ii) of Rule 2-01 of Regulation S-X.
(d) Disclose, under the caption All Other Fees, the aggregate fees billed in each of the last two fiscal years for products and services provided by the principal accountant, other than the services reported in paragraphs (a) through (c) of this Item. Registrants shall describe the nature of the services comprising the fees disclosed under this category.
ALL OTHER FEES
2018 – Not applicable
2017 – Not applicable
(e) (1) Disclose the audit committee’s pre-approval policies and procedures described in paragraph (c)(7) of Rule 2-01 of Regulation S-X.
Pursuant to the Registrant’s Audit Committee Charter and written policies and procedures for the pre-approval of audit and non-audit services (the “Pre-approval Policy”), the Audit Committee pre-approves all audit and non-audit services performed by the Registrant’s independent public registered accounting firm for the Registrant. In addition, the Audit Committee pre-approves the auditor’s engagement for non-audit services with the Registrant’s investment adviser (not including a sub-adviser whose role is primarily portfolio management and is sub-contracted or overseen by another investment adviser) and any Service Affiliate in accordance with paragraph (c)(7)(ii) of Rule 2-01 of Regulation S-X, if the engagement relates directly to the operations and financial reporting of the Registrant. Proposed services may be pre-approved either 1) without consideration of specific case-by-case services or 2) require the specific pre-approval of the Audit Committee. Therefore, initially the Pre-approval Policy listed a number of audit and non-audit services that have been approved by the Audit Committee, or which were not subject to pre-approval under the transition provisions of Sarbanes-Oxley Act of 2002 (the
“Pre-approval List”). The Audit Committee annually reviews and pre-approves the services included on the Pre-approval List that may be provided by the independent public registered accounting firm without obtaining additional specific pre-approval of individual services from the Audit Committee. The Audit Committee adds to, or subtracts from, the list of general pre-approved services from time to time, based on subsequent determinations. All other audit and non-audit services not on the Pre-approval List must be specifically pre-approved by the Audit Committee.
One or more members of the Audit Committee may be appointed as the Committee’s delegate for the purposes of considering whether to approve such services. Any pre-approvals granted by the delegate will be reported, for informational purposes only, to the Audit Committee at its next scheduled meeting. The Audit Committee’s responsibilities to pre-approve services performed by the independent public registered accounting firm are not delegated to management.
(2) Disclose the percentage of services described in each of paragraphs (b) through (d) of this Item that were approved by the audit committee pursuant to paragraph (c)(7)(i)(C) of Rule 2-01 of Regulation S-X.
2018 – 0.0%
2017 – 0.0%
(f) If greater than 50 percent, disclose the percentage of hours expended on the principal accountant’s engagement to audit the registrant’s financial statements for the most recent fiscal year that were attributed to work performed by persons other than the principal accountant’s full-time, permanent employees.
Not applicable – Less than 50%.
(g) Disclose the aggregate non-audit fees billed by the registrant’s accountant for services rendered to the registrant, and rendered to the registrant’s investment adviser (not including any sub-adviser whose role is primarily portfolio management and is subcontracted with or overseen by another investment adviser), and any entity controlling, controlled by, or under common control with the adviser that provides ongoing services to the registrant for each of the last two fiscal years of the registrant.
The aggregate non-audit fees billed by the independent registered public accounting firm for services rendered to the Registrant, and rendered to Service Affiliates, for the last two calendar year ends were:
2018 – $32.1 million
2017 – $28.4 million
(h) Disclose whether the registrant’s audit committee of the board of directors has considered whether the provision of non-audit services that were rendered to the registrant’s investment adviser (not including any subadviser whose role is primarily portfolio management and is subcontracted with or overseen by another investment adviser), and any entity controlling, controlled by, or under common control with the investment adviser that provides ongoing services to the registrant that were not pre-approved pursuant to paragraph (c)(7)(ii) of Rule 2-01 of Regulation S-X is compatible with maintaining the principal accountant’s independence.
The Registrant’s Audit Committee has considered whether the provision of the non-audit services that were rendered to Service Affiliates that were not pre-approved (not requiring pre-approval) is compatible with maintaining the independent public registered accounting firm’s independence. All services provided by the independent public registered accounting firm to the Registrant or to Service Affiliates that were required to be pre-approved were pre-approved as required.
ITEM 5. AUDIT COMMITTEE OF LISTED REGISTRANTS.
(a) If the registrant is a listed issuer as defined in Rule 10A-3 under the Exchange Act (17CFR 240.10A-3), state whether or not the registrant has a separately-designated standing audit committee established in accordance with Section 3(a)(58)(A) of the Exchange Act (15 U.S.C. 78c(a)(58)(A)). If the registrant has such a committee, however designated, identify each committee member. If the entire board of directors is acting as the registrant’s audit committee as specified in Section 3(a)(58)(B) of the Exchange Act (15 U.S.C. 78c(a)(58)(B)), so state.
(b) If applicable, provide the disclosure required by Rule 10A-3(d) under the Exchange Act (17CFR 240.10A-3(d)) regarding an exemption from the listing standards for all audit committees.
Not applicable.
ITEM 6. INVESTMENTS.
File Schedule I – Investments in securities of unaffiliated issuers as of the close of the reporting period as set forth in Section 210.12-12 of Regulation S-X, unless the schedule is included as part of the report to shareholders filed under Item 1 of this Form.
Included in Item 1.
ITEM 7. DISCLOSURE OF PROXY VOTING POLICIES AND PROCEDURES FOR CLOSED-END MANAGEMENT INVESTMENT COMPANIES.
Not applicable.
ITEM 8. PORTFOLIO MANAGERS OF CLOSED-END MANAGEMENT INVESTMENT COMPANIES.
Not applicable.
ITEM 9. PURCHASE OF EQUITY SECURITIES BY CLOSED-END MANAGEMENT INVESTMENT COMPANY AND AFFILIATED PURCHASERS.
Not applicable.
ITEM 10. SUBMISSION OF MATTERS TO A VOTE OF SECURITY HOLDERS.
Describe any material changes to the procedures by which shareholders may recommend nominees to the registrant’s board of directors, where those changes were implemented after the registrant last provided disclosure in response to the requirements of Item 7(d)(2)(ii)(G) of Schedule 14A (17 CFR 240.14a-101), or this Item.
No material changes to report.
ITEM 11. CONTROLS AND PROCEDURES.
(a) Disclose the conclusions of the registrant’s principal executive and principal financial officers, or persons performing similar functions, regarding the effectiveness of the registrant’s disclosure controls and procedures (as defined in Rule 30a-3(c) under the Act (17 CFR 270.30a-3(c))) as of a date within 90 days of the filing date of the report that includes the disclosure required by this paragraph, based on the evaluation of these controls and procedures required by Rule 30a-3(b) under the Act (17 CFR 270.30a-3(b)) and Rules 13a-15(b) or 15d-15(b) under the Exchange Act (17 CFR 240.13a-15(b) or 240.15d-15(b)).
The Registrant’s principal executive and principal financial officers have concluded, based on their evaluation of the Registrant’s disclosure controls and procedures as of a date within 90 days of the filing date of this report, that the Registrant’s disclosure controls and procedures are reasonably designed to ensure that information required to be disclosed by the Registrant on Form N-CSR is recorded, processed, summarized and reported within the required time periods and that information required to be disclosed by the Registrant in the reports that it files or submits on Form N-CSR is accumulated and communicated to the Registrant’s management, including its principal executive and principal financial officers, as appropriate to allow timely decisions regarding required disclosure.
(b) Disclose any change in the registrant’s internal control over financial reporting (as defined in Rule 30a-3(d) under the Act (17 CFR 270.30a-3(d)) that occurred during the registrant’s second fiscal quarter of the period covered by this report that has materially affected, or is reasonably likely to materially affect, the registrant’s internal control over financial reporting.
There were no changes in the Registrant’s internal control over financial reporting that occurred during the last fiscal quarter covered by this report that have materially affected, or are reasonably likely to materially affect, the Registrant’s internal control over financial reporting.
ITEM 12. DISCLOSURE OF SECURITIES LENDING ACTIVITIES FOR CLOSED-END MANAGEMENT INVESTMENT COMPANIES.
Not applicable.
ITEM 13. EXHIBITS.
| | (a) | File the exhibits listed below as part of this Form. Letter or number the exhibits in the sequence indicated. |
(1) Any code of ethics, or amendment thereto, that is the subject of the disclosure required by Item 2, to the extent that the registrant intends to satisfy the Item 2 requirements through filing of an exhibit.
Code of Ethics applicable to its Principal Executive and Principal Financial Officers pursuant to Section 406 of the Sarbanes-Oxley Act of 2002 attached hereto.
(2) A separate certification for each principal executive officer and principal financial officer of the registrant as required by Rule 30a-2(a) under the Act (17 CFR 270.30a-2).
Certifications pursuant to Rule 30a-2(a) under the Investment Company Act of 1940 are attached hereto.
(3) Any written solicitation to purchase securities under Rule 23c-1 under the Act (17 CFR 270.23c-1) sent or given during the period covered by the report by or on behalf of the registrant to 10 or more persons.
Not applicable.
| | (b) | A separate or combined certification for each principal executive officer and principal officer of the registrant as required by Rule 30a-2(b) under the Act of 1940. |
Certifications pursuant to Rule 30a-2(b) under the Investment Company Act of 1940 are attached hereto.
SIGNATURES
Pursuant to the requirements of the Securities Exchange Act of 1934 and the Investment Company Act of 1940, the registrant has duly caused this report to be signed on its behalf by the undersigned, thereunto duly authorized.
| | |
| JPMorgan Trust I |
| |
| By: | | /s/ Brian S. Shlissel |
| | Brian S. Shlissel |
| | President and Principal Executive Officer |
| | November 07, 2018 |
Pursuant to the requirements of the Securities Exchange Act of 1934 and the Investment Company Act of 1940, this report has been signed below by the following persons on behalf of the registrant and in the capacities and on the dates indicated.
| | |
| |
| By: | | /s/ Brian S. Shlissel |
| | Brian S. Shlissel |
| | President and Principal Executive Officer |
| | November 07, 2018 |
| | |
| |
| By: | | /s/ Timothy J. Clemens |
| | Timothy J. Clemens |
| | Treasurer and Principal Financial Officer |
| | November 07, 2018 |