| | |
OMB APPROVAL |
OMB Number: | | 3235 - 0570 |
Expires: | | August 31, 2010 |
Estimated average burden |
hours per response . . . | | 18.9 |
UNITED STATES
SECURITIES AND EXCHANGE COMMISSION
Washington, D.C. 20549
FORM N-CSR
CERTIFIED SHAREHOLDER REPORT OF REGISTERED
MANAGEMENT INVESTMENT COMPANIES
| | |
Investment Company Act file number: 811-21296 | | |
BARON SELECT FUNDS
|
| (Exact name of registrant as specified in charter) |
| | |
| 767 Fifth Avenue, 49th Floor | | New York, NY 10153 |
| (Address of Principal Executive Offices) | | (Zip Code) |
Patrick M. Patalino, Esq.
c/o Baron Select Funds
767 Fifth Avenue, 49th Floor
New York, NY 10153
|
| (Name and Address of Agent for Service) |
Registrant’s Telephone Number, including Area Code: 212-583-2000
Date of fiscal year end: December 31
Date of reporting period: December 31, 2008
Form N-CSR is to be used by management investment companies to file reports with the Commission not later than 10 days after the transmission to stockholders of any report that is required to be transmitted to stockholders under Rule 30e-1 under the Investment Company Act of 1940 (17CRF 270.30e-1). The Commission may use the information provided on Form N-CSR in its regulatory, disclosure review, inspection, and policymaking roles.
A registrant is required to disclose the information specified by Form N-CSR, and the Commission will make this information public. A registrant is not required to respond to the collection of information contained in Form N-CSR unless the Form displays a currently valid Office of Management and Budget (“OMB”) control number. Please direct comments concerning the accuracy of the information collection burden estimate and suggestions for reducing the burden to Secretary, Securities and Exchange Commission, 450 5th Street, NW, Washington, D.C. 20549-0609. The OMB has reviewed this collection of information under the clearance requirements of 44 U.S.C. Section 3507.
Persons who are to respond to the collection of information contained in this form are not required to respond unless the form displays a currently valid OMB control number.
SEC 2569 (5-07)
Item 1. Reports to Stockholders.
Baron Select Funds Annual Report for the period ended December 31, 2008.
Baron Partners Fund
Baron Retirement Income Fund
December 31, 2008
Baron Funds®
Annual Financial Report
767 Fifth Avenue
NY, NY 10153
212-583-2100
DEAR BARON SELECT FUNDS SHAREHOLDER:
In this report you will find audited financial statements for Baron Partners Fund and Baron Retirement Income Fund for the fiscal year ended December 31, 2008. The Securities and Exchange Commission requires mutual funds to furnish these statements semi-annually to their shareholders. We hope you find these statements informative and useful.
We thank you for choosing to join us as fellow shareholders in Baron Funds. We will continue to work hard to justify your confidence.
Sincerely,
| | | | |

| |  | |  |
Ronald Baron Chief Executive Officer and Chief Investment Officer February 25, 2009 | | Linda S. Martinson President and Chief Operating Officer February 25, 2009 | | Peggy Wong Treasurer and Chief Financial Officer February 25, 2009 |
This Annual Financial Report is for the Baron Select Funds which currently has three series: Baron Partners Fund, Baron Retirement Income Fund and Baron International Growth Fund. Baron International Growth Fund commenced operations on January 1, 2009 and, therefore, is not included in this report. If you are interested in Baron Investment Funds Trust, which contains the Baron Asset Fund, Baron Growth Fund, Baron Small Cap Fund, Baron iOpportunity Fund and Baron Fifth Avenue Growth Fund series, please visit the Funds’ website www.BaronFunds.com or contact us at 1-800-99BARON.
A description of the Funds’ proxy voting policies and procedures is available without charge on the Funds’ website, www.BaronFunds.com, or by calling 1-800-99BARON and on the SEC’s website at www.sec.gov. The Funds’ most current proxy voting record, Form N-PX, is also available on the Funds’ website and on the SEC’s website.
The Funds file their complete schedules of portfolio holdings with the SEC for the first and third quarters of each fiscal year on Form N-Q. The Funds’ Forms N-Q are available on the SEC’s website at www.sec.gov. The Funds’ Forms N-Q may also be reviewed and copied at the SEC’s Public Reference Room in Washington, DC; information on the operation of the SEC’s Public Reference Room may be obtained by calling 1-800-SEC-0330. A copy of the Funds’ Forms N-Q may also be obtained upon request by contacting Baron Funds at 1-800-99BARON. Schedules of portfolio holdings current to the most recent quarter are also available on the Funds’ website.
Some of the comments are based on current management expectations and are considered “forward-looking statements.” Actual future results, however, may prove to be different from our expectations. You can identify forward-looking statements by words such as “estimate,” “may,” “expect,” “should,” “could,” “believe,” “plan” and other similar terms. We cannot promise future returns and our opinions are a reflection of our best judgment at the time this report is compiled.
The views expressed in this report reflect those of BAMCO, Inc. (“BAMCO” or the “Adviser”) only through the end of the period stated in this report. The views are not intended as recommendations or investment advice to any person reading this report and are subject to change at any time without notice based on market and other conditions.
Past performance is no guarantee of future results. The investment return and principal value of an investment will fluctuate; an investor’s shares, when redeemed, may be worth more or less than their original cost. For more complete information about Baron Funds, including charges and expenses, call or write for a prospectus. Read it carefully before you invest or send money. This report is not authorized for use as an offer of sale or a solicitation of an offer to buy shares of Baron Funds, unless accompanied or preceded by the Funds’ current prospectus.
| | |
| Baron Partners Fund | | December 31, 2008 |
1.800.99 BARON
www.BaronFunds.com
©2009 All Rights Reserved
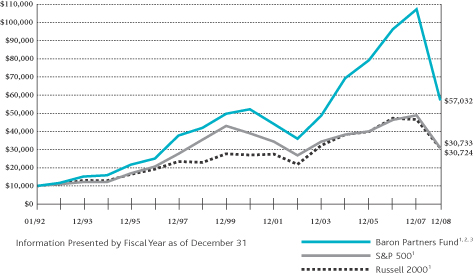
COMPARISONOFTHECHANGEIN VALUEOF $10,000INVESTMENT
IN BARON PARTNERS FUNDINRELATIONTOTHE S&P 500ANDTHE
RUSSELL 2000 INDEXES
AVERAGE ANNUAL TOTAL RETURNSFORTHEPERIODSENDED DECEMBER 31, 2008
| | | | | | | | | |
| | | Baron Partners
Fund1,2,3 | | | S&P
5001 | | | Russell
20001 | |
One Year | | (46.67% | ) | | (37.03% | ) | | (33.79% | ) |
Three Years | | (10.30% | ) | | (8.38% | ) | | (8.29% | ) |
Five Years | | 3.28% | | | (2.22% | ) | | (0.93% | ) |
Ten Years | | 3.12% | | | (1.41% | ) | | 3.02% | |
Since Inception (January 31, 1992) | | 10.84% | | | 6.86% | | | 6.86% | |
| 1 | The S & P 500 and the Russell 2000 are unmanaged indexes. The S & P 500 measures the performance of larger cap U.S. equities in the stock market in general. The Russell 2000 measures the performance of 2,000 small U.S companies. The indexes and the Baron Partners Fund are with dividends, which positively impact the performance results. |
| 2 | Reflects the actual fees and expenses that were charged when the Fund was a partnership. The predecessor partnership charged a 20% performance fee after reaching a certain performance benchmark. If the annual returns for the Fund did not reflect the performance fee for the years it was a partnership, the returns would be higher. The Fund’s shareholders will not be charged a performance fee. The predecessor partnership’s performance is only for the periods before the Fund’s registration statement was effective, which was April 30, 2003. During those periods, the predecessor partnership was not registered under the Investment Company Act of 1940 and was not subject to its requirements or the requirements of the Internal Revenue Code relating to registered investment companies, which, if it were, might have adversely affected its performance. |
| 3 | Past performance is not predictive of future performance. The performance data does not reflect the deduction of taxes that a shareholder would pay on Fund distributions or redemption of Fund shares. |
2
| | |
| December 31, 2008 | | Baron Partners Fund |
TOP TEN HOLDINGSASOF DECEMBER 31, 2008
| | |
| Baron Partners Fund | | Percentage of
Net Assets |
Fastenal Co. | | 7.6% |
Arch Capital Group, Ltd. | | 6.5% |
Charles Schwab Corp. | | 6.2% |
FactSet Research Systems, Inc. | | 5.6% |
ITC Holdings Corp. | | 5.1% |
Wynn Resorts, Ltd. | | 4.9% |
Ecolab, Inc. | | 4.0% |
Ritchie Bros. Auctioneers, Inc. | | 3.4% |
Iron Mountain, Inc. | | 3.3% |
C. H. Robinson Worldwide, Inc. | | 3.2% |
| | | 49.8% |
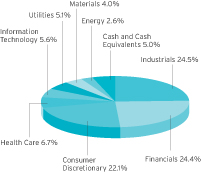
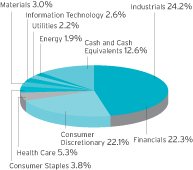
SECTOR BREAKDOWNASOF DECEMBER 31, 2008†
(as a percentage of net assets)
MANAGEMENT’S DISCUSSIONOF FUND PERFORMANCE
Baron Partners Fund declined 46.67% for the year ended December 31, 2008. The Fund underperformed its comparative indexes, the S&P 500, which declined 37.03%, and the Russell 2000, which declined 33.79%. The Fund has performed well since it converted into an open-end mutual fund on April 30, 2003. In the period since the Fund’s conversion on April 30, 2003 through December 31, 2008, the Fund gained an annualized 8.58% versus an annualized 1.65% for the S&P 500 and an annualized 5.36% for the Russell 2000. Since its inception on January 31, 1992,* the Fund also has significantly outperformed both the S&P 500 and the Russell 2000. Since its inception on January 31, 1992 through December 31, 2008, the Fund gained an annualized 10.84% compared to an annualized 6.86% for the S&P 500 and an annualized 6.86% for the Russell 2000.
Baron Partners Fund uses value purchase disciplines to invest in all-cap companies that we believe have significant long-term growth opportunities. We believe that our independent research will identify investment opportunities that are attractively priced relative to their future prospects. However, Baron Partners Fund is different from most of the other Baron Funds with its non-diversified portfolio and its ability to leverage and sell short.
The Fund’s performance was negative in all four quarters: down 13.68%, 1.90%, 7.39% and 32.00% respectively. The performance of the S&P 500 was stronger than the Fund in the first and fourth quarters, down 9.47%, 2.73%, 8.37% and 21.96% respectively. The Russell 2000 outperformed the Fund in all four quarters, down 9.90%, 1.11% and 26.12% in the first, third and fourth quarters while gaining 0.58% in the second. Below we discuss the reasons for the Fund’s underperformance during the past year.
Baron Partners Fund underperformed the Russell 2000 index for the year 2008 mainly due to overweighting and stock selection in the Consumer Discretionary and the Financial sectors. The Fund’s relative performance was helped by its stock selection and its underweighting in the Information Technology sector and its stock selection in the Industrial sector. CME Group, a provider of benchmark futures and options products, had the biggest negative impact while Arch Capital, a provider of insurance and reinsurance products, had the biggest positive impact on the Fund.
CME Group shares were down for the year as trading volumes in the second half of 2008 declined on a year-over-year basis. The credit crisis negatively affected CME Group’s trading volumes through several channels. Unprecedented volatility and dislocations in the credit markets caused CME Group’s interest rate products to be less effective than usual for traditional hedging and speculating strategies. In addition, across product categories customers had less access to credit and, therefore, capital with which to trade. We are optimistic that CME Group’s volume growth will improve as the volatility in credit markets recedes, relationships among various credit instruments stabilize, and credit becomes more readily available.
Shares of Arch Capital have held up well so far this year compared to the broader property & casualty insurance index. Most recently, given the credit crisis, Arch has been rewarded because of its conservative investment portfolio and the perception that it will benefit from AIG’s woes. Specifically, we think Arch will be able to bring over several good producers from AIG, as well as write new business that was formerly held by AIG. We believe Arch has a great management team and the ability to nimbly switch between the best lines of business at any given moment.
The Fund expects to continue to establish long positions in securities that, in our opinion, have favorable price-to-value characteristics based on our assessment of their prospects for future growth and profitability. The Fund may establish short positions in securities that we believe have limited growth prospects, are poorly managed, have a highly leveraged balance sheet or are over priced.
| * | Please see Footnote 2 on page 2. |
| † | The Fund generally uses Global Industry Classification Standard (“GICS”) to determine industry classifications. GICS was developed by and is the exclusive property and a service mark of MSCI, Inc. (“MSCI”) and Standard & Poor’s, a division of The McGraw-Hill Companies, Inc. (“S&P”). GICS is provided “as is” without warranty and excludes all warranties of Merchantability and Fitness for a Particular Use. S&P and its licensors disclaim all liability associated with GICS to the extent permitted by law. GICS presents industry classification as a series of levels (i.e. sector, industry group, industry, and sub-industry). Allocations shown are at the sector or sub-industry group level. The Adviser may reclassify a company into an entirely different sub-industry if it believes that the GICS classification for a specific company does not accurately describe the company. If there is no GICS classification for a certain security, the Adviser will provide a classification. |
| | |
| Baron Retirement Income Fund | | December 31, 2008 |
1.800.99 BARON
www.BaronFunds.com
©2009 All Rights Reserved
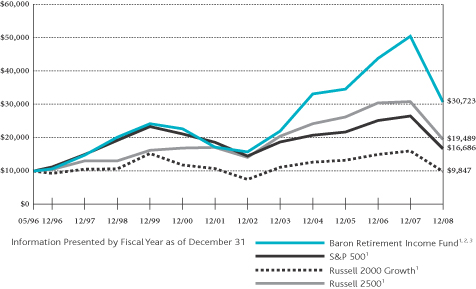
COMPARISONOFTHECHANGEIN VALUEOF $10,000INVESTMENT
IN BARON RETIREMENT INCOME FUNDINRELATIONTOTHE S&P 500,THE
RUSSELL 2000 GROWTHANDTHE RUSSELL 2500 INDEXES
AVERAGE ANNUAL TOTAL RETURNSFORTHEPERIODSENDED DECEMBER 31, 2008
| | | | | | | | | | | | |
| | | Baron Retirement
Income
Fund1,2,3 | | | S&P
5001 | | | Russell 2000
Growth1 | | | Russell
25001 | |
One Year | | (39.06% | ) | | (37.03% | ) | | (38.54% | ) | | (36.79% | ) |
Three Years | | (3.83% | ) | | (8.38% | ) | | (9.32% | ) | | (9.37% | ) |
Five Years | | 6.91% | | | (2.22% | ) | | (2.35% | ) | | (0.98% | ) |
Ten Years | | 4.32% | | | (1.41% | ) | | (0.76% | ) | | 4.08% | |
Since Inception (May 31, 1996) | | 9.33% | | | 4.15% | | | (0.12% | ) | | 5.45% | |
| 1 | The S & P 500, the Russell 2000 Growth and the Russell 2500 are unmanaged indexes. The S & P 500 measures the performance of larger cap U.S. equities in the stock market in general. The Russell 2000 Growth measures the performance of those Russell 2000 U.S. companies classified as growth. The Russell 2500 measures the performance of small to mid-sized U.S. companies. The indexes and the Baron Retirement Income Fund are with dividends, which positively impact the performance results. |
| 2 | Reflects the actual fees and expenses that were charged when the Fund was a partnership. Prior to 2003, the predecessor partnership charged a 15% performance fee after reaching a certain performance benchmark. If the annual returns for the Fund did not reflect the performance fee for the years it was a partnership, the returns would be higher. The Fund’s shareholders will not be charged a performance fee. The predecessor partnership’s performance is only for the periods before the Fund’s registration statement was effective, which was June 30, 2008. During those periods, the predecessor partnership was not registered under the Investment Company Act of 1940 and was not subject to its requirements or the requirements of the Internal Revenue Code relating to registered investment companies, which, if it were, might have adversely affected its performance. |
| 3 | Past performance is not predictive of future performance. The performance data does not reflect the deduction of taxes that a shareholder would pay on Fund distributions or redemption of Fund shares. |
4
| | |
| December 31, 2008 | | Baron Retirement Income Fund |
TOP TEN HOLDINGSASOF DECEMBER 31, 2008
| | |
| Baron Retirement Income Fund | | Percentage
of Net
Assets |
Charles Schwab Corp. | | 5.2% |
Genesee & Wyoming, Inc., Cl A | | 5.1% |
Arch Capital Group, Ltd. | | 4.7% |
C. H. Robinson Worldwide, Inc. | | 4.6% |
MSCI, Inc., Cl A | | 4.6% |
Ritchie Bros. Auctioneers, Inc. | | 3.9% |
Church & Dwight Co., Inc. | | 3.8% |
Eaton Vance Corp. | | 3.5% |
Ecolab, Inc. | | 3.0% |
Fastenal Co. | | 2.9% |
| | | 41.3% |
SECTOR BREAKDOWNASOF DECEMBER 31, 2008†
(as a percentage of net assets)
MANAGEMENT’S DISCUSSIONOF FUND PERFORMANCE
In the six-month period ending December 31, 2008, from its conversion into an open-end mutual fund through year end, Baron Retirement Income Fund declined 33.11%. The Fund underperformed the indexes against which it is compared. The Russell 2500 declined 31.21% while the S&P 500 declined 28.49% for the six months ended December 31, 2008. Since its inception on May 31, 1996* to December 31, 2008, the Fund gained an annualized 9.33% compared to an annualized 5.45% for the Russell 2500 and an annualized 4.15% for the S&P 500.
Baron Retirement Income Fund, a non-diversified fund, utilizes value purchase disciplines when investing in small and mid-sized
growth companies that we believe have significant long-term growth opportunities. We believe that our independent research will identify investment opportunities that are attractively priced relative to their future prospects. The Fund is unique when compared to other Baron Funds because it intends to make an annual distribution equal to a minimum of 4% of the Fund’s net assets per share measured as of December 31 of the preceding year. The adviser anticipates that the annual distributions will be characterized as either dividend income, capital gains or return of capital, or some combination thereof.
The Fund’s performance was negative in both quarters, down 6.90% and 28.15% respectively. The performance of the Russell 2500 was slightly stronger, while the S&P was stronger only in the fourth quarter. Below, we discuss the factors that contributed to the Fund’s performance during the past year.
The Fund underperformed the Russell 2500 index for the six months ended December 31, 2008. The Fund underperformed the Russell 2500 due to its stock selection and overweighting in the Consumer Discretionary sector. Eaton Vance, a provider of investment management services, made the most positive contribution to the Fund, while Encore Acquisition, a crude oil production company, had the most negative impact on results.
Eaton Vance had a very difficult year as a result of the struggling economy. The falling stock market, coupled with heavy investor redemptions, led to lower assets under management and a significant reduction in revenue. We began purchasing the stock in the fourth quarter, taking advantage of its depressed price and generating a positive return for the Fund as the price increased through December.
Encore Acquisition trades over short-term periods in relation to the price of oil and natural gas. During the fourth quarter, the benchmark price of oil dropped 56% from just over $100 to $45 per barrel, while the decline in natural gas was a more modest 24%, from $7.44 to $5.62 per million British thermal units. Reduced demand for oil from the deteriorating world economy was the driver behind the drop in oil prices as supply has remained stable. Of particular note, evidence of energy demand in China slowing during the quarter undercut the key argument of remaining oil bulls who had said that growth from emerging markets could support oil prices even in the face of declining demand in the developed world. In addition, the energy stocks were hurt by the tight credit markets. Energy is a capital intensive business, and tightening credit has resulted in sharp cuts to drilling budgets and major capital projects. We believe the company is in good financial condition. However, it is scaling back spending plans for 2009 as customers have reduced consumption, and it has projected reduced earnings estimates.
In 2009, the Fund expects to continue to establish positions in small and mid-sized businesses that, in our opinion, have favorable price-to-value characteristics based on our assessment of prospects for future growth and profitability.
| * | Please see Footnote 2 on page 4. |
| † | The Fund generally uses Global Industry Classification Standard (“GICS”) to determine industry classifications. GICS was developed by and is the exclusive property and a service mark of MSCI, Inc. (“MSCI”) and Standard & Poor’s, a division of The McGraw-Hill Companies, Inc. (“S&P”). GICS is provided “as is” without warranty and excludes all warranties of Merchantability and Fitness for a Particular Use. S&P and its licensors disclaim all liability associated with GICS to the extent permitted by law. GICS presents industry classification as a series of levels (i.e. sector, industry group, industry, and sub-industry). Allocations shown are at the sector or sub-industry group level. The Adviser may reclassify a company into an entirely different sub-industry if it believes that the GICS classification for a specific company does not accurately describe the company. If there is no GICS classification for a certain security, the Adviser will provide a classification. |
5
| | |
| Baron Select Funds | | December 31, 2008 |
FUND EXPENSES (UNAUDITED)
As a shareholder of the Funds, you may incur two types of costs: ongoing expenses and transaction costs. Ongoing expenses include advisory fees, distribution and service (12b-1) fees and other Fund expenses. Due to the payment of Rule 12b-1 fees, long-term shareholders may indirectly pay more than the maximum permitted front-end sales charge. The information on this page is intended to help you understand your ongoing costs of investing in the Funds and to compare these costs with the ongoing costs of investing in other mutual funds.
The information in the following table is based on an investment of $1,000 invested on July 1, 2008 and held for the six months ended December 31, 2008.
ACTUAL EXPENSES
The table below titled “Based on Actual Total Return” provides information about actual account values and actual expenses. You may use the information provided in this table, together with the amount you invested, to estimate the expenses that you paid over the period. To estimate the expenses you paid on your account, divide your ending account value by $1,000 (for example, an $8,600 ending account value divided by $1,000 = 8.6), then multiply the result by the number under the heading titled “Expenses Paid During the Period”.
BASED ON ACTUAL TOTAL RETURN FOR THE SIX MONTHS ENDED DECEMBER 31, 20081
| | | | | | | | | | | | | | | |
| | | Actual Total Return | | | Beginning
Account Value
July 1, 2008 | | Ending
Account Value
December 31, 2008 | | Annualized Expense Ratio | | | Expenses
Paid During
the Period3 |
| | | | | |
Baron Partners Fund | | (37.02% | ) | | $ | 1,000.00 | | $ | 629.80 | | 1.82% | 2 | | $ | 7.46 |
| | | | | |
Baron Retirement Income Fund | | (33.11% | ) | | $ | 1,000.00 | | $ | 668.94 | | 1.35% | | | $ | 5.66 |
HYPOTHETICAL EXAMPLE FOR COMPARISON PURPOSES
The table below titled “Based on Hypothetical Total Return” provides information about hypothetical account values and hypothetical expenses based on the actual expense ratio and an assumed rate of return of 5% per year before expenses, which is not the Funds’ actual return. The hypothetical account values and expenses may not be used to estimate the actual ending account values and expenses you paid for the period. You may use the information provided in this table to compare the ongoing costs of investing in the Funds and other funds. To do so, compare the 5% hypothetical example relating to the Funds with the 5% hypothetical examples that appear in the shareholder reports of other funds.
Please note that expenses shown in the table below are meant to highlight your ongoing costs and do not reflect any transactional costs, such as redemption fees, if any. Therefore, the table is useful in comparing ongoing costs only and will not help you determine your relative total costs of owning different mutual funds. In addition, if these transactional costs were included, your costs would have been higher.
BASED ON HYPOTHETICAL TOTAL RETURN FOR THE SIX MONTHS ENDED DECEMBER 31, 2008
| | | | | | | | | | | | | | |
| | | Hypothetical Annualized Total Return | | Beginning
Account Value
July 1, 2008 | | Ending
Account Value
December 31, 2008 | | Annualized Expense Ratio | | | Expenses
Paid During
the Period3 |
| | | | | |
Baron Partners Fund | | 5.00% | | $ | 1,000.00 | | $ | 1,015.99 | | 1.82% | 2 | | $ | 9.22 |
| | | | | |
Baron Retirement Income Fund | | 5.00% | | $ | 1,000.00 | | $ | 1,018.35 | | 1.35% | | | $ | 6.85 |
1 | Assumes reinvestment of all dividends and capital gain distributions, if any. |
2 | Annualized expense ratio for Baron Partners Fund for the six months ended December 31, 2008, includes 1.40% for net operating expenses and 0.42% for interest expense. |
3 | Expenses are equal to each Fund’s respective annualized expense ratio multiplied by the average account value over the period, multiplied by the number of days in the most recent fiscal half-year, then divided by 366. |
6
| | |
| December 31, 2008 | | Baron Partners Fund |
STATEMENT OF NET ASSETS
DECEMBER 31, 2008
| | | | | | | | |
| Shares | | | | Cost | | Value |
| Common Stocks (90.85%) | | | |
| Consumer Discretionary (20.50%) | | | |
| | Advertising (0.92%) | | | | | | |
| 1,100,000 | | Lamar Advertising Co., Cl A1 | | $ | 30,515,252 | | $ | 13,816,000 |
| | | |
| | Apparel, Accessories & Luxury Goods (3.28%) | | | | | | |
| 479,600 | | Polo Ralph Lauren Corp., Cl A | | | 32,625,644 | | | 21,778,636 |
| 1,150,000 | | Under Armour, Inc., Cl A1 | | | 44,631,100 | | | 27,416,000 |
| | | | | | | | |
| | | | | 77,256,744 | | | 49,194,636 |
| | | |
| | Casinos & Gaming (6.35%) | | | | | | |
| 1,000,000 | | Penn National Gaming, Inc.1 | | | 30,963,510 | | | 21,380,000 |
| 1,750,000 | | Wynn Resorts, Ltd.1,4 | | | 49,722,761 | | | 73,955,000 |
| | | | | | | | |
| | | | | 80,686,271 | | | 95,335,000 |
| | | |
| | Education Services (4.20%) | | | | | | |
| 500,000 | | DeVry, Inc. | | | 21,046,853 | | | 28,705,000 |
| 160,000 | | Strayer Education, Inc. | | | 16,954,684 | | | 34,305,600 |
| | | | | | | | |
| | | | | 38,001,537 | | | 63,010,600 |
| | | |
| | Home Furnishings (0.57%) | | | | | | |
| 200,000 | | Mohawk Industries, Inc.1 | | | 8,340,379 | | | 8,594,000 |
| | | |
| | Internet Retail (0.68%) | | | | | | |
| 420,000 | | Blue Nile, Inc.1 | | | 11,345,500 | | | 10,285,800 |
| | | |
| | Leisure Facilities (0.89%) | | | | | | |
| 500,000 | | Vail Resorts, Inc.1 | | | 20,556,499 | | | 13,300,000 |
| | | |
| | Specialty Stores (3.61%) | | | | | | |
| 2,500,000 | | Dick’s Sporting Goods, Inc.1 | | | 41,657,536 | | | 35,275,000 |
| 800,000 | | Tiffany & Co. | | | 24,251,581 | | | 18,904,000 |
| | | | | | | | |
| | | | | 65,909,117 | | | 54,179,000 |
| | | | | | | | |
| Total Consumer Discretionary | | | 332,611,299 | | | 307,715,036 |
| | | | | | | | |
| Energy (2.57%) | | | |
| | Oil & Gas Drilling (2.57%) | | | | | | |
| 1,700,000 | | Helmerich & Payne, Inc. | | | 42,694,845 | | | 38,675,000 |
| Financials (21.90%) | | | |
| | Asset Management &
Custody Banks (2.20%) | | | | | | |
| 1,573,208 | | Eaton Vance Corp. | | | 48,606,211 | | | 33,053,100 |
| | | |
| | Investment Banking &
Brokerage (7.13%) | | | | | | |
| 5,750,000 | | Charles Schwab Corp. | | | 67,222,728 | | | 92,977,500 |
| 1,000,000 | | Jefferies Group, Inc. | | | 19,696,154 | | | 14,060,000 |
| | | | | | | | |
| | | | | 86,918,882 | | | 107,037,500 |
| | | |
| | Reinsurance (6.54%) | | | | | | |
| 1,400,000 | | Arch Capital Group, Ltd.1,2 | | | 74,189,869 | | | 98,140,000 |
| | | |
| | Specialized Finance (4.43%) | | | | | | |
| 140,000 | | CME Group, Inc., Cl A | | | 25,721,444 | | | 29,135,400 |
| 2,100,000 | | MSCI, Inc., Cl A1 | | | 57,146,328 | | | 37,296,000 |
| | | | | | | | |
| | | | | 82,867,772 | | | 66,431,400 |
| | | |
| | Thrifts & Mortgage Finance (1.60%) | | | | | | |
| 1,350,000 | | People’s United Financial, Inc. | | | 23,763,239 | | | 24,070,500 |
| | | | | | | | |
| Total Financials | | | 316,345,973 | | | 328,732,500 |
| | | | | | | | |
| Health Care (6.70%) | | | |
| | Health Care Equipment (4.27%) | | | | | | |
| 800,000 | | Edwards Lifesciences Corp.1 | | | 37,835,435 | | | 43,960,000 |
| 500,000 | | Zimmer Holdings, Inc.1 | | | 29,581,661 | | | 20,210,000 |
| | | | | | | | |
| | | | | 67,417,096 | | | 64,170,000 |
| | | | | | | | |
| Shares | | | | Cost | | Value |
| Common Stocks (continued) | | | |
| Health Care (continued) | | | |
| | Health Care Facilities (2.43%) | | | | | | |
| 2,500,000 | | Community Health Systems, Inc.1 | | $ | 73,423,018 | | $ | 36,450,000 |
| | | | | | | | |
| Total Health Care | | | 140,840,114 | | | 100,620,000 |
| | | | | | | | |
| Industrials (24.51%) | | | |
| | | |
| | Air Freight & Logistics (6.33%) | | | | | | |
| 880,000 | | C. H. Robinson Worldwide, Inc. | | | 24,227,605 | | | 48,426,400 |
| 1,400,000 | | Expeditors International of Washington, Inc. | | | 47,170,838 | | | 46,578,000 |
| | | | | | | | |
| | | | | 71,398,443 | | | 95,004,400 |
| | | |
| | Construction & Engineering (1.64%) | | | | | | |
| 800,000 | | AECOM Technology Corp.1 | | | 21,960,965 | | | 24,584,000 |
| | | |
| | Diversified Support Services (6.69%) | | | | | | |
| 2,000,000 | | Iron Mountain, Inc.1 | | | 38,124,121 | | | 49,460,000 |
| 2,379,623 | | Ritchie Bros. Auctioneers, Inc.2 | | | 60,202,920 | | | 50,971,525 |
| | | | | | | | |
| | | | | 98,327,041 | | | 100,431,525 |
| | | |
| | Research & Consulting Services (1.20%) | | | | | | |
| 550,000 | | CoStar Group, Inc.1 | | | 21,612,360 | | | 18,117,000 |
| | | |
| | Trading Companies & Distributors (8.65%) | | | | | | |
| 3,250,000 | | Fastenal Co. | | | 125,030,170 | | | 113,262,500 |
| 450,000 | | MSC Industrial Direct Co., Inc., Cl A | | | 21,927,653 | | | 16,573,500 |
| | | | | | | | |
| | | | | 146,957,823 | | | 129,836,000 |
| | | | | | | | |
| Total Industrials | | | 360,256,632 | | | 367,972,925 |
| | | | | | | | |
| Information Technology (5.60%) | | | |
| | Application Software (5.60%) | | | | | | |
| 1,900,000 | | FactSet Research Systems, Inc. | | | 111,932,486 | | | 84,056,000 |
| Materials (3.98%) | | | |
| | | |
| | Specialty Chemicals (3.98%) | | | | | | |
| 1,700,000 | | Ecolab, Inc. | | | 72,116,111 | | | 59,755,000 |
| Utilities (5.09%) | | | |
| | Electric Utilities (5.09%) | | | | | | |
| 1,750,000 | | ITC Holdings Corp. | | | 60,048,201 | | | 76,440,000 |
| | | | | | | | |
| TOTAL COMMON STOCKS | | | 1,436,845,661 | | | 1,363,966,461 |
| | | | | | | | |
|
| Private Equity Investments (3.96%) | | | |
| Consumer Discretionary (1.50%) | | | |
| | Hotels, Resorts & Cruise
Lines (1.50%) | | | | | | |
| 1,250,000 | | Fontainebleau Resorts, LLC1,3 | | | 15,000,000 | | | 3,125,000 |
| 3,900,000 | | Kerzner Intl. Holdings, Ltd., Cl A1,2,3 | | | 39,000,000 | | | 19,500,000 |
| | | | | | | | |
| Total Consumer Discretionary | | | 54,000,000 | | | 22,625,000 |
| | | | | | | | |
| Financials (2.46%) | | | |
| | Asset Management & Custody Banks (2.46%) | | | | | | |
| 6,014,997 | | Windy City Investments Holdings LLC1,3 | | | 38,319,447 | | | 36,891,537 |
| | | | | | | | |
| TOTAL PRIVATE EQUITY INVESTMENTS | | | 92,319,447 | | | 59,516,537 |
| | | | | | | | |
| | |
| See Notes to Financial Statements. | | 7 |
| | |
| Baron Partners Fund | | December 31, 2008 |
STATEMENT OF NET ASSETS (Continued)
DECEMBER 31, 2008
| | | | | | | | | | |
Principal
Amount | | | | Cost | | Value | |
| | Convertible Bonds (0.14%) | | | | | | | |
| | Consumer Discretionary (0.14%) | | | | |
| | | Advertising (0.14%) | | | | | | | |
| $ | 2,750,000 | | Lamar Advertising Co.,
2.875% due 12/31/2010 | | $ | 2,093,437 | | $ | 2,059,062 | |
| | | | | | | | | | |
| | | | | | |
| | Short Term Investments (5.40%) | | | | |
| | 81,058,513 | | Repurchase Agreement with Fixed Income Clearing Corp., dated 12/31/2008, 0.01% due 01/02/2009; Proceeds at maturity - $81,058,558; (Fully collateralized by U.S. Treasury Note, 3.875% due 02/15/2013; Market value - $85,113,240) | | | 81,058,513 | | | 81,058,513 | |
| | | | | | | | | | |
| | TOTAL INVESTMENTS (100.35%) | | $ | 1,612,317,058 | | | 1,506,600,573 | |
| | | | | | | | | | |
| | LIABILITIES LESS CASH AND OTHER ASSETS (-0.35%) | | | (5,305,764 | ) |
| | | | | | | | | | |
| NET ASSETS (Equivalent to $12.20 per share
based on 123,098,441 shares
outstanding) | | $ | 1,501,294,809 | |
| | | | | | | | | | |
| % | Represents percentage of net assets. |
1 | Non-income producing securities. |
3 | At December 31, 2008, the market value of restricted and fair valued securities amounted to $59,516,537 or 3.96% of Net Assets. None of these securities are deemed liquid. See Note 8. |
4 | Represents securities or a portion thereof, in segregated custodian account. See Note 9. |
| | |
| 8 | | See Notes to Financial Statements. |
| | |
| December 31, 2008 | | Baron Retirement Income Fund |
STATEMENT OF NET ASSETS
DECEMBER 31, 2008
| | | | | | | | |
| Shares | | | | Cost | | Value |
| Common Stocks (79.22%) | | | |
| Consumer Discretionary (13.96%) | | | |
| | Apparel, Accessories & Luxury Goods (2.01%) | | | | | | |
| 50,000 | | Under Armour, Inc., Cl A1 | | $ | 1,682,725 | | $ | 1,192,000 |
| | Casinos & Gaming (2.62%) | | | | | | |
| 36,742 | | Wynn Resorts, Ltd.1 | | | 1,587,723 | | | 1,552,717 |
| | Education Services (2.89%) | | | | | | |
| 8,000 | | Strayer Education, Inc. | | | 1,261,166 | | | 1,715,280 |
| | Internet Retail (2.07%) | | | | | | |
| 50,000 | | Blue Nile, Inc.1 | | | 2,067,076 | | | 1,224,500 |
| | Specialty Stores (4.37%) | | | | | | |
| 100,000 | | Dick’s Sporting Goods, Inc.1 | | | 1,630,006 | | | 1,411,000 |
| 50,000 | | Tiffany & Co. | | | 1,191,006 | | | 1,181,500 |
| | | | | | | | |
| | | | | 2,821,012 | | | 2,592,500 |
| | | | | | | | |
| Total Consumer Discretionary | | | 9,419,702 | | | 8,276,997 |
| | | | | | | | |
| Consumer Staples (3.78%) | | | | | | |
| | Household Products (3.78%) | | | | | | |
| 40,000 | | Church & Dwight Co., Inc. | | | 2,038,763 | | | 2,244,800 |
Energy (1.92%)
| | | | | | |
| | Oil & Gas Drilling (1.92%) | | | | | | |
| 50,000 | | Helmerich & Payne, Inc. | | | 2,034,555 | | | 1,137,500 |
| Financials (22.33%) | | | | | | |
| | Asset Management & Custody Banks (5.27%) | | | | | | |
| 98,041 | | Eaton Vance Corp. | | | 1,642,271 | | | 2,059,842 |
| 30,000 | | T. Rowe Price Group, Inc. | | | 915,801 | | | 1,063,200 |
| | | | | | | | |
| | | | | 2,558,072 | | | 3,123,042 |
| | Investment Banking & Brokerage (5.18%) | | | | | | |
| 190,000 | | Charles Schwab Corp. | | | 2,850,241 | | | 3,072,300 |
| | | |
| | Office REIT’s (2.58%) | | | | | | |
| 6,000 | | Alexander’s, Inc.1^ | | | 2,119,422 | | | 1,529,400 |
| | Reinsurance (4.73%) | | | | | | |
| 40,000 | | Arch Capital Group, Ltd.1,2 | | | 2,098,534 | | | 2,804,000 |
| | Specialized Finance (4.57%) | | | | | | |
| 152,661 | | MSCI, Inc., Cl A1 | | | 4,078,403 | | | 2,711,259 |
| | | | | | | | |
| Total Financials | | | 13,704,672 | | | 13,240,001 |
| | | | | | | | |
| Health Care (5.25%) | | | |
| | Health Care Distributors (2.47%) | | | | | | |
| 40,000 | | Henry Schein, Inc.1 | | | 1,600,049 | | | 1,467,600 |
| | Health Care Equipment (2.78%) | | | | | | |
| 30,000 | | Edwards Lifesciences Corp.1 | | | 1,670,347 | | | 1,648,500 |
| | | | | | | | |
| Total Health Care | | | 3,270,396 | | | 3,116,100 |
| | | | | | | | |
| Industrials (24.20%) | | | |
| | Air Freight & Logistics (7.45%) | | | | | | |
| 50,000 | | C. H. Robinson Worldwide, Inc. | | | 1,841,534 | | | 2,751,500 |
| 50,000 | | Expeditors International of Washington, Inc. | | | 2,188,448 | | | 1,663,500 |
| | | | | | | | |
| | | | | 4,029,982 | | | 4,415,000 |
| | Construction & Engineering (2.07%) | | | | | | |
| 40,000 | | AECOM Technology Corp.1 | | | 1,241,453 | | | 1,229,200 |
| | Diversified Support Services (6.60%) | | | | | | |
| 65,000 | | Iron Mountain, Inc.1 | | | 1,506,590 | | | 1,607,450 |
| 107,644 | | Ritchie Bros. Auctioneers, Inc.2 | | | 2,739,875 | | | 2,305,734 |
| | | | | | | | |
| | | | | 4,246,465 | | | 3,913,184 |
| | | | | | | | | |
| Shares | | | | Cost | | Value |
| | Common Stocks (continued) | | | |
| | Industrials (continued) | | | |
| | | Railroads (5.14%) | | | | | | |
| | 100,000 | | Genesee & Wyoming, Inc., Cl A1 | | $ | 3,101,975 | | $ | 3,050,000 |
| | | |
| | | Trading Companies & Distributors (2.94%) | | | | | | |
| | 50,000 | | Fastenal Co. | | | 2,169,716 | | | 1,742,500 |
| | | | | | | | | |
| | Total Industrials | | | 14,789,591 | | | 14,349,884 |
| | | | | | | | | |
| | Information Technology (2.61%) | | | |
| | | Application Software (2.61%) | | | | | | |
| | 35,000 | | FactSet Research Systems, Inc. | | | 1,982,041 | | | 1,548,400 |
| | Materials (2.96%) | | | |
| | | |
| | | Specialty Chemicals (2.96%) | | | | | | |
| | 50,000 | | Ecolab, Inc. | | | 1,763,210 | | | 1,757,500 |
| | Utilities (2.21%) | | | |
| | | Electric Utilities (2.21%) | | | | | | |
| | 30,000 | | ITC Holdings Corp. | | | 1,552,701 | | | 1,310,400 |
| | | | | | | | | |
| | TOTAL COMMON STOCKS | | | 50,555,631 | | | 46,981,582 |
| | | | | | | | | |
| | |
| Principal Amount | | | | |
| | Convertible Bonds (8.14%) | | | | | | |
| | Consumer Discretionary (8.14%) | | | |
| | | Advertising (2.53%) | | | | | | |
| $ | 2,000,000 | | Lamar Advertising Co.,
2.875% due 12/31/2010 | | | 1,518,390 | | | 1,497,500 |
| | | |
| | | Automotive Retail (2.76%) | | | | | | |
| | 2,900,000 | | Penske Automotive Group, Inc.,
3.50% due 04/01/2026 | | | 1,529,024 | | | 1,634,875 |
| | | |
| | | Broadcasting (2.85%) | | | | | | |
| | 3,700,000 | | Central European Media Enterprises, Ltd., 144A, 3.50% due 03/15/2013 | | | 1,474,313 | | | 1,692,750 |
| | | | | | | | | |
| | TOTAL CONVERTIBLE BONDS | | | 4,521,727 | | | 4,825,125 |
| | | | | | | | | |
| |
| | Short Term Investments (12.56%) | | | | | | |
| | 7,445,505 | | Repurchase Agreement with Fixed Income Clearing Corp., dated 12/31/2008, 0.01% due 01/02/2009; Proceeds at maturity - $7,445,509; (Fully collateralized by U.S. Treasury Note, 3.625% due 05/15/2013; Market value - $7,823,106) | | | 7,445,505 | | | 7,445,505 |
| | | | | | | | | |
| | TOTAL INVESTMENTS (99.92%) | | $ | 62,522,863 | | | 59,252,212 |
| | | | | | | | | |
| CASH AND OTHER ASSETS LESS
LIABILITIES (0.08%) | | | | | | 48,854 |
| | | | | | | | | |
| NET ASSETS (equivalent to $6.27 per share based
on 9,457,532 shares outstanding) | | | | | $ | 59,301,066 |
| | | | | | | | | |
| % | Represents percentage of net assets. |
1 | Non-income producing securities. |
144A | Security is exempt from registration under Rule 144A of the Securities Act of 1933. This security may be resold in transactions that are exempt from registration, normally to qualified institutional buyers. This security has been deemed liquid pursuant to Policies and Procedures approved by the Board of Trustees, unless otherwise noted. At December 31, 2008, the market value of Rule 144A securities amounted to $1,692,750 or 2.85% of Net Assets. |
| ^ | The adviser has reclassified certain securities in or out of this sub-Industry. Such reclassifications are not supported by S & P or MSCI. |
| | |
| See Notes to Financial Statements. | | 9 |
| | |
| Baron Select Funds | | December 31, 2008 |
STATEMENTS OF ASSETS AND LIABILITIES
DECEMBER 31, 2008
| | | | | | | | |
| | | Baron
Partners Fund | | | Baron
Retirement
Income Fund | |
Assets: | | | | | | | | |
Investments in securities, at cost | | $ | 1,612,317,058 | | | $ | 62,522,863 | |
| | | | | | | | |
Investments in securities, at value | | $ | 1,506,600,573 | | | $ | 59,252,212 | |
Cash | | | 34,955 | | | | 7,065 | |
Receivable for shares sold | | | 3,969,617 | | | | 48,166 | |
Dividends and interest receivable | | | 638,801 | | | | 89,767 | |
Prepaid expenses | | | 5,221 | | | | — | |
Due from investment adviser | | | — | | | | 1,408 | |
| | | | | | | | |
| | | 1,511,249,167 | | | | 59,398,618 | |
| | | | | | | | |
Liabilities: | | | | | | | | |
Payable for shares redeemed | | | 7,387,855 | | | | 6,892 | |
Payable for securities purchased | | | 2,094,536 | | | | — | |
Distribution fees payable (Note 4) | | | 899 | | | | 561 | |
Investment advisory fees payable (Note 4) | | | 277 | | | | — | |
Accrued expenses and other payables | | | 470,791 | | | | 90,099 | |
| | | | | | | | |
| | | 9,954,358 | | | | 97,552 | |
| | | | | | | | |
Net Assets | | $ | 1,501,294,809 | | | $ | 59,301,066 | |
| | | | | | | | |
Net Assets consist of: | | | | | | | | |
Paid-in capital | | $ | 2,257,321,975 | | | $ | 82,093,942 | |
Accumulated net realized loss on investments, short sells and foreign currency transactions | | | (650,310,681 | ) | | | (19,522,225 | ) |
Net unrealized depreciation on investments | | | (105,716,485 | ) | | | (3,270,651 | ) |
| | | | | | | | |
Net Assets | | $ | 1,501,294,809 | | | $ | 59,301,066 | |
| | | | | | | | |
Shares Outstanding ($.01 par value; indefinite shares authorized) | | | 123,098,441 | | | | 9,457,532 | |
| | | | | | | | |
Net Asset Value Per Share | | $ | 12.20 | | | $ | 6.27 | |
| | | | | | | | |
| | |
| 10 | | See Notes to Financial Statements. |
| | |
| December 31, 2008 | | Baron Select Funds |
STATEMENTS OF OPERATIONS
FOR THE YEAR ENDED DECEMBER 31, 2008
| | | | | | | | |
| | |
| | | Baron
Partners Fund | | | Baron
Retirement
Income Fund1 | |
Investment income: | | | | | | | | |
Income: | | | | | | | | |
Interest | | $ | 216,886 | | | $ | 110,382 | |
Dividends | | | 33,476,501 | | | | 371,694 | |
Securities lending income | | | 1,120,056 | | | | — | |
Taxes withheld on dividends | | | (327,436 | ) | | | (4,013 | ) |
| | | | | | | | |
Total income | | | 34,486,007 | | | | 478,063 | |
| | | | | | | | |
Expenses: | | | | | | | | |
Investment advisory fees (Note 4) | | | 25,184,799 | | | | 350,244 | |
Distribution fees (Note 4) | | | 6,296,200 | | | | 87,561 | |
Reports to shareholders | | | 1,233,000 | | | | 17,320 | |
Shareholder servicing agent fees and expenses | | | 516,248 | | | | 13,812 | |
Line of credit fees | | | 301,281 | | | | — | |
Custodian fees | | | 157,873 | | | | 9,740 | |
Professional fees | | | 137,400 | | | | 15,668 | |
Trustee fees and expenses | | | 118,537 | | | | 2,105 | |
Registration and filing fees | | | 87,630 | | | | 22,235 | |
Administration fees | | | 26,675 | | | | 18,880 | |
Insurance expense | | | 44,319 | | | | 820 | |
Miscellaneous expenses | | | 2,311 | | | | — | |
| | | | | | | | |
Total operating expenses | | | 34,106,273 | | | | 538,385 | |
Interest expense | | | 12,617,978 | | | | — | |
| | | | | | | | |
Total expenses | | | 46,724,251 | | | | 538,385 | |
Expense reimbursements from Adviser (Note 4) | | | — | | | | (65,514 | ) |
Expense offsets (Note 2) | | | (16,711 | ) | | | (42 | ) |
| | | | | | | | |
Net expenses | | | 46,707,540 | | | | 472,829 | |
| | | | | | | | |
Net investment income (loss) | | | (12,221,533 | ) | | | 5,234 | |
| | | | | | | | |
Realized and unrealized gain (loss) on investments: | | | | | | | | |
Net realized gain (loss) on: | | | | | | | | |
Investments | | | (651,103,351 | ) | | | (19,522,225 | ) |
Taxes and interest paid on net built-in gain ($1,409,109) and reimbursed by Adviser ($1,409,109)
for Baron Partners Fund (Note 11) | | | — | | | | — | |
Short sells | | | (499,235 | ) | | | — | |
Foreign currency transactions | | | 88,918 | | | | — | |
Net change in unrealized appreciation (depreciation) of investments | | | (790,500,304 | ) | | | (9,565,818 | ) |
| | | | | | | | |
Net loss on investments | | | (1,442,013,972 | ) | | | (29,088,043 | ) |
| | | | | | | | |
Net decrease in net assets resulting from operations | | $ | (1,454,235,505 | ) | | $ | (29,082,809 | ) |
| | | | | | | | |
1 | For the period July 1, 2008 (Commencement of Operations) to December 31, 2008. |
| | |
| See Notes to Financial Statements. | | 11 |
| | |
| Baron Select Funds | | December 31, 2008 |
STATEMENTS OF CHANGES IN NET ASSETS
| | | | | | | | | | | | |
| | | Baron Partners Fund | | | Baron
Retirement
Income Fund | |
| | | For the Year Ended
December 31, 2008 | | | For the Year Ended
December 31, 2007 | | | For the Period
Ended
December 31, 20081 | |
Increase (Decrease) in Net Assets: | | | | | | | | | | | | |
Operations: | | | | | | | | | | | | |
Net investment income (loss) | | $ | (12,221,533 | ) | | $ | (27,199,784 | ) | | $ | 5,234 | |
Net realized gain (loss) | | | (651,513,668 | ) | | | 267,613,933 | | | | (19,522,225 | ) |
Net change in unrealized appreciation (depreciation) | | | (790,500,304 | ) | | | 54,609,395 | | | | (9,565,818 | ) |
| | | | | | | | | | | | |
Increase (decrease) in net assets resulting from operations | | | (1,454,235,505 | ) | | | 295,023,544 | | | | (29,082,809 | ) |
| | | | | | | | | | | | |
Distributions to shareholders from: | | | | | | | | | | | | |
Net realized gain on investments | | | (92,544,363 | ) | | | (151,406,674 | ) | | | — | |
Return of capital | | | — | | | | — | | | | (3,551,393 | ) |
| | | | | | | | | | | | |
Decrease in net assets from distributions to shareholders | | | (92,544,363 | ) | | | (151,406,674 | ) | | | (3,551,393 | ) |
| | | | | | | | | | | | |
Capital share transactions: | | | | | | | | | | | | |
Proceeds from the sale of shares | | | 707,757,623 | | | | 1,522,908,883 | | | | 18,886,522 | |
Proceeds from shares issued in reorganization of Baron Investment Partners, L.P. | | | — | | | | — | | | | 72,421,528 | |
Net asset value of shares issued in reinvestment of dividends | | | 85,684,169 | | | | 143,306,344 | | | | 3,432,665 | |
Cost of shares redeemed | | | (1,129,440,844 | ) | | | (828,827,683 | ) | | | (2,805,447 | ) |
| | | | | | | | | | | | |
Increase (decrease) in net assets derived from capital share transactions | | | (335,999,052 | ) | | | 837,387,544 | | | | 91,935,268 | |
| | | | | | | | | | | | |
Increase (decrease) in net assets | | | (1,882,778,920 | ) | | | 981,004,414 | | | | 59,301,066 | |
| | | | | | | | | | | | |
Net Assets: | | | | | | | | | | | | |
Beginning of year | | | 3,384,073,729 | | | | 2,403,069,315 | | | | — | |
| | | | | | | | | | | | |
End of year | | $ | 1,501,294,809 | | | $ | 3,384,073,729 | | | $ | 59,301,066 | |
| | | | | | | | | | | | |
Accumulated net investment loss at end of year | | $ | — | | | $ | (31,686 | ) | | $ | — | |
| | | | | | | | | | | | |
Shares: | | | | | | | | | | | | |
Shares sold | | | 39,242,334 | | | | 63,184,444 | | | | 2,022,741 | |
Shares issued in reorganization of Baron Investment Partners, L.P. | | | — | | | | — | | | | 7,242,153 | |
Shares issued in reinvestment of dividends | | | 4,562,518 | | | | 6,019,349 | | | | 574,024 | |
Shares redeemed | | | (63,143,108 | ) | | | (34,316,511 | ) | | | (381,386 | ) |
| | | | | | | | | | | | |
Net increase (decrease) | | | (19,338,256 | ) | | | 34,887,282 | | | | 9,457,532 | |
| | | | | | | | | | | | |
1 | For the period July 1, 2008 (Commencement of Operations) to December 31, 2008. |
STATEMENT OF CASH FLOWS
| | | | |
FOR THE YEAR ENDED DECEMBER 31, 2008 | | | | |
| |
| | | Baron Partners Fund | |
Cash Provided (Used) by Financing Activities: | | | | |
Sales of capital shares | | $ | 713,778,012 | |
Cash distributions paid | | | (6,860,194 | ) |
Repurchase of capital shares | | | (1,126,563,725 | ) |
| | | | |
Cash used by capital share transactions | | | (419,645,907 | ) |
Decrease in payable for borrowings against line of credit | | | (524,000,000 | ) |
| | | | |
| | | (943,645,907 | ) |
| | | | |
Cash Provided (Used) by Operations: | | | | |
Purchases of portfolio securities | | | (1,266,125,872 | ) |
Proceeds from sales of portfolio securities | | | 2,219,471,410 | |
| | | | |
| | | 953,345,538 | |
Net investment loss | | | (12,221,533 | ) |
Net change in receivables/payables related to operations | | | 2,556,700 | |
| | | | |
| | | 943,680,705 | |
| | | | |
Net increase in cash and cash equivalents | | | 34,798 | |
Cash beginning of year | | | 157 | |
| | | | |
Cash end of year | | $ | 34,955 | |
| | | | |
Supplemental cash flow information: | | | | |
Interest paid | | $ | 13,774,034 | |
| | | | |
Non-cash financing activities: | | | | |
Net asset value of shares issued in reinvestment of dividends | | $ | 85,684,169 | |
| | | | |
| | |
| 12 | | See Notes to Financial Statements. |
| | |
| December 31, 2008 | | Baron Select Funds |
NOTES TO FINANCIAL STATEMENTS
1. ORGANIZATION.
Baron Select Funds (the “Trust”) is registered under the Investment Company Act of 1940, as amended (the “1940 Act”), as an open-end management investment company established as a Delaware statutory trust on April 30, 2003. The Trust currently offers three series (individually a “Fund” and collectively the “Funds”): Baron Partners Fund and Baron Retirement Income Fund, which are non-diversified and Baron International Growth Fund, which is diversified. Baron International Growth Fund commenced operations on January 1, 2009 and, therefore, is not included in this report. The Funds’ investment objective is to seek capital appreciation. Baron Partners Fund may employ “leverage” by borrowing money and using it for the purchase of additional securities. Borrowing for investment increases both investment opportunity and investment risk. Baron Retirement Income Fund also intends to make annual distributions equal to a minimum 4% of the Fund’s net assets per share measured as of December 31 of the preceding year. Baron International Growth Fund expects to invest its assets primarily in non-U.S. companies.
Baron Partners Fund was organized originally as a limited partnership in January 1992, under the laws of the State of Delaware. Effective as of the close of business on April 30, 2003, the predecessor partnership was reorganized into a Delaware statutory trust. Baron Partners Fund commenced operations on May 1, 2003 with a contribution of assets and liabilities, including securities-in-kind from the predecessor partnership.
Baron Retirement Income Fund was organized originally as a limited partnership in May 1996, under the laws of the State of Delaware. Effective as of the close of business on June 30, 2008, the predecessor partnership was reorganized into a series of the Trust. Baron Retirement Income Fund commenced operations on July 1, 2008 with a contribution of assets and liabilities, including securities-in-kind from the predecessor partnership. At the time of the exchange, the predecessor partnership had net assets of $72,421,528 including net unrealized appreciation of $6,295,167.
2. SIGNIFICANT ACCOUNTING POLICIES.
The following is a summary of significant accounting policies followed by the Funds. The policies are in conformity with accounting principles generally accepted in the United States of America.
a) Security Valuation. Portfolio securities traded on any national stock exchange are valued based on the last sale price. For securities traded on NASDAQ, the Funds use the NASDAQ Official Closing Price. Securities traded in foreign markets are valued based on the last sale price reported by local foreign markets and translated into U.S. dollars using the price of such currencies at the time the net asset value is determined. Where market quotations are not readily available, or if in the Adviser’s judgment, they do not accurately reflect fair value of a security, or an event occurs after the market close but before the Funds are priced that materially affects the value of a security, the securities will be valued by the Adviser using policies and procedures approved by the Board. The Adviser has a Fair Valuation Committee comprised of senior executives and the committee reports to the Board every quarter. Factors the Committee considers when valuing a security include whether a current price is stale, there is recent news, the security is thinly traded, transactions are infrequent and quotations are genuine. There can be no guarantee, however, that a fair valuation used by the Funds on any given day will more accurately reflect the market value of an investment than the closing price of such investment in its market. Debt instruments having a remaining maturity greater than sixty days will be valued at the highest bid price from the dealer maintaining an active market in that security or on the basis of prices obtained from a pricing service approved by the Board of Trustees. Money market instruments held by the Funds with a remaining maturity of sixty days or less are valued at amortized cost, which approximates value.
b) Foreign Currency Translations. Values of investments denominated in foreign currencies are translated into U.S. dollars using the price of such currencies at the time net asset value is determined. Purchases and sales of investments and dividend income are converted at the prevailing rate of exchange on the respective dates of such transactions. Net realized gain (loss) on foreign currency transactions include gain (loss) arising from the fluctuation in the exchange rates between trade and settlement dates on security transactions and currency gain (loss) between the accrual and payment dates on dividends and foreign withholding taxes. The Funds do not isolate that portion of the results of operations resulting from changes in foreign exchange rates on investments from the fluctuations arising from changes in market prices of securities held. Such fluctuations are included with the net realized and unrealized gain or loss from investments.
c) Securities Transactions, Investment Income, Expense Allocation and Expense Offsets. Securities transactions are recorded on a trade date basis. Realized gain and loss from securities transactions are recorded on an identified cost basis for financial reporting and federal income tax purposes. Dividend income/expense is recognized on the ex-dividend date and interest income is recognized on an accrual basis which includes the accretion of discounts and amortization of premiums. Distributions received from certain investments held by the Funds may be comprised of dividends, realized gains and return of capital. The Funds originally estimate the expected classification of such payments. The amounts may subsequently be reclassified upon receipt of information from the issuer. The Funds are charged for those expenses that are directly attributable to each Fund, such as advisory and custodian fees. Expenses that are not directly attributable to a Fund are typically allocated among the Funds in proportion to their respective net assets. The Funds’ expenses were reduced by expense offsets from an unaffiliated transfer agent. The Funds earned cash management credits which were used to reduce shareholder servicing agent fees and expenses. These offsets are included in the Statements of Operations.
13
| | |
| Baron Select Funds | | December 31, 2008 |
2. SIGNIFICANT ACCOUNTING POLICIES. (Continued)
d) Securities Lending. The Funds may loan securities to certain brokers. Upon such loans, the Funds receive collateral which is maintained by the custodian. The Funds earn interest on such collateral and earn income in the form of negotiated lenders’ fees, both of which are included in securities lending income in the Statements of Operations. Securities loaned are required to be secured at all times by collateral equal to at least 102% of the market value of the securities loaned. Risks may arise upon entering into securities lending to the extent that the value of the collateral is less than the value of the securities loaned due to the changes in the value of collateral or the loaned securities. The Funds may receive collateral in the form of cash or other eligible securities, such as a letter of credit issued by a U.S. bank or securities issued or guaranteed by the U.S. government. Securities purchased with cash collateral are subject to the risks inherent in investing in these securities.
At December 31, 2008, the Funds did not have any securities on loan. For the year ended December 31, 2008, Baron Partners Fund had securities lending income of $1,120,056 which is included in the Statements of Operations.
e) Repurchase Agreements. The Funds may invest in repurchase agreements, which are short-term investments whereby the Funds acquire ownership of a debt security and the seller agrees to repurchase the security at a future date at a specified price. When entering into repurchase agreements, it is the Funds’ policy that their custodian or a third party custodian take possession of the underlying collateral securities, the market value of which, at all times, equals at least 105% of the principal amount of the repurchase transaction. To the extent that any repurchase transaction exceeds one business day, the value of the collateral is marked-to-market to ensure the adequacy of the collateral. If the seller defaults and the market value of the collateral declines or if bankruptcy proceedings are commenced with respect to the seller of the security, realization of the collateral by the Fund may be delayed or limited.
f) Federal Income Taxes. Each Fund of the Trust is treated as a separate entity for federal income tax purposes. It is the policy of each Fund to continue to qualify as a regulated investment company under Subchapter M of the Internal Revenue Code and to distribute all of its taxable income, including net realized capital gains, if any, to its shareholders. Therefore, no federal income tax provision is required.
g) Restricted Securities. The Funds may invest in securities which are restricted as to public sale in accordance with the Securities Act of 1933. Such assets are valued by the Adviser using procedures approved by the Board of Trustees.
h) Distributions. Income and capital gain distributions are determined in accordance with income tax regulations which may differ from generally accepted accounting principles. These differences are primarily due to differing treatments for net investment loss, foreign currency gains and losses, partnership basis adjustments and wash sale losses deferred.
i) Use of Estimates. The preparation of financial statements in accordance with accounting principles generally accepted in the United States of America requires management to make estimates and assumptions that affect the reported amounts of assets and liabilities at the date of the financial statements and the amounts of income and expenses during the period. Actual results could differ from those estimates.
j) Commitments and Contingencies. In the normal course of business, the Funds may enter into contracts and agreements that contain a variety of representations and warranties, which provide general indemnification. The maximum exposure to the Funds under these agreements is unknown, as this would involve future claims that may be made against the Funds that have not yet occurred. However, based on experience, the Funds expect the risk of loss to be remote.
k) Cash and Cash Equivalents. The Funds consider all short term liquid investments with a maturity of three months or less when purchased to be cash equivalents.
l) New Accounting Pronouncements. In March 2008, Financial Accounting Standards Board (“FASB”) issued Statement of Financial Accounting Standards No. 161, “Disclosures about Derivative Instruments and Hedging Activities” (“SFAS 161”). SFAS 161 is effective for fiscal years and interim periods beginning after November 15, 2008. SFAS 161 requires enhanced disclosures about the Funds’ derivative and hedging activities. Management is currently evaluating the impact the adoption of SFAS 161 will have on the Funds’ financial statement disclosures.
In September 2008, FASB issued a FASB Staff Position No. 133-1 and FIN 45-4 “Disclosures about Credit Derivatives and Certain Guarantees: An Amendment of FASB Statement No. 133 and FASB Interpretation No. 45; and Clarification of the Effective Date of FASB Statement No. 161” (“FSP”). FSP requires enhanced transparency of the effect of credit derivatives and guarantees on an issuer’s financial position, financial performance and cash flows. FSP is effective for fiscal years ending after November 15, 2008. This FSP applies to certain credit derivatives, hybrid instruments that have embedded credit derivatives (for example, credit-linked notes), and certain guarantees and it requires additional disclosures regarding credit derivatives with sold protection. Management has evaluated the adoption of FSP No. 133-1 and determined that there is no impact on the Funds’ financial statements.
14
| | |
| December 31, 2008 | | Baron Select Funds |
3. PURCHASES AND SALES OF SECURITIES.
Purchases and sales of securities, other than short term securities, for the year ended December 31, 2008 were as follows:
| | | | | | |
Fund | | Purchases | | Sales |
Baron Partners Fund | | $ | 1,105,382,911 | | $ | 2,170,545,051 |
Baron Retirement Income Fund* | | | 31,608,924 | | | 23,433,772 |
| * | For the period July 1, 2008 (Commencement of Operations) to December 31, 2008. |
4. INVESTMENT ADVISORY FEES AND OTHER TRANSACTIONS WITH AFFILIATES.
a) Investment Advisory Fees. BAMCO, Inc. (the “Adviser”), a wholly owned subsidiary of Baron Capital Group, Inc. (“BCG”), serves as investment adviser to the Funds. As compensation for services rendered, the Adviser receives a fee payable monthly equal to 1% per annum of the Funds’ average daily net assets of the respective Funds. For Baron Partners Fund and Baron Retirement Income Fund, the Adviser has contractually agreed to reduce its fee to the extent required to limit the expense ratio (excluding portfolio transaction costs, interest and extraordinary expenses) to 1.45% and 1.35% of average daily net assets, respectively.
b) Distribution Fees. Baron Capital, Inc. (“BCI”), a wholly owned subsidiary of BCG, is a registered broker-dealer and the distributor of the shares of the Funds pursuant to a distribution plan under Rule 12b-1 of the 1940 Act. The distribution plan authorizes the Funds to pay BCI a distribution fee payable monthly equal to 0.25% per annum of the Funds’ average daily net assets of the respective Funds.
c) Trustee Fees. Certain Trustees of the Trust may be deemed to be affiliated with, or interested persons (as defined by the 1940 Act) of the Funds’ Adviser or of BCI. None of the Trustees so affiliated received compensation for his or her services as a Trustee of the Trust. None of the Funds’ officers received compensation from the Funds in that capacity.
d) Fund Accounting and Administration Fees. The Funds have entered into an agreement with the custodian bank to perform accounting and certain administrative services. The custodian bank is compensated for fund accounting based on a percentage of the Funds’ net assets, subject to certain minimums plus fixed annual fees for the administrative services.
5. LINE OF CREDIT.
Baron Partners Fund participates in a committed line of credit provided by a syndicate of banks (including the custodian bank) in the amount of $450 million. A commitment fee of 0.20% per annum is incurred on the unused portion of the line of credit. In addition, Baron Partners Fund has an uncommitted line of credit of $100 million with the custodian bank. Both lines of credit are to be used for investment purposes. Baron Partners Fund may borrow up to the lesser of $550 million or the maximum amount Baron Partners Fund may borrow under the 1940 Act, the limitations included in Baron Partners Fund’s prospectus, or any limit or restriction under any law or regulation to which Baron Partners Fund is subject or any agreement to which Baron Partners Fund is a party. Interest is charged to Baron Partners Fund, based on its borrowings. For the year ended December 31, 2008, interest expense incurred on these loans amounted to $12,617,978.
During the year ended December 31, 2008, Baron Partners Fund had an average daily balance on the line of credit of $371.6 million at a weighted average interest rate of 3.40%. At December 31, 2008, Baron Partners Fund did not have an outstanding loan under the line of credit.
6. SWAP CONTRACTS.
The Funds may enter into equity swap transactions as a substitute for investing or selling short directly in securities. A swap transaction is entered into with a counterparty to exchange the returns on a particular security or a basket of securities. The gross returns to be exchanged or “swapped” between the parties are calculated with respect to a “notional amount.” The counterparty will generally agree to pay the Funds the amount, if any, by which the notional amount of the swap contract would have increased had it been invested or decreased if sold short in the particular stocks. Upon entering into the swap contract, the Funds are required to pledge to the broker an amount of cash and/or other assets equal to a certain percentage of the contract amount. During the period the swap contract is open, the Funds mark to market the underlying instruments, including accrued dividends and recognize any unrealized gain or loss. Net payments made or received periodically are recognized as realized gain or loss. Swap contracts may involve exposure to loss in excess of the amount recognized in the Statement of Assets and Liabilities. The notional amount reflects the exposure the Funds have in the underlying securities. These transactions are subject to credit risks in addition to the various risks related to the underlying securities. During the year ended December 31, 2008, the Funds did not enter into any swap contracts.
15
| | |
| Baron Select Funds | | December 31, 2008 |
7. SHORT SALES.
The Funds may sell securities short. When the Funds sell short, the Funds record a liability for securities sold short and record an asset equal to the proceeds received. The amount of the liability is subsequently marked to market to reflect the market value of the securities sold short. The Funds may incur dividend expense if a security that has been sold short declares a dividend. The Funds are exposed to market risk based on the amount, if any, that the market value of the securities sold short exceeds the proceeds received. The Funds are required to maintain collateral in a segregated account for the outstanding short sales. Short sales involve elements of market risks and exposure to loss in excess of the amount recognized in the Statements of Assets and Liabilities. The Funds’ risk of loss in these types of short sales is unlimited because there is no limit to the cost of replacing the borrowed security. As of December 31, 2008, the Funds had no open short sales.
8. RESTRICTED SECURITIES.
At December 31, 2008, investments in securities included securities that are restricted and illiquid. Restricted securities are often purchased in private placement transactions, are not registered under the Securities Act of 1933, may have contractual restrictions on resale and are valued pursuant to policies and procedures for fair value pricing approved by the Board of Trustees. A security may be considered illiquid if it lacks a readily available market or if its valuation has not changed for a certain period of time. The Funds may receive more or less than this valuation in an actual sale and that difference could be material. At December 31, 2008, the Funds held investments in restricted and illiquid securities that were valued pursuant to policies and procedures for fair value pricing as follows:
| | | | | |
| | | Baron Partners Fund |
| Name of Issuer | | Acquisition Date | | Value |
Private Equity Investments | | | | | |
Fontainebleau Resorts, LLC | | 06/01/07 | | $ | 3,125,000 |
Kerzner Intl. Holdings, Ltd., Cl A (see Note 9) | | 09/27/06 | | | 19,500,000 |
Windy City Investments Holdings LLC | | 11/30/07 | | | 36,891,537 |
| | | | | |
Total Restricted Securities
(Cost $92,319,447) (3.96% of Net Assets) | | | | $ | 59,516,537 |
| | | | | |
9. COMMITMENTS AND CONTINGENCIES.
On September 27, 2006, Baron Partners Fund, in connection with its investment in Kerzner Intl. Holdings Ltd. (“Kerzner”), agreed to guarantee (“Windstorm Guarantee”) its proportionate share (based on Baron Partners Fund’s ownership interests in Kerzner), of certain obligations relating to amounts that may become payable due to wind or storm damage at Kerzner’s Bahamian properties to the lenders that financed the Kerzner acquisition. The maximum amount of potential future payments would be $3,334,656. The Windstorm Guarantee will expire June 2009. Accordingly, Baron Partners Fund has segregated securities valued in excess of the guarantee amount to meet these contingencies.
10. FAIR VALUE MEASUREMENTS.
Effective January 1, 2008, the Funds adopted FASB Statement of Financial Accounting Standards No. 157, Fair Value Measurements (“FAS 157”). In accordance with FAS 157, fair value is defined as the price that the Funds would receive upon selling an investment in a timely transaction to an independent buyer in the principal or most advantageous market of the investment. FAS 157 established a three-tier hierarchy to maximize the use of observable market data and minimize the use of unobservable inputs and to establish classification of fair value measurements for disclosure purposes. Inputs refer broadly to the assumptions that market participants would use in pricing the asset or liability. Inputs may be observable or unobservable. Observable inputs are based on market data obtained from sources independent of the Funds. Unobservable inputs are inputs that reflect the Funds’ own assumptions based on the best information available in the circumstances. The three-tier hierarchy of inputs is summarized in the three broad Levels listed below.
| | • | | Level 1 — quoted prices in active markets for identical investments |
| | • | | Level 2 — other significant observable inputs (including quoted prices for similar investments, interest rates, prepayment speeds, credit risk, etc.) |
| | • | | Level 3 — significant unobservable inputs (including the Funds’ own assumptions in determining the fair value of investments) |
The inputs or methodology used for valuing securities are not necessarily an indication of the risk associated with investing in those securities. For example, money market securities are valued using amortized cost, in accordance with rules under the Investment Company Act of 1940. Generally, amortized cost approximates the current fair value of a security, but since the value is not obtained from a quoted price in an active market, such securities are reflected as Level 2.
16
| | |
| December 31, 2008 | | Baron Select Funds |
10. FAIR VALUE MEASUREMENTS. (Continued)
The following is a summary of the inputs used as of December 31, 2008 in valuing the Funds’ investments carried at fair value:
| | | | | | |
| | | Baron Partners
Fund | | Baron Retirement
Income Fund |
| Valuation Inputs | | Investments in
Securities | | Investments in
Securities |
Level 1 — Quoted Prices | | $ | 1,363,966,461 | | $ | 46,981,582 |
Level 2 — Other Significant Observable Inputs | | | 83,117,575 | | | 12,270,630 |
Level 3 — Significant Unobservable Inputs | | | 59,516,537 | | | — |
| | | | | | |
Total | | $ | 1,506,600,573 | | $ | 59,252,212 |
| | | | | | |
Following is a reconciliation of investments in which significant unobservable inputs (Level 3) were used in determining fair value:
| | | | |
| | | Baron
Partners
Fund | |
| | | Investments
in Securities | |
Balance as of 12/31/07 | | $ | 125,849,965 | |
Accrued discounts/premiums | | | — | |
Realized gain (loss) and change in unrealized appreciation (depreciation) | | | (66,333,428 | ) |
Net purchases (sales) | | | — | |
Net transfers in and (or out)
of Level 3 | | | — | |
| | | | |
Balance as of 12/31/08 | | $ | 59,516,537 | |
| | | | |
Net change in unrealized appreciation (depreciation) from investments
still held as of 12/31/08 | | $ | (66,333,428 | ) |
| | | | |
11. INCOME TAXES AND DISTRIBUTIONS TO SHAREHOLDERS.
Federal income tax regulations differ from generally accepted accounting principles. Therefore, distributions determined in accordance with tax regulations may differ in amount or character from net investment income and net realized gain for financial reporting purposes. Net investment loss and net realized and unrealized gain (loss) differ for financial statement and tax purposes due to differing treatments of wash sale losses deferred, foreign currency gains and losses, partnership basis adjustments and net investment loss. Financial reporting records are adjusted for permanent book/tax differences to reflect tax character. Financial records are not adjusted for temporary differences.
For the year ended December 31, 2008, the Funds recorded the following permanent reclassifications to reflect tax character. Reclassifications between income, gains and paid-in capital relate primarily to the tax treatment of net investment loss, foreign currency gains and losses, partnership basis adjustments, reclassification of distributions and nondeductible expenses. Results of operations and net assets were not affected by these reclassifications.
| | | | | | | | |
| | | Baron Partners
Fund | | | Baron
Retirement
Income Fund | |
Accumulated net investment income (loss) | | $ | 12,253,219 | | | $ | (5,234 | ) |
Accumulated realized loss | | | 1,269,066 | | | | — | |
Paid-in capital | | | (13,522,285 | ) | | | 5,234 | |
17
| | |
| Baron Select Funds | | December 31, 2008 |
11. INCOME TAXES AND DISTRIBUTIONS TO SHAREHOLDERS. (Continued)
As of December 31, 2008, the components of net assets on a tax basis were as follows:
| | | | | | | | |
| | | Baron Partners
Fund | | | Baron
Retirement
Income Fund | |
Cost of investments | | $ | 1,632,089,149 | | | $ | 62,707,754 | |
| | | | | | | | |
Gross tax unrealized appreciation | | $ | 163,595,114 | | | $ | 9,654,318 | |
Gross tax unrealized depreciation | | | (289,083,690 | ) | | | (13,109,860 | ) |
| | | | | | | | |
Net tax unrealized depreciation | | | (125,488,576 | ) | | | (3,455,542 | ) |
Post October loss deferral | | | (244,994,386 | ) | | | (12,827,867 | ) |
Capital loss carryforwards | | | (385,544,204 | ) | | | (6,509,467 | ) |
Paid-in capital | | | 2,257,321,975 | | | | 82,093,942 | |
| | | | | | | | |
Net Assets | | $ | 1,501,294,809 | | | $ | 59,301,066 | |
| | | | | | | | |
As of December 31, 2008, the Funds had capital loss carryforwards expiring as follows:
| | | | | | | | |
| | | Baron
Partners Fund | | | Baron
Retirement
Income Fund | |
December 31, 2016 | | ($ | 385,544,204 | ) | | ($ | 6,509,467 | ) |
The tax character of distributions paid during the fiscal years ended December 31, 2008 and 2007 were as follows:
| | | | | | | | | | | | | | | |
| | | Year Ended
December 31, 2008 | | Year Ended
December 31, 2007 |
| Fund | | Ordinary1 | | Long Term Capital Gain | | Return of
Capital | | Ordinary1 | | Long Term Capital Gain |
Baron Partners Fund | | $ | 21,725,651 | | $ | 70,818,712 | | $ | — | | $ | 64,674,805 | | $ | 86,731,869 |
Baron Retirement Income Fund | | | 54,852 | | | — | | | 3,496,541 | | | — | | | — |
1 | For tax purposes, short-term capital gains are considered ordinary income distributions. |
In July 2006, FASB issued FASB Interpretation No. 48, “Accounting for Uncertainty in Income Taxes” (“FIN 48”), which clarifies the accounting for uncertainty in tax positions taken or expected to be taken on a tax return. FIN 48 sets forth a threshold for financial statement recognition, measurement and disclosure of tax positions taken or expected to be taken on a tax return. FIN 48 is effective for fiscal years beginning after December 15, 2006, and applies to all open tax years as of the date of effectiveness. Management has evaluated the adoption of FIN 48 and determined that there is no impact on the Funds’ financial statements.
Baron Partners Fund is required to pay U.S. federal income tax (currently, at a maximum rate of 35%) on its “net built-in gain” attributable to certain assets of Baron Capital Partners, L.P. (the predecessor partnership of Baron Partners Fund), to the extent that any such net built-in gain is realized during the ten-year period beginning on the date of the conversion of the predecessor partnership into the Fund. The Adviser has agreed that it, or one of its affiliates, will reimburse the Fund for any taxes, and for any other related payments, that the Fund pays in respect of any net built-in gain attributable to these assets. The Fund has amended its tax returns for open tax years and has accrued taxes and interest on net built-in gain and the reimbursement of these taxes and interest by the Adviser as shown in the Statement of Operations. The Fund holds three securities at December 31, 2008 with a market value of $38,021,250 which may be subject to the tax on net built-in gain and reimbursement by the Adviser. The net built-in gain on these securities unrealized as of December 31, 2008 was $5,663,745.
18
| | |
| December 31, 2008 | | Baron Select Funds |
FINANCIAL HIGHLIGHTS
BARON PARTNERS FUND
Selected data for a share outstanding throughout each year:
| | | | | | | | | | | | | | | | | | | | | | | | |
| | | Year Ended December 31, | |
| | | 2008 | | | 2007 | | | 2006 | | | 2005 | | | 2004 | | | 20031 | |
| | | | | | |
Net asset value, beginning of year | | $ | 23.76 | | | $ | 22.34 | | | $ | 18.43 | | | $ | 16.85 | | | $ | 12.17 | | | $ | 10.00 | |
| | | | | | | | | | | | | | | | | | | | | | | | |
| | | | | | |
Income from investment operations: | | | | | | | | | | | | | | | | | | | | | | | | |
Net investment loss | | | (0.09 | )2 | | | (0.21 | )2 | | | (0.16 | )2 | | | (0.13 | ) | | | (0.06 | ) | | | (0.10 | ) |
Net realized and unrealized gain (loss) on investments | | | (10.74 | ) | | | 2.74 | | | | 4.13 | | | | 2.49 | | | | 5.17 | | | | 3.63 | |
| | | | | | | | | | | | | | | | | | | | | | | | |
Total from investment operations | | | (10.83 | ) | | | 2.53 | | | | 3.97 | | | | 2.36 | | | | 5.11 | | | | 3.53 | |
| | | | | | | | | | | | | | | | | | | | | | | | |
| | | | | | |
Less distributions to shareholders from: | | | | | | | | | | | | | | | | | | | | | | | | |
Net investment income | | | 0.00 | | | | 0.00 | | | | 0.00 | | | | 0.00 | | | | 0.00 | | | | 0.00 | |
Net realized gain on investments | | | (0.73 | ) | | | (1.11 | ) | | | (0.06 | ) | | | (0.78 | ) | | | (0.43 | ) | | | (1.36 | ) |
| | | | | | | | | | | | | | | | | | | | | | | | |
Total distributions | | | (0.73 | ) | | | (1.11 | ) | | | (0.06 | ) | | | (0.78 | ) | | | (0.43 | ) | | | (1.36 | ) |
| | | | | | | | | | | | | | | | | | | | | | | | |
| | | | | | |
Net asset value, end of year | | $ | 12.20 | | | $ | 23.76 | | | $ | 22.34 | | | $ | 18.43 | | | $ | 16.85 | | | $ | 12.17 | |
| | | | | | | | | | | | | | | | | | | | | | | | |
Total return | | | (46.67 | %) | | | 11.34 | % | | | 21.55 | % | | | 14.37 | % | | | 42.35 | % | | | 35.76 | %4 |
| | | | | | | | | | | | | | | | | | | | | | | | |
| | | | | | |
Ratios/Supplemental data: | | | | | | | | | | | | | | | | | | | | | | | | |
Net assets (in millions), end of year | | $ | 1,501.3 | | | $ | 3,384.1 | | | $ | 2,403.1 | | | $ | 1,403.0 | | | $ | 632.7 | | | $ | 164.3 | |
Ratio of total expenses to average net assets | | | 1.86 | %3 | | | 1.88 | %3 | | | 1.77 | % | | | 1.62 | % | | | 1.46 | % | | | 1.77 | %5 |
Less: Ratio of interest expense to average net assets | | | (0.51 | %) | | | (0.57 | %) | | | (0.45 | %) | | | (0.27 | %) | | | (0.12 | %) | | | (0.37 | %)5 |
| | | | | | | | | | | | | | | | | | | | | | | | |
Ratio of operating expenses to average net assets | | | 1.35 | % | | | 1.31 | % | | | 1.32 | % | | | 1.35 | % | | | 1.34 | % | | | 1.40 | %5 |
| | | | | | | | | | | | | | | | | | | | | | | | |
Ratio of net investment loss to average net assets | | | (0.49 | %) | | | (0.86 | %) | | | (0.80 | %) | | | (0.85 | %) | | | (0.83 | %) | | | (1.39 | %)5 |
Portfolio turnover rate | | | 38.02 | % | | | 32.95 | % | | | 35.92 | % | | | 37.62 | % | | | 57.77 | % | | | 36.67 | %4 |
1 | For the period April 30, 2003 (Commencement of Operations) to December 31, 2003. |
2 | Based on average shares outstanding. |
3 | Benefit of expense reduction rounds to less than 0.01%. |
19
| | |
| Baron Select Funds | | December 31, 2008 |
FINANCIAL HIGHLIGHTS (Continued)
BARON RETIREMENT INCOME FUND
Selected data for a share outstanding throughout the period:
| | | | |
| | | Period Ended
December 31,
20081 | |
| | |
| |
Net asset value, beginning of period | | $ | 10.00 | |
| | | | |
| |
Income from investment operations: | | | | |
Net investment income | | | 0.00 | 2,3 |
Net realized and unrealized loss on investments | | | (3.33 | ) |
| | | | |
Total from investment operations | | | (3.33 | ) |
| | | | |
| |
Less distributions to shareholders from: | | | | |
Net investment income | | | 0.00 | |
Net realized gain on investments | | | 0.00 | |
Return of capital | | | (0.40 | ) |
| | | | |
Total distributions | | | (0.40 | ) |
| | | | |
| |
Net asset value, end of period | | $ | 6.27 | |
| | | | |
Total return | | | (33.11 | %)4,5 |
| | | | |
| |
Ratios/Supplemental data: | | | | |
Net assets (in millions), end of period | | $ | 59.3 | |
Ratio of operating expenses to average net assets | | | 1.54 | %6 |
Less: Expense reimbursements from Adviser | | | (0.19 | %)6 |
| | | | |
Ratio of net expenses to average net assets | | | 1.35 | %6 |
| | | | |
Ratio of net investment income to average net assets | | | 0.01 | %6 |
Portfolio turnover rate | | | 35.43 | %5 |
1 | For the period July 1, 2008 (Commencement of Operations) to December 31, 2008. |
2 | Based on average shares outstanding. |
3 | Less than $0.01 per share. |
4 | The total returns would have been lower had certain expenses not been reduced during the period shown. |
20
| | |
| December 31, 2008 | | Baron Select Funds |
REPORT OF INDEPENDENT REGISTERED PUBLIC ACCOUNTING FIRM
To the Board of Trustees and Shareholders of
Baron Select Funds
In our opinion, the accompanying statements of assets and liabilities, including the statements of net assets, and the related statements of operations, of changes in net assets and of cash flows (Baron Partners Fund only), and the financial highlights present fairly, in all material respects, the financial position of Baron Partners Fund and Baron Retirement Income Fund (the “Funds”) at December 31, 2008, and the results of their operations, the changes in their net assets and their cash flows (Baron Partners Fund only), and the financial highlights for each of the periods presented, in conformity with accounting principles generally accepted in the United States of America. These financial statements and financial highlights (hereafter referred to as “financial statements”) are the responsibility of the Funds’ management. Our responsibility is to express an opinion on these financial statements based on our audits. We conducted our audits of these financial statements in accordance with the standards of the Public Company Accounting Oversight Board (United States). Those standards require that we plan and perform the audit to obtain reasonable assurance about whether the financial statements are free of material misstatement. An audit includes examining, on a test basis, evidence supporting the amounts and disclosures in the financial statements, assessing the accounting principles used and significant estimates made by management, and evaluating the overall financial statement presentation. We believe that our audits, which included confirmation of securities at December 31, 2008 by correspondence with the custodian and brokers, provide a reasonable basis for our opinion.
PricewaterhouseCoopers LLP
New York, New York
February 25, 2009
21
| | |
| Baron Select Funds | | December 31, 2008 |
TAX INFORMATION (UNAUDITED)
We are required by the Internal Revenue Code to advise you within 60 days of the Funds’ fiscal year end as to the federal tax status of distributions paid by the Funds during such fiscal year.
During the fiscal year ended December 31, 2008, the Funds’ distributions to shareholders included:
| | | | | | | | | |
| Fund | | Ordinary
Income1 | | Long-Term
Capital Gain2 | | Return of
Capital3 |
Baron Partners Fund | | $ | 21,725,651 | | $ | 70,818,712 | | $ | — |
Baron Retirement Income Fund | | | 54,852 | | | — | | | 3,496,541 |
1 | For tax purposes, short-term capital gains are considered ordinary income distributions. |
2 | Long-term capital gains are subject to a maximum allowable rate of 15% for individuals pursuant to The Jobs and Growth Tax Relief Reconciliation Act of 2003. |
3 | Distribution will be treated as a tax free return of capital to the extent of a shareholder’s adjusted basis and as a capital gain thereafter. |
Of the total ordinary income distributions paid by Baron Partners Fund, 0% is qualified dividend income subject to a reduced tax rate.
The information and distributions reported may differ from the information and distributions taxable to the shareholders for the calendar year ended December 31, 2008. The information necessary to complete your income tax return for the calendar year ended December 31, 2008 will be listed on Form 1099-DIV mailed to you in January 2009.
22
| | |
| December 31, 2008 | | Baron Funds |
MANAGEMENT OF THE FUNDS
Board of Trustees and Officers
The Board oversees the management of the Funds. The following table lists the Trustees and Executive Officers of the Funds, their ages, current positions held with the Funds, length of time served with the Funds, principal occupations during the past five years and other Trusteeships/Directorships held outside of the Fund complex. Unless otherwise noted, the address of each Executive Officer and Trustee is Baron Select Funds, 767 Fifth Avenue, 49th Floor, New York, NY 10153. Trustees who are not deemed to be “interested persons” of the Funds as defined in the Investment Company Act of 1940 (the “1940 Act”), are referred to as “Independent Trustees.” Trustees who are deemed to be “interested persons” of the Funds, as defined in the 1940 Act, are referred to as “Interested Trustees.” All Trustees listed below, whether Interested or Disinterested, serve as Trustees for the Funds.
| | | | | | | | |
Name, Address & Date of Birth | | Position(s) Held
With the Funds | | Length of
Time Served | | Principal Occupation(s)
During the Past Five Years | | Other
Trustee/Directorships
Held by the Trustee |
| | | | |
| Interested Trustees | | | | | | | | |
| | | | |
Ronald Baron(1),(2) 767 Fifth Avenue New York, NY 10153 Age: 65 | | Chief Executive Officer, Chief Investment Officer, Trustee and Portfolio Manager | | 5 years | | Director, Chairman, CEO and CIO: the Firm* (2003-Present); President (2004-02/07), Chairman (1999-2004), and Trustee (1987-Present): Baron Investment Funds Trust; President (2004-02/07), Chairman (2003-2004), and Trustee (2003-Present): Baron Select Funds; Portfolio Manager: Baron USA Partners Fund, Ltd. (2003-Present); President: the Firm* (03/06-06/07); Portfolio Manager: Baron Managed Funds plc (2005-Present); President (2004-02/07), Chairman (1997-2004), and Trustee (1997-06/07): Baron Capital Funds Trust. | | None |
| | | | |
Linda S. Martinson(1),(2) 767 Fifth Avenue New York, NY 10153 Age: 53 | | President, Chief Operating Officer
and Trustee | | 5 years | | Director: the Firm* (2003-Present); Secretary: the Firm* (2003-04/08); President: the Firm* (02/07-Present); Chief Operating Officer: the Firm (05/06-present); General Counsel and Vice President: the Firm* (2003-2007); President (02/07-Present), Trustee (1987-Present), Secretary (2003-10/08): Baron Investment Funds Trust; President (02/07-Present), Trustee (2003-Present): Baron Select Funds; Director: Baron USA Partners Fund, Ltd. (2006-Present); Director: Baron Managed Funds plc (2005-Present); President (02/07-06/07) Trustee (1998-Present): Baron Capital Funds Trust. | | None |
| | | | |
| Independent Trustees | | | | | | | | |
| | | | |
Norman S. Edelcup(3),(4),(5) City of Sunny Isles Beach 18070 Collins Avenue Sunny Isles Beach, FL 33160 Age: 73 | | Trustee | | 5 years | | Director: Marquis Bank (2007-Present) Director: CompX International, Inc. (diversified manufacturer of engineered components) (2006-Present); Mayor (2003-Present), Commissioner (2001-2003): Sunny Isles Beach, Florida; Director (2001-2006), Senior Vice President (2001-2004): Florida Savings Bank; Director: Valhi, Inc. (diversified company) (1975-Present); Trustee: Baron Investment Funds Trust (1987-Present), Baron Capital Funds Trust (1997-06/07), Baron Select Funds (2003-Present). | | Director: Marquis Bank (2007-Present); Director: CompX International, Inc. (diversified manufacturer of engineered components) (2006-Present); Director: Valhi, Inc. (diversified company) (1975-Present). |
| | | | |
David I. Fuente(4),(5) 701 Tern Point Circle Boca Raton, FL 33431 Age: 62 | | Trustee | | 3 years | | Director (1987-Present): Office Depot; Director: Ryder Systems, Inc. (1998-Present); Director: Dick’s Sporting Goods, Inc. (1993-Present); Trustee: Baron Capital Funds Trust (2004-06/07), Baron Investment Funds Trust, Baron Select Funds (2004-Present). | | Director: Office Depot (1987-Present); Director: Ryder Systems, Inc. (1998-Present); Director: Dick’s Sporting Goods, Inc. (1993-Present). |
23
| | |
| Baron Funds | | December 31, 2008 |
| | | | | | | | |
Name, Address & Date of Birth | | Position(s) Held
With the Funds | | Length of
Time Served | | Principal Occupation(s)
During the Past Five Years | | Other
Trustee/Directorships
Held by the Trustee |
| | | | |
Charles N. Mathewson(4),(5) 9295 Prototype Drive Reno, NV 89521 Age: 80 | | Chairman and Trustee | | 5 years; (Elected as Chairman 08/04) | | Chairman Emeritus (October 2003-Present), Chairman (1986-2003): International Game Technology, Inc. (manufacturer of microprocessor-controlled gaming machines and monitoring systems); Chairman: Baron Capital Funds Trust (2004-06/07), Baron Investment Funds Trust, Baron Select Funds (2004-Present); Trustee: Baron Investment Funds Trust (1987-Present), Baron Capital Funds Trust (1997-06/07), Baron Select Funds (2003-Present). | | None |
| | | | |
Harold W. Milner(4),(5) 2293 Morningstar Drive Park City, UT 84060 Age: 74 | | Trustee | | 5 years | | Retired; Trustee: Baron Investment Funds Trust (1987-Present), Baron Capital Funds Trust (1997-06/07), Baron Select Funds (2003-Present); Chairman: Lightning Protection Systems, LLC (10/06-Present). | | None |
| | | | |
Raymond Noveck(3),(4),(5) 31 Karen Road Waban, MA 02168 Age: 65 | | Trustee | | 5 years | | Private Investor (1999-Present); Trustee: Baron Investment Funds Trust (1987-Present), Baron Capital Funds Trust (1997-06/07), Baron Select Funds (2003-Present). | | None |
| | | | |
David A. Silverman, MD(4),(5) 146 Central Park West New York, NY 10024 Age: 58 | | Trustee | | 5 years | | Physician and Faculty: New York University School of Medicine (1976-Present); Trustee: Baron Investment Funds Trust (1987-Present), Baron Capital Funds Trust (1997-06/07), Baron Select Funds (2003-Present). | | Director: New York Blood Center (1999-Present). |
| | | | |
Alex Yemenidjian(4),(5) 1925 Century Park East Suite 1975 Los Angeles, CA 90067 Age: 53 | | Trustee | | 2 years | | Chairman and CEO: Armenco Holdings, LLC (investment company) (2005-Present); Director: Guess?, Inc. (retail) (2005-Present); Director: Regal Entertainment Group (entertainment company) (2005-Present); Director: USC Marshall School of Business Board of Leaders (2005-Present); Co-chair: Imagine the Arts Campaign, California State University-Northridge (2005-Present); Trustee: American Film Institute (2000-Present); Chairman and CEO: Metro-Goldwyn-Mayer, Inc. (1999-2005); Director: The Lincy Foundation (1989-Present); Director: The United Armenian Fund (1989-Present); Director and member of Executive Committee: MGM MIRAGE, Inc. (1989-2005); Trustee: Baron Investment Funds Trust (2006-Present), Baron Capital Funds Trust (12/06-06/07), Baron Select Funds (12/06-Present). | | Director: Guess?, Inc. (2005-Present); Director: Regal Entertainment Group (2005-Present); Director, USC Marshall School of Business Board of Leaders (2005-Present); Co-chair: Imagine the Arts Campaign, California State University-Northridge (2005-Present); Trustee: American Film Institute (2000-2007); Director: The Lincy Foundation (1989-Present); Director (1989-2008), Chairman (10/08-Present): The United Armenian Fund (1989-Present); Director and member of Executive Committee: MGM MIRAGE, Inc. (1989-2005). |
24
| | |
| December 31, 2008 | | Baron Funds |
| | | | | | | | |
Name, Address & Date of Birth | | Position(s) Held
With the Funds | | Length of
Time Served | | Principal Occupation(s)
During the Past Five Years | | Other
Trustee/Directorships
Held by the Trustee |
| | | |
| Additional Officers of the Funds | | | | | | |
| | | | |
Larry Cohn 767 Fifth Avenue New York, NY 10153 Age: 51 | | Vice President and Chief Information Officer | | <1 year | | Vice President and Chief Information Officer: Baron Capital, Inc., Baron Capital Management, Inc. and BAMCO, Inc. (2008-Present); Global Divisional Chief Information Officer, Investment Management Division: Lehman Brothers (2003-2008); Chief Information Officer: Neuberger Berman (1993-2003). | | Director: Hebrew Academy of Nassau County (1996-Present). |
| | | | |
Clifford Greenberg 767 Fifth Avenue New York, NY 10153 Age: 49 | | Senior Vice President and Portfolio Manager | | 5 years | | Director and Senior Vice President: the Firm* (2003-Present); Vice President: Baron Capital, Inc. (1997-2003); Portfolio Manager: Baron Small Cap Fund (1997-Present). | | None |
| | | | |
Gretta J. Heaney 767 Fifth Avenue New York, NY 10153 Age: 48 | | Vice President and Chief Compliance Officer | | 4 years | | Vice President and Chief Compliance Officer: the Firm* (2003-Present), Baron Investment Funds Trust, Baron Select Funds (2004-Present), Baron USA Partners Fund, Ltd (2006-Present), Baron Managed Funds plc (2005-Present), Baron Capital Funds Trust (2003-06/07). | | None |
| | | | |
Patrick M. Patalino 767 Fifth Avenue New York, NY 10153 Age: 40 | | Vice President, General Counsel and Secretary | | 1 year (Appointed 08/07) | | Vice President and Chief Legal Officer: the Firm*, Baron Investment Funds Trust, Baron Select Funds, Baron Managed Funds plc, Baron USA Partners Fund, Ltd. (08/07-Present); Secretary: the Firm* (04/08-Present); Secretary: Baron Investment Funds Trust, Baron Select Funds (10/08-Present); Managing Director and Chief Operating Officer: Legal and Compliance Division, Morgan Stanley (01/06-06/07); Director of Regulatory Matters: Credit Suisse Securities (USA) (04/04-01/06); Counsel to Vice Chairman: Credit Suisse Securities (USA) (09/02-04/04). | | None |
| | | | |
Andrew Peck 767 Fifth Avenue New York, NY 10153 Age: 39 | | Senior Vice President and Portfolio Manager | | 5 years | | Portfolio Manager: Baron Asset Fund (01/08-Present); Vice President: BAMCO, Inc. (2003-Present); Vice President: Baron Investment Funds Trust (2003-Present); Vice President, Research Analyst: Baron Capital, Inc. (1998-Present); Co-Portfolio Manager: Baron Asset Fund (2003-01/08); Co-Portfolio Manager (mid cap accounts): Baron Capital Management, Inc. (04/06-Present). | | None |
| | | | |
Susan Robbins 767 Fifth Avenue New York, NY 10153 Age: 54 | | Vice President | | 5 years | | Director, Vice President and Senior Analyst: the Firm* (2003-Present); Vice President: Baron Investment Funds Trust (1994-Present), Baron Select Funds (2003-Present), Baron Capital Funds Trust (1998-06/07). | | None |
| | | | |
Peggy C. Wong 767 Fifth Avenue New York, NY 10153 Age: 47 | | Treasurer and Chief Financial Officer | | 5 years | | Chief Financial Officer and Treasurer: the Firm* (2003-Present), Baron Investment Funds Trust (1987-Present), Baron Select Funds (2003-Present), Baron USA Partners Fund, Ltd. (1993-Present), Baron Managed Funds plc. (2005-Present), Baron Capital Funds Trust (1998-06/07). | | None |
| * | The Firm (Baron Capital Group, Inc. with its subsidiaries Baron Capital, Inc., Baron Capital Management, Inc. and BAMCO, Inc.). |
(1) | Trustees deemed to be “Interested Trustees” of the Funds, as that term is defined in the 1940 Act by reason of their employment with the Funds’ Adviser and Distributor. |
(2) | Members of the Executive Committee, which is empowered to exercise all of the powers, including the power to declare dividends, of the full Board when the full Board is not in session. |
(3) | Members of the Audit Committee. |
(4) | Members of the Nominating Committee. |
(5) | Members of the Independent Committee. |
25
767 Fifth Avenue, 49th Fl.
New York, NY 10153
1.800.99.BARON
212-583-2000
www.BaronFunds.com
DEC08
Item 2. Code of Ethics.
The Registrant has adopted a Code of Ethics for Principal Executive and Senior Financial Officers (the “Code”). Upon request, the Registrant will provide a copy of the Code to any person without charge. To obtain a copy of the Code, please send your request to info@Baronfunds.com or call 1-800-99BARON (1-800-992-2766).
Item 3. Audit Committee Financial Expert.
The Registrant’s Board of Trustees has determined that the Registrant has two audit committee financial experts serving on its Audit Committee, Norman S. Edelcup and Raymond Noveck. Both Mr. Edelcup and Mr. Noveck are “independent” for purposes of Item 3(a)(2) of Form N-CSR.
Item 4. Principal Accountant Fees and Services.
The following table shows the fees paid to PricewaterhouseCoopers, LLP, the registrant’s principal accounting firm during the fiscal year January 1, 2008 to December 31, 2008 (a) for professional services rendered for the audit of the registrant’s annual financial statements or services that are normally provided in connection with statutory and regulatory filings or engagements (“Audit Fees”), (b) for assurance and related services that are reasonably related to the performance of the audit and are not included as Audit Fees (“Audit-Related Fees”), (c) for professional services rendered for tax compliance, tax advice and tax planning (“Tax Fees”), and (d) for products and services provided by such accounting firm that are not included in (a), (b) or (c) above (“All Other Fees”).
For the Fiscal Year Ended December 31, 2008:
| | | | | | |
| | | Audit Fees | | Tax Fees |
Baron Partners Fund | | $ | 42,250 | | $ | 56,170 |
Baron Retirement Income Fund | | | 0 | | | 0 |
Pursuant to its charter, the Audit Committee shall pre-approve all audit and non-audit services provided by the independent auditors and in connection therewith to review and evaluate the qualifications, independence and performance of the Funds’ independent auditors.
Item 5. Audit Committee of Listed Registrants.
The Registrant has a separately-designated standing Audit Committee established in accordance with Section 3(a)(58)(A) of the Securities Exchange Act of 1934. The members of the Audit Committee are Norman S. Edelcup and Raymond Noveck.
Item 6. Schedule of Investments.
Included herein under Item 1.
Item 7. Disclosure of Proxy Voting Policies and Procedures for Closed-End Management Investment Companies.
Not applicable.
Item 8. Portfolio Managers of Closed-End Management Investment Companies.
Not applicable.
Item 9. Purchases of Equity Securities by Closed-End Management Investment Company and Affiliated Purchasers.
Not applicable.
Item 10. Submission of Matters to a Vote of Security Holders.
Not applicable.
Item 11. Controls and Procedures.
(a) The Registrant’s principal executive officer and principal financial officer have concluded that the Registrant’s disclosure controls and procedures (as defined in Rule 30a-3(c) under the Investment Company Act of 1940 (the “1940 Act”)) are effective based on their evaluation of these controls and procedures as of a date within 90 days of the filing date of this report.
(b) There were no changes in the Registrant’s internal control over financial reporting (as defined in Rule 30a-3(d) under the 1940 Act) that occurred during the Registrant’s second fiscal quarter of the period covered by this report that have materially affected, or are reasonably likely to materially affect, the Registrant’s internal control over financial reporting.
Item 12. Exhibits.
(a)(1) Certifications pursuant to Section 302 of the Sarbanes Oxley Act of 2002.
Exhibit 99.CERT
(b) Certifications pursuant to Section 906 of the Sarbanes Oxley Act of 2002.
Exhibit 99.906CERT
SIGNATURES
Pursuant to the requirements of the Securities Exchange Act of 1934 and the Investment Company Act of 1940, the registrant has duly caused this report to be signed on its behalf by the undersigned, thereunto duly authorized.
| | |
| BARON SELECT FUNDS |
| |
| By: | | /s/ Ronald Baron |
| | Ronald Baron |
| | Chief Executive Officer |
|
| Date: March 2, 2009 |
Pursuant to the requirements of the Securities Exchange Act of 1934 and the Investment Company Act of 1940, this report has been signed below by the following persons on behalf of the registrant and in the capacities and on the dates indicated.
| | |
| By: | | /s/ Ronald Baron |
| | Ronald Baron |
| | Chief Executive Officer |
|
| Date: March 2, 2009 |
| |
| By: | | /s/ Peggy Wong |
| | Peggy Wong |
| | Treasurer and Chief Financial Officer |
|
| Date: March 2, 2009 |