| | |
OMB APPROVAL |
OMB Number: | | 3235 - 0570 |
Expires: | | January 31, 2014 |
Estimated average burden |
hours per response . . . | | 20.6 |
UNITED STATES
SECURITIES AND EXCHANGE COMMISSION
Washington, D.C. 20549
FORM N-CSR
CERTIFIED SHAREHOLDER REPORT OF REGISTERED
MANAGEMENT INVESTMENT COMPANIES
| | |
Investment Company Act file number: 811-21296 | | |
BARON SELECT FUNDS
|
| (Exact name of registrant as specified in charter) |
| | |
| 767 Fifth Avenue, 49th Floor | | New York, NY 10153 |
| (Address of Principal Executive Offices) | | (Zip Code) |
Patrick M. Patalino, Esq.
c/o Baron Select Funds
767 Fifth Avenue, 49th Floor
New York, NY 10153
|
| (Name and Address of Agent for Service) |
Registrant’s Telephone Number, including Area Code: 212-583-2000
Date of fiscal year end: December 31
Date of reporting period: December 31, 2010
Form N-CSR is to be used by management investment companies to file reports with the Commission not later than 10 days after the transmission to stockholders of any report that is required to be transmitted to stockholders under Rule 30e-1 under the Investment Company Act of 1940 (17CRF 270.30e-1). The Commission may use the information provided on Form N-CSR in its regulatory, disclosure review, inspection, and policymaking roles.
A registrant is required to disclose the information specified by Form N-CSR, and the Commission will make this information public. A registrant is not required to respond to the collection of information contained in Form N-CSR unless the Form displays a currently valid Office of Management and Budget (“OMB”) control number. Please direct comments concerning the accuracy of the information collection burden estimate and suggestions for reducing the burden to Secretary, Securities and Exchange Commission, 450 5th Street, NW, Washington, D.C. 20549-0609. The OMB has reviewed this collection of information under the clearance requirements of 44 U.S.C. Section 3507.
Persons who are to respond to the collection of information contained in this form are not required to respond unless the form displays a currently valid OMB control number.
SEC 2569 (5-07)
Item 1. Reports to Stockholders.
Baron Select Funds Annual Report for the period ended December 31, 2010.
Baron Partners Fund
Baron Focused Growth Fund
Baron International Growth Fund
Baron Real Estate Fund
December 31, 2010
Baron Funds®
Annual Financial Report
DEAR BARON SELECT FUNDS SHAREHOLDER:
In this report you will find audited financial statements for Baron Partners Fund, Baron Focused Growth Fund, Baron International Growth Fund and Baron Real Estate Fund (the “Funds”) for the fiscal year ended December 31, 2010. The U.S. Securities and Exchange Commission (the “SEC”) requires mutual funds to furnish these statements semi-annually to their shareholders. We hope you find these statements informative and useful.
We thank you for choosing to join us as fellow shareholders in Baron Funds. We will continue to work hard to justify your confidence.
Sincerely,
| | | | |
 | |  | |  |
Ronald Baron Chief Executive Officer and Chief Investment Officer February 24, 2011 | | Linda S. Martinson Chairman, President and Chief Operating Officer February 24, 2011 | | Peggy Wong Treasurer and Chief Financial Officer February 24, 2011 |
This Annual Financial Report is for the Baron Select Funds which currently has five series: Baron Partners Fund, Baron Focused Growth Fund (formerly, Baron Retirement Income Fund), Baron International Growth Fund, Baron Real Estate Fund and Baron Emerging Markets Fund. Baron Emerging Markets Fund commenced operations on January 1, 2011 and, therefore, is not included in this report. If you are interested in Baron Investment Funds Trust, which contains the Baron Asset Fund, Baron Growth Fund, Baron Small Cap Fund, Baron Opportunity Fund and Baron Fifth Avenue Growth Fund series, please visit the Funds’ website at www.BaronFunds.com or contact us at 1-800-99BARON.
A description of the Funds’ proxy voting policies and procedures is available without charge on the Funds’ website at www.BaronFunds.com, or by calling 1-800-99BARON and on the SEC’s website at www.sec.gov. The Funds’ most current proxy voting record, Form N-PX, is also available on the Funds’ website and on the SEC’s website.
The Funds file their complete schedules of portfolio holdings with the SEC for the first and third quarters of each fiscal year on Form N-Q. The Funds’ Forms N-Q are available on the SEC’s website at www.sec.gov. The Funds’ Forms N-Q may also be reviewed and copied at the SEC’s Public Reference Room in Washington, DC; information on the operation of the SEC’s Public Reference Room may be obtained by calling 1-202-551-8090. A copy of the Funds’ Forms N-Q may also be obtained upon request by contacting Baron Funds at 1-800-99BARON. Schedules of portfolio holdings current to the most recent quarter are also available on the Funds’ website.
Some of the comments are based on current management expectations and are considered “forward-looking statements.” Actual future results, however, may prove to be different from our expectations. You can identify forward-looking statements by words such as “estimate,” “may,” “expect,” “should,” “could,” “believe,” “plan” and other similar terms. We cannot promise future returns and our opinions are a reflection of our best judgment at the time this report is compiled.
The views expressed in this report reflect those of BAMCO, Inc. (“BAMCO” or the “Adviser”) only through the end of the period stated in this report. The views are not intended as recommendations or investment advice to any person reading this report and are subject to change at any time without notice based on market and other conditions.
Past performance is no guarantee of future results. The investment return and principal value of an investment will fluctuate; an investor’s shares, when redeemed, may be worth more or less than their original cost. For more complete information about Baron Funds, including charges and expenses, call or write for a prospectus. Read it carefully before you invest or send money. This report is not authorized for use as an offer of sale or a solicitation of an offer to buy shares of Baron Funds, unless accompanied or preceded by the Funds’ current prospectus.
767 Fifth Avenue
NY, NY 10153
212-583-2100
| | |
| Baron Partners Fund | | December 31, 2010 |
| | | | | | | | |
Baron Partners Fund | | | | | | | | |
| | |
Ticker Symbols: | | | | | | | | |
Retail Shares: BPTRX | | | | | | | | |
Institutional Shares: BPTIX | | | | | | | | |
Performance | | | 2 | | | | | |
Top Ten Holdings | | | 3 | | | | | |
Sector Breakdown | | | 3 | | | | | |
Management’s Discussion of Fund Performance | | | 3 | | | | | |
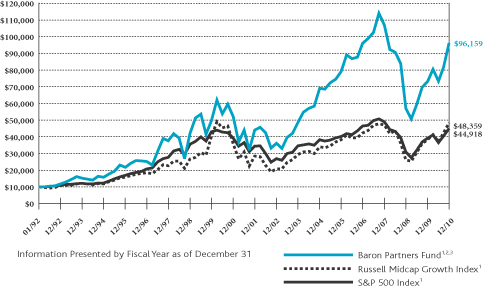
COMPARISONOFTHECHANGEIN VALUEOF $10,000INVESTMENT
IN BARON PARTNERS FUND†INRELATIONTOTHE RUSSELL MIDCAP GROWTH INDEXANDTHE S&P 500 INDEX
AVERAGE ANNUAL TOTAL RETURNSFORTHEPERIODSENDED DECEMBER 31, 2010
| | | | | | | | | | | | | | | | | | | | |
| | | One
Year | | | Three
Years | | | Five
Years | | | Ten
Years | | | Since
Inception
(January 31,
1992) | |
Baron Partners Fund — Retail Shares1,2,3 | | | 31.52% | | | | –3.48% | | | | 4.00% | | | | 6.32% | | | | 12.71% | |
Baron Partners Fund — Institutional Shares1,2,3,4 | | | 31.93% | | | | –3.34% | | | | 4.09% | | | | 6.37% | | | | 12.74% | |
Russell Midcap Growth1 | | | 26.38% | | | | 0.97% | | | | 4.88% | | | | 3.12% | | | | 8.69% | |
S&P 5001 | | | 15.06% | | | | –2.85% | | | | 2.29% | | | | 1.41% | | | | 8.27% | |
| 1 | The Russell Midcap Growth Index and S&P 500 Index are unmanaged. The Russell Midcap Growth Index measures the performance of medium-sized companies classified as growth. The S&P 500 Index measures the performance of larger-cap equities in the stock market in general. The indexes and the Baron Partners Fund are with dividends, which positively impact the performance results. |
| 2 | Reflects the actual fees and expenses that were charged when the Fund was a partnership. The predecessor partnership charged a 20% performance fee after reaching a certain performance benchmark. If the annual returns for the Fund did not reflect the performance fee for the years it was a partnership, the returns would be higher. The Fund’s shareholders will not be charged a performance fee. The predecessor partnership’s performance is only for the periods before the Fund’s registration statement was effective, which was April 30, 2003. During those periods, the predecessor partnership was not registered under the Investment Company Act of 1940 and was not subject to its requirements or the requirements of the Internal Revenue Code relating to registered investment companies, which, if it were, might have adversely affected its performance. |
| 3 | Past performance is not predictive of future performance. The performance data does not reflect the deduction of taxes that a shareholder would pay on Fund distributions or redemption of Fund shares. The Fund’s transfer agency expenses may be reduced by expense offsets from an unaffiliated transfer agent, without which performance would have been lower. |
| 4 | Performance for the Institutional Shares prior to May 29, 2009 is based on the performance of the Retail Shares, which have a distribution fee. The Institutional Shares do not have a distribution fee. If the annual returns prior to May 29, 2009 did not reflect this fee, the returns would be higher. |
| † | Performance information reflects results of the Retail Shares. |
1.800.99 BARON
www.BaronFunds.com
©2011 All Rights Reserved
2
| | |
| December 31, 2010 | | Baron Partners Fund |
TOP TEN HOLDINGSASOF DECEMBER 31, 2010
| | | | |
| | | Percent of
Net Assets | |
FactSet Research Systems, Inc. | | | 8.9% | |
Hyatt Hotels Corp. (Cl A) | | | 8.3% | |
ITC Holdings Corp. | | | 7.8% | |
Fastenal Co. | | | 7.5% | |
Arch Capital Group, Ltd. | | | 7.2% | |
Dick’s Sporting Goods, Inc. | | | 6.6% | |
Charles Schwab Corp. | | | 6.5% | |
MSCI, Inc. (Cl A) | | | 6.0% | |
Edwards Lifesciences Corp. | | | 5.2% | |
C.H. Robinson Worldwide, Inc. | | | 4.7% | |
| | | | 68.7% | |
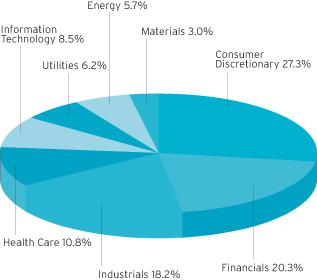
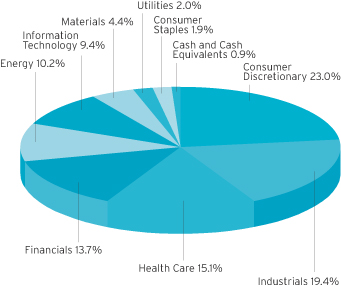
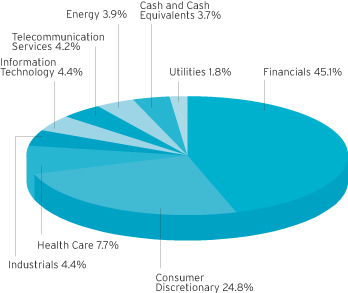
SECTOR BREAKDOWNASOF DECEMBER 31, 2010†
(as a percentage of long positions)
MANAGEMENT’S DISCUSSIONOF FUND PERFORMANCE
For the year ended December 31, 2010, Baron Partners Fund (Retail Shares) gained 31.52%, outperforming both the Russell Midcap Growth Index, up 26.38%, and the S&P 500 Index, up 15.06%.
Baron Partners Fund has performed well since its conversion to an open-end mutual fund on April 30, 2003. In the period since the Fund’s conversion through December 31, 2010, the Fund gained
an annualized 13.76%. This compares to an annualized 10.80% for the Russell Midcap Growth and 6.32% for the S&P 500. Since its inception on January 31, 1992, the Fund also has outperformed, gaining an annualized 12.71%*. This compares to 8.69% for the Russell Midcap Growth and 8.27% for the S&P 500.
Baron Partners Fund uses value purchase disciplines to invest in all-cap companies that we believe have significant long-term growth opportunities. We believe that our independent research will identify investment opportunities that are attractively priced relative to their future prospects. However, Baron Partners Fund is different from most of the other Baron Funds with its non-diversified portfolio and its ability to leverage, which are more risky investment strategies.
The market achieved a 52-week high in December, overcoming declines in May and June and a choppy third quarter. At the end of the year, with fear of a “double-dip” recession abated, U.S. stock prices were within 14% of their value at the market peak in October, 2007.
Economic recovery continues, with corporate profits and GDP growth on the rise. The “bellwether” auto and housing industries are delivering positive news. Even with the recent positive movement of the U.S. stock market, we think stocks remain inexpensive relative to their earnings growth potential and are poised for multiple expansion. Investors are regaining confidence in the equity markets as net flows to small- and mid-cap growth funds were positive in the fourth quarter for the first time since April.
Buoyed by strong financial results, FactSet Research Systems, Inc. made the largest contribution to the Fund’s performance in 2010. For the 12 months ended in November, the company grew its seat count by almost 17%, well ahead of industry growth that we estimate at less than 5%. We believe that FactSet is continuing to benefit from improved spending on market data systems, market-share gains due to its superior product offerings, growing adoption of its new fixed-income tools, and the launch of proprietary content. The company is continuing to roll out its next-generation platform, which is designed to widen the company’s technological edge, lower barriers to adoption, and increase utilization.
Strayer Education, Inc., a 115-year-old provider of post-secondary education, was the largest detractor from Fund performance in 2010. New Gainful Employment rules, expected to be released in early 2011, together with a slowdown in enrollment, resulted in sharp stock-price declines. Given its emphasis on academic quality, strong student outcomes, programmatic diversity, more measured historic enrollment growth, long history of regulatory compliance, and its somewhat selective admission practices, we continue to believe that Strayer is favorably positioned in the sector.
In 2011, the Fund expects to continue to invest in securities of businesses that, in our opinion, have favorable price-to-value characteristics based on our assessment of their prospects for future growth and profitability.
| * | Please see Footnote 2 on page 2. |
| † | Industry sector levels are provided from the Global Industry Classification Standard (“GICS”), developed and exclusively owned by MSCI, Inc. and Standard & Poor’s Financial Services LLC, unless otherwise stated that they have been reclassified or classified by the Adviser. All GICS data is provided “as is” with no warranties. |
3
| | |
| Baron Focused Growth Fund | | December 31, 2010 |
| | | | | | | | |
| | | | | |
Baron Focused Growth Fund | | | | | | | | |
| | |
Ticker Symbols: | | | | | | | | |
Retail Shares: BFGFX | | | | | | | | |
Institutional Shares: BFGIX | | | | | | | | |
Performance | | | 4 | | | | | |
Top Ten Holdings | | | 5 | | | | | |
Sector Breakdown | | | 5 | | | | | |
Management’s Discussion of
Fund Performance | | | 5 | | | | | |
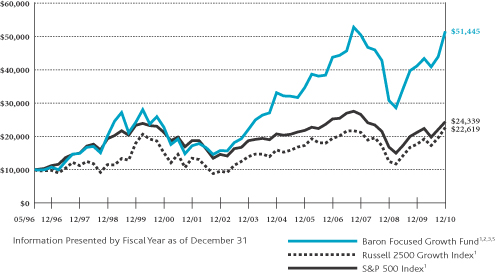
COMPARISONOFTHECHANGEIN VALUEOF $10,000INVESTMENT
IN BARON FOCUSED GROWTH FUND†INRELATIONTOTHE RUSSELL 2500 GROWTH INDEXANDTHE S&P 500 INDEX
AVERAGE ANNUAL TOTAL RETURNSFORTHEPERIODSENDED DECEMBER 31, 2010
| | | | | | | | | | | | | | | | | | | | |
| | | One
Year | | | Three
Years | | | Five
Years | | | Ten
Years | | | Since
Inception
(May 31,
1996) | |
Baron Focused Growth Fund — Retail Shares1,2,3,5 | | | 25.17% | | | | 0.68% | | | | 8.29% | | | | 8.53% | | | | 11.89% | |
Baron Focused Growth Fund — Institutional Shares1,2,3,4,5 | | | 25.39% | | | | 0.77% | | | | 8.35% | | | | 8.57% | | | | 11.91% | |
Russell 2500 Growth1 | | | 28.86% | | | | 2.21% | | | | 5.63% | | | | 4.19% | | | | 5.76% | |
S&P 5001 | | | 15.06% | | | | –2.85% | | | | 2.29% | | | | 1.41% | | | | 6.29% | |
| 1 | The Russell 2500 Growth Index and S&P 500 Index are unmanaged. The Russell 2500 Growth Index measures the performance of small to medium-sized companies that are classified as growth. The S&P 500 Index measures the performance of larger cap equities in the stock market in general. The indexes and Baron Focused Growth Fund are with dividends, which positively impact the performance results. |
| 2 | Reflects the actual fees and expenses that were charged when the Fund was a partnership. Prior to 2003, the predecessor partnership charged a 15% performance fee after reaching a certain performance benchmark. If the annual returns for the Fund did not reflect the performance fee for the years it was a partnership, the returns would be higher. The Fund’s shareholders will not be charged a performance fee. The predecessor partnership’s performance is only for the periods before the Fund’s registration statement was effective, which was June 30, 2008. During those periods, the predecessor partnership was not registered under the Investment Company Act of 1940 and was not subject to its requirements or the requirements of the Internal Revenue Code relating to registered investment companies, which, if it were, might have adversely affected its performance. |
| 3 | Past performance is not predictive of future performance. The performance data does not reflect the deduction of taxes that a shareholder would pay on Fund distributions or redemption of Fund shares. The Adviser has reimbursed certain Fund expenses and the Fund’s transfer agency expenses may be reduced by expense offsets from an unaffiliated transfer agent, without which performance would have been lower. |
| 4 | Performance for the Institutional Shares prior to May 29, 2009 is based on the performance of the Retail Shares, which have a distribution fee. The Institutional Shares do not have a distribution fee. If the annual returns prior to May 29, 2009 did not reflect this fee, the returns would be higher. |
| 5 | The Fund had a distribution policy, which required the Fund to pay a minimum annual distribution of 4% of the Fund’s net assets per share measured as of December 31 of the preceding year. All or a portion of the 4% annual distribution was a return of capital for the fiscal years ended December 31, 2009 and December 31, 2008. This distribution policy has been terminated as of December 31, 2010. |
| † | Performance information reflects results of the Retail Shares. |
1.800.99 BARON
www.BaronFunds.com
©2011 All Rights Reserved
4
| | |
| December 31, 2010 | | Baron Focused Growth Fund |
TOP TEN HOLDINGSASOF DECEMBER 31, 2010
| | | | |
| | | Percent of
Net Assets | |
MSCI, Inc. (Cl A) | | | 6.4% | |
Genesee & Wyoming, Inc. (Cl A) | | | 5.8% | |
Hyatt Hotels Corp. (Cl A) | | | 5.1% | |
Verisk Analytics, Inc. (Cl A) | | | 4.8% | |
Molycorp, Inc. | | | 4.4% | |
Dick’s Sporting Goods, Inc. | | | 4.1% | |
SM Energy Co. | | | 3.9% | |
Concho Resources, Inc. | | | 3.9% | |
Choice Hotels International, Inc. | | | 3.8% | |
Anhanguera Educacional Participacoes SA | | | 3.7% | |
| | | | 45.9% | |
SECTOR BREAKDOWNASOF DECEMBER 31, 2010†
(as a percentage of net assets)
MANAGEMENT’S DISCUSSIONOF FUND PERFORMANCE
For the year ended December 31, 2010, Baron Focused Growth Fund (Retail Shares) gained 25.17%, compared to a 28.86% gain for the Russell 2500 Growth Index and a 15.06% gain for the S&P 500 Index.
The Fund converted to an open-end mutual fund on June 30, 2008. In the period since the Fund’s conversion through December 31, 2010, the Fund gained an annualized 4.64% versus an annualized 6.08% for the Russell 2500 Growth and 1.61% for the S&P 500.
The Fund has performed well for the five and ten-year periods ended December 31, 2010, as well as since its inception. For the five-year period ended December 31, 2010, the Fund gained an annualized 8.29% versus an annualized 5.63% for the Russell 2500 Growth Index
and an annualized 2.29% for the S&P 500 Index. For the ten years ended December 31, 2010, the Fund gained an annualized 8.53% versus an annualized 4.19% for the Russell 2500 Growth Index and an annualized 1.41% for the S&P 500 Index.
Since its inception on May 31, 1996 to December 31, 2010, the Fund also outperformed its comparative indexes, gaining an annualized 11.89%* compared to an annualized 5.76% for the Russell 2500 Growth and 6.29% for the S&P 500.
The Fund has achieved these returns while assuming less risk than the overall market as measured by the Russell 2500 Growth Index. For the five-year period ended December 31, 2010, the Fund’s Beta was 0.91. Since the Fund’s inception on May 31, 1996 through December 31, 2010, the Fund’s Beta was 0.77. Beta is a measure of the Fund’s volatility, or systematic risk, compared to the market as a whole.
Baron Focused Growth Fund invests in a focused portfolio of companies that we believe are well capitalized with exceptional management, significant growth potential, and sustainable barriers to competition. We seek to invest in companies that we believe will double in size within four or five years. Of course there can be no assurance that the Adviser will be successful in achieving its goals.
The market achieved a 52-week high in December, overcoming declines in May and June and a choppy third quarter. At the end of the year, with fear of a “double-dip” recession abated, U.S. stock prices were within 14% of their value at the market peak in October, 2007.
Economic recovery continues, with corporate profits and GDP growth on the rise. The “bellwether” auto and housing industries are delivering positive news. Even with the recent positive movement of the U.S. stock market, we think stocks remain inexpensive relative to their earnings growth potential and are poised for multiple expansion. Investors are regaining confidence in the equity markets as net flows to small and mid-cap growth funds were positive in the fourth quarter for the first time since April.
Genesee & Wyoming, Inc., a leading short-line railroad, was the leading contributor to the Fund’s performance in 2010. The company reported strong, double-digit growth in carload volumes, increased prices and announced a significant new acquisition. In June, Genesee said it would acquire an Australian rail line that is poised to benefit from several mining projects with key export customers in China and India. Combined with Genesee’s existing Australian business, we expect the new line will boost international revenue to roughly one-third of the company’s total business, offering good diversity and leverage to secular growth drivers in emerging Asian markets.
Charles Schwab, a leading discount brokerage, was the Fund’s most significant detractor. Low interest rates resulted in the company earning a lower net interest margin on client cash balances, as well as the company waiving a significant portion of its asset management fees to avoid a negative yield on its money market funds. In the fourth quarter, interest rates rallied significantly, which bodes well for an improvement in Charles Schwab’s earnings power in 2011.
This non-diversified Fund utilizes value purchase disciplines when investing in small and mid-sized growth companies that we believe have significant long-term growth opportunities. We believe that our independent research will identify investment opportunities that are attractively priced relative to their future prospects.
In 2011, the Fund expects to continue to establish positions in small and mid-sized businesses that, in our opinion, have favorable price-to-value characteristics based on our assessment of prospects for future growth and profitability.
| * | Please see Footnote 2 on page 4. |
| † | Industry sector levels are provided from the Global Industry Classification Standard (“GICS”), developed and exclusively owned by MSCI, Inc. and Standard & Poor’s Financial Services LLC, unless otherwise stated that they have been reclassified or classified by the Adviser. All GICS data is provided “as is” with no warranties. |
5
| | |
| Baron International Growth Fund | | December 31, 2010 |
| | | | | | | | |
| | | | | |
Baron International Growth Fund | | | | | |
| | |
Ticker Symbols: | | | | | | | | |
Retail Shares: BIGFX | | | | | | | | |
Institutional Shares: BINIX | | | | | | | | |
Performance | | | 6 | | | | | |
Top Ten Holdings | | | 7 | | | | | |
Sector Breakdown | | | 7 | | | | | |
Management’s Discussion of Fund Performance | | | 7 | | | | | |
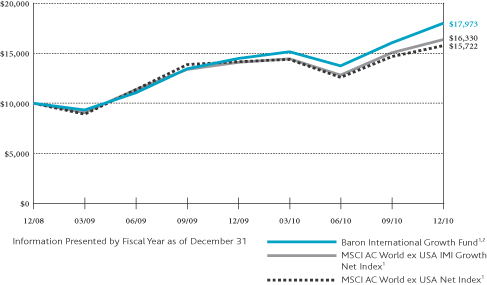
COMPARISONOFTHECHANGEIN VALUEOF $10,000INVESTMENT
IN BARON INTERNATIONAL GROWTH FUND†INRELATIONTOTHE MSCI AC WORLDEX USA IMI GROWTH NET (USD) INDEXANDTHE MSCI AC WORLDEX USA NET (USD) INDEX
AVERAGE ANNUAL TOTAL RETURNSFORTHEPERIODSENDED DECEMBER 31, 2010
| | | | | | | | |
| | | One
Year | | | Since Inception
(December 31,
2008) | |
Baron International Growth Fund — Retail Shares1,2 | | | 24.22% | | | | 34.06% | |
Baron International Growth Fund — Institutional Shares1,2,3 | | | 24.54% | | | | 34.33% | |
MSCI AC World ex USA IMI Growth Net (USD)1 | | | 15.90% | | | | 27.79% | |
MSCI AC World ex USA Net (USD)1 | | | 11.15% | | | | 25.39% | |
| 1 | The MSCI AC World ex USA indexes are an unmanaged, free float-adjusted market capitalization weighted indexes. The MSCI AC World ex USA IMI Growth Net Index measures the equity market performance of large, mid, and small-cap growth securities across developed and emerging markets, excluding the United States. The MSCI AC World ex USA Net Index measures the equity market performance of large and mid-cap securities across developed and emerging markets, excluding the United States. The indexes and Baron International Growth Fund include reinvestment of dividends, net of foreign withholding taxes, which positively impact the performance results. |
| 2 | Past performance is not predictive of future performance. The performance data does not reflect the deduction of taxes that a shareholder would pay on Fund distributions or redemption of Fund shares. The Adviser has reimbursed certain Fund expenses and the Fund’s transfer agency expenses may be reduced by expense offsets from an unaffiliated transfer agent, without which performance would have been lower. |
| 3 | Performance for the Institutional Shares prior to May 29, 2009 is based on the performance of the Retail Shares, which have a distribution fee. The Institutional Shares do not have a distribution fee. If the annual returns prior to May 29, 2009 did not reflect this fee, the returns would be higher. |
| † | Performance information reflects results of the Retail Shares. |
1.800.99 BARON
www.BaronFunds.com
©2011 All Rights Reserved
6
| | |
| December 31, 2010 | | Baron International Growth Fund |
TOP TEN HOLDINGSASOF DECEMBER 31, 2010
| | | | |
| | | Percent of
Net Assets | |
NII Holdings, Inc. | | | 3.2% | |
Fanuc, Ltd. | | | 2.8% | |
Sony Financial Holdings, Inc. | | | 2.7% | |
Symrise AG | | | 2.6% | |
TOTVS SA | | | 2.4% | |
Ingenico SA | | | 2.4% | |
Compagnie Financiere Richemont SA | | | 2.3% | |
China-Biotics, Inc. | | | 2.3% | |
Wynn Macau, Ltd. | | | 2.2% | |
Julius Baer Group, Ltd. | | | 2.2% | |
| | | | 25.1% | |
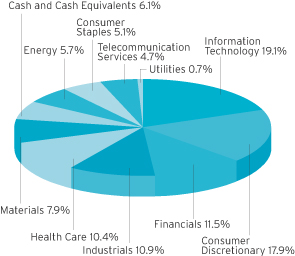
SECTOR BREAKDOWNASOF DECEMBER 31, 2010†
(as a percentage of net assets)
MANAGEMENT’S DISCUSSIONOF FUND PERFORMANCE
Baron International Growth Fund (Retail Shares) gained 24.22% for the year ended December 31, 2010, significantly outperforming both of its comparative indexes. The MSCI AC World ex USA IMI Growth Net Index gained 15.90% while the MSCI AC World ex USA Net Index gained 11.15%.
Baron International Growth Fund is a diversified fund that invests for the long term primarily in securities of non-U.S. growth companies. The Fund expects to diversify among several developed countries and developing countries throughout the world, although the Fund’s total exposure to developing countries will not exceed 30%. The Fund may purchase securities of companies of any size, but expects to focus on small- and mid-sized growth companies with market capitalization of $10 billion or less at the time of purchase. The Fund seeks to purchase companies with the potential to increase in value 100% within four to five years based on our evaluation of the company’s prospects for future growth, profitability and competitive advantages. Of course, there can be no assurance that the Adviser will be successful in achieving its goals.
The markets’ steep second-quarter declines were erased in the second half of the year as concern over the European debt crisis eased, fear of a “double-dip” recession abated and the Federal Reserve indicated it would engage in additional qualitative easing, if necessary, to prevent deflation. For the first time in a while, and particularly in a strong equity market, the developed world markets began to outperform the developing markets. This phenomenon could continue for an extended period if, as we suspect, it is a consequence of vanquishing fears of deflation in the U.S.
Kingdee International Software Group, China’s No. 2 Enterprise Resource Planning (ERP) software and service provider, was the Fund’s largest contributor in 2010. The company focuses on small and medium-size companies. Kingdee appreciated more than 150%, mainly due to China’s need to improve productivity and efficiency. China’s ERP market is growing 3.5 times faster than world’s average. With its strong technology and local knowledge, we think Kingdee is well positioned to take advantage of a significant growth opportunity.
Thales SA was the Fund’s largest detractor in 2010. We were attracted to Thales given its position as a world-class defense electronics, aerospace and security systems contractor and the potential for significant margin expansion. During 2009, the Company announced a major restructuring review that resulted in potentially material write-downs of existing contracts. Considering the balance of opportunity and risk, we chose to sell Thales in favor of more compelling ideas.
The Fund expects to continue making investments in non-U.S. companies that we believe have superior long-term growth prospects. The Adviser believes that there are exciting business prospects that are driven by the increasing demand for consumer goods and services in developing countries, which we think creates growth opportunities for both local businesses in those countries as well as for companies in developed countries that can help satisfy that demand.
| † | Industry sector or sub-industry group levels are provided from the Global Industry Classification Standard (“GICS”), developed and exclusively owned by MSCI, Inc. and Standard & Poor’s Financial Services LLC, unless otherwise stated that they have been reclassified or classified by the Adviser. All GICS data is provided “as is” with no warranties. |
7
| | |
| Baron Real Estate Fund | | December 31, 2010 |
| | | | | | | | |
| | | | | |
Baron Real Estate Fund | | | | | | | | |
Retail Shares: BREFX | | | | | | | | |
Institutional Shares: BREIX | | | | | | | | |
Performance | | | 8 | | | | | |
Top Ten Holdings | | | 9 | | | | | |
Sector Breakdown | | | 9 | | | | | |
Management’s Discussion of
Fund Performance | | | 9 | | | | | |
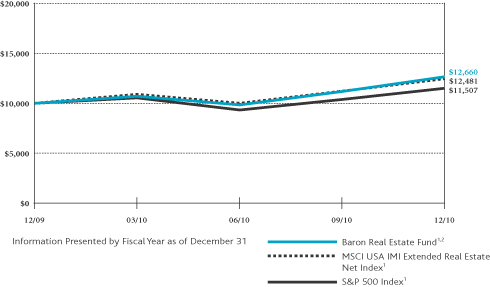
COMPARISONOFTHECHANGEIN VALUEOF $10,000INVESTMENT
IN BARON REAL ESTATE FUND†INRELATIONTOTHE MSCI USA IMI EXTENDED REAL ESTATE NET INDEXANDTHE S&P 500 INDEX
AVERAGE ANNUAL TOTAL RETURNSFORTHEPERIODSENDED DECEMBER 31, 2010
| | | | | | | | |
| | | One
Year | | | Since
Inception
(December 31,
2009) | |
Baron Real Estate Fund — Retail Shares1,2 | | | 26.60% | | | | 26.60% | |
Baron Real Estate Fund — Institutional Shares1,2 | | | 26.90% | | | | 26.90% | |
MSCI USA IMI Extended Real Estate Net1 | | | 24.81% | | | | 24.81% | |
S&P 5001 | | | 15.06% | | | | 15.06% | |
| 1 | The MSCI USA IMI Extended Real Estate Net Index is a custom index calculated by MSCI for, and as requested by, BAMCO, Inc. The index includes real estate and real estate-related GICS classification securities. MSCI makes no express or implied warranties or representation and shall have no liability whatsoever with respect to any MSCI data contained herein. The MSCI data may not be further redistributed or used as a basis for other indexes or any securities or financial products. This report is not approved, reviewed or produced by MSCI. The S&P 500 measures the performance of larger cap U.S. equities in the stock market in general. The indexes and the Fund are with dividends, which positively impact the performance results. |
| 2 | Past performance is not predictive of future performance. The performance data does not reflect the deduction of taxes that a shareholder would pay on Fund distributions or redemption of Fund shares. The Adviser has reimbursed certain Fund expenses without which performance would have been lower. |
| † | Performance information reflects results of the Retail shares. |
1.800.99 BARON
www.BaronFunds.com
©2011 All Rights Reserved
8
| | |
| December 31, 2010 | | Baron Real Estate Fund |
TOP TEN HOLDINGSASOF DECEMBER 31, 2010
| | | | |
| | | Percent of
Net Assets | |
Brookfield Asset Management, Inc. (Cl A) | | | 3.1% | |
RealPage, Inc. | | | 2.9% | |
Penn National Gaming, Inc. | | | 2.6% | |
Brookdale Senior Living, Inc. | | | 2.5% | |
Targa Resources Corp. | | | 2.5% | |
SBA Communications Corp. (Cl A) | | | 2.5% | |
Hyatt Hotels Corp. (Cl A) | | | 2.4% | |
Wyndham Worldwide Corp. | | | 2.4% | |
Forest City Enterprises, Inc. (Cl A) | | | 2.3% | |
Carnival Corp. | | | 2.2% | |
| | | | 25.4% | |
SECTOR BREAKDOWNASOF DECEMBER 31, 2010†
(as a percentage of net assets)
MANAGEMENT’S DISCUSSIONOF FUND PERFORMANCE
Baron Real Estate Fund (Retail Shares) gained 26.60% in its first full year of operation ended December 31, 2010, outperforming both of its comparative indexes. The MSCI USA IMI Extended Real Estate Net Index gained 24.81% and the S&P 500 Index gained 15.06%
Baron Real Estate Fund is a non-diversified fund that invests primarily in securities of real estate and real estate-related companies of all sizes. The Fund seeks to invest in well managed companies that the Adviser believes have significant long-term
growth opportunities. Unlike many other real estate funds that invest primarily in real estate investment trusts (REITs), the Fund expands its investment universe to include a more comprehensive group of real estate and real estate-related companies. These include home builders, hotels, manufacturers of building supplies and products, retailers with significant real estate holdings, real estate service companies, real estate operating companies, and infrastructure-related companies.
Baron Real Estate Fund invests in securities that we believe have favorable price-to-value characteristics, are well managed, have significant long-term growth prospects, have significant barriers to competition and are attractively priced relative to the Adviser’s assessment of the businesses’ long-term growth prospects, future cash flows and asset values.
In 2010, strong business conditions and economic prosperity were not absolute prerequisites for strong performance in real estate. Despite the difficult economic environment, several categories of real estate companies generated solid returns. These include office, apartment, retail, hotel, industrial, select homebuilder, and certain other real estate-related categories.
Some of the factors that contributed to positive performance are: business conditions bottomed across a number of real estate categories; interest rates fell (the 10-year treasury reached 2.41%!) making costs of borrowing attractive; high dividend paying companies, like REITs, were appealing in a world of low returns on savings and investment; the long-term nature of the revenue streams for several real estate categories (i.e., multi-year leases) became attractive to investors in an uncertain economic environment; and valuations were favorable for certain real estate-related companies.
RealPage, Inc. was the largest contributor to Fund performance in 2010. Its shares more than doubled since its mid-August IPO. RealPage sells a comprehensive suite of property management software and analytical tools for the rental housing industry, all delivered on a SaaS (software as a service) basis. Investors were enthusiastic over the company’s vast addressable market opportunity, scalable margin structure, robust free cash flow generation, and defensible market position. We believe that RealPage’s addressable market opportunity is in excess of $5 billion annually, or more than 25 times larger than the company’s current revenue base.
Equinix, Inc. was the largest detractor from Fund performance in 2010. Shares were volatile throughout the year before selling off sharply in October, following the company’s announcement that it would miss both third-quarter and full-year 2010 revenue expectations by 1% to 2%. This focused additional attention on pricing concessions for certain magnet customers, and a slightly elevated level of client churn. We continue to perform rigorous due diligence and remain comfortable that the company maintains a solid competitive advantage in its core, interconnection-focused offering and remains undervalued relative to what appears to be a solid, multi-year opportunity.
In 2011, the Adviser expects to continue to establish positions in “best-in-class” real estate companies that we believe have talented management, are well positioned against competitors and are attractively priced.
| † | Industry sector levels are provided from the Global Industry Classification Standard (“GICS”), developed and exclusively owned by MSCI, Inc. and Standard & Poor’s Financial Services LLC, unless otherwise stated that they have been reclassified or classified by the Adviser. All GICS data is provided “as is” with no warranties. |
9
| | |
| Baron Partners Fund | | December 31, 2010 |
STATEMENT OF NET ASSETS
DECEMBER 31, 2010
| | | | | | | | | | | | |
| Shares | | | | | Cost | | | Value | |
| Common Stocks (123.23%) | | | | | | | | |
| Consumer Discretionary (33.68%) | | | | | |
| | | | Broadcasting (2.89%) | |
| | 950,000 | | | Discovery Communications, Inc., Cl A1 | | $ | 23,332,159 | | | $ | 39,615,000 | |
| |
| | | | Casinos & Gaming (2.69%) | |
| | 1,050,000 | | | Penn National Gaming, Inc.1 | | | 31,457,686 | | | | 36,907,500 | |
| |
| | | | Education Services (5.59%) | |
| | 275,000 | | | Anhanguera Educacional
Participacoes SA (Brazil)2 | | | 5,872,171 | | | | 6,626,506 | |
| | 825,000 | | | DeVry, Inc. | | | 35,163,137 | | | | 39,583,500 | |
| | 200,000 | | | Strayer Education, Inc. | | | 22,931,492 | | | | 30,444,000 | |
| | | | | | | | | | | | |
| | | | | | | 63,966,800 | | | | 76,654,006 | |
| |
| | | | Hotels, Resorts & Cruise
Lines (11.85%) | |
| | 450,000 | | | Carnival Corp.2 | | | 17,814,673 | | | | 20,749,500 | |
| | 2,500,000 | | | Hyatt Hotels Corp., Cl A1 | | | 66,878,141 | | | | 114,400,000 | |
| | 450,000 | | | Starwood Hotels & Resorts
Worldwide, Inc. | | | 24,409,170 | | | | 27,351,000 | |
| | | | | | | | | | | | |
| | | | | | | 109,101,984 | | | | 162,500,500 | |
| |
| | | | Leisure Facilities (4.10%) | |
| | 1,081,800 | | | Vail Resorts, Inc.1 | | | 34,304,772 | | | | 56,296,872 | |
| |
| | | | Specialty Stores (6.56%) | |
| | 2,400,000 | | | Dick’s Sporting Goods, Inc.1 | | | 38,814,999 | | | | 90,000,000 | |
| | | | | | | | | | | | |
| Total Consumer Discretionary | | | 300,978,400 | | | | 461,973,878 | |
| | | | | | | | | | | | |
| | | | | | | | | | | | |
| Energy (7.11%) | | | | | |
| | | | Oil & Gas Drilling (2.48%) | |
| | 700,000 | | | Helmerich & Payne, Inc. | | | 16,484,771 | | | | 33,936,000 | |
| |
| | | | Oil & Gas Exploration &
Production (4.63%) | |
| | 725,000 | | | Concho Resources, Inc.1 | | | 30,513,642 | | | | 63,560,750 | |
| | | | | | | | | | | | |
| Total Energy | | | 46,998,413 | | | | 97,496,750 | |
| | | | | | | | | | | | |
| | | | | | | | | | | | |
| Financials (23.80%) | | | | | |
| | | | Asset Management &
Custody Banks (1.93%) | |
| | 875,000 | | | Eaton Vance Corp. | | | 23,431,074 | | | | 26,451,250 | |
| |
| | | | Investment Banking &
Brokerage (6.55%) | |
| | 5,250,000 | | | Charles Schwab Corp. | | | 56,269,218 | | | | 89,827,500 | |
| |
| | | | Reinsurance (7.22%) | |
| | 1,125,000 | | | Arch Capital Group, Ltd.1,2 | | | 54,553,658 | | | | 99,056,250 | |
| |
| | | | Specialized Finance (8.10%) | |
| | 1,650,000 | | | Interactive Brokers Group, Inc., Cl A1 | | | 25,308,214 | | | | 29,403,000 | |
| | 2,100,000 | | | MSCI, Inc., Cl A1 | | | 57,146,328 | | | | 81,816,000 | |
| | | | | | | | | | | | |
| | | | | | | 82,454,542 | | | | 111,219,000 | |
| | | | | | | | | | | | |
| Total Financials | | | 216,708,492 | | | | 326,554,000 | |
| | | | | | | | | | | | |
| | | | | | | | | | | | |
| Health Care (13.51%) | | | | | |
| | | | Health Care Equipment (9.42%) | |
| | 875,000 | | | Edwards Lifesciences Corp.1 | | | 20,361,601 | | | | 70,735,000 | |
| | 250,000 | | | IDEXX Laboratories, Inc.1 | | | 15,397,555 | | | | 17,305,000 | |
| | 160,000 | | | Intuitive Surgical, Inc.1 | | | 42,124,119 | | | | 41,240,000 | |
| | | | | | | | | | | | |
| | | | | | | 77,883,275 | | | | 129,280,000 | |
| | | | | | | | | | | | |
| Shares | | | | | Cost | | | Value | |
| Common Stocks (continued) | | | | | | | | |
| Health Care (continued) | | | | | |
| | | | Health Care Facilities (4.09%) | |
| | 1,500,000 | | | Community Health Systems, Inc.1 | | $ | 40,771,130 | | | $ | 56,055,000 | |
| | | | | | | | | | | | |
| Total Health Care | | | 118,654,405 | | | | 185,335,000 | |
| | | | | | | | | | | | |
| Industrials (22.85%) | | | | | |
| | | | Air Freight & Logistics (6.27%) | |
| | 800,000 | | | C. H. Robinson Worldwide, Inc. | | | 20,066,739 | | | | 64,152,000 | |
| | 400,000 | | | Expeditors International of
Washington, Inc. | | | 10,195,163 | | | | 21,840,000 | |
| | | | | | | | | | | | |
| | | | | | | 30,261,902 | | | | 85,992,000 | |
| |
| | | | Diversified Support
Services (2.35%) | |
| | 1,400,000 | | | Ritchie Bros. Auctioneers, Inc.2 | | | 34,297,483 | | | | 32,270,000 | |
| |
| | | | Research & Consulting
Services (6.70%) | |
| | 500,000 | | | CoStar Group, Inc.1 | | | 19,068,649 | | | | 28,780,000 | |
| | 1,850,000 | | | Verisk Analytics, Inc., Cl A1 | | | 51,366,473 | | | | 63,048,000 | |
| | | | | | | | | | | | |
| | | | | | | 70,435,122 | | | | 91,828,000 | |
| |
| | | | Trading Companies &
Distributors (7.53%) | |
| | 1,725,000 | | | Fastenal Co. | | | 61,849,446 | | | | 103,344,750 | |
| | | | | | | | | | | | |
| Total Industrials | | | 196,843,953 | | | | 313,434,750 | |
| | | | | | | | | | | | |
| | | | | | | | | | | | |
| Information Technology (10.65%) | | | | | |
| | | | Application Software (8.89%) | |
| | 1,300,000 | | | FactSet Research Systems, Inc. | | | 74,181,103 | | | | 121,888,000 | |
| |
| | | | Data Processing & Outsourced
Services (1.22%) | |
| | 900,000 | | | Western Union Co. | | | 15,582,921 | | | | 16,713,000 | |
| |
| | | | Home Entertainment
Software (0.54%) | |
| | 600,000 | | | Activision Blizzard, Inc. | | | 6,638,244 | | | | 7,464,000 | |
| | | | | | | | | | | | |
| Total Information Technology | | | 96,402,268 | | | | 146,065,000 | |
| | | | | | | | | | | | |
| | | | | | | | | | | | |
| Materials (3.84%) | | | | | |
| | | | Diversified Metals &
Mining (1.64%) | |
| | 450,075 | | | Molycorp, Inc.1 | | | 18,465,143 | | | | 22,458,742 | |
| |
| | | | Specialty Chemicals (2.20%) | |
| | 600,000 | | | Ecolab, Inc. | | | 22,391,513 | | | | 30,252,000 | |
| | | | | | | | | | | | |
| Total Materials | | | 40,856,656 | | | | 52,710,742 | |
| | | | | | | | | | | | |
| | | | | | | | | | | | |
| Utilities (7.79%) | | | | | |
| | | | Electric Utilities (7.79%) | | | | | | | | |
| | 1,725,000 | | | ITC Holdings Corp. | | | 58,794,451 | | | | 106,915,500 | |
| | | | | | | | | | | | |
| Total Common Stocks | | | 1,076,237,038 | | | | 1,690,485,620 | |
| | | | | | | | | | | | |
| | |
| 10 | | See Notes to Financial Statements. |
| | |
| December 31, 2010 | | Baron Partners Fund |
STATEMENT OF NET ASSETS (Continued)
DECEMBER 31, 2010
| | | | | | | | | | | | |
Shares | | | | | Cost | | | Value | |
| Private Equity Investments (2.24%) | |
| Consumer Discretionary (0.57%) | | | | | |
| | | | Hotels, Resorts &
Cruise Lines (0.57%) | |
| | 3,900,000 | | | Kerzner International Holdings, Ltd., Cl A1,2,3,4,6 | | $ | 39,000,000 | | | $ | 7,800,000 | |
| | | | | | | | | | | | |
| | | | | | | | | | | | |
| Financials (1.67%) | | | | | |
| | | | Asset Management &
Custody Banks (1.67%) | |
| | 6,014,997 | | | Windy City Investments
Holdings LLC1,3,4,6 | | | 38,319,447 | | | | 22,856,987 | |
| | | | | | | | | | | | |
| Total Private Equity Investments | | | 77,319,447 | | | | 30,656,987 | |
| | | | | | | | | | | | |
| | | | | | | | | | | | |
Principal
Amount | | | | | | | | | |
| Short Term Investments (0.01%) | | | | | |
| | $133,335 | | | Repurchase Agreement with Fixed Income Clearing Corp., dated 12/31/2010, 0.04% due 01/03/2011; Proceeds at maturity - $133,336; (Fully collateralized by U.S. Treasury Note, 1.25% due 10/31/2015; Market value - $140,469)5 | | | 133,335 | | | | 133,335 | |
| | | | | | | | | | | | |
| Total Investments (125.48%) | | $ | 1,153,689,820 | | | | 1,721,275,942 | |
| | | | | | | | | | | | |
| Liabilities Less Cash and Other
Assets (-25.48%) | | | | (349,473,717 | ) |
| | | | | | | | | | | | |
| Net Assets | | | $ | 1,371,802,225 | |
| | | | | | | | | | | | |
| Retail Shares (Equivalent to $20.57 per share based on
60,847,931 shares outstanding) |
| | $ | 1,251,912,829 | |
| | | | | | | | | | | | |
| Institutional Shares (Equivalent to $20.66 per share based on
5,803,391 shares outstanding) |
| | $ | 119,889,396 | |
| | | | | | | | | | | | |
| % | Represents percentage of net assets. |
| 1 | Non-income producing securities. |
| 3 | At December 31, 2010, the market value of restricted and fair valued securities amounted to $30,656,987 or 2.24% of net assets. None of these securities are deemed liquid. See Note 6 regarding restricted securities. |
| 4 | The Adviser has reclassified/classified certain securities in or out of this sub-industry. Such reclassifications/classifications are not supported by S&P or MSCI. |
| 5 | Level 2 security. See Note 7 regarding Fair Value Measurements. |
| 6 | Level 3 security. See Note 7 regarding Fair Value Measurements. |
| | |
| See Notes to Financial Statements. | | 11 |
| | |
| Baron Focused Growth Fund | | December 31, 2010 |
STATEMENT OF NET ASSETS (Continued)
DECEMBER 31, 2010
| | | | | | | | | | | | |
| Shares | | | | | Cost | | | Value | |
| Common Stocks (99.12%) | |
| Consumer Discretionary (22.96%) | |
| | | | Education Services (6.84%) | |
| | 140,557 | | | Anhanguera Educacional Participacoes
SA (Brazil)2 | | $ | 2,091,343 | | | $ | 3,386,916 | |
| | 35,000 | | | DeVry, Inc. | | | 1,497,572 | | | | 1,679,300 | |
| | 7,500 | | | Strayer Education, Inc. | | | 1,179,518 | | | | 1,141,650 | |
| | | | | | | | | | | | |
| | | | | | | 4,768,433 | | | | 6,207,866 | |
| |
| | | | Hotels, Resorts & Cruise Lines (8.84%) | |
| | 90,000 | | | Choice Hotels International, Inc. | | | 2,969,235 | | | | 3,444,300 | |
| | 100,000 | | | Hyatt Hotels Corp., Cl A1 | | | 2,666,530 | | | | 4,576,000 | |
| | | | | | | | | | | | |
| | | | | | | 5,635,765 | | | | 8,020,300 | |
| |
| | | | Internet Retail (3.15%) | |
| | 50,000 | | | Blue Nile, Inc.1 | | | 1,951,755 | | | | 2,853,000 | |
| |
| | | | Specialty Stores (4.13%) | |
| | 100,000 | | | Dick’s Sporting Goods, Inc.1 | | | 1,630,006 | | | | 3,750,000 | |
| | | | | | | | | | | | |
| Total Consumer Discretionary | | | 13,985,959 | | | | 20,831,166 | |
| | | | | | | | | | | | |
| | | | | | | | | | | | |
| Consumer Staples (1.90%) | |
| | | | Household Products (1.90%) | |
| | 25,000 | | | Church & Dwight Co., Inc. | | | 1,274,171 | | | | 1,725,500 | |
| | | | | | | | | | | | |
| | | | | | | | | | | | |
| Energy (10.16%) | |
| | | | Oil & Gas Drilling (2.40%) | |
| | 45,000 | | | Helmerich & Payne, Inc. | | | 1,763,828 | | | | 2,181,600 | |
| |
| | | | Oil & Gas Exploration & Production (7.76%) | |
| | 40,000 | | | Concho Resources, Inc.1 | | | 1,202,056 | | | | 3,506,800 | |
| | 60,000 | | | SM Energy Co. | | | 3,438,184 | | | | 3,535,800 | |
| | | | | | | | | | | | |
| | | | | | | 4,640,240 | | | | 7,042,600 | |
| | | | | | | | | | | | |
| Total Energy | | | 6,404,068 | | | | 9,224,200 | |
| | | | | | | | | | | | |
| | | | | | | | | | | | |
| Financials (13.71%) | |
| | | | Asset Management & Custody Banks (2.00%) | |
| | 60,000 | | | Eaton Vance Corp. | | | 962,587 | | | | 1,813,800 | |
| |
| | | | Reinsurance (2.91%) | |
| | 30,000 | | | Arch Capital Group, Ltd.1,2 | | | 1,469,556 | | | | 2,641,500 | |
| |
| | | | Specialized Finance (8.80%) | |
| | 120,000 | | | Interactive Brokers Group, Inc., Cl A1 | | | 1,882,249 | | | | 2,138,400 | |
| | 150,000 | | | MSCI, Inc., Cl A1 | | | 3,990,189 | | | | 5,844,000 | |
| | | | | | | | | | | | |
| | | | | | | 5,872,438 | | | | 7,982,400 | |
| | | | | | | | | | | | |
| Total Financials | | | 8,304,581 | | | | 12,437,700 | |
| | | | | | | | | | | | |
| | | | | | | | | | | | |
| Health Care (15.12%) | |
| | | | Health Care Distributors (2.37%) | |
| | 35,000 | | | Henry Schein, Inc.1 | | | 1,394,758 | | | | 2,148,650 | |
| |
| | | | Health Care Equipment (4.91%) | |
| | 38,000 | | | Edwards Lifesciences Corp.1 | | | 1,057,771 | | | | 3,071,920 | |
| | 20,000 | | | IDEXX Laboratories, Inc.1 | | | 1,211,865 | | | | 1,384,400 | |
| | | | | | | | | | | | |
| | | | | | | 2,269,636 | | | | 4,456,320 | |
| |
| | | | Health Care Facilities (2.88%) | |
| | 70,000 | | | Community Health Systems, Inc.1 | | | 1,210,356 | | | | 2,615,900 | |
| |
| | | | Health Care Technology (2.13%) | |
| | 100,000 | | | Allscripts Healthcare Solutions, Inc.1 | | | 1,756,017 | | | | 1,927,000 | |
| |
| | | | Life Sciences Tools & Services (2.83%) | |
| | 17,000 | | | Mettler-Toledo International, Inc.1 | | | 797,334 | | | | 2,570,570 | |
| | | | | | | | | | | | |
| Total Health Care | | | 7,428,101 | | | | 13,718,440 | |
| | | | | | | | | | | | |
| | | | | | | | | | | | |
| Shares | | | | | Cost | | | Value | |
| Common Stocks (continued) | |
| Industrials (19.38%) | |
| | | | Air Freight & Logistics (3.53%) | |
| | 40,000 | | | C. H. Robinson Worldwide, Inc. | | $ | 1,466,812 | | | $ | 3,207,600 | |
| |
| | | | Diversified Support Services (1.90%) | |
| | 75,000 | | | Ritchie Bros. Auctioneers, Inc.2 | | | 1,866,297 | | | | 1,728,750 | |
| |
| | | | Railroads (5.84%) | |
| | 100,000 | | | Genesee & Wyoming, Inc., Cl A1 | | | 3,101,975 | | | | 5,295,000 | |
| |
| | | | Research & Consulting Services (4.81%) | |
| | 128,050 | | | Verisk Analytics, Inc., Cl A1 | | | 3,651,694 | | | | 4,363,944 | |
| |
| | | | Trading Companies & Distributors (3.30%) | |
| | 50,000 | | | Fastenal Co. | | | 2,169,716 | | | | 2,995,500 | |
| | | | | | | | | | | | |
| Total Industrials | | | 12,256,494 | | | | 17,590,794 | |
| | | | | | | | | | | | |
| | | | | | | | | | | | |
| Information Technology (9.44%) | |
| | | | Application Software (8.37%) | |
| | 30,000 | | | ANSYS, Inc.1 | | | 658,716 | | | | 1,562,100 | |
| | 35,000 | | | FactSet Research Systems, Inc. | | | 1,982,041 | | | | 3,281,600 | |
| | 75,000 | | | Pegasystems, Inc. | | | 2,140,474 | | | | 2,747,250 | |
| | | | | | | | | | | | |
| | | | | | | 4,781,231 | | | | 7,590,950 | |
| |
| | | | Communications Equipment (1.07%) | |
| | 25,000 | | | Polycom, Inc.1 | | | 1,001,143 | | | | 974,500 | |
| | | | | | | | | | | | |
| Total Information Technology | | | 5,782,374 | | | | 8,565,450 | |
| | | | | | | | | | | | |
| | | | | | | | | | | | |
| Materials (4.40%) | |
| | | | Diversified Metals & Mining (4.40%) | |
| | 80,000 | | | Molycorp, Inc.1 | | | 2,220,549 | | | | 3,992,000 | |
| | | | | | | | | | | | |
| | | | | | | | | | | | |
| Utilities (2.05%) | |
| | | | Electric Utilities (2.05%) | |
| | 30,000 | | | ITC Holdings Corp. | | | 1,552,701 | | | | 1,859,400 | |
| | | | | | | | | | | | |
| Total Common Stocks | | | 59,208,998 | | | | 89,944,650 | |
| | | | | | | | | | | | |
| | | | | | | | | | | | |
Principal
Amount | | | | | | |
| Short Term Investments (0.87%) | |
| | $790,401 | | | Repurchase Agreement with Fixed Income Clearing Corp., dated 12/31/2010, 0.04% due 01/03/2011; Proceeds at maturity - $790,404; (Fully collateralized by U.S. Treasury Note, 2.125% due 12/31/2015; Market value - $833,113)3 | | | 790,401 | | | | 790,401 | |
| | | | | | | | | | | | |
| Total Investments (99.99%) | | $ | 59,999,399 | | | | 90,735,051 | |
| | | | | | | | | | | | |
| Cash and Other Assets Less Liabilities (0.01%) | | | | 7,336 | |
| | | | | | | | | | | | |
| Net Assets | | | $ | 90,742,387 | |
| | | | | | | | | | | | |
| Retail Shares (Equivalent to $9.85 per share
based on 4,709,277 shares outstanding) |
| | $ | 46,385,376 | |
| | | | | | | | | | | | |
| Institutional Shares (Equivalent to $9.88 per share
based on 4,488,831 shares outstanding) |
| | $ | 44,357,011 | |
| | | | | | | | | | | | |
| % | Represents percentage of net assets. |
| 1 | Non-income producing securities. |
| 3 | Level 2 security. See Note 7 regarding Fair Value Measurements. |
| | |
| 12 | | See Notes to Financial Statements. |
| | |
| December 31, 2010 | | Baron International Growth Fund |
STATEMENT OF NET ASSETS
DECEMBER 31, 2010
| | | | | | | | | | | | |
| Shares | | | | | Cost | | | Value | |
| Common Stocks (93.86%) | |
| Australia (1.11%) | |
| | 115,000 | | | Wotif.com Holdings, Ltd. | | $ | 471,689 | | | $ | 585,758 | |
| | | | | | | | | | | | |
| Austria (1.42%) | |
| | 19,000 | | | bwin Interactive Entertainment AG5 | | | 1,023,278 | | | | 750,825 | |
| | | | | | | | | | | | |
| Brazil (8.06%) | |
| | 40,000 | | | Anhanguera Educacional Participacoes SA | | | 525,991 | | | | 963,856 | |
| | 48,000 | | | Companhia Hering SA | | | 310,331 | | | | 780,723 | |
| | 32,000 | | | Itau Unibanco Holding SA, ADR | | | 507,851 | | | | 768,320 | |
| | 45,000 | | | Restoque Comercio e Confeccoes de Roupas SA2 | | | 63,654 | | | | 463,554 | |
| | 12,500 | | | TOTVS SA | | | 325,803 | | | | 1,272,590 | |
| | | | | | | | | | | | |
| Total Brazil | | | 1,733,630 | | | | 4,249,043 | |
| | | | | | | | | | | | |
| Canada (2.70%) | |
| | 70,000 | | | Kirkland Lake Gold, Inc.1 | | | 508,906 | | | | 1,124,308 | |
| | 13,000 | | | Ritchie Bros. Auctioneers, Inc.2 | | | 262,486 | | | | 299,650 | |
| | | | | | | | | | | | |
| Total Canada | | | 771,392 | | | | 1,423,958 | |
| | | | | | | | | | | | |
| China (12.32%) | |
| | 40,000 | | | Bona Film Group, Ltd., ADR1 | | | 324,885 | | | | 218,000 | |
| | 30,000 | | | China Automotive Systems, Inc.1,2 | | | 384,636 | | | | 408,000 | |
| | 83,000 | | | China-Biotics, Inc.1,2,3 | | | 1,020,538 | | | | 1,220,100 | |
| | 41,000 | | | E-Commerce China Dangdang, Inc., ADR1 | | | 656,000 | | | | 1,109,870 | |
| | 25,000 | | | Harbin Electric, Inc.1 | | | 436,979 | | | | 433,750 | |
| | 2,003,800 | | | Kingdee International Software
Group Co., Ltd. | | | 238,789 | | | | 1,123,992 | |
| | 65,000 | | | Origin Agritech, Ltd.1 | | | 577,929 | | | | 692,250 | |
| | 190,000 | | | Shandong Weigao Group Medical
Polymer Co., Ltd. | | | 249,563 | | | | 537,773 | |
| | 20,000 | | | Tencent Holdings, Ltd. | | | 272,772 | | | | 439,996 | |
| | 121,500 | | | Tingyi Holding Corp. | | | 137,065 | | | | 314,192 | |
| | | | | | | | | | | | |
| Total China | | | 4,299,156 | | | | 6,497,923 | |
| | | | | | | | | | | | |
| France (4.56%) | |
| | 6,020 | | | Edenred1 | | | 83,136 | | | | 142,509 | |
| | 14,000 | | | Eurofins Scientific | | | 869,424 | | | | 1,008,372 | |
| | 34,650 | | | Ingenico SA | | | 653,238 | | | | 1,254,574 | |
| | | | | | | | | | | | |
| Total France | | | 1,605,798 | | | | 2,405,455 | |
| | | | | | | | | | | | |
| Germany (6.24%) | |
| | 13,000 | | | Gerresheimer AG1,5 | | | 292,731 | | | | 571,385 | |
| | 37,500 | | | QIAGEN N.V.1,2 | | | 795,798 | | | | 733,125 | |
| | 50,000 | | | Symrise AG5 | | | 705,337 | | | | 1,370,004 | |
| | 7,530 | | | Wincor Nixdorf AG5 | | | 358,783 | | | | 616,399 | |
| | | | | | | | | | | | |
| Total Germany | | | 2,152,649 | | | | 3,290,913 | |
| | | | | | | | | | | | |
| Hong Kong (2.22%) | |
| | 525,000 | | | Wynn Macau, Ltd.1,2 | | | 689,724 | | | | 1,172,550 | |
| | | | | | | | | | | | |
| India (1.77%) | |
| | 35,000 | | | Financial Technologies , Ltd. | | | 853,268 | | | | 699,765 | |
| | 50,000 | | | Jain Irrigation Systems, Ltd. | | | 246,540 | | | | 235,492 | |
| | | | | | | | | | | | |
| Total India | | | 1,099,808 | | | | 935,257 | |
| | | | | | | | | | | | |
| Ireland (1.75%) | |
| | 30,000 | | | Ryanair Holdings plc, ADR | | | 779,604 | | | | 922,800 | |
| | | | | | | | | | | | |
| Italy (1.89%) | |
| | 200,000 | | | Amplifon SpA5 | | | 1,035,184 | | | | 996,747 | |
| | | | | | | | | | | | |
| Japan (12.92%) | |
| | 30,000 | | | Bridgestone Corp.5 | | | 576,956 | | | | 577,469 | |
| | 22,000 | | | Canon, Inc., ADR | | | 769,004 | | | | 1,129,480 | |
| | | | | | | | | | | | |
| Shares | | | | | Cost | | | Value | |
| Common Stocks (continued) | |
| Japan (continued) | |
| | 9,500 | | | Fanuc, Ltd.5 | | $ | 808,893 | | | $ | 1,452,135 | |
| | 55,000 | | | Kubota Corp.5 | | | 495,367 | | | | 518,161 | |
| | 22,000 | | | Softbank Corp.5 | | | 744,863 | | | | 758,570 | |
| | 350 | | | Sony Financial Holdings, Inc.5 | | | 1,122,484 | | | | 1,409,567 | |
| | 2,500 | | | Yahoo! Japan Corp.5 | | | 815,100 | | | | 966,319 | |
| | | | | | | | | | | | |
| Total Japan | | | 5,332,667 | | | | 6,811,701 | |
| | | | | | | | | | | | |
| Korea, Republic Of (2.21%) | |
| | 1,350 | | | LG Household & Health Care, Ltd.1,5 | | | 367,341 | | | | 464,186 | |
| | 3,500 | | | NHN Corp.1,5 | | | 585,056 | | | | 698,667 | |
| | | | | | | | | | | | |
| Total Korea, Republic Of | | | 952,397 | | | | 1,162,853 | |
| | | | | | | | | | | | |
| Mexico (2.16%) | |
| | 289,600 | | | Compartamos SAB de CV (formerly, Banco Compartamos SA de CV)1 | | | 128,306 | | | | 629,851 | |
| | 210,000 | | | Genomma Lab Internacional SA1 | | | 336,612 | | | | 509,781 | |
| | | | | | | | | | | | |
| Total Mexico | | | 464,918 | | | | 1,139,632 | |
| | | | | | | | | | | | |
| Norway (0.91%) | |
| | 425,000 | | | Sevan Marine ASA1,5 | | | 592,703 | | | | 479,406 | |
| | | | | | | | | | | | |
| Peru (1.35%) | |
| | 6,000 | | | Credicorp, Ltd. | | | 346,447 | | | | 713,460 | |
| | | | | | | | | | | | |
| Spain (1.15%) | |
| | 23,000 | | | Telvent GIT SA1,2 | | | 580,682 | | | | 607,660 | |
| | | | | | | | | | | | |
| Switzerland (8.88%) | |
| | 21,000 | | | Compagnie Financiere Richemont SA5 | | | 380,490 | | | | 1,234,880 | |
| | 9,500 | | | GAM Holding, Ltd.1,5 | | | 55,338 | | | | 157,032 | |
| | 25,000 | | | Julius Baer Group, Ltd.5 | | | 658,587 | | | | 1,170,576 | |
| | 5,000 | | | Sonova Holding AG5 | | | 635,075 | | | | 644,532 | |
| | 1,200 | | | Swatch Group AG-BR5 | | | 407,743 | | | | 535,045 | |
| | 16,000 | | | Syngenta AG, ADR | | | 769,642 | | | | 940,480 | |
| | | | | | | | | | | | |
| Total Switzerland | | | 2,906,875 | | | | 4,682,545 | |
| | | | | | | | | | | | |
| United Kingdom (9.92%) | |
| | 450,000 | | | Borders & Southern Petroleum plc1,2 | | | 407,229 | | | | 442,005 | |
| | 90,000 | | | Cairn Energy plc1 | | | 279,673 | | | | 589,340 | |
| | 200,000 | | | Caparo Energy, Ltd.1 | | | 366,401 | | | | 349,238 | |
| | 75,000 | | | Experian plc | | | 476,937 | | | | 933,121 | |
| | 30,000 | | | Intertek Group plc | | | 533,516 | | | | 830,220 | |
| | 25,000 | | | Micro Focus International plc | | | 136,575 | | | | 151,505 | |
| | 130,000 | | | PartyGaming plc1 | | | 534,755 | | | | 416,513 | |
| | 25,000 | | | Premier Oil plc1 | | | 466,957 | | | | 760,061 | |
| | 28,125 | | | Standard Chartered plc | | | 611,130 | | | | 756,626 | |
| | | | | | | | | | | | |
| Total United Kingdom | | | 3,813,173 | | | | 5,228,629 | |
| | | | | | | | | | | | |
| United States (10.32%) | |
| | 12,000 | | | Agilent Technologies, Inc.1 | | | 181,967 | | | | 497,160 | |
| | 5,000 | | | Arch Capital Group, Ltd.1 | | | 293,022 | | | | 440,250 | |
| | 8,000 | | | Core Laboratories N.V. | | | 351,996 | | | | 712,400 | |
| | 6,000 | | | Liberty Global, Inc., Cl A1 | | | 89,578 | | | | 212,280 | |
| | 50,000 | | | Net 1 UEPS Technologies, Inc.1 | | | 632,847 | | | | 613,000 | |
| | 38,000 | | | NII Holdings, Inc.1 | | | 1,112,005 | | | | 1,697,080 | |
| | 12,000 | | | Schweitzer-Mauduit International, Inc. | | | 542,139 | | | | 755,040 | |
| | 10,000 | | | Solera Holdings, Inc. | | | 232,074 | | | | 513,200 | |
| | | | | | | | | | | | |
| Total United States | | | 3,435,628 | | | | 5,440,410 | |
| | | | | | | | | | | | |
| Total Common Stocks | | | 34,087,402 | | | | 49,497,525 | |
| | | | | | | | | | | | |
| | |
| See Notes to Financial Statements. | | 13 |
| | |
| Baron International Growth Fund | | December 31, 2010 |
STATEMENT OF NET ASSETS (Continued)
DECEMBER 31, 2010
| | | | | | | | | | | | |
Principal
Amount | | | | | Cost | | | Value | |
| Short Term Investments (7.65%) | |
| | $2,754,252 | | | Repurchase Agreement with Fixed Income Clearing Corp., dated 12/31/2010, 0.04% due 01/03/2011; Proceeds at maturity - $2,754,261; (Fully collateralized by U.S. Treasury Note, 1.25% - due 10/31/2015; Market value - $2,896,563)5 | | $ | 2,754,252 | | | $ | 2,754,252 | |
| | 1,280,000 | | | Repurchase Agreement with Fixed Income Clearing Corp., dated 12/31/2010, 0.04% due 01/03/2011; Proceeds at maturity - $1,280,004; (Fully collateralized by U.S. Treasury Note, 1.25% - due 10/31/2015; Market value - $1,346,563)4,5 | | | 1,280,000 | | | | 1,280,000 | |
| | | | | | | | | | | | |
| Total Short Term Investments | | | 4,034,252 | | | | 4,034,252 | |
| | | | | | | | | | | | |
| Total Investments (101.51%) | | $ | 38,121,654 | | | | 53,531,777 | |
| | | | | | | | | | | | |
| Liabilities Less Cash and Other Assets (-1.51%) | | | | (797,735 | ) |
| | | | | | | | | | | | |
| Net Assets | | | $ | 52,734,042 | |
| | | | | | | | | | | | |
| Retail Shares (Equivalent to $17.29 per share
based on 886,987 shares outstanding) |
| | $ | 15,337,532 | |
| | | | | | | | | | | | |
| Institutional Shares (Equivalent to $17.36 per share
based on 2,153,789 shares outstanding) |
| | $ | 37,396,510 | |
| | | | | | | | | | | | |
| % | Represents percentage of net assets. |
| 1 | Non-income producing securities. |
| 2 | The Adviser has classified certain securities into this country. MSCI does not currently provide a classification for these securities. |
| 3 | All or a portion of this security is on loan. The value of all securities loaned at December 31, 2010 amounted to $1,176,000, which represents 2.23% of net assets. See Note 2(d) regarding “Securities Lending.” |
| 4 | Represents security purchased with the cash collateral received for security on loan. |
| 5 | Level 2 security. See Note 7 regarding Fair Value Measurements. |
| ADR | American Depositary Receipt. |
| | | | |
Summary of Investments by Sector
as of December 31, 2010 | | Percentage
of Net Assets | |
| |
Information Technology | | | 19.1 | % |
| |
Consumer Discretionary | | | 17.9 | |
| |
Financials | | | 11.5 | |
| |
Industrials | | | 10.9 | |
| |
Health Care | | | 10.4 | |
| |
Materials | | | 7.9 | |
| |
Energy | | | 5.7 | |
| |
Consumer Staples | | | 5.1 | |
| |
Telecommunication Services | | | 4.7 | |
| |
Utilities | | | 0.7 | |
| |
Cash and Cash Equivalents* | | | 6.1 | |
| | | | 100.0 | % |
| * | Includes short term investments. |
| | |
| 14 | | See Notes to Financial Statements. |
| | |
| December 31, 2010 | | Baron Real Estate Fund |
STATEMENT OF NET ASSETS
DECEMBER 31, 2010
| | | | | | | | | | | | |
| Shares | | | | | Cost | | | Value | |
| Common Stocks (96.27%) | |
| Consumer Discretionary (24.79%) | |
| | | | Casinos & Gaming (3.69%) | |
| | 1,950 | | | Las Vegas Sands Corp.1 | | $ | 45,107 | | | $ | 89,603 | |
| | 6,570 | | | Penn National Gaming, Inc.1 | | | 184,386 | | | | 230,935 | |
| | | | | | | | | | | | |
| | | | | | | 229,493 | | | | 320,538 | |
| |
| | | | Home Furnishings (1.02%) | |
| | 1,560 | | | Mohawk Industries, Inc.1 | | | 74,942 | | | | 88,546 | |
| |
| | | | Home Improvement Retail (1.33%) | |
| | 4,650 | | | Lumber Liquidators Holdings, Inc.1 | | | 105,962 | | | | 115,831 | |
| |
| | | | Homebuilding (2.34%) | |
| | 2,825 | | | Brookfield Homes Corp.1 | | | 19,810 | | | | 26,555 | |
| | 7,400 | | | Lennar Corp., Cl A | | | 120,273 | | | | 138,750 | |
| | 2,010 | | | Toll Brothers, Inc.1 | | | 37,284 | | | | 38,190 | |
| | | | | | | | | | | | |
| | | | | | | 177,367 | | | | 203,495 | |
| |
| | | | Hotels, Resorts & Cruise Lines (12.56%) | |
| | 4,150 | | | Carnival Corp.2 | | | 165,209 | | | | 191,356 | |
| | 42,350 | | | Great Wolf Resorts, Inc.1 | | | 108,504 | | | | 110,957 | |
| | 4,625 | | | Hyatt Hotels Corp., Cl A1 | | | 160,352 | | | | 211,640 | |
| | 48,000 | | | Mandarin Oriental International, Ltd. (Singapore)2 | | | 79,018 | | | | 99,360 | |
| | 10,050 | | | Morgans Hotel Group Co.1 | | | 54,391 | | | | 91,154 | |
| | 3,000 | | | Starwood Hotels & Resorts Worldwide, Inc. | | | 133,513 | | | | 182,340 | |
| | 6,850 | | | Wyndham Worldwide Corp. | | | 192,477 | | | | 205,226 | |
| | | | | | | | | | | | |
| | | | | | | 893,464 | | | | 1,092,033 | |
| |
| | | | Household Appliances (1.98%) | |
| | 2,565 | | | Stanley Black & Decker, Inc. | | | 143,510 | | | | 171,522 | |
| |
| | | | Leisure Facilities (1.87%) | |
| | 3,128 | | | Vail Resorts, Inc.1 | | | 123,309 | | | | 162,781 | |
| | | | | | | | | | | | |
| Total Consumer Discretionary | | | 1,748,047 | | | | 2,154,746 | |
| | | | | | | | | | | | |
| | | | | | | | | | | | |
| Energy (3.90%) | | | | | |
| | | | Oil & Gas Storage & Transportation (3.90%) | |
| | 5,000 | | | PAA Natural Gas Storage LP | | | 108,621 | | | | 124,700 | |
| | 8,000 | | | Targa Resources Corp.1 | | | 184,180 | | | | 214,480 | |
| | | | | | | | | | | | |
| Total Energy | | | 292,801 | | | | 339,180 | |
| | | | | | | | | | | | |
| | | | | | | | | | | | |
| Financials (45.07%) | |
| | | | Diversified Capital Markets (1.50%) | |
| | 13,450 | | | HFF, Inc., Cl A1 | | | 129,198 | | | | 129,927 | |
| |
| | | | Diversified Real Estate Activities (6.97%) | |
| | 8,005 | | | Brookfield Asset Management, Inc., Cl A2 | | | 192,124 | | | | 266,486 | |
| | 11,550 | | | Campus Crest Communities, Inc. | | | 144,565 | | | | 161,931 | |
| | 8,100 | | | St. Joe Co.1 | | | 163,532 | | | | 176,985 | |
| | | | | | | | | | | | |
| | | | | | | 500,221 | | | | 605,402 | |
| |
| | | | Diversified REITs (3.80%) | |
| | 8,350 | | | Colonial Properties Trust | | | 122,502 | | | | 150,717 | |
| | 2,160 | | | Vornado Realty Trust | | | 154,494 | | | | 179,993 | |
| | | | | | | | | | | | |
| | | | | | | 276,996 | | | | 330,710 | |
| |
| | | | Industrial REITs (2.85%) | |
| | 4,200 | | | AMB Property Corp. | | | 98,989 | | | | 133,182 | |
| | 7,950 | | | ProLogis | | | 82,757 | | | | 114,798 | |
| | | | | | | | | | | | |
| | | | | | | 181,746 | | | | 247,980 | |
| |
| | | | Mortgage REITs (2.00%) | |
| | 8,100 | | | Starwood Property Trust, Inc. | | | 156,573 | | | | 173,988 | |
| |
| | | | Office REITs (4.20%) | |
| | 4,200 | | | Corporate Office Properties Trust | | | 143,633 | | | | 146,790 | |
| | 7,800 | | | Douglas Emmett, Inc. | | | 113,562 | | | | 129,480 | |
| | 1,315 | | | SL Green Realty Corp. | | | 65,748 | | | | 88,776 | |
| | | | | | | | | | | | |
| | | | | | | 322,943 | | | | 365,046 | |
| | | | | | | | | | | | |
| Shares | | | | | Cost | | | Value | |
| Common Stocks (continued) | |
| Financials (continued) | |
| | | | Real Estate Operating Companies (2.33%) | |
| | 12,150 | | | Forest City Enterprises, Inc., Cl A1 | | $ | 159,219 | | | $ | 202,783 | |
| |
| | | | Real Estate Services (1.52%) | |
| | 6,450 | | | CB Richard Ellis Group, Inc., Cl A1 | | | 88,156 | | | | 132,096 | |
| |
| | | | Residential REITs (4.73%) | |
| | 4,184 | | | American Campus Communities, Inc. | | | 109,401 | | | | 132,884 | |
| | 11,350 | | | Associated Estates Realty Corp. | | | 159,722 | | | | 173,541 | |
| | 930 | | | AvalonBay Communities, Inc. | | | 76,173 | | | | 104,672 | |
| | | | | | | | | | | | |
| | | | | | | 345,296 | | | | 411,097 | |
| |
| | | | Retail REITs (1.77%) | |
| | 1,550 | | | Simon Property Group, Inc. | | | 124,048 | | | | 154,210 | |
| |
| | | | Specialized REITs (13.40%) | |
| | 2,395 | | | Alexandria Real Estate Equities, Inc.3 | | | 157,287 | | | | 175,458 | |
| | 3,100 | | | Chesapeake Lodging Trust3 | | | 56,340 | | | | 58,311 | |
| | 3,000 | | | Chesapeake Lodging Trust3,4,5 | | | 56,400 | | | | 55,290 | |
| | 2,450 | | | Entertainment Properties Trust | | | 93,424 | | | | 113,312 | |
| | 5,800 | | | LaSalle Hotel Properties | | | 129,765 | | | | 153,120 | |
| | 7,400 | | | Pebblebrook Hotel Trust | | | 143,724 | | | | 150,368 | |
| | 1,600 | | | Public Storage | | | 139,065 | | | | 162,272 | |
| | 18,900 | | | U-Store-It Trust | | | 147,752 | | | | 180,117 | |
| | 2,220 | | | Ventas, Inc. | | | 100,306 | | | | 116,506 | |
| | | | | | | | | | | | |
| | | | | | | 1,024,063 | | | | 1,164,754 | |
| | | | | | | | | | | | |
| Total Financials | | | 3,308,459 | | | | 3,917,993 | |
| | | | | | | | | | | | |
| | | | | | | | | | | | |
| Health Care (7.74%) | |
| | | | Health Care Facilities (7.74%) | |
| | 3,542 | | | Assisted Living Concepts, Inc.1 | | | 102,521 | | | | 115,221 | |
| | 10,130 | | | Brookdale Senior Living, Inc.1 | | | 179,009 | | | | 216,884 | |
| | 28,550 | | | Capital Senior Living Corp.1 | | | 143,293 | | | | 191,285 | |
| | 7,600 | | | Emeritus Corp.1 | | | 147,623 | | | | 149,796 | |
| | | | | | | | | | | | |
| Total Health Care | | | 572,446 | | | | 673,186 | |
| | | | | | | | | | | | |
| | | | | | | | | | | | |
| Industrials (4.43%) | |
| | | | Building Products (2.46%) | |
| | 2,100 | | | Armstrong World Industries, Inc. 1 | | | 43,796 | | | | 90,300 | |
| | 3,950 | | | Owens Corning, Inc.1 | | | 98,545 | | | | 123,042 | |
| | | | | | | | | | | | |
| | | | | | | 142,341 | | | | 213,342 | |
| |
| | | | Construction & Engineering (0.91%) | |
| | 2,830 | | | AECOM Technology Corp.1 | | | 76,333 | | | | 79,155 | |
| |
| | | | Research & Consulting Services (1.06%) | |
| | 1,603 | | | CoStar Group, Inc.1 | | | 81,992 | | | | 92,269 | |
| | | | | | | | | | | | |
| Total Industrials | | | 300,666 | | | | 384,766 | |
| | | | | | | | | | | | |
| | | | | | | | | | | | |
| Information Technology (4.40%) | |
| | | | Application Software (2.95%) | |
| | 8,296 | | | RealPage, Inc.1 | | | 159,298 | | | | 256,595 | |
| |
| | | | IT Consulting & Other Services (1.45%) | |
| | 1,545 | | | Equinix, Inc.1,3 | | | 153,060 | | | | 125,547 | |
| | | | | | | | | | | | |
| Total Information Technology | | | 312,358 | | | | 382,142 | |
| | | | | | | | | | | | |
| | | | | | | | | | | | |
| Telecommunication Services (4.18%) | |
| | | | Wireless Telecommunication Services (4.18%) | |
| | 2,900 | | | American Tower Corp., Cl A1 | | | 128,490 | | | | 149,756 | |
| | 5,225 | | | SBA Communications Corp., Cl A1 | | | 184,893 | | | | 213,911 | |
| | | | | | | | | | | | |
| Total Telecommunication Services | | | 313,383 | | | | 363,667 | |
| | | | | | | | | | | | |
| | |
| See Notes to Financial Statements. | | 15 |
| | |
| Baron Real Estate Fund | | December 31, 2010 |
STATEMENT OF NET ASSETS (Continued)
DECEMBER 31, 2010
| | | | | | | | | | | | |
| Shares | | | | | Cost | | | Value | |
| Common Stocks (continued) | |
| Utilities (1.76%) | |
| | | | Electric Utilities (1.76%) | |
| | 7,250 | | | Brookfield Infrastructure Partners LP2 | | $ | 122,809 | | | $ | 152,613 | |
| | | | | | | | | | | | |
| Total Common Stocks | | | 6,970,969 | | | | 8,368,293 | |
| | | | | | | | | | | | |
| | | | | | | | | | | | |
Principal
Amount | | | | | | |
| Short Term Investments (2.81%) | |
| | $244,045 | | | Repurchase Agreement with Fixed Income Clearing Corp., dated 12/31/2010, 0.04% due 01/03/2011; Proceeds at maturity - $244,046; (Fully collateralized by U.S. Treasury Note, 2.125% due 12/31/2015; Market value - $260,975)5 | | | 244,045 | | | | 244,045 | |
| | | | | | | | | | | | |
| Total Investments (99.08%) | | $ | 7,215,014 | | | | 8,612,338 | |
| | | | | | | | | | | | |
| Cash and Other Assets Less Liabilities (0.92%) | | | | 80,012 | |
| | | | | | | | | | | | |
| Net Assets | | | $ | 8,692,350 | |
| | | | | | | | | | | | |
| Retail Shares (Equivalent to $12.66 per share
based on 432,489 shares outstanding) |
| | $ | 5,473,834 | |
| | | | | | | | | | | | |
| Institutional Shares (Equivalent to $12.69 per share
based on 253,649 shares outstanding) |
| | $ | 3,218,516 | |
| | | | | | | | | | | | |
| % | Represents percentage of net assets. |
| 1 | Non-income producing securities. |
| 3 | The Adviser has reclassified/classified certain securities in or out of this sub-industry. Such reclassifications/classifications are not supported by S&P or MSCI. |
| 4 | At December 31, 2010, the market value of restricted and fair valued securities amounted to $55,290 or 0.64% of net assets. All of these securities are deemed liquid. See Note 6 regarding restricted securities. |
| 5 | Level 2 security. See Note 7 regarding Fair Value Measurements. |
| | |
| 16 | | See Notes to Financial Statements. |
| | |
| December 31, 2010 | | Baron Select Funds |
STATEMENTS OF ASSETS AND LIABILITIES
DECEMBER 31, 2010
| | | | | | | | | | | | | | | | |
| | | Baron Partners
Fund | | | Baron Focused
Growth Fund | | | Baron International
Growth Fund | | | Baron Real
Estate Fund | |
Assets: | | | | | | | | | | | | | | | | |
Investments in securities, at cost | | $ | 1,153,689,820 | | | $ | 59,999,399 | | | $ | 38,121,654 | | | $ | 7,215,014 | |
Foreign currency, at cost | | | — | | | | — | | | | 505,530 | | | | — | |
| | | | |
Investments in securities, at value | | $ | 1,721,275,942 | | | $ | 90,735,051 | | | $ | 53,531,777 | | | $ | 8,612,338 | |
Foreign currency, at value | | | — | | | | — | | | | 535,368 | | | | — | |
Receivable for shares sold | | | 2,041,606 | | | | 5,551 | | | | 78,652 | | | | 53,451 | |
Dividends and interest receivable | | | 436,000 | | | | 34,701 | | | | 68,541 | | | | 14,173 | |
Prepaid expenses | | | 151,077 | | | | 159 | | | | 70 | | | | — | |
Due from investment adviser | | | — | | | | — | | | | — | | | | 32,833 | |
| | | | | | | | | | | | | | | | |
| | | 1,723,904,625 | | | | 90,775,462 | | | | 54,214,408 | | | | 8,712,795 | |
| | | | | | | | | | | | | | | | |
Liabilities: | | | | | | | | | | | | | | | | |
Payable for borrowings against line of credit | | | 347,500,000 | | | | — | | | | — | | | | — | |
Payable for securities purchased | | | 2,571,890 | | | | — | | | | 172,379 | | | | — | |
Payable for shares redeemed | | | 1,460,884 | | | | 730 | | | | — | | | | — | |
Payable for collateral on loaned securities | | | — | | | | — | | | | 1,280,000 | | | | — | |
Distribution fees payable (Note 4) | | | 978 | | | | 581 | | | | 444 | | | | 481 | |
Investment advisory fees payable (Note 4) | | | 197 | | | | 847 | | | | 907 | | | | — | |
Accrued expenses and other payables | | | 568,451 | | | | 30,917 | | | | 26,636 | | | | 19,964 | |
| | | | | | | | | | | | | | | | |
| | | 352,102,400 | | | | 33,075 | | | | 1,480,366 | | | | 20,445 | |
| | | | | | | | | | | | | | | | |
Net Assets | | $ | 1,371,802,225 | | | $ | 90,742,387 | | | $ | 52,734,042 | | | $ | 8,692,350 | |
| | | | | | | | | | | | | | | | |
Net Assets consist of: | | | | | | | | | | | | | | | | |
Paid-in capital | | $ | 1,431,653,445 | | | $ | 76,649,578 | | | $ | 36,366,248 | | | $ | 7,169,332 | |
Accumulated net investment income (loss) | | | (204,698 | ) | | | — | | | | 181,403 | | | | 3,839 | |
Accumulated net realized gain (loss) on investments and foreign currency transactions | | | (627,232,644 | ) | | | (16,642,843 | ) | | | 745,765 | | | | 121,855 | |
Net unrealized appreciation of investments and foreign currency translations | | | 567,586,122 | | | | 30,735,652 | | | | 15,440,626 | | | | 1,397,324 | |
| | | | | | | | | | | | | | | | |
Net Assets | | $ | 1,371,802,225 | | | $ | 90,742,387 | | | $ | 52,734,042 | | | $ | 8,692,350 | |
| | | | | | | | | | | | | | | | |
Retail Shares: | | | | | | | | | | | | | | | | |
Net Assets | | $ | 1,251,912,829 | | | $ | 46,385,376 | | | $ | 15,337,532 | | | $ | 5,473,834 | |
| | | | | | | | | | | | | | | | |
Shares Outstanding ($0.01 par value; indefinite shares authorized) | | | 60,847,931 | | | | 4,709,277 | | | | 886,987 | | | | 432,489 | |
| | | | | | | | | | | | | | | | |
Net Asset Value Per Share | | $ | 20.57 | | | $ | 9.85 | | | $ | 17.29 | | | $ | 12.66 | |
| | | | | | | | | | | | | | | | |
Institutional Shares: | | | | | | | | | | | | | | | | |
Net Assets | | $ | 119,889,396 | | | $ | 44,357,011 | | | $ | 37,396,510 | | | $ | 3,218,516 | |
| | | | | | | | | | | | | | | | |
Shares Outstanding ($0.01 par value; indefinite shares authorized) | | | 5,803,391 | | | | 4,488,831 | | | | 2,153,789 | | | | 253,649 | |
| | | | | | | | | | | | | | | | |
Net Asset Value Per Share | | $ | 20.66 | | | $ | 9.88 | | | $ | 17.36 | | | $ | 12.69 | |
| | | | | | | | | | | | | | | | |
| | |
| See Notes to Financial Statements. | | 17 |
| | |
| Baron Select Funds | | December 31, 2010 |
STATEMENTS OF OPERATIONS
FORTHE YEAR ENDED DECEMBER 31, 2010
| | | | | | | | | | | | | | | | |
| | | Baron Partners
Fund | | | Baron Focused
Growth Fund | | | Baron International
Growth Fund | | | Baron Real
Estate Fund | |
Investment income: | | | | | | | | | | | | | | | | |
Income: | | | | | | | | | | | | | | | | |
Dividends | | $ | 15,350,393 | | | $ | 670,529 | | | $ | 542,495 | | | $ | 85,542 | |
Interest | | | 340,798 | | | | 263,014 | | | | 490 | | | | 112 | |
Securities lending income | | | — | | | | — | | | | 93,948 | | | | — | |
Foreign taxes withheld on dividends | | | (115,963 | ) | | | (6,153 | ) | | | (26,807 | ) | | | (442 | ) |
| | | | | | | | | | | | | | | | |
Total income | | | 15,575,228 | | | | 927,390 | | | | 610,126 | | | | 85,212 | |
| | | | | | | | | | | | | | | | |
Expenses: | | | | | | | | | | | | | | | | |
Investment advisory fees (Note 4) | | | 13,090,699 | | | | 782,706 | | | | 390,256 | | | | 57,539 | |
Distribution fees — Retail Shares (Note 4) | | | 2,878,107 | | | | 99,170 | | | | 28,900 | | | | 9,481 | |
Shareholder servicing agent fees and expenses — Retail Shares | | | 366,190 | | | | 22,474 | | | | 16,473 | | | | 14,977 | |
Shareholder servicing agent fees and expenses — Institutional Shares | | | 36,053 | | | | 9,901 | | | | 8,988 | | | | 9,089 | |
Reports to shareholders | | | 582,671 | | | | 5,975 | | | | 882 | | | | 2,544 | |
Professional fees | | | 82,647 | | | | 33,941 | | | | 35,270 | | | | 35,515 | |
Registration and filing fees | | | 50,489 | | | | 24,909 | | | | 35,737 | | | | 65,039 | |
Custodian fees | | | 65,497 | | | | 26,230 | | | | 41,254 | | | | 27,101 | |
Administration fees | | | 26,505 | | | | 26,391 | | | | 26,402 | | | | 26,503 | |
Trustee fees and expenses | | | 86,683 | | | | 5,331 | | | | 2,648 | | | | 471 | |
Line of credit fees | | | 230,612 | | | | — | | | | — | | | | — | |
Insurance expense | | | 29,158 | | | | 964 | | | | 668 | | | | 58 | |
Miscellaneous expenses | | | 797 | | | | 1,773 | | | | 2,011 | | | | 198 | |
| | | | | | | | | | | | | | | | |
Total operating expenses | | | 17,526,108 | | | | 1,039,765 | | | | 589,489 | | | | 248,515 | |
Interest expense | | | 4,434,446 | | | | — | | | | — | | | | — | |
| | | | | | | | | | | | | | | | |
Total expenses | | | 21,960,554 | | | | 1,039,765 | | | | 589,489 | | | | 248,515 | |
Reimbursement of expenses by Adviser — Retail Shares (Note 4) | | | — | | | | (46,395 | ) | | | (30,589 | ) | | | (113,802 | ) |
Reimbursement of expenses by Adviser — Institutional Shares (Note 4) | | | — | | | | (33,223 | ) | | | (42,180 | ) | | | (61,939 | ) |
| | | | | | | | | | | | | | | | |
Net expenses | | | 21,960,554 | | | | 960,147 | | | | 516,720 | | | | 72,774 | |
| | | | | | | | | | | | | | | | |
Net investment income (loss) | | | (6,385,326 | ) | | | (32,757 | ) | | | 93,406 | | | | 12,438 | |
| | | | | | | | | | | | | | | | |
Realized and unrealized gain (loss) on investments: | | | | | | | | | | | | | | | | |
Net realized gain (loss) on: | | | | | | | | | | | | | | | | |
Investments | | | 96,863,710 | | | | 3,789,812 | | | | 937,970 | | | | 111,960 | |
Foreign currency transactions | | | (204,698 | ) | | | (45,735 | ) | | | (64,431 | ) | | | 15 | |
Net change in unrealized appreciation (depreciation) of: | | | | | | | | | | | | | | | | |
Investments | | | 267,145,354 | | | | 14,908,861 | | | | 8,354,972 | 1 | | | 1,397,324 | |
Foreign currency translations | | | — | | | | — | | | | 45,894 | | | | — | |
| | | | | | | | | | | | | | | | |
Net gain on investments | | | 363,804,366 | | | | 18,652,938 | | | | 9,274,405 | | | | 1,509,299 | |
| | | | | | | | | | | | | | | | |
Net increase in net assets resulting from operations | | $ | 357,419,040 | | | $ | 18,620,181 | | | $ | 9,367,811 | | | $ | 1,521,737 | |
| | | | | | | | | | | | | | | | |
| 1 | Net of change in accrued foreign capital gains tax of $(631). |
| | |
| 18 | | See Notes to Financial Statements. |
| | |
| December 31, 2010 | | Baron Select Funds |
STATEMENTS OF CHANGES IN NET ASSETS
DECEMBER 31, 2010
| | | | | | | | | | | | | | | | |
| | | Baron Partners Fund | | | Baron Focused Growth Fund | |
| | | For the
Year Ended
December 31,
2010 | | | For the
Year Ended
December 31,
2009 | | | For the
Year Ended
December 31,
2010 | | | For the
Year Ended
December 31,
2009 | |
Increase (Decrease) in Net Assets: | | | | | | | | | | | | | | | | |
Operations: | | | | | | | | | | | | | | | | |
Net investment income (loss) | | $ | (6,385,326 | ) | | $ | (4,180,882 | ) | | $ | (32,757 | ) | | $ | 1,147,084 | |
Net realized gain (loss) | | | 96,659,012 | | | | (77,229,085 | ) | | | 3,744,077 | | | | (910,428 | ) |
Net change in unrealized appreciation | | | 267,145,354 | | | | 406,157,253 | | | | 14,908,861 | | | | 19,097,442 | |
| | | | | | | | | | | | | | | | |
Increase in net assets resulting from operations | | | 357,419,040 | | | | 324,747,286 | | | | 18,620,181 | | | | 19,334,098 | |
| | | | | | | | | | | | | | | | |
Distributions to shareholders from: | | | | | | | | | | | | | | | | |
Net investment income — Retail Shares | | | — | | | | — | | | | (1,488,122 | ) | | | (642,945 | ) |
Net investment income — Institutional Shares | | | — | | | | — | | | | (1,414,220 | ) | | | (507,863 | ) |
Net realized gain on investments — Retail Shares | | | — | | | | — | | | | — | | | | — | |
Net realized gain on investments — Institutional Shares | | | — | | | | — | | | | — | | | | — | |
Return of capital — Retail Shares | | | — | | | | — | | | | — | | | | (637,842 | ) |
Return of capital — Institutional Shares | | | — | | | | — | | | | — | | | | (503,832 | ) |
| | | | | | | | | | | | | | | | |
Decrease in net assets from distributions to shareholders | | | — | | | | — | | | | (2,902,342 | ) | | | (2,292,482 | ) |
| | | | | | | | | | | | | | | | |
Capital share transactions: | | | | | | | | | | | | | | | | |
Proceeds from the sale of shares — Retail Shares | | | 127,303,615 | | | | 188,188,917 | | | | 4,023,830 | | | | 3,844,910 | |
Proceeds from the sale of shares — Institutional Shares | | | 33,295,847 | | | | 163,722,457 | | | | 1,488,854 | | | | 31,725,608 | |
Net asset value of shares issued in reinvestment of distributions — Retail Shares | | | — | | | | — | | | | 1,387,261 | | | | 1,202,142 | |
Net asset value of shares issued in reinvestment of distributions — Institutional Shares | | | — | | | | — | | | | 1,404,261 | | | | 1,011,694 | |
Cost of shares redeemed — Retail Shares | | | (443,431,776 | ) | | | (743,836,296 | ) | | | (6,817,657 | ) | | | (37,625,256 | ) |
Cost of shares redeemed — Institutional Shares | | | (110,570,717 | ) | | | (26,330,957 | ) | | | (2,963,628 | ) | | | (153 | ) |
| | | | | | | | | | | | | | | | |
Increase (decrease) in net assets derived from capital share transactions | | | (393,403,031 | ) | | | (418,255,879 | ) | | | (1,477,079 | ) | | | 158,945 | |
| | | | | | | | | | | | | | | | |
Increase (decrease) in net assets | | | (35,983,991 | ) | | | (93,508,593 | ) | | | 14,240,760 | | | | 17,200,561 | |
| | | | | | | | | | | | | | | | |
Net Assets: | | | | | | | | | | | | | | | | |
Beginning of year | | | 1,407,786,216 | | | | 1,501,294,809 | | | | 76,501,627 | | | | 59,301,066 | |
| | | | | | | | | | | | | | | | |
End of year | | $ | 1,371,802,225 | | | $ | 1,407,786,216 | | | $ | 90,742,387 | | | $ | 76,501,627 | |
| | | | | | | | | | | | | | | | |
Accumulated net investment loss at end of year | | $ | (204,698 | ) | | $ | (46 | ) | | $ | — | | | $ | (10 | ) |
| | | | | | | | | | | | | | | | |
Capital share transactions — Retail Shares: | | | | | | | | | | | | | | | | |
Shares sold | | | 7,346,426 | | | | 15,270,630 | | | | 458,290 | | | | 560,170 | |
Shares issued in reinvestment of distributions | | | — | | | | — | | | | 146,490 | | | | 145,714 | |
Shares redeemed | | | (26,399,948 | ) | | | (58,467,618 | ) | | | (798,436 | ) | | | (5,260,483 | ) |
| | | | | | | | | | | | | | | | |
Net decrease | | | (19,053,522 | ) | | | (43,196,988 | ) | | | (193,656 | ) | | | (4,554,599 | ) |
| | | | | | | | | | | | | | | | |
Capital share transactions — Institutional Shares: | | | | | | | | | | | | | | | | |
Shares sold | | | 1,978,755 | | | | 11,883,097 | | | | 169,546 | | | | 4,369,990 | |
Shares issued in reinvestment of distributions | | | — | | | | — | | | | 147,817 | | | | 122,630 | |
Shares redeemed | | | (6,297,610 | ) | | | (1,760,851 | ) | | | (321,133 | ) | | | (19 | ) |
| | | | | | | | | | | | | | | | |
Net increase (decrease) | | | (4,318,855 | ) | | | 10,122,246 | | | | (3,770 | ) | | | 4,492,601 | |
| | | | | | | | | | | | | | | | |
| | |
| See Notes to Financial Statements. | | 19 |
| | |
| Baron Select Funds | | December 31, 2010 |
STATEMENTS OF CHANGES IN NET ASSETS (Continued)
DECEMBER 31, 2010
| | | | | | | | | | | | |
| | | Baron International Growth Fund | | | Baron Real Estate Fund | |
| | | For the
Year Ended
December 31,
2010 | | | For the
Year Ended
December 31,
2009 | | | For the
Year Ended
December 31,
2010 | |
Increase (Decrease) in Net Assets: | | | | | | | | | | | | |
Operations: | | | | | | | | | | | | |
Net investment income | | $ | 93,406 | | | $ | 5,979 | | | $ | 12,438 | |
Net realized gain | | | 873,539 | | | | 1,269,245 | | | | 111,975 | |
Net change in unrealized appreciation | | | 8,400,866 | | | | 7,039,760 | | | | 1,397,324 | |
| | | | | | | | | | | | |
Increase in net assets resulting from operations | | | 9,367,811 | | | | 8,314,984 | | | | 1,521,737 | |
| | | | | | | | | | | | |
Distributions to shareholders from: | | | | | | | | | | | | |
Net investment income — Retail Shares | | | — | | | | — | | | | — | |
Net investment income — Institutional Shares | | | — | | | | — | | | | — | |
Net realized gain on investments — Retail Shares | | | (164,017 | ) | | | (206,238 | ) | | | — | |
Net realized gain on investments — Institutional Shares | | | (402,971 | ) | | | (550,122 | ) | | | — | |
Return of capital — Retail Shares | | | — | | | | — | | | | — | |
Return of capital — Institutional Shares | | | — | | | | — | | | | — | |
| | | | | | | | | | | | |
Decrease in net assets from distributions to shareholders | | | (566,988 | ) | | | (756,360 | ) | | | — | |
| | | | | | | | | | | | |
Capital share transactions: | | | | | | | | | | | | |
Proceeds from the sale of shares — Retail Shares | | | 8,010,189 | | | | 22,955,174 | | | | 5,395,141 | |
Proceeds from the sale of shares — Institutional Shares | | | 8,626,269 | | | | 17,305,249 | | | | 2,663,989 | |
Net asset value of shares issued in reinvestment of distributions — Retail Shares | | | 162,095 | | | | 205,235 | | | | — | |
Net asset value of shares issued in reinvestment of distributions — Institutional Shares | | | 402,971 | | | | 550,121 | | | | — | |
Cost of shares redeemed — Retail Shares | | | (3,707,694 | ) | | | (18,095,505 | ) | | | (888,517 | ) |
Cost of shares redeemed — Institutional Shares | | | (39,509 | ) | | | — | | | | — | |
| | | | | | | | | | | | |
Increase in net assets derived from capital share transactions | | | 13,454,321 | | | | 22,920,274 | | | | 7,170,613 | |
| | | | | | | | | | | | |
Increase in net assets | | | 22,255,144 | | | | 30,478,898 | | | | 8,692,350 | |
| | | | | | | | | | | | |
Net Assets: | | | | | | | | | | | | |
Beginning of year | | | 30,478,898 | | | | — | | | | — | |
| | | | | | | | | | | | |
End of year | | $ | 52,734,042 | | | $ | 30,478,898 | | | $ | 8,692,350 | |
| | | | | | | | | | | | |
Undistributed net investment income (loss) at end of year | | $ | 181,403 | | | $ | (37,208 | ) | | $ | 3,839 | |
| | | | | | | | | | | | |
Capital share transactions — Retail Shares: | | | | | | | | | | | | |
Shares sold | | | 533,701 | | | | 2,168,079 | | | | 513,533 | |
Shares issued in reinvestment of distributions | | | 10,539 | | | | 14,504 | | | | — | |
Shares redeemed | | | (248,636 | ) | | | (1,591,200 | ) | | | (81,044 | ) |
| | | | | | | | | | | | |
Net increase | | | 295,604 | | | | 591,383 | | | | 432,489 | |
| | | | | | | | | | | | |
Capital share transactions — Institutional Shares: | | | | | | | | | | | | |
Shares sold | | | 563,646 | | | | 1,528,116 | | | | 253,649 | |
Shares issued in reinvestment of distributions | | | 26,099 | | | | 38,823 | | | | — | |
Shares redeemed | | | (2,895 | ) | | | — | | | | — | |
| | | | | | | | | | | | |
Net increase | | | 586,850 | | | | 1,566,939 | | | | 253,649 | |
| | | | | | | | | | | | |
| | |
| 20 | | See Notes to Financial Statements. |
| | |
| December 31, 2010 | | Baron Select Funds |
STATEMENT OF CASH FLOWS
FORTHE YEAR ENDED DECEMBER 31, 2010
| | | | |
| | | Baron Partners Fund | |
Increase (Decrease) in Cash: | | | | |
Cash Provided from Operating Activities: | | | | |
Net increase in net assets from operations | | $ | 357,419,040 | |
Adjustments to reconcile net increase in net assets from operations to net cash provided by operating activities: | | | | |
Purchases of portfolio securities | | | (249,677,004 | ) |
Proceeds from sales of portfolio securities | | | 583,234,055 | |
Net purchases, sales and maturities of short-term investments | | | (133,335 | ) |
Decrease in dividends and interest receivable | | | 98,498 | |
Increase in other assets | | | (71,110 | ) |
Decrease in accrued expenses | | | (43,413 | ) |
Net realized gain on investments | | | (96,863,710 | ) |
Net change in net unrealized appreciation of investments | | | (267,145,354 | ) |
Other increase | | | 260,825 | |
| | | | |
Net cash provided by operating activities | | | 327,078,492 | |
| | | | |
Cash Used from Financing Activities: | | | | |
Proceeds from shares sold | | | 159,677,056 | |
Payment for shares redeemed | | | (557,807,729 | ) |
Increase in payable for borrowings against line of credit | | | 71,000,000 | |
| | | | |
Net cash used in financing activities | | | (327,130,673 | ) |
| | | | |
Net decrease in cash | | | (52,181 | ) |
Cash beginning of year | | | 52,181 | |
| | | | |
Cash end of year | | $ | — | |
| | | | |
Supplemental cash flow information: | | | | |
Interest paid | | $ | 4,525,370 | |
| | | | |
| | |
| See Notes to Financial Statements. | | 21 |
| | |
| Baron Select Funds | | December 31, 2010 |
NOTES TO FINANCIAL STATEMENTS
1. ORGANIZATION
Baron Select Funds (the “Trust”) is registered under the Investment Company Act of 1940, as amended (the “1940 Act”), as an open-end management investment company established as a Delaware statutory trust on April 30, 2003. The Trust currently offers five series (individually a “Fund” and collectively the “Funds”): Baron Partners Fund, Baron Focused Growth Fund (effective December 31, 2010, Baron Retirement Income Fund was renamed Baron Focused Growth Fund) and Baron Real Estate Fund, which are non-diversified; and Baron International Growth Fund and Baron Emerging Markets Fund, which are diversified. Baron Emerging Markets Fund commenced trading operations on January 1, 2011 and, therefore, is not included in this report. The Funds’ investment objective is to seek capital appreciation. Baron Partners Fund may employ “leverage” by borrowing money and using it for the purchase of additional securities. Borrowing for investment increases both investment opportunity and investment risk. Baron International Growth Fund and Baron Emerging Markets Fund invest their assets primarily in non-U.S. companies. Baron Real Estate Fund invests its assets primarily in U.S. and non-U.S. real estate and real estate-related companies.
Each Fund offers two classes of shares, Retail Shares and Institutional Shares, which differ only in their ongoing fees, expenses and eligibility requirements. Retail Shares are offered to all investors. Institutional Shares are for investments in the amount of $1 million or more per Fund. Institutional Shares are intended for certain financial intermediaries that offer shares of Baron Funds through fee based platforms, retirement platforms or other platforms. Each class of shares has equal rights to earnings and assets except that each class bears different expenses for distribution and shareholder servicing. Investment income, realized and unrealized gains or losses on investment and foreign currency, and expenses other than those attributable to a specific class are allocated to each class based on its relative net assets. Each class of shares has exclusive voting rights with respect to matters that affect just that class.
Baron Partners Fund was organized originally as a limited partnership in January 1992, under the laws of the State of Delaware. Effective as of the close of business on April 30, 2003, the predecessor partnership was reorganized into a Delaware statutory trust. Baron Partners Fund commenced operations on April 30, 2003 with a contribution of assets and liabilities, including securities-in-kind from the predecessor partnership.
Baron Focused Growth Fund was organized originally as a limited partnership in May 1996, under the laws of the State of Delaware. Effective as of the close of business on June 30, 2008, the predecessor partnership was reorganized into a series of the Trust. Baron Focused Growth Fund commenced operations on June 30, 2008 with a contribution of assets and liabilities, including securities-in-kind from the predecessor partnership.
Baron Real Estate Fund commenced trading operations on January 1, 2010.
2. SIGNIFICANT ACCOUNTING POLICIES
The following is a summary of significant accounting policies followed by the Funds. The policies are in conformity with accounting principles generally accepted in the United States of America (“GAAP”). The preparation of financial statements in accordance with GAAP requires management to make estimates and assumptions that affect the reported amounts of assets and liabilities at the date of the financial statements and the amounts of income and expenses during the period. Actual results could differ from those estimates. Events occurring subsequent to the date of the Statements of Assets and Liabilities and through the date of issuance of the financial statements have been evaluated for adjustment to or disclosure in the financial statements.
a) Security Valuation. The Funds’ share prices or net asset values are calculated as of the close of regular session trading (usually 4 p.m. E.T.) on the New York Stock Exchange (“NYSE”) on any day on which the NYSE is open for trading. Portfolio securities traded on any national stock exchange are valued based on the last sale price. For securities traded on NASDAQ, the Funds use the NASDAQ Official Closing Price. Where market quotations are not readily available, or, if in the Adviser’s judgment, they do not accurately reflect the fair value of a security, or an event occurs after the market close but before the Funds are priced that materially affects the value of a security, the securities will be valued by the Adviser using policies and procedures approved by the Board of Trustees (the “Board”). The Adviser has a Fair Valuation Committee (the “Committee”) comprised of senior executives and the Committee reports to the Board every quarter. Factors the Committee considers when valuing a security include whether a current price is stale, there is recent news, the security is thinly traded, transactions are infrequent or quotations are genuine. There can be no guarantee, however, that a fair valuation used by the Funds on any given day will more accurately reflect the market value of an investment than the closing price of such investment in its market. Debt instruments having a remaining maturity greater than sixty days will be valued on the basis of prices obtained from a pricing service approved by the Board or at the mean of the bid and ask prices from the dealer maintaining an active market in that security. Money market instruments held by the Funds with a remaining maturity of sixty days or less are valued at amortized cost, which approximates fair value.
Non-U.S. equity securities are valued on the basis of their most recent closing market prices and translated into U.S. dollars at 4 p.m. E.T., except under the circumstances described below. Most foreign markets close before 4 p.m. E.T. For securities primarily traded in the Far East, for example, the most recent closing prices may be as much as fifteen hours old at 4 p.m. E.T. If the Adviser determines that developments between the close of the foreign market and 4 p.m. E.T. will, in its judgment, materially affect the value of some or all of the Funds’ securities, the Adviser will adjust the previous closing
22
| | |
| December 31, 2010 | | Baron Select Funds |
NOTES TO FINANCIAL STATEMENTS (Continued)
2. SIGNIFICANT ACCOUNTING POLICIES (Continued)
prices to reflect what it believes to be the fair value of the securities as of 4 p.m. E.T. In deciding whether to make these adjustments, the Adviser reviews a variety of factors, including developments in foreign markets, the performance of U.S. securities markets, and the performance of instruments trading in U.S. markets that represent non-U.S. securities and baskets of non-U.S. securities. The Adviser may also fair value securities in other situations, for example, when a particular foreign market is closed but the Funds are open. The Adviser uses outside pricing services to provide it with closing market prices and information used for adjusting those prices. The Adviser cannot predict how often it will use closing prices or how often it will adjust those prices. As a means of evaluating its fair value process, the Adviser routinely compares closing market prices, the next day’s opening prices in the same markets, and adjusted prices. Other mutual funds may adjust the prices of their securities by different amounts.
b) Foreign Currency Translations. Values of assets and liabilities denominated in foreign currencies are translated into U.S. dollars using the price of such currencies at the time the net asset value is determined. Purchases and sales of investments and dividend income are converted at the prevailing rate of exchange on the respective dates of such transactions. Net realized gain (loss) on foreign currency transactions include gain (loss) arising from the fluctuation in the exchange rates between trade and settlement dates on security transactions and currency gain (loss) between the accrual and payment dates on dividends and foreign withholding taxes. The Funds do not isolate that portion of the results of operations resulting from changes in foreign exchange rates on investments from the fluctuations arising from changes in market prices of securities held. Such fluctuations are included with the net realized and unrealized gain or loss from investments and foreign currency transactions.
c) Securities Transactions, Investment Income and Expense Allocation. Securities transactions are recorded on a trade date basis. Realized gain and loss from securities transactions are recorded on an identified cost basis for financial reporting and federal income tax purposes. Dividend income is recognized on the ex-dividend date and interest income is recognized on an accrual basis which includes the accretion of discounts and amortization of premiums. Certain dividends from foreign securities will be recorded as soon as the Funds are informed of the dividend if such information is obtained subsequent to the ex-dividend date. Distributions received from certain investments held by the Funds may be comprised of dividends, realized gains and returns of capital. The Funds originally estimate the expected classification of such payments. The amounts may subsequently be reclassified upon receipt of information from the issuer. The Funds are charged for those expenses of the Trust that are directly attributable to each Fund, such as advisory and custodian fees. Expenses that are not directly attributable to a Fund are typically allocated among the Funds in proportion to their respective net assets.
d) Securities Lending. The Funds may lend securities to certain brokers. Upon such loans, the Funds receive collateral which is maintained by the custodian. The Funds earn interest on such collateral and earn income in the form of negotiated lenders’ fees, both of which are included in securities lending income in the Statements of Operations. Securities loaned are required to be secured at all times by collateral equal to at least 102% of the market value of the securities loaned. Risks may arise upon entering into securities lending to the extent that the value of the collateral is less than the value of the securities loaned due to the changes in the value of collateral or the loaned securities. The Funds may receive collateral in the form of cash or other eligible securities, such as a letter of credit issued by a U.S. bank or securities issued or guaranteed by the U.S. government. Securities purchased with cash collateral are subject to the risks inherent in investing in these securities.
At December 31, 2010, Baron International Growth Fund had securities on loan with a value of $1,176,000 and held $1,280,000 of short-term investments as collateral for these loans. For the year ended December 31, 2010, Baron International Growth Fund had securities lending income of $93,948 which is included in the Statements of Operations.
e) Repurchase Agreements. The Funds may invest in repurchase agreements, which are short-term investments whereby the Funds acquire ownership of a debt security and the seller agrees to repurchase the security at a future date at a specified price. When entering into repurchase agreements, it is the Funds’ policy that their custodian or a third party custodian take possession of the underlying collateral securities, the market value of which, at all times, equals at least 105% of the principal amount of the repurchase transaction. To the extent that any repurchase transaction exceeds one business day, the value of the collateral is marked-to-market to ensure the adequacy of the collateral. If the seller defaults and the market value of the collateral declines or if bankruptcy proceedings are commenced with respect to the seller of the security, realization of the collateral by the Funds may be delayed or limited.
f) Federal and Foreign Income Taxes. The Trust treats each Fund as a separate entity for federal income tax purposes. Each Fund intends to meet the requirements of the Internal Revenue Code of 1986, as amended, applicable to regulated investment companies, and to distribute to its shareholders substantially all of its net investment income and any net realized capital gains at least annually.
The Funds may be subject to foreign taxes on income and gains on investments that are accrued based upon the Funds’ understanding of the tax rules and regulations that exist in the countries in which the Funds invest. Foreign governments may also impose taxes or other payments on investments with respect to foreign securities. Such taxes are accrued as applicable.
23
| | |
| Baron Select Funds | | December 31, 2010 |
NOTES TO FINANCIAL STATEMENTS (Continued)
2. SIGNIFICANT ACCOUNTING POLICIES (Continued)
g) Restricted Securities. The Funds may invest in securities which are restricted as to public sale in accordance with the Securities Act of 1933. Such assets are valued by the Adviser pursuant to policies and procedures approved by the Board.
h) Distributions to Shareholders. Income and capital gain distributions to shareholders are determined in accordance with income tax regulations which may differ from GAAP. These differences are primarily due to differing treatments for net investment loss, foreign currency gains and losses, partnership basis adjustments and wash sale losses deferred.
i) Commitments and Contingencies. In the normal course of business, the Funds may enter into contracts and agreements that contain a variety of representations and warranties, which provide general indemnification. The maximum exposure to the Funds under these agreements is unknown, as this would involve future claims that may be made against the Funds that have not yet occurred. However, based on experience, the Funds expect the risk of loss to be remote.
j) Cash and Cash Equivalents. The Funds consider all short term liquid investments with a maturity of three months or less when purchased to be cash equivalents.
3. PURCHASES AND SALES OF SECURITIES
Purchases and sales of securities, other than short term securities, for the year ended December 31, 2010 were as follows:
| | | | | | | | |
| Fund | | Purchases | | | Sales | |
Baron Partners Fund | | $ | 252,248,894 | | | $ | 571,012,137 | |
Baron Focused Growth Fund | | | 18,514,371 | | | | 21,896,114 | |
Baron International Growth Fund | | | 23,707,366 | | | | 11,723,823 | |
Baron Real Estate Fund | | | 9,995,996 | | | | 3,092,228 | |
4. INVESTMENT ADVISORY FEES AND OTHER TRANSACTIONS WITH AFFILIATES
a) Investment Advisory Fees. BAMCO, Inc. (the “Adviser”), a wholly owned subsidiary of Baron Capital Group, Inc. (“BCG”), serves as investment adviser to the Funds. As compensation for services rendered, the Adviser receives a fee payable monthly equal to 1% per annum of the average daily net assets of the respective Funds. For Baron Partners Fund, Baron Focused Growth Fund, Baron International Growth Fund and Baron Real Estate Fund, the Adviser has contractually agreed to reduce its fee, until December 31, 2011, to the extent required to limit the net operating expense ratio (excluding portfolio transaction costs, interest and extraordinary expenses) to 1.45%, 1.35%, 1.50% and 1.35% of average daily net assets of the Retail Shares, and 1.20%, 1.10%, 1.25% and 1.10% of average daily net assets of the Institutional Shares, respectively.
b) Distribution Fees. Baron Capital, Inc. (“BCI”), a wholly owned subsidiary of BCG, is a registered broker-dealer and the distributor of the Retail Shares pursuant to a distribution plan under Rule 12b-1 of the 1940 Act. The distribution plan authorizes the Funds to pay BCI a distribution fee payable monthly equal to 0.25% per annum of the Retail Shares’ average daily net assets of the respective Funds.
c) Trustee Fees. Certain Trustees of the Trust may be deemed to be affiliated with, or interested persons (as defined by the 1940 Act) of the Funds’ Adviser or of BCI. None of the Trustees so affiliated received compensation for his or her services as a Trustee of the Trust. None of the Funds’ officers received compensation from the Funds in that capacity.
d) Fund Accounting and Administration Fees. The Funds have entered into an agreement with State Street Bank and Trust Company (the “Custodian”) to perform accounting and certain administrative services. The Custodian is compensated for fund accounting based on a percentage of the Funds’ net assets, subject to certain minimums plus fixed annual fees for the administrative services.
5. LINE OF CREDIT
Baron Partners Fund participates in a committed line of credit provided by a syndicate of banks (including the Custodian) in the amount of $350 million. A commitment fee of 0.20% per annum is incurred on the unused portion of the line of credit. The line of credit is used for investment purposes and expires on September 23, 2011. Baron Partners Fund may borrow up to the lesser of $350 million or the maximum amount Baron Partners Fund may borrow under the 1940 Act, the limitations included in Baron Partners Fund’s prospectus, or any limit or restriction under any law or regulation to which Baron Partners Fund is subject or any agreement to which Baron Partners Fund is a party. Interest is charged to Baron Partners Fund, based on its borrowings, at a rate per annum equal to the higher of the Federal Funds Rate or the Libor rate plus a margin of 1.25%. For the year ended December 31, 2010, interest expense incurred on these loans amounted to $4,434,446.
24
| | |
| December 31, 2010 | | Baron Select Funds |
NOTES TO FINANCIAL STATEMENTS (Continued)
5. LINE OF CREDIT (Continued)
During the year ended December 31, 2010, Baron Partners Fund had an average daily balance on the line of credit of $291.2 million at a weighted average interest rate of 1.52%. At December 31, 2010, Baron Partners Fund had an outstanding loan in the amount of $347,500,000.
6. RESTRICTED SECURITIES
At December 31, 2010, investments in securities included securities that are restricted and/or illiquid. Restricted securities are often purchased in private placement transactions, are not registered under the Securities Act of 1933, may have contractual restrictions on resale and are valued pursuant to the policies and procedures for fair value pricing approved by the Board. A security may be considered illiquid if it lacks a readily available market or if its valuation has not changed for a certain period of time. The Funds may receive more or less than this valuation in an actual sale and that difference could be material. At December 31, 2010, the Funds held investments in restricted and/or illiquid securities that were valued pursuant to policies and procedures for fair value pricing as follows:
| | | | | | | | |
| | | Baron Partners Fund | |
| Name of Issuer | | Acquisition
Date | | | Value | |
Private Equity Investments | | | | | | | | |
Kerzner International Holdings, Ltd., Cl A | | | 9/27/06 | | | $ | 7,800,000 | |
Windy City Investments Holdings LLC | | | 11/13/07 | | | | 22,856,987 | |
| | | | | | | | |
Total Restricted Securities: | | | | | |
(Cost $77,319,447) (2.24% of Net Assets) | | | | | | $ | 30,656,987 | |
| | | | | | | | |
| | | Baron Real Estate Fund | |
| Name of Issuer | | Acquisition
Date | | | Value | |
Common Stock | | | | | | | | |
Chesapeake Lodging Trust | | | | | | | | |
(Cost $56,400) (0.64% of Net Assets) | | | 1/21/10 | | | $ | 55,290 | |
| | | | | | | | |
7. FAIR VALUE MEASUREMENTS
Fair value is defined by GAAP as the price that the Funds would receive upon selling an investment in a timely transaction to an independent buyer in the principal or most advantageous market for the investment. GAAP provides a three-tier hierarchy to maximize the use of observable market data and minimize the use of unobservable inputs and to establish classification of fair value measurements for disclosure purposes. Inputs refer broadly to the assumptions that market participants would use in pricing the asset or liability. Inputs may be observable or unobservable. Observable inputs are based on market data obtained from sources independent of the Funds. Unobservable inputs are inputs that reflect the Funds’ own assumptions based on the best information available in the circumstances. The three-tier hierarchy of inputs is summarized in the three broad Levels listed below.
| | • | | Level 1 — quoted prices in active markets for identical assets or liabilities; |
| | • | | Level 2 — prices determined using other significant inputs that are observable either directly, or indirectly through corroboration with observable market data (which could include quoted prices for similar assets or liabilities, interest rates, credit risk, etc.); |
| | • | | Level 3 — prices determined using significant unobservable inputs when quoted prices or observable inputs are unavailable such as when there is little or no market activity for an asset or liability (unobservable inputs reflect each Fund’s own assumptions in determining the fair value of assets or liabilities and would be based on the best information available). |
The inputs or methodology used for valuing securities are not necessarily an indication of the risk associated with investing in those securities. For example, non-U.S. securities, whose markets close hours before the Funds value their holdings, may require revised valuations due to significant movement in the U.S. markets. Since these values are not obtained from quoted prices in an active market such securities are reflected as Level 2.
25
| | |
| Baron Select Funds | | December 31, 2010 |
NOTES TO FINANCIAL STATEMENTS (Continued)
7. FAIR VALUE MEASUREMENTS (Continued)
The following is a summary of the inputs used as of December 31, 2010 in valuing the Funds’ investments carried at fair value:
| | | | | | | | | | | | | | | | |
| | | Baron Partners Fund | |
| Description | | Quoted Prices in
Active Markets
for Identical
Assets
(Level 1) | | | Other
Significant
Observable
Inputs
(Level 2) | | | Significant
Unobservable
Inputs
(Level 3) | | | Total | |
Common Stocks† | | $ | 1,690,485,620 | | | $ | — | | | $ | — | | | $ | 1,690,485,620 | |
Private Equity Investments† | | | — | | | | — | | | | 30,656,987 | | | | 30,656,987 | |
Short Term Investments | | | — | | | | 133,335 | | | | — | | | | 133,335 | |
| | | | | | | | | | | | | | | | |
Total Investments | | $ | 1,690,485,620 | | | $ | 133,335 | | | $ | 30,656,987 | | | $ | 1,721,275,942 | |
| | | | | | | | | | | | | | | | |
| | | | | | | | | | | | | | | | |
| | | Baron Focused Growth Fund | |
| Description | | Quoted Prices in
Active Markets
for Identical
Assets
(Level 1) | | | Other
Significant
Observable
Inputs
(Level 2) | | | Significant
Unobservable
Inputs
(Level 3) | | | Total | |
Common Stocks† | | $ | 89,944,650 | | | $ | — | | | $ | — | | | $ | 89,944,650 | |
Short Term Investments | | | — | | | | 790,401 | | | | — | | | | 790,401 | |
| | | | | | | | | | | | | | | | |
Total Investments | | $ | 89,944,650 | | | $ | 790,401 | | | $ | — | | | $ | 90,735,051 | |
| | | | | | | | | | | | | | | | |
| | | | | | | | | | | | | | | | |
| | | Baron International Growth Fund | |
| Description | | Quoted Prices in
Active Markets
for Identical
Assets
(Level 1) | | | Other
Significant
Observable
Inputs
(Level 2) | | | Significant
Unobservable
Inputs
(Level 3) | | | Total | |
Common Stocks† | | $ | 34,125,620 | | | $ | 15,371,905 | | | $ | — | | | $ | 49,497,525 | |
Short Term Investments | | | — | | | | 4,034,252 | | | | — | | | | 4,034,252 | |
| | | | | | | | | | | | | | | | |
Total Investments | | $ | 34,125,620 | | | $ | 19,406,157 | | | $ | — | | | $ | 53,531,777 | |
| | | | | | | | | | | | | | | | |
The fair value of Level 2 investments at 12/31/09 was $19,174,653. $12,744,136 was transferred out of Level 2 into Level 1 at 12/31/10 as a result of no longer adjusting closing prices for certain securities (as described in Note 2a), due to the lack of significant market movements between the time at which the Fund valued its securities and the earlier closing of foreign markets. It is the Fund’s policy to recognize transfers in and transfers out at the fair value as of the end of the period.
| † | See Statements of Net Assets for additional detailed categorizations. |
26
| | |
| December 31, 2010 | | Baron Select Funds |
NOTES TO FINANCIAL STATEMENTS (Continued)
7. FAIR VALUE MEASUREMENTS (Continued)
| | | | | | | | | | | | | | | | |
| | | Baron Real Estate Fund | |
| Description | | Quoted Prices in
Active Markets
for Identical
Assets
(Level 1) | | | Other
Significant
Observable
Inputs
(Level 2) | | | Significant
Unobservable
Inputs
(Level 3) | | | Total | |
Common Stocks† | | $ | 8,313,003 | | | $ | 55,290 | | | $ | — | | | $ | 8,368,293 | |
Short Term Investments | | | — | | | | 244,045 | | | | — | | | | 244,045 | |
| | | | | | | | | | | | | | | | |
Total Investments | | $ | 8,313,003 | | | $ | 299,335 | | | $ | — | | | $ | 8,612,338 | |
| | | | | | | | | | | | | | | | |
| † | See Statements of Net Assets for additional detailed categorizations. |
The following is a reconciliation of investments in which significant unobservable inputs (Level 3) were used in determining fair value:
| | | | | | | | | | | | | | | | | | | | | | | | | | | | | | | | | | | | |
| | | Baron Partners Fund | |
Investments in
Securities | | Balance as of
December 31,
2009 | | | Accrued
Premiums/
Discounts | | | Net
Realized
Gain
(Loss) | | | Net Change in
Unrealized
Appreciation
(Depreciation) | | | Net
Purchases
(Sales) | | | Transfers
Into
Level 3 | | | Transfers
Out of
Level 3 | | | Balance as of
December 31,
2010 | | | Change in Net
Unrealized
Appreciation
(Depreciation)
from Investments
still held at
December 31,
2010 | |
Private Equity
Investments | | | | | | | | | | | | | | | | | | | | | | | | | | | | | | | | | |
Consumer Discretionary | | $ | 15,600,000 | | | $ | — | | | $ | — | | | $ | (7,800,000 | ) | | $ | — | | | $ | — | | | $ | — | | | $ | 7,800,000 | | | $ | (7,800,000 | ) |
Financials | | | 18,044,989 | | | | — | | | | — | | | | 4,811,998 | | | | — | | | | — | | | | — | | | | 22,856,987 | | | | 4,811,998 | |
| | | | | | | | | | | | | | | | | | | | | | | | | | | | | | | | | | | | |
Total | | $ | 33,644,989 | | | $ | — | | | $ | — | | | $ | (2,988,002 | ) | | $ | — | | | $ | — | | | $ | — | | | $ | 30,656,987 | | | $ | (2,988,002 | ) |
| | | | | | | | | | | | | | | | | | | | | | | | | | | | | | | | | | | | |
8. INCOME TAXES AND DISTRIBUTIONS TO SHAREHOLDERS
Federal income tax regulations differ from GAAP. Therefore, distributions determined in accordance with tax regulations may differ in amount or character from net investment income and net realized gain for financial reporting purposes. Net investment income (loss) and net realized and unrealized gain (loss) differ for financial statement and tax purposes due to differing treatments of wash sale losses deferred, foreign currency gains and losses, income from passive foreign investment corporations, partnership basis adjustments and net investment loss. Financial reporting records are adjusted for permanent book/tax differences to reflect tax character. Financial records are not adjusted for temporary differences.
For the year ended December 31, 2010, the Funds recorded the following permanent reclassifications to reflect tax character. Reclassifications between income, gains and paid-in capital relate primarily to the tax treatment of overdistributions, net investment loss, foreign currency gains and losses and partnership basis adjustments. Results of operations and net assets were not affected by these reclassifications.
| | | | | | | | | | | | |
| Fund | | Accumulated Net Investment Income (Loss) | | | Accumulated Realized Gain (Loss) | | | Paid-In
Capital | |
Baron Partners Fund | | $ | 6,180,674 | | | $ | 136,136 | | | $ | (6,316,810 | ) |
Baron Focused Growth Fund | | | 2,935,109 | | | | 45,734 | | | | (2,980,843 | ) |
Baron International Growth Fund | | | 125,205 | | | | (125,205 | ) | | | — | |
Baron Real Estate Fund | | | (8,599 | ) | | | 9,880 | | | | (1,281 | ) |
27
| | |
| Baron Select Funds | | December 31, 2010 |
NOTES TO FINANCIAL STATEMENTS (Continued)
8. INCOME TAXES AND DISTRIBUTIONS TO SHAREHOLDERS (Continued)
As of December 31, 2010, the components of net assets on a tax basis were as follows:
| | | | | | | | | | | | | | | | |
| | | Baron Partners Fund | | | Baron
Focused Growth Fund | | | Baron
International
Growth Fund | | | Baron
Real Estate Fund | |
Cost of investments | | $ | 1,157,690,694 | | | $ | 59,999,399 | | | $ | 38,285,357 | | | $ | 7,236,491 | |
| | | | | | | | | | | | | | | | |
Gross tax unrealized appreciation | | | 613,159,311 | | | | 30,937,710 | | | | 16,163,197 | | | | 1,404,470 | |
Gross tax unrealized depreciation | | | (49,574,063 | ) | | | (202,058 | ) | | | (916,777 | ) | | | (28,623 | ) |
| | | | | | | | | | | | | | | | |
Net tax unrealized appreciation | | | 563,585,248 | | | | 30,735,652 | | | | 15,246,420 | | | | 1,375,847 | |
Net tax unrealized currency appreciation | | | — | | | | — | | | | 30,503 | | | | — | |
Undistributed ordinary income | | | — | | | | — | | | | 377,316 | | | | 143,523 | |
Undistributed net realized gain | | | — | | | | — | | | | 713,555 | | | | 3,648 | |
Post October capital/currency loss deferral | | | (204,698 | ) | | | — | | | | — | | | | — | |
Capital loss carryforwards | | | (623,231,770 | ) | | | (16,642,843 | ) | | | — | | | | — | |
Paid-in capital | | | 1,431,653,445 | | | | 76,649,578 | | | | 36,366,248 | | | | 7,169,332 | |
| | | | | | | | | | | | | | | | |
Net Assets | | $ | 1,371,802,225 | | | $ | 90,742,387 | | | $ | 52,734,042 | | | $ | 8,692,350 | |
| | | | | | | | | | | | | | | | |
As of December 31, 2010, the Funds had capital loss carryforwards expiring as follows:
| | | | | | | | | | | | | | | | |
| | | Baron Partners Fund | | | Baron
Focused Growth Fund | | | Baron
International
Growth Fund | | | Baron
Real Estate Fund | |
December 31, 2016 | | $ | 288,564,591 | | | $ | 2,686,495 | | | $ | — | | | $ | — | |
December 31, 2017 | | | 334,667,179 | | | | 13,956,348 | | | | — | | | | — | |
| | | | | | | | | | | | | | | | |
| | $ | 623,231,770 | | | $ | 16,642,843 | | | $ | — | | | $ | — | |
| | | | | | | | | | | | | | | | |
Capital loss carryforward utilized during the
year ended December 31, 2010 | | $ | 96,873,583 | | | $ | 3,491,293 | | | $ | — | | | $ | — | |
| | | | | | | | | | | | | | | | |
The tax character of distributions paid during the fiscal years ended December 31, 2010 and December 31, 2009 was as follows:
| | | | | | | | | | | | | | | | | | | | | | | | |
| | | Year Ended
December 31, 2010 | | | Year Ended
December 31, 2009 | |
| Fund | | Ordinary1 | | | Long Term
Capital Gain | | | Return
of
Capital | | | Ordinary1 | | | Long Term
Capital Gain | | | Return of
Capital | |
Baron Partners Fund | | $ | — | | | $ | — | | | $ | — | | | $ | — | | | $ | — | | | $ | — | |
Baron Focused Growth Fund | | | 2,902,342 | | | | — | | | | — | | | | 1,150,808 | | | | — | | | | 1,141,674 | |
Baron International Growth Fund | | | 566,988 | | | | — | | | | — | | | | 756,360 | | | | — | | | | — | |
Baron Real Estate Fund | | | — | | | | — | | | | — | | | | N/A | | | | N/A | | | | N/A | |
| 1 | For tax purposes, short-term capital gains are considered ordinary income distributions. |
The Funds follow the provisions of the FASB Codification Section 740 (“ASC Section 740”) “Accounting for Uncertainty in Income Taxes” which clarifies the accounting for uncertainty in tax positions taken or expected to be taken on a tax return. ASC Section 740 sets forth a threshold for financial statement recognition, measurement and disclosure of tax positions taken or expected to be taken on a tax return. The Funds are required to recognize the tax effects of certain tax positions under a “more likely than not” standard, that based on their technical merits, have more than 50 percent likelihood of being sustained upon examination. Management has analyzed the tax positions taken on the Funds’ federal income tax returns for all open years (current and prior three years), and has concluded that no provision for federal income tax is required in the Funds’ financial statements. At December 31, 2010, the Funds did not have any unrecognized tax benefits. The Funds’ federal, state and local income and federal excise tax returns for which the applicable statutes of limitations have not expired are subject to examination by the Internal Revenue Service and state departments of revenue.
28
| | |
| December 31, 2010 | | Baron Select Funds |
NOTES TO FINANCIAL STATEMENTS (Continued)
8. INCOME TAXES AND DISTRIBUTIONS TO SHAREHOLDERS (Continued)
Baron Partners Fund is required to pay U.S. federal income tax (currently, at a maximum rate of 35%) on its “net built-in gain” attributable to certain assets of Baron Capital Partners, L.P. (the predecessor partnership of Baron Partners Fund), to the extent that any such net built-in gain is realized during the ten-year period beginning on the date of the conversion of the predecessor partnership into the Fund. The Fund holds two securities at December 31, 2010 with a market value of $22,190,250 which may be subject to the tax on net-built-in gain and reimbursement by the Adviser. The net built-in gain on these securities unrealized as of December 31, 2010 was $3,878,600.
9. MANAGEMENT OWNERSHIP
As of December 31, 2010, the officers and trustees owned, directly or indirectly, 45.23% of Baron Focused Growth Fund, 53.30% of Baron International Growth Fund and 47.05% of Baron Real Estate Fund. As a result of their ownership, the officers and trustees may be able to materially affect the outcome of matters presented to Baron Focused Growth Fund, Baron International Growth Fund and Baron Real Estate Fund shareholders.
29
| | |
| Baron Select Funds | | December 31, 2010 |
FINANCIAL HIGHLIGHTS
BARON PARTNERS FUND
Selected data for a share outstanding throughout each year:
| | | | | | | | | | | | | | | | | | | | | | | | | | | | | | | | | | | | | | | | |
| | | RETAIL SHARES | | | INSTITUTIONAL
SHARES | |
| | | Year Ended December 31, | | | Year Ended
December 31, | |
| | | 2010 | | | 2009 | | | 2008 | | | 2007 | | | 2006 | | | 2005 | | | 2004 | | | 20031 | | | 2010 | | | 20096 | |
| | | | | | | | | | |
Net asset value, beginning of year | | $ | 15.64 | | | $ | 12.20 | | | $ | 23.76 | | | $ | 22.34 | | | $ | 18.43 | | | $ | 16.85 | | | $ | 12.17 | | | $ | 10.00 | | | $ | 15.66 | | | | $12.66 | |
| | | | | | | | | | | | | | | | | | | | | | | | | | | | | | | | | | | | | | | | |
| | | | | | | | | | |
Income (loss) from investment operations: | | | | | | | | | | | | | | | | | | | | | | | | | | | | | | | | | | | | | | | | |
Net investment loss | | | (0.09 | )2 | | | (0.04 | )2 | | | (0.09 | )2 | | | (0.21 | )2 | | | (0.16 | )2 | | | (0.13 | ) | | | (0.06 | ) | | | (0.10 | ) | | | (0.06 | )2 | | | (0.03 | )2 |
Net realized and unrealized gain (loss) on investments | | | 5.02 | | | | 3.48 | | | | (10.74 | ) | | | 2.74 | | | | 4.13 | | | | 2.49 | | | | 5.17 | | | | 3.63 | | | | 5.06 | | | | 3.03 | |
| | | | | | | | | | | | | | | | | | | | | | | | | | | | | | | | | | | | | | | | |
Total from investment operations | | | 4.93 | | | | 3.44 | | | | (10.83 | ) | | | 2.53 | | | | 3.97 | | | | 2.36 | | | | 5.11 | | | | 3.53 | | | | 5.00 | | | | 3.00 | |
| | | | | | | | | | | | | | | | | | | | | | | | | | | | | | | | | | | | | | | | |
| | | | | | | | | | |
Less distributions to shareholders from: | | | | | | | | | | | | | | | | | | | | | | | | | | | | | | | | | | | | | | | | |
Net investment income | | | 0.00 | | | | 0.00 | | | | 0.00 | | | | 0.00 | | | | 0.00 | | | | 0.00 | | | | 0.00 | | | | 0.00 | | | | 0.00 | | | | 0.00 | |
Net realized gain on investments | | | 0.00 | | | | 0.00 | | | | (0.73 | ) | | | (1.11 | ) | | | (0.06 | ) | | | (0.78 | ) | | | (0.43 | ) | | | (1.36 | ) | | | 0.00 | | | | 0.00 | |
| | | | | | | | | | | | | | | | | | | | | | | | | | | | | | | | | | | | | | | | |
Total distributions | | | 0.00 | | | | 0.00 | | | | (0.73 | ) | | | (1.11 | ) | | | (0.06 | ) | | | (0.78 | ) | | | (0.43 | ) | | | (1.36 | ) | | | 0.00 | | | | 0.00 | |
| | | | | | | | | | | | | | | | | | | | | | | | | | | | | | | | | | | | | | | | |
| | | | | | | | | | |
Net asset value, end of year | | $ | 20.57 | | | $ | 15.64 | | | $ | 12.20 | | | $ | 23.76 | | | $ | 22.34 | | | $ | 18.43 | | | $ | 16.85 | | | $ | 12.17 | | | $ | 20.66 | | | $ | 15.66 | |
| | | | | | | | | | | | | | | | | | | | | | | | | | | | | | | | | | | | | | | | |
Total return | | | 31.52 | % | | | 28.20 | % | | | (46.67 | )% | | | 11.34 | % | | | 21.55 | % | | | 14.37 | % | | | 42.35 | % | | | 35.76 | %3 | | | 31.93 | % | | | 23.70 | %3 |
| | | | | | | | | | | | | | | | | | | | | | | | | | | | | | | | | | | | | | | | |
| | | | | | | | | | |
Ratios/Supplemental data: | | | | | | | | | | | | | | | | | | | | | | | | | | | | | | | | | | | | | | | | |
Net assets (in millions), end of year | | $ | 1,251.9 | | | $ | 1,249.3 | | | $ | 1,501.3 | | | $ | 3,384.1 | | | $ | 2,403.1 | | | $ | 1,403.0 | | | $ | 632.7 | | | $ | 164.3 | | | $ | 119.9 | | | $ | 158.5 | |
| | | | | | | | | | | | | | | | | | | | | | | | | | | | | | | | | | | | | | | | |
Ratio of total expenses to average net assets | | | 1.71 | % | | | 1.51 | % | | | 1.86 | %5 | | | 1.88 | %5 | | | 1.77 | % | | | 1.62 | % | | | 1.46 | % | | | 1.77 | %4 | | | 1.45 | % | | | 1.38 | %4 |
Less: Ratio of interest expense to average net assets | | | (0.34 | )% | | | (0.10 | )% | | | (0.51 | )% | | | (0.57 | )% | | | (0.45 | )% | | | (0.27 | )% | | | (0.12 | )% | | | (0.37 | )%4 | | | (0.34 | )% | | | (0.21 | )%4 |
| | | | | | | | | | | | | | | | | | | | | | | | | | | | | | | | | | | | | | | | |
Ratio of net operating expenses to average net assets | | | 1.37 | % | | | 1.41 | % | | | 1.35 | % | | | 1.31 | % | | | 1.32 | % | | | 1. 35 | % | | | 1.34 | % | | | 1.40 | %4 | | | 1.11 | % | | | 1.17 | %4 |
| | | | | | | | | | | | | | | | | | | | | | | | | | | | | | | | | | | | | | | | |
Ratio of net investment loss to average net assets | | | (0.51 | )% | | | (0.30 | )% | | | (0.49 | )% | | | (0.86 | )% | | | (0.80 | )% | | | (0.85 | )% | | | (0.83 | )% | | | (1.39 | )%4 | | | (0.36 | )% | | | (0.31 | )%4 |
| | | | | | | | | | | | | | | | | | | | | | | | | | | | | | | | | | | | | | | | |
Portfolio turnover rate | | | 15.85 | % | | | 32.43 | % | | | 38.02 | % | | | 32.95 | % | | | 35.92 | % | | | 37.62 | % | | | 57.77 | % | | | 36.67 | %3 | | | 15.85 | % | | | 32.43 | % |
| | | | | | | | | | | | | | | | | | | | | | | | | | | | | | | | | | | | | | | | |
| 1 | For the period April 30, 2003 (commencement of operations) to December 31, 2003. |
| 2 | Based on average shares outstanding. |
| 5 | Benefit of expense reduction rounds to less than 0.01%. |
| 6 | For the period May 29, 2009 (commencement of operations) to December 31, 2009. |
| | |
| 30 | | See Notes to Financial Statements. |
| | |
| December 31, 2010 | | Baron Select Funds |
FINANCIAL HIGHLIGHTS (Continued)
BARON FOCUSED GROWTH FUND
Selected data for a share outstanding throughout each year:
| | | | | | | | | | | | | | | | | | | | |
| | | RETAIL SHARES | | | INSTITUTIONAL SHARES | |
| | | Year Ended December 31, | | | Year Ended December 31, | |
| | | 2010 | | | 2009 | | | 20081 | | | 2010 | | | 20097 | |
| | | | | |
Net asset value, beginning of year | | $ | 8.14 | | | $ | 6.27 | | | $ | 10.00 | | | $ | 8.15 | | | $ | 6.88 | |
| | | | | | | | | | | | | | | | | | | | |
| | | | | |
Income (loss) from investment operations: | | | | | | | | | | | | | | | | | | | | |
Net investment income (loss) | | | (0.01 | )2 | | | 0.12 | 2 | | | 0.00 | 2,3 | | | 0.01 | 2 | | | 0.07 | 2 |
Net realized and unrealized gain (loss) on investments | | | 2.05 | | | | 2.00 | | | | (3.33 | ) | | | 2.05 | | | | 1.45 | |
| | | | | | | | | | | | | | | | | | | | |
Total from investment operations | | | 2.04 | | | | 2.12 | | | | (3.33 | ) | | | 2.06 | | | | 1.52 | |
| | | | | | | | | | | | | | | | | | | | |
| | | | | |
Less distributions to shareholders from: | | | | | | | | | | | | | | | | | | | | |
Net investment income | | | (0.33 | ) | | | (0.13 | ) | | | 0.00 | | | | (0.33 | ) | | | (0.13 | ) |
Net realized gain on investments | | | 0.00 | | | | 0.00 | | | | 0.00 | | | | 0.00 | | | | 0.00 | |
Return of capital | | | 0.00 | | | | (0.12 | ) | | | (0.40 | ) | | | 0.00 | | | | (0.12 | ) |
| | | | | | | | | | | | | | | | | | | | |
Total distributions | | | (0.33 | ) | | | (0.25 | ) | | | (0.40 | ) | | | (0.33 | ) | | | (0.25 | ) |
| | | | | | | | | | | | | | | | | | | | |
| | | | | |
Net asset value, end of year | | $ | 9.85 | | | $ | 8.14 | | | $ | 6.27 | | | $ | 9.88 | | | $ | 8.15 | |
| | | | | | | | | | | | | | | | | | | | |
Total return | | | 25.17 | %5 | | | 33.77 | %5 | | | (33.11 | )%4,5 | | | 25.39 | %5 | | | 22.06 | %4,5 |
| | | | | | | | | | | | | | | | | | | | |
| | | | | |
Ratios/Supplemental data: | | | | | | | | | | | | | | | | | | | | |
Net assets (in millions), end of year | | $ | 46.4 | | | $ | 39.9 | | | $ | 59.3 | | | $ | 44.3 | | | $ | 36.6 | |
| | | | | | | | | | | | | | | | | | | | |
Ratio of operating expenses to average net assets | | | 1.47 | % | | | 1.52 | % | | | 1.54 | %6 | | | 1.19 | % | | | 1.25 | %6 |
Less: Reimbursement of expenses by Adviser | | | (0.12 | )% | | | (0.17 | )% | | | (0.19 | )%6 | | | (0.09 | )% | | | (0.15 | )%6 |
| | | | | | | | | | | | | | | | | | | | |
Ratio of net operating expenses to average net assets | | | 1.35 | % | | | 1.35 | % | | | 1.35 | %6 | | | 1.10 | % | | | 1.10 | %6 |
| | | | | | | | | | | | | | | | | | | | |
Ratio of net investment income (loss) to average net assets | | | (0.16 | )% | | | 1.81 | % | | | 0.01 | %6 | | | 0.08 | % | | | 1.63 | %6 |
| | | | | | | | | | | | | | | | | | | | |
Portfolio turnover rate | | | 24.08 | % | | | 34.76 | % | | | 35.43 | %4 | | | 24.08 | % | | | 34.76 | % |
| | | | | | | | | | | | | | | | | | | | |
| 1 | For the period June 30, 2008 (commencement of operations) to December 31, 2008. |
| 2 | Based on average shares outstanding. |
| 3 | Less than $0.01 per share. |
| 5 | The total returns would have been lower had certain expenses not been reduced during the periods shown. |
| 7 | For the period May 29, 2009 (commencement of operations) to December 31, 2009. |
| | |
| See Notes to Financial Statements. | | 31 |
| | |
| Baron Select Funds | | December 31, 2010 |
FINANCIAL HIGHLIGHTS (Continued)
BARON INTERNATIONAL GROWTH FUND
Selected data for a share outstanding throughout each year:
| | | | | | | | | | | | | | | | |
| | | RETAIL SHARES | | | INSTITUTIONAL SHARES | |
| | | Year Ended December 31, | | | Year Ended December 31, | |
| | | 2010 | | | 2009 | | | 2010 | | | 20095 | |
| | | | |
Net asset value, beginning of year | | $ | 14.11 | | | $ | 10.00 | | | $ | 14.13 | | | $ | 11.13 | |
| | | | | | | | | | | | | | | | |
| | | | |
Income (loss) from investment operations: | | | | | | | | | | | | | | | | |
Net investment income (loss) | | | 0.01 | 1 | | | 0.04 | 1 | | | 0.05 | 1 | | | (0.02 | )1 |
Net realized and unrealized gain on investments | | | 3.38 | | | | 4.43 | | | | 3.39 | | | | 3.38 | |
| | | | | | | | | | | | | | | | |
Total from investment operations | | | 3.39 | | | | 4.47 | | | | 3.44 | | | | 3.36 | |
| | | | | | | | | | | | | | | | |
| | | | |
Less distributions to shareholders from: | | | | | | | | | | | | | | | | |
Net investment income | | | 0.00 | | | | 0.00 | | | | 0.00 | | | | 0.00 | |
Net realized gain on investments | | | (0.21 | ) | | | (0.36 | ) | | | (0.21 | ) | | | (0.36 | ) |
| | | | | | | | | | | | | | | | |
Total distributions | | | (0.21 | ) | | | (0.36 | ) | | | (0.21 | ) | | | (0.36 | ) |
| | | | | | | | | | | | | | | | |
| | | | |
Net asset value, end of year | | $ | 17.29 | | | $ | 14.11 | | | $ | 17.36 | | | $ | 14.13 | |
| | | | | | | | | | | | | | | | |
Total return | | | 24.22 | %2 | | | 44.69 | %2 | | | 24.54 | %2 | | | 30.18 | %2,4 |
| | | | | | | | | | | | | | | | |
| | | | |
Ratios/Supplemental data: | | | | | | | | | | | | | | | | |
Net assets (in millions), end of year | | $ | 15.3 | | | $ | 8.4 | | | $ | 37.4 | | | $ | 22.1 | |
| | | | | | | | | | | | | | | | |
Ratio of operating expenses to average net assets | | | 1.76 | % | | | 2.33 | % | | | 1.40 | % | | | 1.89 | %3 |
Less: Reimbursement of expenses by Adviser | | | (0.26 | )% | | | (0.83 | )% | | | (0.15 | )% | | | (0.64 | )%3 |
| | | | | | | | | | | | | | | | |
Ratio of net operating expenses to average net assets | | | 1.50 | % | | | 1.50 | % | | | 1.25 | % | | | 1.25 | %3 |
| | | | | | | | | | | | | | | | |
Ratio of net investment income (loss) to average net assets | | | 0.07 | % | | | 0.38 | % | | | 0.31 | % | | | (0.29 | )%3 |
| | | | | | | | | | | | | | | | |
Portfolio turnover rate | | | 32.70 | % | | | 53.94 | % | | | 32.70 | % | | | 53.94 | % |
| | | | | | | | | | | | | | | | |
| 1 | Based on average shares outstanding. |
| 2 | The total returns would have been lower had certain expenses not been reduced during the period shown. |
| 5 | For the period May 29, 2009 (commencement of operations) to December 31, 2009. |
| | |
| 32 | | See Notes to Financial Statements. |
| | |
| December 31, 2010 | | Baron Select Funds |
FINANCIAL HIGHLIGHTS (Continued)
BARON REAL ESTATE FUND
Selected data for a share outstanding throughout each year:
| | | | | | | | |
| | | RETAIL SHARES | | | INSTITUTIONAL SHARES | |
| | | Year Ended
December 31, 2010 | | | Year Ended
December 31, 2010 | |
| | |
Net asset value, beginning of year | | $ | 10.00 | | | $ | 10.00 | |
| | | | | | | | |
| | |
Income from investment operations: | | | | | | | | |
Net investment income | | | 0.02 | 1 | | | 0.04 | 1 |
Net realized and unrealized gain on investments | | | 2.64 | | | | 2.65 | |
| | | | | | | | |
Total from investment operations | | | 2.66 | | | | 2.69 | |
| | | | | | | | |
| | |
Less distributions to shareholders from: | | | | | | | | |
Net investment income | | | 0.00 | | | | 0.00 | |
Net realized gain on investments | | | 0.00 | | | | 0.00 | |
| | | | | | | | |
Total distributions | | | 0.00 | | | | 0.00 | |
| | | | | | | | |
| | |
Net asset value, end of year | | $ | 12.66 | | | $ | 12.69 | |
| | | | | | | | |
Total return | | | 26.60 | %2 | | | 26.90 | %2 |
| | | | | | | | |
| | |
Ratios/Supplemental data: | | | | | | | | |
Net assets (in millions), end of year | | $ | 5.5 | | | $ | 3.2 | |
| | | | | | | | |
Ratio of operating expenses to average net assets | | | 4.35 | % | | | 4.26 | % |
Less: Reimbursement of expenses by Adviser | | | (3.00 | )% | | | (3.16 | )% |
| | | | | | | | |
Ratio of net operating expenses to average net assets | | | 1.35 | % | | | 1.10 | % |
| | | | | | | | |
Ratio of net investment income to average net assets | | | 0.14 | % | | | 0.36 | % |
| | | | | | | | |
Portfolio turnover rate | | | 58.03 | % | | | 58.03 | % |
| | | | | | | | |
| 1 | Based on average shares outstanding. |
| 2 | The total returns would have been lower had certain expenses not been reduced during the period shown. |
| | |
| See Notes to Financial Statements. | | 33 |
| | |
| Baron Select Funds | | December 31, 2010 |
REPORT OF INDEPENDENT REGISTERED PUBLIC ACCOUNTING FIRM
To the Board of Trustees and Shareholders of
Baron Select Funds:
In our opinion, the accompanying statements of assets and liabilities, including the statements of net assets, and the related statements of operations, of changes in net assets and of cash flows and the financial highlights present fairly, in all material respects, the financial position of each of Baron Partners Fund, Baron Focused Growth Fund (formerly, Baron Retirement Income Fund), Baron International Growth Fund and Baron Real Estate Fund (four of the portfolios constituting the Baron Select Funds and hereafter referred to as the “Funds”) at December 31, 2010, and the results of each of their operations, the changes in each of their net assets, the cash flows of Baron Partners Fund and the financial highlights, for each of the periods presented, in conformity with accounting principles generally accepted in the United States of America. These financial statements and financial highlights (hereafter referred to as “financial statements”) are the responsibility of the Funds’ management. Our responsibility is to express an opinion on these financial statements based on our audits. We conducted our audits of these financial statements in accordance with the standards of the Public Company Accounting Oversight Board (United States). Those standards require that we plan and perform the audit to obtain reasonable assurance about whether the financial statements are free of material misstatement. An audit includes examining, on a test basis, evidence supporting the amounts and disclosures in the financial statements, assessing the accounting principles used and significant estimates made by management, and evaluating the overall financial statement presentation. We believe that our audits, which included confirmation of securities at December 31, 2010 by correspondence with the custodian and brokers, provide a reasonable basis for our opinion.
PricewaterhouseCoopers LLP
New York, New York
February 24, 2011
34
| | |
| December 31, 2010 | | Baron Select Funds |
FUND EXPENSES (UNAUDITED)
As a shareholder of the Funds, you may incur two types of costs: ongoing expenses and transaction costs. Ongoing expenses include advisory fees, distribution and service (12b-1) fees and other Fund expenses. Due to the payment of Rule 12b-1 fees, long-term shareholders may indirectly pay more than the maximum permitted front-end sales charge. The information on this page is intended to help you understand your ongoing costs of investing in the Funds and to compare these costs with the ongoing costs of investing in other mutual funds.
The information in the following table is based on an investment of $1,000 invested on July 1, 2010 and held for the six months ended December 31, 2010.
ACTUAL EXPENSES
The table below titled “Based on Actual Total Return” provides information about actual account values and actual expenses. You may use the information provided in this table, together with the amount you invested, to estimate the expenses that you paid over the period. To estimate the expenses you paid on your account, divide your ending account value by $1,000 (for example, an $8,600 ending account value divided by $1,000 = 8.6), then multiply the result by the number under the heading titled “Expenses Paid During the Period”.
BASED ON ACTUAL TOTAL RETURN FOR THE SIX MONTHS ENDED DECEMBER 31, 20101
| | | | | | | | | | | | | | | | | | | | |
| | | Actual Total Return | | | Beginning Account Value July 1, 2010 | | | Ending
Account Value December 31, 2010 | | | Annualized Expense Ratio | | | Expenses
Paid During
the Period3 | |
Baron Partners Fund — Retail Shares2 | | | 31.19% | | | $ | 1,000.00 | | | $ | 1,311.90 | | | | 1.76% | | | $ | 10.26 | |
Baron Partners Fund — Institutional Shares2 | | | 31.42% | | | $ | 1,000.00 | | | $ | 1,314.20 | | | | 1.49% | | | $ | 8.69 | |
Baron Focused Growth Fund — Retail Shares | | | 26.10% | | | $ | 1,000.00 | | | $ | 1,261.00 | | | | 1.35% | | | $ | 7.69 | |
Baron Focused Growth Fund — Institutional Shares | | | 26.16% | | | $ | 1,000.00 | | | $ | 1,261.60 | | | | 1.10% | | | $ | 6.27 | |
Baron International Growth Fund — Retail Shares | | | 31.00% | | | $ | 1,000.00 | | | $ | 1,310.00 | | | | 1.50% | | | $ | 8.73 | |
Baron International Growth Fund — Institutional Shares | | | 31.13% | | | $ | 1,000.00 | | | $ | 1,311.30 | | | | 1.25% | | | $ | 7.28 | |
Baron Real Estate Fund — Retail Shares | | | 28.66% | | | $ | 1,000.00 | | | $ | 1,286.60 | | | | 1.35% | | | $ | 7.78 | |
Baron Real Estate Fund — Institutional Shares | | | 28.83% | | | $ | 1,000.00 | | | $ | 1,288.30 | | | | 1.10% | | | $ | 6.34 | |
HYPOTHETICAL EXAMPLE FOR COMPARISON PURPOSES
The table below titled “Based on Hypothetical Total Return” provides information about hypothetical account values and hypothetical expenses based on the actual expense ratio and an assumed rate of return of 5% per year before expenses, which is not the Funds’ actual return. The hypothetical account values and expenses may not be used to estimate the actual ending account values and expenses you paid for the period. You may use the information provided in this table to compare the ongoing costs of investing in the Funds and other funds. To do so, compare the 5% hypothetical example relating to the Funds with the 5% hypothetical examples that appear in the shareholder reports of other funds.
Please note that expenses shown in the table below are meant to highlight your ongoing costs and do not reflect any transactional costs, such as redemption fees, if any. Therefore, the table is useful in comparing ongoing costs only and will not help you determine your relative total costs of owning different mutual funds. In addition, if these transactional costs were included, your costs would have been higher.
BASED ON HYPOTHETICAL TOTAL RETURN FOR THE SIX MONTHS ENDED DECEMBER 31, 2010
| | | | | | | | | | | | | | | | | | | | |
| | | Hypothetical Annualized Total Return | | | Beginning Account Value December 31, 2010 | | | Ending
Account Value December 31, 2010 | | | Annualized Expense Ratio | | | Expenses
Paid During
the Period3 | |
Baron Partners Fund — Retail Shares2 | | | 5.00% | | | $ | 1,000.00 | | | $ | 1,016.33 | | | | 1.76% | | | $ | 8.94 | |
Baron Partners Fund — Institutional Shares2 | | | 5.00% | | | $ | 1,000.00 | | | $ | 1,017.69 | | | | 1.49% | | | $ | 7.58 | |
Baron Focused Growth Fund — Retail Shares | | | 5.00% | | | $ | 1,000.00 | | | $ | 1,018.40 | | | | 1.35% | | | $ | 6.87 | |
Baron Focused Growth Fund — Institutional Shares | | | 5.00% | | | $ | 1,000.00 | | | $ | 1,019.66 | | | | 1.10% | | | $ | 5.60 | |
Baron International Growth Fund — Retail Shares | | | 5.00% | | | $ | 1,000.00 | | | $ | 1,017.64 | | | | 1.50% | | | $ | 7.63 | |
Baron International Growth Fund — Institutional Shares | | | 5.00% | | | $ | 1,000.00 | | | $ | 1,018.90 | | | | 1.25% | | | $ | 6.36 | |
Baron Real Estate Fund — Retail Shares | | | 5.00% | | | $ | 1,000.00 | | | $ | 1,018.40 | | | | 1.35% | | | $ | 6.87 | |
Baron Real Estate Fund — Institutional Shares | | | 5.00% | | | $ | 1,000.00 | | | $ | 1,019.66 | | | | 1.10% | | | $ | 5.60 | |
| 1 | Assumes reinvestment of all dividends and capital gain distributions, if any. |
| 2 | Annualized expense ratio for Baron Partners Fund for the six months ended December 31, 2010, includes 1.37% and 1.11% for net operating expenses and 0.39% and 0.38% for interest expense for the Retail and Institutional Shares, respectively. |
| 3 | Expenses are equal to each Share Class’ respective annualized expense ratio multiplied by the average account value over the period, multiplied by the number of days in the most recent fiscal half-year, then divided by 365. |
35
| | |
| Baron Select Funds | | December 31, 2010 |
TAX INFORMATION (UNAUDITED)
We are required by the Internal Revenue Code to advise you within 60 days of the Funds’ fiscal year end as to the federal tax status of distributions paid by the Funds during such fiscal year.
During the fiscal year ended December 31, 2010, the Funds’ distributions to shareholders included:
| | | | | | | | |
| Fund | | Ordinary
Income1 | | | Long-Term
Capital Gain2 | |
Baron Partners Fund | | $ | — | | | $ | — | |
Baron Focused Growth Fund | | | 2,902,342 | | | | — | |
Baron International Growth Fund | | | 566,988 | | | | — | |
Baron Real Estate Fund | | | — | | | | — | |
| 1 | For tax purposes, short-term capital gains are considered ordinary income distributions. |
| 2 | Long-term capital gains are subject to a maximum allowable rate of 15% for individuals. |
Of the total ordinary income distributions paid by Baron Focused Growth Fund and Baron International Growth Fund, 23.09% and 0.00%, respectively, is qualified dividend income subject to a reduced tax rate. Of the total ordinary income distributions paid by Baron International Growth Fund, 0.73% qualifies for the Corporate Dividends Received Deduction.
The information and distributions reported may differ from the information and distributions taxable to the shareholders for the calendar year ended December 31, 2010. The information necessary to complete your income tax return for the calendar year ended December 31, 2010 will be listed on the Form 1099-DIV which will be mailed to you in January.
36
| | |
| December 31, 2010 | | Baron Select Funds |
MANAGEMENT OF THE FUNDS
Board of Trustees and Officers
The Board of Trustee’s (the “Board”) role in management of the Trust is oversight. As is the case with virtually all investment companies (as distinguished from operating companies), service providers to the Trust, primarily the Adviser and its affiliates, have responsibility for the day-to-day management of the Funds, which includes responsibility for risk management (including management of investment performance and investment risk, valuation risk, issuer and counterparty credit risk, compliance risk and operational risk). As part of its oversight, the Board, acting at its scheduled meetings, or the Chairman, acting between Board meetings, regularly interacts with and receives reports from senior personnel of service providers, including the Adviser’s Chief Investment Officer, the Trust’s and the Adviser’s Chief Compliance Officer and portfolio management personnel. The Board’s Audit Committee (which consists of two trustees who are not affiliated with the Adviser (“Independent Trustees”)) meets regularly with the Trust’s independent registered public accounting firm and the Trust’s Chief Financial Officer. The Board also receives periodic presentations from senior personnel of the Adviser or its affiliates regarding risk management generally, as well as periodic presentations regarding specific operational, compliance or investment areas, such as business continuity, anti-money laundering, personal trading, valuation, credit, investment research and securities lending. The Board has adopted policies and procedures designed to address certain risks to the Funds. In addition, the Adviser and other service providers to the Funds have adopted a variety of policies, procedures and controls designed to address particular risks to the Funds. However, it is not possible to eliminate all of the risks applicable to the Funds. The Board also receives reports from counsel to the Trust or counsel to the Adviser and the Board’s own independent legal counsel regarding regulatory compliance and governance matters. The Board’s oversight role does not make the Board a guarantor of the Trust’s investments or activities.
The 1940 Act requires that at least 40% of a fund’s trustees not be “interested persons” (as defined in the 1940 Act) of the fund, and to rely on certain exemptive rules under the 1940 Act, a majority of a fund’s trustees must not be interested persons of the fund. For certain important matters, such as the approval of investment advisory agreements or transactions with affiliates, the 1940 Act or the rules thereunder require the approval of a majority of the trustees who are not interested persons of the fund. Currently, six of the Trustees are Independent Trustees. Linda Martinson was elected Chairman of the Baron Funds in October 2010. Prior to that, Charles Mathewson served as Chairman. Linda Martinson is an interested person of the Trust (“Interested Trustee”), and the Independent Trustees have designated two lead Independent Trustees who chair meetings or executive sessions of the Independent Trustees, review and comment on Board meeting agendas, represent the views of the Independent Trustees to management and facilitate communication among the Independent Trustees and their independent legal counsel. The Board has determined that its leadership structure, in which the Independent Trustees have designated two lead Independent Trustees to function as described above is appropriate in light of the services that the Adviser and its affiliates provide to the Trust and potential conflicts of interest that could arise from these relationships.
Trustees of the Trust, together with information as to their positions with the Trust, principal occupations and other board memberships and affiliations for the past five years, are shown below. Each Trustee serves as Trustee of a Fund until its termination; until the Trustee’s retirement, resignation or death; or as otherwise specified in the Trust’s organizational documents. Unless otherwise noted, the address of each Executive Officer and Trustee is Baron Select Funds, 767 Fifth Avenue, 49th Floor, New York, NY 10153. All Trustees listed below, whether Interested or Independent, serve as Trustees for the Trust. Additional information about the Trustees and Officers of the Trust can be found in the Trust’s Statement of Additional Information (the “SAI”) which may be obtained without charge by writing or calling 1-800-99BARON. The SAI is also available on the Baron Funds’ website, www.BaronFunds.com.
37
| | |
| Baron Select Funds | | December 31, 2010 |
| | | | | | | | | | |
| Name, Address & Age | | Position(s) Held
With the Funds | | Length of
Time Served | | Principal Occupation(s)
During the Past Five Years | | Number of
Portfolios
in Fund
Complex
Overseen
by Trustee | | Other
Trustee/Directorships
During Past 5 Years |
Interested Trustees | | | | | | | | | | |
| | | | | |
Ronald Baron(1),(2) 767 Fifth Avenue New York, NY 10153 Age: 67 | | Chief Executive Officer, Chief Investment Officer, Trustee and Portfolio Manager | | 7 years | | Director, Chairman, CEO and CIO: the Firm* (2003-Present); President (2004-02/07), Chairman (1999-2004), and Trustee (1987-Present): Baron Investment Funds Trust; President (2004-02/07), Chairman (2003-2004), and Trustee (2003-Present): Baron Select Funds; Portfolio Manager: Baron USA Partners Fund, Ltd. (2003-Present); President: the Firm* (03/06-06/07); Portfolio Manager: Baron Managed Funds plc (2005-2009); President (2004-02/07), Chairman (1997-2004), and Trustee (1997-06/07): Baron Capital Funds Trust. | | 10 | | None |
| | | | | |
Linda S. Martinson(1),(2) 767 Fifth Avenue New York, NY 10153 Age: 55 | | Chairman, President, Chief Operating Officer and Trustee | | 7 years | | Director: the Firm* (2003-Present); Secretary: the Firm* (2003-04/08); President: the Firm* (02/07-Present); Chief Operating Officer: the Firm (05/06-present); General Counsel and Vice President: the Firm* (2003-2007); Chairman (10/10-Present) President (02/07-Present), Trustee (1987-Present), Secretary (2003-10/08): Baron Investment Funds Trust; Chairman (10/10-Present) President (02/07-Present), Trustee (2003-Present): Baron Select Funds; Director: Baron USA Partners Fund, Ltd. (2006-Present); Director: Baron Managed Funds plc (2005-2009); President (02/07-06/07) Trustee (1998-06/07): Baron Capital Funds Trust. | | 10 | | None |
Independent Trustees | | | | | | | | | | |
| | | | | |
Norman S. Edelcup(3),(4),(5) City of Sunny Isles Beach 18070 Collins Avenue Sunny Isles Beach, FL 33160 Age: 75 | | Trustee | | 7 years | | Director: Marquis Bank (2007-Present) Director: CompX International, Inc. (diversified manufacturer of engineered components) (2006-Present); Mayor (2003-Present), Commissioner (2001-2003): Sunny Isles Beach, Florida; Director (2001-2006), Senior Vice President (2001-2004): Florida Savings Bank; Director: Valhi, Inc. (diversified company) (1975-Present); Trustee: Baron Investment Funds Trust (1987-Present), Baron Capital Funds Trust (1997-06/07), Baron Select Funds (2003-Present). | | 10 | | Director: Marquis Bank (2007-Present); Director: CompX International, Inc. (diversified manufacturer of engineered components) (2006-Present); Director: Valhi, Inc. (diversified company) (1985-1998). |
38
| | |
| December 31, 2010 | | Baron Select Funds |
| | | | | | | | | | |
| Name, Address & Age | | Position(s) Held
With the Funds | | Length of
Time Served | | Principal Occupation(s)
During the Past Five Years | | Number of
Portfolios
in Fund
Complex
Overseen
by Trustee | | Other
Trustee/Directorships
During Past 5 Years |
Independent Trustees (continued) | | | | | | | | |
| | | | | |
Charles N. Mathewson(4),(5) 9295 Prototype Drive Reno, NV 89521 Age: 82 | | Trustee | | 7 years | | Chairman Emeritus (October 2003-Present), Chairman (1986-2003): International Game Technology, Inc. (manufacturer of microprocessor-controlled gaming machines and monitoring systems); Chairman: Baron Capital Funds Trust (2004-06/07), Baron Investment Funds Trust, Baron Select Funds (2004-10/10); Trustee: Baron Investment Funds Trust (1987-Present), Baron Capital Funds Trust (1997-06/07), Baron Select Funds (2003-Present). | | 10 | | None |
| | | | | |
Harold W. Milner(4),(5) 2293 Morningstar Drive Park City, UT 84060 Age: 76 | | Trustee | | 7 years | | Retired; Trustee: Baron Investment Funds Trust (1987-Present), Baron Capital Funds Trust (1997-06/07), Baron Select Funds (2003-Present); Chairman: Lighning Protection Systems, LLC (10/06-Present); Director: COMPETExRM (2009-Present). | | 10 | | None |
| | | | | |
Raymond Noveck(3),(4),(5) 31 Karen Road Waban, MA 02468 Age: 67 | | Trustee | | 7 years | | Private Investor (1999-Present); Trustee: Baron Investment Funds Trust (1987-Present), Baron Capital Funds Trust (1997-06/07), Baron Select Funds (2003-Present). | | 10 | | None |
| | | | | |
David A. Silverman, MD(4),(5) 146 Central Park West New York, NY 10024 Age: 60 | | Trustee | | 7 years | | Physician and Faculty: New York University School of Medicine (1976-Present); Trustee: Baron Investment Funds Trust (1987-Present), Baron Capital Funds Trust (1997-06/07), Baron Select Funds (2003-Present). | | 10 | | Director: New York Blood Center (1999-Present). |
| | | | | |
Alex Yemenidjian(4),(5) 3801 Las Vegas Blvd. South
Las Vegas, NV 89109
Suite 1975 Los Angeles, CA 90067 Age: 55 | | Trustee | | 4 years | | Chairman and CEO: Tropicana Las Vegas (gaming) (2009-Present); Chairman and CEO: Armenco Holdings, LLC (investment company) (2005-Present); Director: Guess?, Inc. (retail) (2005-Present); Director: Regal Entertainment Group (entertainment company) (2005-Present); Director: USC Marshall School of Business Board of Leaders (2005-Present); Co-chair: Imagine the Arts Campaign, California State University-Northridge (2005-Present); Trustee: American Film Institute (2000-2007); Chairman and CEO: Metro-Goldwyn-Mayer, Inc. (1999-2005); Director: The Lincy Foundation (1989-Present); Chairman: The United Armenian Fund (1989-Present); Director and member of Executive Committee: MGM MIRAGE, Inc. (1989-2005); Trustee: Baron Investment Funds Trust (2006-Present), Baron Capital Funds Trust (12/06-06/07), Baron Select Funds (12/06-Present). | | 10 | | Chairman: Tropicana Las Vegas (2009-Present); Director: Guess?, Inc. (2005-Present); Director: Regal Entertainment Group (2005-Present); Director, USC Marshall School of Business Board of Leaders (2005-Present); Co-chair: Imagine the Arts Campaign, California State University-Northridge (2005-Present); Trustee: American Film Institute (2000-2007); Director: The Lincy Foundation (1989-Present); Chairman: The United Armenian Fund (1989-Present); Director and member of Executive Committee: MGM MIRAGE, Inc. (1989-2005). |
39
| | |
| Baron Select Funds | | December 31, 2010 |
| | | | | | | | | | |
| Name, Address & Age | | Position(s) Held
With the Funds | | Length of
Time Served | | Principal Occupation(s)
During the Past Five Years | | Number of
Portfolios
in Fund
Complex
Overseen
by Trustee | | Other
Trustee/Directorships
During Past 5 Years |
Additional Officers of the Funds | | | | | | | | |
| | | | | |
Clifford Greenberg 767 Fifth Avenue New York, NY 10153 Age: 51 | | Senior Vice President and Portfolio Manager | | 7 years | | Director and Senior Vice President: the Firm* (2003-Present); Vice President: Baron Capital, Inc. (1997-2003); Portfolio Manager: Baron Small Cap Fund (1997-Present). | | 10 | | None |
| | | | | |
Gretta J. Heaney 767 Fifth Avenue New York, NY 10153 Age: 50 | | Vice President and Chief Compliance Officer | | 6 years | | Vice President and Chief Compliance Officer: the Firm* (2003-Present), Baron Investment Funds Trust, Baron Select Funds (2004-Present), Baron USA Partners Fund, Ltd (2006-Present), Baron Managed Funds plc (2005-2009), Baron Capital Funds Trust (2003-06/07). | | 10 | | None |
| | | | | |
Patrick M. Patalino 767 Fifth Avenue New York, NY 10153 Age: 42 | | Vice President, General Counsel and Secretary | | 3 years | | Vice President and General Counsel: the Firm*, Baron Investment Funds Trust, Baron Select Funds, (08/07-Present); Baron USA Partners Fund, Ltd. (08/07-Present); Secretary: the Firm* (04/08-Present); Secretary: Baron Investment Funds Trust, Baron Select Funds (10/08-Present); Managing Director and Chief Operating Officer: Legal and Compliance Division, Morgan Stanley (01/06-06/07); Director of Regulatory Matters: Credit Suisse Securities (USA) (04/04-01/06); Counsel to Vice Chairman: Credit Suisse Securities (USA) (09/02-04/04). | | 10 | | None |
| | | | | |
Andrew Peck 767 Fifth Avenue New York, NY 10153 Age: 41 | | Senior Vice President and Portfolio Manager | | 7 years | | Portfolio Manager: Baron Asset Fund (01/08-Present); Vice President: BAMCO, Inc. (2003-Present); Vice President: Baron Investment Funds Trust (2003-Present); Vice President, Research Analyst: Baron Capital, Inc. (1998-2003); Co-Portfolio Manager: Baron Asset Fund (2003-01/08); Co-Portfolio Manager (mid cap accounts): Baron Capital Management, Inc. (04/06-Present). | | 10 | | None |
| | | | | |
Susan Robbins 767 Fifth Avenue New York, NY 10153 Age: 56 | | Vice President | | 7 years | | Director, Vice President and Senior Analyst: the Firm* (2003-Present); Vice President: Baron Investment Funds Trust (1994-Present), Baron Select Funds (2003-Present), Baron Capital Funds Trust (1998-06/07). | | 10 | | None |
| | | | | |
Peggy C. Wong 767 Fifth Avenue New York, NY 10153 Age: 49 | | Treasurer and Chief Financial Officer | | 7 years | | Chief Financial Officer and Treasurer: the Firm* (2003-Present), Baron Investment Funds Trust (1987-Present), Baron Select Funds (2003-Present), Baron USA Partners Fund, Ltd. (1993-Present), Baron Managed Funds plc. (2005-2009), Baron Capital Funds Trust (1998-06/07). | | 10 | | None |
| * | The Firm (Baron Capital Group, Inc. (“BCG”) with its subsidiaries BCI, Baron Capital Management, Inc. (“BCM”) and BAMCO). |
| (1) | Trustees deemed to be “Interested Trustees” of the Funds, as that term is defined in the 1940 Act by reason of their employment with the Funds’ Adviser and Distributor. |
| (2) | Members of the Executive Committee, which is empowered to exercise all of the powers, including the power to declare dividends, of the full Board when the full Board is not in session. |
| (3) | Members of the Audit Committee. |
| (4) | Members of the Nominating Committee. |
| (5) | Members of the Independent Committee. |
40
767 Fifth Avenue, 49th Fl.
New York, NY 10153
1.800.99.BARON
212-583-2000
www.BaronFunds.com
DEC10
Item 2. Code of Ethics.
The Registrant has adopted a Code of Ethics for Principal Executive and Senior Financial Officers (the “Code”). Upon request, the Registrant will provide a copy of the Code to any person without charge. To obtain a copy of the Code, please send your request to info@Baronfunds.com or call 1-800-99BARON (1-800-992-2766).
Item 3. Audit Committee Financial Expert.
The Registrant’s Board of Trustees has determined that the Registrant has two audit committee financial experts serving on its Audit Committee, Norman S. Edelcup and Raymond Noveck. Both Mr. Edelcup and Mr. Noveck are “independent” for purposes of Item 3(a)(2) of Form N-CSR.
Item 4. Principal Accountant Fees and Services.
The following table shows the fees paid to Pricewaterhouse Coopers, LLP, the Registrant’s principal accounting firm during the fiscal years ended December 31, 2010 and December 31, 2009:
(a) Audit Fees: for professional services rendered for the audit of the Registrant’s annual financial statements or services that are normally provided in connection with the statutory and regulatory filings or engagements:
| | | | | | | | |
| | | 2010 | | | 2009 | |
Baron Partners Fund | | $ | 42,250 | | | $ | 42,250 | |
Baron Focused Growth Fund | | $ | 25,000 | | | $ | 25,000 | |
Baron International Growth Fund | | $ | 25,000 | | | $ | 0 | |
Baron Real Estate Fund | | $ | 22,500 | | | | N/A | |
(b) Audit-Related Fees: for assurance and related services that are reasonably related to the performance of the audit and are not included as Audit Fees:
| | | | | | | | |
| | | 2010 | | | 2009 | |
Baron Partners Fund | | $ | 0 | | | | $0 | |
Baron Focused Growth Fund | | $ | 0 | | | | $0 | |
Baron International Growth Fund | | $ | 0 | | | | $0 | |
Baron Real Estate Fund | | $ | 0 | | | | N/A | |
(c) Tax Fees: for professional services rendered for tax compliance, tax advice and tax planning:
| | | | | | | | |
| | | 2010 | | | 2009 | |
Baron Partners Fund | | $ | 5,400 | | | $ | 21,150 | |
Baron Focused Growth Fund | | $ | 4,400 | | | $ | 31,700 | |
Baron International Growth Fund | | $ | 4,400 | | | $ | 4,400 | |
Baron Real Estate Fund | | $ | 0 | | | | N/A | |
The Tax Fees represent services provided in connection with the preparation of tax returns and year-end distribution review.
(d) All Other Fees: for products and services provided by such accounting firm that are not included in (a), (b) or (c) above:
| | | | | | | | |
| | | 2010 | | | 2009 | |
Baron Partners Fund | | $ | 0 | | | | $0 | |
Baron Focused Growth Fund | | $ | 0 | | | | $0 | |
Baron International Growth Fund | | $ | 0 | | | | $0 | |
Baron Real Estate Fund | | $ | 0 | | | | N/A | |
(e) Audit Committee Pre-Approval Policies and Procedures: (i) Pursuant to paragraph (c)(7) of Rule 2-01 of Regulation S-X and to its charter, the Audit Committee shall pre-approve all audit and non-audit services provided by the independent auditors and in connection therewith to review and evaluate the qualifications, independence and performance of the Fund’s independent auditors; (ii) 100% of the services described in each of items 4(b) through 4(d) were approved by the Audit Committee pursuant to paragraph (c)(7)(i)(C) of Rule 2-01 of Regulation S-X.
(f) Less than 50% of the hours expended on the principal accountant’s engagement to audit the financial statements were attributed to work performed by persons other than the principal accountant’s full-time, permanent employees.
(g) The aggregate non-audit fees billed by the registrant’s accountant for services rendered to the registrant, and rendered to the registrant’s investment adviser (not including any sub-adviser whose role is primarily portfolio management and is subcontracted with or overseen by another investment adviser), and any entity controlling, controlled by, or under common control with the adviser that provides ongoing services to the registrant for the last two fiscal years is as follows:
2010: $45,000
2009: $44,000
(h) Not Applicable.
Item 5. Audit Committee of Listed Registrants.
The Registrant has a separately-designated standing Audit Committee established in accordance with Section 3(a)(58)(A) of the Securities Exchange Act of 1934. The members of the Audit Committee are Norman S. Edelcup and Raymond Noveck.
Item 6. Schedule of Investments.
Included herein under Item 1.
Item 7. Disclosure of Proxy Voting Policies and Procedures for Closed-End Management Investment Companies.
Not applicable.
Item 8. Portfolio Managers of Closed-End Management Investment Companies.
Not applicable.
Item 9. Purchases of Equity Securities by Closed-End Management Investment Company and Affiliated Purchasers.
Not applicable.
Item 10. Submission of Matters to a Vote of Security Holders.
Not applicable.
Item 11. Controls and Procedures.
(a) The Registrant’s principal executive officer and principal financial officer have concluded that the Registrant’s disclosure controls and procedures (as defined in Rule 30a-3(c) under the Investment Company Act of 1940 (the “1940 Act”)) are effective based on their evaluation of these controls and procedures as of a date within 90 days of the filing date of this report.
(b) There were no changes in the Registrant’s internal control over financial reporting (as defined in Rule 30a-3(d) under the 1940 Act) that occurred during the Registrant’s second fiscal quarter of the period covered by this report that have materially affected, or are reasonably likely to materially affect, the Registrant’s internal control over financial reporting.
Item 12. Exhibits.
(a)(2) Certification of each of the principal executive officers and principal financial officers of the Registrant as required by Rule 30a-2 under the Act (17 CFR 270.30a-2) is attached hereto as a part of EX-99.CERT.
(b) Certification of each of the principal executive officers and principal financial officers of the Registrant as required by Section 906 of the Sarbanes-Oxley Act of 2002 is attached hereto as a part of EX-99.906CERT.
SIGNATURES
Pursuant to the requirements of the Securities Exchange Act of 1934 and the Investment Company Act of 1940, the registrant has duly caused this report to be signed on its behalf by the undersigned, thereunto duly authorized.
| | |
| BARON SELECT FUNDS |
| |
| By: | | /s/ Ronald Baron |
| | Ronald Baron |
| | Chief Executive Officer |
|
| Date: February 28, 2011 |
Pursuant to the requirements of the Securities Exchange Act of 1934 and the Investment Company Act of 1940, this report has been signed below by the following persons on behalf of the registrant and in the capacities and on the dates indicated.
| | |
| By: | | /s/ Ronald Baron |
| | Ronald Baron |
| | Chief Executive Officer |
|
| Date: February 28, 2011 |
| |
| By: | | /s/ Peggy Wong |
| | Peggy Wong |
| | Treasurer and Chief Financial Officer |
|
| Date: February 28, 2011 |