| | |
OMB APPROVAL |
OMB Number: | | 3235 - 0570 |
Expires: | | August 31, 2010 |
Estimated average burden |
hours per response . . . | | 18.9 |
UNITED STATES
SECURITIES AND EXCHANGE COMMISSION
Washington, D.C. 20549
FORM N-CSR
CERTIFIED SHAREHOLDER REPORT OF REGISTERED
MANAGEMENT INVESTMENT COMPANIES
| | |
Investment Company Act file number: 811-21296 | | |
BARON SELECT FUNDS
|
| (Exact name of registrant as specified in charter) |
| | |
| 767 Fifth Avenue, 49th Floor | | New York, NY 10153 |
| (Address of Principal Executive Offices) | | (Zip Code) |
Patrick M. Patalino, Esq.
c/o Baron Select Funds
767 Fifth Avenue, 49th Floor
New York, NY 10153
|
| (Name and Address of Agent for Service) |
Registrant’s Telephone Number, including Area Code: 212-583-2000
Date of fiscal year end: December 31
Date of reporting period: December 31, 2009
Form N-CSR is to be used by management investment companies to file reports with the Commission not later than 10 days after the transmission to stockholders of any report that is required to be transmitted to stockholders under Rule 30e-1 under the Investment Company Act of 1940 (17CRF 270.30e-1). The Commission may use the information provided on Form N-CSR in its regulatory, disclosure review, inspection, and policymaking roles.
A registrant is required to disclose the information specified by Form N-CSR, and the Commission will make this information public. A registrant is not required to respond to the collection of information contained in Form N-CSR unless the Form displays a currently valid Office of Management and Budget (“OMB”) control number. Please direct comments concerning the accuracy of the information collection burden estimate and suggestions for reducing the burden to Secretary, Securities and Exchange Commission, 450 5th Street, NW, Washington, D.C. 20549-0609. The OMB has reviewed this collection of information under the clearance requirements of 44 U.S.C. Section 3507.
Persons who are to respond to the collection of information contained in this form are not required to respond unless the form displays a currently valid OMB control number.
SEC 2569 (5-07)
Item 1. Reports to Stockholders.
Baron Select Funds Annual Report for the period ended December 31, 2009.
Baron Partners Fund
Baron Retirement Income Fund
Baron International Growth Fund
December 31, 2009
Baron Funds®
Annual Financial Report
DEAR BARON SELECT FUNDS SHAREHOLDER:
In this report you will find audited financial statements for Baron Partners Fund, Baron Retirement Income Fund and Baron International Growth Fund for the fiscal year ended December 31, 2009. The Securities and Exchange Commission (the “SEC”) requires mutual funds to furnish these statements semi-annually to their shareholders. We hope you find these statements informative and useful.
We thank you for choosing to join us as fellow shareholders in Baron Funds. We will continue to work hard to justify your confidence.
Sincerely,
| | | | |
 | |  | |  |
Ronald Baron Chief Executive Officer and Chief Investment Officer February 23, 2010 | | Linda S. Martinson President and Chief Operating Officer February 23, 2010 | | Peggy Wong Treasurer and Chief Financial Officer February 23, 2010 |
This Annual Financial Report is for the Baron Select Funds which currently has four series: Baron Partners Fund, Baron Retirement Income Fund, Baron International Growth Fund and Baron Real Estate Fund. Baron Real Estate Fund commenced operations on January 1, 2010 and, therefore, is not included in this report. If you are interested in Baron Investment Funds Trust, which contains the Baron Asset Fund, Baron Growth Fund, Baron Small Cap Fund, Baron iOpportunity Fund and Baron Fifth Avenue Growth Fund series, please visit the Funds’ website www.BaronFunds.com or contact us at 1-800-99BARON.
A description of the Funds’ proxy voting policies and procedures is available without charge on the Funds’ website, www.BaronFunds.com, or by calling 1-800-99BARON and on the SEC’s website at www.sec.gov. The Funds’ most current proxy voting record, Form N-PX, is also available on the Funds’ website and on the SEC’s website.
The Funds file their complete schedules of portfolio holdings with the SEC for the first and third quarters of each fiscal year on Form N-Q. The Funds’ Forms N-Q are available on the SEC’s website at www.sec.gov. The Funds’ Forms N-Q may also be reviewed and copied at the SEC’s Public Reference Room in Washington, DC; information on the operation of the SEC’s Public Reference Room may be obtained by calling 1-202-551-8090. A copy of the Funds’ Forms N-Q may also be obtained upon request by contacting Baron Funds at 1-800-99BARON. Schedules of portfolio holdings current to the most recent quarter are also available on the Funds’ website.
Some of the comments are based on current management expectations and are considered “forward-looking statements.” Actual future results, however, may prove to be different from our expectations. You can identify forward-looking statements by words such as “estimate,” “may,” “expect,” “should,” “could,” “believe,” “plan” and other similar terms. We cannot promise future returns and our opinions are a reflection of our best judgment at the time this report is compiled.
The views expressed in this report reflect those of BAMCO, Inc. (“BAMCO” or the “Adviser”) only through the end of the period stated in this report. The views are not intended as recommendations or investment advice to any person reading this report and are subject to change at any time without notice based on market and other conditions.
Past performance is no guarantee of future results. The investment return and principal value of an investment will fluctuate; an investor’s shares, when redeemed, may be worth more or less than their original cost. For more complete information about Baron Funds, including charges and expenses, call or write for a prospectus. Read it carefully before you invest or send money. This report is not authorized for use as an offer of sale or a solicitation of an offer to buy shares of Baron Funds, unless accompanied or preceded by the Funds’ current prospectus.
767 Fifth Avenue
NY, NY 10153
212-583-2100
| | |
| Baron Partners Fund | | December 31, 2009 |
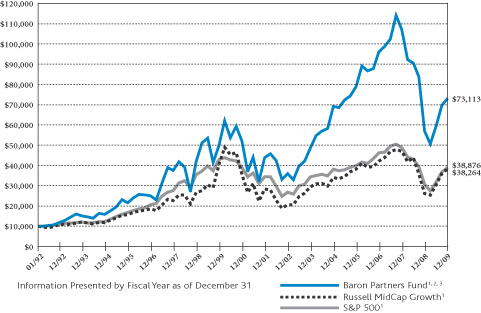
COMPARISONOFTHECHANGEIN VALUEOF $10,000INVESTMENT
IN BARON PARTNERS FUND†INRELATIONTOTHE RUSSELL MIDCAP GROWTHANDTHE S&P 500 INDEXES
AVERAGE ANNUAL TOTAL RETURNSFORTHEPERIODSENDED DECEMBER 31, 2009
| | | | | | | | | | |
| | | One
Year | | Three
Years | | Five
Years | | Ten
Years | | Since
Inception
(January 31,
1992) |
Baron Partners Fund — Retail Shares1,2,3 | | 28.20% | | -8.69% | | 1.14% | | 3.94% | | 11.74% |
Baron Partners Fund — Institutional Shares1,2,3,4 | | 28.36% | | -8.65% | | 1.16% | | 3.95% | | 11.75% |
Russell MidCap Growth1 | | 46.29% | | -3.18% | | 2.40% | | -0.52% | | 7.78% |
Russell MidCap1 | | 40.48% | | -4.59% | | 2.43% | | 4.98% | | 10.07% |
Russell 20001 | | 27.17% | | -6.07% | | 0.51% | | 3.51% | | 7.90% |
S & P 5001 | | 26.50% | | -5.64% | | 0.40% | | -0.97% | | 7.87% |
| 1 | The Russell MidCap, Russell MidCap Growth, Russell 2000 and S&P 500 are unmanaged indexes. The Russell MidCap measures the performance of mid-sized companies. The Russell MidCap Growth measures the performance of those Russell MidCap companies classified as growth. The Russell 2000 measures the performance of 2,000 small companies. The S&P 500 measures the performance of larger-cap equities in the stock market in general. These indexes and the Baron Partners Fund are with dividends, which positively impact the performance results. The Russell MidCap Growth has replaced the Russell 2000 as the primary broad-based index for Baron Partners Fund. The Adviser believes that the Russell 2000 is not the appropriate broad-based index because the Russell 2000 includes only small-cap companies and Baron Partners Fund invests in companies of all sizes. |
| 2 | Reflects the actual fees and expenses that were charged when the Fund was a partnership. The predecessor partnership charged a 20% performance fee after reaching a certain performance benchmark. If the annual returns for the Fund did not reflect the performance fee for the years it was a partnership, the returns would be higher. The Fund’s shareholders will not be charged a performance fee. The predecessor partnership’s performance is only for the periods before the Fund’s registration statement was effective, which was April 30, 2003. During those periods, the predecessor partnership was not registered under the Investment Company Act of 1940 and was not subject to its requirements or the requirements of the Internal Revenue Code relating to registered investment companies, which, if it were, might have adversely affected its performance. |
| 3 | Past performance is not predictive of future performance. The performance data does not reflect the deduction of taxes that a shareholder would pay on Fund distributions or redemption of Fund shares. The Fund’s transfer agency expenses may be reduced by expense offsets from an unaffiliated transfer agent, without which performance would have been lower. |
| 4 | Performance for the Institutional Shares prior to May 29, 2009 is based on the performance of the Retail Shares, which have a distribution fee. The Institutional Shares do not have a distribution fee. If the annual returns prior to May 29, 2009 did not reflect this fee, the returns would be higher. |
| † | Performance information reflects results of the Retail Shares. |
1.800.99 BARON
www.BaronFunds.com
©2010 All Rights Reserved
2
| | |
| December 31, 2009 | | Baron Partners Fund |
TOP TEN HOLDINGSASOF DECEMBER 31, 2009
| | |
| Baron Partners Fund | | Percent of
Long Positions |
Charles Schwab Corp. | | 6.3% |
Arch Capital Group, Ltd. | | 6.0% |
Fastenal Co. | | 6.0% |
FactSet Research Systems, Inc. | | 5.5% |
ITC Holdings Corp. | | 5.4% |
Community Health Systems, Inc. | | 4.7% |
Hyatt Hotels Corp., Cl A | | 4.4% |
MSCI, Inc., Cl A | | 4.0% |
Dick's Sporting Goods, Inc. | | 3.7% |
Edwards Lifesciences Corp. | | 3.2% |
| | | 49.2% |
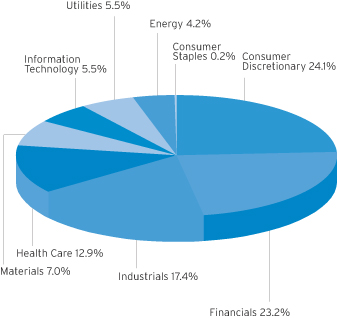
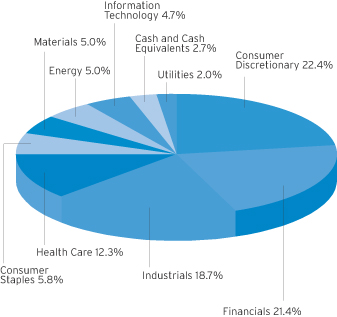
SECTOR BREAKDOWNASOF DECEMBER 31, 2009†
(as a percentage of long positions)
MANAGEMENT’S DISCUSSIONOF FUND PERFORMANCE
For the year ended December 31, 2009, Baron Partners Fund (Retail Shares) gained 28.20%. That compared favorably with the S&P 500, which gained 26.50%, and the Russell 2000, up 27.17%. The Fund underperformed both the Russell MidCap, up 40.48%, and the Russell MidCap Growth, up 46.29%. That latter index had a 21.4% average weight in technology stocks, which gained 68% for the year. On average, less than 6.7% of Baron Partners Fund’s portfolio was invested in technology companies throughout the year.
Baron Partners Fund has performed well since its conversion to an open-end mutual fund on April 30, 2003. In the period since the Fund’s conversion through December 31, 2009, the Fund gained an annualized 11.32%. This compares to an annualized 8.64% for the Russell MidCap Growth, 9.33% for the Russell MidCap, 8.37% for the Russell 2000 and 5.04% for the S&P 500. Since its inception on January 31, 1992,* the Fund also has outperformed, gaining an annualized 11.74%. This compares to 7.78% for the Russell MidCap Growth, 10.07% for the Russell MidCap, 7.90% for the Russell 2000 and 7.87% for the S&P 500.
We believe that Baron Partners Fund’s performance relative to its benchmarks in the past year was consistent with the Fund’s investment approach. In rapidly rising markets, such as that experienced for much of 2009, Baron Partners Fund has often lagged. This is because we avoid highly leveraged, speculative stocks, which have often outperformed in such periods. Technology stocks have also often outperformed in such periods. Historically, the Fund has had relatively few investments in technology companies and has often achieved relative outperformance when technology businesses underperformed.
Baron Partners Fund invests in what we believe are financially solid companies with exceptional managements, sustainable competitive advantages and significant growth potential. We believe the companies in our portfolio have appropriately strong balance sheets. In our opinion, 88% of our holdings will have higher earnings in 2010 than they had in 2009.
As the chart below indicates, the Fund has tended to outperform the market when stocks declined or grew at more moderate levels than they did in the latter half of 2009.
| | | | | | | | |
Performance
of Russell
MidCap
Growth Index | | Number
of
Years^ | | Number of
Years the Fund
Outperformed | | Number of
Years the Fund
Underperformed | | % of Years
the Fund
Outperformed |
Negative | | 5 | | 4 | | 1 | | 80% |
0-25% | | 9 | | 7 | | 2 | | 78% |
>25% | | 4 | | 1 | | 3 | | 25% |
| ^ | Includes the years 1993 to 2009, as well as the “stub period” of 1/31/92-12/31/92. |
We believe that as the economy recovers, Baron Partners Fund, with its emphasis on high quality companies and strong management teams, is positioned to perform well.
Baron Partners Fund uses value purchase disciplines to invest in all-cap companies that we believe have significant long-term growth opportunities. We believe that our independent research will identify investment opportunities that are attractively priced relative to their future prospects. However, Baron Partners Fund is different from most of the other Baron Funds with its non-diversified portfolio and its ability to leverage, which are more risky investment strategies.
The Fund expects to continue to invest in securities of businesses that, in our opinion, have favorable price-to-value characteristics based on our assessment of their prospects for future growth and profitability.
| * | Please see Footnote 2 on page 2. |
| † | Industry sector levels are provided from the Global Industry Classification Standard (“GICS”), developed and exclusively owned by MSCI, Inc. and Standard & Poor’s Financial Services LLC, unless otherwise stated that they have been reclassified or classified by the Adviser. All GICS data is provided “as is” with no warranties. |
3
| | |
| Baron Retirement Income Fund | | December 31, 2009 |
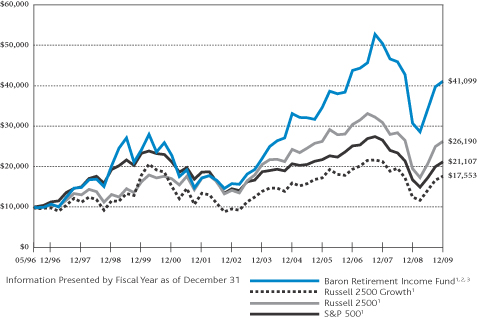
COMPARISONOFTHECHANGEIN VALUEOF $10,000INVESTMENT
IN BARON RETIREMENT INCOME FUND†INRELATIONTOTHE
RUSSELL 2500 GROWTH,THE RUSSELL 2500ANDTHE S&P 500 INDEXES
AVERAGE ANNUAL TOTAL RETURNSFORTHEPERIODSENDED DECEMBER 31, 2009
| | | | | | | | | | |
| | | One
Year | | Three
Years | | Five
Years | | Ten
Years | | Since
Inception
(May 31,
1996) |
Baron Retirement Income Fund — Retail Shares1,2,3 | | 33.77% | | -2.06% | | 4.45% | | 5.47% | | 10.97% |
Baron Retirement Income Fund — Institutional Shares1,2,3,4 | | 33.94% | | -2.02% | | 4.48% | | 5.48% | | 10.98% |
Russell 2500 Growth1 | | 41.66% | | -3.13% | | 2.00% | | -0.18% | | 4.23% |
Russell 25001 | | 34.39% | | -4.86% | | 1.58% | | 4.91% | | 7.35% |
Russell 2000 Growth1 | | 34.47% | | -4.00% | | 0.87% | | -1.37% | | 2.09% |
S & P 5001 | | 26.50% | | -5.64% | | 0.40% | | -0.97% | | 5.65% |
| 1 | The Russell 2500, Russell 2500 Growth, Russell 2000 Growth and S&P 500 are unmanaged indexes. The Russell 2500 measures the performance of 2,500 small and medium-sized companies. The Russell 2500 Growth measures the performance of those Russell 2500 companies that are classified as growth. The Russell 2000 measures the performance of 2,000 small companies. The Russell 2000 Growth measures the performance of those Russell 2000 companies that are classified as growth. The S&P 500 measures the performance of larger cap equities in the stock market in general. These indexes and Baron Retirement Income Fund are with dividends, which positively impact the performance results. The Russell 2500 Growth has replaced the Russell 2000 Growth as the primary broad-based index for Baron Retirement Income Fund. The Adviser believes that the Russell 2000 Growth is not the appropriate primary broad-based index because the Russell 2000 Growth includes only small-cap companies and Baron Retirement Income Fund invests in small and mid-cap companies. |
| 2 | Reflects the actual fees and expenses that were charged when the Fund was a partnership. Prior to 2003, the predecessor partnership charged a 15% performance fee after reaching a certain performance benchmark. If the annual returns for the Fund did not reflect the performance fee for the years it was a partnership, the returns would be higher. The Fund’s shareholders will not be charged a performance fee. The predecessor partnership’s performance is only for the periods before the Fund’s registration statement was effective, which was June 30, 2008. During those periods, the predecessor partnership was not registered under the Investment Company Act of 1940 and was not subject to its requirements or the requirements of the Internal Revenue Code relating to registered investment companies, which, if it were, might have adversely affected its performance. |
| 3 | Past performance is not predictive of future performance. The performance data does not reflect the deduction of taxes that a shareholder would pay on Fund distributions or redemption of Fund shares. The Adviser has reimbursed certain Fund expenses and the Fund’s transfer agency expenses may be reduced by expense offsets from an unaffiliated transfer agent, without which performance would have been lower. |
| 4 | Performance for the Institutional Shares prior to May 29, 2009 is based on the performance of the Retail Shares, which have a distribution fee. The Institutional Shares do not have a distribution fee. If the annual returns prior to May 29, 2009 did not reflect this fee, the returns would be higher. |
| † | Performance information reflects results of the Retail Shares. |
1.800.99 BARON
www.BaronFunds.com
©2010 All Rights Reserved
4
| | |
| December 31, 2009 | | Baron Retirement Income Fund |
TOP TEN HOLDINGSASOF DECEMBER 31, 2009
| | |
| Baron Retirement Income Fund | | Percent of
Net Assets |
MSCI, Inc., Cl A | | 6.3% |
Verisk Analytics, Inc., Cl A | | 5.1% |
Charles Schwab Corp. | | 4.7% |
Genesee & Wyoming, Inc., Cl A | | 4.3% |
Eaton Vance Corp. | | 3.9% |
Hyatt Hotels Corp., Cl A | | 3.9% |
Penske Automotive Group, Inc. | | 3.8% |
Arch Capital Group, Ltd. | | 3.7% |
Community Health Systems, Inc. | | 3.7% |
C. H. Robinson Worldwide, Inc. | | 3.5% |
| | | 42.9% |
SECTOR BREAKDOWNASOF DECEMBER 31, 2009†
(as a percentage of net assets)
MANAGEMENT’S DISCUSSIONOF FUND PERFORMANCE
For the year ended December 31, 2009, Baron Retirement Income Fund (Retail shares) gained 33.77%. The Fund outperformed the S&P 500, which gained 26.50%. The Fund’s performance was in line with the Russell 2500, which increased 34.39%, and the Russell 2000 Growth, which gained 34.47%. The Fund underperformed the Russell 2500 Growth, which was up 41.66%. That index had a 21.3% average weight in technology, which gained 60% for the year. Baron Retirement Income Fund’s ownership of technology stocks averaged 4.1% throughout the year.
The Fund modestly underperformed its comparative indexes since it converted to an open-end mutual fund on June 30, 2008. In the period since the Fund’s conversion through December 31, 2009, the Fund lost an annualized 7.14% versus an annualized 6.82% for the Russell 2500 Growth, 5.10% for the Russell 2500, 6.27% for the Russell 2000 Growth and 6.47% for the S&P 500.
However, since its inception on May 31, 1996* to December 31, 2009, the Fund has outperformed its comparative indexes, gaining an annualized 10.97% compared to an annualized 4.23% for the Russell 2500 Growth, 7.35% for the Russell 2500, 2.09% for the Russell 2000 Growth and 5.65% for the S&P 500.
We believe that the Fund’s performance relative to its benchmarks in the past year was consistent with the Fund’s long-term investment approach. As the chart below indicates, in rapidly rising markets, such as that experienced for much of 2009, Baron Retirement Income Fund has often lagged as we avoid highly leveraged, speculative stocks, which have outperformed in such periods. Technology stocks have also outperformed in such periods. Historically, the Fund has had relatively few investments in technology companies. As a result, the Fund has often achieved relative outperformance when technology stocks have faltered.
| | | | | | | | |
Performance
of Russell
2500 Growth
Index | | Number
of
Years^ | | Number of
Years the Fund
Outperformed | | Number of
Years the Fund
Underperformed | | % of Years
the Fund
Outperformed |
Negative | | 5 | | 4 | | 1 | | 80% |
0-25% | | 6 | | 5 | | 1 | | 83% |
>25% | | 3 | | 0 | | 3 | | 0% |
| ^ | Includes the Years 1997 to 2009, as well as the “stub period” of 5/31/96-12/31/96. |
Baron Retirement Income Fund invests companies that we believe are well capitalized with exceptional management, significant growth potential, and sustainable barriers to competition. In our opinion, about 73% of our holdings will have higher earnings in 2010 than they had in 2009.
We seek to invest in companies that we believe will double in size within four or five years. We believe that as the economy recovers and markets continue to rally, Baron Retirement Income Fund, with its emphasis on quality companies and management, is positioned to perform well.
The non-diversified Fund utilizes value purchase disciplines when investing in small and mid-sized growth companies that we believe has significant long-term growth opportunities. We believe that our independent research will identify investment opportunities that are attractively priced relative to their future prospects. The Fund is unique when compared to other Baron Funds because it intends to make an annual distribution equal to a minimum of 4% of the Fund’s net assets per share measured as of December 31 of the preceding year. The adviser anticipates that the annual distributions will be characterized as either dividend income, capital gains or return of capital, or some combination thereof.
In 2010, the Fund expects to continue to establish positions in small and mid-sized businesses that, in our opinion, have favorable price-to-value characteristics based on our assessment of prospects for future growth and profitability.
| * | Please see Footnote 2 on page 4. |
| † | Industry sector levels are provided from the Global Industry Classification Standard (“GICS”), developed and exclusively owned by MSCI, Inc. and Standard & Poor’s Financial Services LLC, unless otherwise stated that they have been reclassified or classified by the Adviser. All GICS data is provided “as is” with no warranties. |
5
| | |
| Baron International Growth Fund | | December 31, 2009 |
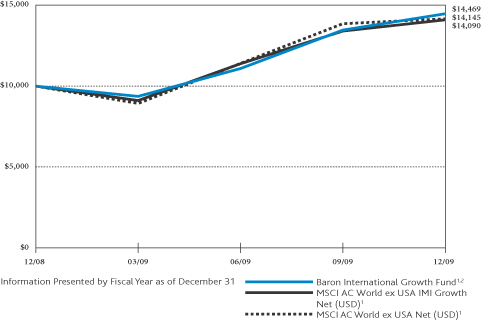
COMPARISONOFTHECHANGEIN VALUEOF $10,000INVESTMENT
IN BARON INTERNATIONAL GROWTH FUND†INRELATIONTOTHE MSCI AC WORLDEX USA IMI GROWTH NET (USD)ANDTHE MSCI AC WORLDEX USA NET (USD) INDEXES
AVERAGE ANNUAL TOTAL RETURNSFORTHEPERIODSENDED DECEMBER 31, 2009
| | | | |
| | | One
Year | | Since Inception
(December 31, 2008) |
Baron International Growth Fund — Retail Shares1,2 | | 44.69% | | 44.69% |
Baron International Growth Fund —Institutional Shares1,2,3 | | 44.89% | | 44.89% |
MSCI AC World ex USA IMI Growth Net (USD)1 | | 40.90% | | 40.90% |
MSCI AC World ex USA Net (USD)1 | | 41.45% | | 41.45% |
| 1 | The MSCI AC World ex USA indexes are an unmanaged, free float-adjusted market capitalization weighted indexes. The MSCI AC World ex USA IMI Growth Net Index measure the equity market performance of large-, mid-, and small-cap growth securities across developed and emerging markets, excluding the United States. The MSCI AC World ex USA Net Index measures the equity market performance of large- and mid-cap securities across developed and emerging markets, excluding the United States. The indexes and Baron International Growth Fund include reinvestment of dividends, net of foreign withholding taxes, which positively impact the performance results. |
| 2 | Past performance is not predictive of future performance. The performance data does not reflect the deduction of taxes that a shareholder would pay on Fund distributions or redemption of Fund shares. The Adviser has reimbursed certain Fund expenses and the Fund’s transfer agency expenses may be reduced by expense offsets from an unaffiliated transfer agent, without which performance would have been lower. |
| 3 | Performance for the Institutional Shares prior to May 29, 2009 is based on the performance of the Retail Shares, which have a distribution fee. The Institutional Shares do not have a distribution fee. If the annual returns prior to May 29, 2009 did not reflect this fee, the returns would be higher. |
| † | Performance information reflects results of the Retail Shares. |
1.800.99 BARON
www.BaronFunds.com
©2010 All Rights Reserved
6
| | |
| December 31, 2009 | | Baron International Growth Fund |
TOP TEN HOLDINGSASOF DECEMBER 31, 2009
| | |
| Baron International Growth Fund | | Percent of
Net Assets |
Schweitzer-Mauduit International, Inc. | | 3.6% |
Symrise AG | | 3.1% |
Totvs SA | | 2.8% |
Jupiter Telecommunications Co., Ltd. | | 2.6% |
Wynn Macau, Ltd. | | 2.6% |
Experian plc | | 2.4% |
Compagnie Financiere Richemont SA | | 2.3% |
NII Holdings, Inc. | | 2.2% |
Ryanair Holdings plc, ADR | | 2.1% |
Thales SA | | 2.1% |
| | | 25.8% |
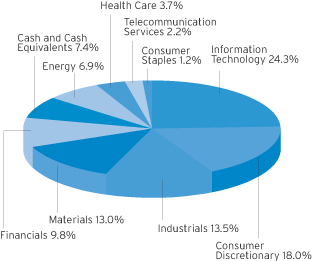
SECTOR BREAKDOWNASOF DECEMBER 31, 2009†
(as a percentage of net assets)
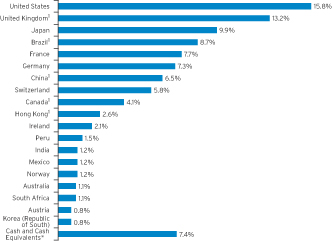
SUMMARYOF INVESTMENTSBY COUNTRYASOF DECEMBER 31, 2009
(as a percentage of net assets)
MANAGEMENT’S DISCUSSIONOF FUND PERFORMANCE
Baron International Growth Fund (Retail Shares) gained 44.69% in its first full year of operation ended December 31, 2009, outperforming both of its comparative indexes. The MSCI All Country World ex USA IMI Growth Net gained 40.90% while the MSCI All Country World ex USA Net gained 41.45%.
The Fund focuses on non-U.S. companies that we believe have significant growth opportunities and competitive advantages. The Fund may invest up to 30% of its assets in developing countries, the rest in developed countries.
The Fund’s bottom-up stock selection approach, emphasizing high-quality, capital-efficient growth stocks, drives our international portfolio construction. The primary driver of the Fund’s outperformance during 2009 was its strong stock selection within sectors and countries. The Fund’s relative performance benefited from stock selection and an overweight allocation to the Information Technology sector. Stock selection in the Consumer Discretionary sector and underweighting in the Utilities sector also helped performance. The only sector with a meaningful negative impact was the Materials sector. Although the Fund’s country allocation is incidental to its bottom-up investment process, the Fund’s underweight in Japan, and strong stock selection in Germany and China helped relative performance. The Fund’s stock selection and currency effect in the United Kingdom hurt relative performance. Brazilian software developer Totvs made the most positive contribution to the Fund, while Nintendo had the most negative impact on results.
Shares of Totvs have almost tripled over the last year. We believe the company is a champion in the industry of enterprise resource planning (ERP) and, with a penetration rate of less than 8 percent and nearly 40 percent of market share (for small- and medium-size enterprises in Brazil), we believe the company will continue to enjoy a long-term competitive advantage. The company’s platform is unique in that it allows independence for its clients by adapting to their existing legacy system or hardware platform. Further, we expect the Brazilian government’s new regulatory requirements will drive ERP penetration and implementation as companies seek products, such as those offered by Totvs, that will help them comply. We believe that management has proven over the years that it is capable of making wise acquisitions that achieve true synergies and improve margins and returns. We have confidence that the company will continue to deliver outstanding results in the future.
Nintendo declined 35 percent last year mainly due to lower-than-expected sales of its Wii console. As sales of, what was the hot new motion-sensor game in 2006, started to subside, the company was forced to cut prices on the console, which hurt the company’s revenue. In addition, the company’s software, a high-margin part of the business, did not sell as well as expected, causing the company’s earnings to fall further. Unfavorable currency movements in the Japanese yen also hurt financial performance.
Baron International Growth Fund will continue to invest in non-U.S. companies that, in our opinion, have favorable price-to-value characteristics based on our assessment of their prospects for future growth and profitability.
| * | Includes short-term investments and other assets less liabilities. |
| † | Industry sector or sub-industry group levels are provided from the Global Industry Classification Standard (“GICS”), developed and exclusively owned by MSCI, Inc. (“MSCI”) and Standard & Poor’s Financial Services LLC, unless otherwise stated that they have been reclassified or classified by the Adviser. All GICS data is provided “as is” with no warranties. |
| 1 | The Adviser has classified certain securities into this country. MSCI does not currently provide a classification for these securities. |
7
| | |
| Baron Partners Fund | | December 31, 2009 |
STATEMENT OF NET ASSETS
DECEMBER 31, 2009
| | | | | | | | |
| Shares | | Cost | | Value |
Common Stocks (116.07%) | | | | | | |
Consumer Discretionary (27.03%) | | | |
| | Apparel, Accessories & Luxury Goods (1.94%) | | | | | | |
| 1,000,000 | | Under Armour, Inc.,
Cl A1 | | $ | 36,482,948 | | $ | 27,270,000 |
| | | |
| | Broadcasting (2.07%) | | | | | | |
| 950,000 | | Discovery Communications, Inc., Cl A1 | | | 23,332,159 | | | 29,136,500 |
| | | |
| | Casinos & Gaming (2.12%) | | | | | | |
| 1,100,000 | | Penn National
Gaming, Inc.1 | | | 33,022,418 | | | 29,898,000 |
| | | |
| | Education Services (6.44%) | | | | | | |
| 850,000 | | DeVry, Inc. | | | 36,283,282 | | | 48,220,500 |
| 200,000 | | Strayer Education, Inc. | | | 22,931,492 | | | 42,498,000 |
| | | | | | | | |
| | | | | 59,214,774 | | | 90,718,500 |
| | |
| | Hotels, Resorts & Cruise
Lines (5.29%) | | | |
| 2,500,000 | | Hyatt Hotels Corp., Cl A1 | | | 66,878,141 | | | 74,525,000 |
| | |
| | Internet Retail (1.84%) | | | |
| 410,000 | | Blue Nile, Inc.1 | | | 11,071,131 | | | 25,965,300 |
| | |
| | Leisure Facilities (2.91%) | | | |
| 1,081,800 | | Vail Resorts, Inc.1 | | | 34,304,772 | | | 40,892,040 |
| | |
| | Specialty Stores (4.42%) | | | |
| 2,500,000 | | Dick’s Sporting Goods, Inc.1 | | | 41,657,536 | | | 62,175,000 |
| | | | | | | | |
Total Consumer Discretionary | | | 305,963,879 | | | 380,580,340 |
| | | | | | | | |
| | | | | | | | |
Consumer Staples (0.29%) | | | | | | |
| | Packaged Foods & Meats (0.29%) | | | |
| 50,000 | | Green Mountain Coffee Roasters, Inc.1 | | | 3,298,368 | | | 4,073,500 |
| | | | | | | | |
| | | | | | | | |
Energy (4.98%) | | | | | | |
| | Oil & Gas Drilling (3.54%) | | | |
| 1,250,000 | | Helmerich &
Payne, Inc. | | | 30,574,767 | | | 49,850,000 |
| | |
| | Oil & Gas Exploration &
Production (1.44%) | | | |
| 450,000 | | Concho Resources, Inc.1 | | | 13,859,047 | | | 20,205,000 |
| | | | | | | | |
Total Energy | | | 44,433,814 | | | 70,055,000 |
| | | | | | | | |
| | | | | | | | |
Financials (26.37%) | | | | | | |
| | Asset Management & Custody
Banks (3.02%) | | | | | | |
| 1,400,000 | | Eaton Vance Corp. | | | 42,041,195 | | | 42,574,000 |
| | | |
| | Investment Banking &
Brokerage (7.49%) | | | | | | |
| 5,600,000 | | Charles Schwab Corp. | | | 63,746,443 | | | 105,392,000 |
| | | |
| | Reinsurance (7.12%) | | | | | | |
| 1,400,000 | | Arch Capital Group, Ltd.1,2 | | | 74,189,869 | | | 100,170,000 |
| | |
| | Specialized Finance (7.26%) | | | |
| 2,000,000 | | Interactive Brokers Group, Inc., Cl A1 | | | 31,106,831 | | | 35,440,000 |
| 2,100,000 | | MSCI, Inc., Cl A1 | | | 57,146,328 | | | 66,780,000 |
| | | | | | | | |
| | | | | 88,253,159 | | | 102,220,000 |
| | |
| | Thrifts & Mortgage Finance (1.48%) | | | |
| 1,250,000 | | People’s United
Financial, Inc. | | | 21,463,734 | | | 20,875,000 |
| | | | | | | | |
Total Financials | | | 289,694,400 | | | 371,231,000 |
| | | | | | | | |
| | | | | | | | |
Health Care (15.29%) | | | | | | |
| | Health Care Equipment (6.13%) | | | |
| 620,000 | | Edwards Lifesciences Corp.1 | | | 29,137,672 | | | 53,847,000 |
| 550,000 | | Zimmer Holdings, Inc.1 | | | 25,012,799 | | | 32,510,500 |
| | | | | | | | |
| | | | | 54,150,471 | | | 86,357,500 |
| | | | | | | | |
| Shares | | Cost | | Value |
Common Stocks (continued) | | | |
Health Care (continued) | | | |
| | Health Care Facilities (5.56%) | | | |
| 2,200,000 | | Community Health
Systems, Inc.1 | | $ | 62,994,221 | | $ | 78,320,000 |
| | |
| | Life Sciences Tools &
Services (3.60%) | | | |
| 700,000 | | Millipore Corp.1 | | | 40,354,444 | | | 50,645,000 |
| | | | | | | | |
Total Health Care | | | 157,499,136 | | | 215,322,500 |
| | | | | | | | |
| | | | | | | | |
Industrials (20.70%) | | | | | | |
| | Air Freight & Logistics (5.06%) | | | |
| 800,000 | | C. H. Robinson Worldwide, Inc. | | | 20,066,739 | | | 46,984,000 |
| 700,000 | | Expeditors International of Washington, Inc. | | | 18,118,006 | | | 24,311,000 |
| | | | | | | | |
| | | | | 38,184,745 | | | 71,295,000 |
| | |
| | Diversified Support Services (3.51%) | | | |
| 2,200,021 | | Ritchie Bros.
Auctioneers, Inc.2 | | | 55,301,780 | | | 49,346,471 |
| | |
| | Research & Consulting
Services (5.03%) | | | |
| 500,000 | | CoStar Group, Inc.1 | | | 19,068,649 | | | 20,885,000 |
| 1,650,000 | | Verisk Analytics, Inc.,
Cl A1 | | | 45,916,473 | | | 49,962,000 |
| | | | | | | | |
| | | | | 64,985,122 | | | 70,847,000 |
| | |
| | Trading Companies &
Distributors (7.10%) | | | |
| 2,400,000 | | Fastenal Co. | | | 87,946,830 | | | 99,936,000 |
| | | | | | | | |
Total Industrials | | | 246,418,477 | | | 291,424,471 |
| | | | | | | | |
| | | | | | | | |
Information Technology (6.59%) | | | |
| | Application Software (6.59%) | | | |
| 1,408,500 | | FactSet Research
Systems, Inc. | | | 80,852,228 | | | 92,777,896 |
| | | | | | | | |
| | | | | | | | |
Materials (8.34%) | | | | | | |
| | Fertilizers & Agricultural
Chemicals (1.16%) | | | |
| 200,000 | | Monsanto Co. | | | 15,497,347 | | | 16,350,000 |
| | |
| | Industrial Gases (3.38%) | | | |
| 1,000,000 | | Airgas, Inc. | | | 37,551,738 | | | 47,600,000 |
| | |
| | Specialty Chemicals (3.80%) | | | |
| 1,200,000 | | Ecolab, Inc. | | | 48,445,808 | | | 53,496,000 |
| | | | | | | | |
Total Materials | | | 101,494,893 | | | 117,446,000 |
| | | | | | | | |
| | | | | | | | |
Utilities (6.48%) | | | | | | |
| | Electric Utilities (6.48%) | | | |
| 1,750,000 | | ITC Holdings Corp. | | | 60,048,201 | | | 91,157,500 |
| | | | | | | | |
Total Common Stocks | | | 1,289,703,396 | | | 1,634,068,207 |
| | | | | | | | |
| | | | | | | | |
Private Equity Investments (2.39%) |
Consumer Discretionary (1.11%) | | | |
| | Hotels, Resorts & Cruise
Lines (1.11%) | | | |
| 3,900,000 | | Kerzner Intl. Holdings, Ltd., Cl A1,2,3,4 | | | 39,000,000 | | | 15,600,000 |
| | | | | | | | |
| | | | | | | | |
Financials (1.28%) | | | | | | |
| | Asset Management & Custody
Banks (1.28%) | | | |
| 6,014,997 | | Windy City Investments
Holdings LLC1,3,4 | | | 38,319,447 | | | 18,044,989 |
| | | | | | | | |
Total Private Equity Investments | | | 77,319,447 | | | 33,644,989 |
| | | | | | | | |
| | | | | | | | | |
| | |
| 8 | | See Notes to Financial Statements. |
| | |
| December 31, 2009 | | Baron Partners Fund |
STATEMENT OF NET ASSETS (Continued)
DECEMBER 31, 2009
| | | | | | | | | |
| Shares | | Cost | | Value | |
Warrants (0.00%) | | | | |
Consumer Discretionary (0.00%) | | | | |
| | Restaurants (0.00%) | | | | |
| 6,124 | | Krispy Kreme Doughnuts, Inc.
Warrants, Exp 03/02/20121 | | $ | 0 | | $ | 367 | |
| | | | | | | | | |
| | | | | | | | | |
| Principal Amount | | | | | |
Corporate Bonds (0.60%) | | | | |
Consumer Discretionary (0.60%) | | | | |
| | Casinos & Gaming (0.60%) | | | | |
| $8,694,000 | | Wynn Las Vegas, LLC, AD7, 6.625% due 12/01/20144 | | | 8,694,000 | | | 8,444,048 | |
| | | | | | | | | |
Total Investments (119.06%) | | $ | 1,375,716,843 | | | 1,676,157,611 | |
| | | | | | | |
Liabilities Less Cash And Other Assets (-19.06%) | | | (268,371,395 | ) |
| | | | | | | | | |
Net Assets | | | | | $ | 1,407,786,216 | |
| | | | | | | | | |
Retail Shares (Equivalent to $15.64 per share based on 79,901,453 shares outstanding) | | $ | 1,249,297,851 | |
| | | | | | | |
Institutional Shares (Equivalent to $15.66 per share based on 10,122,246 shares outstanding) | | $ | 158,488,365 | |
| | | | | | | | | |
| % | Represents percentage of net assets. |
| 1 | Non-income producing securities. |
| 3 | At December 31, 2009, the market value of restricted and fair valued securities amounted to $33,644,989 or 2.39% of Net Assets. None of these securities are deemed liquid. See Note 8. |
| 4 | The Adviser has reclassified/classified certain securities in or out of this sub-industry. Such reclassifications/classifications are not supported by S&P or MSCI. |
| | |
| See Notes to Financial Statements. | | 9 |
| | |
| Baron Retirement Income Fund | | December 31, 2009 |
STATEMENT OF NET ASSETS
DECEMBER 31, 2009
| | | | | | | | |
| Shares | | | | Cost | | Value |
Common Stocks (90.88%) | | | |
Consumer Discretionary (16.04%) | | | |
| | Casinos & Gaming (0.76%) | | | | | | |
| 10,000 | | Wynn Resorts, Ltd. | | $ | 296,681 | | $ | 582,300 |
| | | |
| | Education Services (4.82%) | | | | | | |
| 35,000 | | DeVry, Inc. | | | 1,497,572 | | | 1,985,550 |
| 8,000 | | Strayer Education, Inc. | | | 1,261,166 | | | 1,699,920 |
| | | | | | | | |
| | | | | 2,758,738 | | | 3,685,470 |
| | | |
| | Hotels, Resorts &
Cruise Lines (3.90%) | | | | | | |
| 100,000 | | Hyatt Hotels Corp., Cl A1 | | | 2,666,530 | | | 2,981,000 |
| | | |
| | Internet Retail (3.31%) | | | | | | |
| 40,000 | | Blue Nile, Inc.1 | | | 1,554,930 | | | 2,533,200 |
| | | |
| | Specialty Stores (3.25%) | | | | | | |
| 100,000 | | Dick’s Sporting Goods, Inc.1 | | | 1,630,006 | | | 2,487,000 |
| | | | | | | | |
Total Consumer Discretionary | | | 8,906,885 | | | 12,268,970 |
| | | | | | | | |
| | | | | | | | |
Consumer Staples (5.74%) | | | |
| | Household Products (3.16%) | | | | | | |
| 40,000 | | Church & Dwight Co., Inc. | | | 2,038,763 | | | 2,418,000 |
| | | |
| | Packaged Foods &
Meats (2.58%) | | | | | | |
| 159,324 | | Dole Food Co., Inc.1 | | | 1,930,991 | | | 1,977,211 |
| | | | | | | | |
Total Consumer Staples | | | 3,969,754 | | | 4,395,211 |
| | | | | | | | |
| | | | | | | | |
Energy (4.95%) | | | |
| | Oil & Gas Drilling (2.60%) | | | | | | |
| 49,990 | | Helmerich & Payne, Inc. | | | 2,034,014 | | | 1,993,601 |
| | | |
| | Oil & Gas Exploration &
Production (2.35%) | | | | | | |
| 40,000 | | Concho Resources, Inc.1 | | | 1,202,056 | | | 1,796,000 |
| | | | | | | | |
Total Energy | | | 3,236,070 | | | 3,789,601 |
| | | | | | | | |
| | | | | | | | |
Financials (21.44%) | | | |
| | Asset Management &
Custody Banks (3.90%) | | | | | | |
| 98,041 | | Eaton Vance Corp. | | | 1,642,271 | | | 2,981,427 |
| | | |
| | Investment Banking &
Brokerage (4.67%) | | | | | | |
| 190,000 | | Charles Schwab Corp. | | | 2,850,241 | | | 3,575,800 |
| | | |
| | Reinsurance (3.74%) | | | | | | |
| 40,000 | | Arch Capital Group, Ltd.1,2 | | | 2,098,533 | | | 2,862,000 |
| | | |
| | Specialized Finance (9.13%) | | | | | | |
| 120,000 | | Interactive Brokers Group, Inc., Cl A1 | | | 1,882,249 | | | 2,126,400 |
| 152,661 | | MSCI, Inc., Cl A1 | | | 4,078,403 | | | 4,854,620 |
| | | | | | | | |
| | | | | 5,960,652 | | | 6,981,020 |
| | | | | | | | |
Total Financials | | | 12,551,697 | | | 16,400,247 |
| | | | | | | | |
| | | | | | | | |
Health Care (12.30%) | | | | | | |
| | Health Care Distributors (2.75%) | | | |
| 40,000 | | Henry Schein, Inc.1 | | | 1,600,049 | | | 2,104,000 |
| |
| | Health Care Equipment (3.41%) |
| 30,000 | | Edwards Lifesciences Corp.1 | | | 1,670,346 | | | 2,605,500 |
| |
| | Health Care Facilities (3.72%) |
| 80,000 | | Community Health
Systems, Inc.1 | | | 1,383,958 | | | 2,848,000 |
| | | | | | | | |
| Shares | | | | Cost | | Value |
Common Stocks (continued) | | | | | | |
Health Care (continued) | | | | | | |
| | Life Sciences Tools &
Services (2.42%) | | | | | | |
| 17,675 | | Mettler-Toledo
International, Inc.1 | | $ | 829,695 | | $ | 1,855,698 |
| | | | | | | | |
Total Health Care | | | 5,484,048 | | | 9,413,198 |
| | | | | | | | |
| | | | | | | | |
Industrials (18.67%) | | | | | | |
| | Air Freight &
Logistics (3.45%) | | | | | | |
| 45,000 | | C. H. Robinson Worldwide, Inc. | | | 1,654,173 | | | 2,642,850 |
| | | |
| | Diversified Support
Services (3.16%) | | | | | | |
| 107,644 | | Ritchie Bros. Auctioneers, Inc.2 | | | 2,739,875 | | | 2,414,455 |
| | | |
| | Railroads (4.27%) | | | | | | |
| 100,000 | | Genesee & Wyoming, Inc.,
Cl A1 | | | 3,101,975 | | | 3,264,000 |
| | | |
| | Research & Consulting
Services (5.07%) | | | | | | |
| 128,050 | | Verisk Analytics, Inc.,
Cl A1 | | | 3,651,694 | | | 3,877,354 |
| | | |
| | Trading Companies &
Distributors (2.72%) | | | | | | |
| 50,000 | | Fastenal Co. | | | 2,169,716 | | | 2,082,000 |
| | | | | | | | |
Total Industrials | | | 13,317,433 | | | 14,280,659 |
| | | | | | | | |
| | | | | | | | |
Information Technology (4.72%) | | | |
| | Application Software (4.72%) | | | | | | |
| 30,000 | | ANSYS, Inc.1 | | | 658,716 | | | 1,303,800 |
| 35,000 | | FactSet Research Systems, Inc. | | | 1,982,041 | | | 2,305,450 |
| | | | | | | | |
Total Information Technology | | | 2,640,757 | | | 3,609,250 |
| | | | | | | | |
| | | | | | | | |
Materials (4.98%) | | | |
| | Industrial Gases (2.65%) | | | | | | |
| 42,500 | | Airgas, Inc. | | | 1,492,492 | | | 2,023,000 |
| | |
| | Specialty Chemicals (2.33%) | | | |
| 40,000 | | Ecolab, Inc. | | | 1,410,197 | | | 1,783,200 |
| | | | | | | | |
Total Materials | | | 2,902,689 | | | 3,806,200 |
| | | | | | | | |
| | | | | | | | |
Utilities (2.04%) | | | |
| | Electric Utilities (2.04%) | | | | | | |
| 30,000 | | ITC Holdings Corp. | | | 1,552,701 | | | 1,562,700 |
| | | | | | | | |
Total Common Stocks | | | 54,562,034 | | | 69,526,036 |
| | | | | | | | |
| | | | | | | | |
Warrants (0.00%) | | | |
Consumer Discretionary (0.00%) | | | |
| | Restaurants (0.00%) | | | | | | |
| 1,332 | | Krispy Kreme Doughnuts, Inc. Warrants, Exp 03/02/20121 | | | 0 | | | 80 |
| | | | | | | | |
| | | | | | | | |
| Principal Amount | | | | |
Convertible Bonds (3.85%) | | | |
Consumer Discretionary (3.85%) | | | |
| | Automotive Retail (3.85%) | | | |
| $2,900,000 | | Penske Automotive Group, Inc., 3.50% due 04/01/20263 | | | 2,019,666 | | | 2,939,875 |
| | | | | | | | |
| | | | | | | | | |
| | |
| 10 | | See Notes to Financial Statements. |
| | |
| December 31, 2009 | | Baron Retirement Income Fund |
STATEMENT OF NET ASSETS (Continued)
DECEMBER 31, 2009
| | | | | | | | |
| Principal Amount | | Cost | | Value |
Corporate Bonds (2.54%) | | | | | | |
Consumer Discretionary (2.54%) | | | | | | |
| | Casinos & Gaming (2.54%) | | | |
| $2,000,000 | | Wynn Las Vegas,
LLC, AD7, 6.625% due 12/01/20143 | | $ | 2,000,000 | | $ | 1,942,500 |
| | | | | | | | |
| | | | | | | | |
Short Term Investments (0.98%) | | | | | | |
| 752,207 | | Repurchase Agreement with Fixed Income Clearing Corp., dated 12/31/2009, 0.00% due 01/04/2010; Proceeds at maturity - $752,207; (Fully collateralized by U.S. Treasury Note, 2.625% due 12/31/2014;
Market value - $794,006) | | | 752,207 | | | 752,207 |
| | | | | | | | |
Total Investments (98.25%) | | $ | 59,333,907 | | | 75,160,698 |
| | | | | | | | |
Cash and Other Assets Less
Liabilities (1.75%) | | | | | | 1,340,929 |
| | | | | | | | |
Net Assets | | | | | $ | 76,501,627 |
| | | | | | | | |
Retail Shares (Equivalent to $8.14 per share based on 4,902,933 shares outstanding) | | $ | 39,909,159 |
| | | | | | | | |
Institutional Shares (Equivalent to $8.15 per share based on 4,492,601 shares outstanding) | | $ | 36,592,468 |
| | | | | | | | |
| % | Represents percentage of net assets. |
| 1 | Non-income producing securities. |
| 3 | The Adviser has reclassified/classified certain securities in or out of this sub-industry. Such reclassifications/classifications are not supported by S&P or MSCI. |
| | |
| See Notes to Financial Statements. | | 11 |
| | |
| Baron International Growth Fund | | December 31, 2009 |
STATEMENT OF NET ASSETS
DECEMBER 31, 2009
| | | | | | | | |
| Shares | | | | Cost | | Value |
Common Stocks (92.60%) | | | | | | |
Consumer Discretionary (18.00%) | | | |
| | Apparel, Accessories &
Luxury Goods (3.23%) | | | |
| 21,000 | | Compagnie Financiere Richemont SA2 | | $ | 380,490 | | $ | 706,164 |
| 75,000 | | Restoque Comercio e Confeccoes
de Roupas SA2 | | | 108,263 | | | 280,011 |
| | | | | | | | |
| | | | | 488,753 | | | 986,175 |
| | | |
| | Auto Parts & Equipment (1.84%) | | | | | | |
| 30,000 | | China Automotive Systems, Inc.1 | | | 329,987 | | | 561,300 |
| | | |
| | Cable & Satellite (4.13%) | | | | | | |
| 800 | | Jupiter Telecommunications Co., Ltd.2 | | | 751,620 | | | 791,619 |
| 12,000 | | Liberty Global, Inc., Cl A1 | | | 176,822 | | | 262,920 |
| 15,000 | | Net Servicos de Comunicacao SA, ADR2 | | | 91,135 | | | 202,950 |
| | | | | | | | |
| | | | | 1,019,577 | | | 1,257,489 |
| | | | | | | | |
| | | |
| | Casinos & Gaming (4.24%) | | | | | | |
| 4,000 | | bwin Interactive Entertainment AG1,2 | | | 235,194 | | | 238,127 |
| 65,000 | | PartyGaming plc1,2 | | | 271,344 | | | 271,620 |
| 633,333 | | Wynn Macau, Ltd.1,2 | | | 832,048 | | | 781,721 |
| | | | | | | | |
| | | | | 1,338,586 | | | 1,291,468 |
| | |
| | Education Services (2.36%) | | | |
| 26,639 | | Anhanguera Educacional Participacoes SA1,2 | | | 339,880 | | | 380,535 |
| 6,000 | | Educomp Solutions, Ltd.2 | | | 89,702 | | | 91,878 |
| 1,200 | | MegaStudy Co., Ltd.1,2 | | | 212,660 | | | 246,680 |
| | | | | | | | |
| | | | | 642,242 | | | 719,093 |
| |
| | Hotels, Resorts & Cruise Lines (1.08%) |
| 6,020 | | Accor SA2 | | | 239,176 | | | 329,427 |
| | | |
| | Internet Retail (1.12%) | | | | | | |
| 55,000 | | Wotif.com Holdings, Ltd.2 | | | 191,890 | | | 342,139 |
| | | | | | | | |
Total Consumer Discretionary | | | 4,250,211 | | | 5,487,091 |
| | | | | | | | |
| | | | | | | | |
Consumer Staples (1.23%) | | | |
| | Packaged Foods & Meats (1.23%) | | | |
| 151,500 | | Tingyi (Cayman Islands) Holding Corp.2 | | | 170,080 | | | 374,886 |
| | | | | | | | |
| | | | | | | | |
Energy (6.94%) | | | | | | |
| | Oil & Gas Equipment & Services (2.78%) |
| 4,000 | | Core Laboratories N.V.2 | | | 351,996 | | | 472,480 |
| 215,000 | | Sevan Marine ASA1,2 | | | 351,897 | | | 375,175 |
| | | | | | | | |
| | | | | 703,893 | | | 847,655 |
| | | |
| | Oil & Gas Exploration &
Production (4.16%) | | | | | | |
| 350,000 | | Borders & Southern Petroleum1,2 | | | 320,103 | | | 349,526 |
| 105,000 | | Cairn Energy plc1,2 | | | 331,210 | | | 562,096 |
| 20,000 | | Premier Oil plc1,2 | | | 370,087 | | | 355,304 |
| | | | | | | | |
| | | | | 1,021,400 | | �� | 1,266,926 |
| | | | | | | | |
Total Energy | | | 1,725,293 | | | 2,114,581 |
| | | | | | | | |
| | | | | | | | |
Financials (9.83%) | | | | | | |
| | Asset Management & Custody
Banks (1.47%) | | | | | | |
| 9,500 | | GAM Holding, Ltd.2
(formerly Julius Baer
Holding AG) | | | 55,337 | | | 115,036 |
| 9,500 | | Julius Baer Group, Ltd.2 | | | 177,612 | | | 334,100 |
| | | | | | | | |
| | | | | 232,949 | | | 449,136 |
| | | | | | | | |
| Shares | | | | Cost | | Value |
Common Stocks (continued) | | | | | | |
Financials (continued) | | | | | | |
| | Consumer Finance (1.23%) | | | | | | |
| 72,400 | | Banco Compartamos SA de CV2 | | $ | 128,306 | | $ | 373,678 |
| | | |
| | Diversified Banks (4.25%) | | | | | | |
| 6,000 | | Credicorp, Ltd.2 | | | 326,754 | | | 462,120 |
| 19,824 | | Itau Unibanco Holding SA, ADR2 | | | 242,738 | | | 452,780 |
| 15,000 | | Standard Chartered plc2 | | | 300,234 | | | 378,689 |
| | | | | | | | |
| | | | | 869,726 | | | 1,293,589 |
| | | |
| | Life & Health Insurance (1.71%) | | | | | | |
| 200 | | Sony Financial Holdings, Inc.2 | | | 628,011 | | | 520,486 |
| | | |
| | Reinsurance (1.17%) | | | | | | |
| 5,000 | | Arch Capital Group, Ltd.1,2 | | | 293,022 | | | 357,750 |
| | | | | | | | |
Total Financials | | | 2,152,014 | | | 2,994,639 |
| | | | | | | | |
| | | | | | | | |
Health Care (3.71%) | | | | | | |
| | Health Care Supplies (0.88%) | | | | | | |
| 80,000 | | Shandong Weigao Group Medical
Polymer Co., Ltd.2 | | | 198,142 | | | 266,618 |
| | | |
| | Life Sciences Tools &
Services (1.77%) | | | | | | |
| 16,000 | | Gerresheimer AG2 | | | 352,938 | | | 539,064 |
| | | |
| | Pharmaceuticals (1.06%) | | | | | | |
| 150,000 | | Prostrakan Group plc1,2 | | | 313,549 | | | 208,473 |
| 30,000 | | Tongjitang Chinese Medicines
Co., ADR1,2 | | | 119,770 | | | 115,500 |
| | | | | | | | |
| | | | | 433,319 | | | 323,973 |
| | | | | | | | |
Total Health Care | | | 984,399 | | | 1,129,655 |
| | | | | | | | |
| | | | | | | | |
Industrials (13.48%) | | | | | | |
| | Aerospace & Defense (2.11%) | | | | | | |
| 12,500 | | Thales SA2 | | | 576,370 | | | 642,441 |
| | | |
| | Airlines (2.11%) | | | | | | |
| 24,000 | | Ryanair Holdings plc, ADR1,2 | | | 618,664 | | | 643,680 |
| | | |
| | Diversified Support
Services (1.91%) | | | | | | |
| 26,000 | | Ritchie Bros. Auctioneers, Inc.2 | | | 554,904 | | | 583,180 |
| | | |
| | Heavy Electrical
Equipment (1.38%) | | | | | | |
| 6,000 | | Alstom SA2 | | | 427,906 | | | 419,615 |
| | | |
| | Industrial Machinery (1.68%) | | | | | | |
| 5,500 | | Fanuc, Ltd.2 | | | 380,326 | | | 512,611 |
| | | |
| | Research & Consulting
Services (4.29%) | | | | | | |
| 75,000 | | Experian plc2 | | | 476,937 | | | 740,829 |
| 28,000 | | Intertek Group plc2 | | | 493,862 | | | 565,939 |
| | | | | | | | |
| | | | | 970,799 | | | 1,306,768 |
| | | | | | | | |
Total Industrials | | | 3,528,969 | | | 4,108,295 |
| | | | | | | | |
| | | | | | | | |
Information Technology (24.23%) | | | | | | |
| | Application Software (7.29%) | | | | | | |
| 10,000 | | Financial Technologies
(India), Ltd.2 | | | 270,924 | | | 286,370 |
| 2,003,800 | | Kingdee International Software Group Co., Ltd.2 | | | 238,789 | | | 446,223 |
| 80,000 | | Micro Focus International plc2 | | | 464,005 | | | 585,154 |
| 28,000 | | Net 1 UEPS Technologies, Inc.1 | | | 384,475 | | | 543,760 |
| 10,000 | | Solera Holdings, Inc. | | | 232,074 | | | 360,100 |
| | | | | | | | |
| | | | | 1,590,267 | | | 2,221,607 |
| | | |
| | Communications
Equipment (0.78%) | | | | | | |
| 3,500 | | Research in Motion, Ltd.1,2 | | | 136,288 | | | 236,390 |
| | | |
| | Computer Hardware(1.35%) | | | | | | |
| 6,030 | | Wincor Nixdorf AG2 | | | 270,890 | | | 412,988 |
| | |
| 12 | | See Notes to Financial Statements. |
| | |
| December 31, 2009 | | Baron International Growth Fund |
STATEMENT OF NET ASSETS (Continued)
DECEMBER 31, 2009
| | | | | | | | |
| Shares | | | | Cost | | Value |
Common Stocks (continued) | | | | | | |
Information Technology (continued) | | | |
| | Data Processing & Outsourced
Services (1.65%) | | | | | | |
| 38,000 | | Cielo SA (formerly Cia Brasileira de Meios de Pagamento)2 | | $ | 293,074 | | $ | 334,819 |
| 10,000 | | Redecard SA2 | | | 106,774 | | | 166,571 |
| | | | | | | | |
| | | | | 399,848 | | | 501,390 |
| | | |
| | Electronic Equipment & Instruments (3.47%) | | | | | | |
| 16,500 | | Agilent Technologies, Inc.1 | | | 265,097 | | | 512,655 |
| 22,500 | | Ingenico SA2 | | | 401,952 | | | 545,274 |
| | | | | | | | |
| | | | | 667,049 | | | 1,057,929 |
| | Internet Software &
Services (3.84%) | | | | | | |
| 15,149 | | Meetic SA1,2 | | | 443,297 | | | 413,304 |
| 10,000 | | Tencent Holdings, Ltd.2 | | | 73,421 | | | 216,534 |
| 1,800 | | Yahoo! Japan Corp.2 | | | 577,023 | | | 541,203 |
| | | | | | | | |
| | | | | 1,093,741 | | | 1,171,041 |
| | Office Electronics (2.08%) | | | | | | |
| 15,000 | | Canon, Inc., ADR2 | | | 489,385 | | | 634,800 |
| | | |
| | Semiconductor
Equipment (0.99%) | | | | | | |
| 9,000 | | Aixtron AG, ADR2 | | | 131,578 | | | 301,500 |
| | | |
| | Systems Software (2.78%) | | | | | | |
| 12,500 | | Totvs SA2 | | | 325,803 | | | 847,214 |
| | | | | | | | |
Total Information Technology | | | 5,104,849 | | | 7,384,859 |
| | | | | | | | |
| | | | | | | | |
Materials (12.98%) | | | | | | |
| | Fertilizers & Agricultural
Chemicals (3.77%) | | | | | | |
| 6,500 | | Monsanto Co. | | | 528,867 | | | 531,375 |
| 11,000 | | Syngenta AG, ADR2 | | | 521,570 | | | 618,970 |
| | | | | | | | |
| | | | | 1,050,437 | | | 1,150,345 |
| | | |
| | Gold (2.48%) | | | | | | |
| 25,000 | | Gold Fields, Ltd., ADR2 | | | 277,002 | | | 327,750 |
| 50,000 | | Kirkland Lake Gold, Inc.1,2 | | | 363,230 | | | 428,360 |
| | | | | | | | |
| | | | | 640,232 | | | 756,110 |
| | | |
| | Paper Products (3.58%) | | | | | | |
| 15,500 | | Schweitzer-Mauduit
International, Inc. | | | 509,628 | | | 1,090,425 |
| | | |
| | Specialty Chemicals (3.15%) | | | | | | |
| 45,000 | | Symrise AG2 | | | 594,444 | | | 959,184 |
| | | | | | | | |
Total Materials | | | 2,794,741 | | | 3,956,064 |
| | | | | | | | |
| | | | | | | | |
Telecommunication Services (2.20%) | | | |
| | Wireless Telecommunication Services (2.20%) | | | | | | |
| 20,000 | | NII Holdings, Inc.1 | | | 455,332 | | | 671,600 |
| | | | | | | | |
Total Common Stocks | | | 21,165,888 | | | 28,221,670 |
| | | | | | | | |
| | | | | | | | |
| Principal Amount | | Cost | | Value |
Short Term Investments (5.57%) | | | |
| $1,699,006 | | Repurchase Agreement with Fixed Income Clearing Corp., dated 12/31/2009, 0.00% due 01/04/2010; Proceeds at maturity - $1,699,006; (Fully collateralized by U.S. Treasury Note, 1.375% due 04/15/2012; Market value - $1,784,450) | | $ | 1,699,006 | | $ | 1,699,006 |
| | | | | | | | |
Total Investments (98.17%) | | $ | 22,864,894 | | | 29,920,676 |
| | | | | | | | |
Cash and Other Assets Less Liabilities (1.83%) | | | | | | 558,222 |
| | | | | | | | |
Net Assets | | | | | $ | 30,478,898 |
| | | | | | | | |
Retail Shares (Equivalent to $14.11 per share based on 591,383
shares outstanding) | | | | | $ | 8,341,703 |
| | | | | | | | |
Institutional Shares (Equivalent to $14.13 per share based on 1,566,939
shares outstanding) | | | | | $ | 22,137,195 |
| | | | | | | | |
| % | Represents percentage of net assets. |
| 1 | Non-income producing securities. |
| ADR | American Depositary Receipt. |
| | | |
Summary of Investments by Country as of December 31, 2009 | |
Percentage of Net Assets | |
United States | | 15.8 | % |
United Kingdom† | | 13.2 | |
Japan | | 9.9 | |
Brazil† | | 8.7 | |
France | | 7.7 | |
Germany | | 7.3 | |
China† | | 6.5 | |
Switzerland | | 5.8 | |
Canada† | | 4.1 | |
Hong Kong† | | 2.6 | |
Ireland | | 2.1 | |
Peru | | 1.5 | |
India | | 1.2 | |
Mexico | | 1.2 | |
Norway | | 1.2 | |
Australia | | 1.1 | |
South Africa | | 1.1 | |
Austria | | 0.8 | |
Korea (Republic of South) | | 0.8 | |
Cash and Cash Equivalents* | | 7.4 | |
| | | 100.0 | % |
| * | Includes short-term investments and other assets less liabilities. |
| † | The Adviser has classified certain securities into this country. MSCI does not currently provide a classification for these securities. |
| | |
| See Notes to Financial Statements. | | 13 |
| | |
| Baron Select Funds | | December 31, 2009 |
STATEMENTS OF ASSETS AND LIABILITIES
DECEMBER 31, 2009
| | | | | | | | | | | | |
| | | Baron Partners
Fund | | | Baron Retirement
Income Fund | | | Baron International
Growth Fund | |
Assets: | | | | | | | | | | | | |
Investments in securities, at cost | | $ | 1,375,716,843 | | | $ | 58,581,700 | | | $ | 21,165,888 | |
Repurchase Agreements, at cost | | | — | | | | 752,207 | | | | 1,699,006 | |
Foreign currency, at cost | | | — | | | | — | | | | 1 | |
| | | |
Investments in securities, at value | | $ | 1,676,157,611 | | | $ | 74,408,491 | | | $ | 28,221,670 | |
Repurchase Agreements, at value | | | — | | | | 752,207 | | | | 1,699,006 | |
Foreign currency, at value | | | — | | | | — | | | | 1 | |
Cash | | | 52,181 | | | | — | | | | — | |
Receivable for securities sold | | | 12,221,918 | | | | 1,469,573 | | | | 498,783 | |
Receivable for shares sold | | | 1,119,200 | | | | 1,071 | | | | 74,891 | |
Dividends and interest receivable | | | 534,498 | | | | 57,367 | | | | 26,498 | |
Prepaid expenses | | | 79,967 | | | | — | | | | 49 | |
| | | | | | | | | | | | |
| | | 1,690,165,375 | | | | 76,688,709 | | | | 30,520,898 | |
| | | | | | | | | | | | |
Liabilities: | | | | | | | | | | | | |
Payable for borrowings against line of credit | | | 276,500,000 | | | | — | | | | — | |
Payable for shares redeemed | | | 5,266,120 | | | | 22,063 | | | | 5,000 | |
Payable for securities purchased | | | — | | | | 114,913 | | | | — | |
Distribution fees payable (Note 4) | | | 871 | | | | 411 | | | | 544 | |
Investment advisory fees payable (Note 4) | | | 499 | | | | 760 | | | | 419 | |
Accrued expenses and other payables | | | 611,669 | | | | 48,935 | | | | 36,037 | |
| | | | | | | | | | | | |
| | | 282,379,159 | | | | 187,082 | | | | 42,000 | |
| | | | | | | | | | | | |
Net Assets | | $ | 1,407,786,216 | | | $ | 76,501,627 | | | $ | 30,478,898 | |
| | | | | | | | | | | | |
Net Assets consist of: | | | | | | | | | | | | |
Paid-in capital | | $ | 1,831,373,286 | | | $ | 81,107,500 | | | $ | 22,911,927 | |
Accumulated net investment loss | | | (46 | ) | | | (10 | ) | | | (37,208 | ) |
Accumulated net realized gain (loss) on investments, short sells and foreign currency transactions | | | (724,027,792 | ) | | | (20,432,654 | ) | | | 564,419 | |
Net unrealized appreciation of investments, foreign capital gains tax and foreign currency transactions | | | 300,440,768 | | | | 15,826,791 | | | | 7,039,760 | 1 |
| | | | | | | | | | | | |
Net Assets | | $ | 1,407,786,216 | | | $ | 76,501,627 | | | $ | 30,478,898 | |
| | | | | | | | | | | | |
Retail Shares: | | | | | | | | | | | | |
Net Assets | | $ | 1,249,297,851 | | | $ | 39,909,159 | | | $ | 8,341,703 | |
| | | | | | | | | | | | |
Shares Outstanding ($0.01 par value; indefinite shares authorized) | | | 79,901,453 | | | | 4,902,933 | | | | 591,383 | |
| | | | | | | | | | | | |
Net Asset Value Per Share | | $ | 15.64 | | | $ | 8.14 | | | $ | 14.11 | |
| | | | | | | | | | | | |
Institutional Shares: | | | | | | | | | | | | |
Net Assets | | $ | 158,488,365 | | | $ | 36,592,468 | | | $ | 22,137,195 | |
| | | | | | | | | | | | |
Shares Outstanding ($0.01 par value; indefinite shares authorized) | | | 10,122,246 | | | | 4,492,601 | | | | 1,566,939 | |
| | | | | | | | | | | | |
Net Asset Value Per Share | | $ | 15.66 | | | $ | 8.15 | | | $ | 14.13 | |
| | | | | | | | | | | | |
| 1 | Net of accrued foreign capital gains tax of $631. |
| | |
| 14 | | See Notes to Financial Statements. |
| | |
| December 31, 2009 | | Baron Select Funds |
STATEMENTS OF OPERATIONS
FOR THE YEAR ENDED DECEMBER 31, 2009
| | | | | | | | | | | | |
| | | Baron Partners
Fund | | | Baron Retirement
Income Fund | | | Baron International
Growth Fund | |
Investment income: | | | | | | | | | | | | |
Income: | | | | | | | | | | | | |
Dividends | | $ | 13,667,765 | | | $ | 457,358 | | | $ | 260,784 | |
Interest | | | 3,060,626 | | | | 1,532,530 | | | | 27,067 | |
Miscellaneous | | | — | | | | — | | | | 12,500 | |
Foreign taxes withheld on dividends | | | (130,000 | ) | | | (6,136 | ) | | | (13,015 | ) |
| | | | | | | | | | | | |
Total income | | | 16,598,391 | | | | 1,983,752 | | | | 287,336 | |
| | | | | | | | | | | | |
Expenses: | | | | | | | | | | | | |
Investment advisory fees (Note 4) | | | 13,799,221 | | | | 650,744 | | | | 205,450 | |
Distribution fees — Retail Shares (Note 4) | | | 3,300,973 | | | | 120,850 | | | | 24,544 | |
Shareholder servicing agent fees and expenses — Retail Shares | | | 525,430 | | | | 22,026 | | | | 14,345 | |
Shareholder servicing agent fees and expenses — Institutional Shares | | | 19,139 | | | | 6,832 | | | | 7,166 | |
Reports to shareholders | | | 1,006,385 | | | | 6,010 | | | | 11,825 | |
Line of credit fees | | | 282,034 | | | | — | | | | — | |
Registration and filing fees | | | 62,280 | | | | 57,625 | | | | 64,655 | |
Professional fees | | | 74,654 | | | | 30,530 | | | | 34,097 | |
Custodian fees | | | 48,573 | | | | 21,222 | | | | 38,890 | |
Trustee fees and expenses | | | 90,885 | | | | 3,574 | | | | 1,599 | |
Administration fees | | | 26,864 | | | | 25,745 | | | | 27,001 | |
Insurance expense | | | 40,963 | | | | 1,213 | | | | 352 | |
Miscellaneous expenses | | | 5,937 | | | | 743 | | | | 801 | |
| | | | | | | | | | | | |
Total operating expenses | | | 19,283,338 | | | | 947,114 | | | | 430,725 | |
Interest expense | | | 1,495,935 | | | | — | | | | — | |
| | | | | | | | | | | | |
Total expenses | | | 20,779,273 | | | | 947,114 | | | | 430,725 | |
Reimbursement of expenses by Adviser — Retail Shares (Note 4) | | | — | | | | (84,570 | ) | | | (81,087 | ) |
Reimbursement of expenses by Adviser — Institutional Shares (Note 4) | | | — | | | | (25,876 | ) | | | (68,281 | ) |
| | | | | | | | | | | | |
Net expenses | | | 20,779,273 | | | | 836,668 | | | | 281,357 | |
| | | | | | | | | | | | |
Net investment income (loss) | | | (4,180,882 | ) | | | 1,147,084 | | | | 5,979 | |
| | | | | | | | | | | | |
Realized and unrealized gain (loss) on investments: | | | | | | | | | | | | |
Net realized gain (loss) on: | | | | | | | | | | | | |
Investments | | | (75,535,596 | ) | | | (910,429 | ) | | | 1,330,243 | 1 |
Short sells | | | (1,693,497 | ) | | | — | | | | — | |
Foreign currency transactions | | | 8 | | | | 1 | | | | (60,998 | ) |
Net change in unrealized appreciation (depreciation) of: | | | | | | | | | | | | |
Investments | | | 406,157,253 | | | | 19,097,442 | | | | 7,055,151 | 2 |
Foreign currency transactions | | | — | | | | — | | | | (15,391 | ) |
| | | | | | | | | | | | |
Net gain on investments | | | 328,928,168 | | | | 18,187,014 | | | | 8,309,005 | |
| | | | | | | | | | | | |
Net increase in net assets resulting from operations | | $ | 324,747,286 | | | $ | 19,334,098 | | | $ | 8,314,984 | |
| | | | | | | | | | | | |
| 1 | Net of realized foreign capital gains tax of $1,035. |
| 2 | Net of change in accrued foreign capital gains tax of $631. |
| | |
| See Notes to Financial Statements. | | 15 |
| | |
| Baron Select Funds | | December 31, 2009 |
STATEMENTS OF CHANGES IN NET ASSETS
DECEMBER 31, 2009
| | | | | | | | | | | | | | | | | | | | |
| | | Baron Partners Fund | | | Baron Retirement Income Fund | | | Baron
International
Growth Fund | |
| | | For the Year
Ended
December 31, 2009 | | | For the Year
Ended
December 31, 2008 | | | For the Year
Ended
December 31, 2009 | | | For the Period
Ended
December 31, 20081 | | | For the Year
Ended
December 31, 2009 | |
Increase (Decrease) in Net Assets: | | | | | | | | | | | | | | | | | | | | |
Operations: | | | | | | | | | | | | | | | | | | | | |
Net investment
income (loss) | | $ | (4,180,882 | ) | | $ | (12,221,533 | ) | | $ | 1,147,084 | | | $ | 5,234 | | | $ | 5,979 | |
Net realized gain (loss) | | | (77,229,085 | ) | | | (651,513,668 | ) | | | (910,428 | ) | | | (19,522,225 | ) | | | 1,269,245 | |
Net change in unrealized appreciation (depreciation) | | | 406,157,253 | | | | (790,500,304 | ) | | | 19,097,442 | | | | (9,565,818 | ) | | | 7,039,760 | |
| | | | | | | | | | | | | | | | | | | | |
Increase (decrease) in net assets resulting from operations | | | 324,747,286 | | | | (1,454,235,505 | ) | | | 19,334,098 | | | | (29,082,809 | ) | | | 8,314,984 | |
| | | | | | | | | | | | | | | | | | | | |
Distributions to shareholders from (Note 10): | | | | | | | | | | | | | | | | | | | | |
Net investment income | | | — | | | | — | | | | (1,150,808 | ) | | | — | | | | — | |
Net realized gain on investments | | | — | | | | (92,544,363 | ) | | | — | | | | — | | | | (756,360 | ) |
Return of capital | | | — | | | | — | | | | (1,141,674 | ) | | | (3,551,393 | ) | | | — | |
| | | | | | | | | | | | | | | | | | | | |
Decrease in net assets from distributions to shareholders | | | — | | | | (92,544,363 | ) | | | (2,292,482 | ) | | | (3,551,393 | ) | | | (756,360 | ) |
| | | | | | | | | | | | | | | | | | | | |
Capital share transactions (Note 11): | | | | | | | | | | | | | | | | | | | | |
Proceeds from the sale of shares | | | 351,911,374 | | | | 707,757,623 | | | | 35,570,518 | | | | 18,886,522 | | | | 40,260,423 | |
Proceeds from shares issued in reorganization of Baron Investment Partners, L.P. | | | — | | | | — | | | | — | | | | 72,421,528 | | | | — | |
Net asset value of shares issued in reinvestment of distributions | | | — | | | | 85,684,169 | | | | 2,213,836 | | | | 3,432,665 | | | | 755,356 | |
Cost of shares redeemed | | | (770,167,253 | ) | | | (1,129,440,844 | ) | | | (37,625,409 | ) | | | (2,805,447 | ) | | | (18,095,505 | ) |
| | | | | | | | | | | | | | | | | | | | |
Increase (decrease) in net assets derived from capital share transactions | | | (418,255,879 | ) | | | (335,999,052 | ) | | | 158,945 | | | | 91,935,268 | | | | 22,920,274 | |
| | | | | | | | | | | | | | | | | | | | |
Increase (decrease) in net assets | | | (93,508,593 | ) | | | (1,882,778,920 | ) | | | 17,200,561 | | | | 59,301,066 | | | | 30,478,898 | |
Net Assets: | | | | | | | | | | | | | | | | | | | | |
Beginning of year | | | 1,501,294,809 | | | | 3,384,073,729 | | | | 59,301,066 | | | | — | | | | — | |
| | | | | | | | | | | | | | | | | | | | |
End of year | | $ | 1,407,786,216 | | | $ | 1,501,294,809 | | | $ | 76,501,627 | | | $ | 59,301,066 | | | $ | 30,478,898 | |
| | | | | | | | | | | | | | | | | | | | |
Accumulated net investment income (loss)
at end of year | | $ | (46 | ) | | $ | — | | | $ | (10 | ) | | $ | — | | | $ | (37,208 | ) |
| | | | | | | | | | | | | | | | | | | | |
| 1 | For the period June 30, 2008 (commencement of operations) to December 31, 2008. |
STATEMENT OF CASH FLOWS
| | | | |
FOR THE YEAR ENDED DECEMBER 31, 2009 | | | | |
| | | Baron Partners Fund | |
Increase (Decrease) in Cash: | | | | |
Cash Flows from Operating Activities: | | | | |
Net increase in net assets from operations | | $ | 324,747,286 | |
Adjustments to reconcile net increase in net assets from operations to net cash provided by operating activities: | | | | |
Purchases of portfolio securities | | | (517,921,575 | ) |
Proceeds from sales of portfolio securities | | | 665,558,562 | |
Decrease in dividends and interest receivable | | | 104,303 | |
Increase in other assets | | | (74,746 | ) |
Increase in accrued expenses | | | 141,072 | |
Net realized loss on investments | | | 77,229,085 | |
Net change in unrealized appreciation of investments | | | (406,157,253 | ) |
Other decreases | | | (2,582,311 | ) |
| | | | |
Net cash provided by operating activities | | | 141,044,423 | |
| | | | |
Cash Flows from Financing Activities: | | | | |
Proceeds from shares sold | | | 196,628,550 | |
Payment for shares redeemed | | | (614,155,747 | ) |
Increase in payable for borrowings against line of credit | | | 276,500,000 | |
| | | | |
Net cash used in financing activities | | | (141,027,197 | ) |
| | | | |
Net increase in cash | | | 17,226 | |
Cash beginning of year | | | 34,955 | |
| | | | |
Cash end of year | | $ | 52,181 | |
| | | | |
Supplemental cash flow information: | | | | |
Interest paid | | $ | 1,185,468 | |
| | | | |
| | |
| 16 | | See Notes to Financial Statements. |
| | |
| December 31, 2009 | | Baron Select Funds |
NOTES TO FINANCIAL STATEMENTS
1. ORGANIZATION
Baron Select Funds (the “Trust”) is registered under the Investment Company Act of 1940, as amended (the “1940 Act”), as an open-end management investment company established as a Delaware statutory trust on April 30, 2003. The Trust currently offers four series (individually a “Fund” and collectively the “Funds”): Baron Partners Fund, Baron Retirement Income Fund and Baron Real Estate Fund, which are non-diversified; and Baron International Growth Fund, which is diversified. Baron Real Estate Fund commenced trading operations on January 1, 2010 and, therefore, is not included in this report. The Funds’ investment objective is to seek capital appreciation. Baron Partners Fund may employ “leverage” by borrowing money and using it for the purchase of additional securities. Borrowing for investment increases both investment opportunity and investment risk. Baron Retirement Income Fund also intends to make annual distributions equal to a minimum 4% of the Fund’s net assets per share measured as of December 31 of the preceding year. Baron International Growth Fund expects to invest its assets primarily in non-U.S. companies. Baron Real Estate Fund expects to invest its assets primarily in U.S. and non-U.S. real estate and real estate-related companies of any size.
Each Fund offers two classes of shares, Retail Shares and Institutional Shares, which differ only in their ongoing fees, expenses and eligibility requirements. Retail Shares are offered to all investors. Institutional Shares are for accounts in the amount of $1 million or more and are intended for certain financial intermediaries that offer shares through fee based platforms, retirement platforms or other platforms. Each class of shares has equal rights to earnings and assets except that each class bears different expenses for distribution and shareholder servicing. Investment income, realized and unrealized gains or losses on investment and foreign currency, and expenses other than those attributable to a specific class are allocated to each class based on its relative net assets. Each class of shares has exclusive voting rights with respect to matters that affect just that class.
Baron Partners Fund was organized originally as a limited partnership in January 1992, under the laws of the State of Delaware. Effective as of the close of business on April 30, 2003, the predecessor partnership was reorganized into a Delaware statutory trust. Baron Partners Fund commenced operations on April 30, 2003 with a contribution of assets and liabilities, including securities-in-kind from the predecessor partnership.
Baron Retirement Income Fund was organized originally as a limited partnership in May 1996, under the laws of the State of Delaware. Effective as of the close of business on June 30, 2008, the predecessor partnership was reorganized into a series of the Trust. Baron Retirement Income Fund commenced operations on June 30, 2008 with a contribution of assets and liabilities, including securities-in-kind from the predecessor partnership.
Baron International Growth Fund commenced trading operations on January 1, 2009.
2. SIGNIFICANT ACCOUNTING POLICIES
The following is a summary of significant accounting policies followed by the Funds. The policies are in conformity with generally accepted accounting principles (“GAAP”) in the United States of America. Subsequent events have been disclosed through February 23, 2010, the issuance date of the financial statements.
a) Security Valuation. Portfolio securities traded on any national stock exchange are valued based on the last sale price. For securities traded on NASDAQ, the Funds use the NASDAQ Official Closing Price. Where market quotations are not readily available, or, if in the Adviser’s judgment, they do not accurately reflect the fair value of a security, or an event occurs after the market close but before the Funds are priced that materially affects the value of a security, the securities will be valued by the Adviser using policies and procedures approved by the Board of Trustees (the “Board”). The Adviser has a Fair Valuation Committee (the “Committee”) comprised of senior executives and the Committee reports to the Board every quarter. Factors the Committee considers when valuing a security include whether a current price is stale, there is recent news, the security is thinly traded, transactions are infrequent or quotations are genuine. There can be no guarantee, however, that a fair valuation used by the Funds on any given day will more accurately reflect the market value of an investment than the closing price of such investment in its market. Debt instruments will be valued on the basis of prices obtained from a pricing service approved by the Board or at the mean of the bid and ask prices from the dealer maintaining an active market in that security. Money market instruments held by the Funds with a remaining maturity of sixty days or less are valued at amortized cost, which approximates value.
Non-U.S. equity securities are valued on the basis of their most recent closing market prices and translated into U.S. dollars at 4 p.m. E.T., except under the circumstances described below. Most foreign markets close before 4 p.m. E.T. For securities primarily traded in the Far East, for example, the most recent closing prices may be as much as 15 hours old at 4 p.m. E.T. If the Adviser determines that developments between the close of the foreign market and 4 p.m. E.T. will, in its judgment, materially affect the value of some or all of the Funds’ securities, the Adviser will adjust the previous closing prices to reflect what it believes to be the fair value of the securities as of 4 p.m. E.T. In deciding whether to make these adjustments, the Adviser reviews a variety of factors, including developments in foreign markets, the performance of U.S. securities markets, and the performance of instruments trading in U.S. markets that represent non-U.S. securities and baskets of non-U.S. securities. The Adviser may also fair value securities in other situations, for example, when a particular foreign market is closed but the Funds are open. The Adviser uses outside pricing services to provide it with closing market prices and
17
| | |
| Baron Select Funds | | December 31, 2009 |
2. SIGNIFICANT ACCOUNTING POLICIES (Continued)
information used for adjusting those prices. The Adviser cannot predict how often it will use closing prices or how often it will adjust those prices. As a means of evaluating its fair value process, the Adviser routinely compares closing market prices, the next day’s opening prices in the same markets, and adjusted prices. Other mutual funds may adjust the prices of their securities by different amounts.
b) Foreign Currency Translations. Values of investments denominated in foreign currencies are translated into U.S. dollars using the price of such currencies at the time the net asset value is determined. Purchases and sales of investments and dividend income are converted at the prevailing rate of exchange on the respective dates of such transactions. Net realized gain (loss) on foreign currency transactions include gain (loss) arising from the fluctuation in the exchange rates between trade and settlement dates on security transactions and currency gain (loss) between the accrual and payment dates on dividends and foreign withholding taxes. The Funds do not isolate that portion of the results of operations resulting from changes in foreign exchange rates on investments from the fluctuations arising from changes in market prices of securities held. Such fluctuations are included with the net realized and unrealized gain or loss from investments and foreign currency transactions.
c) Securities Transactions, Investment Income and Expense Allocation. Securities transactions are recorded on a trade date basis. Realized gain and loss from securities transactions are recorded on an identified cost basis for financial reporting and federal income tax purposes. Dividend income is recognized on the ex-dividend date and interest income is recognized on an accrual basis which includes the accretion of discounts and amortization of premiums. Certain dividends from foreign securities will be recorded as soon as the Funds are informed of the dividend if such information is obtained subsequent to the ex-dividend date. Distributions received from certain investments held by the Funds may be comprised of dividends, realized gains and return of capital. The Funds originally estimate the expected classification of such payments. The amounts may subsequently be reclassified upon receipt of information from the issuer. The Funds are charged for those expenses that are directly attributable to each Fund, such as advisory and custodian fees. Expenses that are not directly attributable to a Fund are typically allocated among the Funds in proportion to their respective net assets.
d) Securities Lending. The Funds may lend securities to certain brokers. Upon such loans, the Funds receive collateral which is maintained by the custodian. The Funds earn interest on such collateral and earn income in the form of negotiated lenders’ fees, both of which are included in securities lending income in the Statements of Operations. Securities loaned are required to be secured at all times by collateral equal to at least 102% of the market value of the securities loaned. Risks may arise upon entering into securities lending to the extent that the value of the collateral is less than the value of the securities loaned due to the changes in the value of collateral or the loaned securities. The Funds may receive collateral in the form of cash or other eligible securities, such as a letter of credit issued by a U.S. bank or securities issued or guaranteed by the U.S. government. Securities purchased with cash collateral are subject to the risks inherent in investing in these securities.
For the year ended December 31, 2009, the Funds did not engage in any securities lending transactions.
e) Repurchase Agreements. The Funds may invest in repurchase agreements, which are short-term investments whereby the Funds acquire ownership of a debt security and the seller agrees to repurchase the security at a future date at a specified price. When entering into repurchase agreements, it is the Funds’ policy that their custodian or a third party custodian take possession of the underlying collateral securities, the market value of which, at all times, equals at least 105% of the principal amount of the repurchase transaction. To the extent that any repurchase transaction exceeds one business day, the value of the collateral is marked-to-market to ensure the adequacy of the collateral. If the seller defaults and the market value of the collateral declines or if bankruptcy proceedings are commenced with respect to the seller of the security, realization of the collateral by the Funds may be delayed or limited.
f) Federal Income Taxes. Each Fund is treated as a separate entity for federal income tax purposes. It is the policy of each Fund to qualify as a regulated investment company under Subchapter M of the Internal Revenue Code and to distribute all of its taxable income, including net realized capital gains, if any, to its shareholders. Therefore, no federal income tax provision is required.
g) Restricted Securities. The Funds may invest in securities which are restricted as to public sale in accordance with the Securities Act of 1933. Such assets are valued by the Adviser pursuant to policies and procedures approved by the Board.
h) Distributions. Income and capital gain distributions are determined in accordance with income tax regulations which may differ from generally accepted accounting principles. These differences are primarily due to differing treatments for net investment loss, foreign currency gains and losses, partnership basis adjustments and wash sale losses deferred.
i) Use of Estimates. The preparation of financial statements in accordance with accounting principles generally accepted in the United States of America requires management to make estimates and assumptions that affect the reported amounts of assets and liabilities at the date of the financial statements and the amounts of income and expenses during the period. Actual results could differ from those estimates.
18
| | |
| December 31, 2009 | | Baron Select Funds |
2. SIGNIFICANT ACCOUNTING POLICIES (Continued)
j) Commitments and Contingencies. In the normal course of business, the Funds may enter into contracts and agreements that contain a variety of representations and warranties, which provide general indemnification. The maximum exposure to the Funds under these agreements is unknown, as this would involve future claims that may be made against the Funds that have not yet occurred. However, based on experience, the Funds expect the risk of loss to be remote.
k) Cash and Cash Equivalents. The Funds consider all short term liquid investments with a maturity of three months or less when purchased to be cash equivalents.
l) Foreign Taxes. The Funds may be subject to foreign taxes on income, gains on investments or currency repatriation, a portion of which may be recoverable. The Funds will accrue such taxes and recoveries as applicable, based upon their current interpretation of tax rules and regulations that exist in the markets in which they invest.
3. PURCHASES AND SALES OF SECURITIES
Purchases and sales of securities, other than short term securities, for the year ended December 31, 2009 were as follows:
| | | | | | |
| Fund | | Purchases | | Sales |
Baron Partners Fund | | $ | 477,217,842 | | $ | 559,736,141 |
Baron Retirement Income Fund | | | 24,669,353 | | | 21,491,014 |
Baron International Growth Fund | | | 29,361,290 | | | 9,539,291 |
4. INVESTMENT ADVISORY FEES AND OTHER TRANSACTIONS WITH AFFILIATES
a) Investment Advisory Fees. BAMCO, Inc. (the “Adviser”), a wholly owned subsidiary of Baron Capital Group, Inc. (“BCG”), serves as investment adviser to the Funds. As compensation for services rendered, the Adviser receives a fee payable monthly equal to 1% per annum of the average daily net assets of the respective Funds. For Baron Partners Fund, Baron Retirement Income Fund and Baron International Growth Fund, the Adviser has contractually agreed to reduce its fee to the extent required to limit the net operating expense ratio (excluding portfolio transaction costs, interest and extraordinary expenses) to 1.45%, 1.35% and 1.50% of average daily net assets of the Retail Shares, and 1.20%, 1.10% and 1.25% of average daily net assets of the Institutional Shares, respectively.
b) Distribution Fees. Baron Capital, Inc. (“BCI”), a wholly owned subsidiary of BCG, is a registered broker-dealer and the distributor of the Retail Shares pursuant to a distribution plan under Rule 12b-1 of the 1940 Act. The distribution plan authorizes the Funds to pay BCI a distribution fee payable monthly equal to 0.25% per annum of the Retail Shares’ average daily net assets of the respective Funds.
c) Trustee Fees. Certain Trustees of the Trust may be deemed to be affiliated with, or interested persons (as defined by the 1940 Act) of the Funds’ Adviser or of BCI. None of the Trustees so affiliated received compensation for his or her services as a Trustee of the Trust. None of the Funds’ officers received compensation from the Funds in that capacity.
d) Fund Accounting and Administration Fees. The Funds have entered into an agreement with State Street Bank and Trust Company (the “Custodian”) to perform accounting and certain administrative services. The Custodian is compensated for fund accounting based on a percentage of the Funds’ net assets, subject to certain minimums plus fixed annual fees for the administrative services.
5. LINE OF CREDIT
Baron Partners Fund participates in a committed line of credit with the Custodian in the amount of $200 million. A commitment fee of 0.20% per annum is incurred on the unused portion of the line of credit. In addition, Baron Partners Fund has an uncommitted line of credit in the amount of $100 million with the Custodian. Both lines of credit are to be used for investment purposes and expire on September 24, 2010. Baron Partners Fund may borrow up to the lesser of $300 million or the maximum amount Baron Partners Fund may borrow under the 1940 Act, the limitations included in Baron Partners Fund’s prospectus, or any limit or restriction under any law or regulation to which Baron Partners Fund is subject or any agreement to which Baron Partners Fund is a party. Interest is charged to Baron Partners Fund, based on its borrowings, at a rate per annum equal to the higher of the Federal Funds Rate or the Libor rate plus a margin of 1.25%. For the year ended December 31, 2009, interest expense incurred on these loans amounted to $1,495,935.
During the year ended December 31, 2009, Baron Partners Fund had an average daily balance on the line of credit of $108.6 million at a weighted average interest rate of 1.38%. At December 31, 2009, Baron Partners Fund had an outstanding loan in the amount of $276,500,000.
19
| | |
| Baron Select Funds | | December 31, 2009 |
6. SWAP CONTRACTS
The Funds may enter into equity swap transactions as a substitute for investing or selling short directly in securities. A swap transaction is entered into with a counterparty to exchange the returns on a particular security or a basket of securities. The gross returns to be exchanged or “swapped” between the parties are calculated with respect to a “notional amount”. The counterparty will generally agree to pay the Funds the amount, if any, by which the notional amount of the swap contract would have increased had it been invested or decreased if sold short in the particular stocks. Upon entering into the swap contract, the Funds are required to pledge to the broker an amount of cash and/or other assets equal to a certain percentage of the contract amount. During the period the swap contract is open, the Funds mark to market the underlying instruments, including accrued dividends and recognize any unrealized gain or loss. Net payments made or received periodically are recognized as realized gain or loss. Swap contracts may involve exposure to loss in excess of the amount recognized in the Statements of Assets and Liabilities. The notional amount reflects the exposure the Funds have in the underlying securities. These transactions are subject to credit risks in addition to the various risks related to the underlying securities. During the year ended December 31, 2009, the Funds did not enter into any swap contracts.
7. SHORT SALES
The Funds may sell securities short. When the Funds sell short, the Funds record a liability for securities sold short and record an asset equal to the proceeds received. The amount of the liability is subsequently marked to market to reflect the market value of the securities sold short. The Funds may incur dividend expense if a security that has been sold short declares a dividend. The Funds are exposed to market risk based on the amount, if any, that the market value of the securities sold short exceeds the proceeds received.
The Funds are required to maintain collateral in a segregated account for the outstanding short sales. Short sales involve elements of market risks and exposure to loss in excess of the amount recognized in the Statements of Assets and Liabilities. The Funds’ risk of loss in these types of short sales is unlimited because there is no limit to the cost of replacing the borrowed security. As of December 31, 2009, the Funds had no open short sales.
8. RESTRICTED SECURITIES
At December 31, 2009, investments in securities included securities that are restricted and illiquid. Restricted securities are often purchased in private placement transactions, are not registered under the Securities Act of 1933, may have contractual restrictions on resale and are valued pursuant to the policies and procedures for fair value pricing approved by the Board. A security may be considered illiquid if it lacks a readily available market or if its valuation has not changed for a certain period of time. The Funds may receive more or less than this valuation in an actual sale and that difference could be material. At December 31, 2009, Baron Partners Fund held investments in restricted and illiquid securities that were valued pursuant to policies and procedures for fair value pricing as follows:
| | | | | |
| | | Baron Partners Fund |
| Name of Issuer | | Acquisition
Date | | Value |
Private Equity Investments | | | | | |
Kerzner Intl. Holdings, Ltd., Cl A | | 09/27/06 | | $ | 15,600,000 |
Windy City Investments Holdings LLC | | 11/30/07 | | | 18,044,989 |
| | | | | |
Total Restricted Securities: | | | |
(Cost $77,319,447) (2.39% of Net Assets) | | | | $ | 33,644,989 |
| | | | | |
9. FAIR VALUE MEASUREMENTS
Fair value is defined by GAAP as the price that the Funds would receive upon selling an investment in a timely transaction to an independent buyer in the principal or most advantageous market of the investment. GAAP provides a three-tier hierarchy to maximize the use of observable market data and minimize the use of unobservable inputs and to establish classification of fair value measurements for disclosure purposes. Inputs refer broadly to the assumptions that market participants would use in pricing the asset or liability. Inputs may be observable or unobservable. Observable inputs are based on market data obtained from sources independent of the Funds. Unobservable inputs are inputs that reflect the Funds’ own assumptions based on the best information available in the circumstances. The three-tier hierarchy of inputs is summarized in the three broad Levels listed below.
| | • | | Level 1 — quoted prices in active markets for identical investments |
| | • | | Level 2 — other significant observable inputs (including quoted prices for similar investments, for non-U.S. securities that may be fair valued, repurchase agreements, etc.) |
| | • | | Level 3 — significant unobservable inputs (including the Funds’ own assumptions in determining the fair value of investments) |
The inputs or methodology used for valuing securities are not necessarily an indication of the risk or liquidity associated with investing in those securities. For example, non-U.S. securities, whose markets close hours before the Funds value their holdings, may require revised valuations due to significant movement in the U.S. markets. Since these values are not obtained from quoted prices in an active market such securities are reflected as Level 2.
20
| | |
| December 31, 2009 | | Baron Select Funds |
9. FAIR VALUE MEASUREMENTS (Continued)
The following is a summary of the inputs used as of December 31, 2009 in valuing the Funds’ investments carried at fair value:
| | | | | | | | | | | | |
| | | Baron Partners Fund |
| Description | | Quoted Prices
in Active
Markets for
Identical Assets
(Level 1) | | Other
Significant
Observable
Inputs
(Level 2) | | Significant
Unobservable
Inputs
(Level 3) | | Total |
Common Stocks† | | $ | 1,634,068,207 | | $ | — | | $ | — | | $ | 1,634,068,207 |
Private Equity Investments† | | | — | | | — | | | 33,644,989 | | | 33,644,989 |
Warrants | | | 367 | | | — | | | — | | | 367 |
Corporate Bonds | | | — | | | 8,444,048 | | | — | | | 8,444,048 |
| | | | | | | | | | | | |
Total Investments | | $ | 1,634,068,574 | | $ | 8,444,048 | | $ | 33,644,989 | | $ | 1,676,157,611 |
| | | | | | | | | | | | |
| | | | | | | | | | | | |
| | | Baron Retirement Income Fund |
| Description | | Quoted Prices
in Active
Markets for
Identical Assets
(Level 1) | | Other
Significant
Observable
Inputs
(Level 2) | | Significant
Unobservable
Inputs
(Level 3) | | Total |
Common Stocks† | | $ | 69,526,036 | | $ | — | | $ | — | | $ | 69,526,036 |
Warrants | | | 80 | | | — | | | — | | | 80 |
Convertible Bonds | | | — | | | 2,939,875 | | | — | | | 2,939,875 |
Corporate Bonds | | | — | | | 1,942,500 | | | — | | | 1,942,500 |
Short Term Investments | | | — | | | 752,207 | | | — | | | 752,207 |
| | | | | | | | | | | | |
Total Investments | | $ | 69,526,116 | | $ | 5,634,582 | | $ | — | | $ | 75,160,698 |
| | | | | | | | | | | | |
| | | | | | | | | | | | |
| | | Baron International Growth Fund |
| Description | | Quoted Prices
in Active
Markets for
Identical Assets
(Level 1) | | Other
Significant
Observable
Inputs
(Level 2) | | Significant
Unobservable
Inputs
(Level 3) | | Total |
Common Stocks | | | | | | | | | | | | |
Consumer Discretionary | | $ | 1,027,170 | | $ | 4,459,921 | | $ | — | | $ | 5,487,091 |
Consumer Staples | | | — | | | 374,886 | | | — | | | 374,886 |
Energy | | | 472,480 | | | 1,642,101 | | | — | | | 2,114,581 |
Financials | | | 1,646,328 | | | 1,348,311 | | | — | | | 2,994,639 |
Health Care | | | 115,500 | | | 1,014,155 | | | — | | | 1,129,655 |
Industrials | | | 1,226,860 | | | 2,881,435 | | | — | | | 4,108,295 |
Information Technology | | | 2,589,205 | | | 4,795,654 | | | — | | | 7,384,859 |
Materials | | | 2,996,880 | | | 959,184 | | | — | | | 3,956,064 |
Telecommunication Services | | | 671,600 | | | — | | | — | | | 671,600 |
| | | | | | | | | | | | |
Total Common Stocks | | | 10,746,023 | | | 17,475,647 | | | — | | | 28,221,670 |
| | | | | | | | | | | | |
Short Term Investments | | | — | | | 1,699,006 | | | — | | | 1,699,006 |
| | | | | | | | | | | | |
Total Investments | | $ | 10,746,023 | | $ | 19,174,653 | | $ | — | | $ | 29,920,676 |
| | | | | | | | | | | | |
| † | See Statement of Net Assets for additional detailed categorizations. |
21
| | |
| Baron Select Funds | | December 31, 2009 |
9. FAIR VALUE MEASUREMENTS (Continued)
Following is a reconciliation of investments in which significant unobservable inputs (Level 3) were used in determining fair value:
BARON PARTNERS FUND
| | | | | | | | | | | | | | | | | | | | | | | | | | | |
| Investments in Securities | | Balance as of
December 31,
2008 | | Accrued
Premiums/
Discounts | | Net Realized
Gain (Loss) | | | Net Change in
Unrealized
Appreciation
(Depreciation) | | | Net
Purchases
(Sales) | | Net
Transfers
In (Out) | | Balance as of
December 31,
2009 | | Net Change in
Unrealized
Appreciation
(Depreciation)
from
Investments
still held at
December 31, 2009 | |
Private Equity Investments | | | | | | | | | | | | | | | | | | | | | | | | | | | |
Consumer Discretionary | | $ | 22,625,000 | | $ | — | | $ | (15,000,000 | ) | | $ | 7,975,000 | | | $ | — | | $ | — | | $ | 15,600,000 | | $ | (3,900,000 | ) |
Financials | | | 36,891,537 | | | — | | | — | | | | (18,846,548 | ) | | | — | | | — | | | 18,044,989 | | | (18,846,548 | ) |
| | | | | | | | | | | | | | | | | | | | | | | | | | | |
Total | | $ | 59,516,537 | | $ | — | | $ | (15,000,000 | ) | | $ | (10,871,548 | ) | | $ | — | | $ | — | | $ | 33,644,989 | | $ | (22,746,548 | ) |
| | | | | | | | | | | | | | | | | | | | | | | | | | | |
All net realized gain (loss) and net change in unrealized appreciation (depreciation) in the table above are reflected in the accompanying Statement of Operations.
10. INCOME TAXES AND DISTRIBUTIONS TO SHAREHOLDERS
Federal income tax regulations differ from generally accepted accounting principles. Therefore, distributions determined in accordance with tax regulations may differ in amount or character from net investment income and net realized gain for financial reporting purposes. Net investment income (loss) and net realized and unrealized gain (loss) differ for financial statement and tax purposes due to differing treatments of wash sale losses deferred, foreign currency gains and losses and net investment loss. Financial reporting records are adjusted for permanent book/tax differences to reflect tax character. Financial records are not adjusted for temporary differences.
For the year ended December 31, 2009, the Funds recorded the following permanent reclassifications to reflect tax character. Reclassifications between income, gains and paid-in capital relate primarily to the tax treatment of net investment loss, foreign currency gains and losses and partnership basis adjustments. Results of operations and net assets were not affected by these reclassifications.
| | | | | | | | | | | | |
| Fund | | Accumulated Net Investment Income (Loss) | | | Accumulated Realized Gain (Loss) | | | Paid-In Capital | |
Baron Partners Fund | | $ | 4,180,836 | | | $ | 3,511,974 | | | $ | (7,692,810 | ) |
Baron Retirement Income Fund | | | 3,714 | | | | (1 | ) | | | (3,713 | ) |
Baron International Growth Fund | | | (43,187 | ) | | | 51,534 | | | | (8,347 | ) |
As of December 31, 2009, the components of net assets on a tax basis were as follows:
| | | | | | | | | | | | |
| | | Baron Partners
Fund | | | Baron
Retirement
Income
Fund | | | Baron
International
Growth
Fund | |
Cost of investments | | $ | 1,379,707,376 | | | $ | 59,333,906 | | | $ | 22,902,529 | |
| | | | | | | | | | | | |
Gross tax unrealized appreciation | | $ | 359,256,055 | | | $ | 16,337,841 | | | $ | 7,374,230 | |
Gross tax unrealized depreciation | | | (62,805,820 | ) | | | (511,049 | ) | | | (356,083 | ) |
| | | | | | | | | | | | |
Net tax unrealized appreciation | | | 296,450,235 | | | | 15,826,792 | | | | 7,018,147 | |
Net tax unrealized currency depreciation | | | — | | | | — | | | | (16,022 | ) |
Undistributed ordinary income | | | — | | | | — | | | | 564,846 | |
Post October capital/currency loss deferral | | | (46 | ) | | | (298,529 | ) | | | — | |
Capital loss carryforwards | | | (720,037,259 | ) | | | (20,134,136 | ) | | | — | |
Paid-in Capital | | | 1,831,373,286 | | | | 81,107,500 | | | | 22,911,927 | |
| | | | | | | | | | | | |
Net Assets | | $ | 1,407,786,216 | | | $ | 76,501,627 | | | $ | 30,478,898 | |
| | | | | | | | | | | | |
22
| | |
| December 31, 2009 | | Baron Select Funds |
10. INCOME TAXES AND DISTRIBUTIONS TO SHAREHOLDERS (Continued)
As of December 31, 2009, The Funds had capital loss carryforwards expiring as follows:
| | | | | | | | | |
| | | Baron Partners
Fund | | Baron
Retirement
Income
Fund | | Baron
International
Growth
Fund |
| | | | | | | | | |
December 31, 2016 | | $ | 385,438,174 | | $ | 6,177,788 | | $ | — |
December 31, 2017 | | | 334,599,085 | | | 13,956,348 | | | — |
| | | | | | | | | |
| | $ | 720,037,259 | | $ | 20,134,136 | | $ | — |
| | | | | | | | | |
Capital loss carryforward utilized during the year ended December 31, 2009 | | $ | — | | $ | — | | $ | — |
| | | | | | | | | |
The tax character of distributions paid during the fiscal years ended December 31, 2009 and December 31, 2008 was as follows:
| | | | | | | | | | | | | | | | | | |
| | | Year Ended
December 31, 2009 | | Year Ended
December 31, 2008 |
| Fund | | Ordinary1 | | Long Term
Capital Gain | | Return of Capital | | Ordinary1 | | Long Term
Capital Gain | | Return of
Capital |
Baron Partners Fund | | | | | | | | | | | | | | | | | | |
Retail Shares | | $ | — | | $ | — | | $ | — | | $ | 21,725,651 | | $ | 70,818,712 | | $ | — |
Institutional Shares2 | | | — | | | — | | | — | | | N/A | | | N/A | | | N/A |
Baron Retirement Income Fund | | | | | | | | | | | | | | | | | | |
Retail Shares | | | 642,945 | | | — | | | 637,842 | | | — | | | — | | | 3,551,393 |
Institutional Shares2 | | | 507,863 | | | — | | | 503,832 | | | N/A | | | N/A | | | N/A |
Baron International Growth Fund | | | | | | | | | | | | | | | | | | |
Retail Shares | | | 206,238 | | | — | | | — | | | N/A | | | N/A | | | N/A |
Institutional Shares2 | | | 550,122 | | | — | | | — | | | N/A | | | N/A | | | N/A |
| 1 | For tax purposes, short-term capital gains are considered ordinary income distributions. |
| 2 | For the period May 29, 2009 (commencement of operations) to December 31, 2009. |
The Funds follow the provisions of the FASB Codification Section 740 (“ASC Section 740”) “Accounting for Uncertainty in Income Taxes” (formerly, FASB Interpretation No. 48), which clarifies the accounting for uncertainty in tax positions taken or expected to be taken on a tax return. ASC Section 740 sets forth a threshold for financial statement recognition, measurement and disclosure of tax positions taken or expected to be taken on a tax return. The Funds are required to recognize the tax effects of certain tax positions under a “more likely than not” standard, that based on their technical merits, have more than 50 percent likelihood of being sustained upon examination. Management has analyzed the tax positions taken on the Funds’ federal income tax returns for all open years (current and prior three years), and has concluded that no provision for federal income tax is required in the Funds’ financial statements. The Funds’ federal, state and local income and federal excise tax returns for which the applicable statutes of limitations have not expired are subject to examination by the Internal Revenue Service and state departments of revenue.
Baron Partners Fund is required to pay U.S. federal income tax (currently, at a maximum rate of 35%) on its “net built-in gain” attributable to certain assets of Baron Capital Partners, L.P. (the predecessor partnership of Baron Partners Fund), to the extent that any such net built-in gain is realized during the ten-year period beginning on the date of the conversion of the predecessor partnership into the Fund. The Fund holds two securities at December 31, 2009 with a market value of $20,613,000 which may be subject to the tax on net-built-in gain and reimbursement by the Adviser. The net built-in gain on these securities unrealized as of December 31, 2009 was $3,878,600.
23
| | |
| Baron Select Funds | | December 31, 2009 |
11. CAPITAL SHARE TRANSACTIONS
The Trust has an indefinite number of shares authorized with a par value of $0.01 per share. Each Fund offers two classes of shares. Each share of a class represents an identical interest and has the same rights, except that each class bears certain direct expenses, including those specifically related to the distribution of its shares.
Transactions in shares of each class were as follows:
| | | | | | | | | | | | | | |
| | | For the Year Ended
December 31, 2009 | | | For the Year Ended
December 31, 2008 | |
| Baron Partners Fund | | Shares | | | Amount | | | Shares | | | Amount | |
Retail Shares | | | | | | | | | | | | | | |
Shares sold | | 15,068,769 | | | $ | 185,694,555 | | | 39,242,334 | | | $ | 707,757,623 | |
Exchanges-in | | 201,861 | | | | 2,494,362 | | | — | | | | — | |
Shares issued in reinvestment of distributions | | — | | | | — | | | 4,562,518 | | | | 85,684,169 | |
Shares redeemed | | (46,666,610 | ) | | | (582,119,195 | ) | | (63,143,108 | ) | | | (1,129,440,844 | ) |
Exchanges-out | | (11,801,008 | ) | | | (161,717,101 | ) | | — | | | | — | |
| | | | | | | | | | | | | | |
Net decrease | | (43,196,988 | ) | | $ | (555,647,379 | ) | | (19,338,256 | ) | | $ | (335,999,052 | ) |
| | | | | | | | | | | | | | |
Institutional Shares1 | | | | | | | | | | | | | | |
Shares sold | | 539,678 | | | $ | 8,083,578 | | | — | | | $ | — | |
Exchanges-in | | 11,343,419 | | | | 155,638,879 | | | — | | | | — | |
Shares issued in reinvestment of distributions | | — | | | | — | | | — | | | | — | |
Shares redeemed | | (1,757,386 | ) | | | (26,278,184 | ) | | — | | | | — | |
Exchanges-out | | (3,465 | ) | | | (52,773 | ) | | — | | | | — | |
| | | | | | | | | | | | | | |
Net increase | | 10,122,246 | | | $ | 137,391,500 | | | — | | | $ | — | |
| | | | | | | | | | | | | | |
| | | | | | | | | | | | | | |
| | | For the Year Ended
December 31, 2009 | | | For the Period
December 31, 20082 | |
| Baron Retirement Income Fund | | Shares | | | Amount | | | Shares | | | Amount | |
Retail Shares | | | | | | | | | | | | | | |
Shares sold | | 463,490 | | | $ | 3,183,891 | | | 2,022,741 | | | $ | 18,886,522 | |
Proceeds from shares issued in reorganization of Baron Investment Partners, L.P. | | — | | | | — | | | 7,242,153 | | | | 72,421,528 | |
Exchanges-in | | 96,680 | | | | 661,019 | | | — | | | | — | |
Shares issued in reinvestment of distributions | | 145,714 | | | | 1,202,142 | | | 574,024 | | | | 3,432,665 | |
Shares redeemed | | (832,578 | ) | | | (5,454,396 | ) | | (381,386 | ) | | | (2,805,447 | ) |
Exchanges-out | | (4,427,905 | ) | | | (32,170,860 | ) | | — | | | | — | |
| | | | | | | | | | | | | | |
Net increase (decrease) | | (4,554,599 | ) | | $ | (32,578,204 | ) | | 9,457,532 | | | $ | 91,935,268 | |
| | | | | | | | | | | | | | |
Institutional Shares1 | | | | | | | | | | | | | | |
Shares sold | | 840 | | | $ | 6,100 | | | — | | | $ | — | |
Exchanges-in | | 4,369,150 | | | | 31,719,508 | | | — | | | | — | |
Shares issued in reinvestment of distributions | | 122,630 | | | | 1,011,694 | | | — | | | | — | |
Shares redeemed | | (19 | ) | | | (153 | ) | | — | | | | — | |
Exchanges-out | | — | | | | — | | | — | | | | — | |
| | | | | | | | | | | | | | |
Net increase | | 4,492,601 | | | $ | 32,737,149 | | | — | | | $ | — | |
| | | | | | | | | | | | | | |
| 1 | For the period May 29, 2009 (commencement of operations) to December 31, 2009. |
| 2 | For the period June 30, 2008 (commencement of operations) to December 31, 2008. |
24
| | |
| December 31, 2009 | | Baron Select Funds |
11. CAPITAL SHARE TRANSACTIONS (Continued)
| | | | | | | |
| | | For the Year Ended
December 31, 2009 | |
| Baron International Growth Fund | | Shares | | | Amount | |
Retail Shares | | | | | | | |
Shares sold | | 2,098,449 | | | $ | 22,052,097 | |
Exchanges-in | | 69,630 | | | | 903,077 | |
Shares issued in reinvestment of distributions | | 14,504 | | | | 205,235 | |
Shares redeemed | | (52,178 | ) | | | (735,978 | ) |
Exchanges-out | | (1,539,022 | ) | | | (17,359,527 | ) |
| | | | | | | |
Net increase | | 591,383 | | | $ | 5,064,904 | |
| | | | | | | |
Institutional Shares1 | | | | | | | |
Shares sold | | 6,687 | | | $ | 90,377 | |
Exchanges-in | | 1,521,429 | | | | 17,214,872 | |
Shares issued in reinvestment of distributions | | 38,823 | | | | 550,121 | |
Shares redeemed | | — | | | | — | |
Exchanges-out | | — | | | | — | |
| | | | | | | |
Net increase | | 1,566,939 | | | $ | 17,855,370 | |
| | | | | | | |
| 1 | For the period May 29, 2009 (commencement of operations) to December 31, 2009. |
12. MANAGEMENT OWNERSHIP
As of December 31, 2009, Mr. Baron owned, directly or indirectly, 39.84% of Baron Retirement Income Fund. Mr. Baron and a trustee owned, directly or indirectly, 61.22% of Baron International Growth Fund. As a result of their ownership, Mr. Baron and the trustee may be able to materially affect the outcome of matters presented to Baron Retirement Income Fund and Baron International Growth Fund shareholders.
25
| | |
| Baron Select Funds | | December 31, 2009 |
FINANCIAL HIGHLIGHTS
BARON PARTNERS FUND
Selected data for a share outstanding throughout each year:
| | | | | | | | | | | | | | | | | | | | | | | | | | | | | | | | |
| | | RETAIL SHARES | | | INSTITUTIONAL
SHARES | |
| | | Year Ended December 31, | | | 20096 | |
| | | 2009 | | | 2008 | | | 2007 | | | 2006 | | | 2005 | | | 2004 | | | 20031 | | |
| | | | | | | | |
Net asset value, beginning of year | | $ | 12.20 | | | $ | 23.76 | | | $ | 22.34 | | | $ | 18.43 | | | $ | 16.85 | | | $ | 12.17 | | | $ | 10.00 | | | $ | 12.66 | |
| | | | | | | | | | | | | | | | | | | | | | | | | | | | | | | | |
| | | | | | | | |
Income from investment operations: | | | | | | | | | | | | | | | | | | | | | | | | | | | | | | | | |
Net investment loss | | | (0.04 | )2 | | | (0.09 | )2 | | | (0.21 | )2 | | | (0.16 | )2 | | | (0.13 | ) | | | (0.06 | ) | | | (0.10 | ) | | | (0.03 | )2 |
Net realized and unrealized gain (loss) on investments | | | 3.48 | | | | (10.74 | ) | | | 2.74 | | | | 4.13 | | | | 2.49 | | | | 5.17 | | | | 3.63 | | | | 3.03 | |
| | | | | | | | | | | | | | | | | | | | | | | | | | | | | | | | |
Total from investment operations | | | 3.44 | | | | (10.83 | ) | | | 2.53 | | | | 3.97 | | | | 2.36 | | | | 5.11 | | | | 3.53 | | | | 3.00 | |
| | | | | | | | | | | | | | | | | | | | | | | | | | | | | | | | |
| | | | | | | | |
Less distributions to shareholders from: | | | | | | | | | | | | | | | | | | | | | | | | | | | | | | | | |
Net investment income | | | 0.00 | | | | 0.00 | | | | 0.00 | | | | 0.00 | | | | 0.00 | | | | 0.00 | | | | 0.00 | | | | 0.00 | |
Net realized gain on investments | | | 0.00 | | | | (0.73 | ) | | | (1.11 | ) | | | (0.06 | ) | | | (0.78 | ) | | | (0.43 | ) | | | (1.36 | ) | | | 0.00 | |
| | | | | | | | | | | | | | | | | | | | | | | | | | | | | | | | |
Total distributions | | | 0.00 | | | | (0.73 | ) | | | (1.11 | ) | | | (0.06 | ) | | | (0.78 | ) | | | (0.43 | ) | | | (1.36 | ) | | | 0.00 | |
| | | | | | | | | | | | | | | | | | | | | | | | | | | | | | | | |
| | | | | | | | |
Net asset value, end of year | | $ | 15.64 | | | $ | 12.20 | | | $ | 23.76 | | | $ | 22.34 | | | $ | 18.43 | | | $ | 16.85 | | | $ | 12.17 | | | $ | 15.66 | |
| | | | | | | | | | | | | | | | | | | | | | | | | | | | | | | | |
Total return | | | 28.20 | % | | | (46.67 | )% | | | 11.34 | % | | | 21.55 | % | | | 14.37 | % | | | 42.35 | % | | | 35.76 | %3 | | | 23.70 | %3 |
| | | | | | | | | | | | | | | | | | | | | | | | | | | | | | | | |
| | | | | | | | |
Ratios/Supplemental data: | | | | | | | | | | | | | | | | | | | | | | | | | | | | | | | | |
Net assets (in millions), end of year | | $ | 1,249.3 | | | $ | 1,501.3 | | | $ | 3,384.1 | | | $ | 2,403.1 | | | $ | 1,403.0 | | | $ | 632.7 | | | $ | 164.3 | | | $ | 158.5 | |
| | | | | | | | | | | | | | | | | | | | | | | | | | | | | | | | |
Ratio of total expenses to average net assets | | | 1.51 | % | | | 1.86 | %5 | | | 1.88 | %5 | | | 1.77 | % | | | 1.62 | % | | | 1.46 | % | | | 1.77 | %4 | | | 1.38 | %4 |
Less: Ratio of interest expense to average net assets | | | (0.10 | )% | | | (0.51 | )% | | | (0.57 | )% | | | (0.45 | )% | | | (0.27 | )% | | | (0.12 | )% | | | (0.37 | )%4 | | | (0.21 | )%4 |
| | | | | | | | | | | | | | | | | | | | | | | | | | | | | | | | |
Ratio of operating expenses to average net assets | | | 1.41 | % | | | 1.35 | % | | | 1.31 | % | | | 1.32 | % | | | 1. 35 | % | | | 1.34 | % | | | 1.40 | %4 | | | 1.17 | %4 |
| | | | | | | | | | | | | | | | | | | | | | | | | | | | | | | | |
Ratio of net investment loss to average net assets | | | (0.30 | )% | | | (0.49 | )% | | | (0.86 | )% | | | (0.80 | )% | | | (0.85 | )% | | | (0.83 | )% | | | (1.39 | )%4 | | | (0.31 | )%4 |
| | | | | | | | | | | | | | | | | | | | | | | | | | | | | | | | |
Portfolio turnover rate | | | 32.43 | % | | | 38.02 | % | | | 32.95 | % | | | 35.92 | % | | | 37.62 | % | | | 57.77 | % | | | 36.67 | %3 | | | 32.43 | % |
| | | | | | | | | | | | | | | | | | | | | | | | | | | | | | | | |
| 1 | For the period April 30, 2003 (commencement of operations) to December 31, 2003. |
| 2 | Based on average shares outstanding. |
| 5 | Benefit of expense reduction rounds to less than 0.01%. |
| 6 | For the period May 29, 2009 (commencement of operations) to December 31, 2009. |
| | |
| 26 | | See Notes to Financial Statements. |
| | |
| December 31, 2009 | | Baron Select Funds |
FINANCIAL HIGHLIGHTS (Continued)
BARON RETIREMENT INCOME FUND
Selected data for a share outstanding throughout each year:
| | | | | | | | | | | | |
| | | RETAIL SHARES | | | INSTITUTIONAL
SHARES | |
| | | Year Ended December 31, | | | | |
| | | 2009 | | | 20081 | | | 20097 | |
| | | |
Net asset value, beginning of year | | $ | 6.27 | | | $ | 10.00 | | | $ | 6.88 | |
| | | | | | | | | | | | |
| | | |
Income from investment operations: | | | | | | | | | | | | |
Net investment income | | | 0.12 | 2 | | | 0.00 | 2,3 | | | 0.07 | 2 |
Net realized and unrealized gain (loss) on investments | | | 2.00 | | | | (3.33 | ) | | | 1.45 | |
| | | | | | | | | | | | |
Total from investment operations | | | 2.12 | | | | (3.33 | ) | | | 1.52 | |
| | | | | | | | | | | | |
| | | |
Less distributions to shareholders from: | | | | | | | | | | | | |
Net investment income | | | (0.13 | ) | | | 0.00 | | | | (0.13 | ) |
Net realized gain on investments | | | 0.00 | | | | 0.00 | | | | 0.00 | |
Return of capital | | | (0.12 | ) | | | (0.40 | ) | | | (0.12 | ) |
| | | | | | | | | | | | |
Total distributions | | | (0.25 | ) | | | (0.40 | ) | | | (0.25 | ) |
| | | | | | | | | | | | |
| | | |
Net asset value, end of year | | $ | 8.14 | | | $ | 6.27 | | | $ | 8.15 | |
| | | | | | | | | | | | |
Total return | | | 33.77 | %5 | | | (33.11 | )%4,5 | | | 22.06 | %4,5 |
| | | | | | | | | | | | |
| | | |
Ratios/Supplemental data: | | | | | | | | | | | | |
Net assets (in millions), end of year | | $ | 39.9 | | | $ | 59.3 | | | $ | 36.6 | |
| | | | | | | | | | | | |
Ratio of operating expenses to average net assets | | | 1.52 | % | | | 1.54 | %6 | | | 1.25 | %6 |
Less: Reimbursement of expenses by Adviser | | | (0.17 | )% | | | (0.19 | )%6 | | | (0.15 | )%6 |
| | | | | | | | | | | | |
Ratio of net expenses to average net assets | | | 1.35 | % | | | 1.35 | %6 | | | 1.10 | %6 |
| | | | | | | | | | | | |
Ratio of net investment income to average net assets | | | 1.81 | % | | | 0.01 | %6 | | | 1.63 | %6 |
| | | | | | | | | | | | |
Portfolio turnover rate | | | 34.76 | % | | | 35.43 | %4 | | | 34.76 | % |
| | | | | | | | | | | | |
| 1 | For the period June 30, 2008 (commencement of operations) to December 31, 2008. |
| 2 | Based on average shares outstanding. |
| 3 | Less than $0.01 per share. |
| 5 | The total returns would have been lower had certain expenses not been reduced during the periods shown. |
| 7 | For the period May 29, 2009 (commencement of operations) to December 31, 2009. |
| | |
| See Notes to Financial Statements. | | 27 |
| | |
| Baron Select Funds | | December 31, 2009 |
FINANCIAL HIGHLIGHTS (Continued)
BARON INTERNATIONAL GROWTH FUND
Selected data for a share outstanding throughout each year:
| | | | | | | | |
| | | RETAIL
SHARES | | | INSTITUTIONAL
SHARES | |
| | | Year Ended
December 31,
2009 | | | Year Ended December 31, 20095 | |
| | |
Net asset value, beginning of year | | $ | 10.00 | | | $ | 11.13 | |
| | | | | | | | |
| | |
Income from investment operations: | | | | | | | | |
Net investment income (loss) | | | 0.04 | 1 | | | (0.02 | )1 |
Net realized and unrealized gain on investments | | | 4.43 | | | | 3.38 | |
| | | | | | | | |
Total from investment operations | | | 4.47 | | | | 3.36 | |
| | | | | | | | |
| | |
Less distributions to shareholders from: | | | | | | | | |
Net investment income | | | 0.00 | | | | 0.00 | |
Net realized gain on investments | | | (0.36 | ) | | | (0.36 | ) |
| | | | | | | | |
Total distributions | | | (0.36 | ) | | | (0.36 | ) |
| | | | | | | | |
| | |
Net asset value, end of year | | $ | 14.11 | | | $ | 14.13 | |
| | | | | | | | |
Total return | | | 44.69 | %3 | | | 30.18 | %2,3 |
| | | | | | | | |
| | |
Ratios/Supplemental data: | | | | | | | | |
Net assets (in millions), end of year | | $ | 8.4 | | | $ | 22.1 | |
| | | | | | | | |
Ratio of operating expenses to average net assets | | | 2.33 | % | | | 1.89 | %4 |
Less: Reimbursement of expenses by Adviser | | | (0.83 | )% | | | (0.64 | )%4 |
| | | | | | | | |
Ratio of net expenses to average net assets | | | 1.50 | % | | | 1.25 | %4 |
| | | | | | | | |
Ratio of net investment income (loss) to average net assets | | | 0.38 | % | | | (0.29 | )%4 |
| | | | | | | | |
Portfolio turnover rate | | | 53.94 | % | | | 53.94 | % |
| | | | | | | | |
| 1 | Based on average shares outstanding. |
| 3 | The total returns would have been lower had certain expenses not been reduced during the period shown. |
| 5 | For the period May 29, 2009 (commencement of operations) to December 31, 2009. |
| | |
| 28 | | See Notes to Financial Statements. |
| | |
| December 31, 2009 | | Baron Select Funds |
REPORT OF INDEPENDENT REGISTERED PUBLIC ACCOUNTING FIRM
To the Board of Trustees and Shareholders of
Baron Select Funds
In our opinion, the accompanying statements of assets and liabilities, including the statements of net assets, and the related statements of operations , of changes in net assets and of cash flows, and the financial highlights present fairly, in all material respects, the financial position of each of Baron Partners Fund, Baron Retirement Income Fund and Baron International Growth Fund (three of the portfolios constituting the Baron Select Funds and hereafter referred to as the “Funds”) at December 31, 2009, and the results of each of their operations, the changes in each of their net assets and the cash flows of Baron Partners Fund and the financial highlights for each of the periods presented, in conformity with accounting principles generally accepted in the United States of America. These financial statements and financial highlights (hereafter referred to as “financial statements”) are the responsibility of the Funds’ management. Our responsibility is to express an opinion on these financial statements based on our audits. We conducted our audits of these financial statements in accordance with the standards of the Public Company Accounting Oversight Board (United States). Those standards require that we plan and perform the audit to obtain reasonable assurance about whether the financial statements are free of material misstatement. An audit includes examining, on a test basis, evidence supporting the amounts and disclosures in the financial statements, assessing the accounting principles used and significant estimates made by management, and evaluating the overall financial statement presentation. We believe that our audits, which included confirmation of securities at December 31, 2009 by correspondence with the custodian and brokers, provide a reasonable basis for our opinion.
PricewaterhouseCoopers LLP
New York, New York
February 23, 2010
29
| | |
| Baron Select Funds | | December 31, 2009 |
FUND EXPENSES (Unaudited)
As a shareholder of the Funds, you may incur two types of costs: ongoing expenses and transaction costs. Ongoing expenses include advisory fees, distribution and service (12b-1) fees and other Fund expenses. Due to the payment of Rule 12b-1 fees, long-term shareholders may indirectly pay more than the maximum permitted front-end sales charge. The information on this page is intended to help you understand your ongoing costs of investing in the Funds and to compare these costs with the ongoing costs of investing in other mutual funds.
The information in the following table is based on an investment of $1,000 invested on July 1, 2009 and held for the six months ended December 31, 2009.
ACTUAL EXPENSES
The table below titled “Based on Actual Total Return” provides information about actual account values and actual expenses. You may use the information provided in this table, together with the amount you invested, to estimate the expenses that you paid over the period. To estimate the expenses you paid on your account, divide your ending account value by $1,000 (for example, an $8,600 ending account value divided by $1,000 = 8.6), then multiply the result by the number under the heading titled “Expenses Paid During the Period”.
BASED ON ACTUAL TOTAL RETURN FOR THE SIX MONTHS ENDED DECEMBER 31, 20091
| | | | | | | | | | | | | |
| | | Actual Total Return | | Beginning Account Value July 1, 2009 | | Ending
Account Value
December 31, 2009 | | Annualized Expense Ratio2 | | Expenses
Paid During
the Period3 |
| | | | | |
Baron Partners Fund — Retail Shares | | 23.15% | | $ | 1,000.00 | | $ | 1,231.50 | | 1.56% | | $ | 8.77 |
| | | | | |
Baron Partners Fund — Institutional Shares | | 23.31% | | $ | 1,000.00 | | $ | 1,233.10 | | 1.38% | | $ | 7.77 |
| | | | | |
Baron Retirement Income Fund — Retail Shares | | 20.00% | | $ | 1,000.00 | | $ | 1,200.00 | | 1.35% | | $ | 7.49 |
| | | | | |
Baron Retirement Income Fund — Institutional Shares | | 20.14% | | $ | 1,000.00 | | $ | 1,201.40 | | 1.10% | | $ | 6.10 |
| | | | | |
Baron International Growth Fund — Retail Shares | | 30.70% | | $ | 1,000.00 | | $ | 1,307.00 | | 1.50% | | $ | 8.72 |
| | | | | |
Baron International Growth Fund — Institutional Shares | | 30.77% | | $ | 1,000.00 | | $ | 1,307.70 | | 1.25% | | $ | 7.27 |
HYPOTHETICAL EXAMPLE FOR COMPARISON PURPOSES
The table below titled “Based on Hypothetical Total Return” provides information about hypothetical account values and hypothetical expenses based on the actual expense ratio and an assumed rate of return of 5% per year before expenses, which is not the Funds’ actual return. The hypothetical account values and expenses may not be used to estimate the actual ending account values and expenses you paid for the period. You may use the information provided in this table to compare the ongoing costs of investing in the Funds and other funds. To do so, compare the 5% hypothetical example relating to the Funds with the 5% hypothetical examples that appear in the shareholder reports of other funds.
Please note that expenses shown in the table below are meant to highlight your ongoing costs and do not reflect any transactional costs, such as redemption fees, if any. Therefore, the table is useful in comparing ongoing costs only and will not help you determine your relative total costs of owning different mutual funds. In addition, if these transactional costs were included, your costs would have been higher.
BASED ON HYPOTHETICAL TOTAL RETURN FOR THE SIX MONTHS ENDED DECEMBER 31, 2009
| | | | | | | | | | | | | |
| | | Hypothetical Annualized Total Return | | Beginning Account Value July 1, 2009 | | Ending
Account Value
December 31, 2009 | | Annualized Expense Ratio2 | | Expenses
Paid During
the Period3 |
| | | | | |
Baron Partners Fund — Retail Shares | | 5.00% | | $ | 1,000.00 | | $ | 1,017.34 | | 1.56% | | $ | 7.93 |
| | | | | |
Baron Partners Fund — Institutional Shares | | 5.00% | | $ | 1,000.00 | | $ | 1,018.25 | | 1.38% | | $ | 7.02 |
| | | | | |
Baron Retirement Income Fund — Retail Shares | | 5.00% | | $ | 1,000.00 | | $ | 1,018.40 | | 1.35% | | $ | 6.87 |
| | | | | |
Baron Retirement Income Fund — Institutional Shares | | 5.00% | | $ | 1,000.00 | | $ | 1,019.66 | | 1.10% | | $ | 5.60 |
| | | | | |
Baron International Growth Fund — Retail Shares | | 5.00% | | $ | 1,000.00 | | $ | 1,017.64 | | 1.50% | | $ | 7.63 |
| | | | | |
Baron International Growth Fund — Institutional Shares | | 5.00% | | $ | 1,000.00 | | $ | 1,018.90 | | 1.25% | | $ | 6.36 |
| 1 | Assumes reinvestment of all dividends and capital gain distributions, if any. |
| 2 | Annualized expense ratio for Baron Partners Fund for the six months ended December 31, 2009, includes 1.38% and 1.17% for net operating expenses and 0.18% and 0.21% for interest expense for the Retail and Institutional Shares, respectively. |
| 3 | Expenses are equal to each Share Class’ respective annualized expense ratio multiplied by the average account value over the period, multiplied by the number of days in the most recent fiscal half-year, then divided by 365. |
30
| | |
| December 31, 2009 | | Baron Select Funds |
TAX INFORMATION (Unaudited)
We are required by the Internal Revenue Code to advise you within 60 days of the Funds’ fiscal year end as to the federal tax status of distributions paid by the Funds during such fiscal year.
During the fiscal year ended December 31, 2009, the Funds’ distributions to shareholders included:
| | | | | | | | | |
| Fund | | Ordinary
Income1 | | Long-Term
Capital Gain2 | | Return of
Capital3 |
Baron Partners Fund | | $ | — | | $ | — | | $ | — |
Baron Retirement Income Fund | | | 1,150,808 | | | — | | | 1,141,674 |
Baron International Growth Fund | | | 756,360 | | | — | | | — |
| 1 | For tax purposes, short-term capital gains are considered ordinary income distributions. |
| 2 | Long-term capital gains are subject to a maximum allowable rate of 15% for individuals pursuant to The Jobs and Growth Tax Relief Reconciliation Act of 2003. |
| 3 | Distribution will be treated as a tax free return of capital to the extent of a shareholder’s adjusted basis and as a capital gain thereafter. |
Of the total ordinary income distributions paid by Baron Retirement Income Fund and Baron International Growth Fund, 39.05% and 28.60%, respectively, is qualified dividend income subject to a reduced tax rate.
The information and distributions reported may differ from the information and distributions taxable to the shareholders for the calendar year ended December 31, 2009. The information necessary to complete your income tax return for the calendar year ended December 31, 2009 will be listed on the Form 1099-DIV which will be mailed to you in January 2010.
31
| | |
| Baron Select Funds | | December 31, 2009 |
MANAGEMENT OF THE FUNDS
Board of Trustees and Officers
The Board oversees the management of the Funds. The following table lists the Trustees and Executive Officers of the Funds, their ages, current positions held with the Funds, length of time served with the Funds, principal occupations during the past five years and other Trusteeships/Directorships held outside of the Fund complex. Unless otherwise noted, the address of each Executive Officer and Trustee is Baron Select Funds, 767 Fifth Avenue, 49th Floor, New York, NY 10153. Trustees who are not deemed to be “interested persons” of the Funds as defined in the Investment Company Act of 1940 (the “1940 Act”), are referred to as “Independent Trustees.” Trustees who are deemed to be “interested persons” of the Funds, as defined in the 1940 Act, are referred to as “Interested Trustees.” All Trustees listed below, whether Interested or Disinterested, serve as Trustees for the Funds.
| | | | | | | | | | |
| Name, Address & Age | | Position(s) Held With the Funds | | Length of
Time Served | | Principal Occupation(s)
During the Past Five Years | | Number of Portfolios in Fund Complex Overseen by Trustee | | Other
Trustee/Directorships
Held by the Trustee |
Interested Trustees | | | | | | | | | | |
| | | | | |
Ronald Baron(1),(2) 767 Fifth Avenue New York, NY 10153 Age: 66 | | Chief Executive Officer, Chief Investment Officer, Trustee and Portfolio Manager | | 6 years | | Director, Chairman, CEO and CIO: the Firm* (2003-Present); President (2004-02/07), Chairman (1999-2004), and Trustee (1987-Present): Baron Investment Funds Trust; President (2004-02/07), Chairman (2003-2004), and Trustee (2003-Present): Baron Select Funds; Portfolio Manager: Baron USA Partners Fund, Ltd. (2003-Present); President: the Firm* (03/06-06/07); Portfolio Manager: Baron Managed Funds plc (2005-2009); President (2004-02/07), Chairman (1997-2004), and Trustee (1997-06/07): Baron Capital Funds Trust. | | 9 | | None |
| | | | | |
Linda S. Martinson(1),(2) 767 Fifth Avenue New York, NY 10153 Age: 54 | | President, Chief Operating Officer and Trustee | | 6 years | | Director: the Firm* (2003-Present); Secretary: the Firm* (2003-04/08); President: the Firm* (02/07-Present); Chief Operating Officer: the Firm (05/06-present); General Counsel and Vice President: the Firm* (2003-2007); President (02/07-Present), Trustee (1987-Present), Secretary (2003-10/08): Baron Investment Funds Trust; President (02/07-Present), Trustee (2003-Present): Baron Select Funds; Director: Baron USA Partners Fund, Ltd. (2006-Present); Director: Baron Managed Funds plc (2005-2009); President (02/07-06/07) Trustee (1998-Present): Baron Capital Funds Trust. | | 9 | | None |
Independent Trustees | | | | | | | | | | |
| | | | | |
Norman S. Edelcup(3),(4),(5) City of Sunny Isles Beach 18070 Collins Avenue Sunny Isles Beach, FL 33160 Age: 74 | | Trustee | | 6 years | | Director: Marquis Bank (2007-Present) Director: CompX International, Inc. (diversified manufacturer of engineered components) (2006-Present); Mayor (2003-Present), Commissioner (2001-2003): Sunny Isles Beach, Florida; Director (2001-2006), Senior Vice President (2001-2004): Florida Savings Bank; Director: Valhi, Inc. (diversified company) (1975-Present); Trustee: Baron Investment Funds Trust (1987-Present), Baron Capital Funds Trust (1997-06/07), Baron Select Funds (2003-Present). | | 9 | | Director: Marquis Bank (2007-Present); Director: CompX International, Inc. (diversified manufacturer of engineered components) (2006-Present); Director: Valhi, Inc. (diversified company) (1985-1998). |
32
| | |
| December 31, 2009 | | Baron Select Funds |
| | | | | | | | | | |
| Name, Address & Age | | Position(s) Held With the Funds | | Length of
Time Served | | Principal Occupation(s)
During the Past Five Years | | Number of Portfolios in Fund Complex Overseen by Trustee | | Other
Trustee/Directorships
Held by the Trustee |
Charles N. Mathewson(4),(5) 9295 Prototype Drive Reno, NV 89521 Age: 81 | | Chairman and Trustee | | 6 years; (Elected as Chairman 08/04) | | Chairman Emeritus (October 2003-Present), Chairman (1986-2003): International Game Technology, Inc. (manufacturer of microprocessor-controlled gaming machines and monitoring systems); Chairman: Baron Capital Funds Trust (2004-06/07), Baron Investment Funds Trust, Baron Select Funds (2004-Present); Trustee: Baron Investment Funds Trust (1987-Present), Baron Capital Funds Trust (1997-06/07), Baron Select Funds (2003-Present). | | 9 | | None |
| | | | | |
Harold W. Milner(4),(5) 2293 Morningstar Drive Park City, UT 84060 Age: 75 | | Trustee | | 6 years | | Retired; Trustee: Baron Investment Funds Trust (1987-Present), Baron Capital Funds Trust (1997-06/07), Baron Select Funds (2003-Present); Chairman: Lighting Protection Systems, LLC (10/06-Present). | | 9 | | None |
| | | | | |
Raymond Noveck(3),(4),(5) 31 Karen Road Waban, MA 02168 Age: 66 | | Trustee | | 6 years | | Private Investor (1999-Present); Trustee: Baron Investment Funds Trust (1987-Present), Baron Capital Funds Trust (1997-06/07), Baron Select Funds (2003-Present). | | 9 | | None |
| | | | | |
David A. Silverman, MD(4),(5) 146 Central Park West New York, NY 10024 Age: 59 | | Trustee | | 6 years | | Physician and Faculty: New York University School of Medicine (1976-Present); Trustee: Baron Investment Funds Trust (1987-Present), Baron Capital Funds Trust (1997-06/07), Baron Select Funds (2003-Present). | | 9 | | Director: New York Blood Center (1999-Present). |
| | | | | |
Alex Yemenidjian(4),(5) 1925 Century Park East Suite 1975 Los Angeles, CA 90067 Age: 54 | | Trustee | | 3 years | | Chairman and CEO: Tropicana Las Vegas (gaming) (2009-Present); Chairman and CEO: Armenco Holdings, LLC (investment company) (2005-Present); Director: Guess?, Inc. (retail) (2005-Present); Director: Regal Entertainment Group (entertainment company) (2005-Present); Director: USC Marshall School of Business Board of Leaders (2005-Present); Co-chair: Imagine the Arts Campaign, California State University-Northridge (2005-Present); Trustee: American Film Institute (2000-Present); Chairman and CEO: Metro-Goldwyn-Mayer, Inc. (1999-2005); Director: The Lincy Foundation (1989-Present); Director: The United Armenian Fund (1989-Present); Director and member of Executive Committee: MGM MIRAGE, Inc. (1989-2005); Trustee: Baron Investment Funds Trust (2006-Present), Baron Capital Funds Trust (12/06-06/07), Baron Select Funds (12/06-Present). | | 9 | | Chairman: Tropicana Las Vegas (2009-Present); Director: Guess?, Inc. (2005-Present); Director: Regal Entertainment Group (2005-Present); Director, USC Marshall School of Business Board of Leaders (2005-Present); Co-chair: Imagine the Arts Campaign, California State University-Northridge (2005-Present); Trustee: American Film Institute (2000-2007); Director: The Lincy Foundation (1989-Present); Director (1989-2008), Chairman (10/08-Present): The United Armenian Fund (1989-Present); Director and member of Executive Committee: MGM MIRAGE, Inc. (1989-2005). |
33
| | |
| Baron Select Funds | | December 31, 2009 |
| | | | | | | | | | |
| Name, Address & Age | | Position(s) Held With the Funds | | Length of
Time Served | | Principal Occupation(s)
During the Past Five Years | | Number of Portfolios in Fund Complex Overseen by Trustee | | Other
Trustee/Directorships
Held by the Trustee |
| | | | |
Additional Officers of the Funds | | | | | | | | |
| | | | | |
Larry Cohn 767 Fifth Avenue New York, NY 10153 Age: 52 | | Vice President and Chief Information Officer | | 2 years | | Vice President and Chief Information Officer: Baron Capital, Inc., Baron Capital Management, Inc. and BAMCO, Inc. (2008-Present); Global Divisional Chief Information Officer, Investment Management Division: Lehman Brothers (2003-2008); Chief Information Officer: Neuberger Berman (1993-2003). | | 9 | | Director: Hebrew Academy of Nassau County (1996-Present). |
| | | | | |
Clifford Greenberg 767 Fifth Avenue New York, NY 10153 Age: 50 | | Senior Vice President and Portfolio Manager | | 6 years | | Director and Senior Vice President: the Firm* (2003-Present); Vice President: Baron Capital, Inc. (1997-2003); Portfolio Manager: Baron Small Cap Fund (1997-Present). | | 9 | | None |
| | | | | |
Gretta J. Heaney 767 Fifth Avenue New York, NY 10153 Age: 49 | | Vice President and Chief Compliance Officer | | 5 years | | Vice President and Chief Compliance Officer: the Firm* (2003-Present), Baron Investment Funds Trust, Baron Select Funds (2004-Present), Baron USA Partners Fund, Ltd (2006-Present), Baron Managed Funds plc (2005-2009), Baron Capital Funds Trust (2003-06/07). | | 9 | | None |
| | | | | |
Patrick M. Patalino 767 Fifth Avenue New York, NY 10153 Age: 41 | | Vice President, General Counsel and Secretary | | 2 years | | Vice President and General Counsel: the Firm*, Baron Investment Funds Trust, Baron Select Funds, Baron USA Partners Fund, Ltd. (08/07-Present), Baron Managed Funds plc (2007-2009); Secretary: the Firm* (04/08-Present); Secretary: Baron Investment Funds Trust, Baron Select Funds (10/08-Present); Managing Director and Chief Operating Officer: Legal and Compliance Division, Morgan Stanley (01/06-06/07); Director of Regulatory Matters: Credit Suisse Securities (USA) (04/04-01/06); Counsel to Vice Chairman: Credit Suisse Securities (USA) (09/02-04/04). | | 9 | | None |
| | | | | |
Andrew Peck 767 Fifth Avenue New York, NY 10153 Age: 40 | | Senior Vice President and Portfolio Manager | | 6 years | | Portfolio Manager: Baron Asset Fund (01/08-Present); Vice President: BAMCO, Inc. (2003-Present); Vice President: Baron Investment Funds Trust (2003-Present); Vice President, Research Analyst: Baron Capital, Inc. (1998-Present); Co-Portfolio Manager: Baron Asset Fund (2003-01/08); Co-Portfolio Manager (mid cap accounts): Baron Capital Management, Inc. (04/06-Present). | | 9 | | None |
| | | | | |
Susan Robbins 767 Fifth Avenue New York, NY 10153 Age: 55 | | Vice President | | 6 years | | Director, Vice President and Senior Analyst: the Firm* (2003-Present); Vice President: Baron Investment Funds Trust (1994-Present), Baron Select Funds (2003-Present), Baron Capital Funds Trust (1998-06/07). | | 9 | | None |
| | | | | |
Peggy C. Wong 767 Fifth Avenue New York, NY 10153 Age: 48 | | Treasurer and Chief Financial Officer | | 6 years | | Chief Financial Officer and Treasurer: the Firm* (2003-Present), Baron Investment Funds Trust (1987-Present), Baron Select Funds (2003-Present), Baron USA Partners Fund, Ltd. (1993-Present), Baron Managed Funds plc. (2005-2009), Baron Capital Funds Trust (1998-06/07). | | 9 | | None |
| * | The Firm (Baron Capital Group, Inc. (“BCG”) with its subsidiaries BCI, Baron Capital Management, Inc. and BAMCO). |
| (1) | Trustees deemed to be “Interested Trustees” of the Funds, as that term is defined in the 1940 Act by reason of their employment with the Funds’ Adviser and Distributor. |
| (2) | Members of the Executive Committee, which is empowered to exercise all of the powers, including the power to declare dividends, of the full Board when the full Board is not in session. |
| (3) | Members of the Audit Committee. |
| (4) | Members of the Nominating Committee. |
| (5) | Members of the Independent Committee. |
34
767 Fifth Avenue, 49th Fl.
New York, NY 10153
1.800.99.BARON
212-583-2000
www.BaronFunds.com
DEC09
Item 2. Code of Ethics.
The Registrant has adopted a Code of Ethics for Principal Executive and Senior Financial Officers (the “Code”). Upon request, the Registrant will provide a copy of the Code to any person without charge. To obtain a copy of the Code, please send your request to info@Baronfunds.com or call 1-800-99BARON (1-800-992-2766).
Item 3. Audit Committee Financial Expert.
The Registrant’s Board of Trustees has determined that the Registrant has two audit committee financial experts serving on its Audit Committee, Norman S. Edelcup and Raymond Noveck. Both Mr. Edelcup and Mr. Noveck are “independent” for purposes of Item 3(a)(2) of Form N-CSR.
Item 4. Principal Accountant Fees and Services.
The following table shows the fees paid to PricewaterhouseCoopers, LLP, the registrant’s principal accounting firm during the fiscal year January 1, 2009 to December 31, 2009 (a) for professional services rendered for the audit of the registrant’s annual financial statements or services that are normally provided in connection with statutory and regulatory filings or engagements (“Audit Fees”), (b) for assurance and related services that are reasonably related to the performance of the audit and are not included as Audit Fees (“Audit-Related Fees”), (c) for professional services rendered for tax compliance, tax advice and tax planning (“Tax Fees”), and (d) for products and services provided by such accounting firm that are not included in (a), (b) or (c) above (“All Other Fees”).
For the Fiscal Year Ended December 31, 2009:
| | | | | | |
| | | Audit Fees | | Tax Fees |
Baron Partners Fund | | $ | 42,250 | | $ | 21,150 |
Baron Retirement Income Fund | | | 25,000 | | | 31,700 |
Baron International Growth Fund | | | — | | | 4,400 |
Pursuant to its charter, the Audit Committee shall pre-approve all audit and non-audit services provided by the independent auditors and in connection therewith to review and evaluate the qualifications, independence and performance of the Funds’ independent auditors.
Item 5. Audit Committee of Listed Registrants.
The Registrant has a separately-designated standing Audit Committee established in accordance with Section 3(a)(58)(A) of the Securities Exchange Act of 1934. The members of the Audit Committee are Norman S. Edelcup and Raymond Noveck.
Item 6. Schedule of Investments.
Included herein under Item 1.
Item 7. Disclosure of Proxy Voting Policies and Procedures for Closed-End Management Investment Companies.
Not applicable.
Item 8. Portfolio Managers of Closed-End Management Investment Companies.
Not applicable.
Item 9. Purchases of Equity Securities by Closed-End Management Investment Company and Affiliated Purchasers.
Not applicable.
Item 10. Submission of Matters to a Vote of Security Holders.
Not applicable.
Item 11. Controls and Procedures.
(a) The Registrant’s principal executive officer and principal financial officer have concluded that the Registrant’s disclosure controls and procedures (as defined in Rule 30a-3(c) under the Investment Company Act of 1940 (the “1940 Act”)) are effective based on their evaluation of these controls and procedures as of a date within 90 days of the filing date of this report.
(b) There were no changes in the Registrant’s internal control over financial reporting (as defined in Rule 30a-3(d) under the 1940 Act) that occurred during the Registrant’s second fiscal quarter of the period covered by this report that have materially affected, or are reasonably likely to materially affect, the Registrant’s internal control over financial reporting.
Item 12. Exhibits.
(a)(1) Certifications pursuant to Section 302 of the Sarbanes Oxley Act of 2002.
Exhibit 99.CERT
(b) Certifications pursuant to Section 906 of the Sarbanes Oxley Act of 2002.
Exhibit 99.906CERT
SIGNATURES
Pursuant to the requirements of the Securities Exchange Act of 1934 and the Investment Company Act of 1940, the registrant has duly caused this report to be signed on its behalf by the undersigned, thereunto duly authorized.
| | |
| BARON SELECT FUNDS |
| |
| By: | | /s/ Ronald Baron |
| | Ronald Baron |
| | Chief Executive Officer |
|
| Date: February 26, 2010 |
Pursuant to the requirements of the Securities Exchange Act of 1934 and the Investment Company Act of 1940, this report has been signed below by the following persons on behalf of the registrant and in the capacities and on the dates indicated.
| | |
| By: | | /s/ Ronald Baron |
| | Ronald Baron |
| | Chief Executive Officer |
|
| Date: February 26, 2010 |
| |
| By: | | /s/ Peggy Wong |
| | Peggy Wong |
| | Treasurer and Chief Financial Officer |
|
| Date: February 26, 2010 |