| OMB APPROVAL |
| OMB Number: 3235-0570 |
| Expires: January 31, 2014 |
Estimated average burden
Hours per response 20.6 |
UNITED STATES
SECURITIES AND EXCHANGE COMMISSION
Washington, DC 20549
FORM N-CSR
CERTIFIED SHAREHOLDER REPORT OF REGISTERED
MANAGEMENT INVESTMENT COMPANIES
Investment Company Act file number: 811-21296
BARON SELECT FUNDS
(Exact Name of Registrant as Specified in Charter)
767 Fifth Avenue, 49th Floor
New York, NY 10153
(Address of Principal Executive Offices) (Zip Code)
Patrick M. Patalino, General Counsel
c/o Baron Select Funds
767 Fifth Avenue, 49th Floor
New York, NY 10153
(Name and Address of Agent for Service)
(Registrant’s Telephone Number, including Area Code): 212-583-2000
Date of fiscal year end: December 31
Date of reporting period: December 31, 2011
Form N-CSR is to be used by management investment companies to file reports with the Commission not later than 10 days after the transmission to stockholders of any report that is required to be transmitted to stockholders under Rule 30e-1 under the Investment Company Act of 1940 (17CRF 270.30e-1). The Commission may use the information provided on Form N-CSR in its regulatory, disclosure review, inspection, and policymaking roles.
A registrant is required to disclose the information specified by Form N-CSR, and the Commission will make this information public. A registrant is not required to respond to the collection of information contained in Form N-CSR unless the Form displays a currently valid Office of Management and Budget (“OMB”) control number. Please direct comments concerning the accuracy of the information collection burden estimate and suggestions for reducing the burden to Secretary, Securities and Exchange Commission, 450 5th Street, NW, Washington, D.C. 20549-0609. The OMB has reviewed this collection of information under the clearance requirements of 44 U.S.C. Section 3507.
Persons who are to respond to the collection of information contained in this form are not required to respond unless the form displays a currently valid OMB control number.
SEC 2569 (5-07)
| | | | | |
| | | | | |
| | Baron Partners Fund | | | Baron Funds® |
| | Baron Focused Growth Fund | | |
| | Baron International Growth Fund | | |
| | Baron Real Estate Fund | | |
| | Baron Emerging Markets Fund | | |
| | | | |
| | | | | |
| | | | | |
| | December 31, 2011 | | | Annual Financial Report |
| | | | | |
| | | | | |
DEAR BARON SELECT FUNDS SHAREHOLDER: In this report you will find audited financial statements for Baron Partners Fund, Baron Focused Growth Fund, Baron International Growth Fund, Baron Real Estate Fund and Baron Emerging Markets Fund (the “Funds”) for the fiscal year ended December 31, 2011. The U.S. Securities and Exchange Commission (the “SEC”) requires mutual funds to furnish these statements semi-annually to their shareholders. We hope you find these statements informative and useful. We thank you for choosing to join us as fellow shareholders in Baron Funds. We will continue to work hard to justify your confidence. Sincerely, |
 | |  | |  |
| | | | | |
| Ronald Baron | | Linda S. Martinson | | Peggy Wong |
| Chief Executive Officer and | | Chairman, President and | | Treasurer and |
| Chief Investment Officer | | Chief Operating Officer | | Chief Financial Officer |
| February 24, 2012 | | February 24, 2012 | | February 24, 2012 |
| | | | | | |
This Annual Financial Report is for the Baron Select Funds which currently has six series: Baron Partners Fund, Baron Focused Growth Fund, Baron International Growth Fund, Baron Real Estate Fund, Baron Emerging Markets Fund and Baron Energy and Resources Fund. Baron Energy and Resources Fund commenced investment operations on January 3, 2012 and, therefore, is not included in this report. If you are interested in Baron Investment Funds Trust, which contains the Baron Asset Fund, Baron Growth Fund, Baron Small Cap Fund, Baron Opportunity Fund and Baron Fifth Avenue Growth Fund series, please visit the Funds’ website at www.BaronFunds.com or contact us at 1-800-99BARON. A description of the Funds’ proxy voting policies and procedures is available without charge on the Funds’ website at www.BaronFunds.com, or by calling 1-800-99BARON and on the SEC’s website at www.sec.gov. The Funds’ most current proxy voting record, Form N-PX, is also available on the Funds’ website and on the SEC’s website. The Funds file their complete schedules of portfolio holdings with the SEC for the first and third quarters of each fiscal year on Form N-Q. The Funds’ Forms N-Q are available on the SEC’s website at www.sec.gov. The Funds’ Forms N-Q may also be reviewed and copied at the SEC’s Public Reference Room in Washington, DC; information on the operation of the SEC’s Public Reference Room may be obtained by calling 1-202-551-8090. A copy of the Funds’ Forms N-Q may also be obtained upon request by contacting Baron Funds at 1-800-99BARON. Schedules of portfolio holdings current to the most recent quarter are also available on the Funds’ website. Some of the comments are based on current management expectations and are considered “forward-looking statements.” Actual future results, however, may prove to be different from our expectations. You can identify forward-looking statements by words such as “estimate,” “may,” “expect,” “should,” “could,” “believe,” “plan” and other similar terms. We cannot promise future returns and our opinions are a reflection of our best judgment at the time this report is compiled. The views expressed in this report reflect those of BAMCO, Inc. (“BAMCO” or the “Adviser”) only through the end of the period stated in this report. The views are not intended as recommendations or investment advice to any person reading this report and are subject to change at any time without notice based on market and other conditions. |
Past performance is no guarantee of future results. The investment return and principal value of an investment will fluctuate; an investor’s shares, when redeemed, may be worth more or less than their original cost. For more complete information about Baron Funds, including charges and expenses, call or write for a prospectus. Read it carefully before you invest or send money. This report is not authorized for use as an offer of sale or a solicitation of an offer to buy shares of Baron Funds, unless accompanied or preceded by the Funds’ current prospectus. | |  |
Baron Partners Fund (Unaudited) | | December 31, 2011 |
| |
| |
COMPARISON OF THE CHANGE IN VALUE OF $10,000 INVESTMENT IN BARON PARTNERS FUND (RETAIL SHARES)†
IN RELATION TO THE RUSSELL MIDCAP GROWTH INDEX AND THE S&P 500 INDEX |
| | | | | | | | | | | | | | | | | | |
 |
| |
| AVERAGE ANNUAL TOTAL RETURNS FOR THE PERIODS ENDED DECEMBER 31, 2011 |
| | | | | | | | | | | | | | | | | Since |
| | | | | | | | | | | | | | | | | Inception |
| | | | | One | | Three | | Five | | Ten | | (January 31, |
| | | | | Year | | Years | | Years | | Years | | 1992) |
| Baron Partners Fund — Retail Shares1, 2, 3 | | | –5.74 | % | | 16.70 | % | | –1.15 | % | | 7.52 | % | | 11.70 | % |
| Baron Partners Fund — Institutional Shares1, 2, 3, 4 | | | –5.52 | % | | 16.96 | % | | –1.02 | % | | 7.59 | % | | 11.74 | % |
| Russell Midcap Growth Index1 | | | –1.65 | % | | 22.06 | % | | 2.44 | % | | 5.29 | % | | 8.14 | % |
| S&P 500 Index1 | | | 2.11 | % | | 14.11 | % | | –0.25 | % | | 2.92 | % | | 7.95 | % |
| |
| |
| |
| |
| |
| |
| |
| |
| |
| |
|
| † | If the Fund’s historical performance was impacted by gains from IPOs and/or secondary offerings, there is no guarantee that these results can be repeated or that the Fund’s level of participation in IPOs and secondary offerings will be the same in the future. |
| |
| 1 | The Russell Midcap Growth Index and S&P 500 Index are unmanaged. The Russell Midcap Growth Index measures the performance of medium-sized companies classified as growth. The S&P 500 Index measures the performance of larger-cap equities in the stock market in general. The indexes and the Baron Partners Fund are with dividends, which positively impact the performance results. |
| |
| 2 | Reflects the actual fees and expenses that were charged when the Fund was a partnership. The predecessor partnership charged a 20% performance fee after reaching a certain performance benchmark. If the annual returns for the Fund did not reflect the performance fee for the years it was a partnership, the returns would be higher. The Fund’s shareholders will not be charged a performance fee. The predecessor partnership’s performance is only for the periods before the Fund’s registration statement was effective, which was April 30, 2003. During those periods, the predecessor partnership was not registered under the Investment Company Act of 1940 and was not subject to its requirements or the requirements of the Internal Revenue Code relating to registered investment companies, which, if it were, might have adversely affected its performance. |
| |
| 3 | Past performance is not predictive of future performance. The performance data does not reflect the deduction of taxes that a shareholder would pay on Fund distributions or redemption of Fund shares. The Fund’s transfer agency expenses may be reduced by expense offsets from an unaffiliated transfer agent, without which performance would have been lower. |
| |
| 4 | Performance for the Institutional Shares prior to May 29, 2009 is based on the performance of the Retail Shares, which have a distribution fee. The Institutional Shares do not have a distribution fee. If the annual returns prior to May 29, 2009 did not reflect this fee, the returns would be higher. |
2
| |
| December 31, 2011 (Unaudited) | Baron Partners Fund |
| TOP TEN HOLDINGS AS OF DECEMBER 31, 2011 |
| | | Percent of Total | |
| | | Investments | |
| Fastenal Co. | | 9.8% | |
| |
| ITC Holdings Corp. | | 8.6% | |
| |
| Arch Capital Group Ltd. | | 8.4% | |
| |
| FactSet Research Systems, Inc. | | 7.9% | |
| |
| Hyatt Hotels Corp. | | 7.2% | |
| |
| Dick’s Sporting Goods, Inc. | | 6.7% | |
| |
| Verisk Analytics, Inc. | | 5.6% | |
| |
| MSCI, Inc. | | 4.6% | |
| |
| C. H. Robinson Worldwide, Inc. | | 4.2% | |
| |
| The Charles Schwab Corp. | | 3.8% | |
| | | 66.8% | |
| |
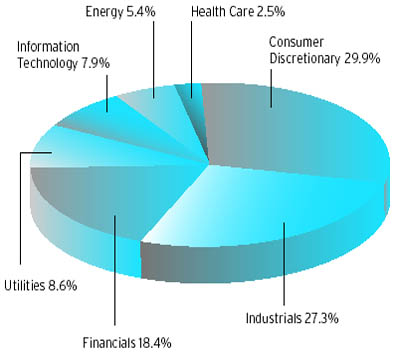
SECTOR BREAKDOWN AS OF DECEMBER 31, 2011†
(as a percentage of total investments) |
| |
 |
| |
| MANAGEMENT’S DISCUSSION OF FUND PERFORMANCE |
| |
For the year ended December 31, 2011, Baron Partners Fund‡ declined 5.74%, while the Russell Midcap Growth Index was down 1.65%.
For the 10 years ended December 31, 2011, the Fund gained an annualized 7.52% versus an annualized 5.29% for the Russell Midcap Growth Index. Since its inception on January 31, 1992, the Fund also has outperformed, gaining an annualized 11.70%.* This compares to 8.14% for the Russell Midcap Growth Index. |
| Baron Partners Fund uses value purchase disciplines to invest in all-cap companies that the Adviser believes have significant long-term growth opportunities. We believe that our independent research will identify investment opportunities that are attractively priced relative to their future prospects. However, Baron Partners Fund is non-diversified and may use leverage, which is a riskier investment strategy. |
| |
| The U.S. stock markets ended 2011 at almost the point at which they began. The year started out on a promising note with markets climbing steadily through the first three months of the year, before retreating in mid-June. Stock prices then rebounded at mid-year, corrected once again in the third quarter and then advanced in the fourth quarter, benefiting from generally positive economic data and strong reported business results. We believe the primary reason for the rebound was that a number of economic indicators provided reassurance that a recession was not imminent, as had been feared in the fall. The markets, however, remain dominated by macro concerns. Daily headlines concerning developments in Europe have led to continued volatility. |
| |
| We think the companies we own have mostly solid balance sheets, and are equipped with ample capital to fund growth opportunities, make acquisitions, or return capital to shareholders. And though there is momentum at present, we think we are in for a period of modest economic growth. Even in this environment, we believe the businesses in which we have invested can grow earnings and accrete value. We also believe that current stock market valuations are compelling. U.S. interest rates remain near historically low levels, and the fixed income markets offer limited inflation-adjusted returns. |
| |
| Fastenal Co. was the strongest contributor to Fund performance during the year. The leading industrial-supplies distributor advanced 48.5% to an all-time high as demand from manufacturing and commercial construction clients improved. Sales across the company’s 2,500 branches strengthened as the year progressed. This broad-based strength is indicative of a growing rebound in factory production, new initiatives such as automated vending taking hold, and market-share gains out of the 2008-2009 downturn. Fastenal’s customers increasingly are relying on the company to save costs, cut working capital and improve productivity. Fastenal is converting this renewed demand into faster profit growth. |
| |
| Online broker The Charles Schwab Corp. fell 33.1% in 2011 and was the leading detractor from Fund performance. While the core day-to-day business at Schwab remains intact, the stock declined as interest rates remained low with the outlook for reduced net interest income and associated fee waivers continuing through at least 2012. We continue to like the long-term prospects for Schwab because of its best-in-class online platform and brand, which, we believe, should enable Schwab to continue gathering assets as the economy improves. |
| |
| In 2012, we expect the Fund to continue to invest in securities of businesses that, in our opinion, have favorable price-to-value characteristics based on our assessment of their prospects for future growth and profitability. |
| |
|
| † | | Industry sector levels are provided from the Global Industry Classification Standard (“GICS”), developed and exclusively owned by MSCI, Inc. and Standard & Poor’s Financial Services LLC, unless otherwise stated that they have been reclassified or classified by the Adviser. All GICS data is provided “as is” with no warranties. |
| |
| ‡ | | Performance information reflects results of the Retail Shares. |
| |
| * | | Please see Footnote 2 on page 2. |
3
Baron Focused Growth Fund (Unaudited) | | December 31, 2011 |
| |
| |
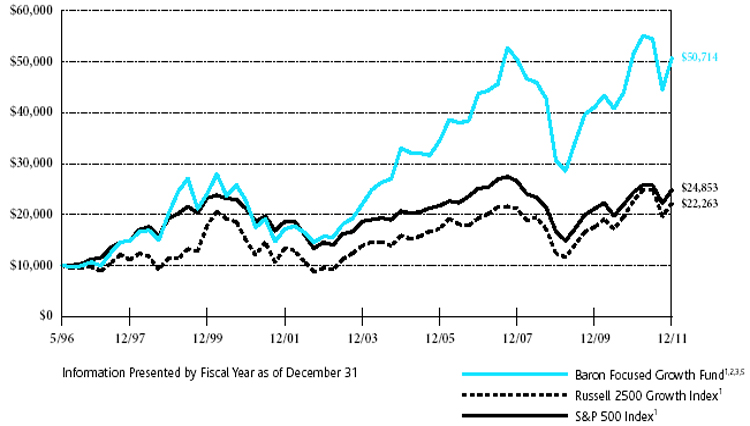
COMPARISON OF THE CHANGE IN VALUE OF $10,000 INVESTMENT IN BARON FOCUSED GROWTH FUND (RETAIL SHARES)†
IN RELATION TO THE RUSSELL 2500 GROWTH INDEX AND THE S&P 500 INDEX |
| | | | | | | | | | | | | | | | | | |
 |
| |
| AVERAGE ANNUAL TOTAL RETURNS FOR THE PERIODS ENDED DECEMBER 31, 2011 |
| | | | | | | | | | | | | | | | | Since |
| | | | | | | | | | | | | | | | | Inception |
| | | | | One | | Three | | Five | | Ten | | (May 31, |
| | | | | Year | | Years | | Years | | Years | | 1996) |
| Baron Focused Growth Fund — Retail Shares1, 2, 3, 5 | | | –1.42 | % | | 18.18 | % | | 3.00 | % | | 11.44 | % | | 10.98 | % |
| Baron Focused Growth Fund — Institutional Shares1, 2, 3, 4, 5 | | | –1.11 | % | | 18.42 | % | | 3.13 | % | | 11.51 | % | | 11.02 | % |
| Russell 2500 Growth Index1 | | | –1.57 | % | | 21.57 | % | | 2.89 | % | | 5.23 | % | | 5.27 | % |
| S&P 500 Index1 | | | 2.11 | % | | 14.11 | % | | –0.25 | % | | 2.92 | % | | 6.02 | % |
| |
| |
| |
| |
| |
| |
| |
| |
| |
| |
|
| † | If the Fund’s historical performance was impacted by gains from IPOs and/or secondary offerings, there is no guarantee that these results can be repeated or that the Fund’s level of participation in IPOs and secondary offerings will be the same in the future. |
| |
| 1 | The Russell 2500 Growth Index and S&P 500 Index are unmanaged. The Russell 2500 Growth Index measures the performance of small to medium-sized companies that are classified as growth. The S&P 500 Index measures the performance of larger cap equities in the stock market in general. The indexes and Baron Focused Growth Fund are with dividends, which positively impact the performance results. |
| | |
| 2 | Reflects the actual fees and expenses that were charged when the Fund was a partnership. Prior to 2003, the predecessor partnership charged a 15% performance fee after reaching a certain performance benchmark. If the annual returns for the Fund did not reflect the performance fee for the years it was a partnership, the returns would be higher. The Fund’s shareholders will not be charged a performance fee. The predecessor partnership’s performance is only for the periods before the Fund’s registration statement was effective, which was June 30, 2008. During those periods, the predecessor partnership was not registered under the Investment Company Act of 1940 and was not subject to its requirements or the requirements of the Internal Revenue Code relating to registered investment companies, which, if it were, might have adversely affected its performance. |
| | |
| 3 | Past performance is not predictive of future performance. The performance data does not reflect the deduction of taxes that a shareholder would pay on Fund distributions or redemption of Fund shares. The Adviser has reimbursed certain Fund expenses and the Fund’s transfer agency expenses may be reduced by expense offsets from an unaffiliated transfer agent, without which performance would have been lower. |
| | |
| 4 | Performance for the Institutional Shares prior to May 29, 2009 is based on the performance of the Retail Shares, which have a distribution fee. The Institutional Shares do not have a distribution fee. If the annual returns prior to May 29, 2009 did not reflect this fee, the returns would be higher. |
| | |
| 5 | Prior to January 1, 2011, the Fund had a distribution policy which required the Fund to pay a minimum annual distribution of 4% of the Fund’s net assets per share measured as of December 31 of the preceding year. |
4
| |
| December 31, 2011 (Unaudited) | Baron Focused Growth Fund |
| |
| TOP TEN HOLDINGS AS OF DECEMBER 31, 2011 |
| | | Percent of | |
| | | Net Assets | |
| Hyatt Hotels Corp. | | 6.6 | % | |
| |
| Genesee & Wyoming, Inc. | | 5.9 | % | |
| |
| Verisk Analytics, Inc. | | 5.6 | % | |
| |
| Airgas, Inc. | | 5.1 | % | |
| |
| Fastenal Co. | | 4.7 | % | |
| |
| Choice Hotels International, Inc. | | 4.6 | % | |
| |
| MSCI, Inc. | | 4.3 | % | |
| |
| Arch Capital Group Ltd. | | 4.1 | % | |
| |
| Dick’s Sporting Goods, Inc. | | 4.0 | % | |
| |
| AMERIGROUP Corp. | | 3.9 | % | |
| | | 48.8 | % | |
| | | | | |
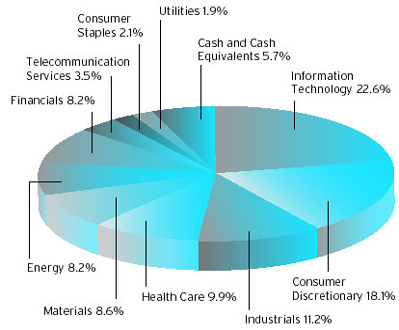
SECTOR BREAKDOWN AS OF DECEMBER 31, 2011†
(as a percentage of net assets) |
| |
 |
| |
| |
| MANAGEMENT’S DISCUSSION OF FUND PERFORMANCE |
| |
For the year ended December 31, 2011, Baron Focused Growth Fund‡ declined 1.42%, compared to a 1.57% loss for the Russell 2500 Growth Index. |
| |
| For the 10 years ended December 31, 2011, the Fund gained an annualized 11.44% versus an annualized 5.23% for the Russell 2500 Growth Index. Since its inception on May 31, 1996 to December 31, 2011, the Fund has outperformed its benchmark, gaining an annualized 10.98%* compared to an annualized 5.27% for the Russell 2500 Growth Index. |
| |
| Baron Focused Growth Fund invests in a focused portfolio of companies that we believe are well capitalized with exceptional |
| |
| |
| | management, significant growth potential, and sustainable barriers to competition. We believe that our independent research will identify investment opportunities that are attractively priced relative to their future prospects. Baron Focused Growth Fund is non-diversified which is a riskier investment strategy. |
| | |
| | The U.S. stock markets ended 2011 at almost the point at which they began. The year started out on a promising note with markets climbing steadily through the first three months of the year, before retreating in mid-June. Stock prices then rebounded at mid-year, corrected once again in the third quarter and then advanced in the fourth quarter, benefiting from generally positive economic data and strong reported business results. We believe the primary reason for the rebound was that a number of economic indicators provided reassurance that a recession was not imminent, as had been feared in the fall. The markets, however, remain dominated by macro concerns. Daily headlines concerning developments in Europe have led to continued volatility. |
| | |
| | We think the companies we own mostly have solid balance sheets, and are equipped with ample capital to fund growth opportunities, make acquisitions, or return capital to shareholders. And though there is momentum at present, we think we are in for a period of modest economic growth. Even in this environment, we believe the businesses in which we have invested can grow earnings and accrete value. We also believe that current stock market valuations are compelling. U.S. interest rates remain near historically low levels, and the fixed income markets offer limited inflation-adjusted returns. |
| | |
| | Fastenal Co. made the most significant contribution to Fund performance during the year. The leading industrial-supplies distributor advanced 48.5% to an all-time high as demand from manufacturing and commercial construction clients improved. Sales across the company’s 2,500 branches strengthened as the year progressed. This broad-based strength is indicative of a growing rebound in factory production, new initiatives such as automated vending taking hold, and market-share gains out of the 2008-2009 downturn. Fastenal’s customers increasingly are relying on the company to save costs, cut working capital and improve productivity. Fastenal is converting this renewed demand into faster profit growth. |
| | |
| | Anhanguera Educational Participações SA was the leading detractor from Fund performance as its shares declined 45% for the period held in 2011. As the leading private, post-secondary education company in Brazil, we thought that Anhanguera would be the main beneficiary of Brazil’s need for skilled workers and an emerging middle class seeking private post-secondary degrees to gain credentials. This year, our investment thesis was overshadowed by multiple headwinds including postponement of government civil service exams that adversely affected enrollment and margin dilution from the largest merger and acquisition in its history. The Fund exited this position in the fourth quarter. |
| | |
| | This non-diversified Fund utilizes value purchase disciplines when investing in small and mid-sized growth companies that we believe have significant long-term growth opportunities. We believe that our independent research will identify investment opportunities that are attractively priced relative to their future prospects. |
| | |
| | In 2012, we expect the Fund to continue to establish positions in small-and mid-sized businesses that, in our opinion, have favorable price-to-value characteristics based on our assessment of prospects for future growth and profitability. |
| | |
|
| † | | Industry sector levels are provided from the Global Industry Classification Standard (“GICS”), developed and exclusively owned by MSCI, Inc. and Standard & Poor’s Financial Services LLC, unless otherwise stated that they have been reclassified or classified by the Adviser. All GICS data is provided “as is” with no warranties. |
| |
| ‡ | | Performance information reflects results of the Retail Shares. |
| |
| * | | Please see Footnote 2 on page 4. |
5
| |
| Baron International Growth Fund (Unaudited) | December 31, 2011 |
| |
| |
| |
| COMPARISON OF THE CHANGE IN VALUE OF $10,000 INVESTMENT IN BARON INTERNATIONAL GROWTH FUND (RETAIL SHARES)† |
| IN RELATION TO THE MSCI AC WORLD EX USA IMI GROWTH INDEX NET AND |
| THE MSCI AC WORLD EX USA INDEX NET |
| |
 |
| | | | | | | |
| AVERAGE ANNUAL TOTAL RETURNS FOR THE PERIODS ENDED DECEMBER 31, 2011 |
| | | | | | Three Years |
| | | | | | and Since |
| | | | | | Inception |
| | | One | | (December 31, |
| | | Year | | 2008) |
| Baron International Growth Fund — Retail Shares1, 2 | | –16.35 | % | | 14.56 | % |
| Baron International Growth Fund — Institutional Shares1, 2, 3 | | –16.13 | % | | 14.81 | % |
| MSCI AC World ex USA IMI Growth Index Net1 | | –14.66 | % | | 11.70 | % |
| MSCI AC World ex USA Index Net1 | | –13.71 | % | | 10.70 | % |
|
| † | | If the Fund’s historical performance was impacted by gains from IPOs and/or secondary offerings, there is no guarantee that these results can be repeated or that the Fund’s level of participation in IPOs and secondary offerings will be the same in the future. |
| | | |
| 1 | | The MSCI AC World ex USA indexes are an unmanaged, free float-adjusted market capitalization weighted indexes. The MSCI AC World ex USA IMI Growth Index Net measures the equity market performance of large-, mid- and small-cap growth securities across developed and emerging markets, excluding the United States. The MSCI AC World ex USA Index Net measures the equity market performance of large and mid-cap securities across developed and emerging markets, excluding the United States. The indexes and Baron International Growth Fund include reinvestment of dividends, net of foreign withholding taxes, which positively impact the performance results. |
| | | |
| 2 | | Past performance is not predictive of future performance. The performance data does not reflect the deduction of taxes that a shareholder would pay on Fund distributions or redemption of Fund shares. The Adviser has reimbursed certain Fund expenses and the Fund’s transfer agency expenses may be reduced by expense offsets from an unaffiliated transfer agent, without which performance would have been lower. |
| | | |
| 3 | | Performance for the Institutional Shares prior to May 29, 2009 is based on the performance of the Retail Shares, which have a distribution fee. The Institutional Shares do not have a distribution fee. If the annual returns prior to May 29, 2009 did not reflect this fee, the returns would be higher. |
6
| |
| December 31, 2011 (Unaudited) | Baron International Growth Fund |
| |
| TOP TEN HOLDINGS AS OF DECEMBER 31, 2011 |
| | | Percent of |
| | | Net Assets |
| Eurofins Scientific SE | | 3.1 | % |
| |
| bwin. party digital entertainment plc | | 3.0 | % |
| |
| Bridgestone Corp. | | 2.7 | % |
| |
| Julius Baer Group Ltd. | | 2.6 | % |
| |
| Symrise AG | | 2.5 | % |
| |
| Experian plc | | 2.4 | % |
| |
| Opera Software ASA | | 2.3 | % |
| |
| FANUC Corp. | | 2.3 | % |
| |
| Compagnie Financiére Richemont SA | | 2.2 | % |
| |
| Kirkland Lake Gold, Inc. | | 2.2 | % |
| | | 25.3 | % |
| | | | |
SECTOR BREAKDOWN AS OF DECEMBER 31, 2011†
(as a percentage of net assets) |
| |
 |
| |
| |
| MANAGEMENT’S DISCUSSION OF FUND PERFORMANCE |
| |
Baron International Growth Fund‡ lost 16.35% for the year ended December 31, 2011, underperforming both of its comparative indexes. The MSCI AC World ex USA IMI Growth Index Net lost 14.66% while the MSCI AC World ex USA Index Net declined 13.71%. |
| |
| Baron International Growth Fund is a diversified fund that invests for the long term primarily in securities of non-U.S. growth companies. The Fund expects to diversify among several developed countries and developing countries throughout the world, although the Fund’s total exposure to developing countries will not exceed 30%. The Fund may purchase securities of companies of any size, but expects to focus on small- and mid-sized growth companies with market capitalizations of $10 billion or less at the time of purchase. We believe that our |
| | independent research will identify investment opportunities that are attractively priced relative to their future prospects. |
| | |
| | From the start, international markets in 2011 were buffeted by unexpected events. In the first quarter, a wave of public demonstrations, riots, and revolutions calling for greater democracy in several Middle East and North African nations began, sending oil prices higher. Then, the tragic earthquake, tsunami, and resulting nuclear incident in Japan presented additional uncertainty to financial markets. In the second quarter, energy stocks corrected sharply, European credit woes emerged and fears grew that the economy would slip into a double-dip recession. As the year progressed, China implemented tight fiscal controls to restrain inflation while Europe’s credit woes worsened. In December, European authorities unveiled a compromise plan to alleviate the sovereign debt and bank funding crisis. While we applaud the progress, we think the plan falls short of the “fiscal union” that would mark a definitive turning point. |
| | |
| | In 2011, a number of factors hurt performance. Emerging market stocks and currencies underperformed developed markets. Larger companies outperformed medium and smaller businesses. We have a bias towards small/mid cap investments. Notwithstanding the effect of these trends, several stocks from both the developed and emerging markets related to the core theme of owning companies that will benefit from growing domestic consumer spending and rising per capita income in the developing world outperformed. Our modest exposure to cyclical and commodity businesses, and no exposure to European banks since the inception of the portfolio, also helped performance. |
| | |
| | Beginning in the second half of 2011, we took advantage of market declines to establish or add to existing positions that we believe offer compelling appreciation potential. In particular, we continue to look for stocks from both developed and emerging markets related to the core theme of owning companies that will benefit from growing domestic consumer spending and rising per capita income in the developing world. |
| | |
| | The leading contributor to Fund performance for the year ended December 31, 2011 was Lundin Petroleum AB, an independent oil & gas company with operations primarily in the Norwegian sector of the North Sea and Asia. Late in the third quarter the company and its partners announced two significant oil discoveries on adjacent blocks in the Norwegian sector of the North Sea that significantly exceeded analyst expectations. The company revised upwards the estimated potential recovery of these fields, adding to Lundin’s performance for the year. The discoveries reaffirmed the technical capabilities of Lundin as an explorer and resulted in a significant increase in the company’s book value. |
| | |
| | NII Holdings, Inc. was the largest detractor from Fund performance during the year, as a confluence of concerns outweighed what has generally been solid operating performance in local currency terms. The key concerns are the rollout of 3G services across the company’s markets, how the company will finance this buildout, the competitive landscape in 3G, and how the company can grow until the 3G transition is complete. The company successfully acquired spectrum inexpensively, and appears to be building out its networks in Mexico and Brazil. Assuming 3G delivers the accelerating trends expected, we believe both growth and multiple expansion will drive share price appreciation.
We expect to continue making investments in non-U.S. companies that we believe have superior long-term growth prospects. We believe that there are exciting business prospects that are driven by the increasing demand for consumer goods and services in developing countries, which we think create growth opportunities for both local businesses in those countries and for companies in developed countries that can help satisfy that demand. |
|
| † | | Industry sector levels are provided from the Global Industry Classification Standard (“GICS”), developed and exclusively owned by MSCI, Inc. and Standard & Poor’s Financial Services LLC, unless otherwise stated that they have been reclassified or classified by the Adviser. All GICS data is provided “as is” with no warranties. |
| | | |
| ‡ | | Performance information reflects results of the Retail Shares. |
7
Baron Real Estate Fund (Unaudited) | | December 31, 2011 |
| |
| |
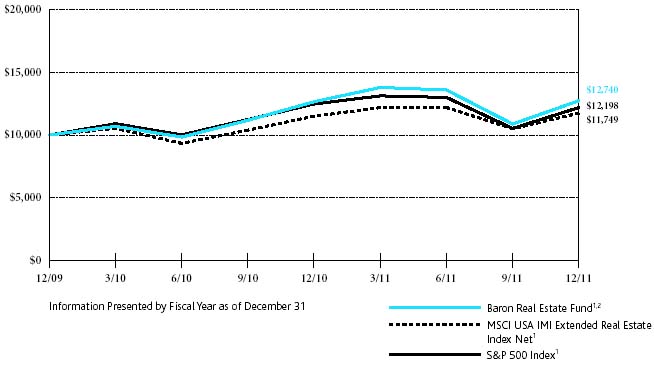
COMPARISON OF THE CHANGE IN VALUE OF $10,000 INVESTMENT IN BARON REAL ESTATE FUND (RETAIL SHARES)†
IN RELATION TO THE MSCI USA IMI EXTENDED REAL ESTATE INDEX NET AND THE S&P 500 INDEX |
| | | | | | | | | | | | | | | |
 |
| |
| AVERAGE ANNUAL TOTAL RETURNS FOR THE PERIODS ENDED DECEMBER 31, 2011 |
| | | | | | | | | | | | | | Since |
| | | | | | | | | | | | | | Inception |
| | | | | One | | | | | | (December 31, |
| | | | | Year | | | | | | 2009) |
| Baron Real Estate Fund — Retail Shares1, 2 | | | 0.63 | % | | | | | | | | 12.87 | % |
| Baron Real Estate Fund — Institutional Shares1, 2 | | | 0.80 | % | | | | | | | | 13.10 | % |
| MSCI USA IMI Extended Real Estate Index Net1 | | | –2.26 | % | | | | | | | | 10.45 | % |
| S&P 500 Index1 | | | 2.11 | % | | | | | | | | 8.39 | % |
| | | | | | | | | | | | | | | |
| |
| |
| |
| |
| |
| |
| |
| |
| |
| |
| |
| |
| |
| |
| |
| |
| |
| |
|
| † | If the Fund’s historical performance was impacted by gains from IPOs and/or secondary offerings, there is no guarantee that these results can be repeated or that the Fund’s level of participation in IPOs and secondary offerings will be the same in the future. |
| | | | | | | | | | | | | | | |
| 1 | The MSCI USA IMI Extended Real Estate Index Net is a custom index calculated by MSCI for, and as requested by, BAMCO, Inc. The index includes real estate and real estate-related GICS classification securities. MSCI makes no express or implied warranties or representation and shall have no liability whatsoever with respect to any MSCI data contained herein. The MSCI data may not be further redistributed or used as a basis for other indexes or any securities or financial products. This report is not approved, reviewed or produced by MSCI. The S&P 500 Index measures the performance of larger cap U.S. equities in the stock market in general. The indexes and the Fund are with dividends, which positively impact the performance results. |
| | | | | | | | | | | | | | | |
| 2 | Past performance is not predictive of future performance. The performance data does not reflect the deduction of taxes that a shareholder would pay on Fund distributions or redemption of Fund shares. The Adviser has reimbursed certain Fund expenses and the Fund’s transfer agency expenses may be reduced by expense offsets from an unaffiliated transfer agent without which performance would have been lower. |
8
December 31, 2011 (Unaudited) | Baron Real Estate Fund |
| TOP TEN HOLDINGS AS OF DECEMBER 31, 2011 |
| | | Percent of | |
| | | Net Assets | |
| Wyndham Worldwide Corp. | | 5.9% | |
| |
| Equinix, Inc. | | 5.1% | |
| |
| Capital Senior Living Corp. | | 4.9% | |
| |
| American Tower Corp. | | 3.5% | |
| |
| Golar LNG Partners L.P. | | 3.4% | |
| |
| Brookdale Senior Living, Inc. | | 3.1% | |
| |
| Hyatt Hotels Corp. | | 3.0% | |
| |
| Starwood Hotels & Resorts Worldwide, Inc. | | 2.9% | |
| |
| LaSalle Hotel Properties | | 2.9% | |
| |
| Brookfield Infrastructure Partners L.P. | | 2.8% | |
| | | 37.5% | |
| |
SECTOR BREAKDOWN AS OF DECEMBER 31, 2011†
(as a percentage of net assets) |
| |
 |
| |
| MANAGEMENT’S DISCUSSION OF FUND PERFORMANCE |
| |
Baron Real Estate Fund‡ gained 0.63% for the year ended December 31, 2011, outperforming its comparative index, the MSCI USA IMI Extended Real Estate Index Net, which lost 2.26%.
Since its inception on December 31, 2009, Baron Real Estate Fund outperformed, gaining an annualized 12.87% compared to its benchmark, the MSCI USA IMI Extended Real Estate Index Net which gained an annualized 10.45%.
Baron Real Estate Fund invests primarily in securities of real estate and real estate-related companies of all sizes. The Fund seeks to |
| invest in well managed companies that we believe have significant long-term growth opportunities. Unlike many other real estate funds that invest primarily in real estate investment trusts (REITs), the Fund expands its investment universe to include a more comprehensive group of real estate and real estate-related companies. These include home builders, hotels, manufacturers of building supplies and products, retailers with significant real estate holdings, real estate service companies, real estate operating companies, and infrastructure-related companies. Baron Real Estate Fund is non-diversified, which is a riskier investment strategy. |
| |
| Baron Real Estate Fund performed well in the first quarter of 2011, with senior-housing stocks generating strong returns. In the second quarter, REITs were among the few segments that continued to do well, even as soft home prices, higher gas prices, insufficient job creation and soaring U.S. Government debt took their toll on the economy generally. In the third quarter, concern that the economic recovery was stalling, the downgrading of the country’s credit rating and the European debt crisis all had a negative impact on the real estate market. Weaker performance in the most economically sensitive real estate-related areas, such as senior housing; hotels, resorts and cruise lines; real estate services; and building products, negatively affected the portfolio. Despite an uncertain macro backdrop packed with structural issues in the U.S. and Europe, the stock market rebounded in the fourth quarter. The U.S. stock market benefited from generally positive economic data and strong reported business performance. We remain positive about the outlook for many real estate categories. Several tailwinds – including low interest rates, a backdrop of low new supply, improving credit availability, generally strong balance sheets, earnings growth, and attractive valuations – should, in our view, benefit real estate-related stocks. |
| |
| The largest contributor to Fund performance during 2011 was Zillow, Inc., the leading online real estate website for U.S. consumers. The company’s shares gained after going public in the third quarter. Zillow represents an opportunity to invest in the transition of the U.S. real estate industry to the online environment. Zillow has an extremely knowledgeable and respected management team, board, and founders. The company’s goal is to consolidate its leadership position in the online sector. We believe the company will benefit from expansion into related markets that include mortgages, rentals, and product offerings for brokers. |
| |
| Molycorp, Inc., owner of the largest rare earth deposit outside of China, was the leading detractor from Fund performance during the year. As rare earth prices fell from summer highs, so did the company’s stock. We have exited our position in Molycorp. |
| |
| Baron Real Estate Fund invests in securities that we believe have favorable price-to-value characteristics, are well managed, have significant long-term growth prospects, have significant barriers to competition and are attractively priced relative to our assessment of the businesses’ long-term growth prospects, future cash flows and asset values. |
| |
| In 2012, we expect to continue to establish positions in “best-inclass” real estate companies that we believe have talented management, are well positioned against competitors and are attractively priced. |
| |
|
| † | | Industry sector levels are provided from the Global Industry Classification Standard (“GICS”), developed and exclusively owned by MSCI, Inc. and Standard & Poor’s Financial Services LLC, unless otherwise stated that they have been reclassified or classified by the Adviser. All GICS data is provided “as is” with no warranties. |
| |
| ‡ | | Performance information reflects results of the Retail Shares. |
9
Baron Emerging Markets Fund (Unaudited) | |
December 31, 2011 |
| |
| |
COMPARISON OF THE CHANGE IN VALUE OF $10,000 INVESTMENT IN BARON EMERGING MARKETS FUND (RETAIL SHARES)†
IN RELATION TO THE MSCI EM (EMERGING MARKETS) IMI GROWTH INDEX NET AND THE MSCI EM (EMERGING MARKETS)
IMI INDEX NET |
| | | | | | | | | | | | | | | |
 |
| |
| AVERAGE ANNUAL TOTAL RETURNS FOR THE PERIODS ENDED DECEMBER 31, 2011 |
| | | | | | | | | | | | | | One Year |
| | | | | | | | | | | | | | and Since |
| | | | | | | | | | | | | | Inception |
| | | | | | | | | | | (December 31, |
| | | | | | | | | | | 2010) |
| Baron Emerging Markets Fund — Retail Shares1, 2 | | | | | | | | | | | | –17.20 | % |
| Baron Emerging Markets Fund — Institutional Shares1, 2 | | | | | | | | | | | | –17.00 | % |
| MSCI EM (Emerging Markets) IMI Growth Index Net1 | | | | | | | | | | | | –20.04 | % |
| MSCI EM (Emerging Markets) IMI Index Net1 | | | | | | | | | | | | –19.49 | % |
| | | | | | | | | | | | | | | |
| |
| |
| |
| |
| |
| |
| |
| |
| |
| |
| |
| |
| |
| |
| |
| |
| |
| |
|
| † | If the Fund’s historical performance was impacted by gains from IPOs and/or secondary offerings, there is no guarantee that these results can be repeated or that the Fund’s level of participation in IPOs and secondary offerings will be the same in the future. |
| | | | | | | | | | | | | | | |
| 1 | The MSCI EM (Emerging Markets) IMI indexes cited are unmanaged, free float-adjusted market capitalization weighted indexes reflected in US dollars. The MSCI EM (Emerging Markets) IMI Growth Index Net and the MSCI EM (Emerging Markets) IMI Index Net are designed to measure equity market performance of large-, mid- and small-cap securities in the emerging markets. The MSCI EM (Emerging Markets) IMI Growth Index Net screens for growth-style securities. The indexes and Baron Emerging Markets Fund include reinvestment of dividends, net of foreign withholding taxes, which positively impact the performance results. |
| | | | | | | | | | | | | | | |
| 2 | Past performance is not predictive of future performance. The performance data does not reflect the deduction of taxes that a shareholder would pay on Fund distributions or redemption of Fund shares. The Adviser has reimbursed certain Fund expenses and the Fund’s transfer agency expenses may be reduced by expense offsets from an unaffiliated transfer agent without which performance would have been lower. |
10
December 31, 2011 (Unaudited) | Baron Emerging Markets Fund |
| TOP TEN HOLDINGS AS OF DECEMBER 31, 2011 |
| | | Percent of | |
| | | Net Assets | |
| OGX Petróleo e Gás Participações SA | | 2.3% | |
| |
| TOTVS SA | | 2.3% | |
| |
| Itaú Unibanco Holding SA | | 2.2% | |
| |
| Bank Rakyat Indonesia (Persero) Tbk PT | | 2.2% | |
| |
| CFR Pharmaceuticals SA | | 2.2% | |
| |
| Daum Communications Corp. | | 2.0% | |
| |
| Anhanguera Educacional Participações SA | | 1.9% | |
| |
| Dah Chong Hong Holdings Ltd. | | 1.9% | |
| |
| Exillon Energy plc | | 1.9% | |
| |
| Qualicorp SA | | 1.9% | |
| | | 20.8% | |
| |
SECTOR BREAKDOWN AS OF DECEMBER 31, 2011†
(as a percentage of net assets) |
| |
 |
| |
| MANAGEMENT’S DISCUSSION OF FUND PERFORMANCE |
| |
For the year ended December 31, 2011, Baron Emerging Markets Fund‡ declined 17.20%, compared to a loss of 20.04% for the MSCI EM (Emerging Markets) IMI Growth Index Net and a loss of 19.49% for the MSCI EM (Emerging Markets) IMI Index Net.
Baron Emerging Markets Fund is a diversified fund that invests for the long term primarily in companies of any size that have their principal business activities or trading markets in developing countries. The Fund seeks to invest in companies that have significant long-term growth prospects and to purchase them at prices we believe to be favorable. We see exciting business prospects and growth opportunities in developing countries that |
| are driven by the increasing demand for consumer goods and services. |
| |
| From the start, international markets in 2011 were buffeted by unexpected events. In the first quarter, a wave of public demonstrations, riots, and revolutions calling for greater democracy in several Middle East and North African nations began, sending oil prices higher. Then, the tragic earthquake, tsunami, and resulting nuclear incident in Japan presented additional uncertainty to financial markets. In the second quarter, energy stocks corrected sharply, European credit woes emerged and fears grew that the economy would slip into a double-dip recession. As the year progressed, China implemented tight fiscal controls to restrain inflation while Europe’s credit woes worsened. In December, European authorities unveiled a compromise plan to alleviate the sovereign debt and bank funding crisis. While we applaud the progress, we think the plan falls short of the “fiscal union” that would mark a definitive turning point. |
| |
| When we launched the Fund last year, we were well aware of the headwinds facing businesses in the emerging markets. We were cautious early in the year, emphasizing well capitalized, stable businesses with competitive advantages and cash flow characteristics. We felt this was particularly important in overheated markets, such as those of China, Brazil, and India. We also maintained a modest cash cushion through the year, which contributed positively to our performance. Portfolio investments in the Financials, Materials, Health Care, and Information Technology sectors contributed to absolute performance, while investments in Consumer Staples, Consumer Discretionary, Telecommunication Services, and Energy detracted. Our smaller and mid-cap companies also weighed on performance, as these categories lagged large-cap stocks. This happens in times of uncertainty and fear. We believe that when the markets stabilize, companies in emerging markets will perform well again, and we remain focused on creating a portfolio of uniquely positioned, well managed businesses. |
| |
| Daum Communications Corp., the second-largest Internet portal in South Korea, was the leading contributor to Fund performance in 2011. The company has a significant presence in search, email, social networking and e-commerce. Daum shares performed well as it became clear that its competitor’s change in pricing policy, which many believed would harm Daum, instead had the opposite effect. The company posted stronger-than-expected earnings through most of the year, driven by both better-than-expected pricing and margin expansion. The company also initiated a dividend payout during the year. |
| |
| The leading detractor from Fund performance was China Automotive Systems, Inc., China’s leading manufacturer of automotive steering systems with a 27% market share. The shares declined sharply during the year, mainly due to the significant slowdown of the automobile industry in China. The government tightened restrictions on car sales in major cities in order to improve air quality and reduce traffic. Additionally, increased competition resulted in deteriorating margins. The Fund has exited its position in China Automotive Systems. |
| |
| In 2012, we expect to continue making investments in emerging market companies that we believe have superior long-term growth prospects. We believe that there are exciting business prospects that are driven by economic and per capita income growth, a shift from export-driven to consumption-based models and the increasing availability of consumer credit and mortgages in developing countries. |
| |
|
| † | | Industry sector levels are provided from the Global Industry Classification Standard (“GICS”), developed and exclusively owned by MSCI, Inc. and Standard & Poor’s Financial Services LLC, unless otherwise stated that they have been reclassified or classified by the Adviser. All GICS data is provided “as is” with no warranties. |
| |
| ‡ | | Performance information reflects results of the Retail Shares. |
11
Baron Partners Fund |
December 31, 2011 |
| STATEMENT OF NET ASSETS |
| |
| |
| DECEMBER 31, 2011 |
| |
| Shares | | | Cost | | | | Value | |
| Common Stocks (118.98%) | | | | | | | | |
| Consumer Discretionary (35.90%) | | | | | | | | |
| | | Automotive Retail (2.92%) | | | | | | | | |
| 1,050,000 | | CarMax, Inc.1 | | $ | 29,487,956 | | | $ | 32,004,000 | |
| | | Broadcasting (2.25%) | | | | | | | | |
| 600,000 | | Discovery Communications, Inc., Cl A1 | | | 13,191,950 | | | | 24,582,000 | |
| | | Casinos & Gaming (3.57%) | | | | | | | | |
| 1,025,000 | | Penn National Gaming, Inc.1 | | | 30,676,248 | | | | 39,021,750 | |
| | | Education Services (2.90%) | | | | | | | | |
| 825,000 | | DeVry, Inc. | | | 35,163,137 | | | | 31,729,500 | |
| | | Hotels, Resorts & Cruise Lines (10.53%) | | | | | | | | |
| 2,550,000 | | Hyatt Hotels Corp., Cl A1 | | | 68,562,607 | | | | 95,982,000 | |
| 400,000 | | Starwood Hotels & Resorts Worldwide, Inc. | | | 21,442,707 | | | | 19,188,000 | |
| | | | | | 90,005,314 | | | | 115,170,000 | |
| | | Leisure Facilities (4.19%) | | | | | | | | |
| 1,081,800 | | Vail Resorts, Inc. | | | 34,304,772 | | | | 45,825,048 | |
| | | Restaurants (1.45%) | | | | | | | | |
| 775,000 | | Arcos Dorados Holdings, Inc.2 | | | 17,162,628 | | | | 15,910,750 | |
| | | Specialty Stores (8.09%) | | | | | | | | |
| 2,400,000 | | Dick’s Sporting Goods, Inc. | | | 38,814,999 | | | | 88,512,000 | |
| Total Consumer Discretionary | | | 288,807,004 | | | | 392,755,048 | |
| Energy (6.52%) | | | | | | | | |
| | | Oil & Gas Drilling (2.67%) | | | | | | | | |
| 500,000 | | Helmerich & Payne, Inc. | | | 11,603,764 | | | | 29,180,000 | |
| | | Oil & Gas Exploration & Production (3.85%) | | | | | | | | |
| 450,000 | | Concho Resources, Inc.1 | | | 18,991,084 | | | | 42,187,500 | |
| Total Energy | | | 30,594,848 | | | | 71,367,500 | |
| Financials (20.38%) | | | | | | | | |
| | | Investment Banking & Brokerage (4.63%) | | | | | | | | |
| 4,500,000 | | The Charles Schwab Corp. | | | 43,860,512 | | | | 50,670,000 | |
| | | Reinsurance (10.21%) | | | | | | | | |
| 3,000,000 | | Arch Capital Group Ltd.1,2 | | | 45,708,458 | | | | 111,690,000 | |
| | | Specialized Finance (5.54%) | | | | | | | | |
| 1,840,000 | | MSCI, Inc., Cl A1 | | | 48,553,313 | | | | 60,591,200 | |
| Total Financials | | | 138,122,283 | | | | 222,951,200 | |
| Health Care (3.05%) | | | | | | | | |
| | | Health Care Equipment (3.05%) | | | | | | | | |
| 275,000 | | Edwards Lifesciences Corp.1 | | | 7,486,814 | | | | 19,442,500 | |
| 30,000 | | Intuitive Surgical, Inc.1 | | | 7,704,123 | | | | 13,890,300 | |
| Total Health Care | | | 15,190,937 | | | | 33,332,800 | |
| Industrials (33.16%) | | | | | | | | |
| | | Air Freight & Logistics (6.23%) | | | | | | | | |
| 800,000 | | C. H. Robinson Worldwide, Inc. | | | 20,066,739 | | | | 55,824,000 | |
| 300,000 | | Expeditors International of Washington, Inc. | | | 7,602,292 | | | | 12,288,000 | |
| | | | | | 27,669,031 | | | | 68,112,000 | |
| | | Diversified Support Services (2.42%) | | | | | | | | |
| 1,200,000 | | Ritchie Bros. Auctioneers, Inc.2 | | | 29,248,842 | | | | 26,496,000 | |
| | | Research & Consulting Services (12.55%) | | | | | | | | |
| 500,000 | | CoStar Group, Inc.1 | | | 19,068,649 | | | | 33,365,000 | |
| 1,000,000 | | Nielsen Holdings N.V.1,2 | | | 26,202,392 | | | | 29,690,000 | |
| 1,850,000 | | Verisk Analytics, Inc., Cl A1 | | | 51,366,473 | | | | 74,240,500 | |
| | | | | | 96,637,514 | | | | 137,295,500 | |
| Shares | | | Cost | | | | Value | |
| Common Stocks (continued) | | | | | | | | |
| Industrials (continued) | | | | | | | | |
| | | Trading Companies & Distributors (11.96%) | | | | | | | | |
| 3,000,000 | | Fastenal Co. | | $ | 53,397,985 | | | $ | 130,830,000 | |
| Total Industrials | | | 206,953,372 | | | | 362,733,500 | |
| Information Technology (9.57%) | | | | | | | | |
| | | Application Software (9.57%) | | | | | | | | |
| 1,200,000 | | FactSet Research Systems, Inc. | | | 68,084,463 | | | | 104,736,000 | |
| Utilities (10.40%) | | | | | | | | |
| | | Electric Utilities (10.40%) | | | | | | | | |
| 1,500,000 | | ITC Holdings Corp. | | | 47,510,701 | | | | 113,820,000 | |
| Total Common Stocks | | | 795,263,608 | | | | 1,301,696,048 | |
| |
| Private Equity Investments (2.38%) | | | | | | | | |
| Consumer Discretionary (0.36%) | | | | | | | | |
| | | Hotels, Resorts & Cruise Lines (0.36%) | | | | | | | | |
| 3,900,000 | | Kerzner International Holdings Ltd., Cl A1,2,3,4,6 | | | 39,000,000 | | | | 3,900,000 | |
| Financials (2.02%) | | | | | | | | |
| | | Asset Management & Custody Banks (2.02%) | | | | | | | | |
| 7,579,130 | | Windy City Investments Holdings, L.L.C.1,3,4,6 | | | 41,134,888 | | | | 22,055,268 | |
| Total Private Equity Investments | | | 80,134,888 | | | | 25,955,268 | |
| |
| Principal | | | | | | | | |
| Amount | | | | | | | | |
| Short Term Investments (0.03%) | | | | | | | | |
| $ 370,174 | | Repurchase Agreement with Fixed Income Clearing Corp., dated 12/30/2011, 0.01% due 1/3/2012; Proceeds at maturity – $370,174; (Fully collateralized by U.S. Treasury Note, 1.50% due 6/30/2016; Market value – $390,000)5 | | | 370,174 | | | | 370,174 | |
| Total Investments (121.39%) | | $ | 875,768,670 | | | | 1,328,021,490 | |
Liabilities Less Cash and Other Assets (-21.39%) | | | | | | | (233,971,499 | ) |
| Net Assets | | | | | | $ | 1,094,049,991 | |
Retail Shares (Equivalent to $19.39 per share based on 50,049,468 shares outstanding) | | | | | | $ | 970,388,618 | |
Institutional Shares (Equivalent to $19.52 per share based on 6,335,392 shares outstanding) | | | | | | $ | 123,661,373 | |
| % | | Represents percentage of net assets. |
| 1 | | Non-income producing securities. |
| 2 | | Foreign corporation. |
| 3 | | At December 31, 2011, the market value of restricted and fair valued securities amounted to $25,955,268 or 2.38% of net assets. None of these securities are deemed liquid. See Note 7 regarding Restricted Securities. |
| 4 | | The Adviser has reclassified/classified certain securities in or out of this sub-industry. Such reclassifications/classifications are not supported by S&P or MSCI. |
| 5 | | Level 2 security. See Note 8 regarding Fair Value Measurements. |
| 6 | | Level 3 security. See Note 8 regarding Fair Value Measurements. |
| | | |
| | | All securities are Level 1, unless otherwise noted. |
| 12 | | See Notes to Financial Statements. |
December 31, 2011 |
Baron Focused Growth Fund |
| STATEMENT OF NET ASSETS (Continued) |
| |
| |
| DECEMBER 31, 2011 |
| |
| Shares | | | Cost | | | | Value | |
| Common Stocks (93.88%) | | | | | | | | |
| Consumer Discretionary (20.73%) | | | | | | | | |
| | | Automotive Retail (2.65%) | | | | | | | | |
| 80,000 | | CarMax, Inc.1 | | $ | 2,017,317 | | | $ | 2,438,400 | |
| | | Education Services (2.95%) | | | | | | | | |
| 35,000 | | DeVry, Inc. | | | 1,497,572 | | | | 1,346,100 | |
| 14,000 | | Strayer Education, Inc. | | | 1,669,421 | | | | 1,360,660 | |
| | | | | | 3,166,993 | | | | 2,706,760 | |
| | | Hotels, Resorts & Cruise Lines (11.11%) | | | | | | | | |
| 110,000 | | Choice Hotels International, Inc. | | | 3,627,113 | | | | 4,185,500 | |
| 160,000 | | Hyatt Hotels Corp., Cl A1 | | | 4,766,354 | | | | 6,022,400 | |
| | | | | | 8,393,467 | | | | 10,207,900 | |
| | | Specialty Stores (4.02%) | | | | | | | | |
| 100,000 | | Dick’s Sporting Goods, Inc. | | | 1,630,006 | | | | 3,688,000 | |
| Total Consumer Discretionary | | | 15,207,783 | | | | 19,041,060 | |
| Consumer Staples (2.49%) | | | | | | | | |
| | | Household Products (2.49%) | | | | | | | | |
| 50,000 | | Church & Dwight Co., Inc. | | | 1,274,171 | | | | 2,288,000 | |
| Energy (11.31%) | | | | | | | | |
| | | Oil & Gas Drilling (2.54%) | | | | | | | | |
| 40,000 | | Helmerich & Payne, Inc. | | | 1,493,099 | | | | 2,334,400 | |
| | | Oil & Gas Equipment & Services (2.01%) | | | | | | | | |
| 15,000 | | CARBO Ceramics, Inc. | | | 1,734,754 | | | | 1,849,950 | |
| | | Oil & Gas Exploration & Production (6.76%) | | | | | | | | |
| 35,000 | | Concho Resources, Inc.1 | | | 1,051,799 | | | | 3,281,250 | |
| 40,000 | | SM Energy Co. | | | 2,275,966 | | | | 2,924,000 | |
| | | | | | 3,327,765 | | | | 6,205,250 | |
| Total Energy | | | 6,555,618 | | | | 10,389,600 | |
| Financials (9.90%) | | | | | | | | |
| | | Asset Management & Custody Banks (1.55%) | | | | | | | | |
| 60,000 | | Eaton Vance Corp. | | | 962,587 | | | | 1,418,400 | |
| | | Reinsurance (4.05%) | | | | | | | | |
| 100,000 | | Arch Capital Group Ltd.1,2 | | | 1,800,056 | | | | 3,723,000 | |
| | | Specialized Finance (4.30%) | | | | | | | | |
| 120,000 | | MSCI, Inc., Cl A1 | | | 3,001,749 | | | | 3,951,600 | |
| Total Financials | | | 5,764,392 | | | | 9,093,000 | |
| Health Care (10.96%) | | | | | | | | |
| | | Health Care Distributors (2.38%) | | | | | | | | |
| 34,000 | | Henry Schein, Inc.1 | | | 1,353,700 | | | | 2,190,620 | |
| | | Health Care Equipment (2.31%) | | | | | | | | |
| 30,000 | | Edwards Lifesciences Corp.1 | | | 1,710,358 | | | | 2,121,000 | |
| | | Life Sciences Tools & Services (2.41%) | | | | | | | | |
| 15,000 | | Mettler-Toledo International, Inc.1 | | | 702,213 | | | | 2,215,650 | |
| | | Managed Health Care (3.86%) | | | | | | | | |
| 60,000 | | AMERIGROUP Corp.1 | | | 2,535,302 | | | | 3,544,800 | |
| Total Health Care | | | 6,301,573 | | | | 10,072,070 | |
| Industrials (20.75%) | | | | | | | | |
| | | Air Freight & Logistics (3.04%) | | | | | | | | |
| 40,000 | | C. H. Robinson Worldwide, Inc. | | | 1,466,812 | | | | 2,791,200 | |
| Shares | | | Cost | | | | Value | |
| Common Stocks (continued) | | | | | | | | |
| Industrials (continued) | | | | | | | | |
| | | Diversified Support Services (1.44%) | | | | | | | | |
| 60,000 | | Ritchie Bros. Auctioneers, Inc.2 | | $ | 1,475,258 | | | $ | 1,324,800 | |
| | | Railroads (5.93%) | | | | | | | | |
| 90,000 | | Genesee & Wyoming, Inc., Cl A1 | | | 2,791,608 | | | | 5,452,200 | |
| | | Research & Consulting Services (5.59%) | | | | | | | | |
| 128,050 | | Verisk Analytics, Inc., Cl A1 | | | 3,651,694 | | | | 5,138,646 | |
| | | Trading Companies & Distributors (4.75%) | | | | | | | | |
| 100,000 | | Fastenal Co. | | | 2,169,716 | | | | 4,361,000 | |
| Total Industrials | | | 11,555,088 | | | | 19,067,846 | |
| Information Technology (10.16%) | | | | | | | | |
| | | Application Software (7.12%) | | | | | | | | |
| 25,000 | | ANSYS, Inc.1 | | | 548,887 | | | | 1,432,000 | |
| 35,000 | | FactSet Research Systems, Inc. | | | 1,982,041 | | | | 3,054,800 | |
| 70,000 | | Pegasystems, Inc. | | | 1,989,069 | | | | 2,058,000 | |
| | | | | | 4,519,997 | | | | 6,544,800 | |
| | | Systems Software (3.04%) | | | | | | | | |
| 60,000 | | MICROS Systems, Inc.1 | | | 2,808,657 | | | | 2,794,800 | |
| Total Information Technology | | | 7,328,654 | | | | 9,339,600 | |
| Materials (5.10%) | | | | | | | | |
| | | Industrial Gases (5.10%) | | | | | | | | |
| 60,000 | | Airgas, Inc. | | | 3,783,761 | | | | 4,684,800 | |
| Utilities (2.48%) | | | | | | | | |
| | | Electric Utilities (2.48%) | | | | | | | | |
| 30,000 | | ITC Holdings Corp. | | | 1,552,701 | | | | 2,276,400 | |
| Total Common Stocks | | | 59,323,741 | | | | 86,252,376 | |
| |
| Principal | | | | | | | | |
| Amount | | | | | | | | |
| Short Term Investments (6.16%) | | | | | | | | |
| $5,654,687 | | Repurchase Agreement with Fixed Income Clearing Corp., dated 12/30/2011, 0.01% due 1/3/2012; Proceeds at maturity – $5,654,693; (Fully collateralized by U.S. Treasury Note, 1.50% due 6/30/2016; Market value – $5,938,400)3 | | | 5,654,687 | | | | 5,654,687 | |
| Total Investments (100.04%) | | $ | 64,978,428 | | | | 91,907,063 | |
| |
Liabilities Less Cash and Other Assets (-0.04%) | | | | | | | (40,113 | ) |
Net Assets | | | | | | $ | 91,866,950 | |
Retail Shares (Equivalent to $9.71 per share based on 2,915,875 shares outstanding) | | | | | | $ | 28,305,012 | |
| |
Institutional Shares (Equivalent to $9.77 per share based on 6,509,157 shares outstanding) | | | | | | $ | 63,561,938 | |
| | | | | | | | | | | |
| % | | Represents percentage of net assets. |
| 1 | | Non-income producing securities. |
| 2 | | Foreign corporation. |
| 3 | | Level 2 security. See Note 8 regarding Fair Value Measurements. |
| | |
All securities are Level 1, unless otherwise noted. |
| See Notes to Financial Statements. | | 13 |
Baron International Growth Fund |
December 31, 2011 |
| STATEMENT OF NET ASSETS |
| |
| |
| DECEMBER 31, 2011 |
| |
| Shares | | | Cost | | | | Value | |
| Common Stocks (93.62%) | | | | | | | | |
| Australia (3.21%) | | | | | | | | |
| 95,000 | | Domino’s Pizza Enterprises Ltd. | | $ | 641,052 | | | $ | 767,612 | |
| 160,000 | | Wotif.com Holdings Ltd. | | | 690,168 | | | | 584,224 | |
| Total Australia | | | 1,331,220 | | | | 1,351,836 | |
| Brazil (9.42%) | | | | | | | | |
| 58,000 | | Anhanguera Educacional Participações SA | | | 775,825 | | | | 625,010 | |
| 40,000 | | Cia. Hering SA | | | 260,448 | | | | 696,100 | |
| 32,000 | | Itaú Unibanco Holding SA, ADR | | | 507,851 | | | | 593,920 | |
| 40,000 | | OGX Petróleo e Gás Participações SA1 | | | 333,381 | | | | 292,079 | |
| 65,000 | | Qualicorp SA1 | | | 536,833 | | | | 583,702 | |
| 20,000 | | Restoque Comercio e Confecções de Roupas SA1 | | | 28,291 | | | | 292,722 | |
| 50,000 | | TOTVS SA | | | 232,220 | | | | 891,569 | |
| Total Brazil | | | 2,674,849 | | | | 3,975,102 | |
| Canada (6.10%) | | | | | | | | |
| 18,000 | | Crescent Point Energy Corp. | | | 794,569 | | | | 793,325 | |
| 80,988 | | Ecosynthetix, Inc.1 | | | 768,590 | | | | 397,487 | |
| 100,000 | | Goldgroup Mining, Inc.1 | | | 149,297 | | | | 109,939 | |
| 60,000 | | Kirkland Lake Gold, Inc.1 | | | 440,517 | | | | 908,172 | |
| 10,000 | | Ritchie Bros. Auctioneers, Inc. | | | 198,761 | | | | 220,800 | |
| 70,000 | | Vero Energy, Inc.1 | | | 460,521 | | | | 142,920 | |
| Total Canada | | | 2,812,255 | | | | 2,572,643 | |
| China (5.56%) | | | | | | | | |
| 55,000 | | AsiaInfo-Linkage, Inc.1 | | | 448,849 | | | | 426,250 | |
| 1,300,000 | | Kingdee International Software Group Co. Ltd. | | | 118,011 | | | | 349,832 | |
| 70,000 | | Origin Agritech Ltd.1 | | | 530,110 | | | | 165,200 | |
| 20,000 | | Qihoo 360 Technology Co. Ltd., ADR1 | | | 394,724 | | | | 313,800 | |
| 400,000 | | Shandong Weigao Group Medical Polymer Co. Ltd. | | | 264,223 | | | | 361,033 | |
| 18,000 | | Tencent Holdings Ltd. | | | 230,886 | | | | 361,548 | |
| 121,500 | | Tingyi (Cayman Islands) Holding Corp. | | | 137,065 | | | | 369,196 | |
| Total China | | | 2,123,868 | | | | 2,346,859 | |
| France (4.74%) | | | | | | | | |
| 18,000 | | Eurofins Scientific SE | | | 1,139,476 | | | | 1,312,292 | |
| 19,000 | | Ingenico SA | | | 306,915 | | | | 686,082 | |
| Total France | | | 1,446,391 | | | | 1,998,374 | |
| Germany (5.43%) | | | | | | | | |
| 6,000 | | Gerresheimer AG | | | 137,143 | | | | 250,010 | |
| 31,500 | | Qiagen N.V.1 | | | 678,206 | | | | 435,015 | |
| 110,000 | | RIB Software AG1 | | | 687,360 | | | | 539,146 | |
| 40,000 | | Symrise AG | | | 494,498 | | | | 1,067,498 | |
| Total Germany | | | 1,997,207 | | | | 2,291,669 | |
| Hong Kong (1.64%) | | | | | | | | |
| 275,000 | | Wynn Macau Ltd. | | | 361,284 | | | | 689,748 | |
| India (1.64%) | | | | | | | | |
| 38,000 | | Financial Technologies Ltd. | | | 907,114 | | | | 379,749 | |
| 149,067 | | Hathway Cables and Datacom Ltd.1 | | | 435,706 | | | | 310,036 | |
| Total India | | | 1,342,820 | | | | 689,785 | |
| Shares | | | Cost | | | | Value | |
| Common Stocks (continued) | | | | | | | | |
| Ireland (2.98%) | | | | | | | | |
| 28,000 | | Ryanair Holdings plc, ADR1 | | $ | 708,192 | | | $ | 780,080 | |
| 70,000 | | Velti plc1 | | | 739,187 | | | | 476,000 | |
| Total Ireland | | | 1,447,379 | | | | 1,256,080 | |
| Israel (1.54%) | | | | | | | | |
| 20,000 | | Mellanox Technologies Ltd.1 | | | 621,527 | | | | 649,800 | |
| Italy (1.00%) | | | | | | | | |
| 100,000 | | Amplifon SpA | | | 524,464 | | | | 423,479 | |
| Japan (12.02%) | | | | | | | | |
| 50,000 | | Bridgestone Corp. | | | 994,656 | | | | 1,133,559 | |
| 19,000 | | Canon, Inc., ADR | | | 647,350 | | | | 836,760 | |
| 6,300 | | FANUC Corp. | | | 468,068 | | | | 964,194 | |
| 18,000 | | Kakaku.com, Inc. | | | 471,899 | | | | 659,945 | |
| 30,000 | | Softbank Corp. | | | 1,039,471 | | | | 883,591 | |
| 20,000 | | Sony Financial Holdings, Inc. | | | 333,340 | | | | 294,660 | |
| 15,000 | | THK Co. Ltd. | | | 376,402 | | | | 295,635 | |
| Total Japan | | | 4,331,186 | | | | 5,068,344 | |
| Korea, Republic of (3.16%) | | | | | | | | |
| 5,300 | | Daum Communications Corp.1,2 | | | 421,284 | | | | 552,825 | |
| 850 | | LG Household & Health Care Ltd.1,2 | | | 231,289 | | | | 359,754 | |
| 2,300 | | NHN Corp.1,2 | | | 396,478 | | | | 421,532 | |
| Total Korea, Republic of | | | 1,049,051 | | | | 1,334,111 | |
| Mexico (1.89%) | | | | | | | | |
| 45,000 | | Agrinos AS1 | | | 320,488 | | | | 300,961 | |
| 154,600 | | Compartamos S.A.B. de C.V. | | | 69,859 | | | | 189,446 | |
| 160,000 | | Genomma Lab Internacional S.A.B. de C.V.1 | | | 262,400 | | | | 308,541 | |
| Total Mexico | | | 652,747 | | | | 798,948 | |
| Norway (2.31%) | | | | | | | | |
| 200,000 | | Opera Software ASA | | | 1,125,147 | | | | 973,106 | |
| South Africa (1.46%) | | | | | | | | |
| 80,000 | | Net 1 UEPS Technologies, Inc.1 | | | 858,420 | | | | 613,600 | |
| Spain (1.05%) | | | | | | | | |
| 80,000 | | Grifols SA, ADR1 | | | 458,472 | | | | 442,400 | |
| Sweden (1.83%) | | | | | | | | |
| 31,400 | | Lundin Petroleum AB1 | | | 395,567 | | | | 771,991 | |
| Switzerland (6.71%) | | | | | | | | |
| 18,000 | | Compagnie Financière Richemont SA | | | 321,503 | | | | 910,444 | |
| 28,000 | | Julius Baer Group Ltd. | | | 765,467 | | | | 1,095,198 | |
| 14,000 | | Syngenta AG, ADR | | | 659,300 | | | | 825,160 | |
| Total Switzerland | | | 1,746,270 | | | | 2,830,802 | |
| 14 | | See Notes to Financial Statements. |
December 31, 2011 |
Baron International Growth Fund |
| STATEMENT OF NET ASSETS (Continued) |
| |
| |
| DECEMBER 31, 2011 |
| |
| Shares | | | Cost | | | | Value | |
| Common Stocks (continued) | | | | | | | | |
| United Kingdom (13.07%) | | | | | | | | |
| 15,000 | | APR Energy plc1 | | $ | 240,185 | | | $ | 232,717 | |
| 450,000 | | Borders & Southern Petroleum plc1 | | | 407,229 | | | | 443,770 | |
| 500,000 | | bwin.party digital entertainment plc1 | | | 1,743,575 | | | | 1,273,460 | |
| 75,000 | | Experian plc | | | 476,937 | | | | 1,019,738 | |
| 27,000 | | Intertek Group plc | | | 474,276 | | | | 853,296 | |
| 200,000 | | Mytrah Energy Ltd.1 | | | 366,401 | | | | 288,858 | |
| 120,000 | | Premier Oil plc1 | | | 568,825 | | | | 676,487 | |
| 33,125 | | Standard Chartered PLC | | | 704,706 | | | | 724,834 | |
| Total United Kingdom | | | 4,982,134 | | | | 5,513,160 | |
| United States (6.86%) | | | | | | | | |
| 19,000 | | Agilent Technologies, Inc.1 | | | 406,140 | | | | 663,670 | |
| 15,000 | | Arch Capital Group Ltd.1 | | | 293,022 | | | | 558,450 | |
| 3,000 | | Core Laboratories N.V. | | | 127,140 | | | | 341,850 | |
| 28,000 | | NII Holdings, Inc.1 | | | 735,696 | | | | 596,400 | |
| 10,200 | | SodaStream International Ltd.1 | | | 324,818 | | | | 333,438 | |
| 22,000 | | Ubiquiti Networks, Inc.1 | | | 349,491 | | | | 401,060 | |
| Total United States | | | 2,236,307 | | | | 2,894,868 | |
| Total Common Stocks | | | 34,518,565 | | | | 39,486,705 | |
| | | | | | | | | | | |
| Preferred Stocks (0.65%) | | | | | | | | |
| United States (0.65%) | | | | | | | | |
| 60,573 | | Better Place, Inc., Series C1,3,4 | | | 275,001 | | | | 275,001 | |
| |
| Principal | | | | | | | | |
| Amount | | | | | | | | |
| Short Term Investments (5.46%) | | | | | | | | |
| $2,303,207 | | Repurchase Agreement with Fixed Income Clearing Corp., dated 12/30/2011, 0.01% due 1/3/2012; Proceeds at maturity – $2,303,209; (Fully collateralized by U.S. Treasury Note, 2.75% due 2/15/2019; Market value – $2,419,950)2 | | | 2,303,207 | | | | 2,303,207 | |
| Total Investments (99.73%) | | $ | 37,096,773 | | | | 42,064,913 | |
| Cash and Other Assets Less Liabilities (0.27%) | | | | | | | 115,401 | |
| Net Assets | | | | | | $ | 42,180,314 | |
Retail Shares (Equivalent to $13.20 per share based on 883,092 shares outstanding) | | | | | | $ | 11,655,283 | |
Institutional Shares (Equivalent to $13.25 per share based on 2,303,783 shares outstanding) | | | | | | $ | 30,525,031 | |
| % | | Represents percentage of net assets. |
| 1 | | Non-income producing securities. |
| 2 | | Level 2 security. See Note 8 regarding Fair Value Measurements. |
| 3 | | Level 3 security. See Note 8 regarding Fair Value Measurements. |
| 4 | | At December 31, 2011, the market value of restricted and fair valued securities amounted to $275,001 or 0.65% of net assets. None of these securities are deemed liquid. See Note 7 regarding Restricted Securities. |
| ADR | | American Depositary Receipt. |
| | | |
| | | All securities are Level 1, unless otherwise noted. |
| Summary of Investments by Sector | | Percentage of | |
| as of December 31, 2011 | | Net Assets | |
| Information Technology | | | 22.6 | % | |
| Consumer Discretionary | | | 18.1 | | |
| Industrials | | | 11.2 | | |
| Health Care | | | 9.9 | | |
| Materials | | | 8.6 | | |
| Energy | | | 8.2 | | |
| Financials | | | 8.2 | | |
| Telecommunication Services | | | 3.5 | | |
| Consumer Staples | | | 2.1 | | |
| Utilities | | | 1.9 | | |
| Cash and Cash Equivalents* | | | 5.7 | | |
| | | | 100.0 | % | |
| * | | Includes short term investments. |
| See Notes to Financial Statements. | | 15 |
Baron Real Estate Fund | |
December 31, 2011 |
| STATEMENT OF NET ASSETS |
| |
| |
| DECEMBER 31, 2011 |
| |
| Shares | | | | | Cost | | | | Value | |
| Common Stocks (99.12%) |
| Consumer Discretionary (20.03%) |
| | | Casinos & Gaming (4.84%) | | | | | | | | |
| 19,300 | | Ameristar Casinos, Inc. | | $ | 427,690 | | | $ | 333,697 | |
| 11,320 | | Penn National Gaming, Inc.1 | | | 360,975 | | | | 430,952 | |
| | | | | | 788,665 | | | | 764,649 | |
| | | Hotels, Resorts & Cruise Lines (13.92%) | | | | | |
| 9,950 | | Carnival Corp.2 | | | 367,972 | | | | 324,768 | |
| 12,805 | | Hyatt Hotels Corp., Cl A1 | | | 475,683 | | | | 481,980 | |
| 9,575 | | Starwood Hotels & Resorts Worldwide, Inc. | | | 491,003 | | | | 459,313 | |
| 24,725 | | Wyndham Worldwide Corp. | | | 763,051 | | | | 935,347 | |
| | | | | | 2,097,709 | | | | 2,201,408 | |
| | | Leisure Facilities (1.27%) | | | | | | | | |
| 4,753 | | Vail Resorts, Inc. | | | 193,463 | | | | 201,337 | |
| Total Consumer Discretionary | | | 3,079,837 | | | | 3,167,394 | |
| | | | | | | | | | | |
| Energy (10.54%) |
| | | Oil & Gas Storage & Transportation (10.54%) | | | | | |
| 17,350 | | Golar LNG Partners L.P.2 | | | 412,357 | | | | 531,778 | |
| 21,400 | | Rose Rock Midstream, L.P.1 | | | 431,722 | | | | 440,412 | |
| 9,941 | | Targa Resources Corp. | | | 256,366 | | | | 404,499 | |
| 8,800 | | Tesoro Logistics LP | | | 184,800 | | | | 289,520 | |
| Total Energy | | | 1,285,245 | | | | 1,666,209 | |
| | | | | | | | | | | |
| Financials (31.80%) |
| | | Diversified Real Estate Activities (2.81%) | | | | | |
| 16,155 | | Brookfield Asset Management, Inc., Cl A2 | | | 442,224 | | | | 443,939 | |
| | | Diversified REIT’s (3.48%) | | | | | | | | |
| 16,500 | | American Assets Trust, Inc. | | | 312,944 | | | | 338,415 | |
| 2,760 | | Vornado Realty Trust | | | 199,156 | | | | 212,134 | |
| | | | | | 512,100 | | | | 550,549 | |
| | | Office REITs (4.94%) | | | | | | | | |
| 21,750 | | Douglas Emmett, Inc. | | | 351,420 | | | | 396,720 | |
| 5,765 | | SL Green Realty Corp. | | | 403,379 | | | | 384,179 | |
| | | | | | 754,799 | | | | 780,899 | |
| | | Real Estate Services (3.71%) | | | | | | | | |
| 29,300 | | CBRE Group, Inc. (formerly, CB Richard Ellis Group, Inc., Cl A)1 | | | 548,453 | | | | 445,946 | |
| 13,300 | | Kennedy-Wilson Holdings, Inc. | | | 141,302 | | | | 140,714 | |
| | | | | | 689,755 | | | | 586,660 | |
| | | Residential REITs (7.73%) | | | | | | | | |
| 9,334 | | American Campus Communities, Inc. | | | 288,771 | | | | 391,655 | |
| 2,800 | | Avalonbay Communities, Inc. | | | 339,664 | | | | 365,680 | |
| 24,050 | | Education Realty Trust, Inc. | | | 228,397 | | | | 246,031 | |
| 1,550 | | Essex Property Trust, Inc. | | | 204,874 | | | | 217,791 | |
| | | | | | 1,061,706 | | | | 1,221,157 | |
| | | Specialized REITs (9.13%) | | | | | | | | |
| 5,150 | | Alexandria Real Estate Equities, Inc.3 | | | 342,110 | | | | 355,195 | |
| 5,150 | | Digital Realty Trust, Inc.3 | | | 279,095 | | | | 343,351 | |
| 6,700 | | Entertainment Properties Trust | | | 256,860 | | | | 292,857 | |
| 18,670 | | LaSalle Hotel Properties | | | 401,321 | | | | 452,001 | |
| | | | | | 1,279,386 | | | | 1,443,404 | |
| Total Financials | | | 4,739,970 | | | | 5,026,608 | |
| | | | | | | | | | | |
| Health Care (9.64%) |
| | | Health Care Facilities (9.64%) | | | | | | | | |
| 28,630 | | Brookdale Senior Living, Inc.1 | | | 540,053 | | | | 497,876 | |
| 96,700 | | Capital Senior Living Corp.1 | | | 720,447 | | | | 767,798 | |
| 39,950 | | Sunrise Senior Living, Inc.1 | | | 296,655 | | | | 258,876 | |
| Total Health Care | | | 1,557,155 | | | | 1,524,550 | |
| Shares | | | | | Cost | | | | Value | |
| Common Stocks (continued) |
| Industrials (6.40%) |
| | | Building Products (0.84%) | | | | | | | | |
| 4,600 | | Owens Corning1 | | $ | 118,868 | | | $ | 132,112 | |
| | | Industrial Machinery (2.80%) | | | | | | | | |
| 6,545 | | Stanley Black & Decker, Inc. | | | 421,204 | | | | 442,442 | |
| | | Research & Consulting Services (2.76%) | | | | | | | | |
| 6,546 | | CoStar Group, Inc.1 | | | 392,690 | | | | 436,814 | |
| Total Industrials | | | 932,762 | | | | 1,011,368 | |
| | | | | | | | | | | |
| Information Technology (11.56%) |
| | | Application Software (2.60%) | | | | | | | | |
| 16,246 | | RealPage, Inc.1 | | | 352,502 | | | | 410,536 | |
| | | Internet Software & Services (1.17%) | | | | | | | | |
| 8,250 | | Zillow, Inc.1 | | | 166,037 | | | | 185,460 | |
| | | IT Consulting & Other Services (5.13%) | | | | | | | | |
| 7,995 | | Equinix, Inc.1,3 | | | 754,842 | | | | 810,693 | |
| | | Systems Software (2.66%) | | | | | | | | |
| 9,025 | | MICROS Systems, Inc.1 | | | 427,009 | | | | 420,385 | |
| Total Information Technology | | | 1,700,390 | | | | 1,827,074 | |
| | | | | | | | | |
| Telecommunication Services (6.30%) |
| | | Wireless Telecommunication Services (6.30%) | | | | | | | | |
| 9,200 | | American Tower Corp., Cl A | | | 481,749 | | | | 552,092 | |
| 10,325 | | SBA Communications Corp., Cl A1 | | | 386,190 | | | | 443,562 | |
| Total Telecommunication Services | | | 867,939 | | | | 995,654 | |
| | | | | | | | | |
| Utilities (2.85%) |
| | | Electric Utilities (2.85%) | | | | | | | | |
| 16,250 | | Brookfield Infrastructure Partners L.P.2 | | | 333,983 | | | | 450,125 | |
| Total Common Stocks | | | 14,497,281 | | | | 15,668,982 | |
| |
| Principal |
| Amount |
| Short Term Investments (0.98%) |
| $154,520 | | Repurchase Agreement with Fixed Income Clearing Corp., dated 12/30/2011, 0.01% due 1/3/2012; Proceeds at maturity - $154,520; (Fully collateralized by U.S. Treasury Note, 2.75% due 2/15/2019; Market value - $165,750)4 | | | 154,520 | | | | 154,520 | |
| Total Investments (100.10%) | | $ | 14,651,801 | | | | 15,823,502 | |
| Liabilities Less Cash and Other Assets (-0.10%) | | | | | | | (15,584 | ) |
| Net Assets | | | | | | $ | 15,807,918 | |
Retail Shares (Equivalent to $12.51 per share based on 869,545 shares outstanding) | | | | | | $ | 10,874,844 | |
Institutional Shares (Equivalent to $12.56 per share based on 392,688 shares outstanding) | | | | | | $ | 4,933,074 | |
| % | | Represents percentage of net assets. |
| 1 | | Non-income producing securities. |
| 2 | | Foreign corporation. |
| 3 | | The Adviser has reclassified/classified certain securities in or out of this sub-industry. Such reclassifications/classifications are not supported by S&P or MSCI. |
| 4 | | Level 2 security. See Note 8 regarding Fair Value Measurements. |
| | | |
| | | All securities are Level 1, unless otherwise noted. |
| 16 | | See Notes to Financial Statements. |
December 31, 2011 | |
Baron Emerging Markets Fund |
| STATEMENT OF NET ASSETS |
| |
| |
| DECEMBER 31, 2011 |
| |
| Shares | | | | | Cost | | | | Value | |
| Common Stocks (88.25%) |
| Brazil (18.33%) |
| 11,000 | | Anhanguera Educacional Participações SA | | $ | 204,764 | | | $ | 118,536 | |
| 12,000 | | BM&FBOVESPA SA | | | 86,237 | | | | 63,048 | |
| 5,500 | | Cia. Hering SA | | | 106,669 | | | | 95,714 | |
| 11,000 | | Estacio Participações SA | | | 149,060 | | | | 106,093 | |
| 7,500 | | Itaú Unibanco Holding SA, ADR | | | 155,939 | | | | 139,200 | |
| 4,000 | | M.Dias Branco SA | | | 98,083 | | | | 102,292 | |
| 20,000 | | OGX Petróleo e Gás Participações SA1 | | | 207,986 | | | | 146,039 | |
| 13,000 | | Qualicorp SA1 | | | 107,367 | | | | 116,740 | |
| 7,000 | | Redecard SA | | | 104,404 | | | | 109,546 | |
| 8,000 | | TOTVS SA | | | 157,248 | | | | 142,651 | |
| Total Brazil | | | 1,377,757 | | | | 1,139,859 | |
| | | | | | | | | | | |
| Canada (3.13%) | | | | | | | | |
| 30,000 | | Africa Oil Corp.1 | | | 41,380 | | | | 46,528 | |
| 70,000 | | Goldgroup Mining, Inc.1 | | | 101,432 | | | | 76,957 | |
| 1,500 | | Niko Resources Ltd. | | | 97,568 | | | | 71,013 | |
| Total Canada | | | 240,380 | | | | 194,498 | |
| | | | | | | | | | | |
| Chile (4.85%) | | | | | | | | |
| 322,211 | | CFR Pharmaceuticals SA1 | | | 61,115 | | | | 75,730 | |
| 2,615 | | CFR Pharmaceuticals SA, 144A, ADR1,2 | | | 47,627 | | | | 61,453 | |
| 1,500 | | Compania Cervecerias Unidas SA, ADR | | | 80,928 | | | | 94,650 | |
| 1,300 | | Sociedad Quimica y Minera de Chile SA, ADR | | | 68,738 | | | | 70,005 | |
| Total Chile | | | 258,408 | | | | 301,838 | |
| | | | | | | | | | | |
| | | | | | | | | | | |
| China (7.75%) | | | | | | | | |
| 12,500 | | AsiaInfo-Linkage, Inc.1 | | | 105,636 | | | | 96,875 | |
| 200,000 | | Kingdee International Software Group Co. Ltd. | | | 95,106 | | | | 53,820 | |
| 16,000 | | Origin Agritech Ltd.1 | | | 95,382 | | | | 37,760 | |
| 4,000 | | Qihoo 360 Technology Co. Ltd., ADR1 | | | 71,281 | | | | 62,760 | |
| 80,000 | | Shandong Weigao Group Medical
Polymer Co. Ltd. | | | 86,563 | | | | 72,207 | |
| 3,800 | | Tencent Holdings Ltd. | | | 94,802 | | | | 76,327 | |
| 27,000 | | Tingyi (Cayman Islands) Holding Corp. | | | 66,257 | | | | 82,043 | |
| Total China | | | 615,027 | | | | 481,792 | |
| | | | | | | | | | | |
| Hong Kong (3.71%) | | | | | | | | |
| 100,000 | | Dah Chong Hong Holdings, Ltd. | | | 113,809 | | | | 117,812 | |
| 45,000 | | Wynn Macau Ltd. | | | 115,522 | | | | 112,868 | |
| Total Hong Kong | | | 229,331 | | | | 230,680 | |
| | | | | | | | | | | |
| India (12.64%) | | | | | | | | |
| 60,000 | | Dish TV India Ltd.1 | | | 86,146 | | | | 66,434 | |
| 2,400 | | Eicher Motors Ltd. | | | 75,148 | | | | 67,248 | |
| 7,000 | | Financial Technologies Ltd. | | | 124,267 | | | | 69,954 | |
| 30,800 | | Hathway Cables and Datacom Ltd.1 | | | 90,025 | | | | 64,059 | |
| 8,000 | | Housing Development Finance Corp. Ltd. | | | 121,339 | | | | 98,228 | |
| 5,000 | | Jubilant FoodWorks Ltd.1 | | | 71,693 | | | | 71,029 | |
| 10,000 | | Lupin Ltd. | | | 89,825 | | | | 84,333 | |
| 7,000 | | Mahindra & Mahindra Ltd. | | | 111,161 | | | | 89,871 | |
| 8,500 | | Torrent Pharmaceuticals Ltd. | | | 111,492 | | | | 86,449 | |
| 40,000 | | Zee Entertainment Enterprises Ltd. | | | 109,271 | | | | 88,768 | |
| Total India | | | 990,367 | | | | 786,373 | |
| Shares | | | | | Cost | | | | Value | |
| Common Stocks (continued) |
| Indonesia (6.50%) |
| 175,000 | | Bank Negara Indonesia (Persero) Tbk PT | | $ | 80,076 | | | $ | 73,339 | |
| 185,000 | | Bank Rakyat Indonesia (Persero) Tbk PT | | | 114,156 | | | | 137,717 | |
| 1,000,000 | | Clipan Finance Indonesia Tbk PT | | | 75,165 | | | | 47,422 | |
| 300,000 | | Tower Bersama Infrastructure Tbk PT | | | 77,010 | | | | 78,577 | |
| 135,000 | | XL Axiata Tbk PT | | | 88,888 | | | | 67,370 | |
| Total Indonesia | | | 435,295 | | | | 404,425 | |
| | | | | | | | | | | |
| Korea, Republic of (6.15%) | | | | | | | | |
| 1,200 | | Daum Communications Corp.1,2 | | | 94,546 | | | | 125,168 | |
| 150 | | LG Household & Health Care Ltd.1,2 | | | 55,907 | | | | 63,486 | |
| 500 | | NHN Corp.1,2 | | | 96,127 | | | | 91,637 | |
| 7,500 | | SK Telecom Co. Ltd., ADR | | | 137,573 | | | | 102,075 | |
| Total Korea, Republic of | | | 384,153 | | | | 382,366 | |
| | | | | | | | | | | |
| Mexico (4.23%) | | | | | | | | |
| 8,000 | | Agrinos AS1 | | | 56,748 | | | | 53,504 | |
| 23,000 | | Compartamos S.A.B. de C.V. | | | 44,181 | | | | 28,184 | |
| 1,500 | | Fomento Económico Mexicano, S.A.B. de C.V., ADR | | | 85,180 | | | | 104,565 | |
| 40,000 | | Genomma Lab Internacional S.A.B. de C.V.1 | | | 89,866 | | | | 77,136 | |
| Total Mexico | | | 275,975 | | | | 263,389 | |
| | | | | | | | | | | |
| Norway (1.56%) | | | | | | | | |
| 20,000 | | Opera Software ASA | | | 118,166 | | | | 97,311 | |
| | | | | | | | | | | |
| Philippines (5.03%) | | | | | | | | |
| 175,000 | | Ayala Land, Inc.2 | | | 62,357 | | | | 60,586 | |
| 50,000 | | Cebu Air, Inc.2 | | | 97,978 | | | | 73,979 | |
| 1,350,000 | | Metro Pacific Investments Corp.2 | | | 107,441 | | | | 112,749 | |
| 60,000 | | Universal Robina Corp.2 | | | 59,749 | | | | 65,739 | |
| Total Philippines | | | 327,525 | | | | 313,053 | |
| | | | | | | | | | | |
| | | | | | | | | | | |
| Russian Federation (1.88%) | | | | | | | | |
| 30,000 | | Exillon Energy plc1 | | | 103,231 | | | | 116,988 | |
| | | | | | | | | | | |
| South Africa (1.73%) | | | | | | | | |
| 14,000 | | Net 1 UEPS Technologies, Inc.1 | | | 135,916 | | | | 107,380 | |
| | | | | | | | | | | |
| Taiwan, Province of China (3.58%) | | | | | | | | |
| 30,000 | | E Ink Holdings, Inc. | | | 52,845 | | | | 39,136 | |
| 4,400 | | Formosa International Hotels Corp. | | | 78,343 | | | | 56,964 | |
| 7,500 | | HIWIN Technologies Corp. | | | 58,725 | | | | 60,933 | |
| 4,000 | | HTC Corp. | | | 102,379 | | | | 65,656 | |
| Total Taiwan, Province of China | | | 292,292 | | | | 222,689 | |
| | | | | | | | | | | |
| Thailand (2.48%) | | | | | | | | |
| 15,000 | | Bangkok Bank Public Co. Ltd., NVDR | | | 87,127 | | | | 72,979 | |
| 200,000 | | L.P.N. Development PCL, Cl F2 | | | 68,755 | | | | 81,141 | |
| Total Thailand | | | 155,882 | | | | 154,120 | |
| See Notes to Financial Statements. | | 17 |
Baron Emerging Markets Fund | |
December 31, 2011 |
| STATEMENT OF NET ASSETS (Continued) |
| |
| |
| DECEMBER 31, 2011 |
| |
| Shares | | | | | Cost | | | | Value | |
| Common Stocks (continued) |
| United Arab Emirates (0.79%) |
| 325,000 | | SHUAA Capital psc1,2 | | $ | 112,191 | | | $ | 48,825 | |
| | | | | | | | | | | |
| United States (3.91%) | | | | | | | | |
| 4,500 | | Arcos Dorados Holdings, Inc. | | | 80,249 | | | | 92,385 | |
| 4,000 | | NII Holdings, Inc.1 | | | 131,998 | | | | 85,200 | |
| 3,600 | | Ubiquiti Networks, Inc.1 | | | 58,632 | | | | 65,628 | |
| Total United States | | | 270,879 | | | | 243,213 | |
| Total Common Stocks | | | 6,322,775 | | | | 5,488,799 | |
| |
| Warrants (0.03%) |
| Indonesia (0.03%) | | | | | | | | |
| 210,000 | | Clipan Finance Indonesia Tbk PT, Exp 10/07/20141 | | | 0 | | | | 2,015 | |
| |
| Principal |
| Amount |
| Short Term Investments (12.33%) |
| $766,983 | | Repurchase Agreement with Fixed Income Clearing Corp., dated 12/30/2011, 0.01% due 1/3/2012; Proceeds at maturity - $766,984; (Fully collateralized by U.S. Treasury Note, 1.50% due 6/30/2016; Market value - $806,000)2 | | | 766,983 | | | | 766,983 | |
| Total Investments (100.61%) | | $ | 7,089,758 | | | | 6,257,797 | |
| Liabilities Less Cash and Other Assets (-0.61%) | | | | | | | (37,751 | ) |
| | | | | | | | | |
| Net Assets | | | | | | $ | 6,220,046 | |
Retail Shares (Equivalent to $8.28 per share based on 235,794 shares outstanding) | | | | | | $ | 1,952,971 | |
Institutional Shares (Equivalent to $8.30 per share based on 514,041 shares outstanding) | | | | | | $ | 4,267,075 | |
| % | | Represents percentage of net assets. |
| 1 | | Non-income producing securities. |
| 2 | | Level 2 security. See Note 8 regarding Fair Value Measurements. |
| ADR | | American Depositary Receipt. |
| NVDR | | Non-Voting Depositary Receipt. |
| 144A | | Security is exempt from registration under Rule 144A of the Securities Act of 1933. This security may be resold in transactions that are exempt from registration, normally to qualified institutional buyers. This security has been deemed liquid pursuant to policies and procedures approved by the Board of Trustees, unless otherwise noted. At December 31, 2011, the market value of Rule 144A securities amounted to $61,453 or 0.99% of net assets. |
| | | |
| | | All securities are Level 1, unless otherwise noted. |
| Summary of Investments by Sector | | Percentage of |
| as of December 31, 2011 | | Net Assets |
| Information Technology | | | 19.4 | % |
| Consumer Discretionary | | | 17.4 | |
| Financials | | | 15.5 | |
| Consumer Staples | | | 8.8 | |
| Health Care | | | 7.4 | |
| Energy | | | 6.1 | |
| Telecommunication Services | | | 5.4 | |
| Industrials | | | 5.1 | |
| Materials | | | 3.2 | |
| Cash and Cash Equivalents* | | | 11.7 | |
| | | | 100.0 | % |
| | |
| * Includes short term investments. |
| 18 | | See Notes to Financial Statements. |
December 31, 2011 | |
Baron Select Funds |
| STATEMENTS OF ASSETS AND LIABILITIES |
| |
| |
| DECEMBER 31, 2011 |
| |
| | | | | | | | | | | Baron | | | | | | | Baron | |
| | | Baron Partners | | | Baron Focused | | | International | | | Baron Real | | | Emerging | |
| | | Fund | | | Growth Fund | | | Growth Fund | | | Estate Fund | | | Markets Fund | |
| Assets: | | | | | | | | | | | | | | | | | | | | |
Investments in securities, at value* | | $ | 1,327,651,316 | | | $ | 86,252,376 | | | $ | 39,761,706 | | | $ | 15,668,982 | | | $ | 5,490,814 | |
Repurchase agreements, at value** | | | 370,174 | | | | 5,654,687 | | | | 2,303,207 | | | | 154,520 | | | | 766,983 | |
Total investments, at value | | | 1,328,021,490 | | | | 91,907,063 | | | | 42,064,913 | | | | 15,823,502 | | | | 6,257,797 | |
Foreign currency, at value† | | | — | | | | — | | | | 1,860 | | | | — | | | | 2,335 | |
Receivable for securities sold | | | 2,542,436 | | | | — | | | | 13,773 | | | | — | | | | 2,472 | |
Receivable for shares sold | | | 746,974 | | | | 5,271 | | | | 148,818 | | | | 15,100 | | | | 629 | |
Dividends and interest receivable | | | 550,020 | | | | 60,103 | | | | 32,019 | | | | 22,394 | | | | 5,111 | |
Prepaid expenses | | | 148,202 | | | | 194 | | | | 10 | | | | 34 | | | | — | |
| | | | 1,332,009,122 | | | | 91,972,631 | | | | 42,261,393 | | | | 15,861,030 | | | | 6,268,344 | |
| Liabilities: | | | | | | | | | | | | | | | | | | | | |
Payable for borrowings against line of credit | | | 236,500,000 | | | | — | | | | — | | | | — | | | | — | |
Payable for shares redeemed | | | 944,434 | | | | 50,969 | | | | 25,071 | | | | — | | | | — | |
Payable for securities purchased | | | — | | | | — | | | | — | | | | 8,105 | | | | — | |
Accrued capital gains taxes | | | — | | | | — | | | | — | | | | — | | | | 2,358 | |
Distribution fees payable (Note 4) | | | 864 | | | | 349 | | | | 558 | | | | 169 | | | | 322 | |
Investment advisory fees payable (Note 4) | | | 451 | | | | 542 | | | | 516 | | | | — | | | | 521 | |
Accrued expenses and other payables | | | 513,382 | | | | 53,821 | | | | 54,934 | | | | 44,838 | | | | 45,097 | |
| | | | 237,959,131 | | | | 105,681 | | | | 81,079 | | | | 53,112 | | | | 48,298 | |
| Net Assets | | $ | 1,094,049,991 | | | $ | 91,866,950 | | | $ | 42,180,314 | | | $ | 15,807,918 | | | $ | 6,220,046 | |
| Net Assets consist of: | | | | | | | | | | | | | | | | | | | | |
Paid-in capital | | $ | 1,218,459,854 | | | $ | 78,606,671 | | | $ | 38,143,891 | | | $ | 14,884,241 | | | $ | 7,457,564 | |
Undistributed (accumulated) net investment income (loss) | | | — | | | | (1,144 | ) | | | 19,460 | | | | — | | | | (17,492 | ) |
Accumulated net realized loss on investments and foreign currency transactions | | | (576,662,683 | ) | | | (13,667,212 | ) | | | (951,098 | ) | | | (248,024 | ) | | | (385,652 | ) |
Net unrealized appreciation (depreciation) on investments and foreign currency translations | | | 452,252,820 | | | | 26,928,635 | | | | 4,968,061 | | | | 1,171,701 | | | | (834,374 | ) |
| | | | | | | | | | | | | | | | | | | | | |
| Net Assets | | $ | 1,094,049,991 | | | $ | 91,866,950 | | | $ | 42,180,314 | | | $ | 15,807,918 | | | $ | 6,220,046 | |
| Retail Shares: | | | | | | | | | | | | | | | | | | | | |
Net Assets | | $ | 970,388,618 | | | $ | 28,305,012 | | | $ | 11,655,283 | | | $ | 10,874,844 | | | $ | 1,952,971 | |
Shares Outstanding ($0.01 par value; indefinite shares authorized) | | | 50,049,468 | | | | 2,915,875 | | | | 883,092 | | | | 869,545 | | | | 235,794 | |
Net Asset Value Per Share | | $ | 19.39 | | | $ | 9.71 | | | $ | 13.20 | | | $ | 12.51 | | | $ | 8.28 | |
| Institutional Shares: | | | | | | | | | | | | | | | | | | | | |
Net Assets | | $ | 123,661,373 | | | $ | 63,561,938 | | | $ | 30,525,031 | | | $ | 4,933,074 | | | $ | 4,267,075 | |
Shares Outstanding ($0.01 par value; indefinite shares authorized) | | | 6,335,392 | | | | 6,509,157 | | | | 2,303,783 | | | | 392,688 | | | | 514,041 | |
Net Asset Value Per Share | | $ | 19.52 | | | $ | 9.77 | | | $ | 13.25 | | | $ | 12.56 | | | $ | 8.30 | |
*Investments in securities, at cost: | | $ | 875,398,496 | | | $ | 59,323,741 | | | $ | 34,793,566 | | | $ | 14,497,281 | | | $ | 6,322,775 | |
**Repurchase agreements, at cost: | | | 370,174 | | | | 5,654,687 | | | | 2,303,207 | | | | 154,520 | | | | 766,983 | |
Total investments, at cost | | $ | 875,768,670 | | | $ | 64,978,428 | | | $ | 37,096,773 | | | $ | 14,651,801 | | | $ | 7,089,758 | |
†Foreign currency, at cost: | | $ | — | | | $ | — | | | $ | 1,888 | | | $ | — | | | $ | 2,350 | |
| See Notes to Financial Statements. | | 19 |
Baron Select Funds | |
December 31, 2011 |
| STATEMENTS OF OPERATIONS |
| |
| |
| FOR THE YEAR ENDED DECEMBER 31, 2011 |
| |
| | | | | | | | | | | Baron | | | | | | | Baron | |
| | | Baron Partners | | | Baron Focused | | | International | | | Baron Real | | | Emerging | |
| | | Fund | | | Growth Fund | | | Growth Fund | | | Estate Fund | | | Markets Fund | |
| Investment income: | | | | | | | | | | | | | | | | | | | | |
Income: | | | | | | | | | | | | | | | | | | | | |
Dividends | | $ | 13,086,605 | | | $ | 634,545 | | | $ | 636,297 | | | $ | 174,186 | | | $ | 78,904 | |
Interest | | | 19 | | | | 261 | | | | 236 | | | | 55 | | | | 325 | |
Securities lending income | | | 155,160 | | | | — | | | | 123,265 | | | | — | | | | 7,894 | |
Foreign taxes withheld on dividends | | | (83,166 | ) | | | (9,679 | ) | | | (35,112 | ) | | | (907 | ) | | | (6,083 | ) |
Total income | | | 13,158,618 | | | | 625,127 | | | | 724,686 | | | | 173,334 | | | | 81,040 | |
Expenses: | | | | | | | | | | | | | | | | | | | | |
Investment advisory fees (Note 4) | | | 12,812,253 | | | | 913,568 | | | | 501,113 | | | | 136,914 | | | | 68,781 | |
Distribution fees — Retail Shares (Note 4) | | | 2,867,885 | | | | 76,768 | | | | 35,114 | | | | 23,688 | | | | 5,322 | |
Shareholder servicing agent fees and expenses — Retail Shares | | | 318,370 | | | | 22,771 | | | | 18,629 | | | | 17,918 | | | | 12,695 | |
Shareholder servicing agent fees and expenses — Institutional Shares | | | 17,410 | | | | 11,182 | | | | 10,392 | | | | 8,923 | | | | 9,747 | |
Reports to shareholders | | | 401,000 | | | | 12,328 | | | | 8,440 | | | | 5,192 | | | | 5,475 | |
Custodian and fund accounting fees | | | 89,062 | | | | 29,601 | | | | 62,579 | | | | 24,326 | | | | 52,094 | |
Professional fees | | | 68,542 | | | | 33,771 | | | | 45,197 | | | | 33,982 | | | | 42,642 | |
Registration and filing fees | | | 76,300 | | | | 32,695 | | | | 27,420 | | | | 30,139 | | | | 53,293 | |
Line of credit fees | | | 200,045 | | | | — | | | | — | | | | — | | | | — | |
Administration fees | | | 26,491 | | | | 26,497 | | | | 26,499 | | | | 26,508 | | | | 26,518 | |
Trustee fees and expenses | | | 101,673 | | | | 7,085 | | | | 3,968 | | | | 990 | | | | 536 | |
Insurance expense | | | 25,091 | | | | 1,557 | | | | 1,019 | | | | 139 | | | | 119 | |
Interest expense on short sales | | | 10,147 | | | | — | | | | — | | | | — | | | | — | |
Miscellaneous expenses | | | 416 | | | | 745 | | | | 901 | | | | 1,969 | | | | 374 | |
Total operating expenses | | | 17,014,685 | | | | 1,168,568 | | | | 741,271 | | | | 310,688 | | | | 277,596 | |
Interest expense on borrowings | | | 4,580,392 | | | | — | | | | — | | | | — | | | | — | |
Total expenses | | | 21,595,077 | | | | 1,168,568 | | | | 741,271 | | | | 310,688 | | | | 277,596 | |
Reimbursement of expenses by Adviser — Retail Shares (Note 4) | | | — | | | | (38,439 | ) | | | (32,863 | ) | | | (92,520 | ) | | | (63,547 | ) |
Reimbursement of expenses by Adviser — Institutional Shares (Note 4) | | | — | | | | (48,435 | ) | | | (46,641 | ) | | | (43,875 | ) | | | (122,750 | ) |
Net expenses | | | 21,595,077 | | | | 1,081,694 | | | | 661,767 | | | | 174,293 | | | | 91,299 | |
Net investment income (loss) | | | (8,436,459 | ) | | | (456,567 | ) | | | 62,919 | | | | (959 | ) | | | (10,259 | ) |
| Realized and unrealized gain (loss) on investments: | | | | | | | | | | | | | | | | | | | | |
Net realized gain (loss) on: | | | | | | | | | | | | | | | | | | | | |
Investments sold | | | 52,274,609 | | | | 2,975,631 | | | | 2,037,417 | | | | (109,997 | ) | | | (385,652 | ) |
Short sales | | | (1,704,652 | ) | | | — | | | | — | | | | — | | | | — | |
Foreign currency transactions | | | (570,818 | ) | | | (24 | ) | | | (9,793 | ) | | | — | | | | (42,143 | ) |
Net change in unrealized appreciation (depreciation) of: | | | | | | | | | | | | | | | | | | | | |
Investments | | | (115,333,302 | ) | | | (3,807,017 | ) | | | (10,441,983 | ) | | | (225,623 | ) | | | (834,319 | )1 |
Foreign currency translations | | | — | | | | — | | | | (30,582 | ) | | | — | | | | (55 | ) |
| Net loss on investments | | | (65,334,163 | ) | | | (831,410 | ) | | | (8,444,941 | ) | | | (335,620 | ) | | | (1,262,169 | ) |
| Net decrease in net assets resulting from operations | | $ | (73,770,622 | ) | | $ | (1,287,977 | ) | | $ | (8,382,022 | ) | | $ | (336,579 | ) | | $ | (1,272,428 | ) |
| | | | | | | | | | | | | | | | | | | | | |
1 Net of change in accrued foreign capital gains tax of $2,358.| 20 | | See Notes to Financial Statements. |
December 31, 2011 | |
Baron Select Funds |
| STATEMENTS OF CHANGES IN NET ASSETS |
| |
| |
| |
| |
| | | Baron Partners Fund | | | Baron Focused Growth Fund | | | Baron International Growth Fund | |
| | | For the Year | | | For the Year | | | For the Year | | | For the Year | | | For the Year | | | For the Year | |
| | | Ended | | | Ended | | | Ended | | | Ended | | | Ended | | | Ended | |
| | | December 31, | | | December 31, | | | December 31, | | | December 31, | | | December 31, | | | December 31, | |
| | | 2011 | | | 2010 | | | 2011 | | | 2010 | | | 2011 | | | 2010 | |
| Increase (Decrease) in Net Assets: | | | | | | | | | | | | | | | | | | | | | | | | |
| Operations: | | | | | | | | | | | | | | | | | | | | | | | | |
Net investment income (loss) | | $ | (8,436,459 | ) | | $ | (6,385,326 | ) | | $ | (456,567 | ) | | $ | (32,757 | ) | | $ | 62,919 | | | $ | 93,406 | |
Net realized gain | | | 49,999,139 | | | | 96,659,012 | | | | 2,975,607 | | | | 3,744,077 | | | | 2,027,624 | | | | 873,539 | |
Net change in unrealized appreciation (depreciation) | | | (115,333,302 | ) | | | 267,145,354 | | | | (3,807,017 | ) | | | 14,908,861 | | | | (10,472,565 | ) | | | 8,400,866 | |
| | | | | | | | | | | | | | | | | | | | | | | | | |
Increase (decrease) in net assets resulting from operations | | | (73,770,622 | ) | | | 357,419,040 | | | | (1,287,977 | ) | | | 18,620,181 | | | | (8,382,022 | ) | | | 9,367,811 | |
| | | | | | | | | | | | | | | | | | | | | | | | | |
| Distributions to shareholders from: | | | | | | | | | | | | | | | | | | | | | | | | |
Net investment income — Retail Shares | | | — | | | | — | | | | — | | | | (1,488,122 | ) | | | (33,234 | ) | | | — | |
Net investment income — Institutional Shares | | | — | | | | — | | | | — | | | | (1,414,220 | ) | | | (188,855 | ) | | | — | |
Net realized gain on investments — Retail Shares | | | — | | | | — | | | | — | | | | — | | | | (1,042,445 | ) | | | (164,017 | ) |
Net realized gain on investments — Institutional Shares | | | — | | | | — | | | | — | | | | — | | | | (2,684,815 | ) | | | (402,971 | ) |
| | | | | | | | | | | | | | | | | | | | | | | | | |
Decrease in net assets from distributions to shareholders | | | — | | | | — | | | | — | | | | (2,902,342 | ) | | | (3,949,349 | ) | | | (566,988 | ) |
| | | | | | | | | | | | | | | | | | | | | | | | | |
| Capital share transactions: | | | | | | | | | | | | | | | | | | | | | | | | |
Proceeds from the sale of shares — Retail Shares | | | 148,846,560 | | | | 127,303,615 | | | | 5,364,967 | | | | 4,023,830 | | | | 5,134,774 | | | | 8,010,189 | |
Proceeds from the sale of shares — Institutional Shares | | | 46,420,025 | | | | 33,295,847 | | | | 24,234,791 | | | | 1,488,854 | | | | 3,668,591 | | | | 8,626,269 | |
Net asset value of shares issued in reinvestment of | | | | | | | | | | | | | | | | | | | | | | | | |
distributions — Retail Shares | | | — | | | | — | | | | — | | | | 1,387,261 | | | | 1,043,079 | | | | 162,095 | |
Net asset value of shares issued in reinvestment | | | | | | | | | | | | | | | | | | | | | | | | |
of distributions — Institutional Shares | | | — | | | | — | | | | — | | | | 1,404,261 | | | | 2,845,159 | | | | 402,971 | |
Cost of shares redeemed — Retail Shares | | | (364,930,094 | ) | | | (443,431,776 | ) | | | (23,504,272 | ) | | | (6,817,657 | ) | | | (6,466,538 | ) | | | (3,707,694 | ) |
Cost of shares redeemed — Institutional Shares | | | (34,318,103 | ) | | | (110,570,717 | ) | | | (3,682,946 | ) | | | (2,963,628 | ) | | | (4,447,422 | ) | | | (39,509 | ) |
| | | | | | | | | | | | | | | | | | | | | | | | | |
Increase (decrease) in net assets derived from capital | | | | | | | | | | | | | | | | | | | | | | | | |
share transactions | | | (203,981,612 | ) | | | (393,403,031 | ) | | | 2,412,540 | | | | (1,477,079 | ) | | | 1,777,643 | | | | 13,454,321 | |
| | | | | | | | | | | | | | | | | | | | | | | | | |
Net increase (decrease) in net assets | | | (277,752,234 | ) | | | (35,983,991 | ) | | | 1,124,563 | | | | 14,240,760 | | | | (10,553,728 | ) | | | 22,255,144 | |
| | | | | | | | | | | | | | | | | | | | | | | | | |
| Net Assets: | | | | | | | | | | | | | | | | | | | | | | | | |
Beginning of year | | | 1,371,802,225 | | | | 1,407,786,216 | | | | 90,742,387 | | | | 76,501,627 | | | | 52,734,042 | | | | 30,478,898 | |
End of year | | $ | 1,094,049,991 | | | $ | 1,371,802,225 | | | $ | 91,866,950 | | | $ | 90,742,387 | | | $ | 42,180,314 | | | $ | 52,734,042 | |
| Undistributed (accumulated) net investment | | | | | | | | | | | | | | | | | | | | | | | | |
income (loss) at end of year | | $ | — | | | $ | (204,698 | ) | | $ | (1,144 | ) | | $ | — | | | $ | 19,460 | | | $ | 181,403 | |
| | | | | | | | | | | | | | | | | | | | | | | | | |
| Capital share transactions — Retail Shares | | | | | | | | | | | | | | | | | | | | | | | | |
Shares sold | | | 7,239,313 | | | | 7,346,426 | | | | 538,631 | | | | 458,290 | | | | 315,969 | | | | 533,701 | |
Shares issued in reinvestment of distributions | | | — | | | | — | | | | — | | | | 146,490 | | | | 75,768 | | | | 10,539 | |
Shares redeemed | | | (18,037,776 | ) | | | (26,399,948 | ) | | | (2,332,033 | ) | | | (798,436 | ) | | | (395,632 | ) | | | (248,636 | ) |
| Net increase (decrease) | | | (10,798,463 | ) | | | (19,053,522 | ) | | | (1,793,402 | ) | | | (193,656 | ) | | | (3,895 | ) | | | 295,604 | |
| | | | | | | | | | | | | | | | | | | | | | | | | |
| Capital share transactions — Institutional Shares | | | | | | | | | | | | | | | | | | | | | | | | |
Shares sold | | | 2,225,751 | | | | 1,978,755 | | | | 2,388,891 | | | | 169,546 | | | | 210,535 | | | | 563,646 | |
Shares issued in reinvestment of distributions | | | — | | | | — | | | | — | | | | 147,817 | | | | 205,430 | | | | 26,099 | |
Shares redeemed | | | (1,693,750 | ) | | | (6,297,610 | ) | | | (368,565 | ) | | | (321,133 | ) | | | (265,971 | ) | | | (2,895 | ) |
| | | | | | | | | | | | | | | | | | | | | | | | | |
| Net increase (decrease) | | | 532,001 | | | | (4,318,855 | ) | | | 2,020,326 | | | | (3,770 | ) | | | 149,994 | | | | 586,850 | |
| | | | | | | | | | | | | | | | | | | | | | | | | |
| See Notes to Financial Statements. | | 21 |
Baron Select Funds | |
December 31, 2011 |
| STATEMENTS OF CHANGES IN NET ASSETS (Continued) |
| |
| |
| |
| |
| | | | | | | | | | | Baron Emerging | |
| | | Baron Real Estate Fund | | | Markets Fund | |
| | | For the Year | | | For the Year | | | For the Year | |
| | | Ended | | | Ended | | | Ended | |
| | | December 31, | | | December 31, | | | December 31, | |
| | | 2011 | | | 2010 | | | 2011 | |
| Increase (Decrease) in Net Assets: | | | | | | | | | | | | |
| Operations: | | | | | | | | | | | | |
Net investment income (loss) | | $ | (959 | ) | | $ | 12,438 | | | $ | (10,259 | ) |
Net realized gain (loss) | | | (109,997 | ) | | | 111,975 | | | | (427,795 | ) |
Net change in unrealized appreciation (depreciation) | | | (225,623 | ) | | | 1,397,324 | | | | (834,374 | ) |
| | | | | | | | | | | | |
Increase (decrease) in net assets resulting from operations | | | (336,579 | ) | | | 1,521,737 | | | | (1,272,428 | ) |
| | | | | | | | | | | | |
| Distributions to shareholders from: | | | | | | | | | | | | |
Net investment income — Retail Shares | | | (3,496 | ) | | | — | | | | — | |
Net investment income — Institutional Shares | | | (2,252 | ) | | | — | | | | — | |
Net realized gain on investments — Retail Shares | | | (182,704 | ) | | | — | | | | — | |
Net realized gain on investments — Institutional Shares | | | (78,613 | ) | | | — | | | | — | |
| | | | | | | | | | | | |
Decrease in net assets from distributions to shareholders | | | (267,065 | ) | | | — | | | | — | |
| | | | | | | | | | | | |
| Capital share transactions: | | | | | | | | | | | | |
Proceeds from the sale of shares — Retail Shares | | | 7,600,784 | | | | 5,395,141 | | | | 3,683,013 | |
Proceeds from the sale of shares — Institutional Shares | | | 1,788,912 | | | | 2,663,989 | | | | 5,147,817 | |
Net asset value of shares issued in reinvestment of distributions — Retail Shares | | | 182,608 | | | | — | | | | — | |
Net asset value of shares issued in reinvestment of distributions — Institutional Shares | | | 80,865 | | | | — | | | | — | |
Cost of shares redeemed — Retail Shares | | | (1,863,733 | ) | | | (888,517 | ) | | | (1,327,437 | ) |
Cost of shares redeemed — Institutional Shares | | | (70,224 | ) | | | — | | | | (10,919 | ) |
| | | | | | | | | | | | |
Increase in net assets derived from capital share transactions | | | 7,719,212 | | | | 7,170,613 | | | | 7,492,474 | |
Net increase in net assets | | | 7,115,568 | | | | 8,692,350 | | | | 6,220,046 | |
| Net assets: | | | | | | | | | | | | |
Beginning of year | | | 8,692,350 | | | | — | | | | — | |
End of year | | $ | 15,807,918 | | | $ | 8,692,350 | | | $ | 6,220,046 | |
| Undistributed (accumulated) net investment income (loss) at end of year | | $ | — | | | $ | 3,839 | | | $ | (17,492 | ) |
| | | | | | | | | | | | |
| Capital share transactions — Retail Shares | | | | | | | | | | | | |
Shares sold | | | 571,234 | | | | 513,533 | | | | 372,273 | |
Shares issued in reinvestment of distributions | | | 15,674 | | | | — | | | | — | |
Shares redeemed | | | (149,852 | ) | | | (81,044 | ) | | | (136,479 | ) |
| | | | | | | | | | | | |
| Net increase | | | 437,056 | | | | 432,489 | | | | 235,794 | |
| Capital share transactions — Institutional Shares | | | | | | | | | | | | |
Shares sold | | | 137,682 | | | | 253,649 | | | | 515,221 | |
Shares issued in reinvestment of distributions | | | 6,915 | | | | — | | | | — | |
Shares redeemed | | | (5,558 | ) | | | — | | | | (1,180 | ) |
| | | | | | | | | | | | |
| Net increase | | | 139,039 | | | | 253,649 | | | | 514,041 | |
| 22 | | See Notes to Financial Statements. |
December 31, 2011 | |
Baron Select Funds |
| STATEMENT OF CASH FLOWS |
| |
| |
| FOR THE YEAR ENDED DECEMBER 31, 2011 |
| |
| | Baron Partners |
| | Fund |
| Increase (Decrease) in Cash: | | | | |
| Cash Provided from Operating Activities | | | | |
Net decrease in net assets resulting from operations | | $ | (73,770,622 | ) |
Adjustments to reconcile net decrease in net assets resulting from operations to net cash provided by operating activities: | | | | |
Purchases of portfolio securities | | | (273,579,768 | ) |
Payments to cover short securities | | | (15,814,775 | ) |
Proceeds from sales of portfolio securities | | | 604,012,366 | |
Proceeds from securities sold short | | | 14,110,123 | |
Net purchases, sales and maturities of short-term investments | | | (236,839 | ) |
Increase in dividends and interest receivable | | | (114,020 | ) |
Increase in receivable for securities sold | | | (2,542,436 | ) |
Decrease in prepaid expenses | | | 2,875 | |
Decrease in payable for investment securities purchased | | | (2,571,890 | ) |
Decrease in accrued expenses | | | (54,929 | ) |
Net realized gain on investments | | | (52,274,609 | ) |
Net realized loss on short sales | | | 1,704,652 | |
Net change in unrealized appreciation of investments | | | 115,333,302 | |
Net cash provided by operating activities | | | 314,203,430 | |
| Cash Used from Financing Activities | | | | |
Proceeds from shares sold | | | 196,561,217 | |
Payment for shares redeemed | | | (399,764,647 | ) |
Decrease in payable for borrowings against line of credit | | | (111,000,000 | ) |
Net cash used in financing activities | | | (314,203,430 | ) |
Net increase in cash | | | — | |
Cash at beginning of year | | | — | |
Cash at end of year | | $ | — | |
| Supplemental cash flow information: | | | | |
Interest paid | | $ | 4,544,981 | |
| See Notes to Financial Statements. | | 23 |
Baron Select Funds | |
December 31, 2011 |
| NOTES TO FINANCIAL STATEMENTS |
| |
1. ORGANIZATION
Baron Select Funds (the “Trust”) is registered under the Investment Company Act of 1940, as amended (the “1940 Act”), as an open-end management investment company established as a Delaware statutory trust on April 30, 2003. The Trust currently offers six series (individually, a “Fund” and collectively, the “Funds”): Baron Partners Fund, Baron Focused Growth Fund, Baron Real Estate Fund and Baron Energy and Resources Fund, which are non-diversified; and Baron International Growth Fund and Baron Emerging Markets Fund, which are diversified. Baron Energy and Resources Fund commenced investment operations on January 3, 2012 and, therefore, is not included in this report. The Funds’ investment objective is to seek capital appreciation. Baron Partners Fund may employ “leverage” by borrowing money and using it for the purchase of additional securities. Borrowing for investment increases both investment opportunity and investment risk. Baron International Growth Fund and Baron Emerging Markets Fund invest their assets primarily in non-U.S. companies. Baron Real Estate Fund invests its assets primarily in U.S. and non-U.S. real estate and real estate-related companies. Baron Energy and Resources Fund invests its assets primarily in common stock of U.S. and non-U.S. energy and resources companies and related companies and energy and resources master limited partnerships (“MLPs”) of any market capitalization.
Each Fund offers two classes of shares, Retail Shares and Institutional Shares, which differ only in their ongoing fees, expenses and eligibility requirements. Retail Shares are offered to all investors. Institutional Shares are for investments in the amount of $1 million or more per Fund. Institutional Shares are intended for certain financial intermediaries that offer shares of Baron Funds through fee based platforms, retirement platforms or other platforms. Each class of shares has equal rights to earnings and assets except that each class bears different expenses for distribution and shareholder servicing. Each Fund’s investment income, realized and unrealized gains or losses on investments and foreign currency, and expenses other than those attributable to a specific class are allocated to each class based on its relative net assets. Each class of shares has exclusive voting rights with respect to matters that affect just that class.
Baron Partners Fund was organized originally as a limited partnership in January 1992, under the laws of the State of Delaware. Effective as of the close of business on April 30, 2003, the predecessor partnership was reorganized into a Delaware statutory trust. Baron Partners Fund commenced operations on April 30, 2003 with a contribution of assets and liabilities, including securities-in-kind from the predecessor partnership.
Baron Focused Growth Fund was organized originally as a limited partnership in May 1996, under the laws of the State of Delaware. Effective as of the close of business on June 30, 2008, the predecessor partnership was reorganized into a series of the Trust. Baron Focused Growth Fund commenced operations on June 30, 2008 with a contribution of assets and liabilities, including securities-in-kind from the predecessor partnership.
Baron Emerging Markets Fund commenced investment operations on January 2, 2011.
2. SIGNIFICANT ACCOUNTING POLICIES
The following is a summary of significant accounting policies followed by the Funds. The policies are in conformity with accounting principles generally accepted in the United States of America (“GAAP”). The preparation of financial statements in accordance with GAAP requires management to make estimates and assumptions that affect the reported amounts of assets and liabilities at the date of the financial statements and the amounts of income and expenses during the period. Actual results could differ from those estimates. Events occurring subsequent to the date of the Statements of Assets and Liabilities and through the date of issuance of the financial statements have been evaluated for adjustment to or disclosure in the financial statements.
a) Security Valuation. The Funds’ share prices or net asset values are calculated as of the close of the regular trading session (usually 4 p.m. E.T.) on the New York Stock Exchange (“NYSE”) on any day on which the NYSE is open. Portfolio securities traded on any national stock exchange are valued based on the last sale price. For securities traded on NASDAQ, the Funds use the NASDAQ Official Closing Price. Where market quotations are not readily available, or, if in BAMCO, Inc.’s (the “Adviser”) judgment, they do not accurately reflect the fair value of a security, or an event occurs after the market close but before the Funds are priced that materially affects the value of a security, the securities will be valued by the Adviser using policies and procedures approved by the Board of Trustees (the “Board”). The Adviser has a Fair Valuation Committee (the “Committee”) comprised of senior executives and the Committee reports to the Board every quarter. Factors the Committee considers when valuing a security include whether a current price is stale, there is recent news, the security is thinly traded, transactions are infrequent or quotations are genuine. There can be no guarantee, however, that a fair valuation used by the Funds on any given day will more accurately reflect the market value of an investment than the closing price of such investment in its market. Debt instruments having a remaining maturity greater than sixty days will be valued on the basis of prices obtained from a pricing service approved by the Board or at the mean of the bid and ask prices from the dealer maintaining an active market in that security. Money market instruments held by the Funds with a remaining maturity of sixty days or less are valued at amortized cost, which approximates fair value.
Non-U.S. equity securities are valued on the basis of their most recent closing market prices and translated into U.S. dollars at 4 p.m. E.T., except under the circumstances described below. Most foreign markets close before 4 p.m. E.T. For securities primarily traded in the Far East, for example, the most recent closing prices may be as much as fifteen hours old at 4 p.m. E.T. If the Adviser determines that developments between the close of the foreign markets and 4 p.m. E.T. will, in its judgment, materially affect the value of some or all of the Funds’ securities, the Adviser will adjust the previous closing prices to reflect what it believes to be the fair value of the securities as of 4 p.m. E.T. In deciding whether to make these adjustments, the Adviser reviews a variety of factors, including developments in foreign markets, the performance of U.S. securities markets, and the performance of instruments trading in U.S. markets that represent non-U.S. securities and baskets of non-U.S. securities. The Adviser may also fair value securities in other situations, for example, when a particular foreign market is closed but the Funds are open. The Adviser uses outside pricing services to provide it with closing market prices and information used for adjusting those prices. The Adviser cannot predict how often it will use closing prices or how often it will adjust those prices. As a means of evaluating its fair value process, the Adviser routinely compares closing market prices, the next day’s opening prices in the same markets, and adjusted prices. Other mutual funds may adjust the prices of their securities by different amounts.
b) Foreign Currency Translations. Values of assets and liabilities denominated in foreign currencies are translated into U.S. dollars using the price of such currencies at the time the net asset value is determined. Purchases and sales of investments and dividend income are converted at the prevailing rate of exchange on the respective dates of such transactions. Net realized gain (loss) on foreign currency transactions include gain (loss) arising from the fluctuation in the exchange rates between trade and settlement dates on security transactions and currency gain (loss) between the accrual and payment dates on dividends and foreign withholding taxes. The Funds do not isolate that portion of the results of operations resulting from changes in foreign exchange rates on investments from the fluctuations arising from changes in market prices of securities held. Such fluctuations are included with the net realized and unrealized gain or loss from investments and foreign currency transactions. The Funds may invest in foreign securities and foreign currency transactions that may involve risks not associated with domestic investments as a result of the level of governmental supervision and regulation of foreign securities markets and the possibility of political or economic instability, among others.
24
December 31, 2011 | |
Baron Select Funds |
| NOTES TO FINANCIAL STATEMENTS (Continued) |
| |
2. SIGNIFICANT ACCOUNTING POLICIES (Continued)
c) Securities Transactions, Investment Income and Expense Allocation. Securities transactions are recorded on a trade date basis. Realized gain and loss from securities transactions are recorded on an identified cost basis for financial reporting and federal income tax purposes. Dividend income is recognized on the ex-dividend date and interest income is recognized on an accrual basis which includes the accretion of discounts and amortization of premiums. Certain dividends from foreign securities will be recorded as soon as the Funds are informed of the dividend if such information is obtained subsequent to the ex-dividend date. Distributions received from certain investments held by the Funds may be comprised of dividends, realized gains and returns of capital. The Funds originally estimate the expected classification of such payments. The amounts may subsequently be reclassified upon receipt of information from the issuer. The Funds are charged for those expenses of the Trust that are directly attributable to each Fund, such as advisory and custodian fees. Expenses that are not directly attributable to a Fund are typically allocated among the Funds in proportion to their respective net assets.
d) Securities Lending. The Funds may lend securities to certain brokers. Upon such loans, the Funds receive collateral which is maintained by the custodian. The Funds earn interest on such collateral and earn income in the form of negotiated lenders’ fees, both of which are included in securities lending income in the Statements of Operations. Securities loaned are required to be secured at all times by collateral equal to at least 102% of the market value of the securities loaned. Risks may arise upon entering into securities lending to the extent that the value of the collateral is less than the value of the securities loaned due to the changes in the value of collateral or the loaned securities. The Funds may receive collateral in the form of cash or other eligible securities, such as a letter of credit issued by a U.S. bank or securities issued or guaranteed by the U.S. government. Securities purchased with cash collateral are subject to the risks inherent in investing in these securities. At December 31, 2011, the Funds did not have any securities on loan.
e) Repurchase Agreements. The Funds may invest in repurchase agreements,which are short-term investments whereby the Funds acquire ownership of a debt security and the seller agrees to repurchase the security at a future date at a specified price. When entering into repurchase agreements, it is the Funds’ policy that their custodian or a third party custodian take possession of the underlying collateral securities, the market value of which, at all times, equals at least 105% of the principal amount of the repurchase transaction. To the extent that any repurchase transaction exceeds one business day, the value of the collateral is marked-to-market to ensure the adequacy of the collateral. If the seller defaults and the market value of the collateral declines or if bankruptcy proceedings are commenced with respect to the seller of the security, realization of the collateral by the Funds may be delayed or limited.
f) Federal and Foreign Income Taxes. The Trust treats each Fund as a separate entity for federal income tax purposes. Each Fund intends to meet the requirements of the Internal Revenue Code of 1986, as amended, applicable to regulated investment companies, and to distribute to its shareholders substantially all of its net investment income and any net realized capital gains at least annually. None of the Funds will be subject to federal or state income taxes to the extent that they qualify as Regulated Investment Companies and all of their income is distributed.
The Funds may be subject to foreign taxes on income and gains on investments that are accrued based upon the Funds’ understanding of the tax rules and regulations that exist in the countries in which the Funds invest. Foreign governments may also impose taxes or other payments on investments with respect to foreign securities. Such taxes are accrued as applicable.
g) Restricted Securities. The Funds may invest in securities which are restricted as to public sale in accordance with the Securities Act of 1933. Such assets are valued by the Adviser pursuant to policies and procedures approved by the Board.
h) Distributions to Shareholders. Income and capital gain distributions to shareholders are determined in accordance with income tax regulations which may differ from GAAP. These differences are primarily due to differing treatments for net investment loss, foreign currency gains and losses, partnership basis adjustments, income from passive foreign investment corporations and wash sale losses deferred.
i) Commitments and Contingencies. In the normal course of business, the Funds may enter into contracts and agreements that contain a variety of representations and warranties, which provide general indemnification. The maximum exposure to the Funds under these agreements is unknown, as this would involve future claims that may be made against the Funds that have not yet occurred. However, based on experience, the Funds expect the risk of loss to be remote.
j) Cash and Cash Equivalents. The Funds consider all short term liquid investments with a maturity of three months or less when purchased to be cash equivalents.
3. PURCHASES AND SALES OF SECURITIES
Purchases and sales of securities, other than short term securities, for the year ended December 31, 2011 were as follows:
| Fund | | | Purchases | | | Sales |
| Baron Partners Fund | | | $273,579,768 | | | $603,944,945 |
| Baron Focused Growth Fund | | | 39,973,910 | | | 42,814,827 |
| Baron International Growth Fund | | | 25,717,425 | | | 27,048,678 |
| Baron Real Estate Fund | | | 17,202,226 | | | 9,536,016 |
| Baron Emerging Markets Fund | | | 8,988,320 | | | 2,278,497 |
| | | | | | | |
| Short sales and purchases to cover for Baron Partners Fund were $14,110,123 and $15,814,775, respectively. | | | | | | |
4. INVESTMENT ADVISORY FEES AND OTHER TRANSACTIONS WITH AFFILIATES
a) Investment Advisory Fees. The Adviser, a wholly owned subsidiary of Baron Capital Group, Inc. (“BCG”), serves as investment adviser to the Funds. As compensation for services rendered, the Adviser receives a fee payable monthly equal to 1% per annum of the average daily net assets of the respective Funds. For Baron Partners Fund, Baron Focused Growth Fund, Baron International Growth Fund, Baron Real Estate Fund and Baron Emerging Markets Fund, the Adviser has contractually agreed to reduce its fee, to the extent required to limit the net operating expense ratio (excluding portfolio transaction costs, interest and extraordinary expenses) to 1.45%, 1.35%, 1.50%, 1.35% and 1.50% of average daily net assets of the Retail Shares, and 1.20%, 1.10%, 1.25%, 1.10% and 1.25% of average daily net assets of the Institutional Shares, respectively.
b) Distribution Fees. Baron Capital, Inc. (“BCI”), a wholly owned subsidiary of BCG, is a registered broker-dealer and the distributor of the Retail Shares pursuant to a distribution plan under Rule 12b-1 of the 1940 Act. The distribution plan authorizes the Funds to pay BCI a distribution fee payable monthly equal to 0.25% per annum of the Retail Shares’ average daily net assets of the respective Funds.
c) Trustee Fees. Certain Trustees of the Trust may be deemed to be affiliated with, or interested persons (as defined by the 1940 Act) of the Funds’ Adviser or of BCI. None of the Trustees so affiliated received compensation for his or her services as a Trustee of the Trust. None of the Funds’ officers received compensation from the Funds in that capacity.
d) Fund Accounting and Administration Fees. The Funds have entered into an agreement with State Street Bank and Trust Company (the “Custodian”) to perform accounting and certain administrative services. The Custodian is compensated for fund accounting services based on a percentage of the Funds’ net assets, subject to certain minimums plus fixed annual fees for the administrative services.
25
Baron Select Funds | |
December 31, 2011 |
| NOTES TO FINANCIAL STATEMENTS (Continued) |
| |
5. LINE OF CREDIT
Baron Partners Fund participates in a committed line of credit provided by a syndicate of banks (including the Custodian) in the amount of $400 million. A commitment fee of 0.15% per annum is incurred on the unused portion of the line of credit. The line of credit is used for investment purposes and expires on September 21, 2012. Baron Partners Fund may borrow up to the lesser of $400 million or the maximum amount Baron Partners Fund may borrow under the 1940 Act, the limitations included in Baron Partners Fund’s prospectus, or any limit or restriction under any law or regulation to which Baron Partners Fund is subject or any agreement to which Baron Partners Fund is a party. Interest is charged to Baron Partners Fund, based on its borrowings, at a rate per annum equal to the higher of the Federal Funds Rate or the Libor rate plus a margin of 1.15%. For the year ended December 31, 2011, interest expense incurred on these loans amounted to $4,580,392.
During the year ended December 31, 2011, Baron Partners Fund had an average daily balance on the line of credit of $319.0 million at a weighted average interest rate of 1.44%. At December 31, 2011, Baron Partners Fund had an outstanding loan in the amount of $236,500,000.
6. SHORT SALES
The Funds may sell securities short. When the Funds sell short, the Funds record a liability for securities sold short and record an asset equal to the proceeds received. The amount of the liability is subsequently marked to market to reflect the market value of the securities sold short. The Funds may incur dividend expense if a security that has been sold short declares a dividend. The Funds are exposed to market risk based on the amount, if any, that the market value of the securities sold short exceeds the proceeds received.
The Funds are required to maintain collateral in a segregated account for the outstanding short sales. Short sales involve elements of market risks and exposure to loss in excess of the amount recognized in the Statements of Assets and Liabilities. The Funds’ risk of loss in these types of short sales is unlimited because there is no limit to the cost of replacing the borrowed security. During the year ended December 31, 2011, Baron Partners Fund engaged in short selling. As of December 31, 2011, the Funds did not have any open short sales.
7. RESTRICTED SECURITIES
At December 31, 2011, investments in securities included securities that are restricted and/or illiquid. Restricted securities are often purchased in private placement transactions, are not registered under the Securities Act of 1933, may have contractual restrictions on resale and are valued pursuant to the policies and procedures for fair value pricing approved by the Board. A security may be considered illiquid if it lacks a readily available market or if its valuation has not changed for a certain period of time. The Funds may receive more or less than this valuation in an actual sale and that difference could be material. At December 31, 2011, the Funds held investments in restricted and/or illiquid securities that were valued pursuant to policies and procedures for fair value pricing as follows:
| | | | Baron Partners Fund |
| | | | Acquisition | | | |
| Name of Issuer | | | Date(s) | | | Value |
| Private Equity Investments | | | | | | | |
Kerzner International Holdings Ltd., Cl A | | | 9/27/2006 | | | $ | 3,900,000 |
Windy City Investments Holdings, L.L.C. | | | 11/13/2007, 1/27/2011 | | | | 22,055,268 |
| | | | | | | | |
| Total Restricted Securities: | | | | | | | |
(Cost $80,134,888)† (2.38% of Net Assets) | | | | | | $ | 25,955,268 |
| | | | | | | | |
| | | | Baron International Growth Fund |
| | | | Acquisition | | | | |
| Name of Issuer | | | Date | | | Value |
| Private Equity Investments | | | | | | | |
Better Place, Inc. (Series C) | | | | | | | |
(Cost $275,001) (0.65% of Net Assets) | | | 12/1/2011 | | | $ | 275,001 |
† See Statements of Net Assets for cost of individual securities.8. FAIR VALUE MEASUREMENTS
Fair value is defined by GAAP as the price that the Funds would receive upon selling an investment in a timely transaction to an independent buyer in the principal or most advantageous market for the investment. GAAP provides a three-tier hierarchy to maximize the use of observable market data and minimize the use of unobservable inputs and to establish classification of fair value measurements for disclosure purposes. Inputs refer broadly to the assumptions that market participants would use in pricing the asset or liability. Inputs may be observable or unobservable. Observable inputs are based on market data obtained from sources independent of the Funds. Unobservable inputs are inputs that reflect the Funds’ own assumptions based on the best information available in the circumstances. The three-tier hierarchy of inputs is summarized in the three broad Levels listed below.
| | • | | Level 1 — quoted prices in active markets for identical assets or liabilities; |
| |
| | • | | Level 2 — prices determined using other significant inputs that are observable either directly, or indirectly through corroboration with observable market data (which could include quoted prices for similar assets or liabilities, interest rates, credit risk, etc.); |
| |
| | • | | Level 3 — prices determined using significant unobservable inputs when quoted prices or observable inputs are unavailable such as when there is little or no market activity for an asset or liability (unobservable inputs reflect each Fund’s own assumptions in determining the fair value of assets or liabilities and would be based on the best information available). |
The inputs or methodology used for valuing securities are not necessarily an indication of the risk associated with investing in those securities. For example, non-U.S. securities, whose markets close hours before the Funds value their holdings, may require revised valuations due to significant movement in the U.S. markets. Since these values are not obtained from quoted prices in an active market such securities are reflected as Level 2.
26
December 31, 2011 | |
Baron Select Funds |
| NOTES TO FINANCIAL STATEMENTS (Continued) |
| |
8. FAIR VALUE MEASUREMENTS (Continued)
The Funds have procedures to determine the fair value of securities and other financial instruments for which market prices are not readily available or which may not be reliably priced. Under these procedures, the Funds primarily employ a market-based approach which may use related or comparable assets or liabilities, recent transactions, market multiples, book values, and other relevant information for the investment to determine the fair value of the investment. The Funds may also use an income-based valuation approach in which the anticipated future cash flows of the investment are discounted to calculate fair value. Discounts may also be applied due to the nature or duration of any restrictions on the disposition of the investments. Due to the inherent uncertainty of valuations of such investments, the fair values may differ significantly from the values that would have been used had an active market existed.
The following is a summary of the inputs used as of December 31, 2011 in valuing the Funds’ investments carried at fair value:
| | Baron Partners Fund |
| | Quoted Prices in | | Other | | | | | | | | | |
| | Active Markets | | Significant | | Significant | | | | |
| | for Identical | | Observable | | Unobservable | | | | |
| | Assets | | Inputs | | Inputs | | | | |
| Description | (Level 1) | | (Level 2) | | (Level 3) | | | Total |
| Common Stocks† | | $ | 1,301,696,048 | | | | $ | — | | | | $ | — | | | | $ | 1,301,696,048 |
| Private Equity Investments† | | | — | | | | | — | | | | | 25,955,268 | | | | | 25,955,268 |
| Short Term Investments | | | — | | | | | 370,174 | | | | | — | | | | | 370,174 |
| Total Investments | | $ | 1,301,696,048 | | | | $ | 370,174 | | | | $ | 25,955,268 | | | | $ | 1,328,021,490 |
Transfers between Levels 1, 2 or 3, if any, are recognized at ending value on December 31, 2011. There have been no significant transfers in and out of Level 1, 2 or 3 fair value measurements for the Fund for the year ended December 31, 2011 from the previous year end.
| | Baron Focused Growth Fund |
| | Quoted Prices in | | Other | | | | | | | | | |
| | Active Markets | | Significant | | Significant | | | | |
| | for Identical | | Observable | | Unobservable | | | | |
| | Assets | | Inputs | | Inputs | | | | |
| Description | (Level 1) | | (Level 2) | | (Level 3) | | | Total |
| Common Stocks† | | $ | 86,252,376 | | | | $ | — | | | | $ | — | | | | $ | 86,252,376 |
| Short Term Investments | | | — | | | | | 5,654,687 | | | | | — | | | | | 5,654,687 |
| Total Investments | | $ | 86,252,376 | | | | $ | 5,654,687 | | | | $ | — | | | | $ | 91,907,063 |
Transfers between Levels 1, 2 or 3, if any, are recognized at ending value on December 31, 2011. There have been no significant transfers in and out of Level 1, 2 or 3 fair value measurements for the Fund for the year ended December 31, 2011 from the previous year end.
| | Baron International Growth Fund |
| | Quoted Prices in | | Other | | | | | | | | | |
| | Active Markets | | Significant | | Significant | | | | |
| | for Identical | | Observable | | Unobservable | | | | |
| | Assets | | Inputs | | Inputs | | | | |
| Description | (Level 1) | | (Level 2) | | (Level 3) | | | Total |
| Common Stocks† | | $ | 38,152,594 | | | | $ | 1,334,111 | | | | $ | — | | | | $ | 39,486,705 |
| Preferred Stocks | | | — | | | | | — | | | | | 275,001 | | | | | 275,001 |
| Short Term Investments | | | — | | | | | 2,303,207 | | | | | — | | | | | 2,303,207 |
| Total Investments | | $ | 38,152,594 | | | | $ | 3,637,318 | | | | $ | 275,001 | | | | $ | 42,064,913 |
The fair value of Level 2 investments at December 31, 2010 was $19,406,157. $7,022,633 was transferred out of Level 2 into Level 1 at December 31, 2011 as a result of no longer adjusting closing prices for certain securities (as described in Note 2a), due to significant market movements between the time at which the Fund valued its securities and the earlier closing of foreign markets. It is the Fund’s policy to recognize transfers in and transfers out at the fair value as of the end of the period.
| | Baron Real Estate Fund |
| | Quoted Prices in | | Other | | | | | | | | | |
| | Active Markets | | Significant | | Significant | | | | |
| | for Identical | | Observable | | Unobservable | | | | |
| | Assets | | Inputs | | Inputs | | | | |
| Description | (Level 1) | | (Level 2) | | (Level 3) | | | Total |
| Common Stocks† | | $ | 15,668,982 | | | | $ | — | | | | $ | — | | | | $ | 15,668,982 |
| Short Term Investments | | | — | | | | | 154,520 | | | | | — | | | | | 154,520 |
| Total Investments | | $ | 15,668,982 | | | | $ | 154,520 | | | | $ | — | | | | $ | 15,823,502 |
27
Baron Select Funds | |
December 31, 2011 |
| NOTES TO FINANCIAL STATEMENTS (Continued) |
| |
8. FAIR VALUE MEASUREMENTS (Continued)
Transfers between Levels 1, 2 or 3, if any, are recognized at ending value on December 31, 2011. There have been no significant transfers in and out of Level 1, 2 or 3 fair value measurements for the Fund for the year ended December 31, 2011 from the previous year end.
| | Baron Emerging Markets Fund |
| | Quoted Prices in | | Other | | | | | | | | | |
| | Active Markets | | Significant | | Significant | | | | |
| | for Identical | | Observable | | Unobservable | | | | |
| | Assets | | Inputs | | Inputs | | | | |
| Description | (Level 1) | | (Level 2) | | (Level 3) | | | Total |
| Common Stocks† | | $ | 4,704,036 | | | | $ | 784,763 | | | | $ | — | | | | $ | 5,488,799 |
| Warrants | | | 2,015 | | | | | — | | | | | — | | | | | 2,015 |
| Short Term Investments | | | — | | | | | 766,983 | | | | | — | | | | | 766,983 |
| Total Investments | | $ | 4,706,051 | | | | $ | 1,551,746 | | | | $ | — | | | | $ | 6,257,797 |
† See Statements of Net Assets for additional detailed categorizations.The following is a reconciliation of investments in which significant unobservable inputs (Level 3) were used in determining fair value:
| | | Baron Partners Fund |
| | | | | | | | | | | | | | | | | | | | | | | | | | | | | | | | | | | | | | | | | | | | | | | | Change in Net |
| | | | | | | | | | | | | | | | | | | | | | | | | | | | | | | | | | | | | | | | | | | | | | | | Unrealized |
| | | | | | | | | | | | | | | | | | | | | | | | | | | | | | | | | | | | | | | | | | | | | | | | Appreciation |
| | | | | | | | | | | | | | | | | | | | | | | | | | | | | | | | | | | | | | | | | | | | | | | | (Depreciation) |
| | | | | | | | Net | | Net Change in | | | | | | | | | | | | | | | | | | | | | | | | | | | | | | | | from Investments |
| | | Balance as of | | Accrued | | Realized | | Unrealized | | | | | | | | | | | | Transfers | | Transfers | | Balance as of | | still held at |
| Investments in | | December 31, | | Premiums/ | | Gain | | Appreciation | | | | | | | | | | | | Into | | Out of | | December 31, | | December 31, |
| Securities | | 2010 | | Discounts | | (Loss) | | (Depreciation) | | Purchases | | Sales | | Level 3 | | Level 3 | | 2011 | | 2011 |
| |
| Private Equity Investments | | | | | | | | | | | | | | | | | | | | | | | | | | | | | | | | | | | | | | | | | | | | |
Consumer | | | | | | | | | | | | | | | | | | | | | | | | | | | | | | | | | | | | | | | | | | | | | | | | | | |
Discretionary | | | $ | 7,800,000 | | | | $ | — | | | | $ | — | | | | $ | (3,900,000 | ) | | | $ | — | | | | $ | — | | | | $ | — | | | | $ | — | | | | $ | 3,900,000 | | | | $ | (3,900,000 | ) |
Financials | | | | 22,856,987 | | | | | — | | | | | — | | | | | (3,617,160 | ) | | | | 2,815,441 | | | | | — | | | | | — | | | | | — | | | | | 22,055,268 | | | | | (3,617,160 | ) |
| Total | | | $ | 30,656,987 | | | | $ | — | | | | $ | — | | | | $ | (7,517,160 | ) | | | $ | 2,815,441 | | | | $ | — | | | | $ | — | | | | $ | — | | | | $ | 25,955,268 | | | | $ | (7,517,160 | ) |
| | | Baron International Growth Fund |
| | | | | | | | | | | | | | | | | | | | | | | | | | | | | | | | | | | | | | | | | | | | | | | | Change in Net |
| | | | | | | | | | | | | | | | | | | | | | | | | | | | | | | | | | | | | | | | | | | | | | | | Unrealized |
| | | | | | | | | | | | | | | | | | | | | | | | | | | | | | | | | | | | | | | | | | | | | | | | Appreciation |
| | | | | | | | | | | | | | | | | | | | | | | | | | | | | | | | | | | | | | | | | | | | | | | | (Depreciation) |
| | | | | | | | Net | | Net Change in | | | | | | | | | | | | | | | | | | | | | | | | | | | | | | | | from Investments |
| | | Balance as of | | Accrued | | Realized | | Unrealized | | | | | | | | | | | | Transfers | | Transfers | | Balance as of | | still held at |
| Investments in | | December 31, | | Premiums/ | | Gain | | Appreciation | | | | | | | | | | | | Into | | Out of | | December 31, | | December 31, |
| Securities | | 2010 | | Discounts | | (Loss) | | (Depreciation) | | Purchases | | Sales | | Level 3 | | Level 3 | | 2011 | | 2011 |
| |
| Private Equity Investments | | | | | | | | | | | | | | | | | | | | | | | | | | | | | | | | | | | | | | | | | | | | |
Preferred Stock | | | $ | — | | | | $ | — | | | | $ | — | | | | $ | — | | | | $ | 275,001 | | | | $ | — | | | | $ | — | | | | $ | — | | | | $ | 275,001 | | | | $ | — | |
| Total | | | $ | — | | | | $ | — | | | | $ | — | | | | $ | — | | | | $ | 275,001 | | | | $ | — | | | | $ | — | | | | $ | — | | | | $ | 275,001 | | | | $ | — | |
9. INCOME TAXES AND DISTRIBUTIONS TO SHAREHOLDERS
Federal income tax regulations differ from GAAP. Therefore, distributions determined in accordance with tax regulations may differ in amount or character from net investment income and net realized gain for financial reporting purposes. Net investment income (loss) and net realized and unrealized gain (loss) differ for financial statement and tax purposes due to differing treatments of net investment loss, foreign currency gains and losses, partnership basis adjustments, income from passive foreign investment corporations and wash sale losses deferred. Financial reporting records are adjusted for permanent book/tax differences to reflect tax character. Financial records are not adjusted for temporary differences.
28
December 31, 2011 | |
Baron Select Funds |
| NOTES TO FINANCIAL STATEMENTS (Continued) |
| |
9. INCOME TAXES AND DISTRIBUTIONS TO SHAREHOLDERS (Continued)
For the year ended December 31, 2011, the Funds recorded the following permanent reclassifications to reflect tax character. Reclassifications between income, gains and paid-in capital relate primarily to the tax treatment of net investment loss, foreign currency gains and losses and partnership basis adjustments. Results of operations and net assets were not affected by these reclassifications.
| | Undistributed | | | | | | | | | | |
| | (Accumulated) | | Accumulated | | | | | |
| | Net Investment | | Realized | | Paid-In |
| Fund | Income (Loss) | | Loss | | Capital |
| Baron Partners Fund | | $ | 8,641,157 | | | | $ | 570,822 | | | | $ | (9,211,979 | ) |
| Baron Focused Growth Fund | | | 455,423 | | | | | 24 | | | | | (455,447 | ) |
| Baron International Growth Fund | | | (2,773 | ) | | | | 2,773 | | | | | — | |
| Baron Real Estate Fund | | | 2,868 | | | | | 1,435 | | | | | (4,303 | ) |
| Baron Emerging Markets Fund | | | (7,233 | ) | | | | 42,143 | | | | | (34,910 | ) |
As of December 31, 2011, the components of net assets on a tax basis were as follows:
| | | | | | | Baron | | Baron | | Baron | | Baron |
| | Baron | | Focused | | International | | Real | | Emerging |
| | Partners Fund | | Growth Fund | | Growth Fund | | Estate Fund | | Markets Fund |
| Cost of investments | | $ | 875,773,432 | | | | $ | 64,978,428 | | | | $ | 37,148,035 | | | | $ | 14,779,202 | | | | $ | 7,101,337 | |
| | | | | | | | | | | | | | | | | | | | | | | | | |
| Gross tax unrealized appreciation | | | 516,744,928 | | | | | 27,553,184 | | | | | 9,223,501 | | | | | 1,422,063 | | | | | 230,603 | |
| Gross tax unrealized depreciation | | | (64,496,870 | ) | | | | (624,549 | ) | | | | (4,306,623 | ) | | | | (377,763 | ) | | | | (1,074,143 | ) |
| Net tax unrealized appreciation (depreciation) | | | 452,248,058 | | | | | 26,928,635 | | | | | 4,916,878 | | | | | 1,044,300 | | | | | (843,540 | ) |
| Net tax unrealized currency depreciation | | | — | | | | | — | | | | | (79 | ) | | | | — | | | | | (2,413 | ) |
| Undistributed net investment income | | | — | | | | | — | | | | | 39,476 | | | | | — | | | | | — | |
| Late year ordinary and post—October capital/currency loss deferrals | | | — | | | | | (1,246,078 | ) | | | | (919,852 | ) | | | | (120,623 | ) | | | | (227,007 | ) |
| Capital loss carryforwards | | | (576,657,921 | ) | | | | (12,422,278 | ) | | | | — | | | | | — | | | | | (164,558 | ) |
| Paid-in capital | | | 1,218,459,854 | | | | | 78,606,671 | | | | | 38,143,891 | | | | | 14,884,241 | | | | | 7,457,564 | |
| Net Assets | | $ | 1,094,049,991 | | | | $ | 91,866,950 | | | | $ | 42,180,314 | | | | $ | 15,807,918 | | | | $ | 6,220,046 | |
As of December 31, 2011, the Funds had capital loss carryforwards expiring as follows:
| | | | | | | | Baron | | Baron | | Baron | | Baron |
| | | Baron | | Focused | | International | | Real | | Emerging |
| | | Partners Fund | | Growth Fund | | Growth Fund | | Estate Fund | | Markets Fund |
| Short term: | | | | | | | | | | | | | | | | | | | | | | | | | |
| December 31, 2016 | | | $ | 241,990,742 | | | | $ | — | | | | $ | — | | | | $ | — | | | | $ | — | |
| December 31, 2017 | | | | 334,667,179 | | | | | 12,422,278 | | | | | — | | | | | — | | | | | — | |
| No expiration date | | | | — | | | | | — | | | | | — | | | | | — | | | | | 164,558 | |
| | | | $ | 576,657,921 | | | | $ | 12,422,278 | | | | $ | — | | | | $ | — | | | | $ | 164,558 | |
| Capital loss carryforward utilized during the year ended December 31, 2011 | | | $ | 46,573,849 | | | | $ | 4,220,565 | | | | $ | — | | | | $ | — | | | | $ | — | |
The tax character of distributions paid during the fiscal years ended December 31, 2011 and December 31, 2010 was as follows:
| | | Year Ended | | | Year Ended |
| | | December 31, 2011 | | | December 31, 2010 |
| | | | | | | Long Term | | | | | | | Long Term |
| Fund | | Ordinary1 | | | Capital Gain | | | Ordinary1 | | | Capital Gain |
| Baron Partners Fund | | $ | — | | | $ | — | | | $ | — | | | $ | — |
| Baron Focused Growth Fund | | | — | | | | — | | | | 2,902,342 | | | | — |
| Baron International Growth Fund | | | 379,919 | | | | 3,569,430 | | | | 566,988 | | | | — |
| Baron Real Estate Fund | | | 142,811 | | | | 124,254 | | | | — | | | | — |
| Baron Emerging Markets Fund | | | — | | | | — | | | | N/A | | | | N/A |
1 For tax purposes, short-term capital gains are considered ordinary income distributions.The Funds follow the provisions of the FASB Codification Section 740 (“ASC Section 740”) “Accounting for Uncertainty in Income Taxes” which clarifies the accounting for uncertainty in tax positions taken or expected to be taken on a tax return. ASC Section 740 sets forth a threshold for financial statement recognition, measurement and disclosure of tax positions taken or expected to be taken on a tax return. The Funds are required to recognize the tax effects of certain tax positions under a “more likely than not” standard, that based on their technical merits, have more than 50 percent likelihood of being sustained upon examination. Management has analyzed the tax positions taken on the Funds’ federal income tax returns for all open years (current and prior three years), and has concluded that no provision for federal income tax is required in the Funds’ financial statements. At December 31, 2011, the Funds did not have any uncertain tax benefits that require recognition, de-recognition or disclosure. The Funds’ federal, state and local income and federal excise tax returns for which the applicable statutes of limitations have not expired (current and prior three years) are subject to examination by the Internal Revenue Service and state departments of revenue.
29
Baron Select Funds | |
December 31, 2011 |
| NOTES TO FINANCIAL STATEMENTS (Continued) |
| |
9. INCOME TAXES AND DISTRIBUTIONS TO SHAREHOLDERS (Continued)
On December 22, 2010, the Regulated Investment Company Modernization Act of 2010 (the “Act”) was enacted. The Act modernizes several of the federal income and excise tax provisions related to regulated investment companies, and with certain exceptions, is effective for taxable years beginning after December 22, 2010. New capital losses may now be carried forward indefinitely. Rules in effect prior to December 22, 2010 limited the carryforward period to eight years. Post-enactment capital loss carryforwards must be fully used before capital loss carryforwards generated prior to the enactment of the Act. As a result of this ordering rule, pre-enactment capital loss carryforwards may have an increased likelihood to expire unused. Additionally, post-enactment capital losses that are carried forward will retain their character as either short term or long-term capital losses rather than all short-term as under previous rules.
Baron Partners Fund is required to pay U.S. federal income tax (currently, at a maximum rate of 35%) on its “net built-in gain” attributable to certain assets of Baron Capital Partners, L.P. (the predecessor partnership of Baron Partners Fund), to the extent that any such net built-in gain is realized during the ten-year period beginning on the date of the conversion of the predecessor partnership into the Fund. The Fund holds two securities at December 31, 2011 with a market value of $22,665,000 which may be subject to the tax on net-built-in gain and reimbursement by the Adviser. The net built-in gain on these securities unrealized as of December 31, 2011 was $3,878,600.
10. MANAGEMENT OWNERSHIP
As of December 31, 2011, the officers and trustees owned, directly or indirectly, 48.20% of Baron Focused Growth Fund, 60.35% of Baron International Growth Fund, 32.04% of Baron Real Estate Fund and 53.69% of Baron Emerging Markets Fund. As a result of their ownership, the officers and trustees may be able to materially affect the outcome of matters presented to Baron Focused Growth Fund, Baron International Growth Fund, Baron Real Estate Fund and Baron Emerging Markets Fund shareholders.
11. NEW ACCOUNTING PRONOUNCEMENT
In May 2011, the Financial Accounting Standards Board issued Accounting Standard Update (“ASU”) No. 2011-04, Fair Value Measurement (Topic 820) – Amendments to Achieve Common Fair Value Measurement and Disclosure Requirements in U.S. GAAP and International Financial Reporting Standards. Specifically, the ASU requires reporting entities to disclose i) the amounts of any transfers between Level 1 and Level 2, and the reasons for the transfers; ii) for Level 3 fair value measurements, a) quantitative information about significant unobservable inputs used, b) a description of the valuation processes used by the reporting entity, and c) a narrative description of the sensitivity of the fair value measurement to changes in unobservable inputs if a change in those inputs might result in a significantly higher or lower fair value measurement. The effective date of the ASU is for interim and annual periods beginning after December 15, 2011. The Adviser is currently evaluating the impact this disclosure may have on the Funds’ financial statements.
30
December 31, 2011 | |
Baron Select Funds |
| FINANCIAL HIGHLIGHTS |
| |
| BARON PARTNERS FUND |
| |
| Selected data for a share outstanding throughout each year: |
| | | | | | | | | | | | | | | | | | | | | | | | | | | | | | | | | | | | | | | INSTITUTIONAL |
| | | RETAIL SHARES | | SHARES |
| | | | | | | | | | | | | | | | | | | | | | | | | | | | | | | | | | | | | | | Year Ended |
| | | Year Ended December 31, | | December 31, |
| | | 2011 | | | 2010 | | | 2009 | | | 2008 | | | 2007 | | | 2006 | | | 2005 | | | 2004 | | | 20031 | | | 2011 | | | 2010 | | | | 20096 | |
| | | | | | | | | | | | | | | | | | | | | | | | | | | | | | | | | | | | | | | | | | | | | | | | | |
Net asset value, beginning of year | | $ | 20.57 | | | $ | 15.64 | | | $ | 12.20 | | | $ | 23.76 | | | $ | 22.34 | | | $ | 18.43 | | | $ | 16.85 | | | $ | 12.17 | | | $ | 10.00 | | | $ | 20.66 | | | $ | 15.66 | | | $ | 12.66 | |
| | | | | | | | | | | | | | | | | | | | | | | | | | | | | | | | | | | | | | | | | | | | | | | | | |
Income (loss) from investment operations: | | | | | | | | | | | | | | | | | | | | | | | | | | | | | | | | | | | | | | | | | | | | | | | | |
| Net investment loss | | | (0.14 | )2 | | | (0.09 | )2 | | | (0.04 | )2 | | | (0.09 | )2 | | | (0.21 | )2 | | | (0.16 | )2 | | | (0.13 | ) | | | (0.06 | ) | | | (0.10 | ) | | | (0.08 | )2 | | | (0.06 | )2 | | | (0.03 | )2 |
Net realized and unrealized gain (loss) on investments | | | (1.04 | ) | | | 5.02 | | | | 3.48 | | | | (10.74 | ) | | | 2.74 | | | | 4.13 | | | | 2.49 | | | | 5.17 | | | | 3.63 | | | | (1.06 | ) | | | 5.06 | | | | 3.03 | |
Total from investment operations | | | (1.18 | ) | | | 4.93 | | | | 3.44 | | | | (10.83 | ) | | | 2.53 | | | | 3.97 | | | | 2.36 | | | | 5.11 | | | | 3.53 | | | | (1.14 | ) | | | 5.00 | | | | 3.00 | |
| | | | | | | | | | | | | | | | | | | | | | | | | | | | | | | | | | | | | | | | | | | | | | | | | |
Less distributions to shareholders from: | | | | | | | | | | | | | | | | | | | | | | | | | | | | | | | | | | | | | | | | | | | | | | | | |
| Net investment income | | | 0.00 | | | | 0.00 | | | | 0.00 | | | | 0.00 | | | | 0.00 | | | | 0.00 | | | | 0.00 | | | | 0.00 | | | | 0.00 | | | | 0.00 | | | | 0.00 | | | | 0.00 | |
| Net realized gain on investments | | | 0.00 | | | | 0.00 | | | | 0.00 | | | | (0.73 | ) | | | (1.11 | ) | | | (0.06 | ) | | | (0.78 | ) | | | (0.43 | ) | | | (1.36 | ) | | | 0.00 | | | | 0.00 | | | | 0.00 | |
Total distributions | | | 0.00 | | | | 0.00 | | | | 0.00 | | | | (0.73 | ) | | | (1.11 | ) | | | (0.06 | ) | | | (0.78 | ) | | | (0.43 | ) | | | (1.36 | ) | | | 0.00 | | | | 0.00 | | | | 0.00 | |
| | | | | | | | | | | | | | | | | | | | | | | | | | | | | | | | | | | | | | | | | | | | | | | | | |
| Net asset value, end of year | | $ | 19.39 | | | $ | 20.57 | | | $ | 15.64 | | | $ | 12.20 | | | $ | 23.76 | | | $ | 22.34 | | | $ | 18.43 | | | $ | 16.85 | | | $ | 12.17 | | | $ | 19.52 | | | $ | 20.66 | | | $ | 15.66 | |
| Total return | | | (5.74 | )% | | | 31.52 | % | | | 28.20 | % | | | (46.67 | )% | | | 11.34 | % | | | 21.55 | % | | | 14.37 | % | | | 42.35 | % | | | 35.76 | %3 | | | (5.52 | )% | | | 31.93 | % | | | 23.70 | %3 |
| | | | | | | | | | | | | | | | | | | | | | | | | | | | | | | | | | | | | | | | | | | | | | | | | |
| Ratios/Supplemental data: | | | | | | | | | | | | | | | | | | | | | | | | | | | | | | | | | | | | | | | | | | | | | | | | |
Net assets (in millions), end of year | | $ | 970.4 | | | $ | 1,251.9 | | | $ | 1,249.3 | | | $ | 1,501.3 | | | $ | 3,384.1 | | | $ | 2,403.1 | | | $ | 1,403.0 | | | $ | 632.7 | | | $ | 164.3 | | | $ | 123.7 | | | $ | 119.9 | | | $ | 158.5 | |
Ratio of total expenses to average net assets | | | 1.71 | % | | | 1.71 | % | | | 1.51 | % | | | 1.86 | %5 | | | 1.88 | %5 | | | 1.77 | % | | | 1.62 | % | | | 1.46 | % | | | 1.77 | %4 | | | 1.45 | % | | | 1.45 | % | | | 1.38 | %4 |
Less: Ratio of interest expense to average net assets | | | (0.36 | )% | | | (0.34 | )% | | | (0.10 | )% | | | (0.51 | )% | | | (0.57 | )% | | | (0.45 | )% | | | (0.27 | )% | | | (0.12 | )% | | | (0.37 | )%4 | | | (0.36 | )% | | | (0.34 | )% | | | (0.21 | )%4 |
Ratio of net operating expenses to average net assets | | | 1.35 | % | | | 1.37 | % | | | 1.41 | % | | | 1.35 | % | | | 1.31 | % | | | 1.32 | % | | | 1.35 | % | | | 1.34 | % | | | 1.40 | %4 | | | 1.09 | % | | | 1.11 | % | | | 1.17 | %4 |
| | | | | | | | | | | | | | | | | | | | | | | | | | | | | | | | | | | | | | | | | | | | | | | | | |
Ratio of net investment loss to average net assets | | | (0.69 | )% | | | (0.51 | )% | | | (0.30 | )% | | | (0.49 | )% | | | (0.86 | )% | | | (0.80 | )% | | | (0.85 | )% | | | (0.83 | )% | | | (1.39 | )%4 | | | (0.41 | )% | | | (0.36 | )% | | | (0.31 | )%4 |
| | | | | | | | | | | | | | | | | | | | | | | | | | | | | | | | | | | | | | | | | | | | | | | | | |
| Portfolio turnover rate | | | 16.96 | % | | | 15.85 | % | | | 32.43 | % | | | 38.02 | % | | | 32.95 | % | | | 35.92 | % | | | 37.62 | % | | | 57.77 | % | | | 36.67 | %3 | | | 16.96 | % | | | 15.85 | % | | | 32.43 | % |
| | | | | | | | | | | | | | | | | | | | | | | | | | | | | | | | | | | | | | | | | | | | | | | | | |
| 1 | | For the period April 30, 2003 (commencement of operations) to December 31, 2003. |
| 2 | | Based on average shares outstanding. |
| 3 | | Not Annualized. |
| 4 | | Annualized. |
| 5 | | Benefit of expense reduction rounds to less than 0.01%. |
| 6 | | For the period May 29, 2009 (commencement of operations) to December 31, 2009. |
| See Notes to Financial Statements. | | 31 |
Baron Select Funds | |
December 31, 2011 |
| FINANCIAL HIGHLIGHTS (Continued) |
BARON FOCUSED GROWTH FUND
Selected data for a share outstanding throughout each year:
| | | RETAIL SHARES | | | INSTITUTIONAL SHARES | |
| | | Year Ended December 31, | | | Year Ended December 31, | |
| | | 2011 | | | 2010 | | | 2009 | | | 20081 | | | 2011 | | | 2010 | | | 20097 | |
| | | | | | | | | | | | | | | | | | | | | | | | | | | | | |
| Net asset value, beginning of year | | $ | 9.85 | | | $ | 8.14 | | | $ | 6.27 | | | $ | 10.00 | | | $ | 9.88 | | | $ | 8.15 | | | $ | 6.88 | |
| | | | | | | | | | | | | | | | | | | | | | | | | | | | | |
| Income (loss) from investment operations: | | | | | | | | | | | | | | | | | | | | | | | | | | | | |
| Net investment income (loss) | | | (0.07 | )2 | | | (0.01 | )2 | | | 0.12 | 2 | | | 0.00 | 2,3 | | | (0.04 | )2 | | | 0.01 | 2 | | | 0.07 | 2 |
| Net realized and unrealized gain (loss) on investments | | | (0.07 | ) | | | 2.05 | | | | 2.00 | | | | (3.33 | ) | | | (0.07 | ) | | | 2.05 | | | | 1.45 | |
| | | | | | | | | | | | | | | | | | | | | | | | | | | | | |
Total from investment operations | | | (0.14 | ) | | | 2.04 | | | | 2.12 | | | | (3.33 | ) | | | (0.11 | ) | | | 2.06 | | | | 1.52 | |
| | | | | | | | | | | | | | | | | | | | | | | | | | | | | |
| | | | | | | | | | | | | | | | | | | | | | | | | | | | | |
| Less distributions to shareholders from: | | | | | | | | | | | | | | | | | | | | | | | | | | | | |
| Net investment income | | | 0.00 | | | | (0.33 | ) | | | (0.13 | ) | | | 0.00 | | | | 0.00 | | | | (0.33 | ) | | | (0.13 | ) |
| Net realized gain on investments | | | 0.00 | | | | 0.00 | | | | 0.00 | | | | 0.00 | | | | 0.00 | | | | 0.00 | | | | 0.00 | |
| Return of capital | | | 0.00 | | | | 0.00 | | | | (0.12 | ) | | | (0.40 | ) | | | 0.00 | | | | 0.00 | | | | (0.12 | ) |
| | | | | | | | | | | | | | | | | | | | | | | | | | | | | |
Total distributions | | | 0.00 | | | | (0.33 | ) | | | (0.25 | ) | | | (0.40 | ) | | | 0.00 | | | | (0.33 | ) | | | (0.25 | ) |
| | | | | | | | | | | | | | | | | | | | | | | | | | | | | |
| | | | | | | | | | | | | | | | | | | | | | | | | | | | | |
| Net asset value, end of year | | $ | 9.71 | | | $ | 9.85 | | | $ | 8.14 | | | $ | 6.27 | | | $ | 9.77 | | | $ | 9.88 | | | $ | 8.15 | |
| Total return | | | (1.42 | )%5 | | | 25.17 | %5 | | | 33.77 | %5 | | | (33.11 | )%4,5 | | | (1.11 | )%5 | | | 25.39 | %5 | | | 22.06 | %4,5 |
| | | | | | | | | | | | | | | | | | | | | | | | | | | | | |
| Ratios/Supplemental data: | | | | | | | | | | | | | | | | | | | | | | | | | | | | |
| Net assets (in millions), end of year | | $ | 28.3 | | | $ | 46.4 | | | $ | 39.9 | | | $ | 59.3 | | | $ | 63.6 | | | $ | 44.3 | | | $ | 36.6 | |
| Ratio of operating expenses to average net assets | | | 1.48 | % | | | 1.47 | % | | | 1.52 | % | | | 1.54 | %6 | | | 1.18 | % | | | 1.19 | % | | | 1.25 | %6 |
| Less: Reimbursement of expenses by Adviser | | | (0.13 | )% | | | (0.12 | )% | | | (0.17 | )% | | | (0.19 | )%6 | | | (0.08 | )% | | | (0.09 | )% | | | (0.15 | )%6 |
| | | | | | | | | | | | | | | | | | | | | | | | | | | | | |
| Ratio of net operating expenses to average net assets | | | 1.35 | % | | | 1.35 | % | | | 1.35 | % | | | 1.35 | %6 | | | 1.10 | % | | | 1.10 | % | | | 1.10 | %6 |
| | | | | | | | | | | | | | | | | | | | | | | | | | | | | |
| Ratio of net investment income (loss) to average net assets | | | (0.69 | )% | | | (0.16 | )% | | | 1.81 | % | | | 0.01 | %6 | | | (0.40 | )% | | | 0.08 | % | | | 1.63 | %6 |
| | | | | | | | | | | | | | | | | | | | | | | | | | | | | |
| Portfolio turnover rate | | | 44.58 | % | | | 24.08 | % | | | 34.76 | % | | | 35.43 | %4 | | | 44.58 | % | | | 24.08 | % | | | 34.76 | % |
| | | | | | | | | | | | | | | | | | | | | | | | | | | | | |
| 1 | For the period June 30, 2008 (commencement of operations) to December 31, 2008. |
| 2 | Based on average shares outstanding. |
| 3 | Less than $0.01 per share. |
| 4 | Not Annualized. |
| 5 | The total returns would have been lower had certain expenses not been reduced during the periods shown. |
| 6 | Annualized. |
| 7 | For the period May 29, 2009 (commencement of operations) to December 31, 2009. |
| 32 | See Notes to Financial Statements. |
December 31, 2011 | |
Baron Select Funds |
| FINANCIAL HIGHLIGHTS (Continued) |
BARON INTERNATIONAL GROWTH FUND
Selected data for a share outstanding throughout each year:
| | | RETAIL SHARES | | | INSTITUTIONAL SHARES | |
| | | Year Ended December 31, | | | Year Ended December 31, | |
| | | 2011 | | | 2010 | | | 2009 | | | 2011 | | | 2010 | | | 20095 | |
| | | | | | | | | | | | | | | | | | | | | | | | | |
| Net asset value, beginning of year | | $ | 17.29 | | | $ | 14.11 | | | $ | 10.00 | | | $ | 17.36 | | | $ | 14.13 | | | $ | 11.13 | |
| | | | | | | | | | | | | | | | | | | | | | | | | |
| Income (loss) from investment operations: | | | | | | | | | | | | | | | | | | | | | | | | |
| Net investment income (loss) | | | (0.01 | )1 | | | 0.01 | 1 | | | 0.04 | 1 | | | 0.03 | 1 | | | 0.05 | 1 | | | (0.02 | )1 |
| Net realized and unrealized gain on investments | | | (2.78 | ) | | | 3.38 | | | | 4.43 | | | | (2.79 | ) | | | 3.39 | | | | 3.38 | |
| | | | | | | | | | | | | | | | | | | | | | | | | |
Total from investment operations | | | (2.79 | ) | | | 3.39 | | | | 4.47 | | | | (2.76 | ) | | | 3.44 | | | | 3.36 | |
| | | | | | | | | | | | | | | | | | | | | | | | | |
| | | | | | | | | | | | | | | | | | | | | | | | | |
| Less distributions to shareholders from: | | | | | | | | | | | | | | | | | | | | | | | | |
| Net investment income | | | (0.04 | ) | | | 0.00 | | | | 0.00 | | | | (0.09 | ) | | | 0.00 | | | | 0.00 | |
| Net realized gain on investments | | | (1.26 | ) | | | (0.21 | ) | | | (0.36 | ) | | | (1.26 | ) | | | (0.21 | ) | | | (0.36 | ) |
| | | | | | | | | | | | | | | | | | | | | | | | | |
Total distributions | | | (1.30 | ) | | | (0.21 | ) | | | (0.36 | ) | | | (1.35 | ) | | | (0.21 | ) | | | (0.36 | ) |
| | | | | | | | | | | | | | | | | | | | | | | | | |
| | | | | | | | | | | | | | | | | | | | | | | | | |
| Net asset value, end of year | | $ | 13.20 | | | $ | 17.29 | | | $ | 14.11 | | | $ | 13.25 | | | $ | 17.36 | | | $ | 14.13 | |
| Total return | | | (16.35 | )%2 | | | 24.22 | %2 | | | 44.69 | %2 | | | (16.13 | )%2 | | | 24.54 | %2 | | | 30.18 | %2,4 |
| | | | | | | | | | | | | | | | | | | | | | | | | |
| Ratios/Supplemental data: | | | | | | | | | | | | | | | | | | | | | | | | |
| Net assets (in millions), end of year | | $ | 11.7 | | | $ | 15.3 | | | $ | 8.4 | | | $ | 30.5 | | | $ | 37.4 | | | $ | 22.1 | |
| Ratio of operating expenses to average net assets | | | 1.73 | % | | | 1.76 | % | | | 2.33 | % | | | 1.38 | % | | | 1.40 | % | | | 1.89 | %3 |
| Less: Reimbursement of expenses by Adviser | | | (0.23 | )% | | | (0.26 | )% | | | (0.83 | )% | | | (0.13 | )% | | | (0.15 | )% | | | (0.64 | )%3 |
| Ratio of net operating expenses to average net assets | | | 1.50 | % | | | 1.50 | % | | | 1.50 | % | | | 1.25 | % | | | 1.25 | % | | | 1.25 | %3 |
| Ratio of net investment income (loss) to average net assets | | | (0.05 | )% | | | 0.07 | % | | | 0.38 | % | | | 0.19 | % | | | 0.31 | % | | | (0.29 | )%3 |
| Portfolio turnover rate | | | 53.20 | % | | | 32.70 | % | | | 53.94 | % | | | 53.20 | % | | | 32.70 | % | | | 53.94 | % |
| |
| 1 | Based on average shares outstanding. |
| 2 | The total returns would have been lower had certain expenses not been reduced during the period shown. |
| 3 | Annualized. |
| 4 | Not annualized. |
| 5 | For the period May 29, 2009 (commencement of operations) to December 31, 2009. |
| See Notes to Financial Statements. | 33 |
Baron Select Funds | |
December 31, 2011 |
| FINANCIAL HIGHLIGHTS (Continued) |
BARON REAL ESTATE FUND
Selected data for a share outstanding throughout each year:
| | | | RETAIL SHARES | | | | INSTITUTIONAL SHARES | |
| | | | Year Ended December 31, | | | | Year Ended December 31, | |
| | | | 2011 | | | | 2010 | | | | 2011 | | | | 2010 | |
| | | | | | | | | | | | | | | | | | | | | |
| Net asset value, beginning of year | | | $ | 12.66 | | | | $ | 10.00 | | | | $ | 12.69 | | | | $ | 10.00 | |
| | | | | | | | | | | | | | | | | | | | | |
| Income from investment operations: | | | | | | | | | | | | | | | | | | | | |
| Net investment income (loss) | | | | (0.01 | )1 | | | | 0.02 | 1 | | | | 0.02 | 1 | | | | 0.04 | 1 |
| Net realized and unrealized gain on investments | | | | 0.07 | 3 | | | | 2.64 | | | | | 0.07 | 3 | | | | 2.65 | |
Total from investment operations | | | | 0.06 | | | | | 2.66 | | | | | 0.09 | | | | | 2.69 | |
| | | | | | | | | | | | | | | | | | | | | |
| Less distributions to shareholders from: | | | | | | | | | | | | | | | | | | | | |
| Net investment income | | | | (0.00 | )4 | | | | 0.00 | | | | | (0.01 | ) | | | | 0.00 | |
| Net realized gain on investments | | | | (0.21 | ) | | | | 0.00 | | | | | (0.21 | ) | | | | 0.00 | |
Total distributions | | | | (0.21 | ) | | | | 0.00 | | | | | (0.22 | ) | | | | 0.00 | |
| | | | | | | | | | | | | | | | | | | | | |
| Net asset value, end of year | | | $ | 12.51 | | | | $ | 12.66 | | | | $ | 12.56 | | | | $ | 12.69 | |
| Total return | | | | 0.63 | %2 | | | | 26.60 | %2 | | | | 0.80 | %2 | | | | 26.90 | %2 |
| | | | | | | | | | | | | | | | | | | | | |
| Ratios/Supplemental data: | | | | | | | | | | | | | | | | | | | | |
| Net assets (in millions), end of year | | | $ | 10.9 | | | | $ | 5.5 | | | | $ | 4.9 | | | | $ | 3.2 | |
| Ratio of operating expenses to average net assets | | | | 2.33 | % | | | | 4.35 | % | | | | 2.14 | % | | | | 4.26 | % |
| Less: Reimbursement of expenses by Adviser | | | | (0.98 | )% | | | | (3.00 | )% | | | | (1.04 | )% | | | | (3.16 | )% |
| Ratio of net operating expenses to average net assets | | | | 1.35 | % | | | | 1.35 | % | | | | 1.10 | % | | | | 1.10 | % |
| Ratio of net investment income (loss) to average net assets | | | | (0.08 | )% | | | | 0.14 | % | | | | 0.17 | % | | | | 0.36 | % |
| Portfolio turnover rate | | | | 70.99 | % | | | | 58.03 | % | | | | 70.99 | % | | | | 58.03 | % |
| |
| 1 | Based on average shares outstanding. |
| 2 | The total returns would have been lower had certain expenses not been reduced during the period shown. |
| 3 | The amount shown for a share outstanding does not correspond with the aggregate realized and unrealized gain (loss) on investments for the year due to the timing of sales and redemptions of fund shares in relation to fluctuating market values of investments of the Fund. |
| 4 | Less than $0.01 per share. |
| 34 | See Notes to Financial Statements. |
December 31, 2011 | |
Baron Select Funds |
| FINANCIAL HIGHLIGHTS (Continued) |
BARON EMERGING MARKETS FUND
Selected data for a share outstanding throughout each year:
| | RETAIL SHARES | | INSTITUTIONAL SHARES |
| | Year Ended | | Year Ended |
| | December 31, 2011 | | December 31, 2011 |
| | | | | | | | | | |
| Net asset value, beginning of year | | $ | 10.00 | | | | $ | 10.00 | |
| | | | | | | | | | |
| Income from investment operations: | | | | | | | | | |
| Net investment income (loss) | | | (0.03 | )1 | | | | (0.01 | )1 |
| Net realized and unrealized loss on investments | | | (1.69 | ) | | | | (1.69 | ) |
Total from investment operations | | | (1.72 | ) | | | | (1.70 | ) |
| | | | | | | | | | |
| Less distributions to shareholders from: | | | | | | | | | |
| Net investment income | | | 0.00 | | | | | 0.00 | |
| Net realized gain on investments | | | 0.00 | | | | | 0.00 | |
Total distributions | | | 0.00 | | | | | 0.00 | |
| | | | | | | | | | |
| Net asset value, end of year | | $ | 8.28 | | | | $ | 8.30 | |
| Total return | | | (17.20 | )%2 | | | | (17.00 | )%2 |
| | | | | | | | | | |
| Ratios/Supplemental data: | | | | | | | | | |
| Net assets (in millions), end of year | | $ | 2.0 | | | | $ | 4.3 | |
| Ratio of operating expenses to average net assets | | | 4.49 | % | | | | 3.83 | % |
| Less: Reimbursement of expenses by Adviser | | | (2.99 | )% | | | | (2.58 | )% |
| Ratio of net operating expenses to average net assets | | | 1.50 | % | | | | 1.25 | % |
| Ratio of net investment income (loss) to average net assets | | | (0.32 | )% | | | | (0.07 | )% |
| Portfolio turnover rate | | | 45.86 | % | | | | 45.86 | % |
|
| 1 | | Based on average shares outstanding. |
| 2 | | The total returns would have been lower had certain expenses not been reduced during the period shown. |
| See Notes to Financial Statements. | | 35 |
Baron Select Funds | |
December 31, 2011 |
| REPORT OF INDEPENDENT REGISTERED PUBLIC ACCOUNTING FIRM |
|
To the Shareholders and Board of Trustees of
Baron Select Funds
In our opinion, the accompanying statements of assets and liabilities, including the statements of net assets, and the related statements of operations and of changes in net assets and of cash flows and the financial highlights present fairly, in all material respects, the financial position of each of Baron Partners Fund, Baron Focused Growth Fund, Baron International Growth Fund, Baron Real Estate Fund and Baron Emerging Markets Fund (five of the portfolios constituting the Baron Select Funds, hereafter referred to as the “Funds”) at December 31, 2011, and the results of each of their operations, the changes in each of their net assets, the cash flows of Baron Partners Fund and the financial highlights, for each of the periods presented, in conformity with accounting principles generally accepted in the United States of America. These financial statements and financial highlights (hereafter referred to as “financial statements”) are the responsibility of the Funds’ management. Our responsibility is to express an opinion on these financial statements based on our audits. We conducted our audits of these financial statements in accordance with the standards of the Public Company Accounting Oversight Board (United States). Those standards require that we plan and perform the audit to obtain reasonable assurance about whether the financial statements are free of material misstatement. An audit includes examining, on a test basis, evidence supporting the amounts and disclosures in the financial statements, assessing the accounting principles used and significant estimates made by management, and evaluating the overall financial statement presentation. We believe that our audits, which included confirmation of securities at December 31, 2011 by correspondence with the custodian, brokers and issuers, provide a reasonable basis for our opinion.

PricewaterhouseCoopers LLP
New York, New York
February 24, 2012
36
December 31, 2011 | |
Baron Select Funds |
| FUND EXPENSES (Unaudited) |
|
As a shareholder of the Funds, you may incur two types of costs: ongoing expenses and transaction costs. Ongoing expenses include advisory fees, distribution and service (12b-1) fees and other Fund expenses. Due to the payment of Rule 12b-1 fees, long-term shareholders may indirectly pay more than the maximum permitted front-end sales charge. The information on this page is intended to help you understand your ongoing costs of investing in the Funds and to compare these costs with the ongoing costs of investing in other mutual funds.
The information in the following table is based on an investment of $1,000 invested on July 1, 2011 and held for the six months ended December 31, 2011.
ACTUAL EXPENSES
The table below titled “Based on Actual Total Return” provides information about actual account values and actual expenses. You may use the information provided in this table, together with the amount you invested, to estimate the expenses that you paid over the period. To estimate the expenses you paid on your account, divide your ending account value by $1,000 (for example, an $8,600 ending account value divided by $1,000 = 8.6), then multiply the result by the number under the heading titled “Expenses Paid During the Period”.
BASED ON ACTUAL TOTAL RETURN FOR THE SIX MONTHS ENDED DECEMBER 31, 20111
| | Actual | | Beginning | | | Ending | | Annualized | | Expenses |
| | Total | | Account Value | | | Account Value | | Expense | | Paid During |
| | Return | | July 1, 2011 | | | December 31, 2011 | | Ratio | | the Period3 |
| Baron Partners Fund — Retail Shares | | (10.77 | )% | | $ | 1,000.00 | | | | $ | 892.30 | | | 1.72 | %2 | | $ | 8.20 | |
| Baron Partners Fund — Institutional Shares | | (10.66 | )% | | $ | 1,000.00 | | | | $ | 893.40 | | | 1.46 | %2 | | $ | 6.97 | |
| Baron Focused Growth Fund — Retail Shares | | (6.81 | )% | | $ | 1,000.00 | | | | $ | 931.90 | 4 | | 1.35 | %5 | | $ | 6.57 | |
| Baron Focused Growth Fund — Institutional Shares | | (6.69 | )% | | $ | 1,000.00 | | | | $ | 933.10 | 4 | | 1.10 | %5 | | $ | 5.36 | |
| Baron International Growth Fund — Retail Shares | | (17.54 | )% | | $ | 1,000.00 | | | | $ | 824.60 | 4 | | 1.50 | %5 | | $ | 6.90 | |
| Baron International Growth Fund — Institutional Shares | | (17.46 | )% | | $ | 1,000.00 | | | | $ | 825.40 | 4 | | 1.25 | %5 | | $ | 5.75 | |
| Baron Real Estate Fund — Retail Shares | | (6.33 | )% | | $ | 1,000.00 | | | | $ | 936.70 | 4 | | 1.35 | %5 | | $ | 6.59 | |
| Baron Real Estate Fund — Institutional Shares | | (6.29 | )% | | $ | 1,000.00 | | | | $ | 937.10 | 4 | | 1.10 | %5 | | $ | 5.37 | |
| Baron Emerging Markets Fund — Retail Shares | | (16.53 | )% | | $ | 1,000.00 | | | | $ | 834.70 | 4 | | 1.50 | %5 | | $ | 6.94 | |
| Baron Emerging Markets Fund — Institutional Shares | | (16.41 | )% | | $ | 1,000.00 | | | | $ | 835.90 | 4 | | 1.25 | %5 | | $ | 5.78 | |
HYPOTHETICAL EXAMPLE FOR COMPARISON PURPOSES
The table below titled “Based on Hypothetical Total Return” provides information about hypothetical account values and hypothetical expenses based on the actual expense ratio and an assumed rate of return of 5% per year before expenses, which is not the Funds’ actual return. The hypothetical account values and expenses may not be used to estimate the actual ending account values and expenses you paid for the period. You may use the information provided in this table to compare the ongoing costs of investing in the Funds and other funds. To do so, compare the 5% hypothetical example relating to the Funds with the 5% hypothetical examples that appear in the shareholder reports of other funds.
Please note that expenses shown in the table below are meant to highlight your ongoing costs and do not reflect any transactional costs, such as redemption fees, if any. Therefore, the table is useful in comparing ongoing costs only and will not help you determine your relative total costs of owning different mutual funds. In addition, if these transactional costs were included, your costs would have been higher.
BASED ON HYPOTHETICAL TOTAL RETURN FOR THE SIX MONTHS ENDED DECEMBER 31, 2011
| | | Hypothetical | | Beginning | | Ending | | Annualized | | Expenses |
| | | Annualized | | Account Value | | Account Value | | Expense | | Paid During |
| | | Total Return | | July 1, 2011 | | December 31, 2011 | | Ratio | | the Period3 |
| Baron Partners Fund — Retail Shares | | 5.00 | % | | $ | 1,000.00 | | | $ | 1,016.53 | | | 1.72 | %2 | | $ | 8.74 | |
| Baron Partners Fund — Institutional Shares | | 5.00 | % | | $ | 1,000.00 | | | $ | 1,017.85 | | | 1.46 | %2 | | $ | 7.43 | |
| Baron Focused Growth Fund — Retail Shares | | 5.00 | % | | $ | 1,000.00 | | | $ | 1,018.40 | 4 | | 1.35 | %5 | | $ | 6.87 | |
| Baron Focused Growth Fund — Institutional Shares | | 5.00 | % | | $ | 1,000.00 | | | $ | 1,019.66 | 4 | | 1.10 | %5 | | $ | 5.60 | |
| Baron International Growth Fund — Retail Shares | | 5.00 | % | | $ | 1,000.00 | | | $ | 1,017.64 | 4 | | 1.50 | %5 | | $ | 7.63 | |
| Baron International Growth Fund — Institutional Shares | | 5.00 | % | | $ | 1,000.00 | | | $ | 1,018.90 | 4 | | 1.25 | %5 | | $ | 6.36 | |
| Baron Real Estate Fund — Retail Shares | | 5.00 | % | | $ | 1,000.00 | | | $ | 1,018.40 | 4 | | 1.35 | %5 | | $ | 6.87 | |
| Baron Real Estate Fund — Institutional Shares | | 5.00 | % | | $ | 1,000.00 | | | $ | 1,019.66 | 4 | | 1.10 | %5 | | $ | 5.60 | |
| Baron Emerging Markets Fund — Retail Shares | | 5.00 | % | | $ | 1,000.00 | | | $ | 1,017.64 | 4 | | 1.50 | %5 | | $ | 7.63 | |
| Baron Emerging Markets Fund — Institutional Shares | | 5.00 | % | | $ | 1,000.00 | | | $ | 1,018.90 | 4 | | 1.25 | %5 | | $ | 6.36 | |
|
| 1 | | Assumes reinvestment of all dividends and capital gain distributions, if any. |
| 2 | | Annualized expense ratio for Baron Partners Fund for the six months ended December 31, 2011, includes 1.36% and 1.10% for net operating expenses and 0.36% and 0.36% for interest expense for the Retail and Institutional Shares, respectively. |
| 3 | | Expenses are equal to each Share Class’ respective annualized expense ratio multiplied by the average account value over the period, multiplied by the number of days in the most recent fiscal half-year, then divided by 365. |
| 4 | | Ending account value assumes the return earned after waiver and would have been lower if a portion of the expenses had not been waived. |
| 5 | | Annualized expense ratios are adjusted to reflect fee waiver. |
37
Baron Select Funds | |
December 31, 2011 |
DISCLOSURE REGARDING THE APPROVAL OF THE INVESTMENT ADVISORY AGREEMENT FOR BARON ENERGY AND RESOURCES FUND BY THE BOARD OF TRUSTEES (UNAUDITED) |
The Board of Trustees (the “Board”) of Baron Select Funds (the “Trust”) met on August 11, 2011 to discuss the selection of BAMCO, Inc. (the “Adviser”) as the investment adviser and the approval of the investment advisory agreement for the Baron Energy and Resources Fund (the “Fund”). The members of the Board who are not affiliated with the Adviser (the “Independent Trustees”) met in separate session to discuss and consider the approval of the proposed advisory contract for the Fund. The Trustees received a substantial amount of information from the Adviser and were advised by independent counsel. Based on its evaluation of this and other information, the Board, including a majority of the Independent Trustees, approved the advisory agreement for the Fund for an initial two-year period. The Independent Trustees considered a broad scope of information and their experiences, including the following, which they had considered in past years and remained, in their thinking, as material to their consideration:
1. NATURE, EXTENT AND QUALITY OF SERVICES
As part of their consideration of the nature, extent and quality of proposed services to be provided by the Adviser, the Independent Trustees relied on the information they received at the Board meeting, as well as other information they received. In particular, the Board considered the following:
| • | | Their confidence in the senior personnel, portfolio management, the financial condition of the Adviser and its affiliates and the Adviser’s available resources; |
| • | | The nature, quality and the level of long-term performance of the services to be provided by the Adviser, including: intensive devotion to research, selection of broker/dealers for Fund portfolio transactions, relationships with and supervision of third party service providers, such as the Fund’s custodian and transfer agent, the quality of shareholder reports, the ability to monitor adherence to investment guidelines and restrictions, the legal, accounting and compliance services to be provided to the Fund and the support services to be provided to the Board; |
| • | | The Adviser’s investment principles and processes; |
| • | | The total expense ratio of the Fund and its comparison to similar funds managed by other advisers; and |
| • | | Any additional services to be provided by the Adviser. |
The Board concluded that the nature, extent and quality of the services to be provided by the Adviser to the Fund were appropriate and that the Fund was likely to benefit from those services to be provided under the advisory agreement with the Adviser.
2. COSTS OF SERVICES PROVIDED AND PROFITS TO BE REALIZED BY THE ADVISER
As part of its consideration of the cost of services to be provided, the Board examined the fees to be charged by the Adviser as compared to the fees charged by comparable funds, based on information provided by the Adviser.
The Board also considered the Adviser’s management fees for other public pooled investment vehicles for which the Adviser serves as a sub-adviser and the basis of compensation for separate accounts and private accounts managed by an affiliated adviser. While the fees for the other funds and accounts are the same as, or lower than, the proposed fees for the Fund, the Adviser performs only portfolio management services for those clients and does not provide many of the other services to be provided to the Fund. The Board discussed and considered those other services, which include accounting, oversight of service providers, legal, regulatory, compliance, risk management and Trustee support.
In addition, the Board also considered the financial condition of the Adviser and its affiliates. Since the Fund is newly formed, had not commenced operations and the eventual aggregate amount of the Fund’s assets was uncertain, the Adviser was not able to provide the Board with specific information concerning the cost of services to be provided and the expected profits to be realized by the Adviser and its affiliate from their relationships with the Fund.
The Board concluded that the proposed management fee, as well as the total expenses to be paid by the Fund to the Adviser and its affiliates, were reasonable in light of the services to be provided.
3. ECONOMIES OF SCALE AND BENEFITS TO INVESTORS
Since the Fund is newly formed, had not commenced operations and the eventual aggregate amount of the Fund’s assets was uncertain, the Adviser was not able to provide the Board with specific information concerning the extent to which economies of scale would be realized as the Fund grows and whether fee levels would reflect such economies of scale, if any. It was agreed that the issue would be revisited no later than when the Board next reviewed the advisory fee in connection with the renewal of the advisory contract for the Fund.
After due consideration, including in executive session, of the above enumerated factors, among others, the Board, including a majority of the Independent Trustees, approved the Fund’s investment advisory agreement.
38
December 31, 2011 | |
Baron Select Funds |
| TAX INFORMATION (Unaudited) |
We are required by the Internal Revenue Code to advise you within 60 days of the Funds’ fiscal year end as to the federal tax status of distributions paid by the Funds during such fiscal year.
During the fiscal year ended December 31, 2011, the Funds’ distributions to shareholders included:
| | | | Ordinary | | Long-Term |
| Fund | | | Income1 | | Capital Gains2 |
| Baron International Growth Fund | | | $379,919 | | | $3,569,430 | |
| | | | | | | | |
| Baron Real Estate Fund | | | 142,811 | | | 124,254 | |
| 1 | | For tax purposes, short-term capital gains are considered ordinary income distributions. |
| 2 | | Long-term capital gains are subject to a maximum allowable rate of 15% for individuals pursuant to the Tax Relief, Unemployment Insurance Reauthorization, and Job Creation Act of 2010. |
Of the total ordinary income distributions paid by Baron International Growth Fund and Baron Real Estate Fund, 100.00% and 27.69%, respectively, is qualified dividend income subject to a reduced tax rate. Of the total ordinary income distributions paid by Baron International Growth Fund and Baron Real Estate Fund, 0.75% and 24.92%, respectively, qualifies for the Corporate Dividends Received Deduction.
The information and distributions reported may differ from the information and distributions taxable to the shareholders for the calendar year ended December 31, 2011. The information necessary to complete your income tax return for the calendar year ended December 31, 2011 will be listed on the Form 1099-DIV, which will be mailed to you in January 2012.
39
Baron Select Funds | |
December 31, 2011 |
| MANAGEMENT OF THE FUNDS (Unaudited) |
| Board of Trustees and Officers |
The Board of Trustee’s (the “Board”) role in management of the Trust is oversight. As is the case with virtually all investment companies (as distinguished from operating companies), service providers to the Trust, primarily the Adviser and its affiliates, have responsibility for the day-to-day management of the Funds, which includes responsibility for risk management (including management of investment performance and investment risk, valuation risk, issuer and counterparty credit risk, compliance risk and operational risk). As part of its oversight, the Board, acting at its scheduled meetings, or the Chairman, acting between Board meetings, regularly interacts with and receives reports from senior personnel of service providers, including the Adviser’s Chief Investment Officer, the Trust’s and the Adviser’s Chief Compliance Officer and portfolio management personnel. The Board’s Audit Committee (which consists of two trustees who are not affiliated with the Adviser (“Independent Trustees”)) meets regularly with the Trust’s independent registered public accounting firm and the Trust’s Chief Financial Officer. The Board also receives periodic presentations from senior personnel of the Adviser or its affiliates regarding risk management generally, as well as periodic presentations regarding specific operational, compliance or investment areas, such as business continuity, anti-money laundering, personal trading, valuation, credit, investment research and securities lending. The Board has adopted policies and procedures designed to address certain risks to the Funds. In addition, the Adviser and other service providers to the Funds have adopted a variety of policies, procedures and controls designed to address particular risks to the Funds. However, it is not possible to eliminate all of the risks applicable to the Funds. The Board also receives reports from counsel to the Trust or counsel to the Adviser and the Board’s own independent legal counsel regarding regulatory compliance and governance matters. The Board’s oversight role does not make the Board a guarantor of the Trust’s investments or activities.
The 1940 Act requires that at least 40% of a fund’s trustees not be “interested persons” (as defined in the 1940 Act) of the fund, and to rely on certain exemptive rules under the 1940 Act, a majority of a fund’s trustees must not be interested persons of the fund. For certain important matters, such as the approval of investment advisory agreements or transactions with affiliates, the 1940 Act or the rules thereunder require the approval of a majority of the Trustees who are Independent Trustees. Currently, six of the Trustees are not interested persons of the Trust (as such, the Trustees are not affiliated with the Adviser). The Chairman of the Board, Linda Martinson, is an interested person of the Trust (“Interested Trustee”), and the Independent Trustees have designated two lead Independent Trustees who chair meetings or executive sessions of the Independent Trustees, review and comment on Board meeting agendas, represent the views of the Independent Trustees to management and facilitate communication among the Independent Trustees and their independent legal counsel. The Board has determined that its leadership structure, in which the Independent Trustees have designated two lead Independent Trustees to function as described above is appropriate in light of the services that the Adviser and its affiliates provide to the Trust and potential conflicts of interest that could arise from these relationships.
Trustees of the Trust, together with information as to their positions with the Trust, principal occupations and other board memberships and affiliations for the past five years, are shown below. Each Trustee serves as Trustee of a Fund until its termination; until the Trustee’s retirement, resignation or death; or as otherwise specified in the Trust’s organizational documents. Unless otherwise noted, the address of each Executive Officer and Trustee is Baron Select Funds, 767 Fifth Avenue, 49th Floor, New York, NY 10153. All Trustees listed below, whether Interested or Independent, serve as Trustees for the Trust. Additional information about the Trustees and Officers of the Trust can be found in the Trust’s Statement of Additional Information (the “SAI”) which may be obtained without charge by writing or calling 1-800-99BARON. The SAI is also available on the Baron Funds’ website, www.BaronFunds.com.
| | | | | | | | | | Number of | | |
| | | | | | | | | | Portfolios | | |
| | | | | | | | | | in Fund | | |
| | | | | | | | | | Complex | | Other |
| | | Position(s) Held | | Length of | | Principal Occupation(s) | | | Overseen | | Trustee/Directorships |
| Name, Address & Age | | With the Funds | | Time Served | | During the Past Five Years | | | by Trustee | | Held by the Trustee |
| |
| Interested Trustees |
| |
Ronald Baron(1),(2)
767 Fifth Avenue
New York, NY 10153
Age: 68 | | Chief Executive Officer, Chief Investment Officer, Trustee and Portfolio Manager | | 24 years | | Director, Chairman, CEO and CIO: the Firm* (2003-Present); President (2004-02/07), Chairman (1999-2004), and Trustee (1987-Present): Baron Investment Funds Trust; President (2004-02/07), Chairman (2003-2004), and Trustee (2003-Present): Baron Select Funds; Portfolio Manager: Baron USA Partners Fund, Ltd. (2003-Present); President: the Firm* (03/06-06/07); Portfolio Manager: Baron Managed Funds plc (2005-2009); President (2004-02/07), Chairman (1997-2004), and Trustee (1997-06/07): Baron Capital Funds Trust. | | | 10 | | None |
| |
Linda S. Martinson(1),(2)
767 Fifth Avenue
New York, NY 10153
Age: 56 | | Chairman, President, Chief Operating Officer and Trustee | | 24 years | | Director: the Firm* (2003-Present); Secretary: the Firm* (2003-04/08); President: the Firm* (02/07-Present); Chief Operating Officer: the Firm (05/06-present); General Counsel and Vice President: the Firm* (2003-2007); Chairman (10/10-Present); President (02/07-Present), Trustee (1987-Present), Secretary (2003-10/08): Baron Investment Funds Trust; Chairman (10/10-Present); President (02/07-Present), Trustee (2003-Present): Baron Select Funds; Director: Baron USA Partners Fund, Ltd. (2006-Present); Director: Baron Managed Funds plc (2005-2009); President (02/07-06/07) Trustee (1998-06/07): Baron Capital Funds Trust. | | | 10 | | None |
40
December 31, 2011 | |
Baron Select Funds |
| MANAGEMENT OF THE FUNDS (Unaudited) (Continued) |
| | | | | | | | | | Number of | | |
| | | | | | | | | | Portfolios | | |
| | | | | | | | | | in Fund | | |
| | | | | | | | | | Complex | | Other |
| | | Position(s) Held | | Length of | | Principal Occupation(s) | | | Overseen | | Trustee/Directorships |
| Name, Address & Age | | With the Funds | | Time Served | | During the Past Five Years | | | by Trustee | | Held by the Trustee |
| |
| Independent Trustees | | | | | | | | | | | |
| | | | | | | | | | | | |
Norman S. Edelcup(3),(4),(5)
City of Sunny Isles Beach
18070 Collins Avenue
Sunny Isles Beach, FL 33160
Age: 76 | | Trustee | | 24 years | | Director: Marquis Bank (2007-Present); Director: CompX International, Inc. (diversified manufacturer of engineered components) (2006-Present); Mayor (2003-Present), Commissioner (2001-2003): Sunny Isles Beach, Florida; Director (2001-2006), Senior Vice President (2001-2004): Florida Savings Bank; Director: Valhi, Inc. (diversified company) (1975-Present); Trustee: Baron Investment Funds Trust (1987-Present), Baron Capital Funds Trust (1997-06/07), Baron Select Funds (2003-Present). | | | 10 | | Director: Marquis Bank (2007-Present); Director: CompX International, Inc. (diversified manufacturer of engineered components) (2006-Present). |
| | | | | | | | | | | | |
Charles N. Mathewson(4),(5)
9295 Prototype Drive
Reno, NV 89521
Age: 83 | | Trustee | | 24 years | | Chairman: Grill Concepts, Inc. (December 2009-Present); Chairman Emeritus (October 2003-Present), Chairman (1986-2003): International Game Technology, Inc. (manufacturer of microprocessor controlled gaming machines and monitoring systems); Chairman: Baron Capital Funds Trust (2004-06/07), Baron Investment Funds Trust, Baron Select Funds (2004-10/10); Trustee: Baron Investment Funds Trust (1987-Present), Baron Capital Funds Trust (1997-06/07), Baron Select Funds (2003-Present). | | | 10 | | Chairman: Grill Concepts, Inc. (December 2009-Present). |
| | | | | | | | | | | | |
Harold W. Milner(4),(5)
2293 Morningstar Drive
Park City, UT 84060
Age: 77 | | Trustee | | 24 years | | Retired; Trustee: Baron Investment Funds Trust (1987-Present), Baron Capital Funds Trust (1997-06/07), Baron Select Funds (2003-Present); Chairman: Lighting Protection Systems, LLC (10/06-Present); Director: CompletexRM (2009-Present). | | | 10 | | Chairman: Lighting Protection Systems, LLC (10/06-Present); Director: CompletexRM (2009-Present). |
| | | | | | | | | | | | |
Raymond Noveck(3),(4),(5)
31 Karen Road
Waban, MA 02168
Age: 68 | | Trustee | | 24 years | | Private Investor (1999-Present); Trustee: Baron Investment Funds Trust (1987-Present), Baron Capital Funds Trust (1997-06/07), Baron Select Funds (2003-Present). | | | 10 | | None |
| | | | | | | | | | | | |
David A. Silverman, MD(4),(5)
146 Central Park West
New York, NY 10024
Age: 61 | | Trustee | | 24 years | | Physician and Faculty: New York University School of Medicine (1976-Present); Trustee: Baron Investment Funds Trust (1987-Present), Baron Capital Funds Trust (1997-06/07), Baron Select Funds (2003-Present). | | | 10 | | Director: New York Blood Center (1999-Present). |
41
Baron Select Funds | |
December 31, 2011 |
| MANAGEMENT OF THE FUNDS (Unaudited) (Continued) |
| | | | | | | | | | Number of | | |
| | | | | | | | | | Portfolios | | |
| | | | | | | | | | in Fund | | |
| | | | | | | | | | Complex | | Other |
| | | Position(s) Held | | Length of | | Principal Occupation(s) | | | Overseen | | Trustee/Directorships |
| Name, Address & Age | | With the Funds | | Time Served | | During the Past Five Years | | | by Trustee | | Held by the Trustee |
| |
| Independent Trustees (continued) |
| | | | | | | | | | | | |
Alex Yemenidjian(4),(5)
1925 Century Park East
Suite 1975
Los Angeles, CA 90067
Age: 56 | | Trustee | | 4 years | | Chairman and CEO: Tropicana Las Vegas (gaming) (2009-Present); Chairman and CEO: Armenco Holdings, LLC (investment company) (2005-Present); Director: Guess?, Inc. (retail) (2005-Present); Director: Regal Entertainment Group (entertainment company) (2005-Present); Director: USC Marshall School of Business Board of Leaders (2005-Present); Co-chair: Imagine the Arts Campaign, California State University-Northridge (2005-Present); Trustee: American Film Institute (2000-2007); Chairman and CEO: Metro-Goldwyn-Mayer, Inc. (1999-2005); Director: The Lincy Foundation (1989-2011); Chairman: The United Armenian Fund (1989-2011); Director and member of Executive Committee: MGM MIRAGE, Inc. (1989-2005); Trustee: Baron Investment Funds Trust (12/06-Present), Baron Capital Funds Trust (12/06-06/07), Baron Select Funds (12/06-Present). | | | 10 | | Chairman and CEO: Tropicana Las Vegas (gaming) (2009-Present); Chairman and CEO: Armenco Holdings, LLC (investment company) (2005-Present); Director: Guess?, Inc. (retail) (2005-Present); Director: Regal Entertainment Group (entertainment company) (2005-Present); Director: USC Marshall School of Business Board of Leaders (2005-Present); Co-chair: Imagine the Arts Campaign, California State University-Northridge (2005-Present); Trustee: American Film Institute (2000-2007); Chairman and CEO: Metro-Goldwyn-Mayer, Inc. (1999-2005); Director: The Lincy Foundation (1989-2011); Chairman: The United Armenian Fund (1989-2011); Director and member of Executive Committee: MGM MIRAGE, Inc. (1989-2005). |
42
December 31, 2011 | |
Baron Select Funds |
| MANAGEMENT OF THE FUNDS (Unaudited) (Continued) |
| | | | | | | | | | Number of | | |
| | | | | | | | | | Portfolios | | |
| | | | | | | | | | in Fund | | |
| | | | | | | | | | Complex | | Other |
| | | Position(s) Held | | Length of | | Principal Occupation(s) | | | Overseen | | Trustee/Directorships |
| Name, Address & Age | | With the Funds | | Time Served | | During the Past Five Years | | | by Trustee | | Held by the Trustee |
| |
| Additional Officers of the Funds |
| | | | | | | | | | | | |
Clifford Greenberg
767 Fifth Avenue
New York, NY 10153
Age: 52 | | Senior Vice
President and
Portfolio Manager | | 15 years | | Director and Senior Vice President: the Firm* (2003-Present); Vice President: Baron Capital, Inc. (1997-2003); Portfolio Manager: Baron Small Cap Fund (1997-Present). | | | N/A | | None |
| | | | | | | | | | | | |
Gretta J. Heaney
767 Fifth Avenue
New York, NY 10153
Age: 51 | | Vice President and
Chief Compliance
Officer | | 8 years | | Vice President and Chief Compliance Officer: the Firm* (2003-Present), Baron Investment Funds Trust, Baron Select Funds (2004-Present), Baron USA Partners Fund, Ltd (2006-Present), Baron Managed Funds plc (2005-2009), Baron Capital Funds Trust (2003-06/07). | | | N/A | | None |
| | | | | | | | | | | | |
Patrick M. Patalino
767 Fifth Avenue
New York, NY 10153
Age: 43 | | Vice President,
General Counsel and
Secretary | | 4 years | | Vice President and General Counsel: the Firm*, Baron Investment Funds Trust, Baron Select Funds, (08/07-Present); Baron USA Partners Fund, Ltd. (08/07-Present); Secretary: the Firm* (04/08-Present); Secretary: Baron Investment Funds Trust, Baron Select Funds (10/08-Present); Managing Director and Chief Operating Officer: Legal and Compliance Division, Morgan Stanley (01/06-06/07); Director of Regulatory Matters: Credit Suisse Securities (USA) (04/04-01/06); Counsel to Vice Chairman: Credit Suisse Securities (USA) (09/02-04/04). | | | N/A | | None |
| | | | | | | | | | | | |
Andrew Peck
767 Fifth Avenue
New York, NY 10153
Age: 42 | | Senior Vice
President and
Portfolio Manager | | 9 years | | Portfolio Manager: Baron Asset Fund (01/08-Present); Vice President: BAMCO, Inc. (2003-Present); Vice President: Baron Investment Funds Trust (2003-Present); Vice President, Research Analyst: Baron Capital, Inc. (1998-2003); Co-Portfolio Manager: Baron Asset Fund (2003-01/08); Co-Portfolio Manager (mid cap accounts): Baron Capital Management, Inc. (04/06-Present). | | | N/A | | None |
| | | | | | | | | | | | |
Susan Robbins
767 Fifth Avenue
New York, NY 10153
Age: 57 | | Vice President | | 24 years | | Director, Vice President and Senior Analyst: the Firm* (2003-Present); Vice President: Baron Investment Funds Trust (1994-Present), Baron Select Funds (2003-Present), Baron Capital Funds Trust (1998-06/07). | | | N/A | | None |
| | | | | | | | | | | | |
Peggy C. Wong
767 Fifth Avenue
New York, NY 10153
Age: 50 | | Treasurer and
Chief Financial
Officer | | 24 years | | Chief Financial Officer and Treasurer: the Firm* (2003-Present), Baron Investment Funds Trust (1987-Present), Baron Select Funds (2003-Present), Baron USA Partners Fund, Ltd. (1993-Present), Baron Managed Funds plc. (2005-2009), Baron Capital Funds Trust (1998-06/07). | | | N/A | | None |
| * | | The Firm (Baron Capital Group, Inc. (“BCG”) with its subsidiaries BCI, Baron Capital Management, Inc. (“BCM”) and BAMCO). |
| (1) | | Trustees deemed to be “Interested Trustees” of the Funds, as that term is defined in the 1940 Act by reason of their employment with the Funds’ Adviser and Distributor. |
| (2) | | Members of the Executive Committee, which is empowered to exercise all of the powers, including the power to declare dividends, of the full Board when the full Board is not in session. |
| (3) | | Members of the Audit Committee. |
| (4) | | Members of the Nominating Committee. |
| (5) | | Members of the Independent Committee. |
43
Go Paperless!
It’s fast simple and a smart way to help the enviroment.
Enjoy the speed and convenience of receiving Fund documents electronically.
For more information and to enroll today go to www.baronfunds.com/edelivery
767 Fifth Avenue, 49th Fl.
New York, NY 10153
1.800.99. BARON
212-583-2000
www.BaronFunds.com
DEC 11
Item 2. Code of Ethics.
The Registrant has adopted a Code of Ethics for Principal Executive and Senior Financial Officers (the “Code”). Upon request, the Registrant will provide a copy of the Code to any person without charge. To obtain a copy of the Code, please send your request to info@Baronfunds.com or call 1-800-99BARON (1-800-992-2766).
Item 3. Audit Committee Financial Expert.
The Registrant’s Board of Trustees has determined that the Registrant has two audit committee financial experts serving on its Audit Committee, Norman S. Edelcup and Raymond Noveck. Both Mr. Edelcup and Mr. Noveck are “independent” for purposes of Item 3(a)(2) of Form N-CSR.
Item 4. Principal Accountant Fees and Services.
The following table shows the fees paid to Pricewaterhouse Coopers, LLP, the Registrant’s principal accounting firm during the fiscal years ended December 31, 2011 and December 31, 2010:
(a) Audit Fees: for professional services rendered for the audit of the Registrant’s annual financial statements or services that are normally provided in connection with the statutory and regulatory filings or engagements:
| | | | 2011 | | 2010 |
| | | |
| |
|
| | Baron Select Funds | | | $163,000 | | | $114,750 |
(b) Audit-Related Fees: for assurance and related services that are reasonably related to the performance of the audit and are not included as Audit Fees:
| | | | 2011 | | 2010 |
| | | |
| |
|
| | Baron Select Funds | | | $0 | | | $0 |
(c) Tax Fees: for professional services rendered for tax compliance, tax advice and tax planning:
| | | | 2011 | | 2010 |
| | | |
| |
|
| | Baron Select Funds | | | $46,750 | | | $36,000 |
The Tax Fees represent services provided in connection with the preparation of tax returns and year-end distribution review.
(d) All Other Fees: for products and services provided by such accounting firm that are not included in (a), (b) or (c) above:
| | | | 2011 | | 2010 |
| | | |
| |
|
| | Baron Select Funds | | | $0 | | | $0 |
(e) Audit Committee Pre-Approval Policies and Procedures: (i) Pursuant to paragraph (c)(7) of Rule 2-01 of Regulation S-X and to its charter, the Audit Committee shall pre-approve all audit and non-audit services provided by the independent auditors and in connection therewith to review and evaluate the qualifications, independence and performance of the Fund’s independent auditors; (ii) 100% of the services described in each of items 4(b) through 4(d) were approved by the Audit Committee pursuant to paragraph (c)(7)(i)(C) of Rule 2-01 of Regulation S-X.
(f) Not Applicable.
(g) The aggregate non-audit fees billed by the registrant’s accountant for services rendered to the registrant, and rendered to the registrant’s investment adviser (not including any sub-adviser whose role is primarily portfolio management and is subcontracted with or overseen by another investment adviser), and any entity controlling, controlled by, or under common control with the adviser that provides ongoing services to the registrant for the last two fiscal years is as follows:
2011: $45,000
2010: $45,000
(h) Not Applicable.
Item 5. Audit Committee of Listed Registrants.
The Registrant has a separately-designated standing Audit Committee established in accordance with Section 3(a)(58)(A) of the Securities Exchange Act of 1934. The members of the Audit Committee are Norman S. Edelcup and Raymond Noveck.
Item 6. Schedule of Investments.
Included herein under Item 1.
Item 7. Disclosure of Proxy Voting Policies and Procedures for Closed-End Management Investment Companies.
Not applicable.
Item 8. Portfolio Managers of Closed-End Management Investment Companies.
Not applicable.
Item 9. Purchases of Equity Securities by Closed-End Management Investment Company and Affiliated Purchasers.
Not applicable.
Item 10. Submission of Matters to a Vote of Security Holders.
Not applicable.
| Item 11. Controls and Procedures. |
| | |
| | (a) The Registrant’s principal executive officer and principal financial officer have concluded that the Registrant’s disclosure controls and procedures (as defined in Rule 30a-3(c) under the Investment Company Act of 1940 (the “1940 Act”)) are effective based on their evaluation of these controls and procedures as of a date within 90 days of the filing date of this report. |
| | |
| | (b) There were no changes in the Registrant’s internal control over financial reporting (as defined in Rule 30a-3(d) under the 1940 Act) that occurred during the Registrant’s second fiscal quarter of the period covered by this report that have materially affected, or are reasonably likely to materially affect, the Registrant’s internal control over financial reporting. |
| | |
| Item 12. Exhibits. |
| | |
| | (a)(2) Certification of each of the principal executive officers and principal financial officers of the Registrant as required by Rule 30a-2 under the Act (17 CFR 270.30a-2) is attached hereto as a part of EX-99.CERT. |
| | |
| | (b) Certification of each of the principal executive officers and principal financial officers of the Registrant as required by Section 906 of the Sarbanes-Oxley Act of 2002 is attached hereto as a part of EX-99.906CERT. |
SIGNATURES
Pursuant to the requirements of the Securities Exchange Act of 1934 and the Investment Company Act of 1940, the registrant has duly caused this report to be signed on its behalf by the undersigned, thereunto duly authorized.
| | BARON INVESTMENT FUNDS TRUST |
| | | |
| | By: | /s/ Ronald Baron |
| | | Ronald Baron |
| | | Chief Executive Officer |
| | | |
| | Date: | February 27, 2012 |
Pursuant to the requirements of the Securities Exchange Act of 1934 and the Investment Company Act of 1940, this report has been signed below by the following persons on behalf of the registrant and in the capacities and on the dates indicated.
| | By: | /s/ Ronald Baron |
| | | Ronald Baron |
| | | Chief Executive Officer |
| | | |
| | Date: | February 27, 2012 |
| | | |
| | By: | /s/ Peggy Wong |
| | | Peggy Wong |
| | | Treasurer and Chief Financial Officer |
| | | |
| | Date: | February 27, 2012 |