| OMB APPROVAL |
| OMB Number: 3235-0570 |
| Expires: January 31, 2017 |
Estimated average burden
Hours per response. . . . . . . . . 20.6 |
UNITED STATES
SECURITIES AND EXCHANGE COMMISSION
Washington, DC 20549
FORM N-CSR
CERTIFIED SHAREHOLDER REPORT OF REGISTERED
MANAGEMENT INVESTMENT COMPANIES
Investment Company Act file number: 811-21296
BARON SELECT FUNDS
(Exact Name of Registrant as Specified in Charter)
767 Fifth Avenue, 49th Floor
New York, NY 10153
(Address of Principal Executive Offices) (Zip Code)
Patrick M. Patalino, General Counsel
c/o Baron Select Funds
767 Fifth Avenue, 49th Floor
New York, NY 10153
(Name and Address of Agent for Service)
(Registrant’s Telephone Number, including Area Code): 212-583-2000
Date of fiscal year end: December 31
Date of reporting period: December 31, 2014
Form N-CSR is to be used by management investment companies to file reports with the Commission not later than 10 days after the transmission to stockholders of any report that is required to be transmitted to stockholders under Rule 30e-1 under the Investment Company Act of 1940 (17CRF 270.30e-1). The Commission may use the information provided on Form N-CSR in its regulatory, disclosure review, inspection, and policymaking roles.
A registrant is required to disclose the information specified by Form N-CSR, and the Commission will make this information public. A registrant is not required to respond to the collection of information contained in Form N-CSR unless the Form displays a currently valid Office of Management and Budget (“OMB”) control number. Please direct comments concerning the accuracy of the information collection burden estimate and suggestions for reducing the burden to Secretary, Securities and Exchange Commission, 450 5th Street, NW, Washington, D.C. 20549-0609. The OMB has reviewed this collection of information under the clearance requirements of 44 U.S.C. Section 3507.
Persons who are to respond to the collection of information contained in this form are not required to respond unless the form displays a currently valid OMB control number.
SEC 2569 (5-07)
Item 1. Reports to Stockholders.
| | | | | |
| | | | | |
| | Baron Partners Fund | | | Baron Funds® |
| | Baron Focused Growth Fund | | |
| | Baron International Growth Fund | | |
| | Baron Real Estate Fund | | |
| | Baron Emerging Markets Fund | | |
| | Baron Energy and Resources Fund | | |
| | Baron Global Advantage Fund | | |
| | | | |
| | | | | |
| | | | | |
| | December 31, 2014 | | | Annual Financial Report |
| | | | | |
| | | | | |
| | |
| | Baron Partners Fund | | |
| | Ticker Symbols: | | |
| | Retail Shares: BPTRX | | |
| | Institutional Shares: BPTIX | | |
| | Performance | | 2 |
| | Top Ten Holdings | | 3 |
| | Sector Breakdown | | 3 |
| | Management’s Discussion of Fund Performance | | 3 |
| | |
| | Baron Focused Growth Fund | | |
| | Ticker Symbols: | | |
| | Retail Shares: BFGFX | | |
| | Institutional Shares: BFGIX | | |
| | Performance | | 4 |
| | Top Ten Holdings | | 5 |
| | Sector Breakdown | | 5 |
| | Management’s Discussion of Fund Performance | | 5 |
| | |
| | Baron International Growth Fund | | |
| | Ticker Symbols: | | |
| | Retail Shares: BIGFX | | |
| | Institutional Shares: BINIX | | |
| | Performance | | 6 |
| | Top Ten Holdings | | 7 |
| | Sector Breakdown | | 7 |
| | Management’s Discussion of Fund Performance | | 7 |
| | |
| | Baron Real Estate Fund | | |
| | Ticker Symbols: | | |
| | Retail Shares: BREFX | | |
| | Institutional Shares: BREIX | | |
| | Performance | | 8 |
| | Top Ten Holdings | | 9 |
| | Sector Breakdown | | 9 |
| | Management’s Discussion of Fund Performance | | 9 |
| | |
| | Baron Emerging Markets Fund | | |
| | Ticker Symbols: | | |
| | Retail Shares: BEXFX | | |
| | Institutional Shares: BEXIX | | |
| | Performance | | 10 |
| | Top Ten Holdings | | 11 |
| | Sector Breakdown | | 11 |
| | Management’s Discussion of Fund Performance | | 11 |
| | |
| | Baron Energy and Resources Fund | | |
| | Ticker Symbols: | | |
| | Retail Shares: BENFX | | |
| | Institutional Shares: BENIX | | |
| | Performance | | 12 |
| | Top Ten Holdings | | 13 |
| | Sector Breakdown | | 13 |
| | Management’s Discussion of Fund Performance | | 13 |
| | |
| | Baron Global Advantage Fund | | |
| | Ticker Symbols: | | |
| | Retail Shares: BGAFX | | |
| | Institutional Shares: BGAIX | | |
| | Performance | | 14 |
| | Top Ten Holdings | | 15 |
| | Sector Breakdown | | 15 |
| | Management’s Discussion of Fund Performance | | 15 |
| | |
| | Financial Statements | | |
| | |
| | Statements of Net Assets | | 16 |
| | Statements of Assets and Liabilities | | 27 |
| | Statements of Operations | | 29 |
| | Statements of Changes in Net Assets | | 31 |
| | Statement of Cash Flows | | 34 |
| | Notes to Financial Statements | | 35 |
| | |
| | Financial Highlights | | 43 |
| | |
| | Report of Independent Registered Public
Accounting Firm | | 50 |
| | |
| | Tax Information | | 51 |
| | |
| | Fund Expenses | | 52 |
| | |
| | Management of the Funds | | 53 |
| | |
DEAR BARON SELECT FUNDS SHAREHOLDER: In this report, you will find audited financial statements for Baron Partners Fund, Baron Focused Growth Fund, Baron International Growth Fund, Baron Real Estate Fund, Baron Emerging Markets Fund, Baron Energy and Resources Fund and Baron Global Advantage Fund (the “Funds”) for the year ended December 31, 2014. The U.S. Securities and Exchange Commission (the “SEC”) requires mutual funds to furnish these statements semi-annually to their shareholders. We hope you find these statements informative and useful. We thank you for choosing to join us as fellow shareholders in Baron Funds. We will continue to work hard to justify your confidence. Sincerely, |
 | |  | |  |
| | | | | |
| Ronald Baron | | Linda S. Martinson | | Peggy Wong |
| Chief Executive Officer and | | Chairman, President and | | Treasurer and |
| Chief Investment Officer | | Chief Operating Officer | | Chief Financial Officer |
| February 25, 2015 | | February 25, 2015 | | February 25, 2015 |
| | | | | | |
This Annual Financial Report is for the Baron Select Funds, which currently has seven series: Baron Partners Fund, Baron Focused Growth Fund, Baron International Growth Fund, Baron Real Estate Fund, Baron Emerging Markets Fund, Baron Energy and Resources Fund and Baron Global Advantage Fund. If you are interested in Baron Investment Funds Trust, which contains the Baron Asset Fund, Baron Growth Fund, Baron Small Cap Fund, Baron Opportunity Fund, Baron Fifth Avenue Growth Fund and Baron Discovery Fund series, please visit the Funds’ website at www.BaronFunds.com or contact us at 1-800-99BARON. The Funds’ Proxy Voting Policy is available without charge on the Funds’ website at www.BaronFunds.com, or by calling 1-800-99BARON and on the SEC’s website at www.sec.gov. The Funds’ most current proxy voting record, Form N-PX, is also available on the Funds’ website and on the SEC’s website. The Funds file their complete schedules of portfolio holdings with the SEC for the first and third quarters of each fiscal year on Form N-Q. The Funds’ Forms N-Q are available on the SEC’s website at www.sec.gov. The Funds’ Forms N-Q may also be reviewed and copied at the SEC’s Public Reference Room in Washington, DC; information on the operation of the SEC’s Public Reference Room may be obtained by calling 1-202-551-8090. A copy of the Funds’ Forms N-Q may also be obtained upon request by calling 1-800-99BARON. Schedules of portfolio holdings current to the most recent quarter are also available on the Funds’ website. Some of the comments are based on current management expectations and are considered “forward-looking statements.” Actual future results, however, may prove to be different from our expectations. You can identify forward-looking statements by words such as “estimate,” “may,” “expect,” “should,” “could,” “believe,” “plan” and other similar terms. We cannot promise future returns and our opinions are a reflection of our best judgment at the time this report is compiled. The views expressed in this report reflect those of BAMCO, Inc. (“BAMCO” or the “Adviser”) only through the end of the period stated in this report. The views are not intended as recommendations or investment advice to any person reading this report and are subject to change at any time without notice based on market and other conditions. |
Past performance is no guarantee of future results. The investment return and principal value of an investment will fluctuate; an investor’s shares, when redeemed, may be worth more or less than their original cost. For more complete information about Baron Funds, including charges and expenses, call, write or go to www.BaronFunds.com for a prospectus or summary prospectus. Read them carefully before you invest or send money. This report is not authorized for use as an offer of sale or a solicitation of an offer to buy shares of the Funds, unless accompanied or preceded by the Funds’ current prospectus or summary prospectus. | | 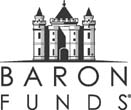 |
Baron Partners Fund (Unaudited) | | December 31, 2014 |
| |
| |
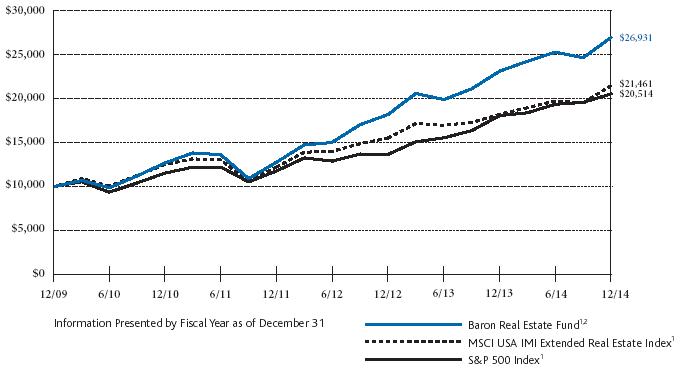
COMPARISON OF THE CHANGE IN VALUE OF $10,000 INVESTMENT IN BARON PARTNERS FUND (RETAIL SHARES)
IN RELATION TO THE RUSSELL MIDCAP GROWTH INDEX AND THE S&P 500 INDEX |
| | | | | | | | | | | | | | | | | | |
 |
| |
| AVERAGE ANNUAL TOTAL RETURNS FOR THE PERIODS ENDED DECEMBER 31, 2014 |
| | | | | | | | | | | | | | | | | | Since |
| | | | | | | | | | | | | | | | | | Inception |
| | | | | | One | | Three | | Five | | Ten | | (January 31, |
| | | | | | Year | | Years | | Years | | Years | | 1992) |
| Baron Partners Fund — Retail Shares1, 2, 3 | | | | | 10.26 | % | | 23.74 | % | | 18.63 | % | | 9.53 | % | | 13.21 | % |
| Baron Partners Fund — Institutional Shares1, 2, 3, 4 | | | | | 10.56 | % | | 24.07 | % | | 18.94 | % | | 9.69 | % | | 13.28 | % |
| Russell Midcap Growth Index1 | | | | | 11.90 | % | | 20.71 | % | | 16.94 | % | | 9.43 | % | | 9.71 | % |
| S&P 500 Index1 | | | | | 13.69 | % | | 20.41 | % | | 15.45 | % | | 7.67 | % | | 9.50 | % |
| | | |
| | | |
| | | |
| | | |
| | | |
| | | |
| | | |
|
| 1 | | The indexes are unmanaged. The Russell Midcap® Growth Index measures the performance of medium-sized U.S. companies that are classified as growth and the S&P 500 Index of 500 widely held large-cap U.S. companies. The indexes and Baron Partners Fund are with dividends, which positively impact the performance results. |
| | | |
| 2 | | Reflects the actual fees and expenses that were charged when the Fund was a partnership. The predecessor partnership charged a 20% performance fee after reaching a certain performance benchmark. If the annual returns for the Fund did not reflect the performance fees for the years the predecessor partnership charged a performance fee, returns would be higher. The Fund’s shareholders will not be charged a performance fee. The predecessor partnership’s performance is only for periods before the Fund’s registration statement was effective, which was April 30, 2003. During those periods, the predecessor partnership was not registered under the Investment Company Act of 1940 and was not subject to its requirements or the requirements of the Internal Revenue Code relating to regulated investment companies, which, if it were, might have adversely affected its performance. |
| | | |
| 3 | | Past performance is not predictive of future performance. The performance data does not reflect the deduction of taxes that a shareholder would pay on Fund distributions or redemption of Fund shares. The Fund’s transfer agency expenses may be reduced by expense offsets from an unaffiliated transfer agent, without which performance would have been lower. |
| | | |
| 4 | | Performance for the Institutional Shares prior to May 29, 2009 is based on the performance of the Retail Shares, which have a distribution fee. The Institutional Shares do not have a distribution fee. If the annual returns for the Institutional Shares prior to May 29, 2009 did not reflect this fee, the returns would be higher. |
2
| |
| December 31, 2014 (Unaudited) | Baron Partners Fund |
| TOP TEN HOLDINGS AS OF DECEMBER 31, 2014 |
| | | Percent of Total | |
| | | Investments | |
| CoStar Group, Inc. | | 8.9% | |
| Tesla Motors Inc. | | 8.1% | |
| ITC Holdings Corp. | | 7.2% | |
| Hyatt Hotels Corp. | | 6.6% | |
| Arch Capital Group Ltd. | | 6.4% | |
| CarMax, Inc. | | 5.9% | |
| Air Lease Corp. | | 5.7% | |
| The Charles Schwab Corp. | | 5.1% | |
| FactSet Research Systems, Inc. | | 4.8% | |
| Dick’s Sporting Goods, Inc. | | 4.6% | |
| | | 63.3% | |
| |
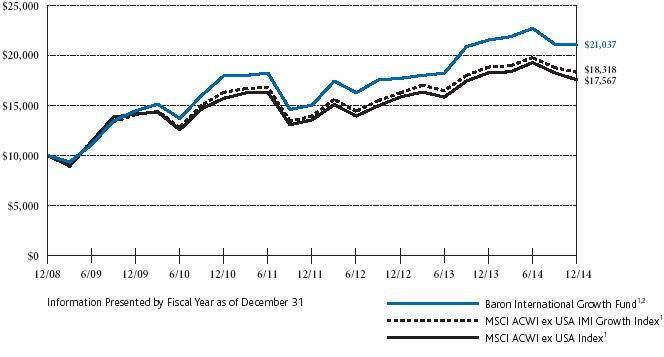
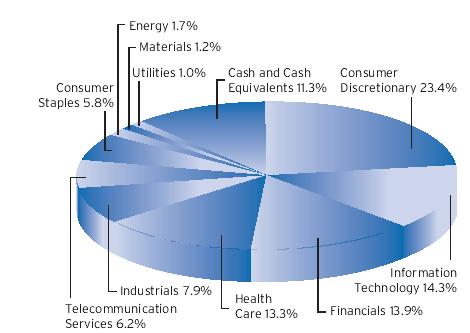
SECTOR BREAKDOWN AS OF DECEMBER 31, 2014†
(as a percentage of total investments) |
| |
 |
| |
| MANAGEMENT’S DISCUSSION OF FUND PERFORMANCE |
| |
For the year ended December 31, 2014, Baron Partners Fund1 (the “Fund”) gained 10.26%, underperforming the Russell Midcap Growth Index, which gained 11.90%.
The Fund has performed well since its conversion into an open end mutual fund on April 30, 2003. In the period since the Fund’s conversion through December 31, 2014, the Fund gained an annualized 14.39% versus an annualized 12.12% for the Russell Midcap Growth Index. The Fund also has meaningfully outperformed the Russell Midcap Growth Index since its inception on January 31, 1992, gaining an annualized 13.21%* compared to an annualized 9.71% for its index. |
| The Fund invests primarily in U.S. companies of any size with significant long-term growth potential. We believe our process can identify investment opportunities that we believe are attractively priced relative to future prospects. The Fund is non-diversified, so its top 10 holdings are expected to comprise a significant percentage of the portfolio, and the Fund uses leverage, both of which increase risk. |
| |
| Results for U.S. stock markets were volatile in 2014, as investors rotated among sub-asset classes and sectors in reaction to geopolitical events, the pace of global economic growth, interest rates, and, in the second half of the year, plummeting oil prices. Since we invest based on fundamentals – open-ended growth opportunities, significant competitive advantages, and talented management teams – we used the sell-off as an opportunity to purchase or add to existing holdings at what we consider to be attractive prices. Generally positive domestic economic reports over the year supported the view that the U.S. economy is accelerating, outpacing much of the rest of the developed world. |
| |
| At the sector level, the Fund’s investments in Health Care, Consumer Discretionary and Utilities were the largest contributors to performance in 2014. Energy, Financials and Industrials detracted. |
| |
| The largest individual contributor was Illumina, Inc. Shares of Illumina, the leader in next generation DNA sequencing instruments and consumables, rose significantly in 2014, driven by multiple new product introductions, including a new ultra-high throughput platform that is the first to sequence a full human genome for less than $1,000. Over the year, management increased guidance from 15-17% revenue growth to, most recently, 30% growth. We believe Illumina has further distanced itself from its competitors and holds an effective monopoly on DNA sequencing at a time when demand is accelerating. |
| |
| athenahealth, Inc. was the largest individual detractor in 2014. athenahealth provides cloud-based software-enabled business services for physicians and other healthcare providers. Shares declined on news that its enterprise bookings fell short of management targets and on the release of a short thesis by a prominent hedge fund manager. The Fund exited its position in athenahealth. |
| |
| We expect to continue to establish long positions in securities that, in our opinion, have favorable price-to-value characteristics based on our assessment of their prospects for future growth and profitability. |
| |
|
| † | | Industry sector levels are provided from the Global Industry Classification Standard (“GICS”), developed and exclusively owned by MSCI, Inc. and Standard & Poor’s Financial Services LLC, unless otherwise stated that they have been reclassified or classified by the Adviser. All GICS data is provided “as is” with no warranties. |
| |
| 1 | | Performance information reflects results of the Retail Shares. |
| |
| * | | Please see Footnote 2 on page 2. |
3
Baron Focused Growth Fund (Unaudited) | | December 31, 2014 |
| |
| |
COMPARISON OF THE CHANGE IN VALUE OF $10,000 INVESTMENT IN BARON FOCUSED GROWTH FUND† (RETAIL SHARES)
IN RELATION TO THE RUSSELL 2500 GROWTH INDEX AND THE S&P 500 INDEX |
| | | | | | | | | | | | | | | | | | |
 |
| |
| AVERAGE ANNUAL TOTAL RETURNS FOR THE PERIODS ENDED DECEMBER 31, 2014 |
| | | | | | | | | | | | | | | | | | Since |
| | | | | | | | | | | | | | | | | | Inception |
| | | | | One | | Three | | Five | | Ten | | (May 31, |
| | | | | Year | | Years | | Years | | Years | | 1996) |
| Baron Focused Growth Fund — Retail Shares1, 2, 3 | | | | | 2.35 | % | | 14.26 | % | | 12.98 | % | | 8.63 | % | | 11.50 | % |
| Baron Focused Growth Fund — Institutional Shares1, 2, 3, 4 | | | | | 2.54 | % | | 14.53 | % | | 13.25 | % | | 8.77 | % | | 11.58 | % |
| Russell 2500 Growth Index1 | | | | | 7.05 | % | | 20.47 | % | | 17.27 | % | | 9.37 | % | | 7.59 | % |
| S&P 500 Index1 | | | | | 13.69 | % | | 20.41 | % | | 15.45 | % | | 7.67 | % | | 8.22 | % |
| | | |
| | | |
| | | |
| | | |
| | | |
| | | |
|
| † | | The Fund’s historical performance was impacted by gains from IPOs and/or secondary offerings. There is no guarantee that these results can be repeated or that the Fund’s level of participation in IPOs and secondary offerings will be the same in the future. |
| | | |
| 1 | | The indexes are unmanaged. The Russell 2500” Growth Index measures the performance of small to medium-sized U.S. companies that are classified as growth and the S&P 500 Index of 500 widely held large-cap U.S. companies. The indexes and Baron Focused Growth Fund are with dividends, which positively impact the performance results. |
| | | |
| 2 | | Reflects the actual fees and expenses that were charged when the Fund was a partnership. The predecessor partnership charged a 15% performance fee through 2003 after reaching a certain performance benchmark. If the annual returns for the Fund did not reflect the performance fees for the years the predecessor partnership charged a performance fee, the returns would be higher. The Fund’s shareholders will not be charged a performance fee. The predecessor partnership’s performance is only for periods before the Fund’s registration statement was effective, which was June 30, 2008. During those periods, the predecessor partnership was not registered under the Investment Company Act of 1940 and was not subject to its requirements or the requirements of the Internal Revenue Code relating to regulated investment companies, which, if it were, might have adversely affected its performance. |
| | | |
| 3 | | Past performance is not predictive of future performance. The performance data does not reflect the deduction of taxes that a shareholder would pay on Fund distributions or redemption of Fund shares. The Adviser has reimbursed certain Fund expenses (by contract as long as BAMCO, Inc. is the Adviser to the Fund) and the Fund’s transfer agency expenses may be reduced by expense offsets from an unaffiliated transfer agent, without which performance would have been lower. |
| | | |
| 4 | | Performance for the Institutional Shares prior to May 29, 2009 is based on the performance of the Retail Shares, which have a distribution fee. The Institutional Shares do not have a distribution fee. If the annual returns for the Institutional Shares prior to May 29, 2009 did not reflect this fee, the returns would be higher. |
4
| |
| December 31, 2014 (Unaudited) | Baron Focused Growth Fund |
| TOP TEN HOLDINGS AS OF DECEMBER 31, 2014 |
| | | Percent of
Net Assets | |
| Tesla Motors Inc. | | 7.4% | |
| Hyatt Hotels Corp. | | 7.4% | |
| CoStar Group, Inc. | | 6.6% | |
| Vail Resorts, Inc. | | 6.4% | |
| FactSet Research Systems, Inc. | | 5.4% | |
| CarMax, Inc. | | 5.1% | |
| Colfax Corp. | | 4.7% | |
| Manchester United plc | | 4.5% | |
| Choice Hotels International, Inc. | | 4.3% | |
| Iridium Communications Inc. | | 4.2% | |
| | | 56.0% | |
| |
SECTOR BREAKDOWN AS OF DECEMBER 31, 2014†
(as a percentage of net assets) |
| |
 |
| |
| MANAGEMENT’S DISCUSSION OF FUND PERFORMANCE |
| |
For the year ended December 31, 2014, Baron Focused Growth Fund1 (the “Fund”) gained 2.35%, while the Russell 2500 Growth Index gained 7.05%. |
| |
| Since its inception on May 31, 1996, through December 31, 2014, the Fund has significantly outperformed the Russell 2500 Growth Index, gaining an annualized 11.50%*, compared to an annualized 7.59% for its index. |
| The Fund invests in a non-diversified portfolio of U.S. companies that we believe are well-capitalized, and have exceptional management, significant growth potential, and sustainable barriers to competition. The Fund invests primarily in common stock of small- and mid-sized U.S. companies. The Fund is non-diversified, so the top ten holdings are expected to comprise a significant percentage of the Fund. |
| |
| Results for U.S. stock markets were volatile in 2014, as investors rotated among sub-asset classes and sectors in reaction to geopolitical events, the pace of global economic growth, interest rates, and, in the second half of the year, plummeting oil prices. After outperforming in 2013, small cap stocks underperformed their large cap counterparts in 2014. This cyclical behavior is a well established pattern. Since we invest based on fundamentals – open-ended growth opportunities, significant competitive advantages, and talented management teams – we used the sell off as an opportunity to purchase or add to existing holdings at what we consider to be attractive prices. We are confident that stocks of smaller, faster growing companies once again will return to favor, although we cannot predict exactly when, how, or if, it will happen. |
| |
| At the sector level, the Fund’s investments in Information Technology, Telecommunication Services and Utilities were the largest contributors to performance in 2014. Industrials and Financials detracted from performance. |
| |
| The largest individual contributor was CarMax, Inc. Shares of CarMax, the nation’s largest used car retailer, rose strongly during 2014 on reports of solid results, highlighted by accelerating sales and earnings growth. We believe CarMax’s $3 billion share repurchase program, a young and growing store base, and improving demand will allow the company to deliver industry leading, double-digit growth over the next several years. Our long term outlook calls for 200-plus stores, more than $20 billion in revenue and close to $5 in earnings power in five years. |
| |
| The largest individual detractor in 2014 was Benefitfocus, Inc., the leading provider of cloud-based benefits software. Shares have been highly volatile, more than doubling in the months after its IPO in September 2013, but declining in 2014 on higher-than planned investment spending, a secondary offering, and the pullback in high growth tech stocks. Despite the volatility, the company’s fundamental performance has been strong. Benefitfocus serves a market more than 100 times larger than its current business, which we believe will allow the company to compound revenue at more than 30% annually. |
| |
| We expect to continue to establish positions in small and mid-sized businesses that, in our opinion, have favorable price-to-value characteristics based on our assessment of prospects for future growth and profitability. |
| |
|
| † | | Industry sector levels are provided from the Global Industry Classification Standard (“GICS ”), developed and exclusively owned by MSCI, Inc. and Standard & Poor’s Financial Services LLC, unless otherwise stated that they have been reclassified or classified by the Adviser. All GICS data is provided “as is” with no warranties. |
| |
| 1 | | Performance information reflects results of the Retail Shares. |
| |
| * | | Please see Footnote 2 on page 4. |
5
Baron International Growth Fund (Unaudited) | | December 31, 2014 |
| |
| |
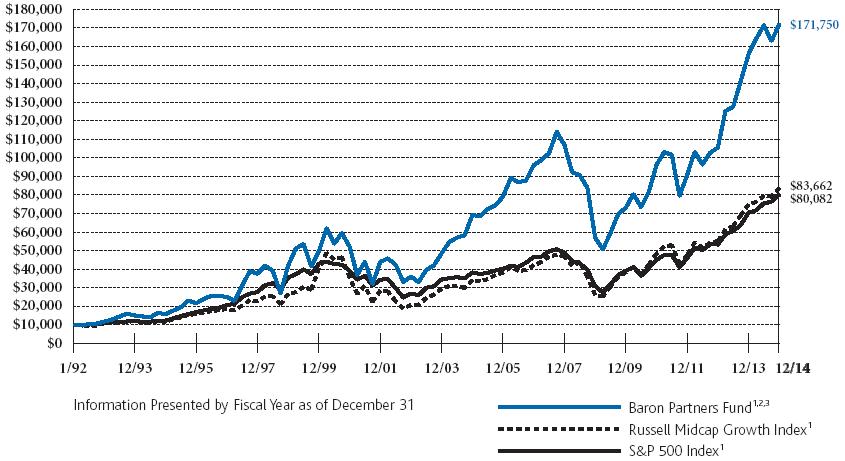
COMPARISON OF THE CHANGE IN VALUE OF $10,000 INVESTMENT IN BARON INTERNATIONAL GROWTH FUND† (RETAIL SHARES)
IN RELATION TO THE MSCI ACWIEX USA IMI GROWTH INDEX ANDTHE MSCI ACWIEX USA INDEX |
| | | | | | | | | | | | | | | | | | |
 |
| |
| AVERAGE ANNUAL TOTAL RETURNS FOR THE PERIODS ENDED DECEMBER 31, 2014 |
| | | | | | | | | | Since |
| | | | | | | | | | Inception |
| | | One | | | Three | | Five | | (December 31, |
| | | Year | | | Years | | Years | | 2008) |
| Baron International Growth Fund — Retail Shares1, 2 | | -2.33 | % | | | 11.85 | % | | 7.77 | % | | 13.20 | % |
| Baron International Growth Fund — Institutional Shares1, 2, 3 | | -2.07 | % | | | 12.15 | % | | 8.06 | % | | 13.47 | % |
| MSCI ACWI ex USA IMI Growth Index1 | | -2.77 | % | | | 9.54 | % | | 5.39 | % | | 10.62 | % |
| MSCI ACWI ex USA Index1 | | -3.87 | % | | | 8.99 | % | | 4.43 | % | | 9.85 | % |
|
| † | | The Fund ’s historical performance was impacted by gains from IPOs and/or secondary offerings. There is no guarantee that these results can be repeated or that the Fund’s level of participation in IPOs and secondary offerings will be the same in the future. |
| | | |
| 1 | | The MSCI ACWI ex USA indexes cited are unmanaged, free float-adjusted market capitalization weighted indexes. The MSCI ACWI ex USA IMI Growth Index Net USD measures the performance of large-, mid- and small-cap growth securities across developed and emerging markets, excluding the United States. The MSCI ACWI ex USA Index Net USD measures the equity market performance of large and mid-cap securities across developed and emerging markets, excluding the United States. The indexes and Baron International Growth Fund include reinvestment of dividends, net of foreign withholding taxes, which positively impact the performance results. |
| | | |
| 2 | | Past performance is not predictive of future performance. The performance data does not reflect the deduction of taxes that a shareholder would pay on Fund distributions or redemption of Fund shares. The Adviser has reimbursed certain Fund expenses (by contract as long as BAMCO, Inc. is the Adviser to the Fund) and the Fund’s transfer agency expenses may be reduced by expense offsets from an unaffiliated transfer agent, without which performance would have been lower. |
| | | |
| 3 | | Performance for the Institutional Shares prior to May 29, 2009 is based on the performance of the Retail Shares, which have a distribution fee. The Institutional Shares do not have a distribution fee. If the annual returns for the Institutional Shares prior to May 29, 2009 did not reflect this fee, the returns would be higher. |
6
| |
| December 31, 2014 (Unaudited) | Baron International Growth Fund |
| TOP TEN HOLDINGS AS OF DECEMBER 31, 2014 |
| | | Percent of | |
| | | Net Assets | |
| Constellation Software, Inc. | | 2.7% | |
| Check Point Software Technologies Ltd. | | 2.7% | |
| Kroton Educacional SA | | 2.4% | |
| Ingenico SA | | 2.2% | |
| Mellanox Technologies Ltd. | | 2.2% | |
| RIB Software AG | | 2.2% | |
| Symrise AG | | 2.1% | |
| Haitong Securities Co., Ltd. | | 2.1% | |
| Opera Software ASA | | 1.9% | |
| Domino’s Pizza Group plc | | 1.9% | |
| | | 22.4% | |
| |
SECTOR BREAKDOWN AS OF DECEMBER 31, 2014†
(as a percentage of net assets) |
| |
 |
| |
| MANAGEMENT’S DISCUSSION OF FUND PERFORMANCE |
| |
For the year ended December 31, 2014, Baron International Growth Fund1 (the “Fund”) declined 2.33%, outperforming the MSCI ACWI ex USA IMI Growth Index, which declined 2.77%.
The Fund is a diversified fund that invests for the long term primarily in securities of non-U.S. growth companies. The Fund seeks to diversify among several developed countries and |
| developing countries throughout the world, although the Fund’s total exposure to developing countries will not exceed 30%. The Fund may purchase securities of companies of any size. |
| |
| The international equities markets were volatile in 2014, with the key related indices finishing down for the full year (in dollar terms). The developed markets were challenged by sluggish economic growth and very low inflation alongside fairly high debt-to-GDP levels. Conditions also represented a challenge for emerging markets, particularly those with significant commodity-based exports and/or U.S. dollar borrowings. It remains to be seen whether the multi-year offensive against deflation and deleveraging in many key economies will achieve lasting success. Late in 2014, the Bank of Japan, the ECB and China’s authorities “reloaded” expectations of aggressive monetary and fiscal support. Of course such moves, when juxtaposed with a strengthening U.S. economy and a tighter Fed, undermine the host currencies against the dollar. In our view, a material rise in the dollar suggests the specter of deflation, and generally coincides with weak commodity and oil prices, and often, falling interest rates. As such, we anticipate the standard deviation of returns among countries, currencies and sectors will remain wide for the time being. |
| |
| On a sector basis, the largest contributors to performance in 2014 were Consumer Discretionary and Information Technology. Energy, Telecommunication Services and Health Care were the largest detractors. On a country basis, the largest contributors to performance were Brazil, Germany and India. Top detractors included Japan, Norway and the U.K. |
| |
| Smiles SA was the Fund’s largest contributor. As the frequent flyer program of the Brazil-based airline GOL Linhas Aéreas Inteligentes SA, Smiles benefited from operational improvements at GOL that resulted in increased yield and improved margins for the airline. Additionally, Smiles out-delivered on its own strategy of winning market share, improving margins and continuing to generate exceptional cash flow. In addition to its near 100% dividend payout ratio, Smiles paid an exceptional dividend in 2014 equivalent to nearly 20% of its market cap. |
| |
| The Fund’s largest detractor was SoftBank Corp. After strong gains in 2013, shares of this mobile communications and broadband Internet access provider in Japan and the U.S. retreated in 2014. Late in the year, shares fell following the successful IPO of Alibaba Group Holding Ltd., of which SoftBank, as a major holder of Alibaba with a roughly one-third stake, had acted as an investment proxy. SoftBank shares further reflected the weakness in Sprint Corp., the U.S. mobile phone company controlled by SoftBank, after Sprint reduced its financial guidance late in the year. |
| |
| We believe the ongoing shift in opportunity, resources and capital towards those international companies and entrepreneurs most capable of driving economic efficiency and productivity remains on course. We believe this trend underlies the Fund’s strong performance to date, and we remain enthusiastic regarding the long term prospects for the many companies in which we are invested. |
| |
|
| † | | Industry sector levels are provided from the Global Industry Classification Standard (“GICS”), developed and exclusively owned by MSCI, Inc. and Standard & Poor’s Financial Services LLC, unless otherwise stated that they have been reclassified or classified by the Adviser. All GICS data is provided “as is” with no warranties. |
| | | |
| 1 | | Performance information reflects results of the Retail Shares. |
7
Baron Real Estate Fund (Unaudited) | | December 31, 2014 |
| |
| |
COMPARISON OF THE CHANGE IN VALUE OF $10,000 INVESTMENT IN BARON REAL ESTATE FUND (RETAIL SHARES)
IN RELATION TO THE MSCI USA IMI EXTENDED REAL ESTATE INDEX AND THE S&P 500 INDEX |
| | | | | | | | | | | | | | | | | | |
 |
| |
| AVERAGE ANNUAL TOTAL RETURNS FOR THE PERIODS ENDED DECEMBER 31, 2014 |
| | | | | | | | Five Years |
| | | | | | | | and Since |
| | | | | | | | Inception |
| | | One | | | Three | | (December 31, |
| | | Year | | | Years | | 2009) |
| Baron Real Estate Fund — Retail Shares1, 2 | | 16.61 | % | | | 28.34 | % | | 21.91 | % |
| Baron Real Estate Fund — Institutional Shares1, 2 | | 16.93 | % | | | 28.69 | % | | 22.21 | % |
| MSCI USA IMI Extended Real Estate Index1 | | 17.96 | % | | | 20.72 | % | | 16.50 | % |
| S&P 500 Index1 | | 13.69 | % | | | 20.41 | % | | 15.45 | % |
|
| 1 | The MSCI USA IMI Extended Real Estate Index is a custom index calculated by MSCI for, and as requested by, BAMCO, Inc. The index includes real estate and real estate-related GICS classification securities. MSCI makes no express or implied warranties or representation and shall have no liability whatsoever with respect to any MSCI data contained herein. The MSCI data may not be further redistributed or used as a basis for other indexes or any securities or financial products. This report is not approved, reviewed or produced by MSCI. The S&P 500 Index measures the performance of 500 widely held large-cap U.S. companies. The indexes and Baron Real Estate Fund are with dividends, which positively impact the performance results. |
| | |
| 2 | Past performance is not predictive of future performance. The performance data does not reflect the deduction of taxes that a shareholder would pay on Fund distributions or redemption of Fund shares. The Adviser has reimbursed certain Fund expenses (by contract as long as BAMCO, Inc. is the Adviser to the Fund) and the Fund’s transfer agency expenses may be reduced by expense offsets from an unaffiliated transfer agent, without which performance would have been lower. |
8
| |
| December 31, 2014 (Unaudited) | Baron Real Estate Fund |
| TOP TEN HOLDINGS AS OF DECEMBER 31, 2014 |
| | | Percent of | |
| | | Net Assets | |
| Brookdale Senior Living, Inc. | | 9.0% | |
| Jones Lang LaSalle, Inc. | | 3.6% | |
| Hyatt Hotels Corp. | | 3.6% | |
| CBRE Group, Inc. | | 3.6% | |
| Starwood Hotels & Resorts Worldwide, Inc. | | 3.4% | |
| Capital Senior Living Corp. | | 3.3% | |
| Home Depot, Inc. | | 3.1% | |
| Wyndham Worldwide Corp. | | 3.0% | |
| Equinix, Inc. | | 2.9% | |
| Mohawk Industries, Inc. | | 2.8% | |
| | | 38.3% | |
| |
SECTOR BREAKDOWN AS OF DECEMBER 31, 2014†
(as a percentage of net assets) |
| |
 |
| |
| MANAGEMENT’S DISCUSSION OF FUND PERFORMANCE |
| |
For the year ended December 31, 2014, Baron Real Estate Fund1 (the “Fund”) gained 16.61%, underperforming the MSCI USA IMI Extended Real Estate Index, which gained 17.96%. Since its inception on December 31, 2009 through December 31, 2014, the Fund significantly outperformed its index, generating an annualized return of 21.91%, compared with an annualized return of 16.50% for the index.
The Fund is a non-diversified fund that invests broadly in real estate and real estate-related companies of all sizes. The Fund seeks |
| to invest in well-managed U.S. and non-U.S. companies that we believe have significant long-term growth opportunities. The Fund’s investment universe extends beyond real estate investment trusts (REITs) to include a more comprehensive group of real estate and real estate-related companies. These include hotels, senior housing operators, casino and gaming operators, tower operators, infrastructure-related companies and master limited partnerships (MLPs), data centers, building products companies, real estate service companies, and real estate operating companies. |
| |
| Our investments in REITs, senior housing operators and health care service providers, and hotels & leisure companies contributed the most to performance in 2014. Only casinos & gaming operators detracted from performance. |
| |
| Performance of REITs was driven largely by historically low interest rates. Generally, we continue to hold the view that REITs will be relatively more vulnerable to an eventual rise in interest rates, and are therefore monitoring our REIT exposure accordingly. However, if interest rates remain low, REITs may continue to outperform. |
| |
| Performance of senior housing operators was attributable primarily to favorable industry consolidation developments. We believe these companies are poised to benefit from attractive demographic trends, our expectation for a cyclical economic and housing market recovery, modest construction activity, favorable valuations, and perhaps further industry consolidation. |
| |
| We believe our hotels & leisure investments remain well positioned amid expectations of solid demand, low supply forecasts and reasonable current stock valuations. In our opinion, as economic growth improves, hotels should benefit from higher occupancy and the opportunity to increase nightly rates, both resulting in strong cash flow growth. |
| |
| The top contributor to performance in 2014 was senior housing provider Emeritus Corp., whose shares climbed on news of its July acquisition by Brookdale Senior Living, Inc., in an all-stock transaction valued at $2.8 billion or $28.41/share, representing a 32% premium to Emeritus’ trading price on February 20 when the deal was announced. The combined company is the nation’s largest and only nationally branded senior housing provider, with roughly 1,200 communities in 46 states. Given demographics, supply/demand imbalance and increasing consumer acceptance of senior housing, we believe prospects for the combined company are extremely positive. |
| |
| The top detractor was Las Vegas Sands Corp., a casino company with locations in Macau, Singapore and Las Vegas. The Chinese government’s anti-corruption crackdown and increased visa restrictions, and credit concerns related to an ongoing investigation into money laundering at certain junkets, resulted in investor pessimism toward the Macau market and pressured the stock. We believe the market will rebound when new supply comes online in 2016 and a new bridge is built from Hong Kong in early 2017, which in turn should improve earnings and sentiment toward the company. |
| |
| We seek to establish positions in real estate and real estate-related companies that we believe have exceptional management, sustainable competitive advantages, and compelling valuations. |
| |
|
| † | | Industry sector levels are provided from the Global Industry Classification Standard (“GICS”), developed and exclusively owned by MSCI, Inc. and Standard & Poor’s Financial Services LLC, unless otherwise stated that they have been reclassified or classified by the Adviser. All GICS data is provided “as is” with no warranties. |
| | | |
| 1 | | Performance information reflects results of the Retail Shares. |
9
Baron Emerging Markets Fund (Unaudited) | | December 31, 2014 |
| |
| |
COMPARISON OF THE CHANGE IN VALUE OF $10,000 INVESTMENT IN BARON EMERGING MARKETS FUND (RETAIL SHARES)
IN RELATION TO THE MSCI EM IMI GROWTH INDEX AND THE MSCI EM IMI INDEX |
| | | | | | | | | | | | | | | | | | |
 |
| |
| AVERAGE ANNUAL TOTAL RETURNS FOR THE PERIODS ENDED DECEMBER 31, 2014 |
| | | | | | | | Since |
| | | | | | | | Inception |
| | | One | | | Three | | (December 31, |
| | | Year | | | Years | | 2010) |
| Baron Emerging Markets Fund — Retail Shares1, 2 | | 3.47 | % | | | 13.44 | % | | 4.85 | % |
| Baron Emerging Markets Fund — Institutional Shares1, 2 | | 3.75 | % | | | 13.71 | % | | 5.11 | % |
| MSCI EM IMI Growth Index1 | | –0.15 | % | | | 6.46 | % | | –0.89 | % |
| MSCI EM IMI Index1 | | –1.79 | % | | | 4.46 | % | | –2.12 | % |
|
| 1 | The MSCI EM (Emerging Markets) IMI indexes cited are unmanaged, free float-adjusted market capitalization indexes. The MSCI EM (Emerging Markets) IMI Growth Index Net USD and the MSCI EM (Emerging Markets) IMI Index Net USD are designed to measure equity market performance of large-, mid- and small-cap securities in the emerging markets. The MSCI EM (Emerging Markets) IMI Growth Index Net USD screens for growth-style securities. The indexes and Baron Emerging Markets Fund include reinvestment of dividends, net of foreign withholding taxes, which positively impact the performance results. |
| | |
| 2 | Past performance is not predictive of future performance. The performance data does not reflect the deduction of taxes that a shareholder would pay on Fund distributions or redemption of Fund shares. The Adviser has reimbursed certain Fund expenses (by contract as long as BAMCO, Inc. is the Adviser to the Fund) and the Fund’s transfer agency expenses may be reduced by expense offsets from an unaffiliated transfer agent without which performance would have been lower. |
10
| |
| December 31, 2014 (Unaudited) | Baron Emerging Markets Fund |
| TOP TEN HOLDINGS AS OF DECEMBER 31, 2014 |
| | | Percent of | |
| | | Net Assets | |
| Haitong Securities Co., Ltd. | | 3.2% | |
| Kroton Educacional SA | | 2.6% | |
| Torrent Pharmaceuticals Ltd. | | 2.1% | |
| Smiles SA | | 2.1% | |
| Axis Bank Ltd. | | 1.9% | |
| Tower Bersama Infrastructure Tbk PT | | 1.9% | |
| Divi’s Laboratories Ltd. | | 1.8% | |
| Fomento Económico Mexicano, S.A.B. de C.V. | | 1.8% | |
| Aspen Pharmacare Holdings Ltd. | | 1.8% | |
| GOL Linhas Aéreas Inteligentes SA | | 1.8% | |
| | | 21.0% | |
| | | | |
SECTOR BREAKDOWN AS OF DECEMBER 31, 2014†
(as a percentage of net assets) |
| | | | |
 |
| | | | |
| MANAGEMENT’S DISCUSSION OF FUND PERFORMANCE |
| | | | |
For the year ended December 31, 2014, Baron Emerging Markets Fund1 (the “Fund”) gained 3.47%, outperforming the MSCI EM IMI Growth Index, which returned -0.15%.
The Fund is a diversified fund that invests for the long term, primarily in companies of any size domiciled or headquartered, or that have their principal business activities or trading markets in developing countries. The Fund may invest up to 20% of its net assets in developed countries (including the U.S.), and frontier |
countries. The Fund seeks to invest in companies that have significant long-term growth prospects and to purchase their stock at prices we believe to be favorable. |
| Emerging markets were volatile in 2014. The material strengthening of the dollar, which generally coincides with weak commodity and oil prices, and often, falling interest rates, represent a challenge for emerging markets, particularly those with significant commodity-based exports and/or U.S. dollar borrowings. We would not be surprised to see a crisis in a commodity exporting country, as we have likely already seen initiated in Russia and/or Venezuela. In contrast, countries and companies benefiting from weaker oil and commodity prices, and/or generally insulated from a rising cost of capital, in our view, will continue to experience relative strength in currency values and equity prices. |
| 2014 also saw the advancement of market-friendly and value enhancing reforms in several developing countries. Specifically, we are encouraged by the renewed commitment demonstrated in India, Indonesia and China. Even in Brazil, after a disappointing election result, we are relieved that President Rousseff appears to have shifted to a more market-friendly posture, and remain comfortable with our overweight position, which we note has been purely based on bottom-up and theme-driven investments. |
| On a sector basis, the largest contributors to performance in 2014 were Financials, Health Care, Industrials and Consumer Discretionary. Consumer Staples, Energy and Information Technology were the largest detractors from performance. On a regional basis, India, Brazil and Indonesia contributed the most. China, Korea and Hong Kong detracted the most. |
| The largest contributor to performance in 2014 was Torrent Pharmaceuticals Ltd. As a fast growing India-based generic pharmaceutical company, Torrent is seeing substantial growth in the U.S. as branded drugs continue to go off-patent. Torrent is also generating strong growth in domestic markets. Performance can be attributed to above-consensus financial performance and a broad re-rating on Indian mid-cap pharmaceutical stocks. |
| The largest detractor from performance was Biostime International Holdings Ltd. Weak financial performance as a result of increased competition in the Chinese infant formula industry drove share price down. The emergence of e-commerce as a dominant sales channel has significantly reduced barriers to entry as new players can gain market share by offering online promotions and no longer require deep distribution networks. This has eroded a key competitive advantage for Biostime, which is still in early stages of formulating its online sales strategy. We exited our equity position. |
| The ongoing shift in opportunity, resources and capital towards the emerging market companies and entrepreneurs most capable of driving economic efficiency and productivity remains on course. We believe this trend underlies the Fund’s strong performance to date, and we remain enthusiastic regarding the long-term prospects for the many companies in which we are invested. |
|
| † | | Industry sector levels are provided from the Global Industry Classification Standard (“GICS”), developed and exclusively owned by MSCI, Inc. and Standard & Poor’s Financial Services LLC, unless otherwise stated that they have been reclassified or classified by the Adviser. All GICS data is provided “as is” with no warranties. |
| |
| 1 | | Performance information reflects results of the Retail Shares. |
11
| |
| Baron Energy and Resources Fund (Unaudited) | December 31, 2014 |
| | | | | | | |
| | | | | | | |
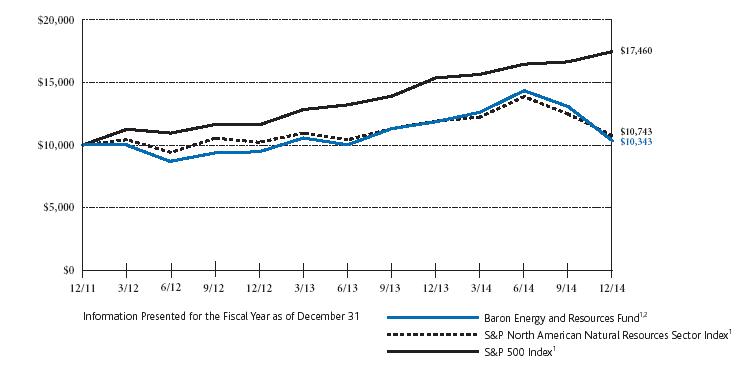
COMPARISON OF THE CHANGE IN VALUE OF $10,000 INVESTMENT IN BARON ENERGY AND RESOURCES FUND† (RETAIL SHARES)
IN RELATION TO THE S&P NORTH AMERICAN NATURAL RESOURCES SECTOR INDEX
AND THE S&P 500 INDEX |
| | | | | | | |
 |
| | | | | | | |
| AVERAGE ANNUAL TOTAL RETURNS FOR THE PERIODS ENDED DECEMBER 31, 2014 |
| | | | | | Three Years |
| | | | | | and Since |
| | | | | | Inception |
| | | One | | (December 31, |
| | | Year | | 2011 | ) |
| Baron Energy and Resources Fund — Retail Shares1, 2 | | –12.75 | % | | 1.13 | % |
| Baron Energy and Resources Fund — Institutional Shares1, 2 | | –12.59 | % | | 1.35 | % |
| S&P North American Natural Resources Sector Index1 | | –9.77 | % | | 2.42 | % |
| S&P 500 Index1 | | 13.69 | % | | 20.41 | % |
|
| † | | The Fund’s historical performance was impacted by gains from IPOs and/or secondary offerings. There is no guarantee that these results can be repeated or that the Fund’s level of participation in IPOs and secondary offerings will be the same in the future. |
| | | |
| 1 | | The indexes are unmanaged. The S&P 500 North American Natural Resources Sector Index measures the performance of U.S.-traded natural resources-related stocks, including mining, energy, paper and forest products, and plantation owning companies. The S&P 500 Index measures the performance of 500 widely held large-cap U.S. companies. The indexes and Baron Energy and Resources Fund are with dividends, which positively impact the performance results. |
| | | |
| 2 | | Past performance is not predictive of future performance. The performance data does not reflect the deduction of taxes that a shareholder would pay on Fund distributions or redemption of Fund shares. The Adviser has reimbursed certain Fund expenses (by contract as long as BAMCO, Inc. is the Adviser to the Fund) and the Fund’s transfer agency expenses may be reduced by expense offsets from an unaffiliated transfer agent, without which performance would have been lower. |
12
| |
| December 31, 2014 (Unaudited) | Baron Energy and Resources Fund |
| TOP TEN HOLDINGS AS OF DECEMBER 31, 2014 |
| | | Percent of | |
| | | Net Assets | |
| Concho Resources, Inc. | | 4.2% | |
| Parsley Energy, Inc. | | 3.8% | |
| Atlas Energy, L.P. | | 3.5% | |
| Tallgrass Energy Partners, LP | | 3.5% | |
| Halliburton Co. | | 2.9% | |
| Gulfport Energy Corp. | | 2.9% | |
| Flotek Industries, Inc. | | 2.9% | |
| Western Refining Logistics, LP | | 2.8% | |
| SM Energy Co. | | 2.7% | |
| RSP Permian, Inc. | | 2.6% | |
| | | 31.8% | |
| | | | |
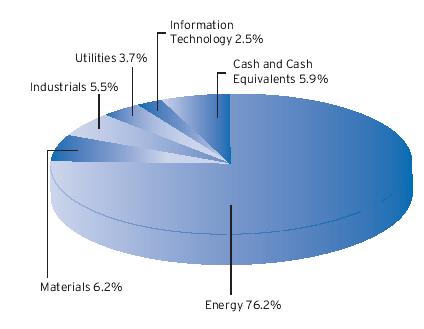
SECTOR BREAKDOWN AS OF DECEMBER 31, 2014†
(as a percentage of net assets) |
| | | | |
 |
| | | | |
| MANAGEMENT’S DISCUSSION OF FUND PERFORMANCE |
| | | | |
For the year ended December 31, 2014, Baron Energy and Resources Fund1 (the “Fund”) fell 12.75%, underperforming the S&P North American Natural Resources Sector Index, which fell 9.77%.
The Fund is a non-diversified fund that invests primarily in energy and resources companies and related companies of any market capitalization, including master limited partnerships (MLPs). The |
Fund invests primarily in U.S. securities and may invest up to 25% in non-U.S. securities. We select securities that we believe have favorable price-to-value characteristics, are well-managed and appropriately financed, and have significant long-term growth prospects and competitive advantages. |
| Although the first half of the year suggested renewed strength in the Energy sector, the decline in oil and gas prices that began around mid-year accelerated through to year end, precipitating steep declines in share prices across the energy spectrum. In the second half of the year, as the U.S. dollar strengthened and the European, Japanese, and Chinese economies weakened, global oil demand expectations weakened as well. At the same time, supplies were boosted by a rebound in Libyan and Iranian oil production, along with growth in U.S. oil supplies. When in late November, Saudi Arabia decided not to cut production to restore the supply/demand imbalance, oil prices went into free fall, and finished the year down nearly 46%. |
| Tallgrass Energy Partners, LP was the largest contributor to the Fund in 2014. Tallgrass is a midstream energy MLP formed in 2013. Company performance was strong as management continued to outperform expectations. The acquisition of Rockies Express Pipeline, LLC also helped the stock price. We believe Tallgrass has top notch management and opportunities to quickly grow distribution (up 70% in 18 months). We view Tallgrass as a three- year growth story at a reasonable price. |
| The largest detractor from performance in 2014 was Oasis Petroleum, Inc. Oasis is one of the largest exploration & production companies in the Williston Basin Bakken shale oil play. Weak oil prices weighed heavily on shares in the second half of the year. Diminishing cash flow forecasts led Oasis to curtail its investment spending and growth outlook for 2015. Oasis has ample financial flexibility, but its shares remain levered to oil price changes as the economics of drilling in the Williston basin are increasingly marginal at current prices. However, Oasis shares represent significant optionality on any rebound in oil prices. |
| Our near-term outlook will largely be a function of what happens in the oil market. If our assumption is correct that oil markets will stabilize over the next six months and begin to rebound in the second half of the year, we would expect a strong rebound in energy share prices, especially of small and mid-cap companies. Nevertheless, the next several months are likely to be volatile. Longer-term, we still expect that oil prices will revert to a more “normalized” level of perhaps $70-90 per barrel, which is what we believe is needed to offset production declines and generate incremental supply growth to meet future demand. In this environment, we still favor U.S. unconventional oil and gas producers, midstream MLPs, and, to a lesser extent, oilfield service & equipment companies. |
|
| † | | Industry sector levels are provided from the Global Industry Classification Standard (“GICS”), developed and exclusively owned by MSCI, Inc. and Standard & Poor’s Financial Services LLC, unless otherwise stated that they have been reclassified or classified by the Adviser. All GICS data is provided “as is” with no warranties. |
| | | |
| 1 | | Performance information reflects results of the Retail Shares. |
13
| |
| Baron Global Advantage Fund (Unaudited) | December 31, 2014 |
| |
| |
COMPARISON OF THE CHANGE IN VALUE OF $10,000 INVESTMENT IN BARON GLOBAL ADVANTAGE FUND† (RETAIL SHARES)
IN RELATION TO THE MSCI ACWI GROWTH INDEX AND THE MSCI ACWI INDEX |
| | | | | | | |
| | | | | | | |
 |
| | | | | | | |
| AVERAGE ANNUAL TOTAL RETURNS FOR THE PERIODS ENDED DECEMBER 31, 2014 |
| | | | | | Since |
| | | | | | Inception |
| | | One | | (April 30, |
| | | Year | | 2012 | ) |
| Baron Global Advantage Fund — Retail Shares1, 2 | | 5.11 | % | | 14.06 | % |
| Baron Global Advantage Fund — Institutional Shares1, 2 | | 5.32 | % | | 14.30 | % |
| MSCI ACWI Growth Index Net1 | | 5.43 | % | | 11.73 | % |
| MSCI ACWI Index Net1 | | 4.16 | % | | 11.70 | % |
|
| † | | The Fund’s historical performance was impacted by gains from IPOs and/or secondary offerings. There is no guarantee that these results can be repeated or that the Fund’s level of participation in IPOs and secondary offerings will be the same in the future. |
| | | |
| 1 | | The MSCI ACWI indexes cited are unmanaged, free float-adjusted market capitalization weighted indexes reflected in US dollars. The MSCI ACWI Growth Index Net USD measures the equity market performance of large- and mid-cap growth securities across developed and emerging markets. The MSCI ACWI Index Net USD measures the equity market performance of large- and mid-cap securities across developed and emerging markets. The indexes and the Baron Global Advantage Fund include reinvestment of dividends, net of foreign withholding taxes, which positively impact the performance results. |
| | | |
| 2 | | Past performance is not predictive of future performance. The performance data does not reflect the deduction of taxes that a shareholder would pay on Fund distributions or redemption of Fund shares. The Adviser has reimbursed certain Fund expenses (by contract as long as BAMCO, Inc. is the Adviser to the Fund) and the Fund’s transfer agency expenses may be reduced by expense offsets from an unaffiliated transfer agent, without which performance would have been lower. |
14
| |
| December 31, 2014 (Unaudited) | Baron Global Advantage Fund |
| TOP TEN HOLDINGS AS OF DECEMBER 31, 2014 |
| | | Percent of | |
| | | Net Assets | |
| Amazon.com, Inc. | | 5.1% | |
| Sarana Menara Nusantara Tbk PT | | 4.7% | |
| Facebook Inc. | | 4.6% | |
| Alibaba Group Holding Ltd. | | 4.4% | |
| Google, Inc. | | 4.2% | |
| SunEdison, Inc. | | 4.1% | |
| Illumina, Inc. | | 4.0% | |
| Just Eat plc | | 3.7% | |
| Mellanox Technologies Ltd. | | 3.7% | |
| Tower Bersama Infrastructure Tbk PT | | 3.4% | |
| | | 41.9% | |
| | | | |
SECTOR BREAKDOWN AS OF DECEMBER 31, 2014†
(as a percentage of net assets) |
| | | | |
 |
| | | | |
| MANAGEMENT’S DISCUSSION OF FUND PERFORMANCE |
| | | | |
For the year ended December 31, 2014, Baron Global Advantage Fund1 (the “Fund”) gained 5.11%, slightly underperforming the MSCI ACWI Growth Index, which gained 5.43%. |
| | | | |
The Fund is a diversified fund that invests primarily in established and emerging markets growth companies with capitalizations within the range of companies included in the MSCI ACWI Growth Index located throughout the world. We have a long-term mindset, conduct bottom-up research, and believe insights and perspective are more important than short-term events or results. We invest in companies that we believe have favorable price-to-value and |
risk/reward characteristics, have strong free cash flow and returns on capital, are well-managed, and have sustainable competitive advantages. |
| |
Global equity markets were volatile in 2014. Generally positive domestic economic reports over the year support the view that the U.S. economy is accelerating, outpacing much of the rest of the developed world. Outside the U.S., the developed markets were challenged by sluggish economic growth and very low inflation alongside fairly high debt-to-GDP levels. Conditions also represented a challenge for emerging markets, particularly those with significant commodity-based exports and/or U.S. dollar borrowings. |
| |
We made significant changes to the portfolio during the year. We doubled down on a few investments where we had particularly high conviction and initiated positions in others, while reducing the overall number of holdings. |
| |
On a sector basis, the Fund’s investments in Health Care, Financials and Energy contributed the most to performance. Information Technology and Industrials detracted from performance. From a country perspective, our holdings in the United States, Indonesia, and China were top contributors to performance. Our investments in Japan and the U.K. detracted the most from performance. |
| |
The largest individual contributor was Illumina, Inc. Shares of Illumina, the leader in next generation DNA sequencing instruments and consumables, rose significantly in 2014, driven by multiple new product introductions, including a new ultra-high throughput platform that is the first to sequence a full human genome for less than $1,000. Over the year, management increased guidance from 15-17% revenue growth to, most recently, 30% growth. We believe Illumina has further distanced itself from its competitors and holds an effective monopoly on DNA sequencing at a time when demand is accelerating. |
| |
The largest detractor was Acxiom Corp. Shares of this leading provider of database marketing solutions declined in 2014, as a result of disappointing results in the first half of the year and a high priced acquisition. Revenues from its core business were light, and adoption of its new Audience Operating System (“AOS”) platform was slower than expected. We believe in the future growth prospects of Acxiom’s AOS and LiveRamp products and think the company is gaining client traction with these efforts. We think Acxiom shares also trade at a sizeable discount. |
| |
The portfolio is constructed on a bottom-up basis, with the quality of ideas and conviction level being the most important determinants of the size of each individual investment. We continue to focus on identifying and investing in what we believe are unique companies with sustainable competitive advantages and the ability to redeploy capital at high rates of return. We are optimistic about the long-term opportunities of the companies in which we are invested and continue to search for new ideas and investments. |
| | | |
| † | | Industry sector levels are provided from the Global Industry Classification Standard (“GICS”), developed and exclusively owned by MSCI, Inc. and Standard & Services LLC, unless otherwise stated that they have been reclassified or classified by the Adviser. All GICS data is provided “as is” with no warranties. |
| | | | |
| 1 | | Performance information reflects results of the Retail Shares. |
| |
| Baron Partners Fund | December 31, 2014 |
| STATEMENT OF NET ASSETS |
| |
| DECEMBER 31, 2014 |
| Shares | | | | | Cost | | | | Value | |
| |
| Common Stocks (116.62%) | | | | | | | | |
| |
| Consumer Discretionary (39.79%) | | | | | | | | |
| | | Automobile Manufacturers (9.47%) | | | | | | | | |
| 825,000 | | Tesla Motors Inc.1 | | $ | 177,823,619 | | | $ | 183,488,250 | |
| | | Automotive Retail (6.87%) | | | | | | | | |
| 2,000,000 | | CarMax, Inc. 1 | | | 69,489,756 | | | | 133,160,000 | |
| | | Broadcasting (1.23%) | | | | | | | | |
| 400,000 | | Discovery Communications, Inc., Cl A1 | | | 4,415,713 | | | | 13,780,000 | |
| 300,000 | | Discovery Communications, Inc., Cl C1 | | | 3,249,165 | | | | 10,116,000 | |
| | | | | | | | | |
| | | | | | 7,664,878 | | | | 23,896,000 | |
| | | Hotels, Resorts & Cruise | | | | | | | | |
| | | Lines (8.08%) | | | | | | | | |
| 2,500,000 | | Hyatt Hotels Corp., Cl A1 | | | 67,148,542 | | | | 150,525,000 | |
| 129,208 | | Norwegian Cruise Line | | | | | | | | |
| | | Holdings Ltd.1,2 | | | 4,338,221 | | | | 6,041,766 | |
| | | | | | | | | |
| | | | | | 71,486,763 | | | | 156,566,766 | |
| | | Leisure Facilities (4.35%) | | | | | | | | |
| 925,800 | | Vail Resorts, Inc. | | | 27,801,851 | | | | 84,368,154 | |
| | | Movies & Entertainment (4.41%) | | | | | | | | |
| 5,374,321 | | Manchester United plc, Cl A1,2 | | | 91,547,645 | | | | 85,451,704 | |
| | | Specialty Stores (5.38%) | | | | | | | | |
| 2,100,000 | | Dick’s Sporting Goods, Inc. | | | 58,896,964 | | | | 104,265,000 | |
| | | | | | | | | |
| Total Consumer Discretionary | | | 504,711,476 | | | | 771,195,874 | |
| | | | | | | | | |
| | | | | | | | | | | |
| Energy (2.24%) | | | | | | | | |
| | | Oil & Gas Drilling (0.70%) | | | | | | | | |
| 200,000 | | Helmerich & Payne, Inc. | | | 4,611,541 | | | | 13,484,000 | |
| | | Oil & Gas Exploration | | | | | | | | |
| | | & Production (1.54%) | | | | | | | | |
| 300,000 | | Concho Resources, Inc.1 | | | 24,137,180 | | | | 29,925,000 | |
| | | | | | | | | |
| Total Energy | | | 28,748,721 | | | | 43,409,000 | |
| | | | | | | | | |
| | | | | | | | | | | |
| Financials (21.51%) | | | | | | | | |
| | | Asset Management & | | | | | | | | |
| | | Custody Banks (4.75%) | | | | | | | | |
| 3,345,500 | | The Carlyle Group | | | 89,375,354 | | | | 92,001,250 | |
| | | Investment Banking & | | | | | | | | |
| | | Brokerage (5.92%) | | | | | | | | |
| 3,800,000 | | The Charles Schwab Corp. | | | 49,157,674 | | | | 114,722,000 | |
| | | Property & Casualty | | | | | | | | |
| | | Insurance (7.47%) | | | | | | | | |
| 2,450,000 | | Arch Capital Group Ltd.1,2 | | | 33,071,318 | | | | 144,795,000 | |
| | | Specialized REITs (3.37%) | | | | | | | | |
| 2,225,000 | | Gaming and Leisure Properties, Inc. | | | 72,866,439 | | | | 65,281,500 | |
| | | | | | | | | |
| Total Financials | | | 244,470,785 | | | | 416,799,750 | |
| | | | | | | | | |
| | | | | | | | | | | |
| Health Care (6.75%) | | | | | | | | |
| | | Health Care Equipment (4.02%) | | | | | | | | |
| 525,000 | | IDEXX Laboratories, Inc.1 | | | 45,812,786 | | | | 77,841,750 | |
| | | Life Sciences Tools & | | | | | | | | |
| | | Services (2.73%) | | | | | | | | |
| 287,000 | | Illumina, Inc.1 | | | 15,671,895 | | | | 52,974,460 | |
| | | | | | | | | |
| Total Health Care | | | 61,484,681 | | | | 130,816,210 | |
| | | | | | | | | |
| | | | | | | | | | | |
| Industrials (17.44%) | | | | | | | | |
| | | Industrial Machinery (1.41%) | | | | | | | | |
| 276,687 | | The Middleby Corp.1 | | | 21,507,177 | | | | 27,419,682 | |
| | | Research & Consulting | | | | | | | | |
| | | Services (4.96%) | | | | | | | | |
| 1,500,000 | | Verisk Analytics, Inc., Cl A1 | | | 40,826,578 | | | | 96,075,000 | |
| Shares | | | | | Cost | | | | Value | |
| |
| Common Stocks (continued) | | | | | | | | |
| |
| Industrials (continued) | | | | | | | | |
| | | Trading Companies& Distributors (11.07%) | | | | | | | | |
| 3,754,866 | | Air Lease Corp. | | $ | 125,661,521 | | | $ | 128,829,452 | |
| 1,800,000 | | Fastenal Co. | | | 31,516,561 | | | | 85,608,000 | |
| | | | | | | | | |
| | | | | | 157,178,082 | | | | 214,437,452 | |
| | | | | | | | | |
| Total Industrials | | | 219,511,837 | | | | 337,932,134 | |
| | | | | | | | | |
| | | | | | | | | | | |
| Information Technology (20.49%) | | | | | | | | |
| | | Application Software (6.56%) | | | | | | | | |
| 775,000 | | FactSet Research Systems, Inc. | | | 50,806,618 | | | | 109,081,250 | |
| 445,000 | | Mobileye N.V. 1,2,5 | | | 13,391,406 | | | | 18,049,200 | |
| | | | | | | | | |
| | | | | | 64,198,024 | | | | 127,130,450 | |
| | | Internet Software & | | | | | | | | |
| | | Services (11.11%) | | | | | | | | |
| 1,100,000 | | CoStar Group, Inc.1 | | | 112,737,431 | | | | 201,993,000 | |
| 125,000 | | Zillow, Inc., Cl A1 | | | 13,412,462 | | | | 13,236,250 | |
| | | | | | | | | |
| | | | | | 126,149,893 | | | | 215,229,250 | |
| | | IT Consulting & Other | | | | | | | | |
| | | Services (2.82%) | | | | | | | | |
| 649,000 | | Gartner, Inc. 1 | | | 41,264,138 | | | | 54,652,290 | |
| | | | | | | | | |
| Total Information Technology | | | 231,612,055 | | | | 397,011,990 | |
| | | | | | | | | |
| | | | | | | | | | | |
| Utilities (8.40%) | | | | | | | | |
| | | Electric Utilities (8.40%) | | | | | | | | |
| 4,025,000 | | ITC Holdings Corp. | | | 40,804,409 | | | | 162,730,750 | |
| | | | | | | | | |
| Total Common Stocks | | | 1,331,343,964 | | | | 2,259,895,708 | |
| | | | | | | | | |
| | | | | | | | | | | |
| |
Private Equity Investments (0.34%) | | | | | | | | |
| |
| Financials (0.34%) | | | | | | | | |
| | | Asset Management & Custody Banks (0.34%) | | | | | | | | |
| 7,579,130 | | Windy City Investments | | | | | | | | |
| | | Holdings, L.L.C.1,3,4,8 | | | 1,832,926 | | | | 6,593,843 | |
| | | | | | | | | |
| | | | | | | | | | | |
| |
| Short Term Investments (0.97%) | | | | | | | | |
| |
| | | Securities Lending Collateral (0.97%) | | | | | | | | |
| 18,690,000 | | State Street Navigator Securities | | | | | | | | |
| | | Lending Prime Portfolio6,7 | | | 18,690,000 | | | | 18,690,000 | |
| | | | | | | | | |
| Total Investments (117.93%) | | $ | 1,351,866,890 | | | | 2,285,179,551 | |
| | | | | | | | | | |
Liabilities Less Cash and Other Assets (-17.93%) | | | | | | | (347,357,097 | ) |
| | | | | | | | | | |
| Net Assets | | | | | | $ | 1,937,822,454 | |
| | | | | | | | | | |
Retail Shares (Equivalent to $36.74 per share based on 34,198,463 shares outstanding) | | | | | | $ | 1,256,308,310 | |
| | | | | | | | | | |
Institutional Shares (Equivalent to $37.28 per share based on 18,280,177 shares outstanding) | | | | | | $ | 681,514,144 | |
| | | | | | | | | | |
| | | |
| % | | Represents percentage of net assets. |
| 1 | | Non-income producing securities. |
| 2 | | Foreign corporation. |
| 3 | | At December 31, 2014, the market value of restricted and fair valued securities amounted to $6,593,843 or 0.34% of net assets. This security is not deemed liquid. See Note 6 regarding Restricted Securities. |
| 4 | | The Adviser has reclassified/classified certain securities in or out of this sub-industry. Such reclassifications/classifications are not supported by S&P or MSCI. |
| 5 | | The value on loan at December 31, 2014 amounted to $18,049,200 or 0.93% of net assets. See Note 2d regarding Securities Lending. |
| 6 | | Represents investment of cash collateral received from securities lending transactions. See Note 2d regarding Securities Lending. |
| 7 | | Level 2 security. See Note 7 regarding Fair Value Measurements. |
| 8 | | Level 3 security. See Note 7 regarding Fair Value Measurements. |
| | | |
| | | All securities are Level 1, unless otherwise noted. |
| 16 | | See Notes to Financial Statements. |
| |
| December 31, 2014 | Baron Focused Growth Fund |
| STATEMENT OF NET ASSETS |
| |
| DECEMBER 31, 2014 |
| Shares | | | | | Cost | | | | Value | |
| |
| Common Stocks (94.41%) | | | | | | | | |
| |
| Consumer Discretionary (38.75%) | | | | | | | | |
| | | Automobile Manufacturers (7.40%) | | | | | | | | |
| 65,000 | | Tesla Motors Inc.1 | | $ | 15,819,030 | | $ | | 14,456,650 | |
| | | Automotive Retail (5.12%) | | | | | | | | |
| 150,000 | | CarMax, Inc.1 | | | 4,242,382 | | | | 9,987,000 | |
| | | Hotels, Resorts & Cruise | | | | | | | | |
| | | Lines (11.70%) | | | | | | | | |
| 150,000 | | Choice Hotels International, Inc. | | | 5,080,139 | | | | 8,403,000 | |
| 240,000 | | Hyatt Hotels Corp., Cl A1 | | | 7,807,007 | | | | 14,450,400 | |
| | | | | | | | | |
| | | | | | 12,887,146 | | | | 22,853,400 | |
| | | Leisure Facilities (6.36%) | | | | | | | | |
| 136,230 | | Vail Resorts, Inc. | | | 8,272,836 | | | | 12,414,640 | |
| | | Movies & Entertainment (4.48%) | | | | | | | | |
| 550,000 | | Manchester United plc, Cl A1,2 | | | 8,719,506 | | | | 8,745,000 | |
| | | Specialty Stores (3.69%) | | | | | | | | |
| 145,000 | | Dick’s Sporting Goods, Inc. | | | 3,839,505 | | | | 7,199,250 | |
| | | | | | | | | |
| Total Consumer Discretionary | | | 53,780,405 | | | | 75,655,940 | |
| | | | | | | | | |
| | | | | | | | | | | |
| Consumer Staples (2.02%) | | | | | | | | |
| | | Household Products (2.02%) | | | | | | | | |
| 50,000 | | Church & Dwight Co., Inc. | | | 1,274,171 | | | | 3,940,500 | |
| | | | | | | | | |
| | | | | | | | | | | |
| Financials (10.43%) | | | | | | | | |
| | | Asset Management & Custody | | | | | | | | |
| | | Banks (7.40%) | | | | | | | | |
| 260,000 | | The Carlyle Group | | | 6,556,081 | | | | 7,150,000 | |
| 200,000 | | Financial Engines, Inc. | | | 6,804,436 | | | | 7,310,000 | |
| | | | | | | | | |
| | | | | | 13,360,517 | | | | 14,460,000 | |
| | | Property & Casualty | | | | | | | | |
| | | Insurance (3.03%) | | | | | | | | |
| 100,000 | | Arch Capital Group Ltd.1,2 | | | 1,800,055 | | | | 5,910,000 | |
| | | | | | | | | |
| Total Financials | | | 15,160,572 | | | | 20,370,000 | |
| | | | | | | | | |
| | | | | | | | | | | |
| Industrials (14.15%) | | | | | | | | |
| | | Industrial Machinery (4.75%) | | | | | | | | |
| 180,000 | | Colfax Corp.1 | | | 5,562,277 | | | | 9,282,600 | |
| | | Railroads (3.69%) | | | | | | | | |
| 80,000 | | Genesee & Wyoming, Inc., Cl A1 | | | 2,481,307 | | | | 7,193,600 | |
| | | Research & Consulting | | | | | | | | |
| | | Services (2.79%) | | | | | | | | |
| 85,000 | | Verisk Analytics, Inc., Cl A1 | | | 2,405,727 | | | | 5,444,250 | |
| | | Trading Companies & | | | | | | | | |
| | | Distributors (2.92%) | | | | | | | | |
| 120,000 | | Fastenal Co. | | | 3,138,161 | | | | 5,707,200 | |
| | | | | | | | | |
| Total Industrials | | | 13,587,472 | | | | 27,627,650 | |
| | | | | | | | | |
| | | | | | | | | | | |
| Information Technology (17.50%) | | | | | | | | |
| | | Application Software (8.05%) | | | | | | | | |
| 75,000 | | FactSet Research Systems, Inc. | | | 5,828,282 | | | | 10,556,250 | |
| 101,870 | | Guidewire Software, Inc.1 | | | 4,816,692 | | | | 5,157,678 | |
| | | | | | | | | |
| | | | | | 10,644,974 | | | | 15,713,928 | |
| | | Internet Software & | | | | | | | | |
| | | Services (9.45%) | | | | | | | | |
| 170,816 | | Benefitfocus, Inc.1 | | | 4,509,382 | | | | 5,609,598 | |
| 70,000 | | CoStar Group, Inc.1 | | | 12,770,207 | | | | 12,854,100 | |
| | | | | | | | | |
| | | | | | 17,279,589 | | | | 18,463,698 | |
| | | | | | | | | |
| Total Information Technology | | | 27,924,563 | | | | 34,177,626 | |
| | | | | | | | | |
| Shares | | | | | Cost | | | | Value | |
| |
| Common Stocks (continued) | | | | | | | | |
| |
| Materials (5.74%) | | | | | | | | |
| | | Construction Materials (3.68%) | | | | | | | | |
| 120,000 | | CaesarStone Sdot-Yam Ltd.1,2 | | $ | 5,406,710 | | | $ | 7,178,400 | |
| | | Industrial Gases (2.06%) | | | | | | | | |
| 35,000 | | Airgas, Inc. | | | 2,176,188 | | | | 4,031,300 | |
| | | | | | | | | |
| Total Materials | | | 7,582,898 | | | | 11,209,700 | |
| | | | | | | | | |
| | | | | | | | | | | |
| Utilities (5.82%) | | | | | | | | |
| | | Electric Utilities (4.14%) | | | | | | | | |
| 200,000 | | ITC Holdings Corp. | | | 4,273,076 | | | | 8,086,000 | |
| | | Renewable Electricity (1.68%) | | | | | | | | |
| 25,000 | | TerraForm Power, Inc., Cl A | | | 766,334 | | | | 772,000 | |
| 83,333 | | TerraForm Power, Inc., Cl A3,4 | | | 2,499,990 | | | | 2,505,823 | |
| | | | | | | | | |
| | | | | | 3,266,324 | | | | 3,277,823 | |
| | | | | | | | | |
| Total Utilities | | | 7,539,400 | | | | 11,363,823 | |
| | | | | | | | | |
| Total Common Stocks | | | 126,849,481 | | | | 184,345,239 | |
| | | | | | | | | |
| | | | | | | | | | | |
| |
| Preferred Stocks (4.15%) | | | | | | | | |
| |
| Telecommunication Services (4.15%) | | | | | | | | |
| | | Alternative Carriers (4.15%) | | | | | | | | |
| 22,300 | | Iridium Communications | | | | | | | | |
| | | Inc., Series B, 6.75% | | | 5,814,082 | | | | 8,111,179 | |
| | | | | | | | | |
| | | | | | | | | | | |
| | | | | | | | | | | |
| |
| Principal | | | | | | | | | | |
| Amount | | | | | | | | | | |
| |
| Short Term Investments (2.17%) | | | | | | | | |
| |
| $4,236,809 | | Repurchase Agreement | | | | | | | | |
| | | with Fixed Income | | | | | | | | |
| | | Clearing Corp., dated | | | | | | | | |
| | | 12/31/2014, 0.00% due | | | | | | | | |
| | | 1/2/2015; Proceeds at | | | | | | | | |
| | | maturity – $4,236,809; | | | | | | | | |
| | | (Fully collateralized by | | | | | | | | |
| | | $4,280,000 U.S. Treasury | | | | | | | | |
| | | Note, 2.125% due | | | | | | | | |
| | | 12/31/2021; Market | | | | | | | | |
| | | value – $4,322,800)4 | | | 4,236,809 | | | | 4,236,809 | |
| | | | | | | | | |
| Total Investments (100.73%) | | $ | 136,900,372 | | | | 196,693,227 | |
| | | | | | | | | | |
| Liabilities Less Cash and Other | | | | | | | | |
Assets (-0.73%) | | | | (1,427,120 | ) |
| | | | | | | | | | |
| Net Assets | | | | | | $ | 195,266,107 | |
| | | | | | | | | | |
| Retail Shares (Equivalent to $14.21 per share | | | | | | | | |
based on 3,241,641 shares outstanding) | | | $ | 46,049,867 | |
| | | | | | | | | | |
| Institutional Shares (Equivalent to $14.37 per share | | | | | |
based on 10,381,982 shares outstanding) | | | $ | 149,216,240 | |
| | | | | | | | | | |
| | | |
| % | | Represents percentage of net assets. |
| 1 | | Non-income producing securities. |
| 2 | | Foreign corporation. |
| 3 | | At December 31, 2014, the market value of restricted and fair valued securities amounted to $2,505,823 or 1.28% of net assets. This security is deemed liquid. See Note 6 regarding Restricted Securities. |
| 4 | | Level 2 security. See Note 7 regarding Fair Value Measurements. |
| | | |
| | | All securities are Level 1, unless otherwise noted. |
| See Notes to Financial Statements. | | 17 |
| |
| Baron International Growth Fund | December 31, 2014 |
| STATEMENT OF NET ASSETS |
| |
| DECEMBER 31, 2014 |
| Shares | | | | | Cost | | | | Value | |
| |
| Common Stocks (94.80%) | | | | | | | | |
| |
| Australia (2.68%) | | | | | | | | |
| 149,700 | | Brambles Ltd.2 | | $ | 1,286,770 | | | $ | 1,289,550 | |
| 75,169 | | Domino’s Pizza Enterprises Ltd.2 | | | 1,019,935 | | | | 1,530,518 | |
| | | | | | | | | |
| Total Australia | | | 2,306,705 | | | | 2,820,068 | |
| | | | �� | | | | | |
| | | | | | | | | | | |
| | | | | | | | | | | |
| Brazil (8.60%) | | | | | | | | |
| 50,151 | | Cetip SA - Mercados Organizados | | | 573,177 | | | | 607,502 | |
| 108,722 | | GAEC Educação S.A | | | 1,275,061 | | | | 1,445,837 | |
| 290,700 | | GOL Linhas Aéreas Inteligentes SA, ADR1 | | | 1,586,358 | | | | 1,671,525 | |
| 428,108 | | Kroton Educacional SA | | | 1,516,832 | | | | 2,496,303 | |
| 93,000 | | Smiles SA | | | 1,277,823 | | | | 1,611,109 | |
| 93,000 | | TOTVS SA | | | 974,040 | | | | 1,224,513 | |
| | | | | | | | | |
| Total Brazil | | | 7,203,291 | | | | 9,056,789 | |
| | | | | | | | | |
| | | | | | | | | | | |
| | | | | | | | | | | |
| Canada (5.20%) | | | | | | | | |
| 9,600 | | Constellation Software, Inc. | | | 1,744,605 | | | | 2,854,384 | |
| 50,000 | | Crescent Point Energy Corp. | | | 1,794,189 | | | | 1,158,117 | |
| 46,000 | | Suncor Energy, Inc. | | | 1,633,185 | | | | 1,461,880 | |
| | | | | | | | | |
| Total Canada | | | 5,171,979 | | | | 5,474,381 | |
| | | | | | | | | |
| | | | | | | | | | | |
| | | | | | | | | | | |
| China (7.83%) | | | | | | | | |
| 14,500 | | Alibaba Group Holding Ltd., ADR1 | | | 1,225,574 | | | | 1,507,130 | |
| 1,500,000 | | China Telecom Corp. Ltd. , Cl H2 | | | 932,823 | | | | 862,315 | |
| 500,000 | | China Unicom (Hong Kong) Ltd.2 | | | 746,067 | | | | 668,781 | |
| 875,771 | | Haitong Securities Co., Ltd., Cl H2 | | | 1,384,372 | | | | 2,183,583 | |
| 3,401,700 | | Kingdee International Software | | | | | | | | |
| | | Group Co. Ltd.1,2 | | | 621,454 | | | | 1,003,666 | |
| 50,000 | | Perfect World Co. Ltd., ADR | | | 1,061,390 | | | | 788,000 | |
| 85,000 | | Tencent Holdings Ltd.2 | | | 524,458 | | | | 1,229,858 | |
| | | | | | | | | |
| Total China | | | 6,496,138 | | | | 8,243,333 | |
| | | | | | | | | |
| | | | | | | | | | | |
| | | | | | | | | | | |
| France (4.06%) | | | | | | | | |
| 7,500 | | Eurofins Scientific SE2 | | | 803,359 | | | | 1,914,390 | |
| 22,400 | | Ingenico SA2 | | | 1,061,193 | | | | 2,359,579 | |
| | | | | | | | | |
| Total France | | | 1,864,552 | | | | 4,273,969 | |
| | | | | | | | | |
| | | | | | | | | | | |
| | | | | | | | | | | |
| Germany (10.14%) | | | | | | | | |
| 28,000 | | Brenntag AG2 | | | 1,416,354 | | | | 1,565,482 | |
| 58,000 | | Deutsche Post AG2 | | | 1,393,122 | | | | 1,882,791 | |
| 85,307 | | PATRIZIA Immobilien AG1,2 | | | 445,011 | | | | 1,252,662 | |
| 34,466 | | ProSiebenSat.1 Media AG2 | | | 1,507,252 | | | | 1,440,103 | |
| 175,100 | | RIB Software AG2 | | | 1,555,584 | | | | 2,297,942 | |
| 37,000 | | Symrise AG 2 | | | 958,117 | | | | 2,229,068 | |
| | | | | | | | | |
| Total Germany | | | 7,275,440 | | | | 10,668,048 | |
| | | | | | | | | |
| | | | | | | | | | | |
| | | | | | | | | | | |
| Hong Kong (1.94%) | | | | | | | | |
| 321,700 | | Luk Fook Holdings International Ltd.2 | | | 1,009,008 | | | | 1,206,417 | |
| 299,800 | | Wynn Macau Ltd.2 | | | 541,941 | | | | 838,311 | |
| | | | | | | | | |
| Total Hong Kong | | | 1,550,949 | | | | 2,044,728 | |
| | | | | | | | | |
| | | | | | | | | | | |
| | | | | | | | | | | |
| India (6.42%) | | | | | | | | |
| 225,900 | | Axis Bank Ltd.2 | | | 1,225,011 | | | | 1,787,979 | |
| 315,700 | | DEN Networks Ltd.1,2 | | | 788,483 | | | | 666,701 | |
| 1,000,000 | | Dish TV India Ltd.1,2 | | | 1,019,362 | | | | 1,065,205 | |
| 100,767 | | Hathway Cable and Datacom Ltd.1,2 | | | 353,232 | | | | 555,057 | |
| Shares | | | | | Cost | | | | Value | |
| |
| Common Stocks (continued) | | | | | | | | |
| |
| India (continued) | | | | | | | | |
| 63,300 | | Larsen & Toubro Ltd.2 | | $ | 1,428,046 | | | | 1,491,330 | |
| 199,000 | | Zee Entertainment Enterprises Ltd.2 | | | 1,010,424 | | | | 1,195,372 | |
| | | | | | | | | |
| Total India | | | 5,824,558 | | | | 6,761,644 | |
| | | | | | | | | |
| | | | | | | | | | | |
| Indonesia (3.12%) | | | | | | | | |
| 949,373 | | Matahari Department Store Tbk PT2 | | | 1,196,255 | | | | 1,143,957 | |
| 1,250,000 | | Sarana Menara Nusantara Tbk PT1 | | | 260,297 | | | | 418,854 | |
| 2,201,400 | | Tower Bersama Infrastructure Tbk PT2 | | | 1,183,940 | | | | 1,721,750 | |
| | | | | | | | | |
| Total Indonesia | | | 2,640,492 | | | | 3,284,561 | |
| | | | | | | | | |
| | | | | | | | | | | |
| | | | | | | | | | | |
| Ireland (1.62%) | | | | | | | | |
| 24,000 | | Ryanair Holdings plc, ADR1 | | | 789,828 | | | | 1,710,480 | |
| | | | | | | | | |
| | | | | | | | | | | |
| | | | | | | | | | | |
| Israel (4.88%) | | | | | | | | |
| 36,000 | | Check Point Software Technologies Ltd.1 | | | 2,051,140 | | | | 2,828,520 | |
| 54,000 | | Mellanox Technologies Ltd.1 | | | 2,217,047 | | | | 2,307,420 | |
| | | | | | | | | |
| Total Israel | | | 4,268,187 | | | | 5,135,940 | |
| | | | | | | | | |
| | | | | | | | | | | |
| | | | | | | | | | | |
| Japan (11.57%) | | | | | | | | |
| 40,000 | | Bridgestone Corp.2 | | | 984,974 | | | | 1,387,277 | |
| 9,900 | | FANUC Corp.2 | | | 1,080,434 | | | | 1,632,315 | |
| 59,800 | | Mitsui Fudosan Co. Ltd.2 | | | 1,448,031 | | | | 1,603,569 | |
| 50,000 | | MonotaRO Co. Ltd.2 | | | 1,178,507 | | | | 1,007,449 | |
| 90,000 | | Panasonic Corp.2 | | | 1,092,820 | | | | 1,060,059 | |
| 105,000 | | Rakuten, Inc.2 | | | 1,361,548 | | | | 1,460,110 | |
| 55,800 | | Sanrio Co. Ltd.2 | | | 1,664,590 | | | | 1,378,684 | |
| 27,000 | | SoftBank Corp.2 | | | 1,032,423 | | | | 1,607,128 | |
| 271,400 | | Sumitomo Mitsui Trust Holdings, Inc.2 | | | 1,186,662 | | | | 1,039,540 | |
| | | | | | | | | |
| Total Japan | | | 11,029,989 | | | | 12,176,131 | |
| | | | | | | | | |
| | | | | | | | | | | |
| | | | | | | | | | | |
| Korea, Republic of (0.87%) | | | | | | | | |
| 27,000 | | WeMade Entertainment Co., Ltd.1,2 | | | 1,100,458 | | | | 920,592 | |
| | | | | | | | | |
| | | | | | | | | | | |
| | | | | | | | | | | |
| Norway (4.34%) | | | | | | | | |
| 56,700 | | DNB ASA2 | | | 948,916 | | | | 836,360 | |
| 31,000 | | Golar LNG Ltd. | | | 1,395,805 | | | | 1,130,570 | |
| 160,000 | | Opera Software ASA2 | | | 1,669,218 | | | | 2,022,889 | |
| 35,624 | | Seadrill Partners, LLC | | | 799,412 | | | | 578,178 | |
| | | | | | | | | |
| Total Norway | | | 4,813,351 | | | | 4,567,997 | |
| | | | | | | | | |
| | | | | | | | | | | |
| | | | | | | | | | | |
| South Africa (1.35%) | | | | | | | | |
| 277,622 | | Steinhoff International Holdings Ltd.2 | | | 1,288,445 | | | | 1,420,261 | |
| | | | | | | | | |
| | | | | | | | | | | |
| | | | | | | | | | | |
| Spain (2.02%) | | | | | | | | |
| 33,000 | | Grifols SA, ADR | | | 488,751 | | | | 1,121,670 | |
| 35,105 | | Inditex SA2 | | | 1,009,741 | | | | 1,001,384 | |
| | | | | | | | | |
| Total Spain | | | 1,498,492 | | | | 2,123,054 | |
| | | | | | | | | |
| | | | | | | | | | | |
| Switzerland (3.06%) | | | | | | | | |
| 9,300 | | Compagnie Financière Richemont SA2 | | | 220,200 | | | | 824,525 | |
| 36,067 | | Julius Baer Group Ltd.2 | | | 1,224,146 | | | | 1,646,747 | |
| 11,600 | | Syngenta AG, ADR | | | 567,792 | | | | 745,184 | |
| | | | | | | | | |
| Total Switzerland | | | 2,012,138 | | | | 3,216,456 | |
| | | | | | | | | |
| 18 | | See Notes to Financial Statements. |
| |
| December 31, 2014 | Baron International Growth Fund |
| STATEMENT OF NET ASSETS |
| |
| DECEMBER 31, 2014 |
| | | | | | | | | | | |
| Shares | | | | | Cost | | | | Value | |
| |
| Common Stocks (continued) | | | | | | | | |
| |
| United Kingdom (11.60%) | | | | | | | | |
| 330,738 | | AO World plc1 | | $ | 1,379,333 | | $ | | 1,444,399 | |
| 185,000 | | Domino’s Pizza Group plc2 | | | 1,688,526 | | | | 2,019,901 | |
| 65,200 | | easyJet plc2 | | | 1,496,219 | | | | 1,687,316 | |
| 64,800 | | Experian plc2 | | | 623,019 | | | | 1,092,330 | |
| 115,300 | | Inchcape plc2 | | | 1,062,155 | | | | 1,295,403 | |
| 27,600 | | Intertek Group plc2 | | | 754,184 | | | | 998,899 | |
| 340,728 | | Just Eat plc1 | | | 1,498,828 | | | | 1,644,690 | |
| 249,200 | | Premier Oil plc2 | | | 1,216,623 | | | | 644,543 | |
| 245,600 | | William Hill plc2 | | | 1,424,569 | | | | 1,380,049 | |
| | | | | | | | | |
| Total United Kingdom | | | 11,143,456 | | | | 12,207,530 | |
| | | | | | | | | |
| | | | | | | | | | | |
| | | | | | | | | | | |
| United States (3.50%) | | | | | | | | |
| 33,900 | | Agilent Technologies, Inc. | | | 833,456 | | | | 1,387,866 | |
| 25,000 | | Arch Capital Group Ltd.1 | | | 842,724 | | | | 1,477,500 | |
| 75,000 | | Nomad Holdings Ltd.1,2 | | | 749,250 | | | | 813,518 | |
| | | | | | | | | |
| Total United States | | | 2,425,430 | | | | 3,678,884 | |
| | | | | | | | | |
| Total Common Stocks | | | 80,703,878 | | | | 99,784,846 | |
| | | | | | | | | |
| | | | | | | | | | | |
| |
| Warrants (0.04%) | | | | | | | | |
| |
| United States (0.04%) | | | | | | | | |
| 75,000 | | Nomad Holdings Ltd. | | | | | | | | |
| | | Warrants Exp 4/10/20171,2 | | | 750 | | | | 39,000 | |
| | | | | | | | | |
| Principal | | | | | | | | | | |
| Amount | | | | | Cost | | | | Value | |
| |
| Short Term Investments (4.82%) | | | | | | | | |
| |
| $5,069,849 | | Repurchase Agreement with | | | | | | | | |
| | | Fixed Income Clearing Corp., | | | | | | | | |
| | | dated 12/31/2014, 0.00% due | | | | | | | | |
| | | 1/2/2015; Proceeds at maturity – | | | | | | | | |
| | | $5,069,849; (Fully collateralized by | | | | | | | | |
| | | $5,125,000 U.S. Treasury Note, | | | | | | | | |
| | | 2.125% due 12/31/2021; | | | | | | | | |
| | | Market value – $5,176,250)2 | | $ | 5,069,849 | | | $ | 5,069,849 | |
| | | | | | | | | |
| Total Investments (99.66%) | | $ | 85,774,477 | | | | 104,893,695 | |
| | | | | | | | | | |
| Cash and Other Assets Less Liabilities (0.34%) | | | | | | | 363,003 | |
| | | | | | | | | | |
| Net Assets | | | | | | $ | 105,256,698 | |
| | | | | | | | | | |
| Retail Shares (Equivalent to $17.94 per share | | | | | | | | |
based on 2,950,457 shares outstanding) | | | | | | $ | 52,933,317 | |
| | | | | | | | | | |
| Institutional Shares (Equivalent to $18.09 per share | | | | | |
based on 2,892,286 shares outstanding) | | | | | | $ | 52,323,381 | |
| | | | | | | | | | |
| % | | Represents percentage of net assets. |
| 1 | | Non-income producing securities. |
| 2 | | Level 2 security. See Note 7 regarding Fair Value Measurements. |
| ADR | | American Depositary Receipt. |
| | | |
| | | All securities are Level 1, unless otherwise noted. |
| |
Summary of Investments by Sector
as of December 31, 2014 | | Percentage of
Net Assets |
| |
| Consumer Discretionary | | 28.4 | % |
| Information Technology | | 21.9 | |
| Industrials | | 15.2 | |
| Financials | | 11.8 | |
| Telecommunication Services | | 5.0 | |
| Energy | | 4.7 | |
| Health Care | | 4.2 | |
| Materials | | 2.8 | |
| Unclassified | | 0.8 | |
| Cash and Cash Equivalents* | | 5.2 | |
| |
| | | 100.0 | % |
| |
| * | | Includes short term investments. |
| See Notes to Financial Statements. | | 19 |
| |
| Baron Real Estate Fund | December 31, 2014 |
| STATEMENT OF NET ASSETS |
| |
| DECEMBER 31, 2014 |
| Shares | | | | | Cost | | | | Value | |
| |
| Common Stocks (98.37%) | | | | | | | | |
| |
| Consumer Discretionary (32.80%) | | | | | | | | |
| | | Casinos & Gaming (2.03%) | | | | | | | | |
| 302,650 | | Las Vegas Sands Corp. | | $ | 15,450,294 | | | $ | 17,602,124 | |
| 113,800 | | Wynn Resorts Ltd. | | | 13,347,035 | | | | 16,928,888 | |
| | | | | | | | | |
| | | | | | 28,797,329 | | | | 34,531,012 | |
| | | Home Furnishings (2.80%) | | | | | | | | |
| 307,307 | | Mohawk Industries, Inc.1 | | | 40,464,123 | | | | 47,743,216 | |
| | | Home Improvement Retail (4.84%) | | | | | | | | |
| 495,307 | | Home Depot, Inc. | | | 39,457,800 | | | | 51,992,376 | |
| 440,900 | | Lowe’s Companies, Inc. | | | 17,591,082 | | | | 30,333,920 | |
| | | | | | | | | |
| | | | | | 57,048,882 | | | | 82,326,296 | |
| | | Homebuilding (5.01%) | | | | | | | | |
| 1,022,407 | | Brookfield Residential Properties, Inc.1,2 | | | 20,767,234 | | | | 24,599,112 | |
| 1,160,000 | | D.R. Horton, Inc. | | | 24,033,166 | | | | 29,336,400 | |
| 913,900 | | Toll Brothers, Inc.1 | | | 31,048,376 | | | | 31,319,353 | |
| | | | | | | | | |
| | | | | | 75,848,776 | | | | 85,254,865 | |
| | | Hotels, Resorts & Cruise Lines (18.12%) | | | | | | | | |
| 1,457,199 | | Diamond Resorts International, Inc.1 | | | 23,028,372 | | | | 40,655,852 | |
| 1,679,201 | | Hilton Worldwide Holdings, Inc.1 | | | 41,969,733 | | | | 43,810,354 | |
| 1,016,106 | | Hyatt Hotels Corp., Cl A1 | | | 45,966,098 | | | | 61,179,742 | |
| 178,039 | | Marriott Vacations Worldwide Corp. | | | 8,057,025 | | | | 13,271,027 | |
| 853,400 | | Norwegian Cruise Line Holdings Ltd.1,2 | | | 26,079,986 | | | | 39,904,984 | |
| 721,950 | | Starwood Hotels & Resorts | | | | | | | | |
| | | Worldwide, Inc. | | | 47,434,821 | | | | 58,528,487 | |
| 596,400 | | Wyndham Worldwide Corp. | | | 35,923,943 | | | | 51,147,264 | |
| | | | | | | | | |
| | | | | | 228,459,978 | | | | 308,497,710 | |
| | | | | | | | | |
| Total Consumer Discretionary | | | 430,619,088 | | | | 558,353,099 | |
| | | | | | | | | |
| | | | | | | | | | | |
| Financials (39.08%) | | | | | | | | |
| | | Diversified Real Estate Activities (1.23%) | | | | | |
| 418,900 | | Brookfield Asset | | | | | | | | |
| | | Management, Inc., Cl A2 | | | 15,497,738 | | | | 20,999,457 | |
| | | Diversified REITs (1.29%) | | | | | | | | |
| 186,900 | | Vornado Realty Trust | | | 17,072,939 | | | | 21,999,999 | |
| | | Hotel & Resort REITs (3.72%) | | | | | | | | |
| 310,550 | | LaSalle Hotel Properties | | | 8,295,291 | | | | 12,567,959 | |
| 1,806,250 | | Strategic Hotels & Resorts, Inc.1,2 | | | 14,538,726 | | | | 23,896,687 | |
| 1,627,900 | | Sunstone Hotel Investors, Inc. | | | 19,897,354 | | | | 26,876,629 | |
| | | | | | | | | |
| | | | | | 42,731,371 | | | | 63,341,275 | |
| | | Industrial REITs (1.22%) | | | | | | | | |
| 482,850 | | Prologis, Inc. | | | 20,291,690 | | | | 20,777,035 | |
| | | Mortgage REITs (1.21%) | | | | | | | | |
| 706,757 | | Blackstone Mortgage Trust, Inc., Cl A | | | 19,208,904 | | | | 20,594,899 | |
| | | Office REITs (4.99%) | | | | | | | | |
| 155,550 | | Boston Properties, Inc. | | | 20,189,049 | | | | 20,017,729 | |
| 614,858 | | CyrusOne, Inc. | | | 12,668,816 | | | | 16,939,338 | |
| 923,110 | | Douglas Emmett, Inc. | | | 22,743,784 | | | | 26,216,324 | |
| 182,900 | | SL Green Realty Corp. | | | 18,253,016 | | | | 21,768,758 | |
| | | | | | | | | |
| | | | | | 73,854,665 | | | | 84,942,149 | |
| | | Real Estate Development (1.35%) | | | | | | | | |
| 176,650 | | The Howard Hughes Corp.1 | | | 22,909,191 | | | | 23,038,693 | |
| | | Real Estate Operating Companies (3.62%) | | | | | |
| 1,232,500 | | Forest City Enterprises, Inc., Cl A1 | | | 23,465,642 | | | | 26,252,250 | |
| 2,149,514 | | Kennedy Wilson Europe Real | | | | | | | | |
| | | Estate plc (United Kingdom)2,3 | | | 36,657,699 | | | | 35,344,977 | |
| | | | | | | | | |
| | | | | | 60,123,341 | | | | 61,597,227 | |
| | | Real Estate Services (9.08%) | | | | | | | | |
| 1,772,000 | | CBRE Group, Inc., Cl A1 | | | 41,005,305 | | | | 60,691,000 | |
| 411,330 | | Jones Lang LaSalle, Inc. | | | 39,825,851 | | | | 61,670,707 | |
| 1,273,717 | | Kennedy-Wilson Holdings, Inc. | | | 21,258,836 | | | | 32,225,040 | |
| | | | | | | | | |
| | | | | | 102,089,992 | | | | 154,586,747 | |
| Shares | | | | | Cost | | | | Value | |
| |
| Common Stocks (continued) | | | | | | | | |
| |
| Financials (continued) | | | | | | | | |
| | | Residential REITs (3.39%) | | | | | | | | |
| 451,434 | | American Campus | | | | | | | | |
| | | Communities, Inc. | | $ | 16,155,232 | | | $ | 18,671,310 | |
| 110,000 | | AvalonBay Communities, Inc. | | | 18,402,941 | | | | 17,972,900 | |
| 575,377 | | Education Realty Trust, Inc. | | | 18,194,628 | | | | 21,053,045 | |
| | | | | | | | | |
| | | | | | 52,752,801 | | | | 57,697,255 | |
| | | Retail REITs (3.61%) | | | | | | | | |
| 743,800 | | General Growth Properties, Inc. | | | 20,338,139 | | | | 20,923,094 | |
| 172,200 | | Simon Property Group, Inc. | | | 27,227,683 | | | | 31,359,342 | |
| 248,000 | | Tanger Factory Outlet Centers, Inc. | | | 8,035,591 | | | | 9,166,080 | |
| | | | | | | | | |
| | | | | | 55,601,413 | | | | 61,448,516 | |
| | | Specialized REITs (3.07%) | | | | | | | | |
| 249,650 | | Alexandria Real Estate Equities, Inc.3 | | | 18,238,063 | | | | 22,153,941 | |
| 303,596 | | American Tower Corp. | | | 25,768,711 | | | | 30,010,465 | |
| | | | | | | | | |
| | | | | | 44,006,774 | | | | 52,164,406 | |
| | | Thrifts & Mortgage Finance (1.30%) | | | | | | | | |
| 859,022 | | Essent Group, Ltd.1,2 | | | 18,411,145 | | | | 22,085,456 | |
| | | | | | | | | |
| Total Financials | | | 544,551,964 | | | | 665,273,114 | |
| | | | | | | | | |
| | | | | | | | | | | |
| Health Care (12.26%) | | | | | | | | |
| | | Health Care Facilities (12.26%) | | | | | | | | |
| 4,180,100 | | Brookdale Senior Living, Inc.1 | | | 113,930,057 | | | | 153,284,267 | |
| 2,228,063 | | Capital Senior Living Corp.1,4 | | | 48,627,349 | | | | 55,501,049 | |
| | | | | | | | | |
| Total Health Care | | | 162,557,406 | | | | 208,785,316 | |
| | | | | | | | | |
| | | | | | | | | | | |
| Industrials (2.66%) | | | | | | | | |
| | | Building Products (2.66%) | | | | | | | | |
| 2,760,116 | | Builders FirstSource, Inc.1 | | | 18,456,809 | | | | 18,961,997 | |
| 429,269 | | Masonite International Corp.1,2 | | | 25,081,508 | | | | 26,382,872 | |
| | | | | | | | | |
| Total Industrials | | | 43,538,317 | | | | 45,344,869 | |
| | | | | | | | | |
| | | | | | | | | | | |
| Information Technology (2.90%) | | | | | | | | |
| | | IT Consulting & Other Services (2.90%) | | | | | | | | |
| 217,419 | | Equinix, Inc.1,3 | | | 42,033,358 | | | | 49,295,410 | |
| | | | | | | | | |
| | | | | | | | | | | |
| Materials (1.71%) | | | | | | | | |
| | | Construction Materials (1.71%) | | | | | | | | |
| 485,700 | | CaesarStone Sdot-Yam Ltd.1,2 | | | 13,212,735 | | | | 29,054,574 | |
| | | | | | | | | |
| | | | | | | | | | | |
| Telecommunication Services (4.44%) | | | | | | | | |
| | | Wireless Telecommunication Services (4.44%) | | | | | | | | |
| 57,211,650 | | Sarana Menara Nusantara | | | | | | | | |
| | | Tbk PT (Indonesia)1,2 | | | 15,144,114 | | | | 19,170,638 | |
| 269,800 | | SBA Communications Corp., Cl A1 | | | 21,583,639 | | | | 29,883,048 | |
| 34,047,909 | | Tower Bersama Infrastructure | | | | | | | | |
| | | Tbk PT (Indonesia)2,5 | | | 17,742,224 | | | | 26,629,416 | |
| | | | | | | | | |
| Total Telecommunication Services | | | 54,469,977 | | | | 75,683,102 | |
| | | | | | | | | |
| | | | | | | | | | | |
| Utilities (2.52%) | | | | | | | | |
| | | Electric Utilities (2.52%) | | | | | | | | |
| 648,310 | | Brookfield Infrastructure | | | | | | | | |
| | | Partners L.P.2 | | | 24,754,222 | | | | 27,144,740 | |
| 391,300 | | ITC Holdings Corp. | | | 11,965,191 | | | | 15,820,259 | |
| | | | | | | | | |
| Total Utilities | | | 36,719,413 | | | | 42,964,999 | |
| | | | | | | | | |
| Total Common Stocks | | | 1,327,702,258 | | | | 1,674,754,483 | |
| | | | | | | | | |
| 20 | | See Notes to Financial Statements. |
DECEMBER 31, 2014 | |
Baron Real Estate Fund |
| STATEMENT OF NET ASSETS (Continued) |
| |
| DECEMBER 31, 2014 |
| Principal | | | | | | | | |
| Amount | | | | | Cost | | | Value |
| |
| Short Term Investments (1.21%) | | | | | | |
| |
| $20,541,480 | | Repurchase Agreement with
Fixed Income Clearing Corp.,
dated 12/31/2014, 0.00% due
1/2/2015; Proceeds at maturity –
$20,541,480; (Fully collateralized by
$20,745,000 U.S. Treasury
Note, 2.125% due 12/31/2021;
Market value – $20,952,450)5 | | $ | 20,541,480 | | $ | 20,541,480 |
| | | | | | | |
| Total Investments (99.58%) | | $ | 1,348,243,738 | | | 1,695,295,963 |
| | | | | | | | |
| | | | | | | | | |
| Cash and Other Assets Less Liabilities (0.42%) | | | | | | |
| | | | | | | | | 7,224,264 |
| | | | | | | | |
| Net Assets | | | | | $ | 1,702,520,227 |
| | | | | | | | |
| Retail Shares (Equivalent to $25.92 per share | | | | | | |
based on 30,198,572 shares outstanding) | | | | | $ | 782,788,170 |
| | | | | | | | |
| Institutional Shares (Equivalent to $26.14 per share | | | | | | |
based on 35,186,963 shares outstanding) | | | | | $ | 919,732,057 |
| | | | | | | | |
| | |
| % | | Represents percentage of net assets. |
| 1 | | Non-income producing securities. |
| 2 | | Foreign corporation. |
| 3 | | The Adviser has reclassified/classified certain securities in or out of this sub- |
| | | industry. Such reclassifications/classifications are not supported by S & P or MSCI. |
| 4 | | See Note 10 regarding “Affiliated” companies. |
| 5 | | Level 2 security. See Note 7 regarding Fair Value Measurements. |
| | | |
| | | All securities are Level 1, unless otherwise noted. |
| | | |
| See Notes to Financial Statements. | | 21 |
| Baron Emerging Markets Fund | | December 31, 2014 |
| STATEMENT OF NET ASSETS |
| |
| DECEMBER 31, 2014 |
| Shares | | | Cost | | | Value |
| |
| Common Stocks (88.20%) | | | | | | |
| |
| Brazil (12.23%) | | | | | | |
| 1,471,275 | | Cetip SA - Mercados | | | | | | |
| | | Organizados | | $ | 17,153,651 | | $ | 17,822,231 |
| 700,000 | | Estácio Participações SA | | | 6,657,442 | | | 6,272,666 |
| 800,678 | | GAEC Educaçäo SA | | | 10,232,178 | | | 10,647,794 |
| 4,175,300 | | GOL Linhas Aéreas | | | | | | |
| | | Inteligentes SA, ADR1 | | | 23,580,703 | | | 24,007,975 |
| 6,000,876 | | Kroton Educacional SA | | | 31,281,130 | | | 34,991,189 |
| 465,000 | | Linx SA | | | 9,293,847 | | | 8,833,985 |
| 366,000 | | M. Dias Branco SA | | | 15,043,294 | | | 12,529,531 |
| 625,000 | | Multiplus SA | | | 7,393,964 | | | 7,523,888 |
| 1,600,000 | | Smiles SA | | | 25,709,959 | | | 27,718,005 |
| 1,100,818 | | TOTVS SA | | | 17,454,564 | | | 14,494,256 |
| | | | | | | |
| Total Brazil | | | 163,800,732 | | | 164,841,520 |
| | | | | | | |
| | | | | | | | | |
| Chile (1.24%) | | | | | | |
| 700,000 | | Sociedad Química y Minera de | | | | | | |
| | | Chile SA, ADR | | | 18,590,844 | | | 16,716,000 |
| | | | | | | |
| | | | | | | | | |
| China (17.28%) | | | | | | |
| 220,000 | | Alibaba Group Holding Ltd., ADR1 | | | 19,087,805 | | | 22,866,800 |
| 4,000,000 | | China Mengniu Dairy Co. Ltd.2 | | | 18,068,979 | | | 16,470,506 |
| 8,000,000 | | China Petroleum & | | | | | | |
| | | Chemical Corp., Cl H2 | | | 8,158,908 | | | 6,478,712 |
| 28,000,000 | | China Telecom Corp. Ltd., Cl H2 | | | 17,387,848 | | | 16,096,556 |
| 8,750,000 | | China Unicom (Hong Kong) Ltd.2 | | | 13,832,432 | | | 11,703,660 |
| 17,501,000 | | Haitong Securities Co., Ltd., Cl H2 | | | 28,222,685 | | | 43,635,706 |
| 41,000,000 | | Kingdee International | | | | | | |
| | | Software Group Co. Ltd.1,2 | | | 12,874,327 | | | 12,096,984 |
| 700,000 | | Perfect World Co. Ltd., ADR | | | 14,372,043 | | | 11,032,000 |
| 12,000,000 | | PetroChina Co. Ltd.2 | | | 14,817,396 | | | 13,290,061 |
| 2,652,000 | | Shandong Weigao Group | | | | | | |
| | | Medical Polymer Co. Ltd. | | | 2,494,804 | | | 2,151,107 |
| 23,000,600 | | Sihuan Pharmaceutical | | | | | | |
| | | Holdings Group Ltd.2 | | | 12,675,731 | | | 15,387,476 |
| 6,000,000 | | Sinopharm Group Co. Ltd., Cl H2 | | | 21,548,357 | | | 21,151,550 |
| 585,515 | | TAL Education Group, ADR1 | | | 16,422,925 | | | 16,447,116 |
| 1,060,000 | | Tencent Holdings Ltd.2 | | | 14,494,597 | | | 15,337,057 |
| 251,500 | | WuXi PharmaTech | | | | | | |
| | | (Cayman), Inc., ADR1 | | | 8,272,269 | | | 8,468,005 |
| 950,000 | | Yashili International | | | | | | |
| | | Holdings Ltd. 2 | | | 340,036 | | | 267,115 |
| | | | | | | |
| Total China | | | 223,071,142 | | | 232,880,411 |
| | | | | | | |
| | | | | | | | | |
| Hong Kong (3.35%) | | | | | | |
| 4,300,000 | | Luk Fook Holdings | | | | | | |
| | | International Ltd.2 | | | 14,146,586 | | | 16,125,557 |
| 6,250,000 | | Man Wah Holdings Ltd.2 | | | 10,364,962 | | | 10,279,485 |
| 3,097,000 | | Melco International | | | | | | |
| | | Development Ltd.2 | | | 10,131,317 | | | 6,787,625 |
| 4,250,000 | | Wynn Macau Ltd.2 | | | 16,410,408 | | | 11,883,999 |
| | | | | | | |
| Total Hong Kong | | | 51,053,273 | | | 45,076,666 |
| | | | | | | |
| | | | | | | | | |
| India (18.31%) | | | | | | |
| 1,802,000 | | Amara Raja Batteries Ltd.2 | | | 11,177,253 | | | 23,462,277 |
| 3,200,000 | | Axis Bank Ltd.2 | | | 18,168,879 | | | 25,327,725 |
| 1,801,000 | | Crompton Greaves Ltd.2 | | | 4,453,668 | | | 5,315,989 |
| 3,752,679 | | DEN Networks Ltd.1,2 | | | 10,244,650 | | | 7,924,978 |
| 17,599,000 | | Dish TV India Ltd.1,2 | | | 16,695,495 | | | 18,746,534 |
| 900,000 | | Divi’s Laboratories Ltd.2 | | | 19,365,191 | | | 24,562,588 |
| 4,800,000 | | Exide Industries Ltd.2 | | | 12,756,201 | | | 13,465,768 |
| Shares | | | Cost | | | Value |
| |
| Common Stocks (continued) | | | | | | |
| |
| India (continued) | | | | | | |
| 1,025,000 | | Glenmark Pharmaceuticals Ltd.2 | | $ | 12,790,693 | | $ | 12,478,936 |
| 1,154,000 | | Hathway Cable and | | | | | | |
| | | Datacom Ltd.1,2 | | | 5,093,897 | | | 6,356,598 |
| 850,000 | | Larsen & Toubro Ltd.2 | | | 20,487,540 | | | 20,025,761 |
| 760,653 | | Lupin Ltd. 2 | | | 12,607,242 | | | 17,185,776 |
| 1,400,000 | | PVR Ltd. | | | 13,210,241 | | | 15,544,220 |
| 2,100,000 | | Sun TV Network Ltd.2 | | | 13,198,170 | | | 12,606,894 |
| 1,601,000 | | Torrent Pharmaceuticals Ltd. | | | 15,455,211 | | | 28,669,497 |
| 2,504,000 | | Zee Entertainment | | | | | | |
| | | Enterprises Ltd.2 | | | 10,864,027 | | | 15,041,267 |
| | | | | | | |
| Total India | | | 196,568,358 | | | 246,714,808 |
| | | | | | | |
| | | | | | | | | |
| Indonesia (4.73%) | | | | | | |
| 14,042,000 | | Bank Rakyat Indonesia | | | | | | |
| | | (Persero) Tbk PT2 | | | 9,930,994 | | | 13,199,206 |
| 13,503,527 | | Matahari Department | | | | | | |
| | | Store Tbk PT2 | | | 17,195,848 | | | 16,271,221 |
| 27,631,350 | | Sarana Menara | | | | | | |
| | | Nusantara Tbk PT1 | | | 8,841,958 | | | 9,258,789 |
| 32,000,000 | | Tower Bersama | | | | | | |
| | | Infrastructure Tbk PT2 | | | 17,821,369 | | | 25,027,714 |
| | | | | | | |
| Total Indonesia | | | 53,790,169 | | | 63,756,930 |
| | | | | | | |
| | | | | | | | | |
| Korea, Republic of (5.35%) | | | | | | |
| 66,970 | | CJ O Shopping Co., Ltd.2 | | | 21,425,673 | | | 15,788,255 |
| 300,000 | | Grand Korea Leisure Co., Ltd.2 | | | 12,341,001 | | | 8,719,163 |
| 220,000 | | i-SENS, Inc. 1,2 | | | 12,397,305 | | | 12,564,211 |
| 12,000 | | Samsung Electronics Co., Ltd.2 | | | 15,640,967 | | | 14,426,928 |
| 40,000 | | Samsung Life Insurance Co. Ltd2 | | | 4,246,322 | | | 4,235,553 |
| 480,000 | | WeMade Entertainment Co., Ltd.1,2 | | | 18,481,755 | | | 16,366,081 |
| | | | | | | |
| Total Korea, Republic of | | | 84,533,023 | | | 72,100,191 |
| | | | | | | |
| | | | | | | | | |
| Mexico (2.87%) | | | | | | |
| 275,000 | | Fomento Económico Mexicano, | | | | | | |
| | | S.A.B. de C.V., ADR1 | | | 25,318,081 | | | 24,208,250 |
| 789,369 | | Grupo Lala S.A.B. de C.V.1 | | | 1,524,141 | | | 1,525,904 |
| 2,600,000 | | Infraestructura Energetica | | | | | | |
| | | Nova S.A.B. de C.V. | | | 14,790,528 | | | 12,970,262 |
| | | | | | | |
| Total Mexico | | | 41,632,750 | | | 38,704,416 |
| | | | | | | |
| | | | | | | | | |
| Norway (1.67%) | | | | | | |
| 1,775,500 | | Opera Software ASA2 | | | 23,169,549 | | | 22,447,746 |
| | | | | | | |
| | | | | | | | | |
| Philippines (4.46%) | | | | | | |
| 21,005,000 | | Ayala Land, Inc.2 | | | 14,218,675 | | | 15,662,942 |
| 6,000,000 | | BDO Unibank, Inc.2 | | | 12,940,582 | | | 14,677,621 |
| 119,000,000 | | Metro Pacific Investments Corp.2 | | | 12,770,816 | | | 12,159,149 |
| 4,022,000 | | Universal Robina Corp.2 | | | 11,492,570 | | | 17,535,464 |
| | | | | | | |
| Total Philippines | | | 51,422,643 | | | 60,035,176 |
| | | | | | | | |
| | | | | | | | | |
| Singapore (0.91%) | | | | | | |
| 6,600,000 | | Global Logistic Properties Ltd.2 | | | 14,683,704 | | | 12,305,053 |
| | | | | | | | |
| 22 | | See Notes to Financial Statements. |
December 31, 2014 | |
Baron Emerging Market Fund |
| | | | | | | | | | |
| Shares | | | | Cost | | | Value |
| |
| Common Stocks (continued) | | | | | | | |
| |
| South Africa (5.65%) | | | | | | | |
| 692,700 | | Aspen Pharmacare Holdings Ltd.2 | | | $ | 18,507,474 | | $ | 24,165,587 |
| 635,138 | | Bidvest Group Ltd.2 | | | | 17,129,340 | | | 16,604,959 |
| 675,000 | | Mr Price Group Ltd.2 | | | | 13,101,011 | | | 13,654,496 |
| 4,250,000 | | Steinhoff International | | | | | | | |
| | | Holdings Ltd.2 | | | | 18,421,468 | | | 21,742,180 |
| | | | | | | | |
| Total South Africa | | | | 67,159,293 | | | 76,167,222 |
| | | | | | | | |
| | | | | | | | | | |
| Taiwan, Province of China (7.79%) | | | | | | | |
| 9,001,000 | | Far EasTone | | | | | | | |
| | | Telecommunications Co., Ltd.2 | | | | 19,320,523 | | | 20,736,036 |
| 1,180,000 | | Ginko International Co., Ltd.2 | | | | 19,899,876 | | | 12,452,300 |
| 2,051,180 | | HIWIN Technologies Corp.2 | | | | 18,634,176 | | | 16,975,748 |
| 1,000,000 | | MediaTek Inc.2 | | | | 15,150,842 | | | 14,537,430 |
| 3,600,000 | | Novatek Microelectronics Corp.2 | | | | 16,883,162 | | | 20,117,150 |
| 900,000 | | Taiwan Semiconductor | | | | | | | |
| | | Manufacturing Co. Ltd., ADR | | | | 17,018,673 | | | 20,142,000 |
| | | | | | | | |
| Total Taiwan, Province of China | | | | 106,907,252 | | | 104,960,664 |
| | | | | | | | |
| | | | | | | | | | |
| Thailand (1.82%) | | | | | | | |
| 100,000 | | Bangkok Bank PCL, Cl F2 | | | | 629,574 | | | 594,111 |
| 2,201,000 | | Bangkok Bank Public | | | | | | | |
| | | Co., Ltd., NVDR2 | | | | 12,706,874 | | | 12,927,808 |
| 16,500,000 | | L.P.N. Development PCL, Cl F2 | | | | 9,655,310 | | | 11,033,435 |
| | | | | | | | |
| Total Thailand | | | | 22,991,758 | | | 24,555,354 |
| | | | | | | | |
| | | | | | | | | | |
| United Arab Emirates (0.26%) | | | | | | | |
| 20,062,000 | | SHUAA Capital psc1,2 | | | | 6,684,893 | | | 3,520,568 |
| | | | | | | | |
| | | | | | | | | | |
| United Kingdom (0.28%) | | | | | | | |
| 8,637,363 | | Lekoil Ltd.1 | | | | 7,340,352 | | | 3,752,589 |
| | | | | | | | |
| Total Common Stocks | | | | 1,133,399,735 | | | 1,188,535,314 |
| | | | | | | | |
| | | | | | | | | | |
| |
| Preferred Stocks (0.03%) | | | | | | | |
| |
| India (0.03%) | | | | | | | |
| 30,983,400 | | Zee Entertainment Enterprises | | | | | | | |
| | | Ltd., 6% due 3/5/2022 | | | | 367,971 | | | 427,036 |
| | | | | | | | |
| Principal | | | | | | | | |
| Amount | | | | | Cost | | | | Value | |
| |
| Convertible Bonds (0.42%) | | | | | | | | |
| |
| China (0.42%) | | | | | | | | |
| $50,000,000 | | Biostime International Holdings | | | | | | | | |
| | | Ltd., 0.00% due 2/20/20191,2 | | $ | 6,590,207 | | | $ | 5,593,418 | | |
| | | | | | | | | |
| | | | | | | | | | | |
| |
| Short Term Investments (11.97%) | | | | | | | | |
| |
| 161,340,865 | | Repurchase Agreement with Fixed Income Clearing Corp., dated 12/31/2014, 0.00% due 1/2/2015; Proceeds at maturity –$161,340,865; (Fully collateralized by $162,940,000 U.S. Treasury Note, 2.125% due 12/31/2021; Market value – $164,569,400)2 | | | 161,340,865 | | | | 161,340,865 | |
| | | | | | | | | | |
| Total Investments (100.62%) | | $ | 1,301,698,778 | | | $ | 1,355,896,633 | |
| | | | | | | | | | |
Liabilities Less Cash and Other Assets (-0.62%) | | | | | | | (8,406,881 | ) |
| | | | | | | | | | |
| Net Assets | | | | | | $ | 1,347,489,752 | |
| | | | | | | | | | |
Retail Shares (Equivalent to $11.91 per share | | | | | | | | |
based on 54,532,566 shares outstanding) | | | | | | $ | 649,647,950 | |
| | | | | | | | | | |
Institutional Shares (Equivalent to $11.94 per share | | | | | | | | |
based on 58,440,628 shares outstanding) | | | | | | $ | 697,841,802 | |
| | | | | | | | | | |
| % | | Represents percentage of net assets. |
| 1 | | Non-income producing securities. |
| 2 | | Level 2 security. See Note 7 regarding Fair Value Measurements. |
| ADR | | American Depositary Receipt. |
| NVDR | | Non-Voting Depositary Receipt. |
| | | |
| | | All securities are Level 1, unless otherwise noted. |
| |
| Summary of Investments by Sector | | Percentage of |
| as of December 31, 2014 | | Net Assets |
| |
| Consumer Discretionary | | 23.4 | % |
| Information Technology | | 14.3 | |
| Financials | | 13.9 | |
| Health Care | | 13.3 | |
| Industrials | | 7.9 | |
| Telecommunication Services | | 6.2 | |
| Consumer Staples | | 5.8 | |
| Energy | | 1.7 | |
| Materials | | 1.2 | |
| Utilities | | 1.0 | |
| Cash and Cash Equivalents* | | 11.3 | |
| |
| | | 100.0 | % |
| |
| | |
| * Includes short term investments. |
| See Notes to Financial Statements. | | 23 |
Baron Energy and Resources Fund | |
December 31, 2014 |
| STATEMENT OF NET ASSETS |
| |
| DECEMBER 31, 2014 |
| Shares | | | Cost | | | Value |
| |
| Common Stocks (94.08%) | | | | | | |
| |
| Energy (76.25%) | | | | | | |
| | | Oil & Gas Drilling (1.70%) | | | | | | |
| 17,446 | | Helmerich & Payne, Inc. | | $ | 1,356,280 | | $ | 1,176,210 |
| | | Oil & Gas Equipment | | | | | | |
| | | & Services (14.13%) | | | | | | |
| 104,200 | | Canyon Services Group, Inc. (Canada)2 | | | 1,034,540 | | | 806,299 |
| 8,950 | | Core Laboratories N.V.2 | | | 1,348,501 | | | 1,077,043 |
| 71,442 | | Forum Energy Technologies, Inc.1 | | | 1,991,890 | | | 1,480,992 |
| 51,196 | | Halliburton Co. | | | 2,728,499 | | | 2,013,539 |
| 2,543 | | National Oilwell Varco, Inc. | | | 157,740 | | | 166,643 |
| 15,431 | | Oil States International, Inc.1 | | | 846,155 | | | 754,576 |
| 17,890 | | RigNet, Inc.1 | | | 685,662 | | | 734,027 |
| 74,257 | | Superior Energy Services, Inc. | | | 2,009,248 | | | 1,496,278 |
| 95,400 | | Tesco Corp.2 | | | 1,815,819 | | | 1,223,028 |
| | | | | | | |
| | | | | | 12,618,054 | | | 9,752,425 |
| | | Oil & Gas Exploration & | | | | | | |
| | | Production (30.21%) | | | | | | |
| 12,139 | | Anadarko Petroleum Corporation | | | 1,160,970 | | | 1,001,467 |
| 23,700 | | Antero Resources Corp.1 | | | 1,203,372 | | | 961,746 |
| 73,848 | | Bonanza Creek Energy, Inc.1 | | | 2,986,159 | | | 1,772,352 |
| 59,800 | | Cabot Oil & Gas Corp. | | | 1,978,664 | | | 1,770,678 |
| 29,299 | | Concho Resources, Inc.1 | | | 3,100,773 | | | 2,922,575 |
| 11,868 | | EOG Resources, Inc. | | | 1,051,171 | | | 1,092,687 |
| 48,236 | | Gulfport Energy Corp.1 | | | 2,679,746 | | | 2,013,371 |
| 841,400 | | Lekoil Ltd. (United Kingdom)1,2 | | | 730,464 | | | 365,555 |
| 23,549 | | Noble Energy, Inc. | | | 1,357,495 | | | 1,116,929 |
| 67,538 | | Oasis Petroleum, Inc.1 | | | 2,378,029 | | | 1,117,078 |
| 165,500 | | Parsley Energy, Inc., Cl A1 | | | 3,013,858 | | | 2,641,380 |
| 72,000 | | RSP Permian, Inc.1 | | | 1,641,359 | | | 1,810,080 |
| 47,848 | | SM Energy Co. | | | 2,863,101 | | | 1,845,976 |
| 12,858 | | Whiting Petroleum Corp.1 | | | 682,901 | | | 424,314 |
| | | | | | | |
| | | | | | 26,828,062 | | | 20,856,188 |
| | | Oil & Gas Refining & Marketing (1.72%) | | | | | | |
| 13,178 | | Marathon Petroleum Corp. | | | 1,109,688 | | | 1,189,446 |
| | | Oil & Gas Storage & | | | | | | |
| | | Transportation (28.49%) | | | | | | |
| 78,450 | | Atlas Energy, L.P. | | | 3,333,836 | | | 2,443,718 |
| 28,711 | | Dominion Midstream Partners, L.P. | | | 653,611 | | | 1,125,471 |
| 21,600 | | Energy Transfer Equity LP | | | 1,221,807 | | | 1,239,408 |
| 21,535 | | Golar LNG Ltd.2 | | | 810,268 | | | 785,381 |
| 27,721 | | PBF Logistics LP | | | 667,323 | | | 591,843 |
| 12,640 | | Phillips 66 Partners LP | | | 411,982 | | | 871,275 |
| 16,942 | | Rose Rock Midstream, L.P. | | | 618,535 | | | 770,014 |
| 124,404 | | Scorpio Tankers Inc.2 | | | 1,144,555 | | | 1,081,071 |
| 15,400 | | SemGroup Corp., Cl A | | | 1,153,529 | | | 1,053,206 |
| 34,161 | | Shell Midstream Partners, L.P.1 | | | 838,162 | | | 1,399,918 |
| 54,040 | | Tallgrass Energy Partners, LP | | | 1,588,964 | | | 2,415,588 |
| 12,646 | | Targa Resources Corp. | | | 1,090,646 | | | 1,341,108 |
| 11,528 | | Tesoro Logistics LP | | | 614,732 | | | 678,423 |
| 12,400 | | Valero Energy Partners LP | | | 310,410 | | | 536,300 |
| 12,176 | | Western Gas Equity Partners LP | | | 513,838 | | | 733,360 |
| 9,337 | | Western Gas Partners, LP | | | 563,361 | | | 682,068 |
| 63,039 | | Western Refining Logistics, LP | | | 1,736,860 | | | 1,922,690 |
| | | | | | | |
| | | | | | 17,272,419 | | | 19,670,842 |
| | | | | | | |
| Total Energy | | | 59,184,503 | | | 52,645,111 |
| | | | | | | |
| | | | | | | | | |
| Industrials (5.47%) | | | | | | |
| | | Construction & Engineering (2.24%) | | | | | | |
| 27,000 | | Badger Daylighting Ltd. (Canada)2 | | | 864,127 | | | 614,693 |
| 40,102 | | Primoris Services Corp. | | | 943,178 | | | 931,970 |
| | | | | | | |
| | | | | | 1,807,305 | | | 1,546,663 |
| | | Electrical Components & | | | | | | |
| | | Equipment (0.47%) | | | | | | |
| 6,863 | | Polypore International, Inc.1 | | | 273,545 | | | 322,904 |
| Shares | | | Cost | | | Value |
| |
| Common Stocks (continued) | | | | | | |
| |
| Industrials (continued) | | | | | | |
| | | Industrial Machinery (1.79%) | | | | | | |
| 16,294 | | Chart Industries, Inc.1 | | $ | 1,214,850 | | $ | 557,255 |
| 11,300 | | Flowserve Corp. | | | 798,293 | | | 676,079 |
| | | | | | | |
| | | | | | 2,013,143 | | | 1,233,334 |
| | | Trading Companies & | | | | | | |
| | | Distributors (0.97%) | | | | | | |
| 44,400 | | MRC Global, Inc.1 | | | 1,109,000 | | | 672,660 |
| | | | | | | |
| Total Industrials | | | 5,202,993 | | | 3,775,561 |
| | | | | | | |
| | | | | | | | | |
| Information Technology (2.48%) | | | | | | |
| | | Semiconductor Equipment (2.48%) | | | | | | |
| 87,800 | | SunEdison, Inc.1 | | | 1,768,450 | | | 1,712,978 |
| | | | | | | |
| | | | | | | | | |
| Materials (6.22%) | | | | | | |
| | | Commodity Chemicals (1.89%) | | | | | | |
| 44,932 | | Westlake Chemical Partners LP | | | 1,252,808 | | | 1,303,028 |
| | | | | | | | | |
| | | Diversified Metals & Mining (0.45%) | | | | | | |
| 13,337 | | Freeport-McMoRan, Inc. | | | 449,999 | | | 311,552 |
| | | | | | | | | |
| | | Specialty Chemicals (2.88%) | | | | | | |
| 106,052 | | Flotek Industries, Inc.1 | | | 2,443,806 | | | 1,986,354 |
| | | | | | | | | |
| | | Steel (1.00%) | | | | | | |
| 35,817 | | SunCoke Energy, Inc. | | | 685,657 | | | 692,701 |
| | | | | | | |
| Total Materials | | | 4,832,270 | | | 4,293,635 |
| | | | | | | |
| | | | | | | | | |
| Utilities (3.66%) | | | | | | |
| | | Renewable Electricity (3.66%) | | | | | | |
| 41,748 | | Abengoa Yield plc2 | | | 1,271,998 | | | 1,140,556 |
| 45,010 | | TerraForm Power, Inc., Cl A | | | 1,273,504 | | | 1,389,909 |
| | | | | | | |
| | | Total Utilities | | | 2,545,502 | | | 2,530,465 |
| | | | | | | |
| | | Total Common Stocks | | | 73,533,718 | | | 64,957,750 |
| | | | | | | | |
| |
| Principal | | | | | | | |
| Amount | | | | | | | |
| |
| Short Term Investments (13.59%) | | | | | | | |
| |
| $9,382,619 | | Repurchase Agreement with Fixed Income Clearing Corp., dated 12/31/2014, 0.00% due 1/2/2015; Proceeds at maturity – $9,382,619; (Fully collateralized by $9,480,000 U.S. Treasury Note, 2.125% due 12/31/2021; Market value – $9,574,800)3 | | | 9,382,619 | | | 9,382,619 | |
| | | | | | | | |
| Total Investments (107.67%) | | $ | 82,916,337 | | $ | 74,340,369 | |
| | | | | | | | | |
| Liabilities Less Cash and Other Assets (-7.67%) | | | | | | (5,295,837 | ) |
| | | | | | | | | |
| Net Assets | | | | | $ | 69,044,532 | |
| | | | | | | | | |
| Retail Shares (Equivalent to $10.33 per share | | | | | | | |
based on 3,846,623 shares outstanding) | | | | | $ | 39,722,316 | |
| | | | | | | | | |
| Institutional Shares (Equivalent to $10.41 per share | | | | | | | |
based on 2,817,340 shares outstanding) | | | | | $ | 29,322,216 | |
| | | | | | | | | |
| | |
| % | | Represents percentage of net assets. |
| 1 | | Non-income producing securities. |
| 2 | | Foreign corporation. |
| 3 | | Level 2 security. See Note 7 regarding Fair Value Measurements. |
| | | |
| | | All securities are Level 1, unless otherwise noted. |
| | | |
| 24 | | See Notes to Financial Statements. |
December 31, 2014 | |
Baron Global Advantage Fund |
| STATEMENT OF NET ASSETS |
| |
| DECEMBER 31, 2014 |
| | | | | | | | | |
| Shares | | | Cost | | | Value |
| |
| Common Stocks (97.35%) | | | | | | |
| |
| Brazil (5.55%) | | | | | | |
| 18,367 | | Cetip SA - Mercados Organizados | | $ | 196,454 | | $ | 222,488 |
| 12,663 | | Smiles SA | | | 202,747 | | | 219,371 |
| | | | | | | |
| Total Brazil | | | 399,201 | | | 441,859 |
| | | | | | | |
|
| | | | | | | | | |
| Canada (3.55%) | | | | | | |
| 2,056 | | Brookfield Asset Management, Inc., Cl A | | | 67,930 | | | 103,067 |
| 604 | | Constellation Software, Inc. | | | 139,461 | | | 179,589 |
| | | | | | | |
|
| Total Canada | | | 207,391 | | | 282,656 |
| | | | | | | |
|
| | | | | | | | | |
| China (11.42%) | | | | | | |
| 3,393 | | Alibaba Group Holding Ltd., ADR1 | | | 292,688 | | | 352,668 |
| 1,037 | | Baidu, Inc., ADR1 | | | 143,994 | | | 236,405 |
| 4,150 | | Qunar Cayman Islands Ltd., ADR1 | | | 62,250 | | | 117,985 |
| 5,249 | | TAL Education Group, ADR1 | | | 119,564 | | | 147,444 |
| 3,138 | | Youku Tudou, Inc., ADR1 | | | 73,321 | | | 55,888 |
| | | | | | | |
|
| Total China | | | 691,817 | | | 910,390 |
| | | | | | | |
|
| | | | | | | | | |
| India (3.69%) | | | | | | |
| 13,495 | | ICICI Bank Limited, ADR | | | 95,316 | | | 155,867 |
| 3,291 | | Just Dial Ltd.4 | | | 49,159 | | | 70,127 |
| 2,625 | | MakeMyTrip, Limited1 | | | 52,793 | | | 68,224 |
| | | | | | | |
|
| Total India | | | 197,268 | | | 294,218 |
| | | | | | | |
|
| | | | | | | | | |
| Indonesia (8.07%) | | | | | | |
| 1,116,770 | | Sarana Menara Nusantara Tbk PT1 | | | 321,392 | | | 374,210 |
| 343,836 | | Tower Bersama Infrastructure Tbk PT4 | | | 157,981 | | | 268,920 |
| | | | | | | |
|
| Total Indonesia | | | 479,373 | | | 643,130 |
| | | | | | | |
|
| | | | | | | | | |
| Israel (5.48%) | | | | | | |
| 1,273 | | Check Point Software Technologies Ltd.1 | | | 85,420 | | | 100,020 |
| 6,843 | | Mellanox Technologies Ltd.1 | | | 271,325 | | | 292,401 |
| 1,091 | | Mobileye N.V.1,2 | | | 27,275 | | | 44,251 |
| | | | | �� | | |
|
| Total Israel | | | 384,020 | | | 436,672 |
| | | | | | | |
|
| | | | | | | | | |
| Japan (1.98%) | | | | | | |
| 2,656 | | SoftBank Corp. 4 | | | 203,364 | | | 158,094 |
| | | | | | | |
|
| | | | | | | | | |
| Netherlands (1.78%) | | | | | | |
| 1,316 | | ASML Holding N.V.4 | | | 91,106 | | | 142,190 |
| | | | | | | |
|
| | | | | | | | | |
| Norway (0.99%) | | | | | | |
| 4,853 | | Seadrill Partners, LLC | | | 113,321 | | | 78,764 |
| | | | | | | |
|
| | | | | | | | | |
| Spain (2.05%) | | | | | | |
| 4,800 | | Grifols SA, ADR | | | 192,456 | | | 163,152 |
| | | | | | | |
|
| | | | | | | | | |
| United Kingdom (5.03%) | | | | | | |
| 6,934 | | ARM Holdings plc4 | | | 113,571 | | | 106,523 |
| 61,037 | | Just Eat plc1 | | | 263,150 | | | 294,625 |
| | | | | | | |
|
| Total United Kingdom | | | 376,721 | | | 401,148 |
| | | | | | | |
|
| Shares | | | | Cost | | | Value | |
| |
| Common Stocks (continued) | | | | | | | |
| |
| United States (47.76%) | | | | | | | |
| 6,784 | | Acxiom Corp. 1 | | $ | 139,334 | | $ | 137,512 | |
| 1,302 | | Amazon.com, Inc.1 | | | 375,093 | | | 404,076 | |
| 8,302 | | Atlas Energy, L.P. | | | 331,486 | | | 258,607 | |
| 4,399 | | Benefitfocus, Inc.1 | | | 117,819 | | | 144,463 | |
| 5,026 | | Coupons.com Incorporated1 | | | 80,416 | | | 89,212 | |
| 3,000 | | Dominion Midstream Partners, LP1 | | | 71,763 | | | 117,600 | |
| 4,702 | | Facebook Inc., Cl A1 | | | 126,568 | | | 366,850 | |
| 636 | | Google, Inc., Cl C1 | | | 322,674 | | | 334,790 | |
| 1,710 | | Illumina, Inc.1 | | | 74,766 | | | 315,632 | |
| 12 | | Juno Therapeutics, Inc.1 | | | 288 | | | 627 | |
| 3,830 | | Medidata Solutions, Inc.1 | | | 172,852 | | | 182,882 | |
| 689 | | Monsanto Co. | | | 56,646 | | | 82,315 | |
| 1,498 | | Pacira Pharmaceuticals, Inc.1 | | | 116,118 | | | 132,813 | |
| 5,126 | | PBF Logistics LP | | | 120,443 | | | 109,440 | |
| 197 | | The Priceline Group, Inc.1 | | | 167,416 | | | 224,621 | |
| 2,867 | | Shell Midstream Partners L.P.1 | | | 65,941 | | | 117,490 | |
| 16,788 | | SunEdison, Inc.1 | | | 292,762 | | | 327,534 | |
| 3,975 | | Tallgrass Energy Partners, LP | | | 92,964 | | | 177,682 | |
| 6,507 | | TerraForm Power, Inc., Cl A | | | 178,527 | | | 200,936 | |
| 2,766 | | Westlake Chemical Partners LP | | | 76,005 | | | 80,214 | |
| | | | | | | | |
| Total United States | | | 2,979,881 | | | 3,805,296 | |
| | | | | | | | |
| Total Common Stocks | | | 6,315,919 | | | 7,757,569 | |
| | | | | | | | |
| | | | | | | | | | |
| |
| Short Term Investments (3.50%) | | | | | | | |
| |
| Principal | | | | | | | | | |
| Amount | | | | | | | | | |
| Repurchase Agreement (2.92%) | | | | | | | |
| $232,997 | | Repurchase Agreement with
Fixed Income Clearing Corp.,
dated 12/31/2014, 0.00% due
1/2/2015; Proceeds at maturity –
$232,997; (Fully collateralized by
$240,000 U.S. Treasury
Note, 2.125% due 12/31/2021;
Market value – $242,400)4 | | | 232,997 | | | 232,997 | |
| | | | | | | | |
| | | | | | | | | | |
| Shares | | | | | | | |
| Securities Lending Collateral (0.58%) | | | | | | | |
| 45,822 | | State Street Navigator Securities | | | | | | | |
| | | Lending Prime Portfolio3,4 | | | 45,822 | | | 45,822 | |
| | | | | | | | |
| Total Short Term Investments | | | 278,819 | | | 278,819 | |
| | | | | | | | |
| Total Investments (100.85%) | | $ | 6,594,738 | | | 8,036,388 | |
| | | | | | | | | |
| Liabilities Less Cash and Other Assets (-0.85%) | | | | | | (68,053 | ) |
| | | | | | | | | |
| Net Assets | | | | | $ | 7,968,335 | |
| | | | | | | | | |
| Retail Shares (Equivalent to $14.20 per share | | | | | | | |
based on 272,681 shares outstanding) | | | | | $ | 3,870,810 | |
| | | | | | | | | |
| Institutional Shares (Equivalent to $14.28 per share | | | | | | | |
based on 286,931 shares outstanding) | | | | | $ | 4,097,525 | |
| | | | | | | | | |
| % | | Represents percentage of net assets. |
| 1 | | Non-income producing securities. |
| 2 | | The value on loan at December 31, 2014 amounted to $44,251 or 0.56% of net assets. See Note 2d regarding Securities Lending. |
| 3 | | Represents investment of cash collateral received from securities lending transactions. See Note 2d regarding Securities Lending. |
| 4 | | Level 2 security. See Note 7 regarding Fair Value Measurements. |
| ADR | | American Depositary Receipt. |
| | | |
| | | All securities are Level 1, unless otherwise noted. |
| | | |
| See Notes to Financial Statements. | | 25 |
Baron Global Advantage Fund | |
December 31, 2014 |
| STATEMENT OF NET ASSETS (Continued) |
| |
| DECEMBER 31, 2014 |
| |
| Summary of Investments by Sector as | | Percentage of | |
| of December 31, 2014 | | Net Assets | |
| |
| Information Technology | | 40.0 | % |
| Consumer Discretionary | | 16.0 | |
| Energy | | 10.8 | |
| Telecommunication Services | | 10.1 | |
| Health Care | | 10.0 | |
| Financials | | 6.0 | |
| Utilities | | 2.5 | |
| Materials | | 2.0 | |
| Cash and Cash Equivalents* | | 2.6 | |
| |
| | | 100.0 | % |
| |
| | |
| * Includes short term investments. | | |
| 26 | | See Notes to Financial Statements. |
December 31, 2014 | |
Baron Select Funds |
| STATEMENT OF ASSETS AND LIABILITIES |
| |
| DECEMBER 31, 2014 |
| | | Baron Partners | | Baron Focused | | Baron
International | | Baron Real |
| | | Fund | | Growth Fund | | Growth Fund | | Estate Fund |
| | | | | | | | | |
| Assets: | | | | | | | | | | | | | | | | |
| Investments in securities, at value* | | | | | | | | | | | | | | | | |
Unaffiliated investments | | $ | 2,285,179,551 | 1 | | $ | 192,456,418 | | | $ | 99,823,846 | | | $ | 1,619,253,434 | |
“Affiliated” investments | | | — | | | | — | | | | — | | | | 55,501,049 | |
| Repurchase agreements, at value** | | | — | | | | 4,236,809 | | | | 5,069,849 | | | | 20,541,480 | |
| | | | | | | | | | | | | |
| Total investments, at value | | | 2,285,179,551 | | | | 196,693,227 | | | | 104,893,695 | | | | 1,695,295,963 | |
| Foreign currency, at value† | | | — | | | | — | | | | 4 | | | | — | |
| Cash | | | 83,105 | | | | — | | | | — | | | | 295,386 | |
| Receivable for securities sold | | | 23,906,528 | | | | — | | | | — | | | | — | |
| Receivable for shares sold | | | 3,063,480 | | | | 723 | | | | 894,665 | | | | 6,294,833 | |
| Dividends and interest receivable | | | 914,754 | | | | 97,785 | | | | 70,699 | | | | 2,839,768 | |
| Prepaid expenses | | | 2,452 | | | | 312 | | | | 98 | | | | 1,705 | |
| | | | | | | | | | | | | |
| | | | 2,313,149,870 | | | | 196,792,047 | | | | 105,859,161 | | | | 1,704,727,655 | |
| | | | | | | | | | | | | |
| Liabilities: | | | | | | | | | | | | | | | | |
| Payable for borrowings against line of credit | | | 355,000,000 | | | | — | | | | — | | | | — | |
| Payable for collateral on loaned securities | | | 18,690,000 | | | | — | | | | — | | | | — | |
| Payable for shares redeemed | | | 1,098,050 | | | | 174,493 | | | | 83,619 | | | | 2,058,986 | |
| Distribution fees payable (Note 4) | | | 907 | | | | 711 | | | | 596 | | | | 361 | |
| Investment advisory fees payable (Note 4) | | | 687 | | | | 297 | | | | 907 | | | | 365 | |
| Payable for securities purchased | | | — | | | | 1,304,835 | | | | 302,769 | | | | — | |
| Accrued capital gains taxes | | | — | | | | — | | | | 158,205 | | | | — | |
| Accrued expenses and other payables | | | 537,772 | | | | 45,604 | | | | 56,367 | | | | 147,716 | |
| | | | | | | | | | | | | |
| | | | 375,327,416 | | | | 1,525,940 | | | | 602,463 | | | | 2,207,428 | |
| | | | | | | | | | | | | |
| Net Assets | | $ | 1,937,822,454 | | | $ | 195,266,107 | | | $ | 105,256,698 | | | $ | 1,702,520,227 | |
| | | | | | | | | | | | | |
| Net Assets consist of: | | | | | | | | | | | | | | | | |
| Paid-in capital | | $ | 1,332,299,442 | | | $ | 128,858,314 | | | $ | 86,271,696 | | | $ | 1,354,612,971 | |
| Undistributed net investment income | | | 8,534,521 | | | | 668,990 | | | | 97,411 | | | | 627,790 | |
| Undistributed (accumulated) net realized gain (loss) on investments and | | | | | | | | | | | | | | | | |
foreign currency transactions | | | (336,324,170 | ) | | | 5,945,948 | | | | (71,540 | ) | | | 227,241 | |
| Net unrealized appreciation on investments, foreign capital gains tax and | | | | | | | | | | | | | | | | |
foreign currency translations | | | 933,312,661 | | | | 59,792,855 | | | | 18,959,131 | | | | 347,052,225 | |
| | | | | | | | | | | | | |
| Net Assets | | $ | 1,937,822,454 | | | $ | 195,266,107 | | | $ | 105,256,698 | | | $ | 1,702,520,227 | |
| | | | | | | | | | | | | |
| Retail Shares: | | | | | | | | | | | | | | | | |
Net Assets | | $ | 1,256,308,310 | | | | 46,049,867 | | | $ | 52,933,317 | | | $ | 782,788,170 | |
Shares Outstanding ($0.01 par value; indefinite shares authorized) | | | 34,198,463 | | | | 3,241,641 | | | | 2,950,457 | | | | 30,198,572 | |
| | | | | | | | | | | | | |
Net Asset Value and Offering Price Per Share | | $ | 36.74 | | | $ | 14.21 | | | $ | 17.94 | | | $ | 25.92 | |
| | | | | | | | | | | | | |
| Institutional Shares: | | | | | | | | | | | | | | | | |
Net Assets | | $ | 681,514,144 | | | $ | 149,216,240 | | | $ | 52,323,381 | | | $ | 919,732,057 | |
Shares Outstanding ($0.01 par value; indefinite shares authorized) | | | 18,280,177 | | | | 10,381,982 | | | | 2,892,286 | | | | 35,186,963 | |
| | | | | | | | | | | | | |
Net Asset Value and Offering Price Per Share | | $ | 37.28 | | | $ | 14.37 | | | $ | 18.09 | | | $ | 26.14 | |
| | | | | | | | | | | | | |
| | | | | | | | | | | | | | | | | |
*Investments in securities, at cost: | | | | | | | | | | | | | | | | |
Unaffiliated investments | | $ | 1,351,866,890 | | | $ | 132,663,563 | | | $ | 80,704,628 | | | $ | 1,279,074,909 | |
“Affiliated” investments | | | — | | | | — | | | | — | | | | 48,627,349 | |
**Repurchase agreements, at cost | | | — | | | | 4,236,809 | | | | 5,069,849 | | | | 20,541,480 | |
| | | | | | | | | | | | | |
Total investments in securities, at cost | | $ | 1,351,866,890 | | | $ | 136,900,372 | | | $ | 85,774,477 | | | $ | 1,348,243,738 | |
| | | | | | | | | | | | | |
| | | | | | | | | | | | | | | | | |
†Foreign currency, at cost: | | $ | — | | | $ | — | | | $ | 4 | | | $ | — | |
| | | | | | | | | | | | | |
| | |
| 1$18,049,200 included in investments in securities, at value is out on loan. See Note 2d. |
| See Notes to Financial Statements. | | 27 |
Baron Select Funds | |
December 31, 2014 |
| STATEMENT OF ASSETS AND LIABILITIES (Continued) |
| |
| DECEMBER 31, 2014 |
| | | Baron | | Baron | | Baron Global |
| | | Emerging | | Energy and | | Advantage |
| | | Markets Fund | | Resources Fund | | Fund |
| | | | | | | |
| Assets: | | | | | | | | | | | | |
Investments in securities, at value* | | | | | | | | | | | | |
Unaffiliated investments | | $ | 1,194,555,768 | | | $ | 64,957,750 | | | $ | 7,803,391 | 1 |
Repurchase agreements, at value** | | | 161,340,865 | | | | 9,382,619 | | | | 232,997 | |
| | | | | | | | | | |
Total investments, at value | | | 1,355,896,633 | | | | 74,340,369 | | | | 8,036,388 | |
Foreign currency, at value† | | | 2,324,089 | | | | 61 | | | | 16 | |
Cash | | | — | | | | — | | | | — | |
Receivable for securities sold | | | 1,155,135 | | | | — | | | | — | |
Receivable for shares sold | | | 16,739,394 | | | | 686,484 | | | | 30,021 | |
Dividends and interest receivable | | | 809,943 | | | | 3,664 | | | | 5,041 | |
Prepaid expenses | | | 616 | | | | 38 | | | | 9 | |
| | | | | | | | | | |
| | | | 1,376,925,810 | | | | 75,030,616 | | | | 8,071,475 | |
| | | | | | | | | | |
| Liabilities: | | | | | | | | | | | | |
Payable for collateral on loaned securities | | | — | | | | — | | | | 45,822 | |
Payable for shares redeemed | | | 688,964 | | | | 1,056,815 | | | | — | |
Distribution fees payable (Note 4) | | | 876 | | | | 988 | | | | 421 | |
Investment advisory fees payable (Note 4) | | | 310 | | | | 637 | | | | 944 | |
Payable for securities purchased | | | 21,840,386 | | | | 4,875,963 | | | | 17,555 | |
Accrued capital gains taxes | | | 6,648,689 | | | | — | | | | — | |
Accrued expenses and other payables | | | 256,833 | | | | 51,681 | | | | 38,398 | |
| | | | | | | | | | |
| | | | 29,436,058 | | | | 5,986,084 | | | | 103,140 | |
| | | | | | | | | | |
| Net Assets | | $ | 1,347,489,752 | | | $ | 69,044,532 | | | $ | 7,968,335 | |
| | | | | | | | | | |
| Net Assets consist of: | | | | | | | | | | | | |
Paid-in capital | | $ | 1,333,952,531 | | | $ | 77,487,226 | | | $ | 6,516,126 | |
Undistributed (accumulated) net investment income (loss) | | | (407,897 | ) | | | 517,240 | | | | 43,412 | |
Accumulated net realized loss on investments and | | | | | | | | | | | | |
foreign currency transactions | | | (33,581,660 | ) | | | (383,737 | ) | | | (32,769 | ) |
Net unrealized appreciation (depreciation) on investments, foreign capital gains tax and | | | | | | | | | | | | |
foreign currency translations | | | 47,526,778 | | | | (8,576,197 | ) | | | 1,441,566 | |
| | | | | | | | | | |
| Net Assets | | $ | 1,347,489,752 | | | $ | 69,044,532 | | | $ | 7,968,335 | |
| | | | | | | | | | |
| Retail Shares: | | | | | | | | | | | | |
Net Assets | | $ | 649,647,950 | | | $ | 39,722,316 | | | $ | 3,870,810 | |
Shares Outstanding ($0.01 par value; indefinite shares authorized) | | | 54,532,566 | | | | 3,846,623 | | | | 272,681 | |
| | | | | | | | | | |
Net Asset Value and Offering Price Per Share | | $ | 11.91 | | | $ | 10.33 | | | $ | 14.20 | |
| | | | | | | | | | |
| Institutional Shares: | | | | | | | | | | | | |
Net Assets | | $ | 697,841,802 | | | $ | 29,322,216 | | | $ | 4,097,525 | |
Shares Outstanding ($0.01 par value; indefinite shares authorized) | | | 58,440,628 | | | | 2,817,340 | | | | 286,931 | |
| | | | | | | | | | |
Net Asset Value and Offering Price Per Share | | $ | 11.94 | | | $ | 10.41 | | | $ | 14.28 | |
| | | | | | | | | | |
| | | | | | | | | | | | | |
*Investments in securities, at cost: | | | | | | | | | | | | |
Unaffiliated investments | | $ | 1,140,357,913 | | | $ | 73,533,718 | | | $ | 6,361,741 | |
**Repurchase agreements, at cost | | | 161,340,865 | | | | 9,382,619 | | | | 232,997 | |
| | | | | | | | | | |
Total investments in securities, at cost | | $ | 1,301,698,778 | | | $ | 82,916,337 | | | $ | 6,594,738 | |
| | | | | | | | | | |
†Foreign currency, at cost: | | $ | 2,323,017 | | | $ | 61 | | | $ | 18 | |
| | | | | | | | | | |
| | |
| 1 $44,251 included in investments in securities, at value is out on loan. See Note 2d. |
| 28 | | See Notes to Financial Statements. |
December 31, 2014 | |
Baron Select Funds |
| STATEMENTS OF OPERATIONS |
| |
| FOR THE YEAR ENDED DECEMBER 31, 2014 |
| | | | | | | | | | | Baron | | | | |
| | | Baron Partners | | Baron Focused | | International | | Baron Real |
| | | Fund | | Growth Fund | | Growth Fund | | Estate Fund |
| | | | | | | | | | |
| Investment income: | | | | | | | | | | | | | | | | |
Income: | | | | | | | | | | | | | | | | |
Dividends — unaffiliated investments | | $ | 35,502,123 | | | $ | 3,173,549 | | | $ | 1,433,998 | | | $ | 20,831,352 | |
Interest | | | — | | | | — | | | | — | | | | 122 | |
Securities lending income, net | | | 777,380 | | | | 15,317 | | | | — | | | | — | |
Foreign taxes withheld on dividends | | | — | | | | (11,343 | ) | | | (82,681 | ) | | | (165,796 | ) |
| | | | | | | | | | | | | |
Total income | | | 36,279,503 | | | | 3,177,523 | | | | 1,351,317 | | | | 20,665,678 | |
| | | | | | | | | | | | | |
Expenses: | | | | | | | | | | | | | | | | |
Investment advisory fees (Note 4) | | | 17,264,113 | | | | 1,926,544 | | | | 751,508 | | | | 13,852,205 | |
Distribution fees — Retail Shares (Note 4) | | | 3,068,289 | | | | 115,639 | | | | 68,777 | | | | 1,685,511 | |
Shareholder servicing agent fees and expenses — Retail Shares | | | 232,605 | | | | 26,833 | | | | 22,192 | | | | 90,680 | |
Shareholder servicing agent fees and expenses — Institutional Shares | | | 39,765 | | | | 14,260 | | | | 11,460 | | | | 49,290 | |
Reports to shareholders | | | 314,810 | | | | 8,478 | | | | 13,078 | | | | 342,020 | |
Line of credit fees | | | 200,104 | | | | — | | | | — | | | | — | |
Registration and filing fees | | | 104,140 | | | | 41,171 | | | | 38,330 | | | | 104,225 | |
Custodian and fund accounting fees | | | 78,717 | | | | 30,393 | | | | 94,056 | | | | 127,353 | |
Professional fees | | | 75,474 | | | | 35,319 | | | | 54,641 | | | | 53,765 | |
Trustee fees and expenses | | | 69,264 | | | | 7,824 | | | | 3,024 | | | | 55,591 | |
Administration fees | | | 26,477 | | | | 26,488 | | | | 26,488 | | | | 26,456 | |
Insurance expense | | | 20,503 | | | | 2,766 | | | | 903 | | | | 13,301 | |
Miscellaneous expenses | | | 1,111 | | | | 1,121 | | | | 2,000 | | | | 1,455 | |
| | | | | | | | | | | | | |
Total operating expenses | | | 21,495,372 | | | | 2,236,836 | | | | 1,086,457 | | | | 16,401,852 | |
Interest expense on borrowings | | | 3,307,937 | | | | — | | | | — | | | | — | |
| | | | | | | | | | | | | |
Total expenses | | | 24,803,309 | | | | 2,236,836 | | | | 1,086,457 | | | | 16,401,852 | |
Reimbursement of expenses by Adviser — Retail Shares (Note 4) | | | — | | | | (17,448 | ) | | | (36,934 | ) | | | — | |
Reimbursement of expenses by Adviser — Institutional Shares (Note 4) | | | — | | | | — | | | | (40,768 | ) | | | — | |
| | | | | | | | | | | | | |
Net expenses | | | 24,803,309 | | | | 2,219,388 | | | | 1,008,755 | | | | 16,401,852 | |
| | | | | | | | | | | | | |
Net investment income | | | 11,476,194 | | | | 958,135 | | | | 342,562 | | | | 4,263,826 | |
| | | | | | | | | | | | | |
| Realized and unrealized gain (loss) on investments: | | | | | | | | | | | | | | | | |
Net realized gain on | | | | | | | | | | | | | | | | |
investments sold — unaffiliated investments | | | 35,573,747 | | | | 7,755,027 | | | | 2,157,916 | | | | 6,388,113 | |
Net realized loss on | | | | | | | | | | | | | | | | |
foreign currency transactions | | | — | | | | (29,071 | ) | | | (144,450 | ) | | | (97,252 | ) |
Net change in unrealized appreciation (depreciation) of: | | | | | | | | | | | | | | | | |
Investments — unaffiliated investments | | | 113,173,631 | | | | (3,887,218 | ) | | | (3,516,089 | )1 | | | 204,915,539 | |
Investments — “affiliated” investments | | | — | | | | — | | | | — | | | | 1,925,788 | |
Foreign currency translations | | | — | | | | — | | | | (2,313 | ) | | | — | |
| | | | | | | | | | | | | |
| Net gain (loss) on investments | | | 148,747,378 | | | | 3,838,738 | | | | (1,504,936 | ) | | | 213,132,188 | |
| | | | | | | | | | | | | |
| Net increase (decrease) in net assets resulting from operations | | $ | 160,223,572 | | | $ | 4,796,873 | | | $ | (1,162,374 | ) | | $ | 217,396,014 | |
| | | | | | | | | | | | | |
| ____________________ |
| 1 | Net of change in accrued foreign capital gains tax of $(158,205). |
| See Notes to Financial Statements. | | 29 |
Baron Select Funds | |
December 31, 2014 |
| STATEMENTS OF OPERATIONS (Continued) |
| |
| |
| FOR THE YEAR ENDED DECEMBER 31, 2014 |
| | | Baron | | Baron Energy | | Baron Global |
| | | Emerging | | and Resources | | Advantage |
| | | Markets Fund | | Fund | | Fund |
| | | | | | | | | | |
| Investment income: | | | | | | | | | | | | |
Income: | | | | | | | | | | | | |
Dividends — unaffiliated investments | | $ | 19,507,703 | | | $ | 734,408 | | | $ | 152,595 | |
Interest | | | 2 | | | | — | | | | — | |
Securities lending income, net | | | — | | | | — | | | | 1,791 | |
Foreign taxes withheld on dividends | | | (1,298,828 | ) | | | (4,368 | ) | | | (3,386 | ) |
| | | | | | | | | | |
Total income | | | 18,208,877 | | | | 730,040 | | | | 151,000 | |
| | | | | | | | | | |
Expenses: | | | | | | | | | | | | |
Investment advisory fees (Note 4) | | | 8,940,062 | | | | 557,319 | | | | 88,065 | |
Distribution fees — Retail Shares (Note 4) | | | 1,216,868 | | | | 107,406 | | | | 7,579 | |
Shareholder servicing agent fees and expenses — Retail Shares | | | 52,255 | | | | 24,246 | | | | 13,596 | |
Shareholder servicing agent fees and expenses — Institutional Shares | | | 29,160 | | | | 10,727 | | | | 9,671 | |
Reports to shareholders | | | 408,340 | | | | 39,958 | | | | 1,569 | |
Registration and filing fees | | | 568,470 | | | | 107,040 | | | | 35,672 | |
Custodian and fund accounting fees | | | 1,224,606 | | | | 32,787 | | | | 40,733 | |
Professional fees | | | 88,846 | | | | 53,820 | | | | 52,938 | |
Trustee fees and expenses | | | 34,000 | | | | 2,130 | | | | 352 | |
Administration fees | | | 26,488 | | | | 26,510 | | | | 26,476 | |
Insurance expense | | | 4,772 | | | | 436 | | | | 70 | |
Miscellaneous expenses | | | 2,406 | | | | 1,409 | | | | 1,409 | |
| | | | | | | | | | |
Total operating expenses | | | 12,596,273 | | | | 963,788 | | | | 278,130 | |
Interest expense on borrowings | | | — | | | | — | | | | — | |
| | | | | | | | | | |
Total expenses | | | 12,596,273 | | | | 963,788 | | | | 278,130 | |
Reimbursement of expenses by Adviser — Retail Shares (Note 4) | | | (102,371 | ) | | | (189,937 | ) | | | (63,955 | ) |
Reimbursement of expenses by Adviser — Institutional Shares (Note 4) | | | (101,245 | ) | | | (53,394 | ) | | | (96,516 | ) |
| | | | | | | | | | |
Net expenses | | | 12,392,657 | | | | 720,457 | | | | 117,659 | |
| | | | | | | | | | |
Net investment income | | | 5,816,220 | | | | 9,583 | | | | 33,341 | |
| | | | | | | | | | |
Realized and unrealized gain (loss) on investments: | | | | | | | | | | | | |
Net realized gain (loss) on investments sold — unaffiliated investments | | | (32,274,053 | )1 | | | 85,492 | | | | (61,867 | ) |
Net realized gain (loss) on foreign currency transactions | | | (1,208,364 | ) | | | (2,469 | ) | | | 5,966 | |
Net change in unrealized appreciation (depreciation) of: | | | | | | | | | | | | |
Investments — unaffiliated investments | | | 38,017,451 | 2 | | | (12,482,260 | ) | | | 168,734 | 3 |
Foreign currency translations | | | (24,164 | ) | | | (217 | ) | | | 20 | |
| | | | | | | | | | |
| Net gain (loss) on investments | | | 4,510,870 | | | | (12,399,454 | ) | | | 112,853 | |
| | | | | | | | | | |
| Net increase (decrease) in net assets resulting from operations | | $ | 10,327,090 | | | $ | (12,389,871 | ) | | $ | 146,194 | |
| | | | | | | | | | |
| _________________ |
| 1 | Net of foreign capital gains tax $(128,401). |
| 2 | Net of change in accrued foreign capital gains tax of $(6,533,615). |
| 3 | Net of change in accrued foreign capital gains tax of $5,121. |
| 30 | | See Notes to Financial Statements. |
December 31, 2014 | |
Baron Select Funds |
| STATEMENTS OF CHANGES IN NET ASSETS |
| |
| |
| | | Baron Partners Fund | | Baron Focused Growth Fund | | Baron International Growth Fund |
| | | | | | | | | | |
| | | For the Year | | For the Year | | For the Year | | For the Year | | For the Year | | For the Year |
| | | Ended | | Ended | | Ended | | Ended | | Ended | | Ended |
| | | December 31, | | December 31, | | December 31, | | December 31, | | December 31, | | December 31, |
| | | 2014 | | 2013 | | 2014 | | 2013 | | 2014 | | 2013 |
| | | | | | | | | | | | | | | | | | | |
| Increase (Decrease) in Net Assets: | | | | | | | | | | | | | | | | | | | | | | |
| Operations: | | | | | | | | | | | | | | | | | | | | | | | | |
Net investment income (loss) | | $ | 11,476,194 | | | $ | (6,813,285 | ) | | $ | 958,135 | | | $ | (544,326 | ) | | $ | 342,562 | | | $ | 75,498 | |
Net realized gain | | | 35,573,747 | | | | 64,954,592 | | | | 7,725,956 | | | | 8,164,726 | | | | 2,013,466 | | | | 927,846 | |
Net change in unrealized appreciation (depreciation) | | | 113,173,631 | | | | 362,148,549 | | | | (3,887,218 | ) | | | 28,092,151 | | | | (3,518,402 | ) | | | 10,275,836 | |
| | | | | | | | | | | | | | | | | | | |
Increase (decrease) in net assets resulting from operations | | | 160,223,572 | | | | 420,289,856 | | | | 4,796,873 | | | | 35,712,551 | | | | (1,162,374 | ) | | | 11,279,180 | |
| | | | | | | | | | | | | | | | | | | |
| Distributions to shareholders from: |
Net investment income — Retail Shares | | | — | | | | — | | | | — | | | | (589,056 | ) | | | (3,623 | ) | | | — | |
Net investment income — Institutional Shares | | | — | | | | — | | | | — | | | | (1,882,528 | ) | | | (98,375 | ) | | | (3,362 | ) |
Net realized gain on investments — Retail Shares | | | — | | | | — | | | | (280,753 | ) | | | — | | | | (1,292,820 | ) | | | — | |
Net realized gain on investments — Institutional Shares | | | — | | | | — | | | | (888,003 | ) | | | — | | | | (1,458,824 | ) | | | — | |
| | | | | | | | | | | | | | | | | | | |
Decrease in net assets from distributions to shareholders | | | — | | | | — | | | | (1,168,756 | ) | | | (2,471,584 | ) | | | (2,853,642 | ) | | | (3,362 | ) |
| | | | | | | | | | | | | | | | | | | |
| Capital share transactions: | | | | | | | | | | | | | | | | | | | | | | | | |
Proceeds from the sale of shares — Retail Shares | | | 379,165,924 | | | | 319,476,623 | | | | 6,089,801 | | | | 15,673,823 | | | | 43,841,435 | | | | 3,859,851 | |
Proceeds from the sale of shares — Institutional Shares | | | 406,299,084 | | | | 135,710,008 | | | | 18,131,213 | | | | 36,524,526 | | | | 9,269,012 | | | | 1,218,416 | |
| Net asset value of shares issued in reinvestment of |
distributions — Retail Shares | | | — | | | | — | | | | 262,206 | | | | 542,020 | | | | 1,289,455 | | | | — | |
| Net asset value of shares issued in reinvestment of |
distributions — Institutional Shares | | | — | | | | — | | | | 745,447 | | | | 1,461,962 | | | | 969,333 | | | | 1,942 | |
Cost of shares redeemed — Retail Shares | | | (363,359,869 | ) | | | (178,070,535 | ) | | | (8,656,710 | ) | | | (8,626,273 | ) | | | (7,443,792 | ) | | | (5,517,299 | ) |
Cost of shares redeemed — Institutional Shares | | | (119,134,044 | ) | | | (22,934,509 | ) | | | (20,960,859 | ) | | | (2,042,457 | ) | | | (1,054,523 | ) | | | (3,055,312 | ) |
| | | | | | | | | | | | | | | | | | | |
Increase (decrease) in net assets derived from capital share transactions | | | 302,971,095 | | | | 254,181,587 | | | | (4,388,902 | ) | | | 43,533,601 | | | | 46,870,920 | | | | (3,492,402 | ) |
| | | | | | | | | | | | | | | | | | | |
Net increase (decrease) in net assets | | | 463,194,667 | | | | 674,471,443 | | | | (760,785 | ) | | | 76,774,568 | | | | 42,854,904 | | | | 7,783,416 | |
| | | | | | | | | | | | | | | | | | | |
| Net Assets: | | | | | | | | | | | | | | | | | | | | | | | | |
Beginning of year | | | 1,474,627,787 | | | | 800,156,344 | | | | 196,026,892 | | | | 119,252,324 | | | | 62,401,794 | | | | 54,618,378 | |
| | | | | | | | | | | | | | | | | | | |
End of year | | $ | 1,937,822,454 | | | $ | 1,474,627,787 | | | $ | 195,266,107 | | | $ | 196,026,892 | | | $ | 105,256,698 | | | $ | 62,401,794 | |
| | | | | | | | | | | | | | | | | | | |
| | | | | | | | | | | | | | | | | | | | | | | | | |
Undistributed net investment income at end of year | | $ | 8,534,521 | | | $ | 2,180,691 | | | $ | 668,990 | | | $ | 198,260 | | | $ | 97,411 | | | $ | 1,297 | |
| | | | | | | | | | | | | | | | | | | |
Capital share transactions — Retail Shares | | | | | | | | | | | | | | | | | | | | | | | | |
Shares sold | | | 10,797,205 | | | | 11,129,880 | | | | 440,677 | | | | 1,256,069 | | | | 2,384,046 | | | | 232,666 | |
Shares issued in reinvestment of distributions | | | — | | | | — | | | | 19,056 | | | | 41,375 | | | | 70,314 | | | | — | |
Shares redeemed | | | (10,383,981 | ) | | | (6,312,005 | ) | | | (626,666 | ) | | | (676,961 | ) | | | (400,939 | ) | | | (339,698 | ) |
| | | | | | | | | | | | | | | | | | | |
| Net increase (decrease) | | | 413,224 | | | | 4,817,875 | | | | (166,933 | ) | | | 620,483 | | | | 2,053,421 | | | | (107,032 | ) |
| | | | | | | | | | | | | | | | | | | |
Capital share transactions — Institutional Shares | | | | | | | | | | | | | | | | | | | | | | | | |
Shares sold | | | 11,333,912 | | | | 4,721,060 | | | | 1,291,866 | | | | 2,837,634 | | | | 510,858 | | | | 71,324 | |
Shares issued in reinvestment of distributions | | | — | | | | — | | | | 53,557 | | | | 110,671 | | | | 52,228 | | | | 104 | |
Shares redeemed | | | (3,401,602 | ) | | | (805,337 | ) | | | (1,492,179 | ) | | | (159,800 | ) | | | (56,268 | ) | | | (182,122 | ) |
| | | | | | | | | | | | | | | | | | | |
| Net increase (decrease) | | | 7,932,310 | | | | 3,915,723 | | | | (146,756 | ) | | | 2,788,505 | | | | 506,818 | | | | (110,694 | ) |
| | | | | | | | | | | | | | | | | | | |
| See Notes to Financial Statements. | | 31 |
Baron Select Funds | |
December 31, 2014 |
| STATEMENTS OF CHANGES IN NET ASSETS (Continued) |
| |
| |
| | | Baron Real Estate Fund | | Baron Emerging Markets Fund |
| | | | | | | |
| | | For the Year | | For the Year | | For the Year | | For the Year |
| | | Ended | | Ended | | Ended | | Ended |
| | | December 31, | | December 31, | | December 31, | | December 31, |
| | | 2014 | | 2013 | | 2014 | | 2013 |
| | | | | | | | | | | | | |
| Increase (Decrease) in Net Assets: | | | | | | | | | | | | | | |
| Operations: | | | | | | | | | | | | | | | | |
Net investment income (loss) | | $ | 4,263,826 | | | $ | (466,653 | ) | | $ | 5,816,220 | | | $ | (84,387 | ) |
Net realized gain (loss) | | | 6,290,861 | | | | (5,794,140 | ) | | | (33,482,417 | ) | | | (855,798 | ) |
Net change in unrealized appreciation | | | 206,841,327 | | | | 127,344,877 | | | | 37,993,287 | | | | 8,314,403 | |
| | | | | | | | | | | | | |
Increase in net assets resulting from operations | | | 217,396,014 | | | | 121,084,084 | | | | 10,327,090 | | | | 7,374,218 | |
| | | | | | | | | | | | | |
| Distributions to shareholders from: | | | | | | | | | | | | | | | | |
Net investment income — Retail Shares | | | (777,909 | ) | | | — | | | | (1,606,970 | ) | | | — | |
Net investment income — Institutional Shares | | | (2,920,316 | ) | | | (39,020 | ) | | | (2,808,551 | ) | | | — | |
Net realized gain on investments — Retail Shares | | | — | | | | (428,314 | ) | | | — | | | | — | |
Net realized gain on investments — Institutional Shares | | | — | | | | (335,602 | ) | | | — | | | | — | |
Return of capital — Institutional Shares | | | — | | | | (673,756 | ) | | | — | | | | — | |
| | | | | | | | | | | | |
Decrease in net assets from distributions to shareholders | | | (3,698,225 | ) | | | (1,476,692 | ) | | | (4,415,521 | ) | | | — | |
| | | | | | | | | | | | | |
| Capital share transactions: | | | | | | | | | | | | | | | | |
Proceeds from the sale of shares — Retail Shares | | | 359,613,557 | | | | 626,959,201 | | | | 512,990,962 | | | | 257,250,002 | |
Proceeds from the sale of shares — Institutional Shares | | | 462,284,949 | | | | 450,764,807 | | | | 655,166,110 | | | | 108,017,552 | |
Net asset value of shares issued in reinvestment of | | | | | | | | | | | | | | | | |
distributions — Retail Shares | | | 758,478 | | | | 421,721 | | | | 1,298,646 | | | | — | |
Net asset value of shares issued in reinvestment of | | | | | | | | | | | | | | | | |
distributions — Institutional Shares | | | 2,578,979 | | | | 925,719 | | | | 2,583,317 | | | | — | |
Cost of shares redeemed — Retail Shares | | | (220,188,549 | ) | | | (208,982,668 | ) | | | (130,628,402 | ) | | | (4,454,947 | ) |
Cost of shares redeemed — Institutional Shares | | | (141,870,774 | ) | | | (53,133,613 | ) | | | (75,421,684 | ) | | | (1,474,834 | ) |
| | | | | | | | | | | | | |
Increase in net assets derived from capital share transactions | | | 463,176,640 | | | | 816,955,167 | | | | 965,988,949 | | | | 359,337,773 | |
| | | | | | | | | | | | | |
Net increase in net assets | | | 676,874,429 | | | | 936,562,559 | | | | 971,900,518 | | | | 366,711,991 | |
| | | | | | | | | | | | | |
| Net Assets: | | | | | | | | | | | | | | | | |
Beginning of year | | | 1,025,645,798 | | | | 89,083,239 | | | | 375,589,234 | | | | 8,877,243 | |
| | | | | | | | | | | | | |
End of year | | $ | 1,702,520,227 | | | $ | 1,025,645,798 | | | $ | 1,347,489,752 | | | $ | 375,589,234 | |
| | | | | | | | | | | | | |
Undistributed (accumulated) net investment income (loss) at end of year | | $ | 627,790 | | | $ | 559,075 | | | $ | (407,897 | ) | | $ | (485,266 | ) |
| | | | | | | | | | | | | |
| Capital share transactions — Retail Shares | | | | | | | | | | | | | | | | |
Shares sold | | | 15,173,423 | | | | 31,615,177 | | | | 42,783,705 | | | | 22,605,570 | |
Shares issued in reinvestment of distributions | | | 29,791 | | | | 20,612 | | | | 106,797 | | | | — | |
Shares redeemed | | | (9,251,061 | ) | | | (10,448,310 | ) | | | (10,851,179 | ) | | | (399,705 | ) |
| | | | | | | | | | | | | |
| Net increase | | | 5,952,153 | | | | 21,187,479 | | | | 32,039,323 | | | | 22,205,865 | |
| | | | | | | | | | | | | |
| Capital share transactions — Institutional Shares | | | | | | | | | | | | | | | | |
Shares sold | | | 19,329,716 | | | | 22,205,732 | | | | 54,507,301 | | | | 9,571,296 | |
Shares issued in reinvestment of distributions | | | 100,467 | | | | 43,354 | | | | 212,095 | | | | — | |
Shares redeemed | | | (5,917,745 | ) | | | (2,586,207 | ) | | | (6,307,754 | ) | | | (137,973 | ) |
| | | | | | | | | | | | | |
| Net increase | | | 13,512,438 | | | | 19,662,879 | | | | 48,411,642 | | | | 9,433,323 | |
| | | | | | | | | | | | | |
| 32 | | See Notes to Financial Statements. |
December 31, 2014 | |
Baron Select Funds |
| STATEMENTS OF CHANGES IN NET ASSETS (Continued) |
| |
| |
| | | Baron Energy and Resources Fund | | Baron Global Advantage Fund |
| | | | | |
| | | For the Year | | For the Year | | For the Year | | For the Year |
| | | Ended | | Ended | | Ended | | Ended |
| | | December 31, | | December 31, | | December 31, | | December 31, |
| | | 2014 | | 2013 | | 2014 | | 2013 |
| | | | | | | | | | | | | |
| Increase (Decrease) in Net Assets: | | | | | | | | | | | | | | | | |
| Operations: | | | | | | | | | | | | | | | | |
Net investment income (loss) | | $ | 9,583 | | | $ | (3,486 | ) | | $ | 33,341 | | | $ | (2,915 | ) |
Net realized gain (loss) | | | 83,023 | | | | (355,260 | ) | | | (55,901 | ) | | | 93,472 | |
Net change in unrealized appreciation (depreciation) | | | (12,482,477 | ) | | | 3,916,849 | | | | 168,754 | | | | 1,009,873 | |
| | | | | | | | | | | | | |
Increase (decrease) in net assets resulting from operations | | | (12,389,871 | ) | | | 3,558,103 | | | | 146,194 | | | | 1,100,430 | |
| | | | | | | | | | | | | |
| Distributions to shareholders from: | | | | | | | | | | | | | | | | |
Net investment income — Retail Shares | | | — | | | | (26,290 | ) | | | — | | | | — | |
Net realized gain on investments — Retail Shares | | | — | | | | — | | | | (218 | ) | | | — | |
Net realized gain on investments — Institutional Shares | | | — | | | | — | | | | (258 | ) | | | — | |
| | | | | | | | | | | | | |
Decrease in net assets from distributions to shareholders | | | — | | | | (26,290 | ) | | | (476 | ) | | | — | |
| | | | | | | | | | | | | |
| Capital share transactions: | | | | | | | | | | | | | | | | |
Proceeds from the sale of shares — Retail Shares | | | 43,493,847 | | | | 27,881,735 | | | | 1,819,597 | 1 | | | 758,547 | |
Proceeds from the sale of shares — Institutional Shares | | | 34,261,471 | | | | 2,765,215 | | | | 9,278,574 | 1 | | | 985,124 | |
Net asset value of shares issued in reinvestment of | | | | | | | | | | | | | | | | |
distributions — Retail Shares | | | — | | | | 26,200 | | | | 217 | | | | — | |
Net asset value of shares issued in reinvestment of | | | | | | | | | | | | | | | | |
distributions — Institutional Shares | | | — | | | | — | | | | 258 | | | | — | |
Cost of shares redeemed — Retail Shares | | | (25,945,076 | ) | | | (3,582,582 | ) | | | (412,710 | ) | | | (404,290 | ) |
Cost of shares redeemed — Institutional Shares | | | (3,584,224 | ) | | | (626,525 | ) | | | (8,419,488 | ) | | | (21,487 | ) |
| | | | | | | | | | | | | |
Increase in net assets derived from capital share transactions | | | 48,226,018 | | | | 26,464,043 | | | | 2,266,448 | | | | 1,317,894 | |
| | | | | | | | | | | | | |
Net increase in net assets | | | 35,836,147 | | | | 29,995,856 | | | | 2,412,166 | | | | 2,418,324 | |
| | | | | | | | | | | | | |
| Net Assets: | | | | | | | | | | | | | | | | |
Beginning of year | | | 33,208,385 | | | | 3,212,529 | | | | 5,556,169 | | | | 3,137,845 | |
| | | | | | | | | | | | | |
End of year | | $ | 69,044,532 | | | $ | 33,208,385 | | | $ | 7,968,335 | | | $ | 5,556,169 | |
| | | | | | | | | | | | | |
| Undistributed net investment income at end of year | | $ | 517,240 | | | $ | 15,974 | | | $ | 43,412 | | | $ | 4,483 | |
| | | | | | | | | | | | | |
| Capital share transactions — Retail Shares | | | | | | | | | | | | | | | | |
Shares sold | | | 3,517,172 | | | | 2,599,991 | | | | 132,444 | | | | 65,574 | |
Shares issued in reinvestment of distributions | | | — | | | | 2,306 | | | | 15 | | | | — | |
Shares redeemed | | | (2,138,992 | ) | | | (326,102 | ) | | | (31,772 | ) | | | (35,958 | ) |
| | | | | | | | | | | | | |
| Net increase | | | 1,378,180 | | | | 2,276,195 | | | | 100,687 | | | | 29,616 | |
| | | | | | | | | | | | | |
| Capital share transactions — Institutional Shares | | | | | | | | | | | | | | | | |
Shares sold | | | 2,813,702 | | | | 244,381 | | | | 652,391 | | | | 81,500 | |
Shares issued in reinvestment of distributions | | | — | | | | — | | | | 18 | | | | — | |
Shares redeemed | | | (330,244 | ) | | | (57,449 | ) | | | (603,895 | ) | | | (1,999 | ) |
| | | | | | | | | | | | | |
| Net increase | | | 2,483,458 | | | | 186,932 | | | | 48,514 | | | | 79,501 | |
| | | | | | | | | | | | | |
| _____________________ |
| 1 | See Note 4e. |
| See Notes to Financial Statements. | | 33 |
Baron Select Funds | |
December 31, 2014 |
| STATEMENT OF CASH FLOWS |
| |
| FOR THE YEAR ENDED DECEMBER 31, 2014 |
| |
| | | Baron Partners |
| | | Fund |
| | | | |
| Increase (Decrease) in Cash: | | | | |
| Cash Used from Operating Activities | | | | |
Net increase in net assets resulting from operations | | $ | 160,223,572 | |
Adjustments to reconcile net increase in net assets resulting from operations to net cash used by operating activities: | | | | |
Purchases of portfolio securities | | | (1,052,299,524 | ) |
Proceeds from sales of portfolio securities | | | 658,547,257 | |
Net purchases, sales and maturities of short-term investments | | | (18,487,936 | ) |
Increase in dividends and interest receivable | | | (722,650 | ) |
Increase in prepaid expenses | | | (551 | ) |
Increase in payable for collateral on loaned securities | | | 18,690,000 | |
Increase in accrued expenses | | | 83,520 | |
Net realized gain on investments | | | (35,573,747 | ) |
Net change in unrealized appreciation of investments | | | (113,173,631 | ) |
| | | | |
Net cash used by operating activities | | $ | (382,713,690 | ) |
| | | | |
| Cash Provided from Financing Activities | | | | |
Proceeds from shares sold | | | 789,346,780 | |
Payment for shares redeemed | | | (482,549,985 | ) |
Increase in payable for borrowings against line of credit | | | 76,000,000 | |
| | | | |
Net cash provided in financing activities | | | 382,796,795 | |
| | | | |
Net increase in cash | | | 83,105 | |
| Cash at beginning of year | | | — | |
| | | | |
| Cash at end of year | | $ | 83,105 | |
| | | | |
| | | | | |
| Supplemental cash flow information: | | | | |
Interest paid | | $ | 3,194,562 | |
| | | | |
| 34 | | See Notes to Financial Statements. |
December 31, 2014 | | Baron Select Funds |
| NOTES TO FINANCIAL STATEMENTS |
|
1. ORGANIZATION
Baron Select Funds (the “Trust”) is registered under the Investment Company Act of 1940, as amended (the “1940 Act”), as an open-end management investment company established as a Delaware statutory trust on April 30, 2003, and accordingly, follows the investment company accounting and reporting guidance of the Financial Accounting Standards Board (“FASB”) Accounting Standard Codification Topic 946 Financial Services – Investment Companies. The Trust currently offers seven series (individually, a “Fund” and collectively, the “Funds”): Baron Partners Fund, Baron Focused Growth Fund, Baron Real Estate Fund and Baron Energy and Resources Fund, which are non-diversified; and Baron International Growth Fund, Baron Emerging Markets Fund, and Baron Global Advantage Fund, which are diversified. The Funds’ investment objective is to seek capital appreciation. Baron Partners Fund may employ “leverage” by borrowing money and using it to purchase additional securities. Borrowing for investment increases both investment opportunity and investment risk. Baron International Growth Fund, Baron Emerging Markets Fund and Baron Global Advantage Fund invest their assets primarily in non-U.S. companies. Baron Real Estate Fund invests its assets primarily in U.S. and non-U.S. real estate and real estate-related companies. Baron Energy and Resources Fund invests its assets primarily in U.S. and non-U.S. energy and resources companies and related companies and energy and resources master limited partnerships (“MLPs”) of any market capitalization.
Each Fund offers two classes of shares, Retail Shares and Institutional Shares, which differ only in their ongoing fees, expenses and eligibility requirements. Retail Shares are offered to all investors. Institutional Shares are for investments in the amount of $1 million or more per Fund. Institutional Shares are intended for certain financial intermediaries that offer shares of Baron Funds through fee-based platforms, retirement platforms or other platforms. Each class of shares has equal rights to earnings and assets, except that each class bears different expenses for distribution and shareholder servicing. Each Fund’s investment income, realized and unrealized gains or losses on investments and foreign currency, and expenses other than those attributable to a specific class are allocated to each class based on its relative net assets. Each class of shares has exclusive voting rights with respect to matters that affect just that class.
Baron Partners Fund was organized originally as a limited partnership in January 1992 under the laws of the State of Delaware. Effective as of the close of business on April 30, 2003, the predecessor partnership was reorganized into a series of the Trust. Baron Partners Fund commenced operations on April 30, 2003 with a contribution of assets and liabilities, including securities-in-kind, from the predecessor partnership.
Baron Focused Growth Fund was organized originally as a limited partnership in May 1996 under the laws of the State of Delaware. Effective as of the close of business on June 30, 2008, the predecessor partnership was reorganized into a series of the Trust. Baron Focused Growth Fund commenced operations on June 30, 2008 with a contribution of assets and liabilities, including securities-in-kind, from the predecessor partnership.
1. SIGNIFICANT ACCOUNTING POLICIES
The following is a summary of significant accounting policies followed by the Funds. The policies are in conformity with accounting principles generally accepted in the United States of America (“GAAP”). The preparation of financial statements in accordance with GAAP requires management to make estimates and assumptions that affect the reported amounts of assets and liabilities at the date of the financial statements and the amounts of income and expenses during the period. Actual results could differ from those estimates. Events occurring subsequent to the date of the Statements of Assets and Liabilities and through the date of issuance of the financial statements have been evaluated for adjustment to or disclosure in the financial statements.
a) Security Valuation. The Funds’ share prices or net asset values are calculated as of the close of the regular trading session (usually 4 p.m. E.T.) on the New York Stock Exchange (“NYSE”) on any day the NYSE is open. Portfolio securities traded on any national stock exchange are valued based on the last sale price on the exchange where such shares are principally traded. For securities traded on NASDAQ, the Funds use the NASDAQ Official Closing Price. If there are no sales on a given day, the value of the security may be the average of the most recent bid and asked quotations on such exchange or the last sale price from a prior day. Where market quotations are not readily available, or, if in BAMCO, Inc.’s (the “Adviser”) judgment, they do not accurately reflect the fair value of a security, or an event occurs after the market close but before the Funds are priced that materially affects the value of a security, the security will be valued by the Adviser using policies and procedures approved by the Board of Trustees (the “Board”). The Adviser has a Fair Valuation Committee (the “Committee”) comprised of senior executives, and the Committee reports to the Board every quarter. Factors the Committee may consider when valuing a security include whether a current price is stale, there is recent news, the security is thinly traded, transactions are infrequent or quotations are genuine. There can be no guarantee, however, that a fair valuation used by the Funds on any given day will more accurately reflect the market value of an investment than the closing price of such investment in its market. Debt instruments having a remaining maturity greater than 60 days will be valued on the basis of prices obtained from a pricing service approved by the Board or at the mean of the bid and ask prices from the dealer maintaining an active market in that security. The value of the Funds’ investments in convertible bonds is determined by the Adviser primarily by obtaining valuations from independent pricing services based on readily available bid quotations or, if quotations are not available, by methods which include various considerations such as yields or prices of securities of comparable quality, coupon, maturity and type; indications as to values from dealers; and general market conditions (generally Level 2 inputs). Other Level 2 inputs used by an independent pricing service to value convertible bonds generally include underlying stock data, dealer quotes, conversion premiums, listed bond and preferred stock prices and other market information which may include benchmark curves, trade execution data, and sensitivity analysis, when available. Money market instruments held by the Funds with a remaining maturity of 60 days or less are generally valued at amortized cost, which approximates fair value. Open end investment companies, including securities lending collateral invested in registered investment company money market funds, are valued at their net asset value each day.
Non-U.S. equity securities are valued on the basis of their most recent closing market prices and translated into U.S. dollars at 4 p.m. E.T., except under the circumstances described below. Most foreign markets close before 4 p.m. E.T. For securities primarily traded in the Far East, for example, the most recent closing prices may be as much as fifteen hours old at 4 p.m. E.T. If the Adviser determines that developments between the close of the foreign markets and 4 p.m. E.T. will, in its judgment, materially affect the value of some or all of the Funds’ non-U.S. securities, the Adviser will adjust the previous closing prices to reflect what it believes to be the fair value of the securities as of 4 p.m. E.T. In deciding whether to make these adjustments, the Adviser may review a variety of factors, including developments in foreign markets, the performance of U.S. securities markets, and the performance of instruments trading in U.S. markets that represent non-U.S. securities and baskets of non-U.S. securities. The Adviser may also fair value securities in other situations, for example, when a particular foreign market is closed but the Funds are open. The Adviser uses an outside pricing service that utilizes a systematic methodology to provide the Adviser with closing market prices and information used for adjusting those prices. The Adviser cannot predict how often it will use closing prices or how often it will adjust those prices. As a means of evaluating its fair value process, the Adviser routinely compares closing market prices, the next day’s opening prices in the same markets, and the adjusted prices. Other mutual funds may adjust the prices of their securities by different amounts.
b) Securities Transactions, Investment Income and Expense Allocation. Securities transactions are recorded on a trade date basis. Realized gain and loss from securities transactions are recorded on an identified cost basis for financial reporting and federal income tax purposes. Dividend income is recognized on the ex-dividend date and interest income is recognized on an accrual basis, which includes the accretion of discounts and amortization of premiums. Certain dividends from foreign securities will be recorded as soon as the Funds are informed of the dividend if such information is obtained subsequent to the ex-dividend date. Distributions received from certain investments held by the Funds may be comprised of dividends, realized gains and returns of capital. The Funds originally estimate the expected classification of such payments. The amounts may subsequently be reclassified upon receipt of information from the issuer. The Funds are charged for those expenses of the Trust that are directly attributable to each Fund, such as advisory and custodian fees. Expenses that are not directly attributable to a Fund are typically allocated among the Funds in proportion to their respective net assets.
35
Baron Select Funds | | December 31, 2014 |
| NOTES TO FINANCIAL STATEMENTS (Continued) |
|
2. SIGNIFICANT ACCOUNTING POLICIES (Continued)
c) Foreign Currency Translations. Values of assets and liabilities denominated in foreign currencies are translated into U.S. dollars using the price of such currencies at the time the net asset value is determined. Purchases and sales of investments and dividend income are converted at the prevailing rate of exchange on the respective dates of such transactions. Net realized gain (loss) on foreign currency transactions includes gain (loss) arising from the fluctuation in the exchange rates between trade and settlement dates on security transactions and currency gain (loss) between the accrual and payment dates on dividends and foreign withholding taxes. The Funds do not isolate that portion of the results of operations resulting from changes in foreign exchange rates on investments from the fluctuations arising from changes in market prices of securities held. Such fluctuations are included with the net realized and unrealized gain or loss from investments and foreign currency transactions. The Funds may invest in foreign securities and foreign currency transactions that may involve risks not associated with domestic investments as a result of the level of governmental supervision and regulation of foreign securities markets and the possibility of political or economic instability, among others.
Pursuant to U.S. federal income tax regulations, gains and losses from certain foreign currency transactions and the foreign currency portion of gains and losses realized on sales and maturities of foreign denominated debt securities are generally treated as ordinary income for U.S. federal income tax purposes.
d) Securities Lending. The Funds may lend securities to certain brokers under the terms of a master netting agreement. Upon such loans, the Funds receive collateral which is maintained by the custodian. The Funds may pay fees to the custodian for administering the securities lending program. The Funds earn interest on such collateral and earn income in the form of negotiated lenders’ fees, both of which are included in securities lending income in the Statements of Operations. Securities loaned are required to be secured at all times by collateral equal to at least 102% of the market value of the securities loaned. Risks may arise upon entering into securities lending to the extent that the value of the collateral is less than the value of the securities loaned due to the changes in the value of collateral or the loaned securities. The Funds may receive collateral in the form of cash or other eligible securities, such as a letter of credit issued by a U.S. bank or securities issued or guaranteed by the U.S. government. Securities purchased with cash collateral are subject to the risks inherent in investing in these securities.
At December 31, 2014, Baron Partners Fund and Baron Global Advantage Fund had securities on loan with values of $18,049,200 and $44,251, respectively, and held $18,690,000 and $45,822, of short term investments as collateral for these loans, respectively.
e) Repurchase Agreements. The Funds may invest in repurchase agreements, which are short-term investments whereby the Funds acquire ownership of a debt security and the seller agrees to repurchase the security at a future date at a specified price. When entering into repurchase agreements, it is the Funds’ policy that their custodian take possession of the underlying collateral securities, the market value of which, at all times, equals at least 102% of the principal amount of the repurchase transaction. To the extent that any repurchase transaction exceeds one business day, the value of the collateral is marked-to-market to ensure the adequacy of the collateral. If the seller defaults and the market value of the collateral declines or if bankruptcy proceedings are commenced with respect to the seller of the security, realization of the collateral by the Funds may be delayed or limited.
f) Federal and Foreign Income Taxes. The Trust treats each Fund as a separate entity for federal income tax purposes. Each Fund intends to meet the requirements of the Internal Revenue Code of 1986, as amended, applicable to regulated investment companies, and to distribute to its shareholders substantially all of its net investment income and any net realized capital gains at least annually. None of the Funds will be subject to federal or state income taxes to the extent that they qualify as regulated investment companies and substantially all of their income is distributed.
The Funds may be subject to foreign taxes on income and gains on investments that are accrued based upon the Funds’ understanding of the tax rules and regulations that exist in the countries in which the Funds invest. Foreign governments may also impose taxes or other payments on investments with respect to foreign securities. Such taxes are accrued as applicable.
g) Restricted Securities. The Funds may invest in securities that are restricted as to public sale in accordance with the Securities Act of 1933. Such assets are valued by the Adviser pursuant to policies and procedures approved by the Board.
h) Distributions to Shareholders. Income and capital gain distributions to shareholders are determined in accordance with income tax regulations which may differ from GAAP. These differences are primarily due to differing treatments for net investment loss, foreign currency gains and losses, reclassification of distributions, partnership basis adjustments, income from passive foreign investment corporations and wash sale losses deferred.
i) Commitments and Contingencies. In the normal course of business, the Funds may enter into contracts and agreements that contain a variety of representations and warranties, which provide general indemnification. The maximum exposure to the Funds under these agreements is unknown, as this would involve future claims that may be made against the Funds that have not yet occurred. However, based on experience, the Funds expect the risk of loss to be remote.
j) Cash and Cash Equivalents. The Funds consider all short term liquid investments with a maturity of three months or less when purchased to be cash equivalents.
k) Fund Diversification and Concentration. Certain of the Funds hold non-diversified or concentrated portfolios that may contain fewer securities or invest in fewer industries than the portfolios of other mutual funds. This may increase the risk that the value of a Fund could decrease because of the poor performance of one or a few investments or of a particular industry. Additionally, non-diversified funds may encounter difficulty liquidating securities.
3. PURCHASES AND SALES OF SECURITIES
Purchases and sales of securities, other than short term securities, for the year ended December 31, 2014 were as follows:
| Fund | | | Purchases | | | Sales |
| | | | | | | |
| Baron Partners Fund | | | $1,047,811,053 | | | $637,284,094 |
| Baron Focused Growth Fund | | | 70,602,432 | | | 75,944,776 |
| Baron International Growth Fund | | | 64,863,646 | | | 24,780,197 |
| Baron Real Estate Fund | | | 821,544,135 | | | 327,247,956 |
| Baron Emerging Markets Fund | | | 1,047,813,640 | | | 186,765,782 |
| Baron Energy and Resources Fund | | | 57,418,838 | | | 12,294,282 |
| Baron Global Advantage Fund | | | 12,619,231 | | | 10,439,284 |
36
| |
| December 31, 2014 | Baron Select Funds |
| NOTES TO FINANCIAL STATEMENTS (Continued) |
| |
4. INVESTMENT ADVISORY FEES AND OTHER TRANSACTIONS WITH AFFILIATES
a) Investment Advisory Fees. The Adviser, a wholly owned subsidiary of Baron Capital Group, Inc. (“BCG”), serves as investment adviser to the Funds. As compensation for services rendered, the Adviser receives a fee payable monthly equal to 1% per annum of the average daily net assets of the respective Funds. The Adviser has contractually agreed to reduce its fee, to the extent required to limit the net annual operating expense ratio (excluding portfolio transaction costs, interest, dividend and extraordinary expenses), as follows:
| | | Annual Operating |
| | | Expense Ratio Cap |
| | | |
| | | Retail | | Institutional |
| Fund | | Shares | | Shares |
| | | | | |
| Baron Partners Fund | | 1.45% | | 1.20% |
| Baron Focused Growth Fund | | 1.35% | | 1.10% |
| Baron International Growth Fund | | 1.50% | | 1.25% |
| Baron Real Estate Fund | | 1.35% | | 1.10% |
| Baron Emerging Markets Fund | | 1.50% | | 1.25% |
| Baron Energy and Resources Fund | | 1.35% | | 1.10% |
| Baron Global Advantage Fund | | 1.50% | | 1.25% |
b) Distribution Fees. Baron Capital, Inc. (“BCI”), a wholly owned subsidiary of BCG, is a registered limited purpose broker-dealer and the distributor of the Funds’ shares. The Funds are authorized to pay BCI a distribution fee payable monthly pursuant to a distribution plan under Rule 12b-1 of the 1940 Act equal to 0.25% per annum of the Retail Shares’ average daily net assets of the respective Funds.
c) Trustee Fees. Certain Trustees of the Trust may be deemed to be affiliated with, or interested persons (as defined by the 1940 Act) of the Funds’ Adviser or of BCI. None of the Trustees so affiliated received compensation for his or her services as a Trustee of the Trust. None of the Funds’ officers received compensation from the Funds for their services as an officer.
d) Fund Accounting and Administration Fees. The Funds have entered into an agreement with State Street Bank and Trust Company (“State Street”) to perform accounting and certain administrative services. State Street is compensated for fund accounting services based on a percentage of the Funds’ net assets, subject to certain minimums plus fixed annual fees for the administrative services.
e) Voluntary Payment. The Adviser made a voluntary payment to Baron Global Advantage Fund in the amount of $47,291 to compensate the Fund for a loss incurred due to a shareholder activity processing error. The impact of this payment increased the Fund’s total return by 0.54%.
5. LINE OF CREDIT
Baron Partners Fund participates in a committed line of credit agreement with State Street in the amount of $475 million. A commitment fee of 0.15% per annum is incurred on the unused portion of the line of credit. The line of credit is used for investment purposes and expires on September 18, 2015. Baron Partners Fund may borrow up to the lesser of $475 million or the maximum amount Baron Partners Fund may borrow under the 1940 Act, the limitations included in Baron Partners Fund’s prospectus, or any limit or restriction under any law or regulation to which Baron Partners Fund is subject or any agreement to which Baron Partners Fund is a party. Interest is charged to Baron Partners Fund, based on its borrowings, at a rate per annum equal to the higher of the Federal Funds Rate or the Overnight LIBOR Rate plus a margin of 0.85%. For the year ended December 31, 2014, interest expense incurred on these loans amounted to $3,307,937.
During the year ended December 31, 2014, Baron Partners Fund had an average daily balance on the line of credit of $343.4 million at a weighted average interest rate of 0.96%. At December 31, 2014, Baron Partners Fund had an outstanding balance in the amount of $355,000,000.
6. RESTRICTED SECURITIES
At December 31, 2014, investments in securities included securities that are restricted and/or illiquid. Restricted securities are often purchased in private placement transactions, are not registered under the Securities Act of 1933, may have contractual restrictions on resale and are valued pursuant to the policies and procedures for fair value pricing approved by the Board. A security may be considered illiquid if it lacks a readily available market or if its valuation has not changed for a certain period of time. The Funds may receive more or less than this valuation in an actual sale and that difference could be material. At December 31, 2014, the Funds held investments in restricted and/or illiquid securities that were valued pursuant to policies and procedures for fair value pricing as follows:
| | | Baron Partners Fund |
| | | |
| | | Acquisition | | |
| Name of Issuer | | Date(s) | | Value |
| | | | | |
| Private Equity Investments | | | | |
Windy City Investments Holdings, L.L.C. | | 11/13/2007- 1/27/2011 | | $6,593,843 |
| | | | | |
(Cost $1,832,926) (0.34% of Net Assets) | | | | |
| | | | | |
| | | Baron Focused Growth Fund |
| | | |
| | | Acquisition | | |
| Name of Issuer | | Date(s) | | Value |
| | | | | |
| Common Stocks | | | | |
TerraForm Power, Inc., Cl A | | 11/21/2014 | | $2,505,823 |
| | | | | |
(Cost $2,499,990) (1.28% of Net Assets) | | | | |
| |
| Baron Select Funds | December 31, 2014 |
| NOTES TO FINANCIAL STATEMENTS (Continued) |
| |
7. FAIR VALUE MEASUREMENTS
Fair value is defined by GAAP as the price that the Funds would receive upon selling an investment in a timely transaction to an independent buyer in the principal or most advantageous market for the investment. GAAP provides a three-tier hierarchy to maximize the use of observable market data and minimize the use of unobservable inputs and to establish classification of fair value measurements for disclosure purposes. Inputs refer broadly to the assumptions that market participants would use in pricing the asset or liability. Inputs may be observable or unobservable. Observable inputs are based on market data obtained from sources independent of the Funds. Unobservable inputs are inputs that reflect the Funds’ own assumptions based on the best information available in the circumstances. The three-tier hierarchy of inputs is summarized in the three broad Levels listed below.
| | • | | Level 1 — quoted prices in active markets for identical assets or liabilities; |
| | | | |
| | • | | Level 2 — prices determined using other significant inputs that are observable either directly, or indirectly through corroboration with observable market data (which could include quoted prices for similar assets or liabilities, interest rates, credit risk, etc.); |
| | | | |
| | • | | Level 3 —prices determined using significant unobservable inputs when quoted prices or observable inputs are unavailable, such as when there is little or no market activity for an asset or liability (unobservable inputs reflect each Fund’s on the best own assumptions in determining the fair value of assets or liabilities and would be based on the best information available). |
The inputs or methodology used for valuing securities are not necessarily an indication of the risk associated with investing in those securities. For example, non-U.S. securities, with markets that close hours before the Funds value their holdings, may require revised valuations due to significant movement in the U.S. markets. Since these values are not obtained from quoted prices in an active market, such securities are reflected as Level 2.
The Funds have procedures to determine the fair value of securities and other financial instruments for which market prices are not readily available or which may not be reliably priced. Under these procedures, the Funds primarily employ a market-based approach that may use related or comparable assets or liabilities, recent transactions, market multiples, book values, and other relevant information for the investment to determine its fair value. The Funds may also use an income-based valuation approach in which the anticipated future cash flows of the investment are discounted to calculate fair value. Discounts may also be applied due to the nature or duration of any restrictions on the disposition of the investments. Due to the inherent uncertainty of valuations of such investments, the fair values may differ significantly from the values that would have been used had an active market existed.
The following is a summary of the inputs used as of December 31, 2014 in valuing the Funds’ investments carried at fair value:
| | | Baron Partners Fund | |
| | | | |
| Description | | Quoted Prices in
Active Markets
for Identical
Assets
(Level 1) | | Other
Observable
Inputs
(Level 2) | | Unobservable
Inputs
(Level 3) | | Total | |
| Common Stocks† | | $ | 2,259,895,708 | | $ | — | | $ | — | | $ | 2,259,895,708 | |
| Private Equity Investments | | | — | | | — | | | 6,593,843 | | | 6,593,843 | |
| Short Term Investments | | | — | | | 18,690,000 | | | — | | | 18,690,000 | |
| | | | | | | | | | |
| Total Investments | | $ | 2,259,895,708 | | $ | 18,690,000 | | $ | 6,593,843 | | $ | 2,285,179,551 | |
| | | | | | | | | | |
Transfers between Levels 1, 2 or 3, if any, are recognized at ending value on December 31, 2014. There have been no transfers in and out of Level 1, 2 or 3 fair value measurements for the Fund for the year ended December 31, 2014.
| | | Baron Focused Growth Fund | |
| | | | |
| Description | | | Quoted Prices in
Active Markets
for Identical
Assets
(Level 1) | | Other
Observable
Inputs
(Level 2) | | Unobservable
Inputs
(Level 3) | | Total | |
| Common Stocks† | | $ | 181,839,416 | | $ | 2,505,823 | | $ | — | | $ | 184,345,239 | |
| Preferred Stocks | | | 8,111,179 | | | — | | | — | | | 8,111,179 | |
| Short Term Investments | | | — | | | 4,236,809 | | | — | | | 4,236,809 | |
| | | | | | | | | | |
| Total Investments | | $ | 189,950,595 | | $ | 6,742,632 | | $ | — | | $ | 196,693,227 | |
| | | | | | | | | | |
Transfers between Levels 1, 2 or 3, if any, are recognized at ending value on December 31, 2014. There have been no transfers in and out of Level 1, 2 or 3 fair value measurements for the Fund for the year ended December 31, 2014.
| † See Statements of Net Assets for additional detailed categorizations. |
| |
| December 31, 2014 | Baron Select Funds |
| NOTES TO FINANCIAL STATEMENTS (Continued) |
| |
| |
| 7. FAIR VALUE MEASUREMENTS (Continued) |
| | | Baron International Growth Fund | |
| | | | |
| Description | | Quoted Prices in
Active Markets
for Identical
Assets
(Level 1) | | Other
Observable
Inputs
(Level 2) | | Unobservable
Inputs
(Level 3) | | Total | |
| Common Stocks† | | $ | 33,621,631 | | $ | 66,163,215 | | $ | — | | $ | 99,784,846 | |
| Warrants | | | — | | | 39,000 | | | — | | | 39,000 | |
| Short Term Investments | | | — | | | 5,069,849 | | | — | | | 5,069,849 | |
| | | | | | | | | | |
| Total Investments | | $ | 33,621,631 | | $ | 71,272,064 | | $ | — | | $ | 104,893,695 | |
| | | | | | | | | | |
$418,854 was transferred out of Level 2 into Level 1 at December 31, 2014 as a result of not adjusting closing prices for certain securities (as described in Note 2a) due to significant market movements between the time at which the Fund valued its securities and the earlier closing of foreign markets. $19,289,704 was transferred out of Level 1 into Level 2 at December 31, 2014 as a result of adjusting closing prices for certain securities and the earlier closing of foreign markets. It is the Fund’s policy to recognize transfers in and transfers out at the fair value as of the end of the period.
| | | Baron Real Estate Fund | |
| | | | |
| Description | | Quoted Prices in
Active Markets
for Identical
Assets
(Level 1) | | Other
Observable
Inputs
(Level 2) | | Unobservable
Inputs
(Level 3) | | Total | |
| Common Stocks† | | $ | 1,648,125,067 | | $ | 26,629,416 | | $ | — | | $ | 1,674,754,483 | |
| Short Term Investments | �� | | — | | | 20,541,480 | | | — | | | 20,541,480 | |
| | | | | | | | | | |
| Total Investments | | $ | 1,648,125,067 | | $ | 47,170,896 | | $ | — | | $ | 1,695,295,963 | |
| | | | | | | | | | |
$19,170,638 was transferred out of Level 2 into Level 1 at December 31, 2014 as a result of not adjusting closing prices for certain securities (as described in Note 2a) due to significant market movements between the time at which the Fund valued its securities and the earlier closing of foreign markets. It is the Fund’s policy to recognize transfers in and transfers out at the fair value as of the end of the period.
| | | Baron Emerging Markets Fund | |
| | | | |
| Description | | Quoted Prices in
Active Markets
for Identical
Assets
(Level 1) | | Other
Observable
Inputs
(Level 2) | | Unobservable
Inputs
(Level 3) | | Total | |
| Common Stocks† | | $ | 358,594,059 | | $ | 829,941,255 | | $ | — | | $ | 1,188,535,314 | |
| Preferred Stocks | | | 427,036 | | | — | | | — | | | 427,036 | |
| Convertible Bonds | | | — | | | 5,593,418 | | | — | | | 5,593,418 | |
| Short Term Investments | | | — | | | 161,340,865 | | | — | | | 161,340,865 | |
| | | | | | | | | | |
| Total Investments | | $ | 359,021,095 | | $ | 996,875,538 | | $ | — | | $ | 1,355,896,633 | |
| | | | | | | | | | |
$9,258,789 was transferred out of Level 2 into Level 1 at December 31, 2014 as a result of not adjusting closing prices for certain securities (as described in Note 2a) due to significant market movements between the time at which the Fund valued its securities and the earlier closing of foreign markets. $420,443,359 was transferred out of Level 1 into Level 2 at December 31, 2014 as a result of adjusting closing prices for certain securities and the earlier closing of foreign markets. It is the Fund’s policy to recognize transfers in and transfers out at the fair value as of the end of the period.
| | | Baron Energy and Resources Fund | |
| | | | |
| Description | | | Quoted Prices in
Active Markets
for Identical
Assets
(Level 1) | | | Other
Observable
Inputs
(Level 2) | | | Unobservable
Inputs
(Level 3) | | | Total | |
| Common Stocks† | | $ | 64,957,750 | | $ | — | | $ | — | | $ | 64,957,750 | |
| Short Term Investments | | | — | | | 9,382,619 | | | — | | | 9,382,619 | |
| | | | | | | | | | |
| Total Investments | | $ | 64,957,750 | | $ | 9,382,619 | | $ | — | | $ | 74,340,369 | |
| | | | | | | | | | |
Transfers between Levels 1, 2 or 3, if any, are recognized at ending value on December 31, 2014. There have been no transfers in and out of Level 1, 2 or 3 fair value measurements for the Fund for the year ended December 31, 2014.
| † See Statements of Net Assets for additional detailed categorizations. |
| |
| Baron Select Funds | December 31, 2014 |
| NOTES TO FINANCIAL STATEMENTS (Continued) |
| |
| |
| 7. FAIR VALUE MEASUREMENTS (Continued) |
| | | Baron Global Advantage Fund | |
| | | | |
| Description | | Quoted Prices in
Active Markets
for Identical
Assets
(Level 1) | | Other
Observable
Inputs
(Level 2) | | Unobservable
Inputs
(Level 3) | | Total | |
| Common Stocks† | | $ | 7,011,715 | | $ | 745,854 | | $ | — | | $ | 7,757,569 | |
| Short Term Investments† | | | — | | | 278,819 | | | — | | | 278,819 | |
| | | | | | | | | | |
| Total Investments | | $ | 7,011,715 | | $ | 1,024,673 | | $ | — | | $ | 8,036,388 | |
| | | | | | | | | | |
$374,210 was transferred out of Level 2 into Level 1 at December 31, 2014 as a result of not adjusting closing prices for certain securities (as described in Note 2a) due to significant market movements between the time at which the Fund valued its securities and the earlier closing of foreign markets. $318,840 was transferred out of Level 1 into Level 2 at December 31, 2014 as a result of adjusting closing prices for certain securities and the earlier closing of foreign markets. It is the Fund’s policy to recognize transfers in and transfers out at the fair value as of the end of the period.
| † See Statements of Net Assets for additional detailed categorizations. |
The following is a reconciliation of investments in which unobservable inputs (Level 3) were used in determining fair value:
| | | Baron Partners Fund | |
| | | | |
Investments in
Securities | | | Balance as of
December 31,
2013 | | | Accrued
Premiums/
Discounts | | | Net
Realized
Gain
(Loss) | | | | Net Change in
Unrealized
Appreciation
(Depreciation) | | | Purchases | | | Sales/
Distributions | | | | Transfers
Into
Level 3 | | | Transfers
Out of
Level 3 | | | Balance as of
December 31,
2014 | | | Change in Net
Unrealized
Appreciation
(Depreciation)
from Investments
still held at
December 31,
2014 | |
| Private Equity Investments | | | | | | | | | | | | | | | | | | | | | | | | | | | | | | | | | |
| Consumer | | | | | | | | | | | | | | | | | | | | | | | | | | | | | | | | | |
Discretionary | | $ | 13,923,000 | | $ | — | | $ | (23,400,000 | ) | | $ | 25,077,000 | | $ | — | | $ | (15,600,000 | ) | | $ | — | | $ | — | | $ | — | | $ | — | |
| Financials | | | 31,832,346 | | | — | | | — | | | | 14,063,459 | | | — | | | (39,301,962 | ) | | | — | | | — | | | 6,593,843 | | | 14,063,459 | |
| | | | | | | | | | | | | | | | | | | | | | | | |
| Total | | $ | 45,755,346 | | $ | — | | $ | (23,400,000 | ) | | $ | 39,140,459 | | $ | — | | $ | (54,901,962 | ) | | $ | — | | $ | — | | $ | 6,593,843 | | $ | 14,063,459 | |
| | | | | | | | | | | | | | | | | | | | | | | | |
| 8. INCOME TAXES AND DISTRIBUTIONS TO SHAREHOLDERS |
Federal income tax regulations differ from GAAP. Therefore, distributions determined in accordance with tax regulations may differ in amount or character from net investment income and net realized gain for financial reporting purposes. Net investment income (loss) and net realized and unrealized gain (loss) differ for financial statement and tax purposes due to differing treatments of net investment loss, foreign currency gains and losses, reclassification of distributions, partnership basis adjustments, income from passive foreign investment corporations and wash sale losses deferred. Financial reporting records are adjusted for permanent book/tax differences to reflect tax character. Financial records are not adjusted for temporary differences.
For the year ended December 31, 2014, the Funds recorded the following permanent reclassifications to reflect tax character. Reclassifications between income, gains and paid in capital relate primarily to the tax treatment of net investment loss, foreign currency gains and losses and partnership basis adjustments. Results of operations and net assets were not affected by these reclassifications.
| Fund | | | Undistributed
(Accumulated)
Net Investment
Income (Loss) | | | | Undistributed
(Accumulated)
Net Realized
Gain (Loss) | | | | Paid-In Capital | |
| Baron Partners Fund | | | $(5,122,364 | ) | | | $3,892,527 | | | | $1,229,837 | |
| Baron Focused Growth Fund | | | (487,405 | ) | | | 379,421 | | | | 107,984 | |
| Baron International Growth Fund | | | (144,450 | ) | | | 144,450 | | | | — | |
| Baron Real Estate Fund | | | (496,886 | ) | | | (58,172 | ) | | | 555,058 | |
| Baron Emerging Markets Fund | | | (1,323,330 | ) | | | 1,323,330 | | | | — | |
| Baron Energy and Resources Fund | | | 491,683 | | | | (21,874 | ) | | | (469,809 | ) |
| Baron Global Advantage Fund | | | 5,588 | | | | 41,709 | | | | (47,297 | ) |
December 31, 2014 | |
Baron Select Funds |
| NOTES TO FINANCIAL STATEMENTS (Continued) |
| |
8. INCOME TAXES AND DISTRIBUTIONS TO SHAREHOLDERS (Continued)
As of December 31, 2014, the components of net assets on a tax basis were as follows:
| | | | | | | | | | | Baron | | | | | | Baron | | Baron | | Baron |
| | | Baron Partners | | Baron Focused | | International | | Baron Real | | Emerging | | Energy and | | Global |
| | | Fund | | Growth Fund | | Growth Fund | | Estate Fund | | Markets Fund | | Resources Fund | | Advantage Fund |
| |
| Cost of investments | | $ | 1,351,679,289 | | | $ | 136,797,840 | | | $ | 85,953,559 | | | $ | 1,349,031,824 | | | $ | 1,302,468,018 | | | $ | 82,507,842 | | | $ | 6,620,758 | |
| | | | | | | | | | | | | | | | | | | | | | |
| Gross tax unrealized | | | | | | | | | | | | | | | | | | | | | | | | | | | | |
appreciation | | | 947,393,043 | | | | 61,266,409 | | | | 22,629,705 | | | | 348,178,221 | | | | 124,613,850 | | | | 4,116,050 | | | | 1,680,647 | |
| Gross tax unrealized | | | | | | | | | | | | | | | | | | | | | | | | | | | | |
depreciation | | | (13,892,781 | ) | | | (1,371,022 | ) | | | (3,689,569 | ) | | | (1,914,082 | ) | | | (71,185,235 | ) | | | (12,283,523 | ) | | | (265,017 | ) |
| | | | | | | | | | | | | | | | | | | | | | |
| Net tax unrealized | | | | | | | | | | | | | | | | | | | | | | | | | | | | |
appreciation (depreciation) | | | 933,500,262 | | | | 59,895,387 | | | | 18,940,136 | | | | 346,264,139 | | | | 53,428,615 | | | | (8,167,473 | ) | | | 1,415,630 | |
| Net tax unrealized currency | | | | | | | | | | | | | | | | | | | | | | | | | | | | |
depreciation | | | — | | | | — | | | | (159,095 | ) | | | — | | | | (6,668,692 | ) | | | (99 | ) | | | (84 | ) |
| Undistributed net investment income | | | 7,951,442 | | | | 565,643 | | | | 98,361 | | | | 391,498 | | | | — | | | | — | | | | 15,177 | |
| Undistributed net realized gain | | | — | | | | 5,946,763 | | | | 105,600 | | | | 1,251,619 | | | | — | | | | — | | | | 21,486 | |
| Qualified late year loss deferral | | | (3,748,488 | ) | | | — | | | | — | | | | — | | | | (131,981 | ) | | | — | | | | — | |
| Capital loss carryforwards | | | (332,180,204 | ) | | | — | | | | — | | | | — | | | | (33,090,721 | ) | | | (275,122 | ) | | | — | |
| Paid-in capital | | | 1,332,299,442 | | | | 128,858,314 | | | | 86,271,696 | | | | 1,354,612,971 | | | | 1,333,952,531 | | | | 77,487,226 | | | | 6,516,126 | |
| | | | | | | | | | | | | | | | | | | | | | |
| Net Assets | | $ | 1,937,822,454 | | | $ | 195,266,107 | | | $ | 105,256,698 | | | $ | 1,702,520,227 | | | $ | 1,347,489,752 | | | $ | 69,044,532 | | | $ | 7,968,335 | |
| | | | | | | | | | | | | | | | | | | | | | |
As of December 31, 2014, the Funds had capital loss carryforwards expiring as follows:
| | | | | | | | | | | Baron | | | | | | | Baron | | Baron | | Baron |
| | | Baron Partners | | Baron Focused | | International | | Baron Real | | | Emerging | | Energy and | | Global |
| | | Fund | | Growth Fund | | Growth Fund | | Estate Fund | | | Markets Fund | | Resources Fund | | Advantage Fund |
|
| |
Short term capital loss carryforwards: | | | | | | | | | | | | | | | | | | | | | | | | | | | | | | | December 31, 2017 | | $ | 332,180,204 | | | $ | — | | | $ | — | | | $ | — | | | | $ | — | | | $ | — | | | $ | — | |
| No expiration date | | | — | | | | — | | | | — | | | | — | | | | | 33,090,721 | | | | 275,122 | | | | — | |
| | | | | | | | | | | | | | | | | | | | | | | | | |
| | | $ | 332,180,204 | | | $ | — | | | $ | — | | | $ | — | | | | $ | 33,090,721 | | | | 275,122 | | | $ | — | |
| | | | | | | | | | | | | | | | | | | | | | | |
| | | | | | | | | | | | | | | | | | | | | | | | | | | | | | |
| Capital loss carryforward | | | | | | | | | | | | | | | | | | | | | | | | | | | | | |
utilized during the year | | | | | | | | | | | | | | | | | | | | | | | | | | | | | |
ended December 31, 2014 | | $ | 36,588,722 | | | $ | — | | | $ | — | | | $ | 4, 999,909 | | | | $ | — | | | $ | 26,628 | | | $ | — | |
| | | | | | | | | | | | | | | | | | | | | | | |
The tax character of distributions paid during the fiscal years ended December 31, 2014 and December 31, 2013 was as follows:
| | | Year Ended | | Year Ended | |
| | | December 31, 2014 | | December 31, 2013 | |
| | | | | | |
| Fund | | Ordinary1 | | Long Term
Capital Gain | | Ordinary1 | | Long Term
Capital Gain | | Return of
Capital |
| Baron Partners Fund | | $ | — | | | $ | — | | | $ | — | | | $ | — | | | $ | — | |
| Baron Focused Growth Fund | | | — | | | | 1,168,756 | | | | 2,471,584 | | | | — | | | | — | |
| Baron International Growth Fund | | | 101,998 | | | | 2,751,644 | | | | 3,362 | | | | — | | | | — | |
| Baron Real Estate Fund | | | 3,698,225 | | | | — | | | | 247,412 | | | | 555,524 | | | | 673,756 | |
| Baron Emerging Markets Fund | | | 4,415,521 | | | | — | | | | — | | | | — | | | | — | |
| Baron Energy and Resources Fund | | | — | | | | — | | | | 26,290 | | | | — | | | | — | |
| Baron Global Advantage Fund | | | 476 | | | | — | | | | — | | | | — | | | | — | |
1 For tax purposes, short-term capital gains are considered ordinary income distributions.The Funds follow the provisions of FASB Codification Section 740 (“ASC Section 740”) “Accounting for Uncertainty in Income Taxes” which clarifies the accounting for uncertainty in tax positions taken or expected to be taken on a tax return. ASC Section 740 sets forth a threshold for financial statement recognition, measurement and disclosure of tax positions taken or expected to be taken on a tax return. The Funds are required to recognize the tax effects of certain tax positions under a “more likely than not” standard, that based on their technical merits, have more than 50 percent likelihood of being sustained upon examination. Management has analyzed the tax positions taken on the Funds’ federal income tax returns for all open years (current and prior three years), and has concluded that no provision for federal income tax is required in the Funds’ financial statements. At December 31, 2014, the Funds did not have any uncertain tax benefits that require recognition, de-recognition or disclosure. The Funds’ federal, state and local income and federal excise tax returns for which the applicable statutes of limitations have not expired (current and prior three years) are subject to examination by the Internal Revenue Service and state departments of revenue.
Baron Select Funds | |
December 31, 2014 |
| NOTES TO FINANCIAL STATEMENTS (Continued) |
| |
9. OWNERSHIP CONCENTRATION
As of December 31, 2014, the officers, trustees and portfolio managers owned, directly or indirectly, 33.59% of Baron Focused Growth Fund and 42.92% of Baron Global Advantage Fund. As of December 31, 2014, the officers, trustees, portfolio managers and one other investor owned, directly or indirectly, 30.71% of Baron International Growth Fund. As a result of their ownership, these investors may be able to materially affect the outcome of matters presented to Baron Focused Growth Fund, Baron International Growth Fund and Baron Global Advantage Fund shareholders.
10. TRANSACTIONS IN “AFFILIATED” COMPANIES1
BARON REAL ESTATE FUND
| | | | | | | | | | | | | | | Net Change in | | | | | | | | | | Shares | | | | |
| | | Value at | | | | | | | | | | Unrealized | | | | | | | | | | Held at | | Value at |
| | | December 31, | | Purchase | | Sales | | Appreciation | | Realized | | Dividend | | December 31, | | December 31, |
| Name of Issuer | | 2013 | | Cost | | Proceeds | | (Depreciation) | | Gains/(Losses) | | Income | | 2014 | | 2014 |
| “Affiliated” Company as of December 31, 2014: | | | | | | | | | | | | | | | | | | | | | | | | | | | | | |
| Capital Senior Living Corp. | | $ | 38,730,775 | | | $ | 14,844,486 | | | $ | — | | | $ | 1,925,788 | | | $ | — | | | $ | — | | | | 2,228,063 | | | $ | 55,501,049 | |
| | | | | | | | | | | | | | | | | | | | | | | | | |
1 An “Affiliated” Company, as defined in the 1940 Act, is a company in which a Fund held 5% or more of the company’s outstanding voting securities at any time during the year ended December 31, 2014.11. DISCLOSURES REGARDING OFFSETTING ASSETS AND LIABILITIES
In December 2011, the FASB issued an Accounting Standards Update (“ASU”) related to disclosures about offsetting assets and liabilities in financial statements. This ASU requires an entity to disclose both gross and net information for derivatives, repurchase agreements and reverse repurchase agreements, and securities borrowing and securities lending transactions that are either offset in the statement of assets and liabilities or subject to an enforceable master netting arrangement or similar agreement. In January 2013, the FASB issued an ASU to clarify the scope of disclosures about offsetting assets and liabilities. The ASU is effective for reporting periods beginning on or after January 1, 2013. The information required to be disclosed by the ASU for the Funds’ investments in repurchase agreements at December 31, 2014, including the fair value of the repurchase agreement and the amount of collateral, can be found in each respective Fund’s Statement of Net Assets. The information required to be disclosed by the ASU for the Funds’ securities lending agreement at December 31, 2014, including the market value of securities on loan and the amount of collateral, can be found in each respective Fund’s Statement of Assets and Liabilities. The Funds did not hold derivatives or participate in securities borrowing activities at December 31, 2014.
12. RECENT ACCOUNTING PRONOUNCEMENT
In June 2014, the FASB issued “ASU 2014-11 Transfers & Servicing (Topic 860): Repurchase-to-Maturity Transactions, Repurchase Financings, and Disclosures” to improve the financial reporting of repurchase agreements and other similar transactions. The guidance includes expanded disclosure requirements for entities that enter into repurchase agreements or securities lending transactions. The guidance is effective for financial statements with fiscal years beginning on or after December 15, 2014, and interim periods within those fiscal years. The Adviser is evaluating the impact, if any, of this guidance on the Funds’ financial statement disclosures.
December 31, 2014 | |
Baron Select Funds |
BARON PARTNERS FUND
Selected data for a share outstanding throughout each year:
| RETAIL SHARES | | Year Ended December 31, |
| | | |
| | | 2014 | | 2013 | | 2012 | | 2011 | | | 2010 | | | 2009 | | | 2008 | | 2007 | | 2006 | | 2005 |
| Net asset value, beginning of year | | $ | 33.32 | | | $ | 22.56 | | | $ | 19.39 | | | $ | 20.57 | | | | $ | 15.64 | | | | $ | 12.20 | | | | $ | 23.76 | | | $ | 22.34 | | | $ | 18.43 | | | $ | 16.85 | |
| | | | | | | | | | | | | | | | | | | | | | | | | | | | | | | | | | |
| Income (loss) from investment operations: | | | | | | | | | | | | | | | | | | | | | | | | | | | | | | | | | | | | | | | | | | | |
| Net investment income (loss) | | | 0.23 | 1 | | | (0.19 | )1 | | | (0.04 | )1 | | | (0.14 | )1 | | | | (0.09 | )1 | | | | (0.04 | )1 | | | | (0.09 | )1 | | | (0.21 | )1 | | | (0.16 | )1 | | | (0.13 | ) |
| Net realized and unrealized gain (loss) on investments | | | 3.19 | | | | 10.95 | | | | 3.21 | | | | (1.04 | ) | | | | 5.02 | | | | | 3.48 | | | | | (10.74 | ) | | | 2.74 | | | | 4.13 | | | | 2.49 | |
| | | | | | | | | | | | | | | | | | | | | | | | | | | | | | | | | | |
Total from investment operations | | | 3.42 | | | | 10.76 | | | | 3.17 | | | | (1.18 | ) | | | | 4.93 | | | | | 3.44 | | | | | (10.83 | ) | | | 2.53 | | | | 3.97 | | | | 2.36 | |
| | | | | | | | | | | | | | | | | | | | | | | | | | | | | | | | | | |
| Less distributions to shareholders from: | | | | | | | | | | | | | | | | | | | | | | | | | | | | | | | | | | | | | | | | | | | |
| Net investment income | | | 0.00 | | | | 0.00 | | | | 0.00 | | | | 0.00 | | | | | 0.00 | | | | | 0.00 | | | | | 0.00 | | | | 0.00 | | | | 0.00 | | | | 0.00 | |
| Net realized gain on investments | | | 0.00 | | | | 0.00 | | | | 0.00 | | | | 0.00 | | | | | 0.00 | | | | | 0.00 | | | | | (0.73 | ) | | | (1.11 | ) | | | (0.06 | ) | | | (0.78 | ) |
| | | | | | | | | | | | | | | | | | | | | | | | | | | | | | | | | | |
Total distributions | | | 0.00 | | | | 0.00 | | | | 0.00 | | | | 0.00 | | | | | 0.00 | | | | | 0.00 | | | | | (0.73 | ) | | | (1.11 | ) | | | (0.06 | ) | | | (0.78 | ) |
| | | | | | | | | | | | | | | | | | | | | | | | | | | | | | | | | | |
| Net asset value, end of year | | $ | 36.74 | | | $ | 33.32 | | | $ | 22.56 | | | $ | 19.39 | | | | $ | 20.57 | | | | $ | 15.64 | | | | $ | 12.20 | | | $ | 23.76 | | | $ | 22.34 | | | $ | 18.43 | |
| | | | | | | | | | | | | | | | | | | | | | | | | | | | | | | | | | |
Total return | | | 10.26 | % | | | 47.69 | % | | | 16.35 | % | | | (5.74 | )% | | | | 31.52 | % | | | | 28.20 | % | | | | (46.67 | )% | | | 11.34 | % | | | 21.55 | % | | | 14.37 | % |
| | | | | | | | | | | | | | | | | | | | | | | | | | | | | | | | | | |
| Ratios/Supplemental data: | | | | | | | | | | | | | | | | | | | | | | | | | | | | | | | | | | | | | | | | | | | |
| Net assets (in millions), end of year | | $ | 1,256.3 | | | $ | 1,125.6 | | | $ | 653.7 | | | $ | 970.4 | | | | $ | 1,251.9 | | | | $ | 1,249.3 | | | | $ | 1,501.3 | | | $ | 3,384.1 | | | $ | 2,403.1 | | | $ | 1,403.0 | |
| | | | | | | | | | | | | | | | | | | | | | | | | | | | | | | | | | |
| Ratio of total expenses to average net assets | | | 1.51 | % | | | 1.67 | % | | | 1.74 | % | | | 1.71 | % | | | | 1.71 | % | | | | 1.51 | % | | | | 1.86 | %2 | | | 1.88 | %2 | | | 1.77 | % | | | 1.62 | % |
| Less: Ratio of interest expense to average net assets | | | (0.19 | )% | | | (0.29 | )% | | | (0.34 | )% | | | (0.36 | )% | | | | (0.34 | )% | | | | (0.10 | )% | | | | (0.51 | )% | | | (0.57 | )% | | | (0.45 | )% | | | (0.27 | )% |
| | | | | | | | | | | | | | | | | | | | | | | | | | | | | | | | | | |
| Ratio of operating expenses to average net assets | | | 1.32 | % | | | 1.38 | % | | | 1.40 | % | | | 1.35 | % | | | | 1.37 | % | | | | 1.41 | % | | | | 1.35 | % | | | 1.31 | % | | | 1.32 | % | | | 1.35 | % |
| | | | | | | | | | | | | | | | | | | | | | | | | | | | | | | | | | |
Ratio of net investment income (loss) to average net assets | | | 0.66 | % | | | (0.66 | )% | | | (0.18 | )% | | | (0.69 | )% | | | | (0.51 | )% | | | | (0.30 | )% | | | | (0.49 | )% | | | (0.86 | )% | | | (0.80 | )% | | | (0.85 | )% |
| | | | | | | | | | | | | | | | | | | | | | | | | | | | | | | | | | |
| Portfolio turnover rate | | | 30.82 | % | | | 18.57 | % | | | 13.04 | % | | | 16.96 | % | | | | 15.85 | % | | | | 32.43 | % | | | | 38.02 | % | | | 32.95 | % | | | 35.92 | % | | | 37.62 | % |
| | | | | | | | | | | | | | | | | | | | | | | | | | | | | | | | | | |
| INSTITUTIONAL SHARES | | Year Ended December 31, |
| | | |
| | | 2014 | | 2013 | | 2012 | | 2011 | | 2010 | | 20093 |
| Net asset value, beginning of year | | $ | 33.72 | | | $ | 22.78 | | | $ | 19.52 | | | $ | 20.66 | | | $ | 15.66 | | | $ | 12.66 | |
| | | | | | | | | | | | | | | | | | | |
| Income (loss) from investment operations: | | | | | | | | | | | | | | | | | | | | | | | | |
| Net investment income (loss) | | | 0.25 | 1 | | | (0.12 | )1 | | | 0.04 | 1 | | | (0.08 | )1 | | | (0.06 | )1 | | | (0.03 | )1 |
| Net realized and unrealized gain (loss) on investments | | | 3.31 | | | | 11.06 | | | | 3.22 | | | | (1.06 | ) | | | 5.06 | | | | 3.03 | |
| | | | | | | | | | | | | | | | | | | |
Total from investment operations | | | 3.56 | | | | 10.94 | | | | 3.26 | | | | (1.14 | ) | | | 5.00 | | | | 3.00 | |
| | | | | | | | | | | | | | | | | | | |
| Less distributions to shareholders from: | | | | | | | | | | | | | | | | | | | | | | | | |
| Net investment income | | | 0.00 | | | | 0.00 | | | | 0.00 | | | | 0.00 | | | | 0.00 | | | | 0.00 | |
| Net realized gain on investments | | | 0.00 | | | | 0.00 | | | | 0.00 | | | | 0.00 | | | | 0.00 | | | | 0.00 | |
| | | | | | | | | | | | | | | | | | | |
Total distributions | | | 0.00 | | | | 0.00 | | | | 0.00 | | | | 0.00 | | | | 0.00 | | | | 0.00 | |
| | | | | | | | | | | | | | | | | | | |
| Net asset value, end of year | | $ | 37.28 | | | $ | 33.72 | | | $ | 22.78 | | | $ | 19.52 | | | $ | 20.66 | | | $ | 15.66 | |
| | | | | | | | | | | | | | | | | | | |
Total return | | | 10.56 | % | | | 48.02 | % | | | 16.70 | % | | | (5.52 | )% | | | 31.93 | % | | | 23.70 | %4 |
| | | | | | | | | | | | | | | | | | | |
| Ratios/Supplemental data: | | | | | | | | | | | | | | | | | | | | | | | | |
| Net assets (in millions), end of year | | $ | 681.5 | | | $ | 349.0 | | | $ | 146.5 | | | $ | 123.7 | | | $ | 119.9 | | | $ | 158.5 | |
| | | | | | | | | | | | | | | | | | | |
| Ratio of total expenses to average net assets | | | 1.26 | % | | | 1.41 | % | | | 1.48 | % | | | 1.45 | % | | | 1.45 | % | | | 1.38 | %5 |
| Less: Ratio of interest expense to average net assets | | | (0.20 | )% | | | (0.30 | )% | | | (0.35 | )% | | | (0.36 | )% | | | (0.34 | )% | | | (0.21 | )%5 |
| | | | | | | | | | | | | | | | | | | |
| Ratio of operating expenses to average net assets | | | 1.06 | % | | | 1.11 | % | | | 1.13 | % | | | 1.09 | % | | | 1.11 | % | | | 1.17 | %5 |
| | | | | | | | | | | | | | | | | | | |
| Ratio of net investment income (loss) to average net assets | | | 0.69 | % | | | (0.41 | )% | | | 0.18 | % | | | (0.41 | )% | | | (0.36 | )% | | | (0.31 | )%5 |
| | | | | | | | | | | | | | | | | | | |
| Portfolio turnover rate | | | 30.82 | % | | | 18.57 | % | | | 13.04 | % | | | 16.96 | % | | | 15.85 | % | | | 32.43 | % |
| | | | | | | | | | | | | | | | | | | |
|
| 1 | | Based on average shares outstanding. |
| 2 | | Benefit of expense reduction rounds to less than 0.01%. |
| 3 | | For the period May 29, 2009 (initial offering of Institutional Shares) to December 31, 2009. |
| 4 | | Not Annualized. |
| 5 | | Annualized. |
| See Notes to Financial Statements. | | 43 |
Baron Select Funds | |
December 31, 2014 |
BARON FOCUSED GROWTH FUND
Selected data for a share outstanding throughout each year:
| RETAIL SHARES | Year Ended December 31, |
| | |
| | | 2014 | | 2013 | | 2012 | | 2011 | | | 2010 | | | 2009 | | | 20081 |
| Net asset value, beginning of year | | $ | 13.97 | | | $ | 11.26 | | | $ | 9.71 | | | $ | 9.85 | | | $ | 8.14 | | | $ | 6.27 | | | $ | 10.00 | |
| | | | | | | | | | | | | | | | | | | | | | |
| Income (loss) from investment operations: | | | | | | | | | | | | | | | | | | | | | | | | | | | | |
| Net investment income (loss) | | | 0.04 | 2 | | | (0.07 | )2 | | | 0.24 | 2 | | | (0.07 | )2 | | | (0.01 | )2 | | | 0.12 | 2 | | | 0.00 | 2,3 |
| Net realized and unrealized gain (loss) on investments | | | 0.29 | | | | 2.95 | | | | 1.31 | | | | (0.07 | ) | | | 2.05 | | | | 2.00 | | | | (3.33 | ) |
| | | | | | | | | | | | | | | | | | | | | | |
Total from investment operations | | | 0.33 | | | | 2.88 | | | | 1.55 | | | | (0.14 | ) | | | 2.04 | | | | 2.12 | | | | (3.33 | ) |
| | | | | | | | | | | | | | | | | | | | | | |
| Less distributions to shareholders from: | | | | | | | | | | | | | | | | | | | | | | | | | | | | |
| Net investment income | | | 0.00 | | | | (0.17 | ) | | | 0.00 | | | | 0.00 | | | | (0.33 | ) | | | (0.13 | ) | | | 0.00 | |
| Net realized gain on investments | | | (0.09 | ) | | | 0.00 | | | | 0.00 | | | | 0.00 | | | | 0.00 | | | | 0.00 | | | | 0.00 | |
| Return of capital | | | 0.00 | | | | 0.00 | | | | 0.00 | | | | 0.00 | | | | 0.00 | | | | (0.12 | ) | | | (0.40 | ) |
| | | | | | | | | | | | | | | | | | | | | | |
Total distributions | | | (0.09 | ) | | | (0.17 | ) | | | 0.00 | | | | 0.00 | | | | (0.33 | ) | | | (0.25 | ) | | | (0.40 | ) |
| | | | | | | | | | | | | | | | | | | | | | |
| Net asset value, end of year | | $ | 14.21 | | | $ | 13.97 | | | $ | 11.26 | | | $ | 9.71 | | | $ | 9.85 | | | $ | 8.14 | | | $ | 6.27 | |
| | | | | | | | | | | | | | | | | | | | | | |
Total return | | | 2.35 | %4 | | | 25.69 | %4 | | | 15.96 | %4 | | | (1.42 | )%4 | | | 25.17 | %4 | | | 33.77 | %4 | | | (33.11 | )%4,5 |
| | | | | | | | | | | | | | | | | | | | | | |
| Ratios/Supplemental data: | | | | | | | | | | | | | | | | | | | | | | | | �� | | | | |
| Net assets (in millions), end of year | | $ | 46.1 | | | $ | 47.6 | | | $ | 31.4 | | | $ | 28.3 | | | $ | 46.4 | | | $ | 39.9 | | | $ | 59.3 | |
| | | | | | | | | | | | | | | | | | | | | | |
| Ratio of operating expenses to average net assets | | | 1.39 | % | | | 1.42 | % | | | 1.48 | % | | | 1.48 | % | | | 1.47 | % | | | 1.52 | % | | | 1.54 | %6 |
| Less: Reimbursement of expenses by Adviser | | | (0.04 | )% | | | (0.07 | )% | | | (0.13 | )% | | | (0.13 | )% | | | (0.12 | )% | | | (0.17 | )% | | | (0.19 | )%6 |
| | | | | | | | | | | | | | | | | | | | | | |
| Ratio of net operating expenses to average net assets | | | 1.35 | % | | | 1.35 | % | | | 1.35 | % | | | 1.35 | % | | | 1.35 | % | | | 1.35 | % | | | 1.35 | %6 |
| | | | | | | | | | | | | | | | | | | | | | |
| Ratio of net investment income (loss) to average net assets | | | 0.31 | % | | | (0.53 | )% | | | 2.30 | % | | | (0.69 | )% | | | (0.16 | )% | | | 1.81 | % | | | 0.01 | %6 |
| | | | | | | | | | | | | | | | | | | | | | |
| Portfolio turnover rate | | | 36.92 | % | | | 33.67 | % | | | 38.38 | % | | | 44.58 | % | | | 24.08 | % | | | 34.76 | % | | | 35.43 | %5 |
| | | | | | | | | | | | | | | | | | | | | | |
| INSTITUTIONAL SHARES | | Year Ended December 31, |
| | | |
| | | 2014 | | 2013 | | 2012 | | 2011 | | 2010 | | 20097 |
| Net asset value, beginning of year | | $ | 14.10 | | | $ | 11.35 | | | $ | 9.77 | | | $ | 9.88 | | | $ | 8.15 | | | $ | 6.88 | |
| | | | | | | | | | | | | | | | | | | |
| Income (loss) from investment operations: | | | | | | | | | | | | | | | | | | | | | | | | |
| Net investment income (loss) | | | 0.08 | 2 | | | (0.04 | )2 | | | 0.26 | 2 | | | (0.04 | )2 | | | 0.01 | 2 | | | 0.07 | 2 |
| Net realized and unrealized gain (loss) on investments | | | 0.28 | | | | 2.99 | | | | 1.32 | | | | (0.07 | ) | | | 2.05 | | | | 1.45 | |
| | | | | | | | | | | | | | | | | | | |
Total from investment operations | | | 0.36 | | | | 2.95 | | | | 1.58 | | | | (0.11 | ) | | | 2.06 | | | | 1.52 | |
| | | | | | | | | | | | | | | | | | | |
| Less distributions to shareholders from: | | | | | | | | | | | | | | | | | | | | | | | | |
| Net investment income | | | 0.00 | | | | (0.20 | ) | | | 0.00 | | | | 0.00 | | | | (0.33 | ) | | | (0.13 | ) |
| Net realized gain on investments | | | (0.09 | ) | | | 0.00 | | | | 0.00 | | | | 0.00 | | | | 0.00 | | | | 0.00 | |
| Return of capital | �� | | 0.00 | | | | 0.00 | | | | 0.00 | | | | 0.00 | | | | 0.00 | | | | (0.12 | ) |
| | | | | | | | | | | | | | | | | | | |
Total distributions | | | (0.09 | ) | | | (0.20 | ) | | | 0.00 | | | | 0.00 | | | | (0.33 | ) | | | (0.25 | ) |
| | | | | | | | | | | | | | | | | | | |
| Net asset value, end of year | | $ | 14.37 | | | $ | 14.10 | | | $ | 11.35 | | | $ | 9.77 | | | $ | 9.88 | | | $ | 8.15 | |
| | | | | | | | | | | | | | | | | | | |
Total return | | | 2.54 | % | | | 26.09 | %4 | | | 16.17 | %4 | | | (1.11 | )%4 | | | 25.39 | %4 | | | 22.06 | %4,5 |
| | | | | | | | | | | | | | | | | | | |
| Ratios/Supplemental data: | | | | | | | | | | | | | | | | | | | | | | | | |
| Net assets (in millions), end of year | | $ | 149.2 | | | $ | 148.4 | | | $ | 87.9 | | | $ | 63.6 | | | $ | 44.3 | | | $ | 36.6 | |
| | | | | | | | | | | | | | | | | | | |
| Ratio of operating expenses to average net assets | | | 1.09 | % | | | 1.12 | % | | | 1.16 | % | | | 1.18 | % | | | 1.19 | % | | | 1.25 | %6 |
| Less: Reimbursement of expenses by Adviser | | | 0.00 | % | | | (0.02 | )% | | | (0.06 | )% | | | (0.08 | )% | | | (0.09 | )% | | | (0.15 | )%6 |
| | | | | | | | | | | | | | | | | | | |
| Ratio of net operating expenses to average net assets | | | 1.09 | % | | | 1.10 | % | | | 1.10 | % | | | 1.10 | % | | | 1.10 | % | | | 1.10 | %6 |
| | | | | | | | | | | | | | | | | | | |
| Ratio of net investment income (loss) to average net assets | | | 0.56 | % | | | (0.28 | )% | | | 2.53 | % | | | (0.40 | )% | | | 0.08 | % | | | 1.63 | %6 |
| | | | | | | | | | | | | | | | | | | |
| Portfolio turnover rate | | | 36.92 | % | | | 33.67 | % | | | 38.38 | % | | | 44.58 | % | | | 24.08 | % | | | 34.76 | % |
| | | | | | | | | | | | | | | | | | | |
|
| 1 | | For the period June 30, 2008 (commencement of operations) to December 31, 2008. |
| 2 | | Based on average shares outstanding. |
| 3 | | Less than $0.01 per share. |
| 4 | | The total returns would have been lower had certain expenses not been reduced during the period shown. |
| 5 | | Not Annualized. |
| 6 | | Annualized. |
| 7 | | For the period May 29, 2009 (initial offering of Institutional Shares) to December 31, 2009. |
| 44 | | See Notes to Financial Statements. |
December 31, 2014 | |
Baron Select Funds |
| FINANCIAL HIGHLIGHTS |
| |
| |
| BARON INTERNATIONAL GROWTH FUND |
| Selected data for a share outstanding throughout each year: |
| RETAIL SHARES | | Year Ended December 31, |
| | | |
| | | 2014 | | 2013 | | | 2012 | | | 2011 | | | 2010 | | | 2009 | |
| Net asset value, beginning of year | | $ | 18.91 | | | $ | 15.55 | | | $ | 13.20 | | | $ | 17.29 | | | $ | 14.11 | | | $ | 10.00 | |
| | | | | | | | | | | | | | | | | | | |
| Income (loss) from investment operations: | | | | | | | | | | | | | | | | | | | | | | | | |
| Net investment income (loss) | | | 0.03 | 1 | | | (0.01 | )1 | | | (0.02 | )1 | | | (0.01 | )1 | | | 0.01 | 1 | | | 0.04 | 1 |
| Net realized and unrealized gain (loss) on investments | | | (0.46 | ) | | | 3.37 | | | | 2.37 | | | | (2.78 | ) | | | 3.38 | | | | 4.43 | |
| | | | | | | | | | | | | | | | | | | |
Total from investment operations | | | (0.43 | ) | | | 3.36 | | | | 2.35 | | | | (2.79 | ) | | | 3.39 | | | | 4.47 | |
| | | | | | | | | | | | | | | | | | | |
| Less distributions to shareholders from: | | | | | | | | | | | | | | | | | | | | | | | | |
| Net investment income | | | (0.00 | )2 | | | 0.00 | | | | 0.00 | | | | (0.04 | ) | | | 0.00 | | | | 0.00 | |
| Net realized gain on investments | | | (0.54 | ) | | | 0.00 | | | | 0.00 | | | | (1.26 | ) | | | (0.21 | ) | | | (0.36 | ) |
| | | | | | | | | | | | | | | | | | | |
Total distributions | | | (0.54 | ) | | | 0.00 | | | | 0.00 | | | | (1.30 | ) | | | (0.21 | ) | | | (0.36 | ) |
| | | | | | | | | | | | | | | | | | | |
| Net asset value, end of year | | $ | 17.94 | | | $ | 18.91 | | | $ | 15.55 | | | $ | 13.20 | | | $ | 17.29 | | | $ | 14.11 | |
| | | | | | | | | | | | | | | | | | | |
Total return | | | (2.33 | )%3 | | | 21.61 | %3 | | | 17.80 | %3 | | | (16.35 | )%3 | | | 24.22 | %3 | | | 44.69 | %3 |
| | | | | | | | | | | | | | | | | | | |
| Ratios/Supplemental data: | | | | | | | | | | | | | | | | | | | | | | | | |
| Net assets (in millions), end of year | | $ | 53.0 | | | $ | 17.0 | | | $ | 15.6 | | | $ | 11.7 | | | $ | 15.3 | | | $ | 8.4 | |
| | | | | | | | | | | | | | | | | | | |
| Ratio of operating expenses to average net assets | | | 1.63 | % | | | 1.74 | % | | | 1.78 | % | | | 1.73 | % | | | 1.76 | % | | | 2.33 | % |
| Less: Reimbursement of expenses by Adviser | | | (0.13 | )% | | | (0.24 | )% | | | (0.28 | )% | | | (0.23 | )% | | | (0.26 | )% | | | (0.83 | )% |
| | | | | | | | | | | | | | | | | | | |
| Ratio of net operating expenses to average net assets | | | 1.50 | % | | | 1.50 | % | | | 1.50 | % | | | 1.50 | % | | | 1.50 | % | | | 1.50 | % |
| | | | | | | | | | | | | | | | | | | |
| Ratio of net investment income (loss) to average net assets | | | 0.14 | % | | | (0.05 | )% | | | (0.16 | )% | | | (0.05 | )% | | | 0.07 | % | | | 0.38 | % |
| | | | | | | | | | | | | | | | | | | |
| Portfolio turnover rate | | | 34.67 | % | | | 40.60 | % | | | 39.02 | % | | | 53.20 | % | | | 32.70 | % | | | 53.94 | % |
| | | | | | | | | | | | | | | | | | | |
| | | | | | | | | | | | | | | | | | | | | |
| INSTITUTIONAL SHARES | | Year Ended December 31, |
| | | |
| | | 2014 | | 2013 | | 2012 | | 2011 | | 2010 | | 20096 |
| Net asset value, beginning of year | | $ | 19.05 | | | $ | 15.63 | | | $ | 13.25 | | | $ | 17.36 | | | $ | 14.13 | | | $ | 11.13 | |
| | | | | | | | | | | | | | | | | | | |
| Income (loss) from investment operations: | | | | | | | | | | | | | | | | | | | | | | | | |
| Net investment income (loss) | | | 0.12 | 1 | | | 0.03 | 1 | | | 0.01 | 1 | | | 0.03 | 1 | | | 0.05 | 1 | | | (0.02 | )1 |
| Net realized and unrealized gain (loss) on investments | | | (0.50 | ) | | | 3.39 | | | | 2.40 | | | | (2.79 | ) | | | 3.39 | | | | 3.38 | |
| | | | | | | | | | | | | | | | | | | |
Total from investment operations | | | (0.38 | ) | | | 3.42 | | | | 2.41 | | | | (2.76 | ) | | | 3.44 | | | | 3.36 | |
| | | | | | | | | | | | | | | | | | | |
| Less distributions to shareholders from: | | | | | | | | | | | | | | | | | | | | | | | | |
| Net investment income | | | (0.04 | ) | | | (0.00 | )2 | | | (0.03 | ) | | | (0.09 | ) | | | 0.00 | | | | 0.00 | |
| Net realized gain on investments | | | (0.54 | ) | | | 0.00 | | | | 0.00 | | | | (1.26 | ) | | | (0.21 | ) | | | (0.36 | ) |
| | | | | | | | | | | | | | | | | | | |
Total distributions | | | (0.58 | ) | | | (0.00 | )2 | | | (0.03 | ) | | | (1.35 | ) | | | (0.21 | ) | | | (0.36 | ) |
| | | | | | | | | | | | | | | | | | | |
| Net asset value, end of year | | $ | 18.09 | | | $ | 19.05 | | | $ | 15.63 | | | $ | 13.25 | | | $ | 17.36 | | | $ | 14.13 | |
| | | | | | | | | | | | | | | | | | | |
Total return | | | (2.07 | )%3 | | | 21.89 | %3 | | | 18.17 | %3 | | | (16.13 | )%3 | | | 24.54 | %3 | | | 30.18 | %3,4 |
| | | | | | | | | | | | | | | | | | | |
| Ratios/Supplemental data: | | | | | | | | | | | | | | | | | | | | | | | | |
| Net assets (in millions), end of year | | $ | 52.3 | | | $ | 45.4 | | | $ | 39.0 | | | $ | 30.5 | | | $ | 37.4 | | | $ | 22.1 | |
| | | | | | | | | | | | | | | | | | | |
| Ratio of operating expenses to average net assets | | | 1.34 | % | | | 1.37 | % | | | 1.40 | % | | | 1.38 | % | | | 1.40 | % | | | 1.89 | %5 |
| Less: Reimbursement of expenses by Adviser | | | (0.09 | )% | | | (0.12 | )% | | | (0.15 | )% | | | (0.13 | )% | | | (0.15 | )% | | | (0.64 | )%5 |
| | | | | | | | | | | | | | | | | | | |
| Ratio of net operating expenses to average net assets | | | 1.25 | % | | | 1.25 | % | | | 1.25 | % | | | 1.25 | % | | | 1.25 | % | | | 1.25 | %5 |
| | | | | | | | | | | | | | | | | | | |
| Ratio of net investment income (loss) to average net assets | | | 0.64 | % | | | 0.20 | % | | | 0.09 | % | | | 0.19 | % | | | 0.31 | % | | | (0.29 | )%5 |
| | | | | | | | | | | | | | | | | | | |
| Portfolio turnover rate | | | 34.67 | % | | | 40.60 | % | | | 39.02 | % | | | 53.20 | % | | | 32.70 | % | | | 53.94 | % |
| | | | | | | | | | | | | | | | | | | |
|
| 1 | | Based on average shares outstanding. |
| 2 | | Less than $0.01 per share. |
| 3 | | The total returns would have been lower had certain expenses not been reduced during the period shown. |
| 4 | | Not Annualized. |
| 5 | | Annualized. |
| 6 | | For the period May 29, 2009 (initial offering of Institutional Shares) to December 31, 2009. |
| See Notes to Financial Statements. | | 45 |
Baron Select Funds | |
December 31, 2014 |
BARON REAL ESTATE FUND
Selected data for a share outstanding throughout each year:
| RETAIL SHARES | | | | | | | | | | | | | | | | | | |
| | | Year Ended December 31, |
| | | |
| | | 2014 | | 2013 | | | 2012 | | | 2011 | | | 2010 | |
Net asset value, beginning of year | | $ | 22.25 | | | $ | 17.52 | | | $ | 12.51 | | | $ | 12.66 | | | $ | 10.00 | |
| | | | | | | | | | | | | | | | |
Income (loss) from investment operations: | | | | | | | | | | | | | | | | | | | | |
Net investment income (loss) | | | 0.04 | 1 | | | (0.05 | )1 | | | 0.01 | 1 | | | (0.01 | )1 | | | 0.02 | 1 |
Net realized and unrealized gain on investments | | | 3.66 | | | | 4.80 | | | | 5.31 | | | | 0.07 | 2 | | | 2.64 | |
| | | | | | | | | | | | | | | | |
Total from investment operations | | | 3.70 | | | | 4.75 | | | | 5.32 | | | | 0.06 | | | | 2.66 | |
| | | | | | | | | | | | | | | | |
Less distributions to shareholders from: | | | | | | | | | | | | | | | | | | | | |
Net investment income | | | (0.03 | ) | | | 0.00 | | | | 0.00 | | | | (0.00 | )3 | | | 0.00 | |
Net realized gain on investments | | | 0.00 | | | | (0.02 | ) | | | (0.31 | ) | | | (0.21 | ) | | | 0.00 | |
| | | | | | | | | | | | | | | | |
Total distributions | | | (0.03 | ) | | | (0.02 | ) | | | (0.31 | ) | | | (0.21 | ) | | | 0.00 | |
| | | | | | | | | | | | | | | | |
Net asset value, end of year | | $ | 25.92 | | | $ | 22.25 | | | $ | 17.52 | | | $ | 12.51 | | | $ | 12.66 | |
| | | | | | | | | | | | | | | | |
Total return | | | 16.61 | % | | | 27.12 | % | | | 42.60 | %4 | | | 0.63 | %4 | | | 26.60 | %4 |
| | | | | | | | | | | | | | | | |
Ratios/Supplemental data: | | | | | | | | | | | | | | | | | | | | |
Net assets (in millions), end of year | | $ | 782.8 | | | $ | 539.5 | | | $ | 53.6 | | | $ | 10.9 | | | $ | 5.5 | |
| | | | | | | | | | | | | | | | |
Ratio of operating expenses to average net assets | | | 1.32 | % | | | 1.35 | % | | | 1.76 | % | | | 2.33 | % | | | 4.35 | % |
Less: Reimbursement of expenses by Adviser | | | 0.00 | % | | | 0.00 | % | | | (0.41 | )% | | | (0.98 | )% | | | (3.00 | )% |
| | | | | | | | | | | | | | | | |
Ratio of net operating expenses to average net assets | | | 1.32 | % | | | 1.35 | % | | | 1.35 | % | | | 1.35 | % | | | 1.35 | % |
| | | | | | | | | | | | | | | | |
Ratio of net investment income (loss) to average net assets | | | 0.17 | % | | | (0.23 | )% | | | 0.07 | % | | | (0.08 | )% | | | 0.14 | % |
| | | | | | | | | | | | | | | | |
Portfolio turnover rate | | | 24.40 | % | | | 19.36 | % | | | 30.14 | % | | | 70.99 | % | | | 58.03 | % |
| | | | | | | | | | | | | | | | |
| INSTITUTIONAL SHARES | | | | | | | | | | | | | | | | | | |
| | | Year Ended December 31, |
| | | |
| | | 2014 | | 2013 | | | 2012 | | | 2011 | | | 2010 | |
Net asset value, beginning of year | | $ | 22.43 | | | $ | 17.64 | | | $ | 12.56 | | | $ | 12.69 | | | $ | 10.00 | |
| | | | | | | | | | | | | | | | |
Income (loss) from investment operations: | | | | | | | | | | | | | | | | | | | | |
Net investment income | | | 0.11 | 1 | | | 0.03 | 1 | | | 0.06 | 1 | | | 0.02 | 1 | | | 0.04 | 1 |
Net realized and unrealized gain on investments | | | 3.68 | | | | 4.81 | | | | 5.33 | | | | 0.07 | 2 | | | 2.65 | |
| | | | | | | | | | | | | | | | |
Total from investment operations | | | 3.79 | | | | 4.84 | | | | 5.39 | | | | 0.09 | | | | 2.69 | |
| | | | | | | | | | | | | | | | |
Less distributions to shareholders from: | | | | | | | | | | | | | | | | | | | | |
Net investment income | | | (0.08 | ) | | | (0.00 | )3 | | | 0.00 | | | | (0.01 | ) | | | 0.00 | |
Net realized gain on investments | | | 0.00 | | | | (0.02 | ) | | | (0.31 | ) | | | (0.21 | ) | | | 0.00 | |
Return of capital | | | 0.00 | | | | (0.03 | ) | | | 0.00 | | | | 0.00 | | | | 0.00 | |
| | | | | | | | | | | | | | | | |
Total distributions | | | (0.08 | ) | | | (0.05 | ) | | | (0.31 | ) | | | (0.22 | ) | | | 0.00 | |
| | | | | | | | | | | | | | | | |
Net asset value, end of year | | $ | 26.14 | | | $ | 22.43 | | | $ | 17.64 | | | $ | 12.56 | | | $ | 12.69 | |
| | | | | | | | | | | | | | | | |
Total return | | | 16.93 | % | | | 27.48 | % | | | 42.99 | %4 | | | 0.80 | %4 | | | 26.90 | %4 |
| | | | | | | | | | | | | | | | |
Ratios/Supplemental data: | | | | | | | | | | | | | | | | | | | | |
Net assets (in millions), end of year | | $ | 919.7 | | | $ | 486.1 | | | $ | 35.5 | | | $ | 4.9 | | | $ | 3.2 | |
| | | | | | | | | | | | | | | | |
Ratio of operating expenses to average net assets | | | 1.06 | % | | | 1.09 | % | | | 1.44 | % | | | 2.14 | % | | | 4.26 | % |
Less: Reimbursement of expenses by Adviser | | | 0.00 | % | | | 0.00 | % | | | (0.34 | )% | | | (1.04 | )% | | | (3.16 | )% |
| | | | | | | | | | | | | | | | |
Ratio of net operating expenses to average net assets | | | 1.06 | % | | | 1.09 | % | | | 1.10 | % | | | 1.10 | % | | | 1.10 | % |
| | | | | | | | | | | | | | | | |
Ratio of net investment income to average net assets | | | 0.44 | % | | | 0.15 | % | | | 0.36 | % | | | 0.17 | % | | | 0.36 | % |
| | | | | | | | | | | | | | | | |
Portfolio turnover rate | | | 24.40 | % | | | 19.36 | % | | | 30.14 | % | | | 70.99 | % | | | 58.03 | % |
| | | | | | | | | | | | | | | | |
|
| 1 | | Based on average shares outstanding. |
| 2 | | The amount shown for a share outstanding does not correspond with the aggregate realized and unrealized gain (loss) on investments for the period due to the timing of sales and redemptions of fund shares in relation to fluctuating market values of investments of the Fund. |
| 3 | | Less than $0.01 per share. |
| 4 | | The total returns would have been lower had certain expenses not been reduced during the period shown. |
| 46 | See Notes to Financial Statements. |
December 31, 2014 | |
Baron Select Funds |
BARON EMERGING MARKETS FUND
Selected data for a share outstanding throughout each year:
| RETAIL SHARES | | | | | | | | | | | | | | |
| | | Year Ended December 31, |
| | | |
| | | 2014 | | 2013 | | | 2012 | | | 2011 | |
Net asset value, beginning of year | | $ | 11.54 | | | $ | 10.06 | | | $ | 8.28 | | | $ | 10.00 | |
| | | | | | | | | | | | | |
Income (loss) from investment operations: | | | | | | | | | | | | | | | | |
Net investment income (loss) | | | 0.07 | 1 | | | (0.06 | )1 | | | (0.04 | )1 | | | (0.03 | )1 |
Net realized and unrealized gain (loss) on investments | | | 0.33 | | | | 1.54 | | | | 1.94 | | | | (1.69 | ) |
| | | | | | | | | | | | | |
Total from investment operations | | | 0.40 | | | | 1.48 | | | | 1.90 | | | | (1.72 | ) |
| | | | | | | | | | | | | |
Less distributions to shareholders from: | | | | | | | | | | | | | | | | |
Net investment income | | | (0.03 | ) | | | 0.00 | | | | (0.12 | ) | | | 0.00 | |
Net realized gain on investments | | | 0.00 | | | | 0.00 | | | | 0.00 | | | | 0.00 | |
| | | | | | | | | | | | | |
Total distributions | | | (0.03 | ) | | | 0.00 | | | | (0.12 | ) | | | 0.00 | |
| | | | | | | | | | | | | |
Net asset value, end of year | | $ | 11.91 | | | $ | 11.54 | | | $ | 10.06 | | | $ | 8.28 | |
| | | | | | | | | | | | | |
Total return | | | 3.47 | %2 | | | 14.71 | %2 | | | 22.98 | %2 | | | (17.20 | )%2 |
| | | | | | | | | | | | | |
Ratios/Supplemental data: | | | | | | | | | | | | | | | | |
Net assets (in millions), end of year | | $ | 649.7 | | | $ | 259.6 | | | $ | 2.9 | | | $ | 2.0 | |
| | | | | | | | | | | | | |
Ratio of operating expenses to average net assets | | | 1.52 | % | | | 1.90 | % | | | 4.01 | % | | | 4.49 | % |
Less: Reimbursement of expenses by Adviser | | | (0.02 | )% | | | (0.40 | )% | | | (2.51 | )% | | | (2.99 | )% |
| | | | | | | | | | | | | |
Ratio of net operating expenses to average net assets | | | 1.50 | % | | | 1.50 | % | | | 1.50 | % | | | 1.50 | % |
| | | | | | | | | | | | | |
Ratio of net investment income (loss) to average net assets | | | 0.56 | % | | | (0.53 | )% | | | (0.39 | )% | | | (0.32 | )% |
| | | | | | | | | | | | | |
Portfolio turnover rate | | | 23.38 | % | | | 14.68 | % | | | 42.68 | % | | | 45.86 | % |
| | | | | | | | | | | | | |
| INSTITUTIONAL SHARES | | | | | | | | | | | | | | |
| | | Year Ended December 31, |
| | | |
| | | 2014 | | 2013 | | | 2012 | | | 2011 | |
Net asset value, beginning of year | | $ | 11.56 | | | $ | 10.05 | | | $ | 8.30 | | | $ | 10.00 | |
| | | | | | | | | | | | | |
Income (loss) from investment operations: | | | | | | | | | | | | | | | | |
Net investment income (loss) | | | 0.09 | 1 | | | 0.01 | 1 | | | (0.01 | )1 | | | (0.01 | )1 |
Net realized and unrealized gain (loss) on investments | | | 0.34 | | | | 1.50 | | | | 1.93 | | | | (1.69 | ) |
| | | | | | | | | | | | | |
Total from investment operations | | | 0.43 | | | | 1.51 | | | | 1.92 | | | | (1.70 | ) |
| | | | | | | | | | | | | |
Less distributions to shareholders from: | | | | | | | | | | | | | | | | |
Net investment income | | | (0.05 | ) | | | 0.00 | | | | (0.17 | ) | | | 0.00 | |
Net realized gain on investments | | | 0.00 | | | | 0.00 | | | | 0.00 | | | | 0.00 | |
| | | | | | | | | | | | | |
Total distributions | | | (0.05 | ) | | | 0.00 | | | | (0.17 | ) | | | 0.00 | |
| | | | | | | | | | | | | |
Net asset value, end of year | | $ | 11.94 | | | $ | 11.56 | | | $ | 10.05 | | | $ | 8.30 | |
| | | | | | | | | | | | | |
Total return | | | 3.75 | %2 | | | 15.02 | %2 | | | 23.22 | %2 | | | (17.00 | )%2 |
| | | | | | | | | | | | | |
Ratios/Supplemental data: | | | | | | | | | | | | | | | | |
Net assets (in millions), end of year | | $ | 697.8 | | | $ | 116.0 | | | $ | 6.0 | | | $ | 4.3 | |
| | | | | | | | | | | | | |
Ratio of operating expenses to average net assets | | | 1.27 | % | | | 1.80 | % | | | 3.37 | % | | | 3.83 | % |
Less: Reimbursement of expenses by Adviser | | | (0.02 | )% | | | (0.55 | )% | | | (2.12 | )% | | | (2.58 | )% |
| | | | | | | | | | | | | |
Ratio of net operating expenses to average net assets | | | 1.25 | % | | | 1.25 | % | | | 1.25 | % | | | 1.25 | % |
| | | | | | | | | | | | | |
Ratio of net investment income (loss) to average net assets | | | 0.76 | % | | | 0.05 | % | | | (0.14 | )% | | | (0.07 | )% |
| | | | | | | | | | | | | |
Portfolio turnover rate | | | 23.38 | % | | | 14.68 | % | | | 42.68 | % | | | 45.86 | % |
| | | | | | | | | | | | | |
|
| 1 | | Based on average shares outstanding. |
| 2 | | The total returns would have been lower had certain expenses not been reduced during the period shown. |
| See Notes to Financial Statements. | 47 |
Baron Select Funds | |
December 31, 2014 |
BARON ENERGY AND RESOURCES FUND
Selected data for a share outstanding throughout each year:
| RETAIL SHARES | | Year Ended December 31, |
| | | |
| | | 2014 | | 2013 | | | 2012 | |
Net asset value, beginning of year | | $ | 11.84 | | | $ | 9.46 | | | $ | 10.00 | |
| | | | | | | | | | |
Income (loss) from investment operations: | | | | | | | | | | | | |
Net investment loss | | | (0.01 | )1 | | | (0.01 | )1 | | | (0.03 | )1 |
Net realized and unrealized gain (loss) on investments | | | (1.50 | ) | | | 2.40 | | | | (0.51 | ) |
| | | | | | | | | | |
Total from investment operations | | | (1.51 | ) | | | 2.39 | | | | (0.54 | ) |
| | | | | | | | | | |
Less distributions to shareholders from: | | | | | | | | | | | | |
Net investment income | | | 0.00 | | | | (0.01 | ) | | | 0.00 | |
Net realized gain on investments | | | 0.00 | | | | 0.00 | | | | 0.00 | |
| | | | | | | | | | |
Total distributions | | | 0.00 | | | | (0.01 | ) | | | 0.00 | |
| | | | | | | | | | |
Net asset value, end of year | | $ | 10.33 | | | $ | 11.84 | | | $ | 9.46 | |
| | | | | | | | | | |
Total return | | | (12.75 | )%2 | | | 25.32 | %2 | | | (5.40 | )%2 |
| | | | | | | | | | |
Ratios/Supplemental data: | | | | | | | | | | | | |
Net assets (in millions), end of year | | $ | 39.7 | | | $ | 29.2 | | | $ | 1.8 | |
| | | | | | | | | | |
Ratio of operating expenses to average net assets | | | 1.79 | % | | | 2.25 | % | | | 9.07 | % |
Less: Reimbursement of expenses by Adviser | | | (0.44 | )% | | | (0.90 | )% | | | (7.72 | )% |
| | | | | | | | | | |
Ratio of net operating expenses to average net assets | | | 1.35 | % | | | 1.35 | % | | | 1.35 | % |
| | | | | | | | | | |
Ratio of net investment loss to average net assets | | | (0.04 | )% | | | (0.05 | )% | | | (0.36 | )% |
| | | | | | | | | | |
Portfolio turnover rate | | | 23.12 | % | | | 25.60 | % | | | 35.74 | % |
| | | | | | | | | | |
| INSTITUTIONAL SHARES | | Year Ended December 31, |
| | | |
| | | 2014 | | 2013 | | | 2012 | |
Net asset value, beginning of year | | $ | 11.91 | | | $ | 9.48 | | | $ | 10.00 | |
| | | | | | | | | | |
Income (loss) from investment operations: | | | | | | | | | | | | |
Net investment income (loss) | | | 0.03 | 1 | | | 0.02 | 1 | | | (0.01 | )1 |
Net realized and unrealized gain (loss) on investments | | | (1.53 | ) | | | 2.41 | | | | (0.51 | ) |
| | | | | | | | | | |
Total from investment operations | | | (1.50 | ) | | | 2.43 | | | | (0.52 | ) |
| | | | | | | | | | |
Less distributions to shareholders from: | | | | | | | | | | | | |
Net investment income | | | 0.00 | | | | 0.00 | | | | 0.00 | |
Net realized gain on investments | | | 0.00 | | | | 0.00 | | | | 0.00 | |
| | | | | | | | | | |
Total distributions | | | 0.00 | | | | 0.00 | | | | 0.00 | |
| | | | | | | | | | |
Net asset value, end of year | | $ | 10.41 | | | $ | 11.91 | | | $ | 9.48 | |
| | | | | | | | | | |
Total return | | | (12.59 | )%2 | | | 25.63 | %2 | | | (5.20 | )%2 |
| | | | | | | | | | |
Ratios/Supplemental data: | | | | | | | | | | | | |
Net assets (in millions), end of year | | $ | 29.3 | | | $ | 4.0 | | | $ | 1.4 | |
| | | | | | | | | | |
Ratio of operating expenses to average net assets | | | 1.52 | % | | | 2.84 | % | | | 8.65 | % |
Less: Reimbursement of expenses by Adviser | | | (0.42 | )% | | | (1.74 | )% | | | (7.55 | )% |
| | | | | | | | | | |
Ratio of net operating expenses to average net assets | | | 1.10 | % | | | 1.10 | % | | | 1.10 | % |
| | | | | | | | | | |
Ratio of net investment income (loss) to average net assets | | | 0.22 | % | | | 0.20 | % | | | (0.11 | )% |
| | | | | | | | | | |
Portfolio turnover rate | | | 23.12 | % | | | 25.60 | % | | | 35.74 | % |
| | | | | | | | | | |
|
| 1 | | Based on average shares outstanding. |
| 2 | | The total returns would have been lower had certain expenses not been reduced during the period shown. |
| 48 | See Notes to Financial Statements. |
December 31, 2014 | |
Baron Select Funds |
BARON GLOBAL ADVANTAGE FUND
Selected data for a share outstanding throughout each year:
| RETAIL SHARES | | Year Ended December 31, |
| | | |
| | | 2014 | | 2013 | | | 20121 | |
Net asset value, beginning of year | | $ | 13.51 | | | $ | 10.41 | | | $ | 10.00 | |
| | | | | | | | | | |
Income (loss) from investment operations: | | | | | | | | | | | | |
Net investment income (loss) | | | 0.02 | 2 | | | (0.02 | )2 | | | (0.02 | )2 |
Net realized and unrealized gain on investments | | | 0.67 | | | | 3.12 | | | | 0.43 | |
| | | | | | | | | | |
Total from investment operations | | | 0.69 | | | | 3.10 | | | | 0.41 | |
| | | | | | | | | | |
Less distributions to shareholders from: | | | | | | | | | | | | |
Net investment income | | | 0.00 | | | | 0.00 | | | | 0.00 | |
Net realized gain on investments | | | (0.00 | )3 | | | 0.00 | | | | 0.00 | |
| | | | | | | | | | |
Total distributions | | | (0.00 | ) | | | 0.00 | | | | 0.00 | |
| | | | | | | | | | |
Net asset value, end of year | | $ | 14.20 | | | $ | 13.51 | | | $ | 10.41 | |
| | | | | | | | | | |
Total return | | | 5.11 | %4,5 | | | 29.78 | %4 | | | 4.10 | %4,6 |
| | | | | | | | | | |
Ratios/Supplemental data | | | | | | | | | | | | |
Net assets (in millions), end of year | | $ | 3.9 | | | $ | 2.3 | | | $ | 1.5 | |
| | | | | | | | | | |
Ratio of operating expenses to average net assets | | | 3.61 | % | | | 5.51 | % | | | 8.35 | %7,8 |
Less: Reimbursement of expenses by Adviser | | | (2.11 | )% | | | (4.01 | )% | | | (6.85 | )%7,8 |
| | | | | | | | | | |
Ratio of net operating expenses to average net assets | | | 1.50 | % | | | 1.50 | % | | | 1.50 | %7,8 |
| | | | | | | | | | |
Ratio of net investment income (loss) to average net assets | | | 0.18 | % | | | (0.20 | )% | | | (0.38 | )%7,8 |
| | | | | | | | | | |
Portfolio turnover rate | | | 123.51 | % | | | 32.78 | % | | | 24.64 | %6 |
| | | | | | | | | | |
| INSTITUTIONAL SHARES | | Year Ended December 31, |
| | | |
| | | 2014 | | 2013 | | | 20121 | |
Net asset value, beginning of year | | $ | 13.56 | | | $ | 10.42 | | | $ | 10.00 | |
| | | | | | | | | | |
Income (loss) from investment operations: | | | | | | | | | | | | |
Net investment income (loss) | | | 0.07 | 2 | | | 0.00 | 2,3 | | | (0.02 | )2 |
Net realized and unrealized gain on investments | | | 0.65 | | | | 3.14 | | | | 0.44 | |
| | | | | | | | | | |
Total from investment operations | | | 0.72 | | | | 3.14 | | | | 0.42 | |
| | | | | | | | | | |
Less distributions to shareholders from: | | | | | | | | | | | | |
Net investment income | | | 0.00 | | | | 0.00 | | | | 0.00 | |
Net realized gain on investments | | | (0.00 | )3 | | | 0.00 | | | | 0.00 | |
| | | | | | | | | | |
Total distributions | | | (0.00 | ) | | | 0.00 | | | | 0.00 | |
| | | | | | | | | | |
Net asset value, end of year | | $ | 14.28 | | | $ | 13.56 | | | $ | 10.42 | |
| | | | | | | | | | |
Total return | | | 5.32 | %4,5 | | | 30.13 | %4 | | | 4.20 | %4,6 |
| | | | | | | | | | |
Ratios/Supplemental data: | | | | | | | | | | | | |
Net assets (in millions), end of year | | $ | 4.1 | | | $ | 3.3 | | | $ | 1.6 | |
| | | | | | | | | | |
Ratio of operating expenses to average net assets | | | 2.92 | % | | | 4.91 | % | | | 7.33 | %7,8 |
Less: Reimbursement of expenses by Adviser | | | (1.67 | )% | | | (3.66 | )% | | | (6.08 | )%7,8 |
| | | | | | | | | | |
Ratio of net operating expenses to average net assets | | | 1.25 | % | | | 1.25 | % | | | 1.25 | %7,8 |
| | | | | | | | | | |
Ratio of net investment income (loss) to average net assets | | | 0.48 | % | | | 0.02 | % | | | (0.30 | )%7,8 |
| | | | | | | | | | |
Portfolio turnover rate | | | 123.51 | % | | | 32.78 | % | | | 24.64 | 6 |
| | | | | | | | | | |
|
| 1 | | For the period April 30, 2012 (commencement of operations) to December 31, 2012. |
| 2 | | Based on average shares outstanding. |
| 3 | | Less than $0.01 per share. |
| 4 | | The total returns would have been lower had certain expenses not been reduced during the period shown. |
| 5 | | The Adviser made a voluntary payment to the Fund in the amount of $47,291 to compensate the Fund for a loss incurred due to a shareholder activity processing error. The impact of this payment increased the Fund’s total return by 0.54%. |
| 6 | | Not Annualized. |
| 7 | | Certain fixed expenses incurred by the Fund were not annualized for the period ended December 31, 2012. |
| 8 | | Annualized. |
| See Notes to Financial Statements. | 49 |
Baron Select Funds | |
December 31, 2014 |
| REPORT OF INDEPENDENT REGISTERED PUBLIC ACCOUNTING FIRM |
| |
To the Shareholders and Board of Trustees of
Baron Select Funds
In our opinion, the accompanying statements of assets and liabilities, including the statements of net assets, and the related statements of operations and of changes in net assets and of cash flows (Baron Partners Fund only) and the financial highlights present fairly, in all material respects, the financial position of each of Baron Partners Fund, Baron Focused Growth Fund, Baron International Growth Fund, Baron Real Estate Fund, Baron Emerging Markets Fund, Baron Energy and Resources Fund and Baron Global Advantage Fund (seven of the portfolios constituting the Baron Select Funds, hereafter referred to as the “Funds”) at December 31, 2014, the results of each of their operations and cash flows (Baron Partners Fund only) for the year then ended, the changes in each of their net assets for each of the two years in the period then ended, and the financial highlights for each of the periods presented, in conformity with accounting principles generally accepted in the United States of America. These financial statements and financial highlights (hereafter referred to as “financial statements”) are the responsibility of the Funds’ management. Our responsibility is to express an opinion on these financial statements based on our audits. We conducted our audits of these financial statements in accordance with the standards of the Public Company Accounting Oversight Board (United States). Those standards require that we plan and perform the audit to obtain reasonable assurance about whether the financial statements are free of material misstatement. An audit includes examining, on a test basis, evidence supporting the amounts and disclosures in the financial statements, assessing the accounting principles used and significant estimates made by management, and evaluating the overall financial statement presentation. We believe that our audits, which included confirmation of securities at December 31, 2014 by correspondence with the custodian, brokers, portfolio companies, and transfer agents provide a reasonable basis for our opinion.

PricewaterhouseCoopers LLP
New York, New York
February 25, 2015
December 31, 2014 | |
Baron Select Funds |
| TAX INFORMATION (Unaudited) |
| |
The federal tax status of distributions paid by the Funds during the year ended December 31, 2014 are listed below.
During the fiscal year ended December 31, 2014, the Funds’ distributions to shareholders included:
| | | | Ordinary | | | Long-Term |
| Fund | | | Income1,3 | | | Capital Gains2,3 |
| Baron Focused Growth Fund | | | $ | — | | | | | $1,168,756 | |
| Baron International Growth Fund | | | | 101,998 | | | | | 2,751,644 | |
| Baron Real Estate Fund | | | | 3,698,225 | | | | | — | |
| Baron Emerging Markets Fund | | | | 4,415,521 | | | | | — | |
| Baron Global Advantage Fund | | | | 476 | | | | | — | |
|
| 1 | | For tax purposes, short-term capital gains are considered ordinary income distributions. |
| 2 | | Long-term capital gains are subject to a maximum allowable rate of 20% for individuals pursuant to the American Taxpayer Relief Act of 2012. |
| 3 | | Under the Patient Protection and Affordable Care Act, higher income taxpayers must pay a 3.8% additional tax on net investment income. |
Of the total ordinary income distributions paid by Baron International Growth Fund, Baron Real Estate Fund, Baron Emerging Markets Fund and Baron Global Advantage Fund, 100.00%, 100.00%, 86.57% and 21.00%, respectively, is qualified dividend income subject to a reduced tax rate. Of the total ordinary income distributions paid by Baron International Growth Fund, Baron Real Estate Fund, Baron Emerging Markets Fund and Baron Global Advantage Fund, 13.96%, 100.00%, 0.00% and 0.06%, respectively, qualifies for the corporate dividends received deduction.
The information and distributions reported may differ from the information and distributions taxable to the shareholders for the calendar year ended December 31, 2014. The information necessary to complete your income tax return for the calendar year ended December 31, 2014 will be listed on the Form 1099-DIV, which was mailed to you in January/February 2015.
Baron Select Funds | |
December 31, 2014 |
| FUND EXPENSES (Unaudited) |
| |
As a shareholder of the Funds, you may incur two types of costs: ongoing expenses and transaction costs. Ongoing expenses include advisory fees, distribution and service (12b-1) fees and other Fund expenses. Due to the payment of Rule 12b-1 fees, long-term shareholders may indirectly pay more than the maximum permitted front-end sales charge. The information on this page is intended to help you understand your ongoing costs of investing in the Funds and to compare these costs with the ongoing costs of investing in other mutual funds.
The information in the following table is based on an investment of $1,000 invested on July 1, 2014 and held for the six months ended December 31, 2014.
ACTUAL EXPENSES
The table below titled “Based on Actual Total Return” provides information about actual account values and actual expenses. You may use the information provided in this table, together with the amount you invested, to estimate the expenses that you paid over the period. To estimate the expenses you paid on your account, divide your ending account value by $1,000 (for example, an $8,600 ending account value divided by $1,000 = 8.6), then multiply the result by the number under the heading titled “Expenses Paid During the Period”.
BASED ON ACTUAL TOTAL RETURN FOR THE SIX MONTHS ENDED DECEMBER 31, 20141
| | | Actual
Total
Return | | Beginning
Account Value
July 1, 2014 | | Ending
Account Value
December 31, 2014 | | Annualized
Expense
Ratio | | Expenses
Paid During
the Period3 |
| Baron Partners Fund — Retail Shares 2 | | | | 0.22 | % | | | $ | 1,000.00 | | | | $ | 1,002.20 | | | | | 1.52 | %2 | | | $ | 7.67 | |
| Baron Partners Fund — Institutional Shares 2 | | | | 0.35 | % | | | $ | 1,000.00 | | | | $ | 1,003.50 | | | | | 1.27 | %2 | | | $ | 6.41 | |
| Baron Focused Growth Fund — Retail Shares | | | | 0.13 | % | | | $ | 1,000.00 | | | | $ | 1,001.30 | 4 | | | | 1.35 | %5 | | | $ | 6.81 | |
| Baron Focused Growth Fund — Institutional Shares | | | | 0.20 | % | | | $ | 1,000.00 | | | | $ | 1,002.00 | | | | | 1.08 | % | | | $ | 5.45 | |
| Baron International Growth Fund — Retail Shares | | | | (7.32 | )% | | | $ | 1,000.00 | | | | $ | 926.80 | 4 | | | | 1.50 | %5 | | | $ | 7.28 | |
| Baron International Growth Fund — Institutional Shares | | | | (7.18 | )% | | | $ | 1,000.00 | | | | $ | 928.20 | 4 | | | | 1.25 | %5 | | | $ | 6.08 | |
| Baron Real Estate Fund — Retail Shares | | | | 6.65 | % | | | $ | 1,000.00 | | | | $ | 1,066.50 | | | | | 1.31 | % | | | $ | 6.82 | |
| Baron Real Estate Fund — Institutional Shares | | | | 6.78 | % | | | $ | 1,000.00 | | | | $ | 1,067.80 | | | | | 1.06 | % | | | $ | 5.52 | |
| Baron Emerging Markets Fund — Retail Shares | | | | (4.55 | )% | | | $ | 1,000.00 | | | | $ | 954.50 | | | | | 1.50 | % | | | $ | 7.39 | |
| Baron Emerging Markets Fund — Institutional Shares | | | | (4.36 | )% | | | $ | 1,000.00 | | | | $ | 956.40 | | | | | 1.25 | % | | | $ | 6.16 | |
| Baron Energy & Resources Fund — Retail Shares | | | | (27.86 | )% | | | $ | 1,000.00 | | | | $ | 721.40 | 4 | | | | 1.35 | %5 | | | $ | 5.86 | |
| Baron Energy & Resources Fund — Institutional Shares | | | | (27.81 | )% | | | $ | 1,000.00 | | | | $ | 721.90 | 4 | | | | 1.10 | %5 | | | $ | 4.77 | |
| Baron Global Advantage Fund — Retail Shares | | | | (0.97 | )% | | | $ | 1,000.00 | | | | $ | 990.30 | 4 | | | | 1.50 | %5 | | | $ | 7.52 | |
| Baron Global Advantage Fund — Institutional Shares | | | | (0.90 | )% | | | $ | 1,000.00 | | | | $ | 991.00 | 4 | | | | 1.25 | %5 | | | $ | 6.27 | |
HYPOTHETICAL EXAMPLE FOR COMPARISON PURPOSES
The table below titled “Based on Hypothetical Total Return” provides information about hypothetical account values and hypothetical expenses based on the actual expense ratio and an assumed rate of return of 5% per year before expenses, which is not the Funds’ actual return. The hypothetical account values and expenses may not be used to estimate the actual ending account values and expenses you paid for the period. You may use the information provided in this table to compare the ongoing costs of investing in the Funds and other funds. To do so, compare the 5% hypothetical example relating to the Funds with the 5% hypothetical examples that appear in the shareholder reports of other funds.
Please note that expenses shown in the table below are meant to highlight your ongoing costs and do not reflect any transactional costs, such as redemption fees, if any. Therefore, the table is useful in comparing ongoing costs only and will not help you determine your relative total costs of owning different mutual funds. In addition, if these transactional costs were included, your costs would have been higher.
BASED ON HYPOTHETICAL TOTAL RETURN FOR THE SIX MONTHS ENDED DECEMBER 31, 2014
| | | | Hypothetical | | Beginning | | Ending | | Annualized | | Expenses |
| | | | Annualized | | Account Value | | Account Value | | Expense | | Paid During |
| | | | Total Return | | July 1, 2014 | | December 31, 2014 | | Ratio | | the Period3 |
| Baron Partners Fund — Retail Shares2 | | | | | 5.00 | % | | | $ | 1,000.00 | | | | $ | 1,017.54 | | | | | 1.52 | %2 | | | $ | 7.73 | |
| Baron Partners Fund — Institutional Shares2 | | | | | 5.00 | % | | | $ | 1,000.00 | | | | $ | 1,018.80 | | | | | 1.27 | %2 | | | $ | 6.46 | |
| Baron Focused Growth Fund — Retail Shares | | | | | 5.00 | % | | | $ | 1,000.00 | | | | $ | 1,018.40 | 4 | | | | 1.35 | %5 | | | $ | 6.87 | |
| Baron Focused Growth Fund — Institutional Shares | | | | | 5.00 | % | | | $ | 1,000.00 | | | | $ | 1,019.76 | | | | | 1.08 | % | | | $ | 5.50 | |
| Baron International Growth Fund — Retail Shares | | | | | 5.00 | % | | | $ | 1,000.00 | | | | $ | 1,017.64 | 4 | | | | 1.50 | %5 | | | $ | 7.63 | |
| Baron International Growth Fund — Institutional Shares | | | | | 5.00 | % | | | $ | 1,000.00 | | | | $ | 1,018.90 | 4 | | | | 1.25 | %5 | | | $ | 6.36 | |
| Baron Real Estate Fund — Retail Shares | | | | | 5.00 | % | | | $ | 1,000.00 | | | | $ | 1,018.60 | | | | | 1.31 | % | | | $ | 6.67 | |
| Baron Real Estate Fund — Institutional Shares | | | | | 5.00 | % | | | $ | 1,000.00 | | | | $ | 1,019.86 | | | | | 1.06 | % | | | $ | 5.40 | |
| Baron Emerging Markets Fund — Retail Shares | | | | | 5.00 | % | | | $ | 1,000.00 | | | | $ | 1,017.64 | | | | | 1.50 | % | | | $ | 7.63 | |
| Baron Emerging Markets Fund — Institutional Shares | | | | | 5.00 | % | | | $ | 1,000.00 | | | | $ | 1,018.90 | | | | | 1.25 | % | | | $ | 6.36 | |
| Baron Energy & Resources Fund — Retail Shares | | | | | 5.00 | % | | | $ | 1,000.00 | | | | $ | 1,018.40 | 4 | | | | 1.35 | %5 | | | $ | 6.87 | |
| Baron Energy & Resources Fund — Institutional Shares | | | | | 5.00 | % | | | $ | 1,000.00 | | | | $ | 1,019.66 | 4 | | | | 1.10 | %5 | | | $ | 5.60 | |
| Baron Global Advantage Fund — Retail Shares | | | | | 5.00 | % | | | $ | 1,000.00 | | | | $ | 1,017.64 | 4 | | | | 1.50 | %5 | | | $ | 7.63 | |
| Baron Global Advantage Fund — Institutional Shares | | | | | 5.00 | % | | | $ | 1,000.00 | | | | $ | 1,018.90 | 4 | | | | 1.25 | %5 | | | $ | 6.36 | |
|
| 1 | | Assumes reinvestment of all dividends and capital gain distributions, if any. |
| 2 | | Annualized expense ratio for Baron Partners Fund for the six months ended December 31, 2014, includes 1.30% and 1.05% for net operating expenses and 0.22% and 0.22% for interest expense for the Retail and Institutional Shares, respectively. |
| 3 | | Expenses are equal to each Share Class’ respective annualized expense ratio multiplied by the average account value over the period, multiplied by the number of days in the most recent fiscal half-year, then divided by 365. |
| 4 | | Ending account value assumes the return earned after waiver and would have been lower if a portion of the expenses had not been waived. |
| 5 | | Annualized expense ratios are adjusted to reflect fee waiver. |
December 31, 2014 | |
Baron Select Funds |
| MANAGEMENT OF THE FUNDS (Unaudited) |
| |
| Board of Trustees and Officers. |
| |
Trustees of the Trust, together with information as to their positions with the Trust, principal occupations and other board memberships and affiliations for the past five years, are shown below. Each Trustee serves as Trustee of a Fund until its termination; until the Trustee’s retirement, resignation or death; or as otherwise specified in the Trust’s organizational documents. Unless otherwise noted, the address of each Executive Officer and Trustee is Baron Select Funds, 767 Fifth Avenue, 49th Floor, New York, NY 10153. All Trustees listed below, whether Interested or Independent, serve as Trustees for the Trust. Additional information about the Trustees and Officers of the Trust can be found in the Trust’s Statement of Additional Information (the “SAI”) which may be obtained without charge by writing or calling 1-800-99BARON. The SAI is also available on the Baron Funds® website, www.BaronFunds.com.
| | | | | | | | | Number of | | |
| | | | | | | | | Portfolios | | |
| | | | | | | | | in Fund | | |
| | | | | | | | | Complex | | Other |
| | | Position(s) Held | | Length of | | Principal Occupation(s) | | Overseen | | Trustee/Directorships |
| Name, Address & Age | | With the Funds | | Time Served | | During the Past Five Years | | by Trustee | | During Past 5 Years |
| Interested Trustees | | | | | | | | | | |
Ronald Baron(1),(2)
767 Fifth Avenue
New York, NY 10153
Age: 71 | | Chief Executive Officer, Chief Investment Officer, Trustee and Portfolio Manager | | 11 years | | Director, Chairman, CEO and CIO: the Firm* (1982-Present); Trustee: Baron Investment Funds Trust (1987-Present); Trustee: Baron Select Funds (2003-Present); Portfolio Manager: Baron USA Partners Fund, Ltd. (2003-Present); Portfolio Manager: Baron Managed Funds plc (2005-2009). | | 13 | | None |
| | | | | | | | | | | |
Linda S. Martinson(1),(2)
767 Fifth Avenue
New York, NY 10153
Age: 59 | | Chairman, President, Chief Operating Officer and Trustee | | 11 years | | Director: the Firm* (2003-Present); Secretary: the Firm* (2003-2008); President: the Firm* (2007- Present); Chief Operating Officer: the Firm (2006-present); Chairman (2010-Present) President (2007-Present), Trustee (1987-Present), Secretary (2003-2008): Baron Investment Funds Trust; Chairman (2010-Present) President (2007-Present), Trustee (2003-Present): Baron Select Funds; Director: Baron USA Partners Fund, Ltd. (2006-Present); Director: Baron Managed Funds plc (2005-2009). | | 13 | | None |
| |
| Baron Select Funds | December 31, 2014 |
| MANAGEMENT OF THE FUNDS (Unaudited) (Continued) |
| |
| | | | | | | | | Number of | | |
| | | | | | | | | Portfolios | | |
| | | | | | | | | in Fund | | |
| | | | | | | | | Complex | | Other |
| | | Position(s) Held | | Length of | | Principal Occupation(s) | | Overseen | | Trustee/Directorships |
| Name, Address & Age | | With the Funds | | Time Served | | During the Past Five Years | | by Trustee | | During Past 5 Years |
| | | | | | | | | | | |
| Independent Trustees | | | | | | | | | | |
| | | | | | | | | | | |
| Norman S. Edelcup(3),(4),(5) | | Trustee | | 11 years | | Mayor (2003-2013): Sunny Isles Beach, Florida; | | 13 | | Director: CompX |
| 244 Atlantic Isle | | | | | | Trustee: Baron Investment Funds Trust (1987- | | | | International, Inc. |
| Sunny Isles Beach, FL 33160 | | | | | | Present), Baron Select Funds (2003-Present). | | | | (diversified manufacturer of |
| Age: 79 | | | | | | | | | | engineered components) |
| | | | | | | | | | | (2006-Present); Director: |
| | | | | | | | | | | Valhi, Inc. (diversified |
| | | | | | | | | | | company) (1975-Present). |
| | | | | | | | | | | |
| Harold W. Milner(4),(5) | | Trustee | | 11 years | | Trustee: Baron Investment Funds Trust (1987- | | 13 | | None |
| 2293 Morningstar Drive | | | | | | Present), Baron Select Funds (2003-Present). | | | | |
| Park City, UT 84060 | | | | | | | | | | |
| Age: 79 | | | | | | | | | | |
| | | | | | | | | | | |
| Raymond Noveck(3),(4),(5) | | Lead Trustee | | 11 years | | Private Investor (1999-Present); Trustee: Baron | | 13 | | None |
| 31 Karen Road | | | | | | Investment Funds Trust (1987-Present), Baron | | | | |
| Waban, MA 02468 | | | | | | Select Funds (2003-Present). | | | | |
| Age: 71 | | | | | | | | | | |
| | | | | | | | | | | |
| Anita Rosenberg(4),(5) | | Trustee | | 1 year | | Senior Advisor: Magnetar Capital (2011-2012); | | | | Director: Golub Capital |
| 1235 N. Astor Street | | | | | | Trustee: Baron Investment Funds Trust, | | | | BDC, Inc. |
| Chicago, IL 60610 | | | | | | Baron Select Funds (2013-Present). | | | | (2011-Present). |
| Age: 50 | | | | | | | | | | |
| | | | | | | | | | | |
| David A. Silverman, MD(4),(5) | | Trustee | | 11 years | | Physician and Faculty: New York University | | 13 | | None |
| 146 Central Park West | | | | | | School of Medicine (1976-Present); Trustee: Baron | | | | |
| New York, NY 10024 | | | | | | Investment Funds Trust (1987-Present), Baron | | | | |
| Age: 64 | | | | | | Select Funds (2003-Present). | | | | |
| | | | | | | | | | | |
| Alex Yemenidjian(4),(5) | | Trustee | | 9 years | | Chairman and CEO: Tropicana Las Vegas (gaming) | | 13 | | Director: Guess?, Inc. |
| 3801 Las Vegas Blvd. South | | | | | | (2009-Present); Chairman and CEO: Armenco | | | | (2005-Present); |
| Las Vegas, NV 89109 | | | | | | Holdings, LLC (investment company) (2005- | | | | Director: Regal |
| Age: 58 | | | | | | Present); Trustee: Baron Investment Funds Trust | | | | Entertainment Group |
| | | | | | | (2006-Present), Baron Select Funds (2006-Present). | | | | (2005-Present). |
| |
| December 31, 2014 | Baron Select Funds |
| MANAGEMENT OF THE FUNDS (Unaudited) (Continued) |
| |
| | | | | | | | | Number of | | |
| | | | | | | | | Portfolios | | |
| | | | | | | | | in Fund | | |
| | | | | | | | | Complex | | Other |
| | | Position(s) Held | | Length of | | Principal Occupation(s) | | Overseen | | Trustee/Directorships |
| Name, Address & Age | | With the Funds | | Time Served | | During the Past Five Years | | by Trustee | | During Past 5 Years |
| | | | | | | | | | | |
| Additional Officers of the Funds | | | | | | | | | | |
| | | | | | | | | | | |
| Louis Beasley | | Vice President and | | <1 year | | Chief Compliance Officer: Baron Capital Group, Inc., | | N/A | | N/A |
| 767 Fifth Avenue | | Chief Compliance | | (appointed | | BAMCO, Inc., Baron Capital Management Inc., Baron | | | | |
| New York, NY 10153 | | Officer | | 9/2014) | | Investment Funds Trust, Baron Select Funds, Baron | | | | |
| Age: 43 | | | | | | USA Partners Fund, Ltd. (9/2014-Present); | | | | |
| | | | | | | Vice President: the Firm* (9/2014-Present); | | | | |
| | | | | | | Principal and Director of Investment Management | | | | |
| | | | | | | Compliance and Risk Management: Bessemer Trust | | | | |
| | | | | | | (2006-9/2014). | | | | |
| | | | | | | | | | | |
| Clifford Greenberg | | Senior Vice | | 10 years | | Director and Senior Vice President: the Firm* | | N/A | | N/A |
| 767 Fifth Avenue | | President and | | | | (1997-Present); Portfolio Manager: Baron Small | | | | |
| New York, NY 10153 | | Portfolio Manager | | | | Cap Fund (1997-Present). | | | | |
| Age: 55 | | | | | | | | | | |
| | | | | | | | | | | |
| Patrick M. Patalino | | Vice President, | | 7 years | | Vice President and General Counsel: the Firm*, | | N/A | | N/A |
| 767 Fifth Avenue | | General Counsel | | | | Baron Investment Funds Trust, Baron Select | | | | |
| New York, NY 10153 | | and Secretary | | | | Funds, (2007-Present); Baron USA Partners Fund, | | | | |
| Age: 46 | | | | | | Ltd. (2007-Present); Secretary: the Firm* (2008- | | | | |
| | | | | | | Present), Baron Investment Funds Trust, Baron | | | | |
| | | | | | | Select Funds (2008-Present). | | | | |
| | | | | | | | | | | |
| Andrew Peck | | Senior Vice | | 11 years | | Vice President: BAMCO, Inc. (2003-Present), | | N/A | | N/A |
| 767 Fifth Avenue | | President and | | | | Baron Investment Funds Trust, Baron | | | | |
| New York, NY 10153 | | Portfolio Manager | | | | Select Funds (2003-Present); Portfolio Manager: | | | | |
| Age: 45 | | | | | | Baron Asset Fund (2008-Present); Vice President, | | | | |
| | | | | | | Research Analyst: Baron Capital, Inc. (1998- | | | | |
| | | | | | | Present); Co-Portfolio Manager (mid cap | | | | |
| | | | | | | accounts): Baron Capital Management, Inc. | | | | |
| | | | | | | (2006-Present). | | | | |
| | | | | | | | | | | |
| Susan Robbins | | Vice President | | 11 years | | Director, Vice President and Senior Analyst: the | | N/A | | N/A |
| 767 Fifth Avenue | | | | | | Firm* (1982-Present); Vice President: Baron | | | | |
| New York, NY 10153 | | | | | | Investment Funds Trust (1994-Present), Baron | | | | |
| Age: 60 | | | | | | Select Funds (2003-Present). | | | | |
| | | | | | | | | | | |
| Peggy C. Wong | | Vice President, | | 11 years | | Chief Financial Officer and Treasurer: the Firm* | | N/A | | N/A |
| 767 Fifth Avenue | | Treasurer and | | | | (1987-Present), Baron Investment Funds Trust | | | | |
| New York, NY 10153 | | Chief Financial | | | | (1987-Present), Baron Select Funds (2003-Present), | | | | |
| Age: 53 | | Officer | | | | Baron USA Partners Fund, Ltd. (1993-Present), | | | | |
| | | | | | | Baron Managed Funds plc. (2005-2009). | | | | |
| * | | The Firm (Baron Capital Group, Inc. (“BCG”) with its subsidiaries BCI, Baron Capital Management, Inc. (“BCM”) and BAMCO). |
| (1) | | Trustees deemed to be “interested persons”(as defined in the 1940 Act) of the Funds by reason of their employment with the Funds’ Adviser and Distributor. |
| (2) | | Members of the Executive Committee, which is empowered to exercise all of the powers, including the power to declare dividends, of the full Board when the full Board is not in session. |
| (3) | | Members of the Audit Committee. |
| (4) | | Members of the Nominating Committee. |
| (5) | | Members of the Independent Committee. |
| Item 2. | Code of Ethics. |
| | |
| The Registrant has adopted a Code of Ethics for Principal Executive and Senior Financial Officers (the “Code”). Upon request, the Registrant will provide a copy of the Code to any person without charge. To obtain a copy of the Code, please send your request to info@Baronfunds.com or call 1-800-99BARON (1-800-992-2766). |
| | |
| Item 3. | Audit Committee Financial Expert. |
| | |
| The Registrant’s Board of Trustees has determined that the Registrant has two audit committee financial experts serving on its Audit Committee, Norman S. Edelcup and Raymond Noveck. Both Mr. Edelcup and Mr. Noveck are “independent” for purposes of Item 3(a)(2) of Form N-CSR. |
| | |
| Item 4. | Principal Accountant Fees and Services. |
| | |
The following table shows the fees paid to PricewaterhouseCoopers, LLP, the Registrant’s principal accounting firm during the fiscal years ended December 31, 2014 and December 31, 2013: |
| (a) Audit Fees: for professional services rendered for the audit of the Registrant’s annual financial statements or services that are normally provided in connection with statutory and regulatory filings or engagements: |
| | | 2014 | | | 2013 | |
| | | | | | |
| Baron Select Funds | | $ | 219,395 | | | $ | 226,660 | |
| | | | | | | | | |
| (b) Audit-Related Fees: for assurance and related services that are reasonably related to the performance of the audit and are not included as Audit Fees: |
| | | | | | | | | |
| | | 2014 | | | 2013 | |
| | | | | | |
| Baron Select Funds | | $ | 0 | | | $ | 0 | |
| | | | | | | | | |
| (c) Tax Fees: for professional services rendered for tax compliance, tax advice and tax planning: |
| | | | | | | | | |
| | | 2014 | | | 2013 | |
| | | | | | |
| Baron Select Funds | | $ | 77,480 | | | $ | 82,725 | |
| | | | | | | | | |
| The Tax Fees represent services provided in connection with the preparation of tax returns and year-end distribution review. |
| | | | | | | | | |
| (d) All Other Fees: for products and services provided by such accounting firm that are not included in (a), (b) or (c) above: |
| | | | | | | | | |
| | | 2014 | | | 2013 | |
| | | | | | |
| Baron Select Funds | | $ | 0 | | | $ | 0 | |
| |
(e) Audit Committee Pre-Approval Policies and Procedures: (i) Pursuant to paragraph (c)(7) of Rule 2-01 of Regulation S-X and to its charter, the Audit Committee shall pre-approve all audit and non-audit services provided by the independent auditors and in connection therewith to review and evaluate the qualifications, independence and performance of the Fund’s independent auditors; (ii) 100% of the services described in each of items 4(b) through 4(d) were approved by the Audit Committee pursuant to paragraph (c)(7)(i)(C) of Rule 2-01 of Regulation S-X. |
| |
| (f) Not Applicable. |
| |
| (g) The aggregate non-audit fees billed by the registrant’s accountant for services rendered to the registrant, and rendered to the registrant’s investment adviser (not including any sub-adviser whose role is primarily portfolio management and is subcontracted with or overseen by another investment adviser), and any entity controlling, controlled by, or under common control with the adviser that provides ongoing services to the registrant for the last two fiscal years is as follows: |
| | 2014: $66,300 |
| | |
| | 2013: $49,035 |
| (h) Not Applicable. |
|
| | |
| Item 5. | Audit Committee of Listed Registrants. |
| | |
| The Registrant has a separately-designated standing Audit Committee established in accordance with Section 3(a)(58)(A) of the Securities Exchange Act of 1934. The members of the Audit Committee are Norman S. Edelcup and Raymond Noveck. |
| | |
Item 6. | Schedule of Investments. | | | |
| Included herein under Item 1. |
| | |
| Item 7. | Disclosure of Proxy Voting Policies and Procedures for Closed-End Management Investment Companies. |
| | |
| Not applicable. |
| | |
| Item 8. | Portfolio Managers of Closed-End Management Investment Companies. |
| | |
| Not applicable. |
| | |
| Item 9. | Purchases of Equity Securities by Closed-End Management Investment Company and Affiliated Purchasers. |
| | |
| Not applicable. |
| | |
| Item 10. | Submission of Matters to a Vote of Security Holders. |
| | |
| Not applicable. |
| | |
| Item 11. | Controls and Procedures. |
| | |
| (a) The Registrant’s principal executive officer and principal financial officer have concluded that the Registrant’s disclosure controls and procedures (as defined in Rule 30a-3(c) under the Investment Company Act of 1940 (the “1940 Act”)) are effective based on their evaluation of these controls and procedures as of a date within 90 days of the filing date of this report. |
| | |
| (b) There were no changes in the Registrant’s internal control over financial reporting (as defined in Rule 30a-3(d) under the 1940 Act) that occurred during the Registrant’s second fiscal quarter of the period covered by this report that have materially affected, or are reasonably likely to materially affect, the Registrant’s internal control over financial reporting. |
| | |
| Item 12. | Exhibits. |
| | |
| (a) (2) Certification of each of the principal executive officers and principal financial officers of the Registrant as required by Rule 30a-2 under the Act (17 CFR 270.30a-2) is attached hereto as a part of EX-99.CERT. |
| | |
| (b) Certification of each of the principal executive officers and principal financial officers of the Registrant as required by Section 906 of the Sarbanes-Oxley Act of 2002 is attached hereto as a part of EX-99.906CERT. |
SIGNATURES
Pursuant to the requirements of the Securities Exchange Act of 1934 and the Investment Company Act of 1940, the registrant has duly caused this report to be signed on its behalf by the undersigned, thereunto duly authorized.
| | BARON SELECT FUNDS |
| | | |
| | By: | /s/ Ronald Baron |
| | | |
| | | Ronald Baron |
| | | Chief Executive Officer |
| | | |
| | Date: March 6, 2015 |
Pursuant to the requirements of the Securities Exchange Act of 1934 and the Investment Company Act of 1940, this report has been signed below by the following persons on behalf of the registrant and in the capacities and on the dates indicated.
| | By: | /s/ Ronald Baron |
| | | |
| | | Ronald Baron |
| | | Chief Executive Officer |
| | | |
| | Date: March 6, 2015 |
| | | |
| | By: | /s/ Peggy Wong |
| | | |
| | | Peggy Wong |
| | | Treasurer and Chief Financial Officer |
| | | |
| | Date: March 6, 2015 |