| OMB APPROVAL |
| OMB Number: 3235-0570 |
| Expires: January 31, 2017 |
Estimated average burden
Hours per response. . . . . . . . . 20.6 |
UNITED STATES
SECURITIES AND EXCHANGE COMMISSION
Washington, DC 20549
FORM N-CSR
CERTIFIED SHAREHOLDER REPORT OF REGISTERED
MANAGEMENT INVESTMENT COMPANIES
Investment Company Act file number: 811-21296
BARON SELECT FUNDS
(Exact Name of Registrant as Specified in Charter)
767 Fifth Avenue, 49th Floor
New York, NY 10153
(Address of Principal Executive Offices) (Zip Code)
Patrick M. Patalino, General Counsel
c/o Baron Select Funds
767 Fifth Avenue, 49th Floor
New York, NY 10153
(Name and Address of Agent for Service)
(Registrant’s Telephone Number, including Area Code): 212-583-2000
Date of fiscal year end: December 31
Date of reporting period: December 31, 2015
Form N-CSR is to be used by management investment companies to file reports with the Commission not later than 10 days after the transmission to stockholders of any report that is required to be transmitted to stockholders under Rule 30e-1 under the Investment Company Act of 1940 (17CRF 270.30e-1). The Commission may use the information provided on Form N-CSR in its regulatory, disclosure review, inspection, and policymaking roles.
A registrant is required to disclose the information specified by Form N-CSR, and the Commission will make this information public. A registrant is not required to respond to the collection of information contained in Form N-CSR unless the Form displays a currently valid Office of Management and Budget (“OMB”) control number. Please direct comments concerning the accuracy of the information collection burden estimate and suggestions for reducing the burden to Secretary, Securities and Exchange Commission, 450 5th Street, NW, Washington, D.C. 20549-0609. The OMB has reviewed this collection of information under the clearance requirements of 44 U.S.C. Section 3507.
Persons who are to respond to the collection of information contained in this form are not required to respond unless the form displays a currently valid OMB control number.
SEC 2569 (5-07)
Item 1. Reports to Stockholders.
| | | | | |
| | | | | |
| | Baron Partners Fund | | | Baron Funds® |
| | Baron Focused Growth Fund | | |
| | Baron International Growth Fund | | |
| | Baron Real Estate Fund | | |
| | Baron Emerging Markets Fund | | |
| | Baron Energy and Resources Fund | | |
| | Baron Global Advantage Fund | | |
| | | | |
| | | | | |
| | | | | |
| | December 31, 2015 | | | Annual Financial Report |
| | | | | |
| | | | | |
| | |
| | Baron Partners Fund | | |
| | Ticker Symbols: | | |
| | Retail Shares: BPTRX | | |
| | Institutional Shares: BPTIX | | |
| | Performance | | 2 |
| | Top Ten Holdings | | 3 |
| | Sector Breakdown | | 3 |
| | Management’s Discussion of Fund Performance | | 3 |
| | |
| | Baron Focused Growth Fund | | |
| | Ticker Symbols: | | |
| | Retail Shares: BFGFX | | |
| | Institutional Shares: BFGIX | | |
| | Performance | | 4 |
| | Top Ten Holdings | | 5 |
| | Sector Breakdown | | 5 |
| | Management’s Discussion of Fund Performance | | 5 |
| | |
| | Baron International Growth Fund | | |
| | Ticker Symbols: | | |
| | Retail Shares: BIGFX | | |
| | Institutional Shares: BINIX | | |
| | Performance | | 6 |
| | Top Ten Holdings | | 7 |
| | Sector Breakdown | | 7 |
| | Management’s Discussion of Fund Performance | | 7 |
| | |
| | Baron Real Estate Fund | | |
| | Ticker Symbols: | | |
| | Retail Shares: BREFX | | |
| | Institutional Shares: BREIX | | |
| | Performance | | 8 |
| | Top Ten Holdings | | 9 |
| | Sector Breakdown | | 9 |
| | Management’s Discussion of Fund Performance | | 9 |
| | |
| | Baron Emerging Markets Fund | | |
| | Ticker Symbols: | | |
| | Retail Shares: BEXFX | | |
| | Institutional Shares: BEXIX | | |
| | Performance | | 10 |
| | Top Ten Holdings | | 11 |
| | Sector Breakdown | | 11 |
| | Management’s Discussion of Fund Performance | | 11 |
| | |
| | Baron Energy and Resources Fund | | |
| | Ticker Symbols: | | |
| | Retail Shares: BENFX | | |
| | Institutional Shares: BENIX | | |
| | Performance | | 12 |
| | Top Ten Holdings | | 13 |
| | Sector Breakdown | | 13 |
| | Management’s Discussion of Fund Performance | | 13 |
| | |
| | Baron Global Advantage Fund | | |
| | Ticker Symbols: | | |
| | Retail Shares: BGAFX | | |
| | Institutional Shares: BGAIX | | |
| | Performance | | 14 |
| | Top Ten Holdings | | 15 |
| | Sector Breakdown | | 15 |
| | Management’s Discussion of Fund Performance | | 15 |
| | |
| | Financial Statements | | |
| | |
| | Statements of Net Assets | | 16 |
| | Statements of Assets and Liabilities | | 27 |
| | Statements of Operations | | 29 |
| | Statements of Changes in Net Assets | | 31 |
| | Statement of Cash Flows | | 34 |
| | Notes to Financial Statements | | 35 |
| | |
| | Financial Highlights | | 44 |
| | |
| | Report of Independent Registered Public
Accounting Firm | | 51 |
| | |
| | Tax Information | | 52 |
| | |
| | Fund Expenses | | 53 |
| | |
| | Management of the Funds | | 54 |
| | |
DEAR BARON SELECT FUNDS SHAREHOLDER: In this report, you will find audited financial statements for Baron Partners Fund, Baron Focused Growth Fund, Baron International Growth Fund, Baron Real Estate Fund, Baron Emerging Markets Fund, Baron Energy and Resources Fund and Baron Global Advantage Fund (the “Funds”) for the year ended December 31, 2015. The U.S. Securities and Exchange Commission (the “SEC”) requires mutual funds to furnish these statements semi-annually to their shareholders. We hope you find these statements informative and useful. We thank you for choosing to join us as fellow shareholders in Baron Funds. We will continue to work hard to justify your confidence. Sincerely, |
 | |  | |  |
| | | | | |
| Ronald Baron | | Linda S. Martinson | | Peggy Wong |
| Chief Executive Officer and | | Chairman, President and | | Treasurer and |
| Chief Investment Officer | | Chief Operating Officer | | Chief Financial Officer |
| February 24, 2016 | | February 24, 2016 | | February 24, 2016 |
| | | | | | |
This Annual Financial Report is for the Baron Select Funds, which currently has seven series: Baron Partners Fund, Baron Focused Growth Fund, Baron International Growth Fund, Baron Real Estate Fund, Baron Emerging Markets Fund, Baron Energy and Resources Fund and Baron Global Advantage Fund. If you are interested in Baron Investment Funds Trust, which contains the Baron Asset Fund, Baron Growth Fund, Baron Small Cap Fund, Baron Opportunity Fund, Baron Fifth Avenue Growth Fund and Baron Discovery Fund series, please visit the Funds’ website at www.BaronFunds.com or contact us at 1-800-99BARON. The Funds’ Proxy Voting Policy is available without charge and can be found on the Funds’ website at www.BaronFunds.com, by clicking on the “Legal Notices” link at the bottom left corner of the homepage or by calling 1-800-99BARON and on the SEC’s website at www.sec.gov. The Funds’ most current proxy voting record, Form N-PX, is also available on the Funds’ website and on the SEC’s website. The Funds file their complete schedules of portfolio holdings with the SEC for the first and third quarters of each fiscal year on Form N-Q. The Funds’ Forms N-Q are available on the SEC’s website at www.sec.gov. The Funds’ Forms N-Q may also be reviewed and copied at the SEC’s Public Reference Room in Washington, DC; information on the operation of the SEC’s Public Reference Room may be obtained by calling 1-202-551-8090. A copy of the Funds’ Forms N-Q may also be obtained upon request by calling 1-800-99BARON. Schedules of portfolio holdings current to the most recent quarter are also available on the Funds’ website. Some of the comments are based on current management expectations and are considered “forward-looking statements.” Actual future results, however, may prove to be different from our expectations. You can identify forward-looking statements by words such as “estimate,” “may,” “expect,” “should,” “could,” “believe,” “plan” and other similar terms. We cannot promise future returns and our opinions are a reflection of our best judgment at the time this report is compiled. The views expressed in this report reflect those of BAMCO, Inc. (“BAMCO” or the “Adviser”) only through the end of the period stated in this report. The views are not intended as recommendations or investment advice to any person reading this report and are subject to change at any time without notice based on market and other conditions. |
Past performance is no guarantee of future results. The investment return and principal value of an investment will fluctuate; an investor’s shares, when redeemed, may be worth more or less than their original cost. For more complete information about Baron Funds, including charges and expenses, call, write or go to www.BaronFunds.com for a prospectus or summary prospectus. Read them carefully before you invest or send money. This report is not authorized for use as an offer of sale or a solicitation of an offer to buy shares of the Funds, unless accompanied or preceded by the Funds’ current prospectus or summary prospectus. | |  |
| |
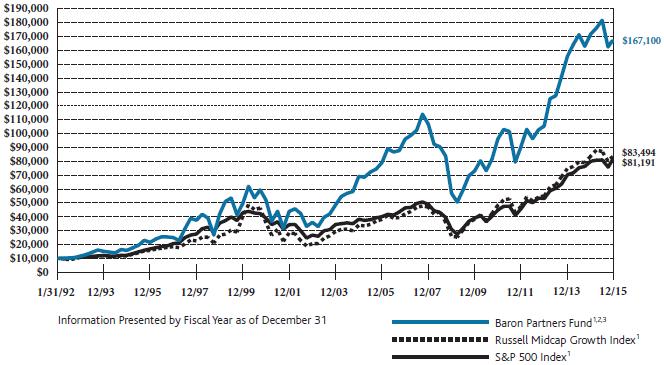
| Baron Partners Fund (Unaudited) | | December 31, 2015 |
COMPARISON OF THE CHANGE IN VALUE OF $10,000 INVESTMENT IN BARON PARTNERS FUND (RETAIL SHARES)
IN RELATION TO THE RUSSELL MIDCAP GROWTH INDEX AND THE S&P 500 INDEX |
| |
 |
| AVERAGE ANNUAL TOTAL RETURNS FOR THE PERIODS ENDED DECEMBER 31, 2015 |
| | | | | | | | | | | | | | | | | | Since |
| | | | | | | | | | | | | | | | | | Inception |
| | | | | One | | Three | | Five | | Ten | | (January 31, |
| | | | | | Year | | Years | | Years | | Years | | 1992) |
| |
| Baron Partners Fund —- Retail Shares1, 2, 3 | | | | | (2.71 | )% | | 16.56 | % | | 11.69 | % | | 7.78 | % | | 12.50 | % |
| Baron Partners Fund —- Institutional Shares1, 2, 3, 4 | | | | | (2.43 | )% | | 16.88 | % | | 11.98 | % | | 7.96 | % | | 12.58 | % |
| Russell Midcap Growth Index1 | | | | | (0.20 | )% | | 14.88 | % | | 11.54 | % | | 8.16 | % | | 9.28 | % |
| S&P 500 Index1 | | | | | 1.38 | % | | 15.13 | % | | 12.57 | % | | 7.31 | % | | 9.15 | % |
| |
| | | |
| | | |
| | | |
| | | |
| | | |
| | | |
| | | |
|
| 1 | | The indexes are unmanaged. The Russell Midcap® Growth Index measures the performance of medium-sized U.S. companies that are classified as growth and the S&P 500 Index of 500 widely held large-cap U.S. companies. The indexes and Baron Partners Fund are with dividends, which positively impact the performance results. |
| | | |
| 2 | | Reflects the actual fees and expenses that were charged when the Fund was a partnership. The predecessor partnership charged a 20% performance fee after reaching a certain performance benchmark. If the annual returns for the Fund did not reflect the performance fees for the years the predecessor partnership charged a performance fee, returns would be higher. The Fund’s shareholders will not be charged a performance fee. The predecessor partnership’s performance is only for periods before the Fund’s registration statement was effective, which was April 30, 2003. During those periods, the predecessor partnership was not registered under the Investment Company Act of 1940 and was not subject to its requirements or the requirements of the Internal Revenue Code relating to regulated investment companies, which, if it were, might have adversely affected its performance. |
| | | |
| 3 | | Past performance is not predictive of future performance. The performance data does not reflect the deduction of taxes that a shareholder would pay on Fund distributions or redemption of Fund shares. The Fund’s transfer agency expenses may be reduced by expense offsets from an unaffiliated transfer agent, without which performance would have been lower. |
| | | |
| 4 | | Performance for the Institutional Shares prior to May 29, 2009 is based on the performance of the Retail Shares, which have a distribution fee. The Institutional Shares do not have a distribution fee. If the annual returns for the Institutional Shares prior to May 29, 2009 did not reflect this fee, the returns would be higher. |
2
| |
| December 31, 2015 (Unaudited) | | Baron Partners Fund |
| TOP TEN HOLDINGS AS OF DECEMBER 31, 2015 | | | |
| | | Percent of Total |
| | | Investments |
| |
| Tesla Motors, Inc. | | 10.0% | |
| |
| CoStar Group, Inc. | | 9.2% | |
| |
| Arch Capital Group Ltd. | | 6.8% | |
| |
| ITC Holdings Corp. | | 6.1% | |
| |
| FactSet Research Systems, Inc. | | 5.1% | |
| |
| The Charles Schwab Corp. | | 5.1% | |
| |
| Hyatt Hotels Corp. | | 5.0% | |
| |
| Vail Resorts, Inc. | | 4.8% | |
| |
| Verisk Analytics, Inc. | | 4.5% | |
| |
| CarMax, Inc. | | 4.3% | |
| |
| | | 60.9% | |
| |
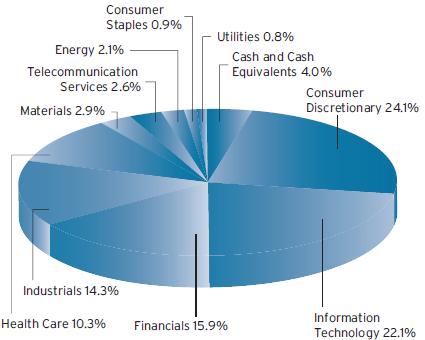
SECTOR BREAKDOWN AS OF DECEMBER 31, 2015†
(as a percentage of total investments) |
| |
 |
| |
| |
| MANAGEMENT’S DISCUSSION OF FUND PERFORMANCE |
For the year ended December 31, 2015, Baron Partners Fund1 lost 2.71%, underperforming the Russell Midcap Growth Index, which lost 0.20%. |
| |
The Fund has performed well since its conversion into an open end mutual fund on April 30, 2003. In the period since the Fund’s conversion through December 31, 2015, the Fund gained an annualized 12.94% versus an annualized 11.09% for the Russell Midcap Growth Index. The Fund also has meaningfully outperformed the Russell Midcap Growth Index since its inception |
on January 31, 1992, gaining an annualized 12.50%* compared to an annualized 9.28% for its index. |
| |
Baron Partners Fund invests primarily in U.S. companies of any size with significant long-term growth potential. We believe our process can identify investment opportunities that are attractively priced relative to future prospects. The Fund is non-diversified, so its top 10 holdings are expected to comprise a significant percentage of the portfolio, and the Fund uses leverage, both of which increase risk. Of course, there can be no assurance that we will be successful in achieving the Fund’s investment goals. |
| |
Many sectors and capitalization ranges experienced significant volatility in 2015, in reaction to geopolitical events, global monetary policies, sagging oil and commodity prices, and a strengthening U.S. dollar. For the first seven and a half months of 2015, the markets generally increased. In late August, and again in late September, however, stocks plunged sharply, largely as a reaction to the collapse of China’s A-shares stock market and concerns around a slowing Chinese economy. In October, the markets again reversed course, boosted by signals from central banks that they would extend the global trend of easy monetary policy. Toward the end of the year, the Fed raised interest rates for the first time since 2006. After an initial rally, the markets sold off over concerns about the implications of Fed tightening in the face of lingering concerns around employment trends, soft commodity prices, slowing overseas growth, and weakness in corporate earnings. |
| |
At the sector level, the Fund’s investments in Information Technology and Industrials were the largest contributors to performance. Health Care, Consumer Discretionary, and Utilities were the largest detractors in the period. |
| |
The largest contributor was Vail Resorts, Inc., an operator of ski resorts across the U.S. and Australia. The purchase of Park City resort in Utah and the Perisher resort in Australia provided Vail with enhanced diversification and scale that helped improve margins and facilitated cross marketing among its locations. These improvements led to stronger season pass sales and increased earnings and cash flow, which the company used to increase its dividend and repurchase shares. |
| |
The largest detractor was Hyatt Hotels Corp., a global hotelier. Shares decreased as decelerating revenue per available room suggested that the current lodging cycle may be coming to an end. Concerns that Airbnb was taking market share and affecting pricing power and that the smaller Hyatt would have trouble competing with a behemoth in the Marriott/Starwood merger also contributed to negative sentiment. However, Hyatt continues to generate strong cash flow and is using it to buy back much of its stock. |
| |
We expect to continue to establish long positions in securities that, in our opinion, have favorable price-to-value characteristics based on our assessment of their prospects for future growth and profitability. |
|
| † | | Industry sector levels are provided from the Global Industry Classification Standard (“GICS”), developed and exclusively owned by MSCI, Inc. and Standard & Poor’s Financial Services LLC, unless otherwise stated that they have been reclassified or classified by the Adviser. All GICS data is provided “as is” with no warranties. |
| | | |
| 1 | | Performance information reflects results of the Retail Shares. |
| | | |
| * | | Please see Footnote 2 on page 2. |
3
| |
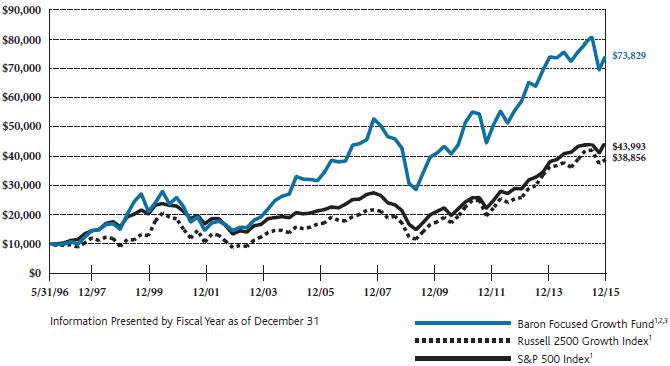
| Baron Focused Growth Fund (Unaudited) | | December 31, 2015 |
COMPARISON OF THE CHANGE IN VALUE OF $10,000 INVESTMENT IN BARON FOCUSED GROWTH FUND† (RETAIL SHARES)
IN RELATION TO THE RUSSELL 2500 GROWTH INDEX AND THE S&P 500 INDEX |
| AVERAGE ANNUAL TOTAL RETURNS FOR THE PERIODS ENDED DECEMBER 31, 2015 | | | | | | | | | | | | | | | |
| | | | | | | | | | | | | | | Since |
| | | | | | | | | | | | | | | Inception |
| | | One | | Three | | Five | | Ten | | (May 31, |
| | | Year | | Years | | Years | | Years | | 1996) |
| |
| Baron Focused Growth Fund —- Retail Shares1, 2, 3 | | (2.42 | )% | | 7.88 | % | | 7.49 | % | | 7.89 | % | | 10.75 | % |
| Baron Focused Growth Fund —- Institutional Shares1, 2, 3, 4 | | (2.12 | )% | | 8.17 | % | | 7.77 | % | | 8.06 | % | | 10.84 | % |
| Russell 2500 Growth Index1 | | (0.19 | )% | | 14.54 | % | | 11.43 | % | | 8.49 | % | | 7.18 | % |
| S&P 500 Index1 | | 1.38 | % | | 15.13 | % | | 12.57 | % | | 7.31 | % | | 7.86 | % |
| |
| | | |
| | | |
| | | |
| | | |
| | | |
| | | |
|
| † | | The Fund’s historical performance was impacted by gains from IPOs and/or secondary offerings. There is no guarantee that these results can be repeated or that the Fund’s level of participation in IPOs and secondary offerings will be the same in the future. |
| | | |
| 1 | | The indexes are unmanaged. The Russell 2500™ Growth Index measures the performance of small to medium-sized U.S. companies that are classified as growth and the S&P 500 Index of 500 widely held large-cap U.S. companies. The indexes and Baron Focused Growth Fund are with dividends, which positively impact the performance results. |
| | | |
| 2 | | Reflects the actual fees and expenses that were charged when the Fund was a partnership. The predecessor partnership charged a 15% performance fee through 2003 after reaching a certain performance benchmark. If the annual returns for the Fund did not reflect the performance fees for the years the predecessor partnership charged a performance fee, the returns would be higher. The Fund’s shareholders will not be charged a performance fee. The predecessor partnership’s performance is only for periods before the Fund’s registration statement was effective, which was June 30, 2008. During those periods, the predecessor partnership was not registered under the Investment Company Act of 1940 and was not subject to its requirements or the requirements of the Internal Revenue Code relating to regulated investment companies, which, if it were, might have adversely affected its performance. |
| | | |
| 3 | | Past performance is not predictive of future performance. The performance data does not reflect the deduction of taxes that a shareholder would pay on Fund distributions or redemption of Fund shares. The Adviser has reimbursed certain Fund expenses (by contract as long as BAMCO, Inc. is the Adviser to the Fund) and the Fund’s transfer agency expenses may be reduced by expense offsets from an unaffiliated transfer agent, without which performance would have been lower. |
| | | |
| 4 | | Performance for the Institutional Shares prior to May 29, 2009 is based on the performance of the Retail Shares, which have a distribution fee. The Institutional Shares do not have a distribution fee. If the annual returns for the Institutional Shares prior to May 29, 2009 did not reflect this fee, the returns would be higher. |
4
| |
| December 31, 2015 (Unaudited) | | Baron Focused Growth Fund |
| TOP TEN HOLDINGS AS OF DECEMBER 31, 2015 | | | |
| | | Percent of | |
| | | Net Assets | |
| |
| Tesla Motors, Inc. | | 10.7% | |
| |
| Vail Resorts, Inc. | | 9.5% | |
| |
| CoStar Group, Inc. | | 8.4% | |
| |
| Hyatt Hotels Corp. | | 7.3% | |
| |
| FactSet Research Systems, Inc. | | 6.6% | |
| |
| Manchester United plc | | 5.3% | |
| |
| Benefitfocus, Inc. | | 4.5% | |
| |
| ITC Holdings Corp. | | 4.3% | |
| |
| Choice Hotels International, Inc. | | 4.1% | |
| |
| Arch Capital Group Ltd. | | 3.8% | |
| |
| | | 64.5% | |
| |
| SECTOR BREAKDOWN AS OF DECEMBER 31, 2015† |
| (as a percentage of net assets) |
| |
 |
| |
| MANAGEMENT’S DISCUSSION OF FUND PERFORMANCE |
For year ended December 31, 2015, Baron Focused Growth Fund1 declined 2.42%, underperforming the Russell 2500 Growth Index, which declined 0.19%. |
| |
Since its inception on May 31, 1996, through December 31, 2015, the Fund has outperformed the Russell 2500 Growth Index, gaining an annualized 10.75%,* compared to an annualized 7.18% for its index. |
Baron Focused Growth Fund invests in a non-diversified portfolio of small and mid-sized growth companies that we believe are well capitalized, and have exceptional management, significant growth potential, and sustainable barriers to competition. The Fund is non-diversified, which is a riskier investment strategy. Of course, there can be no assurance that we will be successful in achieving the Fund’s investment goals. |
| |
Many sectors and capitalization ranges experienced significant volatility in 2015, in reaction to geopolitical events, global monetary policies, sagging oil and commodity prices, and a strengthening U.S. dollar. For the first seven and a half months of 2015, the markets generally increased. In late August, and again in late September, however, stocks plunged sharply, largely as a reaction to the collapse of China’s A-shares stock market and concerns around a slowing Chinese economy. In October, the markets again reversed course, boosted by signals from central banks that they would extend the global trend of easy monetary policy. Toward the end of the year, the Fed raised interest rates for the first time since 2006. After an initial rally, the markets sold off over concerns about the implications of Fed tightening in the face of lingering concerns around employment trends, soft commodity prices, slowing overseas growth, and weakness in corporate earnings. |
| |
At the sector level, the Fund’s investments in Information Technology and Materials were the largest contributors to performance. Industrials, Financials, and Health Care were the biggest sector detractors. |
| |
The largest contributor was Vail Resorts, Inc., an operator of ski resorts across the U.S. and Australia. The purchase of Park City resort in Utah and the Perisher resort in Australia provided Vail with enhanced diversification and scale that helped improve margins and facilitated cross marketing among its locations. These improvements led to stronger season pass sales and increased earnings and cash flow, which the company used to increase its dividend and repurchase shares. |
| |
The largest detractor was Hyatt Hotels Corp., a global hotelier. Shares decreased as decelerating revenue per available room suggested that the current lodging cycle may be coming to an end. Concerns that Airbnb was taking market share and affecting pricing power and that the smaller Hyatt would have trouble competing with a behemoth in the Marriott/Starwood merger also contributed to negative sentiment. However, Hyatt continues to generate strong cash flow and is using it to buy back much of its stock. |
| |
We expect to continue to establish positions in small and mid-sized businesses that, in our opinion, have favorable price-to-value characteristics based on our assessment of prospects for future growth and profitability. |
|
| † | | Industry sector levels are provided from the Global Industry Classification Standard (“GICS”), developed and exclusively owned by MSCI, Inc. and Standard & Poor’s Financial Services LLC, unless otherwise stated that they have been reclassified or classified by the Adviser. All GICS data is provided “as is” with no warranties. |
| 1 | | Performance information reflects results of the Retail Shares. |
| * | | Please see Footnote 2 on page 4. |
5
| |
| Baron International Growth Fund (Unaudited) | | December 31, 2015 |
COMPARISON OF THE CHANGE IN VALUE OF $10,000 INVESTMENT IN BARON INTERNATIONAL GROWTH FUND† (RETAIL SHARES)
IN RELATION TO THE MSCI ACWI EX USA IMI GROWTH INDEX AND
THE MSCI ACWI EX USA INDEX |

| AVERAGE ANNUAL TOTAL RETURNS FOR THE PERIODS ENDED DECEMBER 31, 2015 | | | | | | | | | | | | |
| | | | | | | | | | | | Since |
| | | | | | | | | | | | Inception |
| | | One | | Three | | Five | | (December 31, |
| | | Year | | Years | | Years | | 2008) |
| |
| Baron International Growth Fund —- Retail Shares1, 2 | | 1.23 | % | | 6.34 | % | | 3.45 | % | | 11.40 | % |
| Baron International Growth Fund —- Institutional Shares1, 2, 3 | | 1.48 | % | | 6.60 | % | | 3.72 | % | | 11.68 | % |
| MSCI ACWI ex USA IMI Growth Index1 | | (0.26 | )% | | 3.96 | % | | 2.27 | % | | 8.99 | % |
| MSCI ACWI ex USA Index1 | | (5.66 | )% | | 1.50 | % | | 1.06 | % | | 7.48 | % |
| |
|
| † | | The Fund’s historical performance was impacted by gains from IPOs and/or secondary offerings. There is no guarantee that these results can be repeated or that the Fund’s level of participation in IPOs and secondary offerings will be the same in the future. |
| | | |
| 1 | | The MSCI ACWI ex USA indexes cited are unmanaged, free float-adjusted market capitalization weighted indexes. The MSCI ACWI ex USA IMI Growth Index Net USD measures the performance of large-, mid- and small-cap growth securities across developed and emerging markets, excluding the United States. The MSCI ACWI ex USA Index Net USD measures the equity market performance of large and mid-cap securities across developed and emerging markets, excluding the United States. The indexes and Baron International Growth Fund include reinvestment of dividends, net of foreign withholding taxes, which positively impact the performance results. |
| | | |
| 2 | | Past performance is not predictive of future performance. The performance data does not reflect the deduction of taxes that a shareholder would pay on Fund distributions or redemption of Fund shares. The Adviser has reimbursed certain Fund expenses (by contract as long as BAMCO, Inc. is the Adviser to the Fund) and the Fund’s transfer agency expenses may be reduced by expense offsets from an unaffiliated transfer agent, without which performance would have been lower. |
| | | |
| 3 | | Performance for the Institutional Shares prior to May 29, 2009 is based on the performance of the Retail Shares, which have a distribution fee. The Institutional Shares do not have a distribution fee. If the annual returns for the Institutional Shares prior to May 29, 2009 did not reflect this fee, the returns would be higher. |
6
| |
| December 31, 2015 (Unaudited) | | Baron International Growth Fund |
| TOP TEN HOLDINGS AS OF DECEMBER 31, 2015 | | | |
| | | Percent of | |
| | | Net Assets | |
| |
| Constellation Software, Inc. | | 3.4% | |
| |
| Domino’s Pizza Enterprises Ltd. | | 3.2% | |
| |
| Aena SA | | 2.7% | |
| |
| Eurofins Scientific SE | | 2.7% | |
| |
| ProSiebenSat.1 Media AG | | 2.6% | |
| |
| Check Point Software Technologies Ltd. | | 2.5% | |
| |
| Ryanair Holdings plc | | 2.3% | |
| |
| Arch Capital Group Ltd. | | 2.1% | |
| |
| Abcam plc | | 2.0% | |
| |
| Julius Baer Group Ltd. | | 2.0% | |
| |
| | | 25.5% | |
| |
SECTOR BREAKDOWN AS OF DECEMBER 31, 2015†
(as a percentage of net assets) |
| |
 |
| |
| MANAGEMENT’S DISCUSSION OF FUND PERFORMANCE |
For the year ended December 31, 2015, Baron International Growth Fund1 gained 1.23%, outperforming the MSCI ACWI ex USA IMI Growth Index, which lost 0.26%. |
| |
Baron International Growth Fund is a diversified fund that invests for the long term primarily in securities of non-U.S. growth companies. The Fund expects to diversify among several developed countries and developing countries throughout the world, although the Fund’s total exposure to developing countries will |
not exceed 30%. The Fund may purchase securities of companies of any size. |
| |
2015 was a volatile year for international markets. Stocks were buffeted by numerous macro events, including the bursting of the China A- shares market bubble, concerns over slowing growth in China, that government’s devaluation of its currency, continued low oil and commodity prices, and increasing Middle East hostilities. Stocks rallied in late fall, but toward the end of the year, the U.S. Federal Reserve signaled the start of a rate hike cycle, which seemed to act as an immediate financial tightening and stunted the rally. An increase in terrorism and Middle East tensions exacerbated the late year rise in risk premium, leading international equities to end the year virtually flat. |
| |
On a sector basis, the largest contributors to performance were Information Technology, Industrials, and Health Care. Energy, Utilities, and Telecommunication Services were the largest detractors. On a country basis, the largest contributors to performance were the U.K., Australia, and China. Top detractors included Brazil, and to a lesser extent, Norway and the United States. |
| |
The largest contributor was Domino’s Pizza Enterprises Ltd., the largest master franchise of Domino’s Pizza. It operates in Australia/New Zealand, select European countries and Japan. The share price has performed well during 2015 as the company has executed exceptionally well in its home market of Australia/New Zealand, its turnaround markets in Europe and its new market of Japan. Additionally, the company announced entry into Germany, which we believe has the potential to be an additional growth engine for the long term. |
| |
The largest detractor was TerraForm Global, Inc., a divided growth-oriented yield company (yieldco) that owns renewable power assets in emerging markets. The stock fell as the cost of capital for yieldcos increased, which caused concerns regarding the company’s growth prospects. In addition, parent company SunEdison changed TerraForm Global’s management and board to better align the companies, which raised governance concerns. |
| |
For the year ahead, we expect further volatility. The silver lining is that much of the developed world continues to exhibit reasonable economic growth and momentum while much damage has already been done in the emerging and commodity-sensitive markets. To us, the key question is whether the current tightening of financial conditions triggers an international credit event or enough RMB (Chinese currency) depreciation to suggest global contagion and the risk of recession. Should this occur, we believe associated volatility would likely force the Fed to reverse course, with the most likely result an abrupt and sustainable market recovery. While we remain comfortable that our positioning is well aligned given the existing environment, we believe substantial investment opportunities lie ahead and are identifying specific candidates as well as a strategy to take advantage. |
|
| † | | Industry sector levels are provided from the Global Industry Classification Standard (“GICS”), developed and exclusively owned by MSCI, Inc. and Standard & Poor’s Financial Services LLC, unless otherwise stated that they have been reclassified or classified by the Adviser. All GICS data is provided “as is” with no warranties. |
| | | |
| 1 | | Performance information reflects results of the Retail Shares. |
7
Baron Real Estate Fund (Unaudited) | | December 31, 2015 |
COMPARISON OF THE CHANGE IN VALUE OF $10,000 INVESTMENT IN BARON REAL ESTATE FUND† (RETAIL SHARES)
IN RELATION TO THE MSCI USA IMI EXTENDED REAL ESTATE INDEX AND THE S&P 500 INDEX |
| |

| AVERAGE ANNUAL TOTAL RETURNS FOR THE PERIODS ENDED DECEMBER 31, 2015 | | | | | | | |
| | | | | | | | | | | | Since |
| | | | | | | | | | | | Inception |
| | | One | | Three | | Five | | (December 31, |
| | | Year | | Years | | Years | | 2009) |
| |
| Baron Real Estate Fund —- Retail Shares1, 2 | | (4.65 | )% | | 12.23 | % | | 15.19 | % | | 17.02 | % |
| Baron Real Estate Fund —- Institutional Shares1, 2 | | (4.42 | )% | | 12.52 | % | | 15.48 | % | | 17.31 | % |
| MSCI USA IMI Extended Real Estate Index1 | | 2.27 | % | | 12.31 | % | | 11.95 | % | | 14.00 | % |
| S&P 500 Index1 | | 1.38 | % | | 15.13 | % | | 12.57 | % | | 12.98 | % |
| |
|
| † | | The Fund’s historical performance was impacted by gains from IPOs and/or secondary offerings. There is no guarantee that these results can be repeated or that the Fund’s level of participation in IPOs and secondary offerings will be the same in the future. |
| | | |
| 1 | | The MSCI USA IMI Extended Real Estate Index is a custom index calculated by MSCI for, and as requested by, BAMCO, Inc. The index includes real estate and real estate-related GICS classification securities. MSCI makes no express or implied warranties or representation and shall have no liability whatsoever with respect to any MSCI data contained herein. The MSCI data may not be further redistributed or used as a basis for other indexes or any securities or financial products. This report is not approved, reviewed or produced by MSCI. The S&P 500 Index measures the performance of 500 widely held large-cap U.S. companies. The indexes and Baron Real Estate Fund are with dividends, which positively impact the performance results. |
| | | |
| 2 | | Past performance is not predictive of future performance. The performance data does not reflect the deduction of taxes that a shareholder would pay on Fund distributions or redemption of Fund shares. The Adviser has reimbursed certain Fund expenses (by contract as long as BAMCO, Inc. is the Adviser to the Fund) and the Fund’s transfer agency expenses may be reduced by expense offsets from an unaffiliated transfer agent, without which performance would have been lower. |
8
December 31, 2015 (Unaudited) | | Baron Real Estate Fund |
| TOP TEN HOLDINGS AS OF DECEMBER 31, 2015 | |
| | | Percent of | |
| | | Net Assets | |
| |
| CBRE Group, Inc. | | 4.9% | |
| |
| Jones Lang LaSalle, Inc. | | 4.6% | |
| |
| Hilton Worldwide Holdings, Inc. | | 4.5% | |
| |
| Norwegian Cruise Line Holdings, Ltd. | | 4.2% | |
| |
| Equinix, Inc. | | 4.1% | |
| |
| MGM Resorts International | | 4.1% | |
| |
| Mohawk Industries, Inc. | | 3.4% | |
| |
| Simon Property Group, Inc. | | 3.0% | |
| |
| Royal Caribbean Cruises Ltd. | | 2.8% | |
| |
| Home Depot, Inc. | | 2.7% | |
| |
| | | 38.3% | |
| |
SECTOR BREAKDOWN AS OF DECEMBER 31, 2015†
(as a percentage of net assets) |
| |
 |
MANAGEMENT’S DISCUSSION OF FUND PERFORMANCE |
For the year ended December 31, 2015, Baron Real Estate Fund1 declined 4.65%, underperforming the MSCI USA IMI Extended Real Estate Index, which gained 2.27%. Since its inception on December 31, 2009 through December 31, 2015, the Fund has outperformed its index, generating an annualized return of 17.02%, compared with an annualized return of 14.00% for the index. |
| Baron Real Estate Fund is a non-diversified fund that invests broadly in U.S. and non-U.S. real estate and real estate-related companies of all sizes. The Fund seeks to invest in well-managed companies that we believe have significant long-term growth opportunities. The Fund’s investment universe extends beyond real estate investment trusts (REITs) to include hotels, senior housing operators, casino and gaming operators, tower operators, infrastructure-related companies and master limited partnerships (MLPs), data centers, building products companies, real estate service companies, and real estate operating companies. |
| |
| Despite the Fund’s strong overall performance for the six years since inception, we are disappointed with its performance for 2015, in which we made a few key investment mistakes (particularly in our senior housing and hotel investments). We have spent considerable time reviewing 2015, documenting “lessons learned,” and believe we are well positioned to avoid these missteps in the future. |
| |
| Our investments in REITs, building products/services, and data centers contributed the most to returns in the year. Senior housing operators & health care facilities, hotels & leisure, and tower operators & wireless telecommunication services were the largest detractors. |
| |
| The top contributor was Equinix Inc., a carrier-neutral data center and Internet exchange provider. Shares contributed as Equinix completed its REIT transformation, reduced its cost of capital and bid for a large European competitor and a smaller Japanese one. We expect both deals will create significant shareholder value over time. |
| |
| The top detractor was Brookdale Senior Living, Inc. Shares in the nation’s largest senior housing provider declined sharply in 2015, driven down by a highly disruptive integration with Emeritus and several guidance cuts. Investors waiting for a real estate unlocking transaction have largely exited the stock. We sold the stock. |
| |
| While the near-term outlook for real estate is a bit more cautious than a few years ago, we maintain a favorable bias because we believe the positive considerations outweigh the negative ones. Absent a recession, our sense is that business prospects for many categories of real estate will remain positive. |
| |
| We believe the factors that have fueled the real estate recovery largely remain in place. Demand continues to outstrip supply in many markets, most balances sheets are in solid shape, and credit remains available at low interest rates. |
| |
| At the same time, our antenna remains up. We continue to monitor factors that directly impact real estate, such as construction activity, demand prospects, lending practices, interest rates and credit spreads, bank liquidity and valuations, as well a macro considerations such as oil prices, the strength of the U.S. dollar, and the strength of the global economy. |
|
| † | | Industry sector levels are provided from the Global Industry Classification Standard (“GICS”), developed and exclusively owned by MSCI, Inc. and Standard & Poor’s Financial Services LLC, unless otherwise stated that they have been reclassified or classified by the Adviser. All GICS data is provided “as is” with no warranties. |
| | | |
| 1 | | Performance information reflects results of the Retail Shares. |
9
Baron Emerging Markets Fund (Unaudited) | | December 31, 2015 |
COMPARISON OF THE CHANGE IN VALUE OF $10,000 INVESTMENT IN BARON EMERGING MARKETS FUND† (RETAIL SHARES)
IN RELATION TO THE MSCI EM IMI GROWTH INDEX AND THE MSCI EM IMI INDEX |
| |

| AVERAGE ANNUAL TOTAL RETURNS FOR THE PERIODS ENDED DECEMBER 31, 2015 | |
| | | | | | | | | Five Years and |
| | | | | | | | | Since Inception |
| | | One | | Three | | (December 31, |
| | | Year | | Years | | 2010) |
| |
| Baron Emerging Markets Fund —- Retail Shares1, 2 | | (11.16 | )% | | 1.78 | % | | 1.43 | % |
| Baron Emerging Markets Fund —- Institutional Shares1, 2 | | (10.97 | )% | | 2.04 | % | | 1.68 | % |
| MSCI EM IMI Growth Index1 | | (10.51 | )% | | (3.65 | )% | | (2.90 | )% |
| MSCI EM IMI Index1 | | (13.86 | )% | | (6.12 | )% | | (4.59 | )% |
| |
|
| † | The Fund’s historical performance was impacted by gains from IPOs and/or secondary offerings. There is no guarantee that these results can be repeated or that the Fund’s level of participation in IPOs and secondary offerings will be the same in the future. |
| | |
| 1 | The MSCI EM (Emerging Markets) IMI indexes cited are unmanaged, free float-adjusted market capitalization indexes. The MSCI EM (Emerging Markets) IMI Growth Index Net USD and the MSCI EM (Emerging Markets) IMI Index Net USD are designed to measure equity market performance of large-, mid- and small-cap securities in the emerging markets. The MSCI EM (Emerging Markets) IMI Growth Index Net USD screens for growth-style securities. The indexes and Baron Emerging Markets Fund include reinvestment of dividends, net of foreign withholding taxes, which positively impact the performance results. |
| | |
| 2 | Past performance is not predictive of future performance. The performance data does not reflect the deduction of taxes that a shareholder would pay on Fund distributions or redemption of Fund shares. The Adviser has reimbursed certain Fund expenses (by contract as long as BAMCO, Inc. is the Adviser to the Fund) and the Fund’s transfer agency expenses may be reduced by expense offsets from an unaffiliated transfer agent without which performance would have been lower. |
10
December 31, 2015 (Unaudited) | | Baron Emerging Markets Fund |
| TOP TEN HOLDINGS AS OF DECEMBER 31, 2015 |
| | | Percent of | |
| | | Net Assets | |
| |
| Samsung Electronics Co., Ltd. | | 2.3% | |
| |
| Sinopharm Group Co. Ltd. | | 2.0% | |
| |
| TAL Education Group | | 2.0% | |
| |
| LG Household & Health Care Ltd. | | 2.0% | |
| |
| Ctrip.com International, Ltd. | | 1.8% | |
| |
| Shenzhou International Group Holdings Ltd. | | 1.8% | |
| |
| Divi’s Laboratories Ltd. | | 1.7% | |
| |
| Taiwan Semiconductor Manufacturing Company Ltd. | | 1.7% | |
| |
| Fomento Económico Mexicano, S.A.B. de C.V. | | 1.6% | |
| |
| Alibaba Group Holding Limited | | 1.6% | |
| |
| | | 18.5% | |
| |
SECTOR BREAKDOWN AS OF DECEMBER 31, 2015†
(as a percentage of net assets) |
| |
 |
| MANAGEMENT’S DISCUSSION OF FUND PERFORMANCE |
For the year ended December 31, 2015, Baron Emerging Markets Fund1 lost 11.16%, underperforming the MSCI EM IMI Growth Index, which lost 10.51%. |
| |
| Baron Emerging Markets Fund is a diversified fund that invests for the long term primarily in companies of any size that have their principal business activities or trading markets in developing countries. The Fund may invest up to 20% of its net assets in developed and frontier countries. The Fund seeks to |
| invest in companies that have significant long-term growth prospects and to purchase them at prices we believe to be favorable. |
| |
| 2015 was a volatile year for emerging markets. Stocks were buffeted by numerous macro events, including the bursting of the China A- shares market bubble, concerns over slowing growth in China, that government’s devaluation of its currency, continued low oil and commodity prices, and increasing Middle East hostilities. Stocks rallied in late fall, but toward the end of the year, the U.S. Federal Reserve signaled the start of a rate hike cycle, which seemed to act as an immediate financial tightening and stunted the rally. An increase in terrorism and rising Middle East tensions exacerbated the late year rise in risk premium, leading emerging market equities to fade into year end. |
| |
| On a regional basis, investments in India and Mexico contributed to performance in a period when most emerging market countries suffered double-digit declines. The primary detractors were investments in Brazil. Investments in South Africa and the U.S. also hurt performance to a lesser extent. |
| |
| On a sector basis, holdings in Health Care and Consumer Staples contributed to performance. The Financials, Industrials and Telecommunication Services sectors were the largest detractors. |
| |
| The largest contributor was TAL Education Group. The stock price of this leading educational services provider in China reacted favorably as growth and profitability exceeded analyst expectations, and successful expansion in new cities helped confirm the company’s longer-term growth potential. |
| |
| TerraForm Global, Inc. is a divided growth-oriented yield company (yieldco) that owns renewable power assets in emerging markets. The stock price fell as the cost of capital for yieldcos increased, which caused concerns regarding the company’s ability to grow. In addition, parent company SunEdison changed TerraForm Global’s management and board to better align the companies, which raised governance concerns. We continue to hold TerraForm Global as it is currently trading below book value. |
| |
| For the year ahead, we expect further volatility. The silver lining is that we believe we are in the advanced stages of a bear market in the emerging markets, where much of the damage has already been done. To us, the key question is whether the current tightening of financial conditions triggers an international credit event or enough RMB (Chinese currency) depreciation to suggest global contagion and the risk of recession. Should this occur, we believe associated volatility would likely force the Fed to reverse course, with the most likely result an abrupt and sustainable market recovery. While we remain comfortable that our positioning is well aligned given the existing environment, we believe substantial investment opportunities lie ahead and are identifying specific candidates as well as a strategy to take advantage. |
|
| † | | Industry sector levels are provided from the Global Industry Classification Standard (“GICS”), developed and exclusively owned by MSCI, Inc. and Standard & Poor’s Financial Services LLC, unless otherwise stated that they have been reclassified or classified by the Adviser. All GICS data is provided “as is” with no warranties. |
| | | |
| 1 | | Performance information reflects results of the Retail Shares. |
11
Baron Energy and Resources Fund (Unaudited) | | December 31, 2015 |
COMPARISON OF THE CHANGE IN VALUE OF $10,000 INVESTMENT IN BARON ENERGY AND RESOURCES FUND† (RETAIL SHARES)
IN RELATION TO THE S&P NORTH AMERICAN NATURAL RESOURCES SECTOR INDEX
AND THE S&P 500 INDEX |
| |
| |

| AVERAGE ANNUAL TOTAL RETURNS FOR THE PERIODS ENDED DECEMBER 31, 2015 | |
| | | | | | | | | Since Inception |
| | | One | | Three | | (December 31, |
| | | Year | | Years | | 2011) |
| |
| Baron Energy and Resources Fund —- Retail Shares1, 2 | | (31.88 | )% | | (9.36 | )% | | (8.38 | )% |
| Baron Energy and Resources Fund —- Institutional Shares1, 2 | | (31.73 | )% | | (9.16 | )% | | (8.19 | )% |
| S&P North American Natural Resources Sector Index1 | | (24.28 | )% | | (7.32 | )% | | (5.03 | )% |
| S&P 500 Index1 | | 1.38 | % | | 15.13 | % | | 15.35 | % |
| |
|
| † | | The Fund’s historical performance was impacted by gains from IPOs and/or secondary offerings. There is no guarantee that these results can be repeated or that the Fund’s level of participation in IPOs and secondary offerings will be the same in the future. |
| | | |
| 1 | | The indexes are unmanaged. The S&P North American Natural Resources Sector Index measures the performance of U.S.-traded natural resources-related stocks, including mining, energy, paper and forest products, and plantation owning companies. The S&P 500 Index measures the performance of 500 widely held large-cap U.S. companies. The indexes and Baron Energy and Resources Fund are with dividends, which positively impact the performance results. |
| | | |
| 2 | | Past performance is not predictive of future performance. The performance data does not reflect the deduction of taxes that a shareholder would pay on Fund distributions or redemption of Fund shares. The Adviser has reimbursed certain Fund expenses (by contract as long as BAMCO, Inc. is the Adviser to the Fund) and the Fund’s transfer agency expenses may be reduced by expense offsets from an unaffiliated transfer agent, without which performance would have been lower. |
12
December 31, 2015 (Unaudited) | | Baron Energy and Resources Fund |
| TOP TEN HOLDINGS AS OF DECEMBER 31, 2015 |
| | | Percent of |
| | | Net Assets |
| |
| Parsley Energy, Inc. | | 5.7 | % |
| |
| Concho Resources, Inc. | | 5.7 | % |
|
| |
| RSP Permian, Inc. | | 4.7 | % |
| |
| Newfield Exploration Co. | | 4.6 | % |
| |
| Noble Energy, Inc. | | 3.6 | % |
| |
| Flotek Industries, Inc. | | 3.6 | % |
| |
| Marathon Petroleum Corp. | | 3.5 | % |
| |
| Halliburton Co. | | 3.4 | % |
| |
| Valero Energy Corporation | | 3.4 | % |
| |
| Energy Transfer Equity, L.P. | | 3.4 | % |
| |
| | | 41.6 | % |
| |
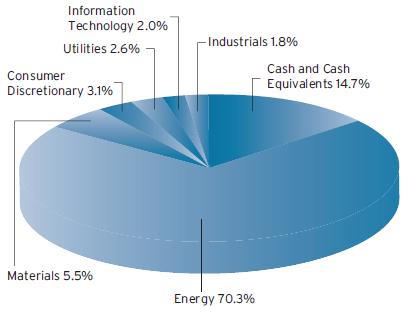
SECTOR BREAKDOWN AS OF DECEMBER 31, 2015†
(as a percentage of net assets)
| MANAGEMENT’S DISCUSSION OF FUND PERFORMANCE |
| For the year ended December 31, 2015, Baron Energy and Resources Fund1 declined 31.88%, underperforming the S&P North American Natural Resources Sector Index, which lost 24.28%. |
| |
| The Fund is a non-diversified fund that invests primarily in energy and resources companies and related companies of any market capitalization, including master limited partnerships (MLPs). The Fund invests primarily in U.S. securities and may invest up to 25% in non-U.S. securities. We select securities that we believe have favorable price-to-value characteristics, are well managed and appropriately financed, and have significant long-term growth prospects and competitive advantages. |
| The current environment is the worst that we have experienced in over 25 years of investing in energy and resources-related companies. Commodity prices across the spectrum from oil to iron ore have been pummeled, producer cash flows have shrunk dramatically, investment is plummeting, and balance sheets have become increasingly stretched. During 2015, the average U.S. oil price fell by 47% and the average U.S. natural gas price fell by 40%. The impact on oil and gas producer cash flows and capital spending has been sharply negative, leading to a dramatic decline in capital spending oriented toward finding, developing, and producing oil and gas in the U.S. and around the world. |
| |
| Toward the end of the year, we restructured the portfolio to reflect our increasing concern regarding the near-term outlook for additional downward pressure on oil & natural gas prices. This restructuring entailed 1) shrinking the number of positions from about 50 to the mid-30s, 2) locking in tax losses to create a tax asset that could be used to offset future gains over the next several years, 3) high-grading our holdings in terms of their balance sheet strength in order to survive a lower-for-longer commodity price environment, and 4) holding a larger-than-normal amount of cash as we ride out the storm to give us more flexibility to be opportunistic. |
| |
| The Fund’s investments in the automobile manufacturers, electrical components & equipment, and oil & gas refining & marketing sub-industries contributed to performance. The oil & gas exploration & production, oil & gas storage & production, and oil & gas equipment & services sub-industries detracted the most during the year. |
| |
| Parsley Energy, Inc. was the largest contributor. Parsley is an oil exploration and production company focused on the Permian Basin in West Texas. Parsley has a strong balance sheet and a superior acreage footprint in the most prolific part of the play that generates some of the highest rates of return in the U.S. Parsley has grown rapidly in the last several years, and we think it will continue to deliver peer leading performance. We believe no other E&P company of its size is in a position to deliver comparable growth and returns in 2016 in the current price environment. |
| |
| SunEdison, Inc., the world’s largest renewable energy developer, detracted the most from performance. Shares declined during 2015 as investors began to question the business model after the cost of capital for yieldcos, of which SunEdison has two, began to rise. Management’s executed on deals without the ability to raise capital to fund them at attractive levels also raised concerns regarding its liquidity position. We sold our position. |
| |
| The near-term environment is as challenging as any we have seen in the past 25-plus years and things can clearly get worse before they get better. However, energy is a cyclical business and the seeds for the next upcycle have already been planted and should begin to sprout this year. We are confident that we are in a good position to take advantage of the opportunities that are in front of us. |
| | |
| † | | Industry sector levels are provided from the Global Industry Classification Standard (“GICS”), developed and exclusively owned by MSCI, Inc. and Standard & Poor’s Financial Services LLC, unless otherwise stated that they have been reclassified or classified by the Adviser. All GICS data is provided “as is” with no warranties. |
| | | | |
| 1 | | Performance information reflects results of the Retail Shares. |
13
Baron Global Advantage Fund (Unaudited) | | December 31, 2015 |
COMPARISON OF THE CHANGE IN VALUE OF $10,000 INVESTMENT IN BARON GLOBAL ADVANTAGE FUND† (RETAIL SHARES)
IN RELATION TO THE MSCI ACWI GROWTH INDEX AND THE MSCI ACWI INDEX
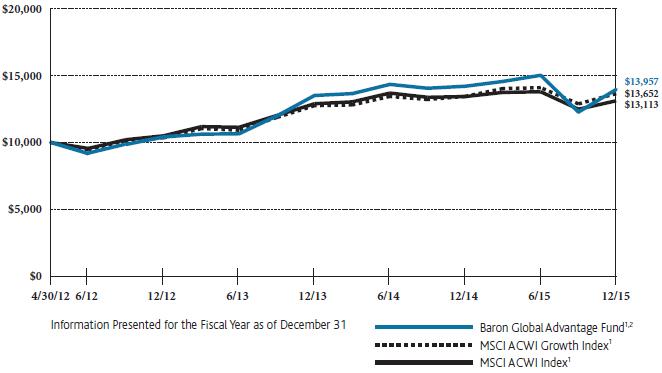
| AVERAGE ANNUAL TOTAL RETURNS FOR THE PERIODS ENDED DECEMBER 31, 2015 |
| | | | | | | | | Since |
| | | One | | Three | | Inception |
| | | Year | | Years | | (April 30, 2012) |
| |
| Baron Global Advantage Fund —- Retail Shares1, 2 | | (1.72 | )% | | 10.27 | % | | 9.52 | % |
| Baron Global Advantage Fund —- Institutional Shares1, 2 | | (1.51 | )% | | 10.52 | % | | 9.75 | % |
| MSCI ACWI Growth Index Net1 | | 1.55 | % | | 9.66 | % | | 8.86 | % |
| MSCI ACWI Index Net1 | | (2.36 | )% | | 7.69 | % | | 7.67 | % |
| |
| | |
| † | | The Fund’s historical performance was impacted by gains from IPOs and/or secondary offerings. There is no guarantee that these results can be repeated or that the Fund’s level of participation in IPOs and secondary offerings will be the same in the future. |
| | | | |
| 1 | | The MSCI ACWI indexes cited are unmanaged, free float-adjusted market capitalization weighted indexes reflected in US dollars. The MSCI ACWI Growth Index Net USD measures the equity market performance of large- and mid-cap growth securities across developed and emerging markets. The MSCI ACWI Index Net USD measures the equity market performance of large- and mid-cap securities across developed and emerging markets. The indexes and Baron Global Advantage Fund include reinvestment of dividends, net of foreign withholding taxes, which positively impact the performance results. |
| | | | |
| 2 | | Past performance is not predictive of future performance. The performance data does not reflect the deduction of taxes that a shareholder would pay on Fund distributions or redemption of Fund shares. The Adviser has reimbursed certain Fund expenses (by contract as long as BAMCO, Inc. is the Adviser to the Fund) and the Fund’s transfer agency expenses may be reduced by expense offsets from an unaffiliated transfer agent, without which performance would have been lower. |
14
December 31, 2015 (Unaudited) | | Baron Global Advantage Fund |
| TOP TEN HOLDINGS AS OF DECEMBER 31, 2015 | | | |
| | | Percent of |
| | | Net Assets |
| |
| Amazon.com, Inc. | | 9.1 | % |
| |
| Alphabet Inc. | | 8.7 | % |
| |
| Facebook, Inc. | | 6.7 | % |
| |
| TAL Education Group | | 6.2 | % |
| |
| JUST EAT plc | | 4.6 | % |
| |
| Alibaba Group Holding Limited | | 3.9 | % |
| |
| Naspers Limited | | 3.8 | % |
| |
| Constellation Software, Inc. | | 3.4 | % |
| |
| Sarana Menara Nusantara Tbk PT | | 3.3 | % |
| |
| Worldpay Group plc | | 3.3 | % |
| |
| | | 53.0 | % |
| |
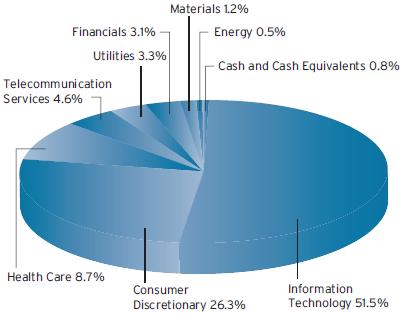
SECTOR BREAKDOWN AS OF DECEMBER 31, 2015†
(as a percentage of net assets)
| MANAGEMENT’s DISCUSSION OF FUND PERFORMANCE |
| For the year ended December 31, 2015, Baron Global Advantage Fund1 lost 1.72%, underperforming the MSCI ACWI Growth Index, which rose 1.55%. |
| |
| Baron Global Advantage Fund is a diversified fund that invests primarily in growth companies of any size located throughout the world. We have a long-term mindset, conduct bottom-up research, |
| and believe insights and perspective are more important than short-term events or results. We invest in companies that we believe have favorable price-to-value and risk/reward characteristics, have strong free cash flow and returns on capital, are well-managed, and have sustainable competitive advantages. |
| |
| 2015 was characterized by significant volatility, with major dislocation in the Energy sector, unyielding concerns about the economic slowdown in China exacerbated by the devaluation of the Yuan, and continued weakness in the emerging markets. The stark disparity in price performance between the leaders and the laggards made for a difficult investing environment. We try hard to focus on company fundamentals, identify the drivers of change, determine if they are real, and ignore the noise. With the wild gyrations in the values of our investments over very short periods of time, it has become increasingly challenging to distinguish between the two. |
| |
| On a sector basis, the Fund’s investments in Consumer Discretionary contributed to performance. Utilities, Energy and Telecommunication Services detracted. From a country perspective, holdings in China, the U.K. and Canada were top contributors. Investments in the U.S., Brazil, Indonesia and India were the biggest detractors. |
| |
| Amazon.com, Inc. was the biggest contributor in 2015, as the stock rose on strong financial results. Enhanced financial disclosures demonstrated that Amazon Web Services (AWS) was more profitable than investors anticipated. Rapid growth in the retail and AWS businesses boosted confidence in Amazon’s growth plans. With e-commerce comprising just 10% of global retail sales, we believe the shift to online retailing represents a multi-year growth opportunity. We also believe that, over time, the nascent AWS cloud computing opportunity will account for the majority of Amazon’s value. |
| |
| The largest detractor from performance was SunEdison, Inc., the world’s largest renewable energy developer. Shares declined sharply during 2015 as investors began to question the business model after the cost of capital for yieldcos, of which SunEdison has two, began to rise. Management’s executed on deals without the ability to raise capital to fund them at attractive levels also raised concerns regarding its liquidity position. We sold our position. |
| |
| The portfolio is constructed on a bottom-up basis, with the quality of ideas and conviction level being the most important determinants of the size of each individual investment. We continue to focus on identifying and investing in unique companies with sustainable competitive advantages and the ability to redeploy capital at high rates of return. We are optimistic about the long-term opportunities of the companies in which we are invested and continue to search for new ideas and investments. |
| | |
| † | | Industry sector levels are provided from the Global Industry Classification Standard (“GICS”), developed and exclusively owned by MSCI, Inc. and Standard & Poor’s Financial Services LLC, unless otherwise stated that they have been reclassified or classified by the Adviser. All GICS data is provided “as is” with no warranties. |
| | | | |
| 1 | | Performance information reflects results of the Retail Shares. |
15
| |
| Baron Partners Fund | December 31, 2015 |
| STATEMENT OF NET ASSETS |
| |
| DECEMBER 31, 2015 |
| Shares | | | | | Cost | | | | Value | |
| |
| Common Stocks (129.48%) | | | | | | | | |
| |
| Consumer Discretionary (43.01%) | | | | | | | | |
| | | Apparel, Accessories & Luxury | | | | | | | | |
| | | Goods (0.42%) | | | | | | | | |
| 100,000 | | Under Armour, Inc., Cl A1 | | $ | 8,215,795 | | | $ | 8,061,000 | |
| | | | | | | | | | | |
| | | Automobile | | | | | | | | |
| | | Manufacturers (12.94%) | | | | | | | | |
| 1,025,000 | | Tesla Motors, Inc.1 | | | 223,491,414 | | | | 246,010,250 | |
| | | | | | | | | | | |
| | | Automotive Retail (5.54%) | | | | | | | | |
| 1,950,000 | | CarMax, Inc.1 | | | 71,153,669 | | | | 105,241,500 | |
| | | | | | | | | | | |
| | | Hotels, Resorts & Cruise | | | | | | | | |
| | | Lines (7.36%) | | | | | | | | |
| 2,600,000 | | Hyatt Hotels Corp., Cl A1 | | | 72,054,423 | | | | 122,252,000 | |
| 300,000 | | Norwegian Cruise Line | | | | | | | | |
| | | Holdings Ltd.1,2 | | | 13,713,389 | | | | 17,580,000 | |
| | | | | | | | | |
| | | | | | 85,767,812 | | | | 139,832,000 | |
| | | Internet Retail (2.47%) | | | | | | | | |
| 20,357,182 | | AO World plc (United Kingdom)1,2 | | | 43,575,320 | | | | 46,846,481 | |
| | | | | | | | | | | |
| | | Leisure Facilities (6.23%) | | | | | | | | |
| 925,800 | | Vail Resorts, Inc. | | | 27,801,851 | | | | 118,493,142 | |
| | | | | | | | | | | |
| | | Movies & Entertainment (5.04%) | | | | | | | | |
| 5,374,321 | | Manchester United plc, Cl A2 | | | 91,547,645 | | | | 95,716,657 | |
| | | | | | | | | | | |
| | | Restaurants (0.41%) | | | | | | | | |
| 40,000 | | Panera Bread Co., Cl A1 | | | 6,855,645 | | | | 7,791,200 | |
| | | | | | | | | | | |
| | | Specialty Stores (2.60%) | | | | | | | | |
| 1,400,000 | | Dick’s Sporting Goods, Inc. | | | 26,087,823 | | | | 49,490,000 | |
| | | | | | | | | |
| Total Consumer Discretionary | | | 584,496,974 | | | | 817,482,230 | |
| | | | | | | | | |
| | | | | | | | | | | |
| Financials (29.28%) | | | | | | | | |
| | | Asset Management & | | | | | | | | |
| | | Custody Banks (2.71%) | | | | | | | | |
| 3,300,000 | | The Carlyle Group | | | 87,855,884 | | | | 51,546,000 | |
| | | | | | | | | | | |
| | | Investment Banking & | | | | | | | | |
| | | Brokerage (6.62%) | | | | | | | | |
| 3,825,000 | | The Charles Schwab Corp. | | | 49,868,095 | | | | 125,957,250 | |
| | | | | | | | | | | |
| | | Office REITs (1.29%) | | | | | | | | |
| 785,000 | | Douglas Emmett, Inc. | | | 23,584,369 | | | | 24,476,300 | |
| | | | | | | | | | | |
| | | Property & Casualty | | | | | | | | |
| | | Insurance (8.81%) | | | | | | | | |
| 2,400,000 | | Arch Capital Group Ltd.1,2 | | | 31,929,993 | | | | 167,400,000 | |
| | | | | | | | | | | |
| | | Specialized Finance (6.63%) | | | | | | | | |
| 775,000 | | FactSet Research Systems, Inc. | | | 50,806,618 | | | | 125,991,750 | |
| | | | | | | | | | | |
| | | Specialized REITs (3.22%) | | | | | | | | |
| 2,200,000 | | Gaming and Leisure Properties, Inc. | | | 71,552,343 | | | | 61,160,000 | |
| | | | | | | | | |
| Total Financials | | | 315,597,302 | | | | 556,531,300 | |
| | | | | | | | | |
| | | | | | | | | | | |
| Health Care (11.31%) | | | | | | | | |
| | | Health Care Equipment (4.03%) | | | | | | | | |
| 1,050,000 | | IDEXX Laboratories, Inc.1 | | | 45,812,786 | | | | 76,566,000 | |
| | | | | | | | | | | |
| | | Health Care Technology (2.23%) | | | | | | | | |
| 2,500,000 | | Inovalon Holdings, Inc., CI A1 | | | 67,944,323 | | | | 42,500,000 | |
| | | | | | | | | | | |
| | | Life Sciences Tools & | | | | | | | | |
| | | Services (5.05%) | | | | | | | | |
| 500,000 | | Illumina, Inc.1 | | | 63,840,699 | | | | 95,972,500 | |
| | | | | | | | | |
| Total Health Care | | | 177,597,808 | | | | 215,038,500 | |
| | | | | | | | | |
| Shares | | | | | Cost | | | | Value | |
| |
| Common Stocks (continued) | | | | | | | | |
| |
| Industrials (15.02%) | | | | | | | | |
| | | Industrial Machinery (1.14%) | | | | | | | | |
| 200,000 | | The Middleby Corp.1 | | $ | 15,278,471 | | | $ | 21,574,000 | |
| | | | | | | | | | | |
| | | Research & Consulting | | | | | | | | |
| | | Services (5.86%) | | | | | | | | |
| 1,450,000 | | Verisk Analytics, Inc.1 | | | 39,366,384 | | | | 111,476,000 | |
| | | | | | | | | | | |
| | | Trading Companies & | | | | | | | | |
| | | Distributors (8.02%) | | | | | | | | |
| 2,418,400 | | Air Lease Corp. | | | 77,411,281 | | | | 80,968,032 | |
| 1,750,000 | | Fastenal Co. | | | 30,618,161 | | | | 71,435,000 | |
| | | | | | | | | |
| | | | | | 108,029,442 | | | | 152,403,032 | |
| | | | | | | | | |
| Total Industrials | | | 162,674,297 | | | | 285,453,032 | |
| | | | | | | | | |
| | | | | | | | | | | |
| Information Technology (22.59%) | | | | | | | | |
| | | Application Software (3.56%) | | | | | | | | |
| 1,600,000 | | Mobileye N.V.1,2 | | | 68,055,917 | | | | 67,648,000 | |
| | | | | | | | | | | |
| | | Internet Software & | | | | | | | | |
| | | Services (15.94%) | | | | | | | | |
| 321,405 | | Benefitfocus, Inc.1 | | | 11,922,714 | | | | 11,695,928 | |
| 1,100,000 | | CoStar Group, Inc.1 | | | 112,737,431 | | | | 227,359,000 | |
| 1,281,350 | | Zillow Group, Inc., Cl A1 | | | 34,585,938 | | | | 33,366,354 | |
| 1,300,000 | | Zillow Group, Inc., Cl C1 | | | 36,094,223 | | | | 30,524,000 | |
| | | | | | | | | |
| | | | | | 195,340,306 | | | | 302,945,282 | |
| | | IT Consulting & Other | | | | | | | | |
| | | Services (3.09%) | | | | | | | | |
| 649,000 | | Gartner, Inc.1 | | | 41,264,138 | | | | 58,864,300 | |
| | | | | | | | | |
| Total Information Technology | | | 304,660,361 | | | | 429,457,582 | |
| | | | | | | | | |
| | | | | | | | | | | |
| Utilities (8.27%) | | | | | | | | |
| | | Electric Utilities (7.90%) | | | | | | | | |
| 3,827,500 | | ITC Holdings Corp. | | | 38,093,597 | | | | 150,229,375 | |
| | | | | | | | | | | |
| | | Renewable Electricity (0.37%) | | | | | | | | |
| 1,333,333 | | TerraForm Global, Inc., Cl A3,5 | | | 20,000,000 | | | | 7,013,332 | |
| | | | | | | | | |
| Total Utilities | | | 58,093,597 | | | | 157,242,707 | |
| | | | | | | | | |
| Total Common Stocks | | | 1,603,120,339 | | | | 2,461,205,351 | |
| | | | | | | | | |
| | | | | | | | | | | |
| |
| Private Equity Investments (0.34%) | | | | | | | | |
| |
| Financials (0.34%) | | | | | | | | |
| | | Asset Management & | | | | | | | | |
| | | Custody Banks (0.34%) | | | | | | | | |
| 7,579,130 | | Windy City Investments | | | | | | | | |
| | | Holdings, L.L.C.1,3,4,6 | | | 1,832,926 | | | | 6,442,261 | |
| | | | | | | | | |
| 16 | | See Notes to Financial Statements. |
| |
| December 31, 2015 | Baron Partners Fund |
| STATEMENT OF NET ASSETS (Continued) |
| |
| DECEMBER 31, 2015 |
| Principal Amount | | | Cost | | | | Value | |
| |
| Short Term Investments (0.01%) | | | | | | | | |
| |
| $141,285 | | Repurchase Agreement | | | | | | | | |
| | | with Fixed Income | | | | | | | | |
| | | Clearing Corp., dated | | | | | | | | |
| | | 12/31/2015, 0.03% due | | | | | | | | |
| | | 1/4/2016; Proceeds at | | | | | | | | |
| | | maturity - $141,286; | | | | | | | | |
| | | (Fully collateralized by | | | | | | | | |
| | | $100,000 U.S. Treasury | | | | | | | | |
| | | Bond, 7.625% due | | | | | | | | |
| | | 2/15/2025; Market | | | | | | | | |
| | | value - $147,625)5 | | $ | 141,285 | | | $ | 141,285 | |
| | | | | | | | | |
| Total Investments (129.83%) | | $ | 1,605,094,550 | | | | 2,467,788,897 | |
| | | | | | | | | | |
Liabilities Less Cash and Other Assets (-29.83%) | | (566,995,843 | ) |
| | | | | | | | | | |
| Net Assets | | | | | | $ | 1,900,793,054 | |
| | | | | | | | | | |
| Retail Shares (Equivalent to $35.62 per share |
based on 31,091,294 shares outstanding) | | $ | 1,107,480,559 | |
| | | | | | | | | | |
| Institutional Shares (Equivalent to $36.15 per share |
based on 21,946,557 shares outstanding) | | $ | 793,312,495 | |
| | | | | | | | | | |
| % | | Represents percentage of net assets. |
| 1 | | Non-income producing securities. |
| 2 | | Foreign corporation. |
| 3 | | At December 31, 2015, the market value of restricted and fair valued securities amounted to $13,455,593 or 0.71% of net assets. These securities are not deemed liquid. See Note 6 regarding Restricted Securities. |
| 4 | | The Adviser has reclassified/classified certain securities in or out of this sub- industry. Such reclassifications/classifications are not supported by S&P or MSCI. |
| 5 | | Level 2 security. See Note 7 regarding Fair Value Measurements. |
| 6 | | Level 3 security. See Note 7 regarding Fair Value Measurements. |
| | | |
| | | All securities are Level 1, unless otherwise noted. |
| See Notes to Financial Statements. | | 17 |
| |
| Baron Focused Growth Fund | December 31, 2015 |
| STATEMENT OF NET ASSETS |
| |
| DECEMBER 31, 2015 |
| Shares | | | | | Cost | | | | Value | |
| |
| Common Stocks (89.48%) | | | | | | | | |
| |
| Consumer Discretionary (38.53%) | | | | | | | | |
| | | Automobile Manufacturers (10.69%) | | | | | | | | |
| 82,000 | | Tesla Motors, Inc.1 | | $ | 19,145,973 | | | $ | 19,680,820 | |
| | | | | | | | | | | |
| | | Hotels, Resorts & Cruise | | | | | | | | |
| | | Lines (11.42%) | | | | | | | | |
| 150,000 | | Choice Hotels International, Inc. | | | 5,080,138 | | | | 7,561,500 | |
| 286,703 | | Hyatt Hotels Corp., Cl A1 | | | 10,279,766 | | | | 13,480,775 | |
| | | | | | | | | |
| | | | | | 15,359,904 | | | | 21,042,275 | |
| | | Leisure Facilities (9.47%) | | | | | | | | |
| 136,230 | | Vail Resorts, Inc. | | | 8,272,836 | | | | 17,436,078 | |
| | | | | | | | | | | |
| | | Movies & Entertainment (5.32%) | | | | | | | | |
| 550,000 | | Manchester United plc, Cl A2 | | | 8,719,507 | | | | 9,795,500 | |
| | | | | | | | | | | |
| | | Specialty Stores (1.63%) | | | | | | | | |
| 85,000 | | Dick’s Sporting Goods, Inc. | | | 1,375,455 | | | | 3,004,750 | |
| | | | | | | | | |
| Total Consumer Discretionary | | | 52,873,675 | | | | 70,959,423 | |
| | | | | | | | | |
| | | | | | | | | | | |
| Consumer Staples (2.30%) | | | | | | | | |
| | | Household Products (2.30%) | | | | | | | | |
| 50,000 | | Church & Dwight Co., Inc. | | | 1,274,171 | | | | 4,244,000 | |
| | | | | | | | | |
| | | | | | | | | | | |
| Financials (17.00%) | | | | | | | | |
| | | Asset Management & | | | | | | | | |
| | | Custody Banks (5.86%) | | | | | | | | |
| 260,000 | | The Carlyle Group | | | 6,556,081 | | | | 4,061,200 | |
| 200,000 | | Financial Engines, Inc. | | | 6,804,436 | | | | 6,734,000 | |
| | | | | | | | | |
| | | | | | 13,360,517 | | | | 10,795,200 | |
| | | Investment Banking & | | | | | | | | |
| | | Brokerage (0.73%) | | | | | | | | |
| 59,500 | | Virtu Financial, Inc., Cl A | | | 1,130,500 | | | | 1,347,080 | |
| | | | | | | | | | | |
| | | Property & Casualty | | | | | | | | |
| | | Insurance (3.79%) | | | | | | | | |
| 100,000 | | Arch Capital Group Ltd.1,2 | | | 1,800,055 | | | | 6,975,000 | |
| | | | | | | | | | | |
| | | Specialized Finance (6.62%) | | | | | | | | |
| 75,000 | | FactSet Research Systems, Inc. | | | 5,828,282 | | | | 12,192,750 | |
| | | | | | | | | |
| Total Financials | | | 22,119,354 | | | | 31,310,030 | |
| | | | | | | | | |
| | | | | | | | | | | |
| Health Care (2.58%) | | | | | | | | |
| | | Health Care Technology (2.58%) | | | | | | | | |
| 280,000 | | Inovalon Holdings, Inc., CI A1 | | | 5,394,884 | | | | 4,760,000 | |
| | | | | | | | | |
| | | | | | | | | | | |
| Industrials (8.62%) | | | | | | | | |
| | | Building Products (3.06%) | | | | | | | | |
| 130,000 | | CaesarStone Sdot-Yam Ltd.1,2 | | | 5,831,418 | | | | 5,634,200 | |
| | | | | | | | | | | |
| | | Research & Consulting | | | | | | | | |
| | | Services (3.34%) | | | | | | | | |
| 80,000 | | Verisk Analytics, Inc.1 | | | 2,262,317 | | | | 6,150,400 | |
| | | | | | | | | | | |
| | | Trading Companies & | | | | | | | | |
| | | Distributors (2.22%) | | | | | | | | |
| 100,000 | | Fastenal Co. | | | 2,169,715 | | | | 4,082,000 | |
| | | | | | | | | |
| Total Industrials | | | 10,263,450 | | | | 15,866,600 | |
| | | | | | | | | |
| Shares | | | | | Cost | | | | Value | |
| |
| Common Stocks (continued) | | | | | | | | |
| |
| Information Technology (16.19%) | | | | | | | | |
| | | | | | | | | | | |
| | | Application Software (3.33%) | | | | | | | | |
| 101,870 | | Guidewire Software, Inc.1 | | $ | 4,816,692 | | | $ | 6,128,499 | |
| | | | | | | | | | | |
| | | Internet Software & | | | | | | | | |
| | | Services (12.86%) | | | | | | | | |
| 225,000 | | Benefitfocus, Inc.1 | | | 5,980,202 | | | | 8,187,750 | |
| 75,000 | | CoStar Group, Inc.1 | | | 13,824,622 | | | | 15,501,750 | |
| | | | | | | | | |
| | | | | | 19,804,824 | | | | 23,689,500 | |
| | | | | | | | | |
| Total Information Technology | | | 24,621,516 | | | | 29,817,999 | |
| | | | | | | | | |
| | | | | | | | | | | |
| Utilities (4.26%) | | | | | | | | |
| | | Electric Utilities (4.26%) | | | | | | | | |
| 200,000 | | ITC Holdings Corp. | | | 4,273,076 | | | | 7,850,000 | |
| | | | | | | | | |
| Total Common Stocks | | | 120,820,126 | | | | 164,808,052 | |
| | | | | | | | | |
| | | | | | | | | | | |
| |
| Preferred Stocks (3.75%) | | | | | | | | |
| |
| Telecommunication Services (3.75%) | | | | | | | | |
| | | Alternative Carriers (3.75%) | | | | | | | | |
| 22,300 | | Iridium Communications, | | | | | | | | |
| | | Inc., Series B, 6.75%3 | | | 5,814,082 | | | | 6,892,707 | |
| | | | | | | | | |
| | | | | | | | | | | |
| |
| Principal Amount | | | | | | | | |
| |
| Short Term Investments (7.53%) | | | | | | | | |
| |
| $13,876,643 | | Repurchase Agreement | | | | | | | | |
| | | with Fixed Income | | | | | | | | |
| | | Clearing Corp., dated | | | | | | | | |
| | | 12/31/2015, 0.03% due | | | | | | | | |
| | | 1/4/2016; Proceeds at | | | | | | | | |
| | | maturity - $13,876,689; | | | | | | | | |
| | | (Fully collateralized by | | | | | | | | |
| | | $13,845,000 U.S. | | | | | | | | |
| | | Treasury Note, 2.50% | | | | | | | | |
| | | due 5/15/2024; Market | | | | | | | | |
| | | value - $14,156,513)3 | | | 13,876,643 | | | | 13,876,643 | |
| | | | | | | | | |
| Total Investments (100.76%) | | $ | 140,510,851 | | | | 185,577,402 | |
| | | | | | | | | | |
| Liabilities Less Cash and | | | | | | | | |
| Other Assets (-0.76%) | | | | | | | (1,394,478 | ) |
| | | | | | | | | | |
| Net Assets | | | | | | $ | 184,182,924 | |
| | | | | | | | | | |
| Retail Shares (Equivalent to $13.09 per share | | |
based on 3,342,339 shares outstanding) | $ | 43,740,641 | |
| | | | | | | | | | |
| Institutional Shares (Equivalent to $13.25 per share |
based on 10,601,629 shares outstanding) | | | $ | 140,442,283 | |
| | | | | | | | | | |
| % | | Represents percentage of net assets. |
| 1 | | Non-income producing securities. |
| 2 | | Foreign corporation. |
| 3 | | Level 2 security. See Note 7 regarding Fair Value Measurements. |
| | | |
| | | All securities are Level 1, unless otherwise noted. |
| 18 | | See Notes to Financial Statements. |
| |
| December 31, 2015 | Baron International Growth Fund |
| STATEMENT OF NET ASSETS |
| |
| DECEMBER 31, 2015 |
| Shares | | | | | Cost | | | | Value | |
| |
| Common Stocks (96.04%) | | | | | | | | |
| |
| Australia (4.26%) | | | | | | | | |
| 75,169 | | Domino’s Pizza Enterprises Ltd. | | $ | 1,019,935 | | | $ | 3,163,294 | |
| 110,000 | | Newcrest Mining Ltd.1 | | | 1,196,025 | | | | 1,039,636 | |
| | | | | | | | | |
| Total Australia | | | 2,215,960 | | | | 4,202,930 | |
| | | | | | | | | |
| | | | | | | | | | | |
| Brazil (2.06%) | | | | | | | | |
| 325,000 | | BM&FBOVESPA SA3 | | | 1,078,357 | | | | 888,639 | |
| 55,000 | | Smiles SA 3 | | | 597,426 | | | | 481,983 | |
| 85,000 | | TOTVS SA 3 | | | 703,494 | | | | 664,788 | |
| | | | | | | | | |
| Total Brazil | | | 2,379,277 | | | | 2,035,410 | |
| | | | | | | | | |
| | | | | | | | | | | |
| Canada (4.59%) | | | | | | | | |
| 8,000 | | Constellation Software, Inc. | | | 1,357,302 | | | | 3,335,289 | |
| 46,000 | | Suncor Energy, Inc. | | | 1,633,185 | | | | 1,186,800 | |
| | | | | | | | | |
| Total Canada | | | 2,990,487 | | | | 4,522,089 | |
| | | | | | | | | |
| | | | | | | | | | | |
| China (10.51%) | | | | | | | | |
| 15,000 | | Alibaba Group Holding Limited, ADR1 | | | 1,214,982 | | | | 1,219,050 | |
| 1,000,000 | | China Telecom Corp. Ltd., Cl H | | | 613,993 | | | | 469,674 | |
| 32,000 | | Ctrip.com International Ltd., ADR1 | | | 1,192,683 | | | | 1,482,560 | |
| 425,771 | | Haitong Securities Co., Ltd., Cl H | | | 653,845 | | | | 752,648 | |
| 2,801,700 | | Kingdee International Software | | | | | | | | |
| | | Group Co. Ltd. | | | 468,933 | | | | 1,286,966 | |
| 16,000 | | Qihoo 360 Technology Co. Ltd., ADR1 | | | 1,009,642 | | | | 1,164,960 | |
| 120,000 | | SouFun Holdings Ltd., ADR | | | 1,007,965 | | | | 886,800 | |
| 35,000 | | TAL Education Group, ADR1 | | | 1,101,101 | | | | 1,626,450 | |
| 75,000 | | Tencent Holdings Ltd. | | | 368,377 | | | | 1,477,733 | |
| | | | | | | | | |
| Total China | | | 7,631,521 | | | | 10,366,841 | |
| | | | | | | | | |
| | | | | | | | | | | |
| France (4.26%) | | | | | | | | |
| 7,500 | | Eurofins Scientific SE | | | 803,358 | | | | 2,623,278 | |
| 12,500 | | Ingenico Group SA | | | 199,911 | | | | 1,582,580 | |
| | | | | | | | | |
| Total France | | | 1,003,269 | | | | 4,205,858 | |
| | | | | | | | | |
| | | | | | | | | | | |
| Germany (9.41%) | | | | | | | | |
| 34,000 | | Brenntag AG3 | | | 1,738,953 | | | | 1,771,663 | |
| 22,000 | | Fresenius Medical Care Ag & Co.3 | | | 1,852,956 | | | | 1,848,760 | |
| 50,066 | | ProSiebenSat.1 MediaAG3 | | | 2,236,247 | | | | 2,525,895 | |
| 110,100 | | RIB Software AG3 | | | 700,405 | | | | 1,341,943 | |
| 27,000 | | Symrise AG3 | | | 419,599 | | | | 1,787,357 | |
| | | | | | | | | |
| Total Germany | | | 6,948,160 | | | | 9,275,618 | |
| | | | | | | | | |
| | | | | | | | | | | |
| India (2.39%) | | | | | | | | |
| 493,598 | | Dish TV India Ltd.1 | | | 502,643 | | | | 757,674 | |
| 90,000 | | SKS Microfinance Ltd.1 | | | 659,983 | | | | 678,916 | |
| 140,000 | | Zee Entertainment Enterprises Ltd. | | | 719,129 | | | | 925,309 | |
| | | | | | | | | |
| Total India | | | 1,881,755 | | | | 2,361,899 | |
| | | | | | | | | |
| | | | | | | | | | | |
| Indonesia (2.10%) | | | | | | | | |
| 849,373 | | Matahari Department Store Tbk PT3 | | | 1,064,961 | | | | 1,075,250 | |
| 1,250,000 | | Sarana Menara Nusantara Tbk PT1,3 | | | 260,297 | | | | 429,861 | |
| 1,347,368 | | Tower Bersama Infrastructure Tbk PT1,3 | | | 582,701 | | | | 569,960 | |
| | | | | | | | | |
| Total Indonesia | | | 1,907,959 | | | | 2,075,071 | |
| | | | | | | | | |
| | | | | | | | | | | | |
| Shares | | | | | Cost | | | | Value | |
| |
| Common Stocks (continued) | | | | | | | | |
| |
| Ireland (2.31%) | | | | | | | | |
| 26,325 | | Ryanair Holdings plc, ADR | | $ | 986,106 | | | $ | 2,276,060 | |
| | | | | | | | | |
| | | | | | | | | | | |
| Israel (5.47%) | | | | | | | | |
| 30,000 | | Check Point Software Technologies Ltd.1 | | | 1,632,858 | | | | 2,441,400 | |
| 42,000 | | Mellanox Technologies Ltd.1 | | | 1,683,039 | | | | 1,769,880 | |
| 28,000 | | Mobileye N.V.1 | | | 1,326,743 | | | | 1,183,840 | |
| | | | | | | | | |
| Total Israel | | | 4,642,640 | | | | 5,395,120 | |
| | | | | | | | | |
| | | | | | | | | | | |
| Italy (2.36%) | | | | | | | | |
| 40,000 | | Azimut Holding SpA3 | | | 958,684 | | | | 994,247 | |
| 400,000 | | Intesa Sanpaolo SpA3 | | | 1,403,008 | | | | 1,328,400 | |
| | | | | | | | | |
| Total Italy | | | 2,361,692 | | | | 2,322,647 | |
| | | | | | | | | |
| | | | | | | | | | | |
| Japan (12.20%) | | | | | | | | |
| 40,000 | | Bridgestone Corp.3 | | | 984,974 | | | | 1,372,056 | |
| 250,000 | | Daiwa Securities Group, Inc.3 | | | 2,059,579 | | | | 1,528,423 | |
| 7,700 | | FANUC Corp.3 | | | 715,566 | | | | 1,326,632 | |
| 60,000 | | Mitsui Fudosan Co. Ltd.3 | | | 1,416,039 | | | | 1,505,872 | |
| 60,000 | | MonotaRO Co. Ltd.3 | | | 673,509 | | | | 1,660,180 | |
| 150,000 | | Rakuten, Inc.3 | | | 2,017,843 | | | | 1,727,663 | |
| 22,000 | | SoftBank Group Corp.3 | | | 739,574 | | | | 1,110,349 | |
| 475,400 | | Sumitomo Mitsui Trust Holdings, Inc.3 | | | 2,031,540 | | | | 1,800,497 | |
| | | | | | | | | |
| Total Japan | | | 10,638,624 | | | | 12,031,672 | |
| | | | | | | | | |
| | | | | | | | | | | |
| Mexico (0.84%) | | | | | | | | |
| 150,000 | | Grupo Financiero Banorte S.A.B. | | | | | | | | |
| | | de C.V., Cl O | | | 839,950 | | | | 825,089 | |
| | | | | | | | | |
| | | | | | | | | | | |
| Norway (0.51%) | | | | | | | | |
| 32,000 | | Golar LNG Ltd. | | | 1,005,759 | | | | 505,280 | |
| | | | | | | | | |
| | | | | | | | | | | |
| South Africa (1.20%) | | | | | | | | |
| 227,622 | | Steinhoff International Holdings N.V. | | | | | | | | |
| | | (formerly, Steinhoff International | | | | | | | | |
| | | Holdings Ltd.) | | | 1,052,624 | | | | 1,182,420 | |
| | | | | | | | | |
| | | | | | | | | | | |
| Spain (5.12%) | | | | | | | | |
| 23,000 | | Aena SA, 144A1 | | | 2,156,543 | | | | 2,634,499 | |
| 35,000 | | Grifols SA, ADR | | | 555,989 | | | | 1,134,000 | |
| 37,105 | | Industria de Diseño Textil SA | | | 1,067,201 | | | | 1,277,863 | |
| | | | | | | | | |
| Total Spain | | | 3,779,733 | | | | 5,046,362 | |
| | | | | | | | | |
| | | | | | | | | | | |
| Switzerland (1.97%) | | | | | | | | |
| 40,067 | | Julius Baer Group Ltd.3 | | | 1,399,262 | | | | 1,938,327 | |
| | | | | | | | | |
| | | | | | | | | | | |
| United Kingdom (19.69%) | | | | | | | | |
| 203,000 | | Abcam plc | | | 1,384,255 | | | | 1,990,096 | |
| 425,214 | | AO World plc1 | | | 1,399,942 | | | | 978,514 | |
| 100,000 | | Domino’s Pizza Group plc | | | 904,175 | | | | 1,550,858 | |
| 60,200 | | easyJet plc | | | 1,373,403 | | | | 1,544,195 | |
| 95,000 | | EMIS Group plc | | | 1,395,612 | | | | 1,593,758 | |
| See Notes to Financial Statements. | | 19 |
| |
| Baron International Growth Fund | December 31, 2015 |
| STATEMENT OF NET ASSETS (Continued) |
| |
| DECEMBER 31, 2015 |
| Shares | | | | | Cost | | | | Value | |
| |
| Common Stocks (continued) | | | | | | | | |
| |
| United Kingdom (continued) | | | | | | | | |
| 70,000 | | Experian plc | | $ | 718,046 | | | $ | 1,239,360 | |
| 115,300 | | Inchcape plc | | | 1,062,155 | | | | 1,334,306 | |
| 40,600 | | Intertek Group plc | | | 1,248,372 | | | | 1,662,105 | |
| 210,159 | | JUST EAT plc1 | | | 926,837 | | | | 1,529,564 | |
| 150,000 | | Lancashire Holdings Ltd. | | | 1,484,033 | | | | 1,388,696 | |
| 1,281,886 | | Lekoil Ltd.1 | | | 478,064 | | | | 351,967 | |
| 80,000 | | Nomad Food Limited1 | | | 812,700 | | | | 944,000 | |
| 240,600 | | William Hill plc | | | 1,394,337 | | | | 1,404,582 | |
| 419,000 | | Worldpay Group plc, 144A1 | | | 1,544,879 | | | | 1,898,161 | |
| | | | | | | | | |
| Total United Kingdom | | | 16,126,810 | | | | 19,410,162 | |
| | | | | | | | | |
| | | | | | | | | | | |
| United States (4.79%) | | | | | | | | |
| 23,000 | | Agilent Technologies, Inc. | | | 417,740 | | | | 961,630 | |
| 30,000 | | Arch Capital Group Ltd.1 | | | 1,149,524 | | | | 2,092,500 | |
| 17,000 | | lululemon athletica, Inc.1 | | | 1,050,116 | | | | 891,990 | |
| 131,228 | | TerraForm Global, Inc., Cl A2,3 | | | 1,900,000 | | | | 690,259 | |
| 15,000 | | TerraForm Global, Inc., Cl A | | | 68,107 | | | | 83,850 | |
| | | | | | | | | |
| Total United States | | | 4,585,487 | | | | 4,720,229 | |
| | | | | | | | | |
| Total Common Stocks | | | 74,377,075 | | | | 94,699,084 | |
| | | | | | | | | |
| Principal Amount | | | Cost | | | | Value | |
| |
| Short Term Investments (4.01%) | | | | | | | | |
| |
| $3,949,806 | | Repurchase Agreement with | | | | | | | | |
| | | Fixed Income Clearing Corp., | | | | | | | | |
| | | dated 12/31/2015, 0.03% due | | | | | | | | |
| | | 1/4/2016; Proceeds at maturity - | | | | | | | | |
| | | $3,949,819; (Fully collateralized by | | | | | | | | |
| | | $3,945,000 U.S. Treasury Note, | | | | | | | | |
| | | 2.50% due 5/15/2024 Market | | | | | | | | |
| | | value - $4,033,763)3 | | $ | 3,949,806 | | | $ | 3,949,806 | |
| | | | | | | | | |
| Total Investments (100.05%) | | $ | 78,326,881 | | | | 98,648,890 | |
| | | | | | | | | | |
| Liabilities Less Cash and Other Assets (-0.05%) | | | (50,945 | ) |
| | | | | | | | | | |
| Net Assets | | | | | | $ | 98,597,945 | |
| | | | | | | | | | |
| Retail Shares (Equivalent to $18.05 per share |
based on 2,486,454 shares outstanding) | | | $ | 44,882,418 | |
| | | | | | | | | | |
| Institutional Shares (Equivalent to $18.17 per share |
| based on 2,956,335 shares outstanding) | | | | | | $ | 53,715,527 | |
| | | | | | | | | | |
| | | |
| % | | Represents percentage of net assets. |
| 1 | | Non-income producing securities. |
| 2 | | At December 31, 2015, the market value of restricted and fair valued securities amounted to $690,259 or 0.70% of net assets. This security is not deemed liquid.
See Note 6 regarding Restricted Securities. |
| 3 | | Level 2 security. See Note 7 regarding Fair Value Measurements. |
| ADR | | American Depositary Receipt. |
| 144A | | Security is exempt from registration under Rule 144A of the Securities Act of 1933. This security may be resold in transactions that are exempt from registration, normally to qualified institutional buyers. This security has been deemed liquid pursuant to policies and procedures approved by the Board of Trustees, unless otherwise noted. At December 31, 2015, the market value of Rule 144A securities amounted to $4,532,660 or 4.60% of net assets. |
| | | |
| | | All securities are Level 1, unless otherwise noted. |
| |
| Summary of Investments by Sector | | Percentage of | |
| as of December 31, 2015 | | Net Assets | |
| |
| Consumer Discretionary | | 24.1 | % |
| Information Technology | | 22.1 | |
| Financials | | 15.9 | |
| Industrials | | 14.3 | |
| Health Care | | 10.3 | |
| Materials | | 2.9 | |
| Telecommunication Services | | 2.6 | |
| Energy | | 2.1 | |
| Consumer Staples | | 0.9 | |
| Utilities | | 0.8 | |
| Cash and Cash Equivalents* | | 4.0 | |
| |
| | | 100.0 | % |
| |
| * | | Includes short term investments. |
| 20 | | See Notes to Financial Statements. |
| |
| December 31, 2015 | Baron Real Estate Fund |
| STATEMENT OF NET ASSETS |
| |
| DECEMBER 31, 2015 |
| Shares | | | | | Cost | | | | Value | |
| |
| Common Stocks (97.64%) | | | | | | | | |
| |
| Consumer Discretionary (35.73%) | | | | | | | | |
| | | Casinos & Gaming (4.12%) | | | | | | | | |
| 3,228,950 | | MGM Resorts International1 | | $ | 66,233,236 | | | $ | 73,361,744 | |
| | | | | | | | | | | |
| | | Home Furnishings (3.40%) | | | | | | | | |
| 320,507 | | Mohawk Industries, Inc.1 | | | 46,387,172 | | | | 60,700,820 | |
| | | | | | | | | | | |
| | | Home Improvement Retail (4.85%) | | | | | | | | |
| 362,507 | | Home Depot, Inc. | | | 28,715,856 | | | | 47,941,551 | |
| 505,550 | | Lowe’s Companies, Inc. | | | 23,225,213 | | | | 38,442,022 | |
| | | | | | | | | |
| | | | | | 51,941,069 | | | | 86,383,573 | |
| | | Homebuilding (2.47%) | | | | | | | | |
| 1,320,800 | | Toll Brothers, Inc.1 | | | 45,772,826 | | | | 43,982,640 | |
| | | | | | | | | | | |
| | | Hotels, Resorts & Cruise | | | | | | | | |
| | | Lines (19.16%) | | | | | | | | |
| 1,148,296 | | Diamond Resorts International, Inc.1 | | | 16,717,521 | | | | 29,293,031 | |
| 3,773,000 | | Hilton Worldwide Holdings, Inc. | | | 97,249,957 | | | | 80,742,200 | |
| 756,244 | | Hyatt Hotels Corp., Cl A1 | | | 31,583,176 | | | | 35,558,593 | |
| 1,274,000 | | Norwegian Cruise Line Holdings Ltd.1,2 | | | 47,779,620 | | | | 74,656,400 | |
| 492,600 | | Royal Caribbean Cruises Ltd.2 | | | 42,977,855 | | | | 49,856,046 | |
| 370,050 | | Starwood Hotels & | | | | | | | | |
| | | Resorts Worldwide, Inc. | | | 22,318,653 | | | | 25,637,064 | |
| 627,400 | | Wyndham Worldwide Corp. | | | 38,793,570 | | | | 45,580,610 | |
| | | | | | | | | |
| | | | | | 297,420,352 | | | | 341,323,944 | |
| | | Leisure Facilities (1.73%) | | | | | | | | |
| 1,686,555 | | ClubCorp Holdings, Inc. | | | 35,559,681 | | | | 30,813,360 | |
| | | | | | | | | |
| Total Consumer Discretionary | | | 543,314,336 | | | | 636,566,081 | |
| | | | | | | | | |
| | | | | | | | | | | |
| Financials (45.24%) | | | | | | | | |
| | | Diversified Real Estate | | | | | | | | |
| | | Activities (2.05%) | | | | | | | | |
| 1,156,650 | | Brookfield Asset | | | | | | | | |
| | | Management, Inc., Cl A2 | | | 34,282,820 | | | | 36,469,175 | |
| | | | | | | | | | | |
| | | Office REITs (6.44%) | | | | | | | | |
| 345,650 | | Boston Properties, Inc. | | | 44,722,317 | | | | 44,084,201 | |
| 1,136,610 | | Douglas Emmett, Inc. | | | 28,448,279 | | | | 35,439,500 | |
| 311,800 | | SL Green Realty Corp. | | | 32,718,930 | | | | 35,227,164 | |
| | | | | | | | | |
| | | | | | 105,889,526 | | | | 114,750,865 | |
| | | Real Estate Development (2.01%) | | | | | | | | |
| 317,300 | | The Howard Hughes Corp.1 | | | 41,921,218 | | | | 35,905,668 | |
| | | | | | | | | | | |
| | | Real Estate Operating | | | | | | | | |
| | | Companies (4.21%) | | | | | | | | |
| 1,674,000 | | Forest City Enterprises, Inc., Cl A1 | | | 33,461,290 | | | | 36,710,820 | |
| 2,149,514 | | Kennedy Wilson Europe Real Estate plc | | | | | | | |
| | | (United Kingdom)2,3 | | | 36,608,516 | | | | 38,342,644 | |
| | | | | | | | | |
| | | | | | 70,069,806 | | | | 75,053,464 | |
| | | Real Estate Services (12.04%) | | | | | | | | |
| 2,528,200 | | CBRE Group, Inc., Cl A1 | | | 71,487,085 | | | | 87,425,156 | |
| 513,330 | | Jones Lang LaSalle, Inc. | | | 61,535,554 | | | | 82,060,934 | |
| 1,867,000 | | Kennedy-Wilson Holdings, Inc. | | | 35,101,460 | | | | 44,957,360 | |
| | | | | | | | | |
| | | | | | 168,124,099 | | | | 214,443,450 | |
| | | Residential REITs (5.06%) | | | | | | | | |
| 245,450 | | AvalonBay Communities, Inc. | | | 42,524,647 | | | | 45,194,708 | |
| 550,650 | | Equity Residential | | | 44,256,242 | | | | 44,927,534 | |
| | | | | | | | | |
| | | | | | 86,780,889 | | | | 90,122,242 | |
| Shares | | | | | Cost | | | | Value | |
| |
| Common Stocks (continued) | | | | | | | | |
| |
| Financials (continued) | | | | | | | | |
| | | Retail REITs (5.11%) | | | | | | | | |
| 1,364,450 | | General Growth Properties, Inc. | | $ | 37,572,014 | | | $ | 37,126,684 | |
| 277,400 | | Simon Property Group, Inc. | | | 47,458,436 | | | | 53,937,656 | |
| | | | | | | | | |
| | | | | | 85,030,450 | | | | 91,064,340 | |
| | | Specialized REITs (8.32%) | | | | | | | | |
| 373,950 | | Alexandria Real Estate Equities, Inc.3 | | | 29,461,690 | | | | 33,790,122 | |
| 419,735 | | American Tower Corp. | | | 37,082,222 | | | | 40,693,308 | |
| 243,996 | | Equinix, Inc. | | | 52,760,621 | | | | 73,784,391 | |
| | | | | | | | | |
| | | | | | 119,304,533 | | | | 148,267,821 | |
| | | | | | | | | |
| Total Financials | | | 711,403,341 | | | | 806,077,025 | |
| | | | | | | | | |
| | | | | | | | | | | |
| Health Care (1.54%) | | | | | | | | |
| | | Health Care Facilities (1.54%) | | | | | | | | |
| 1,319,844 | | Capital Senior Living Corp.1 | | | 27,791,899 | | | | 27,531,946 | |
| | | | | | | | | |
| | | | | | | | | | | |
| Industrials (7.50%) | | | | | | | | |
| | | Airport Services (0.72%) | | | | | | | | |
| 111,600 | | Aena SA, 144A (Spain)1,2 | | | 11,972,893 | | | | 12,783,047 | |
| | | | | | | | | | | |
| | | Building Products (6.78%) | | | | | | | | |
| 2,783,180 | | Builders FirstSource, Inc.1 | | | 18,552,146 | | | | 30,837,634 | |
| 1,043,500 | | CaesarStone Sdot-Yam Ltd.1,2 | | | 29,791,597 | | | | 45,225,290 | |
| 731,600 | | Masonite International Corp.1,2 | | | 44,831,339 | | | | 44,795,868 | |
| | | | | | | | | |
| | | | | | 93,175,082 | | | | 120,858,792 | |
| | | | | | | | | |
| Total Industrials | | | 105,147,975 | | | | 133,641,839 | |
| | | | | | | | | |
| | | | | | | | | | | |
| Information Technology (1.09%) | | | | | | | | |
| | | IT Consulting & Other | | | | | | | | |
| | | Services (1.09%) | | | | | | | | |
| 642,189 | | InterXion Holding N.V.1,2 | | | 19,284,986 | | | | 19,361,999 | |
| | | | | | | | | |
| | | | | | | | | | | |
| Materials (1.50%) | | | | | | | | |
| | | Construction Materials (1.50%) | | | | | | | | |
| 1,337,293 | | Summit Materials, Inc., Cl A1 | | | 31,367,016 | | | | 26,799,355 | |
| | | | | | | | | |
| | | | | | | | | | | |
| Telecommunication Services (3.28%) | | | | | | | | |
| | | Wireless Telecommunication | | | | | | | | |
| | | Services (3.28%) | | | | | | | | |
| 57,211,650 | | Sarana Menara Nusantara | | | | | | | | |
| | | Tbk PT (Indonesia)1,2,4 | | | 15,144,114 | | | | 19,674,436 | |
| 335,600 | | SBA Communications Corp., Cl A1 | | | 29,212,017 | | | | 35,261,492 | |
| 8,240,410 | | Tower Bersama Infrastructure | | | | | | | | |
| | | Tbk PT (Indonesia)1,2,4 | | | 4,132,982 | | | | 3,485,837 | |
| | | | | | | | | |
| Total Telecommunication Services | | | 48,489,113 | | | | 58,421,765 | |
| | | | | | | | | |
| | | | | | | | | | | |
| Utilities (1.76%) | | | | | | | | |
| | | Electric Utilities (1.76%) | | | | | | | | |
| 825,500 | | Brookfield Infrastructure | | | | | | | | |
| | | Partners L.P.2 | | | 33,198,675 | | | | 31,294,705 | |
| | | | | | | | | |
| Total Common Stocks | | | 1,519,997,341 | | | | 1,739,694,715 | |
| | | | | | | | | |
| See Notes to Financial Statements. | | 21 |
| |
| Baron Real Estate Fund | December 31, 2015 |
| STATEMENT OF NET ASSETS (Continued) |
| |
| DECEMBER 31, 2015 |
| Principal Amount | | | Cost | | | | Value | |
| |
| Short Term Investments (2.13%) | | | | | | | | |
| |
| $37,889,013 | | Repurchase Agreement with | | | | | | | | |
| | | Fixed Income Clearing Corp., | | | | | | | | |
| | | dated 12/31/2015, 0.03% due | | | | | | | | |
| | | 1/4/2016; Proceeds at maturity - | | | | | | | | |
| | | $37,889,139; (Fully collateralized | | | | | | | | |
| | | by $37,800,000 U.S. Treasury | | | | | | | | |
| | | Note, 2.50% due 5/15/2024; | | | | | | | | |
| | | Market value - $38,650,500)4 | | $ | 37,889,013 | | | $ | 37,889,013 | |
| | | | | | | | | |
| Total Investments (99.77%) | | $ | 1,557,886,354 | | | | 1,777,583,728 | |
| | | | | | | | | | |
| Cash and Other Assets Less Liabilities (0.23%) | | | 4,098,066 | |
| | | | | | | | | | |
| Net Assets | | | | | | $ | 1,781,681,794 | |
| | | | | | | | | | |
| Retail Shares (Equivalent to $24.24 per share |
based on 32,540,726 shares outstanding) | | | $ | 788,912,265 | |
| | | | | | | | | | |
| Institutional Shares (Equivalent to $24.51 per share |
based on 40,497,394 shares outstanding) | | | $ | 992,769,529 | |
| | | | | | | | | | |
| % | | Represents percentage of net assets. |
| 1 | | Non-income producing securities. |
| 2 | | Foreign corporation. |
| 3 | | The Adviser has reclassified/classified certain securities in or out of this sub- industry. Such reclassifications/classifications are not supported by S&P or MSCI. |
| 4 | | Level 2 security. See Note 7 regarding Fair Value Measurements. |
| 144A | | Security is exempt from registration under Rule 144A of the Securities Act of 1933. This security may be resold in transactions that are exempt from registration, normally to qualified institutional buyers. This security has been deemed liquid pursuant to policies and procedures approved by the Board of Trustees, unless otherwise noted. At December 31, 2015, the market value of Rule 144A securities amounted to $12,783,047 or 0.72% of net assets. |
| | | |
| | | All securities are Level 1, unless otherwise noted. |
| 22 | | See Notes to Financial Statements. |
| |
| December 31, 2015 | Baron Emerging Markets Fund |
| STATEMENT OF NET ASSETS |
| |
| DECEMBER 31, 2015 |
| Shares | | | | | Cost | | | | Value | |
| |
| Common Stocks (88.76%) | | | | | | | | |
| |
| Brazil (4.59%) | | | | | | | | |
| 5,250,000 | | BM&FBOVESPA SA3 | | $ | 17,071,860 | | | $ | 14,354,939 | |
| 2,000,312 | | Cetip SA - Mercados Organizados3 | | | 22,581,358 | | | | 18,902,607 | |
| 440,000 | | Linx SA | | | 8,591,358 | | | | 4,926,888 | |
| 1,350,000 | | Multiplus SA3 | | | 15,400,071 | | | | 12,710,993 | |
| 1,700,400 | | Smiles SA3 | | | 22,974,258 | | | | 14,901,163 | |
| 1,600,818 | | TOTVS SA3 | | | 23,771,784 | | | | 12,520,052 | |
| | | | | | | | | |
| Total Brazil | | | 110,390,689 | | | | 78,316,642 | |
| | | | | | | | | |
| | | | | | | | | | | |
| China (25.04%) | | | | | | | | |
| 340,000 | | Alibaba Group Holding Limited, ADR1 | | | 27,138,662 | | | | 27,631,800 | |
| 7,200,000 | | China Everbright Ltd. | | | 22,958,189 | | | | 16,573,829 | |
| 5,850,000 | | China Life Insurance Co., Ltd., Cl H | | | 26,755,804 | | | | 18,946,329 | |
| 9,800,000 | | China Mengniu Dairy Co. Ltd. | | | 22,198,442 | | | | 15,983,381 | |
| 2,200,000 | | China Mobile Ltd. | | | 28,271,704 | | | | 24,838,549 | |
| 40,000,000 | | China Telecom Corp. Ltd., Cl H | | | 25,115,460 | | | | 18,786,976 | |
| 7,000,000 | | China Unicom (Hong Kong) Ltd. | | | 10,537,283 | | | | 8,544,461 | |
| 660,850 | | Ctrip.com International Ltd., ADR1 | | | 21,676,701 | | | | 30,617,180 | |
| 14,659,400 | | Haitong Securities Co., Ltd., Cl H | | | 22,998,747 | | | | 25,913,869 | |
| 5,000,000 | | Huatai Securities Co. Ltd., | | | | | | | | |
| | | Cl H, 144A1 | | | 15,220,206 | | | | 11,664,441 | |
| 700,000 | | Jumei International | | | | | | | | |
| | | Holding Ltd., ADR1 | | | 12,161,934 | | | | 6,342,000 | |
| 48,000,000 | | Kingdee International Software | | | | | | | | |
| | | Group Co. Ltd. | | | 15,319,031 | | | | 22,048,890 | |
| 25,200,000 | | PetroChina Co. Ltd. | | | 26,399,580 | | | | 16,550,603 | |
| 265,000 | | Qihoo 360 Technology Co. | | | | | | | | |
| | | Ltd., ADR1 | | | 16,581,447 | | | | 19,294,650 | |
| 5,200,000 | | Shenzhou International Group | | | | | | | | |
| | | Holdings Ltd. | | | 23,397,303 | | | | 29,891,420 | |
| 15,000,600 | | Sihuan Pharmaceutical | | | | | | | | |
| | | Holdings Group Ltd.2,4 | | | 7,125,260 | | | | 7,935,750 | |
| 8,700,000 | | Sinopharm Group Co. Ltd., Cl H | | | 31,785,273 | | | | 34,912,033 | |
| 2,300,000 | | SouFun Holdings Ltd., ADR | | | 19,181,705 | | | | 16,997,000 | |
| 5,750,000 | | Sunny Optical Technology | | | | | | | | |
| | | Group Co., Ltd. | | | 13,298,017 | | | | 13,221,205 | |
| 750,515 | | TAL Education Group, ADR1 | | | 21,919,286 | | | | 34,876,432 | |
| 1,300,000 | | Tencent Holdings Ltd. | | | 18,822,063 | | | | 25,614,028 | |
| | | | | | | | | |
| Total China | | | 428,862,097 | | | | 427,184,826 | |
| | | | | | | | | |
| | | | | | | | | | | |
| Hong Kong (3.28%) | | | | | | | | |
| 4,500,000 | | Luk Fook Holdings International Ltd. | | | 14,890,081 | | | | 9,545,745 | |
| 21,000,000 | | Man Wah Holdings Ltd. | | | 18,876,067 | | | | 24,712,099 | |
| 4,402,100 | | Techtronic Industries Co. Ltd. | | | 17,782,821 | | | | 17,949,092 | |
| 3,250,000 | | Wynn Macau Ltd.1 | | | 12,269,473 | | | | 3,799,330 | |
| | | | | | | | | |
| Total Hong Kong | | | 63,818,442 | | | | 56,006,266 | |
| | | | | | | | | |
| | | | | | | | | | | |
| India (15.97%) | | | | | | | | |
| 1,427,000 | | Amara Raja Batteries Ltd. | | | 8,867,611 | | | | 18,589,152 | |
| 4,900,000 | | Coal India Ltd. | | | 29,245,403 | | | | 24,427,322 | |
| 3,752,679 | | DEN Networks Ltd.1 | | | 10,244,650 | | | | 6,370,159 | |
| 12,584,985 | | Dish TV India Ltd.1 | | | 11,786,781 | | | | 19,317,982 | |
| 1,650,000 | | Divi’s Laboratories Ltd. | | | 18,091,285 | | | | 28,803,061 | |
| 7,000,000 | | Exide Industries Ltd. | | | 19,061,869 | | | | 15,495,890 | |
| 1,100,000 | | Glenmark Pharmaceuticals Ltd. | | | 13,917,779 | | | | 15,328,710 | |
| 5,770,000 | | Hathway Cable and Datacom Ltd.1 | | | 5,093,897 | | | | 3,881,190 | |
| 810,653 | | Lupin Ltd. | | | 13,909,764 | | | | 22,512,948 | |
| 3,000,000 | | Motherson Sumi Systems Ltd. | | | 15,065,022 | | | | 13,293,529 | |
| 1,500,000 | | PVR Ltd. | | | 14,319,858 | | | | 18,178,555 | |
| 2,850,000 | | SKS Microfinance Ltd.1 | | | 21,929,467 | | | | 21,498,989 | |
| 2,350,000 | | Sun TV Network Ltd. | | | 14,723,419 | | | | 15,146,566 | |
| 1,176,000 | | Torrent Pharmaceuticals Ltd. | | | 10,517,851 | | | | 25,804,673 | |
| 3,604,000 | | Zee Entertainment Enterprises Ltd. | | | 16,708,626 | | | | 23,820,108 | |
| | | | | | | | | |
| Total India | | | 223,483,282 | | | | 272,468,834 | |
| | | | | | | | | |
| Shares | | | | | Cost | | | | Value | |
| |
| Common Stocks (continued) | | | | | | | | |
| |
| Indonesia (3.56%) | | | | | | | | |
| 23,092,000 | | Bank Rakyat Indonesia | | | | | | | | |
| | | (Persero) Tbk PT3 | | $ | 17,504,331 | | | $ | 18,951,614 | |
| 15,503,527 | | Matahari Department | | | | | | | | |
| | | Store Tbk PT3 | | | 19,623,356 | | | | 19,626,434 | |
| 27,631,350 | | Sarana Menara | | | | | | | | |
| | | Nusantara Tbk PT1,3 | | | 8,841,958 | | | | 9,502,107 | |
| 29,973,122 | | Tower Bersama | | | | | | | | |
| | | Infrastructure Tbk PT1,3 | | | 16,312,936 | | | | 12,679,154 | |
| | | | | | | | | |
| Total Indonesia | | | 62,282,581 | | | | 60,759,309 | |
| | | | | | | | | |
| | | | | | | | | | | |
| Korea, Republic of (7.47%) | | | | | | | | |
| 275,000 | | Grand Korea Leisure Co., Ltd.3 | | | 11,252,182 | | | | 5,626,269 | |
| 95,000 | | LG Chem Ltd.3 | | | 23,916,882 | | | | 26,227,900 | |
| 38,000 | | LG Household & Health Care Ltd. | | | 23,915,147 | | | | 33,743,344 | |
| 37,000 | | Samsung Electronics Co., Ltd.3 | | | 46,796,591 | | | | 39,463,529 | |
| 240,000 | | Samsung Life Insurance Co. Ltd.3 | | | 24,484,202 | | | | 22,427,920 | |
| | | | | | | | | |
| Total Korea, Republic of | | | 130,365,004 | | | | 127,488,962 | |
| | | | | | | | | |
| | | | | | | | | | | |
| Mexico (6.47%) | | | | | | | | |
| 300,000 | | Fomento Económico Mexicano | | | | | | | |
| | | S.A.B. de C.V., ADR | | | 27,502,978 | | | | 27,705,000 | |
| 209,432 | | GRUMA S.A.B. de C.V., Cl B | | | 2,923,532 | | | | 2,946,594 | |
| 4,200,000 | | Grupo Financiero Banorte | | | | | | | | |
| | | S.A.B. de C.V., Cl O | | | 23,213,665 | | | | 23,102,498 | |
| 8,317,513 | | Grupo Lala S.A.B. de C.V. | | | 16,819,981 | | | | 19,246,419 | |
| 3,500,000 | | Infraestructura Energetica | | | | | | | | |
| | | Nova S.A.B. de C.V. | | | 19,638,545 | | | | 14,623,865 | |
| 9,000,000 | | Wal-Mart de Mexico | | | | | | | | |
| | | S.A.B de C.V. | | | 20,679,839 | | | | 22,716,064 | |
| | | | | | | | | |
| Total Mexico | | | 110,778,540 | | | | 110,340,440 | |
| | | | | | | | | |
| | | | | | | | | | | |
| Panama (0.76%) | | | | | | | | |
| 270,000 | | Copa Holdings SA, Cl A | | | 16,640,873 | | | | 13,030,200 | |
| | | | | | | | | |
| | | | | | | | | | | |
| Philippines (3.40%) | | | | | | | | |
| 25,005,000 | | Ayala Land, Inc.3 | | | 17,332,890 | | | | 18,277,968 | |
| 7,750,000 | | BDO Unibank, Inc.3 | | | 16,674,837 | | | | 17,227,047 | |
| 125,000,000 | | Metro Pacific Investments Corp.3 | | | 13,459,244 | | | | 13,789,932 | |
| 2,200,000 | | Universal Robina Corp.3 | | | 5,676,759 | | | | 8,681,275 | |
| | | | | | | | | |
| Total Philippines | | | 53,143,730 | | | | 57,976,222 | |
| | | | | | | | | |
| | | | | | | | | | | |
| Singapore (1.02%) | | | | | | | | |
| 11,500,918 | | Global Logistic Properties Ltd. | | | 23,707,909 | | | | 17,439,152 | |
| | | | | | | | | |
| | | | | | | | | | | |
| South Africa (5.66%) | | | | | | | | |
| 810,700 | | Aspen Pharmacare Holdings Ltd. | | | 21,827,587 | | | | 16,223,436 | |
| 925,138 | | Bidvest Group Ltd. | | | 24,290,387 | | | | 19,633,983 | |
| 1,000,000 | | Mr Price Group Ltd. | | | 18,868,087 | | | | 12,932,428 | |
| 525,000 | | Sasol Limited | | | 17,803,577 | | | | 14,237,633 | |
| 371,500 | | Sasol Limited, ADR | | | 12,565,087 | | | | 9,963,630 | |
| 4,550,000 | | Steinhoff International Holdings | | | | | | | | |
| | | N.V. (formerly, Steinhoff | | | | | | | | |
| | | International Holdings Ltd.) | | | 20,090,511 | | | | 23,635,722 | |
| | | | | | | | | |
| Total South Africa | | | 115,445,236 | | | | 96,626,832 | |
| | | | | | | | | |
| See Notes to Financial Statements. | | 23 |
| |
| Baron Emerging Markets Fund | December 31, 2015 |
| STATEMENT OF NET ASSETS (Continued) |
| |
| DECEMBER 31, 2015 |
| Shares | | | | | Cost | | | | Value | |
| |
| Common Stocks (continued) | | | | | | | | |
| |
| Taiwan, Province of China (9.77%) | | | | | | | | |
| 1,750,000 | | Eclat Textile Co., Ltd. | | $ | 22,432,130 | | | $ | 24,161,263 | |
| 12,001,000 | | Far EasTone | | | | | | | | |
| | | Telecommunications Co., Ltd. | | | 26,332,245 | | | | 24,698,377 | |
| 1,800,000 | | Ginko International Co., Ltd. | | | 26,770,922 | | | | 23,837,794 | |
| 2,400,715 | | HIWIN Technologies Corp. | | | 20,412,744 | | | | 9,464,870 | |
| 3,600,934 | | Makalot Industrial Co. Ltd. | | | 21,675,412 | | | | 25,543,204 | |
| 1,600,000 | | MediaTek, Inc. | | | 20,770,924 | | | | 12,177,672 | |
| 4,700,000 | | Novatek Microelectronics Corp. | | | 20,472,210 | | | | 18,458,307 | |
| 1,250,000 | | Taiwan Semiconductor | | | | | | | | |
| | | Manufacturing Company Ltd., ADR | | | 24,902,371 | | | | 28,437,500 | |
| | | | | | | | | |
| Total Taiwan, Province of China | | | 183,768,958 | | | | 166,778,987 | |
| | | | | | | | | |
| | | | | | | | | | | |
| Thailand (0.73%) | | | | | | | | |
| 750,000 | | Advanced Info Service PCL3 | | | 4,958,323 | | | | 3,167,987 | |
| 100,000 | | Bangkok Bank PCL, Cl F3 | | | 629,574 | | | | 427,011 | |
| 2,101,000 | | Bangkok Bank | | | | | | | | |
| | | Public Co., Ltd., NVDR3 | | | 11,918,045 | | | | 8,863,970 | |
| | | | | | | | | |
| Total Thailand | | | 17,505,942 | | | | 12,458,968 | |
| | | | | | | | | |
| | | | | | | | | | | |
| United Kingdom (0.34%) | | | | | | | | |
| 20,996,223 | | Lekoil Ltd.1 | | | 11,970,580 | | | | 5,764,928 | |
| | | | | | | | | |
| | | | | | | | | | | |
| United States (0.70%) | | | | | | | | |
| 1,938,946 | | TerraForm Global, Inc., Cl A2,3 | | | 28,100,000 | | | | 10,198,856 | |
| 300,000 | | TerraForm Global, Inc., Cl A | | | 1,428,029 | | | | 1,677,000 | |
| | | | | | | | | |
| Total United States | | | 29,528,029 | | | | 11,875,856 | |
| | | | | | | | | |
| Total Common Stocks | | | 1,581,691,892 | | | | 1,514,516,424 | |
| | | | | | | | | |
| | | | | | | | | | | |
| |
| Preferred Stocks (0.02%) | | | | | | | | |
| |
| India (0.02%) | | | | | | | | |
| 30,983,400 | | Zee Entertainment Enterprises | | | | | | | | |
| | | Ltd., 6% due 3/5/2022 | | | 367,971 | | | | 421,503 | |
| | | | | | | | | |
| | | | | | | | | | | |
| |
| Principal Amount | | | | | | | | |
| |
| Convertible Bonds (0.35%) | | | | | | | | |
| |
| China (0.35%) | | | | | | | | |
| $50,000,000 | | Biostime International | | | | | | | | |
| | | Holdings Ltd., 0.00% | | | | | | | | |
| | | due 02/20/20191,3 | | | 6,590,206 | | | | 6,064,477 | |
| | | | | | | | | |
| Principal Amount | | | Cost | | | | Value | |
| |
| Short Term Investments (10.37%) | | | | | | | | |
| |
| $176,864,045 | | Repurchase Agreement with | | | | | | | | |
| | | Fixed Income Clearing Corp., | | | | | | | | |
| | | dated 12/31/2015, 0.03% | | | | | | | | |
| | | due 1/4/2016; Proceeds at | | | | | | | | |
| | | maturity - $176,864,634; | | | | | | | | |
| | | (Fully collateralized by | | | | | | | | |
| | | $179,955,000 U.S. Treasury | | | | | | | | |
| | | Note, 2.25% due 11/15/2024; | | | | | | | | |
| | | Market value - $180,404,888)3 | | $ | 176,864,045 | | | $ | 176,864,045 | |
| | | | | | | | | |
| Total Investments (99.50%) | | $ | 1,765,514,114 | | | | 1,697,866,449 | |
| | | | | | | | | | |
| Cash and Other Assets Less Liabilities (0.50%) | | | | 8,489,982 | |
| | | | | | | | | | |
| Net Assets | | | | | | $ | 1,706,356,431 | |
| | | | | | | | | | |
| Retail Shares (Equivalent to $10.57 per share |
based on 62,960,581 shares outstanding) | | | $ | 665,515,103 | |
| | | | | | | | | | |
| Institutional Shares (Equivalent to $10.59 per share |
based on 98,261,135 shares outstanding) | | | $ | 1,040,841,328 | |
| | | | | | | | | | |
| % | | Represents percentage of net assets. |
| 1 | | Non-income producing securities. |
| 2 | | At December 31, 2015, the market value of restricted and fair valued securities amounted to $18,134,606 or 1.06% of net assets. These securities are not deemed liquid. See Note 6 regarding Restricted Securities. |
| 3 | | Level 2 security. See Note 7 regarding Fair Value Measurements. |
| 4 | | Level 3 security. See Note 7 regarding Fair Value Measurements. |
| ADR | | American Depositary Receipt. |
| NVDR | | Non-Voting Depositary Receipt. |
| 144A | | Security is exempt from registration under Rule 144A of the Securities Act of 1933. This security may be resold in transactions that are exempt from registration, normally to qualified institutional buyers. This security has been deemed liquid pursuant to policies and procedures approved by the Board of Trustees, unless otherwise noted. At December 31, 2015, the market value of Rule 144A securities amounted to $11,664,441 or 0.68% of net assets. |
| | | |
| | | All securities are Level 1, unless otherwise noted. |
| |
| Summary of Investments by Sector | | Percentage of | |
| as of December 31, 2015 | | Net Assets | |
| |
| Consumer Discretionary | | 24.2 | % |
| Financials | | 15.7 | |
| Information Technology | | 14.1 | |
| Health Care | | 10.3 | |
| Consumer Staples | | 8.0 | |
| Telecommunication Services | | 6.0 | |
| Energy | | 4.2 | |
| Industrials | | 3.6 | |
| Materials | | 1.5 | |
| Utilities | | 1.5 | |
| Cash and Cash Equivalents* | | 10.9 | |
| |
| | | 100.0 | % |
| |
| * | | Includes short term investments. |
| 24 | | See Notes to Financial Statements. |
| |
| December 31, 2015 | Baron Energy and Resources Fund |
| STATEMENT OF NET ASSETS |
| |
| DECEMBER 31, 2015 |
| Shares | | | | | Cost | | | | Value | |
| |
| Common Stocks (85.31%) | | | | | | | | |
| |
| Consumer Discretionary (3.12%) | | | | | | | | |
| | | Automobile Manufacturers (3.12%) | | | | | | | | |
| 10,300 | | Tesla Motors, Inc.1 | | $ | 2,340,997 | | | $ | 2,472,103 | |
| | | | | | | | | |
| | | | | | | | | | | |
| Energy (70.28%) | | | | | | | | |
| | | Oil & Gas Drilling (1.13%) | | | | | | | | |
| 16,746 | | Helmerich & Payne, Inc. | | | 1,269,796 | | | | 896,748 | |
| | | | | | | | | | | |
| | | Oil & Gas Equipment & | | | | | | | | |
| | | Services (9.95%) | | | | | | | | |
| 19,450 | | Core Laboratories N.V.2 | | | 2,518,205 | | | | 2,114,993 | |
| 79,996 | | Halliburton Co. | | | 3,846,304 | | | | 2,723,064 | |
| 39,031 | | Oil States International, Inc.1 | | | 1,566,086 | | | | 1,063,595 | |
| 28,400 | | Schlumberger Limited | | | 2,175,805 | | | | 1,980,900 | |
| | | | | | | | | |
| | | | | | 10,106,400 | | | | 7,882,552 | |
| | | Oil & Gas Exploration & | | | | | | | | |
| | | Production (31.07%) | | | | | | | | |
| 48,199 | | Concho Resources, Inc.1 | | | 5,071,179 | | | | 4,475,759 | |
| 26,768 | | EOG Resources, Inc. | | | 2,265,006 | | | | 1,894,907 | |
| 33,800 | | Hess Corporation | | | 1,746,341 | | | | 1,638,624 | |
| 1,544,354 | | Lekoil Ltd. (United Kingdom)1,2 | | | 988,150 | | | | 424,033 | |
| 90,200 | | Memorial Resource Development Corp.1 | | | 1,323,231 | | | | 1,456,730 | |
| 113,000 | | Newfield Exploration Co.1 | | | 3,495,966 | | | | 3,679,280 | |
| 87,049 | | Noble Energy, Inc. | | | 3,781,008 | | | | 2,866,523 | |
| 243,600 | | Parsley Energy, Inc., Cl A1 | | | 4,209,226 | | | | 4,494,420 | |
| 151,200 | | RSP Permian, Inc.1 | | | 3,653,760 | | | | 3,687,768 | |
| | | | | | | | | |
| | | | | | 26,533,867 | | | | 24,618,044 | |
| | | Oil & Gas Refining & | | | | | | | | |
| | | Marketing (6.85%) | | | | | | | | |
| 53,156 | | Marathon Petroleum Corp. | | | 2,495,823 | | | | 2,755,607 | |
| 37,800 | | Valero Energy Corporation | | | 2,655,105 | | | | 2,672,838 | |
| | | | | | | | | |
| | | | | | 5,150,928 | | | | 5,428,445 | |
| | | Oil & Gas Storage & | | | | | | | | |
| | | Transportation (21.28%) | | | | | | | | |
| 148,375 | | Columbia Pipeline Partners LP | | | 3,027,809 | | | | 2,593,595 | |
| 52,811 | | Dominion Midstream Partners, L.P. | | | 1,351,248 | | | | 1,619,185 | |
| 193,300 | | Energy Transfer Equity L.P. | | | 3,796,862 | | | | 2,655,942 | |
| 19,935 | | Golar LNG Ltd.2 | | | 748,435 | | | | 314,774 | |
| 23,500 | | MPLX LP | | | 781,052 | | | | 924,255 | |
| 190,304 | | Scorpio Tankers Inc.2 | | | 1,793,640 | | | | 1,526,238 | |
| 44,179 | | Shell Midstream Partners, L.P. | | | 1,211,708 | | | | 1,834,312 | |
| 46,940 | | Tallgrass Energy Partners, LP | | | 1,248,930 | | | | 1,934,397 | |
| 32,900 | | Valero Energy Partners LP | | | 1,287,409 | | | | 1,697,969 | |
| 19,076 | | Western Gas Equity Partners LP | | | 946,075 | | | | 692,268 | |
| 43,539 | | Western Refining Logistics, LP | | | 1,099,816 | | | | 1,068,012 | |
| | | | | | | | | |
| | | | | | 17,292,984 | | | | 16,860,947 | |
| | | | | | | | | |
| Total Energy | | | 60,353,975 | | | | 55,686,736 | |
| | | | | | | | | |
| | | | | | | | | | | |
| Industrials (1.84%) | | | | | | | | |
| | | Construction & Engineering (1.84%) | | | | | | | | |
| 66,202 | | Primoris Services Corp. | | | 1,352,045 | | | | 1,458,430 | |
| | | | | | | | | |
| | | | | | | | | | | |
| Information Technology (2.03%) | | | | | | | | |
| | | Application Software (2.03%) | | | | | | | | |
| 42,600 | | Aspen Technology, Inc.1 | | | 1,699,174 | | | | 1,608,576 | |
| | | | | | | | | |
| Shares | | | | | Cost | | | | Value | |
| |
| Common Stocks (continued) | | | | | | | | |
| |
| Materials (5.48%) | | | | | | | | |
| | | Commodity Chemicals (1.92%) | | | | | | | | |
| 24,700 | | Methanex Corp.2 | | $ | 1,263,226 | | | $ | 815,347 | |
| 31,832 | | Westlake Chemical Partners LP | | | 850,416 | | | | 706,034 | |
| | | | | | | | | |
| | | | | | 2,113,642 | | | | 1,521,381 | |
| | | Specialty Chemicals (3.56%) | | | | | | | | |
| 246,652 | | Flotek Industries, Inc.1 | | | 3,443,489 | | | | 2,821,699 | |
| | | | | | | | | |
| Total Materials | | | 5,557,131 | | | | 4,343,080 | |
| | | | | | | | | |
| | | | | | | | | | | |
| Utilities (2.56%) | | | | | | | | |
| | | Renewable Electricity (2.56%) | | | | | | | | |
| 210,526 | | TerraForm Global, Inc., Cl A3,4 | | | 3,000,000 | | | | 1,107,367 | |
| 73,410 | | TerraForm Power, Inc., Cl A | | | 1,862,305 | | | | 923,498 | |
| | | | | | | | | |
| Total Utilities | | | 4,862,305 | | | | 2,030,865 | |
| | | | | | | | | |
| Total Common Stocks | | | 76,165,627 | | | | 67,599,790 | |
| | | | | | | | | |
| | | | | | | | | | | |
| |
| Principal Amount | | | | | | | | |
| |
| Short Term Investments (18.20%) | | | | | | | | |
| |
| $14,424,779 | | Repurchase Agreement with | | | | | | | | |
| | | Fixed Income Clearing Corp., | | | | | | | | |
| | | dated 12/31/2015, 0.03% due | | | | | | | | |
| | | 1/4/2016; Proceeds at maturity - | | | | | | | | |
| | | $14,424,828; (Fully collateralized | | | | | | | | |
| | | by $9,970,000 U.S. Treasury Bond, | | | | | | | | |
| | | 7.625% due 2/15/2025; Market | | | | | | | | |
| | | value - $14,718,213)4 | | | 14,424,779 | | | | 14,424,779 | |
| | | | | | | | | |
| Total Investments (103.51%) | | $ | 90,590,406 | | | | 82,024,569 | |
| | | | | | | | | | |
| Liabilities Less Cash and Other Assets (-3.51%) | | | | | | | (2,782,855 | ) |
| | | | | | | | | | |
| Net Assets | | | | | | $ | 79,241,714 | |
| | | | | | | | | | |
| Retail Shares (Equivalent to $7.03 per share | | | | | | | | |
| based on 8,024,615 shares outstanding) | | | | | | $ | 56,419,026 | |
| | | | | | | | | | |
| Institutional Shares (Equivalent to $7.10 per share |
| based on 3,213,927 shares outstanding) | | | | | | $ | 22,822,688 | |
| | | | | | | | | | |
| % | | Represents percentage of net assets. |
| 1 | | Non-income producing securities. |
| 2 | | Foreign corporation. |
| 3 | | At December 31, 2015, the market value of restricted and fair valued securities amounted to $1,107,367 or 1.40% of net assets. This security is not deemed liquid. See Note 6 regarding Restricted Securities. |
| 4 | | Level 2 security. See Note 7 regarding Fair Value Measurements. |
| | | |
| | | All securities are Level 1, unless otherwise noted. |
| See Notes to Financial Statements. | | 25 |
Baron Global Advantage Fund | |
December 31, 2015 |
| STATEMENT OF NET ASSETS |
| |
| DECEMBER 31, 2015 |
| Shares | | | Cost | | | Value |
| |
| Common Stocks (99.24%) | | | | | | |
| |
| Brazil (3.14%) | | | | | | |
| 23,517 | | Cetip SA - Mercados Organizados3 | | $ | 244,353 | | $ | 222,232 |
| 15,974 | | Smiles SA3 | | | 248,613 | | | 139,985 |
| | | | | | | |
| Total Brazil | | | 492,966 | | | 362,217 |
| | | | | | | |
| | | | | | | | | |
| Canada (3.41%) | | | | | | |
| 943 | | Constellation Software, Inc. | | | 278,852 | | | 393,147 |
| | | | | | | |
| | | | | | | | | |
| China (16.82%) | | | | | | |
| 5,575 | | Alibaba Group Holding Limited, ADR1 | | | 469,807 | | | 453,080 |
| 1,517 | | Baidu, Inc., ADR1 | | | 219,237 | | | 286,774 |
| 7,334 | | Ctrip.com International Ltd., ADR1 | | | 220,096 | | | 339,784 |
| 2,792 | | Qunar Cayman Islands Ltd., ADR1 | | | 61,745 | | | 147,250 |
| 15,303 | | TAL Education Group, ADR1 | | | 456,717 | | | 711,131 |
| | | | | | | |
| Total China | | | 1,427,602 | | | 1,938,019 |
| | | | | | | |
| | | | | | | | | |
| India (1.56%) | | | | | | |
| 17,613 | | ICICI Bank Limited, ADR | | | 131,722 | | | 137,910 |
| 3,291 | | Just Dial Ltd. | | | 49,159 | | | 41,923 |
| | | | | | | |
| Total India | | | 180,881 | | | 179,833 |
| | | | | | | |
| | | | | | | | | |
| Indonesia (4.59%) | | | | | | |
| 1,116,770 | | Sarana Menara Nusantara Tbk PT1,3 | | | 321,392 | | | 384,044 |
| 343,836 | | Tower Bersama Infrastructure Tbk PT1,3 | | | 157,981 | | | 145,449 |
| | | | | | | |
| Total Indonesia | | | 479,373 | | | 529,493 |
| | | | | | | |
| | | | | | | | | |
| Israel (8.84%) | | | | | | |
| 3,964 | | Check Point Software Technologies Ltd.1 | | | 307,720 | | | 322,590 |
| 8,321 | | Mellanox Technologies Ltd.1 | | | 332,019 | | | 350,647 |
| 8,164 | | Mobileye N.V.1 | | | 413,789 | | | 345,174 |
| | | | | | | |
| Total Israel | | | 1,053,528 | | | 1,018,411 |
| | | | | | | |
| | | | | | | | | |
| Netherlands (1.48%) | | | | | | |
| 1,898 | | ASML Holding N.V. | | | 143,850 | | | 170,272 |
| | | | | | | |
| | | | | | | | | |
| South Africa (3.80%) | | | | | | |
| 3,193 | | Naspers Limited, Class N | | | 445,555 | | | 437,709 |
| | | | | | | |
| | | | | | | | | |
| United Kingdom (9.17%) | | | | | | |
| 10,079 | | ARM Holdings plc | | | 158,166 | | | 154,379 |
| 72,340 | | JUST EAT plc1 | | | 336,518 | | | 526,500 |
| 82,876 | | Worldpay Group plc, 144A1 | | | 303,127 | | | 375,446 |
| | | | | | | |
| Total United Kingdom | | | 797,811 | | | 1,056,325 |
| | | | | | | |
| | | | | | | | | |
| United States (46.43%) | | | | | | |
| 9,405 | | Acxiom Corp.1 | | | 185,152 | | | 196,753 |
| 2,448 | | Aerie Pharmaceuticals, Inc.1 | | | 56,204 | | | 59,609 |
| 581 | | Allergan plc1 | | | 176,510 | | | 181,562 |
| 1,316 | | Alphabet, Inc., Cl C (formerly, Google, Inc., Cl C)1 | | | 758,966 | | | 998,686 |
| 1,553 | | Amazon.com, Inc.1 | | | 475,611 | | | 1,049,657 |
| 948 | | athenahealth, Inc.1 | | | 143,054 | | | 152,600 |
| 4,399 | | Benefitfocus, Inc.1 | | | 117,819 | | | 160,080 |
| 6,181 | | Brookfield Infrastructure Partners L.P. | | | 272,742 | | | 234,322 |
| 3,468 | | Columbia Pipeline Partners LP | | | 79,179 | | | 60,621 |
| 2,137 | | EPAM Systems, Inc.1 | | | 154,743 | | | 168,011 |
| 7,395 | | Facebook, Inc., Cl A1 | | | 368,809 | | | 773,961 |
| Shares | | | Cost | | | Value |
| |
| Common Stocks (continued) | | | | | | |
| |
| United States (continued) | | | | | | |
| 10,510 | | FireEye, Inc.1 | | $ | 444,934 | | $ | 217,977 |
| 6,725 | | Glaukos Corp.1 | | | 150,392 | | | 166,040 |
| 1,954 | | Illumina, Inc.1 | | | 122,487 | | | 375,060 |
| 923 | | Pacira Pharmaceuticals, Inc.1 | | | 68,849 | | | 70,877 |
| 157 | | The Priceline Group, Inc.1 | | | 118,920 | | | 200,167 |
| 28,070 | | TerraForm Global, Inc., Cl A2,3 | | | 400,000 | | | 147,648 |
| 6,118 | | Westlake Chemical Partners LP | | | 164,098 | | | 135,697 |
| | | | | | | |
| Total United States | | | 4,258,469 | | | 5,349,328 |
| | | | | | | |
| Total Common Stocks | | | 9,558,887 | | | 11,434,754 |
| | | | | | | |
| |
| Principal Amount | | | | | | | |
| |
| Short Term Investments (1.23%) | | | | | | | |
| |
| $141,796 | | Repurchase Agreement with | | | | | | | |
| | | Fixed Income Clearing Corp., | | | | | | | |
| | | dated 12/31/2015, 0.03% due | | | | | | | |
| | | 1/4/2016; Proceeds at maturity - | | | | | | | |
| | | $141,796; (Fully collateralized by | | | | | | | |
| | | $100,000 U.S. Treasury Bond, | | | | | | | |
| | | 7.625% due 2/15/2025; | | | | | | | |
| | | Market value - $147,625)3 | | | 141,796 | | | 141,796 | |
| | | | | | | | |
| Total Investments (100.47%) | | $ | 9,700,683 | | | 11,576,550 | |
| | | | | | | | | |
| Liabilities Less Cash and Other Assets (-0.47%) | | | (54,678 | ) |
| | | | | | | | | |
| Net Assets | | | | | $ | 11,521,872 | |
| | | | | | | | | |
Retail Shares (Equivalent to $13.91 per share
based on 448,175 shares outstanding) | | $ | 6,234,606 | |
| | | | | | | | | |
Institutional Shares (Equivalent to $14.00 per share
based on 377,729 shares outstanding) | | $ | 5,287,266 | |
| | | | | | | | | |
| | | | |
| | |
| % | | Represents percentage of net assets. |
| 1 | | Non-income producing securities. |
| 2 | | At December 31, 2015, the market value of restricted and fair valued securities amounted to $147,648 or 1.28% of net assets. This security is not deemed liquid. See Note 6 regarding Restricted Securities. |
| 3 | | Level 2 security. See Note 7 regarding Fair Value Measurements. |
| ADR | | American Depositary Receipt. |
| 144A | | Security is exempt from registration under Rule 144A of the Securities Act of 1933. This security may be resold in transactions that are exempt from registration, normally to qualified institutional buyers. This security has been deemed liquid pursuant to policies and procedures approved by the Board of Trustees, unless otherwise noted. At December 31, 2015, the market value of Rule 144A securities amounted to $375,446 or 3.26% of net assets.
All securities are Level 1, unless otherwise noted. |
| |
Summary of Investments by Sector
as of December 31, 2015 | | Percentage of
Net Assets |
| |
| Information Technology | | 51.5 | % |
| Consumer Discretionary | | 26.3 | |
| Health Care | | 8.7 | |
| Telecommunication Services | | 4.6 | |
| Utilities | | 3.3 | |
| Financials | | 3.1 | |
| Materials | | 1.2 | |
| Energy | | 0.5 | |
| Cash and Cash Equivalents* | | 0.8 | |
| |
| | | 100.0 | % |
| |
| | | | |
| | |
| * | | Includes short term investments. |
| 26 | | See Notes to Financial Statements. |
December 31, 2015 | |
Baron Select Funds |
| STATEMENTS OF ASSETS AND LIABILITIES |
| |
| DECEMBER 31, 2015 |
| | | Baron Partners
Fund | | Baron Focused
Growth Fund | | Baron
International
Growth Fund | | Baron Real
Estate Fund |
| | | | | | | | | | | | | |
| Assets: | | | | | | | | | | | | | | | | |
Investments in securities, at value* | | $ | 2,467,647,612 | | | $ | 171,700,759 | | | $ | 94,699,084 | | | $ | 1,739,694,715 | |
Repurchase agreements, at value** | | | 141,285 | | | | 13,876,643 | | | | 3,949,806 | | | | 37,889,013 | |
| | | | | | | | | | | | | |
Total investments, at value | | | 2,467,788,897 | | | | 185,577,402 | | | | 98,648,890 | | | | 1,777,583,728 | |
Foreign currency, at value† | | | — | | | | — | | | | 12 | | | | — | |
Cash | | | — | | | | — | | | | — | | | | 673,153 | |
Receivable for securities sold | | | 9,387,208 | | | | — | | | | 18,746 | | | | 7,663,239 | |
Receivable for shares sold | | | 4,282,426 | | | | 61,679 | | | | 65,307 | | | | 3,573,581 | |
Dividends and interest receivable | | | 1,089,775 | | | | 154,315 | | | | 95,293 | | | | 3,059,293 | |
Prepaid expenses | | | 276,298 | | | | 267 | | | | 141 | | | | 2,605 | |
| | | | | | | | | | | | | |
| | | | 2,482,824,604 | | | | 185,793,663 | | | | 98,828,389 | | | | 1,792,555,599 | |
| | | | | | | | | | | | | |
| Liabilities: | | | | | | | | | | | | | | | | |
Payable for borrowings against line of credit | | | 557,000,000 | | | | — | | | | — | | | | — | |
Payable for securities purchased | | | 21,267,992 | | | | 1,522,636 | | | | — | | | | 6,696,961 | |
Payable for shares redeemed | | | 2,986,108 | | | | 30,227 | | | | 130,431 | | | | 3,944,606 | |
Investment advisory fees payable (Note 4) | | | 783 | | | | 894 | | | | 70 | | | | 862 | |
Distribution fees payable (Note 4) | | | 288 | | | | 670 | | | | 72 | | | | 670 | |
Accrued capital gains taxes | | | — | | | | — | | | | 17,561 | | | | — | |
Accrued expenses and other payables | | | 776,379 | | | | 56,312 | | | | 82,310 | | | | 230,706 | |
| | | | | | | | | | | | | |
| | | | 582,031,550 | | | | 1,610,739 | | | | 230,444 | | | | 10,873,805 | |
| | | | | | | | | | | | | |
| Net Assets | | $ | 1,900,793,054 | | | $ | 184,182,924 | | | $ | 98,597,945 | | | $ | 1,781,681,794 | |
| | | | | | | | | | | | | |
| | | | | | | | | | | | | | | | | |
| Net Assets consist of: | | | | | | | | | | | | | | | | |
Paid-in capital | | $ | 1,349,172,858 | | | $ | 131,682,112 | | | $ | 78,833,806 | | | $ | 1,563,065,446 | |
Undistributed (accumulated) net investment income (loss) | | | 11,008,549 | | | | 899,855 | | | | (373,371 | ) | | | (1,815,613 | ) |
Undistributed (accumulated) net realized gain (loss) on investments and foreign currency transactions | | | (322,082,700 | ) | | | 6,534,406 | | | | (164,692 | ) | | | 738,531 | |
Net unrealized appreciation on investments, foreign capital gains tax and foreign currency translations | | | 862,694,347 | | | | 45,066,551 | | | | 20,302,202 | | | | 219,693,430 | |
| | | | | | | | | | | | | |
| Net Assets | | $ | 1,900,793,054 | | | $ | 184,182,924 | | | $ | 98,597,945 | | | $ | 1,781,681,794 | |
| | | | | | | | | | | | | |
| | | | | | | | | | | | | | | | | |
| Retail Shares: | | | | | | | | | | | | | | | | |
Net Assets | | $ | 1,107,480,559 | | | $ | 43,740,641 | | | $ | 44,882,418 | | | $ | 788,912,265 | |
Shares Outstanding ($0.01 par value; indefinite shares authorized) | | | 31,091,294 | | | | 3,342,339 | | | | 2,486,454 | | | | 32,540,726 | |
| | | | | | | | | | | | | |
Net Asset Value and Offering Price Per Share | | $ | 35.62 | | | $ | 13.09 | | | $ | 18.05 | | | $ | 24.24 | |
| | | | | | | | | | | | | |
| | | | | | | | | | | | | | | | | |
| Institutional Shares: | | | | | | | | | | | | | | | | |
Net Assets | | $ | 793,312,495 | | | $ | 140,442,283 | | | $ | 53,715,527 | | | $ | 992,769,529 | |
Shares Outstanding ($0.01 par value; indefinite shares authorized) | | | 21,946,557 | | | | 10,601,629 | | | | 2,956,335 | | | | 40,497,394 | |
| | | | | | | | | | | | | |
Net Asset Value and Offering Price Per Share | | $ | 36.15 | | | $ | 13.25 | | | $ | 18.17 | | | $ | 24.51 | |
| | | | | | | | | | | | | |
| | | | | | | | | | | | | | | | | |
| | | | | | | | | | | | | | | | | |
*Investments in securities, at cost | | $ | 1,604,953,265 | | | $ | 126,634,208 | | | $ | 74,377,075 | | | $ | 1,519,997,341 | |
**Repurchase agreements, at cost | | | 141,285 | | | | 13,876,643 | | | | 3,949,806 | | | | 37,889,013 | |
| | | | | | | | | | | | | |
Total investments, at cost | | $ | 1,605,094,550 | | | $ | 140,510,851 | | | $ | 78,326,881 | | | $ | 1,557,886,354 | |
| | | | | | | | | | | | | |
| | | | | | | | | | | | | | | | | |
†Foreign currency, at cost | | $ | — | | | $ | — | | | $ | 13 | | | $ | — | |
| | | | | | | | | | | | | |
| See Notes to Financial Statements. | | 27 |
Baron Select Funds | |
December 31, 2015 |
| STATEMENTS OF ASSETS AND LIABILITIES (Continued) |
| |
| DECEMBER 31, 2015 |
| | | Baron
Emerging
Markets Fund | | Baron
Energy and
Resources Fund | | Baron Global
Advantage
Fund |
| | | | | | | |
| Assets: | | | | | | | | | | | | |
Investments in securities, at value* | | $ | 1,521,002,404 | | | $ | 67,599,790 | | | $ | 11,434,754 | |
Repurchase agreements, at value** | | | 176,864,045 | | | | 14,424,779 | | | | 141,796 | |
| | | | | | | | | | |
Total investments, at value | | | 1,697,866,449 | | | | 82,024,569 | | | | 11,576,550 | |
Foreign currency, at value† | | | 44 | | | | 58 | | | | 14 | |
Cash | | | — | | | | 5,774 | | | | 3,276 | |
Receivable for securities sold | | | 162,237 | | | | — | | | | — | |
Receivable for shares sold | | | 14,199,411 | | | | 664,564 | | | | 44 | |
Dividends and interest receivable | | | 1,688,740 | | | | 27,589 | | | | 3,718 | |
Prepaid expenses | | | 2,182 | | | | 102 | | | | 17 | |
| | | | | | | | | | |
| | | | 1,713,919,063 | | | | 82,722,656 | | | | 11,583,619 | |
| | | | | | | | | | |
| Liabilities: | | | | | | | | | | | | |
Payable for borrowings against line of credit | | | — | | | | — | | | | — | |
Payable for securities purchased | | | 758,133 | | | | 160,017 | | | | — | |
Payable for shares redeemed | | | 4,878,992 | | | | 3,256,586 | | | | 2,665 | |
Investment advisory fees payable (Note 4) | | | 124 | | | | 754 | | | | — | |
Distribution fees payable (Note 4) | | | 413 | | | | 467 | | | | 687 | |
Accrued capital gains taxes | | | 1,325,465 | | | | — | | | | — | |
Accrued expenses and other payables | | | 599,505 | | | | 63,118 | | | | 58,395 | |
| | | | | | | | | | |
| | | | 7,562,632 | | | | 3,480,942 | | | | 61,747 | |
| | | | | | | | | | |
| Net Assets | | $ | 1,706,356,431 | | | $ | 79,241,714 | | | $ | 11,521,872 | |
| | | | | | | | | | |
| | | | | | | | | | | | | |
| Net Assets consist of: | | | | | | | | | | | | |
Paid-in capital | | $ | 1,894,130,480 | | | $ | 117,724,516 | | | $ | 10,274,585 | |
Undistributed (accumulated) net investment income (loss) | | | (500,002 | ) | | | 557,992 | | | | 17,414 | |
Accumulated net realized loss on investments and foreign currency transactions | | | (118,284,947 | ) | | | (30,474,955 | ) | | | (645,772 | ) |
Net unrealized appreciation (depreciation) on investments, foreign capital gains tax and foreign currency translations | | | (68,989,100 | ) | | | (8,565,839 | ) | | | 1,875,645 | |
| | | | | | | | | | |
| Net Assets | | $ | 1,706,356,431 | | | $ | 79,241,714 | | | $ | 11,521,872 | |
| | | | | | | | | | |
| | | | | | | | | | | | | |
| Retail Shares: | | | | | | | | | | | | |
Net Assets | | $ | 665,515,103 | | | $ | 56,419,026 | | | $ | 6,234,606 | |
Shares Outstanding ($0.01 par value; indefinite shares authorized) | | | 62,960,581 | | | | 8,024,615 | | | | 448,175 | |
| | | | | | | | | | |
Net Asset Value and Offering Price Per Share | | $ | 10.57 | | | $ | 7.03 | | | $ | 13.91 | |
| | | | | | | | | | |
| | | | | | | | | | | | | |
| Institutional Shares: | | | | | | | | | | | | |
Net Assets | | $ | 1,040,841,328 | | | $ | 22,822,688 | | | $ | 5,287,266 | |
Shares Outstanding ($0.01 par value; indefinite shares authorized) | | | 98,261,135 | | | | 3,213,927 | | | | 377,729 | |
| | | | | | | | | | |
Net Asset Value and Offering Price Per Share | | $ | 10.59 | | | $ | 7.10 | | | $ | 14.00 | |
| | | | | | | | | | |
| | | | | | | | | | | | | |
| | | | | | | | | | | | | |
*Investments in securities, at cost | | $ | 1,588,650,069 | | | $ | 76,165,627 | | | $ | 9,558,887 | |
**Repurchase agreements, at cost | | | 176,864,045 | | | | 14,424,779 | | | | 141,796 | |
| | | | | | | | | | |
Total investments, at cost | | $ | 1,765,514,114 | | | $ | 90,590,406 | | | $ | 9,700,683 | |
| | | | | | | | | | |
| | | | | | | | | | | | | |
†Foreign currency, at cost | | $ | 49 | | | $ | 60 | | | $ | 15 | |
| | | | | | | | | | |
| 28 | | See Notes to Financial Statements. |
December 31, 2015 | |
Baron Select Funds |
| STATEMENTS OF OPERATIONS |
| |
| FOR THE YEAR ENDED DECEMBER 31, 2015 |
| | | Baron Partners
Fund | | Baron Focused
Growth Fund | | Baron
International
Growth Fund | | Baron Real
Estate Fund |
| | | | | | | | | |
| Investment income: | | | | | | | | | | | | | | | | |
Income: | | | | | | | | | | | | | | | | |
Dividends | | $ | 27,461,663 | | | $ | 2,429,185 | | | $ | 1,858,715 | | | $ | 20,539,189 | |
Interest | | | 4 | | | | 142 | | | | 41 | | | | 1,056 | |
Securities lending income, net | | | 435,652 | | | | — | | | | — | | | | 14,644 | |
Foreign taxes withheld on dividends | | | — | | | | — | | | | (120,906 | ) | | | (71,646 | ) |
| | | | | | | | | | | | | |
Total income | | | 27,897,319 | | | | 2,429,327 | | | | 1,737,850 | | | | 20,483,243 | |
| | | | | | | | | | | | | |
Expenses: | | | | | | | | | | | | | | | | |
Investment advisory fees (Note 4) | | | 20,169,095 | | | | 1,939,179 | | | | 1,051,298 | | | | 18,687,497 | |
Distribution fees — Retail Shares (Note 4) | | | 3,082,381 | | | | 114,960 | | | | 125,475 | | | | 2,150,309 | |
Shareholder servicing agent fees and expenses — Retail Shares | | | 222,853 | | | | 25,613 | | | | 27,089 | | | | 104,225 | |
Shareholder servicing agent fees and expenses — Institutional Shares | | | 57,331 | | | | 14,581 | | | | 12,381 | | | | 70,340 | |
Reports to shareholders | | | 392,500 | | | | 12,786 | | | | 46,375 | | | | 446,400 | |
Line of credit fees | | | 197,221 | | | | 1,799 | | | | 976 | | | | 17,269 | |
Registration and filing fees | | | 137,020 | | | | 37,753 | | | | 56,013 | | | | 165,205 | |
Custodian and fund accounting fees | | | 80,052 | | | | 29,237 | | | | 112,959 | | | | 167,208 | |
Professional fees | | | 68,535 | | | | 41,812 | | | | 55,353 | | | | 67,884 | |
Trustee fees and expenses | | | 67,059 | | | | 6,637 | | | | 3,608 | | | | 61,061 | |
Administration fees | | | 26,506 | | | | 26,499 | | | | 26,552 | | | | 26,497 | |
Insurance expense | | | 24,529 | | | | 2,510 | | | | 1,323 | | | | 21,583 | |
Miscellaneous expenses | | | 1,304 | | | | 1,316 | | | | 1,489 | | | | 1,659 | |
| | | | | | | | | | | | | |
Total operating expenses | | | 24,526,386 | | | | 2,254,682 | | | | 1,520,891 | | | | 21,987,137 | |
Interest expense on borrowings | | | 4,118,157 | | | | — | | | | — | | | | — | |
| | | | | | | | | | | | | |
Total expenses | | | 28,644,543 | | | | 2,254,682 | | | | 1,520,891 | | | | 21,987,137 | |
Reimbursement of expenses by Adviser — Retail Shares (Note 4) | | | — | | | | (17,583 | ) | | | (46,523 | ) | | | — | |
Reimbursement of expenses by Adviser — Institutional Shares (Note 4) | | | — | | | | — | | | | (34,612 | ) | | | — | |
| | | | | | | | | | | | | |
Net expenses | | | 28,644,543 | | | | 2,237,099 | | | | 1,439,756 | | | | 21,987,137 | |
| | | | | | | | | | | | | |
Net investment income (loss) | | | (747,224 | ) | | | 192,228 | | | | 298,094 | | | | (1,503,894 | ) |
| | | | | | | | | | | | | |
| Realized and unrealized gain (loss) on investments: | | | | | | | | | | | | | | | | |
Net realized gain on investments sold — unaffiliated investments | | | 14,241,470 | | | | 10,479,808 | | | | 97,900 | 1 | | | 36,901,370 | |
Net realized loss on investments sold — affiliated investments | | | — | | | | — | | | | — | | | | (1,693,567 | ) |
Net realized gain (loss) on foreign currency transactions | | | 23,571 | | | | — | | | | (130,426 | ) | | | (139,378 | ) |
Net change in unrealized appreciation (depreciation) of: | | | | | | | | | | | | | | | | |
Investments — unaffiliated investments | | | (70,618,314 | ) | | | (14,726,304 | ) | | | 1,343,435 | 2 | | | (120,221,198 | ) |
Investments — “affiliated” investments | | | — | | | | — | | | | — | | | | (7,133,653 | ) |
Foreign currency translations | | | — | | | | — | | | | (364 | ) | | | (3,944 | ) |
| | | | | | | | | | | | | |
| Net gain (loss) on investments | | | (56,353,273 | ) | | | (4,246,496 | ) | | | 1,310,545 | | | | (92,290,370 | ) |
| | | | | | | | | | | | | |
| Net increase (decrease) in net assets resulting from operations | | $ | (57,100,497 | ) | | $ | (4,054,268 | ) | | $ | 1,608,639 | | | $ | (93,794,264 | ) |
| | | | | | | | | | | | | |
| | |
| 1 Net of realized foreign capital gains tax of $(95,877). |
| 2 Net change in accrued foreign capital gains tax of $140,644. |
| See Notes to Financial Statements. | | 29 |
Baron Select Funds | |
December 31, 2015 |
| STATEMENTS OF OPERATIONS (Continued) |
| |
| FOR THE YEAR ENDED DECEMBER 31, 2015 |
| | | Baron
Emerging
Markets Fund | | Baron Energy
and Resources
Fund | |
Baron Global
Advantage
Fund |
| | | | | | | |
| Investment income: | | | | | | | | | | | | |
Income: | | | | | | | | | | | | |
Dividends | | $ | 30,124,162 | | | $ | 1,275,445 | | | $ | 75,581 | |
Interest | | | 2,312 | | | | 239 | | | | 2 | |
Securities lending income, net | | | — | | | | 30,452 | | | | 1,030 | |
Foreign taxes withheld on dividends | | | (2,970,284 | ) | | | (9,518 | ) | | | (1,370 | ) |
| | | | | | | | | | |
Total income | | | 27,156,190 | | | | 1,296,618 | | | | 75,243 | |
| | | | | | | | | | |
Expenses: | | | | | | | | | | | | |
Investment advisory fees (Note 4) | | | 16,017,814 | | | | 807,045 | | | | 97,956 | |
Distribution fees - Retail Shares (Note 4) | | | 1,813,537 | | | | 108,479 | | | | 12,266 | |
Shareholder servicing agent fees and expenses — Retail Shares | | | 73,060 | | | | 26,219 | | | | 15,293 | |
Shareholder servicing agent fees and expenses — Institutional Shares | | | 50,124 | | | | 12,879 | | | | 9,981 | |
Reports to shareholders | | | 583,500 | | | | 54,930 | | | | 2,065 | |
Line of credit fees | | | 15,205 | | | | 920 | | | | 100 | |
Registration and filing fees | | | 242,455 | | | | 53,200 | | | | 42,422 | |
Custodian and fund accounting fees | | | 2,050,659 | | | | 30,548 | | | | 33,083 | |
Professional fees | | | 82,714 | | | | 42,627 | | | | 56,750 | |
Trustee fees and expenses | | | 50,217 | | | | 2,590 | | | | 283 | |
Administration fees | | | 26,509 | | | | 26,520 | | | | 26,501 | |
Insurance expense | | | 17,135 | | | | 860 | | | | 97 | |
Miscellaneous expenses | | | 8,268 | | | | 1,340 | | | | 1,322 | |
| | | | | | | | | | |
Total operating expenses | | | 21,031,197 | | | | 1,168,157 | | | | 298,119 | |
Interest expense on borrowings | | | — | | | | — | | | | — | |
| | | | | | | | | | |
Total expenses | | | 21,031,197 | | | | 1,168,157 | | | | 298,119 | |
Reimbursement of expenses by Adviser — Retail Shares (Note 4) | | | — | | | | (100,178 | ) | | | (82,982 | ) |
Reimbursement of expenses by Adviser — Institutional Shares (Note 4) | | | — | | | | (71,750 | ) | | | (80,426 | ) |
| | | | | | | | | | |
Net expenses | | | 21,031,197 | | | | 996,229 | | | | 134,711 | |
| | | | | | | | | | |
Net investment income (loss) | | | 6,124,993 | | | | 300,389 | | | | (59,468 | ) |
| | | | | | | | | | |
| Realized and unrealized gain (loss) on investments: | | | | | | | | | | | | |
Net realized loss on investments sold — unaffiliated investments | | | (84,580,874 | )1 | | | (30,795,180 | ) | | | (664,149 | ) |
Net realized loss on foreign currency transactions | | | (1,649,580 | ) | | | (3,548 | ) | | | (6,927 | ) |
Net change in unrealized appreciation (depreciation) of: | | | | | | | | | | | | |
Investments — unaffiliated investments | | | (116,522,296 | )2 | | | 10,131 | | | | 434,217 | |
Foreign currency translations | | | 6,418 | | | | 227 | | | | (138 | ) |
| | | | | | | | | | |
| Net loss on investments | | | (202,746,332 | ) | | | (30,788,370 | ) | | | (236,997 | ) |
| | | | | | | | | | |
| Net decrease in net assets resulting from operations | | $ | (196,621,339 | ) | | $ | (30,487,981 | ) | | $ | (296,465 | ) |
| | | | | | | | | | |
| | |
| 1 Net of realized foreign capital gains tax of $(73). |
| 2 Net change in accrued foreign capital gains tax of $5,323,223. |
| 30 | | See Notes to Financial Statements. |
| |
| December 31, 2015 | Baron Select Funds |
| STATEMENTS OF CHANGES IN NET ASSETS |
| |
| |
| | | Baron Partners Fund | | Baron Focused Growth Fund | | Baron International Growth Fund |
| | | | | | | |
| | | For the Year
Ended
December 31,
2015 | | For the Year
Ended
December 31,
2014 | | For the Year
Ended
December 31,
2015 | | For the Year
Ended
December 31,
2014 | | For the Year
Ended
December 31,
2015 | | For the Year
Ended
December 31,
2014 |
| | | | | | | | | | | | | |
| Increase (Decrease) in Net Assets: | | | | | | | | | | | | | | | | | | | | | | | | |
| Operations: | | | | | | | | | | | | | | | | | | | | | | | | |
Net investment income (loss) | | $ | (747,224 | ) | | $ | 11,476,194 | | | $ | 192,228 | | | $ | 958,135 | | | $ | 298,094 | | | $ | 342,562 | |
Net realized gain (loss) | | | 14,265,041 | | | | 35,573,747 | | | | 10,479,808 | | | | 7,725,956 | | | | (32,526 | ) | | | 2,013,466 | |
Net change in unrealized appreciation (depreciation) | | | (70,618,314 | ) | | | 113,173,631 | | | | (14,726,304 | ) | | | (3,887,218 | ) | | | 1,343,071 | | | | (3,518,402 | ) |
| | | | | | | | | | | | | | | | | | | |
Increase (decrease) in net assets resulting from operations | | | (57,100,497 | ) | | | 160,223,572 | | | | (4,054,268 | ) | | | 4,796,873 | | | | 1,608,639 | | | | (1,162,374 | ) |
| | | | | | | | | | | | | | | | | | | |
| Distributions to shareholders from: | | | | | | | | | | | | | | | | | | | | | | | | |
Net investment income — Retail Shares | | | (4,106,150 | ) | | | — | | | | (70,067 | ) | | | — | | | | (210,570 | ) | | | (3,623 | ) |
Net investment income — Institutional Shares | | | (4,764,671 | ) | | | — | | | | (580,716 | ) | | | — | | | | (462,862 | ) | | | (98,375 | ) |
Net realized gain on investments — Retail Shares | | | — | | | | — | | | | (2,417,214 | ) | | | (280,753 | ) | | | (73,424 | ) | | | (1,292,820 | ) |
Net realized gain on investments — Institutional Shares | | | — | | | | — | | | | (7 ,473,888 | ) | | | (888,003 | ) | | | (82,646 | ) | | | (1,458,824 | ) |
| | | | | | | | | | | | | | | | | | | |
Decrease in net assets from distributions to shareholders | | | (8,870,821 | ) | | | — | | | | (10,541,885 | ) | | | (1,168,756 | ) | | | (829,502 | ) | | | (2,853,642 | ) |
| | | | | | | | | | | | | | | | | | | |
| Capital share transactions: | | | | | | | | | | | | | | | | | | | | | | | | |
Proceeds from the sale of shares — Retail Shares | | | 164,387,862 | | | | 379,165,924 | | | | 6,397,130 | | | | 6,089,801 | | | | 8,899,357 | | | | 43,841,435 | |
Proceeds from the sale of shares — Institutional Shares | | | 347,495,282 | | | | 406,299,084 | | | | 3,624,246 | | | | 18,131,213 | | | | 7,680,292 | | | | 9,269,012 | |
Net asset value of shares issued in reinvestment of distributions — Retail Shares | | | 3,995,569 | | | | — | | | | 2,452,076 | | | | 262,206 | | | | 282,158 | | | | 1,289,455 | |
Net asset value of shares issued in reinvestment of distributions — Institutional Shares | | | 4,177,881 | | | | — | | | | 6,671,379 | | | | 745,447 | | | | 341,079 | | | | 969,333 | |
Cost of shares redeemed — Retail Shares | | | (278,717,168 | ) | | | (363,359,869 | ) | | | (7,449,535 | ) | | | (8,656,710 | ) | | | (17,823,270 | ) | | | (7,443,792 | ) |
Cost of shares redeemed — Institutional Shares | | | (212,397,508 | ) | | | (119,134,044 | ) | | | (8,182,326 | ) | | | (20,960,859 | ) | | | (6,817,506 | ) | | | (1,054,523 | ) |
| | | | | | | | | | | | | | | | | | | |
Increase (decrease) in net assets derived from capital share transactions | | | 28,941,918 | | | | 302,971,095 | | | | 3,512,970 | | | | (4,388,902 | ) | | | (7,437,890 | ) | | | 46,870,920 | |
| | | | | | | | | | | | | | | | | | | |
Net increase (decrease) in net assets | | | (37,029,400 | ) | | | 463,194,667 | | | | (11,083,183 | ) | | | (760,785 | ) | | | (6,658,753 | ) | | | 42,854,904 | |
| | | | | | | | | | | | | | | | | | | |
| Net Assets: | | | | | | | | | | | | | | | | | | | | | | | | |
Beginning of year | | | 1,937,822,454 | | | | 1,474,627,787 | | | | 195,266,107 | | | | 196,026,892 | | | | 105,256,698 | | | | 62,401,794 | |
| | | | | | | | | | | | | | | | | | | |
End of year | | $ | 1,900,793,054 | | | $ | 1,937,822,454 | | | $ | 184,182,924 | | | $ | 195,266,107 | | | $ | 98,597,945 | | | $ | 105,256,698 | |
| | | | | | | | | | | | | | | | | | | |
Undistributed (accumulated) net investment income (loss) at end of year | | $ | 11,008,549 | | | $ | 8,534,521 | | | $ | 899,855 | | | $ | 668,990 | | | $ | (373,371 | ) | | $ | 97,411 | |
| | | | | | | | | | | | | | | | | | | |
| Capital share transactions — Retail Shares | | | | | | | | | | | | | | | | | | | | | | | | |
Shares sold | | | 4,413,521 | | | | 10,797,205 | | | | 442,457 | | | | 440,677 | | | | 479,118 | | | | 2,384,046 | |
Shares issued in reinvestment of distributions | | | 113,189 | | | | — | | | | 189,066 | | | | 19,056 | | | | 15,603 | | | | 70,314 | |
Shares redeemed | | | (7,633,879 | ) | | | (10,383,981 | ) | | | (530,825 | ) | | | (626,666 | ) | | | (958,724 | ) | | | (400,939 | ) |
| | | | | | | | | | | | | | | | | | | |
| Net increase (decrease) | | | (3,107,169 | ) | | | 413,224 | | | | 100,698 | | | | (166,933 | ) | | | (464,003 | ) | | | 2,053,421 | |
| | | | | | | | | | | | | | | | | | | |
| Capital share transactions — Institutional Shares | | | | | | | | | | | | | | | | | | | | | | | | |
Shares sold | | | 9,273,217 | | | | 11,333,912 | | | | 258,675 | | | | 1,291,866 | | | | 406,160 | | | | 510,858 | |
Shares issued in reinvestment of distributions | | | 116,701 | | | | — | | | | 508,487 | | | | 53,557 | | | | 18,782 | | | | 52,228 | |
Shares redeemed | | | (5,723,538 | ) | | | (3,401,602 | ) | | | (547,515 | ) | | | (1,492,179 | ) | | | (360,893 | ) | | | (56,268 | ) |
| | | | | | | | | | | | | | | | | | | |
| Net increase (decrease) | | | 3,666,380 | | | | 7,932,310 | | | | 219,647 | | | | (146,756 | ) | | | 64,049 | | | | 506,818 | |
| | | | | | | | | | | | | | | | | | | |
| See Notes to Financial Statements. | | 31 |
Baron Select Funds | |
December 31, 2015 |
| STATEMENTS OF CHANGES IN NET ASSETS (Continued) |
| |
| |
| | | Baron Real Estate Fund | | Baron Emerging Markets Fund |
| | | | | |
| | | For the Year
Ended
December 31, 2015 | | For the Year
Ended
December 31, 2014 | | For the Year
Ended
December 31, 2015 | | For the Year
Ended
December 31, 2014 |
| | | | | | | | | |
| Increase (Decrease) in Net Assets: | | | | | | | | | | | | | | | | |
| Operations: | | | | | | | | | | | | | | | | |
Net investment income (loss) | | $ | (1,503,894 | ) | | $ | 4,263,826 | | | $ | 6,124,993 | | | $ | 5,816,220 | |
Net realized gain (loss) | | | 35,068,425 | | | | 6,290,861 | | | | (86,230,454 | ) | | | (33,482,417 | ) |
Net change in unrealized appreciation (depreciation) | | | (127,358,795 | ) | | | 206,841,327 | | | | (116,515,878 | ) | | | 37,993,287 | |
| | | | | | | | | | | | | |
Increase (decrease) in net assets resulting from operations | | | (93,794,264 | ) | | | 217,396,014 | | | | (196,621,339 | ) | | | 10,327,090 | |
| | | | | | | | | | | | | |
| Distributions to shareholders from: | | | | | | | | | | | | | | | | |
Net investment income — Retail Shares | | | (364,929 | ) | | | (777,909 | ) | | | (701,411 | ) | | | (1,606,970 | ) |
Net investment income — Institutional Shares | | | (444,647 | ) | | | (2,920,316 | ) | | | (3,988,520 | ) | | | (2,808,551 | ) |
Net realized gain on investments — Retail Shares | | | (15,405,999 | ) | | | — | | | | — | | | | — | |
Net realized gain on investments — Institutional Shares | | | (19,283,111 | ) | | | — | | | | — | | | | — | |
| | | | | | | | | | | | | |
Decrease in net assets from distributions to shareholders | | | (35,498,686 | ) | | | (3,698,225 | ) | | | (4,689,931 | ) | | | (4,415,521 | ) |
| | | | | | | | | | | | | |
| Capital share transactions: | | | | | | | | | | | | | | | | |
Proceeds from the sale of shares — Retail Shares | | | 336,220,314 | | | | 359,613,557 | | | | 426,130,100 | | | | 512,990,962 | |
Proceeds from the sale of shares — Institutional Shares | | | 432,171,142 | | | | 462,284,949 | | | | 903,660,409 | | | | 655,166,110 | |
Net asset value of shares issued in reinvestment of distributions — Retail Shares | | | 15,440,297 | | | | 758,478 | | | | 693,798 | | | | 1,298,646 | |
Net asset value of shares issued in reinvestment of distributions — Institutional Shares | | | 16,601,383 | | | | 2,578,979 | | | | 3,084,734 | | | | 2,583,317 | |
Cost of shares redeemed — Retail Shares | | | (285,156,542 | ) | | | (220,188,549 | ) | | | (320,271,070 | ) | | | (130,628,402 | ) |
Cost of shares redeemed — Institutional Shares | | | (306,822,077 | ) | | | (141,870,774 | ) | | | (453,120,022 | ) | | | (75,421,684 | ) |
| | | | | | | | | | | | | |
Increase in net assets derived from capital share transactions | | | 208,454,517 | | | | 463,176,640 | | | | 560,177,949 | | | | 965,988,949 | |
| | | | | | | | | | | | | |
Net increase in net assets | | | 79,161,567 | | | | 676,874,429 | | | | 358,866,679 | | | | 971,900,518 | |
| | | | | | | | | | | | | |
| Net Assets: | | | | | | | | | | | | | | | | |
Beginning of year | | | 1,702,520,227 | | | | 1,025,645,798 | | | | 1,347,489,752 | | | | 375,589,234 | |
| | | | | | | | | | | | | |
End of year | | $ | 1,781,681,794 | | | $ | 1,702,520,227 | | | $ | 1,706,356,431 | | | $ | 1,347,489,752 | |
| | | | | | | | | | | | | |
| | | | | | | | | | | | | | | | | |
Undistributed (accumulated) net investment income (loss) at end of year | | $ | (1,815,613 | ) | | $ | 627,790 | | | $ | (500,002 | ) | | $ | (407,897 | ) |
| | | | | | | | | | | | | |
| Capital share transactions — Retail Shares | | | | | | | | | | | | | | | | |
Shares sold | | | 12,836,525 | | | | 15,173,423 | | | | 37,014,347 | | | | 42,783,705 | |
Shares issued in reinvestment of distributions | | | 628,995 | | | | 29,791 | | | | 64,902 | | | | 106,797 | |
Shares redeemed | | | (11,123,366 | ) | | | (9,251,061 | ) | | | (28,651,234 | ) | | | (10,851,179 | ) |
| | | | | | | | | | | | | |
| Net increase | | | 2,342,154 | | | | 5,952,153 | | | | 8,428,015 | | | | 32,039,323 | |
| | | | | | | | | | | | | |
| Capital share transactions — Institutional Shares | | | | | | | | | | | | | | | | |
Shares sold | | | 16,521,289 | | | | 19,329,716 | | | | 80,184,256 | | | | 54,507,301 | |
Shares issued in reinvestment of distributions | | | 668,952 | | | | 100,467 | | | | 288,024 | | | | 212,095 | |
Shares redeemed | | | (11,879,810 | ) | | | (5,917,745 | ) | | | (40,651,773 | ) | | | (6,307,754 | ) |
| | | | | | | | | | | | | |
| Net increase | | | 5,310,431 | | | | 13,512,438 | | | | 39,820,507 | | | | 48,411,642 | |
| | | | | | | | | | | | | |
| 32 | | See Notes to Financial Statements. |
December 31, 2015 | |
Baron Select Funds |
| STATEMENTS OF CHANGES IN NET ASSETS (Continued) |
| |
| |
| | | Baron Energy and Resources Fund | | Baron Global Advantage Fund |
| | | | | |
| | | For the Year
Ended
December 31, 2015 | | For the Year
Ended
December 31, 2014 | | For the Year
Ended
December 31, 2015 | | For the Year
Ended
December 31, 2014 |
| | | | | | | | | |
| Increase (Decrease) in Net Assets: | | | | | | | | | | | | | | | | |
| Operations: | | | | | | | | | | | | | | | | |
Net investment income (loss) | | $ | 300,389 | | | $ | 9,583 | | | $ | (59,468 | ) | | $ | 33,341 | |
Net realized gain (loss) | | | (30,798,728 | ) | | | 83,023 | | | | (671,076 | ) | | | (55,901 | ) |
Net change in unrealized appreciation (depreciation) | | | 10,358 | | | | (12,482,477 | ) | | | 434,079 | | | | 168,754 | |
| | | | | | | | | | | | | |
Increase (decrease) in net assets resulting from operations | | | (30,487,981 | ) | | | (12,389,871 | ) | | | (296,465 | ) | | | 146,194 | |
| | | | | | | | | | | | | |
| Distributions to shareholders from: | | | | | | | | | | | | | | | | |
Net investment income — Retail Shares | | | — | | | | — | | | | (11,564 | ) | | | — | |
Net investment income — Institutional Shares | | | — | | | | — | | | | (16,685 | ) | | | — | |
Net realized gain on investments — Retail Shares | | | (34,058 | ) | | | — | | | | (7,375 | ) | | | (218 | ) |
Net realized gain on investments — Institutional Shares | | | (30,966 | ) | | | — | | | | (6,436 | ) | | | (258 | ) |
| | | | | | | | | | | | | |
Decrease in net assets from distributions to shareholders | | | (65,024 | ) | | | — | | | | (42,060 | ) | | | (476 | ) |
| | | | | | | | | | | | | |
| Capital share transactions: | | | | | | | | | | | | | | | | |
Proceeds from the sale of shares — Retail Shares | | | 50,753,381 | | | | 43,493,847 | | | | 3,922,722 | | | | 1,819,597 | 1 |
Proceeds from the sale of shares — Institutional Shares | | | 28,394,513 | | | | 34,261,471 | | | | 2,152,705 | | | | 9,278,574 | 1 |
Net asset value of shares issued in reinvestment of distributions — Retail Shares | | | 33,774 | | | | — | | | | 18,901 | | | | 217 | |
Net asset value of shares issued in reinvestment of distributions — Institutional Shares | | | 26,561 | | | | — | | | | 23,120 | | | | 258 | |
Cost of shares redeemed — Retail Shares | | | (18,562,721 | ) | | | (25,945,076 | ) | | | (1,433,194 | ) | | | (412,710 | ) |
Cost of shares redeemed — Institutional Shares | | | (19,895,321 | ) | | | (3,584,224 | ) | | | (792,192 | ) | | | (8,419,488 | ) |
| | | | | | | | | | | | | |
Increase in net assets derived from capital share transactions | | | 40,750,187 | | | | 48,226,018 | | | | 3,892,062 | | | | 2,266,448 | |
| | | | | | | | | | | | | |
Net increase in net assets | | | 10,197,182 | | | | 35,836,147 | | | | 3,553,537 | | | | 2,412,166 | |
| | | | | | | | | | | | | |
| Net Assets: | | | | | | | | | | | | | | | | |
Beginning of year | | | 69,044,532 | | | | 33,208,385 | | | | 7,968,335 | | | | 5,556,169 | |
| | | | | | | | | | | | | |
End of year | | $ | 79,241,714 | | | $ | 69,044,532 | | | $ | 11,521,872 | | | $ | 7,968,335 | |
| | | | | | | | | | | | | |
Undistributed net investment income at end of year | | $ | 557,992 | | | $ | 517,240 | | | $ | 17,414 | | | $ | 43,412 | |
| | | | | | | | | | | | | |
| Capital share transactions — Retail Shares | | | | | | | | | | | | | | | | |
Shares sold | | | 6,311,650 | | | | 3,517,172 | | | | 275,759 | | | | 132,444 | |
Shares issued in reinvestment of distributions | | | 4,381 | | | | — | | | | 1,505 | | | | 15 | |
Shares redeemed | | | (2,138,039 | ) | | | (2,138,992 | ) | | | (101,770 | ) | | | (31,772 | ) |
| | | | | | | | | | | | | |
| Net increase | | | 4,177,992 | | | | 1,378,180 | | | | 175,494 | | | | 100,687 | |
| | | | | | | | | | | | | |
| Capital share transactions — Institutional Shares | | | | | | | | | | | | | | | | |
Shares sold | | | 2,950,290 | | | | 2,813,702 | | | | 144,495 | | | | 652,391 | |
Shares issued in reinvestment of distributions | | | 3,414 | | | | — | | | | 1,831 | | | | 18 | |
Shares redeemed | | | (2,557,117 | ) | | | (330,244 | ) | | | (55,528 | ) | | | (603,895 | ) |
| | | | | | | | | | | | | |
| Net increase | | | 396,587 | | | | 2,483,458 | | | | 90,798 | | | | 48,514 | |
| | | | | | | | | | | | | |
| See Notes to Financial Statements. | | 33 |
Baron Select Funds | |
December 31, 2015 |
| STATEMENT OF CASH FLOWS |
| |
| FOR THE YEAR ENDED DECEMBER 31, 2015 |
| | | Baron Partners
Fund |
| | | |
| Increase (Decrease) in Cash: | | | | |
| Cash Used from Operating Activities | | | | |
Net decrease in net assets resulting from operations | | $ | (57,100,497 | ) |
Adjustments to reconcile net decrease in net assets resulting from operations to net cash used by operating activities: | | | | |
Purchases of portfolio securities | | | (649,035,360 | ) |
Proceeds from sales of portfolio securities | | | 427,287,767 | |
Net purchases, sales and maturities of short-term investments | | | 18,548,715 | |
Increase in dividends and interest receivable | | | (175,021 | ) |
Increase in prepaid expenses | | | (273,846 | ) |
Decrease in payable for collateral on loaned securities | | | (18,690,000 | ) |
Increase in accrued expenses | | | 238,084 | |
Net realized gain on investments | | | (14,241,470 | ) |
Net change in unrealized depreciation of investments | | | 70,618,314 | |
| | | | |
Net cash used by operating activities | | $ | (222,823,314 | ) |
| | | | |
| Cash Provided from Financing Activities | | | | |
Distributions paid to shareholders | | | (697,371 | ) |
Proceeds from shares sold | | | 510,664,198 | |
Payment for shares redeemed | | | (489,226,618 | ) |
Increase in payable for borrowings against line of credit | | | 202,000,000 | |
| | | | |
Net cash provided in financing activities | | | 222,740,209 | |
| | | | |
Net decrease in cash | | | (83,105 | ) |
Cash at beginning of year | | | 83,105 | |
| | | | |
Cash at end of year | | $ | — | |
| | | | |
| Supplemental cash flow information: | | | | |
Interest paid | | $ | 3,910,695 | |
| | | | |
| 34 | | See Notes to Financial Statements. |
December 31, 2015 | |
Baron Select Funds |
| NOTES TO FINANCIAL STATEMENTS |
| |
1. ORGANIZATION
Baron Select Funds (the “Trust”) is registered under the Investment Company Act of 1940, as amended (the “1940 Act”), as an open-end management investment company established as a Delaware statutory trust on April 30, 2003, and accordingly, follows the investment company accounting and reporting guidance of the Financial Accounting Standards Board (“FASB”) Accounting Standard Codification Topic 946 Financial Services – Investment Companies. The Trust currently offers seven series (individually, a “Fund” and collectively, the “Funds”): Baron Partners Fund, Baron Focused Growth Fund, Baron Real Estate Fund and Baron Energy and Resources Fund, which are non-diversified; and Baron International Growth Fund, Baron Emerging Markets Fund, and Baron Global Advantage Fund, which are diversified. The Funds’ investment objective is to seek capital appreciation. Baron Partners Fund may employ “leverage” by borrowing money and using it to purchase additional securities. Borrowing for investment increases both investment opportunity and investment risk. Baron International Growth Fund, Baron Emerging Markets Fund and Baron Global Advantage Fund invest their assets primarily in non-U.S. companies. Baron Real Estate Fund invests its assets primarily in U.S. and non-U.S. real estate and real estate-related companies. Baron Energy and Resources Fund invests its assets primarily in U.S. and non-U.S. energy and resources companies and related companies and energy and resources master limited partnerships (“MLPs”) of any market capitalization.
Each Fund offers two classes of shares, Retail Shares and Institutional Shares, which differ only in their ongoing fees, expenses and eligibility requirements. Retail Shares are offered to all investors. Institutional Shares are for investments in the amount of $1 million or more per Fund. Institutional Shares are intended for certain financial intermediaries that offer shares of Baron Funds through fee-based platforms, retirement platforms or other platforms. Each class of shares has equal rights to earnings and assets, except that each class bears different expenses for distribution and shareholder servicing. Each Fund’s investment income, realized and unrealized gains or losses on investments and foreign currency, and expenses other than those attributable to a specific class are allocated to each class based on its relative net assets. Each class of shares has exclusive voting rights with respect to matters that affect just that class. R6 Shares for Baron Real Estate Fund and Baron Emerging Markets Fund commenced operations on January 29, 2016 and, therefore, are not included in this report.
Baron Partners Fund was organized originally as a limited partnership in January 1992 under the laws of the State of Delaware. Effective as of the close of business on April 30, 2003, the predecessor partnership was reorganized into a series of the Trust. Baron Partners Fund commenced operations on April 30, 2003 with a contribution of assets and liabilities, including securities-in-kind, from the predecessor partnership.
Baron Focused Growth Fund was organized originally as a limited partnership in May 1996 under the laws of the State of Delaware. Effective as of the close of business on June 30, 2008, the predecessor partnership was reorganized into a series of the Trust. Baron Focused Growth Fund commenced operations on June 30, 2008 with a contribution of assets and liabilities, including securities-in-kind, from the predecessor partnership.
2. SIGNIFICANT ACCOUNTING POLICIES
The following is a summary of significant accounting policies followed by the Funds. The policies are in conformity with accounting principles generally accepted in the United States of America (“GAAP”). The preparation of financial statements in accordance with GAAP requires management to make estimates and assumptions that affect the reported amounts of assets and liabilities at the date of the financial statements and the amounts of income and expenses during the period. Actual results could differ from those estimates. Events occurring subsequent to the date of the Statements of Assets and Liabilities and through the date of issuance of the financial statements have been evaluated for adjustment to or disclosure in the financial statements.
a) Security Valuation. The Funds’ share prices or net asset values are calculated as of the close of the regular trading session (usually 4 p.m. E.T.) on the New York Stock Exchange (“NYSE”) on any day the NYSE is open. Portfolio securities traded on any national stock exchange are valued based on the last sale price on the exchange where such shares are principally traded. For securities traded on NASDAQ, the Funds use the NASDAQ Official Closing Price. If there are no sales on a given day, the value of the security may be the average of the most recent bid and asked quotations on such exchange or the last sale price from a prior day. Where market quotations are not readily available, or, if in BAMCO, Inc.’s (the “Adviser”) judgment, they do not accurately reflect the fair value of a security, or an event occurs after the market close but before the Funds are priced that materially affects the value of a security, the security will be valued by the Adviser using policies and procedures approved by the Board of Trustees (the “Board”). The Adviser has a Fair Valuation Committee (the “Committee”) comprised of senior executives, and the Committee reports to the Board every quarter. Factors the Committee may consider when valuing a security include whether a current price is stale, there is recent news, the security is thinly traded, transactions are infrequent or quotations are genuine. There can be no guarantee, however, that a fair valuation used by the Funds on any given day will more accurately reflect the market value of an investment than the closing price of such investment in its market. Debt instruments having a remaining maturity greater than 60 days will be valued on the basis of prices obtained from a pricing service approved by the Board or at the mean of the bid and ask prices from the dealer maintaining an active market in that security. The value of the Funds’ investments in convertible bonds is determined primarily by obtaining valuations from independent pricing services based on readily available bid quotations or, if quotations are not available, by methods which include various considerations such as yields or prices of securities of comparable quality, coupon, maturity and type; indications as to values from dealers; and general market conditions. Other inputs used by an independent pricing service to value convertible bonds generally include underlying stock data, conversion premiums, listed bond and preferred stock prices and other market information which may include benchmark curves, trade execution data, and sensitivity analysis, when available. Money market instruments held by the Funds with a remaining maturity of 60 days or less are generally valued at amortized cost, which approximates fair value. Open-end investment companies, including securities lending collateral invested in registered investment company money market funds, are valued at their net asset value each day.
Non-U.S. equity securities are valued on the basis of their most recent closing market prices and translated into U.S. dollars at 4 p.m. E.T., except under the circumstances described below. Most foreign markets close before 4 p.m. E.T. For securities primarily traded in the Far East, for example, the most recent closing prices may be as much as fifteen hours old at 4 p.m. E.T. If the Adviser determines that developments between the close of the foreign markets and 4 p.m. E.T. will, in its judgment, materially affect the value of some or all of the Funds’ non-U.S. securities, the Adviser will adjust the previous closing prices to reflect what it believes to be the fair value of the securities as of 4 p.m. E.T. In deciding whether to make these adjustments, the Adviser may review a variety of factors, including developments in foreign markets, the performance of U.S. securities markets, and the performance of instruments trading in U.S. markets that represent non-U.S. securities and baskets of non-U.S. securities. The Adviser may also fair value securities in other situations, for example, when a particular foreign market is closed but the Funds are open. The Adviser uses an outside pricing service that utilizes a systematic methodology to provide the Adviser with closing market prices and information used for adjusting those prices. The Adviser cannot predict how often it will use closing prices or how often it will adjust those prices. As a means of evaluating its fair value process, the Adviser routinely compares closing market prices, the next day’s opening prices in the same markets, and the adjusted prices. Other mutual funds may adjust the prices of their securities by different amounts.
35
Baron Select Funds | |
December 31, 2015 |
| NOTES TO FINANCIAL STATEMENTS (Continued) |
| |
2. SIGNIFICANT ACCOUNTING POLICIES (Continued)
b) Securities Transactions, Investment Income and Expense Allocation. Securities transactions are recorded on a trade date basis. Realized gain and loss from securities transactions are recorded on an identified cost basis for financial reporting and federal income tax purposes. Dividend income is recognized on the ex-dividend date and interest income is recognized on an accrual basis, which includes the accretion of discounts and amortization of premiums. Certain dividends from foreign securities will be recorded as soon as the Funds are informed of the dividend if such information is obtained subsequent to the ex-dividend date. Distributions received from certain investments held by the Funds may be comprised of dividends, realized gains and returns of capital. The Funds originally estimate the expected classification of such payments. The amounts may subsequently be reclassified upon receipt of information from the issuer. The Funds are charged for those expenses of the Trust that are directly attributable to each Fund, such as advisory and custodian fees. Expenses that are not directly attributable to a Fund are typically allocated among the Funds in proportion to their respective net assets.
c) Foreign Currency Translations. Values of assets and liabilities denominated in foreign currencies are translated into U.S. dollars using the price of such currencies at the time the net asset value is determined. Purchases and sales of investments and dividend income are converted at the prevailing rate of exchange on the respective dates of such transactions. Net realized gain (loss) on foreign currency transactions includes gain (loss) arising from the fluctuation in the exchange rates between trade and settlement dates on security transactions and currency gain (loss) between the accrual and payment dates on dividends and foreign withholding taxes. The Funds do not isolate that portion of the results of operations resulting from changes in foreign exchange rates on investments from the fluctuations arising from changes in market prices of securities held. Such fluctuations are included with the net realized and unrealized gain or loss from investments and foreign currency transactions. The Funds may invest in foreign securities and foreign currency transactions that may involve risks not associated with domestic investments as a result of the level of governmental supervision and regulation of foreign securities markets and the possibility of political or economic instability, among others.
Pursuant to U.S. federal income tax regulations, gains and losses from certain foreign currency transactions and the foreign currency portion of gains and losses realized on sales and maturities of foreign denominated debt securities are generally treated as ordinary income for U.S. federal income tax purposes.
d) Securities Lending. The Funds may lend securities to certain brokers under the terms of a master netting agreement. Upon such loans, the Funds receive collateral which is maintained by the custodian. The Funds may pay fees to the custodian for administering the securities lending program. The Funds earn interest on such collateral and earn income in the form of negotiated lenders’ fees, both of which are included in securities lending income in the Statements of Operations. Securities loaned are required to be secured at all times by collateral equal to at least 102% of the market value of the securities loaned. Risks may arise upon entering into securities lending to the extent that the value of the collateral is less than the value of the securities loaned due to the changes in the value of collateral or the loaned securities. The collateral is marked-to-market daily and settled on the next business day. The Funds may receive collateral in the form of cash or other eligible securities, such as a letter of credit issued by a U.S. bank or securities issued or guaranteed by the U.S. government. Securities purchased with cash collateral are subject to the risks inherent in investing in these securities. At December 31, 2015, the Funds did not have any securities on loan.
e) Repurchase Agreements. The Funds may invest in repurchase agreements, which are short term investments whereby the Funds acquire ownership of a debt security and the seller agrees to repurchase the security at a future date at a specified price. When entering into repurchase agreements, it is the Funds’ policy that their custodian take possession of the underlying collateral securities, the market value of which, at all times, equals at least 102% of the principal amount of the repurchase transaction. To the extent that any repurchase transaction exceeds one business day, the value of the collateral is marked-to-market to ensure the adequacy of the collateral. If the seller defaults and the market value of the collateral declines or if bankruptcy proceedings are commenced with respect to the seller of the security, realization of the collateral by the Funds may be delayed or limited.
f) Federal and Foreign Income Taxes. The Trust treats each Fund as a separate entity for federal income tax purposes. Each Fund intends to meet the requirements of the Internal Revenue Code of 1986, as amended, applicable to regulated investment companies, and to distribute to its shareholders substantially all of its net investment income and any net realized capital gains at least annually. None of the Funds will be subject to federal or state income taxes to the extent that they qualify as regulated investment companies and substantially all of their income is distributed.
The Funds may be subject to foreign taxes on income and gains on investments that are accrued based upon the Funds’ understanding of the tax rules and regulations that exist in the countries in which the Funds invest. Foreign governments may also impose taxes or other payments on investments with respect to foreign securities. Such taxes are accrued as applicable.
g) Restricted Securities. The Funds may invest in securities that are restricted as to public sale in accordance with the Securities Act of 1933. Such assets are valued by the Adviser pursuant to policies and procedures approved by the Board.
h) Distributions to Shareholders. Income and capital gain distributions to shareholders are determined in accordance with income tax regulations which may differ from GAAP. These differences are primarily due to differing treatments for net investment loss, foreign currency gains and losses, reclassification of distributions, partnership basis adjustments, income from passive foreign investment companies and wash sale losses deferred.
i) Commitments and Contingencies. In the normal course of business, the Funds may enter into contracts and agreements that contain a variety of representations and warranties, which provide general indemnification. The maximum exposure to the Funds under these agreements is unknown, as this would involve future claims that may be made against the Funds that have not yet occurred. However, based on experience, the Funds expect the risk of loss to be remote.
j) Cash and Cash Equivalents. The Funds consider all short term liquid investments with a maturity of three months or less when purchased to be cash equivalents.
k) Fund Diversification and Concentration. Certain of the Funds hold non-diversified or concentrated portfolios that may contain fewer securities or invest in fewer industries than the portfolios of other mutual funds. This may increase the risk that the value of a Fund could decrease because of the poor performance of one or a few investments or of a particular industry. Additionally, non-diversified funds may encounter difficulty liquidating securities.
3. PURCHASES AND SALES OF SECURITIES
Purchases and sales of securities, other than short term securities, for the year ended December 31, 2015 were as follows:
| Fund | | | Purchases | | | Sales |
| Baron Partners Fund | | $ | 670,702,956 | | $ | 412,230,280 |
| Baron Focused Growth Fund | | | 23,261,751 | | | 39,628,853 |
| Baron International Growth Fund | | | 43,109,697 | | | 49,631,028 |
| Baron Real Estate Fund | | | 1,067,140,518 | | | 906,305,405 |
| Baron Emerging Markets Fund | | | 911,791,142 | | | 378,914,221 |
| Baron Energy and Resources Fund | | | 69,569,194 | | | 36,069,338 |
| Baron Global Advantage Fund | | | 6,365,031 | | | 2,451,784 |
36
December 31, 2015 | |
Baron Select Funds |
| NOTES TO FINANCIAL STATEMENTS (Continued) |
| |
4. INVESTMENT ADVISORY FEES AND OTHER TRANSACTIONS WITH AFFILIATES
a) Investment Advisory Fees. The Adviser, a wholly owned subsidiary of Baron Capital Group, Inc. (“BCG”), serves as investment adviser to the Funds. As compensation for services rendered, the Adviser receives a fee payable monthly equal to 1% per annum of the average daily net assets of the respective Funds. The Adviser has contractually agreed to reduce its fee, to the extent required to limit the net annual operating expense ratio (excluding portfolio transaction costs, interest, dividend and extraordinary expenses), as follows:
| | | Annual Operating
Expense Ratio Cap |
| | | |
| Fund | | Retail
Shares | | Institutional
Shares |
| Baron Partners Fund | | 1.45% | | 1.20% |
| Baron Focused Growth Fund | | 1.35% | | 1.10% |
| Baron International Growth Fund | | 1.50% | | 1.25% |
| Baron Real Estate Fund | | 1.35% | | 1.10% |
| Baron Emerging Markets Fund | | 1.50% | | 1.25% |
| Baron Energy and Resources Fund | | 1.35% | | 1.10% |
| Baron Global Advantage Fund | | 1.50% | | 1.25% |
b) Distribution Fees. Baron Capital, Inc. (“BCI”), a wholly owned subsidiary of BCG, is a registered limited purpose broker-dealer and the distributor of the Funds’ shares. The Funds are authorized to pay BCI a distribution fee payable monthly pursuant to a distribution plan under Rule 12b-1 of the 1940 Act equal to 0.25% per annum of the Retail Shares’ average daily net assets of the respective Funds.
c) Trustee Fees. Certain Trustees of the Trust may be deemed to be affiliated with, or interested persons (as defined by the 1940 Act) of the Funds’ Adviser or of BCI. None of the Trustees so affiliated received compensation for his or her services as a Trustee of the Trust. None of the Funds’ officers received compensation from the Funds for their services as an officer.
d) Fund Accounting and Administration Fees. The Funds have entered into an agreement with State Street Bank and Trust Company (“State Street”) to perform accounting and certain administrative services. State Street is compensated for fund accounting services based on a percentage of the Funds’ net assets, subject to certain minimums plus fixed annual fees for the administrative services.
e) Voluntary Payment. In March 2014, the Adviser made a voluntary payment to Baron Global Advantage Fund in the amount of $47,291 to compensate the Fund for a loss incurred due to a shareholder activity processing error. The impact of this payment increased the Fund’s total return by 0.54%.
f) Cross Trades. The Funds are permitted to purchase securities from, or sell securities to, other funds within the Trust, other Funds in the Baron Investment Funds Trust, and other entities advised or subadvised by the Adviser, pursuant to “Cross-Trading” Procedures adopted by the Board. These procedures have been designed to ensure that any cross-trade of securities by the respective Baron Fund from or to another fund/other entity that is or could be considered an affiliate of the respective Baron Fund under certain limited circumstances by virtue of having a common investment adviser, common officer, or common Trustee complies with Rule 17a-7 under the 1940 Act. Further, as defined under these procedures, each cross-trade is effected at the current market price and with no commissions. Pursuant to these procedures, for the year ended December 31, 2015, the Funds engaged in the following cross-trades, which resulted in the following net realized gains (losses):
| | | | | | | |
| | | Purchases | | Sales | | Net Realized
Gains (Losses) |
| Baron Partners Fund | | $44,968,124 | | $6,181,720 | | $(3,701,777 | ) |
| Baron Focused Growth Fund | | 569,250 | | — | | — | |
| Baron International Growth Fund | | 108,014 | | — | | — | |
| Baron Real Estate Fund | | 928,658 | | 607,304 | | 19,756 | |
| Baron Energy and Resources Fund | | 250,327 | | — | | — | |
5. LINE OF CREDIT
Baron Partners Fund participates in a committed syndicated line of credit agreement with State Street in the amount of $600 million. Depending on the outstanding loan amount, a commitment fee of 0.15% or 0.25% per annum is incurred on the unused portion of the line of credit. The line of credit is used for investment purposes and expires on November 4, 2016. Baron Partners Fund may borrow up to the lesser of $600 million or the maximum amount Baron Partners Fund may borrow under the 1940 Act, the limitations included in Baron Partners Fund’s prospectus, or any limit or restriction under any law or regulation to which Baron Partners Fund is subject or any agreement to which Baron Partners Fund is a party. Interest is charged to Baron Partners Fund, based on its borrowings, at a rate per annum equal to the higher of the Federal Funds Rate or the One Month LIBOR Rate plus a margin of 0.85%. An upfront fee of 0.05% is incurred on the commitment amount. For the year ended December 31, 2015, interest expense incurred on these loans amounted to $4,118,157. During the year ended December 31, 2015, Baron Partners Fund had an average daily balance on the line of credit of $398.8 million at a weighted average interest rate of 1.03%. At December 31, 2015, Baron Partners Fund had an outstanding balance in the amount of $557,000,000.
The Funds (except Baron Partners Fund), together with the Funds in Baron Investment Funds Trust, participate in a committed line of credit agreement with State Street to be used for temporary purposes, primarily for financing redemptions. Each Fund may borrow up to the lesser of $100 million or the maximum amount each Fund may borrow under the 1940 Act, the limitations included in each Fund’s prospectus, or any limit or restriction under any law or regulation to which each Fund is subject or any agreement to which each Fund is a party; provided that the aggregate outstanding principal amount of all loans to any of the Funds may not exceed $100 million. Interest is charged to each Fund, based on its borrowings, at a rate per annum equal to the higher of the Overnight Federal Funds Rate or the Overnight LIBOR Rate plus a margin of 1.00%. An upfront fee of 0.05% is incurred on the commitment amount and a commitment fee of 0.15% per annum is incurred on the unused portion of the line of credit. Both fees are allocated to the participating Funds based on their relative net assets. During the year ended December 31, 2015, the Funds did not have any borrowings under the line of credit.
37
Baron Select Funds | |
December 31, 2015 |
| NOTES TO FINANCIAL STATEMENTS (Continued) |
| |
6. RESTRICTED SECURITIES
At December 31, 2015, investments in securities included securities that are restricted and/or illiquid. Restricted securities are often purchased in private placement transactions, are not registered under the Securities Act of 1933, may have contractual restrictions on resale and are valued pursuant to the policies and procedures for fair value pricing approved by the Board. A security may be considered illiquid if it lacks a readily available market or if its valuation has not changed for a certain period of time. The Funds may receive more or less than this valuation in an actual sale and that difference could be material. At December 31, 2015, the Funds held investments in restricted and/or illiquid securities that were valued pursuant to policies and procedures for fair value pricing as follows:
| | | Baron Partners Fund |
| | | |
| Name of Issuer | | Acquisition Date(s) | | Value |
| Common Stock | | | | | |
TerraForm Global, Inc., Cl A | | 8/5/2015 | | $ | 7,013,332 |
Private Equity Investments | | | | | |
Windy City Investments Holdings, L.L.C. | | 11/13/2007-1/27/2011 | | | 6,442,261 |
| | | | | |
| Total Restricted Securities: | | | | $ | 13,455,593 |
| | | | | |
(Cost $21,832,926)† (0.71% of Net Assets) | | | | | |
| | | | | | |
| | | Baron International Growth Fund |
| | | |
| Name of Issuer | | Acquisition Date(s) | | Value |
| Common Stock | | | | | |
TerraForm Global, Inc., Cl A | | 6/9/2015, 8/5/2015 | | $ | 690,259 |
| | | | | |
(Cost $1,900,000) (0.70% of Net Assets) | | | | | |
| | | | | | |
| | | Baron Emerging Markets Fund |
| | | |
| Name of Issuer | | Acquisition Date(s) | | Value |
| Common Stock | | | | | |
Sihuan Pharmaceutical Holdings Group Ltd. | | 9/18/2013-12/30/2014 | | $ | 7,935,750 |
TerraForm Global, Inc., Cl A | | 6/9/2015, 8/5/2015 | | | 10,198,856 |
| | | | | |
| Total Restricted Securities: | | | | $ | 18,134,606 |
| | | | | |
(Cost $35,225,260)† (1.06% of Net Assets) | | | | | |
| | | | | | |
| | | Baron Energy and Resources Fund |
| | | |
| Name of Issuer | | Acquisition Date(s) | | Value |
| Common Stock | | | | | |
TerraForm Global, Inc., Cl A | | 6/9/2015 | | $ | 1,107,367 |
| | | | | |
(Cost $3,000,000) (1.40% of Net Assets) | | | | | |
| | | | | | |
| | | Baron Global Advantage Fund |
| | | |
| Name of Issuer | | Acquisition Date(s) | | Value |
| Common Stock | | | | | |
TerraForm Global, Inc., Cl A | | 6/9/2015 | | $ | 147,648 |
| | | | | |
(Cost $400,000) (1.28% of Net Assets) | | | | | |
| | |
| | |
| † See Statements of Net Assets for cost of individual securities. |
7. FAIR VALUE MEASUREMENTS
Fair value is defined by GAAP as the price that the Funds would receive upon selling an investment in a timely transaction to an independent buyer in the principal or most advantageous market for the investment. GAAP provides a three-tier hierarchy to maximize the use of observable market data and minimize the use of unobservable inputs and to establish classification of fair value measurements for disclosure purposes. Inputs refer broadly to the assumptions that market participants would use in pricing the asset or liability. Inputs may be observable or unobservable. Observable inputs are based on market data obtained from sources independent of the Funds. Unobservable inputs are inputs that reflect the Funds’ own assumptions based on the best information available in the circumstances. The three-tier hierarchy of inputs is summarized in the three broad Levels listed below.
| • | | Level 1 — quoted prices in active markets for identical assets or liabilities; |
| | | |
| • | | Level 2 — prices determined using other inputs that are observable either directly, or indirectly through corroboration with observable market data (which could include quoted prices for similar assets or liabilities, interest rates, credit risk, etc.); |
| | | |
| • | | Level 3 — prices determined using unobservable inputs when quoted prices or observable inputs are unavailable, such as when there is little or no market activity for an asset or liability (unobservable inputs reflect each Fund’s own assumptions in determining the fair value of assets or liabilities and would be based on the best information available). |
38
December 31, 2015 |
Baron Select Funds |
| NOTES TO FINANCIAL STATEMENTS (Continued) |
| |
7. FAIR VALUE MEASUREMENTS (Continued)
The inputs or methodology used for valuing securities are not necessarily an indication of the risk associated with investing in those securities. For example, non-U.S. securities, with markets that close hours before the Funds value their holdings, may require revised valuations due to significant movement in the U.S. markets. Since these values are not obtained from quoted prices in an active market, such securities are reflected as Level 2.
The Funds have procedures to determine the fair value of securities and other financial instruments for which market prices are not readily available or which may not be reliably priced. Under these procedures, the Funds primarily employ a market-based approach that may use related or comparable assets or liabilities, recent transactions, market multiples, book values, and other relevant information for the investment to determine its fair value. The Funds may also use an income-based valuation approach in which the anticipated future cash flows of the investment are discounted to calculate fair value. Discounts may also be applied due to the nature or duration of any restrictions on the disposition of the investments. Due to the inherent uncertainty of valuations of such investments, the fair values may differ significantly from the values that would have been used had an active market existed.
The following is a summary of the inputs used as of December 31, 2015 in valuing the Funds’ investments carried at fair value:
| | | Baron Partners Fund | |
| | | | |
| | | Quoted Prices in | | | | | | | | | | |
| | | Active Markets | | Other | | | | | | | |
| | | for Identical | | Observable | | Unobservable | | | | |
| | | Assets | | Inputs | | Inputs | | | | |
| Description | | (Level 1) | | (Level 2) | | (Level 3) | | Total | |
| Common Stocks† | | $ | 2,454,192,019 | | $ | 7,013,332 | | $ | — | | $ | 2,461,205,351 | |
| Private Equity Investments | | | — | | | — | | | 6,442,261 | | | 6,442,261 | |
| Short Term Investments | | | — | | | 141,285 | | | — | | | 141,285 | |
| | | | | | | | | | |
| Total Investments | | $ | 2,454,192,019 | | $ | 7,154,617 | | $ | 6,442,261 | | $ | 2,467,788,897 | |
| | | | | | | | | | |
Transfers between Levels 1, 2 or 3, if any, are recognized at ending value on December 31, 2015. There have been no transfers in and out of Level 1, 2 or 3 fair value measurements for the Fund for the year ended December 31, 2015.
| | | Baron Focused Growth Fund | |
| | | | |
| | | Quoted Prices in | | | | | | | | | | |
| | | Active Markets | | Other | | | | | | | |
| | | for Identical | | Observable | | Unobservable | | | | |
| | | Assets | | Inputs | | Inputs | | | | |
| Description | | (Level 1) | | (Level 2) | | (Level 3) | | Total | |
| Common Stocks† | | $ | 164,808,052 | | $ | — | | $ | — | | $ | 164,808,052 | |
| Preferred Stocks | | | — | | | 6,892,707 | | | — | | | 6,892,707 | |
| Short Term Investments | | | — | | | 13,876,643 | | | — | | | 13,876,643 | |
| | | | | | | | | | |
| Total Investments | | $ | 164,808,052 | | $ | 20,769,350 | | $ | — | | $ | 185,577,402 | |
| | | | | | | | | | |
$6,892,707 was transferred out of Level 1 into Level 2 at December 31, 2015 as a result of using a broker quoted price instead of last sale. It is the Fund’s policy to recognize transfers in and transfers out at the fair value as of the end of the period.
| | | Baron International Growth Fund | |
| | | | |
| | | Quoted Prices in | | | | | | | | | | |
| | | Active Markets | | Other | | | | | | | |
| | | for Identical | | Observable | | Unobservable | | | | |
| | | Assets | | Inputs | | Inputs | | | | |
| Description | | (Level 1) | | (Level 2) | | (Level 3) | | Total | |
| Common Stocks† | | $ | 64,330,080 | | $ | 30,369,004 | | $ | — | | $ | 94,699,084 | |
| Short Term Investments | | | — | | | 3,949,806 | | | — | | | 3,949,806 | |
| | | | | | | | | | |
| Total Investments | | $ | 64,330,080 | | $ | 34,318,810 | | $ | — | | $ | 98,648,890 | |
| | | | | | | | | | |
$23,996,425 was transferred out of Level 2 into Level 1 at December 31, 2015 as a result of not adjusting closing prices for certain securities (as described in Note 2a) due to significant market movements between the time at which the Fund valued its securities and the earlier closing of foreign markets. $1,576,632 was transferred out of Level 1 into Level 2 at December 31, 2015 as a result of adjusting closing prices for certain securities and the earlier closing of foreign markets. It is the Fund’s policy to recognize transfers in and transfers out at the fair value as of the end of the period.
| † See Statements of Net Assets for additional detailed categorizations. |
Baron Select Funds |
December 31, 2015 |
| NOTES TO FINANCIAL STATEMENTS (Continued) |
| |
| | | | | | | | | | | | | | |
| 7. FAIR VALUE MEASUREMENTS (Continued) |
| | | Baron Real Estate Fund | |
| | | | |
| | | Quoted Prices in | | | | | | | | | | |
| | | Active Markets | | Other | | | | | | | |
| | | for Identical | | Observable | | Unobservable | | | | |
| | | Assets | | Inputs | | Inputs | | | | |
| Description | | (Level 1) | | (Level 2) | | (Level 3) | | Total | |
| Common Stocks† | | $ | 1,716,534,442 | | $ | 23,160,273 | | $ | — | | $ | 1,739,694,715 | |
| Short Term Investments | | | — | | | 37,889,013 | | | — | | | 37,889,013 | |
| | | | | | | | | | |
| Total Investments | | $ | 1,716,534,442 | | $ | 61,049,286 | | $ | — | | $ | 1,777,583,728 | |
| | | | | | | | | | |
$19,674,436 was transferred out of Level 1 into Level 2 at December 31, 2015 as a result of adjusting closing prices for certain securities (as described in Note 2a) due to significant market movements between the time at which the Fund valued its securities and the earlier closing of foreign markets. It is the Fund’s policy to recognize transfers in and transfers out at the fair value as of the end of the period.
| | | Baron Emerging Markets Fund | |
| | | | |
| | | Quoted Prices in | | | | | | | | | | |
| | | Active Markets | | Other | | | | | | �� | |
| | | for Identical | | Observable | | Unobservable | | | | |
| | | Assets | | Inputs | | Inputs | | | | |
| Description | | (Level 1) | | (Level 2) | | (Level 3) | | Total | |
| Common Stocks† | | $ | 1,164,308,603 | | $ | 342,272,071 | | $ | 7,935,750 | | $ | 1,514,516,424 | |
| Preferred Stocks | | | 421,503 | | | — | | | — | | | 421,503 | |
| Convertible Bonds | | | — | | | 6,064,477 | | | — | | | 6,064,477 | |
| Short Term Investments | | | — | | | 176,864,045 | | | — | | | 176,864,045 | |
| | | | | | | | | | |
| Total Investments | | $ | 1,164,730,106 | | $ | 525,200,593 | | $ | 7,935,750 | | $ | 1,697,866,449 | |
| | | | | | | | | | |
$68,536,922 was transferred out of Level 1 into Level 2 at December 31, 2015 as a result of adjusting closing prices for certain securities (as described in Note 2a) due to significant market movements between the time at which the Fund valued its securities and the earlier closing of foreign markets. $513,729,581 was transferred out of Level 2 into Level 1 at December 31, 2015 as a result of not adjusting closing prices for certain securities and the earlier closing of foreign markets. $7,935,750 was transferred out of Level 2 into Level 3 as a resulting of a trading halt on a security. It is the Fund’s policy to recognize transfers in and transfers out at the fair value as of the end of the period.
| | | Baron Energy and Resources Fund | |
| | | | |
| | | Quoted Prices in | | | | | | | | | | |
| | | Active Markets | | Other | | | | | | | |
| | | for Identical | | Observable | | Unobservable | | | | |
| | | Assets | | Inputs | | Inputs | | | | |
| Description | | (Level 1) | | (Level 2) | | (Level 3) | | Total | |
| Common Stocks† | | $ | 66,492,423 | | $ | 1,107,367 | | $ | — | | $ | 67,599,790 | |
| Short Term Investments | | | — | | | 14,424,779 | | | — | | | 14,424,779 | |
| | | | | | | | | | |
| Total Investments | | $ | 66,492,423 | | $ | 15,532,146 | | $ | — | | $ | 82,024,569 | |
| | | | | | | | | | |
Transfers between Levels 1, 2 or 3, if any, are recognized at ending value on December 31, 2015. There have been no transfers in and out of Level 1, 2 or 3 fair value measurements for the Fund for the year ended December 31, 2015.
| | | Baron Global Advantage Fund | |
| | | | |
| | | Quoted Prices in | | | | | | | | | | |
| | | Active Markets | | Other | | | | | | | |
| | | for Identical | | Observable | | Unobservable | | | | |
| | | Assets | | Inputs | | Inputs | | | | |
| Description | | (Level 1) | | (Level 2) | | (Level 3) | | Total | |
| Common Stocks† | | $ | 10,395,396 | | $ | 1,039,358 | | $ | — | | $ | 11,434,754 | |
| Short Term Investments | | | — | | | 141,796 | | | — | | | 141,796 | |
| | | | | | | | | | |
| Total Investments | | $ | 10,395,396 | | $ | 1,181,154 | | $ | — | | $ | 11,576,550 | |
| | | | | | | | | | |
$746,261 was transferred out of Level 1 into Level 2 at December 31, 2015 as a result of adjusting closing prices for certain securities (as described in Note 2a) due to significant market movements between the time at which the Fund valued its securities and the earlier closing of foreign markets. $366,574 was transferred out of Level 2 into Level 1 at December 31, 2015 as a result of not adjusting closing prices for certain securities and the earlier closing of foreign markets. It is the Fund’s policy to recognize transfers in and transfers out at the fair value as of the end of the period.
| † See Statements of Net Assets for additional detailed categorizations. |
December 31, 2015 |
Baron Select Funds |
| NOTES TO FINANCIAL STATEMENTS (Continued) |
| |
| |
| 7. FAIR VALUE MEASUREMENTS (Continued) |
The following is a reconciliation of investments in which unobservable inputs (Level 3) were used in determining fair value:
| | | Baron Partners Fund | |
| | | | |
Investments in
Securities | | | Balance as of
December 31,
2014 | | | Accrued
Premiums/
Discounts | | | Net Realized
Gain
(Loss) | | | Net
Change in
Unrealized
Appreciation
(Depreciation) | | | | Purchases | | | Sales | | | Transfers
Into
Level 3 | | | Transfers
Out of
Level 3 | | | Balance as of
December 31,
2015 | | | Change in Net
Unrealized
Appreciation
(Depreciation)
from Investments
still held at
December 31,
2015 | |
| Private Equity Investments | | | | | | | | | | | | | | | | | | | | | | | | | | | | | | | | |
| Financials | | $ | 6,593,843 | | $ | — | | $ | — | | $ | (151,582 | ) | | $ | — | | $ | — | | $ | — | | $ | — | | $ | 6,442,261 | | $ | (151,582 | ) |
| | | | | | | | | | | | | | | | | | | | | | | |
| | | | | | | | | | | | | | | | | | | | | | | | | | | | | | | | | |
| | | Baron Emerging Markets Fund | |
| | | | |
Investments in
Securities | | | Balance as of
December 31,
2014 | | | Accrued
Premiums/
Discounts | | | Net
Realized
Gain
(Loss) | | | Net Change in
Unrealized
Appreciation
(Depreciation) | | | | Purchases | | | Sales | | | Transfers
Into
Level 3 | | | Transfers
Out of
Level 3 | | | Balance as of
December 31,
2015 | | | Change in Net
Unrealized
Appreciation
(Depreciation)
from Investments
still held at
December 31,
2015 | |
| Common Stock | | | | | | | | | | | | | | | | | | | | | | | | | | | | | | | | |
Health Care | | $ | — | | $ | — | | $ | — | | $ | — | | | $ | — | | $ | — | | $ | 7,935,750 | | $ | — | | $ | 7,935,750 | | $ | — | |
| | | | | | | | | | | | | | | | | | | | | | | |
8. INCOME TAXES AND DISTRIBUTIONS TO SHAREHOLDERS
Federal income tax regulations differ from GAAP. Therefore, distributions determined in accordance with tax regulations may differ in amount or character from net investment income and net realized gain for financial reporting purposes. Net investment income (loss) and net realized and unrealized gain (loss) differ for financial statement and tax purposes due to differing treatments of net investment loss, foreign currency gains and losses, reclassification of distributions, partnership basis adjustments, income from passive foreign investment companies and wash sale losses deferred. Financial reporting records are adjusted for permanent book/tax differences to reflect tax character. Financial records are not adjusted for temporary differences.
For the year ended December 31, 2015, the Funds recorded the following permanent reclassifications to reflect tax character. Reclassifications between income, gains and paid-in capital relate primarily to the tax treatment of net investment loss, foreign currency gains and losses and partnership basis adjustments. Results of operations and net assets were not affected by these reclassifications.
| Fund | | Undistributed
(Accumulated)
Net Investment
Income (Loss) | | Undistributed
(Accumulated)
Net Realized Gain
(Loss) | | Paid-In Capital |
| Baron Partners Fund | | $ | 12,092,073 | | | $ | (23,571 | ) | | $ | (12,068,502 | ) |
| Baron Focused Growth Fund | | | 689,420 | | | | (248 | ) | | | (689,172 | ) |
| Baron International Growth Fund | | | (95,444 | ) | | | 95,444 | | | | — | |
| Baron Real Estate Fund | | | (129,933 | ) | | | 131,975 | | | | (2,042 | ) |
| Baron Emerging Markets Fund | | | (1,527,167 | ) | | | 1,527,167 | | | | — | |
| Baron Energy and Resources Fund | | | (259,637 | ) | | | 772,534 | | | | (512,897 | ) |
| Baron Global Advantage Fund | | | 61,719 | | | | 71,884 | | | | (133,603 | ) |
Baron Select Funds |
December 31, 2015 |
| NOTES TO FINANCIAL STATEMENTS (Continued) |
| |
| | 8. INCOME TAXES AND DISTRIBUTIONS TO SHAREHOLDERS (Continued) |
As of December 31, 2015, the components of net assets on a tax basis were as follows:
| | | | | | | | | | | Baron | | | | | | Baron | | Baron | | | Baron |
| | | Baron Partners | | Baron Focused | | International | | Baron Real | | Emerging | | Energy and | | Global Advantage |
| | | Fund | | Growth Fund | | Growth Fund | | Estate Fund | | Markets Fund | | Resources Fund | | Fund |
| Cost of investments | | $ | 1,610,716,296 | | | $ | 140,054,358 | | | $ | 78,627,288 | | | $ | 1,562,826,896 | | | $ | 1,770,516,296 | | | $ | 90,427,289 | | | $ | 9,711,334 | |
| | | | | | | | | | | | | | | | | | | | | | |
| | | | | | | | | | | | | | | | | | | | | | | | | | | | | |
| Gross tax unrealized | | | | | | | | | | | | | | | | | | | | | | | | | | | | |
appreciation | | | 966,200,132 | | | | 50,020,737 | | | | 25,693,898 | | | | 265,383,732 | | | | 171,746,297 | | | | 4,290,423 | | | | 2,782,136 | |
| Gross tax unrealized | | | | | | | | | | | | | | | | | | | | | | | | | | | | |
depreciation | | | (109,127,531 | ) | | | (4,497,693 | ) | | | (5,672,296 | ) | | | (50,626,900 | ) | | | (244,396,144 | ) | | | (12,693,143 | ) | | | (916,920 | ) |
| | | | | | | | | | | | | | | | | | | | | | |
| Net tax unrealized | | | | | | | | | | | | | | | | | | | | | | | | | | | | |
appreciation (depreciation) | | | 857,072,601 | | | | 45,523,044 | | | | 20,021,602 | | | | 214,756,832 | | | | (72,649,847 | ) | | | (8,402,720 | ) | | | 1,865,216 | |
| Net tax unrealized currency | | | | | | | | | | | | | | | | | | | | | | | | | | | | |
depreciation | | | — | | | | — | | | | (19,807 | ) | | | (3,944 | ) | | | (1,341,734 | ) | | | (2 | ) | | | (222 | ) |
| Undistributed net | | | | | | | | | | | | | | | | | | | | | | | | | | | | |
investment income | | | — | | | | — | | | | 43,909 | | | | 288,858 | | | | 384,922 | | | | — | | | | — | |
| Undistributed net realized gain | | | — | | | | 6,977,768 | | | | 2,472 | | | | 3,574,602 | | | | — | | | | — | | | | — | |
| Qualified late year loss deferral | | | (842,819 | ) | | | — | | | | (284,037 | ) | | | — | | | | (6,129,327 | ) | | | (23,843,720 | ) | | | (523,081 | ) |
| Capital loss carryforwards | | | (304,609,586 | ) | | | — | | | | — | | | | — | | | | (108,038,063 | ) | | | (6,236,360 | ) | | | (94,626 | ) |
| Paid-in capital | | | 1,349,172,858 | | | | 131,682,112 | | | | 78,833,806 | | | | 1,563,065,446 | | | | 1,894,130,480 | | | | 117,724,516 | | | | 10,274,585 | |
| | | | | | | | | | | | | | | | | | | | | | |
| Net Assets | | $ | 1,900,793,054 | | | $ | 184,182,924 | | | $ | 98,597,945 | | | $ | 1,781,681,794 | | | $ | 1,706,356,431 | | | $ | 79,241,714 | | | $ | 11,521,872 | |
| | | | | | | | | | | | | | | | | | | | | | |
As of December 31, 2015, the Funds had capital loss carryforwards expiring as follows:
| | | | | | | | | | | Baron | | | | | | Baron | | Baron | | Baron |
| | | Baron Partners | | Baron Focused | | International | | Baron Real | | Emerging | | Energy and | | Global Advantage |
| | | Fund | | Growth Fund | | Growth Fund | | Estate Fund | | Markets Fund | | Resources Fund | | Fund |
| Short term: | | | | | | | | | | | | | | | | | | | | | | | | | | | | |
| December 31, 2017 | | $ | 304,609,586 | | | $ | — | | | $ | — | | | $ | — | | | $ | — | | | $ | — | | | $ | — | |
| No expiration date | | | — | | | | — | | | | — | | | | — | | | | 93,180,072 | | | | 4,570,844 | | | | 92,645 | |
| | | | | | | | | | | | | | | | | | | | | | |
| | | $ | 304,609,586 | | | $ | — | | | $ | — | | | $ | — | | | $ | 93,180,072 | | | $ | 4,570,844 | | | $ | 92,645 | |
| | | | | | | | | | | | | | | | | | | | | | |
| | | | | | | | | | | | | | | | | | | | | | | | | | | | | |
| Long term: | | | | | | | | | | | | | | | | | | | | | | | | | | | | |
| No expiration date | | $ | — | | | $ | — | | | $ | — | | | $ | — | | | $ | 14,857,991 | | | $ | 1,665,516 | | | $ | 1,981 | |
| | | | | | | | | | | | | | | | | | | | | | |
| | | | | | | | | | | | | | | | | | | | | | | | | | | | | |
| Capital loss carryforward utilized | | | | | | | | | | | | | | | | | | | | | | | | | | | | |
| during the year ended | | | | | | | | | | | | | | | | | | | | | | | | | | | | |
| December 31, 2015 | | $ | 23,144,299 | | | $ | — | | | $ | — | | | | — | | | $ | — | | | $ | — | | | $ | — | |
| | | | | | | | | | | | | | | | | | | | | | |
The tax character of distributions paid during the fiscal years ended December 31, 2015 and December 31, 2014 was as follows:
| | | Year Ended | | | Year Ended | |
| | | December 31, 2015 | | | December 31, 2014 | |
| | | | | | | |
| | | | | | | Long Term | | | | | | Long Term |
| Fund | | Ordinary1 | | Capital Gain | | Ordinary1 | | Capital Gain |
| Baron Partners Fund | | $ | 8,870,821 | | | $ | — | | | $ | — | | | $ | — | |
| Baron Focused Growth Fund | | | 650,535 | | | | 9,891,350 | | | | — | | | | 1,168,756 | |
| Baron International Growth Fund | | | 673,432 | | | | 156,070 | | | | 101,998 | | | | 2,751,644 | |
| Baron Real Estate Fund | | | 802,173 | | | | 34,696,513 | | | | 3,698,225 | | | | — | |
| Baron Emerging Markets Fund | | | 4,689,931 | | | | — | | | | 4,415,521 | | | | — | |
| Baron Energy and Resources Fund | | | 71 | | | | 64,953 | | | | — | | | | — | |
| Baron Global Advantage Fund | | | 28,281 | | | | 13,779 | | | | 476 | | | | — | |
| 1 For tax purposes, short-term capital gains are considered ordinary income distributions. |
| | The Funds follow the provisions of FASB Codification Section 740 (“ASC Section 740”) “Accounting for Uncertainty in Income Taxes” which clarifies the accounting for uncertainty in tax positions taken or expected to be taken on a tax return. ASC Section 740 sets forth a threshold for financial statement recognition, measurement and disclosure of tax positions taken or expected to be taken on a tax return. The Funds are required to recognize the tax effects of certain tax positions under a “more likely than not” standard, that based on their technical merits, have more than 50 percent likelihood of being sustained upon examination. Management has analyzed the tax positions taken on the Funds’ federal income tax returns for all open years (current and prior three years), and has concluded that no provision for federal income tax is required in the Funds’ financial statements. At December 31, 2015, the Funds did not have any uncertain tax benefits that require recognition, de-recognition or disclosure. The Funds’ federal, state and local income and federal excise tax returns for which the applicable statutes of limitations have not expired (current and prior three years) are subject to examination by the Internal Revenue Service and state departments of revenue. |
December 31, 2015 |
Baron Select Funds |
| NOTES TO FINANCIAL STATEMENTS (Continued) |
| |
| | 9. OWNERSHIP CONCENTRATION |
As of December 31, 2015, the officers, trustees and portfolio managers owned, directly or indirectly, 42.65% of Baron Focused Growth Fund and 36.60% of Baron Global Advantage Fund. As of December 31, 2015 the officers, trustees, portfolio managers and one other investor owned, directly or indirectly, 35.28% of Baron International Growth Fund. As a result of their ownership, these investors may be able to materially affect the outcome of matters presented to Baron Focused Growth Fund, Baron International Growth Fund and Baron Global Advantage Fund shareholders.
10. TRANSACTIONS IN “AFFILIATED” COMPANIES1
BARON REAL ESTATE FUND
| | | | | | | | | | | | | | | Net Change in | | | | | | | | | | Shares | | | | |
| | | Value at | | | | | | | | | | Unrealized | | | | | | | | | | Held at | | Value at |
| | | December 31, | | Purchase | | Sales | | Appreciation | | Realized | | Dividend | | December 31, | | December 31, |
| Name of Issuer | | 2014 | | Cost | | Proceeds | | (Depreciation) | | Gains/(Losses) | | Income | | 2015 | | 2015 |
| No Longer an “Affiliated” Company as of December 31, 2015: |
| Capital Senior Living Corp. | | $ | 55,501,049 | | | $ | 2,238,786 | | | $ | 21,380,669 | | | $ | (7,133,653 | ) | | $ | (1,693,567 | ) | | $ | — | | | | 1,319,844 | | | $ | 27,531,946 | |
| | | | | | | | | | | | | | | | | | | | | | | | | | |
1 An “Affiliated” Company (“affiliated person” as defined in the 1940 Act), is a company in which a Fund held 5% or more of the company’s outstanding voting securities at any time during the year ended December 31, 2015. |
11. DISCLOSURES REGARDING OFFSETTING ASSETS AND LIABILITIES
In December 2011, FASB issued an Accounting Standards Update (“ASU”) related to disclosures about offsetting assets and liabilities in financial statements. This ASU requires an entity to disclose both gross and net information for derivatives, repurchase agreements and reverse repurchase agreements, and securities borrowing and securities lending transactions that are either offset in the statement of assets and liabilities or subject to an enforceable master netting arrangement or similar agreement. In January 2013, the FASB issued an ASU to clarify the scope of disclosures about offsetting assets and liabilities. The ASU is effective for reporting periods beginning on or after January 1, 2013. The Funds did not hold derivatives or participate in borrowing or securities lending activities at December 31, 2015.
Baron Select Funds |
December 31, 2015 |
| BARON PARTNERS FUND |
| Selected data for a share outstanding throughout each year: |
| RETAIL SHARES | | Year Ended December 31, |
| | | |
| | | 2015 | | 2014 | | 2013 | | 2012 | | 2011 | | 2010 | | 2009 | | 2008 | | 2007 | | 2006 |
| Net asset value, beginning of year | | $ | 36.74 | | | $ | 33.32 | | | $ | 22.56 | | | $ | 19.39 | | | $ | 20.57 | | | $ | 15.64 | | | $ | 12.20 | | | $ | 23.76 | | | $ | 22.34 | | | $ | 18.43 | |
| | | | | | | | | | | | | | | | | | | | | | | | | | | | | | | |
| Income (loss) from investment operations: | | | | | | | | | | | | | | | | | | | | | | | | | | | | | | | | | | | | | | | | |
| Net investment income (loss) | | | (0.05 | )1 | | | 0.23 | 1 | | | (0.19 | )1 | | | (0.04 | )1 | | | (0.14 | )1 | | | (0.09 | )1 | | | (0.04 | )1 | | | (0.09 | )1 | | | (0.21 | )1 | | | (0.16 | )1 |
| Net realized and unrealized gain (loss) on investments | | | (0.95 | ) | | | 3.19 | | | | 10.95 | | | | 3.21 | | | | (1.04 | ) | | | 5.02 | | | | 3.48 | | | | (10.74 | ) | | | 2.74 | | | | 4.13 | |
| | | | | | | | | | | | | | | | | | | | | | | | | | | | | | | |
Total from investment operations | | | (1.00 | ) | | | 3.42 | | | | 10.76 | | | | 3.17 | | | | (1.18 | ) | | | 4.93 | | | | 3.44 | | | | (10.83 | ) | | | 2.53 | | | | 3.97 | |
| | | | | | | | | | | | | | | | | | | | | | | | | | | | | | | |
| Less distributions to shareholders from: | | | | | | | | | | | | | | | | | | | | | | | | | | | | | | | | | | | | | | | | |
| Net investment income | | | (0.12 | ) | | | 0.00 | | | | 0.00 | | | | 0.00 | | | | 0.00 | | | | 0.00 | | | | 0.00 | | | | 0.00 | | | | 0.00 | | | | 0.00 | |
| Net realized gain on investments | | | 0.00 | | | | 0.00 | | | | 0.00 | | | | 0.00 | | | | 0.00 | | | | 0.00 | | | | 0.00 | | | | (0.73 | ) | | | (1.11 | ) | | | (0.06 | ) |
| | | | | | | | | | | | | | | | | | | | | | | | | | | | | | | |
Total distributions | | | (0.12 | ) | | | 0.00 | | | | 0.00 | | | | 0.00 | | | | 0.00 | | | | 0.00 | | | | 0.00 | | | | (0.73 | ) | | | (1.11 | ) | | | (0.06 | ) |
| | | | | | | | | | | | | | | | | | | | | | | | | | | | | | | |
| Net asset value, end of year | | $ | 35.62 | | | $ | 36.74 | | | $ | 33.32 | | | $ | 22.56 | | | $ | 19.39 | | | $ | 20.57 | | | $ | 15.64 | | | $ | 12.20 | | | $ | 23.76 | | | $ | 22.34 | |
| | | | | | | | | | | | | | | | | | | | | | | | | | | | | | | |
Total return | | | (2.71 | )% | | | 10.26 | % | | | 47.69 | % | | | 16.35 | % | | | (5.74 | )% | | | 31.52 | % | | | 28.20 | % | | | (46.67 | )% | | | 11.34 | % | | | 21.55 | % |
| | | | | | | | | | | | | | | | | | | | | | | | | | | | | | | |
| Ratios/Supplemental data: | | | | | | | | | | | | | | | | | | | | | | | | | | | | | | | | | | | | | | | | |
| Net assets (in millions), end of year | | $ | 1,107.5 | | | $ | 1,256.3 | | | $ | 1,125.6 | | | $ | 653.7 | | | $ | 970.4 | | | $ | 1,251.9 | | | $ | 1,249.3 | | | $ | 1,501.3 | | | $ | 3,384.1 | | | $ | 2,403.1 | |
| | | | | | | | | | | | | | | | | | | | | | | | | | | | | | | |
| Ratio of total expenses to average net assets | | | 1.52 | % | | | 1.51 | % | | | 1.67 | % | | | 1.74 | % | | | 1.71 | % | | | 1.71 | % | | | 1.51 | % | | | 1.86 | %2 | | | 1.88 | %2 | | | 1.77 | % |
| Less: Ratio of interest expense to average net assets | | | (0.20 | )% | | | (0.19 | )% | | | (0.29 | )% | | | (0.34 | )% | | | (0.36 | )% | | | (0.34 | )% | | | (0.10 | )% | | | (0.51 | )% | | | (0.57 | )% | | | (0.45 | )% |
| | | | | | | | | | | | | | | | | | | | | | | | | | | | | | | |
| Ratio of operating expenses to average net assets | | | 1.32 | % | | | 1.32 | % | | | 1.38 | % | | | 1.40 | % | | | 1.35 | % | | | 1.37 | % | | | 1.41 | % | | | 1.35 | % | | | 1.31 | % | | | 1.32 | % |
| | | | | | | | | | | | | | | | | | | | | | | | | | | | | | | |
| Ratio of net investment income (loss) to average net assets | | | (0.13 | )% | | | 0.66 | % | | | (0.66 | )% | | | (0.18 | )% | | | (0.69 | )% | | | (0.51 | )% | | | (0.30 | )% | | | (0.49 | )% | | | (0.86 | )% | | | (0.80 | )% |
| | | | | | | | | | | | | | | | | | | | | | | | | | | | | | | |
| Portfolio turnover rate | | | 17.08 | % | | | 30.82 | % | | | 18.57 | % | | | 13.04 | % | | | 16.96 | % | | | 15.85 | % | | | 32.43 | % | | | 38.02 | % | | | 32.95 | % | | | 35.92 | % |
| | | | | | | | | | | | | | | | | | | | | | | | | | | | | | | |
| | | | | | | | | | | | | | | | | | | | | | | | | | | | | | | | | | | | | | | | | |
| INSTITUTIONAL SHARES | | Year Ended December 31, | | | | | | | | | | | | |
| | | | | | | | | | | | | | | |
| | | 2015 | | 2014 | | 2013 | | 2012 | | 2011 | | 2010 | | 20093 | | | | | | | | | | | | |
| Net asset value, beginning of year | | $ | 37.28 | | | $ | 33.72 | | | $ | 22.78 | | | $ | 19.52 | | | $ | 20.66 | | | $ | 15.66 | | | $ | 12.66 | | | | | | | | | | | | | |
| | | | | | | | | | | | | | | | | | | | | | | | | | | | | | | |
| Income (loss) from investment operations: | | | | | | | | | | | | | | | | | | | | | | | | | | | | | | | | | | | | | | | | |
| Net investment income (loss) | | | 0.04 | 1 | | | 0.25 | 1 | | | (0.12 | )1 | | | 0.04 | 1 | | | (0.08 | )1 | | | (0.06 | )1 | | | (0.03 | )1 | | | | | | | | | | | | |
| Net realized and unrealized gain (loss) on investments | | | (0.95 | ) | | | 3.31 | | | | 11.06 | | | | 3.22 | | | | (1.06 | ) | | | 5.06 | | | | 3.03 | | | | | | | | | | | | | |
| | | | | | | | | | | | | | | | | | | | | | | | | | | | | | | |
Total from investment operations | | | (0.91 | ) | | | 3.56 | | | | 10.94 | | | | 3.26 | | | | (1.14 | ) | | | 5.00 | | | | 3.00 | | | | | | | | | | | | | |
| | | | | | | | | | | | | | | | | | | | | | | | | | | | | | | |
| Less distributions to shareholders from: | | | | | | | | | | | | | | | | | | | | | | | | | | | | | | | | | | | | | | | | |
| Net investment income | | | (0.22 | ) | | | 0.00 | | | | 0.00 | | | | 0.00 | | | | 0.00 | | | | 0.00 | | | | 0.00 | | | | | | | | | | | | | |
| Net realized gain on investments | | | 0.00 | | | | 0.00 | | | | 0.00 | | | | 0.00 | | | | 0.00 | | | | 0.00 | | | | 0.00 | | | | | | | | | | | | | |
| | | | | | | | | | | | | | | | | | | | | | | | | | | | | | | |
Total distributions | | | (0.22 | ) | | | 0.00 | | | | 0.00 | | | | 0.00 | | | | 0.00 | | | | 0.00 | | | | 0.00 | | | | | | | | | | | | | |
| | | | | | | | | | | | | | | | | | | | | | | | | | | | | | | |
| Net asset value, end of year | | $ | 36.15 | | | $ | 37.28 | | | $ | 33.72 | | | $ | 22.78 | | | $ | 19.52 | | | $ | 20.66 | | | $ | 15.66 | | | | | | | | | | | | | |
| | | | | | | | | | | | | | | | | | | | | | | | | | | | | | | |
Total return | | | (2.43 | )% | | | 10.56 | % | | | 48.02 | % | | | 16.70 | % | | | (5.52 | )% | | | 31.93 | % | | | 23.70 | %4 | | | | | | | | | | | | |
| | | | | | | | | | | | | | | | | | | | | | | | | | | | | | | |
| Ratios/Supplemental data: | | | | | | | | | | | | | | | | | | | | | | | | | | | | | | | | | | | | | | | | |
| Net assets (in millions), end of year | | $ | 793.3 | | | $ | 681.5 | | | $ | 349.0 | | | $ | 146.5 | | | $ | 123.7 | | | $ | 119.9 | | | $ | 158.5 | | | | | | | | | | | | | |
| | | | | | | | | | | | | | | | | | | | | | | | | | | | | | | |
| Ratio of total expenses to average net assets | | | 1.26 | % | | | 1.26 | % | | | 1.41 | % | | | 1.48 | % | | | 1.45 | % | | | 1.45 | % | | | 1.38 | %5 | | | | | | | | | | | | |
| Less: Ratio of interest expense to average net assets | | | (0.20 | )% | | | (0.20 | )% | | | (0.30 | )% | | | (0.35 | )% | | | (0.36 | )% | | | (0.34 | )% | | | (0.21 | %5 | | | | | | | | | | | | |
| | | | | | | | | | | | | | | | | | | | | | | | | | | | | | | |
| Ratio of operating expenses to average net assets | | | 1.06 | % | | | 1.06 | % | | | 1.11 | % | | | 1.13 | % | | | 1.09 | % | | | 1.11 | % | | | 1.17 | %5 | | | | | | | | | | | | |
| | | | | | | | | | | | | | | | | | | | | | | | | | | | | | | |
| Ratio of net investment income (loss) to average net assets | | | 0.11 | % | | | 0.69 | % | | | (0.41 | )% | | | 0.18 | % | | | (0.41 | )% | | | (0.36 | )% | | | (0.31 | )%5 | | | | | | | | | | | | |
| | | | | | | | | | | | | | | | | | | | | | | | | | | | | | | |
| Portfolio turnover rate | | | 17.08 | % | | | 30.82 | % | | | 18.57 | % | | | 13.04 | % | | | 16.96 | % | | | 15.85 | % | | | 32.43 | % | | | | | | | | | | | | |
| | | | | | | | | | | | | | | | | | | | | | | | | | | | | | | |
| | |
| 1 | | Based on average shares outstanding. |
| 2 | | Benefit of expense reduction rounds to less than 0.01%. |
| 3 | | For the period May 29, 2009 (initial offering of Institutional Shares) to December 31, 2009. |
| 4 | | Not Annualized. |
| 5 | | Annualized. |
| 44 | | See Notes to Financial Statements. |
December 31, 2015 |
Baron Select Funds |
| FINANCIAL HIGHLIGHTS (Continued) |
| |
| BARON FOCUSED GROWTH FUND |
| Selected data for a share outstanding throughout each year: |
| RETAIL SHARES | | Year Ended December 31, |
| | | |
| | | 2015 | | 2014 | | 2013 | | 2012 | | 2011 | | 2010 | | 2009 | | 20081 |
| Net asset value, beginning of year | | $ | 14.21 | | | $ | 13.97 | | | $ | 11.26 | | | $ | 9.71 | | | $ | 9.85 | | | $ | 8.14 | | | $ | 6.27 | | | $ | 10.00 | |
| | | | | | | | | | | | | | | | | | | | | | | | | |
| Income (loss) from investment operations: | | | | | | | | | | | | | | | | | | | | | | | | | | | | | | | | |
| Net investment income (loss) | | | (0.01 | )2 | | | 0.04 | 2 | | | (0.07 | )2 | | | 0.24 | 2 | | | (0.07 | )2 | | | (0.01 | )2 | | | 0.12 | 2 | | | 0.00 | 2,3 |
| Net realized and unrealized gain (loss) on investments | | | (0.35 | ) | | | 0.29 | | | | 2.95 | | | | 1.31 | | | | (0.07 | ) | | | 2.05 | | | | 2.00 | | | | (3.33 | ) |
| | | | | | | | | | | | | | | | | | | | | | | | | |
Total from investment operations | | | (0.36 | ) | | | 0.33 | | | | 2.88 | | | | 1.55 | | | | (0.14 | ) | | | 2.04 | | | | 2.12 | | | | (3.33 | ) |
| | | | | | | | | | | | | | | | | | | | | | | | | |
| Less distributions to shareholders from: | | | | | | | | | | | | | | | | | | | | | | | | | | | | | | | | |
| Net investment income | | | (0.02 | ) | | | 0.00 | | | | (0.17 | ) | | | 0.00 | | | | 0.00 | | | | (0.33 | ) | | | (0.13 | ) | | | 0.00 | |
| Net realized gain on investments | | | (0.74 | ) | | | (0.09 | ) | | | 0.00 | | | | 0.00 | | | | 0.00 | | | | 0.00 | | | | 0.00 | | | | 0.00 | |
| Return of capital | | | 0.00 | | | | 0.00 | | | | 0.00 | | | | 0.00 | | | | 0.00 | | | | 0.00 | | | | (0.12 | ) | | | (0.40 | ) |
| | | | | | | | | | | | | | | | | | | | | | | | | |
Total distributions | | | (0.76 | ) | | | (0.09 | ) | | | (0.17 | ) | | | 0.00 | | | | 0.00 | | | | (0.33 | ) | | | (0.25 | ) | | | (0.40 | ) |
| | | | | | | | | | | | | | | | | | | | | | | | | |
| Net asset value, end of year | | $ | 13.09 | | | $ | 14.21 | | | $ | 13.97 | | | $ | 11.26 | | | $ | 9.71 | | | $ | 9.85 | | | $ | 8.14 | | | $ | 6.27 | |
| | | | | | | | | | | | | | | | | | | | | | | | | |
Total return | | | (2.42 | )%4 | | | 2.35 | %4 | | | 25.69 | %4 | | | 15.96 | %4 | | | (1.42 | )%4 | | | 25.17 | %4 | | | 33.77 | %4 | | | (33.11 | )%4,5 |
| | | | | | | | | | | | | | | | | | | | | | | | | |
| Ratios/Supplemental data: | | | | | | | | | | | | | | | | | | | | | | | | | | | | | | | | |
| Net assets (in millions), end of year | | $ | 43.7 | | | $ | 46.1 | | | $ | 47.6 | | | $ | 31.4 | | | $ | 28.3 | | | $ | 46.4 | | | $ | 39.9 | | | $ | 59.3 | |
| | | | | | | | | | | | | | | | | | | | | | | | | |
| Ratio of operating expenses to average net assets | | | 1.39 | % | | | 1.39 | % | | | 1.42 | % | | | 1.48 | % | | | 1.48 | % | | | 1.47 | % | | | 1.52 | % | | | 1.54 | %6 |
| Less: Reimbursement of expenses by Adviser | | | (0.04 | )% | | | (0.04 | )% | | | (0.07 | )% | | | (0.13 | )% | | | (0.13 | )% | | | (0.12 | )% | | | (0.17 | )% | | | (0.19 | )%6 |
| | | | | | | | | | | | | | | | | | | | | | | | | |
| Ratio of net operating expenses to average net assets | | | 1.35 | % | | | 1.35 | % | | | 1.35 | % | | | 1.35 | % | | | 1.35 | % | | | 1.35 | % | | | 1.35 | % | | | 1.35 | %6 |
| | | | | | | | | | | | | | | | | | | | | | | | | |
| Ratio of net investment income (loss) to average net assets | | | (0.10 | )% | | | 0.31 | % | | | (0.53 | )% | | | 2.30 | % | | | (0.69 | )% | | | (0.16 | )% | | | 1.81 | % | | | 0.01 | %6 |
| | | | | | | | | | | | | | | | | | | | | | | | | |
| Portfolio turnover rate | | | 12.18 | % | | | 36.92 | % | | | 33.67 | % | | | 38.38 | % | | | 44.58 | % | | | 24.08 | % | | | 34.76 | % | | | 35.43 | %5 |
| | | | | | | | | | | | | | | | | | | | | | | | | |
| | | | | | | | | | | | | | | | | | | | | | | | | | | | | | | | | |
| INSTITUTIONAL SHARES | | Year Ended December 31, | | | | |
| | | | | | | |
| | | 2015 | | 2014 | | 2013 | | 2012 | | 2011 | | 2010 | | 20097 | | | | |
| Net asset value, beginning of year | | $ | 14.37 | | | $ | 14.10 | | | $ | 11.35 | | | $ | 9.77 | | | $ | 9.88 | | | $ | 8.15 | | | $ | 6.88 | | | | | |
| | | | | | | | | | | | | | | | | | | | | | | | | | |
| Income (loss) from investment operations: | | | | | | | | | | | | | | | | | | | | | | | | | | | | | | | | |
| Net investment income (loss) | | | 0.02 | 2 | | | 0.08 | 2 | | | (0.04 | )2 | | | 0.26 | 2 | | | (0.04 | )2 | | | 0.01 | 2 | | | 0.07 | 2 | | | | |
| Net realized and unrealized gain (loss) on investments | | | (0.34 | ) | | | 0.28 | | | | 2.99 | | | | 1.32 | | | | (0.07 | ) | | | 2.05 | | | | 1.45 | | | | | |
| | | | | | | | | | | | | | | | | | | | | | | | | | |
Total from investment operations | | | (0.32 | ) | | | 0.36 | | | | 2.95 | | | | 1.58 | | | | (0.11 | ) | | | 2.06 | | | | 1.52 | | | | | |
| | | | | | | | | | | | | | | | | | | | | | | | | | |
| Less distributions to shareholders from: | | | | | | | | | | | | | | | | | | | | | | | | | | | | | | | | |
| Net investment income | | | (0.06 | ) | | | 0.00 | | | | (0.20 | ) | | | 0.00 | | | | 0.00 | | | | (0.33 | ) | | | (0.13 | ) | | | | |
| Net realized gain on investments | | | (0.74 | ) | | | (0.09 | ) | | | 0.00 | | | | 0.00 | | | | 0.00 | | | | 0.00 | | | | 0.00 | | | | | |
| Return of capital | | | 0.00 | | | | 0.00 | | | | 0.00 | | | | 0.00 | | | | 0.00 | | | | 0.00 | | | | (0.12 | ) | | | | |
| | | | | | | | | | | | | | | | | | | | | | | | | | |
Total distributions | | | (0.80 | ) | | | (0.09 | ) | | | (0.20 | ) | | | 0.00 | | | | 0.00 | | | | (0.33 | ) | | | (0.25 | ) | | | | |
| | | | | | | | | | | | | | | | | | | | | | | | | | |
| Net asset value, end of year | | $ | 13.25 | | | $ | 14.37 | | | $ | 14.10 | | | $ | 11.35 | | | $ | 9.77 | | | $ | 9.88 | | | $ | 8.15 | | | | | |
| | | | | | | | | | | | | | | | | | | | | | | | | | |
Total return | | | (2.12 | )% | | | 2.54 | % | | | 26.09 | %4 | | | 16.17 | %4 | | | (1.11 | )%4 | | | 25.39 | %4 | | | 22.06 | %4,5 | | | | |
| | | | | | | | | | | | | | | | | | | | | | | | | | |
| Ratios/Supplemental data: | | | | | | | | | | | | | | | | | | | | | | | | | | | | | | | | |
| Net assets (in millions), end of year | | $ | 140.5 | | | $ | 149.2 | | | $ | 148.4 | | | $ | 87.9 | | | $ | 63.6 | | | $ | 44.3 | | | $ | 36.6 | | | | | |
| | | | | | | | | | | | | | | | | | | | | | | | | | |
| Ratio of operating expenses to average net assets | | | 1.09 | % | | | 1.09 | % | | | 1.12 | % | | | 1.16 | % | | | 1.18 | % | | | 1.19 | % | | | 1.25 | %6 | | | | |
| Less: Reimbursement of expenses by Adviser | | | 0.00 | % | | | 0.00 | % | | | (0.02 | )% | | | (0.06 | )% | | | (0.08 | )% | | | (0.09 | )% | | | (0.15 | )%6 | | | | |
| | | | | | | | | | | | | | | | | | | | | | | | | | |
| Ratio of net operating expenses to average net assets | | | 1.09 | % | | | 1.09 | % | | | 1.10 | % | | | 1.10 | % | | | 1.10 | % | | | 1.10 | % | | | 1.10 | %6 | | | | |
| | | | | | | | | | | | | | | | | | | | | | | | | | |
| Ratio of net investment income (loss) to average net assets | | | 0.16 | % | | | 0.56 | % | | | (0.28 | )% | | | 2.53 | % | | | (0.40 | )% | | | 0.08 | % | | | 1.63 | %6 | | | | |
| | | | | | | | | | | | | | | | | | | | | | | | | | |
| Portfolio turnover rate | | | 12.18 | % | | | 36.92 | % | | | 33.67 | % | | | 38.38 | % | | | 44.58 | % | | | 24.08 | % | | | 34.76 | % | | | | |
| | | | | | | | | | | | | | | | | | | | | | | | | | |
| | |
| 1 | | For the period June 30, 2008 (commencement of operations) to December 31, 2008. |
| 2 | | Based on average shares outstanding. |
| 3 | | Less than $0.01 per share. |
| 4 | | The total returns would have been lower had certain expenses not been reduced during the period shown. |
| 5 | | Not Annualized. |
| 6 | | Annualized. |
| 7 | | For the period May 29, 2009 (initial offering of Institutional Shares) to December 31, 2009. |
| See Notes to Financial Statements. | | 45 |
Baron Select Funds |
December 31, 2015 |
| FINANCIAL HIGHLIGHTS (Continued) |
| |
| BARON INTERNATIONAL GROWTH FUND |
| Selected data for a share outstanding throughout each year: |
| RETAIL SHARES | | Year Ended December 31, |
| | | |
| | | 2015 | | 2014 | | 2013 | | 2012 | | 2011 | | 2010 | | 2009 |
| Net asset value, beginning of year | | $ | 17.94 | | | $ | 18.91 | | | $ | 15.55 | | | $ | 13.20 | | | $ | 17.29 | | | $ | 14.11 | | | $ | 10.00 | |
| | | | | | | | | | | | | | | | | | | | | | |
| Income (loss) from investment operations: | | | | | | | | | | | | | | | | | | | | | | | | | | | | |
| Net investment income (loss) | | | 0.03 | 1 | | | 0.03 | 1 | | | (0.01 | )1 | | | (0.02 | )1 | | | (0.01 | )1 | | | 0.01 | 1 | | | 0.04 | 1 |
| Net realized and unrealized gain (loss) on investments | | | 0.19 | | | | (0.46 | ) | | | 3.37 | | | | 2.37 | | | | (2.78 | ) | | | 3.38 | | | | 4.43 | |
| | | | | | | | | | | | | | | | | | | | | | |
Total from investment operations | | | 0.22 | | | | (0.43 | ) | | | 3.36 | | | | 2.35 | | | | (2.79 | ) | | | 3.39 | | | | 4.47 | |
| | | | | | | | | | | | | | | | | | | | | | |
| Less distributions to shareholders from: | | | | | | | | | | | | | | | | | | | | | | | | | | | | |
| Net investment income | | | (0.08 | ) | | | (0.00 | )2 | | | 0.00 | | | | 0.00 | | | | (0.04 | ) | | | 0.00 | | | | 0.00 | |
| Net realized gain on investments | | | (0.03 | ) | | | (0.54 | ) | | | 0.00 | | | | 0.00 | | | | (1.26 | ) | | | (0.21 | ) | | | (0.36 | ) |
| | | | | | | | | | | | | | | | | | | | | | |
Total distributions | | | (0.11 | ) | | | (0.54 | ) | | | 0.00 | | | | 0.00 | | | | (1.30 | ) | | | (0.21 | ) | | | (0.36 | ) |
| | | | | | | | | | | | | | | | | | | | | | |
| Net asset value, end of year | | $ | 18.05 | | | $ | 17.94 | | | $ | 18.91 | | | $ | 15.55 | | | $ | 13.20 | | | $ | 17.29 | | | $ | 14.11 | |
| | | | | | | | | | | | | | | | | | | | | | |
Total return | | | 1.23 | %3 | | | (2.33 | )%3 | | | 21.61 | %3 | | | 17.80 | %3 | | | (16.35 | )%3 | | | 24.22 | %3 | | | 44.69 | %3 |
| | | | | | | | | | | | | | | | | | | | | | |
| Ratios/Supplemental data: | | | | | | | | | | | | | | | | | | | | | | | | | | | | |
| Net assets (in millions), end of year | | $ | 44.9 | | | $ | 53.0 | | | $ | 17.0 | | | $ | 15.6 | | | $ | 11.7 | | | $ | 15.3 | | | $ | 8.4 | |
| | | | | | | | | | | | | | | | | | | | | | |
| Ratio of operating expenses to average net assets | | | 1.59 | % | | | 1.63 | % | | | 1.74 | % | | | 1.78 | % | | | 1.73 | % | | | 1.76 | % | | | 2.33 | % |
| Less: Reimbursement of expenses by Adviser | | | (0.09 | )% | | | (0.13 | )% | | | (0.24 | )% | | | (0.28 | )% | | | (0.23 | )% | | | (0.26 | )% | | | (0.83 | )% |
| | | | | | | | | | | | | | | | | | | | | | |
| Ratio of net operating expenses to average net assets | | | 1.50 | % | | | 1.50 | % | | | 1.50 | % | | | 1.50 | % | | | 1.50 | % | | | 1.50 | % | | | 1.50 | % |
| | | | | | | | | | | | | | | | | | | | | | |
| Ratio of net investment income (loss) to average net assets | | | 0.15 | % | | | 0.14 | % | | | (0.05 | )% | | | (0.16 | )% | | | (0.05 | )% | | | 0.07 | % | | | 0.38 | % |
| | | | | | | | | | | | | | | | | | | | | | |
| Portfolio turnover rate | | | 42.85 | % | | | 34.67 | % | | | 40.60 | % | | | 39.02 | % | | | 53.20 | % | | | 32.70 | % | | | 53.94 | % |
| | | | | | | | | | | | | | | | | | | | | | |
| | | | | | | | | | | | | | | | | | | | | | | | | | | | | |
| INSTITUTIONAL SHARES | | Year Ended December 31, |
| | | |
| | | 2015 | | 2014 | | 2013 | | 2012 | | 2011 | | 2010 | | 20096 |
| Net asset value, beginning of year | | $ | 18.09 | | | $ | 19.05 | | | $ | 15.63 | | | $ | 13.25 | | | $ | 17.36 | | | $ | 14.13 | | | $ | 11.13 | |
| | | | | | | | | | | | | | | | | | | | | | |
| Income (loss) from investment operations: | | | | | | | | | | | | | | | | | | | | | | | | | | | | |
| Net investment income (loss) | | | 0.08 | 1 | | | 0.12 | 1 | | | 0.03 | 1 | | | 0.01 | 1 | | | 0.03 | 1 | | | 0.05 | 1 | | | (0.02 | )1 |
| Net realized and unrealized gain (loss) on investments | | | 0.19 | | | | (0.50 | ) | | | 3.39 | | | | 2.40 | | | | (2.79 | ) | | | 3.39 | | | | 3.38 | |
| | | | | | | | | | | | | | | | | | | | | | |
Total from investment operations | | | 0.27 | | | | (0.38 | ) | | | 3.42 | | | | 2.41 | | | | (2.76 | ) | | | 3.44 | | | | 3.36 | |
| | | | | | | | | | | | | | | | | | | | | | |
| Less distributions to shareholders from: | | | | | | | | | | | | | | | | | | | | | | | | | | | | |
| Net investment income | | | (0.16 | ) | | | (0.04 | ) | | | (0.00 | )2 | | | (0.03 | ) | | | (0.09 | ) | | | 0.00 | | | | 0.00 | |
| Net realized gain on investments | | | (0.03 | ) | | | (0.54 | ) | | | 0.00 | | | | 0.00 | | | | (1.26 | ) | | | (0.21 | ) | | | (0.36 | ) |
| | | | | | | | | | | | | | | | | | | | | | |
Total distributions | | | (0.19 | ) | | | (0.58 | ) | | | (0.00 | )2 | | | (0.03 | ) | | | (1.35 | ) | | | (0.21 | ) | | | (0.36 | ) |
| | | | | | | | | | | | | | | | | | | | | | |
| Net asset value, end of year | | $ | 18.17 | | | $ | 18.09 | | | $ | 19.05 | | | $ | 15.63 | | | $ | 13.25 | | | $ | 17.36 | | | $ | 14.13 | |
| | | | | | | | | | | | | | | | | | | | | | |
Total return | | | 1.48 | %3 | | | (2.07 | )%3 | | | 21.89 | %3 | | | 18.17 | %3 | | | (16.13 | )%3 | | | 24.54 | %3 | | | 30.18 | %3,4 |
| | | | | | | | | | | | | | | | | | | | | | |
| Ratios/Supplemental data: | | | | | | | | | | | | | | | | | | | | | | | | | | | | |
| Net assets (in millions), end of year | | $ | 53.7 | | | $ | 52.3 | | | $ | 45.4 | | | $ | 39.0 | | | $ | 30.5 | | | $ | 37.4 | | | $ | 22.1 | |
| | | | | | | | | | | | | | | | | | | | | | |
| Ratio of operating expenses to average net assets | | | 1.31 | % | | | 1.34 | % | | | 1.37 | % | | | 1.40 | % | | | 1.38 | % | | | 1.40 | % | | | 1.89 | %5 |
| Less: Reimbursement of expenses by Adviser | | | (0.06 | )% | | | (0.09 | )% | | | (0.12 | )% | | | (0.15 | )% | | | (0.13 | )% | | | (0.15 | )% | | | (0.64 | )%5 |
| | | | | | | | | | | | | | | | | | | | | | |
| Ratio of net operating expenses to average net assets | | | 1.25 | % | | | 1.25 | % | | | 1.25 | % | | | 1.25 | % | | | 1.25 | % | | | 1.25 | % | | | 1.25 | %5 |
| | | | | | | | | | | | | | | | | | | | | | |
| Ratio of net investment income (loss) to average net assets | | | 0.41 | % | | | 0.64 | % | | | 0.20 | % | | | 0.09 | % | | | 0.19 | % | | | 0.31 | % | | | (0.29 | )%5 |
| | | | | | | | | | | | | | | | | | | | | | |
| Portfolio turnover rate | | | 42.85 | % | | | 34.67 | % | | | 40.60 | % | | | 39.02 | % | | | 53.20 | % | | | 32.70 | % | | | 53.94 | % |
| | | | | | | | | | | | | | | | | | | | | | |
| | |
| 1 | | Based on average shares outstanding. |
| 2 | | Less than $0.01 per share. |
| 3 | | The total returns would have been lower had certain expenses not been reduced during the period shown. |
| 4 | | Not Annualized. |
| 5 | | Annualized. |
| 6 | | For the period May 29, 2009 (initial offering of Institutional Shares) to December 31, 2009. |
| 46 | | See Notes to Financial Statements. |
December 31, 2015 |
Baron Select Funds |
| FINANCIAL HIGHLIGHTS (Continued) |
| |
BARON REAL ESTATE FUND
Selected data for a share outstanding throughout each year:
| RETAIL SHARES | | Year Ended December 31, |
| | | |
| | | 2015 | | 2014 | | 2013 | | 2012 | | 2011 | | 2010 |
| Net asset value, beginning of year | | $ | 25.92 | | | $ | 22.25 | | | $ | 17.52 | | | $ | 12.51 | | | $ | 12.66 | | | $ | 10.00 | |
| | | | | | | | | | | | | | | | | | | |
| Income (loss) from investment operations: | | | | | | | | | | | | | | | | | | | | | | | | |
| Net investment income (loss) | | | (0.06 | )1 | | | 0.04 | 1 | | | (0.05 | )1 | | | 0.01 | 1 | | | (0.01 | )1 | | | 0.02 | 1 |
| Net realized and unrealized gain (loss) on investments | | | (1.14 | ) | | | 3.66 | | | | 4.80 | | | | 5.31 | | | | 0.07 | 2 | | | 2.64 | |
| | | | | | | | | | | | | | | | | | | |
Total from investment operations | | | (1.20 | ) | | | 3.70 | | | | 4.75 | | | | 5.32 | | | | 0.06 | | | | 2.66 | |
| | | | | | | | | | | | | | | | | | | |
| Less distributions to shareholders from: | | | | | | | | | | | | | | | | | | | | | | | | |
| Net investment income | | | (0.01 | ) | | | (0.03 | ) | | | 0.00 | | | | 0.00 | | | | (0.00 | )3 | | | 0.00 | |
| Net realized gain on investments | | | (0.47 | ) | | | 0.00 | | | | (0.02 | ) | | | (0.31 | ) | | | (0.21 | ) | | | 0.00 | |
| | | | | | | | | | | | | | | | | | | |
Total distributions | | | (0.48 | ) | | | (0.03 | ) | | | (0.02 | ) | | | (0.31 | ) | | | (0.21 | ) | | | 0.00 | |
| | | | | | | | | | | | | | | | | | | |
| Net asset value, end of year | | $ | 24.24 | | | $ | 25.92 | | | $ | 22.25 | | | $ | 17.52 | | | $ | 12.51 | | | $ | 12.66 | |
| | | | | | | | | | | | | | | | | | | |
Total return | | | (4.65 | )% | | | 16.61 | % | | | 27.12 | % | | | 42.60 | %4 | | | 0.63 | %4 | | | 26.60 | %4 |
| | | | | | | | | | | | | | | | | | | |
| Ratios/Supplemental data: | | | | | | | | | | | | | | | | | | | | | | | | |
| Net assets (in millions), end of year | | $ | 788.9 | | | $ | 782.8 | | | $ | 539.5 | | | $ | 53.6 | | | $ | 10.9 | | | $ | 5.5 | |
| | | | | | | | | | | | | | | | | | | |
| Ratio of operating expenses to average net assets | | | 1.31 | % | | | 1.32 | % | | | 1.35 | % | | | 1.76 | % | | | 2.33 | % | | | 4.35 | % |
| Less: Reimbursement of expenses by Adviser | | | 0.00 | % | | | 0.00 | % | | | 0.00 | % | | | (0.41 | )% | | | (0.98 | )% | | | (3.00 | )% |
| | | | | | | | | | | | | | | | | | | |
| Ratio of net operating expenses to average net assets | | | 1.31 | % | | | 1.32 | % | | | 1.35 | % | | | 1.35 | % | | | 1.35 | % | | | 1.35 | % |
| | | | | | | | | | | | | | | | | | | |
| Ratio of net investment income (loss) to average net assets | | | (0.23 | )% | | | 0.17 | % | | | (0.23 | )% | | | 0.07 | % | | | (0.08 | )% | | | 0.14 | % |
| | | | | | | | | | | | | | | | | | | |
| Portfolio turnover rate | | | 50.50 | % | | | 24.40 | % | | | 19.36 | % | | | 30.14 | % | | | 70.99 | % | | | 58.03 | % |
| | | | | | | | | | | | | | | | | | | |
| INSTITUTIONAL SHARES | | Year Ended December 31, |
| | | |
| | | 2015 | | 2014 | | 2013 | | 2012 | | 2011 | | 2010 |
| Net asset value, beginning of year | | $ | 26.14 | | | $ | 22.43 | | | $ | 17.64 | | | $ | 12.56 | | | $ | 12.69 | | | $ | 10.00 | |
| | | | | | | | | | | | | | | | | | | |
| Income (loss) from investment operations: | | | | | | | | | | | | | | | | | | | | | | | | |
| Net investment income | | | 0.01 | 1 | | | 0.11 | 1 | | | 0.03 | 1 | | | 0.06 | 1 | | | 0.02 | 1 | | | 0.04 | 1 |
| Net realized and unrealized gain (loss) on investments | | | (1.16 | ) | | | 3.68 | | | | 4.81 | | | | 5.33 | | | | 0.07 | 2 | | | 2.65 | |
| | | | | | | | | | | | | | | | | | | |
Total from investment operations | | | (1.15 | ) | | | 3.79 | | | | 4.84 | | | | 5.39 | | | | 0.09 | | | | 2.69 | |
| | | | | | | | | | | | | | | | | | | |
| Less distributions to shareholders from: | | | | | | | | | | | | | | | | | | | | | | | | |
| Net investment income | | | (0.01 | ) | | | (0.08 | ) | | | (0.00 | )3 | | | 0.00 | | | | (0.01 | ) | | | 0.00 | |
| Net realized gain on investments | | | (0.47 | ) | | | 0.00 | | | | (0.02 | ) | | | (0.31 | ) | | | (0.21 | ) | | | 0.00 | |
| Return of capital | | | 0.00 | | | | 0.00 | | | | (0.03 | ) | | | 0.00 | | | | 0.00 | | | | 0.00 | |
| | | | | | | | | | | | | | | | | | | |
Total distributions | | | (0.48 | ) | | | (0.08 | ) | | | (0.05 | ) | | | (0.31 | ) | | | (0.22 | ) | | | 0.00 | |
| | | | | | | | | | | | | | | | | | | |
| Net asset value, end of year | | $ | 24.51 | | | $ | 26.14 | | | $ | 22.43 | | | $ | 17.64 | | | $ | 12.56 | | | $ | 12.69 | |
| | | | | | | | | | | | | | | | | | | |
| Total return | | | (4.42 | )% | | | 16.93 | % | | | 27.48 | % | | | 42.99 | %4 | | | 0.80 | %4 | | | 26.90 | %4 |
| | | | | | | | | | | | | | | | | | | |
| Ratios/Supplemental data: | | | | | | | | | | | | | | | | | | | | | | | | |
| Net assets (in millions), end of year | | $ | 992.8 | | | $ | 919.7 | | | $ | 486.1 | | | $ | 35.5 | | | $ | 4.9 | | | $ | 3.2 | |
| | | | | | | | | | | | | | | | | | | |
| Ratio of operating expenses to average net assets | | | 1.06 | % | | | 1.06 | % | | | 1.09 | % | | | 1.44 | % | | | 2.14 | % | | | 4.26 | % |
| Less: Reimbursement of expenses by Adviser | | | 0.00 | % | | | 0.00 | % | | | 0.00 | % | | | (0.34 | )% | | | (1.04 | )% | | | (3.16 | )% |
| | | | | | | | | | | | | | | | | | | |
| Ratio of net operating expenses to average net assets | | | 1.06 | % | | | 1.06 | % | | | 1.09 | % | | | 1.10 | % | | | 1.10 | % | | | 1.10 | % |
| | | | | | | | | | | | | | | | | | | |
| Ratio of net investment income to average net assets | | | 0.04 | % | | | 0.44 | % | | | 0.15 | % | | | 0.36 | % | | | 0.17 | % | | | 0.36 | % |
| | | | | | | | | | | | | | | | | | | |
| Portfolio turnover rate | | | 50.50 | % | | | 24.40 | % | | | 19.36 | % | | | 30.14 | % | | | 70.99 | % | | | 58.03 | % |
| | | | | | | | | | | | | | | | | | | |
| 1 | | Based on average shares outstanding. |
| 2 | | The amount shown for a share outstanding does not correspond with the aggregate realized and unrealized gain (loss) on investments for the period due to the timing of sales and redemptions of Fund shares in relation to fluctuating market values of investments of the Fund. |
| 3 | | Less than $0.01 per share. |
| 4 | | The total returns would have been lower had certain expenses not been reduced during the period shown. |
| See Notes to Financial Statements. | 47 |
Baron Select Funds |
December 31, 2015 |
| FINANCIAL HIGHLIGHTS (Continued) |
| |
BARON EMERGING MARKETS FUND
Selected data for a share outstanding throughout each year:
| RETAIL SHARES | | Year Ended December 31, |
| | | |
| | | 2015 | | 2014 | | 2013 | | 2012 | | 2011 |
| Net asset value, beginning of year | | $ | 11.91 | | | $ | 11.54 | | | $ | 10.06 | | | $ | 8.28 | | | $ | 10.00 | |
| | | | | | | | | | | | | | | | |
| Income (loss) from investment operations: | | | | | | | | | | | | | | | | | | | | |
| Net investment income (loss) | | | 0.03 | 1 | | | 0.07 | 1 | | | (0.06 | )1 | | | (0.04 | )1 | | | (0.03 | )1 |
| Net realized and unrealized gain (loss) on investments | | | (1.36 | ) | | | 0.33 | | | | 1.54 | | | | 1.94 | | | | (1.69 | ) |
| | | | | | | | | | | | | | | | |
Total from investment operations | | | (1.33 | ) | | | 0.40 | | | | 1.48 | | | | 1.90 | | | | (1.72 | ) |
| | | | | | | | | | | | | | | | |
| Less distributions to shareholders from: | | | | | | | | | | | | | | | | | | | | |
| Net investment income | | | (0.01 | ) | | | (0.03 | ) | | | 0.00 | | | | (0.12 | ) | | | 0.00 | |
| Net realized gain on investments | | | 0.00 | | | | 0.00 | | | | 0.00 | | | | 0.00 | | | | 0.00 | |
| | | | | | | | | | | | | | | | |
Total distributions | | | (0.01 | ) | | | (0.03 | ) | | | 0.00 | | | | (0.12 | ) | | | 0.00 | |
| | | | | | | | | | | | | | | | |
| Net asset value, end of year | | $ | 10.57 | | | $ | 11.91 | | | $ | 11.54 | | | $ | 10.06 | | | $ | 8.28 | |
| | | | | | | | | | | | | | | | |
Total return | | | (11.16 | )% | | | 3.47 | %2 | | | 14.71 | %2 | | | 22.98 | %2 | | | (17.20 | )%2 |
| | | | | | | | | | | | | | | | |
| Ratios/Supplemental data: | | | | | | | | | | | | | | | | | | | | |
| Net assets (in millions), end of year | | $ | 665.5 | | | $ | 649.7 | | | $ | 259.6 | | | $ | 2.9 | | | $ | 2.0 | |
| | | | | | | | | | | | | | | | |
| Ratio of operating expenses to average net assets | | | 1.45 | % | | | 1.52 | % | | | 1.90 | % | | | 4.01 | % | | | 4.49 | % |
| Less: Reimbursement of expenses by Adviser | | | 0.00 | % | | | (0.02 | )% | | | (0.40 | )% | | | (2.51 | )% | | | (2.99 | )% |
| | | | | | | | | | | | | | | | |
| Ratio of net operating expenses to average net assets | | | 1.45 | % | | | 1.50 | % | | | 1.50 | % | | | 1.50 | % | | | 1.50 | % |
| | | | | | | | | | | | | | | | |
| Ratio of net investment income (loss) to average net assets | | | 0.25 | % | | | 0.56 | % | | | (0.53 | )% | | | (0.39 | )% | | | (0.32 | )% |
| | | | | | | | | | | | | | | | |
| Portfolio turnover rate | | | 26.34 | % | | | 23.38 | % | | | 14.68 | % | | | 42.68 | % | | | 45.86 | % |
| | | | | | | | | | | | | | | | |
| INSTITUTIONAL SHARES | | Year Ended December 31, |
| | | |
| | | 2015 | | 2014 | | 2013 | | 2012 | | 2011 |
| Net asset value, beginning of year | | $ | 11.94 | | | $ | 11.56 | | | $ | 10.05 | | | $ | 8.30 | | | $ | 10.00 | |
| | | | | | | | | | | | | | | | |
| Income (loss) from investment operations: | | | | | | | | | | | | | | | | | | | | |
| Net investment income (loss) | | | 0.06 | 1 | | | 0.09 | 1 | | | 0.01 | 1 | | | (0.01 | )1 | | | (0.01 | )1 |
| Net realized and unrealized gain (loss) on investments | | | (1.37 | ) | | | 0.34 | | | | 1.50 | | | | 1.93 | | | | (1.69 | ) |
| | | | | | | | | | | | | | | | |
Total from investment operations | | | (1.31 | ) | | | 0.43 | | | | 1.51 | | | | 1.92 | | | | (1.70 | ) |
| | | | | | | | | | | | | | | | |
| Less distributions to shareholders from: | | | | | | | | | | | | | | | | | | | | |
| Net investment income | | | (0.04 | ) | | | (0.05 | ) | | | 0.00 | | | | (0.17 | ) | | | 0.00 | |
| Net realized gain on investments | | | 0.00 | | | | 0.00 | | | | 0.00 | | | | 0.00 | | | | 0.00 | |
| | | | | | | | | | | | | | | | |
Total distributions | | | (0.04 | ) | | | (0.05 | ) | | | 0.00 | | | | (0.17 | ) | | | 0.00 | |
| | | | | | | | | | | | | | | | |
| Net asset value, end of year | | $ | 10.59 | | | $ | 11.94 | | | $ | 11.56 | | | $ | 10.05 | | | $ | 8.30 | |
| | | | | | | | | | | | | | | | |
Total return | | | (10.97 | )% | | | 3.75 | %2 | | | 15.02 | %2 | | | 23.22 | %2 | | | (17.00 | )%2 |
| | | | | | | | | | | | | | | | |
| Ratios/Supplemental data: | | | | | | | | | | | | | | | | | | | | |
| Net assets (in millions), end of year | | $ | 1,040.9 | | | $ | 697.8 | | | $ | 116.0 | | | $ | 6.0 | | | $ | 4.3 | |
| | | | | | | | | | | | | | | | |
| Ratio of operating expenses to average net assets | | | 1.20 | % | | | 1.27 | % | | | 1.80 | % | | | 3.37 | % | | | 3.83 | % |
| Less: Reimbursement of expenses by Adviser | | | 0.00 | % | | | (0.02 | )% | | | (0.55 | )% | | | (2.12 | )% | | | (2.58 | )% |
| | | | | | | | | | | | | | | | |
| Ratio of net operating expenses to average net assets | | | 1.20 | % | | | 1.25 | % | | | 1.25 | % | | | 1.25 | % | | | 1.25 | % |
| | | | | | | | | | | | | | | | |
| Ratio of net investment income (loss) to average net assets | | | 0.49 | % | | | 0.76 | % | | | 0.05 | % | | | (0.14 | )% | | | (0.07 | )% |
| | | | | | | | | | | | | | | | |
| Portfolio turnover rate | | | 26.34 | % | | | 23.38 | % | | | 14.68 | % | | | 42.68 | % | | | 45.86 | % |
| | | | | | | | | | | | | | | | |
| 1 | | Based on average shares outstanding. |
| 2 | | The total returns would have been lower had certain expenses not been reduced during the period shown. |
| 48 | See Notes to Financial Statements. |
December 31, 2015 |
Baron Select Funds |
| FINANCIAL HIGHLIGHTS (Continued) |
| |
BARON ENERGY AND RESOURCES FUND
Selected data for a share outstanding throughout each year:
| RETAIL SHARES | | Year Ended December 31, |
| | | |
| | | 2015 | | 2014 | | 2013 | | 2012 |
| Net asset value, beginning of year | | $ | 10.33 | | | $ | 11.84 | | | $ | 9.46 | | | $ | 10.00 | |
| | | | | | | | | | | | | |
| Income (loss) from investment operations: | | | | | | | | | | | | | | | | |
| Net investment income (loss) | | | 0.02 | 1 | | | (0.01 | )1 | | | (0.01 | )1 | | | (0.03 | )1 |
| Net realized and unrealized gain (loss) on investments | | | (3.31 | ) | | | (1.50 | ) | | | 2.40 | | | | (0.51 | ) |
| | | | | | | | | | | | | |
Total from investment operations | | | (3.29 | ) | | | (1.51 | ) | | | 2.39 | | | | (0.54 | ) |
| | | | | | | | | | | | | |
| Less distributions to shareholders from: | | | | | | | | | | | | | | | | |
| Net investment income | | | 0.00 | | | | 0.00 | | | | (0.01 | ) | | | 0.00 | |
| Net realized gain on investments | | | (0.01 | ) | | | 0.00 | | | | 0.00 | | | | 0.00 | |
| | | | | | | | | | | | | |
Total distributions | | | (0.01 | ) | | | 0.00 | | | | (0.01 | ) | | | 0.00 | |
| | | | | | | | | | | | | |
| Net asset value, end of year | | $ | 7.03 | | | $ | 10.33 | | | $ | 11.84 | | | $ | 9.46 | |
| | | | | | | | | | | | | |
Total return | | | (31.88 | )%2 | | | (12.75 | )%2 | | | 25.32 | %2 | | | (5.40 | )%2 |
| | | | | | | | | | | | | |
| Ratios/Supplemental data: | | | | | | | | | | | | | | | | |
| Net assets (in millions), end of year | | $ | 56.4 | | | $ | 39.7 | | | $ | 29.2 | | | $ | 1.8 | |
| | | | | | | | | | | | | |
| Ratio of operating expenses to average net assets | | | 1.58 | % | | | 1.79 | % | | | 2.25 | % | | | 9.07 | % |
| Less: Reimbursement of expenses by Adviser | | | (0.23 | )% | | | (0.44 | )% | | | (0.90 | )% | | | (7.72 | )% |
| | | | | | | | | | | | | |
| Ratio of net operating expenses to average net assets | | | 1.35 | % | | | 1.35 | % | | | 1.35 | % | | | 1.35 | % |
| | | | | | | | | | | | | |
| Ratio of net investment income (loss) to average net assets | | | 0.24 | % | | | (0.04 | )% | | | (0.05 | )% | | | (0.36 | )% |
| | | | | | | | | | | | | |
| Portfolio turnover rate | | | 48.19 | % | | | 23.12 | % | | | 25.60 | % | | | 35.74 | % |
| | | | | | | | | | | | | |
| INSTITUTIONAL SHARES | | Year Ended December 31, |
| | | |
| | | 2015 | | 2014 | | 2013 | | 2012 |
| Net asset value, beginning of year | | $ | 10.41 | | | $ | 11.91 | | | $ | 9.48 | | | $ | 10.00 | |
| | | | | | | | | | | | | |
| Income (loss) from investment operations: | | | | | | | | | | | | | | | | |
| Net investment income (loss) | | | 0.05 | 1 | | | 0.03 | 1 | | | 0.02 | 1 | | | (0.01 | )1 |
| Net realized and unrealized gain (loss) on investments | | | (3.35 | ) | | | (1.53 | ) | | | 2.41 | | | | (0.51 | ) |
| | | | | | | | | | | | | |
Total from investment operations | | | (3.30 | ) | | | (1.50 | ) | | | 2.43 | | | | (0.52 | ) |
| | | | | | | | | | | | | |
| Less distributions to shareholders from: | | | | | | | | | | | | | | | | |
| Net investment income | | | 0.00 | | | | 0.00 | | | | 0.00 | | | | 0.00 | |
| Net realized gain on investments | | | (0.01 | ) | | | 0.00 | | | | 0.00 | | | | 0.00 | |
| | | | | | | | | | | | | |
Total distributions | | | (0.01 | ) | | | 0.00 | | | | 0.00 | | | | 0.00 | |
| | | | | | | | | | | | | |
| Net asset value, end of year | | $ | 7.10 | | | $ | 10.41 | | | $ | 11.91 | | | $ | 9.48 | |
| | | | | | | | | | | | | |
Total return | | | (31.73 | )%2 | | | (12.59 | )%2 | | | 25.63 | %2 | | | (5.20 | )%2 |
| | | | | | | | | | | | | |
| Ratios/Supplemental data: | | | | | | | | | | | | | | | | |
| Net assets (in millions), end of year | | $ | 22.8 | | | $ | 29.3 | | | $ | 4.0 | | | $ | 1.4 | |
| | | | | | | | | | | | | |
| Ratio of operating expenses to average net assets | | | 1.29 | % | | | 1.52 | % | | | 2.84 | % | | | 8.65 | % |
| Less: Reimbursement of expenses by Adviser | | | (0.19 | )% | | | (0.42 | )% | | | (1.74 | )% | | | (7.55 | )% |
| | | | | | | | | | | | | |
| Ratio of net operating expenses to average net assets | | | 1.10 | % | | | 1.10 | % | | | 1.10 | % | | | 1.10 | % |
| | | | | | | | | | | | | |
| Ratio of net investment income (loss) to average net assets | | | 0.53 | % | | | 0.22 | % | | | 0.20 | % | | | (0.11 | )% |
| | | | | | | | | | | | | |
| Portfolio turnover rate | | | 48.19 | % | | | 23.12 | % | | | 25.60 | % | | | 35.74 | % |
| | | | | | | | | | | | | |
| 1 | | Based on average shares outstanding. |
| 2 | | The total returns would have been lower had certain expenses not been reduced during the period shown. |
| See Notes to Financial Statements. | 49 |
Baron Select Funds |
December 31, 2015 |
| FINANCIAL HIGHLIGHTS (Continued) |
| |
BARON GLOBAL ADVANTAGE FUND
Selected data for a share outstanding throughout each year:
| RETAIL SHARES | | Year Ended December 31, |
| | | |
| | | 2015 | | 2014 | | 2013 | | 20121 |
| Net asset value, beginning of year | | $ | 14.20 | | | $ | 13.51 | | | $ | 10.41 | | | $ | 10.00 | |
| | | | | | | | | | | | | |
| Income (loss) from investment operations: | | | | | | | | | | | | | | | | |
| Net investment income (loss) | | | (0.11 | )2 | | | 0.02 | 2 | | | (0.02 | )2 | | | (0.02 | )2 |
| Net realized and unrealized gain (loss) on investments | | | (0.14 | ) | | | 0.67 | | | | 3.12 | | | | 0.43 | |
| | | | | | | | | | | | | |
Total from investment operations | | | (0.25 | ) | | | 0.69 | | | | 3.10 | | | | 0.41 | |
| | | | | | | | | | | | | |
| Less distributions to shareholders from: | | | | | | | | | | | | | | | | |
| Net investment income | | | (0.02 | ) | | | 0.00 | | | | 0.00 | | | | 0.00 | |
| Net realized gain on investments | | | (0.02 | ) | | | (0.00 | )3 | | | 0.00 | | | | 0.00 | |
| | | | | | | | | | | | | |
Total distributions | | | (0.04 | ) | | | 0.00 | | | | 0.00 | | | | 0.00 | |
| | | | | | | | | | | | | |
| Net asset value, end of year | | $ | 13.91 | | | $ | 14.20 | | | $ | 13.51 | | | $ | 10.41 | |
| | | | | | | | | | | | | |
Total return | | | (1.72 | )%4 | | | 5.11 | %4,5 | | | 29.78 | %4 | | | 4.10 | %4,6 |
| | | | | | | | | | | | | |
| Ratios/Supplemental data: | | | | | | | | | | | | | | | | |
| Net assets (in millions), end of year | | $ | 6.2 | | | $ | 3.9 | | | $ | 2.3 | | | $ | 1.5 | |
| | | | | | | | | | | | | |
| Ratio of operating expenses to average net assets | | | 3.19 | % | | | 3.61 | % | | | 5.51 | % | | | 8.35 | %7,8 |
| Less: Reimbursement of expenses by Adviser | | | (1.69 | )% | | | (2.11 | )% | | | (4.01 | )% | | | (6.85 | )%7,8 |
| | | | | | | | | | | | | |
| Ratio of net operating expenses to average net assets | | | 1.50 | % | | | 1.50 | % | | | 1.50 | % | | | 1.50 | %7,8 |
| | | | | | | | | | | | | |
| Ratio of net investment income (loss) to average net assets | | | (0.75 | )% | | | 0.18 | % | | | (0.20 | )% | | | (0.38 | )%7,8 |
| | | | | | | | | | | | | |
| Portfolio turnover rate | | | 25.88 | % | | | 123.51 | % | | | 32.78 | % | | | 24.64 | %6 |
| | | | | | | | | | | | | |
| INSTITUTIONAL SHARES | | Year Ended December 31, |
| | | |
| | | 2015 | | 2014 | | 2013 | | 20121 |
| Net asset value, beginning of year | | $ | 14.28 | | | $ | 13.56 | | | $ | 10.42 | | | $ | 10.00 | |
| | | | | | | | | | | | | |
| Income (loss) from investment operations: | | | | | | | | | | | | | | | | |
| Net investment income (loss) | | | (0.07 | )2 | | | 0.07 | 2 | | | 0.00 | 2,3 | | | (0.02 | )2 |
| Net realized and unrealized gain (loss) on investments | | | (0.15 | ) | | | 0.65 | | | | 3.14 | | | | 0.44 | |
| | | | | | | | | | | | | |
Total from investment operations | | | (0.22 | ) | | | 0.72 | | | | 3.14 | | | | 0.42 | |
| | | | | | | | | | | | | |
| Less distributions to shareholders from: | | | | | | | | | | | | | | | | |
| Net investment income | | | (0.04 | ) | | | 0.00 | | | | 0.00 | | | | 0.00 | |
| Net realized gain on investments | | | (0.02 | ) | | | (0.00 | )3 | | | 0.00 | | | | 0.00 | |
| | | | | | | | | | | | | |
Total distributions | | | (0.06 | ) | | | 0.00 | | | | 0.00 | | | | 0.00 | |
| | | | | | | | | | | | | |
| Net asset value, end of year | | $ | 14.00 | | | $ | 14.28 | | | $ | 13.56 | | | $ | 10.42 | |
| | | | | | | | | | | | | |
Total return | | | (1.51 | )%4 | | | 5.32 | %4,5 | | | 30.13 | %4 | | | 4.20 | %4,6 |
| | | | | | | | | | | | | |
| Ratios/Supplemental data: | | | | | | | | | | | | | | | | |
| Net assets (in millions), end of year | | $ | 5.3 | | | $ | 4.1 | | | $ | 3.3 | | | $ | 1.6 | |
| | | | | | | | | | | | | |
| Ratio of operating expenses to average net assets | | | 2.89 | % | | | 2.92 | % | | | 4.91 | % | | | 7.33 | %7,8 |
| Less: Reimbursement of expenses by Adviser | | | (1.64 | )% | | | (1.67 | )% | | | (3.66 | )% | | | (6.08 | )%7,8 |
| | | | | | | | | | | | | |
| Ratio of net operating expenses to average net assets | | | 1.25 | % | | | 1.25 | % | | | 1.25 | % | | | 1.25 | %7,8 |
| | | | | | | | | | | | | |
| Ratio of net investment income (loss) to average net assets | | | (0.47 | )% | | | 0.48 | % | | | 0.02 | % | | | (0.30 | )%7,8 |
| | | | | | | | | | | | | |
| Portfolio turnover rate | | | 25.88 | % | | | 123.51 | % | | | 32.78 | % | | | 24.64 | %6 |
| | | | | | | | | | | | | |
| 1 | | For the period April 30, 2012 (commencement of operations) to December 31, 2012. |
| 2 | | Based on average shares outstanding. |
| 3 | | Less than $0.01 per share. |
| 4 | | The total returns would have been lower had certain expenses not been reduced during the period shown. |
| 5 | | The Adviser made a voluntary payment to the Fund in the amount of $47,291 to compensate the Fund for a loss incurred due to a shareholder activity processing error. The impact of this payment increased the Fund’s total return by 0.54%. |
| 6 | | Not Annualized. |
| 7 | | Certain fixed expenses incurred by the Fund were not annualized for the period ended December 31, 2012. |
| 8 | | Annualized. |
| 50 | See Notes to Financial Statements. |
December 31, 2015 |
Baron Select Funds |
| REPORT OF INDEPENDENT REGISTERED PUBLIC ACCOUNTING FIRM |
| |
To the Shareholders and Board of Trustees of
Baron Select Funds
In our opinion, the accompanying statements of assets and liabilities, including the statements of net assets, and the related statements of operations, of changes in net assets and of cash flows (Baron Partners Fund only) and the financial highlights present fairly, in all material respects, the financial position of each of Baron Partners Fund, Baron Focused Growth Fund, Baron International Growth Fund, Baron Real Estate Fund, Baron Emerging Markets Fund, Baron Energy and Resources Fund and Baron Global Advantage Fund (seven of the portfolios constituting Baron Select Funds, hereafter referred to as the “Funds”) at December 31, 2015, the results of each of their operations and cash flows (Baron Partners Fund only) for the year then ended, the changes in each of their net assets for each of the two years in the period then ended, and the financial highlights for each of the periods presented, in conformity with accounting principles generally accepted in the United States of America. These financial statements and financial highlights (hereafter referred to as “financial statements”) are the responsibility of the Funds’ management. Our responsibility is to express an opinion on these financial statements based on our audits. We conducted our audits of these financial statements in accordance with the standards of the Public Company Accounting Oversight Board (United States). Those standards require that we plan and perform the audit to obtain reasonable assurance about whether the financial statements are free of material misstatement. An audit includes examining, on a test basis, evidence supporting the amounts and disclosures in the financial statements, assessing the accounting principles used and significant estimates made by management, and evaluating the overall financial statement presentation. We believe that our audits, which included confirmation of securities at December 31, 2015 by correspondence with the custodian, brokers, portfolio companies, and transfer agents provide a reasonable basis for our opinion.

PricewaterhouseCoopers LLP
New York, New York
February 24, 2016
Baron Select Funds |
December 31, 2015 |
| TAX INFORMATION (Unaudited) |
| |
The federal tax status of distributions paid by the Funds during the year ended December 31, 2015 are listed below.
During the fiscal year ended December 31, 2015, the Funds’ distributions to shareholders included:
| Fund | | Ordinary
Income1,3 | | Long-Term
Capital Gains2,3 |
| Baron Partners Fund | | $ | 8,870,821 | | $ | — | |
| Baron Focused Growth Fund | | | 650,535 | | | 9,891,350 | |
| Baron International Growth Fund | | | 673,432 | | | 156,070 | |
| Baron Real Estate Fund | | | 802,173 | | | 34,696,513 | |
| Baron Emerging Markets Fund | | | 4,689,931 | | | — | |
| Baron Energy and Resources Fund | | | 71 | | | 64,953 | |
| Baron Global Advantage Fund | | | 28,281 | | | 13,779 | |
| | | |
| | |
| 1 | | For tax purposes, short-term capital gains are considered ordinary income distributions. |
| 2 | | Long-term capital gains are subject to a maximum allowable rate of 20% for individuals pursuant to the American Taxpayer Relief Act of 2012. |
| 3 | | Under the Patient Protection and Affordable Care Act, higher income taxpayers must pay a 3.8% additional tax on net investment income. |
Of the total ordinary income distributions paid by Baron Partners Fund, Baron Focused Growth Fund, Baron International Growth Fund, Baron Real Estate Fund, Baron Emerging Markets Fund, Baron Energy and Resources Fund and Baron Global Advantage Fund, 100.00%, 100.00%, 100.00%, 100.00%, 100.00%, 0.00% and 100.00%, respectively, is qualified dividend income subject to a reduced tax rate. Of the total ordinary income distributions paid by Baron Partners Fund. Baron Focused Growth Fund, Baron International Growth Fund, Baron Real Estate Fund, Baron Emerging Markets Fund, Baron Energy and Resources Fund and Baron Global Advantage Fund,100.00%, 100.00%, 4.80%,100.00%, 4.43%, 0.00% and 27.93%, respectively, qualifies for the corporate dividends received deduction.
The information and distributions reported may differ from the information and distributions taxable to the shareholders for the calendar year ended December 31, 2015. The information necessary to complete your income tax return for the calendar year ended December 31, 2015 will be listed on the Form 1099-DIV, which was mailed to you in January/February 2016.
52
December 31, 2015 |
Baron Select Funds |
| FUND EXPENSES (Unaudited) |
| |
As a shareholder of the Funds, you may incur two types of costs: ongoing expenses and transaction costs. Ongoing expenses include advisory fees, distribution and service (12b-1) fees and other Fund expenses. Due to the payment of Rule 12b-1 fees, long-term shareholders may indirectly pay more than the maximum permitted front-end sales charge. The information on this page is intended to help you understand your ongoing costs of investing in the Funds and to compare these costs with the ongoing costs of investing in other mutual funds.
The information in the following table is based on an investment of $1,000 invested on July 1, 2015 and held for the six months ended December 31, 2015.
ACTUAL EXPENSES
The table below titled “Based on Actual Total Return” provides information about actual account values and actual expenses. You may use the information provided in this table, together with the amount you invested, to estimate the expenses that you paid over the period. To estimate the expenses you paid on your account, divide your ending account value by $1,000 (for example, an $8,600 ending account value divided by $1,000 = 8.6), then multiply the result by the number under the heading titled “Expenses Paid During the Period”.
BASED ON ACTUAL TOTAL RETURN FOR THE SIX MONTHS ENDED December 31, 20151
| | | Actual
Total
Return | | Beginning
Account Value
July 1, 2015 | | Ending
Account Value
December 31, 2015 | | Annualized
Expense
Ratio | | Expenses
Paid During
the Period3 |
| Baron Partners Fund — Retail Shares2 | | (8.09 | )% | | | $1,000.00 | | | $919.10 | | | 1.56 | %2 | | | $7.55 | |
| Baron Partners Fund — Institutional Shares2 | | (7.96 | )% | | | $1,000.00 | | | $920.40 | | | 1.30 | %2 | | | $6.29 | |
| Baron Focused Growth Fund — Retail Shares | | (8.41 | )% | | | $1,000.00 | | | $915.90 | 4 | | 1.35 | %5 | | | $6.52 | |
| Baron Focused Growth Fund — Institutional Shares | | (8.31 | )% | | | $1,000.00 | | | $916.90 | | | 1.08 | % | | | $5.22 | |
| Baron International Growth Fund — Retail Shares | | (5.85 | )% | | | $1,000.00 | | | $941.50 | 4 | | 1.50 | %5 | | | $7.34 | |
| Baron International Growth Fund — Institutional Shares | | (5.76 | )% | | | $1,000.00 | | | $942.40 | 4 | | 1.25 | %5 | | | $6.12 | |
| Baron Real Estate Fund — Retail Shares | | (5.24 | )% | | | $1,000.00 | | | $947.60 | | | 1.31 | % | | | $6.43 | |
| Baron Real Estate Fund — Institutional Shares | | (5.11 | )% | | | $1,000.00 | | | $948.90 | | | 1.06 | % | | | $5.21 | |
| Baron Emerging Markets Fund — Retail Shares | | (11.45 | )% | | | $1,000.00 | | | $885.50 | | | 1.44 | % | | | $6.84 | |
| Baron Emerging Markets Fund — Institutional Shares | | (11.34 | )% | | | $1,000.00 | | | $886.60 | | | 1.19 | % | | | $5.66 | |
| Baron Energy & Resources Fund — Retail Shares | | (33.11 | )% | | | $1,000.00 | | | $668.90 | 4 | | 1.35 | %5 | | | $5.68 | |
| Baron Energy & Resources Fund — Institutional Shares | | (33.02 | )% | | | $1,000.00 | | | $669.80 | 4 | | 1.10 | %5 | | | $4.63 | |
| Baron Global Advantage Fund — Retail Shares | | (7.08 | )% | | | $1,000.00 | | | $929.20 | 4 | | 1.50 | %5 | | | $7.29 | |
| Baron Global Advantage Fund — Institutional Shares | | (6.92 | )% | | | $1,000.00 | | | $930.80 | 4 | | 1.25 | %5 | | | $6.08 | |
HYPOTHETICAL EXAMPLE FOR COMPARISON PURPOSES
The table below titled “Based on Hypothetical Total Return” provides information about hypothetical account values and hypothetical expenses based on the actual expense ratio and an assumed rate of return of 5% per year before expenses, which is not the Funds’ actual return. The hypothetical account values and expenses may not be used to estimate the actual ending account values and expenses you paid for the period. You may use the information provided in this table to compare the ongoing costs of investing in the Funds and other funds. To do so, compare the 5% hypothetical example relating to the Funds with the 5% hypothetical examples that appear in the shareholder reports of other funds.
Please note that expenses shown in the table below are meant to highlight your ongoing costs and do not reflect any transactional costs, such as redemption fees, if any. Therefore, the table is useful in comparing ongoing costs only and will not help you determine your relative total costs of owning different mutual funds. In addition, if these transactional costs were included, your costs would have been higher.
BASED ON HYPOTHETICAL TOTAL RETURN FOR THE SIX MONTHS ENDED December 31, 2015
| | | Hypothetical
Annualized
Total Return | | Beginning
Account Value
July 1, 2015 | | Ending
Account Value
December 31, 2015 | | Annualized
Expense
Ratio | | Expenses
Paid During
the Period3 |
| Baron Partners Fund — Retail Shares2 | | 5.00 | % | | | $1,000.00 | | | $1,017.34 | | | 1.56 | %2 | | | $7.93 | |
| Baron Partners Fund — Institutional Shares2 | | 5.00 | % | | | $1,000.00 | | | $1,018.65 | | | 1.30 | %2 | | | $6.61 | |
| Baron Focused Growth Fund — Retail Shares | | 5.00 | % | | | $1,000.00 | | | $1,018.40 | 4 | | 1.35 | %5 | | | $6.87 | |
| Baron Focused Growth Fund — Institutional Shares | | 5.00 | % | | | $1,000.00 | | | $1,019.76 | | | 1.08 | % | | | $5.50 | |
| Baron International Growth Fund — Retail Shares | | 5.00 | % | | | $1,000.00 | | | $1,017.64 | 4 | | 1.50 | %5 | | | $7.63 | |
| Baron International Growth Fund — Institutional Shares | | 5.00 | % | | | $1,000.00 | | | $1,018.90 | 4 | | 1.25 | %5 | | | $6.36 | |
| Baron Real Estate Fund — Retail Shares | | 5.00 | % | | | $1,000.00 | | | $1,018.60 | | | 1.31 | % | | | $6.67 | |
| Baron Real Estate Fund — Institutional Shares | | 5.00 | % | | | $1,000.00 | | | $1,019.86 | | | 1.06 | % | | | $5.40 | |
| Baron Emerging Markets Fund — Retail Shares | | 5.00 | % | | | $1,000.00 | | | $1,017.95 | | | 1.44 | % | | | $7.32 | |
| Baron Emerging Markets Fund — Institutional Shares | | 5.00 | % | | | $1,000.00 | | | $1,019.21 | | | 1.19 | % | | | $6.06 | |
| Baron Energy & Resources Fund — Retail Shares | | 5.00 | % | | | $1,000.00 | | | $1,018.40 | 4 | | 1.35 | %5 | | | $6.87 | |
| Baron Energy & Resources Fund — Institutional Shares | | 5.00 | % | | | $1,000.00 | | | $1,019.66 | 4 | | 1.10 | %5 | | | $5.60 | |
| Baron Global Advantage Fund — Retail Shares | | 5.00 | % | | | $1,000.00 | | | $1,017.64 | 4 | | 1.50 | %5 | | | $7.63 | |
| Baron Global Advantage Fund — Institutional Shares | | 5.00 | % | | | $1,000.00 | | | $1,018.90 | 4 | | 1.25 | %5 | | | $6.36 | |
| | | | |
| | |
| 1 | | Assumes reinvestment of all dividends and capital gain distributions, if any. |
| 2 | | Annualized expense ratio for Baron Partners Fund for the six months ended December 31, 2015, includes 1.31% and 1.05% for net operating expenses and 0.25% and 0.25% for interest expense for the Retail and Institutional Shares, respectively. |
| 3 | | Expenses are equal to each Share Class’ respective annualized expense ratio multiplied by the average account value over the period, multiplied by the number of days in the most recent fiscal half-year, then divided by 365. |
| 4 | | Ending account value assumes the return earned after waiver and would have been lower if a portion of the expenses had not been waived. |
| 5 | | Annualized expense ratios are adjusted to reflect fee waiver. |
53
Baron Select Funds |
December 31, 2015 |
| MANAGEMENT OF THE FUNDS (Unaudited) |
| |
| Board of Trustees and Officers. |
| |
Trustees of the Trust, together with information as to their positions with the Trust, principal occupations and other board memberships and affiliations for the past five years, are shown below. Each Trustee serves as Trustee of a Fund until its termination; until the Trustee’s retirement, resignation or death; or as otherwise specified in the Trust’s organizational documents. Unless otherwise noted, the address of each Executive Officer and Trustee is Baron Select Funds, 767 Fifth Avenue, 49th Floor, New York, NY 10153. All Trustees listed below, whether Interested or Independent, serve as Trustees for the Trust. Additional information about the Trustees and Officers of the Trust can be found in the Trust’s Statement of Additional Information (the “SAI”) which may be obtained without charge by writing or calling 1-800-99BARON. The SAI is also available on the Baron Funds® website, www.BaronFunds.com.
| Name, Address & Age | | Position(s) Held
With the Funds | | Term of
Office and
Length of
Time Served | | Principal Occupation(s)
During the Past Five Years | | Number of
Portfolios
in Fund
Complex
Overseen
by Trustee | | Other
Directorships
Held by Trustee |
| Interested Trustees | | | | | | | | | | |
Ronald Baron(1),(2)
767 Fifth Avenue
New York, NY 10153
Age: 72 | | Chief Executive Officer, Chief Investment Officer, Trustee and Portfolio Manager | | 12 years | | Director, Chairman, CEO and CIO: the Firm* (1982-Present); Trustee: Baron Investment Funds Trust (1987-Present); Trustee: Baron Select Funds (2003-Present); Portfolio Manager: Baron USA Partners Fund, Ltd. (2003-Present); Portfolio Manager: Baron Managed Funds plc (2005-2009). | | 13 | | None |
| | | | | | | | | | | |
Linda S. Martinson(1),(2)
767 Fifth Avenue New York, NY 10153
Age: 60 | | Chairman, President, Chief Operating Officer and Trustee | | 12 years | | Director: the Firm* (2003-Present); Secretary: the Firm* (1997-2008); President: the Firm* (2007- Present); Chief Operating Officer: the Firm (2006- Present); Chairman (2010-Present), President (2007-Present), Trustee (1987-Present), Secretary (2003-2008): Baron Investment Funds Trust; Chairman (2010-Present), President (2007-Present), Trustee (2003-Present): Baron Select Funds; Director: Baron USA Partners Fund, Ltd. (2006-Present); Director: Baron Managed Funds plc (2005-2009). | | 13 | | None |
54
December 31, 2015 | |
Baron Select Funds |
| MANAGEMENT OF THE FUNDS (Unaudited) (Continued) |
| |
| Name, Address & Age | | Position(s) Held
With the Funds | | Term of
Office and
Length of
Time Served | | Principal Occupation(s)
During the Past Five Years | | Number of
Portfolios
in Fund
Complex
Overseen
by Trustee | | Other
Directorships
Held by Trustee |
| | | | | | | | | | | |
| Independent Trustees |
Norman S. Edelcup(3),(4),(5)
City of Sunny Isles Beach
18070 Collins Avenue
Sunny Isles Beach, FL 33160
Age: 80 | | Trustee | | 12 years | | Mayor (2003-2015): Sunny Isles Beach, Florida; Trustee: Baron Investment Funds Trust (1987-Present), Baron Select Funds (2003-Present). | | 13 | | Director: CompX International, Inc. (diversified manufacturer of engineered components) (2006-Present); Director: Valhi, Inc. (diversified company) (1975-Present). |
| | | | | | | | | | | |
Harold W. Milner(4),(5)
2293 Morningstar Drive
Park City, UT 84060
Age: 81 | | Trustee | | 12 years | | Trustee: Baron Investment Funds Trust (1987- Present), Baron Select Funds (2003-Present). | | 13 | | None |
| | | | | | | | | | | |
Raymond Noveck(3),(4),(5)
31 Karen Road
Waban, MA 02468
Age: 72 | | Lead Trustee | | 12 years | | Private Investor (1999-Present); Trustee: Baron Investment Funds Trust (1987-Present), Baron Select Funds (2003-Present). | | 13 | | None |
| | | | | | | | | | | |
Anita Rosenberg(4),(5)
1235 N. Astor Street
Chicago, Il 60610
Age: 51 | | Trustee | | 2 years | | Advisory Board Member: Impala Capital Management, LLC (2014-Present); Advisory Board Member: ValueAct Capital, LLC (2014-Present); Senior Advisor: Magnetar Capital (2011-2012); Trustee: Baron Investment Funds Trust, Baron Select Funds (2013-Present). | | 13 | | Director: Golub Capital BDC, Inc. (2011-Present). |
| | | | | | | | | | | |
David A. Silverman, MD(4),(5)
146 Central Park West
New York, NY 10024
Age: 65 | | Trustee | | 12 years | | Physician and Faculty: New York University School of Medicine (1976-Present); Trustee: Baron Investment Funds Trust (1987-Present), Baron Select Funds (2003-Present). | | 13 | | None |
| | | | | | | | | | | |
Alex Yemenidjian(4),(5)
3801 Las Vegas Blvd. South
Las Vegas, NV 89109
Age: 59 | | Trustee | | 9 years | | Chairman and CEO: Tropicana Las Vegas (gaming) (2009-2015); Chairman and CEO: Armenco Holdings, LLC (investment company) (2005-Present); Managing Partner: Armenco Capital LLC (investment company) (2013-Present); Trustee: Baron Investment Funds Trust (2006-Present), Baron Select Funds (2006-Present). | | 13 | | Director: Guess?, Inc. (2005-Present); Director: Regal Entertainment Group (2005-Present). |
55
Baron Select Funds | |
December 31, 2015 |
| MANAGEMENT OF THE FUNDS (Unaudited) (Continued) |
| |
| Name, Address & Age | | Position(s) Held
With the Funds | | Term of
Office and
Length of
Time Served | | Principal Occupation(s)
During the Past Five Years | | Number of
Portfolios
in Fund
Complex
Overseen
by Trustee | | Other
Directorships
Held by Trustee |
| | | | | | | | | | | |
| Additional Officers of the Funds |
Clifford Greenberg
767 Fifth Avenue
New York, NY 10153
Age: 56 | | Senior Vice
President | | 12 years | | Director and Senior Vice President: the Firm*; Senior Vice President: Baron Investment Funds Trust, Baron Select Funds; Portfolio Manager: Baron Small Cap Fund. | | N/A | | N/A |
| | | | | | | | | | | |
Louis Beasley
767 Fifth Avenue
New York, NY 10153
Age: 44 | | Vice President and
Chief Compliance
Officer | | 1 year | | Chief Compliance Officer: Baron Capital Group, Inc., BAMCO, Inc., Baron Capital Management Inc., Baron Investment Funds Trust, Baron Select Funds, Baron USA Partners Fund, Ltd (9/2014-Present); Vice President: the Firm* (9/2014-Present); Principal and Director of Investment Management Compliance and Risk Management: Bessemer Trust (2006-9/2014). | | N/A | | N/A |
| | | | | | | | | | | |
Patrick M. Patalino
767 Fifth Avenue
New York, NY 10153
Age: 47 | | Vice President,
General Counsel
and Secretary | | 8 years | | Vice President, General Counsel and Secretary: the Firm*, Baron Investment Funds Trust, Baron Select Funds; General Counsel: Baron USA Partners Fund, Ltd. | | N/A | | N/A |
| | | | | | | | | | | |
Andrew Peck
767 Fifth Avenue
New York, NY 10153
Age: 46 | | Senior Vice
President | | 12 years | | Senior Vice President: the Firm*, Baron Investment Funds Trust, Baron Select Funds; Portfolio Manager: Baron Asset Fund. | | N/A | | N/A |
| | | | | | | | | | | |
Susan Robbins
767 Fifth Avenue
New York, NY 10153
Age: 61 | | Vice President | | 12 years | | Director and Vice President: the Firm*; Vice President: Baron Investment Funds Trust, Baron Select Funds. | | N/A | | N/A |
| | | | | | | | | | | |
Peggy C. Wong
767 Fifth Avenue
New York, NY 10153
Age: 54 | | Treasurer and Chief
Financial Officer | | 12 years | | Chief Financial Officer and Treasurer: the Firm*, Baron Investment Funds Trust, Baron Select Funds. | | N/A | | N/A |
| * | | The “Firm” means (Baron Capital Group, Inc. (“BCG”) along with its subsidiaries BCI, Baron Capital Management, Inc. (“BCM”) and BAMCO. |
| (1) | | Trustees deemed to be “Interested Trustees” by reason of their employment with the Adviser and the Distributor. |
| (2) | | Members of the Executive Committee, which is empowered to exercise all of the powers, including the power to declare dividends, of the full Board when the full Board is not in session. |
| (3) | | Members of the Audit Committee. |
| (4) | | Members of the Nominating Committee. |
| (5) | | Members of the Independent Committee. |
56
Privacy Notice
The Funds collect nonpublic personal information about you from the following sources:
| n | | Information we receive from you on applications or other forms; |
| n | | Information about your transactions with us, our Adviser or others; and |
| n | | Information we receive from third parties, such as credit reporting agencies. |
“Nonpublic personal information” is private information about you that we obtain in connection with providing a financial product or service to you.
We may share your name and address with other Baron Funds and the Adviser and its affiliates for the purpose of sending you information about our products that we believe may be of interest to you and informing you of our upcoming Baron Investment Conference and for sending required information.
We do not disclose any nonpublic personal information about our customers to anyone, except as permitted or required by law. Examples of permitted disclosures under the law include sharing with companies that work for us to provide you services, such as the Transfer Agent or mailing house. All such companies that act on our behalf are contractually obligated to keep the information that we provide to them confidential and to use the information only to provide the services that we have asked them to perform for you and us.
We restrict access to nonpublic information about you to those employees who need to know that information to provide products or services to you. We maintain physical, electronic and procedural safeguards to guard your nonpublic personal information.
This privacy notice is also available at all times on the Baron Funds® website, www.BaronFunds.com or by calling 1-800-99BARON.
Go Paperless!
It’s fast, simple and a smart way to help the environment.
Enjoy the speed and convenience of receiving Fund documents electronically.
For more information, and to enroll today, go to www.baronfunds.com/edelivery.
767 Fifth Avenue, 49th Fl.
New York, NY 10153
1.800.99.BARON
212-583-2000
www.BaronFunds.com
Item 2. Code of Ethics.
The Registrant has adopted a Code of Ethics for Principal Executive and Senior Financial Officers (the “Code”). Upon request, the Registrant will provide a copy of the Code to any person without charge. To obtain a copy of the Code, please send your request to info@Baronfunds.com or call 1-800-99BARON (1-800-992-2766).
Item 3. Audit Committee Financial Expert.
The Registrant’s Board of Trustees has determined that the Registrant has two audit committee financial experts serving on its Audit Committee, Norman S. Edelcup and Raymond Noveck. Both Mr. Edelcup and Mr. Noveck are “independent” for purposes of Item 3(a)(2) of Form N-CSR.
Item 4. Principal Accountant Fees and Services.
The following table shows the fees paid to PricewaterhouseCoopers, LLP, the Registrant’s principal accounting firm during the fiscal years ended December 31, 2015 and December 31, 2014:
(a) Audit Fees: for professional services rendered for the audit of the Registrant’s annual financial statements or services that are normally provided in connection with statutory and regulatory filings or engagements:
| | | 2015 | | 2014 |
| | | | | |
| Baron Select Funds | | $225,825 | | $219,395 |
(b) Audit-Related Fees: for assurance and related services that are reasonably related to the performance of the audit and are not included as Audit Fees:
| | | 2015 | | 2014 |
| | | | | |
| Baron Select Funds | | $0 | | $0 |
(c) Tax Fees: for professional services rendered for tax compliance, tax advice and tax planning:
| | | 2015 | | 2014 |
| | | | | |
| Baron Select Funds | | $161,930 | | $77,480 |
The Tax Fees represent services provided in connection with the preparation of tax returns and year-end distribution review.
(d) All Other Fees: for products and services provided by such accounting firm that are not included in (a),
(b) or (c) above:
| | | 2015 | | 2014 |
| | | | | |
| Baron Select Funds | | $0 | | $0 |
(e) Audit Committee Pre-Approval Policies and Procedures: (i) Pursuant to paragraph (c)(7) of Rule 2-01 of Regulation S-X and to its charter, the Audit Committee shall pre-approve all audit and non-audit services provided by the independent auditors and in connection therewith to review and evaluate the qualifications, independence and performance of the Fund’s independent auditors; (ii) 100% of the services described in each of items 4(b) through 4(d) were approved by the Audit Committee pursuant to paragraph (c)(7)(i)(C) of Rule 2-01 of Regulation S-X.
(f) Not Applicable.
(g) The aggregate non-audit fees billed by the registrant’s accountant for services rendered to the registrant, and rendered to the registrant’s investment adviser (not including any sub-adviser whose role is primarily portfolio management and is subcontracted with or overseen by another investment adviser), and any entity controlling, controlled by, or under common control with the adviser that provides ongoing services to the registrant for the last two fiscal years is as follows:
2015: $66,300
2014: $66,300
(h) Not Applicable.
Item 5. Audit Committee of Listed Registrants.
The Registrant has a separately-designated standing Audit Committee established in accordance with Section 3(a)(58)(A) of the Securities Exchange Act of 1934. The members of the Audit Committee are Norman S. Edelcup and Raymond Noveck.
Item 6. Schedule of Investments.
Included herein under Item 1.
Item 7. Disclosure of Proxy Voting Policies and Procedures for Closed-End Management Investment Companies.
Not applicable.
Item 8. Portfolio Managers of Closed-End Management Investment Companies.
Not applicable.
Item 9. Purchases of Equity Securities by Closed-End Management Investment Company and Affiliated Purchasers.
Not applicable.
Item 10. Submission of Matters to a Vote of Security Holders.
Not applicable.
Item 11. Controls and Procedures.
(a) The Registrant’s principal executive officer and principal financial officer have concluded that the Registrant’s disclosure controls and procedures (as defined in Rule 30a-3(c) under the Investment Company Act of 1940 (the “1940 Act”)) are effective based on their evaluation of these controls and procedures as of a date within 90 days of the filing date of this report.
(b) There were no changes in the Registrant’s internal control over financial reporting (as defined in Rule 30a-3(d) under the 1940 Act) that occurred during the Registrant’s second fiscal quarter of the period covered by this report that have materially affected, or are reasonably likely to materially affect, the Registrant’s internal control over financial reporting.
Item 12. Exhibits.
(a) (2) Certification of each of the principal executive officers and principal financial officers of the Registrant as required by Rule 30a-2 under the Act (17 CFR 270.30a-2) is attached hereto as a part of EX-99.CERT.
(b) Certification of each of the principal executive officers and principal financial officers of the Registrant as required by Section 906 of the Sarbanes-Oxley Act of 2002 is attached hereto as a part of EX-99.906CERT.
SIGNATURES
Pursuant to the requirements of the Securities Exchange Act of 1934 and the Investment Company Act of 1940, the registrant has duly caused this report to be signed on its behalf by the undersigned, thereunto duly authorized.
| | BARON SELECT FUNDS |
| | | |
| | By: | /s/ Ronald Baron |
| | | |
| | | Ronald Baron |
| | | Chief Executive Officer |
| | | |
| | Date: March 3, 2016 |
Pursuant to the requirements of the Securities Exchange Act of 1934 and the Investment Company Act of 1940, this report has been signed below by the following persons on behalf of the registrant and in the capacities and on the dates indicated.
| | By: | /s/ Ronald Baron |
| | | |
| | | Ronald Baron |
| | | Chief Executive Officer |
| | | |
| | Date: March 3, 2016 |
| | | |
| | By: | /s/ Peggy Wong |
| | | |
| | | Peggy Wong |
| | | Treasurer and Chief Financial Officer |
| | | |
| | Date: March 3, 2016 |