| | | | |
OMB APPROVAL |
| OMB Number: | | 3235-0570 |
| Expires: | | August 31, 2020 |
| Estimated average burden |
| Hours per response | | 20.6 |
UNITED STATES
SECURITIES AND EXCHANGE COMMISSION
Washington, DC 20549
FORMN-CSR
CERTIFIED SHAREHOLDER REPORT OF REGISTERED
MANAGEMENT INVESTMENT COMPANIES
Investment Company Act file number:811-21296
BARON SELECT FUNDS
(Exact Name of Registrant as Specified in Charter)
767 Fifth Avenue, 49th Floor
New York, NY 10153
(Address of Principal Executive Offices) (Zip Code)
Patrick M. Patalino, General Counsel
c/o Baron Select Funds
767 Fifth Avenue, 49th Floor
New York, NY 10153
(Name and Address of Agent for Service)
(Registrant’s Telephone Number, including Area Code):212-583-2000
Date of fiscal year end: December 31
Date of reporting period: December 31, 2018
FormN-CSR is to be used by management investment companies to file reports with the Commission not later than 10 days after the transmission to stockholders of any report that is required to be transmitted to stockholders under Rule30e-1 under the Investment Company Act of 1940 (17CRF270.30e-1). The Commission may use the information provided on FormN-CSR in its regulatory, disclosure review, inspection, and policymaking roles.
A registrant is required to disclose the information specified by FormN-CSR, and the Commission will make this information public. A registrant is not required to respond to the collection of information contained in Form N-CSR unless the Form displays a currently valid Office of Management and Budget (“OMB”) control number. Please direct comments concerning the accuracy of the information collection burden estimate and suggestions for reducing the burden to Secretary, Securities and Exchange Commission, 450 5th Street, NW, Washington, D.C. 20549-0609. The OMB has reviewed this collection of information under the clearance requirements of 44 U.S.C. Section 3507.
Persons who are to respond to the collection of information contained in this form are not required to respond unless the form displays a currently valid OMB control number.
SEC 2569(5-07)
| Item 1. | Reports to Stockholders. |
Baron Partners Fund
Baron Focused Growth Fund
Baron International Growth Fund
Baron Real Estate Fund
Baron Emerging Markets Fund
Baron Energy and Resources Fund
Baron Global Advantage Fund
Baron Real Estate Income Fund
Baron Health Care Fund
Baron Funds®
Baron Select Funds
Annual Financial Report
Beginning on January 1, 2021, as permitted by regulations adopted by the U.S. Securities and Exchange Commission, paper copies of the Funds’ shareholder reports like this one will no longer be sent by mail, unless you specifically request paper copies of the reports from Baron Funds (“Baron”) or from your financial intermediary, such as a broker-dealer or bank. Instead, the reports will be made available on the Baron website, and you will be notified by mail each time a report is posted and provided with a website link to access the report.
If you already elected to receive shareholder reports electronically, you will not be affected by this change and you need not take any action. You may elect to receive shareholder reports and other communications from Baron or your financial intermediary electronically by contacting your financial intermediary or going toicsdelivery.com/baronfunds.
You may elect to receive all future reports in paper free of charge. You can inform Baron or your financial intermediary that you wish to continue receiving paper copies of your shareholder reports by following the instructions included on the envelope or slip inserted with this disclosure. Your election to receive reports in paper will apply to all funds held with Baron or your financial intermediary.
DEAR BARON SELECT FUNDS SHAREHOLDER:
In this report, you will find audited financial statements for Baron Partners Fund, Baron Focused Growth Fund, Baron International Growth Fund, Baron Real Estate Fund, Baron Emerging Markets Fund, Baron Energy and Resources Fund, Baron Global Advantage Fund, Baron Real Estate Income Fund and Baron Health Care Fund (the “Funds”) for the year ended December 31, 2018. The U.S. Securities and Exchange Commission (the “SEC”) requires mutual funds to furnish these statements semi-annually to their shareholders. We hope you find these statements informative and useful.
We thank you for choosing to join us as fellow shareholders in Baron Funds. We will continue to work hard to justify your confidence.
Sincerely,
| | | | |

| | | | 
|
Ronald Baron Chief Executive Officer and Chief Investment Officer February 26, 2019 | | | | Peggy Wong Treasurer and Chief Financial Officer February 26, 2019 |
This Annual Financial Report is for the following nine series of Baron Select Funds: Baron Partners Fund, Baron Focused Growth Fund, Baron International Growth Fund, Baron Real Estate Fund, Baron Emerging Markets Fund, Baron Energy and Resources Fund, Baron Global Advantage Fund, Baron Real Estate Income Fund and Baron Health Care Fund. Baron WealthBuilder Fund is included in a separate Financial Report. If you are interested in Baron WealthBuilder Fund or Baron Investment Funds Trust, which contains the Baron Asset Fund, Baron Growth Fund, Baron Small Cap Fund, Baron Opportunity Fund, Baron Fifth Avenue Growth Fund, Baron Discovery Fund and Baron Durable Advantage Fund, please visit the Funds’ website at www.BaronFunds.com or contact us at 1-800-99BARON.
The Funds’ Proxy Voting Policy is available without charge and can be found on the Funds’ website at www.BaronFunds.com, by clicking on the “Legal Notices” link at the bottom left corner of the homepage or by calling 1-800-99BARON and on the SEC’s website at www.sec.gov. The Funds’ most current proxy voting record, Form N-PX, is also available on the Funds’ website and on the SEC’s website.
The Funds file their complete schedules of portfolio holdings with the SEC for the first and third quarters of each fiscal year as an exhibit to its reports on Form N-PORT. The Funds’ Form N-PORT reports are available on the SEC’s website at www.sec.gov. Schedules of portfolio holdings current to the most recent quarter are also available on the Funds’ website.
Some of the comments contained in this report are based on current management expectations and are considered “forward-looking statements.” Actual future results, however, may prove to be different from our expectations. You can identify forward-looking statements by words such as “estimate,” “may,” “expect,” “should,” “could,” “believe,” “plan” and other similar terms. We cannot promise future returns and our opinions are a reflection of our best judgment at the time this report is compiled.
The views expressed in this report reflect those of BAMCO, Inc. (“BAMCO” or the “Adviser”) only through the end of the period stated in this report. The views are not intended as recommendations or investment advice to any person reading this report and are subject to change at any time without notice based on market and other conditions.
Past performance is no guarantee of future results. The investment return and principal value of an investment will fluctuate; an investor’s shares, when redeemed, may be worth more or less than their original cost. For more complete information about Baron Funds, including charges and expenses, call, write or go to www.BaronFunds.com for a prospectus or summary prospectus. Read them carefully before you invest or send money. This report is not authorized for use as an offer of sale or a solicitation of an offer to buy shares of the Funds, unless accompanied or preceded by the Funds’ current prospectus or summary prospectus.

| | |
| Baron Partners Fund(Unaudited) | | December 31, 2018 |
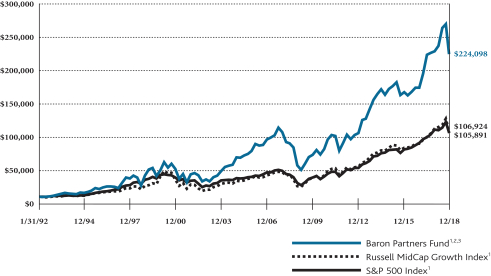
COMPARISONOFTHECHANGEIN VALUEOF $10,000INVESTMENTIN BARON PARTNERS FUND (RETAIL SHARES)
IN RELATIONTOTHE RUSSELL MIDCAP GROWTH INDEXANDTHE S&P 500 INDEX
| | | | | | | | | | | | | | | | | | |
| AVERAGE ANNUAL TOTAL RETURNSFORTHEPERIODSENDED DECEMBER 31, 2018 |
| | | One
Year | | | Three
Years | | | Five
Years | | | Ten
Years | | | Since
Inception
(January 31,
1992) |
Baron Partners Fund — Retail Shares1,2,3 | | | (2.01)% | | | | 10.28% | | | | 7.55% | | | | 14.67% | | | 12.25% |
Baron Partners Fund — Institutional Shares1,2,3,4 | | | (1.75)% | | | | 10.56% | | | | 7.83% | | | | 14.96% | | | 12.35% |
Baron Partners Fund — R6 Shares1,2,3,4 | | | (1.75)% | | | | 10.56% | | | | 7.83% | | | | 14.96% | | | 12.35% |
Russell Midcap Growth Index1 | | | (4.75)% | | | | 8.59% | | | | 7.42% | | | | 15.12% | | | 9.20% |
S&P 500 Index1 | | | (4.38)% | | | | 9.26% | | | | 8.49% | | | | 13.12% | | | 9.16% |
| 1 | The indexes are unmanaged. The Russell Midcap® Growth Index measures the performance of medium-sized U.S. companies that are classified as growth and the S&P 500 Index of 500 widely held large-cap U.S. companies. The indexes and Baron Partners Fund are with dividends, which positively impact the performance results. |
| 2 | Reflects the actual fees and expenses that were charged when the Fund was a partnership. The predecessor partnership charged a 20% performance fee after reaching a certain performance benchmark. If the annual returns for the Fund did not reflect the performance fees for the years the predecessor partnership charged a performance fee, returns would be higher. The Fund’s shareholders will not be charged a performance fee. The predecessor partnership’s performance is only for periods before the Fund’s registration statement was effective, which was April 30, 2003. During those periods, the predecessor partnership was not registered under the Investment Company Act of 1940 and was not subject to its requirements or the requirements of the Internal Revenue Code relating to regulated investment companies, which, if it were, might have adversely affected its performance. |
| 3 | Past performance is not predictive of future performance. The performance data does not reflect the deduction of taxes that a shareholder would pay on Fund distributions or redemption of Fund shares. The Fund’s transfer agency expenses may be reduced by expense offsets from an unaffiliated transfer agent, without which performance would have been lower. |
| 4 | Performance for the Institutional Shares prior to May 29, 2009 is based on the performance of the Retail Shares. Performance for the R6 Shares prior to August 31, 2016 is based on the performance of the Institutional Shares, and prior to May 29, 2009 is based on the Retail Shares. The Retail Shares have a distribution fee, but Institutional Shares and R6 Shares do not. If the annual returns for the Institutional Shares and R6 Shares prior to May 29, 2009 did not reflect this fee, the returns would be higher. |
2
| | |
| December 31, 2018 (Unaudited) | | Baron Partners Fund |
TOP TEN HOLDINGSASOF DECEMBER 31, 2018
| | | | |
| | | Percent of Total
Investments | |
Tesla, Inc. | | | 14.5% | |
CoStar Group, Inc. | | | 11.6% | |
Vail Resorts, Inc. | | | 7.6% | |
Arch Capital Group Ltd. | | | 7.4% | |
Hyatt Hotels Corp. | | | 6.9% | |
IDEXX Laboratories, Inc. | | | 6.6% | |
FactSet Research Systems, Inc. | | | 6.0% | |
Space Exploration Technologies Corp. | | | 5.0% | |
The Charles Schwab Corp. | | | 4.7% | |
Gartner, Inc. | | | 4.3% | |
| |
| | | | 74.6% | |
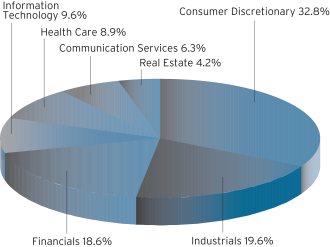
SECTOR BREAKDOWNASOF DECEMBER 31, 2018†
(as a percentage of total investments)
MANAGEMENT’S DISCUSSIONOF FUND PERFORMANCE
For the year ended December 31, 2018, Baron Partners Fund1 declined 2.01%, outperforming the Russell Midcap Growth Index, which declined 4.75%.
The Fund has performed well since its conversion into an open-end mutual fund on April 30, 2003. In the period since the Fund’s conversion through December 31, 2018, the Fund gained an annualized 12.43% versus an annualized 10.61% for the Russell Midcap Growth Index. The Fund also has meaningfully outperformed the Russell Midcap Growth Index since its inception on January 31, 1992, gaining an annualized 12.25%* compared to an annualized 9.20% for its index.
Baron Partners Fund invests primarily in U.S. companies of any size with, in our view, significant long-term growth potential. We believe our process can identify investment opportunities that are attractively priced relative to future prospects. The Fund is non-diversified, so its top 10 holdings are expected to comprise a significant percentage of the portfolio, and the Fund uses leverage, both of which increase risk. Of course, there can be no assurance that we will be successful in achieving the Fund’s investment goals.
After a volatile start to the year, the markets posted mostly positive returns for the second and third quarters of 2018, buoyed by strong corporate earnings results and economic data. Investor sentiment took an abrupt turn in the fourth quarter as projections of a slowdown in economic momentum and corporate earnings growth, coupled with rising interest rates, helped spur a sell-off that lasted through much of the rest of the year. The U.S.-China trade dispute and partial federal government shutdown also put pressure on markets and 2018 ended as the worst year for U.S. stocks since 2008.
At the sector level, the Fund’s investments in Information Technology and Health Care contributed to performance. Financials, Real Estate, and Consumer Discretionary detracted in the period.
CoStar Group, Inc., a real estate information and marketing services company, was the top contributor in 2018. Share appreciation was driven by consistently robust financial results. Business trends are excellent, and we are excited about the successful integration of ForRent into the Apartments.com network. We foresee sustained 20% growth in the multi-family market, and we expect the company to begin raising prices given its unique competitive position in commercial real estate data. Over time, we believe CoStar has an even larger opportunity to optimize its Premium Lister product.
Marriott Vacations Worldwide Corp., a manager and seller of timeshare resorts, was the largest detractor in 2018. Shares fell due to investor concerns over the possible end of the business cycle and the effects of a potential recession on the company’s earnings. Data from Marriott’s Interval Leisure acquisition also drove the decline, despite being in line with the company’s expectations. We believe Marriott should grow as it integrates Interval Leisure and generates strong cash flow for debt reduction and share buybacks, especially with the stock trading at double-digit free cash flow yields.
We remain optimistic about the long-term environment for U.S. equities. While we always monitor macro developments that may have a short-term impact on the markets, we remain focused on the long term. We expect to continue to establish long positions in securities that, in our opinion, have favorable price-to-value characteristics based on our assessment of their prospects for future growth and profitability.
| † | Sector levels are provided from the Global Industry Classification Standard (“GICS”), developed and exclusively owned by MSCI, Inc. and Standard & Poor’s Financial Services LLC, unless otherwise stated that they have been reclassified or classified by the Adviser. All GICS data is provided “as is” with no warranties. |
| 1 | Performance information reflects results of the Retail Shares. |
| * | Please see Footnote 2 on page 2. |
3
| | |
| Baron Focused Growth Fund(Unaudited) | | December 31, 2018 |
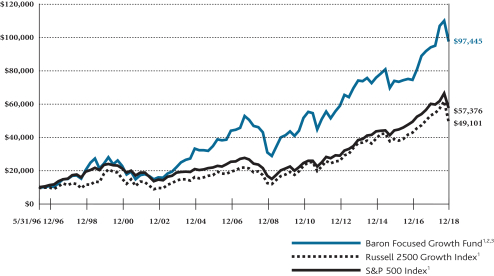
COMPARISONOFTHECHANGEIN VALUEOF $10,000INVESTMENTIN BARON FOCUSED GROWTH FUND (RETAIL SHARES)
INRELATIONTOTHE RUSSELL 2500 GROWTH INDEXANDTHE S&P 500 INDEX
| | | | | | | | | | | | | | | | | | | | |
| AVERAGE ANNUAL TOTAL RETURNSFORTHEPERIODSENDED DECEMBER 31, 2018 | |
| | | One
Year | | | Three
Years | | | Five
Years | | | Ten
Years | | | Since
Inception
(May 31,
1996) | |
Baron Focused Growth Fund — Retail Shares1,2,3 | | | 3.75% | | | | 9.69% | | | | 5.68% | | | | 12.24% | | | | 10.61% | |
Baron Focused Growth Fund — Institutional Shares1,2,3,4 | | | 4.07% | | | | 9.98% | | | | 5.95% | | | | 12.50% | | | | 10.72% | |
Baron Focused Growth Fund — R6 Shares1,2,3,4 | | | 4.07% | | | | 10.00% | | | | 5.96% | | | | 12.51% | | | | 10.73% | |
Russell 2500 Growth Index1 | | | (7.47)% | | | | 8.11% | | | | 6.19% | | | | 14.76% | | | | 7.30% | |
S&P 500 Index1 | | | (4.38)% | | | | 9.26% | | | | 8.49% | | | | 13.12% | | | | 8.04% | |
| 1 | The indexes are unmanaged. The Russell 2500™ Growth Index measures the performance of small to medium-sized U.S. companies that are classified as growth and the S&P 500 Index of 500 widely held large-cap U.S. companies. The indexes and Baron Focused Growth Fund are with dividends, which positively impact the performance results. |
| 2 | Reflects the actual fees and expenses that were charged when the Fund was a partnership. The predecessor partnership charged a 15% performance fee through 2003 after reaching a certain performance benchmark. If the annual returns for the Fund did not reflect the performance fees for the years the predecessor partnership charged a performance fee, the returns would be higher. The Fund’s shareholders will not be charged a performance fee. The predecessor partnership’s performance is only for periods before the Fund’s registration statement was effective, which was June 30, 2008. During those periods, the predecessor partnership was not registered under the Investment Company Act of 1940 and was not subject to its requirements or the requirements of the Internal Revenue Code relating to regulated investment companies, which, if it were, might have adversely affected its performance. |
| 3 | Past performance is not predictive of future performance. The performance data does not reflect the deduction of taxes that a shareholder would pay on Fund distributions or redemption of Fund shares. The Adviser has reimbursed certain Fund expenses (by contract as long as BAMCO, Inc. is the Adviser to the Fund) and the Fund’s transfer agency expenses may be reduced by expense offsets from an unaffiliated transfer agent, without which performance would have been lower. |
| 4 | Performance for the Institutional Shares prior to May 29, 2009 is based on the performance of the Retail Shares. Performance for the R6 Shares prior to August 31, 2016 is based on the performance of the Institutional Shares, and prior to May 29, 2009 is based on the Retail Shares. The Retail Shares have a distribution fee, but Institutional Shares and R6 Shares do not. If the annual returns for the Institutional Shares and R6 Shares prior to May 29, 2009 did not reflect this fee, the returns would be higher. |
4
| | |
| December 31, 2018 (Unaudited) | | Baron Focused Growth Fund |
TOP TEN HOLDINGSASOF DECEMBER 31, 2018
| | | | |
| | | Percent of
Net Assets | |
Tesla, Inc. | | | 14.7% | |
Vail Resorts, Inc. | | | 14.1% | |
CoStar Group, Inc. | | | 11.6% | |
Hyatt Hotels Corp. | | | 11.3% | |
FactSet Research Systems, Inc. | | | 7.4% | |
Iridium Communications Inc. | | | 6.9% | |
Choice Hotels International, Inc. | | | 5.3% | |
Manchester United plc | | | 5.1% | |
Benefitfocus, Inc. | | | 5.0% | |
Space Exploration Technologies Corp. | | | 5.0% | |
| |
| | | | 86.4% | |
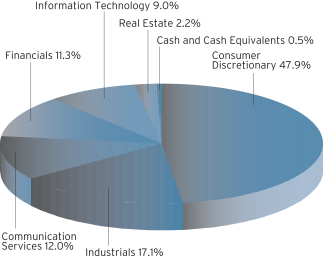
SECTOR BREAKDOWNASOF DECEMBER 31, 2018†
(as a percentage of net assets)
MANAGEMENT’S DISCUSSIONOF FUND PERFORMANCE
For the year ended December 31, 2018, Baron Focused Growth Fund1 appreciated 3.75%, outperforming the Russell 2500 Growth Index, which declined 7.47%.
Since its inception on May 31, 1996 through December 31, 2018, the Fund has outperformed the Russell 2500 Growth Index, gaining an annualized 10.61%*, compared to an annualized 7.30% for its index.
Baron Focused Growth Fund invests in anon-diversified portfolio of companies that we believe are well capitalized, and have exceptional management, significant growth potential, and sustainable barriers to competition. The Fund isnon-diversified, which is a riskier investment strategy. Of course, there can be no assurance that we will be successful in achieving the Fund’s investment goals.
After a volatile start to the year, the markets posted mostly positive returns for the second and third quarters of 2018, buoyed by strong corporate earnings results and economic data. Investor sentiment took an abrupt turn in the fourth quarter as projections of a slowdown in economic momentum and corporate earnings growth, coupled with rising interest rates, helped spur a sell-off that lasted through much of the rest of the year. The U.S.-China trade dispute and partial federal government shutdown also put pressure on markets and 2018 ended as the worst year for U.S. stocks since 2008.
At the sector level, the Fund’s investments in Information Technology, Communication Services, and Industrials contributed to performance. Consumer Discretionary, Financials, and Health Care were the largest detractors in the period.
The largest contributor was Iridium Communications Inc., a leading provider of mobile voice and data communications services, and the only commercial provider offering true global coverage. Following years of investments, Iridium successfully launched 65 of its 75 new satellites into orbit, reducing execution and liquidity risks and resulting in strong stock appreciation. In addition, the company received a key certification, increasing its ability to compete in Maritime. We believe the positive development and higher valuation of Iridium subsidiary Aireon LLC create additional value for Iridium shareholders.
The largest detractor was Red Rock Resorts, Inc., a regional casino operator with assets mainly in the Las Vegas locals market. Shares declined due to investor concerns over a slowdown in traffic at its casinos and the start of a potential recession. However, the market has rebounded from a lackluster summer and the Las Vegas economy looks strong for 2019. While the company is levered due to renovations at two casinos, we believe it should be able to pay down debt after their completion in the third quarter of 2019.
We remain optimistic about the long-term environment for U.S. equities. While we monitor geopolitical and other developments that may have a short-term impact on the markets, we remain focused on the long term. We expect to continue to establish positions in small- andmid-sized businesses that, in our opinion, have favorableprice-to-value characteristics based on our assessment of prospects for future growth and profitability.
| † | Sector levels are provided from the Global Industry Classification Standard (“GICS”), developed and exclusively owned by MSCI, Inc. and Standard & Poor’s Financial Services LLC, unless otherwise stated that they have been reclassified or classified by the Adviser. All GICS data is provided “as is” with no warranties. |
| 1 | Performance information reflects results of the Retail Shares. |
| * | Please see Footnote 2 on page 4. |
5
| | |
| Baron International Growth Fund(Unaudited) | | December 31, 2018 |
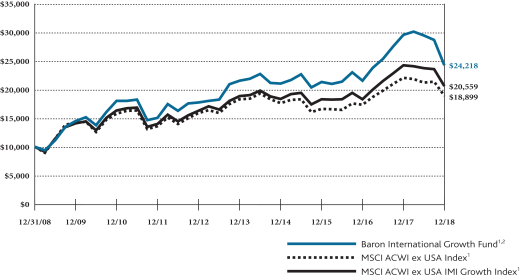
COMPARISONOFTHECHANGEIN VALUEOF $10,000INVESTMENTIN BARON INTERNATIONAL GROWTH FUND† (RETAIL SHARES)
INRELATIONTOTHE MSCI ACWIEX USA INDEXANDTHE MSCI ACWIEX USA IMI GROWTH INDEX
| | | | | | | | | | | | | | | | |
| AVERAGE ANNUAL TOTAL RETURNSFORTHEPERIODSENDED DECEMBER 31, 2018 |
| | | | | One
Year | | | Three
Years | | | Five
Years | | | Ten Years and
Since Inception
(December 31,
2008) |
Baron International Growth Fund — Retail Shares
1,2 | | | | | (17.90)% | | | | 4.38% | | | | 2.37% | | | 9.25% |
Baron International Growth Fund — Institutional Shares1,2,3 | | | | | (17.68)% | | | | 4.64% | | | | 2.63% | | | 9.52% |
Baron International Growth Fund — R6 Shares
1,2,3 | | | | | (17.68)% | | | | 4.64% | | | | 2.63% | | | 9.52% |
MSCI ACWI ex USA Index1 | | | | | (14.20)% | | | | 4.48% | | | | 0.68% | | | 6.57% |
MSCI ACWI ex USA IMI Growth Index1 | | | | | (14.96)% | | | | 4.01% | | | | 1.76% | | | 7.47% |
| † | The Fund’s historical performance was impacted by gains from IPOs and/or secondary offerings. There is no guarantee that these results can be repeated or that the Fund’s level of participation in IPOs and secondary offerings will be the same in the future. |
| 1 | The MSCI ACWI ex USA Index Net USD is an unmanaged, free float-adjusted market capitalization weighted index that is designed to measure the equity market performance of large- and mid-cap securities across developed and emerging markets, excluding the United States. The MSCI ACWI ex USA IMI Growth Index Net USD is an unmanaged, free float-adjusted market capitalization weighted index that is designed to measure the performance of large-, mid-, and small-cap growth securities across developed and emerging markets, excluding the United States. The indexes and Baron International Growth Fund include reinvestment of dividends, net of foreign withholding taxes, which positively impact the performance results. |
| 2 | Past performance is not predictive of future performance. The performance data does not reflect the deduction of taxes that a shareholder would pay on Fund distributions or redemption of Fund shares. The Adviser has reimbursed certain Fund expenses (by contract as long as BAMCO, Inc. is the Adviser to the Fund) and the Fund’s transfer agency expenses may be reduced by expense offsets from an unaffiliated transfer agent, without which performance would have been lower. |
| 3 | Performance for the Institutional Shares prior to May 29, 2009 is based on the performance of the Retail Shares. Performance for the R6 Shares prior to August 31, 2016 is based on the performance of the Institutional Shares, and prior to May 29, 2009 is based on the Retail Shares. The Retail Shares have a distribution fee, but Institutional Shares and R6 Shares do not. If the annual returns for the Institutional Shares and R6 Shares prior to May 29, 2009 did not reflect this fee, the returns would be higher. |
6
| | |
| December 31, 2018 (Unaudited) | | Baron International Growth Fund |
TOP TEN HOLDINGSASOF DECEMBER 31, 2018
| | | | |
| | | Percent of
Net Assets | |
AstraZeneca PLC | | | 2.9% | |
argenx SE | | | 2.6% | |
Nokia Corporation | | | 2.5% | |
Danone SA | | | 2.2% | |
Constellation Software, Inc. | | | 2.2% | |
Mellanox Technologies Ltd. | | | 2.1% | |
Golar LNG Ltd. | | | 1.8% | |
Linde Public Limited Company | | | 1.6% | |
Aena SME, S.A. | | | 1.6% | |
Abcam plc | | | 1.6% | |
| |
| | | | 21.1% | |
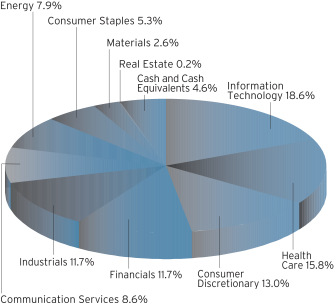
SECTOR BREAKDOWNASOF DECEMBER 31, 2018†
(as a percentage of net assets)
MANAGEMENT’S DISCUSSIONOF FUND PERFORMANCE
For the year ended December 31, 2018, Baron International Growth Fund1 declined 17.90%, underperforming the MSCI ACWI ex USA Index, which fell 14.20%.
Baron International Growth Fund is a diversified fund that invests for the long term primarily in securities of non-U.S. growth companies. The Fund expects to diversify among several developed countries and developing countries throughout the world, although the Fund’s total exposure to developing countries will not exceed 35%. The Fund may purchase securities of companies of any size. Of course, there can be no guarantee that we will be successful in achieving the Fund’s investment goals.
After a strong 2017, international equities reversed course in 2018, pressured by several macro headwinds. The broad withdrawal of liquidity, trade tensions, and uncertainty around political and reform momentum in several key countries weighed on performance throughout much of the year. In early October, the U.S. equity markets began to experience the impact of the global liquidity and protectionist squeeze, setting up what we believe was a significant bottom in international assets. As the year drew to an end, international indexes outperformed the U.S. and global indexes for the first time in several quarters.
On a country basis, holdings in Israel, the Netherlands, and Italy contributed the most to performance. Investments in Japan, U.K., and Canada were the biggest detractors.
On a sector basis, no sector contributed. Investments in Financials, Consumer Discretionary, and Energy detracted the most in the period.
The top contributor was Wix.com Ltd., an Israeli internet company helping micro businesses build and maintain websites and streamline business operations. With over 130 million registered users and over 3.5 million premium subscribers, Wix is the industry leader. Shares of Wix contributed to performance in 2018 as new product introductions drove continued rapid growth. We retain conviction in Wix due to its large market opportunity, its strong cohort economics, and its brand name and innovative culture.
RIB Software SE was the largest detractor in the period. Shares of this German software company servicing the construction industry declined after management raised equity without communicating appropriately and failed to update the market on the progress of new initiatives. Shares continued to suffer after joint partner Flextronic exited a key initiative. We retain conviction, as RIB is deploying funds from its equity raise into relationships we think can help expand the company’s addressable customer base.
While we believe unconventional U.S. foreign policy initiatives have driven international equity risk premium higher and earnings multiples lower in the short term, we are encouraged by several emerging bright spots. Should the outlook for foreign and trade policy reduce pressure on China, and Federal Reserve policy shift to a marginally more accommodative stance, we believe many of our existing investments offer material upside from current levels. As always, we believe that our forward-looking and bottom-up fundamental approach positions us to discover exciting long-term investment opportunities regardless of the market environment.
| † | Sector levels are provided from the Global Industry Classification Standard (“GICS”), developed and exclusively owned by MSCI, Inc. and Standard & Poor’s Financial Services LLC, unless otherwise stated that they have been reclassified or classified by the Adviser. All GICS data is provided “as is” with no warranties. |
| 1 | Performance information reflects results of the Retail Shares. |
7
| | |
| Baron Real Estate Fund(Unaudited) | | December 31, 2018 |
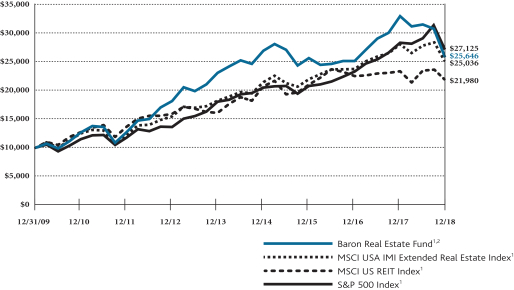
COMPARISONOFTHECHANGEIN VALUEOF $10,000INVESTMENTIN BARON REAL ESTATE FUND† (RETAIL SHARES)
INRELATIONTOTHE MSCI USA IMI EXTENDED REAL ESTATE INDEX, MSCI US REIT INDEXANDTHE S&P 500 INDEX
| | | | | | | | | | | | | | |
| AVERAGE ANNUAL TOTAL RETURNSFORTHEPERIODSENDED DECEMBER 31, 2018 |
| | | One
Year | | | Three
Years | | | Five
Years | | | Since
Inception
(December 31,
2009) |
Baron Real Estate Fund — Retail Shares1,2 | | | (22.22)% | | | | (0.04)% | | | | 2.12% | | | 11.03% |
Baron Real Estate Fund — Institutional Shares
1,2 | | | (22.04)% | | | | 0.22% | | | | 2.38% | | | 11.31% |
Baron Real Estate Fund — R6 Shares1,2,3 | | | (22.03)% | | | | 0.23% | | | | 2.39% | | | 11.31% |
MSCI USA IMI Extended Real Estate Index1 | | | (10.73)% | | | | 4.48% | | | | 6.59% | | | 10.74% |
MSCI US REIT Index1 | | | (5.83)% | | | | 1.53% | | | | 6.43% | | | 9.14% |
S&P 500 Index1 | | | (4.38)% | | | | 9.26% | | | | 8.49% | | | 11.73% |
| † | The Fund’s historical performance was impacted by gains from IPOs and/or secondary offerings. There is no guarantee that these results can be repeated or that the Fund’s level of participation in IPOs and secondary offerings will be the same in the future. |
| 1 | The indexes are unmanaged. The MSCI USA IMI Extended Real Estate Index is a custom index calculated by MSCI for, and as requested by, BAMCO, Inc. The index includes real estate and real estate-related GICS classification securities. MSCI makes no express or implied warranties or representation and shall have no liability whatsoever with respect to any MSCI data contained herein. The MSCI data may not be further redistributed or used as a basis for other indexes or any securities or financial products. This report is not approved, reviewed or produced by MSCI. The MSCI US REIT Index is a free float-adjusted market capitalization index that measures the performance of all equity REITs in the U.S. equity market, except for specialty equity REITs that do not generate a majority of their revenue and income from real estate rental and leasing operations. The S&P 500 Index measures the performance of 500 widely held large-cap U.S. companies. The indexes and Baron Real Estate Fund are with dividends, which positively impact the performance results. |
| 2 | Past performance is not predictive of future performance. The performance data does not reflect the deduction of taxes that a shareholder would pay on Fund distributions or redemption of Fund shares. The Adviser has reimbursed certain Fund expenses (by contract as long as BAMCO, Inc. is the Adviser to the Fund) and the Fund’s transfer agency expenses may be reduced by expense offsets from an unaffiliated transfer agent, without which performance would have been lower. |
| 3 | Performance for the R6 Shares prior to January 29, 2016 is based on the performance of the Institutional Shares. |
8
| | |
| December 31, 2018 (Unaudited) | | Baron Real Estate Fund |
TOP TEN HOLDINGSASOF DECEMBER 31, 2018
| | | | |
| | | Percent of
Net Asset | |
American Tower Corp. | | | 7.3% | |
CBRE Group, Inc. | | | 6.4% | |
Equinix, Inc. | | | 6.3% | |
InterXion Holding N.V. | | | 5.2% | |
MGM Resorts International | | | 4.6% | |
Lowe’s Companies, Inc. | | | 4.1% | |
Brookfield Asset Management, Inc. | | | 3.7% | |
Home Depot, Inc. | | | 3.6% | |
D.R. Horton, Inc. | | | 3.4% | |
Americold Realty Trust | | | 2.8% | |
| |
| | | | 47.4% | |
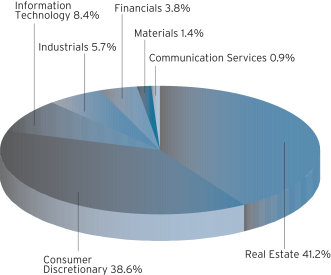
SECTOR BREAKDOWNASOF DECEMBER 31, 2018†
(as a percentage of total investments)
MANAGEMENT’S DISCUSSIONOF FUND PERFORMANCE
For the year ended December 31, 2018, Baron Real Estate Fund1 declined 22.22%, trailing the MSCI USA IMI Extended Real Estate Index, which fell 10.73%. Since its inception on December 31, 2009 through December 31, 2018, the Fund has slightly outperformed its index, generating an annualized return of 11.03%, compared with an annualized return of 10.74% for the index.
Baron Real Estate Fund is a diversified fund that, under normal circumstances, invests 80% of its net assets in real estate and real estate-related companies of all sizes, and in companies which, in the opinion of the Adviser, own significant real estate assets at the time of investment. The Fund seeks to invest in well-managed companies that we believe have significant long-term growth opportunities. The Fund’s investment universe extends beyond real estate investment trusts (REITs) to include hotels, senior housing operators, casino and gaming operators, tower operators, infrastructure-related companies and master limited partnerships, data centers, building products companies, real estate service companies, and real estate operating companies. Of course, there can be no guarantee that we will be successful in achieving the Fund’s investment goals.
2018 was a challenging year for many of the real estate and real estate-related companies in which the Fund invests. In particular, the spike in U.S. interest rates and the Federal Reserve’s increasingly assertive removal of monetary accommodation sparked a negative correction in the real estate market, with housing-related securities such as homebuilders, building product/services companies, home center retailers, and construction materials companies especially hard hit.
Our investments in tower operators & wireless telecommunication services contributed to performance. Holdings in the building products/services, casinos & gaming operators, and hotels & leisure categories were the largest detractors.
The top contributor was American Tower Corp. Shares of this global owner of wireless towers rose as continued network build activity boosted the company’s rising financial momentum. We believe American Tower’s balance sheet andin-country scale afford it the best growth opportunities of any major tower company globally.
The top detractor was Macquarie Infrastructure Corporation, which owns a diversified group of U.S. infrastructure assets. Shares fell during the period held following a 30% dividend cut and projected declines in free cash flow in 2018 after several contract cancellations within its liquid storage segment. We exited our position in February due to the impairment of growth visibility and uncertainty surrounding contract cancellations.
While the outlook for real estate is more scrutinized than in the early stages of the economic and real estate recovery (i.e., economic growth is tempering, commercial real estate construction activity has increased, lenders are requiring wider credit spreads, and the Federal Reserve continues to monitor conditions that might lead to a pullback from 10 years of monetary accommodation), we maintain a favorable outlook because our research continues to confirm that the opportunities for real estate outweigh the caveats identified above. Absent a recession, our sense is that business prospects for many categories of real estate will remain positive.
| † | Sector levels are provided from the Global Industry Classification Standard (“GICS”), developed and exclusively owned by MSCI, Inc. and Standard & Poor’s Financial Services LLC, unless otherwise stated that they have been reclassified or classified by the Adviser. All GICS data is provided “as is” with no warranties. |
| 1 | Performance information reflects results of the Retail Shares. |
9
| | |
| Baron Emerging Markets Fund(Unaudited) | | December 31, 2018 |
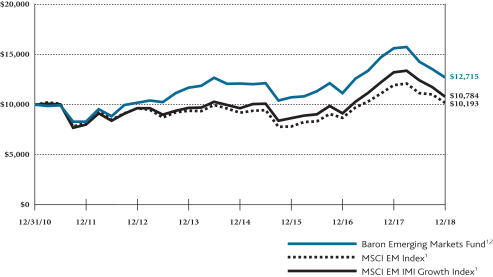
COMPARISONOFTHECHANGEIN VALUEOF $10,000INVESTMENTIN BARON EMERGING MARKETS FUND (RETAIL SHARES)
INRELATIONTOTHE MSCI EM INDEXANDTHE MSCI EM IMI GROWTH INDEX
| | | | | | | | | | | | | | |
| AVERAGE ANNUAL TOTAL RETURNSFORTHEPERIODSENDED DECEMBER 31, 2018 |
| | | One
Year | | | Three
Years | | | Five
Years | | | Since
Inception
(December 31,
2010) |
Baron Emerging Markets Fund — Retail Shares1,2 | | | (18.67)% | | | | 5.80% | | | | 1.71% | | | 3.05% |
Baron Emerging Markets Fund — Institutional Shares1,2 | | | (18.49)% | | | | 6.06% | | | | 1.96% | | | 3.30% |
Baron Emerging Markets Fund — R6 Shares1,2,3 | | | (18.47)% | | | | 6.09% | | | | 1.98% | | | 3.31% |
MSCI EM Index1 | | | (14.58)% | | | | 9.25% | | | | 1.65% | | | 0.24% |
MSCI EM IMI Growth Index1 | | | (18.44)% | | | | 7.70% | | | | 2.22% | | | 0.95% |
| 1 | The MSCI EM (Emerging Markets) Index and the MSCI EM (Emerging Markets) IMI Growth Index are unmanaged, free float-adjusted market capitalization weighted indexes. The MSCI EM (Emerging Markets) Index Net USD and the MSCI EM (Emerging Markets) IMI Growth Index Net USD are designed to measure the equity market performance of large-, mid-, and small-cap securities in the emerging markets. The MSCI EM (Emerging Markets) IMI Growth Index Net USD screens for growth-style securities. The indexes and the Fund include reinvestment of dividends, net of withholding taxes, which positively impact the performance results. |
| 2 | Past performance is not predictive of future performance. The performance data does not reflect the deduction of taxes that a shareholder would pay on Fund distributions or redemption of Fund shares. The Adviser has reimbursed certain Fund expenses (by contract as long as BAMCO, Inc. is the Adviser to the Fund) and the Fund’s transfer agency expenses may be reduced by expense offsets from an unaffiliated transfer agent without which performance would have been lower. |
| 3 | Performance for the R6 Shares prior to January 29, 2016 is based on the performance of the Institutional Shares. |
10
| | |
| December 31, 2018 (Unaudited) | | Baron Emerging Markets Fund |
TOP TEN HOLDINGSASOF DECEMBER 31, 2018
| | | | |
| | | Percent of
Net Assets | |
Tencent Holdings Limited | | | 3.3% | |
Alibaba Group Holding Limited | | | 2.4% | |
Taiwan Semiconductor Manufacturing Company Ltd. | | | 2.4% | |
China Tower Corporation Limited | | | 2.3% | |
Samsung Electronics Co., Ltd. | | | 2.3% | |
Petróleo Brasileiro S.A. — Petrobras | | | 2.1% | |
China Mobile Ltd. | | | 1.7% | |
KIA Motors Corporation | | | 1.7% | |
Rumo S.A. | | | 1.7% | |
WH Group Limited | | | 1.6% | |
| |
| | | | 21.5% | |
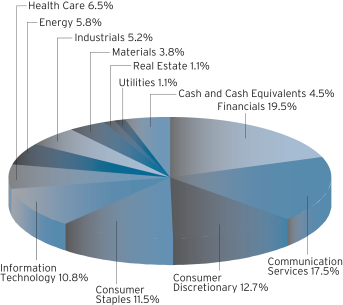
SECTOR BREAKDOWNASOF DECEMBER 31, 2018†
(as a percentage of net assets)
MANAGEMENT’S DISCUSSIONOF FUND PERFORMANCE
For the year ended December 31, 2018, Baron Emerging Markets Fund1 declined 18.67%, underperforming the MSCI EM Index, which fell 14.58%.
Baron Emerging Markets Fund is a diversified fund that invests for the long term primarily in companies of any size that have their principal business activities or trading markets in developing countries. The Fund may invest up to 20% of its net assets in developed and frontier countries. The Fund seeks to invest in companies that have significant long-term growth prospects and to purchase them at prices we believe to be favorable. Of course, there can be no guarantee that we will be successful in achieving the Fund’s investment goals.
After a strong 2017, emerging markets reversed course in 2018, pressured by several macro headwinds. The broad withdrawal of liquidity, trade tensions, and uncertainty around political and reform momentum in several key emerging market countries weighed on performance throughout much of the year. In early October, the U.S. equity markets began to experience the impact of the global liquidity and protectionist squeeze, setting up what we believe was a significant bottom in emerging market assets. As the year drew to an end, emerging markets outperformed the U.S. and global indexes for the first time in several quarters.
On a country basis, Taiwan and Hungary contributed the most to performance, while China, India, and Korea were the largest detractors.
On a sector basis, no sector contributed, while Financials, Communication Services, and Information Technology detracted the most.
China Tower Corp. Limited was the largest contributor. Following China Tower’s IPO over the summer, shares appreciated as fears of a merger between two important customers eased. China Tower is the largest owner of wireless towers globally, with dominant market share in China. We continue to believe the company will be a major beneficiary of the 5G network build in China. In addition, we think that despite offering deflationary pricing terms to customers, China Tower should be able to compound value in the double-digit range for more than five years.
Kangde Xin Composite Material Group Co., Ltd. was the largest detractor. Kangde is a leading specialty film producer based in China. Shares fell largely due to a weak Chinese macro environment that led to slow growth in downstream industries. In addition, a domestic market liquidity crunch adversely affected investor sentiment regarding the company’s high-pledged shares. We continue to believe in Kangde’s long-term prospects, and we think we could see a recovery in 2019 as liquidity issues are resolved and the Chinese economy recovers.
While we believe unconventional U.S. foreign policy initiatives have driven the emerging market equity risk premium higher and earnings multiples lower in the short term, we are encouraged by several emerging bright spots. Should the outlook for foreign and trade policy reduce pressure on China, and Fed policy shift to a marginally more accommodative stance, we believe many of our existing investments offer material upside from current levels. As always, we remain confident that our forward-looking andbottom-up fundamental approach positions us to discover what we believe are exciting long-term investment opportunities regardless of the market environment.
| † | Sector levels are provided from the Global Industry Classification Standard (“GICS”), developed and exclusively owned by MSCI, Inc. and Standard & Poor’s Financial Services LLC, unless otherwise stated that they have been reclassified or classified by the Adviser. All GICS data is provided “as is” with no warranties. |
| 1 | Performance information reflects results of the Retail Shares. |
11
| | |
| Baron Energy and Resources Fund(Unaudited) | | December 31, 2018 |
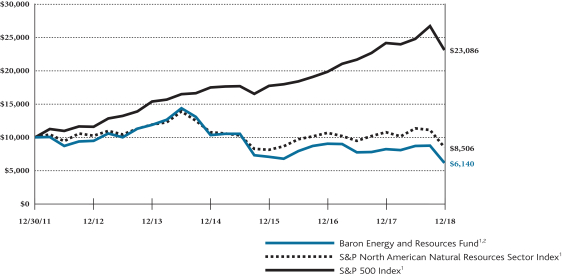
COMPARISONOFTHECHANGEIN VALUEOF $10,000INVESTMENTIN BARON ENERGYAND RESOURCES FUND (RETAIL SHARES)
INRELATIONTOTHE S&P NORTH AMERICAN NATURAL RESOURCES SECTOR INDEXANDTHE S&P 500 INDEX
| | | | | | | | | | | | | | |
| AVERAGE ANNUAL TOTAL RETURNSFORTHEPERIODSENDED DECEMBER 31, 2018 |
| | | One
Year | | | Three
Years | | | Five
Years | | | Since
Inception
(December 30,
2011) |
Baron Energy and Resources Fund — Retail Shares1,2 | | | (25.27)% | | | | (4.48)% | | | | (12.33)% | | | (6.73)% |
Baron Energy and Resources Fund — Institutional Shares1,2 | | | (25.03)% | | | | (4.23)% | | | | (12.12)% | | | (6.51)% |
Baron Energy and Resources Fund — R6 Shares1,2,3 | | | (25.03)% | | | | (4.23)% | | | | (12.12)% | | | (6.51)% |
S&P North American Natural Resources Sector Index1 | | | (21.07)% | | | | 1.50% | | | | (6.50)% | | | (2.28)% |
S&P 500 Index1 | | | (4.38)% | | | | 9.26% | | | | 8.49% | | | 12.70% |
| 1 | The indexes are unmanaged. The S&P North American Natural Resources Sector Index measures the performance of U.S.-traded natural resources-related stocks, including mining, energy, paper and forest products, and plantation owning companies. The S&P 500 Index measures the performance of 500 widely held large-cap U.S. companies. The indexes and Baron Energy and Resources Fund are with dividends, which positively impact the performance results. |
| 2 | Past performance is not predictive of future performance. The performance data does not reflect the deduction of taxes that a shareholder would pay on Fund distributions or redemption of Fund shares. The Adviser has reimbursed certain Fund expenses (by contract as long as BAMCO, Inc. is the Adviser to the Fund) and the Fund’s transfer agency expenses may be reduced by expense offsets from an unaffiliated transfer agent, without which performance would have been lower. |
| 3 | Performance for the R6 Shares prior to August 31, 2016 is based on the performance of the Institutional Shares. |
12
| | |
| December 31, 2018 (Unaudited) | | Baron Energy and Resources Fund |
TOP TEN HOLDINGSASOF DECEMBER 31, 2018
| | | | |
| | | Percent of
Net Assets | |
Tesla, Inc. | | | 13.8% | |
Concho Resources, Inc. | | | 12.6% | |
Aspen Technology, Inc. | | | 6.0% | |
TPI Composites, Inc. | | | 5.8% | |
Golar LNG Ltd. | | | 5.6% | |
Gravity Oilfield Services Inc. | | | 4.6% | |
Marathon Petroleum Corporation | | | 4.5% | |
Cactus, Inc. | | | 4.3% | |
Petróleo Brasileiro S.A. — Petrobras | | | 3.4% | |
Magnolia Oil & Gas Corporation | | | 2.8% | |
| |
| | | | 63.4% | |
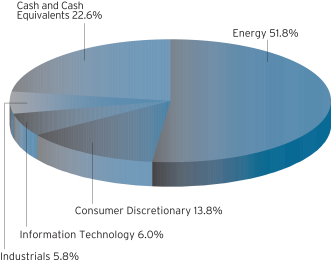
SECTOR BREAKDOWNASOF DECEMBER 31, 2018†
(as a percentage of net assets)
MANAGEMENT’S DISCUSSIONOF FUND PERFORMANCE
The Board of Trustees approved the liquidation of the Baron Energy and Resources Fund which will occur on or about April 29, 2019 (the “Liquidation Date”). Effective at the close of market on February 8, 2019, the Fund has ceased accepting purchase orders from new and existing investors. Shareholders of the Fund may redeem their shares or exchange their shares for shares of another Baron Fund that they are eligible to purchase at any time prior to the Liquidation Date. If a shareholder has not redeemed his or her shares as of the Liquidation Date, the shareholder’s account will be automatically redeemed and proceeds, subject to any required withholding, will be sent to the shareholder at the shareholder’s address of record. Additional information is included in the Fund’s supplement dated February 8, 2019 to the Prospectus, Summary Prospectus and SAI dated April 30, 2018.
For the year ended December 31, 2018, Baron Energy and Resources Fund1 declined 25.27%, underperforming the S&P 500 North American Natural Resources Sector Index, which declined 21.07%, and the S&P 500 Index, which fell 4.38%.
Baron Energy and Resources Fund is a diversified fund that, under normal circumstances, invests 80% of its net assets in equity securities in the form of common stock of U.S. and non-U.S. energy and resources companies and related companies and energy and resources master limited partnerships (MLPs) of any market capitalization. The Fund seeks to invest in businesses it believes have significant opportunities for growth, sustainable competitive advantages, exceptional management, and an attractive valuation. The Fund invests more than 25% of its net assets in the energy and resources industries.
After outperforming the broader market in the first half of the year, energy and resource-related stocks reversed course in the second half, ending the year with the sharpest losses since late 2008 as oil prices plummeted. It is clear to us that fears surrounding slowing global growth spurred by signs of a slowdown in China and elsewhere and increasing concerns surrounding the U.S.-China tariff war had a significantly negative impact on the stock market, which bled over into the markets for commodities and commodity-related shares such as energy.
On a sector basis, Information Technology, Consumer Discretionary, and Industrials contributed to performance, while Energy, Materials, and Utilities detracted.
The top contributor was RSP Permian, Inc., an exploration and production company focused on the Permian Basin in Texas. Shares appreciated after Concho Resources announced its acquisition of the company. We like the combined entity, as we believe it offers industry-leading production growth and exposure to some of the best acreage in the Delaware and Midland sub-basins. We believe Concho should benefit from larger scale associated with the integration and improvements in operating results.
Concho Resources, Inc. was the largest detractor in the period. Shares of this independent exploration and production company focused on the Permian basin in West Texas and New Mexico declined as investors became increasingly concerned about Permian oil takeaway constraints and their impact on Concho’s ability to grow oil volumes. We believe these issues are temporary, and we expect the company to deliver on its multi-year production growth plans. Management has indicated it will increase its focus on free cash flow generation, returning cash to shareholders, and improving capital efficiency.
The oil market and the direction of oil prices continue to be the dominant factors in driving share price performance across the energy landscape. Currently, the oil market remains quite volatile due to a myriad of risks and uncertainties facing both the demand and supply side of the market. While estimates for 2019 still show robust demand growth, investors are growing increasingly doubtful that these levels can be achieved in the face of slowing global economic growth. These fears have been exacerbated by the tariff war, the tightening of monetary policy in the U.S., and the rising dollar. While markets appear to have bounced back in the early part of 2019, many of these factors remain unresolved, and we think the outlook for energy and resource-related equities will hinge largely on these factors driving demand.
| † | Sector levels are provided from the Global Industry Classification Standard (“GICS”), developed and exclusively owned by MSCI, Inc. and Standard & Poor’s Financial Services LLC, unless otherwise stated that they have been reclassified or classified by the Adviser. All GICS data is provided “as is” with no warranties. |
| 1 | Performance information reflects results of the Retail Shares. |
13
| | |
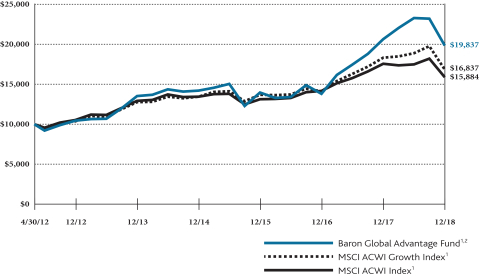
| Baron Global Advantage Fund(Unaudited) | | December 31, 2018 |
COMPARISONOFTHECHANGEIN VALUEOF $10,000INVESTMENTIN BARON GLOBAL ADVANTAGE FUND† (RETAIL SHARES)
INRELATIONTOTHE MSCI ACWI GROWTH INDEXANDTHE MSCI ACWI INDEX
| | | | | | | | | | | | | | | | |
| AVERAGE ANNUAL TOTAL RETURNSFORTHEPERIODSENDED DECEMBER 31, 2018 | |
| | | One
Year | | | Three
Years | | | Five
Years | | | Since
Inception
(April 30,
2012) | |
Baron Global Advantage Fund — Retail Shares1,2 | | | (3.84)% | | | | 12.43% | | | | 7.98% | | | | 10.82% | |
Baron Global Advantage Fund — Institutional Shares1,2 | | | (3.61)% | | | | 12.66% | | | | 8.20% | | | | 11.05% | |
Baron Global Advantage Fund — R6 Shares1,2,3 | | | (3.66)% | | | | 12.68% | | | | 8.22% | | | | 11.06% | |
MSCI ACWI Growth Index1 | | | (8.13)% | | | | 7.24% | | | | 5.72% | | | | 8.13% | |
MSCI ACWI Index1 | | | (9.42)% | | | | 6.60% | | | | 4.26% | | | | 7.19% | |
| † | The Fund’s historical performance was impacted by gains from IPOs and/or secondary offerings. There is no guarantee that these results can be repeated or that the Fund’s level of participation in IPOs and secondary offerings will be the same in the future. |
| 1 | The MSCI ACWI indexes cited are unmanaged, free float-adjusted market capitalization weighted indexes reflected in US dollars. The MSCI ACWI Growth Index Net USD measures the equity market performance of large- and mid-cap growth securities across developed and emerging markets. The MSCI ACWI Index Net USD measures the equity market performance of large- and mid-cap securities across developed and emerging markets. The indexes and Baron Global Advantage Fund include reinvestment of dividends, net of foreign withholding taxes, which positively impact the performance results. |
| 2 | Past performance is not predictive of future performance. The performance data does not reflect the deduction of taxes that a shareholder would pay on Fund distributions or redemption of Fund shares. The Adviser has reimbursed certain Fund expenses (by contract as long as BAMCO, Inc. is the Adviser to the Fund) and the Fund’s transfer agency expenses may be reduced by expense offsets from an unaffiliated transfer agent, without which performance would have been lower. |
| 3 | Performance for the R6 Shares prior to August 31, 2016 is based on the performance of the Institutional Shares. |
14
| | |
| December 31, 2018 (Unaudited) | | Baron Global Advantage Fund |
TOP TEN HOLDINGSASOF DECEMBER 31, 2018
| | | | |
| | | Percent of
Net Assets | |
Amazon.com, Inc. | | | 4.9% | |
Naspers Limited | | | 4.9% | |
Alphabet Inc. | | | 4.8% | |
argenx SE | | | 4.7% | |
Alibaba Group Holding Limited | | | 4.7% | |
Veeva Systems Inc. | | | 4.0% | |
Mellanox Technologies Ltd. | | | 3.9% | |
Housing Development Finance Corporation Limited | | | 3.7% | |
Constellation Software, Inc. | | | 3.6% | |
EPAM Systems, Inc. | | | 3.5% | |
| |
| | | | 42.7% | |
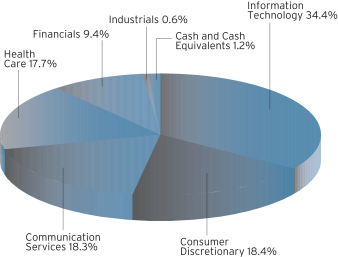
SECTOR BREAKDOWNASOF DECEMBER 31, 2018†
(as a percentage of net assets)
MANAGEMENT’S DISCUSSIONOF FUND PERFORMANCE
For the year ended December 31, 2018, Baron Global Advantage Fund1 declined 3.84%, outperforming the MSCI ACWI Growth Index, which fell 8.13%, and the MSCI ACWI Index, which declined 9.42%.
Baron Global Advantage Fund is a diversified fund that, under normal circumstances, invests primarily in equity securities in the form of common stock of established and emerging markets companies located throughout the world, with capitalizations within the range of companies included in the MSCI ACWI Growth Index. At all times, the Fund will have investments in equity securities of companies in at least three countries outside of the U.S. Under normal conditions, at least 40% of the Fund’s net assets will be invested in stocks of companies outside the U.S. (at least 30% if foreign market conditions are not favorable). The Fund seeks to invest in businesses it believes have significant opportunities for growth, sustainable competitive advantages, exceptional management, and an attractive valuation. Of course, there can be no guarantee that we will be successful in achieving the Fund’s investment goals.
The global markets were volatile in 2018, buffeted by trade tensions, credit tightening, and other macro-economic and geopolitical concerns. The Fund fared relatively better than its benchmark indexes as it benefited from a somewhat more favorable environment for the companies held by the Fund.
On a country basis, the Netherlands and Israel contributed to performance, while China, South Africa, and Japan were the largest detractors.
On a sector basis, Information Technology contributed to performance, while Communication Services, Consumer Discretionary, and Financials detracted the most.
The largest contributor was Dutch biotechnology company argenx SE. The company is developing innovative antibody therapies for treatment of cancer and autoimmune diseases. Recent share price appreciation was due to the resolution of confusion regarding a safety concern and a large licensing deal for the company’s second asset to treat acute mylegenous leukemia.
The largest detractor was Naspers Limited, a South African company that operates pay television, print media, and an internet division. The majority of Naspers’ value is attributed to its large ownership of Tencent Holdings. Naspers shares were down in 2018 as shares of Tencent declined. We retain conviction.
The digitization phenomenon that we believe will continue for years to come is starting to reach inflection points in many new areas where not only media and retail, but health care, transportation, and consumer banking are in a midst of full blown disruptions now. We believe this should continue to favor many of the companies in which we are invested.
Our goal remains to maximize long-term returns without taking significant risks of permanent loss of capital. We are optimistic about the long-term prospects of the companies in which we are invested and continue to search for new ideas and investment opportunities.
| † | Sector levels are provided from the Global Industry Classification Standard (“GICS”), developed and exclusively owned by MSCI, Inc. and Standard & Poor’s Financial Services LLC, unless otherwise stated that they have been reclassified or classified by the Adviser. All GICS data is provided “as is” with no warranties. |
| 1 | Performance information reflects results of the Retail Shares. |
15
| | |
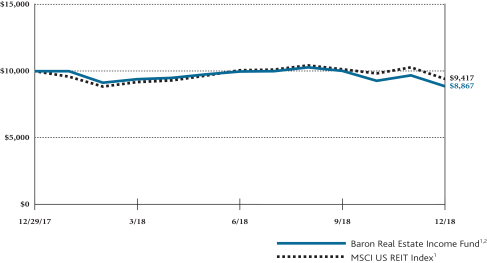
| Baron Real Estate Income Fund(Unaudited) | | December 31, 2018 |
COMPARISONOFTHECHANGEIN VALUEOF $10,000INVESTMENTIN BARON REAL ESTATE INCOME FUND (RETAIL SHARES)
INRELATIONTOTHE MSCI US REIT INDEX
| | |
AVERAGE ANNUAL TOTAL RETURNSFORTHEPERIODENDED DECEMBER 31, 2018 |
| | | One
Year and
Since
Inception
(December 29,
2017)* |
Baron Real Estate Income Fund — Retail Shares1,2 | | (11.33)% |
Baron Real Estate Income Fund — Institutional Shares1,2 | | (11.03)% |
Baron Real Estate Income Fund — R6 Shares1,2 | | (11.03)% |
MSCI US REIT Index1 | | (5.83)% |
| * | Commencement of investment operations was January 2, 2018. |
| 1 | The index is unmanaged. The MSCI US REIT Index is a free float-adjusted market capitalization index that measures the performance of all equity REITs in the US equity market, except for specialty equity REITs that do not generate a majority of their revenue and income from real estate rental and leasing operations. The index and Baron Real Estate Income Fund are with dividends, which positively impact the performance results. |
| 2 | Past performance is not predictive of future performance. The performance data does not reflect the deduction of taxes that a shareholder would pay on Fund distributions or redemption of Fund shares.The Adviser has reimbursed certain Fund expenses (by contract as long as BAMCO, Inc. is the Adviser to the Fund) and the Fund’s transfer agency expenses may be reduced by expense offsets from an unaffiliated transfer agent, without which performance would have been lower. |
16
| | |
| December 31, 2018 (Unaudited) | | Baron Real Estate Income Fund |
TOP TEN HOLDINGSASOF DECEMBER 31, 2018
| | | | |
| | | Percent of
Net Assets | |
American Tower Corp. | | | 6.7% | |
Equinix, Inc. | | | 6.4% | |
Americold Realty Trust | | | 5.5% | |
Equity Residential | | | 4.0% | |
AvalonBay Communities, Inc. | | | 3.9% | |
MGM Resorts International | | | 3.8% | |
Digital Realty Trust, Inc. | | | 3.7% | |
Alexandria Real Estate Equities, Inc. | | | 3.5% | |
Prologis, Inc. | | | 3.4% | |
Crown Castle International Corp. | | | 3.2% | |
| |
| | | | 44.1% | |
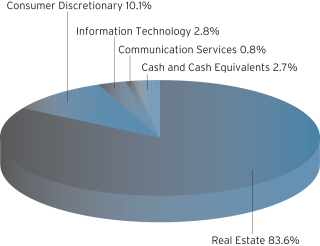
SECTOR BREAKDOWNASOF DECEMBER 31, 2018†
(as a percentage of net assets)
MANAGEMENT’S DISCUSSIONOF FUND PERFORMANCE
For the year ended December 31, 2018, Baron Real Estate Income Fund1 declined 11.33%, trailing the MSCI US REIT Index, which declined 5.83%.
Baron Real Estate Income Fund is a non-diversified fund that, under normal circumstances, invests at least 80% of its net assets in real estate income-producing securities and other real estate securities of any market capitalization, including common stocks and equity securities, debt and preferred securities, non-U.S. real estate income-producing securities, and any other real
estate-related yield securities. The Fund is likely to maintain a significant portion of its assets in real estate investment trusts (“REITs”). The Fund may also invest up to 35% of its total assets in debt securities that have a rating of, or equivalent to, at least “BBB” by Standard & Poor’s Corporation or “Baa” by Moody’s Investors Services, Inc. The Adviser seeks to invest in businesses it believes have sustainable competitive advantages, exceptional management, opportunities for growth, and an attractive valuation. Of course, there can be no guarantee that we will be successful in achieving the Fund’s investment goals.
After a volatile start to the year, REITs posted mostly positive returns for the second and third quarters of 2018 as international trade war fears that led to a risk averse mentality and a corresponding shift into “bond-like” securities such as REITs. While still losing ground in the fourth quarter, REITs also fared relatively better than the overall market, as projections of a slowdown in economic momentum and corporate earnings growth coupled with rising interest rates helped spur a flight to safety.
Our investments in other REITs, wireless tower REITs, and manufactured housing REITs contributed the most to returns in the period. Holdings in the non-REIT real estate companies, data center REITs, and office REITs categories were the largest detractors.
The top contributor was Americold Realty Trust, the world’s largest owner and operator of temperature-controlled warehouses. Strong performance resulted from positive 2017 and first quarter 2018 financial results and a rosy outlook for the remainder of the year. We remain excited about our investment in Americold because of a compelling fundamental backdrop for the cold storage industry and Americold’s differentiated growth strategy.
The top detractor was Macquarie Infrastructure Corporation, which owns a diversified group of U.S. infrastructure assets. Shares fell during the period held following a 30% dividend cut and projected declines in free cash flow in 2018 after several contract cancellations within its liquid storage segment. We exited our position in February due to the impairment of growth visibility and uncertainty surrounding contract cancellations.
Our view is that no one knows with clarity how macroeconomic changes, political events, and central bank actions may unfold, and it is virtually impossible to predict what the market’s reaction will be to these possible scenarios. We support the merits of a diversified investment strategy that incorporates allocations to both equity-like real estate securities and dividend-yield real estate securities such as REITs. We remain bullish about the prospects for many income-oriented real estate securities and the Fund.
| † | Sector levels are provided from the Global Industry Classification Standard (“GICS”), developed and exclusively owned by MSCI, Inc. and Standard & Poor’s Financial Services LLC, unless otherwise stated that they have been reclassified or classified by the Adviser. All GICS data is provided “as is” with no warranties. |
| 1 | Performance information reflects the results of Retail Shares. |
17
| | |
| Baron Health Care Fund(Unaudited) | | December 31, 2018 |
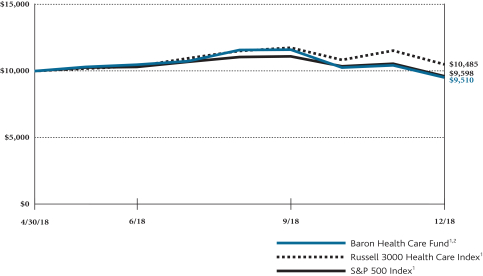
COMPARISONOFTHECHANGEIN VALUEOF $10,000INVESTMENTIN BARON HEALTH CARE FUND (RETAIL SHARES)
INRELATIONTOTHE RUSSELL 3000 HEALTH CARE INDEXANDTHE S&P 500 INDEX
| | |
| TOTAL RETURNSFORTHEPERIODENDED DECEMBER 31, 2018 |
| | | Since
Inception
(April 30,
2018) |
Baron Health Care Fund — Retail Shares1,2 | | (4.90)% |
Baron Health Care Fund — Institutional Shares1,2 | | (4.70)% |
Baron Health Care Fund — R6 Shares1,2 | | (4.80)% |
Russell 3000 Health Care Index1 | | 4.85% |
S&P 500 Index1 | | (4.02)% |
| 1 | The indexes are unmanaged. The Russell 3000 Health Care Index is a free float-adjusted market capitalization index that measures the performance of all equity in the US equity market. The S&P 500 Index measures the performance of 500 widely held large-cap U.S. companies. The indexes and Baron Health Care Fund are with dividends, which positively impact the performance results. |
| 2 | Past performance is not predictive of future performance. The performance data does not reflect the deduction of taxes that a shareholder would pay on Fund distributions or redemption of Fund shares.The Adviser has reimbursed certain Fund expenses (by contract as long as BAMCO, Inc. is the Adviser to the Fund) and the Fund’s transfer agency expenses may be reduced by expense offsets from an unaffiliated transfer agent, without which performance would have been lower. |
18
| | |
| December 31, 2018 (Unaudited) | | Baron Health Care Fund |
TOP TEN HOLDINGSASOF DECEMBER 31, 2018
| | | | |
| | | Percent of
Net Assets | |
UnitedHealth Group Incorporated | | | 6.8% | |
argenx SE | | | 4.6% | |
Teleflex Incorporated | | | 4.5% | |
AstraZeneca PLC | | | 4.0% | |
Vertex Pharmaceuticals Incorporated | | | 3.9% | |
Humana Inc. | | | 3.9% | |
Abbott Laboratories | | | 3.6% | |
Intuitive Surgical, Inc. | | | 3.3% | |
Bio-Techne Corporation | | | 3.3% | |
Boston Scientific Corporation | | | 3.2% | |
| |
| | | | 41.1% | |
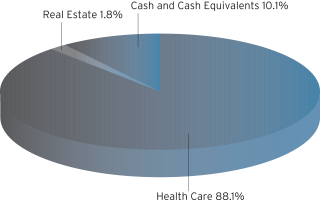
SECTOR BREAKDOWNASOF DECEMBER 31, 2018†
(as a percentage of net assets)
MANAGEMENT’S DISCUSSIONOF FUND PERFORMANCE
For the period April 30, 2018 to December 31, 2018, Baron Health Care Fund1declined 4.90%, underperforming the Russell 3000 Health Care Index, which rose 4.85%, and the S&P 500 Index, which declined 4.02%.
Baron Health Care Fund is a non-diversified fund that, under normal circumstances, invests at least 80% of its net assets in equity securities in the form of common stock of companies engaged in the research, development, production, sale, delivery or distribution of products and services related to the health care industry. These companies may include, among others, pharmaceutical companies, biotechnology companies, life sciences tools and services companies, health care equipment companies, health care supplies companies, managed health care
companies, health care services companies, health care facilities, health care distributors, and health care technology companies. The Fund’s allocation among the different sub-industries of the Health Care sector will vary depending upon the relative potential the Fund sees within each area. The Adviser seeks to invest in businesses it believes have significant growth opportunities, sustainable competitive advantages, exceptional management, and attractive valuations. The Fund may purchase securities of companies of any market capitalization and may invest in foreign stocks. Of course, there can be no guarantee that we will be successful in achieving the Fund’s investment goals.
The return of market volatility due to concerns over interest rates and the potential for a trade war sparked a rotation into defensive sectors, and Health Care fared relatively better than the overall market. Demand continued to rise for health care products and services, and we believe the market is beginning to take note of revolutionary breakthroughs that have introduced a wide range of new treatment options for many prevalent diseases. The regulatory and funding environment for life sciences companies remained favorable, and the number of new drug approvals by the FDA reached a new high in 2018.
Life sciences tools & services, health care technology, and health care services contributed the most to performance. Biotechnology, pharmaceuticals, and health care equipment were the largest detracting sub-industries from performance.
CareDX, Inc. was the largest contributor in the period. Shares of this transplant diagnostics company rose on the strength of rapid revenue growth as the result of a successful new test for kidney transplant compatibility and function called AlloSure. The test expands the company’s market opportunity by $2 billion. As CareDX has a substantial clinical, reimbursement, and market penetration lead over any prospective competitors, we believe that it can maintain majority share in this large market.
Sage Therapeutics, Inc. was the largest detractor in the period. Sage is developing novel drugs for central nervous system disorders, with the lead indications focused on depression. The company received a favorable FDA review of Zulressa in postpartum depression, but also received an FDA request for an additional three months to approve the drug given the need to formalize a risk evaluation mitigation strategy. We expect shares to appreciate in 2019 as data from Sage’s second asset matures. In early January, the company released positive clinical data regarding the oral version of its drug for postpartum depression and the stock has since recovered much of its losses.
As the health care industry grows, it is undergoing transformative change driven by fluctuating governmental policies and regulatory oversight, population demographics, and revolutionary advancements in technologies and treatment of disease. We believe the long-term secular trends impacting health care are giving rise to promising opportunities for investment professionals with an expert understanding of the technology, science, and regulatory landscapes involved, and we believe changes in the industry are opening doors to the types of bottom-up, fundamental investment opportunities we seek.
| † | Sector levels are provided from the Global Industry Classification Standard (“GICS”), developed and exclusively owned by MSCI, Inc. and Standard & Poor’s Financial Services LLC, unless otherwise stated that they have been reclassified or classified by the Adviser. All GICS data is provided “as is” with no warranties. |
| 1 | Performance information reflects results of the Retail Shares. |
19
| | |
| Baron Partners Fund | | December 31, 2018 |
STATEMENT OF NET ASSETS
| | | | | | | | | | | | |
| Shares | | | | | Cost | | | Value | |
| Common Stocks (124.07%) | |
| Communication Services (8.22%) | |
| | | | Interactive Media & Services (3.07%) | | | | | | | | |
| | 1,912,500 | | | Zillow Group, Inc., Cl A1 | | $ | 75,834,876 | | | $ | 60,109,875 | |
| | | |
| | | | Movies & Entertainment (5.15%) | | | | | | | | |
| | 5,300,000 | | | Manchester United plc, Cl A2 | | | 90,320,699 | | | | 100,594,000 | |
| | | | | | | | | | | | |
| | Total Communication Services | | | 166,155,575 | | | | 160,703,875 | |
| | | | | | | | | | | | |
|
| Consumer Discretionary (42.87%) | |
| | | | Automobile Manufacturers (18.89%) | | | | | | | | |
| | 1,110,000 | | | Tesla, Inc.1 | | | 236,819,490 | | | | 369,408,000 | |
| | | |
| | | | Casinos & Gaming (0.86%) | | | | | | | | |
| | 825,000 | | | Red Rock Resorts, Inc., Cl A | | | 19,726,484 | | | | 16,755,750 | |
| | | |
| | | | Hotels, Resorts & Cruise Lines (13.14%) | | | | | | | | |
| | 2,600,000 | | | Hyatt Hotels Corp., Cl A | | | 72,054,423 | | | | 175,760,000 | |
| | 850,000 | | | Marriott Vacations Worldwide Corp. | | | 94,527,425 | | | | 59,933,500 | |
| | 500,000 | | | Norwegian Cruise Line Holdings Ltd.1,2 | | | 23,556,905 | | | | 21,195,000 | |
| | | | | | | | | | | | |
| | | | | | | 190,138,753 | | | | 256,888,500 | |
| | | |
| | | | Leisure Facilities (9.98%) | | | | | | | | |
| | 925,800 | | | Vail Resorts, Inc. | | | 27,801,851 | | | | 195,177,156 | |
| | | | | | | | | | | | |
| | Total Consumer Discretionary | | | 474,486,578 | | | | 838,229,406 | |
| | | | | | | | | | | | |
|
| Financials (24.32%) | |
| | | | Financial Exchanges & Data (8.30%) | | | | | | | | |
| | 770,000 | | | FactSet Research Systems, Inc. | | | 50,187,585 | | | | 154,100,100 | |
| | 55,000 | | | MSCI, Inc. | | | 7,701,455 | | | | 8,108,650 | |
| | | | | | | | | | | | |
| | | | | | | 57,889,040 | | | | 162,208,750 | |
| | | |
| | | | Investment Banking & Brokerage (6.32%) | | | | | | | | |
| | 2,900,000 | | | The Charles Schwab Corp. | | | 50,169,842 | | | | 120,437,000 | |
| | 55,701 | | | Interactive Brokers Group, Inc., Cl A | | | 3,086,946 | | | | 3,044,060 | |
| | | | | | | | | | | | |
| | | | | | | 53,256,788 | | | | 123,481,060 | |
| | | |
| | | | Property & Casualty Insurance (9.70%) | | | | | | | | |
| | 7,100,000 | | | Arch Capital Group Ltd.1,2 | | | 31,667,350 | | | | 189,712,000 | |
| | | | | | | | | | | | |
| | Total Financials | | | 142,813,178 | | | | 475,401,810 | |
| | | | | | | | | | | | |
|
| Health Care (11.56%) | |
| | | | Health Care Equipment (8.56%) | | | | | | | | |
| | 900,000 | | | IDEXX Laboratories, Inc.1 | | | 39,330,858 | | | | 167,418,000 | |
| | | |
| | | | Health Care Supplies (3.00%) | | | | | | | | |
| | 280,000 | | | Align Technology, Inc.1 | | | 64,735,438 | | | | 58,640,400 | |
| | | | | | | | | | | | |
| | Total Health Care | | | 104,066,296 | | | | 226,058,400 | |
| | | | | | | | | | | | |
| | | | | | | | | | | | |
| Shares | | | | | Cost | | | Value | |
| Common Stocks (continued) | |
| Industrials (19.03%) | |
| | | | Aerospace & Defense (0.88%) | | | | | | | | |
| | 125,625 | | | HEICO Corp. | | $ | 9,632,520 | | | $ | 9,733,425 | |
| | 116,875 | | | HEICO Corp., Cl A | | | 7,586,429 | | | | 7,363,125 | |
| | | | | | | | | | | | |
| | | | | | | 17,218,949 | | | | 17,096,550 | |
| | | |
| | | | Research & Consulting Services (15.10%) | | | | | | | | |
| | 875,000 | | | CoStar Group, Inc.1 | | | 104,342,327 | | | | 295,172,500 | |
| | | |
| | | | Trading Companies & Distributors (3.05%) | | | | | | | | |
| | 850,000 | | | Air Lease Corp. | | | 27,229,908 | | | | 25,678,500 | |
| | 650,000 | | | Fastenal Co. | | | 28,501,411 | | | | 33,988,500 | |
| | | | | | | | | | | | |
| | | | | | | 55,731,319 | | | | 59,667,000 | |
| | | | | | | | | | | | |
| | Total Industrials | | | 177,292,595 | | | | 371,936,050 | |
| | | | | | | | | | | | |
|
| Information Technology (12.53%) | |
| | | | Application Software (6.73%) | | | | | | | | |
| | 774,629 | | | Benefitfocus, Inc.1 | | | 25,012,214 | | | | 35,416,038 | |
| | 1,200,000 | | | Guidewire Software, Inc.1 | | | 94,569,830 | | | | 96,276,000 | |
| | | | | | | | | | | | |
| | | | | | | 119,582,044 | | | | 131,692,038 | |
| | | |
| | | | IT Consulting & Other Services (5.56%) | | | | | | | | |
| | 850,000 | | | Gartner, Inc.1 | | | 94,205,471 | | | | 108,664,000 | |
| | | |
| | | | Semiconductors (0.24%) | | | | | | | | |
| | 35,000 | | | NVIDIA Corp. | | | 6,864,000 | | | | 4,672,500 | |
| | | | | | | | | | | | |
| | Total Information Technology | | | 220,651,515 | | | | 245,028,538 | |
| | | | | | | | | | | | |
|
| Real Estate (5.54%) | |
| | | | Hotel & Resort REITs (0.52%) | | | | | | | | |
| | 382,727 | | | MGM Growth Properties LLC, Cl A | | | 7,509,813 | | | | 10,107,820 | |
| | | |
| | | | Office REITs (1.72%) | | | | | | | | |
| | 985,000 | | | Douglas Emmett, Inc. | | | 28,041,642 | | | | 33,618,050 | |
| | | |
| | | | Specialized REITs (3.30%) | | | | | | | | |
| | 2,000,000 | | | Gaming and Leisure Properties, Inc. | | | 60,516,710 | | | | 64,620,000 | |
| | | | | | | | | | | | |
| | Total Real Estate | | | 96,068,165 | | | | 108,345,870 | |
| | | | | | | | | | | | |
| | Total Common Stocks | | | 1,381,533,902 | | | | 2,425,703,949 | |
| | | | | | | | | | | | |
| | | | | | | | | | | | |
| Private Common Stocks (2.39%) | |
| Industrials (2.39%) | |
| | | | Aerospace & Defense (2.39%) | | | | | | | | |
| | 221,631 | | | Space Exploration Technologies Corp., Cl A1,3,4,6 | | | 29,920,185 | | | | 41,116,983 | |
| | 30,221 | | | Space Exploration Technologies Corp., Cl C1,3,4,6 | | | 4,079,835 | | | | 5,606,600 | |
| | | | | | | | | | | | |
| | Total Private Common Stocks | | | 34,000,020 | | | | 46,723,583 | |
| | | | | | | | | | | | |
| | | | | | | | | | | | |
| Private Preferred Stocks (4.20%) | |
| Industrials (4.20%) | |
| | | | Aerospace & Defense (4.20%) | | | | | | | | |
| | 311,111 | | | Space Exploration Technologies Corp., Cl H1,3,4,6 | | | 41,999,985 | | | | 57,717,313 | |
| | 131,657 | | | Space Exploration Technologies Corp., Cl I1,3,4,6 | | | 22,250,032 | | | | 24,425,006 | |
| | | | | | | | | | | | |
| | Total Preferred Stocks | | | 64,250,017 | | | | 82,142,319 | |
| | | | | | | | | | | | |
| | |
| 20 | | See Notes to Financial Statements. |
| | |
| December 31, 2018 | | Baron Partners Fund |
STATEMENT OF NET ASSETS (Continued)
| | | | | | | | | | | | |
| Shares | | | | | Cost | | | Value | |
| Private Partnerships (0.01%) | |
| Financials (0.01%) | |
| | | | Asset Management & Custody Banks (0.01%) | | | | | | | | |
| | 7,579,130 | | | Windy City Investments Holdings, L.L.C.1,3,4,6 | | $ | 0 | | | $ | 197,058 | |
| | | | | | | | | | | | |
| | | | | | | | | | | | |
| | | |
| Principal Amount | | | | | | |
| Short Term Investments (0.02%) | |
| | $439,881 | | | Repurchase Agreement with Fixed Income Clearing Corp., dated 12/31/2018, 0.50% due 1/2/2019; Proceeds at maturity - $439,893; (Fully collateralized by $445,000 U.S. Treasury Note, 2.875% due 5/15/2028;Market value - $451,670)5 | | | 439,881 | | | | 439,881 | |
| | | | | | | | | | | | |
| | Total Investments (130.69%) | | $ | 1,480,223,820 | | | | 2,555,206,790 | |
| | | | | | | | | | | | |
| | Liabilities Less Cash and Other Assets (-30.69%) | | | | (600,049,217 | ) |
| | | | | | | | | | | | |
| | Net Assets | | | $ | 1,955,157,573 | |
| | | | | | | | | | | | |
| Retail Shares (Equivalent to $47.77 per share
based on 21,274,807 shares outstanding) |
| | $ | 1,016,235,268 | |
| | | | | | | | | | | | |
| Institutional Shares (Equivalent to $48.86 per share
based on 16,693,599 shares outstanding) |
| | $ | 815,586,111 | |
| | | | | | | | | | | | |
| R6 Shares (Equivalent to $48.86 per share
based on 2,524,313 shares outstanding) |
| | $ | 123,336,194 | |
| | | | | | | | | | | | |
| % | Represents percentage of net assets. |
| 1 | Non-income producing securities. |
| 3 | At December 31, 2018, the market value of restricted and fair valued securities amounted to $129,062,960 or 6.60% of net assets. These securities are not deemed liquid. See Note 6 regarding Restricted Securities. |
| 4 | The Adviser has reclassified/classified certain securities in or out of this sub-industry. Such reclassifications/classifications are not supported by S&P or MSCI. |
| 5 | Level 2 security. See Note 7 regarding Fair Value Measurements. |
| 6 | Level 3 security. See Note 7 regarding Fair Value Measurements. |
All securities are Level 1, unless otherwise noted.
| | |
| See Notes to Financial Statements. | | 21 |
| | |
| Baron Focused Growth Fund | | December 31, 2018 |
STATEMENT OF NET ASSETS
| | | | | | | | | | | | |
| Shares | | | | | Cost | | | Value | |
| Common Stocks (87.64%) | |
| Communication Services (5.12%) | |
| | | | Movies & Entertainment (5.12%) | | | | | | | | |
| | 550,000 | | | Manchester United plc, Cl A2 | | $ | 8,719,507 | | | $ | 10,439,000 | |
| | | | | | | | | | | | |
|
| Consumer Discretionary (47.87%) | |
| | | | Automobile Manufacturers (14.70%) | | | | | | | | |
| | 90,000 | | | Tesla, Inc.1 | | | 20,342,220 | | | | 29,952,000 | |
| | | |
| | | | Casinos & Gaming (2.54%) | | | | | | | | |
| | 254,939 | | | Red Rock Resorts, Inc., Cl A | | | 5,783,325 | | | | 5,177,811 | |
| | | |
| | | | Hotels, Resorts & Cruise Lines (16.54%) | | | | | | | | |
| | 150,000 | | | Choice Hotels International, Inc. | | | 5,080,139 | | | | 10,737,000 | |
| | 340,000 | | | Hyatt Hotels Corp., Cl A | | | 12,201,302 | | | | 22,984,000 | |
| | | | | | | | | | | | |
| | | | | | | 17,281,441 | | | | 33,721,000 | |
| | | |
| | | | Leisure Facilities (14.09%) | | | | | | | | |
| | 136,230 | | | Vail Resorts, Inc. | | | 8,272,836 | | | | 28,720,009 | |
| | | | | | | | | | | | |
| | Total Consumer Discretionary | | | 51,679,822 | | | | 97,570,820 | |
| | | | | | | | | | | | |
|
| Financials (11.30%) | |
| | | | Financial Exchanges & Data (7.37%) | | | | | | | | |
| | 75,000 | | | FactSet Research Systems, Inc. | | | 5,828,282 | | | | 15,009,750 | |
| | | |
| | | | Property & Casualty Insurance (3.93%) | | | | | | | | |
| | 300,000 | | | Arch Capital Group Ltd.1,2 | | | 1,800,056 | | | | 8,016,000 | |
| | | | | | | | | | | | |
| | Total Financials | | | 7,628,338 | | | | 23,025,750 | |
| | | | | | | | | | | | |
|
| Industrials (12.10%) | |
| | | | Electrical Components & Equipment (0.51%) | | | | | | | | |
| | 105,000 | | | Bloom Energy Corp., Cl A1,4 | | | 1,723,142 | | | | 1,047,900 | |
| | | |
| | | | Research & Consulting Services (11.59%) | | | | | | | | |
| | 70,000 | | | CoStar Group, Inc.1 | | | 12,744,374 | | | | 23,613,800 | |
| | | | | | | | | | | | |
| | Total Industrials | | | 14,467,516 | | | | 24,661,700 | |
| | | | | | | | | | | | |
|
| Information Technology (9.06%) | |
| | | | Application Software (9.06%) | | | | | | | | |
| | 225,000 | | | Benefitfocus, Inc.1 | | | 5,980,203 | | | | 10,287,000 | |
| | 101,870 | | | Guidewire Software, Inc.1 | | | 4,816,691 | | | | 8,173,030 | |
| | | | | | | | | | | | |
| | Total Information Technology | | | 10,796,894 | | | | 18,460,030 | |
| | | | | | | | | | | | |
|
| Real Estate (2.19%) | |
| | | | Residential REITs (2.19%) | | | | | | | | |
| | 225,000 | | | American Homes 4 Rent, Cl A | | | 4,700,804 | | | | 4,466,250 | |
| | | | | | | | | | | | |
| | Total Common Stocks | | | 97,992,881 | | | | 178,623,550 | |
| | | | | | | | | | | | |
| | | | | | | | | | | | |
| Shares | | | | | Cost | | | Value | |
| Private Common Stocks (2.16%) | |
| Industrials (2.16%) | |
| | | | Aerospace & Defense (2.16%) | | | | | | | | |
| | 20,859 | | | Space Exploration Technologies Corp., Cl A1,3,4,6 | | $ | 2,815,965 | | | $ | 3,869,761 | |
| | 2,844 | | | Space Exploration Technologies Corp., Cl C1,3,4,6 | | | 383,940 | | | | 527,619 | |
| | | | | | | | | | | | |
| | Total Private Common Stocks | | | 3,199,905 | | | | 4,397,380 | |
| | | | | | | | | | | | |
| | | | | | | | | | | | |
| Preferred Stocks (6.91%) | |
| Communication Services (6.91%) | |
| | | | Alternative Carriers (6.91%) | | | | | | | | |
| | 22,300 | | | Iridium Communications, Inc., Series B, 6.75%5 | | | 5,720,004 | | | | 14,077,544 | |
| | | | | | | | | | | | |
| | | | | | | | | | | | |
| Private Preferred Stocks (2.83%) | |
| Industrials (2.83%) | |
| | | | Aerospace & Defense (2.83%) | | | | | | | | |
| | 29,630 | | | Space Exploration Technologies Corp., Cl H1,3,4,6 | | | 4,000,050 | | | | 5,496,958 | |
| | 1,479 | | | Space Exploration Technologies Corp., Cl I1,3,4,6 | | | 249,951 | | | | 274,384 | |
| | | | | | | | | | | | |
| | Total Private Preferred Stocks | | | 4,250,001 | | | | 5,771,342 | |
| | | | | | | | | | | | |
| | | | | | | | | | | | |
| | | |
| Principal Amount | | | | | | |
| Short Term Investments (0.06%) | |
| | $119,757 | | | Repurchase Agreement with Fixed Income Clearing Corp., dated 12/31/2018, 0.50% due 1/2/2019; Proceeds at maturity - $119,761; (Fully collateralized by $125,000 U.S. Treasury Note, 2.875% due 5/15/2028; Market value - $126,874)5 | | | 119,757 | | | | 119,757 | |
| | | | | | | | | | | | |
| | Total Investments (99.60%) | | $ | 111,282,548 | | | | 202,989,573 | |
| | | | | | | | | | | | |
| | Cash and Other Assets Less Liabilities (0.40%) | | | | 816,180 | |
| | | | | | | | | | | | |
| | Net Assets | | | $ | 203,805,753 | |
| | | | | | | | | | | | |
| Retail Shares (Equivalent to $15.81 per share
based on 2,584,537 shares outstanding) |
| | $ | 40,867,711 | |
| | | | | | | | | | | | |
| Institutional Shares (Equivalent to $16.15 per share
based on 4,381,939 shares outstanding) |
| | $ | 70,762,850 | |
| | | | | | | | | | | | |
| R6 Shares (Equivalent to $16.16 per share
based on 5,705,546 shares outstanding) |
| | $ | 92,175,192 | |
| | | | | | | | | | | | |
| % | Represents percentage of net assets. |
| 1 | Non-income producing securities. |
| 3 | At December 31, 2018, the market value of restricted and fair valued securities amounted to $10,168,722 or 4.99% of net assets. These securities are not deemed liquid. See Note 6 regarding Restricted Securities. |
| 4 | The Adviser has reclassified/classified certain securities in or out of this sub-industry. Such reclassifications/classifications are not supported by S&P or MSCI. |
| 5 | Level 2 security. See Note 7 regarding Fair Value Measurements. |
| 6 | Level 3 security. See Note 7 regarding Fair Value Measurements. |
All securities are Level 1, unless otherwise noted.
| | |
| 22 | | See Notes to Financial Statements. |
| | |
| December 31, 2018 | | Baron International Growth Fund |
STATEMENT OF NET ASSETS
| | | | | | | | | | | | |
| Shares | | | | | Cost | | | Value | |
| Common Stocks (95.42%) | |
| Argentina (1.44%) | |
| | 100,117 | | | Bolsas y Mercados Argentinos SA2 | | $ | 923,767 | | | $ | 993,189 | |
| | 170,109 | | | YPF SA, ADR | | | 3,325,666 | | | | 2,277,760 | |
| | | | | | | | | | | | |
| | Total Argentina | | | 4,249,433 | | | | 3,270,949 | |
| | | | | | | | | | | | |
|
| Australia (1.72%) | |
| | 88,108 | | | Domino’s Pizza Enterprises Ltd.2 | | | 2,052,472 | | | | 2,524,045 | |
| | 315,608 | | | NEXTDC Ltd.1,2 | | | 1,496,997 | | | | 1,359,823 | |
| | | | | | | | | | | | |
| | Total Australia | | | 3,549,469 | | | | 3,883,868 | |
| | | | | | | | | | | | |
|
| Belgium (1.17%) | |
| | 41,131 | | | KBC Group NV2 | | | 3,196,985 | | | | 2,646,323 | |
| | | | | | | | | | | | |
|
| Brazil (4.69%) | |
| | 142,966 | | | Arco Platform Ltd., Cl A1 | | | 2,786,706 | | | | 3,162,408 | |
| | 156,192 | | | Itaú Unibanco Holding SA, ADR | | | 1,256,447 | | | | 1,427,595 | |
| | 123,537 | | | Pagseguro Digital Ltd., Cl A1 | | | 2,953,746 | | | | 2,313,848 | |
| | 218,000 | | | Petróleo Brasileiro S.A. — Petrobras, ADR | | | 3,338,469 | | | | 2,836,180 | |
| | 78,119 | | | Smiles Fidelidade SA2 | | | 1,023,660 | | | | 881,374 | |
| | | | | | | | | | | | |
| | Total Brazil | | | 11,359,028 | | | | 10,621,405 | |
| | | | | | | | | | | | |
|
| Canada (5.21%) | |
| | 171,714 | | | BlackBerry Limited1 | | | 1,854,674 | | | | 1,220,887 | |
| | 7,775 | | | Constellation Software, Inc. | | | 2,245,621 | | | | 4,976,752 | |
| | 344,653 | | | Encana Corp. | | | 3,568,925 | | | | 1,992,094 | |
| | 128,070 | | | The Stars Group, Inc.1 | | | 4,004,273 | | | | 2,115,716 | |
| | 53,304 | | | Suncor Energy, Inc. | | | 1,771,901 | | | | 1,490,913 | |
| | | | | | | | | | | | |
| | Total Canada | | | 13,445,394 | | | | 11,796,362 | |
| | | | | | | | | | | | |
|
| China (7.95%) | |
| | 11,863 | | | Alibaba Group Holding Limited, ADR1 | | | 1,210,593 | | | | 1,626,061 | |
| | 5,338 | | | Baidu, Inc., ADR1 | | | 974,551 | | | | 846,607 | |
| | 17,402,000 | | | China Tower Corporation Limited, CI H, 144A1,2 | | | 2,593,762 | | | | 3,290,739 | |
| | 1,011,371 | | | Haitong Securities Co., Ltd., Cl H2 | | | 1,506,781 | | | | 965,666 | |
| | 367,517 | | | Hua Hong Semiconductor Limited, 144A2 | | | 762,509 | | | | 679,567 | |
| | 660,390 | | | Kangde Xin Composite Material Group Co. Ltd., Cl A2 | | | 2,000,107 | | | | 733,231 | |
| | 647,374 | | | Kingdee International Software Group Co. Ltd.2 | | | 127,078 | | | | 572,338 | |
| | 172,194 | | | Midea Group Co. Ltd., Cl A2 | | | 1,290,425 | | | | 930,053 | |
| | 25,197 | | | Momo, Inc., ADR1 | | | 1,087,966 | | | | 598,429 | |
| | 45,237 | | | Tencent Holdings Ltd.2 | | | 66,427 | | | | 1,813,113 | |
| | 3,253,500 | | | WH Group Limited, 144A2 | | | 2,588,141 | | | | 2,498,840 | |
| | 16,200 | | | YY, Inc., ADR1 | | | 1,155,256 | | | | 969,732 | |
| | 106,554 | | | Zai Lab Ltd., ADR1 | | | 2,391,984 | | | | 2,474,184 | |
| | | | | | | | | | | | |
| | Total China | | | 17,755,580 | | | | 17,998,560 | |
| | | | | | | | | | | | |
|
| Finland (2.54%) | |
| | 987,335 | | | Nokia Corporation, ADR | | | 5,932,556 | | | | 5,746,290 | |
| | | | | | | | | | | | |
|
| France (7.24%) | |
| | 41,251 | | | BNP Paribas SA2 | | | 2,522,152 | | | | 1,862,925 | |
| | 71,401 | | | Danone SA2 | | | 5,683,146 | | | | 5,032,528 | |
| | 7,330 | | | Eurofins Scientific SE2 | | | 852,055 | | | | 2,737,609 | |
| | 8,587 | | | LVMH Moet Hennessy Louis Vuitton SE2 | | | 2,187,513 | | | | 2,514,065 | |
| | 23,500 | | | Sodexo SA2 | | | 2,503,247 | | | | 2,410,051 | |
| | 75,582 | | | Vivendi SA2 | | | 1,797,212 | | | | 1,831,904 | |
| | | | | | | | | | | | |
| | Total France | | | 15,545,325 | | | | 16,389,082 | |
| | | | | | | | | | | | |
| | | | | | | | | | | | |
| Shares | | | | | Cost | | | Value | |
| Common Stocks (continued) | |
| Germany (4.57%) | |
| | 43,801 | | | Fresenius Medical Care Ag & Co.2 | | $ | 4,048,917 | | | $ | 2,839,234 | |
| | 22,674 | | | Linde PLC | | | 3,302,413 | | | | 3,599,353 | |
| | 170,925 | | | RIB Software SE2 | | | 1,707,159 | | | | 2,330,178 | |
| | 21,419 | | | Symrise AG2 | | | 802,001 | | | | 1,586,999 | |
| | | | | | | | | | | | |
| | Total Germany | | | 9,860,490 | | | | 10,355,764 | |
| | | | | | | | | | | | |
|
| India (3.82%) | |
| | 28,000 | | | Britannia Industries Ltd.2 | | | 1,167,051 | | | | 1,248,390 | |
| | 50,000 | | | Godrej Properties Ltd.1,2 | | | 632,253 | | | | 467,116 | |
| | 41,000 | | | HDFC Bank Ltd.2 | | | 1,245,351 | | | | 1,247,213 | |
| | 60,669 | | | Housing Development Finance Corp. Ltd.2 | | | 1,741,868 | | | | 1,709,306 | |
| | 1,027,162 | | | JM Financial Ltd.2 | | | 1,388,419 | | | | 1,379,026 | |
| | 88,551 | | | Kotak Mahindra Bank Ltd.2 | | | 1,578,501 | | | | 1,592,955 | |
| | 320,408 | | | Tata Global Beverages Ltd.2 | | | 1,434,666 | | | | 1,005,901 | |
| | | | | | | | | | | | |
| | Total India | | | 9,188,109 | | | | 8,649,907 | |
| | | | | | | | | | | | |
|
| Indonesia (0.26%) | |
| | 2,357,500 | | | PT Tower Bersama Infrastructure Tbk2 | | | 1,003,085 | | | | 589,201 | |
| | | | | | | | | | | | |
|
| Ireland (2.28%) | |
| | 2,852,170 | | | Glenveagh Properties PLC, 144A1 | | | 3,740,669 | | | | 2,307,118 | |
| | 40,025 | | | Ryanair Holdings plc, ADR1 | | | 2,731,479 | | | | 2,855,384 | |
| | | | | | | | | | | | |
| | Total Ireland | | | 6,472,148 | | | | 5,162,502 | |
| | | | | | | | | | | | |
|
| Israel (3.68%) | |
| | 52,066 | | | Mellanox Technologies Ltd.1 | | | 2,468,634 | | | | 4,809,857 | |
| | 38,904 | | | Wix.com Ltd.1 | | | 2,052,823 | | | | 3,514,587 | |
| | | | | | | | | | | | |
| | Total Israel | | | 4,521,457 | | | | 8,324,444 | |
| | | | | | | | | | | | |
|
| Japan (12.60%) | |
| | 10,900 | | | FANUC Corp.2 | | | 1,461,013 | | | | 1,654,179 | |
| | 6,274 | | | KEYENCE CORPORATION2 | | | 3,350,583 | | | | 3,171,166 | |
| | 6,000 | | | KOSE Corporation2 | | | 642,144 | | | | 942,467 | |
| | 43,493 | | | Mercari, Inc.1,2 | | | 1,323,017 | | | | 726,066 | |
| | 533,145 | | | Mitsubishi UFJ Financial Group, Inc., ADR | | | 3,538,457 | | | | 2,596,416 | |
| | 67,200 | | | MonotaRO Co. Ltd.2 | | | 503,069 | | | | 1,656,570 | |
| | 140,400 | | | Recruit Holdings Co. Ltd.2 | | | 2,768,693 | | | | 3,391,886 | |
| | 71,600 | | | SMS Co. Ltd.2 | | | 884,612 | | | | 1,133,630 | |
| | 19,600 | | | SoftBank Group Corp.2 | | | 1,770,766 | | | | 1,283,783 | |
| | 56,223 | | | Sony Corp., ADR | | | 2,158,828 | | | | 2,714,446 | |
| | 82,900 | | | Square Enix Holdings Co. Ltd.2 | | | 2,874,949 | | | | 2,256,776 | |
| | 97,100 | | | Takeda Pharmaceutical Co. Ltd.2 | | | 4,591,603 | | | | 3,291,153 | |
| | 52,300 | | | TechnoPro Holdings, Inc.2 | | | 2,127,107 | | | | 2,148,599 | |
| | 86,020 | | | ZOZO, Inc. (formerly, START TODAY CO., LTD.)2 | | | 2,892,612 | | | | 1,575,978 | |
| | | | | | | | | | | | |
| | Total Japan | | | 30,887,453 | | | | 28,543,115 | |
| | | | | | | | | | | | |
|
| Korea, Republic of (1.53%) | |
| | 42,094 | | | KB Financial Group, Inc.2 | | | 2,034,172 | | | | 1,756,027 | |
| | 56,386 | | | KIA Motors Corp.1,2 | | | 1,623,096 | | | | 1,699,580 | |
| | | | | | | | | | | | |
| | Total Korea, Republic of | | | 3,657,268 | | | | 3,455,607 | |
| | | | | | | | | | | | |
|
| Mexico (2.03%) | |
| | 153,114 | | | America Movil S.A.B. de C.V., Cl L, ADR | | | 2,768,425 | | | | 2,181,875 | |
| | 4,041,932 | | | Telesites SAB de CV1 | | | 2,953,177 | | | | 2,404,375 | |
| | | | | | | | | | | | |
| | Total Mexico | | | 5,721,602 | | | | 4,586,250 | |
| | | | | | | | | | | | |
| | |
| See Notes to Financial Statements. | | 23 |
| | |
| Baron International Growth Fund | | December 31, 2018 |
STATEMENT OF NET ASSETS (Continued)
| | | | | | | | | | | | |
| Shares | | | | | Cost | | | Value | |
| Common Stocks (continued) | |
| Netherlands (4.82%) | |
| | 60,905 | | | argenx SE, ADR1 | | $ | 2,682,646 | | | $ | 5,851,143 | |
| | 13,707 | | | Cimpress NV1 | | | 1,331,640 | | | | 1,417,578 | |
| | 20,634 | | | InterXion Holding N.V.1 | | | 682,420 | | | | 1,117,538 | |
| | 56,000 | | | Koninklijke Vopak NV2 | | | 2,835,740 | | | | 2,539,506 | |
| | | | | | | | | | | | |
| | Total Netherlands | | | 7,532,446 | | | | 10,925,765 | |
| | | | | | | | | | | | |
|
| Nigeria (0.07%) | |
| | 1,672,685 | | | Lekoil Ltd.1 | | | 571,534 | | | | 165,017 | |
| | | | | | | | | | | | |
|
| Norway (3.50%) | |
| | 183,500 | | | Golar LNG Ltd. | | | 4,588,932 | | | | 3,992,960 | |
| | 1,069,535 | | | Komplett Bank ASA1 | | | 2,410,678 | | | | 1,558,566 | |
| | 427,777 | | | Opera Ltd., ADR1 | | | 3,935,487 | | | | 2,378,440 | |
| | | | | | | | | | | | |
| | Total Norway | | | 10,935,097 | | | | 7,929,966 | |
| | | | | | | | | | | | |
|
| Panama (0.43%) | |
| | 12,477 | | | Copa Holdings, S.A., Cl A | | | 930,163 | | | | 982,065 | |
| | | | | | | | | | | | |
|
| Russia (0.91%) | |
| | 146,106 | | | Sberbank of Russia PJSC, ADR2 | | | 1,806,245 | | | | 1,600,031 | |
| | 17,130 | | | Yandex N.V., Cl A1 | | | 512,077 | | | | 468,506 | |
| | | | | | | | | | | | |
| | Total Russia | | | 2,318,322 | | | | 2,068,537 | |
| | | | | | | | | | | | |
|
| Spain (3.03%) | |
| | 23,163 | | | Aena SME SA, 144A2 | | | 3,511,216 | | | | 3,598,872 | |
| | 127,745 | | | Industria de Diseño Textil SA2 | | | 3,951,253 | | | | 3,260,648 | |
| | | | | | | | | | | | |
| | Total Spain | | | 7,462,469 | | | | 6,859,520 | |
| | | | | | | | | | | | |
|
| Switzerland (2.13%) | |
| | 55,982 | | | Julius Bäer Group Ltd.2 | | | 2,300,928 | | | | 1,995,003 | |
| | 28,753 | | | Landis & Gyr Group AG2 | | | 2,309,898 | | | | 1,619,262 | |
| | 15,000 | | | Nestle SA2 | | | 1,264,405 | | | | 1,217,441 | |
| | | | | | | | | | | | |
| | Total Switzerland | | | 5,875,231 | | | | 4,831,706 | |
| | | | | | | | | | | | |
|
| United Kingdom (13.99%) | |
| | 256,721 | | | Abcam plc2 | | | 2,516,467 | | | | 3,573,426 | |
| | 162,669 | | | Adaptimmune Therapeutics PLC, ADR1 | | | 1,657,261 | | | | 935,347 | |
| | 173,500 | | | AstraZeneca PLC, ADR | | | 6,226,877 | | | | 6,589,530 | |
| | 534,000 | | | B&M European Value Retail SA2 | | | 2,642,952 | | | | 1,916,324 | |
| | 116,500 | | | Dechra Pharmaceuticals plc2 | | | 4,120,163 | | | | 3,078,058 | |
| | 76,252 | | | Endava plc, ADR1 | | | 1,565,280 | | | | 1,848,348 | |
| | 132,158 | | | Experian plc2 | | | 2,381,629 | | | | 3,203,762 | |
| | 883,049 | | | Horizon Discovery Group plc1 | | | 2,095,042 | | | | 1,969,685 | |
| | 29,537 | | | Intertek Group plc2 | | | 1,087,552 | | | | 1,807,747 | |
| | 650,000 | | | Rentokil Initial PLC2 | | | 2,766,779 | | | | 2,796,297 | |
| | 1,148,151 | | | Tullow Oil plc1,2 | | | 3,189,936 | | | | 2,610,314 | |
| | 220,000 | | | WANdisco PLC1 | | | 2,234,167 | | | | 1,351,586 | |
| | | | | | | | | | | | |
| | Total United Kingdom | | | 32,484,105 | | | | 31,680,424 | |
| | | | | | | | | | | | |
|
| United States (3.81%) | |
| | 35,103 | | | Agilent Technologies, Inc. | | | 1,106,817 | | | | 2,368,048 | |
| | 119,567 | | | Arch Capital Group Ltd.1 | | | 2,128,700 | | | | 3,194,830 | |
| | 39,504 | | | Worldpay, Inc., Cl A1,2 | | | 3,191,888 | | | | 3,061,789 | |
| | | | | | | | | | | | |
| | Total United States | | | 6,427,405 | | | | 8,624,667 | |
| | | | | | | | | | | | |
| | Total Common Stocks | | | 220,882,154 | | | | 216,087,296 | |
| | | | | | | | | | | | |
| | | | | | | | | | | | |
| Principal Amount | | Cost | | | Value | |
| Short Term Investments (3.30%) | |
| | $7,467,184 | | | Repurchase Agreement with Fixed Income Clearing Corp., dated 12/31/2018, 0.50% due 1/2/2019; Proceeds at maturity - $7,467,391; (Fully collateralized by $7,505,000 U.S. Treasury Note, 2.875% due 5/15/2028; Market value - $7,617,492)2 | | $ | 7,467,184 | | | $ | 7,467,184 | |
| | | | | | | | | | | | |
| | Total Investments (98.72%) | | $ | 228,349,338 | | | | 223,554,480 | |
| | | | | | | | | | | | |
| | Cash and Other Assets Less Liabilities (1.28%) | | | | 2,893,774 | |
| | | | | | | | | | | | |
| | Net Assets | | | $ | 226,448,254 | |
| | | | | | | | | | | | |
| Retail Shares (Equivalent to $19.00 per share
based on 3,147,974 shares outstanding) |
| | $ | 59,815,169 | |
| | | | | | | | | | | | |
| Institutional Shares (Equivalent to $19.29 per share
based on 7,992,969 shares outstanding) |
| | $ | 154,187,750 | |
| | | | | | | | | | | | |
| R6 Shares (Equivalent to $19.29 per share
based on 645,114 shares outstanding) |
| | $ | 12,445,335 | |
| | | | | | | | | | | | |
| % | Represents percentage of net assets. |
| 1 | Non-income producing securities. |
| 2 | Level 2 security. See Note 7 regarding Fair Value Measurements. |
| ADR | American Depositary Receipt. |
| 144A | Security is exempt from registration pursuant to Rule 144A under the Securities Act of 1933. This security may be resold in transactions that are exempt from registration, normally to qualified institutional buyers. At December 31, 2018, the market value of Rule 144A securities amounted to $12,375,136 or 5.46% of net assets. These securities have been deemed liquid pursuant to policies and procedures approved by the Board of Trustees, unless otherwise noted. |
All securities are Level 1, unless otherwise noted.
| | | | |
Summary of Investments by Sector
as of December 31, 2018 | | Percentage of
Net Assets | |
| |
Information Technology | | | 18.6 | % |
| |
Health Care | | | 15.8 | |
| |
Consumer Discretionary | | | 13.0 | |
| |
Industrials | | | 11.7 | |
| |
Financials | | | 11.7 | |
| |
Communication Services | | | 8.6 | |
| |
Energy | | | 7.9 | |
| |
Consumer Staples | | | 5.3 | |
| |
Materials | | | 2.6 | |
| |
Real Estate | | | 0.2 | |
| |
Cash and Cash Equivalents* | | | 4.6 | |
| | | | 100.0 | % |
| * | Includes short term investments. |
| | |
| 24 | | See Notes to Financial Statements. |
| | |
| December 31, 2018 | | Baron Real Estate Fund |
STATEMENT OF NET ASSETS
| | | | | | | | | | | | |
| Shares | | | | | Cost | | | Value | |
| Common Stocks (100.43%) | |
| Communication Services (0.87%) | |
| | | | Integrated Telecommunication Services (0.87%) | | | | | | | | |
| | 25,128,728 | | | China Tower Corporation Limited, CI H, 144A (Hong Kong)1,2,4 | | $ | 4,477,605 | | | $ | 4,751,873 | |
| | | | | | | | | | | | |
|
| Consumer Discretionary (38.79%) | |
| | | | Casinos & Gaming (11.00%) | | | | | | | | |
| | 532,700 | | | Boyd Gaming Corp. | | | 11,714,912 | | | | 11,069,506 | |
| | 494,554 | | | Caesars Entertainment Corp.1 | | | 4,359,884 | | | | 3,358,022 | |
| | 1,041,700 | | | MGM Resorts International | | | 21,941,664 | | | | 25,271,642 | |
| | 608,405 | | | Penn National Gaming, Inc.1 | | | 16,572,424 | | | | 11,456,266 | |
| | 423,051 | | | Red Rock Resorts, Inc., Cl A | | | 9,612,104 | | | | 8,592,166 | |
| | | | | | | | | | | | |
| | | | | | | 64,200,988 | | | | 59,747,602 | |
| | | |
| | | | Home Improvement Retail (7.81%) | | | | | | | | |
| | 115,600 | | | Home Depot, Inc. | | | 9,013,941 | | | | 19,862,392 | |
| | 244,150 | | | Lowe’s Companies, Inc. | | | 23,434,843 | | | | 22,549,694 | |
| | | | | | | | | | | | |
| | | | | | | 32,448,784 | | | | 42,412,086 | |
| | | |
| | | | Homebuilding (4.84%) | | | | | | | | |
| | 534,500 | | | D.R. Horton, Inc. | | | 18,954,658 | | | | 18,525,770 | |
| | 198,750 | | | Lennar Corp., Cl A | | | 8,760,359 | | | | 7,781,062 | |
| | | | | | | | | | | | |
| | | | | | | 27,715,017 | | | | 26,306,832 | |
| | | |
| | | | Hotels, Resorts & Cruise Lines (15.14%) | | | | | | | | |
| | 490,687 | | | Hilton Grand Vacations, Inc.1 | | | 13,013,938 | | | | 12,949,230 | |
| | 127,975 | | | Hilton Worldwide Holdings, Inc. | | | 6,171,281 | | | | 9,188,605 | |
| | 176,500 | | | Hyatt Hotels Corp., Cl A | | | 13,857,832 | | | | 11,931,400 | |
| | 82,100 | | | Marriott International, Inc., Cl A | | | 6,003,694 | | | | 8,912,776 | |
| | 170,800 | | | Marriott Vacations Worldwide Corp. | | | 17,282,813 | | | | 12,043,108 | |
| | 331,090 | | | Norwegian Cruise Line Holdings Ltd.1,2 | | | 10,343,920 | | | | 14,034,905 | |
| | 134,800 | | | Royal Caribbean Cruises Ltd.2 | | | 11,567,601 | | | | 13,182,092 | |
| | | | | | | | | | | | |
| | | | | | | 78,241,079 | | | | 82,242,116 | |
| | | | | | | | | | | | |
| | Total Consumer Discretionary | | | 202,605,868 | | | | 210,708,636 | |
| | | | | | | | | | | | |
|
| Financials (3.75%) | |
| | | | Asset Management & Custody Banks (3.75%) | | | | | | | | |
| | 531,700 | | | Brookfield Asset Management, Inc., Cl A2 | | | 12,821,554 | | | | 20,390,695 | |
| | | | | | | | | | | | |
|
| Industrials (5.76%) | |
| | | | Building Products (3.10%) | | | | | | | | |
| | 348,550 | | | Masco Corp. | | | 10,946,290 | | | | 10,191,602 | |
| | 112,283 | | | Trex Co., Inc.1 | | | 6,864,819 | | | | 6,665,119 | |
| | | | | | | | | | | | |
| | | | | | | 17,811,109 | | | | 16,856,721 | |
| | | |
| | | | Research & Consulting Services (1.46%) | | | | | | | | |
| | 23,550 | | | CoStar Group, Inc.1 | | | 4,303,421 | | | | 7,944,357 | |
| | | |
| | | | Trading Companies & Distributors (1.20%) | | | | | | | | |
| | 117,601 | | | SiteOne Landscape Supply, Inc.1 | | | 6,065,380 | | | | 6,499,807 | |
| | | | | | | | | | | | |
| | Total Industrials | | | 28,179,910 | | | | 31,300,885 | |
| | | | | | | | | | | | |
|
| Information Technology (8.46%) | |
| | | | Internet Services & Infrastructure (8.46%) | | | | | | | | |
| | 429,225 | | | GDS Holdings Ltd., ADR1,2,3 | | | 11,410,220 | | | | 9,910,805 | |
| | 526,150 | | | InterXion Holding N.V.1,2,3 | | | 15,223,378 | | | | 28,496,284 | |
| | 1,746,246 | | | NEXTDC Ltd. (Australia)1,2,4 | | | 6,079,603 | | | | 7,523,844 | |
| | | | | | | | | | | | |
| | Total Information Technology | | | 32,713,201 | | | | 45,930,933 | |
| | | | | | | | | | | | |
| | | | | | | | | | | | |
| Shares | | | | | Cost | | | Value | |
| Common Stocks (continued) | |
| Materials (1.40%) | |
| | | | Specialty Chemicals (1.40%) | | | | | | | | |
| | 19,300 | | | The Sherwin-Williams Co. | | $ | 4,773,183 | | | $ | 7,593,778 | |
| | | | | | | | | | | | |
|
| Real Estate (41.40%) | |
| | | | Hotel & Resort REITs (3.18%) | | | | | | | | |
| | 451,000 | | | MGM Growth Properties LLC, Cl A | | | 9,155,383 | | | | 11,910,910 | |
| | 206,650 | | | Park Hotels & Resorts, Inc. | | | 5,876,449 | | | | 5,368,767 | |
| | | | | | | | | | | | |
| | | | | | | 15,031,832 | | | | 17,279,677 | |
| | | |
| | | | Industrial REITs (1.80%) | | | | | | | | |
| | 166,050 | | | Prologis, Inc. | | | 8,270,867 | | | | 9,750,456 | |
| | | |
| | | | Office REITs (1.98%) | | | | | | | | |
| | 314,950 | | | Douglas Emmett, Inc. | | | 6,578,572 | | | | 10,749,243 | |
| | | |
| | | | Real Estate Services (6.39%) | | | | | | | | |
| | 866,600 | | | CBRE Group, Inc., Cl A1 | | | 25,934,836 | | | | 34,698,664 | |
| | | |
| | | | Residential REITs (1.85%) | | | | | | | | |
| | 70,650 | | | Equity LifeStyle Properties, Inc. | | | 7,006,874 | | | | 6,862,235 | |
| | 159,950 | | | Invitation Homes, Inc. | | | 3,184,254 | | | | 3,211,796 | |
| | | | | | | | | | | | |
| | | | | | | 10,191,128 | | | | 10,074,031 | |
| | | |
| | | | Specialized REITs (26.20%) | | | | | | | | |
| | 94,000 | | | Alexandria Real Estate Equities, Inc.3 | | | 6,183,178 | | | | 10,832,560 | |
| | 251,200 | | | American Tower Corp. | | | 20,337,015 | | | | 39,737,328 | |
| | 605,140 | | | Americold Realty Trust3 | | | 15,030,432 | | | | 15,455,276 | |
| | 109,400 | | | CyrusOne, Inc. | | | 7,130,981 | | | | 5,785,072 | |
| | 130,294 | | | Digital Realty Trust, Inc. | | | 14,335,904 | | | | 13,882,826 | |
| | 98,041 | | | Equinix, Inc. | | | 19,048,828 | | | | 34,565,335 | |
| | 392,369 | | | Gaming and Leisure Properties, Inc. | | | 10,532,796 | | | | 12,677,442 | |
| | 57,900 | | | SBA Communications Corp.1 | | | 3,415,994 | | | | 9,373,431 | |
| | | | | | | | | | | | |
| | | | | | | 96,015,128 | | | | 142,309,270 | |
| | | | | | | | | | | | |
| | Total Real Estate | | | 162,022,363 | | | | 224,861,341 | |
| | | | | | | | | | | | |
| | Total Investments (100.43%) | | $ | 447,593,684 | | | | 545,538,141 | |
| | | | | | | | | | | | |
| | Liabilities Less Cash and Other Assets (-0.43%) | | | | (2,342,882 | ) |
| | | | | | | | | | | | |
| | Net Assets | | | $ | 543,195,259 | |
| | | | | | | | | | | | |
| Retail Shares (Equivalent to $20.77 per share
based on 10,257,306 shares outstanding) |
| | $ | 213,014,931 | |
| | | | | | | | | | | | |
| Institutional Shares (Equivalent to $21.10 per share
based on 15,208,894 shares outstanding) |
| | $ | 320,849,321 | |
| | | | | | | | | | | | |
| R6 Shares (Equivalent to $21.10 per share
based on 442,266 shares outstanding) |
| | $ | 9,331,007 | |
| | | | | | | | | | | | |
| % | Represents percentage of net assets. |
| 1 | Non-income producing securities. |
| 3 | The Adviser has reclassified/classified certain securities in or out of this sub-industry. Such reclassifications/classifications are not supported by S&P or MSCI. |
| 4 | Level 2 security. See Note 7 regarding Fair Value Measurements. |
| ADR | American Depositary Receipt. |
| 144A | Security is exempt from registration pursuant to Rule 144A under the Securities Act of 1933. This security may be resold in transactions that are exempt from registration, normally to qualified institutional buyers. At December 31, 2018, the market value of Rule 144A securities amounted to $4,751,873 or 0.87% of net assets. This security has been deemed liquid pursuant to policies and procedures approved by the Board of Trustees, unless otherwise noted. |
All securities are Level 1, unless otherwise noted.
| | |
| See Notes to Financial Statements. | | 25 |
| | |
| Baron Emerging Markets Fund | | December 31, 2018 |
STATEMENT OF NET ASSETS
| | | | | | | | | | | | |
| Shares | | | | | Cost | | | Value | |
| Common Stocks (95.50%) | |
| Argentina (1.99%) | |
| | 284,034 | | | Banco Macro SA, ADR | | $ | 25,072,115 | | | $ | 12,559,983 | |
| | 2,296,280 | | | Loma Negra Cia Industrial Argentina SA, ADR1 | | | 45,062,984 | | | | 25,557,596 | |
| | 4,013,686 | | | YPF SA, ADR | | | 80,410,178 | | | | 53,743,256 | |
| | | | | | | | | | | | |
| | Total Argentina | | | 150,545,277 | | | | 91,860,835 | |
| | | | | | | | | | | | |
|
| Brazil (10.16%) | |
| | 9,979,864 | | | B3 SA — Brasil Bolsa Balcao3 | | | 51,611,754 | | | | 68,954,960 | |
| | 1,684,568 | | | Banco do Brasil SA3 | | | 19,659,069 | | | | 20,166,589 | |
| | 6,328,443 | | | Itaú Unibanco Holding SA, ADR | | | 51,546,640 | | | | 57,841,969 | |
| | 15,238,224 | | | Kroton Educacional SA3 | | | 46,472,357 | | | | 34,811,994 | |
| | 3,333,160 | | | Localiza Rent a Car SA3 | | | 21,722,132 | | | | 25,504,369 | |
| | 2,494,705 | | | Pagseguro Digital Ltd., Cl A1 | | | 65,170,618 | | | | 46,725,825 | |
| | 7,419,383 | | | Petróleo Brasileiro S.A. — Petrobras, ADR | | | 82,452,923 | | | | 96,526,173 | |
| | 18,024,610 | | | Rumo SA1,3 | | | 68,071,546 | | | | 78,920,232 | |
| | 2,280,594 | | | Smiles Fidelidade SA3 | | | 29,709,099 | | | | 25,730,702 | |
| | 733,235 | | | StoneCo Ltd., Cl A1 | | | 18,849,742 | | | | 13,520,853 | |
| | | | | | | | | | | | |
| | Total Brazil | | | 455,265,880 | | | | 468,703,666 | |
| | | | | | | | | | | | |
|
| China (28.28%) | |
| | 819,144 | | | Alibaba Group Holding Limited, ADR1 | | | 69,924,839 | | | | 112,280,068 | |
| | 339,891 | | | Baidu, Inc., ADR1 | | | 62,701,078 | | | | 53,906,713 | |
| | 62,163,707 | | | China Construction
Bank Corp., CI H3 | | | 54,678,774 | | | | 50,902,935 | |
| | 16,416,517 | | | China Everbright Ltd.3 | | | 40,650,140 | | | | 29,098,148 | |
| | 19,577,732 | | | China Mengniu Dairy Co. Ltd.3 | | | 38,318,800 | | | | 60,916,526 | |
| | 8,358,189 | | | China Mobile Ltd.3 | | | 92,948,500 | | | | 80,878,794 | |
| | 574,002,680 | | | China Tower Corporation Limited, CI H, 144A1,3 | | | 89,595,106 | | | | 108,544,599 | |
| | 15,161,727 | | | CSPC Pharmaceutical Group Ltd.3 | | | 33,306,277 | | | | 21,764,206 | |
| | 25,756,546 | | | Haitong Securities Co., Ltd., Cl H3 | | | 40,785,839 | | | | 24,592,576 | |
| | 4,408,290 | | | Han’s Laser Technology Industry Group Co. Ltd., Cl A3 | | | 24,616,402 | | | | 19,578,388 | |
| | 13,041,124 | | | Hangzhou Hikvision Digital Technology Co. Ltd., Cl A3 | | | 42,262,773 | | | | 49,209,435 | |
| | 7,469,886 | | | Hua Hong Semiconductor Limited, 144A3 | | | 15,437,902 | | | | 13,812,389 | |
| | 18,324,812 | | | Industrial & Commercial Bank of China Ltd., Cl H3 | | | 15,103,716 | | | | 13,033,698 | |
| | 24,769,517 | | | Kangde Xin Composite Material Group Co. Ltd., Cl A3 | | | 78,615,355 | | | | 27,501,617 | |
| | 23,855,166 | | | Kingdee International Software Group Co. Ltd.3 | | | 9,034,309 | | | | 21,090,148 | |
| | 33,425,480 | | | KunLun Energy Co. Ltd.3 | | | 39,009,419 | | | | 35,514,063 | |
| | 7,386,605 | | | Midea Group Co. Ltd., Cl A3 | | | 38,583,098 | | | | 39,896,474 | |
| | 801,360 | | | Momo, Inc., ADR1 | | | 27,936,559 | | | | 19,032,300 | |
| | 434,594 | | | New Oriental Education & Technology Group, Inc., ADR1 | | | 24,357,655 | | | | 23,820,097 | |
| | 536,881 | | | Pinduoduo, Inc., ADR1 | | | 10,656,207 | | | | 12,047,610 | |
| | 5,166,486 | | | Shenzhou International Group Holdings Ltd.3 | | | 25,027,163 | | | | 58,721,496 | |
| | 28,503,365 | | | Sino Biopharmaceutical Ltd.3 | | | 15,764,440 | | | | 18,763,430 | |
| | 12,688,550 | | | Sinopharm Group Co. Ltd., Cl H3 | | | 51,949,515 | | | | 53,422,027 | |
| | 1,102,592 | | | Sunny Optical Technology
Group Co., Ltd.3 | | | 2,488,087 | | | | 9,806,493 | |
| | 3,748,392 | | | Tencent Holdings Ltd.3 | | | 87,835,453 | | | | 150,236,761 | |
| | 345,486 | | | Tencent Music Entertainment Group, ADR1 | | | 4,633,390 | | | | 4,567,325 | |
| | 143,569,583 | | | Tongda Group Holdings Ltd.3 | | | 36,830,198 | | | | 14,246,657 | |
| | 96,626,312 | | | WH Group Limited, 144A3 | | | 81,375,707 | | | | 74,213,512 | |
| | 3,845,201 | | | Yunnan Baiyao
Group Co. Ltd., Cl A3 | | | 57,099,341 | | | | 41,453,445 | |
| | 393,687 | | | YY, Inc., ADR1 | | | 27,755,070 | | | | 23,566,104 | |
| | 1,612,615 | | | Zai Lab Ltd., ADR1 | | | 33,082,880 | | | | 37,444,920 | |
| | | | | | | | | | | | |
| | Total China | | | 1,272,363,992 | | | | 1,303,862,954 | |
| | | | | | | | | | | | |
| | | | | | | | | | | | |
| Shares | | | | | Cost | | | Value | |
| Common Stocks (continued) | |
| Finland (0.69%) | |
| | 5,441,214 | | | Nokia Corporation, ADR | | $ | 32,719,914 | | | $ | 31,667,865 | |
| | | | | | | | | | | | |
|
| Hong Kong (0.92%) | |
| | 7,926,950 | | | Techtronic Industries Co. Ltd.3 | | | 32,888,582 | | | | 42,065,652 | |
| | 2,879,303 | | | Tongda Hong Tai Holdings Ltd.1 | | | 901,617 | | | | 455,952 | |
| | | | | | | | | | | | |
| | Total Hong Kong | | | 33,790,199 | | | | 42,521,604 | |
| | | | | | | | | | | | |
|
| Hungary (0.47%) | |
| | 612,366 | | | Wizz Air Holdings Plc, 144A1,3 | | | 20,204,511 | | | | 21,877,387 | |
| | | | | | | | | | | | |
|
| India (16.23%) | |
| | 506,901 | | | Bajaj Finance Ltd.3 | | | 15,693,137 | | | | 19,185,832 | |
| | 1,497,346 | | | Britannia Industries Ltd.3 | | | 45,166,247 | | | | 66,759,712 | |
| | 8,257,953 | | | Coal India Ltd.3 | | | 37,988,208 | | | | 28,469,116 | |
| | 2,126,431 | | | Divi’s Laboratories Ltd.3 | | | 26,277,491 | | | | 45,105,479 | |
| | 5,061,468 | | | Edelweiss Financial Services Ltd.3 | | | 13,883,263 | | | | 13,194,433 | |
| | 14,517,461 | | | Exide Industries Ltd.3 | | | 43,645,168 | | | | 55,685,816 | |
| | 831,235 | | | HDFC Bank Ltd.3 | | | 25,246,965 | | | | 25,286,024 | |
| | 2,545,738 | | | Housing Development Finance Corp. Ltd.3 | | | 55,745,232 | | | | 71,724,355 | |
| | 20,442,727 | | | JM Financial Ltd.3 | | | 38,101,847 | | | | 27,445,583 | |
| | 3,986,670 | | | JSW Steel Ltd.3 | | | 17,568,591 | | | | 17,500,073 | |
| | 3,861,415 | | | Kotak Mahindra Bank Ltd.3 | | | 48,365,030 | | | | 69,463,474 | |
| | 4,025,216 | | | Manpasand Beverages Ltd.3 | | | 20,732,185 | | | | 5,115,060 | |
| | 7,034,754 | | | Max Financial Services Ltd.1,3 | | | 63,175,440 | | | | 44,899,802 | |
| | 4,499,991 | | | Motherson Sumi Systems Ltd.3 | | | 8,834,502 | | | | 10,755,473 | |
| | 648,373 | | | Piramal Enterprises Ltd.3 | | | 23,554,165 | | | | 22,103,379 | |
| | 5,432,490 | | | SBI Life Insurance Co. Ltd., 144A3 | | | 58,298,884 | | | | 46,510,522 | |
| | 5,970,727 | | | Sun Pharmaceutical Industries Ltd.3 | | | 52,892,179 | | | | 36,793,306 | |
| | 2,839,810 | | | Sun TV Network Ltd.3 | | | 20,558,083 | | | | 24,699,512 | |
| | 4,691,112 | | | Tata Chemicals Ltd.3 | | | 52,846,043 | | | | 47,464,208 | |
| | 2,955,898 | | | Tata Communications Ltd.3 | | | 30,610,639 | | | | 22,195,413 | |
| | 9,083,744 | | | Tata Global Beverages Ltd.3 | | | 32,152,953 | | | | 28,517,833 | |
| | 2,879,370 | | | Zee Entertainment Enterprises Ltd.3 | | | 13,327,053 | | | | 19,640,864 | |
| | | | | | | | | | | | |
| | Total India | | | 744,663,305 | | | | 748,515,269 | |
| | | | | | | | | | | | |
|
| Indonesia (0.34%) | |
| | 61,902,105 | | | PT Tower Bersama Infrastructure Tbk3 | | | 31,519,830 | | | | 15,470,953 | |
| | | | | | | | | | | | |
|
| Korea, Republic of (7.56%) | |
| | 72,787 | | | Amorepacific Corp.3 | | | 22,607,718 | | | | 13,695,276 | |
| | 1,619,143 | | | KB Financial Group, Inc.3 | | | 70,462,855 | | | | 67,545,480 | |
| | 2,642,104 | | | KIA Motors Corp.3 | | | 80,993,492 | | | | 79,637,951 | |
| | 3,101,000 | | | Samsung Electronics Co., Ltd.3 | | | 98,195,642 | | | | 107,951,041 | |
| | 322,471 | | | Samsung Life Insurance Co., Ltd.3 | | | 32,459,741 | | | | 23,596,523 | |
| | 232,105 | | | SK Telecom Co. Ltd.3 | | | 50,537,097 | | | | 56,002,246 | |
| | | | | | | | | | | | |
| | Total Korea, Republic of | | | 355,256,545 | | | | 348,428,517 | |
| | | | | | | | | | | | |
|
| Malaysia (0.34%) | |
| | 66,219,593 | | | My EG Services Bhd3 | | | 23,320,275 | | | | 15,648,126 | |
| | | | | | | | | | | | |
|
| Mexico (5.78%) | |
| | 3,438,804 | | | America Movil
S.A.B. de C.V., Cl L, ADR | | | 62,853,746 | | | | 49,002,957 | |
| | 696,064 | | | Fomento Económico Mexicano, S.A.B. de C.V., ADR | | | 64,793,431 | | | | 59,896,307 | |
| | 3,408,095 | | | GRUMA S.A.B. de C.V., Cl B | | | 46,468,863 | | | | 38,477,695 | |
| | 13,070,961 | | | Grupo Lala S.A.B. de C.V. | | | 25,303,050 | | | | 14,107,399 | |
| | 13,308,307 | | | Infraestructura Energetica Nova S.A.B. de C.V. | | | 62,989,321 | | | | 49,449,672 | |
| | 21,841,625 | | | Wal-Mart de México S.A.B de C.V. | | | 50,801,831 | | | | 55,549,476 | |
| | | | | | | | | | | | |
| | Total Mexico | | | 313,210,242 | | | | 266,483,506 | |
| | | | | | | | | | | | |
| | |
| 26 | | See Notes to Financial Statements. |
| | |
| December 31, 2018 | | Baron Emerging Markets Fund |
STATEMENT OF NET ASSETS (Continued)
| | | | | | | | | | | | |
| Shares | | | | | Cost | | | Value | |
| Common Stocks (continued) | |
|
| Nigeria (0.07%) | |
| | 32,618,323 | | | Lekoil Ltd.1,2 | | $ | 14,881,766 | | | $ | 3,217,929 | |
| | | | | | | | | | | | |
|
| Panama (0.69%) | |
| | 403,345 | | | Copa Holdings, S.A., Cl A | | | 24,503,014 | | | | 31,747,285 | |
| | | | | | | | | | | | |
|
| Philippines (2.61%) | |
| | 68,863,365 | | | Ayala Land, Inc.3 | | | 53,955,565 | | | | 53,226,153 | |
| | 22,137,056 | | | BDO Unibank, Inc.3 | | | 49,921,188 | | | | 55,053,611 | |
| | 138,168,735 | | | Metro Pacific Investments Corp.3 | | | 15,125,467 | | | | 12,160,081 | |
| | | | | | | | | | | | |
| | Total Philippines | | | 119,002,220 | | | | 120,439,845 | |
| | | | | | | | | | | | |
|
| Russia (1.87%) | |
| | 5,527,249 | | | Sberbank of Russia PJSC, ADR3 | | | 53,976,176 | | | | 60,529,822 | |
| | 937,278 | | | Yandex N.V., Cl A1 | | | 13,048,513 | | | | 25,634,553 | |
| | | | | | | | | | | | |
| | Total Russia | | | 67,024,689 | | | | 86,164,375 | |
| | | | | | | | | | | | |
|
| South Africa (5.43%) | |
| | 3,377,622 | | | Bid Corp. Ltd.3 | | | 70,311,451 | | | | 62,134,426 | |
| | 4,459,428 | | | Bidvest Group Ltd.3 | | | 53,485,713 | | | | 64,058,085 | |
| | 8,149,856 | | | FirstRand Ltd. 3 | | | 31,785,278 | | | | 37,121,531 | |
| | 20,842,111 | | | Pepkor Holdings Ltd., 144A1 | | | 30,647,007 | | | | 30,406,666 | |
| | 1,243,641 | | | Sasol Ltd.3 | | | 41,899,428 | | | | 36,956,660 | |
| | 664,897 | | | Sasol Ltd., ADR | | | 21,846,771 | | | | 19,474,833 | |
| | | | | | | | | | | | |
| | Total South Africa | | | 249,975,648 | | | | 250,152,201 | |
| | | | | | | | | | | | |
|
| Taiwan, Province of China (8.77%) | |
| | 14,783,879 | | | Delta Electronics, Inc.3 | | | 65,562,410 | | | | 62,222,678 | |
| | 4,336,439 | | | Eclat Textile Co., Ltd.3 | | | 51,611,725 | | | | 49,039,307 | |
| | 25,428,000 | | | Far EasTone Telecommunications Co., Ltd.3 | | | 60,414,153 | | | | 63,162,216 | |
| | 3,175,065 | | | Ginko International Co., Ltd.3 | | | 39,134,743 | | | | 21,982,724 | |
| | 6,242,936 | | | Makalot Industrial Co. Ltd.3 | | | 29,536,642 | | | | 34,419,211 | |
| | 18,495,000 | | | Taiwan Mobile Co., Ltd.3 | | | 66,013,359 | | | | 64,049,943 | |
| | 2,968,492 | | | Taiwan Semiconductor Manufacturing Co., Ltd., ADR | | | 83,250,089 | | | | 109,567,040 | |
| | | | | | | | | | | | |
| | Total Taiwan, Province of China | | | 395,523,121 | | | | 404,443,119 | |
| | | | | | | | | | | | |
|
| Thailand (2.22%) | |
| | 3,952,229 | | | Bangkok Bank PCL, Cl F3 | | | 25,120,691 | | | | 25,156,046 | |
| | 3,872,664 | | | Bangkok Bank PCL, NVDR3 | | | 20,554,524 | | | | 24,169,574 | |
| | 25,071,634 | | | CP All Plc, Cl C3 | | | 56,363,517 | | | | 52,941,698 | |
| | | | | | | | | | | | |
| | Total Thailand | | | 102,038,732 | | | | 102,267,318 | |
| | | | | | | | | | | | |
|
| United Kingdom (1.08%) | |
| | 21,837,142 | | | Tullow Oil plc1,3 | | | 58,186,424 | | | | 49,646,599 | |
| | | | | | | | | | | | |
| | Total Common Stocks | | | 4,463,995,584 | | | | 4,403,119,353 | |
| | | | | | | | | | | | |
| | | | | | | | | | | | |
| Private Preferred Stocks (0.01%) | |
| India (0.01%) | |
| | 3,098,340 | | | Zee Entertainment Enterprises Ltd., 6.00% due 3/5/20223 | | | 367,971 | | | | 339,120 | |
| | | | | | | | | | | | |
| | | | | | | | | | | | |
| Principal Amount | | Cost | | | Value | |
| Short Term Investments (4.06%) | |
| | $187,316,031 | | | Repurchase Agreement with Fixed Income Clearing Corp., dated 12/31/2018, 0.50% due 1/2/2019; Proceeds at maturity - $187,321,234; (Fully collateralized by $188,245,000 U.S. Treasury Note, 2.875% due 5/15/2028; Market value- $191,066,604)3 | | $ | 187,316,031 | | | $ | 187,316,031 | |
| | | | | | | | | | | | |
| | Total Investments (99.57%) | | $ | 4,651,679,586 | | | | 4,590,774,504 | |
| | | | | | | | | | | | |
| | Cash and Other Assets Less Liabilities (0.43%) | | | | 20,011,020 | |
| | | | | | | | | | | | |
| | Net Assets | | | $ | 4,610,785,524 | |
| | | | | | | | | | | | |
| Retail Shares (Equivalent to $12.45 per share
based on 60,524,659 shares outstanding) |
| | $ | 753,457,881 | |
| | | | | | | | | | | | |
| Institutional Shares (Equivalent to $12.47 per share
based on 308,692,007 shares outstanding) |
| | $ | 3,850,048,975 | |
| | | | | | | | | | | | |
| R6 Shares (Equivalent to $12.48 per share
based on 583,291 shares outstanding) |
| | $ | 7,278,668 | |
| | | | | | | | | | | | |
| % | Represents percentage of net assets. |
| 1 | Non-income producing securities. |
| 2 | See Note 10 regarding “Affiliated” companies. |
| 3 | Level 2 security. See Note 7 regarding Fair Value Measurements. |
| ADR | American Depositary Receipt. |
| NVDR | Non-Voting Depositary Receipt. |
| 144A | Security is exempt from registration pursuant to Rule 144A under the Securities Act of 1933. This security may be resold in transactions that are exempt from registration, normally to qualified institutional buyers. At December 31, 2018, the market value of Rule 144A securities amounted to $295,365,075 or 6.41% of net assets. These securities have been deemed liquid pursuant to policies and procedures approved by the Board of Trustees, unless otherwise noted. |
All securities are Level 1, unless otherwise noted.
| | | | |
Summary of Investments by Sector
as of December 31, 2018 | | Percentage of
Net Assets | |
| |
Financials | | | 19.5 | % |
| |
Communication Services | | | 17.5 | |
| |
Consumer Discretionary | | | 12.7 | |
| |
Consumer Staples | | | 11.5 | |
| |
Information Technology | | | 10.8 | |
| |
Health Care | | | 6.5 | |
| |
Energy | | | 5.8 | |
| |
Industrials | | | 5.2 | |
| |
Materials | | | 3.8 | |
| |
Real Estate | | | 1.1 | |
| |
Utilities | | | 1.1 | |
| |
Cash and Cash Equivalents* | | | 4.5 | |
| | | | 100.0 | % |
| * | Includes short term investments. |
| | |
| See Notes to Financial Statements. | | 27 |
| | |
| Baron Energy and Resources Fund | | December 31, 2018 |
STATEMENT OF NET ASSETS
| | | | | | | | | | | | |
| Shares | | | | | Cost | | | Value | |
| Common Stocks (72.78%) | |
| Consumer Discretionary (13.83%) | |
| | | | Automobile Manufacturers (13.83%) | | | | | | | | |
| | 14,100 | | | Tesla, Inc.1 | | $ | 3,242,965 | | | $ | 4,692,480 | |
| | | | | | | | | | | | |
|
| Energy (47.20%) | |
| | | | Integrated Oil & Gas (3.37%) | | | | | | | | |
| | 87,900 | | | Petróleo Brasileiro S.A. — Petrobras, ADR2 | | | 915,846 | | | | 1,143,579 | |
| | | |
| | | | Oil & Gas Equipment & Services (4.28%) | | | | | | | | |
| | 52,900 | | | Cactus, Inc., Cl A1 | | | 1,005,100 | | | | 1,449,989 | |
| | | |
| | | | Oil & Gas Exploration & Production (17.69%) | | | | | | | | |
| | 41,548 | | | Concho Resources, Inc.1 | | | 3,041,724 | | | | 4,270,719 | |
| | 6,968 | | | EOG Resources, Inc. | | | 512,058 | | | | 607,679 | |
| | 1,728,031 | | | Lekoil Ltd. (Nigeria)1,2 | | | 529,285 | | | | 170,477 | |
| | 84,900 | | | Magnolia Oil & Gas Corp.1 | | | 896,911 | | | | 951,729 | |
| | | | | | | | | | | | |
| | | | | | | 4,979,978 | | | | 6,000,604 | |
| | | |
| | | | Oil & Gas Refining & Marketing (7.10%) | | | | | | | | |
| | 25,692 | | | Marathon Petroleum Corp. | | | 1,310,024 | | | | 1,516,085 | |
| | 11,900 | | | Valero Energy Corporation | | | 668,324 | | | | 892,143 | |
| | | | | | | | | | | | |
| | | | | | | 1,978,348 | | | | 2,408,228 | |
| | | |
| | | | Oil & Gas Storage & Transportation (14.76%) | | | | | | | | |
| | 68,200 | | | Energy Transfer LP (formerly Energy Transfer Equity, L.P.) | | | 407,818 | | | | 900,922 | |
| | 87,735 | | | Golar LNG Ltd.2 | | | 1,586,534 | | | | 1,909,114 | |
| | 21,500 | | | MPLX LP | | | 650,701 | | | | 651,450 | |
| | 22,338 | | | Noble Midstream Partners LP | | | 502,605 | | | | 644,228 | |
| | 25,000 | | | Targa Resources Corp. | | | 536,054 | | | | 900,500 | |
| | | | | | | | | | | | |
| | | | | | | 3,683,712 | | | | 5,006,214 | |
| | | | | | | | | | | | |
| | Total Energy | | | 12,562,984 | | | | 16,008,614 | |
| | | | | | | | | | | | |
|
| Industrials (5.79%) | |
| | | | Heavy Electrical Equipment (5.79%) | | | | | | | | |
| | 79,900 | | | TPI Composites, Inc.1 | | | 1,366,447 | | | | 1,963,942 | |
| | | | | | | | | | | | |
|
| Information Technology (5.96%) | |
| | | | Application Software (5.96%) | | | | | | | | |
| | 24,600 | | | Aspen Technology, Inc.1 | | | 929,117 | | | | 2,021,628 | |
| | | | | | | | | | | | |
| | Total Common Stocks | | | 18,101,513 | | | | 24,686,664 | |
| | | | | | | | | | | | |
| | | | | | | | | | | | |
| Private Common Stocks (4.59%) | |
| Energy (4.59%) | |
| | | | Oil & Gas Equipment & Services (4.59%) | | | | | | | | |
| | 127,500 | | | Gravity Oilfield
Services, Inc., Cl A, 144A1,3,4,6 | | | 1,498,125 | | | | 1,558,050 | |
| | | | | | | | | | | | |
| | | | | | | | | | | | |
| Principal Amount | | Cost | | | Value | |
| Short Term Investments (22.21%) | | | | | | |
| | $7,531,940 | | | Repurchase Agreement with
Fixed Income Clearing Corp.,
dated 12/31/2018, 0.50%
due 1/2/2019; Proceeds at
maturity - $7,532,149;
(Fully collateralized by
$7,570,000 U.S. Treasury Note,
2.875% due 5/15/2028;
Marketvalue - $7,683,467)5 | | $ | 7,531,940 | | | $ | 7,531,940 | |
| | | | | | | | | | | | |
| | Total Investments (99.58%) | | $ | 27,131,578 | | | | 33,776,654 | |
| | | | | | | | | | | | |
| | Cash and Other Assets Less Liabilities (0.42%) | | | | 142,516 | |
| | | | | | | | | | | | |
| | Net Assets | | | | | | $ | 33,919,170 | |
| | | | | | | | | | | | |
| Retail Shares (Equivalent to $6.12 per share
based on 4,239,502 shares outstanding) |
| | $ | 25,938,377 | |
| | | | | | | | | | | | |
| Institutional Shares (Equivalent to $6.23 per share
based on 1,218,850 shares outstanding) |
| | $ | 7,590,414 | |
| | | | | | | | | | | | |
| R6 Shares (Equivalent to $6.23 per share
based on 62,711 shares outstanding) |
| | $ | 390,379 | |
| | | | | | | | | | | | |
| % | Represents percentage of net assets. |
| 1 | Non-income producing securities. |
| 3 | At December 31, 2018, the market value of restricted and fair valued securities amounted to $1,558,050 or 4.59% of net assets. This security is not deemed liquid. See Note 6 regarding Restricted Securities. |
| 4 | The Adviser has reclassified/classified certain securities in or out of this sub-industry. Such reclassifications/classifications are not supported by S&P or MSCI. |
| 5 | Level 2 security. See Note 7 regarding Fair Value Measurements. |
| 6 | Level 3 security. See Note 7 regarding Fair Value Measurements. |
| ADR | American Depositary Receipt. |
| 144A | Security is exempt from registration pursuant to Rule 144A under the Securities Act of 1933. This security may be resold in transactions that are exempt from registration, normally to qualified institutional buyers. At December 31, 2018, the market value of Rule 144A securities amounted to $1,558,050 or 4.59% of net assets. This security is not deemed liquid pursuant to policies and procedures approved by the Board of Trustees, unless otherwise noted. |
All securities are Level 1, unless otherwise noted.
| | |
| 28 | | See Notes to Financial Statements. |
| | |
| December 31, 2018 | | Baron Global Advantage Fund |
STATEMENT OF NET ASSETS
| | | | | | | | | | | | |
| Shares | | | | | Cost | | | Value | |
| Common Stocks (98.79%) | |
| Argentina (4.74%) | |
| | 92,743 | | | Bolsas y Mercados Argentinos SA2 | | $ | 1,568,116 | | | $ | 920,037 | |
| | 34,680 | | | Globant SA1 | | | 1,568,088 | | | | 1,953,177 | |
| | 4,629 | | | MercadoLibre, Inc. | | | 1,493,632 | | | | 1,355,603 | |
| | | | | | | | | | | | |
| | Total Argentina | | | 4,629,836 | | | | 4,228,817 | |
| | | | | | | | | | | | |
|
| Brazil (3.18%) | |
| | 42,198 | | | Arco Platform Ltd., Cl A1 | | | 771,578 | | | | 933,420 | |
| | 78,016 | | | Pagseguro Digital Ltd., Cl A1 | | | 2,078,108 | | | | 1,461,240 | |
| | 24,091 | | | StoneCo Ltd., Cl A1 | | | 588,741 | | | | 444,238 | |
| | | | | | | | | | | | |
| | Total Brazil | | | 3,438,427 | | | | 2,838,898 | |
| | | | | | | | | | | | |
|
| Canada (3.58%) | |
| | 4,982 | | | Constellation Software, Inc. | | | 2,799,529 | | | | 3,188,962 | |
| | | | | | | | | | | | |
|
| China (9.39%) | |
| | 30,481 | | | Alibaba Group Holding Ltd., ADR1 | | | 3,947,296 | | | | 4,178,031 | |
| | 49,581 | | | Ctrip.com International Ltd., ADR1 | | | 2,135,193 | | | | 1,341,662 | |
| | 43,518 | | | Meituan Dianping, Cl B1,2 | | | 386,441 | | | | 243,904 | |
| | 54,602 | | | Pinduoduo, Inc., ADR1 | | | 1,293,814 | | | | 1,225,269 | |
| | 51,834 | | | TAL Education Group, ADR1 | | | 546,540 | | | | 1,382,931 | |
| | | | | | | | | | | | |
| | Total China | | | 8,309,284 | | | | 8,371,797 | |
| | | | | | | | | | | | |
|
| India (8.38%) | |
| | 19,071 | | | HDFC Bank Ltd., ADR | | | 1,806,751 | | | | 1,975,565 | |
| | 117,600 | | | Housing Development Finance Corp. Ltd.2 | | | 3,189,841 | | | | 3,313,296 | |
| | 121,500 | | | Kotak Mahindra Bank Ltd.2 | | | 1,978,335 | | | | 2,185,679 | |
| | | | | | | | | | | | |
| | Total India | | | 6,974,927 | | | | 7,474,540 | |
| | | | | | | | | | | | |
|
| Israel (6.54%) | |
| | 37,755 | | | Mellanox Technologies Ltd.1 | | | 2,316,568 | | | | 3,487,807 | |
| | 25,929 | | | Wix.com Ltd.1 | | | 2,211,990 | | | | 2,342,426 | |
| | | | | | | | | | | | |
| | Total Israel | | | 4,528,558 | | | | 5,830,233 | |
| | | | | | | | | | | | |
|
| Japan (0.16%) | |
| | 8,883 | | | Mercari, Inc.1,2 | | | 242,385 | | | | 148,292 | |
| | | | | | | | | | | | |
|
| Netherlands (6.35%) | |
| | 18 | | | Adyen NV, 144A1,2 | | | 5,091 | | | | 9,724 | |
| | 44,012 | | | argenx SE, ADR1 | | | 2,372,759 | | | | 4,228,233 | |
| | 9,070 | | | ASML Holding N.V.2 | | | 1,356,327 | | | | 1,420,901 | |
| | | | | | | | | | | | |
| | Total Netherlands | | | 3,734,177 | | | | 5,658,858 | |
| | | | | | | | | | | | |
|
| South Africa (4.89%) | |
| | 21,775 | | | Naspers Limited, Cl N2 | | | 5,360,091 | | | | 4,359,713 | |
| | | | | | | | | | | | |
|
| United Kingdom (1.51%) | |
| | 55,430 | | | Endava plc, ADR1 | | | 1,177,506 | | | | 1,343,623 | |
| | | | | | | | | | | | |
| | | | | | | | | | | | |
| Shares | | | | | Cost | | | Value | |
| Common Stocks (continued) | |
| United States (50.07%) | |
| | 63,371 | | | Activision Blizzard, Inc. | | $ | 4,435,400 | | | $ | 2,951,187 | |
| | 43,812 | | | Aerie Pharmaceuticals, Inc.1 | | | 2,446,820 | | | | 1,581,613 | |
| | 4,162 | | | Alphabet, Inc., Cl C1 | | | 4,036,919 | | | | 4,310,209 | |
| | 2,921 | | | Amazon.com, Inc.1 | | | 2,285,253 | | | | 4,387,254 | |
| | 22,138 | | | Anaplan, Inc.1 | | | 410,287 | | | | 587,542 | |
| | 6,673 | | | AnaptysBio, Inc.1 | | | 521,344 | | | | 425,671 | |
| | 28,069 | | | AxoGen, Inc.1 | | | 628,709 | | | | 573,450 | |
| | 1,831 | | | Elastic NV1 | | | 65,916 | | | | 130,880 | |
| | 27,205 | | | EPAM Systems, Inc.1 | | | 2,586,513 | | | | 3,156,052 | |
| | 18,531 | | | Facebook, Inc., Cl A1 | | | 2,500,061 | | | | 2,429,229 | |
| | 28,834 | | | Guardant Health, Inc.1 | | | 764,879 | | | | 1,083,870 | |
| | 9,362 | | | Illumina, Inc.1 | | | 1,942,394 | | | | 2,807,945 | |
| | 18,540 | | | Okta, Inc.1 | | | 390,056 | | | | 1,182,852 | |
| | 11,271 | | | RingCentral, Inc., Cl A1 | | | 897,686 | | | | 929,181 | |
| | 16,229 | | | Sage Therapeutics, Inc.1 | | | 1,973,559 | | | | 1,554,576 | |
| | 22,573 | | | Splunk, Inc.1 | | | 1,988,191 | | | | 2,366,779 | |
| | 21,976 | | | Take-Two Interactive Software, Inc.1 | | | 2,248,828 | | | | 2,262,209 | |
| | 41,435 | | | Tenable Holdings, Inc.1 | | | 953,005 | | | | 919,443 | |
| | 3,638 | | | Tesla, Inc.1 | | | 1,048,764 | | | | 1,210,726 | |
| | 27,470 | | | Upwork, Inc.1 | | | 412,050 | | | | 497,482 | |
| | 13,912 | | | Varonis Systems, Inc.1 | | | 405,714 | | | | 735,945 | |
| | 39,621 | | | Veeva Systems, Inc., Cl A1 | | | 2,934,658 | | | | 3,538,948 | |
| | 34,503 | | | Worldpay, Inc., Cl A1 | | | 2,802,704 | | | | 2,637,064 | |
| | 127,342 | | | Yext, Inc.1 | | | 1,772,005 | | | | 1,891,029 | |
| | 12,506 | | | Zscaler, Inc.1 | | | 200,096 | | | | 490,360 | |
| | | | | | | | | | | | |
| | Total United States | | | 40,651,811 | | | | 44,641,496 | |
| | | | | | | | | | | | |
| | Total Investments (98.79%) | | $ | 81,846,531 | | | | 88,085,229 | |
| | | | | | | | | | | | |
| | Cash and Other Assets Less Liabilities (1.21%) | | | | 1,075,185 | |
| | | | | | | | | | | | |
| | Net Assets | | | $ | 89,160,414 | |
| | | | | | | | | | | | |
| Retail Shares (Equivalent to $19.77 per share
based on 1,806,893 shares outstanding) |
| | $ | 35,716,605 | |
| | | | | | | | | | | | |
| Institutional Shares (Equivalent to $20.02 per share
based on 2,458,765 shares outstanding) |
| | $ | 49,220,592 | |
| | | | | | | | | | | | |
| R6 Shares (Equivalent to $20.03 per share
based on 210,843 shares outstanding) |
| | $ | 4,223,217 | |
| | | | | | | | | | | | |
| % | Represents percentage of net assets. |
| 1 | Non-income producing securities. |
| 2 | Level 2 security. See Note 7 regarding Fair Value Measurements. |
| ADR | American Depositary Receipt. |
| 144A | Security is exempt from registration pursuant to Rule 144A under the Securities Act of 1933. This security may be resold in transactions that are exempt from registration, normally to qualified institutional buyers. At December 31, 2018, the market value of Rule 144A securities amounted to $9,724 or 0.01% of net assets. This security has been deemed liquid pursuant to policies and procedures approved by the Board of Trustees, unless otherwise noted. |
All securities are Level 1, unless otherwise noted.
| | | | |
Summary of Investments by Sector as of December 31, 2018 | | Percentage of
Net Assets | |
| |
Information Technology | | | 34.4 | % |
| |
Consumer Discretionary | | | 18.4 | |
| |
Communication Services | | | 18.3 | |
| |
Health Care | | | 17.7 | |
| |
Financials | | | 9.4 | |
| |
Industrials | | | 0.6 | |
| |
Cash and Cash Equivalents | | | 1.2 | |
| | | | 100.0 | % |
| | |
| See Notes to Financial Statements. | | 29 |
| | |
| Baron Real Estate Income Fund | | December 31, 2018 |
STATEMENT OF NET ASSETS
| | | | | | | | | | | | |
| Shares | | | | | Cost | | | Value | |
| Common Stocks (97.31%) | |
| Communication Services (0.82%) | |
| | | | Advertising (0.82%) | |
| | 803 | | | JC Decaux SA (France)2,4 | | $ | 27,304 | | | $ | 22,560 | |
| | | | | | | | | | | | |
|
| Consumer Discretionary (10.09%) | |
| | | | Casinos & Gaming (7.64%) | |
| | 4,332 | | | MGM Resorts International | | | 136,580 | | | | 105,095 | |
| | 3,275 | | | Penn National Gaming, Inc.1 | | | 80,353 | | | | 61,668 | |
| | 2,228 | | | Red Rock Resorts, Inc., Cl A | | | 56,635 | | | | 45,251 | |
| | | | | | | | | | | | |
| | | | 273,568 | | | | 212,014 | |
| |
| | | | Hotels, Resorts & Cruise Lines (2.45%) | |
| | 967 | | | Marriott Vacations Worldwide Corp. | | | 89,002 | | | | 68,183 | |
| | | | | | | | | | | | |
| | Total Consumer Discretionary | | | 362,570 | | | | 280,197 | |
| | | | | | | | | | | | |
|
| Information Technology (2.80%) | |
| | | | Internet Services & Infrastructure (2.80%) | |
| | 1,914 | | | GDS Holdings Ltd., ADR1,2,3 | | | 47,584 | | | | 44,194 | |
| | 7,782 | | | NEXTDC Ltd. (Australia)1,2,4 | | | 41,031 | | | | 33,530 | |
| | | | | | | | | | | | |
| | Total Information Technology | | | 88,615 | | | | 77,724 | |
| | | | | | | | | | | | |
|
| Real Estate (83.60%) | |
| | | | Health Care REITs (3.42%) | |
| | 1,437 | | | HCP, Inc. | | | 41,339 | | | | 40,135 | |
| | 1,706 | | | Medical Properties Trust, Inc. | | | 28,091 | | | | 27,433 | |
| | 396 | | | Welltower, Inc. | | | 28,212 | | | | 27,486 | |
| | | | | | | | | | | | |
| | | | 97,642 | | | | 95,054 | |
| |
| | | | Hotel & Resort REITs (5.59%) | |
| | 2,696 | | | Host Hotels & Resorts, Inc. | | | 52,681 | | | | 44,942 | |
| | 1,518 | | | MGM Growth Properties LLC, Cl A | | | 43,355 | | | | 40,090 | |
| | 1,575 | | | Park Hotels & Resorts, Inc. | | | 45,339 | | | | 40,919 | |
| | 1,028 | | | Pebblebrook Hotel Trust | | | 37,764 | | | | 29,103 | |
| | | | | | | | | | | | |
| | | | 179,139 | | | | 155,054 | |
| |
| | | | Industrial REITs (7.70%) | |
| | 2,637 | | | Duke Realty Corp. | | | 70,662 | | | | 68,298 | |
| | 1,596 | | | Prologis, Inc. | | | 102,803 | | | | 93,717 | |
| | 1,756 | | | Rexford Industrial Realty, Inc. | | | 53,397 | | | | 51,750 | |
| | | | | | | | | | | | |
| | | | 226,862 | | | | 213,765 | |
| |
| | | | Office REITs (7.27%) | |
| | 305 | | | Boston Properties, Inc. | | | 38,504 | | | | 34,328 | |
| | 1,108 | | | Douglas Emmett, Inc. | | | 43,455 | | | | 37,816 | |
| | 1,181 | | | Hudson Pacific Properties, Inc. | | | 37,397 | | | | 34,320 | |
| | 736 | | | Kilroy Realty Corp. | | | 52,995 | | | | 46,280 | |
| | 192 | | | SL Green Realty Corp. | | | 18,651 | | | | 15,183 | |
| | 548 | | | Vornado Realty Trust | | | 39,125 | | | | 33,992 | |
| | | | | | | | | | | | |
| | | | 230,127 | | | | 201,919 | |
| |
| | | | Real Estate Operating Companies (2.51%) | |
| | 892 | | | Brookfield Property Partners LP2 | | | 17,025 | | | | 14,379 | |
| | 3,044 | | | Kennedy-Wilson Holdings, Inc. | | | 52,713 | | | | 55,310 | |
| | | | | | | | | | | | |
| | | | 69,738 | | | | 69,689 | |
| |
| | | | Residential REITs (17.14%) | |
| | 617 | | | AvalonBay Communities, Inc. | | | 104,148 | | | | 107,389 | |
| | 903 | | | Equity LifeStyle Properties, Inc. | | | 82,937 | | | | 87,708 | |
| | 1,671 | | | Equity Residential | | | 104,174 | | | | 110,303 | |
| | 268 | | | Essex Property Trust, Inc. | | | 66,469 | | | | 65,716 | |
| | 1,433 | | | Invitation Homes, Inc. | | | 32,503 | | | | 28,775 | |
| | 747 | | | Sun Communities, Inc. | | | 70,359 | | | | 75,977 | |
| | | | | | | | | | | | |
| | | | 460,590 | | | | 475,868 | |
| | | | | | | | | | | | |
| Shares | | | | | Cost | | | Value | |
| Common Stocks (continued) | |
| Real Estate (continued) | |
| |
| | | | Retail REITs (2.78%) | |
| | 460 | | | Simon Property Group, Inc. | | $ | 79,772 | | | $ | 77,275 | |
| |
| | | | Specialized REITs (37.19%) | |
| | 831 | | | Alexandria Real Estate Equities, Inc.3 | | | 103,796 | | | | 95,764 | |
| | 1,174 | | | American Tower Corp. | | | 167,056 | | | | 185,715 | |
| | 5,933 | | | Americold Realty Trust3 | | | 111,225 | | | | 151,529 | |
| | 824 | | | Crown Castle International Corp. | | | 89,210 | | | | 89,511 | |
| | 625 | | | CyrusOne, Inc. | | | 40,856 | | | | 33,050 | |
| | 971 | | | Digital Realty Trust, Inc. | | | 107,373 | | | | 103,460 | |
| | 503 | | | Equinix, Inc. | | | 217,547 | | | | 177,338 | |
| | 2,098 | | | Gaming and Leisure Properties, Inc. | | | 76,158 | | | | 67,786 | |
| | 222 | | | Public Storage | | | 45,118 | | | | 44,935 | |
| | 2,252 | | | QTS Realty Trust, Inc., Cl A | | | 94,292 | | | | 83,437 | |
| | | | | | | | | | | | |
| | | | | | | 1,052,631 | | | | 1,032,525 | |
| | | | | | | | | | | | |
| | Total Real Estate | | | 2,396,501 | | | | 2,321,149 | |
| | | | | | | | | | | | |
| | Total Common Stocks | | | 2,874,990 | | | | 2,701,630 | |
| | | | | | | | | | | | |
| | | | | | | | | | | | |
| | | |
| Principal Amount | | | | | | |
| Short Term Investments (4.73%) | |
| | $131,459 | | | Repurchase Agreement with
Fixed Income Clearing Corp.,
dated 12/31/2018, 0.50%
due 1/2/2019; Proceeds at
maturity - $131,463;
(Fully collateralized by
$135,000 U.S. Treasury Note,
2.875% due 5/15/2028;
Market value - $137,024)4 | | | 131,459 | | | | 131,459 | |
| | | | | | | | | | | | |
| | Total Investments (102.04%) | | $ | 3,006,449 | | | | 2,833,089 | |
| | | | | | | | | | | | |
| | Liabilities Less Cash and Other Assets (-2.04%) | | | | (56,639 | ) |
| | | | | | | | | | | | |
| | Net Assets | | | $ | 2,776,450 | |
| | | | | | | | | | | | |
| Retail Shares (Equivalent to $8.63 per share
based on 52,351 shares outstanding) |
| | $ | 451,863 | |
| | | | | | | | | | | | |
| Institutional Shares (Equivalent to $8.66 per share
based on 226,951 shares outstanding) |
| | $ | 1,965,159 | |
| | | | | | | | | | | | |
| R6 Shares (Equivalent to $8.66 per share
based on 41,488 shares outstanding) |
| | $ | 359,428 | |
| | | | | | | | | | | | |
| % | Represents percentage of net assets. |
| 1 | Non-income producing securities. |
| 3 | The Adviser has reclassified/classified certain securities in or out of this sub-industry. Such reclassifications/classifications are not supported by S&P or MSCI. |
| 4 | Level 2 security. See Note 7 regarding Fair Value Measurements. |
| ADR | American Depositary Receipt. |
All securities are Level 1, unless otherwise noted.
| | |
| 30 | | See Notes to Financial Statements. |
| | |
| December 31, 2018 | | Baron Health Care Fund |
STATEMENT OF NET ASSETS
| | | | | | | | | | | | |
| Shares | | | | | Cost | | | Value | |
| Common Stocks (89.94%) | |
| Health Care (88.08%) | |
| | | | Biotechnology (16.18%) | | | | | | | | |
| | 6,673 | | | Abcam plc (United Kingdom)2,4 | | $ | 105,981 | | | $ | 92,885 | |
| | 3,373 | | | Acceleron Pharma, Inc.1 | | | 161,122 | | | | 146,894 | |
| | 3,822 | | | argenx SE, ADR1,2 | | | 333,683 | | | | 367,180 | |
| | 4,847 | | | Arrowhead Pharmaceuticals, Inc.1 | | | 83,332 | | | | 60,200 | |
| | 1,703 | | | Neurocrine Biosciences, Inc.1 | | | 154,051 | | | | 121,611 | |
| | 1,557 | | | Sage Therapeutics, Inc.1 | | | 224,213 | | | | 149,145 | |
| | 1,875 | | | Vertex Pharmaceuticals, Inc.1 | | | 308,266 | | | | 310,706 | |
| | 2,130 | | | Zai Lab Ltd., ADR1,2 | | | 46,631 | | | | 49,459 | |
| | | | | | | | | | | | |
| | | | | | | 1,417,279 | | | | 1,298,080 | |
| | | |
| | | | Health Care Equipment (31.04%) | | | | | | | | |
| | 4,023 | | | Abbott Laboratories | | | 286,758 | | | | 290,984 | |
| | 1,302 | | | AxoGen, Inc.1 | | | 35,739 | | | | 26,600 | |
| | 7,314 | | | Boston Scientific Corporation1 | | | 268,835 | | | | 258,477 | |
| | 1,385 | | | Cantel Medical Corp. | | | 137,696 | | | | 103,113 | |
| | 981 | | | DexCom, Inc.1 | | | 107,778 | | | | 117,524 | |
| | 814 | | | Edwards Lifesciences Corp.1 | | | 109,951 | | | | 124,680 | |
| | 1,297 | | | IDEXX Laboratories, Inc.1 | | | 257,263 | | | | 241,268 | |
| | 1,515 | | | Insulet Corp.1 | | | 133,514 | | | | 120,170 | |
| | 5,650 | | | Intersect ENT, Inc.1,3 | | | 173,042 | | | | 159,217 | |
| | 2,077 | | | IntriCon Corp.1 | | | 90,202 | | | | 54,791 | |
| | 558 | | | Intuitive Surgical, Inc.1 | | | 273,263 | | | | 267,237 | |
| | 1,088 | | | LivaNova plc1,2 | | | 124,067 | | | | 99,519 | |
| | 2,575 | | | Medtronic plc2 | | | 220,218 | | | | 234,222 | |
| | 1,385 | | | Teleflex, Inc. | | | 361,467 | | | | 357,995 | |
| | 5,593 | | | ViewRay, Inc.1 | | | 45,691 | | | | 33,950 | |
| | | | | | | | | | | | |
| | | | | | | 2,625,484 | | | | 2,489,747 | |
| | | |
| | | | Health Care Facilities (3.08%) | | | | | | | | |
| | 1,985 | | | HCA Healthcare, Inc. | | | 264,011 | | | | 247,033 | |
| | | |
| | | | Health Care Services (0.99%) | | | | | | | | |
| | 2,117 | | | Guardant Health, Inc.1 | | | 53,736 | | | | 79,578 | |
| | | |
| | | | Health Care Supplies (4.14%) | | | | | | | | |
| | 553 | | | Align Technology, Inc.1 | | | 138,649 | | | | 115,815 | |
| | 656 | | | The Cooper Companies, Inc. | | | 163,139 | | | | 166,952 | |
| | 500 | | | West Pharmaceutical Services, Inc. | | | 46,203 | | | | 49,015 | |
| | | | | | | | | | | | |
| | | | | | | 347,991 | | | | 331,782 | |
| | | |
| | | | Health Care Technology (1.47%) | | | | | | | | |
| | 1,322 | | | Veeva Systems, Inc., Cl A1 | | | 108,167 | | | | 118,081 | |
| | | |
| | | | Life Sciences Tools & Services (13.10%) | | | | | | | | |
| | 1,838 | | | Bio-Techne Corporation | | | 296,395 | | | | 265,995 | |
| | 5,793 | | | CareDx, Inc.1,3 | | | 104,593 | | | | 145,636 | |
| | 343 | | | Eurofins Scientific SE (France)2,4 | | | 185,835 | | | | 128,104 | |
| | 878 | | | ICON plc1,2 | | | 129,544 | | | | 113,446 | |
| | 803 | | | Illumina, Inc.1 | | | 225,367 | | | | 240,844 | |
| | 277 | | | Mettler-Toledo International, Inc.1 | | | 159,276 | | | | 156,666 | |
| | | | | | | | | | | | |
| | | | | | | 1,101,010 | | | | 1,050,691 | |
| | | |
| | | | Managed Health Care (10.92%) | | | | | | | | |
| | 365 | | | HealthEquity, Inc.1 | | | 25,707 | | | | 21,772 | |
| | 1,083 | | | Humana, Inc. | | | 344,281 | | | | 310,258 | |
| | 2,184 | | | UnitedHealth Group, Inc. | | | 561,257 | | | | 544,078 | |
| | | | | | | | | | | | |
| | | | | | | 931,245 | | | | 876,108 | |
| | | |
| | | | Pharmaceuticals (7.16%) | | | | | | | | |
| | 899 | | | Aerie Pharmaceuticals, Inc.1 | | | 46,317 | | | | 32,454 | |
| | 1,895 | | | Assembly Biosciences, Inc.1 | | | 61,587 | | | | 42,865 | |
| | 8,516 | | | AstraZeneca PLC, ADR2 | | | 321,060 | | | | 323,437 | |
| | 6,632 | | | Dechra Pharmaceuticals plc (United Kingdom)2,4 | | | 207,200 | | | | 175,225 | |
| | | | | | | | | | | | |
| | | | | | | 636,164 | | | | 573,981 | |
| | | | | | | | | | | | |
| | Total Health Care | | | 7,485,087 | | | | 7,065,081 | |
| | | | | | | | | | | | |
| | | | | | | | | | | | |
| Shares | | | | | Cost | | | Value | |
| Common Stocks (continued) | |
| Real Estate (1.86%) | |
| | | | Specialized REITs (1.86%) | | | | | | | | |
| | 1,297 | | | Alexandria Real Estate Equities, Inc.3 | | $ | 163,464 | | | $ | 149,466 | |
| | | | | | | | | | | | |
| | Total Common Stocks | | | 7,648,551 | | | | 7,214,547 | |
| | | | | | | | | | | | |
| | | | | | | | | | | | |
| | | |
| Principal Amount | | | | | | |
| Short Term Investments (10.14%) | |
| | $813,558 | | | Repurchase Agreement with
Fixed Income Clearing Corp.,
dated 12/31/2018, 0.50%
due 1/2/2019; Proceeds at
maturity - $813,581;
(Fully collateralized by
$820,000 U.S. Treasury Note,
2.875% due 5/15/2028;
Market value - $832,291)4 | | | 813,558 | | | | 813,558 | |
| | | | | | | | | | | | |
| | Total Investments (100.08%) | | $ | 8,462,109 | | | | 8,028,105 | |
| | | | | | | | | | | | |
| | Liabilities Less Cash and Other Assets (-0.08%) | | | | (6,457 | ) |
| | | | | | | | | | | | |
| | Net Assets | | | $ | 8,021,648 | |
| | | | | | | | | | | | |
| Retail Shares (Equivalent to $9.51 per share
based on 294,847 shares outstanding) |
| | $ | 2,803,159 | |
| | | | | | | | | | | | |
| Institutional Shares (Equivalent to $9.53 per share
based on 471,983 shares outstanding) |
| | $ | 4,495,963 | |
| | | | | | | | | | | | |
| R6 Shares (Equivalent to $9.52 per share
based on 75,892 shares outstanding) |
| | $ | 722,526 | |
| | | | | | | | | | | | |
| % | Represents percentage of net assets. |
| 1 | Non-income producing securities. |
| 3 | The Adviser has reclassified/classified certain securities in or out of this sub-industry. Such reclassifications/classifications are not supported by S&P or MSCI. |
| 4 | Level 2 security. See Note 7 regarding Fair Value Measurements. |
| ADR | American Depositary Receipt. |
All securities are Level 1, unless otherwise noted.
| | |
| See Notes to Financial Statements. | | 31 |
| | |
| Baron Select Funds | | December 31, 2018 |
STATEMENTS OF ASSETS AND LIABILITIES
| | | | | | | | | | | | | | | | | | | | |
| | | Baron Partners
Fund | | | Baron Focused
Growth Fund | | | Baron
International
Growth Fund | | | Baron Real
Estate Fund | | | Baron
Emerging
Markets Fund | |
Assets: | | | | | | | | | | | | | | | | | | | | |
Investments in securities, at value* | | | | | | | | | | | | | | | | | | | | |
Unaffiliated investments | | $ | 2,554,766,909 | | | $ | 202,869,816 | | | $ | 216,087,296 | | | $ | 545,538,141 | | | $ | 4,400,240,544 | |
“Affiliated” investments | | | — | | | | — | | | | — | | | | — | | | | 3,217,929 | |
Repurchase agreements, at value** | | | 439,881 | | | | 119,757 | | | | 7,467,184 | | | | — | | | | 187,316,031 | |
| | | | | | | | | | | | | | | | | | | | |
Total investments, at value | | | 2,555,206,790 | | | | 202,989,573 | | | | 223,554,480 | | | | 545,538,141 | | | | 4,590,774,504 | |
Foreign currency, at value† | | | — | | | | — | | | | 1,560 | | | | — | | | | 88,405 | |
Cash | | | — | | | | — | | | | — | | | | 74,143 | | | | — | |
Receivable for shares sold | | | 7,164,452 | | | | 563,294 | | | | 4,516,158 | | | | 1,785,181 | | | | 37,893,808 | |
Dividends and interest receivable | | | 2,869,802 | | | | 318,754 | | | | 223,363 | | | | 1,404,326 | | | | 8,735,916 | |
Prepaid expenses | | | 352,636 | | | | 258 | | | | 244 | | | | 1,410 | | | | 6,995 | |
Receivable for securities sold | | | — | | | | — | | | | 416,678 | | | | 6,902,620 | | | | — | |
Other assets | | | — | | | | — | | | | — | | | | — | | | | 14,895 | |
| | | | | | | | | | | | | | | | | | | | |
| | | 2,565,593,680 | | | | 203,871,879 | | | | 228,712,483 | | | | 555,705,821 | | | | 4,637,514,523 | |
| | | | | | | | | | | | | | | | | | | | |
Liabilities: | | | | | | | | | | | | | | | | | | | | |
Payable for borrowings against line of credit | | | 601,500,000 | | | | — | | | | — | | | | 3,100,000 | | | | — | |
Payable for securities purchased | | | 3,861,568 | | | | — | | | | — | | | | — | | | | — | |
Payable for shares redeemed | | | 3,058,758 | | | | 2,055 | | | | 1,752,622 | | | | 9,264,769 | | | | 25,346,879 | |
Investment advisory fees payable (Note 4) | | | 633 | | | | 765 | | | | 1,535 | | | | 842 | | | | 928 | |
Distribution fees payable (Note 4) | | | 276 | | | | 449 | | | | 360 | | | | 500 | | | | 929 | |
Due to custodian bank | | | — | | | | — | | | | 412,794 | | | | — | | | | — | |
Accrued capital gains taxes | | | — | | | | — | | | | — | | | | — | | | | 431,619 | |
Accrued expenses and other payables | | | 2,014,872 | | | | 62,857 | | | | 96,918 | | | | 144,451 | | | | 948,644 | |
| | | | | | | | | | | | | | | | | | | | |
| | | 610,436,107 | | | | 66,126 | | | | 2,264,229 | | | | 12,510,562 | | | | 26,728,999 | |
| | | | | | | | | | | | | | | | | | | | |
Net Assets | | $ | 1,955,157,573 | | | $ | 203,805,753 | | | $ | 226,448,254 | | | $ | 543,195,259 | | | $ | 4,610,785,524 | |
| | | | | | | | | | | | | | | | | | | | |
Net Assets consist of: | | | | | | | | | | | | | | | | | | | | |
Paid-in capital | | $ | 896,330,226 | | | $ | 113,350,544 | | | $ | 234,219,708 | | | $ | 447,143,647 | | | $ | 4,737,874,793 | |
Distributable earnings/(losses) | | | 1,058,827,347 | | | | 90,455,209 | | | | (7,771,454 | ) | | | 96,051,612 | | | | (127,089,269 | ) |
| | | | | | | | | | | | | | | | | | | | |
Net Assets | | $ | 1,955,157,573 | | | $ | 203,805,753 | | | $ | 226,448,254 | | | $ | 543,195,259 | | | $ | 4,610,785,524 | |
| | | | | | | | | | | | | | | | | | | | |
Retail Shares: | | | | | | | | | | | | | | | | | | | | |
Net Assets | | $ | 1,016,235,268 | | | $ | 40,867,711 | | | $ | 59,815,169 | | | $ | 213,014,931 | | | $ | 753,457,881 | |
Shares Outstanding ($0.01 par value; indefinite shares authorized) | | | 21,274,807 | | | | 2,584,537 | | | | 3,147,974 | | | | 10,257,306 | | | | 60,524,659 | |
| | | | | | | | | | | | | | | | | | | | |
Net Asset Value and Offering Price Per Share | | $ | 47.77 | | | $ | 15.81 | | | $ | 19.00 | | | $ | 20.77 | | | $ | 12.45 | |
| | | | | | | | | | | | | | | | | | | | |
Institutional Shares: | | | | | | | | | | | | | | | | | | | | |
Net Assets | | $ | 815,586,111 | | | $ | 70,762,850 | | | $ | 154,187,750 | | | $ | 320,849,321 | | | $ | 3,850,048,975 | |
Shares Outstanding ($0.01 par value; indefinite shares authorized) | | | 16,693,599 | | | | 4,381,939 | | | | 7,992,969 | | | | 15,208,894 | | | | 308,692,007 | |
| | | | | | | | | | | | | | | | | | | | |
Net Asset Value and Offering Price Per Share | | $ | 48.86 | | | $ | 16.15 | | | $ | 19.29 | | | $ | 21.10 | | | $ | 12.47 | |
| | | | | | | | | | | | | | | | | | | | |
R6 Shares: | | | | | | | | | | | | | | | | | | | | |
Net Assets | | $ | 123,336,194 | | | $ | 92,175,192 | | | $ | 12,445,335 | | | $ | 9,331,007 | | | $ | 7,278,668 | |
Shares Outstanding ($0.01 par value; indefinite shares authorized) | | | 2,524,313 | | | | 5,705,546 | | | | 645,114 | | | | 442,266 | | | | 583,291 | |
| | | | | | | | | | | | | | | | | | | | |
Net Asset Value and Offering Price Per Share | | $ | 48.86 | | | $ | 16.16 | | | $ | 19.29 | | | $ | 21.10 | | | $ | 12.48 | |
| | | | | | | | | | | | | | | | | | | | |
| | | | | |
*Investments in securities, at cost | | | | | | | | | | | | | | | | | | | | |
Unaffiliated investments | | $ | 1,479,783,939 | | | $ | 111,162,791 | | | $ | 220,882,154 | | | $ | 447,593,684 | | | $ | 4,449,481,789 | |
“Affiliated” investments | | | — | | | | — | | | | — | | | | — | | | | 14,881,766 | |
**Repurchase agreements, at cost | | | 439,881 | | | | 119,757 | | | | 7,467,184 | | | | — | | | | 187,316,031 | |
| | | | | | | | | | | | | | | | | | | | |
Total investments, at cost | | $ | 1,480,223,820 | | | $ | 111,282,548 | | | $ | 228,349,338 | | | $ | 447,593,684 | | | $ | 4,651,679,586 | |
| | | | | | | | | | | | | | | | | | | | |
| | | | | |
†Foreign currency, at cost: | | $ | — | | | $ | — | | | $ | 1,557 | | | $ | — | | | $ | 88,246 | |
| | | | | | | | | | | | | | | | | | | | |
| | |
| 32 | | See Notes to Financial Statements. |
| | |
| December 31, 2018 | | Baron Select Funds |
STATEMENTS OF ASSETS AND LIABILITIES (Continued)
| | | | | | | | | | | | | | | | |
| | | Baron
Energy and
Resources Fund | | | Baron Global
Advantage
Fund | | | Baron Real
Estate Income
Fund | | | Baron Health
Care Fund | |
Assets: | | | | | | | | | | | | | | | | |
Investments in securities, at value* | | | | | | | | | | | | | | | | |
Unaffiliated investments | | $ | 26,244,714 | | | $ | 88,085,229 | | | $ | 2,701,630 | | | $ | 7,214,547 | |
“Affiliated” investments | | | — | | | | — | | | | — | | | | — | |
Repurchase agreements, at value** | | | 7,531,940 | | | | — | | | | 131,459 | | | | 813,558 | |
| | | | | | | | | | | | | | | | |
Total investments, at value | | | 33,776,654 | | | | 88,085,229 | | | | 2,833,089 | | | | 8,028,105 | |
Foreign currency, at value† | | | — | | | | — | | | | — | | | | — | |
Cash | | | 3,325 | | | | 90,888 | | | | 644 | | | | — | |
Receivable for shares sold | | | 76,456 | | | | 2,222,960 | | | | 8,750 | | | | 50,686 | |
Dividends and interest receivable | | | 14,959 | | | | 3,798 | | | | 14,604 | | | | 3,098 | |
Prepaid expenses | | | 73 | | | | 72 | | | | 3 | | | | — | |
Receivable for securities sold | | | 429,854 | | | | — | | | | — | | | | — | |
Other assets | | | 104,294 | | | | — | | | | — | | | | — | |
| | | | | | | | | | | | | | | | |
| | | 34,405,615 | | | | 90,402,947 | | | | 2,857,090 | | | | 8,081,889 | |
| | | | | | | | | | | | | | | | |
Liabilities: | | | | | | | | | | | | | | | | |
Payable for borrowings against line of credit | | | — | | | | 700,000 | | | | — | | | | — | |
Payable for securities purchased | | | — | | | | 392,119 | | | | 20,657 | | | | — | |
Payable for shares redeemed | | | 356,791 | | | | 62,537 | | | | — | | | | — | |
Investment advisory fees payable (Note 4) | | | — | | | | 235 | | | | — | | | | — | |
Distribution fees payable (Note 4) | | | 248 | | | | 565 | | | | 935 | | | | 740 | |
Accrued capital gains taxes | | | — | | | | 477 | | | | — | | | | — | |
Accrued expenses and other payables | | | 129,406 | | | | 86,600 | | | | 59,048 | | | | 59,501 | |
| | | | | | | | | | | | | | | | |
| | | 486,445 | | | | 1,242,533 | | | | 80,640 | | | | 60,241 | |
| | | | | | | | | | | | | | | | |
Net Assets | | $ | 33,919,170 | | | $ | 89,160,414 | | | $ | 2,776,450 | | | $ | 8,021,648 | |
| | | | | | | | | | | | | | | | |
Net Assets consist of: | | | | | | | | | | | | | | | | |
Paid-in capital | | $ | 67,773,232 | | | $ | 86,872,045 | | | $ | 3,141,865 | | | $ | 8,777,285 | |
Distributable earnings/(losses) | | | (33,854,062 | ) | | | 2,288,369 | | | | (365,415 | ) | | | (755,637 | ) |
| | | | | | | | | | | | | | | | |
Net Assets | | $ | 33,919,170 | | | $ | 89,160,414 | | | $ | 2,776,450 | | | $ | 8,021,648 | |
| | | | | | | | | | | | | | | | |
Retail Shares: | | | | | | | | | | | | | | | | |
Net Assets | | $ | 25,938,377 | | | $ | 35,716,605 | | | $ | 451,863 | | | $ | 2,803,159 | |
Shares Outstanding ($0.01 par value; indefinite shares authorized) | | | 4,239,502 | | | | 1,806,893 | | | | 52,351 | | | | 294,847 | |
| | | | | | | | | | | | | | | | |
Net Asset Value and Offering Price Per Share | | $ | 6.12 | | | $ | 19.77 | | | $ | 8.63 | | | $ | 9.51 | |
| | | | | | | | | | | | | | | | |
Institutional Shares: | | | | | | | | | | | | | | | | |
Net Assets | | $ | 7,590,414 | | | $ | 49,220,592 | | | $ | 1,965,159 | | | $ | 4,495,963 | |
Shares Outstanding ($0.01 par value; indefinite shares authorized) | | | 1,218,850 | | | | 2,458,765 | | | | 226,951 | | | | 471,983 | |
| | | | | | | | | | | | | | | | |
Net Asset Value and Offering Price Per Share | | $ | 6.23 | | | $ | 20.02 | | | $ | 8.66 | | | $ | 9.53 | |
| | | | | | | | | | | | | | | | |
R6 Shares: | | | | | | | | | | | | | | | | |
Net Assets | | $ | 390,379 | | | $ | 4,223,217 | | | $ | 359,428 | | | $ | 722,526 | |
Shares Outstanding ($0.01 par value; indefinite shares authorized) | | | 62,711 | | | | 210,843 | | | | 41,488 | | | | 75,892 | |
| | | | | | | | | | | | | | | | |
Net Asset Value and Offering Price Per Share | | $ | 6.23 | | | $ | 20.03 | | | $ | 8.66 | | | $ | 9.52 | |
| | | | | | | | | | | | | | | | |
| | | | |
*Investments in securities, at cost: | | | | | | | | | | | | | | | | |
Unaffiliated investments | | $ | 19,599,638 | | | $ | 81,846,531 | | | | 2,874,990 | | | $ | 7,648,551 | |
“Affiliated” investments | | | — | | | | — | | | | — | | | | — | |
**Repurchase agreements, at cost | | | 7,531,940 | | | | — | | | | 131,459 | | | | 813,558 | |
| | | | | | | | | | | | | | | | |
Total investments, at cost | | $ | 27,131,578 | | | $ | 81,846,531 | | | $ | 3,006,449 | | | $ | 8,462,109 | |
| | | | | | | | | | | | | | | | |
| | | | |
†Foreign currency, at cost: | | $ | — | | | $ | — | | | $ | — | | | $ | — | |
| | | | | | | | | | | | | | | | |
| | |
| See Notes to Financial Statements. | | 33 |
| | |
| Baron Select Funds | | December 31, 2018 |
STATEMENTS OF OPERATIONS
|
FOR THE YEAR ENDED DECEMBER 31, 2018 |
| | | | | | | | | | | | | | | | | | | | |
| | | Baron Partners
Fund | | | Baron Focused
Growth Fund | | | Baron
International
Growth Fund | | | Baron Real
Estate Fund | | | Baron
Emerging
Markets Fund | |
Investment income: | | | | | | | | | | | | | | | | | | | | |
Income: | | | | | | | | | | | | | | | | | | | | |
Dividends — Unaffiliated investments | | $ | 19,654,691 | | | $ | 1,836,404 | | | $ | 3,081,424 | | | $ | 11,228,131 | | | $ | 100,958,916 | |
Interest | | | 1,008 | | | | 3,407 | | | | 71,221 | | | | 122,425 | | | | 1,475,565 | |
Foreign taxes withheld on dividends | | | — | | | | — | | | | (303,597 | ) | | | (54,113 | ) | | | (10,405,742 | ) |
| | | | | | | | | | | | | | | | | | | | |
Total income | | | 19,655,699 | | | | 1,839,811 | | | | 2,849,048 | | | | 11,296,443 | | | | 92,028,739 | |
| | | | | | | | | | | | | | | | | | | | |
Expenses: | | | | | | | | | | | | | | | | | | | | |
Investment advisory fees (Note 4) | | | 21,864,256 | | | | 2,138,083 | | | | 2,078,981 | | | | 9,168,137 | | | | 53,486,279 | |
Distribution fees — Retail Shares (Note 4) | | | 2,913,132 | | | | 110,598 | | | | 162,932 | | | | 869,781 | | | | 2,616,095 | |
Shareholder servicing agent fees and expenses — Retail Shares | | | 150,847 | | | | 21,865 | | | | 22,880 | | | | 63,123 | | | | 91,630 | |
Shareholder servicing agent fees and expenses — Institutional Shares | | | 53,755 | | | | 2,557 | | | | 17,968 | | | | 37,907 | | | | 150,974 | |
Shareholder servicing agent fees and expenses — R6 Shares | | | 5,715 | | | | 4,054 | | | | 580 | | | | 455 | | | | 322 | |
Line of credit fees | | | 485,502 | | | | 2,087 | | | | 2,758 | | | | 8,730 | | | | 57,302 | |
Reports to shareholders | | | 244,720 | | | | 6,907 | | | | 64,430 | | | | 166,820 | | | | 919,650 | |
Registration and filing fees | | | 104,570 | | | | 52,490 | | | | 88,580 | | | | 81,140 | | | | 360,900 | |
Trustee fees and expenses | | | 99,188 | | | | 9,641 | | | | 10,495 | | | | 43,262 | | | | 243,009 | |
Professional fees | | | 93,580 | | | | 51,206 | | | | 53,487 | | | | 61,437 | | | | 273,225 | |
Custodian and fund accounting fees | | | 89,056 | | | | 33,224 | | | | 151,754 | | | | 102,566 | | | | 3,424,425 | |
Administration fees | | | 37,836 | | | | 37,855 | | | | 37,836 | | | | 37,923 | | | | 37,869 | |
Insurance expense | | | 22,986 | | | | 2,265 | | | | 1,991 | | | | 12,397 | | | | 57,238 | |
Miscellaneous expenses | | | 1,800 | | | | 1,859 | | | | 3,445 | | | | 2,342 | | | | 5,321 | |
| | | | | | | | | | | | | | | | | | | | |
Total operating expenses | | | 26,166,943 | | | | 2,474,691 | | | | 2,698,117 | | | | 10,656,020 | | | | 61,724,239 | |
Interest expense on borrowings | | | 15,579,425 | | | | 930 | | | | 306 | | | | 302 | | | | — | |
| | | | | | | | | | | | | | | | | | | | |
Total expenses | | | 41,746,368 | | | | 2,475,621 | | | | 2,698,423 | | | | 10,656,322 | | | | 61,724,239 | |
Reimbursement of expenses by Adviser — Retail Shares (Note 4) | | | — | | | | (18,408 | ) | | | (91,260 | ) | | | — | | | | — | |
Reimbursement of expenses by Adviser — Institutional Shares (Note 4) | | | — | | | | — | | | | (183,304 | ) | | | — | | | | — | |
Reimbursement of expenses by Adviser — R6 Shares (Note 4) | | | — | | | | (526 | ) | | | (14,678 | ) | | | — | | | | — | |
| | | | | | | | | | | | | | | | | | | | |
Net expenses | | | 41,746,368 | | | | 2,456,687 | | | | 2,409,181 | | | | 10,656,322 | | | | 61,724,239 | |
| | | | | | | | | | | | | | | | | | | | |
Net investment income (loss) | | | (22,090,669 | ) | | | (616,876 | ) | | | 439,867 | | | | 640,121 | | | | 30,304,500 | |
| | | | | | | | | | | | | | | | | | | | |
Realized and unrealized gain (loss) on investments: | | | | | | | | | | | | | | | | | | | | |
Net realized gain (loss) on investments sold — Unaffiliated investments | | | 15,083,724 | | | | (452,569 | ) | | | 3,840,867 | 1 | | | 57,171,383 | | | | 60,824,989 | 3 |
Net realized gain (loss) on foreign currency transactions | | | (2,079 | ) | | | — | | | | (269,202 | ) | | | (113,900 | ) | | | (4,696,726 | ) |
Change in net unrealized appreciation (depreciation) of: | | | | | | | | | | | | | | | | | | | | |
Investments — Unaffiliated investments | | | (40,848,117 | ) | | | 8,560,274 | | | | (56,981,390 | )2 | | | (258,446,345 | ) | | | (1,208,709,129 | )4 |
Investments — “Affiliated” investments | | | — | | | | — | | | | — | | | | — | | | | (3,938,515 | ) |
Foreign currency translations | | | (912 | ) | | | — | | | | (1,347 | ) | | | (1,485 | ) | | | 34,391 | |
| | | | | | | | | | | | | | | | | | | | |
Net gain (loss) on investments | | | (25,767,384 | ) | | | 8,107,705 | | | | (53,411,072 | ) | | | (201,390,347 | ) | | | (1,156,484,990 | ) |
| | | | | | | | | | | | | | | | | | | | |
Net increase (decrease) in net assets resulting from operations | | $ | (47,858,053 | ) | | $ | 7,490,829 | | | $ | (52,971,205 | ) | | $ | (200,750,226 | ) | | $ | (1,126,180,490 | ) |
| | | | | | | | | | | | | | | | | | | | |
| 1 | Net of realized foreign capital gains tax of $26,082. |
| 2 | Decrease in accrued foreign capital gains tax payable of $523,862. |
| 3 | Net of realized foreign capital gains tax of $406,594. |
| 4 | Decrease in accrued foreign capital gains tax payable of $14,571,032. |
| | |
| 34 | | See Notes to Financial Statements. |
| | |
| December 31, 2018 | | Baron Select Funds |
STATEMENTS OF OPERATIONS (Continued)
|
FOR THE YEAR ENDED DECEMBER 31, 2018 |
| | | | | | | | | | | | | | | | |
| | | Baron Energy
and Resources
Fund | | | Baron Global
Advantage
Fund | | | Baron Real
Estate Income
Fund2 | | | Baron Health
Care Fund3 | |
Investment income: | | | | | | | | | | | | | | | | |
Income: | | | | | | | | | | | | | | | | |
Dividends — Unaffiliated investments | | $ | 554,533 | | | $ | 168,679 | | | $ | 71,083 | | | $ | 16,548 | |
Interest | | | 105,952 | | | | 12,402 | | | | 452 | | | | 1,439 | |
Foreign taxes withheld on dividends | | | (5,224 | ) | | | (16,366 | ) | | | (563 | ) | | | (62 | ) |
| | | | | | | | | | | | | | | | |
Total income | | | 655,261 | | | | 164,715 | | | | 70,972 | | | | 17,925 | |
| | | | | | | | | | | | | | | | |
Expenses: | | | | | | | | | | | | | | | | |
Investment advisory fees (Note 4) | | | 545,478 | | | | 705,349 | | | | 20,903 | | | | 26,267 | |
Distribution fees — Retail Shares (Note 4) | | | 92,602 | | | | 95,698 | | | | 935 | | | | 3,740 | |
Shareholder servicing agent fees and expenses — Retail Shares | | | 20,931 | | | | 20,317 | | | | 12,185 | | | | 8,402 | |
Shareholder servicing agent fees and expenses — Institutional Shares | | | 11,058 | | | | 11,539 | | | | 9,524 | | | | 6,271 | |
Shareholder servicing agent fees and expenses — R6 Shares | | | 24 | | | | 190 | | | | 15 | | | | 11 | |
Line of credit fees | | | 340 | | | | 940 | | | | 35 | | | | 119 | |
Reports to shareholders | | | 48,218 | | | | 26,340 | | | | 510 | | | | 421 | |
Registration and filing fees | | | 60,070 | | | | 68,713 | | | | 43,999 | | | | 9,640 | |
Trustee fees and expenses | | | 2,534 | | | | 3,598 | | | | 116 | | | | 131 | |
Professional fees | | | 87,362 | | | | 44,014 | | | | 43,630 | | | | 40,750 | |
Custodian and fund accounting fees | | | 41,966 | | | | 62,949 | | | | 39,646 | | | | 29,612 | |
Administration fees | | | 37,803 | | | | 37,829 | | | | 37,857 | | | | 27,696 | |
Insurance expense | | | 741 | | | | 552 | | | | 25 | | | | — | |
Miscellaneous expenses | | | 1,856 | | | | 1,890 | | | | 2,170 | | | | 111 | |
| | | | | | | | | | | | | | | | |
Total operating expenses | | | 950,983 | | | | 1,079,918 | | | | 211,550 | | | | 153,171 | |
Interest expense on borrowings | | | 1,067 | | | | 68 | | | | — | | | | — | |
| | | | | | | | | | | | | | | | |
Total expenses | | | 952,050 | | | | 1,079,986 | | | | 211,550 | | | | 153,171 | |
Reimbursement of expenses by Adviser — Retail Shares (Note 4) | | | (176,512 | ) | | | (114,210 | ) | | | (35,123 | ) | | | (57,503 | ) |
Reimbursement of expenses by Adviser — Institutional Shares (Note 4) | | | (79,554 | ) | | | (112,127 | ) | | | (132,804 | ) | | | (56,437 | ) |
Reimbursement of expenses by Adviser — R6 Shares (Note 4) | | | (2,343 | ) | | | (11,010 | ) | | | (20,392 | ) | | | (5,721 | ) |
| | | | | | | | | | | | | | | | |
Net expenses | | | 693,641 | | | | 842,639 | | | | 23,231 | | | | 33,510 | |
| | | | | | | | | | | | | | | | |
Net investment income (loss) | | | (38,380 | ) | | | (677,924 | ) | | | 47,741 | | | | (15,585 | ) |
| | | | | | | | | | | | | | | | |
Realized and unrealized gain (loss) on investments: | | | | | | | | | | | | | | | | |
Net realized gain (loss) on investments sold — Unaffiliated investments | | | (3,236,347 | ) | | | (2,915,497 | ) | | | (192,755 | ) | | | (321,633 | ) |
Net realized gain (loss) on foreign currency transactions | | | (1,215 | ) | | | (24,744 | ) | | | (559 | ) | | | 140 | |
Change in net unrealized appreciation (depreciation) of: | | | | | | | | | | | | | | | | |
Investments — Unaffiliated investments | | | (8,606,594 | ) | | | (5,969,973 | )1 | | | (173,360 | ) | | | (434,004 | ) |
Investments — “Affiliated” investments | | | — | | | | — | | | | — | | | | — | |
Foreign currency translations | | | (502 | ) | | | 1,847 | | | | (2 | ) | | | — | |
| | | | | | | | | | | | | | | | |
Net gain (loss) on investments | | | (11,844,658 | ) | | | (8,908,367 | ) | | | (366,676 | ) | | | (755,497 | ) |
| | | | | | | | | | | | | | | | |
Net increase (decrease) in net assets resulting from operations | | $ | (11,883,038 | ) | | $ | (9,586,291 | ) | | $ | (318,935 | ) | | $ | (771,082 | ) |
| | | | | | | | | | | | | | | | |
| 1 | Increase in accrued foreign capital gains tax payable of $32,155. |
| 2 | For the period January 2, 2018 (commencement of operations) to December 31, 2018. |
| 3 | For the period April 30, 2018 (commencement of operations) to December 31, 2018. |
| | |
| See Notes to Financial Statements. | | 35 |
| | |
| Baron Select Funds | | December 31, 2018 |
STATEMENTS OF CHANGES IN NET ASSETS
| | | | | | | | | | | | | | | | | | | | | | | | |
| | | Baron Partners Fund | | | Baron Focused Growth Fund | | | Baron International Growth Fund | |
| | | For the Year
Ended
December 31,
2018 | | | For the Year
Ended
December 31,
2017 | | | For the Year
Ended
December 31,
2018 | | | For the Year
Ended
December 31,
2017 | | | For the Year
Ended
December 31,
2018 | | | For the Year
Ended
December 31,
2017 | |
Increase (Decrease) in Net Assets: | | | | | | | | | | | | | | | | | | | | | | | | |
Operations: | | | | | | | | | | | | | | | | | | | | | | | | |
Net investment income (loss) | | $ | (22,090,669 | ) | | $ | (14,034,659 | ) | | $ | (616,876 | ) | | $ | (839,831 | ) | | $ | 439,867 | | | $ | (185,782 | ) |
Net realized gain (loss) | | | 15,081,645 | | | | 161,556,501 | | | | (452,569 | ) | | | 4,443,485 | | | | 3,571,665 | | | | 6,463,190 | |
Change in net unrealized appreciation (depreciation) | | | (40,849,029 | ) | | | 342,753,599 | | | | 8,560,274 | | | | 40,385,685 | | | | (56,982,737 | ) | | | 32,367,624 | |
| | | | | | | | | | | | | | | | | | | | | | | | |
Increase (decrease) in net assets resulting from operations | | | (47,858,053 | ) | | | 490,275,441 | | | | 7,490,829 | | | | 43,989,339 | | | | (52,971,205 | ) | | | 38,645,032 | |
| | | | | | | | | | | | | | | | | | | | | | | | |
Distributions to shareholders from: | | | | | | | | | | | | | | | | | | | | | | | | |
Distributable earnings — Retail Shares | | | — | | | | — | | | | (431,996 | ) | | | (888,028 | ) | | | (2,152,374 | ) | | | (1,934,983 | ) |
Distributable earnings — Institutional Shares | | | — | | | | — | | | | (712,211 | ) | | | (2,636,156 | ) | | | (5,328,219 | ) | | | (3,562,276 | ) |
Distributable earnings — R6 Shares | | | — | | | | — | | | | (944,300 | ) | | | (462,831 | ) | | | (421,535 | ) | | | (26,022 | ) |
Return of capital — Retail Shares | | | — | | | | — | | | | — | | | | — | | | | — | | | | — | |
Return of capital — Institutional Shares | | | — | | | | — | | | | — | | | | — | | | | — | | | | — | |
Return of capital — R6 Shares | | | — | | | | — | | | | — | | | | — | | | | — | | | | — | |
| | | | | | | | | | | | | | | | | | | | | | | | |
Decrease in net assets from distributions to shareholders | | | — | | | | — | | | | (2,088,507 | ) | | | (3,987,015 | ) | | | (7,902,128 | ) | | | (5,523,281 | ) |
| | | | | | | | | | | | | | | | | | | | | | | | |
Capital share transactions: | | | | | | | | | | | | | | | | | | | | | | | | |
Proceeds from the sale of shares — Retail Shares | | | 155,925,276 | | | | 222,009,007 | | | | 3,162,803 | | | | 3,008,092 | | | | 73,609,482 | | | | 14,331,143 | |
Proceeds from the sale of shares — Institutional Shares | | | 314,519,421 | | | | 186,023,573 | | | | 12,083,506 | | | | 3,581,892 | | | | 186,489,970 | | | | 53,836,213 | |
Proceeds from the sale of shares — R6 Shares | | | 119,688,432 | | | | 4,422,315 | | | | 70,752,895 | | | | 10,965,359 | | | | 15,256,024 | | | | 222,236 | |
Net asset value of shares issued in reinvestment of distributions — Retail Shares | | | — | | | | — | | | | 421,927 | | | | 870,815 | | | | 2,122,207 | | | | 1,910,917 | |
Net asset value of shares issued in reinvestment of distributions — Institutional Shares | | | — | | | | — | | | | 704,835 | | | | 2,573,055 | | | | 5,272,168 | | | | 3,517,622 | |
Net asset value of shares issues in reinvestment of distribution — R6 Shares | | | — | | | | — | | | | 944,300 | | | | 462,858 | | | | 421,536 | | | | 26,022 | |
Cost of shares redeemed — Retail Shares | | | (219,787,541 | ) | | | (318,331,141 | ) | | | (6,467,613 | ) | | | (7,636,878 | ) | | | (56,403,653 | ) | | | (15,034,207 | ) |
Cost of shares redeemed — Institutional Shares | | | (339,332,670 | ) | | | (179,824,490 | ) | | | (75,949,660 | ) | | | (36,214,295 | ) | | | (107,486,270 | ) | | | (11,479,128 | ) |
Cost of shares redeemed — R6 Shares | | | (52,377 | ) | | | (1,300 | ) | | | (57,736 | ) | | | — | | | | (32,907 | ) | | | — | |
| | | | | | | | | | | | | | | | | | | | | | | | |
Increase (decrease) in net assets derived from capital share transactions | | | 30,960,541 | | | | (85,702,036 | ) | | | 5,595,257 | | | | (22,389,102 | ) | | | 119,248,557 | | | | 47,330,818 | |
| | | | | | | | | | | | | | | | | | | | | | | | |
Net increase (decrease) in net assets | | | (16,897,512 | ) | | | 404,573,405 | | | | 10,997,579 | | | | 17,613,222 | | | | 58,375,224 | | | | 80,452,569 | |
| | | | | | | | | | | | | | | | | | | | | | | | |
Net Assets: | | | | | | | | | | | | | | | | | | | | | | | | |
Beginning of year | | | 1,972,055,085 | | | | 1,567,481,680 | | | | 192,808,174 | | | | 175,194,952 | | | | 168,073,030 | | | | 87,620,461 | |
| | | | | | | | | | | | | | | | | | | | | | | | |
End of year | | $ | 1,955,157,573 | | | $ | 1,972,055,085 | | | $ | 203,805,753 | | | $ | 192,808,174 | | | $ | 226,448,254 | | | $ | 168,073,030 | |
| | | | | | | | | | | | | | | | | | | | | | | | |
Capital share transactions — Retail Shares | | | | | | | | | | | | | | | | | | | | | | | | |
Shares sold | | | 2,763,676 | | | | 4,888,267 | | | | 185,094 | | | | 204,928 | | | | 3,157,981 | | | | 662,537 | |
Shares issued in reinvestment of distributions | | | — | | | | — | | | | 23,221 | | | | 56,707 | | | | 102,161 | | | | 82,221 | |
Shares redeemed | | | (4,088,270 | ) | | | (6,951,061 | ) | | | (383,305 | ) | | | (533,149 | ) | | | (2,477,734 | ) | | | (693,846 | ) |
| | | | | | | | | | | | | | | | | | | | | | | | |
Net increase (decrease) | | | (1,324,594 | ) | | | (2,062,794 | ) | | | (174,990 | ) | | | (271,514 | ) | | | 782,408 | | | | 50,912 | |
| | | | | | | | | | | | | | | | | | | | | | | | |
Capital share transactions — Institutional Shares | | | | | | | | | | | | | | | | | | | | | | | | |
Shares sold | | | 5,677,101 | | | | 4,028,476 | | | | 700,376 | | | | 233,512 | | | | 7,855,375 | | | | 2,456,126 | |
Shares issued in reinvestment of distributions | | | — | | | | — | | | | 38,017 | | | | 164,730 | | | | 250,659 | | | | 149,548 | |
Shares redeemed | | | (6,172,617 | ) | | | (3,954,884 | ) | | | (4,517,080 | ) | | | (2,446,408 | ) | | | (4,691,537 | ) | | | (513,638 | ) |
| | | | | | | | | | | | | | | | | | | | | | | | |
Net increase (decrease) | | | (495,516 | ) | | | 73,592 | | | | (3,778,687 | ) | | | (2,048,166 | ) | | | 3,414,497 | | | | 2,092,036 | |
| | | | | | | | | | | | | | | | | | | | | | | | |
Capital share transactions — R6 Shares | | | | | | | | | | | | | | | | | | | | | | | | |
Shares sold | | | 2,213,681 | | | | 92,466 | | | | 4,217,821 | | | | 731,458 | | | | 594,888 | | | | 10,195 | |
Shares issued in reinvestment of dividends | | | — | | | | — | | | | 50,906 | | | | 29,602 | | | | 20,056 | | | | 1,107 | |
Shares redeemed | | | (955 | ) | | | (26 | ) | | | (3,343 | ) | | | — | | | | (1,596 | ) | | | — | |
| | | | | | | | | | | | | | | | | | | | | | | | |
Net increase (decrease) | | | 2,212,726 | | | | 92,440 | | | | 4,265,384 | | | | 761,060 | | | | 613,348 | | | | 11,302 | |
| | | | | | | | | | | | | | | | | | | | | | | | |
| | |
| 36 | | See Notes to Financial Statements. |
| | |
| December 31, 2018 | | Baron Select Funds |
STATEMENTS OF CHANGES IN NET ASSETS (Continued)
| | | | | | | | | | | | | | | | | | | | | | | | |
| | | Baron Real Estate Fund | | | Baron Emerging Markets Fund | | | Baron Energy and Resources Fund | |
| | | For the Year
Ended
December 31,
2018 | | | For the Year
Ended
December 31,
2017 | | | For the Year
Ended
December 31,
2018 | | | For the Year
Ended
December 31,
2017 | | | For the Year
Ended
December 31,
2018 | | | For the Year
Ended
December 31,
2017 | |
Increase (Decrease) in Net Assets: | | | | | | | | | | | | | | | | | | | | | | | | |
Operations: | | | | | | | | | | | | | | | | | | | | | | | | |
Net investment income (loss) | | $ | 640,121 | | | $ | 1,516,324 | | | $ | 30,304,500 | | | $ | 15,197,129 | | | $ | (38,380 | ) | | $ | (4,075 | ) |
Net realized gain (loss) | | | 57,057,483 | | | | 93,853,708 | | | | 56,128,263 | | | | 89,764,536 | | | | (3,237,562 | ) | | | (5,501,035 | ) |
Change in net unrealized appreciation (depreciation) | | | (258,447,830 | ) | | | 171,979,121 | | | | (1,212,613,253 | ) | | | 1,110,157,983 | | | | (8,607,096 | ) | | | (6,307,045 | ) |
| | | | | | | | | | | | | | | | | | | | | | | | |
Increase (decrease) in net assets resulting from operations | | | (200,750,226 | ) | | | 267,349,153 | | | | (1,126,180,490 | ) | | | 1,215,119,648 | | | | (11,883,038 | ) | | | (11,812,155 | ) |
| | | | | | | | | | | | | | | | | | | | | | | | |
Distributions to shareholders from: | | | | | | | | | | | | | | | | | | | | | | | | |
Distributable earnings — Retail Shares | | | (26,442,877 | ) | | | (19,586,974 | ) | | | (1,117,756 | ) | | | (2,477,009 | ) | | | — | | | | (42,458 | ) |
Distributable earnings — Institutional Shares | | | (44,416,235 | ) | | | (29,765,405 | ) | | | (19,835,537 | ) | | | (15,761,419 | ) | | | — | | | | (20,747 | ) |
Distributable earnings — R6 Shares | | | (1,041,760 | ) | | | (150,609 | ) | | | (35,277 | ) | | | (19,953 | ) | | | — | | | | (458 | ) |
Return of capital — Retail Shares | | | — | | | | — | | | | — | | | | (97,705 | ) | | | — | | | | — | |
Return of capital — Institutional Shares | | | — | | | | — | | | | — | | | | (668,030 | ) | | | — | | | | — | |
Return of capital — R6 Shares | | | — | | | | — | | | | — | | | | (849 | ) | | | — | | | | — | |
| | | | | | | | | | | | | | | | | | | | | | | | |
Decrease in net assets from distributions to shareholders | | | (71,900,872 | ) | | | (49,502,988 | ) | | | (20,988,570 | ) | | | (19,024,965 | ) | | | — | | | | (63,663 | ) |
| | | | | | | | | | | | | | | | | | | | | | | | |
Capital share transactions: | | | | | | | | | | | | | | | | | | | | | | | | |
Proceeds from the sale of shares — Retail Shares | | | 46,383,253 | | | | 52,297,183 | | | | 437,158,440 | | | | 576,492,989 | | | | 12,092,014 | | | | 15,864,355 | |
Proceeds from the sale of shares — Institutional Shares | | | 157,251,123 | | | | 151,031,484 | | | | 2,493,450,504 | | | | 1,535,106,695 | | | | 7,117,574 | | | | 16,689,985 | |
Proceeds from the sale of shares — R6 Shares | | | 9,119,192 | | | | 788,278 | | | | 5,761,844 | | | | 3,948,649 | | | | 187,053 | | | | 93,188 | |
Net asset value of shares issued in reinvestment of distributions — Retail Shares | | | 25,858,417 | | | | 19,130,055 | | | | 1,105,010 | | | | 2,554,113 | | | | — | | | | 42,127 | |
Net asset value of shares issued in reinvestment of distributions — Institutional Shares | | | 39,636,583 | | | | 26,676,931 | | | | 14,691,205 | | | | 13,281,533 | | | | — | | | | 20,747 | |
Net asset value of shares issues in reinvestment of distribution — R6 Shares | | | 1,041,760 | | | | 150,609 | | | | 35,277 | | | | 20,802 | | | | — | | | | 458 | |
Cost of shares redeemed — Retail Shares | | | (183,064,021 | ) | | | (169,935,360 | ) | | | (589,651,543 | ) | | | (531,964,452 | ) | | | (15,035,679 | ) | | | (43,006,844 | ) |
Cost of shares redeemed — Institutional Shares | | | (367,687,032 | ) | | | (160,776,671 | ) | | | (1,571,656,493 | ) | | | (427,891,569 | ) | | | (13,424,791 | ) | | | (26,748,316 | ) |
Cost of shares redeemed — R6 Shares | | | (342,264 | ) | | | (126,052 | ) | | | (1,703,944 | ) | | | (872,502 | ) | | | (77,166 | ) | | | (34,866 | ) |
| | | | | | | | | | | | | | | | | | | | | | | | |
Increase (decrease) in net assets derived from capital share transactions | | | (271,802,989 | ) | | | (80,763,543 | ) | | | 789,190,300 | | | | 1,170,676,258 | | | | (9,140,995 | ) | | | (37,079,166 | ) |
| | | | | | | | | | | | | | | | | | | | | | | | |
Net increase (decrease) in net assets | | | (544,454,087 | ) | | | 137,082,622 | | | | (357,978,760 | ) | | | 2,366,770,941 | | | | (21,024,033 | ) | | | (48,954,984 | ) |
| | | | | | | | | | | | | | | | | | | | | | | | |
Net Assets: | | | | | | | | | | | | | | | | | | | | | | | | |
Beginning of year | | | 1,087,649,346 | | | | 950,566,724 | | | | 4,968,764,284 | | | | 2,601,993,343 | | | | 54,943,203 | | | | 103,898,187 | |
| | | | | | | | | | | | | | | | | | | | | | | | |
End of year | | $ | 543,195,259 | | | $ | 1,087,649,346 | | | $ | 4,610,785,524 | | | $ | 4,968,764,284 | | | $ | 33,919,170 | | | $ | 54,943,203 | |
| | | | | | | | | | | | | | | | | | | | | | | | |
Capital share transactions — Retail Shares | | | | | | | | | | | | | | | | | | | | | | | | |
Shares sold | | | 1,650,560 | | | | 1,896,505 | | | | 29,805,250 | | | | 43,874,157 | | | | 1,467,519 | | | | 1,960,005 | |
Shares issued in reinvestment of distributions | | | 1,095,758 | | | | 658,295 | | | | 86,127 | | | | 171,603 | | | | — | | | | 5,429 | |
Shares redeemed | | | (6,912,902 | ) | | | (6,466,757 | ) | | | (42,512,468 | ) | | | (41,055,180 | ) | | | (1,824,096 | ) | | | (5,457,480 | ) |
| | | | | | | | | | | | | | | | | | | | | | | | |
Net increase (decrease) | | | (4,166,584 | ) | | | (3,911,957 | ) | | | (12,621,091 | ) | | | 2,990,580 | | | | (356,577 | ) | | | (3,492,046 | ) |
| | | | | | | | | | | | | | | | | | | | | | | | |
Capital share transactions — Institutional Shares | | | | | | | | | | | | | | | | | | | | | | | | |
Shares sold | | | 5,584,334 | | | | 5,485,149 | | | | 174,281,858 | | | | 114,280,220 | | | | 824,801 | | | | 1,970,176 | |
Shares issued in reinvestment of distributions | | | 1,646,864 | | | | 905,223 | | | | 1,143,284 | | | | 887,345 | | | | — | | | | 2,636 | |
Shares redeemed | | | (13,937,485 | ) | | | (5,982,634 | ) | | | (116,693,326 | ) | | | (32,127,885 | ) | | | (1,638,155 | ) | | | (3,312,908 | ) |
| | | | | | | | | | | | | | | | | | | | | | | | |
Net increase (decrease) | | | (6,706,287 | ) | | | 407,738 | | | | 58,731,816 | | | | 83,039,680 | | | | (813,354 | ) | | | (1,340,096 | ) |
| | | | | | | | | | | | | | | | | | | | | | | | |
Capital share transactions — R6 Shares | | | | | | | | | | | | | | | | | | | | | | | | |
Shares sold | | | 299,573 | | | | 29,771 | | | | 393,021 | | | | 312,694 | | | | 21,601 | | | | 12,162 | |
Shares issued in reinvestment of dividends | | | 43,450 | | | | 5,111 | | | | 2,743 | | | | 1,390 | | | | — | | | | 58 | |
Shares redeemed | | | (12,444 | ) | | | (4,460 | ) | | | (126,452 | ) | | | (63,196 | ) | | | (9,754 | ) | | | (4,373 | ) |
| | | | | | | | | | | | | | | | | | | | | | | | |
Net increase (decrease) | | | 330,579 | | | | 30,422 | | | | 269,312 | | | | 250,888 | | | | 11,847 | | | | 7,847 | |
| | | | | | | | | | | | | | | | | | | | | | | | |
| | |
| See Notes to Financial Statements. | | 37 |
| | |
| Baron Select Funds | | December 31, 2018 |
STATEMENTS OF CHANGES IN NET ASSETS (Continued)
| | | | | | | | | | | | | | | | |
| | | Baron Global Advantage Fund | | | Baron Real Estate
Income Fund | | | Baron Health
Care Fund | |
| | | For the Year
Ended
December 31,
2018 | | | For the Year
Ended
December 31,
2017 | | | For the Year
Ended
December 31,
20181 | | | For the Period
Ended
December 31,
20182 | |
Increase (Decrease) in Net Assets: | | | | | | | | | | | | | | | | |
Operations: | | | | | | | | | | | | | | | | |
Net investment income (loss) | | $ | (677,924 | ) | | $ | (247,055 | ) | | $ | 47,741 | | | $ | (15,585 | ) |
Net realized gain (loss) | | | (2,940,241 | ) | | | (110,191 | ) | | | (193,314 | ) | | | (321,493 | ) |
Change in net unrealized appreciation (depreciation) | | | (5,968,126 | ) | | | 10,073,146 | | | | (173,362 | ) | | | (434,004 | ) |
| | | | | | | | | | | | | | | | |
Increase (decrease) in net assets resulting from operations | | | (9,586,291 | ) | | | 9,715,900 | | | | (318,935 | ) | | | (771,082 | ) |
| | | | | | | | | | | | | | | | |
Distributions to shareholders from: | | | | | | | | | | | | | | | | |
Distributable earnings — Retail Shares | | | — | | | | — | | | | (5,824 | ) | | | — | |
Distributable earnings — Institutional Shares | | | — | | | | — | | | | (34,663 | ) | | | — | |
Distributable earnings — R6 Shares | | | — | | | | — | | | | (6,188 | ) | | | — | |
Return of capital — Retail Shares | | | — | | | | — | | | | (3,850 | ) | | | — | |
Return of capital — Institutional Shares | | | — | | | | — | | | | (22,912 | ) | | | — | |
Return of capital — R6 Shares | | | — | | | | — | | | | (4,091 | ) | | | — | |
| | | | | | | | | | | | | | | | |
Decrease in net assets from distributions to shareholders | | | — | | | | — | | | | (77,528 | ) | | | — | |
| | | | | | | | | | | | | | | | |
Capital share transactions: | | | | | | | | | | | | | | | | |
Proceeds from the sale of shares — Retail Shares | | | 48,440,480 | | | | 21,524,300 | | | | 950,100 | | | | 4,202,417 | |
Proceeds from the sale of shares — Institutional Shares | | | 60,517,660 | | | | 15,744,158 | | | | 2,223,055 | | | | 4,913,431 | |
Proceeds from the sale of shares — R6 Shares | | | 4,427,176 | | | | 142,827 | | | | 444,807 | | | | 792,587 | |
Net asset value of shares issued in reinvestment of distributions — Retail Shares | | | — | | | | — | | | | 8,610 | | | | — | |
Net asset value of shares issued in reinvestment of distributions — Institutional Shares | | | — | | | | — | | | | 57,574 | | | | — | |
Net asset value of shares issues in reinvestment of distribution —R6 Shares | | | — | | | | — | | | | 10,278 | | | | — | |
Cost of shares redeemed — Retail Shares | | | (27,107,071 | ) | | | (12,898,122 | ) | | | (450,951 | ) | | | (1,115,304 | ) |
Cost of shares redeemed — Institutional Shares | | | (31,083,207 | ) | | | (337,797 | ) | | | (20,650 | ) | | | (401 | ) |
Cost of shares redeemed — R6 Shares | | | (56,714 | ) | | | — | | | | (49,910 | ) | | | — | |
| | | | | | | | | | | | | | | | |
Increase (decrease) in net assets derived from capital share transactions | | | 55,138,324 | | | | 24,175,366 | | | | 3,172,913 | | | | 8,792,730 | |
| | | | | | | | | | | | | | | | |
Net increase (decrease) in net assets | | | 45,552,033 | | | | 33,891,266 | | | | 2,776,450 | | | | 8,021,648 | |
| | | | | | | | | | | | | | | | |
Net Assets: | | | | | | | | | | | | | | | | |
Beginning of year | | | 43,608,381 | | | | 9,717,115 | | | | — | | | | — | |
| | | | | | | | | | | | | | | | |
End of year | | $ | 89,160,414 | | | $ | 43,608,381 | | | $ | 2,776,450 | | | $ | 8,021,648 | |
| | | | | | | | | | | | | | | | |
Capital share transactions — Retail Shares | | | | | | | | | | | | | | | | |
Shares sold | | | 2,140,868 | | | | 1,256,722 | | | | 97,663 | | | | 401,745 | |
Shares issued in reinvestment of distributions | | | — | | | | — | | | | 903 | | | | — | |
Shares redeemed | | | (1,229,922 | ) | | | (721,991 | ) | | | (46,215 | ) | | | (106,898 | ) |
| | | | | | | | | | | | | | | | |
Net increase (decrease) | | | 910,946 | | | | 534,731 | | | | 52,351 | | | | 294,847 | |
| | | | | | | | | | | | | | | | |
Capital share transactions — Institutional Shares | | | | | | | | | | | | | | | | |
Shares sold | | | 2,682,700 | | | | 880,482 | | | | 223,106 | | | | 472,023 | |
Shares issued in reinvestment of distributions | | | — | | | | — | | | | 5,999 | | | | — | |
Shares redeemed | | | (1,416,631 | ) | | | (18,648 | ) | | | (2,154 | ) | | | (40 | ) |
| | | | | | | | | | | | | | | | |
Net increase (decrease) | | | 1,266,069 | | | | 861,834 | | | | 226,951 | | | | 471,983 | |
| | | | | | | | | | | | | | | | |
Capital share transactions — R6 Shares | | | | | | | | | | | | | | | | |
Shares sold | | | 193,795 | | | | 7,954 | | | | 45,420 | | | | 75,892 | |
Shares issued in reinvestment of dividends | | | — | | | | — | | | | 1,069 | | | | — | |
Shares redeemed | | | (2,549 | ) | | | — | | | | (5,001 | ) | | | — | |
| | | | | | | | | | | | | | | | |
Net increase (decrease) | | | 191,246 | | | | 7,954 | | | | 41,488 | | | | 75,892 | |
| | | | | | | | | | | | | | | | |
| 1 | For the period January 2, 2018 (commencement of operations) to December 31, 2018. |
| 2 | For the period April 30, 2018 (commencement of operations) to December 31, 2018. |
| | |
| 38 | | See Notes to Financial Statements. |
| | |
| December 31, 2018 | | Baron Select Funds |
STATEMENT OF CASH FLOWS
|
FORTHE YEAR ENDED DECEMBER 31, 2018 |
| | | | |
| | | Baron Partners
Fund | |
Increase (Decrease) in Cash: | | | | |
Cash Provided from Operating Activities | | | | |
Net increase (decrease) in net assets resulting from operations | | $ | (47,858,053 | ) |
Adjustments to reconcile net increase (decrease) in net assets resulting from operations to net cash used by operating activities: | | | | |
Purchases of portfolio securities | | | (409,546,862 | ) |
Proceeds from sales of portfolio securities | | | 224,058,857 | |
Net purchases, sales and maturities of short-term investments | | | (54,922 | ) |
Increase in dividends and interest receivable | | | (916,433 | ) |
Increase in prepaid expenses | | | (67,957 | ) |
Increase in accrued expenses | | | 760,398 | |
Net realized gain on investments | | | (15,083,724 | ) |
Change in net unrealized depreciation of investments | | | 40,848,117 | |
| | | | |
Net cash used by operating activities | | $ | (207,860,579 | ) |
| | | | |
Cash Provided in Financing Activities | | | | |
Proceeds from shares sold | | | 588,558,069 | |
Payment for shares redeemed | | | (560,493,672 | ) |
Increase in payable for borrowings against line of credit | | | 176,000,000 | |
| | | | |
Net cash provided in financing activities | | | 204,064,397 | |
| | | | |
Net decrease in cash | | | (3,796,182 | ) |
Cash at beginning of year | | | 3,796,182 | |
| | | | |
Cash at end of year | | $ | — | |
| | | | |
Supplemental cash flow information: | | | | |
Interest paid | | $ | 14,777,589 | |
| | | | |
| | |
| See Notes to Financial Statements. | | 39 |
| | |
| Baron Select Funds | | December 31, 2018 |
NOTES TO FINANCIAL STATEMENTS
1. ORGANIZATION
Baron Select Funds (the “Trust”) is registered under the Investment Company Act of 1940, as amended (the “1940 Act”), as an open-end management investment company established as a Delaware statutory trust on April 30, 2003, and accordingly, follows the investment company accounting and reporting guidance of the Financial Accounting Standards Board (“FASB”) Accounting Standard Codification Topic 946 Financial Services — Investment Companies. The Trust currently offers ten series (individually, a “Fund” and collectively, the “Funds”): Baron Partners Fund, Baron Focused Growth Fund, Baron Real Estate Income Fund, Baron Health Care Fund and Baron WealthBuilder Fund, which are non-diversified; and Baron International Growth Fund, Baron Real Estate Fund, Baron Emerging Markets Fund, Baron Energy and Resources Fund and Baron Global Advantage Fund, which are diversified. Baron WealthBuilder Fund is presented in a separate Annual Report. The Funds’ investment objective is to seek capital appreciation. Baron Partners Fund may employ “leverage” by borrowing money and using it to purchase additional securities. Borrowing for investment increases both investment opportunity and investment risk. Baron International Growth Fund, Baron Emerging Markets Fund and Baron Global Advantage Fund invest their assets primarily in non-U.S. companies. Baron Real Estate Fund invests its assets primarily in U.S. and non-U.S. real estate and real estate-related companies. Baron Energy and Resources Fund invests its assets primarily in U.S. and non-U.S. energy and resources companies and related companies and energy and resources master limited partnerships (“MLPs”) of any market capitalization. Baron Real Estate Income Fund invests its assets in U.S. and non-U.S. real estate income-producing securities and other real estate securities. Baron Health Care Fund invests its assets primarily in equity securities engaged in the research, development, production, sale, delivery or distribution of products and services related to the health care industry.
Each Fund offers Retail Shares, Institutional Shares and R6 Shares. Each class of shares differs only in its ongoing fees, expenses and eligibility requirements. Retail Shares are offered to all investors. Institutional Shares are for investments in the amount of $1 million or more per Fund. Institutional Shares are intended for certain financial intermediaries that offer shares of Baron Funds through fee-based platforms, retirement platforms or other platforms. R6 Shares are for investments in the amount of $5 million or more per Fund. R6 Shares are available only to qualified 401(a) plans (including 401(k) plans, Keogh plans, profit sharing plans, money purchase pension plans, target benefit plans, defined benefit pension plans and Taft-Hartley multi-employer pension plans), endowment funds and foundations, any state, county or city, or its instrumentality, department, authority, or agency, 457 plans, including 457(a) governmental entity plans and tax-exempt plans, accounts registered to insurance companies, trust companies and bank trust departments, investment companies, both affiliated and not affiliated with the adviser, and any entity that is considered a corporation for tax purposes, including corporate non-qualified deferred compensation plans of such corporations. Each class of shares has equal rights to earnings and assets, except that each class bears different expenses for distribution and shareholder servicing. Each Fund’s investment income, realized and unrealized gains or losses on investments and foreign currency, and expenses other than those attributable to a specific class are allocated to each class based on its relative net assets. Each class of shares has exclusive voting rights with respect to matters that affect just that class. Baron Real Estate Income Fund and Baron Health Care Fund commenced investment operations on January 2, 2018 and April 30, 2018, respectively.
Baron Partners Fund was organized originally as a limited partnership in January 1992 under the laws of the State of Delaware. Effective as of the close of business on April 30, 2003, the predecessor partnership was reorganized into a series of the Trust. Baron Partners Fund commenced operations on April 30, 2003 with a contribution of assets and liabilities, including securities-in-kind, from the predecessor partnership.
Baron Focused Growth Fund was organized originally as a limited partnership in May 1996 under the laws of the State of Delaware. Effective as of the close of business on June 30, 2008, the predecessor partnership was reorganized into a series of the Trust. Baron Focused Growth Fund commenced operations on June 30, 2008 with a contribution of assets and liabilities, including securities-in-kind, from the predecessor partnership.
2. SIGNIFICANT ACCOUNTING POLICIES
The following is a summary of significant accounting policies followed by the Funds. The policies are in conformity with accounting principles generally accepted in the United States of America (“GAAP”). The preparation of financial statements in accordance with GAAP requires management to make estimates and assumptions that affect the reported amounts of assets and liabilities at the date of the financial statements and the amounts of income and expenses during the period. Actual results could differ from those estimates. Events occurring subsequent to the date of the Statements of Assets and Liabilities and through the date of issuance of the financial statements have been evaluated for adjustment to or disclosure in the financial statements.
a) Security Valuation. The Funds’ share prices or net asset values (“NAV”) are calculated as of the scheduled close of the regular trading session (usually 4 p.m. E.T. or such other time as of which the Funds’ NAVs are calculated (the “NAV Calculation Time”)) on the New York Stock Exchange (the “Exchange”) on any day the Exchange is scheduled to be open. Portfolio securities traded on any national stock exchange are valued based on the last sale price on the exchange where such shares are principally traded. For securities traded on NASDAQ, the Funds use the NASDAQ Official Closing Price. If there are no sales on a given day, the value of the security may be the average of the most recent bid and asked quotations on such exchange or the last sale price from a prior day. Where market quotations are not readily available, or, if in BAMCO, Inc.’s (the “Adviser”) judgment, they do not accurately reflect the fair value of a security, or an event occurs after the market close but before the Funds are priced that materially affects the value of a security, the security will be valued by the Adviser using policies and procedures approved by the Board of Trustees (the “Board”). Some of the more common reasons that may necessitate that a security be valued using “fair value” pricing may include, but are not limited to: trading of the security has been halted or suspended; or the security has not been traded for an extended period of time. The Adviser has a Fair Valuation Committee (the “Committee”) comprised of senior management representatives and the Committee reports to the Board every quarter. Factors the Committee may consider when valuing a security include whether a current price is stale, there is recent news, the security is thinly traded, transactions are infrequent or quotations are genuine. There can be no guarantee, however, that a fair valuation used by the Funds on any given day will more accurately reflect the market value of an investment than the closing price of such investment in its market. U.S. Government obligations, money market instruments, and other debt instruments held by the Funds with a remaining maturity of 60 days or less are generally valued at amortized cost, which approximates fair value. Debt instruments having a greater remaining maturity will be valued on the basis of prices obtained from a pricing service approved by the Board or at the mean of the bid and ask prices from the dealer maintaining an active market in that security, or at intrinsic value, which is calculated as the price of the common share on the valuation date, adjusted for any accrued and unpaid dividends. The value of the Funds’ investments in convertible bonds is determined primarily by obtaining valuations from independent pricing services based on readily available bid quotations or, if quotations are not available, by methods which include
40
| | |
| December 31, 2018 | | Baron Select Funds |
NOTES TO FINANCIAL STATEMENTS (Continued)
2. SIGNIFICANT ACCOUNTING POLICIES (Continued)
various considerations such as yields or prices of securities of comparable quality, coupon, maturity and type; indications as to values from dealers; and general market conditions. Other inputs used by an independent pricing service to value convertible bonds generally include underlying stock data, conversion premiums, listed bond and preferred stock prices and other market information which may include benchmark curves, trade execution data, and sensitivity analysis, when available. Open-end investment companies, including securities lending collateral invested in registered investment company money market funds, are valued at their NAV each day.
Non-U.S. equity securities are valued on the basis of their most recent closing market prices and translated into U.S. dollars at the NAV Calculation Time, except under the circumstances described below. Most foreign markets close before the NAV Calculation Time. For securities primarily traded in the Far East, for example, the most recent closing prices may be as much as 15 hours old at the NAV Calculation Time. As a result, the Adviser uses a third-party pricing service to assist in determining fair value of foreign securities. This service utilizes a systematic methodology in making fair value estimates. The Adviser may also fair value securities in other situations, for example, when a particular foreign market is closed but the Funds are open. The Adviser cannot predict how often it will use closing prices or how often it will adjust those prices. As a means of evaluating its fair value process, the Adviser routinely compares closing market prices, the next day’s opening prices in the same markets, and the adjusted prices. Other mutual funds may adjust the prices of their securities by different amounts.
b) Securities Transactions, Investment Income and Expense Allocation. Securities transactions are recorded on a trade date basis. Realized gain and loss from securities transactions are recorded on an identified cost basis for financial reporting and federal income tax purposes. Dividend income is recognized on the ex-dividend date and interest income is recognized on an accrual basis, which includes the accretion of discounts and amortization of premiums. Non-cash dividends received in the form of stock, if any, are recognized on the ex-dividend date and recorded as non-cash dividend income at fair value. Certain dividends from foreign securities will be recorded as soon as the Funds are informed of the dividend if such information is obtained subsequent to the ex-dividend date. Distributions received from certain investments held by the Funds may be comprised of dividends, realized gains and returns of capital. The Funds originally estimate the expected classification of such payments. The amounts may subsequently be reclassified upon receipt of information from the issuer. The Funds are charged for those expenses of the Trust that are directly attributable to each Fund, such as advisory and custodian fees. Expenses that are not directly attributable to a Fund are typically allocated among the Funds in proportion to their respective net assets.
c) Foreign Currency Translations. Values of assets and liabilities denominated in foreign currencies are translated into U.S. dollars using the price of such currencies at the time the NAV is determined. Purchases and sales of investments and dividend income are converted at the prevailing rate of exchange on the respective dates of such transactions. Net realized gain (loss) on foreign currency transactions includes gain (loss) arising from the fluctuation in the exchange rates between trade and settlement dates on security transactions and currency gain (loss) between the accrual and payment dates on dividends and foreign withholding taxes. The Funds do not isolate that portion of the results of operations resulting from changes in foreign exchange rates on investments from the fluctuations arising from changes in market prices of securities held. Such fluctuations are included with the net realized and unrealized gain or loss from investments and foreign currency transactions on the Statements of Operations. The Funds may invest in foreign securities and foreign currency transactions that may involve risks not associated with domestic investments as a result of the level of governmental supervision and regulation of foreign securities markets and the possibility of political or economic instability, among others.
Pursuant to U.S. federal income tax regulations, gains and losses from certain foreign currency transactions and the foreign currency portion of gains and losses realized on sales and maturities of foreign denominated debt securities are generally treated as ordinary income for U.S. federal income tax purposes.
d) Securities Lending. The Funds may lend securities to certain brokers under the terms of a master netting agreement. Upon such loans, the Funds receive collateral which is maintained by the custodian. The Funds may pay fees to the custodian for administering the securities lending program. The Funds earn interest on such collateral and earn income in the form of negotiated lenders’ fees, both of which are included in securities lending income in the Statements of Operations. Securities loaned are required to be secured at all times by collateral equal to at least 102% of the market value of the securities loaned. Risks may arise upon entering into securities lending to the extent that the value of the collateral is less than the value of the securities loaned due to the changes in the value of collateral or the loaned securities. The collateral is marked-to-market daily and settled on the next business day. The Funds may receive collateral in the form of cash or other eligible securities, such as a letter of credit issued by a U.S. bank or securities issued or guaranteed by the U.S. government. Securities purchased with cash collateral are subject to the risks inherent in investing in these securities.
The Funds did not participate in securities lending activities during the year ended December 31, 2018.
e) Repurchase Agreements. The Funds may invest in repurchase agreements, which are short term investments whereby the Funds acquire ownership of a debt security and the seller agrees to repurchase the security at a future date at a specified price. When entering into repurchase agreements, it is the Funds’ policy that their custodian take possession of the underlying collateral securities, the market value of which, at all times, equals at least 102% of the principal amount of the repurchase transaction. To the extent that any repurchase transaction exceeds one business day, the value of the collateral is marked-to-market to ensure the adequacy of the collateral. If the seller defaults and the market value of the collateral declines or if bankruptcy proceedings are commenced with respect to the seller of the security, realization of the collateral by the Funds may be delayed or limited. The information required to be disclosed by FASB Accounting Standards Update No. 2011-11 for the Funds’ investments in repurchase agreements at December 31, 2018, including the fair value of the repurchase agreement and the amount of collateral, can be found in each respective Fund’s Statement of Net Assets.
f) Master Limited Partnerships. The Funds may invest in master limited partnerships (“MLPs”). MLPs are limited partnerships or limited liability companies, whose partnership units or limited liability interests are listed and traded on a U.S. securities exchange, and are treated as publicly traded partnerships for federal income tax purposes. To qualify to be treated as a partnership for tax purposes, an MLP must receive at least 90% of its income from qualifying sources as set forth in Section 7704(d) of the Internal Revenue Code of 1986, as amended. These qualifying sources include interest, dividend, real property rent, gain from sale or other disposition of real property and income from activities such as the exploration, development, mining, production, processing, refining, transportation, storage and marketing of mineral or natural resources.
g) Federal and Foreign Income Taxes. The Trust treats each Fund as a separate entity for federal income tax purposes. Each Fund intends to meet the requirements of the Internal Revenue Code of 1986, as amended, applicable to regulated investment companies, and to distribute to its shareholders substantially all of its net investment income and any net realized capital gains at least annually. None of the Funds will be subject to federal or state income taxes to the extent that they qualify as regulated investment companies and substantially all of their income is distributed.
41
| | |
| Baron Select Funds | | December 31, 2018 |
NOTES TO FINANCIAL STATEMENTS (Continued)
2. SIGNIFICANT ACCOUNTING POLICIES (Continued)
The Funds may be subject to foreign taxes on income and gains on investments that are accrued based upon the Funds’ understanding of the tax rules and regulations that exist in the countries in which the Funds invest. Foreign governments may also impose taxes or other payments on investments with respect to foreign securities. Such taxes are accrued as applicable.
h) Restricted Securities. The Funds may invest in securities that are restricted as to public sale in accordance with the Securities Act of 1933. Such assets are valued by the Adviser pursuant to policies and procedures approved by the Board.
i) Distributions to Shareholders. Income and capital gain distributions to shareholders are determined in accordance with income tax regulations which may differ from GAAP. These differences are primarily due to differing treatments for net investment loss, foreign currency gains and losses, reclassification of distributions, partnership basis adjustments, income from passive foreign investment companies, late year loss deferral, post-October loss deferral and wash sale loss deferral.
j) Commitments and Contingencies. In the normal course of business, the Funds may enter into contracts and agreements that contain a variety of representations and warranties, which provide general indemnification. The maximum exposure to the Funds under these agreements is unknown, as this would involve future claims that may be made against the Funds that have not yet occurred. However, based on experience, the Funds expect the risk of loss to be remote.
k) Cash and Cash Equivalents. The Funds consider all short term liquid investments with a maturity of three months or less when purchased to be cash equivalents.
l) Fund Diversification and Concentration. Certain of the Funds hold non-diversified or concentrated portfolios that may contain fewer securities or invest in fewer industries than the portfolios of other mutual funds. This may increase the risk that the value of a Fund could decrease because of the poor performance of one or a few investments or of a particular industry. Additionally, non-diversified funds may encounter difficulty liquidating securities.
3. PURCHASES AND SALES OF SECURITIES
Purchases and sales of securities, other than short term securities, for the year ended December 31, 2018 were as follows:
| | | | | | | | |
| | |
| Fund | | Purchases | | | Sales | |
Baron Partners Fund | | $ | 409,708,838 | | | $ | 218,005,103 | |
Baron Focused Growth Fund | | | 11,063,010 | | | | 3,908,974 | |
Baron International Growth Fund | | | 216,356,444 | | | | 108,595,884 | |
Baron Real Estate Fund | | | 489,882,682 | | | | 811,020,511 | |
Baron Emerging Markets Fund | | | 2,963,732,710 | | | | 2,120,985,192 | |
Baron Energy and Resources Fund | | | 10,040,466 | | | | 27,330,928 | |
Baron Global Advantage Fund | | | 71,213,149 | | | | 15,503,894 | |
Baron Real Estate Income Fund | | | 4,893,954 | | | | 1,810,227 | |
Baron Health Care Fund | | | 9,260,900 | | | | 1,290,716 | |
4. INVESTMENT ADVISORY FEES AND OTHER TRANSACTIONS WITH AFFILIATES
a) Investment Advisory Fees. The Adviser, a wholly owned subsidiary of Baron Capital Group, Inc. (“BCG”), serves as investment adviser to the Funds. As compensation for services rendered, the Adviser receives a fee payable monthly from Baron Partners Fund, Baron Focused Growth Fund, Baron Real Estate Fund, Baron Emerging Markets Fund and Baron Energy and Resources Fund equal to 1% per annum of the average daily net assets of the respective Fund. The Adviser receives a fee payable monthly from Baron International Growth Fund, Baron Global Advantage Fund, Baron Real Estate Income Fund and Baron Health Care Fund equal to 0.88%, 0.85%, 0.75% and 0.75%, respectively, per annum of the average daily net assets of the respective Fund. The Adviser has contractually agreed to reduce its fee, to the extent required to limit the net annual operating expense ratio (excluding portfolio transaction costs, interest, dividend and extraordinary expenses), as follows:
| | | | | | | | | | | | |
| |
| | | Annual Operating
Expense Ratio Cap | |
| | | |
| Fund | | Retail
Shares | | | Institutional
Shares | | | R6 Shares | |
Baron Partners Fund | | | 1.45 | % | | | 1.20 | % | | | 1.20 | % |
Baron Focused Growth Fund | | | 1.35 | % | | | 1.10 | % | | | 1.10 | % |
Baron International Growth Fund | | | 1.20 | % | | | 0.95 | % | | | 0.95 | % |
Baron Real Estate Fund | | | 1.35 | % | | | 1.10 | % | | | 1.10 | % |
Baron Emerging Markets Fund | | | 1.50 | % | | | 1.25 | % | | | 1.25 | % |
Baron Energy and Resources Fund | | | 1.35 | % | | | 1.10 | % | | | 1.09 | % |
Baron Global Advantage Fund | | | 1.15 | % | | | 0.90 | % | | | 0.90 | % |
Baron Real Estate Income Fund | | | 1.05 | % | | | 0.80 | % | | | 0.80 | % |
Baron Health Care Fund | | | 1.10 | % | | | 0.85 | % | | | 0.85 | % |
b) Distribution Fees. Baron Capital, Inc. (“BCI”), a wholly owned subsidiary of BCG, is a registered limited purpose broker-dealer and the distributor of the Funds’ shares. The Funds are authorized to pay BCI a distribution fee payable monthly pursuant to a distribution plan under Rule 12b-1 of the 1940 Act equal to 0.25% per annum of the Retail Shares’ average daily net assets of the respective Funds.
42
| | |
| December 31, 2018 | | Baron Select Funds |
NOTES TO FINANCIAL STATEMENTS (Continued)
4. INVESTMENT ADVISORY FEES AND OTHER TRANSACTIONS WITH AFFILIATES (Continued)
c) Trustee Fees. Certain Trustees of the Trust may be deemed to be affiliated with, or interested persons (as defined by the 1940 Act) of the Funds’ Adviser or of BCI. None of the Trustees so affiliated received compensation for his or her services as a Trustee of the Trust. None of the Funds’ officers received compensation from the Funds for their services as an officer.
d) Fund Accounting and Administration Fees. The Funds have entered into an agreement with State Street Bank and Trust Company (“State Street”) to perform accounting and certain administrative services. State Street is compensated for fund accounting services based on a percentage of the Funds’ net assets, subject to certain minimums plus fixed annual fees for the administrative services.
e) Cross Trades. The Funds are permitted to purchase securities from, or sell securities to, other Funds within the Trust, other funds in the Baron Investment Funds Trust and other entities advised or subadvised by the Adviser, pursuant to “Cross-Trading” Procedures adopted by the Board. These procedures have been designed to ensure that any cross-trade of securities by the respective Baron Fund from or to another fund/other entity that is or could be considered an affiliate of a Fund under certain limited circumstances by virtue of having a common investment adviser, common officers, or common trustees complies with Rule 17a-7 under the 1940 Act. Further, as defined under these procedures, each cross-trade is effected at the current market price and with no commissions. Pursuant to these procedures, for the year ended December 31, 2018, the Funds engaged in the following cross-trades:
| | | | | | | | | | | | |
| | | |
| | | Purchases | | | Sales | | | Net Realized
Gains (Losses) | |
Baron Partners Fund | | $ | 5,379,418 | | | $ | — | | | $ | — | |
Baron International Growth Fund | | | 39,000 | | | | — | | | | — | |
Baron Real Estate Fund | | | — | | | | 3,657,879 | | | | (1,184,983 | ) |
Baron Real Estate Income Fund | | | — | | | | 6,803 | | | | (2,538 | ) |
5. LINE OF CREDIT
Baron Partners Fund participates in a committed syndicated line of credit agreement with State Street in the amount of $750 million. Depending on the outstanding loan amount, a commitment fee of 0.15% or 0.25% per annum is incurred on the unused portion of the line of credit. The line of credit is used for investment purposes and expires on October 30, 2019. Baron Partners Fund may borrow up to the lesser of $750 million or the maximum amount Baron Partners Fund may borrow under the 1940 Act, the limitations included in Baron Partners Fund’s prospectus, or any limit or restriction under any law or regulation to which Baron Partners Fund is subject or any agreement to which Baron Partners Fund is a party. Interest is charged to Baron Partners Fund, based on its borrowings, at a rate per annum equal to the higher of the Overnight Federal Funds Rate or the one month LIBOR Rate plus a margin of 0.85%. An upfront fee of 0.05% is incurred on the commitment amount. For the year ended December 31, 2018, interest expense incurred on these loans amounted to $15,579,425. During the year ended December 31, 2018, Baron Partners Fund had an average daily balance on the line of credit of $530.6 million at a weighted average interest rate of 2.94%. At December 31, 2018, Baron Partners Fund had an outstanding balance in the amount of $601,500,000.
The Funds, (except Baron Partners Fund), together with the funds in Baron Investment Funds Trust, participate in a committed line of credit agreement with State Street to be used for temporary purposes, primarily for financing redemptions. Each fund may borrow up to the lesser of $100 million or the maximum amount each fund may borrow under the 1940 Act, the limitations included in each fund’s prospectus, or any limit or restriction under any law or regulation to which each fund is subject or any agreement to which each fund is a party; provided that the aggregate outstanding principal amount of all loans to any of the funds may not exceed $100 million. Interest is charged to each fund, based on its borrowings, at a rate per annum equal to the higher of the Overnight Federal Funds Rate or the Overnight LIBOR Rate plus a margin of 1.00%. An upfront fee of 0.05% is incurred on the commitment amount and a commitment fee of 0.20% per annum is incurred on the unused portion of the line of credit. Both fees are allocated to the participating funds based on their relative net assets. During the year ended December 31, 2018, Baron Focused Growth Fund, Baron International Growth Fund, Baron Real Estate Fund, Baron Energy and Resources Fund and Baron Global Advantage Fund had borrowings under the line of credit and incurred interest expense of $930, $306, $302, $1,067 and $68, respectively. For the 9 days during which there were borrowings, Baron Focused Growth Fund had an average daily balance on the line of credit of $1.2 million at a weighted average interest rate of 3.27%. For the 4 days during which there were borrowings, Baron International Growth Fund had an average daily balance on the line of credit of $1.0 million at a weighted average interest rate of 2.73%. For the 1 day during which there were borrowings, Baron Real Estate Fund had an average daily balance on the line of credit of $3.1 million at a weighted average interest rate of 3.55%. For the 8 days during which there were borrowings, Baron Energy and Resources Fund had an average daily balance on the line of credit of $1.6 million at a weighted average interest rate of 3.11%. For the 1 day during which there were borrowings, Baron Global Advantage Fund had an average daily balance on the line of credit of $0.7 million at a weighted average interest rate of 3.55%. At December 31, 2018, Baron Real Estate Fund and Baron Global Advantage Fund had outstanding balances in the amounts of $3,100,000 and $700,000, respectively.
43
| | |
| Baron Select Funds | | December 31, 2018 |
NOTES TO FINANCIAL STATEMENTS (Continued)
6. RESTRICTED SECURITIES
At December 31, 2018, investments in securities included securities that are restricted and/or illiquid. Restricted securities are often purchased in private placement transactions, are not registered under the Securities Act of 1933, may have contractual restrictions on resale and are valued pursuant to the policies and procedures for fair value pricing approved by the Board. A security may be considered illiquid if it lacks a readily available market or if its valuation has not changed for a certain period of time. The Funds may receive more or less than this valuation in an actual sale and that difference could be material. At December 31, 2018, the Funds held investments in restricted and/or illiquid securities that were valued pursuant to policies and procedures for fair value pricing as follows:
| | | | | | | | |
| |
| | | Baron Partners Fund | |
| | |
| Name of Issuer | | Acquisition Date(s) | | | Value | |
Private Common Stocks | | | | | | | | |
Space Exploration Technologies Corp. | | | 9/13/2017 | | | $ | 46,723,583 | |
|
Private Preferred Stocks | |
Space Exploration Technologies Corp. | | | 11/15/2017, 4/5/2018 | | | | 82,142,319 | |
| | |
Private Partnerships | | | | | | | | |
Windy City Investments Holdings, L.L.C. | | | 11/13/2007-1/27/2011 | | | | 197,058 | |
| | | | | | | | |
| |
Total Restricted Securities: | | | $ | 129,062,960 | |
| | | | | | | | |
(Cost $98,250,037 )†(6.60% of Net Assets) | | | | | | | | |
| |
| | | Baron Focused Growth Fund | |
| | |
| Name of Issuer | | Acquisition Date(s) | | | Value | |
Private Common Stocks | | | | | | | | |
Space Exploration Technologies Corp. | | | 9/13/2017 | | | $ | 4,397,380 | |
| | |
Private Preferred Stocks | | | | | | | | |
Space Exploration Technologies Corp. | | | 11/15/2017, 4/5/2018 | | | | 5,771,342 | |
| | | | | | | | |
| |
Total Restricted Securities: | | | $ | 10,168,722 | |
| | | | | | | | |
(Cost $7,449,906)† (4.99% of Net Assets) | | | | | | | | |
| |
| | | Baron Energy and Resources Fund | |
| | |
| Name of Issuer | | Acquisition Date(s) | | | Value | |
Private Common Stocks | | | | | | | | |
Gravity Oilfield Services, Inc. | | | 2/15/2017 | | | $ | 1,558,050 | |
| | | | | | | | |
(Cost $1,498,125) (4.59% of Net Assets) | | | | | | | | |
| † | See Statements of Net Assets for cost of individual securities. |
7. FAIR VALUE MEASUREMENTS
Fair value is defined by GAAP as the price that the Funds would receive upon selling an investment in a timely transaction to an independent buyer in the principal or most advantageous market for the investment. GAAP provides a three-tier hierarchy to maximize the use of observable market data and minimize the use of unobservable inputs and to establish classification of fair value measurements for disclosure purposes. Inputs refer broadly to the assumptions that market participants would use in pricing the asset or liability. Inputs may be observable or unobservable. Observable inputs are based on market data obtained from sources independent of the Funds. Unobservable inputs are inputs that reflect the Funds’ own assumptions based on the best information available in the circumstances. The three-tier hierarchy of inputs is summarized in the three broad Levels listed below.
| | • | | Level 1 — quoted prices in active markets for identical assets or liabilities; |
| | • | | Level 2 — prices determined using other inputs that are observable either directly, or indirectly through corroboration with observable market data (which could include quoted prices for similar assets or liabilities, interest rates, credit risk, etc.); |
| | • | | Level 3 — prices determined using unobservable inputs when quoted prices or observable inputs are unavailable, such as when there is little or no market activity for an asset or liability (unobservable inputs reflect each Fund’s own assumptions in determining the fair value of assets or liabilities and would be based on the best information available). |
The inputs or methodology used for valuing securities are not necessarily an indication of the risk associated with investing in those securities. For example, non-U.S. securities, with markets that close hours before the Funds value their holdings, may require revised valuations due to significant movement in the U.S. markets. Since these values are not obtained from quoted prices in an active market, such securities are reflected as Level 2.
The Funds have procedures to determine the fair value of securities and other financial instruments for which market prices are not readily available or which may not be reliably priced. Under these procedures, the Funds primarily employ a market-based approach that may use related or comparable assets or liabilities, recent transactions, market multiples, book values, and other relevant information for the investment to determine its fair value. The Funds may also use an income-based valuation approach in
44
| | |
| December 31, 2018 | | Baron Select Funds |
NOTES TO FINANCIAL STATEMENTS (Continued)
7. FAIR VALUE MEASUREMENTS (Continued)
which the anticipated future cash flows of the investment are discounted to calculate fair value. Discounts may also be applied due to the nature or duration of any restrictions on the disposition of the investments. Due to the inherent uncertainty of valuations of such investments, the fair values may differ significantly from the values that would have been used had an active market existed.
The following is a summary of the inputs used as of December 31, 2018 in valuing the Funds’ investments carried at fair value:
| | | | | | | | | | | | | | | | |
| |
| | | Baron Partners Fund | |
| | | | |
| Description | | Quoted Prices in Active Markets for Identical Assets (Level 1) | | | Other
Observable
Inputs (Level 2) | | | Unobservable
Inputs (Level 3) | | | Total | |
Common Stocks† | | $ | 2,425,703,949 | | | $ | — | | | $ | — | | | $ | 2,425,703,949 | |
Private Common Stocks | | | — | | | | — | | | | 46,723,583 | | | | 46,723,583 | |
Private Preferred Stocks | | | — | | | | — | | | | 82,142,319 | | | | 82,142,319 | |
Private Partnerships | | | — | | | | — | | | | 197,058 | | | | 197,058 | |
Short Term Investments | | | — | | | | 439,881 | | | | — | | | | 439,881 | |
| | | | | | | | | | | | | | | | |
Total Investments | | $ | 2,425,703,949 | | | $ | 439,881 | | | $ | 129,062,960 | | | $ | 2,555,206,790 | |
| | | | | | | | | | | | | | | | |
| |
| | | Baron Focused Growth Fund | |
| | | | |
| Description | | Quoted Prices in Active Markets for Identical
Assets (Level 1) | | | Other
Observable
Inputs (Level 2) | | | Unobservable
Inputs (Level 3) | | | Total | |
Common Stocks† | | $ | 178,623,550 | | | $ | — | | | $ | — | | | $ | 178,623,550 | |
Private Common Stocks | | | — | | | | — | | | | 4,397,380 | | | | 4,397,380 | |
Preferred Stocks | | | — | | | | 14,077,544 | | | | — | | | | 14,077,544 | |
Private Preferred Stocks | | | — | | | | — | | | | 5,771,342 | | | | 5,771,342 | |
Short Term Investments | | | — | | | | 119,757 | | | | — | | | | 119,757 | |
| | | | | | | | | | | | | | | | |
Total Investments | | $ | 178,623,550 | | | $ | 14,197,301 | | | $ | 10,168,722 | | | $ | 202,989,573 | |
| | | | | | | | | | | | | | | | |
| |
| | | Baron International Growth Fund | |
| | | | |
| Description | | Quoted Prices in
Active Markets
for Identical
Assets (Level 1) | | | Other
Observable
Inputs (Level 2) | | | Unobservable
Inputs (Level 3) | | | Total | |
Common Stocks† | | $ | 99,248,054 | | | $ | 116,839,242 | | | $ | — | | | $ | 216,087,296 | |
Short Term Investments | | | — | | | | 7,467,184 | | | | — | | | | 7,467,184 | |
| | | | | | | | | | | | | | | | |
Total Investments | | $ | 99,248,054 | | | $ | 124,306,426 | | | $ | — | | | $ | 223,554,480 | |
| | | | | | | | | | | | | | | | |
| |
| | | Baron Real Estate Fund | |
| | | | |
| Description | | Quoted Prices in
Active Markets
for Identical
Assets (Level 1) | | | Other
Observable Inputs (Level 2) | | | Unobservable
Inputs (Level 3) | | | Total | |
Common Stocks† | | $ | 533,262,424 | | | $ | 12,275,717 | | | $ | — | | | $ | 545,538,141 | |
| | | | | | | | | | | | | | | | |
Total Investments | | $ | 533,262,424 | | | $ | 12,275,717 | | | $ | — | | | $ | 545,538,141 | |
| | | | | | | | | | | | | | | | |
| † | See Statements of Net Assets for additional detailed categorizations. |
45
| | |
| Baron Select Funds | | December 31, 2018 |
NOTES TO FINANCIAL STATEMENTS (Continued)
7. FAIR VALUE MEASUREMENTS (Continued)
| | | | | | | | | | | | | | | | |
| |
| | | Baron Emerging Markets Fund | |
| | | | |
| Description | | Quoted Prices in
Active Markets
for Identical
Assets (Level 1) | | | Other
Observable
Inputs (Level 2) | | | Unobservable
Inputs (Level 3) | | | Total | |
Common Stocks† | | $ | 1,111,796,421 | | | $ | 3,291,322,932 | | | $ | — | | | $ | 4,403,119,353 | |
Private Preferred Stocks | | | — | | | | 339,120 | | | | — | | | | 339,120 | |
Short Term Investments | | | — | | | | 187,316,031 | | | | — | | | | 187,316,031 | |
| | | | | | | | | | | | | | | | |
Total Investments | | $ | 1,111,796,421 | | | $ | 3,478,978,083 | | | $ | — | | | $ | 4,590,774,504 | |
| | | | | | | | | | | | | | | | |
| |
| | | Baron Energy and Resources Fund | |
| | | | |
| Description | | Quoted Prices in
Active Markets
for Identical
Assets (Level 1) | | | Other
Observable
Inputs (Level 2) | | | Unobservable
Inputs (Level 3) | | | Total | |
Common Stocks† | | $ | 24,686,664 | | | $ | — | | | $ | — | | | $ | 24,686,664 | |
Private Common Stocks | | | — | | | | — | | | | 1,558,050 | | | | 1,558,050 | |
Short Term Investments | | | — | | | | 7,531,940 | | | | — | | | | 7,531,940 | |
| | | | | | | | | | | | | | | | |
Total Investments | | $ | 24,686,664 | | | $ | 7,531,940 | | | $ | 1,558,050 | | | $ | 33,776,654 | |
| | | | | | | | | | | | | | | | |
| |
| | | Baron Global Advantage Fund | |
| | | | |
| Description | | Quoted Prices in
Active Markets
for Identical
Assets (Level 1) | | | Other
Observable
Inputs (Level 2) | | | Unobservable
Inputs (Level 3) | | | Total | |
Common Stocks† | | $ | 75,483,683 | | | $ | 12,601,546 | | | $ | — | | | $ | 88,085,229 | |
| | | | | | | | | | | | | | | | |
Total Investments | | $ | 75,483,683 | | | $ | 12,601,546 | | | $ | — | | | $ | 88,085,229 | |
| | | | | | | | | | | | | | | | |
| |
| | | Baron Real Estate Income Fund | |
| | | | |
| Description | | Quoted Prices in
Active Markets
for Identical
Assets (Level 1) | | | Other
Observable
Inputs (Level 2) | | | Unobservable
Inputs (Level 3) | | | Total | |
Common Stocks† | | $ | 2,645,540 | | | $ | 56,090 | | | $ | — | | | $ | 2,701,630 | |
Short Term Investments | | | — | | | | 131,459 | | | | — | | | | 131,459 | |
| | | | | | | | | | | | | | | | |
Total Investments | | $ | 2,645,540 | | | $ | 187,549 | | | $ | — | | | $ | 2,833,089 | |
| | | | | | | | | | | | | | | | |
| |
| | | Baron Health Care Fund | |
| | | | |
| Description | | Quoted Prices in
Active Markets
for Identical
Assets (Level 1) | | | Other
Observable
Inputs (Level 2) | | | Unobservable
Inputs (Level 3) | | | Total | |
Common Stocks† | | $ | 6,818,333 | | | $ | 396,214 | | | $ | — | | | $ | 7,214,547 | |
Short Term Investments | | | — | | | | 813,558 | | | | — | | | | 813,558 | |
| | | | | | | | | | | | | | | | |
Total Investments | | $ | 6,818,333 | | | $ | 1,209,772 | | | $ | — | | | $ | 8,028,105 | |
| | | | | | | | | | | | | | | | |
| † | See Statements of Net Assets for additional detailed categorizations. |
46
| | |
| December 31, 2018 | | Baron Select Funds |
NOTES TO FINANCIAL STATEMENTS (Continued)
7. FAIR VALUE MEASUREMENTS (Continued)
The following is a reconciliation of investments in which unobservable inputs (Level 3) were used in determining fair value:
| | | | | | | | | | | | | | | | | | | | | | | | | | | | | | | | | | | | | | | | |
| |
| | | Baron Partners Fund | |
| | | | | | | | | | |
Investments in
Securities | | Balance as of
December 31,
2017 | | | Accrued
Premiums/
Discounts | | | Net
Realized
Gain (Loss) | | | Change in Net
Unrealized
Appreciation
(Depreciation) | | | Purchases | | | Sales/ Distributions | | | Transfers Into Level 3 | | | Transfers Out of Level 3 | | | Balance as of December 31,
2018 | | | Change in Net Unrealized
Appreciation
(Depreciation)
from Investments
still held at December 31,
2018 | |
Private Common Stocks | | | | | | | | | | | | | | | | | | | | | | | | | | | | | | | | | | | | | |
Industrials | | $ | 34,654,835 | | | $ | — | | | $ | — | | | $ | 12,068,748 | | | $ | — | | | $ | — | | | $ | — | | | $ | — | | | $ | 46,723,583 | | | $ | 12,068,748 | |
Private Preferred Stocks | | | | | | | | | | | | | | | | | | | | | | | | | | | | | | | | | | | | | |
Industrials | | | 42,808,873 | | | | — | | | | — | | | | 17,083,414 | | | | 22,250,032 | | | | — | | | | — | | | | — | | | | 82,142,319 | | | | 17,083,414 | |
Private Partnerships | | | | | | | | | | | | | | | | | | | | | | | | | | | | | | | | | | | | | | | | |
Financials | | | 735,176 | | | | — | | | | 1,518,524 | | | | (538,118 | ) | | | — | | | | (1,518,524 | ) | | | | | | | — | | | | 197,058 | | | | (538,118 | ) |
| | | | | | | | | | | | | | | | | | | | | | | | | | | | | | | | | | | | | | | | |
Total | | $ | 78,198,884 | | | $ | — | | | $ | 1,518,524 | | | $ | 28,614,044 | | | $ | 22,250,032 | | | $ | (1,518,524 | ) | | $ | — | | | $ | — | | | $ | 129,062,960 | | | $ | 28,614,044 | |
| | | | | | | | | | | | | | | | | | | | | | | | | | | | | | | | | | | | | | | | |
| |
| | | Baron Focused Growth Fund | |
| | | | | | | | | | |
Investments in
Securities | | Balance as of
December 31,
2017 | | | Accrued
Premiums/
Discounts | | | Net
Realized
Gain (Loss) | | | Change in Net
Unrealized
Appreciation
(Depreciation) | | | Purchases | | | Sales/ Distributions | | | Transfers
Into
Level 3 | | | Transfers
Out of
Level 3 | | | Balance as of
December 31,
2018 | | | Change in Net
Unrealized
Appreciation
(Depreciation)
from Investments
still held at
December 31,
2018 | |
Private Common Stocks | | | | | | | | | | | | | | | | | | | | | | | | | | | | | | | | | | | | | |
Industrials | | $ | 3,261,533 | | | $ | — | | | $ | — | | | $ | 1,135,847 | | | $ | — | | | $ | — | | | $ | — | | | $ | — | | | $ | 4,397,380 | | | $ | 1,135,847 | |
Private Preferred Stocks | | | | | | | | | | | | | | | | | | | | | | | | | | | | | | | | | | | | | |
Industrials | | | 4,077,088 | | | | — | | | | — | | | | 1,444,303 | | | | 249,951 | | | | — | | | | — | | | | — | | | | 5,771,342 | | | | 1,444,303 | |
| | | | | | | | | | | | | | | | | | | | | | | | | | | | | | | | | | | | | | | | |
Total | | $ | 7,338,621 | | | $ | — | | | $ | — | | | $ | 2,580,150 | | | $ | 249,951 | | | $ | — | | | $ | — | | | $ | — | | | $ | 10,168,722 | | | $ | 2,580,150 | |
| | | | | | | | | | | | | | | | | | | | | | | | | | | | | | | | | | | | | | | | |
| |
| | | Baron Energy and Resources Fund | |
| | | | | | | | | | |
Investments in
Securities | | Balance as of
December 31,
2017 | | | Accrued
Premiums/
Discounts | | | Net
Realized
Gain (Loss) | | | Change in Net
Unrealized
Appreciation
(Depreciation) | | | Purchases | | | Sales/ Distributions | | | Transfers
Into
Level 3 | | | Transfers
Out of
Level 3 | | | Balance as of
December 31,
2018 | | | Change in Net
Unrealized
Appreciation
(Depreciation)
from Investments
still held at
December 31,
2018 | |
Private Common Stocks | | | | | | | | | | | | | | | | | | | | | | | | | | | | | | | | | | | | | |
Energy | | $ | 1,721,250 | | | $ | — | | | $ | — | | | $ | (163,200 | ) | | $ | — | | | $ | — | | | $ | — | | | $ | — | | | $ | 1,558,050 | | | $ | (163,200 | ) |
| | | | | | | | | | | | | | | | | | | | | | | | | | | | | | | | | | | | | | | | |
47
| | |
| Baron Select Funds | | December 31, 2018 |
NOTES TO FINANCIAL STATEMENTS (Continued)
7. FAIR VALUE MEASUREMENTS (Continued)
Unobservable valuation inputs developed by the Adviser for significant (greater than 1% of net assets) Level 3 investments as of December 31, 2018 were as follows:
| | | | | | | | | | | | |
|
Baron Partners Fund |
| | | | | | |
| Sector | | Company | | Fair Value as of
December 31, 2018 | | Valuation Technique | | Unobservable Input | | Weighted Average used on December 31, 2018 | | Range used on December 31, 2018 |
Private Common Stocks and Private Preferred Stocks: Industrials | | Space Exploration
Technologies Corp. | | $128,865,902* | | Combination of
discounted cash flow
analysis, current value
via comparable
companies, option-
pricing, and arms-
length transaction
methods | | Change in the composite
equity index of comparable
companies | | 0.84% | | (1.34)% - 1.59% |
| | Discount for lack of
marketability | | 3.75% | | 3.75% |
| | Estimated volatility of the
returns of equity1 | | 32.80% | | 23.84% - 92.90% |
| | | | | | | | | | | | |
|
Baron Focused Growth Fund |
| | | | | | |
| Sector | | Company | | Fair Value as of
December 31, 2018 | | Valuation Technique | | Unobservable Input | | Weighted Average used on December 31, 2018 | | Range used on December 31, 2018 |
Private Common Stocks and Private Preferred Stocks: Industrials | | Space Exploration
Technologies Corp. | | $10,168,722* | | Combination of
discounted cash flow
analysis, current value
via comparable
companies, option-
pricing, and arms-
length transaction
methods | | Change in the composite
equity index of comparable
companies | | 0.84% | | (1.34)% - 1.59% |
| | Discount for lack of
marketability | | 3.75% | | 3.75% |
| | Estimated volatility of the
returns of equity1 | | 32.80% | | 23.84% - 92.90% |
| | | | | | | | | | | | |
|
Baron Energy and Resources Fund |
| | | | | | |
| Sector | | Company | | Fair Value as of
December 31, 2018 | | Valuation Technique | | Unobservable Input | | Weighted Average used on December 31, 2018 | | Range used on December 31, 2018 |
Private Common Stocks: Energy | | Gravity Oilfield
Services, Inc. | | $1,558,050 | | Combination of
scenario analysis,
current value via
comparable
companies, and
option-pricing
methods. | | EV/EBITDA Multiple2 | | 5.30x | | 3.94x - 6.87x |
| | Scenario Probabilities | | 16.67% | | 5% - 40% |
| | Change in the composite
equity index of comparable
companies | | 1.66% | | (2.02)% - 5.00% |
| | Discount for lack of
marketability | | 12.69% | | 7.41% - 13.95% |
| | Estimated volatility of the
returns of equity3 | | 50.89% | | 50.84% - 51.30% |
| 1 | The volatility was calculated as a weighted-average of the volatilities used for the two business segments of the company. Each business segment’s volatility was calculated as the simple average volatilities of comparable companies relevant to that business segment. |
| 2 | The multiple was derived as a weighted-average of the multiples used in five different valuation scenarios. |
| 3 | The volatility was calculated as a weighted-average of the volatilities used in six valuation scenarios. Each scenario’s volatility was calculated as the simple average of the volatilities of comparable companies. |
| * | The fair value as of December 31, 2018 includes a third party transaction price. |
A significant change in the EV/EBITDA multiple ratio may result in a directionally similar significant change in the fair value measurement, while a significant change in the discount for lack of marketability and equity index of comparable companies may not result in a materially higher or lower fair value measurement.
48
| | |
| December 31, 2018 | | Baron Select Funds |
NOTES TO FINANCIAL STATEMENTS (Continued)
8. INCOME TAXES AND DISTRIBUTIONS TO SHAREHOLDERS
Federal income tax regulations differ from GAAP. Therefore, distributions determined in accordance with tax regulations may differ in amount or character from net investment income and net realized gain for financial reporting purposes. Net investment income (loss) and net realized and unrealized gain (loss) differ for financial statement and tax purposes due to differing treatments of net investment loss, foreign currency gains and losses, non-deductible interest expense, reclassification of distributions, partnership basis adjustments, income from passive foreign investment companies, late year loss deferral, post-October loss deferral, and wash sale loss deferral. Financial reporting records are adjusted for permanent book/tax differences to reflect tax character. Financial records are not adjusted for temporary differences.
For the year ended December 31, 2018, the Funds recorded the following permanent reclassifications to reflect tax character. Reclassifications between income, gains and paid-in capital relate primarily to the tax treatment of net investment loss, Ordinary Loss Netting to Reduce Short Term Capital Gains, Adjustments to the Prior Period Accumulated Balances, foreign currency gains and losses, and partnership basis adjustments. Results of operations and net assets were not affected by these reclassifications.
| | | | | | | | | | | | |
| | | |
| Fund | | Undistributed
(Accumulated)
Net Investment
Income (Loss) | | | Undistributed
(Accumulated)
Net Realized
Gain (Loss) | | | Paid-In
Capital | |
Baron Partners Fund | | $ | 6,913,007 | | | $ | (7,332,587 | ) | | $ | 419,580 | |
Baron Focused Growth Fund | | | 616,876 | | | | (55,797 | ) | | | (561,079 | ) |
Baron International Growth Fund | | | (295,517 | ) | | | 295,517 | | | | — | |
Baron Real Estate Fund | | | (113,900 | ) | | | 113,900 | | | | — | |
Baron Emerging Markets Fund | | | (5,103,320 | ) | | | 5,103,320 | | | | — | |
Baron Energy and Resources Fund | | | (203,499 | ) | | | 1,101,326 | | | | (897,827 | ) |
Baron Global Advantage Fund | | | 686,297 | | | | 17,682 | | | | (703,979 | ) |
Baron Real Estate Income Fund | | | (285 | ) | | | 480 | | | | (195 | ) |
Baron Health Care Fund | | | 15,585 | | | | (140 | ) | | | (15,445 | ) |
As of December 31, 2018, the components of net assets on a tax basis were as follows:
| | | | | | | | | | | | | | | | | | | | |
| | | | | |
| | | Baron
Partners Fund | | | Baron
Focused
Growth
Fund | | | Baron
International
Growth
Fund | | | Baron
Real Estate
Fund | | | Baron
Emerging
Markets Fund | |
Cost of investments | | $ | 1,484,388,813 | | | $ | 111,282,548 | | | $ | 229,998,207 | | | $ | 454,832,026 | | | $ | 4,669,665,206 | |
| | | | | | | | | | | | | | | | | | | | |
Gross tax unrealized appreciation | | | 1,136,573,677 | | | | 93,222,336 | | | | 27,785,663 | | | | 113,201,005 | | | | 491,996,309 | |
Gross tax unrealized depreciation | | | (65,755,700 | ) | | | (1,515,311 | ) | | | (34,229,390 | ) | | | (22,494,890 | ) | | | (570,887,011 | ) |
| | | | | | | | | | | | | | | | | | | | |
Net tax unrealized appreciation (depreciation) | | | 1,070,817,977 | | | | 91,707,025 | | | | (6,443,727 | ) | | | 90,706,115 | | | | (78,890,702 | ) |
Net tax unrealized currency appreciation (depreciation) | | | — | | | | — | | | | 281 | | | | (1,464 | ) | | | (397,232 | ) |
Undistributed net investment income | | | 433,797 | | | | — | | | | 144,350 | | | | 524,306 | | | | 814,456 | |
Non-deductible interest expense | | | (14,492,335 | ) | | | — | | | | — | | | | — | | | | — | |
Undistributed net realized gain | | | 3,233,231 | | | | — | | | | 84,799 | | | | 4,822,655 | | | | — | |
Qualified late year loss deferral | | | (1,165,323 | ) | | | — | | | | (1,557,157 | ) | | | — | | | | (28,372,333 | ) |
Capital loss carryforwards | | | — | | | | (1,251,816 | ) | | | — | | | | — | | | | (20,243,458 | ) |
Paid-in capital | | | 896,330,226 | | | | 113,350,544 | | | | 234,219,708 | | | | 447,143,647 | | | | 4,737,874,793 | |
| | | | | | | | | | | | | | | | | | | | |
Net Assets | | $ | 1,955,157,573 | | | $ | 203,805,753 | | | $ | 226,448,254 | | | $ | 543,195,259 | | | $ | 4,610,785,524 | |
| | | | | | | | | | | | | | | | | | | | |
| | | | | | | | | | | | | | | | |
| | | | |
| | | Baron Energy and Resources Fund | | | Baron Global Advantage Fund | | | Baron
Real Estate
Income Fund | | | Baron
Health Care
Fund | |
Cost of investments | | $ | 26,981,908 | | | $ | 81,880,362 | | | $ | 3,039,147 | | | $ | 8,572,088 | |
| | | | | | | | | | | | | | | | |
Gross tax unrealized appreciation | | | 7,153,554 | | | | 13,040,798 | | | | 78,783 | | | | 182,748 | |
Gross tax unrealized depreciation | | | (358,808 | ) | | | (6,835,931 | ) | | | (284,841 | ) | | | (726,731 | ) |
| | | | | | | | | | | | | | | | |
Net tax unrealized appreciation (depreciation) | | | 6,794,746 | | | | 6,204,867 | | | | (206,058 | ) | | | (543,983 | ) |
Net tax unrealized currency appreciation (depreciation) | | | (502 | ) | | | (321 | ) | | | (2 | ) | | | — | |
Undistributed net investment income | | | — | | | | — | | | | — | | | | — | |
Non-deductible interest expense | | | — | | | | — | | | | — | | | | — | |
Undistributed net realized gain | | | — | | | | — | | | | — | | | | — | |
Qualified late year loss deferral | | | (4,513,634 | ) | | | — | | | | (36,957 | ) | | | — | |
Capital loss carryforwards | | | (36,134,672 | ) | | | (3,916,177 | ) | | | (122,398 | ) | | | (211,654 | ) |
Paid-in capital | | | 67,773,232 | | | | 86,872,045 | | | | 3,141,865 | | | | 8,777,285 | |
| | | | | | | | | | | | | | | | |
Net Assets | | $ | 33,919,170 | | | $ | 89,160,414 | | | $ | 2,776,450 | | | $ | 8,021,648 | |
| | | | | | | | | | | | | | | | |
49
| | |
| Baron Select Funds | | December 31, 2018 |
NOTES TO FINANCIAL STATEMENTS (Continued)
8. INCOME TAXES AND DISTRIBUTIONS TO SHAREHOLDERS (Continued)
As of December 31, 2018, the Funds had capital loss carryforwards expiring as follows:
| | | | | | | | | | | | | | | | | | | | |
| | | | | |
| | | Baron
Partners
Fund | | | Baron
Focused
Growth
Fund | | | Baron
International
Growth
Fund | | | Baron
Real Estate
Fund | | | Baron
Emerging
Markets
Fund | |
Short term: | | | | | | | | | | | | | |
No expiration date | | $ | — | | | $ | 40,867 | | | $ | — | | | $ | — | | | $ | 20,243,458 | |
| | | | | | | | | | | | | | | | | | | | |
Long term: | | | | | | | | | | | | | | | | | | | | |
No expiration date | | | — | | | | 1,210,949 | | | | — | | | | — | | | | — | |
| | | | | | | | | | | | | | | | | | | | |
Capital loss carryforward utilized during the year ended December 31, 2018 | | $ | — | | | $ | — | | | $ | — | | | $ | — | | | $ | 105,397,334 | |
| | | | | | | | | | | | | | | | | | | | |
| | | | | | | | | | | | | | | | |
| | | | |
| | | Baron
Energy and
Resources
Fund | | | Baron
Global
Advantage
Fund | | | Baron
Real Estate
Income
Fund | | | Baron
Health Care
Fund | |
Short term: | | | | | | | | | | | | | | | | |
No expiration date | | $ | 19,689,223 | | | $ | 3,835,504 | | | $ | 122,398 | | | $ | 211,654 | |
| | | | | | | | | | | | | | | | |
Long term: | | | | | | | | | | | | | | | | |
No expiration date | | | 16,445,449 | | | | 80,673 | | | | — | | | | — | |
| | | | | | | | | | | | | | | | |
Capital loss carryforward utilized during the year ended December 31, 2018 | | $ | 2,030,446 | | | $ | — | | | $ | — | | | $ | — | |
| | | | | | | | | | | | | | | | |
The tax character of distributions paid during the years ended December 31, 2018 and December 31, 2017 was as follows:
| | | | | | | | | | | | | | | | | | | | | | | | |
| | |
| | | Year Ended
December 31, 2018 | | | Year Ended
December 31, 2017 | |
| | | | | | |
| Fund | | Ordinary1 | | | Long Term
Capital Gain | | | Return of
Capital | | | Ordinary1 | | | Long Term
Capital Gain | | | Return of
Capital | |
Baron Partners Fund | | $ | — | | | $ | — | | | $ | — | | | $ | — | | | $ | — | | | $ | — | |
Baron Focused Growth Fund | | | — | | | | 2,088,507 | | | | — | | | | 18,516 | | | | 3,968,499 | | | | — | |
Baron International Growth Fund | | | 617,685 | | | | 7,284,443 | | | | — | | | | — | | | | 5,523,281 | | | | — | |
Baron Real Estate Fund | | | 1,388,009 | | | | 70,512,863 | | | | — | | | | — | | | | 49,502,988 | | | | — | |
Baron Emerging Markets Fund | | | 20,988,570 | | | | — | | | | — | | | | 18,258,381 | | | | — | | | | 766,584 | |
Baron Energy and Resources Fund | | | — | | | | — | | | | — | | | | 63,663 | | | | — | | | | — | |
Baron Global Advantage Fund | | | — | | | | — | | | | — | | | | — | | | | — | | | | — | |
Baron Real Estate Income Fund | | | 46,675 | | | | — | | | | 30,853 | | | | N/A | | | | N/A | | | | N/A | |
Baron Health Care Fund | | | — | | | | — | | | | — | | | | N/A | | | | N/A | | | | N/A | |
| 1 | For tax purposes, short-term capital gains are considered ordinary income distributions. |
The Funds follow the provisions of FASB Codification Section 740 (“ASC Section 740”) “Accounting for Uncertainty in Income Taxes” which clarifies the accounting for uncertainty in tax positions taken or expected to be taken on a tax return. ASC Section 740 sets forth a threshold for financial statement recognition, measurement and disclosure of tax positions taken or expected to be taken on a tax return. The Funds are required to recognize the tax effects of certain tax positions under a “more likely than not” standard, that based on their technical merits, have more than 50 percent likelihood of being sustained upon examination. Management has analyzed the tax positions taken on the Funds’ federal income tax returns for all open years (current and prior three years), and has concluded that no provision for federal income tax is required in the Funds’ financial statements. At December 31, 2018, the Funds did not have any uncertain tax benefits that require recognition, de-recognition or disclosure. The Funds’ federal, state and local income and federal excise tax returns for which the applicable statutes of limitations have not expired (current and prior three years) are subject to examination by the Internal Revenue Service and state departments of revenue.
9. OWNERSHIP CONCENTRATION
As of December 31, 2018, the officers, trustees and portfolio managers owned, directly or indirectly, 55.40% of Baron Focused Growth Fund and 74.04% of Baron Real Estate Income Fund. As of December 31, 2018, the officers, trustees, portfolio managers and one other investor owned, directly or indirectly, 55.30% of Baron Health Care Fund. As a result of their ownership, these investors may be able to materially affect the outcome of matters presented to Baron Focused Growth Fund, Baron Real Estate Income Fund and Baron Health Care Fund shareholders.
50
| | |
| December 31, 2018 | | Baron Select Funds |
NOTES TO FINANCIAL STATEMENTS (Continued)
10. TRANSACTIONS IN “AFFILIATED” COMPANIES1
BARON EMERGING MARKETS FUND
| | | | | | | | | | | | | | | | | | | | | | | | | | | | | | | | | | | | |
| | | | | | | | | |
| Name of Issuer | | Value at
December 31,
2017 | | | Purchase
Cost | | | Sales
Proceeds | | | Change in Net
Unrealized
Appreciation
(Depreciation) | | | Realized
Gains/ (Losses) | | | Dividend
Income | | | Shares Held at
December 31,
2018 | | | Value at
December 31,
2018 | | | % of Net
Assets at
December 31,
2018 | |
“Affiliated” Company as of December 31, 2018: | | | | | | | | | | | | | | | | | | | | | | | | | |
Lekoil Ltd. | | $ | 7,156,444 | | | $ | — | | | $ | — | | | $ | (3,938,515 | ) | | $ | — | | | $ | — | | | | 32,618,323 | | | $ | 3,217,929 | | | | 0.07 | % |
| | | | | | | | | | | | | | | | | | | | | | | | | | | | | | | | | | | | |
| 1 | An “Affiliated” Company (“affiliated person” as defined in the 1940 Act) is a company in which a Fund held 5% or more of the company’s outstanding voting securities at any time during the year ended December 31, 2018. |
11. RECENT ACCOUNTING PRONOUNCEMENTS
As of November 5, 2018, pursuant to the SEC Release #33-10532 “Disclosure Update and Simplification,” funds are no longer required to disclose whether the distributions from earnings are either from net investment income or net realized capital gains. We have evaluated the implications of these changes and the amendments are included in the financial statements, which had no effect on the Funds’ net assets or results of operations. The amendments require presentation of the total, rather than the components, of distributable earnings on the Statement of Assets and Liabilities and also require presentation of the total, rather than the components, of distributions to shareholders, except for tax return of capital distributions, if any, on the Statements of Changes in Net Assets. At December 31, 2017, the distributions from net investment income and net realized gain from investments, were as follows:
| | | | | | | | | | | | |
| | | |
| Net Investment Income | | Retail Shares | | | Institutional
Shares | | | R6 Shares | |
Baron Partners Fund | | $ | — | | | $ | — | | | $ | — | |
Baron Focused Growth Fund | | | 260 | | | | 15,567 | | | | 2,689 | |
Baron International Growth Fund | | | — | | | | — | | | | — | |
Baron Real Estate Fund | | | — | | | | — | | | | — | |
Baron Emerging Markets Fund | | | 2,477,009 | | | | 15,761,419 | | | | 19,953 | |
Baron Energy and Resources Fund | | | 42,458 | | | | 20,747 | | | | 458 | |
Baron Global Advantage Fund | | | — | | | | — | | | | — | |
| | | | | | | | | | | | |
| | | |
| Net Realized Gain on Investments | | Retail Shares | | | Institutional
Shares | | | R6 Shares | |
Baron Partners Fund | | $ | — | | | $ | — | | | $ | — | |
Baron Focused Growth Fund | | | 887,768 | | | | 2,620,589 | | | | 460,142 | |
Baron International Growth Fund | | | 1,934,983 | | | | 3,562,276 | | | | 26,022 | |
Baron Real Estate Fund | | | 19,586,974 | | | | 29,765,405 | | | | 150,609 | |
Baron Emerging Markets Fund | | | — | | | | — | | | | — | |
Baron Energy and Resources Fund | | | — | | | | — | | | | — | |
Baron Global Advantage Fund | | | — | | | | — | | | | — | |
As part of this update, it is no longer required to disclose the undistributed (accumulated) net investment income (loss)/(distributions in excess of net investment income), which were as follows as of December 31, 2017:
| | | | |
Baron Partners Fund | | $ | (7,203 | ) |
Baron Focused Growth Fund | | | — | |
Baron International Growth Fund | | | (1,943 | ) |
Baron Real Estate Fund | | | 1,386,093 | |
Baron Emerging Markets Fund | | | (3,398,154 | ) |
Baron Energy and Resources Fund | | | 1,012,030 | |
Baron Global Advantage Fund | | | (11,927 | ) |
In August 2018, FASB issued Accounting Standards Update No. 2018-13, “Fair Value Measurement (Topic 820: Disclosure Framework — Changes to the Disclosure Requirements for Fair Value Measurement” (“ASU 2018-13”). ASU 2018-13 eliminates the requirement to disclose the amount of and reasons for transfers between Level 1 and Level 2 of the fair value hierarchy, the timing of transfers between levels of the fair value hierarchy and the valuation processes for Level 3 fair value measurements. ASU 2018-13 does not eliminate the requirement to disclose the range and weighted average used to develop significant unobservable inputs for Level 3 fair value measurements and the changes in unrealized gains and losses for recurring Level 3 fair value measurements. ASU 2018-13 requires that information is provided about the measurement uncertainty of Level 3 fair value measurements as of the reporting date. The guidance is effective for fiscal years, and interim periods within those fiscal years, beginning after December 15, 2019. Management has elected to early adopt this guidance and the amendments are reflected in the current year financial statements.
12. SUBSEQUENT EVENT
The Board of Trustees approved the liquidation of the Baron Energy and Resources Fund which will occur on or about April 29, 2019 (the “Liquidation Date”). Effective at the close of market on February 8, 2019, the Fund has ceased accepting purchase orders from new and existing investors. Shareholders of the Fund may redeem their shares or exchange their shares for shares of another Baron Fund that they are eligible to purchase at any time prior to the Liquidation Date. If a shareholder has not redeemed his or her shares as of the Liquidation Date, the shareholder’s account will be automatically redeemed and proceeds, subject to any required withholding, will be sent to the shareholder at the shareholder’s address of record. Additional information is included in the Fund’s supplement dated February 8, 2019 to the Prospectus, Summary Prospectus and SAI dated April 30, 2018.
51
| | |
| Baron Select Funds | | December 31, 2018 |
FINANCIAL HIGHLIGHTS
BARON PARTNERS FUND
Selected data for a share outstanding throughout each year:
| | | | | | | | | | | | | | | | | | | | | | | | | | | | | | | | | | | | | | | | | | | | | | | | | | | | | | | | | | | | |
| | | | | | | |
| | | | | | Income (loss) from
investment operations: | | | Less distributions to
shareholders from: | | | | | | | | | Ratios to Average Net Assets: | | | Supplemental
Data: | |
| | | | | | | | | | | | | | | |
| | | Net
asset
value,
beginning
of year
($) | | | Net
investment
income
(loss)
($) | | | Net
realized
and
unrealized
gain
(loss) on
investments
($) | | | Total
from
investment
operations
($) | | | Net
investment
income
($) | | | Net
realized
gain on
investments
($) | | | Total
distributions
($) | | | Net
asset
value,
end of
year
($) | | | Total
return
(%) | | | Total
expenses
(%) | | | Less:
interest
expense
(%) | | | Net
Operating
expenses
(%) | | | Net
investment
income
(loss)
(%) | | | Net
assets (in
millions),
end of
year
($) | | | Portfolio
turnover
rate
(%) | |
|
RETAIL SHARES | |
|
Year Ended December 31, | |
| | | | | | | | | | | | | | | |
2018 | | | 48.75 | | | | (0.61 | )1 | | | (0.37 | ) | | | (0.98 | ) | | | 0.00 | | | | 0.00 | | | | 0.00 | | | | 47.77 | | | | (2.01 | ) | | | 2.03 | | | | (0.71 | ) | | | 1.32 | | | | (1.13 | ) | | | 1,016.2 | | | | 8.09 | |
| | | | | | | | | | | | | | | |
2017 | | | 37.06 | | | | (0.38 | )1 | | | 12.07 | | | | 11.69 | | | | 0.00 | | | | 0.00 | | | | 0.00 | | | | 48.75 | | | | 31.54 | | | | 1.79 | | | | (0.45 | ) | | | 1.34 | | | | (0.84 | ) | | | 1,101.7 | | | | 26.19 | |
| | | | | | | | | | | | | | | |
2016 | | | 35.62 | | | | (0.11 | )1 | | | 1.55 | | | | 1.44 | | | | 0.00 | | | | 0.00 | | | | 0.00 | | | | 37.06 | | | | 4.04 | | | | 1.78 | | | | (0.43 | ) | | | 1.35 | | | | (0.31 | ) | | | 913.9 | | | | 15.59 | |
| | | | | | | | | | | | | | | |
2015 | | | 36.74 | | | | (0.05 | )1 | | | (0.95 | ) | | | (1.00 | ) | | | (0.12 | ) | | | 0.00 | | | | (0.12 | ) | | | 35.62 | | | | (2.71 | ) | | | 1.52 | | | | (0.20 | ) | | | 1.32 | | | | (0.13 | ) | | | 1,107.5 | | | | 17.08 | |
| | | | | | | | | | | | | | | |
2014 | | | 33.32 | | | | 0.23 | 1 | | | 3.19 | | | | 3.42 | | | | 0.00 | | | | 0.00 | | | | 0.00 | | | | 36.74 | | | | 10.26 | | | | 1.51 | | | | (0.19 | ) | | | 1.32 | | | | 0.66 | | | | 1,256.3 | | | | 30.82 | |
| | | | | | | | | | | | | | | |
2013 | | | 22.56 | | | | (0.19 | )1 | | | 10.95 | | | | 10.76 | | | | 0.00 | | | | 0.00 | | | | 0.00 | | | | 33.32 | | | | 47.69 | | | | 1.67 | | | | (0.29 | ) | | | 1.38 | | | | (0.66 | ) | | | 1,125.6 | | | | 18.57 | |
| | | | | | | | | | | | | | | |
2012 | | | 19.39 | | | | (0.04 | )1 | | | 3.21 | | | | 3.17 | | | | 0.00 | | | | 0.00 | | | | 0.00 | | | | 22.56 | | | | 16.35 | | | | 1.74 | | | | (0.34 | ) | | | 1.40 | | | | (0.18 | ) | | | 653.7 | | | | 13.04 | |
| | | | | | | | | | | | | | | |
2011 | | | 20.57 | | | | (0.14 | )1 | | | (1.04 | ) | | | (1.18 | ) | | | 0.00 | | | | 0.00 | | | | 0.00 | | | | 19.39 | | | | (5.74 | ) | | | 1.71 | | | | (0.36 | ) | | | 1.35 | | | | (0.69 | ) | | | 970.4 | | | | 16.96 | |
| | | | | | | | | | | | | | | |
2010 | | | 15.64 | | | | (0.09 | )1 | | | 5.02 | | | | 4.93 | | | | 0.00 | | | | 0.00 | | | | 0.00 | | | | 20.57 | | | | 31.52 | | | | 1.71 | | | | (0.34 | ) | | | 1.37 | | | | (0.51 | ) | | | 1,251.9 | | | | 15.85 | |
| | | | | | | | | | | | | | | |
2009 | | | 12.20 | | | | (0.04 | )1 | | | 3.48 | | | | 3.44 | | | | 0.00 | | | | 0.00 | | | | 0.00 | | | | 15.64 | | | | 28.20 | | | | 1.51 | | | | (0.10 | ) | | | 1.41 | | | | (0.30 | ) | | | 1,249.3 | | | | 32.43 | |
|
INSTITUTIONAL SHARES | |
|
Year Ended December 31, | |
| | | | | | | | | | | | | | | |
2018 | | | 49.73 | | | | (0.49 | )1 | | | (0.38 | ) | | | (0.87 | ) | | | 0.00 | | | | 0.00 | | | | 0.00 | | | | 48.86 | | | | (1.75 | ) | | | 1.77 | | | | (0.71 | ) | | | 1.06 | | | | (0.88 | ) | | | 815.6 | | | | 8.09 | |
| | | | | | | | | | | | | | | |
2017 | | | 37.70 | | | | (0.27 | )1 | | | 12.30 | | | | 12.03 | | | | 0.00 | | | | 0.00 | | | | 0.00 | | | | 49.73 | | | | 31.91 | | | | 1.53 | | | | (0.45 | ) | | | 1.08 | | | | (0.58 | ) | | | 854.9 | | | | 26.19 | |
| | | | | | | | | | | | | | | |
2016 | | | 36.15 | | | | (0.02 | )1 | | | 1.57 | | | | 1.55 | | | | 0.00 | | | | 0.00 | | | | 0.00 | | | | 37.70 | | | | 4.29 | | | | 1.52 | | | | (0.43 | ) | | | 1.09 | | | | (0.05 | ) | | | 645.3 | | | | 15.59 | |
| | | | | | | | | | | | | | | |
2015 | | | 37.28 | | | | 0.04 | 1 | | | (0.95 | ) | | | (0.91 | ) | | | (0.22 | ) | | | 0.00 | | | | (0.22 | ) | | | 36.15 | | | | (2.43 | ) | | | 1.26 | | | | (0.20 | ) | | | 1.06 | | | | 0.11 | | | | 793.3 | | | | 17.08 | |
| | | | | | | | | | | | | | | |
2014 | | | 33.72 | | | | 0.25 | 1 | | | 3.31 | | | | 3.56 | | | | 0.00 | | | | 0.00 | | | | 0.00 | | | | 37.28 | | | | 10.56 | | | | 1.26 | | | | (0.20 | ) | | | 1.06 | | | | 0.69 | | | | 681.5 | | | | 30.82 | |
| | | | | | | | | | | | | | | |
2013 | | | 22.78 | | | | (0.12 | )1 | | | 11.06 | | | | 10.94 | | | | 0.00 | | | | 0.00 | | | | 0.00 | | | | 33.72 | | | | 48.02 | | | | 1.41 | | | | (0.30 | ) | | | 1.11 | | | | (0.41 | ) | | | 349.0 | | | | 18.57 | |
| | | | | | | | | | | | | | | |
2012 | | | 19.52 | | | | 0.04 | 1 | | | 3.22 | | | | 3.26 | | | | 0.00 | | | | 0.00 | | | | 0.00 | | | | 22.78 | | | | 16.70 | | | | 1.48 | | | | (0.35 | ) | | | 1.13 | | | | 0.18 | | | | 146.5 | | | | 13.04 | |
| | | | | | | | | | | | | | | |
2011 | | | 20.66 | | | | (0.08 | )1 | | | (1.06 | ) | | | (1.14 | ) | | | 0.00 | | | | 0.00 | | | | 0.00 | | | | 19.52 | | | | (5.52 | ) | | | 1.45 | | | | (0.36 | ) | | | 1.09 | | | | (0.41 | ) | | | 123.7 | | | | 16.96 | |
| | | | | | | | | | | | | | | |
2010 | | | 15.66 | | | | (0.06 | )1 | | | 5.06 | | | | 5.00 | | | | 0.00 | | | | 0.00 | | | | 0.00 | | | | 20.66 | | | | 31.93 | | | | 1.45 | | | | (0.34 | ) | | | 1.11 | | | | (0.36 | ) | | | 119.9 | | | | 15.85 | |
| | | | | | | | | | | | | | | |
20094 | | | 12.66 | | | | (0.03 | )1 | | | 3.03 | | | | 3.00 | | | | 0.00 | | | | 0.00 | | | | 0.00 | | | | 15.66 | | | | 23.70 | 2 | | | 1.38 | 3 | | | (0.21 | )3 | | | 1.17 | 3 | | | (0.31 | )3 | | | 158.5 | | | | 32.43 | |
|
R6 SHARES | |
|
Year Ended December 31, | |
| | | | | | | | | | | | | | | |
2018 | | | 49.73 | | | | (0.46 | )1 | | | (0.41 | ) | | | (0.87 | ) | | | 0.00 | | | | 0.00 | | | | 0.00 | | | | 48.86 | | | | (1.75 | ) | | | 1.79 | | | | (0.73 | ) | | | 1.06 | | | | (0.82 | ) | | | 123.4 | | | | 8.09 | |
| | | | | | | | | | | | | | | |
2017 | | | 37.71 | | | | (0.26 | )1 | | | 12.28 | | | | 12.02 | | | | 0.00 | | | | 0.00 | | | | 0.00 | | | | 49.73 | | | | 31.88 | | | | 1.52 | | | | (0.45 | ) | | | 1.07 | | | | (0.55 | ) | | | 15.5 | | | | 26.19 | |
| | | | | | | | | | | | | | | |
20165 | | | 38.61 | | | | (0.01 | )1 | | | (0.89 | ) | | | (0.90 | ) | | | 0.00 | | | | 0.00 | | | | 0.00 | | | | 37.71 | | | | (2.33 | )2 | | | 1.62 | 3 | | | (0.53 | )3 | | | 1.09 | 3 | | | (0.04 | )3 | | | 8.3 | | | | 15.59 | |
| 1 | Based on average shares outstanding. |
| 4 | For the period May 29, 2009 (initial offering of Institutional shares) to December 31, 2009. |
| 5 | For the period August 31, 2016 (initial offering of R6 shares) to December 31, 2016. |
| | |
| 52 | | See Notes to Financial Statements. |
| | |
| December 31, 2018 | | Baron Select Funds |
FINANCIAL HIGHLIGHTS (Continued)
BARON FOCUSED GROWTH FUND
Selected data for a share outstanding throughout each year:
| | | | | | | | | | | | | | | | | | | | | | | | | | | | | | | | | | | | | | | | | | | | | | | | | | | | | | | | | | | | | | | | |
| | | | | | | |
| | | | | | Income (loss) from
investment operations: | | | Less distributions to
shareholders: | | | | | | | | | Ratios to Average Net Assets: | | | Supplemental
Data: | |
| | | | | | | | | | | | | | | | |
| | | Net
asset
value,
beginning
of year
($) | | | Net
investment
income
(loss)
($) | | | Net
realized
and
unrealized
gain
(loss)
($) | | | Total
from
investment
operations
($) | | | Net
investment
income
($) | | | Net
realized
gain on
investments
($) | | | Return of
capital
($) | | | Total
distributions
($) | | | Net
asset
value,
end of
year
($) | | | Total
return
(%) | | | Operating
expenses
(%) | | | Less:
Reimbursement
of expenses
by Adviser
(%) | | | Net
operating
expenses
(%) | | | Net
investment
income
(loss)
(%) | | | Net
assets
(in
millions),
end of
year
($) | | | Portfolio
turnover
rate
(%) | |
|
RETAIL SHARES | |
|
Year Ended December 31, | |
| | | | | | | | | | | | | | | | |
2018 | | | 15.38 | | | | (0.08 | )1 | | | 0.68 | | | | 0.60 | | | | 0.00 | | | | (0.17 | ) | | | 0.00 | | | | (0.17 | ) | | | 15.81 | | | | 3.75 | 3 | | | 1.39 | 9 | | | (0.04 | ) | | | 1.35 | | | | (0.49 | ) | | | 40.9 | | | | 1.85 | |
| | | | | | | | | | | | | | | | |
2017 | | | 12.43 | | | | (0.09 | )1 | | | 3.36 | | | | 3.27 | | | | (0.00 | )2 | | | (0.32 | ) | | | 0.00 | | | | (0.32 | ) | | | 15.38 | | | | 26.36 | 3 | | | 1.40 | | | | (0.05 | ) | | | 1.35 | | | | (0.64 | ) | | | 42.4 | | | | 11.48 | |
| | | | | | | | | | | | | | | | |
2016 | | �� | 13.09 | | | | 0.01 | 1 | | | 0.08 | | | | 0.09 | | | | 0.00 | | | | (0.75 | ) | | | 0.00 | | | | (0.75 | ) | | | 12.43 | | | | 0.67 | 3 | | | 1.43 | | | | (0.08 | ) | | | 1.35 | | | | 0.11 | | | | 37.7 | | | | 14.31 | |
| | | | | | | | | | | | | | | | |
2015 | | | 14.21 | | | | (0.01 | )1 | | | (0.35 | ) | | | (0.36 | ) | | | (0.02 | ) | | | (0.74 | ) | | | 0.00 | | | | (0.76 | ) | | | 13.09 | | | | (2.42 | )3 | | | 1.39 | | | | (0.04 | ) | | | 1.35 | | | | (0.10 | ) | | | 43.7 | | | | 12.18 | |
| | | | | | | | | | | | | | | | |
2014 | | | 13.97 | | | | 0.04 | 1 | | | 0.29 | | | | 0.33 | | | | 0.00 | | | | (0.09 | ) | | | 0.00 | | | | (0.09 | ) | | | 14.21 | | | | 2.35 | 3 | | | 1.39 | | | | (0.04 | ) | | | 1.35 | | | | 0.31 | | | | 46.1 | | | | 36.92 | |
| | | | | | | | | | | | | | | | |
2013 | | | 11.26 | | | | (0.07 | )1 | | | 2.95 | | | | 2.88 | | | | (0.17 | ) | | | 0.00 | | | | 0.00 | | | | (0.17 | ) | | | 13.97 | | | | 25.69 | 3 | | | 1.42 | | | | (0.07 | ) | | | 1.35 | | | | (0.53 | ) | | | 47.6 | | | | 33.67 | |
| | | | | | | | | | | | | | | | |
2012 | | | 9.71 | | | | 0.24 | 1 | | | 1.31 | | | | 1.55 | | | | 0.00 | | | | 0.00 | | | | 0.00 | | | | 0.00 | | | | 11.26 | | | | 15.96 | 3 | | | 1.48 | | | | (0.13 | ) | | | 1.35 | | | | 2.30 | | | | 31.4 | | | | 38.38 | |
| | | | | | | | | | | | | | | | |
2011 | | | 9.85 | | | | (0.07 | )1 | | | (0.07 | ) | | | (0.14 | ) | | | 0.00 | | | | 0.00 | | | | 0.00 | | | | 0.00 | | | | 9.71 | | | | (1.42 | )3 | | | 1.48 | | | | (0.13 | ) | | | 1.35 | | | | (0.69 | ) | | | 28.3 | | | | 44.58 | |
| | | | | | | | | | | | | | | | |
2010 | | | 8.14 | | | | (0.01 | )1 | | | 2.05 | | | | 2.04 | | | | (0.33 | ) | | | 0.00 | | | | 0.00 | | | | (0.33 | ) | | | 9.85 | | | | 25.17 | 3 | | | 1.47 | | | | (0.12 | ) | | | 1.35 | | | | (0.16 | ) | | | 46.4 | | | | 24.08 | |
| | | | | | | | | | | | | | | | |
2009 | | | 6.27 | | | | 0.12 | 1 | | | 2.00 | | | | 2.12 | | | | (0.13 | ) | | | 0.00 | | | | (0.12 | ) | | | (0.25 | ) | | | 8.14 | | | | 33.77 | 3 | | | 1.52 | | | | (0.17 | ) | | | 1.35 | | | | 1.81 | | | | 39.9 | | | | 34.76 | |
|
INSTITUTIONAL SHARES | |
|
Year Ended December 31, | |
| | | | | | | | | | | | | | | | |
2018 | | | 15.66 | | | | (0.05 | )1 | | | 0.71 | | | | 0.66 | | | | 0.00 | | | | (0.17 | ) | | | 0.00 | | | | (0.17 | ) | | | 16.15 | | | | 4.07 | | | | 1.09 | 9 | | | 0.00 | | | | 1.09 | | | | (0.30 | ) | | | 70.7 | | | | 1.85 | |
| | | | | | | | | | | | | | | | |
2017 | | | 12.63 | | | | (0.06 | )1 | | | 3.41 | | | | 3.35 | | | | (0.00 | )2 | | | (0.32 | ) | | | 0.00 | | | | (0.32 | ) | | | 15.66 | | | | 26.59 | 3 | | | 1.12 | | | | (0.02 | ) | | | 1.10 | | | | (0.39 | ) | | | 127.8 | | | | 11.48 | |
| | | | | | | | | | | | | | | | |
2016 | | | 13.25 | | | | 0.05 | 1 | | | 0.08 | | | | 0.13 | | | | 0.00 | | | | (0.75 | ) | | | 0.00 | | | | (0.75 | ) | | | 12.63 | | | | 0.97 | 3 | | | 1.13 | | | | (0.03 | ) | | | 1.10 | | | | 0.37 | | | | 128.9 | | | | 14.31 | |
| | | | | | | | | | | | | | | | |
2015 | | | 14.37 | | | | 0.02 | 1 | | | (0.34 | ) | | | (0.32 | ) | | | (0.06 | ) | | | (0.74 | ) | | | 0.00 | | | | (0.80 | ) | | | 13.25 | | | | (2.12 | ) | | | 1.09 | | | | 0.00 | | | | 1.09 | | | | 0.16 | | | | 140.5 | | | | 12.18 | |
| | | | | | | | | | | | | | | | |
2014 | | | 14.10 | | | | 0.08 | 1 | | | 0.28 | | | | 0.36 | | | | 0.00 | | | | (0.09 | ) | | | 0.00 | | | | (0.09 | ) | | | 14.37 | | | | 2.54 | | | | 1.09 | | | | 0.00 | | | | 1.09 | | | | 0.56 | | | | 149.2 | | | | 36.92 | |
| | | | | | | | | | | | | | | | |
2013 | | | 11.35 | | | | (0.04 | )1 | | | 2.99 | | | | 2.95 | | | | (0.20 | ) | | | 0.00 | | | | 0.00 | | | | (0.20 | ) | | | 14.10 | | | | 26.09 | 3 | | | 1.12 | | | | (0.02 | ) | | | 1.10 | | | | (0.28 | ) | | | 148.4 | | | | 33.67 | |
| | | | | | | | | | | | | | | | |
2012 | | | 9.77 | | | | 0.26 | 1 | | | 1.32 | | | | 1.58 | | | | 0.00 | | | | 0.00 | | | | 0.00 | | | | 0.00 | | | | 11.35 | | | | 16.17 | 3 | | | 1.16 | | | | (0.06 | ) | | | 1.10 | | | | 2.53 | | | | 87.9 | | | | 38.38 | |
| | | | | | | | | | | | | | | | |
2011 | | | 9.88 | | | | (0.04 | )1 | | | (0.07 | ) | | | (0.11 | ) | | | 0.00 | | | | 0.00 | | | | 0.00 | | | | 0.00 | | | | 9.77 | | | | (1.11 | )3 | | | 1.18 | | | | (0.08 | ) | | | 1.10 | | | | (0.40 | ) | | | 63.6 | | | | 44.58 | |
| | | | | | | | | | | | | | | | |
2010 | | | 8.15 | | | | 0.01 | 1 | | | 2.05 | | | | 2.06 | | | | (0.33 | ) | | | 0.00 | | | | 0.00 | | | | (0.33 | ) | | | 9.88 | | | | 25.39 | 3 | | | 1.19 | | | | (0.09 | ) | | | 1.10 | | | | 0.08 | | | | 44.3 | | | | 24.08 | |
| | | | | | | | | | | | | | | | |
20096 | | | 6.88 | | | | 0.07 | 1 | | | 1.45 | | | | 1.52 | | | | (0.13 | ) | | | 0.00 | | | | (0.12 | ) | | | (0.25 | ) | | | 8.15 | | | | 22.06 | 3,4 | | | 1.25 | 5 | | | (0.15 | )5 | | | 1.10 | 5 | | | 1.63 | 5 | | | 36.6 | | | | 34.76 | |
|
R6 SHARES | |
|
Year Ended December 31, | |
| | | | | | | | | | | | | | | | |
2018 | | | 15.67 | | | | (0.03 | )1 | | | 0.69 | | | | 0.66 | | | | 0.00 | | | | (0.17 | ) | | | 0.00 | | | | (0.17 | ) | | | 16.16 | | | | 4.07 | 3 | | | 1.10 | 9 | | | (0.00 | )8 | | | 1.10 | | | | (0.18 | ) | | | 92.2 | | | | 1.85 | |
| | | | | | | | | | | | | | | | |
2017 | | | 12.63 | | | | (0.06 | )1 | | | 3.42 | | | | 3.36 | | | | (0.00 | )2 | | | (0.32 | ) | | | 0.00 | | | | (0.32 | ) | | | 15.67 | | | | 26.67 | 3 | | | 1.10 | | | | (0.00 | )8 | | | 1.10 | | | | (0.38 | ) | | | 22.6 | | | | 11.48 | |
| | | | | | | | | | | | | | | | |
20167 | | | 13.87 | | | | 0.02 | 1 | | | (0.51 | ) | | | (0.49 | ) | | | 0.00 | | | | (0.75 | ) | | | 0.00 | | | | (0.75 | ) | | | 12.63 | | | | (3.55 | )3,4 | | | 1.14 | 5 | | | (0.04 | )5 | | | 1.10 | 5 | | | 0.53 | 5 | | | 8.6 | | | | 14.31 | |
| 1 | Based on average shares outstanding. |
| 2 | Less than $0.01 per share. |
| 3 | The total returns would have been lower had certain expenses not been reduced during the period shown. |
| 6 | For the period May 29, 2009 (initial offering of Institutional Shares) to December 31, 2009. |
| 7 | For the period August 31, 2016 (initial offering of R6 Shares) to December 31, 2016. |
| 9 | Interest expense rounds to less than 0.01%. |
| | |
| See Notes to Financial Statements. | | 53 |
| | |
| Baron Select Funds | | December 31, 2018 |
FINANCIAL HIGHLIGHTS (Continued)
BARON INTERNATIONAL GROWTH FUND
Selected data for a share outstanding throughout each year:
| | | | | | | | | | | | | | | | | | | | | | | | | | | | | | | | | | | | | | | | | | | | | | | | | | | | | | | | | | | | | | | | |
| | | | | | | | |
| | | | | | Income (loss) from
investment operations: | | | Less distributions to
shareholders from: | | | | | | | | | Ratios to Average Net Assets: | | | Supplemental
Data: | | | | |
| | | | | | | | | | | | | | | | |
| | | Net
asset
value,
beginning
of year
($) | | | Net
investment
income
(loss)
($) | | | Net
realized
and
unrealized
gain
(loss)
($) | | | Total
from
investment
operations
($) | | | Net
investment
income
($) | | | Net
realized
gain on
investments
($) | | | Total
distributions
($) | | | Net
asset
value,
end of
year
($) | | | Total
return
(%) | | | Operating
expenses
(%) | | | Less:
Reimbursement
of expenses
by Adviser
(%) | | | Net
operating
expenses
(%) | | | Net
investment
income
(loss)
(%) | | | Net
assets (in
millions),
end of
year
($) | | | Portfolio
turnover
rate
(%) | | | | |
| |
RETAIL SHARES | | | | | |
| |
Year Ended December 31, | | | | | |
| | | | | | | | | | | | | | | | |
2018 | | | 23.90 | | | | (0.01 | )1 | | | (4.21 | ) | | | (4.22 | ) | | | 0.00 | | | | (0.68 | ) | | | (0.68 | ) | | | 19.00 | | | | (17.90 | )3 | | | 1.34 | 8 | | | (0.14 | ) | | | 1.20 | | | | (0.03 | ) | | | 59.8 | | | | 50.83 | | | | | |
| | | | | | | | | | | | | | | | |
2017 | | | 18.09 | | | | (0.06 | )1 | | | 6.72 | | | | 6.66 | | | | 0.00 | | | | (0.85 | ) | | | (0.85 | ) | | | 23.90 | | | | 36.94 | 3 | | | 1.51 | | | | (0.14 | ) | | | 1.37 | | | | (0.28 | ) | | | 56.5 | | | | 31.44 | | | | | |
| | | | | | | | | | | | | | | | |
2016 | | | 18.05 | | | | (0.03 | )1 | | | 0.24 | | | | 0.21 | | | | (0.01 | ) | | | (0.16 | ) | | | (0.17 | ) | | | 18.09 | | | | 1.14 | 3 | | | 1.65 | | | | (0.15 | ) | | | 1.50 | | | | (0.16 | ) | | | 41.8 | | | | 38.90 | | | | | |
| | | | | | | | | | | | | | | | |
2015 | | | 17.94 | | | | 0.03 | 1 | | | 0.19 | | | | 0.22 | | | | (0.08 | ) | | | (0.03 | ) | | | (0.11 | ) | | | 18.05 | | | | 1.23 | 3 | | | 1.59 | | | | (0.09 | ) | | | 1.50 | | | | 0.15 | | | | 44.9 | | | | 42.85 | | | | | |
| | | | | | | | | | | | | | | | |
2014 | | | 18.91 | | | | 0.03 | 1 | | | (0.46 | ) | | | (0.43 | ) | | | (0.00 | )2 | | | (0.54 | ) | | | (0.54 | ) | | | 17.94 | | | | (2.33 | )3 | | | 1.63 | | | | (0.13 | ) | | | 1.50 | | | | 0.14 | | | | 53.0 | | | | 34.67 | | | | | |
| | | | | | | | | | | | | | | | |
2013 | | | 15.55 | | | | (0.01 | )1 | | | 3.37 | | | | 3.36 | | | | 0.00 | | | | 0.00 | | | | 0.00 | | | | 18.91 | | | | 21.61 | 3 | | | 1.74 | | | | (0.24 | ) | | | 1.50 | | | | (0.05 | ) | | | 17.0 | | | | 40.60 | | | | | |
| | | | | | | | | | | | | | | | |
2012 | | | 13.20 | | | | (0.02 | )1 | | | 2.37 | | | | 2.35 | | | | 0.00 | | | | 0.00 | | | | 0.00 | | | | 15.55 | | | | 17.80 | 3 | | | 1.78 | | | | (0.28 | ) | | | 1.50 | | | | (0.16 | ) | | | 15.6 | | | | 39.02 | | | | | |
| | | | | | | | | | | | | | | | |
2011 | | | 17.29 | | | | (0.01 | )1 | | | (2.78 | ) | | | (2.79 | ) | | | (0.04 | ) | | | (1.26 | ) | | | (1.30 | ) | | | 13.20 | | | | (16.35 | )3 | | | 1.73 | | | | (0.23 | ) | | | 1.50 | | | | (0.05 | ) | | | 11.7 | | | | 53.20 | | | | | |
| | | | | | | | | | | | | | | | |
2010 | | | 14.11 | | | | 0.01 | 1 | | | 3.38 | | | | 3.39 | | | | 0.00 | | | | (0.21 | ) | | | (0.21 | ) | | | 17.29 | | | | 24.22 | 3 | | | 1.76 | | | | (0.26 | ) | | | 1.50 | | | | 0.07 | | | | 15.3 | | | | 32.70 | | | | | |
| | | | | | | | | | | | | | | | |
2009 | | | 10.00 | | | | 0.04 | 1 | | | 4.43 | | | | 4.47 | | | | 0.00 | | | | (0.36 | ) | | | (0.36 | ) | | | 14.11 | | | | 44.69 | 3 | | | 2.33 | | | | (0.83 | ) | | | 1.50 | | | | 0.38 | | | | 8.4 | | | | 53.94 | | | | | |
| |
INSTITUTIONAL SHARES | | | | | |
| |
Year Ended December 31, | | | | | |
| | | | | | | | | | | | | | | | |
2018 | | | 24.19 | | | | 0.06 | 1 | | | (4.28 | ) | | | (4.22 | ) | | | 0.00 | | | | (0.68 | ) | | | (0.68 | ) | | | 19.29 | | | | (17.68 | )3 | | | 1.07 | 8 | | | (0.12 | ) | | | 0.95 | | | | 0.26 | | | | 154.2 | | | | 50.83 | | | | | |
| | | | | | | | | | | | | | | | |
2017 | | | 18.25 | | | | (0.01 | )1 | | | 6.80 | | | | 6.79 | | | | 0.00 | | | | (0.85 | ) | | | (0.85 | ) | | | 24.19 | | | | 37.33 | 3 | | | 1.23 | | | | (0.12 | ) | | | 1.11 | | | | (0.06 | ) | | | 110.8 | | | | 31.44 | | | | | |
| | | | | | | | | | | | | | | | |
2016 | | | 18.17 | | | | 0.01 | 1 | | | 0.24 | | | | 0.25 | | | | (0.01 | ) | | | (0.16 | ) | | | (0.17 | ) | | | 18.25 | | | | 1.35 | 3 | | | 1.36 | | | | (0.11 | ) | | | 1.25 | | | | 0.07 | | | | 45.4 | | | | 38.90 | | | | | |
| | | | | | | | | | | | | | | | |
2015 | | | 18.09 | | | | 0.08 | 1 | | | 0.19 | | | | 0.27 | | | | (0.16 | ) | | | (0.03 | ) | | | (0.19 | ) | | | 18.17 | | | | 1.48 | 3 | | | 1.31 | | | | (0.06 | ) | | | 1.25 | | | | 0.41 | | | | 53.7 | | | | 42.85 | | | | | |
| | | | | | | | | | | | | | | | |
2014 | | | 19.05 | | | | 0.12 | 1 | | | (0.50 | ) | | | (0.38 | ) | | | (0.04 | ) | | | (0.54 | ) | | | (0.58 | ) | | | 18.09 | | | | (2.07 | )3 | | | 1.34 | | | | (0.09 | ) | | | 1.25 | | | | 0.64 | | | | 52.3 | | | | 34.67 | | | | | |
| | | | | | | | | | | | | | | | |
2013 | | | 15.63 | | | | 0.03 | 1 | | | 3.39 | | | | 3.42 | | | | (0.00 | )2 | | | 0.00 | | | | (0.00 | )2 | | | 19.05 | | | | 21.89 | 3 | | | 1.37 | | | | (0.12 | ) | | | 1.25 | | | | 0.20 | | | | 45.4 | | | | 40.60 | | | | | |
| | | | | | | | | | | | | | | | |
2012 | | | 13.25 | | | | 0.01 | 1 | | | 2.40 | | | | 2.41 | | | | (0.03 | ) | | | 0.00 | | | | (0.03 | ) | | | 15.63 | | | | 18.17 | 3 | | | 1.40 | | | | (0.15 | ) | | | 1.25 | | | | 0.09 | | | | 39.0 | | | | 39.02 | | | | | |
| | | | | | | | | | | | | | | | |
2011 | | | 17.36 | | | | 0.03 | 1 | | | (2.79 | ) | | | (2.76 | ) | | | (0.09 | ) | | | (1.26 | ) | | | (1.35 | ) | | | 13.25 | | | | (16.13 | )3 | | | 1.38 | | | | (0.13 | ) | | | 1.25 | | | | 0.19 | | | | 30.5 | | | | 53.20 | | | | | |
| | | | | | | | | | | | | | | | |
2010 | | | 14.13 | | | | 0.05 | 1 | | | 3.39 | | | | 3.44 | | | | 0.00 | | | | (0.21 | ) | | | (0.21 | ) | | | 17.36 | | | | 24.54 | 3 | | | 1.40 | | | | (0.15 | ) | | | 1.25 | | | | 0.31 | | | | 37.4 | | | | 32.70 | | | | | |
| | | | | | | | | | | | | | | | |
20096 | | | 11.13 | | | | (0.02 | )1 | | | 3.38 | | | | 3.36 | | | | 0.00 | | | | (0.36 | ) | | | (0.36 | ) | | | 14.13 | | | | 30.18 | 3,4 | | | 1.89 | 5 | | | (0.64 | )5 | | | 1.25 | 5 | | | (0.29 | )5 | | | 22.1 | | | | 53.94 | | | | | |
| |
R6 SHARES | | | | | |
| |
Year Ended December 31, | | | | | |
| | | | | | | | | | | | | | | | |
2018 | | | 24.19 | | | | 0.07 | 1 | | | (4.29 | ) | | | (4.22 | ) | | | 0.00 | | | | (0.68 | ) | | | (0.68 | ) | | | 19.29 | | | | (17.68 | )3 | | | 1.06 | 8 | | | (0.11 | ) | | | 0.95 | | | | 0.31 | | | | 12.4 | | | | 50.83 | | | | | |
| | | | | | | | | | | | | | | | |
2017 | | | 18.25 | | | | (0.02 | )1 | | | 6.81 | | | | 6.79 | | | | 0.00 | | | | (0.85 | ) | | | (0.85 | ) | | | 24.19 | | | | 37.33 | 3 | | | 1.22 | | | | (0.12 | ) | | | 1.10 | | | | (0.10 | ) | | | 0.8 | | | | 31.44 | | | | | |
| | | | | | | | | | | | | | | | |
20167 | | | 19.15 | | | | (0.02 | )1 | | | (0.71 | ) | | | (0.73 | ) | | | (0.01 | ) | | | (0.16 | ) | | | (0.17 | ) | | | 18.25 | | | | (3.83 | )3,4 | | | 1.38 | 5 | | | (0.14 | )5 | | | 1.24 | 5 | | | (0.31 | )5 | | | 0.4 | | | | 38.90 | | | | | |
| 1 | Based on average shares outstanding. |
| 2 | Less than $0.01 per share. |
| 3 | The total returns would have been lower had certain expenses not been reduced during the period shown. |
| 6 | For the period May 29, 2009 (initial offering of Institutional Shares) to December 31, 2009. |
| 7 | For the period August 31, 2016 (initial offering of R6 Shares) to December 31, 2016. |
| 8 | Interest expense rounds to less than 0.01%. |
| | |
| 54 | | See Notes to Financial Statements. |
| | |
| December 31, 2018 | | Baron Select Funds |
FINANCIAL HIGHLIGHTS (Continued)
BARON REAL ESTATE FUND
Selected data for a share outstanding throughout each year:
| | | | | | | | | | | | | | | | | | | | | | | | | | | | | | | | | | | | | | | | | | | | | | | | | | | | | | | | | | | | | | | | |
| | | | | | | |
| | | | | | Income (loss) from
investment operations: | | | Less distributions to
shareholders from: | | | | | | | | | Ratios to Average Net Assets: | | | Supplemental
Data: | |
| | | | | | | | | | | | | | | | |
| | | Net
asset
value,
beginning
of year
($) | | | Net
investment
income
(loss)
($) | | | Net
realized
and
unrealized
gain
(loss)
($) | | | Total
from
investment
operations
($) | | | Net
investment
income
($) | | | Net
realized
gain on
investments
($) | | | Return of
capital
($) | | | Total
distributions
($) | | | Net
asset
value,
end of
year
($) | | | Total
return
(%) | | | Operating
expenses
(%) | | | Less:
Reimbursement
of expenses
by Adviser
(%) | | | Net
operating
expenses
(%) | | | Net
investment
income
(loss)
(%) | | | Net
assets (in
millions),
end of
year
($) | | | Portfolio
turnover
rate
(%) | |
|
RETAIL SHARES | |
|
Year Ended December 31, | |
| | | | | | | | | | | | | | | | |
2018 | | | 29.58 | | | | (0.03 | )1 | | | (6.28 | ) | | | (6.31 | ) | | | 0.00 | | | | (2.50 | ) | | | 0.00 | | | | (2.50 | ) | | | 20.77 | | | | (22.22 | ) | | | 1.32 | 8 | | | 0.00 | | | | 1.32 | | | | (0.10 | ) | | | 213.0 | | | | 56.47 | |
| | | | | | | | | | | | | | | | |
2017 | | | 23.67 | | | | 0.00 | 1,3 | | | 7.32 | | | | 7.32 | | | | 0.00 | | | | (1.41 | ) | | | 0.00 | | | | (1.41 | ) | | | 29.58 | | | | 31.04 | | | | 1.32 | | | | 0.00 | | | | 1.32 | | | | 0.01 | | | | 426.7 | | | | 44.56 | |
| | | | | | | | | | | | | | | | |
2016 | | | 24.24 | | | | (0.02 | )1 | | | (0.47 | ) | | | (0.49 | ) | | | 0.00 | | | | (0.08 | ) | | | 0.00 | | | | (0.08 | ) | | | 23.67 | | | | (2.01 | ) | | | 1.33 | | | | 0.00 | | | | 1.33 | | | | (0.07 | ) | | | 434.0 | | | | 55.50 | |
| | | | | | | | | | | | | | | | |
2015 | | | 25.92 | | | | (0.06 | )1 | | | (1.14 | ) | | | (1.20 | ) | | | (0.01 | ) | | | (0.47 | ) | | | 0.00 | | | | (0.48 | ) | | | 24.24 | | | | (4.65 | ) | | | 1.31 | | | | 0.00 | | | | 1.31 | | | | (0.23 | ) | | | 788.9 | | | | 50.50 | |
| | | | | | | | | | | | | | | | |
2014 | | | 22.25 | | | | 0.04 | 1 | | | 3.66 | | | | 3.70 | | | | (0.03 | ) | | | 0.00 | | | | 0.00 | | | | (0.03 | ) | | | 25.92 | | | | 16.61 | | | | 1.32 | | | | 0.00 | | | | 1.32 | | | | 0.17 | | | | 782.8 | | | | 24.40 | |
| | | | | | | | | | | | | | | | |
2013 | | | 17.52 | | | | (0.05 | )1 | | | 4.80 | | | | 4.75 | | | | 0.00 | | | | (0.02 | ) | | | 0.00 | | | | (0.02 | ) | | | 22.25 | | | | 27.12 | | | | 1.35 | | | | 0.00 | | | | 1.35 | | | | (0.23 | ) | | | 539.5 | | | | 19.36 | |
| | | | | | | | | | | | | | | | |
2012 | | | 12.51 | | | | 0.01 | 1 | | | 5.31 | | | | 5.32 | | | | 0.00 | | | | (0.31 | ) | | | 0.00 | | | | (0.31 | ) | | | 17.52 | | | | 42.60 | 4 | | | 1.76 | | | | (0.41 | ) | | | 1.35 | | | | 0.07 | | | | 53.6 | | | | 30.14 | |
| | | | | | | | | | | | | | | | |
2011 | | | 12.66 | | | | (0.01 | )1 | | | 0.07 | 2 | | | 0.06 | | | | (0.00 | )3 | | | (0.21 | ) | | | 0.00 | | | | (0.21 | ) | | | 12.51 | | | | 0.63 | 4 | | | 2.33 | | | | (0.98 | ) | | | 1.35 | | | | (0.08 | ) | | | 10.9 | | | | 70.99 | |
| | | | | | | | | | | | | | | | |
2010 | | | 10.00 | | | | 0.02 | 1 | | | 2.64 | | | | 2.66 | | | | 0.00 | | | | 0.00 | | | | 0.00 | | | | 0.00 | | | | 12.66 | | | | 26.60 | 4 | | | 4.35 | | | | (3.00 | ) | | | 1.35 | | | | 0.14 | | | | 5.5 | | | | 58.03 | |
|
INSTITUTIONAL SHARES | |
|
Year Ended December 31, | |
| | | | | | | | | | | | | | | | |
2018 | | | 30.01 | | | | 0.05 | 1 | | | (6.39 | ) | | | (6.34 | ) | | | (0.07 | ) | | | (2.50 | ) | | | 0.00 | | | | (2.57 | ) | | | 21.10 | | | | (22.04 | ) | | | 1.06 | 8 | | | 0.00 | | | | 1.06 | | | | 0.17 | | | | 320.9 | | | | 56.47 | |
| | | | | | | | | | | | | | | | |
2017 | | | 23.93 | | | | 0.07 | 1 | | | 7.42 | | | | 7.49 | | | | 0.00 | | | | (1.41 | ) | | | 0.00 | | | | (1.41 | ) | | | 30.01 | | | | 31.42 | | | | 1.06 | | | | 0.00 | | | | 1.06 | | | | 0.26 | | | | 657.6 | | | | 44.56 | |
| | | | | | | | | | | | | | | | |
2016 | | | 24.51 | | | | 0.04 | 1 | | | (0.47 | ) | | | (0.43 | ) | | | 0.00 | | | | (0.08 | ) | | | (0.07 | ) | | | (0.15 | ) | | | 23.93 | | | | (1.75 | ) | | | 1.07 | | | | 0.00 | | | | 1.07 | | | | 0.19 | | | | 514.6 | | | | 55.50 | |
| | | | | | | | | | | | | | | | |
2015 | | | 26.14 | | | | 0.01 | 1 | | | (1.16 | ) | | | (1.15 | ) | | | (0.01 | ) | | | (0.47 | ) | | | 0.00 | | | | (0.48 | ) | | | 24.51 | | | | (4.42 | ) | | | 1.06 | | | | 0.00 | | | | 1.06 | | | | 0.04 | | | | 992.8 | | | | 50.50 | |
| | | | | | | | | | | | | | | | |
2014 | | | 22.43 | | | | 0.11 | 1 | | | 3.68 | | | | 3.79 | | | | (0.08 | ) | | | 0.00 | | | | 0.00 | | | | (0.08 | ) | | | 26.14 | | | | 16.93 | | | | 1.06 | | | | 0.00 | | | | 1.06 | | | | 0.44 | | | | 919.7 | | | | 24.40 | |
| | | | | | | | | | | | | | | | |
2013 | | | 17.64 | | | | 0.03 | 1 | | | 4.81 | | | | 4.84 | | | | (0.00 | )3 | | | (0.02 | ) | | | (0.03 | ) | | | (0.05 | ) | | | 22.43 | | | | 27.48 | | | | 1.09 | | | | 0.00 | | | | 1.09 | | | | 0.15 | | | | 486.1 | | | | 19.36 | |
| | | | | | | | | | | | | | | | |
2012 | | | 12.56 | | | | 0.06 | 1 | | | 5.33 | | | | 5.39 | | | | 0.00 | | | | (0.31 | ) | | | 0.00 | | | | (0.31 | ) | | | 17.64 | | | | 42.99 | 4 | | | 1.44 | | | | (0.34 | ) | | | 1.10 | | | | 0.36 | | | | 35.5 | | | | 30.14 | |
| | | | | | | | | | | | | | | | |
2011 | | | 12.69 | | | | 0.02 | 1 | | | 0.07 | 2 | | | 0.09 | | | | (0.01 | ) | | | (0.21 | ) | | | 0.00 | | | | (0.22 | ) | | | 12.56 | | | | 0.80 | 4 | | | 2.14 | | | | (1.04 | ) | | | 1.10 | | | | 0.17 | | | | 4.9 | | | | 70.99 | |
| | | | | | | | | | | | | | | | |
2010 | | | 10.00 | | | | 0.04 | 1 | | | 2.65 | | | | 2.69 | | | | 0.00 | | | | 0.00 | | | | 0.00 | | | | 0.00 | | | | 12.69 | | | | 26.90 | 4 | | | 4.26 | | | | (3.16 | ) | | | 1.10 | | | | 0.36 | | | | 3.2 | | | | 58.03 | |
|
R6 SHARES | |
|
Year Ended December 31, | |
| | | | | | | | | | | | | | | | |
2018 | | | 30.01 | | | | 0.09 | 1 | | | (6.43 | ) | | | (6.34 | ) | | | (0.07 | ) | | | (2.50 | ) | | | 0.00 | | | | (2.57 | ) | | | 21.10 | | | | (22.03 | ) | | | 1.07 | 8 | | | 0.00 | | | | 1.07 | | | | 0.31 | | | | 9.3 | | | | 56.47 | |
| | | | | | | | | | | | | | | | |
2017 | | | 23.93 | | | | 0.07 | 1 | | | 7.42 | | | | 7.49 | | | | 0.00 | | | | (1.41 | ) | | | 0.00 | | | | (1.41 | ) | | | 30.01 | | | | 31.42 | | | | 1.06 | | | | 0.00 | | | | 1.06 | | | | 0.26 | | | | 3.3 | | | | 44.56 | |
| | | | | | | | | | | | | | | | |
20167 | | | 21.80 | | | | 0.02 | 1 | | | 2.26 | | | | 2.28 | | | | 0.00 | | | | (0.08 | ) | | | (0.07 | ) | | | (0.15 | ) | | | 23.93 | | | | 10.47 | 5 | | | 1.07 | 6 | | | 0.00 | | | | 1.07 | 6 | | | 0.08 | 6 | | | 2.0 | | | | 55.50 | |
| 1 | Based on average shares outstanding. |
| 2 | The amount shown for a share outstanding does not correspond with the aggregate realized and unrealized gain (loss) on investments for the period due to the timing of sales and redemptions of Fund shares in relation to fluctuating market values of investments of the Fund. |
| 3 | Less than $0.01 per share. |
| 4 | The total returns would have been lower had certain expenses not been reduced during the period shown. |
| 7 | For the period January 29, 2016 (initial offering of R6 Shares) to December 31, 2016. |
| 8 | Interest expense rounds to less than 0.01%. |
| | |
| See Notes to Financial Statements. | | 55 |
| | |
| Baron Select Funds | | December 31, 2018 |
FINANCIAL HIGHLIGHTS (Continued)
BARON EMERGING MARKETS FUND
Selected data for a share outstanding throughout each year:
| | | | | | | | | | | | | | | | | | | | | | | | | | | | | | | | | | | | | | | | | | | | | | | | | | | | | | | | | | | | | | | | |
| | | | | | | |
| | | | | | Income (loss) from
investment operations: | | | Less distributions to
shareholders from: | | | | | | | | | Ratios to Average Net Assets: | | | Supplemental
Data: | |
| | | | | | | | | | | | | | | | |
| | | Net
asset
value,
beginning
of year
($) | | | Net
investment
income
(loss)
($) | | | Net
realized
and
unrealized
gain
(loss)
($) | | | Total
from
investment
operations
($) | | | Net
investment
income
($) | | | Net
realized
gain on
investments
($) | | | Return of
capital
($) | | | Total
distributions
($) | | | Net
asset
value,
end of
year
($) | | | Total
return
(%) | | | Operating
expenses
(%) | | | Less:
Reimbursement
of expenses
by Adviser
(%) | | | Net
operating
expenses
(%) | | | Net
investment
income
(loss)
(%) | | | Net
assets (in
millions),
end of
year
($) | | | Portfolio
turnover
rate
(%) | |
|
RETAIL SHARES | |
|
Year Ended December 31, | |
| | | | | | | | | | | | | | | | |
2018 | | | 15.33 | | | | 0.05 | 1 | | | (2.91 | ) | | | (2.86 | ) | | | (0.02 | ) | | | 0.00 | | | | 0.00 | | | | (0.02 | ) | | | 12.45 | | | | (18.67 | ) | | | 1.36 | | | | 0.00 | | | | 1.36 | | | | 0.36 | | | | 753.5 | | | | 43.27 | |
| | | | | | | | | | | | | | | | |
2017 | | | 10.95 | | | | 0.03 | 1 | | | 4.39 | | | | 4.42 | | | | (0.04 | ) | | | 0.00 | | | | (0.00 | )6 | | | (0.04 | ) | | | 15.33 | | | | 40.34 | | | | 1.36 | | | | 0.00 | | | | 1.36 | | | | 0.23 | | | | 1,121.4 | | | | 30.75 | |
| | | | | | | | | | | | | | | | |
2016 | | | 10.57 | | | | 0.04 | 1 | | | 0.36 | | | | 0.40 | | | | (0.02 | ) | | | 0.00 | | | | 0.00 | | | | (0.02 | ) | | | 10.95 | | | | 3.75 | | | | 1.38 | | | | 0.00 | | | | 1.38 | | | | 0.33 | | | | 768.5 | | | | 25.31 | |
| | | | | | | | | | | | | | | | |
2015 | | | 11.91 | | | | 0.03 | 1 | | | (1.36 | ) | | | (1.33 | ) | | | (0.01 | ) | | | 0.00 | | | | 0.00 | | | | (0.01 | ) | | | 10.57 | | | | (11.16 | ) | | | 1.45 | | | | 0.00 | | | | 1.45 | | | | 0.25 | | | | 665.5 | | | | 26.34 | |
| | | | | | | | | | | | | | | | |
2014 | | | 11.54 | | | | 0.07 | 1 | | | 0.33 | | | | 0.40 | | | | (0.03 | ) | | | 0.00 | | | | 0.00 | | | | (0.03 | ) | | | 11.91 | | | | 3.47 | 2 | | | 1.52 | | | | (0.02 | ) | | | 1.50 | | | | 0.56 | | | | 649.7 | | | | 23.38 | |
| | | | | | | | | | | | | | | | |
2013 | | | 10.06 | | | | (0.06 | )1 | | | 1.54 | | | | 1.48 | | | | 0.00 | | | | 0.00 | | | | 0.00 | | | | 0.00 | | | | 11.54 | | | | 14.71 | 2 | | | 1.90 | | | | (0.40 | ) | | | 1.50 | | | | (0.53 | ) | | | 259.6 | | | | 14.68 | |
| | | | | | | | | | | | | | | | |
2012 | | | 8.28 | | | | (0.04 | )1 | | | 1.94 | | | | 1.90 | | | | (0.12 | ) | | | 0.00 | | | | 0.00 | | | | (0.12 | ) | | | 10.06 | | | | 22.98 | 2 | | | 4.01 | | | | (2.51 | ) | | | 1.50 | | | | (0.39 | ) | | | 2.9 | | | | 42.68 | |
| | | | | | | | | | | | | | | | |
2011 | | | 10.00 | | | | (0.03 | )1 | | | (1.69 | ) | | | (1.72 | ) | | | 0.00 | | | | 0.00 | | | | 0.00 | | | | 0.00 | | | | 8.28 | | | | (17.20 | )2 | | | 4.49 | | | | (2.99 | ) | | | 1.50 | | | | (0.32 | ) | | | 2.0 | | | | 45.86 | |
|
INSTITUTIONAL SHARES | |
|
Year Ended December 31, | |
| | | | | | | | | | | | | | | | |
2018 | | | 15.37 | | | | 0.09 | 1 | | | (2.93 | ) | | | (2.84 | ) | | | (0.06 | ) | | | 0.00 | | | | 0.00 | | | | (0.06 | ) | | | 12.47 | | | | (18.49 | ) | | | 1.10 | | | | 0.00 | | | | 1.10 | | | | 0.62 | | | | 3,850.0 | | | | 43.27 | |
| | | | | | | | | | | | | | | | |
2017 | | | 10.98 | | | | 0.06 | 1 | | | 4.40 | | | | 4.46 | | | | (0.07 | ) | | | 0.00 | | | | (0.00 | )6 | | | (0.07 | ) | | | 15.37 | | | | 40.63 | | | | 1.10 | | | | 0.00 | | | | 1.10 | | | | 0.47 | | | | 3,842.5 | | | | 30.75 | |
| | | | | | | | | | | | | | | | |
2016 | | | 10.59 | | | | 0.06 | 1 | | | 0.37 | | | | 0.43 | | | | (0.04 | ) | | | 0.00 | | | | 0.00 | | | | (0.04 | ) | | | 10.98 | | | | 4.08 | | | | 1.13 | | | | 0.00 | | | | 1.13 | | | | 0.57 | | | | 1,832.8 | | | | 25.31 | |
| | | | | | | | | | | | | | | | |
2015 | | | 11.94 | | | | 0.06 | 1 | | | (1.37 | ) | | | (1.31 | ) | | | (0.04 | ) | | | 0.00 | | | | 0.00 | | | | (0.04 | ) | | | 10.59 | | | | (10.97 | ) | | | 1.20 | | | | 0.00 | | | | 1.20 | | | | 0.49 | | | | 1,040.9 | | | | 26.34 | |
| | | | | | | | | | | | | | | | |
2014 | | | 11.56 | | | | 0.09 | 1 | | | 0.34 | | | | 0.43 | | | | (0.05 | ) | | | 0.00 | | | | 0.00 | | | | (0.05 | ) | | | 11.94 | | | | 3.75 | 2 | | | 1.27 | | | | (0.02 | ) | | | 1.25 | | | | 0.76 | | | | 697.8 | | | | 23.38 | |
| | | | | | | | | | | | | | | | |
2013 | | | 10.05 | | | | 0.01 | 1 | | | 1.50 | | | | 1.51 | | | | 0.00 | | | | 0.00 | | | | 0.00 | | | | 0.00 | | | | 11.56 | | | | 15.02 | 2 | | | 1.80 | | | | (0.55 | ) | | | 1.25 | | | | 0.05 | | | | 116.0 | | | | 14.68 | |
| | | | | | | | | | | | | | | | |
2012 | | | 8.30 | | | | (0.01 | )1 | | | 1.93 | | | | 1.92 | | | | (0.17 | ) | | | 0.00 | | | | 0.00 | | | | (0.17 | ) | | | 10.05 | | | | 23.22 | 2 | | | 3.37 | | | | (2.12 | ) | | | 1.25 | | | | (0.14 | ) | | | 6.0 | | | | 42.68 | |
| | | | | | | | | | | | | | | | |
2011 | | | 10.00 | | | | (0.01 | )1 | | | (1.69 | ) | | | (1.70 | ) | | | 0.00 | | | | 0.00 | | | | 0.00 | | | | 0.00 | | | | 8.30 | | | | (17.00 | )2 | | | 3.83 | | | | (2.58 | ) | | | 1.25 | | | | (0.07 | ) | | | 4.3 | | | | 45.86 | |
|
R6 SHARES | |
|
Year Ended December 31, | |
| | | | | | | | | | | | | | | | |
2018 | | | 15.38 | | | | 0.10 | 1 | | | (2.94 | ) | | | (2.84 | ) | | | (0.06 | ) | | | 0.00 | | | | 0.00 | | | | (0.06 | ) | | | 12.48 | | | | (18.47 | ) | | | 1.11 | | | | 0.00 | | | | 1.11 | | | | 0.69 | | | | 7.3 | | | | 43.27 | |
| | | | | | | | | | | | | | | | |
2017 | | | 10.99 | | | | 0.07 | 1 | | | 4.39 | | | | 4.46 | | | | (0.07 | ) | | | 0.00 | | | | (0.00 | )6 | | | (0.07 | ) | | | 15.38 | | | | 40.59 | | | | 1.11 | | | | 0.00 | | | | 1.11 | | | | 0.49 | | | | 4.9 | | | | 30.75 | |
| | | | | | | | | | | | | | | | |
20165 | | | 9.94 | | | | 0.05 | 1 | | | 1.04 | | | | 1.09 | | | | (0.04 | ) | | | 0.00 | | | | 0.00 | | | | (0.04 | ) | | | 10.99 | | | | 10.99 | 3 | | | 1.13 | 4 | | | 0.00 | | | | 1.13 | 4 | | | 0.48 | 4 | | | 0.7 | | | | 25.31 | |
| 1 | Based on average shares outstanding. |
| 2 | The total returns would have been lower had certain expenses not been reduced during the period shown. |
| 5 | For the period January 29, 2016 (initial offering of R6 Shares) to December 31, 2016. |
| 6 | Less than $0.01 per share. |
| | |
| 56 | | See Notes to Financial Statements. |
| | |
| December 31, 2018 | | Baron Select Funds |
FINANCIAL HIGHLIGHTS (Continued)
BARON ENERGY AND RESOURCES FUND
Selected data for a share outstanding throughout each year:
| | | | | | | | | | | | | | | | | | | | | | | | | | | | | | | | | | | | | | | | | | | | | | | | | | | | | | | | | | | | |
| | | | | | | |
| | | | | | Income (loss) from
investment operations: | | | Less distributions to
shareholders from: | | | | | | | | | Ratios to Average Net Assets: | | | Supplemental
Data: | |
| | | | | | | | | | | | | | | |
| | | Net
asset
value,
beginning
of year
($) | | | Net
investment
income
(loss)
($) | | | Net
realized
and
unrealized
gain
(loss)
($) | | | Total
from
investment
operations
($) | | | Net
investment
income
($) | | | Net
realized
gain on
investments
($) | | | Total
distributions
($) | | | Net
asset
value,
end of
year
($) | | | Total
return
(%) | | | Operating
expenses
(%) | | | Less:
Reimbursement
of expenses
by Adviser
(%) | | | Net
operating
expenses
(%) | | | Net
investment
income
(loss)
(%) | | | Net
assets (in
millions),
end of
year
($) | | | Portfolio
turnover
rate
(%) | |
|
RETAIL SHARES | |
|
Year Ended December 31, | |
| | | | | | | | | | | | | | | |
2018 | | | 8.19 | | | | (0.01 | )1 | | | (2.06 | ) | | | (2.07 | ) | | | 0.00 | | | | 0.00 | | | | 0.00 | | | | 6.12 | | | | (25.27 | )2 | | | 1.83 | 6 | | | (0.48 | ) | | | 1.35 | | | | (0.16 | ) | | | 25.9 | | | | 19.10 | |
| | | | | | | | | | | | | | | |
2017 | | | 9.00 | | | | (0.01 | )1 | | | (0.79 | ) | | | (0.80 | ) | | | (0.01 | ) | | | 0.00 | | | | (0.01 | ) | | | 8.19 | | | | (8.90 | )2 | | | 1.66 | 6 | | | (0.31 | ) | | | 1.35 | | | | (0.07 | ) | | | 37.6 | | | | 23.48 | |
| | | | | | | | | | | | | | | |
2016 | | | 7.03 | | | | 0.02 | 1 | | | 1.95 | | | | 1.97 | | | | 0.00 | | | | 0.00 | | | | 0.00 | | | | 9.00 | | | | 28.02 | 2 | | | 1.70 | 6 | | | (0.35 | ) | | | 1.35 | | | | 0.28 | | | | 72.8 | | | | 53.52 | |
| | | | | | | | | | | | | | | |
2015 | | | 10.33 | | | | 0.02 | 1 | | | (3.31 | ) | | | (3.29 | ) | | | 0.00 | | | | (0.01 | ) | | | (0.01 | ) | | | 7.03 | | | | (31.88 | )2 | | | 1.58 | | | | (0.23 | ) | | | 1.35 | | | | 0.24 | | | | 56.4 | | | | 48.19 | |
| | | | | | | | | | | | | | | |
2014 | | | 11.84 | | | | (0.01 | )1 | | | (1.50 | ) | | | (1.51 | ) | | | 0.00 | | | | 0.00 | | | | 0.00 | | | | 10.33 | | | | (12.75 | )2 | | | 1.79 | | | | (0.44 | ) | | | 1.35 | | | | (0.04 | ) | | | 39.7 | | | | 23.12 | |
| | | | | | | | | | | | | | | |
2013 | | | 9.46 | | | | (0.01 | )1 | | | 2.40 | | | | 2.39 | | | | (0.01 | ) | | | 0.00 | | | | (0.01 | ) | | | 11.84 | | | | 25.32 | 2 | | | 2.25 | | | | (0.90 | ) | | | 1.35 | | | | (0.05 | ) | | | 29.2 | | | | 25.60 | |
| | | | | | | | | | | | | | | |
2012 | | | 10.00 | | | | (0.03 | )1 | | | (0.51 | ) | | | (0.54 | ) | | | 0.00 | | | | 0.00 | | | | 0.00 | | | | 9.46 | | | | (5.40 | )2 | | | 9.07 | | | | (7.72 | ) | | | 1.35 | | | | (0.36 | ) | | | 1.8 | | | | 35.74 | |
|
INSTITUTIONAL SHARES | |
|
Year Ended December 31, | |
| | | | | | | | | | | | | | | |
2018 | | | 8.31 | | | | 0.01 | 1 | | | (2.09 | ) | | | (2.08 | ) | | | 0.00 | | | | 0.00 | | | | 0.00 | | | | 6.23 | | | | (25.03 | )2 | | | 1.57 | 6 | | | (0.47 | ) | | | 1.10 | | | | 0.11 | | | | 7.6 | | | | 19.10 | |
| | | | | | | | | | | | | | | |
2017 | | | 9.11 | | | | 0.01 | 1 | | | (0.80 | ) | | | (0.79 | ) | | | (0.01 | ) | | | 0.00 | | | | (0.01 | ) | | | 8.31 | | | | (8.68 | )2 | | | 1.42 | 6 | | | (0.32 | ) | | | 1.10 | | | | 0.14 | | | | 16.9 | | | | 23.48 | |
| | | | | | | | | | | | | | | |
2016 | | | 7.10 | | | | 0.04 | 1 | | | 1.97 | | | | 2.01 | | | | 0.00 | | | | 0.00 | | | | 0.00 | | | | 9.11 | | | | 28.31 | 2 | | | 1.46 | 6 | | | (0.36 | ) | | | 1.10 | | | | 0.56 | | | | 30.7 | | | | 53.52 | |
| | | | | | | | | | | | | | | |
2015 | | | 10.41 | | | | 0.05 | 1 | | | (3.35 | ) | | | (3.30 | ) | | | 0.00 | | | | (0.01 | ) | | | (0.01 | ) | | | 7.10 | | | | (31.73 | )2 | | | 1.29 | | | | (0.19 | ) | | | 1.10 | | | | 0.53 | | | | 22.8 | | | | 48.19 | |
| | | | | | | | | | | | | | | |
2014 | | | 11.91 | | | | 0.03 | 1 | | | (1.53 | ) | | | (1.50 | ) | | | 0.00 | | | | 0.00 | | | | 0.00 | | | | 10.41 | | | | (12.59 | )2 | | | 1.52 | | | | (0.42 | ) | | | 1.10 | | | | 0.22 | | | | 29.3 | | | | 23.12 | |
| | | | | | | | | | | | | | | |
2013 | | | 9.48 | | | | 0.02 | 1 | | | 2.41 | | | | 2.43 | | | | 0.00 | | | | 0.00 | | | | 0.00 | | | | 11.91 | | | | 25.63 | 2 | | | 2.84 | | | | (1.74 | ) | | | 1.10 | | | | 0.20 | | | | 4.0 | | | | 25.60 | |
| | | | | | | | | | | | | | | |
2012 | | | 10.00 | | | | (0.01 | )1 | | | (0.51 | ) | | | (0.52 | ) | | | 0.00 | | | | 0.00 | | | | 0.00 | | | | 9.48 | | | | (5.20 | )2 | | | 8.65 | | | | (7.55 | ) | | | 1.10 | | | | (0.11 | ) | | | 1.4 | | | | 35.74 | |
|
R6 SHARES | |
|
Year Ended December 31, | |
| | | | | | | | | | | | | | | |
2018 | | | 8.31 | | | | 0.01 | 1 | | | (2.09 | ) | | | (2.08 | ) | | | 0.00 | | | | 0.00 | | | | 0.00 | | | | 6.23 | | | | (25.03 | )2 | | | 1.53 | 6 | | | (0.44 | ) | | | 1.09 | | | | 0.09 | | | | 0.4 | | | | 19.10 | |
| | | | | | | | | | | | | | | |
2017 | | | 9.10 | | | | 0.00 | 1,7 | | | (0.78 | ) | | | (0.78 | ) | | | (0.01 | ) | | | 0.00 | | | | (0.01 | ) | | | 8.31 | | | | (8.58 | )2 | | | 1.40 | 6 | | | (0.31 | ) | | | 1.09 | | | | 0.03 | | | | 0.4 | | | | 23.48 | |
| | | | | | | | | | | | | | | |
20165 | | | 8.55 | | | | (0.01 | )1 | | | 0.56 | | | | 0.55 | | | | 0.00 | | | | 0.00 | | | | 0.00 | | | | 9.10 | | | | 6.43 | 2,3 | | | 1.55 | 4,6 | | | (0.46 | )4 | | | 1.09 | 4 | | | (0.23 | )4 | | | 0.4 | | | | 53.52 | |
| 1 | Based on average shares outstanding. |
| 2 | The total returns would have been lower had certain expenses not been reduced during the period shown. |
| 5 | For the period August 31, 2016 (initial offering of R6 Shares) to December 31, 2016. |
| 6 | Interest expense rounds to less than 0.01%. |
| 7 | Less than $0.01 per share. |
| | |
| See Notes to Financial Statements. | | 57 |
| | |
| Baron Select Funds | | December 31, 2018 |
FINANCIAL HIGHLIGHTS (Continued)
BARON GLOBAL ADVANTAGE FUND
Selected data for a share outstanding throughout each year:
| | | | | | | | | | | | | | | | | | | | | | | | | | | | | | | | | | | | | | | | | | | | | | | | | | | | | | | | | | | | | | | | | | | | |
| | | | | | | |
| | | | | | Income (loss) from
investment operations: | | | Less distributions to
shareholders from: | | | | | | | | | Ratios to Average Net Assets: | | | Supplemental
Data: | |
| | | | | | | | | | | | | | | | | |
| | | Net
asset
value,
beginning
of year
($) | | | Net
investment
income
(loss)
($) | | | Net
realized
and
unrealized
gain
(loss)
($) | | | Total
from
investment
operations
($) | | | Net
investment
income
($) | | | Net
realized
gain on
investments
($) | | | Total
distributions
($) | | | Net
asset
value,
end of
year
($) | | | Total
return
(%) | | | Total
expenses
(%) | | | Less:
Interest
expense
(%) | | | Operating
expenses
(%) | | | Less:
Reimbursement
of expenses
by Adviser
(%) | | | Net
operating
expenses
(%) | | | Net
investment
income
(loss)
(%) | | | Net
assets (in
millions),
end of
year
($) | | | Portfolio
turnover
rate
(%) | |
|
RETAIL SHARES | |
|
Year Ended December 31, | |
| | | | | | | | | | | | | | | | | |
2018 | | | 20.56 | | | | (0.21 | )2 | | | (0.58 | ) | | | (0.79 | ) | | | 0.00 | | | | 0.00 | | | | 0.00 | | | | 19.77 | | | | (3.84 | )4 | | | 1.45 | | | | 0.00 | 11 | | | 1.45 | | | | (0.30 | ) | | | 1.15 | | | | (0.94 | ) | | | 35.7 | | | | 19.77 | |
| | | | | | | | | | | | | | | | | |
2017 | | | 13.75 | | | | (0.18 | )2 | | | 6.99 | | | | 6.81 | | | | 0.00 | | | | 0.00 | | | | 0.00 | | | | 20.56 | | | | 49.53 | 4 | | | 2.07 | | | | (0.01 | ) | | | 2.06 | | | | (0.70 | ) | | | 1.36 | | | | (1.01 | ) | | | 18.4 | | | | 27.98 | |
| | | | | | | | | | | | | | | | | |
2016 | | | 13.91 | | | | (0.18 | )2 | | | 0.02 | 10 | | | (0.16 | ) | | | 0.00 | | | | 0.00 | | | | 0.00 | | | | 13.75 | | | | (1.15 | )4 | | | 3.86 | | | | 0.00 | | | | 3.86 | | | | (2.36 | ) | | | 1.50 | | | | (1.30 | ) | | | 5.0 | | | | 21.48 | |
| | | | | | | | | | | | | | | | | |
2015 | | | 14.20 | | | | (0.11 | )2 | | | (0.14 | ) | | | (0.25 | ) | | | (0.02 | ) | | | (0.02 | ) | | | (0.04 | ) | | | 13.91 | | | | (1.72 | )4 | | | 3.19 | | | | 0.00 | | | | 3.19 | | | | (1.69 | ) | | | 1.50 | | | | (0.75 | ) | | | 6.2 | | | | 25.88 | |
| | | | | | | | | | | | | | | | | |
2014 | | | 13.51 | | | | 0.02 | 2 | | | 0.67 | | | | 0.69 | | | | 0.00 | | | | (0.00 | )3 | | | 0.00 | | | | 14.20 | | | | 5.11 | 4,5 | | | 3.61 | | | | 0.00 | | | | 3.61 | | | | (2.11 | ) | | | 1.50 | | | | 0.18 | | | | 3.9 | | | | 123.51 | |
| | | | | | | | | | | | | | | | | |
2013 | | | 10.41 | | | | (0.02 | )2 | | | 3.12 | | | | 3.10 | | | | 0.00 | | | | 0.00 | | | | 0.00 | | | | 13.51 | | | | 29.78 | 4 | | | 5.51 | | | | 0.00 | | | | 5.51 | | | | (4.01 | ) | | | 1.50 | | | | (0.20 | ) | | | 2.3 | | | | 32.78 | |
| | | | | | | | | | | | | | | | | |
20121 | | | 10.00 | | | | (0.02 | )2 | | | 0.43 | | | | 0.41 | | | | 0.00 | | | | 0.00 | | | | 0.00 | | | | 10.41 | | | | 4.10 | 4,6 | | | 8.35 | 7,8 | | | 0.00 | | | | 8.35 | 7,8 | | | (6.85 | )7,8 | | | 1.50 | 7,8 | | | (0.38 | )7,8 | | | 1.5 | | | | 24.64 | 6 |
| |
INSTITUTIONAL SHARES | |
|
Year Ended December 31, | |
| | | | | | | | | | | | | | | | | |
2018 | | | 20.77 | | | | (0.16 | )2 | | | (0.59 | ) | | | (0.75 | ) | | | 0.00 | | | | 0.00 | | | | 0.00 | | | | 20.02 | | | | (3.61 | )4 | | | 1.18 | | | | 0.00 | 11 | | | 1.18 | | | | (0.28 | ) | | | 0.90 | | | | (0.71 | ) | | | 49.2 | | | | 19.77 | |
| | | | | | | | | | | | | | | | | |
2017 | | | 13.87 | | | | (0.14 | )2 | | | 7.04 | | | | 6.90 | | | | 0.00 | | | | 0.00 | | | | 0.00 | | | | 20.77 | | | | 49.75 | 4 | | | 1.70 | | | | (0.01 | ) | | | 1.69 | | | | (0.61 | ) | | | 1.08 | | | | (0.77 | ) | | | 24.8 | | | | 27.98 | |
| | | | | | | | | | | | | | | | | |
2016 | | | 14.00 | | | | (0.14 | )2 | | | 0.01 | 10 | | | (0.13 | ) | | | 0.00 | | | | 0.00 | | | | 0.00 | | | | 13.87 | | | | (0.93 | )4 | | | 3.55 | | | | 0.00 | | | | 3.55 | | | | (2.30 | ) | | | 1.25 | | | | (1.06 | ) | | | 4.6 | | | | 21.48 | |
| | | | | | | | | | | | | | | | | |
2015 | | | 14.28 | | | | (0.07 | )2 | | | (0.15 | ) | | | (0.22 | ) | | | (0.04 | ) | | | (0.02 | ) | | | (0.06 | ) | | | 14.00 | | | | (1.51 | )4 | | | 2.89 | | | | 0.00 | | | | 2.89 | | | | (1.64 | ) | | | 1.25 | | | | (0.47 | ) | | | 5.3 | | | | 25.88 | |
| | | | | | | | | | | | | | | | | |
2014 | | | 13.56 | | | | 0.07 | 2 | | | 0.65 | | | | 0.72 | | | | 0.00 | | | | (0.00 | )3 | | | 0.00 | | | | 14.28 | | | | 5.32 | 4,5 | | | 2.92 | | | | 0.00 | | | | 2.92 | | | | (1.67 | ) | | | 1.25 | | | | 0.48 | | | | 4.1 | | | | 123.51 | |
| | | | | | | | | | | | | | | | | |
2013 | | | 10.42 | | | | 0.00 | 2,3 | | | 3.14 | | | | 3.14 | | | | 0.00 | | | | 0.00 | | | | 0.00 | | | | 13.56 | | | | 30.13 | 4 | | | 4.91 | | | | 0.00 | | | | 4.91 | | | | (3.66 | ) | | | 1.25 | | | | 0.02 | | | | 3.3 | | | | 32.78 | |
| | | | | | | | | | | | | | | | | |
20121 | | | 10.00 | | | | (0.02 | )2 | | | 0.44 | | | | 0.42 | | | | 0.00 | | | | 0.00 | | | | 0.00 | | | | 10.42 | | | | 4.20 | 4,6 | | | 7.33 | 7,8 | | | 0.00 | 7,8 | | | 7.33 | 7,8 | | | (6.08 | )7,8 | | | 1.25 | 7,8 | | | (0.30 | )7,8 | | | 1.6 | | | | 24.64 | 6 |
| |
R6 SHARES | |
|
Year Ended December 31, | |
| | | | | | | | | | | | | | | | | |
2018 | | | 20.79 | | | | (0.15 | )2 | | | (0.61 | ) | | | (0.76 | ) | | | 0.00 | | | | 0.00 | | | | 0.00 | | | | 20.03 | | | | (3.66 | )4 | | | 1.16 | | | | 0.00 | 11 | | | 1.16 | | | | (0.26 | ) | | | 0.90 | | | | (0.69 | ) | | | 4.3 | | | | 19.77 | |
| | | | | | | | | | | | | | | | | |
2017 | | | 13.87 | | | | (0.14 | )2 | | | 7.06 | | | | 6.92 | | | | 0.00 | | | | 0.00 | | | | 0.00 | | | | 20.79 | | | | 49.89 | 4 | | | 1.69 | | | | (0.01 | ) | | | 1.68 | | | | (0.59 | ) | | | 1.09 | | | | (0.75 | ) | | | 0.4 | | | | 27.98 | |
| | | | | | | | | | | | | | | | | |
20169 | | | 14.37 | | | | (0.07 | )2 | | | (0.43 | ) | | | (0.50 | ) | | | 0.00 | | | | 0.00 | | | | 0.00 | | | | 13.87 | | | | (3.48 | )4,6 | | | 4.11 | 8 | | | 0.00 | | | | 4.11 | 8 | | | (2.87 | )8 | | | 1.24 | 8 | | | (1.52 | )8 | | | 0.1 | | | | 21.48 | |
| 1 | For the period April 30, 2012 (commencement of operations) to December 31, 2012. |
| 2 | Based on average shares outstanding. |
| 3 | Less than $0.01 per share. |
| 4 | The total returns would have been lower had certain expenses not been reduced during the period shown. |
| 5 | The Adviser made a voluntary payment to the Fund in the amount of $47,291 to compensate the Fund for a loss incurred due to a shareholder activity processing error. The impact of this payment increased the Fund’s total return by 0.54%. |
| 7 | Certain fixed expenses incurred by the Fund were not annualized for the period ended December 31, 2012. |
| 9 | For the period August 31, 2016 (initial offering of R6 Shares) to December 31, 2016. |
| 10 | The amount shown for a share outstanding does not correspond with the aggregate realized and unrealized gain (loss) on investments for the period due to the timing of sales and redemptions of Fund shares in relation to fluctuating market values of investments of the Fund. |
| 11 | Interest expense rounds to less than 0.01%. |
| | |
| 58 | | See Notes to Financial Statements. |
| | |
| December 31, 2018 | | Baron Select Funds |
FINANCIAL HIGHLIGHTS (Continued)
BARON REAL ESTATE INCOME FUND
Selected data for a share outstanding throughout each year:
| | | | | | | | | | | | | | | | | | | | | | | | | | | | | | | | | | | | | | | | | | | | | | | | | | | | | | | | | | | | |
| | | | | | | |
| | | | | | Income (loss) from
investment operations: | | | Less distributions to
shareholders from: | | | | | | | | | Ratios to Average Net Assets: | | | Supplemental
Data: | |
| | | | | | | | | | | | | | | |
| | | Net
asset
value,
beginning
of year
($) | | | Net
investment
income
($) | | | Net
realized
and
unrealized
gain
(loss)
($) | | | Total
from
investment
operations
($) | | | Net
investment
income
($) | | | Net
realized
gain on
investments
($) | | | Total
distributions
($) | | | Net
asset
value,
end of
year
($) | | | Total
return
(%) | | | Operating
expenses
(%) | | | Less:
Reimbursement
of expenses
by Adviser
(%) | | | Net
operating
expenses
(%) | | | Net
investment
income
(loss)
(%) | | | Net
assets (in
millions),
end of
year
($) | | | Portfolio
turnover
rate
(%) | |
|
RETAIL SHARES | |
|
Year Ended December 31, | |
| | | | | | | | | | | | | | | |
20181 | | | 10.00 | | | | 0.14 | 2 | | | (1.25 | ) | | | (1.11 | ) | | | (0.26 | ) | | | 0.00 | | | | (0.26 | ) | | | 8.63 | | | | (11.33 | )3 | | | 10.47 | | | | (9.42 | ) | | | 1.05 | | | | 1.43 | | | | 0.4 | | | | 67.39 | |
|
INSTITUTIONAL SHARES | |
|
Year Ended December 31, | |
| | | | | | | | | | | | | | | |
20181 | | | 10.00 | | | | 0.16 | 2 | | | (1.24 | ) | | | (1.08 | ) | | | (0.26 | ) | | | 0.00 | | | | (0.26 | ) | | | 8.66 | | | | (11.03 | )3 | | | 7.18 | | | | (6.38 | ) | | | 0.80 | | | | 1.71 | | | | 2.0 | | | | 67.39 | |
|
R6 SHARES | |
|
Year Ended December 31, | |
| | | | | | | | | | | | | | | |
20181 | | | 10.00 | | | | 0.20 | 2 | | | (1.28 | ) | | | (1.08 | ) | | | (0.26 | ) | | | 0.00 | | | | (0.26 | ) | | | 8.66 | | | | (11.03 | )3 | | | 7.05 | | | | (6.25 | ) | | | 0.80 | | | | 2.07 | | | | 0.4 | | | | 67.39 | |
| 1 | For the period January 2, 2018 (commencement of operations) to December 31, 2018. |
| 2 | Based on average shares outstanding. |
| 3 | The total returns would have been lower had certain expenses not been reduced during the period shown. |
| | |
| See Notes to Financial Statements. | | 59 |
| | |
| Baron Select Funds | | December 31, 2018 |
FINANCIAL HIGHLIGHTS (Continued)
BARON HEALTH CARE FUND
Selected data for a share outstanding throughout the period:
| | | | | | | | | | | | | | | | | | | | | | | | | | | | | | | | | | | | | | | | | | | | | | | | | | | | | | | | | | | | |
| | | | | | | |
| | | | | | Income (loss) from
investment operations: | | | Less distributions to
shareholders from: | | | | | | | | | Ratios to Average Net Assets: | | | Supplemental
Data: | |
| | | | | | | | | | | | | | | |
| | | Net
asset value,
beginning
of period
($) | | | Net
investment
loss
($) | | | Net
realized
and
unrealized
gain
(loss) on
investments
($) | | | Total
from
investment
operations
($) | | | Net
investment
income
($) | | | Net
realized
gain on
investments
($) | | | Total
distributions
($) | | | Net
asset
value,
end of
period
($) | | | Total
return
(%) | | | Operating
expenses
(%) | | | Less:
Reimbursement
of expenses by
Adviser
(%) | | | Net
operating
expenses
(%) | | | Net
investment
income
(loss)
(%) | | | Net
assets (in
millions),
end of
period
($) | | | Portfolio
turnover
rate
(%) | |
|
RETAIL SHARES | |
|
Period Ended December 31, | |
| | | | | | | | | | | | | | | |
20181 | | | 10.00 | | | | (0.04 | )2 | | | (0.45 | ) | | | (0.49 | ) | | | 0.00 | | | | 0.00 | | | | 0.00 | | | | 9.51 | | | | (4.90 | )3,4 | | | 4.94 | 5 | | | (3.84 | )5 | | | 1.10 | 5 | | | (0.60 | )5 | | | 2.8 | | | | 27.30 | 4 |
| |
INSTITUTIONAL SHARES | |
|
Period Ended December 31, | |
| | | | | | | | | | | | | | | |
20181 | | | 10.00 | | | | (0.02 | )2 | | | (0.45 | ) | | | (0.47 | ) | | | 0.00 | | | | 0.00 | | | | 0.00 | | | | 9.53 | | | | (4.70 | )3,4 | | | 4.06 | 5 | | | (3.21 | )5 | | | 0.85 | 5 | | | (0.33 | )5 | | | 4.5 | | | | 27.30 | 4 |
| |
R6 SHARES | |
|
Period Ended December 31, | |
| | | | | | | | | | | | | | | |
20181 | | | 10.00 | | | | (0.02 | )2 | | | (0.46 | ) | | | (0.48 | ) | | | 0.00 | | | | 0.00 | | | | 0.00 | | | | 9.52 | | | | (4.80 | )3,4 | | | 3.14 | 5 | | | (2.29 | )5 | | | 0.85 | 5 | | | (0.32 | )5 | | | 0.7 | | | | 27.30 | 4 |
| 1 | For the period April 30, 2018 (commencement of operations) to December 31, 2018. |
| 2 | Based on average shares outstanding. |
| 3 | The total returns would have been lower had certain expenses not been reduced during the period shown. |
| | |
| 60 | | See Notes to Financial Statements. |
| | |
| December 31, 2018 | | Baron Select Funds |
REPORT OF INDEPENDENT REGISTERED PUBLIC ACCOUNTING FIRM
To the Board of Trustees of Baron Select Funds and Shareholders of
Baron Partners Fund, Baron Focused Growth Fund, Baron International Growth Fund, Baron Real Estate Fund, Baron Emerging Markets Fund, Baron Energy and Resources Fund, Baron Global Advantage Fund, Baron Real Estate Income Fund and Baron Health Care Fund
Opinions on the Financial Statements
We have audited the accompanying statements of assets and liabilities, including the statements of net assets, of Baron Partners Fund, Baron Focused Growth Fund, Baron International Growth Fund, Baron Real Estate Fund, Baron Emerging Markets Fund, Baron Energy and Resources Fund, Baron Global Advantage Fund, Baron Real Estate Income Fund and Baron Health Care Fund (nine of the funds constituting the Baron Select Funds, hereafter collectively referred to as the “Funds”) as of December 31, 2018, the related statements of operations, and cash flows for Baron Partners Fund, and the statements of changes in net assets for the periods indicated in the table below, including the related notes, and the financial highlights for each of the periods indicated therein (collectively referred to as the “financial statements”). In our opinion, the financial statements present fairly, in all material respects, the financial positions of each of the Funds as of December 31, 2018, and the results of each of their operations, changes in each of their net assets, of its cash flows for Baron Partner Fund, for the periods indicated in the table below and each of the financial highlights for each of the periods indicated therein in conformity with accounting principles generally accepted in the United States of America.
| | |
Baron Partners Fund | | Statements of operations and cash flows for the year ended December 31, 2018 and the statements of changes in net assets for each of the two years in the period ended December 31, 2018 |
Baron Focused Growth Fund Baron International Growth Fund Baron Real Estate Fund Baron Emerging Markets Fund Baron Energy and Resources Fund Baron Global Advantage Fund | | Statements of operations for the year ended December 31, 2018 and the statements of changes in net assets for each of the two years in the period ended December 31, 2018 |
Baron Real Estate Income Fund | | Statements of operations and changes in net assets for the period January 2, 2018 (commencement of operations) through December 31, 2018 |
Baron Health Care Fund | | Statements of operations and changes in net assets for the period April 30, 2018 (commencement of operations) through December 31, 2018 |
Basis for Opinion
These financial statements are the responsibility of the Funds’ management. Our responsibility is to express an opinion on the Funds’ financial statements based on our audits. We are a public accounting firm registered with the Public Company Accounting Oversight Board (United States) (“PCAOB”) and are required to be independent with respect to the Funds in accordance with the U.S. federal securities laws and the applicable rules and regulations of the Securities and Exchange Commission and the PCAOB.
We conducted our audits of these financial statements in accordance with the standards of the PCAOB. Those standards require that we plan and perform the audit to obtain reasonable assurance about whether the financial statements are free of material misstatement, whether due to error or fraud.
Our audits included performing procedures to assess the risks of material misstatement of the financial statements, whether due to error or fraud, and performing procedures that respond to those risks. Such procedures included examining, on a test basis, evidence regarding the amounts and disclosures in the financial statements. Our audits also included evaluating the accounting principles used and significant estimates made by management, as well as evaluating the overall presentation of the financial statements. Our procedures included confirmation of securities owned as of December 31, 2018 by correspondence with the custodian, brokers, and portfolio companies; when replies were not received, we performed other auditing procedures. We believe that our audits provide a reasonable basis for our opinions.
Subsequent Event
As discussed in Note 12 to the financial statements, the Board of Trustees approved the liquidation of Baron Energy and Resources Fund, which will occur on or about April 29, 2019.

PricewaterhouseCoopers LLP
New York, New York
February 26, 2019
We have served as the auditor of one or more investment companies in the Baron group of funds since 1987.
61
| | |
| Baron Select Funds | | December 31, 2018 |
TAX INFORMATION (Unaudited)
The federal tax status of distributions paid by the Funds during the year ended December 31, 2018 are listed below.
During the fiscal year ended December 31, 2018, the Funds’ distributions to shareholders included:
| | | | | | | | | | | | |
| | | |
| Fund | | Ordinary
Income1,3 | | | Long-Term
Capital Gains2.3 | | | Return of
Capital | |
| | | |
Baron Partners Fund | | $ | — | | | $ | — | | | $ | — | |
| | | |
Baron Focused Growth Fund | | | — | | | | 2,088,507 | | | | — | |
| | | |
Baron International Growth Fund | | | 617,685 | | | | 7,284,443 | | | | — | |
| | | |
Baron Real Estate Fund | | | 1,388,009 | | | | 70,512,863 | | | | — | |
| | | |
Baron Emerging Markets Fund | | | 20,988,570 | | | | — | | | | — | |
| | | |
Baron Energy and Resources Fund | | | — | | | | — | | | | — | |
| | | |
Baron Global Advantage Fund | | | — | | | | — | | | | — | |
| | | |
Baron Real Estate Income Fund | | | 46,675 | | | | — | | | | 30,853 | |
| | | |
Baron Health Care Fund | | | — | | | | — | | | | — | |
| 1 | For tax purposes, short-term capital gains are considered ordinary income distributions. |
| 2 | Long-term capital gains are subject to a maximum allowable rate of 20% for individuals pursuant to the Tax Cuts and Jobs Act of 2017. |
| 3 | Under the Patient Protection and Affordable Care Act, higher income taxpayers must pay a 3.8% additional tax on net investment income. |
Of the total ordinary income distributions paid by Baron International Growth Fund, Baron Real Estate Fund, Baron Emerging Markets Fund and Baron Real Estate Income Fund, 100.00%, 100.00%, 100.00% and 10.19%, respectively, is qualified dividend income subject to a reduced tax rate. Of the total ordinary income distributions paid by these Funds, 3.17%, 100.00%, 0.00% and 5.18%, respectively, qualifies for the corporate dividends received deduction.
The information and distributions reported may differ from the information and distributions taxable to the shareholders for the calendar year ended December 31, 2018. The information necessary to complete your income tax return for the calendar year ended December 31, 2018 will be listed on the Form 1099-DIV, which was mailed to you in January/February 2019.
62
| | |
| December 31, 2018 | | Baron Select Funds |
FUND EXPENSES (Unaudited)
As a shareholder of the Funds, you may incur two types of costs: ongoing expenses and transaction costs. Ongoing expenses include advisory fees, distribution and service (12b-1) fees and other Fund expenses. Due to the payment of Rule 12b-1 fees, long-term shareholders may indirectly pay more than the maximum permitted front-end sales charge. The information on this page is intended to help you understand your ongoing costs of investing in the Funds and to compare these costs with the ongoing costs of investing in other mutual funds.
The information in the following table is based on an investment of $1,000 invested on July 1, 2018 and held for the six months ended December 31, 2018.
ACTUAL EXPENSES
The table below titled “Based on Actual Total Return” provides information about actual account values and actual expenses. You may use the information provided in this table, together with the amount you invested, to estimate the expenses that you paid over the period. To estimate the expenses you paid on your account, divide your ending account value by $1,000 (for example, an $8,600 ending account value divided by $1,000 = 8.6), then multiply the result by the number under the heading titled “Expenses Paid During the Period”.
BASED ON ACTUAL TOTAL RETURN FOR THE SIX MONTHS ENDED DECEMBER 31, 20181
| | | | | | | | | | | | | | | | | | | | |
| | | | | |
| | | Actual Total Return | | | Beginning Account Value July 1, 2018 | | | Ending Account Value December 31, 2018 | | | Annualized Expense Ratio | | | Expenses Paid During the Period3 | |
Baron Partners Fund — Retail Shares | | | (15.05 | )% | | $ | 1,000.00 | | | $ | 849.50 | | | | 2.09 | %2 | | $ | 9.74 | |
Baron Partners Fund — Institutional Shares | | | (14.94 | )% | | $ | 1,000.00 | | | $ | 850.60 | | | | 1.84 | %2 | | $ | 8.58 | |
Baron Partners Fund — R6 Shares | | | (14.94 | )% | | $ | 1,000.00 | | | $ | 850.60 | | | | 1.84 | %2 | | $ | 8.58 | |
Baron Focused Growth Fund — Retail Shares | | | (8.76 | )% | | $ | 1,000.00 | | | $ | 912.40 | 4 | | | 1.35 | %5 | | $ | 6.51 | |
Baron Focused Growth Fund — Institutional Shares | | | (8.65 | )% | | $ | 1,000.00 | | | $ | 913.50 | | | | 1.09 | % | | $ | 5.26 | |
Baron Focused Growth Fund — R6 Shares | | | (8.59 | )% | | $ | 1,000.00 | | | $ | 914.10 | 4 | | | 1.10 | %5 | | $ | 5.31 | |
Baron International Growth Fund — Retail Shares | | | (17.62 | )% | | $ | 1,000.00 | | | $ | 823.80 | 4 | | | 1.20 | %5 | | $ | 5.52 | |
Baron International Growth Fund — Institutional Shares | | | (17.54 | )% | | $ | 1,000.00 | | | $ | 824.60 | 4 | | | 0.95 | %5 | | $ | 4.37 | |
Baron International Growth Fund — R6 Shares | | | (17.54 | )% | | $ | 1,000.00 | | | $ | 824.60 | 4 | | | 0.95 | %5 | | $ | 4.37 | |
Baron Real Estate Fund — Retail Shares | | | (18.68 | )% | | $ | 1,000.00 | | | $ | 813.20 | | | | 1.34 | % | | $ | 6.12 | |
Baron Real Estate Fund — Institutional Shares | | | (18.56 | )% | | $ | 1,000.00 | | | $ | 814.40 | | | | 1.07 | % | | $ | 4.89 | |
Baron Real Estate Fund — R6 Shares | | | (18.59 | )% | | $ | 1.000.00 | | | $ | 814.10 | | | | 1.08 | % | | $ | 4.94 | |
Baron Emerging Markets Fund — Retail Shares | | | (10.88 | )% | | $ | 1,000.00 | | | $ | 891.20 | | | | 1.36 | % | | $ | 6.48 | |
Baron Emerging Markets Fund — Institutional Shares | | | (10.83 | )% | | $ | 1,000.00 | | | $ | 891.70 | | | | 1.10 | % | | $ | 5.24 | |
Baron Emerging Markets Fund — R6 Shares | | | (10.82 | )% | | $ | 1,000.00 | | | $ | 891.80 | | | | 1.11 | % | | $ | 5.29 | |
Baron Energy & Resources Fund — Retail Shares | | | (29.33 | )% | | $ | 1,000.00 | | | $ | 706.70 | 4 | | | 1.35 | %5 | | $ | 5.81 | |
Baron Energy & Resources Fund — Institutional Shares | | | (29.20 | )% | | $ | 1,000.00 | | | $ | 708.00 | 4 | | | 1.10 | %5 | | $ | 4.74 | |
Baron Energy & Resources Fund — R6 Shares | | | (29.20 | )% | | $ | 1,000.00 | | | $ | 708.00 | 4 | | | 1.09 | %5 | | $ | 4.69 | |
Baron Global Advantage Fund — Retail Shares | | | (14.75 | )% | | $ | 1,000.00 | | | $ | 852.50 | 4 | | | 1.15 | %5 | | $ | 5.37 | |
Baron Global Advantage Fund — Institutional Shares | | | (14.63 | )% | | $ | 1,000.00 | | | $ | 853.70 | 4 | | | 0.90 | %5 | | $ | 4.21 | |
Baron Global Advantage Fund — R6 Shares | | | (14.62 | )% | | $ | 1,000.00 | | | $ | 853.80 | 4 | | | 0.90 | %5 | | $ | 4.21 | |
Baron Real Estate Income Fund — Retail Shares | | | (11.11 | )% | | $ | 1,000.00 | | | $ | 888.90 | 4 | | | 1.05 | %5 | | $ | 5.00 | |
Baron Real Estate Income Fund — Institutional Shares | | | (10.89 | )% | | $ | 1,000.00 | | | $ | 891.10 | 4 | | | 0.80 | %5 | | $ | 3.81 | |
Baron Real Estate Income Fund — R6 Shares | | | (10.98 | )% | | $ | 1,000.00 | | | $ | 890.20 | 4 | | | 0.80 | %5 | | $ | 3.81 | |
Baron Health Care Fund — Retail Shares | | | (9.26 | )% | | $ | 1,000.00 | | | $ | 907.40 | 4 | | | 1.10 | %5 | | $ | 5.29 | |
Baron Health Care Fund — Institutional Shares | | | (9.15 | )% | | $ | 1,000.00 | | | $ | 908.50 | 4 | | | 0.85 | %5 | | $ | 4.09 | |
Baron Health Care Fund — R6 Shares | | | (9.16 | )% | | $ | 1,000.00 | | | $ | 908.40 | 4 | | | 0.85 | %5 | | $ | 4.09 | |
| 1 | Assumes reinvestment of all dividends and capital gain distributions, if any. |
| 2 | Annualized expense ratio for Baron Partners Fund for the six months ended December 31, 2018, includes 1.31%, 1.06% and 1.06% for net operating expenses and 0.78%, 0.78% and 0.78% for interest expense for the Retail, Institutional and R6 Shares, respectively. |
| 3 | Expenses are equal to each share class’ respective annualized expense ratio multiplied by the average account value over the period, multiplied by the number of days in the most recent fiscal half-year, then divided by 365. |
| 4 | Ending account value assumes the return earned after waiver and would have been lower if a portion of the expenses had not been waived. |
| 5 | Annualized expense ratios are adjusted to reflect fee waiver. |
63
| | |
| Baron Select Funds | | December 31, 2018 |
FUND EXPENSES (Unaudited) (Continued)
HYPOTHETICAL EXAMPLE FOR COMPARISON PURPOSES
The table below titled “Based on Hypothetical Total Return” provides information about hypothetical account values and hypothetical expenses based on the actual expense ratio and an assumed rate of return of 5% per year before expenses, which is not the Funds’ actual return. The hypothetical account values and expenses may not be used to estimate the actual ending account values and expenses you paid for the period. You may use the information provided in this table to compare the ongoing costs of investing in the Funds and other funds. To do so, compare the 5% hypothetical example relating to the Funds with the 5% hypothetical examples that appear in the shareholder reports of other funds.
Please note that expenses shown in the table below are meant to highlight your ongoing costs and do not reflect any transactional costs, such as redemption fees, if any. Therefore, the table is useful in comparing ongoing costs only and will not help you determine your relative total costs of owning different mutual funds. In addition, if these transactional costs were included, your costs would have been higher.
BASED ON HYPOTHETICAL TOTAL RETURN FOR THE SIX MONTHS ENDED DECEMBER 31, 2018
| | | | | | | | | | | | | | | | | | | | |
| | | | | |
| | | Hypothetical Annualized Total Return | | | Beginning Account Value July 1, 2018 | | | Ending Account Value December 31, 2018 | | | Annualized Expense Ratio | | | Expenses Paid During the Period3 | |
Baron Partners Fund — Retail Shares | | | 5.00 | % | | $ | 1,000.00 | | | $ | 1,014.67 | | | | 2.09 | %2 | | $ | 10.61 | |
Baron Partners Fund — Institutional Shares | | | 5.00 | % | | $ | 1,000.00 | | | $ | 1,015.93 | | | | 1.84 | %2 | | $ | 9.35 | |
Baron Partners Fund — R6 Shares | | | 5.00 | % | | $ | 1,000.00 | | | $ | 1,015.93 | | | | 1.84 | %2 | | $ | 9.35 | |
Baron Focused Growth Fund — Retail Shares | | | 5.00 | % | | $ | 1,000.00 | | | $ | 1,018.40 | 4 | | | 1.35 | %5 | | $ | 6.87 | |
Baron Focused Growth Fund — Institutional Shares | | | 5.00 | % | | $ | 1,000.00 | | | $ | 1,019.71 | | | | 1.09 | % | | $ | 5.55 | |
Baron Focused Growth Fund — R6 Shares | | | 5.00 | % | | $ | 1,000.00 | | | $ | 1,019.66 | 4 | | | 1.10 | %5 | | $ | 5.60 | |
Baron International Growth Fund — Retail Shares | | | 5.00 | % | | $ | 1,000.00 | | | $ | 1,019.16 | 4 | | | 1.20 | %5 | | $ | 6.11 | |
Baron International Growth Fund — Institutional Shares | | | 5.00 | % | | $ | 1,000.00 | | | $ | 1,020.42 | 4 | | | 0.95 | %5 | | $ | 4.84 | |
Baron International Growth Fund — R6 Shares | | | 5.00 | % | | $ | 1,000.00 | | | $ | 1,020.42 | 4 | | | 0.95 | %5 | | $ | 4.84 | |
Baron Real Estate Fund — Retail Shares | | | 5.00 | % | | $ | 1,000.00 | | | $ | 1,018.45 | | | | 1.34 | % | | $ | 6.82 | |
Baron Real Estate Fund — Institutional Shares | | | 5.00 | % | | $ | 1,000.00 | | | $ | 1,019.81 | | | | 1.07 | % | | $ | 5.45 | |
Baron Real Estate Fund — R6 Shares | | | 5.00 | % | | $ | 1,000.00 | | | $ | 1,019.76 | | | | 1.08 | % | | $ | 5.50 | |
Baron Emerging Markets Fund — Retail Shares | | | 5.00 | % | | $ | 1,000.00 | | | $ | 1,018.35 | | | | 1.36 | % | | $ | 6.92 | |
Baron Emerging Markets Fund — Institutional Shares | | | 5.00 | % | | $ | 1,000.00 | | | $ | 1,019.66 | | | | 1.10 | % | | $ | 5.60 | |
Baron Emerging Markets Fund — R6 Shares | | | 5.00 | % | | $ | 1,000.00 | | | $ | 1,019.61 | | | | 1.11 | % | | $ | 5.65 | |
Baron Energy & Resources Fund — Retail Shares | | | 5.00 | % | | $ | 1,000.00 | | | $ | 1,018.40 | 4 | | | 1.35 | %5 | | $ | 6.87 | |
Baron Energy & Resources Fund — Institutional Shares | | | 5.00 | % | | $ | 1,000.00 | | | $ | 1,019.66 | 4 | | | 1.10 | %5 | | $ | 5.60 | |
Baron Energy & Resources Fund — R6 Shares | | | 5.00 | % | | $ | 1,000.00 | | | $ | 1,019.71 | 4 | | | 1.09 | %5 | | $ | 5.55 | |
Baron Global Advantage Fund — Retail Shares | | | 5.00 | % | | $ | 1,000.00 | | | $ | 1,019.41 | 4 | | | 1.15 | %5 | | $ | 5.85 | |
Baron Global Advantage Fund — Institutional Shares | | | 5.00 | % | | $ | 1,000.00 | | | $ | 1,020.67 | 4 | | | 0.90 | %5 | | $ | 4.58 | |
Baron Global Advantage Fund — R6 Shares | | | 5.00 | % | | $ | 1,000.00 | | | $ | 1,020.67 | 4 | | | 0.90 | %5 | | $ | 4.58 | |
Baron Real Estate Income Fund — Retail Shares | | | 5.00 | % | | $ | 1,000.00 | | | $ | 1,019.91 | 4 | | | 1.05 | %5 | | $ | 5.35 | |
Baron Real Estate Income Fund — Institutional Shares | | | 5.00 | % | | $ | 1,000.00 | | | $ | 1,021.17 | 4 | | | 0.80 | %5 | | $ | 4.08 | |
Baron Real Estate Income Fund — R6 Shares | | | 5.00 | % | | $ | 1,000.00 | | | $ | 1,021.17 | 4 | | | 0.80 | %5 | | $ | 4.08 | |
Baron Health Care Fund — Retail Shares | | | 5.00 | % | | $ | 1,000.00 | | | $ | 1,019.66 | 4 | | | 1.10 | %5 | | $ | 5.60 | |
Baron Health Care Fund — Institutional Shares | | | 5.00 | % | | $ | 1,000.00 | | | $ | 1,020.92 | 4 | | | 0.85 | %5 | | $ | 4.33 | |
Baron Health Care Fund — R6 Shares | | | 5.00 | % | | $ | 1,000.00 | | | $ | 1,020.92 | 4 | | | 0.85 | %5 | | $ | 4.33 | |
| 1 | Assumes reinvestment of all dividends and capital gain distributions, if any. |
| 2 | Annualized expense ratio for Baron Partners Fund for the six months ended December 31, 2018, includes 1.31%, 1.06% and 1.06% for net operating expenses and 0.78%, 0.78% and 0.78% for interest expense for the Retail, Institutional and R6 Shares, respectively. |
| 3 | Expenses are equal to each share class’ respective annualized expense ratio multiplied by the average account value over the period, multiplied by the number of days in the most recent fiscal half-year, then divided by 365. |
| 4 | Ending account value assumes the return earned after waiver and would have been lower if a portion of the expenses had not been waived. |
| 5 | Annualized expense ratios are adjusted to reflect fee waiver. |
64
| | |
| December 31, 2018 | | Baron Select Funds |
MANAGEMENT OF THE FUNDS (Unaudited)
Board of Trustees and Officers.
Trustees of the Trust, together with information as to their positions with the Trust, principal occupations and other board memberships and affiliations for the past five years, are shown below. Each Trustee serves as Trustee of the Trust until its termination; until the Trustee’s retirement, resignation or death; or as otherwise specified in the Trust’s organizational documents. Unless otherwise noted, the address of each Executive Officer and Trustee is Baron Select Funds, 767 Fifth Avenue, 49th Floor, New York, NY 10153. All Trustees listed below, whether Interested or Independent, serve as Trustees for the Trust. Additional information about the Trustees and Officers of the Trust can be found in the Trust’s Statement of Additional Information (the “SAI”) which may be obtained without charge by writing or calling 1-800-99BARON. The SAI is also available on the Baron Funds® website, www.BaronFunds.com.
| | | | | | | | | | |
| | | | | |
| Name, Address & Age | | Position(s) Held With the Funds | | Term of
Office and
Length of
Time Served | | Principal Occupation(s)
During the Past Five Years | | Number of
Portfolios
in Fund
Complex
Overseen
by Trustee | | Other
Directorships
Held by Trustee |
Interested Trustees | | | | | | | | | | |
| | | | | |
Ronald Baron(1),(2) 767 Fifth Avenue New York, NY 10153 Age: 75 | | Chief Executive Officer, Chief Investment Officer, Trustee and Portfolio Manager | | 15 years | | Director, Chairman, CEO and CIO: the Firm*(1982-Present); Trustee: Baron Investment Funds Trust (1987-Present); Trustee: Baron Select Funds(2003-Present); Portfolio Manager: Baron USA Partners Fund, Ltd. (2003-Present). | | 17 | | None |
| | | | | |
Linda S. Martinson(1),(2) 767 Fifth Avenue New York, NY 10153 Age: 63 | | Chairman, President, Chief Operating Officer and Trustee | | 15 years | | Director: the Firm* (2003-Present); Secretary: the Firm* (1997-2008); President: the Firm*(2007-Present); Chief Operating Officer: the Firm (2006-present); Chairman (2010-Present), President (2007-Present), Trustee (1987-Present): Baron Investment Funds Trust; Chairman(2010-Present), President (2007-Present), Trustee (2003-Present): Baron Select Funds; Director: Baron USA Partners Fund, Ltd. (2006-Present). | | 17 | | None |
Independent Trustees | | | | | | | | | | |
| | | | | |
Norman S. Edelcup(3),(4),(5) 767 Fifth Avenue New York, NY 10153 Age: 83 | | Trustee | | 15 years | | Mayor (2003-2015): Sunny Isles Beach, Florida; Trustee: Baron Investment Funds Trust (1987-Present), Baron Select Funds (2003-Present). | | 17 | | Director: CompX International, Inc. (diversified manufacturer of engineered components)(2006-2016); Director: Valhi, Inc. (diversified company)(1975-2016). |
| | | | | |
Thomas J. Folliard(4),(5) 767 Fifth Avenue New York, NY 10153 Age: 54 | | Trustee | | 1 year | | Non-Executive Chair of the Board: CarMax, Inc. (2016-Present); President and Chief Executive Officer: CarMax, Inc. (2006-2016); Trustee: Baron Investment Funds Trust (2017-Present), Baron Select Funds (2017-Present). | | 17 | | Director: PulteGroup, Inc. (2012-Present) |
| | | | | |
Harold W. Milner(4),(5) 767 Fifth Avenue New York, NY 10153 Age: 84 | | Trustee | | 15 years | | Trustee: Baron Investment Funds Trust(1987-Present), Baron Select Funds (2003-Present). | | 17 | | None |
| | | | | |
Raymond Noveck(3),(4),(5) 767 Fifth Avenue New York, NY 10153 Age: 75 | | Lead Trustee | | 15 years | | Private Investor (1999-Present); Trustee: Baron Investment Funds Trust (1987-Present), Baron Select Funds (2003-Present). | | 17 | | None |
| | | | | |
Anita Rosenberg(4),(5) 767 Fifth Avenue New York, NY 10153 Age: 54 | | Trustee | | 4 years | | Advisory Board Member: Impala Capital Management, LLC (2014-Present); Advisory Board Member: ValueAct Capital, LLC (2014-Present); Senior Advisor: Magnetar Capital (2011-2012); Trustee: Baron Investment Funds Trust, Baron Select Funds (2013-Present). | | 17 | | Director: Golub Capital BDC, Inc. (2011-Present). |
65
| | |
| Baron Select Funds | | December 31, 2018 |
MANAGEMENT OF THE FUNDS (Unaudited) (Continued)
| | | | | | | | | | |
| | | | | |
| Name, Address & Age | | Position(s) Held With the Funds | | Term of
Office and
Length of
Time Served | | Principal Occupation(s)
During the Past Five Years | | Number of
Portfolios
in Fund
Complex
Overseen
by Trustee | | Other
Directorships
Held by Trustee |
Independent Trustees (continued) | | | | | | | | |
| | | | | |
David A. Silverman, MD(4),(5) 767 Fifth Avenue New York, NY 10153 Age: 68 | | Trustee | | 15 years | | Physician and Faculty: New York University School of Medicine (1976-Present); Trustee: Baron Investment Funds Trust (1987-Present), Baron Select Funds (2003-Present). | | 17 | | None |
| | | | | |
Alex Yemenidjian(4),(5) 767 Fifth Avenue New York, NY 10153 Age: 62 | | Trustee | | 11 years | | Chairman and CEO: Tropicana Las Vegas (gaming) (2009-2015); Chairman and CEO: Armenco Holdings, LLC (investment company) (2005-Present); Managing Partner: Armenco Capital LLC (investment company) (2013-Present); Trustee: Baron Investment Funds Trust (2006-Present), Baron Select Funds(2006-Present). | | 17 | | Director: Guess?, Inc.(2005-Present); Director: Regal Entertainment Group(2005-Present). |
Additional Officers of the Funds | | | | | | | | |
| | | | | |
Louis Beasley 767 Fifth Avenue New York, NY 10153 Age: 48 | | Vice President and Chief Compliance Officer | | 3 years | | Chief Compliance Officer: Baron Capital Group, Inc., BAMCO, Inc., Baron Capital Management Inc., Baron Investment Funds Trust, Baron Select Funds, Baron USA Partners Fund, Ltd (2014-Present); Vice President: the Firm* (2014-Present); Principal and Director of Investment Management Compliance and Risk Management: Bessemer Trust (2006-2014). | | N/A | | N/A |
| | | | | |
Clifford Greenberg 767 Fifth Avenue New York, NY 10153 Age: 59 | | Senior Vice President | | 15 years | | Director and Senior Vice President: the Firm*; Senior Vice President: Baron Investment Funds Trust, Baron Select Funds; Portfolio Manager: Baron Small Cap Fund. | | N/A | | N/A |
| | | | | |
Patrick M. Patalino 767 Fifth Avenue New York, NY 10153 Age: 50 | | Vice President, General Counsel and Secretary | | 10 years | | Vice President, General Counsel and Secretary: the Firm*, Baron Investment Funds Trust, Baron Select Funds; General Counsel: Baron USA Partners Fund, Ltd. | | N/A | | N/A |
| | | | | |
Andrew Peck 767 Fifth Avenue New York, NY 10153 Age: 49 | | Senior Vice President | | 15 years | | Senior Vice President: the Firm*, Baron Investment Funds Trust, Baron Select Funds; Portfolio Manager: Baron Asset Fund. | | N/A | | N/A |
| | | | | |
Peggy C. Wong 767 Fifth Avenue New York, NY 10153 Age: 57 | | Treasurer and Chief Financial Officer | | 15 years | | Chief Financial Officer and Treasurer: the Firm*, Baron Investment Funds Trust, Baron Select Funds. | | N/A | | N/A |
| * | The “Firm” means Baron Capital Group, Inc. (“BCG”) along with its subsidiaries BCI, Baron Capital Management, Inc. (“BCM”) and BAMCO. |
| (1) | Trustees deemed to be “Interested Trustees” by reason of their employment with the Adviser and the Distributor. |
| (2) | Members of the Executive Committee, which is empowered to exercise all of the powers, including the power to declare dividends, of the full Board when the full Board is not in session. |
| (3) | Members of the Audit Committee. |
| (4) | Members of the Nominating Committee. |
| (5) | Members of the Independent Committee. |
66
Privacy Notice
The Funds collect nonpublic personal information about you from the following sources:
| ∎ | | Information we receive from you on applications or other forms; |
| ∎ | | Information about your transactions with us, our Adviser or others; and |
| ∎ | | Information we receive from third parties, such as credit reporting agencies. |
“Nonpublic personal information” is private information about you that we obtain in connection with providing a financial product or service to you.
We may share your name and address with other Baron Funds and the Adviser and its affiliates for the purpose of sending you information about our products that we believe may be of interest to you and informing you of our upcoming Baron Investment Conference and for sending required information.
We do not disclose any nonpublic personal information about our customers to anyone, except as permitted or required by law. Examples of permitted disclosures under the law include sharing with companies that work for us to provide you services, such as the Transfer Agent or mailing house. All such companies that act on our behalf are contractually obligated to keep the information that we provide to them confidential and to use the information only to provide the services that we have asked them to perform for you and us.
We restrict access to nonpublic information about you to those employees who need to know that information to provide products or services to you. We maintain physical, electronic and procedural safeguards to guard your nonpublic personal information.
This privacy notice is also available at all times on the Baron Funds® website, www.BaronFunds.com or by calling 1-800-99BARON.
Go Paperless!
It’s fast, simple and a smart way to help the environment.
Enjoy the speed and convenience of receiving Fund documents electronically.
For more information, and to enroll today, go to www.baronfunds.com/edelivery.
767 Fifth Avenue, 49th Fl.
New York, NY 10153
1.800.99.BARON
212-583-2000
www.BaronFunds.com
DECEMBER 18
Baron Funds
Baron WealthBuilder Fund
Annual Financial Report
Beginning on January 1, 2021, as permitted by regulations adopted by the U.S. Securities and Exchange Commission, paper copies of the Funds’ shareholder reports like this one will no longer be sent by mail, unless you specifically request paper copies of the reports from Baron Funds (“Baron”) or from your financial intermediary, such as a broker-dealer or bank. Instead, the reports will be made available on the Baron website, and you will be notified by mail each time a report is posted and provided with a website link to access the report.
If you already elected to receive shareholder reports electronically, you will not be affected by this change and you need not take any action. You may elect to receive shareholder reports and other communications from Baron or your financial intermediary electronically by contacting your financial intermediary or going to icsdelivery.com/baronfunds.
You may elect to receive all future reports in paper free of charge. You can inform Baron or your financial intermediary that you wish to continue receiving paper copies of your shareholder reports by following the instructions included on the envelope or slip inserted with this disclosure. Your election to receive reports in paper will apply to all funds held with Baron or your financial intermediary.
DEAR BARON WEALTHBUILDER FUND SHAREHOLDER:
In this report, you will find audited financial statements for Baron WealthBuilder Fund® (the “Fund”) for the year ended December 31, 2018. The U.S. Securities and Exchange Commission (the “SEC”) requires mutual funds to furnish these statements semi-annually to their shareholders. We hope you find these statements informative and useful.
We thank you for choosing to join us as fellow shareholders in Baron Funds. We will continue to work hard to justify your confidence.
Sincerely,
| | |
 | |  |
Ronald Baron Chief Executive Officer and Chief Investment Officer February 26, 2019 | | Peggy Wong Treasurer and Chief Financial Officer February 26, 2019 |
This Annual Financial Report is for the Baron WealthBuilder Fund. If you are interested in the other series of Baron Select Funds, which contains the Baron Partners Fund, Baron Focused Growth Fund, Baron International Growth Fund, Baron Real Estate Fund, Baron Emerging Markets Fund, Baron Global Advantage Fund, Baron Real Estate Income Fund and Baron Health Care Fund, or Baron Investment Funds Trust, which contains the Baron Asset Fund, Baron Growth Fund, Baron Small Cap Fund, Baron Opportunity Fund, Baron Fifth Avenue Growth Fund, Baron Discovery Fund and Baron Durable Advantage Fund, please visit the Funds’ website at www.BaronFunds.com or contact us at 1-800-99BARON.
The Funds’ Proxy Voting Policy is available without charge and can be found on the Funds’ website at www.BaronFunds.com, by clicking on the “Legal Notices” link at the bottom left corner of the homepage or by calling 1-800-99BARON and on the SEC’s website at www.sec.gov. The Funds’ most current proxy voting record, Form N-PX, is also available on the Funds’ website and on the SEC’s website.
The Funds file their complete schedules of portfolio holdings with the SEC for the first and third quarters of each fiscal year as an exhibit to its report on Form N-PORT. The Funds’ Form N-PORT reports are available on the SEC’s website at www.sec.gov. Schedules of portfolio holdings current to the most recent quarter are also available on the Funds’ website.
Some of the comments contained in this report are based on current management expectations and are considered “forward-looking statements.” Actual future results, however, may prove to be different from our expectations. You can identify forward-looking statements by words such as “estimate,” “may,” “expect,” “should,” “could,” “believe,” “plan” and other similar terms. We cannot promise future returns and our opinions are a reflection of our best judgment at the time this report is compiled.
The views expressed in this report reflect those of BAMCO, Inc. (“BAMCO” or the “Adviser”) only through the end of the period stated in this report. The views are not intended as recommendations or investment advice to any person
reading this report and are subject to change at any time without notice based on market and other conditions.
Past performance is no guarantee of future results. The investment return and principal value of an investment will fluctuate; an investor’s shares, when redeemed, may be worth more or less than their original cost. For more complete information about Baron Funds, including charges and expenses, call, write or go to www.BaronFunds.com for a prospectus or summary prospectus. Read them carefully before you invest or send money. This report is not authorized for use as an offer of sale or a solicitation of an offer to buy shares of the Fund, unless accompanied or preceded by the Fund’s current prospectus or summary prospectus.
| | |
| Baron WealthBuilder Fund | | December 31, 2018 |
Baron WealthBuilder Fund is an open end,no-load mutual fund that invests only in Baron Funds. Long-term capital appreciation is its objective. It is not a target date fund.
| | 1. | Baron WealthBuilder Fund’s objective is to provide investors with a diversified portfolio of Baron mutual funds that will outperform its benchmark index over the long term, although we cannot guarantee it will meet its objective. |
| | 2. | Baron WealthBuilder Fund’s minimum initial investment is $2,000, making it suitable for periodic purchases. |
| | 3. | Baron WealthBuilder Fund has no management fee, but it will indirectly bear its pro-rata share of the expenses of the Baron Funds in which it invests (acquired funds). |
| | 4. | Baron WealthBuilder Fund’s annual operating expenses are capped at 5 bps per year for Institutional Shares and TA Shares (available directly through Baron Funds). Retail Shares operating expenses are capped at 30 bps per year. Portfolio transaction costs, interest, dividend, acquired fund fees and expenses are not subject to the operating expense limitation. |
Several criteria, including our qualitative assessments, are used to continually determine Baron WealthBuilder Fund allocations among Baron Funds.
Among the criteria are: (a) absolute performance; (b) excess performance vs benchmark; (c) performance standard deviation (a measure of risk); (d) Sharpe ratio (a measure of performance per unit of risk); (e) beta (a measure of a fund’s sensitivity to market movements); (f) alpha (a measure of excess return given level of risk as measured by beta); (g) portfolio turnover; (h) growth rates of portfolio investments; (i) fund size; and (j) manager tenure.
As of December 31, 2018, the five largest Baron mutual funds represented 68.5% of Baron WealthBuilder Fund’s portfolio.
Ronald Baron, CEO and CIO of Baron Capital is the portfolio manager of Baron WealthBuilder Fund. Michael Baron, Vice President, is the assistant portfolio manager.
2
| | |
| December 31, 2018 (Unaudited) | | Baron WealthBuilder Fund |
COMPARISONOFTHECHANGEIN VALUEOF $10,000INVESTMENTIN BARON WEALTHBUILDER FUND (RETAIL SHARES)
INRELATIONTOTHE S&P 500 INDEXANDTHE MSCI ACWI INDEX
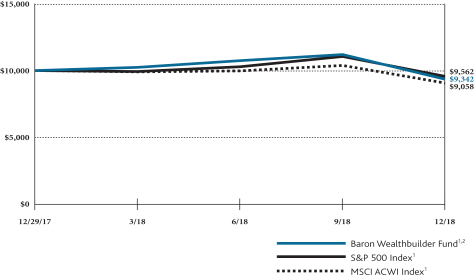
| | | | |
| TOTAL RETURNSFORTHEPERIODENDED DECEMBER 31, 2018 | | | | |
| | | One Year
and Since
Inception
(December 29,
2017) | |
Baron WealthBuilder Fund — Retail Shares1, 2 | | | (6.58%) | |
Baron WealthBuilder Fund — TA Shares1, 2 | | | (6.38%) | |
Baron WealthBuilder Fund — Institutional Shares1, 2 | | | (6.38%) | |
S&P 500 Index1 | | | (4.38%) | |
MSCI ACWI1 | | | (9.42%) | |
| 1 | The indexes are unmanaged. The S&P 500 Index measures the performance of 500 widely held large cap U.S. companies. The MSCI ACWI Index is an unmanaged, free float-adjusted market capitalization weighted index reflected in US dollars that measures the equity market performance of large and mid cap securities across developed and emerging markets. The Indexes and Baron WealthBuilder Fund are with dividends, which positively impact the performance results. |
| 2 | Past performance is not predictive of future performance. The performance data does not reflect the deduction of taxes that a shareholder would pay on Fund distributions or redemption of Fund shares. The Adviser has reimbursed certain Fund expenses (by contract as long as BAMCO, Inc. is the Adviser to the Fund) and the Fund’s transfer agency expenses may be reduced by expense offsets from an unaffiliated transfer agent, without which performance would have been lower. |
3
| | |
| Baron WealthBuilder Fund(Unaudited) | | December 31, 2018 |
COUNTRY EXPOSURESASOF DECEMBER 31, 2018
| | | | |
| | | Percent of
Total
Investments | |
United States | | | 80.4% | |
China | | | 4.5% | |
India | | | 2.3% | |
Brazil | | | 1.7% | |
Israel | | | 1.3% | |
Taiwan | | | 1.1% | |
United Kingdom | | | 1.0% | |
Korea | | | 1.0% | |
South Africa | | | 0.9% | |
Netherlands | | | 0.9% | |
Other | | | 4.9% | |
| |
| | | | 100.0% | |
SECTOR EXPOSURESASOF DECEMBER 31, 2018†
(as a percent of total investments)
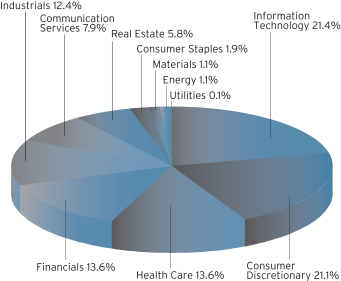
MANAGEMENT’S DISCUSSIONOF FUND PERFORMANCE
For the year ended December 31, 2018, Baron WealthBuilder Fund1 declined 6.58%, underperforming the S&P 500 Index, which fell 4.38%, and outperforming the MSCI ACWI Index, which fell 9.42%.
Baron WealthBuilder Fund is a non-diversified fund that invests exclusively in other Baron mutual funds. At any given time, it invests in the securities of a select number of Baron mutual funds representing specific investment strategies. The Fund can invest in funds holding U.S. and international stocks; small-cap, small- to mid-cap, mid-cap, large-cap, all-cap stocks; and specialty stocks. Baron WealthBuilder Fund normally invests in a variety of domestic and international equity funds. It seeks to invest in businesses it believes have significant opportunities for growth, sustainable competitive advantages, exceptional management, and an attractive valuation. Of course, there can be no assurance that we will be successful in achieving the Fund’s investment goals.
After a volatile start to the year, the markets posted mostly positive returns for the second and third quarters of 2018, buoyed by strong corporate earnings results and economic data. Investor sentiment took an abrupt turn in the fourth quarter as projections of a slowdown in economic momentum and corporate earnings growth coupled with rising interest rates helped spur a sell-off that lasted through much of the rest of the year. The U.S.-China trade dispute and partial federal government shutdown also put pressure on markets and 2018 ended as the worst year for U.S. stocks since 2008.
On a country basis, Israel, the Netherlands, and Taiwan contributed the most to performance, while the United States, China, and India were the largest detractors.
On a sector basis, Information Technology and Health Care contributed to performance while Consumer Discretionary, Industrials, and Financials detracted the most.
Baron Fifth Avenue Growth Fund contributed the most to performance.
Baron Emerging Markets Fund was the top detractor from performance.
Within the U.S., given recent market volatility, we believe the current environment favors active stock picking. Internationally, should the outlook for foreign and trade policy reduce pressure on China and Fed policy shift to a marginally more accommodative stance, we believe many of our investments offer material upside from current levels. As always, we believe that our forward-looking and bottom-up fundamental approach positions us to discover exciting long-term investment opportunities regardless of the market environment.
| † | Sector levels are provided from the Global Industry Classification Standard (“GICS”), developed and exclusively owned by MSCI, Inc. and Standard & Poor’s Financial Services LLC, unless otherwise stated that they have been reclassified or classified by the Adviser. All GICS data is provided “as is” with no warranties. |
| 1 | Performance information reflects results of the Retail Shares. |
4
| | |
| December 31, 2018 | | Baron WealthBuilder Fund |
STATEMENT OF NET ASSETS
| | | | | | | | | | | | |
| Shares | | | | | Cost | | | Value | |
| Affiliated Mutual Funds (99.97%) | |
|
| Small Cap Funds (30.52%) | |
| | 214,538 | | | Baron Discovery Fund — Institutional Shares | | $ | 4,542,948 | | | $ | 3,666,454 | |
| | 203,432 | | | Baron Growth Fund — Institutional Shares | | | 15,469,647 | | | | 12,850,792 | |
| | 498,006 | | | Baron Small Cap Fund — Institutional Shares | | | 15,622,457 | | | | 12,425,246 | |
| | | | | | | | | | | | |
| | Total Small Cap Funds | | | 35,635,052 | | | | 28,942,492 | |
| | | | | | | | | |
|
| Small to Mid Cap Funds (3.84%) | |
| | 225,766 | | | Baron Focused Growth Fund — Institutional Shares | | | 3,973,298 | | | | 3,646,119 | |
| | | | | | | | | | | | |
|
| Mid Cap Funds (15.02%) | |
| | 214,775 | | | Baron Asset Fund — Institutional Shares | | | 16,636,651 | | | | 14,241,715 | |
| | | | | | | | | | | | |
|
| Large Cap Funds (6.29%) | |
| | 98,093 | | | Baron Durable Advantage Fund — Institutional Shares | | | 1,040,212 | | | | 906,382 | |
| | 192,586 | | | Baron Fifth Avenue Growth Fund — Institutional Shares | | | 5,602,445 | | | | 5,059,245 | |
| | | | | | | | | | | | |
| | Total Large Cap Funds | | | 6,642,657 | | | | 5,965,627 | |
| | | | | | | | | |
|
| All Cap Funds (20.30%) | |
| | 299,970 | | | Baron Opportunity Fund — Institutional Shares | | | 6,314,564 | | | | 5,465,449 | |
| | 282,222 | | | Baron Partners Fund — Institutional Shares | | | 15,751,104 | | | | 13,789,365 | |
| | | | | | | | | | | | |
| | Total All Cap Funds | | | 22,065,668 | | | | 19,254,814 | |
| | | | | | | | | |
|
| International Funds (19.41%) | |
| | 931,481 | | | Baron Emerging Markets Fund — Institutional Shares | | | 12,903,550 | | | | 11,615,571 | |
| | 143,563 | | | Baron Global Advantage Fund — Institutional Shares | | | 3,211,171 | | | | 2,874,138 | |
| | 203,276 | | | Baron International Growth Fund — Institutional Shares | | | 4,724,180 | | | | 3,921,185 | |
| | | | | | | | | | | | |
| | Total International Funds | | | 20,838,901 | | | | 18,410,894 | |
| | | | | | | | | |
|
| Specialty Funds (4.59%) | |
| | 31,892 | | | Baron Health Care Fund — Institutional Shares | | | 331,075 | | | | 303,932 | |
| | 192,101 | | | Baron Real Estate Fund — Institutional Shares | | | 5,190,710 | | | | 4,053,338 | |
| | | | | | | | | | | | |
| | Total Specialty Funds | | | 5,521,785 | | | | 4,357,270 | |
| | | | | | | | | |
| | |
| | Total Affiliated Investments (99.97%) | | $ | 111,314,012 | | | | 94,818,931 | |
| | | | | | | | | |
| | |
| | Cash and Other Assets Less Liabilities (0.03%) | | | | | | | 29,726 | |
| | | | | | | | | |
| | |
| | Net Assets | | | | | | $ | 94,848,657 | |
| | | | | | | | | |
| | |
| | Retail Shares (Equivalent to $9.33 per share based on 222,314 shares outstanding) | | | | | | $ | 2,074,950 | |
| | | | | | | | | |
| | |
| | TA Shares (Equivalent to $9.35 per share based on 1,040,919 shares outstanding) | | | | | | $ | 9,733,477 | |
| | | | | | | | | |
| | |
| | Institutional Shares (Equivalent to $9.35 per share based on 8,884,211 shares outstanding) | | | | | | $ | 83,040,230 | |
| | | | | | | | | |
| % | Represents percentage of net assets. |
All Affiliated Mutual Funds are Level 1.
| | |
| See Notes to Financial Statements. | | 5 |
| | |
| Baron WealthBuilder Fund | | December 31, 2018 |
STATEMENT OF ASSETS AND LIABILITIES
| | | | |
Assets: | | | | |
Investments in Affiliated Mutual Funds, at value* | | $ | 94,818,931 | |
Receivable for shares sold | | | 28,000 | |
Due from investment adviser | | | 110,852 | |
| | | | |
| | | 94,957,783 | |
| | | | |
Liabilities: | | | | |
Due to custodian bank | | | 1,000 | |
Payable for securities purchased | | | 18,636 | |
Payable for shares redeemed | | | 8,364 | |
Distribution fees payable (Note 4) | | | 387 | |
Accrued expenses and other payables | | | 80,739 | |
| | | | |
| | | 109,126 | |
| | | | |
Net Assets | | $ | 94,848,657 | |
| | | | |
Net Assets consist of: | | | | |
Paid-in capital | | $ | 107,478,771 | |
Distributable earnings/(losses) | | | (12,630,114 | ) |
| | | | |
Net Assets | | $ | 94,848,657 | |
| | | | |
Retail Shares: | | | | |
Net Assets | | $ | 2,074,950 | |
Shares Outstanding ($0.01 par value; indefinite shares authorized) | | | 222,314 | |
| | | | |
Net Asset Value and Offering Price Per Share | | $ | 9.33 | |
| | | | |
TA Shares: | | | | |
Net Assets | | $ | 9,733,477 | |
Shares Outstanding ($0.01 par value; indefinite shares authorized) | | | 1,040,919 | |
| | | | |
Net Asset Value and Offering Price Per Share | | $ | 9.35 | |
| | | | |
Institutional Shares: | | | | |
Net Assets | | $ | 83,040,230 | |
Shares Outstanding ($0.01 par value; indefinite shares authorized) | | | 8,884,211 | |
| | | | |
Net Asset Value and Offering Price Per Share | | $ | 9.35 | |
| | | | |
| |
*Investments in Affiliated Mutual Funds, at cost | | $ | 111,314,012 | |
| | | | |
| | |
| 6 | | See Notes to Financial Statements. |
| | |
| December 31, 2018 | | Baron WealthBuilder Fund |
STATEMENT OF OPERATIONS
| | | | |
| | | For the Year
Ended
December 31,
2018 | |
Investment income: | | | | |
Income: | | | | |
Dividends from Affiliated Mutual Funds | | $ | 72,025 | |
Interest | | | 10 | |
| | | | |
Total income | | | 72,035 | |
| | | | |
Expenses: | | | | |
Registration and filing fees | | | 95,566 | |
Custodian and fund accounting fees | | | 47,310 | |
Professional fees | | | 44,388 | |
Administration fees | | | 38,947 | |
Shareholder servicing agent fees and expenses — Retail Shares | | | 1,687 | |
Shareholder servicing agent fees and expenses — TA Shares | | | 313 | |
Shareholder servicing agent fees and expenses — Institutional Shares | | | 1,672 | |
Distribution fees — Retail Shares (Note 4) | | | 2,386 | |
Reports to shareholders | | | 2,060 | |
Line of credit fees | | | 481 | |
Trustee fees and expenses | | | 38 | |
Miscellaneous expenses | | | 150 | |
| | | | |
Total operating expenses | | | 234,998 | |
Reimbursement of expenses by Adviser — Retail Shares (Note 4) | | | (5,729 | ) |
Reimbursement of expenses by Adviser — TA Shares (Note 4) | | | (38,421 | ) |
Reimbursement of expenses by Adviser — Institutional Shares (Note 4) | | | (165,710 | ) |
| | | | |
Net expenses | | | 25,138 | |
| | | | |
Net investment income (loss) | | | 46,897 | |
| | | | |
Realized and unrealized gain (loss) on Affiliated Mutual Funds: | | | | |
Net realized gain (loss) on Affiliated Mutual Funds sold | | | (60,980 | ) |
Capital gain distributions received from Affiliated Mutual Funds | | | 4,009,534 | |
Change in net unrealized appreciation (depreciation) of Affiliated Mutual Funds | | | (16,495,081 | ) |
| | | | |
Net gain (loss) on investments | | | (12,546,527 | ) |
| | | | |
Net increase (decrease) in net assets resulting from operations | | $ | (12,499,630 | ) |
| | | | |
| | |
| See Notes to Financial Statements. | | 7 |
| | |
| Baron WealthBuilder Fund | | December 31, 2018 |
STATEMENTS OF CHANGES IN NET ASSETS
| | | | | | | | |
| | | For the Year
Ended
December 31,
2018 | | | For the Period
Ended
December 31,
20171 | |
Increase (Decrease) in Net Assets: | | | | | | | | |
Operations: | | | | | | | | |
Net investment income (loss) | | $ | 46,897 | | | $ | (19 | ) |
Net realized gain (loss) on Affiliated Mutual Funds sold | | | 3,948,554 | | | | — | |
Change in net unrealized appreciation (depreciation) of Affiliated Mutual Funds | | | (16,495,081 | ) | | | — | |
| | | | | | | | |
Increase (decrease) in net assets resulting from operations | | | (12,499,630 | ) | | | (19 | ) |
| | | | | | | | |
Distributions to shareholders from: | | | | | | | | |
Distributable Earnings — Retail Shares | | | (2,877 | ) | | | — | |
Distributable Earnings — TA Shares | | | (12,405 | ) | | | — | |
Distributable Earnings — Institutional Shares | | | (115,202 | ) | | | — | |
| | | | | | | | |
Decrease in net assets from distributions to shareholders | | | (130,484 | ) | | | — | |
| | | | | | | | |
Capital share transactions: | | | | | | | | |
Proceeds from the sale of shares — Retail Shares | | | 3,144,063 | | | | 33,040 | |
Proceeds from the sale of shares — TA Shares | | | 10,573,045 | | | | 1,000,040 | |
Proceeds from the sale of shares — Institutional Shares | | | 90,838,603 | | | | 3,411,273 | |
Net asset value of shares issued in reinvestment of distributions — Retail Shares | | | 2,860 | | | | — | |
Net asset value of shares issues in reinvestment of distribution — TA Shares | | | 12,338 | | | | — | |
Net asset value of shares issued in reinvestment of distributions — Institutional Shares | | | 114,741 | | | | — | |
Cost of shares redeemed — Retail Shares | | | (809,302 | ) | | | — | |
Cost of shares redeemed — TA Shares | | | (803,316 | ) | | | — | |
Cost of shares redeemed — Institutional Shares | | | (38,595 | ) | | | — | |
| | | | | | | | |
Increase (decrease) in net assets derived from capital share transactions | | | 103,034,437 | | | | 4,444,353 | |
| | | | | | | | |
Net increase (decrease) in net assets | | | 90,404,323 | | | | 4,444,334 | |
| | | | | | | | |
Net Assets: | | | | | | | | |
Beginning of year | | | 4,444,334 | | | | — | |
| | | | | | | | |
End of year | | $ | 94,848,657 | | | $ | 4,444,334 | |
| | | | | | | | |
Capital share transactions — Retail Shares | | | | | | | | |
Shares sold | | | 295,564 | | | | 3,304 | |
Shares issued in reinvestment of distributions | | | 282 | | | | — | |
Shares redeemed | | | (76,836 | ) | | | — | |
| | | | | | | | |
Net increase (decrease) | | | 219,010 | | | | 3,304 | |
| | | | | | | | |
Capital share transactions — TA Shares | | | | | | | | |
Shares sold | | | 1,020,035 | | | | 100,004 | |
Shares issued in reinvestment of dividends | | | 1,214 | | | | — | |
Shares redeemed | | | (80,334 | ) | | | — | |
| | | | | | | | |
Net increase (decrease) | | | 940,915 | | | | 100,004 | |
| | | | | | | | |
Capital share transactions — Institutional Shares | | | | | | | | |
Shares sold | | | 8,535,421 | | | | 341,127 | |
Shares issued in reinvestment of distributions | | | 11,294 | | | | — | |
Shares redeemed | | | (3,631 | ) | | | — | |
| | | | | | | | |
Net increase (decrease) | | | 8,543,084 | | | | 341,127 | |
| | | | | | | | |
| 1 | For the period December 29, 2017 (commencement of operations) through December 31, 2017. |
| | |
| 8 | | See Notes to Financial Statements. |
| | |
| December 31, 2018 | | Baron WealthBuilder Fund |
NOTES TO FINANCIAL STATEMENTS
1. ORGANIZATION
Baron Select Funds (the “Trust”) is registered under the Investment Company Act of 1940, as amended (the “1940 Act”), as anopen-end management investment company established as a Delaware statutory trust on April 30, 2003, and accordingly, follows the investment company accounting and reporting guidance of the Financial Accounting Standards Board (“FASB”) Accounting Standard Codification Topic 946 Financial Services — Investment Companies. The Trust currently offers ten series. This report covers only Baron WealthBuilder Fund (the “Fund”). The Fund’s investment objective is capital appreciation. The Fund is anon-diversified fund because it invests, at any given time, in the securities of a select number of Baron mutual funds (the “Underlying Funds”), representing specific investment strategies. However, included in the Underlying Funds are diversified funds (with the exception of Baron Partners Fund, Baron Focused Growth Fund, Baron Real Estate Income Fund and Baron Health Care Fund). The Fund normally invests in a variety of Baron domestic and international equity funds managed by BAMCO, Inc. (“BAMCO” or the “Adviser”). The Fund can invest in Underlying Funds holding U.S. and international stocks;small-cap, small- tomid-cap,large-cap,all-cap stocks; and specialty stocks. The Adviser decides how much of the Fund’s assets to allocate to Underlying Funds based on the outlook for, and on the relative valuations of, the Underlying Funds and the various markets in which they invest. For information on the Underlying Funds, please refer to the Prospectuses and Statements of Additional Information of the Underlying Funds. Also, information on the Underlying Funds is available at www.baronfunds.com.
The Fund offers Retail Shares, TA Shares and Institutional Shares. Each class of shares differs only in its ongoing fees, expenses and eligibility requirements. Retail Shares are offered to all investors but are not available through the Fund’s transfer agent. TA Shares are available only to investors who purchase shares directly through the Fund’s transfer agent. TA Shares do not charge a12b-1 fee or make revenue sharing payments, to include payments tosub-transfer agency or record-keeping services. Institutional Shares are for investments in the amount of $1 million or more. Institutional Shares are intended for certain financial intermediaries that offer shares of the Fund throughfee-based platforms, retirement platforms or other platforms. Each class of shares has equal rights to earnings and assets, except that each class bears different expenses for distribution and shareholder servicing. The Fund’s investment income, realized and unrealized gains or losses on investments, and expenses other than those attributable to a specific class are allocated to each class based on its relative net assets. Each class of shares has exclusive voting rights with respect to matters that affect just that class.
2. SIGNIFICANT ACCOUNTING POLICIES
The following is a summary of significant accounting policies followed by the Fund. The policies are in conformity with accounting principles generally accepted in the United States of America (“GAAP”). The preparation of financial statements in accordance with GAAP requires management to make estimates and assumptions that affect the reported amounts of assets and liabilities at the date of the financial statements and the amounts of income and expenses during the period. Actual results could differ from those estimates. Events occurring subsequent to the date of the Statements of Assets and Liabilities and through the date of issuance of the financial statements have been evaluated for adjustment to or disclosure in the financial statements.
a) Security Valuation. The Fund’s share price or net asset value (“NAV”) is calculated as of the scheduled close of the regular trading session (usually 4 p.m. E.T. or such other time as of which the Fund’s NAV is calculated (the “NAV Calculation Time”) on the New York Stock Exchange (the “Exchange”) on any day the Exchange is scheduled to be open. Investments in the Underlying Funds are valued at their closing NAV per share on the day of valuation.
Portfolio securities held by the Underlying Funds traded on any national stock exchange are valued based on the last sale price on the exchange where such shares are principally traded. For securities traded on NASDAQ, the Underlying Funds use the NASDAQ Official Closing Price. If there are no sales on a given day, the value of the security may be the average of the most recent bid and asked quotations on such exchange or the last sale price from a prior day. Where market quotations are not readily available, or, if in the Adviser’s judgment, they do not accurately reflect the fair value of a security held by one of the Underlying Funds, or an event occurs after the market close but before the Underlying Funds are priced that materially affects the value of a security, the security will be valued by the Adviser using policies and procedures approved by the Board of Trustees (the “Board”). Some of the more common reasons that may necessitate that a security held by one of the Underlying Funds be valued using “fair value” pricing may include, but are not limited to: trading of the security has been halted or suspended; or the security has not been traded for an extended period of time. The Adviser has a Fair Valuation Committee (the “Committee”) comprised of senior management representatives and the Committee reports to the Board every quarter. Factors the Committee may consider when valuing a security include whether a current price is stale, there is recent news, the security is thinly traded, transactions are infrequent, or quotations are genuine. There can be no guarantee, however, that a fair valuation used by the Underlying Funds on any given day will more accurately reflect the market value of an investment than the closing price of such investment in its market. U.S. Government obligations, money market instruments, and other debt instruments held by the Underlying Funds with a remaining maturity of 60 days or less are generally valued at amortized cost, which approximates fair value. Debt instruments having a greater remaining maturity will be valued on the basis of prices obtained from a pricing service approved by the Board or at the mean of the bid and ask prices from the dealer maintaining an active market in that security. The value of the Underlying Funds’ investments in convertible bonds is determined primarily by obtaining valuations from independent pricing services based on readily available bid quotations or, if quotations are not available, by methods which include various considerations such as yields or prices of securities of comparable quality, coupon, maturity and type; indications as to values from dealers; and general market conditions. Other inputs used by an independent pricing service to value convertible bonds generally include underlying stock data, conversion premiums, listed bond and preferred stock prices and other market information which may include benchmark curves, trade execution data, and sensitivity analysis, when available.
Non-U.S. equity securities held by the Underlying Funds are valued on the basis of their most recent closing market prices and translated into U.S. dollars at the NAV Calculation Time, except under the circumstances described below. Most foreign markets close before the NAV Calculation Time. For securities primarily traded in the Far East, for example, the most recent closing prices may be as much as 15 hours old at the NAV Calculation Time. As a result, the Adviser uses a third-party pricing service to assist in determining fair value of foreign securities. This service utilizes a systematic methodology in making fair value estimates. The Adviser may also fair value securities in other situations, for example, when a particular foreign market is closed but the Underlying Funds are open. The Adviser cannot predict how often it will use closing prices or how often it will adjust those prices. As a means of evaluating its fair value process, the Adviser routinely compares closing market prices, the next day’s opening prices in the same markets, and the adjusted prices. Other mutual funds may adjust the prices of their securities by different amounts.
b) Securities Transactions, Investment Income and Expenses. Securities transactions are recorded on a trade date basis. Realized gain and loss from securities transactions are recorded on an identified cost basis for financial reporting and federal income tax purposes. Dividend income and capital gain distributions from the
9
| | |
| Baron WealthBuilder Fund | | December 31, 2018 |
NOTES TO FINANCIAL STATEMENTS (Continued)
2. SIGNIFICANT ACCOUNTING POLICIES (Continued)
Underlying Funds are recognized on theex-dividend date and interest income is recognized on an accrual basis. Dividends received from Underlying Funds are reflected as dividend income; capital gain distributions as realized gain/loss. The Fund is charged for those expenses directly attributable to the Fund, such as distribution and transfer agency fees.
Expenses included in the accompanying financial statements reflect the expenses of the Fund and do not include any expenses associated with the Underlying Funds. Because the Underlying Funds have varied expenses and fee levels and the Fund may own different proportions of Underlying Funds at different times, the amount of fees and expenses incurred indirectly by the Fund will vary.
c) Repurchase Agreements. The Fund may invest in repurchase agreements, which are short term investments whereby the Fund acquires ownership of a debt security and the seller agrees to repurchase the security at a future date at a specified price. When entering into repurchase agreements, it is the Fund’s policy that its custodian takes possession of the underlying collateral securities, the market value of which, at all times, equals at least 102% of the principal amount of the repurchase transaction. To the extent that any repurchase transaction exceeds one business day, the value of the collateral ismarked-to-market to ensure the adequacy of the collateral. If the seller defaults and the market value of the collateral declines or if bankruptcy proceedings are commenced with respect to the seller of the security, realization of the collateral by the Fund may be delayed or limited. The Fund did not own any repurchase agreements at December 31, 2018.
d) Federal and Foreign Income Taxes. The Fund intends to meet the requirements of the Internal Revenue Code of 1986, as amended, applicable to regulated investment companies, and to distribute to its shareholders substantially all of its net investment income and any net realized capital gains at least annually. The Fund will not be subject to federal or state income taxes to the extent that it qualifies as regulated investment companies and substantially all of its income is distributed.
e) Distributions to Shareholders. Income and capital gain distributions to shareholders are determined in accordance with income tax regulations which may differ from GAAP. These differences are primarily due to differing treatments for net investment loss and wash sale losses deferred.
f) Commitments and Contingencies. In the normal course of business, the Fund may enter into contracts and agreements that contain a variety of representations and warranties, which provide general indemnification. The maximum exposure to the Fund under these agreements is unknown, as this would involve future claims that may be made against the Fund that have not yet occurred.
g) Cash and Cash Equivalents. The Fund considers all short term liquid investments with a maturity of three months or less when purchased to be cash equivalents.
h) Diversification and Concentration of Underlying Funds. Certain of the Underlying Funds holdnon-diversified or concentrated portfolios that may contain fewer securities or invest in fewer industries than the portfolios of other mutual funds. This may increase the risk that the value of an Underlying Fund could decrease because of the poor performance of one or a few investments or of a particular industry. Additionally,non-diversified funds may encounter difficulty liquidating securities.
3. PURCHASES AND SALES OF SECURITIES
Purchases and sales of securities, other than short term securities, for the year ended December 31, 2018 were as follows:
| | | | | | | | |
| | |
| Fund | | Purchases | | | Sales | |
Baron WealthBuilder Fund | | $ | 107,521,001 | | | $ | 590,362 | |
4. INVESTMENT ADVISORY FEES AND OTHER TRANSACTIONS WITH AFFILIATES
a) Investment Advisory Fees. The Adviser, a wholly owned subsidiary of Baron Capital Group, Inc. (“BCG”), serves as investment adviser to the Fund and the Underlying Funds. The Adviser will not be paid a management fee for performing investment management services for the Fund. However, the Adviser receives management fees for managing the Underlying Funds. See the Underlying Funds’ Prospectuses or Statements of Additional Information for specific fees. The Adviser is contractually obligated to reimburse certain expenses of the Fund so that its net annual operating expenses (excluding acquired fund fees and expenses, portfolio transaction costs, interest, dividend and extraordinary expenses) are limited to 0.30% of average daily net assets of Retail Shares, 0.05% of average daily net assets of TA Shares and 0.05% of average daily net assets of Institutional Shares.
b) Distribution Fees. Baron Capital, Inc. (“BCI”), a wholly owned subsidiary of BCG, is a registered limited purpose broker-dealer and the distributor of the Fund’s shares. The Fund is authorized to pay BCI a distribution fee payable monthly pursuant to a distribution plan under Rule12b-1 of the 1940 Act equal to 0.25% per annum of the Retail Shares’ average daily net assets.
c) Trustee Fees. Certain Trustees of the Fund may be deemed to be affiliated with, or interested persons (as defined by the 1940 Act) of the Fund’s Adviser or of BCI. None of the Trustees so affiliated received compensation for his or her services as a Trustee of the Fund. None of the Fund’s officers received compensation from the Fund for their services as an officer.
d) Fund Accounting and Administration Fees. The Fund has entered into an agreement with State Street Bank and Trust Company (“State Street”) to perform accounting and certain administrative services. State Street is compensated for fund accounting services based on a percentage of the Fund’s net assets, subject to certain minimums plus fixed annual fees for the administrative services.
5. ASSET ALLOCATION AND RISKS OF INVESTING IN THE UNDERLYING FUNDS
The Fund’s ability to meet its investment objective depends largely upon selecting the best mix of Underlying Funds. The selection of the Underlying Funds and the allocation of the Fund’s assets among the various market sectors could cause the Fund to underperform in comparison to other funds with a similar investment objective. In addition, each of the Underlying Funds has its own investment risks, and those risks can affect the value of the Fund’s investments. To the extent that the Fund invests more of its assets in one Underlying Fund than in another, it will have greater exposure to the risks of that Underlying Fund.
10
| | |
| December 31, 2018 | | Baron WealthBuilder Fund |
NOTES TO FINANCIAL STATEMENTS (Continued)
6. FAIR VALUE MEASUREMENTS
Fair value is defined by GAAP as the price that the Fund would receive upon selling an investment in a timely transaction to an independent buyer in the principal or most advantageous market for the investment. GAAP provides a three-tier hierarchy to maximize the use of observable market data and minimize the use of unobservable inputs and to establish classification of fair value measurements for disclosure purposes. Inputs refer broadly to the assumptions that market participants would use in pricing the asset or liability. Inputs may be observable or unobservable. Observable inputs are based on market data obtained from sources independent of the Fund. Unobservable inputs are inputs that reflect the Fund’s own assumptions based on the best information available in the circumstances. The three-tier hierarchy of inputs is summarized in the three broad Levels listed below.
| | • | | Level 1 — quoted prices in active markets for identical assets or liabilities; |
| | • | | Level 2 — prices determined using other inputs that are observable either directly, or indirectly through corroboration with observable market data (which could include quoted prices for similar assets or liabilities, interest rates, credit risk, etc.); |
| | • | | Level 3 — prices determined using unobservable inputs when quoted prices or observable inputs are unavailable, such as when there is little or no market activity for an asset or liability (unobservable inputs reflect each Fund’s own assumptions in determining the fair value of assets or liabilities and would be based on the best information available). |
Investments inopen-end registered investment companies are valued at NAV and are classified in the fair value hierarchy as Level 1.
7. INCOME TAXES AND DISTRIBUTIONS TO SHAREHOLDERS
Federal income tax regulations differ from GAAP. Therefore, distributions determined in accordance with tax regulations may differ in amount or character from net investment income and net realized gain for financial reporting purposes. Net investment income (loss) and net realized and unrealized gain (loss) differ for financial statement and tax purposes due to differing treatments of net investment loss, and wash sale losses deferred. Financial reporting records are adjusted for permanent book/tax differences to reflect tax character. Financial records are not adjusted for temporary differences.
For the year ended December 31, 2018, the Fund recorded the following permanent reclassifications to reflect tax character. Reclassifications between income, gains andpaid-in capital relate primarily to the tax treatment of net investment loss. Results of operations and net assets were not affected by these reclassifications.
| | | | |
Undistributed (Accumulated) Net Investment Income (Loss) | | $ | — | |
Undistributed (Accumulated) Net Realized Gain (Loss) | | | — | |
Paid-In Capital | | | — | |
As of December 31, 2018, the components of net assets on a tax basis were as follows:
| | | | |
Cost of investments | | $ | 111,375,075 | |
| | | | |
Gross tax unrealized appreciation | | | — | |
Gross tax unrealized depreciation | | | (16,556,144 | ) |
| | | | |
Net tax unrealized appreciation (depreciation) | | | (16,556,144 | ) |
Accumulated net investment income (loss) | | | 46,980 | |
Accumulated net realized gain (loss) | | | 3,879,050 | |
Paid-in capital | | | 107,478,771 | |
| | | | |
Net Assets | | $ | 94,848,657 | |
| | | | |
The tax character of distributions paid during the year ended December 31, 2018 and for the period ended December 31, 2017 was as follows:
| | | | | | | | | | | | | | | | | | | | | | | | |
| | |
| | | Year Ended
December 31, 2018 | | | Period Ended
December 31, 20172 | |
| | | | | | |
| | | Ordinary1 | | | Long Term
Capital Gain | | | Return of
Capital | | | Ordinary1 | | | Long Term
Capital Gain | | | Return of
Capital | |
| | $ | — | | | $ | 130,484 | | | $ | — | | | $ | — | | | $ | — | | | $ | — | |
| 1 | For tax purposes, short-term capital gains are considered ordinary income distributions. |
| 2 | For the period December 29, 2017 (commencement of operations) through December 31, 2017. |
The Fund follows the provisions of FASB Codification Section 740 (“ASC Section 740”) “Accounting for Uncertainty in Income Taxes” which clarifies the accounting for uncertainty in tax positions taken or expected to be taken on a tax return. ASC Section 740 sets forth a threshold for financial statement recognition, measurement and disclosure of tax positions taken or expected to be taken on a tax return. The Fund is required to recognize the tax effects of certain tax positions under a “more likely than not” standard, that based on their technical merits, have more than 50 percent likelihood of being sustained upon examination. Management has analyzed the tax positions taken on the Fund’s federal income tax returns for the current year and prior year, and has concluded that no provision for federal income tax is required in the Fund’s financial statements. At December 31, 2018, the Fund did not have any uncertain tax benefits that require recognition,de-recognition or disclosure. The Fund’s federal, state and local income and federal excise tax returns for which the applicable statutes of limitations have not expired (current year and prior year) are subject to examination by the Internal Revenue Service and state departments of revenue.
11
| | |
| Baron WealthBuilder Fund | | December 31, 2018 |
NOTES TO FINANCIAL STATEMENTS (Continued)
8. OWNERSHIP CONCENTRATION
As of December 31, 2018 the officers, trustees, portfolio managers and three other direct investors owned, directly or indirectly, 58.02% of the Fund. As a result of their ownership, these investors may be able to materially affect the outcome of matters presented to the Fund’s shareholders.
9. TRANSACTIONS IN “AFFILIATED” COMPANIES
The Fund invests primarily in the Institutional Shares of the Underlying Funds which are considered to be affiliated with the Fund.
| | | | | | | | | | | | | | | | | | | | | | | | | | | | | | | | | | | | | | | | |
| | | | | | | | | | |
| Name of Issuer | | Value at
December 31,
2017 | | | Purchase
Cost | | | Sales
Proceeds | | | Change in Net
Unrealized
Appreciation
(Depreciation) | | | Realized
Gains/ (Losses) | | | Dividend
Income | | | Other Distributions | | | Shares
Held at
December 31,
2018 | | | Value at
December 31,
2018 | | | % of Net
Assets at
December 31,
2018 | |
“Affiliated” Company as of December 31, 2018: | | | | | | | | | | | | | | | | | | | | | | | | | | | | | | | | | |
Baron Asset Fund,
Institutional Shares | | $ | 666,653 | | | $ | 16,061,488 | | | $ | 85,702 | | | $ | (2,394,936 | ) | | $ | (5,788 | ) | | $ | — | | | $ | 903,339 | | | | 214,775 | | | $ | 14,241,715 | | | | 15.02 | % |
Baron Discovery Fund,
Institutional Shares | | | 177,774 | | | | 4,392,605 | | | | 25,064 | | | | (876,494 | ) | | | (2,367 | ) | | | — | | | | 277,963 | | | | 214,538 | | | | 3,666,454 | | | | 3.87 | % |
Baron Durable Advantage Fund, Institutional Shares | | | — | | | | 1,048,169 | | | | 7,497 | | | | (133,830 | ) | | | (460 | ) | | | 3,382 | | | | — | | | | 98,093 | | | | 906,382 | | | | 0.96 | % |
Baron Emerging Markets Fund, Institutional Shares | | | 666,653 | | | | 12,325,591 | | | | 74,160 | | | | (1,287,979 | ) | | | (14,534 | ) | | | 53,574 | | | | — | | | | 931,481 | | | | 11,615,571 | | | | 12.25 | % |
Baron Fifth Avenue Growth Fund, Institutional Shares | | | 222,218 | | | | 5,414,018 | | | | 31,299 | | | | (543,200 | ) | | | (2,492 | ) | | | — | | | | — | | | | 192,586 | | | | 5,059,245 | | | | 5.33 | % |
Baron Focused Growth Fund, Institutional Shares | | | 111,109 | | | | 3,885,053 | | | | 20,908 | | | | (327,179 | ) | | | (1,956 | ) | | | — | | | | 24,760 | | | | 225,766 | | | | 3,646,119 | | | | 3.84 | % |
Baron Global Advantage Fund, Institutional Shares | | | — | | | | 3,230,749 | | | | 17,550 | | | | (337,033 | ) | | | (2,028 | ) | | | — | | | | — | | | | 143,563 | | | | 2,874,138 | | | | 3.03 | % |
Baron Growth Fund,
Institutional Shares | | | 666,653 | | | | 14,888,934 | | | | 79,778 | | | | (2,618,855 | ) | | | (6,162 | ) | | | — | | | | 921,614 | | | | 203,432 | | | | 12,850,792 | | | | 13.55 | % |
Baron Health Care Fund,
Institutional Shares | | | — | | | | 331,508 | | | | 401 | | | | (27,143 | ) | | | (32 | ) | | | — | | | | — | | | | 31,892 | | | | 303,932 | | | | 0.32 | % |
Baron International Growth Fund,
Institutional Shares | | | 199,996 | | | | 4,553,190 | | | | 25,670 | | | | (802,995 | ) | | | (3,336 | ) | | | 6,919 | | | | 114,496 | | | | 203,276 | | | | 3,921,185 | | | | 4.13 | % |
Baron Opportunity Fund,
Institutional Shares | | | 66,665 | | | | 6,282,417 | | | | 32,228 | | | | (849,115 | ) | | | (2,290 | ) | | | — | | | | 249,045 | | | | 299,970 | | | | 5,465,449 | | | | 5.76 | % |
Baron Partners Fund,
Institutional Shares | | | 666,653 | | | | 15,179,193 | | | | 85,702 | | | | (1,961,739 | ) | | | (9,040 | ) | | | — | | | | — | | | | 282,222 | | | | 13,789,365 | | | | 14.54 | % |
Baron Real Estate Fund,
Institutional Shares | | | 333,326 | | | | 4,886,540 | | | | 25,137 | | | | (1,137,372 | ) | | | (4,019 | ) | | | 8,150 | | | | 393,110 | | | | 192,101 | | | | 4,053,338 | | | | 4.27 | % |
Baron Small Cap Fund,
Institutional Shares | | | 666,653 | | | | 15,041,546 | | | | 79,266 | | | | (3,197,211 | ) | | | (6,476 | ) | | | — | | | | 1,125,207 | | | | 498,006 | | | | 12,425,246 | | | | 13.10 | % |
| | | | | | | | | | | | | | | | | | | | | | | | | | | | | | | | | | | | | | | | |
| | $ | 4,444,353 | | | $ | 107,521,001 | | | $ | 590,362 | | | $ | (16,495,081 | ) | | $ | (60,980 | ) | | $ | 72,025 | | | $ | 4,009,534 | | | | | | | $ | 94,818,931 | | | | | |
| | | | | | | | | | | | | | | | | | | | | | | | | | | | | | | | | | | | | | | | |
10. RECENT ACCOUNTING PRONOUNCEMENT
As of November 5, 2018, pursuant to the SEC Release #33-10532 “Disclosure Update and Simplification,” funds are no longer required to disclose whether the distributions from earnings are either from net investment income or net realized capital gains. We have evaluated the implications of these changes and the amendments are included in the financial statements, which had no effect on the Fund’s net assets or results of operations. The amendments require presentation of the total, rather than the components, of distributable earnings on the Statement of Assets and Liabilities and also require presentation of the total, rather than the components, of distributions to shareholders, except for tax return of capital distributions, if any, on the Statements of Changes in Net Assets. As a part of this update, it is no longer required to disclose the undistributed (accumulated) net investment income (loss)/(distributions in excess of net investment income).
12
| | |
| December 31, 2018 | | Baron WealthBuilder Fund |
FINANCIAL HIGHLIGHTS
BARON WEALTHBUILDER FUND
Selected data for a share outstanding throughout each year:
| | | | | | | | | | | | | | | | | | | | | | | | | | | | | | | | | | | | | | | | | | | | | | | | | | | | | | | | | | | | |
| | | | | | | |
| | | | | | Income (loss) from
investment operations: | | | Less distributions to
shareholders from: | | | | | | | | | Ratios to Average Net Assets: | | | Supplemental
Data: | |
| | | | | | | | | | | | | | | |
| | | Net
asset
value,
beginning
of year
($) | | | Net
investment
income
(loss)
($) | | | Net
realized
and
unrealized
gain
(loss) on
investments
($) | | | Total
from
investment
operations
($) | | | Net
investment
income
($) | | | Net
realized
gain on
investments
($) | | | Total
distributions
($) | | | Net
asset
value,
end of
year ($) | | | Total
return
(%) | | | Operating
expenses
(%) | | | Less:
Reimbursement
of expenses
by Adviser
(%) | | | Net
operating
expenses
(%) | | | Net
investment
income
(loss)
(%) | | | Net
assets (in
millions),
end of
year
($) | | | Portfolio
turnover
rate
(%) | |
| | |
RETAIL SHARES | | | | | | | | | |
| | |
Year Ended December 31, | | | | | | | | | |
| | | | | | | | | | | | | | | |
2018 | | | 10.00 | | | | (0.01 | )2 | | | (0.65 | ) | | | (0.66 | ) | | | 0.00 | | | | (0.01 | ) | | | (0.01 | ) | | | 9.33 | | | | (6.58 | )4 | | | 0.90 | | | | (0.60 | ) | | | 0.30 | | | | (0.13 | ) | | | 2.1 | | | | 1.24 | |
| | | | | | | | | | | | | | | |
20171 | | | 10.00 | | | | (0.00 | )2,3 | | | 0.00 | | | | (0.00 | )3 | | | 0.00 | | | | 0.00 | | | | 0.00 | | | | 10.00 | | | | 0.00 | 4,7 | | | 0.59 | 5,6 | | | (0.29 | )5,6 | | | 0.30 | 5,6 | | | (0.30 | )5,6 | | | 0.0 | | | | 0.00 | 7 |
| | | | | | | |
TA SHARES | | | | | | | | | | | | | | | | | | | | | | | | | |
| | | | | | |
Year Ended December 31, | | | | | | | | | | | | | | | | | | | | | | | | | |
| | | | | | | | | | | | | | | |
2018 | | | 10.00 | | | | 0.01 | 2 | | | (0.65 | ) | | | (0.64 | ) | | | 0.00 | | | | (0.01 | ) | | | (0.01 | ) | | | 9.35 | | | | (6.38 | )4 | | | 0.59 | | | | (0.54 | ) | | | 0.05 | | | | 0.05 | | | | 9.7 | | | | 1.24 | |
| | | | | | | | | | | | | | | |
20171 | | | 10.00 | | | | (0.00 | )2,3 | | | 0.00 | | | | (0.00 | )3 | | | 0.00 | | | | 0.00 | | | | 0.00 | | | | 10.00 | | | | 0.00 | 4,7 | | | 0.34 | 5,6 | | | (0.29 | )5,6 | | | 0.05 | 5,6 | | | (0.05 | )5,6 | | | 3.4 | | | | 0.00 | 7 |
| | | | | | | |
INSTITUTIONAL SHARES | | | | | | | | | | | | | | | | | | | | | | | | | |
| | | | | | |
Year Ended December 31, | | | | | | | | | | | | | | | | | | | | | | | | | |
| | | | | | | | | | | | | | | |
2018 | | | 10.00 | | | | 0.01 | 2 | | | (0.65 | ) | | | (0.64 | ) | | | 0.00 | | | | (0.01 | ) | | | (0.01 | ) | | | 9.35 | | | | (6.38 | )4 | | | 0.49 | | | | (0.44 | ) | | | 0.05 | | | | 0.12 | | | | 83.0 | | | | 1.24 | |
| | | | | | | | | | | | | | | |
20171 | | | 10.00 | | | | (0.00 | )2,3 | | | 0.00 | | | | (0.00 | )3 | | | 0.00 | | | | 0.00 | | | | 0.00 | | | | 10.00 | | | | 0.00 | 4,7 | | | 0.34 | 5,6 | | | (0.29 | )5,6 | | | 0.05 | 5,6 | | | (0.05 | )5,6 | | | 1.0 | | | | 0.00 | 7 |
| 1 | For the period December 29, 2017 (commencement of operations) through December 31, 2017. |
| 2 | Based on average shares outstanding. |
| 3 | Less than $0.01 per share. |
| 4 | The total returns would have been lower had certain expenses not been reduced during the period shown. |
| 5 | Certain fixed expenses incurred by the Fund were not annualized for the period ended December 31, 2017. |
| | |
| See Notes to Financial Statements. | | 13 |
| | |
| Baron WealthBuilder Fund | | December 31, 2018 |
REPORT OF INDEPENDENT REGISTERED PUBLIC ACCOUNTING FIRM
TotheBoard of Trustees of Baron Select Funds and Shareholders of
Baron WealthBuilder Fund
Opinion on the Financial Statements
We have audited the accompanying statement of assets and liabilities, including the statement of net assets, ofBaron WealthBuilder Fund (one of the funds constituting the Baron Select Funds, hereafter referred to as the “Fund”) as of December 31, 2018, the related statement of operations for the year ended December 31, 2018, and the statement of changes in net assets and the financial highlights for the year ended December 31, 2018, and for the period December 29, 2017 (commencement of operations) through December 31, 2017, including the related notes (collectively referred to as the “financial statements”). In our opinion, the financial statements present fairly, in all material respects, the financial position of the Fund as of December 31, 2018, the results of its operations for the year ended December 31, 2018, and the changes in its net assets and the financial highlights for the year ended December 31, 2018 and for the period December 29, 2017 (commencement of operations) through December 31, 2017 in conformity with accounting principles generally accepted in the United States of America.
Basis for Opinion
These financial statements are the responsibility of the Fund’s management. Our responsibility is to express an opinion on the Fund’s financial statements based on our audits. We are a public accounting firm registered with the Public Company Accounting Oversight Board (United States) (“PCAOB”) and are required to be independent with respect to the Fund in accordance with the U.S. federal securities laws and the applicable rules and regulations of the Securities and Exchange Commission and the PCAOB.
We conducted our audits of these financial statements in accordance with the standards of the PCAOB. Those standards require that we plan and perform the audit to obtain reasonable assurance about whether the financial statements are free of material misstatement, whether due to error or fraud.
Our audits included performing procedures to assess the risks of material misstatement of the financial statements, whether due to error or fraud, and performing procedures that respond to those risks. Such procedures included examining, on a test basis, evidence regarding the amounts and disclosures in the financial statements. Our audits also included evaluating the accounting principles used and significant estimates made by management, as well as evaluating the overall presentation of the financial statements. Our procedures included confirmation of securities owned as of December 31, 2018 by correspondence with the custodian and transfer agent; when replies were not received, we performed other auditing procedures. We believe that our audits provides a reasonable basis for our opinion.

PricewaterhouseCoopers LLP
New York, New York
February 26, 2019
We have served as the auditor of one or more investment companies in the Baron group of funds since 1987.
14
| | |
| December 31, 2018 | | Baron WealthBuilder Fund |
TAX INFORMATION (Unaudited)
The federal tax status of distributions paid by the Fund during the year ended December 31, 2018 are listed below.
During the fiscal year ended December 31, 2018, the Fund’s distributions to shareholders included:
| | | | | | | | | | | | |
| | | |
| Fund | | Ordinary
Income1,3 | | | Long-Term
Capital Gains2.3 | | | Return of
Capital | |
| | | |
| | $ | — | | | $ | 130,484 | | | $ | — | |
| 1 | For tax purposes, short-term capital gains are considered ordinary income distributions. |
| 2 | Long-term capital gains are subject to a maximum allowable rate of 20% for individuals pursuant to the Tax Cuts and Jobs Act of 2017. |
| 3 | Under the Patient Protection and Affordable Care Act, higher income taxpayers must pay a 3.8% additional tax on net investment income. |
The information and distributions reported may differ from the information and distributions taxable to the shareholders for the calendar year ended December 31, 2018. The information necessary to complete your income tax return for the calendar year ended December 31, 2018 will be listed on the Form 1099-DIV, which was mailed to you in January/February 2019.
15
| | |
| Baron WealthBuilder Fund | | December 31, 2018 |
FUND EXPENSES (Unaudited)
As a shareholder of the Fund, you may incur two types of costs: ongoing expenses and transaction costs. Ongoing expenses include distribution and service(12b-1) fees and other Fund expenses. Due to the payment of Rule12b-1 fees, long-term shareholders may indirectly pay more than the maximum permittedfront-end sales charge. The information on this page is intended to help you understand your ongoing costs of investing in the Fund and to compare these costs with the ongoing costs of investing in other mutual funds.
The information in the following table is based on an investment of $1,000 invested on July 1, 2018 and held for the six months ended December 31, 2018.
ACTUAL EXPENSES
The table below titled “Based on Actual Total Return” provides information about actual account values and actual expenses. You may use the information provided in this table, together with the amount you invested, to estimate the expenses that you paid over the period. To estimate the expenses you paid on your account, divide your ending account value by $1,000 (for example, an $8,600 ending account value divided by $1,000 = 8.6), then multiply the result by the number under the heading titled “Expenses Paid During the Period.”
BASED ON ACTUAL TOTAL RETURN FOR THE SIX MONTHS ENDED DECEMBER 31, 20181
| | | | | | | | | | | | | | | | | | | | |
| | | | | |
| | | Actual Total Return | | | Beginning Account Value July 1, 2018 | | | Ending Account Value December 31, 2018 | | | Annualized Expense Ratio | | | Expenses Paid During the Period2 | |
Baron WealthBuilder Fund — Retail Shares | | | (13.01 | )% | | $ | 1,000.00 | | | $ | 869.90 | 3 | | | 0.30 | %4 | | $ | 1.41 | |
Baron WealthBuilder Fund — TA Shares | | | (12.83 | )% | | $ | 1,000.00 | | | $ | 871.70 | 3 | | | 0.05 | %4 | | $ | 0.24 | |
Baron WealthBuilder Fund — Institutional Shares | | | (12.83 | )% | | $ | 1,000.00 | | | $ | 871.70 | 3 | | | 0.05 | %4 | | $ | 0.24 | |
HYPOTHETICAL EXAMPLE FOR COMPARISON PURPOSES
The table below titled “Based on Hypothetical Total Return” provides information about hypothetical account values and hypothetical expenses based on the actual expense ratio and an assumed rate of return of 5% per year before expenses, which is not the Fund’s actual return. The hypothetical account values and expenses may not be used to estimate the actual ending account values and expenses you paid for the period. You may use the information provided in this table to compare the ongoing costs of investing in the Fund and other funds. To do so, compare the 5% hypothetical example relating to the Fund with the 5% hypothetical examples that appear in the shareholder reports of other funds.
Please note that expenses shown in the table below are meant to highlight your ongoing costs and do not reflect any transactional costs, such as redemption fees, if any. Therefore, the table is useful in comparing ongoing costs only and will not help you determine your relative total costs of owning different mutual funds. In addition, if these transactional costs were included, your costs would have been higher.
BASED ON HYPOTHETICAL TOTAL RETURN FOR THE SIX MONTHS ENDED DECEMBER 31, 2018
| | | | | | | | | | | | | | | | | | | | |
| | | | | |
| | | Hypothetical
Annualized
Total Return | | | Beginning Account Value July 1, 2018 | | | Ending Account Value December 31, 2018 | | | Annualized Expense Ratio | | | Expenses Paid During the Period2 | |
Baron WealthBuilder Fund — Retail Shares | | | 5.00 | % | | $ | 1,000.00 | | | $ | 1,023.69 | 3 | | | 0.30 | %4 | | $ | 1.53 | |
Baron WealthBuilder Fund — TA Shares | | | 5.00 | % | | $ | 1,000.00 | | | $ | 1,024.95 | 3 | | | 0.05 | %4 | | $ | 0.26 | |
Baron WealthBuilder Fund — Institutional Shares | | | 5.00 | % | | $ | 1,000.00 | | | $ | 1,024.95 | 3 | | | 0.05 | %4 | | $ | 0.26 | |
| 1 | Assumes reinvestment of all dividends and capital gain distributions, if any. |
| 2 | Expenses are equal to each share class’ respective annualized expense ratio multiplied by the average account value over the period, multiplied by the number of days in the most recent fiscal half-year, then divided by 365. |
| 3 | Ending account value assumes the return earned after waiver and would have been lower if a portion of the expenses had not been waived. |
| 4 | Annualized expense ratios are adjusted to reflect fee waiver. |
16
| | |
| December 31, 2018 | | Baron WealthBuilder Fund |
MANAGEMENT OF THE FUND (Unaudited)
Board of Trustees and Officers.
Trustees of the Trust, together with information as to their positions with the Trust, principal occupations and other board memberships and affiliations for the past five years, are shown below. Each Trustee serves as Trustee of the Trust until its termination; until the Trustee’s retirement, resignation or death; or as otherwise specified in the Trust’s organizational documents. Unless otherwise noted, the address of each Executive Officer and Trustee is Baron Select Funds, 767 Fifth Avenue, 49th Floor, New York, NY 10153. All Trustees listed below, whether Interested or Independent, serve as Trustees for the Trust. Additional information about the Trustees and Officers of the Trust can be found in the Trust’s Statement of Additional Information (the “SAI”) which may be obtained without charge by writing or calling1-800-99BARON. The SAI is also available on the Baron Funds® website, www.BaronFunds.com.
| | | | | | | | | | |
| | | | | |
| Name, Address & Age | | Position(s) Held With the Fund | | Term of
Office and
Length of
Time Served | | Principal Occupation(s)
During the Past Five Years | | Number of
Portfolios
in Fund
Complex
Overseen
by Trustee | | Other
Directorships
Held by Trustee |
Interested Trustees | | | | | | | | | | |
| | | | | |
Ronald Baron(1),(2) 767 Fifth Avenue New York, NY 10153 Age: 75 | | Chief Executive Officer, Chief Investment Officer, Trustee and Portfolio Manager | | 15 years | | Director, Chairman, CEO and CIO: the Firm* (1982-Present); Trustee: Baron Investment Funds Trust (1987-Present); Trustee: Baron Select Funds (2003-Present); Portfolio Manager: Baron USA Partners Fund, Ltd. (2003-Present). | | 17 | | None |
| | | | | |
Linda S. Martinson(1),(2) 767 Fifth Avenue New York, NY 10153 Age: 63 | | Chairman, President, Chief Operating Officer and Trustee | | 15 years | | Director: the Firm* (2003-Present); Secretary: the Firm* (1997-2008); President: the Firm* (2007-Present); Chief Operating Officer: the Firm (2006-present); Chairman (2010-Present), President (2007-Present), Trustee (1987-Present): Baron Investment Funds Trust; Chairman (2010-Present), President (2007-Present), Trustee (2003-Present): Baron Select Funds; Director: Baron USA Partners Fund, Ltd. (2006-Present). | | 17 | | None |
Independent Trustees | | | | | | | | | | |
| | | | | |
Norman S. Edelcup(3),(4),(5) 767 Fifth Avenue New York, NY 10153 Age: 83 | | Trustee | | 15 years | | Mayor (2003-2015): Sunny Isles Beach, Florida; Trustee: Baron Investment Funds Trust (1987-Present), Baron Select Funds (2003-Present). | | 17 | | Director: CompX International, Inc. (diversified manufacturer of engineered components) (2006-2016); Director: Valhi, Inc. (diversified company) (1975-2016). |
| | | | | |
Thomas J. Folliard(4),(5) 767 Fifth Avenue New York, NY 10153 Age: 54 | | Trustee | | 1 year | | Non-Executive Chair of the Board: CarMax, Inc. (2016-Present); President and Chief Executive Officer: CarMax, Inc. (2006-2016); Trustee: Baron Investment Funds Trust (2017-Present), Baron Select Funds (2017-Present). | | 17 | | Director: PulteGroup, Inc. (2012-Present) |
| | | | | |
Harold W. Milner(4),(5) 767 Fifth Avenue New York, NY 10153 Age: 84 | | Trustee | | 15 years | | Trustee: Baron Investment Funds Trust (1987-Present), Baron Select Funds (2003-Present). | | 17 | | None |
| | | | | |
Raymond Noveck(3),(4),(5) 767 Fifth Avenue New York, NY 10153 Age: 75 | | Lead Trustee | | 15 years | | Private Investor (1999-Present); Trustee: Baron Investment Funds Trust (1987-Present), Baron Select Funds (2003-Present). | | 17 | | None |
| | | | | |
Anita Rosenberg(4),(5) 767 Fifth Avenue New York, NY 10153 Age: 54 | | Trustee | | 4 years | | Advisory Board Member: Impala Capital Management, LLC (2014-Present); Advisory Board Member: ValueAct Capital, LLC (2014-Present); Senior Advisor: Magnetar Capital (2011-2012); Trustee: Baron Investment Funds Trust, Baron Select Funds (2013-Present). | | 17 | | Director: Golub Capital BDC, Inc. (2011-Present). |
17
| | |
| Baron WealthBuilder Fund | | December 31, 2018 |
MANAGEMENT OF THE FUND (Unaudited) (Continued)
| | | | | | | | | | |
| | | | | |
| Name, Address & Age | | Position(s) Held With the Fund | | Term of
Office and
Length of
Time Served | | Principal Occupation(s)
During the Past Five Years | | Number of
Portfolios
in Fund
Complex
Overseen
by Trustee | | Other
Directorships
Held by Trustee |
Independent Trustees (continued) | | | | | | | | |
| | | | | |
David A. Silverman, MD(4),(5) 767 Fifth Avenue New York, NY 10153 Age: 68 | | Trustee | | 15 years | | Physician and Faculty: New York University School of Medicine (1976-Present); Trustee: Baron Investment Funds Trust (1987-Present), Baron Select Funds (2003-Present). | | 17 | | None |
| | | | | |
Alex Yemenidjian(4),(5) 767 Fifth Avenue New York, NY 10153 Age: 62 | | Trustee | | 11 years | | Chairman and CEO: Tropicana Las Vegas (gaming) (2009-2015); Chairman and CEO: Armenco Holdings, LLC (investment company) (2005-Present); Managing Partner: Armenco Capital LLC (investment company) (2013-Present); Trustee: Baron Investment Funds Trust (2006-Present), Baron Select Funds (2006-Present). | | 17 | | Director: Guess?, Inc. (2005-Present); Director: Regal Entertainment Group (2005-Present). |
Additional Officers of the Fund | | | | | | | | |
| | | | | |
Louis Beasley 767 Fifth Avenue New York, NY 10153 Age: 48 | | Vice President and Chief Compliance Officer | | 3 years | | Chief Compliance Officer: Baron Capital Group, Inc., BAMCO, Inc., Baron Capital Management Inc., Baron Investment Funds Trust, Baron Select Funds, Baron USA Partners Fund, Ltd (2014-Present); Vice President: the Firm* (2014-Present); Principal and Director of Investment Management Compliance and Risk Management: Bessemer Trust (2006-2014). | | N/A | | N/A |
| | | | | |
Clifford Greenberg 767 Fifth Avenue New York, NY 10153 Age: 59 | | Senior Vice President | | 15 years | | Director and Senior Vice President: the Firm*; Senior Vice President: Baron Investment Funds Trust, Baron Select Funds; Portfolio Manager: Baron Small Cap Fund. | | N/A | | N/A |
| | | | | |
Patrick M. Patalino 767 Fifth Avenue New York, NY 10153 Age: 50 | | Vice President, General Counsel and Secretary | | 10 years | | Vice President, General Counsel and Secretary: the Firm*, Baron Investment Funds Trust, Baron Select Funds; General Counsel: Baron USA Partners Fund, Ltd. | | N/A | | N/A |
| | | | | |
Andrew Peck 767 Fifth Avenue New York, NY 10153 Age: 49 | | Senior Vice President | | 15 years | | Senior Vice President: the Firm*, Baron Investment Funds Trust, Baron Select Funds; Portfolio Manager: Baron Asset Fund. | | N/A | | N/A |
| | | | | |
Peggy C. Wong 767 Fifth Avenue New York, NY 10153 Age: 57 | | Treasurer and Chief Financial Officer | | 15 years | | Chief Financial Officer and Treasurer: the Firm*, Baron Investment Funds Trust, Baron Select Funds. | | N/A | | N/A |
| * | The “Firm” means Baron Capital Group, Inc. (“BCG”) along with its subsidiaries BCI, Baron Capital Management, Inc. (“BCM”) and BAMCO. |
| (1) | Trustees deemed to be “Interested Trustees” by reason of their employment with the Adviser and the Distributor. |
| (2) | Members of the Executive Committee, which is empowered to exercise all of the powers, including the power to declare dividends, of the full Board when the full Board is not in session. |
| (3) | Members of the Audit Committee. |
| (4) | Members of the Nominating Committee. |
| (5) | Members of the Independent Committee. |
18
Privacy Notice
The Fund collects nonpublic personal information about you from the following sources:
| ∎ | | Information we receive from you on applications or other forms; |
| ∎ | | Information about your transactions with us, our Adviser or others; and |
| ∎ | | Information we receive from third parties, such as credit reporting agencies. |
“Nonpublic personal information” is private information about you that we obtain in connection with providing a financial product or service to you.
We may share your name and address with other Baron Funds and the Adviser and its affiliates for the purpose of sending you information about our products that we believe may be of interest to you and informing you of our upcoming Baron Investment Conference and for sending required information.
We do not disclose any nonpublic personal information about our customers to anyone, except as permitted or required by law. Examples of permitted disclosures under the law include sharing with companies that work for us to provide you services, such as the Transfer Agent or mailing house. All such companies that act on our behalf are contractually obligated to keep the information that we provide to them confidential and to use the information only to provide the services that we have asked them to perform for you and us.
We restrict access to nonpublic information about you to those employees who need to know that information to provide products or services to you. We maintain physical, electronic and procedural safeguards to guard your nonpublic personal information.
This privacy notice is also available at all times on the Baron Funds® website, www.BaronFunds.com or by calling 1-800-99BARON.
Go Paperless!
It’s fast, simple and a smart way to help the environment.
Enjoy the speed and convenience of receiving Fund documents electronically.
For more information, and to enroll today, go to www.baronfunds.com/edelivery.
767 Fifth Avenue, 49th Fl.
New York, NY 10153
1.800.99.BARON
212-583-2000
www.BaronFunds.com
DECEMBER 18
The Registrant has adopted a Code of Ethics for Principal Executive and Senior Financial Officers (the “Code”). Upon request, the Registrant will provide a copy of the Code to any person without charge. To obtain a copy of the Code, please send your request to info@Baronfunds.com or call1-800-99BARON(1-800-992-2766).
| Item 3. | Audit Committee Financial Expert. |
The Registrant’s Board of Trustees has determined that the Registrant has two audit committee financial experts serving on its Audit Committee, Norman S. Edelcup and Raymond Noveck. Both Mr. Edelcup and Mr. Noveck are “independent” for purposes of Item 3(a)(2) of FormN-CSR.
| Item 4. | Principal Accountant Fees and Services. |
The following table shows the fees paid to PricewaterhouseCoopers, LLP, the Registrant’s principal accounting firm during the fiscal years ended December 31, 2018 and December 31, 2017:
(a)Audit Fees: for professional services rendered for the audit of the Registrant’s annual financial statements or services that are normally provided in connection with statutory and regulatory filings or engagements:
| | | | | | | | |
| | | 2018 | | | 2017 | |
Baron Select Funds | | $ | 328,650 | | | $ | 264,800 | |
(b)Audit-Related Fees: for assurance and related services that are reasonably related to the performance of the audit and are not included as Audit Fees:
| | | | | | | | |
| | | 2018 | | | 2017 | |
Baron Select Funds | | $ | 0 | | | $ | 0 | |
(c)Tax Fees: for professional services rendered for tax compliance, tax advice and tax planning:
| | | | | | | | |
| | | 2018 | | | 2017 | |
Baron Select Funds | | $ | 151,950 | | | $ | 152,090 | |
The Tax Fees represent services provided in connection with the preparation of tax returns andyear-end distribution review.
(d)All Other Fees: for products and services provided by such accounting firm that are not included in (a), (b) or (c) above:
| | | | | | | | |
| | | 2018 | | | 2017 | |
Baron Select Funds | | $ | 0 | | | $ | 0 | |
(e)Audit CommitteePre-Approval Policies and Procedures: (i) Pursuant to paragraph (c)(7) of Rule2-01 of RegulationS-X and to its charter, the Audit Committee shallpre-approve all audit andnon-audit services
provided by the independent auditors and in connection therewith to review and evaluate the qualifications, independence and performance of the Fund’s independent auditors; (ii) 100% of the services described in each of items 4(b) through 4(d) were approved by the Audit Committee pursuant to paragraph (c)(7)(i)(C) of Rule2-01 of RegulationS-X.
(f) Not Applicable.
(g) The aggregatenon-audit fees billed by the registrant’s accountant for services rendered to the registrant, and rendered to the registrant’s investment adviser (not including anysub-adviser whose role is primarily portfolio management and is subcontracted with or overseen by another investment adviser), and any entity controlling, controlled by, or under common control with the adviser that provides ongoing services to the registrant for the last two fiscal years is as follows:
2018: $30,500
2017: $29,000
(h) Not Applicable.
Item 5. Audit Committee of Listed Registrants.
The Registrant has a separately-designated standing Audit Committee established in accordance with Section 3(a)(58)(A) of the Securities Exchange Act of 1934. The members of the Audit Committee are Norman S. Edelcup and Raymond Noveck.
Item 6. Schedule of Investments.
Included herein under Item 1.
Item 7. Disclosure of Proxy Voting Policies and Procedures forClosed-End Management Investment Companies.
Not applicable.
Item 8. Portfolio Managers ofClosed-End Management Investment Companies.
Not applicable.
Item 9. Purchases of Equity Securities byClosed-End Management Investment Company and Affiliated Purchasers.
Not applicable.
Item 10. Submission of Matters to a Vote of Security Holders.
Not applicable.
Item 11. Controls and Procedures.
(a) The Registrant’s principal executive officer and principal financial officer have concluded that the Registrant’s disclosure controls and procedures (as defined in Rule30a-3(c) under the Investment Company Act of 1940 (the “1940 Act”)) are effective based on their evaluation of these controls and procedures as of a date within 90 days of the filing date of this report.
(b) There were no changes in the Registrant’s internal control over financial reporting (as defined in Rule30a-3(d) under the 1940 Act) that occurred during the Registrant’s second fiscal quarter of the period covered by this report that have materially affected, or are reasonably likely to materially affect, the Registrant’s internal control over financial reporting.
Item 12. Exhibits.
(a) (2) Certification of each of the principal executive officers and principal financial officers of the Registrant as required by Rule30a-2 under the Act (17 CFR270.30a-2) is attached hereto as a part ofEX-99.CERT.
(b) Certification of each of the principal executive officers and principal financial officers of the Registrant as required by Section 906 of the Sarbanes-Oxley Act of 2002 is attached hereto as a part ofEX-99.906CERT.
SIGNATURES
Pursuant to the requirements of the Securities Exchange Act of 1934 and the Investment Company Act of 1940, the registrant has duly caused this report to be signed on its behalf by the undersigned, thereunto duly authorized.
| | |
| BARON SELECT FUNDS |
| |
| By: | | /s/ Ronald Baron |
| | Ronald Baron |
| | Chief Executive Officer |
|
| Date: March 8, 2019 |
Pursuant to the requirements of the Securities Exchange Act of 1934 and the Investment Company Act of 1940, this report has been signed below by the following persons on behalf of the registrant and in the capacities and on the dates indicated.
| | |
| By: | | /s/ Ronald Baron |
| | Ronald Baron |
| | Chief Executive Officer |
|
| Date: March 8, 2019 |
| |
| By: | | /s/ Peggy Wong |
| | Peggy Wong |
| | Treasurer and Chief Financial Officer |
|
| Date: March 8, 2019 |