| | |
| | OMB APPROVAL |
| | OMB Number: 3235-0570 |
| | Expires: January 31, 2017 |
| | Estimated average burden Hours per response 20.6 |
UNITED STATES
SECURITIES AND EXCHANGE COMMISSION
Washington, DC 20549
FORM N-CSR
CERTIFIED SHAREHOLDER REPORT OF REGISTERED
MANAGEMENT INVESTMENT COMPANIES
Investment Company Act file number: 811-21296
BARON SELECT FUNDS
(Exact Name of Registrant as Specified in Charter)
767 Fifth Avenue, 49th Floor
New York, NY 10153
(Address of Principal Executive Offices) (Zip Code)
Patrick M. Patalino, General Counsel
c/o Baron Select Funds
767 Fifth Avenue, 49th Floor
New York, NY 10153
(Name and Address of Agent for Service)
(Registrant’s Telephone Number, including Area Code): 212-583-2000
Date of fiscal year end: December 31
Date of reporting period: December 31, 2016
Form N-CSR is to be used by management investment companies to file reports with the Commission not later than 10 days after the transmission to stockholders of any report that is required to be transmitted to stockholders under Rule 30e-1 under the Investment Company Act of 1940 (17CRF 270.30e-1). The Commission may use the information provided on Form N-CSR in its regulatory, disclosure review, inspection, and policymaking roles.
A registrant is required to disclose the information specified by Form N-CSR, and the Commission will make this information public. A registrant is not required to respond to the collection of information contained in Form N-CSR unless the Form displays a currently valid Office of Management and Budget (“OMB”) control number. Please direct comments concerning the accuracy of the information collection burden estimate and suggestions for reducing the burden to Secretary, Securities and Exchange Commission, 450 5th Street, NW, Washington, D.C. 20549-0609. The OMB has reviewed this collection of information under the clearance requirements of 44 U.S.C. Section 3507.
Persons who are to respond to the collection of information contained in this form are not required to respond unless the form displays a currently valid OMB control number.
SEC 2569 (5-07)
Item 1. Reports to Stockholders.
Baron Partners Fund
Baron Focused Growth Fund
Baron International Growth Fund
Baron Real Estate Fund
Baron Emerging Markets Fund
Baron Energy and Resources Fund
Baron Global Advantage Fund
December 31, 2016
Baron Funds®
Annual Financial Report
DEAR BARON SELECT FUNDS SHAREHOLDER:
In this report, you will find audited financial statements for Baron Partners Fund, Baron Focused Growth Fund, Baron International Growth Fund, Baron Real Estate Fund, Baron Emerging Markets Fund, Baron Energy and Resources Fund and Baron Global Advantage Fund (the “Funds”) for the year ended December 31, 2016. The U.S. Securities and Exchange Commission (the “SEC”) requires mutual funds to furnish these statements semi-annually to their shareholders. We hope you find these statements informative and useful.
We thank you for choosing to join us as fellow shareholders in Baron Funds. We will continue to work hard to justify your confidence.
Sincerely,
| | | | |
 | |  | |  |
Ronald Baron Chief Executive Officer and Chief Investment Officer February 24, 2017 | | Linda S. Martinson Chairman, President and Chief Operating Officer February 24, 2017 | | Peggy Wong Treasurer and Chief Financial Officer February 24, 2017 |
This Annual Financial Report is for the Baron Select Funds, which currently has seven series: Baron Partners Fund, Baron Focused Growth Fund, Baron International Growth Fund, Baron Real Estate Fund, Baron Emerging Markets Fund, Baron Energy and Resources Fund and Baron Global Advantage Fund. If you are interested in Baron Investment Funds Trust, which contains the Baron Asset Fund, Baron Growth Fund, Baron Small Cap Fund, Baron Opportunity Fund, Baron Fifth Avenue Growth Fund and Baron Discovery Fund series, please visit the Funds’ website at www.BaronFunds.com or contact us at 1-800-99BARON.
The Funds’ Proxy Voting Policy is available without charge and can be found on the Funds’ website at www.BaronFunds.com, by clicking on the “Legal Notices” link at the bottom left corner of the homepage or by calling 1-800-99BARON and on the SEC’s website at www.sec.gov. The Funds’ most current proxy voting record, Form N-PX, is also available on the Funds’ website and on the SEC’s website.
The Funds file their complete schedules of portfolio holdings with the SEC for the first and third quarters of each fiscal year on Form N-Q. The Funds’ Forms N-Q are available on the SEC’s website at www.sec.gov. The Funds’ Forms N-Q may also be reviewed and copied at the SEC’s Public Reference Room in Washington, DC; information on the operation of the SEC’s Public Reference Room may be obtained by calling 1-202-551-8090. A copy of the Funds’ Forms N-Q may also be obtained upon request by calling 1-800-99BARON. Schedules of portfolio holdings current to the most recent quarter are also available on the Funds’ website.
Some of the comments are based on current management expectations and are considered “forward-looking statements.” Actual future results, however, may prove to be different from our expectations. You can identify forward-looking statements by words such as “estimate,” “may,” “expect,” “should,” “could,” “believe,” “plan” and other similar terms. We cannot promise future returns and our opinions are a reflection of our best judgment at the time this report is compiled.
The views expressed in this report reflect those of BAMCO, Inc. (“BAMCO” or the “Adviser”) only through the end of the period stated in this report. The views are not intended as recommendations or investment advice to any person reading this report and are subject to change at any time without notice based on market and other conditions.
Past performance is no guarantee of future results. The investment return and principal value of an investment will fluctuate; an investor’s shares, when redeemed, may be worth more or less than their original cost. For more complete information about Baron Funds, including charges and expenses, call, write or go to www.BaronFunds.com for a prospectus or summary prospectus. Read them carefully before you invest or send money. This report is not authorized for use as an offer of sale or a solicitation of an offer to buy shares of the Funds, unless accompanied or preceded by the Funds’ current prospectus or summary prospectus.

| | |
| Baron Partners Fund (Unaudited) | | December 31, 2016 |
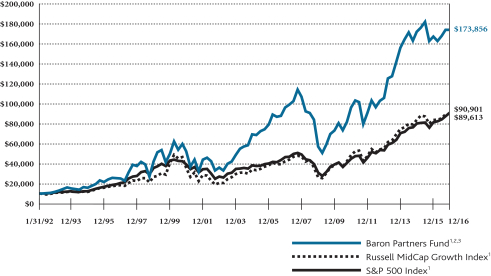
COMPARISONOFTHECHANGEIN VALUEOF $10,000INVESTMENTIN BARON PARTNERS FUND (RETAIL SHARES)
IN RELATIONTOTHE RUSSELL MIDCAP GROWTH INDEXANDTHE S&P 500 INDEX
| | | | | | | | | | | | | | | | | | | | |
| AVERAGE ANNUAL TOTAL RETURNSFORTHEPERIODSENDED DECEMBER 31, 2016 | |
| | | One Year | | | Three
Years | | | Five
Years | | | Ten
Years | | | Since
Inception
(January 31,
1992) | |
Baron Partners Fund — Retail Shares1,2,3 | | | 4.04% | | | | 3.73% | | | | 13.91% | | | | 6.11% | | | | 12.14% | |
Baron Partners Fund — Institutional Shares1,2,3,4 | | | 4.29% | | | | 4.00% | | | | 14.21% | | | | 6.32% | | | | 12.23% | |
Baron Partners Fund — R6 Shares1,2,3,5 | | | 4.32% | | | | 4.01% | | | | 14.22% | | | | 6.33% | | | | 12.23% | |
Russell Midcap Growth Index1 | | | 7.33% | | | | 6.23% | | | | 13.51% | | | | 7.83% | | | | 9.20% | |
S&P 500 Index1 | | | 11.96% | | | | 8.87% | | | | 14.66% | | | | 6.95% | | | | 9.26% | |
| 1 | The indexes are unmanaged. The Russell Midcap® Growth Index measures the performance of medium-sized U.S. companies that are classified as growth and the S&P 500 Index of 500 widely held large-cap U.S. companies. The indexes and Baron Partners Fund are with dividends, which positively impact the performance results. |
| 2 | Reflects the actual fees and expenses that were charged when the Fund was a partnership. The predecessor partnership charged a 20% performance fee after reaching a certain performance benchmark. If the annual returns for the Fund did not reflect the performance fees for the years the predecessor partnership charged a performance fee, returns would be higher. The Fund’s shareholders will not be charged a performance fee. The predecessor partnership’s performance is only for periods before the Fund’s registration statement was effective, which was April 30, 2003. During those periods, the predecessor partnership was not registered under the Investment Company Act of 1940 and was not subject to its requirements or the requirements of the Internal Revenue Code relating to regulated investment companies, which, if it were, might have adversely affected its performance. |
| 3 | Past performance is not predictive of future performance. The performance data does not reflect the deduction of taxes that a shareholder would pay on Fund distributions or redemption of Fund shares. The Fund’s transfer agency expenses may be reduced by expense offsets from an unaffiliated transfer agent, without which performance would have been lower. |
| 4 | Performance for the Institutional Shares prior to May 29, 2009 is based on the performance of the Retail Shares, which have a distribution fee. The Institutional Shares do not have a distribution fee. If the annual returns for the Institutional Shares prior to May 29, 2009 did not reflect this fee, the returns would be higher. |
| 5 | Performance for the R6 Shares prior to August 31, 2016 is based on the performance of the Institutional Shares, and prior to May 29, 2009 is based on the Retail Shares, which have a distribution fee. The Institutional and R6 Shares do not have a distribution fee. If the annual returns for the R6 Shares prior to May 29, 2009 did not reflect this fee, the returns would be higher. |
2
| | |
| December 31, 2016 (Unaudited) | | Baron Partners Fund |
TOP TEN HOLDINGSASOF DECEMBER 31, 2016
| | | | |
| | | Percent of Total
Investments | |
Tesla Motors, Inc. | | | 11.6% | |
CoStar Group, Inc. | | | 10.2% | |
Arch Capital Group Ltd. | | | 10.1% | |
Vail Resorts, Inc. | | | 7.3% | |
Hyatt Hotels Corp. | | | 7.0% | |
FactSet Research Systems, Inc. | | | 6.2% | |
IDEXX Laboratories, Inc. | | | 5.7% | |
The Charles Schwab Corp. | | | 5.4% | |
Zillow Group, Inc. | | | 4.5% | |
Manchester United plc | | | 3.7% | |
| | | | 71.7% | |
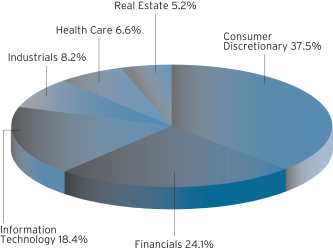
SECTOR BREAKDOWNASOF DECEMBER 31, 2016†
(as a percentage of total investments)
MANAGEMENT’S DISCUSSIONOF FUND PERFORMANCE
For the year ended December 31, 2016, Baron Partners Fund1 gained 4.04%, underperforming the Russell Midcap Growth Index, which gained 7.33%.
The Fund has performed well since its conversion into an open end mutual fund on April 30, 2003. In the period since the Fund’s
conversion through December 31, 2016, the Fund gained an annualized 12.26% versus an annualized 10.81% for the Russell Midcap Growth Index. The Fund also has meaningfully outperformed the Russell Midcap Growth Index since its inception on January 31, 1992, gaining an annualized 12.14%* compared to an annualized 9.20% for the Russell Midcap Growth Index.
Baron Partners Fund invests primarily in U.S. companies of any size with, in our view, significant long-term growth potential. We believe our process can identify investment opportunities that are attractively priced relative to future prospects. The Fund is non-diversified, so its top 10 holdings are expected to comprise a significant percentage of the portfolio, and the Fund uses leverage, both of which increase risk.
The year started with a sell-off driven by concerns around a possible tightening of the credit markets, signs of slowing growth, particularly in China, and continued low oil prices. As global concerns subsided, oil prices ticked up, domestic job numbers improved, and the Federal Reserve deferred interest rate hikes, the markets recovered. In late June, the U.K.’s vote to exit the European Union sent the markets into another sharp, but thankfully short-lived, decline. In November, post-election expectations of corporate tax reform, less regulation, a stronger dollar, higher interest rates, and investment in infrastructure drove rotation into stocks, sectors, and asset classes that are expected to benefit from these developments.
At the sector level, the Fund’s investments in Financials, Real Estate, and Consumer Discretionary were the largest contributors to performance. Health Care and Utilities detracted from performance during the year.
The largest contributor was veterinary diagnostics leader IDEXX Laboratories, Inc. The stock rallied on robust financial results and multiple expansion. Competitive trends have been strong and improving, highlighted by instrument revenue growth of 22%, domestic lab growth more than twice that of its main competitor, rising sales productivity, and stability in rapid assays. We think that IDEXX’s direct go-to-market model and R&D-driven product enhancements will boost revenue and earnings growth over time.
The largest detractor was Illumina, Inc., the leading provider of next generation DNA sequencing platforms. Shares decreased in 2016 after the company reported disappointing financial results on weakness in Europe and weak high-throughput instrument sales in North America. We exited our position.
We expect to continue to establish long positions in securities that, in our opinion, have favorable price-to-value characteristics based on our assessment of their prospects for future growth and profitability.
| † | Sector levels are provided from the Global Industry Classification Standard (“GICS”), developed and exclusively owned by MSCI, Inc. and Standard & Poor’s Financial Services LLC, unless otherwise stated that they have been reclassified or classified by the Adviser. All GICS data is provided “as is” with no warranties. |
| 1 | Performance information reflects results of the Retail Shares. |
| * | Please see Footnote 2 on page 2. |
3
| | |
| Baron Focused Growth Fund (Unaudited) | | December 31, 2016 |
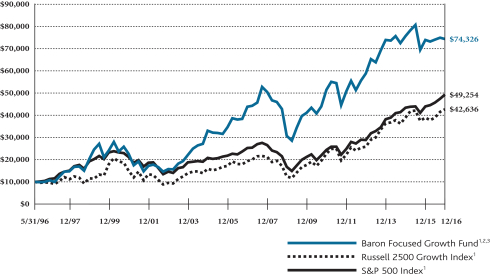
COMPARISONOFTHECHANGEIN VALUEOF $10,000INVESTMENTIN BARON FOCUSED GROWTH FUND† (RETAIL SHARES)
INRELATIONTOTHE RUSSELL 2500 GROWTH INDEXANDTHE S&P 500 INDEX
| | | | | | | | | | | | | | | | | | | | |
| AVERAGE ANNUAL TOTAL RETURNSFORTHEPERIODSENDED DECEMBER 31, 2016 | |
| | | One
Year | | | Three
Years | | | Five
Years | | | Ten
Years | | | Since
Inception
(May 31,
1996) | |
Baron Focused Growth Fund — Retail Shares1,2,3 | | | 0.67% | | | | 0.18% | | | | 7.95% | | | | 5.44% | | | | 10.24% | |
Baron Focused Growth Fund — Institutional Shares1,2,3,4 | | | 0.97% | | | | 0.45% | | | | 8.22% | | | | 5.64% | | | | 10.34% | |
Baron Focused Growth Fund — R6 Shares1,2,3,5 | | | 0.97% | | | | 0.44% | | | | 8.22% | | | | 5.64% | | | | 10.34% | |
Russell 2500 Growth Index1 | | | 9.73% | | | | 5.45% | | | | 13.88% | | | | 8.24% | | | | 7.30% | |
S&P 500 Index1 | | | 11.96% | | | | 8.87% | | | | 14.66% | | | | 6.95% | | | | 8.05% | |
| † | The Fund’s historical performance was impacted by gains from IPOs and/or secondary offerings. There is no guarantee that these results can be repeated or that the Fund’s level of participation in IPOs and secondary offerings will be the same in the future. |
| 1 | The indexes are unmanaged. The Russell 2500™ Growth Index measures the performance of small to medium-sized U.S. companies that are classified as growth and the S&P 500 Index of 500 widely held large-cap U.S. companies. The indexes and Baron Focused Growth Fund are with dividends, which positively impact the performance results. |
| 2 | Reflects the actual fees and expenses that were charged when the Fund was a partnership. The predecessor partnership charged a 15% performance fee through 2003 after reaching a certain performance benchmark. If the annual returns for the Fund did not reflect the performance fees for the years the predecessor partnership charged a performance fee, the returns would be higher. The Fund’s shareholders will not be charged a performance fee. The predecessor partnership’s performance is only for periods before the Fund’s registration statement was effective, which was June 30, 2008. During those periods, the predecessor partnership was not registered under the Investment Company Act of 1940 and was not subject to its requirements or the requirements of the Internal Revenue Code relating to regulated investment companies, which, if it were, might have adversely affected its performance. |
| 3 | Past performance is not predictive of future performance. The performance data does not reflect the deduction of taxes that a shareholder would pay on Fund distributions or redemption of Fund shares. The Adviser has reimbursed certain Fund expenses (by contract as long as BAMCO, Inc. is the Adviser to the Fund) and the Fund’s transfer agency expenses may be reduced by expense offsets from an unaffiliated transfer agent, without which performance would have been lower. |
| 4 | Performance for the Institutional Shares prior to May 29, 2009 is based on the performance of the Retail Shares, which have a distribution fee. The Institutional Shares do not have a distribution fee. If the annual returns for the Institutional Shares prior to May 29, 2009 did not reflect this fee, the returns would be higher. |
| 5 | Performance for the R6 Shares prior to August 31, 2016 is based on the performance of the Institutional Shares, and prior to May 29, 2009 is based on the Retail Shares, which have a distribution fee. The Institutional and R6 Shares do not have a distribution fee. If the annual returns for the R6 Shares prior to May 29, 2009 did not reflect this fee, the returns would be higher. |
4
| | |
| December 31, 2016 (Unaudited) | | Baron Focused Growth Fund |
TOP TEN HOLDINGSASOF DECEMBER 31, 2016
| | | | |
| | | Percent of
Net Assets | |
Vail Resorts, Inc. | | | 12.5% | |
Tesla Motors, Inc. | | | 11.0% | |
Hyatt Hotels Corp. | | | 10.7% | |
CoStar Group, Inc. | | | 8.1% | |
FactSet Research Systems, Inc. | | | 7.0% | |
Arch Capital Group Ltd. | | | 4.9% | |
Choice Hotels International, Inc. | | | 4.8% | |
Manchester United plc | | | 4.5% | |
Iridium Communications Inc. | | | 4.4% | |
Benefitfocus, Inc. | | | 3.8% | |
| | | | 71.7% | |
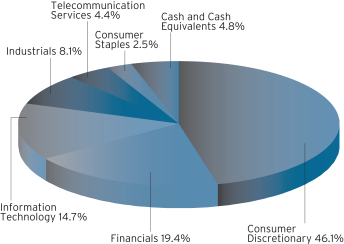
SECTOR BREAKDOWNASOF DECEMBER 31, 2016†
(as a percentage of net assets)
MANAGEMENT’S DISCUSSIONOF FUND PERFORMANCE
For year ended December 31, 2016, Baron Focused Growth Fund1 increased 0.67%, underperforming the Russell 2500 Growth Index, which rose 9.73%. In the period since the Fund’s conversion into an open end mutual fund on June 30, 2008 through December 31, 2016, the Fund gained an annualized 5.83% versus an annualized 9.63% for that index.
Since its inception on May 31, 1996 through December 31, 2016, the Fund has outperformed the Russell 2500 Growth Index, gaining an annualized 10.24%* compared to an annualized 7.30% for that index.
Baron Focused Growth Fund invests in a non-diversified portfolio of companies that we believe are well capitalized, and have exceptional management, significant growth potential, and sustainable barriers to competition. The Fund is non-diversified, which is a riskier investment strategy.
The year started with a sell-off driven by concerns around a possible tightening of the credit markets, signs of slowing growth, particularly in China, and continued low oil prices. As global concerns subsided, oil prices ticked up, domestic job numbers improved, and the Federal Reserve deferred interest rate hikes, the markets recovered. In late June, the U.K.’s vote to exit the European Union sent the markets into another sharp, but thankfully short-lived, decline. In November, post-election expectations of corporate tax reform, less regulation, a stronger dollar, higher interest rates, and investment in infrastructure drove rotation into stocks, sectors, and asset classes that are expected to benefit from these developments.
At the sector level, the Fund’s investments in Consumer Discretionary, Financials and Telecommunication Services were the largest contributors to performance. Information Technology, Industrials and Health Care were the biggest sector detractors.
The largest contributor was ski resort company Vail Resorts, Inc. Shares rose after the company’s acquisition of Whistler Blackcomb resulted in a significant improvement in season pass sales and skier visitation across the company’s resorts. In addition, Vail reported improving results at its recently acquired resorts in Perisher, Australia and Park City, Utah.
The largest detractor was Manchester United plc, an English Premier League professional sports team that generates revenue from broadcasting, sponsorship, and licensing. Shares were down despite enthusiasm around the hiring of Jose Mourinho as the new coach and the addition of marquee players to the roster. We continue to believe that Manchester United is a unique media company with broad global appeal and look forward to news of anticipated future sponsorship deals, the roll-out of new merchandise agreements, and a new digital offering that is under development.
We expect to continue to establish positions in small and mid-sized businesses that, in our opinion, have favorable price-to-value characteristics based on our assessment of prospects for future growth and profitability.
| † | Sector levels are provided from the Global Industry Classification Standard (“GICS”), developed and exclusively owned by MSCI, Inc. and Standard & Poor’s Financial Services LLC, unless otherwise stated that they have been reclassified or classified by the Adviser. All GICS data is provided “as is” with no warranties. |
| 1 | Performance information reflects results of the Retail Shares. |
| * | Please see Footnote 2 on page 4. |
5
| | |
| Baron International Growth Fund (Unaudited) | | December 31, 2016 |
COMPARISONOFTHECHANGEIN VALUEOF $10,000INVESTMENTIN BARON INTERNATIONAL GROWTH FUND† (RETAIL SHARES)
INRELATIONTOTHE MSCI ACWIEX USA IMI GROWTH INDEXANDTHE MSCI ACWIEX USA INDEX
| | | | | | | | | | | | | | | | |
| AVERAGE ANNUAL TOTAL RETURNSFORTHEPERIODSENDED DECEMBER 31, 2016 | |
| | | One
Year | | | Three
Years | | | Five
Years | | | Since
Inception
(December 31,
2008) | |
Baron International Growth Fund — Retail Shares1,2 | | | 1.14% | | | | 0.00% | | | | 7.46% | | | | 10.07% | |
Baron International Growth Fund — Institutional Shares1,2,3 | | | 1.35% | | | | 0.24% | | | | 7.73% | | | | 10.33% | |
Baron International Growth Fund — R6 Shares1,2,4 | | | 1.35% | | | | 0.24% | | | | 7.73% | | | | 10.33% | |
MSCI ACWI ex USA IMI Growth Index1 | | | 0.06% | | | | (1.00)% | | | | 5.58% | | | | 7.83% | |
MSCI ACWI ex USA Index1 | | | 4.50% | | | | (1.78)% | | | | 5.00% | | | | 7.11% | |
| † | The Fund’s historical performance was impacted by gains from IPOs and/or secondary offerings. There is no guarantee that these results can be repeated or that the Fund’s level of participation in IPOs and secondary offerings will be the same in the future. |
| 1 | The MSCI ACWI ex USA indexes cited are unmanaged, free float-adjusted market capitalization weighted indexes. The MSCI ACWI ex USA IMI Growth Index Net USD measures the performance of large-, mid- and small-cap growth securities across developed and emerging markets, excluding the United States. The MSCI ACWI ex USA Index Net USD measures the equity market performance of large and mid-cap securities across developed and emerging markets, excluding the United States. The indexes and Baron International Growth Fund include reinvestment of dividends, net of foreign withholding taxes, which positively impact the performance results. |
| 2 | Past performance is not predictive of future performance. The performance data does not reflect the deduction of taxes that a shareholder would pay on Fund distributions or redemption of Fund shares. The Adviser has reimbursed certain Fund expenses (by contract as long as BAMCO, Inc. is the Adviser to the Fund) and the Fund’s transfer agency expenses may be reduced by expense offsets from an unaffiliated transfer agent, without which performance would have been lower. |
| 3 | Performance for the Institutional Shares prior to May 29, 2009 is based on the performance of the Retail Shares, which have a distribution fee. The Institutional Shares do not have a distribution fee. If the annual returns for the Institutional Shares prior to May 29, 2009 did not reflect this fee, the returns would be higher. |
| 4 | Performance for the R6 Shares prior to August 31, 2016 is based on the performance of the Institutional Shares, and prior to May 29, 2009 is based on the Retail Shares, which have a distribution fee. The Institutional and R6 Shares do not have a distribution fee. If the annual returns for the R6 Shares prior to May 29, 2009 did not reflect this fee, the returns would be higher. |
6
| | |
| December 31, 2016 (Unaudited) | | Baron International Growth Fund |
TOP TEN HOLDINGSASOF DECEMBER 31, 2016
| | | | |
| | | Percent of
Net Assets | |
Eurofins Scientific SE | | | 3.4% | |
Softbank Group Corp. | | | 2.9% | |
Constellation Software, Inc. | | | 2.7% | |
Arch Capital Group Ltd. | | | 2.7% | |
Domino’s Pizza Enterprises Ltd. | | | 2.6% | |
RIB Software AG | | | 2.5% | |
Reckitt Benckiser Group Plc | | | 2.2% | |
Abcam plc | | | 2.2% | |
Julius Baer Group Ltd. | | | 2.1% | |
Tencent Holdings, Ltd. | | | 2.1% | |
| | | | 25.4% | |
SECTOR BREAKDOWNASOF DECEMBER 31, 2016†
(as a percentage of net assets)
MANAGEMENT’S DISCUSSIONOF FUND PERFORMANCE
For the year ended December 31, 2016, Baron International Growth Fund1 gained 1.14%, outperforming the MSCI ACWI ex USA IMI Growth Index, which gained 0.06%.
Baron International Growth Fund is a diversified fund that invests for the long term primarily in securities of non-U.S. growth companies. The Fund expects to diversify among several
developed countries and developing countries throughout the world, although the Fund’s total exposure to developing countries will not exceed 30%. The Fund may purchase securities of companies of any size. Of course, there can be no guarantee that we will be successful in achieving the Fund’s investment goals.
Two clear inflection points dominated global market activity in 2016. First, the G20 meeting of the world’s central bankers in February marked a resynchronization of global monetary policy. Several international and particularly emerging markets currencies, equities, and commodities demonstrated a return to leadership. This trend was accentuated following Brexit. The second inflection point proved less friendly to international markets. Prior to the U.S. presidential election, several global policymakers had already signaled a tolerance for higher inflation. Trump’s election added fuel to the fire of rising inflation and interest rate expectations while opening a Pandora’s box of potential outcomes on fiscal and monetary policy, taxation, trade, protectionism, and foreign policy. Markets were clearly caught off guard by the U.S. election results, and a fairly dramatic repricing occurred in the final weeks of 2016.
On a sector basis, the largest contributors to performance were Materials, Energy, and Financials. Consumer Staples, Information Technology, and Consumer Discretionary were the largest detractors. On a regional basis, the largest contributors to performance were Asia/Pacific excluding Japan, North America, and Latin America. Europe and Japan detracted from performance.
The largest contributor was global gold mining company Newcrest Mining Ltd. Shares rose in 2016 in concert with a general rise in gold prices. The company also significantly cut its capital expenditures and increased free cash flow. We believe it is prudent to maintain a modest exposure to gold at this time. We are optimistic about Newcrest based on our outlook for gold pricing as well as the company’s improved operational performance, falling cost structure, and ramp up of production at its Cadia plant in Australia.
The largest detractor was low-cost European airline easyJet plc. Shares fell following the outcome of the Brexit vote and downward profit revisions. The company faced several operating challenges following air traffic control strikes and terrorist attacks, both of which weakened air travel demand. We concluded that the risk of significant regulatory change altered our investment thesis, and we sold the stock.
Should Trump’s policies remain a challenge for the international markets, we believe they are far better prepared to weather such a development than just a few years ago. Europe and Japan appear financially stable and are showing signs of an economic upturn on a lagged basis to the U.S. cycle. The U.K. is demonstrating solid domestic growth while a weaker currency is lending strength to export activity. We do not believe oil, other commodity prices, or emerging markets currencies will return to the lows of early 2016. We remain optimistic regarding the long-term potential for the high quality growth businesses in which we invest.
| † | Sector levels are provided from the Global Industry Classification Standard (“GICS”), developed and exclusively owned by MSCI, Inc. and Standard & Poor’s Financial Services LLC, unless otherwise stated that they have been reclassified or classified by the Adviser. All GICS data is provided “as is” with no warranties. |
| 1 | Performance information reflects results of the Retail Shares. |
7
| | |
| Baron Real Estate Fund (Unaudited) | | December 31, 2016 |
COMPARISONOFTHECHANGEIN VALUEOF $10,000INVESTMENTIN BARON REAL ESTATE FUND (RETAIL SHARES)
INRELATIONTOTHE MSCI USA IMI EXTENDED REAL ESTATE INDEXANDTHE S&P 500 INDEX
| | | | | | | | | | | | | | | | |
| AVERAGE ANNUAL TOTAL RETURNSFORTHEPERIODSENDED DECEMBER 31, 2016 | |
| | | One
Year | | | Three
Years | | | Five
Years | | | Since
Inception
(December 31,
2009) | |
Baron Real Estate Fund — Retail Shares1,2 | | | (2.01)% | | | | 2.90% | | | | 14.58% | | | | 14.09% | |
Baron Real Estate Fund — Institutional Shares1,2 | | | (1.75)% | | | | 3.17% | | | | 14.89% | | | | 14.37% | |
Baron Real Estate Fund — R6 Shares1,2,3 | | | (1.74)% | | | | 3.17% | | | | 14.89% | | | | 14.38% | |
MSCI USA IMI Extended Real Estate Index1 | | | 8.24% | | | | 9.30% | | | | 14.26% | | | | 13.16% | |
S&P 500 Index1 | | | 11.96% | | | | 8.87% | | | | 14.66% | | | | 12.83% | |
| 1 | The indexes are unmanaged. The MSCI USA IMI Extended Real Estate Index is a custom index calculated by MSCI for, and as requested by, BAMCO, Inc. The index includes real estate and real estate-related GICS classification securities. MSCI makes no express or implied warranties or representation and shall have no liability whatsoever with respect to any MSCI data contained herein. The MSCI data may not be further redistributed or used as a basis for other indexes or any securities or financial products. This report is not approved, reviewed or produced by MSCI. The S&P 500 Index measures the performance of 500 widely held large-cap U.S. companies. The indexes and Baron Real Estate Fund are with dividends, which positively impact the performance results. |
| 2 | Past performance is not predictive of future performance. The performance data does not reflect the deduction of taxes that a shareholder would pay on Fund distributions or redemption of Fund shares. The Adviser has reimbursed certain Fund expenses (by contract as long as BAMCO, Inc. is the Adviser to the Fund) and the Fund’s transfer agency expenses may be reduced by expense offsets from an unaffiliated transfer agent, without which performance would have been lower. |
| 3 | Performance for the R6 Shares prior to January 29, 2016 is based on the performance of the Institutional Shares. |
8
| | |
| December 31, 2016 (Unaudited) | | Baron Real Estate Fund |
TOP TEN HOLDINGSASOF DECEMBER 31, 2016
| | | | |
| | | Percent of
Net Assets | |
Mohawk Industries, Inc. | | | 6.8% | |
MGM Resorts International | | | 6.3% | |
InterXion Holding N.V. | | | 6.1% | |
Equinix, Inc. | | | 5.1% | |
American Tower Corp. | | | 4.8% | |
Hilton Worldwide Holdings, Inc. | | | 4.6% | |
Home Depot, Inc. | | | 4.3% | |
CBRE Group, Inc. | | | 3.8% | |
Macquarie Infrastructure Corporation | | | 3.8% | |
Vulcan Materials Company | | | 3.0% | |
| | | | 48.6% | |
SECTOR BREAKDOWNASOF DECEMBER 31, 2016†
(as a percentage of net assets)
MANAGEMENT’S DISCUSSIONOF FUND PERFORMANCE
For the year ended December 31, 2016, Baron Real Estate Fund1 declined 2.01%, underperforming the MSCI USA IMI Extended Real Estate Index, which gained 8.24%. Since its inception on December 31, 2009 through December 31, 2016, the Fund has outperformed the MSCI USA IMI Extended Real Estate Index, generating an annualized return of 14.09%, compared with an annualized return of 13.16% for that index.
Baron Real Estate Fund is a non-diversified fund that, under normal circumstances, invests 80% of its net assets in real estate and real estate-related companies of all sizes, and in companies which, in the opinion of the Adviser, own significant real estate assets at the time of investment. The Fund seeks to invest in well-managed companies that we believe have significant long-term growth opportunities. The Fund’s investment universe extends beyond real estate investment trusts (REITs) to include hotels, senior housing operators, casino and gaming operators, tower operators, infrastructure-related companies and master limited partnerships (MLPs), data centers, building products companies, real estate service companies, and real estate operating companies. Of course, there can be no guarantee that we will be successful in achieving the Fund’s investment goals.
Certain factors have tempered results of Baron Real Estate Fund in recent years. These include: (i) the Fund’s relatively moderate allocation to REITs, which have benefited from historically low interest rates; (ii) a few investment missteps; and (iii) the strong performance of Home Depot, Inc. and Lowe’s Companies, Inc., which accounted for a combined 13% weighting in the benchmark versus the Fund’s more moderate 5% weighting. Performance in 2016 was also affected by geo-political events. Fears generated by terrorist acts and the Zika virus negatively impacted cruise line holdings. In addition, Brexit triggered widespread uncertainty regarding the prospects for commercial real estate services companies in Europe.
Our investments in REITs, casinos and gaming operators, and building products/services companies contributed the most to returns in the year. Real estate service companies, hotels & leisure, and tower operators and wireless telecommunication services were the largest detractors.
The top contributor was MGM Resorts International, an owner of casinos mainly in Las Vegas and Macau. The company reported strong earnings with robust revenue per available room and cost controls as part of its implementation of its profit growth plan. These strong earnings led to increased free cash flow which the company used for debt reduction. An improved balance sheet and enhanced growth from the openings of its National Harbor and Macau casinos also helped drive up the stock price.
The top detractor was commercial real estate services company Jones Lang LaSalle, Inc. The stock price fell over concerns that capital markets activity would slow dramatically and that the commercial real estate cycle is nearing its peak, given its exposure to the U.K. Brexit further weighed on the stock and we trimmed our position.
The possibility of lower taxes, less regulation, more fiscal spending, faster economic growth, and a normalization of interest rates could bode well for the Fund, in our view. We emphasize what we view as well-managed market leaders that generally possess quality balance sheets, own well-located real estate, and grow cash flow at a faster rate than most peers. We believe many of these high quality companies are also priced at discounts to our assessment of intrinsic value.
| † | Sector levels are provided from the Global Industry Classification Standard (“GICS”), developed and exclusively owned by MSCI, Inc. and Standard & Poor’s Financial Services LLC, unless otherwise stated that they have been reclassified or classified by the Adviser. All GICS data is provided “as is” with no warranties. |
| 1 | Performance information reflects results of the Retail Shares. |
9
| | |
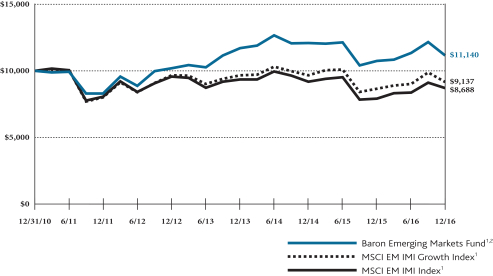
| Baron Emerging Markets Fund (Unaudited) | | December 31, 2016 |
COMPARISONOFTHECHANGEIN VALUEOF $10,000INVESTMENTIN BARON EMERGING MARKETS FUND (RETAIL SHARES)
INRELATIONTOTHE MSCI EM IMI GROWTH INDEXANDTHE MSCI EM IMI INDEX
| | | | | | | | | | | | | | | | |
| AVERAGE ANNUAL TOTAL RETURNSFORTHEPERIODSENDED DECEMBER 31, 2016 | |
| | | One
Year | | | Three
Years | | | Five
Years | | | Since
Inception
(December 31,
2010) | |
Baron Emerging Markets Fund — Retail Shares1,2 | | | 3.75% | | | | (1.57)% | | | | 6.11% | | | | 1.82% | |
Baron Emerging Markets Fund — Institutional Shares1,2 | | | 4.08% | | | | (1.31)% | | | | 6.38% | | | | 2.07% | |
Baron Emerging Markets Fund — R6 Shares1,2,3 | | | 4.17% | | | | (1.27)% | | | | 6.40% | | | | 2.09% | |
MSCI EM IMI Growth Index1 | | | 5.84% | | | | (1.85)% | | | | 2.70% | | | | (1.49)% | |
MSCI EM IMI Index1 | | | 9.90% | | | | (2.40)% | | | | 1.54% | | | | (2.32)% | |
| 1 | The MSCI EM (Emerging Markets) IMI indexes cited are unmanaged, free float-adjusted market capitalization indexes. The MSCI EM (Emerging Markets) IMI Growth Index Net USD and the MSCI EM (Emerging Markets) IMI Index Net USD are designed to measure equity market performance of large-, mid- and small-cap securities in the emerging markets. The MSCI EM (Emerging Markets) IMI Growth Index Net USD screens for growth-style securities. The indexes and Baron Emerging Markets Fund include reinvestment of dividends, net of foreign withholding taxes, which positively impact the performance results. |
| 2 | Past performance is not predictive of future performance. The performance data does not reflect the deduction of taxes that a shareholder would pay on Fund distributions or redemption of Fund shares. The Adviser has reimbursed certain Fund expenses (by contract as long as BAMCO, Inc. is the Adviser to the Fund) and the Fund’s transfer agency expenses may be reduced by expense offsets from an unaffiliated transfer agent without which performance would have been lower. |
| 3 | Performance for the R6 Shares prior to January 29, 2016 is based on the performance of the Institutional Shares. |
10
| | |
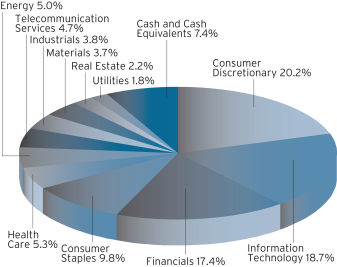
| December 31, 2016 (Unaudited) | | Baron Emerging Markets Fund |
TOP TEN HOLDINGSASOF DECEMBER 31, 2016
| | | | |
| | | Percent of Net
Assets | |
Alibaba Group Holding Limited | | | 3.5% | |
Tencent Holdings, Ltd. | | | 2.3% | |
Samsung Electronics Co., Ltd. | | | 2.2% | |
Taiwan Semiconductor Manufacturing Company Ltd. | | | 2.0% | |
Sberbank of Russia | | | 1.9% | |
Copa Holdings, S.A. | | | 1.7% | |
NAVER Corporation | | | 1.6% | |
Magnit PJSC | | | 1.5% | |
BM&FBOVESPA SA | | | 1.5% | |
China Mobile Ltd. | | | 1.4% | |
| | | | 19.6% | |
SECTOR BREAKDOWNASOF DECEMBER 31, 2016†
(as a percentage of net assets)
MANAGEMENT’S DISCUSSIONOF FUND PERFORMANCE
For the year ended December 31, 2016, Baron Emerging Markets Fund1 gained 3.75%, underperforming the MSCI EM IMI Growth Index, which gained 5.84%.
Baron Emerging Markets Fund is a diversified fund that invests for the long term primarily in companies of any size that have their primary business activities or principal trading markets in developing countries. The Fund may invest up to 20% of its net assets in developed and frontier countries. The Fund seeks to invest in companies that we believe have significant long-term growth
prospects, and to purchase them at prices we believe to be favorable. Of course, there can be no guarantee that we will be successful in achieving the Fund’s investment goals.
Two clear inflection points dominated global market activity in 2016. First, the G20 meeting of the world’s central bankers in February marked a resynchronization of global monetary policy. emerging markets currencies, equities, and commodities demonstrated a return to leadership. This trend was accentuated following Brexit. The second major inflection point proved less friendly to emerging markets. Prior to the U.S. presidential election, several global policymakers had already signaled a tolerance for higher inflation. Trump’s election added fuel to the fire of rising inflation and interest rate expectations while opening a Pandora’s box of potential outcomes on fiscal and monetary policy, taxation, trade, protectionism, and foreign policy. Markets were clearly caught off guard by the U.S. election results, and a fairly dramatic repricing occurred in the final weeks of 2016.
On a country basis, holdings in Brazil, South Africa, and Russia contributed the most to performance. Investments in India, Mexico, and Taiwan were the biggest detractors.
On a sector basis, investments in Information Technology, Financials, and Industrials were the largest contributors. Investments in the Health Care and Consumer Staples sectors were the largest detractors.
The top contributor was Brazilian financial exchanges operator BM&FBOVESPA SA. Brazil’s capital markets and currency rallied on optimism that political reforms will result in economic improvement. Shares also benefited from the company’s announced acquisition of Cetip, creating a unified financial clearinghouse for the Brazilian capital markets. We expect the Cetip acquisition to create significant shareholder value, while longer-term development of the Brazilian capital markets will potentially lead to higher trading volumes.
Leading Indian manufacturer of complex active pharmaceutical ingredients Divi’s Laboratories Ltd., was the top detractor. The stock fell after a surprise FDA inspection of Divi’s manufacturing facilities resulted in unfavorable observations, creating near-term regulatory headwinds for the company. We retain conviction in Divi’s due to its industry-leading profitability and long-term relationships with major pharma clients. We believe the company is well positioned to sustain low-to-mid-teens earnings growth for the next three to five years.
Should Trump’s ultimate policy path remain a challenge for emerging markets, we believe they are far more prepared to weather such a development than just a few years ago. We think emerging markets corporate earnings have likely begun a cyclical recovery. We do not believe oil, other commodity prices and/or emerging markets currencies will return to the lows of early 2016, and we are confident the longer-term structural reforms and political redirection underway in key emerging markets countries will provide support and ultimately restore productivity and value creation. China, always a key barometer of emerging markets health, remains stable. We remain optimistic regarding the long-term potential for the high quality growth businesses in which we invest.
| † | Sector levels are provided from the Global Industry Classification Standard (“GICS”), developed and exclusively owned by MSCI, Inc. and Standard & Poor’s Financial Services LLC, unless otherwise stated that they have been reclassified or classified by the Adviser. All GICS data is provided “as is” with no warranties. |
| 1 | Performance information reflects results of the Retail Shares. |
11
| | |
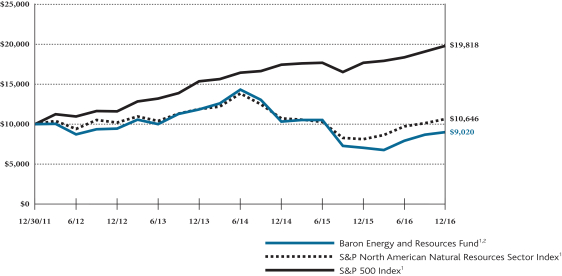
| Baron Energy and Resources Fund (Unaudited) | | December 31, 2016 |
COMPARISONOFTHECHANGEIN VALUEOF $10,000INVESTMENTIN BARON ENERGYAND RESOURCES FUND† (RETAIL SHARES)
INRELATIONTOTHE S&P NORTH AMERICAN NATURAL RESOURCES SECTOR INDEXANDTHE S&P 500 INDEX
| | | | | | | | | | | | |
| AVERAGE ANNUAL TOTAL RETURNSFORTHEPERIODSENDED DECEMBER 31, 2016 | |
| | | One
Year | | | Three
Years | | | Five Years and Since
Inception
(December 31,
2011) | |
Baron Energy and Resources Fund — Retail Shares1,2 | | | 28.02% | | | | (8.71)% | | | | (2.04)% | |
Baron Energy and Resources Fund — Institutional Shares1,2 | | | 28.31% | | | | (8.52)% | | | | (1.83)% | |
Baron Energy and Resources Fund — R6 Shares1,2,3 | | | 28.17% | | | | (8.55)% | | | | (1.85)% | |
S&P North American Natural Resources Sector Index1 | | | 30.87% | | | | (3.66)% | | | | 1.26% | |
S&P 500 Index1 | | | 11.96% | | | | 8.87% | | | | 14.66% | |
| † | The Fund’s historical performance was impacted by gains from IPOs and/or secondary offerings. There is no guarantee that these results can be repeated or that the Fund’s level of participation in IPOs and secondary offerings will be the same in the future. |
| 1 | The indexes are unmanaged. The S&P North American Natural Resources Sector Index measures the performance of U.S.-traded natural resources-related stocks, including mining, energy, paper and forest products, and plantation owning companies. The S&P 500 Index measures the performance of 500 widely held large-cap U.S. companies. The indexes and Baron Energy and Resources Fund are with dividends, which positively impact the performance results. |
| 2 | Past performance is not predictive of future performance. The performance data does not reflect the deduction of taxes that a shareholder would pay on Fund distributions or redemption of Fund shares. The Adviser has reimbursed certain Fund expenses (by contract as long as BAMCO, Inc. is the Adviser to the Fund) and the Fund’s transfer agency expenses may be reduced by expense offsets from an unaffiliated transfer agent, without which performance would have been lower. |
| 3 | Performance for the R6 Shares prior to August 31, 2016 is based on the performance of the Institutional Shares. |
12
| | |
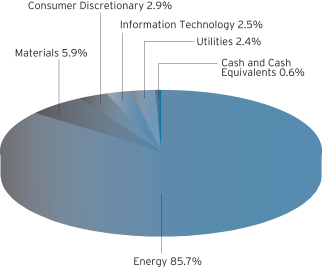
| December 31, 2016 (Unaudited) | | Baron Energy and Resources Fund |
TOP TEN HOLDINGSASOF DECEMBER 31, 2016
| | | | |
| | | Percent of
Net Assets | |
RSP Permian, Inc. | | | 6.9% | |
Parsley Energy, Inc. | | | 6.5% | |
Encana Corp. | | | 5.9% | |
Concho Resources, Inc. | | | 5.8% | |
Newfield Exploration Co. | | | 4.8% | |
Halliburton Co. | | | 3.9% | |
Flotek Industries, Inc. | | | 3.4% | |
Targa Resources Corp. | | | 3.4% | |
Schlumberger Limited | | | 3.0% | |
U.S. Silica Holdings, Inc. | | | 2.9% | |
| | | | 46.5% | |
SECTOR BREAKDOWNASOF DECEMBER 31, 2016†
(as a percentage of net assets)
MANAGEMENT’S DISCUSSIONOF FUND PERFORMANCE
For the year ended December 31, 2016, Baron Energy and Resources Fund1 rose 28.02%, underperforming the S&P North American Natural Resources Sector Index, which gained 30.87%.
The Fund is a non-diversified fund that, under normal circumstances, invests 80% of its net assets in U.S. and non-U.S. energy and resources companies and related companies and master limited partnerships (MLPs) of any market capitalization. The Fund invests primarily in U.S. securities and may invest up to 25% in non-U.S. securities. We select securities that we believe have favorable price-to-value characteristics, are well managed and appropriately financed, and have significant long-term growth prospects and competitive advantages. Of course, there can be no guarantee that we will be successful in achieving the Fund’s investment goals.
After a difficult start, 2016 proved to be a very good year to be invested in energy. It is our view that in 2016 we saw the trough of the energy recession that had begun in 2014, as well as the beginning of a potential multi-year cyclical recovery. Oil prices and equity prices reached low points in February and oilfield activity, investment and earnings reached lows in the middle of the year. We also saw bottoms in industrial and precious metals and other commodities, which coupled with the recovery in oil and natural gas prices led to robust stock performance across much of the energy and resource landscape in 2016.
The Fund’s investments in the oil & gas exploration & production, oil & gas equipment & services, and oil & gas storage & transportation sub-industries contributed the most to performance. The oil & gas refining & marketing, semiconductor equipment, and renewable electricity sub-industries detracted the most during the year.
Parsley Energy, Inc. was the largest contributor. Parsley is an independent exploration and production company focused on the Permian Basin in West Texas. Shares were up in 2016, driven by strong operational performance, raised production guidance, lowered cash costs, and a three-year growth outlook above Street estimates. The company also meaningfully boosted its drilling inventory in the Delaware sub-basin of the Permian through an acquisition. We expect Parsley to continue delivering peer-leading operational performance and growing its acreage footprint through accretive bolt-on acquisitions.
The top detractor was Marathon Petroleum Corp., one of the largest independent refining and marketing companies in the U.S., with operations focused on the Gulf Coast, Texas/Oklahoma and North Dakota. The share price fell in 2016 due to a combination of refining margins that missed Street expectations and investor concerns around growth prospects for Marathon subsidiary MPLX LP following MPLX’s acquisition of MarkWest Energy Partners LP. We chose to exit our position.
Our 2017 outlook remains optimistic. We believe the worst energy recession in a generation is over and the U.S. energy renaissance is alive and well. Finally, equity investors remain significantly underweight in their exposures to the Energy sector and, to a lesser extent, resource-related businesses.
| † | Sector levels are provided from the Global Industry Classification Standard (“GICS”), developed and exclusively owned by MSCI, Inc. and Standard & Poor’s Financial Services LLC, unless otherwise stated that they have been reclassified or classified by the Adviser. All GICS data is provided “as is” with no warranties. |
| 1 | Performance information reflects results of the Retail Shares. |
13
| | |
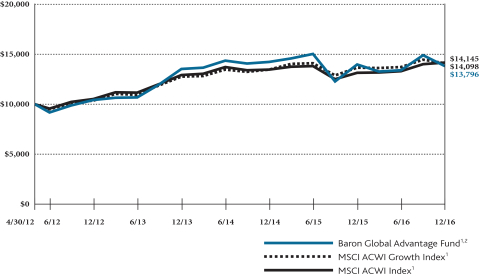
| Baron Global Advantage Fund (Unaudited) | | December 31, 2016 |
COMPARISONOFTHECHANGEIN VALUEOF $10,000INVESTMENTIN BARON GLOBAL ADVANTAGE FUND† (RETAIL SHARES)
INRELATIONTOTHE MSCI ACWI GROWTH INDEXANDTHE MSCI ACWI INDEX
| | | | | | | | | | | | |
| AVERAGE ANNUAL TOTAL RETURNS FORTHEPERIODSENDED DECEMBER 31, 2016 | |
| | | One
Year | | | Three
Years | | | Since
Inception
(April 30,
2012) | |
Baron Global Advantage Fund — Retail Shares1,2 | | | (1.15)% | | | | 0.70% | | | | 7.14% | |
Baron Global Advantage Fund — Institutional Shares1,2 | | | (0.93)% | | | | 0.91% | | | | 7.37% | |
Baron Global Advantage Fund — R6 Shares1,2,3 | | | (0.93)% | | | | 0.91% | | | | 7.37% | |
MSCI ACWI Growth Index Net1 | | | 3.27% | | | | 3.40% | | | | 7.64% | |
MSCI ACWI Index Net1 | | | 7.86% | | | | 3.13% | | | | 7.71% | |
| † | The Fund’s historical performance was impacted by gains from IPOs and/or secondary offerings. There is no guarantee that these results can be repeated or that the Fund’s level of participation in IPOs and secondary offerings will be the same in the future. |
| 1 | The MSCI ACWI indexes cited are unmanaged, free float-adjusted market capitalization weighted indexes reflected in US dollars. The MSCI ACWI Growth Index Net USD measures the equity market performance of large- and mid-cap growth securities across developed and emerging markets. The MSCI ACWI Index Net USD measures the equity market performance of large- and mid-cap securities across developed and emerging markets. The indexes and Baron Global Advantage Fund include reinvestment of dividends, net of foreign withholding taxes, which positively impact the performance results. |
| 2 | Past performance is not predictive of future performance. The performance data does not reflect the deduction of taxes that a shareholder would pay on Fund distributions or redemption of Fund shares. The Adviser has reimbursed certain Fund expenses (by contract as long as BAMCO, Inc. is the Adviser to the Fund) and the Fund’s transfer agency expenses may be reduced by expense offsets from an unaffiliated transfer agent, without which performance would have been lower. |
| 3 | Performance for the R6 Shares prior to August 31, 2016 is based on the performance of the Institutional Shares. |
14
| | |
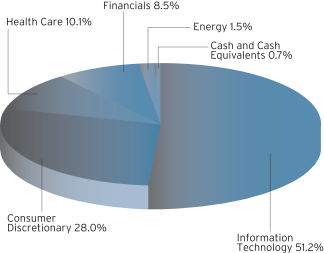
| December 31, 2016 (Unaudited) | | Baron Global Advantage Fund |
TOP TEN HOLDINGSASOF DECEMBER 31, 2016
| | | | |
| | | Percent of
Net Assets | |
Amazon.com, Inc. | | | 12.0% | |
Alibaba Group Holding Limited | | | 5.9% | |
Alphabet Inc. | | | 5.5% | |
Facebook, Inc. | | | 5.4% | |
Constellation Software, Inc. | | | 5.2% | |
TAL Education Group | | | 5.0% | |
Naspers Limited | | | 4.8% | |
JUST EAT plc | | | 4.4% | |
Mellanox Technologies Ltd. | | | 4.0% | |
Ctrip.com International, Ltd. | | | 3.9% | |
| | | | 56.1% | |
SECTOR BREAKDOWNASOF DECEMBER 31, 2016†
(as a percentage of net assets)
MANAGEMENT’S DISCUSSIONOF FUND PERFORMANCE
For the year ended December 31, 2016, Baron Global Advantage Fund1 lost 1.15%, underperforming the MSCI ACWI Growth Index, which rose 3.27%.
Baron Global Advantage Fund is a diversified fund that invests primarily in growth companies of any size located throughout the world. We have a long-term mindset, conduct bottom-up research, and believe insights and perspective are more important
than short-term events or results. We invest in companies that we believe have favorable price-to-value and risk/reward characteristics, have strong free cash flow and returns on capital, are well-managed, and have sustainable competitive advantages. Of course, there can be no guarantee that we will be successful in achieving the Fund’s investment goals.
The year started with a global sell-off driven by concerns around a possible tightening of the credit markets, signs of slowing growth, particularly in China, and continued low oil prices. As global concerns subsided and oil prices ticked up, the markets recovered. The resynchronization of global monetary policy in February also helped boost several international and particularly emerging markets currencies, equities, and commodities. This trend was accentuated following Brexit. Global markets continued a steady, mostly upward climb until the U.S. presidential election in November, when the markets were subject to a powerful rotation from global growth businesses, which are the companies we primarily invest in, into predominantly domestic cyclical and value stocks that investors expect to benefit from U.S. corporate tax cuts, infrastructure investments, military build-up, and trade protectionism.
On a sector basis, investments in Consumer Discretionary, Financials, and Energy were the top contributors to performance. Health Care and, to a lesser extent, Telecommunication Services and Utilities, were the top detractors. From a country perspective, holdings in China, Brazil, and Canada were the top contributors. Investments in the U.S., Indonesia, and the U.K. were the biggest detractors.
TAL Education Group, a leading K-12 tutoring company in China, was the largest contributor in 2016. Shares were driven up by more than 60% growth in student enrollments, the opening of new learning centers, entry to new cities, and expansion of existing learning centers. With less than 5% market share, we believe TAL has the potential to continue to gain share in a fragmented market.
The largest detractor was specialty pharmaceutical company Pacira Pharmaceuticals, Inc. In late 2014, the FDA’s attempt to limit certain promotional materials for Pacira’s main product EXPAREL had a negative impact into 2015. At the end of 2015, Pacira announced a favorable resolution that rescinded the FDA’s prior limitations and clarified EXPAREL’s label in a favorable way. While 2016 was a down year as it took longer than the company expected for sales to recover, we believe 2017 will show good sales acceleration.
The portfolio is constructed on a bottom-up basis, with the quality of ideas and conviction level being the most important determinants of the size of each individual investment. We look for what we believe are unique companies with sustainable competitive advantages and the ability to redeploy capital at high rates of return. We are optimistic about the long-term opportunities of our investments and continue to search for new ideas.
| † | Sector levels are provided from the Global Industry Classification Standard (“GICS”), developed and exclusively owned by MSCI, Inc. and Standard & Poor’s Financial Services LLC, unless otherwise stated that they have been reclassified or classified by the Adviser. All GICS data is provided “as is” with no warranties. |
| 1 | Performance information reflects results of the Retail Shares. |
15
| | |
| Baron Partners Fund | | December 31, 2016 |
STATEMENT OF NET ASSETS
| | | | | | | | | | | | |
| Shares | | Cost | | | Value | |
| Common Stocks (129.96%) | |
| Consumer Discretionary (48.76%) | |
| | | | Apparel, Accessories & Luxury Goods (3.95%) | | | | | | | | |
| | 909,700 | | | Under Armour, Inc., Cl A1 | | $ | 33,032,266 | | | $ | 26,426,785 | |
| | 1,406,500 | | | Under Armour, Inc., Cl C1 | | | 36,183,561 | | | | 35,401,605 | |
| | | | | | | | | | | | |
| | | | | | | 69,215,827 | | | | 61,828,390 | |
| | | | | | | | | | | | |
| | | |
| | | | Automobile Manufacturers (15.13%) | | | | | | | | |
| | 1,110,000 | | | Tesla Motors, Inc.1 | | | 236,819,490 | | | | 237,195,900 | |
| | | |
| | | | Automotive Retail (1.54%) | | | | | | | | |
| | 375,000 | | | CarMax, Inc.1 | | | 10,138,739 | | | | 24,146,250 | |
| | | |
| | | | Hotels, Resorts & Cruise Lines (10.46%) | | | | | | | | |
| | 2,600,000 | | | Hyatt Hotels Corp., Cl A1 | | | 72,054,423 | | | | 143,676,000 | |
| | 475,000 | | | Norwegian Cruise Line Holdings Ltd.1,2 | | | 20,954,950 | | | | 20,201,750 | |
| | | | | | | | | | | | |
| | | | | | | 93,009,373 | | | | 163,877,750 | |
| | | | | | | | | | | | |
| | | |
| | | | Internet & Direct Marketing Retail (2.90%) | | | | | | | | |
| | 20,357,182 | | | AO World plc (United Kingdom)1,2 | | | 43,575,320 | | | | 45,509,971 | |
| | | |
| | | | Leisure Facilities (9.53%) | | | | | | | | |
| | 925,800 | | | Vail Resorts, Inc. | | | 27,801,851 | | | | 149,340,798 | |
| | | |
| | | | Movies & Entertainment (4.86%) | | | | | | | | |
| | 5,350,000 | | | Manchester United plc, Cl A2 | | | 91,115,472 | | | | 76,237,500 | |
| | | |
| | | | Restaurants (0.39%) | | | | | | | | |
| | 30,000 | | | Panera Bread Co., Cl A1 | | | 5,026,025 | | | | 6,152,700 | |
| | | | | | | | | | | | |
| | Total Consumer Discretionary | | | 576,702,097 | | | | 764,289,259 | |
| | | | | | | | | | | | |
|
| Financials (31.10%) | |
| | | | Asset Management & Custody Banks (2.81%) | | | | | | | | |
| | 2,890,000 | | | The Carlyle Group | | | 72,986,195 | | | | 44,072,500 | |
| | | |
| | | | Financial Exchanges & Data (8.03%) | | | | | | | | |
| | 770,000 | | | FactSet Research Systems, Inc. | | | 50,187,585 | | | | 125,841,100 | |
| | | |
| | | | Investment Banking & Brokerage (7.05%) | | | | | | | | |
| | 2,800,000 | | | The Charles Schwab Corp. | | | 24,289,154 | | | | 110,516,000 | |
| | | |
| | | | Property & Casualty Insurance (13.21%) | | | | | | | | |
| | 2,400,000 | | | Arch Capital Group Ltd.1,2 | | | 31,929,992 | | | | 207,096,000 | |
| | | | | | | | | | | | |
| | Total Financials | | | 179,392,926 | | | | 487,525,600 | |
| | | | | | | | | | | | |
|
| Health Care (8.65%) | |
| | | | Health Care Equipment (7.48%) | | | | | | | | |
| | 1,000,000 | | | IDEXX Laboratories, Inc.1 | | | 43,593,540 | | | | 117,270,000 | |
| | | |
| | | | Health Care Technology (1.17%) | | | | | | | | |
| | 1,776,790 | | | Inovalon Holdings, Inc., CI A1 | | | 47,548,581 | | | | 18,300,937 | |
| | | | | | | | | | | | |
| | Total Health Care | | | 91,142,121 | | | | 135,570,937 | |
| | | | | | | | | | | | |
| | | | | | | | | | | | |
| Shares | | Cost | | | Value | |
| Common Stocks (continued) | |
| Industrials (10.70%) | |
| | | | Human Resource & Employment Services (2.49%) | | | | | | | | |
| | 800,000 | | | Robert Half International, Inc. | | $ | 30,067,907 | | | $ | 39,024,000 | |
| | | |
| | | | Research & Consulting Services (3.62%) | | | | | | | | |
| | 700,000 | | | Verisk Analytics, Inc.1 | | | 17,942,027 | | | | 56,819,000 | |
| | | |
| | | | Trading Companies & Distributors (4.59%) | | | | | | | | |
| | 1,000,000 | | | Air Lease Corp. | | | 31,581,290 | | | | 34,330,000 | |
| | 800,000 | | | Fastenal Co. | | | 13,725,871 | | | | 37,584,000 | |
| | | | | | | | | | | | |
| | | | | | | 45,307,161 | | | | 71,914,000 | |
| | | | | | | | | | | | |
| | Total Industrials | | | 93,317,095 | | | | 167,757,000 | |
| | | | | | | | | | | | |
|
| Information Technology (23.93%) | |
| | | | Internet Software & Services (19.80%) | | | | | | | | |
| | 400,000 | | | Benefitfocus, Inc.1 | | | 14,575,230 | | | | 11,880,000 | |
| | 1,100,000 | | | CoStar Group, Inc.1 | | | 112,737,431 | | | | 207,339,000 | |
| | 2,500,000 | | | Zillow Group, Inc., Cl A1 | | | 60,868,348 | | | | 91,125,000 | |
| | | | | | | | | | | | |
| | | | | | | 188,181,009 | | | | 310,344,000 | |
| | | | | | | | | | | | |
| | | | IT Consulting & Other Services (4.13%) | | | | | | | | |
| | 640,000 | | | Gartner, Inc.1 | | | 40,674,307 | | | | 64,684,800 | |
| | | | | | | | | | | | |
| | Total Information Technology | | | 228,855,316 | | | | 375,028,800 | |
| | | | | | | | | | | | |
|
| Real Estate (6.82%) | |
| | | | Hotel & Resort REITs (0.62%) | | | | | | | | |
| | 382,727 | | | MGM Growth Properties LLC, Cl A | | | 8,037,267 | | | | 9,686,820 | |
| | | |
| | | | Office REITs (2.30%) | | | | | | | | |
| | 985,000 | | | Douglas Emmett, Inc. | | | 28,695,526 | | | | 36,011,600 | |
| | | |
| | | | Specialized REITs (3.90%) | | | | | | | | |
| | 2,000,000 | | | Gaming and Leisure Properties, Inc. | | | 61,345,351 | | | | 61,240,000 | |
| | | | | | | | | | | | |
| | Total Real Estate | | | 98,078,144 | | | | 106,938,420 | |
| | | | | | | | | | | | |
| | Total Common Stocks | | | 1,267,487,699 | | | | 2,037,110,016 | |
| | | | | | | | | | | | |
| | | | | | | | | | | | |
| Private Equity Investments (0.22%) | |
| Financials (0.22%) | |
| | | | Asset Management & Custody Banks (0.22%) | | | | | | | | |
| | 7,579,130 | | | Windy City Investments Holdings, L.L.C.1,3,4,6 | | | 0 | | | | 3,456,083 | |
| | | | | | | | | | | | |
| | |
| 16 | | See Notes to Financial Statements. |
| | |
| December 31, 2016 | | Baron Partners Fund |
STATEMENT OF NET ASSETS (Continued)
| | | | | | | | | | | | |
| Principal Amount | | Cost | | | Value | |
| Short Term Investments (0.02%) | |
| | $274,928 | | | Repurchase Agreement with Fixed Income Clearing Corp., dated 12/30/2016, 0.0305% due 1/3/2017; Proceeds at maturity - $274,928; (Fully collateralized by $305,000 U.S. Treasury Note,
1.625% due 5/15/2026; Market value - $283,855)5 | | $ | 274,928 | | | $ | 274,928 | |
| | | | | | | | | | | | |
| | Total Investments (130.20%) | | $ | 1,267,762,627 | | | | 2,040,841,027 | |
| | | | | | | | | | | | |
| | Liabilities Less Cash and Other Assets (-30.20%) | | | | (473,359,347 | ) |
| | | | | | | | | | | | |
| | Net Assets | | | $ | 1,567,481,680 | |
| | | | | | | | | | | | |
| Retail Shares (Equivalent to $37.06 per share based
on 24,662,195 shares outstanding) |
| | $ | 913,879,802 | |
| | | | | | | | | | | | |
| Institutional Shares (Equivalent to $37.70 per share based
on 17,115,523 shares outstanding) |
| | $ | 645,338,910 | |
| | | | | | | | | | | | |
| R6 Shares (Equivalent to $37.71 per share based
on 219,147 shares outstanding) |
| | $ | 8,262,968 | |
| | | | | | | | | | | | |
| % | Represents percentage of net assets. |
| 1 | Non-income producing securities. |
| 3 | At December 31, 2016, the market value of restricted and fair valued securities amounted to $3,456,083 or 0.22% of net assets. This security is not deemed liquid. See Note 6 regarding Restricted Securities. |
| 4 | The Adviser has reclassified/classified certain securities in or out of this sub-industry. Such reclassifications/classifications are not supported by S&P or MSCI. |
| 5 | Level 2 security. See Note 7 regarding Fair Value Measurements. |
| 6 | Level 3 security. See Note 7 regarding Fair Value Measurements. |
All securities are Level 1, unless otherwise noted.
| | |
| See Notes to Financial Statements. | | 17 |
| | |
| Baron Focused Growth Fund | | December 31, 2016 |
STATEMENT OF NET ASSETS
| | | | | | | | | | | | |
| Shares | | Cost | | | Value | |
| Common Stocks (90.80%) | |
| Consumer Discretionary (46.07%) | |
| | | | Automobile Manufacturers (10.98%) | | | | | | | | |
| | 90,000 | | | Tesla Motors, Inc.1 | | $ | 20,342,221 | | | $ | 19,232,100 | |
| | | |
| | | | Hotels, Resorts & Cruise Lines (15.52%) | | | | | | | | |
| | 150,000 | | | Choice Hotels International, Inc. | | | 5,080,139 | | | | 8,407,500 | |
| | 340,000 | | | Hyatt Hotels Corp., Cl A1 | | | 12,201,302 | | | | 18,788,400 | |
| | | | | | | | | | | | |
| | | | | | | 17,281,441 | | | | 27,195,900 | |
| | | | | | | | | | | | |
| | | |
| | | | Internet & Direct Marketing Retail (2.55%) | | | | | | | | |
| | 2,000,000 | | | AO World plc (United Kingdom)1,2 | | | 3,931,658 | | | | 4,471,147 | |
| | | |
| | | | Leisure Facilities (12.54%) | | | | | | | | |
| | 136,230 | | | Vail Resorts, Inc. | | | 8,272,836 | | | | 21,975,261 | |
| | | |
| | | | Movies & Entertainment (4.48%) | | | | | | | | |
| | 550,000 | | | Manchester United plc, Cl A2 | | | 8,719,506 | | | | 7,837,500 | |
| | | | | | | | | | | | |
| | Total Consumer Discretionary | | | 58,547,662 | | | | 80,711,908 | |
| | | | | | | | | | | | |
|
| Consumer Staples (2.52%) | |
| | | | Household Products (2.52%) | | | | | |
| | 100,000 | | | Church & Dwight Co., Inc. | | | 1,274,171 | | | | 4,419,000 | |
| | | | | | | | | | | | |
|
| Financials (19.38%) | |
| | | | Asset Management & Custody Banks (7.46%) | | | | | | | | |
| | 435,000 | | | The Carlyle Group | | | 9,519,389 | | | | 6,633,750 | |
| | 175,000 | | | Financial Engines, Inc. | | | 5,948,430 | | | | 6,431,250 | |
| | | | | | | | | | | | |
| | | | | | | 15,467,819 | | | | 13,065,000 | |
| | | | | | | | | | | | |
| | | |
| | | | Financial Exchanges & Data (7.00%) | | | | | | | | |
| | 75,000 | | | FactSet Research Systems, Inc. | | | 5,828,282 | | | | 12,257,250 | |
| | | |
| | | | Property & Casualty Insurance (4.92%) | | | | | | | | |
| | 100,000 | | | Arch Capital Group Ltd.1,2 | | | 1,800,056 | | | | 8,629,000 | |
| | | | | | | | | | | | |
| | Total Financials | | | 23,096,157 | | | | 33,951,250 | |
| | | | | | | | | | | | |
|
| Industrials (8.08%) | |
| | | | Building Products (2.62%) | | | | | | | | |
| | 160,000 | | | CaesarStone Ltd.1,2 | | | 6,770,357 | | | | 4,584,000 | |
| | | |
| | | | Research & Consulting Services (2.78%) | | | | | | | | |
| | 60,000 | | | Verisk Analytics, Inc.1 | | | 1,688,861 | | | | 4,870,200 | |
| | | |
| | | | Trading Companies & Distributors (2.68%) | | | | | | | | |
| | 100,000 | | | Fastenal Co. | | | 2,169,716 | | | | 4,698,000 | |
| | | | | | | | | | | | |
| | Total Industrials | | | 10,628,934 | | | | 14,152,200 | |
| | | | | | | | | | | | |
| | | | | | | | | | | | |
| Shares | | Cost | | | Value | |
| Common Stocks (continued) | | | | |
| Information Technology (14.75%) | |
| | | | Application Software (2.87%) | | | | | | | | |
| | 101,870 | | | Guidewire Software, Inc.1 | | $ | 4,816,692 | | | $ | 5,025,247 | |
| | | |
| | | | Internet Software & Services (11.88%) | | | | | | | | |
| | 225,000 | | | Benefitfocus, Inc.1 | | | 5,980,202 | | | | 6,682,500 | |
| | 75,000 | | | CoStar Group, Inc.1 | | | 13,824,622 | | | | 14,136,750 | |
| | | | | | | | | | | | |
| | | | | | | 19,804,824 | | | | 20,819,250 | |
| | | | | | | | | | | | |
| | Total Information Technology | | | 24,621,516 | | | | 25,844,497 | |
| | | | | | | | | | | | |
| | Total Common Stocks | | | 118,168,440 | | | | 159,078,855 | |
| | | | | | | | | | | | |
| | | | | | | | | | | | |
| Preferred Stocks (4.37%) | |
| Telecommunication Services (4.37%) | |
| | | | Alternative Carriers (4.37%) | | | | | | | | |
| | 22,300 | | | Iridium Communications, Inc.,
Series B, 6.75%3 | | | 5,814,082 | | | | 7,664,733 | |
| | | | | | | | | | | | |
| | | | | | | | | | | | |
| Principal Amount | | | | | | |
| Short Term Investments (4.77%) | |
| | $8,350,534 | | | Repurchase Agreement with Fixed Income Clearing Corp., dated 12/30/2016, 0.0305% due 1/3/2017; Proceeds at maturity - $8,350,562; (Fully collateralized by $8,430,000 U.S. Treasury Note, 0.375% due 7/15/2025; Market value - $8,521,533)3 | | | 8,350,534 | | | | 8,350,534 | |
| | | | | | | | | | | | |
| | Total Investments (99.94%) | | $ | 132,333,056 | | | | 175,094,122 | |
| | | | | | | | | | | | |
| | Cash and Other Assets Less Liabilities (0.06%) | | | | 100,830 | |
| | | | | | | | | | | | |
| | Net Assets | | | | | | $ | 175,194,952 | |
| | | | | | | | | | | | |
| Retail Shares (Equivalent to $12.43 per share based on
3,031,041 shares outstanding) |
| | $ | 37,688,342 | |
| | | | | | | | | | | | |
| Institutional Shares (Equivalent to $12.63 per share based on
10,208,792 shares outstanding) |
| | $ | 128,926,883 | |
| | | | | | | | | | | | |
| R6 Shares (Equivalent to $12.63 per share based on
679,102 shares outstanding) |
| | $ | 8,579,727 | |
| | | | | | | | | | | | |
| % | Represents percentage of net assets. |
| 1 | Non-income producing securities. |
| 3 | Level 2 security. See Note 7 regarding Fair Value Measurements. |
All securities are Level 1, unless otherwise noted.
| | |
| 18 | | See Notes to Financial Statements. |
| | |
| December 31, 2016 | | Baron International Growth Fund |
STATEMENT OF NET ASSETS
| | | | | | | | | | | | |
| Shares | | Cost | | | Value | |
| Common Stocks (90.16%) | |
| Australia (4.54%) | |
| | 48,169 | | | Domino’s Pizza Enterprises Ltd. | | $ | 388,096 | | | $ | 2,259,128 | |
| | 345,000 | | | MYOB Group Ltd. | | | 951,083 | | | | 911,228 | |
| | 55,000 | | | Newcrest Mining Ltd. | | | 498,261 | | | | 803,738 | |
| | | | | | | | | | | | |
| | Total Australia | | | 1,837,440 | | | | 3,974,094 | |
| | | | | | | | | | | | |
|
| Brazil (3.10%) | |
| | 250,000 | | | BM&FBOVESPA SA2 | | | 827,205 | | | | 1,264,861 | |
| | 60,000 | | | Smiles SA2 | | | 702,409 | | | | 823,519 | |
| | 85,000 | | | TOTVS SA2 | | | 703,494 | | | | 626,536 | |
| | | | | | | | | | | | |
| | Total Brazil | | | 2,233,108 | | | | 2,714,916 | |
| | | | | | | | | | | | |
|
| Canada (6.20%) | |
| | 15,000 | | | Agnico Eagle Mines Ltd. | | | 512,576 | | | | 630,000 | |
| | 5,200 | | | Constellation Software, Inc. | | | 662,016 | | | | 2,362,957 | |
| | 110,000 | | | Encana Corp. | | | 945,261 | | | | 1,291,400 | |
| | 35,000 | | | Suncor Energy, Inc. | | | 1,225,000 | | | | 1,144,150 | |
| | | | | | | | | | | | |
| | Total Canada | | | 3,344,853 | | | | 5,428,507 | |
| | | | | | | | | | | | |
|
| Chile (1.05%) | |
| | 32,000 | | | Sociedad Química y Minera de Chile SA, ADR | | | 661,784 | | | | 916,800 | |
| | | | | | | | | | | | |
|
| China (9.43%) | |
| | 20,000 | | | Alibaba Group Holding Ltd., ADR1 | | | 1,592,811 | | | | 1,756,200 | |
| | 3,500 | | | Baidu, Inc., ADR1 | | | 663,199 | | | | 575,435 | |
| | 76,000 | | | BYD Co., Ltd., Cl H | | | 471,093 | | | | 400,361 | |
| | 90,000 | | | China Distance Education Holdings Ltd., ADR1 | | | 996,684 | | | | 1,006,200 | |
| | 21,000 | | | Ctrip.com International Ltd., ADR1 | | | 756,010 | | | | 840,000 | |
| | 315,771 | | | Haitong Securities Co., Ltd., Cl H | | | 486,565 | | | | 541,589 | |
| | 2,001,700 | | | Kingdee International Software Group Co. Ltd.1 | | | 234,264 | | | | 751,170 | |
| | 8,000 | | | TAL Education Group, ADR1 | | | 250,373 | | | | 561,200 | |
| | 75,000 | | | Tencent Holdings Ltd. | | | 393,663 | | | | 1,834,741 | |
| | | | | | | | | | | | |
| | Total China | | | 5,844,662 | | | | 8,266,896 | |
| | | | | | | | | | | | |
|
| Denmark (1.06%) | |
| | 53,000 | | | Nets A/S, 144A1 | | | 1,178,281 | | | | 927,547 | |
| | | | | | | | | | | | |
|
| France (3.41%) | |
| | 7,000 | | | Eurofins Scientific SE | | | 682,393 | | | | 2,984,264 | |
| | | | | | | | | | | | |
|
| Germany (6.62%) | |
| | 21,425 | | | Fresenius Medical Care Ag & Co. | | | 1,776,883 | | | | 1,814,392 | |
| | 23,566 | | | ProSiebenSat.1 Media SE | | | 953,083 | | | | 908,175 | |
| | 165,100 | | | RIB Software AG | | | 1,395,193 | | | | 2,164,587 | |
| | 15,000 | | | Symrise AG | | | 171,804 | | | | 913,121 | |
| | | | | | | | | | | | |
| | Total Germany | | | 4,296,963 | | | | 5,800,275 | |
| | | | | | | | | | | | |
|
| Hong Kong (1.80%) | |
| | 275,000 | | | L’Occitane International SA | | | 580,547 | | | | 519,892 | |
| | 1,000,000 | | | Man Wah Holdings Ltd. | | | 588,953 | | | | 677,026 | |
| | 240,010 | | | Wynn Macau Ltd.1 | | | 290,539 | | | | 381,936 | |
| | | | | | | | | | | | |
| | Total Hong Kong | | | 1,460,039 | | | | 1,578,854 | |
| | | | | | | | | | | | |
| | | | | | | | | | | | |
| Shares | | Cost | | | Value | |
| Common Stocks (continued) | |
| India (2.46%) | |
| | 8,000 | | | Maruti Suzuki India Ltd. | | $ | 609,012 | | | $ | 627,028 | |
| | 55,000 | | | Multi Commodity Exchange of India Ltd. | | | 790,850 | | | | 1,027,147 | |
| | 75,000 | | | Zee Entertainment Enterprises Ltd. | | | 379,557 | | | | 500,645 | |
| | | | | | | | | | | | |
| | Total India | | | 1,779,419 | | | | 2,154,820 | |
| | | | | | | | | | | | |
|
| Indonesia (1.97%) | |
| | 812,373 | | | PT Matahari Department Store Tbk | | | 1,014,213 | | | | 912,017 | |
| | 1,250,000 | | | PT Sarana Menara Nusantara Tbk1 | | | 260,297 | | | | 332,158 | |
| | 1,301,400 | | | PT Tower Bersama Infrastructure Tbk | | | 534,199 | | | | 481,052 | |
| | | | | | | | | | | | |
| | Total Indonesia | | | 1,808,709 | | | | 1,725,227 | |
| | | | | | | | | | | | |
|
| Ireland (1.53%) | |
| | 16,075 | | | Ryanair Holdings plc, ADR1 | | | 399,042 | | | | 1,338,405 | |
| | | | | | | | | | | | |
|
| Israel (4.09%) | |
| | 16,000 | | | Check Point Software Technologies Ltd.1 | | | 758,407 | | | | 1,351,360 | |
| | 27,000 | | | Mellanox Technologies Ltd.1 | | | 1,046,562 | | | | 1,104,300 | |
| | 18,000 | | | Mobileye N.V.1 | | | 652,001 | | | | 686,160 | |
| | 10,000 | | | Wix.com Ltd.1 | | | 439,285 | | | | 445,500 | |
| | | | | | | | | | | | |
| | Total Israel | | | 2,896,255 | | | | 3,587,320 | |
| | | | | | | | | | | | |
|
| Japan (12.45%) | |
| | 25,000 | | | Bridgestone Corp. | | | 480,797 | | | | 901,390 | |
| | 200,000 | | | Daiwa Securities Group, Inc. | | | 1,367,627 | | | | 1,232,599 | |
| | 6,500 | | | FANUC Corp. | | | 593,652 | | | | 1,102,011 | |
| | 44,000 | | | Mitsui Fudosan Co. Ltd. | | | 908,371 | | | | 1,018,353 | |
| | 38,000 | | | MonotaRO Co. Ltd. | | | 466,100 | | | | 777,070 | |
| | 130,000 | | | Rakuten, Inc. | | | 1,636,392 | | | | 1,274,139 | |
| | 42,000 | | | SMS Co. Ltd. | | | 1,064,897 | | | | 931,097 | |
| | 38,000 | | | SoftBank Group Corp. | | | 1,682,304 | | | | 2,524,663 | |
| | 41,000 | | | Sony Corp., ADR | | | 1,308,191 | | | | 1,149,230 | |
| | | | | | | | | | | | |
| | Total Japan | | | 9,508,331 | | | | 10,910,552 | |
| | | | | | | | | | | | |
|
| Mexico (1.12%) | |
| | 200,000 | | | Grupo Financiero Banorte S.A.B. de C.V., Cl O | | | 1,111,475 | | | | 985,062 | |
| | | | | | | | | | | | |
|
| Netherlands (1.44%) | |
| | 5,000 | | | Cimpress NV1 | | | 475,629 | | | | 458,050 | |
| | 23,000 | | | InterXion Holding N.V.1 | | | 761,293 | | | | 806,610 | |
| | | | | | | | | | | | |
| | Total Netherlands | | | 1,236,922 | | | | 1,264,660 | |
| | | | | | | | | | | | |
|
| Norway (1.31%) | |
| | 50,000 | | | Golar LNG Ltd. | | | 823,128 | | | | 1,147,000 | |
| | | | | | | | | | | | |
|
| Panama (1.24%) | |
| | 12,000 | | | Copa Holdings, S.A., Cl A | | | 973,816 | | | | 1,089,960 | |
| | | | | | | | | | | | |
|
| Russia (1.15%) | |
| | 50,000 | | | Yandex N.V., Cl A1 | | | 714,945 | | | | 1,006,500 | |
| | | | | | | | | | | | |
| | |
| See Notes to Financial Statements. | | 19 |
| | |
| Baron International Growth Fund | | December 31, 2016 |
STATEMENT OF NET ASSETS (Continued)
| | | | | | | | | | | | |
| Shares | | Cost | | | Value | |
| Common Stocks (continued) | |
| South Africa (0.95%) | |
| | 160,622 | | | Steinhoff International Holdings N.V. | | $ | 749,072 | | | $ | 829,163 | |
| | | | | | | | | | | | |
|
| Spain (3.85%) | |
| | 12,000 | | | Aena SA, 144A | | | 1,098,173 | | | | 1,637,713 | |
| | 40,000 | | | Grifols SA, ADR | | | 207,626 | | | | 642,800 | |
| | 32,105 | | | Industria de Diseño Textil SA | | | 919,024 | | | | 1,095,983 | |
| | | | | | | | | | | | |
| | Total Spain | | | 2,224,823 | | | | 3,376,496 | |
| | | | | | | | | | | | |
|
| Switzerland (2.13%) | |
| | 42,067 | | | Julius Baer Group Ltd. | | | 1,489,578 | | | | 1,868,497 | |
| | | | | | | | | | | | |
|
| United Kingdom (12.63%) | |
| | 200,000 | | | Abcam plc | | | 1,362,532 | | | | 1,890,501 | |
| | 240,214 | | | AO World plc1 | | | 546,053 | | | | 537,016 | |
| | 225,000 | | | Domino’s Pizza Group plc | | | 675,667 | | | | 1,000,462 | |
| | 73,000 | | | Experian plc | | | 770,060 | | | | 1,416,052 | |
| | 300,000 | | | Horizon Discovery Group plc1 | | | 608,398 | | | | 532,397 | |
| | 110,000 | | | Howden Joinery Group PLC | | | 511,855 | | | | 520,294 | |
| | 30,000 | | | Intertek Group plc | | | 816,271 | | | | 1,286,995 | |
| | 70,159 | | | JUST EAT plc1 | | | 290,233 | | | | 504,517 | |
| | 1,501,886 | | | Lekoil Ltd.1 | | | 530,554 | | | | 485,868 | |
| | 22,325 | | | Reckitt Benckiser Group PLC | | | 2,145,569 | | | | 1,894,568 | |
| | 300,000 | | | Worldpay Group plc, 144A | | | 1,097,280 | | | | 997,874 | |
| | | | | | | | | | | | |
| | Total United Kingdom | | | 9,354,472 | | | | 11,066,544 | |
| | | | | | | | | | | | |
|
| United States (4.63%) | |
| | 28,000 | | | Agilent Technologies, Inc. | | | 639,432 | | | | 1,275,680 | |
| | 27,000 | | | Arch Capital Group Ltd.1 | | | 983,682 | | | | 2,329,830 | |
| | 115,155 | | | TerraForm Global, Inc., Cl A | | | 904,503 | | | | 454,862 | |
| | | | | | | | | | | | |
| | Total United States | | | 2,527,617 | | | | 4,060,372 | |
| | | | | | | | | | | | |
| | Total Common Stocks | | | 59,137,127 | | | | 79,002,731 | |
| | | | | | | | | | | | |
| | | | | | | | | | | | |
| | | | | | | | | | | | |
| Principal Amount | | Cost | | | Value | |
| Short Term Investments (9.57%) | |
| | $8,384,431 | | | Repurchase Agreement with
Fixed Income Clearing Corp.,
dated 12/30/2016, 0.0305%
due 1/3/2017; Proceeds at
maturity - $8,384,459;
(Fully collateralized by
$8,465,000 U.S. Treasury Note,
0.375% due 7/15/2025
Market value - $8,556,913)2 | | $ | 8,384,431 | | | $ | 8,384,431 | |
| | | | | | | | | | | | |
| | Total Investments (99.73%) | | $ | 67,521,558 | | | | 87,387,162 | |
| | | | | | | | | | | | |
| | Cash and Other Assets Less Liabilities (0.27%) | | | | 233,299 | |
| | | | | | | | | | | | |
| | Net Assets | | | $ | 87,620,461 | |
| | | | | | | | | | | | |
| Retail Shares (Equivalent to $18.09 per share based on
2,314,654 shares outstanding) |
| | $ | 41,862,236 | |
| | | | | | | | | | | | |
| Institutional Shares (Equivalent to $18.25 per share based on
2,486,436 shares outstanding) |
| | $ | 45,384,682 | |
| | | | | | | | | | | | |
| R6 Shares (Equivalent to $18.25 per share based on
20,464 shares outstanding) |
| | $ | 373,543 | |
| | | | | | | | | | | | |
| % | Represents percentage of net assets. |
| 1 | Non-income producing securities. |
| 2 | Level 2 security. See Note 7 regarding Fair Value Measurements. |
| ADR | American Depositary Receipt. |
| 144A | Security is exempt from registration pursuant to Rule 144A under the Securities Act of 1933. This security may be resold in transactions that are exempt from registration, normally to qualified institutional buyers. These securities have been deemed liquid pursuant to policies and procedures approved by the Board of Trustees, unless otherwise noted. At December 31, 2016, the market value of Rule 144A securities amounted to $3,563,134 or 4.07% of net assets. |
All securities are Level 1, unless otherwise noted.
| | | | |
Summary of Investments by Sector
as of December 31, 2016 | | Percentage of
Net Assets | |
| |
Information Technology | | | 23.1 | % |
| |
Consumer Discretionary | | | 19.6 | % |
| |
Financials | | | 10.6 | % |
| |
Industrials | | | 10.5 | % |
| |
Health Care | | | 10.4 | % |
| |
Energy | | | 4.6 | % |
| |
Telecommunication Services | | | 3.8 | % |
| |
Materials | | | 3.7 | % |
| |
Consumer Staples | | | 2.2 | % |
| |
Real Estate | | | 1.2 | % |
| |
Utilities | | | 0.5 | % |
| |
Cash and Cash Equivalents* | | | 9.8 | % |
| | | | 100.0 | % |
| * | Includes short term investments. |
| | |
| 20 | | See Notes to Financial Statements. |
| | |
| December 31, 2016 | | Baron Real Estate Fund |
STATEMENT OF NET ASSETS
| | | | | | | | | | | | |
| Shares | | Cost | | | Value | |
| Common Stocks (97.76%) | |
| Consumer Discretionary (30.60%) | |
| | | | Casinos & Gaming (6.27%) | | | | | | | | |
| | 2,068,700 | | | MGM Resorts International1 | | $ | 41,142,891 | | | $ | 59,640,621 | |
| | | |
| | | | Home Furnishings (6.83%) | | | | | | | | |
| | 325,307 | | | Mohawk Industries, Inc.1 | | | 46,064,799 | | | | 64,957,302 | |
| | | |
| | | | Home Improvement Retail (5.86%) | | | | | | | | |
| | 301,700 | | | Home Depot, Inc. | | | 28,131,634 | | | | 40,451,936 | |
| | 214,000 | | | Lowe’s Companies, Inc. | | | 7,633,690 | | | | 15,219,680 | |
| | | | | | | | | | | | |
| | | | | | | 35,765,324 | | | | 55,671,616 | |
| | | |
| | | | Homebuilding (1.53%) | | | | | | | | |
| | 467,700 | | | Toll Brothers, Inc.1 | | | 14,454,925 | | | | 14,498,700 | |
| | | |
| | | | Hotels, Resorts & Cruise Lines (10.11%) | | | | | | | | |
| | 1,615,900 | | | Hilton Worldwide Holdings, Inc. | | | 39,907,764 | | | | 43,952,480 | |
| | 223,650 | | | Marriott International, Inc., Cl A | | | 17,018,591 | | | | 18,491,382 | |
| | 507,350 | | | Norwegian Cruise Line Holdings Ltd.1,2 | | | 13,905,683 | | | | 21,577,595 | |
| | 147,500 | | | Royal Caribbean Cruises Ltd.2 | | | 11,830,667 | | | | 12,100,900 | |
| | | | | | | | | | | | |
| | | | | | | 82,662,705 | | | | 96,122,357 | |
| | | | | | | | | | | | |
| | Total Consumer Discretionary | | | 220,090,644 | | | | 290,890,596 | |
| | | | | | | | | | | | |
|
| Financials (2.94%) | |
| | | | Asset Management & Custody Banks (2.94%) | | | | | | | | |
| | 845,300 | | | Brookfield Asset Management, Inc., Cl A2 | | | 22,960,517 | | | | 27,903,353 | |
| | | | | | | | | | | | |
|
| Industrials (9.12%) | |
| | | | Building Products (4.26%) | | | | | | | | |
| | 452,650 | | | Masco Corp. | | | 14,595,172 | | | | 14,312,793 | |
| | 397,800 | | | Masonite International Corp.1,2 | | | 23,211,673 | | | | 26,175,240 | |
| | | | | | | | | | | | |
| | | | | | | 37,806,845 | | | | 40,488,033 | |
| | | |
| | | | Industrial Conglomerates (3.77%) | | | | | | | | |
| | 438,600 | | | Macquarie Infrastructure Corp.3 | | | 25,136,095 | | | | 35,833,620 | |
| | | |
| | | | Trading Companies & Distributors (1.09%) | | | | | | | | |
| | 298,300 | | | SiteOne Landscape Supply, Inc.1 | | | 9,844,829 | | | | 10,359,959 | |
| | | | | | | | | | | | |
| | Total Industrials | | | 72,787,769 | | | | 86,681,612 | |
| | | | | | | | | | | | |
|
| Information Technology (8.05%) | |
| | | | Internet Software & Services (1.95%) | | | | | | | | |
| | 98,250 | | | CoStar Group, Inc. 1 | | | 18,281,019 | | | | 18,519,143 | |
| | | |
| | | | IT Consulting & Other Services (6.10%) | | | | | | | | |
| | 1,653,850 | | | InterXion Holding N.V. 1,2 | | | 49,917,131 | | | | 58,000,519 | |
| | | | | | | | | | | | |
| | Total Information Technology | | | 68,198,150 | | | | 76,519,662 | |
| | | | | | | | | | | | |
| | | | | | | | | | | | |
| Shares | | Cost | | | Value | |
| Common Stocks (continued) | |
| Materials (8.48%) | |
| | | | Construction Materials (5.68%) | | | | | | | | |
| | 115,600 | | | Martin Marietta Materials, Inc. | | $ | 15,219,152 | | | $ | 25,608,868 | |
| | 227,100 | | | Vulcan Materials Co. | | | 27,708,159 | | | | 28,421,565 | |
| | | | | | | | | | | | |
| | | | | | | 42,927,311 | | | | 54,030,433 | |
| | | | Specialty Chemicals (2.80%) | | | | | | | | |
| | 98,850 | | | The Sherwin-Williams Co. | | | 25,953,131 | | | | 26,564,949 | |
| | | | | | | | | | | | |
| | Total Materials | | | 68,880,442 | | | | 80,595,382 | |
| | | | | | | | | | | | |
|
| Real Estate (35.82%) | |
| | | | Hotel & Resort REITs (2.09%) | | | | | | | | |
| | 786,144 | | | MGM Growth Properties LLC, Cl A | | | 16,509,024 | | | | 19,897,305 | |
| | | |
| | | | Industrial REITs (3.63%) | | | | | | | | |
| | 387,050 | | | Prologis, Inc. | | | 19,655,596 | | | | 20,432,370 | |
| | 606,300 | | | Rexford Industrial Realty, Inc. | | | 13,321,077 | | | | 14,060,097 | |
| | | | | | | | | | | | |
| | | | | | | 32,976,673 | | | | 34,492,467 | |
| | | |
| | | | Office REITs (4.39%) | | | | | | | | |
| | 58,500 | | | Boston Properties, Inc. | | | 7,333,010 | | | | 7,358,130 | |
| | 457,250 | | | Douglas Emmett, Inc. | | | 10,556,611 | | | | 16,717,060 | |
| | 168,900 | | | Vornado Realty Trust | | | 16,789,325 | | | | 17,628,093 | |
| | | | | | | | | | | | |
| | | | | | | 34,678,946 | | | | 41,703,283 | |
| | | |
| | | | Real Estate Operating Companies (0.65%) | | | | | | | | |
| | 302,750 | | | Kennedy-Wilson Holdings, Inc. | | | 4,149,206 | | | | 6,206,375 | |
| | | |
| | | | Real Estate Services (4.73%) | | | | | | | | |
| | 1,149,950 | | | CBRE Group, Inc., Cl A1 | | | 25,374,283 | | | | 36,211,925 | |
| | 86,400 | | | Jones Lang LaSalle, Inc. | | | 7,310,848 | | | | 8,729,856 | |
| | | | | | | | | | | | |
| | | | | | | 32,685,131 | | | | 44,941,781 | |
| |
| | | | Residential REITs (2.77%) | |
| | 529,839 | | | American Campus Communities, Inc. | | | 21,442,472 | | | | 26,370,087 | |
| |
| | | | Retail REITs (3.38%) | |
| | 336,750 | | | General Growth Properties, Inc. | | | 9,076,543 | | | | 8,412,015 | |
| | 133,350 | | | Simon Property Group, Inc. | | | 20,366,635 | | | | 23,692,295 | |
| | | | | | | | | | | | |
| | | | | | | 29,443,178 | | | | 32,104,310 | |
| |
| | | | Specialized REITs (14.18%) | |
| | 196,950 | | | Alexandria Real Estate Equities, Inc.3 | | | 13,455,583 | | | | 21,887,053 | |
| | 436,200 | | | American Tower Corp. | | | 38,923,694 | | | | 46,097,616 | |
| | 134,541 | | | Equinix, Inc. | | | 30,585,205 | | | | 48,086,299 | |
| | 612,200 | | | Gaming and Leisure Properties, Inc. | | | 16,770,155 | | | | 18,745,564 | |
| | | | | | | | | | | | |
| | | | | | | 99,734,637 | | | | 134,816,532 | |
| | | | | | | | | | | | |
| | Total Real Estate | | | 271,619,267 | | | | 340,532,140 | |
| | | | | | | | | | | | |
|
| Telecommunication Services (2.75%) | |
| | | | Integrated Telecommunication Services (1.65%) | | | | | | | | |
| | 151,800 | | | SBA Communications Corp., Cl A1 | | | 10,586,343 | | | | 15,674,868 | |
| | | |
| | | | Wireless Telecommunication Services (1.10%) | | | | | | | | |
| | 39,421,610 | | | PT Sarana Menara Nusantara Tbk. (Indonesia)1,2 | | | 9,738,076 | | | | 10,475,365 | |
| | | | | | | | | | | | |
| | Total Telecommunication Services | | | 20,324,419 | | | | 26,150,233 | |
| | | | | | | | | | | | |
| | Total Common Stocks | | | 744,861,208 | | | | 929,272,978 | |
| | | | | | | | | | | | |
| | |
| See Notes to Financial Statements. | | 21 |
| | |
| Baron Real Estate Fund | | December 31, 2016 |
STATEMENT OF NET ASSETS (Continued)
| | | | | | | | | | | | |
| Principal Amount | | Cost | | | Value | |
| Short Term Investments (2.61%) | |
| | $24,789,506 | | | Repurchase Agreement with Fixed Income Clearing Corp., dated 12/30/2016, 0.0305% due 1/3/2017; Proceeds at maturity - $24,789,589; (Fully collateralized by $25,015,000 U.S. Treasury Note, 0.375% due 7/15/2025; Market value - $25,286,613)4 | | $ | 24,789,506 | | | $ | 24,789,506 | |
| | | | | | | | | | | | |
| | Total Investments (100.37%) | | $ | 769,650,714 | | | | 954,062,484 | |
| | | | | | | | | | | | |
| | Liabilities Less Cash and Other Assets (-0.37%) | | | | (3,495,760 | ) |
| | | | | | | | | | | | |
| | Net Assets | | | $ | 950,566,724 | |
| | | | | | | | | | | | |
| Retail Shares (Equivalent to $23.67 per share based on
18,335,847 shares outstanding) |
| | $ | 433,979,071 | |
| | | | | | | | | | | | |
| Institutional Shares (Equivalent to $23.93 per share based on
21,507,443 shares outstanding) |
| | $ | 514,643,164 | |
| | | | | | | | | | | | |
| R6 Shares (Equivalent to $23.93 per share based on
81,265 shares outstanding) |
| | $ | 1,944,489 | |
| | | | | | | | | | | | |
| % | Represents percentage of net assets. |
| 1 | Non-income producing securities. |
| 3 | The Adviser has reclassified/classified certain securities in or out of this sub-industry. Such reclassifications/classifications are not supported by S&P or MSCI. |
| 4 | Level 2 security. See Note 7 regarding Fair Value Measurements. |
All securities are Level 1, unless otherwise noted.
| | |
| 22 | | See Notes to Financial Statements. |
| | |
| December 31, 2016 | | Baron Emerging Markets Fund |
STATEMENT OF NET ASSETS
| | | | | | | | | | | | |
| Shares | | Cost | | | Value | |
| Common Stocks (92.36%) | |
| Argentina (0.92%) | |
| | 1,450,000 | | | YPF SA, ADR | | $ | 26,671,589 | | | $ | 23,925,000 | |
| | | | | | | | | | | | |
|
| Brazil (6.74%) | |
| | 7,500,000 | | | BM&FBOVESPA SA3 | | | 27,831,433 | | | | 37,945,817 | |
| | 2,250,312 | | | Cetip SA - Mercados Organizados3 | | | 25,828,094 | | | | 30,807,593 | |
| | 8,697,380 | | | Kroton Educacional SA3 | | | 36,927,878 | | | | 35,520,531 | |
| | 1,325,000 | | | Multiplus SA3 | | | 15,074,723 | | | | 13,732,291 | |
| | 2,650,000 | | | Smiles SA3 | | | 36,301,500 | | | | 36,372,104 | |
| | 2,847,480 | | | TOTVS SA3 | | | 35,217,229 | | | | 20,988,806 | |
| | | | | | | | | | | | |
| | Total Brazil | | | 177,180,857 | | | | 175,367,142 | |
| | | | | | | | | | | | |
|
| Chile (1.95%) | |
| | 1,011,968 | | | Banco Santander Chile, ADR | | | 22,648,809 | | | | 22,131,740 | |
| | 1,000,000 | | | Sociedad Química y Minera de Chile SA, ADR | | | 21,616,350 | | | | 28,650,000 | |
| | | | | | | | | | | | |
| | Total Chile | | | 44,265,159 | | | | 50,781,740 | |
| | | | | | | | | | | | |
|
| China (22.50%) | |
| | 1,050,000 | | | Alibaba Group Holding Ltd., ADR1 | | | 87,353,301 | | | | 92,200,500 | |
| | 200,000 | | | Baidu, Inc., ADR 1 | | | 37,246,112 | | | | 32,882,000 | |
| | 4,250,000 | | | BYD Co., Ltd., Cl H | | | 27,175,564 | | | | 22,388,613 | |
| | 7,000,000 | | | China Everbright Ltd. | | | 20,372,788 | | | | 13,323,876 | |
| | 18,500,000 | | | China Mengniu Dairy Co. Ltd. | | | 37,134,314 | | | | 35,642,530 | |
| | 3,500,000 | | | China Mobile Ltd. | | | 43,857,697 | | | | 37,101,038 | |
| | 875,850 | | | Ctrip.com International Ltd., ADR1 | | | 29,735,667 | | | | 35,034,000 | |
| | 19,000,400 | | | Haitong Securities Co., Ltd., Cl H | | | 30,499,119 | | | | 32,588,216 | |
| | 45,000,000 | | | Kingdee International Software Group Co. Ltd.1 | | | 14,212,410 | | | | 16,886,969 | |
| | 43,000,000 | | | PetroChina Co. Ltd. | | | 38,308,973 | | | | 32,051,067 | |
| | 4,900,000 | | | Shenzhou International Group Holdings Ltd. | | | 21,892,672 | | | | 30,994,261 | |
| | 85,033 | | | Sina Corp.1 | | | 5,816,194 | | | | 5,169,156 | |
| | 8,650,000 | | | Sinopharm Group Co. Ltd., Cl H | | | 33,389,526 | | | | 35,639,629 | |
| | 4,500,000 | | | Sunny Optical Technology Group Co., Ltd. | | | 10,400,223 | | | | 19,701,464 | |
| | 490,754 | | | TAL Education Group, ADR1 | | | 13,284,415 | | | | 34,426,393 | |
| | 2,400,000 | | | Tencent Holdings Ltd. | | | 43,136,502 | | | | 58,711,716 | |
| | 8,503 | | | Weibo Corp., ADR1 | | | 413,428 | | | | 345,222 | |
| | 41,086,494 | | | WH Group Ltd., 144A | | | 34,554,473 | | | | 33,221,009 | |
| | 20,009,500 | | | Zhaojin Mining Industry Co. Ltd. | | | 11,800,657 | | | | 17,211,086 | |
| | | | | | | | | | | | |
| | Total China | | | 540,584,035 | | | | 585,518,745 | |
| | | | | | | | | | | | |
|
| Hong Kong (2.42%) | |
| | 35,000,000 | | | Man Wah Holdings Ltd. | | | 15,256,713 | | | | 23,695,918 | |
| | 6,495,409 | | | Techtronic Industries Co. Ltd. | | | 25,852,443 | | | | 23,286,140 | |
| | 10,000,995 | | | Wynn Macau Ltd.1 | | | 16,914,376 | | | | 15,914,924 | |
| | | | | | | | | | | | |
| | Total Hong Kong | | | 58,023,532 | | | | 62,896,982 | |
| | | | | | | | | | | | |
|
| India (14.15%) | |
| | 2,000,000 | | | Amara Raja Batteries Ltd. | | | 16,897,443 | | | | 25,646,088 | |
| | 14,000,000 | | | Bank of Baroda1 | | | 31,468,000 | | | | 31,642,847 | |
| | 1,189,229 | | | Bharat Financial Inclusion Limited1 | | | 8,352,144 | | | | 10,301,278 | |
| | 7,750,000 | | | Coal India Ltd. | | | 43,072,753 | | | | 34,256,667 | |
| | 3,752,679 | | | DEN Networks Ltd.1 | | | 10,244,650 | | | | 3,721,162 | |
| | 5,034,985 | | | Dish TV India Ltd.1 | | | 4,269,609 | | | | 6,279,821 | |
| | 2,300,000 | | | Divi’s Laboratories Ltd. | | | 29,635,791 | | | | 26,558,273 | |
| | 10,500,000 | | | Exide Industries Ltd. | | | 28,280,902 | | | | 27,862,826 | |
| | | | | | | | | | | | |
| Shares | | Cost | | | Value | |
| Common Stocks (continued) | |
| India (continued) | |
| | 5,770,000 | | | Hathway Cable and Datacom Ltd.1 | | $ | 5,093,897 | | | $ | 2,933,034 | |
| | 2,850,000 | | | Kotak Mahindra Bank Ltd. | | | 32,559,914 | | | | 30,221,674 | |
| | 1,749,596 | | | Manpasand Beverages Ltd. | | | 17,799,139 | | | | 14,227,229 | |
| | 400,000 | | | Maruti Suzuki India Ltd. | | | 30,585,708 | | | | 31,351,407 | |
| | 4,650,000 | | | Motherson Sumi Systems Ltd. | | | 23,017,965 | | | | 22,366,178 | |
| | 1,025,000 | | | Multi Commodity Exchange of India Ltd. | | | 15,676,534 | | | | 19,142,294 | |
| | 1,500,000 | | | PVR Ltd. | | | 14,319,858 | | | | 25,388,611 | |
| | 3,250,000 | | | Sun TV Network Ltd. | | | 20,644,029 | | | | 23,578,901 | |
| | 650,000 | | | Torrent Pharmaceuticals Ltd. | | | 5,131,164 | | | | 12,614,520 | |
| | 3,000,000 | | | Zee Entertainment Enterprises Ltd. | | | 13,489,550 | | | | 20,025,785 | |
| | | | | | | | | | | | |
| | Total India | | | 350,539,050 | | | | 368,118,595 | |
| | | | | | | | | | | | |
|
| Indonesia (3.64%) | |
| | 22,000,000 | | | PT Bank Mandiri (Persero) Tbk | | | 18,672,961 | | | | 18,901,466 | |
| | 55,000,000 | | | PT Bank Negara Indonesia (Persero) Tbk | | | 23,326,306 | | | | 22,555,205 | |
| | 26,000,327 | | | PT Matahari Department Store Tbk | | | 33,058,076 | | | | 29,189,456 | |
| | 27,631,350 | | | PT Sarana Menara Nusantara Tbk.1 | | | 8,841,958 | | | | 7,342,382 | |
| | 45,343,836 | | | PT Tower Bersama Infrastructure Tbk | | | 23,345,968 | | | | 16,760,980 | |
| | | | | | | | | | | | |
| | Total Indonesia | | | 107,245,269 | | | | 94,749,489 | |
| | | | | | | | | | | | |
|
| Korea, Republic of (6.21%) | |
| | 221,541 | | | KB Financial Group, Inc.3 | | | 8,222,119 | | | | 7,829,137 | |
| | 34,000 | | | LG Household & Health Care Ltd.3 | | | 21,675,205 | | | | 24,122,708 | |
| | 65,000 | | | NAVER Corporation3 | | | 38,953,531 | | | | 41,624,523 | |
| | 38,000 | | | Samsung Electronics Co., Ltd.3 | | | 46,455,714 | | | | 56,555,858 | |
| | 250,000 | | | Samsung Life Insurance Co. Ltd.3 | | | 24,724,971 | | | | 23,268,838 | |
| | 221,579 | | | Shinhan Financial Group Co., Ltd.3 | | | 8,911,894 | | | | 8,309,468 | |
| | | | | | | | | | | | |
| | Total Korea, Republic of | | | 148,943,434 | | | | 161,710,532 | |
| | | | | | | | | | | | |
|
| Mexico (5.60%) | |
| | 350,000 | | | Fomento Económico Mexicano, S.A.B. de C.V., ADR | | | 31,958,069 | | | | 26,673,500 | |
| | 1,950,300 | | | GRUMA S.A.B. de C.V., Cl B | | | 27,748,711 | | | | 24,781,365 | |
| | 6,500,000 | | | Grupo Financiero Banorte S.A.B. de C.V., Cl O | | | 35,196,778 | | | | 32,014,530 | |
| | 12,000,513 | | | Grupo Lala S.A.B. de C.V. | | | 23,659,634 | | | | 17,454,007 | |
| | 7,800,634 | | | Infraestructura Energetica Nova S.A.B. de C.V. | | | 36,302,963 | | | | 33,980,181 | |
| | 6,000,000 | | | Wal-Mart de Mexico S.A.B de C.V. | | | 13,222,319 | | | | 10,738,242 | |
| | | | | | | | | | | | |
| | Total Mexico | | | 168,088,474 | | | | 145,641,825 | |
| | | | | | | | | | | | |
|
| Panama (1.75%) | |
| | 500,000 | | | Copa Holdings, S.A., Cl A | | | 31,251,656 | | | | 45,415,000 | |
| | | | | | | | | | | | |
|
| Philippines (2.58%) | |
| | 35,005,000 | | | Ayala Land, Inc.3 | | | 25,979,935 | | | | 22,490,627 | |
| | 11,500,000 | | | BDO Unibank, Inc.3 | | | 25,523,320 | | | | 25,914,554 | |
| | 140,000,000 | | | Metro Pacific Investments Corp.3 | | | 15,473,801 | | | | 18,737,501 | |
| | | | | | | | | | | | |
| | Total Philippines | | | 66,977,056 | | | | 67,142,682 | |
| | | | | | | | | | | | |
| | |
| See Notes to Financial Statements. | | 23 |
| | |
| Baron Emerging Markets Fund | | December 31, 2016 |
STATEMENT OF NET ASSETS (Continued)
| | | | | | | | | | | | |
| Shares | | Cost | | | Value | |
| Common Stocks (continued) | |
| Russia (4.64%) | |
| | 868,213 | | | Magnit PJSC, GDR | | $ | 35,336,430 | | | $ | 38,331,604 | |
| | 4,248,044 | | | Sberbank of Russia, ADR | | | 36,237,218 | | | | 49,171,109 | |
| | 1,650,000 | | | Yandex N.V., Cl A1 | | | 27,173,029 | | | | 33,214,500 | |
| | | | | | | | | | | | |
| | Total Russia | | | 98,746,677 | | | | 120,717,213 | |
| | | | | | | | | | | | |
|
| Singapore (1.33%) | |
| | 22,737,518 | | | Global Logistic Properties Ltd. | | | 40,007,623 | | | | 34,542,375 | |
| | | | | | | | | | | | |
|
| South Africa (6.63%) | |
| | 2,000,708 | | | AngloGold Ashanti Ltd., ADR1 | | | 24,350,042 | | | | 21,027,441 | |
| | 825,700 | | | Aspen Pharmacare Holdings Ltd. | | | 22,175,753 | | | | 17,049,386 | |
| | 1,275,138 | | | Bid Corp. Ltd. | | | 22,788,442 | | | | 22,761,451 | |
| | 2,200,138 | | | Bidvest Group Ltd. | | | 18,556,647 | | | | 29,036,135 | |
| | 8,855,817 | | | Life Healthcare Group Holdings Ltd. | | | 22,463,547 | | | | 21,021,180 | |
| | 575,000 | | | Sasol Limited | | | 18,826,022 | | | | 16,701,010 | |
| | 400,500 | | | Sasol Limited, ADR | | | 12,856,595 | | | | 11,450,295 | |
| | 6,500,764 | | | Steinhoff International Holdings N.V. | | | 31,999,155 | | | | 33,558,229 | |
| | | | | | | | | | | | |
| | Total South Africa | | | 174,016,203 | | | | 172,605,127 | |
| | | | | | | | | | | | |
|
| Taiwan, Province of China (8.58%) | |
| | 6,710,879 | | | Delta Electronics, Inc. | | | 35,335,541 | | | | 33,211,865 | |
| | 1,849,231 | | | Eclat Textile Co., Ltd. | | | 21,992,723 | | | | 19,365,027 | |
| | 15,001,000 | | | Far EasTone Telecommunications Co., Ltd. | | | 33,277,525 | | | | 33,745,152 | |
| | 2,500,000 | | | Ginko International Co., Ltd. | | | 33,951,147 | | | | 25,869,558 | |
| | 1,997,513 | | | Makalot Industrial Co. Ltd. | | | 10,458,553 | | | | 7,685,364 | |
| | 1,006,578 | | | MediaTek, Inc. | | | 14,708,872 | | | | 6,761,741 | |
| | 5,000,000 | | | Novatek Microelectronics Corp. | | | 20,491,039 | | | | 16,522,387 | |
| | 8,800,000 | | | Taiwan Mobile Co., Ltd. | | | 30,026,544 | | | | 28,396,786 | |
| | 1,800,900 | | | Taiwan Semiconductor Manufacturing Company Ltd., ADR | | | 38,286,376 | | | | 51,775,875 | |
| | | | | | | | | | | | |
| | Total Taiwan, Province of China | | | 238,528,320 | | | | 223,333,755 | |
| | | | | | | | | | | | |
|
| Thailand (0.71%) | |
| | 100,000 | | | Bangkok Bank PCL, Cl F3 | | | 629,574 | | | | 450,985 | |
| | 4,026,000 | | | Bangkok Bank Public Co., Ltd., NVDR | | | 21,278,175 | | | | 17,931,808 | |
| | | | | | | | | | | | |
| | Total Thailand | | | 21,907,749 | | | | 18,382,793 | |
| | | | | | | | | | | | |
|
| United Kingdom (1.48%) | |
| | 33,000,000 | | | Lekoil Ltd.1,2 | | | 14,922,322 | | | | 10,675,663 | |
| | 7,250,000 | | | Tullow Oil plc1 | | | 22,398,274 | | | | 27,939,428 | |
| | | | | | | | | | | | |
| | Total United Kingdom | | | 37,320,596 | | | | 38,615,091 | |
| | | | | | | | | | | | |
|
| United States (0.53%) | |
| | 3,500,219 | | | TerraForm Global, Inc., Cl A | | | 32,345,911 | | | | 13,825,865 | |
| | | | | | | | | | | | |
| | Total Common Stocks | | | 2,362,643,190 | | | | 2,403,289,951 | |
| | | | | | | | | | | | |
| | | | | | | | | | | | |
| Preferred Stocks (0.02%) | |
| India (0.02%) | |
| | 3,098,340 | | | Zee Entertainment Enterprises Ltd., 6.00% due 3/5/2022 | | | 367,971 | | | | 446,924 | |
| | | | | | | | | | | | |
| | | | | | | | | | | | |
| | | | | | | | | | | | |
| Principal Amount | | Cost | | | Value | |
| Convertible Bonds (0.27%) | |
| China (0.27%) | | | | | | |
| | $50,000,000 | | | Biostime International Holdings Ltd., 0.00% due 2/20/20191,3 | | $ | 6,590,207 | | | $ | 6,995,938 | |
| | | | | | | | | | | | |
| Short Term Investments (7.16%) | |
| | 186,251,623 | | | Repurchase Agreement with
Fixed Income Clearing Corp.,
dated 12/30/2016, 0.0305%
due 1/3/2017; Proceeds at
maturity - $186,252,244;
(Fully collateralized by
$193,950,000 U.S. Treasury Note, 2.125% due 5/15/2025;
Market value - $189,976,740)3 | | | 186,251,623 | | | | 186,251,623 | |
| | | | | | | | | | | | |
| | Total Investments (99.81%) | | $ | 2,555,852,991 | | | | 2,596,984,436 | |
| | | | | | | | | | | | |
| | Cash and Other Assets Less Liabilities (0.19%) | | | | 5,008,907 | |
| | | | | | | | | | | | |
| | Net Assets | | | $ | 2,601,993,343 | |
| | | | | | | | | | | | |
| Retail Shares (Equivalent to $10.95 per share
based on 70,155,170 shares outstanding) |
| | $ | 768,485,288 | |
| | | | | | | | | | | | |
| Institutional Shares (Equivalent to $10.98 per share
based on 166,920,511 shares outstanding) |
| | $ | 1,832,814,841 | |
| | | | | | | | | | | | |
| R6 Shares (Equivalent to $10.99 per share
based on 63,091 shares outstanding) |
| | $ | 693,214 | |
| | | | | | | | | | | | |
| % | Represents percentage of net assets. |
| 1 | Non-income producing securities. |
| 2 | See Note 10 regarding “Affiliated” companies. |
| 3 | Level 2 security. See Note 7 regarding Fair Value Measurements. |
| ADR | American Depositary Receipt. |
| GDR | Global Depositary Receipt. |
| NVDR | Non-Voting Depositary Receipt. |
| 144A | Security is exempt from registration pursuant to Rule 144A under the Securities Act of 1933. This security may be resold in transactions that are exempt from registration, normally to qualified institutional buyers. This security has been deemed liquid pursuant to policies and procedures approved by the Board of Trustees, unless otherwise noted. At December 31, 2016, the market value of Rule 144A securities amounted to $33,221,009 or 1.28% of net assets. |
All securities are Level 1, unless otherwise noted.
| | | | |
Summary of Investments by Sector as of December 31, 2016 | | Percentage of
Net Assets | |
Consumer Discretionary | | | 20.2 | % |
Information Technology | | | 18.7 | % |
Financials | | | 17.4 | % |
Consumer Staples | | | 9.8 | % |
Health Care | | | 5.3 | % |
Energy | | | 5.0 | % |
Telecommunication Services | | | 4.7 | % |
Industrials | | | 3.8 | % |
Materials | | | 3.7 | % |
Real Estate | | | 2.2 | % |
Utilities | | | 1.8 | % |
Cash and Cash Equivalents* | | | 7.4 | % |
| | | | 100.0 | % |
| * | Includes short term investments. |
| | |
| 24 | | See Notes to Financial Statements. |
| | |
| December 31, 2016 | | Baron Energy and Resources Fund |
STATEMENT OF NET ASSETS
| | | | | | | | | | | | |
| Shares | | Cost | | | Value | |
| Common Stocks (99.43%) | |
| Consumer Discretionary (2.90%) | |
| | | | Automobile Manufacturers (2.90%) | | | | | | | | |
| | 14,100 | | | Tesla Motors, Inc.1 | | $ | 3,242,965 | | | $ | 3,013,029 | |
| | | | | | | | | | | | |
|
| Energy (85.70%) | |
| | | | Oil & Gas Drilling (1.88%) | | | | | | | | |
| | 119,300 | | | Nabors Industries Ltd.2 | | | 1,373,758 | | | | 1,956,520 | |
| | | |
| | | | Oil & Gas Equipment & Services (14.58%) | | | | | | | | |
| | 17,150 | | | Core Laboratories N.V.2 | | | 2,024,011 | | | | 2,058,686 | |
| | 36,000 | | | FMC Technologies, Inc.1 | | | 1,030,621 | | | | 1,279,080 | |
| | 73,900 | | | Forum Energy Technologies, Inc.1 | | | 1,331,497 | | | | 1,625,800 | |
| | 75,496 | | | Halliburton Co. | | | 3,391,871 | | | | 4,083,579 | |
| | 36,800 | | | Schlumberger Limited2 | | | 2,693,203 | | | | 3,089,360 | |
| | 53,200 | | | U.S. Silica Holdings, Inc. | | | 1,376,948 | | | | 3,015,376 | |
| | | | | | | | | | | | |
| | | | | | | 11,848,151 | | | | 15,151,881 | |
| | | |
| | | | Oil & Gas Exploration & Production (47.49%) | | | | | | | | |
| | 25,100 | | | Anadarko Petroleum Corporation | | | 1,478,327 | | | | 1,750,223 | |
| | 85,200 | | | Antero Resources Corp.1 | | | 2,429,491 | | | | 2,014,980 | |
| | 45,599 | | | Concho Resources, Inc.1 | | | 4,521,735 | | | | 6,046,427 | |
| | 524,700 | | | Encana Corp.2 | | | 3,398,305 | | | | 6,159,978 | |
| | 27,666 | | | Energen Corp.1 | | | 1,231,781 | | | | 1,595,498 | |
| | 22,768 | | | EOG Resources, Inc. | | | 1,862,607 | | | | 2,301,845 | |
| | 333,800 | | | Jones Energy, Inc., Cl A1 | | | 1,591,258 | | | | 1,669,000 | |
| | 2,496,354 | | | Lekoil Ltd. (United Kingdom)1,2 | | | 1,228,382 | | | | 807,583 | |
| | 122,200 | | | Newfield Exploration Co.1 | | | 3,561,749 | | | | 4,949,100 | |
| | 29,549 | | | Noble Energy, Inc. | | | 922,418 | | | | 1,124,635 | |
| | 192,500 | | | Parsley Energy, Inc., Cl A1 | | | 3,211,888 | | | | 6,783,700 | |
| | 120,300 | | | Rice Energy, Inc.1 | | | 1,094,647 | | | | 2,568,405 | |
| | 161,800 | | | RSP Permian, Inc.1 | | | 3,928,743 | | | | 7,219,516 | |
| | 125,000 | | | Sanchez Production Partners LP | | | 1,375,000 | | | | 1,462,500 | |
| | 198,000 | | | WPX Energy, Inc.1 | | | 2,447,714 | | | | 2,884,860 | |
| | | | | | | | | | | | |
| | | | | | | 34,284,045 | | | | 49,338,250 | |
| | | |
| | | | Oil & Gas Refining & Marketing (2.90%) | | | | | | | | |
| | 44,100 | | | Valero Energy Corporation | | | 2,812,113 | | | | 3,012,912 | |
| | | |
| | | | Oil & Gas Storage & Transportation (18.85%) | | | | | | | | |
| | 144,000 | | | Energy Transfer Equity L.P. | | | 1,014,500 | | | | 2,780,640 | |
| | 129,635 | | | Golar LNG Ltd.2 | | | 2,858,007 | | | | 2,973,827 | |
| | 34,200 | | | MPLX LP | | | 1,063,167 | | | | 1,184,004 | |
| | 47,738 | | | Noble Midstream Partners LP1 | | | 1,074,105 | | | | 1,718,568 | |
| | 201,804 | | | Scorpio Tankers, Inc.2 | | | 1,862,800 | | | | 914,172 | |
| | 52,000 | | | SemGroup Corp., Cl A | | | 1,610,536 | | | | 2,171,000 | |
| | 43,540 | | | Tallgrass Energy Partners, LP | | | 1,134,548 | | | | 2,065,973 | |
| | 62,600 | | | Targa Resources Corp. | | | 1,793,922 | | | | 3,509,982 | |
| | 51,200 | | | Valero Energy Partners LP | | | 2,144,610 | | | | 2,266,624 | |
| | | | | | | | | | | | |
| | | | | | | 14,556,195 | | | | 19,584,790 | |
| | | | | | | | | | | | |
| | Total Energy | | | 64,874,262 | | | | 89,044,353 | |
| | | | | | | | | | | | |
|
| Information Technology (2.52%) | |
| | | | Application Software (2.52%) | | | | | | | | |
| | 47,800 | | | Aspen Technology, Inc.1 | | | 1,862,658 | | | | 2,613,704 | |
| | | | | | | | | | | | |
| | | | | | | | | | | | |
| Shares | | Cost | | | Value | |
| Common Stocks (continued) | |
| Materials (5.90%) | |
| | | | Commodity Chemicals (0.99%) | | | | | | | | |
| | 47,332 | | | Westlake Chemical Partners LP | | $ | 1,146,768 | | | $ | 1,027,105 | |
| | | |
| | | | Specialty Chemicals (4.91%) | | | | | | | | |
| | 377,852 | | | Flotek Industries, Inc.1 | | | 4,393,946 | | | | 3,548,030 | |
| | 54,700 | | | Kraton Corporation1 | | | 1,443,382 | | | | 1,557,856 | |
| | | | | | | | | | | | |
| | | | | | | 5,837,328 | | | | 5,105,886 | |
| | | | | | | | | | | | |
| | Total Materials | | | 6,984,096 | | | | 6,132,991 | |
| | | | | | | | | | | | |
|
| Utilities (2.41%) | |
| | | | Gas Utilities (1.08%) | | | | | | | | |
| | 256,166 | | | Infraestructura Energetica Nova
S.A.B. de C.V. (Mexico)2 | | | 1,079,252 | | | | 1,115,879 | |
| | | |
| | | | Renewable Electricity (1.33%) | | | | | | | | |
| | 218,126 | | | TerraForm Global, Inc., Cl A | | | 2,967,630 | | | | 861,598 | |
| | 40,910 | | | TerraForm Power, Inc., Cl A1 | | | 736,033 | | | | 524,057 | |
| | | | | | | | | | | | |
| | | | | | | 3,703,663 | | | | 1,385,655 | |
| | | | | | | | | | | | |
| | Total Utilities | | | 4,782,915 | | | | 2,501,534 | |
| | | | | | | | | | | | |
| | Total Common Stocks | | | 81,746,896 | | | | 103,305,611 | |
| | | | | | | | | | | | |
| | | | | | | | | | | | |
| Principal Amount | | | | | | |
| Short Term Investments (0.46%) | |
| | $482,492 | | | Repurchase Agreement with
Fixed Income Clearing Corp.,
dated 12/30/2016, 0.0305%
due 1/3/2017; Proceeds at
maturity - $482,494;
(Fully collateralized by
$530,000 U.S. Treasury Note,
1.625% due 2/15/2026;
Market value - $496,391)3 | | | 482,492 | | | | 482,492 | |
| | | | | | | | | | | | |
| | Total Investments (99.89%) | | $ | 82,229,388 | | | | 103,788,103 | |
| | | | | | | | | | | | |
| | Cash and Other Assets Less Liabilities (0.11%) | | | | 110,084 | |
| | | | | | | | | | | | |
| | Net Assets | | | $ | 103,898,187 | |
| | | | | | | | | | | | |
| Retail Shares (Equivalent to $9.00 per share based on
8,088,125 shares outstanding) |
| | $ | 72,782,135 | |
| | | | | | | | | | | | |
| Institutional Shares (Equivalent to $9.11 per share based on
3,372,300 shares outstanding) |
| | $ | 30,724,449 | |
| | | | | | | | | | | | |
| R6 Shares (Equivalent to $9.10 per share based on
43,017 shares outstanding) |
| | $ | 391,603 | |
| | | | | | | | | | | | |
| % | Represents percentage of net assets. |
| 1 | Non-income producing securities. |
| 3 | Level 2 security. See Note 7 regarding Fair Value Measurements. |
All securities are Level 1, unless otherwise noted.
| | |
| See Notes to Financial Statements. | | 25 |
| | |
| Baron Global Advantage Fund | | December 31, 2016 |
STATEMENT OF NET ASSETS
| | | | | | | | | | | | |
| Shares | | Cost | | | Value | |
| Common Stocks (99.26%) | |
| Argentina (1.30%) | |
| | 3,786 | | | Globant SA1 | | $ | 150,993 | | | $ | 126,263 | |
| | | | | | | | | | | | |
|
| Brazil (3.31%) | |
| | 23,517 | | | Cetip SA - Mercados Organizados 2 | | | 244,353 | | | | 321,956 | |
| | | | | | | | | | | | |
|
| Canada (5.18%) | |
| | 1,107 | | | Constellation Software, Inc. | | | 338,745 | | | | 503,037 | |
| | | | | | | | | | | | |
|
| China (15.92%) | |
| | 6,482 | | | Alibaba Group Holding Ltd., ADR1 | | | 541,292 | | | | 569,184 | |
| | 679 | | | Baidu, Inc., ADR1 | | | 88,840 | | | | 111,634 | |
| | 9,508 | | | Ctrip.com International Ltd., ADR1 | | | 319,515 | | | | 380,320 | |
| | 6,923 | | | TAL Education Group, ADR1 | | | 198,990 | | | | 485,649 | |
| | | | | | | | | | | | |
| | Total China | | | 1,148,637 | | | | 1,546,787 | |
| | | | | | | | | | | | |
|
| Israel (7.66%) | |
| | 1,217 | | | Check Point Software Technologies Ltd.1 | | | 81,662 | | | | 102,788 | |
| | 9,491 | | | Mellanox Technologies Ltd.1 | | | 386,503 | | | | 388,182 | |
| | 6,640 | | | Mobileye N.V.1 | | | 323,741 | | | | 253,117 | |
| | | | | | | | | | | | |
| | Total Israel | | | 791,906 | | | | 744,087 | |
| | | | | | | | | | | | |
|
| Japan (1.65%) | |
| | 26,000 | | | Daiwa Securities Group, Inc. | | | 167,827 | | | | 160,238 | |
| | | | | | | | | | | | |
|
| Netherlands (1.78%) | |
| | 1,544 | | | ASML Holding N.V. | | | 111,558 | | | | 173,337 | |
| | | | | | | | | | | | |
|
| South Africa (4.82%) | |
| | 3,193 | | | Naspers Limited, Cl N | | | 445,555 | | | | 468,262 | |
| | | | | | | | | | | | |
|
| United Kingdom (4.44%) | |
| | 59,967 | | | JUST EAT plc1 | | | 258,537 | | | | 431,226 | |
| | | | | | | | | | | | |
|
| United States (53.20%) | |
| | 9,405 | | | Acxiom Corp.1 | | | 185,152 | | | | 252,054 | |
| | 3,726 | | | Aerie Pharmaceuticals, Inc.1 | | | 61,817 | | | | 141,029 | |
| | 933 | | | Allergan plc | | | 256,633 | | | | 195,939 | |
| | 696 | | | Alphabet Inc., Cl C1 | | | 358,241 | | | | 537,187 | |
| | 1,553 | | | Amazon.com, Inc.1 | | | 475,611 | | | | 1,164,548 | |
| | 291 | | | Bats Global Markets, Inc. | | | 5,529 | | | | 9,751 | |
| | 4,399 | | | Benefitfocus, Inc.1 | | | 117,819 | | | | 130,650 | |
| | 6,818 | | | BlackLine, Inc.1 | | | 115,906 | | | | 188,381 | |
| | 4,888 | | | EPAM Systems, Inc.1 | | | 352,033 | | | | 314,347 | |
| | 4,592 | | | Facebook, Inc., Cl A1 | | | 123,378 | | | | 528,310 | |
| | 18,036 | | | FireEye, Inc.1 | | | 556,784 | | | | 214,628 | |
| | 2,533 | | | First Republic Bank | | | 182,384 | | | | 233,391 | |
| | 6,725 | | | Glaukos Corporation1 | | | 150,392 | | | | 230,668 | |
| | 4,529 | | | Greenlight Capital Re Ltd., Cl A1 | | | 99,623 | | | | 103,261 | |
| | | | | | | | | | | | |
| Shares | | Cost | | | Value | |
| Common Stocks (continued) | |
| United States (continued) | |
| | 1,889 | | | Illumina, Inc.1 | | $ | 109,775 | | | $ | 241,868 | |
| | 1,361 | | | Luxoft Holding, Inc.1 | | | 81,588 | | | | 76,488 | |
| | 4,129 | | | Noble Midstream Partners LP1 | | | 92,903 | | | | 148,644 | |
| | 5,255 | | | Pacira Pharmaceuticals, Inc.1 | | | 336,531 | | | | 169,737 | |
| | 149 | | | The Priceline Group, Inc.1 | | | 109,221 | | | | 218,443 | |
| | 1,377 | | | Splunk, Inc.1 | | | 82,149 | | | | 70,434 | |
| | | | | | | | | | | | |
| | Total United States | | | 3,853,469 | | | | 5,169,758 | |
| | | | | | | | | | | | |
| | Total Common Stocks | | | 7,511,580 | | | | 9,644,951 | |
| | | | | | | | | | | | |
| | | | | | | | | | | | |
| Principal Amount | | | | | | |
| Short Term Investments (1.50%) | |
| | $146,072 | | | Repurchase Agreement with
Fixed Income Clearing Corp.,
dated 12/30/2016, 0.0305%
due 1/3/2017; Proceeds at
maturity - $146,073;
(Fully collateralized by
$160,000 U.S. Treasury
Note, 1.625% due 2/15/2026;
Market value - $149,854) 2 | | | 146,072 | | | | 146,072 | |
| | | | | | | | | | | | |
| | Total Investments (100.76%) | | $ | 7,657,652 | | | | 9,791,023 | |
| | | | | | | | | | | | |
| | Liabilities Less Cash and Other Assets (-0.76%) | | | | (73,908 | ) |
| | | | | | | | | | | | |
| | Net Assets | | | $ | 9,717,115 | |
| | | | | | | | | | | | |
| Retail Shares (Equivalent to $13.75 per share based on
361,216 shares outstanding) |
| | $ | 4,966,496 | |
| | | | | | | | | | | | |
| Institutional Shares (Equivalent to $13.87 per share based on
330,862 shares outstanding) |
| | $ | 4,589,126 | |
| | | | | | | | | | | | |
| R6 Shares (Equivalent to $13.87 per share based on
11,643 shares outstanding) |
| | $ | 161,493 | |
| | | | | | | | | | | | |
| % | Represents percentage of net assets. |
| 1 | Non-income producing securities. |
| 2 | Level 2 Security. See Note 7 regarding Fair Value Measurements. |
| ADR | American Depositary Receipt. |
All securities are Level 1, unless otherwise noted.
| | | | |
Summary of Investments by Sector
as of December 31, 2016 | | Percentage of
Net Assets | |
| |
Information Technology | | | 51.2 | % |
| |
Consumer Discretionary | | | 28.0 | % |
| |
Health Care | | | 10.1 | % |
| |
Financials | | | 8.5 | % |
| |
Energy | | | 1.5 | % |
| |
Cash and Cash Equivalents* | | | 0.7 | % |
| | | | 100.0 | % |
| * | Includes short term investments. |
| | |
| 26 | | See Notes to Financial Statements. |
| | |
| December 31, 2016 | | Baron Select Funds |
STATEMENTS OF ASSETS AND LIABILITIES
| | | | | | | | | | | | | | | | |
| | | Baron Partners
Fund | | | Baron Focused
Growth Fund | | | Baron
International
Growth Fund | | | Baron Real
Estate Fund | |
Assets: | | | | | | | | | | | | | | | | |
Investments in securities, at value* | | | | | | | | | | | | | | | | |
Unaffiliated investments | | $ | 2,040,841,027 | | | $ | 175,094,122 | | | $ | 87,387,162 | | | $ | 954,062,484 | |
“Affiliated” investments | | | — | | | | — | | | | — | | | | — | |
| | | | | | | | | | | | | | | | |
Total investments, at value | | $ | 2,040,841,027 | | | $ | 175,094,122 | | | $ | 87,387,162 | | | $ | 954,062,484 | |
| | | | | | | | | | | | | | | | |
Foreign currency, at value† | | | — | | | | — | | | | 2,565 | | | | — | |
Receivable for shares sold | | | 2,181,828 | | | | 622 | | | | 302,812 | | | | 856,745 | |
Dividends and interest receivable | | | 1,781,467 | | | | 204,360 | | | | 99,481 | | | | 1,394,150 | |
Receivable for securities sold | | | — | | | | — | | | | — | | | | 890,145 | |
Prepaid expenses | | | 275,014 | | | | 331 | | | | 182 | | | | 2,915 | |
Other assets | | | — | | | | — | | | | 9,083 | | | | — | |
| | | | | | | | | | | | | | | | |
| | | 2,045,079,336 | | | | 175,299,435 | | | | 87,801,285 | | | | 957,206,439 | |
| | | | | | | | | | | | | | | | |
Liabilities: | | | | | | | | | | | | | | | | |
Payable for borrowings against line of credit | | | 475,000,000 | | | | — | | | | — | | | | — | |
Payable for shares redeemed | | | 1,735,481 | | | | 41,784 | | | | 65,080 | | | | 6,480,225 | |
Distribution fees payable (Note 4) | | | 85 | | | | 407 | | | | 762 | | | | 579 | |
Investment advisory fees payable (Note 4) | | | 77 | | | | 368 | | | | 316 | | | | 232 | |
Accrued capital gains taxes | | | — | | | | — | | | | 43,843 | | | | — | |
Accrued expenses and other payables | | | 862,013 | | | | 61,924 | | | | 70,823 | | | | 158,679 | |
| | | | | | | | | | | | | | | | |
| | | 477,597,656 | | | | 104,483 | | | | 180,824 | | | | 6,639,715 | |
| | | | | | | | | | | | | | | | |
Net Assets | | $ | 1,567,481,680 | | | $ | 175,194,952 | | | $ | 87,620,461 | | | $ | 950,566,724 | |
| | | | | | | | | | | | | | | | |
Net Assets consist of: | | | | | | | | | | | | | | | | |
Paid-in capital | | $ | 969,532,485 | | | $ | 131,584,275 | | | $ | 67,648,367 | | | $ | 799,431,193 | |
Undistributed (accumulated) net investment income (loss) | | | 15,124,025 | | | | 1,480,259 | | | | (20,705 | ) | | | (330 | ) |
Undistributed (accumulated) net realized gain (loss)
on investments and foreign currency transactions | | | (190,253,230 | ) | | | (630,648 | ) | | | 172,264 | | | | (33,275,842 | ) |
Net unrealized appreciation on investments, foreign
capital gains tax and foreign currency translations | | | 773,078,400 | | | | 42,761,066 | | | | 19,820,535 | | | | 184,411,703 | |
| | | | | | | | | | | | | | | | |
Net Assets | | $ | 1,567,481,680 | | | $ | 175,194,952 | | | $ | 87,620,461 | | | $ | 950,566,724 | |
| | | | | | | | | | | | | | | | |
Retail Shares: | | | | | | | | | | | | | | | | |
Net Assets | | $ | 913,879,802 | | | $ | 37,688,342 | | | $ | 41,862,236 | | | $ | 433,979,071 | |
Shares Outstanding ($0.01 par value; indefinite shares authorized) | | | 24,662,195 | | | | 3,031,041 | | | | 2,314,654 | | | | 18,335,847 | |
| | | | | | | | | | | | | | | | |
Net Asset Value and Offering Price Per Share | | $ | 37.06 | | | $ | 12.43 | | | $ | 18.09 | | | $ | 23.67 | |
| | | | | | | | | | | | | | | | |
Institutional Shares: | | | | | | | | | | | | | | | | |
Net Assets | | $ | 645,338,910 | | | $ | 128,926,883 | | | $ | 45,384,682 | | | $ | 514,643,164 | |
Shares Outstanding ($0.01 par value; indefinite shares authorized) | | | 17,115,523 | | | | 10,208,792 | | | | 2,486,436 | | | | 21,507,443 | |
| | | | | | | | | | | | | | | | |
Net Asset Value and Offering Price Per Share | | $ | 37.70 | | | $ | 12.63 | | | $ | 18.25 | | | $ | 23.93 | |
| | | | | | | | | | | | | | | | |
R6 Shares: | | | | | | | | | | | | | | | | |
Net Assets | | $ | 8,262,968 | | | $ | 8,579,727 | | | $ | 373,543 | | | $ | 1,944,489 | |
Shares Outstanding ($0.01 par value; indefinite shares authorized) | | | 219,147 | | | | 679,102 | | | | 20,464 | | | | 81,265 | |
| | | | | | | | | | | | | | | | |
Net Asset Value and Offering Price Per Share | | $ | 37.71 | | | $ | 12.63 | | | $ | 18.25 | | | $ | 23.93 | |
| | | | | | | | | | | | | | | | |
| | | | |
*Investments in securities, at cost | | | | | | | | | | | | | | | | |
Unaffiliated investments | | $ | 1,267,762,627 | | | $ | 132,333,056 | | | $ | 67,521,558 | | | $ | 769,650,714 | |
“Affiliated” investments | | | — | | | | — | | | | — | | | | — | |
| | | | | | | | | | | | | | | | |
Total investments, at cost | | $ | 1,267,762,627 | | | $ | 132,333,056 | | | $ | 67,521,558 | | | $ | 769,650,714 | |
| | | | | | | | | | | | | | | | |
| | | | |
†Foreign currency, at cost: | | $ | — | | | $ | — | | | $ | 2,554 | | | $ | — | |
| | | | | | | | | | | | | | | | |
| | |
| See Notes to Financial Statements. | | 27 |
| | |
| Baron Select Funds | | December 31, 2016 |
STATEMENTS OF ASSETS AND LIABILITIES (Continued)
| | | | | | | | | | | | |
| | | Baron
Emerging
Markets Fund | | | Baron
Energy and
Resources Fund | | | Baron Global
Advantage
Fund | |
Assets: | | | | | | | | | | | | |
Investments in securities, at value* | | | | | | | | | | | | |
Unaffiliated investments | | $ | 2,586,308,773 | | | $ | 103,788,103 | | | $ | 9,791,023 | |
“Affiliated” investments | | | 10,675,663 | | | | — | | | | — | |
| | | | | | | | | | | | |
Total investments, at value | | $ | 2,596,984,436 | | | $ | 103,788,103 | | | $ | 9,791,023 | |
| | | | | | | | | | | | |
Foreign currency, at value† | | | 48,621 | | | | — | | | | 14 | |
Receivable for shares sold | | | 9,107,244 | | | | 332,247 | | | | 163 | |
Dividends and interest receivable | | | 3,201,441 | | | | 39,733 | | | | 4,709 | |
Receivable for securities sold | | | 1,496,104 | | | | — | | | | — | |
Prepaid expenses | | | 3,082 | | | | 114 | | | | 11 | |
Other assets | | | — | | | | — | | | | — | |
| | | | | | | | | | | | |
| | | 2,610,840,928 | | | | 104,160,197 | | | | 9,795,920 | |
| | | | | | | | | | | | |
Liabilities: | | | | | | | | | | | | |
Payable for borrowings against line of credit | | | — | | | | — | | | | — | |
Payable for shares redeemed | | | 8,434,799 | | | | 148,480 | | | | — | |
Distribution fees payable (Note 4) | | | 478 | | | | 250 | | | | 357 | |
Investment advisory fees payable (Note 4) | | | 807 | | | | 412 | | | | — | |
Accrued capital gains taxes | | | — | | | | — | | | | — | |
Accrued expenses and other payables | | | 411,501 | | | | 112,868 | | | | 78,448 | |
| | | | | | | | | | | | |
| | | 8,847,585 | | | | 262,010 | | | | 78,805 | |
| | | | | | | | | | | | |
Net Assets | | $ | 2,601,993,343 | | | $ | 103,898,187 | | | $ | 9,717,115 | |
| | | | | | | | | | | | |
Net Assets consist of: | | | | | | | | | | | | |
Paid-in capital | | $ | 2,757,038,438 | | | $ | 115,181,323 | | | $ | 8,465,253 | |
Undistributed (accumulated) net investment income (loss) | | | 447,853 | | | | 905,895 | | | | (2,104 | ) |
Accumulated net realized loss on investments and foreign currency transactions | | | (196,645,904 | ) | | | (33,747,746 | ) | | | (879,391 | ) |
Net unrealized appreciation on investments, foreign
capital gains tax and foreign currency translations | | | 41,152,956 | | | | 21,558,715 | | | | 2,133,357 | |
| | | | | | | | | | | | |
Net Assets | | $ | 2,601,993,343 | | | $ | 103,898,187 | | | $ | 9,717,115 | |
| | | | | | | | | | | | |
Retail Shares: | | | | | | | | | | | | |
Net Assets | | $ | 768,485,288 | | | $ | 72,782,135 | | | $ | 4,966,496 | |
Shares Outstanding ($0.01 par value; indefinite shares authorized) | | | 70,155,170 | | | | 8,088,125 | | | | 361,216 | |
| | | | | | | | | | | | |
Net Asset Value and Offering Price Per Share | | $ | 10.95 | | | $ | 9.00 | | | $ | 13.75 | |
| | | | | | | | | | | | |
Institutional Shares: | | | | | | | | | | | | |
Net Assets | | $ | 1,832,814,841 | | | $ | 30,724,449 | | | $ | 4,589,126 | |
Shares Outstanding ($0.01 par value; indefinite shares authorized) | | | 166,920,511 | | | | 3,372,300 | | | | 330,862 | |
| | | | | | | | | | | | |
Net Asset Value and Offering Price Per Share | | $ | 10.98 | | | $ | 9.11 | | | $ | 13.87 | |
| | | | | | | | | | | | |
R6 Shares: | | | | | | | | | | | | |
Net Assets | | $ | 693,214 | | | $ | 391,603 | | | $ | 161,493 | |
Shares Outstanding ($0.01 par value; indefinite shares authorized) | | | 63,091 | | | | 43,017 | | | | 11,643 | |
| | | | | | | | | | | | |
Net Asset Value and Offering Price Per Share | | $ | 10.99 | | | $ | 9.10 | | | $ | 13.87 | |
| | | | | | | | | | | | |
| | | |
*Investments in securities, at cost | | | | | | | | | | | | |
Unaffiliated investments | | $ | 2,540,930,669 | | | $ | 82,229,388 | | | $ | 7,657,652 | |
“Affiliated” investments | | | 14,922,322 | | | | — | | | | — | |
| | | | | | | | | | | | |
Total investments, at cost | | $ | 2,555,852,991 | | | $ | 82,229,388 | | | $ | 7,657,652 | |
| | | | | | | | | | | | |
| | | |
†Foreign currency, at cost: | | $ | 48,514 | | | $ | — | | | $ | 15 | |
| | | | | | | | | | | | |
| | |
| 28 | | See Notes to Financial Statements. |
| | |
| December 31, 2016 | | Baron Select Funds |
STATEMENTS OF OPERATIONS
|
FOR THE YEAR ENDED DECEMBER 31, 2016 |
| | | | | | | | | | | | | | | | |
| | | Baron Partners
Fund | | | Baron Focused
Growth Fund | | | Baron
International
Growth Fund | | | Baron Real
Estate Fund | |
Investment income: | | | | | | | | | | | | | | | | |
Income: | | | | | | | | | | | | | | | | |
Dividends — Unaffiliated investments | | $ | 18,477,509 | | | $ | 2,147,854 | | | $ | 1,255,504 | | | $ | 16,038,470 | |
Interest | | | 78 | | | | 2,648 | | | | 1,414 | | | | 10,487 | |
Securities lending income, net | | | 5,406,325 | | | | 427,248 | | | | — | | | | — | |
Foreign taxes withheld on dividends | | | — | | | | — | | | | (114,109 | ) | | | (183,791 | ) |
| | | | | | | | | | | | | | | | |
Total income | | | 23,883,912 | | | | 2,577,750 | | | | 1,142,809 | | | | 15,865,166 | |
| | | | | | | | | | | | | | | | |
Expenses: | | | | | | | | | | | | | | | | |
Investment advisory fees (Note 4) | | | 16,292,295 | | | | 1,750,565 | | | | 858,800 | | | | 12,582,370 | |
Distribution fees — Retail Shares (Note 4) | | | 2,396,797 | | | | 99,737 | | | | 101,690 | | | | 1,411,908 | |
Shareholder servicing agent fees and expenses — Retail Shares | | | 210,049 | | | | 25,686 | | | | 26,909 | | | | 93,799 | |
Shareholder servicing agent fees and expenses — Institutional Shares | | | 56,619 | | | | 14,196 | | | | 12,170 | | | | 65,735 | |
Shareholder servicing agent fees and expenses — R6 Shares | | | 100 | | | | 103 | | | | 5 | | | | 45 | |
Line of credit fees | | | 470,456 | | | | 2,361 | | | | 1,124 | | | | 16,197 | |
Reports to shareholders | | | 384,050 | | | | 11,005 | | | | 51,540 | | | | 330,670 | |
Professional fees | | | 185,890 | | | | 61,632 | | | | 63,698 | | | | 89,331 | |
Registration and filing fees | | | 93,620 | | | | 56,440 | | | | 56,360 | | | | 112,980 | |
Custodian and fund accounting fees | | | 79,068 | | | | 28,703 | | | | 77,252 | | | | 98,334 | |
Trustee fees and expenses | | | 67,551 | | | | 7,243 | | | | 3,608 | | | | 54,693 | |
Administration fees | | | 31,538 | | | | 31,486 | | | | 31,492 | | | | 31,524 | |
Insurance expense | | | 26,979 | | | | 2,710 | | | | 1,504 | | | | 24,739 | |
Miscellaneous expenses | | | 2,653 | | | | 1,581 | | | | 1,806 | | | | 1,969 | |
| | | | | | | | | | | | | | | | |
Total operating expenses | | | 20,297,665 | | | | 2,093,448 | | | | 1,287,958 | | | | 14,914,294 | |
Interest expense on borrowings | | | 6,948,906 | | | | — | | | | — | | | | — | |
| | | | | | | | | | | | | | | | |
Total expenses | | | 27,246,571 | | | | 2,093,448 | | | | 1,287,958 | | | | 14,914,294 | |
Reimbursement of expenses by Adviser — Retail Shares (Note 4) | | | — | | | | (31,864 | ) | | | (61,446 | ) | | | — | |
Reimbursement of expenses by Adviser — Institutional Shares (Note 4) | | | — | | | | (35,335 | ) | | | (50,963 | ) | | | — | |
Reimbursement of expenses by Adviser — R6 Shares (Note 4) | | | — | | | | (891 | ) | | | (145 | ) | | | — | |
| | | | | | | | | | | | | | | | |
Net expenses | | | 27,246,571 | | | | 2,025,358 | | | | 1,175,404 | | | | 14,914,294 | |
| | | | | | | | | | | | | | | | |
Net investment income (loss) | | | (3,362,659 | ) | | | 552,392 | | | | (32,595 | ) | | | 950,872 | |
| | | | | | | | | | | | | | | | |
Realized and unrealized gain (loss) on investments: | | | | | | | | | | | | | | | | |
Net realized gain (loss) on investments sold | | | 131,829,048 | | | | 2,836,755 | | | | 1,147,320 | 1 | | | (30,212,124 | ) |
Net realized gain (loss) on foreign currency transactions | | | — | | | | 6,745 | | | | (41,615 | ) | | | (105,728 | ) |
Change in net unrealized appreciation (depreciation) of: | | | | | | | | | | | | | | | | |
Investments — Unaffiliated investments | | | (89,615,947 | ) | | | (2,305,485 | ) | | | (482,687 | )2 | | | (35,285,604 | ) |
Investments — “Affiliated” investments | | | — | | | | — | | | | — | | | | — | |
Foreign currency translations | | | — | | | | — | | | | 1,020 | | | | 3,877 | |
| | | | | | | | | | | | | | | | |
Net gain (loss) on investments | | | 42,213,101 | | | | 538,015 | | | | 624,038 | | | | (65,599,579 | ) |
| | | | | | | | | | | | | | | | |
Net increase (decrease) in net assets resulting from operations | | $ | 38,850,442 | | | $ | 1,090,407 | | | $ | 591,443 | | | $ | (64,648,707 | ) |
| | | | | | | | | | | | | | | | |
| 1 | Net of realized foreign capital gains tax of $(23,961). |
| 2 | Net change in accrued foreign capital gains tax of $(26,282). |
| | |
| See Notes to Financial Statements. | | 29 |
| | |
| Baron Select Funds | | December 31, 2016 |
STATEMENTS OF OPERATIONS (Continued)
|
FOR THE YEAR ENDED DECEMBER 31, 2016 |
| | | | | | | | | | | | |
| | | Baron
Emerging
Markets Fund | | | Baron Energy
and Resources
Fund | | | Baron Global
Advantage
Fund | |
Investment income: | | | | | | | | | | | | |
Income: | | | | | | | | | | | | |
Dividends — Unaffiliated investments | | $ | 39,759,904 | | | $ | 1,529,238 | | | $ | 21,786 | |
Interest | | | 59,937 | | | | 1,501 | | | | 46 | |
Securities lending income, net | | | — | | | | 68,362 | | | | — | |
Foreign taxes withheld on dividends | | | (3,865,367 | ) | | | (11,243 | ) | | | (2,118 | ) |
| | | | | | | | | | | | |
Total income | | | 35,954,474 | | | | 1,587,858 | | | | 19,714 | |
| | | | | | | | | | | | |
Expenses: | | | | | | | | | | | | |
Investment advisory fees (Note 4) | | | 21,103,684 | | | | 967,798 | | | | 103,495 | |
Distribution fees — Retail Shares (Note 4) | | | 1,712,064 | | | | 169,783 | | | | 13,670 | |
Shareholder servicing agent fees and expenses — Retail Shares | | | 82,465 | | | | 28,845 | | | | 15,079 | |
Shareholder servicing agent fees and expenses — Institutional Shares | | | 81,380 | | | | 13,424 | | | | 9,896 | |
Shareholder servicing agent fees and expenses — R6 Shares | | | 13 | | | | 4 | | | | 2 | |
Line of credit fees | | | 30,066 | | | | 1,214 | | | | 137 | |
Reports to shareholders | | | 545,920 | | | | 95,890 | | | | 8,292 | |
Professional fees | | | 135,315 | | | | 172,003 | | | | 117,221 | |
Registration and filing fees | | | 246,280 | | | | 59,313 | | | | 49,350 | |
Custodian and fund accounting fees | | | 1,416,590 | | | | 32,027 | | | | 33,514 | |
Trustee fees and expenses | | | 83,530 | | | | 3,812 | | | | 431 | |
Administration fees | | | 31,511 | | | | 31,492 | | | | 31,511 | |
Insurance expense | | | 25,639 | | | | 1,303 | | | | 174 | |
Miscellaneous expenses | | | 2,235 | | | | 1,582 | | | | 1,575 | |
| | | | | | | | | | | | |
Total operating expenses | | | 25,496,692 | | | | 1,578,490 | | | | 384,347 | |
Interest expense on borrowings | | | — | | | | 852 | | | | — | |
| | | | | | | | | | | | |
Total expenses | | | 25,496,692 | | | | 1,579,342 | | | | 384,347 | |
Reimbursement of expenses by Adviser — Retail Shares (Note 4) | | | — | | | | (240,471 | ) | | | (128,960 | ) |
Reimbursement of expenses by Adviser — Institutional Shares (Note 4) | | | — | | | | (103,207 | ) | | | (111,029 | ) |
Reimbursement of expenses by Adviser — R6 Shares (Note 4) | | | — | | | | (461 | ) | | | (1,324 | ) |
| | | | | | | | | | | | |
Net expenses | | | 25,496,692 | | | | 1,235,203 | | | | 143,034 | |
| | | | | | | | | | | | |
Net investment income (loss) | | | 10,457,782 | | | | 352,655 | | | | (123,320 | ) |
| | | | | | | | | | | | |
Realized and unrealized gain (loss) on investments: | | | | | | | | | | | | |
Net realized loss on investments sold | | | (78,360,942 | ) | | | (3,970,885 | ) | | | (281,712 | ) |
Net realized loss on foreign currency transactions | | | (1,532,442 | ) | | | (5,321 | ) | | | (1,076 | ) |
Change in net unrealized appreciation of: | | | | | | | | | | | | |
Investments — Unaffiliated investments | | | 108,145,583 | 1 | | | 30,124,552 | | | | 257,504 | |
Investments — “Affiliated” investments | | | 1,958,993 | | | | — | | | | — | |
Foreign currency translations | | | 37,480 | | | | 2 | | | | 208 | |
| | | | | | | | | | | | |
Net gain (loss) on investments | | | 30,248,672 | | | | 26,148,348 | | | | (25,076 | ) |
| | | | | | | | | | | | |
Net increase (decrease) in net assets resulting from operations | | $ | 40,706,454 | | | $ | 26,501,003 | | | $ | (148,396 | ) |
| | | | | | | | | | | | |
| 1 | Net change in accrued foreign capital gains tax of $1,325,466. |
| | |
| 30 | | See Notes to Financial Statements. |
| | |
| December 31, 2016 | | Baron Select Funds |
STATEMENTS OF CHANGES IN NET ASSETS
| | | | | | | | | | | | | | | | | | | | | | | | |
| | | Baron Partners Fund | | | Baron Focused Growth Fund | | | Baron International Growth Fund | |
| | | For the Year
Ended
December 31,
2016 | | | For the Year
Ended
December 31,
2015 | | | For the Year
Ended
December 31,
2016 | | | For the Year
Ended
December 31,
2015 | | | For the Year
Ended
December 31,
2016 | | | For the Year
Ended
December 31,
2015 | |
Increase (Decrease) in Net Assets: | | | | | | | | | | | | | | | | | | | | | | | | |
Operations: | | | | | | | | | | | | | | | | | | | | | | | | |
Net investment income (loss) | | $ | (3,362,659 | ) | | $ | (747,224 | ) | | $ | 552,392 | | | $ | 192,228 | | | $ | (32,595 | ) | | $ | 298,094 | |
Net realized gain (loss) | | | 131,829,048 | | | | 14,265,041 | | | | 2,843,500 | | | | 10,479,808 | | | | 1,105,705 | | | | (32,526 | ) |
Change in net unrealized appreciation (depreciation) | | | (89,615,947 | ) | | | (70,618,314 | ) | | | (2,305,485 | ) | | | (14,726,304 | ) | | | (481,667 | ) | | | 1,343,071 | |
| | | | | | | | | | | | | | | | | | | | | | | | |
Increase (decrease) in net assets resulting from operations | | | 38,850,442 | | | | (57,100,497 | ) | | | 1,090,407 | | | | (4,054,268 | ) | | | 591,443 | | | | 1,608,639 | |
| | | | | | | | | | | | | | | | | | | | | | | | |
Distributions to shareholders from: | | | | | | | | | | | | | | | | | | | | | | | | |
Net investment income — Retail Shares | | | — | | | | (4,106,150 | ) | | | — | | | | (70,067 | ) | | | (21,114 | ) | | | (210,570 | ) |
Net investment income — Institutional Shares | | | — | | | | (4,764,671 | ) | | | — | | | | (580,716 | ) | | | (22,950 | ) | | | (462,862 | ) |
Net investment income — R6 Shares | | | — | | | | — | | | | — | | | | — | | | | (203 | ) | | | — | |
Net realized gain on investments — Retail Shares | | | — | | | | — | | | | (2,213,476 | ) | | | (2,417,214 | ) | | | (331,053 | ) | | | (73,424 | ) |
Net realized gain on investments — Institutional Shares | | | — | | | | — | | | | (7,303,770 | ) | | | (7,473,888 | ) | | | (368,392 | ) | | | (82,646 | ) |
Net realized gain on investments — R6 Shares | | | — | | | | — | | | | (484,563 | ) | | | — | | | | (3,222 | ) | | | — | |
| | | | | | | | | | | | | | | | | | | | | | | | |
Decrease in net assets from distributions to shareholders | | | — | | | | (8,870,821 | ) | | | (10,001,809 | ) | | | (10,541,885 | ) | | | (746,934 | ) | | | (829,502 | ) |
| | | | | | | | | | | | | | | | | | | | | | | | |
Capital share transactions: | | | | | | | | | | | | | | | | | | | | | | | | |
Proceeds from the sale of shares — Retail Shares | | | 66,762,551 | | | | 164,387,862 | | | | 2,156,926 | | | | 6,397,130 | | | | 9,413,535 | | | | 8,899,357 | |
Proceeds from the sale of shares — Institutional Shares | | | 98,391,933 | | | | 347,495,282 | | | | 1,275,722 | | | | 3,624,246 | | | | 8,743,582 | | | | 7,680,292 | |
Proceeds from the sale of shares — R6 Shares | | | 8,494,133 | | | | — | | | | 8,822,255 | | | | — | | | | 401,056 | | | | — | |
Net asset value of shares issued in reinvestment of distributions — Retail Shares | | | — | | | | 3,995,569 | | | | 2,157,939 | | | | 2,452,076 | | | | 349,834 | | | | 282,158 | |
Net asset value of shares issued in reinvestment of distributions — Institutional Shares | | | — | | | | 4,177,881 | | | | 6,065,578 | | | | 6,671,379 | | | | 366,821 | | | | 341,079 | |
Net asset value of shares issues in reinvestment of distribution — R6 Shares | | | — | | | | — | | | | 484,563 | | | | — | | | | 3,425 | | | | — | |
Cost of shares redeemed — Retail Shares | | | (282,334,947 | ) | | | (278,717,168 | ) | | | (8,369,443 | ) | | | (7,449,535 | ) | | | (12,745,012 | ) | | | (17,823,270 | ) |
Cost of shares redeemed — Institutional Shares | | | (263,475,486 | ) | | | (212,397,508 | ) | | | (12,670,110 | ) | | | (8,182,326 | ) | | | (17,355,234 | ) | | | (6,817,506 | ) |
Cost of shares redeemed — R6 Shares | | | — | | | | — | | | | — | | | | — | | | | — | | | | — | |
| | | | | | | | | | | | | | | | | | | | | | | | |
Increase (decrease) in net assets derived from capital share transactions | | | (372,161,816 | ) | | | 28,941,918 | | | | (76,570 | ) | | | 3,512,970 | | | | (10,821,993 | ) | | | (7,437,890 | ) |
| | | | | | | | | | | | | | | | | | | | | | | | |
Net decrease in net assets | | | (333,311,374 | ) | | | (37,029,400 | ) | | | (8,987,972 | ) | | | (11,083,183 | ) | | | (10,977,484 | ) | | | (6,658,753 | ) |
| | | | | | | | | | | | | | | | | | | | | | | | |
Net Assets: | | | | | | | | | | | | | | | | | | | | | | | | |
Beginning of year | | | 1,900,793,054 | | | | 1,937,822,454 | | | | 184,182,924 | | | | 195,266,107 | | | | 98,597,945 | | | | 105,256,698 | |
| | | | | | | | | | | | | | | | | | | | | | | | |
End of year | | $ | 1,567,481,680 | | | $ | 1,900,793,054 | | | $ | 175,194,952 | | | $ | 184,182,924 | | | $ | 87,620,461 | | | $ | 98,597,945 | |
| | | | | | | | | | | | | | | | | | | | | | | | |
Undistributed (accumulated) net investment income (loss) at end of year | | $ | 15,124,025 | | | $ | 11,008,549 | | | $ | 1,480,259 | | | $ | 899,855 | | | $ | (20,705 | ) | | $ | (373,371 | ) |
| | | | | | | | | | | | | | | | | | | | | | | | |
Capital share transactions — Retail Shares | | | | | | | | | | | | | | | | | | | | | | | | |
Shares sold | | | 1,972,887 | | | | 4,413,521 | | | | 170,798 | | | | 442,457 | | | | 521,310 | | | | 479,118 | |
Shares issued in reinvestment of distributions | | | — | | | | 113,189 | | | | 171,805 | | | | 189,066 | | | | 19,035 | | | | 15,603 | |
Shares redeemed | | | (8,401,986 | ) | | | (7,633,879 | ) | | | (653,901 | ) | | | (530,825 | ) | | | (712,145 | ) | | | (958,724 | ) |
| | | | | | | | | | | | | | | | | | | | | | | | |
Net increase (decrease) | | | (6,429,099 | ) | | | (3,107,169 | ) | | | (311,298 | ) | | | 100,698 | | | | (171,800 | ) | | | (464,003 | ) |
| | | | | | | | | | | | | | | | | | | | | | | | |
Capital share transactions — Institutional Shares | | | | | | | | | | | | | | | | | | | | | | | | |
Shares sold | | | 2,815,566 | | | | 9,273,217 | | | | 100,207 | | | | 258,675 | | | | 487,086 | | | | 406,160 | |
Shares issued in reinvestment of distributions | | | — | | | | 116,701 | | | | 475,762 | | | | 508,487 | | | | 19,778 | | | | 18,782 | |
Shares redeemed | | | (7,646,600 | ) | | | (5,723,538 | ) | | | (968,806 | ) | | | (547,515 | ) | | | (976,763 | ) | | | (360,893 | ) |
| | | | | | | | | | | | | | | | | | | | | | | | |
Net increase (decrease) | | | (4,831,034 | ) | | | 3,666,380 | | | | (392,837 | ) | | | 219,647 | | | | (469,899 | ) | | | 64,049 | |
| | | | | | | | | | | | | | | | | | | | | | | | |
Capital share transactions — R6 Shares | | | | | | | | | | | | | | | | | | | | | | | | |
Shares sold | | | 219,147 | | | | — | | | | 641,124 | | | | — | | | | 20,279 | | | | — | |
Shares issued in reinvestment of dividends | | | — | | | | — | | | | 37,978 | | | | — | | | | 185 | | | | — | |
Shares redeemed | | | — | | | | — | | | | — | | | | — | | | | — | | | | — | |
| | | | | | | | | | | | | | | | | | | | | | | | |
Net increase | | | 219,147 | | | | — | | | | 679,102 | | | | — | | | | 20,464 | | | | — | |
| | | | | | | | | | | | | | | | | | | | | | | | |
| | |
| See Notes to Financial Statements. | | 31 |
| | |
| Baron Select Funds | | December 31, 2016 |
STATEMENTS OF CHANGES IN NET ASSETS (Continued)
| | | | | | | | | | | | | | | | |
| | | Baron Real Estate Fund | | | Baron Emerging Markets Fund | |
| | | For the Year
Ended
December 31,
2016 | | | For the Year
Ended
December 31,
2015 | | | For the Year
Ended
December 31,
2016 | | | For the Year
Ended
December 31,
2015 | |
Increase (Decrease) in Net Assets: | | | | | | | | | | | | | | | | |
Operations: | | | | | | | | | | | | | | | | |
Net investment income (loss) | | $ | 950,872 | | | $ | (1,503,894 | ) | | $ | 10,457,782 | | | $ | 6,124,993 | |
Net realized gain (loss) | | | (30,317,852 | ) | | | 35,068,425 | | | | (79,893,384 | ) | | | (86,230,454 | ) |
Change in net unrealized appreciation (depreciation) | | | (35,281,727 | ) | | | (127,358,795 | ) | | | 110,142,056 | | | | (116,515,878 | ) |
| | | | | | | | | | | | | | | | |
Increase (decrease) in net assets resulting from operations | | | (64,648,707 | ) | | | (93,794,264 | ) | | | 40,706,454 | | | | (196,621,339 | ) |
| | | | | | | | | | | | | | | | |
Distributions to shareholders from: | | | | | | | | | | | | | | | | |
Net investment income — Retail Shares | | | — | | | | (364,929 | ) | | | (1,159,347 | ) | | | (701,411 | ) |
Net investment income — Institutional Shares | | | — | | | | (444,647 | ) | | | (6,815,620 | ) | | | (3,988,520 | ) |
Net investment income — R6 Shares | | | — | | | | — | | | | (2,533 | ) | | | — | |
Net realized gain on investments — Retail Shares | | | (1,731,824 | ) | | | (15,405,999 | ) | | | — | | | | — | |
Net realized gain on investments — Institutional Shares | | | (2,018,145 | ) | | | (19,283,111 | ) | | | — | | | | — | |
Net realized gain on investments — R6 Shares | | | (6,592 | ) | | | — | | | | — | | | | — | |
Return of capital — Institutional Shares | | | (1,494,968 | ) | | | — | | | | — | | | | — | |
Return of capital — R6 Shares | | | (5,641 | ) | | | — | | | | — | | | | — | |
| | | | | | | | | | | | | | | | |
Decrease in net assets from distributions to shareholders | | | (5,257,170 | ) | | | (35,498,686 | ) | | | (7,977,500 | ) | | | (4,689,931 | ) |
| | | | | | | | | | | | | | | | |
Capital share transactions: | | | | | | | | | | | | | | | | |
Proceeds from the sale of shares — Retail Shares | | | 76,821,436 | | | | 336,220,314 | | | | 363,774,905 | | | | 426,130,100 | |
Proceeds from the sale of shares — Institutional Shares | | | 164,942,852 | | | | 432,171,142 | | | | 1,192,172,548 | | | | 903,660,409 | |
Proceeds from the sale of shares — R6 Shares | | | 1,937,472 | | | | — | | | | 708,857 | | | | — | |
Net asset value of shares issued in reinvestment of
distributions — Retail Shares | | | 1,696,071 | | | | 15,440,297 | | | | 1,151,074 | | | | 693,798 | |
Net asset value of shares issued in reinvestment of
distributions — Institutional Shares | | | 2,978,927 | | | | 16,601,383 | | | | 5,212,419 | | | | 3,084,734 | |
Net asset value of shares issues in reinvestment of
distribution — R6 Shares | | | 12,233 | | | | — | | | | 2,533 | | | | — | |
Cost of shares redeemed — Retail Shares | | | (402,206,544 | ) | | | (285,156,542 | ) | | | (275,026,597 | ) | | | (320,271,070 | ) |
Cost of shares redeemed — Institutional Shares | | | (607,362,368 | ) | | | (306,822,077 | ) | | | (425,085,374 | ) | | | (453,120,022 | ) |
Cost of shares redeemed — R6 Shares | | | (29,272 | ) | | | — | | | | (2,407 | ) | | | — | |
| | | | | | | | | | | | | | | | |
Increase (decrease) in net assets derived from capital
share transactions | | | (761,209,193 | ) | | | 208,454,517 | | | | 862,907,958 | | | | 560,177,949 | |
| | | | | | | | | | | | | | | | |
Net increase (decrease) in net assets | | | (831,115,070 | ) | | | 79,161,567 | | | | 895,636,912 | | | | 358,866,679 | |
| | | | | | | | | | | | | | | | |
Net Assets: | | | | | | | | | | | | | | | | |
Beginning of year | | | 1,781,681,794 | | | | 1,702,520,227 | | | | 1,706,356,431 | | | | 1,347,489,752 | |
| | | | | | | | | | | | | | | | |
End of year | | $ | 950,566,724 | | | $ | 1,781,681,794 | | | $ | 2,601,993,343 | | | $ | 1,706,356,431 | |
| | | | | | | | | | | | | | | | |
Undistributed (accumulated) net investment income
(loss) at end of year | | $ | (330 | ) | | $ | (1,815,613 | ) | | $ | 447,853 | | | $ | (500,002 | ) |
| | | | | | | | | | | | | | | | |
Capital share transactions — Retail Shares | | | | | | | | | | | | | | | | |
Shares sold | | | 3,393,127 | | | | 12,836,525 | | | | 32,884,314 | | | | 37,014,347 | |
Shares issued in reinvestment of distributions | | | 72,824 | | | | 628,995 | | | | 102,991 | | | | 64,902 | |
Shares redeemed | | | (17,670,830 | ) | | | (11,123,366 | ) | | | (25,792,716 | ) | | | (28,651,234 | ) |
| | | | | | | | | | | | | | | | |
Net increase (decrease) | | | (14,204,879 | ) | | | 2,342,154 | | | | 7,194,589 | | | | 8,428,015 | |
| | | | | | | | | | | | | | | | |
Capital share transactions — Institutional Shares | | | | | | | | | | | | | | | | |
Shares sold | | | 7,257,564 | | | | 16,521,289 | | | | 107,399,121 | | | | 80,184,256 | |
Shares issued in reinvestment of distributions | | | 126,180 | | | | 668,952 | | | | 467,660 | | | | 288,024 | |
Shares redeemed | | | (26,373,695 | ) | | | (11,879,810 | ) | | | (39,207,405 | ) | | | (40,651,773 | ) |
| | | | | | | | | | | | | | | | |
Net increase (decrease) | | | (18,989,951 | ) | | | 5,310,431 | | | | 68,659,376 | | | | 39,820,507 | |
| | | | | | | | | | | | | | | | |
Capital share transactions — R6 Shares | | | | | | | | | | | | | | | | |
Shares sold | | | 81,973 | | | | — | | | | 63,070 | | | | — | |
Shares issued in reinvestment of dividends | | | 518 | | | | — | | | | 227 | | | | — | |
Shares redeemed | | | (1,226 | ) | | | — | | | | (206 | ) | | | — | |
| | | | | | | | | | | | | | | | |
Net increase | | | 81,265 | | | | — | | | | 63,091 | | | | — | |
| | | | | | | | | | | | | | | | |
| | |
| 32 | | See Notes to Financial Statements. |
| | |
| December 31, 2016 | | Baron Select Funds |
STATEMENTS OF CHANGES IN NET ASSETS (Continued)
| | | | | | | | | | | | | | | | |
| | | Baron Energy and Resources Fund | | | Baron Global Advantage Fund | |
| | | For the Year
Ended
December 31,
2016 | | | For the Year
Ended
December 31,
2015 | | | For the Year
Ended
December 31,
2016 | | | For the Year
Ended
December 31,
2015 | |
Increase (Decrease) in Net Assets: | | | | | | | | | | | | | | | | |
Operations: | | | | | | | | | | | | | | | | |
Net investment income (loss) | | $ | 352,655 | | | $ | 300,389 | | | $ | (123,320 | ) | | $ | (59,468 | ) |
Net realized gain (loss) | | | (3,976,206 | ) | | | (30,798,728 | ) | | | (282,788 | ) | | | (671,076 | ) |
Change in net unrealized appreciation (depreciation) | | | 30,124,554 | | | | 10,358 | | | | 257,712 | | | | 434,079 | |
| | | | | | | | | | | | | | | | |
Increase (decrease) in net assets resulting from operations | | | 26,501,003 | | | | (30,487,981 | ) | | | (148,396 | ) | | | (296,465 | ) |
| | | | | | | | | | | | | | | | |
Distributions to shareholders from: | | | | | | | | | | | | | | | | |
Net investment income — Retail Shares | | | — | | | | — | | | | — | | | | (11,564 | ) |
Net investment income — Institutional Shares | | | — | | | | — | | | | — | | | | (16,685 | ) |
Net investment income — R6 Shares | | | — | | | | — | | | | — | | | | — | |
Net realized gain on investments — Retail Shares | | | — | | | | (34,058 | ) | | | — | | | | (7,375 | ) |
Net realized gain on investments — Institutional Shares | | | — | | | | (30,966 | ) | | | — | | | | (6,436 | ) |
Net realized gain on investments — R6 Shares | | | — | | | | — | | | | — | | | | — | |
| | | | | | | | | | | | | | | | |
Decrease in net assets from distributions to shareholders | | | — | | | | (65,024 | ) | | | — | | | | (42,060 | ) |
| | | | | | | | | | | | | | | | |
Capital share transactions: | | | | | | | | | | | | | | | | |
Proceeds from the sale of shares — Retail Shares | | | 22,973,711 | | | | 50,753,381 | | | | 665,553 | | | | 3,922,722 | |
Proceeds from the sale of shares — Institutional Shares | | | 10,075,124 | | | | 28,394,513 | | | | 313,072 | | | | 2,152,705 | |
Proceeds from the sale of shares — R6 Shares | | | 368,547 | | | | — | | | | 182,431 | | | | — | |
Net asset value of shares issued in reinvestment of
distributions — Retail Shares | | | — | | | | 33,774 | | | | — | | | | 18,901 | |
Net asset value of shares issued in reinvestment of
distributions — Institutional Shares | | | — | | | | 26,561 | | | | — | | | | 23,120 | |
Net asset value of shares issues in reinvestment of
distribution — R6 Shares | | | — | | | | — | | | | — | | | | — | |
Cost of shares redeemed — Retail Shares | | | (24,918,750 | ) | | | (18,562,721 | ) | | | (1,863,887 | ) | | | (1,433,194 | ) |
Cost of shares redeemed — Institutional Shares | | | (10,343,162 | ) | | | (19,895,321 | ) | | | (945,931 | ) | | | (792,192 | ) |
Cost of shares redeemed — R6 Shares | | | — | | | | — | | | | (7,599 | ) | | | — | |
| | | | | | | | | | | | | | | | |
Increase (decrease) in net assets derived from capital
share transactions | | | (1,844,530 | ) | | | 40,750,187 | | | | (1,656,361 | ) | | | 3,892,062 | |
| | | | | | | | | | | | | | | | |
Net increase (decrease) in net assets | | | 24,656,473 | | | | 10,197,182 | | | | (1,804,757 | ) | | | 3,553,537 | |
| | | | | | | | | | | | | | | | |
Net Assets: | | | | | | | | | | | | | | | | |
Beginning of year | | | 79,241,714 | | | | 69,044,532 | | | | 11,521,872 | | | | 7,968,335 | |
| | | | | | | | | | | | | | | | |
End of year | | $ | 103,898,187 | | | $ | 79,241,714 | | | $ | 9,717,115 | | | $ | 11,521,872 | |
| | | | | | | | | | | | | | | | |
Undistributed (accumulated) net investment income
(loss) at end of year | | $ | 905,895 | | | $ | 557,992 | | | $ | (2,104 | ) | | $ | 17,414 | |
| | | | | | | | | | | | | | | | |
Capital share transactions — Retail Shares | | | | | | | | | | | | | | | | |
Shares sold | | | 3,152,753 | | | | 6,311,650 | | | | 49,942 | | | | 275,759 | |
Shares issued in reinvestment of distributions | | | — | | | | 4,381 | | | | — | | | | 1,505 | |
Shares redeemed | | | (3,089,243 | ) | | | (2,138,039 | ) | | | (136,901 | ) | | | (101,770 | ) |
| | | | | | | | | | | | | | | | |
Net increase (decrease) | | | 63,510 | | | | 4,177,992 | | | | (86,959 | ) | | | 175,494 | |
| | | | | | | | | | | | | | | | |
Capital share transactions — Institutional Shares | | | | | | | | | | | | | | | | |
Shares sold | | | 1,492,155 | | | | 2,950,290 | | | | 22,880 | | | | 144,495 | |
Shares issued in reinvestment of distributions | | | — | | | | 3,414 | | | | — | | | | 1,831 | |
Shares redeemed | | | (1,333,782 | ) | | | (2,557,117 | ) | | | (69,747 | ) | | | (55,528 | ) |
| | | | | | | | | | | | | | | | |
Net increase (decrease) | | | 158,373 | | | | 396,587 | | | | (46,867 | ) | | | 90,798 | |
| | | | | | | | | | | | | | | | |
Capital share transactions — R6 Shares | | | | | | | | | | | | | | | | |
Shares sold | | | 43,017 | | | | — | | | | 12,185 | | | | — | |
Shares issued in reinvestment of dividends | | | — | | | | — | | | | — | | | | — | |
Shares redeemed | | | — | | | | — | | | | (542 | ) | | | — | |
| | | | | | | | | | | | | | | | |
Net increase | | | 43,017 | | | | — | | | | 11,643 | | | | — | |
| | | | | | | | | | | | | | | | |
| | |
| See Notes to Financial Statements. | | 33 |
| | |
| Baron Select Funds | | December 31, 2016 |
STATEMENT OF CASH FLOWS
|
FORTHE YEAR ENDED DECEMBER 31, 2016 |
| | | | |
| | | Baron Partners
Fund | |
Increase (Decrease) in Cash: | | | | |
Cash Provided from Operating Activities | | | | |
Net increase in net assets resulting from operations | | $ | 38,850,442 | |
Adjustments to reconcile net increase in net assets resulting from operations to net cash provided by operating activities: | | | | |
Purchases of portfolio securities | | | (355,560,559 | ) |
Proceeds from sales of portfolio securities | | | 812,974,389 | |
Net purchases, sales and maturities of short-term investments | | | (133,643 | ) |
Increase in dividends and interest receivable | | | (691,692 | ) |
Decrease in prepaid expenses | | | 1,284 | |
Increase in accrued expenses | | | 84,725 | |
Net realized gain on investments | | | (131,829,048 | ) |
Change in net unrealized depreciation of investments | | | 89,615,947 | |
| | | | |
Net cash provided by operating activities | | $ | 453,311,845 | |
| | | | |
Cash Used in Financing Activities | | | | |
Proceeds from shares sold | | | 175,749,215 | |
Payment for shares redeemed | | | (547,061,060 | ) |
Decrease in payable for borrowings against line of credit | | | (82,000,000 | ) |
| | | | |
Net cash used in financing activities | | | (453,311,845 | ) |
| | | | |
Net decrease in cash | | | — | |
Cash at beginning of year | | | — | |
| | | | |
Cash at end of year | | | — | |
| | | | |
Supplemental cash flow information: | | | | |
Interest paid | | $ | 6,820,260 | |
| | | | |
| | |
| 34 | | See Notes to Financial Statements. |
| | |
| December 31, 2016 | | Baron Select Funds |
NOTES TO FINANCIAL STATEMENTS
1. ORGANIZATION
Baron Select Funds (the “Trust”) is registered under the Investment Company Act of 1940, as amended (the “1940 Act”), as an open-end management investment company established as a Delaware statutory trust on April 30, 2003, and accordingly, follows the investment company accounting and reporting guidance of the Financial Accounting Standards Board (“FASB”) Accounting Standard Codification Topic 946 Financial Services — Investment Companies. The Trust currently offers seven series (individually, a “Fund” and collectively, the “Funds”): Baron Partners Fund, Baron Focused Growth Fund, Baron Real Estate Fund and Baron Energy and Resources Fund, which are non-diversified; and Baron International Growth Fund, Baron Emerging Markets Fund, and Baron Global Advantage Fund, which are diversified. The Funds’ investment objective is to seek capital appreciation. Baron Partners Fund may employ “leverage” by borrowing money and using it to purchase additional securities. Borrowing for investment increases both investment opportunity and investment risk. Baron International Growth Fund, Baron Emerging Markets Fund and Baron Global Advantage Fund invest their assets primarily in non-U.S. companies. Baron Real Estate Fund invests its assets primarily in U.S. and non-U.S. real estate and real estate-related companies. Baron Energy and Resources Fund invests its assets primarily in U.S. and non-U.S. energy and resources companies and related companies and energy and resources master limited partnerships (“MLPs”) of any market capitalization.
Each Fund offers Retail Shares, Institutional Shares and R6 Shares. Each class of shares differs only in its ongoing fees, expenses and eligibility requirements. Retail Shares are offered to all investors. Institutional Shares are for investments in the amount of $1 million or more per Fund. Institutional Shares are intended for certain financial intermediaries that offer shares of Baron Funds through fee-based platforms, retirement platforms or other platforms. R6 Shares are for investments in the amount of $5 million or more per Fund. R6 Shares are available only to qualified 401(a) plans (including 401(k) plans, Keogh plans, profit sharing plans, money purchase pension plans, target benefit plans, defined benefit pension plans and Taft-Hartley multi-employer pension plans), endowment funds and foundations, any state, county or city, or its instrumentality, department, authority, or agency, 457 plans, including 457(a) governmental entity plans and tax-exempt plans, accounts registered to insurance companies, trust companies and bank trust departments, investment companies, both affiliated and not affiliated with the adviser, and any entity that is considered a corporation for tax purposes, including corporate non-qualified deferred compensation plans of such corporations. Each class of shares has equal rights to earnings and assets, except that each class bears different expenses for distribution and shareholder servicing. Each Fund’s investment income, realized and unrealized gains or losses on investments and foreign currency, and expenses other than those attributable to a specific class are allocated to each class based on its relative net assets. Each class of shares has exclusive voting rights with respect to matters that affect just that class.
Baron Partners Fund was organized originally as a limited partnership in January 1992 under the laws of the State of Delaware. Effective as of the close of business on April 30, 2003, the predecessor partnership was reorganized into a series of the Trust. Baron Partners Fund commenced operations on April 30, 2003 with a contribution of assets and liabilities, including securities-in-kind, from the predecessor partnership.
Baron Focused Growth Fund was organized originally as a limited partnership in May 1996 under the laws of the State of Delaware. Effective as of the close of business on June 30, 2008, the predecessor partnership was reorganized into a series of the Trust. Baron Focused Growth Fund commenced operations on June 30, 2008 with a contribution of assets and liabilities, including securities-in-kind, from the predecessor partnership.
2. SIGNIFICANT ACCOUNTING POLICIES
The following is a summary of significant accounting policies followed by the Funds. The policies are in conformity with accounting principles generally accepted in the United States of America (“GAAP”). The preparation of financial statements in accordance with GAAP requires management to make estimates and assumptions that affect the reported amounts of assets and liabilities at the date of the financial statements and the amounts of income and expenses during the period. Actual results could differ from those estimates. Events occurring subsequent to the date of the Statements of Assets and Liabilities and through the date of issuance of the financial statements have been evaluated for adjustment to or disclosure in the financial statements.
a) Security Valuation. The Funds’ share prices or net asset values (“NAV”) are calculated as of the scheduled close of the regular trading session (usually 4 p.m. E.T. or such other time as of which the Funds’ NAV is calculated (the “NAV Calculation Time”)) on the New York Stock Exchange (the “Exchange”) on any day the Exchange is scheduled to be open. Portfolio securities traded on any national stock exchange are valued based on the last sale price on the exchange where such shares are principally traded. For securities traded on NASDAQ, the Funds use the NASDAQ Official Closing Price. If there are no sales on a given day, the value of the security may be the average of the most recent bid and asked quotations on such exchange or the last sale price from a prior day. Where market quotations are not readily available, or, if in BAMCO, Inc.’s (the “Adviser”) judgment, they do not accurately reflect the fair value of a security, or an event occurs after the market close but before the Funds are priced that materially affects the value of a security, the security will be valued by the Adviser using policies and procedures approved by the Board of Trustees (the “Board”). The Adviser has a Fair Valuation Committee (the “Committee”) comprised of senior management representatives and the Committee reports to the Board every quarter. Factors the Committee may consider when valuing a security include whether a current price is stale, there is recent news, the security is thinly traded, transactions are infrequent or quotations are genuine. There can be no guarantee, however, that a fair valuation used by the Funds on any given day will more accurately reflect the market value of an investment than the closing price of such investment in its market. U.S. Government obligations, money market instruments, and other debt instruments held by the Funds with a remaining maturity of 60 days or less are generally valued at amortized cost, which approximates fair value. Debt instruments having a greater remaining maturity will be valued on the basis of prices obtained from a pricing service approved by the Board or at the mean of the bid and ask prices from the dealer maintaining an active market in that security. The value of the Funds’ investments in convertible bonds is determined primarily by obtaining valuations from independent pricing services based on readily available bid quotations or, if quotations are not available, by methods which include various considerations such as yields or prices of securities of comparable quality, coupon, maturity and type; indications as to values from dealers; and general market conditions. Other inputs used by an independent pricing service to value convertible bonds generally include underlying stock data, conversion premiums, listed bond and preferred stock prices and other market information which may include benchmark curves, trade execution data, and sensitivity analysis, when available. Open-end investment companies, including securities lending collateral invested in registered investment company money market funds, are valued at their NAV each day.
35
| | |
| Baron Select Funds | | December 31, 2016 |
NOTES TO FINANCIAL STATEMENTS (Continued)
2. SIGNIFICANT ACCOUNTING POLICIES (Continued)
Non-U.S. equity securities are valued on the basis of their most recent closing market prices and translated into U.S. dollars at the NAV Calculation Time, except under the circumstances described below. Most foreign markets close before the NAV Calculation Time. For securities primarily traded in the Far East, for example, the most recent closing prices may be as much as 15 hours old at the NAV Calculation Time. As a result, the Adviser may use a third-party pricing service to assist in determining fair value of foreign securities. This service utilizes a systematic methodology in making fair value estimates. The Adviser may also fair value securities in other situations, for example, when a particular foreign market is closed but the Funds are open. The Adviser cannot predict how often it will use closing prices or how often it will adjust those prices. As a means of evaluating its fair value process, the Adviser routinely compares closing market prices, the next day’s opening prices in the same markets, and the adjusted prices. Other mutual funds may adjust the prices of their securities by different amounts.
b) Securities Transactions, Investment Income and Expense Allocation. Securities transactions are recorded on a trade date basis. Realized gain and loss from securities transactions are recorded on an identified cost basis for financial reporting and federal income tax purposes. Dividend income is recognized on the ex-dividend date and interest income is recognized on an accrual basis, which includes the accretion of discounts and amortization of premiums. Certain dividends from foreign securities will be recorded as soon as the Funds are informed of the dividend if such information is obtained subsequent to the ex-dividend date. Distributions received from certain investments held by the Funds may be comprised of dividends, realized gains and returns of capital. The Funds originally estimate the expected classification of such payments. The amounts may subsequently be reclassified upon receipt of information from the issuer. The Funds are charged for those expenses of the Trust that are directly attributable to each Fund, such as advisory and custodian fees. Expenses that are not directly attributable to a Fund are typically allocated among the Funds in proportion to their respective net assets.
c) Foreign Currency Translations. Values of assets and liabilities denominated in foreign currencies are translated into U.S. dollars using the price of such currencies at the time the net asset value is determined. Purchases and sales of investments and dividend income are converted at the prevailing rate of exchange on the respective dates of such transactions. Net realized gain (loss) on foreign currency transactions includes gain (loss) arising from the fluctuation in the exchange rates between trade and settlement dates on security transactions and currency gain (loss) between the accrual and payment dates on dividends and foreign withholding taxes. The Funds do not isolate that portion of the results of operations resulting from changes in foreign exchange rates on investments from the fluctuations arising from changes in market prices of securities held. Such fluctuations are included with the net realized and unrealized gain or loss from investments and foreign currency transactions on the Statements of Operations. The Funds may invest in foreign securities and foreign currency transactions that may involve risks not associated with domestic investments as a result of the level of governmental supervision and regulation of foreign securities markets and the possibility of political or economic instability, among others.
Pursuant to U.S. federal income tax regulations, gains and losses from certain foreign currency transactions and the foreign currency portion of gains and losses realized on sales and maturities of foreign denominated debt securities are generally treated as ordinary income for U.S. federal income tax purposes.
d) Securities Lending. The Funds may lend securities to certain brokers under the terms of a master netting agreement. Upon such loans, the Funds receive collateral which is maintained by the custodian. The Funds may pay fees to the custodian for administering the securities lending program. The Funds earn interest on such collateral and earn income in the form of negotiated lenders’ fees, both of which are included in securities lending income in the Statements of Operations. Securities loaned are required to be secured at all times by collateral equal to at least 102% of the market value of the securities loaned. Risks may arise upon entering into securities lending to the extent that the value of the collateral is less than the value of the securities loaned due to the changes in the value of collateral or the loaned securities. The collateral is marked-to-market daily and settled on the next business day. The Funds may receive collateral in the form of cash or other eligible securities, such as a letter of credit issued by a U.S. bank or securities issued or guaranteed by the U.S. government. Securities purchased with cash collateral are subject to the risks inherent in investing in these securities.
The Funds did not hold derivatives or participate in securities lending/borrowing activities at December 31, 2016.
e) Repurchase Agreements. The Funds may invest in repurchase agreements, which are short term investments whereby the Funds acquire ownership of a debt security and the seller agrees to repurchase the security at a future date at a specified price. When entering into repurchase agreements, it is the Funds’ policy that their custodian take possession of the underlying collateral securities, the market value of which, at all times, equals at least 102% of the principal amount of the repurchase transaction. To the extent that any repurchase transaction exceeds one business day, the value of the collateral is marked-to-market to ensure the adequacy of the collateral. If the seller defaults and the market value of the collateral declines or if bankruptcy proceedings are commenced with respect to the seller of the security, realization of the collateral by the Funds may be delayed or limited. The information required to be disclosed by ASU No. 2011-11 for the Funds’ investments in repurchase agreements at December 31, 2016, including the fair value of the repurchase agreement and the amount of collateral, can be found in each respective Fund’s Statement of Net Assets.
f) Master Limited Partnerships. The Funds may invest in master limited partnerships (“MLPs”). MLPs are limited partnerships or limited liability companies, whose partnership units or limited liability interests are listed and traded on a U.S. securities exchange, and are treated as publicly traded partnerships for federal income tax purposes. To qualify to be treated as a partnership for tax purposes, an MLP must receive at least 90% of its income from qualifying sources as set forth in Section 7704(d) of the Internal Revenue Code of 1986, as amended. These qualifying sources include interest, dividend, real property rent, gain from sale or other disposition of real property and income from activities such as the exploration, development, mining, production, processing, refining, transportation, storage and marketing of mineral or natural resources.
g) Federal and Foreign Income Taxes. The Trust treats each Fund as a separate entity for federal income tax purposes. Each Fund intends to meet the requirements of the Internal Revenue Code of 1986, as amended, applicable to regulated investment companies, and to distribute to its shareholders substantially all of its net investment income and any net realized capital gains at least annually. None of the Funds will be subject to federal or state income taxes to the extent that they qualify as regulated investment companies and substantially all of their income is distributed.
The Funds may be subject to foreign taxes on income and gains on investments that are accrued based upon the Funds’ understanding of the tax rules and regulations that exist in the countries in which the Funds invest. Foreign governments may also impose taxes or other payments on investments with respect to foreign securities. Such taxes are accrued as applicable.
36
| | |
| December 31, 2016 | | Baron Select Funds |
NOTES TO FINANCIAL STATEMENTS (Continued)
2. SIGNIFICANT ACCOUNTING POLICIES (Continued)
h) Restricted Securities. The Funds may invest in securities that are restricted as to public sale in accordance with the Securities Act of 1933. Such assets are valued by the Adviser pursuant to policies and procedures approved by the Board.
i) Distributions to Shareholders. Income and capital gain distributions to shareholders are determined in accordance with income tax regulations which may differ from GAAP. These differences are primarily due to differing treatments for net investment loss, foreign currency gains and losses, reclassification of distributions, partnership basis adjustments, income from passive foreign investment companies and wash sale losses deferred.
j) Commitments and Contingencies. In the normal course of business, the Funds may enter into contracts and agreements that contain a variety of representations and warranties, which provide general indemnification. The maximum exposure to the Funds under these agreements is unknown, as this would involve future claims that may be made against the Funds that have not yet occurred. However, based on experience, the Funds expect the risk of loss to be remote.
k) Cash and Cash Equivalents. The Funds consider all short term liquid investments with a maturity of three months or less when purchased to be cash equivalents.
l) Fund Diversification and Concentration. Certain of the Funds hold non-diversified or concentrated portfolios that may contain fewer securities or invest in fewer industries than the portfolios of other mutual funds. This may increase the risk that the value of a Fund could decrease because of the poor performance of one or a few investments or of a particular industry. Additionally, non-diversified funds may encounter difficulty liquidating securities.
3. PURCHASES AND SALES OF SECURITIES
Purchases and sales of securities, other than short term securities, for the year ended December 31, 2016 were as follows:
| | | | | | | | |
| Fund | | Purchases | | | Sales | |
Baron Partners Fund | | $ | 335,162,545 | | | $ | 800,682,320 | |
Baron Focused Growth Fund | | | 23,941,459 | | | | 29,429,901 | |
Baron International Growth Fund | | | 32,146,210 | | | | 48,507,896 | |
Baron Real Estate Fund | | | 687,487,856 | | | | 1,422,834,791 | |
Baron Emerging Markets Fund | | | 1,347,989,215 | | | | 487,757,605 | |
Baron Energy and Resources Fund | | | 58,894,392 | | | | 49,153,209 | |
Baron Global Advantage Fund | | | 2,215,346 | | | | 3,961,744 | |
4. INVESTMENT ADVISORY FEES AND OTHER TRANSACTIONS WITH AFFILIATES
a) Investment Advisory Fees. The Adviser, a wholly owned subsidiary of Baron Capital Group, Inc. (“BCG”), serves as investment adviser to the Funds. As compensation for services rendered, the Adviser receives a fee payable monthly equal to 1% per annum of the average daily net assets of the respective Funds. The Adviser has contractually agreed to reduce its fee, to the extent required to limit the net annual operating expense ratio (excluding portfolio transaction costs, interest, dividend and extraordinary expenses), as follows:
| | | | | | | | | | | | |
| | | Annual Operating
Expense Ratio Cap | |
| Fund | | Retail
Shares | | | Institutional
Shares | | | R6
Shares | |
Baron Partners Fund | | | 1.45 | % | | | 1.20 | % | | | 1.20 | % |
Baron Focused Growth Fund | | | 1.35 | % | | | 1.10 | % | | | 1.10 | % |
Baron International Growth Fund | | | 1.50 | % | | | 1.25 | % | | | 1.24 | % |
Baron Real Estate Fund | | | 1.35 | % | | | 1.10 | % | | | 1.10 | % |
Baron Emerging Markets Fund | | | 1.50 | % | | | 1.25 | % | | | 1.25 | % |
Baron Energy and Resources Fund | | | 1.35 | % | | | 1.10 | % | | | 1.09 | % |
Baron Global Advantage Fund | | | 1.50 | % | | | 1.25 | % | | | 1.24 | % |
b) Distribution Fees. Baron Capital, Inc. (“BCI”), a wholly owned subsidiary of BCG, is a registered limited purpose broker-dealer and the distributor of the Funds’ shares. The Funds are authorized to pay BCI a distribution fee payable monthly pursuant to a distribution plan under Rule 12b-1 of the 1940 Act equal to 0.25% per annum of the Retail Shares’ average daily net assets of the respective Funds.
c) Trustee Fees. Certain Trustees of the Trust may be deemed to be affiliated with, or interested persons (as defined by the 1940 Act) of the Funds’ Adviser or of BCI. None of the Trustees so affiliated received compensation for his or her services as a Trustee of the Trust. None of the Funds’ officers received compensation from the Funds for their services as an officer.
d) Fund Accounting and Administration Fees. The Funds have entered into an agreement with State Street Bank and Trust Company (“State Street”) to perform accounting and certain administrative services. State Street is compensated for fund accounting services based on a percentage of the Funds’ net assets, subject to certain minimums plus fixed annual fees for the administrative services.
e) Cross Trades. The Funds are permitted to purchase securities from, or sell securities to, other Funds within the Trust, other funds in the Baron Investment Funds Trust, and other entities advised or subadvised by the Adviser, pursuant to “Cross-Trading” Procedures adopted by the Board. These procedures have been designed to ensure that any cross-trade of securities by a Fund from or to another fund/other entity that is or could be considered an affiliate of the respective Baron Fund under certain limited
37
| | |
| Baron Select Funds | | December 31, 2016 |
NOTES TO FINANCIAL STATEMENTS (Continued)
4. INVESTMENT ADVISORY FEES AND OTHER TRANSACTIONS WITH AFFILIATES (Continued)
circumstances by virtue of having a common investment adviser, common officers, or common Trustees complies with Rule 17a-7 under the 1940 Act. Further, as defined under these procedures, each cross-trade is effected at the current market price and with no commissions. Pursuant to these procedures, for the year ended December 31, 2016, the Funds engaged in the following cross-trades, which resulted in the following net realized gains (losses):
| | | | | | | | | | | | |
| | | Purchases | | | Sales | | | Net Realized
Gains (Losses) | |
Baron Partners Fund | | $ | 1,521,507 | | | $ | 1,494,967 | | | $ | (435,111 | ) |
Baron International Growth Fund | | | 39,975 | | | | — | | | | — | |
Baron Real Estate Fund | | | — | | | | 3,491,760 | | | | (244,583 | ) |
Baron Emerging Markets Fund | | | 666,250 | | | | — | | | | — | |
5. LINE OF CREDIT
Baron Partners Fund participates in a committed syndicated line of credit agreement with State Street in the amount of $600 million. Depending on the outstanding loan amount, a commitment fee of 0.15% or 0.25% per annum is incurred on the unused portion of the line of credit. The line of credit is used for investment purposes and expires on November 3, 2017. Baron Partners Fund may borrow up to the lesser of $600 million or the maximum amount Baron Partners Fund may borrow under the 1940 Act, the limitations included in Baron Partners Fund’s prospectus, or any limit or restriction under any law or regulation to which Baron Partners Fund is subject or any agreement to which Baron Partners Fund is a party. Interest is charged to Baron Partners Fund, based on its borrowings, at a rate per annum equal to the higher of the Federal Funds Rate or the One Month LIBOR Rate plus a margin of 0.85%. An upfront fee of 0.05% is incurred on the commitment amount. For the year ended December 31, 2016, interest expense incurred on these loans amounted to $6,948,906. During the year ended December 31, 2016, Baron Partners Fund had an average daily balance on the line of credit of $505.2 million at a weighted average interest rate of 1.38%. At December 31, 2016, Baron Partners Fund had an outstanding balance in the amount of $475,000,000.
The Funds (except Baron Partners Fund), together with the funds in Baron Investment Funds Trust, participate in a committed line of credit agreement with State Street to be used for temporary purposes, primarily for financing redemptions. Each fund may borrow up to the lesser of $100 million or the maximum amount each fund may borrow under the 1940 Act, the limitations included in each fund’s prospectus, or any limit or restriction under any law or regulation to which each fund is subject or any agreement to which each fund is a party; provided that the aggregate outstanding principal amount of all loans to any of the funds may not exceed $100 million. Interest is charged to each fund, based on its borrowings, at a rate per annum equal to the higher of the Overnight Federal Funds Rate or the One Month LIBOR Rate plus a margin of 1.00%. An upfront fee of 0.05% is incurred on the commitment amount and a commitment fee of 0.20% per annum is incurred on the unused portion of the line of credit. Both fees are allocated to the participating funds based on their relative net assets.
During the year ended December 31, 2016, Baron Energy and Resources Fund had borrowings under the line of credit and incurred interest expense of $852. For the three days during which there were borrowings, Baron Energy and Resources Fund had an average daily balance on the line of credit of $5.8 million at a weighted average interest rate of 1.75%.
6. RESTRICTED SECURITIES
At December 31, 2016, investments in securities included securities that are restricted and/or illiquid. Restricted securities are often purchased in private placement transactions, are not registered under the Securities Act of 1933, may have contractual restrictions on resale and are valued pursuant to the policies and procedures for fair value pricing approved by the Board. A security may be considered illiquid if it lacks a readily available market or if its valuation has not changed for a certain period of time. The Funds may receive more or less than this valuation in an actual sale and that difference could be material. At December 31, 2016, the Funds held investments in restricted and/or illiquid securities that were valued pursuant to policies and procedures for fair value pricing as follows:
| | | | | | | | |
| | | Baron Partners Fund | |
| Name of Issuer | | Acquisition Date(s) | | | Value | |
Private Equity Investments | | | | | | | | |
Windy City Investments Holdings, L.L.C. | | | 11/13/2007-1/27/2011 | | | $ | 3,456,083 | |
| | | | | | | | |
(Cost $0) (0.22% of Net Assets) | | | | | | | | |
7. FAIR VALUE MEASUREMENTS
Fair value is defined by GAAP as the price that the Funds would receive upon selling an investment in a timely transaction to an independent buyer in the principal or most advantageous market for the investment. GAAP provides a three-tier hierarchy to maximize the use of observable market data and minimize the use of unobservable inputs and to establish classification of fair value measurements for disclosure purposes. Inputs refer broadly to the assumptions that market participants would use in pricing the asset or liability. Inputs may be observable or unobservable. Observable inputs are based on market data obtained from sources independent of the Funds. Unobservable inputs are inputs that reflect the Funds’ own assumptions based on the best information available in the circumstances. The three-tier hierarchy of inputs is summarized in the three broad Levels listed below.
| | • | | Level 1 — quoted prices in active markets for identical assets or liabilities; |
| | • | | Level 2 — prices determined using other inputs that are observable either directly, or indirectly through corroboration with observable market data (which could include quoted prices for similar assets or liabilities, interest rates, credit risk, etc.); |
38
| | |
| December 31, 2016 | | Baron Select Funds |
NOTES TO FINANCIAL STATEMENTS (Continued)
7. FAIR VALUE MEASUREMENTS (Continued)
| | • | | Level 3 — prices determined using unobservable inputs when quoted prices or observable inputs are unavailable, such as when there is little or no market activity for an asset or liability (unobservable inputs reflect each Fund’s own assumptions in determining the fair value of assets or liabilities and would be based on the best information available). |
The inputs or methodology used for valuing securities are not necessarily an indication of the risk associated with investing in those securities. For example, non-U.S. securities, with markets that close hours before the Funds value their holdings, may require revised valuations due to significant movement in the U.S. markets. Since these values are not obtained from quoted prices in an active market, such securities are reflected as Level 2.
The Funds have procedures to determine the fair value of securities and other financial instruments for which market prices are not readily available or which may not be reliably priced. Under these procedures, the Funds primarily employ a market-based approach that may use related or comparable assets or liabilities, recent transactions, market multiples, book values, and other relevant information for the investment to determine its fair value. The Funds may also use an income-based valuation approach in which the anticipated future cash flows of the investment are discounted to calculate fair value. Discounts may also be applied due to the nature or duration of any restrictions on the disposition of the investments. Due to the inherent uncertainty of valuations of such investments, the fair values may differ significantly from the values that would have been used had an active market existed.
The following is a summary of the inputs used as of December 31, 2016 in valuing the Funds’ investments carried at fair value:
| | | | | | | | | | | | | | | | |
| | | Baron Partners Fund | |
| Description | | Quoted Prices in
Active Markets
for Identical
Assets
(Level 1) | | | Other
Observable
Inputs
(Level 2) | | | Unobservable
Inputs
(Level 3) | | | Total | |
Common Stocks† | | $ | 2,037,110,016 | | | $ | — | | | $ | — | | | $ | 2,037,110,016 | |
Private Equity Investments | | | — | | | | — | | | | 3,456,083 | | | | 3,456,083 | |
Short Term Investments | | | — | | | | 274,928 | | | | — | | | | 274,928 | |
| | | | | | | | | | | | | | | | |
Total Investments | | $ | 2,037,110,016 | | | $ | 274,928 | | | $ | 3,456,083 | | | $ | 2,040,841,027 | |
| | | | | | | | | | | | | | | | |
Transfers between Levels 1, 2 or 3, if any, are recognized at ending value on December 31, 2016. There have been no transfers in and out of Level 1, 2 or 3 fair value measurements for the Fund for the year ended December 31, 2016.
| | | | | | | | | | | | | | | | |
| | | Baron Focused Growth Fund | |
| Description | | Quoted Prices in
Active Markets
for Identical
Assets
(Level 1) | | | Other
Observable
Inputs
(Level 2) | | | Unobservable
Inputs
(Level 3) | | | Total | |
Common Stocks† | | $ | 159,078,855 | | | $ | — | | | $ | — | | | $ | 159,078,855 | |
Preferred Stocks | | | — | | | | 7,664,733 | | | | — | | | | 7,664,733 | |
Short Term Investments | | | — | | | | 8,350,534 | | | | — | | | | 8,350,534 | |
| | | | | | | | | | | | | | | | |
Total Investments | | $ | 159,078,855 | | | $ | 16,015,267 | | | $ | — | | | $ | 175,094,122 | |
| | | | | | | | | | | | | | | | |
Transfers between Levels 1, 2 or 3, if any, are recognized at ending value on December 31, 2016. There have been no transfers in and out of Level 1, 2 or 3 fair value measurements for the Fund for the year ended December 31, 2016.
| | | | | | | | | | | | | | | | |
| | | Baron International Growth Fund | |
| Description | | Quoted Prices in
Active Markets
for Identical
Assets
(Level 1) | | | Other
Observable
Inputs
(Level 2) | | | Unobservable
Inputs
(Level 3) | | | Total | |
Common Stocks† | | $ | 76,287,815 | | | $ | 2,714,916 | | | $ | — | | | $ | 79,002,731 | |
Short Term Investments | | | — | | | | 8,384,431 | | | | — | | | | 8,384,431 | |
| | | | | | | | | | | | | | | | |
Total Investments | | $ | 76,287,815 | | | $ | 11,099,347 | | | $ | — | | | $ | 87,387,162 | |
| | | | | | | | | | | | | | | | |
$18,224,224 was transferred out of Level 2 into Level 1 at December 31, 2016 as a result of not adjusting closing prices for certain securities (as described in Note 2a) due to significant market movements between the time at which the Fund valued its securities and the earlier closing of foreign markets. $454,862 was transferred out of Level 2 into Level 1 at December 31, 2016 due to the expiration of a lock-up restriction. It is the Fund’s policy to recognize transfers in and transfers out at the fair value as of the end of the period.
| † | See Statements of Net Assets for additional detailed categorizations. |
39
| | |
| Baron Select Funds | | December 31, 2016 |
NOTES TO FINANCIAL STATEMENTS (Continued)
7. FAIR VALUE MEASUREMENTS (Continued)
| | | | | | | | | | | | | | | | |
| | | Baron Real Estate Fund | |
| Description | | Quoted Prices in
Active Markets
for Identical
Assets
(Level 1) | | | Other
Observable
Inputs
(Level 2) | | | Unobservable
Inputs
(Level 3) | | | Total | |
Common Stocks† | | $ | 929,272,978 | | | $ | — | | | $ | — | | | $ | 929,272,978 | |
Short Term Investments | | | — | | | | 24,789,506 | | | | — | | | | 24,789,506 | |
| | | | | | | | | | | | | | | | |
Total Investments | | $ | 929,272,978 | | | $ | 24,789,506 | | | $ | — | | | $ | 954,062,484 | |
| | | | | | | | | | | | | | | | |
$10,475,365 was transferred out of Level 2 into Level 1 at December 31, 2016 as a result of not adjusting closing prices for certain securities (as described in Note 2a) due to significant market movements between the time at which the Fund valued its securities and the earlier closing of foreign markets. It is the Fund’s policy to recognize transfers in and transfers out at the fair value as of the end of the period
| | | | | | | | | | | | | | | | |
| | | Baron Emerging Markets Fund | |
| Description | | Quoted Prices in
Active Markets
for Identical
Assets
(Level 1) | | | Other
Observable
Inputs
(Level 2) | | | Unobservable
Inputs
(Level 3) | | | Total | |
Common Stocks† | | $ | 1,998,618,610 | | | $ | 404,671,341 | | | $ | — | | | $ | 2,403,289,951 | |
Preferred Stocks | | | 446,924 | | | | — | | | | — | | | | 446,924 | |
Convertible Bonds | | | — | | | | 6,995,938 | | | | — | | | | 6,995,938 | |
Short Term Investments | | | — | | | | 186,251,623 | | | | — | | | | 186,251,623 | |
| | | | | | | | | | | | | | | | |
Total Investments | | $ | 1,999,065,534 | | | $ | 597,918,902 | | | $ | — | | | $ | 2,596,984,436 | |
| | | | | | | | | | | | | | | | |
$71,224,626 was transferred out of Level 2 into Level 1 at December 31, 2016 as a result of not adjusting closing prices for certain securities (as described in Note 2a) due to significant market movements between the time at which the Fund valued its securities and the earlier closing of foreign markets. $7,658,837 was transferred out of Level 2 into Level 1 at December 31, 2016 due to the expiration of a lock-up restriction. It is the Fund’s policy to recognize transfers in and transfers out at the fair value as of the end of the period.
| | | | | | | | | | | | | | | | |
| | | Baron Energy and Resources Fund | |
| Description | | Quoted Prices in
Active Markets
for Identical
Assets
(Level 1) | | | Other
Observable
Inputs
(Level 2) | | | Unobservable
Inputs
(Level 3) | | | Total | |
Common Stocks† | | $ | 103,305,611 | | | $ | — | | | $ | — | | | $ | 103,305,611 | |
Short Term Investments | | | — | | | | 482,492 | | | | — | | | | 482,492 | |
| | | | | | | | | | | | | | | | |
Total Investments | | $ | 103,305,611 | | | $ | 482,492 | | | $ | — | | | $ | 103,788,103 | |
| | | | | | | | | | | | | | | | |
$831,578 was transferred out of Level 2 into Level 1 at December 31, 2016 due to the expiration of a lock-up restriction. Transfers between Levels 1, 2 or 3, if any, are recognized at ending value on December 31, 2016.
| | | | | | | | | | | | | | | | |
| | | Baron Global Advantage Fund | |
| Description | | Quoted Prices in
Active Markets
for Identical
Assets
(Level 1) | | | Other
Observable
Inputs
(Level 2) | | | Unobservable
Inputs
(Level 3) | | | Total | |
Common Stocks† | | $ | 9,322,995 | | | $ | 321,956 | | | $ | — | | | $ | 9,644,951 | |
Short Term Investments | | | — | | | | 146,072 | | | | — | | | | 146,072 | |
| | | | | | | | | | | | | | | | |
Total Investments | | $ | 9,322,995 | | | $ | 468,028 | | | $ | — | | | $ | 9,791,023 | |
| | | | | | | | | | | | | | | | |
Transfers between Levels 1, 2 or 3, if any, are recognized at ending value on December 31, 2016. There have been no transfers in and out of Level 1, 2 or 3 fair value measurements for the Fund for the year ended December 31, 2016.
| † | See Statements of Net Assets for additional detailed categorizations. |
40
| | |
| December 31, 2016 | | Baron Select Funds |
NOTES TO FINANCIAL STATEMENTS (Continued)
7. FAIR VALUE MEASUREMENTS (Continued)
The following is a reconciliation of investments in which unobservable inputs (Level 3) were used in determining fair value:
| | | | | | | | | | | | | | | | | | | | | | | | | | | | | | | | | | | | | | | | |
| | | Baron Partners Fund | |
Investments in
Securities | | Balance as of
December 31,
2015 | | | Accrued
Premiums/
Discounts | | | Net
Realized
Gain
(Loss) | | | Change in Net
Unrealized
Appreciation
(Depreciation) | | | Purchases | | | Sales/ Distributions | | | Transfers
Into
Level 3 | | | Transfers
Out of
Level 3 | | | Balance as of
December 31,
2016 | | | Change in Net
Unrealized
Appreciation
(Depreciation)
from Investments
still held at
December 31,
2016 | |
Private Equity Investments | | | | | | | | | | | | | | | | | | | | | | | | | | | | | | | | | | | | | |
Financials | | $ | 6,442,261 | | | $ | — | | | $ | 1,071,713 | | | $ | (1,153,251 | ) | | $ | — | | | $ | (2,904,640 | ) | | $ | — | | | $ | — | | | $ | 3,456,083 | | | $ | (1,153,251 | ) |
| | | | | | | | | | | | | | | | | | | | | | | | | | | | | | | | | | | | | | | | |
8. INCOME TAXES AND DISTRIBUTIONS TO SHAREHOLDERS
Federal income tax regulations differ from GAAP. Therefore, distributions determined in accordance with tax regulations may differ in amount or character from net investment income and net realized gain for financial reporting purposes. Net investment income (loss) and net realized and unrealized gain (loss) differ for financial statement and tax purposes due to differing treatments of net investment loss, foreign currency gains and losses, reclassification of distributions, partnership basis adjustments, income from passive foreign investment companies and wash sale losses deferred. Financial reporting records are adjusted for permanent book/tax differences to reflect tax character. Financial records are not adjusted for temporary differences.
For the year ended December 31, 2016, the Funds recorded the following permanent reclassifications to reflect tax character. Reclassifications between income, gains and paid-in capital relate primarily to the tax treatment of net investment loss, foreign currency gains and losses, and partnership basis adjustments. Results of operations and net assets were not affected by these reclassifications.
| | | | | | | | | | | | |
| Fund | | Undistributed
(Accumulated)
Net Investment
Income(Loss) | | | Undistributed
(Accumulated)
Net Realized
Gain(Loss) | | | Paid-In
Capital | |
Baron Partners Fund | | $ | 7,478,135 | | | $ | 422 | | | $ | (7,478,557 | ) |
Baron Focused Growth Fund | | | 28,012 | | | | (6,745 | ) | | | (21,267 | ) |
Baron International Growth Fund | | | 429,528 | | | | (66,082 | ) | | | (363,446 | ) |
Baron Real Estate Fund | | | 864,411 | | | | 60,040 | | | | (924,451 | ) |
Baron Emerging Markets Fund | | | (1,532,427 | ) | | | 1,532,427 | | | | — | |
Baron Energy and Resources Fund | | | (4,752 | ) | | | 703,415 | | | | (698,663 | ) |
Baron Global Advantage Fund | | | 103,802 | | | | 49,169 | | | | (152,971 | ) |
As of December 31, 2016, the components of net assets on a tax basis were as follows:
| | | | | | | | | | | | | | | | | | | | | | | | | | | | |
| | | Baron
Partners
Fund | | | Baron
Focused
Growth Fund | | | Baron
International
Growth Fund | | | Baron Real
Estate Fund | | | Baron
Emerging
Markets Fund | | | Baron
Energy and
Resources
Fund | | | Baron
Global
Advantage
Fund | |
Cost of investments | | $ | 1,268,897,519 | | | $ | 131,819,244 | | | $ | 67,990,544 | | | $ | 773,913,503 | | | $ | 2,558,420,577 | | | $ | 81,918,628 | | | $ | 7,685,717 | |
| | | | | | | | | | | | | | | | | | | | | | | | | | | | |
Gross tax unrealized appreciation | | | 856,080,029 | | | | 50,339,001 | | | | 22,155,767 | | | | 181,095,889 | | | | 239,048,306 | | | | 22,910,193 | | | | 2,834,164 | |
Gross tax unrealized depreciation | | | (84,136,521 | ) | | | (7,064,123 | ) | | | (2,759,149 | ) | | | (946,908 | ) | | | (200,484,447 | ) | | | (1,040,718 | ) | | | (728,858 | ) |
| | | | | | | | | | | | | | | | | | | | | | | | | | | | |
Net tax unrealized appreciation | | | 771,943,508 | | | | 43,274,878 | | | | 19,396,618 | | | | 180,148,981 | | | | 38,563,859 | | | | 21,869,475 | | | | 2,105,306 | |
Net tax unrealized currency appreciation (depreciation) | | | — | | | | — | | | | (45,069 | ) | | | (67 | ) | | | 21,511 | | | | — | | | | (14 | ) |
Undistributed net investment income | | | — | | | | — | | | | — | | | | — | | | | 1,383,804 | | | | — | | | | — | |
Undistributed net realized gain | | | — | | | | 1,966,491 | | | | 620,545 | | | | — | | | | — | | | | — | | | | — | |
Qualified late year loss deferral | | | (2,559,218 | ) | | | (1,630,692 | ) | | | — | | | | (330 | ) | | | (4,854,498 | ) | | | (515,307 | ) | | | (249,460 | ) |
Capital loss carryforwards | | | (171,435,095 | ) | | | — | | | | — | | | | (29,013,053 | ) | | | (190,159,771 | ) | | | (32,637,304 | ) | | | (603,970 | ) |
Paid-in capital | | | 969,532,485 | | | | 131,584,275 | | | | 67,648,367 | | | | 799,431,193 | | | | 2,757,038,438 | | | | 115,181,323 | | | | 8,465,253 | |
| | | | | | | | | | | | | | | | | | | | | | | | | | | | |
Net Assets | | $ | 1,567,481,680 | | | $ | 175,194,952 | | | $ | 87,620,461 | | | $ | 950,566,724 | | | $ | 2,601,993,343 | | | $ | 103,898,187 | | | $ | 9,717,115 | |
| | | | | | | | | | | | | | | | | | | | | | | | | | | | |
41
| | |
| Baron Select Funds | | December 31, 2016 |
NOTES TO FINANCIAL STATEMENTS (Continued)
8. INCOME TAXES AND DISTRIBUTIONS TO SHAREHOLDERS (Continued)
As of December 31, 2016, the Funds had capital loss carryforwards expiring as follows:
| | | | | | | | | | | | | | | | | | | | | | | | | | | | |
| | | Baron
Partners
Fund | | | Baron
Focused
Growth Fund | | | Baron
International
Growth Fund | | | Baron Real
Estate Fund | | | Baron
Emerging
Markets
Fund | | | Baron
Energy and
Resources
Fund | | | Baron
Global
Advantage
Fund | |
Short term: | | | | | | | | | | | | | | | | | | | | | | | | | | | | |
December 31, 2017 | | $ | 171,435,095 | | | $ | — | | | $ | — | | | $ | — | | | $ | — | | | $ | — | | | $ | — | |
No expiration date | | | — | | | | — | | | | — | | | | 29,013,053 | | | | 145,314,006 | | | | 14,587,795 | | | | 401,348 | |
| | | | | | | | | | | | | | | | | | | | | | | | | | | | |
| | $ | 171,435,095 | | | $ | — | | | $ | — | | | $ | 29,013,053 | | | $ | 145,314,006 | | | $ | 14,587,795 | | | $ | 401,348 | |
| | | | | | | | | | | | | | | | | | | | | | | | | | | | |
Long term: | | | | | | | | | | | | | | | | | | | | | | | | | | | | |
No expiration date | | $ | — | | | $ | — | | | $ | — | | | $ | — | | | $ | 44,845,765 | | | $ | 18,049,509 | | | $ | 202,622 | |
| | | | | | | | | | | | | | | | | | | | | | | | | | | | |
Capital loss carryforward utilized during the year ended December 31, 2016 | | $ | 118,545,297 | | | $ | — | | | $ | — | | | $ | — | | | $ | — | | | $ | — | | | $ | — | |
| | | | | | | | | | | | | | | | | | | | | | | | | | | | |
The tax character of distributions paid during the years ended December 31, 2016 and December 31, 2015 was as follows:
| | | | | | | | | | | | | | | | | | | | |
| | | Year Ended
December 31, 2016 | | | Year Ended
December 31, 2015 | |
| Fund | | Ordinary1 | | | Long Term
Capital Gain | | | Return
of Capital | | | Ordinary1 | | | Long Term
Capital Gain | |
Baron Partners Fund | | $ | — | | | $ | — | | | $ | — | | | $ | 8,870,821 | | | $ | — | |
Baron Focused Growth Fund | | | — | | | | 10,001,809 | | | | — | | | | 650,535 | | | | 9,891,350 | |
Baron International Growth Fund | | | 43,909 | | | | 703,025 | | | | — | | | | 673,432 | | | | 156,070 | |
Baron Real Estate Fund | | | — | | | | 3,756,561 | | | | 1,500,609 | | | | 802,173 | | | | 34,696,513 | |
Baron Emerging Markets Fund | | | 7,977,500 | | | | — | | | | — | | | | 4,689,931 | | | | — | |
Baron Energy and Resources Fund | | | — | | | | — | | | | — | | | | 71 | | | | 64,953 | |
Baron Global Advantage Fund | | | — | | | | — | | | | — | | | | 28,281 | | | | 13,779 | |
| 1 | For tax purposes, short-term capital gains are considered ordinary income distributions. |
The Funds follow the provisions of FASB Codification Section 740 (“ASC Section 740”) “Accounting for Uncertainty in Income Taxes” which clarifies the accounting for uncertainty in tax positions taken or expected to be taken on a tax return. ASC Section 740 sets forth a threshold for financial statement recognition, measurement and disclosure of tax positions taken or expected to be taken on a tax return. The Funds are required to recognize the tax effects of certain tax positions under a “more likely than not” standard, that based on their technical merits, have more than 50 percent likelihood of being sustained upon examination. Management has analyzed the tax positions taken on the Funds’ federal income tax returns for all open years (current and prior three years), and has concluded that no provision for federal income tax is required in the Funds’ financial statements. At December 31, 2016, the Funds did not have any uncertain tax benefits that require recognition, de-recognition or disclosure. The Funds’ federal, state and local income and federal excise tax returns for which the applicable statutes of limitations have not expired (current and prior three years) are subject to examination by the Internal Revenue Service and state departments of revenue.
9. OWNERSHIP CONCENTRATION
As of December 31, 2016, the officers, trustees and portfolio managers owned, directly or indirectly, 44.85% of Baron Focused Growth Fund and 41.44% of Baron Global Advantage Fund. As of December 31, 2016 the officers, trustees, portfolio managers and one other investor owned, directly or indirectly, 27.79% of Baron International Growth Fund. As a result of their ownership, these investors may be able to materially affect the outcome of matters presented to Baron Focused Growth Fund, Baron International Growth Fund and Baron Global Advantage Fund shareholders.
10. TRANSACTIONS IN “AFFILIATED” COMPANIES1
| | | | | | | | | | | | | | | | | | | | | | | | | | | | | | | | |
| | | Baron Emerging Markets Fund | |
| Name of Issuer | | Value at
December 31,
2015 | | | Purchase
Cost | | | Sales
Proceeds | | | Change in Net
Unrealized
Appreciation
(Depreciation) | | | Realized
Gains/
(Losses) | | | Dividend
Income | | | Shares
Held at
December 31,
2016 | | | Value at
December 31,
2016 | |
“Affiliated” Company as of December 31, 2016: | | | | | | | | | | | | | | | | | | | | | |
Lekoil Ltd. | | $ | 5,764,928 | | | $ | 2,951,742 | | | $ | — | | | $ | 1,958,993 | | | $ | — | | | $ | — | | | | 33,000,000 | | | $ | 10,675,663 | |
| | | | | | | | | | | | | | | | | | | | | | | | | | | | | | | | |
| 1 | An “Affiliated” Company (“affiliated person” as defined in the 1940 Act) is a company in which a Fund held 5% or more of the company’s outstanding voting securities at any time during the year ended December 31, 2016. |
42
| | |
| December 31, 2016 | | Baron Select Funds |
NOTES TO FINANCIAL STATEMENTS (Continued)
11. RECENT ACCOUNTING PRONOUNCEMENTS
On August 26, 2016, Financial Accounting Standards Board (“FASB”) issued a new Accounting Standards Update No. 2016-15, “Statement of Cash Flows (Topic 230), a consensus of the FASB’s Emerging Issues Task Force” (“ASU 2016-15”). ASU 2016-15 is intended to reduce diversity in practice in how certain transactions are classified in the statement of cash flows. The issues addressed in ASU 2016-15 are: debt prepayment or debt extinguishment costs, settlement of zero-coupon debt instruments, contingent consideration payments made after a business combination, proceeds from the settlement of insurance claims, proceeds from the settlement of corporate-owned life insurance policies, including bank-owned life insurance policies, distributions received from equity method investments, beneficial interests in securitization transactions; and, separately identifiable cash flows and application of the predominance principle. ASU 2016-15 is effective for interim and annual reporting periods beginning after December 15, 2017. Management is currently evaluating the impact, if any, of applying this provision.
In October 2016, the U.S. Securities and Exchange Commission (“SEC”) adopted new rules and forms, and amendments to certain current rules and forms, to modernize reporting and disclosure of information by registered investment companies. The amendments to Regulation S-X will require standardized, enhanced disclosure about derivatives in investment company financial statements, and will also change the rules governing the form and content of such financial statements. The compliance date for the amendments to Regulation S-X is August 1, 2017. The Adviser is currently evaluating the impact that the adoption of the amendments to Regulation S-X will have on the Funds’ financial statements and related disclosures.
In November 2016, FASB issued a new Accounting Standards Update No. 2016-18, “Statement of Cash Flows (Topic 230), Restricted Cash, a consensus of the FASB’s Emerging Issues Task Force” (“ASU 2016-18”). ASU 2016-18 requires that a statement of cash flows explain the change during the period in the total of cash, cash equivalents, and amounts generally described as restricted cash or restricted cash equivalents. Therefore, amounts generally described as restricted cash and restricted cash equivalents should be included with cash and cash equivalents when reconciling the beginning-of-period and end-of-period total amounts shown on the statement of cash flows. The amendments in ASU 2016-18 do not provide a definition of restricted cash or restricted cash equivalents. ASU 2016-18 is effective for interim and annual reporting periods beginning after December 15, 2017. Management is currently evaluating the impact, if any, of applying this provision.
In December 2016, the Financial Accounting Standards Board issued Accounting Standards Update No. 2016-19 (“ASU 2016-19”), “Technical Corrections and Improvements.” The guidance includes an amendment to Topic 820, Fair Value Measurement, which clarifies the difference between a valuation approach and a valuation technique when applying the guidance in that Topic. The amendment also requires an entity to disclose when there has been a change in either or both a valuation approach and/or a valuation technique. The transition guidance for the amendment must be applied prospectively because it could potentially involve the use of hindsight that includes fair value measurements. The guidance is effective for interim periods beginning after December 15, 2016. Management is currently evaluating the implication, if any, of the additional disclosure requirements and its impact on the Funds’ financial statements.
43
| | |
| Baron Select Funds | | December 31, 2016 |
FINANCIAL HIGHLIGHTS
BARON PARTNERS FUND
Selected data for a share outstanding throughout each year:
| | | | | | | | | | | | | | | | | | | | | | | | | | | | | | | | | | | | | | | | |
| | | RETAIL SHARES | |
| | | Year Ended December 31, | |
| | | 2016 | | | 2015 | | | 2014 | | | 2013 | | | 2012 | | | 2011 | | | 2010 | | | 2009 | | | 2008 | | | 2007 | |
Net asset value, beginning of year | | $ | 35.62 | | | $ | 36.74 | | | $ | 33.32 | | | $ | 22.56 | | | $ | 19.39 | | | $ | 20.57 | | | $ | 15.64 | | | $ | 12.20 | | | $ | 23.76 | | | $ | 22.34 | |
| | | | | | | | | | | | | | | | | | | | | | | | | | | | | | | | | | | | | | | | |
Income (loss) from investment operations: | | | | | | | | | | | | | | | | | | | | | | | | | | | | | | | | | | | | | | | | |
Net investment income (loss) | | | (0.11 | )1 | | | (0.05 | )1 | | | 0.23 | 1 | | | (0.19 | )1 | | | (0.04 | )1 | | | (0.14 | )1 | | | (0.09 | )1 | | | (0.04 | )1 | | | (0.09 | )1 | | | (0.21 | )1 |
Net realized and unrealized gain (loss) on investments | | | 1.55 | | | | (0.95 | ) | | | 3.19 | | | | 10.95 | | | | 3.21 | | | | (1.04 | ) | | | 5.02 | | | | 3.48 | | | | (10.74 | ) | | | 2.74 | |
| | | | | | | | | | | | | | | | | | | | | | | | | | | | | | | | | | | | | | | | |
Total from investment operations | | | 1.44 | | | | (1.00 | ) | | | 3.42 | | | | 10.76 | | | | 3.17 | | | | (1.18 | ) | | | 4.93 | | | | 3.44 | | | | (10.83 | ) | | | 2.53 | |
| | | | | | | | | | | | | | | | | | | | | | | | | | | | | | | | | | | | | | | | |
Less distributions to shareholders from: | | | | | | | | | | | | | | | | | | | | | | | | | | | | | | | | | | | | | | | | |
Net investment income | | | 0.00 | | | | (0.12 | ) | | | 0.00 | | | | 0.00 | | | | 0.00 | | | | 0.00 | | | | 0.00 | | | | 0.00 | | | | 0.00 | | | | 0.00 | |
Net realized gain on investments | | | 0.00 | | | | 0.00 | | | | 0.00 | | | | 0.00 | | | | 0.00 | | | | 0.00 | | | | 0.00 | | | | 0.00 | | | | (0.73 | ) | | | (1.11 | ) |
| | | | | | | | | | | | | | | | | | | | | | | | | | | | | | | | | | | | | | | | |
Total distributions | | | 0.00 | | | | (0.12 | ) | | | 0.00 | | | | 0.00 | | | | 0.00 | | | | 0.00 | | | | 0.00 | | | | 0.00 | | | | (0.73 | ) | | | (1.11 | ) |
| | | | | | | | | | | | | | | | | | | | | | | | | | | | | | | | | | | | | | | | |
Net asset value, end of year | | $ | 37.06 | | | $ | 35.62 | | | $ | 36.74 | | | $ | 33.32 | | | $ | 22.56 | | | $ | 19.39 | | | $ | 20.57 | | | $ | 15.64 | | | $ | 12.20 | | | $ | 23.76 | |
| | | | | | | | | | | | | | | | | | | | | | | | | | | | | | | | | | | | | | | | |
Total return | | | 4.04 | % | | | (2.71 | )% | | | 10.26 | % | | | 47.69 | % | | | 16.35 | % | | | (5.74 | )% | | | 31.52 | % | | | 28.20 | % | | | (46.67 | )% | | | 11.34 | % |
| | | | | | | | | | | | | | | | | | | | | | | | | | | | | | | | | | | | | | | | |
Ratios/Supplemental data: | | | | | | | | | | | | | | | | | | | | | | | | | | | | | | | | | | | | | | | | |
Net assets (in millions), end of year | | $ | 913.9 | | | $ | 1,107.5 | | | $ | 1,256.3 | | | $ | 1,125.6 | | | $ | 653.7 | | | $ | 970.4 | | | $ | 1,251.9 | | | $ | 1,249.3 | | | $ | 1,501.3 | | | $ | 3,384.1 | |
| | | | | | | | | | | | | | | | | | | | | | | | | | | | | | | | | | | | | | | | |
Ratio of total expenses to average net assets | | | 1.78 | % | | | 1.52 | % | | | 1.51 | % | | | 1.67 | % | | | 1.74 | % | | | 1.71 | % | | | 1.71 | % | | | 1.51 | % | | | 1.86 | %2 | | | 1.88 | %2 |
Less: Ratio of interest expense to average net assets | | | (0.43 | )% | | | (0.20 | )% | | | (0.19 | )% | | | (0.29 | )% | | | (0.34 | )% | | | (0.36 | )% | | | (0.34 | )% | | | (0.10 | )% | | | (0.51 | )% | | | (0.57 | )% |
| | | | | | | | | | | | | | | | | | | | | | | | | | | | | | | | | | | | | | | | |
Ratio of operating expenses to average net assets | | | 1.35 | % | | | 1.32 | % | | | 1.32 | % | | | 1.38 | % | | | 1.40 | % | | | 1.35 | % | | | 1.37 | % | | | 1.41 | % | | | 1.35 | % | | | 1.31 | % |
| | | | | | | | | | | | | | | | | | | | | | | | | | | | | | | | | | | | | | | | |
Ratio of net investment income (loss) to average net assets | | | (0.31 | )% | | | (0.13 | )% | | | 0.66 | % | | | (0.66 | )% | | | (0.18 | )% | | | (0.69 | )% | | | (0.51 | )% | | | (0.30 | )% | | | (0.49 | )% | | | (0.86 | )% |
| | | | | | | | | | | | | | | | | | | | | | | | | | | | | | | | | | | | | | | | |
Portfolio turnover rate | | | 15.59 | % | | | 17.08 | % | | | 30.82 | % | | | 18.57 | % | | | 13.04 | % | | | 16.96 | % | | | 15.85 | % | | | 32.43 | % | | | 38.02 | % | | | 32.95 | % |
| | | | | | | | | | | | | | | | | | | | | | | | | | | | | | | | | | | | | | | | |
| | | INSTITUTIONAL SHARES | | | | | | R6 SHARES | |
| | | Year Ended December 31, | | | | | | Year Ended
December 31, | |
| | | 2016 | | | 2015 | | | 2014 | | | 2013 | | | 2012 | | | 2011 | | | 2010 | | | 20093 | | | | | | 20166 | |
Net asset value, beginning of year | | $ | 36.15 | | | $ | 37.28 | | | $ | 33.72 | | | $ | 22.78 | | | $ | 19.52 | | | $ | 20.66 | | | $ | 15.66 | | | $ | 12.66 | | | | | | | $ | 38.61 | |
| | | | | | | | | | | | | | | | | | | | | | | | | | | | | | | | | | | | | | | | |
Income (loss) from investment operations: | | | | | | | | | | | | | | | | | | | | | | | | | | | | | | | | | | | | | | | | |
Net investment income (loss) | | | (0.02 | )1 | | | 0.04 | 1 | | | 0.25 | 1 | | | (0.12 | )1 | | | 0.04 | 1 | | | (0.08 | )1 | | | (0.06 | )1 | | | (0.03 | )1 | | | | | | | (0.01 | )1 |
Net realized and unrealized gain (loss) on investments | | | 1.57 | | | | (0.95 | ) | | | 3.31 | | | | 11.06 | | | | 3.22 | | | | (1.06 | ) | | | 5.06 | | | | 3.03 | | | | | | | | (0.89 | ) |
| | | | | | | | | | | | | | | | | | | | | | | | | | | | | | | | | | | | | | | | |
Total from investment operations | | | 1.55 | | | | (0.91 | ) | | | 3.56 | | | | 10.94 | | | | 3.26 | | | | (1.14 | ) | | | 5.00 | | | | 3.00 | | | | | | | | (0.90 | ) |
| | | | | | | | | | | | | | | | | | | | | | | | | | | | | | | | | | | | | | | | |
Less distributions to shareholders from: | | | | | | | | | | | | | | | | | | | | | | | | | | | | | | | | | | | | | | | | |
Net investment income | | | 0.00 | | | | (0.22 | ) | | | 0.00 | | | | 0.00 | | | | 0.00 | | | | 0.00 | | | | 0.00 | | | | 0.00 | | | | | | | | 0.00 | |
Net realized gain on investments | | | 0.00 | | | | 0.00 | | | | 0.00 | | | | 0.00 | | | | 0.00 | | | | 0.00 | | | | 0.00 | | | | 0.00 | | | | | | | | 0.00 | |
| | | | | | | | | | | | | | | | | | | | | | | | | | | | | | | | | | | | | | | | |
Total distributions | | | 0.00 | | | | (0.22 | ) | | | 0.00 | | | | 0.00 | | | | 0.00 | | | | 0.00 | | | | 0.00 | | | | 0.00 | | | | | | | | 0.00 | |
| | | | | | | | | | | | | | | | | | | | | | | | | | | | | | | | | | | | | | | | |
Net asset value, end of year | | $ | 37.70 | | | $ | 36.15 | | | $ | 37.28 | | | $ | 33.72 | | | $ | 22.78 | | | $ | 19.52 | | | $ | 20.66 | | | $ | 15.66 | | | | | | | $ | 37.71 | |
| | | | | | | | | | | | | | | | | | | | | | | | | | | | | | | | | | | | | | | | |
Total return | | | 4.29 | % | | | (2.43 | )% | | | 10.56 | % | | | 48.02 | % | | | 16.70 | % | | | (5.52 | )% | | | 31.93 | % | | | 23.70 | %4 | | | | | | | (2.33 | )%4 |
| | | | | | | | | | | | | | | | | | | | | | | | | | | | | | | | | | | | | | | | |
Ratios/Supplemental data: | | | | | | | | | | | | | | | | | | | | | | | | | | | | | | | | | | | | | | | | |
Net assets (in millions), end of year | | $ | 645.3 | | | $ | 793.3 | | | $ | 681.5 | | | $ | 349.0 | | | $ | 146.5 | | | $ | 123.7 | | | $ | 119.9 | | | $ | 158.5 | | | | | | | $ | 8.3 | |
| | | | | | | | | | | | | | | | | | | | | | | | | | | | | | | | | | | | | | | | |
Ratio of total expenses to average net assets | | | 1.52 | % | | | 1.26 | % | | | 1.26 | % | | | 1.41 | % | | | 1.48 | % | | | 1.45 | % | | | 1.45 | % | | | 1.38 | %5 | | | | | | | 1.62 | %5 |
Less: Ratio of interest expense to average net assets | | | (0.43 | )% | | | (0.20 | )% | | | (0.20 | )% | | | (0.30 | )% | | | (0.35 | )% | | | (0.36 | )% | | | (0.34 | )% | | | (0.21 | )%5 | | | | | | | (0.53 | )%5 |
| | | | | | | | | | | | | | | | | | | | | | | | | | | | | | | | | | | | | | | | |
Ratio of operating expenses to average net assets | | | 1.09 | % | | | 1.06 | % | | | 1.06 | % | | | 1.11 | % | | | 1.13 | % | | | 1.09 | % | | | 1.11 | % | | | 1.17 | %5 | | | | | | | 1.09 | %5 |
| | | | | | | | | | | | | | | | | | | | | | | | | | | | | | | | | | | | | | | | |
Ratio of net investment income (loss) to average net assets | | | (0.05 | )% | | | 0.11 | % | | | 0.69 | % | | | (0.41 | )% | | | 0.18 | % | | | (0.41 | )% | | | (0.36 | )% | | | (0.31 | )%5 | | | | | | | (0.04 | )%5 |
| | | | | | | | | | | | | | | | | | | | | | | | | | | | | | | | | | | | | | | | |
Portfolio turnover rate | | | 15.59 | % | | | 17.08 | % | | | 30.82 | % | | | 18.57 | % | | | 13.04 | % | | | 16.96 | % | | | 15.85 | % | | | 32.43 | % | | | | | | | 15.59 | % |
| | | | | | | | | | | | | | | | | | | | | | | | | | | | | | | | | | | | | | | | |
| | |
1 Based on average shares outstanding. 2 Benefit of expense reduction rounds to less than 0.01%. 3 For the period May 29, 2009 (initial offering of Institutional Shares) to December 31, 2009. | | 4 Not Annualized. 5 Annualized. 6 For the period August 31, 2016 (initial offering of R6 Shares) to December 31, 2016. |
| | |
| 44 | | See Notes to Financial Statements. |
| | |
| December 31, 2016 | | Baron Select Funds |
FINANCIAL HIGHLIGHTS (Continued)
BARON FOCUSED GROWTH FUND
Selected data for a share outstanding throughout each year:
| | | | | | | | | | | | | | | | | | | | | | | | | | | | | | | | | | | | | | | | |
| | | RETAIL SHARES | | | | |
| | | Year Ended December 31, | | | | |
| | | 2016 | | | 2015 | | | 2014 | | | 2013 | | | 2012 | | | 2011 | | | 2010 | | | 2009 | | | 20081 | | | | |
Net asset value, beginning of year | | $ | 13.09 | | | $ | 14.21 | | | $ | 13.97 | | | $ | 11.26 | | | $ | 9.71 | | | $ | 9.85 | | | $ | 8.14 | | | $ | 6.27 | | | $ | 10.00 | | | | | |
| | | | | | | | | | | | | | | | | | | | | | | | | | | | | | | | | | | | | | | | |
Income (loss) from investment operations: | | | | | | | | | | | | | | | | | | | | | | | | | | | | | | | | | | | | | | | | |
Net investment income (loss) | | | 0.01 | 2 | | | (0.01 | )2 | | | 0.04 | 2 | | | (0.07 | )2 | | | 0.24 | 2 | | | (0.07 | )2 | | | (0.01 | )2 | | | 0.12 | 2 | | | 0.00 | 2,3 | | | | |
Net realized and unrealized gain (loss) on investments | | | 0.08 | | | | (0.35 | ) | | | 0.29 | | | | 2.95 | | | | 1.31 | | | | (0.07 | ) | | | 2.05 | | | | 2.00 | | | | (3.33 | ) | | | | |
| | | | | | | | | | | | | | | | | | | | | | | | | | | | | | | | | | | | | | | | |
Total from investment operations | | | 0.09 | | | | (0.36 | ) | | | 0.33 | | | | 2.88 | | | | 1.55 | | | | (0.14 | ) | | | 2.04 | | | | 2.12 | | | | (3.33 | ) | | | | |
| | | | | | | | | | | | | | | | | | | | | | | | | | | | | | | | | | | | | | | | |
Less distributions to shareholders from: | | | | | | | | | | | | | | | | | | | | | | | | | | | | | | | | | | | | | | | | |
Net investment income | | | 0.00 | | | | (0.02 | ) | | | 0.00 | | | | (0.17 | ) | | | 0.00 | | | | 0.00 | | | | (0.33 | ) | | | (0.13 | ) | | | 0.00 | | | | | |
Net realized gain on investments | | | (0.75 | ) | | | (0.74 | ) | | | (0.09 | ) | | | 0.00 | | | | 0.00 | | | | 0.00 | | | | 0.00 | | | | 0.00 | | | | 0.00 | | | | | |
Return of capital | | | 0.00 | | | | 0.00 | | | | 0.00 | | | | 0.00 | | | | 0.00 | | | | 0.00 | | | | 0.00 | | | | (0.12 | ) | | | (0.40 | ) | | | | |
| | | | | | | | | | | | | | | | | | | | | | | | | | | | | | | | | | | | | | | | |
Total distributions | | | (0.75 | ) | | | (0.76 | ) | | | (0.09 | ) | | | (0.17 | ) | | | 0.00 | | | | 0.00 | | | | (0.33 | ) | | | (0.25 | ) | | | (0.40 | ) | | | | |
| | | | | | | | | | | | | | | | | | | | | | | | | | | | | | | | | | | | | | | | |
Net asset value, end of year | | $ | 12.43 | | | $ | 13.09 | | | $ | 14.21 | | | $ | 13.97 | | | $ | 11.26 | | | $ | 9.71 | | | $ | 9.85 | | | $ | 8.14 | | | $ | 6.27 | | | | | |
| | | | | | | | | | | | | | | | | | | | | | | | | | | | | | | | | | | | | | | | |
Total return | | | 0.67 | %4 | | | (2.42 | )%4 | | | 2.35 | %4 | | | 25.69 | %4 | | | 15.96 | %4 | | | (1.42 | )%4 | | | 25.17 | %4 | | | 33.77 | %4 | | | (33.11 | )%4,5 | | | | |
| | | | | | | | | | | | | | | | | | | | | | | | | | | | | | | | | | | | | | | | |
Ratios/Supplemental data: | | | | | | | | | | | | | | | | | | | | | | | | | | | | | | | | | | | | | | | | |
Net assets (in millions), end of year | | $ | 37.7 | | | $ | 43.7 | | | $ | 46.1 | | | $ | 47.6 | | | $ | 31.4 | | | $ | 28.3 | | | $ | 46.4 | | | $ | 39.9 | | | $ | 59.3 | | | | | |
| | | | | | | | | | | | | | | | | | | | | | | | | | | | | | | | | | | | | | | | |
Ratio of operating expenses to average net assets | | | 1.43 | % | | | 1.39 | % | | | 1.39 | % | | | 1.42 | % | | | 1.48 | % | | | 1.48 | % | | | 1.47 | % | | | 1.52 | % | | | 1.54 | %6 | | | | |
Less: Reimbursement of expenses by Adviser | | | (0.08 | )% | | | (0.04 | )% | | | (0.04 | )% | | | (0.07 | )% | | | (0.13 | )% | | | (0.13 | )% | | | (0.12 | )% | | | (0.17 | )% | | | (0.19 | )%6 | | | | |
| | | | | | | | | | | | | | | | | | | | | | | | | | | | | | | | | | | | | | | | |
Ratio of net operating expenses to average net assets | | | 1.35 | % | | | 1.35 | % | | | 1.35 | % | | | 1.35 | % | | | 1.35 | % | | | 1.35 | % | | | 1.35 | % | | | 1.35 | % | | | 1.35 | %6 | | | | |
| | | | | | | | | | | | | | | | | | | | | | | | | | | | | | | | | | | | | | | | |
Ratio of net investment income (loss) to average net assets | | | 0.11 | % | | | (0.10 | )% | | | 0.31 | % | | | (0.53 | )% | | | 2.30 | % | | | (0.69 | )% | | | (0.16 | )% | | | 1.81 | % | | | 0.01 | %6 | | | | |
| | | | | | | | | | | | | | | | | | | | | | | | | | | | | | | | | | | | | | | | |
Portfolio turnover rate | | | 14.31 | % | | | 12.18 | % | | | 36.92 | % | | | 33.67 | % | | | 38.38 | % | | | 44.58 | % | | | 24.08 | % | | | 34.76 | % | | | 35.43 | %5 | | | | |
| | | | | | | | | | | | | | | | | | | | | | | | | | | | | | | | | | | | | | | | |
| | | INSTITUTIONAL SHARES | | | | | | R6 SHARES | |
| | | Year Ended December 31, | | | | | | Year Ended
December 31, | |
| | | 2016 | | | 2015 | | | 2014 | | | 2013 | | | 2012 | | | 2011 | | | 2010 | | | 20097 | | | | | | 20168 | |
Net asset value, beginning of year | | $ | 13.25 | | | $ | 14.37 | | | $ | 14.10 | | | $ | 11.35 | | | $ | 9.77 | | | $ | 9.88 | | | $ | 8.15 | | | $ | 6.88 | | | | | | | $ | 13.87 | |
| | | | | | | | | | | | | | | | | | | | | | | | | | | | | | | | | | | | | | | | |
Income (loss) from investment operations: | | | | | | | | | | | | | | | | | | | | | | | | | | | | | | | | | | | | | | | | |
Net investment income (loss) | | | 0.05 | 2 | | | 0.02 | 2 | | | 0.08 | 2 | | | (0.04 | )2 | | | 0.26 | 2 | | | (0.04 | )2 | | | 0.01 | 2 | | | 0.07 | 2 | | | | | | | 0.02 | 2 |
Net realized and unrealized gain (loss) on investments | | | 0.08 | | | | (0.34 | ) | | | 0.28 | | | | 2.99 | | | | 1.32 | | | | (0.07 | ) | | | 2.05 | | | | 1.45 | | | | | | | | (0.51 | ) |
| | | | | | | | | | | | | | | | | | | | | | | | | | | | | | | | | | | | | | | | |
Total from investment operations | | | 0.13 | | | | (0.32 | ) | | | 0.36 | | | | 2.95 | | | | 1.58 | | | | (0.11 | ) | | | 2.06 | | | | 1.52 | | | | | | | | (0.49 | ) |
| | | | | | | | | | | | | | | | | | | | | | | | | | | | | | | | | | | | | | | | |
Less distributions to shareholders from: | | | | | | | | | | | | | | | | | | | | | | | | | | | | | | | | | | | | | | | | |
Net investment income | | | 0.00 | | | | (0.06 | ) | | | 0.00 | | | | (0.20 | ) | | | 0.00 | | | | 0.00 | | | | (0.33 | ) | | | (0.13 | ) | | | | | | | 0.00 | |
Net realized gain on investments | | | (0.75 | ) | | | (0.74 | ) | | | (0.09 | ) | | | 0.00 | | | | 0.00 | | | | 0.00 | | | | 0.00 | | | | 0.00 | | | | | | | | (0.75 | ) |
Return of capital | | | 0.00 | | | | 0.00 | | | | 0.00 | | | | 0.00 | | | | 0.00 | | | | 0.00 | | | | 0.00 | | | | (0.12 | ) | | | | | | | 0.00 | |
| | | | | | | | | | | | | | | | | | | | | | | | | | | | | | | | | | | | | | | | |
Total distributions | | | (0.75 | ) | | | (0.80 | ) | | | (0.09 | ) | | | (0.20 | ) | | | 0.00 | | | | 0.00 | | | | (0.33 | ) | | | (0.25 | ) | | | | | | | (0.75 | ) |
| | | | | | | | | | | | | | | | | | | | | | | | | | | | | | | | | | | | | | | | |
Net asset value, end of year | | $ | 12.63 | | | $ | 13.25 | | | $ | 14.37 | | | $ | 14.10 | | | $ | 11.35 | | | $ | 9.77 | | | $ | 9.88 | | | $ | 8.15 | | | | | | | $ | 12.63 | |
| | | | | | | | | | | | | | | | | | | | | | | | | | | | | | | | | | | | | | | | |
Total return | | | 0.97 | %4 | | | (2.12 | )% | | | 2.54 | % | | | 26.09 | %4 | | | 16.17 | %4 | | | (1.11 | )%4 | | | 25.39 | %4 | | | 22.06 | %4,5 | | | | | | | (3.55 | )%4,5 |
| | | | | | | | | | | | | | | | | | | | | | | | | | | | | | | | | | | | | | | | |
Ratios/Supplemental data: | | | | | | | | | | | | | | | | | | | | | | | | | | | | | | | | | | | | | | | | |
Net assets (in millions), end of year | | $ | 128.9 | | | $ | 140.5 | | | $ | 149.2 | | | $ | 148.4 | | | $ | 87.9 | | | $ | 63.6 | | | $ | 44.3 | | | $ | 36.6 | | | | | | | $ | 8.6 | |
| | | | | | | | | | | | | | | | | | | | | | | | | | | | | | | | | | | | | | | | |
Ratio of operating expenses to average net assets | | | 1.13 | % | | | 1.09 | % | | | 1.09 | % | | | 1.12 | % | | | 1.16 | % | | | 1.18 | % | | | 1.19 | % | | | 1.25 | %6 | | | | | | | 1.14 | %6 |
Less: Reimbursement of expenses by Adviser | | | (0.03 | )% | | | 0.00 | % | | | 0.00 | % | | | (0.02 | )% | | | (0.06 | )% | | | (0.08 | )% | | | (0.09 | )% | | | (0.15 | )%6 | | | | | | | (0.04 | )%6 |
| | | | | | | | | | | | | | | | | | | | | | | | | | | | | | | | | | | | | | | | |
Ratio of net operating expenses to average net assets | | | 1.10 | % | | | 1.09 | % | | | 1.09 | % | | | 1.10 | % | | �� | 1.10 | % | | | 1.10 | % | | | 1.10 | % | | | 1.10 | %6 | | | | | | | 1.10 | %6 |
| | | | | | | | | | | | | | | | | | | | | | | | | | | | | | | | | | | | | | | | |
Ratio of net investment income (loss) to average net assets | | | 0.37 | % | | | 0.16 | % | | | 0.56 | % | | | (0.28 | )% | | | 2.53 | % | | | (0.40 | )% | | | 0.08 | % | | | 1.63 | %6 | | | | | | | 0.53 | %6 |
| | | | | | | | | | | | | | | | | | | | | | | | | | | | | | | | | | | | | | | | |
Portfolio turnover rate | | | 14.31 | % | | | 12.18 | % | | | 36.92 | % | | | 33.67 | % | | | 38.38 | % | | | 44.58 | % | | | 24.08 | % | | | 34.76 | % | | | | | | | 14.31 | % |
| | | | | | | | | | | | | | | | | | | | | | | | | | | | | | | | | | | | | | | | |
| | |
1 For the period June 30, 2008 (commencement of operations) to December 31, 2008. 2 Based on average shares outstanding. 3 Less than $0.01 per share. 4 The total returns would have been lower had certain expenses not been reduced during the period shown. | | 5 Not Annualized. 6 Annualized. 7 For the period May 29, 2009 (initial offering of Institutional Shares) to September 30, 2009. 8 For the period August 31, 2016 (initial offering of R6 Shares) to December 31, 2016. |
| | |
| See Notes to Financial Statements. | | 45 |
| | |
| Baron Select Funds | | December 31, 2016 |
FINANCIAL HIGHLIGHTS (Continued)
BARON INTERNATIONAL GROWTH FUND
Selected data for a share outstanding throughout each year:
| | | | | | | | | | | | | | | | | | | | | | | | | | | | | | | | | | | | | | | | |
| | | RETAIL SHARES | | | | | | | |
| | | Year Ended December 31, | | | | | | | |
| | | 2016 | | | 2015 | | | 2014 | | | 2013 | | | 2012 | | | 2011 | | | 2010 | | | 2009 | | | | | | | |
Net asset value, beginning of year | | $ | 18.05 | | | $ | 17.94 | | | $ | 18.91 | | | $ | 15.55 | | | $ | 13.20 | | | $ | 17.29 | | | $ | 14.11 | | | $ | 10.00 | | | | | | | | | |
| | | | | | | | | | | | | | | | | | | | | | | | | | | | | | | | | | | | | | | | |
Income (loss) from investment operations: | | | | | | | | | | | | | | | | | | | | | | | | | | | | | | | | | | | | | | | | |
Net investment income (loss) | | | (0.03 | )1 | | | 0.03 | 1 | | | 0.03 | 1 | | | (0.01 | )1 | | | (0.02 | )1 | | | (0.01 | )1 | | | 0.01 | 1 | | | 0.04 | 1 | | | | | | | | |
Net realized and unrealized gain (loss) on investments | | | 0.24 | | | | 0.19 | | | | (0.46 | ) | | | 3.37 | | | | 2.37 | | | | (2.78 | ) | | | 3.38 | | | | 4.43 | | | | | | | | | |
| | | | | | | | | | | | | | | | | | | | | | | | | | | | | | | | | | | | | | | | |
Total from investment operations | | | 0.21 | | | | 0.22 | | | | (0.43 | ) | | | 3.36 | | | | 2.35 | | | | (2.79 | ) | | | 3.39 | | | | 4.47 | | | | | | | | | |
| | | | | | | | | | | | | | | | | | | | | | | | | | | | | | | | | | | | | | | | |
Less distributions to shareholders from: | | | | | | | | | | | | | | | | | | | | | | | | | | | | | | | | | | | | | | | | |
Net investment income | | | (0.01 | ) | | | (0.08 | ) | | | (0.00 | )2 | | | 0.00 | | | | 0.00 | | | | (0.04 | ) | | | 0.00 | | | | 0.00 | | | | | | | | | |
Net realized gain on investments | | | (0.16 | ) | | | (0.03 | ) | | | (0.54 | ) | | | 0.00 | | | | 0.00 | | | | (1.26 | ) | | | (0.21 | ) | | | (0.36 | ) | | | | | | | | |
| | | | | | | | | | | | | | | | | | | | | | | | | | | | | | | | | | | | | | | | |
Total distributions | | | (0.17 | ) | | | (0.11 | ) | | | (0.54 | ) | | | 0.00 | | | | 0.00 | | | | (1.30 | ) | | | (0.21 | ) | | | (0.36 | ) | | | | | | | | |
| | | | | | | | | | | | | | | | | | | | | | | | | | | | | | | | | | | | | | | | |
Net asset value, end of year | | $ | 18.09 | | | $ | 18.05 | | | $ | 17.94 | | | $ | 18.91 | | | $ | 15.55 | | | $ | 13.20 | | | $ | 17.29 | | | $ | 14.11 | | | | | | | | | |
| | | | | | | | | | | | | | | | | | | | | | | | | | | | | | | | | | | | | | | | |
Total return | | | 1.14 | %3 | | | 1.23 | %3 | | | (2.33 | )%3 | | | 21.61 | %3 | | | 17.80 | %3 | | | (16.35 | )%3 | | | 24.22 | %3 | | | 44.69 | %3 | | | | | | | | |
| | | | | | | | | | | | | | | | | | | | | | | | | | | | | | | | | | | | | | | | |
Ratios/Supplemental data: | | | | | | | | | | | | | | | | | | | | | | | | | | | | | | | | | | | | | | | | |
Net assets (in millions), end of year | | $ | 41.8 | | | $ | 44.9 | | | $ | 53.0 | | | $ | 17.0 | | | $ | 15.6 | | | $ | 11.7 | | | $ | 15.3 | | | $ | 8.4 | | | | | | | | | |
| | | | | | | | | | | | | | | | | | | | | | | | | | | | | | | | | | | | | | | | |
Ratio of operating expenses to average net assets | | | 1.65 | % | | | 1.59 | % | | | 1.63 | % | | | 1.74 | % | | | 1.78 | % | | | 1.73 | % | | | 1.76 | % | | | 2.33 | % | | | | | | | | |
Less: Reimbursement of expenses by Adviser | | | (0.15 | )% | | | (0.09 | )% | | | (0.13 | )% | | | (0.24 | )% | | | (0.28 | )% | | | (0.23 | )% | | | (0.26 | )% | | | (0.83 | )% | | | | | | | | |
| | | | | | | | | | | | | | | | | | | | | | | | | | | | | | | | | | | | | | | | |
Ratio of net operating expenses to average net assets | | | 1.50 | % | | | 1.50 | % | | | 1.50 | % | | | 1.50 | % | | | 1.50 | % | | | 1.50 | % | | | 1.50 | % | | | 1.50 | % | | | | | | | | |
| | | | | | | | | | | | | | | | | | | | | | | | | | | | | | | | | | | | | | | | |
Ratio of net investment income (loss) to average net assets | | | (0.16 | )% | | | 0.15 | % | | | 0.14 | % | | | (0.05 | )% | | | (0.16 | )% | | | (0.05 | )% | | | 0.07 | % | | | 0.38 | % | | | | | | | | |
| | | | | | | | | | | | | | | | | | | | | | | | | | | | | | | | | | | | | | | | |
Portfolio turnover rate | | | 38.90 | % | | | 42.85 | % | | | 34.67 | % | | | 40.60 | % | | | 39.02 | % | | | 53.20 | % | | | 32.70 | % | | | 53.94 | % | | | | | | | | |
| | | | | | | | | | | | | | | | | | | | | | | | | | | | | | | | | | | | | | | | |
| | | INSTITUTIONAL SHARES | | | | | | R6 SHARES | |
| | | Year Ended December 31, | | | | | | Year Ended
December 31, | |
| | | 2016 | | | 2015 | | | 2014 | | | 2013 | | | 2012 | | | 2011 | | | 2010 | | | 20096 | | | | | | 20167 | |
Net asset value, beginning of year | | $ | 18.17 | | | $ | 18.09 | | | $ | 19.05 | | | $ | 15.63 | | | $ | 13.25 | | | $ | 17.36 | | | $ | 14.13 | | | $ | 11.13 | | | | | | | $ | 19.15 | |
| | | | | | | | | | | | | | | | | | | | | | | | | | | | | | | | | | | | | | | | |
Income (loss) from investment operations: | | | | | | | | | | | | | | | | | | | | | | | | | | | | | | | | | | | | | | | | |
Net investment income (loss) | | | 0.01 | 1 | | | 0.08 | 1 | | | 0.12 | 1 | | | 0.03 | 1 | | | 0.01 | 1 | | | 0.03 | 1 | | | 0.05 | 1 | | | (0.02 | )1 | | | | | | | (0.02 | )1 |
Net realized and unrealized gain (loss) on investments | | | 0.24 | | | | 0.19 | | | | (0.50 | ) | | | 3.39 | | | | 2.40 | | | | (2.79 | ) | | | 3.39 | | | | 3.38 | | | | | | | | (0.71 | ) |
| | | | | | | | | | | | | | | | | | | | | | | | | | | | | | | | | | | | | | | | |
Total from investment operations | | | 0.25 | | | | 0.27 | | | | (0.38 | ) | | | 3.42 | | | | 2.41 | | | | (2.76 | ) | | | 3.44 | | | | 3.36 | | | | | | | | (0.73 | ) |
| | | | | | | | | | | | | | | | | | | | | | | | | | | | | | | | | | | | | | | | |
Less distributions to shareholders from: | | | | | | | | | | | | | | | | | | | | | | | | | | | | | | | | | | | | | | | | |
Net investment income | | | (0.01 | ) | | | (0.16 | ) | | | (0.04 | ) | | | (0.00 | )2 | | | (0.03 | ) | | | (0.09 | ) | | | 0.00 | | | | 0.00 | | | | | | | | (0.01 | ) |
Net realized gain on investments | | | (0.16 | ) | | | (0.03 | ) | | | (0.54 | ) | | | 0.00 | | | | 0.00 | | | | (1.26 | ) | | | (0.21 | ) | | | (0.36 | ) | | | | | | | (0.16 | ) |
| | | | | | | | | | | | | | | | | | | | | | | | | | | | | | | | | | | | | | | | |
Total distributions | | | (0.17 | ) | | | (0.19 | ) | | | (0.58 | ) | | | (0.00 | )2 | | | (0.03 | ) | | | (1.35 | ) | | | (0.21 | ) | | | (0.36 | ) | | | | | | | (0.17 | ) |
| | | | | | | | | | | | | | | | | | | | | | | | | | | | | | | | | | | | | | | | |
Net asset value, end of year | | $ | 18.25 | | | $ | 18.17 | | | $ | 18.09 | | | $ | 19.05 | | | $ | 15.63 | | | $ | 13.25 | | | $ | 17.36 | | | $ | 14.13 | | | | | | | $ | 18.25 | |
| | | | | | | | | | | | | | | | | | | | | | | | | | | | | | | | | | | | | | | | |
Total return | | | 1.35 | %3 | | | 1.48 | %3 | | | (2.07 | )%3 | | | 21.89 | %3 | | | 18.17 | %3 | | | (16.13 | )%3 | | | 24.54 | %3 | | | 30.18 | %3,4 | | | | | | | (3.83 | )%3,4 |
| | | | | | | | | | | | | | | | | | | | | | | | | | | | | | | | | | | | | | | | |
Ratios/Supplemental data: | | | | | | | | | | | | | | | | | | | | | | | | | | | | | | | | | | | | | | | | |
Net assets (in millions), end of year | | $ | 45.4 | | | $ | 53.7 | | | $ | 52.3 | | | $ | 45.4 | | | $ | 39.0 | | | $ | 30.5 | | | $ | 37.4 | | | $ | 22.1 | | | | | | | $ | 0.4 | |
| | | | | | | | | | | | | | | | | | | | | | | | | | | | | | | | | | | | | | | | |
Ratio of operating expenses to average net assets | | | 1.36 | % | | | 1.31 | % | | | 1.34 | % | | | 1.37 | % | | | 1.40 | % | | | 1.38 | % | | | 1.40 | % | | | 1.89 | %5 | | | | | | | 1.38 | %5 |
Less: Reimbursement of expenses by Adviser | | | (0.11 | )% | | | (0.06 | )% | | | (0.09 | )% | | | (0.12 | )% | | | (0.15 | )% | | | (0.13 | )% | | | (0.15 | )% | | | (0.64 | )%5 | | | | | | | (0.14 | )%5 |
| | | | | | | | | | | | | | | | | | | | | | | | | | | | | | | | | | | | | | | | |
Ratio of net operating expenses to average net assets | | | 1.25 | % | | | 1.25 | % | | | 1.25 | % | | | 1.25 | % | | | 1.25 | % | | | 1.25 | % | | | 1.25 | % | | | 1.25 | %5 | | | | | | | 1.24 | %5 |
| | | | | | | | | | | | | | | | | | | | | | | | | | | | | | | | | | | | | | | | |
Ratio of net investment income (loss) to average net assets | | | 0.07 | % | | | 0.41 | % | | | 0.64 | % | | | 0.20 | % | | | 0.09 | % | | | 0.19 | % | | | 0.31 | % | | | (0.29 | )%5 | | | | | | | (0.31 | )%5 |
| | | | | | | | | | | | | | | | | | | | | | | | | | | | | | | | | | | | | | | | |
Portfolio turnover rate | | | 38.90 | % | | | 42.85 | % | | | 34.67 | % | | | 40.60 | % | | | 39.02 | % | | | 53.20 | % | | | 32.70 | % | | | 53.94 | % | | | | | | | 38.90 | % |
| | | | | | | | | | | | | | | | | | | | | | | | | | | | | | | | | | | | | | | | |
| | |
1 Based on average shares outstanding. 2 Less than $0.01 per share. 3 The total returns would have been lower had certain expenses not been reduced during the period shown. 4 Not Annualized. | | 5 Annualized. 6 For the period May 29, 2009 (initial offering of Institutional Shares) to December 31, 2009. 7 For the period August 31, 2016 (initial offering of R6 Shares) to December 31, 2016. |
| | |
| 46 | | See Notes to Financial Statements. |
| | |
| December 31, 2016 | | Baron Select Funds |
FINANCIAL HIGHLIGHTS (Continued)
BARON REAL ESTATE FUND
Selected data for a share outstanding throughout each year:
| | | | | | | | | | | | | | | | | | | | | | | | | | | | | | | | | | | | |
| | | RETAIL SHARES | | | | | | | |
| | | Year Ended December 31, | | | | | | | |
| | | 2016 | | | 2015 | | | 2014 | | | 2013 | | | 2012 | | | 2011 | | | 2010 | | | | | | | |
Net asset value, beginning of year | | $ | 24.24 | | | $ | 25.92 | | | $ | 22.25 | | | $ | 17.52 | | | $ | 12.51 | | | $ | 12.66 | | | $ | 10.00 | | | | | | | | | |
| | | | | | | | | | | | | | | | | | | | | | | | | | | | | | | | | | | | |
Income (loss) from investment operations: | | | | | | | | | | | | | | | | | | | | | | | | | | | | | | | | | | | | |
Net investment income (loss) | | | (0.02 | )1 | | | (0.06 | )1 | | | 0.04 | 1 | | | (0.05 | )1 | | | 0.01 | 1 | | | (0.01 | )1 | | | 0.02 | 1 | | | | | | | | |
Net realized and unrealized gain (loss) on investments | | | (0.47 | ) | | | (1.14 | ) | | | 3.66 | | | | 4.80 | | | | 5.31 | | | | 0.07 | 2 | | | 2.64 | | | | | | | | | |
| | | | | | | | | | | | | | | | | | | | | | | | | | | | | | | | | | | | |
Total from investment operations | | | (0.49 | ) | | | (1.20 | ) | | | 3.70 | | | | 4.75 | | | | 5.32 | | | | 0.06 | | | | 2.66 | | | | | | | | | |
| | | | | | | | | | | | | | | | | | | | | | | | | | | | | | | | | | | | |
Less distributions to shareholders from: | | | | | | | | | | | | | | | | | | | | | | | | | | | | | | | | | | | | |
Net investment income | | | 0.00 | | | | (0.01 | ) | | | (0.03 | ) | | | 0.00 | | | | 0.00 | | | | (0.00 | )3 | | | 0.00 | | | | | | | | | |
Net realized gain on investments | | | (0.08 | ) | | | (0.47 | ) | | | 0.00 | | | | (0.02 | ) | | | (0.31 | ) | | | (0.21 | ) | | | 0.00 | | | | | | | | | |
| | | | | | | | | | | | | | | | | | | | | | | | | | | | | | | | | | | | |
Total distributions | | | (0.08 | ) | | | (0.48 | ) | | | (0.03 | ) | | | (0.02 | ) | | | (0.31 | ) | | | (0.21 | ) | | | 0.00 | | | | | | | | | |
| | | | | | | | | | | | | | | | | | | | | | | | | | | | | | | | | | | | |
Net asset value, end of year | | $ | 23.67 | | | $ | 24.24 | | | $ | 25.92 | | | $ | 22.25 | | | $ | 17.52 | | | $ | 12.51 | | | $ | 12.66 | | | | | | | | | |
| | | | | | | | | | | | | | | | | | | | | | | | | | | | | | | | | | | | |
Total return | | | (2.01 | )% | | | (4.65 | )% | | | 16.61 | % | | | 27.12 | % | | | 42.60 | %4 | | | 0.63 | %4 | | | 26.60 | %4 | | | | | | | | |
| | | | | | | | | | | | | | | | | | | | | | | | | | | | | | | | | | | | |
Ratios/Supplemental data: | | | | | | | | | | | | | | | | | | | | | | | | | | | | | | | | | | | | |
Net assets (in millions), end of year | | $ | 434.0 | | | $ | 788.9 | | | $ | 782.8 | | | $ | 539.5 | | | $ | 53.6 | | | $ | 10.9 | | | $ | 5.5 | | | | | | | | | |
| | | | | | | | | | | | | | | | | | | | | | | | | | | | | | | | | | | | |
Ratio of operating expenses to average net assets | | | 1.33 | % | | | 1.31 | % | | | 1.32 | % | | | 1.35 | % | | | 1.76 | % | | | 2.33 | % | | | 4.35 | % | | | | | | | | |
Less: Reimbursement of expenses by Adviser | | | 0.00 | % | | | 0.00 | % | | | 0.00 | % | | | 0.00 | % | | | (0.41 | )% | | | (0.98 | )% | | | (3.00 | )% | | | | | | | | |
| | | | | | | | | | | | | | | | | | | | | | | | | | | | | | | | | | | | |
Ratio of net operating expenses to average net assets | | | 1.33 | % | | | 1.31 | % | | | 1.32 | % | | | 1.35 | % | | | 1.35 | % | | | 1.35 | % | | | 1.35 | % | | | | | | | | |
| | | | | | | | | | | | | | | | | | | | | | | | | | | | | | | | | | | | |
Ratio of net investment income (loss) to average net assets | | | (0.07 | )% | | | (0.23 | )% | | | 0.17 | % | | | (0.23 | )% | | | 0.07 | % | | | (0.08 | )% | | | 0.14 | % | | | | | | | | |
| | | | | | | | | | | | | | | | | | | | | | | | | | | | | | | | | | | | |
Portfolio turnover rate | | | 55.50 | % | | | 50.50 | % | | | 24.40 | % | | | 19.36 | % | | | 30.14 | % | | | 70.99 | % | | | 58.03 | % | | | | | | | | |
| | | | | | | | | | | | | | | | | | | | | | | | | | | | | | | | | | | | |
| | | INSTITUTIONAL SHARES | | | | | | R6 SHARES | |
| | | Year Ended December 31, | | | | | | Year Ended
December 31, | |
| | | 2016 | | | 2015 | | | 2014 | | | 2013 | | | 2012 | | | 2011 | | | 2010 | | | | | | 20167 | |
Net asset value, beginning of year | | $ | 24.51 | | | $ | 26.14 | | | $ | 22.43 | | | $ | 17.64 | | | $ | 12.56 | | | $ | 12.69 | | | $ | 10.00 | | | | | | | $ | 21.80 | |
| | | | | | | | | | | | | | | | | | | | | | | | | | | | | | | | | | | | |
Income (loss) from investment operations: | | | | | | | | | | | | | | | | | | | | | | | | | | | | | | | | | | | | |
Net investment income (loss) | | | 0.04 | 1 | | | 0.01 | 1 | | | 0.11 | 1 | | | 0.03 | 1 | | | 0.06 | 1 | | | 0.02 | 1 | | | 0.04 | 1 | | | | | | | 0.02 | 1 |
Net realized and unrealized gain (loss) on investments | | | (0.47 | ) | | | (1.16 | ) | | | 3.68 | | | | 4.81 | | | | 5.33 | | | | 0.07 | 2 | | | 2.65 | | | | | | | | 2.26 | |
| | | | | | | | | | | | | | | | | | | | | | | | | | | | | | | | | | | | |
Total from investment operations | | | (0.43 | ) | | | (1.15 | ) | | | 3.79 | | | | 4.84 | | | | 5.39 | | | | 0.09 | | | | 2.69 | | | | | | | | 2.28 | |
| | | | | | | | | | | | | | | | | | | | | | | | | | | | | | | | | | | | |
Less distributions to shareholders from: | | | | | | | | | | | | | | | | | | | | | | | | | | | | | | | | | | | | |
Net investment income | | | 0.00 | | | | (0.01 | ) | | | (0.08 | ) | | | (0.00 | )3 | | | 0.00 | | | | (0.01 | ) | | | 0.00 | | | | | | | | 0.00 | |
Net realized gain on investments | | | (0.08 | ) | | | (0.47 | ) | | | 0.00 | | | | (0.02 | ) | | | (0.31 | ) | | | (0.21 | ) | | | 0.00 | | | | | | | | (0.08 | ) |
Return of capital | | | (0.07 | ) | | | 0.00 | | | | 0.00 | | | | (0.03 | ) | | | 0.00 | | | | 0.00 | | | | 0.00 | | | | | | | | (0.07 | ) |
| | | | | | | | | | | | | | | | | | | | | | | | | | | | | | | | | | | | |
Total distributions | | | (0.15 | ) | | | (0.48 | ) | | | (0.08 | ) | | | (0.05 | ) | | | (0.31 | ) | | | (0.22 | ) | | | 0.00 | | | | | | | | (0.15 | ) |
| | | | | | | | | | | | | | | | | | | | | | | | | | | | | | | | | | | | |
Net asset value, end of year | | $ | 23.93 | | | $ | 24.51 | | | $ | 26.14 | | | $ | 22.43 | | | $ | 17.64 | | | $ | 12.56 | | | $ | 12.69 | | | | | | | $ | 23.93 | |
| | | | | | | | | | | | | | | | | | | | | | | | | | | | | | | | | | | | |
Total return | | | (1.75 | )% | | | (4.42 | )% | | | 16.93 | % | | | 27.48 | % | | | 42.99 | %4 | | | 0.80 | %4 | | | 26.90 | %4 | | | | | | | 10.47 | %5 |
| | | | | | | | | | | | | | | | | | | | | | | | | | | | | | | | | | | | |
Ratios/Supplemental data: | | | | | | | | | | | | | | | | | | | | | | | | | | | | | | | | | | | | |
Net assets (in millions), end of year | | $ | 514.6 | | | $ | 992.8 | | | $ | 919.7 | | | $ | 486.1 | | | $ | 35.5 | | | $ | 4.9 | | | $ | 3.2 | | | | | | | $ | 2.0 | |
| | | | | | | | | | | | | | | | | | | | | | | | | | | | | | | | | | | | |
Ratio of operating expenses to average net assets | | | 1.07 | % | | | 1.06 | % | | | 1.06 | % | | | 1.09 | % | | | 1.44 | % | | | 2.14 | % | | | 4.26 | % | | | | | | | 1.07 | %6 |
Less: Reimbursement of expenses by Adviser | | | 0.00 | % | | | 0.00 | % | | | 0.00 | % | | | 0.00 | % | | | (0.34 | )% | | | (1.04 | )% | | | (3.16 | )% | | | | | | | 0.00 | % |
| | | | | | | | | | | | | | | | | | | | | | | | | | | | | | | | | | | | |
Ratio of net operating expenses to average net assets | | | 1.07 | % | | | 1.06 | % | | | 1.06 | % | | | 1.09 | % | | | 1.10 | % | | | 1.10 | % | | | 1.10 | % | | | | | | | 1.07 | %6 |
| | | | | | | | | | | | | | | | | | | | | | | | | | | | | | | | | | | | |
Ratio of net investment income (loss) to average net assets | | | 0.19 | % | | | 0.04 | % | | | 0.44 | % | | | 0.15 | % | | | 0.36 | % | | | 0.17 | % | | | 0.36 | % | | | | | | | 0.08 | %6 |
| | | | | | | | | | | | | | | | | | | | | | | | | | | | | | | | | | | | |
Portfolio turnover rate | | | 55.50 | % | | | 50.50 | % | | | 24.40 | % | | | 19.36 | % | | | 30.14 | % | | | 70.99 | % | | | 58.03 | % | | | | | | | 55.50 | % |
| | | | | | | | | | | | | | | | | | | | | | | | | | | | | | | | | | | | |
| | |
1 Based on average shares outstanding. 2 The amount shown for a share outstanding does not correspond with the aggregate realized and unrealized gain (loss) on investments for the period due to the timing of sales and redemptions of Fund shares in relation to fluctuating market values of investments of the Fund. 3 Less than $0.01 per share. | | 4 The total returns would have been lower had certain expenses not been reduced during the period shown. 5 Not Annualized. 6 Annualized. 7 For the period January 29, 2016 (initial offering of R6 Shares) to December 31, 2016. |
| | |
| See Notes to Financial Statements. | | 47 |
| | |
| Baron Select Funds | | December 31, 2016 |
FINANCIAL HIGHLIGHTS (Continued)
BARON EMERGING MARKETS FUND
Selected data for a share outstanding throughout each year:
| | | | | | | | | | | | | | | | | | | | | | | | | | | | | | | | |
| | | RETAIL SHARES | | | | | | | |
| | | Year Ended December 31, | | | | | | | |
| | | 2016 | | | 2015 | | | 2014 | | | 2013 | | | 2012 | | | 2011 | | | | | | | |
Net asset value, beginning of year | | $ | 10.57 | | | $ | 11.91 | | | $ | 11.54 | | | $ | 10.06 | | | $ | 8.28 | | | $ | 10.00 | | | | | | | | | |
| | | | | | | | | | | | | | | | | | | | | | | | | | | | | | | | |
Income (loss) from investment operations: | | | | | | | | | | | | | | | | | | | | | | | | | | | | | | | | |
Net investment income (loss) | | | 0.04 | 1 | | | 0.03 | 1 | | | 0.07 | 1 | | | (0.06 | )1 | | | (0.04 | )1 | | | (0.03 | )1 | | | | | | | | |
Net realized and unrealized gain (loss) on investments | | | 0.36 | | | | (1.36 | ) | | | 0.33 | | | | 1.54 | | | | 1.94 | | | | (1.69 | ) | | | | | | | | |
| | | | | | | | | | | | | | | | | | | | | | | | | | | | | | | | |
Total from investment operations | | | 0.40 | | | | (1.33 | ) | | | 0.40 | | | | 1.48 | | | | 1.90 | | | | (1.72 | ) | | | | | | | | |
| | | | | | | | | | | | | | | | | | | | | | | | | | | | | | | | |
Less distributions to shareholders from: | | | | | | | | | | | | | | | | | | | | | | | | | | | | | | | | |
Net investment income | | | (0.02 | ) | | | (0.01 | ) | | | (0.03 | ) | | | 0.00 | | | | (0.12 | ) | | | 0.00 | | | | | | | | | |
Net realized gain on investments | | | 0.00 | | | | 0.00 | | | | 0.00 | | | | 0.00 | | | | 0.00 | | | | 0.00 | | | | | | | | | |
| | | | | | | | | | | | | | | | | | | | | | | | | | | | | | | | |
Total distributions | | | (0.02 | ) | | | (0.01 | ) | | | (0.03 | ) | | | 0.00 | | | | (0.12 | ) | | | 0.00 | | | | | | | | | |
| | | | | | | | | | | | | | | | | | | | | | | | | | | | | | | | |
Net asset value, end of year | | $ | 10.95 | | | $ | 10.57 | | | $ | 11.91 | | | $ | 11.54 | | | $ | 10.06 | | | $ | 8.28 | | | | | | | | | |
| | | | | | | | | | | | | | | | | | | | | | | | | | | | | | | | |
Total return | | | 3.75 | % | | | (11.16 | )% | | | 3.47 | %2 | | | 14.71 | %2 | | | 22.98 | %2 | | | (17.20 | )%2 | | | | | | | | |
| | | | | | | | | | | | | | | | | | | | | | | | | | | | | | | | |
Ratios/Supplemental data: | | | | | | | | | | | | | | | | | | | | | | | | | | | | | | | | |
Net assets (in millions), end of year | | $ | 768.5 | | | $ | 665.5 | | | $ | 649.7 | | | $ | 259.6 | | | $ | 2.9 | | | $ | 2.0 | | | | | | | | | |
| | | | | | | | | | | | | | | | | | | | | | | | | | | | | | | | |
Ratio of operating expenses to average net assets | | | 1.38 | % | | | 1.45 | % | | | 1.52 | % | | | 1.90 | % | | | 4.01 | % | | | 4.49 | % | | | | | | | | |
Less: Reimbursement of expenses by Adviser | | | 0.00 | % | | | 0.00 | % | | | (0.02 | )% | | | (0.40 | )% | | | (2.51 | )% | | | (2.99 | )% | | | | | | | | |
| | | | | | | | | | | | | | | | | | | | | | | | | | | | | | | | |
Ratio of net operating expenses to average net assets | | | 1.38 | % | | | 1.45 | % | | | 1.50 | % | | | 1.50 | % | | | 1.50 | % | | | 1.50 | % | | | | | | | | |
| | | | | | | | | | | | | | | | | | | | | | | | | | | | | | | | |
Ratio of net investment income (loss) to average net assets | | | 0.33 | % | | | 0.25 | % | | | 0.56 | % | | | (0.53 | )% | | | (0.39 | )% | | | (0.32 | )% | | | | | | | | |
| | | | | | | | | | | | | | | | | | | | | | | | | | | | | | | | |
Portfolio turnover rate | | | 25.31 | % | | | 26.34 | % | | | 23.38 | % | | | 14.68 | % | | | 42.68 | % | | | 45.86 | % | | | | | | | | |
| | | | | | | | | | | | | | | | | | | | | | | | | | | | | | | | |
| | | INSTITUTIONAL SHARES | | | | | | R6 SHARES | |
| | | Year Ended December 31, | | | | | | Year Ended
December 31, | |
| | | 2016 | | | 2015 | | | 2014 | | | 2013 | | | 2012 | | | 2011 | | | | | | 20165 | |
Net asset value, beginning of year | | $ | 10.59 | | | $ | 11.94 | | | $ | 11.56 | | | $ | 10.05 | | | $ | 8.30 | | | $ | 10.00 | | | | | | | $ | 9.94 | |
| | | | | | | | | | | | | | | | | | | | | | | | | | | | | | | | |
Income (loss) from investment operations: | | | | | | | | | | | | | | | | | | | | | | | | | | | | | | | | |
Net investment income (loss) | | | 0.06 | 1 | | | 0.06 | 1 | | | 0.09 | 1 | | | 0.01 | 1 | | | (0.01 | )1 | | | (0.01 | )1 | | | | | | | 0.05 | 1 |
Net realized and unrealized gain (loss) on investments | | | 0.37 | | | | (1.37 | ) | | | 0.34 | | | | 1.50 | | | | 1.93 | | | | (1.69 | ) | | | | | | | 1.04 | |
| | | | | | | | | | | | | | | | | | | | | | | | | | | | | | | | |
Total from investment operations | | | 0.43 | | | | (1.31 | ) | | | 0.43 | | | | 1.51 | | | | 1.92 | | | | (1.70 | ) | | | | | | | 1.09 | |
| | | | | | | | | | | | | | | | | | | | | | | | | | | | | | | | |
Less distributions to shareholders from: | | | | | | | | | | | | | | | | | | | | | | | | | | | | | | | | |
Net investment income | | | (0.04 | ) | | | (0.04 | ) | | | (0.05 | ) | | | 0.00 | | | | (0.17 | ) | | | 0.00 | | | | | | | | (0.04 | ) |
Net realized gain on investments | | | 0.00 | | | | 0.00 | | | | 0.00 | | | | 0.00 | | | | 0.00 | | | | 0.00 | | | | | | | | 0.00 | |
| | | | | | | | | | | | | | | | | | | | | | | | | | | | | | | | |
Total distributions | | | (0.04 | ) | | | (0.04 | ) | | | (0.05 | ) | | | 0.00 | | | | (0.17 | ) | | | 0.00 | | | | | | | | (0.04 | ) |
| | | | | | | | | | | | | | | | | | | | | | | | | | | | | | | | |
Net asset value, end of year | | $ | 10.98 | | | $ | 10.59 | | | $ | 11.94 | | | $ | 11.56 | | | $ | 10.05 | | | $ | 8.30 | | | | | | | $ | 10.99 | |
| | | | | | | | | | | | | | | | | | | | | | | | | | | | | | | | |
Total return | | | 4.08 | % | | | (10.97 | )% | | | 3.75 | %2 | | | 15.02 | %2 | | | 23.22 | %2 | | | (17.00 | )%2 | | | | | | | 10.99 | %3 |
| | | | | | | | | | | | | | | | | | | | | | | | | | | | | | | | |
Ratios/Supplemental data: | | | | | | | | | | | | | | | | | | | | | | | | | | | | | | | | |
Net assets (in millions), end of year | | $ | 1,832.8 | | | $ | 1,040.9 | | | $ | 697.8 | | | $ | 116.0 | | | $ | 6.0 | | | $ | 4.3 | | | | | | | $ | 0.7 | |
| | | | | | | | | | | | | | | | | | | | | | | | | | | | | | | | |
Ratio of operating expenses to average net assets | | | 1.13 | % | | | 1.20 | % | | | 1.27 | % | | | 1.80 | % | | | 3.37 | % | | | 3.83 | % | | | | | | | 1.13 | %4 |
Less: Reimbursement of expenses by Adviser | | | 0.00 | % | | | 0.00 | % | | | (0.02 | )% | | | (0.55 | )% | | | (2.12 | )% | | | (2.58 | )% | | | | | | | 0.00 | % |
| | | | | | | | | | | | | | | | | | | | | | | | | | | | | | | | |
Ratio of net operating expenses to average net assets | | | 1.13 | % | | | 1.20 | % | | | 1.25 | % | | | 1.25 | % | | | 1.25 | % | | | 1.25 | % | | | | | | | 1.13 | %4 |
| | | | | | | | | | | | | | | | | | | | | | | | | | | | | | | | |
Ratio of net investment income (loss) to average net assets | | | 0.57 | % | | | 0.49 | % | | | 0.76 | % | | | 0.05 | % | | | (0.14 | )% | | | (0.07 | )% | | | | | | | 0.48 | %4 |
| | | | | | | | | | | | | | | | | | | | | | | | | | | | | | | | |
Portfolio turnover rate | | | 25.31 | % | | | 26.34 | % | | | 23.38 | % | | | 14.68 | % | | | 42.68 | % | | | 45.86 | % | | | | | | | 25.31 | % |
| | | | | | | | | | | | | | | | | | | | | | | | | | | | | | | | |
| | |
1 Based on average shares outstanding. 2 The total returns would have been lower had certain expenses not been reduced during the period shown. 3 Not Annualized. | | 4 Annualized. 5 For the period January 29, 2016 (initial offering of R6 shares) to December 31, 2016. |
| | |
| 48 | | See Notes to Financial Statements. |
| | |
| December 31, 2016 | | Baron Select Funds |
FINANCIAL HIGHLIGHTS (Continued)
BARON ENERGY AND RESOURCES FUND
Selected data for a share outstanding throughout each year:
| | | | | | | | | | | | | | | | | | | | | | | | | | | | |
| | | RETAIL SHARES | | | | | | | |
| | | Year Ended December 31, | | | | | | | |
| | | 2016 | | | 2015 | | | 2014 | | | 2013 | | | 2012 | | | | | | | |
Net asset value, beginning of year | | $ | 7.03 | | | $ | 10.33 | | | $ | 11.84 | | | $ | 9.46 | | | $ | 10.00 | | | | | | | | | |
| | | | | | | | | | | | | | | | | | | | | | | | | | | | |
Income (loss) from investment operations: | | | | | | | | | | | | | | | | | | | | | | | | | | | | |
Net investment income (loss) | | | 0.02 | 1 | | | 0.02 | 1 | | | (0.01 | )1 | | | (0.01 | )1 | | | (0.03 | )1 | | | | | | | | |
Net realized and unrealized gain (loss) on investments | | | 1.95 | | | | (3.31 | ) | | | (1.50 | ) | | | 2.40 | | | | (0.51 | ) | | | | | | | | |
| | | | | | | | | | | | | | | | | | | | | | | | | | | | |
Total from investment operations | | | 1.97 | | | | (3.29 | ) | | | (1.51 | ) | | | 2.39 | | | | (0.54 | ) | | | | | | | | |
| | | | | | | | | | | | | | | | | | | | | | | | | | | | |
Less distributions to shareholders from: | | | | | | | | | | | | | | | | | | | | | | | | | | | | |
Net investment income | | | 0.00 | | | | 0.00 | | | | 0.00 | | | | (0.01 | ) | | | 0.00 | | | | | | | | | |
Net realized gain on investments | | | 0.00 | | | | (0.01 | ) | | | 0.00 | | | | 0.00 | | | | 0.00 | | | | | | | | | |
| | | | | | | | | | | | | | | | | | | | | | | | | | | | |
Total distributions | | | 0.00 | | | | (0.01 | ) | | | 0.00 | | | | (0.01 | ) | | | 0.00 | | | | | | | | | |
| | | | | | | | | | | | | | | | | | | | | | | | | | | | |
Net asset value, end of year | | $ | 9.00 | | | $ | 7.03 | | | $ | 10.33 | | | $ | 11.84 | | | $ | 9.46 | | | | | | | | | |
| | | | | | | | | | | | | | | | | | | | | | | | | | | | |
Total return | | | 28.02 | %2 | | | (31.88 | )%2 | | | (12.75 | )%2 | | | 25.32 | %2 | | | (5.40 | )%2 | | | | | | | | |
| | | | | | | | | | | | | | | | | | | | | | | | | | | | |
Ratios/Supplemental data: | | | | | | | | | | | | | | | | | | | | | | | | | | | | |
Net assets (in millions), end of year | | $ | 72.8 | | | $ | 56.4 | | | $ | 39.7 | | | $ | 29.2 | | | $ | 1.8 | | | | | | | | | |
| | | | | | | | | | | | | | | | | | | | | | | | | | | | |
Ratio of operating expenses to average net assets | | | 1.70 | %6 | | | 1.58 | % | | | 1.79 | % | | | 2.25 | % | | | 9.07 | % | | | | | | | | |
Less: Reimbursement of expenses by Adviser | | | (0.35 | )% | | | (0.23 | )% | | | (0.44 | )% | | | (0.90 | )% | | | (7.72 | )% | | | | | | | | |
| | | | | | | | | | | | | | | | | | | | | | | | | | | | |
Ratio of net operating expenses to average net assets | | | 1.35 | % | | | 1.35 | % | | | 1.35 | % | | | 1.35 | % | | | 1.35 | % | | | | | | | | |
| | | | | | | | | | | | | | | | | | | | | | | | | | | | |
Ratio of net investment income (loss) to average net assets | | | 0.28 | % | | | 0.24 | % | | | (0.04 | )% | | | (0.05 | )% | | | (0.36 | )% | | | | | | | | |
| | | | | | | | | | | | | | | | | | | | | | | | | | | | |
Portfolio turnover rate | | | 53.52 | % | | | 48.19 | % | | | 23.12 | % | | | 25.60 | % | | | 35.74 | % | | | | | | | | |
| | | | | | | | | | | | | | | | | | | | | | | | | | | | |
| | | INSTITUTIONAL SHARES | | | | | | R6 SHARES | |
| | | Year Ended December 31, | | | | | | Year Ended
December 31, | |
| | | 2016 | | | 2015 | | | 2014 | | | 2013 | | | 2012 | | | | | | 20165 | |
Net asset value, beginning of year | | $ | 7.10 | | | $ | 10.41 | | | $ | 11.91 | | | $ | 9.48 | | | $ | 10.00 | | | | | | | $ | 8.55 | |
| | | | | | | | | | | | | | | | | | | | | | | | | | | | |
Income (loss) from investment operations: | | | | | | | | | | | | | | | | | | | | | | | | | | | | |
Net investment income (loss) | | | 0.04 | 1 | | | 0.05 | 1 | | | 0.03 | 1 | | | 0.02 | 1 | | | (0.01 | )1 | | | | | | | (0.01 | )1 |
Net realized and unrealized gain (loss) on investments | | | 1.97 | | | | (3.35 | ) | | | (1.53 | ) | | | 2.41 | | | | (0.51 | ) | | | | | | | 0.56 | |
| | | | | | | | | | | | | | | | | | | | | | | | | | | | |
Total from investment operations | | | 2.01 | | | | (3.30 | ) | | | (1.50 | ) | | | 2.43 | | | | (0.52 | ) | | | | | | | 0.55 | |
| | | | | | | | | | | | | | | | | | | | | | | | | | | | |
Less distributions to shareholders from: | | | | | | | | | | | | | | | | | | | | | | | | | | | | |
Net investment income | | | 0.00 | | | | 0.00 | | | | 0.00 | | | | 0.00 | | | | 0.00 | | | | | | | | 0.00 | |
Net realized gain on investments | | | 0.00 | | | | (0.01 | ) | | | 0.00 | | | | 0.00 | | | | 0.00 | | | | | | | | 0.00 | |
| | | | | | | | | | | | | | | | | | | | | | | | | | | | |
Total distributions | | | 0.00 | | | | (0.01 | ) | | | 0.00 | | | | 0.00 | | | | 0.00 | | | | | | | | 0.00 | |
| | | | | | | | | | | | | | | | | | | | | | | | | | | | |
Net asset value, end of year | | $ | 9.11 | | | $ | 7.10 | | | $ | 10.41 | | | $ | 11.91 | | | $ | 9.48 | | | | | | | $ | 9.10 | |
| | | | | | | | | | | | | | | | | | | | | | | | | | | | |
Total return | | | 28.31 | %2 | | | (31.73 | )%2 | | | (12.59 | )%2 | | | 25.63 | %2 | | | (5.20 | )%2 | | | | | | | 6.43 | %2,3 |
| | | | | | | | | | | | | | | | | | | | | | | | | | | | |
Ratios/Supplemental data: | | | | | | | | | | | | | | | | | | | | | | | | | | | | |
Net assets (in millions), end of year | | $ | 30.7 | | | $ | 22.8 | | | $ | 29.3 | | | $ | 4.0 | | | $ | 1.4 | | | | | | | $ | 0.4 | |
| | | | | | | | | | | | | | | | | | | | | | | | | | | | |
Ratio of operating expenses to average net assets | | | 1.46 | %6 | | | 1.29 | % | | | 1.52 | % | | | 2.84 | % | | | 8.65 | % | | | | | | | 1.55 | %4,6 |
Less: Reimbursement of expenses by Adviser | | | (0.36 | )% | | | (0.19 | )% | | | (0.42 | )% | | | (1.74 | )% | | | (7.55 | )% | | | | | | | (0.46 | )%4 |
| | | | | | | | | | | | | | | | | | | | | | | | | | | | |
Ratio of net operating expenses to average net assets | | | 1.10 | % | | | 1.10 | % | | | 1.10 | % | | | 1.10 | % | | | 1.10 | % | | | | | | | 1.09 | 4 |
| | | | | | | | | | | | | | | | | | | | | | | | | | | | |
Ratio of net investment income (loss) to average net assets | | | 0.56 | % | | | 0.53 | % | | | 0.22 | % | | | 0.20 | % | | | (0.11 | )% | | | | | | | (0.23 | )%4 |
| | | | | | | | | | | | | | | | | | | | | | | | | | | | |
Portfolio turnover rate | | | 53.52 | % | | | 48.19 | % | | | 23.12 | % | | | 25.60 | % | | | 35.74 | % | | | | | | | 53.52 | % |
| | | | | | | | | | | | | | | | | | | | | | | | | | | | |
| | |
1 Based on average shares outstanding. 2 The total returns would have been lower had certain expenses not been reduced during the period shown. 3 Not Annualized | | 4 Annualized 5 For the period August 31, 2016 (initial offering of R6 Shares) to December 31, 2016. 6 Interest expense rounds to less than 0.01% |
| | |
| See Notes to Financial Statements. | | 49 |
| | |
| Baron Select Funds | | December 31, 2016 |
FINANCIAL HIGHLIGHTS (Continued)
BARON GLOBAL ADVANTAGE FUND
Selected data for a share outstanding throughout each year:
| | | | | | | | | | | | | | | | | | | | | | | | | | | | |
| | | RETAIL SHARES | | | | | | | |
| | | Year Ended December 31, | | | | | | | |
| | | 2016 | | | 2015 | | | 2014 | | | 2013 | | | 20121 | | | | | | | |
Net asset value, beginning of year | | $ | 13.91 | | | $ | 14.20 | | | $ | 13.51 | | | $ | 10.41 | | | $ | 10.00 | | | | | | | | | |
| | | | | | | | | | | | | | | | | | | | | | | | | | | | |
Income (loss) from investment operations: | | | | | | | | | | | | | | | | | | | | | | | | | | | | |
Net investment income (loss) | | | (0.18 | )2 | | | (0.11 | )2 | | | 0.02 | 2 | | | (0.02 | )2 | | | (0.02 | )2 | | | | | | | | |
Net realized and unrealized gain (loss) on investments | | | 0.02 | 10 | | | (0.14 | ) | | | 0.67 | | | | 3.12 | | | | 0.43 | | | | | | | | | |
| | | | | | | | | | | | | | | | | | | | | | | | | | | | |
Total from investment operations | | | (0.16 | ) | | | (0.25 | ) | | | 0.69 | | | | 3.10 | | | | 0.41 | | | | | | | | | |
| | | | | | | | | | | | | | | | | | | | | | | | | | | | |
Less distributions to shareholders from: | | | | | | | | | | | | | | | | | | | | | | | | | | | | |
Net investment income | | | 0.00 | | | | (0.02 | ) | | | 0.00 | | | | 0.00 | | | | 0.00 | | | | | | | | | |
Net realized gain on investments | | | 0.00 | | | | (0.02 | ) | | | (0.00 | )3 | | | 0.00 | | | | 0.00 | | | | | | | | | |
| | | | | | | | | | | | | | | | | | | | | | | | | | | | |
Total distributions | | | 0.00 | | | | (0.04 | ) | | | 0.00 | | | | 0.00 | | | | 0.00 | | | | | | | | | |
| | | | | | | | | | | | | | | | | | | | | | | | | | | | |
Net asset value, end of year | | $ | 13.75 | | | $ | 13.91 | | | $ | 14.20 | | | $ | 13.51 | | | $ | 10.41 | | | | | | | | | |
| | | | | | | | | | | | | | | | | | | | | | | | | | | | |
Total return | | | (1.15 | )%4 | | | (1.72 | )%4 | | | 5.11 | %4,5 | | | 29.78 | %4 | | | 4.10 | %4,6 | | | | | | | | |
| | | | | | | | | | | | | | | | | | | | | | | | | | | | |
Ratios/Supplemental data: | | | | | | | | | | | | | | | | | | | | | | | | | | | | |
Net assets (in millions), end of year | | $ | 5.0 | | | $ | 6.2 | | | $ | 3.9 | | | $ | 2.3 | | | $ | 1.5 | | | | | | | | | |
| | | | | | | | | | | | | | | | | | | | | | | | | | | | |
Ratio of operating expenses to average net assets | | | 3.86 | % | | | 3.19 | % | | | 3.61 | % | | | 5.51 | % | | | 8.35 | %7,8 | | | | | | | | |
Less: Reimbursement of expenses by Adviser | | | (2.36 | )% | | | (1.69 | )% | | | (2.11 | )% | | | (4.01 | )% | | | (6.85 | )%7,8 | | | | | | | | |
| | | | | | | | | | | | | | | | | | | | | | | | | | | | |
Ratio of net operating expenses to average net assets | | | 1.50 | % | | | 1.50 | % | | | 1.50 | % | | | 1.50 | % | | | 1.50 | %7,8 | | | | | | | | |
| | | | | | | | | | | | | | | | | | | | | | | | | | | | |
Ratio of net investment income (loss) to average net assets | | | (1.30 | )% | | | (0.75 | )% | | | 0.18 | % | | | (0.20 | )% | | | (0.38 | )%7,8 | | | | | | | | |
| | | | | | | | | | | | | | | | | | | | | | | | | | | | |
Portfolio turnover rate | | | 21.48 | % | | | 25.88 | % | | | 123.51 | % | | | 32.78 | % | | | 24.64 | %6 | | | | | | | | |
| | | | | | | | | | | | | | | | | | | | | | | | | | | | |
| | | INSTITUTIONAL SHARES | | | | | | R6 SHARES | |
| | | Year Ended December 31, | | | | | | Year Ended
December 31, | |
| | | 2016 | | | 2015 | | | 2014 | | | 2013 | | | 20121 | | | | | | 20169 | |
Net asset value, beginning of year | | $ | 14.00 | | | $ | 14.28 | | | $ | 13.56 | | | $ | 10.42 | | | $ | 10.00 | | | | | | | $ | 14.37 | |
| | | | | | | | | | | | | | | | | | | | | | | | | | | | |
Income (loss) from investment operations: | | | | | | | | | | | | | | | | | | | | | | | | | | | | |
Net investment income (loss) | | | (0.14 | )2 | | | (0.07 | )2 | | | 0.07 | 2 | | | 0.00 | 2,3 | | | (0.02 | )2 | | | | | | | (0.07 | )2 |
Net realized and unrealized gain (loss) on investments | | | 0.01 | 10 | | | (0.15 | ) | | | 0.65 | | | | 3.14 | | | | 0.44 | | | | | | | | (0.43 | ) |
| | | | | | | | | | | | | | | | | | | | | | | | | | | | |
Total from investment operations | | | (0.13 | ) | | | (0.22 | ) | | | 0.72 | | | | 3.14 | | | | 0.42 | | | | | | | | (0.50 | ) |
| | | | | | | | | | | | | | | | | | | | | | | | | | | | |
Less distributions to shareholders from: | | | | | | | | | | | | | | | | | | | | | | | | | | | | |
Net investment income | | | 0.00 | | | | (0.04 | ) | | | 0.00 | | | | 0.00 | | | | 0.00 | | | | | | | | 0.00 | |
Net realized gain on investments | | | 0.00 | | | | (0.02 | ) | | | (0.00 | )3 | | | 0.00 | | | | 0.00 | | | | | | | | 0.00 | |
| | | | | | | | | | | | | | | | | | | | | | | | | | | | |
Total distributions | | | 0.00 | | | | (0.06 | ) | | | 0.00 | | | | 0.00 | | | | 0.00 | | | | | | | | 0.00 | |
| | | | | | | | | | | | | | | | | | | | | | | | | | | | |
Net asset value, end of year | | $ | 13.87 | | | $ | 14.00 | | | $ | 14.28 | | | $ | 13.56 | | | $ | 10.42 | | | | | | | $ | 13.87 | |
| | | | | | | | | | | | | | | | | | | | | | | | | | | | |
Total return | | | (0.93 | )%4 | | | (1.51 | )%4 | | | 5.32 | %4,5 | | | 30.13 | %4 | | | 4.20 | %4,6 | | | | | | | (3.48 | )%4,6 |
| | | | | | | | | | | | | | | | | | | | | | | | | | | | |
Ratios/Supplemental data: | | | | | | | | | | | | | | | | | | | | | | | | | | | | |
Net assets (in millions), end of year | | $ | 4.6 | | | $ | 5.3 | | | $ | 4.1 | | | $ | 3.3 | | | $ | 1.6 | | | | | | | $ | 0.1 | |
| | | | | | | | | | | | | | | | | | | | | | | | | | | | |
Ratio of operating expenses to average net assets | | | 3.55 | % | | | 2.89 | % | | | 2.92 | % | | | 4.91 | % | | | 7.33 | %7,8 | | | | | | | 4.11 | %8 |
Less: Reimbursement of expenses by Adviser | | | (2.30 | )% | | | (1.64 | )% | | | (1.67 | )% | | | (3.66 | )% | | | (6.08 | )%7,8 | | | | | | | (2.87 | )%8 |
| | | | | | | | | | | | | | | | | | | | | | | | | | | | |
Ratio of net operating expenses to average net assets | | | 1.25 | % | | | 1.25 | % | | | 1.25 | % | | | 1.25 | % | | | 1.25 | %7,8 | | | | | | | 1.24 | %8 |
| | | | | | | | | | | | | | | | | | | | | | | | | | | | |
Ratio of net investment income (loss) to average net assets | | | (1.06 | )% | | | (0.47 | )% | | | 0.48 | % | | | 0.02 | % | | | (0.30 | )%7,8 | | | | | | | (1.52 | )%8 |
| | | | | | | | | | | | | | | | | | | | | | | | | | | | |
Portfolio turnover rate | | | 21.48 | % | | | 25.88 | % | | | 123.51 | % | | | 32.78 | % | | | 24.64 | %6 | | | | | | | 21.48 | % |
| | | | | | | | | | | | | | | | | | | | | | | | | | | | |
| | |
1 For the period April 30, 2012 (commencement of operations) to December 31, 2012. 2 Based on average shares outstanding. 3 Less than $0.01 per share. 4 The total returns would have been lower had certain expenses not been reduced during the period shown. 5 The Adviser made a voluntary payment to the Fund in the amount of $47,291 to compensate the Fund for a loss incurred due to shareholder activity processing error. The impact of this payment increased the Fund’s total return by 0.54%. | | 6 Not Annualized. 7 Certain fixed expenses incurred by the Fund were not annualized for the period ended December 31, 2012. 8 Annualized. 9 For the period August 31, 2016 (initial offering of R6 Shares) to December 31, 2016. 10 The amount shown for a share outstanding does not correspond with the aggregate realized and unrealized gain (loss) on investments for the period due to the timing of sales and redemptions of Fund shares in relation to fluctuating market values of investments of the Fund. |
| | |
| 50 | | See Notes to Financial Statements. |
| | |
| December 31, 2016 | | Baron Select Funds |
REPORT OF INDEPENDENT REGISTERED PUBLIC ACCOUNTING FIRM
To the Board of Trustees of Baron Select Funds and Shareholders of
Baron Partners Fund, Baron Focused Growth Fund, Baron International Growth Fund, Baron Real Estate Fund,
Baron Emerging Markets Fund, Baron Energy and Resources Fund and Baron Global Advantage Fund
In our opinion, the accompanying statements of assets and liabilities, including the statements of net assets, and the related statements of operations, of changes in net assets and with respect to the Baron Partners Fund of cash flows and the financial highlights present fairly, in all material respects, the financial position of Baron Partners Fund, Baron Focused Growth Fund, Baron International Growth Fund, Baron Real Estate Fund, Baron Emerging Markets Fund, Baron Energy and Resources Fund and Baron Global Advantage Fund (seven portfolios constituting the Baron Select Funds, hereafter referred to as the “Funds”) as of December 31, 2016, the results of each of their operations, with respect to the Baron Partners Fund its cash flows for the year then ended, the changes in each of their net assets for each of the two years in the period then ended, and the financial highlights for each of the periods indicated, in conformity with accounting principles generally accepted in the United States of America. These financial statements and financial highlights (hereafter referred to as “financial statements”) are the responsibility of the Funds ’ management. Our responsibility is to express an opinion on these financial statements based on our audits. We conducted our audits of these financial statements in accordance with the standards of the Public Company Accounting Oversight Board (United States). Those standards require that we plan and perform the audit to obtain reasonable assurance about whether the financial statements are free of material misstatement. An audit includes examining, on a test basis, evidence supporting the amounts and disclosures in the financial statements, assessing the accounting principles used and significant estimates made by management, and evaluating the overall financial statement presentation. We believe that our audits, which included confirmation of securities as of December 31, 2016 by correspondence with the custodian, brokers, and portfolio companies, provide a reasonable basis for our opinion.

PricewaterhouseCoopers LLP
New York, NY
February 24, 2017
51
| | |
| Baron Select Funds | | December 31, 2016 |
TAX INFORMATION (Unaudited)
The federal tax status of distributions paid by the Funds during the year ended December 31, 2016 are listed below.
During the fiscal year ended December 31, 2016, the Funds’ distributions to shareholders included:
| | | | | | | | | | | | |
| Fund | | Ordinary
Income1,3 | | | Long-Term
Capital Gains2.3 | | | Return of
Capital | |
| | | |
Baron Partners Fund | | $ | — | | | $ | — | | | $ | — | |
| | | |
Baron Focused Growth Fund | | | — | | | | 10,001,809 | | | | — | |
| | | |
Baron International Growth Fund | | | 43,909 | | | | 703,025 | | | | — | |
| | | |
Baron Real Estate Fund | | | — | | | | 3,756,561 | | | | 1,500,609 | |
| | | |
Baron Emerging Markets Fund | | | 7,977,500 | | | | — | | | | — | |
| | | |
Baron Energy and Resources Fund | | | — | | | | — | | | | — | |
| | | |
Baron Global Advantage Fund | | | — | | | | — | | | | — | |
| 1 | For tax purposes, short-term capital gains are considered ordinary income distributions. |
| 2 | Long-term capital gains are subject to a maximum allowable rate of 20% for individuals pursuant to the American Taxpayer Relief Act of 2012. |
| 3 | Under the Patient Protection and Affordable Care Act, higher income taxpayers must pay a 3.8% additional tax on net investment income. |
Of the total ordinary income distributions paid by Baron International Growth Fund and Baron Emerging Markets Fund, 99.19% and 100.00%, respectively, is qualified dividend income subject to a reduced tax rate. Of the total ordinary income distributions paid by Baron International Growth Fund and Baron Emerging Markets Fund, 5.28% and 0.16%, respectively, qualifies for the corporate dividends received deduction.
The information and distributions reported may differ from the information and distributions taxable to the shareholders for the calendar year ended December 31, 2016. The information necessary to complete your income tax return for the calendar year ended December 31, 2016 will be listed on the Form 1099-DIV, which was mailed to you in January/February 2017.
52
| | |
| December 31, 2016 | | Baron Select Funds |
FUND EXPENSES (Unaudited)
As a shareholder of the Funds, you may incur two types of costs: ongoing expenses and transaction costs. Ongoing expenses include advisory fees, distribution and service (12b-1) fees and other Fund expenses. Due to the payment of Rule 12b-1 fees, long-term shareholders may indirectly pay more than the maximum permitted front-end sales charge. The information on this page is intended to help you understand your ongoing costs of investing in the Funds and to compare these costs with the ongoing costs of investing in other mutual funds.
The information in the following table is based on an investment of $1,000 invested on July 1, 2016 and held for the six months ended December 31, 2016.
ACTUAL EXPENSES
The table below titled “Based on Actual Total Return” provides information about actual account values and actual expenses. You may use the information provided in this table, together with the amount you invested, to estimate the expenses that you paid over the period. To estimate the expenses you paid on your account, divide your ending account value by $1,000 (for example, an $8,600 ending account value divided by $1,000 = 8.6), then multiply the result by the number under the heading titled “Expenses Paid During the Period”.
BASED ON ACTUAL TOTAL RETURN FOR THE SIX MONTHS ENDED DECEMBER 31, 20161
| | | | | | | | | | | | | | | | | | | | |
| | | Actual Total Return | | | Beginning
Account Value
July 1, 2016 | | | Ending
Account Value
December 31, 2016 | | | Annualized
Expense Ratio | | | Expenses
Paid During
the Period3 | |
Baron Partners Fund — Retail Shares | | | 3.64 | % | | $ | 1,000.00 | | | $ | 1,036.40 | | | | 1.83 | %2 | | $ | 9.37 | |
Baron Partners Fund — Institutional Shares | | | 3.74 | % | | $ | 1,000.00 | | | $ | 1,037.40 | | | | 1.57 | %2 | | $ | 8.04 | |
Baron Partners Fund — R6 Shares6 | | | (2.33 | )% | | $ | 1,000.00 | | | $ | 976.70 | | | | 1.62 | %2 | | $ | 5.34 | |
Baron Focused Growth Fund — Retail Shares | | | 0.29 | % | | $ | 1,000.00 | | | $ | 1,002.90 | 4 | | | 1.35 | %5 | | $ | 6.80 | |
Baron Focused Growth Fund — Institutional Shares | | | 0.44 | % | | $ | 1,000.00 | | | $ | 1,004.40 | 4 | | | 1.10 | %5 | | $ | 5.54 | |
Baron Focused Growth Fund — R6 Shares6 | | | (3.55 | )% | | $ | 1,000.00 | | | $ | 964.50 | 4 | | | 1.10 | %5 | | $ | 3.60 | |
Baron International Growth Fund — Retail Shares | | | 0.92 | % | | $ | 1,000.00 | | | $ | 1,009.20 | 4 | | | 1.50 | %5 | | $ | 7.58 | |
Baron International Growth Fund — Institutional Shares | | | 0.97 | % | | $ | 1,000.00 | | | $ | 1,009.70 | 4 | | | 1.25 | %5 | | $ | 6.31 | |
Baron International Growth Fund — R6 Shares6 | | | (3.83 | )% | | $ | 1,000.00 | | | $ | 961.70 | 4 | | | 1.24 | %5 | | $ | 4.05 | |
Baron Real Estate Fund — Retail Shares | | | 2.17 | % | | $ | 1,000.00 | | | $ | 1,021.70 | | | | 1.32 | % | | $ | 6.71 | |
Baron Real Estate Fund — Institutional Shares | | | 2.30 | % | | $ | 1,000.00 | | | $ | 1,023.00 | | | | 1.06 | % | | $ | 5.39 | |
Baron Real Estate Fund — R6 Shares | | | 2.31 | % | | $ | 1.000.00 | | | $ | 1,023.10 | | | | 1.07 | % | | $ | 5.44 | |
Baron Emerging Markets Fund — Retail Shares | | | (1.65 | )% | | $ | 1,000.00 | | | $ | 983.50 | | | | 1.38 | % | | $ | 6.88 | |
Baron Emerging Markets Fund — Institutional Shares | | | (1.50 | )% | | $ | 1,000.00 | | | $ | 985.00 | | | | 1.12 | % | | $ | 5.59 | |
Baron Emerging Markets Fund — R6 Shares | | | (1.50 | )% | | $ | 1,000.00 | | | $ | 985.00 | | | | 1.14 | % | | $ | 5.69 | |
Baron Energy & Resources Fund — Retail Shares | | | 13.92 | % | | $ | 1,000.00 | | | $ | 1,139.20 | 4 | | | 1.35 | %5 | | $ | 7.26 | |
Baron Energy & Resources Fund — Institutional Shares | | | 14.02 | % | | $ | 1,000.00 | | | $ | 1,140.20 | 4 | | | 1.10 | %5 | | $ | 5.92 | |
Baron Energy & Resources Fund — R6 Shares6 | | | 6.43 | % | | $ | 1,000.00 | | | $ | 1,064.30 | 4 | | | 1.09 | %5 | | $ | 3.75 | |
Baron Global Advantage Fund — Retail Shares | | | 3.00 | % | | $ | 1,000.00 | | | $ | 1,030.00 | 4 | | | 1.50 | %5 | | $ | 7.65 | |
Baron Global Advantage Fund — Institutional Shares | | | 3.12 | % | | $ | 1,000.00 | | | $ | 1,031.20 | 4 | | | 1.25 | %5 | | $ | 6.38 | |
Baron Global Advantage Fund — R6 Shares6 | | | (3.48 | )% | | $ | 1,000.00 | | | $ | 965.20 | 4 | | | 1.24 | %5 | | $ | 4.06 | |
| 1 | Assumes reinvestment of all dividends and capital gain distributions, if any. |
| 2 | Annualized expense ratio for Baron Partners Fund for the six months ended December 31, 2016, includes 1.34%, 1.08% and 1.09% for net operating expenses and 0.49%, 0.49% and 0.53% for interest expense for the Retail, Institutional and R6 Shares, respectively. |
| 3 | Expenses are equal to each Share Class’ respective annualized expense ratio multiplied by the average account value over the period, multiplied by the number of days in the most recent fiscal half-year, then divided by 366. |
| 4 | Ending account value assumes the return earned after waiver and would have been lower if a portion of the expenses had not been waived. |
| 5 | Annualized expense ratios are adjusted to reflect fee waiver. |
| 6 | For the period August 31, 2016 (initial offering of R6 Shares) to December 31, 2016. |
53
| | |
| Baron Select Funds | | December 31, 2016 |
FUND EXPENSES (Unaudited) (Continued)
HYPOTHETICAL EXAMPLE FOR COMPARISON PURPOSES
The table below titled “Based on Hypothetical Total Return” provides information about hypothetical account values and hypothetical expenses based on the actual expense ratio and an assumed rate of return of 5% per year before expenses, which is not the Funds’ actual return. The hypothetical account values and expenses may not be used to estimate the actual ending account values and expenses you paid for the period. You may use the information provided in this table to compare the ongoing costs of investing in the Funds and other funds. To do so, compare the 5% hypothetical example relating to the Funds with the 5% hypothetical examples that appear in the shareholder reports of other funds.
Please note that expenses shown in the table below are meant to highlight your ongoing costs and do not reflect any transactional costs, such as redemption fees, if any. Therefore, the table is useful in comparing ongoing costs only and will not help you determine your relative total costs of owning different mutual funds. In addition, if these transactional costs were included, your costs would have been higher.
BASED ON HYPOTHETICAL TOTAL RETURN FOR THE SIX MONTHS ENDED DECEMBER 31, 20161
| | | | | | | | | | | | | | | | | | | | |
| | | Hypothetical Annualized Total Return | | | Beginning
Account Value
July 1, 2016 | | | Ending
Account Value
December 31, 2016 | | | Annualized
Expense Ratio | | | Expenses
Paid During
the Period3 | |
Baron Partners Fund — Retail Shares | | | 5.00 | % | | $ | 1,000.00 | | | $ | 1,015.94 | | | | 1.83 | %2 | | $ | 9.27 | |
Baron Partners Fund — Institutional Shares | | | 5.00 | % | | $ | 1,000.00 | | | $ | 1,017.24 | | | | 1.57 | %2 | | $ | 7.96 | |
Baron Partners Fund — R6 Shares6 | | | 5.00 | % | | $ | 1,000.00 | | | $ | 1,011.27 | | | | 1.62 | %2 | | $ | 5.43 | |
Baron Focused Growth Fund — Retail Shares | | | 5.00 | % | | $ | 1,000.00 | | | $ | 1,018.35 | 4 | | | 1.35 | %5 | | $ | 6.85 | |
Baron Focused Growth Fund — Institutional Shares | | | 5.00 | % | | $ | 1,000.00 | | | $ | 1,019.61 | 4 | | | 1.10 | %5 | | $ | 5.58 | |
Baron Focused Growth Fund — R6 Shares6 | | | 5.00 | % | | $ | 1,000.00 | | | $ | 1,013.00 | 4 | | | 1.10 | %5 | | $ | 3.69 | |
Baron International Growth Fund — Retail Shares | | | 5.00 | % | | $ | 1,000.00 | | | $ | 1,017.60 | 4 | | | 1.50 | %5 | | $ | 7.61 | |
Baron International Growth Fund — Institutional Shares | | | 5.00 | % | | $ | 1,000.00 | | | $ | 1,018.85 | 4 | | | 1.25 | %5 | | $ | 6.34 | |
Baron International Growth Fund — R6 Shares6 | | | 5.00 | % | | $ | 1,000.00 | | | $ | 1,012.53 | 4 | | | 1.24 | %5 | | $ | 4.16 | |
Baron Real Estate Fund — Retail Shares | | | 5.00 | % | | $ | 1,000.00 | | | $ | 1,018.50 | | | | 1.32 | % | | $ | 6.70 | |
Baron Real Estate Fund — Institutional Shares | | | 5.00 | % | | $ | 1,000.00 | | | $ | 1,019.81 | | | | 1.06 | % | | $ | 5.38 | |
Baron Real Estate Fund — R6 Shares | | | 5.00 | % | | $ | 1,000.00 | | | $ | 1,019.76 | | | | 1.07 | % | | $ | 5.43 | |
Baron Emerging Markets Fund — Retail Shares | | | 5.00 | % | | $ | 1,000.00 | | | $ | 1,018.20 | | | | 1.38 | % | | $ | 7.00 | |
Baron Emerging Markets Fund — Institutional Shares | | | 5.00 | % | | $ | 1,000.00 | | | $ | 1,019.51 | | | | 1.12 | % | | $ | 5.69 | |
Baron Emerging Markets Fund — R6 Shares | | | 5.00 | % | | $ | 1,000.00 | | | $ | 1,019.41 | | | | 1.14 | % | | $ | 5.79 | |
Baron Energy & Resources Fund — Retail Shares | | | 5.00 | % | | $ | 1,000.00 | | | $ | 1,018.35 | 4 | | | 1.35 | %5 | | $ | 6.85 | |
Baron Energy & Resources Fund — Institutional Shares | | | 5.00 | % | | $ | 1,000.00 | | | $ | 1,019.61 | 4 | | | 1.10 | %5 | | $ | 5.58 | |
Baron Energy & Resources Fund — R6 Shares6 | | | 5.00 | % | | $ | 1,000.00 | | | $ | 1,013.03 | 4 | | | 1.09 | %5 | | $ | 3.66 | |
Baron Global Advantage Fund — Retail Shares | | | 5.00 | % | | $ | 1,000.00 | | | $ | 1,017.60 | 4 | | | 1.50 | %5 | | $ | 7.61 | |
Baron Global Advantage Fund — Institutional Shares | | | 5.00 | % | | $ | 1,000.00 | | | $ | 1,018.85 | 4 | | | 1.25 | %5 | | $ | 6.34 | |
Baron Global Advantage Fund — R6 Shares6 | | | 5.00 | % | | $ | 1,000.00 | | | $ | 1,012.53 | 4 | | | 1.24 | %5 | | $ | 4.16 | |
| 1 | Assumes reinvestment of all dividends and capital gain distributions, if any. |
| 2 | Annualized expense ratio for Baron Partners Fund for the six months ended December 31, 2016, includes 1.34%, 1.08% and 1.09% for net operating expenses and 0.49%, 0.49% and 0.53% for interest expense for the Retail, Institutional and R6 Shares, respectively. |
| 3 | Expenses are equal to each Share Class’ respective annualized expense ratio multiplied by the average account value over the period, multiplied by the number of days in the most recent fiscal half-year, then divided by 366. |
| 4 | Ending account value assumes the return earned after waiver and would have been lower if a portion of the expenses had not been waived. |
| 5 | Annualized expense ratios are adjusted to reflect fee waiver. |
| 6 | For the period August 31, 2016 (initial offering of R6 Shares) to December 31, 2016. |
54
| | |
| December 31, 2016 | | Baron Select Funds |
MANAGEMENT OF THE FUNDS (Unaudited)
Board of Trustees and Executive Officers.
Trustees of the Trust, together with information as to their positions with the Trust, principal occupations and other board memberships and affiliations for the past five years, are shown below. Each Trustee serves as Trustee of a Fund until its termination; until the Trustee’s retirement, resignation or death; or as otherwise specified in the Trust’s organizational documents. Unless otherwise noted, the address of each Executive Officer and Trustee is Baron Select Funds, 767 Fifth Avenue, 49th Floor, New York, NY 10153. ”Interested Trustees” are considered “interested persons” (as defined in the 1940 Act) of the Trust, and “Independent Trustees” are not considered “interested persons” (as defined in the 1940 Act). Additional information about the Trustees and Executive Officers of the Trust can be found in the Trust’s Statement of Additional Information (the “SAI”) which may be obtained without charge by writing or calling 1-800-99BARON. The SAI is also available on the Baron Funds® website, www.BaronFunds.com.
| | | | | | | | | | |
| Name, Address & Age | | Position(s) Held
With the Funds | | Term of
Office and
Length of
Time Served | | Principal Occupation(s)
During the Past Five Years | | Number of
Portfolios
in Fund
Complex
Overseen
by Trustee | | Other
Directorships
Held by Trustee |
Interested Trustees | | | | | | | | | | |
| | | | | |
Ronald Baron(1),(2) 767 Fifth Avenue New York, NY 10153 Age: 73 | | Chief Executive Officer, Chief Investment Officer, Trustee and Portfolio Manager | | 13 years | | Director, Chairman, CEO and CIO: the Firm* (1982-Present); Trustee: Baron Investment Funds Trust (1987-Present); Trustee: Baron Select Funds (2003-Present); Portfolio Manager: Baron USA Partners Fund, Ltd. (2003-Present). | | 13 | | None |
| | | | | |
Linda S. Martinson(1),(2) 767 Fifth Avenue New York, NY 10153 Age: 61 | | Chairman, President, Chief Operating Officer and Trustee | | 13 years | | Director: the Firm* (2003-Present); Secretary: the Firm* (1997-2008); President: the Firm* (2007-Present); Chief Operating Officer: the Firm (2006-present); Chairman (2010-Present), President (2007-Present), Trustee (1987-Present): Baron Investment Funds Trust; Chairman (2010-Present), President (2007-Present), Trustee (2003-Present): Baron Select Funds; Director: Baron USA Partners Fund, Ltd. (2006-Present); Director: Baron Managed Funds plc (2005-2009). | | 13 | | None |
Independent Trustees | | | | | | | | | | |
| | | | | |
Norman S. Edelcup(3),(4),(5) 244 Atlantic Isles, Sunny Isles Beach, FL 33160 Age: 81 | | Trustee | | 13 years | | Mayor (2003-2015): Sunny Isles Beach, Florida; Trustee: Baron Investment Funds Trust (1987-Present), Baron Select Funds (2003-Present). | | 13 | | Director: CompX International, Inc. (diversified manufacturer of engineered components) (2006-2016); Director: Valhi, Inc. (diversified company) (1975-2016). |
| | | | | |
Harold W. Milner(4),(5) 2293 Morningstar Drive Park City, UT 84060 Age: 82 | | Trustee | | 13 years | | Trustee: Baron Investment Funds Trust (1987-Present), Baron Select Funds (2003-Present). | | 13 | | None |
| | | | | |
Raymond Noveck(3),(4),(5) 31 Karen Road Waban, MA 02468 Age: 73 | | Lead Trustee | | 13 years | | Private Investor (1999-Present); Trustee: Baron Investment Funds Trust (1987-Present), Baron Select Funds (2003-Present). | | 13 | | None |
| | | | | |
Anita Rosenberg(4),(5) 1540 N. Lake Shore Drive Chicago, Il 60610 Age: 52 | | Trustee | | 3 years | | Advisory Board Member: Impala Capital Management, LLC (2014-Present); Advisory Board Member: ValueAct Capital, LLC (2014-Present); Senior Advisor: Magnetar Capital (2011-2012); Trustee: Baron Investment Funds Trust, Baron Select Funds (2013-Present). | | 13 | | Director: Golub Capital BDC, Inc. (2011-Present). |
| | | | | |
David A. Silverman, MD(4),(5) 146 Central Park West New York, NY 10024 Age: 66 | | Trustee | | 13 years | | Physician and Faculty: New York University School of Medicine (1976-Present); Trustee: Baron Investment Funds Trust (1987-Present), Baron Select Funds (2003-Present). | | 13 | | None |
55
| | |
| Baron Select Funds | | December 31, 2016 |
MANAGEMENT OF THE FUNDS (Unaudited) (Continued)
| | | | | | | | | | |
| Name, Address & Age | | Position(s) Held
With the Funds | | Term of
Office and
Length of
Time Served | | Principal Occupation(s)
During the Past Five Years | | Number of
Portfolios
in Fund
Complex
Overseen
by Trustee | | Other
Directorships
Held by Trustee |
Independent Trustees (continued) | | | | | | | | |
| | | | | |
Alex Yemenidjian(4),(5) 3801 Las Vegas Blvd. South Las Vegas, NV 89109 Age: 61 | | Trustee | | 10 years | | Chairman and CEO: Tropicana Las Vegas (gaming) (2009-2015); Chairman and CEO: Armenco Holdings, LLC (investment company) (2005-Present); Managing Partner: Armenco Capital LLC (investment company) (2013-Present); Trustee: Baron Investment Funds Trust (2006-Present), Baron Select Funds (2006-Present). | | 13 | | Director: Guess?, Inc. (2005-Present); Director: Regal Entertainment Group (2005-Present). |
Additional Officers of the Funds | | | | | | | | |
| | | | | |
Clifford Greenberg 767 Fifth Avenue New York, NY 10153 Age: 57 | | Senior Vice President | | 13 years | | Director and Senior Vice President: the Firm*; Senior Vice President: Baron Investment Funds Trust, Baron Select Funds; Portfolio Manager: Baron Small Cap Fund. | | N/A | | N/A |
| | | | | |
Louis Beasley 767 Fifth Avenue New York, NY 10153 Age: 45 | | Vice President and Chief Compliance Officer | | 2 years | | Chief Compliance Officer: Baron Capital Group, Inc., BAMCO, Inc., Baron Capital Management Inc., Baron Investment Funds Trust, Baron Select Funds, Baron USA Partners Fund, Ltd (2014-Present); Vice President: the Firm* (2014-Present); Principal and Director of Investment Management Compliance and Risk Management: Bessemer Trust (2006-2014). | | N/A | | N/A |
| | | | | |
Patrick M. Patalino 767 Fifth Avenue New York, NY 10153 Age: 48 | | Vice President, General Counsel and Secretary | | 9 years | | Vice President, General Counsel and Secretary: the Firm*, Baron Investment Funds Trust, Baron Select Funds; General Counsel: Baron USA Partners Fund, Ltd. | | N/A | | N/A |
| | | | | |
Andrew Peck 767 Fifth Avenue New York, NY 10153 Age: 47 | | Senior Vice President | | 13 years | | Senior Vice President: the Firm*, Baron Investment Funds Trust, Baron Select Funds; Portfolio Manager: Baron Asset Fund. | | N/A | | N/A |
| | | | | |
Susan Robbins 767 Fifth Avenue New York, NY 10153 Age: 62 | | Vice President | | 13 years | | Director and Vice President: the Firm*; Vice President: Baron Investment Funds Trust, Baron Select Funds. | | N/A | | N/A |
| | | | | |
Peggy C. Wong 767 Fifth Avenue New York, NY 10153 Age: 55 | | Treasurer and Chief Financial Officer | | 13 years | | Chief Financial Officer and Treasurer: the Firm*, Baron Investment Funds Trust, Baron Select Funds. | | N/A | | N/A |
| * | The “Firm” means BCG along with its subsidiaries BCI, Baron Capital Management, Inc. and the Adviser. |
| (1) | Trustees deemed to be “Interested Trustees” by reason of their employment with the Adviser and BCI. |
| (2) | Members of the Executive Committee, which is empowered to exercise all of the powers, including the power to declare dividends, of the full Board when the full Board is not in session. |
| (3) | Members of the Audit Committee. |
| (4) | Members of the Nominating Committee. |
| (5) | Members of the Independent Committee. |
56
Privacy Notice
The Funds collect nonpublic personal information about you from the following sources:
| ∎ | | Information we receive from you on applications or other forms; |
| ∎ | | Information about your transactions with us, our Adviser or others; and |
| ∎ | | Information we receive from third parties, such as credit reporting agencies. |
“Nonpublic personal information” is private information about you that we obtain in connection with providing a financial product or service to you.
We may share your name and address with other Baron Funds and the Adviser and its affiliates for the purpose of sending you information about our products that we believe may be of interest to you and informing you of our upcoming Baron Investment Conference and for sending required information.
We do not disclose any nonpublic personal information about our customers to anyone, except as permitted or required by law. Examples of permitted disclosures under the law include sharing with companies that work for us to provide you services, such as the Transfer Agent or mailing house. All such companies that act on our behalf are contractually obligated to keep the information that we provide to them confidential and to use the information only to provide the services that we have asked them to perform for you and us.
We restrict access to nonpublic information about you to those employees who need to know that information to provide products or services to you. We maintain physical, electronic and procedural safeguards to guard your nonpublic personal information.
This privacy notice is also available at all times on the Baron Funds® website, www.BaronFunds.com or by calling 1-800-99BARON.
Go Paperless!
It’s fast, simple and a smart way to help the environment.
Enjoy the speed and convenience of receiving Fund documents electronically.
For more information, and to enroll today, go to www.baronfunds.com/edelivery.

767 Fifth Avenue, 49th Fl.
New York, NY 10153
1.800.99.BARON
212-583-2000
www.BaronFunds.com
DECEMBER 31
Item 2. Code of Ethics.
The Registrant has adopted a Code of Ethics for Principal Executive and Senior Financial Officers (the “Code”). Upon request, the Registrant will provide a copy of the Code to any person without charge. To obtain a copy of the Code, please send your request to info@Baronfunds.com or call 1-800-99BARON (1-800-992-2766).
Item 3. Audit Committee Financial Expert.
The Registrant’s Board of Trustees has determined that the Registrant has two audit committee financial experts serving on its Audit Committee, Norman S. Edelcup and Raymond Noveck. Both Mr. Edelcup and Mr. Noveck are “independent” for purposes of Item 3(a)(2) of Form N-CSR.
Item 4. Principal Accountant Fees and Services.
The following table shows the fees paid to PricewaterhouseCoopers, LLP, the Registrant’s principal accounting firm during the fiscal years ended December 31, 2016 and December 31, 2015:
(a) Audit Fees: for professional services rendered for the audit of the Registrant’s annual financial statements or services that are normally provided in connection with statutory and regulatory filings or engagements:
| | | | | | | | |
| | | 2016 | | | 2015 | |
Baron Select Funds | | $ | 249,450 | | | $ | 225,825 | |
(b) Audit-Related Fees: for assurance and related services that are reasonably related to the performance of the audit and are not included as Audit Fees:
| | | | | | | | |
| | | 2016 | | | 2015 | |
Baron Select Funds | | $ | 0 | | | $ | 0 | |
(c) Tax Fees: for professional services rendered for tax compliance, tax advice and tax planning:
| | | | | | | | |
| | | 2016 | | | 2015 | |
Baron Select Funds | | $ | 178,350 | | | $ | 161,930 | |
The Tax Fees represent services provided in connection with the preparation of tax returns and year-end distribution review.
(d) All Other Fees: for products and services provided by such accounting firm that are not included in (a), (b) or (c) above:
| | | | | | | | |
| | | 2016 | | | 2015 | |
Baron Select Funds | | $ | 0 | | | $ | 0 | |
(e) Audit Committee Pre-Approval Policies and Procedures: (i) Pursuant to paragraph (c)(7) of Rule 2-01 of Regulation S-X and to its charter, the Audit Committee shall pre-approve all audit and non-audit services provided by the independent auditors and in connection therewith to review and evaluate the qualifications, independence and performance of the Fund’s independent auditors; (ii) 100% of the services described in each of items 4(b) through 4(d) were approved by the Audit Committee pursuant to paragraph (c)(7)(i)(C) of
Rule 2-01 of Regulation S-X.
(f) Not Applicable.
(g) The aggregate non-audit fees billed by the registrant’s accountant for services rendered to the registrant, and rendered to the registrant’s investment adviser (not including any sub-adviser whose role is primarily portfolio management and is subcontracted with or overseen by another investment adviser), and any entity
controlling, controlled by, or under common control with the adviser that provides ongoing services to the registrant for the last two fiscal years is as follows:
2016: $25,000
2015: $66,300
(h) Not Applicable.
Item 5. Audit Committee of Listed Registrants.
The Registrant has a separately-designated standing Audit Committee established in accordance with Section 3(a)(58)(A) of the Securities Exchange Act of 1934. The members of the Audit Committee are Norman S. Edelcup and Raymond Noveck.
Item 6. Schedule of Investments.
Included herein under Item 1.
Item 7. Disclosure of Proxy Voting Policies and Procedures for Closed-End Management Investment Companies.
Not applicable.
Item 8. Portfolio Managers of Closed-End Management Investment Companies.
Not applicable.
Item 9. Purchases of Equity Securities by Closed-End Management Investment Company and Affiliated Purchasers.
Not applicable.
Item 10. Submission of Matters to a Vote of Security Holders.
Not applicable.
Item 11. Controls and Procedures.
(a) The Registrant’s principal executive officer and principal financial officer have concluded that the Registrant’s disclosure controls and procedures (as defined in Rule 30a-3(c) under the Investment Company Act of 1940 (the “1940 Act”)) are effective based on their evaluation of these controls and procedures as of a date within 90 days of the filing date of this report.
(b) There were no changes in the Registrant’s internal control over financial reporting (as defined in Rule 30a-3(d) under the 1940 Act) that occurred during the Registrant’s second fiscal quarter of the period covered by this report that have materially affected, or are reasonably likely to materially affect, the Registrant’s internal control over financial reporting.
Item 12. Exhibits.
(a) (2) Certification of each of the principal executive officers and principal financial officers of the Registrant as required by Rule 30a-2 under the Act (17 CFR 270.30a-2) is attached hereto as a part of EX-99.CERT.
(b) Certification of each of the principal executive officers and principal financial officers of the Registrant as required by Section 906 of the Sarbanes-Oxley Act of 2002 is attached hereto as a part of EX-99.906CERT.
SIGNATURES
Pursuant to the requirements of the Securities Exchange Act of 1934 and the Investment Company Act of 1940, the registrant has duly caused this report to be signed on its behalf by the undersigned, thereunto duly authorized.
| | |
| BARON SELECT FUNDS |
| |
| By: | | /s/ Ronald Baron |
| | Ronald Baron |
| | Chief Executive Officer |
| |
| Date: | | March 3, 2017 |
Pursuant to the requirements of the Securities Exchange Act of 1934 and the Investment Company Act of 1940, this report has been signed below by the following persons on behalf of the registrant and in the capacities and on the dates indicated.
| | |
| By: | | /s/ Ronald Baron |
| | Ronald Baron |
| | Chief Executive Officer |
| |
| Date: | | March 3, 2017 |
| |
| By: | | /s/ Peggy Wong |
| | Peggy Wong |
| | Treasurer and Chief Financial Officer |
| |
| Date: | | March 3, 2017 |