| | OMB APPROVAL |
| | OMB Number: | 3235-0570 |
| | Expires: | August 31, 2010 |
| UNITED STATES | Estimated average burden hours per response. . . . . . . . . . . . . . . . .18.9 |
| SECURITIES AND EXCHANGE COMMISSION | |
| Washington, D.C. 20549 | |
| | | | |
FORM N-CSR
CERTIFIED SHAREHOLDER REPORT OF REGISTERED
MANAGEMENT INVESTMENT COMPANIES
Investment Company Act file number | 811-21308 |
|
The China-U.S. Growth Fund |
(Exact name of registrant as specified in charter) |
|
111 Fifth Avenue New York, New York | | 10003 |
(Address of principal executive offices) | | (Zip code) |
|
Mr. Hal Liebes
Fred Alger Management, Inc.
111 Fifth Avenue
New York, New York 10003 |
(Name and address of agent for service) |
|
Registrant’s telephone number, including area code: | 212-806-8800 | |
|
Date of fiscal year end: | October 31 | |
|
Date of reporting period: | April 30, 2008 | |
| | | | | | | | |
ITEM 1. REPORT(S) TO STOCKHOLDERS.
Effective September 2008, The China-U.S. Growth Fund
will be renamed Alger China-U.S. Growth Fund

The China-U.S.
Growth Fund

SEMI–ANNUAL REPORT
April 30, 2008
(Unaudited)

Dear Shareholders, May 30, 2008
Typically, halfway through the fiscal year is not the time to start making predictions. Those often rose-tinged foresights are usually better saved for year-end when the turbulence and froth of a hectic year have begun to settle down and investors have started to relax in an atmosphere of seasonal and consumer-driven glad tidings.
However, finding any reason to relax — much less celebrate — at our previous fiscal year-end proved difficult. Following one of the strongest growth-driven markets in years — with the Dow Jones Industrial Averagei spending several days above 14,000 — the end of 2007 saw the markets take a severe tailspin fueled by the subprime debacle and subsequent mass paranoia, only to worsen in early 2008. Only in the past month has the fallout begun to subside, providing investors with much needed breathing room.
So, while we'll save our broad predictions for another six months, we feel optimistic enough to reflect on why we think the worst of this cycle may be behind us, and why the recent downturn may actually provide investors with an opportunity to take advantage of what we are calling an "if only" market.
First Quarter Blues
The beginning of 2008 was remarkably painful in the markets, both in the United States and globally. Fall-out from the subprime mess touched almost every aspect of the economy, and reached well beyond the financial sector. The sell-off happened rapidly and with little fanfare, and few names or investors escaped unscathed. Without question, economic data for January was almost completely grim: an anemic jobs report that showed the first contraction (-17,000) of the labor force since 2003, although the unemployment rate did tick down to 4.9%; a preliminary reading of GDP growth for the last quarter of 2007 that showed the economy barely expanding at 0.6%.
It would be nice to say that the markets took these data points in stride. They did not. In fact, through the first week of February, both the S&P 500ii (down 9.3%) and the Nasdaqiii (down 13.2%) had their worst performance ever for the beginning of the year. While markets often end the year up when they begin the year down, the depth, speed, and intensity of the sell-off in January and early February hardly instilled investors with an optimistic sense of what lay ahead.
As of this writing, whether the economy as a whole ever officially entered a statistical recession or not seems beside the point. A significant majority of the American public — not to mention investors abroad — believed that it did, with investors feeling a significant psychological impediment to the aggressive devil-may-care spending of years past. Perception — particularly in the early months of 2008 — dictated that Wall Street earnings expectations for the year ahead were unrealistically high, with future growth likely to be minimal or non-existent.
Now, at the halfway mark of the fiscal year, it would be presumptuous to imply that the pain experienced during the first months of the year is over. Bear Stearn's meltdown may — or may not — be an isolated institutional failure, and
-1-
repercussions from the fall-out may be felt throughout this year, and perhaps even into the next. As investors, we think that it's wise in the current market climate to take a conservative view of the economy and future earnings. At a time when negative results trigger sharp stock sell-offs and good results fade quickly, investors are well served by assessing base case and bear scenarios rigorously and steering clear of names where the downside risk outweighs the upside potential.
The above being said, we think there are certainly positives to consider, particularly concerning growth equity investing. Stocks and the economy do not necessarily move in sync, and few believe that we are looking at a protracted or steep economic contraction. Corporate balance sheets appear as stable and clean as they have ever been, with little debt and lots of cash. And the equity markets have already priced in most negative economic scenarios. In fact, we believe that years from now, today's market may be seen as one of the great "if only" markets: a missed opportunity for those who withdrew and have yet to re-enter; and a boom time for those who have returned or "stuck it out."
The "If Only" Market
What exactly is an "if only" market? It is a market looked back upon wistfully by those not in it, who mutter to themselves, "If only I had known then what I know now, I would have bought, bought, and bought some more." And then they sigh, and say even more quietly, "If only..."
This is not a judgment call on the next few months. The markets have been trading sideways since early February and may even "violate" the lows of January and go down sharply. However, in our view, the markets have been witnessing a classic financial crisis unfolding in the context of a softening domestic economy. Unlike previous crises, however, the present issues are offset by a climate of global strength that benefits the earnings potential of many U.S.-listed companies. It is also occurring in a world awash in liquidity and where interest rates are historically low.
Typically, in periods of market flight, it is rare for growth managers to do particularly well, especially when the selling is not based on weak fundamentals. However, stock declines notwithstanding, the composition of many of our portfolios suggest strong earnings and revenue growth, certainly when compared to the S&P 500, as well as price-to-earnings-growth ratios that we believe are quite reasonable.
Investors discounting the possibility of future growth — a typical reaction in negative markets — have themselves created buying opportunities. Some companies we follow have sold off as much as 30% or more with forward earnings still looking to be above 20%. In many cases, that leads to buy points for growth stocks at unusually low prices.
And just to put too fine a point on it, historical evidence shows us that "significantly down" quarters (defined as a decline of 5% or more of the S&P 500 over the last 25 years) rarely happen back-to-back. During the subsequent rebound periods, those markets were more likely to favor growth-style investing.
-2-
Our research has shown us that investors who immediately invested after each down quarter fared significantly better than investors who waited to invest only after returns had already improved or enough time for the "markets to stabilize" had passed. So, it's quite possible that, years from now, the second fiscal quarter of 2008 may be viewed as that tremendous quarter in which to have invested, leaving many investors saying, "If only I had gotten in then."
Portfolio Matters
For the six months ending April 30, 2008, The China-U.S. Growth Fund returned -17.30%. During the same period the S&P 500 Index returned -9.64%, and the MSCI Zhong Hua Indexiv returned -23.19%.
As of this writing, the north western Sichuan Province is still recovering from a horrific earthquake. Our hearts are with the families and communities whose deaths are now said to reach 50,000 or more. The macro-economic impact, however, will likely not be significant, largely because the heaviest damage was in areas considered to be lesser contributors to China's overall industrial and agricultural production.
The Fund's largest sector exposure was the Industrials sector. At an average weight of 17.60%, the Fund was overweight compared to both the benchmarks, and underperformed the S&P 500, but outperformed the MSCI Zhong Hua. Solar energy equipment providers drove solid returns during this period with solid contributions from First Solar, Inc., a manufacturer of thin film solar modules for solar power plants, and JA Solar Holdings Co., Ltd., a China-based manufacturer of high-performance solar cells. Far Eastern Textile, Ltd., a Taiwanese producer of synthetic fibers and other textiles, was also a key contributor. Detractors in this sector included Dongfang Electric Corp., Ltd., a company specializing in power equipment manufacturing, China Shipping Container Lines Co., Ltd., a containerized marine shipping company based in Shanghai, and China Communications Construction Co., Ltd., the largest port construction and design company in China.
In the Information Technology sector, the Fund, at an average weight of 16.72% was overweight both benchmarks, and outperformed the S&P 500, while underperforming the MSCI Zhong Hua. In this sector, the Fund saw strong performances from Corning, Inc., a diversified technology company, Yahoo, Inc., and International Business Machines (IBM) Corp. The Fund saw less prominent returns in this sector from VanceInfo Technologies, Inc., one of the leading offshore software development companies in China, Hon Hai Precision Industry Co., Ltd., a manufacturer of connectors and cable assemblies, and Spreadtrum Communications, Inc., a semiconductor company that develops wireless communications solutions.
In the Consumer Discretionary sector, the Fund, at an average weight of 13.05% was overweight both benchmarks and underperformed both. Despite strong contributions from Nike, Inc., and Yum! Brands, Inc., the Fund was weighed down in this sector by substandard returns from Peace Mark Holdings, Ltd., a watch and clock manufacturer, Focus Media Holdings Ltd., the largest outdoor TV advertising network in China, and AviChina Industry & Technology Co., Ltd., a manufacturer of automotives, vehicle engines, helicopters, and airplanes.
-3-
In the Financials sector, the Fund, at an average weight of 12.21%, was underweight both benchmarks, and showed mixed performance, slightly underperforming the S&P 500 and significantly outperforming the MSCI Zhong Hua. Despite an increasingly difficult market environment for financials, the Fund saw solid contributors in this sector from China Construction Bank Corp., one of the top four banks in China, Industrial and Commercial Bank of China, Ltd., a leading Chinese financial institution, and Fubon Financial Holding Co., Ltd., one of the primary, Taiwanese-based financial institutions. Detractors included Hong Kong Exchanges & Clearing, Ltd., operators of the Hong Kong stock exchange, New World Development Co., Ltd., one of China's largest property developers, and Franshion Properties (China) Ltd., a developer of commercial real estate projects.
In Summary
There may still be continued fall-out in the credit markets; the U.S. economy may remain weak or even contract in the coming quarters; but the long-term investing climate for stocks strikes us as extremely favorable given both the global profit growth, reasonable valuations, and signs that not all areas of the U.S. economy are impacted by the twin blows of the housing crisis and the credit crunch. To reiterate, we firmly believe that years from now, the present could be seen as one of the great "if only" markets, a time when the stocks of quality growth companies could be purchased at deep discounts and deliver returns that most investors dream of but never quite attain.
Effective mid-September 2008, The China-U.S. Growth Fund will be renamed The Alger China-U.S. Growth Fund. Fred Alger Management, Inc. will continue to be the investment adviser to your fund, and there are no changes anticipated to the portfolio managers.
Respectfully submitted,
 | |
|
| Daniel C. Chung | |
|
| Chief Investment Officer | |
|
i The Dow Jones Industrial Average is an index of common stocks comprised of major industrial companies and assumes reinvestment of dividends. It is frequently used as a general measure of stock market performance.
ii Standard & Poor's 500 Index is an index of the 500 largest and most profitable companies in the United States.
iii The Nasdaq Composite Index is a market value-weighted index that measures all domestic and non-U.S.-based securities listed on the Nasdaq stock market.
iv The MSCI Zhong Hua Index is an aggregate of the MSCI Hong Kong Index (a capitalization-weighted index that monitors the performance of stocks from Hong Kong) and the MSCI China Free Index (an unmanaged market capitalization-weighted index of Chinese companies available to non-domestic investors).
-4-
Investors cannot invest directly in an index. Index performance does not reflect the deduction for fees, expenses or taxes.
This report and the financial statements contained herein are submitted for the general information of shareholders of the Fund. This report is not authorized for distribution to prospective investors in the Fund unless preceded or accompanied by an effective prospectus for the Fund. Fund returns represent the fiscal six month period return of Class A shares prior to the deduction of any sales charges. The performance data quoted represents past performance, which is not an indication or guarantee of future results. Standardized performance results can be found on the following pages. The investment return and principal value of an investment in a fund will fluctuate so that an investor's shares when redeemed may be worth more or less than their original cost. Current performance may be lower or higher than the performance quoted. For performance data current to the most recent month-end, visit us at www.alger.com, or call us at (800) 992-3863.
The views and opinions of the Fund's management in this report are as of the date of the Shareholders letter and are subject to change at any time subsequent to this date. There is no guarantee that any of the assumptions that formed the basis for the opinions stated herein are accurate or that they will materialize. Moreover, the information forming the basis for such assumptions is from sources believed to be reliable, however, there is no guarantee that such information is accurate. Any securities mentioned should be considered in the context of the construction of an overall portfolio of securities and therefore reference to them should not be construed as a recommendation or offer to purchase or sell any such security. Inclusion of such securities in a fund and transactions in such securities may be for a variety of reasons, including without limitation, in response to cash flows, inclusion in a benchmark and risk control. Please refer to the Schedule of Investments for the Fund which is included in this report for a complete list of fund holdings as of April 30, 2008. Securities mentioned in the Shareholders letter, if not found in the Schedule of Investments, were held by the Fund during the Fund's fiscal year. The Fund did not hold Bear Stearns Companies, Inc.
A Word About Risk
Growth stocks tend to be more volatile than other stocks as the price of growth stocks tends to be higher in relation to their companies' earnings and may be more sensitive to market, political and economic developments. Investing in the stock market involves gains and losses and may not be suitable for all investors. Stocks of small- and mid-sized companies are subject to greater risk than stocks of larger, more established companies owing to such factors as limited liquidity, inexperienced management, and limited financial resources. Investing in foreign securities involves additional risk (including currency risk, risks related to political, social or economic conditions, and risks associated with the Chinese markets, such as increased volatility, limited liquidity, less stringent regulatory and legal system, and lack of industry and country diversification), and may not be suitable for all investors. For a more detailed discussion of the risks associated with a Fund, please see the Fund's Prospectus.
Before investing, carefully consider a fund's investment objective, risks, charges, and expenses. For a prospectus containing this and other information about The China Fund call us at (800) 992-3863 or visit us at www.alger.com. Read it carefully before investing. Fred Alger & Company, Incorporated, Distributor. Member NYSE, SIPC.
NOT FDIC INSURED. NOT BANK GUARANTEED. MAY LOSE VALUE.
-5-
THE CHINA-U.S. GROWTH FUND
Fund Highlights Through April 30, 2008 (Unaudited)
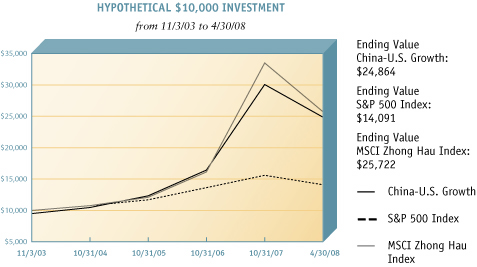
The chart above illustrates the change in value of a hypothetical $10,000 investment made in The China-U.S. Growth Fund, with an initial 5.25% maximum sales charge, the S&P 500 Index and the MSCI Zhong Hau Index (unmanaged indices of common stocks) on November 3, 2003, the inception date of The China-U.S. Growth Fund, through April 30, 2008. Figures for The China-U.S. Growth Fund, the S&P 500 Index and the MSCI Zhong Hau Index include reinvestment of dividends.
PERFORMANCE COMPARISON
AVERAGE ANNUAL TOTAL RETURNS
| | 1
YEAR | | SINCE
INCEPTION (11/3/03) | |
| AS OF 4/30/08† | |
| The China-U.S. Growth Fund | |
| Class A | | | 17.30 | % | | | 22.47 | % | |
| Class C* | | | 23.31 | % | | | 23.29 | % | |
| S&P 500 Index | | | (4.68 | %) | | | 7.93 | % | |
| MSCI Zhong Hau Index | | | 30.60 | % | | | 23.29 | % | |
| AS OF 3/31/08† | |
| The China-U.S. Growth Fund | |
| Class A | | | 13.19 | % | | | 20.74 | % | |
| Class C* | | | 18.96 | % | | | 21.55 | % | |
| S&P 500 Index | | | 5.08 | % | | | 6.93 | % | |
| MSCI Zhong Hau Index | | | 19.31 | % | | | 20.60 | % | |
† Returns reflect maximum sales charges on Class A shares and applicable contingent deferred sales charges on Class C shares.
* Class C shares did not exist prior to 3/1/08. Performance figures prior to 3/1/08 are those of the Fund's Class A shares with an inception date of 11/3/03. Performance has been adjusted to remove the front-end sales charge imposed by Class A shares. Class C shares do not impose a front-end sales charge but do impose a contingent deferred sales charge of 1% on shares redeemed. If sales charges were reflected, annual returns for the Class C shares would be lower. The performance figures prior to 3/1/08 have also been adjusted to reflect the higher operating expenses of Class C shares.
The performance data quoted represents past performance, which is not an indication or a guarantee of future results. The fund's total returns include changes in share price and reinvestment of dividends and capital gains. The graph and table above do not reflect the deduction of taxes that a shareholder would have paid on fund distributions or on the redemption of fund shares. Investment return and principal will fluctuate and the fund's shares, when redeemed, may be worth more or less than their original cost. Current performance may be higher or lower than the performance quoted. For performance current to the most recent month end, visit us at ww.alger.com or call us at (800) 992-3863.
-6-
PORTFOLIO SUMMARY†
April 30, 2008 (Unaudited)
| | | VALUE (%) | |
| Brazil | | | 2.8 | % | |
| Britain | | | 0.9 | % | |
| Canada | | | 3.4 | % | |
| China | | | 23.9 | % | |
| France | | | 1.0 | % | |
| Hong Kong | | | 15.3 | % | |
| Singapore | | | 0.3 | % | |
| Taiwan | | | 7.9 | % | |
| United States | | | 38.0 | % | |
| Cash and Net Other Assets | | | 6.5 | % | |
| | | | 100.0 | % | |
† Based on net assets.
-7-
THE CHINA-U.S. GROWTH FUND
Schedule of Investments (Unaudited) April 30, 2008
| COMMON STOCKS—93.5% | | SHARES | | VALUE | |
| UNITED STATES—38.0% | |
| AEROSPACE/DEFENSE—0.9% | |
| BE Aerospace Inc.* | | | 35,950 | | | $ | 1,450,942 | | |
| APPAREL—2.1% | |
| Deckers Outdoor Corp.* | | | 7,550 | | | | 1,042,428 | | |
| Nike Inc., Cl. B | | | 35,050 | | | | 2,341,340 | | |
| | | | 3,383,768 | | |
| BEVERAGES—2.2% | |
| Anheuser-Busch Companies Inc. | | | 30,150 | | | | 1,483,380 | | |
| PepsiCo Inc. | | | 29,050 | | | | 1,990,797 | | |
| | | | 3,474,177 | | |
| CHEMICALS—1.5% | |
| Monsanto Co. | | | 20,250 | | | | 2,308,904 | | |
| COMMERCIAL SERVICES—0.3% | |
| Visa Inc., Cl. A* | | | 5,200 | | | | 433,940 | | |
| COMPUTERS—2.3% | |
| International Business Machines Corp. | | | 17,450 | | | | 2,106,215 | | |
| Lenovo Group Ltd. | | | 2,012,000 | | | | 1,538,439 | | |
| | | | 3,644,654 | | |
| COSMETICS/PERSONAL CARE—1.5% | |
| Procter & Gamble Co. | | | 34,950 | | | | 2,343,397 | | |
| DIVERSIFIED FINANCIAL SERVICES—1.2% | |
| CME Group Inc. | | | 4,250 | | | | 1,944,163 | | |
| ENERGY-ALTERNATE SOURCES—1% | |
| First Solar Inc.* | | | 5,500 | | | | 1,605,945 | | |
| ENGINEERING & CONSTRUCTION—1.9% | |
| Fluor Corp. | | | 19,350 | | | | 2,958,035 | | |
| ENTERTAINMENT—0.9% | |
| Bally Technologies Inc.* | | | 39,200 | | | | 1,320,648 | | |
| EQUITY FUND—1.1% | |
| iShares MSCI Taiwan Index Fund | | | 105,539 | | | | 1,747,726 | | |
| HEALTHCARE-PRODUCTS—1.7% | |
| Johnson & Johnson | | | 39,150 | | | | 2,626,574 | | |
| INTERNET—1.1% | |
| Yahoo! Inc.* | | | 63,700 | | | | 1,746,016 | | |
| LODGING—1.0% | |
| Wynn Resorts Ltd. | | | 15,550 | | | | 1,638,037 | | |
| MACHINERY-CONSTRUCTION & MINING—1.6% | |
| Caterpillar Inc. | | | 30,050 | | | | 2,460,494 | | |
-8-
THE CHINA-U.S. GROWTH FUND
Schedule of Investments (Continued) (Unaudited) April 30, 2008
| COMMON STOCKS—(CONT.) | | SHARES | | VALUE | |
| MEDIA—0.8% | |
| News Corp., Cl. A* | | | 68,400 | | | $ | 1,224,360 | | |
| MINING—1.2% | |
| Freeport-McMoRan Copper & Gold Inc. | | | 16,872 | | | | 1,919,190 | | |
| OIL & GAS SERVICES—2.1% | |
| National Oilwell Varco Inc.* | | | 24,200 | | | | 1,656,490 | | |
| Schlumberger Ltd. | | | 16,300 | | | | 1,638,966 | | |
| | | | 3,295,456 | | |
| PHARMACEUTICALS—0.9% | |
| United Therapeutics Corp.* | | | 17,050 | | | | 1,440,725 | | |
| RETAIL—2.6% | |
| Wal-Mart Stores Inc. | | | 15,650 | | | | 907,387 | | |
| Yum! Brands Inc. | | | 78,250 | | | | 3,183,210 | | |
| | | | 4,090,597 | | |
| SEMICONDUCTORS—1.0% | |
| MEMC Electronic Materials Inc.* | | | 24,450 | | | | 1,539,617 | | |
| SOFTWARE—1.2% | |
| Autodesk Inc.* | | | 49,300 | | | | 1,873,400 | | |
| TELECOMMUNICATIONS—4.6% | |
| Atheros Communications Inc.* | | | 41,750 | | | | 1,111,385 | | |
| Cisco Systems Inc.* | | | 99,450 | | | | 2,549,898 | | |
| Corning Inc. | | | 67,600 | | | | 1,805,595 | | |
| QUALCOMM Inc. | | | 42,800 | | | | 1,848,532 | | |
| | | | 7,315,410 | | |
| TRANSPORTATION—1.3% | |
| Expeditors International of Washington Inc. | | | 44,550 | | | | 2,075,585 | | |
TOTAL UNITED STATES
(Cost $51,446,216) | | | | | | | 59,861,760 | | |
| BRAZIL—2.8% | |
| MINING—1.5% | |
| Companhia Vale do Rio Doce# | | | 62,050 | | | | 2,424,914 | | |
| OIL & GAS—1.3% | |
| Petroleo Brasileiro SA# | | | 17,100 | | | | 2,076,282 | | |
TOTAL BRAZIL
(Cost $1,570,404) | | | | | | | 4,501,196 | | |
| BRITAIN—0.9% | |
| BANKS—0.9% | |
HSBC Holdings PLC
(Cost $1,423,152) | | | 86,400 | | | | 1,496,421 | | |
-9-
THE CHINA-U.S. GROWTH FUND
Schedule of Investments (Continued) (Unaudited) April 30, 2008
| COMMON STOCKS—(CONT.) | | SHARES | | VALUE | |
| CANADA—3.4% | |
| CHEMICALS—1.1% | |
| Agrium Inc. | | | 21,750 | | | $ | 1,718,250 | | |
| MINING—2.3% | |
| Cameco Corp. | | | 22,650 | | | | 792,524 | | |
| Thompson Creek Metals Co., Inc.* | | | 134,350 | | | | 2,905,990 | | |
| | | | 3,698,514 | | |
TOTAL CANADA
(Cost $4,055,536) | | | | | | | 5,416,764 | | |
| CHINA—23.9% | |
| BANKS—6.2% | |
| China Construction Bank Corp. | | | 3,945,000 | | | | 3,558,021 | | |
| China Merchants Bank Co., Ltd. | | | 486,500 | | | | 2,034,729 | | |
| Industrial & Commercial Bank of China | | | 5,388,000 | | | | 4,271,910 | | |
| | | | 9,864,660 | | |
| BUILDING MATERIALS—1.2% | |
| Anhui Conch Cement Co., Ltd. | | | 158,000 | | | | 1,263,862 | | |
| China National Building Material Co., Ltd. | | | 242,000 | | | | 596,726 | | |
| | | | 1,860,588 | | |
| COAL—1.5% | |
| Hidili Industry International Development Ltd.* | | | 984,035 | | | | 1,502,324 | | |
| Yanzhou Coal Mining Co., Ltd. | | | 480,617 | | | | 886,674 | | |
| | | | 2,388,998 | | |
| COMMERCIAL SERVICES—.5% | |
| New Oriental Education & Technology Group*# | | | 11,200 | | | | 840,672 | | |
| ELECTRICAL COMPONENTS & EQUIPMENT—.7% | |
| China High Speed Transmission Equipment Group Co., Ltd.* | | | 669,000 | | | | 1,175,853 | | |
| ENERGY-ALTERNATE SOURCES—.9% | |
| JA Solar Holdings Co., Ltd.*# | | | 58,300 | | | | 1,399,783 | | |
| ENGINEERING & CONSTRUCTION—1.8% | |
| China Communications Construction Company | | | 1,160,000 | | | | 2,765,094 | | |
| FOREST PRODUCTS & PAPER—.5% | |
| Shandong Chenming Paper Holdings Ltd. | | | 738,983 | | | | 774,574 | | |
| HEALTHCARE-PRODUCTS—.3% | |
| Mindray Medical International Ltd.# | | | 11,700 | | | | 397,800 | | |
| INTERNET—4.2% | |
| Ctrip.com International Ltd.# | | | 29,750 | | | | 1,846,285 | | |
| Netease.com*# | | | 121,150 | | | | 2,704,068 | | |
| Sina Corp.* | | | 44,000 | | | | 2,032,800 | | |
| | | | 6,583,153 | | |
-10-
THE CHINA-U.S. GROWTH FUND
Schedule of Investments (Continued) (Unaudited) April 30, 2008
| COMMON STOCKS—(CONT.) | | SHARES | | VALUE | |
| IRON/STEEL—.5% | |
| Maanshan Iron & Steel | | | 1,293,265 | | | $ | 832,909 | | |
| LODGING—.2% | |
| Home Inns & Hotels Management Inc.*# | | | 17,000 | | | | 380,970 | | |
| OIL & GAS SERVICES—.7% | |
| China Oilfield Services Ltd.* | | | 580,000 | | | | 1,068,535 | | |
| RETAIL—.9% | |
| Belle International Holdings Ltd. | | | 632,841 | | | | 673,874 | | |
| New World Department Store China Ltd.* | | | 662,000 | | | | 722,759 | | |
| | | | 1,396,633 | | |
| SEMICONDUCTORS—1.2% | |
| Spreadtrum Communications Inc.*# | | | 218,750 | | | | 1,900,938 | | |
| TELECOMMUNICATIONS—.7% | |
| ZTE Corp. | | | 251,160 | | | | 1,048,836 | | |
| TRANSPORTATION—1.9% | |
| China COSCO Holdings Co., Ltd. | | | 280,000 | | | | 836,990 | | |
| China Shipping Development Co., Ltd. | | | 665,906 | | | | 2,234,039 | | |
| | | | 3,071,029 | | |
TOTAL CHINA
(Cost $29,904,564) | | | | | | | 37,751,025 | | |
| FRANCE—1.0% | |
| WATER—1.0% | |
Veolia Environnement#
(Cost $1,304,430) | | | 21,900 | | | | 1,586,655 | | |
| HONG KONG—15.3% | |
| AUTO PARTS & EQUIPMENT—1.0% | |
| Minth Group Ltd. | | | 1,378,000 | | | | 1,545,136 | | |
| BANKS—.5% | |
| BOC Hong Kong Holdings Ltd. | | | 281,500 | | | | 731,324 | | |
| CHEMICALS—.4% | |
| Sinofert Holdings Ltd. | | | 898,000 | | | | 685,487 | | |
| DISTRIBUTION/WHOLESALE—.7% | |
| Li & Fung Ltd. | | | 248,000 | | | | 1,029,277 | | |
| ELECTRIC—1.0% | |
| China Resources Power Holdings Co. | | | 600,672 | | | | 1,525,839 | | |
| ENGINEERING & CONSTRUCTION—1.6% | |
| Cheung Kong Infrastructure Holdings Ltd. | | | 228,559 | | | | 989,642 | | |
| China State Construction International Holdings Ltd. | | | 880,897 | | | | 1,466,919 | | |
| | | | 2,456,561 | | |
-11-
THE CHINA-U.S. GROWTH FUND
Schedule of Investments (Continued) (Unaudited) April 30, 2008
| COMMON STOCKS—(CONT.) | | SHARES | | VALUE | |
| GAS—1.4% | |
| Hong Kong & China Gas Co. | | | 753,600 | | | $ | 2,204,357 | | |
| HOLDING COMPANIES-DIVERS—.9% | |
| Wharf Holdings Ltd. | | | 285,000 | | | | 1,444,269 | | |
| MISCELLANEOUS MANUFACTURING—1.1% | |
| Peace Mark Holdings Ltd. | | | 1,540,000 | | | | 1,790,008 | | |
| OIL & GAS—2.0% | |
| CNOOC Ltd. | | | 1,828,000 | | | | 3,227,014 | | |
| REAL ESTATE—1.4% | |
| Cheung Kong Holdings Ltd. | | | 97,000 | | | | 1,510,764 | | |
| China Everbright International Ltd. | | | 1,791,459 | | | | 712,483 | | |
| | | | 2,223,247 | | |
| TELECOMMUNICATIONS—2.8% | |
| China Mobile Ltd. | | | 259,000 | | | | 4,452,570 | | |
| TRANSPORTATION—.5% | |
| Pacific Basin Shipping Ltd. | | | 460,000 | | | | 842,737 | | |
TOTAL HONG KONG
(Cost $20,087,062) | | | | | | | 24,157,826 | | |
| SINGAPORE—.3% | |
| AGRICULTURE—.3% | |
Golden Agri-Resources Ltd.
(Cost $513,967) | | | 756,288 | | | | 473,481 | | |
| TAIWAN—7.9% | |
| AUTO MANUFACTURERS—.8% | |
| Yulon Motor Co., Ltd. | | | 935,000 | | | | 1,228,344 | | |
| COMPUTERS—.7% | |
| Acer Inc. | | | 544,000 | | | | 1,179,210 | | |
| DIVERSIFIED FINANCIAL SERVICES—1.5% | |
| Fubon Financial Holding Co., Ltd. | | | 1,174,000 | | | | 1,399,662 | | |
| Yuanta Financial Holding Co., Ltd.* | | | 1,000,632 | | | | 953,061 | | |
| | | | 2,352,723 | | |
| ELECTRICAL COMPONENTS & EQUIPMENT—.7% | |
| Simplo Technology Co., Ltd. | | | 196,800 | | | | 1,085,882 | | |
| ELECTRONICS—.8% | |
| Asustek Computer Inc. | | | 398,000 | | | | 1,291,482 | | |
| INSURANCE—.9% | |
| Cathay Financial Holding Co., Ltd. | | | 507,000 | | | | 1,423,713 | | |
| RETAIL—.1% | |
| President Chain Store Corp. | | | 29,000 | | | | 101,913 | | |
-12-
THE CHINA-U.S. GROWTH FUND
Schedule of Investments (Continued) (Unaudited) April 30, 2008
| COMMON STOCKS—(CONT.) | | SHARES | | VALUE | |
| SEMICONDUCTORS—.9% | |
| Taiwan Semiconductor Manufacturing Co., Ltd. | | | 673,000 | | | $ | 1,474,312 | | |
| TELECOMMUNICATIONS—1.5% | |
| Chunghwa Telecom Co., Ltd. | | | 901,000 | | | | 2,322,966 | | |
TOTAL TAIWAN
(Cost $11,417,344) | | | | | | | 12,460,545 | | |
TOTAL COMMON STOCKS
(Cost $121,722,675) | | | | | | | 147,705,673 | | |
| SHORT-TERM INVESTMENT—5.5% | | PRINCIPAL
AMOUNT | | | |
TIME DEPOSITS
Citibank London, 1.84%, due 5/1/08 | | $ | 8,452,331 | | | | 8,452,331 | | |
| Wells Fargo Grand Cayman, 1.84%, due 5/1/08 | | | 250,847 | | | | 250,847 | | |
TOTAL TIME DEPOSITS
(Cost $8,703,178) | | | | | | | 8,703,178 | | |
Total Investments
(Cost $130,425,853)(a) | | | 99.0 | % | | | 156,408,851 | | |
| Other Assets in Excess of Liabilities | | | 1.0 | | | | 1,546,464 | | |
| NET ASSETS | | | 100.0 | % | | $ | 157,955,315 | | |
* Non-income producing securities.
# American Depositary Receipts.
(a) At April 30, 2008, the net unrealized appreciation on investments, based on cost for federal income tax purposes of $130,425,853 amounted to $25,982,998 which consisted of aggregate gross unrealized appreciation of $28,639,778 and aggregate gross unrealized depreciation of $2,656,780.
See Notes to Financial Statements.
-13-
THE CHINA-U.S. GROWTH FUND
Statement of Assets and Liabilities (Unaudited) April 30, 2008
| ASSETS: | |
Investments In securities, at value (cost $130,425,853)
see accompanying schedule of investments | | $ | 156,408,851 | | |
| Cash foreign (cost $1,099,557) | | | 1,098,049 | | |
| Receivable for investment securities sold | | | 2,027,128 | | |
| Receivable for shares of beneficial interest sold | | | 374,317 | | |
| Dividends and interest receivable | | | 86,525 | | |
| Prepaid Expenses | | | 39,808 | | |
| Total Assets | | | 160,034,678 | | |
| LIABILITIES: | |
| Payable for investment securities purchased | | | 1,619,582 | | |
| Payable for shares of beneficial interest redeemed | | | 371,716 | | |
| Payable foreign currency contracts | | | 120 | | |
| Due to custodian | | | 5,511 | | |
| Accrued advisory fees | | | 5,183 | | |
| Administrative fees | | | 173 | | |
| Distribution fees | | | 1,086 | | |
| Accrued expenses | | | 75,992 | | |
| Total Liabilities | | | 2,079,363 | | |
| NET ASSETS | | $ | 157,955,315 | | |
| Net Assets Consist of: | |
| Paid in capital | | $ | 131,935,358 | | |
| Undistributed net investment income(accumulated loss) | | | (1,025,816 | ) | |
| Undistributed net realized gain (accumulated loss) | | | 1,064,433 | | |
| Net unrealized appreciation (depreciation) of investments | | | 25,981,340 | | |
| NET ASSETS | | $ | 157,955,315 | | |
| Class A — Net Asset Value Per Share | | $ | 18.81 | | |
| Class A — Offering Price Per Share | | $ | 19.85 | | |
| Class C — Net Asset Value and Offering Price Per Share | | $ | 18.84 | | |
| SHARES OF BENEFICIAL INTEREST OUTSTANDING—NOTE 6 | |
| Class A | | | 8,381,970 | | |
| Class C | | | 16,616 | | |
See Notes to Financial Statements.
-14-
THE CHINA-U.S. GROWTH FUND
Statement of Operations (Unaudited) for the six months ended April 30, 2008
| INVESTMENT INCOME: | |
| Dividends (net of $11,722 of foreign withholding taxes) | | $ | 415,264 | | |
| Interest | | | 64,007 | | |
| Total Income | | | 479,271 | | |
| EXPENSES: | |
| Investment advisory fees—Note 3(a) | | | 1,224,553 | | |
| Distribution fees—Note 3(f) | | | 209,902 | | |
| Administrative fees—Note 3(a) | | | 33,549 | | |
| Interest expense | | | 601 | | |
| Custodian fees | | | 73,050 | | |
| Transfer agent fees and expenses—Note 3(b) | | | 79,740 | | |
| Professional fees | | | 35,791 | | |
| Printing | | | 22,370 | | |
| Trustees fees | | | 6,482 | | |
| Registration fees | | | 18,660 | | |
| Miscellaneous | | | 18,460 | | |
| Total Expenses | | | 1,723,158 | | |
| Less fees waiver—Note 3(a) | | | (218,071 | ) | |
| Net Expenses | | | 1,505,087 | | |
| NET INVESTMENT INCOME (LOSS) | | | (1,025,816 | ) | |
REALIZED AND UNREALIZED GAIN (LOSS) ON INVESTMENTS
AND FOREIGN CURRENCY TRANSACTIONS: | |
| Net realized gain on investments | | | 1,101,555 | | |
| Net realized gain on foreign currency transactions | | | 163,287 | | |
Net change in unrealized appreciation (depreciation)
on investments and foreign currency translations | | | (37,433,671 | ) | |
| Net realized and unrealized loss on investments and foreign currency | | | (36,168,829 | ) | |
| NET DECREASE IN NET ASSETS RESULTING FROM OPERATIONS | | $ | (37,194,645 | ) | |
See Notes to Financial Statements.
-15-
THE CHINA-U.S. GROWTH FUND
Statements of Changes in Net Assets
| | | For the
Six Months Ended
April 30, 2008
(Unaudited) | | For the
Year Ended
October 31, 2007 | |
| Net investment loss | | $ | (1,025,816 | ) | | $ | (805,857 | ) | |
Net realized gain on investments
and foreign currency transactions | | | 1,264,842 | | | | 17,946,126 | | |
Net change in unrealized appreciation (depreciation)
on investments and foreign currency translations | | | (37,433,671 | ) | | | 58,287,728 | | |
| Net increase (decrease) in net assets resulting from operations | | | (37,194,645 | ) | | | 75,427,997 | | |
| Distributions to shareholders from: | |
Net realized gains
Class A | | | (17,061,054 | ) | | | (10,078,310 | ) | |
| Increase from shares of beneficial interest transactions: | |
| Class A | | | 10,288,804 | | | | 63,126,536 | | |
| Class C* | | | 298,835 | | | | — | | |
Net increase from shares of beneficial
interest transactions—Note 6 | | | 10,587,639 | | | | 63,126,536 | | |
| Total increase (decrease) in net assets | | | (43,668,060 | ) | | | 128,476,223 | | |
| Net Assets: | |
| Beginning of period | | | 201,623,375 | | | | 73,147,152 | | |
| END OF PERIOD | | $ | 157,955,315 | | | $ | 201,623,375 | | |
*Commenced operations March 3, 2008.
See Notes to Financial Statements.
-16-
[This page intentionally left blank]
THE CHINA-U.S. GROWTH FUND
Financial Highlights for a share outstanding throughout the period
| | | CLASS A | |
| | | For the
Six months
ended
4/30/08 (ii)(ix) | | For the
Year ended
10/31/07 | | For the
Year ended
10/31/06 | | For the
Year ended
10/31/05 | | 11/3/03 (i) to
10/31/04 (ii) | |
Net asset value, beginning
of period | | $ | 25.09 | | | $ | 15.57 | | | $ | 12.99 | | | $ | 11.05 | | | $ | 10.00 | | |
| Net investment loss (iii) | | | (0.12 | ) | | | (0.13 | ) | | | (0.04 | ) | | | (0.07 | ) | | | (0.08 | ) | |
Net realized and unrealized
gain (loss) on investments
and foreign currency | | | (4.12 | ) | | | 11.67 | | | | 4.03 | | | | 2.01 | | | | 1.13 | | |
Total from investment
operations | | | (4.24 | ) | | | 11.54 | | | | 3.99 | | | | 1.94 | | | | 1.05 | | |
Distributions from net
realized gains | | | (2.04 | ) | | | (2.02 | ) | | | (1.41 | ) | | | — | | | | — | | |
Net asset value,
end of period | | $ | 18.81 | | | $ | 25.09 | | | $ | 15.57 | | | $ | 12.99 | | | $ | 11.05 | | |
| Total return (iv) | | | (17.3 | )% | | | 83.01 | % | | | 33.48 | % | | | 17.56 | % | | | 10.50 | % | |
RATIOS AND
SUPPLEMENTAL DATA: | |
Net assets, end of period
(000's omitted) | | $ | 157,642 | | | $ | 201,623 | | | $ | 73,147 | | | $ | 36,630 | | | $ | 26,290 | | |
Ratio of expenses to
average net assets | | | 1.79 | %(xi) | | | 1.92 | %(viii) | | | 2.20 | %(vii) | | | 2.26 | %(v) | | | 2.44 | %(vi) | |
Ratio of net investment
loss to average net assets | | | (1.22 | )% | | | (0.71 | )% | | | (0.30 | )% | | | (0.56 | )% | | | (0.81 | )% | |
| Portfolio turnover rate | | | 72.98 | % | | | 107.57 | % | | | 192.21 | % | | | 288.53 | % | | | 267.42 | % | |
(i) Commencement of operations.
(ii) Ratios have been annualized; total return and portfolio turnover rate have not been annualized.
(iii) Amount was computed based on average shares outstanding during the period.
(iv) Does not reflect the effect of any sales charges.
(v) Amount has been reduced by 0.51% due to expense reimbursements.
(vi) Amount has been reduced by 0.43% due to expense reimbursements.
(vii) Amount has been reduced by 0.16% due to expense reimbursements.
(viii) Amount has been reduced by 0.25% due to expense reimbursements.
(ix) Unaudited.
(x) Commencement of operations.
(xi) Amount has been reduced by 0.26% due to expense reimbursements.
See Notes to Financial Statements.
-18-
| | | CLASS C | |
| | | 3/3/08 (x) to
4/30/08 (ii)(ix) | |
Net asset value, beginning
of period | | $ | 18.20 | | |
| Net investment loss (iii) | | | (0.04 | ) | |
Net realized and unrealized
gain (loss) on investments
and foreign currency | | | 0.68 | | |
Total from investment
operations | | | 0.64 | | |
Distributions from net
realized gains | | | — | | |
Net asset value,
end of period | | $ | 18.84 | | |
| Total return (iv) | | | 3.52 | % | |
RATIOS AND
SUPPLEMENTAL DATA: | |
Net assets, end of period
(000's omitted) | | $ | 313 | | |
Ratio of expenses to
average net assets | | | 2.51 | %(xi) | |
Ratio of net investment
loss to average net assets | | | (1.67 | )% | |
| Portfolio turnover rate | | | 72.98 | % | |
-19-
THE CHINA-U.S. GROWTH FUND |
NOTES TO FINANCIAL STATEMENTS (Unaudited)
NOTE 1 — General:
The China-U.S. Growth Fund (the "Fund") is a diversified open-end registered investment company organized as a business trust under the laws of the Commonwealth of Massachusetts. The Fund's investment objective is long-term capital appreciation. It seeks to achieve its objective by normally investing in equity securities which are publicly traded in the United States, China, Hong Kong and Taiwan markets. The Fund commenced operations on November 3, 2003 with the issuance of 10,000 shares at $10.00 per share to Fred Alger Management, Inc. ("Alger Management"), the Fund's investment manager. The Fund's single share class was re-designated as Class A shares effective January 24, 2005, and are generally subject to an initial sales charge. Class C shares were first offered March 3, 2008, and are generally subject to a deferred sales charge.
NOTE 2 — Significant Accounting Policies:
(a) Investment Valuation: Investments of the Fund are valued on each day the New York Stock Exchange (the "NYSE") is open as of the close of the NYSE (normally 4:00 p.m. Eastern time). Securities for which such information is readily available are valued at the last reported sales price or official closing price as reported by an independent pricing service on the primary market or exchange on which they are traded. In the absence of reported sales, securities are valued at a price within the bid and asked price or, in the absence of a recent bid or asked price, the equivalent as obtained from one or more of the major market makers for the securities to be valued.
Securities for which market quotations are not readily available are valued at fair value, as determined in good faith pursuant to procedures established by the Board of Trustees.
Securities in which the Fund invests may be traded in markets that close before the close of the NYSE. Developments that occur between the close of the foreign markets and the close of the NYSE (normally 4:00 p.m. Eastern time) may result in adjustments to the closing prices to reflect what the investment adviser, pursuant to policies established by the Board of Trustees, believes to be the fair value of these securities as of the close of the NYSE. The Fund may also fair value securities in other situations, for example, when a particular foreign market is closed but the Fund is open.
Short-term securities having a remaining maturity of sixty days or less are valued at amortized cost which approximates market value. Shares of mutual funds are valued at the net asset value of the underlying mutual fund.
Statement on Financial Accounting Standards No. 157, "Fair Value Measurements" (FAS 157) defines fair value for financial reporting, establishes a framework for measuring fair value and requires additional disclosures about the use of fair value
-20-
THE CHINA-U.S. GROWTH FUND |
NOTES TO FINANCIAL STATEMENTS (Unaudited) (Continued)
measurements. FAS 157 is effective for financial statements issued for fiscal years beginning after November 15, 2007 and interim periods within those fiscal years. The Fund does not believe the adoption of FAS 157 will impact the amounts reported in the financial statements, however, additional disclosures will be required about the inputs used to develop the measurements of fair value and the effect of certain of the measurements reported in the statement of operations for a fiscal period. These inputs are summarized in the three broad levels listed below:
• Level 1 – quoted prices in active markets for identical securities
• Level 2 – other significant observable inputs (including quoted prices for similar securities, interest rates, credit risk, etc.)
• Level 3 – significant unobservable inputs (including the Fund's own assumptions in determining the fair value of investments)
The inputs or methodology used for valuing securities are not necessarily an indication of the risk associated with investing in those securities.
Recent Accounting Pronouncements
In March 2008, the Financial Accounting Standards Board issued the Statement of Financial Accounting Standards No. 161, Disclosures about Derivative Instruments and Hedging Activities ("FAS 161"). FAS 161 is effective for fiscal years and interim periods beginning after November 15, 2008. FAS 161 requires enhanced disclosures about the Fund's derivative and hedging activities, including how such activities are accounted for and their effect on the Fund's financial position, performance and cash flows. Management is currently evaluating the impact the adoption of FAS 161 will have on the Fund's financial statements and related disclosures.
(b) Securities Transactions and Investment Income: Securities transactions are recorded on a trade date basis. Realized gains and losses from securities transactions are recorded on the basis of identified cost. Dividend income is recognized on the ex-dividend date and interest income is recognized on the accrual basis. Occasionally, dividends are recorded as soon after the ex-dividend date as the Fund, using reasonable diligence, becomes aware of such dividends.
(c) Foreign Currency Translations: The books and records of the Fund are maintained in U.S. dollars. Foreign currencies, investments and other assets and liabilities are translated into U.S. dollars at the prevailing rates of exchange on the valuation date. Purchases and sales of investment securities and income and expenses are translated into U.S. dollars at the prevailing exchange rates on the respective dates of such transactions.
Net realized gains and losses on foreign currency transactions represent net gains and losses from the disposition of foreign currencies, currency gains and losses realized between the trade dates and settlement dates of security transactions, and the difference between the amount of net investment income accrued and the U.S. dollar amount actually received. The effects of changes in foreign currency exchange rates
-21-
THE CHINA-U.S. GROWTH FUND |
NOTES TO FINANCIAL STATEMENTS (Unaudited) (Continued)
on investments in securities are included in realized and unrealized gain or loss on investments in the Statement of Operations.
(d) Dividends to Shareholders: Dividends and distributions payable to shareholders are recorded by the Fund on the ex-dividend date. Dividends from net investment income and distributions from net realized gains are declared and paid annually after the end of the fiscal year in which earned.
The characterization of distributions to shareholders for financial statement purposes is determined in accordance with federal income tax rules. Therefore, the source of the Fund's distributions may be shown in the accompanying financial statements as either from, or in excess of net investment income, net realized gain on investment transactions or return of capital, depending on the type of book/tax differences that may exist. Capital accounts within the financial statements are adjusted for permanent book/tax differences. Reclassifications result primarily from the differences in tax treatment of net operating losses and foreign currency transactions. The reclassifications have no impact on the net asset value of the Fund and are designed to present the Fund's capital accounts on a tax basis.
(e) Federal Income Taxes: It is the Fund's policy to comply with the requirements of the Internal Revenue Code applicable to regulated investment companies and to distribute all of its investment company taxable income to its shareholders. Provided the Fund maintains such compliance, no federal income tax provision is required.
(f) Indemnification: The Fund enters into contracts that contain a variety of indemnification provisions. The Fund's maximum exposure under these arrangements is unknown. The Fund does not anticipate recognizing any loss related to these arrangements.
(g) Other: These financial statements have been prepared using estimates and assumptions that affect the reported amounts therein. Actual results may differ from those estimates.
NOTE 3 — Investment Advisory Fees and Other Transactions with Affiliates:
(a) Investment Advisory and Administration Fees: Fees incurred by the Fund, pursuant to the provisions of its Investment Advisory Agreement and its Administration Agreement with Fred Alger Management Inc. ("Alger Management") are payable monthly and computed based on the value of the average daily net assets of the Fund, at the following rates:
| Advisory fee | | | 1.4600 | % | |
| Administration fee through March 16, 2008 | | | 0.0400 | | |
| Administration fee effective March 17, 2008 | | | 0.0275 | | |
Prior to September 12, 2006, Alger Management provided both advisory services and administrative services to the Fund pursuant to an investment advisory agreement.
-22-
THE CHINA-U.S. GROWTH FUND |
NOTES TO FINANCIAL STATEMENTS (Unaudited) (Continued)
Martin Currie, Inc., a registered investment adviser, acted as sub-advisor to the Fund under a written sub-advisory agreement with Alger Management effective September 20, 2006.
As part of the settlement with the New York State Attorney General (see Note 8—Litigation) Alger Management has agreed to reduce its advisory fee to 1.20% for the period from December 1, 2006 through November 30, 2011. For the six months ended April 30, 2008, Alger Management reimbursed/waived fees of the Fund totaling $218,071.
(b) Shareholder Administrative Servicing Fees: The Fund has entered into a shareholder administrative services agreement with Alger Management to compensate Alger Management on a per account basis for its liaison and administrative oversight of Boston Financial Data Services, Inc., the transfer agent for the Fund ("BFDS") and other related services. During the six months ended April 30, 2008, the Fund incurred fees of $14,473 for these services provided by Alger Management.
(c) Sales Charges: Purchases of shares of the Fund may be subject to initial sales charges or contingent deferred sales charges. For the six months ended April 30, 2008, the initial sales charges and contingent deferred sales charges retained by Fred Alger & Company (the "Distributor"), were approximately $6,585 and $954, respectively. The contingent deferred sales charges are used by the Distributor to offset distribution expenses previously incurred. Sales charges do not represent expenses of the Fund.
(d) Brokerage Commissions: During the six months ended April 30, 2008, the Fund paid Fred Alger & Company, Incorporated ("Alger Inc."), an affiliate of Alger Management, $21,307 in connection with securities transactions.
(e) Trustees' Fees: The Fund pays each trustee who is not affiliated with Alger Management or its affiliates $500 for each meeting attended, to a maximum of $2,000 per annum. The chairman of the Board of Trustees receives an additional annual fee of $10,000 which is paid, pro rata, by all funds managed by Alger Management. Additionally, each member of the audit committee receives an additional $50 for each audit committee meeting attended, to a maximum of $200 per annum.
(f) Distribution/Shareholder Servicing Fees: The Fund has entered into a shareholder servicing agreement with Alger Inc. whereby Alger Inc. provides the Fund with ongoing servicing of shareholder accounts. As compensation for such services, the Fund pays Alger Inc. a monthly fee at an annual rate equal to .25% of the value of the Fund's average daily net assets. The shareholder servicing agreement was terminated on February 28, 2007. On March 1, 2007, the Fund adopted a distribution plan pursuant to which the Fund pays Alger Inc. a fee at the annual rate of .25% of the average daily net assets of the Class A shares and 1.00% of the daily net assets of the Class C shares to compensate Alger Inc. for its activities and expenses incurred
-23-
THE CHINA-U.S. GROWTH FUND |
NOTES TO FINANCIAL STATEMENTS (Unaudited) (Continued)
in distributing the Fund's shares. Fees charged may be more or less than the expenses incurred by Alger Inc.
(g) Other Transactions with Affiliates: Certain trustees and officers of the Fund are directors and officers of Alger Management, the Distributor and Alger Services.
NOTE 4 — Securities Transactions:
During the six months ended April 30, 2008, purchases and sales of investment securities, excluding short-term securities, aggregated $126,846,494 and $123,525,328, respectively.
Transactions in foreign securities may involve certain considerations and risks not typically associated with those of U.S. companies because of, among other factors, the level of governmental supervision and regulation of foreign security markets, and the possibility of political or economic instability.
NOTE 5 — Line of Credit:
The Fund participated in a $50 million committed line of credit with other mutual funds managed by Alger Management through March 14, 2008. All borrowings had variable interest rates and were payable on demand. The Fund may borrow under such line of credit exclusively for temporary or emergency purposes. Effective March 17, 2008, the Fund borrows from its custodian on an uncommitted basis.
For the six months ended April 30, 2008, the Fund had average borrowings of $26,846, with a weighted average interest rate of 4.43%.
NOTE 6 — Share Capital:
The Fund has an unlimited number of authorized shares of beneficial interest of $.001 par value. Transactions of shares of beneficial interest were as follows:
| | | FOR THE SIX MONTHS ENDED
APRIL 30, 2008 | | FOR THE YEAR ENDED
OCTOBER 31, 2007 | |
| | | SHARES | | AMOUNT | | SHARES | | AMOUNT | |
| Class A: | |
| Shares sold | | | 1,658,164 | | | $ | 33,491,564 | | | | 4,685,600 | | | $ | 87,914,296 | | |
| Dividends reinvested | | | 692,401 | | | | 13,695,683 | | | | 551,695 | | | | 8,192,670 | | |
| Shares redeemed | | | (2,005,886 | ) | | | (36,898,443 | ) | | | (1,899,217 | ) | | | (32,980,430 | ) | |
| Net increase | | | 344,679 | | | $ | 10,288,804 | | | | 3,338,078 | | | $ | 63,126,536 | | |
| Class C:* | |
| Shares sold | | | 16,616 | | | $ | 298,835 | | | | — | | | $ | — | | |
* Initially offered March 3, 2008
-24-
THE CHINA-U.S. GROWTH FUND |
NOTES TO FINANCIAL STATEMENTS (Unaudited) (Continued)
The Fund may impose a 2.00% redemption fee on Fund shares redeemed (including shares redeemed by exchange) less than one year after such shares were acquired. The fees retained by the Fund are included as paid-in capital on the Statement of Assets and Liabilities. During the six months ended April 30, 2008 and the year ended October 31, 2007, redemption fees were $255,226 and $98,891, respectively.
NOTE 7 — Tax Character of Distributions to Shareholders:
The tax character of distributions paid during the six months ended April 30, 2008 and the year ended October 31, 2007 were as follows:
| | | SIX MONTHS ENDED
APRIL 30, 2008 | | YEAR ENDED
OCTOBER 31, 2007 | |
| Distributions paid from: | |
| Ordinary Income | | $ | 13,376,315 | | | $ | 8,336,911 | | |
| Long-term capital gain | | | 3,684,739 | | | | 1,741,399 | | |
| Total distributions paid | | $ | 17,061,054 | | | $ | 10,078,310 | | |
As of October 31, 2007, the components of distributable earnings on a tax basis were as follows:
| Undistributed ordinary income | | $ | 13,375,945 | | |
| Undistributed long-term gain | | $ | 3,684,707 | | |
| Unrealized appreciation | | $ | 63,215,003 | | |
The difference between book basis and tax basis unrealized appreciation is determined annually and is attributable primarily to the tax deferral of losses on wash sales.
NOTE 8 — Litigation:
Alger Management has responded to inquiries, document requests and/or subpoenas from various regulatory authorities, in connection with their investigations of practices in the mutual fund industry identified as "market timing" and "late trading." On October 11, 2006, Alger Management, Alger Inc. and Alger Shareholder Services, Inc. executed an Assurance of Discontinuance with the Office of the New York State Attorney General ("NYAG"). On January 18, 2007 the Securities and Exchange Commission issued an order implementing settlements reached with Alger Management and Alger Inc. As part of the settlements with the Commission and the NYAG, without admitting or denying liability, the firms paid $30 million to reimburse fund shareholders and a fine of $10 million; and agreed to certain other remedial measures including a reduction in management fees of $1 million per year for five years. The entire $40 million and fee reduction will be available for the benefit of investors. Alger Management has advised the Funds that the settlement has not adversely affected the operations of Alger Management, Alger Inc. or their affiliates, or adversely affected their ability to continue to provide services to the Funds.
-25-
THE CHINA-U.S. GROWTH FUND |
NOTES TO FINANCIAL STATEMENTS (Unaudited) (Continued)
On August 31, 2005, the West Virginia Securities Commissioner (the "WVSC") in an ex parte Summary Order to Cease and Desist and Notice of Right to Hearing concluded that Alger Management and Alger Inc. had violated the West Virginia Uniform Securities Act (the "WVUSA"), and ordered Alger Management and Alger Inc. to cease and desist from further violations of the WVUSA by engaging in the market-timing related conduct described in the order. The ex parte order provided notice of their right to a hearing with respect to the violations of law asserted by the WVSC. Other firms unaffiliated with Alger Management were served with similar orders. Alger Management and Alger Inc. intend to request a hearing for the purpose of seeking to vacate or modify the order.
In addition, in 2003 and 2004 several purported class actions and shareholder derivative suits were filed against various parties in the mutual fund industry, including Alger Management, certain mutual funds managed by Alger Management (the "Alger Mutual Funds"), and certain current and former Alger Mutual Fund trustees and officers, alleging wrongful conduct related to market-timing and late-trading by mutual fund shareholders. These cases were transferred to the U.S. District Court of Maryland by the Judicial Panel on Multidistrict Litigation for consolidated pre-trial proceedings. In September 2004, consolidated amended complaints involving these cases—a Consolidated Amended Fund Derivative Complaint (the "Derivative Complaint") and two substantially identical Consolidated Amended Class Action Complaints (together, the "Class Action Complaint")—were filed in the Maryland federal district court under the caption number 1:04-MD-15 863 (JFM). In April 2005, a civil lawsuit involving similar allegations was filed by the West Virginia Attorney General and also transferred to the Maryland District Court, but such lawsuit has since been withdrawn.
The Derivative Complaint (which was later amended a second time) alleged (i) violations, by Alger Management and, depending on the specific offense alleged, by Alger Inc. and/or the fund trustee defendants, of Sections 36(a), 36(b), 47, and 48 of the Investment Company Act of 1940, as amended, (the "1940 Act") and of Sections 206 and 215 of the Investment Advisers Act of 1940, as amended, breach of fiduciary duty, and breach of contract, (ii) various offenses by other third-party defendants, and (iii) unjust enrichment by all the named defendants. The Class Action Complaint alleged, in addition to the offenses listed above, (i) violations, by Alger Management, Alger Inc., their affiliates, the funds named as defendants, including the Funds, and the current and former fund trustees and officers, of Sections 11, 12(a)(2), and 15 of the Securities Act of 1933, as amended, Sections 10(b) (and Rule 10b-5 thereunder) and 20(a) of the Securities Exchange Act of 1934, as amended, (the "1934 Act"), and Section 34(b) of the Investment Company Act, (ii) breach of contract by the funds named as defendants, and (iii) unjust enrichment of the defendants.
-26-
THE CHINA-U.S. GROWTH FUND |
NOTES TO FINANCIAL STATEMENTS (Unaudited) (Continued)
Motions to dismiss the Class Action Complaint and the Derivative Complaint were subsequently filed.
As a result of a series of court orders, all claims in the Class Action Complaint and the Derivative Complaint have been dismissed, other than claims under the 1934 Act against Alger Management, Alger Inc., Alger Associates, Inc. and Alger Shareholder Services, Inc., and certain present and former members of the senior management of Alger Management and/or Alger Inc., and claims under Section 36(b) of the Investment Company Act against Alger Management, Alger Inc., Alger Associates, Inc. and Alger Shareholder Services, Inc.
-27-
THE CHINA-U.S. GROWTH FUND
ADDITIONAL INFORMATION (Unaudited)
Shareholder Expense Example (Unaudited)
As a shareholder of the Fund, you incur two types of costs: transaction costs, if applicable, including sales charges (loads) and redemption fees; and ongoing costs, including management fees and other fund expenses. This example is intended to help you understand your ongoing costs (in dollars) of investing in the Fund and to compare these costs with the ongoing costs of investing in other mutual funds.
The example below is based on an investment of $1,000 invested at the beginning of the six-month period starting November 1, 2007 and ending April 30, 2008.
Actual Expenses
The first line in the table below provides information about actual account values and actual expenses. You may use the information in this line, together with the amount you invested, to estimate the expenses that you would have paid over the period. Simply divide your account value by $1,000 (for example, an $8,600 account value divided by $1,000 = 8.6), then multiply the result by the number in the first line under the heading entitled "Expenses Paid During the Period" to estimate the expenses you paid on your account during this period.
Hypothetical Example For Comparison Purposes
The second line in the table below provides information about hypothetical account values and hypothetical expenses based on the Fund's actual expense ratios and an assumed rate of return of 5% per year before expenses, which is not the Fund's actual return. The hypothetical account values and expenses may not be used to estimate the actual ending account balance or expenses you paid for the period. You may use this information to compare the ongoing costs of investing in the Fund and other funds. To do so, compare this 5% hypothetical example with the 5% hypothetical examples that appear in the shareholder reports of other funds.
Please note that the expenses shown in the table are meant to highlight your ongoing costs only and do not reflect any transaction costs, such as sales charges (loads) and redemption fees. Therefore, the second line in the table is useful in comparing ongoing costs only, and will not help you determine the relative total costs of owning different funds. In addition, if these transactional costs were included, your costs would have been higher.
-28-
THE CHINA-U.S. GROWTH FUND
ADDITIONAL INFORMATION (Unaudited) (Continued)
| | | |
Beginning
Account Value
November 1, 2007 | |
Ending
Account Value
April 30, 2008 | |
Expenses Paid
During the Period
November 1, 2007 to
April 30, 2008(b) | | Ratio of Expenses to
Average Net Assets
For the Period
November 1, 2007 to
April 30, 2008(c) | |
| Class A | | Actual | | $ | 1,000.00 | | | $ | 827.00 | | | $ | 8.13 | | | | 1.79 | % | |
| | | Hypothetical(a) | | | 1,000.00 | | | | 1,015.96 | | | | 8.97 | | | | 1.79 | | |
| Class C* | | Actual | | | 1,000.00 | | | | 820.60 | | | | 3.62 | | | | 2.51 | | |
| | | Hypothetical(a) | | | 1,000.00 | | | | 1,003.95 | | | | 3.99 | | | | 2.51 | | |
* From March 3, 2008 — Commencement of operations.
(a) 5% annual return before expenses.
(b) Expenses are equal to the fund's annualized expense ratio of the respective share class, multiplied by the average account value over the period, multiplied by 182/366 (to reflect the one-half year period).
(c) Annualized.
Proxy Voting Policies
A description of the policies and procedures the Fund uses to determine how to vote proxies relating to portfolio securities and the proxy voting record is available, without charge, by calling (800) 254-3796 or online on the Fund's website at http://www.alger.com or on the EDGAR Database on the SEC's website (http://www.sec.gov).
Fund Holdings
The Fund's most recent month end portfolio holdings are available approximately sixty days after month end on the Fund's website at www.alger.com. The Fund also files its complete schedule of portfolio holdings with the SEC for the first and third quarter of each fiscal year on Form N-Q. The Fund's Forms N-Q are available online on the SEC's website at www.sec.gov or may be reviewed and copied at the SEC's Public Reference Room in Washington, D.C. Information regarding the operation of the SEC's Public Reference Room may be obtained by calling 1-800-SEC-0330. A copy of the most recent quarterly holdings may also be obtained from the Fund by calling (800) 254-3796.
-29-
(This page has been intentionally left blank.)
(This page has been intentionally left blank.)
(This page has been intentionally left blank.)
THE CHINA-U.S. GROWTH FUND
111 Fifth Avenue
New York, NY 10003
(800) 254-3796
www.alger.com
Investment Manager
Fred Alger Management, Inc.
111 Fifth Avenue
New York, NY 10003
Transfer Agent and Dividend Disbursing Agent
Boston Financial Data Services, Inc.
P.O. Box 8480
Boston, MA 02266
This report is submitted for the general information of the shareholders of The China-U.S. Growth Fund. It is not authorized for distribution to prospective investors unless accompanied by an effective Prospectus for the Fund, which contains information concerning the Fund's investment policies, fees and expenses as well as other pertinent information.
Go Paperless with Alger Electronic Delivery Service
Alger is pleased to provide you with the ability to access regulatory materials online. When documents such as prospectuses and annual and semi-annual reports are available, we'll send you an e-mail notification with a convenient link that will take you directly to the fund information on our website. To sign up for this free service, simply enroll at www.icsdelivery.com/alger.

SAC 043008


ITEM 2. CODE OF ETHICS.
Not applicable.
ITEM 3. AUDIT COMMITTEE FINANCIAL EXPERT.
Not applicable.
ITEM 4. PRINCIPAL ACCOUNTANT FEES AND SERVICES.
Not applicable.
ITEM 5. AUDIT COMMITTEE OF LISTED REGISTRANTS.
Not applicable.
ITEM 6. INVESTMENTS.
Not applicable.
ITEM 7. DISCLOSURE OF PROXY VOTING POLICIES AND PROCEDURES FOR CLOSED END MANAGEMENT INVESTMENT COMPANIES.
Not applicable.
ITEM 8. PORTFOLIO MANAGERS OF CLOSED-END MANAGEMENT INVESTMENT COMPANIES.
Not applicable.
ITEM 9. PURCHASES OF EQUITY SECURITIES BY CLOSED-END MANAGEMENT INVESTMENT COMPANY AND AFFILIATED PURCHASERS.
Not applicable.
ITEM 10. SUBMISSION OF MATTERS TO A VOTE OF SECURITY HOLDERS.
Not applicable.
ITEM 11. CONTROLS AND PROCEDURES.
(a) The registrant’s principal executive officer and principal financial officer have concluded that the registrant’s disclosure controls and procedures (as defined in Rule 30a-3(c) under the Investment Company Act of 1940, as amended) are effective based on their evaluation of the disclosure controls and procedures as of a date within 90 days of the filing date of this document.
(b) No changes in the registrant’s internal control over financial reporting occurred during the registrant’s second fiscal quarter of the period covered by this report that materially affected, or are reasonably likely to materially affect, the registrant’s internal control over financial reporting.
ITEM 12. EXHIBITS.
(a) (1) Not applicable
(a) (2) Certifications of principal executive officer and principal financial officer as required by rule 30a-2(a) under the Investment Company Act of 1940 are attached as Exhibit 99.CERT
(a) (3) Not applicable
(b) Certifications of principal executive officer and principal financial officer as required by rule 30a-2(b) under the Investment Company Act of 1940 are attached as Exhibit 99.906CERT
SIGNATURES
Pursuant to the requirements of the Securities Exchange Act of 1934 and the Investment Company Act of 1940, the registrant has duly caused this report to be signed on its behalf by the undersigned, thereunto duly authorized.
The China-U.S. Growth Fund
By: | /s/Dan C. Chung | | |
| | | |
| Dan C. Chung | | |
| | | |
| President | | |
| |
Date: June 17, 2008 | |
Pursuant to the requirements of the Securities Exchange Act of 1934 and the Investment Company Act of 1940, this report has been signed below by the following persons on behalf of the registrant and in the capacities and on the dates indicated.
By: | /s/Dan C. Chung | | |
| | | |
| Dan C. Chung | | |
| | | |
| President | | |
| |
Date: June 17, 2008 | |
By: | /s/Michael D. Martins | | |
| | | |
| Michael D. Martins | | |
| | | |
| Treasurer | | |
| |
Date: June 17, 2008 | |