| | OMB APPROVAL |
| | OMB Number: | 3235-0570 |
| | Expires: | August 31, 2011 |
| UNITED STATES | Estimated average burden hours per response. . . . . . . . . . . . . . . . .18.9 |
| SECURITIES AND EXCHANGE COMMISSION | |
| Washington, D.C. 20549 | |
| | | | |
FORM N-CSR
CERTIFIED SHAREHOLDER REPORT OF REGISTERED
MANAGEMENT INVESTMENT COMPANIES
Investment Company Act file number | 811-21308 |
|
Alger China-U.S. Growth Fund |
(Exact name of registrant as specified in charter) |
|
111 Fifth Avenue New York, New York | | 10003 |
(Address of principal executive offices) | | (Zip code) |
|
Mr. Hal Liebes Fred Alger Management, Inc. 111 Fifth Avenue New York, New York 10003 |
(Name and address of agent for service) |
|
Registrant’s telephone number, including area code: | 212-806-8800 | |
|
Date of fiscal year end: | October 31 | |
|
Date of reporting period: | April 30, 2010 | |
| | | | | | | | |
ITEM 1. REPORT(S) TO STOCKHOLDERS.
Alger China-U.S. Growth Fund |
| |
SEMI-ANNUAL REPORT | |
April 30, 2010 | |
(Unaudited) | |
Table of Contents
ALGER CHINA-U.S. GROWTH FUND
Letter to Our Shareholders | 1 |
| |
Fund Highlights | 8 |
| |
Portfolio Summary | 9 |
| |
Schedule of Investments | 10 |
| |
Statement of Assets and Liabilities | 17 |
| |
Statement of Operations | 18 |
| |
Statements of Changes in Net Assets | 19 |
| |
Financial Highlights | 21 |
| |
Notes to Financial Statements | 23 |
| |
Additional Information | 33 |
Go Paperless With Alger Electronic Delivery Service
Alger is pleased to provide you with the ability to access regulatory materials online. When documents such as prospectuses and annual and semi-annual reports are available, we’ll send you an e-mail notification with a convenient link that will take you directly to the fund information on our website. To sign up for this free service, simply enroll at www.icsdelivery.com/alger.
Dear Shareholders, | | June 3, 2010 |
Lewis Carroll chose the title “Through the Looking Glass and What Alice Found There,” for his sequel to “Alice’s Adventures in Wonderland.” I will confess that I had to look that up, uncertain of the exact title of the sequel from which the current hit movie is based, only to find that today’s movie storyline is drawn from both books, to the disapproval, I might add, of at least one friend, a frequent critic of contemporary adaptations of classic literature. For our purpose, the title “Through the Looking Glass” serves as a useful reminder to us as investors to both think, as Alice did, about what the world is like on the other side of a mirror’s reflection and to look in the mirror itself. In this letter, we look in the mirror of our own past letters and commentaries as well as continue to step through to the other side and offer a viewpoint on what we think lies “on the other side.”
In our Semi-Annual letter of April 2009, we maintained that March market lows were a turning point for the S&P 500. At the same time, we noted that economic growth and improvements in investor sentiment would improve, although neither would do so in a straight line, which would drive market volatility. Our expectations of a market turnaround proved correct, with the S&P 500 returning 49.77% during the 12-month period ended March 31, 2010. While market volatility as measured by the VIX during that timeframe declined, it’s been a strange kind of calm. Starting in mid-January of this year, for example, there were four consecutive weekly declines of the S&P 500 Index, almost immediately followed by an impressive series of weekly gains.
More recently, in our Alger 2010 Market Outlook and fourth quarter 2009 Market Commentary, we noted two principle insights for 2010. The first being that 2010 was likely to be a year of uncertainty as investors waited for guidance on the direction of governmental policies (i.e., from health care to international trade to economic stimulus), rather than focus on the fundamental economic uncertainty that drove equity markets in 2009. The second principle derives from the first: that U.S. equity markets would vacillate from this policy uncertainty, while ultimately remaining on an upward trend due to improving broad-based fundamentals like corporate revenues and earnings growth. This upward trend resulted in the S&P 500 posting a 5.39% return for the first quarter of this year and a 15.66% return for the six-month reporting period ended April 30 of 2010.
Black and Red: Corporate Earnings Unchecked Across a Background of Economic (and Other) Concerns
Have investors, psychologically, moved to the other side of our mirror called “risk and reward” and, thus, become willing to engage again with U.S. equities? We think not yet. And, as in “Through the Looking Glass,” we find, like Alice, the landscape ahead for investors is a chessboard to be navigated, not clear sailing on the optimism of a new bull market.
The accuracy of our earlier forecast of an improving economy was validated in the first quarter of 2010. Bellwethers like FedEx Corp. (FDX) and NIKE Inc (NKE)
1
reported surprisingly strong results. The supposedly weak U.S. consumer appeared surprisingly well dressed, with retailers such as J. Crew Group (JCP) and Tiffany’s (TIF) posting strong results for their fourth quarters and intra-quarter sales reports suggesting surprisingly strong sales in February and March, driving their share prices to near multi-year highs. In sum, the strong corporate results lend support to optimistic investors, with first quarter earnings for the S&P 500 expected to have grown more than 35% on a year-over-year basis. That growth, if realized, will mark the first two consecutive quarters of year-over-year expansion since the first half of 2007.
As we have noted in the past, strong corporate earnings can occur at a time when broad-based economic data is mixed. In particular, while 2009 fourth-quarter GDP growth was encouraging, high unemployment and weakness in real estate persisted. Unemployment had dropped in January, but the resulting 9.7% was still high, and new jobs data reported during the first quarter missed on the downside. In real estate, the National Association of Realtors reported that sales of existing homes dropped 0.6% in February from January and that the median sales price fell to $165,100, a 1.8% decline. Home inventories also grew to an 8.6 month supply.
Even positive numbers, such as GDP growth of 5.7% in the fourth quarter of 2009, must be taken with a dousing of reality—much of that gain resulted from businesses replenishing inventories drawn down in the depths of the recession.
In April, however, an abundance of positive economic data was released: first quarter GDP grew 3.2% —its third straight quarter—while household spending rose 3.6%. Data also showed that housing starts, industrial production and orders for manufactured goods increased in March.
Remembering Future Events: The White Queen
Lewis Carroll’s White Queen claims to have the ability to remember future events, even in her absentmindedness. Carroll’s literary and linguistic puzzles have entertained millions for over a century, even before the emergence of 3-D movie technologies. In 2009, near the bottom of the U.S. equity market, our analysts looked at an investment puzzle: the fundamental disregard, reflected in the market valuation, for a quality growth company we called “USA Inc.” (Alger Market Commentary, March 2009).
To recall that past event, USA Inc. was a group of 20 companies held in Alger mutual funds and client accounts. As a group, in the prior decade it grew revenues at a 14% per annum rate, expanded its gross margins significantly while expanding overseas and it also maintained a solid balance sheet at a time of crisis. Last year, in March, we estimated that USA Inc.’s free cash flow (before dividends) to enterprise value yield was over 8.5%. Today, we want to look back and remember the (very recent) past to help us think about the future.
In the past year, USA Inc. companies have sustained, and in some cases exceeded, that fundamental performance. Earnings have grown at a double digit rate from the
2
EPS estimates of March 2009, while actual revenues for calendar year 2009 exceeded forecasts. USA Inc. companies have continued to capitalize on global expansion, with more than 40% of their revenue stream being generated in other countries and they have delivered on their ability to generate free cash flow. As a group, the combined value of the companies’ stocks climbed 57% over the past year; however, cash and investments on their balance sheets still constitutes more than 13% of their market cap. Finally, while their stocks have climbed, their valuations remain very reasonable, in our view, trading at an Enterprise Value to Free Cash Flow of approximately 16X at the end of the first quarter 2010 (that is, a 6.5% yield in a land where bond yields remain paltry).
In fact, U.S. equity markets generally look appealing from a Free Cash-Flow Yield perspective. The yields reached record highs during the market trough last year and have since declined. However, at nearly 5% in April, we believe the yields are still attractive.
What’s on the Horizon?
Having experienced a year of remarkable market performance—on both the domestic and international fronts—it is only natural to question if market gains will continue. Certainly, we do not expect to see portfolio appreciation at the levels of the past 12 months, yet we believe a variety of broad ongoing trends will support additional market gains.
We believe that the theme of strong corporate earnings overshadowing investors’ concerns over the economy and government policies will continue. Markets, it appears, have only just begun to price in economic growth that we believe will ultimately drive additional business expansion. Indeed, much of the equity gains of 2009 resulted not from economic growth but from investors’ belief that an economic doomsday had been avoided.
Investor psychology may be the key factor for markets in 2010. From 2007 to the end of 2009, risk-averse investors deposited more than half a trillion dollars into bond funds, according to data from the Investment Company Institute. That amount dwarfs the $81 billion captured by the funds during the three-year period leading up to 2007. In comparison, domestic equity funds had net outflows of $151 billion from 2007 to the end of 2009, compared to the nearly $473 billion of inflows during the three years prior to that period. We believe this trend may moderate or even reverse as investor psychology reaches a tipping point.
During the past 12 months, market volatility has been followed by strong market gains that have rewarded investors who have purchased during dips. The first quarter was no exception. The S&P 500’s considerable gain for the period occurred even though markets declined in each of the four weeks leading up to February 5. Strong market performance following that decline and other market dips, we believe, will ultimately move investors to a tipping point, causing them to move assets from bond funds to equity funds. This reallocation of a sizeable pool of non-equity assets into stocks could provide substantial levels of market support.
3
A potential decline in the performance of bond funds could also drive investors to reallocate assets. Indeed, PIMCO Bond Manager Bill Gross recently commented that the prospect of a strengthening economy and rising interest rates argues against maintaining a large bond allocation and that the nearly three-decade long rally in fixed-income securities may have run its course.
Finally, with widespread expectations for a slow, gradual economic recovery, investors may return to growth style investing. In such an environment, companies are challenged to generate substantial earnings growth, so investors are willing to pay a premium for high-quality growing companies that Alger analysts are researching and discovering every day.
At Alger, we also believe that changing conditions present unique opportunities. Indeed, the past months have reinforced that belief, which has been a basic tenet of our investing philosophy since 1964. Going forward, our research-driven strategy and deep team of experienced analysts will continue to identify companies benefiting from the change all around us, and in particular, from creating “Positive Dynamic Change” in their industries, regardless of market conditions.
Portfolio Matters
For the six-month period ended April 30, 2010, the Alger China-U.S. Growth Fund returned 13.08%. During the same period, the S&P 500 Index returned 15.66% and the MSCI Zhong Hua Index returned 0.53%.
During the period, the largest portfolio weightings in the Alger China-U.S. Growth Fund were in the Information Technology and Financials sectors. The largest sector overweight for the period was in Information Technology. The largest sector underweight for the period was in Consumer Staples. Relative outperformance in the Information Technology and Materials sectors was the most important contributor to performance. Sectors that detracted from the portfolio included Financials and Industrials.
Among the most important relative contributors were VanceInfo Technologies Inc. (ADS), Baidu Inc. (ADS), Cliffs Natural Resources Inc., Las Vegas Sands Corp., and China Shineway Pharmaceutical Group Ltd. Conversely, detracting from overall results on a relative basis were China Metal Recycling (Holdings) Ltd., Bank of America Corp., China Nuokang Bio-Pharmaceutical Inc. (ADS), Ausnutria Dairy Corp. Ltd. and Hong Kong Exchanges & Clearing Ltd.
4
As always, we strive to deliver consistently superior investment results for you, our shareholders, and we thank you for your business and your continued confidence in Alger.
Respectfully submitted,

Daniel C. Chung
Chief Investment Officer
Investors cannot invest directly in an index. Index performance does not reflect the deduction for fees, expenses or taxes.
This report and the financial statements contained herein are submitted for the general information of shareholders of the Fund. This report is not authorized for distribution to prospective investors in the Fund unless proceeded or accompanied by an effective prospectus for the Fund. Fund returns represent the fiscal six-month period return of Class A shares prior to the deduction of any sales charges.
The performance data quoted represents past performance, which is not an indication or guarantee of future results.
Standardized performance results can be found on the following pages. The investment return and principal value of an investment in a fund will fluctuate so that an investor’s shares when redeemed may be worth more or less than their original cost. Current performance may be lower or higher than the performance quoted. Recent performance has been impacted by an unusually strong period in the U.S. equity market and there is no guarantee that such conditions will be repeated. For performance data current to the most recent month-end, visit us at www.alger.com, or call us at (800) 992-3863.
The views and opinions of the Fund’s management in this report are as of the date of the Shareholders letter and are subject to change at any time subsequent to this date. There is no guarantee that any of the assumptions that formed the basis for the opinions stated herein are accurate or that they will materialize. Moreover, the information forming the basis for such assumptions is from sources believed to be reliable, however, there is no guarantee that such information is accurate. Any securities mentioned, whether owned in a fund or otherwise, are considered in the context of the construction of an overall portfolio of securities and therefore reference to them should not be construed as a recommendation or offer to purchase or sell any such security. Inclusion of such securities in a fund and transactions in such securities, if any, may be for a variety of reasons, including without limitation, in response to cash flows, inclusion in a benchmark, and risk control. The reference to a specific security should also be understood in such context and not viewed as a statement that the security is a significant holding in a portfolio. Please refer to the Schedule of Investments for each fund which is included in this report for a complete
5
list of fund holdings as of April 30, 2010. Securities mentioned in the Shareholders letter, if not found in the Schedule of Investments, may have been held by the Fund during the six-month fiscal period.
A Word About Risk
Growth stocks tend to be more volatile than other stocks as the price of growth stocks tends to be higher in relation to their companies’ earnings and may be more sensitive to market, political, and economic developments. Investing in the stock market involves gains and losses and may not be suitable for all investors. Stocks of small- and mid-sized companies are subject to greater risk than stocks of larger, more established companies owing to such factors as limited liquidity, inexperienced management, and limited financial resources. Investing in foreign securities involves additional risk (including currency risk, risks related to political, social, or economic conditions, and risks associated with the Chinese markets, such as increased volatility, limited liquidity, less stringent regulatory and legal system, and lack of industry and country diversification), and may not be suitable for all investors. Funds that participate in leveraging, such as the Alger China-U.S. Growth Fund, are subject to the risk that borrowing money to leverage will exceed the returns for securities purchased or that the securities purchased may actually go down in value; thus, the funds’ net asset value can decrease more quickly than if the fund had not borrowed.
For a more detailed discussion of the risks associated with the Fund, please see the Fund’s Prospectus.
Before investing, carefully consider a fund’s investment objective, risks, charges, and expenses. For a prospectus containing this and other information about The Alger Funds call us at (800) 992-3863 or visit us at www.alger.com. Read it carefully before investing. Fred Alger & Company, Incorporated, Distributor. Member NYSE Euronext, SIPC.
NOT FDIC INSURED. NOT BANK GUARANTEED. MAY LOSE VALUE.
Definitions:
· Standard & Poor’s 500 Index (S&P 500 Index) is an index of 500 leading companies in leading industries in the United States.
· The VIX (CBOE Volatility Index) is a popular measure of the implied volatility of S&P 500 index options.
· The MSCI Zhong Hua Index is an aggregate of the MSCI Hong Kong Index (a capitalization-weighted index that monitors the performance of stocks from Hong Kong) and the MSCI China Free Index (an unmanaged market capitalization-weighted index of Chinese companies available to non-domestic investors).
· The following companies represented the stated percentage of firm wide assets as of April 30, 2010: FedEx Corp., 0.01%; NIKE Inc., 0.05%; Tiffany’s, 0.06% and J. Crew Group, Inc., 0.0%.
6
· The National Association of Realtors is a trade association representing members involved in the residential and commercial real estate industries.
· The group of companies that we call USA, Inc. does not represent an actual portfolio and the specific securities within the group may or may not be held in more than one portfolio or portfolio style advised by Fred Alger Management, Inc. Inclusion of a security in this group is not a recommendation to purchase such security or an indication regarding such security’s prior performance. Further, the securities in the group are held in one or more portfolio advised by Fred Alger Management, Inc. as of the date hereof and are subject to change at any time.
· PIMCO is a subsidiary of Allianz Global Investors. As of April 30, Allianz Global Investors represented 0.0% of Alger assets under management.
FUND PERFORMANCE AS OF 3/31/10 (Unaudited)
AVERAGE ANNUAL TOTAL RETURNS
| | 1
YEAR | | 5
YEARS | | 10
YEARS | | SINCE
INCEPTION | |
Alger China-U.S. Growth Class A | | | | | | | | | |
(Inception 11/3/03) | | 52.65 | % | 10.82 | % | n/a | | 11.58 | % |
Alger China-U.S. Growth Class C* | | | | | | | | | |
(Inception 3/3/08) | | 59.23 | % | 11.41 | % | n/a | | 11.88 | % |
* Performance figures prior to 3/3/08, inception of Class C shares, are those of the Fund’s Class A shares. Performance has been adjusted to remove the front-end sales charge imposed by Class A shares. Class C shares do not impose a front-end sales charge but do impose a contingent deferred sales charge of 1% on shares redeemed. If Class A sales charges were reflected, annual returns for the Class C shares would be lower. The performance figures prior to 3/3/08 have also been adjusted to reflect the higher operating expenses and applicable contingent deferred sales charge of Class C shares.
7
ALGER CHINA-U.S. GROWTH FUND
Fund Highlights Through April 30, 2010 (Unaudited)
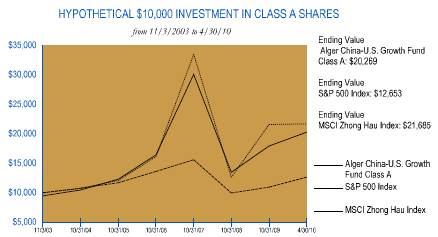
The chart above illustrates the growth in value of a hypothetical $10,000 investment made in the Alger China-U.S. Growth Fund Class A shares, with an initial maximum sales charge of 5.25%, and the S&P 500 Index and the MSCI Zhong Hau Index (unmanaged indices of common stocks) from November 3, 2003, the inception date of the Alger China-U.S. Growth Fund Class A shares, through April 30, 2010. The figures for the Alger China-U.S. Growth Fund Class A shares, the S&P 500 Index, and the MSCI Zhong Hau Index include reinvestment of dividends.
Investors cannot invest directly in any index. Index performance does not reflect deduction for fees, expenses, or taxes.
PERFORMANCE COMPARISON AS OF 4/30/10 †
AVERAGE ANNUAL TOTAL RETURNS
| | 1 YEAR | | 5 YEARS | | 10 YEARS | | SINCE
INCEPTION | |
Class A (Inception 11/3/03) | | 36.42 | % | 11.71 | % | n/a | | 11.49 | % |
S&P 500 Index | | 38.84 | % | 2.63 | % | n/a | | 3.69 | % |
MSCI Zhong Hau Index | | 37.06 | % | 13.09 | % | n/a | | 12.66 | % |
| | | | | | | | | |
Class C (Inception 3/3/08)* | | 42.15 | % | 12.32 | % | n/a | | 11.78 | % |
S&P 500 Index | | 38.84 | % | 2.63 | % | n/a | | 3.69 | % |
MSCI Zhong Hau Index | | 37.06 | % | 13.09 | % | n/a | | 12.66 | % |
The performance data quoted represents past performance, which is not an indication or a guarantee of future results. The Fund’s average annual total returns include changes in share price and reinvestment of dividends and capital gains. The chart and table above do not reflect the deduction of taxes that a shareholder would have paid on Fund distributions or on the redemption of Fund shares. Investment return and principal will fluctuate and the Fund’s shares, when redeemed, may be worth more or less than their original cost. Current performance may be higher or lower than the performance quoted. For performance current to the most recent month end, visit us at www.alger.com or call us at (800) 992-3863.
† Returns reflect maximum sales charges on Class A shares and applicable contingent deferred sales charges on Class C shares.
* Performance figures prior to 3/3/08, inception of Class C shares, are those of the Fund’s Class A shares. Performance has been adjusted to remove the front-end sales charge imposed by Class A shares. Class C shares do not impose a front-end sales charge but do impose a contingent deferred sales charge of 1% on shares redeemed. If Class A sales charges were reflected, annual returns for the Class C shares would be lower. The performance figures prior to 3/3/08 have also been adjusted to reflect the higher operating expenses and applicable contingent deferred sales charge of Class C shares.
8
PORTFOLIO SUMMARY†
April 30, 2010 (Unaudited)
COUNTRY | | ALGER
CHINA-U.S.
GROWTH
FUND | |
Australia | | 0.5 | % |
Bermuda | | 0.2 | |
Brazil | | 2.5 | |
Canada | | 2.6 | |
Cayman Islands | | 1.9 | |
China | | 26.2 | |
Hong Kong | | 19.9 | |
Ireland | | 0.7 | |
Japan | | 1.2 | |
Taiwan | | 10.8 | |
United States | | 33.0 | |
Cash and Net Other Assets | | 0.5 | |
| | 100.0 | % |
† Based on net assets.
9
ALGER CHINA-U.S. GROWTH FUND
Schedule of Investments‡ (Unaudited) April 30, 2010
| | SHARES | | VALUE | |
COMMON STOCKS—97.4% | | | | | |
AUSTRALIA—0.5% | | | | | |
COAL & CONSUMABLE FUELS—0.5% | | | | | |
Linc Energy Ltd.*,(L2)
(Cost $233,885) | | 260,100 | | $ | 368,784 | |
| | | | | |
BERMUDA—0.2% | | | | | |
DISTRIBUTORS—0.2% | | | | | |
Li & Fung Ltd.(L2)
(Cost $162,800) | | 36,000 | | 172,873 | |
| | | | | |
BRAZIL—1.3% | | | | | |
DIVERSIFIED METALS & MINING—1.3% | | | | | |
Vale S.A.#*
(Cost $322,190) | | 31,550 | | 966,377 | |
| | | | | |
CANADA—2.6% | | | | | |
AUTO PARTS & EQUIPMENT—0.3% | | | | | |
Westport Innovations Inc.* | | 10,100 | | 191,900 | |
| | | | | |
FERTILIZERS & AGRICULTURAL CHEMICALS—1.0% | | | | | |
Potash Corporation of Saskatchewan Inc. | | 7,050 | | 779,024 | |
| | | | | |
GOLD—1.3% | | | | | |
Yamana Gold Inc. | | 93,650 | | 1,017,976 | |
| | | | | |
TOTAL CANADA
(Cost $1,775,483) | | | | 1,988,900 | |
| | | | | |
CAYMAN ISLANDS—1.9% | | | | | |
COMPUTER STORAGE & PERIPHERALS—0.9% | | | | | |
Seagate Technology* | | 37,850 | | 695,304 | |
| | | | | |
INTERNET SOFTWARE & SERVICES—1.0% | | | | | |
Tencent Holdings Ltd.(L2) | | 36,950 | | 763,210 | |
| | | | | |
TOTAL CAYMAN ISLANDS
(Cost $1,113,700) | | | | 1,458,514 | |
| | | | | |
CHINA—26.2% | | | | | |
ADVERTISING—0.5% | | | | | |
Focus Media Holding Ltd.#* | | 24,500 | | 411,110 | |
| | | | | |
AGRICULTURAL PRODUCTS—0.5% | | | | | |
Ausnutria Dairy Corp Ltd.*,(L2) | | 546,000 | | 381,777 | |
| | | | | |
APPLICATION SOFTWARE—1.7% | | | | | |
VanceInfo Technologies Inc.#* | | 53,050 | | 1,265,243 | |
| | | | | |
BIOTECHNOLOGY—0.8% | | | | | |
China Nuokang Bio-Pharmaceutical Inc.#* | | 96,700 | | 638,220 | |
| | | | | |
COAL & CONSUMABLE FUELS—0.5% | | | | | |
China Shenhua Energy Co.*,(L2) | | 89,000 | | 381,917 | |
| | | | | |
COMMUNICATIONS EQUIPMENT—0.5% | | | | | |
ZTE Corp.(L2) | | 100,200 | | 359,587 | |
| | | | | |
COMPUTER & ELECTRONICS RETAIL—0.6% | | | | | |
GOME Electrical Appliances Holdings Ltd.*,(L2) | | 1,329,000 | | 428,334 | |
| | | | | | |
10
| | SHARES | | VALUE | |
COMMON STOCKS—(CONT.) | | | | | |
CHINA—(CONT.) | | | | | |
CONSTRUCTION & FARM MACHINERY & HEAVY TRUCKS—0.7% | | | | | |
Sany Heavy Equipment International Holdings Co., Ltd.*,(L2) | | 429,000 | | $ | 518,499 | |
| | | | | |
DISTILLERS & VINTNERS—0.7% | | | | | |
Yantai Changyu Pioneer Wine Co.*,(L2) | | 61,700 | | 518,617 | |
| | | | | |
DIVERSIFIED BANKS—2.2% | | | | | |
Bank of China Ltd. (L2) | | 797,000 | | 410,292 | |
China Construction Bank Corp. (L2) | | 710,000 | | 577,481 | |
Industrial & Commercial Bank of China (L2) | | 899,000 | | 655,246 | |
| | | | 1,643,019 | |
HEALTH CARE EQUIPMENT—1.4% | | | | | |
China Medical Technologies Inc. # | | 35,250 | | 489,270 | |
Mindray Medical International Ltd. # | | 16,300 | | 622,660 | |
| | | | 1,111,930 | |
HIGHWAYS & RAILTRACKS—0.5% | | | | | |
Hainan Meilan International Airport Co., Ltd.(L2) | | 331,000 | | 411,249 | |
| | | | | |
HOTELS RESORTS & CRUISE LINES—1.0% | | | | | |
China Lodging Group Ltd. #* | | 5,000 | | 75,450 | |
Ctrip.com International Ltd. #* | | 18,600 | | 679,272 | |
| | | | 754,722 | |
INDUSTRIAL MACHINERY—2.2% | | | | | |
Chongqing Machinery & Electric Co., Ltd. *,(L2) | | 1,780,000 | | 469,057 | |
Duoyuan Global Water Inc. #* | | 22,150 | | 590,962 | |
SmartHeat Inc. * | | 75,800 | | 635,962 | |
| | | | 1,695,981 | |
INTEGRATED OIL & GAS—1.7% | | | | | |
China Petroleum & Chemical Corp. (L2) | | 566,000 | | 453,827 | |
PetroChina Co., Ltd. (L2) | | 702,000 | | 808,414 | |
| | | | 1,262,241 | |
INTERNET SOFTWARE & SERVICES—2.1% | | | | | |
Baidu Inc. #* | | 1,750 | | 1,206,274 | |
Netease.com #* | | 9,050 | | 315,574 | |
| | | | 1,521,848 | |
LEISURE PRODUCTS—1.0% | | | | | |
Anta Sports Products Ltd.(L2) | | 439,000 | | 782,677 | |
| | | | | |
LIFE & HEALTH INSURANCE—1.5% | | | | | |
China Life Insurance Co., Ltd. | | 247,000 | | 1,135,742 | |
| | | | | |
MARINE—0.9% | | | | | |
China COSCO Holdings Co., Ltd.(L2) | | 537,000 | | 681,199 | |
| | | | | |
MULTI-LINE INSURANCE—0.6% | | | | | |
China Pacific Insurance Group Co., Ltd.* | | 109,117 | | 456,060 | |
| | | | | |
PACKAGED FOODS & MEATS—1.5% | | | | | |
China Minzhong Food Corp., Ltd. * | | 809,000 | | 708,380 | |
China Yurun Food Group Ltd. (L2) | | 143,000 | | 436,373 | |
| | | | 1,144,753 | |
| | | | | | |
11
| | SHARES | | VALUE | |
COMMON STOCKS—(CONT.) | | | | | |
CHINA—(CONT.) | | | | | |
PAPER PRODUCTS—1.2% | | | | | |
Nine Dragons Paper Holdings Ltd.(L2) | | 527,649 | | $ | 890,104 | |
| | | | | |
PHARMACEUTICALS—1.2% | | | | | |
China Shineway Pharmaceutical Group Ltd.(L2) | | 266,000 | | 813,744 | |
| | | | | |
SPECIALTY CHEMICALS—0.7% | | | | | |
Dongyue Group(L2) | | 2,140,000 | | 494,589 | |
| | | | | |
TOTAL CHINA
(Cost $15,942,076) | | | | 19,703,162 | |
| | | | | |
HONG KONG—19.9% | | | | | |
AGRICULTURAL PRODUCTS—0.8% | | | | | |
China Agri-Industries Holdings Ltd.(L2) | | 456,000 | | 596,285 | |
| | | | | |
COMMUNICATIONS EQUIPMENT—0.6% | | | | | |
Comba Telecom Systems Holdings Ltd.(L2) | | 330,000 | | 468,420 | |
| | | | | |
CONSTRUCTION & ENGINEERING—0.5% | | | | | |
China State Construction International Holdings Ltd.(L2) | | 1,113,600 | | 383,958 | |
| | | | | |
CONSUMER ELECTRONICS—0.6% | | | | | |
Haier Electronics Group Co., Ltd.*,(L2) | | 651,000 | | 434,651 | |
| | | | | |
DIVERSIFIED CONSUMER SERVICES—1.1% | | | | | |
China Resources Enterprise Ltd.(L2) | | 236,200 | | 833,337 | |
| | | | | |
ELECTRIC UTILITIES—1.0% | | | | | |
Hongkong Electric Holdings Ltd.(L2) | | 134,000 | | 792,437 | |
| | | | | |
ELECTRONIC COMPONENTS—1.8% | | | | | |
AAC Acoustic Technologies Holdings Inc. *,(L2) | | 330,000 | | 542,776 | |
Truly International Holdings (L2) | | 470,000 | | 866,891 | |
| | | | 1,409,667 | |
ELECTRONIC MANUFACTURING SERVICES—0.6% | | | | | |
Ju Teng International Holdings Ltd.(L2) | | 514,000 | | 473,795 | |
| | | | | |
GAS UTILITIES—1.0% | | | | | |
China Resources Gas Group Ltd.(L2) | | 500,000 | | 745,799 | |
| | | | | |
MARINE—0.8% | | | | | |
Orient Overseas International Ltd.*,(L2) | | 77,500 | | 586,977 | |
| | | | | |
MARINE PORTS & SERVICES—0.7% | | | | | |
China Merchants Holdings International Co., Ltd.(L2) | | 142,000 | | 493,291 | |
| | | | | |
MULTI-LINE INSURANCE—0.7% | | | | | |
China Taiping Insurance Holdings Co., Ltd.*,(L2) | | 161,600 | | 534,853 | |
| | | | | |
OIL & GAS EXPLORATION & PRODUCTION—0.8% | | | | | |
CNOOC Ltd.(L2) | | 327,000 | | 574,364 | |
| | | | | |
PAPER PRODUCTS—0.4% | | | | | |
Fook Woo Group Holdings Ltd.* | | 1,012,000 | | 338,897 | |
| | | | | |
PHARMACEUTICALS—1.6% | | | | | |
China Pharmaceutical Group Ltd. (L2) | | 530,000 | | 386,784 | |
Hua Han Bio-Pharmaceutical Holdings Ltd. (L2) | | 1,016,000 | | 410,808 | |
| | | | | | |
12
| | SHARES | | VALUE | |
COMMON STOCKS—(CONT.) | | | | | |
HONG KONG—(CONT.) | | | | | |
United Laboratories Ltd., /The (L2) | | 414,000 | | $ | 475,677 | |
| | | | 1,273,269 | |
RAILROADS—0.8% | | | | | |
MTR Corp.(L2) | | 163,921 | | 574,447 | |
| | | | | |
REAL ESTATE MANAGEMENT & DEVELOPMENT—2.4% | | | | | |
Cheung Kong Holdings Ltd. (L2) | | 47,000 | | 579,310 | |
Poly Hong Kong Investments Ltd. *,(L2) | | 361,000 | | 355,525 | |
Silver Grant International *,(L2) | | 1,534,000 | | 537,162 | |
Sun Hung Kai Properties Ltd. (L2) | | 26,000 | | 360,144 | |
| | | | 1,832,141 | |
SPECIALIZED FINANCE—2.0% | | | | | |
Hong Kong Exchanges and Clearing Ltd.(L2) | | 89,550 | | 1,464,557 | |
| | | | | |
SPECIALTY STORES—0.5% | | | | | |
Hengdeli Holdings Ltd.(L2) | | 928,000 | | 384,600 | |
| | | | | |
WIRELESS TELECOMMUNICATION SERVICES—1.2% | | | | | |
China Mobile Ltd.(L2) | | 94,000 | | 921,379 | |
| | | | | |
TOTAL HONG KONG
(Cost $11,715,256) | | | | 15,117,124 | |
| | | | | |
IRELAND—0.7% | | | | | |
HEALTH CARE EQUIPMENT—0.7% | | | | | |
Covidien PLC
(Cost $494,320) | | 11,400 | | 547,086 | |
| | | | | |
JAPAN—1.2% | | | | | |
AUTOMOBILE MANUFACTURERS—1.2% | | | | | |
Honda Motor Co., Ltd.(L2)
(Cost $872,684) | | 27,950 | | 945,005 | |
| | | | | |
LUXEMBOURG—0.0% | | | | | |
SPECIALTY STORES—0.0% | | | | | |
L’Occitane International SA*,(L2)
(Cost $18,648) | | 9,600 | | 18,648 | |
| | | | | |
TAIWAN—10.8% | | | | | |
COMPUTER HARDWARE—1.6% | | | | | |
Wistron Corp. *,(L2) | | 313,009 | | 601,418 | |
Wistron NeWeb Corp. *,(L2) | | 346,000 | | 619,799 | |
| | | | 1,221,217 | |
COMPUTER STORAGE & PERIPHERALS—1.0% | | | | | |
InnoLux Display Corp. *,(L2) | | 234,830 | | 342,819 | |
Lite-On Technology Corp. *,(L2) | | 281,501 | | 373,601 | |
| | | | 716,420 | |
DISTRIBUTORS—1.0% | | | | | |
WPG Holdings Co., Ltd.*,(L2) | | 356,000 | | 730,731 | |
| | | | | |
ELECTRICAL COMPONENTS & EQUIPMENT—1.4% | | | | | |
Cheng Uei Precision Industry Co., Ltd. *,(L2) | | 286,620 | | 553,170 | |
| | | | | | |
13
| | SHARES | | VALUE | |
COMMON STOCKS—(CONT.) | | | | | |
TAIWAN—(CONT.) | | | | | |
Simplo Technology Co., Ltd. *,(L2) | | 84,128 | | $ | 506,957 | |
| | | | 1,060,127 | |
ELECTRONIC COMPONENTS—0.6% | | | | | |
Wintek Corp.*,(L2) | | 510,000 | | 424,622 | |
| | | | | |
ELECTRONIC MANUFACTURING SERVICES—2.3% | | | | | |
Hon Hai Precision Industry Co., Ltd.*,(L2) | | 365,200 | | 1,714,442 | |
| | | | | |
FERTILIZERS & AGRICULTURAL CHEMICALS—0.5% | | | | | |
Taiwan Fertilizer Co., Ltd.*,(L2) | | 116,000 | | 369,121 | |
| | | | | |
MARINE—0.6% | | | | | |
Evergreen Marine Corp Taiwan Ltd.*,(L2) | | 731,000 | | 467,312 | |
| | | | | |
OTHER DIVERSIFIED FINANCIAL SERVICES—0.2% | | | | | |
Fubon Financial Holding Co., Ltd.*,(L2) | | 147,000 | | 179,205 | |
| | | | | |
PACKAGED FOODS & MEATS—0.4% | | | | | |
Uni-President Enterprises Corp.*,(L2) | | 274,572 | | 305,245 | |
| | | | | |
SEMICONDUCTORS—1.2% | | | | | |
Pixart Imaging Inc. *,(L2) | | 44,434 | | 278,057 | |
Ralink Technology Corp. (L2) | | 137,000 | | 639,288 | |
| | | | 917,345 | |
TOTAL TAIWAN
(Cost $5,598,957) | | | | 8,105,787 | |
| | | | | |
UNITED STATES—32.1% | | | | | |
AIR FREIGHT & LOGISTICS—1.4% | | | | | |
United Parcel Service Inc., Cl. B | | 15,050 | | 1,040,557 | |
| | | | | |
ASSET MANAGEMENT & CUSTODY BANKS—1.0% | | | | | |
BlackRock Inc. | | 950 | | 174,800 | |
T Rowe Price Group Inc. | | 10,050 | | 577,976 | |
| | | | 752,776 | |
BIOTECHNOLOGY—0.9% | | | | | |
Human Genome Sciences Inc.* | | 24,100 | | 667,329 | |
| | | | | |
CASINOS & GAMING—1.5% | | | | | |
Las Vegas Sands Corp.* | | 43,650 | | 1,085,139 | |
| | | | | |
COAL & CONSUMABLE FUELS—1.0% | | | | | |
Peabody Energy Corp. | | 16,600 | | 775,553 | |
| | | | | |
COMMUNICATIONS EQUIPMENT—3.4% | | | | | |
Cisco Systems Inc. * | | 55,050 | | 1,481,946 | |
Opnext Inc. * | | 72,800 | | 171,080 | |
Qualcomm Inc. | | 23,450 | | 908,453 | |
| | | | 2,561,479 | |
COMPUTER HARDWARE—2.6% | | | | | |
Apple Inc. * | | 5,450 | | 1,423,104 | |
Lenovo Group Ltd. (L2) | | 684,000 | | 504,264 | |
| | | | 1,927,368 | |
| | | | | | |
14
| | SHARES | | VALUE | |
COMMON STOCKS—(CONT.) | | | | | |
UNITED STATES—(CONT.) | | | | | |
CONSTRUCTION & FARM MACHINERY & HEAVY TRUCKS—2.2% | | | | | |
Bucyrus International Inc. | | 10,900 | | $ | 686,809 | |
Cummins Inc. | | 14,000 | | 1,011,220 | |
| | | | 1,698,029 | |
DATA PROCESSING & OUTSOURCED SERVICES—0.2% | | | | | |
Mastercard Inc. | | 750 | | 186,030 | |
| | | | | |
ELECTRICAL COMPONENTS & EQUIPMENT—0.4% | | | | | |
First Solar Inc.* | | 2,200 | | 315,810 | |
| | | | | |
ELECTRONIC EQUIPMENT MANUFACTURERS—0.7% | | | | | |
Hollysys Automation Technologies Ltd.* | | 48,000 | | 497,760 | |
| | | | | |
FERTILIZERS & AGRICULTURAL CHEMICALS—1.0% | | | | | |
Monsanto Co. | | 11,750 | | 740,955 | |
| | | | | |
GENERAL MERCHANDISE STORES—0.3% | | | | | |
Target Corp. | | 4,650 | | 264,446 | |
| | | | | |
HEALTH CARE EQUIPMENT—0.8% | | | | | |
CR Bard Inc. | | 4,300 | | 372,079 | |
Hologic Inc. * | | 10,900 | | 194,783 | |
| | | | 566,862 | |
HOME ENTERTAINMENT SOFTWARE—1.0% | | | | | |
Activision Blizzard Inc. | | 67,100 | | 743,468 | |
| | | | | |
INDUSTRIAL MACHINERY—1.6% | | | | | |
SPX Corp. | | 17,200 | | 1,201,936 | |
| | | | | |
INTERNET RETAIL—0.5% | | | | | |
Amazon.com Inc.* | | 2,600 | | 356,356 | |
| | | | | |
INTERNET SOFTWARE & SERVICES—0.6% | | | | | |
GSI Commerce Inc.* | | 17,650 | | 480,963 | |
| | | | | |
LIFE SCIENCES TOOLS & SERVICES—0.6% | | | | | |
Illumina Inc.* | | 10,400 | | 435,448 | |
| | | | | |
OFFICE SERVICES & SUPPLIES—1.0% | | | | | |
SYKES Enterprises Inc.* | | 33,500 | | 761,455 | |
| | | | | |
OIL & GAS EXPLORATION & PRODUCTION—0.7% | | | | | |
Devon Energy Corp. | | 8,550 | | 575,671 | |
| | | | | |
RESTAURANTS—1.1% | | | | | |
Yum! Brands Inc. | | 20,100 | | 852,642 | |
| | | | | |
SEMICONDUCTOR EQUIPMENT—1.0% | | | | | |
Lam Research Corp.* | | 18,250 | | 740,038 | |
| | | | | |
SEMICONDUCTORS—4.8% | | | | | |
Altera Corp. | | 43,850 | | 1,112,035 | |
Atheros Communications Inc. * | | 13,450 | | 522,398 | |
Broadcom Corp., Cl. A | | 5,450 | | 187,971 | |
Intel Corp. | | 48,350 | | 1,103,830 | |
Skyworks Solutions Inc. * | | 44,700 | | 752,748 | |
| | | | 3,678,982 | |
| | | | | | |
15
| | SHARES | | VALUE | |
COMMON STOCKS—(CONT.) | | | | | |
UNITED STATES—(CONT.) | | | | | |
SPECIALIZED FINANCE—1.0% | | | | | |
CME Group Inc. | | 2,350 | | $ | 771,764 | |
| | | | | |
STEEL—0.8% | | | | | |
Cliffs Natural Resources Inc. | | 10,100 | | 631,553 | |
| | | | | |
TOTAL UNITED STATES
(Cost $20,414,002) | | | | 24,310,369 | |
| | | | | |
TOTAL COMMON STOCKS
(Cost $58,664,001) | | | | 73,702,629 | |
| | | | | |
CONVERTIBLE PREFERRED STOCK—1.2% | | | | | |
BRAZIL—1.2% | | | | | |
DIVERSIFIED METALS & MINING—1.2% | | | | | |
Vale Capital II, 6.75%, 6/15/2012*
(Cost $630,315) | | 10,430 | | 919,717 | |
| | | | | |
| | PRINCIPAL
AMOUNT | | | |
CORPORATE BONDS—0.9% | | | | | |
UNITED STATES—0.9% | | | | | |
CASINOS & GAMING—0.9% | | | | | |
Wynn Las Vegas LLC / Wynn Las Vegas Capital Corp., 662.50%, 12/1/14(L2)
(Cost $599,749) | | 650,000 | | 661,375 | |
| | | | | |
SHORT-TERM INVESTMENTS—1.2% | | | | | |
TIME DEPOSITS—1.2% | | | | | |
Wells Fargo Grand Cayman, 0.03%, 4/01/10(L2)
(Cost $937,788) | | 937,788 | | 937,788 | |
| | | | | |
Total Investments
(Cost $60,831,853)(a) | | 100.7 | % | 76,221,509 | |
Liabilities in Excess of Other Assets | | (0.7 | ) | (495,199 | ) |
NET ASSETS | | 100.0 | % | $ | 75,726,310 | |
‡ | Securities classified as Level 1 for ASC 820 disclosure purposes based on valuation inputs unless otherwise noted. |
| |
* | Non-income producing security. |
# | American Depository Receipts. |
(a) | At April 30, 2010, the net unrealized appreciation on investments, based on cost for federal income tax purposes of $63,294,190 amounted to $12,927,319 which consisted of aggregate gross unrealized appreciation of $17,033,155 and aggregate gross unrealized depreciation of $4,105,836. |
(L2) | Security classified as Level 2 for ASC 820 disclosure purposes based on valuation inputs. |
See Notes to Financial Statements.
16
ALGER CHINA-U.S. GROWTH FUND
Statement of Assets and Liabilities (Unaudited) April 30, 2010
ASSETS: | | | |
Investments in securities, at value (identified cost)*
see accompanying schedules of investments | | $ | 76,221,509 | |
Foreign cash** | | 480,903 | |
Receivable for investment securities sold | | 434,632 | |
Receivable for shares of beneficial interest sold | | 187,437 | |
Dividends and interest receivable | | 149,287 | |
Prepaid expenses | | 24,745 | |
Total Assets | | 77,498,513 | |
LIABILITIES: | | | |
Payable for investment securities purchased | | 1,071,084 | |
Payable for foreign currency contracts | | 117,398 | |
Bank overdraft | | 178,257 | |
Payable for shares of beneficial interest redeemed | | 227,306 | |
Accrued investment advisory fees | | 76,909 | |
Accrued transfer agent fees | | 25,049 | |
Accrued distribution fees | | 18,060 | |
Accrued administrative fees | | 1,762 | |
Accrued other expenses | | 56,378 | |
Total Liabilities | | 1,772,203 | |
NET ASSETS | | $ | 75,726,310 | |
Net Assets Consist of: | | | |
Paid in capital (par value of $.001 per share) | | 90,010,255 | |
Undistributed net investment income (accumulated loss) | | (571,292 | ) |
Undistributed net realized gain (accumulated realized loss) | | (29,101,730 | ) |
Net unrealized appreciation on investments | | 15,389,077 | |
NET ASSETS | | $ | 75,726,310 | |
Net Assets By Class | | | |
Class A | | $ | 72,385,423 | |
Class C | | $ | 3,340,887 | |
Shares Of Beneficial Interest Outstanding—Note 6 | | | |
Class A | | 4,727,613 | |
Class C | | 220,398 | |
Net Asset Value Per Share | | | |
Class A | | $ | 15.31 | |
Class C | | $ | 15.16 | |
Offering Price Per Share(a) | | | |
Class A | | $ | 16.16 | |
Class C | | $ | 15.16 | |
*Identified Cost | | $ | 60,831,853 | |
**Cost of Foreign Cash | | $ | 480,888 | |
(a) Class A Offering Price includes a 5.25% sales charge.
See Notes to Financial Statements.
17
ALGER CHINA-U.S. GROWTH FUND
Statement of Operations (Unaudited)
For the six months ended April 30, 2010
INCOME | | | |
Dividends (net of foreign withholding taxes*) | | $ | 318,218 | |
Interest | | 26,254 | |
Total Income | | 344,472 | |
EXPENSES | | | |
Advisory fees—Note 3(a) | | 446,307 | |
Distribution fees—Note 3(f): | | | |
Class A | | 89,781 | |
Class C | | 12,799 | |
Administrative fees—Note 3(a) | | 10,228 | |
Custodian fees | | 46,585 | |
Interest expenses | | 22 | |
Transfer agent fees and expenses—Note 3(b) | | 61,472 | |
Printing fees | | 17,195 | |
Professional fees | | 47,191 | |
Registration fees | | 24,666 | |
Trustee fees—Note 3(e) | | 8,677 | |
Miscellaneous | | 7,993 | |
Total Expenses | | 772,916 | |
NET INVESTMENT LOSS | | (428,444 | ) |
REALIZED AND UNREALIZED GAIN (LOSS) ON INVESTMENTS AND FOREIGN CURRENCY | | | |
Net realized gain on investments and options | | 7,772,644 | |
Net realized gain on foreign currency transactions | | 7,323 | |
Net change in unrealized appreciation (depreciation) on investments, options and foreign currency | | 1,621,602 | |
Net realized and unrealized gain on investments, options and foreign currency | | 9,401,569 | |
NET INCREASE IN NET ASSETS RESULTING FROM OPERATIONS | | $ | 8,973,125 | |
*Foreign withholding taxes | | $ | 11,436 | |
See Notes to Financial Statements.
18
ALGER CHINA-U.S. GROWTH FUND
Statements of Changes in Net Assets
| | For the
Six Months Ended
April 30, 2010
(Unaudited) | | For the
Year Ended
October 31, 2009 | |
Net investment loss | | $ | (428,444 | ) | $ | (281,704 | ) |
Net realized gain (loss) on investments and foreign currency | | 7,779,967 | | (21,717,996 | ) |
Net change in unrealized appreciation on investments, options and foreign currency | | 1,621,602 | | 36,757,580 | |
Net increase in net assets resulting from operations | | 8,973,125 | | 14,757,880 | |
Dividends and distributions to shareholders from: | | | | | |
Net investment income | | | | | |
Class A | | (109,702 | ) | — | |
Total dividends and distributions to shareholders | | (109,702 | ) | — | |
Increase (decrease) from shares of beneficial interest transactions: | | | | | |
Class A | | (4,226,649 | ) | (11,430,468 | ) |
Class C | | 1,505,418 | | 1,053,089 | |
Net decrease from shares of beneficial interest transactions—Note 6 | | (2,721,231 | ) | (10,377,379 | ) |
Total increase | | 6,142,192 | | 4,380,501 | |
Net Assets: | | | | | |
Beginning of period | | 69,584,118 | | 65,203,617 | |
END OF PERIOD | | $ | 75,726,310 | | $ | 69,584,118 | |
Undistributed net investment income (accumulated loss) | | $ | (571,292 | ) | $ | (33,146 | ) |
See Notes to Financial Statements.
19
(This page has been intentionally left blank)
ALGER CHINA-U.S. GROWTH FUND
Financial Highlights for a share outstanding throughout the period
| | Class A | |
| | Six months
ended
4/30/2010(i) | | Year ended
10/31/2009 | | Year ended
10/31/2008 | | Year ended
10/31/2007 | | Year ended
10/31/2006 | | Year ended
10/31/2005 | |
Net asset value, beginning of period | | $ | 13.55 | | $ | 10.18 | | $ | 25.09 | | $ | 15.57 | | $ | 12.99 | | $ | 11.05 | |
INCOME FROM INVESTMENT OPERATIONS: | | | | | | | | | | | | | |
Net investment loss(ii) | | (0.08 | ) | (0.05 | ) | (0.08 | ) | (0.13 | ) | (0.04 | ) | (0.07 | ) |
Net realized and unrealized gain (loss) on investments | | 1.86 | | 3.42 | | (12.79 | ) | 11.67 | | 4.03 | | 2.01 | |
Total from investment operations | | 1.78 | | 3.37 | | (12.87 | ) | 11.54 | | 3.99 | | 1.94 | |
Dividends from net investment income | | (0.02 | ) | — | | — | | — | | — | | — | |
Distributions from net realized gains | | — | | — | | (2.04 | ) | (2.02 | ) | (1.41 | ) | — | |
Net asset value, end of period | | $ | 15.31 | | $ | 13.55 | | $ | 10.18 | | $ | 25.09 | | $ | 15.57 | | $ | 12.99 | |
Total return (iii) | | 13.1 | % | 33.1 | % | (55.2 | )% | 83.0 | % | 33.5 | % | 17.6 | % |
RATIOS/SUPPLEMENTAL DATA: | | | | | | | | | | | | | |
Net assets, end of period (000’s omitted) | | $ | 72,385 | | $ | 67,989 | | $ | 64,865 | | $ | 201,623 | | $ | 73,147 | | $ | 36,630 | |
Ratio of gross expenses to average net assets | | 2.05 | % | 2.31 | % | 2.15 | % | 2.17 | % | 2.36 | % | 2.77 | % |
Ratio of expense reimbursements to average net assets | | 0.00 | % | 0.00 | % | (0.25 | )% | (0.25 | )% | (0.16 | )% | (0.51 | )% |
Ratio of net expenses to average net assets | | 2.05 | % | 2.31 | % | 1.90 | % | 1.92 | % | 2.20 | % | 2.26 | % |
Ratio of net investment income (loss) to average net assets | | (1.13 | )% | (0.48 | )% | (0.43 | )% | (0.71 | )% | (0.30 | )% | (0.56 | )% |
Portfolio turnover rate | | 53.75 | % | 149.17 | % | 190.60 | % | 107.57 | % | 192.21 | % | 288.53 | % |
(i) Unaudited. Ratios have been annualized; total return and portfolio turnover rate have not been annualized.
(ii) Amount was computed based on average shares outstanding during the period.
(iii) Does not reflect the effect of sales charges, if applicable.
See Notes to Financial Statements.
21
| | Class C | |
| | Six months
ended
4/30/2010(i) | | Year ended
10/31/2009 | | From
3/3/2008
(commence-
ment of
operations) to
10/31/2008(ii) | |
Net asset value, beginning of period | | $ | 13.43 | | $ | 10.16 | | $ | 18.20 | |
INCOME FROM INVESTMENT OPERATIONS: | | | | | | | |
Net investment loss(iii) | | (0.14 | ) | (0.14 | ) | (0.05 | ) |
Net realized and unrealized gain (loss) on investments | | 1.87 | | 3.41 | | (7.99 | ) |
Total from investment operations | | 1.73 | | 3.27 | | (8.04 | ) |
Net asset value, end of period | | $ | 15.16 | | $ | 13.43 | | $ | 10.16 | |
Total return (iv) | | 12.8 | % | 32.2 | % | (44.2 | )% |
RATIOS/SUPPLEMENTAL DATA: | | | | | | | |
Net assets, end of period (000’s omitted) | | $ | 3,341 | | $ | 1,595 | | $ | 339 | |
Ratio of gross expenses to average net assets | | 2.84 | % | 3.03 | % | 3.02 | % |
Ratio of expense reimbursements to average net assets | | 0.00 | % | 0.00 | % | (0.21 | )% |
Ratio of net expenses to average net assets | | 2.84 | % | 3.03 | % | 2.81 | % |
Ratio of net investment income (loss) to average net assets | | (1.87 | )% | (1.19 | )% | (0.52 | )% |
Portfolio turnover rate | | 53.75 | % | 149.17 | % | 190.60 | % |
(i) Unaudited. Ratios have been annualized; total return and portfolio turnover rate have not been annualized.
(ii) Ratios have been annualized; total return and portfolio turnover rate have not been annualized.
(iii) Amount was computed based on average shares outstanding during the period.
(iv) Does not reflect the effect of sales charges, if applicable.
See Notes to Financial Statements.
22
ALGER CHINA-U.S. GROWTH FUND
NOTES TO FINANCIAL STATEMENTS (Unaudited)
NOTE 1 — General:
The Alger China-U.S. Growth Fund (formerly The China-U.S. Growth Fund) (the “Fund”) is a diversified open-end registered investment company organized as a business trust under the laws of the Commonwealth of Massachusetts. The Fund’s investment objective is long-term capital appreciation. It seeks to achieve its objective by normally investing in equity securities which are publicly traded in the United States, China, Hong Kong and Taiwan markets. The Fund commenced operations on November 3, 2003 with the issuance of 10,000 shares at $10.00 per share to Fred Alger Management, Inc. (“Alger Management”), the Fund’s investment manager. The Fund’s single share class was re-designated as Class A shares effective January 24, 2005, and are generally subject to an initial sales charge. Class C shares were first offered March 3, 2008, and are generally subject to a deferred sales charge.
NOTE 2 — Significant Accounting Policies:
(a) Investment Valuation: Investments of the Fund are valued on each day the New York Stock Exchange (the “NYSE”) is open, as of the close of the NYSE (normally 4:00 p.m. Eastern time). Equity securities and option contracts for which such information is readily available are valued at the last reported sales price or official closing price as reported by an independent pricing service on the primary market or exchange on which they are traded. In the absence of reported sales, securities are valued at a price within the bid and ask price or, in the absence of a recent bid or ask price, the equivalent as obtained from one or more of the major market makers for the securities to be valued.
Debt securities generally trade in the over-the-counter market. Securities with remaining maturities of more than sixty days at the time of acquisition are valued at prices furnished by dealers who make markets in such securities or by an independent pricing service, which considers the yield or price of bonds of comparable quality, coupon, maturity and type, as well as prices quoted by dealers who make markets in such securities.
Short-term securities held by the Fund having a remaining maturity of sixty days or less are valued at amortized cost which approximates market value. Shares of mutual funds are valued at the net asset value of the underlying mutual fund.
Securities for which market quotations are not readily available are valued at fair value, as determined in good faith pursuant to procedures established by the Board of Trustees.
Securities in which the Fund invests may be traded in foreign markets that close before the close of the NYSE. Developments that occur between the close of the foreign markets and the close of the NYSE may result in adjustments to the closing prices to reflect what the investment adviser, pursuant to policies established by the Board of Trustees, believes to be the fair value of these securities as of the close of the NYSE. The Fund may also fair value securities in other situations, for example, when a particular foreign market is closed but the Fund is open.
23
ALGER CHINA-U.S. GROWTH FUND
NOTES TO FINANCIAL STATEMENTS (Unaudited)(Continued)
Financial Accounting Standards Board Accounting Standards Codification 820 — Fair Value Measurements and Disclosures (“ASC 820”) defines fair value as the price that the Fund would receive upon selling an investment in a timely transaction to an independent buyer in the principal or most advantageous market of the investment. ASC 820 established a three-tier hierarchy to maximize the use of observable market data and minimize the use of unobservable inputs and to establish classification of fair value measurements for disclosure purposes. Inputs refer broadly to the assumptions that market participants would use in pricing the asset or liability and may be observable or unobservable. Observable inputs are based on market data obtained from sources independent of the Fund. Unobservable inputs are inputs that reflect the Fund’s own assumptions based on the best information available in the circumstances. The three-tier hierarchy of inputs is summarized in the three broad Levels listed below.
· Level 1 — quoted prices in active markets for identical investments
· Level 2 — significant other observable inputs (including quoted prices for similar investments, interest rates, prepayment speeds, credit risk, etc.)
· Level 3 — significant unobservable inputs (including the Funds’ own assumptions in determining the fair value of investments)
The Fund’s valuation techniques are consistent with the market approach whereby prices and other relevant information generated by market transactions involving identical or comparable assets are used to measure fair value. Inputs for Level 1 include exchange listed prices and broker quotes in an active market. Inputs for Level 2 include the last trade price in the case of a halted security, a broker quote in an inactive market, an exchange listed price which has been adjusted for fair value factors, and prices of closely related securities. Additional Level 2 inputs include an evaluated price which is based upon a compilation of observable market information such as spreads for fixed income and preferred securities. Inputs for Level 3 include derived prices from unobservable market information which can include cash flows and other information obtained from a company’s financial statements, or from market indicators such as benchmarks and indices.
(b) Securities Transactions and Investment Income: Securities transactions are recorded on a trade date basis. Realized gains and losses from securities transactions are recorded on the identified cost basis. Dividend income is recognized on the ex-dividend date and interest income is recognized on the accrual basis.
(c) Foreign Currency Translations: The books and records of the Fund are maintained in U.S. dollars. Foreign currencies, investments and other assets and liabilities are translated into U.S. dollars at the prevailing rates of exchange on the valuation date. Purchases and sales of investment securities and income and expenses are translated into U.S. dollars at the prevailing exchange rates on the respective dates of such transactions.
Net realized gains and losses on foreign currency transactions represent net gains and losses from the disposition of foreign currencies, currency gains and losses realized between the trade dates and settlement dates of security transactions, and the difference
24
ALGER CHINA-U.S. GROWTH FUND
NOTES TO FINANCIAL STATEMENTS (Unaudited)(Continued)
between the amount of net investment income accrued and the U.S. dollar amount actually received. The effects of changes in foreign currency exchange rates on investments in securities are included in realized and unrealized gain or loss on investments in the Statement of Operations.
(d) Option Contracts: When the Fund writes an option, an amount equal to the premium received by the Fund is recorded as a liability and is subsequently adjusted to the current fair value of the option written. Premiums received from writing options that expire unexercised are treated by the Fund on the expiration date as realized gains from investments. The difference between the premium and the amount paid on effecting a closing purchase transaction, including brokerage commissions, is also treated as a realized gain, or, if the premium is less than the amount paid for the closing purchase transaction, as a realized loss. If a call option is exercised, the premium is added to the proceeds from the sale of the underlying security in determining whether the Fund has realized a gain or loss. If a put option is exercised, the premium reduces the cost basis of the securities purchased by the Fund. The Fund as writer of an option bears the market risk of an unfavorable change in the price of the security underlying the written option.
The Fund may also purchase put and call options. Purchasing put and call options tends to decrease the Fund’s exposure to the underlying instrument. The Fund pays a premium which is included in the Fund’s Statement of Assets and Liabilities as an investment and subsequently marked to market to reflect the current value of the option. Premiums paid for purchasing options which expire are treated as realized losses. The risk associated with purchasing put and call options is limited to the premium paid. Premiums paid for purchasing options which are exercised or closed are added to the amounts paid or offset against the proceeds on the underlying security to determine the realized gain or loss. There were no option transactions during the six months ended April 30, 2010.
(e) Dividends to Shareholders: Dividends and distributions payable to shareholders are recorded by the Fund on the ex-dividend date. Dividends from net investment income and distributions from net realized gains are declared and paid annually after the end of the fiscal year in which earned.
The characterization of distributions to shareholders for financial reporting purposes is determined in accordance with federal income tax rules. Therefore, the source of the Fund’s distributions may be shown in the accompanying financial statements as either from, or in excess of net investment income, net realized gain on investment transactions or return of capital, depending on the type of book/tax differences that may exist. Capital accounts within the financial statements are adjusted for permanent book/tax differences. Reclassifications result primarily from the difference in tax treatment of net operating losses, passive foreign investment companies, and foreign currency transactions. The reclassifications are done annually at fiscal year end and have no impact on the net asset value of the Fund and are designed to present the Fund’s capital accounts on a tax basis.
(f) Federal Income Taxes: It is the Fund’s policy to comply with the requirements of the Internal Revenue Code Subchapter M applicable to regulated investment companies and to distribute all of its taxable income to its shareholders. Provided that the Fund maintains such compliance, no federal income tax provision is required.
25
ALGER CHINA-U.S. GROWTH FUND
NOTES TO FINANCIAL STATEMENTS (Unaudited)(Continued)
Financial Accounting Standards Board Accounting Standards Codification 740 — Income Taxes (“ASC 740”) requires the Fund to measure and recognize in its financial statements the benefit of a tax position taken (or expected to be taken) on an income tax return if such position will more likely than not be sustained upon examination based on the technical merits of the position. The Fund files income tax returns in the U.S. Federal jurisdiction, as well as the New York State and New York City jurisdictions. Based upon its review of tax positions for the Fund’s open tax years of 2006-2009 in these jurisdictions, the Fund has determined that ASC 740 did not have a material impact on the Fund’s financial statements for the six months ended April 30, 2010.
(g) Estimates: These financial statements have been prepared in accordance with accounting principles generally accepted in the United States of America, which require using estimates and assumptions that affect the reported amounts therein. Actual results may differ from those estimates. These unaudited interim financial statements reflect all adjustments which are, in the opinion of management, necessary to a fair statement of results for the interim period presented. All such adjustments are of a normal recurring nature.
NOTE 3 — Investment Advisory Fees and Other Transactions with Affiliates:
(a) Investment Advisory and Administration Fees: Fees incurred by the Fund, pursuant to the provisions of its Investment Advisory Agreement and its Administration Agreement with Fred Alger Management, Inc. (Alger Management), are payable monthly and computed based on the value of the average daily net assets of the Fund, at the following rates:
Advisory
Fee | | Administration
Fee | |
1.20 | % | 0.0275 | % |
Martin Currie, Inc., a registered investment adviser, acts as sub-advisor to the Fund under a written sub-advisory agreement with Alger Management.
(b) Shareholder Administrative Fees: The Fund has entered into a shareholder administrative services agreement with Alger Management to compensate Alger Management on a per account basis for its liaison and administrative oversight of Boston Financial Data Services, Inc., the transfer agent for the Fund (“BFDS”), and other related services. During the six months ended April 30, 2010, the Fund incurred fees of $10,432 for these services provided by Alger Management, which are included in transfer agent fees and expenses in the Statement of Operations.
Alger Management makes payments to intermediaries that provide omnibus account services, sub-accounting services and/or networking services. All fees paid by Alger Management to intermediaries that provide omnibus account services or sub-accounting are charged back to the Fund, subject to certain limitations, all as approved by the Trust’s Board of Trustees. For the six months ended April 30, 2010, these expenses are included in the transfer agent fees and expenses in the Statement of Operations.
26
ALGER CHINA-U.S. GROWTH FUND
NOTES TO FINANCIAL STATEMENTS (Unaudited)(Continued)
(c) Sales Charges: Purchases of shares of the Fund may be subject to initial sales charges or contingent deferred sales charges. For the six months ended April 30, 2010, the initial sales charges and contingent deferred sales charges imposed, all of which were retained by Fred Alger & Company (the “Distributor”), were approximately $3,759 and $1,410 respectively. The contingent deferred sales charges are used by the Distributor to offset distribution expenses previously incurred. Sales charges do not represent expenses of the Fund.
(d) Brokerage Commissions: During the six months ended April 30, 2010, the Fund paid Fred Alger & Company, Incorporated (“Alger Inc.”), an affiliate of Alger Management, $10,633 in connection with securities transactions.
(e) Trustees’ Fees: From November 1, 2009 through February 8, 2010 the Fund paid each trustee who is not affiliated with Alger Management or its affiliates $500 for each meeting attended, to a maximum of $2,000 per annum, plus travel expenses incurred for attending the meeting. The chairman of the Board of Trustees received an additional annual fee of $10,000 paid, pro rata, by all funds managed by Alger Management. Additionally, each member of the audit committee received an additional $50 for each audit committee meeting attended, to a maximum of $200 per annum.
Effective February 9, 2010 the Fund pays each trustee who is not affiliated with Alger Management or its affiliates $750 for each meeting attended, to a maximum of $3,000 per annum, plus travel expenses incurred for attending the meeting. The chairman of the Board of Trustees receives an additional annual fee of $15,000 which is paid, pro rata, by all funds managed by Alger Management. Additionally, each member of the audit committee receives an additional $75 for each audit committee meeting attended, to a maximum of $300 per annum.
(f) Distribution/Shareholder Servicing Fees: The Fund has adopted a distribution plan pursuant to which the Fund pays Alger Inc. a fee at the annual rate of 0.25% of the average daily net assets of the Class A shares and 1.00% of the daily net assets of the Class C shares to compensate Alger Inc. for its activities and expenses incurred in distributing the Fund’s shares and shareholder servicing. Fees charged may be more or less than the expenses incurred by Alger Inc.
(g) Interfund Loans: The Fund, along with other funds advised by Alger Management, may borrow money from and lend money to each other for temporary or emergency purposes. To the extent permitted under its investment restrictions, each fund may lend uninvested cash in an amount up to 15% of its net assets to other funds, and each fund may borrow in an amount up to 10% of its net assets from other funds. If a fund has borrowed from other funds and has aggregate borrowings from all sources that exceed 10% of the fund’s total assets, such fund will secure all of its loans from other funds. The interest rate charged on interfund loans is equal to the average of the overnight time deposit rate and bank loan rate available to the funds. There were no interfund loans outstanding for the period ended April 30, 2010.
(h) Other Transactions with Affiliates: Certain trustees and officers of the Fund are directors and officers of Alger Management and the Distributor.
27
ALGER CHINA-U.S. GROWTH FUND
NOTES TO FINANCIAL STATEMENTS (Unaudited)(Continued)
NOTE 4 — Securities Transactions:
The following summarizes the securities transactions by the Fund, other than short-term securities, for the six months ended April 30, 2010:
| | PURCHASES | | SALES | |
Alger China-U.S. Growth Fund | | $ | 38,589,671 | | $ | 40,851,432 | |
| | | | | | | |
Transactions in foreign securities may involve certain considerations and risks not typically associated with those of U.S. companies because of, among other factors, the level of governmental supervision and regulation of foreign security markets, and the possibility of political or economic instability.
NOTE 5 — Borrowings:
The Fund may borrow from its custodian on an uncommitted basis. The Fund pays the custodian a market rate of interest, generally based upon the London Inter-Bank Offer Rate. The Fund may also borrow from other funds advised by Alger Management, as discussed in Note 3(g). For the six months ended April 30, 2010, the Fund had the following borrowings:
| | AVERAGE DAILY
BORROWING | | WEIGHTED AVERAGE
INTEREST RATE | |
Alger China-U.S. Growth Fund | | $ | 4,006 | | 2.25 | % |
| | | | | | |
The highest amount borrowed during the six months ended April 30, 2010 was $178,252.
NOTE 6 — Share Capital:
(a) The Fund has an unlimited number of authorized shares of beneficial interest of $.001 par value. Transactions of shares of beneficial interest were as follows:
| | FOR THE SIX MONTHS ENDED
APRIL 30, 2010 | | FOR THE YEAR ENDED
OCTOBER 31, 2009 | |
| | SHARES | | AMOUNT | | SHARES | | AMOUNT | |
Alger China-U.S. Growth Fund | | | | | | | | | |
Class A: | | | | | | | | | |
Shares sold | | 460,231 | | $ | 6,749,211 | | 1,034,492 | | $ | 12,155,008 | |
Dividends reinvested | | 6,130 | | 88,830 | | — | | — | |
Shares redeemed | | (749,705 | ) | (11,064,690 | ) | (2,386,547 | ) | (23,585,476 | ) |
Net decrease | | (283,344 | ) | $ | (4,226,649 | ) | (1,352,055 | ) | $ | (11,430,468 | ) |
Class C: | | | | | | | | | |
Shares sold | | 118,409 | | $ | 1,748,687 | | 104,858 | | $ | 1,278,801 | |
Shares redeemed | | (16,762 | ) | (243,269 | ) | (19,425 | ) | (225,712 | ) |
Net increase | | 101,647 | | $ | 1,505,418 | | 85,433 | | $ | 1,053,089 | |
(b) Redemption Fee: The Fund may impose a 2.00% redemption fee on Fund shares redeemed (including shares redeemed by exchange) less than 30 days after such shares
28
ALGER CHINA-U.S. GROWTH FUND
NOTES TO FINANCIAL STATEMENTS (Unaudited)(Continued)
were acquired. The fees retained by the Fund are included as paid-in capital on the Statement of Assets and Liabilities and were as follows:
FOR THE SIX MONTHS
ENDED APRIL 30, 2010 | | FOR THE YEAR ENDED
OCTOBER 31, 2009 | |
$ | 1,494 | | $ | 23,945 | |
| | | | | |
NOTE 7 — Income Tax Information:
The tax character of distributions paid during the six months ended April 30, 2010 and the year ended October 31, 2009 was as follows:
| | FOR THE SIX MONTHS
ENDED
APRIL 30, 2010 | | FOR THE YEAR ENDED
OCTOBER 31, 2009 | |
| | | | | |
Distributions paid from: | | | | | |
Ordinary Income | | $ | 109,701 | | — | |
Long-term capital gain | | — | | — | |
Total distributions paid | | $ | 109,701 | | — | |
As of October 31, 2009, the components of accumulated gains and losses on a tax basis were as follows:
Undistributed ordinary income | | $ | 109,499 | |
Undistributed long-term gain | | — | |
Unrealized appreciation | | $ | 11,303,958 | |
The difference between book basis and tax basis unrealized appreciation is determined annually at October 31, 2009, and is attributable primarily to the tax deferral of losses on wash sales.
At October 31, 2009, the Fund, for federal income tax purposes, had a capital loss carryforward of $34,560,826 of which $12,021,793 expires in 2016 and $22,539,033 expires in 2017. The amounts may be applied against future net realized gains until the earlier of their utilization or expiration.
NOTE 8 — Fair Value Measurements:
The major categories of securities and their respective fair value inputs are detailed in the Fund’s Schedule of Investments. The following is a summary of the inputs used as of April 30, 2010 in valuing the Fund’s investments carried at fair value:
29
ALGER CHINA-U.S. GROWTH FUND
NOTES TO FINANCIAL STATEMENTS (Unaudited)(Continued)
Alger China-U.S. Growth Fund | | TOTAL FUND | | LEVEL 1 | | LEVEL 2 | | LEVEL 3 | |
COMMON STOCKS | | | | | | | | | |
Consumer Discretionary | | $ | 7,813,834 | | $ | 3,916,315 | | $ | 3,897,519 | | — | |
Consumer Staples | | 2,946,677 | | 708,380 | | 2,238,297 | | — | |
Energy | | 3,938,530 | | 1,351,224 | | 2,587,306 | | — | |
Financials | | 9,603,454 | | 3,116,342 | | 6,487,112 | | — | |
Health Care | | 6,053,888 | | 3,966,875 | | 2,087,013 | | — | |
Industrials | | 11,890,827 | | 6,244,711 | | 5,646,116 | | — | |
Information Technology | | 22,767,208 | | 13,794,219 | | 8,972,989 | | — | |
Materials | | 6,228,596 | | 4,474,782 | | 1,753,814 | | — | |
Telecommunication Services | | 921,379 | | — | | 921,379 | | — | |
Utilities | | 1,538,236 | | — | | 1,538,236 | | — | |
TOTAL COMMON STOCKS | | 73,702,629 | | 37,572,848 | | 36,129,781 | | — | |
CONVERTIBLE PREFERRED STOCK | | | | | | | | | |
Materials | | $ | 919,717 | | $ | 919,717 | | — | | — | |
CORPORATE BONDS | | | | | | | | | |
Consumer Discretionary | | $ | 661,375 | | — | | $ | 661,375 | | — | |
SHORT-TERM INVESTMENTS | | | | | | | | | |
Time Deposits | | $ | 937,788 | | — | | $ | 937,788 | | — | |
TOTAL INVESTMENTS IN SECURITIES | | $ | 76,221,509 | | $ | 38,492,565 | | $ | 37,728,944 | | — | |
NOTE 9 — Derivatives:
Financial Accounting Standards Board Accounting Standards Codification 815 — Derivatives and Hedging (“ASC 815”) requires qualitative disclosures about objectives and strategies for using derivatives, quantitative disclosures about fair value amounts of and gains and losses on derivative instruments, and disclosures about credit-risk-related contingent features in derivative agreements.
Forward currency contracts—In connection with portfolio purchases and sales of securities denominated in foreign currencies, the Fund may enter into forward currency contracts. Additionally, the Fund may enter into such contracts to economically hedge certain other foreign currency denominated investments. These contracts are valued at the current cost of covering or offsetting such contracts, and the related realized and unrealized foreign exchange gains and losses are included in the statement of operations. In the event that counterparties fail to settle these currency contracts or the related foreign security trades, the Fund could be exposed to foreign currency fluctuations.
Options—In order to produce incremental earnings or protect against changes in the value of portfolio securities, the Fund may buy and sell put and call options, write covered call options on portfolio securities and write cash-secured put options.
The Funds purchase put and call options or writes covered call options and put options for speculative purposes or to economically hedge against adverse movements in the value of portfolio holdings. The Fund will segregate assets to cover its obligations under option contracts.
There were no derivative transactions for the six months ended April 30, 2010.
30
ALGER CHINA-U.S. GROWTH FUND
NOTES TO FINANCIAL STATEMENTS (Unaudited)(Continued)
NOTE 10 — Litigation:
In October 2006, Alger Management, the Distributor and Alger Shareholder Services, Inc. entered into a settlement with the office of the New York State Attorney General, and in January 2007, the Manager and Distributor entered into a settlement with the Securities and Exchange Commission (the “SEC”) in connection with practices in the mutual fund industry identified as “market timing” and “late trading.” As part of these settlements, without admitting or denying liability, the firms consented to the payment of $30 million to reimburse fund shareholders; a fine of $10 million; and certain other remedial measures including a reduction in management fees of $1 million per year for five years. The $40 million was paid into an SEC Fair Fund for distribution to investors.
On August 31, 2005, the West Virginia Securities Commissioner (the “WVSC”), in an ex parte Summary Order to Cease and Desist and Notice of Right to Hearing, concluded that the Manager and the Distributor had violated the West Virginia Uniform Securities Act (the “WVUSA”), and ordered the Manager and the Distributor to cease and desist from further violations of the WVUSA by engaging in the market-timing-related conduct described in the order. The ex parte order provided notice of their right to a hearing with respect to the violations of law asserted by the WVSC. Other firms unaffiliated with the Manager were served with similar orders. The Manager and the Distributor intend to request a hearing for the purpose of seeking to vacate or modify the order.
In addition, in 2003 and 2004 several purported class actions and shareholder derivative suits were filed against various parties in the mutual fund industry, including the Manager, certain mutual funds managed by the Manager (the “Alger Mutual Funds”), and certain current and former Alger Mutual Fund trustees and officers, alleging wrongful conduct related to market-timing and late-trading by mutual fund shareholders. These cases were transferred to the U.S. District Court of Maryland by the Judicial Panel on Multidistrict Litigation for consolidated pre-trial proceedings under the caption number 1:04-MD-15863 (JFM). After a number of the claims in the Alger lawsuits were dismissed by the court, the Alger-related class and derivative suits were settled in principle, but such settlement remains subject to court approval. On May 19, 2010 the court preliminarily approved the settlement of the Alger-related lawsuits, subject to the hearing in due course of objections to the settlement, if any, by former or present shareholders entitled to raise such objections.
NOTE 11 — Recent Accounting Pronouncements:
On January 21, 2010, the FASB issued Accounting Standards Update (ASU) 2010-06. The ASU amends ASC 820 to add new requirements for disclosures about transfers into and out of Levels 1 and 2 and separate disclosures about purchases, sales, issuances, and settlements relating to Level 3 measurements. It also clarifies existing fair value disclosures about the level of disaggregation and about inputs and valuation techniques used to measure fair value. The application of ASU 2010-06 is required for fiscal years and interim periods beginning after December 15, 2009. At this time, management is evaluating the implications of ASU 2010-06.
31
ALGER CHINA-U.S. GROWTH FUND
NOTES TO FINANCIAL STATEMENTS (Unaudited)(Continued)
NOTE 12 — Subsequent Events:
Management of the Fund has evaluated events that have occurred subsequent to April 30, 2010. No such events have been identified which require recognition and disclosure.
32
ALGER CHINA-U.S. GROWTH FUND
ADDITIONAL INFORMATION (Unaudited)
Shareholder Expense Example
As a shareholder of the Fund, you incur two types of costs: transaction costs, if applicable, including sales charges (loads) and redemption fees; and ongoing costs, including management fees, distribution (12b-1) fees, if applicable, and other fund expenses. This example is intended to help you understand your ongoing costs (in dollars) of investing in the Fund and to compare these costs with the ongoing costs of investing in other mutual funds.
The example below is based on an investment of $1,000 invested at the beginning of the six-month period starting November 1, 2009 and ending April 30, 2010.
Actual Expenses
The first line for each class of shares in the table below provides information about actual account values and actual expenses. You may use the information in this line, together with the amount you invested, to estimate the expenses that you would have paid over the period. Simply divide your account value by $1,000 (for example, an $8,600 account value divided by $1,000 = 8.6), then multiply the result by the number in the first line under the heading entitled “Expenses Paid During the Period” to estimate the expenses you paid on your account during this period.
Hypothetical Example for Comparison Purposes
The second line for each class of shares in the table below provides information about hypothetical account values and hypothetical expenses based on the Fund’s actual expense ratios for each class of shares and an assumed rate of return of 5% per year before expenses, which is not the Fund’s actual return. The hypothetical account values and expenses may not be used to estimate the actual ending account balance or expenses you paid for the period. You may use this information to compare the ongoing costs of investing in the Fund and other funds. To do so, compare this 5% hypothetical example with the 5% hypothetical examples that appear in the shareholder reports of other funds.
Please note that the expenses shown in the table are meant to highlight your ongoing costs only and do not reflect any transaction costs, such as sales charges (loads) and redemption fees. Therefore, the second line under each class of shares in the table is useful in comparing ongoing costs only, and will not help you determine the relative total costs of owning different funds. In addition, if these transactional costs were included, your costs would have been higher.
33
| | | Beginning
Account
Value
November 1, 2009 | | Ending
Account
Value
April 30, 2010 | | Expenses
Paid During
the Six Months
Ended
April 30, 2010(a) | | Ratio of
Expenses to
Average
Net Assets
For the
Six Months
Ended
April 30, 2010(b) | |
Class A | Actual | | $ | 1,000.00 | | $ | 1,130.80 | | $ | 11.01 | | 2.05 | % |
| Hypothetical(c) | | 1,000.00 | | 1,014.87 | | 10.41 | | 2.05 | |
| | | | | | | | | | |
Class C | Actual | | 1,000.00 | | 1,128.00 | | 15.23 | | 2.84 | |
| Hypothetical(c) | | 1,000.00 | | 1,010.89 | | 14.39 | | 2.84 | |
| | | | | | | | | | | | | |
(a) | Expenses are equal to the annualized expense ratio of the respective share class, multiplied by the average account value over the period, multiplied by 181/365 (to reflect the one-half year period). |
(b) | Annualized. |
(c) | 5% annual return before expenses. |
Privacy Policy
Your Privacy Is Our Priority
At Fred Alger & Company, Incorporated (“Alger”) we value the confidence you have placed in us. In trusting us with your assets, you provide us with personal and financial data. Alger is committed to maintaining the confidentiality of the personal nonpublic information (“personal information”) entrusted to us by our customers. Your privacy is very important to us, and we are dedicated to safeguarding your personal information as we serve your financial needs.
Our Privacy Policy
We believe you should know about Alger’s Privacy Policy and how we collect and protect your personal information. This Privacy Policy (“Policy”) describes our practices and policy for collecting, sharing and protecting the personal information of our prospective, current and former customers. The Policy is applicable to Alger and its affiliate, Fred Alger Management, Inc., as well as the following funds: The Alger Funds, The Alger Institutional Funds, The Alger Portfolios, Alger China-U.S. Growth Fund and The Alger Funds II. We are proud of our Policy and hope you will take a moment to read about it.
Information We Collect
The type of personal information we collect and use varies depending on the Alger products or services you select.
We collect personal information that enables us to serve your financial needs, develop and offer new products and services, and fulfill legal and regulatory requirements. Depending on the products or services you request, we obtain personal information about you from the following sources:
· Information, such as your name, address and social security number, provided on applications and other forms we receive from you or your representative;
34
· Information from your communications with Alger employees or from your representative, which may be provided to us by telephone, in writing or through Internet transactions; and
· Information about your transactions, such as the purchase and redemption of fund shares, account balances and parties to the transactions, which we receive from our affiliates or other third parties.
Sharing of Personal Information
We may share your personal information with our affiliates so that they may process and service your transactions.
However, Alger never sells customer lists to any third party. Further, we do not disclose personal information to nonaffiliated third parties, except as required by law or as permitted by law to service your account, such as follows:
· To third-party service providers that assist us in servicing your accounts (e.g. securities clearinghouses);
· To governmental agencies and law enforcement officials (e.g. valid subpoenas, court orders); and
· To financial institutions that perform marketing services on our behalf or with whom we have joint marketing agreements that provide for the confidentiality of personal information.
Our Security Practices
We protect your personal information by maintaining physical, electronic and procedural safeguards. When you visit Alger’s Internet sites your information is protected by our systems that utilize 128-bit data encryption, Secure Socket Layer (SSL) protocol, user names, passwords and other precautions. We have implemented safeguards to ensure that access to customer information is limited to employees, such as customer service representatives, who require such information to carry out their job responsibilities. Our employees are aware of their strict responsibility to respect the confidentiality of your personal information.
Thank you for choosing to invest with Alger. We value your relationship with us and assure you we will abide by our policy to protect your information.
Proxy Voting Policies
A description of the policies and procedures the Fund uses to determine how to vote proxies relating to portfolio securities and the proxy voting record is available, without charge, by calling (800) 992-3863 or online on the Fund’s website at http://www.alger.com or on the SEC’s website at http://www.sec.gov.
35
Fund Holdings
The Fund’s most recent month end portfolio holdings are available approximately sixty days after month end on the Fund’s website at www.alger.com. The Fund also files its complete schedule of portfolio holdings with the SEC for the first and third quarter of each fiscal year on Form N-Q. The Fund’s Forms N-Q is available online on the SEC’s website at http://www.sec.gov or may be reviewed and copied at the SEC’s Public Reference Room in Washington, D.C. Information regarding the operation of the SEC’s Public Reference Room may be obtained by calling 1-800-SEC-0330. A copy of the most recent quarterly holdings may also be obtained from the Fund by calling (800) 992-3863.
36
ALGER CHINA-U.S. GROWTH FUND
111 Fifth Avenue
New York, NY 10003
(800) 992-3863
www.alger.com
Investment Manager
Fred Alger Management, Inc.
111 Fifth Avenue
New York, NY 10003
Distributor
Fred Alger & Company, Incorporated
111 Fifth Avenue
New York, NY 10003
Transfer Agent and Dividend Disbursing Agent
Boston Financial Data Services, Inc.
P.O. Box 8480
Boston, MA 02266
This report is submitted for the general information of the shareholders of Alger China-U.S. Growth Fund. It is not authorized for distribution to prospective investors unless accompanied by an effective prospectus for the Fund, which contains information concerning the Fund’s investment policies, fees and expenses as well as other pertinent information.

ITEM 2. CODE OF ETHICS.
Not applicable.
ITEM 3. AUDIT COMMITTEE FINANCIAL EXPERT.
Not applicable.
ITEM 4. PRINCIPAL ACCOUNTANT FEES AND SERVICES.
Not applicable.
ITEM 5. AUDIT COMMITTEE OF LISTED REGISTRANTS.
Not applicable.
ITEM 6. INVESTMENTS.
Not applicable.
ITEM 7. DISCLOSURE OF PROXY VOTING POLICIES AND PROCEDURES FOR CLOSED-END MANAGEMENT INVESTMENT COMPANIES.
Not applicable.
ITEM 8. PORTFOLIO MANAGERS OF CLOSED-END MANAGEMENT INVESTMENT COMPANIES.
Not applicable.
ITEM 9. PURCHASES OF EQUITY SECURITIES BY CLOSED-END MANAGEMENT INVESTMENT COMPANY AND AFFILIATED PURCHASERS.
Not applicable.
ITEM 10. SUBMISSION OF MATTERS TO A VOTE OF SECURITY HOLDERS.
Not applicable.
ITEM 11. CONTROLS AND PROCEDURES.
(a) The Registrant’s principal executive officer and principal financial officer have concluded that the Registrant’s disclosure controls and procedures (as defined in Rule 30a-3(c) under the Investment Company Act of 1940, as amended) are effective based on their evaluation of the disclosure controls and procedures as of a date within 90 days of the filing date of this document.
(b) No changes in the Registrant’s internal control over financial reporting occurred during the Registrant’s second fiscal quarter of the period covered by this report that materially affected, or are reasonably likely to materially affect, the Registrant’s internal control over financial reporting.
ITEM 12. EXHIBITS.
(a) (1) Not applicable
(a) (2) Certifications of principal executive officer and principal financial officer as required by rule 30a-2(a) under the Investment Company Act of 1940 are attached as Exhibit 99.CERT
(a) (3) Not applicable
(b) Certifications of principal executive officer and principal financial officer as required by rule 30a-2(b) under the Investment Company Act of 1940 are attached as Exhibit 99.906CERT
SIGNATURES
Pursuant to the requirements of the Securities Exchange Act of 1934 and the Investment Company Act of 1940, the registrant has duly caused this report to be signed on its behalf by the undersigned, thereunto duly authorized.
Alger China-U.S. Growth Fund |
|
By: | /s/Dan C. Chung | |
| | |
| Dan C. Chung | |
| | |
| President | |
|
Date: June 29, 2010 |
Pursuant to the requirements of the Securities Exchange Act of 1934 and the Investment Company Act of 1940, this report has been signed below by the following persons on behalf of the registrant and in the capacities and on the dates indicated.
By: | /s/Dan C. Chung | |
| | |
| Dan C. Chung | |
| | |
| President | |
Date: June 29, 2010
By: | /s/Michael D. Martins | |
| | |
| Michael D. Martins | |
| | |
| Treasurer | |
Date: June 29, 2010