UNITED STATES
SECURITIES AND EXCHANGE COMMISSION
Washington, D.C. 20549
FORM N-CSR
CERTIFIED SHAREHOLDER REPORT OF REGISTERED MANAGEMENT INVESTMENT COMPANIES
Investment Company Act file number: 811-21457
| Name of Fund: | | BlackRock Allocation Target Shares |
| Fund Address: | | 100 Bellevue Parkway, Wilmington, DE 19809 |
Name and address of agent for service: John M. Perlowski, Chief Executive Officer, BlackRock Allocation Target Shares, 50 Hudson Yards, New York, NY 10001
Registrant’s telephone number, including area code: (800) 441-7762
Date of fiscal year end: 03/31/2024
Date of reporting period: 03/31/2024
Item 1 – Report to Stockholders
(a) The Report to Shareholders is attached herewith.
| | |

| | MARCH 31, 2024 |
BlackRock Allocation Target Shares
· BATS: Series A Portfolio
· BATS: Series C Portfolio
· BATS: Series E Portfolio
· BATS: Series M Portfolio
· BATS: Series P Portfolio
· BATS: Series S Portfolio
· BATS: Series V Portfolio
|
Not FDIC Insured • May Lose Value • No Bank Guarantee |
The Markets in Review
Dear Shareholder,
The combination of continued economic growth and cooling inflation provided a supportive backdrop for investors during the 12-month reporting period ended March 31, 2024. Higher interest rates helped to rein in inflation, and the Consumer Price Index decelerated substantially while remaining above pre-pandemic levels. A moderating labor market helped ease inflationary pressure, although wages continued to grow. Wage and job growth powered robust consumer spending, backstopping the economy. On October 7, 2023, Hamas launched a horrific attack on Israel. The ensuing war has had a significant humanitarian impact and could lead to heightened economic and market volatility. We see geopolitics as a structural market risk going forward. See our geopolitical risk dashboard at blackrock.com for more details.
Equity returns were robust during the period, as interest rates stabilized and the economy proved to be more resilient than many investors expected. The U.S. economy continued to show strength, and growth further accelerated in the second half of 2023. Large-capitalization U.S. stocks posted particularly substantial gains, supported by the performance of a few notable technology companies, while small-capitalization U.S. stocks’ advance was slower but still robust. Meanwhile, international developed market equities also gained strongly, while emerging market stocks advanced at a more modest pace.
The 10-year U.S. Treasury yield rose during the reporting period, as investors reacted to elevated inflation and attempted to anticipate future interest rate changes. However, higher yields drove positive returns overall for 10-year U.S. Treasuries and solid gains in shorter-duration U.S. Treasuries. The corporate bond market benefited from improving economic sentiment, although high-yield corporate bond prices fared significantly better than investment-grade bonds as demand from yield-seeking investors remained strong.
The U.S. Federal Reserve (the “Fed”), attempting to manage persistent inflation, raised interest rates twice during the 12-month period, but paused its tightening after its July meeting. The Fed also continued to reduce its balance sheet by not replacing some of the securities that reach maturity.
Supply constraints appear to have become an embedded feature of the new macroeconomic environment, making it difficult for developed economies to increase production without sparking higher inflation. Geopolitical fragmentation and an aging population risk further exacerbating these constraints, keeping the labor market tight and wage growth high. Although the Fed has stopped tightening for now, we believe that the new economic regime means that the Fed will need to maintain high rates for an extended period despite the market’s hopes for rapid interest rate cuts, as reflected in the ongoing rally. In this new regime, we anticipate greater volatility and dispersion of returns, creating more opportunities for selective portfolio management.
Looking at developed market stocks, we have an overweight stance on U.S. stocks overall, particularly given the promise of emerging AI technologies. We are also overweight Japanese stocks as shareholder-friendly policies generate increased investor interest, although we maintain an underweight stance on European stocks. In credit, there are selective opportunities in the near term despite tighter credit and financial conditions. For fixed income investing with a six- to twelve-month horizon, we see the most attractive investments in short-term U.S. Treasuries and hard-currency emerging market bonds.
Overall, our view is that investors need to think globally, position themselves to be prepared for a decarbonizing economy, and be nimble as market conditions change. We encourage you to talk with your financial advisor and visit blackrock.com for further insight about investing in today’s markets.
Sincerely,

Rob Kapito
President, BlackRock Advisors, LLC

Rob Kapito
President, BlackRock Advisors, LLC
| | | | | | | | |
|
| Total Returns as of March 31, 2024 | |
| | | |
| | | 6-Month | | | 12-Month | |
| | | |
U.S. large cap equities (S&P 500® Index) | | | 23.48% | | | | 29.88% | |
| | | |
U.S. small cap equities (Russell 2000® Index) | | | 19.94 | | | | 19.71 | |
| | | |
International equities (MSCI Europe, Australasia, Far East Index) | | | 16.81 | | | | 15.32 | |
| | | |
Emerging market equities (MSCI Emerging Markets Index) | | | 10.42 | | | | 8.15 | |
| | | |
3-month Treasury bills (ICE BofA 3-Month U.S. Treasury Bill Index) | | | 2.68 | | | | 5.24 | |
| | | |
U.S. Treasury securities (ICE BofA 10-Year U.S. Treasury Index) | | | 4.88 | | | | (2.44) | |
| | | |
U.S. investment grade bonds (Bloomberg U.S. Aggregate Bond Index) | | | 5.99 | | | | 1.70 | |
| | | |
Tax-exempt municipal bonds (Bloomberg Municipal Bond Index) | | | 7.48 | | | | 3.13 | |
| | | |
U.S. high yield bonds (Bloomberg U.S. Corporate High Yield 2% Issuer Capped Index) | | | 8.73 | | | | 11.15 | |
Past performance is not an indication of future results. Index performance is shown for illustrative purposes only. You cannot invest directly in an index. | |
| | |
| 2 | | THIS PAGE IS NOT PART OF YOUR FUND REPORT |
Table of Contents
| | |
Fund Summary as of March 31, 2024 | | BATS: Series A Portfolio |
Investment Objective
BATS: Series A Portfolio’s (the “Fund”) investment objective is to seek a high level of current income consistent with capital preservation.
Portfolio Management Commentary
How did the Fund perform?
For the 12-month period ended March 31, 2024, the Fund outperformed its broad-based benchmark, the Bloomberg U.S. Universal Index, and outperformed its customized weighted index comprised of 50% Bloomberg U.S. Asset-Backed Securities Index and 50% Bloomberg Non-Agency Investment Grade CMBS Index (the “Reference Benchmark”). Shares of the Fund can be purchased or held only by or on behalf of (i) certain separately managed account clients; (ii) collective trust funds managed by BlackRock Institutional Trust Company, N.A., an affiliate of the investment adviser; and (iii) mutual funds advised by BlackRock Advisors, LLC or its affiliates. Comparisons of the Fund’s performance versus its benchmark index will differ from comparisons of the benchmark against the performance of the separately managed accounts.
What factors influenced performance?
Positive contributions to the Fund’s performance relative to the benchmark over the reporting period were led by out-of-benchmark allocations, most notably AAA-rated collateralized loan obligations (“CLOs”). Exposure to non-agency residential mortgage-backed securities (“RMBS”), specifically to Legacy and 2.0 bonds (non-agency RMBS securities issued prior to the end of the global financial crisis in 2008 and securities issued under post global financial crisis regulatory regimes, respectively) also proved additive.
The largest detractor from relative performance was the Fund’s exposure to conduit structures within asset-backed securities (“ABS”) in auto loans and credit card receivables. Commercial mortgage-backed securities (“CMBS”), both senior and subordinated, also detracted from active performance.
Describe recent portfolio activity.
The Fund rotated opportunistically among securitized asset subsectors during the reporting period, increasing risk exposures as the economy has shown continuous strength. Over the reporting period, the Fund slightly increased exposure to CMBS but had the largest increase in CLOs. Allocations to ABS and non-agency RMBS have remained relatively stable. The Fund also decreased its cash-equivalent exposure significantly.
The Fund’s cash position averaged 7.4% during the period and was 5.7% at the end of the period as the Fund used cash and cash equivalents to tactically reduce risk. The Fund’s cash position did not have a material impact on performance during the period.
Describe portfolio positioning at period end.
The Fund ended the period short duration (and corresponding interest rate sensitivity) relative to the benchmark. The Fund was positioned underweight ABS and CMBS relative to the benchmark and had out-of-benchmark exposures to non-agency RMBS and CLOs.
The views expressed reflect the opinions of BlackRock as of the date of this report and are subject to change based on changes in market, economic or other conditions. These views are not intended to be a forecast of future events and are no guarantee of future results.
| | |
| 4 | | 2 0 2 4 BLACK ROCK ANNUAL REPORT TO SHAREHOLDERS |
| | |
Fund Summary as of March 31, 2024 (continued) | | BATS: Series A Portfolio |
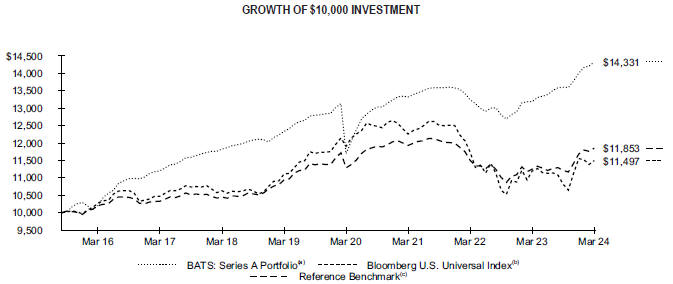
The Fund commenced operations on September 21, 2015.
| | (a) | The Fund will principally invest its assets in fixed-income securities, such as ABS, CMBS and RMBS issued or guaranteed by the U.S. Government, various agencies of the U.S. Government or various instrumentalities that have been established or sponsored by the U.S. Government, CMBS and RMBS issued by banks and other financial institutions, collateralized mortgage obligations, loans backed by commercial or residential real estate, derivatives, repurchase agreements and reverse repurchase agreements. | |
| | (b) | An index representing the union of the US Aggregate Index, US Corporate High Yield Index, Investment Grade 144A Index, Eurodollar Index, US Emerging Markets Index, and the non-ERISA eligible portion of the CMBS Index. The index covers USD-denominated, taxable bonds that are rated either investment grade or high-yield. | |
| | (c) | A customized weighted index comprised of the returns of the Bloomberg U.S. Asset-Backed Securities Index (50%)/Bloomberg Non-Agency Investment Grade CMBS Index (50%). The Bloomberg U.S. Asset-Backed Securities Index is composed of debt securities backed by credit card, auto and home equity loans that are rated investment grade or higher by Moody’s Investors Service (“Moody’s”), S&P Global Ratings (“S&P”) or Fitch Ratings, Inc. (“Fitch”). Issues must have at least one year to maturity and an outstanding par value of at least $50 million. The Bloomberg Non-Agency Investment Grade CMBS Index measures the market of conduit and fusion CMBS deals with a minimum current deal size of $300 million that are rated investment grade or higher using the middle rating of Moody’s, S&P, and Fitch after dropping the highest and lowest available ratings. Securities must have a remaining average life of at least one year and must be fixed-rate, weighted average coupon (“WAC”), or capped WAC securities. | |
Performance
| | | | | | | | | | | | | | | | |
| | | | | | Average Annual Total Returns(a) | |
| | | | |
| | | | | | | | 1 Year | | | | 5 Years | | |
| Since
Inception |
(b) |
| | | | |
BATS: Series A Portfolio | | | | | | | 8.66 | % | | | 3.05 | % | | | 4.31 | % |
| | | | |
Bloomberg U.S. Universal Index | | | | | | | 2.67 | | | | 0.69 | | | | 1.65 | |
Reference Benchmark | | | | | | | 5.35 | | | | 1.62 | | | | 2.01 | |
| (a) | See “About Fund Performance” for a detailed description of performance related information. | |
| (b) | The Fund commenced operations on September 21, 2015. | |
Past performance is not an indication of future results.
Performance results may include adjustments made for financial reporting purposes in accordance with U.S. generally accepted accounting principles.
Expense Example
| | | | | | | | | | | | | | | | | | | | | | | | | | |
| Actual | | | Hypothetical 5% Return | | | | |
| | | | | | |
| Beginning
Account Value (10/01/23) |
| |
| Ending
Account Value (03/31/24) |
| |
| Expenses
Paid During the Period |
(a) | |
| Beginning
Account Value (10/01/23) |
| |
| Ending
Account Value (03/31/24) |
| |
| Expenses
Paid During the Period |
(a) | |
| Annualized
Expense Ratio |
|
| $ | 1,000.00 | | | $ | 1,053.60 | | | $ | 0.00 | | | $ | 1,000.00 | | | $ | 1,025.00 | | | $ | 0.00 | | | | 0.00 | % |
| (a) | For shares of the Fund, expenses are equal to the annualized expense ratio, multiplied by the average account value over the period, multiplied by 183/366 (to reflect the one-half year period shown). BlackRock has contractually agreed to waive all fees and pay or reimburse all direct expenses, except extraordinary expenses, incurred by the Fund. Extraordinary expenses may include dividend expense, interest expense, acquired fund fees and expenses and certain other Fund expenses. This agreement has no fixed term. | |
See “Disclosure of Expenses” for further information on how expenses were calculated.
| | |
| Fund Summary as of March 31, 2024 (continued) | | BATS: Series A Portfolio |
Portfolio Information
| | | | |
PORTFOLIO COMPOSITION | |
| | |
| Asset Type | |
| Percent of
Total Investments |
(a) |
| |
Asset-Backed Securities | | | 50.7 | % |
Non-Agency Mortgage-Backed Securities | | | 48.4 | |
Floating Rate Loan Interests | | | 0.6 | |
U.S. Government Sponsored Agency Securities | | | 0.3 | |
Corporate Bonds | | | —(b) | |
| | | | |
CREDIT QUALITY ALLOCATION | |
| | |
| Credit Rating(c) | |
| Percent of
Total Investments |
(a) |
| |
AAA/Aaa(d) | | | 34.0 | % |
AA/Aa | | | 7.6 | |
A | | | 3.9 | |
BBB/Baa | | | 3.8 | |
BB/Ba | | | 4.3 | |
B | | | 1.7 | |
CCC/Caa | | | 2.3 | |
CC/Ca | | | 2.1 | |
C | | | 0.6 | |
N/R | | | 39.7 | |
| (a) | Total investments exclude short-term securities and TBA sale commitments. |
| (b) | Amount is less than 0.1%. |
| (c) | For financial reporting purposes, credit quality ratings shown above reflect the highest rating assigned by either S&P Global Ratings or Moody’s Investors Service (“Moody’s”) if ratings differ. These rating agencies are independent, nationally recognized statistical rating organizations and are widely used. Investment grade ratings are credit ratings of BBB/Baa or higher. Below investment grade ratings are credit ratings of BB/Ba or lower. Investments designated N/R are not rated by either rating agency. Unrated investments do not necessarily indicate low credit quality. Credit quality ratings are subject to change. |
| (d) | The investment adviser evaluates the credit quality of unrated investments based upon certain factors including, but not limited to, credit ratings for similar investments and financial analysis of sectors, individual investments and/or issuers. Using this approach, the investment adviser has deemed unrated U.S. Government Sponsored Agency Securities and U.S. Treasury Obligations to be of similar credit quality as investments rated AAA/Aaa. |
| | |
| 6 | | 2 0 2 4 BLACK ROCK ANNUAL REPORT TO SHAREHOLDERS |
| | |
| Fund Summary as of March 31, 2024 | | BATS: Series C Portfolio |
Investment Objective
BATS: Series C Portfolio’s (the “Fund”) investment objective is to seek to maximize total return, consistent with income generation and prudent investment management.
Portfolio Management Commentary
How did the Fund perform?
For the 12-month period ended March 31, 2024, the Fund outperformed its benchmark, the Bloomberg U.S. Credit Index. Shares of the Fund can be purchased or held only by or on behalf of certain separately managed account clients. Comparisons of the Fund’s performance versus its benchmark index will differ from comparisons of the benchmark against the performance of the separately managed accounts.
What factors influenced performance?
The Fund’s duration/yield curve positioning was the largest contributor to relative performance during the reporting period. (Duration is a measure of interest rate sensitivity). An allocation to capital securities and an overweight in midstream energy also contributed. (Capital securities are dividend-paying securities that combine some features of both corporate bonds and preferred stocks, while generally providing higher yields to compensate for being less senior in the issuers’ capital structures). The Fund’s underweight in the life insurance sector was the largest detractor from relative performance, followed by underweights in media/entertainment and property/casualty insurance.
Describe recent portfolio activity.
Early in the reporting period, the investment advisor focused on mitigating risk in anticipation of slowing economic growth and a possible mild recession brought about by stringent monetary policies and tight financial conditions. As part of this process, it increased the Fund’s weightings in defensive non-cyclical sectors such as electric utilities and pharmaceuticals. Additionally, the Fund strategically increased its holdings in certain cyclical sectors it believed would be resilient in a mild recession, including specific midstream energy and metals and mining companies.
In the latter half of 2023, positive economic indicators and favorable dynamics in the investment-grade corporate market—specifically, muted supply and high demand from investors seeking yield—prompted the investment adviser to reassess its stance and shift the Fund towards a more “risk-on” approach. This shift initially involved reducing the portfolio’s weighting in defensive non-cyclical sectors and adding lower-quality industrial issues with 30-year maturities. Later in the reporting period, it exchanged these holdings for 10-year bank issues and capital securities. The Fund also took a larger position in emerging market government bonds, based on the category’s attractive relative value compared to U.S. investment-grade issues.
Describe portfolio positioning at period end.
The Fund’s largest overweights were in the banking, foreign agencies, midstream energy and aerospace/defense sectors, while its largest underweights were in food/beverage, media/entertainment, retailers, and diversified manufacturing issues. The Fund’s duration was longer than that of the benchmark.
The views expressed reflect the opinions of BlackRock as of the date of this report and are subject to change based on changes in market, economic or other conditions. These views are not intended to be a forecast of future events and are no guarantee of future results.
| | |
Fund Summary as of March 31, 2024 (continued) | | BATS: Series C Portfolio |
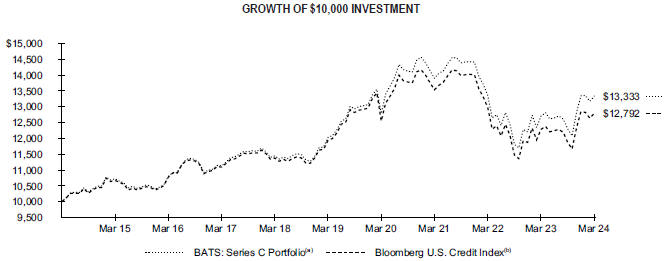
| | (a) | The Fund will principally invest its assets in investment grade fixed-income securities, such as corporate bonds, notes and debentures, ABS, CMBS and RMBS, obligations of non-U.S. governments and supranational organizations which are chartered to promote economic development, collateralized mortgage obligations, U.S. Treasury and agency securities, cash equivalent investments, when-issued and delayed delivery securities, derivatives, repurchase agreements and reverse repurchase agreements. | |
| | (b) | Bloomberg U.S. Credit Index, an index that measures the investment grade, US dollar-denominated, fixed-rate, taxable corporate and government related bond markets. It is composed of the US Corporate Index and a non-corporate component that includes foreign agencies, sovereigns, supranationals and local authorities. | |
Performance
| | | | | | | | | | | | | | | | |
| | | | | | Average Annual Total Returns(a) | |
| | | | |
| | | | | | | | 1 Year | | | | 5 Years | | | | 10 Years | |
| | | | |
BATS: Series C Portfolio | | | | | | | 4.98 | % | | | 2.08 | % | | | 2.92 | % |
Bloomberg U.S. Credit Index | | | | | | | 4.15 | | | | 1.39 | | | | 2.49 | |
| (a) | See “About Fund Performance” for a detailed description of performance related information. | |
| Past | performance is not an indication of future results. | |
Performance results may include adjustments made for financial reporting purposes in accordance with U.S. generally accepted accounting principles.
Expense Example
| | | | | | | | | | | | | | | | | | | | | | | | | | |
| Actual | | | Hypothetical 5% Return | | | | |
| | | | | | |
| Beginning
Account Value (10/01/23) |
| |
| Ending
Account Value (03/31/24) |
| |
| Expenses
Paid During the Period |
(a) | |
| Beginning
Account Value (10/01/23) |
| |
| Ending
Account Value (03/31/24) |
| |
| Expenses
Paid During the Period |
(a) | |
| Annualized
Expense Ratio |
|
| $ | 1,000.00 | | | $ | 1,083.80 | | | $ | 0.02 | | | $ | 1,000.00 | | | $ | 1,024.98 | | | $ | 0.00 | | | | 0.00 | % |
| (a) | For shares of the Fund, expenses are equal to the annualized expense ratio, multiplied by the average account value over the period, multiplied by 183/366 (to reflect the one-half year period shown). BlackRock has contractually agreed to waive all fees and pay or reimburse all direct expenses, except extraordinary expenses, incurred by the Fund. Extraordinary expenses may include dividend expense, interest expense, acquired fund fees and expenses and certain other Fund expenses. This agreement has no fixed term. | |
See “Disclosure of Expenses” for further information on how expenses were calculated.
| | |
| 8 | | 2 0 2 4 BLACK ROCK ANNUAL REPORT TO SHAREHOLDERS |
| | |
| Fund Summary as of March 31, 2024 (continued) | | BATS: Series C Portfolio |
Portfolio Information
| | | | |
PORTFOLIO COMPOSITION | |
| | |
| Asset Type | |
| Percent of
Total Investments |
(a) |
| |
Corporate Bonds | | | 87.6 | % |
Preferred Securities | | | 5.0 | |
Foreign Government Obligations | | | 2.9 | |
U.S. Treasury Obligations | | | 1.6 | |
Foreign Agency Obligations | | | 1.5 | |
Municipal Bonds | | | 1.4 | |
| | | | |
CREDIT QUALITY ALLOCATION | |
| | |
| Credit Rating(b) | |
| Percent of
Total Investments |
(a) |
AAA/Aaa(c) | | | 1.6 | % |
AA/Aa | | | 4.2 | |
A | | | 32.6 | |
BBB/Baa | | | 60.6 | |
BB/Ba | | | 1.0 | |
| (a) | Total investments exclude short-term securities and options purchased. |
| (b) | For financial reporting purposes, credit quality ratings shown above reflect the highest rating assigned by either S&P Global Ratings or Moody’s if ratings differ. These rating agencies are independent, nationally recognized statistical rating organizations and are widely used. Investment grade ratings are credit ratings of BBB/Baa or higher. Below investment grade ratings are credit ratings of BB/Ba or lower. Investments designated N/R are not rated by either rating agency. Unrated investments do not necessarily indicate low credit quality. Credit quality ratings are subject to change. |
| (c) | The investment adviser evaluates the credit quality of unrated investments based upon certain factors including, but not limited to, credit ratings for similar investments and financial analysis of sectors, individual investments and/or issuers. Using this approach, the investment adviser has deemed unrated U.S. Government Sponsored Agency Securities and U.S. Treasury Obligations to be of similar credit quality as investments rated AAA/Aaa. |
| | |
| Fund Summary as of March 31, 2024 | | BATS: Series E Portfolio |
Investment Objective
BATS: Series E Portfolio’s (the “Fund”) investment objective is to seek to maximize Federal tax-free yield with a secondary goal of total return.
Portfolio Management Commentary
How did the Fund perform?
For the 12-month period ended March 31, 2024, the Fund underperformed its broad-based benchmark, the Bloomberg Municipal High Yield Bond Index, but it outperformed its customized weighted index comprised of 65% Bloomberg Municipal Bond Index Total Return Index Value Unhedged/35% Bloomberg Municipal Bond: High Yield (non-Investment Grade) Total Return Index (the “Customized Reference Benchmark”). Shares of the Fund can be purchased or held only by or on behalf of certain separately managed account clients. Comparisons of the Fund’s performance versus its benchmark index will differ from comparisons of the benchmark against the performance of the separately managed accounts.
What factors influenced performance?
The Fund’s positioning in the tax-backed states, corporate-backed, tobacco, other industries, education, and transportation sectors contributed to relative performance. Bonds with positive convexity, primarily those with low coupons trading at a discount to par, generally outpaced their higher-coupon, premium counterparts. (Positive convexity refers to a bond whose price increases by a greater rate as interest rates fall and decreases by a slower pace as rates rise). In terms of ratings categories, holdings in non-rated, BBB, and A rated securities were the primary drivers of relative performance. Issues with maturities of 20 years and longer made a strong contribution to results, as well.
Positioning in the utilities, tax-backed local, school districts, and housing sectors hurt relative performance. An underweight position in bonds with maturities of 15 years and below also detracted, as did an underweight in those rated AA. The Fund’s cash position had no material impact on performance.
Describe recent portfolio activity.
The investment adviser prioritized convexity early in the reporting period, favoring the asymmetrical risk-reward profile offered by lower coupon bonds at the time. As the new year commenced, the investment adviser’s strategy shifted toward enhancing income and bolstering the portfolio’s allocation to high yield bonds in an effort to capitalize on the favorable supply-demand dynamics in this area of the market.
The investment adviser strategically increased the Fund’s cash position late in the period due to significant inflows. It maintained the elevated cash position intentionally to reduce portfolio duration, as it perceived market valuations to be rich and the yields on cash to be relatively attractive. (Duration is a measure of interest rate sensitivity).
Describe portfolio positioning at period end.
The Fund strategically maintained a long position in convexity and discount bonds, while holding an underweight in premium bonds with 5% coupons. At the sector level, the investment adviser favored corporate and education issues. Conversely, it was underweight in tax-backed securities at both the local and state levels, as well as in utilities, school districts, and transportation. The Fund was overweight in non-rated, BBB, and A rated debt, and it was underweight in AA and AAA rated issues. The investment adviser preferred bonds with maturities of over 20 years, and it maintained an underweight in those with maturities of 15 years and below.
The views expressed reflect the opinions of BlackRock as of the date of this report and are subject to change based on changes in market, economic or other conditions. These views are not intended to be a forecast of future events and are no guarantee of future results.
| | |
| 10 | | 2 0 2 4 BLACK ROCK ANNUAL REPORT TO SHAREHOLDERS |
| | |
Fund Summary as of March 31, 2024 (continued) | | BATS: Series E Portfolio |
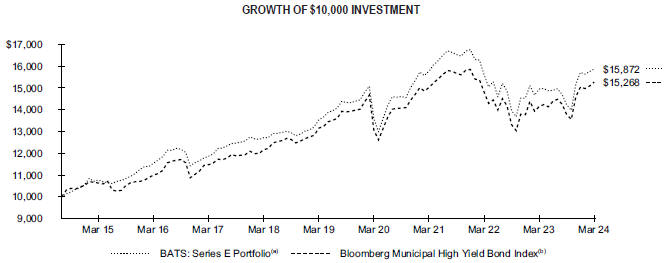
The Fund commenced operations on August 4, 2014.
| | (a) | The Fund will invest in investment grade and non-investment grade municipal bonds. | |
| | (b) | An index designed to measure the performance of U.S. dollar-denominated high-yield municipal bonds issued by U.S. states, the District of Columbia, U.S. territories and local governments or agencies. | |
Performance
| | | | | | | | | | | | | | | | |
| | | | | | Average Annual Total Returns(a) | |
| | | | |
| | | | | | | | 1 Year | | | | 5 Years | | |
| Since
Inception |
(b) |
| | | | |
BATS: Series E Portfolio | | | | | | | 6.18 | % | | | 3.24 | % | | | 4.90 | % |
| | | | |
Bloomberg Municipal High Yield Bond Index | | | | | | | 7.91 | | | | 3.03 | | | | 4.48 | |
Customized Reference Benchmark(c) | | | | | | | 4.78 | | | | 2.12 | | | | N/A | |
| (a) | See “About Fund Performance” for a detailed description of performance related information. | |
| (b) | The Fund commenced operations on August 4, 2014. | |
| (c) | The Customized Reference Benchmark is comprised of the Bloomberg Municipal Bond Index Total Return Index Value Unhedged (65%) and the Bloomberg Municipal Bond: High Yield (non-Investment Grade) Total Return Index (35%). The Customized Reference Benchmark commenced on September 30, 2016. | |
Past performance is not an indication of future results.
Performance results may include adjustments made for financial reporting purposes in accordance with U.S. generally accepted accounting principles.
Expense Example
| | | | | | | | | | | | | | | | | | | | | | | | | | | | | | | | | | | | | | |
| Actual | | | Hypothetical 5% Return | | | | |
| | | | | | | |
| | | | | | | Including
Interest Expense and Fees | | | Excluding
Interest Expense and Fees | | | | | | Including
Interest Expense and Fees | | | Excluding
Interest Expense and Fees | | | | |
| | | | | | | | | |
| Beginning
Account Value (10/01/23) |
| |
| Ending
Account Value (03/31/24) |
| |
| Expenses
Paid During the Period |
(a) | |
| Expenses
Paid During the Period |
(b) | |
| Beginning
Account Value (10/01/23) |
| |
| Ending
Account Value (03/31/24) |
| |
| Expenses
Paid During the Period |
(a) | |
| Ending
Account Value (03/31/24) |
| |
| Expenses
Paid During the Period |
(b) | | | | |
| $ | 1,000.00 | | | $ | 1,116.00 | | | $ | 0.45 | | | $ | 0.00 | | | $ | 1,000.00 | | | $ | 1,024.57 | | | $ | 0.46 | | | $ | 1,025.00 | | | $ | 0.00 | | | | | |
| (a) | For shares of the Fund, expenses are equal to the annualized expense ratio of 0.09%, multiplied by the average account value over the period, multiplied by 183/366 (to reflect the one-half year period shown). BlackRock has contractually agreed to waive all fees and pay or reimburse all direct expenses, except extraordinary expenses, incurred by the Fund. Extraordinary expenses may include dividend expense, interest expense, acquired fund fees and expenses and certain other Fund expenses. This agreement has no fixed term. | |
| (b) | For shares of the Fund, expenses are equal to the annualized expense ratio of 0.00%, multiplied by the average account value over the period, multiplied by 183/366 (to reflect the one-half year period shown). BlackRock has contractually agreed to waive all fees and pay or reimburse all direct expenses, except extraordinary expenses, incurred by the Fund. Extraordinary expenses may include dividend expense, interest expense, acquired fund fees and expenses and certain other Fund expenses. This agreement has no fixed term. | |
See “Disclosure of Expenses” for further information on how expenses were calculated.
| | |
| Fund Summary as of March 31, 2024 (continued) | | BATS: Series E Portfolio |
Portfolio Information
| | | | |
SECTOR ALLOCATION | |
| | |
| Sector | |
| Percent of
Total Investments |
(a) |
County/City/Special District/School District | | | 29.9 | % |
Utilities | | | 17.8 | |
Education | | | 14.9 | |
Transportation | | | 14.4 | |
Health Care | | | 12.5 | |
Tobacco | | | 6.2 | |
Housing | | | 4.3 | |
| | | | |
CREDIT QUALITY ALLOCATION | |
| | |
| Credit Rating(b) | |
| Percent of
Total Investments |
(a) |
AAA/Aaa | | | 2.3 | % |
AA/Aa | | | 10.2 | |
A | | | 21.9 | |
BBB/Baa | | | 10.9 | |
BB/Ba | | | 10.1 | |
B | | | 0.8 | |
N/R | | | 43.8 | |
| (a) | Total investments exclude money market funds. |
| (b) | For financial reporting purposes, credit quality ratings shown above reflect the highest rating assigned by either S&P Global Ratings or Moody’s if ratings differ. These rating agencies are independent, nationally recognized statistical rating organizations and are widely used. Investment grade ratings are credit ratings of BBB/Baa or higher. Below investment grade ratings are credit ratings of BB/Ba or lower. Investments designated N/R are not rated by either rating agency. Unrated investments do not necessarily indicate low credit quality. Credit quality ratings are subject to change. |
| | |
| 12 | | 2 0 2 4 BLACK ROCK ANNUAL REPORT TO SHAREHOLDERS |
| | |
| Fund Summary as of March 31, 2024 | | BATS: Series M Portfolio |
Investment Objective
BATS: Series M Portfolio’s (the “Fund”) investment objective is to seek to maximize total return, consistent with income generation and prudent investment management.
Portfolio Management Commentary
How did the Fund perform?
For the 12-month period ended March 31, 2024, the Fund outperformed its benchmark, the Bloomberg MBS Index. Shares of the Fund can be purchased or held only by or on behalf of certain separately managed account clients. Comparisons of the Fund’s performance versus its benchmark index will differ from comparisons of the benchmark against the performance of the separately managed accounts.
What factors influenced performance?
The Fund’s active benchmark strategy, which implements relative value decisions between specified pools and to-be-announced securities (“TBAs”), contributed positively to relative performance. Relative value positioning between conventional 30-year agency MBS and similar duration U.S. Treasuries also proved additive. Finally, trades expressing a preference for lower coupon agency MBS pools contributed over the period.
Describe recent portfolio activity.
During the reporting period, exposure to fixed rate collateralized mortgage obligations was increased. Within passthrough MBS, exposure within the coupon stack shifted slightly away from lower coupons and toward middle and higher coupons. The allocation to CMBS was modestly decreased over the period while continuing to favor senior conduit and single-asset/single-borrower issues.
Describe portfolio positioning at period end.
Within agency MBS, the Fund preferred specified pools relative to TBAs, with a tilt toward low loan balance pools that provide incremental income relative to seasoned generic pools. The Fund moved to a slight underweight relative to the benchmark in CMBS following the sector’s strong performance in the first quarter of 2024.
The views expressed reflect the opinions of BlackRock as of the date of this report and are subject to change based on changes in market, economic or other conditions. These views are not intended to be a forecast of future events and are no guarantee of future results.
| | |
| Fund Summary as of March 31, 2024 (continued) | | BATS: Series M Portfolio |
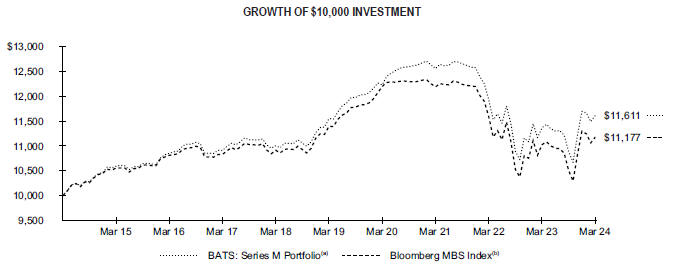
| | (a) | The Fund will principally invest its assets in investment grade CMBS and RMBS, ABS, collateralized mortgage obligations, U.S. Treasury and agency securities, cash equivalent investments, when-issued and delayed delivery securities, derivatives and dollar rolls. | |
| | (b) | Bloomberg MBS Index, an unmanaged market value-weighted index, which covers the mortgage-backed securities component of the Bloomberg U.S. Aggregate Bond Index. It is comprised of agency mortgage-backed pass-through securities of the Government National Mortgage Association (Ginnie Mae), the Federal National Mortgage Association (Fannie Mae), and the Federal Home Loan Mortgage Corporation (Freddie Mac) with a minimum $150 million par amount outstanding and a weighted-average maturity of at least 1 year. The index includes reinvestment of income. | |
Performance
| | | | | | | | | | | | | | | | |
| | | | | | Average Annual Total Returns(a) | |
| | | | |
| | | | | | | | 1 Year | | | | 5 Years | | | | 10 Years | |
BATS: Series M Portfolio | | | | | | | 2.19 | % | | | 0.11 | % | | | 1.50 | % |
Bloomberg MBS Index | | | | | | | 1.39 | | | | (0.39 | ) | | | 1.12 | |
| (a) | See “About Fund Performance” for a detailed description of performance related information. | |
Past performance is not an indication of future results.
Performance results may include adjustments made for financial reporting purposes in accordance with U.S. generally accepted accounting principles.
Expense Example
| | | | | | | | | | | | | | | | | | | | | | | | | | | | | | |
| | | | | |
| | | | Actual | | | | | | | | | Hypothetical 5% Return | | | | |
| | | | | | | | | | | | | | |
| | | | | | | |
| Beginning
Account Value (10/01/23) |
| |
| Ending
Account Value (03/31/24) |
| |
| Expenses
Paid During the Period |
(a) | | | | | |
| Beginning
Account Value (10/01/23) |
| |
| Ending
Account Value (03/31/24) |
| |
| Expenses
Paid During the Period |
(a) | |
| Annualized
Expense Ratio |
|
| | | | | | | |
| | $ 1,000.00 | | | | $ 1,066.80 | | | | $ 0.01 | | | | | | | | $ 1,000.00 | | | | $ 1,024.99 | | | | $ 0.00 | | | | 0.00 | % |
| (a) | For shares of the Fund, expenses are equal to the annualized expense ratio, multiplied by the average account value over the period, multiplied by 183/366 (to reflect the one-half year period shown). BlackRock has contractually agreed to waive all fees and pay or reimburse all direct expenses, except extraordinary expenses, incurred by the Fund. Extraordinary expenses may include dividend expense, interest expense, acquired fund fees and expenses and certain other Fund expenses. This agreement has no fixed term. | |
See “Disclosure of Expenses” for further information on how expenses were calculated.
| | |
| 14 | | 2 0 2 4 BLACK ROCK ANNUAL REPORT TO SHAREHOLDERS |
| | |
Fund Summary as of March 31, 2024 (continued) | | BATS: Series M Portfolio |
Portfolio Information
| | | | |
PORTFOLIO COMPOSITION | |
| | |
| Asset Type | |
| Percent of
Total Investments |
(a) |
| |
U.S. Government Sponsored Agency Securities | | | 90.8 | % |
Non-Agency Mortgage-Backed Securities | | | 7.8 | |
Asset-Backed Securities | | | 1.4 | |
| | | | |
CREDIT QUALITY ALLOCATION | |
| | |
| Credit Rating(b) | |
| Percent of
Total Investments |
(a) |
| |
AAA/Aaa(c) | | | 96.8 | % |
AA/Aa | | | 0.8 | |
A | | | 0.2 | |
BBB/Baa | | | 0.1 | |
N/R | | | 2.1 | |
| (a) | Total investments exclude short-term securities and TBA sale commitments. |
| (b) | For financial reporting purposes, credit quality ratings shown above reflect the highest rating assigned by either S&P Global Ratings or Moody’s if ratings differ. These rating agencies are independent, nationally recognized statistical rating organizations and are widely used. Investment grade ratings are credit ratings of BBB/Baa or higher. Below investment grade ratings are credit ratings of BB/Ba or lower. Investments designated N/R are not rated by either rating agency. Unrated investments do not necessarily indicate low credit quality. Credit quality ratings are subject to change. |
| (c) | The investment adviser evaluates the credit quality of unrated investments based upon certain factors including, but not limited to, credit ratings for similar investments and financial analysis of sectors, individual investments and/or issuers. Using this approach, the investment adviser has deemed unrated U.S. Government Sponsored Agency Securities and U.S. Treasury Obligations to be of similar credit quality as investments rated AAA/Aaa. |
| | |
| Fund Summary as of March 31, 2024 | | BATS: Series P Portfolio |
Investment Objective
BATS: Series P Portfolio’s (the “Fund”) investment objective is to seek to provide a duration that is the inverse of its benchmark.
Portfolio Management Commentary
How did the Fund perform?
For the 12-month period ended March 31, 2024, the Fund outperformed the Bloomberg U.S. Treasury 7-10 Year Bond Index and the Bloomberg U.S. Bellwether 10 Year Swap Index. Shares of the Fund can be purchased or held only by or on behalf of certain separately managed account clients. Comparisons of the Fund’s performance versus its benchmark index will differ from comparisons of the benchmark against the performance of the separately managed accounts.
What factors influenced performance?
The use and cost of derivatives will result in a negative contribution to returns when interest rates fall; however, the Fund’s strategy is designed to offset these costs by holding shares of BlackRock Allocation Target Shares: Series S Portfolio (“Series S Portfolio”), a short-term proprietary fund. The use of derivatives is necessary to achieve the Fund’s objective and should therefore be evaluated in a portfolio context and not as a standalone strategy. The Fund’s use of derivatives contributed to results given that bond yields moved higher in the period.
The Fund’s position in the Series S Portfolio detracted from performance.
The Fund held cash as collateral in conjunction with its investments in U.S. Treasury futures and interest rate swaps. The cash position had no material impact on performance.
Describe recent portfolio activity.
The Fund actively managed interest rate risk on the seven- to 10-year part of the yield curve by using derivatives as described above. The Fund maintained its allocation to Series S Portfolio in order to offset the cost of the derivatives. Since this is an overlay strategy designed to manage interest-rate risk, the portfolio’s positioning is relatively static.
Describe portfolio positioning at period end.
The Fund held positions in U.S. Treasury futures and interest rate swaps, and it had an out-of-benchmark allocation to Series S Portfolio.
The views expressed reflect the opinions of BlackRock as of the date of this report and are subject to change based on changes in market, economic or other conditions. These views are not intended to be a forecast of future events and are no guarantee of future results.
| | |
| 16 | | 2 0 2 4 BLACK ROCK ANNUAL REPORT TO SHAREHOLDERS |
| | |
Fund Summary as of March 31, 2024 (continued) | | BATS: Series P Portfolio |
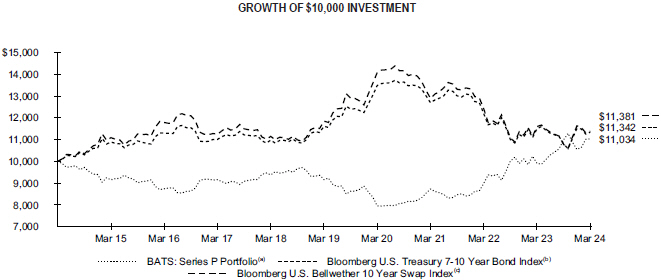
| | (a) | The Fund may invest in a portfolio of securities and other financial instruments, including derivative instruments, in an attempt to provide returns that are the inverse of its benchmark index, the Bloomberg U.S. Treasury 7-10 Year Bond Index. |
| | (b) | Bloomberg U.S. Treasury 7-10 Year Bond Index, an index that measures the performance of the U.S. Government bond market and includes public obligations of the U.S. Treasury with a maturity of between seven and up to (but not including) ten years. Securities must be fixed rate and rated investment grade, as defined by the Index methodology. |
| | (c) | Bloomberg U.S. Bellwether 10 Year Swap Index, an index that provides total returns for swaps with varying maturities. For example, the 10-year swap index measures the total return of investing in 10-year par swaps over time. |
Performance
| | | | | | | | | | | | |
| | | Average Annual Total Returns(a) | |
| | | | 1 Year | | | | 5 Years | | | | 10 Years | |
BATS: Series P Portfolio | | | 11.44 | % | | | 3.79 | % | | | 0.99 | % |
Bloomberg U.S. Treasury 7-10 Year Bond Index | | | (1.38 | ) | | | (0.46 | ) | | | 1.27 | |
Bloomberg U.S. Bellwether 10 Year Swap Index | | | (1.89 | ) | | | (0.80 | ) | | | 1.30 | |
(a) See “About Fund Performance” for a detailed description of performance related information.
Past performance is not an indication of future results.
Performance results may include adjustments made for financial reporting purposes in accordance with U.S. generally accepted accounting principles.
Expense Example
| | | | | | | | | | | | | | | | | | | | | | | | | | | | | | | | | | | | | | | | | | | | | | | | | | |
| Actual | | | | | | Hypothetical 5% Return | | | | | | | |
| | | | | | | | | | | | |
| Beginning
Account Value
(10/01/23) |
| | | | | |
| Ending
Account Value (03/31/24) |
| | | | | |
| Expenses
Paid During the Period |
(a) | | | | | |
| Beginning
Account Value (10/01/23) |
| | | | | |
| Ending
Account Value (03/31/24) |
| | | | | |
| Expenses
Paid During the Period |
(a) | | | | | |
| Annualized
Expense Ratio |
|
| $ | 1,000.00 | | | | | | | $ | 1,004.20 | | | | | | | $ | 0.10 | | | | | | | $ | 1,000.00 | | | | | | | $ | 1,024.90 | | | | | | | $ | 0.10 | | | | | | | | 0.02 | % |
| (a) | For shares of the Fund, expenses are equal to the annualized expense ratio, multiplied by the average account value over the period, multiplied by 183/366 (to reflect the one-half year period shown). BlackRock has contractually agreed to waive all fees and pay or reimburse all direct expenses, except extraordinary expenses, incurred by the Fund. Extraordinary expenses may include dividend expense, interest expense, acquired fund fees and expenses and certain other Fund expenses. This agreement has no fixed term. | |
See “Disclosure of Expenses” for further information on how expenses were calculated.
Portfolio Information
PORTFOLIO COMPOSITION
| | | | |
| | |
| Asset Type | | Percent of
Total Investments | |
Fixed-Income Funds | | | 100.0 | % |
| | |
| Fund Summary as of March 31, 2024 | | BATS: Series S Portfolio |
Investment Objective
BATS: Series S Portfolio’s (the “Fund”) investment objective is to seek to maximize total return, consistent with income generation and prudent investment management.
Portfolio Management Commentary
How did the Fund perform?
For the 12-month period ended March 31, 2024, the Fund outperformed its benchmark, the ICE BofA 1-3 Year U.S. Treasury Index. Shares of the Fund can be purchased or held only by or on behalf of certain separately managed account clients. Comparisons of the Fund’s performance versus its benchmark index will differ from comparisons of the benchmark against the performance of the separately managed accounts.
What factors influenced performance?
The Fund’s out-of-benchmark allocations to investment-grade corporate bonds, asset-backed securities (“ABS”), agency residential mortgage-backed securities, residential mortgage-backed securities (“MBS”), commercial mortgage-backed securities (“CMBS”), collateralized loan obligations (“CLOs”), non-agency mortgage-backed securities (“RMBS”), and U.S. agency notes all made positive contributions to performance. Duration and yield curve positioning contributed, as well. (Duration is a measure of interest rate sensitivity).
The Fund’s use of derivatives—specifically, the use of U.S. Treasury futures and swaps to manage duration—detracted, as did holdings in non-U.S. sovereign debt and cash. The Fund’s cash position had no material impact on performance.
Describe recent portfolio activity.
The investment adviser increased the portfolio’s allocation to ABS. It largely added prime auto securities and CLOs, with a preference for issuers with higher levels of credit enhancement and high-quality collateral. In addition, it views CLOs as an attractive source of yield. On the other hand, the investment adviser reduced the allocation to CMBS due in part to the category’s elevated volatility. In addition, the investment adviser decreased the portfolio’s weighting in investment-grade corporates while tactically adjusting its positioning in the category. It also shifted the Fund’s positioning in agency MBS to capitalize on volatility, increasing the weighting as the sector cheapened and reducing the position when it performed well. The allocation to agency MBS rose over the course of the year.
Describe portfolio positioning at period end.
The Fund was positioned with a neutral duration bias following an increase in duration over the first quarter of 2024. Given that the benchmark is comprised solely of U.S. Treasuries, the Fund was underweight in Treasuries and overweight in all other segments of the market.
The views expressed reflect the opinions of BlackRock as of the date of this report and are subject to change based on changes in market, economic or other conditions. These views are not intended to be a forecast of future events and are no guarantee of future results.
| | |
| 18 | | 2 0 2 4 BLACK ROCK ANNUAL REPORT TO SHAREHOLDERS |
| | |
Fund Summary as of March 31, 2024 (continued) | | BATS: Series S Portfolio |
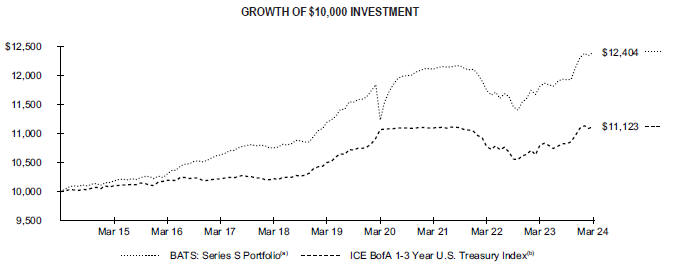
| | (a) | The Fund will principally invest its assets in investment grade fixed-income securities, such as CMBS and RMBS, obligations of non-U.S. governments and supranational organizations, which are chartered to promote economic development, obligations of domestic and non-U.S. corporations, ABS, collateralized mortgage obligations, U.S. Treasury and agency securities, cash equivalent investments, when-issued and delayed delivery securities, derivatives, repurchase agreements, reverse repurchase agreements and dollar rolls. | |
| | (b) | An index that is a subset of ICE BofA US Treasury Index including all securities with a remaining term to final maturity less than 3 years. On December 1, 2023, the Fund began to compare its performance to the standard pricing time of the ICE BofA 1-3 Year U.S. Treasury Index (the “Index”). Index data prior to March 1, 2021 is for the Index’s standard pricing time of 3pm. Index data from March 1, 2021 through November 30, 2023 is for a custom 4pm pricing variant of the Index. Index returns beginning on December 1, 2023 reflect the Index’s new standard pricing time of 4pm. The change of the Index’s standard pricing time from 3pm to 4pm resulted in the discontinuation of the custom 4pm pricing variant used from March 1, 2021 through November 30, 2023. | |
Performance
| | | | | | | | | | | | | | | | |
| | | | | | Average Annual Total Returns(a) | |
| | | | |
| | | | | | | | 1 Year | | | | 5 Years | | | | 10 Years | |
| | | | |
BATS: Series S Portfolio | | | | | | | 4.98 | % | | | 2.07 | % | | | 2.18 | % |
ICE BofA 1-3 Year U.S. Treasury Index | | | | | | | 2.97 | | | | 1.16 | | | | 1.07 | |
| (a) | See “About Fund Performance” for a detailed description of performance related information. | |
Past performance is not an indication of future results.
Performance results may include adjustments made for financial reporting purposes in accordance with U.S. generally accepted accounting principles.
Expense Example
| | | | | | | | | | | | | | | | | | | | | | | | | | |
| Actual | | | Hypothetical 5% Return | | | | |
| | | | | | |
| Beginning
Account Value (10/01/23) |
| |
| Ending
Account Value (03/31/24) |
| |
| Expenses
Paid During the Period |
(a) | |
| Beginning
Account Value (10/01/23) |
| |
| Ending
Account Value (03/31/24) |
| |
| Expenses
Paid During the Period |
(a) | |
| Annualized
Expense Ratio |
|
| $ | 1,000.00 | | | $ | 1,040.10 | | | $ | 0.02 | | | $ | 1,000.00 | | | $ | 1,024.98 | | | $ | 0.00 | | | | 0.00 | % |
| (a) | For shares of the Fund, expenses are equal to the annualized expense ratio, multiplied by the average account value over the period, multiplied by 183/366 (to reflect the one-half year period shown). BlackRock has contractually agreed to waive all fees and pay or reimburse all direct expenses, except extraordinary expenses, incurred by the Fund. Extraordinary expenses may include dividend expense, interest expense, acquired fund fees and expenses and certain other Fund expenses. This agreement has no fixed term. | |
See “Disclosure of Expenses” for further information on how expenses were calculated.
| | |
Fund Summary as of March 31, 2024 (continued) | | BATS: Series S Portfolio |
Portfolio Information
PORTFOLIO COMPOSITION
| | | | |
| | |
Asset Type | |
| Percent of
Total Investments |
(a) |
| |
Asset-Backed Securities | | | 34.9 | % |
Corporate Bonds | | | 26.9 | |
U.S. Government Sponsored Agency Securities | | | 17.4 | |
U.S. Treasury Obligations | | | 10.3 | |
Non-Agency Mortgage-Backed Securities | | | 9.6 | |
Foreign Agency Obligations | | | 0.5 | |
Foreign Government Obligations | | | 0.3 | |
Preferred Securities | | | 0.1 | |
CREDIT QUALITY ALLOCATION
| | | | | | | | |
| | | |
Credit Rating(b) | | | | | |
| Percent of
Total Investments |
(a) |
| | |
AAA/Aaa(c) | | | | | | | 67.8 | % |
AA/Aa | | | | | | | 2.5 | |
A | | | | | | | 9.8 | |
BBB/Baa | | | | | | | 16.7 | |
N/R | | | | | | | 3.2 | |
| (a) | Total investments exclude short-term securities and TBA sale commitments. |
| (b) | For financial reporting purposes, credit quality ratings shown above reflect the highest rating assigned by either S&P Global Ratings or Moody’s if ratings differ. These rating agencies are independent, nationally recognized statistical rating organizations and are widely used. Investment grade ratings are credit ratings of BBB/Baa or higher. Below investment grade ratings are credit ratings of BB/Ba or lower. Investments designated N/R are not rated by either rating agency. Unrated investments do not necessarily indicate low credit quality. Credit quality ratings are subject to change. |
| (c) | The investment adviser evaluates the credit quality of unrated investments based upon certain factors including, but not limited to, credit ratings for similar investments and financial analysis of sectors, individual investments and/or issuers. Using this approach, the investment adviser has deemed unrated U.S. Government Sponsored Agency Securities and U.S. Treasury Obligations to be of similar credit quality as investments rated AAA/Aaa. |
| | |
| 20 | | 2 0 2 4 BLACK ROCK ANNUAL REPORT TO SHAREHOLDERS |
| | |
| Fund Summary as of March 31, 2024 | | BATS: Series V Portfolio |
Investment Objective
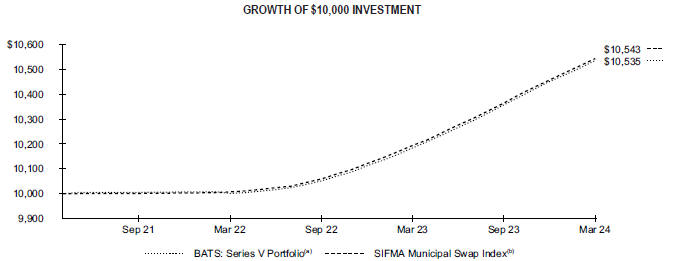
BATS: Series V Portfolio’s (the “Fund”) investment objective is to seek as high a level of income exempt from federal income tax consistent with preservation of capital while seeking to minimize price volatility.
Portfolio Management Commentary
How did the Fund perform?
For the 12-month period ended March 31, 2024, the Fund performed in line with its benchmark, the SIFMA Municipal Swap Index. Shares of the Fund can be purchased or held only by or on behalf of certain separately managed account clients. Comparisons of the Fund’s performance versus its benchmark index will differ from comparisons of the benchmark against the performance of the separately managed accounts.
What factors influenced performance?
Positive contributors to the Fund’s performance relative to the benchmark included holdings of variable rate demand notes (“VRDNs”) which quickly and efficiently repriced coupons in line with market levels as the Fed maintained a higher rate environment. In addition, opportunistic exposure to select attractively priced municipal commercial paper instruments benefited the Fund’s yield.
There were no material detractors from the Fund’s performance relative to the benchmark for the period. The Fund’s cash position had no material impact on performance.
Describe recent portfolio activity.
The Fund maintained high levels of liquidity while providing an attractive yield primarily through holdings of VRDNs, while opportunistically laddering attractive municipal commercial paper maturities and select fixed-rate exposures to tax-backed local credits through both municipal note and bond holdings.
Describe portfolio positioning at period end.
The Fund maintained a bias for daily and weekly reset VRDNs while also maintaining select exposure to longer-dated commercial paper and municipal note holdings. The Fund’s weighted average maturity of 14 days was longer than the benchmark’s 7 days, as the Fund remained opportunistic given the volatile rate environment, holding select fixed-rate exposures where yields appeared attractive relative to expected VRDN yields.
The views expressed reflect the opinions of BlackRock as of the date of this report and are subject to change based on changes in market, economic or other conditions. These views are not intended to be a forecast of future events and are no guarantee of future results.
| | |
Fund Summary as of March 31, 2024 (continued) | | BATS: Series V Portfolio |
The Fund commenced operations on May 5, 2021.
| | (a) | The Fund will principally invest in a broad range of short-term obligations issued by or on behalf of states, territories and possessions of the United States, the District of Columbia, and their respective authorities, agencies, instrumentalities and political subdivisions, the interest of which, in the opinion of counsel to the issuer of the obligation, is exempt from regular federal income tax. | |
| | (b) | A 7-day high-grade market index comprised of tax-exempt variable rate demand obligations with certain characteristics. The index is calculated and published by Bloomberg. | |
Performance
| | | | | | | | | | | | |
| | | | | | Average Annual Total Returns(a) | |
| | | | | | | | 1 Year | | |
| Since
Inception |
(b) |
| | | |
BATS: Series V Portfolio | | | | | | | 3.44 | % | | | 1.81 | % |
SIFMA Municipal Swap Index | | | | | | | 3.42 | | | | 1.84 | |
| (a) | See “About Fund Performance” for a detailed description of performance related information. | |
| (b) | Commencement of operations on May 5, 2021. | |
Past performance is not an indication of future results.
Performance results may include adjustments made for financial reporting purposes in accordance with U.S. generally accepted accounting principles.
Expense Example
| | | | | | | | | | | | | | | | | | | | | | | | | | | | | | |
| | | | | |
| | | | Actual | | | | | | | | | Hypothetical 5% Return | | | | |
| | | | | | | | | | | | | | |
| | | | | | | |
| Beginning
Account Value (10/01/23) |
| |
| Ending
Account Value (03/31/24) |
| |
| Expenses
Paid During the Period |
(a) | | | | | |
| Beginning
Account Value (10/01/23) |
| |
| Ending
Account Value (03/31/24) |
| |
| Expenses
Paid During the Period |
(a) | |
| Annualized
Expense Ratio |
|
| | | | | | | |
| $ | 1,000.00 | | | $ | 1,017.20 | | | $ | 0.03 | | | | | | | $ | 1,000.00 | | | $ | 1,024.97 | | | $ | 0.05 | | | | 0.01 | % |
| (a) | For shares of the Fund, expenses are equal to the annualized expense ratio, multiplied by the average account value over the period, multiplied by 183/366 (to reflect the one-half year period shown). BlackRock has contractually agreed to waive all fees and pay or reimburse all direct expenses, except extraordinary expenses, incurred by the Fund. Extraordinary expenses may include dividend expense, interest expense, acquired fund fees and expenses and certain other Fund expenses. This agreement has no fixed term. | |
See “Disclosure of Expenses” for further information on how expenses were calculated.
Portfolio Information
SECTOR ALLOCATION
| | | | |
| | |
| Sector | |
| Percent of
Total Investments |
|
| |
Utilities | | | 23.5 | % |
Health Care | | | 19.8 | |
| |
County/City/Special District/School District | | | 18.0 | |
| |
Housing | | | 17.6 | |
Education | | | 16.8 | |
Transportation | | | 4.3 | |
| | |
| 22 | | 2 0 2 4 BLACK ROCK ANNUAL REPORT TO SHAREHOLDERS |
About Fund Performance
Past performance is not an indication of future results. Financial markets have experienced extreme volatility and trading in many instruments has been disrupted. These circumstances may continue for an extended period of time and may continue to affect adversely the value and liquidity of each Fund’s investments. As a result, current performance may be lower or higher than the performance data quoted. Refer to blackrock.com to obtain performance data current to the most recent month-end. Performance results do not reflect the deduction of taxes that a shareholder would pay on Fund distributions or the redemption of Fund shares. Figures shown in the performance tables assume reinvestment of all distributions, if any, at net asset value (“NAV”) on the ex-dividend date or payable date, as applicable. Investment return and principal value of shares will fluctuate so that shares, when redeemed, may be worth more or less than their original cost.
The performance information also reflects fee waivers and reimbursements that subsidize and reduce the total operating expenses of each Fund. The Funds’ returns would have been lower if there were no such waivers and reimbursements.
Disclosure of Expenses
Shareholders of each Fund may incur the following charges: (a) transactional expenses and (b) operating expenses, including administration fees and other fund expenses. The expense examples shown (which are based on a hypothetical investment of $1,000 invested at the beginning of the period and held through the end of the period) are intended to assist shareholders both in calculating expenses based on an investment in each Fund and in comparing these expenses with similar costs of investing in other mutual funds.
The expense examples provide information about actual account values and actual expenses. Annualized expense ratios reflect contractual and voluntary fee waivers, if any. In order to estimate the expenses a shareholder paid during the period covered by this report, shareholders can divide their account value by $1,000 and then multiply the result by the number corresponding to their Fund under the heading entitled “Expenses Paid During the Period.”
The expense examples also provide information about hypothetical account values and hypothetical expenses based on a Fund’s actual expense ratio and an assumed rate of return of 5% per year before expenses. In order to assist shareholders in comparing the ongoing expenses of investing in these Funds and other funds, compare the 5% hypothetical examples with the 5% hypothetical examples that appear in shareholder reports of other funds.
The expenses shown in the expense examples are intended to highlight shareholders’ ongoing costs only and do not reflect transactional expenses, if any. Therefore, the hypothetical examples are useful in comparing ongoing expenses only, and will not help shareholders determine the relative total expenses of owning different funds. If these transactional expenses were included, shareholder expenses would have been higher.
The Benefits and Risks of Leveraging
The Funds may utilize leverage to seek to enhance returns and NAV. However, there is no guarantee that these objectives can be achieved in all interest rate environments.
Series E Portfolio may leverage its assets through the use of proceeds received in tender option bond (“TOB”) transactions, as described in the Notes to Financial Statements. In a TOB Trust transaction, the Fund transfers municipal bonds or other municipal securities into a special purpose entity (a “TOB Trust”). TOB investments generally provide the Fund with economic benefits in periods of declining short-term interest rates but expose the Fund to risks during periods of rising short-term interest rates. Additionally, fluctuations in the market value of municipal bonds deposited into a TOB Trust may adversely affect the Fund’s NAV per share.
In general, the concept of leveraging is based on the premise that the financing cost of leverage, which is based on short-term interest rates, is normally lower than the income earned by each Fund on its longer-term portfolio investments purchased with the proceeds from leverage. To the extent that the total assets of each Fund (including the assets obtained from leverage) are invested in higher-yielding portfolio investments, each Fund’s shareholders benefit from the incremental net income.
The interest earned on securities purchased with the proceeds from leverage is distributed to each Fund’s shareholders, and the value of these portfolio holdings is reflected in each Fund’s per share NAV. However, in order to benefit shareholders, the return on assets purchased with leverage proceeds must exceed the ongoing costs associated with the leverage. If interest and other ongoing costs of leverage exceed a Fund’s return on assets purchased with leverage proceeds, income to shareholders is lower than if the Funds had not used leverage.
Furthermore, the value of each Fund’s portfolio investments generally varies inversely with the direction of long-term interest rates, although other factors can also influence the value of portfolio investments. As a result, changes in interest rates can influence each Fund’s NAV positively or negatively in addition to the impact on each Fund’s performance from leverage. Changes in the direction of interest rates are difficult to predict accurately, and there is no assurance that a Fund’s leveraging strategy will be successful.
The use of leverage also generally causes greater changes in each Fund’s NAV and dividend rates than comparable portfolios without leverage. In a declining market, leverage is likely to cause a greater decline in the NAV of a Fund’s shares than if the Fund were not leveraged. In addition, each Fund may be required to sell portfolio securities at inopportune times or at distressed values in order to comply with regulatory requirements applicable to the use of leverage or as required by the terms of the leverage instruments, which may cause the Funds to incur losses. The use of leverage may limit a Fund’s ability to invest in certain types of securities or use certain types of hedging strategies. Each Fund incurs expenses in connection with the use of leverage, all of which are borne by each Fund’s shareholders and may reduce income.
| | |
ABOUT FUND PERFORMANCE / DISCLOSURE OF EXPENSES / THE BENEFITS AND RISKS OF LEVERAGING | | 23 |
Derivative Financial Instruments
The Funds may invest in various derivative financial instruments. These instruments are used to obtain exposure to a security, commodity, index, market, and/or other assets without owning or taking physical custody of securities, commodities and/or other referenced assets or to manage market, equity, credit, interest rate, foreign currency exchange rate, commodity and/or other risks. Derivative financial instruments may give rise to a form of economic leverage and involve risks, including the imperfect correlation between the value of a derivative financial instrument and the underlying asset, possible default of the counterparty to the transaction or illiquidity of the instrument. Pursuant to Rule 18f-4 under the 1940 Act, among other things, the Funds must either use derivative financial instruments with embedded leverage in a limited manner or comply with an outer limit on fund leverage risk based on value-at-risk. The Funds’ successful use of a derivative financial instrument depends on the investment adviser’s ability to predict pertinent market movements accurately, which cannot be assured. The use of these instruments may result in losses greater than if they had not been used, may limit the amount of appreciation a Fund can realize on an investment and/or may result in lower distributions paid to shareholders. The Funds’ investments in these instruments, if any, are discussed in detail in the Notes to Financial Statements.
| | |
| 24 | | 2 0 2 4 BLACK ROCK ANNUAL REPORT TO SHAREHOLDERS |
| | |
Schedule of Investments March 31, 2024 | | BATS: Series A Portfolio (Percentages shown are based on Net Assets) |
| | | | | | | | | | | | |
| Security | | | | | Par (000) | | | Value | |
|
Asset-Backed Securities | |
510 Loan Acquisition Trust, Series 2020-1, Class A, 8.11%, 09/25/60(a)(b) | | | USD | | | | 490 | | | $ | 487,475 | |
522 Funding CLO Ltd. | | | | | | | | | | | | |
Series 2018-3A, Class CR, (3-mo. CME Term SOFR + 2.31%), 7.63%, 10/20/31(a)(c) | | | | | | | 500 | | | | 500,050 | |
Series 2019-5A, Class AR, (3-mo. CME Term SOFR + 1.33%), 6.64%, 04/15/35(a)(c) | | | | | | | 430 | | | | 430,218 | |
ABFC Trust, Series 2007-WMC1, Class A2B, (1-mo. CME Term SOFR + 1.11%), 6.44%, 06/25/37(c) | | | | | | | 2,775 | | | | 2,154,634 | |
AccessLex Institute, Series 2007-A, Class A3, (3-mo. CME Term SOFR + 0.56%), 5.89%, 05/25/36(c) | | | | | | | 2,100 | | | | 2,061,809 | |
Affirm Asset Securitization Trust, Series 2024-A, Class A, 5.61%, 02/15/29(a) | | | | | | | 1,973 | | | | 1,968,310 | |
AGL CLO 1 Ltd., Series 2019-1A, Class BR, (3-mo. CME Term SOFR + 1.91%), 7.23%, 10/20/34(a)(c) | | | | | | | 400 | | | | 399,003 | |
AGL CLO 12 Ltd., Series 2021-12A, Class A1, (3-mo. CME Term SOFR + 1.42%), 6.74%, 07/20/34(a)(c) | | | | | | | 4,000 | | | | 4,002,240 | |
AGL CLO 14 Ltd. | | | | | | | | | | | | |
Series 2021-14A, Class A, (3-mo. CME Term SOFR + 1.41%), 6.73%, 12/02/34(a)(c) | | | | | | | 15,870 | | | | 15,878,844 | |
Series 2021-14A, Class B1, (3-mo. CME Term SOFR + 1.91%), 7.23%, 12/02/34(a)(c) | | | | | | | 1,050 | | | | 1,050,431 | |
AGL CLO 3 Ltd. | | | | | | | | | | | | |
Series 2020-3A, Class A, (3-mo. CME Term SOFR + 1.56%), 6.88%, 01/15/33(a)(c) | | | | | | | 250 | | | | 249,880 | |
Series 2020-3A, Class D, (3-mo. CME Term SOFR + 3.56%), 8.88%, 01/15/33(a)(c) | | | | | | | 1,250 | | | | 1,242,952 | |
AGL Core CLO 27 Ltd., Series 2023-27A, Class A, (3-mo. CME Term SOFR + 1.73%), 7.05%, 10/21/36(a)(c) | | | | | | | 4,000 | | | | 4,028,328 | |
AGL Core CLO 4 Ltd., Series 2020-4A, Class A1R, (3-mo. CME Term SOFR + 1.33%), 6.65%, 04/20/33(a)(c) | | | | | | | 4,350 | | | | 4,350,964 | |
AIG CLO Ltd., Series 2018-1A, Class A1R, (3-mo. CME Term SOFR + 1.38%), 6.70%, 04/20/32(a)(c) | | | | | | | 1,740 | | | | 1,742,618 | |
AIMCO CLO, Series 2017-AA, Class AR, (3-mo. CME Term SOFR + 1.31%), 6.63%, 04/20/34(a)(c) | | | | | | | 2,500 | | | | 2,494,259 | |
AIMCO CLO 11 Ltd., Series 2020-11A, Class BR, (3-mo. CME Term SOFR + 1.86%), 7.18%, 10/17/34(a)(c) | | | | | | | 2,180 | | | | 2,181,837 | |
Ajax Mortgage Loan Trust | | | | | | | | | | | | |
Series 2021-G, Class A, 1.88%, 06/25/61(a)(c) | | | | | | | 7,642 | | | | 7,258,520 | |
Series 2021-G, Class B, 3.75%, 06/25/61(a)(c) | | | | | | | 1,283 | | | | 1,277,208 | |
Series 2021-G, Class C, 0.00%, 06/25/61(a)(d) | | | | | | | 2,307 | | | | 2,012,455 | |
Series 2023-B, Class A, 4.25%, 10/25/62(a)(b) | | | | | | | 8,166 | | | | 7,920,023 | |
Series 2023-B, Class B, 4.25%, 10/25/62(a)(b) | | | | | | | 881 | | | | 786,646 | |
Series 2023-B, Class C, 0.00%, 10/25/62(a)(d) | | | | | | | 2,082 | | | | 724,014 | |
Series 2023-B, Class SA, 0.00%,
10/25/62(a)(d) | | | | | | | 361 | | | | 268,247 | |
Allegro CLO II-S Ltd. | | | | | | | | | | | | |
Series 2014-1RA, Class A1, (3-mo. CME Term SOFR + 1.34%), 6.66%, 10/21/28(a)(c) | | | | | | | 552 | | | | 552,715 | |
Series 2014-1RA, Class B, (3-mo. CME Term SOFR + 2.41%), 7.73%, 10/21/28(a)(c) | | | | | | | 300 | | | | 300,033 | |
Series 2014-1RA, Class C, (3-mo. CME Term SOFR + 3.26%), 8.58%, 10/21/28(a)(c) | | | | | | | 750 | | | | 748,655 | |
| | | | | | | | | | | | |
| Security | | | | | Par
(000) | | | Value | |
|
Asset-Backed Securities (continued) | |
Allegro CLO V Ltd., Series 2017-1A, Class BR, (3-mo. CME Term SOFR + 1.71%), 7.03%, 10/16/30(a)(c) | | | USD | | | | 730 | | | $ | 728,992 | |
Allegro CLO VI Ltd., Series 2017-2A, Class A, (3-mo. CME Term SOFR + 1.39%), 6.71%, 01/17/31(a)(c) | | | | | | | 731 | | | | 731,182 | |
Allegro CLO XI Ltd. | | | | | | | | | | | | |
Series 2019-2A, Class A2A, (3-mo. CME Term SOFR + 2.11%), 7.42%, 01/19/33(a)(c) | | | | | | | 250 | | | | 251,482 | |
Series 2019-2A, Class C, (3-mo. CME Term SOFR + 3.26%), 8.57%, 01/19/33(a)(c) | | | | | | | 250 | | | | 250,604 | |
ALM Ltd. | | | | | | | | | | | | |
Series 2020-1A, Class A2, (3-mo. CME Term SOFR + 2.11%), 7.43%, 10/15/29(a)(c) | | | | | | | 250 | | | | 250,650 | |
Series 2020-1A, Class B, (3-mo. CME Term SOFR + 2.26%), 7.58%, 10/15/29(a)(c) | | | | | | | 350 | | | | 350,473 | |
AMSR Trust | | | | | | | | | | | | |
Series 2020-SFR4, Class F, 2.86%, 11/17/37(a) | | | | | | | 4,000 | | | | 3,751,413 | |
Series 2020-SFR4, Class G2, 4.87%, 11/17/37(a) | | | | | | | 2,537 | | | | 2,432,647 | |
Series 2021-SFR1, Class F, 3.60%, 06/17/38(a) | | | | | | | 2,872 | | | | 2,462,165 | |
Series 2021-SFR2, Class F1, 3.28%, 08/17/38(a) | | | | | | | 3,756 | | | | 3,394,353 | |
Anchorage Capital CLO 16 Ltd., Series 2020-16A, Class A1R, (3-mo. CME Term SOFR + 1.46%), 6.77%, 01/19/35(a)(c) | | | | | | | 380 | | | | 378,791 | |
Anchorage Capital CLO 3-R Ltd. | | | | | | | | | | | | |
Series 2014-3RA, Class A, (3-mo. CME Term SOFR + 1.31%), 6.63%, 01/28/31(a)(c) | | | | | | | 874 | | | | 874,000 | |
Series 2014-3RA, Class B, (3-mo. CME Term SOFR + 1.76%), 7.08%, 01/28/31(a)(c) | | | | | | | 1,250 | | | | 1,248,639 | |
Series 2014-3RA, Class C, (3-mo. CME Term SOFR + 2.11%), 7.43%, 01/28/31(a)(c) | | | | | | | 500 | | | | 496,631 | |
Anchorage Capital CLO 4-R Ltd. | | | | | | | | | | | | |
Series 2014-4RA, Class A, (3-mo. CME Term SOFR + 1.31%), 6.63%, 01/28/31(a)(c) | | | | | | | 1,698 | | | | 1,693,141 | |
Series 2014-4RA, Class D, (3-mo. CME Term SOFR + 2.86%), 8.18%, 01/28/31(a)(c) | | | | | | | 750 | | | | 746,283 | |
Anchorage Capital CLO 6 Ltd., Series 2015-6A, Class BR3, (3-mo. CME Term SOFR + 2.10%), 04/22/34(a)(c)(e) | | | | | | | 3,720 | | | | 3,720,000 | |
Anchorage Capital CLO 7 Ltd. | | | | | | | | | | | | |
Series 2015-7A, Class AR2, (3-mo. CME Term SOFR + 1.35%), 6.67%, 01/28/31(a)(c) | | | | | | | 627 | | | | 623,171 | |
Series 2015-7A, Class BR2, (3-mo. CME Term SOFR + 2.01%), 7.33%, 01/28/31(a)(c) | | | | | | | 1,500 | | | | 1,504,487 | |
Series 2015-7A, Class CR2, (3-mo. CME Term SOFR + 2.46%), 7.78%, 01/28/31(a)(c) | | | | | | | 3,125 | | | | 3,125,027 | |
Series 2015-7A, Class D1R2, (3-mo. CME Term SOFR + 3.76%), 9.08%, 01/28/31(a)(c) | | | | | | | 1,000 | | | | 997,969 | |
Anchorage Capital CLO 8 Ltd. | | | | | | | | | | | | |
Series 2016-8A, Class AR2A, (3-mo. CME Term SOFR + 1.46%), 6.78%, 10/27/34(a)(c) | | | | | | | 5,000 | | | | 4,986,263 | |
Series 2016-8A, Class BR2, (3-mo. CME Term SOFR + 2.06%), 7.38%, 10/27/34(a)(c) | | | | | | | 1,000 | | | | 996,009 | |
Series 2016-8A, Class CR2, (3-mo. CME Term SOFR + 2.66%), 7.98%, 10/27/34(a)(c) | | | | | | | 1,000 | | | | 993,049 | |
Anchorage Capital CLO Ltd. | | | | | | | | | | | | |
Series 2013-1A, Class A1R, (3-mo. CME Term SOFR + 1.51%), 6.83%, 10/13/30(a)(c) | | | | | | | 165 | | | | 165,054 | |
Series 2013-1A, Class BR, (3-mo. CME Term SOFR + 2.41%), 7.73%, 10/13/30(a)(c) | | | | | | | 500 | | | | 500,517 | |
| | |
SCHEDULES OF INVESTMENTS | | 25 |
| | |
Schedule of Investments (continued) March 31, 2024 | | BATS: Series A Portfolio (Percentages shown are based on Net Assets) |
| | | | | | | | | | | | |
| Security | | | | | Par (000) | | | Value | |
|
Asset-Backed Securities (continued) | |
Anchorage Capital CLO Ltd. | | | | | | | | | | | | |
Series 2013-1A, Class DR, (3-mo. CME Term SOFR + 7.06%), 12.38%, 10/13/30(a)(c) | | | USD | | | | 1,000 | | | $ | 1,000,057 | |
Series 2018-10A, Class A2, (3-mo. CME Term SOFR + 1.76%), 7.08%,
10/15/31(a)(c) | | | | | | | 450 | | | | 452,562 | |
Apidos CLO XII, Series 2013-12A, Class AR, (3-mo. CME Term SOFR + 1.34%), 6.66%, 04/15/31(a)(c) | | | | | | | 1,285 | | | | 1,285,831 | |
Apidos CLO XV, Series 2013-15A, Class A1RR, (3-mo. CME Term SOFR + 1.27%), 6.59%, 04/20/31(a)(c) | | | | | | | 899 | | | | 900,739 | |
Apidos CLO XX, Series 2015-20A, Class A1RA, (3-mo. CME Term SOFR + 1.36%), 6.68%, 07/16/31(a)(c) | | | | | | | 343 | | | | 343,197 | |
Apidos CLO XXIV, Series 2016-24A, Class A2LX, (3-mo. CME Term SOFR + 1.61%), 6.93%, 10/20/30(a)(c) | | | | | | | 340 | | | | 340,065 | |
Apidos CLO XXV | | | | | | | | | | | | |
Series 2016-25A, Class A1R2, (3-mo. CME Term SOFR + 1.15%), 10/20/31(a)(c)(e) | | | | | | | 10,000 | | | | 10,000,000 | |
Series 2016-25A, Class A2R2, (3-mo. CME Term SOFR + 1.80%), 10/20/31(a)(c)(e) | | | | | | | 4,500 | | | | 4,500,000 | |
Series 2016-25A, Class AJR2, (3-mo. CME Term SOFR + 1.50%), 10/20/31(a)(c)(e) | | | | | | | 5,000 | | | | 5,000,000 | |
Apidos CLO XXVI, Series 2017-26A, Class BR, (3-mo. CME Term SOFR + 2.21%), 7.51%, 07/18/29(a)(c) | | | | | | | 2,830 | | | | 2,832,487 | |
Apidos CLO XXX, Series XXXA, Class A1A, (3-mo. CME Term SOFR + 1.40%), 6.70%, 10/18/31(a)(c) | | | | | | | 398 | | | | 398,187 | |
Apidos CLO XXXIX, Series 2022-39A, Class A1, (3-mo. CME Term SOFR + 1.30%), 6.62%, 04/21/35(a)(c) | | | | | | | 5,000 | | | | 5,007,502 | |
Apidos CLO XXXVI, Series 2021-36A, Class B, (3-mo. CME Term SOFR + 1.86%), 7.18%, 07/20/34(a)(c) | | | | | | | 250 | | | | 250,203 | |
Apidos CLO XXXVII, Series 2021-37A, Class A, (3-mo. CME Term SOFR + 1.39%), 6.71%, 10/22/34(a)(c) | | | | | | | 1,780 | | | | 1,780,985 | |
Aqua Finance Trust, Series 2021-A, Class A, 1.54%, 07/17/46(a) | | | | | | | 207 | | | | 184,811 | |
Arbor Realty Commercial Real Estate Notes Ltd. | | | | | | | | | | | | |
Series 2021-FL1, Class A, (1-mo. CME Term SOFR + 1.08%), 6.41%, 12/15/35(a)(c) | | | | | | | 279 | | | | 277,210 | |
Series 2021-FL4, Class A, (1-mo. CME Term SOFR + 1.46%), 6.79%,
11/15/36(a)(c) | | | | | | | 421 | | | | 418,895 | |
Series 2022-FL1, Class A, (SOFR (30-day) + 1.45%), 6.77%,
01/15/37(a)(c) | | | | | | | 594 | | | | 590,473 | |
Series 2022-FL2, Class A, (1-mo. CME Term SOFR + 1.85%), 7.18%,
05/15/37(a)(c) | | | | | | | 5,328 | | | | 5,314,707 | |
Ares L CLO Ltd., Series 2018-50A, Class BR, (3-mo. CME Term SOFR + 1.86%), 7.18%, 01/15/32(a)(c) | | | | | | | 1,000 | | | | 997,378 | |
Ares LIX CLO Ltd., Series 2021-59A, Class A, (3-mo. CME Term SOFR + 1.29%), 6.62%, 04/25/34(a)(c) | | | | | | | 250 | | | | 249,698 | |
Ares LVI CLO Ltd. | | | | | | | | | | | | |
Series 2020-56A, Class AR, (3-mo. CME Term SOFR + 1.42%), 6.75%,
10/25/34(a)(c) | | | | | | | 2,130 | | | | 2,131,589 | |
Series 2020-56A, Class ER, (3-mo. CME Term SOFR + 6.76%), 12.09%, 10/25/34(a)(c) | | | | | | | 250 | | | | 249,975 | |
| | | | | | | | | | | | |
| Security | | | | | Par
(000) | | | Value | |
|
Asset-Backed Securities (continued) | |
Ares XLI CLO Ltd., Series 2016-41A, Class BR, (3-mo. CME Term SOFR + 1.71%), 7.03%, 04/15/34(a)(c) | | | USD | | | | 2,500 | | | $ | 2,489,260 | |
Ares XLVIII CLO Ltd., Series 2018-48A, Class B, (3-mo. CME Term SOFR + 1.84%), 7.16%, 07/20/30(a)(c) | | | | | | | 680 | | | | 679,647 | |
Ares XXXIIR CLO Ltd., Series 2014-32RA, Class A1A, (3-mo. CME Term SOFR + 1.20%), 6.51%, 05/15/30(a)(c) | | | | | | | 571 | | | | 571,384 | |
Ares XXXVII CLO Ltd., Series 2015-4A, Class A1R, (3-mo. CME Term SOFR + 1.43%), 6.75%, 10/15/30(a)(c) | | | | | | | 461 | | | | 460,828 | |
Argent Mortgage Loan Trust, Series 2005-W1, Class A2, (1-mo. CME Term SOFR + 0.59%), 5.92%, 05/25/35(c) | | | | | | | 40 | | | | 31,252 | |
Argent Securities Trust | | | | | | | | | | | | |
Series 2006-M1, Class A2C, (1-mo. CME Term SOFR + 0.41%), 5.74%, 07/25/36(c) | | | | | | | 2,137 | | | | 542,497 | |
Series 2006-W2, Class A2C, (1-mo. CME Term SOFR + 0.69%), 6.02%, 03/25/36(c) | | | | | | | 562 | | | | 301,122 | |
ARM Master Trust LLC Agricultural Loan Backed Notes, Series 2021-T1, Class A, 2.43%, 11/15/27(a) | | | | | | | 138 | | | | 132,700 | |
Asset-Backed Securities Corp. Home Equity Loan Trust OOMC, Series 2005-HE6, Class M6, (1-mo. CME Term SOFR + 1.22%), 6.55%, 07/25/35(c) | | | | | | | 914 | | | | 782,102 | |
Assurant CLO I Ltd., Series 2017-1A, Class BR, (3-mo. CME Term SOFR + 1.96%), 7.28%, 10/20/34(a)(c) | | | | | | | 1,400 | | | | 1,386,404 | |
Assurant CLO Ltd., Series 2018-2A, Class A, (3-mo. CME Term SOFR + 1.30%), 6.62%, 04/20/31(a)(c) | | | | | | | 387 | | | | 387,072 | |
Atrium IX, Series 9A, Class AR2, (3-mo. CME Term SOFR + 1.25%), 6.59%, 05/28/30(a)(c) | | | | | | | 1,761 | | | | 1,761,410 | |
Atrium XIII | | | | | | | | | | | | |
Series 13A, Class AR, (3-mo. CME Term SOFR + 1.15%), 11/21/30(a)(c)(e) | | | | | | | 500 | | | | 499,994 | |
Series 13A, Class B, (3-mo. CME Term SOFR + 1.76%), 7.08%, 11/21/30(a)(c) | | | | | | | 1,250 | | | | 1,251,841 | |
Series 13A, Class C, (3-mo. CME Term SOFR + 2.06%), 7.38%, 11/21/30(a)(c) | | | | | | | 1,610 | | | | 1,606,181 | |
Bain Capital Credit CLO Ltd. | | | | | | | | | | | | |
Series 2017-1A, Class A1R, (3-mo. CME Term SOFR + 1.23%), 6.55%, 07/20/30(a)(c) | | | | | | | 899 | | | | 899,307 | |
Series 2018-1A, Class A1, (3-mo. CME Term SOFR + 1.22%), 6.54%, 04/23/31(a)(c) | | | | | | | 220 | | | | 220,371 | |
Series 2018-2A, Class A1, (3-mo. CME Term SOFR + 1.34%), 6.65%, 07/19/31(a)(c) | | | | | | | 920 | | | | 918,354 | |
Series 2021-4A, Class A1, (3-mo. CME Term SOFR + 1.43%), 6.75%, 10/20/34(a)(c) | | | | | | | 350 | | | | 349,944 | |
Series 2022-1A, Class A1, (3-mo. CME Term SOFR + 1.32%), 6.62%, 04/18/35(a)(c) | | | | | | | 1,200 | | | | 1,200,196 | |
Ballyrock CLO Ltd. | | | | | | | | | | | | |
Series 2018-1A, Class A2, (3-mo. CME Term SOFR + 1.86%), 7.18%, 04/20/31(a)(c) | | | | | | | 250 | | | | 250,765 | |
Series 2023-25A, Class C, (3-mo. CME Term SOFR + 4.70%), 10.02%, 01/25/36(a)(c) | | | | | | | 250 | | | | 252,951 | |
BankAmerica Manufactured Housing Contract Trust, Series 1997-2, Class B1, 7.07%, 02/10/22(c) | | | | | | | 5,740 | | | | 1,113,651 | |
| | |
| 26 | | 2 0 2 4 BLACK ROCK ANNUAL REPORT TO SHAREHOLDERS |
| | |
Schedule of Investments (continued) March 31, 2024 | | BATS: Series A Portfolio (Percentages shown are based on Net Assets) |
| | | | | | | | | | | | |
| Security | | | | | Par
(000) | | | Value | |
|
Asset-Backed Securities (continued) | |
Bankers Healthcare Group Securitization Trust, Series 2020-A, Class C, 5.17%, 09/17/31(a) | | | USD | | | | 1,940 | | | $ | 1,880,423 | |
Barings CLO Ltd. | | | | | | | | | | | | |
Series 2015-2A, Class AR, (3-mo. CME Term SOFR + 1.45%), 6.77%, 10/20/30(a)(c) | | | | | | | 728 | | | | 729,110 | |
Series 2015-IA, Class BR, (3-mo. CME Term SOFR + 1.66%), 6.98%, 01/20/31(a)(c) | | | | | | | 250 | | | | 249,920 | |
Series 2018-3A, Class A1, (3-mo. CME Term SOFR + 1.21%), 6.53%, 07/20/29(a)(c) | | | | | | | 221 | | | | 220,715 | |
Series 2019-3A, Class A1R, (3-mo. CME Term SOFR + 1.33%), 6.65%, 04/20/31(a)(c) | | | | | | | 1,170 | | | | 1,170,768 | |
Battalion CLO 18 Ltd. | | | | | | | | | | | | |
Series 2020-18A, Class AR, (3-mo. CME Term SOFR + 1.46%), 6.78%, 10/15/36(a)(c) | | | | | | | 500 | | | | 499,750 | |
Series 2020-18A, Class BR, (3-mo. CME Term SOFR + 2.01%), 7.33%, 10/15/36(a)(c) | | | | | | | 1,000 | | | | 995,023 | |
Battalion CLO VIII Ltd., Series 2015-8A, Class A1R2, (3-mo. CME Term SOFR + 1.33%), 6.63%, 07/18/30(a)(c) | | | | | | | 953 | | | | 953,211 | |
Battalion CLO XII Ltd., Series 2018-12A, Class B2R, (3-mo. CME Term SOFR + 2.34%), 7.66%, 05/17/31(a)(c) | | | | | | | 250 | | | | 250,645 | |
Battalion CLO XX Ltd., Series 2021-20A, Class A, (3-mo. CME Term SOFR + 1.44%), 6.76%, 07/15/34(a)(c) | | | | | | | 3,000 | | | | 2,999,775 | |
Bayview Financial Mortgage Pass-Through Trust, | | | | | | | | | | | | |
Series 2006-A, Class B2, (1-mo. CME Term SOFR + 2.59%), 7.92%, 02/28/41(c) | | | | | | | 5,459 | | | | 5,410,450 | |
Bayview Financial Revolving Asset Trust | | | | | | | | | | | | |
Series 2005-A, Class A1, (1-mo. CME Term SOFR + 1.11%), 6.45%, 02/28/40(a)(c) | | | | | | | 3,339 | | | | 3,048,571 | |
Series 2005-E, Class A1, (1-mo. CME Term SOFR + 1.11%), 6.45%, 12/28/40(a)(c) | | | | | | | 1,151 | | | | 1,137,830 | |
Series 2005-E, Class A2A, (1-mo. CME Term SOFR + 1.04%), 6.38%, 12/28/40(a)(c) | | | | | | | 943 | | | | 899,248 | |
BDS Ltd. | | | | | | | | | | | | |
Series 2021-FL7, Class A, (1-mo. CME Term SOFR + 1.18%), 6.51%, 06/16/36(a)(c) | | | | | | | 1,777 | | | | 1,769,743 | |
Series 2021-FL9, Class A, (1-mo. CME Term SOFR + 1.18%), 6.51%, 11/16/38(a)(c) | | | | | | | 1,512 | | | | 1,497,738 | |
Series 2022-FL11, Class ATS, (1-mo. CME Term SOFR + 1.80%), 7.13%, 03/19/39(a)(c) | | | | | | | 5,453 | | | | 5,422,517 | |
Bean Creek CLO Ltd., Series 2015-1A, Class BR, (3-mo. CME Term SOFR + 1.71%), 7.03%, 04/20/31(a)(c) | | | | | | | 450 | | | | 450,138 | |
Bear Stearns Asset-Backed Securities I Trust | | | | | | | | | | | | |
Series 2005-HE8, Class M3, (1-mo. CME Term SOFR + 2.06%), 7.39%, 08/25/35(c) | | | | | | | 3,604 | | | | 3,411,101 | |
Series 2006-HE7, Class 1A2, (1-mo. CME Term SOFR + 0.45%), 5.78%, 09/25/36(c) | | | | | | | 90 | | | | 88,687 | |
Series 2007-HE2, Class 1A4, (1-mo. CME Term SOFR + 0.43%), 5.76%, 03/25/37(c) | | | | | | | 900 | | | | 786,530 | |
Series 2007-HE2, Class 23A, (1-mo. CME Term SOFR + 0.25%), 5.58%, 03/25/37(c) | | | | | | | 36 | | | | 32,926 | |
Series 2007-HE3, Class 1A4, (1-mo. CME Term SOFR + 0.46%), 5.79%, 04/25/37(c) | | | | | | | 309 | | | | 320,355 | |
Benefit Street Partners CLO Ltd. | | | | | | | | | | | | |
Series 2015-6BR, Class A, (3-mo. CME Term SOFR + 1.45%), 6.77%, 07/20/34(a)(c) | | | | | | | 1,460 | | | | 1,461,076 | |
Series 2015-6BR, Class B, (3-mo. CME Term SOFR + 2.06%), 7.38%, 07/20/34(a)(c) | | | | | | | 250 | | | | 249,807 | |
| | | | | | | | | | | | |
| Security | | | | | Par
(000) | | | Value | |
|
Asset-Backed Securities (continued) | |
Benefit Street Partners CLO V-B Ltd., Series 2018- 5BA, Class A1A, (3-mo. CME Term SOFR + 1.35%), 6.67%, 04/20/31(a)(c) | | | USD | | | | 906 | | | $ | 906,512 | |
Benefit Street Partners CLO VIII Ltd., Series 2015- 8A, Class A1AR, (3-mo. CME Term SOFR + 1.36%), 6.68%, 01/20/31(a)(c) | | | | | | | 1,481 | | | | 1,481,939 | |
Benefit Street Partners CLO XIX Ltd., Series 2019- 19A, Class B, (3-mo. CME Term SOFR + 2.26%), 7.58%, 01/15/33(a)(c) | | | | | | | 250 | | | | 250,645 | |
Benefit Street Partners CLO XXIV Ltd. | | | | | | | | | | | | |
Series 2021-24A, Class A, (3-mo. CME Term SOFR + 1.43%), 6.75%, 10/20/34(a)(c) | | | | | | | 1,000 | | | | 1,000,301 | |
Series 2021-24A, Class D, (3-mo. CME Term SOFR + 3.61%), 8.93%, 10/20/34(a)(c) | | | | | | | 500 | | | | 496,134 | |
Benefit Street Partners CLO XXV Ltd., | | | | | | | | | | | | |
Series 2021-25A, Class B, (3-mo. CME Term SOFR + 1.96%), 7.28%, 01/15/35(a)(c) | | | | | | | 250 | | | | 249,770 | |
Betony CLO 2 Ltd., Series 2018-1A, Class A1, (3-mo. CME Term SOFR + 1.34%), 6.66%, 04/30/31(a)(c) | | | | | | | 215 | | | | 214,979 | |
BHG Securitization Trust | | | | | | | | | | | | |
Series 2021-A, Class A, 1.42%, 11/17/33(a) | | | | | | | 107 | | | | 102,541 | |
Series 2021-A, Class B, 2.79%, 11/17/33(a) | | | | | | | 3,714 | | | | 3,373,232 | |
Series 2022-C, Class B, 5.93%, 10/17/35(a) | | | | | | | 880 | | | | 871,731 | |
Birch Grove CLO 2 Ltd. | | | | | | | | | | | | |
Series 2021-2A, Class A1, (3-mo. CME Term SOFR + 1.52%), 6.83%, 10/19/34(a)(c) | | | | | | | 320 | | | | 319,543 | |
Series 2021-2A, Class B, (3-mo. CME Term SOFR + 2.01%), 7.32%, 10/19/34(a)(c) | | | | | | | 250 | | | | 250,627 | |
Birch Grove CLO 3 Ltd. | | | | | | | | | | | | |
Series 2021-3A, Class B1, (3-mo. CME Term SOFR + 2.06%), 7.37%, 01/19/35(a)(c) | | | | | | | 730 | | | | 729,273 | |
Series 2021-3A, Class B2, (3-mo. CME Term SOFR + 2.06%), 7.37%, 01/19/35(a)(c) | | | | | | | 1,000 | | | | 996,044 | |
Birch Grove CLO Ltd. | | | | | | | | | | | | |
Series 19A, Class BR, (3-mo. CME Term SOFR + 2.01%), 7.34%, 06/15/31(a)(c) | | | | | | | 1,000 | | | | 1,001,173 | |
Series 19A, Class DR, (3-mo. CME Term SOFR + 3.61%), 8.94%, 06/15/31(a)(c) | | | | | | | 500 | | | | 499,064 | |
BlueMountain CLO Ltd. | | | | | | | | | | | | |
Series 2013-2A, Class A1R, (3-mo. CME Term SOFR + 1.44%), 6.76%, 10/22/30(a)(c) | | | | | | | 1,460 | | | | 1,461,125 | |
Series 2013-2A, Class BR, (3-mo. CME Term SOFR + 1.86%), 7.18%, 10/22/30(a)(c) | | | | | | | 1,250 | | | | 1,251,237 | |
Series 2015-3A, Class A1R, (3-mo. CME Term SOFR + 1.26%), 6.58%, 04/20/31(a)(c) | | | | | | | 1,724 | | | | 1,725,184 | |
Series 2016-3A, Class A1R2, (3-mo. CME Term SOFR + 1.20%), 11/15/30(a)(c)(e) | | | | | | | 10,000 | | | | 10,000,000 | |
Series 2016-3A, Class A2R2, (3-mo. CME Term SOFR + 1.70%), 11/15/30(a)(c)(e) | | | | | | | 1,000 | | | | 1,000,000 | |
Series 2018-2A, Class B, (3-mo. CME Term SOFR + 1.96%), 7.27%, 08/15/31(a)(c) | | | | | | | 1,320 | | | | 1,320,986 | |
Series 2018-3A, Class BR, (3-mo. CME Term SOFR + 1.85%), 10/25/30(a)(c)(e) | | | | | | | 6,350 | | | | 6,344,733 | |
BlueMountain CLO XXIII Ltd. | | | | | | | | | | | | |
Series 2018-23A, Class A1, (3-mo. CME Term SOFR + 1.41%), 6.73%, 10/20/31(a)(c) | | | | | | | 250 | | | | 250,393 | |
Series 2018-23A, Class B, (3-mo. CME Term SOFR + 1.96%), 7.28%, 10/20/31(a)(c) | | | | | | | 750 | | | | 749,717 | |
Series 2018-23A, Class C, (3-mo. CME Term SOFR + 2.41%), 7.73%, 10/20/31(a)(c) | | | | | | | 950 | | | | 941,463 | |
| | |
SCHEDULES OF INVESTMENTS | | 27 |
| | |
Schedule of Investments (continued) March 31, 2024 | | BATS: Series A Portfolio (Percentages shown are based on Net Assets) |
| | | | | | | | | | | | |
| Security | | | | | Par
(000) | | | Value | |
|
Asset-Backed Securities (continued) | |
BlueMountain CLO XXIX Ltd., Series 2020-29A, Class BR, (3-mo. CME Term SOFR + 2.01%), 7.34%, 07/25/34(a)(c) | | | USD | | | | 420 | | | $ | 420,046 | |
BlueMountain CLO XXVIII Ltd., Series 2021-28A, Class A, (3-mo. CME Term SOFR + 1.52%), 6.84%, 04/15/34(a)(c) | | | | | | | 250 | | | | 250,106 | |
BlueMountain Fuji U.S. CLO III Ltd., Series 2017- 3A, Class B, (3-mo. CME Term SOFR + 1.64%), 6.95%, 01/15/30(a)(c) | | | | | | | 550 | | | | 549,022 | |
BPCRE Ltd., Series 2022-FL2, Class A, (1-mo. CME Term SOFR + 2.40%), 7.73%, 01/16/37(a)(c) | | | | | | | 1,721 | | | | 1,717,486 | |
Brex Commercial Charge Card Master Trust,
Series 2024-1, Class A1, 07/15/27(a)(e) | | | | | | | 2,027 | | | | 2,028,188 | |
Bridge Street CLO II Ltd., Series 2021-1A, Class A1A, (3-mo. CME Term SOFR + 1.49%), 6.81%, 07/20/34(a)(c) | | | | | | | 250 | | | | 250,188 | |
Bristol Park CLO Ltd. | | | | | | | | | | | | |
Series 2016-1A, Class BR, (3-mo. CME Term SOFR + 1.71%), 7.03%, 04/15/29(a)(c) | | | | | | | 350 | | | | 350,454 | |
Series 2016-1A, Class DR, (3-mo. CME Term SOFR + 3.21%), 8.53%, 04/15/29(a)(c) | | | | | | | 250 | | | | 248,407 | |
Capital One Multi-Asset Execution Trust,
Series 2005-B3, Class B3, (3-mo. CME Term SOFR + 0.81%), 6.13%, 05/15/28(c) | | | | | | | 2,048 | | | | 2,045,595 | |
Carbone CLO Ltd., Series 2017-1A, Class A1, (3-mo. CME Term SOFR + 1.40%), 6.72%, 01/20/31(a)(c) | | | | | | | 456 | | | | 456,307 | |
Carlyle C17 CLO Ltd., Series C17A, Class A1AR, (3-mo. CME Term SOFR + 1.29%), 6.61%, 04/30/31(a)(c) | | | | | | | 2,135 | | | | 2,122,117 | |
Carlyle Global Market Strategies CLO Ltd. | | | | | | | | | | | | |
Series 2013-4A, Class A1RR, (3-mo. CME Term SOFR + 1.26%), 6.58%, 01/15/31(a)(c) | | | | | | | 194 | | | | 193,620 | |
Series 2014-1A, Class A1R2, (3-mo. CME Term SOFR + 1.23%), 6.55%, 04/17/31(a)(c) | | | | | | | 3,406 | | | | 3,406,833 | |
Series 2014-3RA, Class A1A, (3-mo. CME Term SOFR + 1.31%), 6.63%, 07/27/31(a)(c) | | | | | | | 256 | | | | 256,333 | |
Series 2014-3RA, Class A1B, (3-mo. CME Term SOFR + 1.56%), 6.88%, 07/27/31(a)(c) | | | | | | | 1,000 | | | | 1,002,098 | |
Carlyle U.S. CLO Ltd. | | | | | | | | | | | | |
Series 2017-3A, Class A2R, (3-mo. CME Term SOFR + 1.69%), 7.01%, 07/20/29(a)(c) | | | | | | | 2,810 | | | | 2,814,405 | |
Series 2018-4A, Class B, (3-mo. CME Term SOFR + 2.33%), 7.65%, 01/20/31(a)(c) | | | | | | | 2,430 | | | | 2,430,198 | |
Series 2019-1A, Class A1AR, (3-mo. CME Term SOFR + 1.34%), 6.66%, 04/20/31(a)(c) | | | | | | | 360 | | | | 360,180 | |
Series 2019-2A, Class A1R, (3-mo. CME Term SOFR + 1.38%), 6.70%, 07/15/32(a)(c) | | | | | | | 250 | | | | 250,291 | |
Series 2021-10A, Class A, (3-mo. CME Term SOFR + 1.41%), 6.73%, 10/20/34(a)(c) | | | | | | | 4,360 | | | | 4,362,616 | |
Series 2021-1A, Class A1, (3-mo. CME Term SOFR + 1.40%), 6.72%, 04/15/34(a)(c) | | | | | | | 250 | | | | 250,198 | |
Series 2021-7A, Class A1, (3-mo. CME Term SOFR + 1.42%), 6.74%, 10/15/35(a)(c) | | | | | | | 1,000 | | | | 999,812 | |
Carrington Mortgage Loan Trust | | | | | | | | | | | | |
Series 2006-FRE2, Class A4, (1-mo. CME Term SOFR + 0.36%), 5.69%, 10/25/36(c) | | | | | | | 1,366 | | | | 1,066,830 | |
Series 2006-NC4, Class A3, (1-mo. CME Term SOFR + 0.27%), 5.60%, 10/25/36(c) | | | | | | | 24 | | | | 23,390 | |
Series 2007-FRE1, Class A3, (1-mo. CME Term SOFR + 0.37%), 5.70%, 02/25/37(c) | | | | | | | 4,356 | | | | 4,002,957 | |
| | | | | | | | | | | | |
| Security | | | | | Par
(000) | | | Value | |
|
Asset-Backed Securities (continued) | |
CarVal CLO VC Ltd. | | | | | | | | | | | | |
Series 2021-2A, Class D, (3-mo. CME Term SOFR + 3.51%), 8.83%, 10/15/34(a)(c) | | | USD | | | | 1,000 | | | $ | 995,743 | |
Series 2021-2A, Class E, (3-mo. CME Term SOFR + 7.01%), 12.33%, 10/15/34(a)(c) | | | | | | | 1,250 | | | | 1,240,133 | |
Cascade MH Asset Trust, Series 2019-MH1, Class A, 4.00%, 11/25/44(a)(c) | | | | | | | 4,928 | | | | 4,727,146 | |
CBAM Ltd. | | | | | | | | | | | | |
Series 2017-1A, Class A1, (3-mo. CME Term SOFR + 1.51%), 6.83%, 07/20/30(a)(c) | | | | | | | 937 | | | | 938,373 | |
Series 2018-5A, Class B1, (3-mo. CME Term SOFR + 1.66%), 6.98%, 04/17/31(a)(c) | | | | | | | 540 | | | | 538,598 | |
Series 2018-6A, Class B1R, (3-mo. CME Term SOFR + 2.36%), 7.68%, 01/15/31(a)(c) | | | | | | | 1,000 | | | | 1,001,523 | |
Series 2018-7A, Class B1, (3-mo. CME Term SOFR + 1.86%), 7.18%, 07/20/31(a)(c) | | | | | | | 500 | | | | 499,500 | |
C-BASS Trust, Series 2006-CB9, Class A4, (1-mo. CME Term SOFR + 0.57%), 5.90%, 11/25/36(c) | | | | | | | 179 | | | | 79,691 | |
Cedar Funding II CLO Ltd. | | | | | | | | | | | | |
Series 2013-1A, Class ARR, (3-mo. CME Term SOFR + 1.34%), 6.66%, 04/20/34(a)(c) | | | | | | | 750 | | | | 749,225 | |
Series 2013-1A, Class BRR, (3-mo. CME Term SOFR + 1.61%), 6.93%, 04/20/34(a)(c) | | | | | | | 500 | | | | 496,463 | |
Cedar Funding IX CLO Ltd., Series 2018-9A, Class A1, (3-mo. CME Term SOFR + 1.24%), 6.56%, 04/20/31(a)(c) | | | | | | | 1,221 | | | | 1,222,225 | |
Cedar Funding V CLO Ltd., Series 2016-5A, Class A1R, (3-mo. CME Term SOFR + 1.36%), 6.68%, 07/17/31(a)(c) | | | | | | | 1,848 | | | | 1,849,190 | |
Cedar Funding VI CLO Ltd., Series 2016-6A, Class ARR, (3-mo. CME Term SOFR + 1.31%), 6.63%, 04/20/34(a)(c) | | | | | | | 500 | | | | 500,000 | |
Cedar Funding VII CLO Ltd. | | | | | | | | | | | | |
Series 2018-7A, Class A1, (3-mo. CME Term SOFR + 1.26%), 6.58%, 01/20/31(a)(c) | | | | | | | 299 | | | | 299,053 | |
Series 2018-7A, Class A2, (3-mo. CME Term SOFR + 1.39%), 6.71%, 01/20/31(a)(c) | | | | | | | 250 | | | | 250,405 | |
Cedar Funding VIII CLO Ltd. | | | | | | | | | | | | |
Series 2017-8A, Class A1R, (3-mo. CME Term SOFR + 1.41%), 6.73%, 10/17/34(a)(c) | | | | | | | 2,750 | | | | 2,754,602 | |
Series 2017-8A, Class BR, (3-mo. CME Term SOFR + 1.91%), 7.23%, 10/17/34(a)(c) | | | | | | | 2,500 | | | | 2,487,287 | |
Cedar Funding XI CLO Ltd. | | | | | | | | | | | | |
Series 2019-11A, Class A1R, (3-mo. CME Term SOFR + 1.31%), 6.66%, 05/29/32(a)(c) | | | | | | | 1,000 | | | | 997,755 | |
Series 2019-11A, Class A2R, (3-mo. CME Term SOFR + 1.61%), 6.96%, 05/29/32(a)(c) | | | | | | | 250 | | | | 249,665 | |
Cedar Funding XIV CLO Ltd., Series 2021-14A, Class B, (3-mo. CME Term SOFR + 1.86%), 7.18%, 07/15/33(a)(c) | | | | | | | 1,480 | | | | 1,473,236 | |
CIFC Funding Ltd. | | | | | | | | | | | | |
Series 2013-1A, Class A2R, (3-mo. CME Term SOFR + 2.01%), 7.33%, 07/16/30(a)(c) | | | | | | | 250 | | | | 250,625 | |
Series 2013-2A, Class A1L2, (3-mo. CME Term SOFR + 1.26%), 6.56%, 10/18/30(a)(c) | | | | | | | 1,408 | | | | 1,407,813 | |
Series 2014-1A, Class BR2, (3-mo. CME Term SOFR + 1.66%), 6.96%, 01/18/31(a)(c) | | | | | | | 2,100 | | | | 2,100,327 | |
Series 2014-2RA, Class A1, (3-mo. CME Term SOFR + 1.31%), 6.63%, 04/24/30(a)(c) | | | | | | | 169 | | | | 169,408 | |
Series 2014-3A, Class A1R2, (3-mo. CME Term SOFR + 1.46%), 6.78%, 10/22/31(a)(c) | | | | | | | 3,446 | | | | 3,449,154 | |
| | |
| 28 | | 2 0 2 4 BLACK ROCK ANNUAL REPORT TO SHAREHOLDERS |
| | |
Schedule of Investments (continued) March 31, 2024 | | BATS: Series A Portfolio (Percentages shown are based on Net Assets) |
| | | | | | | | | | | | |
| Security | | | | | Par
(000) | | | Value | |
|
Asset-Backed Securities (continued) | |
CIFC Funding Ltd. | | | | | | | | | | | | |
Series 2014-4RA, Class A1AR, (3-mo. CME Term SOFR + 1.43%), 6.75%, 01/17/35(a)(c) | | | USD | | | | 1,000 | | | $ | 999,713 | |
Series 2014-5A, Class A1R2, (3-mo. CME Term SOFR + 1.46%), 6.78%, 10/17/31(a)(c) | | | | | | | 5,250 | | | | 5,251,479 | |
Series 2014-5A, Class BR2, (3-mo. CME Term SOFR + 2.06%), 7.38%, 10/17/31(a)(c) | | | | | | | 1,800 | | | | 1,804,369 | |
Series 2015-1A, Class ARR, (3-mo. CME Term SOFR + 1.37%), 6.69%, 01/22/31(a)(c) | | | | | | | 214 | | | | 213,613 | |
Series 2017-5A, Class A1, (3-mo. CME Term SOFR + 1.44%), 6.76%, 11/16/30(a)(c) | | | | | | | 203 | | | | 203,675 | |
Series 2018-1A, Class A, (3-mo. CME Term SOFR + 1.26%), 6.56%, 04/18/31(a)(c) | | | | | | | 3,175 | | | | 3,176,186 | |
Series 2018-2A, Class A1, (3-mo. CME Term SOFR + 1.30%), 6.62%, 04/20/31(a)(c) | | | | | | | 238 | | | | 237,991 | |
Series 2018-3A, Class B, (3-mo. CME Term SOFR + 1.86%), 7.16%, 07/18/31(a)(c) | | | | | | | 256 | | | | 255,975 | |
Series 2018-4A, Class A2, (3-mo. CME Term SOFR + 1.96%), 7.28%, 10/17/31(a)(c) | | | | | | | 250 | | | | 249,933 | |
Series 2019-5A, Class A1R1, (3-mo. CME Term SOFR + 1.40%), 6.72%, 01/15/35(a)(c) | | | | | | | 2,250 | | | | 2,250,102 | |
Series 2020-3A, Class A1R, (3-mo. CME Term SOFR + 1.39%), 6.71%, 10/20/34(a)(c) | | | | | | | 7,000 | | | | 7,003,738 | |
Series 2020-3A, Class BR, (3-mo. CME Term SOFR + 1.91%), 7.23%, 10/20/34(a)(c) | | | | | | | 970 | | | | 971,278 | |
Series 2021-1A, Class B, (3-mo. CME Term SOFR + 1.81%), 7.14%, 04/25/33(a)(c) | | | | | | | 2,800 | | | | 2,801,700 | |
Series 2021-4A, Class A, (3-mo. CME Term SOFR + 1.31%), 6.63%, 07/15/33(a)(c) | | | | | | | 3,000 | | | | 3,002,287 | |
Series 2021-4A, Class B, (3-mo. CME Term SOFR + 1.84%), 7.16%, 07/15/33(a)(c) | | | | | | | 2,500 | | | | 2,499,137 | |
Series 2021-4A, Class C, (3-mo. CME Term SOFR + 2.11%), 7.43%, 07/15/33(a)(c) | | | | | | | 1,000 | | | | 994,034 | |
Series 2021-5A, Class A, (3-mo. CME Term SOFR + 1.40%), 6.72%, 07/15/34(a)(c) | | | | | | | 1,700 | | | | 1,703,251 | |
Series 2021-6A, Class B, (3-mo. CME Term SOFR + 1.91%), 7.23%, 10/15/34(a)(c) | | | | | | | 550 | | | | 550,015 | |
CIT Mortgage Loan Trust, Series 2007-1, Class 1M2, (1-mo. CME Term SOFR + 1.86%), 7.19%, 10/25/37(a)(c) | | | | | | | 2,144 | | | | 1,966,685 | |
Citigroup Mortgage Loan Trust | | | | | | | | | | | | |
Series 2007-AHL2, Class A3B, (1-mo. CME Term SOFR + 0.31%), 5.64%, 05/25/37(c) | | | | | | | 938 | | | | 620,525 | |
Series 2007-AHL2, Class A3C, (1-mo. CME Term SOFR + 0.38%), 5.71%, 05/25/37(c) | | | | | | | 437 | | | | 288,928 | |
Series 2007-WFH2, Class M3, (1-mo. CME Term SOFR + 0.82%), 6.15%, 03/25/37(c) | | | | | | | 5,000 | | | | 4,610,326 | |
Series 2007-WFH4, Class M3A, (1-mo. CME Term SOFR + 3.86%), 9.19%, 07/25/37(c) | | | | | | | 1,000 | | | | 946,347 | |
Clear Creek CLO | | | | | | | | | | | | |
Series 2015-1A, Class AR, (3-mo. CME Term SOFR + 1.46%), 6.78%, 10/20/30(a)(c) | | | | | | | 121 | | | | 120,918 | |
Series 2015-1A, Class DR, (3-mo. CME Term SOFR + 3.21%), 8.53%, 10/20/30(a)(c) | | | | | | | 330 | | | | 329,341 | |
Series 2015-1A, Class ER, (3-mo. CME Term SOFR + 6.56%), 11.88%, 10/20/30(a)(c) | | | | | | | 1,000 | | | | 999,039 | |
Clover CLO LLC | | | | | | | | | | | | |
Series 2020-1A, Class AR, (3-mo. CME Term SOFR + 1.42%), 6.74%, 04/15/34(a)(c) | | | | | | | 500 | | | | 500,508 | |
Series 2021-1A, Class A, (3-mo. CME Term SOFR + 1.36%), 6.68%, 04/22/34(a)(c) | | | | | | | 500 | | | | 500,300 | |
| | | | | | | | | | | | |
| Security | | | | | Par (000) | | | Value | |
|
Asset-Backed Securities (continued) | |
College Ave Student Loans LLC | | | | | | | | | | | | |
Series 2021-B, Class B, 2.42%, 06/25/52(a) | | | USD | | | | 490 | | | $ | 428,910 | |
Series 2021-B, Class C, 2.72%, 06/25/52(a) | | | | | | | 2,096 | | | | 1,851,527 | |
Series 2021-B, Class D, 3.78%, 06/25/52(a) | | | | | | | 500 | | | | 449,318 | |
Series 2021-C, Class B, 2.72%, 07/26/55(a) | | | | | | | 406 | | | | 356,164 | |
Series 2021-C, Class C, 3.06%, 07/26/55(a) | | | | | | | 3,647 | | | | 3,186,816 | |
Series 2021-C, Class D, 4.11%, 07/26/55(a) | | | | | | | 270 | | | | 238,495 | |
College Ave Student Loans Trust, Series 2024-A, Class A1B, (SOFR (30-day) + 1.75%), 06/25/54(a)(c)(e) | | | | | | | 6,399 | | | | 6,399,000 | |
Conseco Finance Corp. | | | | | | | | | | | | |
Series 1996-10, Class B1, 7.24%, 11/15/28(c) | | | | 33 | | | | 32,340 | |
Series 1998-4, Class M1, 6.83%, 04/01/30(c) | | | | | | | 673 | | | | 631,740 | |
Conseco Finance Securitizations Corp. | | | | | | | | | | | | |
Series 2000-1, Class A5, 8.06%, 09/01/29(c) | | | | | | | 2,165 | | | | 388,755 | |
Series 2000-4, Class A6, 8.31%, 05/01/32(c) | | | | | | | 2,157 | | | | 392,257 | |
Cook Park CLO Ltd., Series 2018-1A, Class B, (3-mo. CME Term SOFR + 1.66%), 6.98%, 04/17/30(a)(c) | | | | | | | 250 | | | | 249,949 | |
Countrywide Asset-Backed Certificates | | | | | | | | | | | | |
Series 2005-16, Class 1AF, 4.55%, 04/25/36(c) | | | | 1,343 | | | | 1,153,777 | |
Series 2006-11, Class 3AV2, (1-mo. CME Term SOFR + 0.43%), 5.76%, 09/25/46(c) | | | | | | | 0 | (f) | | | 31 | |
Series 2006-22, Class M1, (1-mo. CME Term SOFR + 0.34%), 5.67%, 05/25/47(c) | | | | | | | 456 | | | | 373,624 | |
Countrywide Asset-Backed Certificates Revolving Home Equity Loan Trust, Series 2004-U, Class 2A, (1-mo. CME Term SOFR + 0.38%), 5.71%, 03/15/34(c) | | | | | | | 10 | | | | 9,623 | |
Credit Suisse Mortgage Trust, Series 2021-JR1, Class A1, 2.47%,
09/27/66(a)(c) | | | | | | | 3,827 | | | | 3,780,970 | |
Credit-Based Asset Servicing & Securitization LLC | | | | | | | | | | | | |
Series 2006-CB2, Class AF4, 3.05%, 12/25/36(b) | | | | | | | 15 | | | | 12,791 | |
Series 2006-MH1, Class B1, 6.75%,
10/25/36(a)(b) | | | | | | | 1,487 | | | | 1,449,276 | |
Series 2006-MH1, Class B2, 6.75%,
10/25/36(a)(b) | | | | | | | 1,793 | | | | 1,339,044 | |
Series 2006-SL1, Class A3, (1-mo. CME Term SOFR + 0.55%), 5.88%, 09/25/36(a)(c) | | | | | | | 5,556 | | | | 285,435 | |
CWHEQ Revolving Home Equity Loan Resuritization Trust, Series 2006-RES, Class 5B1B, (1-mo. CME Term SOFR + 0.30%), 5.63%, 05/15/35(a)(c) | | | | | | | 1 | | | | 636 | |
CWHEQ Revolving Home Equity Loan Trust | | | | | | | | | | | | |
Series 2006-C, Class 2A, (1-mo. CME Term SOFR + 0.29%), 5.62%, 05/15/36(c) | | | | | | | 502 | | | | 488,838 | |
Series 2006-I, Class 1A, (1-mo. CME Term SOFR + 0.25%), 5.58%, 01/15/37(c) | | | | | | | 145 | | | | 133,138 | |
Deer Creek CLO Ltd. | | | | | | | | | | | | |
Series 2017-1A, Class A, (3-mo. CME Term SOFR + 1.44%), 6.76%, 10/20/30(a)(c) | | | | | | | 477 | | | | 477,916 | |
Series 2017-1A, Class B, (3-mo. CME Term SOFR + 1.91%), 7.23%, 10/20/30(a)(c) | | | | | | | 750 | | | | 742,930 | |
Dewolf Park CLO Ltd. | | | | | | | | | | | | |
Series 2017-1A, Class AR, (3-mo. CME Term SOFR + 1.18%), 6.50%, 10/15/30(a)(c) | | | | | | | 6,900 | | | | 6,898,860 | |
Series 2017-1A, Class CR, (3-mo. CME Term SOFR + 2.11%), 7.43%, 10/15/30(a)(c) | | | | | | | 500 | | | | 498,411 | |
Diameter Capital CLO 1 Ltd., Series 2021-1A, Class A1A, (3-mo. CME Term SOFR + 1.50%), 6.82%, 07/15/36(a)(c) | | | | | | | 1,530 | | | | 1,530,918 | |
| | |
SCHEDULES OF INVESTMENTS | | 29 |
| | |
Schedule of Investments (continued) March 31, 2024 | | BATS: Series A Portfolio (Percentages shown are based on Net Assets) |
| | | | | | | | | | | | |
| Security | | | | | Par (000) | | | Value | |
|
Asset-Backed Securities (continued) | |
Diameter Capital CLO 2 Ltd. | | | | | | | | | | | | |
Series 2021-2A, Class A1, (3-mo. CME Term SOFR + 1.48%), 6.80%, 10/15/36(a)(c) | | | USD | | | | 250 | | | $ | 250,228 | |
Series 2021-2A, Class A2, (3-mo. CME Term SOFR + 2.01%), 7.33%, 10/15/36(a)(c) | | | | | | | 500 | | | | 500,852 | |
Diameter Capital CLO 3 Ltd., Series 2022-3A, Class A1A, (3-mo. CME Term SOFR + 1.39%), 6.70%, 04/15/37(a)(c) | | | | | | | 470 | | | | 469,811 | |
Dryden 119 CLO Ltd., Series 2024-119A, Class C1, (3-mo. CME Term SOFR + 2.35%),
04/15/36(a)(c)(e) | | | | | | | 1,000 | | | | 1,000,000 | |
Dryden 37 Senior Loan Fund, Series 2015-37A, Class AR, (3-mo. CME Term SOFR + 1.36%), 6.68%, 01/15/31(a)(c) | | | | | | | 1,142 | | | | 1,141,805 | |
Dryden 40 Senior Loan Fund, Series 2015-40A, Class CR, (3-mo. CME Term SOFR + 2.36%), 7.67%, 08/15/31(a)(c) | | | | | | | 1,200 | | | | 1,190,567 | |
Dryden 42 Senior Loan Fund
| | | | | | | | | | | | |
Series 2016-42A, Class BR, (3-mo. CME Term SOFR + 1.81%), 7.13%, 07/15/30(a)(c) | | | | | | | 810 | | | | 807,818 | |
Series 2016-42A, Class CR, (3-mo. CME Term SOFR + 2.31%), 7.63%, 07/15/30(a)(c) | | | | | | | 250 | | | | 249,987 | |
Dryden 43 Senior Loan Fund, Series 2016-43A, Class AR2, (3-mo. CME Term SOFR + 1.30%), 6.62%, 04/20/34(a)(c) | | | | | | | 1,620 | | | | 1,618,859 | |
Dryden 45 Senior Loan Fund, Series 2016-45A, Class BR, (3-mo. CME Term SOFR + 1.96%), 7.28%, 10/15/30(a)(c) | | | | | | | 7,240 | | | | 7,253,364 | |
Dryden 49 Senior Loan Fund, Series 2017-49A, Class AR, (3-mo. CME Term SOFR + 1.21%), 6.51%, 07/18/30(a)(c) | | | | | | | 872 | | | | 872,819 | |
Dryden 53 CLO Ltd., Series 2017-53A, Class A, (3-mo. CME Term SOFR + 1.38%), 6.70%, 01/15/31(a)(c) | | | | | | | 1,819 | | | | 1,819,595 | |
Dryden 58 CLO Ltd., Series 2018-58A, Class B, (3-mo. CME Term SOFR + 1.76%), 7.08%, 07/17/31(a)(c) | | | | | | | 250 | | | | 250,257 | |
Dryden 60 CLO Ltd., Series 2018-60A, Class A, (3-mo. CME Term SOFR + 1.31%), 6.63%, 07/15/31(a)(c) | | | | | | | 241 | | | | 240,625 | |
Dryden 65 CLO Ltd., Series 2018-65A, Class B, (3-mo. CME Term SOFR + 1.86%), 7.16%, 07/18/30(a)(c) | | | | | | | 500 | | | | 501,259 | |
Dryden 68 CLO Ltd., Series 2019-68A, Class BR, (3-mo. CME Term SOFR + 1.96%), 7.28%, 07/15/35(a)(c) | | | | | | | 810 | | | | 808,785 | |
Dryden 77 CLO Ltd. | | | | | | | | | | | | |
Series 2020-77A, Class AR, (3-mo. CME Term SOFR + 1.38%), 6.70%, 05/20/34(a)(c) | | | | | | | 2,000 | | | | 2,000,700 | |
Series 2020-77A, Class XR, (3-mo. CME Term SOFR + 1.26%), 6.58%, 05/20/34(a)(c) | | | | | | | 141 | | | | 140,540 | |
Dryden 78 CLO Ltd., Series 2020-78A, Class B, (3-mo. CME Term SOFR + 1.76%), 7.08%, 04/17/33(a)(c) | | | | | | | 250 | | | | 249,662 | |
Dryden XXVIII Senior Loan Fund, Series 2013- 28A, Class A1LR, (3-mo. CME Term SOFR + 1.46%), 6.77%, 08/15/30(a)(c) | | | | | | | 1,060 | | | | 1,060,018 | |
Eaton Vance CLO Ltd. | | | | | | | | | | | | |
Series 2014-1RA, Class A2, (3-mo. CME Term SOFR + 1.75%), 7.07%, 07/15/30(a)(c) | | | | | | | 250 | | | | 250,484 | |
Series 2018-1A, Class A2, (3-mo. CME Term SOFR + 1.71%), 7.03%, 10/15/30(a)(c) | | | | | | | 250 | | | | 250,360 | |
| | | | | | | | | | | | |
| Security | | | | | Par (000) | | | Value | |
|
Asset-Backed Securities (continued) | |
EDvestinU Private Education Loan Issue No. 1 LLC, Series 2019-A, Class A, 3.58%, 11/25/38(a) | | | USD | | | | 644 | | | $ | 618,536 | |
EDvestinU Private Education Loan Issue No. 3 LLC | | | | | | | | | | | | |
Series 2021-A, Class A, 1.80%, 11/25/45(a) | | | | | | | 231 | | | | 205,448 | |
Series 2021-A, Class B, 3.50%, 11/25/50(a) | | | | | | | 1,200 | | | | 958,956 | |
EDvestinU Private Education Loan Issue No. 4 LLC, Series 2022-A, Class A, 5.25%, 11/25/40(a) | | | | | | | 1,016 | | | | 999,847 | |
Elmwood CLO 15 Ltd. | | | | | | | | | | | | |
Series 2022-2A, Class A1, (3-mo. CME Term SOFR + 1.34%), 6.66%, 04/22/35(a)(c) | | | | | | | 10,590 | | | | 10,591,189 | |
Series 2022-2A, Class D, (3-mo. CME Term SOFR + 3.67%), 8.99%, 04/22/35(a)(c) | | | | | | | 1,625 | | | | 1,632,117 | |
Elmwood CLO 27 Ltd. | | | | | | | | | | | | |
Series 2024-3A, Class B, (3-mo. CME Term SOFR + 1.95%), 04/18/37(a)(c)(e) | | | | | | | 1,210 | | | | 1,210,000 | |
Series 2024-3A, Class D, (3-mo. CME Term SOFR + 3.45%), 04/18/37(a)(c)(e) | | | | | | | 250 | | | | 250,000 | |
Elmwood CLO I Ltd., Series 2019-1A, Class A1RR, (3-mo. CME Term SOFR + 1.52%), 6.83%,
04/20/37(a)(c) | | | | | | | 250 | | | | 250,627 | |
Elmwood CLO II Ltd. | | | | | | | | | | | | |
Series 2019-2A, Class AR, (3-mo. CME Term SOFR + 1.41%), 6.73%, 04/20/34(a)(c) | | | | | | | 2,250 | | | | 2,252,025 | |
Series 2019-2A, Class BR, (3-mo. CME Term SOFR + 1.91%), 7.23%, 04/20/34(a)(c) | | | | | | | 900 | | | | 900,919 | |
Series 2019-2A, Class DR, (3-mo. CME Term SOFR + 3.26%), 8.58%, 04/20/34(a)(c) | | | | | | | 250 | | | | 249,066 | |
Elmwood CLO IV Ltd. | | | | | | | | | | | | |
Series 2020-1A, Class A, (3-mo. CME Term SOFR + 1.50%), 6.82%, 04/15/33(a)(c) | | | | | | | 1,500 | | | | 1,501,502 | |
Series 2020-1A, Class D, (3-mo. CME Term SOFR + 3.41%), 8.73%, 04/15/33(a)(c) | | | | | | | 1,000 | | | | 1,001,284 | |
Elmwood CLO X Ltd., Series 2021-3A, Class C, (3-mo. CME Term SOFR + 2.21%), 7.53%,
10/20/34(a)(c) | | | | | | | 6,300 | | | | 6,310,965 | |
Elmwood CLO XII Ltd., Series 2021-5A, Class A, (3-mo. CME Term SOFR + 1.41%), 6.73%, 01/20/35(a)(c) | | | | | | | 960 | | | | 960,334 | |
FBR Securitization Trust, Series 2005-5, Class M2, (1-mo. CME Term SOFR + 0.82%), 6.15%,
11/25/35(c) | | | | | | | 2,089 | | | | 2,034,207 | |
Fillmore Park CLO Ltd., Series 2018-1A, Class A2, (3-mo. CME Term SOFR + 1.60%), 6.92%,
07/15/30(a)(c) | | | | | | | 250 | | | | 249,643 | |
First Franklin Mortgage Loan Trust | | | | | | | | | | | | |
Series 2006-FF16, Class 2A3, (1-mo. CME Term SOFR + 0.39%), 5.72%, 12/25/36(c) | | | | | | | 461 | | | | 188,562 | |
Series 2006-FF17, Class A5, (1-mo. CME Term SOFR + 0.26%), 5.59%, 12/25/36(c) | | | | | | | 1,499 | | | | 1,229,573 | |
FirstKey Homes Trust | | | | | | | | | | | | |
Series 2020-SFR1, Class G, 4.78%, 08/17/37(a) . | | | | | | | 3,650 | | | | 3,494,097 | |
Series 2021-SFR1, Class F1, 3.24%, 08/17/38(a) | | | | | | | 4,464 | | | | 4,021,121 | |
Series 2021-SFR2, Class F1, 2.91%, 09/17/38(a) | | | | | | | 5,500 | | | | 4,912,367 | |
Series 2022-SFR1, Class E1, 5.00%, 05/19/39(a) | | | | | | | 4,000 | | | | 3,847,613 | |
Series 2022-SFR1, Class E2, 5.00%, 05/19/39(a) | | | | | | | 2,990 | | | | 2,861,217 | |
| | |
| 30 | | 2 0 2 4 BLACK ROCK ANNUAL REPORT TO SHAREHOLDERS |
| | |
Schedule of Investments (continued) March 31, 2024 | | BATS: Series A Portfolio (Percentages shown are based on Net Assets) |
| | | | | | | | | | | | |
| Security | | | | | Par (000) | | | Value | |
|
Asset-Backed Securities (continued) | |
FirstKey Homes Trust | | | | | | | | | | | | |
Series 2022-SFR2, Class E1, 4.50%, 07/17/39(a) | | | USD | | | | 2,681 | | | $ | 2,509,236 | |
Series 2022-SFR3, Class E2, 3.50%, 07/17/38(a) | | | | | | | 6,928 | | | | 6,366,800 | |
Flatiron CLO 18 Ltd., Series 2018-1A, Class A, (3-mo. CME Term SOFR + 1.21%), 6.53%, 04/17/31(a)(c) | | | | | | | 959 | | | | 959,020 | |
Flatiron CLO 19 Ltd. | | | | | | | | | | | | |
Series 2019-1A, Class AR, (3-mo. CME Term SOFR + 1.34%), 6.67%, 11/16/34(a)(c) | | | | | | | 500 | | | | 500,282 | |
Series 2019-1A, Class DR, (3-mo. CME Term SOFR + 3.26%), 8.59%, 11/16/34(a)(c) | | | | | | | 900 | | | | 899,854 | |
Flatiron CLO 20 Ltd. | | | | | | | | | | | | |
Series 2020-1A, Class BR, (3-mo. CME Term SOFR + 1.92%), 05/20/36(a)(c)(e) | | | | | | | 1,330 | | | | 1,330,000 | |
Series 2020-1A, Class DR, (3-mo. CME Term SOFR + 3.45%), 05/20/36(a)(c)(e) | | | | | | | 1,000 | | | | 1,000,000 | |
Flatiron CLO 21 Ltd., Series 2021-1A, Class B, (3-mo. CME Term SOFR + 1.86%), 7.17%, 07/19/34(a)(c) | | | | | | | 1,200 | | | | 1,200,945 | |
Foundation Finance Trust | | | | | | | | | | | | |
Series 2021-2A, Class A, 2.19%, 01/15/42(a) | | | | | | | 1,542 | | | | 1,417,852 | |
Series 2024-1A, Class B,
12/15/49(a)(e) | | | | | | | 706 | | | | 706,000 | |
Fremont Home Loan Trust, Series 2006-3, Class 1A1, (1-mo. CME Term SOFR + 0.39%), 5.72%, 02/25/37(c) | | | | | | | 1,918 | | | | 1,443,856 | |
FS Rialto Issuer Ltd. | | | | | | | | | | | | |
Series 2021-FL3, Class A, (1-mo. CME Term SOFR + 1.36%), 6.69%, 11/16/36(a)(c) | | | | | | | 2,094 | | | | 2,083,140 | |
Series 2022-FL4, Class A, (SOFR (30-day) + 1.90%), 7.22%, 01/19/39(a)(c) | | | | | | | 9,467 | | | | 9,426,820 | |
Series 2022-FL5, Class A, (1-mo. CME Term SOFR + 2.30%), 7.63%, 06/19/37(a)(c) | | | | | | | 2,721 | | | | 2,720,979 | |
Series 2022-FL6, Class A, (1-mo. CME Term SOFR + 2.58%), 7.91%, 08/17/37(a)(c) | | | | | | | 6,015 | | | | 6,046,139 | |
Galaxy 33 CLO Ltd., Series 2024-33A, Class D1, (3-mo. CME Term SOFR + 3.55%), 04/20/37(a)(c)(e) | | | | | | | 1,900 | | | | 1,885,518 | |
Galaxy XIX CLO Ltd. | | | | | | | | | | | | |
Series 2015-19A, Class A1RR, (3-mo. CME Term SOFR + 1.21%), 6.53%, 07/24/30(a)(c) | | | | | | | 410 | | | | 410,019 | |
Series 2015-19A, Class A2RR, (3-mo. CME Term SOFR + 1.66%), 6.98%, 07/24/30(a)(c) | | | | | | | 250 | | | | 249,927 | |
Galaxy XX CLO Ltd., Series 2015-20A, Class AR, (3-mo. CME Term SOFR + 1.26%), 6.58%, 04/20/31(a)(c) | | | | | | | 2,527 | | | | 2,527,497 | |
Galaxy XXII CLO Ltd., Series 2016-22A, Class ARR, (3-mo. CME Term SOFR + 1.46%), 6.78%, 04/16/34(a)(c) | | | | | | | 1,000 | | | | 1,002,683 | |
Galaxy XXVII CLO Ltd., Series 2018-27A, Class A, (3-mo. CME Term SOFR + 1.28%), 6.61%, 05/16/31(a)(c) | | | | | | | 1,863 | | | | 1,862,912 | |
Galaxy XXVIII CLO Ltd., Series 2018-28A, Class B, (3-mo. CME Term SOFR + 1.86%), 7.18%, 07/15/31(a)(c) | | | | | | | 510 | | | | 510,401 | |
Generate CLO 2 Ltd. | | | | | | | | | | | | |
Series 2A, Class AR, (3-mo. CME Term SOFR + 1.41%), 6.73%, 01/22/31(a)(c) | | | | | | | 1,051 | | | | 1,051,707 | |
Series 2A, Class BR, (3-mo. CME Term SOFR + 1.71%), 7.03%, 01/22/31(a)(c) | | | | | | | 250 | | | | 250,076 | |
| | | | | | | | | | | | |
| Security | | | | | Par (000) | | | Value | |
|
Asset-Backed Securities (continued) | |
Generate CLO 2 Ltd. | | | | | | | | | | | | |
Series 2A, Class ER, (3-mo. CME Term SOFR + 5.91%), 11.23%,
01/22/31(a)(c) | | | USD | | | | 1,000 | | | $ | 996,947 | |
Generate CLO 6 Ltd. | | | | | | | | | | | | |
Series 6A, Class A1R, (3-mo. CME Term SOFR + 1.46%), 6.78%, 01/22/35(a)(c) | | | | | | | 250 | | | | 250,179 | |
Series 6A, Class DR, (3-mo. CME Term SOFR + 3.76%), 9.08%, 01/22/35(a)(c) | | | | | | | 4,500 | | | | 4,448,842 | |
Generate CLO 7 Ltd., Series 7A, Class A1R, (3-mo. CME Term SOFR + 1.62%), 04/22/37(a)(c)(e) . | | | | | | | 7,665 | | | | 7,669,205 | |
Generate CLO 8 Ltd., Series 8A, Class BR, (3-mo. CME Term SOFR + 2.01%), 7.33%, 10/20/34(a)(c) | | | | | | | 390 | | | | 391,055 | |
Gilbert Park CLO Ltd., Series 2017-1A, Class A, (3-mo. CME Term SOFR + 1.45%), 6.77%, 10/15/30(a)(c) | | | | | | | 168 | | | | 167,832 | |
GoldenTree Loan Management U.S. CLO 1 Ltd. | | | | | | | | | | | | |
Series 2017-1A, Class A1R2, (3-mo. CME Term SOFR + 1.28%), 6.60%, 04/20/34(a)(c) | | | | | | | 250 | | | | 249,750 | |
Series 2021-11A, Class A, (3-mo. CME Term SOFR + 1.39%), 6.71%, 10/20/34(a)(c) | | | | | | | 5,530 | | | | 5,534,791 | |
Series 2021-11A, Class E, (3-mo. CME Term SOFR + 5.61%), 10.93%, 10/20/34(a)(c) | | | | | | | 1,750 | | | | 1,690,006 | |
Series 2021-9A, Class E, (3-mo. CME Term SOFR + 5.01%), 10.33%, 01/20/33(a)(c) | | | | | | | 1,000 | | | | 966,608 | |
Series 2021-9R, Class DR, (3-mo. CME Term SOFR + 3.35%), 04/20/37(a)(c)(e) | | | | | | | 750 | | | | 750,000 | |
GoldenTree Loan Management U.S. CLO 10 Ltd., Series 2021-10A, Class A, (3-mo. CME Term SOFR + 1.36%), 6.68%, 07/20/34(a)(c) | | | | | | | 250 | | | | 250,152 | |
GoldenTree Loan Management U.S. CLO 12 Ltd., Series 2022-12A, Class B, (3-mo. CME Term SOFR + 1.95%), 7.27%, 04/20/34(a)(c) | | | | | | | 2,500 | | | | 2,496,179 | |
GoldenTree Loan Management U.S. CLO 3 Ltd., Series 2018-3A, Class AJ, (3-mo. CME Term SOFR + 1.56%), 6.88%, 04/20/30(a)(c) | | | | | | | 850 | | | | 855,295 | |
GoldenTree Loan Opportunities XI Ltd., Series 2015-11A, Class AR2, (3-mo. CME Term SOFR + 1.33%), 6.63%,
01/18/31(a)(c) | | | | | | | 318 | | | | 318,687 | |
Goldman Home Improvement Trust | | | | | | | | | | | | |
Series 2021-GRN2, Class B, 1.97%, 06/25/51(a). | | | | | | | 2,439 | | | | 2,233,649 | |
Series 2022-GRN2, Class A, 6.80%, 10/25/52(a) . | | | | | | | 1,168 | | | | 1,172,609 | |
Golub Capital Partners CLO Ltd. | | | | | | | | | | | | |
Series 2021-53A, Class E, (3-mo. CME Term SOFR + 6.96%), 12.28%, 07/20/34(a)(c) | | | | | | | 250 | | | | 250,712 | |
Series 2021-55A, Class A, (3-mo. CME Term SOFR + 1.46%), 6.78%, 07/20/34(a)(c) | | | | | | | 330 | | | | 330,230 | |
Series 2021-58A, Class A1, (3-mo. CME Term SOFR + 1.44%), 6.77%, 01/25/35(a)(c) | | | | | | | 1,780 | | | | 1,780,377 | |
Series 2024-71A, Class A, (3-mo. CME Term SOFR + 1.95%), 7.27%, 02/09/37(a)(c) | | | | | | | 6,000 | | | | 6,025,328 | |
GoodLeap Sustainable Home Solutions Trust | | | | | | | | | | | | |
Series 2021-5CS, Class A, 2.31%, 10/20/48(a) | | | | | | | 1,340 | | | | 1,077,395 | |
Series 2022-3CS, Class A, 4.95%, 07/20/49(a) | | | | | | | 926 | | | | 869,838 | |
Series 2023-1GS, Class A, 5.52%, 02/22/55(a) | | | | | | | 1,488 | | | | 1,444,861 | |
Series 2023-3C, Class A, 6.50%, 07/20/55(a) | | | | | | | 692 | | | | 714,311 | |
Gracie Point International Funding LLC | | | | | | | | | | | | |
Series 2023-1A, Class A, (SOFR (90-day) + 1.95%), 7.31%, 09/01/26(a)(c) | | | | | | | 1,475 | | | | 1,484,304 | |
Series 2024-1A, Class A, (SOFR (90-day) + 1.70%), 7.06%, 03/01/28(a)(c) | | | | | | | 4,053 | | | | 4,063,451 | |
| | |
SCHEDULES OF INVESTMENTS | | 31 |
| | |
Schedule of Investments (continued) March 31, 2024 | | BATS: Series A Portfolio (Percentages shown are based on Net Assets) |
| | | | | | | | | | | | |
| Security | | | | | Par (000) | | | Value | |
|
Asset-Backed Securities (continued) | |
Greystone CRE Notes Ltd., Series 2021-FL3, Class A, (1-mo. CME Term SOFR + 1.13%), 6.46%, 07/15/39(a)(c) | | | USD | | | | 849 | | | $ | 838,480 | |
Greywolf CLO III Ltd., Series 2020-3RA, Class A1R, (3-mo. CME Term SOFR + 1.55%), 6.87%, 04/15/33(a)(c) | | | | | | | 500 | | | | 501,666 | |
GSAA Home Equity Trust | | | | | | | | | | | | |
Series 2005-14, Class 1A2, (1-mo. CME Term SOFR + 0.81%), 6.14%, 12/25/35(c) | | | | | | | 283 | | | | 120,943 | |
Series 2006-14, Class A3A, (1-mo. CME Term SOFR + 0.61%), 5.94%, 09/25/36(c) | | | | | | | 4,667 | | | | 1,431,132 | |
Series 2006-18, Class AF3A, 5.77%, 11/25/36(c). | | | | | | | 1,369 | | | | 407,160 | |
Series 2006-4, Class 1A1, 4.21%, 03/25/36(c) | | | | | | | 695 | | | | 469,557 | |
Series 2007-2, Class AF3, 5.92%, 03/25/37(c) | | | | | | | 24 | | | | 4,587 | |
GSAMP Trust | | | | | | | | | | | | |
Series 2007-H1, Class A1B, (1-mo. CME Term SOFR + 0.51%), 5.84%, 01/25/47(c) | | | | | | | 10 | | | | 4,941 | |
Series 2007-HS1, Class M5, (1-mo. CME Term SOFR + 3.49%), 8.82%, 02/25/47(c) | | | | | | | 3,566 | | | | 3,497,567 | |
Series 2007-HS1, Class M7, (1-mo. CME Term SOFR + 3.49%), 8.82%, 02/25/47(c) | | | | | | | 3,000 | | | | 2,682,902 | |
Gulf Stream Meridian 3 Ltd., Series 2021-3A, Class A1, (3-mo. CME Term SOFR + 1.58%), 6.90%, 04/15/34(a)(c) | | | | | | | 250 | | | | 250,415 | |
Gulf Stream Meridian 4 Ltd. | | | | | | | | | | | | |
Series 2021-4A, Class A1, (3-mo. CME Term SOFR + 1.46%), 6.78%,
07/15/34(a)(c) | | | | | | | 10,000 | | | | 10,006,673 | |
Series 2021-4A, Class A2, (3-mo. CME Term SOFR + 2.11%), 7.43%,
07/15/34(a)(c) | | | | | | | 1,000 | | | | 1,004,358 | |
Gulf Stream Meridian 5 Ltd., Series 2021-5A, Class A2, (3-mo. CME Term SOFR + 2.06%), 7.38%, 07/15/34(a)(c) | | | | | | | 650 | | | | 653,086 | |
Gulf Stream Meridian 7 Ltd., Series 2022-7A, Class A1, (3-mo. CME Term SOFR + 1.36%), 6.68%, 07/15/35(a)(c) | | | | | | | 2,420 | | | | 2,421,125 | |
Highbridge Loan Management Ltd., Series 3A- 2014, Class A1R, (3-mo. CME Term SOFR + 1.44%), 6.74%, 07/18/29(a)(c) | | | | | | | 132 | | | | 132,509 | |
Hipgnosis Music Assets LP, Series 2022-1, Class A, 5.00%, 05/16/62(a) | | | | | | | 2,726 | | | | 2,622,361 | |
Home Equity Asset Trust, Series 2006-3, Class M2, (1-mo. CME Term SOFR + 0.71%), 6.04%, 07/25/36(c) | | | | | | | 280 | | | | 255,443 | |
Home Equity Mortgage Loan Asset-Backed Trust, Series 2004-A, Class M2, (1-mo. CME Term SOFR + 2.14%), 4.03%, 07/25/34(c) | | | | | | | 14 | | | | 13,428 | |
Home Partners of America Trust, Series 2021-2, Class F, 3.80%, 12/17/26(a) | | | | | | | 5,769 | | | | 5,157,636 | |
HPS Loan Management Ltd. | | | | | | | | | | | | |
Series 10A-16, Class A1RR, (3-mo. CME Term SOFR + 1.40%), 6.72%,
04/20/34(a)(c) | | | | | | | 7,260 | | | | 7,264,101 | |
Series 6A-2015, Class A1R, (3-mo. CME Term SOFR + 1.26%), 6.53%,
02/05/31(a)(c) | | | | | | | 406 | | | | 405,149 | |
ICG U.S. CLO Ltd., Series 2014-3A, Class A1RR, (3-mo. CME Term SOFR + 1.29%), 6.62%, 04/25/31(a)(c) | | | | | | | 168 | | | | 167,839 | |
Invesco CLO Ltd., Series 2022-1A, Class B, (3-mo. CME Term SOFR + 1.80%), 7.12%, 04/20/35(a)(c) | | | | | | | 510 | | | | 508,725 | |
Jamestown CLO XV Ltd., Series 2020-15A, Class A, (3-mo. CME Term SOFR + 1.60%), 6.92%, 04/15/33(a)(c) | | | | | | | 1,750 | | | | 1,750,000 | |
| | | | | | | | | | | | |
| Security | | | | | Par (000) | | | Value | |
|
Asset-Backed Securities (continued) | |
JPMorgan Mortgage Acquisition Trust | | | | | | | | | | | | |
Series 2006-CH1, Class M7, (1-mo. CME Term SOFR + 1.31%), 6.64%, 07/25/36(c) | | | USD | | | | 3,498 | | | $ | 2,996,319 | |
Series 2007-CH1, Class MF1, 4.55%, 11/25/36(b) | | | | | | | 100 | | | | 96,319 | |
KeyCorp Student Loan Trust, Series 2004-A, Class 2D, (3-mo. LIBOR US + 1.25%), 6.83%, 07/28/42(c) | | | | | | | 2,691 | | | | 2,510,772 | |
KKR CLO 10 Ltd., Series 10, Class BR, (3-mo. CME Term SOFR + 1.96%), 7.29%, 09/15/29(a)(c) | | | | | | | 640 | | | | 639,859 | |
KKR CLO 17 Ltd., Series 17, Class AR, (3-mo. CME Term SOFR + 1.34%), 6.66%, 04/15/34(a)(c) | | | | | | | 500 | | | | 499,268 | |
LCM 26 Ltd., Series 26A, Class A1, (3-mo. CME Term SOFR + 1.33%), 6.65%, 01/20/31(a)(c) | | | | | | | 1,322 | | | | 1,323,293 | |
LCM XVIII LP, Series 18A, Class A1R, (3-mo. CME Term SOFR + 1.28%), 6.60%, 04/20/31(a)(c) | | | | | | | 182 | | | | 182,292 | |
Legacy Mortgage Asset Trust | | | | | | | | | | | | |
Series 2019-SL2, Class A, 3.38%,
02/25/59(a)(c) . | | | | | | | 3,289 | | | | 3,120,716 | |
Series 2019-SL2, Class B, 0.00%,
02/25/59(a)(d) . | | | | | | | 524 | | | | 89,725 | |
Series 2019-SL2, Class M, 4.25%, 02/25/59(a)(c). | | | | | | | 646 | | | | 514,007 | |
Lehman ABS Manufactured Housing Contract Trust, Series 2002-A, Class C, 0.00%, 06/15/33(d) | | | | | | | 444 | | | | 414,346 | |
Lehman ABS Mortgage Loan Trust, Series 2007-1, Class 2A1, (1-mo. CME Term SOFR + 0.20%), 5.53%, 06/25/37(a)(c) | | | | | | | 75 | | | | 48,767 | |
Lendmark Funding Trust | | | | | | | | | | | | |
Series 2021-1A, Class B, 2.47%, 11/20/31(a) | | | | | | | 1,525 | | | | 1,325,147 | |
Series 2021-2A, Class B, 2.37%, 04/20/32(a) | | | | | | | 4,630 | | | | 3,961,916 | |
Series 2021-2A, Class D, 4.46%, 04/20/32(a) | | | | | | | 3,500 | | | | 2,850,457 | |
Series 2022-1A, Class A, 5.12%, 07/20/32(a) | | | | | | | 4,589 | | | | 4,535,574 | |
Series 2023-1A, Class D, 8.69%, 05/20/33(a) | | | | | | | 1,310 | | | | 1,353,318 | |
Series 2024-1A, Class B, 5.88%, 06/21/32(a) | | | | | | | 1,205 | | | | 1,204,456 | |
Series 2024-1A, Class C, 6.40%, 06/21/32(a) | | | | | | | 2,447 | | | | 2,451,247 | |
Series 2024-1A, Class D, 7.21%, 06/21/32(a) | | | | | | | 5,550 | | | | 5,625,981 | |
LoanCore Issuer Ltd., Series 2022-CRE7, Class A, (SOFR (30-day) + 1.55%), 6.87%, 01/17/37(a)(c) | | | | | | | 13,118 | | | | 12,971,636 | |
Loanpal Solar Loan Ltd. | | | | | | | | | | | | |
Series 2020-2GF, Class A, 2.75%, 07/20/47(a) | | | | | | | 849 | | | | 684,434 | |
Series 2021-2GS, Class A, 2.22%, 03/20/48(a) | | | | | | | 3,269 | | | | 2,541,578 | |
Logan CLO I Ltd., Series 2021-1A, Class A, (3-mo. CME Term SOFR + 1.42%), 6.74%, 07/20/34(a)(c) | | | | | | | 4,000 | | | | 4,002,806 | |
Long Beach Mortgage Loan Trust | | | | | | | | | | | | |
Series 2006-2, Class 1A, (1-mo. CME Term SOFR + 0.47%), 5.80%, 03/25/46(c) | | | | | | | 598 | | | | 465,799 | |
Series 2006-5, Class 2A3, (1-mo. CME Term SOFR + 0.41%), 5.74%, 06/25/36(c) | | | | | | | 3,031 | | | | 1,402,970 | |
Series 2006-7, Class 2A3, (1-mo. CME Term SOFR + 0.43%), 5.76%, 08/25/36(c) | | | | | | | 5,530 | | | | 2,175,234 | |
Series 2006-7, Class 2A4, (1-mo. CME Term SOFR + 0.59%), 5.92%, 08/25/36(c) | | | | | | | 1,276 | | | | 502,354 | |
Series 2006-9, Class 2A3, (1-mo. CME Term SOFR + 0.43%), 5.76%, 10/25/36(c) | | | | | | | 1,966 | | | | 626,543 | |
Series 2006-WL3, Class 2A4, (1-mo. CME Term SOFR + 0.71%), 6.04%, 01/25/36(c) | | | | | | | 3,128 | | | | 2,720,415 | |
Long Point Park CLO Ltd., Series 2017-1A, Class A2, (3-mo. CME Term SOFR + 1.64%), 6.95%, 01/17/30(a)(c) | | | | | | | 820 | | | | 820,238 | |
| | |
| 32 | | 2 0 2 4 BLACK ROCK ANNUAL REPORT TO SHAREHOLDERS |
| | |
Schedule of Investments (continued) March 31, 2024 | | BATS: Series A Portfolio (Percentages shown are based on Net Assets) |
| | | | | | | | | | | | |
| Security | | | | | Par (000) | | | Value | |
|
Asset-Backed Securities (continued) | |
Madison Park Funding LXVII Ltd., Series 2024- 67A, Class B, (3-mo. CME Term SOFR + 2.05%), 04/25/37(a)(c)(e) | | | USD | | | | 4,230 | | | $ | 4,230,000 | |
Madison Park Funding XI Ltd., Series 2013-11A, Class AR2, (3-mo. CME Term SOFR + 1.16%), 6.48%, 07/23/29(a)(c) | | | | | | | 1,928 | | | | 1,928,406 | |
Madison Park Funding XIII Ltd. | | | | | | | | | | | | |
Series 2014-13A, Class AR2, (3-mo. CME Term SOFR + 1.21%), 6.52%,
04/19/30(a)(c) | | | | | | | 550 | | | | 550,412 | |
Series 2014-13A, Class BR2, (3-mo. CME Term SOFR + 1.76%), 7.07%,
04/19/30(a)(c) | | | | | | | 600 | | | | 600,672 | |
Madison Park Funding XIX Ltd., Series 2015-19A, Class AR3, (3-mo. CME Term SOFR + 1.60%), 6.92%, 01/22/37(a)(c) | | | | | | | 330 | | | | 331,049 | |
Madison Park Funding XLVI Ltd., Series 2020-46A, Class B1R, (3-mo. CME Term SOFR + 1.91%), 7.23%, 10/15/34(a)(c) | | | | | | | 250 | | | | 249,270 | |
Madison Park Funding XLVIII Ltd., Series 2021- 48A, Class E, (3-mo. CME Term SOFR + 6.51%), 11.82%, 04/19/33(a)(c) | | | | | | | 500 | | | | 499,317 | |
Madison Park Funding XVIII Ltd. | | | | | | | | | | | | |
Series 2015-18A, Class ARR, (3-mo. CME Term SOFR + 1.20%), 6.52%,
10/21/30(a)(c) | | | | | | | 3,370 | | | | 3,369,219 | |
Series 2015-18A, Class BR, (3-mo. CME Term SOFR + 1.86%), 7.18%,
10/21/30(a)(c) | | | | | | | 390 | | | | 390,070 | |
Madison Park Funding XXII Ltd., Series 2016-22A, Class BR, (3-mo. CME Term SOFR + 1.86%), 7.18%, 01/15/33(a)(c) | | | | | | | 1,500 | | | | 1,497,609 | |
Madison Park Funding XXIII Ltd., Series 2017-23A, Class AR, (3-mo. CME Term SOFR + 1.23%), 6.55%, 07/27/31(a)(c) | | | | | | | 963 | | | | 962,724 | |
Madison Park Funding XXIV Ltd., Series 2016- 24A, Class BR, (3-mo. CME Term SOFR + 2.01%), 7.33%, 10/20/29(a)(c) | | | | | | | 740 | | | | 741,642 | |
Madison Park Funding XXVI Ltd., Series 2017- 26A, Class AR, (3-mo. CME Term SOFR + 1.46%), 6.78%, 07/29/30(a)(c) | | | | | | | 2,638 | | | | 2,640,097 | |
Madison Park Funding XXVIII Ltd., Series 2018- 28A, Class C, (3-mo. CME Term SOFR + 2.11%), 7.43%, 07/15/30(a)(c) | | | | | | | 500 | | | | 497,245 | |
Madison Park Funding XXX Ltd. | | | | | | | | | | | | |
Series 2018-30A, Class E, (3-mo. CME Term SOFR + 5.21%), 10.53%, 04/15/29(a)(c) | | | | | | | 1,000 | | | | 992,589 | |
Series 2018-30X, Class E, (3-mo. CME Term SOFR + 5.21%), 10.53%, 04/15/29(c)(g) | | | | | | | 250 | | | | 248,147 | |
Madison Park Funding XXXI Ltd., Series 2018- 31A, Class B, (3-mo. CME Term SOFR + 1.96%), 7.28%, 01/23/31(a)(c) | | | | | | | 250 | | | | 249,669 | |
Madison Park Funding XXXIII Ltd., Series 2019- 33A, Class AR, (3-mo. CME Term SOFR + 1.29%), 6.60%, 10/15/32(a)(c) | | | | | | | 1,790 | | | | 1,790,537 | |
Madison Park Funding XXXV Ltd., Series 2019- 35A, Class BR, (3-mo. CME Term SOFR + 1.66%), 6.98%, 04/20/32(a)(c) | | | | | | | 720 | | | | 718,689 | |
Madison Park Funding XXXVII Ltd., Series 2019- 37A, Class AR, (3-mo. CME Term SOFR + 1.33%), 6.65%, 07/15/33(a)(c) | | | | | | | 2,130 | | | | 2,130,341 | |
Madison Park Funding XXXVIII Ltd., Series 2021- 38A, Class A, (3-mo. CME Term SOFR + 1.38%), 6.70%, 07/17/34(a)(c) | | | | | | | 1,250 | | | | 1,250,750 | |
| | | | | | | | | | | | |
| Security | | | | | Par (000) | | | Value | |
|
Asset-Backed Securities (continued) | |
Marble Point CLO XXIII Ltd., Series 2021-4A, Class D1, (3-mo. CME Term SOFR + 3.91%), 9.23%, 01/22/35(a)(c) | | | USD | | | | 750 | | | $ | 747,718 | |
Mariner Finance Issuance Trust | | | | | | | | | | | | |
Series 2019-AA, Class C, 4.01%, 07/20/32(a) | | | | | | | 638 | | | | 636,670 | |
Series 2021-AA, Class A, 1.86%, 03/20/36(a) | | | | | | | 700 | | | | 644,231 | |
Series 2021-AA, Class B, 2.33%, 03/20/36(a) | | | | | | | 1,620 | | | | 1,448,239 | |
Series 2021-AA, Class C, 2.96%, 03/20/36(a) | | | | | | | 2,850 | | | | 2,526,689 | |
Series 2021-BA, Class C, 2.66%, 11/20/36(a) | | | | | | | 4,403 | | | | 3,790,079 | |
Series 2021-BA, Class E, 4.68%, 11/20/36(a) | | | | | | | 3,620 | | | | 3,045,431 | |
Series 2022-AA, Class A, 6.45%, 10/20/37(a) | | | | | | | 2,345 | | | | 2,350,787 | |
MASTR Asset-Backed Securities Trust | | | | | | | | | | | | |
Series 2005-WF1, Class M8, (1-mo. CME Term SOFR + 1.97%), 7.30%, 06/25/35(c) | | | | | | | 1,119 | | | | 1,141,509 | |
Series 2006-AM2, Class A4, (1-mo. CME Term SOFR + 0.63%), 5.96%, 06/25/36(a)(c) | | | | | | | 238 | | | | 213,377 | |
Series 2006-WMC2, Class A4, (1-mo. CME Term SOFR + 0.41%), 5.74%, 04/25/36(c) | | | | | | | 3,259 | | | | 733,071 | |
Series 2007-HE1, Class A4, (1-mo. CME Term SOFR + 0.39%), 5.72%, 05/25/37(c) | | | | | | | 83 | | | | 65,107 | |
MASTR Specialized Loan Trust, Series 2006-3, Class A, (1-mo. CME Term SOFR + 0.63%), 5.96%, 06/25/46(a)(c) | | | | | | | 12 | | | | 11,120 | |
MERIT Securities Corp., Series 13, Class M2, 7.88%, 12/28/33(b) | | | | | | | 897 | | | | 783,130 | |
Merrill Lynch First Franklin Mortgage Loan Trust | | | | | | | | | | | | |
Series 2007-2, Class A2C, (1-mo. CME Term SOFR + 0.59%), 5.92%, 05/25/37(c) | | | | | | | 1,704 | | | | 1,189,874 | |
Series 2007-H1, Class 1A2, (1-mo. CME Term SOFR + 3.61%), 8.94%, 10/25/37(c) | | | | | | | 2,341 | | | | 2,136,203 | |
Merrill Lynch Mortgage Investors Trust, Series 2006-OPT1, Class M1, (1-mo. CME Term SOFR + 0.50%), 5.83%, 08/25/37(c) | | | | | | | 1,752 | | | | 1,491,992 | |
MF1 LLC | | | | | | | | | | | | |
Series 2022-FL10, Class A, (1-mo. CME Term SOFR + 2.64%), 7.96%, 09/17/37(a)(c) | | | | | | | 1,428 | | | | 1,431,446 | |
Series 2022-FL9, Class A, (1-mo. CME Term SOFR + 2.15%), 7.48%, 06/19/37(a)(c) | | | | | | | 2,844 | | | | 2,846,467 | |
Series 2023-FL12, Class A, (1-mo. CME Term SOFR + 2.07%), 7.39%, 10/19/38(a)(c) | | | | | | | 1,306 | | | | 1,302,258 | |
MF1 Ltd., Series 2021-FL7, Class A, (1-mo. CME Term SOFR + 1.19%), 6.52%, 10/16/36(a)(c) | | | | | | | 487 | | | | 483,775 | |
MidOcean Credit CLO III Ltd., Series 2014-3A, Class A3A2, (3-mo. CME Term SOFR + 1.23%), 6.55%, 04/21/31(a)(c) | | | | | | | 750 | | | | 751,229 | |
MidOcean Credit CLO XII Ltd., Series 2023-12A, Class A1R, (3-mo. CME Term SOFR + 1.34%), 04/18/36(a)(c)(e) | | | | | | | 9,000 | | | | 9,000,000 | |
Mill City Solar Loan Ltd. | | | | | | | | | | | | |
Series 2019-1A, Class A, 4.34%, 03/20/43(a) | | | | | | | 1,047 | | | | 969,589 | |
Series 2019-2GS, Class A, 3.69%, 07/20/43(a) | | | | | | | 1,782 | | | | 1,593,480 | |
Morgan Stanley ABS Capital I, Inc. Trust | | | | | | | | | | | | |
Series 2007-NC1, Class A2D, (1-mo. CME Term SOFR + 0.33%), 5.66%, 11/25/36(c) | | | | | | | 5,005 | | | | 2,343,476 | |
Series 2007-SEA1, Class 2A1, (1-mo. CME Term SOFR + 3.91%), 9.24%, 02/25/47(a)(c) | | | | | | | 50 | | | | 45,763 | |
Morgan Stanley Mortgage Loan Trust | | | | | | | | | | | | |
Series 2006-12XS, Class A4, 6.51%, 10/25/36(b) | | | | | | | 2,350 | | | | 568,919 | |
Series 2006-12XS, Class A6A, 6.23%, 10/25/36(b) | | | | | | | 582 | | | | 172,891 | |
| | |
SCHEDULES OF INVESTMENTS | | 33 |
| | |
Schedule of Investments (continued) March 31, 2024 | | BATS: Series A Portfolio (Percentages shown are based on Net Assets) |
| | | | | | | | | | | | |
| Security | | | | | Par (000) | | | Value | |
|
Asset-Backed Securities (continued) | |
Morgan Stanley Mortgage Loan Trust | | | | | | | | | | | | |
Series 2006-16AX, Class 2A3, (1-mo. CME Term SOFR + 0.61%), 5.94%, 11/25/36(c) | | | USD | | | | 613 | | | $ | 173,341 | |
Mosaic Solar Loan Trust | | | | | | | | | | | | |
Series 2018-2GS, Class A, 4.20%, 02/22/44(a) | | | | | | | 981 | | | | 911,669 | |
Series 2019-1A, Class A, 4.37%, 12/21/43(a) | | | | | | | 1,502 | | | | 1,409,497 | |
Series 2019-2A, Class A, 2.88%, 09/20/40(a) | | | | | | | 240 | | | | 213,215 | |
Series 2020-2A, Class B, 2.21%, 08/20/46(a) | | | | | | | 1,300 | | | | 1,048,041 | |
Series 2021-1A, Class B, 2.05%, 12/20/46(a) | | | | | | | 366 | | | | 287,293 | |
Series 2021-2A, Class B, 2.09%, 04/22/47(a) | | | | | | | 3,311 | | | | 2,520,075 | |
Series 2022-3A, Class A, 6.10%, 06/20/53(a) | | | | | | | 798 | | | | 820,118 | |
Series 2023-1A, Class A, 5.32%, 06/20/53(a) | | | | | | | 2,712 | | | | 2,680,974 | |
Myers Park CLO Ltd., Series 2018-1A, Class B1, (3-mo. CME Term SOFR + 1.86%), 7.18%, 10/20/30(a)(c) | | | | | | | 250 | | | | 249,574 | |
Nationstar Home Equity Loan Trust, Series 2007-B, Class M1, (1-mo. CME Term SOFR + 0.52%), 5.85%, 04/25/37(c) | | | | | | | 380 | | | | 352,566 | |
Navient Private Education Loan Trust, Series 2020- IA, Class B, 2.95%, 04/15/69(a) | | | | | | | 1,880 | | | | 1,533,925 | |
Navient Private Education Refi Loan Trust | | | | | | | | | | | | |
Series 2018-DA, Class A2A, 4.00%, 12/15/59(a) . | | | | | | | 744 | | | | 721,900 | |
Series 2019-D, Class A2A, 3.01%, 12/15/59(a) | | | | | | | 2,424 | | | | 2,293,435 | |
Series 2020-CA, Class A2B, (1-mo. CME Term SOFR + 1.71%), 7.04%,
11/15/68(a)(c) | | | | | | | 2,654 | | | | 2,680,635 | |
Series 2021-DA, Class A, (Prime Rate + (1.99)%), 6.51%, 04/15/60(a)(c) | | | | | | | 1,019 | | | | 979,912 | |
Series 2021-DA, Class B, 2.61%, 04/15/60(a) | | | | | | | 1,110 | | | | 1,017,020 | |
Series 2021-DA, Class C, 3.48%, 04/15/60(a) | | | | | | | 5,000 | | | | 4,417,727 | |
Series 2021-DA, Class D, 4.00%, 04/15/60(a) | | | | | | | 5,000 | | | | 4,532,577 | |
Navient Student Loan Trust, Series 2019-BA, Class A2A, 3.39%, 12/15/59(a) | | | | | | | 1,094 | | | | 1,050,017 | |
Nelnet Student Loan Trust | | | | | | | | | | | | |
Series 2021-A, Class A1, (1-mo. CME Term SOFR + 0.91%), 6.24%, 04/20/62(a)(c) | | | | | | | 1,303 | | | | 1,293,296 | |
Series 2021-A, Class A2, (1-mo. CME Term SOFR + 1.14%), 6.47%, 04/20/62(a)(c) | | | | | | | 2,680 | | | | 2,653,398 | |
Series 2021-A, Class APT2, 1.36%, 04/20/62(a) . | | | | | | | 1,816 | | | | 1,641,665 | |
Series 2021-A, Class B1, 2.85%, 04/20/62(a) | | | | | | | 1,979 | | | | 1,638,466 | |
Series 2021-A, Class B2, 2.85%, 04/20/62(a) | | | | | | | 1,640 | | | | 1,357,799 | |
Series 2021-A, Class C, 3.75%, 04/20/62(a) | | | | | | | 124 | | | | 101,295 | |
Series 2021-A, Class D, 4.93%, 04/20/62(a) | | | | | | | 735 | | | | 612,431 | |
Series 2021-BA, Class B, 2.68%, 04/20/62(a) | | | | | | | 8,450 | | | | 6,991,699 | |
Series 2021-BA, Class C, 3.57%, 04/20/62(a) | | | | | | | 386 | | | | 312,878 | |
Series 2021-BA, Class D, 4.75%, 04/20/62(a) | | | | | | | 8,380 | | | | 6,883,048 | |
Series 2021-CA, Class B, 2.53%, 04/20/62(a) | | | | | | | 5,370 | | | | 4,364,367 | |
Series 2021-CA, Class C, 3.36%, 04/20/62(a) | | | | | | | 2,770 | | | | 2,245,899 | |
Series 2021-CA, Class D, 4.44%, 04/20/62(a) | | | | | | | 5,590 | | | | 4,529,247 | |
Series 2021-DA, Class B, 2.90%, 04/20/62(a) | | | | | | | 4,800 | | | | 3,982,514 | |
Series 2021-DA, Class C, 3.50%, 04/20/62(a) | | | | | | | 2,700 | | | | 2,145,578 | |
Series 2021-DA, Class D, 4.38%, 04/20/62(a) | | | | | | | 680 | | | | 539,095 | |
Series 2023-PL1A, Class A1A, (SOFR (30-day) + 2.25%), 7.57%,
11/25/53(a)(c) | | | | | | | 2,924 | | | | 2,915,519 | |
Neuberger Berman CLO XIV Ltd., Series 2013- 14A, Class AR2, (3-mo. CME Term SOFR + 1.29%), 6.61%, 01/28/30(a)(c) | | | | | | | 602 | | | | 602,561 | |
Neuberger Berman CLO XV Ltd., Series 2013-15A, Class BR2, (3-mo. CME Term SOFR + 1.61%), 6.93%, 10/15/29(a)(c) | | | | | | | 250 | | | | 250,230 | |
Neuberger Berman CLO XVII Ltd. | | | | | | | | | | | | |
Series 2014-17A, Class AR2, (3-mo. CME Term SOFR + 1.29%), 6.61%,
04/22/29(a)(c) | | | | | | | 970 | | | | 970,098 | |
| | | | | | | | | | | | |
| Security | | | | | Par (000) | | | Value | |
|
Asset-Backed Securities (continued) | |
Neuberger Berman CLO XVII Ltd. Series 2014-17A, Class CR2, (3-mo. CME Term SOFR + 2.26%), 7.58%, 04/22/29(a)(c) | | | USD | | | | 750 | | | $ | 746,287 | |
Neuberger Berman CLO XX Ltd. | | | | | | | | | | | | |
Series 2015-20A, Class ARR, (3-mo. CME Term SOFR + 1.42%), 6.74%, 07/15/34(a)(c) | | | | | | | 525 | | | | 524,738 | |
Series 2015-20A, Class DRR, (3-mo. CME Term SOFR + 3.21%), 8.53%, 07/15/34(a)(c) | | | | | | | 1,000 | | | | 1,006,655 | |
Series 2015-20A, Class ERR, (3-mo. CME Term SOFR + 6.76%), 12.08%,
07/15/34(a)(c) | | | | | | | 750 | | | | 747,813 | |
Neuberger Berman CLO XXII Ltd., Series 2016- 22A, Class BR, (3-mo. CME Term SOFR + 1.91%), 7.23%, 10/17/30(a)(c) | | | | | | | 250 | | | | 250,094 | |
Neuberger Berman Loan Advisers CLO 26 Ltd., Series 2017-26A, Class AR, (3-mo. CME Term SOFR + 1.18%), 6.48%, 10/18/30(a)(c) | | | | | | | 3,807 | | | | 3,805,523 | |
Neuberger Berman Loan Advisers CLO 29 Ltd., Series 2018-29A, Class A2, (3-mo. CME Term SOFR + 1.66%), 6.97%, 10/19/31(a)(c) | | | | | | | 250 | | | | 249,969 | |
Neuberger Berman Loan Advisers CLO 32 Ltd., Series 2019-32A, Class BR, (3-mo. CME Term SOFR + 1.66%), 6.97%, 01/20/32(a)(c) | | | | | | | 910 | | | | 906,850 | |
Neuberger Berman Loan Advisers CLO 34 Ltd., Series 2019-34A, Class BR, (3-mo. CME Term SOFR + 1.75%), 7.07%, 01/20/35(a)(c) | | | | | | | 1,000 | | | | 998,023 | |
Neuberger Berman Loan Advisers CLO 42 Ltd., Series 2021-42A, Class A, (3-mo. CME Term SOFR + 1.36%), 6.68%, 07/16/35(a)(c) | | | | | | | 3,000 | | | | 3,002,334 | |
Neuberger Berman Loan Advisers CLO 43 Ltd., Series 2021-43A, Class A, (3-mo. CME Term SOFR + 1.39%), 6.71%, 07/17/35(a)(c) | | | | | | | 1,000 | | | | 1,000,812 | |
Neuberger Berman Loan Advisers CLO 45 Ltd., Series 2021-45A, Class A, (3-mo. CME Term SOFR + 1.39%), 6.71%, 10/14/35(a)(c) | | | | | | | 5,000 | | | | 5,004,625 | |
Neuberger Berman Loan Advisers CLO 46 Ltd., Series 2021-46A, Class B, (3-mo. CME Term SOFR + 1.91%), 7.23%, 01/20/36(a)(c) | | | | | | | 1,220 | | | | 1,221,354 | |
Neuberger Berman Loan Advisers CLO 55 Ltd., Series 2024-55A, Class C, (3-mo. CME Term SOFR + 2.35%),
04/22/38(a)(c)(e) | | | | | | | 1,000 | | | | 1,000,000 | |
New Residential Mortgage Loan Trust, Series 2022-SFR2, Class F, 4.00%, 09/04/39(a) . | | | | | | | 3,692 | | | | 3,156,057 | |
Nomura Asset Acceptance Corp. Alternative Loan Trust, Series 2006-S5, Class A1, (1-mo. CME Term SOFR + 0.51%), 5.84%, 10/25/36(a)(c) | | | | | | | 118 | | | | 137,790 | |
NovaStar Mortgage Funding Trust, Series 2006-5, Class A2D, (1-mo. CME Term SOFR + 0.59%), 5.92%, 11/25/36(c) | | | | | | | 3,772 | | | | 1,150,938 | |
Oakwood Mortgage Investors, Inc. | | | | | | | | | | | | |
Series 1999-C, Class A2, 7.48%, 08/15/27 | | | | | | | 1,780 | | | | 1,392,626 | |
Series 2001-D, Class A2, 5.26%, 01/15/19(c) | | | | | | | 25 | | | | 10,515 | |
Series 2002-A, Class M1, 7.76%, 03/15/32(c) | | | | | | | 1,992 | | | | 1,834,576 | |
Series 2002-C, Class M1, 6.89%, 11/15/32(c) | | | | | | | 2,025 | | | | 1,914,637 | |
Ocean Trails CLO V, Series 2014-5A, Class BRR, (3-mo. CME Term SOFR + 2.21%), 7.53%,
10/13/31(a)(c) | | | | | | | 500 | | | | 501,427 | |
OCP CLO Ltd. | | | | | | | | | | | | |
Series 2016-12A, Class BR2, (3-mo. CME Term SOFR + 1.81%), 7.11%, 04/18/33(a)(c) | | | | | | | 3,000 | | | | 2,998,831 | |
Series 2017-13A, Class A1AR, (3-mo. CME Term SOFR + 1.22%), 6.54%, 07/15/30(a)(c) | | | | | | | 3,063 | | | | 3,064,256 | |
| | |
| 34 | | 2 0 2 4 BLACK ROCK ANNUAL REPORT TO SHAREHOLDERS |
| | |
Schedule of Investments (continued) March 31, 2024 | | BATS: Series A Portfolio (Percentages shown are based on Net Assets) |
| | | | | | | | | | | | |
| Security | | | | | Par (000) | | | Value | |
|
| Asset-Backed Securities (continued) | |
OCP CLO Ltd. | | | | | | | | | | | | |
Series 2017-13A, Class A2R, (3-mo. CME Term SOFR + 1.81%), 7.13%,
07/15/30(a)(c) | | | USD | | | | 250 | | | $ | 249,573 | |
Series 2019-16A, Class AR, (3-mo. CME Term SOFR + 1.26%), 6.59%,
04/10/33(a)(c) | | | | | | | 1,490 | | | | 1,494,724 | |
Series 2019-17A, Class A1R, (3-mo. CME Term SOFR + 1.30%), 6.62%,
07/20/32(a)(c) | | | | | | | 1,000 | | | | 1,000,008 | |
Series 2020-18A, Class AR, (3-mo. CME Term SOFR + 1.35%), 6.67%,
07/20/32(a)(c) | | | | | | | 1,100 | | | | 1,100,587 | |
Series 2020-20A, Class B1R, (3-mo. CME Term SOFR + 1.95%), 04/18/37(a)(c)(e) | | | | | | | 370 | | | | 370,000 | |
Series 2021-22A, Class A, (3-mo. CME Term SOFR + 1.44%), 6.76%,
12/02/34(a)(c) | | | | | | | 2,020 | | | | 2,020,538 | |
Series 2021-22A, Class B1, (3-mo. CME Term SOFR + 1.96%), 7.28%,
12/02/34(a)(c) | | | | | | | 340 | | | | 339,571 | |
Octagon 56 Ltd., Series 2021-1A, Class B, (3-mo. CME Term SOFR + 1.91%), 7.23%, 10/15/34(a)(c) | | | | | | | 250 | | | | 248,708 | |
Octagon 57 Ltd., Series 2021-1A, Class B1, (3-mo. CME Term SOFR + 1.91%), 7.23%, 10/15/34(a)(c) | | | | | | | 870 | | | | 869,485 | |
Octagon Investment Partners 18-R Ltd., Series 2018-18A, Class A1A, (3-mo. CME Term SOFR + 1.22%), 6.54%, 04/16/31(a)(c) | | | | | | | 2,582 | | | | 2,583,202 | |
Octagon Investment Partners 29 Ltd., Series 2016- 1A, Class AR, (3-mo. CME Term SOFR + 1.44%), 6.76%, 01/24/33(a)(c) | | | | | | | 250 | | | | 250,002 | |
Octagon Investment Partners 33 Ltd., Series 2017- 1A, Class A1, (3-mo. CME Term SOFR + 1.45%), 6.77%, 01/20/31(a)(c) | | | | | | | 924 | | | | 924,363 | |
Octagon Investment Partners 36 Ltd., Series 2018- 1A, Class A1, (3-mo. CME Term SOFR + 1.23%), 6.55%, 04/15/31(a)(c) | | | | | | | 226 | | | | 226,202 | |
Octagon Investment Partners 37 Ltd., Series 2018- 2A, Class A2, (3-mo. CME Term SOFR + 1.84%), 7.17%, 07/25/30(a)(c) | | | | | | | 650 | | | | 649,756 | |
Octagon Investment Partners 39 Ltd., Series 2018- 3A, Class BR, (3-mo. CME Term SOFR + 1.80%), 10/20/30(a)(c)(e) | | | | | | | 5,640 | | | | 5,651,305 | |
Octagon Investment Partners 51 Ltd., Series 2021- 1A, Class A, (3-mo. CME Term SOFR + 1.41%), 6.73%, 07/20/34(a)(c) | | | | | | | 1,250 | | | | 1,248,921 | |
Octagon Investment Partners XV Ltd., Series 2013-1A, Class A2R, (3-mo. CME Term SOFR + 1.61%), 6.92%, 07/19/30(a)(c) | | | | | | | 350 | | | | 349,872 | |
Octagon Investment Partners XVII Ltd. | | | | | | | | | | | | |
Series 2013-1A, Class A1R2, (3-mo. CME Term SOFR + 1.26%), 6.59%,
01/25/31(a)(c) | | | | | | | 811 | | | | 810,830 | |
Series 2013-1A, Class A2R2, (3-mo. CME Term SOFR + 1.36%), 6.69%,
01/25/31(a)(c) | | | | | | | 500 | | | | 500,086 | |
OHA Credit Funding 2 Ltd., Series 2019-2A, Class AR, (3-mo. CME Term SOFR + 1.41%), 6.73%, 04/21/34(a)(c) | | | | | | | 1,500 | | | | 1,500,670 | |
OHA Credit Funding 3 Ltd., Series 2019-3A, Class AR, (3-mo. CME Term SOFR + 1.40%), 6.72%, 07/02/35(a)(c) | | | | | | | 250 | | | | 250,146 | |
OHA Credit Funding 4 Ltd., Series 2019-4A, Class AR, (3-mo. CME Term SOFR + 1.41%), 6.73%, 10/22/36(a)(c) | | | | | | | 1,000 | | | | 1,000,825 | |
OHA Credit Funding 5 Ltd., Series 2020-5A, Class A2A, (3-mo. CME Term SOFR + 1.71%), 7.01%, 04/18/33(a)(c) | | | | | | | 300 | | | | 301,251 | |
| | | | | | | | | | | | |
| Security | | | | | Par (000) | | | Value | |
|
| Asset-Backed Securities (continued) | |
OHA Credit Funding 6 Ltd., Series 2020-6A, Class AR, (3-mo. CME Term SOFR + 1.40%), 6.72%, 07/20/34(a)(c) | | | USD | | | | 670 | | | $ | 670,441 | |
OHA Credit Funding 7 Ltd., Series 2020-7A, Class AR, (3-mo. CME Term SOFR + 1.30%), 6.61%, 02/24/37(a)(c) | | | | | | | 770 | | | | 768,990 | |
OHA Credit Funding 9 Ltd., Series 2021-9A, Class B, (3-mo. CME Term SOFR + 1.96%), 7.27%, 07/19/35(a)(c) | | | | | | | 1,890 | | | | 1,894,529 | |
OHA Credit Partners XII Ltd., Series 2015-12A, Class B1R2, (3-mo. CME Term SOFR + 1.95%), 04/23/37(a)(c)(e) | | | | | | | 1,700 | | | | 1,700,000 | |
OHA Loan Funding Ltd., Series 2013-2A, Class AR, (3-mo. CME Term SOFR + 1.30%), 6.62%, 05/23/31(a)(c) | | | | | | | 757 | | | | 758,011 | |
OneMain Financial Issuance Trust | | | | | | | | | | | | |
Series 2021-1A, Class A2, (SOFR (30-day) + 0.76%), 6.08%, 06/16/36(a)(c) | | | | | | | 1,201 | | | | 1,196,714 | |
Series 2021-1A, Class B, 1.95%, 06/16/36(a) | | | | | | | 4,700 | | | | 4,116,564 | |
Series 2021-1A, Class C, 2.22%, 06/16/36(a) | | | | | | | 4,680 | | | | 4,020,127 | |
Series 2023-2A, Class D, 7.52%, 09/15/36(a) | | | | | | | 1,720 | | | | 1,763,354 | |
Option One Mortgage Loan Trust | | | | | | | | | | | | |
Series 2005-4, Class M3, (1-mo. CME Term SOFR + 0.85%), 6.18%, 11/25/35(c) | | | | | | | 460 | | | | 370,966 | |
Series 2007-FXD1, Class 1A1, 5.87%, 01/25/37(b) | | | | | | | 4,123 | | | | 3,367,605 | |
Series 2007-FXD1, Class 2A1, 5.87%, 01/25/37(b) | | | | | | | 2,486 | | | | 2,075,770 | |
Origen Manufactured Housing Contract Trust, Series 2007-B, Class A1, (1-mo. LIBOR US + 1.20%), 6.64%, 10/15/37(a)(c) | | | | | | | 741 | | | | 725,014 | |
OSD CLO Ltd., Series 2021-23A, Class E, (3-mo. CME Term SOFR + 6.26%), 11.58%, 04/17/31(a)(c) | | | | | | | 1,000 | | | | 987,365 | |
OZLM Funding IV Ltd. | | | | | | | | | | | | |
Series 2013-4A, Class A1R, (3-mo. CME Term SOFR + 1.51%), 6.83%, 10/22/30(a)(c) | | | | | | | 355 | | | | 354,629 | |
Series 2013-4A, Class A2R, (3-mo. CME Term SOFR + 1.96%), 7.28%, 10/22/30(a)(c) | | | | | | | 500 | | | | 499,331 | |
OZLM VI Ltd., Series 2014-6A, Class A2AS, (3-mo. CME Term SOFR + 2.01%), 7.33%, 04/17/31(a)(c) | | | | | | | 2,570 | | | | 2,570,005 | |
OZLM VIII Ltd. | | | | | | | | | | | | |
Series 2014-8A, Class A2R3, (3-mo. CME Term SOFR + 1.91%), 7.23%, 10/17/29(a)(c) | | | | | | | 1,185 | | | | 1,193,892 | |
Series 2014-8A, Class BR3, (3-mo. CME Term SOFR + 2.36%), 7.68%, 10/17/29(a)(c) | | | | | | | 1,750 | | | | 1,753,503 | |
OZLM XIV Ltd., Series 2015-14A, Class A1SR, (3-mo. CME Term SOFR + 1.51%), 6.83%, 07/15/34(a)(c) | | | | | | | 1,500 | | | | 1,504,518 | |
OZLM XVIII Ltd., Series 2018-18A, Class B, (3-mo. CME Term SOFR + 1.81%), 7.13%, 04/15/31(a)(c) | | | | | | | 550 | | | | 550,499 | |
OZLM XXII Ltd. | | | | | | | | | | | | |
Series 2018-22A, Class A1, (3-mo. CME Term SOFR + 1.33%), 6.65%, 01/17/31(a)(c) | | | | | | | 747 | | | | 747,861 | |
Series 2018-22A, Class A2, (3-mo. CME Term SOFR + 1.76%), 7.08%, 01/17/31(a)(c) | | | | | | | 500 | | | | 500,553 | |
Pagaya AI Debt Selection Trust, Series 2021-2, Class NOTE, 3.00%, 01/25/29(a) | | | | | | | 529 | | | | 515,378 | |
Pagaya AI Technology in Housing Trust, Series 2023-1, Class F, 3.60%, 10/25/40(a) | | | | | | | 1,000 | | | | 711,026 | |
| | |
SCHEDULES OF INVESTMENTS | | 35 |
| | |
Schedule of Investments (continued) March 31, 2024 | | BATS: Series A Portfolio (Percentages shown are based on Net Assets) |
| | | | | | | | | | | | |
| Security | | | | | Par (000) | | | Value | |
|
Asset-Backed Securities (continued) | |
Palmer Square CLO Ltd. | | | | | | | | | | | | |
Series 2013-2A, Class A1A3, (3-mo. CME Term SOFR + 1.26%), 6.58%,
10/17/31(a)(c) | | | USD | | | | 3,048 | | | $ | 3,049,875 | |
Series 2014-1A, Class A1R2, (3-mo. CME Term SOFR + 1.39%), 6.71%,
01/17/31(a)(c) | | | | | | | 518 | | | | 518,574 | |
Series 2014-1A, Class CR2, (3-mo. CME Term SOFR + 2.91%), 8.23%,
01/17/31(a)(c) | | | | | | | 400 | | | | 402,094 | |
Series 2015-1A, Class A1A4, (3-mo. CME Term SOFR + 1.39%), 6.71%,
05/21/34(a)(c) | | | | | | | 660 | | | | 660,450 | |
Series 2015-1A, Class A2R4, (3-mo. CME Term SOFR + 1.96%), 7.28%,
05/21/34(a)(c) | | | | | | | 1,000 | | | | 999,499 | |
Series 2015-2A, Class CR2, (3-mo. CME Term SOFR + 3.01%), 8.33%,
07/20/30(a)(c) | | | | | | | 1,250 | | | | 1,250,289 | |
Series 2020-3A, Class A1R2, (3-mo. CME Term SOFR + 1.65%), 6.96%,
11/15/36(a)(c) | | | | | | | 960 | | | | 963,380 | |
Series 2021-3A, Class A1, (3-mo. CME Term SOFR + 1.41%), 6.73%,
01/15/35(a)(c) | | | | | | | 390 | | | | 390,898 | |
Series 2021-4A, Class B, (3-mo. CME Term SOFR + 1.91%), 7.23%, 10/15/34(a)(c) | | | | | | | 250 | | | | 249,233 | |
Palmer Square Loan Funding Ltd. | | | | | | | | | | | | |
Series 2021-2A, Class A2, (3-mo. CME Term SOFR + 1.51%), 6.83%,
05/20/29(a)(c) | | | | | | | 3,560 | | | | 3,568,461 | |
Series 2021-3A, Class D, (3-mo. CME Term SOFR + 5.26%), 10.58%,
07/20/29(a)(c) | | | | | | | 250 | | | | 245,846 | |
Series 2021-4A, Class B, (3-mo. CME Term SOFR + 2.01%), 7.33%,
10/15/29(a)(c) | | | | | | | 250 | | | | 250,298 | |
Series 2021-4A, Class C, (3-mo. CME Term SOFR + 2.86%), 8.18%,
10/15/29(a)(c) | | | | | | | 250 | | | | 250,280 | |
Series 2022-2A, Class A2, (3-mo. CME Term SOFR + 1.90%), 7.21%,
10/15/30(a)(c) | | | | | | | 2,350 | | | | 2,351,160 | |
Series 2022-2A, Class B, (3-mo. CME Term SOFR + 2.20%), 7.51%, 10/15/30(a)(c) | | | | | | | 1,360 | | | | 1,360,036 | |
Series 2022-2A, Class C, (3-mo. CME Term SOFR + 3.10%), 8.41%, 10/15/30(a)(c) | | | | | | | 250 | | | | 247,960 | |
Series 2022-3A, Class A2R, (3-mo. CME Term SOFR + 1.60%), 04/15/31(a)(c)(e) | | | | | | | 10,380 | | | | 10,379,897 | |
Park Avenue Institutional Advisers CLO Ltd. | | | | | | | | | | | | |
Series 2016-1A, Class A1R, (3-mo. CME Term SOFR + 1.46%), 6.78%,
08/23/31(a)(c) | | | | | | | 303 | | | | 302,688 | |
Series 2017-1A, Class DR, (3-mo. CME Term SOFR + 7.07%), 12.38%, 02/14/34(a)(c) | | | | | | | 900 | | | | 839,886 | |
Series 2021-2A, Class D, (3-mo. CME Term SOFR + 3.66%), 8.98%,
07/15/34(a)(c) | | | | | | | 1,900 | | | | 1,865,918 | |
Pikes Peak CLO 1, Series 2018-1A, Class A, (3-mo. CME Term SOFR + 1.44%), 6.76%, 07/24/31(a)(c) | | | | | | | 740 | | | | 741,026 | |
Pikes Peak CLO 11, Series 2022-11A, Class A1, (3-mo. CME Term SOFR + 1.95%), 7.28%, 07/25/34(a)(c) | | | | | | | 3,000 | | | | 3,018,745 | |
Pikes Peak CLO 6, Series 2020-6A, Class AR2, (3-mo. CME Term SOFR + 1.43%), 6.75%, 05/18/34(a)(c) | | | | | | | 1,000 | | | | 1,000,026 | |
Popular ABS Mortgage Pass-Through Trust, | | | | | | | | | | | | |
Series 2006-B, Class M1, (1-mo. CME Term SOFR + 0.65%), 5.98%, 05/25/36(c) | | | | | | | 3,540 | | | | 3,315,735 | |
PRET LLC | | | | | | | | | | | | |
Series 2021-NPL6, Class A1, 2.49%, 07/25/51(a)(b) | | | | | | | 6,363 | | | | 6,154,051 | |
Series 2021-RN4, Class A1, 2.49%, 10/25/51(a)(c) | | | | | | | 5,348 | | | | 5,228,682 | |
Series 2023-RN2, Class A1, 8.11%, 11/25/53(a)(b) | | | | | | | 4,680 | | | | 4,687,942 | |
| | | | | | | | | | | | |
| Security | | | | | Par (000) | | | Value | |
|
Asset-Backed Securities (continued) | |
Prodigy Finance DAC | | | | | | | | | | | | |
Series 2021-1A, Class B, (1-mo. CME Term SOFR + 2.61%), 7.94%, 07/25/51(a)(c) | | | USD | | | | 940 | | | $ | 947,375 | |
Series 2021-1A, Class C, (1-mo. CME Term SOFR + 3.86%), 9.19%, 07/25/51(a)(c) | | | | | | | 941 | | | | 952,100 | |
Series 2021-1A, Class D, (1-mo. CME Term SOFR + 6.01%), 11.34%, 07/25/51(a)(c) | | | | | | | 1,077 | | | | 1,095,391 | |
Progress Residential Trust | | | | | | | | | | | | |
Series 2021-SFR10, Class E2, 3.67%, 12/17/40(a) | | | | | | | 976 | | | | 861,523 | |
Series 2021-SFR10, Class F, 4.61%, 12/17/40(a) | | | | | | | 3,942 | | | | 3,481,501 | |
Series 2021-SFR5, Class F, 3.16%, 07/17/38(a) | | | . | | | | 1,808 | | | | 1,635,730 | |
Series 2021-SFR6, Class F, 3.42%, 07/17/38(a) | | | . | | | | 3,577 | | | | 3,245,344 | |
Series 2021-SFR8, Class F, 3.18%, 10/17/38(a) | | | . | | | | 4,500 | | | | 4,026,617 | |
Series 2021-SFR9, Class F, 4.05%, 11/17/40(a) | | | | | | | 2,400 | | | | 2,075,276 | |
Series 2022-SFR1, Class F, 4.88%, 02/17/41(a) | | | . | | | | 5,000 | | | | 4,391,891 | |
Series 2022-SFR5, Class E1, 6.62%, 06/17/39(a) | | | | | | | 2,180 | | | | 2,153,088 | |
Series 2023-SFR2, Class E1, 4.75%, 10/17/28(a) | | | | | | | 1,041 | | | | 956,650 | |
Series 2024-SFR2, Class E1, 3.40%, 04/01/41(a) | | | | | | | 2,000 | | | | 1,715,404 | |
Series 2024-SFR2, Class E2, 3.65%, 04/01/41(a) | | | | | | | 2,000 | | | | 1,706,113 | |
Race Point VIII CLO Ltd., Series 2013-8A, Class AR2, (3-mo. CME Term SOFR + 1.30%), 6.62%, 02/20/30(a)(c) | | | | | | | 738 | | | | 737,457 | |
Rad CLO 15 Ltd. | | | | | | | | | | | | |
Series 2021-15A, Class A, (3-mo. CME Term SOFR + 1.35%), 6.67%, 01/20/34(a)(c) | | | | | | | 390 | | | | 390,312 | |
Series 2021-15A, Class B, (3-mo. CME Term SOFR + 1.91%), 7.23%, 01/20/34(a)(c) | | | | | | | 820 | | | | 820,255 | |
Series 2021-15A, Class E, (3-mo. CME Term SOFR + 6.46%), 11.78%, 01/20/34(a)(c) | | | | | | | 4,500 | | | | 4,453,141 | |
Rad CLO 2 Ltd., Series 2018-2A, Class AR, (3-mo. CME Term SOFR + 1.34%), 6.66%, 10/15/31(a)(c) | | | | | | | 1,155 | | | | 1,156,198 | |
Rad CLO 3 Ltd. | | | | | | | | | | | | |
Series 2019-3A, Class BR, (3-mo. CME Term SOFR + 1.81%), 7.13%, 04/15/32(a)(c) | | | | | | | 325 | | | | 324,092 | |
Series 2019-3A, Class CR, (3-mo. CME Term SOFR + 2.11%), 7.43%, 04/15/32(a)(c) | | | | | | | 250 | | | | 249,009 | |
Series 2019-3A, Class DR, (3-mo. CME Term SOFR + 3.01%), 8.33%, 04/15/32(a)(c) | | | | | | | 250 | | | | 245,047 | |
Rad CLO 4 Ltd., Series 2019-4A, Class D, (3-mo. CME Term SOFR + 4.11%), 9.44%, 04/25/32(a)(c) | | | | | | | 500 | | | | 504,599 | |
Rad CLO 7 Ltd. | | | | | | | | | | | | |
Series 2020-7A, Class A1R, (3-mo. CME Term SOFR + 1.35%), 6.68%, 04/17/36(a)(c) | | | | | | | 250 | | | | 249,692 | |
Series 2020-7A, Class B1R, (3-mo. CME Term SOFR + 1.90%), 7.23%, 04/17/36(a)(c) | | | | | | | 2,500 | | | | 2,499,750 | |
Series 2020-7A, Class CR, (3-mo. CME Term SOFR + 2.60%), 7.93%, 04/17/36(a)(c) | | | | | | | 1,340 | | | | 1,339,965 | |
Series 2020-7A, Class D1R, (3-mo. CME Term SOFR + 4.15%), 9.48%, 04/17/36(a)(c) | | | | | | | 480 | | | | 479,989 | |
Rad CLO 9 Ltd., Series 2020-9A, Class B1, (3-mo. CME Term SOFR + 2.16%), 7.48%, 01/15/34(a)(c) | | | | | | | 500 | | | | 500,374 | |
Redwood Funding Trust, Series 2023-1, Class A, 7.50%, 07/25/59(a)(b) | | | | | | | 636 | | | | 635,229 | |
| | |
| 36 | | 2 0 2 4 BLACK ROCK ANNUAL REPORT TO SHAREHOLDERS |
| | |
Schedule of Investments (continued) March 31, 2024 | | BATS: Series A Portfolio (Percentages shown are based on Net Assets) |
| | | | | | | | | | | | |
| Security | | | | | Par (000) | | | Value | |
|
| Asset-Backed Securities (continued) | |
Regatta IX Funding Ltd. | | | | | | | | | | | | |
Series 2017-1A, Class C, (3-mo. CME Term SOFR + 2.71%), 8.03%, 04/17/30(a)(c) | | | USD | | | | 250 | | | $ | 250,351 | |
Series 2017-1A, Class D, (3-mo. CME Term SOFR + 4.16%), 9.48%, 04/17/30(a)(c) | | | | | | | 250 | | | | 250,382 | |
Regatta VI Funding Ltd., Series 2016-1A, Class AR2, (3-mo. CME Term SOFR + 1.42%), 6.74%, 04/20/34(a)(c) | | | | | | | 3,000 | | | | 3,003,036 | |
Regatta VII Funding Ltd., Series 2016-1A, Class BR2, (3-mo. CME Term SOFR + 1.86%), 7.19%, 06/20/34(a)(c) | | | | | | | 250 | | | | 250,317 | |
Regatta VIII Funding Ltd. | | | | | | | | | | | | |
Series 2017-1A, Class B, (3-mo. CME Term SOFR + 1.96%), 7.28%, 10/17/30(a)(c) | | | | | | | 1,255 | | | | 1,259,886 | |
Series 2017-1A, Class D, (3-mo. CME Term SOFR + 3.46%), 8.78%, 10/17/30(a)(c) | | | | | | | 250 | | | | 251,535 | |
Regatta X Funding Ltd., Series 2017-3A, Class B, (3-mo. CME Term SOFR + 1.71%), 7.03%, 01/17/31(a)(c) | | | | | | | 330 | | | | 330,214 | |
Regatta XIX Funding Ltd., Series 2022-1A, Class B, (3-mo. CME Term SOFR + 1.85%), 7.17%, 04/20/35(a)(c) | | | | | | | 420 | | | | 420,650 | |
Regatta XVI Funding Ltd. | | | | | | | | | | | | |
Series 2019-2A, Class B, (3-mo. CME Term SOFR + 2.31%), 7.63%, 01/15/33(a)(c) | | | | | | | 750 | | | | 750,755 | |
Series 2019-2A, Class D, (3-mo. CME Term SOFR + 4.16%), 9.48%, 01/15/33(a)(c) | | | | | | | 500 | | | | 500,760 | |
Regatta XVII Funding Ltd., Series 2020-1A, Class E, (3-mo. CME Term SOFR + 7.87%), 13.19%, 10/15/33(a)(c) | | | | | | | 500 | | | | 501,235 | |
Regatta XXIV Funding Ltd., Series 2021-5A, Class E, (3-mo. CME Term SOFR + 7.06%), 12.38%, 01/20/35(a)(c) | | | | | | | 1,500 | | | | 1,493,143 | |
Regional Management Issuance Trust | | | | | | | | | | | | |
Series 2020-1, Class A, 2.34%, 10/15/30(a) | | | | | | | 610 | | | | 598,754 | |
Series 2020-1, Class B, 3.23%, 10/15/30(a) | | | | | | | 320 | | | | 306,805 | |
Series 2021-1, Class A, 1.68%, 03/17/31(a) | | | | | | | 127 | | | | 122,667 | |
Series 2021-2, Class B, 2.35%, 08/15/33(a) | | | | | | | 1,098 | | | | 945,833 | |
Series 2021-2, Class C, 3.23%, 08/15/33(a) | | | | | | | 820 | | | | 690,480 | |
Series 2021-3, Class A, 3.88%, 10/17/33(a)(h) | | | | | | | 10,210 | | | | 9,304,373 | |
Series 2022-1, Class A, 3.07%, 03/15/32(a) | | | | | | | 2,527 | | | | 2,421,191 | |
Series 2022-1, Class B, 3.71%, 03/15/32(a) | | | | | | | 5,452 | | | | 5,121,319 | |
Series 2022-1, Class C, 4.46%, 03/15/32(a) | | | | | | | 1,111 | | | | 1,016,413 | |
Series 2022-1, Class D, 6.72%, 03/15/32(a) | | | | | | | 2,072 | | | | 1,936,383 | |
Series 2022-2B, Class A, 7.10%, 11/17/32(a) | | | | | | | 6,193 | | | | 6,254,669 | |
Renaissance Home Equity Loan Trust, Series 2005-3, Class AF4, 5.14%, 11/25/35(b) | | | | | | | 640 | | | | 630,515 | |
Republic Finance Issuance Trust, Series 2021-A, Class D, 5.23%, 12/22/31(a) | | | | | | | 3,550 | | | | 3,218,394 | |
Riserva CLO Ltd., Series 2016-3A, Class ARR, (3-mo. CME Term SOFR + 1.32%), 6.62%, 01/18/34(a)(c) | | | | | | | 1,100 | | | | 1,098,185 | |
Rockford Tower CLO Ltd. | | | | | | | | | | | | |
Series 2017-1A, Class AR2, (3-mo. CME Term SOFR + 1.36%), 6.68%, 04/20/34(a)(c) | | | | | | | 500 | | | | 500,189 | |
Series 2017-2A, Class BR, (3-mo. CME Term SOFR + 1.76%), 7.08%, 10/15/29(a)(c) | | | | | | | 1,250 | | | | 1,249,015 | |
Series 2017-2A, Class CR, (3-mo. CME Term SOFR + 2.16%), 7.48%, 10/15/29(a)(c) | | | | | | | 1,000 | | | | 1,001,166 | |
Series 2017-2A, Class DR, (3-mo. CME Term SOFR + 3.11%), 8.43%, 10/15/29(a)(c) | | | | | | | 1,000 | | | | 999,591 | |
| | | | | | | | | | | | |
| Security | | | | | Par (000) | | | Value | |
|
| Asset-Backed Securities (continued) | |
Rockford Tower CLO Ltd. | | | | | | | | | | | | |
Series 2017-3A, Class A, (3-mo. CME Term SOFR + 1.45%), 6.77%, 10/20/30(a)(c) | | | USD | | | | 2,207 | | | $ | 2,208,563 | |
Series 2018-1A, Class A, (3-mo. CME Term SOFR + 1.36%), 6.68%, 05/20/31(a)(c) | | | | | | | 613 | | | | 613,943 | |
Series 2018-2A, Class B, (3-mo. CME Term SOFR + 2.06%), 7.38%, 10/20/31(a)(c) | | | | | | | 620 | | | | 620,624 | |
Series 2021-1A, Class A1, (3-mo. CME Term SOFR + 1.43%), 6.75%, 07/20/34(a)(c) | | | | | | | 3,500 | | | | 3,500,770 | |
Romark CLO II Ltd., Series 2018-2A, Class A1, (3-mo. CME Term SOFR + 1.44%), 6.76%, 07/25/31(a)(c) | | | | | | | 220 | | | | 220,918 | |
Romark WM-R Ltd., Series 2018-1A, Class A1, (3-mo. CME Term SOFR + 1.29%), 6.61%, 04/20/31(a)(c) | | | | | | | 1,063 | | | | 1,064,976 | |
RR 12 Ltd., Series 2020-12A, Class A2R2, (3-mo. CME Term SOFR + 1.96%), 7.28%, 01/15/36(a)(c) | | | | | | | 1,210 | | | | 1,211,102 | |
RR 18 Ltd., Series 2021-18A, Class A2, (3-mo. CME Term SOFR + 1.86%), 7.18%, 10/15/34(a)(c) | | | | | | | 250 | | | | 250,193 | |
RR 19 Ltd., Series 2021-19A, Class A2, (3-mo. CME Term SOFR + 1.91%), 7.23%, 10/15/35(a)(c) | | | | | | | 500 | | | | 501,371 | |
RR 28 Ltd., Series 2024-28RA, Class A1R, (3-mo. CME Term SOFR + 1.55%), 6.84%, 04/15/37(a)(c) | | | | | | | 250 | | | | 251,046 | |
RR 3 Ltd., Series 2018-3A, Class A1R2, (3-mo. CME Term SOFR + 1.35%), 6.67%, 01/15/30(a)(c) | | | | | | | 3,160 | | | | 3,161,281 | |
Saxon Asset Securities Trust, Series 2004-2, Class MF5, 3.24%, 08/25/35(b) | | | | | | | 397 | | | | 279,987 | |
Securitized Asset-Backed Receivables LLC Trust | | | | | | | | | | | | |
Series 2007-BR1, Class A2A, (1-mo. CME Term SOFR + 0.33%), 5.66%, 02/25/37(c) | | | | | | | 393 | | | | 167,383 | |
Series 2007-BR1, Class A2B, (1-mo. CME Term SOFR + 0.65%), 5.98%, 02/25/37(c) | | | | | | | 2,092 | | | | 892,042 | |
Series 2007-NC2, Class A2C, (1-mo. CME Term SOFR + 0.55%), 5.88%, 01/25/37(c) | | | | | | | 446 | | | | 306,092 | |
Service Experts Issuer LLC, Series 2021-1A, Class A, 2.67%, 02/02/32(a) | | | | | | | 2,029 | | | | 1,893,562 | |
SESAC Finance LLC | | | | | | | | | | | | |
Series 2019-1, Class A2, 5.22%, 07/25/49(a) | | | | | | | 2,491 | | | | 2,427,564 | |
Series 2024-1, Class A2, 6.42%, 01/25/54(a) | | | | | | | 674 | | | | 676,044 | |
SG Mortgage Securities Trust, Series 2006-FRE2, Class A2C, (1-mo. CME Term SOFR + 0.43%), 5.76%, 07/25/36(c) | | | | | | | 185 | | | | 39,480 | |
Shackleton CLO Ltd., Series 2013-3A, Class AR, (3-mo. CME Term SOFR + 1.38%), 6.70%, 07/15/30(a)(c) | | | | | | | 506 | | | | 506,327 | |
Signal Peak CLO 1 Ltd., Series 2014-1A, Class AR3, (3-mo. CME Term SOFR + 1.42%), 6.74%, 04/17/34(a)(c) | | | | | | | 2,750 | | | | 2,760,767 | |
Signal Peak CLO 2 LLC, Series 2015-1A, | | | | | | | | | | | | |
Class AR2, (3-mo. CME Term SOFR + 1.24%), 6.56%, 04/20/29(a)(c) | | | | | | | 595 | | | | 594,921 | |
Signal Peak CLO 5 Ltd. | | | | | | | | | | | | |
Series 2018-5A, Class A1R, (3-mo. CME Term SOFR + 1.55%), 04/25/37(a)(c)(e) | | | | | | | 1,810 | | | | 1,813,224 | |
Series 2018-5A, Class BR, (3-mo. CME Term SOFR + 2.20%), 04/25/37(a)(c)(e) | | | | | | | 390 | | | | 391,822 | |
| | |
SCHEDULES OF INVESTMENTS | | 37 |
| | |
Schedule of Investments (continued) March 31, 2024 | | BATS: Series A Portfolio (Percentages shown are based on Net Assets) |
| | | | | | | | | | | | |
| Security | | | | | Par (000) | | | Value | |
|
| Asset-Backed Securities (continued) | |
Signal Peak CLO 8 Ltd., Series 2020-8A, Class A, (3-mo. CME Term SOFR + 1.53%), 6.85%, 04/20/33(a)(c) | | | USD | | | | 500 | | | $ | 500,455 | |
Sixth Street CLO XVII Ltd., Series 2021-17A, Class E, (3-mo. CME Term SOFR + 6.46%), 11.78%, 01/20/34(a)(c) | | | | | | | 500 | | | | 494,571 | |
Sixth Street CLO XX Ltd., Series 2021-20A, Class B, (3-mo. CME Term SOFR + 1.91%), 7.23%, 10/20/34(a)(c) | | | | | | | 970 | | | | 970,239 | |
SLM Private Credit Student Loan Trust | | | | | | | | | | | | |
Series 2005-A, Class A4, (3-mo. CME Term SOFR + 0.57%), 5.90%, 12/15/38(c) | | | | | | | 1,007 | | | | 990,233 | |
Series 2005-B, Class A4, (3-mo. CME Term SOFR + 0.59%), 5.92%, 06/15/39(c) | | | | | | | 767 | | | | 750,375 | |
Series 2006-BW, Class A5, (3-mo. CME Term SOFR + 0.46%), 5.79%, 12/15/39(c) | | | | | | | 1,429 | | | | 1,376,498 | |
SLM Private Education Loan Trust, Series 2010-C, Class A5, (1-mo. CME Term SOFR + 4.86%), 10.19%, 10/15/41(a)(c) | | | | | | | 2,590 | | | | 2,781,211 | |
SMB Private Education Loan Trust | | | | | | | | | | | | |
Series 2015-C, Class B, 3.50%, 09/15/43(a) | | | | | | | 1,620 | | | | 1,572,101 | |
Series 2016-B, Class A2A, 2.43%, 02/17/32(a) | | | | | | | 370 | | | | 362,652 | |
Series 2017-A, Class A2B, (1-mo. CME Term SOFR + 1.01%), 6.34%, 09/15/34(a)(c) | | | | | | | 671 | | | | 669,941 | |
Series 2017-B, Class A2A, 2.82%, 10/15/35(a) | | | | | | | 449 | | | | 434,669 | |
Series 2017-B, Class A2B, (1-mo. CME Term SOFR + 0.86%), 6.19%, 10/15/35(a)(c) | | | | | | | 737 | | | | 734,278 | |
Series 2018-A, Class A2B, (1-mo. CME Term SOFR + 0.91%), 6.24%, 02/15/36(a)(c) | | | | | | | 1,541 | | | | 1,535,947 | |
Series 2019-B, Class A2A, 2.84%, 06/15/37(a) | | | | | | | 2,057 | | | | 1,960,421 | |
Series 2021-A, Class C, 2.99%, 01/15/53(a) | | | | | | | 2,055 | | | | 1,746,921 | |
Series 2021-A, Class D1, 3.86%, 01/15/53(a) | | | | | | | 532 | | | | 460,479 | |
Series 2021-A, Class D2, 3.86%, 01/15/53(a) | | | | | | | 362 | | | | 313,518 | |
Series 2021-B, Class A, 1.31%, 07/17/51(a) | | | | | | | 2,176 | | | | 1,972,594 | |
Series 2021-C, Class A2, (1-mo. CME Term SOFR + 0.91%), 6.24%, 01/15/53(a)(c) | | | | | | | 1,269 | | | | 1,257,246 | |
Series 2021-C, Class APT1, 1.39%, 01/15/53(a) . | | | | | | | 1,145 | | | | 1,010,127 | |
Series 2021-C, Class B, 2.30%, 01/15/53(a) | | | | | | | 819 | | | | 762,242 | |
Series 2024-A, Class A1B, (SOFR (30-day) + 1.45%), 03/15/56(a)(c)(e) | | | | | | | 6,833 | | | | 6,860,998 | |
Series 2024-A, Class B, 03/15/56(a)(e) | | | | | | | 6,500 | | | | 6,514,318 | |
SoFi Professional Loan Program LLC | | | | | | | | | | | | |
Series 2018-A, Class B, 3.61%, 02/25/42(a) | | | | | | | 290 | | | | 263,313 | |
Series 2019-B, Class A2FX, 3.09%, 08/17/48(a) . | | | | | | | 311 | | | | 295,680 | |
SoFi Professional Loan Program Trust | | | | | | | | | | | | |
Series 2018-B, Class BFX, 3.83%, 08/25/47(a) | | | | | | | 156 | | | | 142,485 | |
Series 2018-D, Class BFX, 4.14%, 02/25/48(a) | | | | | | | 100 | | | | 90,612 | |
Series 2020-A, Class BFX, 3.12%, 05/15/46(a) | | | | | | | 226 | | | | 182,987 | |
Sound Point CLO II Ltd., Series 2013-1A, Class A1R, (3-mo. CME Term SOFR + 1.33%), 6.66%, 01/26/31(a)(c) | | | | | | | 193 | | | | 193,545 | |
Sound Point CLO XV Ltd., Series 2017-1A, Class ARR, (3-mo. CME Term SOFR + 1.16%), 6.48%, 01/23/29(a)(c) | | | | | | | 127 | | | | 126,504 | |
Sound Point CLO XXVIII Ltd., Series 2020-3A, Class A1, (3-mo. CME Term SOFR + 1.54%), 6.87%, 01/25/32(a)(c) | | | | | | | 1,000 | | | | 1,000,659 | |
Soundview Home Loan Trust | | | | | | | | | | | | |
Series 2004-WMC1, Class M2, (1-mo. CME Term SOFR + 0.91%), 6.24%, 01/25/35(c) | | | | | | | 92 | | | | 78,816 | |
Series 2005-OPT3, Class M4, (1-mo. CME Term SOFR + 1.13%), 6.46%, 11/25/35(c) | | | | | | | 313 | | | | 225,741 | |
| | | | | | | | | | | | |
| Security | | | | | Par (000) | | | Value | |
|
| Asset-Backed Securities (continued) | |
Soundview Home Loan Trust | | | | | | | | | | | | |
Series 2007-NS1, Class M1, (1-mo. CME Term SOFR + 0.46%), 5.79%, 01/25/37(c) | | | USD | | | | 445 | | | $ | 405,397 | |
SPLT | | | | | | | | | | | | |
Series 23-1, Class A, 6.00%, 10/12/30(a) | | | | | | | 7,644 | | | | 7,646,851 | |
Series 23-1, Class R1, 0.00%,
10/15/30(a)(d) | | | | | | | 43 | | | | 2,500,587 | |
Series 24-1, Class A,, 6.06%, 02/12/31(a) | | | | | | | 9,342 | | | | 9,341,592 | |
Series 24-1, Class R1, 0.00%,
02/12/31(a)(d) | | | | | | | 136 | | | | 6,782,464 | |
SpringCastle America Funding LLC, Series 2020- AA, Class A, 1.97%, 09/25/37(a) | | | | | | | 1,075 | | | | 997,544 | |
Steele Creek CLO Ltd., Series 2017-1A, Class A, (3-mo. CME Term SOFR + 1.51%), 6.83%, 10/15/30(a)(c) | | | | | | | 199 | | | | 199,077 | |
Stratus CLO Ltd. | | | | | | | | | | | | |
Series 2021-1A, Class A, (3-mo. CME Term SOFR + 1.06%), 6.38%, 12/29/29(a)(c) | | | | | | | 295 | | | | 294,918 | |
Series 2021-1A, Class E, (3-mo. CME Term SOFR + 5.26%), 10.58%, 12/29/29(a)(c) | | | | | | | 1,250 | | | | 1,226,514 | |
Series 2021-1A, Class SUB, 0.00%, 12/29/29(a)(c)(d) | | | | | | | 1,000 | | | | 622,010 | |
Series 2021-2A, Class E, (3-mo. CME Term SOFR + 6.01%), 11.33%, 12/28/29(a)(c) | | | | | | | 1,550 | | | | 1,550,086 | |
Structured Asset Investment Loan Trust, Series 2004-10, Class A11, (1-mo. CME Term SOFR + 1.61%), 6.94%, 11/25/34(c) | | | | | | | 123 | | | | 126,090 | |
Structured Asset Securities Corp. Mortgage Loan Trust | | | | | | | | | | | | |
Series 2007-GEL1, Class A3, (1-mo. CME Term SOFR + 0.71%), 6.04%, 01/25/37(a)(c) | | | | | | | 1,546 | | | | 1,229,578 | |
Series 2007-GEL2, Class M1, (1-mo. CME Term SOFR + 1.16%), 6.49%, 05/25/37(a)(c) | | | | | | | 1,650 | | | | 1,203,450 | |
Sunrun Xanadu Issuer LLC, Series 2019-1A, Class A, 3.98%, 06/30/54(a) | | | | | | | 951 | | | | 887,478 | |
Sycamore Tree CLO Ltd., Series 2024-5A, Class B, (3-mo. CME Term SOFR + 2.25%), 04/20/36(a)(c)(e) | | | | | | | 2,150 | | | | 2,150,000 | |
Symphony CLO XIX Ltd., Series 2018-19A, Class A, (3-mo. CME Term SOFR + 1.22%), 6.54%, 04/16/31(a)(c) | | | | | | | 460 | | | | 460,299 | |
Symphony CLO XVI Ltd., Series 2015-16A, Class AR, (3-mo. CME Term SOFR + 1.41%), 6.73%, 10/15/31(a)(c) | | | | | | | 297 | | | | 296,875 | |
Symphony CLO XX Ltd., Series 2018-20A, Class BR, (3-mo. CME Term SOFR + 1.91%), 7.23%, 01/16/32(a)(c) | | | | | | | 640 | | | | 639,308 | |
Symphony CLO XXII Ltd., Series 2020-22A, Class B, (3-mo. CME Term SOFR + 1.96%), 7.26%, 04/18/33(a)(c) | | | | | | | 560 | | | | 559,753 | |
Symphony CLO XXIII Ltd. | | | | | | | | | | | | |
Series 2020-23A, Class BR, (3-mo. CME Term SOFR + 1.86%), 7.18%, 01/15/34(a)(c) | | | | | | | 1,150 | | | | 1,148,567 | |
Series 2020-23A, Class CR, (3-mo. CME Term SOFR + 2.26%), 7.58%, 01/15/34(a)(c) | | | | | | | 1,500 | | | | 1,502,005 | |
Series 2020-23A, Class ER, (3-mo. CME Term SOFR + 6.41%), 11.73%, 01/15/34(a)(c) | | | | | | | 1,250 | | | | 1,252,683 | |
Symphony CLO XXVI Ltd., Series 2021-26A, Class AR, (3-mo. CME Term SOFR + 1.34%), 6.66%, 04/20/33(a)(c) | | | | | | | 689 | | | | 688,259 | |
Symphony Static CLO I Ltd., Series 2021-1A, Class C, (3-mo. CME Term SOFR + 2.11%), 7.44%, 10/25/29(a)(c) | | | | | | | 500 | | | | 494,804 | |
| | |
| 38 | | 2 0 2 4 BLACK ROCK ANNUAL REPORT TO SHAREHOLDERS |
| | |
Schedule of Investments (continued) March 31, 2024 | | BATS: Series A Portfolio (Percentages shown are based on Net Assets) |
| | | | | | | | | | | | |
| Security | | | | | Par (000) | | | Value | |
|
| Asset-Backed Securities (continued) | |
TCI-Flatiron CLO Ltd., Series 2017-1A, Class AR, (3-mo. CME Term SOFR + 1.22%), 6.54%, 11/18/30(a)(c) | | | USD | | | | 613 | | | $ | 613,314 | |
TCI-Symphony CLO Ltd., Series 2017-1A, Class BR, (3-mo. CME Term SOFR + 1.81%), 7.13%, 07/15/30(a)(c) | | | | | | | 1,000 | | | | 997,466 | |
TCW CLO AMR Ltd., Series 2019-1A, Class ASNR, (3-mo. CME Term SOFR + 1.48%), 6.81%, 08/16/34(a)(c) | | | | | | | 250 | | | | 249,397 | |
TICP CLO IX Ltd., Series 2017-9A, Class B, (3-mo. CME Term SOFR + 1.86%), 7.18%, 01/20/31(a)(c) | | | | | | | 250 | | | | 250,632 | |
TICP CLO V Ltd., Series 2016-5A, Class DR, (3-mo. CME Term SOFR + 3.41%), 8.73%, 07/17/31(a)(c) | | | | | | | 250 | | | | 251,277 | |
TICP CLO VI Ltd. | | | | | | | | | | | | |
Series 2016-6A, Class AR2, (3-mo. CME Term SOFR + 1.38%), 6.70%, 01/15/34(a)(c) | | | | | | | 4,250 | | | | 4,254,760 | |
Series 2016-6A, Class BR2, (3-mo. CME Term SOFR + 1.76%), 7.08%, 01/15/34(a)(c) | | | | | | | 320 | | | | 319,085 | |
TICP CLO VII Ltd. | | | | | | | | | | | | |
Series 2017-7A, Class BR2, (3-mo. CME Term SOFR + 1.90%), 04/15/33(a)(c)(e) | | | | | | | 2,740 | | | | 2,736,659 | |
Series 2017-7A, Class ER, (3-mo. CME Term SOFR + 7.31%), 12.63%, 04/15/33(a)(c) | | | | | | | 600 | | | | 592,547 | |
TICP CLO VIII Ltd., Series 2017-8A, Class A2R, (3-mo. CME Term SOFR + 1.96%), 7.28%, 10/20/34(a)(c) | | | | | | | 1,780 | | | | 1,779,624 | |
TICP CLO X Ltd., Series 2018-10A, Class B, (3-mo. CME Term SOFR + 1.73%), 7.05%, 04/20/31(a)(c) | | | | | | | 570 | | | | 570,743 | |
TICP CLO XI Ltd. | | | | | | | | | | | | |
Series 2018-11A, Class AR, (3-mo. CME Term SOFR + 1.53%), 04/25/37(a)(c)(e) | | | | | | | 250 | | | | 250,000 | |
Series 2018-11A, Class B, (3-mo. CME Term SOFR + 1.99%), 7.31%, 10/20/31(a)(c) | | | | | | | 450 | | | | 450,000 | |
Series 2018-11A, Class BR, (3-mo. CME Term SOFR + 2.05%), 04/25/37(a)(c)(e) | | | | | | | 2,760 | | | | 2,760,000 | |
TICP CLO XII Ltd., Series 2018-12A, Class AR, (3-mo. CME Term SOFR + 1.43%), 6.75%, 07/15/34(a)(c) | | | | | | | 250 | | | | 250,141 | |
TICP CLO XIV Ltd., Series 2019-14A, Class DR, (3-mo. CME Term SOFR + 6.96%), 12.28%, 10/20/32(a)(c) | | | | | | | 1,250 | | | | 1,258,482 | |
TICP CLO XV Ltd., Series 2020-15A, Class A, (3-mo. CME Term SOFR + 1.54%), 6.86%, 04/20/33(a)(c) | | | | | | | 1,250 | | | | 1,251,139 | |
Towd Point Mortgage Trust, Series 2019-HY2, Class A1, (1-mo. CME Term SOFR + 1.11%), 6.44%, 05/25/58(a)(c) | | | | | | | 918 | | | | 932,858 | |
Trestles CLO IV Ltd., Series 2021-4A, Class A, (3-mo. CME Term SOFR + 1.43%), 6.75%, 07/21/34(a)(c) | | | | | | | 250 | | | | 250,000 | |
Trestles CLO Ltd., Series 2017-1A, Class A1R, (3-mo. CME Term SOFR + 1.25%), 6.58%, 04/25/32(a)(c) | | | | | | | 650 | | | | 650,260 | |
Trestles CLO V Ltd., Series 2021-5A, Class A1, (3-mo. CME Term SOFR + 1.43%), 6.75%, 10/20/34(a)(c) | | | | | | | 7,230 | | | | 7,233,120 | |
Tricon American Homes Trust | | | | | | | | | | | | |
Series 2018-SFR1, Class E, 4.56%, 05/17/37(a) | | | | | | | 2,000 | | | | 1,967,895 | |
Series 2019-SFR1, Class E, 3.40%, 03/17/38(a) | | | | | | | 2,000 | | | | 1,892,823 | |
| | | | | | | | | | | | |
| Security | | | | | Par (000) | | | Value | |
|
| Asset-Backed Securities (continued) | |
Tricon American Homes Trust Series 2020-SFR1, Class F, 4.88%, 07/17/38(a) | |
| .
USD |
| | | 7,351 | | | $ | 7,102,943 | |
Tricon Residential Trust | | | | | | | | | | | | |
Series 2021-SFR1, Class F, 3.69%, 07/17/38(a) | | | . | | | | 3,250 | | | | 2,968,524 | |
Series 2021-SFR1, Class G, 4.13%, 07/17/38(a) . | | | | | | | 2,099 | | | | 1,883,504 | |
Trimaran Cavu Ltd. | | | | | | | | | | | | |
Series 2019-1A, Class A2, (3-mo. CME Term SOFR + 2.16%), 7.48%, 07/20/32(a)(c) | | | | | | | 250 | | | | 250,257 | |
Series 2021-2A, Class D1, (3-mo. CME Term SOFR + 3.51%), 8.84%, 10/25/34(a)(c) | | | | | | | 300 | | | | 296,494 | |
Trinitas CLO IV Ltd., Series 2016-4A, Class A2L2, (3-mo. CME Term SOFR + 1.66%), 6.96%, 10/18/31(a)(c) | | | | | | | 250 | | | | 249,780 | |
Venture 39 CLO Ltd., Series 2020-39A, Class A1, (3-mo. CME Term SOFR + 1.54%), 6.86%, 04/15/33(a)(c) | | | | | | | 340 | | | | 340,655 | |
VOLT CVI LLC, Series 2021-NP12, Class A1, 2.73%, 12/26/51(a)(b) | | | | | | | 10,221 | | | | 9,777,290 | |
Voya CLO Ltd. | | | | | | | | | | | | |
Series 2013-2A, Class A1R, (3-mo. CME Term SOFR + 1.23%), 6.56%, 04/25/31(a)(c) | | | | | | | 803 | | | | 803,373 | |
Series 2013-3A, Class A1RR, (3-mo. CME Term SOFR + 1.41%), 6.71%, 10/18/31(a)(c) | | | | | | | 472 | | | | 471,835 | |
Series 2015-1A, Class A1R, (3-mo. CME Term SOFR + 1.16%), 6.46%, 01/18/29(a)(c) | | | | | | | 29 | | | | 29,398 | |
Series 2015-3A, Class A1R, (3-mo. CME Term SOFR + 1.45%), 6.77%, 10/20/31(a)(c) | | | | | | | 476 | | | | 476,387 | |
Series 2017-1A, Class A1R, (3-mo. CME Term SOFR + 1.21%), 6.53%, 04/17/30(a)(c) | | | | | | | 143 | | | | 142,414 | |
Series 2017-3A, Class A1R, (3-mo. CME Term SOFR + 1.30%), 6.62%, 04/20/34(a)(c) | | | | | | | 1,000 | | | | 1,000,639 | |
Series 2017-4A, Class A1, (3-mo. CME Term SOFR + 1.39%), 6.71%, 10/15/30(a)(c) | | | | | | | 865 | | | | 865,629 | |
Series 2018-1A, Class A2, (3-mo. CME Term SOFR + 1.56%), 6.87%, 04/19/31(a)(c) | | | | | | | 250 | | | | 249,902 | |
Series 2018-2A, Class A1, (3-mo. CME Term SOFR + 1.26%), 6.58%, 07/15/31(a)(c) | | | | | | | 207 | | | | 207,105 | |
Series 2018-3A, Class A1A, (3-mo. CME Term SOFR + 1.41%), 6.73%, 10/15/31(a)(c) | | | | | | | 229 | | | | 229,261 | |
Series 2019-2A, Class AR, (3-mo. CME Term SOFR + 1.20%), 07/20/32(a)(c)(e) | | | | | | | 4,000 | | | | 4,000,000 | |
Series 2021-2A, Class B, (3-mo. CME Term SOFR + 1.86%), 7.18%, 10/20/34(a)(c) | | | | | | | 810 | | | | 809,154 | |
Series 2022-1A, Class A1, (3-mo. CME Term SOFR + 1.39%), 6.71%, 04/20/35(a)(c) | | | | | | | 1,000 | | | | 1,000,500 | |
Washington Mutual Asset-Backed Certificates Trust | | | | | | | | | | | | |
Series 2006-HE3, Class 1A, (1-mo. CME Term SOFR + 0.42%), 5.75%, 08/25/36(c) | | | | | | | 6,171 | | | | 5,812,661 | |
Series 2006-HE4, Class 2A2, (1-mo. CME Term SOFR + 0.47%), 5.80%, 09/25/36(c) | | | | | | | 205 | | | | 55,677 | |
Series 2006-HE5, Class 1A, (1-mo. CME Term SOFR + 0.42%), 4.66%, 10/25/36(c) | | | | | | | 2,434 | | | | 1,790,981 | |
Series 2007-HE3, Class 2A3, (1-mo. CME Term SOFR + 0.35%), 5.68%, 05/25/37(c) | | | | | | | 105 | | | | 91,888 | |
Wellfleet CLO Ltd., Series 2017-3A, Class A1, (3-mo. CME Term SOFR + 1.41%), 6.73%, 01/17/31(a)(c) | | | | | | | 1,141 | | | | 1,141,430 | |
Whitebox CLO II Ltd. | | | | | | | | | | | | |
Series 2020-2A, Class BR, (3-mo. CME Term SOFR + 2.01%), 7.33%, 10/24/34(a)(c) | | | | | | | 410 | | | | 411,269 | |
Series 2020-2A, Class DR, (3-mo. CME Term SOFR + 3.61%), 8.93%, 10/24/34(a)(c) | | | | | | | 250 | | | | 248,216 | |
| | |
SCHEDULES OF INVESTMENTS | | 39 |
| | |
Schedule of Investments (continued) March 31, 2024 | | BATS: Series A Portfolio (Percentages shown are based on Net Assets) |
| | | | | | | | | | | | |
| Security | | | | | Par (000) | | | Value | |
|
Asset-Backed Securities (continued) | |
Whitebox CLO II Ltd. | | | | | | | | | | | | |
Series 2020-2A, Class ER, (3-mo. CME Term SOFR + 7.36%), 12.68%, 10/24/34(a)(c) | | | USD | | | | 500 | | | $ | 503,366 | |
Whitebox CLO III Ltd., Series 2021-3A, Class A1, (3-mo. CME Term SOFR + 1.48%), 6.80%, 10/15/34(a)(c) | | | | | | | 4,000 | | | | 4,000,646 | |
Whitebox CLO IV Ltd., Series 2023-4A, Class B, (3-mo. CME Term SOFR + 2.60%), 7.92%, 04/20/36(a)(c) | | | | | | | 1,000 | | | | 1,004,000 | |
Yale Mortgage Loan Trust, Series 2007-1, Class A, (1-mo. CME Term SOFR + 0.51%), 5.84%, 06/25/37(a)(c) | | | | | | | 417 | | | | 131,440 | |
| | | | | | | | | | | | |
| |
Total Asset-Backed Securities — 49.7%
(Cost: $1,291,488,514) | | | | 1,238,439,903 | |
| | | | | | | | | | | | |
|
Corporate Bonds | |
|
| Banks — 0.0% | |
Washington Mutual Escrow Bonds | | | | | | | | | | | | |
0.00% (d)(h)(i)(j)(k) | | | | | | | 500 | | | | — | |
0.00% (d)(h)(i)(j)(k) | | | | | | | 250 | | | | — | |
| | | | | | | | | | | | |
| | | |
| | | | | | | | | | | — | |
|
| Insurance — 0.0% | |
Ambac Assurance Corp., 5.10% (a)(k) | | | | | | | 58 | | | | 83,582 | |
| | | | | | | | | | | | |
| | | |
Total Corporate Bonds — 0.0%
(Cost: $75,213) | | | | | | | | | | | 83,582 | |
| | | | | | | | | | | | |
|
Floating Rate Loan Interests(h) | |
|
| Financial Services — 0.3% | |
Project Pearl Pasco Holdings LLC, Advance, (1-mo. CME Term SOFR at 0.00% Floor + 2.86%), 8.19%, 09/15/24 | | | | | | | 1,114 | | | | 1,113,474 | |
Sirocco Lux S.A., Facility A, (3-mo. EURIBOR at 0.00% Floor + 3.90%), 7.87%, 02/28/26 | | | EUR | | | | 6,913 | | | | 7,458,363 | |
| | | | | | | | | | | | |
| | | | | | | | | | | 8,571,837 | |
|
| Oil, Gas & Consumable Fuels — 0.3% | |
Promontoria Beech DAC, Senior Loan, (1-mo. EURIBOR at 0.00% Floor + 3.75%), 7.61%, 05/17/27 | | | | | | | 5,964 | | | | 6,418,397 | |
| | | | | | | | | | | | |
| |
Total Floating Rate Loan Interests — 0.6%
(Cost: $15,157,309) | | | | 14,990,234 | |
| | | | | | | | | | | | |
|
Non-Agency Mortgage-Backed Securities | |
|
| Collateralized Mortgage Obligations — 19.9% | |
A&D Mortgage Trust, Series 2023-NQM5, Class A1, 7.05%, 11/25/68(a)(b) | | | USD | | | | 6,061 | | | | 6,139,358 | |
Adjustable Rate Mortgage Trust, Series 2006-2, Class 4A1, 3.96%, 05/25/36(c) | | | | | | | 4,328 | | | | 3,354,741 | |
Agate Bay Mortgage Trust | | | | | | | | | | | | |
Series 2015-1, Class B5, 3.65%,
01/25/45(a)(c) | | | | | | | 723 | | | | 463,409 | |
Series 2015-3, Class B5, 3.50%,
04/25/45(a)(c) | | | | | | | 832 | | | | 535,510 | |
Series 2015-4, Class B5, 3.50%,
06/25/45(a)(c) | | | | | | | 580 | | | | 350,389 | |
Ajax Mortgage Loan Trust | | | | | | | | | | | | |
Series 2017-D, Class B, 0.00%,
12/25/57(a)(c)(d) . | | | | | | | 86 | | | | 28,957 | |
Series 2020-C, Class C, 0.00%,
09/27/60(a)(d) | | | | | | | 11 | | | | 9,518 | |
Series 2020-C, Class RW, 0.00%, 09/27/60(a)(d) . | | | | | | | 9 | | | | 8,747 | |
Series 2020-D, Class RW, 0.00%, 06/25/60(a)(d) . | | | | | | | 13 | | | | 12,879 | |
Series 2021-C, Class A, 2.12%,
01/25/61(a)(b) | | | | | | | 2,425 | | | | 2,351,705 | |
Series 2021-C, Class B, 3.72%,
01/25/61(a)(b) | | | | | | | 817 | | | | 782,538 | |
| | | | | | | | | | | | |
| Security | | | | | Par (000) | | | Value | |
|
| Collateralized Mortgage Obligations (continued) | |
Ajax Mortgage Loan Trust | | | | | | | | | | | | |
Series 2021-C, Class C, 0.00%, 01/25/61(a)(d) | | | USD | | | | 2,024 | | | $ | 1,960,252 | |
Series 2021-D, Class A, 2.00%, 03/25/60(a)(b) | | | | | | | 6,167 | | | | 5,876,654 | |
Series 2021-D, Class B, 4.00%, 03/25/60(a)(c) | | | | | | | 1,634 | | | | 1,490,016 | |
Series 2021-D, Class C, 0.00%,
03/25/60(a)(c)(d) . | | | | | | | 2,387 | | | | 2,304,876 | |
Series 2021-E, Class A1, 1.74%,
12/25/60(a)(c) | | | | | | | 11,140 | | | | 9,446,465 | |
Series 2021-E, Class A2, 2.69%,
12/25/60(a)(c) | | | | | | | 1,770 | | | | 1,314,867 | |
Series 2021-E, Class B1, 3.73%,
12/25/60(a)(c) | | | | | | | 1,068 | | | | 721,411 | |
Series 2021-E, Class B3, 3.96%,
12/25/60(a)(c) | | | | | | | 633 | | | | 171,416 | |
Series 2021-E, Class M1, 2.94%,
12/25/60(a)(c) | | | | | | | 698 | | | | 480,087 | |
Series 2021-E, Class SA, 0.00%,
12/25/60(a)(c)(d) | | | | | | | 7 | | | | 3,263 | |
Series 2021-F, Class A, 1.88%, 06/25/61(a)(b) | | | | | | | 16,085 | | | | 15,283,900 | |
Series 2021-F, Class B, 3.75%, 06/25/61(a)(b) | | | | | | | 1,945 | | | | 1,843,050 | |
Series 2021-F, Class C, 0.00%, 06/25/61(a)(d) | | | | | | | 3,603 | | | | 2,935,001 | |
Series 2022-A, Class A2, 3.00%, 10/25/61(a)(c) | | | | | | | 478 | | | | 413,852 | |
Series 2022-A, Class A3, 3.00%, 10/25/61(a)(c) | | | | | | | 255 | | | | 216,785 | |
Series 2022-A, Class B, 3.00%, 10/25/61(a) | | | | | | | 1,912 | | | | 1,383,266 | |
Series 2022-A, Class C, 3.00%, 10/25/61(a) | | | | | | | 945 | | | | 834,940 | |
Series 2022-A, Class M1, 3.00%, 10/25/61(a) | | | | | | | 279 | | | | 231,510 | |
Series 2022-A, Class M2, 3.00%, 10/25/61(a) | | | | | | | 1,250 | | | | 1,001,561 | |
Series 2022-A, Class M3, 3.00%, 10/25/61(a) | | | | | | | 80 | | | | 61,699 | |
Series 2022-B, Class A2, 3.00%,
03/27/62(a)(c) | | | | | | | 376 | | | | 305,537 | |
Series 2022-B, Class A3, 3.00%,
03/27/62(a)(c) | | | | | | | 322 | | | | 259,030 | |
Series 2022-B, Class B, 3.00%, 03/27/62(a) | | | | | | | 1,789 | | | | 1,205,693 | |
Series 2022-B, Class C, 3.00%, 03/27/62(a) | | | | | | | 1,349 | | | | 1,044,202 | |
Series 2022-B, Class M1, 3.00%, 03/27/62(a) | | | | | | | 241 | | | | 193,013 | |
Series 2022-B, Class M2, 3.00%, 03/27/62(a) | | | | | | | 1,198 | | | | 914,264 | |
Series 2023-A, Class A1, 3.50%,
07/25/62(a)(b) | | | | | | | 11,255 | | | | 10,527,039 | |
Series 2023-A, Class A2, 3.00%,
07/25/62(a)(c) | | | | | | | 515 | | | | 438,450 | |
Series 2023-A, Class A3, 2.50%,
07/25/62(a)(c) | | | | | | | 292 | | | | 233,633 | |
Series 2023-A, Class B, 2.50%, 07/25/62(a)(c) | | | | | | | 1,717 | | | | 1,196,721 | |
Series 2023-A, Class C, 2.50%, 07/25/62(a)(c) | | | | | | | 1,020 | | | | 426,777 | |
Series 2023-A, Class M1, 2.50%,
07/25/62(a)(c) | | | | | | | 884 | | | | 687,501 | |
Series 2023-C, Class A1, 3.50%,
05/25/63(a)(b) | | | | | | | 12,964 | | | | 12,219,427 | |
Series 2023-C, Class A2, 3.00%,
05/25/63(a)(c) | | | | | | | 789 | | | | 665,949 | |
Series 2023-C, Class A3, 2.50%,
05/25/63(a)(c) | | | | | | | 421 | | | | 336,422 | |
Series 2023-C, Class C, 2.50%,
05/25/63(a)(c) | | | | | | | 3,415 | | | | 2,755,234 | |
Series 2023-C, Class M1, 2.50%,
05/25/63(a)(c) | | | | | | | 368 | | | | 290,514 | |
Series 2023-C, Class M2, 2.50%,
05/25/63(a)(c) | | | | | | | 2,284 | | | | 1,648,986 | |
American Home Mortgage Assets Trust | | | | | | | | | | | | |
Series 2006-4, Class 1A12, (1-mo. CME Term SOFR + 0.32%), 5.65%, 10/25/46(c) | | | | | | | 82 | | | | 43,026 | |
Series 2006-6, Class A1A, (1-mo. CME Term SOFR + 0.30%), 5.63%, 12/25/46(c) | | | | | | | 4,583 | | | | 3,803,530 | |
Series 2007-1, Class A1, (12-mo. Federal Reserve Cumulative Average US + 0.70%), 5.79%, 02/25/47(c) | | | | | | | 31 | | | | 11,264 | |
American Home Mortgage Investment Trust, Series 2007-1, Class GA1C, (1-mo. CME Term SOFR + 0.30%), 5.63%, 05/25/47(c) | | | | | | | 1,291 | | | | 712,644 | |
Angel Oak Mortgage Trust | | | | | | | | | | | | |
Series 2019-5, Class B1, 3.96%,
10/25/49(a)(c) | | | | | | | 405 | | | | 363,667 | |
Series 2022-2, Class A1, 3.35%, 01/25/67(a)(c) | | | | | | | 250 | | | | 228,983 | |
Series 2023-7, Class A1, 4.80%, 11/25/67(a)(b) | | | | | | | 7,355 | | | | 7,126,559 | |
Series 2024-1, Class A1, 5.21%,
08/25/68(a)(b) | | | | | | | 1,122 | | | | 1,097,784 | |
APS Resecuritization Trust | | | | | | | | | | | | |
Series 2016-1, Class 1MZ, 3.02%,
07/31/57(a)(c) | | | | | | | 2,291 | | | | 887,175 | |
Series 2016-3, Class 3A, (1-mo. CME Term SOFR + 2.96%), 8.29%, 09/27/46(a)(c) | | | | | | | 19 | | | | 19,317 | |
| | |
| 40 | | 2 0 2 4 BLACK ROCK ANNUAL REPORT TO SHAREHOLDERS |
| | |
Schedule of Investments (continued) March 31, 2024 | | BATS: Series A Portfolio (Percentages shown are based on Net Assets) |
| | | | | | | | | | | | |
| Security | | | | | Par (000) | | | Value | |
|
| Collateralized Mortgage Obligations (continued) | |
Banc of America Alternative Loan Trust | | | | | | | | | | | | |
Series 2006-4, Class 3CB1, (1-mo. CME Term SOFR + 0.91%), 6.00%, 05/25/46(c) | | | USD | | | | 482 | | | $ | 381,992 | |
Series 2006-7, Class A4, 6.50%, 10/25/36(b) | | | | | | | 2,333 | | | | 687,674 | |
Banc of America Funding Trust | | | | | | | | | | | | |
Series 2014-R2, Class 1C, 0.00%, 11/26/36(a)(c)(d) | | | | | | | 7,236 | | | | 2,214,298 | |
Series 2016-R2, Class 1A1, 4.70%, 05/01/33(a)(c) | | | | | | | 272 | | | | 267,434 | |
Banc of America Mortgage Trust, Series 2007-4, Class 1A1, 6.25%, 12/28/37 | | | | | | | 857 | | | | 614,535 | |
Barclays Mortgage Loan Trust | | | | | | | | | | | | |
Series 2021-NPL1, Class A, 2.00%, 11/25/51(a)(b) | | | | | | | 8,763 | | | | 8,365,210 | |
Series 2021-NPL1, Class B, 4.63%, 11/25/51(a)(b) | | | | | | | 1,060 | | | | 982,897 | |
Series 2021-NPL1, Class C, 0.00%, 11/25/51(a)(d) | | | | | | | 2,312 | | | | 2,470,528 | |
Series 2022-NQM1, Class A1, 4.55%, 07/25/52(a)(b) | | | | | | | 3,483 | | | | 3,397,106 | |
Series 2022-RPL1, Class A, 4.25%, 02/25/28(a)(b) | | | | | | | 7,025 | | | | 7,022,717 | |
Series 2022-RPL1, Class B, 4.25%, 02/25/28(a)(b) | | | | | | | 1,242 | | | | 807,383 | |
Series 2022-RPL1, Class C, 0.00%, 02/25/28(a)(d) | | | | | | | 2,159 | | | | 802,311 | |
Series 2022-RPL1, Class SA, 0.00%, 02/25/28(a)(d) | | | | | | | 69 | | | | 41,782 | |
Series 2023-NQM3, Class A1, 6.90%, 10/25/63(a)(b) | | | | | | | 13,584 | | | | 13,731,146 | |
Series 2023-NQM3, Class A2, 7.36%, 10/25/63(a)(b) | | | | | | | 2,160 | | | | 2,181,128 | |
Series 2023-NQM3, Class A3, 7.69%, 10/25/63(a)(b) | | | | | | | 1,304 | | | | 1,315,184 | |
Series 2023-NQM3, Class B1, 8.10%, 10/25/63(a)(c) | | | | | | | 681 | | | | 680,734 | |
Series 2023-NQM3, Class B2, 8.10%, 10/25/63(a)(c) | | | | | | | 573 | | | | 556,190 | |
Series 2023-NQM3, Class B3, 8.10%, 10/25/63(a)(c) | | | | | | | 1,567 | | | | 1,396,287 | |
Series 2023-NQM3, Class M1, 8.10%, 10/25/63(a)(c) | | | | | | | 1,134 | | | | 1,146,857 | |
Series 2023-NQM3, Class SA, 0.00%, 10/25/63(a)(c)(d) | | | | | | | 1 | | | | 953 | |
Series 2024-NQM1, Class A1, 5.90%, 01/25/64(a)(b) | | | | | | | 2,260 | | | | 2,245,555 | |
Series 2024-NQM1, Class A2, 6.11%, 01/25/64(a)(b) | | | | | | | 1,539 | | | | 1,520,063 | |
Series 2024-NQM1, Class A3, 6.31%, 01/25/64(a)(b) | | | | | | | 1,176 | | | | 1,169,279 | |
Series 2024-NQM1, Class B1, 8.09%, 01/25/64(a)(c) | | | | | | | 512 | | | | 511,955 | |
Series 2024-NQM1, Class B2, 8.76%, 01/25/64(a)(c) | | | | | | | 469 | | | | 467,289 | |
Series 2024-NQM1, Class B3, 8.76%, 01/25/64(a)(c) | | | | | | | 1,007 | | | | 837,011 | |
Series 2024-NQM1, Class M1, 6.80%, 01/25/64(a)(c) | | | | | | | 879 | | | | 871,552 | |
Series 2024-NQM1, Class SA, 0.00%, 01/25/64(a)(c)(d) | | | | | | | 2 | | | | 2,093 | |
| | | | | | | | | | | | |
| Security | | | | | Par (000) | | | Value | |
|
| Collateralized Mortgage Obligations (continued) | |
BCAP LLC Trust | | | | | | | | | | | | |
Series 2011-RR4, Class 3A6, 4.52%, 07/26/36(a)(c) | | | USD | | | | 1,153 | | | $ | 1,093,818 | |
Series 2011-RR5, Class 11A5, (1-mo. CME Term SOFR + 0.26%), 0.43%, 05/28/36(a)(c) | | | | | | | 249 | | | | 236,260 | |
Bear Stearns Asset-Backed Securities I Trust | | | | | | | | | | | | |
Series 2006-AC1, Class 1A2, 6.25%, 02/25/36(b) | | | | | | | 119 | | | | 114,960 | |
Series 2006-AC2, Class 1A1, (1-mo. CME Term SOFR + 0.46%), 5.79%, 03/25/36(c) | | | | | | | 1,949 | | | | 547,022 | |
Bear Stearns Mortgage Funding Trust | | | | | | | | | | | | |
Series 2006-SL1, Class A1, (1-mo. CME Term SOFR + 0.39%), 5.72%, 08/25/36(c) | | | | | | | 311 | | | | 303,659 | |
Series 2007-AR2, Class A1, (1-mo. CME Term SOFR + 0.45%), 5.78%, 03/25/37(c) | | | | | | | 175 | | | | 160,061 | |
Series 2007-AR4, Class 2A1, (1-mo. CME Term SOFR + 0.32%), 5.65%, 06/25/37(c) | | | | | | | 16 | | | | 14,671 | |
Chase Mortgage Finance Corp., Series 2016-SH1, Class M4, 3.75%,
04/25/45(a)(c) | | | | | | | 513 | | | | 448,903 | |
Chase Mortgage Finance Trust, Series 2007-S6, Class 1A1, 6.00%, 12/25/37 | | | | | | | 9,040 | | | | 3,721,071 | |
CHNGE Mortgage Trust | | | | | | | | | | | | |
Series 2022-1, Class A1, 3.01%, 01/25/67(a)(c) | | | | | | | 2,271 | | | | 2,066,988 | |
Series 2022-2, Class A1, 3.76%, 03/25/67(a)(c) | | | | | | | 7,703 | | | | 7,218,582 | |
Series 2022-4, Class A1, 6.00%, 10/25/57(a)(b) | | | | | | | 535 | | | | 527,240 | |
CIM Trust | | | | | | | | | | | | |
Series 2019-J2, Class B4, 3.77%, 10/25/49(a)(c) . | | | | | | | 869 | | | | 641,893 | |
Series 2023-I2, Class A2, 6.85%, 12/25/67(a)(b) | | | | | | | 893 | | | | 896,692 | |
Citicorp Mortgage Securities Trust | | | | | | | | | | | | |
Series 2007-4, Class 1A14, 6.00%, 05/25/37 | | | | | | | 362 | | | | 314,180 | |
Series 2007-9, Class 1A1, 6.25%, 12/25/37 | | | | | | | 1,771 | | | | 1,554,836 | |
Series 2008-2, Class 1A1, 6.50%, 06/25/38 | | | | | | | 277 | | | | 214,310 | |
Citigroup Mortgage Loan Trust | | | | | | | | | | | | |
Series 2007-6, Class 2A1, (1-mo. CME Term SOFR + 0.61%), 5.94%, 05/25/37(c) | | | | | | | 1,131 | | | | 1,006,902 | |
Series 2014-C, Class B2, 4.25%, 02/25/54(a) | | | | | | | 317 | | | | 292,097 | |
Series 2019-RP1, Class A1, 3.50%, 01/25/66(a)(c) | | | | | | | 1,292 | | | | 1,230,821 | |
Series 2022-A, Class A1, 6.17%, 09/25/62(a)(b) | | | | | | | 6,531 | | | | 6,528,829 | |
CitiMortgage Alternative Loan Trust, Series 2007- A3, Class 1A5, 6.00%, 03/25/37 | | | | | | | 1,592 | | | | 1,427,330 | |
COLT Mortgage Loan Trust | | | | | | | | | | | | |
Series 2020-2, Class M1, 5.25%, 03/25/65(a)(c) | | | | | | | 761 | | | | 739,602 | |
Series 2022-3, Class B1, 4.23%, 02/25/67(a)(c) | | | | | | | 1,500 | | | | 1,226,922 | |
Countrywide Alternative Loan Trust | | | | | | | | | | | | |
Series 2005-11CB, Class 2A1, 5.50%, 06/25/35 . | | | | | | | 76 | | | | 60,185 | |
Series 2005-11CB, Class 2A6, 5.50%, 06/25/25 . | | | | | | | 649 | | | | 516,103 | |
Series 2005-22T1, Class A1, (1-mo. CME Term SOFR + 0.46%), 5.42%, 06/25/35(c) | | | | | | | 999 | | | | 828,791 | |
Series 2005-51, Class 3A3A, (1-mo. CME Term SOFR + 0.75%), 6.08%, 11/20/35(c) | | | | | | | 385 | | | | 325,514 | |
Series 2005-59, Class 1A1, (1-mo. CME Term SOFR + 0.77%), 6.10%, 11/20/35(c) | | | | | | | 959 | | | | 863,559 | |
Series 2005-76, Class 2A1, (12-mo. Federal Reserve Cumulative Average US + 1.00%), 6.09%, 02/25/36(c) | | | | | | | 374 | | | | 324,128 | |
Series 2006-11CB, Class 3A1, 6.50%, 05/25/36 . | | | | | | | 987 | | | | 477,737 | |
Series 2006-28CB, Class A14, 6.25%, 10/25/36 . | | | | | | | 651 | | | | 337,277 | |
Series 2006-29T1, Class 2A6, 6.50%, 10/25/36 . | | | | | | | 2,254 | | | | 1,388,694 | |
Series 2006-6CB, Class 2A10, 6.00%, 05/25/36 . | | | | | | | 175 | | | | 71,682 | |
Series 2006-J7, Class 1A2, 6.25%, 11/25/36 | | | | | | | 2,794 | | | | 1,310,478 | |
| | |
SCHEDULES OF INVESTMENTS | | 41 |
| | |
Schedule of Investments (continued) March 31, 2024 | | BATS: Series A Portfolio (Percentages shown are based on Net Assets) |
| | | | | | | | | | | | |
| Security | | | | | Par (000) | | | Value | |
|
| Collateralized Mortgage Obligations (continued) | |
Countrywide Alternative Loan Trust | | | | | | | | | | | | |
Series 2006-OC1, Class 1A1, (1-mo. CME Term SOFR + 0.57%), 5.90%, 03/25/36(c) | | | USD | | | | 685 | | | $ | 652,337 | |
Series 2006-OC10, Class 2A3, (1-mo. CME Term SOFR + 0.57%), 5.90%, 11/25/36(c) | | | | | | | 468 | | | | 376,315 | |
Series 2006-OC7, Class 2A3, (1-mo. CME Term SOFR + 0.61%), 5.94%, 07/25/46(c) | | | | | | | 2,943 | | | | 2,462,941 | |
Series 2007-3T1, Class 1A1, 6.00%, 04/25/37 | | | | | | | 1,124 | | | | 524,659 | |
Series 2007-9T1, Class 1A1, 6.00%, 05/25/37 | | | | | | | 163 | | | | 78,343 | |
Series 2007-OA2, Class 1A1, (12-mo. Federal Reserve Cumulative Average US + 0.84%), 5.93%, 03/25/47(c) | | | | | | | 155 | | | | 128,910 | |
Countrywide Home Loan Mortgage Pass-Through Trust | | | | | | | | | | | | |
Series 2005-J2, Class 3A9, (1-mo. CME Term SOFR + 1.51%), 6.00%, 08/25/35(c) | | | | | | | 2,383 | | | | 1,564,009 | |
Series 2007-1, Class A2, 6.00%, 03/25/37 | | | | | | | 210 | | | | 97,983 | |
Series 2007-14, Class A18, 6.00%, 09/25/37 | | | | | | | 6,260 | | | | 3,339,371 | |
Series 2007-15, Class 2A2, 6.50%, 09/25/37 | | | | | | | 630 | | | | 225,573 | |
Series 2007-9, Class A1, 5.75%, 07/25/37 | | | | | | | 745 | | | | 371,838 | |
Series 2007-9, Class A11, 5.75%, 07/25/37 | | | | | | | 407 | | | | 203,210 | |
Series 2007-HYB1, Class 3A1, 4.45%, 03/25/37(c) | | | | | | | 1,257 | | | | 1,044,775 | |
Credit Suisse Mortgage Capital Certificates | | | | | | | | | | | | |
Series 2009-12R, Class 3A1, 6.50%, 10/27/37(a) | | | | | | | 39 | | | | 15,240 | |
Series 2020-SPT1, Class B2, 3.39%, 04/25/65(a)(c) | | | | | | | 8,400 | | | | 6,580,998 | |
Series 2021-RPL9, Class A1, 2.44%, 02/25/61(a)(c) | | | | | | | 3,908 | | | | 3,774,334 | |
Credit Suisse Mortgage Trust | | | | | | | | | | | | |
Series 2006-4, Class 1A3, 6.00%, 05/25/36 | | | | | | | 376 | | | | 207,009 | |
Series 2007-5, Class 1A11, 6.59%, 08/25/37(c) | | | | | | | 1,857 | | | | 930,666 | |
Series 2014-9R, Class 9A1, (1-mo. CME Term SOFR + 0.23%), 5.68%, 08/27/36(a)(c) | | | | | | | 73 | | | | 57,120 | |
Series 2014-SAF1, Class B5, 3.73%, 03/25/44(a)(c) | | | | | | | 1,578 | | | | 1,151,805 | |
Series 2015-6R, Class 5A2, (1-mo. CME Term SOFR + 0.29%), 3.98%, 03/27/36(a)(c) | | | | | | | 1,263 | | | | 943,302 | |
Series 2020-RPL2, Class A12, 3.54%, 02/25/60(a)(c) | | | | | | | 2,586 | | | | 2,592,694 | |
Series 2021-NQM1, Class M1, 2.13%, 05/25/65(a)(c) | | | | | | | 3,299 | | | | 2,222,075 | |
Series 2021-NQM8, Class M1, 3.26%, 10/25/66(a)(c) | | | | | | | 590 | | | | 413,492 | |
Series 2022-NQM1, Class A1, 2.27%, 11/25/66(a)(c) | | | | | | | 4,857 | | | | 4,236,728 | |
Series 2022-NQM3, Class A1B, 4.27%, 03/25/67(a)(c) | | | | | | | 2,291 | | | | 2,138,227 | |
Series 2022-NQM6, Class PT, 8.95%, 12/25/67(a)(c) | | | | | | | 8,524 | | | | 8,628,364 | |
Cross Mortgage Trust, Series 2023-H2, Class A1A, 7.14%,
11/25/68(a)(b) | | | | | | | 1,945 | | | | 1,971,126 | |
Deephaven Residential Mortgage Trust | | | | | | | | | | | | |
Series 2021-1, Class B2, 3.96%, 05/25/65(a)(c) | | | | | | | 150 | | | | 125,692 | |
Series 2021-1, Class M1, 2.09%, 05/25/65(a)(c) | | | | | | | 1,620 | | | | 1,399,535 | |
Series 2021-3, Class B1, 3.27%, 08/25/66(a)(c) | | | | | | | 3,671 | | | | 2,554,834 | |
Series 2022-2, Class M1, 4.34%, 03/25/67(a)(c) | | | | | | | 884 | | | | 749,518 | |
Series 2022-3, Class B1, 5.26%, 07/25/67(a)(c) | | | | | | | 1,349 | | | | 1,050,048 | |
Series 2022-3, Class M1, 5.26%, 07/25/67(a)(c) | | | | | | | 2,742 | | | | 2,487,670 | |
Deutsche Alt-B Securities Mortgage Loan Trust, | | | | | | | | | | | | |
Series 2006-AB3, Class A8, 6.36%, 07/25/36(c) | | | | | | | 15 | | | | 12,770 | |
| | | | | | | | | | | | |
| Security | | | | | Par (000) | | | Value | |
|
| Collateralized Mortgage Obligations (continued) | |
FWD Securitization Trust | | | | | | | | | | | | |
Series 2020-INV1, Class A2, 2.34%, 01/25/50(a)(c) | | | USD | | | | 1,199 | | | $ | 1,099,651 | |
Series 2020-INV1, Class A3, 2.44%, 01/25/50(a)(c) | | | | | | | 25 | | | | 23,024 | |
GCAT Trust | | | | | | | | | | | | |
Series 2020-NQM2, Class B1, 4.85%, 04/25/65(a)(c) | | | | | | | 2,533 | | | | 2,296,425 | |
Series 2022-HX1, Class A1, 2.89%, 12/27/66(a)(c) | | | | | | | 309 | | | | 280,282 | |
Series 2022-NQM4, Class A1, 5.27%, 08/25/67(a)(b) | | | | | | | 3,436 | | | | 3,393,526 | |
Series 2023-NQM4, Class A1, 4.25%, 05/25/67(a)(c) | | | | | | | 3,951 | | | | 3,655,626 | |
GreenPoint Mortgage Funding Trust, Series 2006- AR2, Class 4A1, (12-mo. Federal Reserve Cumulative Average US + 2.00%), 7.09%, 03/25/36(c) | | | | | | | 14 | | | | 12,517 | |
GS Mortgage-Backed Securities Corp. Trust | | | | | | | | | | | | |
Series 2019-PJ2, Class A4, 4.00%, 11/25/49(a)(c) | | | | | | | 238 | | | | 219,039 | |
Series 2020-PJ2, Class B4, 3.55%, 07/25/50(a)(c) | | | | | | | 1,065 | | | | 851,910 | |
GS Mortgage-Backed Securities Trust, Series 2022-NQM1, Class A4, 4.00%,
05/25/62(a)(c) | | | | | | | 345 | | | | 312,415 | |
GSMPS Mortgage Loan Trust | | | | | | | | | | | | |
Series 2004-4, Class 1AF, (1-mo. CME Term SOFR + 0.51%), 5.84%, 06/25/34(a)(c) | | | | | | | 2,885 | | | | 2,534,034 | |
Series 2005-RP2, Class 1AF, (1-mo. CME Term SOFR + 0.46%), 5.79%, 03/25/35(a)(c) | | | | | | | 50 | | | | 45,027 | |
Series 2005-RP3, Class 2A1, 3.98%, 09/25/35(a)(c) | | | | | | | 2,755 | | | | 2,283,969 | |
Series 2006-RP1, Class 1AF1, (1-mo. CME Term SOFR + 0.46%), 5.79%, 01/25/36(a)(c) | | | | | | | 41 | | | | 33,089 | |
Series 2006-RP2, Class 2A1, 4.24%, 04/25/36(a)(c) | | | | | | | 2,133 | | | | 1,714,636 | |
GSMSC Resecuritization Trust, Series 2015-5R, Class 1D, (1-mo. CME Term SOFR + 0.25%), 4.05%, 04/26/37(a)(c) | | | | | | | 3,989 | | | | 2,320,218 | |
GSR Mortgage Loan Trust, Series 2006-AR2, Class 3A1, 5.89%, 04/25/36(c) | | | | | | | 1,628 | | | | 986,225 | |
Homeward Opportunities Fund I Trust | | | | | | | | | | | | |
Series 2020-2, Class B1, 5.45%, 05/25/65(a)(c) | | | | | | | 3,640 | | | | 3,518,731 | |
Series 2022-1, Class A1, 5.08%, 07/25/67(a)(b) | | | | | | | 6,172 | | | | 6,091,219 | |
Series 2022-1, Class M1, 5.05%, 07/25/67(a)(c) | | | | | | | 3,077 | | | | 2,894,770 | |
Impac Secured Assets Trust, Series 2006-2, Class 1A2B, (1-mo. CME Term SOFR + 0.45%), 5.78%, 08/25/36(c) | | | | | | | 1,659 | | | | 1,651,162 | |
IndyMac Index Mortgage Loan Trust | | | | | | | | | | | | |
Series 2006-AR27, Class 2A2, (1-mo. CME Term SOFR + 0.51%), 5.84%, 10/25/36(c) | | | | | | | 189 | | | | 166,295 | |
Series 2006-AR35, Class 2A1A, (1-mo. CME Term SOFR + 0.45%), 5.78%, 01/25/37(c) | | | | | | | 340 | | | | 300,205 | |
Series 2007-AR19, Class 3A1, 3.75%, 09/25/37(c) | | | | | | | 617 | | | | 406,634 | |
Series 2007-FLX5, Class 2A2, (1-mo. CME Term SOFR + 0.35%), 5.68%, 08/25/37(c) | | | | | | | 2,494 | | | | 2,157,763 | |
IndyMac INDX Mortgage Loan Trust, Series 2007- FLX2, Class A1A, (1-mo. CME Term SOFR + 0.27%), 5.76%, 04/25/37(c) | | | | | | | 4,632 | | | | 3,882,728 | |
| | |
| 42 | | 2 0 2 4 BLACK ROCK ANNUAL REPORT TO SHAREHOLDERS |
| | |
Schedule of Investments (continued) March 31, 2024 | | BATS: Series A Portfolio (Percentages shown are based on Net Assets) |
| | | | | | | | | | | | |
| Security | | | | | Par (000) | | | Value | |
|
| Collateralized Mortgage Obligations (continued) | |
JPMorgan Alternative Loan Trust, Series 2006-S2, Class A5, 6.88%, 05/25/36(b) | | | USD | | | | 4,136 | | | $ | 3,474,691 | |
JPMorgan Mortgage Trust | | | | | | | | | | | | |
Series 2005-A4, Class B1, 5.09%, 07/25/35(c) | | | | 291 | | | | 265,001 | |
Series 2020-5, Class B3, 3.57%, 12/25/50(a)(c) | | | | 3,669 | | | | 3,025,897 | |
Series 2021-INV7, Class A3A, 2.50%, 02/25/52(a)(c) | | | | | | | 14,510 | | | | 12,648,741 | |
Series 2021-INV7, Class A4A, 2.50%, 02/25/52(a)(c) | | | | | | | 6,218 | | | | 3,895,739 | |
Series 2021-INV7, Class B1, 3.27%, 02/25/52(a)(c) | | | | | | | 3,722 | | | | 3,080,827 | |
Series 2021-INV7, Class B2, 3.27%, 02/25/52(a)(c) | | | | | | | 873 | | | | 715,221 | |
Series 2021-INV7, Class B3, 3.27%, 02/25/52(a)(c) | | | | | | | 1,215 | | | | 966,890 | |
Series 2021-INV7, Class B4, 3.27%, 02/25/52(a)(c) | | | | | | | 646 | | | | 502,936 | |
Series 2021-INV7, Class B5, 3.27%, 02/25/52(a)(c) | | | | | | | 266 | | | | 194,525 | |
Series 2021-INV7, Class B6, 3.21%, 02/25/52(a)(c) | | | | | | | 868 | | | | 352,642 | |
Legacy Mortgage Asset Trust, Series 2020-SL1, Class A, 5.73%,
01/25/60(a)(b) | | | | | | | 21 | | | | 20,785 | |
Lehman XS Trust, Series 2007-20N, Class A1, (1-mo. CME Term SOFR + 2.41%), 7.74%, 12/25/37(c) | | | | | | | 23 | | | | 21,600 | |
MASTR Reperforming Loan Trust, Series 2005-1, Class 1A3, 7.00%, 08/25/34(a) | | | | | | | 1,963 | | | | 1,384,477 | |
MASTR Resecuritization Trust, Series 2008-1, Class A1, 6.00%, 09/27/37(a)(c) | | | | | | | 868 | | | | 629,017 | |
MCM Trust | | | | | | | | | | | | |
Series 2021-VFN1, Class Cert, 0.00%, 09/25/31(d)(h) | | | | | | | 1,424 | | | | 934,090 | |
Series 2021-VFN1, Class Note, 2.50%, 09/25/31(a)(h) | | | | | | | 1,841 | | | | 1,767,624 | |
Merrill Lynch Mortgage Investors Trust, Series 2006-AF2, Class AV1, (1-mo. CME Term SOFR + 0.43%), 5.76%, 09/25/37(c) | | | | | | | 568 | | | | 303,181 | |
MFA Trust | | | | | | | | | | | | |
Series 2021-INV1, Class M1, 2.29%, 01/25/56(a)(c) | | | | | | | 700 | | | | 627,998 | |
Series 2022-NQM1, Class M1, 4.27%, 12/25/66(a)(c) | | | | | | | 2,112 | | | | 1,820,952 | |
Series 2024-RTL1, Class A1, 7.09%, 02/25/29(a)(b) | | | | | | | 3,231 | | | | 3,232,026 | |
MFRA Trust, Series 2022-CHM1, Class A1, 3.88%, 09/25/56(a)(b) | | | | | | | 6,030 | | | | 5,735,157 | |
Mill City Mortgage Loan Trust, Series 2023-NQM1, Class A1, 6.05%, 10/25/67(a)(b) | | | | | | | 4,499 | | | | 4,482,067 | |
Morgan Stanley Residential Mortgage Loan Trust, Series 2014-1A, Class B3, 6.87%, 06/25/44(a)(c) . | | | | | | | 198 | | | | 196,418 | |
Mortgage Loan Resecuritization Trust, Series 2009-RS1, Class A85, (1-mo. LIBOR US + 0.34%), 5.78%, 04/16/36(a)(c) | | | | | | | 165 | | | | 158,601 | |
New Residential Mortgage Loan Trust, Series 2019-2A, Class A1, 4.25%, 12/25/57(a)(c) . | | | | | | | 1,136 | | | | 1,088,891 | |
Nomura Asset Acceptance Corp. Alternative Loan Trust | | | | | | | | | | | | |
Series 2005-AP1, Class 2A4, 6.05%, 02/25/35(b) | | | | | | | 315 | | | | 301,049 | |
Series 2007-2, Class A4, (1-mo. CME Term SOFR + 0.95%), 6.28%, 06/25/37(c) | | | | | | | 563 | | | | 449,105 | |
| | | | | | | | | | | | |
| Security | | | | | Par (000) | | | Value | |
|
| Collateralized Mortgage Obligations (continued) | |
OBX Trust, Series 2019-EXP1, Class 1A3, 4.00%, 01/25/59(a)(c) | | | USD | | | | 132 | | | $ | 126,479 | |
Preston Ridge Partners Mortgage LLC | | | | | | | | | | | | |
Series 2021-4, Class A1, 1.87%, 04/25/26(a)(b) | | | | | | | 3,080 | | | | 3,003,391 | |
Series 2022-1, Class A1, 3.72%, 02/25/27(a)(b) | | | | | | | 4,126 | | | | 4,007,615 | |
Series 2023-1, Class A1, 6.88%, 02/25/28(a)(c) | | | | | | | 4,572 | | | | 4,595,734 | |
PRET LLC | | | | | | | | | | | | |
Series 2024-NPL1, Class A1, 7.14%, 01/25/54(a)(b) | | | | | | | 7,238 | | | | 7,756,187 | |
Series 2024-NPL2, Class A1, 7.02%, 02/25/54(a)(b) | | | | | | | 6,580 | | | | 6,558,288 | |
PRKCM Trust | | | | | | | | | | | | |
Series 2021-AFC2, Class A1, 2.07%, 11/25/56(a)(c) | | | | | | | 1,134 | | | | 960,064 | |
Series 2022-AFC1, Class A1A, 4.10%, 04/25/57(a)(c) | | | | | | | 470 | | | | 449,858 | |
Series 2022-AFC2, Class A1, 5.34%, 08/25/57(a)(c) | | | | | | | 7,069 | | | | 6,960,638 | |
RALI Trust | | | | | | | | | | | | |
Series 2005-QA10, Class A21, 4.69%, 09/25/35(c) | | | | | | | 5,095 | | | | 2,119,556 | |
Series 2006-QA10, Class A2, (1-mo. CME Term SOFR + 0.47%), 5.80%, 12/25/36(c) | | | | | | | 1,451 | | | | 1,234,406 | |
Series 2006-QO1, Class 3A1, (1-mo. CME Term SOFR + 0.65%), 5.71%, 02/25/46(c) | | | | | | | 1,814 | | | | 773,641 | |
Series 2006-QO10, Class A1, (1-mo. CME Term SOFR + 0.43%), 5.76%, 01/25/37(c) | | | | | | | 1,717 | | | | 1,459,970 | |
Series 2007-QH3, Class A1, (1-mo. CME Term SOFR + 0.43%), 5.76%, 04/25/37(c) | | | | | | | 4,853 | | | | 4,277,708 | |
Series 2007-QO2, Class A1, (1-mo. CME Term SOFR + 0.26%), 5.59%, 02/25/47(c) | | | | | | | 123 | | | | 41,929 | |
RCKT Mortgage Trust, Series 2020-1, Class B4, 3.47%, 02/25/50(a)(c) | | | | | | | 917 | | | | 762,799 | |
RCO VI Mortgage LLC, Series 2022-1, Class A1, 3.00%, 01/25/27(a)(b) | | | | | | | 8,027 | | | | 7,771,447 | |
RCO VII Mortgage LLC, Series 2024-1, Class A1, 7.02%, 01/25/29(a)(b) | | | | | | | 4,480 | | | | 4,467,042 | |
Reperforming Loan REMIC Trust | | | | | | | | | | | | |
Series 2005-R1, Class 1AF1, (1-mo. CME Term SOFR + 0.47%), 5.80%, 03/25/35(a)(c) | | | | | | | 1,330 | | | | 1,257,484 | |
Series 2005-R2, Class 1AF1, (1-mo. CME Term SOFR + 0.45%), 5.78%, 06/25/35(a)(c) | | | | | | | 252 | | | | 236,173 | |
Series 2005-R3, Class AF, (1-mo. CME Term SOFR + 0.51%), 5.84%, 09/25/35(a)(c) | | | | | | | 402 | | | | 335,675 | |
Residential Mortgage Loan Trust, Series 2019-3, Class B2, 5.66%, 09/25/59(a)(c) | | | | | | | 2,900 | | | | 2,542,145 | |
RFMSI Series Trust | | | | | | | | | | | | |
Series 2005-SA4, Class 2A1, 5.17%, 09/25/35(c) | | | | | | | 1,878 | | | | 1,158,958 | |
Series 2006-SA2, Class 2A1, 5.44%, 08/25/36(c) | | | | | | | 432 | | | | 299,951 | |
RMF Buyout Issuance Trust | | | | | | | | | | | | |
Series 2021-HB1, Class M3, 3.69%, 11/25/31(a)(c) | | | | | | | 3,379 | | | | 2,950,881 | |
Series 2021-HB1, Class M6, 6.00%, 11/25/31(a)(c)(h) | | | | | | | 1,185 | | | | 857,530 | |
Saluda Grade Alternative Mortgage Trust | | | | | | | | | | | | |
Series 2024-RTL4, Class A1, 7.50%, 02/25/30(a)(b) | | | | | | | 5,668 | | | | 5,619,208 | |
Series 2024-RTL5, Class A1, 7.76%, 04/25/30(a)(b) | | | | | | | 4,013 | | | | 4,012,953 | |
| | |
SCHEDULES OF INVESTMENTS | | 43 |
| | |
Schedule of Investments (continued) March 31, 2024 | | BATS: Series A Portfolio (Percentages shown are based on Net Assets) |
| | | | | | | | | | | | |
| Security | | | | | Par (000) | | | Value | |
|
| Collateralized Mortgage Obligations (continued) | |
Seasoned Loans Structured Transaction Trust, Series 2020-3, Class M1, 4.75%, 04/26/60(a)(c) | | | USD | | | | 848 | | | $ | 821,912 | |
SG Residential Mortgage Trust | | | | | | | | | | | | |
Series 2022-2, Class A1, 5.35%, 08/25/62(a)(b) | | | | | | | 722 | | | | 716,952 | |
Series 2022-2, Class B1, 5.30%, 08/25/62(a)(c) | | | | | | | 3,715 | | | | 3,349,127 | |
Spruce Hill Mortgage Loan Trust, Series 2022- SH1, Class A3, 4.10%,
07/25/57(a)(b) | | | | | | | 759 | | | | 677,026 | |
Starwood Mortgage Residential Trust | | | | | | | | | | | | |
Series 2020-3, Class B1, 4.75%, 04/25/65(a)(c) | | | | | | | 2,820 | | | | 2,492,926 | |
Series 2020-INV1, Class B1, 3.26%, 11/25/55(a) . | | | | | | | 260 | | | | 212,351 | |
Series 2020-INV1, Class M1, 2.50%, 11/25/55(a) | | | | | | | 2,688 | | | | 2,330,814 | |
Series 2021-1, Class B1, 3.52%, 05/25/65(a)(c) | | | | | | | 648 | | | | 532,551 | |
Structured Asset Mortgage Investments II Trust, | | | | | | | | | | | | |
Series 2006-AR5, Class 2A1, (1-mo. CME Term SOFR + 0.53%), 5.86%, 05/25/46(c) | | | | | | | 29 | | | | 19,663 | |
Structured Asset Securities Corp. | | | | | | | | | | | | |
Series 2005-RF3, Class 1A, (1-mo. CME Term SOFR + 0.46%), 5.79%, 06/25/35(a)(c) | | | | | | | 693 | | | | 593,553 | |
Series 2005-RF5, Class 2A, 4.04%, 07/25/35(a)(c) | | | | | | | 1,768 | | | | 1,606,687 | |
Structured Asset Securities Corp. Mortgage Loan Trust | | | | | | | | | | | | |
Series 2006-RF3, Class 1A2, 6.00%, 10/25/36(a) | | | | | | | 4,313 | | | | 2,398,963 | |
Series 2006-RF4, Class 2A1, 6.00%, 10/25/36(a) | | | | | | | 1,262 | | | | 674,892 | |
Thornburg Mortgage Securities Trust, Series 2006-3, Class A1, 4.06%, 06/25/46(c) | | | | | | | 971 | | | | 606,876 | |
Toorak Mortgage Corp., Series 2021-INV2, Class B1, 4.10%, 11/25/56(a)(c) | | | | | | | 3,755 | | | | 2,892,433 | |
TVC Mortgage Trust, Series 2023-RTL1, Class A1, 8.25%, 11/25/27(a)(b) | | | | | | | 4,107 | | | | 4,109,689 | |
Verus Securitization Trust | | | | | | | | | | | | |
Series 2019-4, Class B1, 3.86%, 11/25/59(a)(c) | | | | | | | 800 | | | | 685,222 | |
Series 2020-4, Class B1, 5.05%, 05/25/65(a)(c) | | | | | | | 2,600 | | | | 2,420,591 | |
Series 2021-1, Class M1, 1.97%, 01/25/66(a)(c) | | | | | | | 3,000 | | | | 2,266,108 | |
Series 2021-6, Class B1, 4.05%, 10/25/66(a)(c) | | | | | | | 169 | | | | 128,261 | |
Series 2021-6, Class M1, 2.94%, 10/25/66(a)(c) | | | | | | | 462 | | | | 334,221 | |
Series 2021-R1, Class M1, 2.34%, 10/25/63(a) | | | | | | | 3,250 | | | | 2,778,561 | |
Series 2021-R2, Class B1, 3.25%, 02/25/64(a)(c) . | | | | | | | 265 | | | | 195,341 | |
Series 2022-1, Class B1, 4.01%, 01/25/67(a)(c) | | | | | | | 1,507 | | | | 1,113,022 | |
Series 2022-3, Class B1, 4.08%, 02/25/67(a)(c) | | | | | | | 2,188 | | | | 1,693,154 | |
Visio Trust, Series 2019-2, Class B1, 3.91%, 11/25/54(a)(c) | | | | | | | 100 | | | | 75,876 | |
Vista Point Securitization Trust | | | | | | | | | | | | |
Series 2020-2, Class A3, 2.50%, 04/25/65(a)(c) | | | | | | | 115 | | | | 106,433 | |
Series 2020-2, Class M1, 3.40%, 04/25/65(a)(c) | | | | | | | 170 | | | | 155,305 | |
Washington Mutual Mortgage Pass-Through Certificates Trust | | | | | | | | | | | | |
Series 2005-11, Class A1, 5.75%, 01/25/36 | | | | | | | 1,158 | | | | 968,945 | |
Series 2005-11, Class A7, 5.75%, 01/25/36 | | | | | | | 2,354 | | | | 1,968,203 | |
Series 2005-9, Class 5A6, (1-mo. CME Term SOFR + 0.66%), 5.50%, 11/25/35(c) | | | | | | | 371 | | | | 255,905 | |
Series 2005-9, Class 5A9, 5.50%, 11/25/35 | | | | | | | 153 | | | | 115,926 | |
Series 2006-4, Class 1A1, 6.00%, 04/25/36 | | | | | | | 142 | | | | 126,346 | |
Series 2006-4, Class 3A1, 7.00%, 05/25/36(b) | | | | | | | 89 | | | | 74,694 | |
Series 2006-6, Class 3CB1, 7.00%, 08/25/36 | | | | | | | 4,212 | | | | 1,653,621 | |
Series 2006-AR1, Class A1A, (1-mo. CME Term SOFR + 0.61%), 5.94%, 02/25/36(c) | | | | | | | 1,157 | | | | 895,117 | |
| | | | | | | | | | | | |
| Security | | | | | Par (000) | | | Value | |
|
| Collateralized Mortgage Obligations (continued) | |
Washington Mutual Mortgage Pass-Through Certificates Trust | | | | | | | | | | | | |
Series 2006-AR5, Class A1A, (12-mo. Federal Reserve Cumulative Average US + 0.99%), 6.08%, 06/25/46(c) | | | USD | | | | 150 | | | $ | 128,413 | |
Series 2007-HY1, Class A2A, (1-mo. CME Term SOFR + 0.43%), 5.76%, 02/25/37(c) | | | | | | | 496 | | | | 368,792 | |
Series 2007-OA1, Class 1A, (12-mo. Federal Reserve Cumulative Average US + 0.71%), 5.80%, 12/25/46(c) | | | | | | | 2,359 | | | | 1,913,951 | |
Series 2007-OA1, Class 2A, (12-mo. Federal Reserve Cumulative Average US + 0.72%), 5.81%, 12/25/46(c) | | | | | | | 140 | | | | 106,236 | |
Series 2007-OA3, Class 5A, (12-mo. Federal Reserve Cumulative Average US + 1.25%), 6.34%, 04/25/47(c) | | | | | | | 594 | | | | 489,257 | |
Series 2007-OA4, Class 2A, (12-mo. Federal Reserve Cumulative Average US + 0.80%), 5.89%, 05/25/47(c) | | | | | | | 2,000 | | | | 1,634,199 | |
Series 2007-OA5, Class 1A, (12-mo. Federal Reserve Cumulative Average US + 0.75%), 5.84%, 06/25/47(c) | | | | | | | 463 | | | | 369,120 | |
Series 2007-OA5, Class 2A, (12-mo. Federal Reserve Cumulative Average US + 0.80%), 5.89%, 06/25/47(c) | | | | | | | 1,722 | | | | 1,348,700 | |
Series 2007-OC2, Class A3, (1-mo. CME Term SOFR + 0.73%), 6.06%, 06/25/37(c) | | | | | | | 731 | | | | 679,022 | |
Wells Fargo Mortgage Backed Securities Trust, Series 2006-AR15, Class A1, 6.48%, 10/25/36(c) | | | | | | | 840 | | | | 774,954 | |
Western Alliance Bank | | | | | | | | | | | | |
Series 2021-CL2, Class M1, (SOFR (30-day) + 3.15%), 8.47%, 07/25/59(a)(c) | | | | | | | 3,993 | | | | 4,107,208 | |
Series 2021-CL2, Class M2, (SOFR (30-day) + 3.70%), 9.02%, 07/25/59(a)(c) | | | | | | | 5,709 | | | | 5,820,014 | |
WinWater Mortgage Loan Trust, Series 2014-3, Class B5, 3.98%, 11/20/44(a)(c) | | | | | | | 923 | | | | 693,417 | |
| | | | | | | | | | | | |
| | | |
| | | | | | | | | | | 495,174,942 | |
|
| Commercial Mortgage-Backed Securities — 26.6% | |
245 Park Avenue Trust | | | | | | | | | | | | |
Series 2017-245P, Class A, 3.51%, 06/05/37(a) | | | | 5,000 | | | | 4,588,519 | |
Series 2017-245P, Class C, 3.66%, 06/05/37(a)(c) | | | | | | | 3,000 | | | | 2,644,256 | |
Series 2017-245P, Class E, 3.66%, 06/05/37(a)(c) | | | | | | | 1,151 | | | | 941,855 | |
280 Park Avenue Mortgage Trust | | | | | | | | | | | | |
Series 2017-280P, Class A, (1-mo. CME Term SOFR + 1.18%), 6.50%, 09/15/34(a)(c) | | | | | | | 5,000 | | | | 4,907,924 | |
Series 2017-280P, Class B, (1-mo. CME Term SOFR + 1.38%), 6.70%, 09/15/34(a)(c) | | | | | | | 585 | | | | 563,990 | |
Series 2017-280P, Class E, (1-mo. CME Term SOFR + 2.42%), 7.74%, 09/15/34(a)(c) | | | | | | | 1,432 | | | | 1,315,682 | |
3650R Commercial Mortgage Trust, Series 2022- PF2, Class A5, 5.29%, 11/15/55(c) | | | | | | | 600 | | | | 601,721 | |
ACREC LLC, Series 2023-FL2, Class A, (1-mo. CME Term SOFR + 2.23%), 7.56%, 02/19/38(a)(c) | | | | | | | 3,250 | | | | 3,248,257 | |
Alen Mortgage Trust, Series 2021-ACEN, Class A, (1-mo. CME Term SOFR + 1.26%), 6.59%,
04/15/34(a)(c) | | | | | | | 644 | | | | 588,429 | |
| | |
| 44 | | 2 0 2 4 BLACK ROCK ANNUAL REPORT TO SHAREHOLDERS |
| | |
Schedule of Investments (continued) March 31, 2024 | | BATS: Series A Portfolio (Percentages shown are based on Net Assets) |
| | | | | | | | | | | | |
| Security | | | | | Par (000) | | | Value | |
|
| Commercial Mortgage-Backed Securities (continued) | |
Angel Oak SB Commercial Mortgage Trust, Series 2020-SBC1, Class A1, 2.07%, 05/25/50(a)(c) | | | USD | | | | 6,084 | | | $ | 5,535,868 | |
Arbor Multifamily Mortgage Securities Trust, Series 2021-MF3, Class A5, 2.58%, 10/15/54(a) . | | | | | | | 3,394 | | | | 2,872,648 | |
AREIT LLC | | | | | | | | | | | | |
Series 2022-CRE7, Class A, (1-mo. CME Term SOFR + 2.24%), 7.57%, 06/17/39(a)(c) | | | | | | | 3,080 | | | | 3,079,980 | |
Series 2023-CRE8, Class A, (1-mo. CME Term SOFR + 2.11%), 7.44%, 08/17/41(a)(c) | | | | | | | 1,679 | | | | 1,666,987 | |
Ashford Hospitality Trust, Series 2018-ASHF, Class D, (1-mo. CME Term SOFR + 2.27%), 7.60%, 04/15/35(a)(c) | | | | | | | 1,128 | | | | 1,095,108 | |
Austin Fairmont Hotel Trust, Series 2019-FAIR, Class A, (1-mo. CME Term SOFR + 1.10%), 6.42%, 09/15/32(a)(c) | | | | | | | 2,000 | | | | 1,991,250 | |
Banc of America Merrill Lynch Commercial Mortgage Securities Trust | | | | | | | | | | | | |
Series 2015-200P, Class F, 3.60%, 04/14/33(a)(c) | | | | | | | 794 | | | | 739,158 | |
Series 2017-SCH, Class AL, (1-mo. CME Term SOFR + 0.95%), 6.27%, 11/15/32(a)(c) | | | | | | | 2,470 | | | | 2,452,417 | |
Series 2017-SCH, Class BF, (1-mo. CME Term SOFR + 1.45%), 6.77%, 11/15/33(a)(c) | | | | | | | 500 | | | | 473,905 | |
Series 2017-SCH, Class DL, (1-mo. CME Term SOFR + 2.05%), 7.37%, 11/15/32(a)(c) | | | | | | | 1,090 | | | | 1,080,320 | |
Series 2018-DSNY, Class B, (1-mo. CME Term SOFR + 1.45%), 6.77%, 09/15/34(a)(c) | | | | | | | 162 | | | | 161,595 | |
Series 2018-DSNY, Class D, (1-mo. CME Term SOFR + 2.00%), 7.32%, 09/15/34(a)(c) | | | | | | | 227 | | | | 225,298 | |
BANK | | | | | | | | | | | | |
Series 2019-BN22, Class A4, 2.98%, 11/15/62 | | | | 3,000 | | | | 2,687,672 | |
Series 2021-BN35, Class A5, 2.29%, 06/15/64 | | | | 744 | | | | 617,977 | |
Bayview Commercial Asset Trust | | | | | | | | | | | | |
Series 2006-1A, Class A1, (1-mo. CME Term SOFR + 0.52%), 5.85%, 04/25/36(a)(c) | | | | | | | 5,696 | | | | 5,231,013 | |
Series 2006-1A, Class A2, (1-mo. CME Term SOFR + 0.65%), 5.98%, 04/25/36(a)(c) | | | | | | | 13 | | | | 11,772 | |
Series 2006-4A, Class A2, (1-mo. CME Term SOFR + 0.52%), 5.85%, 12/25/36(a)(c) | | | | | | | 1,183 | | | | 1,105,840 | |
Series 2006-SP2, Class A, (1-mo. CME Term SOFR + 0.53%), 5.86%, 01/25/37(a)(c) | | | | | | | 1,208 | | | | 1,128,494 | |
Series 2007-1, Class A2, (1-mo. CME Term SOFR + 0.52%), 5.85%, 03/25/37(a)(c) | | | | | | | 5,220 | | | | 4,858,720 | |
Series 2007-2A, Class A1, (1-mo. CME Term SOFR + 0.52%), 5.85%, 07/25/37(a)(c) | | | | | | | 28 | | | | 25,102 | |
Series 2007-4A, Class A1, (1-mo. CME Term SOFR + 0.79%), 6.12%, 09/25/37(a)(c) | | | | | | | 5,010 | | | | 4,634,805 | |
Series 2007-6A, Class A4A, (1-mo. CME Term SOFR + 1.61%), 6.94%, 12/25/37(a)(c) | | | | | | | 3,224 | | | | 2,778,848 | |
BBCMS Mortgage Trust | | | | | | | | | | | | |
Series 2015-SRCH, Class A1, 3.31%, 08/10/35(a) | | | | | | | 263 | | | | 249,368 | |
Series 2018-CHRS, Class E, 4.27%, 08/05/38(a)(c) | | | | | | | 1,000 | | | | 709,148 | |
Series 2018-TALL, Class A, (1-mo. CME Term SOFR + 0.92%), 6.25%, 03/15/37(a)(c) | | | | | | | 3,997 | | | | 3,837,463 | |
Series 2018-TALL, Class B, (1-mo. CME Term SOFR + 1.17%), 6.49%, 03/15/37(a)(c) | | | | | | | 781 | | | | 726,453 | |
Series 2023-5C23, Class D, 7.46%, 12/15/56(a)(c) | | | | | | | 332 | | | | 318,826 | |
| | | | | | | | | | | | |
| Security | | | | | Par (000) | | | Value | |
|
| Commercial Mortgage-Backed Securities (continued) | |
BDS LLC, Series 2022-FL12, Class A, (1-mo. CME Term SOFR + 2.14%), 7.46%, 08/19/38(a)(c) | | | USD | | | | 1,870 | | | $ | 1,876,975 | |
Beast Mortgage Trust | | | | | | | | | | | | |
Series 2021-SSCP, Class A, (1-mo. CME Term SOFR + 0.86%), 6.19%, 04/15/36(a)(c) | | | | | | | 2,901 | | | | 2,879,433 | |
Series 2021-SSCP, Class B, (1-mo. CME Term SOFR + 1.21%), 6.54%, 04/15/36(a)(c) | | | | | | | 268 | | | | 262,775 | |
Series 2021-SSCP, Class C, (1-mo. CME Term SOFR + 1.46%), 6.79%, 04/15/36(a)(c) | | | | | | | 325 | | | | 318,563 | |
Series 2021-SSCP, Class D, (1-mo. CME Term SOFR + 1.71%), 7.04%, 04/15/36(a)(c) | | | | | | | 312 | | | | 304,008 | |
Series 2021-SSCP, Class E, (1-mo. CME Term SOFR + 2.21%), 7.54%, 04/15/36(a)(c) | | | | | | | 268 | | | | 257,522 | |
Series 2021-SSCP, Class F, (1-mo. CME Term SOFR + 3.01%), 8.34%, 04/15/36(a)(c) | | | | | | | 253 | | | | 243,141 | |
Series 2021-SSCP, Class G, (1-mo. CME Term SOFR + 3.91%), 9.24%, 04/15/36(a)(c) | | | | | | | 283 | | | | 268,140 | |
Series 2021-SSCP, Class H, (1-mo. CME Term SOFR + 5.02%), 10.34%, 04/15/36(a)(c) | | | | | | | 208 | | | | 197,256 | |
BFLD Trust, Series 2020-EYP, Class E, (1-mo. CME Term SOFR + 3.81%), 9.14%, 10/15/35(a)(c) | | | | | | | 1,353 | | | | 148,286 | |
BHMS | | | | | | | | | | | | |
Series 2018-ATLS, Class A, (1-mo. CME Term SOFR + 1.55%), 6.87%, 07/15/35(a)(c) | | | | | | | 2,850 | | | | 2,846,232 | |
Series 2018-ATLS, Class C, (1-mo. CME Term SOFR + 2.20%), 7.52%, 07/15/35(a)(c) | | | | | | | 2,600 | | | | 2,543,656 | |
BHP Trust, Series 2019-BXHP, Class C, (1-mo. CME Term SOFR + 1.57%), 6.90%, 08/15/36(a)(c) | | | | | | | 897 | | | | 893,678 | |
BLP Commercial Mortgage Trust, Series 2023-IND, Class A, (1-mo. CME Term SOFR + 1.69%), 7.02%, 03/15/40(a)(c) | | | | | | | 2,114 | | | | 2,117,964 | |
BOCA Commercial Mortgage Trust, Series 2022- BOCA, Class A, (1-mo. CME Term SOFR + 1.77%), 7.10%, 05/15/39(a)(c) | | | | | | | 1,540 | | | | 1,540,961 | |
BPR Trust | | | | | | | | | | | | |
Series 2021-TY, Class A, (1-mo. CME Term SOFR + 1.16%), 6.49%, 09/15/38(a)(c) | | | | | | | 1,255 | | | | 1,247,156 | |
Series 2021-TY, Class E, (1-mo. CME Term SOFR + 3.71%), 9.04%, 09/15/38(a)(c) | | | | | | | 3,138 | | | | 3,098,837 | |
Series 2022-SSP, Class A, (1-mo. CME Term SOFR + 3.00%), 8.33%, 05/15/39(a)(c) | | | | | | | 770 | | | | 773,369 | |
BWAY Mortgage Trust | | | | | | | | | | | | |
Series 2013-1515, Class A2, 3.45%, 03/10/33(a) . | | | | 1,108 | | | | 1,052,473 | |
Series 2013-1515, Class C, 3.45%, 03/10/33(a) | | | | 250 | | | | 220,513 | |
BX Commercial Mortgage Trust | | | | | | | | | | | | |
Series 2019-XL, Class J, (1-mo. CME Term SOFR + 2.76%), 8.09%, 10/15/36(a)(c) | | | | | | | 2,743 | | | | 2,703,939 | |
Series 2020-VIV2, Class C, 3.54%, 03/09/44(a)(c) | | | | | | | 2,204 | | | | 1,913,119 | |
Series 2020-VIV3, Class B, 3.54%, 03/09/44(a)(c) | | | | | | | 2,788 | | | | 2,452,037 | |
Series 2020-VIV4, Class A, 2.84%, 03/09/44(a) | | | | 781 | | | | 674,921 | |
Series 2020-VIVA, Class D, 3.55%, 03/11/44(a)(c) | | | | | | | 3,000 | | | | 2,578,353 | |
Series 2020-VKNG, Class F, (1-mo. CME Term SOFR + 2.86%), 8.19%, 10/15/37(a)(c) | | | | | | | 1,400 | | | | 1,370,995 | |
Series 2021-NWM, Class A, (1-mo. CME Term SOFR + 1.02%), 6.35%, 02/15/33(a)(c) | | | | | | | 1,061 | | | | 1,042,488 | |
Series 2021-NWM, Class B, (1-mo. CME Term SOFR + 2.26%), 7.59%, 02/15/33(a)(c) | | | | | | | 622 | | | | 613,935 | |
| | |
SCHEDULES OF INVESTMENTS | | 45 |
| | |
Schedule of Investments (continued) March 31, 2024 | | BATS: Series A Portfolio (Percentages shown are based on Net Assets) |
| | | | | | | | | | | | |
| Security | | | | | Par (000) | | | Value | |
|
| Commercial Mortgage-Backed Securities (continued) | |
BX Commercial Mortgage Trust | | | | | | | | | | | | |
Series 2021-NWM, Class C, (1-mo. CME Term SOFR + 4.36%), 9.69%, 02/15/33(a)(c) | | | USD | | | | 411 | | | $ | 409,522 | |
Series 2021-SOAR, Class G, (1-mo. CME Term SOFR + 2.91%), 8.24%, 06/15/38(a)(c) | | | | | | | 2,561 | | | | 2,527,736 | |
Series 2021-VINO, Class A, (1-mo. CME Term SOFR + 0.77%), 6.09%, 05/15/38(a)(c) | | | | | | | 4,672 | | | | 4,636,737 | |
Series 2021-VINO, Class F, (1-mo. CME Term SOFR + 2.92%), 8.24%, 05/15/38(a)(c) | | | | | | | 905 | | | | 892,287 | |
Series 2021-VIV5, Class A, 2.84%, 03/09/44(a)(c) | | | | | | | 1,522 | | | | 1,291,742 | |
Series 2021-XL2, Class F, (1-mo. CME Term SOFR + 2.36%), 7.68%, 10/15/38(a)(c) | | | | | | | 3,959 | | | | 3,919,323 | |
Series 2022-CSMO, Class C, (1-mo. CME Term SOFR + 3.89%), 9.21%, 06/15/27(a)(c) | | | | | | | 1,080 | | | | 1,083,375 | |
Series 2023-VLT3, Class A, (1-mo. CME Term SOFR + 1.94%), 7.27%, 11/15/28(a)(c) | | | | | | | 1,010 | | | | 1,009,999 | |
Series 2023-XL3, Class A, (1-mo. CME Term SOFR + 1.76%), 7.09%, 12/09/40(a)(c) | | | | | | | 5,845 | | | | 5,881,330 | |
Series 2023-XL3, Class D, (1-mo. CME Term SOFR + 3.59%), 8.91%, 12/09/40(a)(c) | | | | | | | 4,580 | | | | 4,614,292 | |
Series 2024-MF, Class A, (1-mo. CME Term SOFR + 1.44%), 6.77%, 02/15/39(a)(c) | | | | | | | 1,330 | | | | 1,333,324 | |
Series 2024-MF, Class E, (1-mo. CME Term SOFR + 3.74%), 9.06%, 02/15/39(a)(c) | | | | | | | 2,181 | | | | 2,184,981 | |
Series 2024-XL4, Class A, (1-mo. CME Term SOFR + 1.44%), 6.77%, 02/15/39(a)(c) | | | | | | | 5,000 | | | | 5,006,208 | |
Series 2024-XL4, Class D, (1-mo. CME Term SOFR + 3.14%), 8.47%, 02/15/39(a)(c) | | | | | | | 3,270 | | | | 3,270,001 | |
Series 2024-XL4, Class E, (1-mo. CME Term SOFR + 4.19%), 9.51%, 02/15/39(a)(c) | | | | | | | 1,770 | | | | 1,759,850 | |
Series 2024-XL5, Class A, (1-mo. CME Term SOFR + 1.39%),
03/15/41(a)(c)(e) | | | | | | | 3,642 | | | | 3,643,833 | |
BX Trust | | | | | | | | | | | | |
Series 2019-CALM, Class E, (1-mo. CME Term SOFR + 2.11%), 7.44%, 11/15/32(a)(c) | | | | | | | 2,100 | | | | 2,087,531 | |
Series 2019-OC11, Class A, 3.20%, 12/09/41(a) . | | | | 2,786 | | | | 2,479,363 | |
Series 2021-ARIA, Class A, (1-mo. CME Term SOFR + 1.01%), 6.34%, 10/15/36(a)(c) | | | | | | | 3,062 | | | | 3,031,380 | |
Series 2021-ARIA, Class C, (1-mo. CME Term SOFR + 1.76%), 7.09%, 10/15/36(a)(c) | | | | | | | 150 | | | | 147,944 | |
Series 2021-ARIA, Class D, (1-mo. CME Term SOFR + 2.01%), 7.34%, 10/15/36(a)(c) | | | | | | | 1,249 | | | | 1,224,020 | |
Series 2021-ARIA, Class G, (1-mo. CME Term SOFR + 3.26%), 8.58%, 10/15/36(a)(c) | | | | | | | 829 | | | | 803,133 | |
Series 2021-LBA, Class AJV, (1-mo. CME Term SOFR + 0.91%), 6.24%, 02/15/36(a)(c) | | | | | | | 916 | | | | 911,717 | |
Series 2021-LBA, Class AV, (1-mo. CME Term SOFR + 0.91%), 6.24%, 02/15/36(a)(c) | | | | | | | 594 | | | | 591,300 | |
Series 2021-MFM1, Class A, (1-mo. CME Term SOFR + 0.81%), 6.14%, 01/15/34(a)(c) | | | | | | | 3,778 | | | | 3,756,421 | |
Series 2021-MFM1, Class G, (1-mo. CME Term SOFR + 4.01%), 9.34%, 01/15/34(a)(c) | | | | | | | 575 | | | | 558,196 | |
Series 2021-VIEW, Class E, (1-mo. CME Term SOFR + 3.71%), 9.04%, 06/15/36(a)(c) | | | | | | | 3,716 | | | | 3,437,535 | |
Series 2021-VIEW, Class F, (1-mo. CME Term SOFR + 4.04%), 9.37%, 06/15/36(a)(c) | | | | | | | 856 | | | | 757,560 | |
Series 2022-GPA, Class A, (1-mo. CME Term SOFR + 2.17%), 7.49%, 08/15/39(a)(c) | | | | | | | 12,146 | | | | 12,176,229 | |
Series 2022-GPA, Class B, (1-mo. CME Term SOFR + 2.66%), 7.99%, 08/15/41(a)(c) | | | | | | | 355 | | | | 356,135 | |
| | | | | | | | | | | | |
| Security | | | | | Par (000) | | | Value | |
|
| Commercial Mortgage-Backed Securities (continued) | |
BX Trust | | | | | | | | | | | | |
Series 2022-GPA, Class D, (1-mo. CME Term SOFR + 4.06%), 9.39%, 08/15/43(a)(c) | | | USD | | | | 1,860 | | | $ | 1,864,234 | |
Series 2022-LBA6, Class A, (1-mo. CME Term SOFR + 1.00%), 6.33%, 01/15/39(a)(c) | | | | | | | 1,065 | | | | 1,059,342 | |
Series 2022-VAMF, Class A, (1-mo. CME Term SOFR + 0.85%), 6.18%, 01/15/39(a)(c) | | | | | | | 5,000 | | | | 4,956,250 | |
Series 2022-VAMF, Class B, (1-mo. CME Term SOFR + 1.28%), 6.61%, 01/15/39(a)(c) | | | | | | | 397 | | | | 392,410 | |
Series 2023-DELC, Class A, (1-mo. CME Term SOFR + 2.69%), 8.02%, 05/15/38(a)(c) | | | | | | | 5,023 | | | | 5,085,787 | |
Series 2023-DELC, Class D, (1-mo. CME Term SOFR + 4.39%), 9.71%, 05/15/38(a)(c) | | | | | | | 270 | | | | 271,350 | |
Series 2024-CNYN, Class A, (1-mo. CME Term SOFR + 1.44%), 04/15/29(a)(c)(e) | | | | | | | 5,463 | | | | 5,463,000 | |
Series 2024-CNYN, Class D, (1-mo. CME Term SOFR + 2.69%), 04/15/29(a)(c)(e) | | | | | | | 1,950 | | | | 1,951,686 | |
Series 2024-CNYN, Class E, (1-mo. CME Term SOFR + 3.69%), 04/15/29(a)(c)(e) | | | | | | | 2,964 | | | | 2,962,146 | |
Series 2024-PAT, Class A, (1-mo. CME Term SOFR + 2.09%), 7.34%, 03/15/26(a)(c) | | | | | | | 2,210 | | | | 2,208,871 | |
Series 2024-PAT, Class C, (1-mo. CME Term SOFR + 4.44%), 9.69%, 03/15/26(a)(c) | | | | | | | 4,722 | | | | 4,721,758 | |
Series 2024-PAT, Class D, (1-mo. CME Term SOFR + 5.39%), 10.64%, 03/15/26(a)(c) | | | | | | | 2,263 | | | | 2,262,880 | |
BXP Trust | | | | | | | | | | | | |
Series 2017-GM, Class B, 3.43%, 06/13/39(a)(c) | | | | | | | 265 | | | | 243,242 | |
Series 2021-601L, Class D, 2.78%, 01/15/44(a)(c) | | | | | | | 1,120 | | | | 720,201 | |
CAMB Commercial Mortgage Trust | | | | | | | | | | | | |
Series 2019-LIFE, Class D, (1-mo. CME Term SOFR + 2.05%), 7.37%, 12/15/37(a)(c) | | | | | | | 1,000 | | | | 999,375 | |
Series 2019-LIFE, Class E, (1-mo. CME Term SOFR + 2.45%), 7.77%, 12/15/37(a)(c) | | | | | | | 1,437 | | | | 1,433,445 | |
CD Mortgage Trust | | | | | | | | | | | | |
Series 2016-CD1, Class A3, 2.46%, 08/10/49 | | | | | | | 4,339 | | | | 4,041,707 | |
Series 2017-CD6, Class B, 3.91%, 11/13/50(c) | | | | | | | 336 | | | | 288,329 | |
CENT Trust, Series 2023-CITY, Class A, (1-mo. CME Term SOFR + 2.62%), 7.95%, 09/15/38(a)(c) | | | | | | | 5,474 | | | | 5,528,749 | |
CFCRE Commercial Mortgage Trust, Series 2016- C4, Class C, 4.84%, 05/10/58(c) | | | | | | | 130 | | | | 121,255 | |
CFK Trust | | | | | | | | | | | | |
Series 2019-FAX, Class D, 4.64%, 01/15/39(a)(c) | | | | | | | 2,500 | | | | 2,217,249 | |
Series 2019-FAX, Class E, 4.64%, 01/15/39(a)(c) | | | | | | | 2,600 | | | | 2,218,709 | |
Citigroup Commercial Mortgage Trust | | | | | | | | | | | | |
Series 2013-375P, Class C, 3.52%, 05/10/35(a)(c) | | | | | | | 100 | | | | 92,497 | |
Series 2016-P3, Class A4, 3.33%, 04/15/49 | | | | | | | 2,635 | | | | 2,511,132 | |
Series 2017-P7, Class A4, 3.71%, 04/14/50 | | | | | | | 6,000 | | | | 5,632,224 | |
COAST Commercial Mortgage Trust | | | | | | | | | | | | |
Series 2023-2HTL, Class A, (1-mo. CME Term SOFR + 2.59%), 7.92%, 08/15/36(a)(c) | | | | | | | 1,482 | | | | 1,486,032 | |
Series 2023-2HTL, Class D, (1-mo. CME Term SOFR + 4.44%), 9.76%, 08/15/36(a)(c) | | | | | | | 2,600 | | | | 2,599,995 | |
Cold Storage Trust | | | | | | | | | | | | |
Series 2020-ICE5, Class A, (1-mo. CME Term SOFR + 1.01%), 6.33%,
11/15/37(a)(c) | | | | | | | 4,554 | | | | 4,544,233 | |
Series 2020-ICE5, Class E, (1-mo. CME Term SOFR + 2.88%), 8.20%,
11/15/37(a)(c) | | | | | | | 1,966 | | | | 1,962,295 | |
Series 2020-ICE5, Class F, (1-mo. CME Term SOFR + 3.61%), 8.93%,
11/15/37(a)(c) | | | | | | | 1,729 | | | | 1,722,318 | |
| | |
| 46 | | 2 0 2 4 BLACK ROCK ANNUAL REPORT TO SHAREHOLDERS |
| | |
Schedule of Investments (continued) March 31, 2024 | | BATS: Series A Portfolio (Percentages shown are based on Net Assets) |
| | | | | | | | | | | | |
| Security | | | | | Par (000) | | | Value | |
|
| Commercial Mortgage-Backed Securities (continued) | |
Commercial Mortgage Trust | | | | | | | | | | | | |
Series 2015-CR23, Class A4, 3.50%, 05/10/48 | | | USD | | | | 2,000 | | | $ | 1,951,642 | |
Series 2015-CR26, Class A4, 3.63%, 10/10/48 | | | | | | | 3,535 | | | | 3,423,692 | |
Series 2015-LC19, Class B, 3.83%, 02/10/48(c) | | | | | | | 296 | | | | 278,602 | |
Series 2015-PC1, Class B, 4.29%, 07/10/50(c) | | | | | | | 3,175 | | | | 3,000,228 | |
Series 2016-667M, Class D, 3.18%, 10/10/36(a)(c) | | | | | | | 500 | | | | 398,449 | |
Credit Suisse Mortgage Capital Certificates | | | | | | | | | | | | |
Series 2019-ICE4, Class A, (1-mo. CME Term SOFR + 1.03%), 6.35%,
05/15/36(a)(c) | | | | | | | 8,313 | | | | 8,313,334 | |
Series 2019-ICE4, Class B, (1-mo. CME Term SOFR + 1.28%), 6.60%,
05/15/36(a)(c) | | | | | | | 3,008 | | | | 3,005,424 | |
Series 2019-ICE4, Class E, (1-mo. CME Term SOFR + 2.20%), 7.52%,
05/15/36(a)(c) | | | | | | | 6,315 | | | | 6,310,434 | |
Series 2019-ICE4, Class F, (1-mo. CME Term SOFR + 2.70%), 8.02%,
05/15/36(a)(c) | | | | | | | 8,875 | | | | 8,849,795 | |
Credit Suisse Mortgage Trust | | | | | | | | | | | | |
Series 2017-PFHP, Class A, (1-mo. CME Term SOFR + 1.00%), 6.32%,
12/15/30(a)(c) | | | | | | | 240 | | | | 229,606 | |
Series 2020-FACT, Class E, (1-mo. CME Term SOFR + 5.23%), 10.55%,
10/15/37(a)(c) | | | | | | | 1,134 | | | | 1,057,156 | |
Series 2021-980M, Class D, 3.54%, 07/15/31(a)(c) | | | | | | | 3,364 | | | | 3,023,784 | |
Series 2021-980M, Class E, 3.54%, 07/15/31(a)(c) | | | | | | | 2,195 | | | | 1,935,886 | |
Series 2021-BHAR, Class A, (1-mo. CME Term SOFR + 1.26%), 6.59%, 11/15/38(a)(c) | | | | | | | 4,487 | | | | 4,470,174 | |
Series 2021-BHAR, Class B, (1-mo. CME Term SOFR + 1.61%), 6.94%, 11/15/38(a)(c) | | | | | | | 649 | | | | 644,517 | |
Series 2021-BHAR, Class C, (1-mo. CME Term SOFR + 2.11%), 7.44%, 11/15/38(a)(c) | | | | | | | 1,095 | | | | 1,086,128 | |
Series 2021-BHAR, Class E, (1-mo. CME Term SOFR + 3.61%), 8.94%, 11/15/38(a)(c) | | | | | | | 633 | | | | 624,123 | |
Series 2022-NWPT, Class A, (1-mo. CME Term SOFR + 3.14%), 8.47%,
09/09/24(a)(c) | | | | | | | 3,759 | | | | 3,769,494 | |
CRSO Trust, Series 2023-BRND, 7.12%, 07/10/40(a) | | | | | | | 1,289 | | | | 1,350,737 | |
CSAIL Commercial Mortgage Trust, Series 2019-C16, Class C, 4.24%, 06/15/52(c) | | | | | | | 802 | | | | 677,283 | |
DBGS Mortgage Trust | | | | | | | | | | | | |
Series 2018-5BP, Class A, (1-mo. CME Term SOFR + 0.89%), 6.22%,
06/15/33(a)(c) | | | | | | | 5,000 | | | | 4,610,498 | |
Series 2018-BIOD, Class D, (1-mo. CME Term SOFR + 1.60%), 6.92%,
05/15/35(a)(c) | | | | | | | 3,198 | | | | 3,168,187 | |
Series 2018-BIOD, Class F, (1-mo. CME Term SOFR + 2.30%), 7.62%, 05/15/35(a)(c) | | | | | | | 3,052 | | | | 2,984,949 | |
DC Trust | | | | | | | | | | | | |
Series 2024-HLTN, Class A,
04/13/28(a)(c)(e) | | | | | | | 1,110 | | | | 1,109,918 | |
Series 2024-HLTN, Class F,
04/13/28(a)(c)(e) | | | | | | | 2,932 | | | | 2,931,714 | |
Deutsche Bank UBS Mortgage Trust | | | | | | | | | | | | |
Series 2017-BRBK, Class D, 3.53%, 10/10/34(a)(c) | | | | | | | 990 | | | | 842,687 | |
Series 2017-BRBK, Class F, 3.53%, 10/10/34(a)(c) | | | | | | | 1,094 | | | | 840,097 | |
DK Trust | | | | | | | | | | | | |
Series 2024-SPBX, Class A, (1-mo. CME Term SOFR + 1.50%), 03/15/34(a)(c)(e) | | | | | | | 2,860 | | | | 2,864,988 | |
Series 2024-SPBX, Class E, (1-mo. CME Term SOFR + 4.00%), 03/15/34(a)(c)(e) | | | | | | | 8,186 | | | | 8,185,871 | |
ELP Commercial Mortgage Trust, Series 2021-ELP, Class G, (1-mo. CME Term SOFR + 3.23%), 8.56%, 11/15/38(a)(c) | | | | | | | 660 | | | | 636,594 | |
| | | | | | | | | | | | |
| Security | | | | | Par (000) | | | Value | |
|
| Commercial Mortgage-Backed Securities (continued) | |
Extended Stay America Trust | | | | | | | | | | | | |
Series 2021-ESH, Class A, (1-mo. CME Term SOFR + 1.19%), 6.52%, 07/15/38(a)(c) | | | USD | | | | 3,657 | | | $ | 3,655,874 | |
Series 2021-ESH, Class D, (1-mo. CME Term SOFR + 2.36%), 7.69%, 07/15/38(a)(c) | | | | | | | 3,514 | | | | 3,510,006 | |
Series 2021-ESH, Class E, (1-mo. CME Term SOFR + 2.96%), 8.29%, 07/15/38(a)(c) | | | | | | | 2,843 | | | | 2,838,893 | |
Series 2021-ESH, Class F, (1-mo. CME Term SOFR + 3.81%), 9.14%, 07/15/38(a)(c) | | | | | | | 9,799 | | | | 9,786,744 | |
FREMF Mortgage Trust | | | | | | | | | | | | |
Series 2018-K74, Class B, 4.09%, 02/25/51(a)(c) . | | | | 2,150 | | | | 2,048,482 | |
Series 2018-W5FX, Class CFX, 3.54%, 04/25/28(a)(c) | | | | | | | 4,100 | | | | 3,517,081 | |
Series 2020-K105, Class B, 3.53%,
03/25/53(a)(c) | | | | | | | 2,905 | | | | 2,623,220 | |
FS Rialto Issuer Ltd., Series 2022-FL7, Class A, (1-mo. CME Term SOFR + 2.90%), 8.22%, 10/19/39(a)(c) | | | | | | | 2,976 | | | | 2,991,769 | |
Great Wolf Trust, Series 2024-WOLF, Class A, (1-mo. CME Term SOFR + 1.54%), 03/15/39(a)(c)(e) | | | | | | | 3,080 | | | | 3,084,813 | |
GS Mortgage Securities Corp. II, Series 2018- GS10, Class A5, 4.16%, 07/10/51(c) | | | | | | | 4,100 | | | | 3,835,368 | |
GS Mortgage Securities Trust | | | | | | | | | | | | |
Series 2015-GC32, Class C, 4.40%,
07/10/48(c) . | | | | | | | 881 | | | | 826,816 | |
Series 2017-GS6, Class A3, 3.43%, 05/10/50 | | | | 2,000 | | | | 1,866,368 | |
Series 2017-SLP, Class C, 3.92%, 10/10/32(a) | | | | 293 | | | | 285,288 | |
Series 2019-GSA1, Class A4, 3.05%, 11/10/52 | | | | 2,587 | | | | 2,337,683 | |
Series 2019-GSA1, Class C, 3.81%,
11/10/52(c) . | | | | | | | 2,530 | | | | 2,126,646 | |
Series 2021-DM, Class A, (1-mo. CME Term SOFR + 1.00%), 6.33%,
11/15/36(a)(c) | | | | | | | 1,970 | | | | 1,959,534 | |
Series 2022-AGSS, Class A, (1-mo. CME Term SOFR + 2.69%), 8.02%,
11/15/27(a)(c) | | | | | | | 3,424 | | | | 3,435,153 | |
Series 2022-ECI, Class A, (1-mo. CME Term SOFR + 2.19%), 7.52%, 08/15/39(a)(c) | | | | | | | 3,170 | | | | 3,189,948 | |
Series 2023-FUN, Class A, (1-mo. CME Term SOFR + 2.09%), 7.42%, 03/15/28(a)(c) | | | | | | | 4,360 | | | | 4,373,625 | |
Series 2023-SHIP, Class C, 5.51%,
09/10/38(a)(c) | | | | | | | 1,000 | | | | 979,139 | |
Series 2023-SHIP, Class E, 7.43%,
09/10/38(a)(c) | | | | | | | 9,607 | | | | 9,623,839 | |
Harvest Commercial Capital Loan Trust, Series 2020-1, Class M4, 5.96%, 04/25/52(a)(c) | | | | | | | 669 | | | | 609,079 | |
HIG RCP LLC, Series 2023-FL1, Class A, (1-mo. CME Term SOFR + 2.27%), 7.60%,
09/19/38(a)(c) | | | | | | | 3,520 | | | | 3,530,088 | |
HIT Trust, Series 2022-HI32, Class A, (1-mo. CME Term SOFR + 2.39%), 7.72%,
07/15/24(a)(c) | | | | | | | 688 | | | | 689,594 | |
HONO Mortgage Trust | | | | | | | | | | | | |
Series 2021-LULU, Class A, (1-mo. CME Term SOFR + 1.26%), 6.59%, 10/15/36(a)(c) | | | | | | | 4,812 | | | | 4,634,557 | |
Series 2021-LULU, Class E, (1-mo. CME Term SOFR + 3.46%), 8.79%, 10/15/36(a)(c) | | | | | | | 1,382 | | | | 1,290,284 | |
Series 2021-LULU, Class F, (1-mo. CME Term SOFR + 4.51%), 9.84%, 10/15/36(a)(c) | | | | | | | 1,629 | | | | 1,497,328 | |
Houston Galleria Mall Trust, Series 2015-HGLR, Class D, 3.98%, 03/05/37(a) | | | | | | | 578 | | | | 545,659 | |
Hudson Yards Mortgage Trust, Series 2019-55HY, Class F, 2.94%, 12/10/41(a)(c) | | | | | | | 712 | | | | 519,717 | |
ILPT Commercial Mortgage Trust, Series 2022- LPF2, Class A, (1-mo. CME Term SOFR + 2.25%), 7.57%, 10/15/39(a)(c) | | | | | | | 5,218 | | | | 5,213,092 | |
| | |
SCHEDULES OF INVESTMENTS | | 47 |
| | |
Schedule of Investments (continued) March 31, 2024 | | BATS: Series A Portfolio (Percentages shown are based on Net Assets) |
| | | | | | | | | | | | |
| Security | | | | | Par (000) | | | Value | |
|
| Commercial Mortgage-Backed Securities (continued) | |
INTOWN Mortgage Trust, Series 2022-STAY, Class A, (1-mo. CME Term SOFR + 2.49%), 7.81%, 08/15/39(a)(c) | | | USD | | | | 3,483 | | | $ | 3,500,415 | |
JPMBB Commercial Mortgage Securities Trust, Series 2015-C33, Class D1, 4.14%, 12/15/48(a)(c) | | | | | | | 1,007 | | | | 893,432 | |
JPMDB Commercial Mortgage Securities Trust, Series 2018-C8, Class AS, 4.42%, 06/15/51 | | | | | | | 111 | | | | 102,340 | |
JPMorgan Chase Commercial Mortgage Securities Trust | | | | | | | | | | | | |
Series 2016-JP2, Class A4, 2.82%, 08/15/49 | | | | | | | 3,655 | | | | 3,434,481 | |
Series 2016-NINE, Class B, 2.85%, 09/06/38(a)(c) | | | | | | | 2,073 | | | | 1,899,810 | |
Series 2018-PHH, Class A, (1-mo. CME Term SOFR + 1.26%), 6.58%, 06/15/35(a)(c) | | | | | | | 1,938 | | | | 1,806,724 | |
Series 2020-609M, Class D, (1-mo. CME Term SOFR + 3.13%), 8.46%, 10/15/33(a)(c) | | | | | | | 700 | | | | 540,903 | |
Series 2021-MHC, Class A, (1-mo. CME Term SOFR + 0.91%), 6.24%, 04/15/38(a)(c) | | | | | | | 277 | | | | 276,509 | |
Series 2021-MHC, Class E, (1-mo. CME Term SOFR + 2.56%), 7.89%, 04/15/38(a)(c) | | | | | | | 3,330 | | | | 3,295,161 | |
Series 2022-CGSS, Class A, (1-mo. CME Term SOFR + 2.87%), 8.20%, 12/15/36(a)(c) | | | | | | | 5,343 | | | | 5,352,802 | |
Series 2022-NLP, Class F, (1-mo. CME Term SOFR + 3.54%), 8.87%, 04/15/37(a)(c) | | | | | | | 3,360 | | | | 2,722,523 | |
Series 2022-NXSS, Class A, (1-mo. CME Term SOFR + 2.18%), 7.50%, 09/15/39(a)(c) | | | | | | | 5,605 | | | | 5,620,743 | |
Series 2022-OPO, Class D, 3.45%, 01/05/39(a)(c) | | | | | | | 2,481 | | | | 1,787,417 | |
KSL Commercial Mortgage Trust | | | | | | | | | | | | |
Series 2023-HT, Class A, (1-mo. CME Term SOFR + 2.29%), 7.62%, 12/15/36(a)(c) | | | | | | | 3,000 | | | | 3,017,813 | |
Series 2023-HT, Class D, (1-mo. CME Term SOFR + 4.29%), 9.61%, 12/15/36(a)(c) | | | | | | | 11,220 | | | | 11,276,087 | |
Lehman Brothers Small Balance Commercial Mortgage Trust | | | | | | | | | | | | |
Series 2007-2A, Class M1, (1-mo. CME Term SOFR + 0.51%), 5.84%, 06/25/37(a)(c) | | | | | | | 293 | | | | 289,902 | |
Series 2007-3A, Class M2, (1-mo. CME Term SOFR + 2.11%), 7.44%, 10/25/37(a)(c) | | | | | | | 3,340 | | | | 2,886,035 | |
LUX, Series 2023-LION, Class A, (1-mo. CME Term SOFR + 2.69%), 8.02%, 08/15/40(a)(c) | | | | | | | 1,281 | | | | 1,293,942 | |
LUXE Trust, Series 2021-TRIP, Class E, (1-mo. CME Term SOFR + 2.86%), 8.19%, 10/15/38(a)(c) | | | | | | | 654 | | | | 654,452 | |
MCR Mortgage Trust, Series 2024-HTL, Class E, (1-mo. CME Term SOFR + 4.65%), 9.98%, 02/15/37(a)(c) | | | | | | | 1,710 | | | | 1,705,691 | |
Med Trust | | | | | | | | | | | | |
Series 2021-MDLN, Class E, (1-mo. CME Term SOFR + 3.26%), 8.59%, 11/15/38(a)(c) | | | | | | | 436 | | | | 434,001 | |
Series 2021-MDLN, Class F, (1-mo. CME Term SOFR + 4.11%), 9.44%, 11/15/38(a)(c) | | | | | | | 6,027 | | | | 6,015,182 | |
Series 2021-MDLN, Class G, (1-mo. CME Term SOFR + 5.36%), 10.69%, 11/15/38(a)(c) | | | | | | | 6,536 | | | | 6,523,553 | |
MF1, Series 2021-W10, Class G, (1-mo. CME Term SOFR + 4.22%), 9.55%, 12/15/34(a)(c) | | | | | | | 560 | | | | 525,285 | |
MF1 LLC, Series 2024-FL14, Class A, (1-mo. CME Term SOFR + 1.74%), 7.06%, 03/19/39(a)(c) | | | | | | | 1,010 | | | | 1,010,949 | |
MHC Commercial Mortgage Trust Series 2021-MHC, Class A, (1-mo. CME Term SOFR + 0.92%), 6.24%, 04/15/38(a)(c) | | | | | | | 4,197 | | | | 4,177,227 | |
| | | | | | | | | | | | |
| Security | | | | | Par (000) | | | Value | |
|
| Commercial Mortgage-Backed Securities (continued) | |
MHC Commercial Mortgage Trust | | | | | | | | | | | | |
Series 2021-MHC, Class F, (1-mo. CME Term SOFR + 2.72%), 8.04%, 04/15/38(a)(c) | | | USD | | | | 191 | | | $ | 189,352 | |
Series 2021-MHC2, Class A, (1-mo. CME Term SOFR + 0.96%), 6.29%, 05/15/38(a)(c) | | | | | | | 2,268 | | | | 2,257,006 | |
MHP | | | | | | | | | | | | |
Series 2021-STOR, Class A, (1-mo. CME Term SOFR + 0.81%), 6.14%, 07/15/38(a)(c) | | | | | | | 1,105 | | | | 1,097,058 | |
Series 2021-STOR, Class G, (1-mo. CME Term SOFR + 2.86%), 8.19%, 07/15/38(a)(c) | | | | | | | 3,426 | | | | 3,378,891 | |
Series 2021-STOR, Class J, (1-mo. CME Term SOFR + 4.06%), 9.39%, 07/15/38(a)(c) | | | | | | | 1,917 | | | | 1,883,401 | |
MIC Trust (The), Series 2023-MIC, Class A, 8.44%, 12/05/38(a)(c) | | | | | | | 1,670 | | | | 1,732,833 | |
MIRA Trust, Series 2023-MILE, Class A, 6.76%, 06/10/38(a) | | | | | | | 1,978 | | | | 2,053,764 | |
Morgan Stanley Bank of America Merrill Lynch Trust | | | | | | | | | | | | |
Series 2015-C25, Class A5, 3.64%, 10/15/48 | | | | | | | 1,455 | | | | 1,411,248 | |
Series 2016-C32, Class A4, 3.72%, 12/15/49 | | | | | | | 1,060 | | | | 1,014,977 | |
Morgan Stanley Capital I Trust | | | | | | | | | | | | |
Series 2015-MS1, Class A4, 3.78%, 05/15/48(c) . | | | | 2,000 | | | | 1,945,133 | |
Series 2017-ASHF, Class G, (1-mo. CME Term SOFR + 7.20%), 12.52%, 11/15/34(a)(c) | | | | | | | 939 | | | | 872,335 | |
Series 2017-H1, Class B, 4.08%, 06/15/50 | | | | | | | 2,400 | | | | 2,168,299 | |
Series 2018-MP, Class E, 4.28%, 07/11/40(a)(c) | | | | 2,184 | | | | 1,360,983 | |
Series 2018-SUN, Class D, (1-mo. CME Term SOFR + 1.95%), 7.27%, 07/15/35(a)(c) | | | | | | | 1,000 | | | | 995,000 | |
Series 2018-SUN, Class F, (1-mo. CME Term SOFR + 2.85%), 8.17%, 07/15/35(a)(c) | | | | | | | 22 | | | | 21,315 | |
Series 2019-H7, Class AS, 3.52%, 07/15/52 | | | | | | | 1,900 | | | | 1,717,502 | |
Series 2019-H7, Class C, 4.13%, 07/15/52 | | | | | | | 5,000 | | | | 4,364,286 | |
Series 2019-H7, Class D, 3.00%, 07/15/52(a) | | | | | | | 3,000 | | | | 2,199,312 | |
MSWF Commercial Mortgage Trust, Series 2023-2, Class A5, 6.01%, 12/15/56(c) | | | | | | | 1,364 | | | | 1,459,512 | |
MTN Commercial Mortgage Trust | | | | | | | | | | | | |
Series 2022-LPFL, Class A, (1-mo. CME Term SOFR + 1.40%), 6.73%, 03/15/39(a)(c) | | | | | | | 910 | | | | 900,469 | |
Series 2022-LPFL, Class F, (1-mo. CME Term SOFR + 5.29%), 10.62%, 03/15/39(a)(c) | | | | | | | 829 | | | | 775,137 | |
Natixis Commercial Mortgage Securities Trust, Series 2017-75B, Class A, 3.86%, 04/10/37(a) | | | | | | | 1,850 | | | | 1,601,977 | |
NJ Trust, Series 2023-GSP, Class A, 6.48%, 01/06/29(a)(c) | | | | | | | 1,470 | | | | 1,536,060 | |
Olympic Tower Mortgage Trust | | | | | | | | | | | | |
Series 2017-OT, Class A, 3.57%, 05/10/39(a) | | | | | | | 2,920 | | | | 2,528,208 | |
Series 2017-OT, Class D, 3.95%, 05/10/39(a)(c) | | | | 1,080 | | | | 726,980 | |
Series 2017-OT, Class E, 3.95%, 05/10/39(a)(c) | | | | 498 | | | | 316,396 | |
One Bryant Park Trust, Series 2019-OBP, Class A, 2.52%, 09/15/54(a) | | | | | | | 1,930 | | | | 1,648,133 | |
One Market Plaza Trust, Series 2017-1MKT, Class D, 4.15%, 02/10/32(a) | | | | | | | 1,127 | | | | 983,999 | |
One New York Plaza Trust | | | | | | | | | | | | |
Series 2020-1NYP, Class A, (1-mo. CME Term SOFR + 1.06%), 6.39%, 01/15/36(a)(c) | | | | | | | 1,035 | | | | 1,009,193 | |
Series 2020-1NYP, Class AJ, (1-mo. CME Term SOFR + 1.36%), 6.69%, 01/15/36(a)(c) | | | | | | | 1,753 | | | | 1,674,319 | |
Series 2020-1NYP, Class B, (1-mo. CME Term SOFR + 1.61%), 6.94%, 01/15/36(a)(c) | | | | | | | 1,338 | | | | 1,251,252 | |
OPEN Trust, Series 2023-AIR, Class A, (1-mo. CME Term SOFR + 3.09%), 8.41%, 10/15/28(a)(c) | | | | | | | 2,392 | | | | 2,416,077 | |
| | |
| 48 | | 2 0 2 4 BLACK ROCK ANNUAL REPORT TO SHAREHOLDERS |
| | |
Schedule of Investments (continued) March 31, 2024 | | BATS: Series A Portfolio (Percentages shown are based on Net Assets) |
| | | | | | | | | | | | |
| Security | | | | | Par (000) | | | Value | |
|
| Commercial Mortgage-Backed Securities (continued) | |
PKHL Commercial Mortgage Trust | | | | | | | | | | | | |
Series 2021-MF, Class F, (1-mo. CME Term SOFR + 3.46%), 8.79%, 07/15/38(a)(c) | | | USD | | | | 1,824 | | | $ | 1,188,363 | |
Series 2021-MF, Class G, (1-mo. CME Term SOFR + 4.46%), 9.79%, 07/15/38(a)(c) | | | | | | | 1,967 | | | | 436,359 | |
Ready Capital Mortgage Financing LLC | | | | | | | | | | | | |
Series 2022-FL10, Class A, (1-mo. CME Term SOFR + 2.55%), 7.88%,
10/25/39(a)(c) | | | | | | | 5,528 | | | | 5,555,761 | |
Series 2022-FL9, Class A, (1-mo. CME Term SOFR + 2.47%), 7.80%, 06/25/37(a)(c) | | | | | | | 1,021 | | | | 1,022,116 | |
Series 2023-FL11, Class A, (1-mo. CME Term SOFR + 2.37%), 7.70%,
10/25/39(a)(c) | | | | | | | 3,024 | | | | 3,026,550 | |
RIAL Issuer Ltd., Series 2022-FL8, Class A, (1-mo. CME Term SOFR + 2.25%), 7.58%, 01/19/37(a)(c) | | | | | | | 6,154 | | | | 6,130,922 | |
SCG Mortgage Trust, Series 2024-MSP, Class A, (1-mo. CME Term SOFR + 1.74%), 04/15/41(a)(c)(e) | | | | | | | 2,750 | | | | 2,750,117 | |
SG Commercial Mortgage Securities Trust | | | | | | | | | | | | |
Series 2016-C5, Class B, 3.93%, 10/10/48 | | | | | | | 1,000 | | | | 895,172 | |
Series 2019-PREZ, Class E, 3.48%, 09/15/39(a)(c) | | | | | | | 3,391 | | | | 2,657,967 | |
SLG Office Trust, Series 2021-OVA, Class A, 2.59%, 07/15/41(a) | | | | | | | 3,500 | | | | 2,892,977 | |
SREIT Trust | | | | | | | | | | | | |
Series 2021-MFP, Class F, (1-mo. CME Term SOFR + 2.74%), 8.07%, 11/15/38(a)(c) | | | | | | | 2,832 | | | | 2,813,147 | |
Series 2021-MFP2, Class A, (1-mo. CME Term SOFR + 0.94%), 6.26%, 11/15/36(a)(c) | | | | | | | 5,000 | | | | 4,973,437 | |
Series 2021-MFP2, Class F, (1-mo. CME Term SOFR + 2.73%), 8.06%, 11/15/36(a)(c) | | | | | | | 2,226 | | | | 2,185,654 | |
STWD Trust | | | | | | | | | | | | |
Series 2021-FLWR, Class A, (1-mo. CME Term SOFR + 0.69%), 6.02%,
07/15/36(a)(c) | | | | | | | 1,446 | | | | 1,431,540 | |
Series 2021-FLWR, Class B, (1-mo. CME Term SOFR + 1.04%), 6.37%,
07/15/36(a)(c) | | | | | | | 7,000 | | | | 6,923,437 | |
Series 2021-FLWR, Class E, (1-mo. CME Term SOFR + 2.04%), 7.36%,
07/15/36(a)(c) | | | | | | | 1,738 | | | | 1,713,559 | |
Taubman Centers Commercial Mortgage Trust, Series 2022-DPM, Class A, (1-mo. CME Term SOFR + 2.19%), 7.51%, 05/15/37(a)(c) | | | | | | | 7,992 | | | | 8,051,940 | |
THPT Mortgage Trust, Series 2023-THL, Class A, 6.99%, 12/10/34(a)(c) | | | | | | | 969 | | | | 991,637 | |
TPGI Trust, Series 2021-DGWD, Class E, (1-mo. CME Term SOFR + 2.46%), 7.79%, 06/15/26(a)(c) | | | | | | | 2,879 | | | | 2,872,007 | |
TTAN, Series 2021-MHC, Class A, (1-mo. CME Term SOFR + 0.96%), 6.29%, 03/15/38(a)(c) | | | | | | | 1,679 | | | | 1,676,601 | |
TYSN Mortgage Trust, Series 2023-CRNR, Class A, 6.58%, 12/10/33(a)(c) | | | | | | | 1,340 | | | | 1,400,353 | |
UBS Commercial Mortgage Trust, Series 2017-C4, Class AS, 3.84%, 10/15/50(c) | | | | | | | 765 | | | | 703,784 | |
Velocity Commercial Capital Loan Trust | | | | | | | | | | | | |
Series 2018-2, Class M6, 7.05%,
10/26/48(a)(c) | | | | 900 | | | | 690,662 | |
Series 2019-1, Class M2, 4.01%,
03/25/49(a)(c) | | | | 164 | | | | 143,793 | |
Series 2019-2, Class M2, 3.39%,
07/25/49(a)(c) | | | | 1,257 | | | | 1,106,316 | |
Series 2019-2, Class M3, 3.48%,
07/25/49(a)(c) | | | | 574 | | | | 502,775 | |
Series 2019-2, Class M4, 3.99%,
07/25/49(a)(c) | | | | 1,412 | | | | 1,206,090 | |
Series 2020-1, Class AFX, 2.61%,
02/25/50(a)(c) . | | | | 2,471 | | | | 2,209,043 | |
Series 2021-1, Class M4, 2.85%,
05/25/51(a)(c) | | | | 1,946 | | | | 1,426,367 | |
Series 2021-3, Class M4, 3.48%,
10/25/51(a)(c) | | | | 2,481 | | | | 2,048,811 | |
Series 2021-4, Class A, 2.52%, 12/26/51(a)(c) | | | | | | | 7,038 | | | | 5,921,234 | |
| | | | | | | | | | | | |
| Security | | | | | Par (000) | | | Value | |
|
| Commercial Mortgage-Backed Securities (continued) | |
Velocity Commercial Capital Loan Trust | | | | | | | | | | | | |
Series 2021-4, Class M4, 4.48%, 12/26/51(a)(c) | | | USD | | | | 1,215 | | | $ | 910,437 | |
Series 2022-1, Class M4, 5.20%, 02/25/52(a)(c) | | | | | | | 5,226 | | | | 3,943,472 | |
Series 2022-4, Class M2, 6.97%, 08/25/52(a)(c) | | | | | | | 1,087 | | | | 1,054,697 | |
Series 2022-4, Class M3, 7.54%, 08/25/52(a)(c) | | | | | | | 1,021 | | | | 925,010 | |
Series 2023-2, Class A, 6.22%, 05/25/53(a)(c) | | | | | | | 851 | | | | 853,885 | |
Series 2024-1, Class A, 6.55%, 01/25/54(a)(c) | | | | | | | 4,614 | | | | 4,645,929 | |
Series 2024-1, Class M2, 7.23%, 01/25/54(a)(c) | | | | | | | 357 | | | | 355,102 | |
Series 2024-1, Class M3, 8.44%, 01/25/54(a)(c) | | | | | | | 420 | | | | 417,526 | |
Wells Fargo Commercial Mortgage Trust | | | | | | | | | | | | |
Series 2017-C39, Class B, 4.03%, 09/15/50 | | | | | | | 1,000 | | | | 919,877 | |
Series 2018-1745, Class A, 3.75%,
06/15/36(a)(c) | | | | | | | 3,155 | | | | 2,757,770 | |
Series 2018-C46, Class A4, 4.15%, 08/15/51 | | | | | | | 3,740 | | | | 3,559,315 | |
Series 2019-C50, Class B, 4.19%, 05/15/52 | | | | | | | 3,121 | | | | 2,883,938 | |
Series 2019-C53, Class A3, 2.79%, 10/15/52 | | | | | | | 1,000 | | | | 898,443 | |
Series 2020-SDAL, Class D, (1-mo. CME Term SOFR + 2.20%), 7.53%, 02/15/37(a)(c) | | | | | | | 1,612 | | | | 1,603,986 | |
Series 2020-SDAL, Class E, (1-mo. CME Term SOFR + 2.85%), 8.18%, 02/15/37(a)(c) | | | | | | | 1,600 | | | | 1,588,069 | |
Series 2021-C59, Class A4, 2.34%, 04/15/54 | | | | | | | 5,000 | | | | 4,232,322 | |
Series 2021-FCMT, Class A, (1-mo. CME Term SOFR + 1.31%), 6.64%, 05/15/31(a)(c) | | | | | | | 4,660 | | | | 4,569,834 | |
WMRK Commercial Mortgage Trust | | | | | | | | | | | | |
Series 2022-WMRK, Class A, (1-mo. CME Term SOFR + 2.79%), 8.11%, 11/15/27(a)(c) | | | | | | | 3,829 | | | | 3,843,371 | |
Series 2022-WMRK, Class B, (1-mo. CME Term SOFR + 3.44%), 8.76%, 11/15/27(a)(c) | | | | | | | 1,435 | | | | 1,439,936 | |
| | | | | | | | | | | | |
| | | |
| | | | | | | | | | | 662,969,972 | |
|
| Interest Only Collateralized Mortgage Obligations — 0.2% | |
Ajax Mortgage Loan Trust, Series 2021-E, Class XS, 0.00%, 12/25/60(a)(c)(d) | | | | | | | 8,651 | | | | 341,324 | |
Barclays Mortgage Loan Trust | | | | | | | | | | | | |
Series 2023-NQM3, Class XS, 0.82%, 10/25/63(a)(c) | | | | | | | 21,002 | | | | 433,514 | |
Series 2024-NQM1, Class XS, 2.45%, 01/25/64(a)(c) | | | | | | | 16,941 | | | | 787,427 | |
JPMorgan Mortgage Trust | | | | | | | | | | | | |
Series 2021-INV7, Class A2X, 0.50%, 02/25/52(a)(c) | | | | | | | 30,837 | | | | 885,133 | |
Series 2021-INV7, Class A3X, 0.50%, 02/25/52(a)(c) | | | | | | | 18,372 | | | | 355,224 | |
Series 2021-INV7, Class A4X, 0.50%, 02/25/52(a)(c) | | | | | | | 7,873 | | | | 348,850 | |
Series 2021-INV7, Class A5X, 0.50%, 02/25/52(a)(c) | | | | | | | 3,358 | | | | 96,383 | |
Series 2021-INV7, Class AX1, 0.27%, 02/25/52(a)(c) | | | | | | | 60,440 | | | | 872,620 | |
Voyager OPTONE Delaware Trust, Series 2009-1, Class SAA7, 5.93%,
02/25/38(a)(c) | | | | | | | 9,552 | | | | 2,162,658 | |
| | | | | | | | | | | | |
| | | |
| | | | | | | | | | | 6,283,133 | |
|
| Interest Only Commercial Mortgage-Backed Securities — 0.7% | |
Banc of America Merrill Lynch Commercial Mortgage Securities Trust | | | | | | | | | | | | |
Series 2017-SCH, Class XFCP, 0.00%, 11/15/19(a)(c)(d) | | | | | | | 95,950 | | | | 432 | |
Series 2017-SCH, Class XLCP, 0.00%, 11/15/19(a)(c)(d) | | | | | | | 56,050 | | | | 73 | |
BANK | | | | | | | | | | | | |
Series 2019-BN22, Class XA, 0.59%, 11/15/62(c) | | | | | | | 38,467 | | | | 1,058,565 | |
| | |
SCHEDULES OF INVESTMENTS | | 49 |
| | |
Schedule of Investments (continued) March 31, 2024 | | BATS: Series A Portfolio (Percentages shown are based on Net Assets) |
| | | | | | | | | | | | |
| Security | | | | | Par (000) | | | Value | |
|
| Interest Only Commercial Mortgage-Backed Securities (continued) | |
BANK | | | | | | | | | | | | |
Series 2019-BN22, Class XB, 0.15%, 11/15/62(c) | | | USD | | | | 85,561 | | | $ | 704,167 | |
Series 2020-BN28, Class XB, 0.97%, 03/15/63(c) | | | | | | | 29,820 | | | | 1,591,667 | |
Bank of America Merrill Lynch Commercial Mortgage Trust, Series 2017-BNK3, Class XD, 1.24%, 02/15/50(a)(c) | | | | | | | 10,000 | | | | 303,507 | |
BBCMS Trust, Series 2015-SRCH, Class XB, 0.20%, 08/10/35(a)(c) | | | | | | | 12,500 | | | | 78,659 | |
Benchmark Mortgage Trust | | | | | | | | | | | | |
Series 2019-B12, Class XA, 1.02%, 08/15/52(c) | | | | | | | 36,803 | | | | 1,221,535 | |
Series 2019-B9, Class XA, 1.02%, 03/15/52(c) | | | | | | | 15,158 | | | | 568,905 | |
Series 2020-B17, Class XB, 0.53%, 03/15/53(c) | | | | | | | 17,599 | | | | 404,321 | |
Series 2020-B19, Class XA, 1.76%, 09/15/53(c) | | | | | | | 23,660 | | | | 1,484,463 | |
Series 2021-B23, Class XA, 1.27%, 02/15/54(c) | | | | | | | 18,262 | | | | 1,077,335 | |
BMO Mortgage Trust, Series 2023-C5, Class XA, 0.73%, 06/15/56(c) | | | | | | | 8,100 | | | | 414,817 | |
BX Trust, Series 2022-GPA, Class XCP, 0.00%,
08/15/23(a)(c)(d) | | | | | | | 65,811 | | | | 1,928 | |
CFK Trust, Series 2019-FAX, Class XA, 0.23%, 01/15/39(a)(c) | | | | | | | 62,648 | | | | 686,294 | |
Commercial Mortgage Trust, Series 2019-GC44, Class XA, 0.63%, 08/15/57(c) | | | | | | | 40,170 | | | | 931,735 | |
CSAIL Commercial Mortgage Trust | | | | | | | | | | | | |
Series 2019-C16, Class XA, 1.54%, 06/15/52(c) | | | | | | | 9,619 | | | | 591,345 | |
Series 2019-C17, Class XA, 1.32%, 09/15/52(c) | | | | | | | 3,826 | | | | 196,892 | |
Deutsche Bank JPMorgan Mortgage Trust, Series 2017-C6, Class XD, 1.00%, 06/10/50(c) | | | | | | | 11,214 | | | | 292,159 | |
GS Mortgage Securities Corp. II, Series 2005-ROCK, Class X1, 0.21%, 05/03/32(a)(c) | | | | | | | 144,016 | | | | 331,410 | |
JPMDB Commercial Mortgage Securities Trust | | | | | | | | | | | | |
Series 2016-C4, Class XC, 0.75%, 12/15/49(a)(c) | | | | | | | 8,570 | | | | 137,844 | |
Series 2017-C5, Class XB, 0.26%, 03/15/50(c) | | | | | | | 30,000 | | | | 270,387 | |
JPMorgan Chase Commercial Mortgage Securities Trust, Series 2016-JP3, Class XC, 0.75%, 08/15/49(a)(c) | | | | | | | 17,400 | | | | 260,659 | |
LSTAR Commercial Mortgage Trust, Series 2017-5, Class X, 0.83%, 03/10/50(a)(c) | | | | | | | 8,473 | | | | 126,514 | |
Morgan Stanley Bank of America Merrill Lynch Trust, Series 2014-C19, Class XF, 1.18%, 12/15/47(a)(c) | | | | | | | 220 | | | | 2,615 | |
Morgan Stanley Capital I Trust | | | | | | | | | | | | |
Series 2017-H1, Class XD, 2.15%, 06/15/50(a)(c) | | | | | | | 8,625 | | | | 484,097 | |
Series 2019-L2, Class XA, 1.00%, 03/15/52(c) | | | | | | | 10,947 | | | | 422,342 | |
MSWF Commercial Mortgage Trust, Series 2023-2, Class XA, 0.91%, 12/15/56(c) | | | | | | | 34,052 | | | | 2,254,502 | |
Olympic Tower Mortgage Trust, Series 2017-OT, Class XA, 0.38%, 05/10/39(a)(c) | | | | | | | 28,100 | | | | 294,643 | |
One Market Plaza Trust | | | | | | | | | | | | |
Series 2017-1MKT, Class XCP, 0.00%, 02/10/32(a)(c)(d)(h) | | | | | | | 91,391 | | | | 9 | |
Series 2017-1MKT, Class XNCP, 0.12%, 02/10/32(a)(c) | | | | | | | 18,278 | | | | 47,432 | |
UBS Commercial Mortgage Trust, Series 2019-C17, Class XA, 1.44%, 10/15/52(c) | | | | | | | 8,711 | | | | 533,898 | |
Wells Fargo Commercial Mortgage Trust Series 2015-LC20, Class XB, 0.48%, 04/15/50(c) | | | | | | | 7,000 | | | | 31,683 | |
| | | | | | | | | | | | |
| Security | | | | | Par (000) | | | Value | |
|
| Interest Only Commercial Mortgage-Backed Securities (continued) | |
Wells Fargo Commercial Mortgage Trust
Series 2016-BNK1, Class XD,
1.25%, 08/15/49(a)(c) | | | USD | | | | 1,000 | | | $ | 24,004 | |
WFRBS Commercial Mortgage Trust, Series 2014-C21, Class XA, 0.97%, 08/15/47(c) | | | | | | | 6,119 | | | | 3,390 | |
| | | | | | | | | | | | |
| | | |
| | | | | | | | | | | 16,834,228 | |
| | | | | | | | | | | | |
| |
Total Non-Agency Mortgage-Backed Securities — 47.4%
(Cost: $1,250,772,446) | | | | 1,181,262,275 | |
| | | | | | | | | | | | |
|
U.S. Government Sponsored Agency Securities | |
|
| Commercial Mortgage-Backed Securities — 0.1% | |
Freddie Mac, Series KJ48, Class A2, 5.03%, 10/25/31 | | | | | | | 1,413 | | | | 1,414,878 | |
Ginnie Mae | | | | | | | | | | | | |
Series 2023-118, Class BA, 3.75%, 05/16/65(c) | | | | 810 | | | | 753,854 | |
Series 2023-119, Class AD, 2.25%, 04/16/65 | | | | | | | 1,443 | | | | 1,158,382 | |
| | | | | | | | | | | | |
| | | |
| | | | | | | | | | | 3,327,114 | |
|
| Interest Only Commercial Mortgage-Backed Securities — 0.1% | |
Freddie Mac | | | | | | | | | | | | |
Series K116, Class X1, 1.42%, 07/25/30(c) | | | | | | | 23,782 | | | | 1,632,592 | |
Series KL05, Class X1P, 0.89%, 06/25/29(c) | | | | | | | 12,845 | | | | 515,410 | |
Ginnie Mae | | | | | | | | | | | | |
Series 2016-36, Class IO, 0.66%, 08/16/57(c) | | | | 2,643 | | | | 70,155 | |
Series 2017-24, Class IO, 0.75%, 12/16/56(c) | | | | 11,622 | | | | 379,688 | |
| | | | | | | | | | | | |
| | | |
| | | | | | | | | | | 2,597,845 | |
| | | | | | | | | | | | |
| |
Total U.S. Government Sponsored Agency Securities — 0.2%
(Cost: $7,005,013) | | | | 5,924,959 | |
| | | | | | | | | | | | |
| |
Total Long-Term Investments — 97.9%
(Cost: $2,564,498,495) | | | | 2,440,700,953 | |
| | | | | | | | | | | | |
| | | |
| | | | | | Shares | | | | |
|
Short-Term Securities | |
|
| Money Market Funds — 5.9% | |
Dreyfus Treasury Securities Cash Management, Institutional Class, 5.19%(l) | | | | | | | 147,201,332 | | | | 147,201,332 | |
| | | | | | | | | | | | |
| |
Total Short-Term Securities — 5.9%
(Cost: $147,201,332) | | | | 147,201,332 | |
| | | | | | | | | | | | |
| |
Total Investments Before TBA Sale Commitments — 103.8%
(Cost: $2,711,699,827) | | | | 2,587,902,285 | |
| | | | | | | | | | | | |
| | |
| 50 | | 2 0 2 4 BLACK ROCK ANNUAL REPORT TO SHAREHOLDERS |
| | |
Schedule of Investments (continued) March 31, 2024 | | BATS: Series A Portfolio (Percentages shown are based on Net Assets) |
| | | | | | | | | | | | |
| Security | | | | | Par (000) | | | Value | |
| |
|
TBA Sale Commitments(m) | |
|
Mortgage-Backed Securities — (0.9)% | |
Uniform Mortgage-Backed Securities | | | | | | | | | | | | |
2.00%, 04/01/54 | | | USD | | | | (4,579 | ) | | $ | (3,621,803 | ) |
2.50%, 04/01/54 | | | | | | | (22,139 | ) | | | (18,296,867 | ) |
| | | | | | | | | | | | |
| |
Total TBA Sale Commitments — (0.9)%
(Proceeds: $(21,864,982)) | | | | (21,918,670 | ) |
| | | | | | | | | | | | |
| |
Total Investments Net of TBA Sale Commitments — 102.9%
(Cost: $2,689,834,845) | | | | 2,565,983,615 | |
| |
Liabilities in Excess of Other Assets — (2.9)% | | | | (71,943,387 | ) |
| | | | | | | | | | | | |
| |
Net Assets — 100.0% | | | $ | 2,494,040,228 | |
| | | | | | | | | | | | |
| (a) | Security exempt from registration pursuant to Rule 144A under the Securities Act of 1933, as amended. These securities may be resold in transactions exempt from registration to qualified institutional investors. |
| (b) | Step coupon security. Coupon rate will either increase (step-up bond) or decrease (step-down bond) at regular intervals until maturity. Interest rate shown reflects the rate currently in effect. |
| (c) | Variable rate security. Interest rate resets periodically. The rate shown is the effective interest rate as of period end. Security description also includes the reference rate and spread if published and available. |
| (e) | When-issued security. |
| (f) | Rounds to less than 1,000. |
| (g) | This security may be resold to qualified foreign investors and foreign institutional buyers under Regulation S of the Securities Act of 1933. |
| (h) | Security is valued using significant unobservable inputs and is classified as Level 3 in the fair value hierarchy. |
| (i) | Issuer filed for bankruptcy and/or is in default. |
| (j) | Non-income producing security. |
| (k) | Perpetual security with no stated maturity date. |
| (l) | Annualized 7-day yield as of period end. |
| (m) | Represents or includes a TBA transaction. |
For purposes of this report, industry and sector sub-classifications may differ from those utilized by the Fund for compliance purposes.
Derivative Financial Instruments Outstanding as of Period End
Forward Foreign Currency Exchange Contracts
| | | | | | | | | | | | | | | | |
| | | | | |
| Currency Purchased | | | Currency Sold | | | Counterparty | | Settlement Date | | | Unrealized Appreciation (Depreciation) | |
| | | | |
| | USD 13,234,142 | | | | EUR 12,102,000 | | | UBS AG | | | 06/20/24 | | | $ | 133,705 | |
| | | | | | | | | | | | | | | | |
OTC Credit Default Swaps — Buy Protection
| | | | | | | | | | | | | | | | | | | | | | | | | | | | | | | | | | |
| | | | | | | | | |
| Reference Obligation/Index | | Financing
Rate
Paid
by the
Fund | | | Payment
Frequency | | | Counterparty | | Termination
Date | | | Notional Amount (000) | | | Value | | | Upfront
Premium
Paid
(Received) | | | Unrealized
Appreciation
(Depreciation) | |
| | | | | | | | | |
CMBX.NA.9.BBB- | | | 3.00 | % | | | Monthly | | | Citigroup Global Markets, Inc. | | | 09/17/58 | | | | USD | | | | 140 | | | $ | 20,490 | | | $ | 4,321 | | | $ | 16,169 | |
CMBX.NA.9.BBB- | | | 3.00 | | | | Monthly | | | Morgan Stanley & Co.
International PLC | | | 09/17/58 | | | | USD | | | | 53 | | | | 7,757 | | | | 3,749 | | | | 4,008 | |
CMBX.NA.9.BBB- | | | 3.00 | | | | Monthly | | | Morgan Stanley & Co.
International PLC | | | 09/17/58 | | | | USD | | | | 27 | | | | 3,951 | | | | 1,364 | | | | 2,587 | |
CMBX.NA.6.AAA | | | 0.50 | | | | Monthly | | | Deutsche Bank AG | | | 05/11/63 | | | | USD | | | | 1 | | | | — | | | | — | | | | — | |
| | | | | | | | | | | | | | | | | | | | | | | | | | | | | | | | | | |
| | | | | | | | | |
| | | | | | | | | | | | | | | | | | | | | | | | $ | 32,198 | | | $ | 9,434 | | | $ | 22,764 | |
| | | | | | | | | | | | | | | | | | | | | | | | | | | | | | | | | | |
| | |
SCHEDULES OF INVESTMENTS | | 51 |
| | |
Schedule of Investments (continued) March 31, 2024 | | BATS: Series A Portfolio |
| | |
OTC Credit Default Swaps — Sell Protection
| | | | | | | | | | | | | | | | | | | | | | | | | | | | | | | | | | | | | | | | | | | | |
| | Reference Obligation/Index | |
| Financing
Rate Received by the Fund |
| |
| Payment
Frequency |
| | Counterparty | |
| Termination
Date |
| |
| Credit
Rating(a) |
| | | | | |
| Notional
Amount (000)(b) |
| | | Value | | |
| Upfront
Premium Paid (Received |
) | |
| Unrealized
Appreciation (Depreciation |
) | | | | |
| | | | | | | | | | | | |
| | CMBX.NA.9.A | | | 2.00 | % | | | Monthly | | | Goldman Sachs Bank USA | | | 09/17/58 | | | | Not Rated | | | | USD | | | | 3,587 | | | $ | (181,838 | ) | | $ | (63,802 | ) | | $ | (118,036 | ) | | | | |
| | CMBX.NA.9.BBB- | | | 3.00 | | | | Monthly | | | Deutsche Bank AG | | | 09/17/58 | | | | Not Rated | | | | USD | | | | 220 | | | | (32,198 | ) | | | (23,993 | ) | | | (8,205 | ) | | | | |
| | CMBX.NA.10.BBB- | | | 3.00 | | | | Monthly | | | Deutsche Bank AG | | | 11/17/59 | | | | BBB- | | | | USD | | | | 1,000 | | | | (188,229 | ) | | | (76,451 | ) | | | (111,778 | ) | | | | |
| | CMBX.NA.10.BBB- | | | 3.00 | | | | Monthly | | | Deutsche Bank AG | | | 11/17/59 | | | | BBB- | | | | USD | | | | 500 | | | | (94,115 | ) | | | (46,110 | ) | | | (48,005 | ) | | | | |
| | | | | | | | | | | | | | | | | | | | | | | | | | | | | | | | | | | | | | | | | | | | |
| | | | | | | | | | | | |
| | | | | | | | | | | | | | | | | | | | | | | | | | | | | | $ | (496,380) | | | $ | (210,356 | ) | | $ | (286,024 | ) | | | | |
| | | | | | | | | | | | | | | | | | | | | | | | | | | | | | | | | | | | | | | | | | | | |
| | (a) | Using the rating of the issuer or the underlying securities of the index, as applicable, provided by S&P Global Ratings. | |
| | (b) | The maximum potential amount the Fund may pay should a negative credit event take place as defined under the terms of the agreement. | |
Balances Reported in the Statements of Assets and Liabilities for OTC Swaps
| | | | | | | | | | | | | | | | |
| | | | | |
| | | Swap Premiums Paid | | | Swap Premiums Received | | | Unrealized Appreciation | | | Unrealized Depreciation | |
| | | | |
OTC Swaps | | $ | 9,434 | | | $ | (210,356 | ) | | $ | 22,764 | | | $ | (286,024 | ) |
Derivative Financial Instruments Categorized by Risk Exposure
As of period end, the fair values of derivative financial instruments located in the Statements of Assets and Liabilities were as follows:
| | | | | | | | | | | | | | | | | | | | | | | | | | | | |
| | | | | | | | |
| | | Commodity
Contracts | | | Credit
Contracts | | | Equity
Contracts | | | Foreign
Currency
Exchange
Contracts | | | Interest Rate Contracts | | | Other
Contracts | | | Total | |
| | | | | | | |
Assets — Derivative Financial Instruments | | | | | | | | | | | | | | | | | | | | | | | | | | | | |
Forward foreign currency exchange contracts | | | | | | | | | | | | | | | | | | | | | | | | | | | | |
Unrealized appreciation on forward foreign currency exchange contracts | | $ | — | | | $ | — | | | $ | — | | | $ | 133,705 | | | $ | — | | | $ | — | | | $ | 133,705 | |
Swaps — OTC | | | | | | | | | | | | | | | | | | | | | | | | | | | | |
Unrealized appreciation on OTC swaps;
Swap premiums paid | | | — | | | | 32,198 | | | | — | | | | — | | | | — | | | | — | | | | 32,198 | |
| | | | | | | | | | | | | | | | | | | | | | | | | | | | |
| | | | | | | |
| | $ | — | | | $ | 32,198 | | | $ | — | | | $ | 133,705 | | | $ | — | | | $ | — | | | $ | 165,903 | |
| | | | | | | | | | | | | | | | | | | | | | | | | | | | |
| | | | | | | |
Liabilities — Derivative Financial Instruments | | | | | | | | | | | | | | | | | | | | | | | | | | | | |
Swaps — OTC | | | | | | | | | | | | | | | | | | | | | | | | | | | | |
Unrealized depreciation on OTC swaps;
Swap premiums received | | $ | — | | | $ | 496,380 | | | $ | — | | | $ | — | | | $ | — | | | $ | — | | | $ | 496,380 | |
| | | | | | | | | | | | | | | | | | | | | | | | | | | | |
For the period ended March 31, 2024, the effect of derivative financial instruments in the Statements of Operations was as follows:
| | | | | | | | | | | | | | | | | | | | | | | | | | | | |
| | | | | | | | |
| | | Commodity Contracts | | | Credit Contracts | | | Equity Contracts | | | Foreign Currency Exchange Contracts | | | Interest Rate Contracts | | | Other Contracts | | | Total | |
| | | | | | | |
Net Realized Gain (Loss) from: | | | | | | | | | | | | | | | | | | | | | | | | | | | | |
Forward foreign currency exchange contracts | | $ | — | | | $ | — | | | $ | — | | | $ | 246,266 | | | $ | — | | | $ | — | | | $ | 246,266 | |
Swaps | | | — | | | | (9,850 | ) | | | — | | | | — | | | | — | | | | — | | | | (9,850 | ) |
| | | | | | | | | | | | | | | | | | | | | | | | | | | | |
| | | | | | | |
| | $ | — | | | $ | (9,850 | ) | | $ | — | | | $ | 246,266 | | | $ | — | | | $ | — | | | $ | 236,416 | |
| | | | | | | | | | | | | | | | | | | | | | | | | | | | |
Net Change in Unrealized Appreciation (Depreciation) on: | |
Forward foreign currency exchange contracts | | $ | — | | | $ | — | | | $ | — | | | $ | 138,356 | | | $ | — | | | $ | — | | | $ | 138,356 | |
Swaps | | | — | | | | 607,744 | | | | — | | | | — | | | | — | | | | — | | | | 607,744 | |
| | | | | | | | | | | | | | | | | | | | | | | | | | | | |
| | | | | | | |
| | $ | — | | | $ | 607,744 | | | $ | — | | | $ | 138,356 | | | $ | — | | | $ | — | | | $ | 746,100 | |
| | | | | | | | | | | | | | | | | | | | | | | | | | | | |
| | |
| 52 | | 2 0 2 4 BLACK ROCK ANNUAL REPORT TO SHAREHOLDERS |
| | |
Schedule of Investments (continued) March 31, 2024 | | BATS: Series A Portfolio |
Average Quarterly Balances of Outstanding Derivative Financial Instruments
| | | | |
| | |
Forward foreign currency exchange contracts | | | | |
Average amounts purchased — in USD | | | $12,786,195 | |
Credit default swaps | | | | |
Average notional value — buy protection | | | $220,889 | |
Average notional value — sell protection | | | $7,888,583 | |
For more information about the Fund’s investment risks regarding derivative financial instruments, refer to the Notes to Financial Statements.
Derivative Financial Instruments – Offsetting as of Period End
The Fund’s derivative assets and liabilities (by type) were as follows:
| | | | | | | | |
| | | |
| | | Assets | | | Liabilities | |
| | |
Derivative Financial Instruments | | | | | | | | |
Forward foreign currency exchange contracts | | $ | 133,705 | | | $ | — | |
Swaps — OTC(a) | | | 32,198 | | | | 496,380 | |
| | | | | | | | |
| | |
Total derivative assets and liabilities in the Statements of Assets and Liabilities | | $ | 165,903 | | | $ | 496,380 | |
| | | | | | | | |
| | |
Derivatives not subject to a Master Netting Agreement or similar agreement (“MNA”) | | | — | | | | — | |
| | | | | | | | |
| | |
Total derivative assets and liabilities subject to an MNA | | $ | 165,903 | | | $ | 496,380 | |
| | | | | | | | |
| | (a) | Includes unrealized appreciation (depreciation) on OTC swaps and swap premiums (paid/received) in the Statements of Assets and Liabilities. | |
The following tables present the Fund’s derivative assets and liabilities by counterparty net of amounts available for offset under an MNA and net of the related collateral received and pledged by the Fund:
| | | | | | | | | | | | | | | | | | | | |
| | | | | | |
| Counterparty | | Derivative Assets Subject to an MNA by Counterparty | | | Derivatives Available for Offset(a) | | | Non- Cash Collateral Received(b) | | | Cash Collateral Received(b) | | | Net Amount of Derivative Assets(c)(d) | |
| | | | | |
Citigroup Global Markets, Inc. | | $ | 20,490 | | | $ | — | | | $ | — | | | $ | — | | | $ | 20,490 | |
Morgan Stanley & Co. International PLC | | | 11,708 | | | | — | | | | — | | | | — | | | | 11,708 | |
UBS AG | | | 133,705 | | | | — | | | | — | | | | — | | | | 133,705 | |
| | | | | | | | | | | | | | | | | | | | |
| | | | | |
| | $ | 165,903 | | | $ | — | | | $ | — | | | $ | — | | | $ | 165,903 | |
| | | | | | | | | | | | | | | | | | | | |
| | | | | |
| Counterparty | | Derivative Liabilities Subject to an MNA by Counterparty | | | Derivatives Available for Offset(a) | | | Non- Cash Collateral Pledged(b) | | | Cash Collateral Pledged(b) | | | Net Amount of Derivative Liabilities(e) | |
| | | | | |
Deutsche Bank AG | | $ | 314,542 | | | $ | — | | | $ | — | | | $ | (314,542 | ) | | $ | — | |
Goldman Sachs International | | | 181,838 | | | | — | | | | — | | | | (181,838 | ) | | | — | |
| | | | | | | | | | | | | | | | | | | | |
| | | | | |
| | $ | 496,380 | | | $ | — | | | $ | — | | | $ | (496,380 | ) | | $ | — | |
| | | | | | | | | | | | | | | | | | | | |
| | (a) | The amount of derivatives available for offset is limited to the amount of derivative assets and/or liabilities that are subject to an MNA. | |
| | (b) | Excess of collateral received/pledged, if any, from the individual counterparty is not shown for financial reporting purposes. | |
| | (c) | Net amount represents the net amount receivable from the counterparty in the event of default. | |
| | (d) | Net amount may also include forward foreign currency exchange contracts that are not required to be collateralized. | |
| | (e) | Net amount represents the net amount payable due to the counterparty in the event of default. | |
| | |
SCHEDULES OF INVESTMENTS | | 53 |
| | |
Schedule of Investments (continued) March 31, 2024 | | BATS: Series A Portfolio |
Fair Value Hierarchy as of Period End
Various inputs are used in determining the fair value of financial instruments. For a description of the input levels and information about the Fund’s policy regarding valuation of financial instruments, refer to the Notes to Financial Statements.
The following table summarizes the Fund’s financial instruments categorized in the fair value hierarchy. The breakdown of the Fund’s financial instruments into major categories is disclosed in the Schedule of Investments above.
| | | | | | | | | | | | | | | | |
| |
| | | | |
| | | Level 1 | | | Level 2 | | | Level 3 | | | Total | |
| |
| | | | |
Assets | | | | | | | | | | | | | | | | |
Investments | | | | | | | | | | | | | | | | |
Long-Term Investments | | | | | | | | | | | | | | | | |
Asset-Backed Securities | | $ | — | | | $ | 1,229,135,530 | | | $ | 9,304,373 | | | $ | 1,238,439,903 | |
Corporate Bonds | | | — | | | | 83,582 | | | | — | | | | 83,582 | |
Floating Rate Loan Interests | | | — | | | | — | | | | 14,990,234 | | | | 14,990,234 | |
Non-Agency Mortgage-Backed Securities | | | — | | | | 1,177,703,022 | | | | 3,559,253 | | | | 1,181,262,275 | |
U.S. Government Sponsored Agency Securities | | | — | | | | 5,924,959 | | | | — | | | | 5,924,959 | |
Short-Term Securities | | | | | | | | | | | | | | | | |
Money Market Funds | | | 147,201,332 | | | | — | | | | — | | | | 147,201,332 | |
Liabilities | | | | | | | | | | | | | | | | |
TBA Sale Commitments | | | — | | | | (21,918,670 | ) | | | — | | | | (21,918,670 | ) |
| | | | | | | | | | | | | | | | |
| | | | |
| | $ | 147,201,332 | | | $ | 2,390,928,423 | | | $ | 27,853,860 | | | $ | 2,565,983,615 | |
| | | | | | | | | | | | | | | | |
Derivative Financial Instruments(a) | | | | | | | | | | | | | | | | |
Assets | | | | | | | | | | | | | | | | |
Credit Contracts | | $ | — | | | $ | 22,764 | | | $ | — | | | $ | 22,764 | |
Foreign Currency Exchange Contracts | | | — | | | | 133,705 | | | | — | | | | 133,705 | |
Liabilities | | | | | | | | | | | | | | | | |
Credit Contracts | | | — | | | | (286,024 | ) | | | — | | | | (286,024 | ) |
| | | | | | | | | | | | | | | | |
| | | | |
| | $ | — | | | $ | (129,555 | ) | | $ | — | | | $ | (129,555 | ) |
| | | | | | | | | | | | | | | | |
| | (a) | Derivative financial instruments are swaps and forward foreign currency exchange contracts. Swaps and forward foreign currency exchange contracts are valued at the unrealized appreciation (depreciation) on the instrument. | |
A reconciliation of Level 3 financial instruments is presented when the Fund had a significant amount of Level 3 investments at the beginning and/or end of the period in relation to net assets. The following table is a reconciliation of Level 3 investments for which significant unobservable inputs were used in determining fair value:
| | | | | | | | | | | | | | | | | | | | | | | | |
| |
| | | | | | |
| | | Asset-Backed
Securities | | | Corporate
Bonds | | | Floating-Rate
Loan Interests | | | Non-Agency
Mortgage-Backed
Securities | | | Unfunded
Floating Rate
Loan Interests | | | Total | |
| |
| | | | | | |
Assets | | | | | | | | | | | | | | | | | | | | | | | | |
Opening Balance, as of March 31, 2023 | | $ | 16,155,741 | | | $ | —(a) | | | $ | 10,673,297 | | | $ | 29,337,894 | | | $ | 17,129 | | | $ | 56,184,061 | |
Transfers into Level 3(b) | | | — | | | | — | | | | 7,643,442 | | | | 3,146 | | | | — | | | | 7,646,588 | |
Transfers out of Level 3(c) | | | (7,285,293 | ) | | | — | | | | — | | | | (26,367,966 | ) | | | — | | | | (33,653,259 | ) |
Accrued discounts/premiums | | | — | | | | — | | | | 37,818 | | | | 65,943 | | | | — | | | | 103,761 | |
Net realized gain (loss) | | | — | | | | — | | | | (34,258 | ) | | | — | | | | — | | | | (34,258 | ) |
Net change in unrealized appreciation (depreciation)(d)(e) | | | 433,925 | | | | — | | | | (163,809 | ) | | | 73,479 | | | | (17,129 | ) | | | 326,466 | |
Purchases | | | — | | | | — | | | | 8,670,193 | | | | 1,675,993 | | | | — | | | | 10,346,186 | |
Sales | | | — | | | | — | | | | (11,836,449 | ) | | | (1,229,236 | ) | | | — | | | | (13,065,685 | ) |
| | | | | | | | | | | | | | | | | | | | | | | | |
| | | | | | |
Closing Balance, as of March 31, 2024 | | $ | 9,304,373 | | | $ | —(a) | | | $ | 14,990,234 | | | $ | 3,559,253 | | | $ | — | | | $ | 27,853,860 | |
| | | | | | | | | | | | | | | | | | | | | | | | |
| | | | | | |
Net change in unrealized appreciation (depreciation) on investments still held at March 31, 2024(e) | | $ | 433,925 | | | $ | — | | | $ | (146,122 | ) | | $ | 73,479 | | | $ | — | | | $ | 361,282 | |
| | | | | | | | | | | | | | | | | | | | | | | | |
| | (a) | Rounds to less than $1. | |
| | (b) | As of March 31, 2023, the Fund used observable inputs in determining the value of certain investments. As of March 31, 2024, the Fund used significant unobservable inputs in determining the value of the same investments. As a result, investments at beginning of period value were transferred from Level 2 to Level 3 in the fair value hierarchy. | |
| | (c) | As of March 31, 2023, the Fund used significant unobservable inputs in determining the value of certain investments. As of March 31, 2024, the Fund used observable inputs in determining the value of the same investments. As a result, investments at beginning of period value were transferred from Level 3 to Level 2 in the disclosure hierarchy. | |
| | (d) | Included in the related net change in unrealized appreciation (depreciation) in the Statements of Operations. | |
| | (e) | Any difference between net change in unrealized appreciation (depreciation) and net change in unrealized appreciation (depreciation) on investments still held at March 31, 2024 is generally due to investments no longer held or categorized as Level 3 at period end. | |
The Fund’s financial instruments that are categorized as Level 3 were valued utilizing third-party pricing information without adjustment. Such valuations are based on unobservable inputs. A significant change in third-party information could result in a significantly lower or higher value of such Level 3 financial instruments.
| | |
| 54 | | 2 0 2 4 BLACK ROCK ANNUAL REPORT TO SHAREHOLDERS |
| | |
Schedule of Investments (continued) March 31, 2024 | | BATS: Series A Portfolio |
The following table summarizes the valuation approaches used and unobservable inputs utilized by the BlackRock Valuation Committee (the “Valuation Committee”) to determine the value of certain of the Fund’s Level 3 investments as of period end. The table does not include Level 3 investments with values based upon unadjusted third party pricing information in the amount of $2,701,723. A significant change in the third party information could result in a significantly lower or higher value of such Level 3 investments.
| | | | | | | | | | | | | | | | | | | | |
| |
| | | Value | | | Valuation Approach | | | Unobservable
Inputs | | | Range of
Unobservable Inputs
Utilized(a) | | | Weighted Average of
Unobservable Inputs
Based on Fair Value | |
| |
| | | | | |
Assets | | | | | | | | | | | | | | | | | | | | |
Asset-Backed Securities | | $ | 9,304,373 | | | | Income | | | | Discount Rate | | | | 8% | | | | — | |
Floating Rate Loan Interests | | | 14,990,234 | | | | Income | | | | Discount Rate | | | | 7% - 8% | | | | 7% | |
Non-Agency Mortgage-Backed Securities | | | 857,530 | | | | Income | | | | Discount Rate | | | | 11% | | | | — | |
| | | | | | | | | | | | | | | | | | | | |
| | | | | |
| | $ | 25,152,137 | | | | | | | | | | | | | | | | | |
| | | | | | | | | | | | | | | | | | | | |
| | (a) | A significant change in unobservable input would have resulted in a correlated (inverse) significant change to value. | |
See notes to financial statements.
| | |
SCHEDULES OF INVESTMENTS | | 55 |
| | |
Schedule of Investments March 31, 2024 | | BATS: Series C Portfolio (Percentages shown are based on Net Assets) |
| | | | | | | | | | | | |
| Security | | | | | Par (000) | | | Value | |
| | | |
Corporate Bonds | | | | | | | | | | | | |
| | | |
Aerospace & Defense — 3.5% | | | | | | | | | | | | |
Boeing Co. (The) | | | | | | | | | | | | |
2.85%, 10/30/24 | | | USD | | | | 980 | | | $ | 962,182 | |
2.20%, 02/04/26 | | | | | | | 1,120 | | | | 1,048,543 | |
2.70%, 02/01/27 | | | | | | | 200 | | | | 184,221 | |
2.95%, 02/01/30 | | | | | | | 200 | | | | 172,731 | |
3.25%, 02/01/35 | | | | | | | 194 | | | | 152,655 | |
3.38%, 06/15/46 | | | | | | | 140 | | | | 94,411 | |
3.85%, 11/01/48 | | | | | | | 135 | | | | 95,138 | |
3.90%, 05/01/49 | | | | | | | 31 | | | | 22,088 | |
3.75%, 02/01/50 | | | | | | | 374 | | | | 260,170 | |
5.81%, 05/01/50 | | | | | | | 2,805 | | | | 2,653,888 | |
5.93%, 05/01/60 | | | | | | | 345 | | | | 323,449 | |
L3Harris Technologies, Inc. | | | | | | | | | | | | |
4.40%, 06/15/28 | | | | | | | 533 | | | | 518,420 | |
4.40%, 06/15/28 | | | | | | | 1,913 | | | | 1,860,672 | |
2.90%, 12/15/29 | | | | | | | 441 | | | | 392,519 | |
5.40%, 07/31/33 | | | | | | | 264 | | | | 265,659 | |
06/01/34(a) | | | | | | | 810 | | | | 810,007 | |
5.60%, 07/31/53 | | | | | | | 46 | | | | 46,691 | |
Lockheed Martin Corp. | | | | | | | | | | | | |
4.50%, 05/15/36 | | | | | | | 37 | | | | 35,141 | |
3.80%, 03/01/45 | | | | | | | 161 | | | | 131,820 | |
5.70%, 11/15/54 | | | | | | | 115 | | | | 122,559 | |
5.20%, 02/15/55 | | | | | | | 339 | | | | 338,441 | |
Northrop Grumman Corp. | | | | | | | | | | | | |
7.88%, 03/01/26 | | | | | | | 1,000 | | | | 1,051,837 | |
4.03%, 10/15/47 | | | | | | | 229 | | | | 187,261 | |
5.25%, 05/01/50 | | | | | | | 22 | | | | 21,580 | |
RTX Corp. | | | | | | | | | | | | |
4.13%, 11/16/28 | | | | | | | 820 | | | | 793,172 | |
4.45%, 11/16/38 | | | | | | | 136 | | | | 122,497 | |
4.50%, 06/01/42 | | | | | | | 202 | | | | 180,233 | |
4.15%, 05/15/45 | | | | | | | 414 | | | | 343,610 | |
4.35%, 04/15/47 | | | | | | | 252 | | | | 214,531 | |
3.13%, 07/01/50 | | | | | | | 95 | | | | 64,838 | |
2.82%, 09/01/51 | | | | | | | 772 | | | | 491,043 | |
3.03%, 03/15/52 | | | | | | | 95 | | | | 62,904 | |
5.38%, 02/27/53 | | | | | | | 620 | | | | 611,454 | |
6.40%, 03/15/54 | | | | | | | 125 | | | | 141,420 | |
| | | | | | | | | | | | |
| | | |
| | | | | | | | | | | 14,777,785 | |
| | | |
| Air Freight & Logistics — 0.0% | | | | | | | | | |
FedEx Corp. | | | | | | | | | | | | |
2.40%, 05/15/31 | | | | | | | 69 | | | | 58,565 | |
4.55%, 04/01/46 | | | | | | | 37 | | | | 31,911 | |
| | | | | | | | | | | | |
| | | |
| | | | | | | | | | | 90,476 | |
| | | |
| Automobile Components — 0.3% | | | | | | | | | |
Aptiv PLC, 3.10%, 12/01/51 | | | | | | | 283 | | | | 178,487 | |
Aptiv PLC/Aptiv Corp. | | | | | | | | | | | | |
3.25%, 03/01/32 | | | | | | | 171 | | | | 148,735 | |
4.15%, 05/01/52 | | | | | | | 332 | | | | 254,295 | |
Magna International, Inc., 03/14/29(a) | | | | | | | 758 | | | | 757,605 | |
| | | | | | | | | | | | |
| | | |
| | | | | | | | | | | 1,339,122 | |
| | | |
| Automobiles — 2.1% | | | | | | | | | |
Daimler Truck Finance North America LLC | | | | | | | | | | | | |
5.60%, 08/08/25(b) | | | | | | | 165 | | | | 165,098 | |
5.15%, 01/16/26(b) | | | | | | | 306 | | | | 304,878 | |
5.00%, 01/15/27(b) | | | | | | | 369 | | | | 367,957 | |
Ford Motor Co. | | | | | | | | | | | | |
6.10%, 08/19/32 | | | | | | | 2,679 | | | | 2,714,671 | |
5.29%, 12/08/46 | | | | | | | 82 | | | | 72,904 | |
| | | | | | | | | | | | |
| Security | | | | | Par (000) | | | Value | |
| | | |
| Automobiles (continued) | | | | | | | | | |
General Motors Co. | | | | | | | | | | | | |
5.00%, 04/01/35 | | | USD | | | | 250 | | | $ | 236,931 | |
6.60%, 04/01/36 | | | | | | | 156 | | | | 165,837 | |
6.25%, 10/02/43 | | | | | | | 168 | | | | 171,855 | |
Mercedes-Benz Finance North America LLC, 5.00%, 01/11/34(b) | | | | | | | 505 | | | | 500,752 | |
Nissan Motor Acceptance Co. LLC | | | | | | | | | | | | |
1.85%, 09/16/26(b) | | | | | | | 3,090 | | | | 2,796,006 | |
2.45%, 09/15/28(b) | | | | | | | 112 | | | | 96,492 | |
7.05%, 09/15/28(b) | | | | | | | 235 | | | | 245,642 | |
Volkswagen Group of America Finance LLC | | | | | | | | | | | | |
3.35%, 05/13/25(b) | | | | | | | 350 | | | | 341,649 | |
1.25%, 11/24/25(b) | | | | | | | 655 | | | | 612,009 | |
| | | | | | | | | | | | |
| | | |
| | | | | | | | | | | 8,792,681 | |
| | | |
| Banks — 13.8% | | | | | | | | | |
Bank of America Corp. | | | | | | | | | | | | |
3.37%, 01/23/26 | | | | | | | 930 | | | | 912,940 | |
1.32%, 06/19/26 | | | | | | | 1,836 | | | | 1,745,229 | |
2.55%, 02/04/28 | | | | | | | 164 | | | | 152,441 | |
3.97%, 03/05/29 | | | | | | | 212 | | | | 202,648 | |
5.20%, 04/25/29 | | | | | | | 20 | | | | 20,019 | |
3.97%, 02/07/30 | | | | | | | 1,159 | | | | 1,098,318 | |
2.69%, 04/22/32 | | | | | | | 2,375 | | | | 2,010,319 | |
2.97%, 02/04/33 | | | | | | | 1,831 | | | | 1,557,156 | |
4.08%, 04/23/40 | | | | | | | 185 | | | | 159,839 | |
2.68%, 06/19/41 | | | | | | | 565 | | | | 402,013 | |
2.83%, 10/24/51 | | | | | | | 35 | | | | 22,868 | |
Series L, 4.75%, 04/21/45 | | | | | | | 39 | | | | 36,068 | |
Series N, 1.66%, 03/11/27 | | | | | | | 654 | | | | 609,212 | |
Bank of Ireland Group PLC, 6.25%, 09/16/26(b) | | | | | | | 1,204 | | | | 1,210,935 | |
Barclays PLC | | | | | | | | | | | | |
3.93%, 05/07/25 | | | | | | | 760 | | | | 758,457 | |
5.20%, 05/12/26 | | | | | | | 600 | | | | 593,821 | |
5.83%, 05/09/27 | | | | | | | 1,232 | | | | 1,234,616 | |
5.09%, 06/20/30 | | | | | | | 1,100 | | | | 1,059,672 | |
Citigroup, Inc. | | | | | | | | | | | | |
3.89%, 01/10/28 | | | | | | | 526 | | | | 507,206 | |
2.67%, 01/29/31 | | | | | | | 392 | | | | 339,734 | |
2.57%, 06/03/31 | | | | | | | 302 | | | | 258,058 | |
2.56%, 05/01/32 | | | | | | | 589 | | | | 491,228 | |
6.17%, 05/25/34 | | | | | | | 1,396 | | | | 1,417,623 | |
Commonwealth Bank of Australia, 03/13/34(a)(b) | | | | | | | 1,347 | | | | 1,354,555 | |
Danske Bank A/S, 5.71%, 03/01/30(b) | | | | | | | 2,278 | | | | 2,292,555 | |
Discover Bank | | | | | | | | | | | | |
2.45%, 09/12/24 | | | | | | | 255 | | | | 251,221 | |
5.97%, 08/09/28 | | | | | | | 300 | | | | 298,431 | |
Fifth Third Bancorp | | | | | | | | | | | | |
6.36%, 10/27/28 | | | | | | | 946 | | | | 968,010 | |
6.34%, 07/27/29 | | | | | | | 1,429 | | | | 1,473,115 | |
5.63%, 01/29/32 | | | | | | | 500 | | | | 500,512 | |
4.34%, 04/25/33 | | | | | | | 153 | | | | 139,655 | |
HSBC Holdings PLC | | | | | | | | | | | | |
5.89%, 08/14/27 | | | | | | | 499 | | | | 503,365 | |
7.39%, 11/03/28 | | | | | | | 755 | | | | 803,255 | |
2.87%, 11/22/32 | | | | | | | 200 | | | | 167,071 | |
8.11%, 11/03/33 | | | | | | | 1,015 | | | | 1,162,101 | |
Huntington Bancshares, Inc. | | | | | | | | | | | | |
6.21%, 08/21/29 | | | | | | | 109 | | | | 111,563 | |
5.02%, 05/17/33 | | | | | | | 100 | | | | 95,281 | |
5.71%, 02/02/35 | | | | | | | 1,455 | | | | 1,450,811 | |
Intesa Sanpaolo SpA, 5.02%, 06/26/24(b) | | | | | | | 416 | | | | 414,626 | |
| | |
| 56 | | 2 0 2 4 BLACK ROCK ANNUAL REPORT TO SHAREHOLDERS |
| | |
Schedule of Investments (continued) March 31, 2024 | | BATS: Series C Portfolio (Percentages shown are based on Net Assets) |
| | | | | | | | | | | | |
| Security | | | | | Par (000) | | | Value | |
| | | |
| Banks (continued) | | | | | | | | | |
JPMorgan Chase & Co. | | | | | | | | | | | | |
2.95%, 02/24/28 | | | USD | | | | 313 | | | $ | 294,091 | |
4.01%, 04/23/29 | | | | | | | 50 | | | | 47,926 | |
2.07%, 06/01/29 | | | | | | | 442 | | | | 392,078 | |
5.30%, 07/24/29 | | | | | | | 1,428 | | | | 1,438,609 | |
5.34%, 01/23/35 | | | | | | | 1,524 | | | | 1,529,955 | |
3.11%, 04/22/41 | | | | | | | 330 | | | | 251,447 | |
2.53%, 11/19/41 | | | | | | | 942 | | | | 657,367 | |
3.16%, 04/22/42 | | | | | | | 450 | | | | 342,373 | |
4.95%, 06/01/45 | | | | | | | 201 | | | | 191,116 | |
KeyCorp | | | | | | | | | | | | |
4.79%, 06/01/33 | | | | | | | 35 | | | | 32,045 | |
6.40%, 03/06/35 | | | | | | | 850 | | | | 868,025 | |
Lloyds Banking Group PLC, 4.58%, 12/10/25 | | | | | | | 1,075 | | | | 1,053,994 | |
Mitsubishi UFJ Financial Group, Inc. | | | | | | | | | | | | |
0.95%, 07/19/25 | | | | | | | 1,091 | | | | 1,074,837 | |
2.05%, 07/17/30 | | | | | | | 200 | | | | 167,695 | |
2.85%, 01/19/33 | | | | | | | 200 | | | | 169,826 | |
PNC Financial Services Group, Inc. (The) | | | | | | | | | | | | |
6.88%, 10/20/34 | | | | | | | 854 | | | | 935,155 | |
5.68%, 01/22/35 | | | | | | | 776 | | | | 783,068 | |
Santander Holdings U.S.A., Inc., 6.17%, 01/09/30 | | | | | | | 605 | | | | 610,453 | |
Sumitomo Mitsui Financial Group, Inc. | | | | | | | | | | | | |
5.46%, 01/13/26 | | | | | | | 1,040 | | | | 1,043,501 | |
3.78%, 03/09/26 | | | | | | | 21 | | | | 20,463 | |
5.88%, 07/13/26 | | | | | | | 461 | | | | 467,826 | |
2.17%, 01/14/27 | | | | | | | 200 | | | | 185,218 | |
Toronto-Dominion Bank (The), 4.69%, 09/15/27 | | | | | | | 478 | | | | 473,442 | |
Truist Financial Corp. | | | | | | | | | | | | |
5.44%, 01/24/30 | | | | | | | 2,500 | | | | 2,497,084 | |
5.87%, 06/08/34 | | | | | | | 379 | | | | 383,647 | |
5.71%, 01/24/35 | | | | | | | 1,541 | | | | 1,547,653 | |
U.S. Bancorp, 5.68%, 01/23/35 | | | | | | | 2,155 | | | | 2,175,967 | |
Wells Fargo & Co. | | | | | | | | | | | | |
3.91%, 04/25/26 | | | | | | | 1,235 | | | | 1,212,101 | |
3.58%, 05/22/28 | | | | | | | 1,260 | | | | 1,197,898 | |
5.57%, 07/25/29 | | | | | | | 1,236 | | | | 1,250,649 | |
6.30%, 10/23/29 | | | | | | | 779 | | | | 811,360 | |
2.88%, 10/30/30 | | | | | | | 160 | | | | 141,439 | |
5.39%, 04/24/34 | | | | | | | 303 | | | | 301,113 | |
6.49%, 10/23/34 | | | | | | | 459 | | | | 492,311 | |
5.50%, 01/23/35 | | | | | | | 2,017 | | | | 2,021,749 | |
5.61%, 01/15/44 | | | | | | | 597 | | | | 588,118 | |
4.65%, 11/04/44 | | | | | | | 65 | | | | 56,800 | |
4.40%, 06/14/46 | | | | | | | 28 | | | | 23,298 | |
5.01%, 04/04/51 | | | | | | | 630 | | | | 591,494 | |
Wells Fargo Bank N.A., 5.25%, 12/11/26 | | | | | | | 1,084 | | | | 1,088,215 | |
Westpac Banking Corp. | | | | | | | | | | | | |
2.67%, 11/15/35 | | | | | | | 284 | | | | 234,249 | |
3.02%, 11/18/36 | | | | | | | 83 | | | | 68,179 | |
3.13%, 11/18/41 | | | | | | | 111 | | | | 78,460 | |
| | | | | | | | | | | | |
| | | |
| | | | | | | | | | | 58,578,841 | |
| | | |
| Beverages — 0.5% | | | | | | | | | |
Anheuser-Busch Cos. LLC/Anheuser-Busch InBev Worldwide, Inc., 4.90%, 02/01/46 | | | | | | | 24 | | | | 22,807 | |
Anheuser-Busch InBev Finance, Inc., 4.90%, 02/01/46 . | | | | | | | 310 | | | | 291,112 | |
Anheuser-Busch InBev Worldwide, Inc. | | | | | | | | | | | | |
4.00%, 04/13/28 | | | | | | | 530 | | | | 516,960 | |
06/15/34(a) | | | | | | | 50 | | | | 50,298 | |
4.44%, 10/06/48 | | | | | | | 535 | | | | 476,032 | |
5.55%, 01/23/49 | | | | | | | 624 | | | | 650,606 | |
| | | | | | | | | | | | |
| Security | | | | | Par (000) | | | Value | |
| | | |
| Beverages (continued) | | | | | | | | | |
Anheuser-Busch InBev Worldwide, Inc. | | | | | | | | | | | | |
4.75%, 04/15/58 | | | USD | | | | 26 | | | $ | 23,986 | |
5.80%, 01/23/59 | | | | | | | 254 | | | | 273,183 | |
| | | | | | | | | | | | |
| | | |
| | | | | | | | | | | 2,304,984 | |
| | | |
| Biotechnology — 2.5% | | | | | | | | | |
AbbVie, Inc. | | | | | | | | | | | | |
3.60%, 05/14/25 | | | | | | | 1,706 | | | | 1,674,395 | |
2.95%, 11/21/26 | | | | | | | 233 | | | | 221,909 | |
4.80%, 03/15/29 | | | | | | | 985 | | | | 986,445 | |
4.95%, 03/15/31 | | | | | | | 500 | | | | 503,568 | |
5.05%, 03/15/34 | | | | | | | 275 | | | | 278,409 | |
4.63%, 10/01/42 | | | | | | | 268 | | | | 249,915 | |
4.40%, 11/06/42 | | | | | | | 759 | | | | 688,907 | |
4.75%, 03/15/45 | | | | | | | 166 | | | | 156,329 | |
4.45%, 05/14/46 | | | | | | | 680 | | | | 610,609 | |
4.88%, 11/14/48 | | | | | | | 165 | | | | 157,825 | |
5.40%, 03/15/54 | | | | | | | 286 | | | | 294,378 | |
Amgen, Inc. | | | | | | | | | | | | |
5.25%, 03/02/33 | | | | | | | 849 | | | | 856,142 | |
3.00%, 01/15/52 | | | | | | | 52 | | | | 35,212 | |
4.20%, 02/22/52 | | | | | | | 435 | | | | 357,796 | |
4.88%, 03/01/53 | | | | | | | 898 | | | | 817,576 | |
5.65%, 03/02/53 | | | | | | | 64 | | | | 65,213 | |
2.77%, 09/01/53 | | | | | | | 1,249 | | | | 773,500 | |
Gilead Sciences, Inc. | | | | | | | | | | | | |
4.50%, 02/01/45 | | | | | | | 51 | | | | 45,387 | |
4.75%, 03/01/46 | | | | | | | 171 | | | | 157,047 | |
4.15%, 03/01/47 | | | | | | | 544 | | | | 456,947 | |
2.80%, 10/01/50 | | | | | | | 856 | | | | 557,976 | |
5.55%, 10/15/53 | | | | | | | 454 | | | | 469,926 | |
| | | | | | | | | | | | |
| | | |
| | | | | | | | | | | 10,415,411 | |
| | | |
| Broadline Retail — 0.5% | | | | | | | | | |
Alibaba Group Holding Ltd. | | | | | | | | | | | | |
4.20%, 12/06/47 | | | | | | | 200 | | | | 164,442 | |
3.15%, 02/09/51 | | | | | | | 500 | | | | 333,005 | |
Amazon.com, Inc. | | | | | | | | | | | | |
3.15%, 08/22/27 | | | | | | | 1,370 | | | | 1,305,732 | |
3.10%, 05/12/51 | | | | | | | 197 | | | | 141,485 | |
2.70%, 06/03/60 | | | | | | | 400 | | | | 247,908 | |
3.25%, 05/12/61 | | | | | | | 159 | | | | 111,663 | |
| | | | | | | | | | | | |
| | | |
| | | | | | | | | | | 2,304,235 | |
| | | |
| Building Products — 0.0% | | | | | | | | | |
Carrier Global Corp. | | | | | | | | | | | | |
5.90%, 03/15/34 | | | | | | | 112 | | | | 117,712 | |
6.20%, 03/15/54 | | | | | | | 57 | | | | 62,764 | |
| | | | | | | | | | | | |
| | | |
| | | | | | | | | | | 180,476 | |
| | | |
| Capital Markets — 6.3% | | | | | | | | | |
Ares Capital Corp., 5.88%, 03/01/29 | | | | | | | 1,084 | | | | 1,080,758 | |
Blue Owl Credit Income Corp., 7.75%, 01/15/29(b) | | | | | | | 1,024 | | | | 1,054,617 | |
Charles Schwab Corp. (The) | | | | | | | | | | | | |
5.88%, 08/24/26 | | | | | | | 780 | | | | 793,000 | |
6.14%, 08/24/34 | | | | | | | 301 | | | | 314,002 | |
Credit Suisse AG | | | | | | | | | | | | |
4.75%, 08/09/24 | | | | | | | 380 | | | | 378,612 | |
3.63%, 09/09/24 | | | | | | | 1,165 | | | | 1,154,081 | |
7.95%, 01/09/25 | | | | | | | 795 | | | | 808,181 | |
3.70%, 02/21/25 | | | | | | | 800 | | | | 786,306 | |
2.95%, 04/09/25 | | | | | | | 757 | | | | 736,989 | |
Deutsche Bank AG | | | | | | | | | | | | |
1.45%, 04/01/25 | | | | | | | 190 | | | | 190,000 | |
4.10%, 01/13/26 | | | | | | | 100 | | | | 97,606 | |
| | |
SCHEDULES OF INVESTMENTS | | 57 |
| | |
Schedule of Investments (continued) March 31, 2024 | | BATS: Series C Portfolio (Percentages shown are based on Net Assets) |
| | | | | | | | | | | | |
| Security | | | | | Par (000) | | | Value | |
| | | |
| Capital Markets (continued) | | | | | | | | | |
Deutsche Bank AG | | | | | | | | | | | | |
6.12%, 07/14/26 | | | USD | | | | 150 | | | $ | 150,567 | |
5.71%, 02/08/28 | | | | | | | 940 | | | | 938,635 | |
6.82%, 11/20/29 | | | | | | | 1,734 | | | | 1,812,730 | |
4.88%, 12/01/32 | | | | | | | 370 | | | | 347,130 | |
7.08%, 02/10/34 | | | | | | | 314 | | | | 322,927 | |
Goldman Sachs Group, Inc. (The) | | | | | | | | | | | | |
2.60%, 02/07/30 | | | | | | | 500 | | | | 437,659 | |
1.99%, 01/27/32 | | | | | | | 29 | | | | 23,467 | |
2.62%, 04/22/32 | | | | | | | 830 | | | | 696,579 | |
2.38%, 07/21/32 | | | | | | | 243 | | | | 199,347 | |
2.65%, 10/21/32 | | | | | | | 725 | | | | 603,215 | |
6.45%, 05/01/36 | | | | | | | 45 | | | | 48,006 | |
Series VAR, 1.09%, 12/09/26 | | | | | | | 37 | | | | 34,372 | |
Intercontinental Exchange, Inc. | | | | | | | | | | | | |
4.60%, 03/15/33 | | | | | | | 409 | | | | 395,740 | |
4.25%, 09/21/48 | | | | | | | 46 | | | | 39,214 | |
3.00%, 06/15/50 | | | | | | | 129 | | | | 86,518 | |
Morgan Stanley | | | | | | | | | | | | |
2.19%, 04/28/26 | | | | | | | 70 | | | | 67,533 | |
4.68%, 07/17/26 | | | | | | | 1,520 | | | | 1,503,622 | |
1.59%, 05/04/27 | | | | | | | 1,390 | | | | 1,285,740 | |
1.51%, 07/20/27 | | | | | | | 735 | | | | 674,584 | |
3.77%, 01/24/29 | | | | | | | 1,011 | | | | 962,345 | |
5.16%, 04/20/29 | | | | | | | 714 | | | | 713,424 | |
5.45%, 07/20/29 | | | | | | | 425 | | | | 428,727 | |
6.41%, 11/01/29 | | | | | | | 850 | | | | 891,278 | |
2.70%, 01/22/31 | | | | | | | 470 | | | | 410,632 | |
2.24%, 07/21/32 | | | | | | | 50 | | | | 40,844 | |
6.63%, 11/01/34 | | | | | | | 985 | | | | 1,077,695 | |
5.47%, 01/18/35 | | | | | | | 1,130 | | | | 1,140,101 | |
3.22%, 04/22/42 | | | | | | | 815 | | | | 623,341 | |
4.30%, 01/27/45 | | | | | | | 260 | | | | 228,306 | |
UBS AG, (Secured Overnight Financing Rate + 0.93%), | | | | | | | | | | | | |
6.29%, 09/11/25(c) | | | | | | | 456 | | | | 458,983 | |
UBS Group AG, 9.02%, 11/15/33(b) | | | | | | | 2,000 | | | | 2,426,692 | |
| | | | | | | | | | | | |
| | | |
| | | | | | | | | | | 26,464,105 | |
| | | |
| Chemicals — 0.7% | | | | | | | | | |
DuPont de Nemours, Inc., 5.32%, 11/15/38 | | | | | | | 297 | | | | 296,819 | |
Eastman Chemical Co. | | | | | | | | | | | | |
5.75%, 03/08/33 | | | | | | | 1,085 | | | | 1,103,398 | |
4.80%, 09/01/42 | | | | | | | 36 | | | | 31,605 | |
4.65%, 10/15/44 | | | | | | | 39 | | | | 33,189 | |
Ecolab, Inc. | | | | | | | | | | | | |
2.70%, 12/15/51 | | | | | | | 183 | | | | 118,327 | |
2.75%, 08/18/55 | | | | | | | 48 | | | | 30,569 | |
Nutrien Ltd. | | | | | | | | | | | | |
5.90%, 11/07/24 | | | | | | | 246 | | | | 246,277 | |
4.90%, 03/27/28 | | | | | | | 664 | | | | 660,483 | |
5.80%, 03/27/53 | | | | | | | 53 | | | | 54,113 | |
Sherwin-Williams Co. (The) | | | | | | | | | | | | |
3.45%, 08/01/25 | | | | | | | 135 | | | | 131,631 | |
4.25%, 08/08/25 | | | | | | | 169 | | | | 166,508 | |
2.30%, 05/15/30 | | | | | | | 203 | | | | 174,354 | |
4.50%, 06/01/47 | | | | | | | 24 | | | | 20,972 | |
3.80%, 08/15/49 | | | | | | | 30 | | | | 23,648 | |
3.30%, 05/15/50 | | | | | | | 57 | | | | 40,275 | |
2.90%, 03/15/52 | | | | | | | 33 | | | | 21,474 | |
| | | | | | | | | | | | |
| | | |
| | | | | | | | | | | 3,153,642 | |
| |
| Commercial Services & Supplies — 0.2% | | | | |
GATX Corp., 5.40%, 03/15/27 | | | | | | | 360 | | | | 362,463 | |
| | | | | | | | | | | | |
| Security | | | | | Par (000) | | | Value | |
|
| Commercial Services & Supplies (continued) | |
Republic Services, Inc. | | | | | | | | | | | | |
4.88%, 04/01/29 | | | USD | | | | 398 | | | $ | 398,621 | |
1.45%, 02/15/31 | | | | | | | 133 | | | | 105,898 | |
| | | | | | | | | | | | |
| | | |
| | | | | | | | | | | 866,982 | |
| | | |
| Communications Equipment — 0.7% | | | | | | | | | |
Cisco Systems, Inc. | | | | | | | | | | | | |
4.95%, 02/26/31 | | | | | | | 505 | | | | 509,457 | |
5.05%, 02/26/34 | | | | | | | 370 | | | | 374,982 | |
5.30%, 02/26/54 | | | | | | | 100 | | | | 102,648 | |
Motorola Solutions, Inc. | | | | | | | | | | | | |
4.60%, 05/23/29 | | | | | | | 33 | | | | 32,344 | |
2.30%, 11/15/30 | | | | | | | 110 | | | | 92,336 | |
2.75%, 05/24/31 | | | | | | | 81 | | | | 68,642 | |
04/15/34(a) | | | | | | | 1,639 | | | | 1,635,762 | |
| | | | | | | | | | | | |
| | | |
| | | | | | | | | | | 2,816,171 | |
| | | |
| Consumer Finance — 4.0% | | | | | | | | | |
Ally Financial, Inc. | | | | | | | | | | | | |
4.63%, 03/30/25 | | | | | | | 21 | | | | 20,746 | |
5.80%, 05/01/25 | | | | | | | 109 | | | | 108,816 | |
5.75%, 11/20/25 | | | | | | | 1,023 | | | | 1,015,633 | |
6.85%, 01/03/30 | | | | | | | 2,302 | | | | 2,369,139 | |
American Honda Finance Corp., 5.65%, 11/15/28 | | | | | | | 38 | | | | 39,158 | |
Capital One Financial Corp. | | | | | | | | | | | | |
3.75%, 07/28/26 | | | | | | | 793 | | | | 763,965 | |
2.36%, 07/29/32 | | | | | | | 143 | | | | 110,195 | |
6.38%, 06/08/34 | | | | | | | 373 | | | | 387,366 | |
Ford Motor Credit Co. LLC | | | | | | | | | | | | |
5.80%, 03/05/27 | | | | | | | 1,390 | | | | 1,395,140 | |
5.11%, 05/03/29 | | | | | | | 465 | | | | 451,433 | |
6.05%, 03/05/31 | | | | | | | 400 | | | | 402,844 | |
7.12%, 11/07/33 | | | | | | | 270 | | | | 290,496 | |
General Motors Financial Co., Inc. | | | | | | | | | | | | |
1.20%, 10/15/24 | | | | | | | 1,000 | | | | 976,124 | |
2.90%, 02/26/25 | | | | | | | 1,045 | | | | 1,019,392 | |
4.35%, 04/09/25 | | | | | | | 284 | | | | 280,493 | |
5.80%, 06/23/28 | | | | | | | 383 | | | | 390,493 | |
5.75%, 02/08/31 | | | | | | | 105 | | | | 106,138 | |
Hyundai Capital America | | | | | | | | | | | | |
1.00%, 09/17/24(b) | | | | | | | 1,711 | | | | 1,673,875 | |
5.80%, 06/26/25(b) | | | | | | | 965 | | | | 967,216 | |
6.25%, 11/03/25(b) | | | | | | | 760 | | | | 767,771 | |
5.70%, 06/26/30(b) | | | | | | | 990 | | | | 1,008,847 | |
Synchrony Financial, 5.15%, 03/19/29 | | | | | | | 1,320 | | | | 1,268,200 | |
Toyota Motor Credit Corp. | | | | | | | | | | | | |
4.55%, 09/20/27 | | | | | | | 613 | | | | 607,046 | |
5.25%, 09/11/28 | | | | | | | 43 | | | | 43,742 | |
2.15%, 02/13/30 | | | | | | | 469 | | | | 405,851 | |
5.55%, 11/20/30 | | | | | | | 117 | | | | 121,042 | |
| | | | | | | | | | | | |
| | | |
| | | | | | | | | | | 16,991,161 | |
| |
| Consumer Staples Distribution & Retail — 0.4% | | | | |
7-Eleven, Inc., 0.95%, 02/10/26(b) | | | | | | | 755 | | | | 697,631 | |
CVS Health Corp. | | | | | | | | | | | | |
5.00%, 02/20/26 | | | | | | | 268 | | | | 267,064 | |
5.13%, 07/20/45 | | | | | | | 296 | | | | 272,775 | |
4.25%, 04/01/50 | | | | | | | 160 | | | | 129,649 | |
5.88%, 06/01/53 | | | | | | | 180 | | | | 183,116 | |
| | | | | | | | | | | | |
| | | |
| | | | | | | | | | | 1,550,235 | |
| | | |
| Containers & Packaging — 1.0% | | | | | | | | | |
Berry Global, Inc., 1.57%, 01/15/26 | | | | | | | 2,335 | | | | 2,182,729 | |
Smurfit Kappa Treasury ULC, 04/03/34(a)(b) | | | | | | | 425 | | | | 425,162 | |
| | |
| 58 | | 2 0 2 4 BLACK ROCK ANNUAL REPORT TO SHAREHOLDERS |
| | |
Schedule of Investments (continued) March 31, 2024 | | BATS: Series C Portfolio (Percentages shown are based on Net Assets) |
| | | | | | | | | | | | |
| Security | | | | | Par (000) | | | Value | |
| |
| Containers & Packaging (continued) | | | | |
WRKCo, Inc. | | | | | | | | | | | | |
4.65%, 03/15/26 | | | USD | | | | 596 | | | $ | 588,541 | |
3.38%, 09/15/27 | | | | | | | 884 | | | | 838,403 | |
3.90%, 06/01/28 | | | | | | | 303 | | | | 288,853 | |
| | | | | | | | | | | | |
| | | |
| | | | | | | | | | | 4,323,688 | |
| |
| Diversified Consumer Services — 0.3% | | | | |
Northwestern University, 4.64%, 12/01/44 | | | | | | | 255 | | | | 243,422 | |
United Rentals North America, Inc., 6.00%, 12/15/29(b) . | | | | 819 | | | | 824,427 | |
University of Miami, Series 2022, 4.06%, 04/01/52 | | | | | | | 170 | | | | 143,234 | |
University of Southern California, Series 2017, 3.84%, 10/01/47 | | | | | | | 205 | | | | 172,434 | |
| | | | | | | | | | | | |
| | | |
| | | | | | | | | | | 1,383,517 | |
| | | |
| Diversified REITs — 1.1% | | | | | | | | | |
American Tower Corp. | | | | | | | | | | | | |
3.95%, 03/15/29 | | | | | | | 215 | | | | 203,115 | |
3.80%, 08/15/29 | | | | | | | 450 | | | | 419,968 | |
2.90%, 01/15/30 | | | | | | | 281 | | | | 247,066 | |
2.10%, 06/15/30 | | | | | | | 55 | | | | 45,689 | |
2.30%, 09/15/31 | | | | | | | 196 | | | | 159,972 | |
Equinix, Inc. | | | | | | | | | | | | |
3.20%, 11/18/29 | | | | | | | 233 | | | | 208,588 | |
2.15%, 07/15/30 | | | | | | | 43 | | | | 35,636 | |
2.50%, 05/15/31 | | | | | | | 25 | | | | 20,854 | |
3.90%, 04/15/32 | | | | | | | 157 | | | | 142,060 | |
3.00%, 07/15/50 | | | | | | | 288 | | | | 188,437 | |
2.95%, 09/15/51 | | | | | | | 377 | | | | 242,022 | |
GLP Capital LP/GLP Financing II, Inc. | | | | | | | | | | | | |
5.75%, 06/01/28 | | | | | | | 46 | | | | 46,034 | |
5.30%, 01/15/29 | | | | | | | 42 | | | | 41,298 | |
4.00%, 01/15/30 | | | | | | | 135 | | | | 123,249 | |
VICI Properties LP | | | | | | | | | | | | |
5.13%, 05/15/32 | | | | | | | 1,302 | | | | 1,245,360 | |
04/01/54(a) | | | | | | | 85 | | | | 83,838 | |
VICI Properties LP/VICI Note Co., Inc. | | | | | | | | | | | | |
4.63%, 12/01/29(b) | | | | | | | 141 | | | | 133,347 | |
4.13%, 08/15/30(b) | | | | | | | 960 | | | | 872,934 | |
| | | | | | | | | | | | |
| | | |
| | | | | | | | | | | 4,459,467 | |
| |
| Diversified Telecommunication Services — 1.7% | | | | |
AT&T Inc. | | | | | | | | | | | | |
5.40%, 02/15/34 | | | | | | | 437 | | | | 442,732 | |
4.50%, 05/15/35 | | | | | | | 716 | | | | 668,773 | |
4.90%, 08/15/37 | | | | | | | 250 | | | | 237,213 | |
3.50%, 06/01/41 | | | | | | | 387 | | | | 302,091 | |
3.10%, 02/01/43 | | | | | | | 398 | | | | 294,895 | |
4.35%, 06/15/45 | | | | | | | 150 | | | | 127,818 | |
3.65%, 06/01/51 | | | | | | | 508 | | | | 372,942 | |
3.65%, 09/15/59 | | | | | | | 1,193 | | | | 830,581 | |
Sprint Capital Corp., 6.88%, 11/15/28 | | | | | | | 1,659 | | | | 1,767,892 | |
Telefonica Emisiones SAU | | | | | | | | | | | | |
4.10%, 03/08/27 | | | | | | | 359 | | | | 349,121 | |
4.90%, 03/06/48 | | | | | | | 360 | | | | 316,548 | |
Verizon Communications, Inc. | | | | | | | | | | | | |
2.36%, 03/15/32 | | | | | | | 931 | | | | 765,092 | |
5.05%, 05/09/33 | | | | | | | 122 | | | | 121,954 | |
5.85%, 09/15/35 | | | | | | | 665 | | | | 700,553 | |
| | | | | | | | | | | | |
| | | |
| | | | | | | | | | | 7,298,205 | |
| | | |
| Electric Utilities — 8.7% | | | | | | | | | |
AES Corp. (The) | | | | | | | | | | | | |
1.38%, 01/15/26 | | | | | | | 1,007 | | | | 932,528 | |
3.95%, 07/15/30(b) | | | | | | | 276 | | | | 251,019 | |
2.45%, 01/15/31 | | | | | | | 622 | | | | 508,894 | |
| | | | | | | | | | | | |
| Security | | | | | Par (000) | | | Value | |
| | | |
| Electric Utilities (continued) | | | | | | | | | |
Alabama Power Co. | | | | | | | | | | | | |
3.94%, 09/01/32 | | | USD | | | | 551 | | | $ | 510,908 | |
5.85%, 11/15/33 | | | | | | | 25 | | | | 26,324 | |
Baltimore Gas & Electric Co. | | | | | | | | | | | | |
3.50%, 08/15/46 | | | | | | | 40 | | | | 29,869 | |
3.75%, 08/15/47 | | | | | | | 38 | | | | 29,505 | |
3.20%, 09/15/49 | | | | | | | 82 | | | | 56,534 | |
2.90%, 06/15/50 | | | | | | | 20 | | | | 13,119 | |
4.55%, 06/01/52 | | | | | | | 30 | | | | 26,184 | |
Berkshire Hathaway Energy Co. | | | | | | | | | | | | |
4.45%, 01/15/49 | | | | | | | 185 | | | | 156,080 | |
4.25%, 10/15/50 | | | | | | | 287 | | | | 233,076 | |
Colbun SA, 3.15%, 01/19/32(b) | | | | | | | 615 | | | | 516,440 | |
Duke Energy Carolinas LLC | | | | | | | | | | | | |
3.95%, 11/15/28 | | | | | | | 380 | | | | 367,354 | |
3.95%, 03/15/48 | | | | | | | 96 | | | | 76,534 | |
3.20%, 08/15/49 | | | | | | | 914 | | | | 637,901 | |
Duke Energy Florida LLC | | | | | | | | | | | | |
2.50%, 12/01/29 | | | | | | | 496 | | | | 439,729 | |
4.20%, 07/15/48 | | | | | | | 109 | | | | 90,301 | |
3.00%, 12/15/51 | | | | | | | 32 | | | | 20,996 | |
Duke Energy Progress LLC | | | | | | | | | | | | |
3.45%, 03/15/29 | | | | | | | 732 | | | | 688,653 | |
6.30%, 04/01/38 | | | | | | | 23 | | | | 24,912 | |
4.10%, 03/15/43 | | | | | | | 210 | | | | 174,890 | |
3.70%, 10/15/46 | | | | | | | 25 | | | | 19,201 | |
3.60%, 09/15/47 | | | | | | | 250 | | | | 186,503 | |
5.35%, 03/15/53 | | | | | | | 214 | | | | 208,750 | |
Edison International | | | | | | | | | | | | |
5.75%, 06/15/27 | | | | | | | 240 | | | | 243,163 | |
4.13%, 03/15/28 | | | | | | | 54 | | | | 51,810 | |
5.25%, 11/15/28 | | | | | | | 800 | | | | 797,184 | |
6.95%, 11/15/29 | | | | | | | 397 | | | | 425,319 | |
Emera U.S. Finance LP, 0.83%, 06/15/24 | | | | | | | 420 | | | | 415,188 | |
Enel Finance International NV, 1.38%, 07/12/26(b) | | | | | | | 1,145 | | | | 1,047,405 | |
Eversource Energy | | | | | | | | | | | | |
4.75%, 05/15/26 | | | | | | | 150 | | | | 148,444 | |
2.90%, 03/01/27 | | | | | | | 27 | | | | 25,383 | |
4.60%, 07/01/27 | | | | | | | 74 | | | | 72,732 | |
5.45%, 03/01/28 | | | | | | | 339 | | | | 343,185 | |
Exelon Corp. | | | | | | | | | | | | |
4.05%, 04/15/30 | | | | | | | 79 | | | | 74,503 | |
5.45%, 03/15/34 | | | | | | | 960 | | | | 966,457 | |
4.70%, 04/15/50 | | | | | | | 91 | | | | 79,699 | |
FirstEnergy Corp., Series B, 4.15%, 07/15/27 | | | | | | | 150 | | | | 143,864 | |
FirstEnergy Transmission LLC | | | | | | | | | | | | |
4.35%, 01/15/25(b) | | | | | | | 965 | | | | 953,219 | |
4.55%, 04/01/49(b) | | | | | | | 89 | | | | 75,308 | |
Florida Power & Light Co. | | | | | | | | | | | | |
5.95%, 02/01/38 | | | | | | | 389 | | | | 418,787 | |
3.15%, 10/01/49 | | | | | | | 140 | | | | 98,548 | |
2.88%, 12/04/51 | | | | | | | 167 | | | | 109,756 | |
Georgia Power Co. | | | | | | | | | | | | |
4.70%, 05/15/32 | | | | | | | 1,013 | | | | 989,691 | |
4.95%, 05/17/33 | | | | | | | 69 | | | | 68,032 | |
5.25%, 03/15/34 | | | | | | | 1,105 | | | | 1,116,158 | |
Interstate Power & Light Co. | | | | | | | | | | | | |
3.25%, 12/01/24 | | | | | | | 350 | | | | 344,615 | |
3.40%, 08/15/25 | | | | | | | 255 | | | | 247,968 | |
MidAmerican Energy Co. | | | | | | | | | | | | |
3.65%, 04/15/29 | | | | | | | 390 | | | | 370,924 | |
3.95%, 08/01/47 | | | | | | | 25 | | | | 20,081 | |
| | |
SCHEDULES OF INVESTMENTS | | 59 |
| | |
Schedule of Investments (continued) March 31, 2024 | | BATS: Series C Portfolio (Percentages shown are based on Net Assets) |
| | | | | | | | | | | | |
| Security | | | | | Par (000) | | | Value | |
| | | |
| Electric Utilities (continued) | | | | | | | | | |
MidAmerican Energy Co. | | | | | | | | | | | | |
4.25%, 07/15/49 | | | USD | | | | 45 | | | $ | 38,289 | |
3.15%, 04/15/50 | | | | | | | 29 | | | | 20,214 | |
2.70%, 08/01/52 | | | | | | | 61 | | | | 37,981 | |
5.85%, 09/15/54 | | | | | | | 19 | | | | 20,273 | |
5.30%, 02/01/55 | | | | | | | 185 | | | | 183,002 | |
NextEra Energy Capital Holdings, Inc. | | | | | | | | | | | | |
6.05%, 03/01/25 | | | | | | | 519 | | | | 520,974 | |
5.75%, 09/01/25 | | | | | | | 933 | | | | 937,003 | |
4.90%, 02/28/28 | | | | | | | 291 | | | | 290,087 | |
2.75%, 11/01/29 | | | | | | | 23 | | | | 20,539 | |
5.00%, 02/28/30 | | | | | | | 27 | | | | 27,093 | |
2.25%, 06/01/30 | | | | | | | 231 | | | | 196,690 | |
Northern States Power Co. | | | | | | | | | | | | |
2.60%, 06/01/51 | | | | | | | 298 | | | | 183,560 | |
4.50%, 06/01/52 | | | | | | | 100 | | | | 87,831 | |
NRG Energy, Inc. | | | | | | | | | | | | |
2.45%, 12/02/27(b) | | | | | | | 558 | | | | 501,565 | |
4.45%, 06/15/29(b) | | | | | | | 22 | | | | 20,797 | |
Ohio Power Co. | | | | | | | | | | | | |
4.00%, 06/01/49 | | | | | | | 469 | | | | 371,854 | |
Series D, 6.60%, 03/01/33 | | | | | | | 612 | | | | 655,112 | |
Series R, 2.90%, 10/01/51 | | | | | | | 106 | | | | 68,057 | |
Oncor Electric Delivery Co. LLC, 2.70%, 11/15/51 | | | | | | | 162 | | | | 101,763 | |
Pacific Gas & Electric Co. | | | | | | | | | | | | |
3.45%, 07/01/25 | | | | | | | 975 | | | | 948,425 | |
3.30%, 12/01/27 | | | | | | | 565 | | | | 525,017 | |
2.50%, 02/01/31 | | | | | | | 315 | | | | 261,947 | |
4.45%, 04/15/42 | | | | | | | 45 | | | | 36,863 | |
4.00%, 12/01/46 | | | | | | | 136 | | | | 101,915 | |
4.95%, 07/01/50 | | | | | | | 678 | | | | 583,210 | |
3.50%, 08/01/50 | | | | | | | 525 | | | | 358,710 | |
5.25%, 03/01/52 | | | | | | | 470 | | | | 419,396 | |
PacifiCorp | | | | | | | | | | | | |
4.13%, 01/15/49 | | | | | | | 28 | | | | 21,984 | |
3.30%, 03/15/51 | | | | | | | 32 | | | | 21,348 | |
2.90%, 06/15/52 | | | | | | | 365 | | | | 223,726 | |
5.35%, 12/01/53 | | | | | | | 24 | | | | 22,327 | |
5.50%, 05/15/54 | | | | | | | 23 | | | | 22,128 | |
PECO Energy Co. | | | | | | | | | | | | |
4.90%, 06/15/33 | | | | | | | 21 | | | | 21,005 | |
3.70%, 09/15/47 | | | | | | | 34 | | | | 26,671 | |
3.90%, 03/01/48 | | | | | | | 36 | | | | 29,178 | |
2.85%, 09/15/51 | | | | | | | 31 | | | | 20,012 | |
4.38%, 08/15/52 | | | | | | | 246 | | | | 213,570 | |
Public Service Co. of Colorado, Series 36, 2.70%, 01/15/51 | | | | | | | 341 | | | | 205,989 | |
Public Service Electric & Gas Co. | | | | | | | | | | | | |
3.10%, 03/15/32 | | | | | | | 272 | | | | 238,442 | |
4.90%, 12/15/32 | | | | | | | 959 | | | | 954,637 | |
2.05%, 08/01/50 | | | | | | | 79 | | | | 44,756 | |
3.00%, 03/01/51 | | | | | | | 311 | | | | 212,713 | |
San Diego Gas & Electric Co. | | | | | | | | | | | | |
4.95%, 08/15/28 | | | | | | | 895 | | | | 898,357 | |
3.70%, 03/15/52 | | | | | | | 285 | | | | 215,998 | |
5.35%, 04/01/53 | | | | | | | 120 | | | | 118,192 | |
Series TTT, 4.10%, 06/15/49 | | | | | | | 177 | | | | 144,236 | |
Series WWW, 2.95%, 08/15/51 | | | | | | | 36 | | | | 24,241 | |
Southern California Edison Co. | | | | | | | | | | | | |
1.10%, 04/01/24 | | | | | | | 1,135 | | | | 1,135,000 | |
4.00%, 04/01/47 | | | | | | | 490 | | | | 387,821 | |
3.65%, 02/01/50 | | | | | | | 73 | | | | 54,065 | |
| | | | | | | | | | | | |
| Security | | | | | Par (000) | | | Value | |
| | | |
| Electric Utilities (continued) | | | | | | | | | |
Southern California Edison Co. | | | | | | | | | | | | |
3.45%, 02/01/52 | | | USD | | | | 228 | | | $ | 161,076 | |
5.70%, 03/01/53 | | | | | | | 53 | | | | 53,113 | |
5.88%, 12/01/53 | | | | | | | 59 | | | | 60,806 | |
Series 20A, 2.95%, 02/01/51 | | | | | | | 251 | | | | 163,002 | |
Series B, 4.88%, 03/01/49 | | | | | | | 33 | | | | 29,485 | |
Series E, 3.70%, 08/01/25 | | | | | | | 355 | | | | 347,215 | |
Series E, 5.45%, 06/01/52 | | | | | | | 471 | | | | 460,481 | |
Series H, 3.65%, 06/01/51 | | | | | | | 305 | | | | 225,150 | |
Southern Co. (The) | | | | | | | | | | | | |
5.70%, 10/15/32 | | | | | | | 441 | | | | 454,600 | |
5.20%, 06/15/33 | | | | | | | 518 | | | | 517,598 | |
5.70%, 03/15/34 | | | | | | | 877 | | | | 904,489 | |
Tampa Electric Co. | | | | | | | | | | | | |
4.30%, 06/15/48 | | | | | | | 240 | | | | 200,628 | |
4.45%, 06/15/49 | | | | | | | 39 | | | | 33,401 | |
3.45%, 03/15/51 | | | | | | | 210 | | | | 149,277 | |
Vistra Operations Co. LLC | | | | | | | | | | | | |
3.55%, 07/15/24(b) | | | | | | | 1,679 | | | | 1,666,956 | |
5.13%, 05/13/25(b) | | | | | | | 2,498 | | | | 2,475,906 | |
Wisconsin Electric Power Co., 2.05%, 12/15/24 | | | | | | | 291 | | | | 284,265 | |
| | | | | | | | | | | | |
| | | |
| | | | | | | | | | | 36,835,638 | |
| | | |
| Electrical Equipment — 0.1% | | | | | | | | | |
Otis Worldwide Corp., 5.25%, 08/16/28 | | | | | | | 319 | | | | 323,145 | |
| | | | | | | | | | | | |
| |
| Energy Equipment & Services — 0.1% | | | | |
Halliburton Co. | | | | | | | | | | | | |
3.80%, 11/15/25 | | | | | | | 109 | | | | 106,543 | |
2.92%, 03/01/30 | | | | | | | 205 | | | | 183,831 | |
4.50%, 11/15/41 | | | | | | | 54 | | | | 48,119 | |
5.00%, 11/15/45 | | | | | | | 163 | | | | 153,033 | |
| | | | | | | | | | | | |
| | | |
| | | | | | | | | | | 491,526 | |
| | | |
| Financial Services — 2.0% | | | | | | | | | |
AerCap Ireland Capital DAC/AerCap Global Aviation Trust | | | | | | | | | | | | |
1.75%, 01/30/26 | | | | | | | 242 | | | | 225,958 | |
2.45%, 10/29/26 | | | | | | | 820 | | | | 761,501 | |
5.75%, 06/06/28 | | | | | | | 1,195 | | | | 1,210,951 | |
Aviation Capital Group LLC | | | | | | | | | | | | |
1.95%, 09/20/26(b) | | | | | | | 1,471 | | | | 1,344,105 | |
6.75%, 10/25/28(b) | | | | | | | 1,441 | | | | 1,502,360 | |
Fidelity National Information Services, Inc., 1.15%, 03/01/26 | | | | | | | 729 | | | | 674,914 | |
Glencore Funding LLC | | | | | | | | | | | | |
5.70%, 05/08/33(b) | | | | | | | 744 | | | | 756,041 | |
6.50%, 10/06/33(b) | | | | | | | 541 | | | | 578,678 | |
04/04/34(a)(b) | | | | | | | 1,042 | | | | 1,044,784 | |
Nasdaq, Inc., 5.55%, 02/15/34 | | | | | | | 387 | | | | 393,528 | |
| | | | | | | | | | | | |
| | | |
| | | | | | | | | | | 8,492,820 | |
| | | |
| Food Products — 0.2% | | | | | | | | | |
Kraft Heinz Foods Co. | | | | | | | | | | | | |
3.00%, 06/01/26 | | | | | | | 248 | | | | 237,380 | |
4.88%, 10/01/49 | | | | | | | 540 | | | | 488,658 | |
| | | | | | | | | | | | |
| | | |
| | | | | | | | | | | 726,038 | |
| | | |
| Ground Transportation — 1.8% | | | | | | | | | |
Burlington Northern Santa Fe LLC | | | | | | | | | | | | |
5.75%, 05/01/40 | | | | | | | 350 | | | | 369,618 | |
4.40%, 03/15/42 | | | | | | | 235 | | | | 211,690 | |
4.90%, 04/01/44 | | | | | | | 385 | | | | 365,899 | |
4.15%, 04/01/45 | | | | | | | 52 | | | | 44,382 | |
4.05%, 06/15/48 | | | | | | | 35 | | | | 29,154 | |
| | |
| 60 | | 2 0 2 4 BLACK ROCK ANNUAL REPORT TO SHAREHOLDERS |
| | |
Schedule of Investments (continued) March 31, 2024 | | BATS: Series C Portfolio (Percentages shown are based on Net Assets) |
| | | | | | | | | | | | |
| Security | | Par (000) | | | Value | |
|
| Ground Transportation (continued) | |
Burlington Northern Santa Fe LLC | | | | | | | | | | | | |
4.15%, 12/15/48 | | | USD | | | | 33 | | | $ | 28,044 | |
3.55%, 02/15/50 | | | | | | | 35 | | | | 26,593 | |
3.05%, 02/15/51 | | | | | | | 38 | | | | 26,084 | |
2.88%, 06/15/52 | | | | | | | 123 | | | | 80,535 | |
5.20%, 04/15/54 | | | | | | | 28 | | | | 27,754 | |
Canadian National Railway Co. | | | | | | | | | | | | |
3.85%, 08/05/32 | | | | | | | 553 | | | | 513,839 | |
5.85%, 11/01/33 | | | | | | | 65 | | | | 69,505 | |
3.65%, 02/03/48 | | | | | | | 25 | | | | 20,161 | |
4.45%, 01/20/49 | | | | | | | 23 | | | | 20,721 | |
4.40%, 08/05/52 | | | | | | | 23 | | | | 20,540 | |
6.13%, 11/01/53 | | | | | | | 18 | | | | 20,634 | |
CSX Corp. | | | | | | | | | | | | |
3.80%, 03/01/28 | | | | | | | 65 | | | | 62,876 | |
4.25%, 03/15/29 | | | | | | | 44 | | | | 43,072 | |
3.80%, 11/01/46 | | | | | | | 67 | | | | 53,291 | |
4.30%, 03/01/48 | | | | | | | 77 | | | | 66,522 | |
4.75%, 11/15/48 | | | | | | | 34 | | | | 31,257 | |
4.50%, 03/15/49 | | | | | | | 91 | | | | 79,853 | |
2.50%, 05/15/51 | | | | | | | 33 | | | | 20,213 | |
Norfolk Southern Corp. | | | | | | | | | | | | |
3.40%, 11/01/49 | | | | | | | 100 | | | | 73,302 | |
3.05%, 05/15/50 | | | | | | | 463 | | | | 313,145 | |
3.70%, 03/15/53 | | | | | | | 228 | | | | 171,293 | |
Penske Truck Leasing Co. LP/PTL Finance Corp. | | | | | | | | | | | | |
3.45%, 07/01/24(b) | | | | | | | 60 | | | | 59,632 | |
3.95%, 03/10/25(b) | | | | | | | 159 | | | | 156,467 | |
4.00%, 07/15/25(b) | | | | | | | 2,115 | | | | 2,071,126 | |
5.70%, 02/01/28(b) | | | | | | | 347 | | | | 351,712 | |
6.05%, 08/01/28(b) | | | | | | | 412 | | | | 423,901 | |
03/30/29(a)(b) | | | | | | | 295 | | | | 295,202 | |
Ryder System, Inc. | | | | | | | | | | | | |
2.85%, 03/01/27 | | | | | | | 272 | | | | 254,969 | |
5.65%, 03/01/28 | | | | | | | 35 | | | | 35,670 | |
5.25%, 06/01/28 | | | | | | | 459 | | | | 461,098 | |
Union Pacific Corp. | | | | | | | | | | | | |
4.50%, 09/10/48 | | | | | | | 182 | | | | 161,241 | |
3.50%, 02/14/53 | | | | | | | 86 | | | | 64,510 | |
3.84%, 03/20/60 | | | | | | | 422 | | | | 324,013 | |
| | | | | | | | | | | | |
| | | |
| | | | | | | | | | | 7,449,518 | |
| |
| Health Care Equipment & Supplies — 1.8% | | | | |
Abbott Laboratories | | | | | | | | | | | | |
3.75%, 11/30/26 | | | | | | | 85 | | | | 83,066 | |
4.75%, 11/30/36 | | | | | | | 170 | | | | 168,605 | |
5.30%, 05/27/40 | | | | | | | 132 | | | | 136,291 | |
4.75%, 04/15/43 | | | | | | | 134 | | | | 128,998 | |
Baxter International, Inc., 2.54%, 02/01/32 | | | | | | | 670 | | | | 553,654 | |
Becton Dickinson & Co. | | | | | | | | | | | | |
3.73%, 12/15/24 | | | | | | | 48 | | | | 47,380 | |
3.70%, 06/06/27 | | | | | | | 635 | | | | 610,070 | |
4.69%, 02/13/28 | | | | | | | 247 | | | | 244,489 | |
4.87%, 02/08/29 | | | | | | | 1,085 | | | | 1,078,522 | |
GE HealthCare Technologies, Inc., 5.55%, 11/15/24 | | | | | | | 775 | | | | 773,987 | |
Medtronic Global Holdings SCA, 4.25%, 03/30/28 | | | | | | | 461 | | | | 452,892 | |
Medtronic, Inc., 4.38%, 03/15/35 | | | | | | | 407 | | | | 389,180 | |
Solventum Corp. | | | | | | | | | | | | |
5.40%, 03/01/29(b) | | | | | | | 735 | | | | 736,481 | |
5.60%, 03/23/34(b) | | | | | | | 1,076 | | | | 1,079,519 | |
5.90%, 04/30/54(b) | | | | | | | 610 | | | | 608,498 | |
Thermo Fisher Scientific, Inc. | | | | | | | | | | | | |
2.00%, 10/15/31 | | | | | | | 62 | | | | 51,078 | |
| | | | | | | | | | | | |
| Security | | Par (000) | | | Value | |
|
| Health Care Equipment & Supplies (continued) | |
Thermo Fisher Scientific, Inc. | | | | | | | | | | | | |
4.95%, 11/21/32 | | | USD | | | | 426 | | | $ | 427,835 | |
5.09%, 08/10/33 | | | | | | | 102 | | | | 103,121 | |
| | | | | | | | | | | | |
| | | |
| | | | | | | | | | | 7,673,666 | |
| |
| Health Care Providers & Services — 3.1% | | | | |
Aetna, Inc. | | | | | | | | | | | | |
3.50%, 11/15/24 | | | | | | | 656 | | | | 647,231 | |
3.88%, 08/15/47 | | | | | | | 540 | | | | 411,972 | |
Banner Health | | | | | | | | | | | | |
2.91%, 01/01/42 | | | | | | | 183 | | | | 134,575 | |
2.91%, 01/01/51 | | | | | | | 65 | | | | 43,862 | |
Centene Corp. | | | | | | | | | | | | |
4.63%, 12/15/29 | | | | | | | 1,453 | | | | 1,379,448 | |
3.38%, 02/15/30 | | | | | | | 29 | | | | 25,663 | |
3.00%, 10/15/30 | | | | | | | 262 | | | | 224,638 | |
2.50%, 03/01/31 | | | | | | | 78 | | | | 64,157 | |
CommonSpirit Health | | | | | | | | | | | | |
3.35%, 10/01/29 | | | | | | | 450 | | | | 412,694 | |
2.78%, 10/01/30 | | | | | | | 139 | | | | 120,565 | |
3.91%, 10/01/50 | | | | | | | 340 | | | | 265,981 | |
12/01/54(a) | | | | | | | 180 | | | | 182,135 | |
Elevance Health, Inc. | | | | | | | | | | | | |
2.38%, 01/15/25 | | | | | | | 35 | | | | 34,141 | |
5.50%, 10/15/32 | | | | | | | 428 | | | | 438,850 | |
4.63%, 05/15/42 | | | | | | | 81 | | | | 73,577 | |
4.65%, 01/15/43 | | | | | | | 47 | | | | 42,778 | |
5.10%, 01/15/44 | | | | | | | 222 | | | | 210,751 | |
4.65%, 08/15/44 | | | | | | | 222 | | | | 200,031 | |
HCA, Inc. | | | | | | | | | | | | |
5.45%, 04/01/31 | | | | | | | 520 | | | | 522,712 | |
3.63%, 03/15/32 | | | | | | | 625 | | | | 553,273 | |
5.50%, 06/01/33 | | | | | | | 59 | | | | 59,212 | |
5.25%, 06/15/49 | | | | | | | 410 | | | | 374,218 | |
3.50%, 07/15/51 | | | | | | | 243 | | | | 167,862 | |
4.63%, 03/15/52 | | | | | | | 305 | | | | 254,908 | |
6.00%, 04/01/54 | | | | | | | 435 | | | | 441,517 | |
Hoag Memorial Hospital Presbyterian, 3.80%, 07/15/52. | | | | 251 | | | | 204,089 | |
Humana, Inc. | | | | | | | | | | | | |
5.95%, 03/15/34 | | | | | | | 460 | | | | 477,643 | |
04/15/54(a) | | | | | | | 385 | | | | 387,508 | |
Memorial Health Services, 3.45%, 11/01/49 | | | | | | | 191 | | | | 146,008 | |
Mount Nittany Medical Center Obligated Group, Series 2022, 3.80%, 11/15/52 | | | | | | | 140 | | | | 111,488 | |
Nationwide Children’s Hospital, Inc., 4.56%, 11/01/52 | | | | | | | 174 | | | | 160,276 | |
RWJ Barnabas Health, Inc. | | | | | | | | | | | | |
3.95%, 07/01/46 | | | | | | | 105 | | | | 87,066 | |
3.48%, 07/01/49 | | | | | | | 310 | | | | 239,104 | |
Sutter Health | | | | | | | | | | | | |
Series 2018, 4.09%, 08/15/48 | | | | | | | 33 | | | | 27,905 | |
Series 20A, 2.29%, 08/15/30 | | | | | | | 388 | | | | 332,556 | |
Series 20A, 3.36%, 08/15/50 | | | | | | | 177 | | | | 130,322 | |
UnitedHealth Group, Inc. | | | | | | | | | | | | |
04/15/31(a) | | | | | | | 1,141 | | | | 1,141,527 | |
3.50%, 08/15/39 | | | | | | | 433 | | | | 356,684 | |
2.75%, 05/15/40 | | | | | | | 215 | | | | 158,207 | |
5.70%, 10/15/40 | | | | | | | 382 | | | | 399,554 | |
4.63%, 11/15/41 | | | | | | | 370 | | | | 343,869 | |
4.75%, 07/15/45 | | | | | | | 238 | | | | 223,138 | |
4.25%, 06/15/48 | | | | | | | 40 | | | | 34,540 | |
3.70%, 08/15/49 | | | | | | | 150 | | | | 117,608 | |
2.90%, 05/15/50 | | | | | | | 75 | | | | 50,622 | |
3.25%, 05/15/51 | | | | | | | 48 | | | | 34,508 | |
| | |
SCHEDULES OF INVESTMENTS | | 61 |
| | |
Schedule of Investments (continued) March 31, 2024 | | BATS: Series C Portfolio (Percentages shown are based on Net Assets) |
| | | | | | | | | | | | |
| Security | | Par (000) | | | Value | |
|
| Health Care Providers & Services (continued) | |
UnitedHealth Group, Inc. | | | | | | | | | | | | |
4.75%, 05/15/52 | | | USD | | | | 60 | | | $ | 55,646 | |
5.88%, 02/15/53 | | | | | | | 385 | | | | 416,533 | |
04/15/54(a) | | | | | | | 285 | | | | 289,860 | |
3.88%, 08/15/59 | | | | | | | 41 | | | | 31,740 | |
| | | | | | | | | | | | |
| | | |
| | | | | | | | | | | 13,244,752 | |
| | | |
| Health Care REITs — 0.6% | | | | | | | | | |
Healthpeak OP LLC | | | | | | | | | | | | |
3.00%, 01/15/30 | | | | | | | 74 | | | | 65,536 | |
2.88%, 01/15/31 | | | | | | | 98 | | | | 84,139 | |
5.25%, 12/15/32 | | | | | | | 333 | | | | 330,283 | |
Ventas Realty LP, 3.00%, 01/15/30 | | | | | | | 273 | | | | 240,598 | |
Welltower OP LLC | | | | | | | | | | | | |
4.25%, 04/15/28 | | | | | | | 135 | | | | 130,886 | |
2.05%, 01/15/29 | | | | | | | 402 | | | | 349,921 | |
4.13%, 03/15/29 | | | | | | | 171 | | | | 163,653 | |
3.85%, 06/15/32 | | | | | | | 1,080 | | | | 976,955 | |
| | | | | | | | | | | | |
| | | |
| | | | | | | | | | | 2,341,971 | |
|
| Independent Power and Renewable Electricity Producers — 0.2% | |
Algonquin Power & Utilities Corp., 06/15/26(a)(d) | | | | | | | 730 | | | | 726,048 | |
| | | | | | | | | | | | |
|
| Industrial REITs — 0.3% | |
Prologis LP | | | | | | | | | | | | |
2.25%, 04/15/30 | | | | | | | 170 | | | | 147,343 | |
1.75%, 07/01/30 | | | | | | | 28 | | | | 23,258 | |
4.75%, 06/15/33 | | | | | | | 58 | | | | 56,835 | |
5.13%, 01/15/34 | | | | | | | 344 | | | | 345,491 | |
Prologis Targeted U.S. Logistics Fund LP | | | | | | | | | | | | |
5.25%, 04/01/29(b) | | | | | | | 310 | | | | 309,111 | |
5.50%, 04/01/34(b) | | | | | | | 430 | | | | 432,700 | |
| | | | | | | | | | | | |
| | | |
| | | | | | | | | | | 1,314,738 | |
|
| Insurance — 0.9% | |
Aon Corp., 2.80%, 05/15/30 | | | | | | | 88 | | | | 77,516 | |
Aon Corp./Aon Global Holdings PLC | | | | | | | | | | | | |
2.05%, 08/23/31 | | | | | | | 338 | | | | 275,723 | |
2.60%, 12/02/31 | | | | | | | 498 | | | | 419,004 | |
5.00%, 09/12/32 | | | | | | | 267 | | | | 264,598 | |
5.35%, 02/28/33 | | | | | | | 237 | | | | 238,283 | |
Aon North America, Inc. | | | | | | | | | | | | |
5.45%, 03/01/34 | | | | | | | 1,441 | | | | 1,457,633 | |
5.75%, 03/01/54 | | | | | | | 683 | | | | 700,215 | |
Marsh & McLennan Cos., Inc. | | | | | | | | | | | | |
3.75%, 03/14/26 | | | | | | | 200 | | | | 195,556 | |
2.25%, 11/15/30 | | | | | | | 91 | | | | 77,362 | |
Progressive Corp. (The) | | | | | | | | | | | | |
3.00%, 03/15/32 | | | | | | | 77 | | | | 67,090 | |
4.20%, 03/15/48 | | | | | | | 24 | | | | 20,792 | |
| | | | | | | | | | | | |
| | | |
| | | | | | | | | | | 3,793,772 | |
|
| Interactive Media & Services — 0.3% | |
Meta Platforms, Inc. | | | | | | | | | | | | |
3.85%, 08/15/32 | | | | | | | 398 | | | | 372,952 | |
4.95%, 05/15/33 | | | | | | | 126 | | | | 127,536 | |
4.45%, 08/15/52 | | | | | | | 288 | | | | 255,987 | |
5.60%, 05/15/53 | | | | | | | 112 | | | | 118,377 | |
Netflix, Inc. | | | | | | | | | | | | |
5.88%, 11/15/28 | | | | | | | 160 | | | | 166,325 | |
5.38%, 11/15/29(b) | | | | | | | 27 | | | | 27,553 | |
4.88%, 06/15/30(b) | | | | | | | 21 | | | | 20,853 | |
| | | | | | | | | | | | |
| | | |
| | | | | | | | | | | 1,089,583 | |
| | | | | | | | | | | | |
| Security | | Par (000) | | | Value | |
|
| IT Services — 0.5% | |
Fiserv, Inc. | | | | | | | | | | | | |
2.75%, 07/01/24 | | | USD | | | | 170 | | | $ | 168,732 | |
3.85%, 06/01/25 | | | | | | | 417 | | | | 409,084 | |
4.40%, 07/01/49 | | | | | | | 85 | | | | 72,113 | |
Global Payments, Inc. | | | | | | | | | | | | |
1.20%, 03/01/26 | | | | | | | 808 | | | | 747,422 | |
2.15%, 01/15/27 | | | | | | | 360 | | | | 332,203 | |
S&P Global, Inc. | | | | | | | | | | | | |
5.25%, 09/15/33(b) | | | | | | | 101 | | | | 103,206 | |
3.25%, 12/01/49 | | | | | | | 258 | | | | 186,686 | |
| | | | | | | | | | | | |
| | | |
| | | | | | | | | | | 2,019,446 | |
| | | |
| Machinery — 0.0% | | | | | | | | | |
Cummins, Inc., 5.45%, 02/20/54 | | | | | | | 170 | | | | 173,802 | |
| | | | | | | | | | | | |
| | | |
| Media — 1.4% | | | | | | | | | |
Charter Communications Operating LLC/Charter Communications Operating Capital | | | | | | | | | | | | |
6.38%, 10/23/35 | | | | | | | 370 | | | | 365,663 | |
6.48%, 10/23/45 | | | | | | | 34 | | | | 31,512 | |
5.38%, 05/01/47 | | | | | | | 512 | | | | 412,552 | |
5.75%, 04/01/48 | | | | | | | 122 | | | | 102,737 | |
5.13%, 07/01/49 | | | | | | | 633 | | | | 490,482 | |
4.80%, 03/01/50 | | | | | | | 635 | | | | 470,034 | |
3.70%, 04/01/51 | | | | | | | 424 | | | | 262,223 | |
3.90%, 06/01/52 | | | | | | | 623 | | | | 396,207 | |
5.25%, 04/01/53 | | | | | | | 301 | | | | 238,381 | |
Comcast Corp. | | | | | | | | | | | | |
3.75%, 04/01/40 | | | | | | | 582 | | | | 483,782 | |
4.60%, 08/15/45 | | | | | | | 231 | | | | 206,536 | |
3.40%, 07/15/46 | | | | | | | 490 | | | | 365,844 | |
4.00%, 03/01/48 | | | | | | | 40 | | | | 32,463 | |
4.00%, 11/01/49 | | | | | | | 102 | | | | 82,582 | |
2.80%, 01/15/51 | | | | | | | 116 | | | | 74,220 | |
2.89%, 11/01/51 | | | | | | | 260 | | | | 168,772 | |
2.45%, 08/15/52 | | | | | | | 144 | | | | 84,483 | |
2.94%, 11/01/56 | | | | | | | 1,461 | | | | 919,855 | |
Interpublic Group of Cos., Inc. (The), 3.38%, 03/01/41 | | | | | | | 103 | | | | 76,872 | |
Paramount Global | | | | | | | | | | | | |
5.85%, 09/01/43 | | | | | | | 328 | | | | 265,760 | |
4.90%, 08/15/44 | | | | | | | 78 | | | | 55,764 | |
4.60%, 01/15/45 | | | | | | | 115 | | | | 79,221 | |
Time Warner Cable LLC, 4.50%, 09/15/42 | | | | | | | 137 | | | | 101,353 | |
Warnermedia Holdings, Inc., 3.79%, 03/15/25 | | | | | | | 160 | | | | 157,035 | |
| | | | | | | | | | | | |
| | | |
| | | | | | | | | | | 5,924,333 | |
|
| Metals & Mining — 0.9% | |
BHP Billiton Finance U.S.A. Ltd., 5.50%, 09/08/53 | | | | | | | 29 | | | | 29,969 | |
Freeport-McMoRan, Inc., 5.40%, 11/14/34 | | | | | | | 206 | | | | 203,501 | |
Glencore Canada Corp., 6.20%, 06/15/35 | | | | | | | 38 | | | | 39,281 | |
Newmont Corp., 2.25%, 10/01/30 | | | | | | | 40 | | | | 34,038 | |
Steel Dynamics, Inc. | | | | | | | | | | | | |
2.40%, 06/15/25 | | | | | | | 372 | | | | 358,210 | |
1.65%, 10/15/27 | | | | | | | 612 | | | | 545,355 | |
3.25%, 10/15/50 | | | | | | | 180 | | | | 119,747 | |
Teck Resources Ltd. | | | | | | | | | | | | |
6.00%, 08/15/40 | | | | | | | 45 | | | | 45,146 | |
6.25%, 07/15/41 | | | | | | | 111 | | | | 113,385 | |
5.20%, 03/01/42 | | | | | | | 183 | | | | 167,193 | |
5.40%, 02/01/43 | | | | | | | 331 | | | | 308,096 | |
Vale Overseas Ltd. | | | | | | | | | | | | |
3.75%, 07/08/30 | | | | | | | 1,003 | | | | 902,073 | |
6.13%, 06/12/33 | | | | | | | 846 | | | | 852,345 | |
| | | | | | | | | | | | |
| | | |
| | | | | | | | | | | 3,718,339 | |
| | |
| 62 | | 2 0 2 4 BLACK ROCK ANNUAL REPORT TO SHAREHOLDERS |
| | |
Schedule of Investments (continued) March 31, 2024 | | BATS: Series C Portfolio (Percentages shown are based on Net Assets) |
| | | | | | | | | | | | |
| Security | | Par (000) | | | Value | |
|
| Multi-Utilities — 2.0% | |
CenterPoint Energy Houston Electric LLC | | | | | | | | | | | | |
4.95%, 04/01/33 | | | USD | | | | 20 | | | $ | 19,864 | |
5.30%, 04/01/53 | | | | | | | 20 | | | | 19,960 | |
Series AC, 4.25%, 02/01/49 | | | | | | | 35 | | | | 29,539 | |
Series AD, 2.90%, 07/01/50 | | | | | | | 30 | | | | 20,102 | |
Series AG, 3.00%, 03/01/32 | | | | | | | 318 | | | | 276,728 | |
Series AJ, 4.85%, 10/01/52 | | | | | | | 22 | | | | 20,469 | |
CMS Energy Corp. | | | | | | | | | | | | |
3.00%, 05/15/26 | | | | | | | 359 | | | | 342,290 | |
2.95%, 02/15/27 | | | | | | | 115 | | | | 107,809 | |
4.88%, 03/01/44 | | | | | | | 103 | | | | 95,680 | |
Constellation Energy Generation LLC, 6.13%, 01/15/34. | | | | | | | 21 | | | | 22,174 | |
Consumers Energy Co. | | | | | | | | | | | | |
4.90%, 02/15/29 | | | | | | | 1,348 | | | | 1,352,319 | |
2.50%, 05/01/60 | | | | | | | 131 | | | | 75,518 | |
Dominion Energy, Inc. | | | | | | | | | | | | |
3.90%, 10/01/25 | | | | | | | 650 | | | | 635,679 | |
Series A, 3.30%, 03/15/25 | | | | | | | 100 | | | | 97,911 | |
Series A, 1.45%, 04/15/26 | | | | | | | 533 | | | | 493,662 | |
Series C, 3.38%, 04/01/30 | | | | | | | 156 | | | | 141,772 | |
Series C, 2.25%, 08/15/31 | | | | | | | 119 | | | | 97,379 | |
NiSource, Inc. | | | | | | | | | | | | |
0.95%, 08/15/25 | | | | | | | 250 | | | | 235,264 | |
5.25%, 03/30/28 | | | | | | | 264 | | | | 265,815 | |
5.40%, 06/30/33 | | | | | | | 575 | | | | 579,625 | |
5.25%, 02/15/43 | | | | | | | 147 | | | | 138,976 | |
4.80%, 02/15/44 | | | | | | | 78 | | | | 69,774 | |
5.65%, 02/01/45 | | | | | | | 109 | | | | 107,984 | |
Sempra | | | | | | | | | | | | |
5.40%, 08/01/26 | | | | | | | 1,174 | | | | 1,177,395 | |
3.40%, 02/01/28 | | | | | | | 722 | | | | 682,189 | |
3.70%, 04/01/29 | | | | | | | 208 | | | | 194,460 | |
Virginia Electric & Power Co. | | | | | | | | | | | | |
6.35%, 11/30/37 | | | | | | | 313 | | | | 339,050 | |
4.00%, 01/15/43 | | | | | | | 49 | | | | 40,594 | |
Series B, 3.80%, 09/15/47 | | | | | | | 319 | | | | 246,734 | |
WEC Energy Group, Inc., 5.60%, 09/12/26 | | | | | | | 580 | | | | 586,703 | |
| | | | | | | | | | | | |
| | | |
| | | | | | | | | | | 8,513,418 | |
|
| Office REITs — 0.8% | |
Alexandria Real Estate Equities, Inc. | | | | | | | | | | | | |
4.70%, 07/01/30 | | | | | | | 292 | | | | 283,107 | |
4.90%, 12/15/30 | | | | | | | 759 | | | | 748,210 | |
1.88%, 02/01/33 | | | | | | | 657 | | | | 499,118 | |
2.95%, 03/15/34 | | | | | | | 158 | | | | 129,800 | |
4.85%, 04/15/49 | | | | | | | 32 | | | | 28,079 | |
4.00%, 02/01/50 | | | | | | | 239 | | | | 183,941 | |
3.55%, 03/15/52 | | | | | | | 62 | | | | 43,494 | |
5.15%, 04/15/53 | | | | | | | 78 | | | | 71,836 | |
Boston Properties LP | | | | | | | | | | | | |
2.90%, 03/15/30 | | | | | | | 143 | | | | 122,481 | |
2.45%, 10/01/33 | | | | | | | 160 | | | | 120,509 | |
Kilroy Realty LP | | | | | | | | | | | | |
4.25%, 08/15/29 | | | | | | | 167 | | | | 153,266 | |
3.05%, 02/15/30 | | | | | | | 220 | | | | 187,207 | |
2.65%, 11/15/33 | | | | | | | 166 | | | | 123,006 | |
6.25%, 01/15/36 | | | | | | | 667 | | | | 651,537 | |
| | | | | | | | | | | | |
| | | |
| | | | | | | | | | | 3,345,591 | |
|
| Oil, Gas & Consumable Fuels — 9.6% | |
Atmos Energy Corp. | | | | | | | | | | | | |
3.38%, 09/15/49 | | | | | | | 211 | | | | 153,572 | |
2.85%, 02/15/52 | | | | | | | 70 | | | | 45,373 | |
6.20%, 11/15/53 | | | | | | | 18 | | | | 20,278 | |
| | | | | | | | | | | | |
| Security | | Par (000) | | | Value | |
|
| Oil, Gas & Consumable Fuels (continued) | |
BP Capital Markets America, Inc., 3.06%, 06/17/41 | | | USD | | | | 1,142 | | | $ | 866,936 | |
Cameron LNG LLC | | | | | | | | | | | | |
3.30%, 01/15/35(b) | | | | | | | 505 | | | | 420,215 | |
3.40%, 01/15/38(b) | | | | | | | 25 | | | | 20,654 | |
Cenovus Energy, Inc. | | | | | | | | | | | | |
5.40%, 06/15/47 | | | | | | | 22 | | | | 20,721 | |
3.75%, 02/15/52 | | | | | | | 106 | | | | 77,934 | |
Cheniere Corpus Christi Holdings LLC | | | | | | | | | | | | |
5.88%, 03/31/25 | | | | | | | 2,246 | | | | 2,246,646 | |
3.70%, 11/15/29 | | | | | | | 194 | | | | 180,453 | |
Cheniere Energy Partners LP | | | | | | | | | | | | |
4.00%, 03/01/31 | | | | | | | 713 | | | | 648,052 | |
3.25%, 01/31/32 | | | | | | | 50 | | | | 42,592 | |
5.95%, 06/30/33 | | | | | | | 757 | | | | 773,936 | |
Cheniere Energy, Inc., 04/15/34(a)(b) | | | | | | | 730 | | | | 735,213 | |
Columbia Pipelines Holding Co. LLC, 6.06%, 08/15/26(b) | | | | | | | 240 | | | | 242,623 | |
ConocoPhillips Co. | | | | | | | | | | | | |
6.95%, 04/15/29 | | | | | | | 1,358 | | | | 1,492,208 | |
3.80%, 03/15/52 | | | | | | | 125 | | | | 97,610 | |
Coterra Energy, Inc., 3.90%, 05/15/27 | | | | | | | 27 | | | | 25,987 | |
DCP Midstream Operating LP, 3.25%, 02/15/32 | | | | | | | 2,058 | | | | 1,772,505 | |
Devon Energy Corp. | | | | | | | | | | | | |
4.50%, 01/15/30 | | | | | | | 239 | | | | 230,362 | |
4.75%, 05/15/42 | | | | | | | 318 | | | | 276,779 | |
Diamondback Energy, Inc. | | | | | | | | | | | | |
3.25%, 12/01/26 | | | | | | | 446 | | | | 427,548 | |
3.50%, 12/01/29 | | | | | | | 1,995 | | | | 1,845,451 | |
3.13%, 03/24/31 | | | | | | | 1,254 | | | | 1,110,927 | |
4.25%, 03/15/52 | | | | | | | 418 | | | | 338,342 | |
6.25%, 03/15/53 | | | | | | | 35 | | | | 37,760 | |
Enbridge, Inc. | | | | | | | | | | | | |
2.50%, 01/15/25 | | | | | | | 615 | | | | 600,396 | |
3.70%, 07/15/27 | | | | | | | 297 | | | | 285,483 | |
5.70%, 03/08/33 | | | | | | | 1,299 | | | | 1,330,376 | |
2.50%, 08/01/33 | | | | | | | 544 | | | | 438,334 | |
6.25%, 03/01/78 | | | | | | | 780 | | | | 759,159 | |
8.50%, 01/15/84 | | | | | | | 753 | | | | 818,161 | |
Series 20-A, 5.75%, 07/15/80 | | | | | | | 202 | | | | 191,172 | |
Series NC5, 8.25%, 01/15/84 | | | | | | | 285 | | | | 296,570 | |
Energy Transfer LP | | | | | | | | | | | | |
4.50%, 04/15/24 | | | | | | | 550 | | | | 549,700 | |
6.40%, 12/01/30 | | | | | | | 455 | | | | 480,286 | |
6.55%, 12/01/33 | | | | | | | 260 | | | | 279,108 | |
5.95%, 10/01/43 | | | | | | | 160 | | | | 158,080 | |
5.35%, 05/15/45 | | | | | | | 624 | | | | 576,218 | |
6.13%, 12/15/45 | | | | | | | 415 | | | | 417,135 | |
5.30%, 04/15/47 | | | | | | | 104 | | | | 94,554 | |
5.40%, 10/01/47 | | | | | | | 705 | | | | 650,622 | |
6.00%, 06/15/48 | | | | | | | 49 | | | | 48,703 | |
6.25%, 04/15/49 | | | | | | | 250 | | | | 256,584 | |
5.00%, 05/15/50 | | | | | | | 328 | | | | 287,777 | |
5.95%, 05/15/54 | | | | | | | 187 | | | | 186,616 | |
Enterprise Products Operating LLC | | | | | | | | | | | | |
3.95%, 02/15/27 | | | | | | | 213 | | | | 207,993 | |
5.70%, 02/15/42 | | | | | | | 139 | | | | 141,990 | |
4.45%, 02/15/43 | | | | | | | 158 | | | | 140,912 | |
4.80%, 02/01/49 | | | | | | | 406 | | | | 373,934 | |
4.20%, 01/31/50 | | | | | | | 509 | | | | 430,290 | |
3.20%, 02/15/52 | | | | | | | 182 | | | | 127,494 | |
EOG Resources, Inc., 4.95%, 04/15/50 | | | | | | | 59 | | | | 56,124 | |
| | |
SCHEDULES OF INVESTMENTS | | 63 |
| | |
Schedule of Investments (continued) March 31, 2024 | | BATS: Series C Portfolio (Percentages shown are based on Net Assets) |
| | | | | | | | | | | | |
| Security | | Par (000) | | | Value | |
|
| Oil, Gas & Consumable Fuels (continued) | |
EQT Corp. | | | | | | | | | | | | |
3.90%, 10/01/27 | | | USD | | | | 120 | | | $ | 114,064 | |
5.75%, 02/01/34 | | | | | | | 602 | | | | 600,013 | |
Hess Corp. | | | | | | | | | | | | |
4.30%, 04/01/27 | | | | | | | 293 | | | | 287,291 | |
5.60%, 02/15/41 | | | | | | | 609 | | | | 620,639 | |
5.80%, 04/01/47 | | | | | | | 303 | | | | 311,542 | |
Kinder Morgan Energy Partners LP | | | | | | | | | | | | |
6.50%, 09/01/39 | | | | | | | 81 | | | | 84,366 | |
4.70%, 11/01/42 | | | | | | | 253 | | | | 215,905 | |
Kinder Morgan, Inc. | | | | | | | | | | | | |
5.55%, 06/01/45 | | | | | | | 250 | | | | 238,546 | |
5.05%, 02/15/46 | | | | | | | 349 | | | | 309,872 | |
Marathon Oil Corp., 4.40%, 07/15/27 | | | | | | | 315 | | | | 306,099 | |
Marathon Petroleum Corp. | | | | | | | | | | | | |
4.70%, 05/01/25 | | | | | | | 86 | | | | 85,270 | |
4.75%, 09/15/44 | | | | | | | 161 | | | | 143,253 | |
MPLX LP | | | | | | | | | | | | |
1.75%, 03/01/26 | | | | | | | 714 | | | | 667,443 | |
5.20%, 12/01/47 | | | | | | | 37 | | | | 34,011 | |
4.95%, 03/14/52 | | | | | | | 380 | | | | 333,778 | |
5.65%, 03/01/53 | | | | | | | 33 | | | | 32,278 | |
Occidental Petroleum Corp. | | | | | | | | | | | | |
7.50%, 05/01/31 | | | | | | | 634 | | | | 705,717 | |
6.45%, 09/15/36 | | | | | | | 415 | | | | 442,500 | |
6.20%, 03/15/40 | | | | | | | 32 | | | | 32,836 | |
4.20%, 03/15/48 | | | | | | | 47 | | | | 36,138 | |
ONEOK, Inc. | | | | | | | | | | | | |
5.20%, 07/15/48 | | | | | | | 67 | | | | 61,507 | |
6.63%, 09/01/53 | | | | | | | 335 | | | | 369,204 | |
Ovintiv, Inc. | | | | | | | | | | | | |
5.65%, 05/15/25 | | | | | | | 1,298 | | | | 1,298,222 | |
5.65%, 05/15/28 | | | | | | | 1,503 | | | | 1,527,851 | |
Phillips 66, 3.30%, 03/15/52 | | | | | | | 356 | | | | 249,009 | |
Phillips 66 Co., 4.90%, 10/01/46 | | | | | | | 40 | | | | 36,800 | |
Pioneer Natural Resources Co. | | | | | | | | | | | | |
1.13%, 01/15/26 | | | | | | | 43 | | | | 40,017 | |
5.10%, 03/29/26 | | | | | | | 165 | | | | 164,792 | |
1.90%, 08/15/30 | | | | | | | 589 | | | | 494,788 | |
2.15%, 01/15/31 | | | | | | | 237 | | | | 199,398 | |
Plains All American Pipeline LP/PAA Finance Corp., | | | | | | | | | | | | |
4.30%, 01/31/43 | | | | | | | 197 | | | | 159,614 | |
Sabine Pass Liquefaction LLC | | | | | | | | | | | | |
5.88%, 06/30/26 | | | | | | | 111 | | | | 111,876 | |
5.00%, 03/15/27 | | | | | | | 145 | | | | 144,576 | |
4.20%, 03/15/28 | | | | | | | 188 | | | | 182,027 | |
Targa Resources Corp., 6.50%, 03/30/34 | | | | | | | 278 | | | | 298,704 | |
Targa Resources Partners LP/Targa Resources Partners Finance Corp., 4.00%, 01/15/32 | | | | | | | 235 | | | | 211,520 | |
Transcontinental Gas Pipe Line Co. LLC, 4.00%, 03/15/28 | | | | | | | 333 | | | | 320,801 | |
Valero Energy Corp., 4.00%, 06/01/52 | | | | | | | 28 | | | | 21,552 | |
Viper Energy, Inc., 7.38%, 11/01/31(b) | | | | | | | 705 | | | | 732,901 | |
Western Midstream Operating LP | | | | | | | | | | | | |
3.10%, 02/01/25 | | | | | | | 653 | | | | 638,924 | |
3.95%, 06/01/25 | | | | | | | 505 | | | | 494,567 | |
4.75%, 08/15/28 | | | | | | | 269 | | | | 261,662 | |
Williams Cos., Inc. (The) | | | | | | | | | | | | |
4.00%, 09/15/25 | | | | | | | 367 | | | | 359,999 | |
3.75%, 06/15/27 | | | | | | | 555 | | | | 534,086 | |
5.30%, 08/15/28 | | | | | | | 1,890 | | | | 1,906,009 | |
| | | | | | | | | | | | |
| | | |
| | | | | | | | | | | 40,756,415 | |
| | | | | | | | | | | | |
| Security | | Par (000) | | | Value | |
|
| Pharmaceuticals — 2.1% | |
Bayer U.S. Finance II LLC | | | | | | | | | | | | |
4.25%, 12/15/25(b) | | | USD | | | | 215 | | | $ | 209,632 | |
4.38%, 12/15/28(b) | | | | | | | 1,260 | | | | 1,185,954 | |
Bayer U.S. Finance LLC, 6.50%, 11/21/33(b) | | | | | | | 965 | | | | 981,895 | |
Bristol-Myers Squibb Co. | | | | | | | | | | | | |
5.10%, 02/22/31 | | | | | | | 150 | | | | 151,451 | |
4.35%, 11/15/47 | | | | | | | 55 | | | | 47,492 | |
4.55%, 02/20/48 | | | | | | | 52 | | | | 46,516 | |
5.55%, 02/22/54 | | | | | | | 493 | | | | 506,993 | |
6.40%, 11/15/63 | | | | | | | 200 | | | | 228,582 | |
Eli Lilly & Co. | | | | | | | | | | | | |
4.70%, 02/09/34 | | | | | | | 1,560 | | | | 1,551,310 | |
5.00%, 02/09/54 | | | | | | | 265 | | | | 263,508 | |
Merck & Co., Inc. | | | | | | | | | | | | |
3.70%, 02/10/45 | | | | | | | 25 | | | | 20,402 | |
4.00%, 03/07/49 | | | | | | | 37 | | | | 31,068 | |
5.00%, 05/17/53 | | | | | | | 32 | | | | 31,329 | |
Pfizer, Inc. | | | | | | | | | | | | |
2.55%, 05/28/40 | | | | | | | 29 | | | | 20,716 | |
4.30%, 06/15/43 | | | | | | | 552 | | | | 490,380 | |
4.40%, 05/15/44 | | | | | | | 3,119 | | | | 2,858,263 | |
Takeda Pharmaceutical Co. Ltd., 3.18%, 07/09/50 | | | | | | | 307 | | | | 213,948 | |
| | | | | | | | | | | | |
| | | |
| | | | | | | | | | | 8,839,439 | |
|
| Residential REITs — 0.4% | |
AvalonBay Communities, Inc. | | | | | | | | | | | | |
2.05%, 01/15/32 | | | | | | | 34 | | | | 27,949 | |
5.00%, 02/15/33 | | | | | | | 195 | | | | 193,176 | |
5.30%, 12/07/33 | | | | | | | 27 | | | | 27,316 | |
Camden Property Trust, 2.80%, 05/15/30 | | | | | | | 97 | | | | 86,028 | |
Invitation Homes Operating Partnership LP | | | | | | | | | | | | |
2.30%, 11/15/28 | | | | | | | 155 | | | | 137,146 | |
4.15%, 04/15/32 | | | | | | | 137 | | | | 125,379 | |
5.50%, 08/15/33 | | | | | | | 910 | | | | 906,494 | |
2.70%, 01/15/34 | | | | | | | 153 | | | | 121,788 | |
Mid-America Apartments LP | | | | | | | | | | | | |
3.60%, 06/01/27 | | | | | | | 98 | | | | 94,134 | |
1.70%, 02/15/31 | | | | | | | 42 | | | | 33,816 | |
UDR, Inc. | | | | | | | | | | | | |
3.00%, 08/15/31 | | | | | | | 63 | | | | 54,686 | |
2.10%, 08/01/32 | | | | | | | 72 | | | | 56,452 | |
| | | | | | | | | | | | |
| | | |
| | | | | | | | | | | 1,864,364 | |
|
| Retail REITs — 1.1% | |
Brixmor Operating Partnership LP | | | | | | | | | | | | |
2.25%, 04/01/28 | | | | | | | 170 | | | | 150,955 | |
2.50%, 08/16/31 | | | | | | | 125 | | | | 102,612 | |
Kimco Realty OP LLC, 3.20%, 04/01/32 | | | | | | | 341 | | | | 293,848 | |
Realty Income Corp. | | | | | | | | | | | | |
4.70%, 12/15/28 | | | | | | | 62 | | | | 61,065 | |
5.63%, 10/13/32 | | | | | | | 792 | | | | 808,496 | |
2.85%, 12/15/32 | | | | | | | 168 | | | | 139,722 | |
4.90%, 07/15/33 | | | | | | | 86 | | | | 83,093 | |
5.13%, 02/15/34 | | | | | | | 787 | | | | 772,266 | |
Regency Centers LP | | | | | | | | | | | | |
3.70%, 06/15/30 | | | | | | | 1,439 | | | | 1,326,975 | |
5.25%, 01/15/34 | | | | | | | 656 | | | | 653,503 | |
Simon Property Group LP | | | | | | | | | | | | |
2.25%, 01/15/32 | | | | | | | 369 | | | | 301,568 | |
5.50%, 03/08/33 | | | | | | | 152 | | | | 154,791 | |
| | | | | | | | | | | | |
| | | |
| | | | | | | | | | | 4,848,894 | |
|
| Semiconductors & Semiconductor Equipment — 1.4% | |
Analog Devices, Inc., 2.80%, 10/01/41 | | | | | | | 189 | | | | 137,205 | |
| | |
| 64 | | 2 0 2 4 BLACK ROCK ANNUAL REPORT TO SHAREHOLDERS |
| | |
Schedule of Investments (continued) March 31, 2024 | | BATS: Series C Portfolio (Percentages shown are based on Net Assets) |
| | | | | | | | | | | | |
| Security | | Par (000) | | | Value | |
|
| Semiconductors & Semiconductor Equipment (continued) | |
Applied Materials, Inc., 3.30%, 04/01/27 | | | USD | | | | 656 | | | $ | 630,566 | |
Broadcom, Inc. | | | | | | | | | | | | |
4.15%, 04/15/32(b) | | | | | | | 370 | | | | 343,263 | |
2.60%, 02/15/33(b) | | | | | | | 374 | | | | 303,748 | |
3.42%, 04/15/33(b) | | | | | | | 608 | | | | 527,075 | |
3.14%, 11/15/35(b) | | | | | | | 424 | | | | 342,550 | |
3.19%, 11/15/36(b) | | | | | | | 502 | | | | 399,518 | |
3.50%, 02/15/41(b) | | | | | | | 86 | | | | 66,750 | |
Intel Corp. | | | | | | | | | | | | |
3.05%, 08/12/51 | | | | | | | 30 | | | | 20,222 | |
5.70%, 02/10/53 | | | | | | | 566 | | | | 585,088 | |
5.60%, 02/21/54 | | | | | | | 230 | | | | 234,346 | |
5.90%, 02/10/63 | | | | | | | 313 | | | | 332,076 | |
KLA Corp. | | | | | | | | | | | | |
4.10%, 03/15/29 | | | | | | | 492 | | | | 480,494 | |
5.00%, 03/15/49 | | | | | | | 263 | | | | 255,508 | |
3.30%, 03/01/50 | | | | | | | 159 | | | | 116,710 | |
4.95%, 07/15/52 | | | | | | | 201 | | | | 193,734 | |
Lam Research Corp., 2.88%, 06/15/50 | | | | | | | 138 | | | | 94,236 | |
NVIDIA Corp., 3.50%, 04/01/40 | | | | | | | 316 | | | | 267,552 | |
NXP BV/NXP Funding LLC/NXP U.S.A., Inc., 2.50%, 05/11/31 | | | | | | | 502 | | | | 420,535 | |
QUALCOMM, Inc. | | | | | | | | | | | | |
4.30%, 05/20/47 | | | | | | | 239 | | | | 210,720 | |
4.50%, 05/20/52 | | | | | | | 67 | | | | 60,162 | |
| | | | | | | | | | | | |
| | | |
| | | | | | | | | | | 6,022,058 | |
|
| Software — 1.6% | |
Autodesk, Inc., 2.40%, 12/15/31 | | | | | | | 1,091 | | | | 913,726 | |
Black Knight InfoServ LLC, 3.63%, 09/01/28(b) | | | | | | | 985 | | | | 930,825 | |
Oracle Corp. | | | | | | | | | | | | |
3.60%, 04/01/40 | | | | | | | 150 | | | | 118,241 | |
5.38%, 07/15/40 | | | | | | | 800 | | | | 776,016 | |
3.65%, 03/25/41 | | | | | | | 125 | | | | 98,150 | |
4.50%, 07/08/44 | | | | | | | 300 | | | | 256,442 | |
4.13%, 05/15/45 | | | | | | | 364 | | | | 293,821 | |
4.00%, 07/15/46 | | | | | | | 172 | | | | 135,496 | |
4.00%, 11/15/47 | | | | | | | 1,006 | | | | 785,351 | |
3.60%, 04/01/50 | | | | | | | 1,280 | | | | 924,769 | |
3.95%, 03/25/51 | | | | | | | 61 | | | | 46,478 | |
4.38%, 05/15/55 | | | | | | | 27 | | | | 21,730 | |
VMware LLC | | | | | | | | | | | | |
4.70%, 05/15/30 | | | | | | | 180 | | | | 175,214 | |
2.20%, 08/15/31 | | | | | | | 1,440 | | | | 1,171,851 | |
| | | | | | | | | | | | |
| | | |
| | | | | | | | | | | 6,648,110 | |
|
| Specialized REITs — 0.4% | |
Extra Space Storage LP, 5.40%, 02/01/34 | | | | | | | 1,590 | | | | 1,583,007 | |
| | | | | | | | | | | | |
|
| Specialty Retail — 0.2% | |
Lowe’s Cos., Inc. | | | | | | | | | | | | |
4.55%, 04/05/49 | | | | | | | 199 | | | | 171,342 | |
5.13%, 04/15/50 | | | | | | | 484 | | | | 452,861 | |
3.00%, 10/15/50 | | | | | | | 504 | | | | 330,119 | |
| | | | | | | | | | | | |
| | | |
| | | | | | | | | | | 954,322 | |
|
| Technology Hardware, Storage & Peripherals — 0.6% | |
Dell International LLC/EMC Corp. | | | | | | | | | | | | |
5.85%, 07/15/25 | | | | | | | 125 | | | | 125,630 | |
6.02%, 06/15/26 | | | | | | | 79 | | | | 80,010 | |
04/15/34(a) | | | | | | | 236 | | | | 236,553 | |
3.38%, 12/15/41 | | | | | | | 82 | | | | 60,999 | |
8.35%, 07/15/46 | | | | | | | 43 | | | | 55,620 | |
3.45%, 12/15/51 | | | | | | | 55 | | | | 38,701 | |
Hewlett Packard Enterprise Co., 5.90%, 10/01/24 | | | | 810 | | | | 811,211 | |
| | | | | | | | | | | | |
| Security | | Par (000) | | | Value | |
|
| Technology Hardware, Storage & Peripherals (continued) | |
HP, Inc. | | | | | | | | | | | | |
2.20%, 06/17/25 | | | USD | | | | 1,200 | | | $ | 1,155,022 | |
4.75%, 01/15/28 | | | | | | | 109 | | | | 108,366 | |
| | | | | | | | | | | | |
| | | |
| | | | | | | | | | | 2,672,112 | |
Tobacco — 1.0% | | | | | | | | | | | | |
Altria Group, Inc. | | | | | | | | | | | | |
4.80%, 02/14/29 | | | | | | | 28 | | | | 27,725 | |
4.50%, 05/02/43 | | | | | | | 27 | | | | 22,749 | |
3.88%, 09/16/46 | | | | | | | 30 | | | | 22,470 | |
5.95%, 02/14/49 | | | | | | | 505 | | | | 513,954 | |
4.45%, 05/06/50 | | | | | | | 28 | | | | 22,264 | |
3.70%, 02/04/51 | | | | | | | 128 | | | | 89,448 | |
BAT Capital Corp. | | | | | | | | | | | | |
3.22%, 09/06/26 | | | | | | | 225 | | | | 214,068 | |
4.70%, 04/02/27 | | | | | | | 926 | | | | 910,595 | |
5.83%, 02/20/31 | | | | | | | 585 | | | | 590,020 | |
6.42%, 08/02/33 | | | | | | | 664 | | | | 694,592 | |
3.73%, 09/25/40 | | | | | | | 324 | | | | 240,108 | |
3.98%, 09/25/50 | | | | | | | 139 | | | | 97,758 | |
7.08%, 08/02/53 | | | | | | | 440 | | | | 474,341 | |
Reynolds American, Inc. | | | | | | | | | | | | |
5.70%, 08/15/35 | | | | | | | 380 | | | | 371,065 | |
7.00%, 08/04/41 | | | | | | | 26 | | | | 27,122 | |
| | | | | | | | | | | | |
| | | |
| | | | | | | | | | | 4,318,279 | |
|
| Trading Companies & Distributors — 0.6% | |
Air Lease Corp. | | | | | | | | | | | | |
3.38%, 07/01/25 | | | | | | | 844 | | | | 822,485 | |
1.88%, 08/15/26 | | | | | | | 1,740 | | | | 1,604,204 | |
| | | | | | | | | | | | |
| | | |
| | | | | | | | | | | 2,426,689 | |
|
| Wireless Telecommunication Services — 1.9% | |
America Movil SAB de CV, 4.38%, 04/22/49 | | | | | | | 525 | | | | 451,500 | |
Rogers Communications, Inc. | | | | | | | | | | | | |
3.80%, 03/15/32 | | | | | | | 3,119 | | | | 2,803,040 | |
4.30%, 02/15/48 | | | | | | | 231 | | | | 188,879 | |
4.35%, 05/01/49 | | | | | | | 51 | | | | 41,834 | |
3.70%, 11/15/49 | | | | | | | 133 | | | | 97,592 | |
4.55%, 03/15/52 | | | | | | | 1,490 | | | | 1,253,730 | |
T-Mobile U.S.A., Inc. | | | | | | | | | | | | |
2.05%, 02/15/28 | | | | | | | 765 | | | | 685,446 | |
3.88%, 04/15/30 | | | | | | | 723 | | | | 677,294 | |
2.70%, 03/15/32 | | | | | | | 451 | | | | 379,263 | |
4.38%, 04/15/40 | | | | | | | 350 | | | | 311,725 | |
3.00%, 02/15/41 | | | | | | | 165 | | | | 121,530 | |
4.50%, 04/15/50 | | | | | | | 150 | | | | 130,020 | |
3.30%, 02/15/51 | | | | | | | 265 | | | | 185,297 | |
3.40%, 10/15/52 | | | | | | | 780 | | | | 553,249 | |
| | | | | | | | | | | | |
| | | |
| | | | | | | | | | | 7,880,399 | |
| | | | | | | | | | | | |
|
| Total Corporate Bonds — 86.2% | |
(Cost: $375,921,505) | | | | | | | | | | | 365,103,416 | |
| | | | | | | | | | | | |
| |
Foreign Agency Obligations | | | | | |
|
| Mexico — 1.4% | |
Petroleos Mexicanos | | | | | | | | | | | | |
6.88%, 08/04/26 | | | | | | | 2,775 | | | | 2,692,444 | |
6.70%, 02/16/32 | | | | | | | 2,470 | | | | 2,056,275 | |
7.69%, 01/23/50 | | | | | | | 1,782 | | | | 1,280,402 | |
| | | | | | | | | | | | |
| | | |
| | | | | | | | | | | 6,029,121 | |
| | |
SCHEDULES OF INVESTMENTS | | 65 |
| | |
Schedule of Investments (continued) March 31, 2024 | | BATS: Series C Portfolio (Percentages shown are based on Net Assets) |
| | | | | | | | | | | | |
| Security | | Par (000) | | | Value | |
|
| Panama — 0.1% | |
Banco Nacional de Panama, 2.50%, 08/11/30(b) | | | USD | | | | 560 | | | $ | 434,700 | |
| | | | | | | | | | | | |
|
| Total Foreign Agency Obligations — 1.5% | |
(Cost: $6,380,672) | | | | | | | | | | | 6,463,821 | |
| | | | | | | | | | | | |
|
Foreign Government Obligations | |
|
| Chile — 0.2% | |
Republic of Chile, 3.50%, 01/25/50 | | | | | | | 955 | | | | 695,861 | |
| | | | | | | | | | | | |
| | | |
| Hungary — 0.1% | | | | | | | | | |
Hungarian People’s Republic, 6.75%, 09/25/52(b) | | | | | | | 590 | | | | 633,707 | |
| | | | | | | | | | | | |
| | | |
| Indonesia — 0.2% | | | | | | | | | |
Republic of Indonesia, 5.45%, 09/20/52 | | | | | | | 700 | | | | 707,219 | |
| | | | | | | | | | | | |
| | | |
| Italy — 0.3% | | | | | | | | | |
Republic of Italy, 0.88%, 05/06/24 | | | | | | | 1,332 | | | | 1,325,739 | |
| | | | | | | | | | | | |
| | | |
| Mexico — 0.7% | | | | | | | | | |
United Mexican States | | | | | | | | | | | | |
6.34%, 05/04/53 | | | | | | | 1,316 | | | | 1,301,606 | |
6.40%, 05/07/54 | | | | | | | 1,750 | | | | 1,748,360 | |
| | | | | | | | | | | | |
| | | |
| | | | | | | | | | | 3,049,966 | |
| | | |
| Panama — 0.3% | | | | | | | | | |
Republic of Panama | | | | | | | | | | | | |
3.16%, 01/23/30 | | | | | | | 600 | | | | 498,187 | |
7.50%, 03/01/31 | | | | | | | 365 | | | | 378,003 | |
4.50%, 04/01/56 | | | | | | | 200 | | | | 129,500 | |
4.50%, 01/19/63 | | | | | | | 765 | | | | 489,122 | |
| | | | | | | | | | | | |
| | | |
| | | | | | | | | | | 1,494,812 | |
| | | |
| Peru — 0.2% | | | | | | | | | |
Republic of Peru | | | | | | | | | | | | |
3.00%, 01/15/34 | | | | | | | 515 | | | | 422,139 | |
3.30%, 03/11/41 | | | | | | | 410 | | | | 307,756 | |
2.78%, 12/01/60 | | | | | | | 285 | | | | 164,499 | |
| | | | | | | | | | | | |
| | | |
| | | | | | | | | | | 894,394 | |
| | | |
| Philippines — 0.3% | | | | | | | | | |
Republic of Philippines, 5.50%, 01/17/48 | | | | | | | 1,110 | | | | 1,125,385 | |
| | | | | | | | | | | | |
| | | |
| Romania — 0.2% | | | | | | | | | |
Romania, 7.63%, 01/17/53(b) | | | | | | | 604 | | | | 670,440 | |
| | | | | | | | | | | | |
| | | |
| Saudi Arabia — 0.3% | | | | | | | | | |
Kingdom of Saudi Arabia | | | | | | | | | | | | |
5.00%, 01/18/53(b) | | | | | | | 900 | | | | 805,500 | |
5.75%, 01/16/54(b) | | | | | | | 590 | | | | 583,916 | |
| | | | | | | | | | | | |
| | | |
| | | | | | | | | | | 1,389,416 | |
| | | | | | | | | | | | |
Total Foreign Government Obligations — 2.8% | | | | | |
(Cost: $12,399,054) | | | | | | | | | | | 11,986,939 | |
| | | | | | | | | | | | |
| | | |
Municipal Bonds | | | | | | | | | | | | |
| | | |
| California — 0.6% | | | | | | | | | |
Los Angeles Department of Water & Power Power System RB, 6.57%, 07/01/45 | | | | | | | 1,075 | | | | 1,228,791 | |
State of California, GO, 7.63%, 03/01/40 | | | | | | | 950 | | | | 1,163,116 | |
| | | | | | | | | | | | |
| | | |
| | | | | | | | | | | 2,391,907 | |
| | | |
| Illinois — 0.3% | | | | | | | | | |
Chicago O’Hare International Airport RB, Series B, 6.40%, 01/01/40 | | | | | | | 1,000 | | | | 1,098,851 | |
| | | | | | | | | | | | |
| | | |
| New York — 0.5% | | | | | | | | | |
Metropolitan Transportation Authority, New York RB, 7.34%, 11/15/39 | | | | | | | 1,125 | | | | 1,376,531 | |
| | | | | | | | | | | | |
| Security | | Par (000) | | | Value | |
|
| New York (continued) | |
New York State Dormitory Authority RB, Series F, 3.11%, 02/15/39 | | | USD | | | | 590 | | | $ | 507,259 | |
Port Authority of New York & New Jersey RB, 4.46%, 10/01/62 | | | | | | | 385 | | | | 346,057 | |
| | | | | | | | | | | | |
| | | |
| | | | | | | | | | | 2,229,847 | |
| | | | | | | | | | | | |
Total Municipal Bonds — 1.4% | | | | | | | | | | | | |
(Cost: $5,550,147) | | | | | | | | | | | 5,720,605 | |
| | | | | | | | | | | | |
| | | |
Preferred Securities | | | | | | | | | | | | |
|
| Capital Trusts — 4.9% | |
| | | |
| Banks — 2.6% | | | | | | | | | |
Bank of America Corp. | | | | | | | | | | | | |
Series FF, 5.88%(e) | | | | | | | 362 | | | | 356,462 | |
Series RR, 4.38%(e) | | | | | | | 427 | | | | 400,288 | |
Bank of Montreal, 7.70%, 05/26/84 | | | | | | | 213 | | | | 215,503 | |
Barclays PLC | | | | | | | | | | | | |
4.38%(e) | | | | | | | 627 | | | | 514,007 | |
9.63%(e) | | | | | | | 625 | | | | 662,751 | |
BNP Paribas SA | | | | | | | | | | | | |
4.63%(b)(e) | | | | | | | 400 | | | | 329,971 | |
8.50%(b)(e) | | | | | | | 610 | | | | 637,604 | |
Citigroup, Inc., Series X, 3.88%(e) | | | | | | | 427 | | | | 402,991 | |
Credit Agricole SA, 4.75%(b)(e) | | | | | | | 580 | | | | 509,410 | |
ING Groep NV, 3.88%(e) | | | | | | | 640 | | | | 534,976 | |
JPMorgan Chase & Co. | | | | | | | | | | | | |
Series KK, 3.65%(e) | | | | | | | 435 | | | | 413,136 | |
Series U, (3-mo. CME Term SOFR + 1.21%), 6.53%, 02/02/37(c) | | | | | | | 46 | | | | 42,147 | |
Series W, (3-mo. CME Term SOFR + 1.26%), 6.57%, 05/15/47(c) | | | | | | | 169 | | | | 150,407 | |
Lloyds Banking Group PLC, 8.00%(e) | | | | | | | 526 | | | | 529,612 | |
NatWest Group PLC, 6.00%(e) | | | | | | | 810 | | | | 790,958 | |
PNC Financial Services Group, Inc. (The) | | | | | | | | | | | | |
Series T, 3.40%(e) | | | | | | | 723 | | | | 631,931 | |
Series U, 6.00%(e) | | | | | | | 422 | | | | 412,525 | |
Series W, 6.25%(e) | | | | | | | 423 | | | | 409,960 | |
Sumitomo Mitsui Financial Group, Inc., 6.60%(e) | | | | | | | 826 | | | | 827,048 | |
Truist Financial Corp. | | | | | | | | | | | | |
Series P, 4.95%(e) | | | | | | | 235 | | | | 230,555 | |
Series Q, 5.10%(e) | | | | | | | 206 | | | | 191,629 | |
U.S. Bancorp | | | | | | | | | | | | |
3.70%(e) | | | | | | | 575 | | | | 498,703 | |
Series J, 5.30%(e) | | | | | | | 349 | | | | 334,135 | |
Wells Fargo & Co., Series BB, 3.90%(e) | | | | | | | 869 | | | | 826,789 | |
| | | | | | | | | | | | |
| | | |
| | | | | | | | | | | 10,853,498 | |
| | | |
| Capital Markets — 1.4% | | | | | | | | | |
Charles Schwab Corp. (The) | | | | | | | | | | | | |
Series H, 4.00%(e) | | | | | | | 345 | | | | 291,095 | |
Series I, 4.00%(e) | | | | | | | 1,896 | | | | 1,773,848 | |
Goldman Sachs Group, Inc. (The) | | | | | | | | | | | | |
Series T, 3.80%(e) | | | | | | | 417 | | | | 388,407 | |
Series U, 3.65%(e) | | | | | | | 456 | | | | 416,493 | |
UBS Group AG | | | | | | | | | | | | |
4.38%(b)(e) | | | | | | | 1,140 | | | | 937,446 | |
4.88%(b)(e) | | | | | | | 770 | | | | 707,027 | |
7.00%(e)(f) | | | | | | | 273 | | | | 272,400 | |
9.25%(b)(e) | | | | | | | 883 | | | | 996,498 | |
9.25%(b)(e) | | | | | | | 335 | | | | 362,964 | |
| | | | | | | | | | | | |
| | | |
| | | | | | | | | | | 6,146,178 | |
| | |
| 66 | | 2 0 2 4 BLACK ROCK ANNUAL REPORT TO SHAREHOLDERS |
| | |
Schedule of Investments (continued) March 31, 2024 | | BATS: Series C Portfolio (Percentages shown are based on Net Assets) |
| | | | | | | | | | | | |
| Security | | Par (000) | | | Value | |
| | | |
| Consumer Finance — 0.0% | | | | | | | | | |
Capital One Financial Corp., Series M, 3.95%(e) | | | USD | | | | 217 | | | $ | 192,756 | |
| | | | | | | | | | | | |
| | | |
| Electric Utilities — 0.6% | | | | | | | | | |
American Electric Power Co., Inc., 5.70%, 08/15/25 | | | | | | | 1,383 | | | | 1,385,830 | |
Edison International, 7.88%, 06/15/54 | | | | | | | 565 | | | | 580,439 | |
Southern Co. (The), 4.48%, 08/01/24(d) | | | | | | | 662 | | | | 658,707 | |
| | | | | | | | | | | | |
| | | |
| | | | | | | | | | | 2,624,976 | |
| | | |
| Insurance — 0.1% | | | | | | | | | |
Sumitomo Life Insurance Co., 5.88%(b)(e) | | | | 240 | | | | 239,057 | |
| | | | | | | | | | | | |
| |
| Oil, Gas & Consumable Fuels — 0.2% | | | | |
BP Capital Markets PLC, 6.45%(e) | | | | | | | 605 | | | | 626,532 | |
Transcanada Trust, 5.60%, 03/07/82 | | | | | | | 38 | | | | 34,690 | |
| | | | | | | | | | | | |
| | | |
| | | | | | | | | | | 661,222 | |
| | | | | | | | | | | | |
Total Preferred Securities — 4.9%
(Cost: $20,504,151) | | | | 20,717,687 | |
| | | | | | | | | | | | |
| | | |
U.S. Treasury Obligations | | | | | | | | | | | | |
U.S. Treasury Bonds | | | | | | | | | | | | |
4.75%, 11/15/43 | | | | | | | 225 | | | | 233,402 | |
3.00%, 05/15/45 | | | | | | | 250 | | | | 199,317 | |
2.75%, 08/15/47 | | | | | | | 2,110 | | | | 1,579,038 | |
U.S. Treasury Notes, 4.63%, 02/28/26 | | | | | | | 4,800 | | | | 4,796,063 | |
| | | | | | | | | | | | |
| |
Total U.S. Treasury Obligations — 1.6%
(Cost: $7,007,218) | | | | 6,807,820 | |
| | | | | | | | | | | | |
| |
Total Long-Term Investments — 98.4%
(Cost: $427,762,747) | | | | 416,800,288 | |
| | | | | | | | | | | | |
| | | | | | | | | | | | |
| Security | | Shares | | | Value | |
| | | |
Short-Term Securities | | | | | | | | | | | | |
| | | |
| Money Market Funds — 0.9% | | | | | | | | | |
Dreyfus Treasury Securities Cash Management, Institutional Class,
5.19%(g) | | | | | | | 3,672,106 | | | $ | 3,672,106 | |
| | | | | | | | | | | | |
| | | |
Total Short-Term Securities — 0.9% | | | | | | | | | | | | |
(Cost: $3,672,106) | | | | | | | | | | | 3,672,106 | |
| | | | | | | | | | | | |
| | | |
Options Purchased — 0.2% | | | | | | | | | | | | |
(Cost: $859,491) | | | | | | | | | | | 951,410 | |
| | | | | | | | | | | | |
| | | |
Total Investments — 99.5% | | | | | | | | | | | | |
(Cost: $432,294,344) | | | | | | | | | | | 421,423,804 | |
Other Assets Less Liabilities — 0.5% | | | | | | | | | | | 2,173,236 | |
| | | | | | | | | | | | |
| | | |
Net Assets — 100.0% | | | | | | | | | | $ | 423,597,040 | |
| | | | | | | | | | | | |
| (a) | When-issued security. |
| (b) | Security exempt from registration pursuant to Rule 144A under the Securities Act of 1933, as amended. These securities may be resold in transactions exempt from registration to qualified institutional investors. |
| (c) | Variable rate security. Interest rate resets periodically. The rate shown is the effective interest rate as of period end. Security description also includes the reference rate and spread if published and available. |
| (d) | Step coupon security. Coupon rate will either increase (step-up bond) or decrease (step-down bond) at regular intervals until maturity. Interest rate shown reflects the rate currently in effect. |
| (e) | Perpetual security with no stated maturity date. |
| (f) | This security may be resold to qualified foreign investors and foreign institutional buyers under Regulation S of the Securities Act of 1933. |
| (g) | Annualized 7-day yield as of period end. |
For purposes of this report, industry and sector sub-classifications may differ from those utilized by the Fund for compliance purposes.
Derivative Financial Instruments Outstanding as of Period End
Futures Contracts
| | | | | | | | | | | | | | | | |
| | | | | |
| Description | | Number of Contracts | | | Expiration Date | | | Notional Amount (000) | | | Value/ Unrealized Appreciation (Depreciation) | |
| | | | |
Long Contracts | | | | | | | | | | | | | | | | |
U.S. Treasury Bonds (30 Year) | | | 24 | | | | 06/18/24 | | | $ | 2,891 | | | $ | (21,449 | ) |
U.S. Treasury Notes (10 Year) | | | 2 | | | | 06/18/24 | | | | 222 | | | | 278 | |
U.S. Ultra Treasury Bonds | | | 69 | | | | 06/18/24 | | | | 8,901 | | | | 21,739 | |
U.S. Treasury Notes (2 Year) | | | 193 | | | | 06/28/24 | | | | 39,465 | | | | (88,905 | ) |
U.S. Treasury Notes (5 Year) | | | 248 | | | | 06/28/24 | | | | 26,540 | | | | 63,681 | |
| | | | | | | | | | | | | | | | |
| | | | |
| | | | | | | | | | | | | | | (24,656 | ) |
| | | | | | | | | | | | | | | | |
Short Contracts | | | | | | | | | | | | | | | | |
U.S. Ultra Treasury Notes (10 Year) | | | 78 | | | | 06/18/24 | | | | 8,940 | | | | 7,724 | |
| | | | | | | | | | | | | | | | |
| | | | |
| | | | | | | | | | | | | | $ | (16,932 | ) |
| | | | | | | | | | | | | | | | |
| | |
SCHEDULES OF INVESTMENTS | | 67 |
| | |
Schedule of Investments (continued) March 31, 2024 | | BATS: Series C Portfolio |
OTC Interest Rate Swaptions Purchased
| | | | | | | | | | | | | | | | | | | | | | | | | | |
| |
| | | | | | | | | | | | | | | | | | | | | Notional | | | | | |
| | Paid by the Fund | | Received by the Fund | | | | | Expiration | | | | Exercise | | | | Amount | | | | | |
| | | | | | | | | | | | | | | | | | | | | | |
| Description | | Rate | | Frequency | | Rate | | Frequency | | Counterparty | | Date | | | Rate | | | (000) | | | Value | |
| |
| | | | | | | | | |
Put | | | | | | | | | | | | | | | | | | | | | | | | | | |
2-Year Interest
Rate Swap,
01/18/27 | | 3.96% | | Annual | | 1-day SOFR, 5.34% | | Annual | | Bank of America N.A. | | | 01/16/25 | | | | 3.96 | % | | | USD 60,200 | | | $ | 470,983 | |
10-Year Interest Rate Swap, 02/14/35 | | 4.27% | | Annual | | 1-day SOFR, 5.34% | | Annual | | JPMorgan Chase Bank N.A. | | | 02/12/25 | | | | 4.27 | % | | | USD 14,340 | | | | 211,308 | |
30-Year Interest Rate Swap, 03/07/55 | | 3.75% | | Annual | | 1-day SOFR, 5.34% | | Annual | | Deutsche Bank AG | | | 03/05/25 | | | | 3.75 | % | | | USD 6,380 | | | | 269,119 | |
| | | | | | | | | | | | | | | | | | | | | | | | | | |
| | | | | | | | | |
| | | | | | | | | | | | | | | | | | | | | | | | | 951,410 | |
| | | | | | | | | | | | | | | | | | | | | | | | | | |
Centrally Cleared Credit Default Swaps — Sell Protection
| | | | | | | | | | | | | | | | | | | | | | | | | | | | | | | | | | | | | | | | |
| | | Reference Obligation/Index | | Financing Rate Received by the Fund | | | Payment Frequency | | | Termination Date | | | Credit
Rating(a) | | | | | | Notional Amount (000)(b) | | | Value | | | Upfront Premium Paid (Received) | | | Unrealized Appreciation (Depreciation) | | | |
| | | | | | | | | | | |
| | CDX.NA.IG.42.V1 | | | 1.00 | % | | | Quarterly | | | | 06/20/29 | | | | BBB+ | | | | USD | | | | 10,050 | | | $ | (230,375 | ) | | $ | (218,225 | ) | | $ | (12,150 | ) | | |
| | | | | | | | | | | | | | | | | | | | | | | | | | | | | | | | | | | | | | | | |
| | (a) | Using the rating of the issuer or the underlying securities of the index, as applicable, provided by S&P Global Ratings. | |
| | (b) | The maximum potential amount the Fund may pay should a negative credit event take place as defined under the terms of the agreement. | |
Centrally Cleared Interest Rate Swaps
| | | | | | | | | | | | | | | | | | | | | | | | | | | | | | | | | | | | | | |
| | | | | |
| | | | | | | | | | | | | | | | | | | | | | | | | | Upfront | | | | | | |
| | | | | | | | | | | | | | | | | | | | Notional | | | | | | Premium | | | Unrealized | | | |
| | | Paid by the Fund | | Received by the Fund | | Effective | | | Termination | | | | | | Amount | | | | | | Paid | | | Appreciation | | | |
| | | | | | | | | | | | | | | | | | | | | | | | | | | | | | | | | | |
| | | Rate | | Frequency | | Rate | | Frequency | | Date | | | Date | | | | | | (000) | | | Value | | | (Received) | | | (Depreciation) | | | |
| | | | | |
| | 1-day SOFR, 5.34% | | Annual | | 3.83% | | Annual | | | 01/14/25(a) | | | | 01/14/27 | | | | USD | | | | 6,790 | | | $ | (12,904 | ) | | $ | — | | | $ | (12,904 | ) | | |
| | 1-day SOFR, 5.34% | | Annual | | 3.44% | | Annual | | | 01/21/25(a) | | | | 01/21/27 | | | | USD | | | | 21,130 | | | | (188,830 | ) | | | — | | | | (188,830 | ) | | |
| | 1-day SOFR, 5.34% | | Annual | | 3.98% | | Annual | | | 01/21/25(a) | | | | 01/21/27 | | | | USD | | | | 3,360 | | | | 3,221 | | | | 585 | | | | 2,636 | | | |
| | 3.80% | | Annual | | 1-day SOFR, 5.34% | | Annual | | | 01/21/25(a) | | | | 01/21/27 | | | | USD | | | | 1,870 | | | | 4,375 | | | | (844 | ) | | | 5,219 | | | |
| | 1-day SOFR, 5.34% | | Annual | | 3.77% | | Annual | | | 02/14/25(a) | | | | 02/14/35 | | | | USD | | | | 4,431 | | | | 25,623 | | | | — | | | | 25,623 | | | |
| | 1-day SOFR, 5.34% | | Annual | | 3.81% | | Annual | | | 02/14/25(a) | | | | 02/14/35 | | | | USD | | | | 770 | | | | 6,905 | | | | (107 | ) | | | 7,012 | | | |
| | 3.62% | | Annual | | 1-day SOFR, 5.34% | | Annual | | | 02/14/25(a) | | | | 02/14/35 | | | | USD | | | | 180 | | | | 1,072 | | | | (40 | ) | | | 1,112 | | | |
| | 3.67% | | Annual | | 1-day SOFR, 5.34% | | Annual | | | 03/04/25(a) | | | | 03/04/35 | | | | USD | | | | 500 | | | | 902 | | | | (275 | ) | | | 1,177 | | | |
| | 1-day SOFR, 5.34% | | Annual | | 3.40% | | Annual | | | 03/07/25(a) | | | | 03/07/55 | | | | USD | | | | 1,952 | | | | (40,371 | ) | | | — | | | | (40,371 | ) | | |
| | 1-day SOFR, 5.34% | | Annual | | 3.57% | | Annual | | | 03/07/25(a) | | | | 03/07/55 | | | | USD | | | | 480 | | | | 4,251 | | | | 1,286 | | | | 2,965 | | | |
| | | | | | | | | | | | | | | | | | | | | | | | | | | | | | | | | | | | | | |
| | | | | | | | | | | | |
| | | | | | | | | | | | | | | | | | | | | | | | | | $ | (195,756 | ) | | $ | 605 | | | $ | (196,361 | ) | | |
| | | | | | | | | | | | | | | | | | | | | | | | | | | | | | | | | | | | | | |
OTC Credit Default Swaps — Buy Protection
| | | | | | | | | | | | | | | | | | | | | | | | | | | | | | | | | | | | |
| | | | | |
| | | | | | | | | | |
| | | Reference Obligation/Index | | Financing Rate Paid by the Fund | | | Payment Frequency | | Counterparty | | Termination Date | | | Notional Amount (000) | | | Value | | | Upfront Premium Paid (Received) | | | Unrealized Appreciation (Depreciation) | | | |
| | | | | |
| | | | | | | | | | | |
| | AutoZone, Inc. | | | 1.00 | % | | Quarterly | | Citibank N.A. | | | 06/20/29 | | | | USD | | | | 1,330 | | | $ | (46,330 | ) | | $ | (42,175 | ) | | $ | (4,155 | ) | | |
| | Conagra Brands, Inc. | | | 1.00 | | | Quarterly | | Bank of America N.A. | | | 06/20/29 | | | | USD | | | | 744 | | | | (16,672 | ) | | | (14,295 | ) | | | (2,377 | ) | | |
| | CVS Health Corp. | | | 1.00 | | | Quarterly | | Bank of America N.A. | | | 06/20/29 | | | | USD | | | | 1,330 | | | | (37,460 | ) | | | (34,883 | ) | | | (2,577 | ) | | |
| | Dow Chemical Co. (The) | | | 1.00 | | | Quarterly | | Morgan Stanley & Co. International PLC | | | 06/20/29 | | | | USD | | | | 1,330 | | | | (23,012 | ) | | | (20,396 | ) | | | (2,616 | ) | | |
| | DR Horton, Inc. | | | 1.00 | | | Quarterly | | Barclays Bank PLC | | | 06/20/29 | | | | USD | | | | 1,330 | | | | (35,031 | ) | | | (29,337 | ) | | | (5,694 | ) | | |
| | Lowe’s Cos., Inc. | | | 1.00 | | | Quarterly | | Bank of America N.A. | | | 06/20/29 | | | | USD | | | | 1,330 | | | | (43,751 | ) | | | (38,462 | ) | | | (5,289 | ) | | |
| | Tyson Foods, Inc. | | | 1.00 | | | Quarterly | | Bank of America N.A. | | | 06/20/29 | | | | USD | | | | 1,330 | | | | (25,744 | ) | | | (22,923 | ) | | | (2,821 | ) | | |
| | | | | | | | | | | | | | | | | | | | | | | | | | | | | | | | | | | | |
| | | | | | | | | | | |
| | | | | | | | | | | | | | | | | | | | | | | | $ | (228,000 | ) | | $ | (202,471 | ) | | $ | (25,529 | ) | | |
| | | | | | | | | | | | | | | | | | | | | | | | | | | | | | | | | | | | |
| | |
| 68 | | 2 0 2 4 BLACK ROCK ANNUAL REPORT TO SHAREHOLDERS |
| | |
Schedule of Investments (continued) March 31, 2024 | | BATS: Series C Portfolio |
OTC Credit Default Swaps — Sell Protection
| | | | | | | | | | | | | | | | | | | | | | | | | | | | | | | | | | | | | | | | | | | | |
| | Reference Obligation/Index | |
| Financing
Rate Received by the Fund |
| |
| Payment
Frequency |
| | Counterparty | |
| Termination
Date |
| |
| Credit
Rating(a) |
| |
| Notional
Amount (000)(b) |
| | | Value | | |
| Upfront
Premium Paid (Received |
) | |
| Unrealized
Appreciation (Depreciation) |
| |
|
|
|
| | | | | | | | | | | | |
| | Verizon Communications, Inc. | | | 1.00 | % | | | Quarterly | | | Deutsche Bank AG | | | 12/20/24 | | | | BBB+ | | | | USD | | | | 2,211 | | | $ | 12,353 | | | $ | 4,345 | | | $ | 8,008 | | | | | |
| | Bank of America Corp. | | | 1.00 | | | | Quarterly | | | JPMorgan Chase Bank N.A. | | | 12/20/28 | | | | A- | | | | USD | | | | 2,180 | | | | 46,297 | | | | 11,707 | | | | 34,590 | | | | | |
| | Teck Resources Ltd. | | | 5.00 | | | | Quarterly | | | Bank of America N.A. | | | 06/20/29 | | | | BBB- | | | | USD | | | | 790 | | | | 142,983 | | | | 139,324 | | | | 3,659 | | | | | |
| | | | | | | | | | | | | | | | | | | | | | | | | | | | | | | | | | | | | | | | | | | | |
| | | | | | | | | | | | |
| | | | | | | | | | | | | | | | | | | | | | | | | | | | | | $ | 201,633 | | | $ | 155,376 | | | $ | 46,257 | | | | | |
| | | | | | | | | | | | | | | | | | | | | | | | | | | | | | | | | | | | | | | | | | | | |
| | (a) | Using the rating of the issuer or the underlying securities of the index, as applicable, provided by S&P Global Ratings. | |
| | (b) | The maximum potential amount the Fund may pay should a negative credit event take place as defined under the terms of the agreement. | |
Balances Reported in the Statements of Assets and Liabilities for Centrally Cleared Swaps and OTC Swaps
| | | | | | | | | | | | | | | | |
| | | | | |
| | | Swap
Premiums
Paid | | | Swap
Premiums
Received | | | Unrealized
Appreciation | | | Unrealized
Depreciation | |
| | | | |
Centrally Cleared Swaps(a) | | $ | 1,871 | | | $ | (219,491 | ) | | $ | 45,744 | | | $ | (254,255 | ) |
OTC Swaps | | | 155,376 | | | | (202,471 | ) | | | 46,257 | | | | (25,529 | ) |
| | (a) | Includes cumulative appreciation (depreciation) on centrally cleared swaps, as reported in the Schedule of Investments. Only current day’s variation margin is reported within the Statements of Assets and Liabilities and is net of any previously paid (received) swap premium amounts. | |
Derivative Financial Instruments Categorized by Risk Exposure
As of period end, the fair values of derivative financial instruments located in the Statements of Assets and Liabilities were as follows:
| | | | | | | | | | | | | | | | | | | | | | | | | | | | |
| | | | | | | | |
| | | Commodity
Contracts | | | Credit
Contracts | | | Equity
Contracts | | | Foreign
Currency
Exchange
Contracts | | | Interest
Rate
Contracts | | | Other
Contracts | | | Total | |
| | | | | | | |
Assets — Derivative Financial Instruments | | | | | | | | | | | | | | | | | | | | | | | | | | | | |
Futures contracts | | | | | | | | | | | | | | | | | | | | | | | | | | | | |
Unrealized appreciation on futures contracts(a) | | $ | — | | | $ | — | | | $ | — | | | $ | — | | | $ | 93,422 | | | $ | — | | | $ | 93,422 | |
Options purchased | | | | | | | | | | | | | | | | | | | | | | | | | | | | |
Investments at value — unaffiliated(b) | | | — | | | | — | | | | — | | | | — | | | | 951,410 | | | | — | | | | 951,410 | |
Swaps — centrally cleared | | | | | | | | | | | | | | | | | | | | | | | | | | | | |
Unrealized appreciation on centrally cleared swaps(a) | | | — | | | | — | | | | — | | | | — | | | | 45,744 | | | | — | | | | 45,744 | |
Swaps — OTC | | | | | | | | | | | | | | | | | | | | | | | | | | | | |
Unrealized appreciation on OTC swaps; | | | | | | | | | | | | | | | | | | | | | | | | | | | | |
Swap premiums paid | | | — | | | | 201,633 | | | | — | | | | — | | | | — | | | | — | | | | 201,633 | |
| | | | | | | | | | | | | | | | | | | | | | | | | | | | |
| | | | | | | |
| | $ | — | | | $ | 201,633 | | | $ | — | | | $ | — | | | $ | 1,090,576 | | | $ | — | | | $ | 1,292,209 | |
| | | | | | | | | | | | | | | | | | | | | | | | | | | | |
| | | | | | | |
Liabilities — Derivative Financial Instruments | | | | | | | | | | | | | | | | | | | | | | | | | | | | |
Futures contracts | | | | | | | | | | | | | | | | | | | | | | | | | | | | |
Unrealized depreciation on futures contracts(a) | | $ | — | | | $ | — | | | $ | — | | | $ | — | | | $ | 110,354 | | | $ | — | | | $ | 110,354 | |
Swaps — centrally cleared | | | | | | | | | | | | | | | | | | | | | | | | | | | | |
Unrealized depreciation on centrally cleared swaps(a) | | | — | | | | 12,150 | | | | — | | | | — | | | | 242,105 | | | | — | | | | 254,255 | |
Swaps — OTC | | | | | | | | | | | | | | | | | | | | | | | | | | | | |
Unrealized depreciation on OTC swaps; | | | | | | | | | | | | | | | | | | | | | | | | | | | | |
Swap premiums received | | | — | | | | 228,000 | | | | — | | | | — | | | | — | | | | — | | | | 228,000 | |
| | | | | | | | | | | | | | | | | | | | | | | | | | | | |
| | | | | | | |
| | $ | — | | | $ | 240,150 | | | $ | — | | | $ | — | | | $ | 352,459 | | | $ | — | | | $ | 592,609 | |
| | | | | | | | | | | | | | | | | | | | | | | | | | | | |
| | (a) | Net cumulative unrealized appreciation (depreciation) on futures contracts and centrally cleared swaps, if any, are reported in the Schedule of Investments. In the Statements of Assets and Liabilities, only current day’s variation margin is reported in receivables or payables and the net cumulative unrealized appreciation (depreciation) is included in accumulated earnings (loss). | |
| | (b) | Includes options purchased at value as reported in the Schedule of Investments. | |
| | |
SCHEDULES OF INVESTMENTS | | 69 |
| | |
Schedule of Investments (continued) March 31, 2024 | | BATS: Series C Portfolio |
For the period ended March 31, 2024, the effect of derivative financial instruments in the Statements of Operations was as follows:
| | | | | | | | | | | | | | | | | | | | | | | | | | | | |
| | | | | | | | |
| | | Commodity Contracts | | | Credit Contracts | | | Equity Contracts | | | Foreign Currency Exchange Contracts | | | Interest Rate Contracts | | | Other Contracts | | | Total | |
| | | | | | | |
Net Realized Gain (Loss) from: | | | | | | | | | | | | | | | | | | | | | | | | | | | | |
Futures contracts | | $ | — | | | $ | — | | | $ | — | | | $ | — | | | $ | (242,986 | ) | | $ | — | | | $ | (242,986 | ) |
Options purchased(a) | | | — | | | | — | | | | — | | | | — | | | | (35,993 | ) | | | — | | | | (35,993 | ) |
Options written | | | — | | | | — | | | | — | | | | — | | | | 383,437 | | | | — | | | | 383,437 | |
Swaps | | | — | | | | (251,504 | ) | | | — | | | | — | | | | (199,523 | ) | | | — | | | | (451,027 | ) |
| | | | | | | | | | | | | | | | | | | | | | | | | | | | |
| | | | | | | |
| | $ | — | | | $ | (251,504 | ) | | $ | — | | | $ | — | | | $ | (95,065 | ) | | $ | — | | | $ | (346,569 | ) |
| | | | | | | | | | | | | | | | | | | | | | | | | | | | |
|
Net Change in Unrealized Appreciation (Depreciation) on: | |
Futures contracts | | $ | — | | | $ | — | | | $ | — | | | $ | — | | | $ | (560,239 | ) | | $ | — | | | $ | (560,239 | ) |
Options purchased(b) | | | — | | | | — | | | | — | | | | — | | | | 91,919 | | | | — | | | | 91,919 | |
Swaps | | | — | | | | (22,045 | ) | | | — | | | | — | | | | (196,361 | ) | | | — | | | | (218,406 | ) |
| | | | | | | | | | | | | | | | | | | | | | | | | | | | |
| | | | | | | |
| | $ | — | | | $ | (22,045 | ) | | $ | — | | | $ | — | | | $ | (664,681 | ) | | $ | — | | | $ | (686,726 | ) |
| | | | | | | | | | | | | | | | | | | | | | | | | | | | |
| | (a) | Options purchased are included in net realized gain (loss) from investments — unaffiliated. | |
| | (b) | Options purchased are included in net change in unrealized appreciation (depreciation) on investments. | |
Average Quarterly Balances of Outstanding Derivative Financial Instruments
| | | | |
Futures contracts | | | | |
Average notional value of contracts — long | | | $57,165,360 | |
Average notional value of contracts — short | | | $29,442,305 | |
Options: | | | | |
Average notional value of swaption contracts purchased | | | $20,230,000 | |
Average notional value of swaption contracts written | | | $62,901,250 | |
Credit default swaps | | | | |
Average notional value — buy protection | | | $17,379,379 | |
Average notional value — sell protection | | | $6,715,804 | |
Interest rate swaps | | | | |
Average notional value — pays fixed rate | | | $15,297,000 | |
Average notional value — received fixed rate | | | $21,510,000 | |
For more information about the Fund’s investment risks regarding derivative financial instruments, refer to the Notes to Financial Statements.
Derivative Financial Instruments – Offsetting as of Period End
The Fund’s derivative assets and liabilities (by type) were as follows:
| | | | | | | | | | | | |
| |
| | | Assets | | | | | | Liabilities | |
| |
Derivative Financial Instruments | | | | | | | | | | | | |
Options(a) | | $ | 951,410 | | | | | | | $ | — | |
Swaps — centrally cleared | | | — | | | | | | | | 34,735 | |
Swaps — OTC(b) | | | 201,633 | | | | | | | | 228,000 | |
| | | | | | | | | | | | |
| | | |
Total derivative assets and liabilities in the Statements of Assets and Liabilities | | $ | 1,153,043 | | | | | | | $ | 262,735 | |
| | | | | | | | | | | | |
| | | |
Derivatives not subject to a Master Netting Agreement or similar agreement (“MNA”) | | | — | | | | | | | | (34,735 | ) |
| | | | | | | | | | | | |
| | | |
Total derivative assets and liabilities subject to an MNA | | $ | 1,153,043 | | | | | | | $ | 228,000 | |
| | | | | | | | | | | | |
| | (a) | Includes options purchased at value which is included in Investments at value — unaffiliated in the Statements of Assets and Liabilities and reported in the Schedule of Investments. | |
| | (b) | Includes unrealized appreciation (depreciation) on OTC swaps and swap premiums (paid/received) in the Statements of Assets and Liabilities. | |
| | |
| 70 | | 2 0 2 4 BLACK ROCK ANNUAL REPORT TO SHAREHOLDERS |
| | |
Schedule of Investments (continued) March 31, 2024 | | BATS: Series C Portfolio |
The following tables present the Fund’s derivative assets and liabilities by counterparty net of amounts available for offset under an MNA and net of the related collateral received and pledged by the Fund:
| | | | | | | | | | | | | | | | | | | | |
| | | | | | |
| Counterparty | | Derivative Assets Subject to an MNA by Counterparty | | | Derivatives Available for Offset(a) | | | Non- Cash Collateral Received(b) | | | Cash Collateral Received(b) | | | Net Amount of Derivative Assets(c) | |
| | | | | |
Bank of America N.A. | | $ | 613,966 | | | $ | (123,627 | ) | | $ | — | | | $ | (410,000 | ) | | $ | 80,339 | |
Deutsche Bank AG | | | 281,472 | | | | — | | | | — | | | | — | | | | 281,472 | |
JPMorgan Chase Bank N.A. | | | 257,605 | | | | — | | | | — | | | | (257,605 | ) | | | — | |
| | | | | | | | | | | | | | | | | | | | |
| | | | | |
| | $ | 1,153,043 | | | $ | (123,627 | ) | | $ | — | | | $ | (667,605 | ) | | $ | 361,811 | |
| | | | | | | | | | | | | | | | | | | | |
| | | | | |
| Counterparty | | Derivative Liabilities Subject to an MNA by Counterparty | | | Derivatives Available for Offset(a) | | | Non- Cash
Collateral
Pledged(b) | | | Cash Collateral Pledged(b) | | | Net Amount of Derivative Liabilities(d) | |
| | | | | |
Bank of America N.A. | | $ | 123,627 | | | $ | (123,627 | ) | | $ | — | | | $ | — | | | $ | — | |
Barclays Bank PLC | | | 35,031 | | | | — | | | | — | | | | — | | | | 35,031 | |
Citibank N.A. | | | 46,330 | | | | — | | | | — | | | | — | | | | 46,330 | |
Morgan Stanley & Co. International PLC | | | 23,012 | | | | — | | | | — | | | | — | | | | 23,012 | |
| | | | | | | | | | | | | | | | | | | | |
| | | | | |
| | $ | 228,000 | | | $ | (123,627 | ) | | $ | — | | | $ | — | | | $ | 104,373 | |
| | | | | | | | | | | | | | | | | | | | |
| | (a) | The amount of derivatives available for offset is limited to the amount of derivative assets and/or liabilities that are subject to an MNA. | |
| | (b) | Excess of collateral received/pledged, if any, from the individual counterparty is not shown for financial reporting purposes. | |
| | (c) | Net amount represents the net amount receivable from the counterparty in the event of default. | |
| | (d) | Net amount represents the net amount payable due to the counterparty in the event of default. | |
Fair Value Hierarchy as of Period End
Various inputs are used in determining the fair value of financial instruments. For a description of the input levels and information about the Fund’s policy regarding valuation of financial instruments, refer to the Notes to Financial Statements.
The following table summarizes the Fund’s financial instruments categorized in the fair value hierarchy. The breakdown of the Fund’s financial instruments into major categories is disclosed in the Schedule of Investments above.
| | | | | | | | | | | | | | | | |
| |
| | | | |
| | | Level 1 | | | Level 2 | | | Level 3 | | | Total | |
| |
| | | | |
Assets | | | | | | | | | | | | | | | | |
Investments | | | | | | | | | | | | | | | | |
Long-Term Investments | | | | | | | | | | | | | | | | |
Corporate Bonds | | $ | — | | | $ | 365,103,416 | | | $ | — | | | $ | 365,103,416 | |
Foreign Agency Obligations | | | — | | | | 6,463,821 | | | | — | | | | 6,463,821 | |
Foreign Government Obligations | | | — | | | | 11,986,939 | | | | — | | | | 11,986,939 | |
Municipal Bonds | | | — | | | | 5,720,605 | | | | — | | | | 5,720,605 | |
Preferred Securities | | | — | | | | 20,717,687 | | | | — | | | | 20,717,687 | |
U.S. Treasury Obligations | | | — | | | | 6,807,820 | | | | — | | | | 6,807,820 | |
Short-Term Securities | | | | | | | | | | | | | | | | |
Money Market Funds | | | 3,672,106 | | | | — | | | | — | | | | 3,672,106 | |
Options Purchased | | | | | | | | | | | | | | | | |
Interest Rate Contracts | | | — | | | | 951,410 | | | | — | | | | 951,410 | |
| | | | | | | | | | | | | | | | |
| | | | |
| | $ | 3,672,106 | | | $ | 417,751,698 | | | $ | — | | | $ | 421,423,804 | |
| | | | | | | | | | | | | | | | |
Derivative Financial Instruments(a) | | | | | | | | | | | | | | | | |
Assets | | | | | | | | | | | | | | | | |
Credit Contracts | | $ | — | | | $ | 46,257 | | | $ | — | | | $ | 46,257 | |
Interest Rate Contracts | | | 93,422 | | | | 45,744 | | | | — | | | | 139,166 | |
| | |
SCHEDULES OF INVESTMENTS | | 71 |
| | |
Schedule of Investments (continued) March 31, 2024 | | BATS: Series C Portfolio |
Fair Value Hierarchy as of Period End (continued)
| | | | | | | | | | | | | | | | |
| | | | | |
| | | Level 1 | | | Level 2 | | | Level 3 | | | Total | |
| | | | |
Liabilities | | | | | | | | | | | | | | | | |
Credit Contracts | | $ | — | | | $ | (37,679 | ) | | $ | — | | | $ | (37,679 | ) |
Interest Rate Contracts | | | (110,354 | ) | | | (242,105 | ) | | | — | | | | (352,459 | ) |
| | | | | | | | | | | | | | | | |
| | | | |
| | $ | (16,932 | ) | | $ | (187,783 | ) | | $ | — | | | $ | (204,715 | ) |
| | | | | | | | | | | | | | | | |
| | (a) | Derivative financial instruments are swaps and futures contracts. Swaps and futures contracts are valued at the unrealized appreciation (depreciation) on the instrument. | |
See notes to financial statements.
| | |
| 72 | | 2 0 2 4 BLACK ROCK ANNUAL REPORT TO SHAREHOLDERS |
| | |
Schedule of Investments March 31, 2024 | | BATS: Series E Portfolio (Percentages shown are based on Net Assets) |
| | | | | | | | | | | | |
| Security | | | | | Par
(000) | | | Value | |
|
Municipal Bonds | |
|
| Alabama — 4.9% | |
Black Belt Energy Gas District | | | | | | | | | | | | |
RB, Series A, 05/01/55(a)(b) | | | USD | | | | 535 | | | $ | 577,445 | |
Refunding RB, 4.00%, 06/01/51(a) | | | | | | | 1,715 | | | | 1,726,117 | |
County of Jefferson Sewer Revenue, Refunding RB, 5.25%, 10/01/49 | | | | | | | 3,020 | | | | 3,243,103 | |
Hoover IDB, RB, AMT, 6.38%, 11/01/50(a) | | | | | | | 1,295 | | | | 1,395,251 | |
Southeast Alabama Gas Supply District (The) | | | | | | | | | | | | |
Refunding RB, 5.00%, 06/01/49(a) | | | | | | | 6,000 | | | | 6,427,586 | |
Refunding RB, Series A, 5.00%, 08/01/54(a) | | | | | | | 4,000 | | | | 4,297,794 | |
Southeast Energy Authority Cooperative District | | | | | | | | | | | | |
RB, Series A, 4.00%, 11/01/51(a) | | | | | | | 1,785 | | | | 1,781,338 | |
RB, Series A-1, 5.50%, 01/01/53(a) | | | | | | | 655 | | | | 703,844 | |
| | | | | | | | | | | | |
| | | |
| | | | | | | | | | | 20,152,478 | |
|
| Arizona — 1.9% | |
Arizona IDA | | | | | | | | | | | | |
RB, 5.00%, 07/01/45(c) | | | | | | | 265 | | | | 240,714 | |
RB, 7.10%, 01/01/55(c) | | | | | | | 910 | | | | 928,283 | |
RB, 5.00%, 07/01/55(c) | | | | | | | 285 | | | | 245,334 | |
RB, Series B, 5.13%, 07/01/47(c) | | | | | | | 195 | | | | 183,474 | |
Refunding RB, 5.50%, 07/01/52(c) | | | | | | | 610 | | | | 569,008 | |
Refunding RB, Series A, 5.00%, 07/01/26(c) | | | | | | | 175 | | | | 174,429 | |
Refunding RB, Series A, 5.13%, 07/01/37(c) | | | | | | | 605 | | | | 608,773 | |
Refunding RB, Series G, 5.00%, 07/01/47(c) | | | | | | | 185 | | | | 172,430 | |
Chandler IDA, RB, AMT, 5.00%, 06/01/49(a) | | | | | | | 200 | | | | 200,212 | |
City of Phoenix Arizona IDA (The), RB, 5.00%, 07/01/46(c) | | | | | | | 570 | | | | 537,746 | |
County of Pima IDA (The) | | | | | | | | | | | | |
RB, 5.13%, 07/01/39 | | | | | | | 145 | | | | 137,322 | |
RB, 5.25%, 07/01/49 | | | | | | | 180 | | | | 161,545 | |
Refunding RB, 4.00%, 06/15/51(c) | | | | | | | 625 | | | | 471,951 | |
Refunding RB, 5.00%, 07/01/56(c) | | | | | | | 295 | | | | 256,017 | |
La Paz County IDA, RB, 5.88%, 06/15/48(c) | | | | | | | 285 | | | | 261,433 | |
Maricopa County IDA | | | | | | | | | | | | |
RB, 5.25%, 10/01/40(c) | | | | | | | 280 | | | | 282,516 | |
RB, 5.50%, 10/01/51(c) | | | | | | | 280 | | | | 277,755 | |
RB, AMT, 4.00%, 10/15/47(c) | | | | | | | 1,470 | | | | 1,292,842 | |
Refunding RB, Series A, 4.13%, 09/01/38 | | | | | | | 230 | | | | 234,228 | |
Salt Verde Financial Corp., RB, 5.00%, 12/01/37 | | | | | | | 500 | | | | 546,126 | |
| | | | | | | | | | | | |
| | | |
| | | | | | | | | | | 7,782,138 | |
|
| Arkansas — 2.0% | |
Arkansas Development Finance Authority | | | | | | | | | | | | |
RB, AMT, 4.50%, 09/01/49(c) | | | | | | | 2,600 | | | | 2,565,772 | |
RB, AMT, 4.75%, 09/01/49(c) | | | | | | | 4,165 | | | | 4,138,342 | |
RB, AMT, 5.70%, 05/01/53 | | | | | | | 350 | | | | 361,400 | |
RB, AMT, Series A, 6.88%, 07/01/48(c) | | | | | | | 900 | | | | 967,910 | |
| | | | | | | | | | | | |
| | | |
| | | | | | | | | | | 8,033,424 | |
|
| California — 2.9% | |
California HFA, RB, Series 2021-3, Class A, 3.25%, 08/20/36 | | | | | | | 945 | | | | 870,941 | |
California Municipal Finance Authority | | | | | | | | | | | | |
RB, 5.63%, 07/01/44(c) | | | | | | | 150 | | | | 149,757 | |
RB, AMT, 4.00%, 07/15/29 | | | | | | | 2,500 | | | | 2,461,525 | |
California School Finance Authority | | | | | | | | | | | | |
RB, Series A, 6.75%, 11/01/45(c) | | | | | | | 250 | | | | 251,480 | |
Refunding RB, 5.00%, 07/01/51(c) | | | | | | | 300 | | | | 300,314 | |
California Statewide Communities Development Authority, Refunding RB, Series A, 5.25%, 11/01/44(c) | | | | | | | 250 | | | | 212,562 | |
California Statewide Financing Authority RB, 6.00%, 05/01/43 | | | | | | | 315 | | | | 315,169 | |
| | | | | | | | | | | | |
| Security | | | | | Par
(000) | | | Value | |
|
| California (continued) | |
California Statewide Financing Authority RB, 6.00%, 05/01/43 | | | USD | | | | 85 | | | $ | 85,046 | |
City of Los Angeles Department of Airports, RB, AMT, 5.25%, 05/15/47 | | | | | | | 1,500 | | | | 1,622,998 | |
CMFA Special Finance Agency I, RB,
Series A-2, 4.00%, 04/01/56(c) | | | | | | | 1,505 | | | | 1,128,654 | |
CSCDA Community Improvement Authority | | | | | | | | | | | | |
RB, 4.00%, 10/01/46(c) | | | | | | | 1,055 | | | | 823,298 | |
RB, 4.00%, 07/01/56(c) | | | | | | | 205 | | | | 152,213 | |
RB, 4.00%, 03/01/57(c) | | | | | | | 505 | | | | 361,529 | |
RB, 4.00%, 07/01/58(c) | | | | | | | 300 | | | | 200,311 | |
RB, 4.00%, 07/01/58(c) | | | | | | | 265 | | | | 183,175 | |
RB, 4.00%, 12/01/59(c) | | | | | | | 435 | | | | 284,580 | |
RB, 4.00%, 12/01/59(c) | | | | | | | 1,080 | | | | 621,440 | |
RB, Series A, 3.00%, 09/01/56(c) | | | | | | | 1,090 | | | | 723,108 | |
Golden State Tobacco Securitization Corp., Refunding RB, Series B-2, 0.00%, 06/01/66(d) | | | | | | | 2,845 | | | | 321,040 | |
Hastings Campus Housing Finance Authority, RB, Series A, 0.00%, 07/01/61(c)(d) | | | | | | | 1,045 | | | | 430,228 | |
San Francisco City & County Redevelopment Agency Successor Agency, TA, 0.00%, 08/01/31(c)(d) | | | | | | | 580 | | | | 407,279 | |
| | | | | | | | | | | | |
| | | |
| | | | | | | | | | | 11,906,647 | |
|
| Colorado — 2.9% | |
Amber Creek Metropolitan District, GO, Refunding, Series A, 5.13%, 12/01/47 | | | | | | | 1,000 | | | | 872,321 | |
Aurora Crossroads Metropolitan District No. 2, GO, Series A, 5.00%, 12/01/50 | | | | | | | 500 | | | | 465,677 | |
Aviation Station North Metropolitan District No. 2, GO, Series A, 5.00%, 12/01/48 | | | | | | | 500 | | | | 455,100 | |
Banning Lewis Ranch Metropolitan District No. 8, GO, 4.88%, 12/01/51(c) | | | | | | | 500 | | | | 392,866 | |
Centerra Metropolitan District No. 1, TA, 5.00%, 12/01/47(c) | | | | | | | 155 | | | | 144,637 | |
City & County of Denver Airport System Revenue, Refunding RB, AMT, Series A, 4.13%, 11/15/53 | | | | | | | 455 | | | | 430,968 | |
Colorado Educational & Cultural Facilities Authority, Refunding RB, 5.00%, 12/15/45(c) | | | | | | | 500 | | | | 487,207 | |
Colorado Health Facilities Authority | | | | | | | | | | | | |
RB, 5.25%, 11/01/39 | | | | | | | 195 | | | | 221,742 | |
RB, 5.50%, 11/01/47 | | | | | | | 120 | | | | 133,495 | |
RB, 5.25%, 11/01/52 | | | | | | | 305 | | | | 329,011 | |
RB, Series A, 5.00%, 05/15/35 | | | | | | | 250 | | | | 203,175 | |
RB, Series A, 5.00%, 05/15/44 | | | | | | | 270 | | | | 184,700 | |
RB, Series A, 5.00%, 05/15/49 | | | | | | | 420 | | | | 271,060 | |
Denver Convention Center Hotel Authority, Refunding RB, 5.00%, 12/01/40 | | | | | | | 950 | | | | 962,293 | |
First Creek Village Metropolitan District | | | | | | | | | | | | |
GO, Series A, 5.00%, 12/01/39 | | | | | | | 600 | | | | 601,306 | |
GO, Series A, 5.00%, 08/01/49 | | | | | | | 540 | | | | 521,335 | |
Highlands Metropolitan District No. 1, GO, 5.00%, 12/01/51 | | | | | | | 575 | | | | 516,906 | |
Lanterns Metropolitan District No. 2, GO, Series A, 4.50%, 12/01/50 | | | | | | | 500 | | | | 376,196 | |
Loretto Heights Community Authority, RB, 4.88%, 12/01/51 | | | | | | | 570 | | | | 458,223 | |
North Holly Metropolitan District, GO, Series A, 5.50%, 12/01/48 | | | | | | | 500 | | | | 494,741 | |
North Range Metropolitan District No. 3, GO, Series A, 5.25%, 12/01/50 | | | | | | | 500 | | | | 480,128 | |
Palisade Metropolitan District No. 2, GO, 7.25%, 12/15/49 | | | | | | | 675 | | | | 637,772 | |
| | |
SCHEDULES OF INVESTMENTS | | 73 |
| | |
Schedule of Investments (continued) March 31, 2024 | | BATS: Series E Portfolio (Percentages shown are based on Net Assets) |
| | | | | | | | | | | | |
| Security | | | | | Par
(000) | | | Value | |
|
| Colorado (continued) | |
Pueblo Urban Renewal Authority, TA, 4.75%, 12/01/45(c) | | | USD | | | | 725 | | | $ | 491,188 | |
Southlands Metropolitan District No. 1, GO, Refunding, Series A-1, 5.00%, 12/01/37 | | | | | | | 250 | | | | 247,987 | |
Thompson Crossing Metropolitan District No. 4, GO, Refunding, 5.00%, 12/01/49 | | | | | | | 645 | | | | 592,183 | |
Waters’ Edge Metropolitan District No. 2, GO, 5.00%, 12/01/51 | | | | | | | 560 | | | | 482,237 | |
Westcreek Metropolitan District No. 2, GO, Series A, 5.38%, 12/01/48 | | | | | | | 500 | | | | 475,221 | |
| | | | | | | | | | | | |
| | | |
| | | | | | | | | | | 11,929,675 | |
|
| Connecticut — 0.3% | |
Connecticut State Health & Educational Facilities Authority, RB, Series A, 5.00%, 01/01/55(c) | | | | | | | 470 | | | | 365,893 | |
Mohegan Tribal Finance Authority, RB, 7.00%, 02/01/45(c) | | | | | | | 675 | | | | 675,150 | |
| | | | | | | | | | | | |
| | | |
| | | | | | | | | | | 1,041,043 | |
|
| Delaware — 0.2% | |
Affordable Housing Opportunities Trust, RB, Series AH-01, Class B, 6.88%, 05/01/39(c) | | | | | | | 665 | | | | 639,976 | |
| | | | | | | | | | | | |
|
| District of Columbia — 1.6% | |
District of Columbia Tobacco Settlement Financing Corp. | | | | | | | | | | | | |
RB, 0.00%, 06/15/46(d) | | | | | | | 8,970 | | | | 2,168,549 | |
RB, 0.00%, 06/15/46(d) | | | | | | | 10,325 | | | | 2,241,959 | |
RB, 0.00%, 06/15/55(d) | | | | | | | 19,300 | | | | 2,021,624 | |
| | | | | | | | | | | | |
| | | |
| | | | | | | | | | | 6,432,132 | |
|
| Florida — 8.0% | |
Brevard County Health Facilities Authority | | | | | | | | | | | | |
Refunding RB, 4.00%, 11/15/26(c) | | | | | | | 475 | | | | 460,384 | |
Refunding RB, 4.00%, 11/15/28(c) | | | | | | | 510 | | | | 490,032 | |
Refunding RB, 4.00%, 11/15/30(c) | | | | | | | 555 | | | | 520,148 | |
Refunding RB, 4.00%, 11/15/34(c) | | | | | | | 650 | | | | 595,566 | |
Refunding RB, 5.00%, 04/01/47 | | | | | | | 505 | | | | 532,368 | |
Refunding RB, 5.00%, 04/01/52 | | | | | | | 715 | | | | 748,683 | |
Buckhead Trails Community Development District | | | | | | | | | | | | |
Special Assessment RB, 05/01/44(b) | | | | | | | 350 | | | | 349,782 | |
Special Assessment RB, Series 2022, 5.75%, 05/01/52 | | | | | | | 210 | | | | 217,120 | |
Cabot Citrus Farms Community Development District, Special Assessment RB, 5.25%, 03/01/29 | | | | | | | 675 | | | | 680,887 | |
Capital Region Community Development District, Special Assessment Refunding RB, Series A-2, 4.60%, 05/01/31 | | | | | | | 470 | | | | 470,676 | |
Capital Trust Agency, Inc. | | | | | | | | | | | | |
RB, 5.00%, 06/15/49(c) | | | | | | | 100 | | | | 97,062 | |
RB, 5.75%, 06/01/54(c) | | | | | | | 420 | | | | 344,848 | |
RB, 5.00%, 01/01/55(c) | | | | | | | 1,570 | | | | 1,308,550 | |
RB, 4.88%, 06/15/56(c) | | | | | | | 1,335 | | | | 1,060,763 | |
RB, 0.00%, 07/01/61(c)(d) | | | | | | | 10,070 | | | | 683,862 | |
Celebration Pointe Community Development District No. 1, Special Assessment RB, 5.13%, 05/01/45 | | | | | | | 235 | | | | 232,172 | |
Charlotte County IDA, RB, 5.00%, 10/01/49(c) | | | | | | | 615 | | | | 613,134 | |
Coral Creek Community Development District, Special Assessment RB, 5.75%, 05/01/54 | | | | | | | 140 | | | | 143,549 | |
County of Miami-Dade Seaport Department, Refunding RB, AMT, Series A, 5.25%, 10/01/52 | | | | | | | 460 | | | | 484,099 | |
County of Osceola Transportation Revenue | | | | | | | | | | | | |
Refunding RB, Series A-2, 0.00%, 10/01/46(d) | | | | | | | 935 | | | | 297,370 | |
Refunding RB, Series A-2, 0.00%, 10/01/47(d) | | | | | | | 900 | | | | 270,819 | |
Refunding RB, Series A-2, 0.00%, 10/01/48(d) | | | | | | | 635 | | | | 191,307 | |
| | | | | | | | | | | | |
| Security | | | | | Par
(000) | | | Value | |
|
| Florida (continued) | |
County of Osceola Transportation Revenue Refunding RB, Series A-2, 0.00%, 10/01/49(d) | | | USD | | | | 525 | | | $ | 140,569 | |
Crosswinds East Community Development District, Special Assessment RB, 5.75%, 05/01/54 | | | | | | | 105 | | | | 105,125 | |
Darby Community Development District, Special Assessment RB, Series 2, 5.88%, 05/01/35 | | | | | | | 1,025 | | | | 1,007,664 | |
Escambia County Health Facilities Authority | | | | | | | | | | | | |
Refunding RB, 4.00%, 08/15/45 | | | | | | | 3,060 | | | | 2,700,028 | |
Refunding RB, (AGM), 3.00%, 08/15/50 | | | | | | | 2,500 | | | | 1,857,640 | |
Florida Development Finance Corp. | | | | | | | | | | | | |
RB, 5.25%, 06/01/55(c) | | | | | | | 645 | | | | 513,697 | |
RB, 5.13%, 06/15/55(c) | | | | | | | 2,490 | | | | 2,141,727 | |
RB, 6.50%, 06/30/57(c) | | | | | | | 265 | | | | 250,559 | |
RB, Series A, 6.13%, 06/15/44(c) | | | | | | | 45 | | | | 45,037 | |
RB, Series C, 5.75%, 12/15/56(c) | | | | | | | 370 | | | | 305,093 | |
RB, AMT, 6.13%, 07/01/32(a)(c) | | | | | | | 1,375 | | | | 1,403,464 | |
RB, AMT, Series C, 07/01/57(a)(b)(c) | | | | | | | 1,000 | | | | 999,986 | |
Refunding RB, 4.00%, 06/01/46(c) | | | | | | | 300 | | | | 206,587 | |
Refunding RB, Series A, 4.50%, 12/15/56(c) | | | | | | | 1,085 | | | | 804,739 | |
Grand Oaks Community Development District | | | | | | | | | | | | |
Special Assessment RB, 4.25%, 05/01/40 | | | | | | | 210 | | | | 190,622 | |
Special Assessment RB, 4.50%, 05/01/52 | | | | | | | 235 | | | | 205,055 | |
Harbor Bay Community Development District, Special Assessment Refunding RB,
Series A-2, 3.70%, 05/01/33 | | | | | | | 370 | | | | 338,637 | |
Lakewood Ranch Stewardship District | | | | | | | | | | | | |
Special Assessment RB, 3.13%, 05/01/25 | | | | | | | 140 | | | | 138,862 | |
Special Assessment RB, 3.25%, 05/01/29 | | | | | | | 225 | | | | 216,699 | |
Special Assessment RB, 4.75%, 05/01/29 | | | | | | | 180 | | | | 181,214 | |
Special Assessment RB, 4.88%, 05/01/35 | | | | | | | 150 | | | | 149,761 | |
Special Assessment RB, 4.40%, 05/01/39 | | | | | | | 525 | | | | 491,940 | |
Special Assessment RB, 5.30%, 05/01/39 | | | | | | | 205 | | | | 207,728 | |
Special Assessment RB, 5.50%, 05/01/39(c) | | | | | | | 25 | | | | 25,555 | |
Special Assessment RB, 5.45%, 05/01/48 | | | | | | | 365 | | | | 367,391 | |
Special Assessment RB, 5.65%, 05/01/48(c) | | | | | | | 115 | | | | 116,766 | |
Special Assessment RB, 4.00%, 05/01/49(c) | | | | | | | 200 | | | | 163,582 | |
Special Assessment RB, 3.90%, 05/01/50 | | | | | | | 240 | | | | 195,242 | |
Orange County Health Facilities Authority, RB, 5.00%, 08/01/35 | | | | | | | 250 | | | | 253,083 | |
Osceola Chain Lakes Community Development District, Special Assessment RB, 3.25%, 05/01/25 | | | | | | | 150 | | | | 148,996 | |
Parker Road Community Development District | | | | | | | | | | | | |
Special Assessment Refunding RB, 3.10%, 05/01/25 | | | | | | | 100 | | | | 98,895 | |
Special Assessment Refunding RB, 3.38%, 05/01/30 | | | | | | | 335 | | | | 312,640 | |
Poitras East Community Development District, Special Assessment RB, 5.00%, 05/01/43 | | | | | | | 355 | | | | 348,884 | |
Portico Community Development District | | | | | | | | | | | | |
Special Assessment RB, Series 2, 3.25%, 05/01/31 | | | | | | | 100 | | | | 92,721 | |
Special Assessment RB, Series 2, 4.00%, 05/01/50 | | | | | | | 425 | | | | 344,865 | |
Preserve at South Branch Community Development District | | | | | | | | | | | | |
Special Assessment RB, 3.25%, 11/01/24 | | | | | | | 25 | | | | 24,832 | |
Special Assessment RB, 3.50%, 11/01/30 | | | | | | | 200 | | | | 189,399 | |
Sandridge Community Development District | | | | | | | | | | | | |
Special Assessment RB, Series A1, 3.88%, 05/01/41 | | | | | | | 135 | | | | 118,300 | |
Special Assessment RB, Series A1, 4.00%, 05/01/51 | | | | | | | 130 | | | | 106,882 | |
| | |
| 74 | | 2 0 2 4 BLACK ROCK ANNUAL REPORT TO SHAREHOLDERS |
| | |
Schedule of Investments (continued) March 31, 2024 | | BATS: Series E Portfolio (Percentages shown are based on Net Assets) |
| | | | | | | | | | | | |
| Security | | | | | Par (000) | | | Value | |
|
| Florida (continued) | |
Sawyers Landing Community Development District, Special Assessment RB, 4.25%, 05/01/53 | | | USD | | | | 815 | | | $ | 624,356 | |
Seminole County IDA, Refunding RB, 5.75%, 11/15/54 | | | | | | | 595 | | | | 484,379 | |
Shadowlawn Community Development District, Special Assessment RB, 05/01/54(b) | | | | | | | 920 | | | | 921,265 | |
Southern Groves Community Development District No. 5, Special Assessment Refunding RB, 3.60%, 05/01/34 | | | | | | | 365 | | | | 328,366 | |
Tolomato Community Development District, Special Assessment Refunding RB,
Sub-Series A-2, 4.25%, 05/01/37 | | | | | | | 185 | | | | 172,690 | |
Trout Creek Community Development District | | | | | | | | | | | | |
Special Assessment RB, 5.00%, 05/01/28 | | | | | | | 240 | | | | 242,098 | |
Special Assessment RB, 5.63%, 05/01/45 | | | | | | | 200 | | | | 201,093 | |
West Villages Improvement District | | | | | | | | | | | | |
Special Assessment RB, 4.25%, 05/01/29 | | | | | | | 100 | | | | 98,775 | |
Special Assessment RB, 4.75%, 05/01/39 | | | | | | | 190 | | | | 186,157 | |
Special Assessment RB, 5.00%, 05/01/50 | | | | | | | 290 | | | | 280,599 | |
Special Assessment RB, 5.63%, 05/01/54 | | | | | | | 220 | | | | 217,479 | |
Westside Community Development District, Special Assessment Refunding RB, 3.75%, 05/01/29(c) | | | | | | | 805 | | | | 786,991 | |
Windward at Lakewood Ranch Community | | | | | | | | | | | | |
Development District | | | | | | | | | | | | |
Special Assessment RB, 4.00%, 05/01/42 | | | | | | | 55 | | | | 47,904 | |
Special Assessment RB, 4.25%, 05/01/52 | | | | | | | 165 | | | | 137,909 | |
| | | | | | | | | | | | |
| | | |
| | | | | | | | | | | 33,033,708 | |
|
| Georgia — 0.9% | |
Development Authority of Cobb County (The), RB, Series A, 6.38%, 06/15/58(c) | | | | | | | 145 | | | | 140,683 | |
East Point Business & IDA, RB, Series A, 5.25%, 06/15/62(c) | | | | | | | 150 | | | | 133,510 | |
Main Street Natural Gas, Inc. | | | | | | | | | | | | |
RB, Series A, 5.00%, 05/15/49 | | | | | | | 905 | | | | 968,773 | |
RB, Series B, 5.00%, 12/01/52(a) | | | | | | | 1,635 | | | | 1,718,184 | |
Municipal Electric Authority of Georgia, RB, 5.00%, 07/01/52 | | | | | | | 645 | | | | 669,776 | |
| | | | | | | | | | | | |
| | | |
| | | | | | | | | | | 3,630,926 | |
|
| Idaho — 0.1% | |
Idaho Health Facilities Authority, RB, 4.00%, 12/01/43 | | | | | | | 330 | | | | 325,447 | |
| | | | | | | | | | | | |
|
| Illinois — 3.3% | |
Chicago Board of Education | | | | | | | | | | | | |
GO, Series D, 5.00%, 12/01/46 | | | | | | | 485 | | | | 485,119 | |
GO, Refunding, Series A, 5.00%, 12/01/30 | | | | | | | 505 | | | | 530,168 | |
GO, Refunding, Series B, 4.00%, 12/01/35 | | | | | | | 230 | | | | 229,997 | |
GO, Refunding, Series B, 4.00%, 12/01/41 | | | | | | | 930 | | | | 871,790 | |
GO, Refunding, Series C, 5.00%, 12/01/34 | | | | | | | 625 | | | | 644,628 | |
Chicago O’Hare International Airport, Refunding RB, Series D, 5.00%, 01/01/46 | | | | | | | 1,000 | | | | 1,004,260 | |
Chicago Transit Authority Sales Tax Receipts Fund, Refunding RB, Series A, 4.00%, 12/01/49 | | | | | | | 810 | | | | 746,379 | |
City of Chicago Wastewater Transmission Revenue, Refunding RB, Series C, 5.00%, 01/01/39 | | | | | | | 500 | | | | 501,667 | |
Cook County Community College District No. 508, GO, 5.25%, 12/01/30 | | | | | | | 920 | | | | 920,516 | |
Illinois Finance Authority, Refunding RB, 6.13%, 02/01/45 | | | | | | | 150 | | | | 150,006 | |
Illinois State Toll Highway Authority, RB, Series A, 4.00%, 01/01/46 | | | | | | | 2,000 | | | | 1,956,602 | |
Metropolitan Pier & Exposition Authority RB, 5.50%, 06/15/53 | | | | | | | 390 | | | | 397,836 | |
| | | | | | | | | | | | |
| Security | | | | | Par (000) | | | Value | |
|
| Illinois (continued) | |
Metropolitan Pier & Exposition Authority | | | | | | | | | | | | |
RB, 5.00%, 06/15/57 | | | USD | | | | 660 | | | $ | 672,827 | |
Refunding RB, 4.00%, 06/15/50 | | | | | | | 1,895 | | | | 1,764,662 | |
State of Illinois | | | | | | | | | | | | |
GO, 5.00%, 04/01/31 | | | | | | | 1,000 | | | | 1,000,869 | |
GO, 5.00%, 05/01/39 | | | | | | | 1,275 | | | | 1,276,598 | |
GO, Series D, 5.00%, 11/01/28 | | | | | | | 295 | | | | 313,007 | |
GO, Refunding, Series B, 5.00%, 10/01/27 | | | | | | | 105 | | | | 111,081 | |
| | | | | | | | | | | | |
| | | |
| | | | | | | | | | | 13,578,012 | |
|
| Indiana — 0.3% | |
City of Vincennes, Refunding RB, 6.25%, 01/01/29(c)(e)(f) | | | | | | | 325 | | | | 225,875 | |
Indiana Finance Authority, RB, AMT, 6.75%, 05/01/39 | | | | | | | 640 | | | | 709,701 | |
Indianapolis Local Public Improvement Bond Bank, RB, Series E, 6.00%, 03/01/53 | | | | | | | 400 | | | | 427,248 | |
| | | | | | | | | | | | |
| | | |
| | | | | | | | | | | 1,362,824 | |
|
| Iowa — 0.6% | |
Iowa Finance Authority, Refunding RB, Series E, 4.00%, 08/15/46 | | | | | | | 570 | | | | 530,951 | |
Iowa Student Loan Liquidity Corp., Refunding RB, AMT, 3.50%, 12/01/44 | | | | | | | 2,000 | | | | 1,618,669 | |
PEFA, Inc., RB, 5.00%, 09/01/49(a) | | | | | | | 400 | | | | 408,786 | |
| | | | | | | | | | | | |
| | | |
| | | | | | | | | | | 2,558,406 | |
|
| Kentucky — 0.6% | |
City of Henderson, RB, AMT, 4.70%, 01/01/52(c) | | | | | | | 130 | | | | 128,000 | |
Kentucky Public Energy Authority, RB, Series C, 4.00%, 02/01/50(a) | | | | | | | 2,310 | | | | 2,329,685 | |
| | | | | | | | | | | | |
| | | |
| | | | | | | | | | | 2,457,685 | |
|
| Louisiana — 0.7% | |
Lafayette Parish School Board Sale Tax Revenue | | | | | | | | | | | | |
RB, 4.00%, 04/01/48 | | | | | | | 175 | | | | 173,567 | |
RB, 4.00%, 04/01/53 | | | | | | | 110 | | | | 105,539 | |
Louisiana Public Facilities Authority | | | | | | | | | | | | |
RB, 5.25%, 06/01/51(c) | | | | | | | 455 | | | | 378,383 | |
RB, 5.25%, 06/01/60(c) | | | | | | | 840 | | | | 669,023 | |
RB, Series A, 6.50%, 06/01/62(c) | | | | | | | 150 | | | | 143,849 | |
RB, AMT, Series R2, 6.50%,
10/01/53(a)(c) | | | | | | | 505 | | | | 534,117 | |
Parish of St. James, RB, Series 2, 6.35%, 07/01/40(c) . | | | | | | | 950 | | | | 1,035,087 | |
| | | | | | | | | | | | |
| | | |
| | | | | | | | | | | 3,039,565 | |
|
| Maine — 0.1% | |
Finance Authority of Maine, RB, AMT, 8.00%, 12/01/51(c) | | | | | | | 670 | | | | 525,142 | |
| | | | | | | | | | | | |
|
| Maryland — 1.4% | |
Anne Arundel County Consolidated Special Taxing District, Special Tax Bonds, 5.25%, 07/01/44 | | | | | | | 250 | | | | 250,150 | |
City of Baltimore | | | | | | | | | | | | |
RB, 4.88%, 06/01/42 | | | | | | | 170 | | | | 170,558 | |
Refunding TA, 3.20%, 06/01/30(c) | | | | | | | 200 | | | | 185,113 | |
Refunding TA, 3.25%, 06/01/31(c) | | | | | | | 225 | | | | 205,939 | |
Refunding TA, 3.30%, 06/01/32(c) | | | | | | | 500 | | | | 453,753 | |
Refunding TA, 3.35%, 06/01/33(c) | | | | | | | 540 | | | | 486,272 | |
Refunding TA, 3.40%, 06/01/34(c) | | | | | | | 570 | | | | 510,737 | |
Refunding TA, 3.45%, 06/01/35(c) | | | | | | | 610 | | | | 543,735 | |
Maryland EDC, RB, AMT, 5.25%, 06/30/47 | | | | | | | 570 | | | | 596,953 | |
Maryland Health & Higher Educational Facilities Authority | | | | | | | | | | | | |
RB, 7.00%, 03/01/55(c) | | | | | | | 1,940 | | | | 2,016,528 | |
Refunding RB, 5.00%, 07/01/40 | | | | | | | 500 | | | | 504,815 | |
| | | | | | | | | | | | |
| | | |
| | | | | | | | | | | 5,924,553 | |
| | |
SCHEDULES OF INVESTMENTS | | 75 |
| | |
Schedule of Investments (continued) March 31, 2024 | | BATS: Series E Portfolio (Percentages shown are based on Net Assets) |
| | | | | | | | | | | | |
| Security | | | | | Par (000) | | | Value | |
|
| Massachusetts — 0.8% | |
Massachusetts Development Finance Agency | | | | | | | | | | | | |
RB, 5.00%, 01/01/48 | | | USD | | | | 1,000 | | | $ | 1,002,582 | |
RB, 5.00%, 10/01/54 | | | | | | | 710 | | | | 658,129 | |
RB, Series A, 5.00%, 01/01/47 | | | | | | | 500 | | | | 501,143 | |
RB, Series N, 5.00%, 07/01/44 | | | | | | | 500 | | | | 501,113 | |
Massachusetts HFA | | | | | | | | | | | | |
Refunding RB, AMT, Series A, 4.45%, 12/01/42 | | | | | | | 310 | | | | 300,196 | |
Refunding RB, AMT, Series A, 4.50%, 12/01/47 | | | | | | | 490 | | | | 478,603 | |
| | | | | | | | | | | | |
| | | |
| | | | | | | | | | | 3,441,766 | |
|
| Michigan — 0.6% | |
Michigan Strategic Fund | | | | | | | | | | | | |
RB, 5.00%, 11/15/42 | | | | | | | 210 | | | | 194,016 | |
RB, AMT, 4.00%, 10/01/61(a) | | | | | | | 1,200 | | | | 1,197,968 | |
Wayne County Airport Authority | | | | | | | | | | | | |
RB, Series B, 5.00%, 12/01/44 | | | | | | | 500 | | | | 503,416 | |
RB, Series D, 5.00%, 12/01/40 | | | | | | | 500 | | | | 512,756 | |
RB, AMT, 5.00%, 12/01/39 | | | | | | | 250 | | | | 251,986 | |
| | | | | | | | | | | | |
| | | |
| | | | | | | | | | | 2,660,142 | |
|
| Minnesota — 1.1% | |
City of Deephaven, Refunding RB, 5.25%, 07/01/37 | | | | | | | 605 | | | | 606,894 | |
City of Forest Lake, Refunding RB, 5.00%, 07/01/56 | | | | | | | 2,140 | | | | 1,785,925 | |
City of Minneapolis, RB, Series A, 5.75%, 07/01/55 | | | | | | | 960 | | | | 819,827 | |
Duluth EDA, Refunding RB, 5.25%, 02/15/58 | | | | | | | 425 | | | | 432,760 | |
Housing & Redevelopment Authority of the City of St. Paul Minnesota, RB, Series A, 5.50%, 07/01/38(c) | | | | | | | 240 | | | | 241,528 | |
Minnesota HFA, RB, (GNMA/FNMA/FHLMC COL), Series M, 6.00%, 01/01/53 | | | | | | | 695 | | | | 738,592 | |
| | | | | | | | | | | | |
| | | |
| | | | | | | | | | | 4,625,526 | |
|
| Missouri — 0.8% | |
City of St. Louis Missouri IDA (The), Refunding RB, 4.38%, 11/15/35 | | | | | | | 215 | | | | 173,982 | |
Kansas City IDA | | | | | | | | | | | | |
RB, Series C, 7.50%, 11/15/46 | | | | | | | 64 | | | | 51,137 | |
RB, AMT, 5.00%, 03/01/54 | | | | | | | 1,275 | | | | 1,310,137 | |
Refunding RB, 2.00%, 11/15/46 | | | | | | | 52 | | | | 2,317 | |
Refunding RB, 5.00%, 11/15/46 | | | | | | | 116 | | | | 95,263 | |
Kansas City Land Clearance Redevelopment Authority | | | | | | | | | | | | |
TA, 4.38%, 02/01/31(c) | | | | | | | 640 | | | | 594,860 | |
TA, 5.00%, 02/01/40(c) | | | | | | | 260 | | | | 242,044 | |
St. Louis County IDA, Refunding RB, 5.00%, 09/01/37 | | | | | | | 695 | | | | 680,165 | |
| | | | | | | | | | | | |
| | | |
| | | | | | | | | | | 3,149,905 | |
|
| Montana — 0.8% | |
City of Forsyth, Refunding RB, Series A, 3.90%, 03/01/31(a) | | | | | | | 3,500 | | | | 3,413,078 | |
| | | | | | | | | | | | |
|
| Nebraska — 0.1% | |
Douglas County Hospital Authority No. 3, Refunding RB, 5.00%, 11/01/45 | | | | | | | 500 | | | | 506,751 | |
| | | | | | | | | | | | |
|
| Nevada — 0.2% | |
City of Las Vegas Special Improvement District No. 815, Special Assessment RB, 5.00%, 12/01/49 | | | | | | | 190 | | | | 174,757 | |
Tahoe-Douglas Visitors Authority | | | | | | | | | | | | |
RB, 5.00%, 07/01/40 | | | | | | | 405 | | | | 417,004 | |
RB, 5.00%, 07/01/45 | | | | | | | 280 | | | | 285,205 | |
| | | | | | | | | | | | |
| | | |
| | | | | | | | | | | 876,966 | |
|
| New Hampshire — 0.5% | |
New Hampshire Business Finance Authority | | | | | | | | | | | | |
RB, Series 2024-1, Class A, 4.25%, 07/01/51 | | | | | | | 625 | | | | 621,066 | |
RB, Series A, 4.13%, 08/15/40 | | | | | | | 320 | | | | 274,479 | |
| | | | | | | | | | | | |
| Security | | | | | Par (000) | | | Value | |
|
| New Hampshire (continued) | |
New Hampshire Business Finance Authority | | | | | | | | | | | | |
RB, Series A, 4.25%, 08/15/46 | | | USD | | | | 365 | | | $ | 294,160 | |
RB, Series A, 4.50%, 08/15/55 | | | | | | | 755 | | | | 600,171 | |
Refunding RB, 4.63%, 11/01/42(c) | | | | | | | 320 | | | | 284,237 | |
Refunding RB, AMT, 4.88%, 11/01/42(c) | | | | | | | 130 | | | | 116,427 | |
| | | | | | | | | | | | |
| | | |
| | | | | | | | | | | 2,190,540 | |
|
| New Jersey — 2.8% | |
Casino Reinvestment Development Authority, Inc., Refunding RB, 5.25%, 11/01/39 | | | | | | | 250 | | | | 251,916 | |
Middlesex County Improvement Authority | | | | | | | | | | | | |
RB, Series B, 6.13%, 01/01/25 | | | | | | | 555 | | | | 6,854 | |
RB, Series B, 6.25%, 01/01/37 | | | | | | | 1,210 | | | | 14,944 | |
New Jersey EDA | | | | | | | | | | | | |
RB, 5.25%, 11/01/54(c) | | | | | | | 945 | | | | 831,068 | |
RB, Series WW, 5.25%, 06/15/40 | | | | | | | 55 | | | | 56,211 | |
RB, Series WW, 5.25%, 06/15/40 | | | | | | | 945 | | | | 965,813 | |
RB, AMT, 6.50%, 04/01/31 | | | | | | | 75 | | | | 75,258 | |
Refunding RB, Series A, 6.00%, 08/01/49(c) | | | | | | | 250 | | | | 250,054 | |
New Jersey Health Care Facilities Financing Authority | | | | | | | | | | | | |
RB, 4.00%, 07/01/51 | | | | | | | 1,065 | | | | 1,029,202 | |
Refunding RB, 4.25%, 07/01/44 | | | | | | | 395 | | | | 395,266 | |
Refunding RB, 5.00%, 07/01/44 | | | | | | | 220 | | | | 220,541 | |
New Jersey Higher Education Student Assistance Authority | | | | | | | | | | | | |
Refunding RB, AMT, Series C, 4.25%, 12/01/50 | | | | | | | 1,540 | | | | 1,419,502 | |
Refunding RB, AMT, Sub-Series C, 3.63%, 12/01/49 | | | | | | | 820 | | | | 662,898 | |
New Jersey Transportation Trust Fund Authority | | | | | | | | | | | | |
RB, Series AA, 5.25%, 06/15/41 | | | | | | | 205 | | | | 209,209 | |
RB, Series AA, 4.00%, 06/15/45 | | | | | | | 3,000 | | | | 2,927,838 | |
Tobacco Settlement Financing Corp. | | | | | | | | | | | | |
Refunding RB, Series A, 5.00%, 06/01/35 | | | | | | | 375 | | | | 398,044 | |
Refunding RB, Sub-Series B, 5.00%, 06/01/46 | | | | | | | 1,675 | | | | 1,700,718 | |
| | | | | | | | | | | | |
| | | |
| | | | | | | | | | | 11,415,336 | |
|
| New York — 6.5% | |
Build NYC Resource Corp. | | | | | | | | | | | | |
RB, Series A, 6.13%, 07/01/43 | | | | | | | 385 | | | | 401,072 | |
RB, Series A, 6.38%, 07/01/53 | | | | | | | 705 | | | | 727,314 | |
Refunding RB, AMT, 5.00%, 01/01/35(c) | | | | | | | 485 | | | | 486,813 | |
County of Cattaraugus, RB, 5.00%, 05/01/44 | | | | | | | 195 | | | | 195,070 | |
Hempstead Town Local Development Corp., RB, 5.00%, 07/01/44 | | | | | | | 500 | | | | 500,317 | |
Huntington Local Development Corp., RB, Series A, 5.25%, 07/01/56 | | | | | | | 125 | | | | 95,725 | |
Metropolitan Transportation Authority, RB, Series B, 3.00%, 11/15/25 | | | | | | | 165 | | | | 162,334 | |
New York City Housing Development Corp., RB, Series C-1, 4.20%, 11/01/44 | | | | | | | 1,000 | | | | 978,869 | |
New York City Transitional Finance Authority Future Tax Secured Revenue, RB, Sub-Series E-1, 4.00%, 02/01/49 | | | | | | | 2,845 | | | | 2,708,442 | |
New York Counties Tobacco Trust IV, Refunding RB, Series A, 5.00%, 06/01/42 | | | | | | | 915 | | | | 869,410 | |
New York Counties Tobacco Trust VI, Refunding RB, Series 2B, 5.00%, 06/01/51 | | | | | | | 835 | | | | 776,275 | |
New York State Dormitory Authority, Refunding RB, Series A, 3.00%, 03/15/51 | | | | | | | 800 | | | | 595,387 | |
New York State Thruway Authority | | | | | | | | | | | | |
Refunding RB, Series A, 4.00%, 03/15/49 | | | | | | | 3,690 | | | | 3,519,401 | |
Refunding RB, Series B, 4.00%, 01/01/45 | | | | | | | 1,190 | | | | 1,154,237 | |
New York Transportation Development Corp. RB, AMT, 5.00%, 07/01/34 | | | | | | | 500 | | | | 501,005 | |
| | |
| 76 | | 2 0 2 4 BLACK ROCK ANNUAL REPORT TO SHAREHOLDERS |
| | |
Schedule of Investments (continued) March 31, 2024 | | BATS: Series E Portfolio (Percentages shown are based on Net Assets) |
| | | | | | | | | | | | |
| Security | | | | | Par (000) | | | Value | |
|
| New York (continued) | |
New York Transportation Development Corp. | | | | | | | | | | | | |
RB, AMT, 5.00%, 10/01/35 | | | USD | | | | 710 | | | $ | 747,582 | |
RB, AMT, 5.63%, 04/01/40 | | | | | | | 500 | | | | 545,116 | |
RB, AMT, 5.00%, 12/01/40 | | | | | | | 830 | | | | 890,239 | |
RB, AMT, 4.00%, 04/30/53 | | | | | | | 640 | | | | 538,810 | |
RB, AMT, 6.00%, 06/30/54 | | | | | | | 6,000 | | | | 6,646,035 | |
Refunding RB, AMT, 5.38%, 08/01/36 | | | | | | | 865 | | | | 905,888 | |
Oneida Indian Nation of New York, RB, Series B, 6.00%, 09/01/43(c) | | | | | | | 270 | | | | 285,135 | |
Suffolk Regional Off-Track Betting Co., RB, 12/01/34(b) | | | | | | | 405 | | | | 411,083 | |
Westchester County Local Development Corp. | | | | | | | | | | | | |
Refunding RB, 5.00%, 07/01/41(c) | | | | | | | 510 | | | | 492,822 | |
Refunding RB, 5.00%, 07/01/56(c) | | | | | | | 560 | | | | 518,192 | |
Westchester Tobacco Asset Securitization Corp. | | | | | | | | | | | | |
Refunding RB, Sub-Series C, 4.00%, 06/01/42 | | | | | | | 670 | | | | 628,561 | |
Refunding RB, Sub-Series C, 5.13%, 06/01/51 | | | | | | | 500 | | | | 502,795 | |
| | | | | | | | | | | | |
| | | |
| | | | | | | | | | | 26,783,929 | |
|
| North Carolina — 0.3% | |
North Carolina HFA, RB, (GNMA/FNMA/FHLMC), 6.00%, 07/01/53 | | | | | | | 805 | | | | 856,610 | |
North Carolina Medical Care Commission, Refunding RB, Series A, 5.25%, 01/01/41 | | | | | | | 230 | | | | 219,465 | |
Town of Mooresville, Special Assessment RB, 5.38%, 03/01/40(c) | | | | | | | 250 | | | | 250,494 | |
| | | | | | | | | | | | |
| | | |
| | | | | | | | | | | 1,326,569 | |
|
| North Dakota — 0.3% | |
City of Grand Forks, RB, (AGM), Series A, 5.00%, 12/01/53 | | | | | | | 350 | | | | 367,442 | |
County of Cass, Refunding RB, 5.25%, 02/15/58 | | | | | | | 855 | | | | 882,354 | |
| | | | | | | | | | | | |
| | | |
| | | | | | | | | | | 1,249,796 | |
|
| Ohio — 2.8% | |
Buckeye Tobacco Settlement Financing Authority, Refunding RB, Series B-2, 5.00%, 06/01/55 | | | | | | | 8,895 | | | | 8,398,362 | |
County of Hamilton | | | | | | | | | | | | |
Refunding RB, 5.00%, 01/01/46 | | | | | | | 190 | | | | 171,254 | |
Refunding RB, 4.00%, 08/15/50 | | | | | | | 915 | | | | 857,854 | |
County of Hardin | | | | | | | | | | | | |
Refunding RB, 5.00%, 05/01/30 | | | | | | | 140 | | | | 137,905 | |
Refunding RB, 5.25%, 05/01/40 | | | | | | | 145 | | | | 138,565 | |
Refunding RB, 5.50%, 05/01/50 | | | | | | | 670 | | | | 610,864 | |
Hickory Chase Community Authority, Refunding RB, 5.00%, 12/01/40(c) | | | | | | | 790 | | | | 722,570 | |
Port of Greater Cincinnati Development Authority, RB, 4.25%, 12/01/50(c) | | | | | | | 265 | | | | 222,292 | |
State of Ohio, RB, AMT, Series P-3, 5.00%, 06/30/53 | | | | | | | 370 | | | | 370,448 | |
| | | | | | | | | | | | |
| | | |
| | | | | | | | | | | 11,630,114 | |
|
| Oklahoma — 1.4% | |
Oklahoma Development Finance Authority | | | | | | | | | | | | |
RB, 7.25%, 09/01/51(c) | | | | | | | 3,290 | | | | 3,452,062 | |
RB, Series B, 5.00%, 08/15/38 | | | | | | | 475 | | | | 486,310 | |
RB, Series B, 5.50%, 08/15/52 | | | | | | | 580 | | | | 596,114 | |
Tulsa Authority for Economic Opportunity, TA, 4.38%, 12/01/41(c) | | | | | | | 235 | | | | 215,535 | |
Tulsa County Industrial Authority, Refunding RB, 5.25%, 11/15/45 | | | | | | | 965 | | | | 913,980 | |
| | | | | | | | | | | | |
| | | |
| | | | | | | | | | | 5,664,001 | |
|
| Oregon — 1.3% | |
Clackamas County Hospital Facility Authority, Refunding RB, Series A, 5.25%, 11/15/50 | | | | | | | 200 | | | | 187,958 | |
| | | | | | | | | | | | |
| Security | | | | | Par (000) | | | Value | |
|
| Oregon (continued) | |
Clackamas County School District No. 12 North Clackamas, GO, (School Bond Guaranty), Series A, 0.00%, 06/15/38(d) | | | USD | | | | 275 | | | $ | 143,805 | |
Hospital Facilities Authority of Multnomah County Oregon, Refunding RB, 5.50%, 10/01/49 | | | | | | | 150 | | | | 151,485 | |
Oregon State Facilities Authority, RB, 5.25%, 06/15/55(c) | | | | | | | 305 | | | | 272,734 | |
Salem Hospital Facility Authority, Refunding RB, 4.00%, 05/15/49 | | | | | | | 5,000 | | | | 4,527,306 | |
Yamhill County Hospital Authority, Refunding RB, 5.00%, 11/15/36 | | | | | | | 300 | | | | 261,547 | |
| | | | | | | | | | | | |
| | | |
| | | | | | | | | | | 5,544,835 | |
|
| Pennsylvania — 2.2% | |
Allentown Neighborhood Improvement Zone Development Authority, RB, 5.00%, 05/01/42(c) | | | | | | | 2,125 | | | | 2,144,127 | |
Bucks County IDA, RB, 4.00%, 07/01/46 | | | | | | | 200 | | | | 141,496 | |
Montgomery County Higher Education & Health Authority, Refunding RB, 4.00%, 09/01/49 | | | | | | | 1,255 | | | | 1,168,926 | |
Montgomery County IDA, RB, 5.00%, 11/15/45 | | | | | | | 875 | | | | 897,053 | |
Pennsylvania Economic Development Financing Authority | | | | | | | | | | | | |
RB, AMT, 5.75%, 06/30/48 | | | | | | | 490 | | | | 543,816 | |
RB, AMT, 5.25%, 06/30/53 | | | | | | | 770 | | | | 818,248 | |
Refunding RB, AMT, 5.50%, 11/01/44 | | | | | | | 500 | | | | 500,081 | |
Pennsylvania Higher Education Assistance Agency, RB, AMT, Series B, 3.00%, 06/01/47 | | | | | | | 1,010 | | | | 754,574 | |
Pennsylvania Higher Educational Facilities Authority, RB, 4.00%, 08/15/44 | | | | | | | 1,045 | | | | 1,047,624 | |
Philadelphia Authority for Industrial Development RB, 5.25%, 11/01/52 | | | | | | | 235 | | | | 246,856 | |
Refunding RB, Series 2015, 5.00%, 04/01/45 | | | | | | | 500 | | | | 502,965 | |
School District of Philadelphia (The), GO, Series A, 5.50%, 09/01/48 | | | | | | | 265 | | | | 298,711 | |
| | | | | | | | | | | | |
| | | |
| | | | | | | | | | | 9,064,477 | |
|
| Puerto Rico — 8.1% | |
Children’s Trust Fund, RB, Series A, 0.00%, 05/15/57(d) | | | | | | | 19,285 | | | | 1,528,756 | |
Commonwealth of Puerto Rico | | | | | | | | | | | | |
GO, Series A, 0.00%, 07/01/33(d) | | | | | | | 537 | | | | 353,733 | |
GO, Series A1, 5.63%, 07/01/29 | | | | | | | 1,049 | | | | 1,143,655 | |
GO, Series A1, 5.75%, 07/01/31 | | | | | | | 440 | | | | 491,948 | |
GO, Series A1, 4.00%, 07/01/33 | | | | | | | 418 | | | | 415,346 | |
GO, Series A1, 4.00%, 07/01/35 | | | | | | | 375 | | | | 367,987 | |
GO, Series A1, 4.00%, 07/01/37 | | | | | | | 322 | | | | 311,892 | |
GO, Series A1, 4.00%, 07/01/41 | | | | | | | 438 | | | | 411,899 | |
GO, Series A1, 4.00%, 07/01/46 | | | | | | | 455 | | | | 416,603 | |
GO, Sub-Series CW, 0.00%, 11/01/43(a)(d)(f) | | | | | | | 2,899 | | | | 1,673,405 | |
GO, Sub-Series CW/CONV, 0.00%, 11/01/51(a)(d)(f) . | | | | 131 | | | | 52,971 | |
GO, Sub-Series CW/HTA-98, 0.00%, 11/01/51(a)(d)(f) | | | | | | | 7,043 | | | | 4,138,032 | |
GO, Sub-Series CW/HTA-98, 0.00%, 11/01/51(a)(d)(f) | | | | | | | 5,106 | | | | 1,286,303 | |
GO, Sub-Series CW/PRIFA, 0.00%, 11/01/51(a)(d)(f) . | | | | 5,894 | | | | 2,786,542 | |
Puerto Rico Electric Power Authority | | | | | | | | | | | | |
RB, Series A, 5.00%, 07/01/29(e)(f) | | | | | | | 385 | | | | 100,823 | |
RB, Series A, 7.00%, 07/01/33(e)(f) | | | | | | | 1,795 | | | | 470,070 | |
RB, Series A, 6.75%, 07/01/36(e)(f) | | | | | | | 775 | | | | 202,955 | |
RB, Series A, 5.00%, 07/01/42(e)(f) | | | | | | | 325 | | | | 85,110 | |
RB, Series A, 7.00%, 07/01/43(e)(f) | | | | | | | 175 | | | | 45,829 | |
RB, Series A-1, 10.00%, 07/01/19(e)(f) | | | | | | | 42 | | | | 11,001 | |
RB, Series A-2, 10.00%, 07/01/19(e)(f) | | | | | | | 212 | | | | 55,503 | |
RB, Series A-3, 10.00%, 07/01/19(e)(f) | | | | | | | 177 | | | | 46,357 | |
| | |
SCHEDULES OF INVESTMENTS | | 77 |
| | |
Schedule of Investments (continued) March 31, 2024 | | BATS: Series E Portfolio (Percentages shown are based on Net Assets) |
| | | | | | | | | | | | |
| Security | | | | | Par (000) | | | Value | |
|
| Puerto Rico (continued) | |
Puerto Rico Electric Power Authority | | | | | | | | | | | | |
RB, Series B-3, 10.00%, 07/01/19(e)(f) | | | USD | | | | 177 | | | $ | 46,357 | |
RB, Series C-1, 5.40%, 01/01/18(e)(f) | | | | | | | 486 | | | | 127,363 | |
RB, Series C-2, 5.40%, 07/01/18(e)(f) | | | | | | | 486 | | | | 127,384 | |
RB, Series C-3, 5.40%, 01/01/20(e)(f) | | | | | | | 49 | | | | 12,877 | |
RB, Series C-4, 5.40%, 07/01/20(e)(f) | | | | | | | 49 | | | | 12,877 | |
RB, Series CCC, 5.25%, 07/01/26(e)(f) | | | | | | | 125 | | | | 32,735 | |
RB, Series CCC, 5.00%, 07/01/27(e)(f) | | | | | | | 545 | | | | 142,723 | |
RB, Series CCC, 5.25%, 07/01/28(e)(f) | | | | | | | 70 | | | | 18,331 | |
RB, Series D-1, 7.50%, 01/01/20(e)(f) | | | | | | | 426 | | | | 111,454 | |
RB, Series D-2, 7.50%, 01/01/20(e)(f) | | | | | | | 840 | | | | 220,068 | |
RB, Series D-4, 7.50%, 07/01/20(e)(f) | | | | | | | 145 | | | | 37,971 | |
RB, Series TT, 5.00%, 07/01/18(e)(f) | | | | | | | 160 | | | | 41,900 | |
RB, Series TT, 5.00%, 07/01/25(e)(f) | | | | | | | 45 | | | | 11,785 | |
RB, Series TT, 5.00%, 07/01/26(e)(f) | | | | | | | 190 | | | | 49,757 | |
RB, Series TT, 5.00%, 07/01/32(e)(f) | | | | | | | 395 | | | | 103,442 | |
RB, Series WW, 5.50%, 07/01/17(e)(f) | | | | | | | 110 | | | | 28,807 | |
RB, Series WW, 5.50%, 07/01/18(e)(f) | | | | | | | 95 | | | | 24,878 | |
RB, Series WW, 5.50%, 07/01/19(e)(f) | | | | | | | 70 | | | | 18,331 | |
RB, Series WW, 5.38%, 07/01/22(e)(f) | | | | | | | 940 | | | | 246,165 | |
RB, Series WW, 5.38%, 07/01/24(e)(f) | | | | | | | 65 | | | | 17,022 | |
RB, Series WW, 5.00%, 07/01/28(e)(f) | | | | | | | 165 | | | | 43,210 | |
RB, Series WW, 5.25%, 07/01/33(e)(f) | | | | | | | 75 | | | | 19,641 | |
RB, Series WW, 5.50%, 07/01/38(e)(f) | | | | | | | 220 | | | | 57,613 | |
RB, Series XX, 5.25%, 07/01/27(e)(f) | | | | | | | 50 | | | | 13,094 | |
RB, Series XX, 5.25%, 07/01/35(e)(f) | | | | | | | 30 | | | | 7,856 | |
RB, Series XX, 5.75%, 07/01/36(e)(f) | | | | | | | 600 | | | | 157,126 | |
RB, Series XX, 5.25%, 07/01/40(e)(f) | | | | | | | 2,320 | | | | 607,556 | |
Refunding RB, Series AAA, 5.25%, 07/01/22(e)(f) | | | | | | | 160 | | | | 41,900 | |
Refunding RB, Series AAA, 5.25%, 07/01/28(e)(f) | | | | | | | 265 | | | | 69,398 | |
Refunding RB, Series AAA, 5.25%, 07/01/29(e)(f) | | | | | | | 40 | | | | 10,475 | |
Refunding RB, Series DDD, 5.00%, 07/01/19(e)(f) | | | | | | | 895 | | | | 234,380 | |
Refunding RB, Series UU, 0.00%, 07/01/17(a)(d)(e)(f). | | | | | | | 30 | | | | 7,856 | |
Refunding RB, Series UU, 0.00%, 07/01/18(a)(d)(e)(f). | | | | | | | 30 | | | | 7,856 | |
Refunding RB, Series UU, 0.00%, 07/01/20(a)(d)(e)(f). | | | | | | | 250 | | | | 65,469 | |
Refunding RB, Series UU, 4.45%, 07/01/31(a)(e)(f) | | | | | | | 300 | | | | 78,563 | |
Refunding RB, Series ZZ, 5.00%, 07/01/17(e)(f) | | | | | | | 70 | | | | 18,331 | |
Refunding RB, Series ZZ, 5.25%, 07/01/19(e)(f) | | | | | | | 235 | | | | 61,541 | |
Refunding RB, Series ZZ, 5.25%, 07/01/23(e)(f) | | | | | | | 930 | | | | 243,546 | |
Refunding RB, Series ZZ, 5.25%, 07/01/24(e)(f) | | | | | | | 150 | | | | 39,282 | |
Refunding RB, Series ZZ, 5.00%, 07/01/28(e)(f) | | | | | | | 75 | | | | 19,641 | |
Puerto Rico Industrial Tourist Educational Medical & Environmental Control Facilities Financing Authority | | | | | | | | | | | | |
RB, AMT, Series 1, 6.75%, 01/01/45 | | | | | | | 165 | | | | 197,012 | |
RB, AMT, Series 2, 6.50%, 01/01/42 | | | | | | | 110 | | | | 129,834 | |
RB, AMT, Series 2, 6.75%, 01/01/45 | | | | | | | 165 | | | | 196,434 | |
Puerto Rico Sales Tax Financing Corp. Sales Tax Revenue | | | | | | | | | | | | |
RB, Series A-1, 0.00%, 07/01/29(d) | | | | | | | 613 | | | | 504,457 | |
RB, Series A-1, 0.00%, 07/01/33(d) | | | | | | | 496 | | | | 346,996 | |
RB, Series A-1, 0.00%, 07/01/46(d) | | | | | | | 1,971 | | | | 629,600 | |
RB, Series A-1, 4.75%, 07/01/53 | | | | | | | 3,377 | | | | 3,338,586 | |
RB, Series A-1, 5.00%, 07/01/58 | | | | | | | 2,125 | | | | 2,126,264 | |
RB, Series A-2, 4.33%, 07/01/40 | | | | | | | 3,825 | | | | 3,782,917 | |
RB, Series A-2, 4.33%, 07/01/40 | | | | | | | 34 | | | | 33,769 | |
RB, Series A-2, 4.54%, 07/01/53 | | | | | | | 317 | | | | 301,549 | |
RB, Series A-2, 4.78%, 07/01/58 | | | | | | | 2,226 | | | | 2,215,981 | |
RB, Series B-1, 0.00%, 07/01/46(d) | | | | | | | 477 | | | | 152,559 | |
| | | | | | | | | | | | |
| | | |
| | | | | | | | | | | 33,589,239 | |
|
| Rhode Island — 0.1% | |
Rhode Island Student Loan Authority, RB, AMT, Series A, 3.63%, 12/01/37 | | | | | | | 460 | | | | 436,131 | |
| | | | | | | | | | | | |
| | | | | | | | | | | | |
| Security | | | | | Par (000) | | | Value | |
|
| South Carolina — 0.9% | |
Patriots Energy Group Financing Agency, RB, Series A1, 5.25%, 10/01/54(a) | | | USD | | | | 1,880 | | | $ | 2,012,642 | |
South Carolina Jobs EDA | | | | | | | | | | | | |
RB, 7.50%, 08/15/62(c) | | | | | | | 325 | | | | 292,488 | |
Refunding RB, 4.00%, 11/15/27 | | | | | | | 105 | | | | 100,969 | |
Refunding RB, 5.00%, 02/01/38 | | | | | | | 200 | | | | 206,352 | |
Refunding RB, 5.00%, 02/01/38 | | | | | | | 800 | | | | 821,057 | |
South Carolina Public Service Authority, Refunding RB, Series B, 4.00%, 12/01/56 | | | | | | | 200 | | | | 182,684 | |
| | | | | | | | | | | | |
| | | |
| | | | | | | | | | | 3,616,192 | |
|
| Tennessee — 1.7% | |
Chattanooga-Hamilton County Hospital Authority, Refunding RB, Series A, 5.00%, 10/01/44 | | | | | | | 250 | | | | 250,108 | |
Franklin Health & Educational Facilities Board, Refunding RB, 7.50%,
06/01/47(c)(e)(f) | | | | | | | 1,205 | | | | 131,224 | |
Metropolitan Government Nashville & Davidson County Health & Educational Facilities Board, Refunding RB, 4.00%, 10/01/49 | | | | | | | 220 | | | | 190,296 | |
Metropolitan Government Nashville & Davidson County IDB, Special Assessment RB, 0.00%, 06/01/43(c)(d) | | | | | | | 685 | | | | 250,813 | |
Metropolitan Government Nashville & Davidson County Sports Authority, RB, (AGM), Series A, 5.25%, 07/01/48 | | | | | | | 935 | | | | 1,043,895 | |
Metropolitan Nashville Airport Authority (The) | | | | | | | | | | | | |
RB, AMT, Series B, 5.25%, 07/01/35 | | | | | | | 320 | | | | 363,419 | |
RB, AMT, Series B, 5.50%, 07/01/36 | | | | | | | 265 | | | | 305,002 | |
Tennergy Corp., RB, Series A, 5.50%, 10/01/53(a) | | | | | | | 2,320 | | | | 2,476,104 | |
Tennessee Energy Acquisition Corp., RB, Series A, 5.00%, 05/01/52(a) | | | | | | | 1,750 | | | | 1,848,597 | |
| | | | | | | | | | | | |
| | | |
| | | | | | | | | | | 6,859,458 | |
|
| Texas — 6.8% | |
Angelina & Neches River Authority, RB, AMT, 7.50%, 12/01/45(c) | | | | | | | 510 | | | | 335,863 | |
Arlington Higher Education Finance Corp. | | | | | | | | | | | | |
RB, 5.63%, 08/15/54(c) | | | | | | | 1,305 | | | | 1,179,795 | |
RB, 7.88%, 11/01/62(c) | | | | | | | 280 | | | | 282,656 | |
Brazoria County IDC, RB, AMT, 7.00%, 03/01/39 | | | | | | | 375 | | | | 346,478 | |
Central Texas Turnpike System | | | | | | | | | | | | |
Refunding RB, Series C, 5.00%, 08/15/37 | | | | | | | 200 | | | | 200,791 | |
Refunding RB, Series C, 5.00%, 08/15/42 | | | | | | | 250 | | | | 250,910 | |
City of Crandall, Special Assessment RB, 4.25%, 09/15/41(c) | | | | | | | 230 | | | | 207,055 | |
City of Fate, Special Assessment RB, 08/15/54(b)(c) | | | | | | | 100 | | | | 100,114 | |
City of Houston Airport System Revenue | | | | | | | | | | | | |
RB, AMT, 4.00%, 07/01/41 | | | | | | | 700 | | | | 651,755 | |
RB, AMT, Series 1, 5.00%, 07/15/30 | | | | | | | 395 | | | | 397,965 | |
Refunding RB, AMT, 4.75%, 07/01/24 | | | | | | | 200 | | | | 200,285 | |
Refunding RB, AMT, 5.00%, 07/15/27 | | | | | | | 140 | | | | 143,361 | |
Refunding RB, AMT, 5.00%, 07/01/29 | | | | | | | 1,500 | | | | 1,502,230 | |
Refunding RB, AMT, Series C, 5.00%, 07/15/27 | | | | | | | 910 | | | | 931,849 | |
Refunding RB, AMT, Sub-Series A, 4.00%, 07/01/41 | | | | | | | 3,590 | | | | 3,579,653 | |
Refunding RB, AMT, (AGM), Series A, 5.25%, 07/01/48 | | | | | | | 485 | | | | 523,136 | |
City of San Antonio Airport System, RB, AMT, 5.00%, 07/01/45 | | | | | | | 500 | | | | 503,862 | |
County of Hays, Special Assessment RB, 7.00%, 09/15/45 | | | | | | | 200 | | | | 204,143 | |
Dallas ISD, GO (Permanent School Fund Guaranteed), 5.00%, 02/15/48 | | | | | | | 1,375 | | | | 1,486,202 | |
| | |
| 78 | | 2 0 2 4 BLACK ROCK ANNUAL REPORT TO SHAREHOLDERS |
| | |
Schedule of Investments (continued) March 31, 2024 | | BATS: Series E Portfolio (Percentages shown are based on Net Assets) |
| | | | | | | | | | | | |
| Security | | | | | Par (000) | | | Value | |
|
| Texas (continued) | |
Del Valle ISD, GO (Permanent School Fund Guaranteed), 4.00%, 06/15/47 | | | USD | | | | 1,335 | | | $ | 1,313,618 | |
Fort Bend County IDC, RB, Series B, 4.75%, 11/01/42. | | | | | | | 1,465 | | | | 1,465,248 | |
Fort Worth ISD, GO (Permanent School Fund Guaranteed), 4.00%, 02/15/48 | | | | | | | 230 | | | | 223,195 | |
Mission EDC, Refunding RB, AMT, 4.63%, 10/01/31(c) . | | | | | | | 285 | | | | 279,405 | |
New Hope Cultural Education Facilities Finance Corp. | | | | | | | | | | | | |
RB, 6.75%, 10/01/52 | | | | | | | 800 | | | | 744,777 | |
RB, Series A, 5.00%, 08/15/51(c) | | | | | | | 250 | | | | 227,147 | |
New Hope Higher Education Finance Corp., RB, Series A, 5.75%, 06/15/51(c) | | | | | | | 1,175 | | | | 1,063,139 | |
Newark Higher Education Finance Corp., RB, Series A, 5.50%, 08/15/35(c) | | | | | | | 300 | | | | 305,120 | |
Port Beaumont Navigation District | | | | | | | | | | | | |
RB, AMT, 2.75%, 01/01/36(c) | | | | | | | 1,105 | | | | 847,059 | |
RB, AMT, 2.88%, 01/01/41(c) | | | | | | | 350 | | | | 251,792 | |
RB, AMT, 3.00%, 01/01/50(c) | | | | | | | 1,495 | | | | 969,271 | |
Refunding RB, AMT, 3.63%, 01/01/35(c) | | | | | | | 1,375 | | | | 1,180,647 | |
Refunding RB, AMT, 4.00%, 01/01/50(c) | | | | | | | 1,975 | | | | 1,540,871 | |
Tarrant County Cultural Education Facilities Finance Corp. | | | | | | | | | | | | |
RB, 5.50%, 11/15/47 | | | | | | | 595 | | | | 666,653 | |
Refunding RB, 5.00%, 10/01/49 | | | | | | | 250 | | | | 237,643 | |
Texas Private Activity Bond Surface Transportation Corp. | | | | | | | | | | | | |
RB, AMT, 5.00%, 06/30/58 | | | | | | | 315 | | | | 318,323 | |
RB, AMT, 5.50%, 12/31/58 | | | | | | | 1,050 | | | | 1,151,840 | |
Texas Transportation Commission State Highway 249 System | | | | | | | | | | | | |
RB, 0.00%, 08/01/40(d) | | | | | | | 1,000 | | | | 472,549 | |
RB, 0.00%, 08/01/42(d) | | | | | | | 655 | | | | 276,363 | |
Texas Water Development Board, RB, 4.00%, 10/15/45 | | | | | | | 1,295 | | | | 1,286,115 | |
| | | | | | | | | | | | |
| | | |
| | | | | | | | | | | 27,848,878 | |
|
| Utah — 0.5% | |
Utah Charter School Finance Authority | | | | | | | | | | | | |
RB, Series A, 5.00%, 06/15/52(c) | | | | | | | 285 | | | | 235,013 | |
Refunding RB, 5.00%, 10/15/44 | | | | | | | 1,615 | | | | 1,617,286 | |
Refunding RB, 5.00%, 06/15/55(c) | | | | | | | 230 | | | | 207,036 | |
| | | | | | | | | | | | |
| | | |
| | | | | | | | | | | 2,059,335 | |
|
| Vermont — 0.4% | |
East Central Vermont Telecommunications District | | | | | | | | | | | | |
RB, Series A, 4.75%, 12/01/40(c) | | | | | | | 695 | | | | 539,884 | |
RB, Series A, 4.50%, 12/01/44(c) | | | | | | | 705 | | | | 504,147 | |
RB, Series A, 6.88%, 12/01/46(c) | | | | | | | 785 | | | | 756,919 | |
| | | | | | | | | | | | |
| | | |
| | | | | | | | | | | 1,800,950 | |
|
| Virginia — 0.7% | |
Ballston Quarter Community Development Authority | | | | | | | | | | | | |
TA, Series A, 5.50%, 03/01/46 | | | | | | | 92 | | | | 87,309 | |
TA, Series A, 0.00%, 03/01/59(d) | | | | | | | 220 | | | | 162,719 | |
Hampton Roads Transportation Accountability Commission, RB,
Series A, 4.00%, 07/01/55 | | | | | | | 285 | | | | 272,887 | |
James City County EDA | | | | | | | | | | | | |
RB, Series A, 6.88%, 12/01/58 | | | | | | | 345 | | | | 377,738 | |
RB, Series C3, 5.25%, 12/01/27 | | | | | | | 250 | | | | 250,618 | |
Lower Magnolia Green Community Development Authority | | | | | | | | | | | | |
Special Assessment RB, 5.00%, 03/01/35(c) | | | | | | | 230 | | | | 230,012 | |
Special Assessment RB, 5.00%, 03/01/45(c) | | | | | | | 85 | | | | 81,139 | |
Norfolk Redevelopment & Housing Authority RB, 4.00%, 01/01/29 | | | | | | | 250 | | | | 232,829 | |
| | | | | | | | | | | | |
| Security | | | | | Par (000) | | | Value | |
|
| Virginia (continued) | |
Norfolk Redevelopment & Housing Authority | | | | | | | | | | | | |
RB, 5.00%, 01/01/34 | | | USD | | | | 190 | | | $ | 178,827 | |
RB, 5.00%, 01/01/49 | | | | | | | 365 | | | | 316,224 | |
Virginia Beach Development Authority | | | | | | | | | | | | |
RB, Series A, 7.00%, 09/01/53 | | | | | | | 360 | | | | 403,868 | |
RB, Series B3, 5.38%, 09/01/29 | | | | | | | 235 | | | | 239,751 | |
| | | | | | | | | | | | |
| | | |
| | | | | | | | | | | 2,833,921 | |
|
| Washington — 0.7% | |
King County Public Hospital District No. 4, GO, Refunding, 5.00%, 12/01/30 | | | | | | | 200 | | | | 198,178 | |
Port of Seattle, RB, AMT, Series C, 5.00%, 04/01/40 | | | | | | | 250 | | | | 251,287 | |
Washington State Housing Finance Commission | | | | | | | | | | | | |
RB, Series A, 5.00%, 07/01/50(c) | | | | | | | 310 | | | | 269,899 | |
Refunding RB, 5.00%, 01/01/43(c) | | | | | | | 1,935 | | | | 1,757,691 | |
Refunding RB, 6.00%, 01/01/45(c) | | | | | | | 210 | | | | 193,320 | |
Refunding RB, Series A, 5.00%, 07/01/43 | | | | | | | 200 | | | | 201,481 | |
Refunding RB, Series A, 5.00%, 07/01/48 | | | | | | | 190 | | | | 188,054 | |
| | | | | | | | | | | | |
| | | |
| | | | | | | | | | | 3,059,910 | |
|
| West Virginia — 0.4% | |
City of Martinsburg, RB, Series A-1, 4.63%, 12/01/43 | | | | | | | 430 | | | | 372,861 | |
Morgantown Utility Board, Inc., RB, Series B, 4.00%, 12/01/48 | | | | | | | 1,215 | | | | 1,167,169 | |
| | | | | | | | | | | | |
| | | |
| | | | | | | | | | | 1,540,030 | |
|
| Wisconsin — 4.4% | |
Public Finance Authority | | | | | | | | | | | | |
RB, 6.25%, 10/01/31(c)(e)(f) | | | | | | | 195 | | | | 27,300 | |
RB, 0.00%, 01/01/35(c)(d) | | | | | | | 1,105 | | | | 552,616 | |
RB, 4.50%, 01/01/35(c) | | | | | | | 700 | | | | 668,049 | |
RB, 5.00%, 06/15/41(c) | | | | | | | 210 | | | | 192,346 | |
RB, 6.85%, 11/01/46(c)(e)(f) | | | | | | | 275 | | | | 137,500 | |
RB, 7.00%, 11/01/46(c)(e)(f) | | | | | | | 155 | | | | 77,500 | |
RB, 5.38%, 07/15/47(c) | | | | | | | 335 | | | | 320,908 | |
RB, 7.00%, 10/01/47(c) | | | | | | | 195 | | | | 27,300 | |
RB, 5.63%, 06/15/49(c) | | | | | | | 1,430 | | | | 1,191,838 | |
RB, 5.00%, 06/15/51(c) | | | | | | | 195 | | | | 160,519 | |
RB, 5.25%, 12/01/51(c) | | | | | | | 1,060 | | | | 805,563 | |
RB, 5.00%, 06/15/55(c) | | | | | | | 550 | | | | 455,734 | |
RB, 5.00%, 06/15/55(c) | | | | | | | 2,750 | | | | 2,056,091 | |
RB, 5.00%, 07/01/55(c) | | | | | | | 880 | | | | 734,875 | |
RB, 5.00%, 01/01/56(c) | | | | | | | 875 | | | | 751,038 | |
RB, 4.75%, 06/15/56(c) | | | | | | | 440 | | | | 301,285 | |
RB, 5.00%, 06/15/56(c) | | | | | | | 145 | | | | 116,213 | |
RB, 0.00%, 01/01/60(c)(d) | | | | | | | 19,530 | | | | 1,190,427 | |
RB, Series A, 7.75%, 07/01/43(c) | | | | | | | 1,920 | | | | 1,951,567 | |
RB, Series A, 5.63%, 06/15/49(c) | | | | | | | 865 | | | | 818,093 | |
RB, AMT, 4.00%, 09/30/51 | | | | | | | 2,025 | | | | 1,702,236 | |
RB, AMT, 4.25%, 07/01/54 | | | | | | | 1,160 | | | | 823,600 | |
RB, AMT, 4.00%, 03/31/56 | | | | | | | 680 | | | | 559,778 | |
Refunding RB, AMT, Series B, 5.00%, 07/01/42 | | | | | | | 750 | | | | 750,109 | |
TA, Series A, 06/01/41(b)(c) | | | | | | | 130 | | | | 126,377 | |
Wisconsin Health & Educational Facilities Authority | | | | | | | | | | | | |
RB, 08/15/44(b) | | | | | | | 1,305 | | | | 1,343,463 | |
RB, 08/15/54(b) | | | | | | | 250 | | | | 256,311 | |
Wisconsin Housing & EDA, RB, Series A, 4.55%, 07/01/37 | | | | | | | 165 | | | | 165,667 | |
| | | | | | | | | | | | |
| | | |
| | | | | | | | | | | 18,264,303 | |
| | |
SCHEDULES OF INVESTMENTS | | 79 |
| | |
Schedule of Investments (continued) March 31, 2024 | | BATS: Series E Portfolio (Percentages shown are based on Net Assets) |
| | | | | | | | | | | | |
| Security | | | | | Par (000) | | | Value | |
| |
| Wyoming — 0.2% | | | | |
University of Wyoming, RB, (AGM), Series C, 4.00%, 06/01/51 | | | USD | | | | 775 | | | $ | 735,667 | |
| | | | | | | | | | | | |
| |
Total Municipal Bonds — 80.1%
(Cost: $348,146,075) | | | | 330,541,526 | |
| | | | | | | | | | | | |
|
Municipal Bonds Transferred to Tender Option Bond Trusts(g) | |
| | | |
| Alabama — 1.3% | | | | | | | | | |
Black Belt Energy Gas District, RB, Series C-1, 5.25%, 02/01/53 | | | | | | | 5,095 | | | | 5,387,374 | |
| | | | | | | | | | | | |
| | | |
| New York — 1.7% | | | | | | | | | |
New York City Housing Development Corp. | | | | | | | | | | | | |
RB, Series D-1-B, 4.25%, 11/01/45 | | | | | | | 1,000 | | | | 919,786 | |
Refunding RB, Series A-1, 4.15%, 11/01/38 | | | | | | | 1,414 | | | | 1,386,232 | |
Port Authority of New York & New Jersey, RB, AMT, Series 221, 4.00%, 07/15/55 | | | | | | | 5,015 | | | | 4,550,707 | |
| | | | | | | | | | | | |
| | | |
| | | | | | | | | | | 6,856,725 | |
| | | | | | | | | | | | |
| |
Total Municipal Bonds Transferred to Tender Option Bond Trusts — 3.0%
(Cost: $12,510,442) | | | | 12,244,099 | |
| | | | | | | | | | | | |
| |
Total Long-Term Investments — 83.1%
(Cost: $360,656,517) | | | | 342,785,625 | |
| | | | | | | | | | | | |
| | | |
| | | | | | Shares | | | | |
| | | |
Short-Term Securities | | | | | | | | | | | | |
| | | |
| Money Market Funds — 15.0% | | | | | | | | | |
Dreyfus AMT-Free Tax Exempt Cash Management, Institutional Class, 3.54%(h) | | | | | | | 61,771,384 | | | | 61,765,206 | |
| | | | | | | | | | | | |
| | | |
| | | | | | Par (000) | | | | |
| | | |
Municipal Bonds | | | | | | | | | | | | |
| | | |
| Florida — 1.2% | | | | | | | | | |
City of Gainesville Utilities System Revenue, Refunding RB, Series B, VRDN, (Barclays Bank plc SBPA), 4.50%, 04/01/24(i) | | | USD | | | | 2,500 | | | | 2,500,000 | |
JEA Electric System Revenue, Refunding RB, Series THREE-B-3, VRDN, (Royal Bank of Canada SBPA), 3.60%, 04/08/24(i) | | | | | | | 2,500 | | | | 2,500,000 | |
| | | | | | | | | | | | |
| | | |
| | | | | | | | | | | 5,000,000 | |
| | | | | | | | | | | | |
| Security | | | | | Par (000) | | | Value | |
| | | |
New York — 0.6% | | | | | | | | | | | | |
City of New York, GO, Sub-Series A-2, VRDN, (Mizuho Bank Ltd. LOC), 4.50%, 04/01/24(i) | | | USD | | | | 2,500 | | | $ | 2,500,000 | |
| | | | | | | | | | | | |
| | | |
Virginia — 0.6% | | | | | | | | | | | | |
Loudoun County EDA, RB, Series F, VRDN, 3.75%, 04/08/24(i) | | | | | | | 2,500 | | | | 2,500,000 | |
| | | | | | | | | | | | |
| |
Total Municipal Bonds — 2.4%
(Cost: $10,000,000) | | | | 10,000,000 | |
| | | | | | | | | | | | |
| |
Total Short-Term Securities — 17.4%
(Cost: $71,764,391) | | | | 71,765,206 | |
| | | | | | | | | | | | |
| |
Total Investments — 100.5%
(Cost: $432,420,908) | | | | 414,550,831 | |
| Other Assets Less Liabilities — 1.1% | | | 4,658,047 | |
Liability for TOB Trust Certificates,
Including Interest Expense and Fees Payable — (1.6)% | | | | (6,730,547 | ) |
| | | | | | | | | | | | |
| | | |
Net Assets — 100.0% | | | | | | | | | | $ | 412,478,331 | |
| | | | | | | | | | | | |
| (a) | Variable rate security. Interest rate resets periodically. The rate shown is the effective interest rate as of period end. Security description also includes the reference rate and spread if published and available. |
| (b) | When-issued security. |
| (c) | Security exempt from registration pursuant to Rule 144A under the Securities Act of 1933, as amended. These securities may be resold in transactions exempt from registration to qualified institutional investors. |
| (e) | Issuer filed for bankruptcy and/or is in default. |
| (f) | Non-income producing security. |
| (g) | Represents bonds transferred to a TOB Trust in exchange of cash and residual certificates received by the Fund. These bonds serve as collateral in a secured borrowing. See Note 4 of the Notes to Financial Statements for details. |
| (h) | Annualized 7-day yield as of period end. |
| (i) | Variable rate security. Rate as of period end and maturity is the date the principal owed can be recovered through demand. |
Derivative Financial Instruments Categorized by Risk Exposure
For the period ended March 31, 2024, the effect of derivative financial instruments in the Statements of Operations was as follows:
| | | | | | | | | | | | | | | | | | | | | | | | | | | | |
| | | | | | | | |
| | | Commodity Contracts | | | Credit Contracts | | | Equity Contracts | | | Foreign Currency Exchange Contracts | | | Interest Rate Contracts | | | Other Contracts | | | Total | |
| | | | | | | |
Net Realized Gain (Loss) from: | | | | | | | | | | | | | | | | | | | | | | | | | | | | |
Futures contracts | | $ | — | | | $ | — | | | $ | — | | | $ | — | | | $ | (266,242 | ) | | $ | — | | | $ | (266,242 | ) |
| | | | | | | | | | | | | | | | | | | | | | | | | | | | |
| | | | | | | |
Net Change in Unrealized Appreciation (Depreciation) on: | | | | | | | | | | | | | | | | | | | | | | | | | | | | |
Futures contracts | | $ | — | | | $ | — | | | $ | — | | | $ | — | | | $ | 266,330 | | | $ | — | | | $ | 266,330 | |
| | | | | | | | | | | | | | | | | | | | | | | | | | | | |
| | |
| 80 | | 2 0 2 4 BLACK ROCK ANNUAL REPORT TO SHAREHOLDERS |
| | |
Schedule of Investments (continued) March 31, 2024 | | BATS: Series E Portfolio |
Average Quarterly Balances of Outstanding Derivative Financial Instruments
| | | | |
| | |
Futures contracts | | | | |
Average notional value of contracts — short | | | $— | (a) |
| | (a) | Derivative not held at any quarter-end. The risk exposure table serves as an indicator of activity during the period. | |
For more information about the Fund’s investment risks regarding derivative financial instruments, refer to the Notes to Financial Statements.
Fair Value Hierarchy as of Period End
Various inputs are used in determining the fair value of financial instruments. For a description of the input levels and information about the Fund’s policy regarding valuation of financial instruments, refer to the Notes to Financial Statements.
The following table summarizes the Fund’s financial instruments categorized in the fair value hierarchy. The breakdown of the Fund’s financial instruments into major categories is disclosed in the Schedule of Investments above.
| | | | | | | | | | | | | | | | |
| |
| | | | |
| | | Level 1 | | | Level 2 | | | Level 3 | | | Total | |
| |
| | | | |
Assets | | | | | | | | | | | | | | | | |
Investments | | | | | | | | | | | | | | | | |
Long-Term Investments | | | | | | | | | | | | | | | | |
Municipal Bonds | | $ | — | | | $ | 330,541,526 | | | $ | — | | | $ | 330,541,526 | |
Municipal Bonds Transferred to Tender Option Bond Trusts | | | — | | | | 12,244,099 | | | | — | | | | 12,244,099 | |
Short-Term Securities | | | | | | | | | | | | | | | | |
Money Market Funds | | | 61,765,206 | | | | — | | | | — | | | | 61,765,206 | |
Municipal Bonds | | | — | | | | 10,000,000 | | | | — | | | | 10,000,000 | |
Unfunded Commitments(a) | | | — | | | | — | | | | 3,445,231 | | | | 3,445,231 | |
| | | | | | | | | | | | | | | | |
| | | | |
| | $ | 61,765,206 | | | $ | 352,785,625 | | | $ | 3,445,231 | | | $ | 417,996,062 | |
| | | | | | | | | | | | | | | | |
| | (a) | Unfunded commitments are valued at the unrealized appreciation (depreciation) on the commitment. | |
The Fund may hold assets and/or liabilities in which the fair value approximates the carrying amount for financial statement purposes. As of period end, TOB Trust Certificates of $6,647,000 are categorized as Level 2 within the fair value hierarchy.
See notes to financial statements.
| | |
SCHEDULES OF INVESTMENTS | | 81 |
| | |
Schedule of Investments March 31, 2024 | | BATS: Series M Portfolio (Percentages shown are based on Net Assets) |
| | | | | | | | | | | | |
| Security | | | | | Par (000) | | | Value | |
| | | |
Asset-Backed Securities | | | | | | | | | | | | |
ARI Fleet Lease Trust, Series 2024-A, Class A2, 5.30%, 11/15/32(a) | | | USD | | | | 1,454 | | | $ | 1,450,862 | |
Chesapeake Funding II LLC, Series 2023-2A, Class A1, 6.16%, 10/15/35(a) | | | | | | | 1,238 | | | | 1,245,752 | |
Enterprise Fleet Financing LLC | | | | | | | | | | | | |
Series 2023-2, Class A2, 5.56%, 04/22/30(a) | | | | | | | 2,229 | | | | 2,230,568 | |
Series 2024-1, Class A3, 5.16%, 09/20/30(a) | | | | | | | 294 | | | | 293,233 | |
Ford Credit Floorplan Master Owner Trust A, Series 2023-1, Class A1, 4.92%, 05/15/28(a) | | | | | | | 3,331 | | | | 3,314,574 | |
GMF Floorplan Owner Revolving Trust | | | | | | | | | | | | |
Series 2023-1, Class A1, 5.34%, 06/15/28(a) | | | | | | | 1,805 | | | | 1,813,782 | |
Series 2023-2, Class A, 5.34%, 06/15/30(a) | | | | | | | 617 | | | | 625,346 | |
Mosaic Solar Loan Trust,
Series 2019-2A, Class A, 2.88%, 09/20/40(a) | | | | | | | 111 | | | | 98,883 | |
Navistar Financial Dealer Note Master Owner Trust II, Series 2023-1, Class A, 6.18%, 08/25/28(a) | | | | | | | 794 | | | | 800,197 | |
PFS Financing Corp. | | | | | | | | | | | | |
Series 2023-A, Class A, 5.80%, 03/15/28(a) | | | | | | | 2,658 | | | | 2,686,372 | |
Series 2023-B, Class A, 5.27%, 05/15/28(a) | | | | | | | 3,792 | | | | 3,796,117 | |
Series 2023-C, Class A, 5.52%, 10/15/28(a) | | | | | | | 873 | | | | 880,702 | |
| | | | | | | | | | | | |
| |
Total Asset-Backed Securities — 1.7%
(Cost: $19,193,336) | | | | 19,236,388 | |
| | | | | | | | | | | | |
| |
Non-Agency Mortgage-Backed Securities | | | | | |
|
Commercial Mortgage-Backed Securities — 9.1% | |
1211 Avenue of the Americas Trust, Series 2015-1211, Class A1A2, 3.90%, 08/10/35(a) | | | | | | | 945 | | | | 910,423 | |
280 Park Avenue Mortgage Trust, Series 2017-280P, Class A, (1-mo. CME Term SOFR + 1.18%), 6.50%, 09/15/34(a)(b) | | | | | | | 3,928 | | | | 3,855,665 | |
Arbor Multifamily Mortgage Securities Trust, Series 2020-MF1, Class C, 3.60%,
05/15/53(a)(b) | | | | | | | 400 | | | | 347,163 | |
Banc of America Merrill Lynch Commercial Mortgage Securities Trust, Series 2015-200P, Class B, 3.49%, 04/14/33(a) | | | | | | | 2,164 | | | | 2,073,301 | |
BANK | | | | | | | | | | | | |
Series 2018-BN11, Class B, 4.34%, 03/15/61(b) | | | | | | | 1,769 | | | | 1,640,438 | |
Series 2021-BN38, Class A5, 2.52%, 12/15/64 | | | | | | | 5,090 | | | | 4,255,530 | |
Beast Mortgage Trust,
Series 2021-SSCP, Class A, (1-mo. CME Term SOFR + 0.86%), 6.19%, 04/15/36(a)(b) | | | | | | | 1,099 | | | | 1,090,912 | |
Benchmark Mortgage Trust, Series 2018-B2, Class A5, 3.88%, 02/15/51(b) | | | | | | | 1,000 | | | | 937,169 | |
BFLD, Series 2019-DPLO, Class A, (1-mo. CME Term SOFR + 1.20%), 6.53%, 10/15/34(a)(b) | | | | | | | 70 | | | | 69,912 | |
BLP Commercial Mortgage Trust, Series 2023-IND, Class A, (1-mo. CME Term SOFR + 1.69%), 7.02%, 03/15/40(a)(b) | | | | | | | 2,000 | | | | 2,003,750 | |
BWAY Mortgage Trust, Series 2013-1515, Class A2, 3.45%, 03/10/33(a) | | | | | | | 3,920 | | | | 3,723,478 | |
BX Commercial Mortgage Trust | | | | | | | | | | | | |
Series 2022-LP2, Class A, (1-mo. CME Term SOFR + 1.01%), 6.34%, 02/15/39(a)(b) | | | | | | | 5,058 | | | | 5,033,039 | |
Series 2023-VLT3, Class A, (1-mo. CME Term SOFR + 1.94%), 7.27%, 11/15/28(a)(b) | | | | | | | 1,060 | | | | 1,059,999 | |
Series 2023-XL3, Class A, (1-mo. CME Term SOFR + 1.76%), 7.09%, 12/09/40(a)(b) | | | | | | | 3,072 | | | | 3,091,094 | |
Series 2024-MF, Class A, (1-mo. CME Term SOFR + 1.44%), 6.77%, 02/15/39(a)(b) | | | | | | | 2,670 | | | | 2,676,674 | |
Series 2024-XL4, Class A, (1-mo. CME Term SOFR + 1.44%), 6.77%, 02/15/39(a)(b) | | | | | | | 2,500 | | | | 2,503,104 | |
| | | | | | | | | | | | |
| Security | | | | | Par (000) | | | Value | |
|
Commercial Mortgage-Backed Securities (continued) | |
BX Trust | | | | | | | | | | | | |
Series 2019-OC11, Class D, 3.94%,
12/09/41(a)(b) | |
| .
USD |
| | | 1,489 | | | $ | 1,312,141 | |
Series 2021-LBA, Class AV, (1-mo. CME Term SOFR + 0.91%), 6.24%, 02/15/36(a)(b) | | | | | | | 217 | | | | 216,521 | |
Series 2022-GPA, Class A, (1-mo. CME Term SOFR + 2.17%), 7.49%, 08/15/39(a)(b) | | | | | | | 1,045 | | | | 1,047,514 | |
Series 2024-PAT, Class A, (1-mo. CME Term SOFR + 2.09%), 7.34%, 03/15/26(a)(b) | | | | | | | 1,530 | | | | 1,529,218 | |
CENT Trust, Series 2023-CITY, Class A,
(1-mo. CME Term SOFR + 2.62%), 7.95%, 09/15/38(a)(b) | | | | | | | 2,994 | | | | 3,024,433 | |
CFK Trust, Series 2020-MF2, Class B, 2.79%, 03/15/39(a) | | | | | | | 1,254 | | | | 1,066,457 | |
Citigroup Commercial Mortgage Trust | | | | | | | | | | | | |
Series 2020-420K, Class B, 2.86%, 11/10/42(a) | | | | | | | 130 | | | | 109,272 | |
Series 2023-SMRT, Class A, 5.82%,
10/12/40(a)(b) | | | . | | | | 1,370 | | | | 1,393,506 | |
Commercial Mortgage Trust | | | | | | | | | | | | |
Series 2015-CR27, Class B, 4.34%, 10/10/48(b) | | | | | | | 2,917 | | | | 2,768,365 | |
Series 2015-LC23, Class ASB, 3.60%, 10/10/48 | | | | | | | 1,185 | | | | 1,167,649 | |
Series 2017-COR2, Class AM, 3.80%, 09/10/50 | | | | | | | 404 | | | | 369,034 | |
Credit Suisse Mortgage Capital Trust, Series 2020-NET, Class C, 3.53%, 08/15/37(a) | | | | | | | 266 | | | | 245,528 | |
CRSO Trust, Series 2023-BRND, 7.12%, 07/10/40(a) | | | . | | | | 763 | | | | 799,063 | |
Grace Mortgage Trust,
Series 2020-GRCE, Class B, 2.60%, 12/10/40(a) | | | | | | | 900 | | | | 731,215 | |
GS Mortgage Securities Corp. II | | | | | | | | | | | | |
Series 2005-ROCK, Class A, 5.37%, 05/03/32(a) | | | | | | | 910 | | | | 893,358 | |
Series 2005-ROCK, Class F, 5.52%, 05/03/32(a) | | | | | | | 706 | | | | 668,656 | |
GS Mortgage Securities Trust | | | | | | | | | | | | |
Series 2014-GC24, Class A5, 3.93%, 09/10/47 | | | | | | | 4,000 | | | | 3,959,860 | |
Series 2021-ROSS, Class A, (1-mo. CME Term SOFR + 1.26%), 6.59%, 05/15/26(a)(b) | | | | | | | 730 | | | | 679,169 | |
Series 2022-ECI, Class A, (1-mo. CME Term SOFR + 2.19%), 7.52%, 08/15/39(a)(b) | | | | | | | 3,060 | | | | 3,079,256 | |
Series 2023-FUN, Class A, (1-mo. CME Term SOFR + 2.09%), 7.42%, 03/15/28(a)(b) | | | | | | | 1,100 | | | | 1,103,437 | |
Hudson Yards Mortgage Trust, Series 2019-30HY, Class D, 3.44%, 07/10/39(a)(b) | | | | | | | 669 | | | | 561,960 | |
IMT Trust, Series 2017-APTS, Class BFX, 3.50%, 06/15/34(a)(b) | | | | | | | 2,425 | | | | 2,401,466 | |
JPMBB Commercial Mortgage Securities Trust | | | | | | | | | | | | |
Series 2014-C23, Class ASB, 3.66%, 09/15/47 | | | | | | | 537 | | | | 534,377 | |
Series 2015-C28, Class A4, 3.23%, 10/15/48 | | | | | | | 4,058 | | | | 3,951,125 | |
JPMorgan Chase Commercial Mortgage Securities Trust | | | | | | | | | | | | |
Series 2016-NINE, Class A, 2.85%,
09/06/38(a)(b) | | | | | | | 1,790 | | | | 1,674,514 | |
Series 2020-609M, Class A, (1-mo. CME Term SOFR + 1.73%), 7.06%, 10/15/33(a)(b) | | | | | | | 2,000 | | | | 1,960,125 | |
Series 2020-609M, Class D, (1-mo. CME Term SOFR + 3.13%), 8.46%, 10/15/33(a)(b) | | | | | | | 600 | | | | 463,631 | |
Series 2021-2NU, Class A, 1.97%, 01/05/40(a) | | | | | | | 1,210 | | | | 1,023,365 | |
Series 2022-CGSS, Class A, (1-mo. CME Term SOFR + 2.87%), 8.20%, 12/15/36(a)(b) | | | | | | | 399 | | | | 400,103 | |
Series 2022-NXSS, Class A, (1-mo. CME Term SOFR + 2.18%), 7.50%, 09/15/39(a)(b) | | | | | | | 210 | | | | 210,590 | |
KSL Commercial Mortgage Trust, Series 2023-HT, Class A, (1-mo. CME Term SOFR + 2.29%), 7.62%, 12/15/36(a)(b) | | | | | | | 1,920 | | | | 1,931,400 | |
LSTAR Commercial Mortgage Trust, Series 2016-4, Class A2, 2.58%, 03/10/49(a) | | | | | | | 489 | | | | 487,686 | |
LUX, Series 2023-LION, Class A, (1-mo. CME Term SOFR + 2.69%), 8.02%, 08/15/40(a)(b) | | | | | | | 880 | | | | 888,581 | |
| | |
| 82 | | 2 0 2 4 BLACK ROCK ANNUAL REPORT TO SHAREHOLDERS |
| | |
Schedule of Investments (continued) March 31, 2024 | | BATS: Series M Portfolio (Percentages shown are based on Net Assets) |
| | | | | | | | | | | | |
| Security | | | | | Par (000) | | | Value | |
|
Commercial Mortgage-Backed Securities (continued) | |
Med Trust, Series 2021-MDLN, Class A, (1-mo. CME Term SOFR + 1.06%), 6.39%, 11/15/38(a)(b) MF1 | | | USD | | | | 2,888 | | | $ | 2,880,919 | |
Series 2021-W10, Class A, (1-mo. CME Term SOFR + 1.07%), 6.40%, 12/15/34(a)(b) | | | | | | | 480 | | | | 476,400 | |
Series 2021-W10, Class B, (1-mo. CME Term SOFR + 1.37%), 6.70%, 12/15/34(a)(b) | | | | | | | 640 | | | | 627,200 | |
MIRA Trust, Series 2023-MILE, Class A, 6.76%, 06/10/38(a) | | | | | | | 2,355 | | | | 2,445,205 | |
Morgan Stanley Capital I Trust | | | | | | | | | | | | |
Series 2016-UBS9, Class ASB, 3.34%, 03/15/49 | | | | 1,529 | | | | 1,493,287 | |
Series 2018-H3, Class B, 4.62%, 07/15/51(b) | | | | | | | 740 | | | | 692,790 | |
Series 2018-MP, Class A, 4.28%, 07/11/40(a)(b) | | | | | | | 1,000 | | | | 885,734 | |
OPEN Trust, Series 2023-AIR, Class A, (1-mo. CME Term SOFR + 3.09%), 8.41%, 10/15/28(a)(b) | | | | | | | 526 | | | | 531,537 | |
ORL Trust, Series 2023-GLKS, Class A, (1-mo. CME Term SOFR + 2.35%), 7.68%, 10/19/36(a)(b) | | | | | | | 1,963 | | | | 1,970,209 | |
Seasoned Credit Risk Transfer Trust | | | | | | | | | | | | |
Series 2018-3, Class MA, 3.50%, 08/25/57(b) | | | | | | | 1,245 | | | | 1,178,378 | |
Series 2018-4, Class MA, 3.50%, 03/25/58 | | | | | | | 1,377 | | | | 1,290,905 | |
Taubman Centers Commercial Mortgage Trust, Series 2022-DPM, Class A, (1-mo. CME Term SOFR + 2.19%), 7.51%, 05/15/37(a)(b) | | | | | | | 1,250 | | | | 1,259,375 | |
Wells Fargo Commercial Mortgage Trust | | | | | | | | | | | | |
Series 2015-LC22, Class ASB, 3.57%, 09/15/58 | | | | 989 | | | | 973,965 | |
Series 2015-NXS3, Class ASB, 3.37%, 09/15/57 | | | | 1,322 | | | | 1,295,447 | |
Series 2015-P2, Class AS, 4.01%, 12/15/48 | | | | | | | 1,605 | | | | 1,549,723 | |
Series 2017-C41, Class B, 4.19%, 11/15/50(b) | | | | | | | 1,304 | | | | 1,148,254 | |
Series 2018-AUS, Class A, 4.06%, 08/17/36(a)(b) | | | | 2,417 | | | | 2,237,983 | |
Series 2021-FCMT, Class A, (1-mo. CME Term SOFR + 1.31%), 6.64%, 05/15/31(a)(b) | | | | | | | 3,516 | | | | 3,447,761 | |
| | | | | | | | | | | | |
| | | |
| | | | | | | | | | | 104,309,298 | |
|
Interest Only Commercial Mortgage-Backed Securities — 0.4% | |
Arbor Multifamily Mortgage Securities Trust, Series 2020-MF1, Class XA, 0.95%, 05/15/53(a)(b) . | | | | | | | 1,563 | | | | 68,400 | |
BANK | | | | | | | | | | | | |
Series 2020-BN29, Class XA, 1.32%, 11/15/53(b) | | | | 4,224 | | | | 278,970 | |
Series 2021-BN33, Class XA, 1.05%, 05/15/64(b) | | | | 15,772 | | | | 802,664 | |
Benchmark Mortgage Trust | | | | | | | | | | | | |
Series 2020-B20, Class XA, 1.61%, 10/15/53(b) | | | | | | | 15,375 | | | | 992,501 | |
Series 2020-B21, Class XA, 1.45%, 12/17/53(b) | | | | | | | 3,835 | | | | 259,500 | |
BMO Mortgage Trust, Series 2023-C5, Class XA, 0.73%, 06/15/56(b) | | | | | | | 8,808 | | | | 451,044 | |
Commercial Mortgage Trust, Series 2014-LC17, Class XA, 0.64%, 10/10/47(b) | | | | | | | 36,788 | | | | 27,911 | |
CSAIL Commercial Mortgage Trust, Series 2019-C16, Class XA, 1.54%, 06/15/52(b) | | | | | | | 12,783 | | | | 785,892 | |
UBS Commercial Mortgage Trust, Series 2019-C17, Class XA, 1.44%, 10/15/52(b) | | | | | | | 9,801 | | | | 600,707 | |
Wells Fargo Commercial Mortgage Trust | | | | | | | | | | | | |
Series 2018-C44, Class XA, 0.71%, 05/15/51(b) | | | | | | | 8,096 | | | | 190,390 | |
Series 2020-C58, Class XA, 1.80%, 07/15/53(b) | | | | | | | 4,459 | | | | 385,071 | |
| | | | | | | | | | | | |
| | | |
| | | | | | | | | | | 4,843,050 | |
| | | | | | | | | | | | |
| |
Total Non-Agency Mortgage-Backed Securities — 9.5%
(Cost: $114,555,538) | | | | 109,152,348 | |
| | | | | | | | | | | | |
|
U.S. Government Sponsored Agency Securities | |
|
Collateralized Mortgage Obligations — 2.1% | |
Fannie Mae | | | | | | | | | | | | |
Series 2010-134, Class KZ, 4.50%, 12/25/40 | | | | | | | 200 | | | | 175,662 | |
Series 2010-141, Class LZ, 4.50%, 12/25/40 | | | | | | | 410 | | | | 386,678 | |
| | | | | | | | | | | | |
| Security | | | | | Par (000) | | | Value | |
|
Collateralized Mortgage Obligations (continued) | |
Fannie Mae | | | | | | | | | | | | |
Series 2011-131, Class LZ, 4.50%, 12/25/41 | | | USD | | | | 269 | | | $ | 241,875 | |
Series 2011-8, Class ZA, 4.00%, 02/25/41 | | | | | | | 568 | | | | 535,864 | |
Series 2013-81, Class YK, 4.00%, 08/25/43 | | | | | | | 200 | | | | 181,258 | |
Series 2017-100, Class ZJ, 3.50%, 12/25/47 | | | | | | | 3,032 | | | | 2,650,637 | |
Series 2017-76, Class PB, 3.00%, 10/25/57 | | | | | | | 900 | | | | 646,733 | |
Series 2018-32, Class PS, (SOFR (30-day) + 7.10%), 0.89%, 05/25/48(b) | | | | | | | 1,996 | | | | 1,681,613 | |
Series 2018-76, Class ZL, 4.00%, 10/25/58 | | | | | | | 4,609 | | | | 4,083,323 | |
Series 2022-25, Class KL, 4.00%, 05/25/52 | | | | | | | 1,500 | | | | 1,317,972 | |
Freddie Mac | | | | | | | | | | | | |
Series 3745, Class ZA, 4.00%, 10/15/40 | | | | | | | 330 | | | | 308,528 | |
Series 3780, Class ZA, 4.00%, 12/15/40 | | | | | | | 1,321 | | | | 1,257,621 | |
Series 3960, Class PL, 4.00%, 11/15/41 | | | | | | | 899 | | | | 868,598 | |
Series 4161, Class BW, 2.50%, 02/15/43 | | | | | | | 1,400 | | | | 1,182,185 | |
Series 4355, Class ZL, 4.00%, 06/15/44 | | | | | | | 2,376 | | | | 2,158,750 | |
Series 4384, Class LB, 3.50%, 08/15/43 | | | | | | | 978 | | | | 929,659 | |
Series 4758, Class Z, 4.00%, 02/15/48 | | | | | | | 1,689 | | | | 1,549,015 | |
Series 4988, Class AK, 1.00%, 07/25/50 | | | | | | | 2,033 | | | | 1,573,750 | |
Series 5002, Class TJ, 2.00%, 07/25/50 | | | | | | | 2,004 | | | | 1,683,573 | |
Ginnie Mae | | | | | | | | | | | | |
Series 2014-107, Class WX, 6.64%, 07/20/39(b) | | | | 286 | | | | 291,876 | |
Series 2016-123, Class LM, 3.00%, 09/20/46 | | | | | | | 600 | | | | 488,152 | |
| | | | | | | | | | | | |
| | | |
| | | | | | | | | | | 24,193,322 | |
|
Commercial Mortgage-Backed Securities — 1.4% | |
Freddie Mac | | | | | | | | | | | | |
Series K082, Class A2, 3.92%, 09/25/28(b) | | | | | | | 2,400 | | | | 2,329,170 | |
Series K139, Class A2, 2.59%, 01/25/32(b) | | | | | | | 12,000 | | | | 10,394,690 | |
Series K154, Class A2, 3.42%, 04/25/32 | | | | | | | 3,500 | | | | 3,285,019 | |
| | | | | | | | | | | | |
| | | |
| | | | | | | | | | | 16,008,879 | |
|
Interest Only Collateralized Mortgage Obligations — 1.0% | |
Fannie Mae | | | | | | | | | | | | |
Series 2013-10, Class PI, 3.00%, 02/25/43 | | | | | | | 951 | | | | 109,240 | |
Series 2014-68, Class YI, 4.50%, 11/25/44 | | | | | | | 427 | | | | 84,496 | |
Series 2015-66, Class AS, (SOFR
(30-day) + 6.14%), 0.82%, 09/25/45(b) | | | | | | | 2,334 | | | | 161,384 | |
Series 2016-60, Class SD, (SOFR
(30-day) + 5.99%), 0.67%, 09/25/46(b) | | | | | | | 1,059 | | | | 77,820 | |
Series 2016-78, Class CS, (SOFR
(30-day) + 5.99%), 0.67%, 05/25/39(b) | | | | | | | 1,354 | | | | 97,194 | |
Series 2017-68, Class IE, 4.50%, 09/25/47 | | | | | | | 1,610 | | | | 281,100 | |
Series 2020-32, Class IO, 4.00%, 05/25/50 | | | | | | | 1,740 | | | | 356,065 | |
Series 2020-32, Class PI, 4.00%, 05/25/50 | | | | | | | 1,806 | | | | 378,260 | |
Series 2021-23, Class CI, 3.50%, 07/25/46 | | | | | | | 2,392 | | | | 422,078 | |
Series 2021-41, Class IO, 3.50%, 07/25/51 | | | | | | | 4,560 | | | | 804,856 | |
Series 2021-88, Class IO, 2.50%, 12/25/51 | | | | | | | 2,097 | | | | 289,134 | |
Series 2024-7, Class IA, 3.50%, 11/25/49 | | | | | | | 5,766 | | | | 715,951 | |
Series 427, Class C71, 3.00%, 10/25/49 | | | | | | | 2,199 | | | | 361,877 | |
Freddie Mac | | | | | | | | | | | | |
Series 4062, Class GI, 4.00%, 02/15/41 | | | | | | | 161 | | | | 6,081 | |
Series 4119, Class SC, (SOFR
(30-day) + 6.04%), 0.72%, 10/15/42(b) | | | | | | | 1,437 | | | | 150,750 | |
Series 4901, Class CS, (SOFR
(30-day) + 5.99%), 0.67%, 07/25/49(b) | | | | | | | 1,758 | | | | 159,367 | |
Series 4941, Class SH, (SOFR
(30-day) + 5.84%), 0.52%, 12/25/49(b) | | | | | | | 3,748 | | | | 335,897 | |
Series 5109, Class ID, 2.50%, 05/25/51 | | | | | | | 1,875 | | | | 279,253 | |
Series 5112, Class KI, 3.50%, 06/25/51 | | | | | | | 1,459 | | | | 264,299 | |
Series 5127, Class AI, 3.00%, 06/25/51 | | | | | | | 770 | | | | 125,154 | |
Series 5159, Class PI, 3.00%, 11/25/51 | | | | | | | 4,095 | | | | 595,262 | |
Series 5176, Class QI, 3.00%, 12/25/51 | | | | | | | 2,348 | | | | 345,525 | |
| | |
SCHEDULES OF INVESTMENTS | | 83 |
| | |
Schedule of Investments (continued) March 31, 2024 | | BATS: Series M Portfolio (Percentages shown are based on Net Assets) |
| | | | | | | | | | | | |
| Security | | | | | Par (000) | | | Value | |
|
| Interest Only Collateralized Mortgage Obligations (continued) | |
Ginnie Mae | | | | | | | | | | | | |
Series 2017-101, Class SL, (1-mo. CME Term SOFR + 6.09%), 0.76%, 07/20/47(b) | | | USD | | | | 1,466 | | | $ | 159,172 | |
Series 2020-115, Class IM, 3.50%, 08/20/50 | | | | | | | 2,225 | | | | 360,965 | |
Series 2020-146, Class DI, 2.50%, 10/20/50 | | | | | | | 3,015 | | | | 396,936 | |
Series 2020-175, Class DI, 2.50%, 11/20/50 | | | | | | | 1,044 | | | | 133,895 | |
Series 2020-185, Class MI, 2.50%, 12/20/50 | | | | | | | 3,748 | | | | 490,973 | |
Series 2021-104, Class IH, 3.00%, 06/20/51 | | | | | | | 4,376 | | | | 700,432 | |
Series 2021-149, Class KI, 3.00%, 08/20/51 | | | | | | | 8,496 | | | | 1,364,108 | |
Series 2022-5, Class LI, 3.50%, 01/20/52 | | | | | | | 11,306 | | | | 1,945,806 | |
| | | | | | | | |
| | | |
| | | | | | | | | | | 11,953,330 | |
|
| Interest Only Commercial Mortgage-Backed Securities — 0.1% | |
Freddie Mac | | | | | | | | | | | | |
Series K110, Class X1, 1.70%, 04/25/30(b) | | | | | | | 1,195 | | | | 93,138 | |
Series K116, Class X1, 1.42%, 07/25/30(b) | | | | | | | 2,075 | | | | 142,444 | |
Series K119, Class X1, 0.93%, 09/25/30(b) | | | | | | | 3,292 | | | | 154,311 | |
Series K122, Class X1, 0.88%, 11/25/30(b) | | | | | | | 5,035 | | | | 227,730 | |
Ginnie Mae | | | | | | | | | | | | |
Series 2016-151, Class IO, 0.85%, 06/16/58(b) | | | | | | | 18,473 | | | | 762,515 | |
Series 2017-61, Class IO, 0.70%, 05/16/59(b) | | | | | | | 971 | | | | 36,085 | |
| | | | | | | | |
| | | |
| | | | | | | | | | | 1,416,223 | |
| | | |
| Mortgage-Backed Securities — 104.8% | | | | | | | | | |
Fannie Mae Mortgage-Backed Securities | | | | | | | | | | | | |
1.50%, 12/01/35 - 03/01/51 | | | | | | | 43,631 | | | | 35,446,431 | |
2.00%, 10/01/31 - 03/01/52 | | | | | | | 145,640 | | | | 118,709,326 | |
2.50%, 09/01/27 - 02/01/52 | | | | | | | 94,772 | | | | 81,015,447 | |
3.00%, 04/01/28 - 06/01/52 | | | | | | | 44,423 | | | | 39,504,937 | |
3.50%, 03/01/29 - 04/01/52 | | | | | | | 34,280 | | | | 31,479,397 | |
4.00%, 02/01/31 - 05/01/52 | | | | | | | 36,011 | | | | 33,892,681 | |
4.50%, 05/01/24 - 10/01/52 | | | | | | | 35,252 | | | | 33,891,740 | |
5.00%, 02/01/35 - 04/01/53 | | | | | | | 16,867 | | | | 16,642,010 | |
5.50%, 05/01/34 - 06/01/53 | | | | | | | 13,865 | | | | 13,891,370 | |
6.00%, 02/01/38 - 03/01/54 | | | | | | | 21,090 | | | | 21,387,955 | |
6.50%, 07/01/37 - 02/01/54 | | | | | | | 12,754 | | | | 13,101,896 | |
7.00%, 12/01/53 - 01/01/54 | | | | | | | 3,285 | | | | 3,396,059 | |
7.50%, 12/01/53 - 01/01/54 | | | | | | | 549 | | | | 570,715 | |
Freddie Mac Mortgage-Backed Securities | | | | | | | | | | | | |
1.50%, 04/01/36 - 04/01/51 | | | | | | | 8,684 | | | | 7,086,351 | |
2.00%, 01/01/36 - 02/01/52 | | | | | | | 101,726 | | | | 82,934,956 | |
2.50%, 02/01/30 - 04/01/52 | | | | | | | 74,584 | | | | 62,832,782 | |
3.00%, 09/01/27 - 08/01/52(c) | | | | | | | 65,466 | | | | 57,496,096 | |
3.50%, 02/01/31 - 06/01/50 | | | | | | | 21,241 | | | | 19,461,494 | |
4.00%, 08/01/40 - 06/01/52 | | | | | | | 25,954 | | | | 24,529,349 | |
4.50%, 05/01/24 - 08/01/52 | | | | | | | 6,909 | | | | 6,620,611 | |
5.00%, 05/01/28 - 11/01/53 | | | | | | | 29,929 | | | | 29,305,454 | |
5.50%, 01/01/28 - 08/01/53 | | | | | | | 12,465 | | | | 12,441,308 | |
6.00%, 08/01/28 - 11/01/53 | | | | | | | 14,570 | | | | 14,755,399 | |
6.50%, 10/01/53 - 04/01/54 | | | | | | | 6,086 | | | | 6,245,099 | |
7.00%, 01/01/54 | | | | | | | 1,042 | | | | 1,075,465 | |
7.50%, 12/01/53 - 01/01/54 | | | | | | | 283 | | | | 294,944 | |
Ginnie Mae Mortgage-Backed Securities | | | | | | | | | | | | |
2.00%, 08/20/50 - 04/15/54(d) | | | | | | | 55,598 | | | | 45,588,351 | |
2.50%, 04/20/51 - 04/15/54(d) | | | | | | | 54,728 | | | | 46,614,890 | |
3.00%, 12/20/44 - 04/15/54(d) | | | | | | | 38,437 | | | | 33,906,841 | |
3.50%, 01/15/42 - 04/15/54(d) | | | | | | | 32,827 | | | | 29,927,048 | |
4.00%, 04/20/39 - 04/15/54(d) | | | | | | | 29,681 | | | | 27,903,243 | |
4.50%, 09/20/39 - 04/15/54(d) | | | | | | | 18,528 | | | | 17,886,623 | |
5.00%, 07/15/33 - 04/15/54(d) | | | | | | | 17,227 | | | | 16,946,451 | |
5.50%, 07/15/38 - 04/15/54(d) | | | | | | | 3,631 | | | | 3,638,150 | |
6.00%, 03/20/53 - 04/15/54(d) | | | | | | | 2,024 | | | | 2,041,589 | |
6.50%, 04/15/54(d) | | | | | | | 9,592 | | | | 9,751,926 | |
| | | | | | | | | | | | |
| Security | | | | | Par (000) | | | Value | |
|
| Mortgage-Backed Securities (continued) | |
Uniform Mortgage-Backed Securities | | | | | | | | | | | | |
1.50%, 04/01/39 - 04/01/54(d) | | | USD | | | | 8,732 | | | $ | 6,833,373 | |
2.00%, 04/01/39 - 04/01/54(d) | | | | | | | 32,648 | | | | 26,478,343 | |
2.50%, 04/01/39 - 04/01/54(d) | | | | | | | 18,709 | | | | 15,481,157 | |
3.00%, 04/01/39 - 04/01/54(d) | | | | | | | 26,298 | | | | 22,735,322 | |
3.50%, 04/01/39 - 04/01/54(d) | | | | | | | 63,634 | | | | 56,964,195 | |
4.00%, 04/01/39 - 04/01/54(d) | | | | | | | 6,268 | | | | 5,848,149 | |
4.50%, 04/01/39 - 04/01/54(d) | | | | | | | 31,502 | | | | 30,107,834 | |
5.00%, 04/01/54(d) | | | | | | | 8,847 | | | | 8,631,406 | |
5.50%, 04/01/54(d) | | | | | | | 6,795 | | | | 6,761,271 | |
6.00%, 04/01/54(d) | | | | | | | 2,087 | | | | 2,106,000 | |
6.50%, 04/01/54(d) | | | | | | | 12,164 | | | | 12,425,284 | |
7.00%, 04/01/54(d) | | | | | | | 4,325 | | | | 4,457,722 | |
| | | | | | | | |
| | | |
| | | | | | | | | | | 1,201,044,440 | |
|
| Principal Only Collateralized Mortgage Obligations — 1.1% | |
Fannie Mae | | | | | | | | | | | | |
Series 2023-36, Class AO, 0.00%, 08/25/50(e) | | | | | | | 3,849 | | | | 2,711,020 | |
Series 2024-16, Class PO, 0.00%, 03/25/51(e) | | | | | | | 1,700 | | | | 1,157,746 | |
Freddie Mac | | | | | | | | | | | | |
Series 5319, Class PO, 0.00%, 08/25/50(e) | | | | | | | 7,310 | | | | 5,012,640 | |
Series 5341, Class AO, 0.00%, 06/25/50(e) | | | | | | | 4,367 | | | | 3,071,282 | |
Ginnie Mae, Series 2022-195, Class PO, 0.00%, 11/20/52(e) | | | | | | | 617 | | | | 499,936 | |
| | | | | | | | |
| | | |
| | | | | | | | | | | 12,452,624 | |
| | | | | | | | |
| |
Total U.S. Government Sponsored Agency Securities — 110.5%
(Cost: $1,348,966,551) | | | | 1,267,068,818 | |
| | | | | | | | |
| |
Total Long-Term Investments — 121.7%
(Cost: $1,482,715,425) | | | | 1,395,457,554 | |
| | | | | | | | |
| | | |
| | | | | | Shares | | | | |
| | | |
Short-Term Securities | | | | | | | | | | | | |
| | | |
| Money Market Funds — 0.5% | | | | | | | | | |
Dreyfus Treasury Securities Cash Management, Institutional Class,
5.19%(f) | | | | | | | 5,804,208 | | | | 5,804,208 | |
| | | | | | | | |
| | | |
| | | | | | Par (000) | | | | |
| | | |
| U.S. Treasury Obligations(g) — 2.4% | | | | | | | | | |
U.S. Treasury Bills, 5.30%, 04/23/24 | | | USD | | | | 27,396 | | | | 27,307,770 | |
| | | | | | | | |
| |
Total Short-Term Securities — 2.9%
(Cost: $33,111,941) | | | | 33,111,978 | |
| | | | | | | | |
| |
Total Investments Before TBA Sale Commitments — 124.6%
(Cost: $1,515,827,366) | | | | 1,428,569,532 | |
| | | | | | | | |
| | | |
TBA Sale Commitments(d) | | | | | | | | | | | | |
|
| Mortgage-Backed Securities — (14.2)% | |
Ginnie Mae Mortgage-Backed Securities | | | | | | | | | | | | |
2.00%, 04/15/54 | | | | | | | (13,751 | ) | | | (11,263,866 | ) |
2.50%, 04/15/54 | | | | | | | (2,136 | ) | | | (1,819,053 | ) |
3.00%, 04/15/54 | | | | | | | (1,540 | ) | | | (1,357,931 | ) |
3.50%, 04/15/54 | | | | | | | (1,170 | ) | | | (1,064,557 | ) |
4.00%, 04/15/54 | | | | | | | (792 | ) | | | (741,066 | ) |
4.50%, 04/15/54 | | | | | | | (8,265 | ) | | | (7,944,270 | ) |
5.00%, 04/15/54 | | | | | | | (652 | ) | | | (640,757 | ) |
5.50%, 04/15/54 | | | | | | | (585 | ) | | | (584,451 | ) |
6.00%, 04/15/54 | | | | | | | (532 | ) | | | (536,650 | ) |
6.50%, 04/15/54 | | | | | | | (478 | ) | | | (485,970 | ) |
| | |
| 84 | | 2 0 2 4 BLACK ROCK ANNUAL REPORT TO SHAREHOLDERS |
| | |
Schedule of Investments (continued) March 31, 2024 | | BATS: Series M Portfolio (Percentages shown are based on Net Assets) |
| | | | | | | | | | | | |
| Security | | | | | Par (000) | | | Value | |
|
Mortgage-Backed Securities (continued) | |
Uniform Mortgage-Backed Securities | | | | | | | | | |
1.50%, 04/01/39 - 04/01/54 | | | USD | | | | (2,383 | ) | | $ | (1,924,132 | ) |
2.00%, 04/01/39 - 04/01/54 | | | | | | | (10,582 | ) | | | (8,538,866 | ) |
2.50%, 04/01/39 - 04/01/54 | | | | | | | (32,349 | ) | | | (28,137,623 | ) |
3.00%, 04/01/39 - 04/01/54 | | | | | | | (4,207 | ) | | | (3,648,069 | ) |
3.50%, 04/01/39 - 04/01/54 | | | | | | | (2,715 | ) | | | (2,440,874 | ) |
4.00%, 04/01/39 - 04/01/54 | | | | | | | (16,411 | ) | | | (15,200,266 | ) |
4.50%, 04/01/39 - 04/01/54 | | | | | | | (13,980 | ) | | | (13,316,779 | ) |
5.00%, 04/01/54 | | | | | | | (20,194 | ) | | | (19,702,542 | ) |
5.50%, 04/01/54 | | | | | | | (1,315 | ) | | | (1,308,473 | ) |
6.00%, 04/01/54 | | | | | | | (26,369 | ) | | | (26,608,759 | ) |
6.50%, 04/01/54 | | | | | | | (6,662 | ) | | | (6,806,064 | ) |
7.00%, 04/01/54 | | | | | | | (8,650 | ) | | | (8,911,390 | ) |
| | | | | | | | |
| |
Total TBA Sale Commitments — (14.2)%
(Proceeds: $(162,731,894)) | | | | (162,982,408 | ) |
| | | | | | | | |
| |
Total Investments Net of TBA Sale Commitments — 110.4%
(Cost: $1,353,095,472) | | | | 1,265,587,124 | |
Liabilities in Excess of Other Assets — (10.4)% | | | | (119,203,655 | ) |
| | | | | | | | |
| |
Net Assets — 100.0% | | | $ | 1,146,383,469 | |
| | | | | | | | |
| (a) | Security exempt from registration pursuant to Rule 144A under the Securities Act of 1933, as amended. These securities may be resold in transactions exempt from registration to qualified institutional investors. |
| (b) | Variable rate security. Interest rate resets periodically. The rate shown is the effective interest rate as of period end. Security description also includes the reference rate and spread if published and available. |
| (c) | All or a portion of the security has been pledged as collateral in connection with outstanding TBA commitments. |
| (d) | Represents or includes a TBA transaction. |
| (f) | Annualized 7-day yield as of period end. |
| (g) | Rates are discount rates or a range of discount rates as of period end. |
Derivative Financial Instruments Outstanding as of Period End
Futures Contracts
| | | | | | | | | | | | | | | | |
| |
| | | | |
| Description | | Number of
Contracts | | | Expiration Date | | | Notional Amount (000) | | | Value/ Unrealized Appreciation (Depreciation) | |
| |
| | | | |
Long Contracts | | | | | | | | | | | | | | | | |
U.S. Treasury Notes (10 Year) | | | 36 | | | | 06/18/24 | | | $ | 3,989 | | | $ | (1,176 | ) |
U.S. Treasury Notes (5 Year) | | | 283 | | | | 06/28/24 | | | | 30,285 | | | | 105,401 | |
| | | | | | | | | | | | | | | | |
| | | | |
| | | | | | | | | | | | | | | 104,225 | |
| | | | | | | | | | | | | | | | |
Short Contracts | | | | | | | | | | | | | | | | |
3-month SOFR | | | 8 | | | | 06/18/24 | | | | 1,893 | | | | 2,337 | |
U.S. Treasury Bonds (30 Year) | | | 134 | | | | 06/18/24 | | | | 16,139 | | | | (340,830 | ) |
U.S. Ultra Treasury Notes (10 Year) | | | 296 | | | | 06/18/24 | | | | 33,924 | | | | (28,147 | ) |
U.S. Treasury Notes (2 Year) | | | 204 | | | | 06/28/24 | | | | 41,715 | | | | 31,092 | |
3-month SOFR | | | 8 | | | | 09/17/24 | | | | 1,897 | | | | (2,313 | ) |
3-month SOFR | | | 9 | | | | 12/17/24 | | | | 2,141 | | | | 15,121 | |
| | | | | | | | | | | | | | | | |
| | | | |
| | | | | | | | | | | | | | | (322,740 | ) |
| | | | | | | | | | | | | | | | |
| | | | |
| | | | | | | | | | | | | | $ | (218,515 | ) |
| | | | | | | | | | | | | | | | |
| | |
SCHEDULES OF INVESTMENTS | | 85 |
| | |
Schedule of Investments (continued) March 31, 2024 | | BATS: Series M Portfolio |
Centrally Cleared Interest Rate Swaps
| | | | | | | | | | | | | | | | | | | | | | | | | | |
| | | | | | | | | |
| | | | | | | | | | | | | | | | | | Upfront | | | | |
| | | | | | | | | | | | Notional | | | | | | Premium | | | Unrealized | |
| Paid by the Fund | | Received by the Fund | | Termination | | | Amount | | | | | | Paid | | | Appreciation | |
| | | | | | | | | | | | | | | | | | | | | | |
| Rate | | Frequency | | Rate | | Frequency | | Date | | | (000) | | | Value | | | (Received) | | | (Depreciation) | |
| | | | | | | | |
0.18% | | Quarterly | | 1-day Overnight Fed Funds Effective Rate, 5.33% | | Quarterly | | | 10/21/25 | | | USD | 232 | | | $ | 18,107 | | | $ | — | | | $ | 18,107 | |
| | | | | | | | |
1-day SOFR, 5.34% | | Quarterly | | 0.17% | | Quarterly | | | 10/21/25 | | | USD | 232 | | | | (18,154 | ) | | | — | | | | (18,154 | ) |
| | | | | | | | |
0.56% | | Quarterly | | 1-day Overnight Fed Funds Effective Rate, 5.33% | | Quarterly | | | 10/21/30 | | | USD | 83 | | | | 16,554 | | | | — | | | | 16,554 | |
| | | | | | | | |
1-day SOFR, 5.34% | | Quarterly | | 0.53% | | Quarterly | | | 10/21/30 | | | USD | 83 | | | | (16,852 | ) | | | — | | | | (16,852 | ) |
| | | | | | | | | | | | | | | | | | | | | | | | | | |
| | | | | | | | |
| | | | | | | | | | | | | | | | $ | (345 | ) | | $ | — | | | $ | (345 | ) |
| | | | | | | | | | | | | | | | | | | | | | | | | | |
OTC Credit Default Swaps — Buy Protection
| | | | | | | | | | | | | | | | | | | | | | | | | | | | | | |
| | | | | | | | | |
| Reference Obligation/Index | | Financing Rate Paid by the Fund | | | Payment Frequency | | | Counterparty | | Termination Date | | | Notional Amount (000) | | | Value | | | Upfront Premium Paid (Received) | | | Unrealized Appreciation (Depreciation) | |
| | | | | | | | |
CMBX.NA.10.BBB- | | | 3.00 | % | | | Monthly | | | Goldman Sachs International | | | 11/17/59 | | | USD | 3,976 | | | $ | 748,325 | | | $ | 171,103 | | | $ | 577,222 | |
CMBX.NA.10.BBB- | | | 3.00 | | | | Monthly | | | Goldman Sachs International | | | 11/17/59 | | | USD | 4,174 | | | | 785,742 | | | | 188,459 | | | | 597,283 | |
| | | | | | | | | | | | | | | | | | | | | | | | | | | | | | |
| | | | | | | | | | | | | | | | | | | | $ | 1,534,067 | | | $ | 359,562 | | | $ | 1,174,505 | |
| | | | | | | | | | | | | | | | | | | | | | | | | | | | | | |
OTC Credit Default Swaps — Sell Protection
| | | | | | | | | | | | | | | | | | | | | | | | | | | | | | | | | | |
| | | | | | | | | | | |
| | | Reference Obligation/Index | | Financing Rate Received by the Fund | | | Payment Frequency | | Counterparty | | Termination Date | | | Credit Rating(a) | | Notional Amount (000)(b) | | | Value | | | Upfront Premium Paid (Received) | | | Unrealized Appreciation (Depreciation) | | | |
| | CMBX.NA.10.BBB- | | | 3.00 | % | | Monthly | | Goldman Sachs International | | | 11/17/59 | | | BBB- | | USD | 4,398 | | | $ | (827,737 | ) | | $ | (287,722 | ) | | $ | (540,015 | ) | | |
| | CMBX.NA.10.BBB- | | | 3.00 | | | Monthly | | J.P. Morgan Securities LLC | | | 11/17/59 | | | BBB- | | USD | 3,753 | | | | (706,330 | ) | | | (247,427 | ) | | | (458,903 | ) | | |
| | | | | | | | | | | | | | | | | | | | | | | | | | | | | | | | | | |
| | | | | | | | | | | | | | | | | | | | | | $ | (1,534,067 | ) | | $ | (535,149 | ) | | $ | (998,918 | ) | | |
| | | | | | | | | | | | | | | | | | | | | | | | | | | | | | | | | | |
| | (a) | Using the rating of the issuer or the underlying securities of the index, as applicable, provided by S&P Global Ratings. | |
| | (b) | The maximum potential amount the Fund may pay should a negative credit event take place as defined under the terms of the agreement. | |
Balances Reported in the Statements of Assets and Liabilities for Centrally Cleared Swaps and OTC Swaps
| | | | | | | | | | | | | | | | |
| | | | | |
| | | Swap Premiums Paid | | | Swap Premiums Received | | | Unrealized Appreciation | | | Unrealized Depreciation | |
| | | | |
Centrally Cleared Swaps(a) | | $ | — | | | $ | — | | | $ | 34,661 | | | $ | (35,006 | ) |
OTC Swaps | | | 359,562 | | | | (535,149 | ) | | | 1,174,505 | | | | (998,918 | ) |
| | (a) | Includes cumulative appreciation (depreciation) on centrally cleared swaps, as reported in the Schedule of Investments. Only current day’s variation margin is reported within the Statements of Assets and Liabilities and is net of any previously paid (received) swap premium amounts. | |
| | |
| 86 | | 2 0 2 4 BLACK ROCK ANNUAL REPORT TO SHAREHOLDERS |
| | |
Schedule of Investments (continued) March 31, 2024 | | BATS: Series M Portfolio |
Derivative Financial Instruments Categorized by Risk Exposure
As of period end, the fair values of derivative financial instruments located in the Statements of Assets and Liabilities were as follows:
| | | | | | | | | | | | | | | | | | | | | | | | | | | | |
| | | | | | | | |
| | | Commodity Contracts | | | Credit Contracts | | | Equity Contracts | | | Foreign Currency Exchange Contracts | | | Interest Rate Contracts | | | Other Contracts | | | Total | |
Assets — Derivative Financial Instruments | | | | | | | | | | | | | | | | | | | | | | | | | | | | |
Futures contracts | | | | | | | | | | | | | | | | | | | | | | | | | | | | |
Unrealized appreciation on futures contracts(a) | | $ | — | | | $ | — | | | $ | — | | | $ | — | | | $ | 153,951 | | | $ | — | | | $ | 153,951 | |
Swaps — centrally cleared | | | | | | | | | | | | | | | | | | | | | | | | | | | | |
Unrealized appreciation on centrally cleared swaps(a) | | | — | | | | — | | | | — | | | | — | | | | 34,661 | | | | — | | | | 34,661 | |
Swaps — OTC | | | | | | | | | | | | | | | | | | | | | | | | | | | | |
Unrealized appreciation on OTC swaps; | | | | | | | | | | | | | | | | | | | | | | | | | | | | |
Swap premiums paid | | | — | | | | 1,534,067 | | | | — | | | | — | | | | — | | | | — | | | | 1,534,067 | |
| | | | | | | | | | | | | | | | | | | | | | | | | | | | |
| | | | | | | |
| | $ | — | | | $ | 1,534,067 | | | $ | — | | | $ | — | | | $ | 188,612 | | | $ | — | | | $ | 1,722,679 | |
| | | | | | | | | | | | | | | | | | | | | | | | | | | | |
Liabilities — Derivative Financial Instruments | | | | | | | | | | | | | | | | | | | | | | | | | | | | |
Futures contracts | | | | | | | | | | | | | | | | | | | | | | | | | | | | |
Unrealized depreciation on futures contracts(a) | | $ | — | | | $ | — | | | $ | — | | | $ | — | | | $ | 372,466 | | | $ | — | | | $ | 372,466 | |
Swaps — centrally cleared | | | | | | | | | | | | | | | | | | | | | | | | | | | | |
Unrealized depreciation on centrally cleared swaps(a) | | | — | | | | — | | | | — | | | | — | | | | 35,006 | | | | — | | | | 35,006 | |
Swaps — OTC | | | | | | | | | | | | | | | | | | | | | | | | | | | | |
Unrealized depreciation on OTC swaps; | | | | | | | | | | | | | | | | | | | | | | | | | | | | |
Swap premiums received | | | — | | | | 1,534,067 | | | | — | | | | — | | | | — | | | | — | | | | 1,534,067 | |
| | | | | | | | | | | | | | | | | | | | | | | | | | | | |
| | | | | | | |
| | $ | — | | | $ | 1,534,067 | | | $ | — | | | $ | — | | | $ | 407,472 | | | $ | — | | | $ | 1,941,539 | |
| | | | | | | | | | | | | | | | | | | | | | | | | | | | |
| | (a) | Net cumulative unrealized appreciation (depreciation) on futures contracts and centrally cleared swaps, if any, are reported in the Schedule of Investments. In the Statements of Assets and Liabilities, only current day’s variation margin is reported in receivables or payables and the net cumulative unrealized appreciation (depreciation) is included in accumulated earnings (loss). | |
For the period ended March 31, 2024, the effect of derivative financial instruments in the Statements of Operations was as follows:
| | | | | | | | | | | | | | | | | | | | | | | | | | | | |
| | | | | | | | |
| | | Commodity Contracts | | | Credit Contracts | | | Equity Contracts | | | Foreign Currency Exchange Contracts | | | Interest Rate Contracts | | | Other Contracts | | | Total | |
| | | | | | | |
Net Realized Gain (Loss) from: | | | | | | | | | | | | | | | | | | | | | | | | | | | | |
Futures contracts | | $ | — | | | $ | — | | | $ | — | | | $ | — | | | $ | (1,138,373 | ) | | $ | — | | | $ | (1,138,373 | ) |
Swaps | | | — | | | | (141,153 | ) | | | — | | | | — | | | | 45 | | | | — | | | | (141,108 | ) |
| | | | | | | | | | | | | | | | | | | | | | | | | | | | |
| | | | | | | |
| | $ | — | | | $ | (141,153 | ) | | $ | — | | | $ | — | | | $ | (1,138,328 | ) | | $ | — | | | $ | (1,279,481 | ) |
| | | | | | | | | | | | | | | | | | | | | | | | | | | | |
| | | | | | | |
Net Change in Unrealized Appreciation (Depreciation) on: | | | | | | | | | | | | | | | | | | | | | | | | | | | | |
Futures contracts | | $ | — | | | $ | — | | | $ | — | | | $ | — | | | $ | 303,172 | | | $ | — | | | $ | 303,172 | |
Swaps | | | — | | | | 349,860 | | | | — | | | | — | | | | (45 | ) | | | — | | | | 349,815 | |
| | | | | | | | | | | | | | | | | | | | | | | | | | | | |
| | | | | | | |
| | $ | — | | | $ | 349,860 | | | $ | — | | | $ | — | | | $ | 303,127 | | | $ | — | | | $ | 652,987 | |
| | | | | | | | | | | | | | | | | | | | | | | | | | | | |
Average Quarterly Balances of Outstanding Derivative Financial Instruments
| | | | |
| | |
Futures contracts | | | | |
Average notional value of contracts — long | | | $25,463,239 | |
Average notional value of contracts — short | | | $76,096,535 | |
Credit default swaps | | | | |
Average notional value — buy protection | | | $8,150,000 | |
Average notional value — sell protection | | | $9,450,846 | |
Interest rate swaps | | | | |
Average notional value — pays fixed rate | | | $315,014 | |
Average notional value — received fixed rate | | | $315,014 | |
For more information about the Fund’s investment risks regarding derivative financial instruments, refer to the Notes to Financial Statements.
| | |
SCHEDULES OF INVESTMENTS | | 87 |
| | |
Schedule of Investments (continued) March 31, 2024 | | BATS: Series M Portfolio |
Derivative Financial Instruments – Offsetting as of Period End
The Fund’s derivative assets and liabilities (by type) were as follows:
| | | | | | | | |
| |
| | |
| | | Assets | | | Liabilities | |
| |
| | |
Derivative Financial Instruments | | | | | | | | |
Swaps — centrally cleared | | $ | — | | | $ | 28 | |
Swaps — OTC(a) | | | 1,534,067 | | | | 1,534,067 | |
| | | | | | | | |
| | |
Total derivative assets and liabilities in the Statements of Assets and Liabilities | | $ | 1,534,067 | | | $ | 1,534,095 | |
| | | | | | | | |
| | |
Derivatives not subject to a Master Netting Agreement or similar agreement (“MNA”) | | | — | | | | (28 | ) |
| | | | | | | | |
| | |
Total derivative assets and liabilities subject to an MNA | | $ | 1,534,067 | | | $ | 1,534,067 | |
| | | | | | | | |
| | (a) | Includes unrealized appreciation (depreciation) on OTC swaps and swap premiums (paid/received) in the Statements of Assets and Liabilities. | |
The following table presents the Fund’s derivative assets and liabilities by counterparty net of amounts available for offset under an MNA and net of the related collateral received and pledged by the Fund:
| | | | | | | | | | | | | | | | | | | | |
| | | | | | |
| Counterparty | | Derivative Assets Subject to an MNA by
Counterparty | | | Derivatives
Available for Offset(a) | | | Non- Cash
Collateral
Received(b) | | | Cash
Collateral
Received(b) | | | Net Amount of
Derivative
Assets(c) | |
| | | | | |
Goldman Sachs International | | $ | 1,534,067 | | | $ | (827,737 | ) | | $ | — | | | $ | (706,330 | ) | | $ | — | |
| | | | | | | | | | | | | | | | | | | | |
| | | | | |
| Counterparty | | Derivative
Liabilities
Subject to an MNA by
Counterparty | | | Derivatives
Available for Offset(a) | | | Non- Cash
Collateral
Pledged(b) | | | Cash
Collateral
Pledged(b) | | | Net
Amount of
Derivative
Liabilities(d) | |
| | | | | |
Goldman Sachs International | | $ | 827,737 | | | $ | (827,737 | ) | | $ | — | | | $ | — | | | $ | — | |
J.P. Morgan Securities LLC | | | 706,330 | | | | — | | | | — | | | | (706,330 | ) | | | — | |
| | | | | | | | | | | | | | | | | | | | |
| | $ | 1,534,067 | | | $ | (827,737 | ) | | $ | — | | | $ | (706,330 | ) | | $ | — | |
| | | | | | | | | | | | | | | | | | | | |
| | (a) | The amount of derivatives available for offset is limited to the amount of derivative assets and/or liabilities that are subject to an MNA. | |
| | (b) | Excess of collateral received/pledged, if any, from the individual counterparty is not shown for financial reporting purposes. | |
| | (c) | Net amount represents the net amount receivable from the counterparty in the event of default. | |
| | (d) | Net amount represents the net amount payable due to the counterparty in the event of default. | |
Fair Value Hierarchy as of Period End
Various inputs are used in determining the fair value of financial instruments. For a description of the input levels and information about the Fund’s policy regarding valuation of financial instruments, refer to the Notes to Financial Statements.
The following table summarizes the Fund’s financial instruments categorized in the fair value hierarchy. The breakdown of the Fund’s financial instruments into major categories is disclosed in the Schedule of Investments above.
| | | | | | | | | | | | | | | | |
| |
| | | | |
| | | Level 1 | | | Level 2 | | | Level 3 | | | Total | |
| |
| | | | |
Assets | | | | | | | | | | | | | | | | |
Investments | | | | | | | | | | | | | | | | |
Long-Term Investments | | | | | | | | | | | | | | | | |
Asset-Backed Securities | | $ | — | | | $ | 19,236,388 | | | $ | — | | | $ | 19,236,388 | |
Non-Agency Mortgage-Backed Securities | | | — | | | | 109,152,348 | | | | — | | | | 109,152,348 | |
U.S. Government Sponsored Agency Securities | | | — | | | | 1,267,068,818 | | | | — | | | | 1,267,068,818 | |
Short-Term Securities | | | | | | | | | | | | | | | | |
Money Market Funds | | | 5,804,208 | | | | — | | | | — | | | | 5,804,208 | |
U.S. Treasury Obligations | | | — | | | | 27,307,770 | | | | — | | | | 27,307,770 | |
| | | | |
Liabilities | | | | | | | | | | | | | | | | |
TBA Sale Commitments | | | — | | | | (162,982,408 | ) | | | — | | | | (162,982,408 | ) |
| | | | | | | | | | | | | | | | |
| | $ | 5,804,208 | | | $ | 1,259,782,916 | | | $ | — | | | $ | 1,265,587,124 | |
| | | | | | | | | | | | | | | | |
| | |
| 88 | | 2 0 2 4 BLACK ROCK ANNUAL REPORT TO SHAREHOLDERS |
| | |
Schedule of Investments (continued) March 31, 2024 | | BATS: Series M Portfolio |
Fair Value Hierarchy as of Period End (continued)
| | | | | | | | | | | | | | | | |
| |
| | | | |
| | | Level 1 | | | Level 2 | | | Level 3 | | | Total | |
| |
Derivative Financial Instruments(a) | | | | | | | | | | | | | | | | |
Assets | | | | | | | | | | | | | | | | |
Credit Contracts | | $ | — | | | $ | 1,174,505 | | | $ | — | | | $ | 1,174,505 | |
Interest Rate Contracts | | | 153,951 | | | | 34,661 | | | | — | | | | 188,612 | |
Liabilities | | | | | | | | | | | | | | | | |
Credit Contracts | | | — | | | | (998,918 | ) | | | — | | | | (998,918 | ) |
Interest Rate Contracts | | | (372,466 | ) | | | (35,006 | ) | | | — | | | | (407,472 | ) |
| | | | | | | | | | | | | | | | |
| | | | |
| | $ | (218,515 | ) | | $ | 175,242 | | | $ | — | | | $ | (43,273 | ) |
| | | | | | | | | | | | | | | | |
| | (a) | Derivative financial instruments are swaps and futures contracts. Swaps and futures contracts are valued at the unrealized appreciation (depreciation) on the instrument. | |
See notes to financial statements.
| | |
SCHEDULES OF INVESTMENTS | | 89 |
| | |
Schedule of Investments March 31, 2024 | | BATS: Series P Portfolio (Percentages shown are based on Net Assets) |
| | | | | | | | |
| Security | | Shares | | | Value | |
| |
| | |
Investment Companies | | | | | | | | |
| | |
| Fixed-Income Funds — 23.9% | | | | | | |
BATS: Series S Portfolio(a) | | | 148,298 | | | $ | 1,348,560 | |
| | | | | | | | |
| | |
Total Investments — 23.9%
(Cost: $1,373,919) | | | | | | | 1,348,560 | |
| | |
Other Assets Less Liabilities — 76.1% | | | | | | | 4,285,265 | |
| | | | | | | | |
| | |
Net Assets — 100.0% | | | | | | $ | 5,633,825 | |
| | | | | | | | |
| (a) | Affiliate of the Fund. |
Affiliates
Investments in issuers considered to be affiliate(s) of the Fund during the year ended March 31, 2024 for purposes of Section 2(a)(3) of the Investment Company Act of 1940, as amended, were as follows:
| | | | | | | | | | | | | | | | | | | | | | | | | | | | | | | | | | | | |
| | | | | | | | | | |
| Affiliated Issuer | | Value at 03/31/23 | | | Purchases at Cost | | | Proceeds from Sales | | | Net Realized Gain (Loss) | | | Change in Unrealized Appreciation (Depreciation) | | | Value at 03/31/24 | | | Shares Held at 03/31/24 | | | Income | | | Capital Gain Distributions from Underlying Funds | |
| | | | | | | | | |
BATS: Series S Portfolio | | $ | 7,902,401 | | | $ | — | | | $ | (6,581,500) | | | $ | (336,866 | ) | | $ | 364,525 | | | $ | 1,348,560 | | | | 148,298 | | | $ | 201,632 | | | $ | — | |
| | | | | | | | | | | | | | | | | | | | | | | | | | | | | | | | | | | | |
Derivative Financial Instruments Outstanding as of Period End
Futures Contracts
| | | | | | | | | | | | | | | | |
| | | | | |
| Description | | Number of Contracts | | | Expiration Date | | | Notional Amount (000) | | | Value/ Unrealized Appreciation (Depreciation) | |
| | | | |
Long Contracts | | | | | | | | | | | | | | | | |
U.S. Treasury Notes (5 Year) | | | 2 | | | | 06/28/24 | | | $ | 214 | | | $ | 634 | |
| | | | | | | | | | | | | | | | |
| | | | |
Short Contracts | | | | | | | | | | | | | | | | |
U.S. Treasury Notes (10 Year) | | | 27 | | | | 06/18/24 | | | | 2,992 | | | | (20,998 | ) |
U.S. Ultra Treasury Notes (10 Year) | | | 28 | | | | 06/18/24 | | | | 3,209 | | | | (17,247 | ) |
U.S. Treasury Notes (2 Year) | | | 4 | | | | 06/28/24 | | | | 818 | | | | 614 | |
| | | | | | | | | | | | | | | | |
| | | | | | | | | | | | | | | (37,631 | ) |
| | | | | | | | | | | | | | | | |
| | | | | | | | | | | | | | $ | (36,997 | ) |
| | | | | | | | | | | | | | | | |
Centrally Cleared Interest Rate Swaps
| | | | | | | | | | | | | | | | | | | | | | | | | | | | | | | | | | |
| | | | | | | | | | | | | | | | | | | | | | | Upfront | | | | | | |
| | | | | | | | | | | | | | | | | Notional | | | | | | Premium | | | Unrealized | | | |
| | | Paid by the Fund | | Received by the Fund | | Termination | | | | | | Amount | | | | | | Paid | | | Appreciation | | | |
| | | | | | | | | | | | | | | | | | | | | | | | | | | | | | |
| | | Rate | | Frequency | | Rate | | Frequency | | Date | | | | | | (000) | | | Value | | | (Received) | | | (Depreciation) | | | |
| | | | | | 1-day Overnight Fed Funds | | | | | | | | | | | | | | | | | | | | | | | | | | | | |
| | 0.18% | | Quarterly | | Effective Rate, 5.33% | | Quarterly | | | 10/21/25 | | | | USD | | | | 3,167 | | | $ | 247,625 | | | $ | — | | | $ | 247,625 | | | |
| | 1-day SOFR, 5.34% | | Quarterly | | 0.17% | | Quarterly | | | 10/21/25 | | | | USD | | | | 3,167 | | | | (248,264 | ) | | | — | | | | (248,264 | ) | | |
| | | | | | 1-day Overnight Fed Funds | | | | | | | | | | | | | | | | | | | | | | | | | | | | |
| | 0.56% | | Quarterly | | Effective Rate, 5.33% | | Quarterly | | | 10/21/30 | | | | USD | | | | 336 | | | | 66,766 | | | | — | | | | 66,766 | | | |
| | 1-day SOFR, 5.34% | | Quarterly | | 0.53% | | Quarterly | | | 10/21/30 | | | | USD | | | | 336 | | | | (67,969 | ) | | | — | | | | (67,969 | ) | | |
| | 0.75% | | Quarterly | | 1-day SOFR, 5.34% | | Quarterly | | | 10/21/35 | | | | USD | | | | 22 | | | | 6,437 | | | | — | | | | 6,437 | | | |
| | 1-day Overnight Fed Funds | | | | | | | | | | | | | | | | | | | | | | | | | | | | | | | | |
| | Effective Rate, 5.33% | | Quarterly | | 0.79% | | Quarterly | | | 10/21/35 | | | | USD | | | | 22 | | | | (6,260 | ) | | | — | | | | (6,260 | ) | | |
| | 0.84% | | Quarterly | | 1-day SOFR, 5.34% | | Quarterly | | | 10/21/40 | | | | USD | | | | 39 | | | | 14,520 | | | | — | | | | 14,520 | | | |
| | 1-day Overnight Fed Funds | | | | | | | | | | | | | | | | | | | | | | | | | | | | | | | | |
| | Effective Rate, 5.33% | | Quarterly | | 0.91% | | Quarterly | | | 10/21/40 | | | | USD | | | | 39 | | | | (13,989 | ) | | | — | | | | (13,989 | ) | | |
| | |
| 90 | | 2 0 2 4 BLACK ROCK ANNUAL REPORT TO SHAREHOLDERS |
| | |
Schedule of Investments (continued) March 31, 2024 | | BATS: Series P Portfolio |
Centrally Cleared Interest Rate Swaps (continued)
| | | | | | | | | | | | | | | | | | | | | | | | | | | | | | | | | | | | | | |
| | | | | | | | | | | | | | | | | | | | | | | | | Upfront | | | | | | |
| | | | | | | | | | | | | | | | | | | Notional | | | | | | Premium | | | Unrealized | | | |
| | | Paid by the Fund | | | Received by the Fund | | | Termination | | | | | | Amount | | | | | | Paid | | | Appreciation | | | |
| | | | | | | | | | | | | | | | | | | | | | | | | | | | | | | | |
| | | Rate | | Frequency | | | Rate | | Frequency | | | Date | | | | | | (000) | | | Value | | | (Received) | | | (Depreciation) | | | |
| | 0.91% | | | Quarterly | | | 1-day SOFR, 5.34% | | | Quarterly | | | | 10/21/50 | | | | USD | | | | 22 | | | $ | 10,279 | | | $ | — | | | $ | 10,279 | | | |
| | 1-day Overnight Fed Funds | | | | | | | | | | | | | | | | | | | | | | | | | | | | | | | | | | | | |
| | Effective Rate, 5.33% | | | Quarterly | | | 0.99% | | | Quarterly | | | | 10/21/50 | | | | USD | | | | 22 | | | | (9,813 | ) | | | — | | | | (9,813 | ) | | |
| | | | | | | | | | | | | | | | | | | | | | | | | | | | | | | | | | | | | | |
| | | | | | | | | | | | | | | | | | | | | | | | | | $ | (668 | ) | | $ | — | | | $ | (668 | ) | | |
| | | | | | | | | | | | | | | | | | | | | | | | | | | | | | | | | | | | | | |
Balances Reported in the Statements of Assets and Liabilities for Centrally Cleared Swaps
| | | | | | | | | | | | | | | | |
| | | | | |
| | | Swap Premiums Paid | | | Swap Premiums Received | | | Unrealized Appreciation | | | Unrealized Depreciation | |
| | | | |
Centrally Cleared Swaps(a) | | $ | — | | | $ | — | | | $ | 345,627 | | | $ | (346,295 | ) |
| | (a) | Includes cumulative appreciation (depreciation) on centrally cleared swaps, as reported in the Schedule of Investments. Only current day’s variation margin is reported within the Statements of Assets and Liabilities and is net of any previously paid (received) swap premium amounts. | |
Derivative Financial Instruments Categorized by Risk Exposure
As of period end, the fair values of derivative financial instruments located in the Statements of Assets and Liabilities were as follows:
| | | | | | | | | | | | | | | | | | | | | | | | | | | | |
| | | | | | | | |
| | | Commodity Contracts | | | Credit Contracts | | | Equity Contracts | | | Foreign Currency Exchange Contracts | | | Interest Rate Contracts | | | Other Contracts | | | Total | |
| | | | | | | |
Assets — Derivative Financial Instruments | | | | | | | | | | | | | | | | | | | | | | | | | | | | |
Futures contracts | | | | | | | | | | | | | | | | | | | | | | | | | | | | |
Unrealized appreciation on futures contracts(a) | | $ | — | | | $ | — | | | $ | — | | | $ | — | | | $ | 1,248 | | | $ | — | | | $ | 1,248 | |
Swaps — centrally cleared | | | | | | | | | | | | | | | | | | | | | | | | | | | | |
Unrealized appreciation on centrally cleared swaps(a) | | | — | | | | — | | | | — | | | | — | | | | 345,627 | | | | — | | | | 345,627 | |
| | | | | | | | | | | | | | | | | | | | | | | | | | | | |
| | | | | | | |
| | $ | — | | | $ | — | | | $ | — | | | $ | — | | | $ | 346,875 | | | $ | — | | | $ | 346,875 | |
| | | | | | | | | | | | | | | | | | | | | | | | | | | | |
Liabilities — Derivative Financial Instruments | | | | | | | | | | | | | | | | | | | | | | | | | | | | |
Futures contracts | | | | | | | | | | | | | | | | | | | | | | | | | | | | |
Unrealized depreciation on futures contracts(a) | | $ | — | | | $ | — | | | $ | — | | | $ | — | | | $ | 38,245 | | | $ | — | | | $ | 38,245 | |
Swaps — centrally cleared | | | | | | | | | | | | | | | | | | | | | | | | | | | | |
Unrealized depreciation on centrally cleared swaps | | | — | | | | — | | | | — | | | | — | | | | 346,295 | | | | — | | | | 346,295 | |
| | | | | | | | | | | | | | | | | | | | | | | | | | | | |
| | | | | | | |
| | $ | — | | | $ | — | | | $ | — | | | $ | — | | | $ | 384,540 | | | $ | — | | | $ | 384,540 | |
| | | | | | | | | | | | | | | | | | | | | | | | | | | | |
| | (a) | Net cumulative unrealized appreciation (depreciation) on futures contracts and centrally cleared swaps, if any, are reported in the Schedule of Investments. In the Statements of Assets and Liabilities, only current day’s variation margin is reported in receivables or payables and the net cumulative unrealized appreciation (depreciation) is included in accumulated earnings (loss). | |
For the period ended March 31, 2024, the effect of derivative financial instruments in the Statements of Operations was as follows:
| | | | | | | | | | | | | | | | | | | | | | | | | | | | |
| | | | | | | | |
| | | Commodity Contracts | | | Credit Contracts | | | Equity Contracts | | | Foreign Currency Exchange Contracts | | | Interest Rate Contracts | | | Other Contracts | | | Total | |
| | | | | | | |
Net Realized Gain (Loss) from: | | | | | | | | | | | | | | | | | | | | | | | | | | | | |
Futures contracts | | $ | — | | | $ | — | | | $ | — | | | $ | — | | | $ | 397,910 | | | $ | — | | | $ | 397,910 | |
Swaps | | | — | | | | — | | | | — | | | | — | | | | 660 | | | | — | | | | 660 | |
| | | | | | | | | | | | | | | | | | | | | | | | | | | | |
| | | | | | | |
| | $ | — | | | $ | — | | | $ | — | | | $ | — | | | $ | 398,570 | | | $ | — | | | $ | 398,570 | |
| | | | | | | | | | | | | | | | | | | | | | | | | | | | |
Net Change in Unrealized Appreciation (Depreciation) on: | | | | | | | | | | | | | | | | | | | | | | | | | | | | |
Futures contracts | | $ | — | | | $ | — | | | $ | — | | | $ | — | | | $ | 923,325 | | | $ | — | | | $ | 923,325 | |
Swaps | | | — | | | | — | | | | — | | | | — | | | | 720 | | | | — | | | | 720 | |
| | | | | | | | | | | | | | | | | | | | | | | | | | | | |
| | | | | | | |
| | $ | — | | | $ | — | | | $ | — | | | $ | — | | | $ | 924,045 | | | $ | — | | | $ | 924,045 | |
| | | | | | | | | | | | | | | | | | | | | | | | | | | | |
| | |
SCHEDULES OF INVESTMENTS | | 91 |
| | |
Schedule of Investments (continued) March 31, 2024 | | BATS: Series P Portfolio |
Average Quarterly Balances of Outstanding Derivative Financial Instruments
| | | | |
| | |
Futures contracts | | | | |
Average notional value of contracts — long | | | $1,249,480 | |
Average notional value of contracts — short | | $ | 19,617,274 | |
Interest rate swaps | | | | |
Average notional value — pays fixed rate | | | $3,586,320 | |
Average notional value — received fixed rate | | | $3,586,320 | |
For more information about the Fund’s investment risks regarding derivative financial instruments, refer to the Notes to Financial Statements.
Fair Value Hierarchy as of Period End
Various inputs are used in determining the fair value of financial instruments. For a description of the input levels and information about the Fund’s policy regarding valuation of financial instruments, refer to the Notes to Financial Statements.
The following table summarizes the Fund’s financial instruments categorized in the fair value hierarchy. The breakdown of the Fund’s financial instruments into major categories is disclosed in the Schedule of Investments above.
| | | | | | | | | | | | | | | | |
| |
| | | | |
| | | Level 1 | | | Level 2 | | | Level 3 | | | Total | |
| |
| | | | |
Assets | | | | | | | | | | | | | | | | |
Investments | | | | | | | | | | | | | | | | |
Long-Term Investments | | | | | | | | | | | | | | | | |
Investment Companies | | $ | 1,348,560 | | | $ | — | | | $ | — | | | $ | 1,348,560 | |
| | | | | | | | | | | | | | | | |
Derivative Financial Instruments(a) | | | | | | | | | | | | | | | | |
Assets | | | | | | | | | | | | | | | | |
Interest Rate Contracts | | $ | 1,248 | | | $ | 345,627 | | | $ | — | | | $ | 346,875 | |
Liabilities | | | | | | | | | | | | | | | | |
Interest Rate Contracts | | | (38,245 | ) | | | (346,295 | ) | | | — | | | | (384,540 | ) |
| | | | | | | | | | | | | | | | |
| | | | |
| | $ | (36,997 | ) | | $ | (668 | ) | | $ | — | | | $ | (37,665 | ) |
| | | | | | | | | | | | | | | | |
| | (a) | Derivative financial instruments are swaps and futures contracts. Swaps and futures contracts are valued at the unrealized appreciation (depreciation) on the instrument. | |
See notes to financial statements.
| | |
| 92 | | 2 0 2 4 BLACK ROCK ANNUAL REPORT TO SHAREHOLDERS |
| | |
Schedule of Investments March 31, 2024 | | BATS: Series S Portfolio (Percentages shown are based on Net Assets) |
| | | | | | | | | | | | |
| Security | | | | | Par
(000) | | | Value | |
|
Asset-Backed Securities | |
AGL CLO 3 Ltd., Series 2020-3A, Class A, (3-mo. CME Term SOFR + 1.56%), 6.88%, 01/15/33(a)(b) | | | USD | | | | 250 | | | $ | 249,880 | |
American Express Credit Account Master Trust | | | | | | | | | | | | |
Series 2021-1, Class A, 0.90%, 11/15/26 | | | | | | | 1,385 | | | | 1,344,537 | |
Series 2022-1, Class A, 2.21%, 03/15/27 | | | | | | | 1,711 | | | | 1,661,524 | |
Series 2022-2, Class A, 3.39%, 05/15/27 | | | | | | | 3,560 | | | | 3,486,453 | |
Series 2022-3, Class A, 3.75%, 08/15/27 | | | | | | | 4,341 | | | | 4,257,337 | |
AmeriCredit Automobile Receivables Trust | | | | | | | | | | | | |
Series 2021-3, Class A3, 0.76%, 08/18/26 | | | | | | | 596 | | | | 584,964 | |
Series 2022-1, Class A3, 2.45%, 11/18/26 | | | | | | | 548 | | | | 538,432 | |
Anchorage Capital CLO 7 Ltd., Series 2015-7A, Class AR2, (3-mo. CME Term SOFR + 1.35%), 6.67%, 01/28/31(a)(b) | | | | | | | 393 | | | | 390,520 | |
ARI Fleet Lease Trust, Series 2024-A, Class A2, 5.30%, 11/15/32(a) | | | | | | | 265 | | | | 264,428 | |
Atrium XIII, Series 13A, Class B, (3-mo. CME Term SOFR + 1.76%), 7.08%, 11/21/30(a)(b) | | | | | | | 800 | | | | 801,178 | |
BA Credit Card Trust | | | | | | | | | | | | |
Series 2022-A1, Class A1, 3.53%, 11/15/27 | | | | | | | 4,668 | | | | 4,574,535 | |
Series 2022-A2, Class A2, 5.00%, 04/15/28 | | | | | | | 822 | | | | 819,848 | |
Series 2023-A1, Class A1, 4.79%, 05/15/28 | | | | | | | 2,758 | | | | 2,745,176 | |
Bain Capital Credit CLO Ltd., Series 2021-5A, Class B, (3-mo. CME Term SOFR + 1.91%), 7.23%, 10/23/34(a)(b) | | | | | | | 500 | | | | 496,988 | |
Benefit Street Partners CLO VIII Ltd., Series 2015-8A, Class A1AR, (3-mo. CME Term SOFR + 1.36%), 6.68%, 01/20/31(a)(b) | | | | | | | 390 | | | | 389,984 | |
Betony CLO 2 Ltd., Series 2018-1A, Class A1, (3-mo. CME Term SOFR + 1.34%), 6.66%, 04/30/31(a)(b) | | | | | | | 413 | | | | 412,759 | |
BHG Securitization Trust, Series 2022-B, Class A, 3.75%, 06/18/35(a) | | | | | | | 9 | | | | 8,973 | |
Birch Grove CLO 2 Ltd., Series 2021-2A, Class B, (3-mo. CME Term SOFR + 2.01%), 7.32%, 10/19/34(a)(b) | | | | | | | 250 | | | | 250,627 | |
BlueMountain CLO XXIX Ltd., Series 2020-29A, Class BR, (3-mo. CME Term SOFR + 2.01%), 7.34%, 07/25/34(a)(b) | | | | | | | 250 | | | | 250,027 | |
BMW Vehicle Owner Trust | | | | | | | | | | | | |
Series 2022-A, Class A3, 3.21%, 08/25/26 | | | | | | | 2,162 | | | | 2,129,185 | |
Series 2023-A, Class A3, 5.47%, 02/25/28 | | | | | | | 629 | | | | 631,580 | |
Canyon CLO Ltd., Series 2021-4A, Class B, (3-mo. CME Term SOFR + 1.96%), 7.28%, 10/15/34(a)(b) | | | | | | | 250 | | | | 249,449 | |
Capital One Multi-Asset Execution Trust | | | | | | | | | | | | |
Series 2022-A1, Class A1, 2.80%, 03/15/27 | | | | | | | 3,331 | | | | 3,251,334 | |
Series 2022-A2, Class A, 3.49%, 05/15/27 | | | | | | | 4,940 | | | | 4,840,908 | |
Capital One Prime Auto Receivables Trust,
Series 2022-2, Class A3, 3.66%, 05/17/27 | | | | | | | 2,053 | | | | 2,013,830 | |
CarMax Auto Owner Trust | | | | | | | | | | | | |
Series 2021-1, Class A3, 0.34%, 12/15/25 | | | | | | | 210 | | | | 207,366 | |
Series 2021-2, Class A3, 0.52%, 02/17/26 | | | | | | | 257 | | | | 252,578 | |
Series 2022-2, Class A3, 3.49%, 02/16/27 | | | | | | | 2,687 | | | | 2,645,914 | |
Series 2022-3, Class A3, 3.97%, 04/15/27 | | | | | | | 1,390 | | | | 1,371,096 | |
Cedar Funding V CLO Ltd., Series 2016-5A, Class A1R, (3-mo. CME Term SOFR + 1.36%), 6.68%, 07/17/31(a)(b) | | | | | | | 462 | | | | 462,298 | |
Cedar Funding VII CLO Ltd., Series 2018-7A, Class A2, (3-mo. CME Term SOFR + 1.39%), 6.71%, 01/20/31(a)(b) | | | | | | | 875 | | | | 876,419 | |
Chase Issuance Trust, Series 2023-A1, Class A, 5.16%, 09/15/28 | | | | | | | 2,680 | | | | 2,693,660 | |
Chesapeake Funding II LLC, Series 2023-2A, Class A1, 6.16%, 10/15/35(a) | | | | | | | 372 | | | | 374,622 | |
| | | | | | | | | | | | |
| Security | | | | | Par
(000) | | | Value | |
|
Asset-Backed Securities (continued) | |
CIFC Funding Ltd., Series 2014-3A, Class A1R2, (3-mo. CME Term SOFR + 1.46%), 6.78%, 10/22/31(a)(b) | | | USD | | | | 984 | | | $ | 985,472 | |
CNH Equipment Trust | | | | | | | | | | | | |
Series 2022-B, Class A3, 3.89%, 08/16/27 | | | | | | | 614 | | | | 603,288 | |
Series 2024-A, Class A3, 4.77%, 06/15/29 | | | | | | | 452 | | | | 449,412 | |
College Ave Student Loans LLC | | | | | | | | | | | | |
Series 2021-B, Class A1, (1-mo. CME Term SOFR + 0.91%), 6.24%, 06/25/52(a)(b) | | | | | | | 188 | | | | 181,976 | |
Series 2021-C, Class B, 2.72%, 07/26/55(a) | | | | | | | 100 | | | | 87,725 | |
Series 2023-A, Class A1, (SOFR (30-day) + 1.90%), 7.22%, 05/25/55(a)(b) | | | | | | | 454 | | | | 459,885 | |
Credit Acceptance Auto Loan Trust | | | | | | | | | | | | |
Series 2022-1A, Class A, 4.60%, 06/15/32(a) | | | | | | | 780 | | | | 773,031 | |
Series 2022-3A, Class A, 6.57%, 10/15/32(a) | | | | | | | 452 | | | | 454,756 | |
Diameter Capital CLO 1 Ltd., Series 2021-1A, Class A1A, (3-mo. CME Term SOFR + 1.50%), 6.82%, 07/15/36(a)(b) | | | | | | | 250 | | | | 250,150 | |
Diameter Capital CLO 2 Ltd., Series 2021-2A, Class A2, (3-mo. CME Term SOFR + 2.01%), 7.33%, 10/15/36(a)(b) | | | | | | | 250 | | | | 250,426 | |
Discover Card Execution Notes Trust, Series 2017-A5, Class A5, (1-mo. CME Term SOFR + 0.71%), 6.04%, 12/15/26(b) | | | | | | | 925 | | | | 926,012 | |
Donlen Fleet Lease Funding 2 LLC, Series 2021-2, Class A2, 0.56%, 12/11/34(a) | | | | | | | 55 | | | | 54,753 | |
Dryden 36 Senior Loan Fund, Series 2014-36A, Class AR3, (3-mo. CME Term SOFR + 1.28%), 6.60%, 04/15/29(a)(b) | | | | | | | 150 | | | | 149,898 | |
Dryden 45 Senior Loan Fund, Series 2016-45A, Class BR, (3-mo. CME Term SOFR + 1.96%), 7.28%, 10/15/30(a)(b) | | | | | | | 700 | | | | 701,292 | |
EDvestinU Private Education Loan Issue No. 3 LLC, Series 2021-A, Class A, 1.80%, 11/25/45(a) | | | | | | | 68 | | | | 60,131 | |
ELFI Graduate Loan Program LLC | | | | | | | | | | | | |
Series 2022-A, Class A, 4.51%, 08/26/47(a) | | | | | | | 464 | | | | 443,544 | |
Series 2023-A, Class A, 6.37%, 02/04/48(a) | | | | | | | 460 | | | | 469,439 | |
Enterprise Fleet Financing LLC | | | | | | | | | | | | |
Series 2023-2, Class A2, 5.56%, 04/22/30(a) | | | | | | | 935 | | | | 936,145 | |
Series 2024-1, Class A2, 5.23%, 03/20/30(a) | | | | | | | 429 | | | | 428,292 | |
Series 2024-1, Class A3, 5.16%, 09/20/30(a) | | | | | | | 50 | | | | 49,870 | |
Enterprise Fleet Funding LLC, Series 2021-1, Class A2, 0.44%, 12/21/26(a) | | | | | | | 47 | | | | 46,610 | |
Fairstone Financial Issuance Trust, Series 2020-1A, Class A, 2.51%, 10/20/39(a) | | | CAD | | | | 309 | | | | 223,158 | |
Ford Credit Auto Owner Trust | | | | | | | | | | | | |
Series 2021-A, Class A3, 0.30%, 08/15/25 | | | USD | | | | 70 | | | | 69,022 | |
Series 2022-B, Class A4, 3.93%, 08/15/27 | | | | | | | 417 | | | | 408,145 | |
Series 2023-1, Class A, 4.85%, 08/15/35(a) | | | | | | | 1,380 | | | | 1,372,096 | |
Series 2023-2, Class A, 5.28%, 02/15/36(a) | | | | | | | 1,125 | | | | 1,138,268 | |
Series 2023-A, Class A3, 4.65%, 02/15/28 | | | | | | | 201 | | | | 199,209 | |
Series 2024-1, Class A, 4.87%, 08/15/36(a) | | | | | | | 739 | | | | 737,489 | |
Series 2024-A, Class A3, 12/15/28(c) | | | | | | | 1,900 | | | | 1,905,456 | |
Ford Credit Floorplan Master Owner Trust A | | | | | | | | | | | | |
Series 2018-4, Class A, 4.06%, 11/15/30 | | | | | | | 907 | | | | 872,570 | |
Series 2019-4, Class B, 2.64%, 09/15/26 | | | | | | | 264 | | | | 259,676 | |
Series 2023-1, Class A1, 4.92%, 05/15/28(a) | | | | | | | 1,246 | | | | 1,239,856 | |
Series 2023-1, Class A2, (SOFR (30-day) + 1.25%), 6.57%, 05/15/28(a)(b) | | | | | | | 260 | | | | 263,784 | |
Series 2023-1, Class B, 5.31%, 05/15/28(a) | | | | | | | 280 | | | | 278,434 | |
Foundation Finance Trust, Series 2024-1A, Class A, 12/15/49(a)(c) | | | | | | | 393 | | | | 392,956 | |
| | |
SCHEDULES OF INVESTMENTS | | 93 |
| | |
Schedule of Investments (continued) March 31, 2024 | | BATS: Series S Portfolio (Percentages shown are based on Net Assets) |
| | | | | | | | | | | | |
| Security | | | | | Par
(000) | | | Value | |
|
Asset-Backed Securities (continued) | |
FS Rialto Issuer Ltd., Series 2021-FL2, Class A, (1-mo. CME Term SOFR + 1.33%), 6.66%, 05/16/38(a)(b) | | | USD | | | | 275 | | | $ | 270,886 | |
Galaxy XIX CLO Ltd., Series 2015-19A, Class A2RR, (3-mo. CME Term SOFR + 1.66%), 6.98%, 07/24/30(a)(b) | | | | | | | 250 | | | | 249,927 | |
Generate CLO 2 Ltd., Series 2A, Class AR, (3-mo. CME Term SOFR + 1.41%), 6.73%, 01/22/31(a)(b) | | | | | | | 1,293 | | | | 1,293,082 | |
Generate CLO 7 Ltd., Series 7A, Class A1R, (3-mo. CME Term SOFR + 1.62%), 04/22/37(a)(b)(c) | | | | | | | 1,170 | | | | 1,170,642 | |
GM Financial Consumer Automobile Receivables Trust | | | | | | | | | | | | |
Series 2022-1, Class A4, 1.51%, 04/17/28 | | | | | | | 277 | | | | 259,726 | |
Series 2022-2, Class A3, 3.10%, 02/16/27 | | | | | | | 847 | | | | 832,234 | |
Series 2022-2, Class A4, 3.25%, 04/17/28 | | | | | | | 629 | | | | 605,909 | |
Series 2022-3, Class A4, 3.71%, 12/16/27 | | | | | | | 887 | | | | 861,707 | |
Series 2023-4, Class A3, 5.78%, 08/16/28 | | | | | | | 668 | | | | 677,811 | |
GM Financial Revolving Receivables Trust | | | | | | | | | | | | |
Series 2023-2, Class A, 5.77%, 08/11/36(a) | | | | | | | 1,031 | | | | 1,064,374 | |
Series 2024-1, Class A, 4.98%, 12/11/36(a) | | | | | | | 284 | | | | 285,200 | |
GoodLeap Sustainable Home Solutions Trust | | | | | | | | | | | | |
Series 2021-4GS, Class A, 1.93%, 07/20/48(a) | | | | | | | 133 | | | | 103,261 | |
Series 2021-5CS, Class A, 2.31%, 10/20/48(a) | | | | | | | 55 | | | | 43,837 | |
Series 2022-1GS, Class A, 2.70%, 01/20/49(a) | | | | | | | 100 | | | | 82,612 | |
Series 2022-2CS, Class A, 4.00%, 04/20/49(a) | | | | | | | 74 | | | | 65,942 | |
Series 2023-1GS, Class A, 5.52%, 02/22/55(a) | | | | | | | 328 | | | | 318,404 | |
Series 2023-3C, Class A, 6.50%, 07/20/55(a) | | | | | | | 312 | | | | 321,929 | |
Honda Auto Receivables Owner Trust | | | | | | | | | | | | |
Series 2021-1, Class A3, 0.27%, 04/21/25 | | | | | | | 67 | | | | 66,823 | |
Series 2023-1, Class A3, 5.04%, 04/21/27 | | | | | | | 1,050 | | | | 1,047,283 | |
Series 2023-4, Class A3, 5.67%, 06/21/28 | | | | | | | 937 | | | | 948,339 | |
Hyundai Auto Receivables Trust | | | | | | | | | | | | |
Series 2021-C, Class A3, 0.74%, 05/15/26 | | | | | | | 373 | | | | 364,228 | |
Series 2022-B, Class A3, 3.72%, 11/16/26 | | | | | | | 507 | | | | 500,185 | |
Series 2023-A, Class A3, 4.58%, 04/15/27 | | | | | | | 998 | | | | 988,996 | |
Series 2023-B, Class A3, 5.48%, 04/17/28 | | | | | | | 1,424 | | | | 1,433,375 | |
Series 2023-C, Class A3, 5.54%, 10/16/28 | | | | | | | 1,087 | | | | 1,098,864 | |
Series 2024-A, Class A3, 02/15/29(c) | | | | | | | 1,466 | | | | 1,465,910 | |
Jamestown CLO XVI Ltd., Series 2021-16A, Class B, (3-mo. CME Term SOFR + 2.06%), 7.39%, 07/25/34(a)(b) | | | | | | | 250 | | | | 249,236 | |
John Deere Owner Trust | | | | | | | | | | | | |
Series 2023-B, Class A3, 5.18%, 03/15/28 | | | | | | | 529 | | | | 529,102 | |
Series 2024-A, Class A3, 11/15/28(c) | | | | | | | 981 | | | | 980,845 | |
Lendmark Funding Trust, Series 2023-1A, Class A, 5.59%, 05/20/33(a) | | | | | | | 155 | | | | 154,111 | |
Mariner Finance Issuance Trust | | | | | | | | | | | | |
Series 2020-AA, Class A, 2.19%, 08/21/34(a) | | | | | | | 110 | | | | 108,255 | |
Series 2021-AA, Class A, 1.86%, 03/20/36(a) | | | | | | | 140 | | | | 128,846 | |
Mercedes-Benz Auto Receivables Trust, Series 2023-2, Class A3, 5.95%, 11/15/28 | | | | | | | 760 | | | | 773,390 | |
MMAF Equipment Finance LLC, Series 2024-A, Class A3, 4.95%, 07/14/31(a) | | | | | | | 150 | | | | 149,135 | |
Navient Private Education Loan Trust, Series 2020-A, Class A2B, (1-mo. CME Term SOFR + 1.01%), 6.34%,
11/15/68(a)(b) | | | | | | | 1,101 | | | | 1,094,007 | |
Navient Private Education Refi Loan Trust | | | | | | | | | | | | |
Series 2019-CA, Class A2, 3.13%, 02/15/68(a) | | | | | | | 201 | | | | 193,381 | |
Series 2019-GA, Class A, 2.40%, 10/15/68(a) | | | | | | | 82 | | | | 77,421 | |
Series 2020-BA, Class A2, 2.12%, 01/15/69(a) | | | | | | | 305 | | | | 280,350 | |
Series 2020-DA, Class A, 1.69%, 05/15/69(a) | | | | | | | 374 | | | | 341,391 | |
Series 2020-FA, Class A, 1.22%, 07/15/69(a) | | | | | | | 530 | | | | 479,877 | |
Series 2020-IA, Class A1A, 1.33%, 04/15/69(a) | | | | | | | 748 | | | | 675,790 | |
Series 2021-A, Class A, 0.84%, 05/15/69(a) | | | | | | | 64 | | | | 56,130 | |
| | | | | | | | | | | | |
| Security | | | | | Par
(000) | | | Value | |
|
Asset-Backed Securities (continued) | |
Navient Private Education Refi Loan Trust | | | | | | | | | | | | |
Series 2021-BA, Class A, 0.94%, 07/15/69(a) | | | USD | | | | 397 | | | $ | 346,846 | |
Series 2022-BA, Class A, 4.16%, 10/15/70(a) | | | | | | | 904 | | | | 864,297 | |
Navient Student Loan Trust, Series 2023-BA,
Class A1B, (SOFR (30-day) + 1.70%), 7.02%, 03/15/72(a)(b) | | | | | | | 316 | | | | 318,955 | |
Navistar Financial Dealer Note Master Owner Trust II,
Series 2023-1, Class A, 6.18%, 08/25/28(a) | | | | | | | 167 | | | | 168,303 | |
Nelnet Student Loan Trust | | | | | | | | | | | | |
Series 2021-A, Class APT2, 1.36%, 04/20/62(a) | | | | | | | 544 | | | | 492,064 | |
Series 2021-CA, Class AFL, (1-mo. CME Term SOFR + 0.85%), 6.18%, 04/20/62(a)(b) | | | | | | | 400 | | | | 396,540 | |
Neuberger Berman CLO XV Ltd., Series 2013-15A, Class A1R2, (3-mo. CME Term SOFR + 1.18%), 6.50%, 10/15/29(a)(b) | | | | | | | 375 | | | | 375,386 | |
Nissan Auto Receivables Owner Trust, Series 2023-A, Class A3, 4.91%, 11/15/27 | | | | | | | 2,002 | | | | 1,992,955 | |
OCP CLO Ltd., Series 2020-19A, Class BR, (3-mo. CME Term SOFR + 1.96%), 7.28%, 10/20/34(a)(b) | | | | | | | 250 | | | | 249,623 | |
Octagon 56 Ltd., Series 2021-1A, Class B, (3-mo. CME Term SOFR + 1.91%), 7.23%, 10/15/34(a)(b) | | | | | | | 300 | | | | 298,449 | |
Octagon Investment Partners 36 Ltd., Series 2018-1A, Class A1, (3-mo. CME Term SOFR + 1.23%), 6.55%, 04/15/31(a)(b) | | | | | | | 394 | | | | 393,591 | |
OHA Credit Funding 6 Ltd., Series 2020-6A, Class AR, (3-mo. CME Term SOFR + 1.40%), 6.72%, 07/20/34(a)(b) | | | | | | | 1,000 | | | | 1,000,659 | |
OneMain Direct Auto Receivables Trust, Series 2021- 1A, Class A, 0.87%, 07/14/28(a) | | | | | | | 1,412 | | | | 1,361,818 | |
OneMain Financial Issuance Trust | | | | | | | | | | | | |
Series 2019-2A, Class A, 3.14%, 10/14/36(a) | | | | | | | 402 | | | | 378,209 | |
Series 2023-1A, Class A, 5.50%, 06/14/38(a) | | | | | | | 445 | | | | 451,655 | |
Series 2023-2A, Class A2, (SOFR (30-day) + 1.50%), 6.82%, 09/15/36(a)(b) | | | | | | | 377 | | | | 383,027 | |
OZLM XXII Ltd., Series 2018-22A, Class A2, (3-mo. CME Term SOFR + 1.76%), 7.08%, 01/17/31(a)(b) | | | | | | | 250 | | | | 250,276 | |
Pagaya AI Technology in Housing Trust, Series 2023-1, Class A, 3.60%, 10/25/40(a) | | | | | | | 495 | | | | 456,043 | |
Palmer Square CLO Ltd., Series 2014-1A, Class A1R2, (3-mo. CME Term SOFR + 1.39%), 6.71%, 01/17/31(a)(b) | | | | | | | 648 | | | | 648,217 | |
Palmer Square Loan Funding Ltd., Series 2021-3A, Class A1, (3-mo. CME Term SOFR + 1.06%), 6.38%, 07/20/29(a)(b) | | | | | | | 544 | | | | 543,737 | |
Park Avenue Institutional Advisers CLO Ltd.,
Series 2018-1A, Class A1AR, (3-mo. CME Term SOFR + 1.26%), 6.58%, 10/20/31(a)(b) | | | | | | | 747 | | | | 746,341 | |
PFS Financing Corp. | | | | | | | | | | | | |
Series 2021-A, Class A, 0.71%, 04/15/26(a) | | | | | | | 230 | | | | 229,521 | |
Series 2022-D, Class A, 4.27%, 08/15/27(a) | | | | | | | 706 | | | | 694,897 | |
Series 2023-A, Class A, 5.80%, 03/15/28(a) | | | | | | | 1,030 | | | | 1,040,994 | |
Series 2023-C, Class A, 5.52%, 10/15/28(a) | | | | | | | 432 | | | | 435,811 | |
Pikes Peak CLO 8, Series 2021-8A, Class B, (3-mo. CME Term SOFR + 2.01%), 7.33%, 07/20/34(a)(b) | | | | | | | 250 | | | | 249,824 | |
Porsche Financial Auto Securitization Trust | | | | | | | | | | | | |
Series 2023-1A, Class A3, 4.81%, 09/22/28(a) | | | | | | | 1,080 | | | | 1,073,944 | |
Series 2023-2A, Class A3, 5.79%, 01/22/29(a) | | | | | | | 517 | | | | 522,649 | |
Prodigy Finance DAC, Series 2021-1A, Class A, (1-mo. CME Term SOFR + 1.36%), 6.69%, 07/25/51(a)(b) | | | | | | | 56 | | | | 56,006 | |
Progress Residential Trust, Series 2021-SFR10, Class A, 2.39%, 12/17/40(a) | | | | | | | 516 | | | | 458,142 | |
| | |
| 94 | | 2 0 2 4 BLACK ROCK ANNUAL REPORT TO SHAREHOLDERS |
| | |
Schedule of Investments (continued) March 31, 2024 | | BATS: Series S Portfolio (Percentages shown are based on Net Assets) |
| | | | | | | | | | | | |
| Security | | | | | Par
(000) | | | Value | |
|
Asset-Backed Securities (continued) | |
RAD CLO 1 Ltd., Series 2018-1A, Class AR, (3-mo. CME Term SOFR + 1.24%), 6.56%, 07/15/31(a)(b) | | | USD | | | | 411 | | | $ | 411,318 | |
Regional Management Issuance Trust | | | | | | | | | | | | |
Series 2021-1, Class A, 1.68%, 03/17/31(a) | | | | | | | 104 | | | | 100,445 | |
Series 2021-2, Class A, 1.90%, 08/15/33(a) | | | | | | | 421 | | | | 377,308 | |
Series 2022-2B, Class A, 7.10%, 11/17/32(a) | | | | | | | 140 | | | | 141,394 | |
Santander Drive Auto Receivables Trust | | | | | | | | | | | | |
Series 2022-3, Class A3, 3.40%, 12/15/26 | | | | | | | 321 | | | | 319,175 | |
Series 2023-5, Class A3, 6.02%, 09/15/28 | | | | | | | 896 | | | | 905,496 | |
SLM Student Loan Trust, Series 2013-4, Class A, (SOFR (30-day) + 0.66%), 5.99%, 06/25/43(b) | | | | | | | 144 | | | | 142,777 | |
SMB Private Education Loan Trust | | | | | | | | | | | | |
Series 2016-A, Class A2B, (1-mo. CME Term SOFR + 1.61%), 6.94%, 05/15/31(a)(b) | | | | | | | 103 | | | | 103,327 | |
Series 2016-B, Class A2B, (1-mo. CME Term SOFR + 1.56%), 6.89%, 02/17/32(a)(b) | | | | | | | 150 | | | | 150,165 | |
Series 2017-A, Class A2B, (1-mo. CME Term SOFR + 1.01%), 6.34%, 09/15/34(a)(b) | | | | | | | 470 | | | | 468,959 | |
Series 2019-B, Class A2B, (1-mo. CME Term SOFR + 1.11%), 6.44%, 06/15/37(a)(b) | | | | | | | 617 | | | | 618,791 | |
Series 2021-A, Class A2A1, (1-mo. CME Term SOFR + 0.84%), 6.17%, 01/15/53(a)(b) | | | | | | | 780 | | | | 772,395 | |
Series 2021-A, Class APL, (1-mo. CME Term SOFR + 0.84%), 6.17%, 01/15/53(a)(b) | | | | | | | 916 | | | | 890,828 | |
Series 2022-A, Class APT, 2.85%, 11/16/54(a) | | | | | | | 630 | | | | 577,692 | |
Series 2022-B, Class A1A, 3.94%, 02/16/55(a) | | | | | | | 656 | | | | 621,933 | |
Series 2023-B, Class A1B, (SOFR (30-day) + 1.80%), 7.12%, 10/16/56(a)(b) | | | | | | | 714 | | | | 728,286 | |
Series 2023-C, Class A1A, 5.67%, 11/15/52(a) | | | | | | | 159 | | | | 160,804 | |
Series 2024-A, Class A1B, (SOFR (30-day) + 1.45%), 03/15/56(a)(b)(c) | | | | | | | 770 | | | | 773,155 | |
SoFi Professional Loan Program Trust | | | | | | | | | | | | |
Series 2020-A, Class A2FX, 2.54%, 05/15/46(a) | | | | | | | 185 | | | | 173,431 | |
Series 2020-C, Class AFX, 1.95%, 02/15/46(a) | | | | | | | 253 | | | | 230,859 | |
SPLT | | | | | | | | | | | | |
Series 23-1, Class A, 6.00%, 10/12/30(a) | | | | | | | 302 | | | | 302,008 | |
Series 24-1, Class A,, 6.06%, 02/12/31(a) | | | | | | | 460 | | | | 459,980 | |
TCI-Symphony CLO Ltd., Series 2017-1A, Class AR, (3-mo. CME Term SOFR + 1.19%), 6.51%, 07/15/30(a)(b) | | | | | | | 849 | | | | 848,908 | |
Toyota Auto Loan Extended Note Trust, Series 2023-1A, Class A, 4.93%, 06/25/36(a) | | | | | | | 1,589 | | | | 1,591,462 | |
Toyota Auto Receivables Owner Trust | | | | | | | | | | | | |
Series 2020-C, Class A4, 0.57%, 10/15/25 | | | | | | | 1,085 | | | | 1,076,839 | |
Series 2022-B, Class A3, 2.93%, 09/15/26 | | | | | | | 1,076 | | | | 1,058,105 | |
Series 2022-B, Class A4, 3.11%, 08/16/27 | | | | | | | 573 | | | | 551,206 | |
Series 2023-B, Class A3, 4.71%, 02/15/28 | | | | | | | 764 | | | | 758,361 | |
Series 2023-C, Class A3, 5.16%, 04/17/28 | | | | | | | 340 | | | | 340,309 | |
Verizon Master Trust | | | | | | | | | | | | |
Series 2024-1, Class A1A, 5.00%, 12/20/28 | | | | | | | 3,133 | | | | 3,123,468 | |
Series 2024-2, Class A, 4.83%, 12/22/31(a) | | | | | | | 266 | | | | 265,790 | |
Volkswagen Auto Loan Enhanced Trust, Series 2021-1, Class A3, 1.02%, 06/22/26 | | | | | | | 630 | | | | 615,448 | |
Voya CLO Ltd., Series 2018-3A, Class A1A, (3-mo. CME Term SOFR + 1.41%), 6.73%, 10/15/31(a)(b) | | | | | | | 917 | | | | 917,042 | |
WF Card Issuance Trust, Series 2024-A1, Class A, 4.94%, 02/15/29 | | | | | | | 1,902 | | | | 1,902,883 | |
Whitebox CLO II Ltd., Series 2020-2A, Class A1R, (3-mo. CME Term SOFR + 1.48%), 6.80%, 10/24/34(a)(b) | | | | | | | 400 | | | | 399,800 | |
| | | | | | | | |
| |
Total Asset-Backed Securities — 32.2%
(Cost: $127,455,424) | | | | 126,102,314 | |
| | | | | | | | |
| | | | | | | | | | | | |
| Security | | | | | Par
(000) | | | Value | |
|
Corporate Bonds | |
| | | |
| Aerospace & Defense — 1.1% | | | | | | | | | |
BAE Systems PLC, 03/26/27(a)(c) | | | USD | | | | 425 | | | $ | 424,136 | |
Boeing Co. (The), 2.20%, 02/04/26 | | | | | | | 1,470 | | | | 1,376,213 | |
L3Harris Technologies, Inc. | | | | | | | | | | | | |
5.40%, 01/15/27 | | | | | | | 942 | | | | 948,721 | |
4.40%, 06/15/28 | | | | | | | 218 | | | | 212,037 | |
06/01/29(c) | | | | | | | 575 | | | | 573,163 | |
Lockheed Martin Corp., 4.50%, 02/15/29 | | | | | | | 585 | | | | 579,453 | |
RTX Corp. | | | | | | | | | | | | |
2.65%, 11/01/26 | | | | | | | 38 | | | | 35,808 | |
5.75%, 01/15/29 | | | | | | | 315 | | | | 325,937 | |
| | | | | | | | |
| | | | | | | | | | | 4,475,468 | |
| | | |
| Automobiles — 0.3% | | | | | | | | | |
Nissan Motor Acceptance Co. LLC, 7.05%, 09/15/28(a) . | | | | | | | 149 | | | | 155,747 | |
Traton Finance Luxembourg SA | | | | | | | | | | | | |
0.00%, 06/14/24(d)(e) | | | EUR | | | | 500 | | | | 535,061 | |
4.13%, 11/22/25(d) | | | | | | | 100 | | | | 108,285 | |
03/27/27(c)(d) | | | | | | | 300 | | | | 323,914 | |
| | | | | | | | |
| | | | | | | | | | | 1,123,007 | |
| | | |
| Banks — 5.9% | | | | | | | | | |
Banco de Sabadell SA, 4.00%, 01/15/30(d) | | | | | | | 100 | | | | 109,324 | |
Bank of America Corp. | | | | | | | | | | | | |
1.53%, 12/06/25 | | | USD | | | | 1,188 | | | | 1,154,610 | |
1.32%, 06/19/26 | | | | | | | 917 | | | | 871,664 | |
1.20%, 10/24/26 | | | | | | | 163 | | | | 152,562 | |
5.08%, 01/20/27 | | | | | | | 700 | | | | 696,475 | |
2.55%, 02/04/28 | | | | | | | 415 | | | | 385,751 | |
5.82%, 09/15/29 | | | | | | | 661 | | | | 677,749 | |
Barclays PLC | | | | | | | | | | | | |
3.93%, 05/07/25 | | | | | | | 800 | | | | 798,376 | |
03/12/30(c) | | | | | | | 590 | | | | 593,072 | |
Citigroup, Inc. | | | | | | | | | | | | |
3.11%, 04/08/26 | | | | | | | 507 | | | | 494,167 | |
3.40%, 05/01/26 | | | | | | | 1,109 | | | | 1,067,801 | |
5.61%, 09/29/26 | | | | | | | 233 | | | | 233,371 | |
3.89%, 01/10/28 | | | | | | | 245 | | | | 236,246 | |
5.17%, 02/13/30 | | | | | | | 700 | | | | 696,734 | |
Series VAR, 3.07%, 02/24/28 | | | | | | | 925 | | | | 870,075 | |
HSBC Holdings PLC | | | | | | | | | | | | |
2.25%, 11/22/27 | | | | | | | 865 | | | | 797,215 | |
4.58%, 06/19/29 | | | | | | | 200 | | | | 194,083 | |
HSBC U.S.A., Inc., 5.29%, 03/04/27 | | | | | | | 745 | | | | 749,332 | |
JPMorgan Chase & Co. | | | | | | | | | | | | |
3.96%, 01/29/27 | | | | | | | 97 | | | | 94,684 | |
1.58%, 04/22/27 | | | | | | | 238 | | | | 220,653 | |
5.04%, 01/23/28 | | | | | | | 960 | | | | 956,690 | |
3.78%, 02/01/28 | | | | | | | 391 | | | | 376,549 | |
5.30%, 07/24/29 | | | | | | | 1,779 | | | | 1,792,216 | |
6.09%, 10/23/29 | | | | | | | 820 | | | | 852,482 | |
KBC Group NV, 4.25%, 11/28/29(d) | | | EUR | | | | 200 | | | | 220,890 | |
Morgan Stanley Bank N.A., 4.95%, 01/14/28 | | | USD | | | | 1,390 | | | | 1,384,275 | |
NatWest Group PLC, 7.47%, 11/10/26 | | | | | | | 433 | | | | 444,746 | |
Toronto-Dominion Bank (The), 5.52%, 07/17/28 | | | | | | | 422 | | | | 430,978 | |
Truist Financial Corp. | | | | | | | | | | | | |
6.05%, 06/08/27 | | | | | | | 1,032 | | | | 1,045,929 | |
5.44%, 01/24/30 | | | | | | | 275 | | | | 274,679 | |
U.S. Bancorp, 5.38%, 01/23/30 | | | | | | | 285 | | | | 286,259 | |
Wells Fargo & Co. | | | | | | | | | | | | |
5.57%, 07/25/29 | | | | | | | 1,807 | | | | 1,828,417 | |
6.30%, 10/23/29 | | | | | | | 325 | | | | 338,501 | |
| | |
SCHEDULES OF INVESTMENTS | | 95 |
| | |
Schedule of Investments (continued) March 31, 2024 | | BATS: Series S Portfolio (Percentages shown are based on Net Assets) |
| | | | | | | | | | | | |
| Security | | | | | Par
(000) | | | Value | |
|
Banks (continued) | |
Wells Fargo & Co. 5.20%, 01/23/30 | | | USD | | | | 585 | | | $ | 583,767 | |
Westpac Banking Corp., 4.18%, 05/22/28(a) | | | | | | | 1,205 | | | | 1,177,778 | |
| | | | | | | | |
| | | | | | | | | | | 23,088,100 | |
| | | |
| Biotechnology — 0.3% | | | | | | | | | |
AbbVie, Inc., 4.80%, 03/15/29 | | | | | | | 1,140 | | | | 1,141,673 | |
| | | | | | | | |
| | | |
| Capital Markets — 1.9% | | | | | | | | | |
Charles Schwab Corp. (The), 5.88%, 08/24/26 | | | | | | | 547 | | | | 556,117 | |
Credit Suisse AG, 5.00%, 07/09/27 | | | | | | | 491 | | | | 486,525 | |
Deutsche Bank AG | | | | | | | | | | | | |
1.45%, 04/01/25 | | | | | | | 518 | | | | 518,000 | |
2.13%, 11/24/26 | | | | | | | 150 | | | | 141,452 | |
5.37%, 09/09/27 | | | | | | | 150 | | | | 150,777 | |
6.82%, 11/20/29 | | | | | | | 150 | | | | 156,811 | |
Goldman Sachs Group, Inc. (The) | | | | | | | | | | | | |
2.64%, 02/24/28 | | | | | | | 565 | | | | 526,231 | |
6.48%, 10/24/29 | | | | | | | 845 | | | | 889,041 | |
Morgan Stanley | | | | | | | | | | | | |
2.48%, 01/21/28 | | | | | | | 871 | | | | 810,227 | |
4.21%, 04/20/28 | | | | | | | 160 | | | | 155,477 | |
5.16%, 04/20/29 | | | | | | | 1,405 | | | | 1,403,866 | |
6.41%, 11/01/29 | | | | | | | 215 | | | | 225,441 | |
UBS Group AG | | | | | | | | | | | | |
4.70%, 08/05/27(a) | | | | | | | 1,100 | | | | 1,079,363 | |
0.25%, 11/05/28(d) | | | EUR | | | | 294 | | | | 280,287 | |
| | | | | | | | |
| | | | | | | | | | | 7,379,615 | |
| | | |
| Chemicals — 0.0% | | | | | | | | | |
LYB International Finance III LLC, 1.25%, 10/01/25 | | | USD | | | | 203 | | | | 190,576 | |
| | | | | | | | |
| | | |
| Communications Equipment — 0.1% | | | | | | | | | |
Motorola Solutions, Inc., 2.30%, 11/15/30 | | | | | | | 410 | | | | 344,161 | |
| | | | | | | | |
| | | |
| Consumer Finance — 1.8% | | | | | | | | | |
American Express Co. | | | | | | | | | | | | |
2.55%, 03/04/27 | | | | | | | 772 | | | | 721,019 | |
5.10%, 02/16/28 | | | | | | | 440 | | | | 439,321 | |
Capital One Financial Corp. | | | | | | | | | | | | |
3.30%, 10/30/24 | | | | | | | 258 | | | | 254,486 | |
4.17%, 05/09/25 | | | | | | | 700 | | | | 698,571 | |
4.99%, 07/24/26 | | | | | | | 300 | | | | 298,065 | |
6.31%, 06/08/29 | | | | | | | 343 | | | | 352,623 | |
Ford Motor Credit Co. LLC | | | | | | | | | | | | |
6.95%, 06/10/26 | | | | | | | 669 | | | | 683,534 | |
5.80%, 03/05/27 | | | | | | | 915 | | | | 918,384 | |
7.35%, 11/04/27 | | | | | | | 670 | | | | 702,677 | |
03/08/29(c) | | | | | | | 200 | | | | 200,796 | |
General Motors Financial Co., Inc. | | | | | | | | | | | | |
6.05%, 10/10/25 | | | | | | | 500 | | | | 503,703 | |
2.35%, 02/26/27 | | | | | | | 340 | | | | 313,926 | |
5.40%, 05/08/27 | | | | | | | 495 | | | | 496,295 | |
Hyundai Capital America | | | | | | | | | | | | |
5.50%, 03/30/26(a) | | | | | | | 268 | | | | 268,437 | |
1.65%, 09/17/26(a) | | | | | | | 415 | | | | 379,582 | |
| | | | | | | | |
| | | | | | | | | | | 7,231,419 | |
| | | |
| Containers & Packaging — 0.0% | | | | | | | | | |
Sonoco Products Co., 2.25%, 02/01/27 | | | | | | | 121 | | | | 112,105 | |
| | | | | | | | |
| | | |
| Diversified REITs — 1.7% | | | | | | | | | |
American Tower Corp., 5.50%, 03/15/28 | | | | | | | 540 | | | | 544,522 | |
Crown Castle, Inc., 1.05%, 07/15/26 | | | | | | | 618 | | | | 561,743 | |
Equinix, Inc. | | | | | | | | | | | | |
1.25%, 07/15/25 | | | | | | | 150 | | | | 141,885 | |
| | | | | | | | | | | | |
| Security | | | | | Par
(000) | | | Value | |
|
Diversified REITs (continued) | |
Equinix, Inc. | | | | | | | | | | | | |
1.45%, 05/15/26 | | | USD | | | | 125 | | | $ | 114,976 | |
2.90%, 11/18/26 | | | | | | | 672 | | | | 630,371 | |
1.80%, 07/15/27 | | | | | | | 600 | | | | 537,863 | |
3.20%, 11/18/29 | | | | | | | 420 | | | | 375,996 | |
VICI Properties LP, 4.38%, 05/15/25 | | | | | | | 2,479 | | | | 2,436,677 | |
VICI Properties LP/VICI Note Co., Inc. | | | | | | | | | | | | |
4.63%, 06/15/25(a) | | | | | | | 538 | | | | 529,749 | |
4.63%, 12/01/29(a) | | | | | | | 730 | | | | 690,379 | |
| | | | | | | | |
| | | | | | | | | | | 6,564,161 | |
| | |
| Diversified Telecommunication Services — 0.3% | | | | | | | |
British Telecommunications PLC, 4.25%, 01/06/33(d) | | | EUR | | | | 100 | | | | 112,287 | |
NTT Finance Corp. | | | | | | | | | | | | |
4.37%, 07/27/27(a) | | | USD | | | | 275 | | | | 270,161 | |
1.59%, 04/03/28(a) | | | | | | | 200 | | | | 176,457 | |
Verizon Communications, Inc., 4.33%, 09/21/28 | | | | | | | 565 | | | | 552,426 | |
| | | | | | | | |
| | | | | | | | | | | 1,111,331 | |
| | | |
| Electric Utilities — 1.3% | | | | | | | | | |
Duke Energy Corp. | | | | | | | | | | | | |
2.65%, 09/01/26 | | | | | | | 222 | | | | 209,622 | |
4.85%, 01/05/29 | | | | | | | 535 | | | | 529,952 | |
Edison International | | | | | | | | | | | | |
3.55%, 11/15/24 | | | | | | | 123 | | | | 121,337 | |
4.70%, 08/15/25 | | | | | | | 380 | | | | 375,333 | |
Eversource Energy | | | | | | | | | | | | |
4.75%, 05/15/26 | | | | | | | 285 | | | | 282,044 | |
2.90%, 03/01/27 | | | | | | | 353 | | | | 331,860 | |
5.45%, 03/01/28 | | | | | | | 245 | | | | 248,025 | |
Exelon Corp. | | | | | | | | | | | | |
2.75%, 03/15/27 | | | | | | | 387 | | | | 362,291 | |
5.15%, 03/15/28 | | | | | | | 169 | | | | 169,413 | |
Georgia Power Co., 5.00%, 02/23/27 | | | | | | | 295 | | | | 295,354 | |
National Grid Electricity Transmission PLC, 0.19%, 01/20/25(d) | | | EUR | | | | 295 | | | | 309,166 | |
NextEra Energy Capital Holdings, Inc. | | | | | | | | | | | | |
1.88%, 01/15/27 | | | USD | | | | 550 | | | | 503,627 | |
1.90%, 06/15/28 | | | | | | | 112 | | | | 99,200 | |
Pacific Gas & Electric Co., 3.45%, 07/01/25 | | | | | | | 255 | | | | 248,050 | |
San Diego Gas & Electric Co., 4.95%, 08/15/28 | | | | | | | 138 | | | | 138,518 | |
Southern California Edison Co., 5.65%, 10/01/28 | | | | | | | 110 | | | | 113,157 | |
Texas Electric Market Stabilization Funding N LLC, Series A-1, 4.27%, 08/01/34(a) | | | | | | | 308 | | | | 297,824 | |
Virginia Electric & Power Co., Series A, 3.80%, | | | | | | | | | | | | |
04/01/28 | | | | | | | 293 | | | | 281,279 | |
| | | | | | | | |
| | | | | | | | | | | 4,916,052 | |
| | | |
| Financial Services — 0.3% | | | | | | | | | |
Glencore Funding LLC | | | | | | | | | | | | |
6.13%, 10/06/28(a) | | | | | | | 423 | | | | 437,115 | |
04/04/29(a)(c) | | | | | | | 700 | | | | 701,388 | |
| | | | | | | | |
| | | | | | | | | | | 1,138,503 | |
| | | |
| Food Products — 0.0% | | | | | | | | | |
General Mills, Inc., 5.24%, 11/18/25 | | | | | | | 109 | | | | 108,657 | |
| | | | | | | | |
| | | |
| Ground Transportation — 0.7% | | | | | | | | | |
Canadian Pacific Railway Co. | | | | | | | | | | | | |
1.35%, 12/02/24 | | | | | | | 1,398 | | | | 1,359,316 | |
4.00%, 06/01/28 | | | | | | | 114 | | | | 109,873 | |
Penske Truck Leasing Co. LP/PTL Finance Corp. | | | | | | | | | | | | |
1.20%, 11/15/25(a) | | | | | | | 632 | | | | 589,578 | |
5.75%, 05/24/26(a) | | | | | | | 241 | | | | 242,743 | |
| | |
| 96 | | 2 0 2 4 BLACK ROCK ANNUAL REPORT TO SHAREHOLDERS |
| | |
Schedule of Investments (continued) March 31, 2024 | | BATS: Series S Portfolio (Percentages shown are based on Net Assets) |
| | | | | | | | | | | | |
| Security | | | | | Par
(000) | | | Value | |
|
Ground Transportation (continued) | |
Ryder System, Inc., 2.85%, 03/01/27 | | | USD | | | | 370 | | | $ | 346,833 | |
SMBC Aviation Capital Finance DAC, 1.90%, 10/15/26(a) | | | | | | | 200 | | | | 182,514 | |
| | | | | | | | |
| | | | | | | | | | | 2,830,857 | |
| | |
| Health Care Equipment & Supplies — 0.2% | | | | | | | |
Sartorius Finance BV, 4.25%, 09/14/26(d) | | | EUR | | | | 300 | | | | 327,015 | |
Solventum Corp., 5.40%, 03/01/29(a) | | | USD | | | | 330 | | | | 330,665 | |
| | | | | | | | |
| | | | | | | | | | | 657,680 | |
| | |
| Health Care Providers & Services — 0.7% | | | | | | | |
HCA, Inc. | | | | | | | | | | | | |
5.25%, 04/15/25 | | | | | | | 831 | | | | 827,530 | |
5.25%, 06/15/26 | | | | | | | 395 | | | | 393,848 | |
5.38%, 09/01/26 | | | | | | | 1,022 | | | | 1,021,762 | |
3.13%, 03/15/27 | | | | | | | 123 | | | | 116,327 | |
PeaceHealth Obligated Group, Series 2020, 1.38%, 11/15/25 | | | | | | | 114 | | | | 106,044 | |
UnitedHealth Group, Inc., 04/15/29(c) | | | | | | | 200 | | | | 199,311 | |
| | | | | | | | |
| | | | | | | | | | | 2,664,822 | |
| | | |
| Health Care REITs — 0.0% | | | | | | | | | |
Healthpeak OP LLC, 1.35%, 02/01/27 | | | | | | | 100 | | | | 90,242 | |
| | | | | | | | |
| | | |
| Household Durables — 0.1% | | | | | | | | | |
DR Horton, Inc., 1.30%, 10/15/26 | | | | | | | 245 | | | | 222,846 | |
| | | | | | | | |
| | | |
| Insurance — 0.2% | | | | | | | | | |
Aon Corp./Aon Global Holdings PLC, 2.85%, 05/28/27 | | | | | | | 194 | | | | 181,515 | |
Aon North America, Inc., 5.15%, 03/01/29 | | | | | | | 730 | | | | 733,998 | |
| | | | | | | | |
| | | | | | | | | | | 915,513 | |
| | | |
| IT Services — 0.1% | | | | | | | | | |
Global Payments, Inc., 1.20%, 03/01/26 | | | | | | | 282 | | | | 260,858 | |
| | | | | | | | |
| | | |
| Media — 0.4% | | | | | | | | | |
Charter Communications Operating LLC/Charter | | | | | | | | | | | | |
Communications Operating Capital | | | | | | | | | | | | |
6.15%, 11/10/26 | | | | | | | 65 | | | | 65,509 | |
4.20%, 03/15/28 | | | | | | | 813 | | | | 766,276 | |
2.25%, 01/15/29 | | | | | | | 332 | | | | 282,442 | |
Informa PLC, 2.13%, 10/06/25(d) | | | EUR | | | | 437 | | | | 459,444 | |
| | | | | | | | |
| | | | | | | | | | | 1,573,671 | |
| | | |
| Metals & Mining — 0.1% | | | | | | | | | |
Anglo American Capital PLC, 06/15/29(c)(d) | | | | | | | 380 | | | | 410,086 | |
| | | | | | | | |
| | | |
| Multi-Utilities — 0.5% | | | | | | | | | |
Consumers Energy Co., 4.60%, 05/30/29 | | | USD | | | | 270 | | | | 266,860 | |
Engie SA, 3.63%, 12/06/26(d) | | | EUR | | | | 300 | | | | 324,973 | |
National Grid North America, Inc., 4.15%, 09/12/27(d) | | | | | | | 290 | | | | 318,066 | |
NiSource, Inc., 5.25%, 03/30/28 | | | USD | | | | 719 | | | | 723,943 | |
Sempra, 3.30%, 04/01/25 | | | | | | | 148 | | | | 144,796 | |
| | | | | | | | |
| | | | | | | | | | | 1,778,638 | |
| | | |
| Oil, Gas & Consumable Fuels — 2.6% | | | | | | | | | |
Diamondback Energy, Inc., 3.50%, 12/01/29 | | | | | | | 493 | | | | 456,044 | |
Energy Transfer LP | | | | | | | | | | | | |
4.50%, 04/15/24 | | | | | | | 500 | | | | 499,728 | |
2.90%, 05/15/25 | | | | | | | 910 | | | | 883,235 | |
6.10%, 12/01/28 | | | | | | | 827 | | | | 857,351 | |
Eni SpA, 3.63%, 05/19/27(d) | | | EUR | | | | 240 | | | | 260,301 | |
Kinder Morgan, Inc., 5.00%, 02/01/29 | | | USD | | | | 305 | | | | 303,746 | |
Marathon Petroleum Corp., 4.70%, 05/01/25 | | | | | | | 235 | | | | 233,004 | |
MPLX LP, 1.75%, 03/01/26 | | | | | | | 886 | | | | 828,227 | |
Occidental Petroleum Corp. | | | | | | | | | | | | |
8.50%, 07/15/27 | | | | | | | 300 | | | | 325,623 | |
6.38%, 09/01/28 | | | | | | | 220 | | | | 228,457 | |
| | | | | | | | | | | | |
| Security | | | | | Par
(000) | | | Value | |
|
Oil, Gas & Consumable Fuels (continued) | |
ONEOK, Inc. | | | | | | | | | | | | |
5.55%, 11/01/26 | | | USD | | | | 490 | | | $ | 494,485 | |
5.65%, 11/01/28 | | | | | | | 412 | | | | 421,148 | |
Pioneer Natural Resources Co., 5.10%, 03/29/26 | | | | | | | 402 | | | | 401,493 | |
Sabine Pass Liquefaction LLC | | | | | | | | | | | | |
5.63%, 03/01/25 | | | | | | | 1,691 | | | | 1,689,521 | |
5.00%, 03/15/27 | | | | | | | 101 | | | | 100,705 | |
Targa Resources Corp., 5.20%, 07/01/27 | | | | | | | 527 | | | | 526,237 | |
Western Midstream Operating LP, 6.35%, 01/15/29 | | | | | | | 195 | | | | 202,233 | |
Williams Cos., Inc. (The), 5.40%, 03/02/26 | | | | | | | 1,389 | | | | 1,392,567 | |
| | | | | | | | |
| | | | | | | | | | | 10,104,105 | |
| | | |
| Passenger Airlines — 0.2% | | | | | | | | | |
Delta Air Lines, Inc., 7.00%, 05/01/25(a) | | | | | | | 970 | | | | 982,727 | |
| | | | | | | | |
| | | |
| Pharmaceuticals — 0.3% | | | | | | | | | |
Bayer AG | | | | | | | | | | | | |
4.00%, 08/26/26(d) | | | EUR | | | | 280 | | | | 304,281 | |
0.75%, 01/06/27(d) | | | | | | | 200 | | | | 198,339 | |
Bristol-Myers Squibb Co., 4.90%, 02/22/29 | | | USD | | | | 440 | | | | 441,852 | |
Pfizer Investment Enterprises Pte Ltd., 4.45%, 05/19/28 | | | | | | | 309 | | | | 304,603 | |
| | | | | | | | |
| | | | | | | | | | | 1,249,075 | |
| | | |
| Professional Services — 0.1% | | | | | | | | | |
Teleperformance SE, 5.25%, 11/22/28(d) | | | EUR | | | | 200 | | | | 221,403 | |
| | | | | | | | |
| |
| Semiconductors & Semiconductor Equipment — 0.5% | | | | |
Broadcom Corp./Broadcom Cayman Finance Ltd., 3.88%, 01/15/27 | | | USD | | | | 1,099 | | | | 1,065,403 | |
Microchip Technology, Inc., 5.05%, 03/15/29 | | | | | | | 445 | | | | 445,067 | |
NXP BV/NXP Funding LLC/NXP U.S.A., Inc., 2.70%, 05/01/25 | | | | | | | 655 | | | | 634,878 | |
| | | | | | | | |
| | | | | | | | | | | 2,145,348 | |
| | | |
| Software — 0.8% | | | | | | | | | |
Oracle Corp. | | | | | | | | | | | | |
1.65%, 03/25/26 | | | | | | | 973 | | | | 908,126 | |
2.65%, 07/15/26 | | | | | | | 748 | | | | 707,789 | |
VMware LLC, 1.40%, 08/15/26 | | | | | | | 1,585 | | | | 1,447,513 | |
Workday, Inc., 3.50%, 04/01/27 | | | | | | | 278 | | | | 266,202 | |
| | | | | | | | |
| | | | | | | | | | | 3,329,630 | |
| | | |
| Specialized REITs — 0.2% | | | | | | | | | |
American Tower Corp. | | | | | | | | | | | | |
3.38%, 10/15/26 | | | | | | | 502 | | | | 479,480 | |
3.55%, 07/15/27 | | | | | | | 6 | | | | 5,704 | |
02/15/29(c) | | | | | | | 255 | | | | 254,876 | |
| | | | | | | | |
| | | | | | | | | | | 740,060 | |
| | | |
| Tobacco — 0.9% | | | | | | | | | |
Altria Group, Inc., 6.20%, 11/01/28 | | | | | | | 879 | | | | 916,157 | |
BAT Capital Corp. | | | | | | | | | | | | |
3.22%, 08/15/24 | | | | | | | 260 | | | | 257,451 | |
2.79%, 09/06/24 | | | | | | | 700 | | | | 691,160 | |
3.56%, 08/15/27 | | | | | | | 199 | | | | 188,442 | |
BAT International Finance PLC, 5.93%, 02/02/29 | | | | | | | 692 | | | | 710,287 | |
Philip Morris International, Inc. | | | | | | | | | | | | |
5.13%, 11/15/24 | | | | | | | 474 | | | | 472,868 | |
4.88%, 02/13/26 | | | | | | | 241 | | | | 240,038 | |
5.13%, 11/17/27 | | | | | | | 114 | | | | 114,590 | |
| | | | | | | | |
| | | | | | | | | | | 3,590,993 | |
| | |
| Wireless Telecommunication Services — 1.1% | | | | | | | |
Rogers Communications, Inc. | | | | | | | | | | | | |
3.20%, 03/15/27 | | | | | | | 825 | | | | 783,153 | |
5.00%, 02/15/29 | | | | | | | 435 | | | | 431,979 | |
| | |
SCHEDULES OF INVESTMENTS | | 97 |
| | |
Schedule of Investments (continued) March 31, 2024 | | BATS: Series S Portfolio (Percentages shown are based on Net Assets) |
| | | | | | | | | | | | |
| Security | | | | | Par (000) | | | Value | |
|
Wireless Telecommunication Services (continued) | |
Sprint LLC | | | | | | | | | | | | |
7.13%, 06/15/24 | | | USD | | | | 460 | | | $ | 460,788 | |
7.63%, 03/01/26 | | | | | | | 204 | | | | 210,760 | |
Sprint Spectrum Co. LLC/Sprint Spectrum Co. II LLC/Sprint Spectrum Co. III LLC, 4.74%, 03/20/25(a) . | | | | | | | 100 | | | | 99,449 | |
T-Mobile U.S.A., Inc. | | | | | | | | | | | | |
1.50%, 02/15/26 | | | | | | | 224 | | | | 209,132 | |
2.25%, 02/15/26 | | | | | | | 769 | | | | 727,672 | |
2.63%, 04/15/26 | | | | | | | 585 | | | | 555,690 | |
3.75%, 04/15/27 | | | | | | | 343 | | | | 330,346 | |
4.85%, 01/15/29 | | | | | | | 470 | | | | 466,519 | |
| | | | | | | | |
| | | | | | | | | | | 4,275,488 | |
| | | | | | | | |
| |
Total Corporate Bonds — 24.7%
(Cost: $96,806,786) | | | | 96,968,870 | |
| | | | | | | | |
| | | |
Foreign Agency Obligations | | | | | | | | | | | | |
| | | |
| Canada — 0.4% | | | | | | | | | |
CPPIB Capital, Inc., 0.50%, 09/16/24(a) | | | | | | | 1,480 | | | | 1,447,483 | |
| | | | | | | | |
| | | |
| Saudi Arabia — 0.0% | | | | | | | | | |
Saudi Arabian Oil Co., 2.88%, 04/16/24(a) | | | | | | | 220 | | | | 219,362 | |
| | | | | | | | |
| | |
Total Foreign Agency Obligations — 0.4%
(Cost: $1,699,397) | | | | | | | | 1,666,845 | |
| | | | | | | | |
| |
Foreign Government Obligations | | | | | |
| | | |
| Canada — 0.2% | | | | | | | | | |
Ontario Teachers’ Finance Trust, 4.25%, 04/25/28(a) | | | | | | | 965 | | | | 950,993 | |
| | | | | | | | |
| | | |
| Uruguay — 0.0% | | | | | | | | | |
Republic of Uruguay, 4.38%, 01/23/31 | | | | | | | 0 | (f) | | | 3 | |
| | | | | | | | |
| |
Total Foreign Government Obligations — 0.2%
(Cost: $964,116) | | | | 950,996 | |
| | | | | | | | |
| |
Non-Agency Mortgage-Backed Securities | | | | | |
| | |
| Collateralized Mortgage Obligations — 3.4% | | | | | | | |
Angel Oak Mortgage Trust | | | | | | | | | | | | |
Series 2020-2, Class A1A, 2.53%, 01/26/65(a)(b) | | | | | | | 129 | | | | 119,433 | |
Series 2022-2, Class A1, 3.35%, 01/25/67(a)(b) | | | | | | | 286 | | | | 261,695 | |
Series 2023-6, Class A1, 6.50%, 12/25/67(a)(g) | | | | | | | 191 | | | | 192,085 | |
Arroyo Mortgage Trust, Series 2022-2, Class A1, 4.95%, 07/25/57(a)(g) | | | | | | | 250 | | | | 245,713 | |
Barclays Mortgage Loan Trust, Series 2024-NQM1, Class A1, 5.90%, 01/25/64(a)(g) | | | | | | | 486 | | | | 482,703 | |
BRAVO Residential Funding Trust, Series 2023-NQM6, Class A1, 6.60%, 09/25/63(a)(g) | | | | | | | 412 | | | | 414,405 | |
Chase Home Lending Mortgage Trust, Series 2019- ATR2, Class A3, 3.50%, 07/25/49(a)(b) | | | | | | | 144 | | | | 127,339 | |
COLT Mortgage Loan Trust, Series 2022-3, Class A1, 3.90%, 02/25/67(a)(b) | | | | | | | 123 | | | | 116,737 | |
Credit Suisse Mortgage Capital Trust, Series 2022- ATH1, Class A1A, 2.87%, 01/25/67(a)(b) | | | | | | | 271 | | | | 251,628 | |
Flagstar Mortgage Trust | | | | | | | | | | | | |
Series 2020-1INV, Class A11, (1-mo. CME Term SOFR + 0.96%), 6.00%, 03/25/50(a)(b) | | | | | | | 409 | | | | 385,579 | |
Series 2021-12, Class A19, 5.00%, 11/25/51(a)(b) | | | | | | | 631 | | | | 605,466 | |
GCAT Trust, Series 2021-NQM7, Class A1, 1.92%, 08/25/66(a)(b) | | | | | | | 218 | | | | 189,763 | |
GS Mortgage-Backed Securities Corp. Trust, Series 2022-PJ2, Class A4, 2.50%, 06/25/52(a)(b) | | | | | | | 511 | | | | 409,716 | |
| | | | | | | | | | | | |
| Security | | | | | Par
(000) | | | Value | |
|
Collateralized Mortgage Obligations (continued) | |
Homeward Opportunities Fund I Trust, Series 2022-1, Class A1, 5.08%, 07/25/67(a)(g) | | | USD | | | | 181 | | | $ | 178,925 | |
JPMorgan Mortgage Trust | | | | | | | | | | | | |
Series 2014-2, Class 1A1, 3.00%,
06/25/29(a)(b) | | | | | | | 199 | | | | 189,976 | |
Series 2021-7, Class A3, 2.50%, 11/25/51(a)(b) | | | | | | | 994 | | | | 796,719 | |
Series 2022-INV3, Class A3B, 3.00%, 09/25/52(a)(b) | | | | | | | 361 | | | | 299,886 | |
Series 2023-DSC1, Class A1, 4.63%, 07/25/63(a)(b) | | | | | | | 380 | | | | 362,635 | |
Series 2024-2, Class A3, 6.00%, 08/25/54(a)(b) | | | | | | | 164 | | | | 163,345 | |
Mello Mortgage Capital Acceptance, Series 2022-INV2, Class A3, 3.00%, 04/25/52(a)(b) | | | | | | | 421 | | | | 351,376 | |
MFA Trust | | | | | | | | | | | | |
Series 2021-INV2, Class A1, 1.91%, 11/25/56(a)(b) | | | | | | | 272 | | | | 233,587 | |
Series 2023-INV2, Class A1, 6.78%, 10/25/58(a)(g) | | | | | | | 156 | | | | 157,155 | |
Series 2023-NQM3, Class A1, 6.62%, 07/25/68(a)(g) | | | | | | | 452 | | | | 453,976 | |
Mill City Mortgage Loan Trust, Series 2017-3, Class A1, 2.75%, 01/25/61(a)(b) | | | | | | | 142 | | | | 139,535 | |
New Residential Mortgage Loan Trust, Series 2020-1A, Class A1B, 3.50%, 10/25/59(a)(b) | | | | | | | 313 | | | | 288,781 | |
OBX Trust | | | | | | | | | | | | |
Series 2020-EXP3, Class 2A1B, (1-mo. CME Term SOFR + 1.01%), 6.34%, 01/25/60(a)(b) | | | | | | | 868 | | | | 858,768 | |
Series 2022-INV3, Class A1, 3.00%, 02/25/52(a)(b) | | | | | | | 190 | | | | 159,169 | |
Series 2023-NQM6, Class A1, 6.52%, 07/25/63(a)(g) | | | | | | | 539 | | | | 543,622 | |
Preston Ridge Partners Mortgage LLC, Series 2024-RCF1, Class A1, 4.00%, 01/25/54(a)(g) | | | | | | | 105 | | | | 100,313 | |
PRKCM Trust | | | | | | | | | | | | |
Series 2021-AFC2, Class A1, 2.07%, 11/25/56(a)(b) | | | | | | | 323 | | | | 273,249 | |
Series 2023-AFC3, Class A1, 6.58%, 09/25/58(a)(g) | | | | | | | 467 | | | | 470,273 | |
RCKT Mortgage Trust, Series 2022-2, Class A1, 3.00%, 02/25/52(a)(b) | | | | | | | 440 | | | | 367,041 | |
SG Residential Mortgage Trust, Series 2022-2, Class A1, 5.35%, 08/25/62(a)(g) | | | | | | | 145 | | | | 143,737 | |
Starwood Mortgage Residential Trust, Series 2020-3, Class A1, 1.49%, 04/25/65(a)(b) | | | | | | | 155 | | | | 145,660 | |
Towd Point Mortgage Trust | | | | | | | | | | | | |
Series 2015-1, Class A5, 4.53%, 10/25/53(a)(b) | | | | | | | 639 | | | | 632,939 | |
Series 2018-1, Class A1, 3.00%, 01/25/58(a)(b) | | | | | | | 246 | | | | 239,187 | |
Series 2018-2, Class A1, 3.25%, 03/25/58(a)(b) | | | | | | | 669 | | | | 647,451 | |
Series 2018-6, Class A1A, 3.75%,
03/25/58(a)(b) | | | | | | | 649 | | | | 633,624 | |
Verus Securitization Trust | | | | | | | | | | | | |
Series 2022-1, Class A1, 2.72%, 01/25/67(a)(g) | | | | | | | 148 | | | | 133,157 | |
Series 2022-2, Class A1, 4.26%, 02/25/67(a)(g) | | | | | | | 240 | | | | 223,435 | |
Series 2022-3, Class A1, 4.13%, 02/25/67(a)(g) | | | | | | | 353 | | | | 330,443 | |
| | | | | | | | |
| | | | | | | | | | | 13,320,226 | |
| | |
| Commercial Mortgage-Backed Securities — 5.5% | | | | | | | |
280 Park Avenue Mortgage Trust, Series 2017-280P, Class A, (1-mo. CME Term SOFR + 1.18%), 6.50%, 09/15/34(a)(b) | | | | | | | 600 | | | | 588,951 | |
Alen Mortgage Trust, Series 2021-ACEN, Class A, (1-mo. CME Term SOFR + 1.26%), 6.59%, 04/15/34(a)(b) | | | | | | | 420 | | | | 383,758 | |
Arbor Multifamily Mortgage Securities Trust, Series 2020-MF1, Class ASB, 2.58%, 05/15/53(a) | | | | | | | 500 | | | | 463,431 | |
Barclays Commercial Mortgage Trust | | | | | | | | | | | | |
Series 2019-C3, Class B, 4.10%, 05/15/52 | | | | | | | 400 | | | | 361,318 | |
Series 2019-C5, Class ASB, 2.99%, 11/15/52 | | | | | | | 250 | | | | 237,860 | |
Beast Mortgage Trust, Series 2021-SSCP, Class A, (1-mo. CME Term SOFR + 0.86%), 6.19%, 04/15/36(a)(b) | | | | | | | 964 | | | | 956,940 | |
Benchmark Mortgage Trust, Series 2022-B34, Class AM, 3.83%, 04/15/55(b) | | | | | | | 265 | | | | 231,541 | |
| | |
| 98 | | 2 0 2 4 BLACK ROCK ANNUAL REPORT TO SHAREHOLDERS |
| | |
Schedule of Investments (continued) March 31, 2024 | | BATS: Series S Portfolio (Percentages shown are based on Net Assets) |
| | | | | | | | | | | | |
| Security | | | | | Par
(000) | | | Value | |
|
Commercial Mortgage-Backed Securities (continued) | |
BX Commercial Mortgage Trust | | | | | | | | | | | | |
Series 2022-LP2, Class A, (1-mo. CME Term SOFR + 1.01%), 6.34%, 02/15/39(a)(b) | | | USD | | | | 241 | | | $ | 240,317 | |
Series 2023-XL3, Class A, (1-mo. CME Term SOFR + 1.76%), 7.09%, 12/09/40(a)(b) | | | | | | | 480 | | | | 482,984 | |
Series 2024-MF, Class B, (1-mo. CME Term SOFR + 1.69%), 7.02%, 02/15/39(a)(b) | | | | | | | 140 | | | | 139,388 | |
BX Trust | | | | | | | | | | | | |
Series 2018-BILT, Class D, (1-mo. CME Term SOFR + 2.07%), 7.39%, 05/15/30(a)(b) | | | | | | | 270 | | | | 269,325 | |
Series 2022-IND, Class A, (1-mo. CME Term SOFR + 1.49%), 6.82%, 04/15/37(a)(b) | | | | | | | 689 | | | | 689,813 | |
Series 2023-DELC, Class A, (1-mo. CME Term SOFR + 2.69%), 8.02%,
05/15/38(a)(b) | | | | | | | 460 | | | | 465,750 | |
Series 2024-BIO, Class A, (1-mo. CME Term SOFR + 1.64%), 6.97%, 02/15/41(a)(b) | | | | | | | 626 | | | | 627,565 | |
Series 2024-CNYN, Class A, (1-mo. CME Term SOFR + 1.44%), 04/15/29(a)(b)(c) | | | | | | | 132 | | | | 132,100 | |
Series 2024-PAT, Class A, (1-mo. CME Term SOFR + 2.09%), 7.34%, 03/15/26(a)(b) | | | | | | | 250 | | | | 249,872 | |
Series 2024-PAT, Class B, (1-mo. CME Term SOFR + 3.04%), 8.29%, 03/15/26(a)(b) | | | | | | | 100 | | | | 99,945 | |
CD Mortgage Trust | | | | | | | | | | | | |
Series 2016-CD2, Class A4, 3.53%, 11/10/49(b) | | | | | | | 520 | | | | 484,559 | |
Series 2017-CD5, Class A4, 3.43%, 08/15/50 | | | | | | | 525 | | | | 492,529 | |
CENT Trust, Series 2023-CITY, Class A, (1-mo. CME Term SOFR + 2.62%), 7.95%, 09/15/38(a)(b) | | | | | | | 450 | | | | 454,495 | |
CFCRE Commercial Mortgage Trust, Series 2016-C6, Class A3, 3.22%, 11/10/49(b) | | | | | | | 820 | | | | 762,760 | |
Citigroup Commercial Mortgage Trust, Series 2018-B2, Class A4, 4.01%, 03/10/51 | | | | | | | 535 | | | | 509,689 | |
COAST Commercial Mortgage Trust, Series 2023-2HTL, Class A, (1-mo. CME Term SOFR + 2.59%), 7.92%, 08/15/36(a)(b) | | | | | | | 300 | | | | 300,748 | |
Commercial Mortgage Trust | | | | | | | | | | | | |
Series 2013-CR8, Class B, 3.57%, 06/10/46(a)(b) | | | | | | | 131 | | | | 127,203 | |
Series 2014-CR16, Class A4, 4.05%, 04/10/47 | | | | | | | 374 | | | | 372,885 | |
Series 2014-UBS6, Class ASB, 3.39%, 12/10/47 | | | | | | | 122 | | | | 120,905 | |
Series 2015-CR24, Class B, 4.35%, 08/10/48(b) | | | | | | | 500 | | | | 475,739 | |
Series 2015-LC23, Class A4, 3.77%, 10/10/48 | | | | | | | 550 | | | | 532,859 | |
Credit Suisse Mortgage Capital Trust, Series 2021-980M, Class C, 3.20%, 07/15/31(a) | | | | | | | 170 | | | | 152,936 | |
Credit Suisse Mortgage Trust, Series 2022-NWPT, Class A, (1-mo. CME Term SOFR + 3.14%), 8.47%, 09/09/24(a)(b) | | | | | | | 280 | | | | 280,782 | |
CSAIL Commercial Mortgage Trust, Series 2019-C17, Class A4, 2.76%, 09/15/52 | | | | | | | 1,000 | | | | 880,554 | |
FREMF Mortgage Trust, Series 2015-K45, Class B, 3.60%, 04/25/48(a)(b) | | | | | | | 290 | | | | 283,968 | |
GS Mortgage Securities Trust | | | | | | | | | | | | |
Series 2015-GC30, Class AAB, 3.12%, 05/10/50 | | | | | | | 142 | | | | 140,765 | |
Series 2022-ECI, Class A, (1-mo. CME Term SOFR + 2.19%), 7.52%, 08/15/39(a)(b) | | | | | | | 135 | | | | 135,850 | |
Series 2023-FUN, Class A, (1-mo. CME Term SOFR + 2.09%), 7.42%, 03/15/28(a)(b) | | | | | | | 410 | | | | 411,281 | |
Series 2023-FUN, Class B, (1-mo. CME Term SOFR + 2.79%), 8.12%,
03/15/28(a)(b) | | | | | | | 415 | | | | 416,167 | |
ILPT Commercial Mortgage Trust, Series 2022-LPF2, Class A, (1-mo. CME Term SOFR + 2.25%), 7.57%, 10/15/39(a)(b) | | | | | | | 500 | | | | 499,530 | |
JPMBB Commercial Mortgage Securities Trust
Series 2014-C21, Class A5, 3.78%, 08/15/47 | | | | | | | 434 | | | | 431,850 | |
| | | | | | | | | | | | |
| Security | | | | | Par
(000) | | | Value | |
|
Commercial Mortgage-Backed Securities (continued) | |
JPMBB Commercial Mortgage Securities Trust | | | | | | | | | | | | |
Series 2014-C25, Class A4A1, 3.41%, 11/15/47 | | | USD | | | | 367 | | | $ | 361,812 | |
Series 2015-C28, Class ASB, 3.04%, 10/15/48 | | | | | | | 262 | | | | 258,763 | |
JPMorgan Chase Commercial Mortgage Securities Trust | | | | | | | | | | | | |
Series 2017-JP6, Class A3, 3.11%, 07/15/50 | | | | | | | 414 | | | | 392,950 | |
Series 2019-BKWD, Class A, (1-mo. CME Term SOFR + 1.61%), 6.94%,
09/15/29(a)(b) | | | | | | | 164 | | | | 155,618 | |
Series 2022-NXSS, Class A, (1-mo. CME Term SOFR + 2.18%), 7.50%,
09/15/39(a)(b) | | | | | | | 180 | | | | 180,506 | |
Series 2022-OPO, Class D, 3.45%, 01/05/39(a)(b) | | | | | | | 100 | | | | 72,044 | |
KSL Commercial Mortgage Trust, Series 2023-HT, Class A, (1-mo. CME Term SOFR + 2.29%), 7.62%, 12/15/36(a)(b) | | | | | | | 200 | | | | 201,188 | |
Life Mortgage Trust, Series 2021-BMR, Class A, (1-mo. CME Term SOFR + 0.81%), 6.14%, 03/15/38(a)(b) | | | | | | | 531 | | | | 524,887 | |
LUX, Series 2023-LION, Class A, (1-mo. CME Term SOFR + 2.69%), 8.02%, 08/15/40(a)(b) | | | | | | | 183 | | | | 184,778 | |
Morgan Stanley Bank of America Merrill Lynch Trust, Series 2016-C30, Class ASB, 2.73%, 09/15/49 | | | | | | | 106 | | | | 103,663 | |
OPEN Trust, Series 2023-AIR, Class A, (1-mo. CME Term SOFR + 3.09%), 8.41%, 10/15/28(a)(b) | | | | | | | 105 | | | | 106,307 | |
Seasoned Credit Risk Transfer Trust, Series 2018-3, Class MA, 3.50%, 08/25/57(b) | | | | | | | 1,074 | | | | 1,016,734 | |
Taubman Centers Commercial Mortgage Trust, Series 2022-DPM, Class A, (1-mo. CME Term SOFR + 2.19%), 7.51%, 05/15/37(a)(b) | | | | | | | 270 | | | | 272,025 | |
Wells Fargo Commercial Mortgage Trust | | | | | | | | | | | | |
Series 2014-LC18, Class ASB, 3.24%, 12/15/47 | | | | | | | 223 | | | | 220,958 | |
Series 2015-C26, Class B, 3.78%, 02/15/48 | | | | | | | 515 | | | | 496,482 | |
Series 2015-C27, Class A5, 3.45%, 02/15/48 | | | | | | | 495 | | | | 483,152 | |
Series 2016-LC24, Class A3, 2.68%, 10/15/49 | | | | | | | 809 | | | | 767,704 | |
Series 2021-C60, Class ASB, 2.13%, 08/15/54 | | | | | | | 834 | | | | 744,294 | |
| | | | | | | | |
| | | | | | | | | | | 21,432,777 | |
|
| Interest Only Commercial Mortgage-Backed Securities — 0.0% | |
Citigroup Commercial Mortgage Trust, Series 2015-P1, Class XA, 0.70%, 09/15/48(b) | | | | | | | 4,197 | | | | 32,622 | |
Commercial Mortgage Trust | | | | | | | | | | | | |
Series 2015-CR23, Class XA, 0.84%, 05/10/48(b) | | | | | | | 1,817 | | | | 11,689 | |
Series 2015-LC21, Class XA, 0.62%, 07/10/48(b) | | | | | | | 4,116 | | | | 20,902 | |
CSAIL Commercial Mortgage Trust, Series 2016-C6, Class XA, 1.86%, 01/15/49(b) | | | | | | | 594 | | | | 15,990 | |
| | | | | | | | |
| | | | | | | | | | | 81,203 | |
| | | | | | | | |
| |
Total Non-Agency Mortgage-Backed Securities — 8.9%
(Cost: $36,191,207) | | | | 34,834,206 | |
| | | | | | | | |
| | | |
Preferred Securities | | | | | | | | | | | | |
| | | |
| Capital Trusts — 0.2% | | | | | | | | | |
| | | |
| Electric Utilities — 0.2% | | | | | | | | | |
Southern Co. (The), 4.48%, 08/01/24(g) | | | | | | | 571 | | | | 568,160 | |
| | | | | | | | |
|
U.S. Government Sponsored Agency Securities | |
| | | |
| Agency Obligations — 4.8% | | | | | | | | | |
Fannie Mae | | | | | | | | | | | | |
0.54%, 10/27/25 | | | | | | | 4,500 | | | | 4,195,986 | |
0.74%, 08/25/27 | | | | | | | 1,000 | | | | 880,063 | |
0.81%, 09/25/28 | | | | | | | 1,000 | | | | 852,258 | |
Federal Farm Credit Banks Funding Corp. | | | | | | | | | | | | |
2.25%, 08/15/29 | | | | | | | 1,000 | | | | 892,817 | |
| | |
SCHEDULES OF INVESTMENTS | | 99 |
| | |
Schedule of Investments (continued) March 31, 2024 | | BATS: Series S Portfolio (Percentages shown are based on Net Assets) |
| | | | | | | | | | | | |
| Security | | | | | Par
(000) | | | Value | |
|
Agency Obligations (continued) | |
Federal Farm Credit Banks Funding Corp. | | | | | | | | | | | | |
2.17%, 10/29/29 | | | USD | | | | 700 | | | $ | 621,466 | |
1.30%, 02/03/31 | | | | | | | 770 | | | | 618,878 | |
1.68%, 09/17/35 | | | | | | | 2,080 | | | | 1,513,242 | |
Federal Home Loan Banks | | | | | | | | | | | | |
0.60%, 12/30/26 | | | | | | | 1,000 | | | | 892,446 | |
2.06%, 09/27/29 | | | | | | | 1,000 | | | | 884,621 | |
2.18%, 11/06/29 | | | | | | | 700 | | | | 616,331 | |
Freddie Mac | | | | | | | | | | | | |
4.20%, 08/28/25 | | | | | | | 1,300 | | | | 1,286,115 | |
0.60%, 09/30/25 | | | | | | | 3,000 | | | | 2,813,481 | |
0.65%, 05/28/26 | | | | | | | 1,000 | | | | 915,245 | |
0.90%, 10/13/27 | | | | | | | 2,000 | | | | 1,763,522 | |
| | | | | | | | | | | | |
| | | | | | | | | | | 18,746,471 | |
| | |
| Collateralized Mortgage Obligations — 1.3% | | | | | | | |
Fannie Mae | | | | | | | | | | | | |
Series 2018-21, Class CA, 3.50%, 04/25/45 | | | | | | | 94 | | | | 91,376 | |
Series 2019-73, Class P, 3.00%, 03/25/48 | | | | | | | 472 | | | | 442,352 | |
Series 2020-79, Class JA, 1.50%, 11/25/50 | | | | | | | 448 | | | | 390,004 | |
Freddie Mac | | | | | | | | | | | | |
Series 3959, Class MA, 4.50%, 11/15/41 | | | | | | | 45 | | | | 44,684 | |
Series 3986, Class M, 4.50%, 09/15/41 | | | | | | | 6 | | | | 5,983 | |
Series 4274, Class PN, 3.50%, 10/15/35 | | | | | | | 61 | | | | 58,630 | |
Series 4390, Class CA, 3.50%, 06/15/50 | | | | | | | 39 | | | | 38,094 | |
Series 4459, Class BN, 3.00%, 08/15/43 | | | | | | | 264 | | | | 240,043 | |
Series 4482, Class DH, 3.00%, 06/15/42 | | | | | | | 23 | | | | 22,556 | |
Series 4494, Class KA, 3.75%, 10/15/42 | | | | | | | 67 | | | | 65,725 | |
Series 4752, Class PL, 3.00%, 09/15/46 | | | | | | | 312 | | | | 290,938 | |
Series 4777, Class CB, 3.50%, 10/15/45 | | | | | | | 242 | | | | 233,692 | |
Series 4941, Class MB, 3.00%, 07/25/49 | | | | | | | 268 | | | | 233,924 | |
Series 5000, Class MA, 2.00%, 06/25/44 | | | | | | | 220 | | | | 199,005 | |
Series 5006, Class KA, 2.00%, 06/25/45 | | | | | | | 627 | | | | 561,479 | |
Series 5105, Class LA, 1.50%, 04/15/44 | | | | | | | 1,596 | | | | 1,518,892 | |
Ginnie Mae | | | | | | | | | | | | |
Series 2017-136, Class GB, 3.00%, 03/20/47 | | | | | | | 392 | | | | 355,744 | |
Series 2020-127, Class LP, 1.50%, 06/20/50 | | | | | | | 400 | | | | 311,248 | |
| | | | | | | | | | | | |
| | | | | | | | | | | 5,104,369 | |
| |
| Commercial Mortgage-Backed Securities — 0.3% | | | | |
Fannie Mae, Series 2014-M9, Class A2, 3.10%, 07/25/24(b) | | | | | | | 1,145 | | | | 1,135,250 | |
| | | | | | | | | | | | |
| | | |
| Mortgage-Backed Securities — 9.6% | | | | | | | | | |
Fannie Mae, Series 2022-65, Class FB, (SOFR (30-day) + 0.80%), 6.00%, 09/25/52(b) | | | | | | | 3,547 | | | | 3,475,489 | |
Fannie Mae Mortgage-Backed Securities | | | | | | | | | | | | |
1.50%, 07/01/31 | | | | | | | 1,269 | | | | 1,153,131 | |
2.50%, 12/01/27 - 12/01/36 | | | | | | | 1,462 | | | | 1,356,404 | |
3.00%, 09/01/30 - 09/01/35 | | | | | | | 6,961 | | | | 6,561,176 | |
3.03%, 12/01/27 | | | | | | | 1,263 | | | | 1,185,853 | |
3.50%, 05/01/37 | | | | | | | 615 | | | | 590,628 | |
4.00%, 03/01/32 - 08/01/49 | | | | | | | 9,289 | | | | 8,829,360 | |
4.50%, 09/01/26 - 01/01/48 | | | | | | | 2,240 | | | | 2,188,447 | |
5.00%, 07/01/25 - 06/01/39 | | | | | | | 1,195 | | | | 1,201,004 | |
5.50%, 05/01/38 | | | | | | | 199 | | | | 203,240 | |
(Refinitiv USD IBOR Consumer Cash Fallbacks Term 1 Year + 1.59%), 2.92%, 06/01/45(b) | | | | | | | 109 | | | | 108,335 | |
(Refinitiv USD IBOR Consumer Cash Fallbacks Term 1 Year + 1.60%), 5.41%, 07/01/44(b) | | | | | | | 120 | | | | 123,009 | |
(Refinitiv USD IBOR Consumer Cash Fallbacks Term 1 Year + 1.70%), 5.62%, 07/01/43(b) | | | | | | | 196 | | | | 201,401 | |
Freddie Mac Mortgage-Backed Securities
2.50%, 11/01/27 - 03/01/37 | | | | | | | 542 | | | | 501,312 | |
| | | | | | | | | | | | |
| Security | | | | | Par (000) | | | Value | |
|
Mortgage-Backed Securities (continued) | |
Freddie Mac Mortgage-Backed Securities | | | | | | | | | | | | |
3.00%, 12/01/31 - 02/01/36 | | | USD | | | | 845 | | | $ | 792,749 | |
3.50%, 04/01/32 - 11/01/38 | | | | | | | 1,096 | | | | 1,061,872 | |
4.00%, 09/01/33 - 06/01/37 | | | | | | | 1,244 | | | | 1,216,376 | |
4.50%, 03/01/49 - 01/01/50 | | | | | | | 2,764 | | | | 2,712,497 | |
(Refinitiv USD IBOR Consumer Cash Fallbacks Term 1 Year + 1.62%), 3.34%, 05/01/45(b) | | | | | | | 312 | | | | 308,111 | |
(Refinitiv USD IBOR Consumer Cash Fallbacks Term 1 Year + 1.62%), 5.42%, 03/01/45(b) | | | | | | | 109 | | | | 110,283 | |
Uniform Mortgage-Backed Securities, 4.50%, 04/01/54(h) | | | | | | | 4,100 | | | | 3,904,112 | |
| | | | | | | | | | | | |
| | | | | | | | | | | 37,784,789 | |
| | | | | | | | | | | | |
| |
Total U.S. Government Sponsored Agency Securities — 16.0%
(Cost: $65,512,793) | | | | 62,770,879 | |
| | | | | | | | | | | | |
|
U.S. Treasury Obligations | |
U.S. Treasury Notes | | | | | | | | | | | | |
5.00%, 08/31/25 | | | | | | | 8,000 | | | | 8,016,250 | |
4.00%, 02/15/26 | | | | | | | 11,250 | | | | 11,110,254 | |
4.25%, 03/15/27 | | | | | | | 18,000 | | | | 17,917,031 | |
| | | | | | | | | | | | |
| |
Total U.S. Treasury Obligations — 9.5%
(Cost: $37,083,091) | | | | 37,043,535 | |
| | | | | | | | | | | | |
| |
Total Long-Term Investments — 92.1%
(Cost: $366,284,217) | | | | 360,905,805 | |
| | | | | | | | | | | | |
|
Short-Term Securities | |
| | | |
| Commercial Paper — 0.4% | | | | | | | | | |
HSBC U.S.A., Inc., 6.46%, 08/22/24(i) | | | | 1,500 | | | | 1,466,570 | |
| | | | | | | | | | | | |
| | | |
| | | | | | Shares | | | | |
| | | |
| Money Market Funds — 1.1% | | | | | | | | | |
Dreyfus Treasury Securities Cash Management, Institutional Class,
5.19%(j) | | | | | | | 4,208,582 | | | | 4,208,582 | |
| | | | | | | | | | | | |
| | | |
| | | | | | Par (000) | | | | |
| | | |
| U.S. Treasury Obligations(i) — 7.5% | | | | | | | | | |
U.S. Treasury Bills | | | | | | | | | | | | |
5.30%, 05/30/24 | | | USD | | | | 8,000 | | | | 7,931,002 | |
5.31%, 06/13/24 | | | | | | | 13,675 | | | | 13,530,375 | |
5.17%, 06/27/24 | | | | | | | 8,155 | | | | 8,052,174 | |
| | | | | | | | | | | | |
| | | | | | | | | | | 29,513,551 | |
| | | | | | | | | | | | |
| |
Total Short-Term Securities — 9.0%
(Cost: $35,189,218) | | | | 35,188,703 | |
| | | | | | | | | | | | |
| |
Total Investments Before TBA Sale Commitments — 101.1%
(Cost: $401,473,435) | | | | 396,094,508 | |
| | | | | | | | | | | | |
| | |
| 100 | | 2 0 2 4 BLACK ROCK ANNUAL REPORT TO SHAREHOLDERS |
| | |
Schedule of Investments (continued) March 31, 2024 | | BATS: Series S Portfolio (Percentages shown are based on Net Assets) |
| | | | | | | | |
| Security | | Par
(000) | | | Value | |
| | |
TBA Sale Commitments(h) | | | | | | | | |
| | |
| Mortgage-Backed Securities — (1.0)% | | | | | | |
Uniform Mortgage-Backed Securities, 4.50%, 04/01/54 . USD | | | (4,100 | ) | | $ | (3,904,112 | ) |
| | | | | | | | |
| | |
Total TBA Sale Commitments — (1.0)%
(Proceeds: $(3,927,672)) | | | | | | | (3,904,112 | ) |
| | | | | | | | |
| |
Total Investments Net of TBA Sale Commitments — 100.1%
(Cost: $397,545,763) | | | | 392,190,396 | |
| | |
Liabilities in Excess of Other Assets — (0.1)% | | | | | | | (257,267 | ) |
| | | | | | | | |
| |
Net Assets — 100.0% | | | $ | 391,933,129 | |
| | | | | | | | |
| (a) | Security exempt from registration pursuant to Rule 144A under the Securities Act of 1933, as amended. These securities may be resold in transactions exempt from registration to qualified institutional investors. |
| (b) | Variable rate security. Interest rate resets periodically. The rate shown is the effective interest rate as of period end. Security description also includes the reference rate and spread if published and available. |
| (d) | This security may be resold to qualified foreign investors and foreign institutional buyers under Regulation S of the Securities Act of 1933. |
| (f) | Rounds to less than 1,000. |
| (g) | Step coupon security. Coupon rate will either increase (step-up bond) or decrease (step-down bond) at regular intervals until maturity. Interest rate shown reflects the rate currently in effect. |
| (h) | Represents or includes a TBA transaction. |
| (i) | Rates are discount rates or a range of discount rates as of period end. |
| (j) | Annualized 7-day yield as of period end. |
For purposes of this report, industry and sector sub-classifications may differ from those utilized by the Fund for compliance purposes.
Derivative Financial Instruments Outstanding as of Period End
Futures Contracts
| | | | | | | | | | | | | | | | |
| | | | | |
| Description | | Number of Contracts | | | Expiration Date | | | Notional Amount (000) | | | Value/ Unrealized Appreciation (Depreciation) | |
| | | | |
Long Contracts | | | | | | | | | | | | | | | | |
Euro-Schatz | | | 6 | | | | 06/06/24 | | | $ | 684 | | | $ | 534 | |
U.S. Treasury Notes (2 Year) | | | 722 | | | | 06/28/24 | | | | 147,638 | | | | (132,956 | ) |
| | | | | | | | | | | | | | | | |
| | | | |
| | | | | | | | | | | | | | | (132,422 | ) |
| | | | | | | | | | | | | | | | |
Short Contracts | | | | | | | | | | | | | | | | |
Euro-Bobl | | | 21 | | | | 06/06/24 | | | | 2,679 | | | | (13,064 | ) |
U.S. Treasury Bonds (30 Year) | | | 39 | | | | 06/18/24 | | | | 4,697 | | | | (99,395 | ) |
U.S. Treasury Notes (10 Year) | | | 96 | | | | 06/18/24 | | | | 10,637 | | | | (19,241 | ) |
U.S. Ultra Treasury Bonds | | | 3 | | | | 06/18/24 | | | | 387 | | | | (8,726 | ) |
U.S. Ultra Treasury Notes (10 Year) | | | 69 | | | | 06/18/24 | | | | 7,908 | | | | (42,874 | ) |
U.S. Treasury Notes (5 Year) | | | 443 | | | | 06/28/24 | | | | 47,408 | | | | (77,603 | ) |
| | | | | | | | | | | | | | | | |
| | | | |
| | | | | | | | | | | | | | | (260,903 | ) |
| | | | | | | | | | | | | | | | |
| | | | |
| | | | | | | | | | | | | | $ | (393,325 | ) |
| | | | | | | | | | | | | | | | |
Forward Foreign Currency Exchange Contracts
| | | | | | | | | | | | | | | | | | | | | | |
| | | | | | |
| Currency Purchased | | | | | Currency Sold | | | Counterparty | | Settlement
Date | | | Unrealized
Appreciation
(Depreciation) | |
USD | | | 278,138 | | | | CAD | | | | 376,000 | | | Deutsche Bank AG | | | 06/20/24 | | | $ | 222 | |
USD | | | 15,293 | | | | EUR | | | | 14,000 | | | Deutsche Bank AG | | | 06/20/24 | | | | 138 | |
USD | | | 4,298,745 | | | | EUR | | | | 3,931,000 | | | UBS AG | | | 06/20/24 | | | | 43,431 | |
| | | | | | | | | | | | | | | | | | | | | | |
| | | | | | | | | | | | | | | | | | | | $ | 43,791 | |
| | | | | | | | | | | | | | | | | | | | | | |
| | |
SCHEDULES OF INVESTMENTS | | 101 |
| | |
Schedule of Investments (continued) March 31, 2024 | | BATS: Series S Portfolio |
Centrally Cleared Credit Default Swaps — Sell Protection
| | | | | | | | | | | | | | | | | | | | | | | | | | | | | | | | | | |
| | | | | | | | | |
| Reference Obligation/Index | | Financing Rate Received by
the Fund | | | Payment Frequency | | Termination Date | | | Credit Rating(a) | | | Notional Amount (000)(b) | | | Value | | | Upfront Premium Paid (Received) | | | Unrealized Appreciation (Depreciation) | |
CDX.NA.IG.42.V1 | | | 1.00 | % | | Quarterly | | | 06/20/29 | | | | BBB+ | | | | USD | | | | 16,460 | | | $ | (377,298 | ) | | $ | (360,400 | ) | | $ | (16,898 | ) |
| | | | | | | | | | | | | | | | | | | | | | | | | | | | | | | | | | |
| | (a) | Using the rating of the issuer or the underlying securities of the index, as applicable, provided by S&P Global Ratings. | |
| | (b) | The maximum potential amount the Fund may pay should a negative credit event take place as defined under the terms of the agreement. | |
Centrally Cleared Interest Rate Swaps
| | | | | | | | | | | | | | | | | | | | | | | | | | | | | | | | | | |
| | |
| | | | | | | | | | | | | | | | | | | | | | | Upfront | | | | | | |
| | | | | | | | | | | | | | | | | Notional | | | | | | Premium | | | Unrealized | | | |
| | | Paid by the Fund | | Received by the Fund | | Termination | | | | | | Amount | | | | | | Paid | | | Appreciation | | | |
| | | | | | | | | | | | | | | | | | | | | | | | | | | | | | |
| | | Rate | | Frequency | | Rate | | Frequency | | Date | | | | | | (000) | | | Value | | | (Received) | | | (Depreciation) | | | |
| | |
| | 0.23% | | Annual | | 1-day TONA, 0.07% | | Annual | | | 11/24/25 | | | | JPY | | | | 1,454,258 | | | | $ (3,566 | ) | | $ | — | | | $ | (3,566 | ) | | |
| | | | | | | | | | | | | | | | | | | | | | | | | | | | | | | | | | |
Balances Reported in the Statements of Assets and Liabilities for Centrally Cleared Swaps
| | | | | | | | | | | | | | | | |
| | | | | |
| | | Swap
Premiums
Paid | | | Swap
Premiums
Received | | | Unrealized
Appreciation | | | Unrealized
Depreciation | |
Centrally Cleared Swaps(a) | | $ | — | | | $ | (360,400 | ) | | $ | — | | | $ | (20,464 | ) |
| | (a) | Includes cumulative appreciation (depreciation) on centrally cleared swaps, as reported in the Schedule of Investments. Only current day’s variation margin is reported within the Statements of Assets and Liabilities and is net of any previously paid (received) swap premium amounts. | |
Derivative Financial Instruments Categorized by Risk Exposure
As of period end, the fair values of derivative financial instruments located in the Statements of Assets and Liabilities were as follows:
| | | | | | | | | | | | | | | | | | | | | | | | | | | | |
| | | | | | | | |
| | | Commodity
Contracts | | | Credit
Contracts | | | Equity
Contracts | | | Foreign
Currency
Exchange
Contracts | | | Interest
Rate
Contracts | | | Other
Contracts | | | Total | |
| | | | | | | |
Assets — Derivative Financial Instruments | | | | | | | | | | | | | | | | | | | | | | | | | | | | |
Futures contracts | | | | | | | | | | | | | | | | | | | | | | | | | | | | |
Unrealized appreciation on futures contracts(a) | | $ | — | | | $ | — | | | $ | — | | | $ | — | | | $ | 534 | | | $ | — | | | $ | 534 | |
Forward foreign currency exchange contracts | | | | | | | | | | | | | | | | | | | | | | | | | | | | |
Unrealized appreciation on forward foreign currency exchange contracts | | | — | | | | — | | | | — | | | | 43,791 | | | | — | | | | — | | | | 43,791 | |
| | | | | | | | | | | | | | | | | | | | | | | | | | | | |
| | $ | — | | | $ | — | | | $ | — | | | $ | 43,791 | | | $ | 534 | | | $ | — | | | $ | 44,325 | |
| | | | | | | | | | | | | | | | | | | | | | | | | | | | |
| | | | | | | |
Liabilities — Derivative Financial Instruments | | | | | | | | | | | | | | | | | | | | | | | | | | | | |
Futures contracts | | | | | | | | | | | | | | | | | | | | | | | | | | | | |
Unrealized depreciation on futures contracts(a) | | $ | — | | | $ | — | | | $ | — | | | $ | — | | | $ | 393,859 | | | $ | — | | | $ | 393,859 | |
Swaps — centrally cleared | | | | | | | | | | | | | | | | | | | | | | | | | | | | |
Unrealized depreciation on centrally cleared swaps(a) | | | — | | | | 16,898 | | | | — | | | | — | | | | 3,566 | | | | — | | | | 20,464 | |
| | | | | | | | | | | | | | | | | | | | | | | | | | | | |
| | $ | — | | | $ | 16,898 | | | $ | — | | | $ | — | | | $ | 397,425 | | | $ | — | | | $ | 414,323 | |
| | | | | | | | | | | | | | | | | | | | | | | | | | | | |
| | (a) | Net cumulative unrealized appreciation (depreciation) on futures contracts and centrally cleared swaps, if any, are reported in the Schedule of Investments. In the Statements of Assets and Liabilities, only current day’s variation margin is reported in receivables or payables and the net cumulative unrealized appreciation (depreciation) is included in accumulated earnings (loss). | |
| | |
| 102 | | 2 0 2 4 BLACK ROCK ANNUAL REPORT TO SHAREHOLDERS |
| | |
Schedule of Investments (continued) March 31, 2024 | | BATS: Series S Portfolio |
For the period ended March 31, 2024, the effect of derivative financial instruments in the Statements of Operations was as follows:
| | | | | | | | | | | | | | | | | | | | | | | | | | | | |
| | | | | | | | |
| | | Commodity
Contracts | | | Credit
Contracts | | | Equity
Contracts | | | Foreign
Currency
Exchange
Contracts | | | Interest
Rate
Contracts | | | Other
Contracts | | | Total | |
| | | | | | | |
Net Realized Gain (Loss) from: | | | | | | | | | | | | | | | | | | | | | | | | | | | | |
Futures contracts | | $ | — | | | $ | — | | | $ | — | | | $ | — | | | $ | 198,411 | | | $ | — | | | $ | 198,411 | |
Forward foreign currency exchange contracts | | | — | | | | — | | | | — | | | | 16,753 | | | | — | | | | — | | | | 16,753 | |
Swaps | | | — | | | | (163,028 | ) | | | — | | | | — | | | | (55,467 | ) | | | — | | | | (218,495 | ) |
| | | | | | | | | | | | | | | | | | | | | | | | | | | | |
| | $ | — | | | $ | (163,028 | ) | | $ | — | | | $ | 16,753 | | | $ | 142,944 | | | $ | — | | | $ | (3,331 | ) |
| | | | | | | | | | | | | | | | | | | | | | | | | | | | |
| | | | | | | |
Net Change in Unrealized Appreciation (Depreciation) on: | | | | | | | | | | | | | | | | | | | | | | | | | | | | |
Futures contracts | | $ | — | | | $ | — | | | $ | — | | | $ | — | | | $ | (750,739 | ) | | $ | — | | | $ | (750,739 | ) |
Forward foreign currency exchange contracts | | | — | | | | — | | | | — | | | | 149,430 | | | | — | | | | — | | | | 149,430 | |
Swaps | | | — | | | | 20,515 | | | | — | | | | — | | | | 25,992 | | | | — | | | | 46,507 | |
| | | | | | | | | | | | | | | | | | | | | | | | | | | | |
| | $ | — | | | $ | 20,515 | | | $ | — | | | $ | 149,430 | | | $ | (724,747 | ) | | $ | — | | | $ | (554,802 | ) |
| | | | | | | | | | | | | | | | | | | | | | | | | | | | |
Average Quarterly Balances of Outstanding Derivative Financial Instruments
| | | | |
Futures contracts | | | | |
Average notional value of contracts — long | | | $147,962,089 | |
Average notional value of contracts — short | | | $70,037,055 | |
Forward foreign currency exchange contracts | | | | |
Average amounts purchased — in USD | | | $6,862,442 | |
Average amounts sold — in USD | | | $663,311 | |
Credit default swaps | | | | |
Average notional value — buy protection | | | $7,252,500 | |
Average notional value — sell protection | | | $4,115,000 | |
Interest rate swaps | | | | |
Average notional value — pays fixed rate | | | $— | (a) |
Average notional value — received fixed rate | | | $4,980,140 | |
| | (a) | Derivative not held at any quarter-end. The risk exposure table serves as an indicator of activity during the period. | |
For more information about the Fund’s investment risks regarding derivative financial instruments, refer to the Notes to Financial Statements.
Derivative Financial Instruments – Offsetting as of Period End
The Fund’s derivative assets and liabilities (by type) were as follows:
| | | | | | | | |
| |
| | | Assets | | | Liabilities | |
| |
Derivative Financial Instruments | | | | | | | | |
Forward foreign currency exchange contracts | | $ | 43,791 | | | $ | — | |
Swaps — centrally cleared | | | — | | | | 1,157 | |
| | | | | | | | |
Total derivative assets and liabilities in the Statements of Assets and Liabilities | | $ | 43,791 | | | $ | 1,157 | |
| | | | | | | | |
Derivatives not subject to a Master Netting Agreement or similar agreement (“MNA”) | | | — | | | | (1,157 | ) |
| | | | | | | | |
Total derivative assets and liabilities subject to an MNA | | $ | 43,791 | | | $ | — | |
| | | | | | | | |
| | |
SCHEDULES OF INVESTMENTS | | 103 |
| | |
Schedule of Investments (continued) March 31, 2024 | | BATS: Series S Portfolio |
The following tables present the Fund’s derivative assets and liabilities by counterparty net of amounts available for offset under an MNA and net of the related collateral received and pledged by the Fund:
| | | | | | | | | | | | | | | | | | | | |
| | | | | | |
| Counterparty | | Derivative Assets Subject to an MNA by Counterparty | | | Derivatives Available for Offset(a) | | | Non- Cash Collateral Received(b) | | | Cash Collateral Received(b) | | | Net Amount of Derivative Assets(c)(d) | |
Deutsche Bank AG | | $ | 360 | | | $ | — | | | $ | — | | | $ | — | | | $ | 360 | |
UBS AG | | | 43,431 | | | | — | | | | — | | | | — | | | | 43,431 | |
| | | | | | | | | | | | | | | | | | | | |
| | | | | |
| | $ | 43,791 | | | $ | — | | | $ | — | | | $ | — | | | $ | 43,791 | |
| | | | | | | | | | | | | | | | | | | | |
| | (a) | The amount of derivatives available for offset is limited to the amount of derivative assets and/or liabilities that are subject to an MNA. | |
| | (b) | Excess of collateral received/pledged, if any, from the individual counterparty is not shown for financial reporting purposes. | |
| | (c) | Net amount represents the net amount receivable from the counterparty in the event of default. | |
| | (d) | Net amount may also include forward foreign currency exchange contracts that are not required to be collateralized. | |
Fair Value Hierarchy as of Period End
Various inputs are used in determining the fair value of financial instruments. For a description of the input levels and information about the Fund’s policy regarding valuation of financial instruments, refer to the Notes to Financial Statements.
The following table summarizes the Fund’s financial instruments categorized in the fair value hierarchy. The breakdown of the Fund’s financial instruments into major categories is disclosed in the Schedule of Investments above.
| | | | | | | | | | | | | | | | |
| | | | | |
| | | Level 1 | | | Level 2 | | | Level 3 | | | Total | |
| | | | |
Assets | | | | | | | | | | | | | | | | |
Investments | | | | | | | | | | | | | | | | |
Long-Term Investments | | | | | | | | | | | | | | | | |
Asset-Backed Securities | | $ | — | | | $ | 126,102,314 | | | $ | — | | | $ | 126,102,314 | |
Corporate Bonds | | | — | | | | 96,968,870 | | | | — | | | | 96,968,870 | |
Foreign Agency Obligations | | | — | | | | 1,666,845 | | | | — | | | | 1,666,845 | |
Foreign Government Obligations | | | — | | | | 950,996 | | | | — | | | | 950,996 | |
Non-Agency Mortgage-Backed Securities | | | — | | | | 34,834,206 | | | | — | | | | 34,834,206 | |
Preferred Securities | | | — | | | | 568,160 | | | | — | | | | 568,160 | |
U.S. Government Sponsored Agency Securities | | | — | | | | 62,770,879 | | | | — | | | | 62,770,879 | |
U.S. Treasury Obligations | | | — | | | | 37,043,535 | | | | — | | | | 37,043,535 | |
Short-Term Securities | | | | | | | | | | | | | | | | |
Commercial Paper | | | — | | | | 1,466,570 | | | | — | | | | 1,466,570 | |
Money Market Funds | | | 4,208,582 | | | | — | | | | — | | | | 4,208,582 | |
U.S. Treasury Obligations | | | — | | | | 29,513,551 | | | | — | | | | 29,513,551 | |
Liabilities | | | | | | | | | | | | | | | | |
TBA Sale Commitments | | | — | | | | (3,904,112 | ) | | | — | | | | (3,904,112 | ) |
| | | | | | | | | | | | | | | | |
| | | | |
| | $ | 4,208,582 | | | $ | 387,981,814 | | | $ | — | | | $ | 392,190,396 | |
| | | | | | | | | | | | | | | | |
Derivative Financial Instruments(a) | | | | | | | | | | | | | | | | |
Assets | | | | | | | | | | | | | | | | |
Foreign Currency Exchange Contracts | | $ | — | | | $ | 43,791 | | | $ | — | | | $ | 43,791 | |
Interest Rate Contracts | | | 534 | | | | — | | | | — | | | | 534 | |
Liabilities | | | | | | | | | | | | | | | | |
Credit Contracts | | | — | | | | (16,898 | ) | | | — | | | | (16,898 | ) |
Interest Rate Contracts | | | (393,859 | ) | | | (3,566 | ) | | | — | | | | (397,425 | ) |
| | | | | | | | | | | | | | | | |
| | $ | (393,325 | ) | | $ | 23,327 | | | $ | — | | | $ | (369,998 | ) |
| | | | | | | | | | | | | | | | |
| | (a) | Derivative financial instruments are swaps, futures contracts and forward foreign currency exchange contracts. Swaps, futures contracts and forward foreign currency exchange contracts are valued at the unrealized appreciation (depreciation) on the instrument. | |
See notes to financial statements.
| | |
| 104 | | 2 0 2 4 BLACK ROCK ANNUAL REPORT TO SHAREHOLDERS |
| | |
Schedule of Investments March 31, 2024 | | BATS: Series V Portfolio (Percentages shown are based on Net Assets) |
| | | | | | | | | | | | |
| Security | | Par (000) | | | Value | |
| | | |
Municipal Bonds | | | | | | | | | | | | |
| | | |
| Alaska — 1.4% | | | | | | | | | |
Alaska Housing Finance Corp. | | | | | | | | | | | | |
Refunding RB, Series A, VRDN, (Wells Fargo Bank NA SBPA), 3.65%, 04/08/24(a) | | | USD | | | | 300 | | | $ | 300,000 | |
Refunding RB, Series D, VRDN, (Federal Home Loan Bank SBPA), 3.64%, 04/08/24(a) | | | | | | | 1,300 | | | | 1,300,000 | |
| | | | | | | | | | | | |
| | | | | | | | | | | 1,600,000 | |
| | | |
| California — 0.5% | | | | | | | | | |
Southern California Public Power Authority, Refunding RB, VRDN, (Bank of America NA SBPA), 4.39%, 04/01/24(a) | | | | | | | 600 | | | | 600,000 | |
| | | | | | | | | | | | |
| | | |
| Colorado — 3.1% | | | | | | | | | |
City of Colorado Springs Utilities System Revenue, Refunding RB, Series C, VRDN, (Sumitomo Mitsui Banking Corp. SBPA), 3.65%, 04/08/24(a) | | | | | | | 3,710 | | | | 3,710,000 | |
| | | | | | | | | | | | |
| | | |
| Connecticut — 2.4% | | | | | | | | | |
Connecticut Housing Finance Authority | | | | | | | | | | | | |
Refunding RB, Sub-Series A-3, VRDN, (UBS AG SBPA), 3.67%, 04/08/24(a) | | | | | | | 2,100 | | | | 2,100,000 | |
Refunding RB, Sub-Series C-3, VRDN, (Royal Bank of Canada SBPA), 3.62%, 04/08/24(a) | | | | | | | 725 | | | | 725,000 | |
| | | | | | | | | | | | |
| | | | | | | | | | | 2,825,000 | |
| | | |
| Florida — 9.9% | | | | | | | | | |
County of Escambia, RB, VRDN, 4.45%, 04/01/24(a) | | | | | | | 2,400 | | | | 2,400,000 | |
County of St. Lucie Florida Power & Light Co., Refunding RB, VRDN, 3.80%, 04/08/24(a) | | | | | | | 400 | | | | 400,000 | |
Highlands County Health Facilities Development Corp., Refunding RB, VRDN, 3.65%, 04/08/24(a) | | | | | | | 1,950 | | | | 1,950,000 | |
Hillsborough County, RB, TECP, (Wells Fargo Bank NA SBPA), 3.65%, 05/30/24 | | | | | | | 1,000 | | | | 1,000,167 | |
JEA Electric System Revenue, Refunding RB, Series THREE-B-3, VRDN, (Royal Bank of Canada SBPA), 3.60%, 04/08/24(a) | | | | | | | 2,750 | | | | 2,750,000 | |
Orlando Utilities Commission, Refunding RB, Series B, VRDN, (TD Bank NA SBPA), 3.78%, 04/08/24(a) | | | | | | | 1,800 | | | | 1,800,000 | |
Pinellas County Housing Finance Authority, RB, VRDN, (FHLMC LOC), 3.65%, 04/08/24(a) | | | | | | | 1,400 | | | | 1,400,000 | |
| | | | | | | | | | | | |
| | | | | | | | | | | 11,700,167 | |
| | | |
| Georgia — 1.8% | | | | | | | | | |
Private Colleges & Universities Authority, RB, Series B, VRDN, 3.82%, 04/08/24(a) | | | | | | | 2,130 | | | | 2,130,000 | |
| | | | | | | | | | | | |
| | | |
| Illinois — 9.1% | | | | | | | | | |
Illinois Finance Authority | | | | | | | | | | | | |
RB, Series D-2, VRDN, (TD Bank NA LOC), 4.50%, 04/01/24(a) | | | | | | | 2,000 | | | | 2,000,000 | |
Refunding RB, Sub-Series C-1, VRDN, (JPMorgan Chase Bank NA SBPA), 3.57%, 04/08/24(a) | | | | | | | 1,100 | | | | 1,100,000 | |
Illinois Finance Authority Northwestern University, RB, Sub- Series D, VRDN, 3.10%, 04/08/24(a) | | | | | | | 3,300 | | | | 3,300,000 | |
Illinois Finance Authority University of Chicago, Refunding RB, VRDN, 3.95%, 04/08/24(a) | | | | | | | 4,272 | | | | 4,272,000 | |
| | | | | | | | | | | | |
| | | | | | | | | | | 10,672,000 | |
| | | |
| Indiana — 0.6% | | | | | | | | | |
Indiana Finance Authority, RB, VRDN, (Barclays Bank plc LOC), 3.65%, 04/08/24(a) | | | | | | | 750 | | | | 750,000 | |
| | | | | | | | | | | | |
| | | | | | | | | | | | |
| Security | | Par (000) | | | Value | |
| | | |
| Iowa — 1.9% | | | | | | | | | |
Iowa Finance Authority | | | | | | | | | | | | |
RB, Series E, VRDN, (GNMA/FNMA/FHLMC COL), (Fannie Mae LIQ), (Federal Home Loan Bank SBPA), 3.62%, 04/08/24(a) | | | USD | | | | 1,100 | | | $ | 1,100,000 | |
Refunding RB, Series C, VRDN, (JPMorgan Chase Bank NA LOC), 3.50%, 04/08/24(a) | | | | | | | 1,100 | | | | 1,100,000 | |
| | | | | | | | | | | | |
| | | | | | | | | | | 2,200,000 | |
| | | |
| Louisiana — 2.8% | | | | | | | | | |
Louisiana Gasoline & Fuels Tax Revenue, Refunding RB, Series A-1, VRDN, (Toronto-Dominion Bank LOC), 4.50%, 04/01/24(a) | | | | | | | 1,900 | | | | 1,900,000 | |
Louisiana Offshore Terminal Authority, Refunding RB, VRDN, (JPMorgan Chase Bank NA LOC), 3.55%, 04/08/24(a) | | | | | | | 1,415 | | | | 1,415,000 | |
| | | | | | | | | | | | |
| | | | | | | | | | | 3,315,000 | |
| | | |
| Maryland — 0.2% | | | | | | | | | |
Maryland Health & Higher Educational Facilities Authority, Refunding RB, Series A, VRDN, (TD Bank NA LOC), 3.78%, 04/08/24(a) | | | | | | | 200 | | | | 200,000 | |
| | | | | | | | | | | | |
| | | |
| Massachusetts — 2.3% | | | | | | | | | |
City of Somerville, GO, Refunding, BAN, 5.00%, 05/30/24 | | | | | | | 1,000 | | | | 1,002,622 | |
Massachusetts Development Finance Agency, RB, VRDN, (Wells Fargo Bank NA SBPA), 3.64%, 04/08/24(a) | | | | | | | 1,150 | | | | 1,150,000 | |
Town of Plymouth, GO, Refunding, BAN, 5.00%, 06/28/24 | | | | | | | 500 | | | | 501,237 | |
| | | | | | | | | | | | |
| | | | | | | | | | | 2,653,859 | |
| | | |
| Minnesota — 2.1% | | | | | | | | | |
City of Minneapolis, Refunding RB, Series C, VRDN, (Wells Fargo Bank NA LOC), 4.52%, 04/01/24(a) | | | | | | | 1,450 | | | | 1,450,000 | |
County of Hennepin, GO, Refunding, Series B, VRDN, (TD Bank NA SBPA), 3.64%, 04/08/24(a) | | | | | | | 1,080 | | | | 1,080,000 | |
| | | | | | | | | | | | |
| | | | | | | | | | | 2,530,000 | |
| | | |
| Mississippi — 4.2% | | | | | | | | | |
Mississippi Business Finance Corp. | | | | | | | | | | | | |
RB, Series A, VRDN, 4.62%, 04/01/24(a) | | | | | | | 450 | | | | 450,000 | |
RB, Series F, VRDN, 4.62%, 04/01/24(a) | | | | | | | 400 | | | | 400,000 | |
RB, Series G, VRDN, 4.35%, 04/01/24(a) | | | | | | | 2,100 | | | | 2,100,000 | |
Mississippi Development Bank, RB, VRDN, 4.62%, 04/01/24(a) | | | | | | | 2,000 | | | | 2,000,000 | |
| | | | | | | | | | | | |
| | | | | | | | | | | 4,950,000 | |
| | | |
| Nebraska — 2.1% | | | | | | | | | |
Lincoln Nebraska Electric, RB, TECP, (JPMorgan Chase Bank NA SBPA), 3.60%, 06/10/24 | | | | | | | 1,000 | | | | 999,985 | |
Nebraska Investment Finance Authority, RB, Series C, VRDN, (GNMA/FNMA/FHLMC), (Federal Home Loan Bank SBPA), 3.50%, 04/08/24(a) | | | | | | | 525 | | | | 525,000 | |
Omaha Public Power District, GO, TECP, (Bank of America NA SBPA), 3.60%, 07/02/24 | | | | | | | 1,000 | | | | 999,848 | |
| | | | | | | | | | | | |
| | | | | | | | | | | 2,524,833 | |
| | | |
| Nevada — 2.3% | | | | | | | | | |
County of Clark Department of Aviation, Refunding RB, Series D-2B, VRDN, (Sumitomo Mitsui Banking Corp. LOC), 3.63%, 04/08/24(a) | | | | | | | 2,730 | | | | 2,730,000 | |
| | | | | | | | | | | | |
| | | |
| New York — 9.2% | | | | | | | | | |
City of New York | | | | | | | | | | | | |
GO, Series A-4, VRDN, (TD Bank NA SBPA), 4.50%, 04/01/24(a) | | | | | | | 500 | | | | 500,000 | |
GO, Sub-Series B-4, VRDN, (Barclays Bank plc SBPA), 4.45%, 04/01/24(a) | | | | | | | 1,100 | | | | 1,100,000 | |
| | |
SCHEDULES OF INVESTMENTS | | 105 |
| | |
Schedule of Investments (continued) March 31, 2024 | | BATS: Series V Portfolio (Percentages shown are based on Net Assets) |
| | | | | | | | | | | | |
| Security | | Par (000) | | | Value | |
| | | |
| New York (continued) | | | | | | | | | |
City of New York | | | | | | | | | | | | |
GO, Sub-Series F-6, VRDN, (JPMorgan Chase Bank NA SBPA), 4.55%, 04/01/24(a) | | | USD | | | | 1,800 | | | $ | 1,800,000 | |
New York City Housing Development Corp. | | | | | | | | | | | | |
RB, Series A-4, VRDN, (Royal Bank of Canada SBPA), 3.64%, 04/08/24(a) | | | | | | | 2,000 | | | | 2,000,000 | |
RB, VRDN, (Royal Bank of Canada SBPA), 3.60%, 04/08/24(a) | | | | | | | 300 | | | | 300,000 | |
New York City Municipal Water Finance Authority | | | | | | | | | | | | |
RB, Series 2, VRDN, (Barclays Bank plc SBPA), 4.45%, 04/01/24(a) | | | | | | | 1,500 | | | | 1,500,000 | |
Refunding RB, Series 2, VRDN, (Mizuho Bank Ltd. SBPA), 4.57%, 04/01/24(a) | | | | | | | 600 | | | | 600,000 | |
Refunding RB, Series 5, VRDN, (Bank of America NA SBPA), 4.57%, 04/01/24(a) | | | | | | | 300 | | | | 300,000 | |
Refunding RB, Series AA, VRDN, (Bank of America NA SBPA), 4.63%, 04/01/24(a) | | | | | | | 1,800 | | | | 1,800,000 | |
New York State HFA, RB, Series A, VRDN, (Fannie Mae LIQ), 3.62%, 04/08/24(a) | | | | | | | 900 | | | | 900,000 | |
| | | | | | | | | | | | |
| | | | | | | | | | | 10,800,000 | |
| | | |
| North Dakota — 1.2% | | | | | | | | | |
North Dakota Housing Finance Agency, RB, Series E, VRDN, (TD Bank NA SBPA), 3.65%, 04/08/24(a) | | | | | | | 1,360 | | | | 1,360,000 | |
| | | | | | | | | | | | |
| | | |
| Ohio — 7.1% | | | | | | | | | |
Akron Bath Copley Joint Township Hospital District, RB, Series A-R, VRDN, (BMO Harris Bank NA LOC), 3.97%, 04/08/24(a) | | | | | | | 3,300 | | | | 3,300,000 | |
Ohio Higher Educational Facility Commission, Refunding RB, VRDN, (Ohio State Treasurer SBPA), 3.62%, 04/08/24(a) | | | | | | | 1,400 | | | | 1,400,000 | |
Ohio Water Development Authority, RB, TECP, (TD Bank NA SBPA), 3.30%, 05/03/24 | | | | | | | 1,000 | | | | 999,975 | |
Ohio Water Development Authority Water Pollution Control Loan Fund, RB, Series A, VRDN, (TD Bank NA SBPA), 3.55%, 04/08/24(a) | | | | | | | 2,625 | | | | 2,625,000 | |
| | | | | | | | | | | | |
| | | | | | | | | | | 8,324,975 | |
| | | |
| Pennsylvania — 1.6% | | | | | | | | | |
Pennsylvania Turnpike Commission, Refunding RB, VRDN, (TD Bank NA LOC), 3.70%, 04/08/24(a) | | | | | | | 850 | | | | 850,000 | |
Washington County Authority, Refunding RB, Series RF, VRDN, 3.55%, 04/08/24(a) | | | | | | | 1,000 | | | | 1,000,000 | |
| | | | | | | | | | | | |
| | | | | | | | | | | 1,850,000 | |
| | | |
| Rhode Island — 1.8% | | | | | | | | | |
Rhode Island Health & Educational Building Corp., RB, Series A, VRDN, (TD Bank NA SBPA), 3.97%, 04/08/24(a) | | | | | | | 2,100 | | | | 2,100,000 | |
| | | | | | | | | | | | |
| | | |
| South Carolina — 2.1% | | | | | | | | | |
South Carolina Housing Finance & Development Authority, RB, VRDN, (Federal Home Loan Bank LOC), 3.93%, 04/08/24(a) | | | | | | | 1,675 | | | | 1,675,000 | |
South Carolina Jobs EDA, RB, VRDN, (Federal Home Loan Bank LOC), 4.04%, 04/08/24(a) | | | | | | | 800 | | | | 800,000 | |
| | | | | | | | | | | | |
| | | | | | | | | | | 2,475,000 | |
| | | |
| South Dakota — 0.9% | | | | | | | | | |
South Dakota HDA, Refunding RB, Series B, VRDN, (South Dakota HDA SBPA), 3.64%, 04/08/24(a) | | | | | | | 1,025 | | | | 1,025,000 | |
| | | | | | | | | | | | |
| | | | | | | | | | | | |
| Security | | Par (000) | | | Value | |
| | | |
| Tennessee — 1.0% | | | | | | | | | |
Metropolitan Government Nashville & Davidson County, RB, TECP, (TD Bank NA LOC), 3.55%, 04/17/24 | | | USD | | | | 1,000 | | | $ | 999,942 | |
Public Building Authority of Sevier County (The), RB, VRDN, (County GTD), (Bank of America NA LOC), 3.66%, 04/08/24(a) | | | | | | | 200 | | | | 200,000 | |
| | | | | | | | | | | | |
| | | | | | | | | | | 1,199,942 | |
| | | |
| Texas — 16.0% | | | | | | | | | |
Board of Regents University of Texas, RB, TECP, 3.45%, 09/20/24 | | | | | | | 1,000 | | | | 1,000,217 | |
Bowie County IDC, RB, VRDN, (JPMorgan Chase Bank NA LOC), 4.56%, 04/01/24(a) | | | | | | | 500 | | | | 500,000 | |
City of Houston Combined Utility System Revenue, Refunding RB, Series C, VRDN, (Barclays Bank plc LOC), 3.97%, 04/08/24(a) | | | | | | | 3,445 | | | | 3,445,000 | |
Lower Neches Valley Authority Industrial Development Corp., RB, VRDN, 4.62%, 04/01/24(a) | | | | | | | 1,000 | | | | 1,000,000 | |
Permanent University Fund | | | | | | | | | | | | |
RB, Series A, VRDN, (University of Texas Investment Management Co. LIQ), 3.95%, 04/08/24(a) | | | | | | | 3,200 | | | | 3,200,000 | |
RB, TECP, (University of Texas Investment Management Co. LIQ), 3.60%, 07/11/24 | | | | | | | 1,000 | | | | 999,980 | |
Port of Port Arthur Navigation District, Refunding RB, VRDN, 3.60%, 04/08/24(a) | | | | | | | 2,700 | | | | 2,700,000 | |
Red River Education Finance Corp., RB, VRDN, (TD Bank NA SBPA), 3.60%, 04/08/24(a) | | | | | | | 1,000 | | | | 1,000,000 | |
State of Texas | | | | | | | | | | | | |
GO, Series B, VRDN, (Federal Home Loan Bank SBPA), 3.55%, 04/08/24(a) | | | | | | | 1,005 | | | | 1,005,000 | |
GO, VRDN, (Federal Home Loan Bank SBPA), 3.55%, 04/08/24(a) | | | | | | | 2,410 | | | | 2,410,000 | |
GO, VRDN, (Sumitomo Mitsui Banking Corp. LOC), 3.75%, 04/08/24(a) | | | | | | | 1,000 | | | | 1,000,000 | |
University of Texas, RB, TECP, 3.48%, 10/18/24 | | | | | | | 500 | | | | 500,268 | |
| | | | | | | | | | | | |
| | | | | | | | | | | 18,760,465 | |
| | | |
| Utah — 3.2% | | | | | | | | | |
City of Murray, RB, Series A, VRDN, 3.65%, 04/08/24(a) | | | | | | | 1,800 | | | | 1,800,000 | |
County of Utah, RB, Series E, VRDN, (JPMorgan Chase Bank NA SBPA), 3.60%, 04/08/24(a) | | | | | | | 2,000 | | | | 2,000,000 | |
| | | | | | | | | | | | |
| | | | | | | | | | | 3,800,000 | |
| | | |
| Virginia — 1.9% | | | | | | | | | |
Fairfax County IDA, Refunding RB, VRDN, 3.68%, 04/08/24(a) | | | | | | | 940 | | | | 940,000 | |
Loudoun County EDA, RB, Series B, VRDN, 3.79%, 04/08/24(a) | | | | | | | 1,295 | | | | 1,295,000 | |
| | | | | | | | | | | | |
| | | | | | | | | | | 2,235,000 | |
| | | |
| Washington — 1.3% | | | | | | | | | |
Washington Housing Finance Commission, Refunding RB, Series VR, VRDN, (Royal Bank of Canada SBPA), 3.62%, 04/08/24(a) | | | | | | | 1,500 | | | | 1,500,000 | |
| | | | | | | | | | | | |
| | | |
| Wisconsin — 5.5% | | | | | | | | | |
Public Finance Authority, Refunding RB, Series B, VRDN, (TD Bank NA LOC), 4.40%, 04/01/24(a) | | | | | | | 2,600 | | | | 2,600,000 | |
University of Wisconsin Hospitals & Clinics Authority, Refunding RB, Series C, VRDN, (BMO Harris Bank NA SBPA), 4.45%, 04/01/24(a) | | | | | | | 300 | | | | 300,000 | |
Wisconsin Housing & EDA RB, Series C, VRDN, (Federal Home Loan Bank SBPA), 3.70%, 04/08/24(a) | | | | | | | 1,700 | | | | 1,700,000 | |
| | |
| 106 | | 2 0 2 4 BLACK ROCK ANNUAL REPORT TO SHAREHOLDERS |
| | |
Schedule of Investments (continued) March 31, 2024 | | BATS: Series V Portfolio (Percentages shown are based on Net Assets) |
| | | | | | | | | | | | |
| Security | | Par (000) | | | Value | |
| | | |
| Wisconsin (continued) | | | | | | | | | |
Wisconsin Housing & EDA | | | | | | | | | | | | |
RB, Series C, VRDN, (FNMA COL), (Royal Bank of Canada SBPA), 3.62%, 04/08/24(a) | | | USD | | | | 1,390 | | | $ | 1,390,000 | |
RB, Series D, VRDN, (FNMA COL), (Royal Bank of Canada SBPA), 3.62%, 04/08/24(a) | | | | | | | 450 | | | | 450,000 | |
| | | | | | | | | | | | |
| | | |
| | | | | | | | | | | 6,440,000 | |
| | | | | | | | | | | | |
Total Investments — 99.5% | | | | | | | | | | | | |
(Cost: $116,960,750) | | | | | | | | | | | 116,961,241 | |
Other Assets Less Liabilities — 0.5% | | | | | | | | 555,332 | |
| | | | | | | | | | | | |
Net Assets — 100.0% | | | | | | | | | | $ | 117,516,573 | |
| | | | | | | | | | | | |
| | (a) | Variable rate security. Rate as of period end and maturity is the date the principal owed can be recovered through demand. | |
Fair Value Hierarchy as of Period End
Various inputs are used in determining the fair value of financial instruments. For a description of the input levels and information about the Fund’s policy regarding valuation of financial instruments, refer to the Notes to Financial Statements.
The following table summarizes the Fund’s financial instruments categorized in the fair value hierarchy. The breakdown of the Fund’s financial instruments into major categories is disclosed in the Schedule of Investments above.
| | | | | | | | | | | | | | | | |
| | | | | |
| | | Level 1 | | | Level 2 | | | Level 3 | | | Total | |
| | | | |
Assets | | | | | | | | | | | | | | | | |
Investments | | | | | | | | | | | | | | | | |
Short-Term Securities | | | | | | | | | | | | | | | | |
Municipal Bonds | | $ | — | | | $ | 116,961,241 | | | $ | — | | | $ | 116,961,241 | |
| | | | | | | | | | | | | | | | |
See notes to financial statements.
| | |
SCHEDULES OF INVESTMENTS | | 107 |
Statements of Assets and Liabilities
March 31, 2024
| | | | | | | | | | | | |
| | | BATS:
Series A Portfolio | | | BATS:
Series C Portfolio | | | BATS:
Series E Portfolio | |
| | | |
ASSETS | | | | | | | | | | | | |
Investments, at value — unaffiliated(a) | | $ | 2,587,902,285 | | | $ | 421,423,804 | | | $ | 414,550,831 | |
Cash | | | 1,386,923 | | | | 844,256 | | | | 494,473 | |
Cash pledged: | | | | | | | | | | | | |
Collateral — OTC derivatives | | | 900,000 | | | | — | | | | — | |
Futures contracts | | | — | | | | 1,040,000 | | | | — | |
Centrally cleared swaps | | | — | | | | 1,051,000 | | | | — | |
Receivables: | | | | | | | | | | | | |
Investments sold | | | — | | | | 1,471,328 | | | | 1,857,029 | |
TBA sale commitments | | | 21,864,982 | | | | — | | | | — | |
Capital shares sold | | | 117,688 | | | | 515,994 | | | | 579,487 | |
Dividends — unaffiliated | | | 526,442 | | | | 33,007 | | | | 160,443 | |
Interest — unaffiliated | | | 13,979,536 | | | | 4,640,178 | | | | 4,710,456 | |
From the Manager | | | 154,838 | | | | 131,653 | | | | 44,184 | |
Principal paydowns | | | 24,075 | | | | — | | | | — | |
Swap premiums paid | | | 9,434 | | | | 155,376 | | | | — | |
Unrealized appreciation on: | | | | | | | | | | | | |
Forward foreign currency exchange contracts | | | 133,705 | | | | — | | | | — | |
OTC swaps | | | 22,764 | | | | 46,257 | | | | — | |
Unfunded commitments | | | — | | | | — | | | | 3,445,231 | |
Prepaid expenses | | | 27,922 | | | | 18,698 | | | | 116,601 | |
| | | | | | | | | | | | |
| | | |
Total assets | | | 2,627,050,594 | | | | 431,371,551 | | | | 425,958,735 | |
| | | | | | | | | | | | |
| | | |
LIABILITIES | | | | | | | | | | | | |
Cash received: | | | | | | | | | | | | |
Collateral — OTC derivatives | | | — | | | | 730,000 | | | | — | |
TBA sale commitments at value(d) | | | 21,918,670 | | | | — | | | | — | |
Payables: | | | | | | | | | | | | |
Investments purchased | | | 97,569,538 | | | | 4,280,094 | | | | 4,839,993 | |
Accounting services fees | | | 24,551 | | | | 9,393 | | | | 9,213 | |
Capital shares redeemed | | | 254,958 | | | | 474,623 | | | | 289,001 | |
Income dividend distributions | | | 12,621,234 | | | | 1,798,159 | | | | 1,507,181 | |
Interest expense and fees | | | — | | | | — | | | | 83,547 | |
Trustees’ and Officer’s fees | | | 5,764 | | | | 989 | | | | 666 | |
Other accrued expenses | | | 43,248 | | | | 44,112 | | | | 30,706 | |
Printing and postage fees | | | 10,817 | | | | 8,200 | | | | 8,253 | |
Professional fees | | | 65,206 | | | | 64,888 | | | | 62,745 | |
Registration fees | | | — | | | | 101,318 | | | | 2,099 | |
Variation margin on centrally cleared swaps | | | — | | | | 34,735 | | | | — | |
Swap premiums received | | | 210,356 | | | | 202,471 | | | | — | |
Unrealized depreciation on OTC swaps | | | 286,024 | | | | 25,529 | | | | — | |
| | | | | | | | | | | | |
| | | |
Total accrued liabilities | | | 133,010,366 | | | | 7,774,511 | | | | 6,833,404 | |
| | | | | | | | | | | | |
| | | |
Other Liabilities | | | | | | | | | | | | |
TOB Trust Certificates | | | — | | | | — | | | | 6,647,000 | |
| | | | | | | | | | | | |
| | | |
Total other liabilities | | | — | | | | — | | | | 6,647,000 | |
| | | | | | | | | | | | |
| | | |
Total liabilities | | | 133,010,366 | | | | 7,774,511 | | | | 13,480,404 | |
| | | | | | | | | | | | |
Commitments and contingent liabilities | | | | | | | | | | | | |
| | | |
NET ASSETS | | $ | 2,494,040,228 | | | $ | 423,597,040 | | | $ | 412,478,331 | |
| | | | | | | | | | | | |
| | | |
NET ASSETS CONSIST OF: | | | | | | | | | | | | |
Paid-in capital | | $ | 2,680,324,152 | | | $ | 489,928,127 | | | $ | 441,326,892 | |
Accumulated loss | | | (186,283,924 | ) | | | (66,331,087 | ) | | | (28,848,561 | ) |
| | | | | | | | | | | | |
| | | |
NET ASSETS | | $ | 2,494,040,228 | | | $ | 423,597,040 | | | $ | 412,478,331 | |
| | | | | | | | | | | | |
| | |
| 108 | | 2 0 2 4 BLACK ROCK ANNUAL REPORT TO SHAREHOLDERS |
Statements of Assets and Liabilities (continued)
March 31, 2024
| | | | | | | | | | | | |
| | | BATS:
Series A Portfolio | | | BATS:
Series C Portfolio | | | BATS:
Series E Portfolio | |
| | | |
NET ASSET VALUE | | | | | | | | | | | | |
Shares outstanding | | | 265,471,558 | | | | 46,780,567 | | | | 40,657,220 | |
| | | | | | | | | | | | |
| | | |
Net asset value | | $ | 9.39 | | | $ | 9.05 | | | $ | 10.15 | |
| | | | | | | | | | | | |
| | | |
Shares authorized | | | Unlimited | | | | Unlimited | | | | Unlimited | |
| | | | | | | | | | | | |
| | | |
Par value | | $ | 0.001 | | | $ | 0.001 | | | $ | 0.001 | |
| | | | | | | | | | | | |
| | | |
(a) Investments, at cost — unaffiliated | | $ | 2,711,699,827 | | | $ | 432,294,344 | | | $ | 432,420,908 | |
(d) Proceeds from TBA sale commitments | | $ | 21,864,982 | | | $ | — | | | $ | — | |
See notes to financial statements.
Statements of Assets and Liabilities (continued)
March 31, 2024
| | | | | | | | | | | | |
| | | BATS:
Series M Portfolio | | | BATS:
Series P Portfolio | | | BATS:
Series S Portfolio | |
| | | |
ASSETS | | | | | | | | | | | | |
Investments, at value — unaffiliated(a) | | $ | 1,428,569,532 | | | $ | — | | | $ | 396,094,508 | |
Investments, at value — affiliated(b) | | | — | | | | 1,348,560 | | | | — | |
Cash | | | 1,697,178 | | | | 4,161,307 | | | | 328,168 | |
Cash pledged: | | | | | | | | | | | | |
Collateral — OTC derivatives | | | 760,000 | | | | — | | | | — | |
Futures contracts | | | 1,306,000 | | | | 140,190 | | | | 1,407,000 | |
Centrally cleared swaps | | | 1,000 | | | | 3,000 | | | | 251,000 | |
Foreign currency, at value(c) | | | — | | | | — | | | | 151,742 | |
Receivables: | | | | | | | | | | | | |
Investments sold | | | 21,643,052 | | | | — | | | | 3,086,376 | |
TBA sale commitments | | | 162,731,894 | | | | — | | | | 3,927,672 | |
Capital shares sold | | | 1,304,390 | | | | — | | | | 674,439 | |
Dividends — unaffiliated | | | 31,442 | | | | — | | | | 56,052 | |
Dividends — affiliated | | | — | | | | 5,326 | | | | — | |
Interest — unaffiliated | | | 3,885,575 | | | | — | | | | 1,863,599 | |
From the Manager | | | 152,454 | | | | 36,115 | | | | 164,737 | |
Principal paydowns | | | — | | | | — | | | | 2,916 | |
Swap premiums paid | | | 359,562 | | | | — | | | | — | |
Unrealized appreciation on: | | | | | | | | | | | | |
Forward foreign currency exchange contracts | | | — | | | | — | | | | 43,791 | |
OTC swaps | | | 1,174,505 | | | | — | | | | — | |
Prepaid expenses | | | 30,570 | | | | 9,662 | | | | 16,949 | |
| | | | | | | | | | | | |
| | | |
Total assets | | | 1,623,647,154 | | | | 5,704,160 | | | | 408,068,949 | |
| | | | | | | | | | | | |
| | | |
LIABILITIES | | | | | | | | | | | | |
Cash received: | | | | | | | | | | | | |
Collateral — OTC derivatives | | | 820,000 | | | | — | | | | — | |
Collateral — TBA commitments | | | 736 | | | | — | | | | — | |
TBA sale commitments at value(d) | | | 162,982,408 | | | | — | | | | 3,904,112 | |
Payables: | | | | | | | | | | | | |
Investments purchased | | | 305,491,879 | | | | — | | | | 9,140,766 | |
Accounting services fees | | | 15,557 | | | | 5,545 | | | | 9,177 | |
Capital shares redeemed | | | 2,160,501 | | | | — | | | | 1,249,624 | |
Income dividend distributions | | | 3,880,983 | | | | — | | | | 1,535,045 | |
Trustees’ and Officer’s fees | | | 2,745 | | | | 137 | | | | 1,068 | |
Other accrued expenses | | | 52,166 | | | | 6,601 | | | | 38,936 | |
Printing and postage fees | | | 7,936 | | | | 7,998 | | | | 8,204 | |
Professional fees | | | 56,252 | | | | 44,500 | | | | 60,964 | |
Registration fees | | | 258,427 | | | | 5,441 | | | | 186,767 | |
Variation margin on centrally cleared swaps | | | 28 | | | | 113 | | | | 1,157 | |
Swap premiums received | | | 535,149 | | | | — | | | | — | |
Unrealized depreciation on OTC swaps | | | 998,918 | | | | — | | | | — | |
| | | | | | | | | | | | |
| | | |
Total liabilities | | | 477,263,685 | | | | 70,335 | | | | 16,135,820 | |
| | | | | | | | | | | | |
| | | |
Commitments and contingent liabilities | | | | | | | | | | | | |
| | | |
NET ASSETS | | $ | 1,146,383,469 | | | $ | 5,633,825 | | | $ | 391,933,129 | |
| | | | | | | | | | | | |
| | | |
NET ASSETS CONSIST OF: | | | | | | | | | | | | |
Paid-in capital | | $ | 1,340,694,668 | | | $ | 30,991,247 | | | $ | 421,515,551 | |
Accumulated loss | | | (194,311,199 | ) | | | (25,357,422 | ) | | | (29,582,422 | ) |
| | | | | | | | | | | | |
| | | |
NET ASSETS | | $ | 1,146,383,469 | | | $ | 5,633,825 | | | $ | 391,933,129 | |
| | | | | | | | | | | | |
| | |
| 110 | | 2 0 2 4 BLACK ROCK ANNUAL REPORT TO SHAREHOLDERS |
Statements of Assets and Liabilities (continued)
March 31, 2024
| | | | | | | | | | | | |
| | | BATS:
Series M Portfolio | | | BATS:
Series P Portfolio | | | BATS:
Series S Portfolio | |
| | | |
NET ASSET VALUE | | | | | | | | | | | | |
Shares outstanding | | | 138,482,026 | | | | 541,772 | | | | 43,099,774 | |
| | | | | | | | | | | | |
| | | |
Net asset value | | $ | 8.28 | | | $ | 10.40 | | | $ | 9.09 | |
| | | | | | | | | | | | |
| | | |
Shares authorized | | | Unlimited | | | | Unlimited | | | | Unlimited | |
| | | | | | | | | | | | |
| | | |
Par value | | $ | 0.001 | | | $ | 0.001 | | | $ | 0.001 | |
| | | | | | | | | | | | |
| | | |
(a) Investments, at cost — unaffiliated | | $ | 1,515,827,366 | | | $ | — | | | $ | 401,473,435 | |
(b) Investments, at cost — affiliated | | $ | — | | | $ | 1,373,919 | | | $ | — | |
(c) Foreign currency, at cost | | $ | — | | | $ | — | | | $ | 152,859 | |
(d) Proceeds from TBA sale commitments | | $ | 162,731,894 | | | $ | — | | | $ | 3,927,672 | |
See notes to financial statements.
Statements of Assets and Liabilities (continued)
March 31, 2024
| | | | |
| | | BATS:
Series V Portfolio | |
| |
ASSETS | | | | |
Investments, at value — unaffiliated(a) | | $ | 116,961,241 | |
Cash | | | 76,446 | |
Receivables: | | | | |
Capital shares sold | | | 581,651 | |
Interest — unaffiliated | | | 490,891 | |
From the Manager | | | 73,764 | |
Prepaid expenses | | | 28,341 | |
| | | | |
| |
Total assets | | | 118,212,334 | |
| | | | |
| |
LIABILITIES | | | | |
Payables: | | | | |
Accounting services fees | | | 6,917 | |
Capital shares redeemed | | | 278,671 | |
Income dividend distributions | | | 336,232 | |
Trustees’ and Officer’s fees | | | 84 | |
Other accrued expenses | | | 6,020 | |
Printing and postage fees | | | 6,503 | |
Professional fees | | | 61,334 | |
| | | | |
| |
Total liabilities | | | 695,761 | |
| | | | |
| |
Commitments and contingent liabilities | | | | |
| |
NET ASSETS | | $ | 117,516,573 | |
| | | | |
| |
NET ASSETS CONSIST OF: | | | | |
Paid-in capital | | $ | 117,515,626 | |
Accumulated earnings | | | 947 | |
| | | | |
| |
NET ASSETS | | $ | 117,516,573 | |
| | | | |
| |
NET ASSET VALUE | | | | |
| |
Shares outstanding | | | 11,762,359 | |
| | | | |
| |
Net asset value | | $ | 9.99 | |
| | | | |
| |
Shares authorized | | | Unlimited | |
| | | | |
| |
Par value | | $ | 0.001 | |
| | | | |
| |
(a) Investments, at cost — unaffiliated | | $ | 116,960,750 | |
See notes to financial statements.
| | |
| 112 | | 2 0 2 4 BLACK ROCK ANNUAL REPORT TO SHAREHOLDERS |
Statements of Operations
Year Ended March 31, 2024
| | | | | | | | | | | | |
| | | BATS:
Series A Portfolio | | | BATS:
Series C Portfolio | | | BATS:
Series E Portfolio | |
| | | |
INVESTMENT INCOME | | | | | | | | | | | | |
Dividends — unaffiliated | | $ | 8,185,280 | | | $ | 318,895 | | | $ | 1,343,809 | |
Interest — unaffiliated | | | 131,952,734 | | | | 18,126,435 | | | | 15,383,168 | |
Other income | | | 42,589 | | | | 39,395 | | | | 13,463 | |
| | | | | | | | | | | | |
| | | |
Total investment income | | | 140,180,603 | | | | 18,484,725 | | | | 16,740,440 | |
| | | | | | | | | | | | |
| | | |
EXPENSES | | | | | | | | | | | | |
Accounting services | | | 149,438 | | | | 56,230 | | | | 54,029 | |
Professional | | | 103,293 | | | | 83,003 | | | | 146,217 | |
Pricing | | | 69,134 | | | | 67,594 | | | | 64,609 | |
Registration | | | 54,413 | | | | 41,349 | | | | 40,138 | |
Custodian | | | 45,843 | | | | 8,025 | | | | 5,374 | |
Trustees and Officer | | | 39,347 | | | | 7,059 | | | | 6,857 | |
Transfer agent | | | 22,038 | | | | 175,091 | | | | 28,971 | |
Printing and postage | | | 9,133 | | | | 10,045 | | | | 9,535 | |
Miscellaneous | | | 104,752 | | | | 17,822 | | | | 8,882 | |
| | | | | | | | | | | | |
| | | |
Total expenses excluding interest expense and fees | | | 597,391 | | | | 466,218 | | | | 364,612 | |
Interest expense | | | 9,166 | | | | — | | | | 35 | |
Interest expense and fees(a) | | | — | | | | — | | | | 329,633 | |
| | | | | | | | | | | | |
| | | |
Total expenses | | | 606,557 | | | | 466,218 | | | | 694,280 | |
Less: | | | | | | | | | | | | |
Fees waived and/or reimbursed by the Manager | | | (583,178 | ) | | | (453,548 | ) | | | (360,494 | ) |
| | | | | | | | | | | | |
| | | |
Total expenses after fees waived and/or reimbursed | | | 23,379 | | | | 12,670 | | | | 333,786 | |
| | | | | | | | | | | | |
| | | |
Net investment income | | | 140,157,224 | | | | 18,472,055 | | | | 16,406,654 | |
| | | | | | | | | | | | |
| | | |
REALIZED AND UNREALIZED GAIN (LOSS) | | | | | | | | | | | | |
Net realized gain (loss) from: | | | | | | | | | | | | |
Investments — unaffiliated | | | (21,551,017 | ) | | | (21,317,218 | ) | | | (4,028,387 | ) |
Options written | | | — | | | | 383,437 | | | | — | |
Futures contracts | | | — | | | | (242,986 | ) | | | (266,242 | ) |
Forward foreign currency exchange contracts | | | 246,266 | | | | — | | | | — | |
Foreign currency transactions | | | (4,542 | ) | | | (39 | ) | | | — | |
Swaps | | | (9,850 | ) | | | (451,027 | ) | | | — | |
| | | | | | | | | | | | |
| | | |
| | | (21,319,143 | ) | | | (21,627,833 | ) | | | (4,294,629 | ) |
| | | | | | | | | | | | |
Net change in unrealized appreciation (depreciation) on: | | | | | | | | | | | | |
Investments — unaffiliated | | | 68,649,044 | | | | 23,531,177 | | | | 3,577,397 | |
Futures contracts | | | — | | | | (560,239 | ) | | | 266,330 | |
Forward foreign currency exchange contracts | | | 138,356 | | | | — | | | | — | |
Swaps | | | 607,744 | | | | (218,406 | ) | | | — | |
Unfunded floating rate loan interests | | | (17,129 | ) | | | — | | | | — | |
Unfunded commitments | | | — | | | | — | | | | 3,445,231 | |
| | | | | | | | | | | | |
| | | |
| | | 69,378,015 | | | | 22,752,532 | | | | 7,288,958 | |
| | | | | | | | | | | | |
| | | |
Net realized and unrealized gain | | | 48,058,872 | | | | 1,124,699 | | | | 2,994,329 | |
| | | | | | | | | | | | |
| | | |
NET INCREASE IN NET ASSETS RESULTING FROM OPERATIONS | | $ | 188,216,096 | | | $ | 19,596,754 | | | $ | 19,400,983 | |
| | | | | | | | | | | | |
| (a) | Related to TOB Trusts. |
See notes to financial statements.
Statements of Operations (continued)
Year Ended March 31, 2024
| | | | | | | | | | | | |
| | | BATS:
Series M Portfolio | | | BATS:
Series P Portfolio | | | BATS:
Series S Portfolio | |
| | | |
INVESTMENT INCOME | | | | | | | | | | | | |
Dividends — unaffiliated | | $ | 395,910 | | | $ | 231,769 | | | $ | 241,642 | |
Dividends — affiliated | | | — | | | | 201,632 | | | | — | |
Interest — unaffiliated | | | 45,236,297 | | | | — | | | | 16,321,498 | |
Other income | | | 55,378 | | | | 75,093 | | | | 86,359 | |
| | | | | | | | | | | | |
| | | |
Total investment income | | | 45,687,585 | | | | 508,494 | | | | 16,649,499 | |
| | | | | | | | | | | | |
| | | |
EXPENSES | | | | | | | | | | | | |
Transfer agent | | | 183,904 | | | | 14,311 | | | | 183,100 | |
Accounting services | | | 93,562 | | | | 34,268 | | | | 56,244 | |
Custodian | | | 74,335 | | | | 3,382 | | | | 29,169 | |
Professional | | | 71,432 | | | | 56,543 | | | | 76,220 | |
Pricing | | | 71,341 | | | | 26 | | | | 51,408 | |
Registration | | | 60,041 | | | | 24,211 | | | | 87,075 | |
Trustees and Officer | | | 20,189 | | | | 1,465 | | | | 8,248 | |
Printing and postage | | | 8,816 | | | | 8,320 | | | | 7,968 | |
Miscellaneous | | | 54,077 | | | | 2,994 | | | | 35,146 | |
| | | | | | | | | | | | |
| | | |
Total expenses excluding interest expense | | | 637,697 | | | | 145,520 | | | | 534,578 | |
Interest expense | | | 2 | | | | — | | | | 16 | |
| | | | | | | | | | | | |
| | | |
Total expenses | | | 637,699 | | | | 145,520 | | | | 534,594 | |
Less: | | | | | | | | | | | | |
Fees waived and/or reimbursed by the Manager | | | (621,705 | ) | | | (143,062 | ) | | | (520,919 | ) |
| | | | | | | | | | | | |
| | | |
Total expenses after fees waived and/or reimbursed | | | 15,994 | | | | 2,458 | | | | 13,675 | |
| | | | | | | | | | | | |
| | | |
Net investment income | | | 45,671,591 | | | | 506,036 | | | | 16,635,824 | |
| | | | | | | | | | | | |
| | | |
REALIZED AND UNREALIZED GAIN (LOSS) | | | | | | | | | | | | |
Net realized loss from: | | | | | | | | | | | | |
Investments — unaffiliated | | | (15,200,752 | ) | | | — | | | | (3,500,819 | ) |
Investments — affiliated | | | — | | | | (336,866 | ) | | | — | |
Futures contracts | | | (1,138,373 | ) | | | 397,910 | | | | 198,411 | |
Forward foreign currency exchange contracts | | | — | | | | — | | | | 16,753 | |
Foreign currency transactions | | | — | | | | — | | | | 76,261 | |
Swaps | | | (141,108 | ) | | | 660 | | | | (218,495 | ) |
| | | | | | | | | | | | |
| | | |
| | | (16,480,233 | ) | | | 61,704 | | | | (3,427,889 | ) |
| | | | | | | | | | | | |
Net change in unrealized appreciation (depreciation) on: | | | | | | | | | | | | |
Investments — unaffiliated | | | (5,823,728 | ) | | | — | | | | 6,771,022 | |
Investments — affiliated | | | — | | | | 364,525 | | | | — | |
Futures contracts | | | 303,172 | | | | 923,325 | | | | (750,739 | ) |
Forward foreign currency exchange contracts | | | — | | | | — | | | | 149,430 | |
Foreign currency translations | | | — | | | | (27 | ) | | | (4,555 | ) |
Swaps | | | 349,815 | | | | 720 | | | | 46,507 | |
| | | | | | | | | | | | |
| | | |
| | | (5,170,741 | ) | | | 1,288,543 | | | | 6,211,665 | |
| | | | | | | | | | | | |
| | | |
Net realized and unrealized gain (loss) | | | (21,650,974 | ) | | | 1,350,247 | | | | 2,783,776 | |
| | | | | | | | | | | | |
| | | |
NET INCREASE IN NET ASSETS RESULTING FROM OPERATIONS | | $ | 24,020,617 | | | $ | 1,856,283 | | | $ | 19,419,600 | |
| | | | | | | | | | | | |
See notes to financial statements.
| | |
| 114 | | 2 0 2 4 BLACK ROCK ANNUAL REPORT TO SHAREHOLDERS |
Statements of Operations (continued)
Year Ended March 31, 2024
| | | | |
| | | BATS:
Series V Portfolio | |
| |
INVESTMENT INCOME | | | | |
Interest — unaffiliated | | $ | 2,962,662 | |
Other income | | | 267 | |
| | | | |
| |
Total investment income | | | 2,962,929 | |
| | | | |
| |
EXPENSES | | | | |
Professional | | | 82,431 | |
Accounting services | | | 40,816 | |
Registration | | | 35,792 | |
Transfer agent | | | 17,792 | |
Pricing | | | 9,080 | |
Printing and postage | | | 8,371 | |
Custodian | | | 3,910 | |
Trustees and Officer | | | 3,236 | |
Miscellaneous | | | 17,549 | |
| | | | |
| |
Total expenses excluding interest expense | | | 218,977 | |
Interest expense | | | 1,088 | |
| | | | |
| |
Total expenses | | | 220,065 | |
Less: | | | | |
Fees waived and/or reimbursed by the Manager | | | (216,479 | ) |
| | | | |
| |
Total expenses after fees waived and/or reimbursed | | | 3,586 | |
| | | | |
| |
Net investment income | | | 2,959,343 | |
| | | | |
| |
REALIZED AND UNREALIZED GAIN (LOSS) | | | | |
Net realized gain (loss) from investments | | | — | |
Net change in unrealized appreciation (depreciation) on investments | | | 3,814 | |
| | | | |
| |
Net realized and unrealized gain | | | 3,814 | |
| | | | |
| |
NET INCREASE IN NET ASSETS RESULTING FROM OPERATIONS | | $ | 2,963,157 | |
| | | | |
See notes to financial statements.
Statements of Changes in Net Assets
| | | | | | | | | | | | | | | | |
| | | BATS: Series A Portfolio | | | BATS: Series C Portfolio | |
| | | | | | | | |
| | | | |
| | | Year Ended 03/31/24 | | | Year Ended 03/31/23 | | | Year Ended 03/31/24 | | | Year Ended 03/31/23 | |
| | | | |
INCREASE (DECREASE) IN NET ASSETS | | | | | | | | | | | | | | | | |
| | | | |
OPERATIONS | | | | | | | | | | | | | | | | |
Net investment income | | $ | 140,157,224 | | | $ | 116,315,564 | | | $ | 18,472,055 | | | $ | 13,898,073 | |
Net realized loss | | | (21,319,143 | ) | | | (36,526,036 | ) | | | (21,627,833 | ) | | | (30,835,501 | ) |
Net change in unrealized appreciation (depreciation) | | | 69,378,015 | | | | (93,175,475 | ) | | | 22,752,532 | | | | (9,785,502 | ) |
| | | | | | | | | | | | | | | | |
| | | | |
Net increase (decrease) in net assets resulting from operations | | | 188,216,096 | | | | (13,385,947 | ) | | | 19,596,754 | | | | (26,722,930 | ) |
| | | | | | | | | | | | | | | | |
| | | | |
DISTRIBUTIONS TO SHAREHOLDERS(a) | | | | | | | | | | | | | | | | |
Decrease in net assets resulting from distributions to shareholders | | | (139,801,698 | ) | | | (116,299,178 | ) | | | (18,482,170 | ) | | | (13,928,770 | ) |
| | | | | | | | | | | | | | | | |
| | | | |
CAPITAL SHARE TRANSACTIONS | | | | | | | | | | | | | | | | |
Net increase (decrease) in net assets derived from capital share transactions | | | 22,051,489 | | | | (81,749,602 | ) | | | 43,563,103 | | | | (56,907,191 | ) |
| | | | | | | | | | | | | | | | |
| | | | |
NET ASSETS | | | | | | | | | | | | | | | | |
Total increase (decrease) in net assets | | | 70,465,887 | | | | (211,434,727 | ) | | | 44,677,687 | | | | (97,558,891 | ) |
| | | | |
Beginning of year | | | 2,423,574,341 | | | | 2,635,009,068 | | | | 378,919,353 | | | | 476,478,244 | |
| | | | | | | | | | | | | | | | |
| | | | |
End of year | | $ | 2,494,040,228 | | | $ | 2,423,574,341 | | | $ | 423,597,040 | | | $ | 378,919,353 | |
| | | | | | | | | | | | | | | | |
| (a) | Distributions for annual periods determined in accordance with U.S. federal income tax regulations. |
See notes to financial statements.
| | |
| 116 | | 2 0 2 4 BLACK ROCK ANNUAL REPORT TO SHAREHOLDERS |
Statements of Changes in Net Assets (continued)
| | | | | | | | | | | | | | | | |
| | | BATS: Series E Portfolio | | | BATS: Series M Portfolio | |
| | | | | | | | |
| | | | |
| | | Year Ended
03/31/24 | | | Year Ended
03/31/23 | | | Year Ended
03/31/24 | | | Year Ended
03/31/23 | |
| | | | |
INCREASE (DECREASE) IN NET ASSETS | | | | | | | | | | | | | | | | |
| | | | |
OPERATIONS | | | | | | | | | | | | | | | | |
Net investment income | | $ | 16,406,654 | | | $ | 13,768,461 | | | $ | 45,671,591 | | | $ | 31,605,143 | |
Net realized loss | | | (4,294,629 | ) | | | (8,168,616 | ) | | | (16,480,233 | ) | | | (56,374,807 | ) |
Net change in unrealized appreciation (depreciation) | | | 7,288,958 | | | | (24,924,479 | ) | | | (5,170,741 | ) | | | (27,770,327 | ) |
| | | | | | | | | | | | | | | | |
| | | | |
Net increase (decrease) in net assets resulting from operations | | | 19,400,983 | | | | (19,324,634 | ) | | | 24,020,617 | | | | (52,539,991 | ) |
| | | | | | | | | | | | | | | | |
| | | | |
DISTRIBUTIONS TO SHAREHOLDERS(a) | | | | | | | | | | | | | | | | |
Decrease in net assets resulting from distributions to shareholders | | | (16,206,570 | ) | | | (20,539,863 | ) | | | (44,108,637 | ) | | | (31,852,649 | ) |
| | | | | | | | | | | | | | | | |
| | | | |
CAPITAL SHARE TRANSACTIONS | | | | | | | | | | | | | | | | |
Net increase (decrease) in net assets derived from capital share transactions | | | 66,912,335 | | | | (282,588 | ) | | | 60,573,605 | | | | 64,095,151 | |
| | | | | | | | | | | | | | | | |
| | | | |
NET ASSETS | | | | | | | | | | | | | | | | |
Total increase (decrease) in net assets | | | 70,106,748 | | | | (40,147,085 | ) | | | 40,485,585 | | | | (20,297,489 | ) |
| | | | |
Beginning of year | | | 342,371,583 | | | | 382,518,668 | | | | 1,105,897,884 | | | | 1,126,195,373 | |
| | | | | | | | | | | | | | | | |
| | | | |
End of year | | $ | 412,478,331 | | | $ | 342,371,583 | | | $ | 1,146,383,469 | | | $ | 1,105,897,884 | |
| | | | | | | | | | | | | | | | |
| (a) | Distributions for annual periods determined in accordance with U.S. federal income tax regulations. |
See notes to financial statements.
Statements of Changes in Net Assets (continued)
| | | | | | | | | | | | | | | | |
| | | BATS: Series P Portfolio | | | BATS: Series S Portfolio | |
| | | | | | | | |
| | | | |
| | | Year Ended
03/31/24 | | | Year Ended
03/31/23 | | | Year Ended
03/31/24 | | | Year Ended
03/31/23 | |
| | | | |
INCREASE (DECREASE) IN NET ASSETS | | | | | | | | | | | | | | | | |
| | | | |
OPERATIONS | | | | | | | | | | | | | | | | |
Net investment income | | $ | 506,036 | | | $ | 729,736 | | | $ | 16,635,824 | | | $ | 12,462,833 | |
Net realized gain (loss) | | | 61,704 | | | | 7,184,652 | | | | (3,427,889 | ) | | | (11,552,187 | ) |
Net change in unrealized appreciation (depreciation) | | | 1,288,543 | | | | (2,813,282 | ) | | | 6,211,665 | | | | 1,523,646 | |
| | | | | | | | | | | | | | | | |
| | | | |
Net increase in net assets resulting from operations | | | 1,856,283 | | | | 5,101,106 | | | | 19,419,600 | | | | 2,434,292 | |
| | | | | | | | | | | | | | | | |
| | | | |
DISTRIBUTIONS TO SHAREHOLDERS(a) | | | | | | | | | | | | | | | | |
Decrease in net assets resulting from distributions to shareholders | | | (640,002 | ) | | | (485,022 | ) | | | (17,132,314 | ) | | | (13,672,605 | ) |
| | | | | | | | | | | | | | | | |
| | | | |
CAPITAL SHARE TRANSACTIONS | | | | | | | | | | | | | | | | |
Net increase (decrease) in net assets derived from capital share transactions | | | (22,168,143 | ) | | | (32,601,874 | ) | | | (11,225,214 | ) | | | 3,836,805 | |
| | | | | | | | | | | | | | | | |
| | | | |
NET ASSETS | | | | | | | | | | | | | | | | |
Total decrease in net assets | | | (20,951,862 | ) | | | (27,985,790 | ) | | | (8,937,928 | ) | | | (7,401,508 | ) |
| | | | |
Beginning of year | | | 26,585,687 | | | | 54,571,477 | | | | 400,871,057 | | | | 408,272,565 | |
| | | | | | | | | | | | | | | | |
| | | | |
End of year | | $ | 5,633,825 | | | $ | 26,585,687 | | | $ | 391,933,129 | | | $ | 400,871,057 | |
| | | | | | | | | | | | | | | | |
| (a) | Distributions for annual periods determined in accordance with U.S. federal income tax regulations. |
See notes to financial statements.
| | |
| 118 | | 2 0 2 4 BLACK ROCK ANNUAL REPORT TO SHAREHOLDERS |
Statements of Changes in Net Assets (continued)
| | | | | | | | |
| | | BATS: Series V Portfolio | |
| | | | |
| | |
| | | Year Ended
03/31/24 | | | Year Ended
03/31/23 | |
| | |
INCREASE (DECREASE) IN NET ASSETS | | | | | | | | |
| | |
OPERATIONS | | | | | | | | |
Net investment income | | $ | 2,959,343 | | | $ | 824,129 | |
Net change in unrealized appreciation (depreciation) | | | 3,814 | | | | 3,089 | |
| | | | | | | | |
| | |
Net increase in net assets resulting from operations | | | 2,963,157 | | | | 827,218 | |
| | | | | | | | |
| | |
DISTRIBUTIONS TO SHAREHOLDERS(a) | | | | | | | | |
Decrease in net assets resulting from distributions to shareholders | | | (2,961,031 | ) | | | (821,985 | ) |
| | | | | | | | |
| | |
CAPITAL SHARE TRANSACTIONS | | | | | | | | |
Net increase in net assets derived from capital share transactions | | | 32,075,499 | | | | 75,232,554 | |
| | | | | | | | |
| | |
NET ASSETS | | | | | | | | |
Total increase in net assets | | | 32,077,625 | | | | 75,237,787 | |
| | |
Beginning of year | | | 85,438,948 | | | | 10,201,161 | |
| | | | | | | | |
| | |
End of year | | $ | 117,516,573 | | | $ | 85,438,948 | |
| | | | | | | | |
| (a) | Distributions for annual periods determined in accordance with U.S. federal income tax regulations. |
See notes to financial statements.
Financial Highlights
(For a share outstanding throughout each period)
| | | | | | | | | | | | | | | | | | | | |
| | | BATS: Series A Portfolio | |
| | | | | |
| | | Year Ended
03/31/24 | | | Year Ended
03/31/23 | | | Year Ended
03/31/22 | | | Year Ended
03/31/21 | | | Year Ended
03/31/20 | |
| | | | | |
Net asset value, beginning of year | | $ | 9.19 | | | $ | 9.67 | | | $ | 9.99 | | | $ | 9.05 | | | $ | 9.99 | |
| | | | | | | | | | | | | | | | | | | | |
Net investment income(a) | | | 0.57 | | | | 0.43 | | | | 0.26 | | | | 0.31 | | | | 0.45 | |
Net realized and unrealized gain (loss) | | | 0.20 | | | | (0.48 | ) | | | (0.31 | ) | | | 0.94 | | | | (0.94 | ) |
| | | | | | | | | | | | | | | | | | | | |
| | | | | |
Net increase (decrease) from investment operations | | | 0.77 | | | | (0.05 | ) | | | (0.05 | ) | | | 1.25 | | | | (0.49 | ) |
| | | | | | | | | | | | | | | | | | | | |
Distributions(b) | | | | | | | | | | | | | | | | | | | | |
From net investment income | | | (0.57 | ) | | | (0.42 | ) | | | (0.27 | ) | | | (0.31 | ) | | | (0.45 | ) |
From net realized gain | | | — | | | | (0.01 | ) | | | — | | | | — | | | | — | |
| | | | | | | | | | | | | | | | | | | | |
| | | | | |
Total distributions | | | (0.57 | ) | | | (0.43 | ) | | | (0.27 | ) | | | (0.31 | ) | | | (0.45 | ) |
| | | | | | | | | | | | | | | | | | | | |
| | | | | |
Net asset value, end of year | | $ | 9.39 | | | $ | 9.19 | | | $ | 9.67 | | | $ | 9.99 | | | $ | 9.05 | |
| | | | | | | | | | | | | | | | | | | | |
| | | | | |
Total Return(c) | | | | | | | | | | | | | | | | | | | | |
Based on net asset value | | | 8.66 | % | | | (0.42 | )% | | | (0.59 | )% | | | 13.95 | % | | | (5.22 | )% |
| | | | | | | | | | | | | | | | | | | | |
| | | | | |
Ratios to Average Net Assets(d) | | | | | | | | | | | | | | | | | | | | |
Total expenses | | | 0.03 | % | | | 0.02 | % | | | 0.02 | % | | | 0.04 | % | | | 0.05 | % |
| | | | | | | | | | | | | | | | | | | | |
| | | | | |
Total expenses after fees waived and/or reimbursed | | | 0.00 | %(e) | | | 0.00 | %(e) | | | 0.00 | %(e) | | | 0.00 | %(e) | | | 0.00 | %(e) |
| | | | | | | | | | | | | | | | | | | | |
| | | | | |
Net investment income | | | 6.18 | % | | | 4.65 | % | | | 2.64 | % | | | 3.20 | % | | | 4.45 | % |
| | | | | | | | | | | | | | | | | | | | |
| | | | | |
Supplemental Data | | | | | | | | | | | | | | | | | | | | |
Net assets, end of year (000) | | $ | 2,494,040 | | | $ | 2,423,574 | | | $ | 2,635,009 | | | $ | 1,541,153 | | | $ | 1,035,675 | |
| | | | | | | | | | | | | | | | | | | | |
| | | | | |
Portfolio turnover rate(f) | | | 53 | % | | | 43 | % | | | 45 | % | | | 26 | % | | | 48 | % |
| | | | | | | | | | | | | | | | | | | | |
| (a) | Based on average shares outstanding. |
| (b) | Distributions for annual periods determined in accordance with U.S. federal income tax regulations. |
| (c) | Where applicable, assumes the reinvestment of distributions. |
| (d) | Excludes fees and expenses incurred indirectly as a result of investments in underlying funds. |
| (e) | Amount is less than 0.005%. |
| (f) | Includes mortgage dollar roll transactions (“MDRs”). Additional information regarding portfolio turnover rate is as follows: |
| | | | | | | | | | | | | | | | | | | | |
| | | | | | |
| | | Year Ended
03/31/24 | | | Year Ended
03/31/23 | | | Year Ended
03/31/22 | | | Year Ended
03/31/21 | | | Year Ended
03/31/20 | |
| | | | | |
Portfolio turnover rate (excluding MDRs) | | | 42 | % | | | 30 | % | | | 34 | % | | | 26 | % | | | 48 | % |
| | | | | | | | | | | | | | | | | | | | |
See notes to financial statements.
| | |
| 120 | | 2 0 2 4 BLACK ROCK ANNUAL REPORT TO SHAREHOLDERS |
Financial Highlights (continued)
(For a share outstanding throughout each period)
| | | | | | | | | | | | | | | | | | | | |
| | | BATS: Series C Portfolio | |
| | | | | |
| | | Year Ended
03/31/24 | | | Year Ended
03/31/23 | | | Year Ended
03/31/22 | | | Year Ended
03/31/21 | | | Year Ended
03/31/20 | |
| | | | | |
Net asset value, beginning of year | | $ | 9.03 | | | $ | 9.84 | | | $ | 10.69 | | | $ | 10.49 | | | $ | 10.28 | |
| | | | | | | | | | | | | | | | | | | | |
Net investment income(a) | | | 0.41 | | | | 0.32 | | | | 0.28 | | | | 0.33 | | | | 0.38 | |
Net realized and unrealized gain (loss) | | | 0.02 | | | | (0.81 | ) | | | (0.66 | ) | | | 0.60 | | | | 0.27 | |
| | | | | | | | | | | | | | | | | | | | |
Net increase (decrease) from investment operations | | | 0.43 | | | | (0.49 | ) | | | (0.38 | ) | | | 0.93 | | | | 0.65 | |
| | | | | | | | | | | | | | | | | | | | |
| | | | | |
Distributions(b) | | | | | | | | | | | | | | | | | | | | |
From net investment income | | | (0.41 | ) | | | (0.32 | ) | | | (0.29 | ) | | | (0.33 | ) | | | (0.38 | ) |
From net realized gain | | | — | | | | — | | | | (0.18 | ) | | | (0.40 | ) | | | (0.06 | ) |
| | | | | | | | | | | | | | | | | | | | |
| | | | | |
Total distributions | | | (0.41 | ) | | | (0.32 | ) | | | (0.47 | ) | | | (0.73 | ) | | | (0.44 | ) |
| | | | | | | | | | | | | | | | | | | | |
| | | | | |
Net asset value, end of year | | $ | 9.05 | | | $ | 9.03 | | | $ | 9.84 | | | $ | 10.69 | | | $ | 10.49 | |
| | | | | | | | | | | | | | | | | | | | |
| | | | | |
Total Return(c) | | | | | | | | | | | | | | | | | | | | |
Based on net asset value | | | 4.98 | % | | | (4.92 | )% | | | (3.88 | )% | | | 8.70 | % | | | 6.31 | % |
| | | | | | | | | | | | | | | | | | | | |
| | | | | |
Ratios to Average Net Assets(d) | | | | | | | | | | | | | | | | | | | | |
Total expenses | | | 0.12 | % | | | 0.12 | % | | | 0.10 | % | | | 0.09 | % | | | 0.09 | % |
| | | | | | | | | | | | | | | | | | | | |
Total expenses after fees waived and/or reimbursed | | | 0.00 | %(e) | | | 0.00 | %(e) | | | 0.01 | % | | | 0.00 | %(e) | | | 0.00 | %(e) |
| | | | | | | | | | | | | | | | | | | | |
Net investment income | | | 4.66 | % | | | 3.50 | % | | | 2.59 | % | | | 2.96 | % | | | 3.55 | % |
| | | | | | | | | | | | | | | | | | | | |
| | | | | |
Supplemental Data | | | | | | | | | | | | | | | | | | | | |
Net assets, end of year (000) | | $ | 423,597 | | | $ | 378,919 | | | $ | 476,478 | | | $ | 534,926 | | | $ | 464,267 | |
| | | | | | | | | | | | | | | | | | | | |
Portfolio turnover rate | | | 103 | % | | | 47 | % | | | 42 | % | | | 85 | % | | | 83 | % |
| | | | | | | | | | | | | | | | | | | | |
| (a) | Based on average shares outstanding. |
| (b) | Distributions for annual periods determined in accordance with U.S. federal income tax regulations. |
| (c) | Where applicable, assumes the reinvestment of distributions. |
| (d) | Excludes fees and expenses incurred indirectly as a result of investments in underlying funds. |
| (e) | Amount is less than 0.005%. |
See notes to financial statements.
Financial Highlights (continued)
(For a share outstanding throughout each period)
| | | | | | | | | | | | | | | | | | | | |
| | | BATS: Series E Portfolio | |
| | | | | |
| | | Year Ended
03/31/24 | | | Year Ended
03/31/23 | | | Year Ended
03/31/22 | | | Year Ended
03/31/21 | | | Year Ended
03/31/20 | |
| | | | | |
Net asset value, beginning of year | | $ | 10.01 | | | $ | 11.14 | | | $ | 11.75 | | | $ | 10.53 | | | $ | 10.91 | |
| | | | | | | | | | | | | | | | | | | | |
Net investment income(a) | | | 0.46 | | | | 0.43 | | | | 0.46 | | | | 0.45 | | | | 0.43 | |
Net realized and unrealized gain (loss) | | | 0.13 | | | | (0.92 | ) | | | (0.56 | ) | | | 1.22 | | | | (0.37 | ) |
| | | | | | | | | | | | | | | | | | | | |
Net increase (decrease) from investment operations | | | 0.59 | | | | (0.49 | ) | | | (0.10 | ) | | | 1.67 | | | | 0.06 | |
| | | | | | | | | | | | | | | | | | | | |
| | | | | |
Distributions(b) | | | | | | | | | | | | | | | | | | | | |
From net investment income | | | (0.45 | ) | | | (0.46 | ) | | | (0.45 | ) | | | (0.45 | ) | | | (0.44 | ) |
From net realized gain | | | — | | | | (0.18 | ) | | | (0.06 | ) | | | — | | | | — | |
| | | | | | | | | | | | | | | | | | | | |
| | | | | |
Total distributions | | | (0.45 | ) | | | (0.64 | ) | | | (0.51 | ) | | | (0.45 | ) | | | (0.44 | ) |
| | | | | | | | | | | | | | | | | | | | |
| | | | | |
Net asset value, end of year | | $ | 10.15 | | | $ | 10.01 | | | $ | 11.14 | | | $ | 11.75 | | | $ | 10.53 | |
| | | | | | | | | | | | | | | | | | | | |
| | | | | |
Total Return(c) | | | | | | | | | | | | | | | | | | | | |
Based on net asset value | | | 6.18 | % | | | (4.21 | )% | | | (1.07 | )% | | | 16.16 | % | | | 0.33 | % |
| | | | | | | | | | | | | | | | | | | | |
| | | | | |
Ratios to Average Net Assets(d) | | | | | | | | | | | | | | | | | | | | |
Total expenses | | | 0.20 | % | | | 0.26 | % | | | 0.11 | % | | | 0.15 | % | | | 0.18 | % |
| | | | | | | | | | | | | | | | | | | | |
Total expenses after fees waived and/or reimbursed | | | 0.09 | % | | | 0.11 | % | | | 0.03 | % | | | 0.04 | % | | | 0.06 | % |
| | | | | | | | | | | | | | | | | | | | |
Total expenses after fees waived and/or reimbursed and excluding interest expense and fees | | | 0.00 | %(e) | | | 0.00 | %(e) | | | 0.00 | %(e) | | | 0.00 | %(e) | | | 0.00 | %(e) |
| | | | | | | | | | | | | | | | | | | | |
Net investment income | | | 4.66 | % | | | 4.16 | % | | | 3.80 | % | | | 4.06 | % | | | 3.78 | % |
| | | | | | | | | | | | | | | | | | | | |
| | | | | |
Supplemental Data | | | | | | | | | | | | | | | | | | | | |
Net assets, end of year (000) | | $ | 412,478 | | | $ | 342,372 | | | $ | 382,519 | | | $ | 400,615 | | | $ | 313,282 | |
| | | | | | | | | | | | | | | | | | | | |
Borrowings outstanding, end of year (000) | | $ | 6,647 | | | $ | 8,889 | | | $ | 22,111 | | | $ | 18,987 | | | $ | 10,713 | |
| | | | | | | | | | | | | | | | | | | | |
Portfolio turnover rate | | | 19 | % | | | 37 | % | | | 26 | % | | | 31 | % | | | 54 | % |
| | | | | | | | | | | | | | | | | | | | |
| (a) | Based on average shares outstanding. |
| (b) | Distributions for annual periods determined in accordance with U.S. federal income tax regulations. |
| (c) | Where applicable, assumes the reinvestment of distributions. |
| (d) | Excludes fees and expenses incurred indirectly as a result of investments in underlying funds. |
| (e) | Amount is less than 0.005%. |
See notes to financial statements.
| | |
| 122 | | 2 0 2 4 BLACK ROCK ANNUAL REPORT TO SHAREHOLDERS |
Financial Highlights (continued)
(For a share outstanding throughout each period)
| | | | | | | | | | | | | | | | | | | | |
| | | BATS: Series M Portfolio | |
| | | | | |
| | | Year Ended
03/31/24 | | | Year Ended
03/31/23 | | | Year Ended
03/31/22 | | | Year Ended
03/31/21 | | | Year Ended
03/31/20 | |
| | | | | |
Net asset value, beginning of year | | $ | 8.42 | | | $ | 9.11 | | | $ | 9.77 | | | $ | 9.81 | | | $ | 9.59 | |
| | | | | | | | | | | | | | | | | | | | |
Net investment income(a) | | | 0.33 | | | | 0.25 | | | | 0.11 | | | | 0.21 | | | | 0.30 | |
Net realized and unrealized gain (loss) | | | (0.15 | ) | | | (0.68 | ) | | | (0.59 | ) | | | 0.05 | | | | 0.25 | |
| | | | | | | | | | | | | | | | | | | | |
| | | | | |
Net increase (decrease) from investment operations | | | 0.18 | | | | (0.43 | ) | | | (0.48 | ) | | | 0.26 | | | | 0.55 | |
| | | | | | | | | | | | | | | | | | | | |
Distributions from net investment income(b) | | | (0.32 | ) | | | (0.26 | ) | | | (0.18 | ) | | | (0.30 | ) | | | (0.33 | ) |
| | | | | | | | | | | | | | | | | | | | |
| | | | | |
Net asset value, end of year | | $ | 8.28 | | | $ | 8.42 | | | $ | 9.11 | | | $ | 9.77 | | | $ | 9.81 | |
| | | | | | | | | | | | | | | | | | | | |
| | | | | |
Total Return(c) | | | | | | | | | | | | | | | | | | | | |
Based on net asset value | | | 2.19 | % | | | (4.76 | )% | | | (4.98 | )% | | | 2.68 | % | | | 5.86 | % |
| | | | | | | | | | | | | | | | | | | | |
| | | | | |
Ratios to Average Net Assets(d) | | | | | | | | | | | | | | | | | | | | |
Total expenses | | | 0.06 | % | | | 0.06 | % | | | 0.06 | % | | | 0.05 | % | | | 0.06 | % |
| | | | | | | | | | | | | | | | | | | | |
| | | | | |
Total expenses after fees waived and/or reimbursed | | | 0.00 | %(e) | | | 0.00 | %(e) | | | 0.00 | %(e) | | | 0.00 | %(e) | | | 0.00 | %(e) |
| | | | | | | | | | | | | | | | | | | | |
| | | | | |
Net investment income | | | 3.99 | % | | | 2.97 | % | | | 1.11 | % | | | 2.12 | % | | | 3.03 | % |
| | | | | | | | | | | | | | | | | | | | |
| | | | | |
Supplemental Data | | | | | | | | | | | | | | | | | | | | |
Net assets, end of year (000) | | $ | 1,146,383 | | | $ | 1,105,898 | | | $ | 1,126,195 | | | $ | 1,197,167 | | | $ | 1,006,778 | |
| | | | | | | | | | | | | | | | | | | | |
| | | | | |
Portfolio turnover rate(f) | | | 704 | % | | | 873 | % | | | 1,473 | % | | | 1,500 | % | | | 1,316 | % |
| | | | | | | | | | | | | | | | | | | | |
| (a) | Based on average shares outstanding. |
| (b) | Distributions for annual periods determined in accordance with U.S. federal income tax regulations. |
| (c) | Where applicable, assumes the reinvestment of distributions. |
| (d) | Excludes fees and expenses incurred indirectly as a result of investments in underlying funds. |
| (e) | Amount is less than 0.005%. |
| (f) | Includes mortgage dollar roll transactions (“MDRs”). Additional information regarding portfolio turnover rate is as follows: |
| | | | | | | | | | | | | | | | | | | | |
| | | | | | |
| | | Year Ended
03/31/24 | | | Year Ended
03/31/23 | | | Year Ended
03/31/22 | | | Year Ended
03/31/21 | | | Year Ended
03/31/20 | |
| | | | | |
Portfolio turnover rate (excluding MDRs) | | | 420 | % | | | 521 | % | | | 665 | % | | | 896 | % | | | 813 | % |
| | | | | | | | | | | | | | | | | | | | |
See notes to financial statements.
Financial Highlights (continued)
(For a share outstanding throughout each period)
| | | | | | | | | | | | | | | | | | | | |
| | | BATS: Series P Portfolio | |
| | | | | |
| | | Year Ended
03/31/24 | | | Year Ended
03/31/23 | | | Year Ended
03/31/22 | | | Year Ended
03/31/21 | | | Year Ended
03/31/20 | |
| | | | | |
Net asset value, beginning of year | | $ | 9.75 | | | $ | 8.95 | | | $ | 8.69 | | | $ | 7.92 | | | $ | 9.25 | |
| | | | | | | | | | | | | | | | | | | | |
Net investment income(a) | | | 0.31 | | | | 0.15 | | | | 0.04 | | | | 0.06 | | | | 0.12 | |
Net realized and unrealized gain (loss) | | | 0.78 | | | | 0.76 | | | | 0.22 | | | | 0.71 | | | | (1.33 | ) |
| | | | | | | | | | | | | | | | | | | | |
| | | | | |
Net increase (decrease) from investment operations | | | 1.09 | | | | 0.91 | | | | 0.26 | | | | 0.77 | | | | (1.21 | ) |
| | | | | | | | | | | | | | | | | | | | |
Distributions(b) | | | | | | | | | | | | | | | | | | | | |
From net investment income | | | (0.44 | ) | | | (0.11 | ) | | | — | | | | — | | | | (0.12 | ) |
Return of capital | | | — | | | | — | | | | — | | | | — | | | | (0.00 | )(c) |
| | | | | | | | | | | | | | | | | | | | |
| | | | | |
Total distributions | | | (0.44 | ) | | | (0.11 | ) | | | — | | | | — | | | | (0.12 | ) |
| | | | | | | | | | | | | | | | | | | | |
| | | | | |
Net asset value, end of year | | $ | 10.40 | | | $ | 9.75 | | | $ | 8.95 | | | $ | 8.69 | | | $ | 7.92 | |
| | | | | | | | | | | | | | | | | | | | |
| | | | | |
Total Return(d) | | | | | | | | | | | | | | | | | | | | |
Based on net asset value | | | 11.44 | % | | | 10.14 | % | | | 2.99 | % | | | 9.72 | % | | | (13.25 | )% |
| | | | | | | | | | | | | | | | | | | | |
| | | | | |
Ratios to Average Net Assets(e) | | | | | | | | | | | | | | | | | | | | |
Total expenses | | | 0.88 | % | | | 0.33 | % | | | 0.28 | % | | | 0.46 | % | | | 0.31 | % |
| | | | | | | | | | | | | | | | | | | | |
| | | | | |
Total expenses after fees waived and/or reimbursed | | | 0.01 | % | | | 0.00 | %(f) | | | 0.00 | %(f) | | | 0.00 | %(f) | | | 0.00 | %(f) |
| | | | | | | | | | | | | | | | | | | | |
| | | | | |
Net investment income | | | 3.06 | % | | | 1.55 | % | | | 0.45 | % | | | 0.71 | % | | | 1.33 | % |
| | | | | | | | | | | | | | | | | | | | |
| | | | | |
Supplemental Data | | | | | | | | | | | | | | | | | | | | |
Net assets, end of year (000) | | $ | 5,634 | | | $ | 26,586 | | | $ | 54,571 | | | $ | 53,175 | | | $ | 41,305 | |
| | | | | | | | | | | | | | | | | | | | |
| | | | | |
Portfolio turnover rate | | | 0 | % | | | 9 | % | | | 0 | % | | | 36 | % | | | 15 | % |
| | | | | | | | | | | | | | | | | | | | |
| (a) | Based on average shares outstanding. |
| (b) | Distributions for annual periods determined in accordance with U.S. federal income tax regulations. |
| (c) | Amount is greater than $(0.005) per share. |
| (d) | Where applicable, assumes the reinvestment of distributions. |
| (e) | Excludes fees and expenses incurred indirectly as a result of investments in underlying funds. |
| (f) | Amount is less than 0.005%. |
See notes to financial statements.
| | |
| 124 | | 2 0 2 4 BLACK ROCK ANNUAL REPORT TO SHAREHOLDERS |
Financial Highlights (continued)
(For a share outstanding throughout each period)
| | | | | | | | | | | | | | | | | | | | |
| | | BATS: Series S Portfolio | |
| | | | | |
| | | Year Ended
03/31/24 | | | Year Ended
03/31/23 | | | Year Ended
03/31/22 | | | Year Ended
03/31/21 | | | Year Ended
03/31/20 | |
| | | | | |
Net asset value, beginning of year | | $ | 9.04 | | | $ | 9.28 | | | $ | 9.73 | | | $ | 9.23 | | | $ | 9.50 | |
| | | | | | | | | | | | | | | | | | | | |
Net investment income(a) | | | 0.38 | | | | 0.27 | | | | 0.14 | | | | 0.18 | | | | 0.27 | |
Net realized and unrealized gain (loss) | | | 0.06 | | | | (0.21 | ) | | | (0.43 | ) | | | 0.54 | | | | (0.23 | ) |
| | | | | | | | | | | | | | | | | | | | |
| | | | | |
Net increase (decrease) from investment operations | | | 0.44 | | | | 0.06 | | | | (0.29 | ) | | | 0.72 | | | | 0.04 | |
| | | | | | | | | | | | | | | | | | | | |
Distributions(b) | | | | | | | | | | | | | | | | | | | | |
From net investment income | | | (0.39 | ) | | | (0.28 | ) | | | (0.16 | ) | | | (0.22 | ) | | | (0.31 | ) |
From net realized gain | | | — | | | | (0.02 | ) | | | — | | | | — | | | | — | |
| | | | | | | | | | | | | | | | | | | | |
| | | | | |
Total distributions | | | (0.39 | ) | | | (0.30 | ) | | | (0.16 | ) | | | (0.22 | ) | | | (0.31 | ) |
| | | | | | | | | | | | | | | | | | | | |
| | | | | |
Net asset value, end of year | | $ | 9.09 | | | $ | 9.04 | | | $ | 9.28 | | | $ | 9.73 | | | $ | 9.23 | |
| | | | | | | | | | | | | | | | | | | | |
| | | | | |
Total Return(c) | | | | | | | | | | | | | | | | | | | | |
Based on net asset value | | | 4.98 | % | | | 0.62 | % | | | (3.02 | )% | | | 7.80 | %(d) | | | 0.34 | % |
| | | | | | | | | | | | | | | | | | | | |
| | | | | |
Ratios to Average Net Assets(e) | | | | | | | | | | | | | | | | | | | | |
Total expenses | | | 0.13 | % | | | 0.10 | % | | | 0.12 | % | | | 0.13 | % | | | 1.14 | % |
| | | | | | | | | | | | | | | | | | | | |
| | | | | |
Total expenses after fees waived and/or reimbursed | | | 0.00 | %(f) | | | 0.00 | %(f) | | | 0.01 | % | | | 0.02 | % | | | 0.99 | % |
| | | | | | | | | | | | | | | | | | | | |
| | | | | |
Total expenses after fees waived and/or reimbursed and excluding interest expense | | | 0.00 | %(f) | | | 0.00 | %(f) | | | 0.01 | % | | | 0.00 | %(f) | | | 0.00 | %(f) |
| | | | | | | | | | | | | | | | | | | | |
| | | | | |
Net investment income | | | 4.19 | % | | | 2.96 | % | | | 1.42 | % | | | 1.89 | % | | | 2.84 | % |
| | | | | | | | | | | | | | | | | | | | |
| | | | | |
Supplemental Data | | | | | | | | | | | | | | | | | | | | |
Net assets, end of year (000) | | $ | 391,933 | | | $ | 400,871 | | | $ | 408,273 | | | $ | 398,906 | | | $ | 146,302 | |
| | | | | | | | | | | | | | | | | | | | |
| | | | | |
Portfolio turnover rate(g) | | | 166 | % | | | 127 | % | | | 68 | % | | | 124 | % | | | 144 | % |
| | | | | | | | | | | | | | | | | | | | |
| (a) | Based on average shares outstanding. |
| (b) | Distributions for annual periods determined in accordance with U.S. federal income tax regulations. |
| (c) | Where applicable, assumes the reinvestment of distributions. |
| (d) | Includes a payment received from an affiliate, which had no impact on the Fund’s total return. |
| (e) | Excludes fees and expenses incurred indirectly as a result of investments in underlying funds. |
| (f) | Amount is less than 0.005%. |
| (g) | Includes MDRs. Additional information regarding portfolio turnover rate is as follows: |
| | | | | | | | | | | | | | | | | | | | |
| | | | | | |
| | | Year Ended
03/31/24 | | | Year Ended
03/31/23 | | | Year Ended
03/31/22 | | | Year Ended
03/31/21 | | | Year Ended
03/31/20 | |
| | | | | |
Portfolio turnover rate (excluding MDRs) | | | 140 | % | | | 106 | % | | | 67 | % | | | 122 | % | | | 101 | % |
| | | | | | | | | | | | | | | | | | | | |
See notes to financial statements.
Financial Highlights (continued)
(For a share outstanding throughout each period)
| | | | | | | | | | | | |
| | | BATS: Series V Portfolio | |
| | | |
| | |
| Year Ended
03/31/24 |
| |
| Year Ended
03/31/23 |
| |
| Period From
05/05/21to 03/31/22 |
(a) |
| | | |
Net asset value, beginning of period | | $ | 9.99 | | | $ | 9.99 | | | $ | 10.00 | |
| | | | | | | | | | | | |
Net investment income(b) | | | 0.34 | | | | 0.22 | | | | 0.01 | |
Net realized and unrealized loss | | | (0.00 | )(c) | | | (0.04 | ) | | | (0.01 | ) |
| | | | | | | | | | | | |
| | | |
Net increase from investment operations | | | 0.34 | | | | 0.18 | | | | 0.00 | |
| | | | | | | | | | | | |
| | | |
Distributions from net investment income(d) | | | (0.34 | ) | | | (0.18 | ) | | | (0.01 | ) |
| | | | | | | | | | | | |
| | | |
Net asset value, end of period | | $ | 9.99 | | | $ | 9.99 | | | $ | 9.99 | |
| | | | | | | | | | | | |
| | | |
Total Return(e) | | | | | | | | | | | | |
Based on net asset value | | | 3.44 | % | | | 1.83 | % | | | 0.01 | %(f) |
| | | | | | | | | | | | |
| | | |
Ratios to Average Net Assets(g) | | | | | | | | | | | | |
Total expenses | | | 0.25 | % | | | 0.52 | % | | | 4.06 | %(h)(i) |
| | | | | | | | | | | | |
| | | |
Total expenses after fees waived and/or reimbursed | | | 0.00 | %(j) | | | 0.00 | %(j) | | | 0.00 | %(h)(j) |
| | | | | | | | | | | | |
| | | |
Net investment income | | | 3.39 | % | | | 2.21 | % | | | 0.13 | %(h) |
| | | | | | | | | | | | |
| | | |
Supplemental Data | | | | | | | | | | | | |
Net assets, end of period (000) | | $ | 117,517 | | | $ | 85,439 | | | $ | 10,201 | |
| | | | | | | | | | | | |
| | | |
Portfolio turnover rate | | | 170 | % | | | 189 | % | | | 283 | % |
| | | | | | | | | | | | |
| (a) | Commencement of operations. |
| (b) | Based on average shares outstanding. |
| (c) | Amount is greater than $(0.005) per share. |
| (d) | Distributions for annual periods determined in accordance with U.S. federal income tax regulations. |
| (e) | Where applicable, assumes the reinvestment of distributions. |
| (g) | Excludes fees and expenses incurred indirectly as a result of investments in underlying funds. |
| (i) | Audit, offering, organization and printing costs were not annualized in the calculation of the expense ratios. If these expenses were annualized, the total expenses would have been 4.35%. |
| (j) | Amount is less than 0.005%. |
See notes to financial statements.
| | |
| 126 | | 2 0 2 4 BLACK ROCK ANNUAL REPORT TO SHAREHOLDERS |
Notes to Financial Statements
BlackRock Allocation Target Shares (the “Trust”) is registered under the Investment Company Act of 1940, as amended (the “1940 Act”), as an open-end management investment company. The Trust is organized as a Delaware statutory trust. The following, each of which is a series of the Trust, are referred to herein collectively as the “Funds” or individually as a “Fund”:
| | | | |
|
| | |
| Fund Name | | Herein Referred To As | | Diversification Classification |
|
| | |
BATS: Series A Portfolio | | Series A | | Diversified |
BATS: Series C Portfolio | | Series C | | Diversified |
BATS: Series E Portfolio | | Series E | | Diversified |
BATS: Series M Portfolio | | Series M | | Diversified |
BATS: Series P Portfolio | | Series P | | Diversified |
BATS: Series S Portfolio | | Series S | | Diversified |
BATS: Series V Portfolio | | Series V | | Diversified |
|
Shares of the Funds are offered to separate account clients of the adviser, BlackRock Advisors, LLC (the “Manager”) or certain of its affiliates. Shares of Series A are also offered to collective trust funds managed by BlackRock Institutional Trust Company, N.A., an affiliate of the Manager, and mutual funds advised by the Manager or its affiliates. Participants in wrap-fee programs pay a single aggregate fee to the program sponsor for all costs and expenses of the wrap-fee programs including investment advice and portfolio execution.
The Funds, together with certain other registered investment companies advised by the Manager or its affiliates, are included in a complex of funds referred to as the BlackRock Fixed-Income Complex.
| 2. | SIGNIFICANT ACCOUNTING POLICIES |
The financial statements are prepared in conformity with accounting principles generally accepted in the United States of America (“U.S. GAAP”), which may require management to make estimates and assumptions that affect the reported amounts of assets and liabilities in the financial statements, disclosure of contingent assets and liabilities at the date of the financial statements and the reported amounts of increases and decreases in net assets from operations during the reporting period. Actual results could differ from those estimates. Each Fund is considered an investment company under U.S. GAAP and follows the accounting and reporting guidance applicable to investment companies. Below is a summary of significant accounting policies:
Investment Transactions and Income Recognition: For financial reporting purposes, investment transactions are recorded on the dates the transactions are executed (the “trade dates”). Realized gains and losses on investment transactions are determined using the specific identification method. Dividend income and capital gain distributions, if any, are recorded on the ex-dividend dates. Non-cash dividends, if any, are recorded on the ex-dividend dates at fair value. Interest income, including amortization and accretion of premiums and discounts on debt securities, is recognized daily on an accrual basis.
Foreign Currency Translation: Each Fund’s books and records are maintained in U.S. dollars. Securities and other assets and liabilities denominated in foreign currencies are translated into U.S. dollars using exchange rates determined as of the close of trading on the New York Stock Exchange (“NYSE”). Purchases and sales of investments are recorded at the rates of exchange prevailing on the respective dates of such transactions. Generally, when the U.S. dollar rises in value against a foreign currency, the investments denominated in that currency will lose value; the opposite effect occurs if the U.S. dollar falls in relative value.
Each Fund does not isolate the effect of fluctuations in foreign exchange rates from the effect of fluctuations in the market prices of investments for financial reporting purposes. Accordingly, the effects of changes in exchange rates on investments are not segregated in the Statements of Operations from the effects of changes in market prices of those investments, but are included as a component of net realized and unrealized gain (loss) from investments. Each Fund reports realized currency gains (losses) on foreign currency related transactions as components of net realized gain (loss) for financial reporting purposes, whereas such components are generally treated as ordinary income for U.S. federal income tax purposes.
Bank Overdraft: Certain Funds had outstanding cash disbursements exceeding deposited cash amounts at the custodian during the reporting period. The Funds are obligated to repay the custodian for any overdraft, including any related costs or expenses, where applicable. For financial reporting purposes, overdraft fees, if any, are included in interest expense in the Statements of Operations.
Collateralization: If required by an exchange or counterparty agreement, the Funds may be required to deliver/deposit cash and/or securities to/with an exchange, or broker-dealer or custodian as collateral for certain investments.
Distributions: Distributions from net investment income are declared daily and paid monthly, except for Series P, which declares and pays dividends at least annually. Distributions of capital gains are recorded on the ex-dividend date and made at least annually. The character and timing of distributions are determined in accordance with U.S. federal income tax regulations, which may differ from U.S. GAAP.
Deferred Compensation Plan: Under the Deferred Compensation Plan (the “Plan”) approved by the Board of Trustees of the Trust (the “Board”), the trustees who are not “interested persons” of the Funds, as defined in the 1940 Act (“Independent Trustees”), may defer a portion of their annual complex-wide compensation. Deferred amounts earn an approximate return as though equivalent dollar amounts had been invested in common shares of certain funds in the BlackRock Fixed-Income Complex selected by the Independent Trustees. This has the same economic effect for the Independent Trustees as if the Independent Trustees had invested the deferred amounts directly in certain funds in the BlackRock Fixed-Income Complex.
| | |
NOTES TO FINANCIAL STATEMENTS | | 127 |
Notes to Financial Statements (continued)
The Plan is not funded and obligations thereunder represent general unsecured claims against the general assets of each Fund, as applicable. Deferred compensation liabilities, if any, are included in the Trustees’ and Officer’s fees payable in the Statements of Assets and Liabilities and will remain as a liability of the Funds until such amounts are distributed in accordance with the Plan. Net appreciation (depreciation) in the value of participants’ deferral accounts is allocated among the participating funds in the BlackRock Fixed Income Complex and reflected as Trustee and Officer expense on the Statements of Operations. The Trustee and Officer expense may be negative as a result of a decrease in value of the deferred accounts.
Offering Costs: Offering costs are amortized over a 12-month period beginning with the commencement of operations of a class of shares.
Indemnifications: In the normal course of business, a Fund enters into contracts that contain a variety of representations that provide general indemnification. A Fund’s maximum exposure under these arrangements is unknown because it involves future potential claims against a Fund, which cannot be predicted with any certainty.
Other: Expenses directly related to a Fund are charged to that Fund. Other operating expenses shared by several funds, including other funds managed by the Manager, are prorated among those funds on the basis of relative net assets or other appropriate methods.
The Funds have an arrangement with their custodian whereby credits are earned on uninvested cash balances. For financial reporting purposes, custodian credits, if any, are included in interest income in the Statements of Operations.
| 3. | INVESTMENT VALUATION AND FAIR VALUE MEASUREMENTS |
Investment Valuation Policies: Each Fund’s investments are valued at fair value (also referred to as “market value” within the financial statements) each day that the Fund is open for business and, for financial reporting purposes, as of the report date. U.S. GAAP defines fair value as the price a fund would receive to sell an asset or pay to transfer a liability in an orderly transaction between market participants at the measurement date. The Board of each Fund has approved the designation of each Fund’s Manager as the valuation designee for each Fund. Each Fund determines the fair values of its financial instruments using various independent dealers or pricing services under the Manager’s policies. If a security’s market price is not readily available or does not otherwise accurately represent the fair value of the security, the security will be valued in accordance with the Manager’s policies and procedures as reflecting fair value. The Manager has formed a committee (the “Valuation Committee”) to develop pricing policies and procedures and to oversee the pricing function for all financial instruments, with assistance from other BlackRock pricing committees.
Fair Value Inputs and Methodologies: The following methods and inputs are used to establish the fair value of each Fund’s assets and liabilities:
| | • | | Fixed-income investments for which market quotations are readily available are generally valued using the last available bid price or current market quotations provided by independent dealers or third-party pricing services. Floating rate loan interests are valued at the mean of the bid prices from one or more independent brokers or dealers as obtained from a third-party pricing service. Pricing services generally value fixed-income securities assuming orderly transactions of an institutional round lot size, but a fund may hold or transact in such securities in smaller, odd lot sizes. Odd lots may trade at lower prices than institutional round lots. The pricing services may use matrix pricing or valuation models that utilize certain inputs and assumptions to derive values, including transaction data (e.g., recent representative bids and offers), market data, credit quality information, perceived market movements, news, and other relevant information. Certain fixed-income securities, including asset-backed and mortgage related securities may be valued based on valuation models that consider the estimated cash flows of each tranche of the entity, establish a benchmark yield and develop an estimated tranche specific spread to the benchmark yield based on the unique attributes of the tranche. The amortized cost method of valuation may be used with respect to debt obligations with sixty days or less remaining to maturity unless the Manager determines such method does not represent fair value. |
| | • | | Investments in open-end U.S. mutual funds (including money market funds) are valued at that day’s published net asset value (“NAV”). |
| | • | | Futures contracts are valued based on that day’s last reported settlement or trade price on the exchange where the contract is traded. |
| | • | | Forward foreign currency exchange contracts are valued at the mean between the bid and ask prices and are determined as of the close of trading on the NYSE based on that day’s prevailing forward exchange rate for the underlying currencies. |
| | • | | Exchange-traded options are valued at the mean between the last bid and ask prices at the close of the options market in which the options trade. An exchange-traded option for which there is no mean price, is valued at the last bid (long positions) or ask (short positions) price. If no bid or ask price is available, the prior day’s price will be used, unless it is determined that the prior day’s price no longer reflects the fair value of the option. Over-the-counter (“OTC”) options and options on swaps (“swaptions”) are valued by an independent pricing service using a mathematical model, which incorporates a number of market data factors, such as the trades and prices of the underlying instruments. |
| | • | | Swap agreements are valued utilizing quotes received daily by independent pricing services or through brokers, which are derived using daily swap curves and models that incorporate a number of market data factors, such as discounted cash flows, trades and values of the underlying reference instruments. |
Generally, trading in foreign instruments is substantially completed each day at various times prior to the close of trading on the NYSE. Each business day, the Funds use current market factors supplied by independent pricing services to value certain foreign instruments (“Systematic Fair Value Price”). The Systematic Fair Value Price is designed to value such foreign securities at fair value as of the close of trading on the NYSE, which follows the close of the local markets.
If events (e.g., market volatility, company announcement or a natural disaster) occur that are expected to materially affect the value of such investment, or in the event that application of these methods of valuation results in a price for an investment that is deemed not to be representative of the market value of such investment, or if a price is not available, the investment will be valued by the Valuation Committee in accordance with the Manager’s policies and procedures as reflecting fair value (“Fair Valued Investments”). The fair valuation approaches that may be used by the Valuation Committee include market approach, income approach and cost approach. Valuation techniques such as discounted cash flow, use of market comparables and matrix pricing are types of valuation approaches and are typically used in determining fair value. When determining the price for Fair Valued Investments, the Valuation Committee seeks to determine the price that each Fund might reasonably expect to receive or pay from the current sale or purchase of that asset or liability in an arm’s-length transaction. Fair value determinations shall be based upon all available factors that the Valuation Committee deems relevant and consistent with the principles of fair value measurement.
| | |
| 128 | | 2 0 2 4 BLACK ROCK ANNUAL REPORT TO SHAREHOLDERS |
Notes to Financial Statements (continued)
For investments in equity or debt issued by privately held companies or funds (“Private Company” or collectively, the “Private Companies”) and other Fair Valued Investments, the fair valuation approaches that are used by the Valuation Committee and third-party pricing services utilized by the Valuation Committee include one or a combination of, but not limited to, the following inputs.
| | | | |
| |
| Standard Inputs Generally Considered By The Valuation Committee And Third-Party Pricing Services |
| | |
| Market approach | | (i) | | recent market transactions, including subsequent rounds of financing, in the underlying investment or comparable issuers; |
| | (ii) | | recapitalizations and other transactions across the capital structure; and |
| | | (iii) | | market multiples of comparable issuers. |
| | |
| Income approach | | (i) | | future cash flows discounted to present and adjusted as appropriate for liquidity, credit, and/or market risks; |
| | (ii) | | quoted prices for similar investments or assets in active markets; and |
| | | (iii) | | other risk factors, such as interest rates, yield curves, volatilities, prepayment speeds, loss severities, credit risks, recovery rates, liquidation amounts and/or default rates. |
| | |
| Cost approach | | (i) | | audited or unaudited financial statements, investor communications and financial or operational metrics issued by the Private Company; |
| | (ii) | | changes in the valuation of relevant indices or publicly traded companies comparable to the Private Company; |
| | (iii) | | relevant news and other public sources; and |
| | | (iv) | | known secondary market transactions in the Private Company’s interests and merger or acquisition activity in companies comparable to the Private Company. |
Investments in series of preferred stock issued by Private Companies are typically valued utilizing market approach in determining the enterprise value of the company. Such investments often contain rights and preferences that differ from other series of preferred and common stock of the same issuer. Enterprise valuation techniques such as an option pricing model (“OPM”), a probability weighted expected return model (“PWERM”), current value method or a hybrid of those techniques are used as deemed appropriate under the circumstances. The use of these valuation techniques involves a determination of the exit scenarios of the investment in order to appropriately allocate the enterprise value of the company among the various parts of its capital structure.
The Private Companies are not subject to the public company disclosure, timing, and reporting standards applicable to other investments held by a Fund. Typically, the most recently available information by a Private Company is as of a date that is earlier than the date a Fund is calculating its NAV. This factor may result in a difference between the value of the investment and the price a Fund could receive upon the sale of the investment.
Fair Value Hierarchy: Various inputs are used in determining the fair value of financial instruments. These inputs to valuation techniques are categorized into a fair value hierarchy consisting of three broad levels for financial reporting purposes as follows:
| | • | | Level 1 – Unadjusted price quotations in active markets/exchanges for identical assets or liabilities that each Fund has the ability to access; |
| | • | | Level 2 – Other observable inputs (including, but not limited to, quoted prices for similar assets or liabilities in markets that are active, quoted prices for identical or similar assets or liabilities in markets that are not active, inputs other than quoted prices that are observable for the assets or liabilities (such as interest rates, yield curves, volatilities, prepayment speeds, loss severities, credit risks and default rates) or other market–corroborated inputs); and |
| | • | | Level 3 – Unobservable inputs based on the best information available in the circumstances, to the extent observable inputs are not available (including the Valuation Committee’s assumptions used in determining the fair value of financial instruments). |
The hierarchy gives the highest priority to unadjusted quoted prices in active markets for identical assets or liabilities (Level 1 measurements) and the lowest priority to unobservable inputs (Level 3 measurements). Accordingly, the degree of judgment exercised in determining fair value is greatest for instruments categorized in Level 3. The inputs used to measure fair value may fall into different levels of the fair value hierarchy. In such cases, for disclosure purposes, the fair value hierarchy classification is determined based on the lowest level input that is significant to the fair value measurement in its entirety. Investments classified within Level 3 have significant unobservable inputs used by the Valuation Committee in determining the price for Fair Valued Investments. Level 3 investments include equity or debt issued by Private Companies that may not have a secondary market and/or may have a limited number of investors. The categorization of a value determined for financial instruments is based on the pricing transparency of the financial instruments and is not necessarily an indication of the risks associated with investing in those securities.
| 4. | SECURITIES AND OTHER INVESTMENTS |
Asset-Backed and Mortgage-Backed Securities: Asset-backed securities are generally issued as pass-through certificates or as debt instruments. Asset-backed securities issued as pass-through certificates represent undivided fractional ownership interests in an underlying pool of assets. Asset-backed securities issued as debt instruments, which are also known as collateralized obligations, are typically issued as the debt of a special purpose entity organized solely for the purpose of owning such assets and issuing such debt. Asset-backed securities are often backed by a pool of assets representing the obligations of a number of different parties. The yield characteristics of certain asset-backed securities may differ from traditional debt securities. One such major difference is that all or a principal part of the obligations may be prepaid at any time because the underlying assets (i.e., loans) may be prepaid at any time. As a result, a decrease in interest rates in the market may result in increases in the level of prepayments as borrowers, particularly mortgagors, refinance and repay their loans. An increased prepayment rate with respect to an asset-backed security will have the effect of shortening the maturity of the security. In addition, a Fund may subsequently have to reinvest the proceeds at lower interest rates. If a Fund has purchased such an asset-backed security at a premium, a faster than anticipated prepayment rate could result in a loss of principal to the extent of the premium paid.
For mortgage pass-through securities (the “Mortgage Assets”) there are a number of important differences among the agencies and instrumentalities of the U.S. Government that issue mortgage-related securities and among the securities that they issue. For example, mortgage-related securities guaranteed by Ginnie Mae are guaranteed as to the timely payment of principal and interest by Ginnie Mae and such guarantee is backed by the full faith and credit of the United States. However, mortgage-related securities
| | |
NOTES TO FINANCIAL STATEMENTS | | 129 |
Notes to Financial Statements (continued)
issued by Freddie Mac and Fannie Mae, including Freddie Mac and Fannie Mae guaranteed mortgage pass-through certificates, which are solely the obligations of Freddie Mac and Fannie Mae, are not backed by or entitled to the full faith and credit of the United States, but are supported by the right of the issuer to borrow from the U.S. Treasury.
Non-agency mortgage-backed securities are securities issued by non-governmental issuers and have no direct or indirect government guarantees of payment and are subject to various risks. Non-agency mortgage loans are obligations of the borrowers thereunder only and are not typically insured or guaranteed by any other person or entity. The ability of a borrower to repay a loan is dependent upon the income or assets of the borrower. A number of factors, including a general economic downturn, acts of God, terrorism, social unrest and civil disturbances, may impair a borrower’s ability to repay its loans.
Collateralized Debt Obligations: Collateralized debt obligations (“CDOs”), including collateralized bond obligations (“CBOs”) and collateralized loan obligations (“CLOs”), are types of asset-backed securities. A CDO is an entity that is backed by a diversified pool of debt securities (CBOs) or syndicated bank loans (CLOs). The cash flows of the CDO can be split into multiple segments, called “tranches,” which will vary in risk profile and yield. The riskiest segment is the subordinated or “equity” tranche. This tranche bears the greatest risk of defaults from the underlying assets in the CDO and serves to protect the other, more senior, tranches from default in all but the most severe circumstances. Since it is shielded from defaults by the more junior tranches, a “senior” tranche will typically have higher credit ratings and lower yields than their underlying securities, and often receive investment grade ratings from one or more of the nationally recognized rating agencies. Despite the protection from the more junior tranches, senior tranches can experience substantial losses due to actual defaults, increased sensitivity to future defaults and the disappearance of one or more protecting tranches as a result of changes in the credit profile of the underlying pool of assets.
Inflation-Indexed Bonds: Inflation-indexed bonds (other than municipal inflation-indexed and certain corporate inflation-indexed bonds) are fixed-income securities whose principal value is periodically adjusted according to the rate of inflation. If the index measuring inflation rises or falls, the principal value of inflation-indexed bonds (other than municipal inflation-indexed and certain corporate inflation-indexed bonds) will be adjusted upward or downward, and consequently the interest payable on these securities (calculated with respect to a larger or smaller principal amount) will be increased or reduced, respectively. Any upward or downward adjustment in the principal amount of an inflation-indexed bond is included as interest income in the Statements of Operations, even though investors do not receive their principal until maturity. Repayment of the original bond principal upon maturity (as adjusted for inflation) is guaranteed in the case of U.S. Treasury inflation-indexed bonds. For bonds that do not provide a similar guarantee, the adjusted principal value of the bond repaid at maturity may be less than the original principal. With regard to municipal inflation-indexed bonds and certain corporate inflation-indexed bonds, the inflation adjustment is typically reflected in the semi-annual coupon payment. As a result, the principal value of municipal inflation-indexed bonds and such corporate inflation-indexed bonds does not adjust according to the rate of inflation.
Multiple Class Pass-Through Securities: Multiple class pass-through securities, including collateralized mortgage obligations (“CMOs”) and commercial mortgage-backed securities, may be issued by Ginnie Mae, U.S. Government agencies or instrumentalities or by trusts formed by private originators of, or investors in, mortgage loans. In general, CMOs are debt obligations of a legal entity that are collateralized by a pool of residential or commercial mortgage loans or Mortgage Assets. The payments on these are used to make payments on the CMOs or multiple pass-through securities. Multiple class pass-through securities represent direct ownership interests in the Mortgage Assets. Classes of CMOs include interest only (“IOs”), principal only (“POs”), planned amortization classes and targeted amortization classes. IOs and POs are stripped mortgage-backed securities representing interests in a pool of mortgages, the cash flow from which has been separated into interest and principal components. IOs receive the interest portion of the cash flow while POs receive the principal portion. IOs and POs can be extremely volatile in response to changes in interest rates. As interest rates rise and fall, the value of IOs tends to move in the same direction as interest rates. POs perform best when prepayments on the underlying mortgages rise since this increases the rate at which the principal is returned and the yield to maturity on the PO. When payments on mortgages underlying a PO are slower than anticipated, the life of the PO is lengthened and the yield to maturity is reduced. If the underlying Mortgage Assets experience greater than anticipated prepayments of principal, a Fund’s initial investment in the IOs may not fully recoup.
Stripped Mortgage-Backed Securities: Stripped mortgage-backed securities are typically issued by the U.S. Government, its agencies and instrumentalities. Stripped mortgage-backed securities are usually structured with two classes that receive different proportions of the interest (IOs) and principal (POs) distributions on a pool of Mortgage Assets. Stripped mortgage-backed securities may be privately issued.
Zero-Coupon Bonds: Zero-coupon bonds are normally issued at a significant discount from face value and do not provide for periodic interest payments. These bonds may experience greater volatility in market value than other debt obligations of similar maturity which provide for regular interest payments.
Capital Securities and Trust Preferred Securities: Capital securities, including trust preferred securities, are typically issued by corporations, generally in the form of interest-bearing notes with preferred securities characteristics. In the case of trust preferred securities, an affiliated business trust of a corporation issues these securities, generally in the form of beneficial interests in subordinated debentures or similarly structured securities. The securities can be structured with either a fixed or adjustable coupon that can have either a perpetual or stated maturity date. For trust preferred securities, the issuing bank or corporation pays interest to the trust, which is then distributed to holders of these securities as a dividend. Dividends can be deferred without creating an event of default or acceleration, although maturity cannot take place unless all cumulative payment obligations have been met. The deferral of payments does not affect the purchase or sale of these securities in the open market. These securities generally are rated below that of the issuing company’s senior debt securities and are freely callable at the issuer’s option.
Preferred Stocks: Preferred stock has a preference over common stock in liquidation (and generally in receiving dividends as well), but is subordinated to the liabilities of the issuer in all respects. As a general rule, the market value of preferred stock with a fixed dividend rate and no conversion element varies inversely with interest rates and perceived credit risk, while the market price of convertible preferred stock generally also reflects some element of conversion value. Because preferred stock is junior to debt securities and other obligations of the issuer, deterioration in the credit quality of the issuer will cause greater changes in the value of a preferred stock than in a more senior debt security with similar stated yield characteristics. Unlike interest payments on debt securities, preferred stock dividends are payable only if declared by the issuer’s board of directors. Preferred stock also may be subject to optional or mandatory redemption provisions.
Floating Rate Loan Interests: Floating rate loan interests are typically issued to companies (the “borrower”) by banks, other financial institutions, or privately and publicly offered corporations (the “lender”). Floating rate loan interests are generally non-investment grade, often involve borrowers whose financial condition is troubled or uncertain and companies that are highly leveraged or in bankruptcy proceedings. In addition, transactions in floating rate loan interests may settle on a delayed basis, which may result
| | |
| 130 | | 2 0 2 4 BLACK ROCK ANNUAL REPORT TO SHAREHOLDERS |
Notes to Financial Statements (continued)
in proceeds from the sale not being readily available for a fund to make additional investments or meet its redemption obligations. Floating rate loan interests may include fully funded term loans or revolving lines of credit. Floating rate loan interests are typically senior in the corporate capital structure of the borrower. Floating rate loan interests generally pay interest at rates that are periodically determined by reference to a base lending rate plus a premium. Since the rates reset only periodically, changes in prevailing interest rates (and particularly sudden and significant changes) can be expected to cause some fluctuations in the NAV of a fund to the extent that it invests in floating rate loan interests. The base lending rates are generally the lending rate offered by one or more European banks, such as the Secured Overnight Financing Rate (“SOFR”), the prime rate offered by one or more U.S. banks or the certificate of deposit rate. Floating rate loan interests may involve foreign borrowers, and investments may be denominated in foreign currencies. These investments are treated as investments in debt securities for purposes of a fund’s investment policies.
When a fund purchases a floating rate loan interest, it may receive a facility fee and when it sells a floating rate loan interest, it may pay a facility fee. On an ongoing basis, a fund may receive a commitment fee based on the undrawn portion of the underlying line of credit amount of a floating rate loan interest. Facility and commitment fees are typically amortized to income over the term of the loan or term of the commitment, respectively. Consent and amendment fees are recorded to income as earned. Prepayment penalty fees, which may be received by a fund upon the prepayment of a floating rate loan interest by a borrower, are recorded as realized gains. A fund may invest in multiple series or tranches of a loan. A different series or tranche may have varying terms and carry different associated risks.
Floating rate loan interests are usually freely callable at the borrower’s option. A fund may invest in such loans in the form of participations in loans (“Participations”) or assignments (“Assignments”) of all or a portion of loans from third parties. Participations typically will result in a fund having a contractual relationship only with the lender, not with the borrower. A fund has the right to receive payments of principal, interest and any fees to which it is entitled only from the lender selling the Participation and only upon receipt by the lender of the payments from the borrower. In connection with purchasing Participations, a fund generally will have no right to enforce compliance by the borrower with the terms of the loan agreement, nor any rights of offset against the borrower. A fund may not benefit directly from any collateral supporting the loan in which it has purchased the Participation. As a result, a fund assumes the credit risk of both the borrower and the lender that is selling the Participation. A fund’s investment in loan participation interests involves the risk of insolvency of the financial intermediaries who are parties to the transactions. In the event of the insolvency of the lender selling the Participation, a fund may be treated as a general creditor of the lender and may not benefit from any offset between the lender and the borrower. Assignments typically result in a fund having a direct contractual relationship with the borrower, and a fund may enforce compliance by the borrower with the terms of the loan agreement.
Forward Commitments, When-Issued and Delayed Delivery Securities: The Funds may purchase securities on a when-issued basis and may purchase or sell securities on a forward commitment basis. Settlement of such transactions normally occurs within a month or more after the purchase or sale commitment is made. The Funds may purchase securities under such conditions with the intention of actually acquiring them but may enter into a separate agreement to sell the securities before the settlement date. Since the value of securities purchased may fluctuate prior to settlement, the Funds may be required to pay more at settlement than the security is worth. In addition, a fund is not entitled to any of the interest earned prior to settlement. When purchasing a security on a delayed delivery basis, the Funds assume the rights and risks of ownership of the security, including the risk of price and yield fluctuations. In the event of default by the counterparty, the Funds’ maximum amount of loss is the unrealized appreciation of unsettled when-issued transactions. These types of securities may be considered unfunded and may obligate the Funds to make future cash payments. An unfunded commitment is marked-to-market and any unrealized appreciation (depreciation) is separately presented in the Statements of Assets and Liabilities and Statements of Operations. As of period end, the Funds had the following unfunded commitments:
| | | | | | | | | | | | | | |
| |
| | | | |
| Fund Name | | Investment Name | | Commitment Amount | | | Value | | | Unrealized Appreciation (Depreciation) | |
| |
| | | | |
Series E | | Puerto Rico Electric Power Authority, Series B-1 | | $ | 2,323,863 | | | $ | 2,774,886 | | | $ | 451,023 | |
Series E | | Puerto Rico Electric Power Authority, Series B-2 | | | 11,249,141 | | | | 14,243,349 | | | | 2,994,208 | |
| | | | | | | | | | | | | | |
| | | | |
| | | | | | | | | | | | $ | 3,445,231 | |
| | | | | | | | | | | | | | |
TBA Commitments: TBA commitments are forward agreements for the purchase or sale of securities, including mortgage-backed securities for a fixed price, with payment and delivery on an agreed upon future settlement date. The specific securities to be delivered are not identified at the trade date. However, delivered securities must meet specified terms, including issuer, rate and mortgage terms. When entering into TBA commitments, a fund may take possession of or deliver the underlying mortgage-backed securities but can extend the settlement or roll the transaction. TBA commitments involve a risk of loss if the value of the security to be purchased or sold declines or increases, respectively, prior to settlement date, if there are expenses or delays in connection with the TBA transactions, or if the counterparty fails to complete the transaction.
In order to better define contractual rights and to secure rights that will help a fund mitigate its counterparty risk, TBA commitments may be entered into by a fund under Master Securities Forward Transaction Agreements (each, an “MSFTA”). An MSFTA typically contains, among other things, collateral posting terms and netting provisions in the event of default and/or termination event. The collateral requirements are typically calculated by netting the mark-to-market amount for each transaction under such agreement and comparing that amount to the value of the collateral currently pledged by a fund and the counterparty. Cash collateral that has been pledged to cover the obligations of a fund and cash collateral received from the counterparty, if any, is reported separately in the Statements of Assets and Liabilities as cash pledged as collateral for TBA commitments or cash received as collateral for TBA commitments, respectively. Non-cash collateral pledged by a fund, if any, is noted in the Schedules of Investments. Typically, a fund is permitted to sell, re-pledge or use the collateral it receives; however, the counterparty is not permitted to do so. To the extent amounts due to a fund are not fully collateralized, contractually or otherwise, a fund bears the risk of loss from counterparty non-performance.
Mortgage Dollar Roll Transactions: Certain Funds may sell TBA mortgage-backed securities and simultaneously contract to repurchase substantially similar (i.e., same type, coupon and maturity) securities on a specific future date at an agreed upon price. During the period between the sale and repurchase, a fund is not entitled to receive interest and principal payments on the securities sold. Mortgage dollar roll transactions are treated as purchases and sales and a fund realizes gains and losses on these transactions. Mortgage dollar rolls involve the risk that the market value of the securities that a fund is required to purchase may decline below the agreed upon repurchase price of those securities.
| | |
NOTES TO FINANCIAL STATEMENTS | | 131 |
Notes to Financial Statements (continued)
Municipal Bonds Transferred to TOB Trusts: Certain Funds leverage their assets through the use of “TOB Trust” transactions. The funds transfer municipal bonds into a special purpose trust (a “TOB Trust”). A TOB Trust issues two classes of beneficial interests: short-term floating rate interests (“TOB Trust Certificates”), which are sold to third-party investors, and residual inverse floating rate interests (“TOB Residuals”), which are issued to the participating funds that contributed the municipal bonds to the TOB Trust. The TOB Trust Certificates have interest rates that reset weekly and their holders have the option to tender such certificates to the TOB Trust for redemption at par and any accrued interest at each reset date. The TOB Residuals held by a fund provide the fund with the right to cause the holders of a proportional share of the TOB Trust Certificates to tender their certificates to the TOB Trust at par plus accrued interest. The funds may withdraw a corresponding share of the municipal bonds from the TOB Trust. Other funds managed by the investment adviser may also contribute municipal bonds to a TOB Trust into which a fund has contributed bonds. If multiple BlackRock-advised funds participate in the same TOB Trust, the economic rights and obligations under the TOB Residuals will be shared among the funds ratably in proportion to their participation in the TOB Trust.
TOB Trusts are supported by a liquidity facility provided by a third-party bank or other financial institution (the “Liquidity Provider”) that allows the holders of the TOB Trust Certificates to tender their certificates in exchange for payment of par plus accrued interest on any business day. The tendered TOB Trust Certificates are remarketed by a Remarketing Agent. In the event of a failed remarketing, the TOB Trust may draw upon a loan from the Liquidity Provider to purchase the tendered TOB Trust Certificates. Any loans made by the Liquidity Provider will be secured by the purchased TOB Trust Certificates held by the TOB Trust and will be subject to an increased interest rate based on number of days the loan is outstanding.
The TOB Trust may be collapsed without the consent of a fund, upon the occurrence of a termination event as defined in the TOB Trust agreement. Upon the occurrence of a termination event, a TOB Trust would be liquidated with the proceeds applied first to any accrued fees owed to the trustee of the TOB Trust, the Remarketing Agent and the Liquidity Provider. Upon certain termination events, TOB Trust Certificates holders will be paid before the TOB Residuals holders (i.e., the Funds) whereas in other termination events, TOB Trust Certificates holders and TOB Residuals holders will be paid pro rata.
While a fund’s investment policies and restrictions expressly permit investments in inverse floating rate securities, such as TOB Residuals, they restrict the ability of a fund to borrow money for purposes of making investments. Each Fund’s transfer of the municipal bonds to a TOB Trust is considered a secured borrowing for financial reporting purposes. The cash received by the TOB Trust from the sale of the TOB Trust Certificates, less certain transaction expenses, is paid to a Fund. A Fund typically invests the cash received in additional municipal bonds.
Accounting for TOB Trusts: The municipal bonds deposited into a TOB Trust are presented in a Fund’s Schedules of Investments and the TOB Trust Certificates are shown in Other Liabilities in the Statements of Assets and Liabilities. Any loans drawn by the TOB Trust pursuant to the liquidity facility to purchase tendered TOB Trust Certificates are shown as Loan for TOB Trust Certificates. The carrying amount of a Fund’s payable to the holder of the TOB Trust Certificates, as reported in the Statements of Assets and Liabilities as TOB Trust Certificates, approximates its fair value.
Interest income, including amortization and accretion of premiums and discounts, from the underlying municipal bonds is recorded by a Fund on an accrual basis. Interest expense incurred on the TOB Trust transaction and other expenses related to remarketing, administration, trustee, liquidity and other services to a TOB Trust are shown as interest expense, fees and amortization of offering costs in the Statements of Operations. Fees paid upon creation of the TOB Trust are recorded as debt issuance costs and are amortized to interest expense, fees and amortization of offering costs in the Statements of Operations to the expected maturity of the TOB Trust. In connection with the restructurings of the TOB Trusts to non-bank sponsored TOB Trusts, a Fund incurred non-recurring, legal and restructuring fees, which are recorded as interest expense, fees and amortization of offering costs in the Statements of Operations. Amounts recorded within interest expense, fees and amortization of offering costs in the Statements of Operations are:
| | | | | | | | | | | | | | | | |
| |
| | | | |
| Fund Name | | Interest Expense | | | Liquidity Fees | | | Other Expenses | | | Total | |
| |
| | | | |
Series E | | $ | 295,315 | | | $ | 25,785 | | | $ | 8,533 | | | $ | 329,633 | |
| |
For the year ended March 31, 2024, the following table is a summary of each Fund’s TOB Trusts:
| | | | | | | | | | | | | | | | | | | | |
| |
| | | | | |
| Fund Name | | Underlying Municipal Bonds Transferred to TOB Trusts(a) | | | Liability for TOB Trust Certificates(b) | | | Range of Interest Rates on TOB Trust Certificates at Period End | | | Average TOB Trust Certificates Outstanding | | | Daily Weighted Average Rate of Interest and Other Expenses on TOB Trusts | |
| |
| | | | | |
Series E | | $ | 12,244,099 | | | $ | 6,647,000 | | | | 3.67% - 3.94% | | | $ | 7,890,309 | | | | 4.11 | % |
| |
| | (a) | The municipal bonds transferred to a TOB Trust are generally high grade municipal bonds. In certain cases, when municipal bonds transferred are lower grade municipal bonds, the TOB Trust transaction may include a credit enhancement feature that provides for the timely payment of principal and interest on the bonds to the TOB Trust by a credit enhancement provider in the event of default of the municipal bond. The TOB Trust would be responsible for the payment of the credit enhancement fee and the Funds, as TOB Residuals holders, would be responsible for reimbursement of any payments of principal and interest made by the credit enhancement provider. The maximum potential amounts owed by the Funds, for such reimbursements, as applicable, are included in the maximum potential amounts disclosed for recourse TOB Trusts in the Schedules of Investments. | |
| | (b) | TOB Trusts may be structured on a non-recourse or recourse basis. When a Fund invests in TOB Trusts on a non-recourse basis, the Liquidity Provider may be required to make a payment under the liquidity facility to allow the TOB Trust to repurchase TOB Trust Certificates. The Liquidity Provider will be reimbursed from the liquidation of bonds held in the TOB Trust. If a Fund invests in a TOB Trust on a recourse basis, a Fund enters into a reimbursement agreement with the Liquidity Provider where a Fund is required to reimburse the Liquidity Provider for any shortfall between the amount paid by the Liquidity Provider and proceeds received from liquidation of municipal bonds held in the TOB Trust (the “Liquidation Shortfall”). As a result, if a Fund invests in a recourse TOB Trust, a Fund will bear the risk of loss with respect to any Liquidation Shortfall. If multiple funds participate in any such TOB Trust, these losses will be shared ratably, including the maximum potential amounts owed by a Fund at March 31, 2024, in proportion to their participation in the TOB Trust. The recourse TOB Trusts are identified in the Schedules of Investments including the maximum potential amounts owed by a Fund at March 31, 2024. | |
| | |
| 132 | | 2 0 2 4 BLACK ROCK ANNUAL REPORT TO SHAREHOLDERS |
Notes to Financial Statements (continued)
| 5. | DERIVATIVE FINANCIAL INSTRUMENTS |
The Funds engage in various portfolio investment strategies using derivative contracts both to increase the returns of the Funds and/or to manage their exposure to certain risks such as credit risk, equity risk, interest rate risk, foreign currency exchange rate risk, commodity price risk or other risks (e.g., inflation risk). Derivative financial instruments categorized by risk exposure are included in the Schedules of Investments. These contracts may be transacted on an exchange or OTC.
Futures Contracts: Futures contracts are purchased or sold to gain exposure to, or manage exposure to, changes in interest rates (interest rate risk) and changes in the value of equity securities (equity risk) or foreign currencies (foreign currency exchange rate risk).
Futures contracts are exchange-traded agreements between the Funds and a counterparty to buy or sell a specific quantity of an underlying instrument at a specified price and on a specified date. Depending on the terms of a contract, it is settled either through physical delivery of the underlying instrument on the settlement date or by payment of a cash amount on the settlement date. Upon entering into a futures contract, the Funds are required to deposit initial margin with the broker in the form of cash or securities in an amount that varies depending on a contract’s size and risk profile. The initial margin deposit must then be maintained at an established level over the life of the contract. Amounts pledged, which are considered restricted, are included in cash pledged for futures contracts in the Statements of Assets and Liabilities.
Securities deposited as initial margin are designated in the Schedules of Investments and cash deposited, if any, are shown as cash pledged for futures contracts in the Statements of Assets and Liabilities. Pursuant to the contract, the Funds agree to receive from or pay to the broker an amount of cash equal to the daily fluctuation in market value of the contract (“variation margin”). Variation margin is recorded as unrealized appreciation (depreciation) and, if any, shown as variation margin receivable (or payable) on futures contracts in the Statements of Assets and Liabilities. When the contract is closed, a realized gain or loss is recorded in the Statements of Operations equal to the difference between the notional amount of the contract at the time it was opened and the notional amount at the time it was closed. The use of futures contracts involves the risk of an imperfect correlation in the movements in the price of futures contracts and interest rates, foreign currency exchange rates or underlying assets.
Forward Foreign Currency Exchange Contracts: Forward foreign currency exchange contracts are entered into to gain or reduce exposure to foreign currencies (foreign currency exchange rate risk).
A forward foreign currency exchange contract is an agreement between two parties to buy and sell a currency at a set exchange rate on a specified date. These contracts help to manage the overall exposure to the currencies in which some of the investments held by the Funds are denominated and in some cases, may be used to obtain exposure to a particular market. The contracts are traded OTC and not on an organized exchange.
The contract is marked-to-market daily and the change in market value is recorded as unrealized appreciation (depreciation) in the Statements of Assets and Liabilities. When a contract is closed, a realized gain or loss is recorded in the Statements of Operations equal to the difference between the value at the time it was opened and the value at the time it was closed. Non-deliverable forward foreign currency exchange contracts are settled with the counterparty in cash without the delivery of foreign currency. The use of forward foreign currency exchange contracts involves the risk that the value of a forward foreign currency exchange contract changes unfavorably due to movements in the value of the referenced foreign currencies, and such value may exceed the amount(s) reflected in the Statements of Assets and Liabilities. Cash amounts pledged for forward foreign currency exchange contracts are considered restricted and are included in cash pledged as collateral for OTC derivatives in the Statements of Assets and Liabilities. A Fund’s risk of loss from counterparty credit risk on OTC derivatives is generally limited to the aggregate unrealized gain netted against any collateral held by the Fund.
Options: The Funds may purchase and write call and put options to increase or decrease their exposure to the risks of underlying instruments, including equity risk, interest rate risk and/or commodity price risk and/or, in the case of options written, to generate gains from options premiums.
A call option gives the purchaser (holder) of the option the right (but not the obligation) to buy, and obligates the seller (writer) to sell (when the option is exercised) the underlying instrument at the exercise or strike price at any time or at a specified time during the option period. A put option gives the holder the right to sell and obligates the writer to buy the underlying instrument at the exercise or strike price at any time or at a specified time during the option period.
Premiums paid on options purchased and premiums received on options written, as well as the daily fluctuation in market value, are included in investments at value –unaffiliated and options written at value, respectively, in the Statements of Assets and Liabilities. When an instrument is purchased or sold through the exercise of an option, the premium is offset against the cost or proceeds of the underlying instrument. When an option expires, a realized gain or loss is recorded in the Statements of Operations to the extent of the premiums received or paid. When an option is closed or sold, a gain or loss is recorded in the Statements of Operations to the extent the cost of the closing transaction exceeds the premiums received or paid. When the Funds write a call option, such option is typically “covered,” meaning that they hold the underlying instrument subject to being called by the option counterparty. When the Funds write a put option, cash is segregated in an amount sufficient to cover the obligation. These amounts, which are considered restricted, are included in cash pledged as collateral for options written in the Statements of Assets and Liabilities.
| | • | | Swaptions – The Funds may purchase and write swaptions primarily to preserve a return or spread on a particular investment or portion of the Funds’ holdings, as a duration management technique or to protect against an increase in the price of securities it anticipates purchasing at a later date. The purchaser and writer of a swaption is buying or granting the right to enter into a previously agreed upon interest rate or credit default swap agreement (interest rate risk and/or credit risk) at any time before the expiration of the option. |
Swaps: Swap contracts are entered into to manage exposure to issuers, markets and securities. Such contracts are agreements between the Funds and a counterparty to make periodic net payments on a specified notional amount or a net payment upon termination. Swap agreements are privately negotiated in the OTC market and may be entered into as a bilateral contract (“OTC swaps”) or centrally cleared (“centrally cleared swaps”).
For OTC swaps, any upfront premiums paid and any upfront fees received are shown as swap premiums paid and swap premiums received, respectively, in the Statements of Assets and Liabilities and amortized over the term of the contract. The daily fluctuation in market value is recorded as unrealized appreciation (depreciation) on OTC swaps in the Statements of Assets and Liabilities. Payments received or paid are recorded in the Statements of Operations as realized gains or losses, respectively. When an OTC
| | |
NOTES TO FINANCIAL STATEMENTS | | 133 |
Notes to Financial Statements (continued)
swap is terminated, a realized gain or loss is recorded in the Statements of Operations equal to the difference between the proceeds from (or cost of) the closing transaction and the Funds’ basis in the contract, if any. Generally, the basis of the contract is the premium received or paid.
In a centrally cleared swap, immediately following execution of the swap contract, the swap contract is novated to a central counterparty (the “CCP”) and the CCP becomes the Funds’ counterparty on the swap. The Funds are required to interface with the CCP through the broker. Upon entering into a centrally cleared swap, the Funds are required to deposit initial margin with the broker in the form of cash or securities in an amount that varies depending on the size and risk profile of the particular swap. Securities deposited as initial margin are designated in the Schedules of Investments and cash deposited is shown as cash pledged for centrally cleared swaps in the Statements of Assets and Liabilities. Amounts pledged, which are considered restricted cash, are included in cash pledged for centrally cleared swaps in the Statements of Assets and Liabilities. Pursuant to the contract, the Funds agree to receive from or pay to the broker variation margin. Variation margin is recorded as unrealized appreciation (depreciation) and shown as variation margin receivable (or payable) on centrally cleared swaps in the Statements of Assets and Liabilities. Payments received from (paid to) the counterparty are amortized over the term of the contract and recorded as realized gains (losses) in the Statements of Operations, including those at termination.
| | • | | Credit default swaps — Credit default swaps are entered into to manage exposure to the market or certain sectors of the market, to reduce risk exposure to defaults of corporate and/or sovereign issuers or to create exposure to corporate and/or sovereign issuers to which a fund is not otherwise exposed (credit risk). |
The Funds may either buy or sell (write) credit default swaps on single-name issuers (corporate or sovereign), a combination or basket of single-name issuers or traded indexes. Credit default swaps are agreements in which the protection buyer pays fixed periodic payments to the seller in consideration for a promise from the protection seller to make a specific payment should a negative credit event take place with respect to the referenced entity (e.g., bankruptcy, failure to pay, obligation acceleration, repudiation, moratorium or restructuring). As a buyer, if an underlying credit event occurs, the Funds will either (i) receive from the seller an amount equal to the notional amount of the swap and deliver the referenced security or underlying securities comprising the index, or (ii) receive a net settlement of cash equal to the notional amount of the swap less the recovery value of the security or underlying securities comprising the index. As a seller (writer), if an underlying credit event occurs, the Funds will either pay the buyer an amount equal to the notional amount of the swap and take delivery of the referenced security or underlying securities comprising the index or pay a net settlement of cash equal to the notional amount of the swap less the recovery value of the security or underlying securities comprising the index.
| | • | | Interest rate swaps — Interest rate swaps are entered into to gain or reduce exposure to interest rates or to manage duration, the yield curve or interest rate (interest rate risk). |
Interest rate swaps are agreements in which one party pays a stream of interest payments, either fixed or floating, in exchange for another party’s stream of interest payments, either fixed or floating, on the same notional amount for a specified period of time. In more complex interest rate swaps, the notional principal amount may decline (or amortize) over time.
| | • | | Forward swaps — The Funds may enter into forward interest rate swaps and forward total return swaps. In a forward swap, each Fund and the counterparty agree to make periodic net payments beginning on a specified date or a net payment at termination. |
Swap transactions involve, to varying degrees, elements of interest rate, credit and market risks in excess of the amounts recognized in the Statements of Assets and Liabilities. Such risks involve the possibility that there will be no liquid market for these agreements, that the counterparty to the agreements may default on its obligation to perform or disagree as to the meaning of the contractual terms in the agreements, and that there may be unfavorable changes in interest rates and/or market values associated with these transactions.
Master Netting Arrangements: In order to define its contractual rights and to secure rights that will help it mitigate its counterparty risk, a Fund may enter into an International Swaps and Derivatives Association, Inc. Master Agreement (“ISDA Master Agreement”) or similar agreement with its derivative contract counterparties. An ISDA Master Agreement is a bilateral agreement between a Fund and a counterparty that governs certain OTC derivatives and typically contains, among other things, collateral posting terms and netting provisions in the event of a default and/or termination event. Under an ISDA Master Agreement, a Fund may, under certain circumstances, offset with the counterparty certain derivative financial instruments’ payables and/or receivables with collateral held and/or posted and create one single net payment. The provisions of the ISDA Master Agreement typically permit a single net payment in the event of default including the bankruptcy or insolvency of the counterparty. However, bankruptcy or insolvency laws of a particular jurisdiction may impose restrictions on or prohibitions against the right of offset in bankruptcy, insolvency or other events.
Collateral Requirements: For derivatives traded under an ISDA Master Agreement, the collateral requirements are typically calculated by netting the mark-to-market amount for each transaction under such agreement and comparing that amount to the value of any collateral currently pledged by the Funds and the counterparty.
Cash collateral that has been pledged to cover obligations of the Funds and cash collateral received from the counterparty, if any, is reported separately in the Statements of Assets and Liabilities as cash pledged as collateral and cash received as collateral, respectively. Non-cash collateral pledged by the Funds, if any, is noted in the Schedules of Investments. Generally, the amount of collateral due from or to a counterparty is subject to a certain minimum transfer amount threshold before a transfer is required, which is determined at the close of business of the Funds. Any additional required collateral is delivered to/pledged by the Funds on the next business day. Typically, the counterparty is not permitted to sell, re-pledge or use cash and non-cash collateral it receives. A Fund generally agrees not to use non-cash collateral that it receives but may, absent default or certain other circumstances defined in the underlying ISDA Master Agreement, be permitted to use cash collateral received. In such cases, interest may be paid pursuant to the collateral arrangement with the counterparty. To the extent amounts due to the Funds from the counterparties are not fully collateralized, each Fund bears the risk of loss from counterparty non-performance. Likewise, to the extent the Funds have delivered collateral to a counterparty and stand ready to perform under the terms of their agreement with such counterparty, each Fund bears the risk of loss from a counterparty in the amount of the value of the collateral in the event the counterparty fails to return such collateral. Based on the terms of agreements, collateral may not be required for all derivative contracts.
For financial reporting purposes, the Funds do not offset derivative assets and derivative liabilities that are subject to netting arrangements, if any, in the Statements of Assets and Liabilities.
| | |
| 134 | | 2 0 2 4 BLACK ROCK ANNUAL REPORT TO SHAREHOLDERS |
Notes to Financial Statements (continued)
| 6. | INVESTMENT ADVISORY AGREEMENT AND OTHER TRANSACTIONS WITH AFFILIATES |
Investment Advisory: The Trust, on behalf of the Funds, entered into an Investment Advisory Agreement with the Manager, the Funds’ investment adviser and an indirect, wholly-owned subsidiary of BlackRock, Inc. (“BlackRock”), to provide investment advisory services. The Manager receives no advisory fee from the Funds under the Investment Advisory Agreement.
With respect to each Fund, except for Series E and Series V, the Manager entered into a sub-advisory agreement with BlackRock International Limited (“BIL”), an affiliate of the Manager.
Service and Distribution Fees: The Trust, on behalf of the Funds, entered into a Distribution Agreement with BlackRock Investments, LLC (“BRIL”), an affiliate of the Manager.
Expense Limitations, Waivers and Reimbursements: The Manager contractually agreed to waive all fees and pay or reimburse all operating expenses of each Fund, except extraordinary expenses. Extraordinary expenses may include interest expense, dividend expense, tax expense, acquired fund fees and expenses and certain other fund expenses. This agreement has no fixed termination date. With respect to Series C, Series E, Series M, Series P, Series S and Series V, the Manager does not charge the Funds a management fee, although investors in the Funds will pay a fee to BlackRock Investment Management, LLC (“BIM”), an affiliate of the Manager, or their managed account program sponsor. With respect to Series A, the Manager does not charge the Fund a management fee, although investors in the Fund that are (i) retail and institutional separately managed account clients of BIM will pay a fee to BIM or their managed account program sponsor, (ii) participants in the collective trust funds managed by BlackRock Institutional Trust Company, N.A. (“BTC”), an affiliate of the Manager, that invest in the Fund will pay a fee to BTC, and (iii) mutual funds that are advised by the Manager or its affiliates will pay the Manager or its affiliate a management fee pursuant to a management agreement between each such fund and BlackRock or its affiliate. The Manager waived fees for each Fund which are included in fees waived and/or reimbursed by the Manager in the Statements of Operations.
Although the Funds do not compensate the Manager directly for its services under the Investment Advisory Agreement, because each Fund is an investment option for certain wrap-fee or other separately managed account program clients, the Manager may benefit from the fees charged to such clients who have retained the Manager’s affiliates to manage their accounts. The Manager waived fees for each Fund which are included in fees waived and/or reimbursed by the Manager in the Statements of Operations. The waivers were as follows:
| | | | |
| |
| |
| Fund Name | | Amounts Waived | |
| |
| |
Series A | | $ | 583,178 | |
Series C | | | 453,548 | |
Series E | | | 360,494 | |
Series M | | | 621,705 | |
Series P | | | 143,062 | |
Series S | | | 520,919 | |
Series V | | | 216,479 | |
| |
Interfund Lending: In accordance with an exemptive order (the “Order”) from the U.S. Securities and Exchange Commission (“SEC”), each Fund may participate in a joint lending and borrowing facility for temporary purposes (the “Interfund Lending Program”), subject to compliance with the terms and conditions of the Order, and to the extent permitted by each Fund’s investment policies and restrictions. Each Fund is currently permitted to borrow and lend under the Interfund Lending Program.
A lending BlackRock fund may lend in aggregate up to 15% of its net assets, but may not lend more than 5% of its net assets, to any one borrowing fund through the Interfund Lending Program. A borrowing BlackRock fund may not borrow through the Interfund Lending Program or from any other source more than 33 1/3% of its total assets (or any lower threshold provided for by the fund’s investment restrictions). If a borrowing BlackRock fund’s total outstanding borrowings exceed 10% of its total assets, each of its outstanding interfund loans will be subject to collateralization of at least 102% of the outstanding principal value of the loan. All interfund loans are for temporary or emergency purposes and the interest rate to be charged will be the average of the highest current overnight repurchase agreement rate available to a lending fund and the bank loan rate, as calculated according to a formula established by the Board.
During the year ended March 31, 2024, the Funds did not participate in the Interfund Lending Program.
Trustees and Officers: Certain trustees and/or officers of the Trust are directors and/or officers of BlackRock or its affiliates. The Funds reimburse the Manager for a portion of the compensation paid to the Trust’s Chief Compliance Officer, which is included in Trustees and Officer in the Statements of Operations.
Other Transactions: The Funds may purchase securities from, or sell securities to, an affiliated fund provided the affiliation is due solely to having a common investment adviser, common officers, or common trustees. For the year ended March 31, 2024, the purchase and sale transactions and any net realized gains (losses) with an affiliated fund in compliance with Rule 17a-7 under the 1940 Act were as follows:
| | | | | | | | | | | | |
| | | | |
| Fund Name | | Purchases | | | Sales | | | Net Realized Gain (Loss) | |
| | | |
Series V | | $ | 4,106,561 | | | $ | 15,309,771 | | | $ | — | |
| | |
NOTES TO FINANCIAL STATEMENTS | | 135 |
Notes to Financial Statements (continued)
For the year ended March 31, 2024, purchases and sales of investments, including paydowns and mortgage dollar rolls and excluding short-term securities, were as follows:
| | | | | | | | |
| |
| | |
| Fund Name/Asset Type | | Purchases | | | Sales | |
| |
| | |
Series A | | | | | | | | |
Non-U.S. Government Securities | | $ | 1,307,978,619 | | | $ | 1,140,068,759 | |
Series C | | | | | | | | |
Non-U.S. Government Securities | | | 386,888,439 | | | | 342,312,082 | |
U.S. Government Securities | | | 56,208,828 | | | | 55,353,660 | |
Series E | | | | | | | | |
Non-U.S. Government Securities | | | 96,673,677 | | | | 57,841,452 | |
Series M | | | | | | | | |
Non-U.S. Government Securities | | | 9,650,940,531 | | | | 9,566,850,150 | |
Series P | | | | | | | | |
Non-U.S. Government Securities | | | — | | | | 6,581,500 | |
Series S | | | | | | | | |
Non-U.S. Government Securities | | | 571,977,219 | | | | 587,796,198 | |
U.S. Government Securities | | | 42,947,022 | | | | 29,768,325 | |
Series V | | | | | | | | |
Non-U.S. Government Securities | | | 172,621,950 | | | | 139,895,000 | |
| |
For the year ended March 31, 2024, purchases and sales related to mortgage dollar rolls were as follows:
| | | | | | | | |
| |
| | |
| Fund Name | | Purchases | | | Sales | |
| |
| | |
Series A | | $ | 240,794,546 | | | $ | 241,130,273 | |
Series M | | | 3,862,944,810 | | | | 3,861,913,779 | |
Series S | | | 97,850,566 | | | | 97,795,816 | |
| |
It is each Fund’s policy to comply with the requirements of the Internal Revenue Code of 1986, as amended, applicable to regulated investment companies, and to distribute substantially all of its taxable income to its shareholders. Therefore, no U.S. federal income tax provision is required.
Each Fund files U.S. federal and various state and local tax returns. No income tax returns are currently under examination. The statute of limitations on each Fund’s U.S. federal tax returns generally remains open for a period of three years after they are filed. The statutes of limitations on each Fund’s state and local tax returns may remain open for an additional year depending upon the jurisdiction.
Management has analyzed tax laws and regulations and their application to the Funds as of March 31, 2024, inclusive of the open tax return years, and does not believe that there are any uncertain tax positions that require recognition of a tax liability in the Funds’ financial statements.
| | |
| 136 | | 2 0 2 4 BLACK ROCK ANNUAL REPORT TO SHAREHOLDERS |
Notes to Financial Statements (continued)
The tax character of distributions paid was as follows:
| | | | | | | | |
Fund Name | |
| Year Ended
March 31, 2024 |
| |
| Year Ended
March 31, 2023 |
|
| | |
Series A | | | | | | | | |
| | |
Ordinary income | | $ | 139,801,698 | | | $ | 116,299,178 | |
| | | | | | | | |
| | |
Series C | | | | | | | | |
| | |
Ordinary income | | $ | 18,482,170 | | | $ | 13,928,770 | |
| | | | | | | | |
| | |
Series E | | | | | | | | |
| | |
Tax-exempt income | | $ | 16,139,547 | | | $ | 14,910,024 | |
Ordinary income | | | 67,023 | | | | 107,742 | |
Long term capital gains | | | — | | | | 5,522,097 | |
| | | | | | | | |
| | |
| | $ | 16,206,570 | | | $ | 20,539,863 | |
| | |
Series M | | | | | | | | |
| | |
Ordinary income | | $ | 44,108,637 | | | $ | 31,852,649 | |
| | | | | | | | |
| | |
Series P | | | | | | | | |
| | |
Ordinary income | | $ | 640,002 | | | $ | 485,022 | |
| | | | | | | | |
| | |
Series S | | | | | | | | |
| | |
Ordinary income | | $ | 17,132,314 | | | $ | 13,672,605 | |
| | | | | | | | |
| | |
Series V | | | | | | | | |
| | |
Tax-exempt income | | $ | 2,960,931 | | | $ | 819,875 | |
Ordinary income | | | 100 | | | | 2,110 | |
| | | | | | | | |
| | |
| | | $ | 2,961,031 | | | $ | 821,985 | |
As of March 31, 2024, the tax components of accumulated net earnings (losses) were as follows:
| | | | | | | | | | | | | | | | | | | | |
| Fund Name | | Undistributed tax-exempt income | | | Undistributed Ordinary Income | | | Non-expiring Capital Loss Carryforwards(a) | | | Net Unrealized Gains (Losses)(b) | | | Total | |
| | | | | |
Series A | | $ | — | | | $ | 1,201,681 | | | $ | (63,337,034 | ) | | $ | (124,148,571 | ) | | | $ (186,283,924 | ) |
Series C | | | — | | | | — | | | | (54,102,185 | ) | | | (12,228,902 | ) | | | (66,331,087 | ) |
Series E | | | 245,863 | | | | — | | | | (14,538,216 | ) | | | (14,556,208 | ) | | | (28,848,561 | ) |
Series M | | | — | | | | 2,742,234 | | | | (109,703,098 | ) | | | (87,350,335 | ) | | | (194,311,199 | ) |
Series P | | | — | | | | 116,735 | | | | (25,432,893 | ) | | | (41,264 | ) | | | (25,357,422 | ) |
Series S | | | — | | | | — | | | | (23,638,429 | ) | | | (5,943,993 | ) | | | (29,582,422 | ) |
Series V | | | 456 | | | | — | | | | — | | | | 491 | | | | 947 | |
| (a) | | Amounts available to offset future realized capital gains. |
| (b) | | The differences between book-basis and tax-basis net unrealized gains (losses) was attributable primarily to the tax deferral of losses on wash sales and straddles, amortization and accretion methods for premiums and discounts on fixed income securities, the realization for tax purposes of unrealized gains/losses on certain futures and foreign currency exchange contracts, the accounting for swap agreements, the treatment of residual interests in tender option bond trusts and the classification of investments. |
During the year ended March 31, 2024, the funds listed below utilized the following amounts of their respective capital loss carryforwards:
| | | | |
| | | Series P | |
Amount utilized | | | $ 922,427 | |
As of March 31, 2024, gross unrealized appreciation and depreciation based on cost of investments (including short positions and derivatives, if any) for U.S. federal income tax purposes were as follows:
| | | | | | | | | | | | | | | | |
| |
| | | | |
| Fund Name | | Tax Cost | | | Gross Unrealized
Appreciation | | | Gross Unrealized Depreciation | | | Net Unrealized Appreciation (Depreciation) | |
| |
| | | | |
Series A | | $ | 2,711,731,637 | | | $ | 12,961,479 | | | $ | (137,110,050) | | | $ | (124,148,571 | ) |
Series C | | | 433,332,061 | | | | 4,987,412 | | | | (17,079,975 | ) | | | (12,092,563 | ) |
Series E | | | 425,905,270 | | | | 8,697,929 | | | | (23,254,137 | ) | | | (14,556,208 | ) |
Series M | | | 1,515,844,580 | | | | 7,053,570 | | | | (94,403,905 | ) | | | (87,350,335 | ) |
Series P | | | 1,388,855 | | | | 383,645 | | | | (424,835 | ) | | | (41,190 | ) |
Series S | | | 401,557,463 | | | | 1,898,362 | | | | (7,344,574 | ) | | | (5,446,212 | ) |
Series V | | | 116,960,750 | | | | 1,089 | | | | (598 | ) | | | 491 | |
| |
| | |
NOTES TO FINANCIAL STATEMENTS | | 137 |
Notes to Financial Statements (continued)
The Trust, on behalf of each Fund, along with certain other funds managed by the Manager and its affiliates (“Participating Funds”), is party to a 364-day, $2.50 billion credit agreement with a group of lenders. Under this agreement, the Funds may borrow to fund shareholder redemptions. Excluding commitments designated for certain individual funds, the Participating Funds, including the Funds, can borrow up to an aggregate commitment amount of $1.75 billion at any time outstanding, subject to asset coverage and other limitations as specified in the agreement. The credit agreement has the following terms: a fee of 0.10% per annum on unused commitment amounts and interest at a rate equal to the higher of (a) Overnight Bank Funding Rate (“OBFR”) (but, in any event, not less than 0.00%) on the date the loan is made plus 0.80% per annum, (b) the Fed Funds rate (but, in any event, not less than 0.00%) in effect from time to time plus 0.80% per annum on amounts borrowed or (c) the sum of (x) Daily Simple SOFR (but, in any event, not less than 0.00%) on the date the loan is made plus 0.10% and (y) 0.80% per annum. The agreement expires in April 2024 unless extended or renewed. These fees were allocated among such funds based upon portions of the aggregate commitment available to them and relative net assets of Participating Funds. During the year ended March 31, 2024, the Funds did not borrow under the credit agreement.
In the normal course of business, the Funds invest in securities or other instruments and may enter into certain transactions, and such activities subject each Fund to various risks, including among others, fluctuations in the market (market risk) or failure of an issuer to meet all of its obligations. The value of securities or other instruments may also be affected by various factors, including, without limitation: (i) the general economy; (ii) the overall market as well as local, regional or global political and/or social instability; (iii) regulation, taxation or international tax treaties between various countries; or (iv) currency, interest rate and price fluctuations. Local, regional or global events such as war, acts of terrorism, the spread of infectious illness or other public health issues, recessions, or other events could have a significant impact on the Funds and their investments. Each Fund’s prospectus provides details of the risks to which each Fund is subject.
Series E structures and “sponsors” the TOB Trusts in which it holds TOB Residuals and has certain duties and responsibilities, which may give rise to certain additional risks including, but not limited to, compliance, securities law and operational risks.
As short-term interest rates rise, Series E’s investments in the TOB Trusts may adversely affect Series E’s net investment income and dividends to shareholders. Also, fluctuations in the market value of municipal bonds deposited into the TOB Trust may adversely affect Series E’s NAV per share.
The SEC and various federal banking and housing agencies have adopted credit risk retention rules for securitizations (the “Risk Retention Rules”). The Risk Retention Rules would require the sponsor of a TOB Trust to retain at least 5% of the credit risk of the underlying assets supporting the TOB Trust’s municipal bonds. The Risk Retention Rules may adversely affect Series E’s ability to engage in TOB Trust transactions or increase the costs of such transactions in certain circumstances.
TOB Trusts constitute an important component of the municipal bond market. Any modifications or changes to rules governing TOB Trusts may adversely impact the municipal market and Series E, including through reduced demand for and liquidity of municipal bonds and increased financing costs for municipal issuers. The ultimate impact of any potential modifications on the TOB Trust market and the overall municipal market is not yet certain.
Certain obligations held by Series V have a credit enhancement or liquidity feature that may, under certain circumstances, provide for repayment of principal and interest on the obligation when due. These enhancements, which may include letters of credit, stand-by bond purchase agreements and/or third-party insurance, are issued by financial institutions. The value of the obligations may be affected by changes in creditworthiness of the entities that provide the credit enhancements or liquidity features. Series V monitors its exposure by reviewing the creditworthiness of the issuers, as well as the financial institutions issuing the credit enhancements and by limiting the amount of holdings with credit enhancements from one financial institution.
Market Risk: Each Fund may be exposed to prepayment risk, which is the risk that borrowers may exercise their option to prepay principal earlier than scheduled during periods of declining interest rates, which would force each Fund to reinvest in lower yielding securities. Each Fund may also be exposed to reinvestment risk, which is the risk that income from each Fund’s portfolio will decline if each Fund invests the proceeds from matured, traded or called fixed-income securities at market interest rates that are below each Fund portfolio’s current earnings rate.
Municipal securities are subject to the risk that litigation, legislation or other political events, local business or economic conditions, credit rating downgrades, or the bankruptcy of the issuer could have a significant effect on an issuer’s ability to make payments of principal and/or interest or otherwise affect the value of such securities. Municipal securities can be significantly affected by political or economic changes, including changes made in the law after issuance of the securities, as well as uncertainties in the municipal market related to, taxation, legislative changes or the rights of municipal security holders, including in connection with an issuer insolvency. Municipal securities backed by current or anticipated revenues from a specific project or specific assets can be negatively affected by the discontinuance of the tax benefits supporting the project or assets or the inability to collect revenues for the project or from the assets. Municipal securities may be less liquid than taxable bonds, and there may be less publicly available information on the financial condition of municipal security issuers than for issuers of other securities.
Valuation Risk: The price a Fund could receive upon the sale of any particular portfolio investment may differ from a Fund’s valuation of the investment, particularly for securities that trade in thin or volatile markets or that are valued using a fair valuation technique or a price provided by an independent pricing service. Changes to significant unobservable inputs and assumptions (i.e., publicly traded company multiples, growth rate, time to exit) due to the lack of observable inputs may significantly impact the resulting fair value and therefore a Fund’s results of operations. As a result, the price received upon the sale of an investment may be less than the value ascribed by a Fund, and a Fund could realize a greater than expected loss or lesser than expected gain upon the sale of the investment. A Fund’s ability to value its investments may also be impacted by technological issues and/or errors by pricing services or other third-party service providers.
Counterparty Credit Risk: The Funds may be exposed to counterparty credit risk, or the risk that an entity may fail to or be unable to perform on its commitments related to unsettled or open transactions, including making timely interest and/or principal payments or otherwise honoring its obligations. The Funds manage counterparty credit risk by entering into transactions only with counterparties that the Manager believes have the financial resources to honor their obligations and by monitoring the financial stability of
| | |
| 138 | | 2 0 2 4 BLACK ROCK ANNUAL REPORT TO SHAREHOLDERS |
Notes to Financial Statements (continued)
those counterparties. Financial assets, which potentially expose the Funds to market, issuer and counterparty credit risks, consist principally of financial instruments and receivables due from counterparties. The extent of the Funds’ exposure to market, issuer and counterparty credit risks with respect to these financial assets is approximately their value recorded in the Statements of Assets and Liabilities, less any collateral held by the Funds.
A derivative contract may suffer a mark-to-market loss if the value of the contract decreases due to an unfavorable change in the market rates or values of the underlying instrument. Losses can also occur if the counterparty does not perform under the contract.
With exchange-traded futures and centrally cleared swaps, there is less counterparty credit risk to the Funds since the exchange or clearinghouse, as counterparty to such instruments, guarantees against a possible default. The clearinghouse stands between the buyer and the seller of the contract; therefore, credit risk is limited to failure of the clearinghouse. While offset rights may exist under applicable law, a Fund does not have a contractual right of offset against a clearing broker or clearinghouse in the event of a default (including the bankruptcy or insolvency). Additionally, credit risk exists in exchange-traded futures and centrally cleared swaps with respect to initial and variation margin that is held in a clearing broker’s customer accounts. While clearing brokers are required to segregate customer margin from their own assets, in the event that a clearing broker becomes insolvent or goes into bankruptcy and at that time there is a shortfall in the aggregate amount of margin held by the clearing broker for all its clients, typically the shortfall would be allocated on a pro rata basis across all the clearing broker’s customers, potentially resulting in losses to the Funds.
Geographic/Asset Class Risk: A diversified portfolio, where this is appropriate and consistent with a fund’s objectives, minimizes the risk that a price change of a particular investment will have a material impact on the NAV of a fund. The investment concentrations within each Fund’s portfolio are disclosed in its Schedule of Investments.
Certain Funds invest a significant portion of their assets in high yield securities. High yield securities that are rated below investment-grade (commonly referred to as “junk bonds”) or are unrated may be deemed speculative, involve greater levels of risk than higher-rated securities of similar maturity and are more likely to default. High yield securities may be issued by less creditworthy issuers, and issuers of high yield securities may be unable to meet their interest or principal payment obligations. High yield securities are subject to extreme price fluctuations, may be less liquid than higher rated fixed-income securities, even under normal economic conditions, and frequently have redemption features.
Certain Funds invest a significant portion of their assets in fixed-income securities and/or use derivatives tied to the fixed-income markets. Changes in market interest rates or economic conditions may affect the value and/or liquidity of such investments. Interest rate risk is the risk that prices of bonds and other fixed-income securities will decrease as interest rates rise and increase as interest rates fall. The Funds may be subject to a greater risk of rising interest rates due to the period of historically low interest rates that ended in March 2022. The Federal Reserve has raised the federal funds rate as part of its efforts to address inflation. There is a risk that interest rates will continue to rise, which will likely drive down the prices of bonds and other fixed-income securities, and could negatively impact certain Funds’ performance.
The Funds invest a significant portion of their assets in securities of issuers located in the United States. A decrease in imports or exports, changes in trade regulations, inflation and/or an economic recession in the United States may have a material adverse effect on the U.S. economy and the securities listed on U.S. exchanges. Proposed and adopted policy and legislative changes in the United States may also have a significant effect on U.S. markets generally, as well as on the value of certain securities. Governmental agencies project that the United States will continue to maintain elevated public debt levels for the foreseeable future which may constrain future economic growth. Circumstances could arise that could prevent the timely payment of interest or principal on U.S. government debt, such as reaching the legislative “debt ceiling.” Such non-payment would result in substantial negative consequences for the U.S. economy and the global financial system. If U.S. relations with certain countries deteriorate, it could adversely affect issuers that rely on the United States for trade. The United States has also experienced increased internal unrest and discord. If these trends were to continue, they may have an adverse impact on the U.S. economy and the issuers in which the Funds invest.
Certain Funds invest a significant portion of their assets in securities backed by commercial or residential mortgage loans or in issuers that hold mortgage and other asset-backed securities. When a fund concentrates its investments in this manner, it assumes a greater risk of prepayment or payment extension by securities issuers. Changes in economic conditions, including delinquencies and/or defaults on assets underlying these securities, can affect the value, income and/or liquidity of such positions. Investment percentages in these securities are presented in the Schedules of Investments.
Significant Shareholder Redemption Risk: Certain shareholders may own or manage a substantial amount of fund shares and/or hold their fund investments for a limited period of time. Large redemptions of fund shares by these shareholders may force a fund to sell portfolio securities, which may negatively impact the fund’s NAV, increase the fund’s brokerage costs, and/or accelerate the realization of taxable income/gains and cause the fund to make additional taxable distributions to shareholders.
LIBOR Transition Risk: The Funds may be exposed to financial instruments that recently transitioned from, or continue to be tied to, the London Interbank Offered Rate (’’LIBOR’’) to determine payment obligations, financing terms, hedging strategies or investment value. The United Kingdom’s Financial Conduct Authority, which regulates LIBOR, has ceased publishing all LIBOR settings, but some USD LIBOR settings will continue to be published under a synthetic methodology until September 30, 2024 for certain legacy contracts. The SOFR has been used increasingly on a voluntary basis in new instruments and transactions. Under U.S. regulations that implement a statutory fallback mechanism to replace LIBOR, benchmark rates based on SOFR have replaced LIBOR in certain financial contracts. The ultimate effect of the LIBOR transition process on the Funds is uncertain.
| | |
NOTES TO FINANCIAL STATEMENTS | | 139 |
Notes to Financial Statements (continued)
| 11. | CAPITAL SHARE TRANSACTIONS |
Transactions in capital shares were as follows:
| | | | | | | | | | | | | | | | |
| | | |
| | | Year Ended 03/31/24 | | | Year Ended 03/31/23 | |
| | | | | | | | |
| | | | |
| Fund Name | | Shares | | | Amount | | | Shares | | | Amount | |
| | | | |
Series A | | | | | | | | | | | | | | | | |
| | | | |
Shares sold | | | 47,562,008 | | | $ | 445,090,304 | | | | 7,065,891 | | | $ | 65,608,620 | |
| | | | |
Shares redeemed | | | (45,775,267 | ) | | | (423,038,815 | ) | | | (15,979,376 | ) | | | (147,358,222 | ) |
| | | | | | | | | | | | | | | | |
| | | | |
| | | 1,786,741 | | | $ | 22,051,489 | | | | (8,913,485 | ) | | $ | (81,749,602 | ) |
| | | | | | | | | | | | | | | | |
| | | | |
Series C | | | | | | | | | | | | | | | | |
| | | | |
Shares sold | | | 15,783,759 | | | $ | 140,503,861 | | | | 12,713,591 | | | $ | 114,532,902 | |
| | | | |
Shares redeemed | | | (10,951,684 | ) | | | (96,940,758 | ) | | | (19,183,173 | ) | | | (171,440,093 | ) |
| | | | | | | | | | | | | | | | |
| | | | |
| | | 4,832,075 | | | $ | 43,563,103 | | | | (6,469,582 | ) | | $ | (56,907,191 | ) |
| | | | | | | | | | | | | | | | |
| | | | |
Series E | | | | | | | | | | | | | | | | |
| | | | |
Shares sold | | | 23,301,016 | | | $ | 230,906,817 | | | | 19,966,034 | | | $ | 204,068,120 | |
| | | | |
Shares redeemed | | | (16,841,996 | ) | | | (163,994,482 | ) | | | (20,111,185 | ) | | | (204,350,708 | ) |
| | | | | | | | | | | | | | | | |
| | | | |
| | | 6,459,020 | | | $ | 66,912,335 | | | | (145,151 | ) | | $ | (282,588 | ) |
| | | | | | | | | | | | | | | | |
| | | | |
Series M | | | | | | | | | | | | | | | | |
| | | | |
Shares sold | | | 47,160,356 | | | $ | 389,133,798 | | | | 39,412,723 | | | $ | 334,004,244 | |
| | | | |
Shares redeemed | | | (39,977,105 | ) | | | (328,560,193 | ) | | | (31,700,940 | ) | | | (269,909,093 | ) |
| | | | | | | | | | | | | | | | |
| | | | |
| | | 7,183,251 | | | $ | 60,573,605 | | | | 7,711,783 | | | $ | 64,095,151 | |
| | | | | | | | | | | | | | | | |
| | | | |
Series P | | | | | | | | | | | | | | | | |
| | | | |
Shares sold | | | 287,267 | | | $ | 2,940,745 | | | | 2,007,424 | | | $ | 19,091,730 | |
| | | | |
Shares redeemed | | | (2,472,653 | ) | | | (25,108,888 | ) | | | (5,378,955 | ) | | | (51,693,604 | ) |
| | | | | | | | | | | | | | | | |
| | | | |
| | | (2,185,386 | ) | | $ | (22,168,143 | ) | | | (3,371,531 | ) | | $ | (32,601,874 | ) |
| | | | | | | | | | | | | | | | |
| | | | |
Series S | | | | | | | | | | | | | | | | |
| | | | |
Shares sold | | | 12,836,280 | | | $ | 115,922,375 | | | | 20,222,887 | | | $ | 183,515,986 | |
| | | | |
Shares redeemed | | | (14,087,279 | ) | | | (127,147,589 | ) | | | (19,873,154 | ) | | | (179,679,181 | ) |
| | | | | | | | | | | | | | | | |
| | | | |
| | | (1,250,999 | ) | | $ | (11,225,214 | ) | | | 349,733 | | | $ | 3,836,805 | |
| | | | | | | | | | | | | | | | |
| | | | |
Series V | | | | | | | | | | | | | | | | |
| | | | |
Shares sold | | | 14,653,215 | | | $ | 146,385,613 | | | | 12,533,297 | | | $ | 125,207,867 | |
| | | | |
Shares redeemed | | | (11,442,454 | ) | | | (114,310,114 | ) | | | (5,002,457 | ) | | | (49,975,313 | ) |
| | | | | | | | | | | | | | | | |
| | | | |
| | | 3,210,761 | | | $ | 32,075,499 | | | | 7,530,840 | | | $ | 75,232,554 | |
| | | | | | | | | | | | | | | | |
Management’s evaluation of the impact of all subsequent events on the Funds’ financial statements was completed through the date the financial statements were issued and the following item was noted:
Effective April 11, 2024, the 364-day credit agreement to which the Trust, on behalf of the Funds, and the Participating Funds are party, was amended to (i) decrease the aggregate commitment amount to $2.40 billion, and (ii) extend the termination date to April 2025.
| | |
| 140 | | 2 0 2 4 BLACK ROCK ANNUAL REPORT TO SHAREHOLDERS |
Report of Independent Registered Public Accounting Firm
To the Shareholders of BATS: Series A Portfolio, BATS: Series C Portfolio, BATS: Series E Portfolio, BATS: Series M Portfolio, BATS: Series P Portfolio, BATS: Series S Portfolio and BATS: Series V Portfolio and the Board of Trustees of BlackRock Allocation Target Shares:
Opinion on the Financial Statements and Financial Highlights
We have audited the accompanying statements of assets and liabilities of BATS: Series A Portfolio, BATS: Series C Portfolio, BATS: Series E Portfolio, BATS: Series M Portfolio, BATS: Series P Portfolio, BATS: Series S Portfolio, and BATS Series V Portfolio of BlackRock Allocation Target Shares (the “Funds”), including the schedules of investments, as of March 31, 2024, the related statements of operations for the year then ended, the statements of changes in net assets for each of the two years in the period then ended, the financial highlights for the periods indicated in the table below, and the related notes. In our opinion, the financial statements and financial highlights present fairly, in all material respects, the financial position of the Funds as of March 31, 2024, and the results of their operations for the year then ended, the changes in their net assets for each of the two years in the period then ended, and the financial highlights for the periods indicated in the table below, in conformity with accounting principles generally accepted in the United States of America.
| | |
Fund(s) | | Financial Highlights |
BATS: Series A Portfolio, BATS: Series C Portfolio, BATS: Series E Portfolio, BATS: Series M Portfolio, BATS: Series P Portfolio, BATS: Series S Portfolio | | For each of the five years in the period ended March 31, 2024. |
BATS: Series V Portfolio | | For each of the two years in the period ended March 31, 2024 and for the period from May 5, 2021 (commencement of operations) through March 31, 2022. |
Basis for Opinion
These financial statements and financial highlights are the responsibility of the Funds’ management. Our responsibility is to express an opinion on the Funds’ financial statements and financial highlights based on our audits. We are a public accounting firm registered with the Public Company Accounting Oversight Board (United States) (PCAOB) and are required to be independent with respect to the Funds in accordance with the U.S. federal securities laws and the applicable rules and regulations of the Securities and Exchange Commission and the PCAOB.
We conducted our audits in accordance with the standards of the PCAOB. Those standards require that we plan and perform the audit to obtain reasonable assurance about whether the financial statements and financial highlights are free of material misstatement, whether due to error or fraud. The Funds are not required to have, nor were we engaged to perform, an audit of their internal control over financial reporting. As part of our audits we are required to obtain an understanding of internal control over financial reporting but not for the purpose of expressing an opinion on the effectiveness of the Funds’ internal control over financial reporting. Accordingly, we express no such opinion.
Our audits included performing procedures to assess the risks of material misstatement of the financial statements and financial highlights, whether due to error or fraud, and performing procedures that respond to those risks. Such procedures included examining, on a test basis, evidence regarding the amounts and disclosures in the financial statements and financial highlights. Our audits also included evaluating the accounting principles used and significant estimates made by management, as well as evaluating the overall presentation of the financial statements and financial highlights. Our procedures included confirmation of securities owned as of March 31, 2024, by correspondence with custodians or counterparties; when replies were not received, we performed other auditing procedures. We believe that our audits provide a reasonable basis for our opinion.
Deloitte & Touche LLP
Boston, Massachusetts
May 22, 2024
We have served as the auditor of one or more BlackRock investment companies since 1992.
| | |
REPORT OF INDEPENDENT REGISTERED PUBLIC ACCOUNTING FIRM | | 141 |
Important Tax Information (unaudited)
The following amounts, or maximum amounts allowable by law, are hereby designated as exempt-interest dividends for the fiscal year ended March 31, 2024:
| | | | |
| |
| |
| Fund Name | | Exempt-Interest Dividends | |
| |
| |
Series E | | $ | 16,108,399 | |
Series V | | | 2,959,343 | |
| |
The following amounts, or maximum amounts allowable by law, are hereby designated as qualified dividend income for individuals for the fiscal year ended March 31, 2024:
| | | | |
| |
| |
| Fund Name | | Qualified Dividend
Income | |
| |
| |
Series C | | $ | 434,184 | |
| |
The Funds hereby designate the following amounts, or maximum amounts allowable by law, of distributions from direct federal obligation interest for the fiscal year ended March 31, 2024:
| | | | |
| |
| |
| Fund Name | | Federal Obligation
Interest | |
| |
| |
Series A | | $ | 8,184,102 | |
Series C | | | 733,988 | |
Series M | | | 1,219,026 | |
Series P | | | 30,130 | |
Series S | | | 2,540,674 | |
| |
The law varies in each state as to whether and what percent of ordinary income dividends attributable to federal obligations is exempt from state income tax. Shareholders are advised to check with their tax advisers to determine if any portion of the dividends received is exempt from state income tax.
The following percentages, or maximum percentages allowable by law, of ordinary income distributions paid during the fiscal year ended March 31, 2024 qualified for the dividends-received deduction for corporate shareholders:
| | | | |
| |
| |
| Fund Name | | Dividends-Received Deduction | |
| |
| |
Series C | | | 0.83% | |
| |
The Funds hereby designates the following amounts, or maximum amounts allowable by law, as interest income eligible to be treated as a Section 163(j) interest dividend for the fiscal year ended March 31, 2024:
| | | | |
| |
| |
| Fund Name | | Interest Dividends | |
| |
| |
Series A | | $ | 137,231,994 | |
Series C | | | 18,598,346 | |
Series M | | | 42,909,167 | |
Series P | | | 431,315 | |
Series S | | | 17,060,429 | |
| |
The Funds hereby designate the following amounts, or maximum amounts allowable by law, as interest-related dividends eligible for exemption from U.S. withholding tax for nonresident aliens and foreign corporations for the fiscal year ended March 31, 2024:
| | | | |
| |
| |
| Fund Name | | Interest-Related
Dividends | |
| |
| |
Series A | | $ | 96,926,425 | |
Series C | | | 14,842,277 | |
Series M | | | 42,792,525 | |
Series P | | | 431,315 | |
Series S | | | 14,788,812 | |
| |
| | |
| 142 | | 2 0 2 4 BLACK ROCK ANNUAL REPORT TO SHAREHOLDERS |
Statement Regarding Liquidity Risk Management Program
In compliance with Rule 22e-4 under the Investment Company Act of 1940, as amended (the “Liquidity Rule”), BlackRock Allocation Target Shares (the “Trust”) has adopted and implemented a liquidity risk management program (the “Program”) for BATS: Series A Portfolio, BATS: Series C Portfolio, BATS: Series E Portfolio, BATS: Series M Portfolio, BATS: Series P Portfolio, BATS: Series S Portfolio and BATS: Series V Portfolio (the “Funds”), each a series of the Trust, which is reasonably designed to assess and manage each Fund’s liquidity risk.
The Board of Trustees (the “Board”) of the Trust, on behalf of the Funds, met on November 14-15, 2023 (the “Meeting”) to review the Program. The Board previously appointed BlackRock Advisors, LLC or BlackRock Fund Advisors (“BlackRock”), each an investment adviser to certain BlackRock funds, as the program administrator for each Fund’s Program, as applicable. BlackRock also previously delegated oversight of the Program to the 40 Act Liquidity Risk Management Committee (the “Committee”). At the Meeting, the Committee, on behalf of BlackRock, provided the Board with a report that addressed the operation of the Program and assessed its adequacy and effectiveness of implementation, including the management of each Fund’s Highly Liquid Investment Minimum (“HLIM”) where applicable, and any material changes to the Program (the “Report”). The Report covered the period from October 1, 2022 through September 30, 2023 (the “Program Reporting Period”).
The Report described the Program’s liquidity classification methodology for categorizing each Fund’s investments (including derivative transactions) into one of four liquidity buckets. It also referenced the methodology used by BlackRock to establish each Fund’s HLIM and noted that the Committee reviews and ratifies the HLIM assigned to each Fund no less frequently than annually. The Report also discussed notable events affecting liquidity over the Program Reporting Period, including the imposition of capital controls in certain countries.
The Report noted that the Program complied with the key factors for consideration under the Liquidity Rule for assessing, managing and periodically reviewing each Fund’s liquidity risk, as follows:
| | a) | The Fund’s investment strategy and liquidity of portfolio investments during both normal and reasonably foreseeable stressed conditions. During the Program Reporting Period, the Committee reviewed whether each Fund’s strategy is appropriate for an open-end fund structure with a focus on funds with more significant and consistent holdings of less liquid and illiquid assets. The Committee also factored a fund’s concentration in an issuer into the liquidity classification methodology by taking issuer position sizes into account. Where a fund participated in borrowings for investment purposes (such as tender option bonds or reverse repurchase agreements), such borrowings were factored into the Program’s calculation of a fund’s liquidity bucketing. A fund’s derivative exposure was also considered in such calculation. |
| | b) | Short-term and long-term cash flow projections during both normal and reasonably foreseeable stressed conditions. During the Program Reporting Period, the Committee reviewed historical redemption activity and used this information as a component to establish each Fund’s reasonably anticipated trading size utilized for liquidity classifications. Each Fund has adopted an in-kind redemption policy which may be utilized to meet larger redemption requests. The Committee may also take into consideration a fund’s shareholder ownership concentration (which, depending on product type and distribution channel, may or may not be available), a fund’s distribution channels, and the degree of certainty associated with a fund’s short-term and long-term cash flow projections. |
| | c) | Holdings of cash and cash equivalents, as well as borrowing arrangements. The Committee considered the terms of the credit facility committed to each Fund, the financial health of the institution providing the facility and the fact that the credit facility is shared among multiple funds (including that a portion of the aggregate commitment amount is specifically designated for BlackRock Floating Rate Income Portfolio, a series of BlackRock Funds V, and BlackRock Floating Rate Loan ETF, a series of BlackRock ETF Trust II). The Committee also considered other types of borrowing available to the funds, such as the ability to use reverse repurchase agreements and interfund lending, as applicable. |
There were no material changes to the Program during the Program Reporting Period other than the enhancement of certain model components in the Program’s classification methodology. The Report provided to the Board stated that the Committee concluded that based on the operation of the functions, as described in the Report, the Program is operating as intended and is effective in implementing the requirements of the Liquidity Rule.
| | |
STATEMENT REGARDING LIQUIDITY RISK MANAGEMENT PROGRAM | | 143 |
Trustee and Officer Information
| | | | | | | | |
| Independent Trustees(a) |
| | | | | |
Name Year of Birth(b) | | Position(s) Held
(Length of Service)(c) | | Principal Occupation(s) During Past 5 Years | | Number of BlackRock-Advised Registered Investment Companies (“RICs”) Consisting of Investment Portfolios (“Portfolios”) Overseen | | Public Company and Other Investment Company Directorships Held During Past 5 Years |
| | | | |
R. Glenn Hubbard 1958 | | Chair of the Board (Since 2022) Trustee
(Since 2019) | | Dean, Columbia Business School from 2004 to 2019; Faculty member, Columbia Business School since 1988. | | 68 RICs consisting of 102 Portfolios | | ADP (data and information services) from 2004 to 2020; Metropolitan Life Insurance Company (insurance); TotalEnergies SE (multi-energy) |
| | | | |
W. Carl Kester(d) 1951 | | Vice Chair of the Board (Since 2022) Trustee
(Since 2019) | | Baker Foundation Professor and George Fisher Baker Jr. Professor of Business Administration, Emeritus, Harvard Business School since 2022; George Fisher Baker Jr. Professor of Business Administration, Harvard Business School from 2008 to 2022; Deputy Dean for Academic Affairs from 2006 to 2010; Chairman of the Finance Unit, from 2005 to 2006; Senior Associate Dean and Chairman of the MBA Program from 1999 to 2005; Member of the faculty of Harvard Business School since 1981. | | 70 RICs consisting of 104 Portfolios | | None |
| | | | |
Cynthia L. Egan(d) 1955 | | Trustee (Since 2019) | | Advisor, U.S. Department of the Treasury from 2014 to 2015; President, Retirement Plan Services, for T. Rowe Price Group, Inc. from 2007 to 2012; executive positions within Fidelity Investments from 1989 to 2007. | | 70 RICs consisting of 104 Portfolios | | Unum (insurance); The Hanover Insurance Group (Board Chair); Huntsman Corporation (Lead Independent Director and non- Executive Vice Chair of the Board) (chemical products) |
| | | | |
Lorenzo A. Flores 1964 | | Trustee (Since 2021) | | Vice Chairman, Kioxia, Inc. since 2019; Chief Financial Officer, Xilinx, Inc. from 2016 to 2019; Corporate Controller, Xilinx, Inc. from 2008 to 2016. | | 68 RICs consisting of 102 Portfolios | | None |
| | | | |
Stayce D. Harris 1959 | | Trustee (Since 2021) | | Lieutenant General, Inspector General of the United States Air Force from 2017 to 2019; Lieutenant General, Assistant Vice Chief of Staff and Director, Air Staff, United States Air Force from 2016 to 2017; Major General, Commander, 22nd Air Force, AFRC, Dobbins Air Reserve Base, Georgia from 2014 to 2016; Pilot, United Airlines from 1990 to 2020. | | 68 RICs consisting of 102 Portfolios | | KULR Technology Group, Inc. in 2021; The Boeing Company (airplane manufacturer) |
| | | | |
J. Phillip Holloman 1955 | | Trustee (Since 2021) | | President and Chief Operating Officer, Cintas Corporation from 2008 to 2018. | | 68 RICs consisting of 102 Portfolios | | PulteGroup, Inc. (home construction); Rockwell Automation Inc. (industrial automation); Vestis Corporation (uniforms and facilities services) |
| | |
| 144 | | 2 0 2 4 BLACK ROCK ANNUAL REPORT TO SHAREHOLDERS |
Trustee and Officer Information (continued)
| | | | | | | | |
| Independent Trustees(a) |
| | | | | |
Name Year of Birth(b) | | Position(s) Held
(Length of Service)(c) | | Principal Occupation(s) During Past 5 Years | | Number of BlackRock-Advised Registered Investment Companies (“RICs”) Consisting of Investment Portfolios (“Portfolios”) Overseen | | Public Company and Other Investment Company Directorships Held During Past 5 Years |
| | | | |
Catherine A. Lynch(d) 1961 | | Trustee (Since 2019) | | Chief Executive Officer, Chief Investment Officer and various other positions, National Railroad Retirement Investment Trust from 2003 to 2016; Associate Vice President for Treasury Management, The George Washington University from 1999 to 2003; Assistant Treasurer, Episcopal Church of America from 1995 to 1999. | | 70 RICs consisting of 104 Portfolios | | PennyMac Mortgage Investment Trust |
| | | | |
Arthur P. Steinmetz(d) 1958 | | Trustee (Since 2023) | | Consultant, Posit PBC (enterprise data science) since 2020; Director, ScotiaBank (U.S.) from 2020 to 2023; Chairman, Chief Executive Officer and President of OppenheimerFunds, Inc. from 2015, 2014 and 2013, respectively to 2019; Trustee, President and Principal Executive Officer of 104 OppenheimerFunds funds from 2014 to 2019; Portfolio manager of various OppenheimerFunds fixed income mutual funds from 1986 to 2014. | | 70 RICs consisting of 104 Portfolios | | Trustee of 104 OppenheimerFunds funds from 2014 to 2019 |
| | | |
| | | Interested Trustees(a)(e) | | | | |
| | | | | |
Name Year of Birth(b) | | Position(s) Held
(Length of Service)(c) | | Principal Occupation(s) During Past 5 Years | | Number of BlackRock-Advised Registered Investment Companies (“RICs”) Consisting of Investment Portfolios (“Portfolios”) Overseen | | Public Company and Other Investment Company Directorships Held During Past 5 Years |
| | | | |
Robert Fairbairn 1965 | | Trustee (Since 2015) | | Vice Chairman of BlackRock, Inc. since 2019; Member of BlackRock’s Global Executive and Global Operating Committees; Co-Chair of BlackRock’s Human Capital Committee; Senior Managing Director of BlackRock, Inc. from 2010 to 2019; oversaw BlackRock’s Strategic Partner Program and Strategic Product Management Group from 2012 to 2019; Member of the Board of Managers of BlackRock Investments, LLC from 2011 to 2018; Global Head of BlackRock’s Retail and iShares® businesses from 2012 to 2016. | | 96 RICs consisting of 267 Portfolios | | None |
| | | | |
John M. Perlowski(d) 1964 | | Trustee (Since 2015), President and Chief Executive Officer (Since 2010) | | Managing Director of BlackRock, Inc. since 2009; Head of BlackRock Global Accounting and Product Services since 2009; Advisory Director of Family Resource Network (charitable foundation) since 2009. | | 98 RICs consisting of 269 Portfolios | | None |
| (a) | The address of each Trustee is c/o BlackRock, Inc., 50 Hudson Yards, New York, New York 10001. |
| (b) | Each Independent Trustee holds office until his or her successor is duly elected and qualifies or until his or her earlier death, resignation, retirement or removal as provided by the Trust’s by-laws or charter or statute, or until December 31 of the year in which he or she turns 75. Trustees who are “interested persons,” as defined in the Investment Company Act serve until their successor is duly elected and qualifies or until their earlier death, resignation, retirement or removal as provided by the Trust’s by-laws or statute, or until December 31 of the year in which they turn 72. The Board may determine to extend the terms of Independent Trustees on a case-by-case basis, as appropriate. |
| (c) | Following the combination of Merrill Lynch Investment Managers, L.P. (“MLIM”) and BlackRock, Inc. in September 2006, the various legacy MLIM and legacy BlackRock fund boards were realigned and consolidated into three new fund boards in 2007. Certain Independent Trustees first became members of the boards of other legacy MLIM or legacy BlackRock funds as follows: R. Glenn Hubbard, 2004 and W. Carl Kester, 1995. Certain other Independent Trustees became members of the boards of the closed-end funds in the Fixed-Income Complex as follows: Cynthia L. Egan, 2016; and Catherine A. Lynch, 2016. |
| (d) | Ms. Egan, Dr. Kester, Ms. Lynch, Mr. Steinmetz and Mr. Perlowski are also trustees of the BlackRock Credit Strategies Fund and BlackRock Private Investments Fund. |
| (e) | Mr. Fairbairn and Mr. Perlowski are both “interested persons,” as defined in the 1940 Act, of the Trust based on their positions with BlackRock, Inc. and its affiliates. Mr. Fairbairn and Mr. Perlowski are also board members of the BlackRock Multi-Asset Complex. |
| | |
TRUSTEE AND OFFICER INFORMATION | | 145 |
Trustee and Officer Information (continued)
| | | | |
| Officers Who Are Not Trustees(a) |
| | | |
Name Year of Birth(b) | | Position(s) Held (Length of Service) | | Principal Occupation(s) During Past 5 Years |
| | |
Jennifer McGovern 1977 | | Vice President (Since 2014) | | Managing Director of BlackRock, Inc. since 2016. |
| | |
Trent Walker 1974 | | Chief Financial Officer (Since 2021) | | Managing Director of BlackRock, Inc. since 2019; Executive Vice President of PIMCO from 2016 to 2019. |
| | |
Jay M. Fife 1970 | | Treasurer (Since 2007) | | Managing Director of BlackRock, Inc. since 2007. |
| | |
Aaron Wasserman 1974 | | Chief Compliance Officer (Since 2023) | | Managing Director of BlackRock, Inc. since 2018; Chief Compliance Officer of the BlackRock-advised funds in the BlackRock Multi-Asset Complex, the BlackRock Fixed-Income Complex and the iShares Complex since 2023; Deputy Chief Compliance Officer for the BlackRock-advised funds in the BlackRock Multi-Asset Complex, the BlackRock Fixed-Income Complex and the iShares Complex from 2014 to 2023. |
| | |
Lisa Belle 1968 | | Anti-Money Laundering Compliance Officer (Since 2019) | | Managing Director of BlackRock, Inc. since 2019; Global Financial Crime Head for Asset and Wealth Management of JP Morgan from 2013 to 2019. |
| | |
Janey Ahn 1975 | | Secretary (Since 2019) | | Managing Director of BlackRock, Inc. since 2018. |
| (a) | The address of each Officer is c/o BlackRock, Inc., 55 East 52nd Street, New York, New York 10001. |
| (b) | Officers of the Trust serve at the pleasure of the Board. |
Further information about the Trust’s Trustees and Officers is available in the Trust’s Statement of Additional Information, which can be obtained without charge by calling (800) 441-7762.
Effective July 1, 2023, Aaron Wasserman replaced Charles Park as Chief Compliance Officer of the Trust.
Effective December 31, 2023, Frank Fabozzi retired as Trustee of the Trust.
Effective January 19, 2024, Arthur Steinmetz became an Independent Trustee of the Trust.
| | |
| 146 | | 2 0 2 4 BLACK ROCK ANNUAL REPORT TO SHAREHOLDERS |
Additional Information
Proxy Results
A Special Meeting of Shareholders was held on November 9, 2023 for shareholders of record on September 11, 2023, to elect a Board of Trustees of the Funds.
Approved the Trustees as follows:
| | | | | | | | |
| | | | Votes For | | | | Votes Abstained | |
| | |
Lorenzo A. Flores | | | 499,702,260 | | | | 3,137,240 | |
Stayce D. Harris | | | 499,702,260 | | | | 3,137,240 | |
J. Phillip Holloman | | | 499,374,315 | | | | 3,465,185 | |
Arthur P. Steinmetz | | | 502,580,037 | | | | 259,463 | |
Board Members whose term of office continued after the Special Meeting of Shareholders because they were not up for election are R. Glenn Hubbard, W. Carl Kester, Cynthia L. Egan, Frank J. Fabozzi, Catherine A. Lynch, Robert Fairbairn and John M. Perlowski. Frank J. Fabozzi’s term as a Board Member of the Funds ended on December 31, 2023.
Tailored Shareholder Reports for Open-End Mutual Funds and ETFs
Effective January 24, 2023, the SEC adopted rule and form amendments to require open-end mutual funds and ETFs to transmit concise and visually engaging streamlined annual and semiannual reports to shareholders that highlight key information. Other information, including financial statements, will no longer appear in a streamlined shareholder report but must be available online, delivered free of charge upon request, and filed on a semiannual basis on Form N-CSR. The rule and form amendments have a compliance date of July 24, 2024. At this time, management is evaluating the impact of these amendments on the shareholder reports for the Funds.
General Information
Quarterly performance, semi-annual and annual reports, current net asset value and other information regarding the Funds may be found on BlackRock’s website, which can be accessed at blackrock.com. Any reference to BlackRock’s website in this report is intended to allow investors public access to information regarding the Funds and does not, and is not intended to, incorporate BlackRock’s website in this report.
Householding
The Funds will mail only one copy of shareholder documents, including prospectuses, annual and semi-annual reports, Rule 30e-3 notices and proxy statements, to shareholders with multiple accounts at the same address. This practice is commonly called “householding” and is intended to reduce expenses and eliminate duplicate mailings of shareholder documents. Mailings of your shareholder documents may be householded indefinitely unless you instruct us otherwise. If you do not want the mailing of these documents to be combined with those for other members of your household, please call the Funds at (800) 441-7762.
Availability of Quarterly Schedule of Investments
The Funds file their complete schedules of portfolio holdings with the SEC for the first and third quarters of each fiscal year as an exhibit to their reports on Form N-PORT. The Funds’ Forms N-PORT are available on the SEC’s website at sec.gov. Additionally, each Fund makes its portfolio holdings for the first and third quarters of each fiscal year available at blackrock.com/fundreports.
Availability of Proxy Voting Policies, Procedures and Voting Records
A description of the policies and procedures that the Funds use to determine how to vote proxies relating to portfolio securities and information about how the Funds voted proxies relating to securities held in the Funds’ portfolios during the most recent 12-month period ended June 30 is available without charge, upon request (1) by calling (800) 441-7762; (2) on the BlackRock website at blackrock.com; and (3) on the SEC’s website at sec.gov.
BlackRock Privacy Principles
BlackRock is committed to maintaining the privacy of its current and former fund investors and individual clients (collectively, “Clients”) and to safeguarding their non-public personal information. The following information is provided to help you understand what personal information BlackRock collects, how we protect that information and why in certain cases we share such information with select parties.
If you are located in a jurisdiction where specific laws, rules or regulations require BlackRock to provide you with additional or different privacy-related rights beyond what is set forth below, then BlackRock will comply with those specific laws, rules or regulations.
BlackRock obtains or verifies personal non-public information from and about you from different sources, including the following: (i) information we receive from you or, if applicable, your financial intermediary, on applications, forms or other documents; (ii) information about your transactions with us, our affiliates, or others; (iii) information we receive from a consumer reporting agency; and (iv) from visits to our websites.
BlackRock does not sell or disclose to non-affiliated third parties any non-public personal information about its Clients, except as permitted by law or as is necessary to respond to regulatory requests or to service Client accounts. These non-affiliated third parties are required to protect the confidentiality and security of this information and to use it only for its intended purpose.
| | |
ADDITIONAL INFORMATION | | 147 |
Additional Information (continued)
We may share information with our affiliates to service your account or to provide you with information about other BlackRock products or services that may be of interest to you. In addition, BlackRock restricts access to non-public personal information about its Clients to those BlackRock employees with a legitimate business need for the information. BlackRock maintains physical, electronic and procedural safeguards that are designed to protect the non-public personal information of its Clients, including procedures relating to the proper storage and disposal of such information.
| | |
| 148 | | 2 0 2 4 BLACK ROCK ANNUAL REPORT TO SHAREHOLDERS |
Additional Information (continued)
Fund and Service Providers
Investment Adviser
BlackRock Advisors, LLC
Wilmington, DE 19809
Sub-Advisor(a)
BlackRock International Limited
Edinburgh EH3 8BL, United Kingdom
Accounting Agent, Administrator and Transfer Agent
BNY Mellon Investment Servicing (US) Inc.
Wilmington, DE 19809
Custodian
The Bank of New York Mellon
New York, NY 10286
Independent Registered Public Accounting Firm
Deloitte & Touche LLP
Boston, MA 02116
Distributor
BlackRock Investments, LLC
New York, NY 10001
Legal Counsel
Willkie Farr & Gallagher LLP
New York, NY 10019
Address of the Trust
100 Bellevue Parkway
Wilmington, DE 19809
| (a) | Excludes BATS: Series E Portfolio and BATS: Series V Portfolio |
| | |
ADDITIONAL INFORMATION | | 149 |
Glossary of Terms Used in this Report
| | |
| Currency Abbreviation |
| |
| CAD | | Canadian Dollar |
| |
| EUR | | Euro |
| |
| JPY | | Japanese Yen |
| |
| USD | | United States Dollar |
|
| Portfolio Abbreviation |
| |
| ABS | | Asset-Backed Security |
| |
| AGM | | Assured Guaranty Municipal Corp. |
| |
| AMT | | Alternative Minimum Tax |
| |
| BAN | | Bond Anticipation Notes |
| |
| CLO | | Collateralized Loan Obligation |
| |
| COL | | Collateralized |
| |
| DAC | | Designated Activity Co. |
| |
| EDA | | Economic Development Authority |
| |
| EDC | | Economic Development Corp. |
| |
| EURIBOR | | Euro Interbank Offered Rate |
| |
| FHLMC | | Federal Home Loan Mortgage Corp. |
| |
| FNMA | | Federal National Mortgage Association |
| |
| GNMA | | Government National Mortgage Association |
| |
| GO | | General Obligation Bonds |
| |
| GTD | | Guaranteed |
| |
| HDA | | Housing Development Authority |
| |
| HFA | | Housing Finance Agency |
| |
| IDA | | Industrial Development Authority |
| |
| IDB | | Industrial Development Board |
| |
| IDC | | Industrial Development Corp. |
| |
| IO | | Interest Only |
| |
| ISD | | Independent School District |
| |
| LIBOR | | London Interbank Offered Rate |
| |
| LIQ | | Liquidity Agreement |
| |
| LOC | | Letter of Credit |
| |
| LP | | Limited Partnership |
| |
| OTC | | Over-the-Counter |
| |
| RB | | Revenue Bonds |
| |
| REMIC | | Real Estate Mortgage Investment Conduit |
| |
| SBPA | | Stand-By Bond Purchase Agreements |
| |
| SOFR | | Secured Overnight Financing Rate |
| |
| TA | | Tax Allocation |
| |
| TBA | | To-be-Announced |
| |
| TECP | | Tax-Exempt Commercial Paper |
| |
| TONA | | Tokyo Overnight Average Rate |
| |
| VRDN | | Variable Rate Demand Note |
| | |
| 150 | | 2 0 2 4 BLACK ROCK ANNUAL REPORT TO SHAREHOLDERS |
THIS PAGE INTENTIONALLY LEFT BLANK.
Want to know more?
blackrock.com | 800-441-7762
This report is intended for current holders. It is not authorized for use as an offer of sale or a solicitation of an offer to buy shares of the Funds unless preceded or accompanied by the Funds’ current prospectus. Past performance results shown in this report should not be considered a representation of future performance. Investment returns and principal value of shares will fluctuate so that shares, when redeemed, may be worth more or less than their original cost. Statements and other information herein are as dated and are subject to change.
BATS-03/24-AR
(b) Not Applicable
| Item 2 – | Code of Ethics – The registrant (or the “Fund”) has adopted a code of ethics, as of the end of the period covered by this report, applicable to the registrant’s principal executive officer, principal financial officer, principal accounting officer or controller, or persons performing similar functions. During the period covered by this report, the code of ethics was amended to update certain information and to make other non-material changes. During the period covered by this report, there have been no waivers granted under the code of ethics. The registrant undertakes to provide a copy of the code of ethics to any person upon request, without charge, who calls 1-800-441-7762. |
| Item 3 – | Audit Committee Financial Experts – The registrant’s board of directors (the “board of directors”), has determined that (i) the registrant has the following audit committee financial experts serving on its audit committee and (ii) each audit committee financial expert is independent: |
Lorenzo A. Flores
Catherine A. Lynch
Arthur P. Steinmetz
Under applicable securities laws, a person determined to be an audit committee financial expert will not be deemed an “expert” for any purpose, including without limitation for the purposes of Section 11 of the Securities Act of 1933, as a result of being designated or identified as an audit committee financial expert. The designation or identification as an audit committee financial expert does not impose on such person any duties, obligations, or liabilities greater than the duties, obligations, and liabilities imposed on such person as a member of the audit committee and board of directors in the absence of such designation or identification. The designation or identification of a person as an audit committee financial expert does not affect the duties, obligations, or liability of any other member of the audit committee or board of directors.
| Item 4 – | Principal Accountant Fees and Services |
The following table presents fees billed by Deloitte & Touche LLP (“D&T”) in each of the last two fiscal years for the services rendered to the Fund:
| | | | | | | | | | | | | | | | |
| | | | | |
| | | (a) Audit Fees | | (b) Audit-Related Fees1 | | (c) Tax Fees2 | | (d) All Other Fees |
| | | | | | | | | |
| Entity Name | | Current
Fiscal Year
End | | Previous
Fiscal Year
End | | Current
Fiscal Year
End | | Previous
Fiscal Year
End | | Current
Fiscal Year
End | | Previous
Fiscal Year
End | | Current
Fiscal Year
End | | Previous
Fiscal Year
End |
| | | | | | | | | |
| BATS: Series A Portfolio | | $41,718 | | $41,718 | | $0 | | $44 | | $17,576 | | $17,600 | | $407 | | $218 |
| | | | | | | | | |
| BATS: Series C Portfolio | | $36,720 | | $36,720 | | $0 | | $44 | | $17,576 | | $17,600 | | $407 | | $218 |
| | | | | | | | | |
| BATS: Series E Portfolio | | $42,738 | | $42,738 | | $0 | | $44 | | $15,600 | | $15,600 | | $407 | | $218 |
| | | | | | | | | |
| BATS: Series M Portfolio | | $32,640 | | $32,640 | | $0 | | $44 | | $17,576 | | $17,600 | | $407 | | $218 |
| | | | | | | | | |
| BATS: Series P Portfolio | | $20,808 | | $20,808 | | $0 | | $44 | | $17,576 | | $17,600 | | $407 | | $218 |
| | | | | | | | | |
| BATS: Series S Portfolio | | $36,720 | | $36,720 | | $0 | | $44 | | $17,576 | | $17,600 | | $407 | | $218 |
| | | | | | | | | |
| BATS: Series V Portfolio | | $42,738 | | $42,738 | | $0 | | $44 | | $15,600 | | $22,100 | | $407 | | $218 |
2
The following table presents fees billed by D&T that were required to be approved by the registrant’s audit committee (the “Committee”) for services that relate directly to the operations or financial reporting of the Fund and that are rendered on behalf of BlackRock Advisors, LLC (the “Investment Adviser” or “BlackRock”) and entities controlling, controlled by, or under common control with BlackRock (not including any sub-adviser whose role is primarily portfolio management and is subcontracted with or overseen by another investment adviser) that provide ongoing services to the Fund (“Affiliated Service Providers”):
| | | | |
| | | |
| | | Current Fiscal Year End | | Previous Fiscal Year End |
| | | |
(b) Audit-Related Fees1 | | $0 | | $0 |
| | | |
(c) Tax Fees2 | | $0 | | $0 |
| | | |
(d) All Other Fees3 | | $2,149,000 | | $2,154,000 |
1 The nature of the services includes assurance and related services reasonably related to the performance of the audit or review of financial statements not included in Audit Fees, including accounting consultations, agreed-upon procedure reports, attestation reports, comfort letters, out-of-pocket expenses and internal control reviews not required by regulators.
2 The nature of the services includes tax compliance and/or tax preparation, including services relating to the filing or amendment of federal, state or local income tax returns, regulated investment company qualification reviews, taxable income and tax distribution calculations.
3 Non-audit fees of $2,149,000 and $2,154,000 for the current fiscal year and previous fiscal year, respectively, were paid to the Fund’s principal accountant in their entirety by BlackRock, in connection with services provided to the Affiliated Service Providers of the Fund and of certain other funds sponsored and advised by BlackRock or its affiliates for a service organization review and an accounting research tool subscription. These amounts represent aggregate fees paid by BlackRock and were not allocated on a per fund basis.
(e)(1) Audit Committee Pre-Approval Policies and Procedures:
The Committee has adopted policies and procedures with regard to the pre-approval of services. Audit, audit-related and tax compliance services provided to the registrant on an annual basis require specific pre-approval by the Committee. The Committee also must approve other non-audit services provided to the registrant and those non-audit services provided to the Investment Adviser and Affiliated Service Providers that relate directly to the operations and the financial reporting of the registrant. Certain of these non-audit services that the Committee believes are (a) consistent with the SEC’s auditor independence rules and (b) routine and recurring services that will not impair the independence of the independent accountants may be approved by the Committee without consideration on a specific case-by-case basis (“general pre-approval”). The term of any general pre-approval is 12 months from the date of the pre-approval, unless the Committee provides for a different period. Tax or other non-audit services provided to the registrant which have a direct impact on the operations or financial reporting of the registrant will only be deemed pre-approved provided that any individual project does not exceed $10,000 attributable to the registrant or $50,000 per project. For this purpose, multiple projects will be aggregated to determine if they exceed the previously mentioned cost levels.
Any proposed services exceeding the pre-approved cost levels will require specific pre-approval by the Committee, as will any other services not subject to general pre-approval (e.g., unanticipated but permissible services). The Committee is informed of each service approved subject to general pre-approval at the next regularly scheduled in-person board meeting. At this meeting, an analysis of such services is presented to the Committee for ratification. The Committee may delegate to the Committee Chairman the authority to approve the provision of and fees for any specific engagement of permitted non-audit services, including services exceeding pre-approved cost levels.
3
(e)(2) None of the services described in each of Items 4(b) through (d) were approved by the Committee pursuant to the de minimis exception in paragraph (c)(7)(i)(C) of Rule 2-01 of Regulation S-X.
(f) Not Applicable
(g) The aggregate non-audit fees, defined as the sum of the fees shown under “Audit-Related Fees,” “Tax Fees” and “All Other Fees,” paid to the accountant for services rendered by the accountant to the registrant, the Investment Adviser and the Affiliated Service Providers were:
| | | | | | |
| | | | |
| Entity Name | | Current Fiscal Year End | | Previous Fiscal Year End | | |
| BATS: Series A Portfolio | | $17,983 | | $17,862 |
| BATS: Series C Portfolio | | $17,983 | | $17,862 |
| BATS: Series E Portfolio | | $16,007 | | $15,862 |
| BATS: Series M Portfolio | | $17,983 | | $17,862 |
| BATS: Series P Portfolio | | $17,983 | | $17,862 |
| BATS: Series S Portfolio | | $17,983 | | $17,862 |
| BATS: Series V Portfolio | | $16,007 | | $22,362 |
Additionally, the amounts billed by D&T in connection with services provided to the Affiliated Service Providers of the Fund and of other funds sponsored and advised by BlackRock or its affiliates during the current and previous fiscal years for a service organization review and an accounting research tool subscription were:
| | |
Current Fiscal Year End | | Previous Fiscal Year
End |
| $2,149,000 | | $2,154,000 |
These amounts represent aggregate fees paid by BlackRock and were not allocated on a per fund basis.
(h) The Committee has considered and determined that the provision of non-audit services that were rendered to the Investment Adviser and the Affiliated Service Providers that were not pre-approved pursuant to paragraph (c)(7)(ii) of Rule 2-01 of Regulation S-X is compatible with maintaining the principal accountant’s independence.
(i) – Not Applicable
(j) – Not Applicable
| Item 5 – | Audit Committee of Listed Registrant – Not Applicable |
(a) The registrant’s Schedule of Investments is included as part of the Report to Stockholders filed under Item 1(a) of this Form.
4
(b) Not Applicable due to no such divestments during the semi-annual period covered since the previous Form N-CSR filing.
| Item 7 – | Disclosure of Proxy Voting Policies and Procedures for Closed-End Management Investment Companies – Not Applicable |
| Item 8 – | Portfolio Managers of Closed-End Management Investment Companies – Not Applicable |
| Item 9 – | Purchases of Equity Securities by Closed-End Management Investment Company and Affiliated Purchasers – Not Applicable |
| Item 10 – | Submission of Matters to a Vote of Security Holders – There have been no material changes to these procedures. |
| Item 11 – | Controls and Procedures |
(a) The registrant’s principal executive and principal financial officers, or persons performing similar functions, have concluded that the registrant’s disclosure controls and procedures (as defined in Rule 30a-3(c) under the Investment Company Act of 1940, as amended (the “1940 Act”)) are effective as of a date within 90 days of the filing of this report based on the evaluation of these controls and procedures required by Rule 30a-3(b) under the 1940 Act and Rule 15d-15(b) under the Securities Exchange Act of 1934, as amended.
(b) There were no changes in the registrant’s internal control over financial reporting (as defined in Rule 30a-3(d) under the 1940 Act) that occurred during the period covered by this report that have materially affected, or are reasonably likely to materially affect, the registrant’s internal control over financial reporting.
| Item 12 – | Disclosure of Securities Lending Activities for Closed-End Management Investment Companies – Not Applicable |
| Item 13 – | Recovery of Erroneously Awarded Compensation – Not Applicable |
| Item 14 – | Exhibits attached hereto |
(a)(1) Code of Ethics – See Item 2
(a)(2) Section 302 Certifications are attached
(a)(3) Any written solicitation to purchase securities under Rule 23c-1 – Not Applicable
(a)(4) Change in Registrant’s independent public accountant – Not Applicable
(b) Section 906 Certifications are attached
5
Pursuant to the requirements of the Securities Exchange Act of 1934 and the Investment Company Act of 1940, the registrant has duly caused this report to be signed on its behalf by the undersigned, thereunto duly authorized.
BlackRock Allocation Target Shares
| | | | |
| | By: | | /s/ John M. Perlowski |
| | | | John M. Perlowski |
| | | | Chief Executive Officer (principal executive officer) of |
| | | | BlackRock Allocation Target Shares |
Date: May 22, 2024
Pursuant to the requirements of the Securities Exchange Act of 1934 and the Investment Company Act of 1940, this report has been signed below by the following persons on behalf of the registrant and in the capacities and on the dates indicated.
| | | | |
| | By: | | /s/ John M. Perlowski |
| | | | John M. Perlowski |
| | | | Chief Executive Officer (principal executive officer) of |
| | | | BlackRock Allocation Target Shares |
Date: May 22, 2024
| | | | |
| | By: | | /s/ Trent Walker |
| | | | Trent Walker |
| | | | Chief Financial Officer (principal financial officer) of |
| | | | BlackRock Allocation Target Shares |
Date: May 22, 2024
6