UNITED STATES
SECURITIES AND EXCHANGE COMMISSION
Washington, D.C. 20549
FORM N-CSR
CERTIFIED SHAREHOLDER REPORT OF REGISTERED MANAGEMENT INVESTMENT COMPANIES
Investment Company Act file number: 811-21457
Name of Fund: BlackRock Allocation Target Shares
BATS: Series I Portfolio
Fund Address: 100 Bellevue Parkway, Wilmington, DE 19809
Name and address of agent for service: John M. Perlowski, Chief Executive Officer, BlackRock Allocation Target Shares, 50 Hudson Yards, New York, NY 10001
Registrant’s telephone number, including area code: (800) 441-7762
Date of fiscal year end: 09/30/2024
Date of reporting period: 09/30/2024
Item 1 – Reports to Stockholders
(a) The Reports to Shareholders are attached herewith.
BlackRock Allocation Target Shares: Series I Portfolio
Annual Shareholder Report — September 30, 2024
This annual shareholder report contains important information about BlackRock Allocation Target Shares: Series I Portfolio (the “Fund”) for the period of March 6, 2024 to September 30, 2024.You can find additional information about the Fund at blackrock.com/fundreports. You can also request this information by contacting us at (800) 441-7762.
What were the Fund costs for the period?
(based on a hypothetical $10,000 investment)
| Fund name | Costs of a $10,000 investment | Costs paid as a percentage of a $10,000 investment |
|---|
| BlackRock Allocation Target Shares: Series I Portfolio | $0Footnote Reference(a) | -%Footnote Reference(b) |
| Footnote | Description |
Footnote(a) | The Fund commenced operations during the reporting period. Expenses for a full reporting would be higher than the amount shown. |
Footnote(b) | Annualized. |
How did the Fund perform last year?
For the abbreviated reporting period starting March 6, 2024 and ended September 30, 2024, the Fund returned 5.28%.
For the same period, the Bloomberg U.S. Universal Index returned 5.50%.
What contributed to performance?
Positive contributions to the Fund’s absolute performance were highlighted by allocations to corporate bonds, including European investment grade, U.S. high yield and U.S. investment grade issues. Exposure to securitized sectors including agency mortgage-backed securities, asset-backed securities, commercial mortgage-backed securities and non-agency mortgage-backed securities also proved additive, along with holdings of floating rate bank loans. Finally, the Fund’s positioning with respect to U.S. duration and corresponding interest rate sensitivity contributed as well. The Fund's cash position had no material impact on performance.
What detracted from performance?
The Fund’s exposure to emerging market bonds was the sole detractor from absolute performance.
The views expressed reflect the opinions of BlackRock as of the date of this report and are subject to change based on changes in market, economic or other conditions. These views are not intended to be a forecast of future events and are no guarantee of future results.
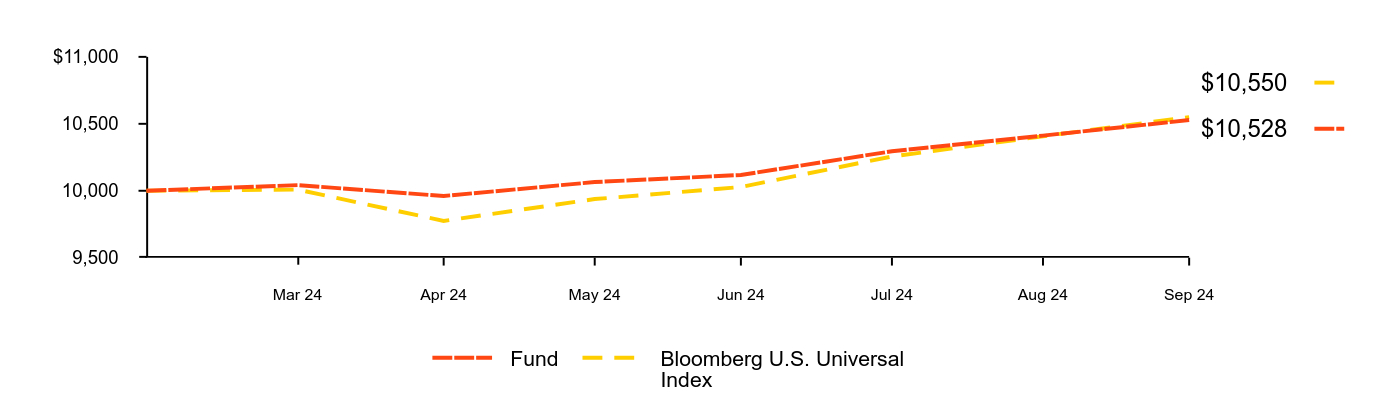
Cumulative performance: March 6, 2024 through September 30, 2024
Initial Investment of $10,000
| Fund | Bloomberg U.S. Universal Index |
|---|
| Feb 24 | $10,000 | $10,000 |
| Mar 24 | $10,042 | $10,009 |
| Apr 24 | $9,961 | $9,775 |
| May 24 | $10,065 | $9,938 |
| Jun 24 | $10,118 | $10,028 |
| Jul 24 | $10,295 | $10,256 |
| Aug 24 | $10,412 | $10,407 |
| Sep 24 | $10,528 | $10,550 |
See “Average annual total returns” for additional information on fund performance.
Average annual total returns
As of the date of this report, the Fund does not have a full fiscal year of performance information to report.
Net Assets........................................................................................................................................................................................................................................................................................................................................................................................................................................................................................................................................................................................................................................................................................................................................................................................................................................................................................................................................................................................................................................ | $55,921,373 |
Number of Portfolio Holdings........................................................................................................................................................................................................................................................................................................................................................................................................................................................................................................................................................................................................................................................................................................................................................................................................................................................................................................................................................................................................................................ | 676 |
Net Investment Advisory Fees........................................................................................................................................................................................................................................................................................................................................................................................................................................................................................................................................................................................................................................................................................................................................................................................................................................................................................................................................................................................................................................ | $0 |
Portfolio Turnover Rate........................................................................................................................................................................................................................................................................................................................................................................................................................................................................................................................................................................................................................................................................................................................................................................................................................................................................................................................................................................................................................................ | 137% |
The Fund commenced operations on March 6, 2024.
Past performance is not an indication of future results. Performance results may include adjustments made for financial reporting purposes in accordance with U.S. generally accepted accounting principles. Performance results do not reflect the deduction of taxes that a shareholder would pay on fund distributions or on the redemption or sale of fund shares. Visit blackrock.com for more recent performance information.
What did the Fund invest in?
(as of September 30, 2024)
Credit quality allocation
| Investment Type | Percent of Total InvestmentsFootnote Reference(a) |
|---|
Corporate Bonds........................................................................................................................................................................................................................................................................................................................................................................................................................................................................................................................................................................................................................................................................................................................................................................................................................................................................................................................................................................................................................................ | 54.5% |
Asset-Backed Securities........................................................................................................................................................................................................................................................................................................................................................................................................................................................................................................................................................................................................................................................................................................................................................................................................................................................................................................................................................................................................................................ | 16.8 |
U.S. Government Sponsored Agency Securities........................................................................................................................................................................................................................................................................................................................................................................................................................................................................................................................................................................................................................................................................................................................................................................................................................................................................................................................................................................................................................................ | 13.8 |
Non-Agency Mortgage-Backed Securities........................................................................................................................................................................................................................................................................................................................................................................................................................................................................................................................................................................................................................................................................................................................................................................................................................................................................................................................................................................................................................................ | 8.6 |
Foreign Government Obligations........................................................................................................................................................................................................................................................................................................................................................................................................................................................................................................................................................................................................................................................................................................................................................................................................................................................................................................................................................................................................................................ | 5.4 |
Foreign Agency Obligations........................................................................................................................................................................................................................................................................................................................................................................................................................................................................................................................................................................................................................................................................................................................................................................................................................................................................................................................................................................................................................................ | 0.9 |
|
Credit RatingFootnote Reference(b) | Percent of Total InvestmentsFootnote Reference(a) |
|---|
AAA/AaaFootnote Reference(c)........................................................................................................................................................................................................................................................................................................................................................................................................................................................................................................................................................................................................................................................................................................................................................................................................................................................................................................................................................................................................................................ | 32.7% |
AA/Aa........................................................................................................................................................................................................................................................................................................................................................................................................................................................................................................................................................................................................................................................................................................................................................................................................................................................................................................................................................................................................................................ | 2.2 |
A........................................................................................................................................................................................................................................................................................................................................................................................................................................................................................................................................................................................................................................................................................................................................................................................................................................................................................................................................................................................................................................ | 7.6 |
BBB/Baa........................................................................................................................................................................................................................................................................................................................................................................................................................................................................................................................................................................................................................................................................................................................................................................................................................................................................................................................................................................................................................................ | 12.6 |
BB/Ba........................................................................................................................................................................................................................................................................................................................................................................................................................................................................................................................................................................................................................................................................................................................................................................................................................................................................................................................................................................................................................................ | 26.4 |
B........................................................................................................................................................................................................................................................................................................................................................................................................................................................................................................................................................................................................................................................................................................................................................................................................................................................................................................................................................................................................................................ | 13.0 |
CCC/Caa........................................................................................................................................................................................................................................................................................................................................................................................................................................................................................................................................................................................................................................................................................................................................................................................................................................................................................................................................................................................................................................ | 0.7 |
N/R........................................................................................................................................................................................................................................................................................................................................................................................................................................................................................................................................................................................................................................................................................................................................................................................................................................................................................................................................................................................................................................ | 4.8 |
| Footnote | Description |
Footnote(a) | Excludes short-term securities, short investments and options, if any. |
Footnote(b) | For purposes of this report, credit quality ratings shown above reflect the highest rating assigned by either S&P Global Ratings or Moody’s Investors Service, Inc. if ratings differ. These rating agencies are independent, nationally recognized statistical rating organizations and are widely used. Investment grade ratings are credit ratings of BBB/Baa or higher. Below investment grade ratings are credit ratings of BB/Ba or lower. Investments designated N/R are not rated by either rating agency. Unrated investments do not necessarily indicate low credit quality. Credit quality ratings are subject to change. |
Footnote(c) | The investment adviser evaluates the credit quality of unrated investments based upon certain factors including, but not limited to, credit ratings for similar investments and financial analysis of sectors, individual investments and/or issuers. Using this approach, the investment adviser has deemed unrated U.S. Government Sponsored Agency Securities and U.S. Treasury Obligations to be of similar credit quality as investments rated AAA/Aaa. |
If you wish to view additional information about the Fund, including but not limited to financial statements, the Fund’s prospectus, and proxy voting policies and procedures, please visit blackrock.com/fundreports. For proxy voting records, visit blackrock.com/proxyrecords.
The Fund will mail only one copy of shareholder documents, including prospectuses, annual and semi-annual reports and proxy statements, to shareholders with multiple accounts at the same address. This practice is commonly called “householding” and is intended to reduce expenses and eliminate duplicate mailings of shareholder documents. Mailings of your shareholder documents may be householded indefinitely unless you instruct us otherwise. If you do not want the mailing of these documents to be combined with those for other members of your household, please call the Fund at (800) 441-7762.
The Fund is not sponsored, endorsed, issued, sold, or promoted by Bloomberg Index Services Limited and its affiliates, nor does this company make any representation regarding the advisability of investing in the Fund. BlackRock is not affiliated with the company listed above.
© 2024 BlackRock, Inc. or its affiliates. All rights reserved. BLACKROCK is a registered trademark of BlackRock, Inc. or its affiliates. All other trademarks are those of their respective owners.
BlackRock Allocation Target Shares: Series I Portfolio
Annual Shareholder Report — September 30, 2024
(b) Not Applicable
Item 2 – Code of Ethics – The registrant (or the “Fund”) has adopted a code of ethics, as of the end of the period covered by this report, applicable to the registrant’s principal executive officer, principal financial officer, principal accounting officer or controller, or persons performing similar functions. During the period covered by this report, the code of ethics was amended to update certain information and to make other non-material changes. During the period covered by this report, there have been no waivers granted under the code of ethics. The registrant undertakes to provide a copy of the code of ethics to any person upon request, without charge, who calls 1-800-441-7762.
Item 3 – Audit Committee Financial Expert – The registrant’s board of directors (the “board of directors”), has determined that (i) the registrant has the following audit committee financial experts serving on its audit committee and (ii) each audit committee financial expert is independent:
Lorenzo A. Flores
Catherine A. Lynch
Arthur P. Steinmetz
Under applicable securities laws, a person determined to be an audit committee financial expert will not be deemed an “expert” for any purpose, including without limitation for the purposes of Section 11 of the Securities Act of 1933, as a result of being designated or identified as an audit committee financial expert. The designation or identification of a person as an audit committee financial expert does not impose on such person any duties, obligations, or liabilities greater than the duties, obligations, and liabilities imposed on such person as a member of the audit committee and board of directors in the absence of such designation or identification. The designation or identification of a person as an audit committee financial expert does not affect the duties, obligations, or liability of any other member of the audit committee or board of directors.
Item 4 – Principal Accountant Fees and Services
The following table presents fees billed by Deloitte & Touche LLP (“D&T”) in each of the last two fiscal years for the services rendered to the Fund:
| | (a) Audit Fees | (b) Audit-Related Fees1 | (c) Tax Fees2 | (d) All Other Fees |
Entity Name | Current Fiscal Year End | Previous Fiscal Year End | Current Fiscal Year End | Previous Fiscal Year End | Current Fiscal Year End | Previous Fiscal Year End | Current Fiscal Year End | Previous Fiscal Year End |
| BATS: Series I Portfolio | $36,720 | $0 | $0 | $0 | $17,600 | $0 | $0 | $0 |
The following table presents fees billed by D&T that were required to be approved by the registrant’s audit committee (the “Committee”) for services that relate directly to the operations or financial reporting of the Fund and that are rendered on behalf of BlackRock Advisors, LLC (the “Investment Adviser” or “BlackRock”) and entities controlling, controlled by, or under common control with BlackRock (not including any sub-adviser whose role is primarily portfolio management and is subcontracted with or overseen by another investment adviser) that provide ongoing services to the Fund (“Affiliated Service Providers”):
| | Current Fiscal Year End | Previous Fiscal Year End |
(b) Audit-Related Fees1 | $0 | $0 |
(c) Tax Fees2 | $0 | $0 |
(d) All Other Fees3 | $2,149,000 | $2,154,000 |
1 The nature of the services includes assurance and related services reasonably related to the performance of the audit or review of financial statements not included in Audit Fees, including accounting consultations, agreed-upon procedure reports, attestation reports, comfort letters, out-of-pocket expenses and internal control reviews not required by regulators.
2 The nature of the services includes tax compliance and/or tax preparation, including services relating to the filing or amendment of federal, state or local income tax returns, regulated investment company qualification reviews, taxable income and tax distribution calculations.
3 Paid in their entirety by BlackRock, relating to a service organization review ("SSAE 18") and subscription to the Deloitte Accounting Research Tool. These amounts represent the aggregate fees paid by BlackRock and were not specifically allocated on a per Fund basis.
(e)(1) Audit Committee Pre-Approval Policies and Procedures:
The Committee has adopted policies and procedures with regard to the pre-approval of services. Audit, audit-related and tax compliance services provided to the registrant on an annual basis require specific pre-approval by the Committee. The Committee also must approve other non-audit services provided to the registrant and those non-audit services provided to the Investment Adviser and Affiliated Service Providers that relate directly to the operations and the financial reporting of the registrant. Certain of these non-audit services that the Committee believes are (a) consistent with the SEC’s auditor independence rules and (b) routine and recurring services that will not impair the independence of the independent accountants may be approved by the Committee without consideration on a specific case-by-case basis (“general pre-approval”). The term of any general pre-approval is 12 months from the date of the pre-approval, unless the Committee provides for a different period. Tax or other non-audit services provided to the registrant which have a direct impact on the operations or financial reporting of the registrant will only be deemed pre-approved provided that any individual project does not exceed $10,000 attributable to the registrant or $50,000 per project. For this purpose, multiple projects will be aggregated to determine if they exceed the previously mentioned cost levels.
Any proposed services exceeding the pre-approved cost levels will require specific pre-approval by the Committee, as will any other services not subject to general pre-approval (e.g., unanticipated but permissible services). The Committee is informed of each service approved subject to general pre-approval at the next regularly scheduled in-person board meeting. At this meeting, an analysis of such services is presented to the Committee for ratification. The Committee may delegate to the Committee Chairman the authority to approve the provision of and fees for any specific engagement of permitted non-audit services, including services exceeding pre-approved cost levels.
(e)(2) None of the services described in each of Items 4(b) through (d) were approved by the Committee pursuant to the de minimis exception in paragraph (c)(7)(i)(C) of Rule 2-01 of Regulation S-X.
(f) Not Applicable
(g) The aggregate non-audit fees, defined as the sum of the fees shown under “Audit-Related Fees,” “Tax Fees” and “All Other Fees,” paid to the accountant for services rendered by the accountant to the registrant, the Investment Adviser and the Affiliated Service Providers were:
Entity Name | Current Fiscal Year End | Previous Fiscal Year End |
| BATS: Series I Portfolio | $17,600 | $0 |
Additionally, the amounts billed by D&T in connection with services provided to the Affiliated Service Providers of the Fund and of other funds sponsored or advised by BlackRock or its affiliates during the current and previous fiscal years for a service organization review and an accounting research tool subscription were:
Current Fiscal Year End | Previous Fiscal Year End |
| $2,149,000 | $2,154,000 |
These amounts represent aggregate fees paid by BlackRock and were not allocated on a per fund basis.
(h) The Committee has considered and determined that the provision of non-audit services that were rendered to the Investment Adviser, and the Affiliated Service Providers that were not pre-approved pursuant to paragraph (c)(7)(ii) of Rule 2-01 of Regulation S-X is compatible with maintaining the principal accountant’s independence.
(i) – Not Applicable
(j) – Not Applicable
Item 5 – Audit Committee of Listed Registrant – Not Applicable
Item 6 – Investments
(a) The registrant’s Schedule of Investments is included as part of the Financial Statement and Financial Highlights for Open-End Management Investment Companies filed under Item 7(a) of this Form.
(b) Not Applicable due to no such divestments during the semi-annual period covered since the previous Form N-CSR filing.
Item 7 – Financial Statements and Financial Highlights for Open-End Management Investment Companies
(a) The registrant’s Financial Statements are attached herewith.
(b) The registrant’s Financial Highlights are attached herewith.
Not
FDIC
Insured
-
May
Lose
Value
-
No
Bank
Guarantee
2024
Annual
Financial
Statements
and
Additional
Information
BlackRock
Allocation
Target
Shares
BATS:
Series
I
Portfolio
The
Benefits
and
Risks
of
Leveraging
..........................................................................................
3
Derivative
Financial
Instruments
.............................................................................................
3
Schedule
of
Investments
..................................................................................................
4
Statement
of
Assets
and
Liabilities
............................................................................................
24
Statement
of
Operations
..................................................................................................
26
Statement
of
Changes
in
Net
Assets
...........................................................................................
27
Financial
Highlights
.....................................................................................................
28
Notes
to
Financial
Statements
...............................................................................................
29
Report
of
Independent
Registered
Public
Accounting
Firm
..............................................................................
39
Important
Tax
Information
.................................................................................................
40
Additional
Information
....................................................................................................
41
Glossary
of
Terms
Used
in
This
Report
.........................................................................................
43
The
Benefits
and
Risks
of
Leveraging
The
Benefits
and
Risks
of
Leveraging
/
Derivative
Financial
Instruments
The
Fund
may
utilize
leverage
to
seek
to
enhance
returns
and
net
asset
value
(“NAV”).
However,
there
is
no
guarantee
that
these
objectives
can
be
achieved
in
all
interest
rate
environments.
In
general,
the
concept
of
leveraging
is
based
on
the
premise
that
the
financing
cost
of
leverage,
which
is
based
on
short-term
interest
rates,
is
normally
lower
than
the
income
earned
by
the
Fund
on
its
longer-term
portfolio
investments
purchased
with
the
proceeds
from
leverage.
To
the
extent
that
the
total
assets
of
the
Fund
(including
the
assets
obtained
from
leverage)
are
invested
in
higher-yielding
portfolio
investments,
the
Fund’s
shareholders
benefit
from
the
incremental
net
income.
The
interest
earned
on
securities
purchased
with
the
proceeds
from
leverage
is
distributed
to
the
Fund’s
shareholders,
and
the
value
of
these
portfolio
holdings
is
reflected
in
the
Fund’s
per
share
NAV.
However,
in
order
to
benefit
shareholders,
the
return
on
assets
purchased
with
leverage
proceeds
must
exceed
the
ongoing
costs
associated
with
the
leverage.
If
interest
and
other
ongoing
costs
of
leverage
exceed
the
Fund’s
return
on
assets
purchased
with
leverage
proceeds,
income
to
shareholders
is
lower
than
if
the
Fund
had
not
used
leverage.
Furthermore,
the
value
of
the
Fund’s
portfolio
investments
generally
varies
inversely
with
the
direction
of
long-term
interest
rates,
although
other
factors
can
also
influence
the
value
of
portfolio
investments.
As
a
result,
changes
in
interest
rates
can
influence
the
Fund’s
NAV
positively
or
negatively
in
addition
to
the
impact
on
the
Fund’s
performance
from
leverage.
Changes
in
the
direction
of
interest
rates
are
difficult
to
predict
accurately,
and
there
is
no
assurance
that
the
Fund’s
leveraging
strategy
will
be
successful.
The
use
of
leverage
also
generally
causes
greater
changes
in
the
Fund’s
NAV
and
dividend
rates
than
comparable
portfolios
without
leverage.
In
a
declining
market,
leverage
is
likely
to
cause
a
greater
decline
in
the
NAV
of the
Fund’s
shares
than
if
the
Fund
were
not
leveraged.
In
addition,
the
Fund
may
be
required
to
sell
portfolio
securities
at
inopportune
times
or
at
distressed
values
in
order
to
comply
with
regulatory
requirements
applicable
to
the
use
of
leverage
or
as
required
by
the
terms
of
the
leverage
instruments,
which
may
cause
the
Fund
to
incur
losses.
The
use
of
leverage
may
limit the
Fund’s
ability
to
invest
in
certain
types
of
securities
or
use
certain
types
of
hedging
strategies.
The
Fund
incurs
expenses
in
connection
with
the
use
of
leverage,
all
of
which
are
borne
by
the
Fund’s
shareholders
and
may
reduce
income.
Derivative
Financial
Instruments
The
Fund
may
invest
in
various
derivative
financial
instruments.
These
instruments
are
used
to
obtain
exposure
to
a
security,
commodity,
index,
market,
and/or
other
assets
without
owning
or
taking
physical
custody
of
securities,
commodities
and/or
other
referenced
assets
or
to
manage
market,
equity,
credit,
interest
rate,
foreign
currency
exchange
rate,
commodity
and/or
other
risks.
Derivative
financial
instruments
may
give
rise
to
a
form
of
economic
leverage
and
involve
risks,
including
the
imperfect
correlation
between
the
value
of
a
derivative
financial
instrument
and
the
underlying
asset,
possible
default
of
the
counterparty
to
the
transaction
or
illiquidity
of
the
instrument. Pursuant
to Rule
18f-4
under
the
1940
Act,
among
other
things,
the
Fund
must
either
use
derivative
financial
instruments
with
embedded
leverage
in
a
limited
manner
or
comply
with
an
outer
limit
on
fund
leverage
risk
based
on
value-at-risk.
The
Fund’s
successful
use
of
a
derivative
financial
instrument
depends
on
the
investment
adviser’s
ability
to
predict
pertinent
market
movements
accurately,
which
cannot
be
assured.
The
use
of
these
instruments
may
result
in
losses
greater
than
if
they
had
not
been
used,
may
limit
the
amount
of
appreciation the
Fund
can
realize
on
an
investment
and/or
may
result
in
lower
distributions
paid
to
shareholders.
The
Fund’s
investments
in
these
instruments,
if
any,
are
discussed
in
detail
in
the
Notes
to
Financial
Statements.
2024
BlackRock
Annual
Financial
Statements
and
Additional
Information
Schedule
of
Investments
September
30,
2024
(Percentages
shown
are
based
on
Net
Assets)
Security
Par
(000)
Pa
r
(
000)
Value
Asset-Backed
Securities
Cayman
Islands
—
11.2%
(a)(b)
Anchorage
Capital
CLO
6
Ltd.,
Series
2015-6A,
Class
AR3,
(3-mo.
CME
Term
SOFR
at
1.44%
Floor
+
1.44%),
6.72%,
04/22/34
.......
USD
250
$
250,070
Apidos
CLO
XXII,
Series
2015-22A,
Class
A1R,
(3-mo.
CME
Term
SOFR
at
0.00%
Floor
+
1.32%),
6.60%,
04/20/31
.................
126
126,242
Apidos
CLO
XXV,
Series
2016-25A,
Class
A1R2,
(3-mo.
CME
Term
SOFR
at
1.15%
Floor
+
1.15%),
6.43%,
10/20/31
............
193
192,948
Barings
CLO
Ltd.,
Series
2019-3A,
Class
A1R,
(3-mo.
CME
Term
SOFR
at
1.07%
Floor
+
1.33%),
6.61%,
04/20/31
.................
246
246,965
Benefit
Street
Partners
CLO
XIX
Ltd.,
Series
2019-19A,
Class
AR,
(3-mo.
CME
Term
SOFR
at
1.18%
Floor
+
1.18%),
6.48%,
01/15/33
.......
250
250,191
Benefit
Street
Partners
CLO
XXI
Ltd.,
Series
2020-21A,
Class
A1R,
(3-mo.
CME
Term
SOFR
at
1.17%
Floor
+
1.43%),
6.73%,
10/15/34
.......
250
250,127
Betony
CLO
2
Ltd.,
Series
2018-1A,
Class
A1,
(3-mo.
CME
Term
SOFR
at
1.08%
Floor
+
1.34%),
6.60%,
04/30/31
.................
169
168,984
BlueMountain
CLO
Ltd.
Series
2013-2A,
Class
A1R,
(3-mo.
CME
Term
SOFR
at
0.00%
Floor
+
1.44%),
6.72%,
10/22/30
...
70
69,896
Series
2018-3A,
Class
A1R,
(3-mo.
CME
Term
SOFR
at
1.19%
Floor
+
1.19%),
6.47%,
10/25/30
...
208
208,447
Series
2018-3A,
Class
BR,
(3-mo.
CME
Term
SOFR
at
1.85%
Floor
+
1.85%),
7.13%,
10/25/30
...
100
100,196
Carlyle
Global
Market
Strategies
CLO
Ltd.,
Series
2014-1A,
Class
A1R2,
(3-mo.
CME
Term
SOFR
at
0.97%
Floor
+
1.23%),
6.52%,
04/17/31
.
130
130,398
CBAM
Ltd.
Series
2019-10A,
Class
A1R,
(3-mo.
CME
Term
SOFR
at
1.12%
Floor
+
1.38%),
6.66%,
04/20/32
...
235
234,842
Series
2020-13A,
Class
A,
(3-mo.
CME
Term
SOFR
at
1.43%
Floor
+
1.69%),
6.97%,
01/20/34
...
250
250,182
Cedar
Funding
XIV
CLO
Ltd.,
Series
2021-14A,
Class
A,
(3-mo.
CME
Term
SOFR
at
1.10%
Floor
+
1.36%),
6.66%,
07/15/33
.......
250
252,116
CIFC
Funding
2013-IV
Ltd.,
Series
2013-4A,
Class
A1RR,
(3-mo.
CME
Term
SOFR
at
1.06%
Floor
+
1.32%),
6.59%,
04/27/31
.......
134
134,332
CIFC
Funding
2018-III
Ltd.,
Series
2018-3A,
Class
A,
(3-mo.
CME
Term
SOFR
at
0.00%
Floor
+
1.36%),
6.64%,
07/18/31
............
209
208,677
CIFC
Funding
Ltd.,
Series
2018-1A,
Class
A,
(3-mo.
CME
Term
SOFR
at
0.00%
Floor
+
1.26%),
6.54%,
04/18/31
.................
170
170,161
Security
Par
(000)
Par
(000)
Value
Cayman
Islands
(continued)
Galaxy
XVIII
CLO
Ltd.,
Series
2018-
28A,
Class
A1,
(3-mo.
CME
Term
SOFR
at
1.10%
Floor
+
1.36%),
6.66%,
07/15/31
............
USD
139
$
139,363
Madison
Park
Funding
XVII
Ltd.,
Series
2015-17A,
Class
AR2,
(3-mo.
CME
Term
SOFR
at
0.00%
Floor
+
1.26%),
6.54%,
07/21/30
.......
175
175,222
Neuberger
Berman
CLO
XIV
Ltd.,
Series
2013-14A,
Class
AR2,
(3-mo.
CME
Term
SOFR
at
1.03%
Floor
+
1.29%),
6.56%,
01/28/30
.......
107
107,163
Neuberger
Berman
Loan
Advisers
CLO
40
Ltd.,
Series
2021-40A,
Class
A,
(3-mo.
CME
Term
SOFR
at
1.06%
Floor
+
1.32%),
6.61%,
04/16/33
.
248
248,690
OCP
CLO
Ltd.
Series
2014-7A,
Class
A1RR,
(3-mo.
CME
Term
SOFR
at
0.00%
Floor
+
1.38%),
6.66%,
07/20/29
...
60
60,309
Series
2016-11A,
Class
A1R2,
(3-
mo.
CME
Term
SOFR
at
1.42%
Floor
+
1.42%),
6.70%,
04/26/36
250
250,065
Series
2019-17A,
Class
AR2,
(3-mo.
CME
Term
SOFR
at
1.40%
Floor
+
1.40%),
6.70%,
07/20/37
...
250
250,619
OHA
Credit
Funding
5
Ltd.
Series
2020-5A,
Class
AR,
(3-mo.
CME
Term
SOFR
at
1.35%
Floor
+
1.35%),
0.00%,
10/18/37
...
250
250,000
Series
2020-5A,
Class
B1R,
(3-mo.
CME
Term
SOFR
at
1.70%
Floor
+
1.70%),
0.00%,
10/18/37
...
250
250,000
OHA
Loan
Funding
Ltd.,
Series
2015-
1A,
Class
AR3,
(3-mo.
CME
Term
SOFR
at
1.15%
Floor
+
1.41%),
6.69%,
01/19/37
............
250
250,253
Palmer
Square
Loan
Funding
Ltd.,
Series
2022-2A,
Class
A1,
(3-mo.
CME
Term
SOFR
at
1.27%
Floor
+
1.27%),
6.57%,
10/15/30
.......
125
125,359
Regatta
XXVIII
Funding
Ltd.,
Series
2024-2A,
Class
A1,
(3-mo.
CME
Term
SOFR
at
1.55%
Floor
+
1.55%),
6.83%,
04/25/37
.......
250
250,630
Trestles
CLO
II
Ltd.,
Series
2018-2A,
Class
A1R,
(3-mo.
CME
Term
SOFR
at
1.57%
Floor
+
1.57%),
6.89%,
07/25/37
.................
250
251,456
Trestles
CLO
III
Ltd.,
Series
2020-3A,
Class
A1,
(3-mo.
CME
Term
SOFR
at
1.33%
Floor
+
1.59%),
6.87%,
01/20/33
.................
250
250,269
Voya
CLO
Ltd.,
Series
2019-1A,
Class
AR,
(3-mo.
CME
Term
SOFR
at
1.06%
Floor
+
1.32%),
6.62%,
04/15/31
.................
138
138,218
6,242,390
Jersey,
Channel
Islands
—
0.5%
Benefit
Street
Partners
CLO
XXXV
Ltd.,
Series
2024-35A,
Class
D,
(3-mo.
CME
Term
SOFR
at
3.30%
Floor
+
3.30%),
8.63%,
04/25/37
(a)
(b)
....
250
253,519
Schedule
of
Investments
(continued)
September
30,
2024
(Percentages
shown
are
based
on
Net
Assets)
Security
Par
(000)
Par
(000)
Value
United
States
—
6.2%
(a)
ARI
Fleet
Lease
Trust,
Series
2023-B,
Class
A3,
5.89%,
07/15/32
.....
USD
100
$
103,591
College
Avenue
Student
Loans
LLC
Series
2021-A,
Class
A1,
(1-mo.
CME
Term
SOFR
at
1.10%
Floor
+
1.21%),
6.07%,
07/25/51
(b)
..
44
43,532
Series
2021-C,
Class
A2,
2.32%,
07/26/55
...............
129
116,895
Series
2023-A,
Class
A2,
5.33%,
05/25/55
...............
92
92,912
EDvestinU
Private
Education
Loan
Issue
No.
LLC,
Series
2021-A,
Class
A,
1.80%,
11/25/45
..........
66
60,378
ELFI
Graduate
Loan
Program
LLC,
Series
2023-A,
Class
A,
6.37%,
02/04/48
.................
92
95,624
Enterprise
Fleet
Financing
LLC,
Series
2022-3,
Class
A3,
4.29%,
07/20/29
132
131,922
Lendmark
Funding
Trust,
Series
2024-
1A,
Class
D,
7.21%,
06/21/32
...
110
112,674
Mariner
Finance
Issuance
Trust,
Series
2021-AA,
Class
A,
1.86%,
03/20/36
100
95,189
Navient
Private
Education
Loan
Trust
Series
2014-AA,
Class
A3,
(1-mo.
CME
Term
SOFR
at
0.00%
Floor
+
1.71%),
6.81%,
10/15/31
(b)
..
44
44,489
Series
2017-A,
Class
B,
3.91%,
12/16/58
...............
78
77,171
Navient
Private
Education
Refi
Loan
Trust
Series
2021-A,
Class
A,
0.84%,
05/15/69
...............
168
152,755
Series
2021-DA,
Class
A,
(US
Prime
Rate
at
0.00%
Floor
-
1.99%),
6.51%,
04/15/60
(b)
.........
51
49,974
Navient
Student
Loan
Trust,
Series
2023-BA,
Class
A1B,
(SOFR
30
day
Average
at
0.00%
Floor
+
1.70%),
7.04%,
03/15/72
(b)
...........
79
79,332
Nelnet
Student
Loan
Trust
Series
2021-A,
Class
APT2,
1.36%,
04/20/62
...............
43
40,022
Series
2021-BA,
Class
AFL,
(1-mo.
CME
Term
SOFR
at
0.00%
Floor
+
0.89%),
5.86%,
04/20/62
(b)
..
86
85,316
Series
2021-CA,
Class
AFL,
(1-mo.
CME
Term
SOFR
at
0.00%
Floor
+
0.85%),
5.82%,
04/20/62
(b)
..
87
86,115
NYMT
Trust,
Series
2024-RR1,
Class
A,
7.37%,
05/25/64
(c)
...........
98
96,914
OneMain
Financial
Issuance
Trust
Series
2023-2A,
Class
A2,
(SOFR
30
day
Average
at
0.00%
Floor
+
1.50%),
6.84%,
09/15/36
(b)
...
125
126,897
Series
2023-2A,
Class
B,
6.17%,
09/15/36
...............
125
130,784
PRET
LLC,
Series
2024-NPL4,
Class
A1,
7.00%,
07/25/54
(c)
........
99
100,210
Regional
Management
Issuance
Trust
Series
2021-1,
Class
A,
1.68%,
03/17/31
...............
55
54,172
Series
2021-2,
Class
A,
1.90%,
08/15/33
...............
100
93,427
Series
2024-1,
Class
A,
5.83%,
07/15/36
...............
100
103,496
Security
Par
(000)
Par
(000)
Value
United
States
(continued)
SMB
Private
Education
Loan
Trust
Series
2018-C,
Class
A2A,
3.63%,
11/15/35
...............
USD
54
$
53,038
Series
2021-A,
Class
A2A1,
(1-mo.
CME
Term
SOFR
at
0.00%
Floor
+
0.84%),
5.94%,
01/15/53
(b)
..
90
88,865
Series
2021-A,
Class
A2B,
1.59%,
01/15/53
...............
90
82,203
Series
2021-C,
Class
APT1,
1.39%,
01/15/53
...............
52
46,917
Series
2021-C,
Class
B,
2.30%,
01/15/53
...............
142
135,884
Series
2022-A,
Class
APT,
2.85%,
11/16/54
...............
91
84,774
Series
2022-D,
Class
B,
6.15%,
10/15/58
...............
77
79,139
Series
2023-A,
Class
A1B,
(SOFR
30
day
Average
at
1.50%
Floor
+
1.50%),
6.84%,
01/15/53
(b)
...
89
89,589
Series
2023-B,
Class
A1B,
(SOFR
30
day
Average
at
1.80%
Floor
+
1.80%),
7.14%,
10/16/56
(b)
...
102
103,911
Series
2023-C,
Class
A1A,
5.67%,
11/15/52
...............
146
150,788
Series
2024-A,
Class
A1A,
5.24%,
03/15/56
...............
128
131,703
Series
2024-A,
Class
A1B,
(SOFR
30
day
Average
at
1.45%
Floor
+
1.45%),
6.79%,
03/15/56
(b)
...
95
95,756
SoFi
Professional
Loan
Program
LLC,
Series
2017-E,
Class
B,
3.49%,
11/26/40
..................
79
78,044
Tricon
Residential
Trust,
Series
2024-
SFR3,
Class
A,
4.50%,
08/17/41
.
100
99,476
3,493,878
Total
Asset-Backed
Securities
—
17.9%
(Cost:
$
9,906,082
)
..............................
9,989,787
Corporate
Bonds
Australia
—
0.4%
(a)
FMG
Resources
August
2006
Pty.
Ltd.
,
6.13%
,
04/15/32
............
100
102,286
Mineral
Resources
Ltd.
,
8.00%
,
11/01/27
..................
100
102,716
205,002
Austria
—
0.2%
ams-OSRAM
AG
,
10.50%
,
03/30/29
(d)
EUR
100
115,184
Canada
—
1.1%
1011778
BC
ULC
,
4.00%
,
10/15/30
(a)
USD
100
92,214
Air
Canada
,
3.88%
,
08/15/26
(a)
.....
2
1,948
Bombardier,
Inc.
,
8.75%
,
11/15/30
(a)
.
100
109,808
Enbridge,
Inc.
,
6.70%
,
11/15/53
....
10
11,579
Methanex
Corp.
,
5.13%
,
10/15/27
...
100
98,951
NOVA
Chemicals
Corp.
,
4.25%
,
05/15/29
(a)
................
100
92,973
Open
Text
Corp.
,
3.88%
,
02/15/28
(a)
.
100
95,504
Parkland
Corp.
,
4.63%
,
05/01/30
(a)
..
100
94,305
597,282
2024
BlackRock
Annual
Financial
Statements
and
Additional
Information
Schedule
of
Investments
(continued)
September
30,
2024
(Percentages
shown
are
based
on
Net
Assets)
Security
Par
(000)
Par
(000)
Value
Czech
Republic
—
0.2%
Allwyn
Entertainment
Financing
UK
plc
,
7.25%
,
04/30/30
(d)
...........
EUR
100
$
117,994
Denmark
—
0.2%
Danske
Bank
A/S
,
(3-mo.
EURIBOR
+
0.65%),
4.35%
,
04/10/27
(b)
(d)
....
100
111,543
Finland
—
0.2%
Citycon
Treasury
BV
,
1.63%
,
03/12/28
(d)
100
102,610
France
—
3.4%
(d)
Altice
France
SA
,
5.88%
,
02/01/27
..
100
87,207
Banijay
Entertainment
SAS
,
7.00%
,
05/01/29
.................
100
117,020
Banque
Federative
du
Credit
Mutuel
SA
,
(3-mo.
EURIBOR
+
0.64%),
4.10%
,
03/05/27
(b)
...........
200
223,632
Bertrand
Franchise
Finance
SAS
,
(3-mo.
EURIBOR
at
0.00%
Floor
+
3.75%),
7.49%
,
07/18/30
(b)
.....
100
112,108
BPCE
SA
(b)
(3-mo.
EURIBOR
+
0.39%),
3.84%
,
03/06/26
...............
100
111,395
(3-mo.
EURIBOR
+
0.61%),
4.08%
,
03/08/27
...............
100
111,765
Credit
Agricole
SA
,
3.75%
,
01/22/34
.
100
115,323
Goldstory
SAS
,
(3-mo.
EURIBOR
at
0.00%
Floor
+
4.00%),
7.63%
,
02/01/30
(b)
................
100
111,446
Iliad
Holding
SASU
,
6.88%
,
04/15/31
100
118,272
iliad
SA
,
5.38%
,
02/15/29
........
100
116,324
Lion/Polaris
Lux
4
SA
,
(3-mo.
EURIBOR
at
0.00%
Floor
+
3.63%),
7.33%
,
07/01/29
(b)
...........
100
111,872
RCI
Banque
SA
,
(5-Year
EURIBOR
ICE
Swap
Rate
+
2.75%),
5.50%
,
10/09/34
(b)
................
200
227,394
Societe
Generale
SA
,
(3-mo.
EURIBOR
+
0.50%),
4.18%
,
01/19/26
(b)
....
100
111,649
Worldline
SA
0.00%
,
07/30/26
(e)
(f)
..........
100
101,018
4.13%
,
09/12/28
............
100
108,454
1,884,879
Germany
—
5.6%
(d)
ADLER
Real
Estate
GmbH
,
3.00%
,
04/27/26
.................
100
106,001
Bayer
AG
(b)
(5-Year
EURIBOR
ICE
Swap
Rate
+
3.27%),
5.50%
,
09/13/54
....
100
111,291
(5-Year
EUR
Swap
Annual
+
3.75%),
4.50%
,
03/25/82
....
100
110,004
Cheplapharm
Arzneimittel
GmbH
,
7.50%
,
05/15/30
............
100
117,194
Commerzbank
AG
(b)
(5-Year
EUR
Swap
Annual
+
6.36%),
6.13%
(g)
..........
200
223,260
(3-mo.
EURIBOR
+
0.70%),
4.16%
,
03/12/27
...............
100
111,740
EnBW
International
Finance
BV
,
3.85%
,
05/23/30
.................
23
26,683
Gruenenthal
GmbH
,
6.75%
,
05/15/30
100
119,360
Heidelberg
Materials
Finance
Luxembourg
SA
,
4.88%
,
11/21/33
100
121,392
HT
Troplast
GmbH
,
9.38%
,
07/15/28
.
100
114,787
Security
Par
(000)
Par
(000)
Value
Germany
(continued)
IHO
Verwaltungs
GmbH
(h)
3.75%
,
(
3.75
%
Cash
or
4.50
%
PIK),
09/15/26
...............
EUR
100
$
111,009
8.75%
,
(
8.75
%
Cash
or
9.50
%
PIK),
05/15/28
(b)
..............
100
116,912
Mahle
GmbH
,
2.38%
,
05/14/28
....
100
96,316
Merck
KGaA
,
(5-Year
EURIBOR
ICE
Swap
Rate
+
1.54%),
3.88%
,
08/27/54
(b)
................
100
111,341
Nidda
Healthcare
Holding
GmbH
,
7.00%
,
02/21/30
............
100
116,046
Sartorius
Finance
BV
,
4.88%
,
09/14/35
100
119,468
TK
Elevator
Holdco
GmbH
,
6.63%
,
07/15/28
.................
90
99,933
Traton
Finance
Luxembourg
SA
,
(3-mo.
EURIBOR
at
0.00%
Floor
+
1.00%),
4.69%
,
01/21/26
(b)
...........
100
111,988
TUI
AG
,
5.88%
,
03/15/29
........
100
115,977
TUI
Cruises
GmbH
,
6.50%
,
05/15/26
90
102,115
Volkswagen
International
Finance
NV
(b)
(3-mo.
EURIBOR
+
0.65%),
4.00%
,
03/27/26
...............
100
111,714
(9-Year
EUR
Swap
Annual
+
3.96%),
3.88%
(g)
..........
100
103,547
Volkswagen
Leasing
GmbH
,
4.75%
,
09/25/31
.................
100
117,238
Wintershall
Dea
Finance
BV
1.33%
,
09/25/28
............
200
205,391
4.36%
,
10/03/32
............
100
111,772
ZF
Europe
Finance
BV
4.75%
,
01/31/29
............
100
107,864
6.13%
,
03/13/29
............
100
113,444
3,133,787
Greece
—
0.2%
National
Bank
of
Greece
SA
,
(5-Year
EURIBOR
ICE
Swap
Rate
+
3.15%),
5.88%
,
06/28/35
(b)
(d)
..........
100
115,927
Ireland
—
0.6%
(d)
Bank
of
Ireland
Group
plc
,
(5-Year
EUR
Swap
Annual
+
6.43%),
6.00%
(b)
(g)
200
224,344
Kerry
Group
Financial
Services
Unltd
Co.
,
3.38%
,
03/05/33
.........
100
112,616
336,960
Israel
—
0.5%
Teva
Pharmaceutical
Finance
Netherlands
II
BV
7.38%
,
09/15/29
............
100
124,951
7.88%
,
09/15/31
............
100
131,769
256,720
Italy
—
3.4%
Azzurra
Aeroporti
SpA
,
2.63%
,
05/30/27
(d)
................
100
107,093
Banca
Monte
dei
Paschi
di
Siena
SpA
,
(5-Year
EURIBOR
ICE
Swap
Rate
at
0.00%
Floor
+
5.01%),
7.71%
,
01/18/28
(b)
(d)
...............
100
121,202
Bubbles
Bidco
SpA
,
(3-mo.
EURIBOR
+
4.25%),
7.53%
,
09/30/31
(b)
(d)
....
100
111,037
Cedacri
Mergeco
SpA
,
(3-mo.
EURIBOR
at
0.00%
Floor
+
5.50%),
9.04%
,
05/15/28
(b)
(d)
..........
100
111,565
Schedule
of
Investments
(continued)
September
30,
2024
(Percentages
shown
are
based
on
Net
Assets)
Security
Par
(000)
Par
(000)
Value
Italy
(continued)
Engineering
-
Ingegneria
Informatica
-
SpA
,
11.13%
,
05/15/28
(d)
.......
EUR
100
$
112,985
Eni
SpA
,
3.88%
,
01/15/34
(d)
.......
100
114,208
FIS
Fabbrica
Italiana
Sintetici
SpA
,
5.63%
,
08/01/27
(d)
...........
100
111,048
Intesa
Sanpaolo
SpA
,
(5-Year
EUR
Swap
Annual
+
5.85%),
5.50%
(b)
(d)
(g)
250
276,896
Lottomatica
SpA
,
5.38%
,
06/01/30
(d)
.
100
115,265
Nexi
SpA
,
0.00%
,
02/24/28
(d)
(e)
(f)
....
200
193,694
Optics
Bidco
SpA
,
7.20%
,
07/18/36
(a)
USD
200
215,234
Pachelbel
Bidco
SpA
,
(3-mo.
EURIBOR
at
0.00%
Floor
+
4.25%),
8.07%
,
05/17/31
(b)
(d)
...............
EUR
100
112,039
Rossini
SARL
,
(3-mo.
EURIBOR
at
0.00%
Floor
+
3.88%),
7.22%
,
12/31/29
(b)
(d)
...............
100
112,264
Snam
SpA
,
(5-Year
EURIBOR
ICE
Swap
Rate
+
2.16%),
4.50%
(b)
(d)
(g)
.
100
112,484
1,927,014
Japan
—
0.4%
SoftBank
Group
Corp.
(d)
4.00%
,
09/19/29
............
100
107,319
3.88%
,
07/06/32
............
100
102,250
209,569
Jersey,
Channel
Islands
—
0.2%
Aston
Martin
Capital
Holdings
Ltd.
,
10.38%
,
03/31/29
(d)
..........
GBP
100
133,087
Luxembourg
—
1.3%
Altice
Financing
SA
,
9.63%
,
07/15/27
(a)
USD
200
194,794
Cidron
Aida
Finco
SARL
,
6.25%
,
04/01/28
(d)
................
GBP
100
126,910
Ephios
Subco
3
SARL
,
7.88%
,
01/31/31
(d)
................
EUR
100
120,007
INEOS
Finance
plc
,
6.38%
,
04/15/29
(d)
100
114,991
Intelsat
Jackson
Holdings
SA
,
6.50%
,
03/15/30
(a)
................
USD
100
95,677
Kleopatra
Finco
SARL
,
4.25%
,
03/01/26
(d)
................
EUR
100
104,408
756,787
Netherlands
—
2.5%
Boels
Topholding
BV
,
5.75%
,
05/15/30
(d)
100
114,399
Cooperatieve
Rabobank
UA
,
(3-mo.
EURIBOR
+
1.15%),
4.23%
,
04/25/29
(b)
(d)
...............
100
115,832
IMCD
NV
,
3.63%
,
04/30/30
(d)
......
100
111,572
ING
Groep
NV
(b)(d)
(3-mo.
EURIBOR
+
1.60%),
4.50%
,
05/23/29
...............
100
116,339
(USISSO05
+
4.36%),
8.00%
(g)
..
USD
200
214,764
Q-Park
Holding
I
BV
,
5.13%
,
02/15/30
(d)
EUR
100
113,541
REWE
International
Finance
BV
,
4.88%
,
09/13/30
(d)
...........
100
119,140
Titan
Holdings
II
BV
,
5.13%
,
07/15/29
(d)
100
112,985
VZ
Secured
Financing
BV
,
5.00%
,
01/15/32
(a)
................
USD
200
184,049
VZ
Vendor
Financing
II
BV
,
2.88%
,
01/15/29
(d)
................
EUR
100
102,837
Ziggo
BV
,
2.88%
,
01/15/30
(d)
......
100
102,856
1,408,314
Security
Par
(000)
Par
(000)
Value
Norway
—
0.2%
Var
Energi
ASA
,
(5-Year
EURIBOR
ICE
Swap
Rate
+
4.77%),
7.86%
,
11/15/83
(b)
(d)
...............
EUR
100
$
122,168
Portugal
—
0.6%
EDP
SA
(b)(d)
(5-Year
EURIBOR
ICE
Swap
Rate
+
2.05%),
4.75%
,
05/29/54
....
100
112,595
(5-Year
EURIBOR
ICE
Swap
Rate
+
2.40%),
4.63%
,
09/16/54
....
100
111,595
(5-Year
EUR
Swap
Annual
+
1.84%),
1.70%
,
07/20/80
....
100
109,315
333,505
Romania
—
0.2%
RCS
&
RDS
SA
,
3.25%
,
02/05/28
(d)
..
100
106,779
Spain
—
1.8%
(d)
Banco
de
Credito
Social
Cooperativo
SA
(b)
(1-Year
EURIBOR
ICE
Swap
Rate
+
4.27%),
7.50%
,
09/14/29
....
100
126,713
(1-Year
EURIBOR
ICE
Swap
Rate
+
1.70%),
4.13%
,
09/03/30
....
100
112,772
Banco
de
Sabadell
SA
,
(1-Year
EUR
Swap
Annual
+
1.60%),
4.00%
,
01/15/30
(b)
................
100
115,276
CaixaBank
SA
,
(5-Year
EUR
Swap
Annual
+
6.35%),
5.88%
(b)
(g)
.....
200
223,743
Cellnex
Telecom
SA
,
0.75%
,
11/20/31
(f)
100
97,993
Kaixo
Bondco
Telecom
SA
,
5.13%
,
09/30/29
.................
100
111,176
Naturgy
Finance
Iberia
SA
,
(5-Year
EUR
Swap
Annual
+
2.44%),
2.37%
(b)
(g)
.................
100
107,474
Telefonica
Europe
BV
,
(7-Year
EUR
Swap
Annual
+
3.35%),
6.14%
(b)
(g)
100
118,887
1,014,034
Sweden
—
0.7%
Fastighets
AB
Balder
,
1.13%
,
01/29/27
(d)
................
100
105,370
Heimstaden
Bostad
Treasury
BV
,
1.38%
,
03/03/27
(d)
...........
100
102,990
Stena
International
SA
,
7.25%
,
01/15/31
(a)
................
USD
200
210,166
418,526
Switzerland
—
1.3%
ABB
Finance
BV
(d)
0.00%
,
01/19/30
............
EUR
100
95,964
3.38%
,
01/15/34
............
100
113,526
Julius
Baer
Group
Ltd.
,
(5-Year
US
Treasury
Yield
Curve
Rate
T
Note
Constant
Maturity
+
4.62%),
4.88%
(b)
(d)
(g)
................
USD
200
192,900
UBS
Group
AG
,
(USISSO05
+
3.63%),
6.85%
(a)
(b)
(g)
................
200
202,381
VistaJet
Malta
Finance
plc
,
9.50%
,
06/01/28
(a)
................
100
97,739
702,510
United
Kingdom
—
6.5%
Ardonagh
Finco
Ltd.
,
6.88%
,
02/15/31
(d)
EUR
100
112,845
Barclays
plc
(b)
(3-mo.
EURIBOR
+
1.00%),
4.58%
,
05/12/26
(d)
..............
100
111,861
2024
BlackRock
Annual
Financial
Statements
and
Additional
Information
Schedule
of
Investments
(continued)
September
30,
2024
(Percentages
shown
are
based
on
Net
Assets)
Security
Par
(000)
Par
(000)
Value
United
Kingdom
(continued)
(3-mo.
EURIBOR
+
0.80%),
4.32%
,
05/08/28
(d)
..............
EUR
100
$
111,569
(BPSWS5
+
5.64%),
9.25%
(g)
...
GBP
200
283,666
(1-Year
EUR
Swap
Annual
+
1.75%),
4.92%
,
08/08/30
(d)
...
EUR
100
119,035
BCP
V
Modular
Services
Finance
II
plc
,
6.13%
,
11/30/28
(d)
...........
GBP
100
127,022
Bellis
Acquisition
Co.
plc
,
8.13%
,
05/14/30
(d)
................
116
153,492
British
Telecommunications
plc
(d)
4.25%
,
01/06/33
............
EUR
100
118,290
(5-Year
U.K.
Government
Bonds
Note
Generic
Bid
Yield
+
3.82%),
8.38%
,
12/20/83
(b)
.........
GBP
100
144,147
Centrica
plc
,
(5-Year
U.K.
Government
Bonds
Note
Generic
Bid
Yield
+
2.51%),
6.50%
,
05/21/55
(b)
(d)
....
100
137,071
CK
Hutchison
Group
Telecom
Finance
SA
,
2.63%
,
10/17/34
(d)
........
200
197,368
CPUK
Finance
Ltd.
,
3.59%
,
08/28/25
(d)
100
131,649
Galaxy
Bidco
Ltd.
,
6.50%
,
07/31/26
(d)
100
132,692
Heathrow
Finance
plc
,
4.13%
,
09/01/29
(c)
(d)
...............
100
122,331
HSBC
Holdings
plc
,
(3-mo.
EURIBOR
+
1.00%),
4.44%
,
09/24/26
(b)
(d)
....
EUR
100
112,082
INEOS
Quattro
Finance
2
plc
,
8.50%
,
03/15/29
(d)
................
100
117,841
Kier
Group
plc
,
9.00%
,
02/15/29
(d)
...
GBP
100
143,054
Market
Bidco
Finco
plc
,
5.50%
,
11/04/27
(d)
................
100
126,026
Motability
Operations
Group
plc
,
0.13%
,
07/20/28
(d)
................
EUR
100
100,691
Motion
Finco
SARL
,
7.38%
,
06/15/30
(d)
200
225,268
Pinewood
Finco
plc
,
6.00%
,
03/27/30
(d)
GBP
100
134,068
Pinnacle
Bidco
plc
,
10.00%
,
10/11/28
(d)
100
142,552
Virgin
Media
Secured
Finance
plc
,
5.25%
,
05/15/29
(d)
...........
100
125,673
Vmed
O2
UK
Financing
I
plc
,
4.75%
,
07/15/31
(a)
................
USD
200
178,005
Vodafone
Group
plc
(b)
Series
60NC10
,
(5-Year
EUR
Swap
Annual
+
3.48%),
3.00%
,
08/27/80
(d)
..............
EUR
200
207,443
(5-Year
US
Treasury
Yield
Curve
Rate
T
Note
Constant
Maturity
+
2.77%),
4.13%
,
06/04/81
....
USD
7
6,346
3,622,087
United
States
—
26.3%
AES
Corp.
(The)
,
(5-Year
US
Treasury
Yield
Curve
Rate
T
Note
Constant
Maturity
+
3.20%),
7.60%
,
01/15/55
(b)
................
100
105,204
Albertsons
Cos.,
Inc.
,
6.50%
,
02/15/28
(a)
................
100
101,820
Allied
Universal
Holdco
LLC
4.88%
,
06/01/28
(d)
...........
GBP
100
123,061
7.88%
,
02/15/31
(a)
...........
USD
100
102,149
AMC
Networks,
Inc.
,
4.25%
,
02/15/29
100
72,324
American
Airlines,
Inc.
,
5.75%
,
04/20/29
(a)
................
100
99,834
American
Axle
&
Manufacturing,
Inc.
,
6.88%
,
07/01/28
............
100
99,836
American
Tower
Corp.
,
3.38%
,
10/15/26
73
71,734
Security
Par
(000)
Par
(000)
Value
United
States
(continued)
Antero
Midstream
Partners
LP
,
5.38%
,
06/15/29
(a)
................
USD
100
$
98,949
Ardagh
Packaging
Finance
plc
,
2.13%
,
08/15/26
(d)
................
EUR
100
96,296
Asbury
Automotive
Group,
Inc.
,
5.00%
,
02/15/32
(a)
................
USD
100
94,828
Avantor
Funding,
Inc.
,
4.63%
,
07/15/28
(a)
................
100
97,739
Avis
Budget
Car
Rental
LLC
,
8.00%
,
02/15/31
(a)
................
100
102,272
Bank
of
America
Corp.
(b)
(3-mo.
CME
Term
SOFR
+
1.07%),
3.37%
,
01/23/26
..........
3
2,983
(1-day
SOFR
+
1.33%),
3.38%
,
04/02/26
...............
5
4,960
(1-day
SOFR
+
0.96%),
1.73%
,
07/22/27
...............
57
54,417
(3-mo.
CME
Term
SOFR
+
1.47%),
3.97%
,
02/07/30
..........
47
46,182
(3-mo.
EURIBOR
+
0.79%),
0.69%
,
03/22/31
(d)
..............
EUR
200
194,650
BP
Capital
Markets
plc
,
1.57%
,
02/16/27
(d)
................
100
108,469
Builders
FirstSource,
Inc.
,
6.38%
,
06/15/32
(a)
................
USD
100
103,662
Caesars
Entertainment,
Inc.
,
6.50%
,
02/15/32
(a)
................
100
103,441
Carnival
Corp.
,
7.00%
,
08/15/29
(a)
...
100
106,250
CCO
Holdings
LLC
5.13%
,
05/01/27
(a)
...........
100
98,421
5.00%
,
02/01/28
(a)
...........
100
97,276
4.75%
,
02/01/32
(a)
...........
100
88,128
4.50%
,
05/01/32
............
100
86,465
Charles
River
Laboratories
International,
Inc.
,
4.00%
,
03/15/31
(a)
100
92,186
Charter
Communications
Operating
LLC
,
4.91%
,
07/23/25
.........
2
1,997
Chemours
Co.
(The)
,
5.75%
,
11/15/28
(a)
100
94,991
Churchill
Downs,
Inc.
,
6.75%
,
05/01/31
(a)
................
100
103,266
Citigroup,
Inc.
,
(1-day
SOFR
+
2.84%),
3.11%
,
04/08/26
(b)
...........
8
7,921
Clarios
Global
LP
,
6.75%
,
05/15/28
(a)
.
100
103,075
Clear
Channel
Outdoor
Holdings,
Inc.
,
5.13%
,
08/15/27
(a)
...........
100
98,311
Cleveland-Cliffs,
Inc.
,
7.00%
,
03/15/32
(a)
100
101,099
Cloud
Software
Group,
Inc.
,
8.25%
,
06/30/32
(a)
................
478
499,653
Comcast
Corp.
,
3.25%
,
09/26/32
...
EUR
100
111,898
Comstock
Resources,
Inc.
,
6.75%
,
03/01/29
(a)
................
USD
100
97,630
Constellium
SE
,
5.38%
,
08/15/32
(d)
..
EUR
100
114,543
Consumers
Energy
Co.
,
4.20%
,
09/01/52
.................
USD
26
22,876
Coty,
Inc.
,
5.00%
,
04/15/26
(a)
......
100
99,567
Dana,
Inc.
,
4.25%
,
09/01/30
......
100
89,789
Delta
Air
Lines,
Inc.
7.38%
,
01/15/26
............
100
102,876
3.75%
,
10/28/29
............
100
94,525
Diamondback
Energy,
Inc.
,
3.50%
,
12/01/29
.................
27
25,680
DirecTV
Financing
LLC
,
5.88%
,
08/15/27
(a)
................
100
98,183
DT
Midstream,
Inc.
,
4.13%
,
06/15/29
(a)
100
95,654
Schedule
of
Investments
(continued)
September
30,
2024
(Percentages
shown
are
based
on
Net
Assets)
Security
Par
(000)
Par
(000)
Value
United
States
(continued)
Duke
Energy
Corp.
,
3.10%
,
06/15/28
EUR
100
$
111,343
Energizer
Holdings,
Inc.
,
4.38%
,
03/31/29
(a)
................
USD
100
94,700
EnLink
Midstream
LLC
,
5.38%
,
06/01/29
.................
100
102,520
Entegris,
Inc.
,
4.75%
,
04/15/29
(a)
...
100
98,545
Enterprise
Products
Operating
LLC
,
3.95%
,
01/31/60
............
14
10,982
EQT
Corp.
,
3.13%
,
05/15/26
(a)
.....
52
50,629
Equinix,
Inc.
1.80%
,
07/15/27
............
15
14,066
2.00%
,
05/15/28
............
15
13,830
FirstEnergy
Corp.
,
Series
B
,
3.90%
,
07/15/27
(c)
................
78
77,190
Florida
Power
&
Light
Co.
,
5.30%
,
04/01/53
.................
21
21,938
Freedom
Mortgage
Holdings
LLC
,
9.25%
,
02/01/29
(a)
...........
100
103,945
Frontier
Communications
Holdings
LLC
(a)
5.00%
,
05/01/28
............
100
99,098
8.75%
,
05/15/30
............
100
106,566
Gen
Digital,
Inc.
,
6.75%
,
09/30/27
(a)
.
100
102,747
Gilead
Sciences,
Inc.
,
2.60%
,
10/01/40
30
22,454
Goldman
Sachs
Group,
Inc.
(The)
(1-day
SOFR
+
0.79%),
1.09%
,
12/09/26
(b)
..............
109
104,551
(1-day
SOFR
+
1.85%),
3.62%
,
03/15/28
(b)
..............
104
102,319
2.00%
,
03/22/28
(d)
...........
EUR
25
27,117
0.88%
,
05/09/29
(d)
...........
100
101,042
(1-day
SOFR
+
1.27%),
5.73%
,
04/25/30
(b)
..............
USD
59
62,006
Goodyear
Tire
&
Rubber
Co.
(The)
,
5.00%
,
07/15/29
............
100
91,973
Gray
Television,
Inc.
,
7.00%
,
05/15/27
(a)
100
98,290
Hanesbrands,
Inc.
,
9.00%
,
02/15/31
(a)
100
107,940
HCA,
Inc.
,
5.63%
,
09/01/28
.......
74
76,830
Helios
Software
Holdings,
Inc.
,
Series
SEPT
,
7.88%
,
05/01/29
(d)
......
EUR
100
113,244
Hess
Midstream
Operations
LP
,
5.63%
,
02/15/26
(a)
................
USD
100
100,008
Hilcorp
Energy
I
LP
,
8.38%
,
11/01/33
(a)
100
107,810
Hilton
Domestic
Operating
Co.,
Inc.
,
5.75%
,
05/01/28
(a)
...........
100
100,439
Hilton
Grand
Vacations
Borrower
Escrow
LLC
,
5.00%
,
06/01/29
(a)
..
100
95,005
Home
Depot,
Inc.
(The)
,
3.63%
,
04/15/52
.................
28
22,530
Honeywell
International,
Inc.
,
3.75%
,
05/17/32
.................
EUR
100
115,189
Intercontinental
Exchange,
Inc.
,
3.63%
,
09/01/28
.................
USD
11
10,743
Iron
Mountain,
Inc.
(a)
7.00%
,
02/15/29
............
100
104,231
4.50%
,
02/15/31
............
100
94,860
Jefferies
GmbH
,
(ESTRON
at
0.00%
Floor
+
0.80%),
4.24%
,
07/22/26
(b)
(d)
EUR
100
111,201
John
Deere
Capital
Corp.
,
3.45%
,
07/16/32
(d)
................
100
114,090
JPMorgan
Chase
&
Co.
(b)
(1-day
SOFR
+
1.33%),
6.07%
,
10/22/27
...............
USD
19
19,692
Security
Par
(000)
Par
(000)
Value
United
States
(continued)
(1-day
SOFR
+
1.19%),
5.04%
,
01/23/28
...............
USD
9
$
9,151
(3-mo.
CME
Term
SOFR
+
1.52%),
4.20%
,
07/23/29
..........
102
101,620
(3-mo.
EURIBOR
+
1.28%),
4.46%
,
11/13/31
(d)
..............
EUR
100
119,004
KLA
Corp.
,
5.25%
,
07/15/62
......
USD
11
11,319
Kronos
International,
Inc.
,
9.50%
,
03/15/29
(d)
................
EUR
100
121,053
L3Harris
Technologies,
Inc.
4.40%
,
06/15/28
............
USD
25
25,105
5.05%
,
06/01/29
............
50
51,499
Lam
Research
Corp.
,
3.13%
,
06/15/60
16
11,044
Lamar
Media
Corp.
,
4.88%
,
01/15/29
100
98,785
Live
Nation
Entertainment,
Inc.
,
6.50%
,
05/15/27
(a)
................
100
101,999
Lowe's
Cos.,
Inc.
,
4.45%
,
04/01/62
..
27
22,875
Macy's
Retail
Holdings
LLC
,
5.88%
,
03/15/30
(a)
................
100
98,046
Match
Group
Holdings
II
LLC
,
5.00%
,
12/15/27
(a)
................
100
98,849
Medline
Borrower
LP
,
3.88%
,
04/01/29
(a)
................
100
94,676
MGM
Resorts
International
,
5.75%
,
06/15/25
.................
100
100,340
Morgan
Stanley
(b)
Series
I
,
(1-day
SOFR
+
0.75%),
0.86%
,
10/21/25
..........
3
2,992
(1-day
SOFR
+
0.56%),
1.16%
,
10/21/25
...............
24
23,952
(3-mo.
EURIBOR
+
0.65%),
4.13%
,
03/19/27
...............
EUR
200
223,349
(1-day
SOFR
+
0.88%),
1.59%
,
05/04/27
...............
USD
27
25,836
(1-day
SOFR
+
1.01%),
5.65%
,
04/13/28
...............
50
51,617
(3-mo.
EURIBOR
+
1.30%),
4.66%
,
03/02/29
...............
EUR
100
116,972
NCL
Corp.
Ltd.
,
8.38%
,
02/01/28
(a)
..
USD
100
105,015
Nestle
Finance
International
Ltd.
,
1.25%
,
11/02/29
(d)
...........
EUR
100
104,741
Newell
Brands,
Inc.
,
5.70%
,
04/01/26
(c)
USD
100
100,245
Nexstar
Media,
Inc.
,
5.63%
,
07/15/27
(a)
100
99,053
NGL
Energy
Operating
LLC
,
8.13%
,
02/15/29
(a)
................
100
102,535
Novelis
Corp.
,
3.88%
,
08/15/31
(a)
...
100
91,416
NRG
Energy,
Inc.
,
5.25%
,
06/15/29
(a)
100
99,668
NuStar
Logistics
LP
,
6.00%
,
06/01/26
100
100,594
OI
European
Group
BV
,
6.25%
,
05/15/28
(d)
................
EUR
100
115,935
Olympus
Water
US
Holding
Corp.
,
9.63%
,
11/15/28
(d)
...........
100
119,423
Oracle
Corp.
2.30%
,
03/25/28
............
USD
83
77,946
3.85%
,
04/01/60
............
30
22,583
Organon
&
Co.
2.88%
,
04/30/28
(d)
...........
EUR
100
106,796
5.13%
,
04/30/31
(a)
...........
USD
200
188,424
Outfront
Media
Capital
LLC
,
4.25%
,
01/15/29
(a)
................
100
95,215
Pacific
Gas
&
Electric
Co.
,
3.30%
,
12/01/27
.................
100
96,509
Park
Intermediate
Holdings
LLC
,
4.88%
,
05/15/29
(a)
...........
100
97,027
2024
BlackRock
Annual
Financial
Statements
and
Additional
Information
Schedule
of
Investments
(continued)
September
30,
2024
(Percentages
shown
are
based
on
Net
Assets)
Security
Par
(000)
Par
(000)
Value
United
States
(continued)
PennyMac
Financial
Services,
Inc.
,
7.88%
,
12/15/29
(a)
...........
USD
100
$
106,632
Performance
Food
Group,
Inc.
,
4.25%
,
08/01/29
(a)
................
100
95,095
Pilgrim's
Pride
Corp.
3.50%
,
03/01/32
............
100
88,790
6.88%
,
05/15/34
............
50
55,490
Post
Holdings,
Inc.
,
4.63%
,
04/15/30
(a)
100
95,686
Prime
Security
Services
Borrower
LLC
,
5.75%
,
04/15/26
(a)
...........
100
100,456
Rocket
Mortgage
LLC
,
3.63%
,
03/01/29
(a)
................
100
94,028
RTX
Corp.
,
2.15%
,
05/18/30
......
EUR
100
104,439
SCIL
IV
LLC
,
9.50%
,
07/15/28
(d)
....
100
120,139
Seagate
HDD
Cayman
,
9.63%
,
12/01/32
.................
USD
100
116,114
Sealed
Air
Corp.
,
6.13%
,
02/01/28
(a)
.
100
101,674
Sensata
Technologies,
Inc.
,
3.75%
,
02/15/31
(a)
................
100
91,555
Service
Properties
Trust
4.75%
,
10/01/26
............
100
96,098
3.95%
,
01/15/28
............
100
86,490
Sirius
XM
Radio,
Inc.
(a)
3.13%
,
09/01/26
............
100
96,616
4.00%
,
07/15/28
............
100
94,344
Solventum
Corp.
,
5.45%
,
02/25/27
(a)
.
40
40,826
Southwestern
Energy
Co.
,
5.38%
,
02/01/29
.................
100
99,663
Sprint
Capital
Corp.
,
6.88%
,
11/15/28
83
90,621
Standard
Industries,
Inc.
,
4.75%
,
01/15/28
(a)
................
100
97,949
Starwood
Property
Trust,
Inc.
,
7.25%
,
04/01/29
(a)
................
100
104,856
Sunoco
LP
,
4.50%
,
04/30/30
......
100
95,820
Tallgrass
Energy
Partners
LP
,
7.38%
,
02/15/29
(a)
................
100
101,128
TEGNA,
Inc.
,
4.63%
,
03/15/28
.....
100
95,420
Tenet
Healthcare
Corp.
,
6.75%
,
05/15/31
.................
100
104,237
T-Mobile
USA,
Inc.
,
2.25%
,
02/15/26
.
5
4,861
TransDigm,
Inc.
4.63%
,
01/15/29
............
100
96,564
6.38%
,
03/01/29
(a)
...........
100
103,172
Travel
+
Leisure
Co.
,
6.63%
,
07/31/26
(a)
100
101,889
United
Airlines
Pass-Through
Trust
,
Series
2013-1
,
Class
A
,
4.30%
,
08/15/25
.................
10
9,963
United
Airlines,
Inc.
,
4.38%
,
04/15/26
(a)
100
98,395
United
Rentals
North
America,
Inc.
,
5.50%
,
05/15/27
............
100
100,162
United
Wholesale
Mortgage
LLC
,
5.50%
,
11/15/25
(a)
...........
100
99,814
UnitedHealth
Group,
Inc.
,
4.95%
,
05/15/62
.................
24
23,214
Univision
Communications,
Inc.
,
8.00%
,
08/15/28
(a)
................
100
102,246
USA
Compression
Partners
LP
,
7.13%
,
03/15/29
(a)
................
100
102,995
Venture
Global
LNG,
Inc.
,
8.38%
,
06/01/31
(a)
................
131
138,326
Verizon
Communications,
Inc.
,
2.99%
,
10/30/56
.................
34
22,301
Security
Par
(000)
Par
(000)
Value
United
States
(continued)
VICI
Properties
LP
4.38%
,
05/15/25
............
USD
4
$
3,978
4.63%
,
06/15/25
(a)
...........
3
2,982
4.50%
,
09/01/26
(a)
...........
3
2,986
5.75%
,
02/01/27
(a)
...........
15
15,258
3.75%
,
02/15/27
(a)
...........
55
53,643
3.88%
,
02/15/29
(a)
...........
54
51,717
Vistra
Operations
Co.
LLC
,
5.63%
,
02/15/27
(a)
................
100
99,848
VMware
LLC
,
3.90%
,
08/21/27
.....
93
92,038
Walgreens
Boots
Alliance,
Inc.
,
3.45%
,
06/01/26
.................
100
96,201
Wells
Fargo
&
Co.
(1-day
SOFR
+
1.32%),
3.91%
,
04/25/26
(b)
..............
4
3,975
(1-day
SOFR
+
2.10%),
2.39%
,
06/02/28
(b)
..............
59
56,098
(1-day
SOFR
+
1.50%),
5.20%
,
01/23/30
(b)
..............
60
61,855
0.63%
,
03/25/30
(d)
...........
EUR
100
97,078
WRKCo,
Inc.
,
4.00%
,
03/15/28
.....
USD
52
51,363
Xerox
Holdings
Corp.
,
5.50%
,
08/15/28
(a)
................
100
85,380
14,714,409
Total
Corporate
Bonds
—
58.0%
(Cost:
$
31,398,495
)
..............................
32,446,677
Foreign
Agency
Obligations
Denmark
—
0.2%
Orsted
A/S
,
(5-Year
U.K.
Government
Bonds
Note
Generic
Bid
Yield
+
2.14%),
2.50%
,
02/18/3021
(b)
(d)
...
GBP
100
98,934
Finland
—
0.2%
Finnair
OYJ
,
4.75%
,
05/24/29
(d)
....
EUR
100
111,674
France
—
0.3%
Electricite
de
France
SA
,
(5-Year
EUR
Swap
Annual
+
3.97%),
3.38%
(b)
(d)
(g)
200
202,838
Italy
—
0.2%
Poste
Italiane
SpA
,
(5-Year
EURIBOR
ICE
Swap
Rate
+
2.68%),
2.63%
(b)
(d)
(g)
................
100
101,725
Total
Foreign
Agency
Obligations
—
0.9%
(Cost:
$
488,552
)
................................
515,171
Foreign
Government
Obligations
Brazil
—
1.6%
Federative
Republic
of
Brazil
10.00%
,
01/01/25
...........
BRL
2
394,042
10.00%
,
01/01/27
...........
3
522,682
916,724
Colombia
—
0.4%
Republic
of
Colombia
5.75%
,
11/03/27
............
COP
311,700
68,219
6.00%
,
04/28/28
............
637,900
137,772
205,991
Czech
Republic
—
0.2%
Czech
Republic
5.00%
,
09/30/30
............
CZK
1,310
62,575
Schedule
of
Investments
(continued)
September
30,
2024
(Percentages
shown
are
based
on
Net
Assets)
Security
Par
(000)
Par
(000)
Value
Czech
Republic
(continued)
4.50%
,
11/11/32
............
CZK
1,100
$
51,477
114,052
Hungary
—
0.0%
Hungary
Government
Bond
,
7.00%
,
10/24/35
.................
HUF
7,640
22,735
Indonesia
—
0.4%
Republic
of
Indonesia
7.00%
,
05/15/27
............
IDR
724,000
48,712
8.25%
,
05/15/36
............
661,000
49,400
7.13%
,
06/15/38
............
1,604,000
110,145
208,257
Mexico
—
1.8%
United
Mexican
States
10.00%
,
12/05/24
...........
MXN
30
152,166
5.75%
,
03/05/26
............
82
395,549
7.00%
,
09/03/26
............
17
81,327
8.50%
,
03/01/29
............
28
136,568
7.50%
,
05/26/33
............
21
93,766
7.75%
,
11/23/34
............
4
17,645
8.50%
,
11/18/38
............
29
136,892
1,013,913
Peru
—
0.3%
Republic
of
Peru
(a)
6.95%
,
08/12/31
............
PEN
304
87,639
7.60%
,
08/12/39
............
295
86,825
174,464
Poland
—
0.3%
Republic
of
Poland
5.75%
,
04/25/29
............
PLN
365
97,807
4.75%
,
07/25/29
............
107
27,443
5.00%
,
10/25/34
............
118
30,045
2.05%
,
08/25/36
............
151
35,345
190,640
South
Africa
—
0.5%
Republic
of
South
Africa
8.00%
,
01/31/30
............
ZAR
2,141
119,576
7.00%
,
02/28/31
............
959
49,668
9.00%
,
01/31/40
............
757
38,293
8.75%
,
01/31/44
............
1,042
50,435
257,972
Thailand
—
0.2%
Kingdom
of
Thailand
,
2.40%
,
03/17/29
THB
2,856
89,228
Uruguay
—
0.0%
Oriental
Republic
of
Uruguay
,
9.75%
,
07/20/33
.................
UYU
222
5,293
Total
Foreign
Government
Obligations
—
5.7%
(Cost:
$
3,402,208
)
..............................
3,199,269
Non-Agency
Mortgage-Backed
Securities
Collateralized
Mortgage
Obligations
—
2
.9
%
United
States
—
2.9%
(a)
A&D
Mortgage
Trust,
Series
2024-
NQM4,
Class
A1,
5.46%,
08/25/69
USD
100
100,121
Angel
Oak
Mortgage
Trust,
Series
2024-3,
Class
A1,
4.80%,
11/26/68
(c)
89
88,852
BINOM
Securitization
Trust,
Series
2021-INV1,
Class
A1,
2.03%,
06/25/56
(b)
................
58
51,834
Security
Par
(000)
Par
(000)
Value
United
States
(continued)
BRAVO
Residential
Funding
Trust,
Series
2024-NQM3,
Class
A1,
6.19%,
03/25/64
(c)
...........
USD
135
$
136,964
Chase
Home
Lending
Mortgage
Trust,
Series
2024-3,
Class
A4,
6.00%,
02/25/55
(b)
................
92
92,803
COLT
Mortgage
Loan
Trust
Series
2021-3,
Class
A1,
0.96%,
09/27/66
(b)
..............
66
55,099
Series
2023-3,
Class
A2,
7.43%,
09/25/68
(c)
..............
84
86,199
Series
2024-INV1,
Class
A1,
5.90%,
12/25/68
(c)
..............
93
93,976
Cross
Mortgage
Trust,
Series
2024-H5,
Class
A1,
5.85%,
08/26/69
(c)
....
97
97,520
CSMC
Trust,
Series
2021-NQM2,
Class
A1,
1.18%,
02/25/66
(b)
........
36
32,215
GS
Mortgage-Backed
Securities
Trust,
Series
2024-RPL2,
Class
A1,
3.75%,
07/25/61
(b)
................
94
92,239
J.P.
Morgan
Mortgage
Trust,
Series
2017-2,
Class
A7,
3.50%,
05/25/47
(b)
98
90,102
MFA
Trust,
Series
2022-NQM1,
Class
M1,
4.25%,
12/25/66
(b)
........
100
89,510
New
Residential
Mortgage
Loan
Trust,
Series
2015-1A,
Class
A3,
3.75%,
05/28/52
(b)
................
8
7,581
OBX
Trust,
Series
2024-NQM11,
Class
A1,
5.87%,
06/25/64
(c)
........
97
98,109
PRPM
Trust,
Series
2024-NQM1,
Class
A1,
6.27%,
12/25/68
(c)
........
91
92,928
Radian
Mortgage
Capital
Trust
LLC,
Series
2024-J1,
Class
A8,
6.00%,
11/25/54
(b)
................
96
95,787
SAIF
Securitization
Trust,
Series
2024-
CES1,
Class
A1,
5.96%,
07/25/54
(c)
98
98,414
Verus
Securitization
Trust
Series
2020-2,
Class
A1,
3.23%,
05/25/60
(b)
..............
21
20,559
Series
2024-INV1,
Class
A1,
6.12%,
03/25/69
(c)
..............
95
96,479
1,617,291
Commercial
Mortgage-Backed
Securities
—
6
.3
%
United
States
—
6.3%
(a)
BAMLL
Trust,
Series
2024-BHP,
Class
A,
(1-mo.
CME
Term
SOFR
at
2.35%
Floor
+
2.35%),
7.45%,
08/15/39
(b)
90
90,310
BSST
Mortgage
Trust,
Series
2021-
SSCP,
Class
A,
(1-mo.
CME
Term
SOFR
at
0.75%
Floor
+
0.86%),
5.96%,
04/15/36
(b)
...........
96
95,513
BX
Commercial
Mortgage
Trust
(b)
Series
2020-VKNG,
Class
A,
(1-mo.
CME
Term
SOFR
at
0.93%
Floor
+
1.04%),
6.14%,
10/15/37
...
73
72,901
Series
2021-VINO,
Class
A,
(1-mo.
CME
Term
SOFR
at
0.77%
Floor
+
0.77%),
5.86%,
05/15/38
...
90
89,612
Series
2023-XL3,
Class
A,
(1-mo.
CME
Term
SOFR
at
1.76%
Floor
+
1.76%),
6.86%,
12/09/40
...
97
97,126
Series
2024-AIRC,
Class
A,
(1-mo.
CME
Term
SOFR
at
1.69%
Floor
+
1.69%),
6.79%,
08/15/39
...
130
130,162
2024
BlackRock
Annual
Financial
Statements
and
Additional
Information
Schedule
of
Investments
(continued)
September
30,
2024
(Percentages
shown
are
based
on
Net
Assets)
Security
Par
(000)
Par
(000)
Value
United
States
(continued)
Series
2024-MF,
Class
A,
(1-mo.
CME
Term
SOFR
at
1.44%
Floor
+
1.44%),
6.54%,
02/15/39
...
USD
111
$
110,578
Series
2024-XL5,
Class
A,
(1-mo.
CME
Term
SOFR
at
1.39%
Floor
+
1.39%),
6.49%,
03/15/41
...
116
115,578
BX
Trust
(b)
Series
2021-LBA,
Class
AV,
(1-mo.
CME
Term
SOFR
at
0.80%
Floor
+
0.91%),
6.01%,
02/15/36
...
79
78,414
Series
2021-MFM1,
Class
A,
(1-mo.
CME
Term
SOFR
at
0.70%
Floor
+
0.81%),
5.91%,
01/15/34
...
48
47,416
Series
2022-GPA,
Class
A,
(1-mo.
CME
Term
SOFR
at
2.17%
Floor
+
2.17%),
7.26%,
08/15/39
...
123
122,684
Series
2022-VAMF,
Class
A,
(1-mo.
CME
Term
SOFR
at
0.85%
Floor
+
0.85%),
5.95%,
01/15/39
...
125
123,984
Series
2023-DELC,
Class
A,
(1-mo.
CME
Term
SOFR
at
2.69%
Floor
+
2.69%),
7.79%,
05/15/38
...
100
100,375
Series
2024-CNYN,
Class
A,
(1-mo.
CME
Term
SOFR
at
1.44%
Floor
+
1.44%),
6.54%,
04/15/41
...
148
148,222
CENT
Trust,
Series
2023-CITY,
Class
A,
(1-mo.
CME
Term
SOFR
at
2.62%
Floor
+
2.62%),
7.72%,
09/15/38
(b)
100
100,187
Citigroup
Commercial
Mortgage
Trust
Series
2020-420K,
Class
A,
2.46%,
11/10/42
...............
100
87,703
Series
2023-SMRT,
Class
A,
6.01%,
10/12/40
(b)
..............
100
103,373
Great
Wolf
Trust,
Series
2024-WOLF,
Class
A,
(1-mo.
CME
Term
SOFR
at
1.54%
Floor
+
1.54%),
6.64%,
03/15/39
(b)
................
100
99,781
GS
Mortgage
Securities
Corp.
Trust
(b)
Series
2022-ECI,
Class
A,
(1-mo.
CME
Term
SOFR
at
2.20%
Floor
+
2.19%),
7.29%,
08/15/39
...
100
100,031
Series
2023-FUN,
Class
A,
(1-mo.
CME
Term
SOFR
at
2.09%
Floor
+
2.09%),
7.19%,
03/15/28
...
100
100,188
Series
2024-RVR,
Class
D,
6.67%,
08/10/29
...............
40
39,965
INTOWN
Mortgage
Trust,
Series
2022-
STAY,
Class
A,
(1-mo.
CME
Term
SOFR
at
2.49%
Floor
+
2.49%),
7.59%,
08/15/39
(b)
...........
125
125,312
J.P.
Morgan
Chase
Commercial
Mortgage
Securities
Trust,
Series
2021-MHC,
Class
A,
(1-mo.
CME
Term
SOFR
at
0.80%
Floor
+
1.16%),
6.26%,
04/15/38
(b)
.....
123
122,568
KSL
Commercial
Mortgage
Trust,
Series
2023-HT,
Class
A,
(1-mo.
CME
Term
SOFR
at
2.29%
Floor
+
2.29%),
7.39%,
12/15/36
(b)
.....
100
100,250
LBA
Trust,
Series
2024-BOLT,
Class
A,
(1-mo.
CME
Term
SOFR
at
1.59%
Floor
+
1.59%),
6.69%,
06/15/26
(b)
40
40,000
MCR
Mortgage
Trust,
Series
2024-HTL,
Class
A,
(1-mo.
CME
Term
SOFR
at
1.76%
Floor
+
1.76%),
6.86%,
02/15/37
(b)
................
86
85,868
Security
Par
(000)
Par
(000)
Value
United
States
(continued)
MHP,
Series
2021-STOR,
Class
A,
(1-mo.
CME
Term
SOFR
at
0.70%
Floor
+
0.81%),
5.91%,
07/15/38
(b)
USD
125
$
124,063
MIRA
Trust,
Series
2023-MILE,
Class
A,
6.75%,
06/10/38
............
100
105,713
NYC
Trust,
Series
2024-3ELV,
Class
A,
(1-mo.
CME
Term
SOFR
at
1.99%
Floor
+
1.99%),
7.09%,
08/15/29
(b)
100
100,439
SHER
Trust,
Series
2024-DAL,
Class
A,
(1-mo.
CME
Term
SOFR
at
1.64%
Floor
+
1.64%),
6.74%,
04/15/37
(b)
150
149,063
SREIT
Trust,
Series
2021-MFP2,
Class
A,
(1-mo.
CME
Term
SOFR
at
0.82%
Floor
+
0.94%),
6.03%,
11/15/36
(b)
125
124,219
STWD
Trust,
Series
2021-FLWR,
Class
A,
(1-mo.
CME
Term
SOFR
at
0.58%
Floor
+
0.69%),
5.79%,
07/15/36
(b)
125
124,375
Taubman
Centers
Commercial
Mortgage
Trust,
Series
2022-DPM,
Class
A,
(1-mo.
CME
Term
SOFR
at
2.19%
Floor
+
2.19%),
7.28%,
05/15/37
(b)
................
100
100,250
TTAN
MHC,
Series
2021-MHC,
Class
A,
(1-mo.
CME
Term
SOFR
at
0.85%
Floor
+
0.96%),
6.06%,
03/15/38
(b)
96
96,146
Velocity
Commercial
Capital
Loan
Trust,
Series
2022-3,
Class
A,
5.22%,
06/25/52
(b)
................
76
74,115
3,526,484
Total
Non-Agency
Mortgage-Backed
Securities
—
9.2%
(Cost:
$
5,106,217
)
..............................
5,143,775
U.S.
Government
Sponsored
Agency
Securities
Collateralized
Mortgage
Obligations
—
3.5%
(b)
Federal
Home
Loan
Mortgage
Corp.
Variable
Rate
Notes
(SOFR
30
day
Average
+
1.10%),
6.36
%
,
11/25/54
........
227
226,965
Series
413
,
Class
F26
,
(SOFR
30
day
Average
at
1.20%
Floor
and
7.00%
Cap
+
1.20%),
6.48
%
,
05/25/54
........
149
149,951
Series
5330
,
Class
FA
,
(SOFR
30
day
Average
at
1.05%
Floor
and
7.00%
Cap
+
1.05%),
6.33
%
,
08/25/53
........
139
139,422
Series
5386
,
Class
FD
,
(SOFR
30
day
Average
at
1.25%
Floor
and
7.00%
Cap
+
1.25%),
6.53
%
,
03/25/54
..
29
28,873
Series
5425
,
Class
FK
,
(SOFR
30
day
Average
at
1.20%
Floor
and
7.00%
Cap
+
1.20%),
6.48
%
,
06/25/54
........
101
101,557
Series
5444
,
Class
FC
,
(SOFR
30
day
Average
at
1.12%
Floor
and
7.00%
Cap
+
1.12%),
6.40
%
,
08/25/54
..
262
262,526
Series
5448
,
Class
CF
,
(SOFR
30
day
Average
at
1.00%
Floor
and
7.00%
Cap
+
1.00%),
6.28
%
,
09/25/54
........
161
160,736
Schedule
of
Investments
(continued)
September
30,
2024
(Percentages
shown
are
based
on
Net
Assets)
Security
Par
(000)
Par
(000)
Value
Collateralized
Mortgage
Obligations
(continued)
Series
5458
,
Class
DF
,
(SOFR
30
day
Average
at
1.10%
Floor
and
6.50%
Cap
+
1.10%),
6.44
%
,
10/25/54
........
USD
222
$
221,861
Series
5458
,
Class
FB
,
(SOFR
30
day
Average
at
1.15%
Floor
and
6.50%
Cap
+
1.15%),
6.49
%
,
10/25/54
........
146
145,954
Federal
National
Mortgage
Association
Variable
Rate
Notes
Series
2024-38
,
Class
FE
,
(SOFR
30
day
Average
at
1.05%
Floor
and
7.00%
Cap
+
1.05%),
6.33
%
,
06/25/54
..
182
182,821
Series
2024-75
,
Class
FC
,
(SOFR
30
day
Average
at
0.95%
Floor
and
7.00%
Cap
+
0.95%),
6.12
%
,
10/25/54
..
163
162,771
Government
National
Mortgage
Association
Variable
Rate
Notes
Series
2024-125
,
Class
HF
,
(SOFR
30
day
Average
at
1.00%
Floor
and
7.00%
Cap
+
1.00%),
6.35
%
,
08/20/54
..
90
89,606
Series
2024-51
,
Class
TF
,
(SOFR
30
day
Average
at
1.00%
Floor
and
7.00%
Cap
+
1.00%),
6.35
%
,
03/20/54
..
35
35,511
Series
2024-96
,
Class
FL
,
(SOFR
30
day
Average
at
1.15%
Floor
and
6.50%
Cap
+
1.15%),
6.50
%
,
06/20/54
..
45
45,034
1,953,588
Mortgage-Backed
Securities
—
11.2%
Uniform
Mortgage-Backed
Securities
(i)
3.50
%
,
10/25/54
..........
6,498
6,050,717
4.50
%
,
10/25/54
..........
209
205,452
6,256,169
Total
U.S.
Government
Sponsored
Agency
Securities
—
14
.7
%
(Cost:
$
8,258,577
)
..............................
8,209,757
Total
Long-Term
Investments
—
106
.4
%
(Cost:
$
58,560,131
)
..............................
59,504,436
Shares
Shares
Short-Term
Securities
Money
Market
Funds
—
5.3%
Dreyfus
Treasury
Prime
Cash
Management
Institutional
Shares
,
4.88
%
(j)
..................
2,938,316
2,938,316
Total
Short-Term
Securities
—
5
.3
%
(Cost:
$
2,938,316
)
..............................
2,938,316
Security
Shares
Shares
Value
Total
Options
Purchased
—
0
.0
%
(Cost:
$
4,564
)
.................................
$
589
Total
Investments
Before
Options
Written
and
TBA
Sale
Commitments
—
111.7%
(Cost:
$
61,503,011
)
..............................
62,443,341
Total
Options
Written
—
(
0
.1
)
%
(Premiums
Received
—
$
(
16,829
)
)
...................
(
10,165
)
Par
(000)
Pa
r
(
000)
TBA
Sale
Commitments
Uniform
Mortgage-Backed
Securities
,
3.50
%
,
10/25/54
(i)
...........
USD
(
1,204
)
(
1,121,126
)
Total
TBA
Sale
Commitments
—
(
2
.0
)
%
(Proceeds:
$
(
1,124,411
)
)
..........................
(
1,121,126
)
Total
Investments
Net
of
Options
Written
and
TBA
Sale
Commitments
—
109
.6
%
(Cost:
$
60,361,771
)
..............................
61,312,050
Liabilities
in
Excess
of
Other
Assets
—
(
9.6
)
%
............
(
5,390,677
)
Net
Assets
—
100.0%
..............................
$
55,921,373
2024
BlackRock
Annual
Financial
Statements
and
Additional
Information
Schedule
of
Investments
(continued)
September
30,
2024
(a)
Security
exempt
from
registration
pursuant
to
Rule
144A
under
the
Securities
Act
of
1933,
as
amended.
These
securities
may
be
resold
in
transactions
exempt
from
registration
to
qualified
institutional
investors.
(b)
Variable
rate
security.
Interest
rate
resets
periodically.
The
rate
shown
is
the
effective
interest
rate
as
of
period
end.
Security
description
also
includes
the
reference
rate
and
spread
if
published
and
available.
(c)
Step
coupon
security.
Coupon
rate
will
either
increase
(step-up
bond)
or
decrease
(step-down
bond)
at
regular
intervals
until
maturity.
Interest
rate
shown
reflects
the
rate
currently
in
effect.
(d)
This
security
may
be
resold
to
qualified
foreign
investors
and
foreign
institutional
buyers
under
Regulation
S
of
the
Securities
Act
of
1933.
(e)
Zero-coupon
bond.
(f)
Convertible
security.
(g)
Perpetual
security
with
no
stated
maturity
date.
(h)
Payment-in-kind
security
which
may
pay
interest/dividends
in
additional
par/shares
and/or
in
cash.
Rates
shown
are
the
current
rate
and
possible
payment
rates.
(i)
Represents
or
includes
a
TBA
transaction.
(j)
Annualized
7-day
yield
as
of
period
end.
Schedule
of
Investments
(continued)
September
30,
2024
Derivative
Financial
Instruments
Outstanding
as
of
Period
End
Futures
Contracts
Description
Number
of
Contracts
Expiration
Date
Notional
Amount
(000)
Value/
Unrealized
Appreciation
(Depreciation)
Long
Contracts
U.S.
Treasury
10-Year
Note
...................................................
35
12/19/24
$
4,003
$
4,008
U.S.
Treasury
10-Year
Ultra
Note
...............................................
1
12/19/24
118
264
Long
Gilt
................................................................
4
12/27/24
526
(
3,793
)
U.S.
Treasury
5-Year
Note
....................................................
163
12/31/24
17,922
(
566
)
3-mo.
SONIA
Index
.........................................................
4
03/17/26
1,291
1,813
1,726
Short
Contracts
Euro-Bobl
...............................................................
13
12/06/24
1,737
(
18,111
)
Euro-Bund
..............................................................
14
12/06/24
2,103
(
25,487
)
U.S.
Treasury
Ultra
Bond
.....................................................
5
12/19/24
666
2,255
U.S.
Treasury
2-Year
Note
....................................................
69
12/31/24
14,371
(
30,429
)
3-mo.
SOFR
.............................................................
6
03/18/25
1,439
(
457
)
(
72,229
)
$
(
70,503
)
Forward
Foreign
Currency
Exchange
Contracts
Currency
Purchased
Currency
Sold
Counterparty
Settlement
Date
Unrealized
Appreciation
(Depreciation)
BRL
223,763
USD
40,000
Barclays
Bank
plc
10/02/24
$
1,075
BRL
577,707
USD
101,350
JPMorgan
Chase
Bank
NA
10/02/24
4,696
USD
103,250
BRL
537,935
JPMorgan
Chase
Bank
NA
10/02/24
4,505
USD
55,261
COP
231,635,993
Barclays
Bank
plc
10/23/24
352
AUD
19,000
USD
13,060
JPMorgan
Chase
Bank
NA
10/24/24
80
AUD
16,000
USD
10,833
Standard
Chartered
Bank
10/24/24
233
BRL
1,397,125
USD
253,699
Barclays
Bank
plc
10/24/24
2,069
CLP
10,219,440
USD
11,000
Bank
of
America
NA
10/24/24
362
CLP
46,712,390
USD
50,406
Barclays
Bank
plc
10/24/24
1,527
CNY
586,431
USD
83,039
Bank
of
America
NA
10/24/24
819
CNY
400,628
USD
57,000
HSBC
Bank
plc
10/24/24
288
COP
161,392,473
USD
38,243
HSBC
Bank
plc
10/24/24
10
EUR
3,000
USD
3,340
Bank
of
America
NA
10/24/24
3
EUR
12,000
USD
13,368
HSBC
Bank
plc
10/24/24
3
GBP
10,945
USD
14,459
Barclays
Bank
plc
10/24/24
174
GBP
3,000
USD
3,993
JPMorgan
Chase
Bank
NA
10/24/24
18
IDR
1,408,322,768
USD
91,575
Barclays
Bank
plc
10/24/24
1,028
INR
1,523,761
USD
18,162
JPMorgan
Chase
Bank
NA
10/24/24
4
JPY
3,068,715
USD
21,411
JPMorgan
Chase
Bank
NA
10/24/24
12
KRW
42,219,097
USD
31,828
Barclays
Bank
plc
10/24/24
215
MYR
688,715
USD
162,800
Barclays
Bank
plc
10/24/24
4,116
NOK
201,346
USD
19,000
Barclays
Bank
plc
10/24/24
84
NOK
105,606
USD
10,000
JPMorgan
Chase
Bank
NA
10/24/24
10
PEN
41,432
USD
11,000
Bank
of
America
NA
10/24/24
173
PEN
174,457
USD
46,304
Barclays
Bank
plc
10/24/24
741
RON
17,902
USD
4,000
JPMorgan
Chase
Bank
NA
10/24/24
4
SGD
27,736
USD
21,447
Barclays
Bank
plc
10/24/24
160
SGD
6,447
USD
5,000
JPMorgan
Chase
Bank
NA
10/24/24
23
THB
4,116,340
USD
123,759
Barclays
Bank
plc
10/24/24
4,374
THB
648,700
USD
20,000
JPMorgan
Chase
Bank
NA
10/24/24
193
TWD
191,999
USD
6,000
Bank
of
America
NA
10/24/24
75
TWD
295,312
USD
9,317
Barclays
Bank
plc
10/24/24
26
USD
22,000
BRL
119,944
Barclays
Bank
plc
10/24/24
42
USD
20,000
IDR
303,840,000
Barclays
Bank
plc
10/24/24
21
USD
49,588
MXN
965,371
Barclays
Bank
plc
10/24/24
735
USD
100,691
MXN
1,770,831
HSBC
Bank
plc
10/24/24
11,078
2024
BlackRock
Annual
Financial
Statements
and
Additional
Information
Schedule
of
Investments
(continued)
September
30,
2024
Forward
Foreign
Currency
Exchange
Contracts
(continued)
Currency
Purchased
Currency
Sold
Counterparty
Settlement
Date
Unrealized
Appreciation
(Depreciation)
USD
135,687
PLN
520,593
HSBC
Bank
plc
10/24/24
$
501
USD
20,000
ZAR
345,317
Bank
of
America
NA
10/24/24
53
ZAR
1,736,786
USD
98,984
HSBC
Bank
plc
10/24/24
1,341
USD
178,328
COP
748,478,285
Barclays
Bank
plc
11/20/24
1,527
USD
27,305
COP
113,710,967
JPMorgan
Chase
Bank
NA
11/20/24
445
USD
105,576
CZK
2,366,745
JPMorgan
Chase
Bank
NA
11/20/24
980
USD
12,535
CZK
282,496
Standard
Chartered
Bank
11/20/24
50
USD
1,177
HUF
418,418
Bank
of
America
NA
11/20/24
7
USD
22,923
HUF
8,101,021
HSBC
Bank
plc
11/20/24
269
USD
107,480
IDR
1,633,060,764
Barclays
Bank
plc
11/20/24
175
USD
27,880
IDR
424,252,050
HSBC
Bank
plc
11/20/24
3
USD
109,327
MXN
2,132,336
Barclays
Bank
plc
11/20/24
1,875
USD
23,347
MXN
457,018
HSBC
Bank
plc
11/20/24
317
USD
167,511
PLN
642,973
HSBC
Bank
plc
11/20/24
666
USD
13,214
BRL
72,281
Barclays
Bank
plc
11/21/24
24
BRL
995,611
USD
174,000
Bank
of
America
NA
12/18/24
7,088
USD
261,245
CHF
219,000
Barclays
Bank
plc
12/18/24
219
USD
167,869
EUR
150,000
Bank
of
America
NA
12/18/24
364
USD
87,254
EUR
78,000
Barclays
Bank
plc
12/18/24
151
USD
34,709
EUR
31,000
JPMorgan
Chase
Bank
NA
12/18/24
90
USD
570,458
MXN
11,140,784
JPMorgan
Chase
Bank
NA
12/18/24
11,464
66,937
BRL
72,281
USD
13,287
Barclays
Bank
plc
10/02/24
(
19
)
USD
60,000
BRL
327,354
Barclays
Bank
plc
10/02/24
(
90
)
COP
59,839,200
USD
14,780
Barclays
Bank
plc
10/23/24
(
597
)
USD
14,015
COP
59,839,200
Barclays
Bank
plc
10/23/24
(
170
)
CNY
69,814
USD
10,000
JPMorgan
Chase
Bank
NA
10/24/24
(
17
)
COP
41,698,500
USD
10,000
Bank
of
America
NA
10/24/24
(
117
)
CZK
1,174,306
USD
52,360
HSBC
Bank
plc
10/24/24
(
489
)
CZK
248,129
USD
11,000
JPMorgan
Chase
Bank
NA
10/24/24
(
40
)
EUR
16,380
GBP
13,785
Standard
Chartered
Bank
10/24/24
(
178
)
HUF
6,913,566
USD
19,457
Barclays
Bank
plc
10/24/24
(
104
)
HUF
4,974,789
USD
14,000
JPMorgan
Chase
Bank
NA
10/24/24
(
74
)
IDR
532,189,000
USD
35,000
Standard
Chartered
Bank
10/24/24
(
6
)
INR
334,646
USD
4,000
JPMorgan
Chase
Bank
NA
10/24/24
(
10
)
JPY
714,767
USD
5,000
JPMorgan
Chase
Bank
NA
10/24/24
(
10
)
KRW
13,060,240
USD
10,000
JPMorgan
Chase
Bank
NA
10/24/24
(
88
)
MXN
2,526,931
USD
132,778
Barclays
Bank
plc
10/24/24
(
4,903
)
MXN
584,325
USD
30,000
HSBC
Bank
plc
10/24/24
(
430
)
NOK
52,532
USD
5,000
JPMorgan
Chase
Bank
NA
10/24/24
(
21
)
PLN
85,436
EUR
19,955
Barclays
Bank
plc
10/24/24
(
49
)
PLN
53,857
USD
14,000
HSBC
Bank
plc
10/24/24
(
14
)
RON
31,360
USD
7,029
JPMorgan
Chase
Bank
NA
10/24/24
(
15
)
USD
20,000
CLP
18,045,800
Bank
of
America
NA
10/24/24
(
63
)
USD
26,411
JPY
3,793,509
Barclays
Bank
plc
10/24/24
(
72
)
USD
3,000
SEK
30,629
Bank
of
America
NA
10/24/24
(
19
)
USD
13,965
SEK
142,610
JPMorgan
Chase
Bank
NA
10/24/24
(
93
)
USD
15,317
TWD
485,779
HSBC
Bank
plc
10/24/24
(
53
)
USD
67,082
ZAR
1,181,672
HSBC
Bank
plc
10/24/24
(
1,177
)
HUF
16,371,891
USD
46,317
HSBC
Bank
plc
11/20/24
(
532
)
MXN
528,113
USD
27,042
HSBC
Bank
plc
11/20/24
(
430
)
PLN
400,531
USD
104,370
Barclays
Bank
plc
11/20/24
(
436
)
USD
151,694
PEN
570,295
Barclays
Bank
plc
11/20/24
(
2,054
)
USD
4,074
THB
133,779
Bank
of
America
NA
11/20/24
(
97
)
USD
83,237
THB
2,738,489
HSBC
Bank
plc
11/20/24
(
2,153
)
USD
4,385
UYU
185,018
Bank
of
America
NA
11/20/24
(
66
)
USD
1,108
UYU
46,639
HSBC
Bank
plc
11/20/24
(
14
)
USD
41,109
ZAR
715,853
Barclays
Bank
plc
11/20/24
(
148
)
USD
116,168
ZAR
2,042,955
JPMorgan
Chase
Bank
NA
11/20/24
(
1,574
)
USD
262,310
BRL
1,447,424
Barclays
Bank
plc
11/21/24
(
1,822
)
USD
20,232
BRL
113,388
JPMorgan
Chase
Bank
NA
11/21/24
(
459
)
USD
19,832
PEN
75,673
Barclays
Bank
plc
12/11/24
(
567
)
Schedule
of
Investments
(continued)
September
30,
2024
Forward
Foreign
Currency
Exchange
Contracts
(continued)
Currency
Purchased
Currency
Sold
Counterparty
Settlement
Date
Unrealized
Appreciation
(Depreciation)
USD
742,067
BRL
4,246,035
Bank
of
America
NA
12/18/24
$
(
30,229
)
USD
110,000
BRL
629,110
Barclays
Bank
plc
12/18/24
(
4,427
)
USD
14,881,436
EUR
13,330,000
Barclays
Bank
plc
12/18/24
(
4,170
)
USD
120,585
EUR
109,000
HSBC
Bank
plc
12/18/24
(
1,135
)
USD
199,859
EUR
179,000
JPMorgan
Chase
Bank
NA
12/18/24
(
30
)
USD
110,215
EUR
99,000
JPMorgan
Chase
Bank
NA
12/18/24
(
338
)
USD
243,415
EUR
218,000
Standard
Chartered
Bank
12/18/24
(
26
)
USD
2,518,590
GBP
1,917,000
Barclays
Bank
plc
12/18/24
(
43,892
)
USD
110,000
MXN
2,240,372
Barclays
Bank
plc
12/18/24
(
2,412
)
COP
160,759,193
USD
40,371
Barclays
Bank
plc
02/21/25
(
2,856
)
COP
70,876,800
USD
17,238
Barclays
Bank
plc
02/24/25
(
706
)
(
109,491
)
$
(
42,554
)
OTC
Credit
Default
Swaptions
Purchased
Paid
by
the
Fund
Received
by
the
Fund
Description
Rate/Reference
Rate/Reference
Frequency
Counterparty
Expiration
Date
Exercise
Price
Notional
Amount
(000)
(a)
Value
Put
Bought
Protection
on
5-Year
Credit
Default
Swap
......
1
.00
%
Markit
CDX
North
American
Investment
Grade
Index
Series
42.V1
Quarterly
Bank
of
America
NA
10/16/24
USD
57.50
USD
2,100
$
292
Bought
Protection
on
5-Year
Credit
Default
Swap
......
5
.00
iTraxx
Europe
Crossover
Index
Series
41.V1
Quarterly
Bank
of
America
NA
10/16/24
EUR
325.00
EUR
329
297
$
589
(a)
The
maximum
potential
amount
the
Fund
may
pay
should
a
negative
credit
event
take
place
as
defined
under
the
terms
of
the
agreement.
OTC
Credit
Default
Swaptions
Written
Paid
by
the
Fund
Received
by
the
Fund
Description
Rate/Reference
Rate/Reference
Frequency
Counterparty
Expiration
Date
Credit
Rating
(a)
Exercise
Price
Notional
Amount
(000)
(b)
Value
Put
Sold
Protection
on
5-Year
Credit
Default
Swap
.........
iTraxx
Europe
Crossover
Index
Series
41.V1
5
.00
%
Quarterly
Bank
of
America
NA
10/16/24
BB-
EUR
400.00
EUR
329
$
(
120
)
(a)
Using
the
rating
of
the
issuer
or
the
underlying
securities
of
the
index,
as
applicable,
provided
by
S&P
Global
Ratings.
(b)
The
maximum
potential
amount
the
Fund
may
pay
should
a
negative
credit
event
take
place
as
defined
under
the
terms
of
the
agreement.
OTC
Interest
Rate
Swaptions
Written
Paid
by
the
Fund
Received
by
the
Fund
Description
Rate
Frequency
Rate
Frequency
Counterparty
Expiration
Date
Exercise
Rate
Notional
Amount
(000)
Value
Call
5-Year
Interest
Rate
Swap
(a)
.
2.90%
Annual
1-day
SOFR
Annual
Bank
of
America
NA
12/03/24
2
.90
%
USD
350
$
(
1,169
)
2024
BlackRock
Annual
Financial
Statements
and
Additional
Information
Schedule
of
Investments
(continued)
September
30,
2024
OTC
Interest
Rate
Swaptions
Written
(continued)
Paid
by
the
Fund
Received
by
the
Fund
Description
Rate
Frequency
Rate
Frequency
Counterparty
Expiration
Date
Exercise
Rate
Notional
Amount
(000)
Value
5-Year
Interest
Rate
Swap
(a)
.
2.62%
Annual
1-day
SOFR
Annual
Bank
of
America
NA
02/24/25
2
.62
%
USD
1,400
$
(
5,859
)
(
7,028
)
Put
5-Year
Interest
Rate
Swap
(a)
.
1-day
SOFR
Annual
3.92%
Annual
JPMorgan
Chase
Bank
NA
02/24/25
3
.92
USD
1,400
(
3,017
)
$
(
10,045
)
(a)
Forward
settling
swaption.
Centrally
Cleared
Credit
Defa
ul
t
Swaps
—
Sell
Protection
Reference
Obligation/Index
Financing
Rate
Received
by
the
Fund
Payment
Frequency
Termination
Date
Credit
Rating
(a)
Notional
Amount
(000)
(b)
Value
Upfront
Premium
Paid
(Received)
Unrealized
Appreciation
(Depreciation)
Markit
CDX
North
American
High
Yield
Index
Series
42.V1
...........
5
.00
%
Quarterly
06/20/29
B+
USD
1,188
$
93,925
$
73,772
$
20,153
(a)
Using
the
rating
of
the
issuer
or
the
underlying
securities
of
the
index,
as
applicable,
provided
by
S&P
Global
Ratings.
(b)
The
maximum
potential
amount
the
Fund
may
pay
should
a
negative
credit
event
take
place
as
defined
under
the
terms
of
the
agreement.
Centrally
Cleared
Interest
Rate
Swap
s
Paid
by
the
Fund
Received
by
the
Fund
Rate
Frequency
Rate
Frequency
Effective
Date
Termination
Date
Notional
Amount
(000)
Value
Upfront
Premium
Paid
(Received)
Unrealized
Appreciation
(Depreciation)
10.47%
Monthly
28-day
MXIBTIIE
Monthly
N/A
08/06/25
MXN
2,409
$
(
541
)
$
—
$
(
541
)
9.71%
Monthly
28-day
MXIBTIIE
Monthly
N/A
09/22/25
MXN
93
3
—
3
8.02%
Quarterly
3-mo.
JIBAR
Quarterly
03/26/25
(a)
03/26/26
ZAR
999
(
566
)
—
(
566
)
8.45%
Quarterly
3-mo.
JIBAR
Quarterly
03/26/25
(a)
03/26/26
ZAR
211
(
167
)
—
(
167
)
4.53%
Annual
1-day
SOFR
Annual
N/A
04/01/26
USD
4,000
(
36,252
)
—
(
36,252
)
8.18%
Quarterly
3-mo.
JIBAR
Quarterly
N/A
04/02/26
ZAR
321
(
237
)
—
(
237
)
8.15%
Quarterly
3-mo.
JIBAR
Quarterly
05/07/25
(a)
05/07/26
ZAR
1,628
(
1,083
)
—
(
1,083
)
7.97%
Quarterly
3-mo.
JIBAR
Quarterly
06/06/25
(a)
06/06/26
ZAR
530
(
298
)
—
(
298
)
6.92%
Quarterly
3-mo.
JIBAR
Quarterly
09/23/25
(a)
09/23/26
ZAR
667
(
14
)
—
(
14
)
4.31%
Annual
1-day
SOFR
Annual
N/A
08/31/28
USD
5,250
(
196,452
)
—
(
196,452
)
1-day
SOFR
Annual
3.86%
Annual
N/A
04/01/31
USD
400
11,034
—
11,034
1-day
MIBOR
Semi-Annual
6.44%
Semi-Annual
N/A
09/18/34
INR
30,000
9,298
—
9,298
$
(
215,275
)
$
—
$
(
215,275
)
(a)
Forward
swap.
Schedule
of
Investments
(continued)
September
30,
2024
OTC
Interest
Rate
Swaps
Paid
by
the
Fund
Received
by
the
Fund
Rate
Frequency
Rate
Frequency
Counterparty
Termination
Date
Notional
Amount
(000)
Value
Upfront
Premium
Paid
(Received)
Unrealized
Appreciation
(Depreciation)
1-day
BZDIOVER
At
Termination
10.98%
At
Termination
Barclays
Bank
plc
01/02/25
BRL
3,758
$
263
$
—
$
263
1-day
BZDIOVER
At
Termination
11.02%
At
Termination
Barclays
Bank
plc
01/02/25
BRL
225
5
—
5
9.80%
At
Termination
1-day
IBR
At
Termination
HSBC
Bank
plc
05/10/25
COP
413,053
(
112
)
—
(
112
)
1-day
BZDIOVER
At
Termination
10.95%
At
Termination
JPMorgan
Chase
Bank
NA
07/01/25
BRL
609
(
594
)
—
(
594
)
1-day
BZDIOVER
At
Termination
11.83%
At
Termination
Barclays
Bank
plc
07/01/25
BRL
63
(
3
)
—
(
3
)
1-day
BZDIOVER
At
Termination
11.52%
At
Termination
HSBC
Bank
plc
01/02/26
BRL
480
(
657
)
—
(
657
)
1-day
BZDIOVER
At
Termination
12.16%
At
Termination
Barclays
Bank
plc
01/02/26
BRL
34
(
8
)
—
(
8
)
7.25%
Quarterly
1-day
IBR
Quarterly
Barclays
Bank
plc
09/25/26
COP
76,495
7
—
7
11.49%
At
Termination
1-day
BZDIOVER
At
Termination
JPMorgan
Chase
Bank
NA
01/04/27
BRL
417
1,211
—
1,211
11.59%
At
Termination
1-day
BZDIOVER
At
Termination
Bank
of
America
NA
01/04/27
BRL
234
521
—
521
1-day
BZDIOVER
At
Termination
10.05%
At
Termination
Barclays
Bank
plc
01/04/27
BRL
147
(
1,367
)
—
(
1,367
)
1-day
BZDIOVER
At
Termination
10.81%
At
Termination
Bank
of
America
NA
01/04/27
BRL
13
(
73
)
—
(
73
)
1-day
BZDIOVER
At
Termination
12.21%
At
Termination
Barclays
Bank
plc
01/04/27
BRL
132
(
51
)
—
(
51
)
4.31%
Semi-Annual
1-day
CLICP
Semi-Annual
Barclays
Bank
plc
09/13/27
CLP
34,385
19
—
19
4.28%
Semi-Annual
1-day
CLICP
Semi-Annual
Barclays
Bank
plc
09/25/27
CLP
6,347
7
—
7
$
(
832
)
$
—
$
(
832
)
OTC
Total
Return
Swaps
Paid
by
the
Fund
Received
by
the
Fund
Rate/Reference
Frequency
Rate/Reference
Frequency
Counterparty
Termination
Date
Notional
Amount
(000)
Value
Upfront
Premium
Paid
(Received)
Unrealized
Appreciation
(Depreciation)
1-day
SOFR
.......
Quarterly
Markit
iBoxx
USD
Liquid
Leveraged
Loans
Total
Return
Index
At
Termination
JPMorgan
Chase
Bank
NA
12/20/24
USD
250
$
4,957
$
(
1,043
)
$
6,000
1-day
SOFR
.......
Quarterly
Markit
iBoxx
USD
Liquid
Leveraged
Loans
Total
Return
Index
At
Termination
JPMorgan
Chase
Bank
NA
12/20/24
USD
110
1,081
(
401
)
1,482
1-day
SOFR
.......
Quarterly
Markit
iBoxx
USD
Liquid
Leveraged
Loans
Total
Return
Index
At
Termination
JPMorgan
Chase
Bank
NA
12/20/24
USD
107
1,267
(
361
)
1,628
$
7,305
$
(
1,805
)
$
9,110
The
following
reference
rates,
and
their
values
as
of
period
end,
are
used
for
security
descriptions:
Reference
Index
Reference
Rate
1-day
BZDIOVER
.....................................
Overnight
Brazil
CETIP
—
Interbank
Rate
0
.04
%
1-day
CLICP
.........................................
Chile
Indice
de
Camara
Promedio
Interbank
Overnight
Index
0
.05
1-day
IBR
...........................................
Colombian
Reference
Banking
Indicator
10
.08
1-day
MIBOR
........................................
Mumbai
Interbank
Offered
Rate
6
.76
2024
BlackRock
Annual
Financial
Statements
and
Additional
Information
Schedule
of
Investments
(continued)
September
30,
2024
Derivative
Financial
Instruments
Categorized
by
Risk
Exposure
Reference
Index
Reference
Rate
1-day
SOFR
.........................................
Secured
Overnight
Financing
Rate
5
.16
%
28-day
MXIBTIIE
......................................
Mexico
Interbank
TIIE
28-Day
10
.74
3-mo.
JIBAR
.........................................
Johannesburg
Interbank
Average
Rate
8
.05
Balances
Reported
in
the
Statement
of
Assets
and
Liabilities
for
Centrally
Cleared
Swaps,
OTC
Swaps
and
Options
Written
Description
Swap
Premiums
Paid
Swap
Premiums
Received
Unrealized
Appreciation
Unrealized
Depreciation
Value
Centrally
Cleared
Swaps
(a)
............................................
$
73,772
$
—
$
40,488
$
(
235,610
)
$
—
OTC
Swaps
.....................................................
—
(
1,805
)
11,143
(
2,865
)
—
Options
Written
...................................................
N/A
N/A
6,664
—
(
10,165
)
(a)
Includes
cumulative
appreciation
(depreciation)
on
centrally
cleared
swaps,
as
reported
in
the
Schedule
of
Investments.
Only
current
day’s
variation
margin
is
reported
within
the
Statement
of
Assets
and
Liabilities
and
is
net
of
any
previously
paid
(received)
swap
premium
amounts.
As
of
period
end,
the
fair
values
of
derivative
financial
instruments
located
in
the
Statement
of
Assets
and
Liabilities
were
as
follows:
Commodity
Contracts
Credit
Contracts
Equity
Contracts
Foreign
Currency
Exchange
Contracts
Interest
Rate
Contracts
Other
Contracts
Total
Assets
—
Derivative
Financial
Instruments
Futures
contracts
Unrealized
appreciation
on
futures
contracts
(a)
......
$
—
$
—
$
—
$
—
$
8,340
$
—
$
8,340
Forward
foreign
currency
exchange
contracts
Unrealized
appreciation
on
forward
foreign
currency
exchange
contracts
......................
—
—
—
66,937
—
—
66,937
Options
purchased
(b)
Investments
at
value
—
unaffiliated
(c)
............
—
589
—
—
—
—
589
Swaps
—
centrally
cleared
Unrealized
appreciation
on
centrally
cleared
swaps
(a)
.
—
20,153
—
—
20,335
—
40,488
Swaps
—
OTC
Unrealized
appreciation
on
OTC
swaps;
Swap
premiums
paid
................................
—
—
—
—
11,143
—
11,143
$
—
$
20,742
$
—
$
66,937
$
39,818
$
—
$
127,497
Liabilities
—
Derivative
Financial
Instruments
Futures
contracts
Unrealized
depreciation
on
futures
contracts
(a)
......
$
—
$
—
$
—
$
—
$
78,843
$
—
$
78,843
Forward
foreign
currency
exchange
contracts
Unrealized
depreciation
on
forward
foreign
currency
exchange
contracts
......................
—
—
—
109,491
—
—
109,491
Options
written
(b)
Options
written
at
value
.....................
—
120
—
—
10,045
—
10,165
Swaps
—
centrally
cleared
Unrealized
depreciation
on
centrally
cleared
swaps
(a)
.
—
—
—
—
235,610
—
235,610
Swaps
—
OTC
Unrealized
depreciation
on
OTC
swaps;
Swap
premiums
received
.............................
—
—
—
—
4,670
—
4,670
$
—
$
120
$
—
$
109,491
$
329,168
$
—
$
438,779
(a)
Net
cumulative
unrealized
appreciation
(depreciation)
on
futures
contracts
and
centrally
cleared
swaps,
if
any,
are
reported
in
the
Schedule
of
Investments.
In
the
Statement
of
Assets
and
Liabilities,
only
current
day’s
variation
margin
is
reported
in
receivables
or
payables
and
the
net
cumulative
unrealized
appreciation
(depreciation)
is
included
in
accumulated
earnings
(loss).
(b)
Includes
forward
settling
swaptions.
(c)
Includes
options
purchased
at
value
as
reported
in
the
Schedule
of
Investments.
Schedule
of
Investments
(continued)
September
30,
2024
For
more
information
about
the
Fund’s
investment
risks
regarding
derivative
financial
instruments,
refer
to
the
Notes
to
Financial
Statements.
Derivative
Financial
Instruments
—
Offsetting
as
of
Period
End
For
the
period
ended
September
30,
2024,
the
effect
of
derivative
financial
instruments
in
the
Statement
of
Operations
was
as
follows:
Commodity
Contracts
Credit
Contracts
Equity
Contracts
Foreign
Currency
Exchange
Contracts
Interest
Rate
Contracts
Other
Contracts
Total
Net
Realized
Gain
(Loss)
from
Futures
c
ontracts
.......................
$
—
$
—
$
—
$
—
$
230,441
$
—
$
230,441
Forward
foreign
currency
exchange
contracts
....
—
—
—
(
64,960
)
—
—
(
64,960
)
Options
purchased
(a)
.....................
—
—
—
(
122
)
—
—
(
122
)
Options
written
........................
—
—
—
46
—
—
46
Swaps
..............................
—
12,893
—
—
6,964
—
19,857
$
—
$
12,893
$
—
$
(65,036)
$
237,405
$
—
$
185,262
Net
Change
in
Unrealized
Appreciation
(Depreciation)
on
Futures
c
ontracts
.......................
$
—
$
—
$
—
$
—
$
(
70,503
)
$
—
$
(
70,503
)
Forward
foreign
currency
exchange
contracts
....
—
—
—
(
42,554
)
—
—
(
42,554
)
Options
purchased
(b)
.....................
—
(
3,975
)
—
—
—
—
(
3,975
)
Options
written
........................
—
453
—
—
6,211
—
6,664
Swaps
..............................
—
20,153
—
—
(
206,997
)
—
(
186,844
)
$
—
$
16,631
$
—
$
(42,554)
$
(271,289)
$
—
$
(297,212)
(a)
Options
purchased
are
included
in
net
realized
gain
(loss)
from
investments
—
unaffiliated.
(b)
Options
purchased
are
included
in
net
change
in
unrealized
appreciation
(depreciation)
on
investments
—
unaffiliated.
Average
Quarterly
Balances
of
Outstanding
Derivative
Financial
Instruments
Futures
contracts
Average
notional
value
of
contracts
—
long
..................................................................................
$
14,579,283
Average
notional
value
of
contracts
—
short
.................................................................................
$
10,323,683
Forward
foreign
currency
exchange
contracts
Average
amounts
purchased
—
in
USD
....................................................................................
$
20,511,651
Average
amounts
sold
—
in
USD
........................................................................................
$
1,805,211
Options
Average
value
of
option
contracts
purchased
................................................................................
$
34
Average
value
of
option
contracts
written
...................................................................................
$
15
Average
notional
value
of
swaption
contracts
purchased
.........................................................................
$
822,075
Average
notional
value
of
swaption
contracts
written
...........................................................................
$
1,172,075
Credit
default
swaps
Average
notional
value
—
sell
protection
...................................................................................
$
592,000
Interest
rate
swaps
Average
notional
value
—
pays
fixed
rate
...................................................................................
$
8,060,046
Average
notional
value
—
receives
fixed
rate
................................................................................
$
1,223,382
Total
return
swaps
Average
notional
value
...............................................................................................
$
155,667
The
Fund's
derivative
assets
and
liabilities
(by
type)
were
as
follows:
Assets
Liabilities
Derivative
Financial
Instruments
$
—
Futures
contracts
....................................................................................
$
30,767
$
70,638
Forward
f
oreign
currency
exchange
contracts
.................................................................
66,937
109,491
Options
(a)
(b)
........................................................................................
589
10,165
Swaps
—
centrally
cleared
..............................................................................
3,912
—
Swaps
—
OTC
(c)
.....................................................................................
11,143
4,670
Total
derivative
assets
and
liabilities
in
the
Statement
of
Assets
and
Liabilities
.............................................
$
113,348
$
194,964
Derivatives
not
subject
to
a
Master
Netting
Agreement
or
similar
agreement
("MNA")
........................................
(
34,679
)
(
70,638
)
Total
derivative
assets
and
liabilities
subject
to
an
MNA
............................................................
$
78,669
$
124,326
(a)
Includes
options
purchased
at
value
which
is
included
in
Investments
at
value
–
unaffiliated
in
the
Statement
of
Assets
and
Liabilities
and
reported
in
the
Schedule
of
Investments.
(b)
Includes
forward
settling
swaptions.
(c)
Includes
unrealized
appreciation
(depreciation)
on
OTC
swaps
and
swap
premiums
paid/(received)
in
the
Statement
of
Assets
and
Liabilities.
2024
BlackRock
Annual
Financial
Statements
and
Additional
Information
Schedule
of
Investments
(continued)
September
30,
2024
Fair
Value
Hierarchy
as
of Period
End
Various
inputs
are
used
in
determining
the
fair
value
of
financial
instruments
at
the
measurement
date.
For
a
description
of
the
input
levels
and
information
about
the
Fund’s
policy
regarding
valuation
of
financial
instruments,
refer
to
the
Notes
to
Financial
Statements.
The
following
table
summarizes
the
Fund’s
financial
instruments
categorized
in
the
fair
value
hierarchy.
The
breakdown
of
the
Fund's
financial
instruments
into
major
categories
is
disclosed
in
the Schedule
of
Investments
above.
The
following
tables
present
the
Fund's
derivative
assets
and
liabilities
by
counterparty
net
of
amounts
available
for
offset
under
an
MNA
and
net
of
the
related
collateral
received
and
pledged
by
the
Fund:
Counterparty
Derivative
Assets
Subject
to
an
MNA
by
Counterparty
Derivatives
Available
for
Offset
(a)
Non-cash
Collateral
Received
Cash
Collateral
Received
Net
Amount
of
Derivative
Assets
(b)(c)
Bank
of
America
NA
..............................
$
10,054
$
(
10,054
)
$
—
$
—
$
—
Barclays
Bank
plc
................................
21,011
(
21,011
)
—
—
—
HSBC
Bank
plc
..................................
14,476
(
7,196
)
—
—
7,280
JPMorgan
Chase
Bank
NA
..........................
32,845
(
8,185
)
—
—
24,660
Standard
Chartered
Bank
...........................
283
(
210
)
—
—
73
$
78,669
$
(
46,656
)
$
—
$
—
$
32,013
Counterparty
Derivative
Liabilities
Subject
to
an
MNA
by
Counterparty
Derivatives
Available
for
Offset
(a)
Non-cash
Collateral
Pledged
Cash
Collateral
Pledged
Net
Amount
of
Derivative
Liabilities
(b)(d)
Bank
of
America
NA
..............................
$
37,812
$
(
10,054
)
$
—
$
—
$
27,758
Barclays
Bank
plc
................................
70,923
(
21,011
)
—
—
49,912
HSBC
Bank
plc
..................................
7,196
(
7,196
)
—
—
—
JPMorgan
Chase
Bank
NA
..........................
8,185
(
8,185
)
—
—
—
Standard
Chartered
Bank
...........................
210
(
210
)
—
—
—
$
124,326
$
(
46,656
)
$
—
$
—
$
77,670
(a)
The
amount
of
derivatives
available
for
offset
is
limited
to
the
amount
of
derivative
assets
and/or
liabilities
that
are
subject
to
an
MNA.
(b)
Net
amount
may
also
include
forward
foreign
currency
exchange
contracts
that
are
not
required
to
be
collateralized.
(c)
Net
amount
represents
the
net
amount
receivable
from
the
counterparty
in
the
event
of
default.
(d)
Net
amount
represents
the
net
amount
payable
due
to
the
counterparty
in
the
event
of
default.
Level
1
Level
2
Level
3
Total
Assets
Investments
Long-Term
Investments
Asset-Backed
Securities
...................................
$
—
$
9,989,787
$
—
$
9,989,787
Corporate
Bonds
........................................
—
32,446,677
—
32,446,677
Foreign
Agency
Obligations
.................................
—
515,171
—
515,171
Foreign
Government
Obligations
..............................
—
3,199,269
—
3,199,269
Non-Agency
Mortgage-Backed
Securities
........................
—
5,143,775
—
5,143,775
U.S.
Government
Sponsored
Agency
Securities
....................
—
8,209,757
—
8,209,757
Short-Term
Securities
Money
Market
Funds
......................................
2,938,316
—
—
2,938,316
Options
Purchased
Credit
contracts
..........................................
—
589
—
589
Liabilities
Investments
TBA
Sale
Commitments
....................................
—
(
1,121,126
)
—
(
1,121,126
)
$
2,938,316
$
58,383,899
$
—
$
61,322,215
Derivative
Financial
Instruments
(a)
Assets
Credit
contracts
...........................................
$
—
$
20,153
$
—
$
20,153
Foreign
currency
exchange
contracts
............................
—
66,937
—
66,937
Interest
rate
contracts
.......................................
8,340
31,478
—
39,818
Schedule
of
Investments
(continued)
September
30,
2024
See
notes
to
financial
statements.
Level
1
Level
2
Level
3
Total
Liabilities
Credit
contracts
...........................................
$
—
$
(
120
)
$
—
$
(
120
)
Foreign
currency
exchange
contracts
............................
—
(
109,491
)
—
(
109,491
)
Interest
rate
contracts
.......................................
(
78,843
)
(
248,520
)
—
(
327,363
)
$
(
70,503
)
$
(
239,563
)
$
—
$
(
310,066
)
(a)
Derivative
financial
instruments
are
swaps,
futures
contracts,
forward
foreign
currency
exchange
contracts
and
options
written.
Swaps,
futures
contracts
and
forward
foreign
currency
exchange
contracts
are
valued
at
the
unrealized
appreciation
(depreciation)
on
the
instrument
and
options
written
are
shown
at
value.
Fair
Value
Hierarchy
as
of Period
End
(continued)
Statement
of
Assets
and
Liabilities
September
30,
2024
2024
BlackRock
Annual
Financial
Statements
and
Additional
Information
BATS:
Series
I
Portfolio
ASSETS
Investments,
at
value
—
unaffiliated
(a)
........................................................................................
$
62,443,341
Cash
.............................................................................................................
13,792
Cash
pledged:
–
Futures
contracts
....................................................................................................
341,000
Centrally
cleared
swaps
................................................................................................
291,970
Foreign
currency,
at
value
(b)
...............................................................................................
261,551
Receivables:
–
TBA
sale
commitments
................................................................................................
1,124,411
Interest
—
unaffiliated
.................................................................................................
694,943
From
the
Manager
...................................................................................................
5,340
Variation
margin
on
futures
contracts
.......................................................................................
30,767
Variation
margin
on
centrally
cleared
swaps
..................................................................................
3,912
Unrealized
appreciation
on:
–
Forward
foreign
currency
exchange
contracts
.................................................................................
66,937
OTC
swaps
........................................................................................................
11,143
Prepaid
e
xpenses
.....................................................................................................
164
Total
a
ssets
.........................................................................................................
65,289,271
LIABILITIES
Options
written,
at
value
(c)
................................................................................................
10,165
TBA
sale
commitments,
at
value
(d)
..........................................................................................
1,121,126
Payables:
–
Investments
purchased
................................................................................................
7,728,731
Swaps
..........................................................................................................
42
Deferred
foreign
capital
gain
tax
..........................................................................................
297
Income
dividend
distributions
............................................................................................
286,653
Professional
fees
....................................................................................................
36,085
Variation
margin
on
futures
contracts
.......................................................................................
70,638
Swap
premiums
received
................................................................................................
1,805
Unrealized
depreciation
on:
–
Forward
foreign
currency
exchange
contracts
.................................................................................
109,491
OTC
swaps
........................................................................................................
2,865
Total
li
abilities
........................................................................................................
9,367,898
Commitments
and
contingent
liabilities
$
–
NET
ASSETS
........................................................................................................
$
55,921,373
NET
ASSETS
CONSIST
OF:
Paid-in
capital
........................................................................................................
$
55,056,223
Accumulated
earnings
..................................................................................................
865,150
NET
ASSETS
........................................................................................................
$
55,921,373
(a)
Investments,
at
cost
—
unaffiliated
.................................................................................
$
61,503,011
(b)
Foreign
currency,
at
cost
.......................................................................................
$
261,907
(c)
Premiums
received
...........................................................................................
$
16,829
(d)
Proceeds
received
from
TBA
sale
commitments
.........................................................................
$
1,124,411
See
notes
to
financial
statements.
Statement
of
Assets
and
Liabilities
(continued)
September
30,
2024
Statement
of
Assets
and
Liabilities
See
notes
to
financial
statements.
BATS:
Series
I
Portfolio
NET
ASSET
VALUE
Net
assets
.........................................................................................................
$
55,921,373
Shares
outstanding
...................................................................................................
5,503,931
Net
asset
value
.....................................................................................................
$
10.16
Shares
authorized
...................................................................................................
Unlimited
Par
value
.........................................................................................................
$
0.001
Statement
of
Operations
Period
Ended
September
30,
2024
2024
BlackRock
Annual
Financial
Statements
and
Additional
Information
See
notes
to
financial
statements.
BATS:
Series
I
Portfolio
(a)
INVESTMENT
INCOME
Interest
—
unaffiliated
.................................................................................................
$
1,783,652
Foreign
taxes
withheld
................................................................................................
(
1,037
)
Total
investment
income
.................................................................................................
1,782,615
EXPENSES
Professional
.......................................................................................................
36,100
Administration
.....................................................................................................
14,634
Trustees
and
Officer
..................................................................................................
855
Total
expenses
.......................................................................................................
51,589
Less:
–
Administration
fees
waived
.............................................................................................
(
14,634
)
Fees
waived
and/or
reimbursed
by
the
Manager
...............................................................................
(
36,955
)
Total
expenses
after
fees
waived
and/or
reimbursed
..............................................................................
—
Net
investment
income
..................................................................................................
1,782,615
REALIZED
AND
UNREALIZED
GAIN
(LOSS)
$
914,629
Net
realized
gain
(loss)
from:
$
–
Investments
—
unaffiliated
(b)
..........................................................................................
54,965
Forward
foreign
currency
exchange
contracts
...............................................................................
(
64,960
)
Foreign
currency
transactions
.........................................................................................
19,358
Futures
contracts
..................................................................................................
230,441
Options
written
...................................................................................................
46
Swaps
.........................................................................................................
19,857
A
259,707
Net
change
in
unrealized
appreciation
(depreciation)
on:
Investments
—
unaffiliated
(c)
..........................................................................................
943,318
Forward
foreign
currency
exchange
contracts
...............................................................................
(
42,554
)
Foreign
currency
translations
..........................................................................................
4,841
Futures
contracts
..................................................................................................
(
70,503
)
Options
written
...................................................................................................
6,664
Swaps
.........................................................................................................
(
186,844
)
A
654,922
Net
realized
and
unrealized
gain
...........................................................................................
914,629
NET
INCREASE
IN
NET
ASSETS
RESULTING
FROM
OPERATIONS
..................................................................
$
2,697,244
(a)
For
the
period
from
March
06,
2024
(commencement
of
operations)
to
September
30,
2024.
(b)
Net
of
foreign
capital
gain
tax
and
capital
gain
tax
refund,
if
applicable
of
...............................................................
$
(
289
)
(c)
Net
of
increase
in
deferred
foreign
capital
gain
tax
of
............................................................................
$
(
297
)
Statement
of
Changes
in
Net
Assets
Statement
of
Changes
in
Net
Assets
See
notes
to
financial
statements.
BATS:
Series
I
Portfolio
Period
from
03/06/24
(a)
to
09/30/24
INCREASE
(DECREASE)
IN
NET
ASSETS
OPERATIONS
Net
investment
income
...............................................................................................
$
1,782,615
Net
realized
gain
...................................................................................................
259,707
Net
change
in
unrealized
appreciation
(depreciation)
...........................................................................
654,922
Net
increase
in
net
assets
resulting
from
operations
..............................................................................
2,697,244
DISTRIBUTIONS
TO
SHAREHOLDERS
(b)
Decrease
in
net
assets
resulting
from
distributions
to
shareholders
....................................................................
(1,832,094
)
CAPITAL
SHARE
TRANSACTIONS
Net
increase
in
net
assets
derived
from
capital
share
transactions
....................................................................
55,056,223
NET
ASSETS
Total
increase
in
net
assets
..............................................................................................
55,921,373
Beginning
of
period
...................................................................................................
—
End
of
period
.......................................................................................................
$
55,921,373
(a)
Commencement
of
operations.
(b)
Distributions
for
annual
periods
determined
in
accordance
with
U.S.
federal
income
tax
regulations.
Financial
Highlights
(For
a
share
outstanding
throughout
the
period)
2024
BlackRock
Annual
Financial
Statements
and
Additional
Information
BATS:
Series
I
Portfolio
Period
from
03/06/24
(a)
to
09/30/24
Net
asset
value,
beginning
of
period
......................................................................................
$
10.00
Net
investment
income
(b)
..............................................................................................
0
.35
Net
realized
and
unrealized
gain
.........................................................................................
0.17
Net
increase
from
investment
operations
.....................................................................................
0.52
Distributions
from
net
investment
income
(c)
.................................................................................
(0.36
)
Net
asset
value,
end
of
period
...........................................................................................
$
10.16
Total
Return
(d)
—
Based
on
net
asset
value
...............................................................................................
5.28
%
(e)
Ratios
to
Average
Net
Assets
(f)
Total
expen
ses
......................................................................................................
0.12
%
(g)
(h)
Total
expenses
after
fees
waived
and/or
reimbursed
.............................................................................
0.00
%
(g)
(h)
Net
investment
income
.................................................................................................
6.09
%
(g)
Supplemental
Data
Net
assets,
end
of
period
(000)
...........................................................................................
$
55,921
Portfolio
turnover
rate
..................................................................................................
137
%
(i)
(a)
Commencement
of
operations.
(b)
Based
on
average
shares
outstanding.
(c)
Distributions
for
annual
periods
determined
in
accordance
with
U.S.
federal
income
tax
regulations.
(d)
Where
applicable,
assumes
the
reinvestment
of
distributions.
(e)
Not
annualized.
(f)
Excludes
fees
and
expenses
incurred
indirectly
as
a
result
of
investments
in
underlying
funds.
(g)
Annualized.
(h)
Audit
fees
were
not
annualized
in
the
calculation
of
the
expense
ratios.
If
these
expenses
were
annualized,
the
total
expenses
and
total
expenses
after
fees
waived
and/or
reimbursed
would
have
been
0.18%
and
0.00%,
respectively.
(i)
Includes
mortgage
dollar
roll
transactions
("MDRs").
Excluding
MDRs,
the
portfolio
turnover
rate
would
have
been
85%.
See
notes
to
financial
statements.
Notes
to
Financial
Statements
Notes
to
Financial
Statements
1.
ORGANIZATION
BlackRock
Allocation
Target
Shares (the
“Trust”)
is
registered
under
the
Investment
Company
Act
of
1940,
as
amended
(the
“1940
Act”),
as
an
open-end
management
investment
company.
The Trust
is
organized
as
a Delaware
statutory trust. BATS:
Series
I
Portfolio
(the
“Fund”)
is
a
series
of
the
Trust.
The
Fund
is
classified
as
non-
diversified.
Shares
of
the
Fund are
offered
to
separate
account
clients
of
the
adviser,
BlackRock
Advisors,
LLC
(the
“Manager”)
or
certain
of
its
affiliates.
Participants
in
wrap-fee
programs
pay
a
single
aggregate
fee
to
the
program
sponsor
for
all
costs
and
expenses
of
the
wrap-fee
programs
including
investment
advice
and
portfolio
execution.
The
Fund,
together
with
certain
other
registered
investment
companies
advised
by
the
Manager
or
its
affiliates,
is
included
in
a
complex
of
funds
referred
to
as
the
BlackRock
Fixed-Income
Complex.
2.
SIGNIFICANT
ACCOUNTING
POLICIES
The
financial
statements
are
prepared
in
conformity
with
accounting
principles
generally
accepted
in
the
United
States
of
America
(“U.S.
GAAP”),
which
may
require
management
to
make
estimates
and
assumptions
that
affect
the
reported
amounts
of
assets
and
liabilities
in
the
financial
statements,
disclosure
of
contingent
assets
and
liabilities
at
the
date
of
the
financial
statements
and
the
reported
amounts
of
increases
and
decreases
in
net
assets
from
operations
during
the
reporting
period.
Actual
results
could
differ
from
those
estimates.
The
Fund
is
considered
an
investment
company
under
U.S.
GAAP
and
follows
the
accounting
and
reporting
guidance
applicable
to
investment
companies.
Below
is
a
summary
of
significant
accounting
policies:
Investment
Transactions
and
Income
Recognition:
For
financial
reporting
purposes,
investment
transactions
are
recorded
on
the
dates
the
transactions
are
executed
(the
“trade
dates”).
Realized
gains
and
losses
on
investment
transactions
are
determined
using
the
specific
identification
method.
Dividends
from
foreign
securities
where
the
ex-dividend
dates
may
have
passed
are
subsequently
recorded
when
the
Fund
is
informed
of
the
ex-dividend
dates.
Under
the
applicable
foreign
tax
laws,
a
withholding
tax
at
various
rates
may
be
imposed
on
capital
gains,
dividends
and
interest.
Interest
income,
including
amortization
and
accretion
of
premiums
and
discounts
on
debt
securities
and
payment-in-kind
interest,
are
recognized
daily
on
an
accrual
basis. For
convertible
securities,
premiums
attributable
to
the
debt
instrument
are
amortized,
but
premiums
attributable
to
the
conversion
feature
are
not
amortized.
Foreign
Currency
Translation:
The
Fund’s
books
and
records
are
maintained
in
U.S.
dollars.
Securities
and
other
assets
and
liabilities
denominated
in
foreign
currencies
are
translated
into
U.S.
dollars
using
exchange
rates
determined
as
of
the
close
of
trading
on
the
New
York
Stock
Exchange
(“NYSE”).
Purchases
and
sales
of
investments
are
recorded
at
the
rates
of
exchange
prevailing
on
the
respective
dates
of
such
transactions.
Generally,
when
the
U.S.
dollar
rises
in
value
against
a
foreign
currency,
the
investments
denominated
in
that
currency
will
lose
value;
the
opposite
effect
occurs
if
the
U.S.
dollar
falls
in
relative
value.
The
Fund
does
not
isolate
the
effect
of
fluctuations
in
foreign
exchange
rates
from
the
effect
of
fluctuations
in
the
market
prices
of
investments
for
financial
reporting
purposes.
Accordingly,
the
effects
of
changes
in
exchange
rates
on
investments
are
not
segregated
in
the
Statement
of
Operations
from
the
effects
of
changes
in
market
prices
of
those
investments,
but
are
included
as
a
component
of
net
realized
and
unrealized
gain
(loss)
from
investments.
The
Fund
reports
realized
currency
gains
(losses)
on
foreign
currency
related
transactions
as
components
of
net
realized
gain
(loss)
for
financial
reporting
purposes,
whereas
such
components
are
generally
treated
as
ordinary
income
for
U.S.
federal
income
tax
purposes.
Foreign
Taxes:
The
Fund
may
be
subject
to
foreign
taxes
(a
portion
of
which
may
be
reclaimable)
on
income,
stock
dividends,
capital
gains
on
investments,
or
certain
foreign
currency
transactions.
All
foreign
taxes
are
recorded
in
accordance
with
the
applicable
foreign
tax
regulations
and
rates
that
exist
in
the
foreign
jurisdictions
in
which
the
Fund
invests.
These
foreign
taxes,
if
any,
are
paid
by
the
Fund
and
are
reflected
in
its
Statement
of
Operations
as
follows:
foreign
taxes
withheld
at
source
are
presented
as
a
reduction
of
income,
foreign
taxes
on
securities
lending
income
are
presented
as
a
reduction
of
securities
lending
income,
foreign
taxes
on
stock
dividends
are
presented
as
“Foreign
taxes
withheld”,
and
foreign
taxes
on
capital
gains
from
sales
of
investments
and
foreign
taxes
on
foreign
currency
transactions
are
included
in
their
respective
net
realized
gain
(loss)
categories.
Foreign
taxes
payable
or
deferred
as
of
September
30,
2024
,
if
any,
are
disclosed
in
the Statement
of
Assets
and
Liabilities.
Consistent
with
U.S.
GAAP
accrual
requirements
for
uncertain
tax
positions,
the
Fund
recognizes
tax
reclaims
when
the
Fund
determines
that
it
is
more
likely
than
not
that
the
Fund
will
sustain
its
position
that
it
is
due
the
reclaim.
The
Fund
files
withholding
tax
reclaims
in
certain
jurisdictions
to
recover
a
portion
of
amounts
previously
withheld.
The
Fund
may
record
a
reclaim
receivable
based
on
collectability,
which
includes
factors
such
as
the
jurisdiction’s
applicable
laws,
payment
history
and
market
convention.
The Statement
of
Operations
includes
tax
reclaims
recorded
as
well
as
professional
and
other
fees,
if
any,
associated
with
recovery
of
foreign
withholding
taxes.
Collateralization:
If
required
by
an
exchange
or
counterparty
agreement,
the
Fund
may
be
required
to
deliver/deposit
cash
and/or
securities
to/with
an
exchange,
or
broker-
dealer
or
custodian
as
collateral
for
certain
investments.
Distributions:
Distributions
from
net
investment
income
are
declared daily
and
paid
monthly.
Distributions
of
capital
gains
are
recorded
on
the
ex-dividend
dates
and
made
at
least
annually.
The
character
and
timing
of
distributions
are
determined
in
accordance
with
U.S.
federal
income
tax
regulations,
which
may
differ
from
U.S.
GAAP.
Deferred
Compensation
Plan:
Under
the
Deferred
Compensation
Plan
(the
“Plan”)
approved
by
the
Board
of
Trustees
of
the
Trust
(the
“Board”), the
trustees
who
are
not
“interested
persons”
of
the
Fund,
as
defined
in
the
1940
Act
(“Independent
Trustees
”),
may
defer
a
portion
of
their
annual
complex-wide
compensation.
Deferred
amounts
earn
an
approximate
return
as
though
equivalent
dollar
amounts
had
been
invested
in
common
shares
of
certain
funds
in
the
BlackRock
Fixed-Income
Complex
selected
by
the
Independent
Trustees
.
This
has
the
same
economic
effect
for
the
Independent
Trustees
as
if
the
Independent
Trustees
had
invested
the
deferred
amounts
directly
in
certain
funds
in
the
BlackRock
Fixed-Income
Complex.
The
Plan
is
not
funded
and
obligations
thereunder
represent
general
unsecured
claims
against
the
general
assets
of
the
Fund,
as
applicable.
Deferred
compensation
liabilities,
if
any, are
included
in
the Trustees’
and
Officer’s
fees
payable
in
the
Statement
of
Assets
and
Liabilities
and
will
remain
as
a
liability
of
the
Fund
until
such
amounts
Notes
to
Financial
Statements
(continued)
2024
Blackrock
Annual
Financial
Statements
and
Additional
Information
are
distributed
in
accordance
with
the
Plan.
Net
appreciation
(depreciation)
in
the
value
of
participants’
deferral
accounts
is
allocated
among
the
participating
funds
in
the
BlackRock
Fixed-Income
Complex
and
reflected
as
Trustee
and
Officer
expense
on
the
Statement
of
Operations.
The
Trustee
and
Officer
expense
may
be
negative
as
a
result
of
a
decrease
in
value
of
the
deferred
accounts.
Indemnifications:
In
the
normal
course
of
business,
the
Fund
enters
into
contracts
that
contain
a
variety
of
representations
that
provide
general
indemnification.
The
Fund’s
maximum
exposure
under
these
arrangements
is
unknown
because
it
involves
future
potential
claims
against
the
Fund,
which
cannot
be
predicted
with
any
certainty.
Other:
Expenses
directly
related
to
the
Fund
are
charged
to
the
Fund.
Other
operating
expenses
shared
by
several
funds,
including
other
funds
managed
by
the
Manager
,
are
prorated
among
those
funds
on
the
basis
of
relative
net
assets
or
other
appropriate
methods.
3.
INVESTMENT
VALUATION
AND
FAIR
VALUE
MEASUREMENTS
Investment
Valuation
Policies:
The
Fund’s
investments
are
valued
at
fair
value
(also
referred
to
as
“market
value”
within
the
financial
statements)
each
day
that
the
Fund
is
open
for
business
and,
for
financial
reporting
purposes,
as
of
the
report
date.
U.S.
GAAP
defines
fair
value
as
the
price
a
fund
would
receive
to
sell
an
asset
or
pay
to
transfer
a
liability
in
an
orderly
transaction
between
market
participants
at
the
measurement
date.
The
Board
has
approved
the
designation
of
the
Fund’s
Manager
as
the
valuation
designee
for
the
Fund.
The
Fund
determines
the
fair
values
of
its
financial
instruments
using
various
independent
dealers
or
pricing
services
under
the
Manager’s
policies.
If
a
security’s
market
price
is
not
readily
available
or
does
not
otherwise
accurately
represent
the
fair
value
of
the
security,
the
security
will
be
valued
in
accordance
with
the
Manager’s
policies
and
procedures
as
reflecting
fair
value.
The
Manager
has
formed
a
committee
(the
“Valuation
Committee”)
to
develop
pricing
policies
and
procedures
and
to
oversee
the
pricing
function
for
all
financial
instruments,
with
assistance
from
other
BlackRock
pricing
committees.
Fair
Value
Inputs
and
Methodologies:
The
following
methods
and
inputs
are
used
to
establish
the
fair
value
of
the
Fund’s
assets
and
liabilities:
Fixed-income investments
for
which
market
quotations
are
readily
available
are
generally
valued
using
the
last
available
bid
price
or
current
market
quotations
provided
by
independent
dealers
or
third-party
pricing
services. Pricing
services
generally
value
fixed-income
securities
assuming
orderly
transactions
of
an
institutional
round
lot
size,
but
a
fund
may
hold
or
transact
in
such
securities
in
smaller,
odd
lot
sizes.
Odd
lots
may
trade
at
lower
prices
than
institutional
round
lots.
The
pricing
services
may
use
matrix
pricing
or
valuation
models
that
utilize
certain
inputs
and
assumptions
to
derive
values,
including
transaction
data
(e.g.,
recent
representative
bids
and
offers),
market
data, credit
quality
information,
perceived
market
movements,
news,
and
other
relevant
information.
Certain
fixed-income
securities,
including
asset-
backed
and
mortgage
related
securities
may
be
valued
based
on
valuation
models
that
consider
the
estimated
cash
flows
of
each
tranche
of
the
entity,
establish
a
benchmark
yield
and
develop
an
estimated
tranche
specific
spread
to
the
benchmark
yield
based
on
the
unique
attributes
of
the
tranche.
The
amortized
cost
method
of
valuation
may
be
used
with
respect
to
debt
obligations
with
sixty
days
or
less
remaining
to
maturity
unless
the
Manager
determines
such
method
does
not
represent
fair
value.
Investments
in
open-end
U.S.
mutual
funds
(including
money
market
funds) are
valued
at
that
day’s
net
asset
value
(“NAV”).
Futures
contracts
are valued
based
on
that
day’s
last
reported
settlement
or
trade price
on
the
exchange
where
the
contract
is
traded.
Forward
foreign
currency
exchange
contracts
are
valued
at
the
mean
between
the
bid
and
ask
prices
and
are
determined
as
of
the
close
of
trading
on
the
NYSE
based
on
that
day’s
prevailing
forward
exchange
rate
for
the
underlying
currencies.
Exchange-traded
options
are
valued
at
the
mean
between
the
last bid
and
ask
prices
at
the
close
of
the
options
market in
which
the
options
trade.
An
exchange-
traded
option
for
which there
is
no
mean
price
is
valued
at
the
last
bid
(long
positions)
or
ask
(short
positions)
price.
If
no
bid
or
ask
price
is
available,
the
prior
day’s
price will
be
used,
unless
it
is
determined
that
the
prior
day’s
price
no
longer
reflects
the
fair
value
of
the
option.
Over-the-counter
(“OTC”)
options
and
options
on
swaps
(“swaptions”)
are
valued
by
an
independent
pricing
service
using
a
mathematical
model,
which
incorporates
a
number
of
market
data
factors,
such
as
the
trades
and
prices
of
the
underlying
instruments.
Interest
rate,
credit
default,
inflation
and
currency
swap
agreements
are
valued
utilizing
quotes
received
daily
by
independent pricing
services
or
through
brokers,
which
are
derived
using
daily
swap
curves
and
models
that
incorporate
market
data
and discounted
cash
flows.
Total
return
swap
agreements
are
valued
utilizing
quotes
received
daily
by
independent
pricing
services
or
through
brokers,
which
are
derived
using
models
that
incorporate
market
trades
and
fair
value
of
the
underlying
reference
instruments.
Generally,
trading
in
foreign
instruments
is
substantially
completed
each
day
at
various
times
prior
to
the
close
of
trading
on
the NYSE.
Each
business
day,
the
Fund
uses
current
market
factors
supplied
by
independent
pricing
services
to
value
certain
foreign
instruments
(“Systematic
Fair
Value
Price”).
The
Systematic
Fair
Value
Price
is
designed
to
value
such
foreign
securities
at
fair
value
as
of
the
close
of
trading
on
the
NYSE,
which
occurs
after the
close
of
the
local
markets.
If
events
(e.g.,
market
volatility,
company
announcement or
a
natural
disaster)
occur
that
are
expected
to
materially
affect
the
value
of
such
investment,
or
in
the
event
that application
of
these
methods
of
valuation
results
in
a
price
for
an
investment
that
is
deemed
not
to
be
representative
of
the
market
value
of
such
investment,
or
if
a
price
is
not
available,
the
investment
will
be
valued
by
the
Valuation
Committee
in
accordance
with the
Manager's policies
and
procedures
as
reflecting
fair
value
(“Fair
Valued
Investments”).
The
fair
valuation
approaches
that
may
be
used
by
the
Valuation
Committee include
market
approach,
income
approach
and
cost
approach.
Valuation
techniques
such
as
discounted
cash
flow,
use
of
market
comparables
and
matrix
pricing
are
types
of
valuation
approaches
and
are
typically
used
in
determining
fair
value.
When
determining
the
price
for
Fair
Valued
Investments,
the
Valuation
Committee
seeks
to
determine
the
price
that
the
Fund
might
reasonably
expect
to
receive
or
pay
from
the
current
sale
or
purchase
of
that
asset
or
liability
in
an
arm’s-length
transaction.
Fair
value
determinations
shall
be
based
upon
all
available
factors
that
the
Valuation
Committee
deems
relevant
and
consistent
with
the
principles
of
fair
value
measurement
as
of
the
measurement
date.
Fair
Value
Hierarchy:
Various
inputs
are
used
in
determining
the
fair
value
of
financial
instruments
at
the
measurement
date.
These
inputs
to
valuation
techniques
are
categorized
into
a
fair
value
hierarchy
consisting
of
three
broad
levels
for
financial reporting purposes
as
follows:
Notes
to
Financial
Statements
(continued)
Notes
to
Financial
Statements
Level
1
—
Unadjusted
price
quotations
in
active
markets/exchanges
that
the
Fund
has
the
ability
to
access
for
identical
assets
or
liabilities;
Level
2
—
Inputs
other
than
quoted
prices
included
within
level
1
that
are
observable
for
the
asset
or
liability,
either
directly
or
indirectly;
and
Level
3 —
Inputs
that
are
unobservable
and
significant
to
the
entire
fair
value
measurement
for the
asset
or
liability
(including
the
Valuation
Committee’s
assumptions
used
in
determining
the
fair
value
of
financial
instruments).
The
hierarchy
gives
the
highest
priority
to
unadjusted
quoted
prices
in
active
markets
for
identical
assets
or
liabilities
(Level
1
measurements)
and
the
lowest
priority
to
unobservable
inputs
(Level
3
measurements).
Accordingly,
the
degree
of
judgment
exercised
in
determining
fair
value
is
greatest
for
instruments
categorized
in
Level
3.
The
inputs
used
to
measure
fair
value
may
fall
into
different
levels
of
the
fair
value
hierarchy.
In
such
cases,
for
disclosure
purposes,
the
fair
value
hierarchy
classification
is
determined
based
on
the
lowest
level
input
that
is
significant
to
the
fair
value
measurement
in
its
entirety. Investments
classified
within
Level
3
have
significant
unobservable
inputs
used
by
the
Valuation
Committee
in
determining
the
price
for
Fair
Valued
Investments.
Level
3
investments
include
equity
or
debt
issued
by
privately
held
companies
or
funds
that
may
not
have
a
secondary
market
and/or
may
have
a
limited
number
of
investors.
The
categorization
of
a
value
determined
for
financial
instruments
is
based
on
the
pricing
transparency
of
the financial
instruments
and
is
not
necessarily
an
indication
of
the
risks
associated
with
investing
in
those
securities.
4.
SECURITIES
AND
OTHER
INVESTMENTS
Asset-Backed
and
Mortgage-Backed
Securities:
Asset-backed
securities
are
generally
issued
as
pass-through
certificates
or
as
debt
instruments.
Asset-backed
securities
issued
as
pass-through
certificates
represent
undivided
fractional
ownership
interests
in
an
underlying
pool
of
assets.
Asset-backed
securities
issued
as
debt
instruments,
which
are
also
known
as
collateralized
obligations,
are
typically
issued
as
the
debt
of
a
special
purpose
entity
organized
solely
for
the
purpose
of
owning
such
assets
and
issuing
such
debt.
Asset-backed
securities
are
often
backed
by
a
pool
of
assets
representing
the
obligations
of
a
number
of
different
parties.
The
yield
characteristics
of
certain
asset-backed
securities
may
differ
from
traditional
debt
securities.
One
such
major
difference
is
that
all
or
a
principal
part
of
the
obligations
may
be
prepaid
at
any
time
because
the
underlying
assets
(i.e.,
loans)
may
be
prepaid
at
any
time.
As
a
result,
a
decrease
in
interest
rates
in
the
market
may
result
in
increases
in
the
level
of
prepayments
as
borrowers,
particularly
mortgagors,
refinance
and
repay
their
loans.
An
increased
prepayment
rate
with
respect
to
an
asset-backed
security
will
have
the
effect
of
shortening
the
maturity
of
the
security.
In
addition,
a
fund
may
subsequently
have
to
reinvest
the
proceeds
at
lower
interest
rates.
If
a
fund
has
purchased
such
an
asset-backed
security
at
a
premium,
a
faster
than
anticipated
prepayment
rate
could
result
in
a
loss
of
principal
to
the
extent
of
the
premium
paid.
For
mortgage
pass-through
securities
(the
“Mortgage
Assets”)
there
are
a
number
of
important
differences
among
the
agencies
and
instrumentalities
of
the
U.S.
Government
that
issue
mortgage-related
securities
and
among
the
securities
that
they
issue.
For
example,
mortgage-related
securities
guaranteed
by
Ginnie
Mae
are
guaranteed
as
to
the
timely
payment
of
principal
and
interest
by
Ginnie
Mae
and
such
guarantee
is
backed
by
the
full
faith
and
credit
of
the
United
States.
However,
mortgage-related
securities
issued
by
Freddie
Mac
and
Fannie
Mae,
including
Freddie
Mac
and
Fannie
Mae
guaranteed
mortgage
pass-through
certificates,
which
are
solely
the
obligations
of
Freddie
Mac
and
Fannie
Mae,
are
not
backed
by
or
entitled
to
the
full
faith
and
credit
of
the
United
States,
but
are
supported
by
the
right
of
the
issuer
to
borrow
from
the
U.S.
Treasury.
Non-agency
mortgage-backed
securities
are
securities
issued
by
non-governmental
issuers
and
have
no
direct
or
indirect
government
guarantees
of
payment
and
are
subject
to
various
risks.
Non-agency
mortgage
loans
are
obligations
of
the
borrowers
thereunder
only
and
are
not
typically
insured
or
guaranteed
by
any
other
person
or
entity.
The
ability
of
a
borrower
to
repay
a
loan
is
dependent
upon
the
income
or
assets
of
the
borrower.
A
number
of
factors,
including
a
general
economic
downturn,
acts
of
God,
terrorism,
social
unrest
and
civil
disturbances,
may
impair
a
borrower’s
ability
to
repay
its
loans.
Collateralized
Debt
Obligations:
Collateralized
debt
obligations
(“CDOs”),
including
collateralized
bond
obligations
(“CBOs”)
and
collateralized
loan
obligations
(“CLOs”),
are
types
of
asset-backed
securities.
A
CDO
is
an
entity
that
is
backed
by
a
diversified
pool
of
debt
securities
(CBOs)
or
syndicated
bank
loans
(CLOs).
The
cash
flows
of
the
CDO
can
be
split
into
multiple
segments,
called
“tranches,”
which
will
vary
in
risk
profile
and
yield.
The
riskiest
segment
is
the
subordinated
or
“equity”
tranche.
This
tranche
bears
the
greatest
risk
of
defaults
from
the
underlying
assets
in
the
CDO
and
serves
to
protect
the
other,
more
senior,
tranches
from
default
in
all
but
the
most
severe
circumstances.
Since
it
is
shielded
from
defaults
by
the
more
junior
tranches,
a
“senior”
tranche
will
typically
have
higher
credit
ratings
and
lower
yields
than
their
underlying
securities,
and
often
receive
investment
grade
ratings
from
one
or
more
of
the
nationally
recognized
rating
agencies.
Despite
the
protection
from
the
more
junior
tranches,
senior
tranches
can
experience
substantial
losses
due
to
actual
defaults,
increased
sensitivity
to
future
defaults
and
the
disappearance
of
one
or
more
protecting
tranches
as
a
result
of
changes
in
the
credit
profile
of
the
underlying
pool
of
assets.
Multiple
Class
Pass-Through
Securities:
Multiple
class
pass-through
securities,
including
collateralized
mortgage
obligations
(“CMOs”)
and
commercial
mortgage-backed
securities,
may
be
issued
by
Ginnie
Mae,
U.S.
Government
agencies
or
instrumentalities
or
by
trusts
formed
by
private
originators
of,
or
investors
in,
mortgage
loans.
In
general,
CMOs
are
debt
obligations
of
a
legal
entity
that
are
collateralized
by
a
pool
of
residential
or
commercial
mortgage
loans
or
Mortgage
Assets.
The
payments
on
these
are
used
to
make
payments
on
the
CMOs
or
multiple
pass-through
securities.
Multiple
class
pass-through
securities
represent
direct
ownership
interests
in
the
Mortgage
Assets.
Classes
of
CMOs
include
interest
only
(“IOs”),
principal
only
(“POs”),
planned
amortization
classes
and
targeted
amortization
classes.
IOs
and
POs
are
stripped
mortgage-backed
securities
representing
interests
in
a
pool
of
mortgages,
the
cash
flow
from
which
has
been
separated
into
interest
and
principal
components.
IOs
receive
the
interest
portion
of
the
cash
flow
while
POs
receive
the
principal
portion.
IOs
and
POs
can
be
extremely
volatile
in
response
to
changes
in
interest
rates.
As
interest
rates
rise
and
fall,
the
value
of
IOs
tends
to
move
in
the
same
direction
as
interest
rates.
POs
perform
best
when
prepayments
on
the
underlying
mortgages
rise
since
this
increases
the
rate
at
which
the
principal
is
returned
and
the
yield
to
maturity
on
the
PO.
When
payments
on
mortgages
underlying
a
PO
are
slower
than
anticipated,
the
life
of
the
PO
is
lengthened
and
the
yield
to
maturity
is
reduced.
If
the
underlying
Mortgage
Assets
experience
greater
than
anticipated
prepayments
of
principal,
a
fund’s
initial
investment
in
the
IOs
may
not
fully
recoup.
Stripped
Mortgage-Backed
Securities:
Stripped
mortgage-backed
securities
are
typically
issued
by
the
U.S.
Government,
its
agencies
and
instrumentalities.
Stripped
mortgage-backed
securities
are
usually
structured
with
two
classes
that
receive
different
proportions
of
the
interest
(IOs)
and
principal
(POs)
distributions
on
a
pool
of
Mortgage
Assets.
Stripped
mortgage-backed
securities
may
be
privately
issued.
Zero-Coupon
Bonds:
Zero-coupon
bonds
are
normally
issued
at
a
significant
discount
from
face
value
and
do
not
provide
for
periodic
interest
payments.
These
bonds
may
experience
greater
volatility
in
market
value
than
other
debt
obligations
of
similar
maturity
which
provide
for
regular
interest
payments.
Notes
to
Financial
Statements
(continued)
2024
Blackrock
Annual
Financial
Statements
and
Additional
Information
TBA
Commitments:
TBA
commitments
are
forward
agreements
for
the
purchase
or
sale
of
securities,
including
mortgage-backed
securities
for
a
fixed
price,
with
payment
and
delivery
on
an
agreed
upon
future
settlement
date.
The
specific
securities
to
be
delivered
are
not
identified
at
the
trade
date.
However,
delivered
securities
must
meet
specified
terms,
including
issuer,
rate
and
mortgage
terms.
When
entering
into
TBA
commitments,
a
fund
may
take
possession
of
or
deliver
the
underlying
mortgage-backed
securities
but
can
extend
the
settlement
or
roll
the
transaction.
TBA
commitments
involve
a
risk
of
loss
if
the
value
of
the
security
to
be
purchased
or
sold
declines
or
increases,
respectively,
prior
to
settlement
date,
if
there
are
expenses
or
delays
in
connection
with
the
TBA
transactions,
or
if
the
counterparty
fails
to
complete
the
transaction.
In
order
to
better
define
contractual
rights
and
to
secure
rights
that
will
help
a
fund
mitigate its
counterparty
risk,
TBA
commitments
may
be
entered
into
by
a
fund
under
Master
Securities
Forward
Transaction
Agreements
(each,
an
“MSFTA”).
An
MSFTA
typically
contains,
among
other
things,
collateral
posting
terms
and
netting
provisions
in
the
event
of
default
and/or
termination
event. The
collateral
requirements
are
typically
calculated
by
netting
the
mark-to-market
amount
for
each
transaction
under
such
agreement
and
comparing
that
amount
to
the
value
of
the
collateral
currently
pledged
by
a
fund
and
the
counterparty. Cash
collateral
that
has
been
pledged
to
cover
the
obligations
of
a
fund
and
cash
collateral
received
from
the
counterparty,
if
any,
is
reported
separately
in
the
Statement
of
Assets
and
Liabilities
as
cash
pledged
as
collateral
for
TBA
commitments
or
cash
received
as
collateral
for
TBA
commitments,
respectively.
Non-cash
collateral
pledged
by
a
fund,
if
any,
is
noted
in
the
Schedule
of
Investments. Typically,
a
fund
is
permitted
to
sell,
re-pledge
or
use
the
collateral
it
receives;
however,
the
counterparty
is
not
permitted
to
do
so.
To
the
extent
amounts
due
to
a
fund
are
not
fully
collateralized,
contractually
or
otherwise,
a
fund
bears
the
risk
of
loss
from
counterparty
non-performance.
Mortgage
Dollar
Roll
Transactions
:
The
Fund
may
sell
TBA
mortgage-backed
securities
and
simultaneously
contract
to
repurchase
substantially
similar
(i.e.,
same
type,
coupon
and
maturity)
securities
on
a
specific
future
date
at
an
agreed
upon
price.
During
the
period
between
the
sale
and
repurchase,
a
fund
is
not
entitled
to
receive
interest
and
principal
payments
on
the
securities
sold.
Mortgage
dollar
roll
transactions
are
treated
as
purchases
and
sales
and
a
fund realizes
gains
and
losses
on
these
transactions.
Mortgage
dollar
rolls
involve
the
risk
that
the
market
value
of
the
securities
that
a
fund
is
required
to
purchase
may
decline
below
the
agreed
upon
repurchase
price
of
those
securities.
5.
Derivative
Financial
Instruments
The
Fund
engages
in
various
portfolio
investment
strategies
using
derivative
contracts
both
to
increase
the
returns
of
the
Fund
and/or
to
manage
its
exposure
to
certain
risks
such
as
credit
risk,
equity
risk,
interest
rate
risk,
foreign
currency
exchange
rate
risk,
commodity
price
risk
or
other
risks
(e.g.,
inflation
risk).
Derivative
financial
instruments
categorized
by
risk
exposure
are
included
in
the
Schedule
of
Investments.
These
contracts
may
be
transacted
on
an
exchange or
OTC.
Futures
Contracts:
Futures
contracts
are
purchased
or
sold
to
gain
exposure
to,
or
manage
exposure
to,
changes
in
interest
rates
(interest
rate
risk)
and
changes
in
the
value
of
equity
securities
(equity
risk)
or
foreign
currencies
(foreign
currency
exchange
rate
risk)
.
Futures
contracts
are
exchange-traded agreements
between
the
Fund
and
a
counterparty
to
buy
or
sell
a
specific
quantity
of
an
underlying
instrument
at
a
specified
price
and
on
a
specified
date.
Depending
on
the
terms
of
a
contract,
it
is
settled
either
through
physical
delivery
of
the
underlying
instrument
on
the
settlement
date
or
by
payment
of
a
cash
amount
on
the
settlement
date.
Upon
entering
into
a
futures
contract,
the
Fund
is
required
to
deposit
initial
margin
with
the
broker
in
the
form
of
cash
or
securities
in
an
amount
that
varies
depending
on
a
contract’s
size
and
risk
profile.
The
initial
margin
deposit
must
then
be
maintained
at
an
established
level
over
the
life
of
the
contract.
Amounts
pledged,
which
are
considered
restricted,
are
included
in
cash
pledged
for
futures
contracts
in
the Statement
of
Assets
and
Liabilities.
Securities
deposited
as
initial
margin
are
designated
in
the
Schedule
of
Investments
and
cash
deposited,
if
any, are
shown
as
cash
pledged
for
futures
contracts
in
the
Statement
of
Assets
and
Liabilities.
Pursuant
to
the
contract,
the
Fund
agrees
to
receive
from
or
pay
to
the
broker
an
amount
of
cash
equal
to
the
daily
fluctuation
in
market
value
of
the
contract
(“variation
margin”).
Variation
margin
is
recorded
as
unrealized
appreciation
(depreciation)
and,
if
any,
shown
as
variation
margin
receivable
(or
payable)
on
futures
contracts
in
the
Statement
of
Assets
and
Liabilities.
When
the
contract
is
closed,
a
realized
gain
or
loss
is
recorded
in
the
Statement
of
Operations
equal
to
the
difference
between
the
notional
amount
of
the
contract
at
the
time
it
was
opened
and
the
notional
amount
at
the
time
it
was
closed.
The
use
of
futures
contracts
involves
the
risk
of
an
imperfect
correlation
in
the
movements
in
the
price
of
futures
contracts
and
interest
rates,
foreign
currency
exchange
rates
or
underlying
assets.
Forward
Foreign
Currency
Exchange
Contracts
:
Forward
foreign
currency
exchange
contracts
are
entered
into
to
gain
or
reduce
exposure
to
foreign
currencies
(foreign
currency
exchange
rate
risk).
A
forward
foreign
currency
exchange
contract
is
an
agreement
between
two
parties
to
buy
and
sell
a
currency
at
a
set
exchange
rate
on
a
specified
date.
These
contracts
help
to
manage
the
overall
exposure
to
the
currencies
in
which
some
of
the
investments
held
by
the
Fund
are
denominated
and
in
some
cases,
may
be
used
to
obtain
exposure
to
a
particular
market.
The
contracts
are
traded
OTC
and
not
on
an
organized
exchange.
The
contract
is
marked-to-market
daily
and
the
change
in
market
value
is
recorded
as
unrealized
appreciation
(depreciation)
in
the
Statement
of
Assets
and
Liabilities.
When
a
contract
is
closed,
a
realized
gain
or
loss
is
recorded
in
the
Statement
of
Operations
equal
to
the
difference
between
the
value
at
the
time
it
was
opened
and
the
value
at
the
time
it
was
closed.
Non-deliverable
forward
foreign
currency
exchange
contracts
are
settled
with
the
counterparty
in
cash
without
the
delivery
of
foreign
currency.
The
use
of
forward
foreign
currency
exchange
contracts
involves
the
risk
that
the
value
of
a
forward
foreign
currency
exchange
contract
changes
unfavorably
due
to
movements
in
the
value
of
the
referenced
foreign
currencies,
and
such
value
may
exceed
the
amount(s)
reflected
in
the
Statement
of
Assets
and
Liabilities.
Cash
amounts
pledged
for
forward
foreign
currency
exchange
contracts
are
considered
restricted
and
are
included
in
cash
pledged
as
collateral
for
OTC
derivatives
in
the
Statement
of
Assets
and
Liabilities. The
Fund’s
risk
of
loss
from
counterparty
credit
risk
on
OTC
derivatives
is
generally
limited
to
the
aggregate
unrealized
gain
netted
against
any
collateral
held
by
the
Fund.
Options:
The
Fund
may purchase
and
write
call
and
put
options
to
increase
or
decrease
its
exposure
to
the
risks
of
underlying
instruments,
including
equity
risk,
interest
rate
risk
and/or
commodity
price
risk
and/or,
in
the
case
of
options
written,
to
generate
gains
from
options
premiums.
A
call
option
gives
the
purchaser
(holder)
of
the
option
the
right
(but
not
the
obligation)
to
buy,
and
obligates
the
seller
(writer)
to
sell
(when
the
option
is
exercised)
the
underlying
instrument
at
the
exercise
or
strike
price
at
any
time
or
at
a
specified
time
during
the
option
period.
A
put
option
gives
the
holder
the
right
to
sell
and
obligates
the
writer
to
buy
the
underlying
instrument
at
the
exercise
or
strike
price
at
any
time
or
at
a
specified
time
during
the
option
period.
Notes
to
Financial
Statements
(continued)
Notes
to
Financial
Statements
Premiums
paid
on
options
purchased
and
premiums
received
on
options
written,
as
well
as
the
daily
fluctuation
in
market
value,
are
included
in
investments
at
value
–
unaffiliated
and
options
written
at
value,
respectively,
in
the
Statement
of
Assets
and
Liabilities.
When
an
instrument
is
purchased
or
sold
through
the
exercise
of
an
option,
the
premium
is
offset
against
the
cost
or
proceeds
of
the
underlying
instrument.
When
an
option
expires,
a
realized
gain
or
loss
is
recorded
in
the
Statement
of
Operations
to
the
extent
of
the
premiums
received
or
paid.
When
an
option
is
closed
or
sold,
a
gain
or
loss
is
recorded
in
the
Statement
of
Operations
to
the
extent
the
cost
of
the
closing
transaction
exceeds
the
premiums
received
or
paid.
When
the
Fund
writes
a
call
option,
such
option
is
typically
“covered,”
meaning
that
it
holds
the
underlying
instrument
subject
to
being
called
by
the
option
counterparty.
When
the
Fund
writes
a
put
option,
cash
is
segregated in
an
amount
sufficient
to
cover
the
obligation.
These
amounts,
which
are
considered
restricted,
are
included
in
cash
pledged
as
collateral
for
options
written
in
the
Statement
of
Assets
and
Liabilities.
Swaptions
–
The
Fund
may purchase
and
write
options
on
swaps
(“swaptions”)
primarily
to
preserve
a
return
or
spread
on
a
particular
investment
or
portion
of
the
Fund’s
holdings,
as
a
duration
management
technique
or
to
protect
against
an
increase
in
the
price
of
securities
it
anticipates
purchasing
at
a
later
date.
The
purchaser
and
writer
of
a
swaption
is
buying
or
granting
the
right
to
enter
into
a
previously
agreed
upon
interest
rate
or
credit
default
swap
agreement
(interest
rate
risk
and/or
credit
risk)
at
any
time
before
the
expiration
of
the
option.
In
purchasing
and
writing
options,
the
Fund
bears
the
risk
of
an
unfavorable
change
in
the
value
of
the
underlying
instrument
or
the
risk
that
it
may
not
be
able
to
enter
into
a
closing
transaction
due
to
an
illiquid
market.
Exercise
of
a
written
option
could
result
in
the
Fund
purchasing
or
selling
a
security
when
it
otherwise
would
not,
or
at
a
price
different
from
the
current
market
value.
Swaps:
Swap
contracts
are
entered
into
to
manage
exposure
to
issuers,
markets
and
securities.
Such
contracts
are
agreements
between
the
Fund
and
a
counterparty
to
make
periodic
net
payments
on
a
specified
notional
amount
or
a
net
payment
upon
termination.
Swap
agreements
are
privately
negotiated
in
the
OTC
market
and
may
be
entered
into
as
a
bilateral
contract
(“OTC
swaps”)
or
centrally
cleared
(“centrally
cleared
swaps”).
For
OTC
swaps,
any
upfront
premiums
paid
and
any
upfront
fees
received
are
shown
as
swap
premiums
paid
and
swap
premiums
received,
respectively,
in
the
Statement
of
Assets
and
Liabilities
and
amortized
over
the
term
of
the
contract.
The
daily
fluctuation
in
market
value
is
recorded
as
unrealized
appreciation
(depreciation)
on
OTC
swaps
in
the
Statement
of
Assets
and
Liabilities.
Payments
received
or
paid
are
recorded
in
the
Statement
of
Operations
as
realized
gains
or
losses,
respectively.
When
an
OTC
swap
is
terminated,
a
realized
gain
or
loss
is
recorded
in
the
Statement
of
Operations
equal
to
the
difference
between
the
proceeds
from
(or
cost
of)
the
closing
transaction
and
the
Fund’s
basis
in
the
contract,
if
any.
Generally,
the
basis
of
the
contract
is
the
premium
received
or
paid.
In
a
centrally
cleared
swap,
immediately
following
execution
of
the
swap
contract,
the
swap
contract
is
novated
to
a
central
counterparty
(the
“CCP”)
and
the
CCP
becomes
the Fund’s
counterparty
on
the
swap.
The
Fund
is
required
to
interface
with
the
CCP
through
the
broker.
Upon
entering
into
a
centrally
cleared
swap,
the
Fund
is
required
to
deposit
initial
margin
with
the
broker
in
the
form
of
cash
or
securities
in
an
amount
that
varies
depending
on
the
size
and
risk
profile
of
the
particular
swap. Securities
deposited
as
initial
margin
are
designated
in
the
Schedule
of
Investments
and
cash
deposited
is
shown
as
cash
pledged
for
centrally
cleared
swaps
in
the
Statement
of
Assets
and
Liabilities. Amounts
pledged,
which
are
considered
restricted
cash,
are
included
in
cash
pledged
for
centrally
cleared
swaps
in
the
Statement
of
Assets
and
Liabilities.
Pursuant
to
the
contract,
the
Fund
agrees
to
receive
from
or
pay
to
the
broker
variation
margin.
Variation
margin
is
recorded
as
unrealized
appreciation
(depreciation)
and
shown
as
variation
margin
receivable
(or
payable)
on
centrally
cleared
swaps
in
the
Statement
of
Assets
and
Liabilities.
Payments
received
from
(paid
to)
the
counterparty
are
amortized
over
the
term
of
the
contract
and
recorded
as
realized
gains
(losses)
in
the
Statement
of
Operations,
including
those
at
termination.
Credit
default
swaps
—
Credit
default
swaps
entered
into
to
manage
exposure
to
the
market
or
certain
sectors
of
the
market,
to
reduce
risk
exposure
to
defaults
of
corporate
and/or
sovereign
issuers
or
to
create
exposure
to
corporate
and/or
sovereign
issuers
to
which
a
fund
is
not
otherwise
exposed
(credit
risk).
The
Fund
may
either
buy
or
sell
(write)
credit
default
swaps
on
single-name
issuers
(corporate
or
sovereign),
a
combination
or
basket
of
single-name
issuers
or
traded
indexes.
Credit
default
swaps
are
agreements
in
which
the
protection
buyer
pays
fixed
periodic
payments
to
the
seller
in
consideration
for
a
promise
from
the
protection
seller
to
make
a
specific
payment
should
a
negative
credit
event
take
place
with
respect
to
the
referenced
entity
(e.g.,
bankruptcy,
failure
to
pay,
obligation
acceleration,
repudiation,
moratorium
or
restructuring).
As
a
buyer,
if
an
underlying
credit
event
occurs,
the
Fund
will
either
(i)
receive
from
the
seller
an
amount
equal
to
the
notional
amount
of
the
swap
and
deliver
the
referenced
security
or
underlying
securities
comprising
the
index,
or
(ii)
receive
a
net
settlement
of
cash
equal
to
the
notional
amount
of
the
swap
less
the
recovery
value
of
the
security
or
underlying
securities
comprising
the
index.
As
a
seller
(writer),
if
an
underlying
credit
event
occurs,
the
Fund
will
either
pay
the
buyer
an
amount
equal
to
the
notional
amount
of
the
swap
and
take
delivery
of
the
referenced
security
or
underlying
securities
comprising
the
index
or
pay
a
net
settlement
of
cash
equal
to
the
notional
amount
of
the
swap
less
the
recovery
value
of
the
security
or
underlying
securities
comprising
the
index.
Total
return
swaps
—
Total
return
swaps
are
entered
into
to
obtain
exposure
to
a
security
or
market
without
owning
such
security
or
investing
directly
in
such
market
or
to
exchange
the
risk/return
of
one
security
or market
(e.g.,
fixed-income)
with
another
security
or
market
(e.g.,
equity
or
commodity
prices)
(equity
risk,
commodity
price
risk
and/or
interest
rate
risk).
Total
return
swaps
are
agreements
in
which
there
is
an
exchange
of
cash
flows
whereby
one
party
commits
to
make
payments
based
on
the
total
return
(distributions
plus
capital
gains/losses)
of
an
underlying
instrument,
or
basket
of
underlying
instruments,
in
exchange
for
fixed
or
floating
rate
interest
payments.
If
the
total
return
of
the
instrument(s)
or
index
underlying
the
transaction
exceeds
or
falls
short
of
the
offsetting
fixed
or
floating
interest
rate
obligation,
the
Fund
receives
payment
from
or
makes
a
payment
to
the
counterparty.
Interest
rate
swaps
—
Interest
rate
swaps
are
entered
into
to
gain
or
reduce
exposure
to
interest
rates
or
to
manage
duration,
the
yield
curve
or
interest
rate
(interest
rate
risk).
Interest
rate
swaps
are
agreements
in
which
one
party
pays
a
stream
of
interest
payments,
either
fixed
or
floating,
in
exchange
for
another
party’s
stream
of
interest
payments,
either
fixed
or
floating,
on
the
same
notional
amount
for
a
specified
period
of
time.
In
more
complex
interest
rate
swaps,
the
notional
principal
amount
may
decline
(or
amortize)
over
time.
Forward
swaps
—
The
Fund
may enter
into
forward
interest
rate
swaps
and
forward
total
return
swaps.
In
a
forward
swap,
the
Fund
and
the
counterparty
agree
to
Notes
to
Financial
Statements
(continued)
2024
Blackrock
Annual
Financial
Statements
and
Additional
Information
make
periodic
net
payments
beginning
on
a
specified
date
or
a
net
payment
at
termination.
Swap
transactions
involve,
to
varying
degrees,
elements
of
interest
rate,
credit
and
market
risks
in
excess
of
the
amounts
recognized
in
the
Statement
of
Assets
and
Liabilities.
Such
risks
involve
the
possibility
that
there
will
be
no
liquid
market
for
these
agreements,
that
the
counterparty
to
the
agreements
may
default
on
its
obligation
to
perform
or
disagree
as
to
the
meaning
of
the
contractual
terms
in
the
agreements,
and
that
there
may
be
unfavorable
changes
in
interest
rates
and/or
market
values
associated
with
these
transactions.
Master
Netting
Arrangements:
In
order
to
define
its
contractual
rights
and
to
secure
rights
that
will
help
it mitigate its
counterparty
risk, the
Fund
may
enter
into
an
International
Swaps
and
Derivatives
Association,
Inc.
Master
Agreement
(“ISDA
Master
Agreement”)
or
similar
agreement
with
its
derivative
contract
counterparties.
An
ISDA
Master
Agreement
is
a
bilateral
agreement
between the
Fund
and
a
counterparty
that
governs
certain
OTC
derivatives
and
typically
contains,
among
other
things,
collateral
posting
terms
and
netting
provisions
in
the
event
of
a
default
and/or
termination
event.
Under
an
ISDA
Master
Agreement, the
Fund
may,
under
certain
circumstances,
offset
with
the
counterparty
certain
derivative
financial
instruments’
payables
and/or
receivables
with
collateral
held
and/or
posted
and
create
one
single
net
payment.
The
provisions
of
the
ISDA
Master
Agreement
typically
permit
a
single
net
payment
in
the
event
of
default
including
the
bankruptcy
or
insolvency
of
the
counterparty.
However,
bankruptcy
or
insolvency
laws
of
a
particular
jurisdiction
may
impose
restrictions
on
or
prohibitions
against
the
right
of
offset
in
bankruptcy,
insolvency
or
other
events.
Collateral
Requirements:
For
derivatives
traded
under
an
ISDA
Master
Agreement,
the
collateral
requirements
are
typically
calculated
by
netting
the
mark-to-market
amount
for
each
transaction
under
such
agreement
and
comparing
that
amount
to
the
value
of
any
collateral
currently
pledged
by
the
Fund(s)
and
the
counterparty.
Cash
collateral
that
has
been
pledged
to
cover
obligations
of
the
Fund
and
cash
collateral
received
from
the
counterparty,
if
any,
is
reported
separately
in
the
Statement
of
Assets
and
Liabilities
as
cash
pledged
as
collateral
and
cash
received
as
collateral,
respectively.
Non-cash
collateral
pledged
by
the
Fund,
if
any,
is
noted
in
the
Schedule
of
Investments.
Generally,
the
amount
of
collateral
due
from
or
to
a
counterparty
is
subject
to
a
certain
minimum
transfer
amount
threshold
before
a
transfer
is
required,
which
is
determined
at
the
close
of
business
of
the
Fund.
Any
additional
required
collateral
is
delivered
to/pledged
by
the
Fund
on
the
next
business
day.
Typically,
the
counterparty
is
not
permitted
to
sell,
re-pledge
or
use
cash
and
non-cash
collateral
it
receives.
The
Fund
generally
agrees
not
to
use
non-cash
collateral
that
it
receives
but
may,
absent
default
or
certain
other
circumstances
defined
in
the
underlying
ISDA
Master
Agreement,
be
permitted
to
use
cash
collateral
received.
In
such
cases,
interest
may
be
paid
pursuant
to
the
collateral
arrangement
with
the
counterparty.
To
the
extent
amounts
due
to
the
Fund
from the
counterparties
are
not
fully
collateralized, the
Fund bears
the
risk
of
loss
from
counterparty
non-performance.
Likewise,
to
the
extent
the
Fund
has
delivered
collateral
to
a
counterparty
and
stands
ready
to
perform
under
the
terms
of
its
agreement
with
such
counterparty, the
Fund bears the
risk
of
loss
from
a
counterparty
in
the
amount
of
the
value
of
the
collateral
in
the
event
the
counterparty
fails
to
return
such
collateral.
Based
on
the
terms
of
agreements,
collateral
may
not
be
required
for
all
derivative
contracts.
For
financial
reporting
purposes,
the
Fund
does
not
offset
derivative
assets
and
derivative
liabilities
that
are
subject
to
netting
arrangements,
if
any,
in
the
Statement
of
Assets
and
Liabilities.
6.
INVESTMENT
ADVISORY
AGREEMENT
AND
OTHER
TRANSACTIONS
WITH
AFFILIATES
Investment
Advisory:
The
Trust,
on
behalf
of
the
Fund,
entered
into
an
Investment
Advisory
Agreement
with
the
Manager,
the
Fund’s
investment
adviser
and
an
indirect,
wholly-owned
subsidiary
of
BlackRock,
Inc.
(“BlackRock”),
to
provide
investment
advisory
and
administrative
services.
The Manager
receives
no
advisory
fee
from
the
Fund
under
the
Investment
Advisory
Agreement.
With
respect
to
the
Fund,
the
Manager
entered
into
separate
sub-advisory
agreements
with
each
of
BlackRock
International
Limited
(“BIL”)
and
BlackRock
(Singapore)
Limited
("BSL"
and,
together
with
BIL,
the
Sub-Advisers"),
each
an
affiliate
of
the
Manager.
The
Manager
pays
BIL
and
BSL
for
services
they
provide
for
that
portion
of
the
Fund
for
which
BIL
and
BSL,
as
applicable,
acts
as
Sub-Adviser,
a
monthly
fee
that
is
equal
to
a
percentage
of
the
investment
advisory
fees
paid
by
the
Fund
to
the
Manager.
Service
and
Distribution
Fees:
The
Trust
,
on behalf
of
the
Fund,
entered
into
a
Distribution
Agreement
with
BlackRock
Investments,
LLC
(“BRIL”),
an
affiliate
of
the
Manager.
Administration:
The
Trust,
on
behalf
of
the
Fund,
entered
into
an
Administration
Agreement
with
the
Manager,
an
indirect,
wholly-owned
subsidiary
of
BlackRock,
to
provide
administrative
services.
For
these
services,
the
Manager
receives
an
administration
fee
computed
daily
and
payable
monthly,
based
on
a
percentage
of
the
average
daily
net
assets
of
the
Fund.
The
administration
fee,
which
is
shown
as
administration
in
the
Statement
of
Operations,
is
paid
at
the
annual
rate
of
0.05%.
Expense
Limitations,
Waivers
and
Reimbursements:
The
Manager
contractually
agreed
to
waive
all
fees
and
pay
or
reimburse
all
operating
expenses
of the
Fund,
except
extraordinary
expenses.
Extraordinary
expenses
may
include
interest
expense,
dividend
expense,
tax
expense,
acquired
fund
fees
and
expenses
and
certain
other
fund
expenses.
This
agreement
has
no
fixed
termination
date.
Although
the
Fund
does
not
compensate
the
Manager
directly
for
its
services
under
the
Investment
Advisory
Agreement,
because
the
Fund
is
an
investment
option
for
certain
wrap-fee
or
other
separately
managed
account
program
clients,
the
Manager
may
benefit
from
the
fees
charged
to
such
clients
who
have
retained
the
Manager's
affiliates
to
manage
their
accounts.
The
Manager
waived
fees
for
the
Fund
which
are
included
in
fees
waived
and/or
reimbursed
by
the
Manager
in
the
Statement
of
Operations.
For
the period
ended
September
30,
2024,
the
amount
waived
was $36,955.
The
Manager
contractually
agreed
to
reimburse,
or
provide
offsetting
credits
to,
the
Fund
for
the
fees
and
expenses
of
the
trustees
who
are
not
“affiliated
persons”
(as
defined
in
the
Investment
Company
Act)
of
BlackRock,
counsel
to
the
Independent
Trustees
and
the
independent
registered
public
accounting
firm
that
provides
audit
services
in
connection
with
the
Fund
(collectively
referred
to
as
the
“Independent
Expenses”)
are
paid
directly
by
the
Fund
through
June
30,
2034.
On
July
1
of
each
year,
the
reimbursement
agreement
will
renew
automatically
for
an
additional
one
year
so
that
the
agreement
will
have
a
perpetual
ten-year
term.
After
giving
effect
to
such
contractual
arrangements,
Independent
Expenses
will
be
0.00%.
Such
contractual
arrangements
may
be
terminated
upon
90
days’
notice
by
a
majority
of
the
Independent
Trustees
or
by
a
vote
of
a
majority
of
the
outstanding
voting
securities
of
the
Fund.
Notes
to
Financial
Statements
(continued)
Notes
to
Financial
Statements
The
Fund
also
had
a
waiver
of
administration
fees,
which
are
included
in
Administration
fees
waived
in
the
Statement
of
Operations.
For
the
period
ended
September
30,
2024,
the
amount
was $14,634.
The
Manager
contractually
agreed
to
waive
its
administration
fee
through
June
30,
2034.
On
July
1
of
each
year,
the
waiver
agreement
will
renew
automatically
for
an
additional
one
year
so
that
the
agreement
will
have
a
perpetual
ten-year
term.
The
contractual
agreement
may
be
terminated
upon
90
days’
notice
by
a
majority
of
the
Independent
Trustees,
or
by
a
vote
of
a
majority
of
the
outstanding
voting
securities
of
the
Fund.
Interfund
Lending:
In
accordance
with
an
exemptive
order
(the
“Order”)
from
the
SEC,
the
Fund
may
participate
in
a
joint
lending
and
borrowing
facility
for
temporary
purposes
(the
“Interfund
Lending
Program”),
subject
to
compliance
with
the
terms
and
conditions
of
the
Order,
and
to
the
extent
permitted
by
the
Fund’s
investment
policies
and
restrictions.
The
Fund
is
currently
permitted
to
borrow
and
lend under
the
Interfund
Lending
Program.
A
lending
BlackRock
fund
may
lend
in
aggregate
up
to
15%
of
its
net
assets
but
may
not
lend
more
than
5%
of
its
net
assets
to
any
one
borrowing
fund
through
the
Interfund
Lending
Program.
A
borrowing
BlackRock
fund
may
not
borrow
through
the
Interfund
Lending
Program
or
from
any
other
source
more
than
33
1/3%
of
its
total
assets
(or
any
lower
threshold
provided
for
by
the fund’s
investment
restrictions).
If
a
borrowing
BlackRock
fund’s
total
outstanding
borrowings
exceed
10%
of
its
total
assets,
each
of
its
outstanding
interfund
loans
will
be
subject
to
collateralization
of
at
least
102%
of
the
outstanding
principal
value
of
the
loan.
All
interfund
loans
are
for
temporary
or
emergency
purposes
and
the
interest
rate
to
be
charged
will
be
the
average
of
the
highest
current
overnight
repurchase
agreement
rate
available
to
a
lending
fund
and
the
bank
loan
rate,
as
calculated
according
to
a
formula
established
by
the
Board.
During the period
ended
September
30,
2024,
the
Fund
did
not
participate
in
the
Interfund
Lending
Program.
Trustees
and
Officers:
Certain
trustees
and/or
officers
of
the Trust are directors and/or
officers
of BlackRock
or
its
affiliates.
The
Fund
reimburses
the
Manager
for
a
portion
of
the
compensation
paid
to
the
Trust’s
Chief
Compliance
Officer,
which
is
included
in
Trustees and
Officer
in
the
Statement
of
Operations.
7.
PURCHASES
AND
SALES
For
the
period
ended
September
30,
2024,
purchases
and
sales
of
investments,
including
paydowns/payups
and
mortgage
dollar
rolls
and
excluding
short-term
securities,
were
as
follows:
For
the period ended
September
30,
2024,
purchases
and
sales
related
to
mortgage
dollar
rolls
were
$26,858,465
and
$26,842,435,
respectively.
8.
INCOME
TAX
INFORMATION
It
is
the
Fund’s
policy
to
comply
with
the
requirements
of
the
Internal
Revenue
Code
of
1986,
as
amended,
applicable
to
regulated
investment
companies,
and
to
distribute
substantially
all
of
its
taxable
income
to
its
shareholders.
Therefore,
no
U.S.
federal
income
tax
provision
is
required.
The
Fund
files
U.S.
federal
and
various
state
and
local
tax
returns.
No
income
tax
returns
are
currently
under
examination.
The
statute
of
limitations
on
the
Fund’s
U.S.
federal
tax
returns
generally
remains
open
for
a
period
of
three
years
after
they
are
filed.
The
statutes
of
limitations
on
the
Fund’s
state
and
local
tax
returns
may
remain
open
for
an
additional
year
depending
upon
the
jurisdiction.
Management
has
analyzed
tax
laws
and
regulations
and
their
application
to
the Fund
as
of
September
30,
2024,
inclusive
of
the
open
tax
return
years,
and
does
not
believe
that
there
are
any
uncertain
tax
positions
that
require
recognition
of
a
tax
liability
in
the
Fund’s
financial
statements.
Management’s
analysis
is
based
on
the
tax
laws
and
judicial
and
administrative
interpretations
thereof
in
effect
as
of
date
of
these
financial
statements,
all
of
which
are
subject
to
change,
possibly
with
retroactive
effect
which
may
impact
the
Fund's
NAV.
The
tax
character
of
distributions
paid
was
as
follows:
U.S.
Government
Securities
Other
Securities
Fund
Name
Purchases
Sales
Purchases
Sales
BATS:
Series
I
Portfolio
..................................................
$
61,213,826
$
54,462,125
$
66,145,728
$
16,361,438
Fund
Name
Period
Ended
09/30/24
BATS:
Series
I
Portfolio
Ordinary
income
........................................................................................................
$
1,832,094
Notes
to
Financial
Statements
(continued)
2024
Blackrock
Annual
Financial
Statements
and
Additional
Information
As
of
September
30,
2024
,
the
tax
components
of
accumulated earnings
(loss) were
as
follows:
(a)
The
difference
between
book-basis
and
tax-basis
net
unrealized
gains
(losses)
were
attributable
primarily
to
the
tax
deferral
of
losses
on
wash
sales
and
straddles,
amortization
and
accretion
methods
of
premiums
and
discounts
on
fixed
income
securities,
the
realization
for
tax
purposes
of
unrealized
gains
(losses)
on
certain
futures
and
foreign
currency
exchange
contracts,
the
accounting
for
swap
agreements
and
the
classification
of
investments.
As
of
September
30,
2024, gross
unrealized
appreciation
and
depreciation
based
on
cost
of
investments
(including
short
positions
and
derivatives,
if
any)
for
U.S.
federal
income
tax
purposes
were
as
follows:
9.
BANK
BORROWINGS
The
Trust,
on
behalf
of
the
Fund,
along
with
certain
other
funds
managed
by
the
Manager
and
its
affiliates
(“Participating
Funds”), is
party
to
a
364-day,
$2.40
billion
credit
agreement
with
a
group
of
lenders.
Under
this
agreement,
the
Fund
may
borrow
to
fund
shareholder
redemptions.
Excluding
commitments
designated
for
certain
individual
funds,
the
Participating
Funds,
including
the
Fund,
can
borrow
up
to
an
aggregate
commitment
amount
of
$1.75
billion
at
any
time
outstanding,
subject
to
asset
coverage
and
other
limitations
as
specified
in
the
agreement.
The
credit
agreement
has
the
following
terms:
a
fee
of
0.10%
per
annum
on
unused
commitment
amounts
and
interest
at
a
rate
equal
to
the
higher
of
(a)
Overnight
Bank
Funding
Rate
(“OBFR”)
(but,
in
any
event,
not
less
than
0.00%)
on
the
date
the
loan
is
made
plus
0.80%
per
annum,
(b)
the
Fed
Funds
rate
(but,
in
any
event,
not
less
than
0.00%)
in
effect
from
time
to
time
plus
0.80%
per
annum
on
amounts
borrowed
or
(c)
the
sum
of
(x)
Daily
Simple
Secured
Overnight
Financing
Rate
(“SOFR”)
(but,
in
any
event,
not
less
than
0.00%)
on
the
date
the
loan
is
made
plus
0.10%
and
(y)
0.80%
per
annum. The
agreement
expires
in
April
2025
unless
extended
or
renewed. These
fees
were
allocated
among
such
funds
based
upon
portions
of
the
aggregate
commitment
available
to
them
and
relative
net
assets
of
Participating
Funds.
During
the period ended
September
30,
2024,
the
Fund
did
not
borrow
under
the
credit
agreement.
10.
PRINCIPAL
RISKS
In
the
normal
course
of
business,
the
Fund
invests
in
securities
or
other
instruments
and
may
enter
into
certain
transactions,
and
such
activities
subject
the
Fund
to
various
risks,
including
among
others,
fluctuations
in
the
market
(market
risk)
or
failure
of
an
issuer
to
meet
all
of
its
obligations.
The
value
of
securities
or
other
instruments
may
also
be
affected
by
various
factors,
including,
without
limitation:
(i)
the
general
economy;
(ii)
the
overall
market
as
well
as
local,
regional
or
global
political
and/or
social
instability;
(iii)
regulation,
taxation
or
international
tax
treaties
between
various
countries;
or
(iv)
currency,
interest
rate
and
price
fluctuations.
Local,
regional
or
global
events
such
as
war,
acts
of
terrorism,
the
spread
of
infectious
illness
or
other
public
health
issues,
recessions,
or
other
events
could
have
a
significant
impact
on
the
Fund
and its
investments.
The
Fund’s
prospectus
provides
details
of
the
risks
to
which
the
Fund
is
subject.
Market Risk:
The
Fund
may
be
exposed
to
prepayment
risk,
which
is
the
risk
that
borrowers
may
exercise
their
option
to
prepay
principal
earlier
than
scheduled
during
periods
of
declining
interest
rates,
which
would
force
the
Fund
to
reinvest
in
lower
yielding
securities. The
Fund
may
also
be
exposed
to
reinvestment
risk,
which
is
the
risk
that
income
from
the
Fund’s
portfolio
will
decline
if
the Fund
invests
the
proceeds
from
matured,
traded
or
called
fixed-income
securities
at
market
interest
rates
that
are
below
the
Fund
portfolio’s
current
earnings
rate.
Counterparty
Credit
Risk:
The
Fund
may
be
exposed
to
counterparty
credit
risk,
or
the
risk
that
an
entity
may
fail
to
or
be
unable
to
perform
on
its
commitments
related
to
unsettled
or
open
transactions,
including
making
timely
interest
and/or
principal
payments
or
otherwise
honoring
its
obligations.
The
Fund
manages
counterparty
credit
risk
by
entering
into
transactions
only
with
counterparties
that
the
Manager
believes
have
the
financial
resources
to
honor
their
obligations
and
by
monitoring
the
financial
stability
of
those
counterparties.
Financial
assets,
which
potentially
expose
the
Fund
to
market,
issuer
and
counterparty
credit
risks,
consist
principally
of
financial
instruments
and
receivables
due
from
counterparties.
The
extent
of
the
Fund’s
exposure
to
market,
issuer
and
counterparty
credit
risks
with
respect
to
these
financial
assets
is
approximately
their
value
recorded
in
the
Statement
of
Assets
and
Liabilities,
less
any
collateral
held
by
the
Fund.
A
derivative
contract
may
suffer
a
mark-to-market
loss
if
the
value
of
the
contract
decreases
due
to
an
unfavorable
change
in
the
market
rates
or
values
of
the
underlying
instrument.
Losses
can
also
occur
if
the
counterparty
does
not
perform
under
the
contract.
For
OTC
options
purchased,
the
Fund
bears
the
risk
of
loss
in
the
amount
of
the
premiums
paid
plus
the
positive
change
in
market
values
net
of
any
collateral
held
by
the
Fund
should
the
counterparty
fail
to
perform
under
the
contracts.
Options
written
by
the
Fund
do
not
typically
give
rise
to
counterparty
credit
risk,
as
options
written
generally
obligate
the
Fund,
and
not
the
counterparty,
to
perform.
The
Fund
may
be
exposed
to
counterparty
credit
risk
with
respect
to
options
written
to
the
extent
the
Fund
deposits
collateral
with
its
counterparty
to
a
written
option.
With
exchange-traded
futures
and
centrally
cleared
swaps,
there
is
less
counterparty
credit
risk
to
the
Fund
since
the
exchange
or
clearinghouse,
as
counterparty
to
such
instruments,
guarantees
against
a
possible
default.
The
clearinghouse
stands
between
the
buyer
and
the
seller
of
the
contract;
therefore,
credit
risk
is
limited
to
failure
of
the
clearinghouse.
While
offset
rights
may
exist
under
applicable
law, the
Fund
does
not
have
a
contractual
right
of
offset
against
a
clearing
broker
or
clearinghouse
in
the
event
of
a
default
(including
the
bankruptcy
or
insolvency).
Additionally,
credit
risk
exists
in exchange-traded
futures
and
centrally
cleared
swaps with
respect
to
initial
and
variation
margin
that
is
held
in
a
clearing
broker’s
customer
accounts.
While
clearing
brokers
are
required
to
segregate
customer
margin
from
their
own
assets,
in
the
event
that
a
Fund
Name
Undistributed
Ordinary
Income
Undistributed
Long-Term
Capital
Gains
Net
Unrealized
Gains
(Losses)
(a)
Total
BATS:
Series
I
Portfolio
.....................................................
$
709,989
$
95,963
$
59,198
$
865,150
Fund
Name
Tax
Cost
Gross
Unrealized
Appreciation
Gross
Unrealized
Depreciation
Net
Unrealized
Appreciation
(Depreciation)
BATS:
Series
I
Portfolio
.............................................
$
61,497,088
$
1,550,283
$
(805,779)
$
744,504
Notes
to
Financial
Statements
(continued)
Notes
to
Financial
Statements
clearing
broker
becomes
insolvent
or
goes
into
bankruptcy
and
at
that
time
there
is
a
shortfall
in
the
aggregate
amount
of
margin
held
by
the
clearing
broker
for
all
its
clients,
typically
the
shortfall
would
be
allocated
on
a
pro
rata
basis
across
all
the
clearing
broker’s
customers,
potentially
resulting
in
losses
to
the
Fund.
Geographic/Asset
Class
Risk:
A
diversified
portfolio,
where
this
is appropriate
and
consistent
with
a
fund’s
objectives,
minimizes
the
risk
that
a
price
change
of
a
particular
investment
will
have
a
material
impact
on
the
NAV
of
a
fund.
The
investment
concentrations
within
the
Fund’s
portfolio
are
disclosed
in
its Schedule
of
Investments.
The
Fund
invests
a
significant
portion
of
its
assets
in
high
yield
securities.
High
yield
securities
that
are
rated
below
investment-grade
(commonly
referred
to
as
“junk
bonds”)
or
are
unrated
may
be
deemed
speculative,
involve
greater
levels
of
risk
than
higher-rated
securities
of
similar
maturity
and
are
more
likely
to
default.
High
yield
securities
may
be
issued
by
less
creditworthy
issuers,
and
issuers
of
high
yield
securities
may
be
unable
to
meet
their
interest
or
principal
payment
obligations.
High
yield
securities
are
subject
to
extreme
price
fluctuations,
may
be
less
liquid
than
higher
rated
fixed-income
securities,
even
under
normal
economic
conditions,
and
frequently
have
redemption
features.
The
Fund
invests
a
significant
portion
of
its
assets
in fixed-income securities and/or uses
derivatives tied
to
the
fixed-income
markets.
Changes
in
market
interest
rates
or
economic
conditions
may affect
the
value
and/or
liquidity
of
such investments.
Interest
rate
risk
is
the
risk
that
prices
of
bonds
and
other
fixed-income
securities
will
decrease
as
interest
rates
rise
and
increase
as
interest
rates
fall.
The
Fund
may
be
subject
to
a
greater
risk
of
rising
interest
rates
during
a
period
of
historically
low
interest
rates. The
Federal
Reserve
has
raised
the
federal
funds
rate
as
part
of
its
efforts
to
address
inflation.
Changing
interest
rates
may
have
unpredictable
effects
on
markets,
may
result
in
heightened
market
volatility,
and
could
negatively
impact
the
Fund’s
performance.
The
Fund
invests
a
significant
portion
of
its
assets
in
securities
of
issuers
located
in
the
United
States.
A
decrease
in
imports
or
exports,
changes
in
trade
regulations,
inflation
and/or
an
economic
recession
in
the
United
States
may
have
a
material
adverse
effect
on
the
U.S.
economy
and
the
securities
listed
on
U.S.
exchanges.
Proposed
and
adopted
policy
and
legislative
changes
in
the
United
States
may
also
have
a
significant
effect
on
U.S.
markets
generally,
as
well
as
on
the
value
of
certain
securities.
Governmental
agencies
project
that
the
United
States
will
continue
to
maintain
elevated
public
debt
levels
for
the
foreseeable
future
which
may
constrain
future
economic
growth.
Circumstances
could
arise
that
could
prevent
the
timely
payment
of
interest
or
principal
on
U.S.
government
debt,
such
as
reaching
the
legislative
“debt
ceiling.”
Such
non-payment
would
result
in
substantial
negative
consequences
for
the
U.S.
economy
and
the
global
financial
system.
If
U.S.
relations
with
certain
countries
deteriorate,
it
could
adversely
affect
issuers
that
rely
on
the
United
States
for
trade.
The
United
States
has
also
experienced
increased
internal
unrest
and
discord.
If
these
trends
were
to
continue,
they
may
have
an
adverse
impact
on
the
U.S.
economy
and
the
issuers
in
which
the
Fund
invests.
The
Fund
invests
a
significant
portion
of
its
assets
in
securities
of
issuers
located
in
Europe
or
with
significant
exposure
to
European
issuers
or
countries.
The
European
financial
markets
have
recently
experienced
volatility
and
adverse
trends
due
to
concerns
about
economic
downturns
in,
or
rising
government
debt
levels
of,
several
European
countries
as
well
as
acts
of
war
in
the
region.
These
events
may
spread
to
other
countries
in
Europe
and
may
affect
the
value
and
liquidity
of
certain
of
the
Fund’s
investments.
Responses
to
the
financial
problems
by
European
governments,
central
banks
and
others,
including
austerity
measures
and
reforms,
may
not
work,
may
result
in
social
unrest
and
may
limit
future
growth
and
economic
recovery
or
have
other
unintended
consequences.
Further
defaults
or
restructurings
by
governments
and
others
of
their
debt
could
have
additional
adverse
effects
on
economies,
financial
markets
and
asset
valuations
around
the
world.
The
United
Kingdom
has
withdrawn
from
the
European
Union,
and
one
or
more
other
countries
may
withdraw
from
the
European
Union
and/or
abandon
the
Euro,
the
common
currency
of
the
European
Union.
These
events
and
actions
have
adversely
affected,
and
may
in
the
future
adversely
affect,
the
value
and
exchange
rate
of
the
Euro
and
may
continue
to
significantly
affect
the
economies
of
every
country
in
Europe,
including
countries
that
do
not
use
the
Euro
and
non-European
Union
member
states. The
impact
of
these
actions,
especially
if
they
occur
in
a
disorderly
fashion,
is
not
clear
but
could
be
significant
and
far
reaching.
In
addition,
Russia
launched
a
large-scale
invasion
of
Ukraine
on
February
24,
2022.
The
extent
and
duration
of
the
military
action,
resulting
sanctions
and
resulting
future
market
disruptions
in
the
region
are
impossible
to
predict,
but
have
been,
and
may
continue
to
be,
significant
and
have
a
severe
adverse
effect
on
the
region,
including
significant
negative
impacts
on
the
economy
and
the
markets
for
certain
securities
and
commodities,
such
as
oil
and
natural
gas,
as
well
as
other
sectors.
The
Fund
invests
a
significant
portion
of
its
assets
in
securities
backed
by
commercial
or
residential
mortgage
loans
or
in
issuers
that
hold
mortgage
and
other
asset-backed
securities.
When
a
fund
concentrates
its
investments
in
this
manner,
it
assumes
a
greater
risk
of
prepayment
or
payment
extension
by
securities
issuers. Changes
in
economic
conditions,
including
delinquencies
and/or
defaults
on
assets
underlying
these
securities,
can
affect
the
value,
income
and/or
liquidity
of
such
positions.
Investment
percentages
in
these
securities
are
presented
in
the
Schedule
of
Investments.
Significant
Shareholder
Redemption
Risk:
Certain
shareholders
may
own
or
manage
a
substantial
amount
of
fund
shares
and/or
hold
their
fund
investments
for
a
limited
period
of
time.
Large
redemptions
of
fund
shares
by
these
shareholders
may
force
a
fund
to
sell
portfolio
securities,
which
may
negatively
impact
the
fund’s
NAV,
increase
the
fund’s
brokerage
costs,
and/or
accelerate
the
realization
of
taxable
income/gains
and
cause
the
fund
to
make
additional
taxable
distributions
to
shareholders.
Notes
to
Financial
Statements
(continued)
2024
Blackrock
Annual
Financial
Statements
and
Additional
Information
11.
CAPITAL
SHARE
TRANSACTIONS
Transactions
in
capital
shares
were
as
follows:
As
of
September
30,
2024,
BlackRock
Financial
Management,
Inc.,
an
affiliate
of
the
Fund,
owned
5,000,000
shares
of
the
Fund.
12.
SUBSEQUENT
EVENTS
Management
has
evaluated
the
impact
of
all
subsequent
events
on
the
Fund
through
the
date
the
financial
statements
were
issued
and
has
determined
that
there
were
no
subsequent
events
requiring
adjustment
or
additional
disclosure
in
the
financial
statements.
d
Period
from
03/06/24
(a)
to
09/30/24
Fund
Name/Share
Class
Shares
Amount
BATS:
Series
I
Portfolio
Shares
sold
...........................................................................
5,504,823
$
55,065,178
Shares
redeemed
.......................................................................
(892)
(8,955)
5,503,931
$
55,056,223
(a)
Commencement
of
operations.
Report
of
Independent
Registered
Public
Accounting
Firm
Report
of
Independent
Registered
Public
Accounting
Firm
To
the
Shareholders
of
BATS:
Series
I
Portfolio
and
the
Board
of
Trustees
of
BlackRock
Allocation
Target
Shares:
Opinion
on
the
Financial
Statements
and
Financial
Highlights
We
have
audited
the
accompanying
statement
of
assets
and
liabilities
of
BATS:
Series
I
Portfolio
of
BlackRock
Allocation
Target
Shares
(the
“Fund”),
including
the
schedule
of
investments,
as
of
September
30,
2024,
the
related
statement
of
operations,
the
statement
of
changes
in
net
assets
and
the
financial
highlights
for
the
period
from
March
6,
2024
(commencement
of
operations)
through
September
30,
2024,
and
the
related
notes.
In
our
opinion,
the
financial
statements
and
financial
highlights
present
fairly,
in
all
material
respects,
the
financial
position
of
the
Fund
as
of
September
30,
2024,
and
the
results
of
its
operations,
the
changes
in
its
net
assets,
and
the
financial
highlights
for
the
period
from
March
6,
2024
(commencement
of
operations)
through
September
30,
2024,
in
conformity
with
accounting
principles
generally
accepted
in
the
United
States
of
America.
Basis
for
Opinion
These
financial
statements
and
financial
highlights
are
the
responsibility
of
the
Fund’s
management.
Our
responsibility
is
to
express
an
opinion
on
the
Fund’s
financial
statements
and
financial
highlights
based
on
our
audit.
We
are
a
public
accounting
firm
registered
with
the
Public
Company
Accounting
Oversight
Board
(United
States)
(PCAOB)
and
are
required
to
be
independent
with
respect
to
the
Fund
in
accordance
with
the
U.S.
federal
securities
laws
and
the
applicable
rules
and
regulations
of
the
Securities
and
Exchange
Commission
and
the
PCAOB.
We
conducted
our
audit
in
accordance
with
the
standards
of
the
PCAOB.
Those
standards
require
that
we
plan
and
perform
the
audit
to
obtain
reasonable
assurance
about
whether
the
financial
statements
and
financial
highlights
are
free
of
material
misstatement,
whether
due
to
error
or
fraud.
The
Fund
is
not
required
to
have,
nor
were
we
engaged
to
perform,
an
audit
of
its
internal
control
over
financial
reporting.
As
part
of
our
audit
we
are
required
to
obtain
an
understanding
of
internal
control
over
financial
reporting
but
not
for
the
purpose
of
expressing
an
opinion
on
the
effectiveness
of
the
Fund’s
internal
control
over
financial
reporting.
Accordingly,
we
express
no
such
opinion.
Our
audit
included
performing
procedures
to
assess
the
risks
of
material
misstatement
of
the
financial
statements
and
financial
highlights,
whether
due
to
error
or
fraud,
and
performing
procedures
that
respond
to
those
risks.
Such
procedures
included
examining,
on
a
test
basis,
evidence
regarding
the
amounts
and
disclosures
in
the
financial
statements
and
financial
highlights.
Our
audit
also
included
evaluating
the
accounting
principles
used
and
significant
estimates
made
by
management,
as
well
as
evaluating
the
overall
presentation
of
the
financial
statements
and
financial
highlights.
Our
procedures
included
confirmation
of
securities
owned
as
of
September
30,
2024,
by
correspondence
with
custodians
or
counterparties;
when
replies
were
not
received,
we
performed
other
auditing
procedures.
We
believe
that
our
audit
provides
a
reasonable
basis
for
our
opinion.
Deloitte
&
Touche
LLP
Boston,
Massachusetts
November
21,
2024
We
have
served
as
the
auditor
of
one
or
more
BlackRock
investment
companies
since
1992.
Important
Tax
Information
(unaudited)
2024
Blackrock
Annual
Financial
Statements
and
Additional
Information
The
following
amount,
or maximum
amount
allowable
by
law, is
hereby
designated
as
qualified
dividend
income
for
individuals
for
the
fiscal
period
ended
September
30,
2024
:
The
Fund
hereby
designates
the
following
amount,
or
maximum
amount
allowable
by
law,
as
interest
income
eligible
to
be
treated
as
a
Section
163(j)
interest
dividend
for
the
fiscal
period
ended
September
30,
2024:
The
Fund
hereby
designates
the
following
amount,
or
maximum
amount
allowable
by
law,
as
interest-related
dividends
eligible
for
exemption
from
U.S.
withholding
tax
for
nonresident
aliens
and
foreign
corporations
for
the
fiscal
period
ended
September
30,
2024:
Fund
Name
Qualified
Dividend
Income
BATS:
Series
I
Portfolio
...............................................................................................
$
15,663
Fund
Name
Interest
Dividends
BATS:
Series
I
Portfolio
...............................................................................................
$
1,769,236
Fund
Name
Interest-Related
Dividends
BATS:
Series
I
Portfolio
...............................................................................................
$
884,926
Changes
in
and
Disagreements
with
Accountants
Not
applicable.
Proxy
Results
Not
applicable.
Remuneration
Paid
to
Trustees,
Officers,
and
Others
Compensation
to
the
independent
directors/trustees
of
the
Trust
is
paid
by
the
Trust,
on
behalf
of
the
Fund.
General
Information
Quarterly
performance,
semi-annual
and
annual
reports,
current
net
asset
value
and
other
information
regarding
the
Fund
may
be
found
on
BlackRock’s
website,
which
can
be
accessed
at
blackrock.com
.
Any
reference
to
BlackRock’s
website
in
this
report
is
intended
to
allow
investors
public
access
to
information
regarding
the
Fund
and
does
not,
and
is
not
intended
to,
incorporate
BlackRock’s
website
in
this
report.
Electronic
Delivery
Shareholders
can
sign
up
for
e-mail
notifications
of
quarterly
statements,
annual
and
semi-annual
shareholder
reports
and
prospectuses
by
enrolling
in
the
electronic
delivery
program.
To
enroll
in
electronic
delivery:
Shareholders
Who
Hold
Accounts
with
Investment
Advisors,
Banks
or
Brokerages:
Please
contact
your
financial
advisor.
Please
note
that
not
all
investment
advisors,
banks
or
brokerages
may
offer
this
service.
Shareholders
Who
Hold
Accounts
Directly
with
BlackRock:
1.
Access
the
BlackRock
website
at
blackrock.com
2.
Select
"Access
Your
Account"
3.
Next,
select
"eDelivery"
in
the
"Related
Resources"
box
and
follow
the
sign-up
instructions.
BlackRock’s
Mutual
Fund
Family
BlackRock
offers
a
diverse
lineup
of
open-end
mutual
funds
crossing
all
investment
styles
and
managed
by
experts
in
equity,
fixed-income
and
tax-exempt
investing.
Visit
blackrock.com
for
more
information.
Shareholder
Privileges
Account
Information
Call
us
at
(800)
441-7762
from
8:00
AM
to
6:00
PM
ET
on
any
business
day
to
get
information
about
your
account
balances,
recent
transactions
and
share
prices.
You
can
also
visit
blackrock.com
for
more
information.
Automatic
Investment
Plans
Investor
class
shareholders
who
want
to
invest
regularly
can
arrange
to
have
$50
or
more
automatically
deducted
from
their
checking
or
savings
account
and
invested
in
any
of
the
BlackRock
funds.
Systematic
Withdrawal
Plans
Investor
class
shareholders
can
establish
a
systematic
withdrawal
plan
and
receive
periodic
payments
of
$50
or
more
from
their
BlackRock
funds,
as
long
as
their
account
balance
is
at
least
$10,000.
Retirement
Plans
Shareholders
may
make
investments
in
conjunction
with
Traditional,
Rollover,
Roth,
Coverdell,
Simple
IRAs,
SEP
IRAs
and
403(b)
Plans.
Additional
Information
(continued)
2024
Blackrock
Annual
Financial
Statements
and
Additional
Information
Fund
and
Service
Providers
Investment
Adviser
and
Administrator
BlackRock
Advisors,
LLC
Wilmington,
DE
19809
Sub-Advisers
BlackRock
International
Limited
Edinburgh,
EH3
8BL
United
Kingdom
BlackRock
(Singapore)
Limited
079912
Singapore
Accounting
Agent
JPMorgan
Chase
Bank,
N.A.
New
York,
NY
10179
Transfer
Agent
BNY
Mellon
Investment
Servicing
(US)
Inc.
Wilmington,
DE
19809
Custodian
JPMorgan
Chase
Bank,
N.A.
New
York,
NY
10179
Independent
Registered
Public
Accounting
Firm
Deloitte
&
Touche
LLP
Boston,
MA
02110
Distributor
BlackRock
Investments,
LLC
New
York,
NY
10001
Legal
Counsel
Willkie
Farr
&
Gallagher
LLP
New
York,
NY
10019
Address
of
the
Trust
100
Bellevue
Parkway
Wilmington,
DE
19809
Glossary
of
Terms
Used
in
This
Report
Glossary
of
Terms
Used
in
This
Report
Currency
Abbreviation
AUD
Australian
Dollar
BRL
Brazilian
Real
CHF
Swiss
Franc
CLP
Chilean
Peso
CNY
Chinese
Yuan
COP
Colombian
Peso
CZK
Czech
Koruna
EUR
Euro
GBP
British
Pound
HUF
Hungarian
Forint
IDR
Indonesian
Rupiah
INR
Indian
Rupee
JPY
Japanese
Yen
KRW
South
Korean
Won
MXN
Mexican
Peso
MYR
Malaysian
Ringgit
NOK
Norwegian
Krone
PEN
Peruvian
Sol
PLN
Polish
Zloty
RON
Romanian
Leu
SEK
Swedish
Krona
SGD
Singapore
Dollar
THB
Thai
Baht
TWD
Taiwan
New
Dollar
USD
United
States
Dollar
UYU
Uruguayan
Peso
ZAR
South
African
Rand
Portfolio
Abbreviation
BZDIOVER
Overnight
Brazil
CETIP
—
Interbank
Rate
CLICP
Chile
Indice
de
Camara
Promedio
Interbank
Overnight
Index
CLO
Collateralized
Loan
Obligation
CSMC
Credit
Suisse
Mortgage
Capital
EURIBOR
Euro
Interbank
Offered
Rate
IBR
Colombian
Reference
Banking
Indicator
JIBAR
Johannesburg
Interbank
Average
Rate
MIBOR
Mumbai
Interbank
Offered
Rate
MXIBTIIE
Mexico
Interbank
TIIE
28-Day
OTC
Over-the-counter
PIK
Payment-In-Kind
SOFR
Secured
Overnight
Financing
Rate
TBA
To-be-announced
Want
to
know
more?
blackrock.com
|
800-441-7762
This
report
is
intended
for
current
holders.
It
is
not
authorized
for
use
as
an
offer
of
sale
or
a
solicitation
of
an
offer
to
buy
shares
of
the
Funds
unless
preceded
or
accompanied
by
the
Fund’s
current
prospectus.
Past
performance
results
shown
in
this
report
should
not
be
considered
a
representation
of
future
performance.
Investment
returns
and
principal
value
of
shares
will
fluctuate
so
that
shares,
when
redeemed,
may
be
worth
more
or
less
than
their
original
cost.
Statements
and
other
information
herein
are
as
dated
and
are
subject
to
change.
Item 8 – Changes in and Disagreements with Accountants for Open-End Management Investment Companies – See Item 7
Item 9 – Proxy Disclosures for Open-End Management Investment Companies – See Item 7
Item 10 – Remuneration Paid to Directors, Officers, and Others of Open-End Management Investment Companies – See Item 7
Item 11 – Statement Regarding Basis for Approval of Investment Advisory Contract – See Item 7
Item 12 – Disclosure of Proxy Voting Policies and Procedures for Closed-End Management Investment Companies – Not Applicable
Item 13 – Portfolio Managers of Closed-End Management Investment Companies - Not Applicable
Item 14 – Purchases of Equity Securities by Closed-End Management Investment Company and Affiliated Purchasers – Not Applicable
Item 15 – Submission of Matters to a Vote of Security Holders – There have been no material changes to these procedures.
Item 16 – Controls and Procedures
(a) The registrant’s principal executive and principal financial officers, or persons performing similar functions, have concluded that the registrant’s disclosure controls and procedures (as defined in Rule 30a-3(c) under the Investment Company Act of 1940, as amended (the “1940 Act”)) are effective as of a date within 90 days of the filing date of this report based on the evaluation of these controls and procedures required by Rule 30a-3(b) under the 1940 Act and Rule 13a-15(b) or 15d-15(b) under the Securities Exchange Act of 1934, as amended.
(b) There were no changes in the registrant’s internal control over financial reporting (as defined in Rule 30a-3(d) under the 1940 Act) that occurred during the period covered by this report that have materially affected, or are reasonably likely to materially affect, the registrant’s internal control over financial reporting.
Item 17 – Disclosure of Securities Lending Activities for Closed-End Management Investment Companies –Not Applicable
Item 18 – Recovery of Erroneously Awarded Compensation – Not Applicable
Item 19 – Exhibits attached hereto
(a)(1) Code of Ethics – See Item 2
(a)(2) Any policy required by the listing standards adopted pursuant to Rule 10D-1 under the Exchange Act (17 CFR 240.10D-1) by the registered national securities exchange or registered national securities association upon which the registrant’s securities are listed – Not Applicable
(a)(3) Section 302 Certifications are attached
(a)(4) Any written solicitation to purchase securities under Rule 23c-1 – Not Applicable
(a)(5) Change in Registrant’s independent public accountant – Not Applicable
(b) Section 906 Certifications are attached
Pursuant to the requirements of the Securities Exchange Act of 1934 and the Investment Company Act of 1940, the registrant has duly caused this report to be signed on its behalf by the undersigned, thereunto duly authorized.
BlackRock Allocation Target Shares
By: /s/ John M. Perlowski
John M. Perlowski
Chief Executive Officer (principal executive officer) of
BlackRock Allocation Target Shares
Date: November 21, 2024
Pursuant to the requirements of the Securities Exchange Act of 1934 and the Investment Company Act of 1940, this report has been signed below by the following persons on behalf of the registrant and in the capacities and on the dates indicated.
By: /s/ John M. Perlowski
John M. Perlowski
Chief Executive Officer (principal executive officer) of
BlackRock Allocation Target Shares
Date: November 21, 2024
By: /s/ Trent Walker
Trent Walker
Chief Financial Officer (principal financial officer) of
BlackRock Allocation Target Shares
Date: November 21, 2024