Results of Operations
In the three months ended March 31, 2018, an additional 23,100,000 Shares (231 Baskets) were created in exchange for 2,191,366 ounces of gold, 19,900,000 Shares (199 Baskets) were redeemed in exchange for 1,887,968 ounces of gold, and 26,183 ounces of gold were sold to pay expenses.
At March 31, 2018, the Custodian held 27,203,556 ounces of gold on behalf of the Trust in its vault, 100% of which is allocated gold in the form of London Good Delivery gold bars with a market value of $36,013,427,615 (cost — $34,157,979,092). Subcustodians did not hold any gold in their vaults on behalf of the Trust.
At September 30, 2017, the Custodian held 27,799,256 ounces of gold on behalf of the Trust, 100% of which is allocated gold in the form of London Good Delivery gold bars with a market value of $35,669,225,374 (cost —$34,720,945,067). Subcustodians did not hold any gold in their vaults on behalf of the Trust.
On March 1, 2018, Inspectorate International Limited, or Inspectorate, concluded the annual random sample count of the Trust’s gold bullion held by the Custodian. The sample count was based on the Trust’s inventory of gold as of February 9, 2018. Inspectorate reported that there were no anomalies identified within the Trust’s gold holdings as of such date. The results can be found on www.spdrgoldshares.com.
Cash Resources and Liquidity
At March 31, 2018, the Trust did not have any cash balances. When selling gold to pay expenses, the Trustee endeavors to sell the exact amount of gold needed to pay expenses in order to minimize the Trust’s holdings of assets other than gold. As a consequence, we expect that the Trust will not record any net cash flow from its operations and that its cash balance will be zero at the end of each reporting period.
Analysis of Movements in the Price of Gold
As movements in the price of gold are expected to directly affect the price of the Trust’s Shares, investors should understand what the recent movements in the price of gold have been. Investors, however, should also be aware that past movements in the gold price are not indicators of future movements. This section identifies recent trends in the movements of the gold price.
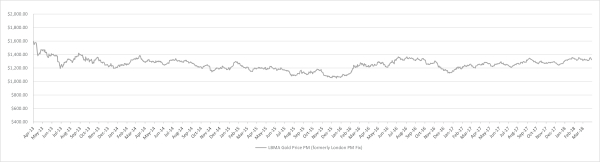
The following chart provides historical background on the price of gold. The chart illustrates movements in the price of gold in US dollars per ounce over the period from April 1, 2013 to March 31, 2018, and is based on the LBMA Gold Price PM when available since March 20, 2015 and previously the London PM Fix.
Daily gold price - April 1, 2013 to March 31, 2018
14