Filed Pursuant To Rule 433
Registration No. 333-217785
July 19, 2019

SPDR® Gold Shares ETF Capital Markets Perspective
INVESTMENT PROFESSIONAL USE ONLY
GLD
SPDR Gold Shares (GLD®) was the firstUS-listed gold bullion-backed exchange traded fund (ETF). Other products have launched since GLD’s 2004 debut, so for institutional investors, understanding that there are many factors to consider when choosing a gold ETF is of paramount importance.
Liquidity
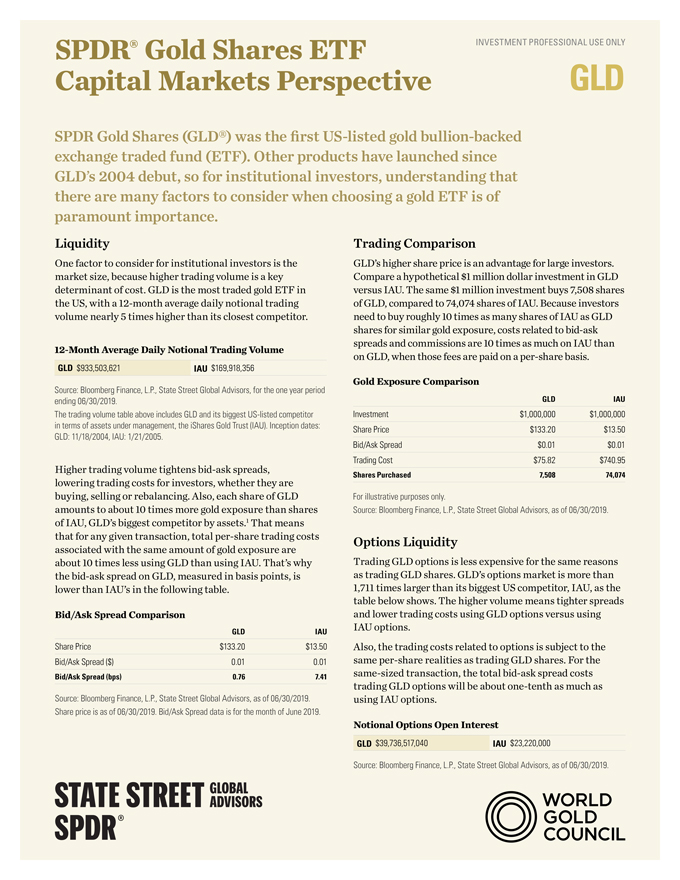
One factor to consider for institutional investors is the market size, because higher trading volume is a key determinant of cost. GLD is the most traded gold ETF in the US, with a12-month average daily notional trading volume nearly 5 times higher than its closest competitor.
12-Month Average Daily Notional Trading Volume
GLD $933,503,621 IAU $169,918,356
Source: Bloomberg Finance, L.P., State Street Global Advisors, for the one year period ending 06/30/2019.
The trading volume table above includes GLD and its biggestUS-listed competitor in terms of assets under management, the iShares Gold Trust (IAU). Inception dates: GLD: 11/18/2004, IAU: 1/21/2005.
Higher trading volume tightensbid-ask spreads, lowering trading costs for investors, whether they are buying, selling or rebalancing. Also, each share of GLD amounts to about 10 times more gold exposure than shares of IAU, GLD’s biggest competitor by assets.1 That means that for any given transaction, totalper-share trading costs associated with the same amount of gold exposure are about 10 times less using GLD than using IAU. That’s why thebid-ask spread on GLD, measured in basis points, is lower than IAU’s in the following table.
Bid/Ask Spread Comparison
GLD IAU
Share Price $133.20 $13.50
Bid/Ask Spread ($) 0.01 0.01
Bid/Ask Spread (bps) 0.76 7.41
Source: Bloomberg Finance, L.P., State Street Global Advisors, as of 06/30/2019. Share price is as of 06/30/2019. Bid/Ask Spread data is for the month of June 2019.
Trading Comparison
GLD’s higher share price is an advantage for large investors. Compare a hypothetical $1 million dollar investment in GLD versus IAU. The same $1 million investment buys 7,508 shares of GLD, compared to 74,074 shares of IAU. Because investors need to buy roughly 10 times as many shares of IAU as GLD shares for similar gold exposure, costs related tobid-ask spreads and commissions are 10 times as much on IAU than on GLD, when those fees are paid on aper-share basis.
Gold Exposure Comparison
GLD IAU
Investment $1,000,000 $1,000,000
Share Price $133.20 $13.50
Bid/Ask Spread $0.01 $0.01
Trading Cost $75.82 $740.95
Shares Purchased 7,508 74,074
For illustrative purposes only.
Source: Bloomberg Finance, L.P., State Street Global Advisors, as of 06/30/2019.
Options Liquidity
Trading GLD options is less expensive for the same reasons as trading GLD shares. GLD’s options market is more than 1,711 times larger than its biggest US competitor, IAU, as the table below shows. The higher volume means tighter spreads and lower trading costs using GLD options versus using IAU options.
Also, the trading costs related to options is subject to the sameper-share realities as trading GLD shares. For thesame-sized transaction, the totalbid-ask spread costs trading GLD options will be aboutone-tenth as much as using IAU options.
Notional Options Open Interest
GLD $39,736,517,040 IAU $23,220,000
Source: Bloomberg Finance, L.P., State Street Global Advisors, as of 06/30/2019.

