Filed Pursuant To Rule 433
RegistrationNo. 333-217785
July 22, 2019
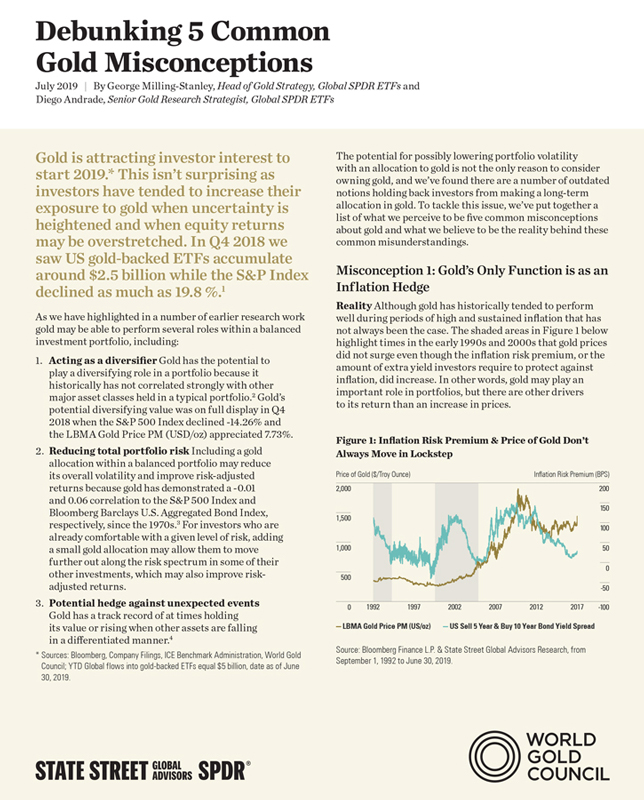
Debunking 5 Common Gold Misconceptions July 2019 By George Milling-Stanley, Head of Gold Strategy, Global SPDR ETFs andDiego Andrade, Senior Gold Research Strategist, Global SPDR ETFs Gold is attracting investor interest to start 2019.* This isn’t surprising as investors have tended to increase their exposure to gold when uncertainty is heightened and when equity returns may be overstretched. In Q4 2018 we saw US gold-backed ETFs accumulate around $2.5 billion while the S&P Index declined as much as 19.8 %.1 As we have highlighted in a number of earlier research work gold may be able to perform several roles within a balanced investment portfolio, including: 1. Acting as a diversifier Gold has the potential to play a diversifying role in a portfolio because it historically has not correlated strongly with other major asset classes held in a typical portfolio.2 Gold’s potential diversifying value was on full display in Q4 2018 when the S&P 500 Index declined-14.26% and the LBMA Gold Price PM (USD/oz) appreciated 7.73%. 2. Reducing total portfolio risk Including a gold allocation within a balanced portfolio may reduce its overall volatility and improve risk-adjusted returns because gold has demonstrated a-0.01 and 0.06 correlation to the S&P 500 Index and Bloomberg Barclays U.S. Aggregated Bond Index, respectively, since the 1970s.3 For investors who are already comfortable with a given level of risk, adding a small gold allocation may allow them to move further out along the risk spectrum in some of their other investments, which may also improve risk-adjusted returns. 3. Potential hedge against unexpected events Gold has a track record of at times holding its value or rising when other assets are falling in a differentiated manner.4 * Sources: Bloomberg, Company Filings, ICE Benchmark Administration, World Gold Council; YTD Global flows into gold-backed ETFs equal $5 billion, date as of June 30, 2019. The potential for possibly lowering portfolio volatility with an allocation to gold is not the only reason to consider owning gold, and we’ve found there are a number of outdated notions holding back investors from making a long-term allocation in gold. To tackle this issue, we’ve put together a list of what we perceive to be five common misconceptions about gold and what we believe to be the reality behind these common misunderstandings. Misconception 1: Gold’s Only Function is as an Inflation Hedge Reality Although gold has historically tended to perform well during periods of high and sustained inflation that has not always been the case. The shaded areas in Figure 1 below highlight times in the early 1990s and 2000s that gold prices did not surge even though the inflation risk premium, or the amount of extra yield investors require to protect against inflation, did increase. In other words, gold may play an important role in portfolios, but there are other drivers to its return than an increase in prices. Figure 1: Inflation Risk Premium & Price of Gold Don’t Always Move in Lockstep — LBMA Gold Price PM (US/oz) — US Sell 5 Year & Buy 10 Year Bond Yield Spread Source: Bloomberg Finance L.P. & State Street Global Advisors Research, from September 1, 1992 to June 30, 2019.
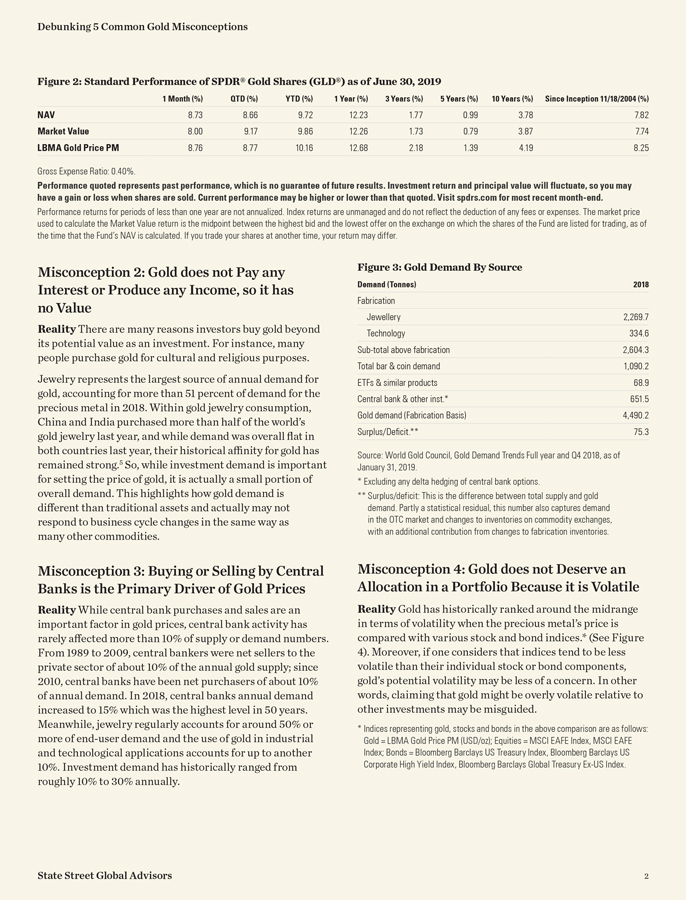
Debunking 5 Common Gold Misconceptions Figure 2: Standard Performance of SPDR® Gold Shares (GLD®) as of June 30, 2019 1 Month (%) QTD (%) YTD (%) 1 Year (%) 3 Years (%) 5 Years (%) 10 Years (%) Since Inception 11/18/2004 (%) NAV 8.73 8.66 9.72 12.23 1.77 0.99 3.78 7.82 Market Value 8.00 9.17 9.86 12.26 1.73 0.79 3.87 7.74 LBMA Gold Price PM 8.76 8.77 10.16 12.68 2.18 1.39 4.19 8.25 Gross Expense Ratio: 0.40%. Performance quoted represents past performance, which is no guarantee of future results. Investment return and principal value will fluctuate, so you may have a gain or loss when shares are sold. Current performance may be higher or lower than that quoted. Visit spdrs.com for most recentmonth-end. Performance returns for periods of less than one year are not annualized. Index returns are unmanaged and do not reflect the deduction of any fees or expenses. The market price used to calculate the Market Value return is the midpoint between the highest bid and the lowest offer on the exchange on which the shares of the Fund are listed for trading, as of the time that the Fund’s NAV is calculated. If you trade your shares at another time, your return may differ. Misconception 2: Gold does not Pay any Interest or Produce any Income, so it has no Value Reality There are many reasons investors buy gold beyond its potential value as an investment. For instance, many people purchase gold for cultural and religious purposes. Jewelry represents the largest source of annual demand for gold, accounting for more than 51 percent of demand for the precious metal in 2018. Within gold jewelry consumption, China and India purchased more than half of the world’s gold jewelry last year, and while demand was overall flat in both countries last year, their historical affinity for gold has remained strong.5 So, while investment demand is important for setting the price of gold, it is actually a small portion of overall demand. This highlights how gold demand is different than traditional assets and actually may not respond to business cycle changes in the same way as many other commodities. Misconception 3: Buying or Selling by Central Banks is the Primary Driver of Gold Prices Reality While central bank purchases and sales are an important factor in gold prices, central bank activity has rarely affected more than 10% of supply or demand numbers. From 1989 to 2009, central bankers were net sellers to the private sector of about 10% of the annual gold supply; since 2010, central banks have been net purchasers of about 10% of annual demand. In 2018, central banks annual demand increased to 15% which was the highest level in 50 years. Meanwhile, jewelry regularly accounts for around 50% or more ofend-user demand and the use of gold in industrial and technological applications accounts for up to another 10%. Investment demand has historically ranged from roughly 10% to 30% annually. Figure 3: Gold Demand By Source Demand (Tonnes) 2018 Fabrication Jewellery 2,269.7 Technology 334.6Sub-total above fabrication 2,604.3 Total bar & coin demand 1,090.2 ETFs & similar products 68.9 Central bank & other inst.* 651.5 Gold demand (Fabrication Basis) 4,490.2 Surplus/Deficit.** 75.3 Source: World Gold Council, Gold Demand Trends Full year and Q4 2018, as of January 31, 2019. * Excluding any delta hedging of central bank options. ** Surplus/deficit: This is the difference between total supply and gold demand. Partly a statistical residual, this number also captures demand in the OTC market and changes to inventories on commodity exchanges, with an additional contribution from changes to fabrication inventories. Misconception 4: Gold does not Deserve an Allocation in a Portfolio Because it is Volatile Reality Gold has historically ranked around the midrange in terms of volatility when the precious metal’s price is compared with various stock and bond indices.* (See Figure 4). Moreover, if one considers that indices tend to be less volatile than their individual stock or bond components, gold’s potential volatility may be less of a concern. In other words, claiming that gold might be overly volatile relative to other investments may be misguided. * Indices representing gold, stocks and bonds in the above comparison are as follows: Gold = LBMA Gold Price PM (USD/oz); Equities = MSCI EAFE Index, MSCI EAFE Index; Bonds = Bloomberg Barclays US Treasury Index, Bloomberg Barclays US Corporate High Yield Index, Bloomberg Barclays Global TreasuryEx-US Index.
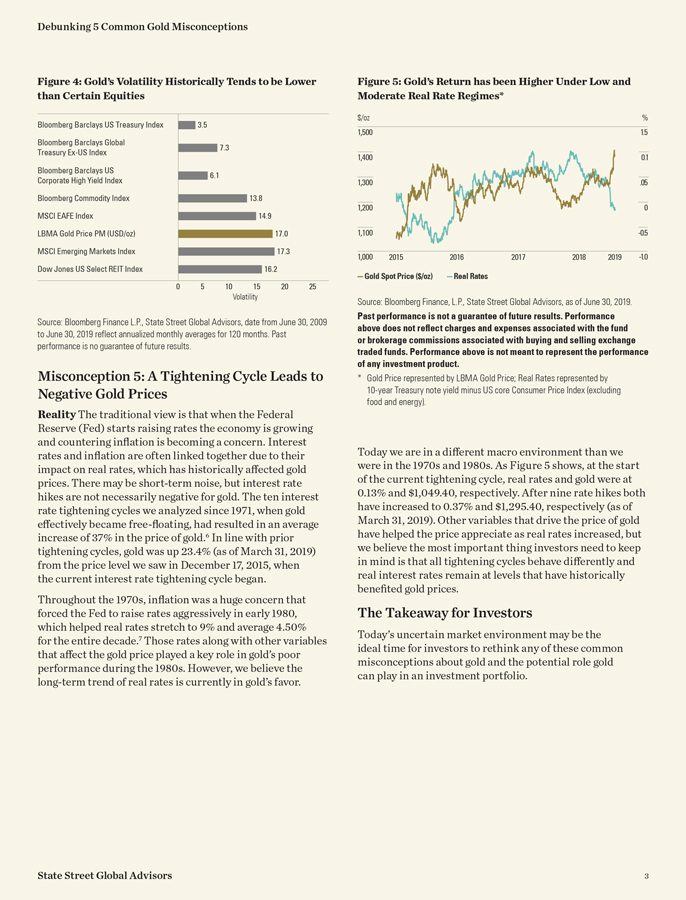
Debunking 5 Common Gold Misconceptions Figure 4: Gold’s Volatility Historically Tends to be Lower than Certain Equities Bloomberg Barclays US Treasury Index 3.5 Bloomberg Barclays Global 7 3 Treasury Ex-US Index Bloomberg Barclays US 6 1 Corporate High Yield Index ‘ Bloomberg Commodity Index 138 MSCI EAFE Index 14.9 LBMA Gold Price PM (USD/oz) 17.0 MSCI Emerging Markets Index 17.3 Dow Jones US Select REIT Index 16.2 Figure 5: Gold’s Return has been Higher Under Low and Moderate Real Rate Regimes* $/oz % 1,500 1.5 1,400 0.1 1,100 -0.5 1,000 2015 2016 2017 2018 2019 -1.0 — — Real Rates 0 5 10 15 20 25 Volatility Source: Bloomberg Finance L.P., State Street Global Advisors, date from June 30, 2009 to June 30, 2019 reflect annualized monthly averages for 120 months. Past performance is no guarantee of future results.
Misconception 5: A Tightening Cycle Leads to Negative Gold Prices Reality The traditional view is that when the Federal Reserve (Fed) starts raising rates the economy is growing and countering inflation is becoming a concern. Interest rates and inflation are often linked together due to their impact on real rates, which has historically affected gold prices. There may be short-term noise, but interest rate hikes are not necessarily negative for gold. The ten interest rate tightening cycles we analyzed since 1971, when gold effectively became free-floating, had resulted in an average increase of 37% in the price of gold.6 In line with prior tightening cycles, gold was up 23.4% (as of March 31, 2019) from the price level we saw in December 17, 2015, when the current interest rate tightening cycle began. Throughout the 1970s, inflation was a huge concern that forced the Fed to raise rates aggressively in early 1980, which helped real rates stretch to 9% and average 4.50% for the entire decade.7 Those rates along with other variables that affect the gold price played a key role in gold’s poor performance during the 1980s. However, we believe the long-term trend of real rates is currently in gold’s favor.
Source: Bloomberg Finance, L.P., State Street Global Advisors, as of June 30, 2019. Past performance is not a guarantee of future results. Performance above does not reflect charges and expenses associated with the fund or brokerage commissions associated with buying and selling exchange traded funds. Performance above is not meant to represent the performance of any investment product.
* Gold Price represented by LBMA Gold Price; Real Rates represented by 10-year Treasury note yield minus US core Consumer Price Index (excluding food and energy).
Today we are in a different macro environment than we were in the 1970s and 1980s. As Figure 5 shows, at the start of the current tightening cycle, real rates and gold were at 0.13% and $1,049.40, respectively. After nine rate hikes both have increased to 0.37% and $1,295.40, respectively (as of March 31, 2019). Other variables that drive the price of gold have helped the price appreciate as real rates increased, but we believe the most important thing investors need to keep in mind is that all tightening cycles behave differently and real interest rates remain at levels that have historically benefited gold prices.
The Takeaway for Investors
Today’s uncertain market environment may be the ideal time for investors to rethink any of these common misconceptions about gold and the potential role gold can play in an investment portfolio.

1 Source: Bloomberg Financial L.P. and State Street Global Advisors, date as of December 31, 2018. 2 Since 2000, the correlation of gold to stocks, bonds and other commodities was-0.01, 0.29, and 0.44, respectively. Source: Bloomberg Financial L.P. & State Street Global Advisors, date as of 6/30/2019. Computed using monthly return data from January 2000 to March 31, 2019. Correlation measures the degree to which the deviations of one variable from its mean are related to those of a different variable from its respective mean. Stocks represented by S&P 500 Index; Bonds represented by the Bloomberg Barclays U.S. Aggregate Index; Commodities represented by Bloomberg Commodity Index. Index returns reflect all items of income, gain and loss and the reinvestment of dividends and other income. 3 Bloomberg Finance L.P. & State Street Global Advisors; S&P 500 monthly correlation is from 8/31/1971 to 6/30/2019 and Bloomberg Barclays U.S. Aggregate Bond Index monthly correlation is from 3/31/1976 to 6/30/2019. 4 Source: Bloomberg Finance L.P., State Street Global Advisors, as of December 31, 2018. Notes:Dot-Com Meltdown: 2/29/2000–3/30/2001 LBMA Gold Price PM (USD/oz) returned-12.2%, MSCI AC World TR returned-20.6% and Bloomberg Barclays US Aggregated Bond Index TR returned 14.0% ; September 11 Terrorist Attacks: 8/31/2001–9/28/2001 LBMA Gold Price PM (USD/oz) returned 7.4%, MSCI AC World TR returned-9.1% and Bloomberg Barclays US Aggregated Bond Index TR returned 1.2%; 2002 Recession: 2/28/2002–8/30/2002 LBMA Gold Price PM (USD/oz) returned 5.4%, MSCI AC World TR returned-12.2% and Bloomberg Barclays US Aggregated Bond Index TR returned 4.9%; Global Financial Crisis: 11/30/2007–3/31/2009 LBMA Gold Price PM (USD/oz) returned 17.0%, MSCI AC World TR returned-48.6% and Bloomberg Barclays US Aggregated Bond Index TR returned 5.7%; Sovereign Debt Crisis I: 4/30/2010–8/31/2010 LBMA Gold Price PM (USD/oz) returned 5.7%, MSCI AC World TR returned-8.3% and Bloomberg Barclays US Aggregated Bond Index TR returned 4.8%; Sovereign Debt Crisis II: 2/28/2011–10/31/2011 LBMA Gold Price PM (USD/oz) returned 22.0%, MSCI AC World TR returned-8.1% and Bloomberg Barclays US Aggregated Bond Index TR returned 6.4%; Brexit: 6/22/2016–6/27/2016 LBMA Gold Price PM (USD/ oz) returned 4.7%, MSCI AC World TR returned-5.6% and Bloomberg Barclays US Aggregated Bond Index TR returned 0.91%. Past performance is not a guarantee of future results. Performance above does not reflect charges and expenses associated with the fund or brokerage commissions associated with buying and selling exchange traded funds. Performance above is not meant to represent the performance of any investment product. Performance data above derived from total return indices. 5 World Gold Council, “Gold Demand Trends Full Year 2018,” published 1/31/2019. 6 Source: Bloomberg Financial L.P. & State Street Global Advisors, as of December 31, 2018. 7 Source: Bloomberg Financial L.P. & State Street Global Advisors, as of Date December 31, 2018. Learn More For more information, please visit spdrs.com/gld. Glossary Bloomberg Barclays Global Treasuryex-U.S. Index A benchmark designed to track the fixed-rate local currency sovereign debt issued by investment-grade countries outside the US. Bonds must have a remaining maturity of one year or more. Bloomberg Barclays U.S. Corporate High Yield Bond Index The Barclays U.S. High Yield Index covers the universe of fixed rate,non-investment grade debt. Eurobonds and debt issues from countries designated as emerging markets (sovereign rating of Baa1/BBB+/BBB+ and below using the middle of Moody’s, S&P, and Fitch) are excluded, but Canadian and global bonds (SEC registered) of issuers innon-EMG countries are included. The index includes both corporate andnon-corporate sectors. Bloomberg Barclays U.S. Aggregate Bond Index A benchmark that provides a measure of the performance of the US dollar denominated investment grade bond market, which includes investment grade government bonds, investment grade corporate bonds, mortgage pass through securities, commercial mortgage backed securities and asset backed securities that are publicly for sale in the US. Bloomberg Barclays U.S. Treasury Index US dollar-denominated, fixed-rate, nominal debt issued by the US Treasury. Treasury bills are excluded by the maturity constraint, but are part of a separate Short Treasury Index. Bloomberg Commodity Index A broadly diversified commodity price index distributed by Bloomberg Indexes that tracks 22 commodity futures and seven sectors. No one commodity can compose less than 2 percent or more than 15 percent of the index, and no sector can represent more than 33 percent of the index. Consumer Prices (CPI) Consumer Prices (CPI) are a measure of prices paid by consumers for a market basket of consumer goods and services. The yearly (or monthly) growth rates represent the inflation rate. Dow Jones U.S. Select REIT Index A benchmark of US REITs and REIT-like securities that screens for market capitalization, liquidity and percentage of revenue derived from ownership and operation of real estate securities. It is float market cap weighted and quoted in dollars. LBMA Gold Price The LBMA Gold Price is determined twice each business day (10:30 a.m. and 3:00 p.m. London time) by the participants in a physically settled, electronic and tradable auction administered by the IBA using a bidding process that determines the price of gold by matching buy and sell orders submitted by the participants for the applicable auction time. MSCI EAFE Index An equities benchmark that captures large- andmid-cap representation across developed market countries around the world, excluding the US and Canada. MSCI Emerging Markets Index The MSCI Emerging Markets Index captures large andmid-cap representation across 23 emerging markets countries. With 834 constituents, the index covers approximately 85% of the free float-adjusted market capitalization in each country. Standard Deviation Measures the historical dispersion of a security, fund or index around an average. Investors use standard deviation to measure expected risk or volatility, and a higher standard deviation means the security has tended to show higher volatility or price swings in the past.
ssga.com | spdrs.com Important risk information The views expressed in this material are the views of George Milling-Stanley and Diego Andrade through 06/30/2019 and are subject to change based on the market and other conditions. Investing involves risk, and you could lose money on an investment in SPDR® Gold Trust (“GLD®”). ETFs trade like stocks, are subject to investment risk, fluctuate in market value and may trade at prices above or below the ETFs’ net asset value. Brokerage commissions and ETF expenses will reduce returns. Commodities and commodity-index linked securities may be affected by changes in overall market movements, changes in interest rates, and other factors such as weather, disease, embargoes, or political and regulatory developments, as well as trading activity of speculators and arbitrageurs in the underlying commodities. Frequent trading of ETFs could significantly increase commissions and other costs such that they may offset any savings from low fees or costs. Diversification does not ensure a profit or guarantee against loss. Investing in commodities entails significant risk and is not appropriate for all investors. Important Information Relating to SPDR® Gold Trust (“GLD®”): The SPDR Gold Trust (“GLD”) has filed a registration statement (including a prospectus) with the Securities and Exchange Commission (“SEC”) for the offering to which this communication relates. Before you invest, you should read the prospectus in that registration statement and other documents GLD has filed with the SEC for more complete information about GLD and this offering. Please see the GLD prospectus for more detailed discussion of the risks of investing in GLD shares. The GLD prospectus is available by clicking here. You may get these documents for free by visiting EDGAR on the SEC website at sec.gov or by visiting spdrgoldshares.com. Alternatively, the Trust or any authorized participant will arrange to send you the prospectus if you request it by calling 866.320.4053. GLD is not an investment company registered under the Investment Company Act of 1940 (the “1940 Act”) and is not subject to regulation under the Commodity Exchange Act of 1936 (the “CEA”). As a result, shareholders of the Trust do not have the protections associated with ownership of shares in an investment company registered under the 1940 Act or the protections afforded by the CEA. GLD shares trade like stocks, are subject to investment risk and will fluctuate in market value. The value of GLD shares relates directly to the value of the gold held by GLD (less its expenses), and fluctuations in the price of gold could materially and adversely affect an investment in the shares. The price received upon the sale of the shares, which trade at market price, may be more or less than the value of the gold represented by them. GLD does not generate any income, and as GLD regularly sells gold to pay for its ongoing expenses, the amount of gold represented by each Share will decline over time to that extent. The World Gold Council name and logo are a registered trademark and used with the permission of the World Gold Council pursuant to a license agreement. The World Gold Council is not responsible for the content of, and is not liable for the use of or reliance on, this material. World Gold Council is an affiliate of GLD’s sponsor. GLD® is a registered trademark of World Gold Trust Services, LLC used with the permission of World Gold Trust Services, LLC. Standard & Poor’s®, S&P® and SPDR® are registered trademarks of Standard & Poor’s Financial Services LLC, a division of S&P Global (S&P); Dow Jones is a registered trademark of Dow Jones Trademark Holdings LLC (Dow Jones); and these trademarks have been licensed for use by S&P Dow Jones Indices LLC (SPDJI) and sublicensed for certain purposes by State Street Corporation. State Street Corporation’s financial products are not sponsored, endorsed, sold or promoted by SPDJI, Dow Jones, S&P, their respective affiliates and third party licensors and none of such parties makes any representation regarding the advisability of investing in such product(s) nor do they have any liability in relation thereto. For more information, please contact the Marketing Agent for GLD: State Street Global Advisors Funds Distributors, LLC, One Iron Street, Boston, MA, 02210; T: +1 866 320 4053 spdrgoldshares.com. © 2019 State Street Corporation. All Rights Reserved. State Street Global Advisors Funds Distributors, LLC, One Iron Street, Boston, MA 02210. © 2019 State Street Corporation. All Rights Reserved. State Street Global Advisors ID25058-2028663.7.1.AM.RTL 0719 Exp. Date: 09/30/2019
SPDR® GOLD TRUST has filed a registration statement (including a prospectus) with the SEC for the offering to which this communication relates. Before you invest, you should read the prospectus in that registration statement and other documents the issuer has filed with the SEC for more complete information about the Trust and this offering. You may get these documents for free by visiting EDGAR on the SEC Web site at www.sec.gov. Alternatively, the Trust or any Authorized Participant will arrange to send you the prospectus if you request it by calling toll free at1-866-320-4053 or contacting State Street Global Advisors Funds Distributors, LLC, One Lincoln Street, Attn: SPDR® Gold Shares, 30th Floor, Boston, MA 02111.