| UNITED STATES | |
| SECURITIES AND EXCHANGE COMMISSION | |
| Washington, D.C. 20549 | |
FORM N-CSR
CERTIFIED SHAREHOLDER REPORT OF REGISTERED
MANAGEMENT INVESTMENT COMPANIES
Investment Company Act file number | 811-21339 |
|
MORGAN STANLEY INSTITUTIONAL LIQUIDITY FUNDS |
(Exact name of registrant as specified in charter) |
|
1221 AVENUE OF THE AMERICAS 22ND FLOOR NEW YORK, NY | | 10020 |
(Address of principal executive offices) | | (Zip code) |
|
RONALD E. ROBISON
1221 AVENUE OF THE AMERICAS 33RD FLOOR NEW YORK, NY 10020 |
(Name and address of agent for service) |
|
Registrant’s telephone number, including area code: | 1888 378-1630 | |
|
Date of fiscal year end: | 10/31 | |
|
Date of reporting period: | 4/30/05 | |
| | | | | | | | |
Form N-CSR is to be used by management investment companies to file reports with the Commission not later than 10 days after the transmission to stockholders of any report that is required to be transmitted to stockholders under Rule 30e-1 under the Investment Company Act of 1940 (17 CFR 270.30e-1). The Commission may use the information provided on Form N-CSR in its regulatory, disclosure review, inspection, and policymaking roles.
A registrant is required to disclose the information specified by Form N-CSR, and the Commission will make this information public. A registrant is not required to respond to the collection of information contained in Form N-CSR unless the Form displays a currently valid Office of Management and Budget (“OMB”) control number. Please direct comments concerning the accuracy of the information collection burden estimate and any suggestions for reducing the burden to Secretary, Securities and Exchange Commission, 450 Fifth Street, NW, Washington, DC 20549-0609. The OMB has reviewed this collection of information under the clearance requirements of 44 U.S.C. Section 3507.
Item 1. Reports to Shareholders.
The Fund’s semi-annual report transmitted to shareholders pursuant to Rule 30e-1 under the Investment Company Act of 1940 is as follows:

| 2005 Semi-Annual Report |
April 30, 2005 |
Morgan Stanley Institutional Liquidity Funds
Money Market Portfolio
Prime Portfolio
Government Portfolio
Treasury Portfolio
Tax-Exempt Portfolio
| 2005 Semi-Annual Report |
| |
| April 30, 2005 |
Table of Contents | |
| 3 |
Shareholder’s Letter | 4 |
Performance Summary | 5 |
Expense Examples | |
Portfolio of Investments | |
Money Market Portfolio | 8 |
Prime Portfolio | 11 |
Government Portfolio | 14 |
Treasury Portfolio | 16 |
Tax-Exempt Portfolio | 17 |
| |
Statements of Assets and Liabilities | 21 |
Statements of Operations | 23 |
Statements of Changes in Net Assets | 24 |
Financial Highlights | 28 |
Notes to Financial Statements | 43 |
Investment Advisory Agreement Approval | 46 |
Trustee and Officer Information | 48 |
This report is authorized for distribution only when preceded or accompanied by prospectuses of the Morgan Stanley Institutional Liquidity Funds. To receive a prospectus and/or SAI, which contains more complete information such as investment objectives, charges, expenses, policies for voting proxies, risk considerations, and describes in detail each of the Portfolio’s investment policies to the prospective investor, please call 1 (888) 378-1630. Please read the prospectus carefully before you invest or send money. Additionally, you can access portfolio information including performance, yields, characteristics, and investment team commentary through Morgan Stanley Investment Management’s website: www.morganstanley.com/im.
1
(This page has been left blank intentionally.)
2
| 2005 Semi-Annual Report |
| |
| April 30, 2005 (unaudited) |
Shareholder’s Letter
Dear Shareholders:
Overview
We are pleased to present the Morgan Stanley Institutional Liquidity Funds (“MSILF”) Semi-Annual Report for the period ended April 30, 2005. The MSILF currently offers five portfolios (Money Market, Prime, Government, Treasury and Tax-Exempt), which together are designed to provide flexible cash management options. MSILF’s portfolios provide investors with a means to help them meet specific cash investment needs, whether they need a rated fund, capital preservation, or tax-efficient returns.
Sincerely, |
|
|
/s/ Ronald E. Robison | |
Ronald E. Robison |
Executive Vice President — |
Principal Executive Officer |
May 2005 |
3
2005 Semi-Annual Report |
| |
April 30, 2005 (unaudited) |
Performance Summary
The seven-day current and seven-day effective yields (which assume an annualization of the current yield with all dividends reinvested) as of April 30, 2005, were as follows:
| | Institutional Class | | Service Class | | Investor Class | | Administrative Class | | Advisory Class | | Participant Class | |
| | 7-day
Current
Yield | | 7-day
Effective
Yield | | 7-day
Current
Yield | | 7-day
Effective
Yield | | 7-day
Current
Yield | | 7-day
Effective
Yield | | 7-day
Current
Yield | | 7-day
Effective
Yield | | 7-day
Current
Yield | | 7-day
Effective
Yield | | 7-day
Current
Yield | | 7-day
Effective
Yield | |
Portfolio: | | | | | | | | | | | | | | | | | | | | | | | | | |
Money Market | | 2.82 | % | 2.86 | % | 2.77 | % | 2.81 | % | 2.72 | % | 2.75 | % | 2.67 | % | 2.70 | % | 2.56 | % | 2.60 | % | 2.42 | % | 2.45 | % |
Prime | | 2.80 | % | 2.84 | % | 2.75 | % | 2.79 | % | 2.70 | % | 2.74 | % | 2.65 | % | 2.69 | % | 2.55 | % | 2.58 | % | 2.40 | % | 2.43 | % |
Government | | 2.85 | % | 2.89 | % | 2.80 | % | 2.84 | % | 2.75 | % | 2.79 | % | 2.70 | % | 2.74 | % | 2.60 | % | 2.64 | % | 2.45 | % | 2.48 | % |
Treasury | | 2.76 | % | 2.80 | % | 2.71 | % | 2.75 | % | 2.66 | % | 2.70 | % | 2.61 | % | 2.64 | % | 2.51 | % | 2.54 | % | 2.36 | % | 2.39 | % |
Tax-Exempt | | 2.74 | % | 2.78 | % | 2.69 | % | 2.72 | % | 2.64 | % | 2.67 | % | 2.59 | % | 2.62 | % | 2.49 | % | 2.52 | % | 2.34 | % | 2.37 | % |
Performance data quoted represent past performance, which is no guarantee of future results, and current performance may be lower or higher than the figures shown. Performance assumes that all dividends and distributions, if any, were reinvested. For the most recent month-end performance figures, please visit www.morganstanley.com/im. Investment return and principal value will fluctuate causing portfolio shares, when redeemed, to be worth more or less than their original cost. Total returns do not reflect the deduction of taxes that a shareholder would pay on portfolio distributions or the redemption of portfolio shares.
Investments in the Money Market, Prime, Government, Treasury and Tax-Exempt Portfolios (the “Portfolios”) are neither insured nor guaranteed by the Federal Deposit Insurance Corporation. Although the Portfolios seek to preserve the value of your investment at $1.00 per share, it is possible to lose money by investing in these Portfolios. Please read the MSILF’s prospectuses carefully before you invest or send money.
Yield quotation more closely reflect the current earnings of the Portfolios than the total return. As with all money market portfolios, yields will fluctuate as market conditions change and the seven-day yields are not necessarily indicative of future performance.
4
| 2005 Semi-Annual Report |
| |
| April 30, 2005 (unaudited) |
Expense Examples
Expense Examples
As a shareholder of the Portfolio, you incur ongoing costs, including management fees, shareholder administration plan fees (in the case of the Service, Investor, and Administrative Classes), service and shareholder administration plan fees (in the case of the Advisory Class); distribution and shareholder service plan fees (in the case of the Participant Class) and other Portfolio expenses. These examples are intended to help you understand your ongoing costs (in dollars) of investing in the Portfolio and to compare these costs with the ongoing costs of investing in other mutual funds.
The examples are based on an investment of $1,000 invested at the beginning of the six-month period ended April 30, 2005 and held for the entire six-month period.
Actual Expenses
The first line of the tables below provides information about actual account values and actual expenses. You may use the information in this line, together with the amount you invested, to estimate the expenses that you paid over the period. Simply divide your account value by $1,000 (for example, an $8,600 account value divided by $1,000 = 8.6), then multiply the result by the number in the first line under the heading entitled ‘‘Expenses Paid During Period’’ to estimate the expenses you paid on your account during this period.
Hypothetical Example for Comparison Purposes
The second line of the tables below provides information about hypothetical account values and hypothetical expenses based on the Portfolio’s actual expense ratio and an assumed rate of return of 5% per year before expenses, which is not the Portfolio’s actual return. The hypothetical account values and expenses may not be used to estimate the actual ending account balance or expenses you paid for the period. You may use this information to compare the ongoing costs of investing in the Portfolio and other funds. To do so, compare this 5% hypothetical example with the 5% hypothetical examples that appear in the shareholder reports of the other funds.
| | Beginning Account Value
November 1, 2004 | | Ending Account Value
April 30, 2005 | | Expenses Paid During Period*
November 1, 2004 — April 30, 2005 | |
| | | | | | | |
Money Market Portfolio | | | | | | | |
Institutional Class | | | | | | | |
Actual | | $ | 1,000.00 | | $ | 1,011.50 | | $ | 0.50 | |
Hypothetical (5% average annual return before expenses) | | 1,000.00 | | 1,024.30 | | 0.50 | |
Service Class | | | | | | | |
Actual | | 1,000.00 | | 1,011.30 | | 0.75 | |
Hypothetical (5% average annual return before expenses) | | 1,000.00 | | 1,024.05 | | 0.75 | |
Investor Class | | | | | | | |
Actual | | 1,000.00 | | 1,011.00 | | 1.00 | |
Hypothetical (5% average annual return before expenses) | | 1,000.00 | | 1,023.80 | | 1.00 | |
Administrative Class | | | | | | | |
Actual | | 1,000.00 | | 1,010.80 | | 1.25 | |
Hypothetical (5% average annual return before expenses) | | 1,000.00 | | 1,023.55 | | 1.25 | |
Advisory Class | | | | | | | |
Actual | | 1,000.00 | | 1,010.30 | | 1.74 | |
Hypothetical (5% average annual return before expenses) | | 1,000.00 | | 1,023.06 | | 1.76 | |
Participant Class | | | | | | | |
Actual | | 1,000.00 | | 1,009.50 | | 2.49 | |
Hypothetical (5% average annual return before expenses) | | 1,000.00 | | 1,022.32 | | 2.51 | |
| | | | | | | | | | |
* Expenses are equal to Institutional Class’, Service Class’, Investor Class’, Administrative Class’, Advisory Class’ and Participant Class’ annualized net expense ratios of 0.10%, 0.15%, 0.20%, 0.25%, 0.35% and 0.50%, respectively, multiplied by the average account value over the period, multiplied by 181/365 (to reflect the one-half year period).
Prime Portfolio | | | | | | | |
Institutional Class | | | | | | | |
Actual | | $ | 1,000.00 | | $ | 1,011.60 | | $ | 0.50 | |
Hypothetical (5% average annual return before expenses) | | 1,000.00 | | 1,024.30 | | 0.50 | |
Service Class | | | | | | | |
Actual | | 1,000.00 | | 1,011.40 | | 0.75 | |
Hypothetical (5% average annual return before expenses) | | 1,000.00 | | 1,024.05 | | 0.75 | |
Investor Class | | | | | | | |
Actual | | 1,000.00 | | 1,011.10 | | 1.00 | |
Hypothetical (5% average annual return before expenses) | | 1,000.00 | | 1,023.80 | | 1.00 | |
| | | | | | | | | | |
5
2005 Semi-Annual Report |
|
April 30, 2005 (unaudited) |
Expense Examples (cont’d)
| | Beginning Account Value
November 1, 2004 | | Ending Account Value
April 30, 2005 | | Expenses Paid During Period*
November 1, 2004 — April 30, 2005 | |
| | | | | | | |
Prime Portfolio (cont’d) | | | | | | | |
Administrative Class | | | | | | | |
Actual | | $ | 1,000.00 | | $ | 1,010.90 | | $ | 1.25 | |
Hypothetical (5% average annual return before expenses) | | 1,000.00 | | 1,023.55 | | 1.25 | |
Advisory Class | | | | | | | |
Actual | | 1,000.00 | | 1,010.40 | | 1.74 | |
Hypothetical (5% average annual return before expenses) | | 1,000.00 | | 1,023.06 | | 1.76 | |
Participant Class | | | | | | | |
Actual | | 1,000.00 | | 1,009.60 | | 2.49 | |
Hypothetical (5% average annual return before expenses) | | 1,000.00 | | 1,022.32 | | 2.51 | |
| | | | | | | | | | |
* Expenses are equal to Institutional Class’, Service Class’, Investor Class’, Administrative Class’, Advisory Class’ and Participant Class’ annualized net expense ratios of 0.10%, 0.15%, 0.20%, 0.25%, 0.35% and 0.50%, respectively, multiplied by the average account value over the period, multiplied by 181/365 (to reflect the one-half year period).
Government Portfolio | | | | | | | |
Institutional Class | | | | | | | |
Actual | | $ | 1,000.00 | | $ | 1,011.90 | | $ | 0.25 | |
Hypothetical (5% average annual return before expenses) | | 1,000.00 | | 1,024.55 | | 0.25 | |
Service Class | | | | | | | |
Actual | | 1,000.00 | | 1,011.60 | | 0.50 | |
Hypothetical (5% average annual return before expenses) | | 1,000.00 | | 1,024.30 | | 0.50 | |
Investor Class | | | | | | | |
Actual | | 1,000.00 | | 1,011.40 | | 0.75 | |
Hypothetical (5% average annual return before expenses) | | 1,000.00 | | 1,024.05 | | 0.75 | |
Administrative Class | | | | | | | |
Actual | | 1,000.00 | | 1,011.10 | | 1.00 | |
Hypothetical (5% average annual return before expenses) | | 1,000.00 | | 1,023.80 | | 1.00 | |
Advisory Class | | | | | | | |
Actual | | 1,000.00 | | 1,010.60 | | 1.50 | |
Hypothetical (5% average annual return before expenses) | | 1,000.00 | | 1,023.31 | | 1.51 | |
Participant Class | | | | | | | |
Actual | | 1,000.00 | | 1,009.80 | | 2.24 | |
Hypothetical (5% average annual return before expenses) | | 1,000.00 | | 1,022.56 | | 2.26 | |
| | | | | | | | | | |
* Expenses are equal to Institutional Class’, Service Class’, Investor Class’, Administrative Class’, Advisory Class’ and Participant Class’ annualized net expense ratios of 0.05%, 0.10%, 0.15%, 0.20%, 0.30% and 0.45%, respectively, multiplied by the average account value over the period, multiplied by 181/365 (to reflect the one-half year period).
Treasury Portfolio | | | | | | | |
Institutional Class | | | | | | | |
Actual | | $ | 1,000.00 | | $ | 1,011.10 | | $ | 0.25 | |
Hypothetical (5% average annual return before expenses) | | 1,000.00 | | 1,024.55 | | 0.25 | |
Service Class | | | | | | | |
Actual | | 1,000.00 | | 1,010.90 | | 0.50 | |
Hypothetical (5% average annual return before expenses) | | 1,000.00 | | 1,024.30 | | 0.50 | |
Investor Class | | | | | | | |
Actual | | 1,000.00 | | 1,010.60 | | 0.75 | |
Hypothetical (5% average annual return before expenses) | | 1,000.00 | | 1,024.05 | | 0.75 | |
Administrative Class | | | | | | | |
Actual | | 1,000.00 | | 1,010.40 | | 1.00 | |
Hypothetical (5% average annual return before expenses) | | 1,000.00 | | 1,023.80 | | 1.00 | |
Advisory Class | | | | | | | |
Actual | | 1,000.00 | | 1,009.90 | | 1.50 | |
Hypothetical (5% average annual return before expenses) | | 1,000.00 | | 1,023.31 | �� | 1.51 | |
Participant Class | | | | | | | |
Actual | | 1,000.00 | | 1,009.10 | | 2.24 | |
Hypothetical (5% average annual return before expenses) | | 1,000.00 | | 1,022.56 | | 2.26 | |
| | | | | | | | | | |
* Expenses are equal to Institutional Class’, Service Class’, Investor Class’, Administrative Class’, Advisory Class’ and Participant Class’ annualized net expense ratios of 0.05%, 0.10%, 0.15%, 0.20%, 0.30% and 0.45%, respectively, multiplied by the average account value over the period, multiplied by 181/365 (to reflect the one-half year period).
6
| 2005 Semi-Annual Report |
| |
| April 30, 2005 (unaudited) |
Expense Examples (cont’d)
| | Beginning Account Value
November 1, 2004 | | Ending Account Value
April 30, 2005 | | Expenses Paid During Period*
November 1, 2004 — April 30, 2005 | |
| | | | | | | |
Tax-Exempt Portfolio | | | | | | | |
Institutional Class | | | | | | | |
Actual | | $ | 1,000.00 | | $ | 1,009.10 | | $ | 0.40 | |
Hypothetical (5% average annual return before expenses) | | 1,000.00 | | 1,024.40 | | 0.40 | |
Service Class | | | | | | | |
Actual | | 1,000.00 | | 1,008.90 | | 0.65 | |
Hypothetical (5% average annual return before expenses) | | 1,000.00 | | 1,024.15 | | 0.65 | |
Investor Class | | | | | | | |
Actual | | 1,000.00 | | 1,008.60 | | 0.90 | |
Hypothetical (5% average annual return before expenses) | | 1,000.00 | | 1,023.90 | | 0.90 | |
Administrative Class | | | | | | | |
Actual | | 1,000.00 | | 1,008.40 | | 1.15 | |
Hypothetical (5% average annual return before expenses) | | 1,000.00 | | 1,023.65 | | 1.15 | |
Advisory Class | | | | | | | |
Actual | | 1,000.00 | | 1,007.90 | | 1.64 | |
Hypothetical (5% average annual return before expenses) | | 1,000.00 | | 1,023.16 | | 1.66 | |
Participant Class | | | | | | | |
Actual | | 1,000.00 | | 1,007.10 | | 2.39 | |
Hypothetical (5% average annual return before expenses) | | 1,000.00 | | 1,022.41 | | 2.41 | |
| | | | | | | | | | |
* Expenses are equal to Institutional Class’, Service Class’, Investor Class’, Administrative Class’, Advisory Class’ and Participant Class�� annualized net expense ratios of 0.08%, 0.13%, 0.18%, 0.23%, 0.33% and 0.48%, respectively, multiplied by the average account value over the period, multiplied by 181/365 (to reflect the one-half year period).
7
2005 Semi-Annual Report |
|
April 30, 2005 (unaudited) |
Portfolio of Investments
Money Market Portfolio
| | Face
Amount
(000) | | Value
(000) | |
Certificate of Deposit (23.6%) | | | | | |
International Banks (17.9%) | | | | | |
Calyon North America, Inc./New York | | | | | |
2.80%, 5/3/05 | | $ | 50,000 | | $ | 50,000 | |
2.95%, 8/23/05 | | (b)75,000 | | 74,990 | |
Credit Suisse First Boston | | | | | |
2.80%, 5/2/05 | | 50,000 | | 50,000 | |
Fortis Bank/New York | | | | | |
2.19%, 6/9/05 | | 25,000 | | 24,998 | |
Norinchukin Bank/New York | | | | | |
2.82%, 5/2/05 | | 15,000 | | 15,000 | |
2.86%, 5/2/05 | | 125,000 | | 125,000 | |
UBS AG | | | | | |
1.47%, 5/6/05 | | 25,000 | | 25,000 | |
2.80%, 5/2/05 | | 50,000 | | 50,000 | |
2.81%, 5/2/05 | | 50,000 | | 50,000 | |
Unicredito Italiano /New York | | | | | |
2.37%, 9/12/05 | | 29,500 | | 29,485 | |
3.03%, 12/28/05 | | (b)50,000 | | 49,989 | |
| | | | 544,462 | |
Major Banks (5.7%) | | | | | |
First Tennessee Bank NA | | | | | |
3.04%, 6/27/05 | | 50,000 | | 50,000 | |
Washington Mutual Bank FA | | | | | |
2.81%, 5/2/05 | | 125,000 | | 125,000 | |
| | | | 175,000 | |
Total Certificate of Deposit (Cost $719,462) | | | | 719,462 | |
Commercial Paper (46.4%) | | | | | |
Asset Backed — Automotive (4.1%) | | | | | |
DaimlerChrysler Revolving Auto Conduit LLC | | | | | |
3.01%, 6/20/05 | | 25,000 | | 24,896 | |
3.06%, 6/24/05 | | 50,256 | | 50,026 | |
Fcar Owner Trust | | | | | |
2.79%, 5/5/05 | | 50,000 | | 49,984 | |
| | | | 124,906 | |
Asset Backed — Consumer (4.2%) | | | | | |
Gemini Securitization Corp. | | | | | |
3.04%, 5/31/05 | | (a)25,000 | | 24,937 | |
Old Line Funding LLC | | | | | |
2.82%, 5/2/05 | | (a)10,048 | | 10,047 | |
Pfizer, Inc. | | | | | |
2.70%, 5/6/05 | | (a)24,910 | | 24,901 | |
Sheffield Receivables Corp. | | | | | |
2.80%, 5/2/05 | | (a)67,320 | | 67,315 | |
| | | | 127,200 | |
Asset Backed — Corporate (5.5%) | | | | | |
Amsterdam Funding Corp. | | | | | |
2.79%, 5/2/05 | | (a)40,000 | | 39,997 | |
Atlantis One Funding Corp. | | | | | |
2.90%, 8/1/05 | | $ | (a)43,125 | | $ | 42,808 | |
2.92%, 8/3/05 | | (a)10,919 | | 10,836 | |
2.99%, 6/20/05 | | (a)25,000 | | 24,897 | |
Eureka Securitization, Inc. | | | | | |
3.04%, 6/7/05 | | (a)33,900 | | 33,794 | |
Moat Funding LLC | | | | | |
2.46%, 5/4/05 | | (a)15,000 | | 14,997 | |
| | | | 167,329 | |
Asset Backed — Diversified (0.6%) | | | | | |
CRC Funding LLC | | | | | |
3.04%, 6/6/05 | | (a)20,000 | | 19,939 | |
Asset Backed — Mortgage (1.7%) | | | | | |
Sydney Capital Corp. | | | | | |
2.81%, 5/2/05 | | (a)25,100 | | 25,098 | |
3.05%, 6/30/05 | | (a)27,240 | | 27,102 | |
| | | | 52,200 | |
Asset Backed — Securities (7.5%) | | | | | |
CC USA, Inc. | | | | | |
3.21%, 9/16/05 | | (a)15,000 | | 14,817 | |
Clipper Receivables Co., LLC | | | | | |
2.80%, 5/2/05 | | 81,008 | | 81,002 | |
3.02%, 5/17/05 | | 35,000 | | 34,953 | |
Dorada Finance, Inc. | | | | | |
3.02%, 6/23/05 | | (a)20,000 | | 19,911 | |
Galaxy Funding, Inc. | | | | | |
3.05%, 6/28/05 | | (a)25,000 | | 24,878 | |
3.06%, 6/29/05 | | (a)25,000 | | 24,876 | |
Grampian Funding LLC | | | | | |
2.85%, 6/30/05 | | (a)30,000 | | 29,858 | |
| | | | 230,295 | |
Banking (1.8%) | | | | | |
HSBC USA, Inc. | | | | | |
2.62%, 5/3/05 | | 25,000 | | 24,996 | |
3.01%, 6/28/05 | | 30,000 | | 29,855 | |
| | | | 54,851 | |
Diversified Financial Services (2.6%) | | | | | |
General Electric Capital Corp. | | | | | |
2.89%, 9/9/05 | | 25,000 | | 24,740 | |
General Electric Co. | | | | | |
3.01%, 6/28/05 | | 25,000 | | 24,879 | |
Siemens Capital Co. LLC | | | | | |
2.79%, 5/3/05 | | 30,000 | | 29,995 | |
| | | | 79,614 | |
Finance — Automotive (1.3%) | | | | | |
Toyota Motor Credit Corp. | | | | | |
2.80%, 5/3/05 | | 40,000 | | 39,994 | |
Finance — Consumer (0.8%) | | | | | |
Pfizer, Inc. | | | | | |
2.90%, 8/30/05 | | (a)25,000 | | 24,759 | |
The accompanying notes are an integral part of the financial statements.
8
| 2005 Semi-Annual Report |
| |
| April 30, 2005 (unaudited) |
Portfolio of Investments (cont’d)
Money Market Portfolio
| | Face
Amount
(000) | | Value
(000) | |
Commercial Paper (cont’d) | | | | | |
Finance — Corporate (4.2%) | | | | | |
CIT Group, Inc. | | | | | |
2.83%, 5/4/05 | | $ | 50,000 | | $ | 49,988 | |
2.84%, 5/5/05 | | 25,000 | | 24,992 | |
3.03%, 6/27/05 | | 35,000 | | 34,833 | |
3.05%, 6/22/05 | | 17,301 | | 17,225 | |
| | | | 127,038 | |
Insurance (2.3%) | | | | | |
Irish Life & Permanent plc | | | | | |
3.02%, 6/28/05 | | (a)70,000 | | 69,661 | |
International Banks (9.8%) | | | | | |
Barclays U.S. Funding Corp. | | | | | |
2.55%, 6/3/05 | | 40,000 | | 39,907 | |
CBA Delaware Finance, Inc. | | | | | |
3.54%, 12/14/05 | | 12,325 | | 12,056 | |
KBC Financial Products International Ltd. | | | | | |
3.26%, 9/12/05 | | (a)27,500 | | 27,170 | |
Network Rail CP Finance plc | | | | | |
3.03%, 6/29/05 | | (a)70,000 | | 69,654 | |
San Paolo IMI U.S. Financial Co. | | | | | |
2.78%, 5/2/05 | | 90,000 | | 89,993 | |
Societe Generale North America, Inc. | | | | | |
3.04%, 6/1/05 | | 60,000 | | 59,844 | |
| | | | 298,624 | |
Total Commercial Paper (Cost $1,416,410) | | | | 1,416,410 | |
Corporate Notes (16.4%) | | | | | |
Asset Backed — Securities (2.0%) | | | | | |
CC USA, Inc. | | | | | |
1.82%, 6/17/05 | | (a)20,000 | | 19,993 | |
Dorada Finance, Inc. | | | | | |
2.95%, 8/15/05 | | (b)40,000 | | 40,001 | |
| | | | 59,994 | |
Finance — Automotive (0.7%) | | | | | |
Toyota Motor Credit Corp. | | | | | |
2.98%, 6/22/05 | | (b)20,000 | | 20,000 | |
Financial Services (1.3%) | | | | | |
Metropolitan Life Global Funding I | | | | | |
2.97%, 8/26/05 | | (a)(b)40,000 | | 40,013 | |
International Banks (3.4%) | | | | | |
HBOS Treasury Services plc | | | | | |
3.00%, 6/10/05 | | (a)(b)30,000 | | 30,002 | |
Royal Bank of Scotland plc | | | | | |
2.97%, 5/16/06 | | (a)(b)75,000 | | 75,000 | |
| | | | 105,002 | |
Investment Bankers/Brokers/Services (7.4%) | | | | | |
Bank of America Corp. | | | | | |
3.08%, 2/20/06 | | 75,000 | | 75,000 | |
Goldman Sachs Group, Inc. | | | | | |
2.99%, 9/12/05 - 11/10/05 | | 100,000 | | 100,000 | |
Merrill Lynch & Co., Inc. | | | | | |
3.22%, 10/3/05 | | $ | (b)50,000 | | $ | 50,028 | |
| | | | 225,028 | |
Major Banks (1.6%) | | | | | |
Bank of America NA/Charlotte, NC | | | | | |
2.82%, 12/9/05 | | (b)50,000 | | 50,000 | |
Total Corporate Notes (Cost $500,037) | | | | 500,037 | |
Repurchase Agreement (13.7%) | | | | | |
Goldman Sachs Group, Inc., 2.97%, dated 4/29/05, due 5/2/05, repurchase price $419,544: fully collateralized by U.S. government securities at the date of this Portfolio of Investments as follows: U.S. Treasury Strips, due 8/15/15 to 5/15/19; Federal Home Loan Mortgage Corp., Adjustable Rate Mortgage: 4.64%, due 12/1/34; Federal National Mortgage Association, Conventional Pools: 4.50% to 6.00%, due 5/1/17 to 10/1/34; Federal National Mortgage Association, Adjustable Rate Mortgage: 4.20%, due 7/1/34, valued at $427,829.
(Cost $419,440) | | 419,440 | | 419,440 | |
Total Investments (100.1%) (Cost $3,055,349) | | | | 3,055,349 | |
Liabilities in Excess of Other Assets (-0.1%) | | | | (2,661 | ) |
Net Assets (100%) | | | | $ | 3,052,688 | |
(a) 144A Security — Certain conditions for public sale may exist. Unless otherwise noted, these securities are deemed to be liquid.
(b) Variable/Floating Rate Security — Interest rate changes on these instruments are based on changes in a designated base rate. The rates shown are those in effect on April 30, 2005.
The accompanying notes are an integral part of the financial statements.
9
2005 Semi-Annual Report |
|
April 30, 2005 (unaudited) |
Portfolio of Investments (cont’d)
Money Market Portfolio
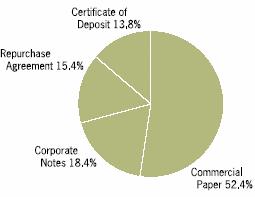
Graphic Presentation of Portfolio Holdings
The following graph depicts the investment type, as a percentage of total investments.
The accompanying notes are an integral part of the financial statements.
10
| 2005 Semi-Annual Report |
| |
| April 30, 2005 (unaudited) |
Portfolio of Investments
Prime Portfolio
| | Face
Amount
(000) | | Value
(000) | |
Certificate of Deposit (14.0%) | | | | | |
Banking (14.0%) | | | | | |
First Tennessee Bank NA | | | | | |
2.80%, 5/2/05 - 5/3/05 | | $ | 350,000 | | $ | 350,000 | |
Key Bank NA | | | | | |
2.98%, 5/2/05 | | 250,000 | | 250,000 | |
M&I Marshall & Isley Bank | | | | | |
3.02%, 6/27/05 | | 100,000 | | 99,998 | |
Regions Bank of Alabama | | | | | |
3.25%, 9/13/05 | | 150,000 | | 150,000 | |
SunTrust Bank | | | | | |
3.04%, 8/5/05 | | (b)130,000 | | 129,993 | |
Washington Mutual Bank FA | | | | | |
2.81%, 5/2/05 | | 250,000 | | 250,000 | |
Wells Fargo Bank NA | | | | | |
2.78%, 5/2/05 | | 350,000 | | 350,000 | |
3.03%, 6/28/05 | | 100,000 | | 99,997 | |
Total Certificate of Deposit (Cost $1,679,988) | | | | 1,679,988 | |
Commercial Paper (53.4%) | | | | | |
Asset Backed — Automotive (3.4%) | | | | | |
DaimlerChrysler Revolving Auto Conduit LLC | | | | | |
2.75%, 5/4/05 | | 92,044 | | 92,023 | |
2.80%, 5/2/05 | | 111,784 | | 111,775 | |
3.04%, 6/2/05 | | 68,448 | | 68,264 | |
3.07%, 6/24/05 | | 55,974 | | 55,717 | |
FCAR Owner Trust | | | | | |
3.01%, 6/15/05 | | 75,000 | | 74,719 | |
| | | | 402,498 | |
Asset Backed — Consumer (11.7%) | | | | | |
Barton Capital Corp. | | | | | |
2.78%, 5/2/05 - 5/3/05 | | (a)179,712 | | 179,685 | |
Delaware Funding Co. LLC | | | | | |
2.79%, 5/3/05 | | (a)50,000 | | 49,992 | |
Gemini Securitization Corp. | | | | | |
3.03%, 6/2/05 | | (a)84,000 | | 83,775 | |
3.04%, 6/1/05 | | (a)70,090 | | 69,907 | |
3.06%, 6/29/05 | | (a)175,000 | | 174,128 | |
Old Line Funding LLC | | | | | |
2.80%, 5/2/05 | | (a)90,243 | | 90,236 | |
3.00%, 5/4/05 | | (a)32,246 | | 32,238 | |
Pfizer, Inc. | | | | | |
2.70%, 5/6/05 | | (a)75,000 | | 74,972 | |
Ranger Funding Corp. | | | | | |
3.04%, 5/25/05 | | (a)105,334 | | 105,121 | |
Sheffield Receivables Corp. | | | | | |
2.80%, 5/2/05 - 5/3/05 | | (a)538,950 | | 538,892 | |
| | | | 1,398,946 | |
Asset Backed — Corporate (6.5%) | | | | | |
Atlantis One Funding Corp. | | | | | |
2.47%, 5/16/05 | | $ | (a)86,000 | | $ | 85,912 | |
2.85%, 7/18/05 | | (a)52,011 | | 51,692 | |
2.90%, 8/1/05 | | (a)135,000 | | 134,007 | |
2.92%, 8/3/05 | | (a)44,000 | | 43,667 | |
2.99%, 6/20/05 | | (a)50,887 | | 50,676 | |
CAFCO LLC | | | | | |
3.05%, 6/27/05 | | 50,000 | | 49,759 | |
Ciesco LLC | | | | | |
2.75%, 5/5/05 | | 75,000 | | 74,977 | |
Eureka Securitization, Inc. | | | | | |
2.72%, 5/4/05 | | (a)100,000 | | 99,977 | |
Moat Funding LLC | | | | | |
2.30%, 5/2/05 | | (a)75,000 | | 74,995 | |
2.46%, 5/4/05 | | (a)58,000 | | 57,988 | |
2.77%, 6/15/05 | | 50,000 | | 49,828 | |
| | | | 773,478 | |
Asset Backed — Diversified (2.0%) | | | | | |
CRC Funding LLC | | | | | |
2.75%, 6/8/05 | | (a)60,000 | | 59,808 | |
Falcon Asset Securitization Corp. | | | | | |
3.04%, 5/27/05 | | (a)100,441 | | 100,222 | |
Fairway Finance Corp. | | | | | |
2.79%, 5/2/05 | | (a)45,560 | | 45,556 | |
Yorktown Capital LLC | | | | | |
3.07%, 6/28/05 | | 36,187 | | 36,009 | |
| | | | 241,595 | |
Asset Backed — Mortgage (2.1%) | | | | | |
Mortgage Interest Networking Trust | | | | | |
2.80%, 5/2/05 | | 75,000 | | 74,994 | |
Sydney Capital Corp. | | | | | |
3.02%, 6/22/05 | | (a)27,260 | | 27,142 | |
3.03%, 6/15/05 | | (a)102,440 | | 102,053 | |
3.04%, 5/27/05 | | (a)43,440 | | 43,345 | |
| | | | 247,534 | |
Asset Backed — Securities (11.1%) | | | | | |
Amstel Funding Corp. | | | | | |
2.79%, 7/11/05 | | (a)64,507 | | 64,155 | |
Cancara Asset Securitization LLC | | | | | |
2.80%, 5/3/05 | | (a)100,230 | | 100,214 | |
3.04%, 5/31/05 | | (a)55,150 | | 55,011 | |
CC USA, Inc. | | | | | |
3.03%, 6/24/05 | | (a)88,500 | | 88,099 | |
3.21%, 9/16/05 | | (a)60,000 | | 59,270 | |
Clipper Receivables Co., LLC | | | | | |
2.80%, 5/2/05 | | 200,000 | | 199,984 | |
2.82%, 5/4/05 | | (a)100,000 | | 99,976 | |
3.02%, 5/17/05 | | 20,000 | | 19,973 | |
Dorada Finance | | | | | |
3.02%, 6/24/05 | | (a)119,000 | | 118,463 | |
Galaxy Funding, Inc. | | | | | |
2.99%, 6/20/05 | | (a)100,000 | | 99,586 | |
The accompanying notes are an integral part of the financial statements.
11
2005 Semi-Annual Report |
|
April 30, 2005 (unaudited) |
Portfolio of Investments (cont’d)
Prime Portfolio
| | Face
Amount
(000) | | Value
(000) | |
Asset Backed — Securities (cont’d) | | | | | |
3.02%, 6/27/05 | | $ | (a)80,000 | | $ | 79,619 | |
3.05%, 6/28/05 | | (a)45,000 | | 44,780 | |
Grampian Funding LLC | | | | | |
2.75%, 6/22/05 | | (a)140,000 | | 139,446 | |
2.85%, 6/30/05 | | (a)130,000 | | 129,385 | |
Scaldis Capital LLC | | | | | |
3.04%, 5/25/05 | | (a)35,514 | | 35,442 | |
| | | | 1,333,403 | |
Banking (1.4%) | | | | | |
HSBC USA, Inc. | | | | | |
2.62%, 5/3/05 | | 50,000 | | 49,993 | |
3.01%, 6/28/05 | | 120,000 | | 119,420 | |
| | | | 169,413 | |
Diversified Financial Services (2.4%) | | | | | |
General Electric Capital Corp. | | | | | |
3.16%, 9/6/05 | | 75,000 | | 74,168 | |
3.21%, 11/17/05 | | 90,000 | | 88,425 | |
General Electric Co. | | | | | |
3.01%, 6/28/05 | | 125,000 | | 124,396 | |
| | | | 286,989 | |
Finance — Automotive (0.9%) | | | | | |
Toyota Motor Credit Corp. | | | | | |
2.56%, 6/1/05 | | 60,000 | | 59,868 | |
3.02%, 6/30/05 | | 50,000 | | 49,750 | |
| | | | 109,618 | |
Finance — Consumer (1.6%) | | | | | |
Pfizer, Inc. | | | | | |
2.60%, 5/3/05 | | (a)83,056 | | 83,044 | |
2.90%, 8/30/05 | | (a)106,750 | | 105,720 | |
| | | | 188,764 | |
Finance — Corporate (2.0%) | | | | | |
CIT Group, Inc. | | | | | |
2.80%, 5/2/05 | | 100,000 | | 99,992 | |
3.04%, 6/13/05 | | 40,500 | | 40,353 | |
3.05%, 6/22/05 | | 50,000 | | 49,781 | |
3.07%, 6/28/05 | | 50,000 | | 49,754 | |
| | | | 239,880 | |
Insurance (1.7%) | | | | | |
AIG Funding, Inc. | | | | | |
2.80%, 5/2/05 | | 75,000 | | 74,994 | |
3.02%, 6/20/05 | | 75,000 | | 74,687 | |
American General Finance Corp. | | | | | |
2.77%, 5/2/05 | | 50,000 | | 49,996 | |
| | | | 199,677 | |
International Banks (1.2%) | | | | | |
Deutsche Bank Financial LLC | | | | | |
2.80%, 5/3/05 | | 150,000 | | 149,977 | |
Investment Bankers/Brokers/Services (5.4%) | | | | | |
Bear Stearns Cos., Inc. (The) | | | | | |
2.79%, 5/2/05 | | 200,000 | | 199,985 | |
Citigroup Global Markets Holdings, Inc. | | | | | |
2.78%, 5/3/05 | | $ | 50,000 | | $ | 49,992 | |
3.04%, 11/28/05 | | (b)250,000 | | 250,000 | |
Goldman Sachs Group, Inc. | | | | | |
2.78%, 5/2/05 | | 150,000 | | 149,988 | |
| | | | 649,965 | |
Total Commercial Paper (Cost $6,391,737) | | | | 6,391,737 | |
Corporate Notes (18.7%) | | | | | |
Asset Backed — Securities (7.0%) | | | | | |
Beta Finance, Inc. | | | | | |
3.07%, 3/14/06 - 3/20/06 | | (a)(b)175,000 | | 175,014 | |
3.20%, 6/13/05 | | (a)(b)30,000 | | 30,005 | |
CC USA, Inc. | | | | | |
1.82%, 6/17/05 | | (a)42,500 | | 42,484 | |
3.04%, 1/17/06 | | (a)(b)115,000 | | 114,984 | |
3.05%, 12/1/05 | | (a)(b)100,000 | | 99,995 | |
3.07%, 9/15/05 | | (a)(b)85,000 | | 84,997 | |
Dorada Finance, Inc. | | | | | |
3.04%, 1/17/06 | | (a)(b)138,000 | | 137,980 | |
3.07%, 9/12/05 | | (a)(b)50,000 | | 49,999 | |
3.09%, 8/15/05 | | (a)(b)100,000 | | 100,004 | |
| | | | 835,462 | |
Banking (1.3%) | | | | | |
Fifth Third Bancorp. | | | | | |
3.05%, 4/21/06 | | (a)(b)150,000 | | 150,000 | |
Financial Services (0.3%) | | | | | |
Metropolitan Life Global Funding I | | | | | |
2.97%, 8/26/05 | | (a)(b)42,000 | | 42,014 | |
Insurance (0.5%) | | | | | |
Mass Mutual Global Funding II | | | | | |
3.19%, 12/13/05 | | (a)(b)65,000 | | 65,077 | |
Investment Bankers/Brokers/Services (5.4%) | | | | | |
Banc of America Securities LLC | | | | | |
3.08%, 2/20/06 | | 273,500 | | 273,500 | |
Goldman Sachs Group, Inc. | | | | | |
2.99%, 9/12/05-11/10/05 | | 325,000 | | 325,000 | |
Merrill Lynch & Co., Inc. | | | | | |
3.40%, 6/13/05 | | (b)52,750 | | 52,776 | |
| | | | 651,276 | |
Major Banks (4.2%) | | | | | |
Bank of America NA/Charlotte, NC | | | | | |
3.07%, 12/9/05 | | (b)150,000 | | 150,000 | |
Chase Manhattan Bank USA NA | | | | | |
3.04%, 5/11/05 | | (b)40,000 | | 40,000 | |
Fifth Third Bank | | | | | |
3.01%, 11/1/05 | | (b)25,000 | | 24,996 | |
Harris Trust & Savings Bank | | | | | |
3.07%, 5/3/06 | | (b)100,000 | | 100,000 | |
La Salle Bancorp, Inc. | | | | | |
2.82%, 5/2/05 | | 150,000 | | 150,000 | |
The accompanying notes are an integral part of the financial statements.
12
| 2005 Semi-Annual Report |
| |
| April 30, 2005 (unaudited) |
Portfolio of Investments (cont’d)
Prime Portfolio
| | Face
Amount
(000) | | Value
(000) | |
Major Banks (cont’d) | | | | | |
US Bank National Association | | | | | |
2.22%, 7/18/05 | | $ | 32,500 | | $ | 32,490 | |
| | | | 497,486 | |
Total Corporate Notes (Cost $2,241,315) | | | | 2,241,315 | |
Repurchase Agreement (15.7%) | | | | | |
Goldman Sachs Group, Inc., 2.97%, dated 4/29/05, due 5/2/05, repurchase price $1,882,571: fully collateralized by U.S. government securities at the date of this Portfolio of Investments as follows: Federal Home Loan Mortgage Corp., Adjustable Rate Mortgages: 3.89% to 5.35%, due 9/1/32 to 5/1/35; Federal Home Loan Mortgage Corp., Gold Pools: 3.50% to 8.00%, due 10/1/09 to 3/1/35; Federal National Mortgage Association, Conventional Pools: 4.00% to 7.00%, due 5/1/16 to 5/1/35; Federal National Mortgage Association, Adjustable Rate Mortgages: 3.37% to 5.13%, due 4/1/33 to 10/1/44; U.S. Treasury Strips, due 5/15/05 to 8/15/25, valued at $1,919,747.
(Cost $1,882,105) | | 1,882,105 | | 1,882,105 | |
Total Investments (101.8%) (Cost $12,195,145) | | | | 12,195,145 | |
Liabilities in Excess of Other Assets (-1.8%) | | | | (219,130 | ) |
Net Assets (100%) | | | | $ | 11,976,015 | |
| | | | | | | |
(a) 144A security — Certain conditions for public sale may exist. Unless otherwise noted, these securities are deemed to be liquid.
(b) Variable/Floating Rate Security — Interest rate changes on these instruments are based on changes in a designated base rate. The rates shown are those in effect on April 30, 2005.
Graphic Presentation of Portfolio Holdings
The following graph depicts the Portfolio’s holdings by investment type, as a percentage of total investments.
The accompanying notes are an integral part of the financial statements.
13
2005 Semi-Annual Report |
|
April 30, 2005 (unaudited) |
Portfolio of Investments
Government Portfolio
| | Face
Amount
(000) | | Value
(000) | |
U.S. Government & Agency Securities (32.0%) | | | | | |
Federal Farm Credit Bank | | | | | |
2.25%, 7/5/05 | | $ | 1,000 | | $ | 996 | |
2.76%, 10/6/06 | | (b)25,000 | | 24,989 | |
2.77%, 8/18/06 | | (b)25,000 | | 24,994 | |
2.78%, 4/20/06 | | (b)15,000 | | 14,999 | |
2.96%, 6/23/05 | | (b)1,350 | | 1,350 | |
Federal Home Loan Bank | | | | | |
1.48%, 6/16/05 | | 1,000 | | 999 | |
2.22%, 6/9/05 | | 250 | | 249 | |
2.23%, 7/8/05 | | 1,000 | | 996 | |
2.68%, 5/16/06 | | (b)6,500 | | 6,495 | |
2.76%, 10/3/05 | | (b)30,000 | | 29,996 | |
2.77%, 8/26/05 | | (b)11,500 | | 11,497 | |
2.78%, 7/15/05 - 1/27/06 | | (b)41,500 | | 41,498 | |
2.83%, 9/8/05 | | (b)30,000 | | 29,991 | |
2.87%, 9/16/05 | | (b)20,000 | | 19,998 | |
2.88%, 9/12/05 | | (b)20,000 | | 19,995 | |
2.89%, 8/21/06 | | (b)25,000 | | 24,981 | |
2.97%, 6/2/06 | | (b)15,000 | | 14,989 | |
3.00%, 8/2/05 - 10/5/05 | | (b)16,670 | | 16,669 | |
3.10%, 8/2/06 | | (b)20,000 | | 19,985 | |
Federal Home Loan Mortgage Corp. | | | | | |
2.29%, 7/26/05 | | 900 | | 895 | |
2.38%, 6/30/05 | | 2,000 | | 1,992 | |
2.44%, 5/17/05 | | 3,000 | | 2,997 | |
2.73%, 6/21/05 | | 4,000 | | 3,985 | |
2.73%, 11/7/05 | | (b)600 | | 600 | |
2.74%, 6/28/05 | | 11,400 | | 11,350 | |
2.75%, 5/3/05 | | 12,729 | | 12,727 | |
2.78%, 8/8/05 | | 4,000 | | 3,970 | |
2.79%, 5/2/05 | | 2,000 | | 2,000 | |
2.88%, 9/15/05 | | 3,000 | | 3,005 | |
2.93%, 9/9/05 | | (b)11,050 | | 11,050 | |
2.97%, 11/15/05 | | 5,000 | | 4,920 | |
3.00%, 9/20/05 | | 16,000 | | 15,813 | |
3.08%, 12/5/05 | | 3,000 | | 2,945 | |
3.21%, 10/26/05 | | 1,702 | | 1,675 | |
3.39%, 12/28/05 | | 7,000 | | 6,845 | |
3.49%, 12/12/05 | | 9,717 | | 9,523 | |
Federal National Mortgage Association | | | | | |
1.40%, 5/3/05 | | 25,000 | | 24,998 | |
2.74%, 5/2/05 | | 21,260 | | 21,258 | |
3.00%, 6/27/05 | | 10,000 | | 9,953 | |
Total U.S. Government & Agency Securities
(Cost $458,167) | | | | 458,167 | |
Repurchase Agreements (68.2%) | | | | | |
Bear Stearns Cos., Inc., 2.98%, dated 4/29/05, due 5/2/05, repurchase price $235,058: fully collateralized by U.S. government securities at the date of this Portfolio of Investments as follows: Federal Home Loan Mortgage Corp., Adjustable Rate Mortgages: 5.07% to 6.93%, due 3/1/31 to 12/1/32; Federal National Mortgage Association, Adjustable Rate Mortgages: 3.37% to 5.07%, due 5/1/27 to 8/1/42; Federal National Mortgage Association, Conventional Pool: 6.01%, due 5/1/09, valued at $239,702. | | $ | 235,000 | | $ | 235,000 | |
CS First Boston LLC, 2.80%, dated 4/29/05, due 5/2/05, repurchase price $60,014: fully collateralized by U.S. government securities at the date of this Portfolio of Investments as follows: Federal Home Loan Mortgage Corp., Adjustable Rate Mortgage: 4.19%, due 4/1/35; Federal National Mortgage Association, Adjustable Rate Mortgages: 3.22% to 4.83%, due 8/1/33 to 4/1/35, valued at $61,204. | | 60,000 | | 60,000 | |
CS First Boston LLC, 2.97% dated 4/29/05, due 5/2/05, repurchase price $220,905: fully collateralized by U.S. government securities at the date of this Portfolio of Investments as follows: Federal Home Loan Mortgage Corp., Adjustable Rate Mortgage: 3.77%, due 7/1/34; Federal National Mortgage Association, Adjustable Rate Mortgages: 3.43% to 4.89%, due 12/1/34 to 7/1/42, valued at $225,270. | | 220,850 | | 220,850 | |
Deutsche Bank Securities, Inc., 2.97%, dated 4/29/05, due 5/2/05, repurchase price $230,057: fully collateralized by U.S. government securities at the date of this Portfolio of Investments as follows: Federal Home Loan Mortgage Corp., Gold Pools: 5.00% to 5.50%, due 4/1/19 to 4/1/35; Federal National Mortgage Association, Adjustable Rate Mortgages: 3.80% to 4.35%, due 7/1/33 to 4/1/35; Federal National Mortgage Association, Conventional Pools: 4.00% to 6.05%, due 3/1/12 to 6/1/19, valued at $234,600. | | 230,000 | | 230,000 | |
Goldman Sachs Group, Inc., 2.97%, dated 4/29/05, due 5/2/05, repurchase price $130,032: fully collateralized by U.S. government securities at the date of this Portfolio of Investments as follows: Federal National Mortgage Association, Conventional Pool: 5.00%, due 3/1/34, valued at $132,600. | | 130,000 | | 130,000 | |
The accompanying notes are an integral part of the financial statements.
14
| 2005 Semi-Annual Report |
| |
| April 30, 2005 (unaudited) |
Portfolio of Investments (cont’d)
Government Portfolio
| | Face
Amount
(000) | | Value
(000) | |
UBS Securities LLC, 2.77%, dated 4/29/05, due 5/3/05, repurchase price $55,017: fully collateralized by U.S. government securities at the date of this Portfolio of Investments as follows: Federal Home Loan Mortgage Corp., Adjustable Rate Mortgages: 3.66% to 4.76%, due 10/1/31 to 4/1/35; Federal National Mortgage Association, Adjustable Rate Mortgages: 3.85% to 4.93%, due 3/1/28 to 12/1/34, valued at $56,102. | | $ | 55,000 | | $ | 55,000 | |
UBS Securities LLC, 2.78%, dated 4/29/05, due 5/2/05, repurchase price $45,010: fully collateralized by U.S. government securities at the date of this Portfolio of Investments as follows: Federal Home Loan Mortgage Corp., Adjustable Rate Mortgages: 3.75% to 4.49%, due 3/1/34 to 9/1/34; Federal National Mortgage Association, Adjustable Rate Mortgages: 3.88% to 5.11%, due 2/1/34 to 9/1/34, valued at $45,902. | | 45,000 | | 45,000 | |
Total Repurchase Agreements (Cost $975,850) | | | | 975,850 | |
Total Investments (100.2%) (Cost $1,434,017) | | | | 1,434,017 | |
Liabilities in Excess of Other Assets (-0.2%) | | | | (2,492 | ) |
Net Assets (100%) | | | | $ | 1,431,525 | |
| | | | | | | |
(b) Variable/Floating Rate Security — Interest rate changes on these instruments are based on changes in a designated base rate. The rates shown are those in effect on April 30, 2005.
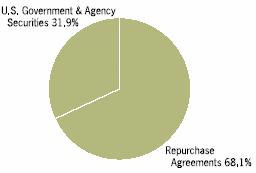
Graphic Presentation of Portfolio Holdings
The following graph depicts the Portfolio’s holdings by investment type, as a percentage of total investments.
The accompanying notes are an integral part of the financial statements.
15
2005 Semi-Annual Report |
|
April 30, 2005 (unaudited) |
Portfolio of Investments
Treasury Portfolio
| | Face
Amount
(000) | | Value
(000) | |
U.S Treasury Securities (3.9%) | | | | | |
U.S. Treasury Bills (1.0%) | | | | | |
U.S. Treasury Bills | | | | | |
2.82%, 7/7/05 | | $ | 1,000 | | $ | 995 | |
U.S. Treasury Notes (2.9%) | | | | | |
U.S. Treasury Notes | | | | | |
1.50%, 7/31/05 | | 1,000 | | 998 | |
2.00%, 8/31/05 | | 2,000 | | 1,998 | |
| | | | 2,996 | |
Total U.S Treasury Securities (Cost $3,991) | | | | 3,991 | |
Repurchase Agreements (96.3%) | | | | | |
CS First Boston LLC, 2.85%, dated 4/29/05, due 5/2/05, repurchase price $23,531; fully collateralized by U.S. government securities at the date of this Portfolio of Investments as follows: U.S. Treasury Notes, 2.625%, due 3/15/09, valued at $23,999. | | 23,525 | | 23,525 | |
Deutsche Bank Securities, Inc., 2.90%, dated 4/29/05, due 5/2/05, repurchase price $24,006; fully collateralized by U.S. government securities at the date of this Portfolio of Investments as follows: U.S. Treasury Bonds, 6.375%, due 8/15/27, and U.S. Treasury Strips, due 11/15/20, valued at $24,481. | | 24,000 | | 24,000 | |
Goldman Sachs Group, Inc., 2.70%, dated 4/15/05, due 5/3/05, repurchase price $4,005; fully collateralized by U.S. government securities at the date of this Portfolio of Investments as follows: U.S. Treasury Notes, 13.875%, due 5/15/11, valued at $4,081. | | 4,000 | | 4,000 | |
J.P. Morgan Securities, Inc., 2.80%, dated 4/29/05, due 5/2/05, repurchase price $22,705; fully collateralized by U.S. government securities at the date of this Portfolio of Investments as follows: U.S. Treasury Strips, due 11/15/15 to 2/15/21, valued at $23,156. | | 22,700 | | 22,700 | |
UBS Securities LLC, 2.86%, dated 4/29/05, due 5/2/05, repurchase price $24,006; fully collateralized by U.S. government securities at the date of this Portfolio of Investments as follows: U.S. Treasury Notes, 3.375%, due 2/15/08, valued at $24,482. | | 24,000 | | 24,000 | |
Total Repurchase Agreements (Cost $98,225) | | | | 98,225 | |
Total Investments (100.2%) (Cost $102,216) | | | | 102,216 | |
Liabilities in Excess of Other Assets (-0.2%) | | | | (162 | ) |
Net Assets (100%) | | | | $ | 102,054 | |
| | | | | | | |
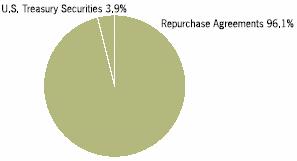
Graphic Presentation of Portfolio Holdings
The following graph depicts the Portfolio’s holdings by investment type, as a percentage of total investments.
The accompanying notes are an integral part of the financial statements.
16
| 2005 Semi-Annual Report |
| |
| April 30, 2005 (unaudited) |
Portfolio of Investments
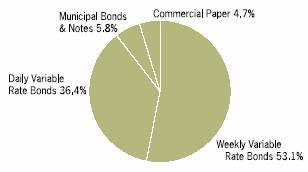
Tax-Exempt Portfolio
| | Face
Amount
(000) | | Value
(000) | |
Tax-Exempt Instruments (99.6%) | | | | | |
Commercial Paper (4.7%) | | | | | |
Broward County, FL, Sales Tax, Series A | | | | | |
2.06%, 5/10/05 | | $ | 1,650 | | $ | 1,650 | |
Illinois Educational Facilities Authority, Pooled, Series 1995 | | | | | |
2.05%, 5/24/05 | | 2,000 | | 2,000 | |
Illinois Health Facilities Authority, Evanston Hospital Corp., Series 1995 | | | | | |
2.45%, 6/23/05 | | 1,500 | | 1,500 | |
Jacksonville, FL, Series A | | | | | |
2.32%, 5/19/05 | | 2,000 | | 2,000 | |
Massachusetts Health & Educational Facilities Authority, Harvard University, Series EE | | | | | |
2.03%, 5/26/05 | | 1,000 | | 1,000 | |
Ohio State University, General Receipts, Series 2004 F | | | | | |
2.03%, 5/25/05 | | 2,000 | | 2,000 | |
Puerto Rico Government Development Bank, Series 1986 | | | | | |
2.00%, 5/12/05 | | 2,872 | | 2,872 | |
University of Texas Regents, Permanent University Fund, Series A | | | | | |
2.05%, 5/23/05 | | 1,000 | | 1,000 | |
| | | | 14,022 | |
Daily Variable Rate Bonds (36.3%) | | | | | |
Breckinridge County, KY, Kentucky Association of Counties Leasing Trust, 2002, Series A | | | | | |
3.05%, 2/1/32 | | 3,000 | | 3,000 | |
California Health Facilities Financing Authority, Adventist Health System/West, 1998, Series B (MBIA) | | | | | |
3.04%, 9/1/28 | | 8,050 | | 8,050 | |
California Statewide Communities Development Authority, University Retirement Community at Davis, Inc., Series 2003 (Radian) | | | | | |
3.05%, 11/15/30 | | 5,800 | | 5,800 | |
Curators of the University of Missouri, Series 2002 A | | | | | |
3.05%, 11/1/32 | | 1,600 | | 1,600 | |
East Baton Rouge Parish, LA, Exxon Corp., Series 1993 | | | | | |
2.96%, 3/1/22 | | 9,200 | | 9,200 | |
Harris County Health Facilities Development Corp., TX, Methodist Hospital, Series 2002 | | | | | |
3.07%, 12/1/32 | | 7,000 | | 7,000 | |
Harris County Health Facilities Development Corp., TX, Texas Medical Center, Series B (FSA) | | | | | |
3.05%, 5/15/29 | | 300 | | 300 | |
Illinois Finance Authority, Northwestern Memorial Hospital, Series 2004 B, Subseries 2004 B-1 | | | | | |
3.05%, 8/15/38 | | 400 | | 400 | |
Illinois Finance Authority, Northwestern Memorial Hospital, Series 2004 B, Subseries 2004 B-2 | | | | | |
3.02%, 8/15/38 | | 7,800 | | 7,800 | |
Illinois Health Facilities Authority, University of Chicago Hospitals, Series 1998 (MBIA) | | | | | |
3.05%, 8/1/26 | | $ | 9,795 | | $ | 9,795 | |
Massachusetts Health & Educational Facilities Authority, Partners Health Care System, Inc., 2003, Series D-5 | | | | | |
3.03%, 7/1/17 | | 400 | | 400 | |
Montgomery County Public Building Authority, TN, Pooled Financing, Series 2002 | | | | | |
3.05%, 4/1/32 | | 5,100 | | 5,100 | |
Mount Vernon, IN, Pollution Control & Solid Waste Disposal General Electric Co., Series 2004 | | | | | |
3.00%, 12/1/14 | | 3,100 | | 3,100 | |
New York City Transitional Finance Authority, NY, Recovery Fiscal 2003 Series 1, Subseries 1D | | | | | |
3.05%, 11/1/22 | | 6,950 | | 6,950 | |
New York City Transitional Finance Authority, NY, Recovery Fiscal 2003 Series 3, Subseries 3F | | | | | |
3.05%, 11/1/22 | | 200 | | 200 | |
New York City, NY, Fiscal 2004 Series H, Subseries H-4 | | | | | |
3.02%, 3/1/34 | | 7,700 | | 7,700 | |
Rhode Island Health & Educational Building Corp., Care New England, Series 2002 A | | | | | |
3.05%, 9/1/32 | | 200 | | 200 | |
Salt Lake County, UT, Service Station Holdings British Petroleum, Series 1994 B | | | | | |
3.05%, 8/1/07 | | 4,200 | | 4,200 | |
Shelby County, KY, Kentucky Association of Counties Leasing Trust, 2004, Series A | | | | | |
3.05%, 9/1/34 | | 5,650 | | 5,650 | |
The University of North Carolina at Chapel Hill, Series 2001 B | | | | | |
3.05%, 2/15/31 | | 4,100 | | 4,100 | |
University of Delaware, 2001, Series B | | | | | |
3.08%, 11/1/26 | | 10,145 | | 10,145 | |
Weber County, UT, IHC Health Services, Inc., Series 2000 C | | | | | |
3.05%, 2/15/35 | | 7,000 | | 7,000 | |
| | | | 107,690 | |
Municipal Bonds & Notes (5.8%) | | | | | |
California, Series 2004-2005 RANs | | | | | |
3.00%, 6/30/05 | | 1,000 | | 1,002 | |
Illinois Finance Authority, Series 2005-A School Notes | | | | | |
3.00%, 12/1/05 | | 630 | | 632 | |
Kentucky Association of Counties Advance Revenue Program, Series 2004 A COPs TRANs | | | | | |
3.00%, 6/30/05 | | 1,000 | | 1,002 | |
Kershaw County School District, SC, Series 2004 BANs | | | | | |
3.00%, 7/15/05 | | 1,275 | | 1,276 | |
New Hampshire, Series 2004 RANs | | | | | |
2.20%, 6/1/05 | | 2,500 | | 2,500 | |
New Jersey, Series Fiscal 2005 A TRANs | | | | | |
3.00%, 6/24/05 | | 1,450 | | 1,451 | |
The accompanying notes are an integral part of the financial statements.
17
2005 Semi-Annual Report |
| |
April 30, 2005 (unaudited) |
Portfolio of Investments (cont’d)
Tax-Exempt Portfolio
| | Face | | | |
| | Amount
(000) | | Value
(000) | |
Municipal Bonds & Notes (cont’d) | | | | | |
Orono Independent School District No. 278, MN, Aid Anticipation Certificates, Series 2004 A | | | | | |
2.75%, 8/29/05 | | $ | 1,000 | | $ | 1,003 | |
Pioneer Valley Transit Authority, MA, Series 2004 RANs | | | | | |
2.75%, 8/5/05 | | 1,000 | | 1,002 | |
Reynoldsburg City School District, OH, Series 2005 BANs | | | | | |
3.00%, 6/24/05 | | 1,000 | | 1,002 | |
South Jefferson Central School District, NY, Series 2005 RANs | | | | | |
3.00%, 6/28/05 | | 1,000 | | 1,001 | |
Spencer-Van Etten Central School District, NY, Series 2004 BANs | | | | | |
3.00%, 6/17/05 | | 515 | | 516 | |
Texas, Series 2004 TRANs | | | | | |
3.00%, 8/31/05 | | 2,215 | | 2,222 | |
Tompkins-Seneca-Tioga Board of Cooperative Educational Services, NY, Series 2005 RANs | | | | | |
3.25%, 6/30/05 | | 1,200 | | 1,202 | |
Troy City School District, OH, Series 2005 BANs | | | | | |
3.00%, 6/28/05 | | 1,305 | | 1,307 | |
| | | | 17,118 | |
Weekly Variable Rate Bonds (52.8%) | | | | | |
American Public Energy Agency, NE, National Public Gas Agency, 2003, Series A | | | | | |
3.00%, 2/1/14 | | 4,930 | | 4,930 | |
Arizona Tourism & Sports Authority, Multi-purpose Stadium, Series 2003 A ROCs II-R, Series 2134 (MBIA) | | | | | |
3.03%, 7/1/21 | | 1,795 | | 1,795 | |
Atlanta, GA, Water & Wastewater, Series 2001 B (FSA) | | | | | |
3.00%, 11/1/38 | | 7,900 | | 7,900 | |
Austin, TX, Water & Wastewater System, Series 2004 (FSA) | | | | | |
3.00%, 5/15/24 | | 200 | | 200 | |
Bexar County Housing Finance Corp., TX, Multi-Family P-FLOATs PT-2082 | | | | | |
3.02%, 1/20/10 | | 1,500 | | 1,500 | |
Centerra Metropolitan District No. 1, CO, Series 2004 | | | | | |
3.02%, 12/1/29 | | 4,900 | | 4,900 | |
Charlotte, NC, Convention Facility, Series 2003 B COPs | | | | | |
3.05%, 12/1/21 | | 5,000 | | 5,000 | |
Chicago Board of Education, IL, Series 2004 D (FSA) | | | | | |
3.01%, 3/1/23 | | 4,000 | | 4,000 | |
Chicago, IL, Neighborhoods Alive, Series 21 B (MBIA) | | | | | |
2.98%, 1/1/37 | | 1,900 | | 1,900 | |
Colorado Health Facilities Authority, Catholic Health Initiatives, Series 2004 B-4 | | | | | |
3.00%, 3/1/23 | | 4,825 | | 4,825 | |
Colorado Springs, CO, Utilities System Sub Lien, Series 2000 A | | | | | |
3.00%, 11/1/29 | | $ | 6,900 | | $ | 6,900 | |
Denver Urban Renewal Authority, CO, Stapleton Senior Tax Increment, Series 2004 A-1 P- FLOATs, Series PT-999 | | | | | |
3.08%, 10/7/06 | | 1,500 | | 1,500 | |
Fort Wayne, IN, Health Quest Realty X, Series 1993 A TOBs (FHA) | | | | | |
3.17%, 8/1/13 | | 1,430 | | 1,430 | |
Glendale Heights, IL, Glendale Lakes, Series 2000 | | | | | |
3.00%, 3/1/30 | | 2,445 | | 2,445 | |
Hamilton County, OH, Twin Towers and Twin Lakes, Series 2003 A | | | | | |
3.07%, 7/1/23 | | 1,500 | | 1,500 | |
Harris County Industrial Development Corp., TX, Baytank, Inc., Series 1998 | | | | | |
3.00%, 2/1/20 | | 10,500 | | 10,500 | |
Houston, TX, Combined Utility System MERLOTs, 2004, Series C13 (MBIA) | | | | | |
3.08%, 5/15/25 | | 1,310 | | 1,310 | |
Kansas Department of Transportation, Highway, Series C-3 | | | | | |
3.00%, 9/1/19 | | 9,300 | | 9,300 | |
Kent Hospital Finance Authority, MI, Metropolitan Hospital, Series 2005 B | | | | | |
3.03%, 7/1/40 | | 1,500 | | 1,500 | |
King County, WA, Harborview Medical Center ROCs II-R, Series 5036 (Ambac) | | | | | |
3.03%, 12/1/13 | | 1,830 | | 1,830 | |
Maine Health & Higher Educational Facilities Authority, VHA of New England Capital Asset Financing, 1985 Series B (Ambac) | | | | | |
2.96%, 12/1/25 | | 1,400 | | 1,400 | |
Massachusetts Health & Educational Facilities Authority, Cape Cod Healthcare Obligated Group, 2004, Series D (Assured Guaranty) | | | | | |
3.06%, 11/15/35 | | 2,000 | | 2,000 | |
Merrillville, IN, Southlake Care Center, Series 1992 A TOBs (FHA) | | | | | |
3.17%, 7/1/11 | | 705 | | 705 | |
Municipal Securities Pooled Trust Receipts, Various States, Series 2004 SG P-18 | | | | | |
3.14%, 1/1/35 | | 4,000 | | 4,000 | |
New Jersey Transportation Trust Fund Authority, Series 2004 A, PUTTERs, Series 503 (FGIC) | | | | | |
3.02%, 6/15/12 | | 2,455 | | 2,455 | |
North Carolina Capital Facilities Finance Agency, Barton College, Series 2004 | | | | | |
3.02%, 7/1/19 | | 700 | | 700 | |
North Carolina Medical Care Commission, Firsthealth of the Carolinas, Series 2002 | | | | | |
2.99%, 10/1/32 | | 2,600 | | 2,600 | |
The accompanying notes are an integral part of the financial statements.
18
| 2005 Semi-Annual Report |
| |
| April 30, 2005 (unaudited) |
Portfolio of Investments (cont’d)
Tax-Exempt Portfolio
| | Face | | | |
| | Amount
(000) | | Value
(000) | |
Weekly Variable Rate Bonds (cont’d) | | | | | |
North Carolina Medical Care Commission, Mission-St. Joseph’s Health System, Series 2003 | | | | | |
3.05%, 10/1/18 | | $ | 5,000 | | $ | 5,000 | |
North Carolina, Series 2002 D | | | | | |
2.95%, 5/1/21 | | 6,200 | | 6,200 | |
Oak Forest, IL, Homewood South Suburban Mayors & Managers Association, Series 1989 | | | | | |
2.99%, 7/1/24 | | 2,050 | | 2,050 | |
Omaha, NE, Eagle #2004001 Class A | | | | | |
3.03%, 4/1/27 | | 1,000 | | 1,000 | |
Orlando Utilities Commission, FL, Water & Electric, Series 2002 A | | | | | |
3.00%, 10/1/17 | | 12,700 | | 12,700 | |
Orlando-Orange County Expressway Authority, FL, Series 2005, Subseries A-1 (Ambac) | | | | | |
3.00%, 7/1/40 | | 2,000 | | 2,000 | |
Palm Beach County, FL, Hospice of Palm Beach County, Inc., Series 2001 | | | | | |
3.03%, 10/1/31 | | 1,900 | | 1,900 | |
Pennsylvania Turnpike Commission, 2002, Series A-2 | | | | | |
3.00%, 12/1/30 | | 400 | | 400 | |
Pima County Industrial Development Authority, AZ, El Dorado Hospital, Series 2004 | | | | | |
3.02%, 4/1/38 | | 1,000 | | 1,000 | |
Portland Housing Authority, OR, New Market West, Series 2004 | | | | | |
3.00%, 4/1/34 | | 675 | | 675 | |
Private Colleges & Universities Authority, GA, Emory University, 2001, Series B | | | | | |
2.95%, 9/1/33 | | 1,900 | | 1,900 | |
Purdue University, IN, Student Facilities System, Series 2005 A | | | | | |
2.97%, 7/1/29 | | 1,600 | | 1,600 | |
Rhode Island Convention Center Authority, Refinancing, 2001, Series A (MBIA) | | | | | |
3.00%, 5/15/27 | | 1,500 | | 1,500 | |
Saline Area Schools, MI, Series 2002 B | | | | | |
3.00%, 5/1/30 | | 12,000 | | 12,000 | |
Sayre Health Care Facilities Authority, PA, VHA of Pennsylvania, Inc., Capital Asset Financing, Series 1985 B (Ambac) | | | | | |
2.96%, 12/1/20 | | 1,700 | | 1,700 | |
South Carolina Jobs Economic Development Authority, Burroughs & Chapin Business Park, Series 2002 | | | | | |
3.05%, 5/1/32 | | 5,300 | | 5,300 | |
South Jordan Municipal Building Authority, UT, Lease, Series 2004 | | | | | |
3.00%, 2/1/29 | | 2,200 | | 2,200 | |
Texas Water Development Board, Revolving Fund Senior Lien, Series 2000 A P-FLOATs PT-2187 | | | | | |
3.01%, 7/15/08 | | 1,040 | | 1,040 | |
University of Minnesota Regents, Series 1999 A | | | | | |
3.07%, 1/1/34 | | $ | 1,065 | | $ | 1,065 | |
University of Texas System, Refinancing, Series 2001 A | | | | | |
3.00%, 8/15/13 | | 1,500 | | 1,500 | |
Utah County, UT, IHC Health Services, Inc., 2002, Series B | | | | | |
3.00%, 5/15/35 | | 2,400 | | 2,400 | |
Virginia Public Building Authority, Series B ROCs II-R Series 6027 | | | | | |
3.03%, 8/1/14 | | 1,395 | | 1,395 | |
Williamsburg, KY, Cumberland College, Series 2002 | | | | | |
2.99%, 9/1/32 | | 1,395 | | 1,395 | |
| | | | 156,945 | |
Total Tax-Exempt Instruments (Cost $295,775) | | | | 295,775 | |
Total Investments (99.6%) (Cost $295,775) | | | | 295,775 | |
Other Assets in Excess of Liabilities (0.4%) | | | | 1,214 | |
Net Assets (100%) | | | | $ | 296,989 | |
Ambac | — Ambac Assurance Corp. |
Assured Guaranty | — Assured Guaranty, Ltd. |
BANs | — Bond Anticipation Notes |
FGIC | — Financial Guaranty Insurance Co. |
FHA | — Federal Housing Administration |
FSA | — Financial Security Assurance, Inc. |
MBIA | — MBIA Insurance Corp. |
Radian | — Radian Group, Inc. |
RANs | — Revenue Anticipation Notes |
TRANs | — Tax and Revenue Anticipation Notes |
The accompanying notes are an integral part of the financial statements.
19
2005 Semi-Annual Report |
|
April 30, 2005 (unaudited) |
Portfolio of Investments (cont’d)
Tax-Exempt Portfolio
SUMMARY OF TAX-EXEMPT INSTRUMENTS BY STATE/TERRITORY
| | | | Percent | |
| | Value | | of Net | |
STATE/TERRITORY | | (000) | | Assets | |
Illinois | | $ | 32,523 | | 11.0 | % |
Texas | | 26,572 | | 9.0 | |
North Carolina | | 23,600 | | 8.0 | |
Florida | | 20,250 | | 6.8 | |
Colorado | | 18,125 | | 6.1 | |
New York | | 17,568 | | 5.9 | |
Utah | | 15,800 | | 5.3 | |
California | | 14,852 | | 5.0 | |
Delaware | | 14,145 | | 4.8 | |
Michigan | | 13,500 | | 4.5 | |
Kentucky | | 11,047 | | 3.7 | |
Georgia | | 9,800 | | 3.3 | |
Kansas | | 9,300 | | 3.1 | |
Louisiana | | 9,200 | | 3.1 | |
Indiana | | 6,835 | | 2.3 | |
South Carolina | | 6,576 | | 2.2 | |
Nebraska | | 5,930 | | 2.0 | |
Ohio | | 5,809 | | 2.0 | |
Tennessee | | 5,100 | | 1.7 | |
New Jersey | | 3,906 | | 1.3 | |
New Hampshire | | 3,500 | | 1.2 | |
Massachusetts | | 3,402 | | 1.1 | |
Puerto Rico | | 2,872 | | 1.0 | |
Arizona | | 2,795 | | 0.9 | |
Pennsylvania | | 2,100 | | 0.7 | |
Minnesota | | 2,068 | | 0.7 | |
Washington | | 1,830 | | 0.6 | |
Rhode Island | | 1,700 | | 0.6 | |
Missouri | | 1,600 | | 0.5 | |
Maine | | 1,400 | | 0.5 | |
Virginia | | 1,395 | | 0.5 | |
Oregon | | 675 | | 0.2 | |
| | $ | 295,775 | | 99.6 | % |
Graphic Presentation of Portfolio Holdings
The following graph depicts the Portfolio’s holdings by investment type, as a percentage of total investments.
The accompanying notes are an integral part of the financial statements.
20
| 2005 Semi-Annual Report |
| |
| April 30, 2005 (unaudited) |
Statements of Assets and Liabilities
| | Money Market | | Prime | | Government | | Treasury | | Tax-Exempt | |
| | Portfolio
(000) | | Portfolio
(000) | | Portfolio
(000) | | Portfolio
(000) | | Portfolio
(000) | |
Assets: | | | | | | | | | | | |
Investments, at Cost: | | $ | 3,055,349 | | $ | 12,195,145 | | $ | 1,434,017 | | $ | 102,216 | | $ | 295,775 | |
Investments, at Value: | | 2,635,909 | | 10,313,040 | | 458,167 | | 3,991 | | 295,775 | |
Repurchase Agreements, at Value | | 419,440 | | 1,882,105 | | 975,850 | | 98,225 | | — | |
Cash | | 5 | | 4 | | 18 | | 30 | | 80 | |
Interest Receivable | | 4,332 | | 10,553 | | 1,211 | | 30 | | 966 | |
Receivable for Investments Sold | | — | | — | | — | | — | | 500 | |
Receivable from Investment Adviser | | — | | — | | 34 | | 6 | | 2 | |
Other Assets | | 31 | | 83 | | 1 | | 3 | | 1 | |
Total Assets | | 3,059,717 | | 12,205,785 | | 1,435,281 | | 102,285 | | 297,324 | |
Liabilities: | | | | | | | | | | | |
Payable for Investments Purchased | | — | | 200,022 | | — | | — | | — | |
Dividends Declared | | 6,766 | | 28,135 | | 3,525 | | 204 | | 305 | |
Investment Advisory Fees Payable | | 59 | | 351 | | — | | — | | — | |
Payable for Administrative Fees | | 123 | | 517 | | 64 | | 4 | | 7 | |
Payable for Custodian Fees | | 45 | | 145 | | 14 | | 7 | | 5 | |
Shareholder Administration Plan Fees Payable — Service Class | | #— | | #— | | 1 | | #— | | #— | |
Shareholder Administration Plan Fees Payable — Investor Class | | #— | | 1 | | 17 | | #— | | #— | |
Shareholder Administration Plan Fees Payable — Administrative Class | | #— | | #— | | 4 | | #— | | #— | |
Service and Shareholder Administration Plan Fees Payable — Advisory Class | | #— | | 5 | | 3 | | #— | | 2 | |
Distribution and Shareholder Service Plan Fees Payable — Participant Class | | #— | | #— | | #— | | #— | | #— | |
Other Liabilities | | 36 | | 594 | | 128 | | 16 | | 16 | |
Total Liabilities | | 7,029 | | 229,770 | | 3,756 | | 231 | | 335 | |
Net Assets | | $ | 3,052,688 | | $ | 11,976,015 | | $ | 1,431,525 | | $ | 102,054 | | $ | 296,989 | |
Net Assets Consist Of: | | | | | | | | | | | |
Paid-in Capital | | $ | 3,052,690 | | $ | 11,976,023 | | $ | 1,431,525 | | $ | 102,054 | | $ | 296,989 | |
Undistributed (Distributions in Excess of) Net Investment Income | | — | | 2 | | — | # | — | | — | |
Accumulated Net Realized Gain (Loss) | | (2 | ) | (10 | ) | — | # | — | # | — | |
Net Assets | | $ | 3,052,688 | | $ | 11,976,015 | | $ | 1,431,525 | | $ | 102,054 | | $ | 296,989 | |
# Amount is less than $500.
21
2005 Semi-Annual Report |
|
April 30, 2005 (unaudited) |
Statements of Assets and Liabilities (cont’d)
| | Money Market | | Prime | | Government | | Treasury | | Tax-Exempt | |
| | Portfolio
(000) | | Portfolio
(000) | | Portfolio
(000) | | Portfolio
(000) | | Portfolio
(000) | |
INSTITUTIONAL CLASS: | | | | | | | | | | | |
Net Assets | | $ | 3,051,880 | | $ | 11,940,660 | | $ | 1,149,008 | | $ | 100,072 | | $ | 284,714 | |
Shares Outstanding $0.01 par value shares of | | | | | | | | | | | |
beneficial interest | | | | | | | | | | | |
(unlimited number of shares authorized) (not in 000’ s) | | 3,051,879,442 | | 11,940,666,768 | | 1,149,008,144 | | 100,072,102 | | 284,714,002 | |
Net Asset Value, Offering and Redemption Price Per Share | | $ | 1.00 | | $ | 1.00 | | $ | 1.00 | | $ | 1.00 | | $ | 1.00 | |
SERVICE CLASS: | | | | | | | | | | | |
Net Assets | | $ | 100 | | $ | 100 | | $ | 17,262 | | $ | 100 | | $ | 100 | |
Shares Outstanding $0.01 par value shares of | | | | | | | | | | | |
beneficial interest | | | | | | | | | | | |
(unlimited number of shares authorized) (not in 000’ s) | | 100,000 | | 100,000 | | 17,261,470 | | 100,000 | | 100,000 | |
Net Asset Value, Offering and Redemption Price Per Share | | $ | 1.00 | | $ | 1.00 | | $ | 1.00 | | $ | 1.00 | | $ | 1.00 | |
INVESTOR CLASS: | | | | | | | | | | | |
Net Assets | | $ | 100 | | $ | 10,000 | | $ | 211,543 | | $ | 100 | | $ | 104 | |
Shares Outstanding $0.01 par value shares of | | | | | | | | | | | |
beneficial interest | | | | | | | | | | | |
(unlimited number of shares authorized) (not in 000’ s) | | 100,000 | | 10,000,000 | | 211,543,300 | | 100,000 | | 104,380 | |
Net Asset Value, Offering and Redemption Price Per Share | | $ | 1.00 | | $ | 1.00 | | $ | 1.00 | | $ | 1.00 | | $ | 1.00 | |
ADMINISTRATIVE CLASS: | | | | | | | | | | | |
Net Assets | | $ | 100 | | $ | 100 | | $ | 31,406 | | $ | 100 | | $ | 100 | |
Shares Outstanding $0.01 par value shares of | | | | | | | | | | | |
beneficial interest | | | | | | | | | | | |
(unlimited number of shares authorized) (not in 000’ s) | | 100,000 | | 100,000 | | 31,405,602 | | 100,000 | | 100,000 | |
Net Asset Value, Offering and Redemption Price Per Share | | $ | 1.00 | | $ | 1.00 | | $ | 1.00 | | $ | 1.00 | | $ | 1.00 | |
ADVISORY CLASS: | | | | | | | | | | | |
Net Assets | | $ | 408 | | $ | 25,055 | | $ | 22,206 | | $ | 1,582 | | $ | 11,869 | |
Shares Outstanding $0.01 par value shares of | | | | | | | | | | | |
beneficial interest | | | | | | | | | | | |
(unlimited number of shares authorized) (not in 000’ s) | | 407,770 | | 25,055,079 | | 22,206,202 | | 1,581,522 | | 11,868,713 | |
Net Asset Value, Offering and Redemption Price Per Share | | $ | 1.00 | | $ | 1.00 | | $ | 1.00 | | $ | 1.00 | | $ | 1.00 | |
PARTICIPANT CLASS: | | | | | | | | | | | |
Net Assets | | $ | 100 | | $ | 100 | | $ | 100 | | $ | 100 | | $ | 102 | |
Shares Outstanding $0.01 par value shares of | | | | | | | | | | | |
beneficial interest | | | | | | | | | | | |
(unlimited number of shares authorized) (not in 000’ s) | | 100,000 | | 100,000 | | 100,000 | | 100,000 | | 101,510 | |
Net Asset Value, Offering and Redemption Price Per Share | | $ | 1.00 | | $ | 1.00 | | $ | 1.00 | | $ | 1.00 | | $ | 1.00 | |
The accompanying notes are an integral part of the financial statements.
22
| 2005 Semi-Annual Report |
| |
| April 30, 2005 (unaudited) |
Statements of Operations
For the Six Months Ended April 30, 2005
| | Money Market | | Prime | | Government | | Treasury | | Tax-Exempt | |
| | Portfolio
(000) | | Portfolio
(000) | | Portfolio
(000) | | Portfolio
(000) | | Portfolio
(000) | |
Investment Income: | | | | | | | | | | | |
Interest | | $ | 37,684 | | $ | 157,170 | | $ | 13,860 | | $ | 1,305 | | $ | 1,478 | |
Expenses: | | | | | | | | | | | |
Investment Advisory Fees (Note B) | | 2,360 | | 9,600 | | 826 | | 88 | | 111 | |
Administrative Fees (Note C) | | 788 | | 3,204 | | 275 | | 29 | | 39 | |
Registration and Filing Fees | | 151 | | 653 | | 270 | | 115 | | 123 | |
Custodian Fees (Note E) | | 69 | | 235 | | 19 | | 13 | | 7 | |
Professional Fees | | 29 | | 96 | | 17 | | 11 | | 12 | |
Trustees’ Fees and Expenses | | 21 | | 71 | | 3 | | 1 | | 1 | |
Shareholder Reporting Fees | | 8 | | 23 | | 1 | | 1 | | 1 | |
Bank Overdraft Expense | | 1 | | 2 | | 2 | | #— | | #— | |
Shareholder Administration Plan Fees — Service Class (Note D) | | #— | | #— | | 4 | | #— | | #— | |
Shareholder Administration Plan Fees — Investor Class (Note D) | | #— | | 8 | | 82 | | #— | | #— | |
Shareholder Administration Plan Fees — Administrative Class (Note D) | | #— | | #— | | 23 | | #— | | #— | |
Service and Shareholder Administration Plan Fees — Advisory Class (Note D) | | 1 | | 34 | | 16 | | 2 | | 33 | |
Distribution and Shareholder Service Plan Fees — Participant Class (Note D) | | #— | | #— | | #— | | #— | | #— | |
Other Expenses | | 72 | | 235 | | 31 | | 28 | | 19 | |
Total Expenses | | 3,500 | | 14,161 | | 1,569 | | 288 | | 346 | |
Waiver of Investment Advisory Fees (Note B) | | (1,924 | ) | (7,470 | ) | (826 | ) | (88 | ) | (111 | ) |
Expenses Reimbursed by Adviser (Note B) | | — | | — | | (340 | ) | (168 | ) | (137 | ) |
Net Expenses | | 1,576 | | 6,691 | | 403 | | 32 | | 98 | |
Net Investment Income (Loss) | | 36,108 | | 150,479 | | 13,457 | | 1,273 | | 1,380 | |
Realized Gain (Loss): | | | | | | | | | | | |
Investments | | #— | | 5 | | #— | | #— | | — | |
Net Increase (Decrease) in Net Assets Resulting from Operations | | $ | 36,108 | | $ | 150,484 | | $ | 13,457 | | $ | 1,273 | | $ | 1,380 | |
# Amount is less than $500.
The accompanying notes are an integral part of the financial statements.
23
2005 Semi-Annual Report |
|
April 30, 2005 (unaudited) |
Statements of Changes in Net Assets
| | Money Market | | Prime | |
| | Portfolio | | Portfolio | |
| | Six Months | | Period from | | Six Months | | Period from | |
| | Ended | | February 2, | | Ended | | February 2, | |
| | April 30, | | 2004* to | | April 30, | | 2004* to | |
| | 2005 | | October 31, | | 2005 | | October 31, | |
| | (unaudited) | | 2004 | | (unaudited) | | 2004 | |
| | (000) | | (000) | | (000) | | (000) | |
Increase (Decrease) in Net Assets Operations: | | | | | | | | | |
Net Investment Income | | $ | 36,108 | | $ | 19,002 | | $ | 150,479 | | $ | 49,256 | |
Net Realized Gain (Loss) | | #— | | (2 | ) | 5 | | (15 | ) |
Net Increase (Decrease) in Net Assets Resulting from Operations | | 36,108 | | 19,000 | | 150,484 | | 49,241 | |
Distributions from and/or in Excess of: | | | | | | | | | |
Institutional Class: | | | | | | | | | |
Net Investment Income | | (36,100 | ) | (18,959 | ) | (150,017 | ) | (49,172 | ) |
Service Class: | | | | | | | | | |
Net Investment Income | | (1 | ) | — | | (1 | ) | — | |
Investor Class: | | | | | | | | | |
Net Investment Income | | (1 | ) | (37 | ) | (165 | ) | — | |
Administrative Class: | | | | | | | | | |
Net Investment Income | | (1 | ) | — | | (1 | ) | — | |
Advisory Class: | | | | | | | | | |
Net Investment Income | | (4 | ) | (6 | ) | (292 | ) | (84 | ) |
Participant Class: | | | | | | | | | |
Net Investment Income | | (1 | ) | — | | (1 | ) | — | |
Total Distributions | | (36,108 | ) | (19,002 | ) | (150,477 | ) | (49,256 | ) |
Capital Share Transactions:(1) | | | | | | | | | |
Institutional Class: | | | | | | | | | |
Subscribed | | 9,783,547 | | 11,439,898 | | 50,468,673 | | 33,974,259 | |
Distributions Reinvested | | 24,104 | | 8,193 | | 82,549 | | 24,233 | |
Redeemed | | (9,832,799 | ) | (8,371,061 | ) | (47,343,431 | ) | (25,265,715 | ) |
Service Class:** | | | | | | | | | |
Subscribed | | 100 | | — | | 100 | | — | |
Distributions Reinvested | | — | | — | | — | | — | |
Redeemed | | — | | — | | — | | — | |
Investor Class:^ | | | | | | | | | |
Subscribed | | 100 | | 50,004 | | 64,800 | | — | |
Distributions Reinvested | | — | | 37 | | 145 | | — | |
Redeemed | | — | | (50,041 | ) | (54,945 | ) | — | |
Administrative Class:** | | | | | | | | | |
Subscribed | | 100 | | — | | 100 | | — | |
Distributions Reinvested | | — | | — | | — | | — | |
Redeemed | | — | | — | | — | | — | |
Advisory Class:† | | | | | | | | | |
Subscribed | | 310 | | 4,832 | | 100,115 | | 70,860 | |
Distributions Reinvested | | — | | — | | 191 | | 62 | |
Redeemed | | (1,407 | ) | (3,327 | ) | (91,601 | ) | (54,572 | ) |
Participant Class:** | | | | | | | | | |
Subscribed | | 100 | | — | | 100 | | — | |
Distributions Reinvested | | — | | — | | — | | — | |
Redeemed | | — | | — | | — | | — | |
Net Increase (Decrease) in Net Assets Resulting from Capital Share Transactions | | (25,845 | ) | 3,078,535 | | 3,226,796 | | 8,749,127 | |
Total Increase (Decrease) in Net Assets | | (25,845 | ) | 3,078,533 | | 3,226,803 | | 8,749,112 | |
Net Assets: | | | | | | | | | |
Beginning of Period | | 3,078,533 | | — | | 8,749,212 | | 100 | |
End of Period | | $ | 3,052,688 | | $ | 3,078,533 | | $ | 11,976,015 | | $ | 8,749,212 | |
Undistributed (Distributions in Excess of) Net Investment Income Included in End of Period Net Assets | | $ | — | | $ | — | | $ | 2 | | $ | — | |
The accompanying notes are an integral part of the financial statements.
24
| 2005 Semi-Annual Report |
| |
| April 30, 2005 (unaudited) |
Statements of Changes in Net Assets (cont’d)
| | | Money Market | | Prime | |
| | | Portfolio | | Portfolio | |
| | | Six Months | | Period from | | Six Months | | Period from | |
| | | Ended | | February 2, | | Ended | | February 2, | |
| | | April 30, | | 2004* to | | April 30, | | 2004* to | |
| | | 2005 | | October 31, | | 2005 | | October 31, | |
| | | (unaudited) | | 2004 | | (unaudited) | | 2004 | |
| | | (000) | | (000) | | (000) | | (000) | |
(1) | Capital Share Transactions: | | | | | | | | | |
| Institutional Class: | | | | | | | | | |
| Shares Subscribed | | 9,783,545 | | 11,439,897 | | 50,468,668 | | 33,974,258 | |
| Shares Issued on Distributions Reinvested | | 24,104 | | 8,193 | | 82,549 | | 24,233 | |
| Shares Redeemed | | (9,832,798 | ) | (8,371,061 | ) | (47,343,429 | ) | (25,265,713 | ) |
| Net Increase (Decrease) in Institutional Class Shares Outstanding | | (25,149 | ) | 3,077,029 | | 3,207,788 | | 8,732,778 | |
| Service Class:** | | | | | | | | | |
| Shares Subscribed | | 100 | | — | | 100 | | — | |
| Shares Issued on Distributions Reinvested | | — | | — | | — | | — | |
| Shares Redeemed | | — | | — | | — | | — | |
| Net Increase (Decrease) in Service Class Shares Outstanding | | 100 | | — | | 100 | | — | |
| Investor Class:^ | | | | | | | | | |
| Shares Subscribed | | 100 | | 50,004 | | 64,800 | | — | |
| Shares Issued on Distributions Reinvested | | — | | 37 | | 145 | | — | |
| Shares Redeemed | | — | | (50,041 | ) | (54,945 | ) | — | |
| Net Increase (Decrease) in Investor Class Shares Outstanding | | 100 | | — | | 10,000 | | — | |
| Administrative Class:** | | | | | | | | | |
| Shares Subscribed | | 100 | | — | | 100 | | — | |
| Shares Issued on Distributions Reinvested | | — | | — | | — | | — | |
| Shares Redeemed | | — | | — | | — | | — | |
| Net Increase (Decrease) in Administrative Class Shares Outstanding | | 100 | | — | | 100 | | — | |
| Advisory Class:† | | | | | | | | | |
| Shares Subscribed | | 310 | | 4,832 | | 100,115 | | 70,838 | |
| Shares Issued on Distributions Reinvested | | — | | — | | 191 | | 84 | |
| Shares Redeemed | | (1,407 | ) | (3,327 | ) | (91,601 | ) | (54,572 | ) |
| Net Increase (Decrease) in Advisory Class Shares Outstanding | | (1,097 | ) | 1,505 | | 8,705 | | 16,350 | |
| Participant Class:** | | | | | | | | | |
| Shares Subscribed | | 100 | | — | | 100 | | — | |
| Shares Issued on Distributions Reinvested | | — | | — | | — | | — | |
| Shares Redeemed | | — | | — | | — | | — | |
| Net Increase (Decrease) in Participant Class Shares Outstanding | | 100 | | — | | 100 | | — | |
* | Commencement of Operations |
** | The Money Market and Prime Portfolios’ Service, Administrative and Participant classes commenced offering on November 1, 2004. |
^ | The Money Market and Prime Portfolios’ Investor classes commenced offering on June 16, 2004 and November 1, 2004, respectively. |
† | The Money Market and Prime Portfolios’ Advisory classes commenced offering on February 6, 2004 and April 29, 2004, respectively. |
# | Amount is less than $500. |
The accompanying notes are an integral part of the financial statements.
25
2005 Semi-Annual Report |
|
April 30, 2005 (unaudited) |
Statement of Changes in Net Assets
| | Government | | Treasury | | Tax-Exempt | |
| | Portfolio | | Portfolio | | Portfolio | |
| | Six Months | | Period from | | Six Months | | Period from | | Six Months | | Period from | |
| | Ended | | August 9, | | Ended | | August 9, | | Ended | | February 2, | |
| | April 30, | | 2004* to | | April 30, | | 2004* to | | April 30, | | 2004* to | |
| | 2005 | | October 31, | | 2005 | | October 31, | | 2005 | | October 31, | |
| | (unaudited) | | 2004 | | (unaudited) | | 2004 | | (unaudited) | | 2004 | |
| | (000) | | (000) | | (000) | | (000) | | (000) | | (000) | |
Increase (Deicrease) in Net Assets | | | | | | | | | | | | | |
Operations: | | | | | | | | | | | | | |
Net Investment Income | | $ | 13,457 | | $ | 1,004 | | $ | 1,273 | | $ | 738 | | $ | 1,380 | | $ | 735 | |
Net Realized Gain (Loss) | | #— | | #— | | #— | | — | | — | | — | |
Net Increase (Decrease) in Net Assets Resulting from Operations | | 13,457 | | 1,004 | | 1,273 | | 738 | | 1,380 | | 735 | |
Distributions from and/or in Excess of: | | | | | | | | | | | | | |
Institutional Class: | | | | | | | | | | | | | |
Net Investment Income | | (10,886 | ) | (612 | ) | (1,249 | ) | (679 | ) | (1,184 | ) | (694 | ) |
Service Class: | | | | | | | | | | | | | |
Net Investment Income | | (214 | ) | — | | (1 | ) | — | | (1 | ) | — | |
Investor Class: | | | | | | | | | | | | | |
Net Investment Income | | (1,878 | ) | (362 | ) | (1 | ) | — | | (1 | ) | (18 | ) |
Administrative Class: | | | | | | | | | | | | | |
Net Investment Income | | (344 | ) | — | | (1 | ) | — | | (1 | ) | — | |
Advisory Class: | | | | | | | | | | | | | |
Net Investment Income | | (134 | ) | (30 | ) | (20 | ) | (59 | ) | (192 | ) | (23 | ) |
Participant Class: | | | | | | | | | | | | | |
Net Investment Income | | (1 | ) | — | | (1 | ) | — | | (1 | ) | — | |
Total Distributions | | (13,457 | ) | (1,004 | ) | (1,273 | ) | (738 | ) | (1,380 | ) | (735 | ) |
Capital Share Transactions:(1) | | | | | | | | | | | | | |
Institutional Class: | | | | | | | | | | | | | |
Subscribed | | 3,479,067 | | 456,075 | | 340,147 | | 365,647 | | 429,221 | | 296,506 | |
Distributions Reinvested | | 5,465 | | 5 | | 1,122 | | 298 | | 914 | | 368 | |
Redeemed | | (2,750,092 | ) | (41,512 | ) | (428,966 | ) | (178,175 | ) | (254,714 | ) | (187,582 | ) |
Service Class:** | | | | | | | | | | | | | |
Subscribed | | 33,102 | | — | | 100 | | — | | 100 | | — | |
Distributions Reinvested | | 161 | | — | | — | | — | | — | | — | |
Redeemed | | (16,001 | ) | — | | — | | — | | — | | — | |
Investor Class:^ | | | | | | | | | | | | | |
Subscribed | | 1,711,697 | | 875,167 | | 100 | | — | | 100 | | 6,106 | |
Distributions Reinvested | | 674 | | 16 | | — | | — | | 2 | | 16 | |
Redeemed | | (1,610,603 | ) | (765,407 | ) | — | | — | | (1,118 | ) | (5,001 | ) |
Administrative Class:** | | | | | | | | | | | | | |
Subscribed | | 354,601 | | — | | 100 | | — | | 100 | | — | |
Distributions Reinvested | | 267 | | — | | — | | — | | — | | — | |
Redeemed | | (323,463 | ) | — | | — | | — | | — | | — | |
Advisory Class:† | | | | | | | | | | | | | |
Subscribed | | 220,147 | | 85,813 | | 115 | | 24,325 | | 58,066 | | 62,003 | |
Distributions Reinvested | | 131 | | — | | 20 | | 41 | | 191 | | 3 | |
Redeemed | | (221,821 | ) | (62,064 | ) | (761 | ) | (22,159 | ) | (102,388 | ) | (6,006 | ) |
Participant Class:** | | | | | | | | | | | | | |
Subscribed | | 100 | | — | | 100 | | — | | 130 | | — | |
Distributions Reinvested | | — | | — | | — | | — | | — | | — | |
Redeemed | | — | | — | | — | | — | | (28 | ) | — | |
Net Increase (Decrease) in Net Assets Resulting from Capital Share Transactions | | 883,432 | | 548,093 | | (87,923 | ) | 189,977 | | 130,576 | | 166,413 | |
Total Increase (Decrease) in Net Assets | | 883,432 | | 548,093 | | (87,923 | ) | 189,977 | | 130,576 | | 166,413 | |
Net Assets: | | | | | | | | | | | | | |
Beginning of Period | | 548,093 | | — | | 189,977 | | — | | 166,413 | | — | |
End of Period | | $ | 1,431,525 | | $ | 548,093 | | $ | 102,054 | | $ | 189,977 | | $ | 296,989 | | $ | 166,413 | |
Undistributed (Distributions in Excess of) Net Investment Income Included in End of Period Net Assets | | $ | #— | | $ | — | | $ | — | | $ | — | | $ | — | | $ | — | |
The accompanying notes are an integral part of the financial statements.
26
| 2005 Semi-Annual Report |
| |
| April 30, 2005 (unaudited) |
Statement of Changes in Net Assets (cont’d)
| | | Government | | Treasury | | Tax-Exempt | |
| | | Portfolio | | Portfolio | | Portfolio | |
| | | Six Months | | Period from | | Six Months | | Period from | | Six Months | | Period from | |
| | | Ended | | August 9, | | Ended | | August 9, | | Ended | | February 2, | |
| | | April 30, | | 2004* to | | April 30, | | 2004* to | | April 30, | | 2004* to | |
| | | 2005 | | October 31, | | 2005 | | October 31, | | 2005 | | October 31, | |
| | | (unaudited) | | 2004 | | (unaudited) | | 2004 | | (unaudited) | | 2004 | |
| | | (000) | | (000) | | (000) | | (000) | | (000) | | (000) | |
(1) | Capital Share Transactions: | | | | | | | | | | | | | |
| Institutional Class: | | | | | | | | | | | | | |
| Shares Subscribed | | 3,479,068 | | 456,074 | | 340,147 | | 365,647 | | 429,221 | | 296,506 | |
| Shares Issued on Distributions Reinvested | | 5,465 | | 5 | | 1,122 | | 298 | | 914 | | 368 | |
| Shares Redeemed | | (2,750,092 | ) | (41,512 | ) | (428,966 | ) | (178,176 | ) | (254,714 | ) | (187,582 | ) |
| Net Increase (Decrease) in Institutional Class Shares Outstanding | | 734,441 | | 414,567 | | (87,697 | ) | 187,769 | | 175,421 | | 109,292 | |
| Service Class:** | | | | | | | | | | | | | |
| Shares Subscribed | | 33,102 | | — | | 100 | | — | | 100 | | — | |
| Shares Issued on Distributions Reinvested | | 160 | | — | | — | | — | | — | | — | |
| Shares Redeemed | | (16,001 | ) | — | | — | | — | | — | | — | |
| Net Increase (Decrease) in Service Class Shares Outstanding | | 17,261 | | — | | 100 | | — | | 100 | | — | |
| Investor Class:^ | | | | | | | | | | | | | |
| Shares Subscribed | | 1,711,695 | | 875,167 | | 100 | | — | | 100 | | 6,106 | |
| Shares Issued on Distributions Reinvested | | 674 | | 16 | | — | | — | | 2 | | 16 | |
| Shares Redeemed | | (1,610,602 | ) | (765,407 | ) | — | | — | | (1,118 | ) | (5,001 | ) |
| Net Increase (Decrease) in Investor Class Shares Outstanding | | 101,767 | | 109,776 | | 100 | | — | | (1,016 | ) | 1,121 | |
| Administrative Class:** | | | | | | | | | | | | | |
| Shares Subscribed | | 354,601 | | — | | 100 | | — | | 100 | | — | |
| Shares Issued on Distributions Reinvested | | 268 | | — | | — | | — | | — | | — | |
| Shares Redeemed | | (323,463 | ) | — | | — | | — | | — | | — | |
| Net Increase (Decrease) in Administrative Class Shares Outstanding | | 31,406 | | — | | 100 | | — | | 100 | | — | |
| Advisory Class:† | | | | | | | | | | | | | |
| Shares Subscribed | | 220,147 | | 85,813 | | 115 | | 24,325 | | 58,066 | | 62,003 | |
| Shares Issued on Distributions Reinvested | | 131 | | — | | 20 | | 41 | | 191 | | 3 | |
| Shares Redeemed | | (221,821 | ) | (62,064 | ) | (761 | ) | (22,159 | ) | (102,388 | ) | (6,006 | ) |
| Net Increase (Decrease) in Advisory Class Shares Outstanding | | (1,543 | ) | 23,749 | | (626 | ) | 2,207 | | (44,131 | ) | 56,000 | |
| Participant Class:** | | | | | | | | | | | | | |
| Shares Subscribed | | 100 | | — | | 100 | | — | | 130 | | — | |
| Shares Issued on Distributions Reinvested | | — | | — | | — | | — | | — | | — | |
| Shares Redeemed | | — | | — | | — | | — | | (28 | ) | — | |
| Net Increase (Decrease) in Participant Class Shares Outstanding | | 100 | | — | | 100 | | — | | 102 | | — | |
* | Commencement of Operations |
** | The Government, Treasury, and Tax-Exempt Portfolios’ Service, Administrative and Participant classes commenced offering on November 1, 2004. |
^ | The Government, Treasury, and Tax-Exempt Portfolios’ Investor classes commenced offering on August 9, 2004, November 1, 2004, and June 8, 2004, respectively. |
† | The Government, Treasury, and Tax-Exempt Portfolios’ Advisory classes commenced offering on October 1, 2004, August 9, 2004, and June 15, 2004, respectively. |
# | Amount is less than $500. |
The accompanying notes are an integral part of the financial statements.
27
2005 Semi-Annual Report |
|
April 30, 2005 (unaudited) |
Financial Highlights
Money Market Portfolio
| | Institutional Class | |
| | | | Period from | |
| | Six Months | | February 2, | |
| | Ended April | | 2004** to | |
| | 30, 2005 | | October 31, | |
Selected Per Share Data and Ratios | | (unaudited) | | 2004 | |
Net Asset Value, Beginning of Period | | $ | 1.000 | | $ | 1.000 | |
Income from Investment Operations | | | | | |
Net Investment Income | | 0.011 | | 0.009 | |
Distributions from and/or in Excess of: | | | | | |
Net Investment Income | | (0.011 | ) | (0.009 | ) |
Net Asset Value, End of Period | | $ | 1.000 | | $ | 1.000 | |
Total Return | | 1.15 | %‡ | 0.95 | %‡ |
Ratios and Supplemental Data: | | | | | |
Net Assets, End of Period (Thousands) | | $ | 3,051,880 | | $ | 3,077,029 | |
Ratio of Expenses to Average Net Assets(1) | | 0.10 | %* | 0.07 | %*† |
Ratio of Net Investment Income to Average Net Assets(1) | | 2.30 | %* | 1.41 | %* |
(1) Supplemental Information on the Ratios to Average Net Assets: | | | | | |
Ratios Before Expenses Waived/Reimbursed by Adviser: | | | | | |
Expenses to Average Net Assets | | 0.22 | %* | 0.24 | %*† |
Net Investment Income to Average Net Assets | | 2.18 | %* | 1.24 | %* |
| | | | Service Class | |
| | | | Six Months | |
| | | | Ended April | |
Selected Per Share Data and Ratios | | | | 30, 2005^
(unaudited) | |
Net Asset Value, Beginning of Period | | | | $ | 1.000 | |
Income from Investment Operations | | | | | |
Net Investment Income | | | | 0.011 | |
Distributions from and/or in Excess of: | | | | | |
Net Investment Income | | | | (0.011 | ) |
Net Asset Value, End of Period | | | | $ | 1.000 | |
Total Return | | | | 1.13 | %‡ |
Ratios and Supplemental Data: | | | | | |
Net Assets, End of Period (Thousands) | | | | $ | 100 | |
Ratio of Expenses to Average Net Assets(2) | | | | 0.15 | %* |
Ratio of Net Investment Income to Average Net Assets(2) | | | | 2.26 | %* |
(2) Supplemental Information on the Ratios to Average Net Assets: | | | | | |
Ratios Before Expenses Waived/Reimbursed by Adviser: | | | | | |
Expenses to Average Net Assets | | | | 0.27 | %* |
Net Investment Income to Average Net Assets | | | | 2.14 | %* |
* | Annualized |
‡ | Not Annualized |
** | Commencement of Operations |
^ | The Portfolio’s Service Class commenced offering on November 1, 2004. |
† | Ratios of Expenses to Average Net Assets before and after Expense Limitations may vary among share classes by more or less than the service and shareholder administration plan fees due to different periods of operation for each share class as well as fluctuations in daily net asset amounts. |
The accompanying notes are an integral part of the financial statements.
28
| 2005 Semi-Annual Report |
| |
| April 30, 2005 (unaudited) |
Financial Highlights
Money Market Portfolio
| | Investor Class(1) | |
| | Six Months | |
| | Ended April | |
Selected Per Share Data and Ratios | | 30, 2005
(unaudited) | |
Net Asset Value, Beginning of Period | | $ | 1.000 | |
Income from Investment Operations | | | |
Net Investment Income | | 0.011 | |
Distributions from and/or in Excess of: | | | |
Net Investment Income | | (0.011 | ) |
Net Asset Value, End of Period | | $ | 1.000 | |
Total Return | | 1.10 | %‡ |
Ratios and Supplemental Data: | | | |
Net Assets, End of Period (Thousands) | | $ | 100 | |
Ratio of Expenses to Average Net Assets(1) | | 0.20 | %* |
Ratio of Net Investment Income to Average Net Assets(1) | | 2.21 | %* |
(1) Supplemental Information on the Ratios to Average Net Assets: | | | |
Ratios Before Expenses Waived/Reimbursed by Adviser: | | | |
Expenses to Average Net Assets | | 0.32 | %* |
Net Investment Income to Average Net Assets | | 2.09 | %* |
| | Administrative Class | |
| | Six Months | |
| | Ended April | |
Selected Per Share Data and Ratios | | 30, 2005^
(unaudited) | |
Net Asset Value, Beginning of Period | | $ | 1.000 | |
Income from Investment Operations | | | |
Net Investment Income | | 0.011 | |
Distributions from and/or in Excess of: | | | |
Net Investment Income | | (0.011 | ) |
Net Asset Value, End of Period | | $ | 1.000 | |
Total Return | | 1.08. | %‡ |
Ratios and Supplemental Data: | | | |
Net Assets, End of Period (Thousands) | | $ | 100 | |
Ratio of Expenses to Average Net Assets(2) | | 0.25 | %* |
Ratio of Net Investment Income to Average Net Assets(2) | | 2.16 | %* |
(2) Supplemental Information on the Ratios to Average Net Assets: | | | |
Ratios Before Expenses Waived/Reimbursed by Adviser: | | | |
Expenses to Average Net Assets | | 0.37 | %* |
Net Investment Income to Average Net Assets | | 2.04 | %* |
(1) | The Portfolio’s Investor Class commenced offering on June 16, 2004. There were no Money Market Portfolio Investor shares outstanding during the periods July 28, 2004 to October 30, 2004. |
* | Annualized |
‡ | Not Annualized |
^ | The Portfolio’s Administrative Class commenced offering on November 1, 2004. |
The accompanying notes are an integral part of the financial statements.
29
2005 Semi-Annual Report |
|
April 30, 2005 (unaudited) |
Financial Highlights
Money Market Portfolio
| | Advisory Class | |
| | | | Period from | |
| | Six Months | | February 6, | |
| | Ended April | | 2004** to | |
| | 30, 2005 | | October 31, | |
Selected Per Share Data and Ratios | | (unaudited) | | 2004 | |
Net Asset Value, Beginning of Period | | $ | 1.000 | | $ | 1.000 | |
Income from Investment Operations | | | | | |
Net Investment Income | | 0.010 | | 0.008 | |
Distributions from and/or in Excess of: | | | | | |
Net Investment Income | | (0.010 | ) | (0.008 | ) |
Net Asset Value, End of Period | | $ | 1.000 | | $ | 1.000 | |
Total Return | | 1.03 | %‡ | 0.76 | %‡ |
Ratios and Supplemental Data: | | | | | |
Net Assets, End of Period (Thousands) | | $ | 408 | | $ | 1,504 | |
Ratio of Expenses to Average Net Assets(1) | | 0.35 | %* | 0.31 | %*† |
Ratio of Net Investment Income to Average Net Assets(1) | | 2.06 | %* | 1.12 | %* |
(1) Supplemental Information on the Ratios to Average Net Assets: | | | | | |
Ratios Before Expenses Waived/Reimbursed by Adviser: | | | | | |
Expenses to Average Net Assets | | 0.47 | %* | 0.50 | %*† |
Net Investment Income to Average Net Assets | | 1.94 | %* | 0.93 | %* |
| | | | Participant Class | |
| | | | Six Months | |
| | | | Ended April | |
Selected Per Share Data and Ratios | | | | 30, 2005^
(unaudited) | |
Net Asset Value, Beginning of Period | | | | $ | 1.000 | |
Income from Investment Operations | | | | | |
Net Investment Income | | | | 0.009 | |
Distributions from and/or in Excess of: | | | | | |
Net Investment Income | | | | (0.009 | ) |
Net Asset Value, End of Period | | | | $ | 1.000 | |
Total Return | | | | 0.95 | %‡ |
Ratios and Supplemental Data: | | | | | |
Net Assets, End of Period (Thousands) | | | | $ | 100 | |
Ratio of Expenses to Average Net Assets(2) | | | | 0.50 | %* |
Ratio of Net Investment Income to Average Net Assets(2) | | | | 1.91 | %* |
(2) Supplemental Information on the Ratios to Average Net Assets: | | | | | |
Ratios Before Expenses Waived/Reimbursed by Adviser: | | | | | |
Expenses to Average Net Assets | | | | 0.62 | %* |
Net Investment Income to Average Net Assets | | | | 1.79 | %* |
* | Annualized |
‡ | Not Annualized |
** | The Portfolio’s Advisory Class commenced offering on February 6, 2004. |
^ | The Portfolio’s Participant Class commenced offering on November 1, 2004. |
† | Ratios of Expenses to Average Net Assets before and after Expense Limitations may vary among share classes by more or less than the service and shareholder administration plan fees due to different periods of operation for each share class as well as fluctuations in daily net asset amounts. |
The accompanying notes are an integral part of the financial statements.
30
| 2005 Semi-Annual Report |
| |
| April 30, 2005 (unaudited) |
Financial Highlights
Prime Portfolio
| | Institutional Class | |
| | | | Period from | |
| | Six Months | | February 2, | |
| | Ended April | | 2004** to | |
| | 30, 2005 | | October 31, | |
Selected Per Share Data and Ratios | | (unaudited) | | 2004 | |
Net Asset Value, Beginning of Period | | $ | 1.000 | | $ | 1.000 | |
Income from Investment Operations | | | | | |
Net Investment Income | | 0.012 | | 0.009 | |
Distributions from and/or in Excess of: | | | | | |
Net Investment Income | | (0.012 | ) | (0.009 | ) |
Net Asset Value, End of Period | | $ | 1.000 | | $ | 1.000 | |
Total Return | | 1.16 | %‡ | 0.94 | %‡ |
Ratios and Supplemental Data: | | | | | |
Net Assets, End of Period (Thousands) | | $ | 11,940,660 | | $ | 8,732,862 | |
Ratio of Expenses to Average Net Assets(1) | | 0.10 | %* | 0.08 | %* |
Ratio of Net Investment Income to Average Net Assets(1) | | 2.36 | %* | 1.41 | %* |
(1) Supplemental Information on the Ratios to Average Net Assets: | | | | | |
Ratios Before Expenses Waived/Reimbursed by Adviser: | | | | | |
Expenses to Average Net Assets | | 0.22 | %* | 0.24 | %* |
Net Investment Income to Average Net Assets | | 2.24 | %* | 1.25 | %* |
| | | | Service Class | |
| | | | Six Months | |
| | | | Ended April | |
Selected Per Share Data and Ratios | | | | 30, 2005^
(unaudited) | |
Net Asset Value, Beginning of Period | | | | $ | 1.000 | |
Income from Investment Operations | | | | | |
Net Investment Income | | | | 0.011 | |
Distributions from and/or in Excess of: | | | | | |
Net Investment Income | | | | (0.011 | ) |
Net Asset Value, End of Period | | | | $ | 1.000 | |
Total Return | | | | 1.14 | %‡ |
Ratios and Supplemental Data: | | | | | |
Net Assets, End of Period (Thousands) | | | | $ | 100 | |
Ratio of Expenses to Average Net Assets(2) | | | | 0.15 | %* |
Ratio of Net Investment Income to Average Net Assets(2) | | | | 2.29 | %* |
(2) Supplemental Information on the Ratios to Average Net Assets: | | | | | |
Ratios Before Expenses Waived/Reimbursed by Adviser: | | | | | |
Expenses to Average Net Assets | | | | 0.27 | %* |
Net Investment Income to Average Net Assets | | | | 2.17 | %* |
* | Annualized |
‡ | Not Annualized |
** | Commencement of Operations |
^ | The Portfolio’s Service Class commenced offering on November 1, 2004. |
The accompanying notes are an integral part of the financial statements.
31
2005 Semi-Annual Report |
|
April 30, 2005 (unaudited) |
Financial Highlights
Prime Portfolio
| | Investor Class | |
| | Six Months | |
| | Ended April | |
Selected Per Share Data and Ratios | | 30,2005^
(unaudited) | |
Net Asset Value, Beginning of Period | | $ | 1.000 | |
Income from Investment Operations | | | |
Net Investment Income | | 0.011 | |
Distributions from and/or in Excess of: | | | |
Net Investment Income | | (0.011 | ) |
Net Asset Value, End of Period | | $ | 1.000 | |
Total Return | | 1.11 | %‡ |
Ratios and Supplemental Data: | | | |
Net Assets, End of Period (Thousands) | | $ | 10,000 | |
Ratio of Expenses to Average Net Assets(1) | | 0.20 | %* |
Ratio of Net Investment Income to Average Net Assets(1) | | 2.14 | %* |
(1) Supplemental Information on the Ratios to Average Net Assets: | | | |
Ratios Before Expenses Waived/Reimbursed by Adviser: | | | |
Expenses to Average Net Assets | | 0.32 | %* |
Net Investment Income to Average Net Assets | | 2.02 | %* |
| | Administrative Class | |
| | Six Months | |
| | Ended April | |
Selected Per Share Data and Ratios | | 30,2005^
(unaudited) | |
Net Asset Value, Beginning of Period | | $ | 1.000 | |
Income from Investment Operations | | | |
Net Investment Income | | 0.011 | |
Distributions from and/or in Excess of: | | | |
Net Investment Income | | (0.011 | ) |
Net Asset Value, End of Period | | $ | 1.000 | |
Total Return | | 1.09 | %‡ |
Ratios and Supplemental Data: | | | |
Net Assets, End of Period (Thousands) | | $ | 100 | |
Ratio of Expenses to Average Net Assets(2) | | 0.25 | %* |
Ratio of Net Investment Income to Average Net Assets(2) | | 2.19 | %* |
(2) Supplemental Information on the Ratios to Average Net Assets: | | | |
Ratios Before Expenses Waived/Reimbursed by Adviser: | | | |
Expenses to Average Net Assets | | 0.37 | %* |
Net Investment Income to Average Net Assets | | 2.07 | %* |
* | Annualized |
‡ | Not Annualized |
^ | The Portfolio’s Investor Class and Administrative Class commenced offering on November 1, 2004. |
The accompanying notes are an integral part of the financial statements.
32
| 2005 Semi-Annual Report |
| |
| April 30, 2005 (unaudited) |
Financial Highlights
Prime Portfolio
| | Advisory Class | |
Selected Per Share Data and Ratios | | Six Months
Ended April
30, 2005
(unaudited) | | Period from
April 29,
2004** to
October 31,
2004 | |
Net Asset Value, Beginning of Period | | $ | 1.000 | | $ | 1.000 | |
Income from Investment Operations | | | | | |
Net Investment Income | | 0.010 | | 0.006 | |
Distributions from and/or in Excess of: | | | | | |
Net Investment Income | | (0.010 | ) | (0.006 | ) |
Net Asset Value, End of Period | | $ | 1.000 | | $ | 1.000 | |
Total Return | | 1.04 | %‡ | 0.57 | %‡ |
Ratios and Supplemental Data: | | | | | |
Net Assets, End of Period (Thousands) | | $ | 25,055 | | $ | 16,350 | |
Ratio of Expenses to Average Net Assets(1) | | 0.35 | %* | 0.33 | %* |
Ratio of Net Investment Income to Average Net Assets(1) | | 2.13 | %* | 1.14 | %* |
(1) Supplemental Information on the Ratios to Average Net Assets: | | | | | |
Ratios Before Expenses Waived/Reimbursed by Adviser: | | | | | |
Expenses to Average Net Assets | | 0.47 | %* | 0.49 | %* |
Net Investment Income to Average Net Assets | | 2.01 | %* | 0.98 | %* |
| | | | Participant Class | |
Selected Per Share Data and Ratios | | | | Six Months
Ended April
30, 2005^
(unaudited) | |
Net Asset Value, Beginning of Period | | | | $ | 1.000 | |
Income from Investment Operations | | | | | |
Net Investment Income | | | | 0.010 | |
Distributions from and/or in Excess of: | | | | | |
Net Investment Income | | | | (0.010 | ) |
Net Asset Value, End of Period | | | | $ | 1.000 | |
Total Return | | | | 0.96 | %‡ |
Ratios and Supplemental Data: | | | | | |
Net Assets, End of Period (Thousands) | | | | $ | 100 | |
Ratio of Expenses to Average Net Assets(2) | | | | 0.50 | %* |
Ratio of Net Investment Income to Average Net Assets(2) | | | | 1.94 | %* |
(2) Supplemental Information on the Ratios to Average Net Assets: | | | | | |
Ratios Before Expenses Waived/Reimbursed by Adviser: | | | | | |
Expenses to Average Net Assets | | | | 0.62 | %* |
Net Investment Income to Average Net Assets | | | | 1.82 | %* |
* | | Annualized |
‡ | | Not Annualized |
** | | The Portfolio’s Advisory Class commenced offering on April 29, 2004. |
^ | | The Portfolio’s Participant Class commenced offering on November 1, 2004. |
The accompanying notes are an integral part of the financial statements.
33
2005 Semi-Annual Report |
|
April 30, 2005 (unaudited) |
Financial Highlights
Government Portfolio
| | Institutional Class | |
Selected Per Share Data and Ratios | | Six Months
Ended April
30, 2005
(unaudited) | | Period from
August 9,
2004** to
October 31,
2004 | |
Net Asset Value, Beginning of Period | | $ | 1.000 | | $ | 1.000 | |
Income from Investment Operations | | | | | |
Net Investment Income | | 0.012 | | 0.004 | |
Distributions from and/or in Excess of: | | | | | |
Net Investment Income | | (0.012 | ) | (0.004 | ) |
Net Asset Value, End of Period | | $ | 1.000 | | $ | 1.000 | |
Total Return | | 1.19 | %‡ | 0.38 | %‡ |
Ratios and Supplemental Data: | | | | | |
Net Assets, End of Period (Thousands) | | $ | 1,149,008 | | $ | 414,567 | |
Ratio of Expenses to Average Net Assets(1) | | 0.05 | %* | 0.05 | %*† |
Ratio of Net Investment Income to Average Net Assets(1) | | 2.48 | %* | 1.73 | %* |
(1) Supplemental Information on the Ratios to Average Net Assets: | | | | | |
Ratios Before Expenses Waived/Reimbursed by Adviser: | | | | | |
Expenses to Average Net Assets | | 0.26 | %* | 0.37 | %*† |
Net Investment Income to Average Net Assets | | 2.27 | %* | 1.41 | %* |
| | | | Service Class | |
Selected Per Share Data and Ratios | | | | Six Months
Ended April
30, 2005^
(unaudited) | |
Net Asset Value, Beginning of Period | | | | $ | 1.000 | |
Income from Investment Operations | | | | | |
Net Investment Income | | | | 0.012 | |
Distributions from and/or in Excess of: | | | | | |
Net Investment Income | | | | (0.012 | ) |
Net Asset Value, End of Period | | | | $ | 1.000 | |
Total Return | | | | 1.16 | %‡ |
Ratios and Supplemental Data: | | | | | |
Net Assets, End of Period (Thousands) | | | | $ | 17,262 | |
Ratio of Expenses to Average Net Assets(2) | | | | 0.10 | %* |
Ratio of Net Investment Income to Average Net Assets(2) | | | | 2.47 | %* |
(2) Supplemental Information on the Ratios to Average Net Assets: | | | | | |
Ratios Before Expenses Waived/Reimbursed by Adviser: | | | | | |
Expenses to Average Net Assets | | | | 0.31 | %* |
Net Investment Income to Average Net Assets | | | | 2.26 | %* |
* | | Annualized |
‡ | | Not Annualized |
** | | Commencement of Operations |
^ | | The Portfolio’s Service Class commenced offering on November 1, 2004. |
† | | Ratios of Expenses to Average Net Assets before and after Expense Limitations may vary among share classes by more or less than the service and shareholder administration plan fees due to different periods of operation for each share class as well as fluctuations in daily net asset amounts. |
The accompanying notes are an integral part of the financial statements.
34
| 2005 Semi-Annual Report |
| |
| April 30, 2005 (unaudited) |
Financial Highlights
Government Portfolio
| | Investor Class | |
Selected Per Share Data and Ratios | | Six Months
Ended April
30, 2005
(unaudited) | | Period from
August 9,
2004** to
October 31,
2004 | |
Net Asset Value, Beginning of Period | | $ | 1.000 | | $ | 1.000 | |
Income from Investment Operations | | | | | |
Net Investment Income | | 0.011 | | 0.004 | |
Distributions from and/or in Excess of: | | | | | |
Net Investment Income | | (0.011 | ) | (0.004 | ) |
Net Asset Value, End of Period | | $ | 1.000 | | $ | 1.000 | |
Total Return | | 1.14 | %‡ | 0.35 | %‡ |
Ratios and Supplemental Data: | | | | | |
Net Assets, End of Period (Thousands) | | $ | 211,543 | | $ | 109,776 | |
Ratio of Expenses to Average Net Assets(1) | | 0.15 | %* | 0.15 | %*† |
Ratio of Net Investment Income to Average Net Assets(1) | | 2.30 | %* | 1.53 | %* |
(1) Supplemental Information on the Ratios to Average Net Assets: | | | | | |
Ratios Before Expenses Waived/Reimbursed by Adviser: | | | | | |
Expenses to Average Net Assets | | 0.36 | %* | 0.53 | %*† |
Net Investment Income to Average Net Assets | | 2.09 | %* | 1.15 | %* |
| | | | Administrative Class | |
Selected Per Share Data and Ratios | | | | Six Months
Ended April
30, 2005^
(unaudited) | |
Net Asset Value, Beginning of Period | | | | $ | 1.000 | |
Income from Investment Operations | | | | | |
Net Investment Income | | | | 0.011 | |
Distributions from and/or in Excess of: | | | | | |
Net Investment Income | | | | (0.011 | ) |
Net Asset Value, End of Period | | | | $ | 1.000 | |
Total Return | | | | 1.11 | %‡ |
Ratios and Supplemental Data: | | | | | |
Net Assets, End of Period (Thousands) | | | | $ | 31,406 | |
Ratio of Expenses to Average Net Assets(2) | | | | 0.20 | %* |
Ratio of Net Investment Income to Average Net Assets(2) | | | | 2.26 | %* |
(2) Supplemental Information on the Ratios to Average Net Assets: | | | | | |
Ratios Before Expenses Waived/Reimbursed by Adviser: | | | | | |
Expenses to Average Net Assets | | | | 0.41 | %* |
Net Investment Income to Average Net Assets | | | | 2.05 | %* |
* | | Annualized |
‡ | | Not Annualized |
** | | The Portfolio’s Investor Class commenced offering on August 9, 2004. |
^ | | The Portfolio’s Administrative Class commenced offering on November 1, 2004. |
† | | Ratios of Expenses to Average Net Assets before and after Expense Limitations may vary among share classes by more or less than the service and shareholder administration plan fees due to different periods of operation for each share class as well as fluctuations in daily net asset amounts. |
The accompanying notes are an integral part of the financial statements.
35
2005 Semi-Annual Report |
|
April 30, 2005 (unaudited) |
Financial Highlights
Government Portfolio
| | Advisory Class | |
Selected Per Share Data and Ratios | | Six Months
Ended April
30,2005
(unaudited) | | Period from
October 1,
2004** to
October 31,
2004 | |
Net Asset Value, Beginning of Period | | $ | 1.000 | | $ | 1.000 | |
Income from Investment Operations | | | | | |
Net Investment Income | | 0.011 | | 0.001 | |
Distributions from and/or in Excess of: | | | | | |
Net Investment Income | | (0.011 | ) | (0.001 | ) |
Net Asset Value, End of Period | | $ | 1.000 | | $ | 1.000 | |
Total Return | | 1.06 | %‡ | 0.13 | %‡ |
Ratios and Supplemental Data: | | | | | |
Net Assets, End of Period (Thousands) | | $ | 22,206 | | $ | 23,750 | |
Ratio of Expenses to Average Net Assets(1) | | 0.30 | %* | 0.30 | %*† |
Ratio of Net Investment Income to Average Net Assets(1) | | 2.16 | %* | 1.53 | %* |
(1) Supplemental Information on the Ratios to Average Net Assets: | | | | | |
Ratios Before Expenses Waived/Reimbursed by Adviser: | | | | | |
Expenses to Average Net Assets | | 0.51 | %* | 0.55 | %*† |
Net Investment Income to Average Net Assets | | 1.95 | %* | 1.28 | %* |
| | | | Participant Class | |
Selected Per Share Data and Ratios | | | | Six Months
Ended April
30, 2005^
(unaudited) | |
Net Asset Value, Beginning of Period | | | | $ | 1.000 | |
Income from Investment Operations | | | | | |
Net Investment Income | | | | 0.010 | |
Distributions from and/or in Excess of: | | | | | |
Net Investment Income | | | | (0.010 | ) |
Net Asset Value, End of Period | | | | $ | 1.000 | |
Total Return | | | | 0.98 | %‡ |
Ratios and Supplemental Data: | | | | | |
Net Assets, End of Period (Thousands) | | | | $ | 100 | |
Ratio of Expenses to Average Net Assets(2) | | | | 0.45 | %* |
Ratio of Net Investment Income to Average Net Assets(2) | | | | 1.98 | %* |
(2) Supplemental Information on the Ratios to Average Net Assets: | | | | | |
Ratios Before Expenses Waived/Reimbursed by Adviser: | | | | | |
Expenses to Average Net Assets | | | | 0.66 | %* |
Net Investment Income to Average Net Assets | | | | 1.77 | %* |
* | | Annualized |
‡ | | Not Annualized |
** | | The Portfolio’s Advisory Class commenced offering on October 1, 2004. |
^ | | The Portfolio’s Participant Class commenced offering on November 1, 2004. |
† | | Ratios of Expenses to Average Net Assets before and after Expense Limitations may vary among share classes by more or less than the service and shareholder administration plan fees due to different periods of operation for each share class as well as fluctuations in daily net asset amounts. |
The accompanying notes are an integral part of the financial statements.
36
| 2005 Semi-Annual Report |
| |
| April 30, 2005 (unaudited) |
Financial Highlights
Treasury Portfolio
| | Institutional Class | |
Selected Per Share Data and Ratios | | Six Months
Ended April
30, 2005
(unaudited) | | Period from
August 9,
2004** to
October 31,
2004 | |
Net Asset Value, Beginning of Period | | $ | 1.000 | | $ | 1.000 | |
Income from Investment Operations | | | | | |
Net Investment Income | | 0.011 | | 0.004 | |
Distributions from and/or in Excess of: | | | | | |
Net Investment Income | | (0.011 | ) | (0.004 | ) |
Net Asset Value, End of Period | | $ | 1.000 | | $ | 1.000 | |
Total Return | | 1.11 | %‡ | 0.36 | %‡ |
Ratios and Supplemental Data: | | | | | �� |
Net Assets, End of Period (Thousands) | | $ | 100,072 | | $ | 187,770 | |
Ratio of Expenses to Average Net Assets(1) | | 0.05 | %* | 0.05 | %*† |
Ratio of Net Investment Income to Average Net Assets(1) | | 2.17 | %* | 1.57 | %* |
(1) Supplemental Information on the Ratios to Average Net Assets: | | | | | |
Ratios Before Expenses Waived/Reimbursed by Adviser: | | | | | |
Expenses to Average Net Assets | | 0.49 | %* | 0.35 | %*† |
Net Investment Income to Average Net Assets | | 1.73 | %* | 1.27 | %* |
| | | |
| | | | Service Class | |
Selected Per Share Data and Ratios | | | | Six Months
Ended April
30, 2005^
(unaudited) | |
Net Asset Value, Beginning of Period | | | | $ | 1.000 | |
Income from Investment Operations | | | | | |
Net Investment Income | | | | 0.011 | |
Distributions from and/or in Excess of: | | | | | |
Net Investment Income | | | | (0.011 | ) |
Net Asset Value, End of Period | | | | $ | 1.000 | |
Total Return | | | | 1.09 | %‡ |
Ratios and Supplemental Data: | | | | | |
Net Assets, End of Period (Thousands) | | | | $ | 100 | |
Ratio of Expenses to Average Net Assets(2) | | | | 0.10 | %* |
Ratio of Net Investment Income to Average Net Assets(2) | | | | 2.19 | %* |
(2) Supplemental Information on the Ratios to Average Net Assets: | | | | | |
Ratios Before Expenses Waived/Reimbursed by Adviser: | | | | | |
Expenses to Average Net Assets | | | | 0.54 | %* |
Net Investment Income to Average Net Assets | | | | 1.75 | %* |
* | | Annualized |
‡ | | Not Annualized |
** | | Commencement of Operations |
^ | | The Portfolio’s Service Class commenced offering on November 1, 2004. |
† | | Ratios of Expenses to Average Net Assets before and after Expense Limitations may vary among share classes by more or less than the service and shareholder administration plan fees due to different periods of operation for each share class as well as fluctuations in daily net asset amounts. |
The accompanying notes are an integral part of the financial statements.
37
2005 Semi-Annual Report |
| |
April 30, 2005 (unaudited) |
Financial Highlights
Treasury Portfolio
| | | | Investor Class | |
Selected Per Share Data and Ratios | | | | Six Months
Ended April
30,2005^
(unaudited) | |
Net Asset Value, Beginning of Period | | | | $ | 1.000 | |
Income from Investment Operations | | | | | |
Net Investment Income | | | | 0.011 | |
Distributions from and/or in Excess of: | | | | | |
Net Investment Income | | | | (0.011 | ) |
Net Asset Value, End of Period | | | | $ | 1.000 | |
Total Return | | | | 1.06 | %‡ |
Ratios and Supplemental Data: | | | | | |
Net Assets, End of Period (Thousands) | | | | $ | 100 | |
Ratio of Expenses to Average Net Assets(1) | | | | 0.15 | %* |
Ratio of Net Investment Income to Average Net Assets(1) | | | | 2.14 | %* |
(1) Supplemental Information on the Ratios to Average Net Assets: | | | | | |
Ratios Before Expenses Waived/Reimbursed by Adviser: | | | | | |
Expenses to Average Net Assets | | | | 0.59 | %* |
Net Investment Income to Average Net Assets | | | | 1.70 | %* |
| | | | Administrative Class | |
Selected Per Share Data and Ratios | | | | Six Months
Ended April
30, 2005^
(unaudited) | |
Net Asset Value, Beginning of Period | | | | $ | 1.000 | |
Income from Investment Operations | | | | | |
Net Investment Income | | | | 0.010 | |
Distributions from and/or in Excess of: | | | | | |
Net Investment Income | | | | (0.010 | ) |
Net Asset Value, End of Period | | | | $ | 1.000 | |
Total Return | | | | 1.04 | %‡ |
Ratios and Supplemental Data: | | | | | |
Net Assets, End of Period (Thousands) | | | | $ | 100 | |
Ratio of Expenses to Average Net Assets(2) | | | | 0.20 | %* |
Ratio of Net Investment Income to Average Net Assets(2) | | | | 2.09 | %* |
(2) Supplemental Information on the Ratios to Average Net Assets: | | | | | |
Ratios Before Expenses Waived/Reimbursed by Adviser: | | | | | |
Expenses to Average Net Assets | | | | 0.64 | %* |
Net Investment Income to Average Net Assets | | | | 1.65 | %* |
* | | Annualized |
‡ | | Not Annualized |
^ | | The Portfolio’s Investor Class and Administrative Class commenced offering on November 1, 2004. |
The accompanying notes are an integral part of the financial statements.
38
| 2005 Semi-Annual Report |
| |
| April 30, 2005 (unaudited) |
Financial Highlights
Treasury Portfolio
| | Advisory Class | |
Selected Per Share Data and Ratios | | Six Months
Ended April
30, 2005
(unaudited) | | Period from
August 9,
2004** to
October 31,
2004 | |
Net Asset Value, Beginning of Period | | $ | 1.000 | | $ | 1.000 | |
Income from Investment Operations | | | | | |
Net Investment Income | | 0.010 | | 0.003 | |
Distributions from and/or in Excess of: | | | | | |
Net Investment Income | | (0.010 | ) | (0.003 | ) |
Net Asset Value, End of Period | | $ | 1.000 | | $ | 1.000 | |
Total Return | | 0.99 | %‡ | 0.30 | %‡ |
Ratios and Supplemental Data: | | | | | |
Net Assets, End of Period (Thousands) | | $ | 1,582 | | $ | 2,207 | |
Ratio of Expenses to Average Net Assets(1) | | 0.30 | %* | 0.30 | %*† |
Ratio of Net Investment Income to Average Net Assets(1) | | 1.96 | %* | 1.30 | %* |
(1) Supplemental Information on the Ratios to Average Net Assets: | | | | | |
Ratios Before Expenses Waived/Reimbursed by Adviser: | | | | | |
Expenses to Average Net Assets | | 0.74 | %* | 0.67 | %*† |
Net Investment Income to Average Net Assets | | 1.52 | %* | 0.93 | %* |
| | | | Participant Class | |
Selected Per Share Data and Ratios | | | | Six Months
Ended April
30, 2005^
(unaudited) | |
Net Asset Value, Beginning of Period | | | | $ | 1.000 | |
Income from Investment Operations | | | | | |
Net Investment Income | | | | 0.009 | |
Distributions from and/or in Excess of: | | | | | |
Net Investment Income | | | | (0.009 | ) |
Net Asset Value, End of Period | | | | $ | 1.000 | |
Total Return | | | | 0.91 | %‡ |
Ratios and Supplemental Data: | | | | | |
Net Assets, End of Period (Thousands) | | | | $ | 100 | |
Ratio of Expenses to Average Net Assets(2) | | | | 0.45 | %* |
Ratio of Net Investment Income to Average Net Assets(2) | | | | 1.84 | %* |
(2) Supplemental Information on the Ratios to Average Net Assets: | | | | | |
Ratios Before Expenses Waived/Reimbursed by Adviser: | | | | | |
Expenses to Average Net Assets | | | | 0.89 | %* |
Net Investment Income to Average Net Assets | | | | 1.40 | %* |
* | | Annualized |
‡ | | Not Annualized |
** | | The Portfolio’s Advisory Class commenced offering on August 9, 2004. |
^ | | The Portfolio’s Participant Class commenced offering on November 1, 2004. |
† | | Ratios of Expenses to Average Net Assets before and after Expense Limitations may vary among share classes by more or less than the service and shareholder administration plan fees due to different periods of operation for each share class as well as fluctuations in daily net asset amounts. |
The accompanying notes are an integral part of the financial statements.
39
2005 Semi-Annual Report |
|
April 30, 2005 (unaudited) |
Financial Highlights
Tax-Exempt Portfolio
| | Institutional Class | |
Selected Per Share Data and Ratios | | Six Months
Ended April
30, 2005
(unaudited) | | Period from
February 2,
2004** to
October 31,
2004 | |
Net Asset Value, Beginning of Period | | $ | 1.000 | | $ | 1.000 | |
Income from Investment Operations | | | | | |
Net Investment Income | | 0.009 | | 0.008 | |
Distributions from and/or in Excess of: | | | | | |
Net Investment Income | | (0.009 | ) | (0.008 | ) |
Net Asset Value, End of Period | | $ | 1.000 | | $ | 1.000 | |
Total Return | | 0.91 | %‡ | 0.84 | %‡ |
Ratios and Supplemental Data: | | | | | |
Net Assets, End of Period (Thousands) | | $ | 284,714 | | $ | 109,292 | |
Ratio of Expenses to Average Net Assets(1) | | 0.08 | %* | 0.06 | %*† |
Ratio of Net Investment Income to Average Net Assets(1) | | 1.85 | %* | 1.19 | %* |
(1) Supplemental Information on the Ratios to Average Net Assets: | | | | | |
Ratios Before Expenses Waived/Reimbursed by Adviser: | | | | | |
Expenses to Average Net Assets | | 0.40 | %* | 0.35 | %*† |
Net Investment Income to Average Net Assets | | 1.53 | %* | 0.90 | %* |
| | | | Service Class | |
Selected Per Share Data and Ratios | | | | Six Months
Ended April
30, 2005^
(unaudited) | |
Net Asset Value, Beginning of Period | | | | $ | 1.000 | |
Income from Investment Operations | | | | | |
Net Investment Income | | | | 0.009 | |
Distributions from and/or in Excess of: | | | | | |
Net Investment Income | | | | (0.009 | ) |
Net Asset Value, End of Period | | | | $ | 1.000 | |
Total Return | | | | 0.89 | %‡ |
Ratios and Supplemental Data: | | | | | |
Net Assets, End of Period (Thousands) | | | | $ | 100 | |
Ratio of Expenses to Average Net Assets(2) | | | | 0.13 | %* |
Ratio of Net Investment Income to Average Net Assets(2) | | | | 1.78 | %* |
(2) Supplemental Information on the Ratios to Average Net Assets: | | | | | |
Ratios Before Expenses Waived/Reimbursed by Adviser: | | | | | |
Expenses to Average Net Assets | | | | 0.45 | %* |
Net Investment Income to Average Net Assets | | | | 1.46 | %* |
* | | Annualized |
‡ | | Not Annualized |
** | | Commencement of Operations |
^ | | The Portfolio’s Service Class commenced offering on November 1, 2004. |
† | | Ratios of Expenses to Average Net Assets before and after Expense Limitations may vary among share classes by more or less than the service and shareholder administration plan fees due to different periods of operation for each share class as well as fluctuations in daily net asset amounts. |
The accompanying notes are an integral part of the financial statements.
40
| 2005 Semi-Annual Report |
| |
| April 30, 2005 (unaudited) |
Financial Highlights
Tax-Exempt Portfolio
| | Investor Class | |
| | | | Period from | |
| | Six Months | | June 8, | |
| | Ended April | | 2004** to | |
| | 30, 2005 | | October 31, | |
Selected Per Share Data and Ratios | | (unaudited) | | 2004 | |
Net Asset Value, Beginning of Period | | $ | 1.000 | | $ | 1.000 | |
Income from Investment Operations | | | | | |
Net Investment Income | | 0.009 | | 0.005 | |
Distributions from and/or in Excess of: | | | | | |
Net Investment Income | | (0.009 | ) | (0.005 | ) |
Net Asset Value, End of Period | | $ | 1.000 | | $ | 1.000 | |
Total Return | | 0.86 | %‡ | 0.45 | %‡ |
Ratios and Supplemental Data: | | | | | |
Net Assets, End of Period (Thousands) | | $ | 104 | | $ | 1,121 | |
Ratio of Expenses to Average Net Assets(1) | | 0.18 | %* | 0.17 | %*† |
Ratio of Net Investment Income to Average Net Assets(1) | | 1.71 | %* | 1.06 | %* |
(1) Supplemental Information on the Ratios to Average Net Assets: | | | | | |
Ratios Before Expenses Waived/Reimbursed by Adviser: | | | | | |
Expenses to Average Net Assets | | 0.50 | %* | 0.38 | %*† |
Net Investment Income to Average Net Assets | | 1.39 | %* | 0.85 | %* |
| | | | Administrative Class | |
| | | | Six Months | |
| | | | Ended April | |
Selected Per Share Data and Ratios | | | | 30,2005^
(unaudited) | |
Net Asset Value, Beginning of Period | | | | $ | 1.000 | |
Income from Investment Operations | | | | | |
Net Investment Income | | | | 0.008 | |
Distributions from and/or in Excess of: | | | | | |
Net Investment Income | | | | (0.008 | ) |
Net Asset Value, End of Period | | | | $ | 1.000 | |
Total Return | | | | 0.84 | %‡ |
Ratios and Supplemental Data: | | | | | |
Net Assets, End of Period (Thousands) | | | | $ | 100 | |
Ratio of Expenses to Average Net Assets(2) | | | | 0.23 | %* |
Ratio of Net Investment Income to Average Net Assets(2) | | | | 1.68 | %* |
(2) Supplemental Information on the Ratios to Average Net Assets: | | | | | |
Ratios Before Expenses Waived/Reimbursed by Adviser: | | | | | |
Expenses to Average Net Assets | | | | 0.55 | %* |
Net Investment Income to Average Net Assets | | | | 1.36 | %* |
* | | Annualized |
‡ | | Not Annualized |
** | | The Portfolio’s Investor Class commenced offering on June 8, 2004. |
^ | | The Portfolio’s Administrative Class commenced offering on November 1, 2004. |
† | | Ratios of Expenses to Average Net Assets before and after Expense Limitations may vary among share classes by more or less than the service and shareholder administration plan fees due to different periods of operation for each share class as well as fluctuations in daily net asset amounts. |
The accompanying notes are an integral part of the financial statements.
41
2005 Semi-Annual Report |
|
April 30, 2005 (unaudited) |
Financial Highlights
Tax - Exempt Portfolio
| | Advisory Class | |
| | | | Period from | |
| | Six Months | | June 15, | |
| | Ended April | | 2004** to | |
| | 30, 2005 | | October 31, | |
Selected Per Share Data and Ratios | | (unaudited) | | 2004(1) | |
Net Asset Value, Beginning of Period | | $ | 1.000 | | $ | 1.000 | |
Income from Investment Operations | | | | | |
Net Investment Income | | 0.008 | | 0.002 | |
Distributions from and/or in Excess of: | | | | | |
Net Investment Income | | (0.008 | ) | (0.002 | ) |
Net Asset Value, End of Period | | $ | 1.000 | | $ | 1.000 | |
Total Return | | 0.79 | %‡ | 0.24 | %‡ |
Ratios and Supplemental Data: | | | | | |
Net Assets, End of Period (Thousands) | | $ | 11,869 | | $ | 56,000 | |
Ratio of Expenses to Average Net Assets(1) | | 0.33 | %* | 0.33 | %*† |
Ratio of Net Investment Income to Average Net Assets(1) | | 1.47 | %* | 1.32 | %* |
(1) Supplemental Information on the Ratios to Average Net Assets: | | | | | |
Ratios Before Expenses Waived/Reimbursed by Adviser: | | | | | |
Expenses to Average Net Assets | | 0.65 | %* | 0.55 | %*† |
Net Investment Income to Average Net Assets | | 1.15 | %* | 1.10 | %* |
| | | | Participant Class | |
| | | | Six Months | |
| | | | Ended April | |
Selected Per Share Data and Ratios | | | | 30, 2005^
(unaudited) | |
Net Asset Value, Beginning of Period | | | | $ | 1.000 | |
Income from Investment Operations | | | | | |
Net Investment Income | | | | 0.007 | |
Distributions from and/or in Excess of: | | | | | |
Net Investment Income | | | | (0.007 | ) |
Net Asset Value, End of Period | | | | $ | 1.000 | |
Total Return | | | | 0.71 | %‡ |
Ratios and Supplemental Data: | | | | | |
Net Assets, End of Period (Thousands) | | | | $ | 102 | |
Ratio of Expenses to Average Net Assets(2) | | | | 0.48 | %* |
Ratio of Net Investment Income to Average Net Assets(2) | | | | 1.44 | %* |
(2) Supplemental Information on the Ratios to Average Net Assets: | | | | | |
Ratios Before Expenses Waived/Reimbursed by Adviser: | | | | | |
Expenses to Average Net Assets | | | | 0.80 | %* |
Net Investment Income to Average Net Assets | | | | 1.12 | %* |
(1) | | There were no Tax-Exempt Portfolio Advisory shares outstanding during the periods June 30, 2004 to July 22, 2004, July 30, 2004 to August 9, 2004, August 30, 2004 to August 31, 2004 and September 2, 2004 to September 21, 2004. |
* | | Annualized |
‡ | | Not Annualized |
** | | The Portfolio’s Advisory Class commenced offering on June 15, 2004. |
^ | | The Portfolio’s Participant Class commenced offering on November 1, 2004. |
† | | Ratios of Expenses to Average Net Assets before and after Expense Limitations may vary among share classes by more or less than the service and shareholder administration plan fees due to different periods of operation for each share class as well as fluctuations in daily net asset amounts. |
The accompanying notes are an integral part of the financial statements.
42
| 2005 Semi-Annual Report |
| |
| April 30, 2005 (unaudited) |
Notes to Financial Statements
Morgan Stanley Institutional Liquidity Funds (the “Fund”) is registered under the Investment Company Act of 1940 (the “1940 Act”), as amended, as a Massachusetts business trust. The Fund is comprised of five separate, active, diversified portfolios (individually referred to as a “Portfolio”, collectively as the “Portfolios”). Each Portfolio currently offers six classes of shares - Institutional Class, Service Class, Investor Class, Administrative Class, Advisory Class and Participant Class. All classes of shares have identical voting rights (except that shareholders of a Class have exclusive voting rights regarding any matter relating solely to that Class of shares), dividend, liquidation and other rights.
For detailed descriptions of the investment objectives of each of the Portfolios and other related information, please refer to the Prospectuses of the Fund. Generally, the investment objective of the Portfolios is to seek preservation of capital, daily liquidity and maximum current income (exempt from federal income tax in the case of Tax-Exempt Portfolio).
A. Accounting Policies: The following significant accounting policies are in conformity with U.S. generally accepted accounting principles for investment companies. Such policies are consistently followed by the Fund in the preparation of the financial statements. U.S. generally accepted accounting principles may require management to make estimates and assumptions that affect the reported amounts and disclosures in the financial statements. Actual results may differ from those estimates.
1. Security Valuation: Securities owned by the Portfolios are stated at amortized cost which approximates market value.
2. Repurchase Agreements: Certain Portfolios may enter into repurchase agreements under which a Portfolio lends excess cash and takes possession of securities with an agreement that the counterparty will repurchase such securities. In connection with transactions in repurchase agreements, a bank as custodian for the Fund takes possession of the underlying securities which are held as collateral, with a market value at least equal to the amount of the repurchase transaction, including principal and accrued interest. To the extent that any repurchase transaction exceeds one business day, the value of the collateral is marked-to-market on a daily basis to determine the adequacy of the collateral. In the event of default on the obligation to repurchase, the Fund has the right to liquidate the collateral and apply the proceeds in satisfaction of the obligation. In the event of default or bankruptcy by the counterparty to the agreement, realization and/or retention of the collateral or proceeds may be subject to legal proceedings. The Portfolios, along with other affiliated investment companies, may utilize a joint trading account for the purpose of entering into repurchase agreements.
3. Other: Security transactions are accounted for on the date the securities are purchased or sold. Realized gains and losses on the sale of investment securities are determined on a “first-in-first-out” basis. Interest income is recognized on the accrual basis except where collection is in doubt. Discounts and premiums on securities purchased are amortized over their respective lives. Most expenses of the Fund can be directly attributed to a particular Portfolio. Expenses which cannot be directly attributed are apportioned among the Portfolios based upon relative net assets. Income, expenses (other than class specific expenses) and realized and unrealized gains or losses are allocated to each class of shares based upon their relative net assets. Dividends to the shareholders of the Portfolios are accrued daily and are distributed on the last business day of each month.
B. Investment Advisory Fees: Morgan Stanley Investment Management, Inc. (the “Adviser” or “MSIM”), a wholly-owned subsidiary of Morgan Stanley, provides the Fund with investment advisory services under the terms of an Investment Advisory and Management Agreement (the “Agreement”) at the annual rates of average daily net assets indicated below. The Adviser has voluntarily agreed to reduce its advisory fee and/or absorb other expenses so that total annual operating expenses of each share class will not exceed the amounts noted below in the first year of operations. After the first year of operations, this fee and expense waiver may be discontinued at any time.
| | Advisory | |
Portfolio | | Fee | |
Money Market | | 0.15 | % |
Prime | | 0.15 | |
Government | | 0.15 | |
Treasury | | 0.15 | |
Tax-Exempt | | 0.15 | |
| | Maximum
Expense Ratio | |
| | Institutional | | Service | | Investor | | Administrative | | Advisory | | Participant | |
Portfolio | | Class | | Class | | Class | | Class | | Class | | Class | |
Money Market | | 0.20 | % | 0.25 | % | 0.30 | % | 0.35 | % | 0.45 | % | 0.60 | % |
Prime | | 0.20 | | 0.25 | | 0.30 | | 0.35 | | 0.45 | | 0.60 | |
Government | | 0.20 | | 0.25 | | 0.30 | | 0.35 | | 0.45 | | 0.60 | |
Treasury | | 0.20 | | 0.25 | | 0.30 | | 0.35 | | 0.45 | | 0.60 | |
Tax-Exempt | | 0.20 | | 0.25 | | 0.30 | | 0.35 | | 0.45 | | 0.60 | |
The Ratio of Expenses to Average Net Assets disclosed in the Portfolios’ Financial Highlights may be lower than the maximum ratios indicated in the table above due to additional voluntary expense limitations imposed by the Adviser. The Adviser may terminate these additional voluntary limitations at any time at its sole discretion.
The Adviser has entered into a Sub-Advisory Agreement with Morgan Stanley Investment Advisors Inc. (the “Sub-Adviser”), a wholly-owned subsidiary of Morgan Stanley. The Sub-Adviser, subject to the control and supervision of the Fund, its officers, Trustees and the Adviser, and in accordance with the investment objectives, policies and restrictions of the Portfolios, makes day-to-day investment decisions for the Portfolios and places the Portfolios’ purchase and sales orders. The Adviser pays the Sub-Adviser on a monthly basis a portion of the net advisory fees the Adviser receives from the Portfolios.
C. Administration Fees: MSIM (the “Administrator”) serves as Administrator to the Fund pursuant to an Administration
43
2005 Semi-Annual Report |
| |
April 30, 2005 (unaudited) |
Notes to Financial Statements (cont’d)
Agreement. Under the agreement, MSIM receives an annual fee, accrued daily and payable monthly, of 0.05% of each Portfolio’s average daily net assets, plus reimbursement of out-of-pocket expenses. J.P. Morgan Investor Services Co. (“JPMIS”), a corporate affiliate of JPMorgan Chase Bank, provides fund accounting and other services pursuant to a sub-administration agreement with MSIM and receives compensation for these services. JPMIS also serves as the Transfer Agent to the Fund pursuant to a Transfer Agency Agreement. An employee of JPMIS is an officer of the Fund.
D. Distribution and Service and Shareholder Administration Fees:
Morgan Stanley Distribution, Inc. (the “Distributor”), a wholly-owned subsidiary of MSIM, and an indirect subsidiary of Morgan Stanley, serves as the distributor of the Fund. The Fund has entered into an Administration Plan with respect to its Service Class, Investor Class and Administrative Class shares pursuant to which each class of shares will pay the Distributor a monthly or quarterly fee at an annual rate of up to 0.05%, 0.10% and 0.15%, of the average daily net assets of each such class of shares, respectively to compensate certain financial intermediaries who provide administrative services to shareholders. The Fund has also entered into a Service and Shareholder Administration Plan with respect to its Advisory Class shares pursuant to which its Advisory Class shares pays the Distributor a monthly or quarterly fee at an annual rate of up to 0.25% of the average daily net assets of such class of shares, to compensate certain financial intermediaries who provide administrative services, personal and account maintenance services to shareholders. The Fund has also entered into a Distribution and Shareholder Service Plan with respect to its Participant Class shares pursuant to which its Participant Class shares pays the Distributor a monthly or quarterly fee at an annual rate of up to 0.40% of the average daily net assets of such class of shares, to compensate certain financial intermediaries who provide administrative services, personal and account maintenance services and for any activities or expenses primarily intended to result in the sale of such class of shares. Prior to April 29, 2005 Morgan Stanley & Co. Incorporated, a wholly-owned subsidiary of Morgan Stanley, and an affiliate of MSIM, served as the distributor of the Fund.
E. Custodian Fees: JPMorgan Chase Bank serves as custodian for the Fund in accordance with a custodian agreement. The Custodian holds cash, securities, and other assets of the Fund as required by the 1940 Act.
F. Federal Income Taxes: It is each Portfolio’s intention to qualify as a regulated investment company and distribute all of its taxable and tax-exempt income. Accordingly, no provision for Federal income taxes is required in the financial statements.
The tax character of distributions paid may differ from the character of distributions shown on the Statements of Changes in Net Assets due to short-term capital gains being treated as ordinary income for tax purposes. The tax character of distributions paid during fiscal 2004 were as follows:
| | 2004 | |
| | Distributions | |
| | Paid From: | |
| | Ordinary | | Long-term | |
Portfolio | | Income
(000) | | Capital Gain
(000) | |
Money Market | | $ | 19,002 | | $ | — | |
Prime | | 49,256 | | — | |
Government | | 1,004 | | — | |
Treasury | | 738 | | — | |
Tax-Exempt | | 735 | * | — | |
| | | | | | | |
* Distributions are tax-exempt.
The amount and character of income and gains to be distributed are determined in accordance with income tax regulations which may differ from U.S. generally accepted accounting principles.
At October 31, 2004, the components of distributable earnings on a tax basis were as follows:
| | Undistributed | |
| | Ordinary | |
Portfolio | | Income
(000) | |
Money Market | | $ | 4,494 | |
Prime | | 13,192 | |
Government | | 661 | |
Treasury | | 273 | |
Tax-Exempt | | 180 | |
| | | | |
At April 30, 2005, cost for U.S. Federal income tax purposes for the investments of the Portfolios were as follows:
Portfolio | | Cost
(000) | |
Money Market | | $ | 3,055,349 | |
Prime | | 12,195,145 | |
Government | | 1,434,017 | |
Treasury | | 102,216 | |
Tax-Exempt | | 295,775 | |
| | | | |
At October 31, 2004, the Money Market Portfolio and Prime Portfolio had capital loss carryforwards for U.S. Federal income tax purposes of approximately $2,000 and $15,000, respectively, available to offset future capital gains which will expire on October 31, 2012.
G. Contractual Obligations: The Fund enters into contracts that contain a variety of indemnifications. The Fund’s maximum exposure under these arrangements is unknown. However, the Fund has not had prior claims or losses pursuant to these contracts and expects the risk of loss to be remote.
H. Organization and/or Offering Costs: The Adviser has agreed to absorb any organization and/or offering costs associated with the opening of the Fund.
44
| 2005 Semi-Annual Report |
| |
| April 30, 2005 (unaudited) |
Notes to Financial Statements (cont’d)
I. Other: A portion of the securities of the Tax-Exempt Portfolio are insured by certain companies specializing in the insurance of municipal debt obligations. At April 30, 2005, approximately 18.9% of the net assets of the Tax-Exempt Portfolio are covered by such insurance. The insurers and their obligations are as follows:
| | Percentage of | |
Insurer | | Net Assets | |
Ambac | | 2.3 | % |
Assured Guaranty | | 0.7 | |
FGIC | | 0.8 | |
FHA | | 0.7 | |
FSA | | 4.2 | |
MBIA | | 8.2 | |
Radian | | 2.0 | |
At April 30, 2005, certain Portfolios had otherwise unaffiliated record owners of 10% or greater. Investment activities of these shareholders could have a material impact on these Portfolios. These Portfolios and the aggregate percentage of such owners were as follows:
| | Percentage of Ownership | |
| | Institutional | | Service | | Investor | | Administrative | | Advisory | | Participant | |
Portfolio | | Class | | Class | | Class | | Class | | Class | | Class | |
Money Market | | 80.9 | % | 100.0 | % | 100.0 | % | 100.0 | % | 99.9 | % | 100.0 | % |
Prime | | 49.8 | | 100.0 | | 99.0 | | 100.0 | | 84.9 | | 100.0 | |
Government | | 81.9 | | 99.4 | | 60.1 | | 95.3 | | 77.4 | | 100.0 | |
Treasury | | 92.2 | | 100.0 | | 100.0 | | 100.0 | | 100.0 | | 100.0 | |
Tax-Exempt | | 86.3 | | 100.0 | | 100.0 | | 100.0 | | 89.4 | | 98.5 | |
45
2005 Semi-Annual Report |
|
April 30, 2005 (unaudited) |
Investment Advisory Agreement Approval
Nature, Extent and Quality of Services: The Board reviewed and considered the nature and extent of the investment advisory services provided by the Investment Adviser under the Investment Advisory and Management Agreement, and the Sub-Adviser (an affiliated company of the Investment Adviser) under the Sub-Advisory Agreement, including portfolio management, investment research and trading in money market instruments. The Board also reviewed and considered the nature and extent of the non-advisory, administrative services provided by the Fund’s Administrator (some of which are subcontracted to an unaffiliated company) under the Administration Agreement, including accounting, clerical, bookkeeping, compliance, business management and planning, and the provision of supplies, office space and utilities at the Adviser’s expense. (The Investment Adviser, the Sub-Adviser and the Administrator are referred to, collectively, as the “Adviser” and the Investment Advisory and Management, the Sub-Advisory, and Administration Agreements, are referred to, collectively, as the “Management Agreement.”)
The Board reviewed and considered the qualifications of the portfolio managers, the senior administrative managers and other key personnel of the Adviser who provide the administrative and investment advisory services to the Fund. The Board determined that the Adviser’s portfolio managers and key personnel are well qualified by education and/or training and experience to perform the services in an efficient and professional manner. The Board concluded that the nature and extent of the advisory and administrative services provided were necessary and appropriate for the conduct of the business and investment activities of the Fund. The Board also concluded that the overall quality of the advisory and administrative services was satisfactory.
Performance Relative to Comparable Funds Managed by Other Advisers: The Board reviewed the performance of the Fund’s Money Market, Prime and Tax-Exempt Portfolios for the period ended November 30, 2004, since February 2004, as shown in reports provided by Lipper Inc. (the “Lipper Reports”), compared to the performance of comparable institutional money marketfunds selected by Lipper (the “performance peer group”), and noted that the performance of each Portfolio was better than its performance peer group average for that period. The Board concluded that performance of the Money Market, Prime and Tax-Exempt Portfolios was satisfactory.
The Board noted that the Lipper Reports did not include a comparison of the Government and Treasury Portfolios with a performance peer group. The Board, therefore, compared the performance of these Portfolios with their benchmark, namely, the Lipper Institutional U.S. Government Money Market Average and the Lipper Institutional U.S. Treasury Money Market Average, respectively, and noted that the performance for each of these Portfolios was better than the benchmark for the three-month period ended November 30, 2004. The Board concluded that the performance of the Government and Treasury Portfolios was satisfactory.
Fees Relative to Other Funds Managed by the Adviser with Comparable Investment Strategies: The Board reviewed the advisory and administrative fees (together, the “management fee”) paid by the Fund under the Management Agreement. The Board noted that the contractual management fee rate for each of the Money Market and Tax-Exempt Portfolios was lower than the contractual management fee rate charged by the Adviser to other funds it manages with investment strategies comparable to those of the Portfolios. With respect to the Government Portfolio, the Board noted that the management fee rate charged by the Adviser was higher than a fund it manages with investment strategies comparable to the Portfolio. However, the Board noted that due to a fee and expense waiver currently in place for the Government Portfolio, the Portfolio paid no advisory fee.
Fees and Expenses Relative to Comparable Funds Managed by Other Advisers: The Board reviewed the management fee rate and total expense ratio of each of the Fund’s five Portfolios and noted that the actual management fee rate for each of the Money Market, Prime and Tax-Exempt Portfolios was lower than the average management fee rate for institutional money market funds, selected by Lipper (the “expense peer group”), managed by other advisers, with investment strategies comparable to those of the Portfolios, as shown in the Lipper Report for the Portfolios; and (ii) the total expense ratio for each of the Money Market, Prime and Tax-Exempt Portfolios was also lower than the average total expense ratio of the funds included in the expense peer group.
The Board noted that the Lipper Reports did not include a comparison of the Government and Treasury Portfolios with an expense peer group. The Board, therefore, compared the management fees and expense ratios of each of these Portfolios with the expense peer groups of the Money Market and Prime Portfolios and noted that the fees and expense ratios of the Government and Treasury Portfolios were lower than the average of those expense peer groups. The Board concluded that the management fee of each of the Government and Treasury Portfolios was competitive with the management fees charged by other investment advisers.
Breakpoints and Economies of Scale: The Board noted that the assets of each of the Fund’s five Portfolios were relatively large and the management fee schedule of each Portfolio did not include any breakpoints. The Board proposed that the Adviser incorporate a breakpoint in the management fee of each Portfolio. The Adviser pointed out that in each case the management fee and total expense ratio of each Portfolio were well below the expense peer group average, that the fee was established at a very low level in the expectation of a large asset base and that there is a cap on the total expense ratio of each Portfolio. Based on the foregoing, the Board concluded that the management fee of each Portfolio appropriately reflects economies of scale.
46
| 2005 Semi-Annual Report |
| |
| April 30, 2005 (unaudited) |
Investment Advisory Agreement Approval (cont’d)
Profitability of Adviser and Affiliates: The Board considered and reviewed information concerning the costs incurred and profits realized by the Adviser and its affiliates during the last two years from their relationship with the Fund and the Morgan Stanley Fund Complex and reviewed with the Controller of the Adviser the cost allocation methodology used to determine the Adviser’s profitability. Based on their review of the information they received, the Board concluded that the profits earned by the Adviser and its affiliates were not excessive in light of the advisory, administrative and other services provided to the Fund.
Fall-Out Benefits: The Board considered so-called “fall-out benefits” derived by the Adviser and its affiliates from their relationship with the Fund and the Fund Complex, such as “float” benefits derived from handling of checks for purchases and redemptions of Fund shares through a broker-dealer affiliate of the Adviser. The Board considered the float benefits and concluded that they were relatively small.
Soft Dollar Benefits: The Board considered whether the Adviser realizes any benefits from commissions paid to brokers who execute securities transactions for the Fund (“soft dollars”). The Board noted that the Fund invests only in fixed income securities, which do not generate soft dollars.
Adviser Financially Sound and Financially Capable of Meeting the Fund’s Needs: The Board considered whether the Adviser is financially sound and has the resources necessary to perform its obligations under the Management Agreement. The Board noted that the Adviser’s operations remain profitable, although increased expenses in recent years have reduced the Adviser’s profitability. The Board concluded that the Adviser has the financial resources necessary to fulfill its obligations under the Management Agreement.
Historical Relationship Between the Fund and the Adviser: The Board also reviewed and considered the historical relationship between the Fund and the Adviser, including the organizational structure of the Adviser, the policies and procedures formulated and adopted by the Adviser for managing the Fund’s operations and the Board’s confidence in the competence and integrity of the senior managers and key personnel of the Adviser. The Board concluded that it is beneficial for the Fund to continue its relationship with the Adviser.
Other Factors and Current Trends: The Board considered the controls and procedures adopted and implemented by the Adviser and monitored by the Fund’s Chief Compliance Officer and concluded that the conduct of business by the Adviser indicates a good faith effort on its part to adhere to high ethical standards in the conduct of the Fund’s business.
General Conclusion: After considering and weighing all of the above factors, the Board concluded it would be in the best interest of the Fund and its shareholders to approve renewal of the Management Agreement for another year.
47
2005 Semi-Annual Report |
| |
April 30, 2005 (unaudited) |
Trustee and Officer Information |
|
Trustees | Officers |
| |
Michael Bozic | Charles A. Fiumefreddo |
| Chairman and Director of the Board |
Edwin J. Garn | |
| Mitchell M. Merin |
Wayne E. Hedien | President |
| |
James F. Higgins | Ronald E. Robison |
| Executive Vice President and Principal Executive Officer |
Dr. Manuel H. Johnson | |
| Barry Fink |
Joseph J. Kearns | Vice President |
| |
Michael Nugent | Joseph J. McAlinden |
| Vice President |
Fergus Reid | |
| Stefanie V. Chang |
Investment Adviser and Administrator | Vice President |
Morgan Stanley Investment Management Inc. | |
1221 Avenue of the Americas | Amy R. Doberman |
New York, NY 10020 | Vice President |
| |
Distributor | |
Morgan Stanley Distribution, Inc. | Carsten Otto |
One Tower Bridge Road | Chief Compliance Officer |
100 Front Street, Suite 1100 | |
West Conshohocken, PA 19428-2899 | James W. Garrett |
| |
Custodian | Treasurer and Chief Financial Officer |
JPMorgan Chase Bank | |
270 Park Avenue | Michael J. Leary |
New York, NY 10017 | Assistant Treasurer |
| |
Legal Counsel | |
Clifford Chance US LLP | Mary E. Mullin |
31 West 52nd Street | Secretary |
New York, NY 10019 | |
| |
Independent Registered Public Accounting Firm | |
Ernst & Young LLP | |
200 Clarendon Street | |
Boston, MA 02116-5072 | |
Reporting to Shareholders
Each Morgan Stanley fund provides a complete schedule of portfolio holdings in its semi-annual and annual reports within 60 days of the end of the fund’s second and fourth fiscal quarters by filing the schedule electronically with the Securities and Exchange Commission (SEC). The semi-annual reports are filed on Form N-CSRS and the annual reports are filed on Form N-CSR. Morgan Stanley also delivers the semi-annual and annual reports to fund shareholders and makes these reports available on its public website, www.morganstanley.com/im. Each Morgan Stanley fund also files a complete schedule of portfolio holdings with the SEC for the fund’s first and third fiscal quarters on Form N-Q. Morgan Stanley does not deliver the reports for the first and third fiscal quarters to shareholders, nor are the reports posted to the Morgan Stanley public website. You may, however, obtain the Form N-Q filings (as well as the Form N-CSR and N-CSRS filings) by accessing the SEC’s website, www.sec.gov. You may also review and copy them at the SEC’s Public Reference Room in Washington, DC. Information on the operation of the SEC’s Public Reference Room may be obtained by calling the SEC at 1(800) SEC-0330. You can also request copies of these materials, upon payment of a duplicating fee, by electronic request at the SEC’s email address (publicinfo@sec.gov) or by writing the Public Reference section of the SEC, Washington, DC 20549-0102.
Proxy Voting Policies and Procedures and Proxy Voting Record
A copy of (1) the Fund’s policies and procedures with respect to the voting of proxies relating to the Fund’s portfolio securities; and (2) how the Fund voted proxies relating to portfolio securities during the most recent twelve-month period ended June 30 is available without charge, upon request, by calling 1-888-378-1630 or by visiting our website at www.morganstanley.com/im. This information is also available on the Securities and Exchange Commission’s web-site at http://www.sec.gov.
This report is authorized for distribution only when preceded or accompanied by the prospectus of the Morgan Stanley Institutional Liquidity Funds which describes in detail each Investment Portfolio’s investment policies, risks, fees and expenses. Please read the prospectus carefully before you invest or send money. For additional information, including information regarding the investments comprising the Portfolio, please visit our website at www.morganstanley.com/im or call 1-888-378-1630.
48
Printed in U.S.A.
This Report has been prepared for shareholders and may be distributed to others only if preceded or accompanied by a current prospectus.
Morgan Stanley Investment Management Inc.
1221 Avenue of the Americas
New York, NY 10020
MSILF: (888) 378-1630
© 2005 Morgan Stanley

49
Item 2. Code of Ethics.
Not applicable for semi-annual reports.
Item 3. Audit Committee Financial Expert.
Not applicable for semi-annual reports.
Item 4. Principal Accountant Fees and Services.
Not applicable for semi-annual reports.
Item 5. Audit Committee of Listed Registrants.
Not applicable for semi-annual reports.
Item 6. Schedule of Investments.
Please refer to Item #1.
Item 7. Disclosure of Proxy Voting Policies and Procedures for Closed-End Management Investment Companies.
Not applicable.
Item 8. Portfolio Managers of Closed-End Management Investment Companies.
Not applicable.
Item 9. Purchases of Equity Securities by Closed-End Management Investment Company and Affiliated Purchasers.
Not applicable.
Item 10. Submission of Matters to a Vote of Security Holders.
Not applicable.
Item 11. Controls and Procedures
(a) The Fund’s principal executive officer and principal financial officer have concluded that the Fund’s disclosure controls and procedures are sufficient to ensure that information required to be disclosed by the Fund in this Form N-CSR was recorded, processed, summarized and reported within the time periods specified in the Securities and Exchange Commission’s rules and forms, based upon such officers’ evaluation of these controls and procedures as of a date within 90 days of the filing date of the report.
(b) There were no changes in the registrant’s internal control over financial reporting that occurred during the registrant’s most recent fiscal half-year (the registrant’s second fiscal half-year in the case of an annual report) that has materially affected, or is reasonably likely to materially affect, the registrant’s internal control over financial reporting.
Item 12. Exhibits.
(a) Code of Ethics – Not applicable for semi-annual reports.
(b)(1) A certification for the Principal Executive Officer of the registrant is attached hereto as part of EX-99.CERT.
(b)(2) A certification for the Principal Financial Officer of the registrant is attached hereto as part of EX-99.CERT.