UNITED STATES
SECURITIES AND EXCHANGE COMMISSION
Washington, D.C. 20549
FORM N-CSR
CERTIFIED SHAREHOLDER REPORT OF REGISTERED
MANAGEMENT INVESTMENT COMPANIES
Investment Company Act file number | 811-21339 |
|
MORGAN STANLEY INSTITUTIONAL LIQUIDITY FUNDS |
(Exact name of registrant as specified in charter) |
|
1221 AVENUE OF THE AMERICAS 5TH FLOOR NEW YORK, NY | | 10020 |
(Address of principal executive offices) | | (Zip code) |
|
RONALD E. ROBISON
1221 AVENUE OF THE AMERICAS 5TH FLOOR NEW YORK, NY 10020 |
(Name and address of agent for service) |
|
Registrant’s telephone number, including area code: | 1-888-378-1630 | |
|
Date of fiscal year end: | 10/31 | |
|
Date of reporting period: | 4/30/06 | |
| | | | | | | | |
Form N-CSR is to be used by management investment companies to file reports with the Commission not later than 10 days after the transmission to stockholders of any report that is required to be transmitted to stockholders under Rule 30e-1 under the Investment Company Act of 1940 (17 CFR 270.30e-1). The Commission may use the information provided on Form N-CSR in its regulatory, disclosure review, inspection, and policymaking roles.
A registrant is required to disclose the information specified by Form N-CSR, and the Commission will make this information public. A registrant is not required to respond to the collection of information contained in Form N-CSR unless the Form displays a currently valid Office of Management and Budget (“OMB”) control number. Please direct comments concerning the accuracy of the information collection burden estimate and any suggestions for reducing the burden to Secretary, Securities and Exchange Commission, 450 Fifth Street, NW, Washington, DC 20549-0609. The OMB has reviewed this collection of information under the clearance requirements of 44 U.S.C. § 3507.
ITEM 1. REPORTS TO STOCKHOLDERS.
The Funds’s semi-annual report transmitted to shareholders pursuant to Rule 30e-1 under the Investment Company Act of 1940 is as follows:

Morgan Stanley Institutional Liquidity Funds
Money Market Portfolio
Prime Portfolio
Government Portfolio
Treasury Portfolio
Tax-Exempt Portfolio

Table of Contents
Shareholder’s Letter | | 3 | |
Investment Advisory Agreement Approval | | 4 | |
Performance Summary | | 14 | |
Expense Examples | | 15 | |
Portfolio of Investments | | | |
Money Market Portfolio | | 18 | |
Prime Portfolio | | 21 | |
Government Portfolio | | 25 | |
Treasury Portfolio | | 27 | |
Tax-Exempt Portfolio | | 28 | |
Statements of Assets and Liabilities | | 33 | |
Statements of Operations | | 35 | |
Statements of Changes in Net Assets | | 36 | |
Financial Highlights | | 40 | |
Notes to Financial Statements | | 46 | |
Trustee and Officer Information | | 49 | |
This report is authorized for distribution only when preceded or accompanied by prospectuses of the Morgan Stanley Institutional Liquidity Funds. To receive a prospectus and/or SAI, which contains more complete information such as investment objectives, charges, expenses, policies for voting proxies, risk considerations, and describes in detail each of the Portfolio’s investment policies to the prospective investor, please call 1 (888) 378-1630. Please read the prospectus carefully before you invest or send money. Additionally, you can access portfolio information including performance, yields, characteristics, and investment team commentary through Morgan Stanley Investment Management’s website: www.morganstanley.com/im.
1
(This page has been left blank intentionally.)

Shareholder’s Letter
Dear Shareholders:
Overview
We are pleased to present the Morgan Stanley Institutional Liquidity Funds (“MSILF”) Semi-Annual Report for the period ended April 30, 2006. MSILF currently offers five portfolios (Money Market, Prime, Government, Treasury and Tax-Exempt), which together are designed to provide flexible cash management options. MSILF’s portfolios provide investors with a means to help them meet specific cash investment needs, whether they need a rated fund, capital preservation, or tax-efficient returns.
Sincerely,

Ronald E. Robinson
President & Principal Executive Officer
May 2006
3

Investment Advisory Agreement Approval
MONEY MARKET PORTFOLIO
Nature, Extent and Quality of Services: The Board reviewed and considered the nature and extent of the investment advisory services provided by the Investment Adviser under the Advisory Agreement, including portfolio management, investment research and fixed income securities trading. The Board reviewed similar information and factors regarding the Sub-Adviser to the extent applicable. The Board also reviewed and considered the nature and extent of the non-advisory, administrative services provided by the Portfolio’s Administrator under the Administration Agreement, including accounting, clerical, bookkeeping, compliance, business management and planning, and the provision of supplies, office space and utilities at the Investment Adviser’s expense. (The Investment Adviser, Sub-Adviser and Administrator together are referred to as the “Adviser” and the Advisory, Sub-Advisory and Administration Agreements together are referred to as the “Management Agreement.”) The Board also compared the nature of the services provided by the Adviser with similar services provided by non-affiliated advisers as reported to the Board by Lipper Inc. (“Lipper”).
The Board reviewed and considered the qualifications of the portfolio managers, the senior administrative managers and other key personnel of the Adviser who provide the administrative and advisory services to the Portfolio. The Board determined that the Adviser’s portfolio managers and key personnel are well qualified by education and/or training and experience to perform the services in an efficient and professional manner. The Board concluded that the nature and extent of the advisory and administrative services provided were necessary and appropriate for the conduct of the business and investment activities of the Portfolio. The Board also concluded that the overall quality of the advisory and administrative services was satisfactory.
Performance Relative to Comparable Funds Managed by Other Advisers: On a regular basis, the Board reviews the performance of all funds in the Morgan Stanley Fund Complex, including the Portfolio, compared to their peers, paying specific attention to the underperforming funds. In addition, the Board specifically reviewed the Portfolio’s performance for the one-year period ended November 30, 2005 and for the period since the end of February 2004, the month of the Portfolio’s inception, as shown in a report provided by Lipper (the “Lipper Report”), compared to the performance of comparable funds selected by Lipper (the “performance peer group”). The Board also discussed with the Adviser the performance goals and the actual results achieved in managing the Portfolio. The Board concluded that the Portfolio’s performance was competitive with that of its performance peer group.
Fees Relative to Other Funds Managed by the Adviser with Comparable Investment Strategies: The Board reviewed the advisory and administrative fee (together, the “management fee”) rate paid by the Portfolio under the Management Agreement. The Board noted that the management fee rate was comparable to the management fee rates charged by the Adviser to other proprietary funds it manages with investment strategies comparable to those of the Portfolio.
Fees and Expenses Relative to Comparable Funds Managed by Other Advisers: The Board reviewed the management fee rate and total expense ratio of the Portfolio as compared to the average management fee rate and average total expense ratio for funds, selected by Lipper (the “expense peer group”), managed by other advisers with investment strategies comparable to those of the Portfolio, as shown in the Lipper Report. The Board concluded that the Portfolio’s management fee rate and total expense ratio, taking into account the cap on the total expense ratio, were competitive with those of its expense peer group.
Breakpoints and Economies of Scale: The Board reviewed the structure of the Portfolio’s management fee schedule under the Management Agreement and noted that it does not include any breakpoints. The Board also reviewed the level of the Portfolio’s management fee and concluded that the fee, compared to the Portfolio’s expense peer group, was sufficiently low, and there is a cap in the total expense ratio, so that, in effect, economies of scale were built into the management fee structure.
Profitability of the Adviser and Affiliates: The Board considered information concerning the costs incurred and profits realized by the Adviser and affiliates during the last year from their relationship with the Portfolio and during the last two years from their relationship with the Morgan Stanley Fund Complex and reviewed with the Adviser the cost allocation methodology used to determine the profitability of the Adviser and affiliates. Based on its review of the information it received, the Board concluded that the profits earned by the Adviser and affiliates were not excessive in light of the advisory, administrative and other services provided to the Portfolio.
Fall-Out Benefits: The Board considered so-called “fall-out benefits” derived by the Adviser and its affiliates from their relationship with the Portfolio and the Morgan Stanley Fund Complex, such as “float” benefits derived from handling of checks for purchases and sales of Portfolio shares through a broker-dealer affiliate of the Adviser. The Board concluded that the float benefits were relatively small.
4
Investment Advisory Agreement Approval (cont’d)
Soft Dollar Benefits: The Board considered whether the Adviser realizes any benefits from commissions paid to brokers who execute securities transactions for the Portfolio (“soft dollars”). The Board noted that the Portfolio invests only in fixed income securities, which do not generate soft dollars.
Adviser Financially Sound and Financially Capable of Meeting the Portfolio’s Needs: The Board considered whether the Adviser is financially sound and has the resources necessary to perform its obligations under the Management Agreement. The Board noted that the Adviser’s operations remain profitable, although increased expenses in recent years have reduced the Adviser’s profitability. The Board concluded that the Adviser has the financial resources necessary to fulfill its obligations under the Management Agreement.
Historical Relationship Between the Portfolio and the Adviser: The Board also reviewed and considered the historical relationship between the Portfolio and the Adviser, including the organizational structure of the Adviser, the policies and procedures formulated and adopted by the Adviser for managing the Portfolio’s operations and the Board’s confidence in the competence and integrity of the senior managers and key personnel of the Adviser. The Board concluded that it is beneficial for the Portfolio to continue its relationship with the Adviser.
Other Factors and Current Trends: The Board considered the controls and procedures adopted and implemented by the Adviser and monitored by the Portfolio’s Chief Compliance Officer and concluded that the conduct of business by the Adviser indicates a good faith effort on its part to adhere to high ethical standards in the conduct of the Portfolio’s business.
General Conclusion: After considering and weighing all of the above factors, the Board concluded that it would be in the best interest of the Portfolio and its shareholders to approve renewal of the Management Agreement for another year.
5
Investment Advisory Agreement Approval (cont’d)
PRIME PORTFOLIO
Nature, Extent and Quality of Services: The Board reviewed and considered the nature and extent of the investment advisory services provided by the Investment Adviser under the Advisory Agreement, including portfolio management, investment research and fixed income securities trading. The Board reviewed similar information and factors regarding the Sub-Adviser, to the extent applicable. The Board also reviewed and considered the nature and extent of the non-advisory, administrative services provided by the Portfolio’s Administrator under the Administration Agreement, including accounting, clerical, bookkeeping, compliance, business management and planning, and the provision of supplies, office space and utilities at the Investment Adviser’s expense. (The Investment Adviser, Sub-Adviser and Administrator together are referred to as the “Adviser” and the Advisory, Sub-Advisory and Administration Agreements together are referred to as the “Management Agreement.”) The Board also compared the nature of the services provided by the Adviser with similar services provided by non-affiliated advisers as reported to the Board by Lipper Inc. (“Lipper”).
The Board reviewed and considered the qualifications of the portfolio managers, the senior administrative managers and other key personnel of the Adviser who provide the administrative and advisory services to the Portfolio. The Board determined that the Adviser’s portfolio managers and key personnel are well qualified by education and/or training and experience to perform the services in an efficient and professional manner. The Board concluded that the nature and extent of the advisory and administrative services provided were necessary and appropriate for the conduct of the business and investment activities of the Portfolio. The Board also concluded that the overall quality of the advisory and administrative services was satisfactory.
Performance Relative to Comparable Funds Managed by Other Advisers: On a regular basis, the Board reviews the performance of all funds in the Morgan Stanley Fund Complex, including the Portfolio, compared to their peers, paying specific attention to the underperforming funds. In addition, the Board specifically reviewed the Portfolio’s performance for the one-year period ended November 30, 2005 and for the period since the end of February 2004, the month of the Portfolio’s inception, as shown in a report provided by Lipper (the “Lipper Report”), compared to the performance of comparable funds selected by Lipper (the “performance peer group”). The Board also discussed with the Adviser the performance goals and the actual results achieved in managing the Portfolio. The Board concluded that the Portfolio’s performance was competitive with that of its performance peer group.
Fees Relative to Other Proprietary Funds Managed by the Adviser with Comparable Investment Strategies: The Board reviewed the advisory and administrative fee (together, the “management fee”) rate paid by the Portfolio under the Management Agreement. The Board noted that the management fee rate was comparable to the management fee rates charged by the Adviser to other proprietary funds it manages with investment strategies comparable to those of the Portfolio.
Fees and Expenses Relative to Comparable Funds Managed by Other Advisers: The Board reviewed the management fee rate and total expense ratio of the Portfolio as compared to the average management fee rate and average total expense ratio for funds, selected by Lipper (the “expense peer group”), managed by other advisers with investment strategies comparable to those of the Portfolio, as shown in the Lipper Report. The Board concluded that the Portfolio’s management fee rate and total expense ratio were competitive with those of its expense peer group.
Breakpoints and Economies of Scale: The Board reviewed the structure of the Portfolio’s management fee schedule under the Management Agreement and noted that it does not include any breakpoints. The Board also reviewed the level of the Portfolio’s management fee and concluded that the fee, compared to the Portfolio’s expense peer group, was sufficiently low, and there is a cap on the total expense ratio, so that, in effect, economies of scale were built into the management fee structure.
Profitability of the Adviser and Affiliates: The Board considered information concerning the costs incurred and profits realized by the Adviser and affiliates during the last year from their relationship with the Portfolio and during the last two years from their relationship with the Morgan Stanley Fund Complex and reviewed with the Adviser the cost allocation methodology used to determine the profitability of the Adviser and affiliates. Based on its review of the information it received, the Board concluded that the profits earned by the Adviser and affiliates were not excessive in light of the advisory, administrative and other services provided to the Portfolio.
Fall-Out Benefits: The Board considered so-called “fall-out benefits” derived by the Adviser and affiliates from their relationship with the Portfolio and the Morgan Stanley Fund Complex, such as “float” benefits derived from handling of checks for purchases and sales of Portfolio shares, through a broker-dealer affiliate of the Adviser. The Board concluded that the float benefits were relatively small.
6
Investment Advisory Agreement Approval (cont’d)
Soft Dollar Benefits: The Board considered whether the Adviser realizes any benefits from commissions paid to brokers who execute securities transactions for the Portfolio (“soft dollars”). The Board noted that the Portfolio invests only in fixed income securities, which do not generate soft dollars.
Adviser Financially Sound and Financially Capable of Meeting the Portfolio’s Needs: The Board considered whether the Adviser is financially sound and has the resources necessary to perform its obligations under the Management Agreement. The Board noted that the Adviser’s operations remain profitable, although increased expenses in recent years have reduced the Adviser’s profitability. The Board concluded that the Adviser has the financial resources necessary to fulfill its obligations under the Management Agreement.
Historical Relationship Between the Portfolio and the Adviser: The Board also reviewed and considered the historical relationship between the Portfolio and the Adviser, including the organizational structure of the Adviser, the policies and procedures formulated and adopted by the Adviser for managing the Portfolio’s operations and the Board’s confidence in the competence and integrity of the senior managers and key personnel of the Adviser. The Board concluded that it is beneficial for the Portfolio to continue its relationship with the Adviser.
Other Factors and Current Trends: The Board considered the controls and procedures adopted and implemented by the Adviser and monitored by the Portfolio’s Chief Compliance Officer and concluded that the conduct of business by the Adviser indicates a good faith effort on its part to adhere to high ethical standards in the conduct of the Portfolio’s business.
General Conclusion: After considering and weighing all of the above factors, the Board concluded that it would be in the best interest of the Portfolio and its shareholders to approve renewal of the Management Agreement for another year.
7
Investment Advisory Agreement Approval (cont’d)
GOVERNMENT PORTFOLIO
Nature, Extent and Quality of Services: The Board reviewed and considered the nature and extent of the investment advisory services provided by the Investment Adviser under the Advisory Agreement, including portfolio management, investment research and fixed income securities trading. The Board reviewed similar information and factors regarding the Sub-Adviser, to the extent applicable. The Board also reviewed and considered the nature and extent of the non-advisory, administrative services provided by the Portfolio’s Administrator under the Administration Agreement, including accounting, clerical, bookkeeping, compliance, business management and planning, and the provision of supplies, office space and utilities at the Investment Adviser’s expense. (The Investment Adviser, Sub-Adviser and Administrator together are referred to as the “Adviser” and the Advisory, Sub-Advisory and Administration Agreements together are referred to as the “Management Agreement.”) The Board also compared the nature of the services provided by the Adviser with similar services provided by non-affiliated advisers as reported to the Board by Lipper Inc. (“Lipper”).
The Board reviewed and considered the qualifications of the portfolio managers, the senior administrative managers and other key personnel of the Adviser who provide the administrative and advisory services to the Portfolio. The Board determined that the Adviser’s portfolio managers and key personnel are well qualified by education and/or training and experience to perform the services in an efficient and professional manner. The Board concluded that the nature and extent of the advisory and administrative services provided were necessary and appropriate for the conduct of the business and investment activities of the Portfolio. The Board also concluded that the overall quality of the advisory and administrative services was satisfactory.
Performance Relative to Comparable Funds Managed by Other Advisers: On a regular basis, the Board reviews the performance of all funds in the Morgan Stanley Fund Complex, including the Portfolio, compared to their peers, paying specific attention to the underperforming funds. In addition, the Board specifically reviewed the Portfolio’s performance for the one-year period ended November 30, 2005 and for the period since the end of August 2004, the month of the Portfolio’s inception, as shown in a report provided by Lipper (the “Lipper Report”), compared to the performance of comparable funds selected by Lipper (the “performance peer group”). The Board also discussed with the Adviser the performance goals and the actual results achieved in managing the Portfolio. The Board concluded that the Portfolio’s performance was competitive with that of its performance peer group.
Fees Relative to Other Proprietary Funds Managed by the Adviser with Comparable Investment Strategies: The Board reviewed the advisory and administrative fee (together, the “management fee”) rate paid by the Portfolio under the Management Agreement. The Board noted that the management fee rate was comparable to the management fee rates charged by the Adviser to other proprietary funds it manages with investment strategies comparable to those of the Portfolio.
Fees and Expenses Relative to Comparable Funds Managed by Other Advisers: The Board reviewed the management fee rate and total expense ratio of the Portfolio as compared to the average management fee rate and average total expense ratio for funds, selected by Lipper (the “expense peer group”), managed by other advisers with investment strategies comparable to those of the Portfolio, as shown in the Lipper Report. The Board noted that the Adviser waived its management fee and paid some expenses of the Portfolio, excluding brokerage. The Board concluded that the Portfolio’s management fee rate and total expense ratio, taking into account the fee waiver and the expenses paid by the Adviser, were competitive with those of its expense peer group.
Breakpoints and Economies of Scale: The Board reviewed the structure of the Portfolio’s management fee schedule under the Management Agreement and noted that it does not include any breakpoints. The Board also reviewed the level of the Portfolio’s management fee and concluded that the fee, compared to the Portfolio’s expense peer group, was sufficiently low, and there is a cap on the total expense ratio, so that, in effect, economies of scale were built into the management fee structure.
Profitability of the Adviser and Affiliates: The Board considered information concerning the costs incurred and profits realized by the Adviser and affiliates during the last year from their relationship with the Portfolio and during the last two years from their relationship with the Morgan Stanley Fund Complex and reviewed with the Adviser the cost allocation methodology used to determine the profitability of the Adviser and affiliates. Based on its review of the information it received, the Board concluded that the profits earned by the Adviser and affiliates were not excessive in light of the advisory, administrative and other services provided to the Portfolio.
Fall-Out Benefits: The Board considered so-called “fall-out benefits” derived by the Adviser and affiliates from their relationship with the Portfolio and the Morgan Stanley Fund Complex, such as “float” benefits derived from handling of checks for purchases and sales of Portfolio shares, through a broker-dealer affiliate of the Adviser. The Board concluded that the float benefits were relatively small.
8
Investment Advisory Agreement Approval (cont’d)
Soft Dollar Benefits: The Board considered whether the Adviser realizes any benefits from commissions paid to brokers who execute securities transactions for the Portfolio (“soft dollars”). The Board noted that the Portfolio invests only in fixed income securities, which do not generate soft dollars.
Adviser Financially Sound and Financially Capable of Meeting the Portfolio’s Needs: The Board considered whether the Adviser is financially sound and has the resources necessary to perform its obligations under the Management Agreement. The Board noted that the Adviser’s operations remain profitable, although increased expenses in recent years have reduced the Adviser’s profitability. The Board concluded that the Adviser has the financial resources necessary to fulfill its obligations under the Management Agreement.
Historical Relationship Between the Portfolio and the Adviser: The Board also reviewed and considered the historical relationship between the Portfolio and the Adviser, including the organizational structure of the Adviser, the policies and procedures formulated and adopted by the Adviser for managing the Portfolio’s operations and the Board’s confidence in the competence and integrity of the senior managers and key personnel of the Adviser. The Board concluded that it is beneficial for the Portfolio to continue its relationship with the Adviser.
Other Factors and Current Trends: The Board considered the controls and procedures adopted and implemented by the Adviser and monitored by the Portfolio’s Chief Compliance Officer and concluded that the conduct of business by the Adviser indicates a good faith effort on its part to adhere to high ethical standards in the conduct of the Portfolio’s business.
General Conclusion: After considering and weighing all of the above factors, the Board concluded that it would be in the best interest of the Portfolio and its shareholders to approve renewal of the Management Agreement for another year.
9

Investment Advisory Agreement Approval (cont’d)
TREASURY PORTFOLIO
Nature, Extent and Quality of Services: The Board reviewed and considered the nature and extent of the investment advisory services provided by the Investment Adviser under the Advisory Agreement, including portfolio management, investment research and fixed income securities trading. The Board reviewed similar information and factors regarding the Sub-Adviser, to the extent applicable. The Board also reviewed and considered the nature and extent of the non-advisory, administrative services provided by the Portfolio’s Administrator under the Administration Agreement, including accounting, clerical, bookkeeping, compliance, business management and planning, and the provision of supplies, office space and utilities at the Investment Adviser’s expense. (The Investment Adviser, Sub-Adviser and Administrator together are referred to as the “Adviser” and the Advisory, Sub-Advisory and Administration Agreements together are referred to as the “Management Agreement.”) The Board also compared the nature of the services provided by the Adviser with similar services provided by non-affiliated advisers as reported to the Board by Lipper Inc. (“Lipper”).
The Board reviewed and considered the qualifications of the portfolio managers, the senior administrative managers, and other key personnel of the Adviser who provide the administrative and advisory services to the Portfolio. The Board determined that the Adviser’s portfolio managers and key personnel are well qualified by education and/or training and experience to perform the services in an efficient and professional manner. The Board concluded that the nature and extent of the advisory and administrative services provided were necessary and appropriate for the conduct of the business and investment activities of the Portfolio. The Board also concluded that the overall quality of the advisory and administrative services was satisfactory.
Performance Relative to Comparable Funds Managed by Other Advisers: On a regular basis, the Board reviews the performance of all funds in the Morgan Stanley Fund Complex, including the Portfolio, compared to their peers, paying specific attention to the underperforming funds. In addition, the Board specifically reviewed the Portfolio’s performance for the one-year period ended November 30, 2005 and for the period since the end of August 2004, the month of the Portfolio’s inception, as shown in a report provided by Lipper (the “Lipper Report”), compared to the performance of comparable funds selected by Lipper (the “performance peer group”). The Board also discussed with the Adviser the performance goals and the actual results achieved in managing the Portfolio. The Board concluded that the Portfolio’s performance was competitive with that of its performance peer group.
Fees Relative to Other Proprietary Funds Managed by the Adviser with Comparable Investment Strategies: The Board reviewed the advisory and administrative fee (together, the “management fee”) rate paid by the Portfolio under the Management Agreement. The Board noted that the management fee rate was comparable to the management fee rates charged by the Adviser to other proprietary funds it manages with investment strategies comparable to those of the Portfolio.
Fees and Expenses Relative to Comparable Funds Managed by Other Advisers: The Board reviewed the management fee rate and total expense ratio of the Portfolio as compared to the average management fee rate and average total expense ratio for funds, selected by Lipper (the “expense peer group”), managed by other advisers with investment strategies comparable to those of the Portfolio, as shown in the Lipper Report. The Board noted that the Adviser waived its management fee and paid some expenses of the Portfolio, excluding brokerage. The Board concluded that the Portfolio’s management fee rate and total expense ratio, taking into account the fee waiver and expenses paid by the Adviser, were competitive with those of its expense peer group.
Breakpoints and Economies of Scale: The Board reviewed the structure of the Portfolio’s management fee schedule under the Management Agreement and noted that it does not include any breakpoints. The Board also reviewed the level of the Portfolio’s management fee and concluded that the fee, compared to the Portfolio’s expense peer group, was sufficiently low, and there is a cap in the total expense ratio, so that, in effect, economies of scale were built into the management fee structure.
Profitability of the Adviser and Affiliates: The Board considered information concerning the costs incurred and profits realized by the Adviser and affiliates during the last year from their relationship with the Portfolio and during the last two years from their relationship with the Morgan Stanley Fund Complex and reviewed with the Adviser the cost allocation methodology used to determine the profitability of the Adviser and affiliates. Based on its review of the information it received, the Board concluded that the profits earned by the Adviser and affiliates were not excessive in light of the advisory, administrative and other services provided to the Portfolio.
Fall-Out Benefits: The Board considered so-called “fall-out benefits” derived by the Adviser and affiliates from their relationship with the Portfolio and the Morgan Stanley Fund Complex, such as “float” benefits derived from handling of checks for purchases and sales of Portfolio shares, through a broker-dealer affiliate of the Adviser. The Board concluded that the float benefits were relatively small.
10
Investment Advisory Agreement Approval (cont’d)
Soft Dollar Benefits: The Board considered whether the Adviser realizes any benefits from commissions paid to brokers who execute securities transactions for the Portfolio (“soft dollars”). The Board noted that the Portfolio invests only in fixed income securities, which do not generate soft dollars.
Adviser Financially Sound and Financially Capable of Meeting the Portfolio’s Needs: The Board considered whether the Adviser is financially sound and has the resources necessary to perform its obligations under the Management Agreement. The Board noted that the Adviser’s operations remain profitable, although increased expenses in recent years have reduced the Adviser’s profitability. The Board concluded that the Adviser has the financial resources necessary to fulfill its obligations under the Management Agreement.
Historical Relationship Between the Portfolio and the Adviser: The Board also reviewed and considered the historical relationship between the Portfolio and the Adviser, including the organizational structure of the Adviser, the policies and procedures formulated and adopted by the Adviser for managing the Portfolio’s operations and the Board’s confidence in the competence and integrity of the senior managers and key personnel of the Adviser. The Board concluded that it is beneficial for the Portfolio to continue its relationship with the Adviser.
Other Factors and Current Trends: The Board considered the controls and procedures adopted and implemented by the Adviser and monitored by the Portfolio’s Chief Compliance Officer and concluded that the conduct of business by the Adviser indicates a good faith effort on its part to adhere to high ethical standards in the conduct of the Portfolio’s business.
General Conclusion: After considering and weighing all of the above factors, the Board concluded that it would be in the best interest of the Portfolio and its shareholders to approve renewal of the Management Agreement for another year.
11
Investment Advisory Agreement Approval (cont’d)
TAX-EXEMPT PORTFOLIO
Nature, Extent and Quality of Services: The Board reviewed and considered the nature and extent of the investment advisory services provided by the Investment Adviser under the Advisory Agreement, including portfolio management, investment research and fixed income securities trading. The Board reviewed similar information and factors regarding the Sub-Adviser, to the extent applicable. The Board also reviewed and considered the nature and extent of the non-advisory, administrative services provided by the Portfolio’s Administrator under the Administration Agreement, including accounting, clerical, bookkeeping, compliance, business management and planning, and the provision of supplies, office space and utilities at the Investment Adviser’s expense. (The Investment Adviser, Sub-Adviser and Administrator together are referred to as the “Adviser” and the Advisory, Sub-Advisory and Administration Agreements together are referred to as the “Management Agreement.”) The Board also compared the nature of the services provided by the Adviser with similar services provided by non-affiliated advisers as reported to the Board by Lipper Inc. (“Lipper”).
The Board reviewed and considered the qualifications of the portfolio managers, the senior administrative managers, and other key personnel of the Adviser who provide the administrative and advisory services to the Portfolio. The Board determined that the Adviser’s portfolio managers and key personnel are well qualified by education and/or training and experience to perform the services in an efficient and professional manner. The Board concluded that the nature and extent of the advisory and administrative services provided were necessary and appropriate for the conduct of the business and investment activities of the Portfolio. The Board also concluded that the overall quality of the advisory and administrative services was satisfactory.
Performance Relative to Comparable Funds Managed by Other Advisers: On a regular basis, the Board reviews the performance of all funds in the Morgan Stanley Fund Complex, including the Portfolio, compared to their peers, paying specific attention to the underperforming funds. In addition, the Board specifically reviewed the Portfolio’s performance for the one-year period ended November 30, 2005 and for the period since the end of February 2004, the month of the Portfolio’s inception, as shown in a report provided by Lipper (the “Lipper Report”), compared to the performance of comparable funds selected by Lipper (the “performance peer group”). The Board also discussed with the Adviser the performance goals and the actual results achieved in managing the Portfolio. The Board concluded that the Portfolio’s performance was competitive with that of its performance peer group.
Fees Relative to Other Proprietary Funds Managed by the Adviser with Comparable Investment Strategies: The Board reviewed the advisory and administrative fee (together, the “management fee”) rate paid by the Portfolio under the Management Agreement. The Board noted that the management fee rate was comparable to the management fee rates charged by the Adviser to other proprietary funds it manages with investment strategies comparable to those of the Portfolio.
Fees and Expenses Relative to Comparable Funds Managed by Other Advisers: The Board reviewed the management fee rate and total expense ratio of the Portfolio as compared to the average management fee rate and average total expense ratio for funds, selected by Lipper (the “expense peer group”), managed by other advisers with investment strategies comparable to those of the Portfolio, as shown in the Lipper Report for the Portfolio. The Board noted that the Adviser waived its management fee and paid some expenses of the Portfolio, excluding brokerage. The Board concluded that the Portfolio’s management fee rate and total expense ratio, taking into account the fee waiver and the expenses paid by the Adviser, were competitive with those of its expense peer group.
Breakpoints and Economies of Scale: The Board reviewed the structure of the Portfolio’s management fee schedule under the Management Agreement and noted that it does not include any breakpoints. The Board also reviewed the level of the Portfolio’s management fee and concluded that the fee, compared to the Portfolio’s expense peer group, was sufficiently low, and there is a cap in the total expense ratio, so that, in effect, economies of scale were built into the management fee structure.
Profitability of the Adviser and Affiliates: The Board considered information concerning the costs incurred and profits realized by the Adviser and affiliates during the last year from their relationship with the Portfolio and during the last two years from their relationship with the Morgan Stanley Fund Complex and reviewed with the Adviser the cost allocation methodology used to determine the profitability of the Adviser and affiliates. Based on its review of the information it received, the Board concluded that the profits earned by the Adviser and affiliates were not excessive in light of the advisory, administrative and other services provided to the Portfolio.
Fall-Out Benefits: The Board considered so-called “fall-out benefits” derived by the Adviser and affiliates from their relationship with the Portfolio and the Morgan Stanley Fund Complex, such as “float” benefits derived from handling of checks for purchases and sales of Portfolio shares, through a broker-dealer affiliate of the Adviser. The Board concluded that the float benefits were relatively small.
12
Investment Advisory Agreement Approval (cont’d)
Soft Dollar Benefits: The Board considered whether the Adviser realizes any benefits from commissions paid to brokers who execute securities transactions for the Portfolio (“soft dollars”). The Board noted that the Portfolio invests only in fixed income securities, which do not generate soft dollars.
Adviser Financially Sound and Financially Capable of Meeting the Portfolio’s Needs: The Board considered whether the Adviser is financially sound and has the resources necessary to perform its obligations under the Management Agreement. The Board noted that the Adviser’s operations remain profitable, although increased expenses in recent years have reduced the Adviser’s profitability. The Board concluded that the Adviser has the financial resources necessary to fulfill its obligations under the Management Agreement.
Historical Relationship Between the Portfolio and the Adviser: The Board also reviewed and considered the historical relationship between the Portfolio and the Adviser, including the organizational structure of the Adviser, the policies and procedures formulated and adopted by the Adviser for managing the Portfolio’s operations and the Board’s confidence in the competence and integrity of the senior managers and key personnel of the Adviser. The Board concluded that it is beneficial for the Portfolio to continue its relationship with the Adviser.
Other Factors and Current Trends: The Board considered the controls and procedures adopted and implemented by the Adviser and monitored by the Portfolio’s Chief Compliance Officer and concluded that the conduct of business by the Adviser indicates a good faith effort on its part to adhere to high ethical standards in the conduct of the Portfolio’s business.
General Conclusion: After considering and weighing all of the above factors, the Board concluded that it would be in the best interest of the Portfolio and its shareholders to approve renewal of the Management Agreement for another year.
13

Performance Summary
The seven-day current and seven-day effective yields (effective yield assumes an annualization of the current yield with all dividends reinvested) as of April 30, 2006, were as follows:
| | Institutional
Class | | Service
Class | | Investor
Class | | Adminisrative
Class | | Advisory
Class | | Participant
Class | | Cash
Management
Class | |
| | 7-day
Current
Yield | | 7-day
Effective
Yield | | 7-day
Current
Yield | | 7-day
Effective
Yield | | 7-day
Current
Yield | | 7-day
Effective
Yield | | 7-day
Current
Yield | | 7-day
Effective
Yield | | 7-day
Current
Yield | | 7-day
Effective
Yield | | 7-day
Current
Yield | | 7-day
Effective
Yield | | 7-day
Current
Yield | | 7-day
Effective Yield | |
Portfolio: | | | | | | | | | | | | | | | | | | | | | | | | | | | | | |
Money Market | | 4.80 | % | 4.92 | % | 4.75 | % | 4.86 | % | 4.70 | % | 4.81 | % | 4.65 | % | 4.76 | % | 4.55 | % | 4.65 | % | 4.30 | % | 4.39 | % | 4.54 | % | 4.64 | % |
Prime | | 4.76 | % | 4.88 | % | 4.71 | % | 4.82 | % | 4.66 | % | 4.77 | % | 4.61 | % | 4.72 | % | 4.51 | % | 4.61 | % | 4.26 | % | 4.35 | % | — | | — | |
Government | | 4.74 | % | 4.86 | % | 4.69 | % | 4.80 | % | 4.64 | % | 4.75 | % | 4.59 | % | 4.70 | % | 4.49 | % | 4.60 | % | 4.24 | % | 4.33 | % | — | | — | |
Treasury | | 4.72 | % | 4.83 | % | 4.67 | % | 4.78 | % | 4.62 | % | 4.73 | % | 4.57 | % | 4.67 | % | 4.47 | % | 4.57 | % | 4.22 | % | 4.31 | % | 4.45 | % | 4.55 | % |
Tax-Exempt | | 3.51 | % | 3.57 | % | 3.46 | % | 3.52 | % | 3.41 | % | 3.47 | % | 3.36 | % | 3.42 | % | 3.26 | % | 3.31 | % | 3.01 | % | 3.06 | % | 3.25 | % | 3.30 | % |
Performance data quoted represent past performance, which is no guarantee of future results, and current performance may be lower or higher than the figures shown. Performance information for the 7-day effective yield assumes that all dividends and distributions, if any, were reinvested. For the most recent month-end performance figures, please visit www.morganstanley.com/im. Investment return and principal value will fluctuate causing portfolio shares, when redeemed, to be worth more or less than their original cost. Total returns do not reflect the deduction of taxes that a shareholder would pay on portfolio distributions or the redemption of portfolio shares.
Investments in the Money Market, Prime, Government, Treasury and Tax-Exempt Portfolios (the “Portfolios”) are neither insured nor guaranteed by the Federal Deposit Insurance Corporation. Although the Portfolios seek to preserve the value of your investment at $1.00 per share, it is possible to lose money by investing in these Portfolios. Please read MSILF’s prospectuses carefully before you invest or send money.
Yield quotation more closely reflects the current earnings of the Portfolios than the total return. As with all money market portfolios, yields will fluctuate as market conditions change and the seven-day yields are not necessarily indicative of future performance.
14
Expense Examples
As a shareholder of a Portfolio, you incur ongoing costs, including management fees, shareholder administration plan fees (in the case of the Service, Investor, and Administrative Classes), service and shareholder administration plan fees (in the case of the Advisory Class); distribution and shareholder service plan fees (in the case of the Participant and Cash Management Classes) and other Portfolio expenses. These examples are intended to help you understand your ongoing costs (in dollars) of investing in each Portfolio and to compare these costs with the ongoing costs of investing in other mutual funds.
The examples are based on an investment of $1,000 invested at the beginning of the six-month period ended April 30, 2006 and held for the entire six-month period.
Actual Expenses
The first line of the tables below provides information about actual account values and actual expenses. You may use the information in this line, together with the amount you invested, to estimate the expenses that you paid over the period. Simply divide your account value by $1,000 (for example, an $8,600 account value divided by $1,000 = 8.6), then multiply the result by the number in the first line under the heading entitled ‘‘Expenses Paid During Period’’ to estimate the expenses you paid on your account during this period.
Hypothetical Example for Comparison Purposes
The second line of the tables below provides information about hypothetical account values and hypothetical expenses based on a Portfolio’s actual expense ratio and an assumed rate of return of 5% per year before expenses, which is not the Portfolio’s actual return. The hypothetical account values and expenses may not be used to estimate the actual ending account balance or expenses you paid for the period. You may use this information to compare the ongoing costs of investing in a Portfolio and other funds. To do so, compare this 5% hypothetical example with the 5% hypothetical examples that appear in the shareholder reports of the other funds.
| | Beginning
Account Value
November 1, 2005 | | Ending
Account Value
April 30, 2006 | | Expenses Paid
During Period*
November 1, 2005—
April 30, 2006 | |
Money Market Portfolio | | | | | | | |
Institutional Class | | | | | | | |
Actual | | $ | 1,000.00 | | $ | 1,021.90 | | $ | 0.45 | |
Hypothetical (5% average annual return before expenses) | | 1,000.00 | | 1,024.35 | | 0.45 | |
Service Class | | | | | | | |
Actual | | 1,000.00 | | 1,021.60 | | 0.70 | |
Hypothetical (5% average annual return before expenses) | | 1,000.00 | | 1,024.10 | | 0.70 | |
Investor Class | | | | | | | |
Actual | | 1,000.00 | | 1,021.40 | | 0.95 | |
Hypothetical (5% average annual return before expenses) | | 1,000.00 | | 1,023.85 | | 0.95 | |
Administrative Class | | | | | | | |
Actual | | 1,000.00 | | 1,021.10 | | 1.20 | |
Hypothetical (5% average annual return before expenses) | | 1,000.00 | | 1,023.60 | | 1.20 | |
Advisory Class | | | | | | | |
Actual | | 1,000.00 | | 1,020.60 | | 1.75 | |
Hypothetical (5% average annual return before expenses) | | 1,000.00 | | 1,023.06 | | 1.76 | |
Participant Class | | | | | | | |
Actual | | 1,000.00 | | 1,019.70 | | 2.60 | |
Hypothetical (5% average annual return before expenses) | | 1,000.00 | | 1,022.22 | | 2.61 | |
Cash Management Class | | | | | | | |
Actual | | 1,000.00 | | 1,021.60 | | 0.75 | |
Hypothetical (5% average annual return before expenses) | | 1,000.00 | | 1,024.05 | | 0.75 | |
| | | | | | | | | | |
* Expenses are equal to Institutional Class’, Service Class’, Investor Class’, Administrative Class’, Advisory Class’, Participant Class’ and Cash Management Class’ annualized net expense ratios of 0.09%, 0.14%, 0.19%, 0.24%, 0.35%, 0.52% and 0.15%, respectively, multiplied by the average account value over the period, multiplied by 181/365 (to reflect the one-half year period).
| | Beginning
Account Value
November 1, 2005 | | Ending
Account Value
April 30, 2006 | | Expenses Paid
During Period*
November 1, 2005—
April 30, 2006 | |
Prime Portfolio | | | | | | | |
Institutional Class | | | | | | | |
Actual | | $ | 1,000.00 | | $ | 1,021.80 | | $ | 0.60 | |
Hypothetical (5% average annual return before expenses) | | 1,000.00 | | 1,024.20 | | 0.60 | |
| | | | | | | | | | |
15
Expense Examples (cont’d)
| | Beginning
Account Value
November 1, 2005 | | Ending
Account Value
April 30, 2006 | | Expenses Paid
During Period*
November 1, 2005 —
April 30, 2006 | |
Prime Portfolio (cont’d) | | | | | | | |
Service Class | | | | | | | |
Actual | | $ | 1,000.00 | | $ | 1,021.60 | | $ | 0.85 | |
Hypothetical (5% average annual return before expenses) | | 1,000.00 | | 1,023.95 | | 0.85 | |
Investor Class | | | | | | | |
Actual | | 1,000.00 | | 1,021.30 | | 1.10 | |
Hypothetical (5% average annual return before expenses) | | 1,000.00 | | 1,023.70 | | 1.10 | |
Administrative Class | | | | | | | |
Actual | | 1,000.00 | | 1,021.10 | | 1.35 | |
Hypothetical (5% average annual return before expenses) | | 1,000.00 | | 1,023.46 | | 1.35 | |
Advisory Class | | | | | | | |
Actual | | 1,000.00 | | 1,020.60 | | 1.85 | |
Hypothetical (5% average annual return before expenses) | | 1,000.00 | | 1.022.96 | | 1.86 | |
Participant Class | | | | | | | |
Actual | | 1,000.00 | | 1,019.60 | | 2.75 | |
Hypothetical (5% average annual return before expenses) | | 1,000.00 | | 1,022.07 | | 2.76 | |
| | | | | | | | | | |
* Expenses are equal to Institutional Class’, Service Class’, Investor Class’, Administrative Class’, Advisory Class’ and Participant Class’ annualized net expense ratios of 0.12%, 0.17%, 0.22%, 0.27%, 0.37% and 0.55%, respectively, multiplied by the average account value over the period, multiplied by 181/365 (to reflect the one-half year period).
| | Beginning
Account Value
November 1, 2005 | | Ending
Account Value
April 30, 2006 | | Expenses Paid
During Period*
November 1, 2005 —
April 30, 2006 | |
Government Portfolio | | | | | | | |
Institutional Class | | | | | | | |
Actual | | $ | 1,000.00 | | $ | 1,021.90 | | $ | 0.40 | |
Hypothetical (5% average annual return before expenses) | | 1,000.00 | | 1,024.40 | | 0.40 | |
Service Class | | | | | | | |
Actual | | 1,000.00 | | 1,021.60 | | 0.65 | |
Hypothetical (5% average annual return before expenses) | | 1,000.00 | | 1,024.15 | | 0.65 | |
Investor Class | | | | | | | |
Actual | | 1,000.00 | | 1,021.40 | | 0.90 | |
Hypothetical (5% average annual return before expenses) | | 1,000.00 | | 1,023.90 | | 0.90 | |
Administrative Class | | | | | | | |
Actual | | 1,000.00 | | 1,021.10 | | 1.15 | |
Hypothetical (5% average annual return before expenses) | | 1,000.00 | | 1,023.65 | | 1.15 | |
Advisory Class | | | | | | | |
Actual | | 1,000.00 | | 1,020.60 | | 1.65 | |
Hypothetical (5% average annual return before expenses) | | 1,000.00 | | 1,023.16 | | 1.66 | |
Participant Class | | | | | | | |
Actual | | 1,000.00 | | 1,019.70 | | 2.50 | |
Hypothetical (5% average annual return before expenses) | | 1,000.00 | | 1,022.32 | | 2.51 | |
| | | | | | | | | | |
* Expenses are equal to Institutional Class’, Service Class’, Investor Class’, Administrative Class’, Advisory Class’ and Participant Class’ annualized net expense ratios of 0.08%, 0.13%, 0.18%, 0.23%, 0.33% and 0.50%, respectively, multiplied by the average account value over the period, multiplied by 181/365 (to reflect the one-half year period).
| | Beginning
Account Value
November 1, 2005 | | Ending
Account Value
April 30, 2006 | | Expenses Paid
During Period*
November 1, 2005 —
April 30, 2006 | |
Treasury Portfolio | | | | | | | |
Institutional Class | | | | | | | |
Actual | | $ | 1,000.00 | | $ | 1,021.60 | | $ | 0.25 | |
Hypothetical (5% average annual return before expenses) | | 1,000.00 | | 1,024.55 | | 0.25 | |
Service Class | | | | | | | |
Actual | | 1,000.00 | | 1,021.30 | | 0.50 | |
Hypothetical (5% average annual return before expenses) | | 1,000.00 | | 1,024.30 | | 0.50 | |
Investor Class | | | | | | | |
Actual | | 1,000.00 | | 1,021.10 | | 0.75 | |
Hypothetical (5% average annual return before expenses) | | 1,000.00 | | 1,024.05 | | 0.75 | |
Administrative Class | | | | | | | |
Actual | | 1,000.00 | | 1,020.80 | | 1.00 | |
Hypothetical (5% average annual return before expenses) | | 1,000.00 | | 1,023.80 | | 1.00 | |
Advisory Class | | | | | | | |
Actual | | 1,000.00 | | 1,020.30 | | 1.50 | |
Hypothetical (5% average annual return before expenses) | | 1,000.00 | | 1,023.31 | | 1.51 | |
Participant Class | | | | | | | |
Actual | | 1,000.00 | | 1,019.40 | | 2.40 | |
Hypothetical (5% average annual return before expenses) | | 1,000.00 | | 1,022.41 | | 2.41 | |
| | | | | | | | | | |
16
Expense Examples (cont’d)
| | Beginning
Account Value
November 1, 2005 | | Ending
Account Value
April 30, 2006 | | Expenses Paid
During Period*
November 1, 2005 —
April 30, 2006 | |
Treasury Portfolio (cont’d) | | | | | | | |
Cash Management Class | | | | | | | |
Actual | | $ | 1,000.00 | | $ | 1,021.30 | | $ | 0.55 | |
Hypothetical (5% average annual return before expenses) | | 1,000.00 | | 1,024.25 | | 0.55 | |
| | | | | | | | | | |
* Expenses are equal to Institutional Class’, Service Class’, Investor Class’, Administrative Class’, Advisory Class’, Participant Class’ and Cash Management Class’ annualized net expense ratios of 0.05%, 0.10%, 0.15%, 0.20%, 0.30%, 0.48% and 0.11%, respectively, multiplied by the average account value over the period, multiplied by 181/365 (to reflect the one-half year period).
| | Beginning
Account Value
November 1, 2005 | | Ending
Account Value
April 30, 2006 | | Expenses Paid
During Period*
November 1, 2005 —
April 30, 2006 | |
Tax-Exempt Portfolio | | | | | | | |
Institutional Class | | | | | | | |
Actual | | $ | 1,000.00 | | $ | 1,015.00 | | $ | 0.50 | |
Hypothetical (5% average annual return before expenses) | | 1,000.00 | | 1,024.30 | | 0.50 | |
Service Class | | | | | | | |
Actual | | 1,000.00 | | 1,014.70 | | 0.75 | |
Hypothetical (5% average annual return before expenses) | | 1,000.00 | | 1,024.05 | | 0.75 | |
Investor Class | | | | | | | |
Actual | | 1,000.00 | | 1,014.50 | | 1.00 | |
Hypothetical (5% average annual return before expenses) | | 1,000.00 | | 1,023.80 | | 1.00 | |
Administrative Class | | | | | | | |
Actual | | 1,000.00 | | 1,014.20 | | 1.25 | |
Hypothetical (5% average annual return before expenses) | | 1,000.00 | | 1,023.55 | | 1.25 | |
Advisory Class | | | | | | | |
Actual | | 1,000.00 | | 1,013.70 | | 1.75 | |
Hypothetical (5% average annual return before expenses) | | 1,000.00 | | 1,023.06 | | 1.76 | |
Participant Class | | | | | | | |
Actual | | 1,000.00 | | 1,012.80 | | 2.69 | |
Hypothetical (5% average annual return before expenses) | | 1,000.00 | | 1,022.17 | | 2.71 | |
Cash Management Class | | | | | | | |
Actual | | 1,000.00 | | 1,014.70 | | 0.80 | |
Hypothetical (5% average annual return before expenses) | | 1,000.00 | | 1,024.00 | | 0.80 | |
| | | | | | | | | | |
* Expenses are equal to Institutional Class’, Service Class’, Investor Class’, Administrative Class’, Advisory Class’, Participant Class’ and Cash Management Class’ annualized net expense ratios of 0.10%, 0.15%, 0.20%, 0.25%, 0.35%, 0.54% and 0.16%, respectively, multiplied by the average account value over the period, multiplied by 181/365 (to reflect the one-half year period).
17

Portfolio of Investments
Money Market Portfolio
| | Face
Amount
(000) | | Value
(000) | |
Certificates of Deposit (6.0%) | | | | | |
Banking (1.9%) | | | | | |
HSBC USA, Inc. | | | | | |
4.00%, 7/18/06 | | $ | 20,000 | | $ | 20,000 | |
Wells Fargo Bank NA | | | | | |
4.80%, 1/17/07 | | 15,000 | | 15,000 | |
4.84%, 1/30/07 | | 12,500 | | 12,498 | |
4.90%, 2/1/07 | | 25,000 | | 25,000 | |
| | | | 72,498 | |
International Banks (4.1%) | | | | | |
Credit Suisse First Boston | | | | | |
4.80%, 5/8/06 | | 40,000 | | 40,000 | |
Norinchukin Bank/New York | | | | | |
4.82%, 5/8/06 | | 25,000 | | 25,000 | |
4.84%, 5/8/06 | | 20,000 | | 20,000 | |
4.85%, 5/8/06 | | 75,000 | | 75,000 | |
| | | | 160,000 | |
Total Certificates of Deposit (Cost $232,498) | | | | 232,498 | |
Commercial Paper (44.1%) | | | | | |
Asset Backed — Consumer (10.5%) | | | | | |
Barton Capital LLC | | | | | |
4.78%, 5/4/06 | | (a)50,000 | | 49,980 | |
Bryant Park Funding LLC | | | | | |
4.77%, 5/5/06 - 5/9/06 | | (a)86,546 | | 86,491 | |
Gemini Securitization Corp. | | | | | |
4.78%, 5/1/06 | | (a)29,560 | | 29,560 | |
4.79%, 5/8/06 | | (a)35,000 | | 34,967 | |
4.82%, 5/4/06 | | (a)95,000 | | 94,962 | |
Regency Markets No. 1 LLC | | | | | |
4.79%, 5/8/06 | | (a)25,000 | | 24,977 | |
Thames Asset Global Securitization | | | | | |
4.79%, 5/1/06 | | (a)49,595 | | 49,595 | |
Thunder Bay Funding LLC | | | | | |
4.76%, 5/10/06 | | (a)14,500 | | 14,483 | |
4.78%, 5/8/06 | | (a)20,398 | | 20,379 | |
| | | | 405,394 | |
Asset Backed — Corporate (3.3%) | | | | | |
Atlantis One Funding | | | | | |
4.60%, 7/13/06 | | (a)10,000 | | 9,907 | |
Davis Square Funding V | | | | | |
4.81%, 5/5/06 | | (a)20,000 | | 19,989 | |
5.06%, 6/26/06 | | (a)20,000 | | 19,844 | |
Davis Square Funding VI | | | | | |
4.83%, 5/9/06 | | (a)20,000 | | 19,979 | |
Eureka Securitization, Inc. | | | | | |
4.77%, 5/10/06 | | (a)20,000 | | 19,976 | |
4.80%, 5/5/06 | | (a)37,800 | | 37,780 | |
| | | | 127,475 | |
Asset Backed — Diversified (1.8%) | | | | | |
Jupiter Securitization Corp. | | | | | |
4.78%, 5/4/06 - 5/5/06 | | (a)71,165 | | 71,134 | |
| | | | | | | |
| | Face
Amount
(000) | | Value
(000) | |
Asset Backed — Mortgage (2.2%) | | | | | |
Sydney Capital Corp. | | | | | |
4.78%, 5/4/06 - 5/5/06 | | $ | (a)50,300 | | $ | 50,277 | |
4.87%, 6/14/06 | | (a)14,880 | | 14,792 | |
4.88%, 5/24/06 | | (a)20,000 | | 19,938 | |
| | | | 85,007 | |
Asset Backed — Securities (18.2%) | | | | | |
Amstel Funding Corp. | | | | | |
4.55%, 6/14/06 - 6/20/06 | | (a)37,612 | | 37,389 | |
4.58%, 7/7/06 | | (a)35,000 | | 34,704 | |
4.64%, 7/24/06 | | (a)15,000 | | 14,839 | |
4.85%, 8/14/06 | | (a)15,000 | | 14,791 | |
4.91%, 8/30/06 | | (a)10,000 | | 9,838 | |
5.12%, 10/6/06 | | (a)30,000 | | 29,340 | |
Beta Finance, Inc. | | | | | |
5.20%, 10/25/06 | | (a)25,500 | | 24,864 | |
CC USA, Inc. | | | | | |
4.88%, 8/21/06 | | (a)20,000 | | 19,701 | |
4.91%, 6/29/06 | | (a)15,000 | | 14,880 | |
5.18%, 10/24/06 | | (a)20,000 | | 19,506 | |
Clipper Receivables Corp., LLC | | | | | |
4.78%, 5/5/06 | | 85,000 | | 84,955 | |
Curzon Funding LLC | | | | | |
4.77%, 5/5/06 | | (a)25,000 | | 24,987 | |
4.96%, 6/27/06 | | 25,000 | | 24,805 | |
5.08%, 9/29/06 | | 15,000 | | 14,687 | |
Galleon Capital LLC | | | | | |
4.77%, 5/5/06 | | (a)40,000 | | 39,979 | |
4.78%, 5/8/06 | | (a)50,000 | | 49,954 | |
Golden Fish LLC | | | | | |
4.72%, 5/8/06 | | (a)10,000 | | 9,991 | |
4.73%, 5/9/06 | | (a)17,573 | | 17,555 | |
5.05%, 6/26/06 | | (a)49,000 | | 48,618 | |
Grampian Funding Ltd. | | | | | |
4.40%, 5/9/06 | | (a)10,000 | | 9,990 | |
4.58%, 6/19/06 | | (a)35,000 | | 34,783 | |
4.64%, 7/21/06 | | (a)60,000 | | 59,380 | |
4.97%, 9/12/06 | | (a)20,000 | | 19,637 | |
4.99%, 9/18/06 | | (a)20,000 | | 19,619 | |
Solitaire Funding LLC | | | | | |
4.77%, 5/5/06 | | (a)25,000 | | 24,987 | |
| | | | 703,779 | |
Banking (1.8%) | | | | | |
Bank of America Corp. | | | | | |
4.74%, 8/1/06 | | 20,000 | | 19,761 | |
4.80%, 5/5/06 - 5/8/06 | | 30,000 | | 29,978 | |
4.90%, 8/28/06 | | 20,000 | | 19,681 | |
| | | | 69,420 | |
Diversified Financial Services (0.7%) | | | | | |
General Electric Co. | | | | | |
4.79%, 6/28/06 | | 25,000 | | 24,809 | |
| | | | | | | |
The accompanying notes are an integral part of the financial statements.
18
Portfolio of Investments (cont’d)
Money Market Portfolio
| | Face
Amount
(000) | | Value
(000) | |
Finance — Corporate (0.9%) | | | | | |
CIT Group, Inc. | | | | | |
4.96%, 6/19/06 | | $ | (a)35,000 | | $ | 34,765 | |
International Banks (4.2%) | | | | | |
Natexis Banques Populaires | | | | | |
4.79%, 5/10/06 | | 55,000 | | 55,000 | |
Nordea N.A. | | | | | |
4.80%, 5/3/06 | | 15,000 | | 14,996 | |
Skandinaviska Enskilda | | | | | |
4.80%, 5/5/06 | | (a)38,000 | | 37,980 | |
Swedbank, Inc. | | | | | |
4.77%, 5/4/06 | | 39,000 | | 38,984 | |
5.17%, 10/24/06 | | 15,400 | | 15,021 | |
| | | | 161,981 | |
Investment Bankers/Brokers/Services (0.5%) | | | | | |
Goldman Sachs Group, Inc. | | | | | |
4.87%, 10/30/06 | | 18,500 | | 18,056 | |
Total Commercial Paper (Cost $1,701,820) | | | | 1,701,820 | |
Corporate Notes (6.9%) | | | | | |
Asset Backed — Securities (1.7%) | | | | | |
CC USA, Inc. | | | | | |
4.05%, 7/24/06 | | (a)7,500 | | 7,500 | |
4.75%, 11/13/06 | | (a)15,000 | | 15,000 | |
Links Finance LLC | | | | | |
5.00%, 3/12/07 | | (a)15,000 | | 15,000 | |
5.17%, 3/16/07 | | (a)15,000 | | 14,999 | |
5.37%, 5/2/07 | | (a)15,000 | | 14,999 | |
| | | | 67,498 | |
Diversified Financial Services (0.9%) | | | | | |
General Electric Capital Corp. | | | | | |
5.00%, 8/16/06 - 4/17/07 | | 35,200 | | 35,245 | |
International Banks (2.2%) | | | | | |
Australia & New Zealand Bank | | | | | |
4.93%, 12/22/06 | | (a)25,000 | | 25,000 | |
Royal Bank of Canada | | | | | |
4.80%, 3/1/07 - 3/30/07 | | (a)60,000 | | 59,993 | |
| | | | 84,993 | |
Investment Bankers/Brokers/Services (2.1%) | | | | | |
Goldman Sachs Group, Inc. | | | | | |
4.82%, 5/5/06 | | 40,000 | | 40,000 | |
4.99%, 8/7/06 | | 40,000 | | 40,000 | |
| | | | 80,000 | |
Total Corporate Notes (Cost $267,736) | | | | 267,736 | |
Extendible Notes (10.9%) | | | | | |
Diversified Financial Services (2.0%) | | | | | |
General Electric Capital Corp. | | | | | |
5.00%, 6/16/06 - 4/17/07 | | 75,000 | | 75,015 | |
International Banks (6.7%) | | | | | |
Commonwealth Bank of Australia | | | | | |
4.92%, 8/24/10 | | 50,000 | | 50,000 | |
Royal Bank of Scotland | | | | | |
4.92%, 4/21/10 | | (a)135,000 | | 135,000 | |
| | | | | | | |
| | Face
Amount
(000) | | Value
(000) | |
Societe Generale | | | | | |
4.80%, 2/2/07 - 4/2/07 | | $ | (a)75,000 | | $ | 74,997 | |
| | | | 259,997 | |
Investment Bankers/Brokers/Services (2.2%) | | | | | |
Merrill Lynch & Co., Inc. | | | | | |
4.88%, 9/15/06 | | 50,000 | | 50,000 | |
5.05%, 11/9/06 | | 35,000 | | 35,045 | |
| | | | 85,045 | |
Total Extendible Notes (Cost $420,057) | | | | 420,057 | |
Floating Rate Notes (6.2%) | | | | | |
Asset Backed — Securities (2.2%) | | | | | |
Links Finance LLC | | | | | |
4.81%, 6/1/06 | | (a)(b)25,000 | | 25,000 | |
4.84%, 2/15/07 | | (a)(b)60,000 | | 60,002 | |
| | | | 85,002 | |
Finance — Automotive (0.7%) | | | | | |
American Honda Finance Corp. | | | | | |
4.70%, 5/12/06 | | (a)(b)25,000 | | 25,000 | |
Insurance (0.1%) | | | | | |
ASIF Global Financing XXII | | | | | |
4.95%, 5/30/06 | | (a)(b)3,300 | | 3,300 | |
Investment Bankers/Brokers/Services (3.2%) | | | | | |
Bank of America Corp. | | | | | |
4.95%, 12/31/49 | | (b)75,000 | | 75,000 | |
Goldman Sachs Group, Inc. | | | | | |
4.91%, 6/9/06 | | (b)50,000 | | 50,000 | |
| | | | 125,000 | |
Total Floating Rate Notes (Cost $238,302) | | | | 238,302 | |
Time Deposits (14.9%) | | | | | |
International Banks (14.9%) | | | | | |
Fortis Bank/New York | | | | | |
4.89%, 5/1/06 | | 150,000 | | 150,000 | |
HSH Nordbank AG | | | | | |
4.88%, 5/1/06 | | 40,000 | | 40,000 | |
Natexis Banques Populaires | | | | | |
4.90%, 5/1/06 | | 125,000 | | 125,000 | |
Rabobank Nederlander | | | | | |
4.86%, 5/1/06 | | 100,000 | | 100,000 | |
Regions Bank | | | | | |
4.88%, 5/1/06 | | 160,205 | | 160,205 | |
Total Time Deposits (Cost $575,205) | | | | 575,205 | |
Repurchase Agreements (11.6%) | | | | | |
Banc of America Securities LLC, 4.78%, dated 4/28/06, due 5/01/06, repurchase price $150,060: fully collateralized by U.S. government securities at the date of this Portfolio of Investments as follows: Federal National Mortgage Association 5.00% due 3/01/2035, valued at $152,396. | | 150,000 | | 150,000 | |
| | | | | | | |
The accompanying notes are an integral part of the financial statements.
19
Portfolio of Investments (cont’d)
Money Market Portfolio
| | Face
Amount
(000) | | Value
(000) | |
Banc of America Securities LLC, 4.87%, dated 4/28/06, due 5/01/06, repurchase price $50,020: fully collateralized by discount commercial paper at the date of this Portfolio of Investments as follows:
Ticonderoga & Ticonderoga, due 5/31/2006, valued at $51,000. | | $50,000 | | $50,000 | |
CS First Boston LLC, 4.87%, dated 4/28/06, due 5/01/06, repurchase price $150,061: fully collateralized by U.S. government securities at the date of this Portfolio of Investments as follows: Federal National Mortgage Association, 4.72%, due 03/15/2010, Federal Home Loan Mortgage Corp., Discount Notes, due 12/26/2006, valued at $153,003. | | 150,000 | | 150,000 | |
Merrill Lynch & Co., 4.91%, dated 4/28/06, due 5/01/06, repurchase price $100,041: fully collateralized by corporate and government securities at the date of this Portfolio of Investments as follows: Abbott Laboratories, 5.63%, due 7/01/2006; Charter One Bank NA, 5.50%, due 4/26/11; Citigroup Capital II, 7.75%, due 12/01/36; Citigroup Inc, 4.88% to 6.63%, due 8/27/12 to 10/31/33; Home Depot Inc, 4.63%, due 8/15/10; ING USA Global Funding Trust, 4.50%, due 10/01/10; Jackson National Life Global Funding, 4.70% to 5.92, due 5/01/14 to 6/01/18; Kimberly-Clark Corp, 7.10%, due 8/01/07; Monumental Global Funding III, 5.20%, due 1/30/07; Pacific Life Global Funding, 3.75%, due 1/15/09; Protective Life Secured Trust, 5.09%, due 9/10/14; Province of Manitoba Canada, 8.88%, due 9/15/21; Province of Saskatchewan Canada, 8.00%, due 2/01/13; Singapore Telecommunications Ltd, 7.38%, due 12/01/31; Southern California Gas Co., 4.38% to 5.75%, due 1/15/11 to 11/15/35; UBS Preferred Funding Trust I, 8.62%, due 10/01/49; US Bancorp, 3.13%, due 3/15/08; Wells Fargo & Co., 4.95%, due 10/16/13, valued at $102,005. | | 100,000 | | 100,000 | |
Total Repurchase Agreements (Cost $450,000) | | | | 450,000 | |
Total Investments (100.6%) (Cost $3,885,618) | | | | 3,885,618 | |
Liabilities in Excess of Other Assets (-0.6%) | | | | (23,147 | ) |
Net Assets (100%) | | | | $3,862,471 | |
(a) 144A Security — Certain conditions for public sale may exist. Unless otherwise noted, these securities are deemed to be liquid.
(b) Variable/Floating Rate Security — Interest rate changes on these securities are based on changes in a designated base rate. The rates shown are those in effect on April 30, 2006.
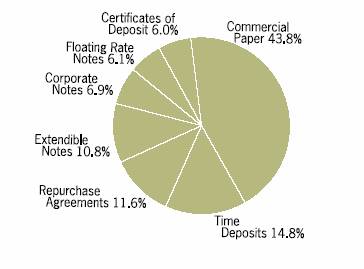
Graphic Presentation of Portfolio Holdings
The following graph depicts the Portfolio’s holdings by investment type, as a percentage of total investments.
The accompanying notes are an integral part of the financial statements.
20

Portfolio of Investments
Prime Portfolio
| | Face | | | |
| | Amount | | Value | |
| | (000) | | (000) | |
Certificates of Deposit (5.9%) | | | | | |
Banking (3.2%) | | | | | |
HSBC USA, Inc. | | | | | |
3.06%, 5/16/06 | | $ | (b)75,000 | | $ | 75,000 | |
4.00%, 7/18/06 | | 55,000 | | 55,000 | |
4.19%, 12/15/06 | | (b)130,000 | | 130,000 | |
Wells Fargo Bank NA | | | | | |
4.05%, 11/27/06 | | (b)140,000 | | 140,000 | |
4.80%, 1/17/07 | | 65,000 | | 65,000 | |
4.84%, 1/30/07 | | 67,500 | | 67,490 | |
| | | | 532,490 | |
Major Banks (2.7%) | | | | | |
Washington Mutual Bank FA | | | | | |
4.79%, 5/8/06 | | 250,000 | | 250,000 | |
4.75%, 5/10/06 | | 200,000 | | 200,000 | |
| | | | 450,000 | |
Total Certificates of Deposit (Cost $982,490) | | | | 982,490 | |
Commercial Paper (52.7%) | | | | | |
Asset Backed — Automotive (0.6%) | | | | | |
Daimler Chrysler Revolving Auto Conduit LLC | | | | | |
4.77%, 5/5/06 | | 102,500 | | 102,446 | |
Asset Backed — Consumer (11.9%) | | | | | |
Barton Capital LLC | | | | | |
4.73%, 5/10/06 | | (a)79,897 | | 79,803 | |
4.77%, 5/9/06 | | (a)82,153 | | 82,066 | |
4.78%, 5/4/06 | | (a)195,303 | | 195,225 | |
4.80%, 5/8/06 | | (a)24,087 | | 24,064 | |
Bryant Park Funding LLC | | | | | |
4.77%, 5/4/06 - 5/9/06 | | (a)165,000 | | 164,883 | |
Gemini Securitization Corp. | | | | | |
4.79%, 5/5/06 - 5/8/06 | | (a)590,000 | | 589,621 | |
4.82%, 5/4/06 | | (a)255,000 | | 254,898 | |
Mont Blanc Capital Corp. | | | | | |
4.85%, 5/1/06 | | (a)69,713 | | 69,713 | |
Park Avenue Receivables Corp. | | | | | |
4.78%, 5/9/06 | | (a)75,537 | | 75,457 | |
Ranger Funding LLC | | | | | |
4.77%, 5/5/06 | | (a)25,000 | | 24,987 | |
Regency Markets No. 1 LLC | | | | | |
4.79%, 5/8/06 | | (a)67,154 | | 67,091 | |
Sheffield Receivables Corp. | | | | | |
4.77%, 5/5/06 | | (a)300,000 | | 299,841 | |
Thames Asset Global Securitization, Inc. | | | | | |
4.79%, 5/1/06 | | (a)25,000 | | 25,000 | |
Thunder Bay Funding LLC | | | | | |
4.76%, 5/10/06 | | (a)45,000 | | 44,947 | |
| | | | 1,997,596 | |
Asset Backed — Corporate (2.9%) | | | | | |
Atlantis One Funding Corp. | | | | | |
4.60%, 7/13/06 | | (a)57,313 | | 56,783 | |
4.77%, 5/4/06 | | (a)113,469 | | 113,424 | |
4.85%, 5/1/06 | | (a)39,980 | | 39,980 | |
| | | | | | | |
| | Face | | | |
| | Amount | | Value | |
| | (000) | | (000) | |
Davis Square Funding IV Corp. | | | | | |
4.82%, 5/4/06 | | $ | (a)100,000 | | $ | 99,960 | |
Eureka Securitization, Inc. | | | | | |
4.77%, 5/10/06 | | (a)55,000 | | 54,934 | |
Tulip Funding Corp. | | | | | |
4.80%, 5/2/06 | | (a)78,434 | | 78,423 | |
Variable Funding Corp. | | | | | |
4.78%, 5/4/06 | | (a)(b)36,192 | | 36,178 | |
| | | | 479,682 | |
Asset Backed — Diversified (3.1%) | | | | | |
CRC Funding LLC | | | | | |
4.77%, 5/4/06 - 5/5/06 | | (a)200,000 | | 199,907 | |
Fairway Finance Corp. | | | | | |
4.75%, 5/10/06 | | (a)41,365 | | 41,316 | |
Falcon Asset Securitization | | | | | |
4.80%, 5/2/06 - 5/4/06 | | (a)193,596 | | 193,543 | |
Jupiter Securitization Corp. | | | | | |
4.78%, 5/5/06 | | (a)81,516 | | 81,473 | |
| | | | 516,239 | |
Asset Backed — Mortgage (2.6%) | | | | | |
Sydney Capital Corp. | | | | | |
4.70%, 6/23/06 | | (a)23,330 | | 23,169 | |
4.78%, 5/8/06 - 5/5/06 | | (a)240,070 | | 239,870 | |
4.87%, 6/14/06 | | (a)120,000 | | 119,290 | |
4.93%, 6/9/06 | | (a)50,376 | | 50,107 | |
| | | | 432,436 | |
Asset Backed — Securities (27.3%) | | | | | |
Amstel Funding Corp. | | | | | |
4.43%, 5/16/06 | | (a)60,000 | | 59,889 | |
4.47%, 5/8/06 | | (a)55,000 | | 54,952 | |
4.50%, 6/2/06 | | (a)77,000 | | 76,692 | |
4.55%, 6/14/06 - 6/20/06 | | (a)126,450 | | 125,709 | |
4.58%, 7/7/06 | | (a)161,345 | | 159,982 | |
4.64%, 7/24/06 | | (a)65,000 | | 64,304 | |
4.71%, 8/1/06 | | (a)50,000 | | 49,398 | |
4.85%, 8/14/06 | | (a)50,000 | | 49,303 | |
4.91%, 8/30/06 | | (a)71,594 | | 70,432 | |
5.12%, 10/6/06 | | (a)130,000 | | 127,142 | |
Beta Finance, Inc. | | | | | |
5.20%, 10/25/06 | | (a)75,000 | | 73,130 | |
Cancara Asset Securitisation LLC | | | | | |
4.87%, 5/2/06 | | (a)109,662 | | 109,647 | |
CC USA, Inc. | | | | | |
4.62%, 7/27/06 | | (a)50,000 | | 49,442 | |
4.70%, 5/17/06 | | (a)34,250 | | 34,178 | |
4.81%, 8/18/06 | | (a)71,000 | | 69,966 | |
4.88%, 8/21/06 | | (a)8,400 | | 8,274 | |
4.91%, 6/29/06 | | (a)25,000 | | 24,801 | |
5.18%, 10/24/06 | | (a)55,000 | | 53,642 | |
Clipper Receivables LLC | | | | | |
4.78%, 5/5/06 - 5/8/06 | | 461,000 | | 460,728 | |
Curzon Funding LLC | | | | | |
5.08%, 9/29/06 | | 70,000 | | 68,539 | |
| | | | | | | |
The accompanying notes are an integral part of the financial statements.
21
Portfolio of Investments (cont’d)
Prime Portfolio
| | Face | | | |
| | Amount | | Value | |
| | (000) | | (000) | |
Asset Backed — Securities (cont’d) | | | | | |
4.77%, 5/3/06 | | $ | 100,000 | | $ | 99,974 | |
4.77%, 5/5/06 - 5/8/06 | | (a)245,000 | | 244,830 | |
4.78%, 5/4/06 | | 125,000 | | 124,950 | |
4.96%, 6/27/06 | | 105,000 | | 104,182 | |
Dorada Finance, Inc. | | | | | |
4.62%, 7/28/06 | | (a)40,000 | | 39,548 | |
4.86%, 5/25/06 | | (a)50,000 | | 49,838 | |
4.87%, 6/28/06 | | (a)35,000 | | 34,725 | |
Galleon Capital LLC | | | | | |
4.77%, 5/5/06 | | (a)100,000 | | 99,947 | |
4.78%, 5/8/06 | | (a)50,000 | | 49,954 | |
Golden Fish LLC | | | | | |
4.72%, 5/8/06 | | (a)65,418 | | 65,358 | |
4.73%, 5/9/06 | | (a)102,409 | | 102,301 | |
4.80%, 5/2/06 | | (a)85,000 | | 84,989 | |
4.91%, 6/5/06 | | (a)129,480 | | 128,862 | |
4.97%, 6/20/06 | | (a)99,746 | | 99,058 | |
5.03%, 6/27/06 - 6/28/06 | | (a)294,595 | | 292,237 | |
5.05%, 6/26/06 | | (a)70,571 | | 70,021 | |
Grampian Funding LLC | | | | | |
4.40%, 5/9/06 | | (a)173,000 | | 172,829 | |
4.58%, 6/19/06 | | (a)196,000 | | 194,786 | |
4.64%, 7/21/06 | | (a)200,000 | | 197,939 | |
4.77%, 5/5/06 | | (a)195,000 | | 194,897 | |
4.97%, 9/12/06 | | (a)70,000 | | 68,729 | |
4.99%, 9/18/06 | | (a)92,500 | | 90,739 | |
Scaldis Capital LLC | | | | | |
4.78%, 5/8/06 | | (a)79,168 | | 79,094 | |
Solitaire Funding LLC | | | | | |
4.77%, 5/8/06 | | (a)100,000 | | 99,907 | |
| | | | 4,579,844 | |
Banking (1.6%) | | | | | |
Bank of America Corp. | | | | | |
4.74%, 8/1/06 | | 150,000 | | 148,203 | |
4.90%, 8/28/06 | | 105,000 | | 103,327 | |
Citigroup Funding, Inc. | | | | | |
5.03%, 10/24/06 | | 24,700 | | 24,093 | |
| | | | 275,623 | |
Diversified Financial Services (0.2%) | | | | | |
General Electric Co. | | | | | |
4.79%, 6/28/06 | | 40,000 | | 39,694 | |
Finance — Corporate (0.2%) | | | | | |
CIT Group, Inc. | | | | | |
4.77%, 5/4/06 | | (a)40,000 | | 39,984 | |
Investment Bankers/Brokers/Services (2.3%) | | | | | |
Citigroup Global Markets Holdings, Inc. | | | | | |
3.25%, 6/6/06 | | (b)45,000 | | 45,009 | |
Goldman Sachs Group, Inc. | | | | | |
3.84%, 7/14/06 | | 150,000 | | 150,000 | |
4.07%, 8/18/06 | | (b)100,000 | | 100,000 | |
4.87%, 10/30/06 | | 100,000 | | 97,598 | |
| | | | 392,607 | |
Total Commercial Paper (Cost $8,856,151) | | | | 8,856,151 | |
| | | | | | | |
| | Face | | | |
| | Amount | | Value | |
| | (000) | | (000) | |
Corporate Notes (6.4%) | | | | | |
Asset Backed — Securities (1.7%) | | | | | |
CC USA, Inc. | | | | | |
4.05%, 7/24/06 | | $ | (a)(b)15,000 | | $ | 15,000 | |
4.75%, 11/13/06 | | (a)(b)65,000 | | 64,998 | |
Links Finance LLC | | | | | |
5.00%, 3/12/07 | | (a)(b)65,000 | | 65,000 | |
5.17%, 3/16/07 | | (a)(b)67,500 | | 67,494 | |
5.37%, 5/2/07 | | (a)(b)65,000 | | 64,997 | |
| | | | 277,489 | |
Banking (2.7%) | | | | | |
World Savings Bank | | | | | |
4.78%, 5/5/06 - 5/8/06 | | 450,000 | | 449,999 | |
Investment Bankers/Brokers/Services (1.8%) | | | | | |
Goldman Sachs Group, Inc. | | | | | |
4.82%, 5/5/06 | | 170,000 | | 170,000 | |
4.99%, 8/7/06 | | (b)140,000 | | 140,000 | |
| | | | 310,000 | |
Major Banks (0.2%) | | | | | |
US Bank NA | | | | | |
2.87%, 2/1/07 | | 38,000 | | 37,387 | |
Total Corporate Notes (Cost $1,074,875) | | | | 1,074,875 | |
Extendible Notes (4.0%) | | | | | |
Banking (0.9%) | | | | | |
Fifth Third Bancorp. | | | | | |
1.92%, 11/23/09 | | (a)(b)150,000 | | 150,000 | |
Diversified Financial Services (1.6%) | | | | | |
General Electric Capital Corp. | | | | | |
4.04%, 11/9/06 | | (b)50,000 | | 50,041 | |
4.44%, 1/9/07 | | (b)120,000 | | 120,159 | |
4.67%, 3/9/07 | | (b)105,000 | | 105,146 | |
| | | | 275,346 | |
Investment Bankers/Brokers/Services (1.5%) | | | | | |
Merrill Lynch & Co., Inc. | | | | | |
4.88%, 9/15/06 | | (b)175,000 | | 175,000 | |
5.05%, 11/9/06 | | (b)75,000 | | 75,097 | |
| | | | 250,097 | |
Total Extendible Notes (Cost $675,443) | | | | 675,443 | |
Floating Rate Notes (21.8%) | | | | | |
Asset Backed — Securities (9.8%) | | | | | |
Beta Finance, Inc. | | | | | |
3.07%, 5/24/06 - 5/25/06 | | (a)(b)283,000 | | 282,999 | |
3.57%, 9/11/06 | | (a)(b)50,000 | | 50,001 | |
4.07%, 6/13/06 - 7/20/06 | | (a)(b)75,000 | | 75,001 | |
CC USA, Inc. | | | | | |
4.07%, 5/19/05 | | (a)(b)78,000 | | 78,000 | |
4.58%, 2/22/07 | | (a)(b)150,000 | | 150,043 | |
Dorada Finance, Inc. | | | | | |
3.07%, 5/25/06 | | (a)(b)125,000 | | 124,999 | |
4.89%, 7/14/06 | | (a)(b)100,000 | | 99,999 | |
| | | | | | | |
The accompanying notes are an integral part of the financial statements.
22
Portfolio of Investments (cont’d)
Prime Portfolio
| | Face | | | |
| | Amount | | Value | |
| | (000) | | (000) | |
Asset Backed — Securities (cont’d) | | | | | |
Links Finance LLC | | | | | |
4.07%, 11/14/06 | | $ | (a)(b)25,000 | | $ | 24,998 | |
4.58%, 3/1/07 | | (a)(b)100,000 | | 100,033 | |
4.81%, 6/1/06 | | (a)(b)75,000 | | 75,000 | |
4.82%, 3/29/07 - 4/18/07 | | (a)(b)250,000 | | 249,976 | |
White Pine Finance LLC | | | | | |
3.60%, 8/25/06 | | (a)(b)185,000 | | 184,991 | |
3.79%, 9/25/06 | | (a)(b)75,000 | | 74,994 | |
3.81%, 10/16/06 | | (a)(b)80,000 | | 79,992 | |
| | | | 1,651,026 | |
Banking (0.7%) | | | | | |
Wells Fargo & Co. | | | | | |
5.00%, 3/23/07 | | (b)112,595 | | 112,684 | |
Diversified Financial Services (2.3%) | | | | | |
General Electric Capital Corp. | | | | | |
4.24%, 12/15/06 | | (b)125,000 | | 125,119 | |
4.35%, 12/29/06 | | (b)200,000 | | 200,000 | |
Wal-Mart Stores, Inc. | | | | | |
4.86%, 3/28/07 | | (b)65,000 | | 64,961 | |
| | | | 390,080 | |
Finance — Automotive (0.6%) | | | | | |
Toyota Motor Credit Corp. | | | | | |
3.79%, 11/6/06 | | (b)100,000 | | 100,000 | |
Insurance (0.8%) | | | | | |
John Hancock Global Funding II | | | | | |
4.46%, 2/23/07 | | (a)(b)115,550 | | 115,646 | |
New York Life Global Funding | | | | | |
4.46%, 2/26/07 | | (a)(b)20,000 | | 20,014 | |
| | | | 135,660 | |
Investment Bankers/Brokers/Services (2.8%) | | | | | |
Bank of America Corp. | | | | | |
4.95%, 12/31/49 | | (b)273,500 | | 273,500 | |
Goldman Sachs Group, Inc. | | | | | |
4.91%, 6/9/06 | | (b)200,000 | | 200,000 | |
| | | | 473,500 | |
Major Banks (4.8%) | | | | | |
American Express Bank | | | | | |
4.36%, 6/13/06 | | (b)150,000 | | 150,006 | |
Bank of America NA | | | | | |
4.57%, 4/18/07 | | (b)200,000 | | 200,000 | |
Fifth Third Bank | | | | | |
4.26%, 11/6/06 | | (b)105,000 | | 104,990 | |
Harris Trust & Savings Bank | | | | | |
2.82%, 5/3/06 | | (b)100,000 | | 100,000 | |
National City Bank | | | | | |
4.38%, 7/26/06 | | (b)97,000 | | 97,008 | |
SunTrust Bank | | | | | |
3.78%, 9/26/06 | | (b)152,000 | | 151,992 | |
| | | | 803,996 | |
Total Floating Rate Notes (Cost $3,666,946) | | | | 3,666,946 | |
| | | | | | | |
| | Face | | | |
| | Amount | | Value | |
| | (000) | | (000) | |
Time Deposit (8.4%) | | | | | |
Banking (5.7%) | | | | | |
Regions Bank of Alabama | | | | | |
4.88%, 5/1/06 | | $ | 457,425 | | $ | 457,425 | |
SunTrust Bank | | | | | |
4.85%, 5/1/06 | | 500,000 | | 500,000 | |
| | | | 957,425 | |
Major Banks (2.7%) | | | | | |
Fifth Third Bank | | | | | |
4.76%, 8/1/06 | | 160,000 | | 160,000 | |
4.88%, 5/1/06 | | 300,000 | | 300,000 | |
| | | | 460,000 | |
Total Time Deposit (Cost $1,417,425) | | | | 1,417,425 | |
Repurchase Agreements (2.5%) | | | | | |
Banc of America Securities LLC, 4.78%, dated 4/28/06, due 5/1/06, repurchase price $290,116: fully collateralized by U.S. government securities at the date of this Portfolio of Investments as follows: Federal National Mortgage Association, Fixed Rate Mortgages, 5.50%, due 4/1/36, valued at $295,548. | | 290,000 | | 290,000 | |
Banc of America Securities LLC, 4.87%, dated 4/28/06, due 5/1/06, repurchase price $120,049: fully collateralized by discount commercial paper at the date of this Portfolio of Investments as follows: Alliance & Leicester plc, due 8/14/06; Anglesea Funding plc, due 5/2/06; Southern Co. Funding Corp., due 6/6/06; Ticonderoga & Ticonderoga, due 5/30/06, valued at $122,400. | | 120,000 | | 120,000 | |
Total Repurchase Agreements (Cost $410,000) | | | | 410,000 | |
Total Investments (101.7%) (Cost $17,083,330) | | | | 17,083,330 | |
Liabilities in Excess of Other Assets (-1.7%) | | | | (281,107) | |
Net Assets (100%) | | | | $ | 16,802,223 | |
| | | | | | | |
(a) 144A Security — Certain conditions for public sale may exist. Unless otherwise noted, these securities are deemed to be liquid.
(b) Variable/Floating Rate Security — interest rate changes on these instruments are based on changes in a designated base rate. The rates shown are those in effect on April 30, 2006.
The accompanying notes are an integral part of the financial statements.
23
Portfolio of Investments (cont’d)
Prime Portfolio
Graphic Presentation of Portfolio Holdings
The following graph depicts the Portfolio’s holdings by investment type, as a percentage of total investments.
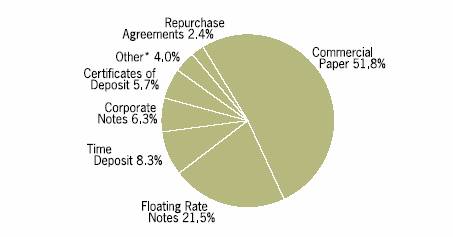
* Industries which do not appear in the above graph, as well as those which represent less than 5% of total investments, if applicable, are included in the category labeled “Other”.
The accompanying notes are an integral part of the financial statements.
24

Portfolio of Investments
Government Portfolio
| | Face | | | |
| | Amount | | Value | |
| | (000) | | (000) | |
U.S. Government & Agency Securities (15.9%) | | | | | |
Federal Farm Credit Bank | | | | | |
4.75%, 2/12/07 | | $ | (b)30,000 | | $ | 29,998 | |
4.76%, 10/6/06 - 12/28/06 | | (b)65,000 | | 64,992 | |
4.77%, 8/18/06 - 10/6/06 | | (b)44,800 | | 44,801 | |
4.82%, 3/22/07 | | (b)25,000 | | 24,994 | |
4.86%, 9/21/07 | | (b)5,000 | | 5,002 | |
4.92%, 12/29/06 | | (b)30,000 | | 29,997 | |
Federal Home Loan Bank | | | | | |
2.05%, 7/24/06 | | 2,500 | | 2,488 | |
2.25%, 7/24/06 | | 1,700 | | 1,692 | |
2.75%, 11/15/06 | | 4,360 | | 4,316 | |
3.00%, 2/5/07 | | 2,000 | | 1,972 | |
3.13%, 11/15/06 | | 1,500 | | 1,488 | |
3.20%, 11/29/06 | | 11,640 | | 11,541 | |
4.58%, 8/10/07 | | (b)25,000 | | 24,989 | |
4.63%, 5/16/06 | | (b)6,500 | | 6,500 | |
4.70%, 6/1/06 | | (b)13,300 | | 13,299 | |
4.77%, 12/13/06 | | (b)20,000 | | 19,996 | |
4.82%, 8/21/06 | | (b)25,000 | | 24,995 | |
4.84%, 12/29/06 | | (b)20,000 | | 19,994 | |
4.89%, 3/5/07 | | 22,000 | | 21,975 | |
4.91%, 6/2/06 | | (b)15,000 | | 14,999 | |
5.04%, 8/2/06 | | (b)25,100 | | 25,097 | |
Federal Home Loan Mortgage Corp. | | | | | |
2.13%, 6/12/06 | | 11,500 | | 11,476 | |
2.25%, 12/4/06 | | 4,750 | | 4,678 | |
2.38%, 2/15/07 | | 5,000 | | 4,892 | |
2.43%, 3/23/07 | | 5,000 | | 4,879 | |
2.75%, 10/6/06 | | 6,125 | | 6,075 | |
3.00%, 5/5/06 | | (c)1,500 | | 1,500 | |
3.00%, 9/29/06 - 12/15/06 | | 9,413 | | 9,339 | |
3.13%, 9/22/06 | | 6,800 | | 6,759 | |
3.80%, 12/27/06 | | 7,000 | | 6,960 | |
4.28%, 8/4/06 | | 5,000 | | 4,944 | |
4.38%, 7/5/06 | | 5,000 | | 4,961 | |
4.69%, 11/14/06 | | 6,970 | | 6,795 | |
4.80%, 6/22/07 | | (b)50,000 | | 49,980 | |
4.88%, 3/15/07 | | 4,275 | | 4,268 | |
4.88%, 7/6/07 | | (b)25,000 | | 24,986 | |
5.20%, 4/3/07 | | 5,000 | | 4,767 | |
5.50%, 7/15/06 | | 7,000 | | 7,017 | |
Federal National Mortgage Association | | | | | |
2.38%, 5/4/06 | | 2,500 | | 2,500 | |
3.25%, 12/21/06 | | 1,500 | | 1,484 | |
3.50%, 12/28/06 | | 2,600 | | 2,575 | |
4.36%, 5/3/06 | | 5,000 | | 4,999 | |
4.67%, 5/22/06 | | (b)20,800 | | 20,799 | |
4.88%, 5/9/06 | | (b)5,000 | | 5,000 | |
Total U.S. Government & Agency Securities (Cost $596,758) | | | | 596,758 | |
| | | | | | | |
| | Face | | | |
| | Amount | | Value | |
| | (000) | | (000) | |
Repurchase Agreements (84.4%) | | | | | |
Banc of America LLC, 4.78%, dated 4/28/06, due 5/1/06, repurchase price $881,476: fully collateralized by U.S. government securities at the date of this Portfolio of Investments as follows: Federal National Mortgage Association, Fixed Rate Mortgages: 0.00% to 6.63%, due 2/23/07 to 11/15/30; Federal Home Loan Mortgage Corporation, Fixed Rate Mortgages: 0.00% to 5.25%, due 12/11/06 to 10/19/15, valued at $898,748. | | $ | 881,125 | | $ | 881,125 | |
Banc of America LLC, 4.80%, dated 4/12/06, due 5/10/06, repurchase price $25,093: fully collateralized by U.S. government securities at the date of this Portfolio of Investments as follows: Federal National Mortgage Association, Fixed Rate Mortgage: 5.00%, due 7/1/34 to 6/1/35, valued at $25,500. | | 25,000 | | 25,000 | |
Barclays Capital, 4.78%, dated 4/28/06, due 5/1/06, repurchase price $675,269: fully collateralized by U.S. government securities at the date of this Portfolio of Investments as follows: Federal National Mortgage Association, Fixed Rate Mortgages: 4.90% to 5.50%, due 6/1/07 to 8/3/15; Federal Home Loan Mortgage Corporation, Fixed Rate Mortgages: 4.63% to 5.75%, due 7/18/07 to 8/3/15, valued at $688,501. | | 675,000 | | 675,000 | |
CS First Boston LLC, 4.73%, dated 3/17/06, due 5/8/06, repurchase price $15,102: fully collateralized by U.S. government securities at the date of this Portfolio of Investments as follows: Federal Home Loan Mortgage Corp., Adjustable Rate Mortgage: 5.00%, due 1/1/31; Federal National Mortgage Association, Adjustable Rate Mortgages: 4.28%, due 4/1/33 to 4/1/35, valued at $15,300. | | 15,000 | | 15,000 | |
CS First Boston LLC, 4.76% dated 4/26/06, due 5/3/06, repurchase price $40,037: fully collateralized by U.S. government securities at the date of this Portfolio of Investments as follows: Federal National Mortgage Association, Adjustable Rate Mortgages: 4.29% to 4.76%, due 4/1/33 to 7/1/35, valued at $40,802. | | 40,000 | | 40,000 | |
CS First Boston LLC, 4.79%, dated 4/28/06, due 5/1/06, repurchase price $685,273: fully collateralized by U.S. government securities at the date of this Portfolio of Investments as follows: Federal Home Loan Mortgage Corp., Adjustable Rate Mortgage: 3.72%, to 6.17%, due 6/1/31 to 5/1/42; Federal National Mortgage Association, Adjustable Rate Mortgages: 3.72% to 6.17%, due 6/1/32 to 5/1/42, valued at $698,701. | | 685,000 | | 685,000 | |
| | | | | | | |
The accompanying notes are an integral part of the financial statements.
25
Portfolio of Investments (cont’d)
Government Portfolio
| | Face | | | |
| | Amount | | Value | |
| | (000) | | (000) | |
UBS Securities LLC, 4.77%, dated 4/28/06, due 5/1/06, repurchase price $675,268: fully collateralized by U.S. government securities at the date of this Portfolio of Investments as follows: Federal Home Loan Bank, Fixed Rate Mortgage: 5.77%, due 12/25/12; Federal National Mortgage Association, Fixed Rate Mortgages: 0.00% to 4.45%, due 8/25/12 to 6/1/17; Federal Home Loan Mortgage Corp., Gold Pool: 7.30%, due 12/17/22; Government National Mortgage Association, Fixed Rate Mortgages: 5.00% to 8.50%, due 1/15/19 to 4/15/36; Government National Mortgage Association, Adjustable Rate Mortgages, 4.38% to 5.50%, due 4/20/33 to 9/20/34; U.S. Treasury Note, Fixed Rate, 2.00%, due 5/15/06, valued at $688,501. | | $ | 675,000 | | $ | 675,000 | |
UBS Securities LLC, 4.78%, dated 3/28/06, due 5/10/06, repurchase price $15,086: fully collateralized by U.S. government securities at the date of this Portfolio of Investments as follows: Federal National Mortgage Association, Fixed Rate Mortgage: 6.00%, due 4/1/35, valued at $15,302. | | 15,000 | | 15,000 | |
UBS Securities LLC, 4.78%, dated 3/29/06, due 5/10/06, repurchase price $20,112: fully collateralized by U.S. government securities at the date of this Portfolio of Investments as follows: Federal National Mortgage Association, Fixed Rate Mortgage: 5.50%, to 6.00%, due 6/1/20 to 4/1/35, valued at $20,404. | | 20,000 | | 20,000 | |
UBS Securities LLC, 4.79%, dated 4/6/06, due 5/10/06, repurchase price $25,113: fully collateralized by U.S. government securities at the date of this Portfolio of Investments as follows: Federal National Mortgage Association, Fixed Rate Mortgage: 5.50%, due 6/1/20 to 6/1/34, valued at $25,501. | | 25,000 | | 25,000 | |
UBS Securities LLC, 4.79%, dated 4/11/06, due 5/10/06, repurchase price $45,174: fully collateralized by U.S. government securities at the date of this Portfolio of Investments as follows: Federal National Mortgage Association, Fixed Rate Mortgage: 5.00% to 5.50%, due 5/1/34 to 6/1/34, valued at $45,901. | | 45,000 | | 45,000 | |
UBS Securities LLC, 4.79%, dated 4/5/06, due 5/10/06, repurchase price $80,373: fully collateralized by U.S. government securities at the date of this Portfolio of Investments as follows: Federal National Mortgage Association, Fixed Rate Mortgage: 4.50% to 6.00%, due 8/1/29 to 3/1/35, valued at $81,602. | | 80,000 | | 80,000 | |
Total Repurchase Agreements (Cost $3,181,125) | | | | 3,181,125 | |
Total Investments (100.3%) (Cost $3,777,883) | | | | $3,777,883 | |
Liabilities in Excess of Other Assets (-0.3%) | | | | (9,704) | |
Net Assets (100%) | | | | $3,768,179 | |
| | | | | | | |
(b) Variable/Floating Rate Security — interest rate changes on these instruments are based on changes in a designated base rate. The rates shown are those in effect on April 30, 2006.
(c) Step Bond — Coupon rate increases in increments to maturity. Rate disclosed is as of April 30, 2006. Maturity date disclosed is the ultimate maturity date.
Graphic Presentation of Portfolio Holdings
The following graph depicts the Portfolio’s holdings by investment type, as a percentage of total investments.
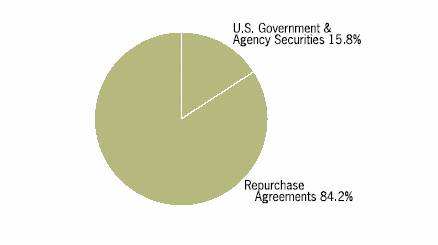
The accompanying notes are an integral part of the financial statements.
26
Portfolio of Investments
Treasury Portfolio
| | Face | | | |
| | Amount | | Value | |
| | (000) | | (000) | |
Repurchase Agreements (100.6%) | | | | | |
Barclays Capital, 4.70%, dated 4/28/06, due 5/1/06, repurchase price $4,652; fully collateralized by U.S. government securities at the date of this Portfolio of Investments as follows: U.S. Treasury Strip, due 2/15/15, valued at $4,743. | | $ | 4,650 | | $ | 4,650 | |
CS First Boston LLC, 4.71%, dated 4/28/06, due 5/1/06, repurchase price $4,652; fully collateralized by U.S. government securities at the date of this Portfolio of Investments as follows: U.S. Treasury Note, 4.50%, due 2/15/09, valued at $4,746. | | 4,650 | | 4,650 | |
Deutsche Bank Securities, Inc., 4.72%, dated 4/28/06, due 5/1/06, repurchase price $4,662; fully collateralized by U.S. government securities at the date of this Portfolio of Investments as follows: U.S. Treasury Bill, due 10/26/06, valued at $4,753. | | 4,660 | | 4,660 | |
Goldman Sachs Group, Inc., 4.68%, dated 4/25/06, due 5/2/06, repurchase price $1,001; fully collateralized by U.S. government securities at the date of this Portfolio of Investments as follows: U.S. Treasury Note, 2.875%, due 11/30/06, valued at $1,021. | | 1,000 | | 1,000 | |
UBS Securities LLC, 4.69%, dated 4/28/06, due 5/1/06, repurchase price $4,652; fully collateralized by U.S. government securities at the date of this Portfolio of Investments as follows: U.S. Treasury Note, 4.50%, due 2/28/11, valued at $4,745. | | 4,650 | | 4,650 | |
Total Investments (100.6%) (Cost $19,610) | | | | 19,610 | |
Liabilities in Excess of Other Assets (-0.6%) | | | | (115) | |
Net Assets (100%) | | | | $ | 19,495 | |
| | | | | | | |
Graphic Presentation of Portfolio Holdings
The following graph depicts the Portfolio’s holdings by investment type, as a percentage of total investments.
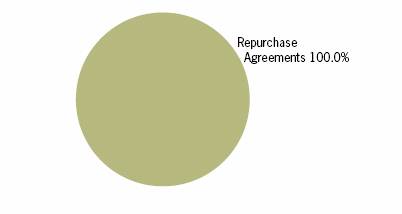
The accompanying notes are an integral part of the financial statements.
27

Portfolio of Investments
Tax Exempt Portfolio
| | Face | | | |
| | Amount | | Value | |
| | (000) | | (000) | |
Tax-Exempt Instruments (99.6%) | | | | | |
Commercial Paper (6.7%) | | | | | |
Illinois Health Facilities Authority, Evanston Hospital Corp., Series 1988
3.50%, 7/13/06 | | $ | 7,000 | | $ | 7,000 | |
JEA, FL, Electric System 2001, Sub-Series C
3.45%, 6/22/06 | | 10,000 | | 10,000 | |
Kentucky Asset Liability Commission, General Fund Second, Series 2005 A-2
3.15%, 10/11/06 | | 15,000 | | 15,000 | |
Metropolitan Atlanta Rapid Transit Authority, GA, Sales Tax, Series 2004 A
3.35%, 5/10/06 | | 7,500 | | 7,500 | |
North Carolina Capital Facilities Finance Agency, Duke University, Series A2
3.35%, 5/4/06 | | 10,000 | | 10,000 | |
| | | | 49,500 | |
Daily Variable Rate Bonds (6.0%) | | | | | |
Charlotte-Mecklenburg Hospital Authority, NC, Carolinas Health Care System, Series 2005 D
3.63%, 5/1/06 | | 3,600 | | 3,600 | |
Geisinger Authority, PA, Geisinger Health System, Series 2005 B
3.72%, 5/1/06 | | 15,900 | | 15,900 | |
Harris County Health Facilities Development Corp., TX, Methodist Hospital System, Series 2005 B
3.73%, 5/1/06 | | 11,900 | | 11,900 | |
New York City, NY, Fiscal 2006 Sub-Series H-2
3.61%, 5/1/06 | | 12,900 | | 12,900 | |
| | | | 44,300 | |
Municipal Bonds & Notes (15.1%) | | | | | |
Aiken County Consolidated School District, SC, Series 2005 BANs
3.25%, 7/14/06 | | 2,800 | | 2,800 | |
Beaufort County School District, SC, Series 2005 A BANs
3.15%, 7/14/06 | | 2,200 | | 2,200 | |
Beaver Area School District, PA, Series 2005 TRANs
3.50%, 6/30/06 | | 1,709 | | 1,710 | |
Bend-La Pine Administrative School District No 1, OR, Series 2005 TRANs
4.00%, 6/29/06 | | 5,000 | | 5,009 | |
Burnt Hills - Ballston Lake Central School District, NY, Series 2005 A TANs
3.75%, 7/13/06 | | 1,250 | | 1,252 | |
Friendship Central School District, NY, Series 2005 BANs
4.00%, 8/3/06 | | 3,000 | | 3,009 | |
Gloversville City School District, NY, Series 2005 BANs
4.50%, 9/28/06 | | 7,800 | | 7,837 | |
Hastings, NY, Series 2005 BANs
3.25%, 7/14/06 | | 1,500 | | 1,500 | |
| | | | | | | |
| | Face | | | |
| | Amount | | Value | |
| | (000) | | (000) | |
Kane, McHenry, Cook & DeKalb Counties Community Unit School District #300, IL, Series 2006 TAWs
4.75%, 6/30/06 | | $ | 10,000 | | $ | 10,014 | |
Marlboro Central School District, NY, Series 2006 A BANs
4.50%, 9/29/06 | | 7,000 | | 7,025 | |
Maryland Community Development Administration, Department of Housing & Community Development Residential Notes 2005, Series F
3.12%, 11/24/06 | | 7,000 | | 7,000 | |
Menomonee Falls School District, WI, Series 2005 TRANs
4.25%, 8/24/06 | | 11,000 | | 11,038 | |
Merrimack County, NH, Series 2006 TANs
4.50%, 12/28/06 | | 2,500 | | 2,515 | |
New Jersey, Series Fiscal 2006 A TRANs
4.00%, 6/23/06 | | 6,000 | | 6,006 | |
Pioneer Valley Transportation Authority, MA, Series 2005 RANs
4.00%, 8/3/06 | | 1,000 | | 1,002 | |
Plainfield, NJ, Series 2005 BANs
4.75%, 9/21/06 | | 11,780 | | 11,851 | |
Spartanburg County School District, SC, Series 2005 BANs
5.25%, 11/16/06 | | 10,000 | | 10,111 | |
Texas, Series 2005 TRANs
4.50%, 8/31/06 | | 12,000 | | 12,048 | |
Utica City School District, NY, Series 2005 RANs
4.00%, 6/23/06 | | 1,500 | | 1,502 | |
Wachusett Regional School District, MA, Series 2005 RANs
3.75%, 6/30/06 | | 1,500 | | 1,502 | |
Worcester Regional Transportation Authority, MA, Series 2005 RANs
4.00%, 6/30/06 | | 4,500 | | 4,503 | |
| | | | 111,434 | |
Put Option Bonds (7.0%) | | | | | |
Harris County Health Facilities Development Corp., TX, Methodist Hospital System, Series 2006 A
3.60%, 7/3/06 | | 10,000 | | 10,000 | |
Northside Independent School District, TX, Series 2005
2.85%, 6/15/06 | | 9,000 | | 9,000 | |
Oklahoma Water Resources Board, State Loan, Series 1994 A, Series 1999
3.38%, 9/1/06 | | 8,985 | | 8,985 | |
Oklahoma Water Resources Board, State Loan, Series 2003 A
3.50%, 10/2/06 | | 9,000 | | 9,000 | |
Plaquemines Port Harbor & Terminal District, LA, Chevron Pipe Line Co., Series 1984
3.00%, 9/1/06 | | 4,700 | | 4,700 | |
| | | | | | | |
The accompanying notes are an integral part of the financial statements.
28
Portfolio of Investments (cont’d)
Tax Exempt Portfolio
| | Face | | | |
| | Amount | | Value | |
| | (000) | | (000) | |
Put Option Bonds (cont’d) | | | | | |
Tulsa County Industrial Authority, OK, Capital Improvement, Series 2003 A
3.13%, 5/15/06 | | $10,000 | | $10,000 | |
| | | | 51,685 | |
Weekly Variable Rate Bonds (64.8%) | | | | | |
Atlanta, GA, Water & Wastewater, Series 2004, Floater-TRs, Series 2006 K2 (FSA)
3.90%, 5/7/06 | | 4,500 | | 4,500 | |
Berkeley County School District, SC, School Building, Series 2005 P-FLOATs PT-3094
3.84%, 5/7/06 | | 5,325 | | 5,325 | |
Bexar County Housing Finance Corp., TX, Multi-Family P-FLOATs PT-2082
3.84%, 5/7/06 | | 1,500 | | 1,500 | |
Centerra Metropolitan District No 1, CO, Series 2004
3.83%, 5/7/06 | | 7,900 | | 7,900 | |
Charlotte, NC, Convention Facility, Series 2003 B COPs
3.85%, 5/7/06 | | 5,000 | | 5,000 | |
Chicago Board of Education, IL, Series 2004 D (FSA)
3.82%, 5/7/06 | | 4,000 | | 4,000 | |
Colorado Educational & Cultural Facilities Authority, Oklahoma’s Public Radio, Series 2005 A
3.82%, 5/7/06 | | 6,255 | | 6,255 | |
Colorado Health Facilities Authority, Catholic Health Initiatives, Series 2004 B-4
3.80%, 5/7/06 | | 1,200 | | 1,200 | |
Columbus Development Authority, GA, Student Housing Facilities, Series 2005 A
3.84%, 5/7/06 | | 5,425 | | 5,425 | |
Denver Urban Renewal Authority, CO, Stapleton Senior Tax Increment, Series 2004 A-1 P-FLOATs PT-999
3.89%, 5/7/06 | | 1,500 | | 1,500 | |
Derry Township Industrial & Commercial Development Authority, PA, Hotel Tax Arena, Series 2000 A
3.83%, 5/7/06 | | 10,700 | | 10,700 | |
Duncanville Independent School District, TX, Series 2005 P-FLOATs PT-3224
3.84%, 5/7/06 | | 5,980 | | 5,980 | |
Fairfax County Industrial Development Authority, VA, Inova Health System Foundation Series 2005 A-2
3.77%, 5/7/06 | | 8,000 | | 8,000 | |
Fort Wayne, IN, Health Quest Realty X, Series 1993 A TOBs (FHA)
3.97%, 5/7/06 | | 1,060 | | 1,060 | |
Franklin County, OH, Doctors OhioHealth Corp., Series 2001 A ROCs II-R Series 55
3.84%, 5/7/06 | | 9,835 | | 9,835 | |
Fulton County Development Authority, GA, St. George Village CCRC, Series 2004
3.80%, 5/7/06 | | 10,700 | | 10,700 | |
Glendale Heights, IL, Glendale Lakes, Series 2000
3.80%, 5/7/06 | | 2,445 | | 2,445 | |
| | Face | | | |
| | Amount | | Value | |
| | (000) | | (000) | |
Hamilton County, OH, Twin Towers & Twin Lakes, Series 2003 A
3.83%, 5/7/06 | | $1,500 | | $1,500 | |
Harrisburg Authority, PA, Harrisburg School District, Series 2006 (FSA)
3.81%, 5/7/06 | | 6,000 | | 6,000 | |
Hawaii Department of Budget & Finance, Queens Health System 1998, Series A
3.83%, 5/7/06 | | 4,800 | | 4,800 | |
Holt Public Schools, MI, Refg, Series 2002
3.78%, 5/7/06 | | 3,645 | | 3,645 | |
Houston, TX, Combined Utility System MERLOTs 2004, Series C13 (MBIA)
3.82%, 5/7/06 | | 1,310 | | 1,310 | |
Illinois Development Finance Authority, Jewish Federation of Metropolitan Chicago Series 1999 (Ambac)
3.83%, 5/7/06 | | 7,460 | | 7,460 | |
Illinois Development Finance Authority, Palos Community Hospital, Series 1998
3.83%, 5/7/06 | | 8,000 | | 8,000 | |
Indiana Educational Facilities Authority, Bethel College, Series 2004
3.80%, 5/7/06 | | 6,040 | | 6,040 | |
Indiana Health Facility Financing Authority, Community Health Network Series 2005 C
3.80%, 5/7/06 | | 7,000 | | 7,000 | |
Indianapolis Local Public Improvement Bond Bank, IN, Waterworks, Series 2005 H (MBIA)
3.80%, 5/7/06 | | 7,000 | | 7,000 | |
Jackson County Hospital Finance Authority, MI, W. A. Foote Memorial Hospital, Series 2005 A
3.82%, 5/7/06 | | 2,400 | | 2,400 | |
Kansas City Industrial Development Authority, MO, Kansas City Downtown Redevelopment District, Series 2005 A (Ambac)
3.82%, 5/7/06 | | 10,000 | | 10,000 | |
Kansas City Tax Increment Financing Commission, MO, Chouteau I-35, Series 2003 A (MBIA)
3.82%, 5/7/06 | | 7,005 | | 7,005 | |
Kent Hospital Finance Authority, MI, Metropolitan Hospital Series 2005 B
3.83%, 5/7/06 | | 1,800 | | 1,800 | |
Kirkwood School District Educational Facilities Authority, MO, Series 2005 B P-FLOATs PT-3164 (MBIA)
3.84%, 5/7/06 | | 7,995 | | 7,995 | |
Lancaster County Hospital Authority, PA, Willow Valley Retirement Communities, Series 2002 B (Radian)
3.83%, 5/7/06 | | 1,350 | | 1,350 | |
Leesburg, FL, The Villages Regional Hospital, Series 2006 (Radian)
3.86%, 5/7/06 | | 8,000 | | 8,000 | |
Lehman Brothers Pooled Municipal Trust Receipts, KY, Jefferson County Christian Church Homes, Series 1994 Floater-TRs, Series 2005 F8
3.95%, 5/7/06 | | 5,235 | | 5,235 | |
The accompanying notes are an integral part of the financial statements.
29
Portfolio of Investments (cont’d)
Tax Exempt Portfolio
| | Face | | | |
| | Amount | | Value | |
| | (000) | | (000) | |
Weekly Variable Rate Bonds (cont’d) | | | | | |
Massachusetts Development Finance Agency, Dana Hall School, Series 2004
3.81%, 5/7/06 | | $ | 2,500 | | $ | 2,500 | |
Massachusetts Development Finance Agency, The Institute of Contemporary Art, Series 2004 A
3.81%, 5/7/06 | | 7,000 | | 7,000 | |
Massachusetts Health & Educational Facilities Authority, Cape Cod Healthcare Obligated Group 2004, Series D (Assured Guaranty)
3.86%, 5/7/06 | | 5,000 | | 5,000 | |
Massachusetts Health & Educational Facilities Authority, Partners HealthCare System Inc., 2003, Series D-4
3.78%, 5/7/06 | | 3,900 | | 3,900 | |
Merrillville, IN, Southlake Care Center, Series 1992 A TOBs (FHA)
3.97%, 5/7/06 | | 570 | | 570 | |
Metropolitan Transportation Authority, NY, ROCs II-R, Series 263 (FSA)
3.83%, 5/7/06 | | 7,680 | | 7,680 | |
Miami - Dade County, FL, Water & Sewer System, Series 2005 (FSA)
3.81%, 5/7/06 | | 25,000 | | 25,000 | |
Minneapolis, MN, Guthrie Theater on the River, Series 2003 A
3.81%, 5/7/06 | | 2,900 | | 2,900 | |
Mississippi Hospital Equipment & Facilities Authority, Baptist Memorial Health Care, Series 2004 B1 P-FLOATs PA-1276
3.85%, 5/7/06 | | 7,100 | | 7,100 | |
Nevada System of Higher Education, PUTTERs, Series 1134 2005 B (Ambac)
3.84%, 5/7/06 | | 5,300 | | 5,300 | |
New Castle County, DE, University Courtyard Apartments, Series 2005
3.83%, 5/7/06 | | 5,000 | | 5,000 | |
New Hampshire Health & Education Facilities Authority, Weeks Medical Center, Series 2005 A
3.80%, 5/7/06 | | 3,545 | | 3,545 | |
New Jersey Transportation Trust Fund Authority, Series 2004 A PUTTERs Series 503 (FGIC)
3.84%, 5/7/06 | | 2,440 | | 2,440 | |
New York State Dormitory Authority, Mount St. Mary College, Series 2005 (Radian)
3.84%, 5/7/06 | | 3,000 | | 3,000 | |
New York State Local Government Assistance Corp., Series 1994 B
3.70%, 5/7/06 | | 3,500 | | 3,500 | |
North Carolina Capital Facilities Finance Agency, Barton College Series 2004
3.82%, 5/7/06 | | 5,200 | | 5,200 | |
North Carolina Medical Care Commission, Firsthealth of the Carolinas, Series 2002
3.79%, 5/7/06 | | 2,600 | | 2,600 | |
| | | | | | | |
| | Face | | | |
| | Amount | | Value | |
| | (000) | | (000) | |
North Carolina Medical Care Commission, Mission St. Joseph’s Health System, Series 2003
3.85%, 5/7/06 | | $ | 4,740 | | $ | 4,740 | |
North Carolina Medical Care Commission, University Health Systems of Eastern Carolina, Series 2006 C-2 (Ambac)
3.78%, 5/7/06 | | 5,800 | | 5,800 | |
North Charleston, SC, Municipal Golf Course, Series 2003
3.85%, 5/7/06 | | 11,520 | | 11,520 | |
Oak Forest, IL, Homewood South Suburban Mayors & Managers Association, Series 1989
3.80%, 5/7/06 | | 13,050 | | 13,050 | |
Oklahoma Capitol Improvement Authority, State Facilities, Series 2005 F P-FLOATs PT-3286 (Ambac)
3.84%, 5/7/06 | | 400 | | 400 | |
Omaha, NE, Eagle #2004001, Class A
3.84%, 5/7/06 | | 1,000 | | 1,000 | |
Oregon Department of Administrative Services, COPs, Series 2005 B ROCs II-R Series 7017 (FGIC)
3.84%, 5/7/06 | | 3,000 | | 3,000 | |
Pima County Industrial Development Authority, AZ, El Dorado Hospital, Series 2004
3.82%, 5/7/06 | | 1,000 | | 1,000 | |
Pine Ridge Village/Campus Heights LLC, AZ, Northern Arizona University, Series 2005 (FGIC)
3.82%, 5/7/06 | | 20,000 | | 20,000 | |
Polk County School Board, FL, Series 2003 A COPs (FSA)
3.79%, 5/7/06 | | 4,600 | | 4,600 | |
Portage County, OH, Robinson Memorial Hospital, Series 2005
3.85%, 5/7/06 | | 16,225 | | 16,225 | |
Portsmouth, VA, Series 2005 A ROCs II-R, Series 6054 (MBIA)
3.84%, 5/7/06 | | 3,170 | | 3,170 | |
Regional Transportation Authority, IL, Refunding, Series 2005 B
3.82%, 5/7/06 | | 3,510 | | 3,510 | |
Rhode Island Convention Center Authority, Refunding 2001,Series A (MBIA)
3.80%, 5/7/06 | | 1,255 | | 1,255 | |
Rhode Island Economic Development Corp., Airport 2005, Series C P-FLOATS PT-2953 (MBIA)
3.84%, 5/7/06 | | 2,165 | | 2,165 | |
Rhode Island Health & Educational Building Corp., Meeting Street Center, Series 2005
3.80%, 5/7/06 | | 6,000 | | 6,000 | |
Richmond, KY, Kentucky League of Cities Funding Trust, Series 2006 A
3.82%, 5/7/06 | | 7,500 | | 7,500 | |
Roaring Fork Municipal Products, WA, Washington Class A Certificates, Series 2005-4 (FSA)
3.88%, 5/7/06 | | 9,395 | | 9,395 | |
Saline Area Schools, MI, Series 2002 B
3.78%, 5/7/06 | | 55 | | 55 | |
| | | | | | | |
The accompanying notes are an integral part of the financial statements.
30
Portfolio of Investments (cont’d)
Tax Exempt Portfolio
| | Face | | | |
| | Amount | | Value | |
| | (000) | | (000) | |
Weekly Variable Rate Bonds (cont’d) | | | | | |
South Carolina Jobs - Economic Development Authority, Oconee Memorial Hospital, Series 2005 A (Radian)
3.86%, 5/7/06 | | $ | 5,000 | | $ | 5,000 | |
South Carolina, Research University Infrastructure, Series 2005 A P-FLOATs PT-3245
3.84%, 5/7/06 | | 10,780 | | 10,780 | |
St. Joseph County, IN, Logan Community Resources, Series 2004
3.82%, 5/7/06 | | 6,500 | | 6,500 | |
Tennergy Corp., TN, Gas, Series 2006 B PUTTERs, Series 1260B
3.85%, 5/7/06 | | 10,000 | | 10,000 | |
Texas Water Development Board, Revolving Fund Senior Lien, Series 2000 A P-FLOATs PT-2187
3.82%, 5/7/06 | | 1,040 | | 1,040 | |
Umatilla County Hospital Facility Authority, OR, Catholic Health Initiatives Series 1997 B
3.82%, 5/7/06 | | 4,100 | | 4,100 | |
University of Massachusetts Building Authority, Series 2006-1 (Ambac)
3.80%, 5/7/06 | | 24,900 | | 24,900 | |
University Of Minnesota Regents, Series 1999 A
3.90%, 5/7/06 | | 1,005 | | 1,005 | |
Upper Trinity Regional Water District, TX Regional Treated Water Supply System Refunding, Series 2005 P-FLOATs PT-3290 (Ambac)
3.84%, 5/7/06 | | 7,200 | | 7,200 | |
Volusia County Educational Facilities Authority, FL, Embry-Riddle Aeronautical University, Series 2005 ROCs II-R Sub-Series 440 (Radian)
3.85%, 5/7/06 | | 5,645 | | 5,645 | |
Washington Higher Education Facilities Authority, Whitman College, Series 2004
3.82%, 5/7/06 | | 5,070 | | 5,070 | |
Williamsburg, KY, Cumberland College, Series 2002
3.80%, 5/7/06 | | 1,375 | | 1,375 | |
| | | | 477,100 | |
Total Tax-Exempt Instruments (Cost $734,019) | | | | 734,019 | |
Total Investments (99.6%) (Cost $734,019) | | | | 734,019 | |
Other Assets in Excess of Liabilities (0.4%) | | | | 3,184 | |
Net Assets (100%) | | | | $ | 737,203 | |
| | | | | | | |
Ambac — Ambac Assurance Corp.
Assured Guaranty — Assured Guaranty, Ltd.
BANs — Bond Anticipation Notes
COPs — Certificates of Participation
FGIC — Financial Guaranty Insurance Co.
FHA — Federal Housing Administration.
FSA — Financial Security Assurance, Inc.
MBIA — MBIA Insurance Corp.
P-FLOATS — Puttable Floating Option Tax-Exempt Receipts
Radian — Radian Group, Inc.
RANs — Revenue Anticipation Notes
ROCs — Reset Option Certificates
TANs — Tax Anticipation Notes
TAWs — Tax Anticipation Warrants
TOBs — Tender Option Bonds
TRANs — Tax and Revenue Anticipation Notes
SUMMARY OF TAX-EXEMPT INSTRUMENTS BY STATE/TERRITORY
STATE/TERRITORY | | Value
(000) | | Percent
of Net
Assets | |
Texas | | $ | 59,978 | | 8.1 | % |
Illinois | | 55,479 | | 7.5 | |
Florida | | 53,245 | | 7.2 | |
Massachusetts | | 50,308 | | 6.8 | |
New York | | 49,205 | | 6.7 | |
South Carolina | | 47,736 | | 6.5 | |
North Carolina | | 36,940 | | 5.0 | |
Pennsylvania | | 35,659 | | 4.8 | |
Kentucky | | 29,110 | | 4.0 | |
Oklahoma | | 28,385 | | 3.9 | |
Indiana | | 28,170 | | 3.8 | |
Georgia | | 28,125 | | 3.8 | |
Ohio | | 27,560 | | 3.7 | |
Missouri | | 25,000 | | 3.4 | |
Arizona | | 21,000 | | 2.9 | |
New Jersey | | 20,297 | | 2.8 | |
Colorado | | 16,855 | | 2.3 | |
Washington | | 14,465 | | 2.0 | |
Oregon | | 12,109 | | 1.6 | |
Virginia | | 11,170 | | 1.5 | |
Wisconsin | | 11,038 | | 1.5 | |
Tennessee | | 10,000 | | 1.4 | |
Rhode Island | | 9,420 | | 1.3 | |
Michigan | | 7,900 | | 1.1 | |
Mississippi | | 7,100 | | 1.0 | |
Maryland | | 7,000 | | 0.9 | |
New Hampshire | | 6,060 | | 0.8 | |
Nevada | | 5,300 | | 0.7 | |
Delaware | | 5,000 | | 0.7 | |
Hawaii | | 4,800 | | 0.7 | |
Louisiana | | 4,700 | | 0.6 | |
Minnesota | | 3,905 | | 0.5 | |
Nebraska | | 1,000 | | 0.1 | |
| | $ | 734,019 | | 99.6 | % |
The accompanying notes are an integral part of the financial statements.
31
Portfolio of Investments (cont’d)
Tax Exempt Portfolio
Graphic Presentation of Portfolio Holdings
The following graph depicts the Portfolio’s holdings by investment type, as a percentage of total investments.
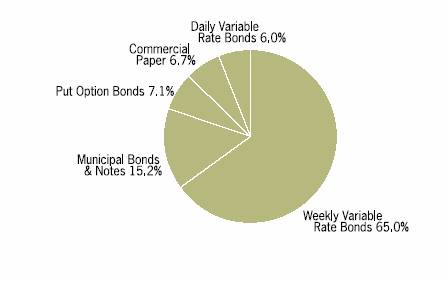
The accompanying notes are an integral part of the financial statements.
32

Statements of Assets and Liabilities
| | Money Market
Portfolio
(000) | | Prime
Portfolio
(000) | | Government
Portfolio
(000) | | Treasury
Portfolio
(000) | | Tax-Exempt
Portfolio
(000) | |
Assets: | | | | | | | | | | | |
Investments, at Cost: | | $ | 3,885,618 | | $ | 17,083,330 | | $ | 3,777,883 | | $ | 19,610 | | $ | 734,019 | |
Investments, at Value:(1) | | 3,885,618 | | 17,083,330 | | 3,777,883 | | 19,610 | | 734,019 | |
Cash | | 5 | | — | | 4 | | 2 | | 96 | |
Interest Receivable | | 6,592 | | 34,940 | | 5,813 | | 8 | | 5,288 | |
Receivable from Investment Adviser | | — | | — | | 54 | | 17 | | — | |
Other Assets | | 25 | | 97 | | 10 | | 1 | | 4 | |
Total Assets | | 3,892,240 | | 17,118,367 | | 3,783,764 | | 19,638 | | 739,407 | |
Liabilities: | | | | | | | | | | | |
Payable for Investments Purchased | | 14,999 | | 243,549 | | — | | — | | — | |
Dividends Declared | | 14,398 | | 70,425 | | 15,116 | | 115 | | 2,127 | |
Investment Advisory Fees Payable | | 71 | | 881 | | — | | — | | 19 | |
Payable for Administrative Fees | | 159 | | 766 | | 173 | | 1 | | 35 | |
Payable for Custodian Fees | | 13 | | 80 | | 4 | | 4 | | 1 | |
Bank Overdraft Payable | | — | | 9 | | — | | — | | — | |
Shareholder Administration Plan Fees Payable — Service Class | | @— | | 2 | | @— | | @— | | @— | |
Shareholder Administration Plan Fees Payable — Investor Class | | @— | | 1 | | 26 | | @— | | @— | |
Shareholder Administration Plan Fees Payable — Administrative Class | | @— | | @— | | 2 | | @— | | @— | |
Service and Shareholder Administration Plan Fees Payable — Advisory Class | | @— | | 12 | | 75 | | 3 | | 6 | |
Distribution and Shareholder Service Plans Fees Payable — Participant Class | | @— | | @— | | @— | | @— | | @— | |
Distribution and Shareholder Service Plans Fees Payable— Cash Management Class | | @— | | — | | — | | @— | | @— | |
Other Liabilities | | 129 | | 419 | | 189 | | 20 | | 16 | |
Total Liabilities | | 29,769 | | 316,144 | | 15,585 | | 143 | | 2,204 | |
Net Assets | | $ | 3,862,471 | | $ | 16,802,223 | | $ | 3,768,179 | | $ | 19,495 | | $ | 737,203 | |
Net Assets Consist Of: | | | | | | | | | | | |
Paid-in Capital | | $ | 3,862,458 | | $ | 16,802,183 | | $ | 3,768,179 | | $ | 19,494 | | $ | 737,200 | |
Undistributed (Distributions in Excess of) Net Investment Income | | 1 | | 5 | | @— | | — | | — | |
Accumulated Net Realized Gain (Loss) | | 12 | | 35 | | @— | | 1 | | 3 | |
Net Assets | | $ | 3,862,471 | | $ | 16,802,223 | | $ | 3,768,179 | | $ | 19,495 | | $ | 737,203 | |
(1) Including: | | | | | | | | | | | |
Repurchase Agreements, at Value: | | $ | 450,000 | | $ | 410,000 | | $ | 3,181,125 | | $ | 19,610 | | $ | — | |
The accompanying notes are an integral part of the financial statements.
33
Statements of Assets and Liabilities (cont’d)
| | Money Market
Portfolio
(000) | | Prime
Portfolio
(000) | | Government
Portfolio
(000) | | Treasury
Portfolo
(000) | | Tax Exempt
Portfolio
(000) | |
INSTITUTIONAL CLASS: | | | | | | | | | | | |
Net Assets | | $ | 3,861,806 | | $ | 16,683,735 | | $ | 3,041,933 | | $ | 3,025 | | $ | 726,944 | |
Shares Outstanding $0.01 par value shares of beneficial interest
(unlimited number of shares authorized) (not in 000’s) | | 3,861,795,990 | | 16,683,694,234 | | 3,041,937,022 | | 3,024,820 | | 726,941,226 | |
Net Asset Value, Offering and Redemption Price Per Share | | $ | 1.00 | | $ | 1.00 | | $ | 1.00 | | $ | 1.00 | | $ | 1.00 | |
SERVICE CLASS: | | | | | | | | | | | |
Net Assets | | $ | 100 | | $ | 57,316 | | $ | 492 | | $ | 100 | | $ | 100 | |
Shares Outstanding $0.01 par value shares of beneficial interest
(unlimited number of shares authorized) (not in 000’s) | | 100,000 | | 57,316,000 | | 492,219 | | 100,000 | | 100,000 | |
Net Asset Value, Offering and Redemption Price Per Share | | $ | 1.00 | | $ | 1.00 | | $ | 1.00 | | $ | 1.00 | | $ | 1.00 | |
INVESTOR CLASS: | | | | | | | | | | | |
Net Assets | | $ | 164 | | $ | 5,901 | | $ | 351,534 | | $ | 100 | | $ | 104 | |
Shares Outstanding $0.01 par value shares of beneficial interest
(unlimited number of shares authorized) (not in 000’s) | | 163,741 | | 5,900,813 | | 351,533,592 | | 100,000 | | 104,380 | |
Net Asset Value, Offering and Redemption Price Per Share | | $ | 1.00 | | $ | 1.00 | | $ | 1.00 | | $ | 1.00 | | $ | 1.00 | |
ADMINISTRATIVE CLASS: | | | | | | | | | | | |
Net Assets | | $ | 100 | | $ | 100 | | $ | 13,611 | | $ | 100 | | $ | 100 | |
Shares Outstanding $0.01 par value shares of beneficial interest
(unlimited number of shares authorized) (not in 000’s) | | 100,000 | | 100,000 | | 13,611,134 | | 100,000 | | 100,000 | |
Net Asset Value, Offering and Redemption Price Per Share | | $ | 1.00 | | $ | 1.00 | | $ | 1.00 | | $ | 1.00 | | $ | 1.00 | |
ADVISORY CLASS: | | | | | | | | | | | |
Net Assets | | $ | 101 | | $ | 55,071 | | $ | 360,509 | | $ | 15,970 | | $ | 9,755 | |
Shares Outstanding $0.01 par value shares of beneficial interest
(unlimited number of shares authorized) (not in 000’s) | | 100,512 | | 55,070,974 | | 360,508,519 | | 15,969,716 | | 9,755,258 | |
Net Asset Value, Offering and Redemption Price Per Share | | $ | 1.00 | | $ | 1.00 | | $ | 1.00 | | $ | 1.00 | | $ | 1.00 | |
PARTICIPANT CLASS: | | | | | | | | | | | |
Net Assets | | $ | 100 | | $ | 100 | | $ | 100 | | $ | 100 | | $ | 100 | |
Shares Outstanding $0.01 par value shares of beneficial interest
(unlimited number of shares authorized) (not in 000’s) | | 100,000 | | 100,000 | | 100,000 | | 100,000 | | 100,000 | |
Net Asset Value, Offering and Redemption Price Per Share | | $ | 1.00 | | $ | 1.00 | | $ | 1.00 | | $ | 1.00 | | $ | 1.00 | |
CASH MANAGEMENT CLASS: | | | | | | | | | | | |
Net Assets | | $ | 100 | | $ | — | | $ | — | | $100 | | $100 | |
Shares Outstanding $0.01 par value shares of beneficial interest
(unlimited number of shares authorized) (not in 000’s) | | 100,000 | | — | | $ | — | | 100,000 | | 100,000 | |
Net Asset Value, Offering and Redemption Price Per Share | | $ | 1.00 | | $ | — | | $ | — | | $ | 1.00 | | $ | 1.00 | |
@ Amount is less than $500.
The accompanying notes are an integral part of the financial statements.
34
Statements of Operations
For the Six Months Ended April 30, 2006
| | Money Market
Portfolio
(000) | | Prime
Portfolio
(000) | | Goverment
Portfolio
(000) | | Treasury
Portfolio
(000) | | Tax-Exempt
(000) | |
Investment Income: | | | | | | | | | | | |
Interest | | $ | 67,564 | | $ | 382,185 | | $ | 73,327 | | $ | 951 | | $ | 16,207 | |
Expenses: | | | | | | | | | | | |
Investment Advisory Fees (Note B) | | 2,248 | | 12,769 | | 2,463 | | 33 | | 791 | |
Administration Fees (Note C) | | 755 | | 4,282 | | 826 | | 11 | | 266 | |
Registration and Filing Fees | | 81 | | 307 | | 167 | | 54 | | 84 | |
Custodian Fees (Note E) | | 47 | | 277 | | 29 | | 12 | | 23 | |
Professional Fees | | 61 | | 217 | | 36 | | 14 | | 18 | |
Trustees’ Fees and Expenses | | 17 | | 99 | | 16 | | @— | | 6 | |
Shareholder Reporting Fees | | 17 | | 56 | | 10 | | 3 | | 4 | |
Transfer Agency Fees (Note C) | | 1 | | 3 | | @— | | @— | | @— | |
Bank Overdraft Expense | | @— | | 14 | | @— | | — | | 2 | |
Shareholder Administration Plan Fees — Service Class (Note D) | | @— | | 9 | | @— | | @— | | @— | |
Shareholder Administration Plan Fees — Investor Class (Note D) | | @— | | 6 | | 149 | | @— | | @— | |
Shareholder Administration Plan Fees — Administrative Class (Note D) | | @— | | @— | | 10 | | @— | | @— | |
Service and Shareholder Administration Plan Fees — Advisory Class (Note D) | | 3 | | 82 | | 197 | | 32 | | 36 | |
Distribution and Shareholder Service Plans Fees — Participant Class (Note D) | | @— | | @— | | @— | | @— | | @— | |
Distribution and Shareholder Service Plans Fees — Cash Management Class (Note D) | | @— | | — | | — | | @— | | @— | |
Other Expenses | | 53 | | 259 | | 64 | | 23 | | 26 | |
Total Expenses | | 3,283 | | 18,380 | | 3,967 | | 182 | | 1,256 | |
Waiver of Investment Advisory Fees (Note B) | | (1,921 | ) | (8,121 | ) | (2,322 | ) | (33 | ) | (677 | ) |
Expenses Reimbursed by Adviser (Note B) | | — | | — | | — | | (105 | ) | — | |
Expense Offset (Note E) | | (9 | ) | (18 | ) | (25 | ) | (1 | ) | (20 | ) |
Net Expenses | | 1,353 | | 10,241 | | 1,620 | | 43 | | 559 | |
Net Investment Income (Loss) | | 66,211 | | 371,944 | | 71,707 | | 908 | | 15,648 | |
Realized Gain (Loss): | | | | | | | | | | | |
Investments | | 12 | | 45 | | — | | @ | — | 3 | |
Net Increase (Decrease) in Net Assets Resulting from Operations | | $ | 66,223 | | $ | 371,989 | | $ | 71,707 | | $ | 908 | | $ | 15,651 | |
@ Amount is less than $500.
The accompanying notes are an integral part of the financial statements.
35

Statements of Changes in Net Assets
| | Money Market Portfolio | | Prime Portfolio | |
| | Six Months Ended
April 30, 2006
(unaudited)
(000) | | Year Ended
October 31, 2005
(000) | | Six Months Ended
April 30, 2006
(unaudited)
(000) | | Year Ended
October 31, 2005
(000) | |
Increase (Decrease) in Net Assets | | | | | | | | | |
Operations: | | | | | | | | | |
Net Investment Income | | $66,211 | | $95,455 | | $371,944 | | $369,743 | |
Net Realized Gain (Loss) | | 12 | | 2 | | 45 | | 5 | |
Net Increase (Decrease) in Net Assets Resulting from Operations | | 66,223 | | 95,457 | | 371,989 | | 369,748 | |
Distributions from and/or in Excess of: | | | | | | | | | |
Institutional Class: | | | | | | | | | |
Net Investment Income | | (66,155 | ) | (95,432 | ) | (369,527 | ) | (368,357 | ) |
Service Class:* | | | | | | | | | |
Net Investment Income | | (2 | ) | (3 | ) | (805 | ) | (81 | ) |
Investor Class:^ | | | | | | | | | |
Net Investment Income | | (3 | ) | (3 | ) | (266 | ) | (382 | ) |
Administrative Class:* | | | | | | | | | |
Net Investment Income | | (2 | ) | (3 | ) | (2 | ) | (3 | ) |
Advisory Class:† | | | | | | | | | |
Net Investment Income | | (44 | ) | (11 | ) | (1,341 | ) | (914 | ) |
Participant Class:* | | | | | | | | | |
Net Investment Income | | (2 | ) | (2 | ) | (2 | ) | (2 | ) |
Cash Management Class:** | | | | | | | | | |
Net Investment Income | | (2 | ) | (1 | ) | — | | — | |
Total Distributions | | (66,210 | ) | (95,455 | ) | (371,943 | ) | (369,739 | ) |
Capital Share Transactions:(1) | | | | | | | | | |
Institutional Class: | | | | | | | | | |
Subscribed | | 15,555,559 | | 22,656,999 | | 88,030,142 | | 113,064,803 | |
Distributions Reinvested | | 35,356 | | 66,407 | | 186,453 | | 199,398 | |
Redeemed | | (14,811,356 | ) | (22,718,202 | ) | (85,498,406 | ) | (108,031,572 | ) |
Service Class:* | | | | | | | | | |
Subscribed | | — | | 100 | | 870,808 | | 58,993 | |
Distributions Reinvested | | — | | — | | — | | — | |
Redeemed | | — | | — | | (823,949 | ) | (48,536 | ) |
Investor Class:^ | | | | | | | | | |
Subscribed | | 64 | | 100 | | 20,401 | | 146,900 | |
Distributions Reinvested | | @— | | — | | 307 | | 310 | |
Redeemed | | @— | | — | | (34,807 | ) | (127,210 | ) |
Administrative Class:* | | | | | | | | | |
Subscribed | | — | | 100 | | — | | 100 | |
Distributions Reinvested | | — | | — | | — | | — | |
Redeemed | | — | | — | | — | | — | |
Advisory Class:† | | | | | | | | | |
Subscribed | | 10,106 | | 15,830 | | 202,254 | | 428,211 | |
Distributions Reinvested | | 27 | | — | | 909 | | 624 | |
Redeemed | | (10,112 | ) | (17,255 | ) | (217,293 | ) | (375,984 | ) |
Participant Class:* | | | | | | | | | |
Subscribed | | — | | 100 | | — | | 100 | |
Distributions Reinvested | | — | | — | | — | | — | |
Redeemed | | — | | — | | — | | — | |
Cash Management Class:** | | | | | | | | | |
Subscribed | | — | | 100 | | — | | — | |
Distributions Reinvested | | — | | — | | — | | — | |
Redeemed | | — | | @— | | — | | — | |
Net Increase (Decrease) in Net Assets Resulting from Capital Share Transactions | | 779,644 | | 4,279 | | 2,736,819 | | 5,316,137 | |
Total Increase (Decrease) in Net Assets | | 779,657 | | 4,281 | | 2,736,865 | | 5,316,146 | |
The accompanying notes are an integral part of the financial statements.
36
Statements of Changes in Net Assets (cont’d)
| | Money Market Portfolio | | Prime Portfolio | |
| | Six Months Ended
April 30, 2006
(unaudited)
(000) | | Year Ended
October 31, 2005
(000) | | Six Months Ended
April 30, 2006
(unaudited)
(000) | | Year Ended
October 31, 2005
(000) | |
Net Assets: | | | | | | | | | |
Beginning of Period | | 3,082,814 | | 3,078,533 | | 14,065,358 | | 8,749,212 | |
End of Period | | $ | 3,862,471 | | $ | 3,082,814 | | $ | 16,802,223 | | $ | 14,065,358 | |
Undistributed (Distributions in Excess of) Net Investment Income Included in End of Period Net Assets | | $ | 1 | | $ | @— | | $ | 5 | | $ | 4 | |
(1)Capital Share Transactions: | | | | | | | | | |
Institutional Class: | | | | | | | | | |
Shares Subscribed | | 15,555,559 | | 22,656,996 | | 88,030,137 | | 113,064,798 | |
Shares Issued on Distributions Reinvested | | 35,356 | | 66,407 | | 186,453 | | 199,394 | |
Shares Redeemed | | (14,811,356 | ) | (22,718,196 | ) | (85,498,402 | ) | (108,031,564 | ) |
Net Increase (Decrease) in Institutional Class Shares Outstanding | | 779,559 | | 5,207 | | 2,718,188 | | 5,232,628 | |
Service Class:* | | | | | | | | | |
Shares Subscribed | | — | | 100 | | 870,808 | | 58,963 | |
Shares Issued on Distributions Reinvested | | — | | — | | — | | — | |
Shares Redeemed | | — | | — | | (823,949 | ) | (48,536 | ) |
Net Increase (Decrease) in Service Class Shares Outstanding | | — | | 100 | | 46,859 | | 10,457 | |
Investor Class:^ | | | | | | | | | |
Shares Subscribed | | 64 | | 100 | | 20,401 | | 146,900 | |
Shares Issued on Distributions Reinvested | | @— | | — | | 307 | | 310 | |
Shares Redeemed | | @— | | — | | (34,807 | ) | (127,210 | ) |
Net Increase (Decrease) in Investor Class Shares Outstanding | | 64 | | 100 | | (14,099) | | 20,000 | |
Administrative Class:* | | | | | | | | | |
Shares Subscribed | | — | | 100 | | — | | 100 | |
Shares Issued on Distributions Reinvested | | — | | — | | — | | — | |
Shares Redeemed | | — | | — | | — | | — | |
Net Increase (Decrease) in Administrative Class Shares Outstanding | | — | | 100 | | — | | 100 | |
Advisory Class:† | | | | | | | | | |
Shares Subscribed | | 10,106 | | 15,830 | | 202,254 | | 428,211 | |
Shares Issued on Distributions Reinvested | | 27 | | — | | 909 | | 624 | |
Shares Redeemed | | (10,112 | ) | (17,255 | ) | (217,293 | ) | (375,984 | ) |
Net Increase (Decrease) in Advisory Class Shares Outstanding | | 21 | | (1,425 | ) | (14,130 | ) | 52,851 | |
Participant Class:* | | | | | | | | | |
Shares Subscribed | | — | | 100 | | — | | 100 | |
Shares Issued on Distributions Reinvested | | — | | — | | — | | — | |
Shares Redeemed | | — | | — | | — | | — | |
Net Increase (Decrease) in Participant Class Shares Outstanding | | — | | 100 | | — | | 100 | |
Cash Management Class:** | | | | | | | | | |
Shares Subscribed | | — | | 100 | | — | | — | |
Shares Issued on Distributions Reinvested | | — | | — | | — | | — | |
Shares Redeemed | | — | | @— | | — | | — | |
Net Increase (Decrease) in Cash Management Class Shares Outstanding | | — | | 100 | | — | | — | |
* The Money Market and Prime Portfolios’ Service, Administrative and Participant classes commenced offering on November 1, 2004.
** The Money Market Portfolio’s Cash Management class commenced offering on August 15, 2005.
^ The Money Market and Prime Portfolios’ Investor classes commenced offering on June 16, 2004 and November 1, 2004, respectively.
† The Money Market and Prime Portfolios’ Advisory classes commenced offering on February 6, 2004 and April 29, 2004, respectively.
@ Amount is less than $500 or 500 shares.
The accompanying notes are an integral part of the financial statements.
37
Statements of Changes in Net Assets
| | Government Portfolio | | Treasury Portfolio | | Tax-Exempt Portfolio | |
| | Six Months
Ended
April 30,
2006
(unaudited)
(000) | | Year
Ended
October 31,
2005
(000) | | Six Months
Ended
April 30,
2006
(unaudited)
(000) | | Year Ended
October 31,
2005
(000) | | Six Months
Ended
April 30,
2006
(unaudited)
(000) | | Year Ended
October 31,
2005
(000) | |
Increase (Decrease) in Net Assets | | | | | | | | | | | | | |
Operations: | | | | | | | | | | | | | |
Net Investment Income | | $ | 71,707 | | $ | 44,911 | | $ | 908 | | $ | 2,758 | | $ | 15,648 | | $ | 8,075 | |
Net Realized Gain (Loss) | | — | | @— | | @— | | 1 | | 3 | | — | |
Net Increase (Decrease) in Net Assets Resulting from Operations | | 71,707 | | 44,911 | | 908 | | 2,759 | | 15,651 | | 8,075 | |
Distributions from and/or in Excess of: | | | | | | | | | | | | | |
Institutional Class: | | | | | | | | | | | | | |
Net Investment Income | | (61,750 | ) | (36,620 | ) | (380 | ) | (2,599 | ) | (15,258 | ) | (7,542 | ) |
Service Class: | | | | | | | | | | | | | |
Net Investment Income | | (10 | ) | (325 | ) | (2 | ) | (3 | ) | (1 | ) | (2 | ) |
Investor Class: | | | | | | | | | | | | | |
Net Investment Income | | (6,353 | ) | (6,049 | ) | (2 | ) | (3 | ) | (1 | ) | (2 | ) |
Administrative Class: | | | | | | | | | | | | | |
Net Investment Income | | (288 | ) | (640 | ) | (2 | ) | (3 | ) | (1 | ) | (2 | ) |
Advisory Class: | | | | | | | | | | | | | |
Net Investment Income | | (3,304 | ) | (1,274 | ) | (518 | ) | (147 | ) | (384 | ) | (524 | ) |
Participant Class: | | | | | | | | | | | | | |
Net Investment Income | | (2 | ) | (3 | ) | (2 | ) | (2 | ) | (2 | ) | (2 | ) |
Cash Management Class:* | | | | | | | | | | | | | |
Net Investment Income | | — | | — | | (2 | ) | (1 | ) | (1 | ) | (1 | ) |
Total Distributions | | (71,707 | ) | (44,911 | ) | (908 | ) | (2,758 | ) | (15,648 | ) | (8,075 | ) |
Capital Share Transactions:(1) | | | | | | | | | | | | | |
Institutional Class: | | | | | | | | | | | | | |
Subscribed | | 15,321,132 | | 10,110,092 | | 140,126 | | 600,333 | | 4,668,519 | | 2,556,703 | |
Distributions Reinvested | | 43,435 | | 19,694 | | 516 | | 2,477 | | 13,015 | | 4,578 | |
Redeemed | | (14,519,145 | ) | (8,347,842 | ) | (207,704 | ) | (720,494 | ) | (5,085,082 | ) | (1,540,084 | ) |
Service Class: | | | | | | | | | | | | | |
Subscribed | | — | | 46,181 | | — | | 100 | | — | | 100 | |
Distributions Reinvested | | 8 | | 321 | | — | | — | | — | | — | |
Redeemed | | — | | (46,017 | ) | — | | — | | — | | — | |
Investor Class: | | | | | | | | | | | | | |
Subscribed | | 2,786,962 | | 3,252,446 | | — | | 100 | | — | | 100 | |
Distributions Reinvested | | 2,379 | | 2,485 | | — | | — | | — | | 2 | |
Redeemed | | (2,716,819 | ) | (3,085,696 | ) | — | | — | | — | | (1,118 | ) |
Administrative Class: | | | | | | | | | | | | | |
Subscribed | | 251,654 | | 645,610 | | — | | 100 | | — | | 100 | |
Distributions Reinvested | | 283 | | 591 | | — | | — | | — | | — | |
Redeemed | | (249,203 | ) | (635,324 | ) | — | | — | | — | | — | |
Advisory Class: | | | | | | | | | | | | | |
Subscribed | | 726,839 | | 607,041 | | 93,656 | | 22,873 | | 148,384 | | 227,121 | |
Distributions Reinvested | | 1,268 | | 844 | | 203 | | 134 | | 393 | | 453 | |
Redeemed | | (499,111 | ) | (500,122 | ) | (95,464 | ) | (7,639 | ) | (237,845 | ) | (184,751 | ) |
Participant Class: | | | | | | | | | | | | | |
Subscribed | | @— | | 147 | | — | | 100 | | — | | 130 | |
Distributions Reinvested | | — | | @— | | — | | — | | @— | | @— | |
Redeemed | | (47 | ) | — | | — | | — | | (2 | ) | (29 | ) |
Cash Management Class:* | | | | | | | | | | | | | |
Subscribed | | — | | — | | — | | 100 | | @— | | 100 | |
Distributions Reinvested | | — | | — | | — | | — | | — | | — | |
Redeemed | | — | | — | | — | | — | | — | | @— | |
Net Increase (Decrease) in Net Assets Resulting from Capital Share Transactions | | 1,149,635 | | 2,070,451 | | (68,667 | ) | (101,816 | ) | (492,618 | ) | 1,063,405 | |
Total Increase (Decrease) in Net Assets | | 1,149,635 | | 2,070,451 | | (68,667 | ) | (101,815 | ) | (492,615 | ) | 1,063,405 | |
| | | | | | | | | | | | | | | | | | | |
The accompanying notes are an integral part of the financial statements.
38

Statements of Changes in Net Assets (cont’d)
| | Government | | Treasury | | Tax-Exempt | |
| | Portfolio | | Portfolio | | Portfolio | |
| | Six Months | | | | Six Months | | | | Six Months | | | |
| | Ended | | | | Ended | | | | Ended | | Year | |
| | April 30, | | Year Ended | | April 30, | | Year Ended | | April 30, | | Ended | |
| | 2006 | | October 31, | | 2006 | | October 31, | | 2006 | | October 31, | |
| | (unaudited) | | 2005 | | (unaudited) | | 2005 | | (unaudited) | | 2005 | |
| | (000) | | (000) | | (000) | | (000) | | (000) | | (000) | |
Net Assets: | | | | | | | | | | | | | |
Beginning of Period | | 2,618,544 | | 548,093 | | 88,162 | | 189,977 | | 1,229,818 | | 166,413 | |
End of Period | | $ | 3,768,179 | | $ | 2,618,544 | | $ | 19,495 | | $ | 88,162 | | $ | 737,203 | | $ | 1,229,818 | |
Undistributed (Distributions in Excess of) Net Investment Income Included in End of Period Net Assets | | $ | @— | | $ | @— | | $ | — | | $ | — | | $ | — | | $ | — | |
(1)Capital Share Transactions: | | | | | | | | | | | | | |
Institutional Class: | | | | | | | | | | | | | |
Shares Subscribed | | 15,321,132 | | 10,110,090 | | 140,126 | | 600,334 | | 4,668,519 | | 2,556,703 | |
Shares Issued on Distributions Reinvested | | 43,435 | | 19,694 | | 516 | | 2,477 | | 13,015 | | 4,578 | |
Shares Redeemed | | (14,519,145 | ) | (8,347,836 | ) | (207,703 | ) | (720,494 | ) | (5,085,081 | ) | (1,540,084 | ) |
Net Increase (Decrease) in Institutional Class Shares Outstanding | | 845,422 | | 1,781,948 | | (67,061 | ) | (117,683 | ) | (403,547 | ) | 1,021,197 | |
Service Class:* | | | | | | | | | | | | | |
Shares Subscribed | | — | | 46,181 | | — | | 100 | | — | | 100 | |
Shares Issued on Distributions Reinvested | | 8 | | 320 | | — | | — | | — | | — | |
Shares Redeemed | | — | | (46,017 | ) | — | | — | | — | | — | |
Net Increase (Decrease) in Service Class Shares Outstanding | | 8 | | 484 | | — | | 100 | | — | | 100 | |
Investor Class:^ | | | | | | | | | | | | | |
Shares Subscribed | | 2,786,962 | | 3,252,445 | | — | | 100 | | — | | 100 | |
Shares Issued on Distributions Reinvested | | 2,379 | | 2,485 | | — | | — | | — | | 2 | |
Shares Redeemed | | (2,716,819 | ) | (3,085,694 | ) | — | | — | | — | | (1,118 | ) |
Net Increase (Decrease) in Investor Class Shares Outstanding | | 72,522 | | 169,236 | | — | | 100 | | — | | (1,016 | ) |
Administrative Class:* | | | | | | | | | | | | | |
Shares Subscribed | | 251,654 | | 645,610 | | — | | 100 | | — | | 100 | |
Shares Issued on Distributions Reinvested | | 283 | | 591 | | — | | — | | — | | — | |
Shares Redeemed | | (249,203 | ) | (635,324 | ) | — | | — | | — | | — | |
Net Increase (Decrease) in Administrative Class Shares Outstanding | | 2,734 | | 10,877 | | — | | 100 | | — | | 100 | |
Advisory Class: | | | | | | | | | | | | | |
Shares Subscribed | | 726,839 | | 607,041 | | 93,656 | | 22,873 | | 148,384 | | 227,121 | |
Shares Issued on Distributions Reinvested | | 1,268 | | 844 | | 203 | | 134 | | 393 | | 453 | |
Shares Redeemed | | (499,111 | ) | (500,122 | ) | (95,464 | ) | (7,639 | ) | (237,845 | ) | (184,751 | ) |
Net Increase (Decrease) in Advisory Class Shares Outstanding | | 228,996 | | 107,763 | | (1,605 | ) | 15,368 | | (89,068 | ) | 42,823 | |
Participant Class:* | | | | | | | | | | | | | |
Shares Subscribed | | @— | | 147 | | — | | 100 | | @— | | 130 | |
Shares Issued on Distributions Reinvested | | — | | @— | | — | | — | | @— | | @— | |
Shares Redeemed | | (47 | ) | — | | — | | — | | (2 | ) | (29 | ) |
Net Increase (Decrease) in Participant Class Shares Outstanding | | (47 | ) | 147 | | — | | 100 | | (2 | ) | 101 | |
Cash Management Class:** | | | | | | | | | | | | | |
Shares Subscribed | | — | | — | | — | | 100 | | — | | 100 | |
Shares Issued on Distributions Reinvested | | — | | — | | — | | — | | — | | — | |
Shares Redeemed | | — | | — | | — | | — | | — | | @— | |
Net Increase (Decrease) in Cash Management Class Shares Outstanding | | — | | — | | — | | 100 | | — | | 100 | |
* The Government, Treasury and Tax-Exempt Portfolios’ Service, Administrative and Participant classes commenced offering on November 1, 2004.
** The Treasury and Tax-Exempt Portfolios’ Cash Management classes commenced offering on August 15, 2005.
^ The Treasury Portfolio’s Investor class commenced offering on November 1, 2004.
@ Amount is less than $500 or 500 shares.
The accompanying notes are an integral part of the financial statements.
39
Financial Highlights
| | Net Asset | | | | | | Net Asset | |
| | Value, | | Net | | Distributions | | Value, | |
| | Beginning | | Investment | | From Net | | End of | |
| | of Period | | Income | | Investment Income | | Period | |
Money Market Portfolio: | | | | | | | | | |
Institutional Class | | | | | | | | | |
Six Months Ended 4/30/06 (unaudited) | | $ | 1.000 | | $ | 0.022 | | $ | (0.022 | ) | $ | 1.000 | |
Year Ended 10/31/05 | | 1.000 | | 0.028 | | (0.028 | ) | 1.000 | |
2/2/04** through 10/31/04 | | 1.000 | | 0.009 | | (0.009 | ) | 1.000 | |
Service Class | | | | | | | | | |
Six Months Ended 4/30/06 (unaudited) | | $ | 1.000 | | $ | 0.021 | | $ | (0.021 | ) | $ | 1.000 | |
Year Ended 10/31/05 | | 1.000 | | 0.028 | | (0.028 | ) | 1.000 | |
Investor Class | | | | | | | | | |
Six Months Ended 4/30/06 (unaudited) | | $ | 1.000 | | $ | 0.021 | | $ | (0.021 | ) | $ | 1.000 | |
Year Ended 10/31/051 | | 1.000 | | 0.027 | | (0.027 | ) | 1.000 | |
Administrative Class | | | | | | | | | |
Six Months Ended 4/30/06 (unaudited) | | $ | 1.000 | | $ | 0.021 | | $ | (0.021 | ) | $ | 1.000 | |
Year Ended 10/31/05 | | 1.000 | | 0.027 | | (0.027 | ) | 1.000 | |
Advisory Class | | | | | | | | | |
Six Months Ended 4/30/06 (unaudited) | | $ | 1.000 | | $ | 0.020 | | $ | (0.020 | ) | $ | 1.000 | |
Year Ended 10/31/05 | | 1.000 | | 0.026 | | (0.026 | ) | 1.000 | |
2/6/04** through 10/31/04 | | 1.000 | | 0.008 | | (0.008 | ) | 1.000 | |
Participant Class | | | | | | | | | |
Six Months Ended 4/30/06 (unaudited) | | $ | 1.000 | | $ | 0.020 | | $ | (0.020 | ) | $ | 1.000 | |
Year Ended 10/31/05 | | 1.000 | | 0.024 | | (0.024 | ) | 1.000 | |
Cash Management Class | | | | | | | | | |
Six Months Ended 4/30/06 (unaudited) | | $ | 1.000 | | $ | 0.021 | | $ | (0.021 | ) | $ | 1.000 | |
8/15/05** through 10/31/05 | | 1.000 | | 0.008 | | (0.008 | ) | 1.000 | |
Prime Portfolio: | | | | | | | | | |
Institutional Class | | | | | | | | | |
Six Months Ended 4/30/06 (unaudited) | | $ | 1.000 | | $ | 0.022 | | $ | (0.022 | ) | $ | 1.000 | |
Year Ended 10/31/05 | | 1.000 | | 0.028 | | (0.028 | ) | 1.000 | |
2/2/04** through 10/31/04 | | 1.000 | | 0.009 | | (0.009 | ) | 1.000 | |
Service Class | | | | | | | | | |
Six Months Ended 4/30/06 (unaudited) | | $ | 1.000 | | $ | 0.021 | | $ | (0.021 | ) | $ | 1.000 | |
Year Ended 10/31/05 | | 1.000 | | 0.028 | | (0.028 | ) | 1.000 | |
Investor Class | | | | | | | | | |
Six Months Ended 4/30/06 (unaudited) | | $ | 1.000 | | $ | 0.021 | | $ | (0.021 | ) | $ | 1.000 | |
Year Ended 10/31/05 | | 1.000 | | 0.027 | | (0.027 | ) | 1.000 | |
Administrative Class | | | | | | | | | |
Six Months Ended 4/30/06 (unaudited) | | $ | 1.000 | | $ | 0.021 | | $ | (0.021 | ) | $ | 1.000 | |
Year Ended 10/31/05 | | 1.000 | | 0.027 | | (0.027 | ) | 1.000 | |
Advisory Class | | | | | | | | | |
Six Months Ended 4/30/06 (unaudited) | | $ | 1.000 | | $ | 0.020 | | $ | (0.020 | ) | $ | 1.000 | |
Year Ended 10/31/05 | | 1.000 | | 0.026 | | (0.026 | ) | 1.000 | |
4/29/04** through 10/31/04 | | 1.000 | | 0.006 | | (0.006 | ) | 1.000 | |
Participant Class | | | | | | | | | |
Six Months Ended 4/30/06 (unaudited) | | $ | 1.000 | | $ | 0.019 | | $ | (0.019 | ) | $ | 1.000 | |
Year Ended 10/31/05 | | 1.000 | | 0.024 | | (0.024 | ) | 1.000 | |
The accompanying notes are an integral part of the financial statements.
40
Financial Highlights (cont’d)
| | | | | | | | | | Ratio of Net | |
| | Net | | | | Ratio of | | Ratio of Net | | Investment Income | |
| | Assets | | Ratio of | | Expenses to Average | | Investment | | to Average | |
| | End of | | Expenses to | | Net Assets | | Income to | | Net Assets | |
Total | | Period | | Average Net | | (Before Waivers/ | | Average Net | | (Before Waivers/ | |
Return | | (000) | | Assets | | Reimbursement) | | Assets | | Reimbursement) | |
2.19 | %‡ | $ | 3,861,806 | | 0.09 | %* | 0.22 | %* | 4.42 | %* | 4.29 | %* |
2.87 | % | 3,082,234 | | 0.10 | % | 0.22 | % | 2.85 | % | 2.73 | % |
0.95 | %‡ | 3,077,029 | | 0.07 | %*† | 0.24 | %*† | 1.41 | %* | 1.24 | %* |
2.16 | %‡ | $ | 100 | | 0.14 | %* | 0.27 | %* | 4.32 | %* | 4.19 | %* |
2.82 | % | 100 | | 0.15 | % | 0.27 | % | 2.78 | % | 2.66 | % |
2.14 | %‡ | $ | 164 | | 0.19 | %* | 0.32 | %* | 4.32 | %* | 4.19 | %* |
2.76 | % | 100 | | 0.20 | % | 0.32 | % | 2.73 | % | 2.61 | % |
2.11 | %‡ | $ | 100 | | 0.24 | %* | 0.37 | %* | 4.22 | %* | 4.09 | %* |
2.71 | % | 100 | | 0.25 | % | 0.37 | % | 2.68 | % | 2.56 | % |
2.06 | %‡ | $ | 101 | | 0.35 | %*† | 0.47 | %*† | 4.02 | %* | 3.90 | %* |
2.61 | % | 80 | | 0.35 | % | 0.47 | % | 2.52 | % | 2.40 | % |
0.76 | %‡ | 1,504 | | 0.31 | %*† | 0.50 | %*† | 1.12 | %* | 0.93 | %* |
1.97 | %‡ | $ | 100 | | 0.52 | %*† | 0.66 | %*† | 3.94 | %* | 3.80 | %* |
2.46 | % | 100 | | 0.50 | % | 0.62 | % | 2.43 | % | 2.31 | % |
2.16 | %‡ | $ | 100 | | 0.15 | %*† | 0.28 | %*† | 4.31 | %* | 4.18 | %* |
0.77 | %‡ | 100 | | 0.15 | %* | 0.27 | %* | 3.58 | %* | 3.46 | %* |
2.18 | %‡ | $ | 16,683,735 | | 0.12 | %* | 0.21 | %* | 4.37 | %* | 4.28 | %* |
2.87 | % | 13,965,500 | | 0.11 | % | 0.22 | % | 2.85 | % | 2.74 | % |
0.94 | %‡ | 8,732,862 | | 0.08 | %* | 0.24 | %* | 1.41 | %* | 1.25 | %* |
2.16 | %‡ | $ | 57,316 | | 0.17 | %* | 0.26 | %* | 4.39 | %* | 4.29 | %* |
2.82 | % | 10,457 | | 0.16 | % | 0.27 | % | 3.54 | % | 3.43 | % |
2.13 | %‡ | $ | 5,901 | | 0.22 | %* | 0.32 | %* | 4.17 | %* | 4.07 | %* |
2.77 | % | 20,000 | | 0.21 | % | 0.32 | % | 2.67 | % | 2.56 | % |
2.11 | %‡ | $ | 100 | | 0.27 | %* | 0.36 | %* | 4.20 | %* | 4.11 | %* |
2.72 | % | 100 | | 0.26 | % | 0.37 | % | 2.68 | % | 2.57 | % |
2.06 | %‡ | $ | 55,071 | | 0.37 | %* | 0.47 | %* | 4.07 | %* | 3.97 | %* |
2.62 | % | 69,201 | | 0.36 | % | 0.47 | % | 2.73 | % | 2.62 | % |
0.57 | %‡ | 16,350 | | 0.33 | %* | 0.49 | %* | 1.14 | %* | 0.98 | %* |
1.96 | %‡ | $ | 100 | | 0.55 | %*† | 0.65 | *† | 3.92 | %* | 3.82 | %* |
2.47 | % | 100 | | 0.51 | % | 0.62 | % | 2.43 | % | 2.32 | % |
The accompanying notes are an integral part of the financial statements.
41

Financial Highlights (cont’d)
| | Net Asset
Value,
Beginning
of Period | | Net
Investment
Income | | Distributions
From Net
Investment
Income | | Net Asset
Value,
End of
Period | |
Government Portfolio: | | | | | | | | | |
Institutional Class | | | | | | | | | |
Six Months Ended 4/30/06 (unaudited) | | $ | 1.000 | | $ | 0.022 | | $ | (0.022 | ) | $ | 1.000 | |
Year Ended 10/31/05 | | 1.000 | | 0.029 | | (0.029 | ) | 1.000 | |
8/9/04** through 10/31/04 | | 1.000 | | 0.004 | | (0.004 | ) | 1.000 | |
Service Class | | | | | | | | | |
Six Months Ended 4/30/06 (unaudited) | | $ | 1.000 | | $ | 0.021 | | $ | (0.021 | ) | $ | 1.000 | |
Year Ended 10/31/05 | | 1.000 | | 0.028 | | (0.028 | ) | 1.000 | |
Investor Class | | | | | | | | | |
Six Months Ended 4/30/06 (unaudited) | | $ | 1.000 | | $ | 0.021 | | $ | (0.021 | ) | $ | 1.000 | |
Year Ended 10/31/05 | | 1.000 | | 0.028 | | (0.028 | ) | 1.000 | |
8/9/04** through 10/31/04 | | 1.000 | | 0.004 | | (0.004 | ) | 1.000 | |
Administrative Class | | | | | | | | | |
Six Months Ended 4/30/06 (unaudited) | | $ | 1.000 | | $ | 0.021 | | $ | (0.021 | ) | $ | 1.000 | |
Year Ended 10/31/05 | | 1.000 | | 0.027 | | (0.027 | ) | 1.000 | |
Advisory Class | | | | | | | | | |
Six Months Ended 4/30/06 (unaudited) | | $ | 1.000 | | $ | 0.020 | | $ | (0.020 | ) | $ | 1.000 | |
Year Ended 10/31/05 | | 1.000 | | 0.026 | | (0.026 | ) | 1.000 | |
10/1/04** through 10/31/04 | | 1.000 | | 0.001 | | (0.001 | ) | 1.000 | |
Participant Class | | | | | | | | | |
Six Months Ended 4/30/06 (unaudited) | | $ | 1.000 | | $ | 0.019 | | $ | (0.019 | ) | $ | 1.000 | |
Year Ended 10/31/05 | | 1.000 | | 0.025 | | (0.025 | ) | 1.000 | |
Treasury Portfolio: | | | | | | | | | |
Institutional Class | | | | | | | | | |
Six Months Ended 4/30/06 (unaudited) | | $ | 1.000 | | $ | 0.021 | | $ | (0.021 | ) | $ | 1.000 | |
Year Ended 10/31/05 | | 1.000 | | 0.028 | | (0.028 | ) | 1.000 | |
8/9/04** through 10/31/04 | | 1.000 | | 0.004 | | (0.004 | ) | 1.000 | |
Service Class | | | | | | | | | |
Six Months Ended 4/30/06 (unaudited) | | $ | 1.000 | | $ | 0.021 | | $ | (0.021 | ) | $ | 1.000 | |
Year Ended 10/31/05 | | 1.000 | | 0.027 | | (0.027 | ) | 1.000 | |
Investor Class | | | | | | | | | |
Six Months Ended 4/30/06 (unaudited) | | $ | 1.000 | | $ | 0.021 | | $ | (0.021 | ) | $ | 1.000 | |
Year Ended 10/31/05 | | 1.000 | | 0.027 | | (0.027 | ) | 1.000 | |
Administrative Class | | | | | | | | | |
Six Months Ended 4/30/06 (unaudited) | | $ | 1.000 | | $ | 0.021 | | $ | (0.021 | ) | $ | 1.000 | |
Year Ended 10/31/05 | | 1.000 | | 0.026 | | (0.026 | ) | 1.000 | |
Advisory Class | | | | | | | | | |
Six Months Ended 4/30/06 (unaudited) | | $ | 1.000 | | $ | 0.020 | | $ | (0.020 | ) | $ | 1.000 | |
Year Ended 10/31/05 | | 1.000 | | 0.025 | | (0.025 | ) | 1.000 | |
8/9/04** through 10/31/04 | | 1.000 | | 0.003 | | (0.003 | ) | 1.000 | |
Participant Class | | | | | | | | | |
Six Months Ended 4/30/06 (unaudited) | | $ | 1.000 | | $ | 0.019 | | $ | (0.019 | ) | $ | 1.000 | |
Year Ended 10/31/05 | | 1.000 | | 0.024 | | (0.024 | ) | 1.000 | |
Cash Management Class | | | | | | | | | |
Six Months Ended 4/30/06 (unaudited) | | $ | 1.000 | | $ | 0.021 | | $ | (0.021 | ) | $ | 1.000 | |
8/15/05** through 10/31/05 | | 1.000 | | 0.008 | | (0.008 | ) | 1.000 | |
The accompanying notes are an integral part of the financial statements.
42
Financial Highlights (cont’d)
Total Return | | Net
Assets,
End of
Period
(000) | | Ratio of
Expenses to
Average
Net Assets | | Ratio of
Expenses to
Average
Net Assets
(Before Waivers/
Reimbursement) | | Ratio of Net
Investment
Income to
Average
Net Assets | | Ratio of
Net Investment
Income to
Average
Net Assets
(Before Waivers/
Reimbursement) | |
| | | | | | | | | | | |
| | | | | | | | | | | |
2.19%‡ | | $ | 3,041,933 | | 0.08 | %* | 0.22 | %* | 4.39 | %* | 4.25 | %* |
2.91% | | 2,196,511 | | 0.05 | % | 0.25 | % | 3.07 | % | 2.87 | % |
0.38%‡ | | 414,567 | | 0.05 | %*† | 0.37 | %*† | 1.73 | %* | 1.41 | %* |
| | | | | | | | | | | |
2.16%‡ | | $ | 492 | | 0.13 | %* | 0.27 | %* | 4.31 | %* | 4.17 | %* |
2.86% | | 484 | | 0.10 | % | 0.30 | % | 2.65 | % | 2.45 | % |
| | | | | | | | | | | |
2.14%‡ | | $ | 351,534 | | 0.18 | %* | 0.31 | %* | 4.28 | %* | 4.14 | %* |
2.81% | | 279,012 | | 0.15 | % | 0.35 | % | 2.91 | % | 2.71 | % |
0.35%‡ | | 109,776 | | 0.15 | %*† | 0.53 | %*† | 1.53 | %* | 1.15 | %* |
| | | | | | | | | | | |
2.11%‡ | | $ | 13,611 | | 0.23 | %* | 0.37 | %* | 4.17 | %* | 4.02 | %* |
2.76% | | 10,877 | | 0.20 | % | 0.40 | % | 2.60 | % | 2.39 | % |
| | | | | | | | | | | |
2.06%‡ | | $ | 360,509 | | 0.33 | %* | 0.48 | %* | 4.19 | %* | 4.04 | %* |
2.65% | | 131,513 | | 0.30 | % | 0.50 | % | 3.12 | % | 2.92 | % |
0.13%‡ | | 23,750 | | 0.30 | %*† | 0.55 | %*† | 1.53 | %* | 1.28 | %* |
| | | | | | | | | | | |
1.97%‡ | | $ | 100 | | 0.50 | %*† | 0.65 | %*† | 3.90 | %* | 3.75 | %* |
2.50% | | 147 | | 0.45 | % | 0.65 | % | 2.53 | % | 2.33 | % |
| | | | | | | | | | | |
| | | | | | | | | | | |
2.16%‡ | | $ | 3,025 | | 0.05 | %* | 0.52 | %* | 4.17 | %* | 3.70 | %* |
2.79% | | 70,087 | | 0.05 | % | 0.49 | %† | 2.61 | % | 2.17 | % |
0.36%‡ | | 187,770 | | 0.05 | %*† | 0.35 | %*† | 1.57 | %* | 1.27 | %* |
| | | | | | | | | | | |
2.13%‡ | | $ | 100 | | 0.10 | %* | 0.96 | %* | 4.26 | %* | 3.40 | %* |
2.74% | | 100 | | 0.10 | % | 0.53 | %† | 2.70 | % | 2.27 | % |
| | | | | | | | | | | |
2.11%‡ | | $ | 100 | | 0.15 | %* | 1.00 | %* | 4.21 | %* | 3.35 | %* |
2.69% | | 100 | | 0.15 | % | 0.58 | %† | 2.65 | % | 2.22 | % |
| | | | | | | | | | | |
2.08%‡ | | $ | 100 | | 0.20 | %* | 1.06 | %* | 4.16 | %* | 3.30 | %* |
2.64% | | 100 | | 0.20 | % | 0.63 | %† | 2.60 | % | 2.17 | % |
| | | | | | | | | | | |
2.03%‡ | | $ | 15,970 | | 0.30 | %* | 1.04 | %* | 4.07 | %* | 3.33 | %* |
2.53% | | 17,575 | | 0.30 | % | 0.64 | % | 2.92 | % | 2.58 | % |
0.30%‡ | | 2,207 | | 0.30 | %*† | 0.67 | %*† | 1.30 | %* | 0.93 | %* |
| | | | | | | | | | | |
1.94%‡ | | $ | 100 | | 0.48 | %*† | 1.34 | %*† | 3.87 | %* | 3.01 | %* |
2.38% | | 100 | | 0.45 | % | 0.88 | %† | 2.35 | % | 1.92 | % |
| | | | | | | | | | | |
2.13%‡ | | $ | 100 | | 0.11 | %*† | 0.97 | %*† | 4.25 | %* | 3.39 | %* |
0.76%‡ | | 100 | | 0.10 | %* | 0.43 | %*† | 3.52 | %* | 3.19 | %* |
The accompanying notes are an integral part of the financial statements.
43
Financial Highlights (cont’d)
| | Net Asset
Value,
Beginning
of Period | | Net
Investment
Income | | Distributions
From Net
Investment
Income | | Net Asset
Value,
End of
Period | |
Tax-Exempt Portfolio: | | | | | | | | | |
Institutional Class | | | | | | | | | |
Six Months Ended 4/30/06 (unaudited) | | $ | 1.000 | | $ | 0.015 | | $ | (0.015 | ) | $ | 1.000 | |
Year Ended 10/31/05 | | 1.000 | | 0.022 | | (0.022 | ) | 1.000 | |
2/2/04** through 10/31/04 | | 1.000 | | 0.008 | | (0.008 | ) | 1.000 | |
Service Class | | | | | | | | | |
Six Months Ended 4/30/06 (unaudited) | | $ | 1.000 | | $ | 0.015 | | $ | (0.015 | ) | $ | 1.000 | |
Year Ended 10/31/05 | | 1.000 | | 0.021 | | (0.021 | ) | 1.000 | |
Investor Class | | | | | | | | | |
Six Months Ended 4/30/06 (unaudited) | | $ | 1.000 | | $ | 0.014 | | $ | (0.014 | ) | $ | 1.000 | |
Year Ended 10/31/05 | | 1.000 | | 0.020 | | (0.020 | ) | 1.000 | |
6/8/04** through 10/31/04 | | 1.000 | | 0.005 | | (0.005 | ) | 1.000 | |
Administrative Class | | | | | | | | | |
Six Months Ended 4/30/06 (unaudited) | | $ | 1.000 | | $ | 0.014 | | $ | (0.014 | ) | $ | 1.000 | |
Year Ended 10/31/05 | | 1.000 | | 0.020 | | (0.020 | ) | 1.000 | |
Advisory Class | | | | | | | | | |
Six Months Ended 4/30/06 (unaudited) | | $ | 1.000 | | $ | 0.014 | | $ | (0.014 | ) | $ | 1.000 | |
Year Ended 10/31/05 | | 1.000 | | 0.019 | | (0.019 | ) | 1.000 | |
6/15/04** through 10/31/042 | | 1.000 | | 0.002 | | (0.002 | ) | 1.000 | |
Participant Class | | | | | | | | | |
Six Months Ended 4/30/06 (unaudited) | | $ | 1.000 | | $ | 0.013 | | $ | (0.013 | ) | $ | 1.000 | |
Year Ended 10/31/05 | | 1.000 | | 0.018 | | (0.018 | ) | 1.000 | |
Cash Management Class | | | | | | | | | |
Six Months Ended 4/30/06 (unaudited) | | $ | 1.000 | | $ | 0.015 | | $ | (0.015 | ) | $ | 1.000 | |
8/15/05** through 10/31/05 | | 1.000 | | 0.005 | | (0.005 | ) | 1.000 | |
* Annualized
** Commencement of Operations
‡ Not Annualized
1 The Money Market Portfolio’s Investor Share Class commenced offering on June 16, 2004. There were no Investor shares outstanding during the period July 28, 2004 to October 31, 2004.
2 The Tax- Exempt Portfolio’s Advisory Share Class had no shares outstanding during the periods June 30, 2004 to July 22, 2004, July 30, 2004 to August 9, 2004, August 30, 2004 to August 31, 2004 and September 2, 2004 to September 21, 2004.
† Ratios of Expenses to Average Net Assets before and after Expense Limitations may vary among share classes by more or less than the service and shareholder administration plan fees due to different periods of operation for each share class as well as fluctuations in daily net asset amounts.
The accompanying notes are an integral part of the financial statements.
44
Financial Highlights (cont’d)
Total Return | | Net
Assets,
End of
Period
(000) | | Ratio of
Expenses to
Average
Net Assets | | Ratio of
Expenses to
Average
Net Assets
(Before Waivers/
Reimbursement) | | Ratio of Net
Investment
Income to
Average
Net Assets | | Ratio of
Net Investment
Income to
Average
Net Assets
(Before Waivers/
Reimbursement) | |
| | | | | | | | | | | |
| | | | | | | | | | | |
1.50%‡ | | $ | 726,944 | | 0.10 | %* | 0.23 | %* | 2.97 | %* | 2.84 | %* |
2.17% | | 1,130,489 | | 0.09 | % | 0.32 | %† | 2.35 | % | 2.12 | % |
0.84%‡ | | 109,292 | | 0.06 | %*† | 0.35 | %*† | 1.19 | %* | 0.90 | %* |
| | | | | | | | | | | |
1.47%‡ | | $ | 100 | | 0.15 | %* | 0.28 | %* | 2.95 | %* | 2.82 | %* |
2.12% | | 100 | | 0.14 | % | 0.40 | %† | 2.10 | % | 1.84 | % |
| | | | | | | | | | | |
1.45%‡ | | $ | 104 | | 0.20 | %* | 0.33 | %* | 2.89 | %* | 2.76 | %* |
2.07% | | 104 | | 0.19 | % | 0.45 | %† | 2.01 | % | 1.75 | % |
0.45%‡ | | 1,121 | | 0.17 | %*† | 0.38 | %*† | 1.06 | %* | 0.85 | %* |
| | | | | | | | | | | |
1.42%‡ | | $ | 100 | | 0.25 | %* | 0.38 | %* | 2.85 | %* | 2.72 | %* |
2.02% | | 100 | | 0.24 | % | 0.50 | %† | 2.00 | % | 1.74 | % |
| | | | | | | | | | | |
1.37%‡ | | $ | 9,755 | | 0.35 | %* | 0.48 | %* | 2.65 | %* | 2.52 | %* |
1.92% | | 98,823 | | 0.34 | % | 0.62 | %��� | 1.86 | % | 1.58 | % |
0.24%‡ | | 56,000 | | 0.33 | %*† | 0.55 | %*† | 1.32 | %* | 1.10 | %* |
| | | | | | | | | | | |
1.28%‡ | | $ | 100 | | 0.54 | %*† | 0.67 | %*† | 2.55 | %* | 2.42 | %* |
1.77% | | 102 | | 0.49 | % | 0.75 | %† | 1.76 | % | 1.49 | % |
| | | | | | | | | | | |
1.47%‡ | | $ | 100 | | 0.16 | %*† | 0.29 | %*† | 2.93 | %* | 2.80 | %* |
0.53%‡ | | 100 | | 0.14 | %* | 0.30 | %*† | 2.47 | %* | 2.30 | %* |
The accompanying notes are an integral part of the financial statements.
45

Notes to Financial Statements
Morgan Stanley Institutional Liquidity Funds (the “Fund”) is registered under the Investment Company Act of 1940 (the “1940 Act”), as amended, as a Massachusetts business trust. The Fund is comprised of five separate, active, diversified portfolios (individually referred to as a “Portfolio”, collectively as the “Portfolios”). The Fund offers up to seven different classes of shares for certain Portfolios - - Institutional Class, Service Class, Investor Class, Administrative Class, Advisory Class, Participant Class and Cash Management Class. All classes of shares have identical voting rights (except that shareholders of a Class have exclusive voting rights regarding any matter relating solely to that Class of shares), dividend, liquidation and other rights.
For detailed descriptions of the investment objectives of each of the Portfolios and other related information, please refer to the Prospectuses of the Fund. Generally, the investment objective of the Portfolios is to seek preservation of capital, daily liquidity and maximum current income (exempt from federal income tax in the case of Tax-Exempt Portfolio).
A. Accounting Policies: The following significant accounting policies are in conformity with U.S. generally accepted accounting principles. Such policies are consistently followed by the Fund in the preparation of the financial statements. U.S. generally accepted accounting principles may require management to make estimates and assumptions that affect the reported amounts and disclosures in the financial statements. Actual results may differ from those estimates.
1. Security Valuation: Securities owned by the Portfolios are stated at amortized cost which approximates market value.
2. Repurchase Agreements: Certain Portfolios may enter into repurchase agreements under which a Portfolio lends excess cash and takes possession of securities with an agreement that the counterparty will repurchase such securities. In connection with transactions in repurchase agreements, a bank as custodian for the Fund takes possession of the underlying securities which are held as collateral, with a market value at least equal to the amount of the repurchase transaction, including principal and accrued interest. To the extent that any repurchase transaction exceeds one business day, the value of the collateral is marked-to-market on a daily basis to determine the adequacy of the collateral. In the event of default on the obligation to repurchase, the Fund has the right to liquidate the collateral and apply the proceeds in satisfaction of the obligation. In the event of default or bankruptcy by the counterparty to the agreement, realization and/or retention of the collateral or proceeds may be subject to legal proceedings. The Portfolios, along with other affiliated investment companies, may utilize a joint trading account for the purpose of entering into repurchase agreements.
3. Other: Security transactions are accounted for on the date the securities are purchased or sold. Realized gains and losses on the sale of investment securities are determined on a “first-in-first-out” basis. Interest income is recognized on the accrual basis except where collection is in doubt. Discounts and premiums on securities purchased are amortized over their respective lives. Most expenses of the Fund can be directly attributed to a particular Portfolio. Expenses which cannot be directly attributed are apportioned among the Portfolios based upon relative net assets. Income, expenses (other than class specific expenses) and realized and unrealized gains or losses are allocated to each class of shares based upon their relative net assets. Dividends to the shareholders of the Portfolios are accrued daily and are distributed on the last business day of each month.
B. Investment Advisory Fees:Morgan Stanley Investment Management Inc. (the “Adviser” or “MS Investment Management”), a wholly-owned subsidiary of Morgan Stanley, provides the Fund with investment advisory services under the terms of an Investment Advisory Agreement (the “Agreement”) at the annual rates of average daily net assets indicated below. The Adviser has voluntarily agreed to reduce its advisory fee and/or absorb other expenses so that total annual operating expenses of each share class will not exceed the amounts noted below. This fee and expense waiver may be discontinued at any time.
Portfolio | | AdvisoryFee | |
Money Market | | 0.15 | % |
Prime | | 0.15 | |
Government | | 0.15 | |
Treasury | | 0.15 | |
Tax-Exempt | | 0.15 | |
| | Maximum | |
| | Expense Ratio | |
| | Money | | | | | | | | Tax- | |
Class | | Market | | Prime | | Government | | Treasury | | Exempt | |
Institutional Class | | 0.20 | % | 0.20 | % | 0.20 | % | 0.20 | % | 0.20 | % |
Service Class | | 0.25 | | 0.25 | | 0.25 | | 0.25 | | 0.25 | |
Investor Class | | 0.30 | | 0.30 | | 0.30 | | 0.30 | | 0.30 | |
Administrative Class | | 0.35 | | 0.35 | | 0.35 | | 0.35 | | 0.35 | |
Advisory Class | | 0.45 | | 0.45 | | 0.45 | | 0.45 | | 0.45 | |
Participant Class | | 0.70 | | 0.70 | | 0.70 | | 0.70 | | 0.70 | |
Cash Management Class | | 0.50 | | — | | — | | 0.50 | | 0.50 | |
The Ratio of Expenses to Average Net Assets disclosed in the Portfolios’ Financial Highlights may be lower than the maximum ratios indicated in the table above due to additional voluntary expense limitations imposed by the Adviser. The Adviser may terminate these additional voluntary limitations at any time at its sole discretion.
The Adviser has entered into a Sub-Advisory Agreement with Morgan Stanley Investment Advisors Inc. (the “Sub-Adviser”), a wholly-owned subsidiary of Morgan Stanley. The Sub-Adviser, subject to the control and supervision of the Fund, its officers, Trustees and the Adviser, and in accordance with the investment objectives, policies and restrictions of the Portfolios, makes day-to-day investment decisions for the Portfolios and places the Portfolios’ purchase and sales orders. The Adviser pays the Sub-Adviser on a monthly basis a portion of the net advisory fees the Adviser receives from the Portfolios.
46
Notes to Financial Statements (cont’d)
C. Administration Fees: MS Investment Management (the “Administrator”) also serves as Administrator to the Fund pursuant to an Administration Agreement. Under the agreement, MS Investment Management receives an annual fee, accrued daily and payable monthly, of 0.05% of each Portfolio’s average daily net assets, plus reimbursement of out-of-pocket expenses. J.P. Morgan Investor Services Co. (“JPMIS”), a corporate affiliate of JPMorgan Chase Bank, N.A., provides fund accounting and other services pursuant to a sub-administration agreement with MS Investment Management and receives compensation for these services from MS Investment Management. JPMIS also serves as the Transfer Agent to the Fund pursuant to a Transfer Agency Agreement. An employee of JPMIS is an officer of the Fund.
D. Distribution and Service and Shareholder Administration Plan Fees: Morgan Stanley Distribution, Inc. (the “Distributor”), a wholly-owned subsidiary of MS Investment Management, and an indirect subsidiary of Morgan Stanley, serves as the distributor of the Fund. The Fund has entered into an Administration Plan with respect to its Service Class, Investor Class and Administrative Class shares pursuant to which each class of shares will pay the Distributor a monthly or quarterly fee at an annual rate of up to 0.05%, 0.10% and 0.15%, of the average daily net assets of each such class of shares, respectively to compensate certain financial intermediaries who provide administrative services to shareholders.
The Fund has also entered into a Service and Shareholder Administration Plan with respect to its Advisory Class shares pursuant to which its Advisory Class shares pays the Distributor a monthly or quarterly fee at an annual rate of up to 0.25% of the average daily net assets of such class of shares, to compensate certain financial intermediaries who provide administrative services, personnel and account maintenance services to shareholders.
The Fund has also entered into a Shareholder Service Plan and a Distribution Plan with respect to its Participant Class shares. Pursuant to the Shareholder Service Plan, the Participant Class shares will pay the Distributor a monthly or quarterly fee at an annual rate of up to 0.25% of the average daily net assets of such class of shares, to compensate certain financial intermediaries who provide administrative services, personnel and account maintenance services. Pursuant to the Distribution Plan, the Participant Class shares will pay the Distributor a monthly or quarterly fee at an annual rate of up to 0.15% of the average daily net assets of such class of shares, to compensate for any activities or expenses primarily intended to result in the sale of such class of shares.
The Fund has also entered into a Shareholder Service Plan with respect to its Cash Management Class shares to pay the Distributor to compensate Service Organizations who provide administrative services to shareholders. Pursuant to the Shareholder Service Plan, the Cash Management Class shares will pay the Distributor a monthly or quarterly service fee at an annual rate of 0.05% of the average daily net assets of such class of shares, to compensate Service Organizations for staffing and maintaining call centers and answering inquiries and addressing issues related to the Cash Management Class shares.
The Fund has also entered into a Distribution Plan with respect to its Cash Management Class shares pursuant to which its Cash Management Class shares pays the Distributor a monthly or quarterly fee at an annual rate of up to 0.25% of the average daily net assets of such class of shares (prior to April 25, 2006, the annual rate was 0.05%), to compensate certain financial intermediaries who provide any activities or expenses primarily intended to result in the sale of such class of shares.
Prior to April 29, 2005 Morgan Stanley & Co. Incorporated, a wholly-owned subsidiary of Morgan Stanley, and an affiliate of MS Investment Management, served as the distributor of the Fund.
E. Custodian Fees: JPMorgan Chase Bank, N.A. (the “Custodian”) serves as Custodian for the Fund in accordance with a custodian agreement. The Custodian holds cash, securities, and other assets of the Fund as required by the 1940 Act.
The Fund has entered into an arrangement with its Custodian whereby credits realized on uninvested cash balances were used to offset a portion of each applicable Portfolio’s expenses. These custodian credits are shown as “Expense Offset” on the Statements of Operations.
F. Federal Income Taxes: It is each Portfolio’s intention to qualify as a regulated investment company and distribute all of its taxable and tax-exempt income. Accordingly, no provision for Federal income taxes is required in the financial statements.
The tax character of distributions paid may differ from the character of distributions shown on the Statements of Changes in Net Assets due to short-term capital gains being treated as ordinary income for tax purposes. The tax character of distributions paid during fiscal 2005 and 2004 were as follows:
| | 2005 | | 2004 | |
| | Distributions | | Distributions | |
| | Paid From: | | Paid From: | |
| | Ordinary | | Long-term | | Ordinary | | Long-term | |
| | Income | | Capital Gain | | Income | | Capital Gain | |
Portfolio | | (000) | | (000) | | (000) | | (000) | |
Money Market | | $ | 95,455 | | $ | — | | $ | 19,002 | | $ | — | |
Prime | | 369,739 | | — | | 49,256 | | — | |
Government | | 44,911 | | — | | 1,004 | | — | |
Treasury | | 2,758 | | — | | 738 | | — | |
Tax-Exempt | | 8,075 | * | — | | 735 | * | — | |
| | | | | | | | | | | | | |
* Distributions are tax-exempt.
The amount and character of income and gains to be distributed are determined in accordance with income tax regulations which may differ from U.S. generally accepted accounting principles.
47
Notes to Financial Statements (cont’d)
At October 31, 2005, the components of distributable earnings on a tax basis were as follows:
Portfolio | | Undistributed
Ordinary Income
(000) | |
Money Market | | $ | 10,220 | |
Prime | | 43,146 | |
Government | | 8,388 | |
Treasury | | 228 | |
Tax-Exempt | | 2,020 | |
| | | | |
At April 30, 2006, cost for U.S. Federal income tax purposes for the investments of the Portfolios were as follows:
Portfolio | | Cost
(000) | |
Money Market | | $ | 3,885,618 | |
Prime | | 17,083,330 | |
Government | | 3,777,883 | |
Treasury | | 19,610 | |
Tax-Exempt | | 734,019 | |
| | | | |
At October 31, 2005, the Prime Portfolio had capital loss carry-forwards for U.S. Federal income tax purposes of approximately $10,000 available to offset future capital gains which will expire on October 31, 2012.
During the year ended October 31, 2005, the Money Market and Prime Portfolios utilized capital loss carryforwards for U.S. Federal income tax purposes of approximately $2,000 and $5,000, respectively.
G. Contractual Obligations: The Fund enters into contracts that contain a variety of indemnifications. The Fund’s maximum exposure under these arrangements is unknown. However, the Fund has not had prior claims or losses pursuant to these contracts and expects the risk of loss to be remote.
H. Other: A portion of the securities of the Tax-Exempt Portfolio are insured by certain companies specializing in the insurance of municipal debt obligations. At April 30, 2006, approximately 29.2% of the net assets of the Tax-Exempt Portfolio are covered by such insurance. The insurers and their obligations are as follows:
Insurer | | Percentage of
Net Assets | |
Ambac | | 10.6 | % |
Assured Guaranty | | 0.7 | |
FGIC | | 3.5 | |
FHA | | 0.2 | |
FSA | | 7.0 | |
MBIA | | 4.1 | |
Radian | | 3.1 | |
At April 30, 2006, certain Portfolios had otherwise unaffiliated record owners of 10% or greater. Investment activities of these shareholders could have a material impact on these Portfolios. These Portfolios and the aggregate percentage of such owners were as follows:
| | Percentage of Ownership | |
| | Money | | | | | | | | Tax- | |
Class | | Market | | Prime | | Government | | Treasury | | Exempt | |
Institutional Class | | — | % | 27.5 | % | 69.6 | % | 87.3 | % | 31.7 | % |
Service Class | | — | | 99.8 | | 70.4 | | — | | — | |
Investor Class | | 32.9 | | 98.3 | | 73.5 | | — | | — | |
Administrative Class | | — | | — | | 84.9 | | — | | — | |
Advisory Class | | — | | 87.5 | | 86.2 | | 97.6 | | 89.3 | |
Participant Class | | — | | — | | — | | — | | — | |
Cash Management Class | | — | | — | | — | | — | | — | |
48
Trustee and Officer Information
Trustees
Michael Bozic
Edwin J. Garn
Wayne E. Hedien
James F. Higgins
Dr. Manuel H. Johnson
Joseph J. Kearns
Michael Nugent
Fergus Reid
Investment Adviser and Administrator
Morgan Stanley Investment Management Inc.
1221 Avenue of the Americas
New York, NY 10020
Distributor
Morgan Stanley Distribution, Inc.
One Tower Bridge Road
100 Front Street, Suite 1100
West Conshohocken, PA 19428-2899
Custodian
JPMorgan Chase Bank, N.A.
270 Park Avenue
New York, NY 10017
Legal Counsel
Clifford Chance US LLP
31 West 52nd Street
New York, NY 10019
Independent Registered Public Accounting Firm
Ernst & Young LLP
200 Clarendon Street
Boston, MA 02116-5072
Officers
Charles A. Fiumefreddo
Chairman of the Board and Trustee
Ronald E. Robison
President and Principal Executive Officer
Barry Fink
Vice President
J. David Germany
Vice President
Dennis F. Shea
Vice President
Stefanie V. Chang Yu
Vice President
Amy R. Doberman
Vice President
Carsten Otto
Chief Compliance Officer
James W. Garrett
Treasurer and Chief Financial Officer
Michael J. Leary
Director of Treasury and Compliance
Mary E. Mullin
Secretary
Reporting to Shareholders
Each Morgan Stanley fund provides a complete schedule of portfolio holdings in its semi-annual and annual reports within 60 days of the end of the Fund’s second and fourth fiscal quarters. The semi-annual reports and the annual reports are filed electronically with the Securities and Exchange Commission (SEC) on Form N-CSRS and Form N-CSR, respectively. Morgan Stanley also delivers the semi-annual and annual reports to Fund shareholders and makes these reports available on its public website, www.morganstanley.com. Each Morgan Stanley fund also files a complete schedule of portfolio holdings with the SEC for the Fund’s first and third fiscal quarters on Form N-Q. Morgan Stanley does not deliver the reports for the first and third fiscal quarters to shareholders, nor are the reports posted to the Morgan Stanley public website. You may, however, obtain the Form N-Q filings (as well as the Form N-CSR and NCSRS filings) by accessing the SEC’s website, http:/www.sec.gov. You may also review and copy them at the SEC’s public reference room in Washington, DC. Information on the operation of the SEC’s Public Reference Room may be obtained by calling the SEC at 1(800) SEC-0330. You can also request copies of these materials, upon payment of a duplicating fee, by electronic request at the SEC’s email address (publicinfo@sec.gov) or by writing the public reference section of the SEC, Washington, DC 20549-0102.
Proxy Voting Policies and Procedures and Proxy Voting Record
A copy of (1) the Fund’s policies and procedures with respect to the voting of proxies relating to the Fund’s portfolio securities; and (2) how the Fund voted proxies relating to portfolio securities during the most recent twelve-month period ended June 30 is available without charge, upon request, by calling 1-888-378-1630 or by visiting the Mutual Fund Center on our website at www.morganstanley.com. This information is also available on the SEC’s website at http://www.sec.gov.
This report is authorized for distribution only when preceded or accompanied by the prospectus of the Morgan Stanley Institutional Liquidity Funds which describes in detail each Investment Portfolio’s investment policies, risks, fees and expenses. Please read the prospectus carefully before you invest or send money. For additional information, including information regarding the investments comprising the Portfolio, please visit our website at www.morganstanley.com/im or call 1-888-378-1630.
49
Printed in U.S.A.
This Report has been prepared for shareholders and may be distributed to
others only if preceded or accompanied by a current prospectus.
Morgan Stanley Investment Management Inc.
1221 Avenue of the Americas
New York, NY 10020
MSILF: (888) 378-1630
© 2006 Morgan Stanley

ISO6-00457P-Y04/06
Item 2. Code of Ethics.
Not applicable for semiannual reports.
Item 3. Audit Committee Financial Expert.
Not applicable for semiannual reports.
Item 4. Principal Accountant Fees and Services
Not applicable for semiannual reports.
Item 5. Audit Committee of Listed Registrants.
Not applicable for semiannual reports.
Item 6. Schedule of Investments
Refer to Item 1.
Item 7. Disclosure of Proxy Voting Policies and Procedures for Closed-End Management Investment Companies.
Applicable to annual reports filed by closed-end funds.
Item 8. Portfolio Managers of Closed-End Management Investment Companies
Applicable to annual reports filed by closed-end funds.
Item 9. Closed-End Fund Repurchases
Applicable to reports filed by closed-end funds.
Item 10. Submission of Matters to a Vote of Security Holders
Not applicable.
Item 11. Controls and Procedures
(a) The Fund’s principal executive officer and principal financial officer have concluded that the Fund’s disclosure controls and procedures are sufficient to ensure that information required to be disclosed by the Fund in this Form N-CSR was recorded, processed, summarized and reported within the time periods specified in the Securities and Exchange Commission’s rules and forms, based upon such officers’ evaluation of these controls and procedures as of a date within 90 days of the filing date of the report.
(b) There were no changes in the registrant’s internal control over financial reporting that occurred during the registrant’s most recent fiscal half-year (the registrant’s second fiscal half-year in the case of an annual report) that has materially affected, or is reasonably likely to materially affect, the registrant’s internal control over financial reporting.
Item 12. Exhibits
(a) Code of Ethics - Not applicable for semiannual reports.
(b) A separate certification for each principal executive officer and principal financial officer of the registrant are attached hereto as part of EX-99.CERT.
SIGNATURES
Pursuant to the requirements of the Securities Exchange Act of 1934 and the Investment Company Act of 1940, the registrant has duly caused this report to be signed on its behalf by the undersigned, thereunto duly authorized.
Morgan Stanley Institutional Liquidity Funds
/s/ Ronald E. Robison | | |
Ronald E. Robison | |
Principal Executive Officer | |
June 20, 2006 | |
Pursuant to the requirements of the Securities Exchange Act of 1934 and the Investment Company Act of 1940, this report has been signed by the following persons on behalf of the registrant and in the capacities and on the dates indicated.
/s/ Ronald E. Robison | | |
Ronald E. Robison | |
Principal Executive Officer | |
June 20, 2006 | |
| |
/s/ James Garrett | | |
James Garrett | |
Principal Financial Officer | |
June 20, 2006 | |
| | | |