UNITED STATES
SECURITIES AND EXCHANGE COMMISSION
Washington, D.C. 20549
FORM N-CSR
CERTIFIED SHAREHOLDER REPORT OF REGISTERED
MANAGEMENT INVESTMENT COMPANIES
Investment Company Act file number | 811-21339 |
|
MORGAN STANLEY INSTITUTIONAL LIQUIDITY FUNDS |
(Exact name of registrant as specified in charter) |
|
1221 AVENUE OF THE AMERICAS 5th FLOOR NEW YORK, NY | | 10020 |
(Address of principal executive offices) | | (Zip code) |
|
RONALD E. ROBISON
1221 AVENUE OF THE AMERICAS 5th FLOOR NEW YORK, NY 10020 |
(Name and address of agent for service) |
|
Registrant’s telephone number, including area code: | 1-888-378-1630 | |
|
Date of fiscal year end: | 10/31 | |
|
Date of reporting period: | 4/30/07 | |
| | | | | | | | |
Form N-CSR is to be used by management investment companies to file reports with the Commission not later than 10 days after the transmission to stockholders of any report that is required to be transmitted to stockholders under Rule 30e-1 under the Investment Company Act of 1940 (17 CFR 270.30e-1). The Commission may use the information provided on Form N-CSR in its regulatory, disclosure review, inspection, and policymaking roles.
A registrant is required to disclose the information specified by Form N-CSR, and the Commission will make this information public. A registrant is not required to respond to the collection of information contained in Form N-CSR unless the Form displays a currently valid Office of Management and Budget (“OMB”) control number. Please direct comments concerning the accuracy of the information collection burden estimate and any suggestions for reducing the burden to Secretary, Securities and Exchange Commission, 450 Fifth Street, NW, Washington, DC 20549-0609. The OMB has reviewed this collection of information under the clearance requirements of 44 U.S.C. § 3507.
ITEM 1. REPORTS TO STOCKHOLDERS.
The Fund’s annual report transmitted to shareholders pursuant to Rule 30e-1 under the Investment Company Act of 1940 is as follows:
Morgan Stanley | 2007 Semi-Annual Report |
|
April 30, 2007 |
Morgan Stanley Institutional Liquidity Funds
Money Market Portfolio
Prime Portfolio
Government Portfolio
Treasury Portfolio
Tax-Exempt Portfolio
| 2007 Semi-Annual Report |
| |
| April 30, 2007 |
Table of Contents
Shareholder’s Letter | | 3 |
| | |
Investment Advisory Agreement Approval | | 4 |
| | |
Performance Summary | | 6 |
| | |
Expense Examples | | 7 |
| | |
Portfolio of Investments | | |
| | |
Money Market Portfolio | | 10 |
| | |
Prime Portfolio | | 14 |
| | |
Government Portfolio | | 20 |
| | |
Treasury Portfolio | | 22 |
| | |
Tax-Exempt Portfolio | | 23 |
| | |
Statements of Assets and Liabilities | | 29 |
| | |
Statements of Operations | | 31 |
| | |
Statements of Changes in Net Assets | | 32 |
| | |
Financial Highlights | | 36 |
| | |
Notes to Financial Statements | | 42 |
| | |
Trustee and Officer Information | | 45 |
This report is authorized for distribution only when preceded or accompanied by prospectuses of the Morgan Stanley Institutional Liquidity Funds. To receive a prospectus and/or SAI, which contains more complete information such as investment objectives, charges, expenses, policies for voting proxies, risk considerations, and describes in detail each of the Portfolio’s investment policies to the prospective investor, please call 1 (888) 378-1630. Please read the prospectus carefully before you invest or send money. Additionally, you can access portfolio information including performance, yields, characteristics, and investment team commentary through Morgan Stanley Investment Management’s website: www.morganstanley.com/im.
1
(This page has been left blank intentionally.)
2
| 2007 Semi-Annual Report |
| |
| April 30, 2007 (unaudited) |
Shareholder’s Letter
Dear Shareholders:
Overview
We are pleased to present the Morgan Stanley Institutional Liquidity Funds (“MSILF”) Semi-Annual Report for the period ended April 30, 2007. MSILF currently offers five portfolios (Money Market, Prime, Government, Treasury and Tax-Exempt), which together are designed to provide flexible cash management options. MSILF’s portfolios provide investors with a means to help them meet specific cash investment needs, whether they need a rated fund, capital preservation, or tax-efficient returns.
Sincerely,

Ronald E. Robison
President & Principal Executive Officer
May 2007
3
2007 Semi-Annual Report | |
| |
April 30, 2007 (unaudited) | |
Investment Advisory Agreement Approval
MORGAN STANLEY INSTITUTIONAL LIQUIDITY FUNDS
Nature, Extent and Quality of Services: The Board reviewed and considered the nature and extent of the investment advisory services provided by the Investment Adviser under the Advisory Agreement, including portfolio management, investment research and fixed income securities trading. The Board reviewed similar information and factors regarding the Sub-Adviser, to the extent applicable. The Board also reviewed and considered the nature and extent of the non-advisory, administrative services provided by the Portfolios’ Administrator under the Administration Agreement, including accounting, clerical, bookkeeping, compliance, business management and planning, and the provision of supplies, office space and utilities at the Investment Adviser’s expense. (The Investment Adviser, Sub-Adviser and Administrator together are referred to as the “Adviser” and the Advisory, Sub-Advisory and Administration Agreements together are referred to as the “Management Agreement.”) The Board also compared the nature of the services provided by the Adviser with similar services provided by non-affiliated advisers as reported to the Board by Lipper Inc. (“Lipper”).
The Board reviewed and considered the qualifications of the portfolio managers, the senior administrative managers and other key personnel of the Adviser who provide the administrative and advisory services to the Portfolios. The Board determined that the Adviser’s portfolio managers and key personnel are well qualified by education and/or training and experience to perform the services in an efficient and professional manner. The Board concluded that the nature and extent of the advisory and administrative services provided were necessary and appropriate for the conduct of the business and investment activities of each Portfolio. The Board also concluded that the overall quality of the advisory and administrative services was satisfactory.
Performance Relative to Comparable Funds Managed by Other Advisers: On a regular basis, the Board reviews the performance of all funds in the Morgan Stanley Fund Complex, including the Portfolios, compared to their peers, paying specific attention to the underperforming funds. In addition, the Board specifically reviewed each Portfolio’s performance for the one-year period ended November 30, 2006 and for the period since the end of February 2004 with respect to the Money-Market, Prime and Tax-Exempt Portfolios and for the period since the end of August 2004 with respect to the Government and Treasury Portfolios, the month of each Portfolio’s inception, as shown in a report provided by Lipper (the “Lipper Report”), compared to the performance of comparable funds selected by Lipper (the “performance peer group”). The Board also discussed with the Adviser the performance goals and the actual results achieved in managing each Portfolio. The Board concluded that each Portfolio’s performance was competitive with that of its performance peer group.
Fees Relative to Other Proprietary Funds Managed by the Adviser with Comparable Investment Strategies: The Board noted that the Adviser did not manage any other proprietary funds with investment strategies comparable to the Portfolios.
Fees and Expenses Relative to Comparable Funds Managed by Other Advisers: The Board reviewed the advisory and administrative fee (together, the “management fee”) rate and total expense ratio of each Portfolio as compared to the average management fee rate and average total expense ratio for funds, selected by Lipper (the “expense peer group”), managed by other advisers with investment strategies comparable to those of the Portfolios, as shown in the Lipper Reports. The Board concluded that each Portfolio’s management fee rate and total expense ratio were competitive with those of its expense peer group.
Breakpoints and Economies of Scale: The Board reviewed the structure of each Portfolio’s management fee schedule under the Management Agreement and noted that it does not include any breakpoints. The Board also reviewed the level of each Portfolio’s management fee and concluded that the fee, compared to the Portfolio’s expense peer group, was sufficiently low, and there is a cap in the total expense ratio of each Portfolio, so that, in effect, economies of scale were built into the management fee structure.
Profitability of the Adviser and Affiliates: The Board considered information concerning the costs incurred and profits realized by the Adviser and affiliates during the last year from their relationship with each Portfolio and during the last two years from their relationship with the Morgan Stanley Fund Complex and reviewed with the Adviser the cost allocation methodology used to determine the profitability of the Adviser and affiliates. Based on its review of the information it received, the Board concluded that the profits earned by the Adviser and affiliates were not excessive in light of the advisory, administrative and other services provided to the Portfolios.
Fall-Out Benefits: The Board considered so-called “fall-out benefits” derived by the Adviser and affiliates from their relationship with each Portfolio and the Morgan Stanley Fund Complex, such as “float” benefits derived from handling of checks for purchases and sales of Portfolio shares, through a broker-dealer affiliate of the Adviser. The Board concluded that the float benefits were relatively small.
4
| 2007 Semi-Annual Report |
| |
| April 30, 2007 (unaudited) |
Investment Advisory Agreement Approval (cont’d)
Soft Dollar Benefits: The Board considered whether the Adviser realizes any benefits from commissions paid to brokers who execute securities transactions for the Portfolios (“soft dollars”). The Board noted that the Portfolios invest only in fixed income securities, which do not generate soft dollars.
Adviser Financially Sound and Financially Capable of Meeting the Portfolio’s Needs: The Board considered whether the Adviser is financially sound and has the resources necessary to perform its obligations under the Management Agreement. The Board concluded that the Adviser has the financial resources necessary to fulfill its obligations under the Management Agreement.
Historical Relationship Between the Portfolio and the Adviser: The Board also reviewed and considered the historical relationship between the Portfolios and the Adviser, including the organizational structure of the Adviser, the policies and procedures formulated and adopted by the Adviser for managing the Portfolios’ operations and the Board’s confidence in the competence and integrity of the senior managers and key personnel of the Adviser. The Board concluded that it is beneficial for the Portfolios to continue their relationship with the Adviser.
Other Factors and Current Trends: The Board considered the controls and procedures adopted and implemented by the Adviser and monitored by the Portfolios’ Chief Compliance Officer and concluded that the conduct of business by the Adviser indicates a good faith effort on its part to adhere to high ethical standards in the conduct of each Portfolio’s business.
General Conclusion: After considering and weighing all of the above factors, the Board concluded that it would be in the best interest of each Portfolio and its shareholders to approve renewal of the Management Agreement for another year.
5
2007 Semi-Annual Report | |
| |
April 30, 2007 (unaudited) | |
Performance Summary
The seven-day current and seven-day effective yields (effective yield assumes an annualization of the current yield with all dividends reinvested) as of April 30, 2007, were as follows:
| | Institutional | | Service | | Investor | | Administrative | | Advisory | | Participant | | Cash Management Class | |
| | Class | | Class | | Class | | Class | | Class | | Class | | |
| | 7-day | | 7-day | | 7-day | | 7-day | | 7-day | | 7-day | | 7-day | | 7-day | | 7-day | | 7-day | | 7-day | | 7-day | | 7-day | | 7-day | |
| | Current | | Effective | | Current | | Effective | | Current | | Effective | | Current | | Effective | | Current | | Effective | | Current | | Effective | | Current | | Effective | |
| | Yield | | Yield | | Yield | | Yield | | Yield | | Yield | | Yield | | Yield | | Yield | | Yield | | Yield | | Yield | | Yield | | Yield | |
Portfolio: | | | | | | | | | | | | | | | | | | | | | | | | | | | | | |
Money Market | | 5.27 | % | 5.41 | % | 5.22 | % | 5.36 | % | 5.17 | % | 5.30 | % | 5.12 | % | 5.25 | % | 5.02 | % | 5.15 | % | 4.77 | % | 4.88 | % | 4.97 | % | 5.09 | % |
Prime | | 5.26 | % | 5.40 | % | 5.21 | % | 5.35 | % | 5.16 | % | 5.30 | % | 5.11 | % | 5.24 | % | 5.01 | % | 5.14 | % | 4.76 | % | 4.87 | % | — | | — | |
Government | | 5.18 | % | 5.31 | % | 5.13 | % | 5.26 | % | 5.08 | % | 5.21 | % | 5.03 | % | 5.15 | % | 4.93 | % | 5.05 | % | 4.68 | % | 4.79 | % | — | | — | |
Treasury | | 5.17 | % | 5.30 | % | 5.12 | % | 5.25 | % | 5.07 | % | 5.20 | % | 5.02 | % | 5.15 | % | 4.92 | % | 5.04 | % | 4.67 | % | 4.78 | % | 4.87 | % | 4.99 | % |
Tax-Exempt | | 3.80 | % | 3.87 | % | 3.75 | % | 3.82 | % | 3.70 | % | 3.77 | % | 3.65 | % | 3.72 | % | 3.55 | % | 3.61 | % | 3.30 | % | 3.36 | % | 3.50 | % | 3.56 | % |
Performance data quoted represents past performance, which is no guarantee of future results, and current performance may be lower or higher than the figures shown. Performance information for the 7-day effective yield assumes that all dividends and distributions, if any, were reinvested. For the most recent month-end performance figures, please visit www.morganstanley.com/im. Investment return and principal value will fluctuate causing portfolio shares, when redeemed, to be worth more or less than their original cost. Total returns do not reflect the deduction of taxes that a shareholder would pay on portfolio distributions or the redemption of portfolio shares.
Investments in the Money Market, Prime, Government, Treasury and Tax-Exempt Portfolios (the “Portfolios”) are neither insured nor guaranteed by the Federal Deposit Insurance Corporation. Although the Portfolios seek to preserve the value of your investment at $1.00 per share, it is possible to lose money by investing in these Portfolios. Please read MSILF’s prospectuses carefully before you invest or send money.
Yield quotation more closely reflects the current earnings of the Portfolios than the total return. As with all money market
portfolios, yields will fluctuate as market conditions change and the seven-day yields are not necessarily indicative of future
performance.
6
| 2007 Semi-Annual Report |
| |
| April 30, 2007 (unaudited) |
Expense Examples
Expense Examples
As a shareholder of a Portfolio, you incur ongoing costs, including management fees, shareholder administration plan fees (in the case of the Service, Investor, and Administrative Classes), service and shareholder administration plan fees (in the case of the Advisory Class); distribution and shareholder service plan fees (in the case of the Participant and Cash Management Classes) and other Portfolio expenses. These examples are intended to help you understand your ongoing costs (in dollars) of investing in each Portfolio and to compare these costs with the ongoing costs of investing in other mutual funds.
The examples are based on an investment of $1,000 invested at the beginning of the six-month period ended April 30, 2007 and held for the entire six-month period.
Actual Expenses
The first line of the tables below provides information about actual account values and actual expenses. You may use the information in this line, together with the amount you invested, to estimate the expenses that you paid over the period. Simply divide your account value by $1,000 (for example, an $8,600 account value divided by $1,000 = 8.6), then multiply the result by the number in the first line under the heading entitled ‘‘Expenses Paid During Period’’ to estimate the expenses you paid on your account during this period.
Please note that “Expenses Paid During Period” are grossed up to reflect Portfolio expenses prior to the effect of Expense Offset (See Note E in the Notes to Financial Statements). Therefore, the annualized net expense ratios may differ from the ratio of expenses to average net assets shown in the Financial Highlights.
Hypothetical Example for Comparison Purposes
The second line of the tables below provides information about hypothetical account values and hypothetical expenses based on a Portfolio’s actual expense ratio and an assumed rate of return of 5% per year before expenses, which is not the Portfolio’s actual return. The hypothetical account values and expenses may not be used to estimate the actual ending account balance or expenses you paid for the period. You may use this information to compare the ongoing costs of investing in a Portfolio and other funds. To do so, compare this 5% hypothetical example with the 5% hypothetical examples that appear in the shareholder reports of the other funds.
| | Beginning Account Value
November 1, 2006 | | Ending Account Value
April 30, 2007 | | Expenses Paid During Period* November 1, 2006 — April 30, 2007 | |
Money Market Portfolio | | | | | | | |
Institutional Class | | | | | | | |
Actual | | $ | 1,000.00 | | $ | 1,026.48 | | $ | 0.60 | |
Hypothetical (5% average annual return before expenses) | | 1,000.00 | | 1,024.20 | | 0.60 | |
Service Class | | | | | | | |
Actual | | 1,000.00 | | 1,026.23 | | 0.85 | |
Hypothetical (5% average annual return before expenses) | | 1,000.00 | | 1,023.95 | | 0.85 | |
Investor Class | | | | | | | |
Actual | | 1,000.00 | | 1,025.98 | | 1.11 | |
Hypothetical (5% average annual return before expenses) | | 1,000.00 | | 1,023.70 | | 1.10 | |
Administrative Class | | | | | | | |
Actual | | 1,000.00 | | 1,025.72 | | 1.36 | |
Hypothetical (5% average annual return before expenses) | | 1,000.00 | | 1,023.46 | | 1.35 | |
Advisory Class | | | | | | | |
Actual | | 1,000.00 | | 1,025.21 | | 1.86 | |
Hypothetical (5% average annual return before expenses) | | 1,000.00 | | 1,022.96 | | 1.86 | |
Participant Class | | | | | | | |
Actual | | 1,000.00 | | 1,023.94 | | 3.06 | |
Hypothetical (5% average annual return before expenses) | | 1,000.00 | | 1,021.77 | | 3.06 | |
Cash Management Class | | | | | | | |
Actual | | 1,000.00 | | 1,025.00 | | 2.11 | |
Hypothetical (5% average annual return before expenses) | | 1,000.00 | | 1,022.71 | | 2.11 | |
| | | | | | | | | | |
* | Expenses are equal to Institutional Class’, Service Class’, Investor Class’, Administrative Class’, Advisory Class’, Participant Class’ and Cash Management Class’ annualized net expense ratios of 0.12%, 0.17%, 0.22%, 0.27%, 0.37%, 0.61% and 0.42%, respectively, multiplied by the average account value over the period, multiplied by 181/365 (to reflect the one-half year period). |
7
2007 Semi-Annual Report | |
| |
April 30, 2007 (unaudited) | |
Expense Examples (cont’d)
| | Beginning Account Value
November 1, 2006 | | Ending Account Value
April 30, 2007 | | Expenses Paid During Period*
November 1, 2006 — April 30, 2007 | |
Prime Portfolio | | | | | | | |
Institutional Class | | | | | | | |
Actual | | $ | 1,000.00 | | $ | 1,026.42 | | $ | 0.60 | |
Hypothetical (5% average annual return before expenses) | | 1,000.00 | | 1,024.20 | | 0.60 | |
Service Class | | | | | | | |
Actual | | 1,000.00 | | 1,026.16 | | 0.85 | |
Hypothetical (5% average annual return before expenses) | | 1,000.00 | | 1,023.95 | | 0.85 | |
Investor Class | | | | | | | |
Actual | | 1,000.00 | | 1,025.91 | | 1.11 | |
Hypothetical (5% average annual return before expenses) | | 1,000.00 | | 1,023.70 | | 1.10 | |
Administrative Class | | | | | | | |
Actual | | 1,000.00 | | 1,025.66 | | 1.36 | |
Hypothetical (5% average annual return before expenses) | | 1,000.00 | | 1,023.46 | | 1.35 | |
Advisory Class | | | | | | | |
Actual | | 1,000.00 | | 1,025.15 | | 1.86 | |
Hypothetical (5% average annual return before expenses) | | 1,000.00 | | 1,022.96 | | 1.86 | |
Participant Class | | | | | | | |
Actual | | 1,000.00 | | 1,023.88 | | 3.11 | |
Hypothetical (5% average annual return before expenses) | | 1,000.00 | | 1,021.72 | | 3.11 | |
| | | | | | | | | | |
* | Expenses are equal to Institutional Class’, Service Class’, Investor Class’, Administrative Class’, Advisory Class’ and Participant Class’ annualized net expense ratios of 0.12%, 0.17%, 0.22%, 0.27%, 0.37% and 0.62%, respectively, multiplied by the average account value over the period, multiplied by 181/365 (to reflect the one-half year period). |
Government Portfolio | | | | | | | |
Institutional Class | | | | | | | |
Actual | | $ | 1,000.00 | | $ | 1,026.20 | | $ | 0.60 | |
Hypothetical (5% average annual return before expenses) | | 1,000.00 | | 1,024.20 | | 0.60 | |
Service Class | | | | | | | |
Actual | | 1,000.00 | | 1,026.00 | | 0.85 | |
Hypothetical (5% average annual return before expenses) | | 1,000.00 | | 1,023.95 | | 0.85 | |
Investor Class | | | | | | | |
Actual | | 1,000.00 | | 1,025.70 | | 1.05 | |
Hypothetical (5% average annual return before expenses) | | 1,000.00 | | 1,023.75 | | 1.05 | |
Administrative Class | | | | | | | |
Actual | | 1,000.00 | | 1,025.40 | | 1.36 | |
Hypothetical (5% average annual return before expenses) | | 1,000.00 | | 1,023.46 | | 1.35 | |
Advisory Class | | | | | | | |
Actual | | 1,000.00 | | 1,024.90 | | 1.86 | |
Hypothetical (5% average annual return before expenses) | | 1,000.00 | | 1,022.96 | | 1.86 | |
Participant Class | | | | | | | |
Actual | | 1,000.00 | | 1,023.70 | | 3.11 | |
Hypothetical (5% average annual return before expenses) | | 1,000.00 | | 1,021.72 | | 3.11 | |
| | | | | | | | | | |
* | Expenses are equal to Institutional Class’, Service Class’, Investor Class’, Administrative Class’, Advisory Class’ and Participant Class’ annualized net expense ratios of 0.12%, 0.17%, 0.21%, 0.27%, 0.37% and 0.62%, respectively, multiplied by the average account value over the period, multiplied by 181/365 (to reflect the one-half year period). |
Treasury Portfolio | | | | | | | |
Institutional Class | | | | | | | |
Actual | | $ | 1,000.00 | | $ | 1,026.30 | | $ | 0.30 | |
Hypothetical (5% average annual return before expenses) | | 1,000.00 | | 1,024.50 | | 0.30 | |
Service Class | | | | | | | |
Actual | | 1,000.00 | | 1,026.10 | | 0.55 | |
Hypothetical (5% average annual return before expenses) | | 1,000.00 | | 1,024.25 | | 0.55 | |
Investor Class | | | | | | | |
Actual | | 1,000.00 | | 1,025.80 | | 0.80 | |
Hypothetical (5% average annual return before expenses) | | 1,000.00 | | 1,024.00 | | 0.80 | |
Administrative Class | | | | | | | |
Actual | | 1,000.00 | | 1,025.50 | | 1.05 | |
Hypothetical (5% average annual return before expenses) | | 1,000.00 | | 1,023.75 | | 1.05 | |
Advisory Class | | | | | | | |
Actual | | 1,000.00 | | 1,025.00 | | 1.56 | |
Hypothetical (5% average annual return before expenses) | | 1,000.00 | | 1,023.26 | | 1.56 | |
| | | | | | | | | | |
8
| 2007 Semi-Annual Report |
| |
| April 30, 2007 (unaudited) |
Expenses Examples (cont’d)
| | Beginning Account Value
November 1, 2006 | | Ending Account Value
April 30, 2007 | | Expenses Paid During Period*
November 1, 2006 — April 30, 2007 | |
Treasury Portfolio (cont’d) | | | | | | | |
Participant Class | | | | | | | |
Actual | | $ | 1,000.00 | | $ | 1,023.80 | | $ | 2.81 | |
Hypothetical (5% average annual return before expenses) | | 1,000.00 | | 1,022.02 | | 2.81 | |
Cash Management Class | | | | | | | |
Actual | | 1,000.00 | | 1,024.80 | | 1.81 | |
Hypothetical (5% average annual return before expenses) | | 1,000.00 | | 1,023.01 | | 1.81 | |
| | | | | | | | | | |
* | Expenses are equal to Institutional Class’, Service Class’, Investor Class’, Administrative Class’, Advisory Class’, Participant Class’ and Cash Management Class’ annualized net expense ratios of 0.06%, 0.11%, 0.16%, 0.21%, 0.31%, 0.56% and 0.36%, respectively, multiplied by the average account value over the period, multiplied by 181/365 (to reflect the one-half year period). |
Tax-Exempt Portfolio | | | | | | | |
Institutional Class | | | | | | | |
Actual | | $ | 1,000.00 | | $ | 1,017.80 | | $ | 0.50 | |
Hypothetical (5% average annual return before expenses) | | 1,000.00 | | 1,024.30 | | 0.50 | |
Service Class | | | | | | | |
Actual | | 1,000.00 | | 1,017.50 | | 0.80 | |
Hypothetical (5% average annual return before expenses) | | 1,000.00 | | 1,024.00 | | 0.80 | |
Investor Class | | | | | | | |
Actual | | 1,000.00 | | 1,017.30 | | 1.00 | |
Hypothetical (5% average annual return before expenses) | | 1,000.00 | | 1,023.80 | | 1.00 | |
Administrative Class | | | | | | | |
Actual | | 1,000.00 | | 1,017.00 | | 1.30 | |
Hypothetical (5% average annual return before expenses) | | 1,000.00 | | 1,023.51 | | 1.30 | |
Advisory Class | | | | | | | |
Actual | | 1,000.00 | | 1,016.50 | | 1.75 | |
Hypothetical (5% average annual return before expenses) | | 1,000.00 | | 1,023.06 | | 1.76 | |
Participant Class | | | | | | | |
Actual | | 1,000.00 | | 1,015.30 | | 3.00 | |
Hypothetical (5% average annual return before expenses) | | 1,000.00 | | 1,021.82 | | 3.01 | |
Cash Management Class | | | | | | | |
Actual | | 1,000.00 | | 1,016.30 | | 2.00 | |
Hypothetical (5% average annual return before expenses) | | 1,000.00 | | 1,022.81 | | 2.01 | |
| | | | | | | | | | |
* | Expenses are equal to Institutional Class’, Service Class’, Investor Class’, Administrative Class’, Advisory Class’, Participant Class’ and Cash Management Class’ annualized net expense ratios of 0.10%, 0.16%, 0.20%, 0.26%, 0.35%, 0.60% and 0.40%, respectively, multiplied by the average account value over the period, multiplied by 181/365 (to reflect the one-half year period). |
9
2007 Semi-Annual Report | |
| |
April 30, 2007 (unaudited) | |
Portfolio of Investments
Money Market Portfolio
| | Face
Amount
(000) | | Value
(000) | |
Certificates of Deposit (7.3%) | | | | | |
Banking (0.4%) | | | | | |
Union Bank of California | | | | | |
5.33%, 8/3/07 | | $ | 35,000 | | $ | 35,000 | |
International Banks (6.9%) | | | | | |
Banco Bilbao Vizcaya Argentaria S.A. | | | | | |
5.30%, 4/3/08 | | (b)125,000 | | 124,959 | |
Barclays Bank plc/New York | | | | | |
5.35%, 4/14/08 | | 25,000 | | 25,000 | |
Calyon/New York | | | | | |
5.31%, 9/13/07 | | 35,000 | | 35,000 | |
Credit Suisse/New York | | | | | |
5.33%, 2/26/08 | | (b)75,000 | | 75,000 | |
Depfa Bank plc | | | | | |
5.35%, 8/15/07 | | 30,000 | | 30,000 | |
Natixis/New York | | | | | |
5.32%, 12/11/07 | | 20,000 | | 20,000 | |
Norinchukin Bank Ltd. | | | | | |
5.32%, 6/5/07 | | 50,000 | | 50,000 | |
5.35%, 6/14/07 - 7/10/07 | | 125,000 | | 125,000 | |
5.36%, 7/12/07 - 8/15/07 | | 150,000 | | 150,000 | |
| | | | 634,959 | |
Total Certificates of Deposit (Cost $669,959) | | | | 669,959 | |
Commercial Paper (47.6%) (e) | | | | | |
Asset Backed — Consumer (0.3%) | | | | | |
Three Rivers Funding | | | | | |
5.31%, 6/28/07 | | (a)25,000 | | 24,788 | |
Asset Backed — Corporate (16.5%) | | | | | |
Atlantis One Funding Corp. | | | | | |
5.35%, 7/24/07 - 7/30/07 | | (a)41,732 | | 41,210 | |
Buckingham CDO LLC | | | | | |
5.33%, 6/8/07 | | (a)29,750 | | 29,585 | |
Buckingham CDO II LLC | | | | | |
5.31%, 5/25/07 | | (a)50,000 | | 49,824 | |
Buckingham CDO III LLC | | | | | |
5.31%, 5/22/07 | | (a)50,000 | | 49,846 | |
5.32%, 5/24/07 | | (a)105,648 | | 105,291 | |
Citius I Funding Ltd. | | | | | |
5.32%, 5/3/07 | | (a)23,910 | | 23,903 | |
5.34%, 7/17/07 | | (a)53,000 | | 52,403 | |
Citius II Funding Ltd. | | | | | |
5.32%, 5/3/07 | | (a)37,673 | | 37,662 | |
5.35%, 6/14/07 | | (a)30,000 | | 29,806 | |
Davis Square Funding IV | | | | | |
5.33%, 5/15/07 | | (a)40,000 | | 39,918 | |
5.34%, 6/11/07 | | (a)25,000 | | 24,849 | |
Davis Square Funding V | | | | | |
5.33%, 6/6/07 | | (a)20,000 | | 19,894 | |
Davis Square Funding VI | | | | | |
5.33%, 5/14/07 - 5/15/07 | | (a)105,000 | | 104,795 | |
Kaiserplatz Funding Ltd. | | | | | |
5.32%, 7/26/07 | | (a)50,000 | | 49,373 | |
5.33%, 5/8/07 - 7/16/07 | | (a)309,718 | | 307,677 | |
Klio Funding Corp. | | | | | |
5.33%, 5/23/07 | | (a)19,684 | | 19,620 | |
Klio III Funding Corp. | | | | | |
5.33%, 6/22/07 - 7/24/07 | | (a)77,000 | | 76,171 | |
5.34%, 6/13/07 | | (a)32,092 | | 31,890 | |
Liberty Harbour II CDO LLC | | | | | |
5.32%, 5/9/07 - 5/11/07 | | (a)139,965 | | 139,788 | |
5.33%, 7/13/07 | | 50,000 | | 49,466 | |
5.34%, 5/25/07 | | (a)20,000 | | 19,930 | |
Nieuw Amsterdam Receivables Corp. | | | | | |
5.33%, 9/27/07 | | (a)14,686 | | 14,370 | |
5.35%, 5/9/07 | | (a)20,540 | | 20,516 | |
Pasa Funding 2007, Ltd. | | | | | |
5.35%, 7/6/07 - 7/20/07 | | (a)188,100 | | 186,019 | |
| | | | 1,523,806 | |
Asset Backed — Diversified (0.4%) | | | | | |
Atlantic Asset Securitization Corp. | | | | | |
5.32%, 6/26/07 | | (a)40,000 | | 39,672 | |
Asset Backed — Mortgage (1.5%) | | | | | |
Sydney Capital Corp. | | | | | |
5.31%, 6/20/07 | | (a)50,000 | | 49,634 | |
5.32%, 5/29/07 | | (a)16,250 | | 16,183 | |
5.33%, 5/4/07 - 7/16/07 | | (a)75,000 | | 74,434 | |
| | | | 140,251 | |
Asset Backed — Securities (10.7%) | | | | | |
Amstel Funding Corp. | | | | | |
5.32%, 6/29/07 | | (a)25,000 | | 24,785 | |
5.33%, 6/13/07 | | (a)25,000 | | 24,845 | |
5.34%, 5/11/07 | | (a)45,000 | | 44,935 | |
5.35%, 5/9/07 | | (a)25,000 | | 24,971 | |
Atlas Capital Funding Corp. | | | | | |
5.32%, 6/25/07 | | (a)50,000 | | 49,598 | |
5.33%, 9/7/07 - 9/12/07 | | (a)60,000 | | 58,865 | |
Beethoven Funding Corp. | | | | | |
5.31%, 6/20/07 | | (a)66,402 | | 65,916 | |
5.33%, 7/20/07 | | (a)61,879 | | 61,156 | |
Beta Finance, Inc. | | | | | |
5.30%, 6/15/07 | | (a)20,000 | | 19,871 | |
Cancara Asset Securitization LLC | | | | | |
5.32%, 6/29/07 | | (a)32,119 | | 31,843 | |
Cullinan Finance Corp. | | | | | |
5.45%, 2/1/08 | | (a)20,000 | | 20,000 | |
Curzon Funding LLC | | | | | |
5.32%, 6/29/07 | | (a)30,000 | | 29,742 | |
5.34%, 5/17/07 | | (a)15,000 | | 14,965 | |
Giro Funding U.S. Corp. | | | | | |
5.16%, 6/1/07 | | (a)(f)17,584 | | 17,504 | |
5.32%, 5/31/07 | | (a)100,000 | | 99,559 | |
Giro Lion Funding Ltd. | | | | | |
5.22%, 7/30/07 - 7/31/07 | | (a)(f)38,097 | | 37,598 | |
5.34%, 7/20/07 | | (a)74,200 | | 73,331 | |
Grampian Funding LLC | | | | | |
5.34%, 5/16/07 | | (a)36,000 | | 35,922 | |
5.35%, 7/20/07 - 8/3/07 | | (a)146,500 | | 144,585 | |
| | | | | | | |
The accompanying notes are an integral part of the financial statements.
10
| 2007 Semi-Annual Report |
| |
| April 30, 2007 (unaudited) |
Portfolio of Investments (cont’d)
Money Market Portfolio
| | Face
Amount
(000) | | Value
(000) | |
Asset Backed — Securities (cont’d) | | | | | |
Links Finance LLC | | | | | |
5.32%, 10/23/07 | | $ | (a)50,000 | | $ | 48,741 | |
Scaldis Capital LLC | | | | | |
5.34%, 7/13/07 | | (a)14,675 | | 14,520 | |
Solitaire Funding LLC | | | | | |
5.35%, 7/23/07 | | (a)45,000 | | 44,459 | |
| | | | 987,711 | |
Banking (4.4%) | | | | | |
Bank of America Corp. | | | | | |
5.32%, 6/11/07 | | 20,000 | | 19,882 | |
Capital Markets Access Co. | | | | | |
5.39%, 10/1/31 | | (b)4,085 | | 4,085 | |
Citigroup Funding, Inc. | | | | | |
5.31%, 6/27/07 | | 5,000 | | 4,958 | |
5.32%, 6/8/07 | | 50,000 | | 49,723 | |
5.33%, 6/12/07 | | 58,500 | | 58,141 | |
5.34%, 5/23/07 - 8/15/07 | | 210,000 | | 208,610 | |
HSBC USA, Inc. | | | | | |
5.21%, 7/24/07 - 8/8/07 | | 54,000 | | 53,300 | |
Kamps Capital LLC | | | | | |
5.37%, 9/1/33 | | (b)6,680 | | 6,680 | |
| | | | 405,379 | |
Diversified Financial Services (0.5%) | | | | | |
General Electric Capital Corp. | | | | | |
5.30%, 6/29/07 | | 20,000 | | 19,831 | |
Nestle Capital Corp. | | | | | |
5.46%, 7/31/07 | | (a)25,000 | | 24,672 | |
| | | | 44,503 | |
Electric Utilities (0.2%) | | | | | |
State of New York | | | | | |
5.32%, 6/12/07 | | (a)20,104 | | 19,981 | |
Integrated Oil Companies (4.9%) | | | | | |
BP Capital Markets plc | | | | | |
5.32%, 5/1/07 | | 449,597 | | 449,597 | |
International Banks (5.3%) | | | | | |
Natexis Banques Populaires | | | | | |
5.31%, 5/1/07 | | 227,400 | | 227,400 | |
Skandinaviska Enskilda Banken | | | | | |
5.35%, 8/13/07 | | (a)20,000 | | 19,699 | |
Societe Generale North America, Inc. | | | | | |
5.32%, 5/1/07 | | 216,555 | | 216,555 | |
Swedbank Hypotek AB | | | | | |
5.30%, 9/21/07 | | 25,000 | | 24,488 | |
| | | | 488,142 | |
Investment Bankers/Brokers/Services (2.9%) | | | | | |
Bear Stearns Cos., Inc. | | | | | |
5.33%, 6/27/07 | | 20,000 | | 19,835 | |
5.38%, 6/28/07 - 8/6/07 | | 250,000 | | 250,000 | |
| | | | 269,835 | |
Total Commercial Paper (Cost $4,393,665) | | | | 4,393,665 | |
Corporate Notes (4.3%) | | | | | |
Asset Backed — Securities (1.6%) | | | | | |
Cullinan Finance Corp. | | | | | |
5.40%, 4/25/08 | | $ | (a)65,000 | | $ | 65,000 | |
Links Finance LLC | | | | | |
5.32%, 12/20/07 - 3/25/08 | | (a)(b)65,000 | | 64,994 | |
5.37%, 5/2/07 | | (a)15,000 | | 15,000 | |
| | | | 144,994 | |
Banking (0.9%) | | | | | |
American Immigration Lawyers Association | | | | | |
5.39%, 6/1/38 | | (b)3,600 | | 3,600 | |
Bank of America Corp. | | | | | |
5.30%, 12/27/07 | | 25,000 | | 25,000 | |
Charter Lakes Capital LLC | | | | | |
5.32%, 10/1/46 | | (b)6,150 | | 6,150 | |
Conestoga Wood Specialties Corp. | | | | | |
5.32%, 3/1/14 | | (b)9,210 | | 9,210 | |
Helmholdt Capital LLC | | | | | |
5.37%, 4/1/47 | | (b)9,000 | | 9,000 | |
Washington Road Properties & WR Partners LLC | | | | | |
5.39%, 12/1/26 | | (b)7,000 | | 7,000 | |
Woerner Holdings, Inc. | | | | | |
5.44%, 6/1/33 | | (b)17,840 | | 17,840 | |
| | | | 77,800 | |
International Banks (0.9%) | | | | | |
Australia & New Zealand Bank | | | | | |
5.32%, 12/21/07 | | (a)25,000 | | 25,000 | |
Royal Bank of Canada | | | | | |
5.31%, 3/1/12 | | (a)60,000 | | 60,000 | |
| | | | 85,000 | |
Investment Bankers/Brokers/Services (0.9%) | | | | | |
Goldman Sachs Group, Inc. | | | | | |
5.36%, 4/10/08 | | 50,000 | | 50,000 | |
Merrill Lynch & Co., Inc. | | | | | |
5.33%, 9/14/07 | | 30,000 | | 30,004 | |
| | | | 80,004 | |
Total Corporate Notes (Cost $387,798) | | | | 387,798 | |
Extendible Floating Rate Notes (13.0%) | | | | | |
Banking (0.4%) | | | | | |
Westpac Banking Corp. | | | | | |
5.30%, 12/6/11 | | (a)(b)35,000 | | 35,000 | |
Diversified Financial Services (1.2%) | | | | | |
General Electric Capital Corp. | | | | | |
5.45%, 6/16/07 - 10/17/07 | | (b)110,200 | | 110,186 | |
International Banks (10.5%) | | | | | |
Banque Federative Credit Mutuel | | | | | |
5.32%, 9/13/07 - 7/13/11 | | (a)(b)180,130 | | 180,130 | |
Caixa d’Estavlis | | | | | |
5.40%, 3/7/08 | | (a)(b)170,000 | | 170,000 | |
Caja de Ahorros y Monte de Piedad de Madrid | | | | | |
5.36%, 10/19/11 | | (b)120,000 | | 120,000 | |
The accompanying notes are an integral part of the financial statements.
11
2007 Semi-Annual Report | |
| |
April 30, 2007 (unaudited) | |
Portfolio of Investments (cont’d)
Money Market Portfolio
| | Face
Amount
(000) | | Value
(000) | |
International Banks (cont’d) | | | | | |
Commercial Bank Australia Ltd. | | | | | |
5.29%, 8/24/10 | | $ | (b)50,000 | | $ | 50,000 | |
Depfa Bank plc | | | | | |
5.31%, 9/21/07 | | (a)(b)30,000 | | 29,392 | |
5.39%, 6/15/09 | | (a)(b)59,000 | | 59,017 | |
Kommunalkredit A.G. | | | | | |
5.34%, 2/22/12 | | (a)(b)150,000 | | 150,000 | |
Royal Bank of Scotland plc | | | | | |
5.33%, 4/21/10 | | (a)(b)135,000 | | 135,000 | |
Societe Generale | | | | | |
5.31%, 2/29/08 - 11/2/10 | | (a)(b)75,000 | | 74,998 | |
| | | | 968,537 | |
Investment Bankers/Brokers/Services (0.9%) | | | | | |
Merrill Lynch & Co., Inc. | | | | | |
5.33%, 9/15/10 | | (b)50,000 | | 50,000 | |
5.57%, 7/11/07 | | (b)35,000 | | 35,000 | |
| | | | 85,000 | |
Total Extendible Floating Rate Notes (Cost $1,198,723) | | | | 1,198,723 | |
Floating Rate Notes (9.8%) | | | | | |
Asset Backed — Securities (7.4%) | | | | | |
Atlas Capital Funding Corp. | | | | | |
5.31%, 4/25/08 | | (a)(b)50,000 | | 50,000 | |
CC USA, Inc. | | | | | |
5.31%, 5/17/07 - 7/18/07 | | (a)(b)145,000 | | 144,998 | |
5.37%, 1/25/08 | | (a)(b)44,000 | | 44,012 | |
Cullinan Finance Corp. | | | | | |
5.32%, 9/28/07 - 4/28/08 | | (a)(b)202,000 | | 201,984 | |
Dorada Finance, Inc. | | | | | |
5.32%, 8/6/07 - 8/7/07 | | (a)(b)90,000 | | 89,998 | |
5.37%, 1/25/08 | | (a)(b)41,000 | | 41,012 | |
Links Finance LLC | | | | | |
5.32%, 4/24/08 | | (a)(b)50,000 | | 49,995 | |
5.33%, 8/8/07 | | (a)(b)60,000 | | 60,000 | |
| | | | 681,999 | |
Banking (1.6%) | | | | | |
Counts Trust | | | | | |
5.35%, 2/6/08 | | (a)(b)95,000 | | 95,000 | |
HSBC USA, Inc. | | | | | |
5.36%, 7/27/07 | | (b)25,000 | | 25,002 | |
Union Hamilton Special Funding LLC | | | | | |
5.35%, 6/15/07 | | (a)(b)28,000 | | 28,000 | |
| | | | 148,002 | |
Investment Bankers/Brokers/Services (0.8%) | | | | | |
Banc of America Corp. | | | | | |
5.39%, 2/20/49 | | (b)75,000 | | 75,000 | |
Total Floating Rate Notes (Cost $905,001) | | | | 905,001 | |
Municipal Bonds (0.6%) | | | | | |
Banking (0.6%) | | | | | |
Catholic University of America | | | | | |
5.46%, 4/1/34 | | $ | (b)25,000 | | $ | 25,000 | |
Urban Campus Environments LLC | | | | | |
5.32%, 10/1/25 | | (b)32,990 | | 32,990 | |
Total Municipal Bonds (Cost $57,990) | | | | 57,990 | |
Promissory Notes (3.2%) | | | | | |
Investment Bankers/Brokers/Services (3.2%) | | | | | |
Goldman Sachs Group, Inc. | | | | | |
5.37%, 12/14/07 | | 35,000 | | 35,000 | |
5.41%, 11/30/07 | | 100,000 | | 100,000 | |
5.43%, 8/9/07 | | 100,000 | | 100,000 | |
Merrill Lynch & Co., Inc. | | | | | |
5.36%, 12/28/07 | | 59,000 | | 59,000 | |
Total Promissory Notes (Cost $294,000) | | | | 294,000 | |
Time Deposits (9.2%) | | | | | |
International Banks (9.2%) | | | | | |
Dexia Credit Local | | | | | |
5.33%, 5/1/07 | | 400,000 | | 400,000 | |
National Bank of Canada | | | | | |
5.32%, 5/1/07 | | 450,000 | | 450,000 | |
Total Time Deposits (Cost $850,000) | | | | 850,000 | |
Repurchase Agreements (5.5%) | | | | | |
Bank of America Corp., 5.32%, dated 4/30/07, due 5/1/07, repurchase price $303,745; fully collateralized by discount commercial paper at the date of this Portfolio of Investments as follows: Alliance & Leicester, due 8/28/07; Avon Capital Corp., due 5/18/07; CBA de Finance, Inc., due 8/30/07; IBM Capital, due 5/24/07; MINT II LLC Securities Liquidation, due 5/11/07; Nelnet Student Association, due 5/24/07; Yorkshire Building, due 8/14/07, valued at $309,774. | | 303,700 | | 303,700 | |
Merrill Lynch & Co., Inc., 5.32%, dated 4/30/07, due 5/1/07, repurchase price $200,030; fully collateralized by discount commercial paper at the date of this Portfolio of Investments as follows: CentreStar Capital No. 1 LLC, due 7/16/07 to 7/25/07; Rhineland Funding Capital Corp., due 5/29/07, valued at $204,002. | | 200,000 | | 200,000 | |
Total Repurchase Agreements (Cost $503,700) | | | | 503,700 | |
Total Investments (100.5%) (Cost $9,260,836) | | | | 9,260,836 | |
Liabilities in Excess of Other Assets (-0.5%) | | | | (45,955 | ) |
Net Assets (100%) | | | | $ | 9,214,881 | |
The accompanying notes are an integral part of the financial statements.
12
| 2007 Semi-Annual Report |
| |
| April 30, 2007 (unaudited) |
Portfolio of Investments (cont’d)
Money Market Portfolio
(a) 144A Security — Certain conditions for public sale may exist. Unless otherwise noted, these securities are deemed to be liquid.
(b) Variable/Floating Rate Security — Interest rate changes on these instruments are based on changes in a designated base rate. The rates shown are those in effect on April 30, 2007.
(e) The rates shown are the effective yields at the date of purchase.
(f) Rate shown is the Yield to Maturity at April 30, 2007.
Graphic Presentation of Portfolio Holdings
The following graph depicts the Portfolio’s holdings by investment type, as a percentage of total investments.
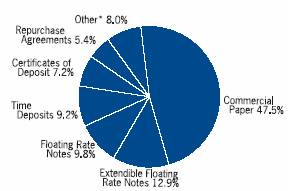
* | Investment types which do not appear in the above graph, as well as those which represent less than 5% of total investments, if applicable, are included in the category labeled “Other”. |
The accompanying notes are an integral part of the financial statements.
13
2007 Semi-Annual Report |
|
April 30, 2007 (unaudited) |
Portfolio of Investments
Prime Portfolio
| | Face
Amount
(000) | | Value
(000) | |
Certificates of Deposit (3.4%) | | | | | |
Banking (3.4%) | | | | | |
Charter One Bank NA | | | | | |
5.33%, 5/29/07 | | $ | 150,000 | | $ | 150,000 | |
Citizens Bank | | | | | |
5.32%, 6/18/07 | | 215,000 | | 215,000 | |
HSBC Bank USA, Inc. | | | | | |
5.32%, 12/15/11 | | (b)130,000 | | 130,000 | |
Union Bank of California | | | | | |
5.33%, 8/3/07 | | 475,000 | | 475,000 | |
Total Certificates of Deposit (Cost $970,000) | | | | 970,000 | |
Commercial Paper (51.5%) (e) | | | | | |
Asset Backed — Consumer (3.8%) | | | | | |
Barton Capital Corp. | | | | | |
5.32%, 5/1/07 | | (a)52,153 | | 52,153 | |
Gemini Securitization Corp. | | | | | |
5.31%, 5/22/07 - 6/11/07 | | (a)104,750 | | 104,210 | |
Park Avenue Receivables Corp. | | | | | |
5.32%, 5/24/07 | | (a)278,066 | | 277,128 | |
Ranger Funding LLC | | | | | |
5.32%, 5/24/07 | | (a)150,000 | | 149,494 | |
Sheffield Receivables Corp. | | | | | |
5.32%, 6/11/07 | | (a)77,200 | | 76,739 | |
Thames Asset Global Securitization, Inc. | | | | | |
5.30%, 6/15/07 | | (a)40,000 | | 39,738 | |
5.31%, 5/8/07 - 6/26/07 | | (a)120,059 | | 119,651 | |
Three Rivers Funding LLC | | | | | |
5.31%, 6/28/07 | | (a)185,719 | | 184,148 | |
5.32%, 6/12/07 | | (a)77,057 | | 76,583 | |
| | | | 1,079,844 | |
Asset Backed — Corporate (17.9%) | | | | | |
Atlantis One Funding Corp. | | | | | |
5.34%, 8/23/07 | | (a)133,332 | | 131,136 | |
5.35%, 7/24/07 - 7/30/07 | | (a)210,920 | | 208,303 | |
Buckingham CDO LLC | | | | | |
5.31%, 5/24/07 - 5/25/07 | | (a)253,077 | | 252,213 | |
5.32%, 5/29/07 | | (a)22,500 | | 22,408 | |
Ciesco LLC | | | | | |
5.31%, 5/1/07 | | (a)302,100 | | 302,100 | |
Citius I Funding LLC | | | | | |
5.32%, 5/3/07 - 5/7/07 | | (a)157,001 | | 156,922 | |
5.34%, 5/18/07 | | (a)22,745 | | 22,688 | |
5.35%, 6/13/07 | | (a)148,428 | | 147,492 | |
Citius II Funding LLC | | | | | |
5.32%, 5/2/07 | | (a)41,750 | | 41,744 | |
5.34%, 6/4/07 - 6/26/07 | | (a)149,012 | | 147,854 | |
Corporate Asset Funding Co., Inc. | | | | | |
5.31%, 5/1/07 | | (a)200,000 | | 200,000 | |
Davis Square Funding IV Corp. | | | | | |
5.33%, 5/15/07 - 6/11/07 | | (a)200,000 | | 199,391 | |
5.34%, 6/11/07 | | (a)100,000 | | 99,398 | |
Davis Square Funding V Corp. | | | | | |
5.33%, 5/15/07 - 6/6/07 | | $ | (a)306,060 | | $ | 305,241 | |
Davis Square Funding VI Corp. | | | | | |
5.33%, 5/14/07 - 6/6/07 | | (a)245,000 | | 244,451 | |
5.34%, 6/11/07 | | (a)20,472 | | 20,349 | |
Kaiserplatz Funding LLC | | | | | |
5.32%, 7/26/07 | | (a)37,913 | | 37,438 | |
5.33%, 5/8/07 - 7/16/07 | | (a)1,351,907 | | 1,344,898 | |
Klio III Funding Corp. | | | | | |
5.32%, 6/5/07 | | (a)35,927 | | 35,744 | |
5.33%, 6/13/07 - 7/24/07 | | (a)117,070 | | 116,107 | |
Liberty Harbour II CDO LLC | | | | | |
5.33%, 7/13/07 | | (a)50,291 | | 49,754 | |
5.34%, 5/25/07 | | (a)80,506 | | 80,223 | |
Nieuw Amsterdam Receivables Corp. | | | | | |
5.31%, 5/15/07 - 6/12/07 | | (a)228,404 | | 227,439 | |
5.32%, 5/11/07 | | (a)140,834 | | 140,627 | |
North Sea Funding LLC | | | | | |
5.32%, 6/21/07 | | (a)13,151 | | 13,053 | |
Pasa Funding Ltd. | | | | | |
5.35%, 6/21/07 - 7/20/07 | | (a)290,905 | | 288,049 | |
Simba Funding Corp. | | | | | |
5.31%, 6/18/07 | | (a)100,000 | | 99,300 | |
Variable Funding Co. LLC | | | | | |
5.30%, 5/4/07 | | (a)100,000 | | 99,955 | |
| | | | 5,034,277 | |
Asset Backed — Diversified (2.0%) | | | | | |
Atlantic Asset Securitization Corp. | | | | | |
5.31%, 6/12/07 | | (a)80,712 | | 80,216 | |
5.32%, 5/1/07 - 6/26/07 | | (a)155,274 | | 154,940 | |
Falcon Asset Securitization Co. LLC | | | | | |
5.32%, 5/24/07 | | (a)66,633 | | 66,408 | |
5.33%, 5/1/07 | | (a)183,239 | | 183,239 | |
Jupiter Securitization Co. LLC | | | | | |
5.33%, 5/1/07 | | (a)83,469 | | 83,469 | |
| | | | 568,272 | |
Asset Backed — Mortgage (2.0%) | | | | | |
Sydney Capital Corp. | | | | | |
5.31%, 6/14/07 - 6/20/07 | | (a)177,740 | | 176,547 | |
5.32%, 5/14/07 - 6/19/07 | | (a)259,580 | | 258,594 | |
5.33%, 5/4/07 - 7/16/07 | | (a)121,690 | | 120,872 | |
| | | | 556,013 | |
Asset Backed — Securities (16.9%) | | | | | |
Amstel Funding Corp. | | | | | |
5.32%, 5/21/07 - 6/29/07 | | (a)229,000 | | 227,902 | |
5.33%, 6/13/07 | | (a)118,563 | | 117,828 | |
5.34%, 5/11/07 | | (a)165,000 | | 164,761 | |
5.35%, 5/9/07 | | (a)75,000 | | 74,913 | |
Atlas Capital Funding Corp. | | | | | |
5.29%, 9/19/07 - 9/28/07 | | (a)250,000 | | 244,758 | |
5.30%, 7/12/07 | | (a)64,000 | | 63,333 | |
5.31%, 6/29/07 | | (a)75,000 | | 74,355 | |
5.32%, 6/12/07 | | (a)200,000 | | 198,775 | |
The accompanying notes are an integral part of the financial statements.
14
| 2007 Semi-Annual Report |
| |
| April 30, 2007 (unaudited) |
Portfolio of Investments (cont’d)
Prime Portfolio
| | Face | | | |
| | Amount | | Value | |
| | (000) | | (000) | |
Asset Backed — Securities (cont’d) | | | | | |
5.33%, 9/7/07 - 9/12/07 | | $ | (a)225,000 | | $ | 220,727 | |
5.34%, 8/7/07 | | (a)48,000 | | 47,319 | |
Beethoven Funding Corp. | | | | | |
5.31%, 6/20/07 | | (a)23,386 | | 23,215 | |
5.33%, 7/20/07 | | (a)75,000 | | 74,123 | |
Beta Finance, Inc. | | | | | |
5.30%, 6/15/07 | | (a)80,000 | | 79,484 | |
5.32%, 7/10/07 | | (a)50,000 | | 49,496 | |
Cancara Asset Securitization LLC | | | | | |
5.31%, 6/14/07 | | (a)39,154 | | 38,903 | |
5.32%, 6/28/07 - 6/29/07 | | (a)223,269 | | 221,363 | |
Curzon Funding LLC | | | | | |
5.32%, 6/29/07 - 7/10/07 | | (a)290,000 | | 287,329 | |
5.34%, 5/17/07 | | (a)110,000 | | 109,746 | |
5.35%, 5/8/07 - 8/8/07 | | (a)110,000 | | 108,757 | |
Dorada Finance, Inc. | | | | | |
5.35%, 5/8/07 | | (a)35,500 | | 35,464 | |
Giro Funding U.S. Corp. | | | | | |
5.30%, 5/4/07 | | 98,015 | | 97,972 | |
5.32%, 5/31/07 - 6/5/07 | | (a)400,000 | | 398,127 | |
5.34%, 7/20/07 | | 125,000 | | 123,536 | |
Grampian Funding LLC | | | | | |
5.30%, 6/25/07 | | (a)65,000 | | 64,481 | |
5.31%, 7/16/07 - 9/12/07 | | (a)275,000 | | 270,310 | |
5.32%, 7/11/07 | | (a)34,000 | | 33,799 | |
5.33%, 6/15/07 | | (a)203,000 | | 201,683 | |
5.34%, 5/16/07 | | (a)100,000 | | 99,783 | |
5.35%, 7/20/07 - 8/3/07 | | (a)526,000 | | 519,134 | |
Scaldis Capital LLC | | | | | |
5.31%, 6/15/07 | | (a)31,880 | | 31,671 | |
5.33%, 7/10/07 - 9/11/07 | | (a)86,009 | | 84,640 | |
5.34%, 7/13/07 | | (a)60,000 | | 59,367 | |
Solitaire Funding LLC | | | | | |
5.32%, 6/27/07 | | (a)150,000 | | 148,753 | |
5.35%, 7/23/07 | | (a)120,000 | | 118,559 | |
| | | | 4,714,366 | |
Banking (6.2%) | | | | | |
Bank of America Corp. | | | | | |
5.32%, 6/11/07 | | 115,000 | | 114,319 | |
Citigroup Funding, Inc. | | | | | |
5.31%, 6/27/07 | | 95,000 | | 94,211 | |
5.32%, 6/8/07 | | (a)200,000 | | 198,891 | |
5.32%, 6/22/07 - 7/25/07 | | 90,000 | | 88,982 | |
5.33%, 6/12/07 - 7/30/07 | | 270,000 | | 267,857 | |
5.34%, 5/23/07 - 8/15/07 | | 640,000 | | 637,196 | |
HSBC Bank USA, Inc. | | | | | |
5.31%, 6/15/07 | | 150,000 | | 149,016 | |
5.35%, 7/24/07 - 8/8/07 | | 200,000 | | 197,395 | |
| | | | 1,747,867 | |
Diversified Financial Services (1.0%) | | | | | |
General Electric Capital Corp. | | | | | |
5.30%, 6/29/07 | | 205,000 | | 203,263 | |
Nestle Capital Corp. | | | | | |
5.46%, 7/30/07 - 7/31/07 | | $ | (a)85,000 | | $ | 83,892 | |
| | | | 287,155 | |
Insurance (0.4%) | | | | | |
Allianz Finance Corp. | | | | | |
5.32%, 6/22/07 | | (a)100,000 | | 99,242 | |
Investment Bankers/Brokers/Services (1.3%) | | | | | |
Bear Stearns Co. Inc, | | | | | |
5.32%, 6/28/07 | | 300,000 | | 300,000 | |
5.33%, 6/27/07 | | 65,000 | | 64,465 | |
| | | | 364,465 | |
Total Commercial Paper (Cost $14,451,501) | | | | 14,451,501 | |
Corporate Notes (5.6%) | | | | | |
Asset Backed — Securities (1.2%) | | | | | |
Cullinan Finance Corp. | | | | | |
5.40%, 4/25/08 | | (a)185,000 | | 185,000 | |
5.45%, 2/1/08 | | (a)79,000 | | 79,000 | |
Links Finance LLC | | | | | |
5.37%, 5/2/07 | | (a)65,000 | | 65,000 | |
| | | | 329,000 | |
Banking (2.1%) | | | | | |
Bank of America Corp. | | | | | |
5.30%, 12/27/07 | | 150,000 | | 150,000 | |
5.36%, 2/8/08 | | 300,000 | | 300,000 | |
Wells Fargo Bank NA | | | | | |
5.30%, 5/8/07 | | 140,000 | | 140,000 | |
| | | | 590,000 | |
Diversified Financial Services (0.4%) | | | | | |
General Electric Capital Corp. | | | | | |
5.45%, 10/17/07 | | 125,000 | | 125,000 | |
Investment Bankers/Brokers/Services (1.9%) | | | | | |
Goldman Sachs Group, Inc. | | | | | |
5.35%, 11/30/07 | | 275,000 | | 275,000 | |
5.39%, 12/17/07 | | 250,000 | | 250,000 | |
| | | | 525,000 | |
Total Corporate Notes (Cost $1,569,000) | | | | 1,569,000 | |
Extendible Floating Rate Notes (2.5%) | | | | | |
Banking (0.5%) | | | | | |
Fifth Third Bancorp. | | | | | |
5.32%, 11/23/09 | | (a)(b)150,000 | | 150,000 | |
Diversified Financial Services (1.0%) | | | | | |
General Electric Capital Corp. | | | | | |
5.45%, 7/9/07 | | (b)275,000 | | 275,025 | |
Investment Bankers/Brokers/Services (1.0%) | | | | | |
Merrill Lynch & Co., Inc. | | | | | |
5.33%, 9/14/07 - 9/15/10 | | (b)215,000 | | 215,005 | |
5.57%, 7/11/07 | | (b)75,000 | | 75,000 | |
| | | | 290,005 | |
Total Extendible Floating Rate Notes (Cost $715,030) | | | | 715,030 | |
The accompanying notes are an integral part of the financial statements.
15
2007 Semi-Annual Report | |
| |
April 30, 2007 (unaudited) | |
Portfolio of Investments (cont’d)
Prime Portfolio
| | Face | | | |
| | Amount | | Value | |
| | (000) | | (000) | |
Floating Rate Notes (17.4%) | | | | | |
Asset Backed — Securities (8.2%) | | | | | |
Beta Finance, Inc. | | | | | |
5.34%, 4/11/08 | | $ | (b)50,000 | | $ | 50,009 | |
CC USA, Inc. | | | | | |
5.31%, 5/18/07 - 7/18/07 | | (a)(b)380,000 | | 379,989 | |
Cullinan Finance Corp. | | | | | |
5.28%, 9/17/07 | | (a)(b)250,000 | | 249,986 | |
5.32%, 9/28/07 - 1/23/08 | | (a)(b)670,000 | | 669,959 | |
Dorada Finance, Inc. | | | | | |
5.31%, 5/25/07 | | (a)(b)100,000 | | 99,999 | |
5.32%, 8/7/07 | | (a)(b)110,000 | | 109,997 | |
Links Finance LLC | | | | | |
5.31%, 3/31/08 | | (a)(b)150,000 | | 149,986 | |
5.32%, 7/12/07 - 4/24/08 | | (a)(b)385,000 | | 384,973 | |
5.33%, 8/8/07 - 10/9/07 | | (a)(b)115,000 | | 114,997 | |
5.35%, 5/25/07 | | (a)(b)100,000 | | 99,999 | |
| | | | 2,309,894 | |
Banking (2.5%) | | | | | |
HSBC Bank USA, Inc. | | | | | |
5.36%, 7/27/07 | | (b)70,950 | | 70,956 | |
U.S. Trust Co. of New York | | | | | |
5.31%, 7/13/07 | | (b)90,000 | | 90,000 | |
Union Hamilton Special Funding LLC | | | | | |
5.35%, 6/15/07 | | (a)(b)170,000 | | 170,000 | |
Wachovia Bank NA | | | | | |
5.31%, 11/30/07 | | (b)27,000 | | 27,002 | |
5.34%, 9/28/07 | | (b)40,000 | | 40,004 | |
5.36%, 5/22/07 | | (b)85,100 | | 85,100 | |
5.40%, 11/30/07 | | (b)225,000 | | 225,058 | |
| | | | 708,120 | |
Finance - Automotive (1.8%) | | | | | |
American Honda Finance Corp. | | | | | |
5.33%, 4/14/08 | | (a)(b)140,000 | | 140,000 | |
Toyota Motor Credit Corp. | | | | | |
5.32%, 6/28/07 - 5/12/08 | | (b)250,000 | | 250,004 | |
5.33%, 8/3/07 | | (b)125,000 | | 125,004 | |
| | | | 515,008 | |
Insurance (0.7%) | | | | | |
AIG Matched Funding Corp. | | | | | |
5.32%, 1/9/08 | | (b)200,000 | | 200,000 | |
Investment Bankers/Brokers/Services (4.2%) | | | | | |
Banc of America Corp. | | | | | |
5.39%, 2/20/49 | | (b)273,500 | | 273,500 | |
JPMorgan Chase & Co. | | | | | |
5.30%, 4/11/12 | | (b)75,000 | | 75,000 | |
Lehman Brothers Holdings, Inc. | | | | | |
5.36%, 5/7/07 | | (b)100,000 | | 100,000 | |
5.37%, 5/31/07 | | (b)110,000 | | 110,006 | |
Merrill Lynch & Co., Inc. | | | | | |
5.33%, 5/29/07 | | $ | (b)90,000 | | $ | 89,997 | |
5.36%, 5/29/07 | | (b)365,000 | | 364,998 | |
5.44%, 7/6/07 | | (b)150,000 | | 150,019 | |
| | | | 1,163,520 | |
Total Floating Rate Notes (Cost $4,896,542) | | | | 4,896,542 | |
Promissory Notes (3.3%) | | | | | |
Investment Bankers/Brokers/Services (3.3%) | | | | | |
Goldman Sachs Group, Inc. | | | | | |
5.36%, 4/10/08 | | 175,000 | | 175,000 | |
5.37%, 12/14/07 - 2/29/08 | | 365,000 | | 365,000 | |
5.43%, 8/9/07 | | 150,000 | | 150,000 | |
Merrill Lynch & Co., Inc. | | | | | |
5.36%, 12/28/07 | | (b)241,000 | | 241,000 | |
Total Promissory Notes (Cost $931,000) | | | | 931,000 | |
Time Deposits (3.0%) | | | | | |
Banking (3.0%) | | | | | |
Regions Bank/Birmingham AL | | | | | |
5.28%, 5/1/07 | | 600,000 | | 600,000 | |
Suntrust Bank | | | | | |
5.25%, 5/1/07 | | 240,760 | | 240,760 | |
Total Time Deposits (Cost $840,760) | | | | 840,760 | |
Repurchase Agreements (13.4%) | | | | | |
Banc of America Securities LLC, 5.32%, dated 4/30/07, due 5/1/07, repurchase price $696,403; fully collateralized by discount commercial paper at the date of this Portfolio of Investments as follows: Abbot Lab., due 5/2/07; Alcoa, Inc., due 8/13/07; Aluminum Co. of America, due 8/13/07; American Honda Finance Corp., due 6/1/07 to 6/12/07; Aquifer Funding, due 5/3/07; ASB Finance Ltd., due 5/22/07; Aspen Funding Corp., due 5/21/07 to 8/13/07; Autobahn Funding, due 5/1/07 to 5/31/07; Avon Capital Corp., due 5/7/07; Barclays Funding, due 8/21/07; Berkeley SQ Funding, due 5/10/07; Broadhollow Funding, due 5/1/07 to 5/22/07; Caisse Nationale d’Epargne et de Provoyance, due 7/23/07; Calyon North America, Inc., due 5/16/07 to 6/11/07; Catapult Pmx Funding, due 5/3/07 to 5/25/07; Cedar Spring Capital Co., due 6/11/07 to 7/23/07; Centrica plc, due 5/11/07 to 6/4/07; Coca Cola Enterprise, Inc., due 5/3/07 to 5/4/07; Corporate Asset Funding Corp., due 5/8/07; County of Wake, North Carolina, due 5/2/07; Deer Valley Funding LLC, due 5/18/07; DNB NOR Bank ASA, | | | | | |
The accompanying notes are an integral part of the financial statements.
16
| 2007 Semi-Annual Report |
| |
| April 30, 2007 (unaudited) |
Portfolio of Investments (cont’d)
Prime Portfolio
| | Face | | | |
| | Amount | | Value | |
| | (000) | | (000) | |
due 6/5/07 to 6/6/07; Depfa Bank plc, due 7/10/07; Delaware Group, due 6/28/07; Eaton Corp., due 6/1/07 to 6/14/07; Ebury Finance LLC, due 6/4/07; Emerson Electric Corp., due 5/14/07; Fenway Funding LLC, due 5/22/07; Foxboro, due 5/4/07; FPL Group Capital, due 5/9/07 to 5/10/07; Freedom Park Capital LLC, due 6/4/07 to 6/25/07; General Electric Capital Corp., due 6/8/07; Genworth Financial, Inc., due 5/24/07; Halkin Finance, due 7/3/07; HBOS Treasury Services plc, due 6/18/07 to 7/20/07; Honeywell International, due 11/20/07; ING Funding LLC, due 5/14/07 to 6/4/07; Intesa Funding LLC, due 5/7/07 to 5/31/07; Liquid Funding, Ltd., due 8/20/07 to 9/6/07; Luminent STR Funding, due 5/8/07; McKinley Funding Ltd., due 5/18/07; McKinley II Funding Ltd., due 5/21/07 to 5/29/07; McKinley Funding Corp., due 5/29/07; McKinley Funding, Ltd., due 7/19/07; Melnet Student, due 7/25/07; Mint II Securitization LLC, due 5/30/07; Mitsui Co., due 7/26/07; Mortgage Interest Network, due 5/2/07; Natixis Corp., due 6/5/07; New Center Asset Trust, due 7/11/07; North Sea Funding, due 5/25/07 to 7/19/07; Northwestern University, due 6/6/07; Old Line Funding, due 5/23/07; Oracle Corp., due 7/12/07; Paccar Financial Corp., due 5/7/07; Parker Finance Corp., due 5/10/07; Raiffeisen Zentralbank Oesterreich A.G., due 7/31/07; Ranger Funding LLC, due 6/1/07 to 6/11/07; Societe Generale, Inc., due 5/8/07 to 8/7/07; Southern Colorado Funding Corp., due 5/3/07 to 5/21/07; Statens Finance, due 5/14/07; Swedbank Hypotek AB, due 5/2/07 to 6/21/07; Ticonderoga Funding LLC, due 5/17/07 to 5/24/07, UBS Finance LLC, due 5/11/07 to 6/25/07; Voyager Funding, due 5/1/07; Westpac Banking Corp., due 5/1/07 to 7/12/07; Xtra, Inc., due 5/15/07 to 5/17/07; Yorkshire Building Soc., due 7/16/07; Yorktown Capital LLC, due 5/15/07; valued at $710,226. | | $ | 696,300 | | $ | 696,300 | |
Credit Suisse First Boston 5.31%, dated 4/30/07, due 5/1/07, repurchase price $500,074; fully collateralized by discount commercial paper and U.S. government securities at the date of this Portfolio of Investments as follows: Alcon Capital Corp., due 5/10/07 to 5/21/07; Alpine Securitization Corp., due 5/1/07 to 5/31/07; Aquinas Funding LLC, due 5/24/07 to 5/30/07; ASB Finance, Ltd. due 5/8/07 to 8/2/07; Atlantis One Funding, due 5/1/07 to 8/13/07; Axon Financial Funding LLC, due 6/25/07; Carrera Capital Finance, due 5/7/07 to 5/18/07; CBA Financial, due 9/28/07; Ciesco LLC, due 5/14/07 to 5/21/07; Corporate Asset Funding Co., Inc., due 5/23/07 to 6/25/07; Eaton LLC, due 5/3/07 to 8/21/07; EVVLF LLC, due 5/1/07 to 7/23/07; ING America Insurance Holdings, due 5/7/07; Ixis Commercial Paper, due 5/2/07 to 8/27/07; Federal Home Loan Mortgage Corp., Gold Pool, Adjustable Rate Mortgage: 5.09% to 5.84%, due 7/1/34 to 4/1/37; Federal National Mortgage Association, Adjustable Rate Mortgage: 6.05%, due 10/1/33; GE2, due 5/14/07; General Electric Capital Corp., due 1/26/11 to 2/15/17; Mitten Residential, due 5/2/07; Natexis Commercial Paper Corp., due 6/5/07; Old Line Funding LLC, due 5/15/07; Santander Central Hispano, Inc., due 5/14/07; Sigma Finance Inc., due 7/25/07; Stanfield Victoria Funding, due 6/1/07; Swedish National Housing, due 5/14/07; Times Square Funding, due 7/20/07; valued at $510,003. | | $ | 500,000 | | $ | 500,000 | |
Deutsche Bank Securities, Inc., 5.31%, dated 4/30/07, due 5/1/07, repurchase price $500,074; fully collateralized by discount commercial paper at the date of this Portfolio of Investments as follows: Austria Corp., due 5/14/07; Air Products & Chemistry, due 5/14/07 to 5/15/07; BASF Aktiengesellschaft, due 6/12/07; Belmont Funding LLC, due 5/25/07; Berkeley Square Finance, due 5/1/07 to 5/10/07; Britannia Building Soc., due 7/25/07; Deutsche Bank A.G., due 5/3/07; Ebury Finance LLC, due 7/5/07; Fox Tror CDO, Ltd., due 7/12/07; Gemini Securitization Corp., due 5/22/07 to 6/13/07; Giro Balanced Funding Corp., due 5/7/07; Henkel Corp., due 6/19/07; Johnson & Johnson, due 5/23/07; Keel Capital, Inc., due 5/9/07 to 5/10/07; KFW International Finance, due 5/4/07; Lake Con Funding, due 5/3/07; Long Lane Master Trust IV, due 5/17/07; Mica Funding LLC, due 5/15/07; | | | | | |
The accompanying notes are an integral part of the financial statements.
17
2007 Semi-Annual Report | |
| |
April 30, 2007 (unaudited) | |
Portfolio of Investments (cont’d)
Prime Portfolio
| | Face | | | |
| | Amount | | Value | |
| | (000) | | (000) | |
Prudential plc, due 7/11/07; Rhein Main, due 5/4/07 to 10/1/07; Rheingold Securitization, Ltd., due 5/4/07 to 9/4/07; Stanfield Victoria Funding LLC, due 7/25/07; Transamerica Asset, due 5/8/07; St. Germain Holdings, due 5/4/07 to 5/24/07; TSL USA, Inc., due 5/14/07 to 7/26/07; Versailles CDS LLC, due 5/7/07 to 5/24/07, valued at $510,000. | | $ | 500,000 | | $ | 500,000 | |
Goldman Sachs Group, Inc., 5.31%, dated 4/30/07, due 5/1/07, repurchase price $280,041; fully collateralized by discount commercial paper at the date of this Portfolio of Investments as follows: Air Liquide U.S. LLC, due 5/16/07; ING Funding Corp., due 7/31/07; Nestle Capital Corp., due 6/4/07; Netjets, Inc., due 5/1/07; Pitney Bowes, Inc., due 5/21/07; Sheffield Receivables Corp., due 5/8/07, valued at $285,600. | | 280,000 | | 280,000 | |
J.P. Morgan Securities, 5.32% dated 4/30/07, due 5/1/07, repurchase price $900,133; fully collateralized by discount commercial paper at the date of this Portfolio of Investments as follows: Abbington Square, due 5/9/07 to 7/6/07; Alcoa, Inc., due 7/25/07; Black Diamond Funding, due 5/1/07 to 7/26/07; BMW U.S. Capital, due 5/21/07; Conoco Phillips, due 5/2/07; Deer Valley Funding, due 5/18/07 to 6/4/07; Fenway Funding, due 5/31/07; Hypo Real Estate, due 5/10/07; Jupiter Securitization Co., due 5/25/07; New Center Asset Trust, due 10/17/07; Nieuw Amsterdam Receivables Corp., due 5/31/07; Park Avenue Receivables Corp., due 5/21/07 to 5/24/07; Raiffeisen Zentralba, due 7/31/07; Thunder Bay DTC, due 5/31/07; Verizon Communications, due 5/29/07 to 6/6/07; Zane Funding LLC, due 5/14/07 to 5/24/07, valued at $918,005. | | 900,000 | | 900,000 | |
Lehman Brothers, Inc., 5.31%, dated 4/30/07, due 5/1/07, repurchase price $400,059; fully collateralized by discount commercial paper at the date of this Portfolio of Investments as follows: Alliance & Leicester plc, due 8/28/07; American General Capital LLC, due 8/15/07 to 11/15/07; Amsterdam Funding Corp., due 5/25/07 to 6/4/07; Anglesea Funding plc, due 5/8/07 to 10/16/07; Bavaria Universal Funding, due 6/12/07 to 7/26/07; Belmont Funding LLC, due 5/1/07; Brown-Forman Corp., due 5/7/07; Catapult Communications Corp., due 5/3/07; Cintas Executive Services, Inc., due 5/1/07; Coral, Inc., due 5/15/07; East-Fleet Finance Ltd., due 5/10/07; Erste Finance LLC, due 7/30/07; FLP Group Capital, Inc., due 5/16/07; Fairway Finance Corp., due 5/1/07 to 6/8/07; Fenway Funding LLC, due 5/1/07 to 5/3/07; Gannett Co., Inc., due 5/7/07; Gotham Funding, due 5/3/07; Hannover Funding Co., LLC due 5/15/07 to 6/7/07; Hewlett-Packard Co., due 5/11/07 to 5/15/07; Intesa Funding LLC, due 5/9/07 to 6/15/07; Jupiter Securitization Co., LLC, due 5/25/07; Koch Industries, due 5/10/07; Koch Resources LLC, due 5/11/07; Mica Funding LLC, due 5/1/07 to 5/14/07; Midamerican Energy Co., due 5/1/07; National Rural Utilities Cooperative Finance Corp., due 5/3/07; Nieuw Amsterdam Receivables Corp., due 5/4/07 to 7/25/07; Northern Rock plc, due 5/23/07; Public Service Co., due 5/31/07; SBLI USA Mutual Life Insurance Co., Inc., due 5/31/07; Silver Tower U.S. Funding, 6/8/07; Skandinaviska Enskilda Banken AB, due 6/29/07 to 1/25/08; Southern Co. Funding Corp., due 5/1/07 to 5/29/07; Swedbank AB, due 5/7/07 to 5/8/07; Swedbank Hypotek AB, due 6/5/07 to 6/21/07; Versailles CDS LLC, due 5/9/07 to 5/14/07, valued at $408,002. | | $ | 400,000 | | $ | 400,000 | |
Merrill Lynch & Co., Inc., 5.32%, dated 4/30/07, due 5/1/07, repurchase price $350,052; fully collateralized by discount commercial paper at the date of this Portfolio of Investments as follows: 7-Eleven, due 5/1/07 to 5/15/07; Athos Fund (The), due 5/31/07; Axon Financial Funding LLC, due 6/18/07 to 10/23/07; Barton Capital Corp., due 5/9/07 to 5/23/07; BNP Paribas, due 5/11/07; Carrera Capital Finance LLC, due 5/2/07; Cooperative Association TRA, due 5/25/07; Davenport CDO, due 5/2/07; Depfa Bank plc, due 6/8/07; Five Finance, Inc., due 7/16/07; General Electric Capital Corp., due 5/4/07 to 5/7/07; George Street Finance LLC, due 5/29/07; Golden Key Ltd., due 7/16/07 to 7/25/07; Greyhawk Funding LLC, due 5/8/07 | | | | | |
The accompanying notes are an integral part of the financial statements.
18
| 2007 Semi-Annual Report |
| |
| April 30, 2007 (unaudited) |
Portfolio of Investments (cont’d)
Prime Portfolio
| | Face | | | |
| | Amount | | Value | |
| | (000) | | (000) | |
to 6/5/07; HBOS Treasury Services plc, due 5/1/07 to 7/19/07; Hudson-Thames Capital, due 5/25/07; Klio III Funding Corp., due 7/11/07; Liberty CDO, due 5/18/07; Medtronic, Inc., due 5/21/07; Natixis, due 5/7/07; Nestle Capital Corp., due 5/15/07 to 6/14/07; NYSE Euronext, due 5/14/07 to 7/10/07; Old Line Funding LLC, due 5/15/07; Raffles Holdings Ltd., due 5/29/07; Ranger Funding Corp., due 5/16/07; SBA Bancorp, Inc., due 5/10/07; Southeast Corp. Federal Credit Union, due 5/15/07 to 5/25/07; Svenska Handelsbanken AB, due 5/9/07; Sydney Capital Corp., due 5/29/07 to 5/30/07; Tasman Funding, Inc., due 5/7/07; Ticonderoga Capital, due 6/1/07; Transamerica Asset Funding Corp., due 5/17/07; UBS Americas, Inc., due 5/1/07; UBS Finance Delaware LLC, due 5/1/07 to 7/19/07; Westpac Banking Corp., due 10/15/07; Westpac Securities NZ Ltd., due 10/18/07; White Pine Finance LLC, due 5/15/07 to 5/23/07; Windmill Funding I Corp., due 6/13/07; Yorktown Capital LLC, due 5/30/07, valued at $357,004. | | $ | 350,000 | | $ | 350,000 | |
Wachovia Capital Market LLC, 5.36%, dated 4/30/07, due 5/1/07, repurchase price $150,022; fully collateralized by discount commercial paper at the date of this Portfolio of Investments as follows: Air Products & Chemistry, due 5/3/07; Atlas Capital Funding Corp., due 7/5/07; Kaiserplatz Funding LLC, due 5/30/07; MICA Funding LLC, due 5/25/07 valued at $153,000. | | 150,000 | | 150,000 | |
Total Repurchase Agreements (Cost $3,776,300) | | | | 3,776,300 | |
Total Investments (100.1%) (Cost $28,150,133) | | | | 28,150,133 | |
Liabilities in Excess of Other Assets (-0.1%) | | | | (28,111 | ) |
Net Assets (100%) | | | | $ | 28,122,022 | |
| | | | | | | |
(a) 144A Security — Certain conditions for public sale may exist. Unless otherwise noted, these securities are deemed to be liquid.
(b) Variable/Floating Rate Security — Interest rate changes on these instruments are based on changes in a designated base rate. The rates shown are those in effect on April 30, 2007.
(e) The rates shown are the effective yields at the date of purchase.
Graphic Presentation of Portfolio Holdings
The following graph depicts the Portfolio’s holdings by investment type, as a percentage of total investments.
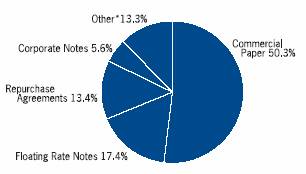
* | Investment types which do not appear in the above graph, as well as those which represent less than 5% of total investments, if applicable, are included in the category labeled “Other”. |
The accompanying notes are an integral part of the financial statements.
19
2007 Semi-Annual Report |
|
April 30, 2007 (unaudited) |
Portfolio of Investments
Government Portfolio
| | Face | | | |
| | Amount | | Value | |
| | (000) | | (000) | |
U.S. Government & Agency Securities (17.8%) | | | | | |
Federal Farm Credit Bank | | | | | |
5.23%, 6/16/08 | | $ | (b)40,000 | | $ | 39,987 | |
Federal Home Loan Bank | | | | | |
3.25%, 12/17/07 | | 2,100 | | 2,074 | |
3.75%, 5/15/07 | | 5,000 | | 4,997 | |
4.00%, 6/13/07 - 7/13/07 | | 6,500 | | 6,489 | |
4.13%, 7/20/07 | | 3,100 | | 3,092 | |
5.18%, 6/18/08 | | (b)30,000 | | 29,985 | |
5.19%, 1/10/08 - 4/10/08 | | (b)55,000 | | 54,978 | |
5.22%, 8/10/07 | | (b)10,000 | | 9,999 | |
5.30%, 11/19/07 - 3/19/08 | | 64,000 | | 64,000 | |
5.38%, 4/18/08 | | 15,000 | | 15,000 | |
5.40%, 2/25/08 | | 10,000 | | 10,000 | |
Federal Home Loan Mortgage Corp. | | | | | |
2.88%, 5/15/07 | | 3,210 | | 3,207 | |
3.00%, 7/27/07 | | 20,000 | | 19,894 | |
4.50%, 5/17/07 | | (b)4,359 | | 4,358 | |
5.04%, 5/29/07 | | (d)23,000 | | 22,910 | |
5.05%, 5/4/07 | | (d)1,410 | | 1,409 | |
5.07%, 8/3/07 | | (d)13,900 | | 13,719 | |
5.10%, 6/22/07 | | (d)7,000 | | 6,949 | |
5.13%, 8/20/07 | | (d)7,541 | | 7,424 | |
5.16%, 9/21/07 | | (d)9,500 | | 9,309 | |
5.20%, 11/30/07 - 12/11/07 | | (d)24,000 | | 23,278 | |
5.21%, 10/16/07 | | (d)2,000 | | 1,952 | |
5.22%, 6/22/07 - 7/6/07 | | (b)75,000 | | 74,996 | |
5.35%, 3/26/08 | | 20,000 | | 20,000 | |
Federal National Mortgage Association | | | | | |
2.75%, 7/23/07 | | 10,750 | | 10,689 | |
3.25%, 5/11/07 | | 5,000 | | 4,997 | |
3.88%, 5/15/07 | | 4,000 | | 3,998 | |
4.25%, 9/15/07 | | 4,912 | | 4,892 | |
4.75%, 8/3/07 | | 3,185 | | 3,181 | |
5.04%, 5/2/07 | | (d)5,817 | | 5,816 | |
5.05%, 5/8/07 | | (d)7,000 | | 6,993 | |
5.09%, 6/29/07 | | (d)15,900 | | 15,769 | |
5.15%, 8/22/07 | | (d)10,000 | | 9,841 | |
5.15%, 9/21/07 | | 1,750 | | 1,750 | |
5.17%, 8/29/07 - 11/30/07 | | (d)26,157 | | 25,531 | |
5.19%, 12/28/07 | | (d)5,000 | | 4,832 | |
5.20%, 10/5/07 | | (d)13,377 | | 13,081 | |
6.63%, 10/15/07 | | 2,280 | | 2,294 | |
Total U.S. Government & Agency Securities (Cost $563,670) | | | | 563,670 | |
| | | | | |
Repurchase Agreements (82.1%) | | | | | |
Barclays Inc., 5.24%, dated 4/30/07, due 5/1/07, repurchase price $384,056; fully collateralized by U.S. government securities at the date of this Portfolio of Investments as follows: Federal Home Loan Mortgage Corp., Gold Pools: 5.00% to 6.00%, due 5/1/33 to 3/1/37; Federal National Mortgage Association, Fixed Rate Mortgages: 5.00% to 6.00%, due 2/1/35 to 3/1/37, valued at $391,680. | | $ | 384,000 | | $ | 384,000 | |
Barclays Inc., 5.26%, dated 3/26/07, due 7/24/07, repurchase price $40,701; fully collateralized by a U.S. government security at the date of this Portfolio of Investments as follows: Federal National Mortgage Association, Adjustable Rate Mortgage: 5.93%, due 11/1/36, valued at $40,800. | | 40,000 | | 40,000 | |
Barclays Inc., 5.27%, dated 3/27/07, due 7/25/07, repurchase price $20,351; fully collateralized by a U.S. government security at the date of this Portfolio of Investments as follows: Federal Home Loan Mortgage Corp., Adjustable Rate Mortgage: 5.07%, due 12/1/35, valued at $20,400. | | 20,000 | | 20,000 | |
Bear Stearns Cos., Inc., 5.24%, dated 4/30/07, due 5/1/07, repurchase price $585,085; fully collateralized by U.S. government securities at the date of this Portfolio of Investments as follows: Federal Home Loan Mortgage Corp., Gold Pools: 5.00% to 6.00%, due 9/1/35 to 2/1/37; Federal National Mortgage Association, Fixed Rate Mortgages: 4.00% to 7.00%, due 11/1/08 to 4/1/37, valued at $596,703. | | 585,000 | | 585,000 | |
CS First Boston LLC, 5.25%, dated 4/30/07, due 5/1/07, repurchase price $255,037; fully collateralized by U.S. government securities at the date of this Portfolio of Investments as follows: Federal Home Loan Mortgage Corp., Gold Pool: 5.00%, due 9/1/35; Federal National Mortgage Association, Fixed Rate Mortgages: 5.00% to 6.50%, due 10/1/08 to 3/1/37, valued at $255,003. | | 250,000 | | 250,000 | |
CS First Boston LLC, 5.28%, dated 2/23/07, due 7/23/07, repurchase price $25,550; fully collateralized by a U.S. government security at the date of this Portfolio of Investments as follows: Federal National Mortgage Association, Fixed Rate Mortgage: 6.50%, due 3/1/37, valued at $25,502. | | 25,000 | | 25,000 | |
The accompanying notes are an integral part of the financial statements.
20
| 2007 Semi-Annual Report |
| |
| April 30, 2007 (unaudited) |
Portfolio of Investments (cont’d)
Government Portfolio
| | Face | | | |
| | Amount | | Value | |
| | (000) | | (000) | |
Deutsche Bank Securities, Inc., 5.24%, dated 4/30/07, due 5/1/07, repurchase price $575,179; fully collateralized by U.S. government securities at the date of this Portfolio of Investments as follows: Federal Home Loan Mortgage Corp., Adjustable Rate Mortgages, 5.56% to 7.43%, due 11/1/32 to 4/1/37; Federal Home Loan Mortgage Corp., Gold Pools: 5.00% to 6.50%, due 7/1/35 to 4/1/37; Federal National Mortgage Association, Adjustable Rate Mortgages: 4.03% to 7.39%, due 12/1/09 to 4/1/44, valued at $587,413. | | $ | 575,095 | | $ | 575,095 | |
UBS Securities LLC, 5.22%, dated 4/30/07, due 5/1/07, repurchase price $51,007; fully collateralized by U.S. government securities at the date of this Portfolio of Investments as follows: Federal Home Loan Mortgage Corp., Gold Pool: 6.00%, due 2/1/37; Federal National Mortgage Association, Fixed Rate Mortgage: 6.50%, due 3/1/29, valued at $52,021. | | 51,000 | | 51,000 | |
UBS Securities LLC, 5.24%, dated 4/30/07, due 5/1/07, repurchase price $315,046; fully collateralized by U.S. government securities at the date of this Portfolio of Investments as follows: Federal Home Loan Mortgage Corp., Gold Pools: 5.50% to 9.00%, due 4/1/25 to 4/1/37; Federal National Mortgage Association, Fixed Rate Mortgages: 5.00% to 8.00%, due 9/1/17 to 3/1/37, valued at $321,301. | | 315,000 | | 315,000 | |
UBS Securities LLC, 5.25%, dated 3/22/07, due 8/10/07, repurchase price $25,514; fully collateralized by U.S. government securities at the date of this Portfolio of Investments as follows: Federal Home Loan Mortgage Corp., Gold Pool: 6.00%, due 2/1/37; Federal National Mortgage Association, Fixed Rate Mortgage: 6.00%, due 4/1/37, valued at $25,504. | | 25,000 | | 25,000 | |
UBS Securities LLC, 5.26%, dated 3/14/07, due 6/12/07, repurchase price $25,329; fully collateralized by U.S. government securities at the date of this Portfolio of Investments as follows: Federal Home Loan Mortgage Corp., Gold Pool: 5.50%, due 6/1/26; Federal National Mortgage Association, Fixed Rate Mortgages: 5.50% to 6.00%, due 12/1/32 to 7/1/33, valued at $25,500. | | 25,000 | | 25,000 | |
UBS Securities LLC, 5.28%, dated 1/11/07, due 6/11/07, repurchase price $30,664; fully collateralized by U.S. government securities at the date of this Portfolio of Investments as follows: Federal National Mortgage Association, Fixed Rate Mortgages: 5.50% to 6.00%, due 3/1/33 to 4/1/37, valued at $30,604. | | 30,000 | | 30,000 | |
UBS Securities LLC, 5.30%, dated 2/2/07, due 8/1/07, repurchase price $25,663; fully collateralized by U.S. government securities at the date of this Portfolio of Investments as follows: Federal Home Loan Mortgage Corp., Gold Pool: 5.50%, due 9/1/19; Federal National Mortgage Association, Fixed Rate Mortgages: 6.00% to 6.50%, due 3/1/29 to 4/1/36, valued at $25,502. | | $ | 25,000 | | $ | 25,000 | |
Wachovia Capital Markets LLC, 5.24%, dated 4/30/07, due 5/1/07, repurchase price $250,036; fully collateralized by U.S. government securities at the date of this Portfolio of Investments as follows: Federal National Mortgage Association, Fixed Rate Mortgages: Zero Coupon to 5.00%, due 5/1/07 to 5/1/36, valued at $255,000. | | 250,000 | | 250,000 | |
Total Repurchase Agreements (Cost $2,600,095) | | | | 2,600,095 | |
Total Investments (99.9%) (Cost $3,163,765) | | | | 3,163,765 | |
Other Assets in Excess of Liabilities (0.1%) | | | | 2,690 | |
Net Assets (100%) | | | | $ | 3,166,455 | |
(b) Variable/Floating Rate Security — Interest rate changes on these instruments are based on changes in a designated base rate. The rates shown are those in effect on April 30, 2007.
(d) Purchased on a discount basis. The interest rate shown has been adjusted to reflect a money market equivalent yield.
Graphic Presentation of Portfolio Holdings
The following graph depicts the Portfolio’s holdings by investment type, as a percentage of total investments.

The accompanying notes are an integral part of the financial statements.
21
2007 Semi-Annual Report | |
| |
April 30, 2007 (unaudited) | |
Portfolio of Investments
Treasury Portfolio
| | Face | | | |
| | Amount | | Value | |
| | (000) | | (000) | |
U.S. Treasury Securities (0.9%) | | | | | |
U.S. Treasury Bills | | | | | |
4.97%, 8/23/07 | | $ | (d)200 | | $ | 197 | |
4.98%, 7/5/07 - 9/27/07 | | (d)1,100 | | 1,083 | |
5.00%, 10/4/07 | | (d)300 | | 294 | |
5.02%, 8/16/07 | | (d)200 | | 197 | |
5.03%, 8/9/07 | | (d)200 | | 197 | |
Total U.S. Treasury Securities (Cost $1,968) | | | | 1,968 | |
Repurchase Agreements (99.2%) | | | | | |
Banc of America LLC, 5.12%, dated 4/30/07, due 5/1/07, repurchase price $44,021; fully collateralized by U.S. government securities at the date of this Portfolio of Investments as follows: U.S. Treasury Bond, 7.13%, due 2/15/23; U.S. Treasury Note, 4.88%, due 8/31/08, valued at $44,895. | | 44,015 | | 44,015 | |
CS First Boston LLC, 5.10%, dated 4/30/07, due 5/1/07, repurchase price $38,305; fully collateralized by U.S. government securities at the date of this Portfolio of Investments as follows: U.S. Treasury Notes, 3.38% to 5.13%, due 2/15/08 to 5/15/16, valued at $39,067. | | 38,300 | | 38,300 | |
Deutsche Bank Securities, Inc., 5.13%, dated 4/30/07, due 5/1/07, repurchase price $47,007; fully collateralized by U.S. government securities at the date of this Portfolio of Investments as follows: U.S. Treasury Notes, 4.00% to 5.00%, due 3/15/10 to 2/29/12, valued at $47,940. | | 47,000 | | 47,000 | |
Merrill Lynch & Co., Inc., 5.11%, dated 4/30/07, due 5/1/07, repurchase price $40,569; fully collateralized by a U.S. government security at the date of this Portfolio of Investments as follows: U.S. Treasury Note, 4.63%, due 2/15/17, valued at $41,375. | | 40,563 | | 40,563 | |
UBS Securities LLC, 5.12%, dated 4/30/07, due 5/1/07, repurchase price $45,006; fully collateralized by a U.S. government security at the date of this Portfolio of Investments as follows: U.S. Treasury Note, 4.38%, due 12/15/10, valued at $45,903. | | 45,000 | | 45,000 | |
UBS Securities LLC, 5.20%, dated 3/27/07, due 7/25/07, repurchase price $1,017; fully collateralized by a U.S. government security at the date of this Portfolio of Investments as follows: U.S. Treasury Note, 3.75%, due 5/15/08, valued at $1,020. | | 1,000 | | 1,000 | |
UBS Securities LLC, 5.23%, dated 11/9/06, due 5/8/07, repurchase price $513; fully collateralized by a U.S. government security at the date of this Portfolio of Investments as follows: U.S. Treasury Note, 3.75%, due 5/15/08, valued at $513. | | 500 | | 500 | |
Total Repurchase Agreements (Cost $216,378) | | | | 216,378 | |
Total Investments (100.1%) (Cost $218,346) | | | | $ | 218,346 | |
Liabilities in Excess of Other Assets (-0.1%) | | | | (233 | ) |
Net Assets (100%) | | | | $ | 218,113 | |
| | | | | | | |
(d) Purchased on a discount basis. The interest rate shown has been adjusted to reflect a money market equivalent yield.
Graphic Presentation of Portfolio Holdings
The following graph depicts the Portfolio’s holdings by investment type, as a percentage of total investments.

* | Investment types which do not appear in the above graph, as well as those which represent less than 5% of total investments, if applicable, are included in the category labeled “Other”. |
The accompanying notes are an integral part of the financial statements.
22
| 2007 Semi-Annual Report |
| |
| April 30, 2007 (unaudited) |
Portfolio of Investments
Tax-Exempt Portfolio
| | Face | | | |
| | Amount | | Value | |
| | (000) | | (000) | |
Tax-Exempt Instruments (99.6%) | | | | | |
Commercial Paper (6.5%) (e) | | | | | |
Austin Independent School District, TX, Series 2005 A | | | | | |
3.82%, 5/1/07 | | $ | 14,000 | | $ | 14,000 | |
Florida Municipal Power Agency, Series A | | | | | |
3.75%, 5/21/07 | | 8,000 | | 8,000 | |
Georgia Municipal Electric Authority, Series TE - A | | | | | |
3.80%, 5/14/07 | | 15,655 | | 15,655 | |
Houston, TX, Combined Utility System, Series 2004 A | | | | | |
3.70%, 6/13/07 | | 8,000 | | 8,000 | |
Kentucky Asset Liability Commission, General Fund Second, Series 2005 A-2 | | | | | |
3.60%, 5/25/07 | | 4,200 | | 4,200 | |
Missouri Development Finance Board, Missouri Association of Municipal Utilities, Series 2006 A | | | | | |
3.70%, 5/3/07 | | 5,450 | | 5,450 | |
New York City Municipal Water Finance Authority, NY, Series 6 | | | | | |
3.82%, 5/17/07 | | 22,000 | | 22,000 | |
Ohio State University, General Receipts, Series 2007 H | | | | | |
3.80%, 5/29/07 | | 8,700 | | 8,700 | |
| | | | 86,005 | |
Daily Variable Rate Bonds (4.6%) | | | | | |
Washington Health Care Facilities Authority, WA, MultiCare Health System, Series 2007 D (FSA) | | | | | |
4.10%, 5/1/07 | | 60,100 | | 60,100 | |
Municipal Bonds & Notes (7.0%) | | | | | |
Cook County School District No 159, IL, Matteson-Richton Park, Series 2006 TAWs | | | | | |
4.75%, 11/1/07 | | 3,518 | | 3,518 | |
District of Columbia, Fiscal Year 2007 TRANs | | | | | |
4.25%, 9/28/07 | | 5,013 | | 5,013 | |
Hastings, NY, Series 2006 BANs | | | | | |
4.25%, 7/13/07 | | 3,000 | | 3,000 | |
Illinois, Series 2007 | | | | | |
4.25%, 6/7/07 | | 10,005 | | 10,005 | |
Indiana Bond Bank, Advance Funding, Series 2007 A | | | | | |
4.25%, 1/31/08 | | 6,026 | | 6,026 | |
New Jersey Transit Corp., Federal Transit Administration Grants, Series 2000 B COPs (Ambac) | | | | | |
5.50%, 9/15/07 | | 4,028 | | 4,028 | |
New Jersey, Series 2007 A TRANs | | | | | |
4.50%, 6/22/07 | | 15,017 | | 15,017 | |
Orange County School District, FL, Series 2006 TANs | | | | | |
4.00%, 9/14/07 | | 6,509 | | 6,509 | |
Pioneer Valley Transit Authority, MA, Series 2006 RANs | | | | | |
4.50%, 8/3/07 | | $ | 2,503 | | $ | 2,503 | |
Rhode Island & Providence Plantations, Fiscal Year 2007 TANs | | | | | |
4.25%, 6/29/07 | | 12,011 | | 12,011 | |
Roosevelt Union Free School District, NY, Series 2006 B BANs | | | | | |
4.35%, 8/2/07 | | 2,893 | | 2,893 | |
Temple University, PA, University Funding Series 2007 | | | | | |
4.25%, 4/24/08 | | 5,030 | | 5,030 | |
Three Rivers Solid Waste Authority, SC, Series 2007 BANs | | | | | |
4.50%, 6/1/07 | | 3,503 | | 3,503 | |
Wichita, KS, Renewal & Improvement Temporary Notes, Series 218 | | | | | |
4.25%, 8/9/07 | | 8,015 | | 8,015 | |
Worthington City School District, OH, Series 2006 BANs | | | | | |
4.38%, 5/3/07 | | 5,000 | | 5,000 | |
| | | | 92,071 | |
Put Option Bonds (2.5%) | | | | | |
Chicago, IL, Tender Notes, Series 2006 | | | | | |
3.52%, 10/11/07 | | 12,000 | | 12,000 | |
Oklahoma Water Resources Board, State Loan, Series 2001 | | | | | |
3.70%, 10/1/07 | | 4,325 | | 4,325 | |
Plaquemines Port Harbor & Terminal District, LA, Chevron Pipe Line Co., Series 1984 | | | | | |
3.85%, 9/1/07 | | 4,700 | | 4,700 | |
Texas Transportation Commission, Mobility Fund, Series 2006-B | | | | | |
3.52%, 9/10/07 | | 4,000 | | 4,000 | |
Wapello County, IA, Ottumwa Regional Health Center, Series 2006 (Radian) | | | | | |
3.60%, 10/1/07 | | 8,500 | | 8,500 | |
| | | | 33,525 | |
Weekly Variable Rate Bonds (79.0%) | | | | | |
Alabama Special Care Facilities Authority of the City of Mobile, Ascension Health Senior Credit Group, Series 2006 D ROCs II-R, Series 687 | | | | | |
3.98%, 5/7/07 | | 11,000 | | 11,000 | |
Albuquerque, NM, Affordable Housing Refinancing, Series 2000 (MBIA) | | | | | |
3.98%, 5/7/07 | | 5,025 | | 5,025 | |
Atlanta, GA, Sub Lien Tax Allocation Atlantic Station, Series 2006 | | | | | |
4.01%, 5/7/07 | | 15,000 | | 15,000 | |
Atlanta, GA, Water & Wastewater, Series 2004 Floater-TRs, Series 2006 K2 (FSA) | | | | | |
4.00%, 5/7/07 | | 4,500 | | 4,500 | |
The accompanying notes are an integral part of the financial statements.
23
2007 Semi-Annual Report |
|
April 30, 2007 (unaudited) |
Portfolio of Investments (cont’d)
Tax-Exempt Portfolio
| | Face | | | |
| | Amount | | Value | |
| | (000) | | (000) | |
Weekly Variable Rate Bonds (cont’d) | | | | | |
Birmingham Public Educational Building Authority, AL, University of Alabama Student Housing, Series 2005 A | | | | | |
3.94%, 5/7/07 | | $ | 11,000 | | $ | 11,000 | |
Broward County Health Facilities Authority, FL, Henderson Mental Health Center, Series 2004 | | | | | |
4.01%, 5/7/07 | | 5,100 | | 5,100 | |
Cary, NC, Series 2006 | | | | | |
3.95%, 5/7/07 | | 31,025 | | 31,025 | |
Centerra Metropolitan District No 1, CO, Series 2004 | | | | | |
3.95%, 5/7/07 | | 4,100 | | 4,100 | |
Central Utah Water Conservancy District, Series 1998 E (Ambac) | | | | | |
3.98%, 5/7/07 | | 12,410 | | 12,410 | |
Series 2004 C (Ambac) | | | | | |
3.98%, 5/7/07 | | 21,000 | | 21,000 | |
Charlotte, NC, Convention Facility, Series 2003 B COPs | | | | | |
3.95%, 5/7/07 | | 4,000 | | 4,000 | |
Chicago Board of Education, IL, Series 2004 D (FSA) | | | | | |
3.96%, 5/7/07 | | 11,030 | | 11,030 | |
Chicago, IL, Chicago O’Hare International Airport Third Lien, Series 2005 C (CIFG) | | | | | |
3.97%, 5/7/07 | | 10,500 | | 10,500 | |
Third Lien, Series 2005 D (CIFG) | | | | | |
3.97%, 5/7/07 | | 8,000 | | 8,000 | |
Colorado Educational & Cultural Facilities Authority, Pueblo Serra Worship Holdings, Series 2006 | | | | | |
3.98%, 5/7/07 | | 7,000 | | 7,000 | |
Columbus Development Authority, GA, Student Housing Facilities, Series 2005 A | | | | | |
3.96%, 5/7/07 | | 5,600 | | 5,600 | |
Cook County, IL, Series 2002 C P-FLOATs PT-1522 (Ambac) | | | | | |
3.99%, 5/7/07 | | 7,265 | | 7,265 | |
DeKalb County Hospital Authority, GA, DeKalb Medical Center, Series 2005 | | | | | |
3.96%, 5/7/07 | | 3,510 | | 3,510 | |
Derry Township Industrial & Commercial Development Authority, PA, Hotel Tax Arena, Series 2000 A | | | | | |
3.94%, 5/7/07 | | 6,700 | | 6,700 | |
FIU Athletics Finance Corporation, FL, Football Stadium Project, Series 2007 A | | | | | |
3.98%, 5/7/07 | | 14,000 | | 14,000 | |
Florida Gas Utility, Gas Supply Acquisition No. 2, Series 2006 A-1 | | | | | |
3.92%, 5/7/07 | | 6,000 | | 6,000 | |
Fulton County Development Authority, GA, Piedmont Healthcare, Inc., Series 2005 | | | | | |
3.96%, 5/7/07 | | 15,800 | | 15,800 | |
Garland Health Facilities Development Corp., TX, Chambrel Club Hill, Series 2002 | | | | | |
3.97%, 5/7/07 | | 4,900 | | 4,900 | |
Glendale Heights, IL, Glendale Lakes, Series 2000 | | | | | |
3.93%, 5/7/07 | | 2,445 | | 2,445 | |
Harris County Industrial Development Corp., TX, Baytank Inc., Series 1998 | | | | | |
3.91%, 5/7/07 | | 9,400 | | 9,400 | |
Illinois Development Finance Authority, Museum of Contemporary Art, Series 1994 | | | | | |
3.91%, 5/7/07 | | 20,000 | | 20,000 | |
Jewish Federation of Metropolitan Chicago, Series 1999 (Ambac) | | | | | |
3.93%, 5/7/07 | | 2,555 | | 2,555 | |
Illinois Educational Facilities Authority, The Art Institute of Chicago, Series 1995 | | | | | |
3.91%, 5/7/07 | | 11,600 | | 11,600 | |
National-Louis University, Series 1999 A | | | | | |
3.96%, 5/7/07 | | 10,750 | | 10,750 | |
CHF-DeKalb LLC at Northern Illinois University, Series 2006 A, | | | | | |
3.99%, 5/7/07 | | 4,500 | | 4,500 | |
Illinois Finance Authority, Edward Hospital Obligated Group, Series 2007 B-1 (Ambac) | | | | | |
3.97%, 5/7/07 | | 14,000 | | 14,000 | |
Elmhurst Memorial Healthcare Municipal CRVS, Series 2006-2001 | | | | | |
3.97%, 5/7/07 | | 4,000 | | 4,000 | |
Village of Oak Park Residence, Series 2006 | | | | | |
3.96%, 5/7/07 | | 4,000 | | 4,000 | |
Illinois Health Facilities Authority, Advocate Health Care Network, Series 1997 B | | | | | |
3.98%, 5/7/07 | | 12,000 | | 12,000 | |
Illinois Housing Development Authority, Village Center Development, Series 2004 | | | | | |
3.96%, 5/7/07 | | 7,150 | | 7,150 | |
Illinois International Port District, Series 2003 | | | | | |
4.02%, 5/7/07 | | 3,500 | | 3,500 | |
Indiana Development Finance Authority, IN, The Culver Educational Foundation, Series 1997 | | | | | |
3.98%, 5/7/07 | | 13,300 | | 13,300 | |
Indiana Health Facility Financing Authority, Community Health Network, Series 2005 C | | | | | |
3.96%, 5/7/07 | | 10,000 | | 10,000 | |
Infirmary Health System Special Care Facilities Financing Authority of Mobile, AL, Series 2006 B | | | | | |
3.95%, 5/7/07 | | 5,000 | | 5,000 | |
J. P. Morgan Chase & Co., Various States, I-PUTTERs, Series 1633P | | | | | |
4.09%, 5/7/07 | | 15,670 | | 15,670 | |
| | | | | | | |
The accompanying notes are an integral part of the financial statements.
24
| 2007 Semi-Annual Report |
| |
| April 30, 2007 (unaudited) |
Portfolio of Investments (cont’d)
Tax-Exempt Portfolio
| | Face | | | |
| | Amount | | Value | |
| | (000) | | (000) | |
Weekly Variable Rate Bonds (cont’d) | | | | | |
Jackson Health Educational & Housing Facility Board, TN, Union University, Series 2005 | | | | | |
3.96%, 5/7/07 | | $ | 6,620 | | $ | 6,620 | |
Kansas City Industrial Development Authority, MO,Kansas City Downtown Redevelopment District,Series 2005 A (Ambac) | | | | | |
3.98%, 5/7/07 | | 25,000 | | 25,000 | |
Kansas City Industrial Development Authority, MO,Kansas City Downtown Redevelopment District, Series 2006 A (Ambac) | | | | | |
3.98%, 5/7/07 | | 5,000 | | 5,000 | |
Kansas City Industrial Development Authority, MO,The Ethans Apartments, Series 2004 | | | | | |
3.96%, 5/7/07 | | 22,000 | | 22,000 | |
Kent Hospital Finance Authority, MI, Metropolitan Hospital, Series 2005 B | | | | | |
3.97%, 5/7/07 | | 3,000 | | 3,000 | |
King County, WA, Sewer, Series 2006 A (MBIA) | | | | | |
3.95%, 5/7/07 | | 5,850 | | 5,850 | |
Knox County Health Educational & Housing Facility Board, TN, Webb School of Knoxville, Series 2006 | | | | | |
3.96%, 5/7/07 | | 7,000 | | 7,000 | |
Lancaster County Hospital Authority, PA, Willow Valley Retirement Communities, Series 2002 B (Radian) | | | | | |
3.94%, 5/7/07 | | 5,350 | | 5,350 | |
Leesburg, FL, The Villages Regional Hospital, Series 2006 (Radian) | | | | | |
3.98%, 5/7/07 | | 10,600 | | 10,600 | |
Lehman Municipal Trust Receipts, WA, NJB Properties 2006, Series A Floater-TRs, Series 2007 P23W | | | | | |
4.03%, 5/7/07 | | 21,400 | | 21,400 | |
Madisonville, KY, Trover Clinic Foundation Inc., Series 2006 (AGC) | | | | | |
3.96%, 5/7/07 | | 19,250 | | 19,250 | |
Main Street Natural Gas Inc., GA, Gas Series 2006 A MERLOTs, Series C6 | | | | | |
4.00%, 5/7/07 | | 25,000 | | 25,000 | |
Main Street Natural Gas Inc., GA, Gas Series 2007 B MERLOTs, Series C11 | | | | | |
4.00%, 5/7/07 | | 11,635 | | 11,635 | |
Massachusetts Development Finance Agency, Dana Hall School, Series 2004 | | | | | |
3.93%, 5/7/07 | | 2,500 | | 2,500 | |
Massachusetts Health & Educational Facilities Authority, Cape Cod Healthcare Obligated Group 2004, Series D (AGC) | | | | | |
3.96%, 5/7/07 | | 5,000 | | 5,000 | |
Merrillville, IN, Southlake Care Center, Series 1992 A TOBs (FHA) | | | | | |
4.10%, 5/7/07 | | 410 | | 410 | |
Minneapolis, MN, Fairview Health Services,Series 2005 B (Ambac) | | | | | |
3.92%, 5/7/07 | | 2,000 | | 2,000 | |
Mississippi Development Bank, Magnolia Regional Health Center, Series 2006 A (Radian) | | | | | |
3.97%, 5/7/07 | | 7,000 | | 7,000 | |
Montgomery County, OH, Catholic Health Initiatives, Series 2006 B-1 | | | | | |
3.92%, 5/7/07 | | 5,000 | | 5,000 | |
Municipal Energy Acquisition Corp., TN, Gas Series 2006 B PUTTERs, Series 1579 | | | | | |
3.98%, 5/7/07 | | 13,100 | | 13,100 | |
Murray City, UT, IHC Health Services Inc., Series 2005 D | | | | | |
3.97%, 5/7/07 | | 4,800 | | 4,800 | |
Nevada System of Higher Education, Series 2005 BPUTTERs, Series 1134 (Ambac) | | | | | |
3.98%, 5/7/07 | | 5,270 | | 5,270 | |
New Castle County, DE, University Courtyard Apartments, Series 2005 | | | | | |
3.99%, 5/7/07 | | 9,800 | | 9,800 | |
New Hampshire Health & Education FacilitiesAuthority, Weeks Medical Center, Series 2005 A | | | | | |
3.92%, 5/7/07 | | 3,545 | | 3,545 | |
Crotched Mountain Rehabilitation Center, Series 2006 | | | | | |
3.95%, 5/7/07 | | 7,500 | | 7,500 | |
New Hampshire Higher Educational Health & Facilities Authority, Riverwoods at Exeter, Series 1997 B | | | | | |
3.94%, 5/7/07 | | 8,385 | | 8,385 | |
New York City Industrial Development Agency, NY, One Bryant Park LLC, Series 2004 A | | | | | |
3.97%, 5/7/07 | | 26,000 | | 26,000 | |
New York State Dormitory Authority, Mount St. Mary College, Series 2005 (Radian) | | | | | |
4.00%, 5/7/07 | | 1,000 | | 1,000 | |
North Carolina Capital Facilities Finance Agency,Barton College, Series 2004 | | | | | |
3.95%, 5/7/07 | | 4,900 | | 4,900 | |
North Carolina Medical Care Commission, Firsthealth of the Carolinas, Series 2002 | | | | | |
3.97%, 5/7/07 | | 2,600 | | 2,600 | |
North Carolina Medical Care Commission, Mission-St. Joseph’s Health System, Series 2003 | | | | | |
4.00%, 5/7/07 | | 10,550 | | 10,550 | |
North Charleston, SC, Municipal Golf Course, Series 2003 | | | | | |
4.00%, 5/7/07 | | 11,100 | | 11,100 | |
North Texas Tollway Authority, TX, Dallas North Tollway System, Series 2005 C (FGIC) | | | | | |
3.93%, 5/7/07 | | 4,770 | | 4,770 | |
Oak Park Heights, MN, Multifamily Boutwells Landing, Series 2005 | | | | | |
3.95%, 5/7/07 | | 4,400 | | 4,400 | |
Ohio, Common Schools, Series 2005 C P-FLOATs PT-3442 | | | | | |
3.97%, 5/7/07 | | 15,140 | | 15,140 | |
| | | | | | | |
The accompanying notes are an integral part of the financial statements.
25
2007 Semi-Annual Report | |
| |
April 30, 2007 (unaudited) | |
Portfolio of Investments (cont’d)
Tax-Exempt Portfolio
| | Face | | | |
| | Amount | | Value | |
| | (000) | | (000) | |
Weekly Variable Rate Bonds (cont’d) | | | | | |
Ohio, Common Schools, Series 2006 C | | | | | |
3.93%, 5/7/07 | | $ | 1,500 | | $ | 1,500 | |
Omaha, NE, Eagle #2004001 Class A | | | | | |
3.99%, 5/7/07 | | 1,000 | | 1,000 | |
Pasco County School Board, FL, Series 1996 COPs (Ambac) | | | | | |
3.93%, 5/7/07 | | 14,325 | | 14,325 | |
Pennsylvania Turnpike Commission, Series 2002 A-1 | | | | | |
3.91%, 5/7/07 | | 9,100 | | 9,100 | |
Perry County, MS, Leaf River Forest Products Inc., Series 2002 | | | | | |
3.94%, 5/7/07 | | 20,000 | | 20,000 | |
Philadelphia Industrial Development Authority, PA, Inglis House, Series 1997 | | | | | |
3.94%, 5/7/07 | | 9,600 | | 9,600 | |
Phoenix Civic Improvement Corp., AZ, Civic Plaza Expansion, Series 2005 B Floaters, Series 84Z (FGIC) | | | | | |
3.98%, 5/7/07 | | 5,660 | | 5,660 | |
Pine Ridge Village/Campus Heights LLC, AZ, Northern Arizona University, Series 2005 (FGIC) | | | | | |
3.94%, 5/7/07 | | 3,000 | | 3,000 | |
Puttable Floating Option Tax-Exempts Receipts, OT, Series 2006 P-FLOATs EC-002 | | | | | |
4.17%, 5/7/07 | | 35,780 | | 35,780 | |
Puttable Floating Option Tax-Exempts Receipts, TX, Texas Municipal Gas Acquisition & Supply Corp., Series 2006 B P-FLOATs PA-1462 | | | | | |
4.00%, 5/7/07 | | 30,000 | | 30,000 | |
Raleigh, NC, Combined Enterprise System, Series 2006 A Eagle #20070010 A | | | | | |
3.97%, 5/7/07 | | 4,950 | | 4,950 | |
Regional Transportation Authority, IL, Refinancing, Series 2005 B | | | | | |
3.93%, 5/7/07 | | 3,445 | | 3,445 | |
Rhode Island Economic Development Corp., Airport 2005, Series C P-FLOATS PT-2953 (MBIA) | | | | | |
3.98%, 5/7/07 | | 2,130 | | 2,130 | |
Richmond, KY, Kentucky League of Cities Funding Trust, Series 2006 A | | | | | |
3.98%, 5/7/07 | | 7,500 | | 7,500 | |
Rickenbacker Port Authority, OH, OASBO Expanded Asset Pooled Financing, Series 2002 A ROCs II-R, Series 591CE | | | | | |
3.98%, 5/7/07 | | 5,620 | | 5,620 | |
Sam Rayburn Municipal Power Agency, TX, Refinancing, Series 2002 P-FLOATs PT-2413 (Radian) | | | | | |
4.00%, 5/7/07 | | 8,610 | | 8,610 | |
San Antonio, TX, Water System Sub Lien, Series 2003 B (MBIA) | | | | | |
3.93%, 5/7/07 | | 5,050 | | 5,050 | |
South Carolina Jobs - Economic Development Authority, Oconee Memorial Hospital, Series 2006 | | | | | |
3.95%, 5/7/07 | | 5,000 | | 5,000 | |
Series 2005 A (Radian) | | | | | |
3.98%, 5/7/07 | | 5,000 | | 5,000 | |
Series 2006 A (Radian) | | | | | |
3.98%, 5/7/07 | | 5,400 | | 5,400 | |
St. Joseph County, IN, Logan Community Resources, Series 2004 | | | | | |
3.98%, 5/7/07 | | 6,350 | | 6,350 | |
Tennergy Corporation, TN, Gas Series 2006 B PUTTERs, Series 1260B | | | | | |
3.98%, 5/7/07 | | 26,100 | | 26,100 | |
Tennessee Energy Acquisition Corp., Gas Series 2006 A ROCs II-R, Series 598 | | | | | |
3.98%, 5/7/07 | | 5,000 | | 5,000 | |
UBS Municipal CRVS, GA, Main Street Natural Gas Inc., Series 2006 A Floaters, Series 2007-6 | | | | | |
3.97%, 5/7/07 | | 26,685 | | 26,685 | |
Umatilla County Hospital Facility Authority, OR, Catholic Health Initiatives, Series 1997 B | | | | | |
3.91%, 5/7/07 | | 4,100 | | 4,100 | |
University of Hawaii Board of Regents, Series 2006 A P-FLOATs PT-3685 (MBIA) | | | | | |
3.99%, 5/7/07 | | 8,880 | | 8,880 | |
University of New Mexico Regents, Series 2002 B | | | | | |
3.93%, 5/7/07 | | 5,000 | | 5,000 | |
Vermont Economic Development Authority, VT, Wake Robin Corp., Series 2006 C | | | | | |
3.96%, 5/7/07 | | 5,250 | | 5,250 | |
Volusia County Educational Facilities Authority, FL, Embry-Riddle Aeronautical University, Series 2005 ROCs II-R, Series 440 (Radian) | | | | | |
3.99%, 5/7/07 | | 5,645 | | 5,645 | |
Washington County Authority, PA, Girard Estate, Series 1999 | | | | | |
3.91%, 5/7/07 | | 8,715 | | 8,715 | |
Washington Health Care Facilities Authority, WA, Swedish Health Services, Series 2006 | | | | | |
4.06%, 5/7/07 | | 9,000 | | 9,000 | |
Washington Higher Education Facilities Authority, Whitman College, Series 2004 | | | | | |
3.91%, 5/7/07 | | 7,320 | | 7,320 | |
Washington State Housing Finance Commission, Judson Park, Series 2007 | | | | | |
3.97%, 5/7/07 | | 10,400 | | 10,400 | |
YMCA of Tacoma-Pierce County, Series 2006 | | | | | |
3.99%, 5/7/07 | | 4,165 | | 4,165 | |
Washington State, Floater-TRs, Series 2006 P23U 2006 D (MBIA) | | | | | |
4.00%, 5/7/07 | | 5,380 | | 5,380 | |
| | | | | | | |
The accompanying notes are an integral part of the financial statements.
26
| 2007 Semi-Annual Report |
| |
| April 30, 2007 (unaudited) |
Portfolio of Investments (cont’d)
Tax-Exempt Portfolio
| | Face | | | |
| | Amount | | Value | |
| | (000) | | (000) | |
Weekly Variable Rate Bonds (cont’d) | | | | | |
Will County, IL, University of St. Francis,Series 2005 | | | | | |
3.95%, 5/7/07 | | $ | 3,500 | | $ | 3,500 | |
Wisconsin Health & Educational Facilities Authority, Amery Regional Medical Center, Series 2006 A | | | | | |
4.01%, 5/7/07 | | 8,000 | | 8,000 | |
Watertown Memorial Hospital, Series 2006 (Radian) | | | | | |
3.99%, 5/7/07 | | 5,000 | | 5,000 | |
York County School District No 4, SC, Fort Mill TOCs, Series 2004 F | | | | | |
3.96%, 5/7/07 | | 7,370 | | 7,370 | |
Yorkville United City Special Services Area 2004-106,IL, Special Tax Series 2004 | | | | | |
3.96%, 5/7/07 | | 3,000 | | 3,000 | |
| | | | 1,044,340 | |
Total Tax-Exempt Instruments (Cost $1,316,041) | | | | 1,316,041 | |
Total Investments (99.6%) (Cost $1,316,041) | | | | 1,316,041 | |
Other Assets in Excess of Liabilities (0.4%) | | | | 5,922 | |
Net Assets (100%) | | | | $ | 1,321,963 | |
| | | | | | | |
(e) The rates shown are the effective yields at the date of purchase.
AGC | — Assured Guaranty Corp. |
Ambac | — Ambac Assurance Corp. |
BANs | — Bond Anticipation Notes |
CIFG | — CDC IXIS Financial Guaranty |
COPs | — Certificates of Participation |
FGIC | — Financial Guaranty Insurance Co. |
FHA | — Federal Housing Administration |
FSA | — Financial Security Assurance, Inc. |
Floater-TRs | — Floating Rate Trust Receipts |
MBIA | — MBIA Insurance Corp. |
P-FLOATs | — Puttable Floating Option Tax-Exempt Receipts |
PUTTERs | — Puttable Tax-exempt Receipts |
Radian | — Radian Group, Inc. |
RANs | — Revenue Anticipation Notes |
ROCs | — Reset Option Certificates |
TANs | — Tax Anticipation Notes |
TAWs | — Tax Anticipation Warrants |
TOBs | — Tender Option Bonds |
TOCs | — Tender Option Certificates |
TRANs | — Tax and Revenue Anticipation Notes |
SUMMARY OF TAX-EXEMPT INSTRUMENTS BY STATE/TERRITORY
STATE/TERRITORY | | Value
(000) | | Percent
of Net
Assets | |
Illinois | | $ | 168,763 | | 12.8 | % |
Washington | | 123,615 | | 9.4 | % |
Georgia | | 123,385 | | 9.3 | % |
Texas | | 88,730 | | 6.7 | % |
Florida | | 70,179 | | 5.3 | % |
North Carolina | | 58,025 | | 4.4 | % |
Tennessee | | 57,820 | | 4.4 | % |
Missouri | | 57,450 | | 4.3 | % |
New York | | 54,893 | | 4.2 | % |
Multi-State | | 51,450 | | 3.9 | % |
Pennsylvania | | 44,495 | | 3.4 | % |
Ohio | | 40,960 | | 3.1 | % |
Utah | | 38,210 | | 2.9 | % |
South Carolina | | 37,373 | | 2.8 | % |
Indiana | | 36,086 | | 2.7 | % |
Kentucky | | 30,950 | | 2.3 | % |
Alabama | | 27,000 | | 2.0 | % |
Mississippi | | 27,000 | | 2.0 | % |
New Hampshire | | 19,430 | | 1.5 | % |
New Jersey | | 19,045 | | 1.4 | % |
Rhode Island | | 14,141 | | 1.1 | % |
Wisconsin | | 13,000 | | 1.0 | % |
Colorado | | 11,100 | | 0.8 | % |
New Mexico | | 10,025 | | 0.8 | % |
Massachusetts | | 10,003 | | 0.8 | % |
Delaware | | 9,800 | | 0.7 | % |
Hawaii | | 8,880 | | 0.7 | % |
Arizona | | 8,660 | | 0.7 | % |
Iowa | | 8,500 | | 0.6 | % |
Kansas | | 8,015 | | 0.6 | % |
Minnesota | | 6,400 | | 0.5 | % |
Nevada | | 5,270 | | 0.4 | % |
Vermont | | 5,250 | | 0.4 | % |
District of Columbia | | 5,013 | | 0.4 | % |
Louisiana | | 4,700 | | 0.4 | % |
Oklahoma | | 4,325 | | 0.3 | % |
Oregon | | 4,100 | | 0.3 | % |
Michigan | | 3,000 | | 0.2 | % |
Nebraska | | 1,000 | | 0.1 | % |
| | $ | 1,316,041 | | 99.6 | % |
The accompanying notes are an integral part of the financial statements.
27
2007 Semi-Annual Report |
|
April 30, 2007 (unaudited) |
Portfolio of Investments (cont’d)
Tax-Exempt Portfolio
Graphic Presentation of Portfolio Holdings
The following graph depicts the Portfolio’s holdings by investment type, as a percentage of total investments.
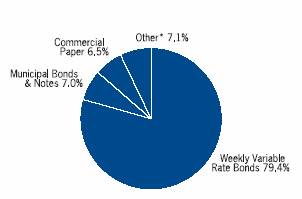
* Investment types which do not appear in the above graph, as well as those which represent less than 5% of total investments, if applicable, are included in the category labeled “Other”.
The accompanying notes are an integral part of the financial statements.
28
| 2007 Semi-Annual Report |
| |
| April 30, 2007 (unaudited) |
Statements of Assets and Liabilities
| | Money Market
Portfolio
(000) | | Prime
Portfolio
(000) | | Government
Portfolio
(000) | | Treasury
Portfolio
(000) | | Tax-Exempt
Portfolio
(000) | |
Assets: | | | | | | | | | | | |
Investments, at Cost: | | $ | 9,260,836 | | $ | 28,150,133 | | $ | 3,163,765 | | $ | 218,346 | | $ | 1,316,041 | |
Investments, at Value:(1) | | 9,260,836 | | 28,150,133 | | 3,163,765 | | 218,346 | | 1,316,041 | |
Cash | | 5 | | — | | 5,000 | | @— | | 65 | |
Interest Receivable | | 21,553 | | 52,251 | | 4,857 | | 48 | | 7,055 | |
OtherAssets | | 47 | | 206 | | 55 | | 36 | | 6 | |
Total Assets | | 9,282,441 | | 28,202,590 | | 3,173,677 | | 218,430 | | 1,323,167 | |
Liabilities: | | | | | | | | | | | |
Payable for Investments Purchased | | 56,527 | | — | | — | | — | | — | |
Dividends Declared | | 10,102 | | 77,035 | | 6,826 | | 237 | | 1,011 | |
Investment Advisory Fees Payable | | 374 | | 1,479 | | 132 | | — | | 25 | |
Payable for Administrative Fees | | 317 | | 1,189 | | 132 | | 8 | | 59 | |
Payable for Custodian Fees | | 38 | | 154 | | — | | 10 | | 7 | |
Bank Overdraft Payable | | — | | 61 | | — | | — | | — | |
Shareholder Administration Plan Fees Payable — Service Class | | @— | | 12 | | @— | | @— | | @— | |
Shareholder Administration Plan Fees Payable — Investor Class | | @— | | 3 | | 4 | | @— | | @— | |
Shareholder Administration Plan Fees Payable — Administrative Class | | 2 | | 1 | | 3 | | 1 | | @— | |
Service and Shareholder Administration Plan Fees Payable — Advisory Class | | 15 | | 32 | | 23 | | 32 | | 5 | |
Distribution and Shareholder Service Plans Fees Payable — Participant Class | | @— | | @— | | @— | | @— | | @— | |
Distribution and Shareholder Service Plans Fees Payable — Cash Management Class | | 49 | | — | | — | | @— | | 56 | |
Other Liabilities | | 136 | | 602 | | 102 | | 29 | | 41 | |
Total Liabilities | | 67,560 | | 80,568 | | 7,222 | | 317 | | 1,204 | |
Net Assets | | $ | 9,214,881 | | $ | 28,122,022 | | $ | 3,166,455 | | $ | 218,113 | | $ | 1,321,963 | |
Net Assets Consist Of: | | | | | | | | | | | |
Paid-in Capital | | $ | 9,214,889 | | $ | 28,122,010 | | $ | 3,166,451 | | $ | 218,113 | | $ | 1,321,970 | |
Undistributed (Distributions in Excess of) Net Investment Income | | @— | | 4 | | 4 | | 1 | | — | |
Accumulated Net Realized Gain (Loss) | | (8 | ) | 8 | | @— | | (1 | ) | (7 | ) |
Net Assets | | $ | 9,214,881 | | $ | 28,122,022 | | $ | 3,166,455 | | $ | 218,113 | | $ | 1,321,963 | |
(1) Including: | | | | | | | | | | | |
Repurchase Agreements, at Value: | | $ | 503,700 | | $ | 3,776,300 | | $ | 2,600,095 | | $ | 216,378 | | $ | — | |
| | | | | | | | | | | | | | | | |
The accompanying notes are an integral part of the financial statements.
29
2007 Semi-Annual Report |
|
April 30, 2007 (unaudited) |
Statements of Assets and Liabilities (cont’d)
| | Money Market
Portfolio
(000) | | Prime
Portfolio
(000) | | Government
Portfolio
(000) | | Treasury
Portfolio
(000) | | Tax-Exempt
Portfolio
(000) | |
INSTITUTIONAL CLASS: | | | | | | | | | | | |
Net Assets | | $ | 8,885,503 | | $ | 27,587,218 | | $ | 3,006,387 | | $ | 30,757 | | $ | 1,084,448 | |
Shares Outstanding $0.01 par value shares of beneficial interest (unlimited number of shares authorized) (not in 000’s) | | 8,885,519,374 | | 27,587,205,961 | | 3,006,387,501 | | 30,757,040 | | 1,084,455,640 | |
Net Asset Value, Offering and Redemption Price Per Share | | $ | 1.00 | | $ | 1.00 | | $ | 1.00 | | $ | 1.00 | | $ | 1.00 | |
| | | | | | | | | | | |
SERVICE CLASS: | | | | | | | | | | | |
Net Assets | | $ | 10,132 | | $ | 346,943 | | $ | 117 | | $ | 100 | | $ | 100 | |
Shares Outstanding $0.01 par value shares of beneficial interest (unlimited number of shares authorized) (not in 000’s) | | 10,131,787 | | 346,943,342 | | 116,926 | | 100,000 | | 100,000 | |
Net Asset Value, Offering and Redemption Price Per Share | | $ | 1.00 | | $ | 1.00 | | $ | 1.00 | | $ | 1.00 | | $ | 1.00 | |
| | | | | | | | | | | |
INVESTOR CLASS: | | | | | | | | | | | |
Net Assets | | $ | 274 | | $ | 16,588 | | $ | 35,482 | | $ | 100 | | $ | 118 | |
Shares Outstanding $0.01 par value shares of beneficial interest (unlimited number of shares authorized) (not in 000’s) | | 273,632 | | 16,587,744 | | 35,482,024 | | 100,000 | | 118,738 | |
Net Asset Value, Offering and Redemption Price Per Share | | $ | 1.00 | | $ | 1.00 | | $ | 1.00 | | $ | 1.00 | | $ | 1.00 | |
| | | | | | | | | | | |
ADMINISTRATIVE CLASS: | | | | | | | | | | | |
Net Assets | | $ | 18,237 | | $ | 5,649 | | $ | 22,905 | | $ | 10,165 | | $ | 100 | |
Shares Outstanding $0.01 par value shares of beneficial interest (unlimited number of shares authorized) (not in 000’s) | | 18,236,576 | | 5,649,391 | | 22,904,740 | | 10,165,234 | | 100,000 | |
Net Asset Value, Offering and Redemption Price Per Share | | $ | 1.00 | | $ | 1.00 | | $ | 1.00 | | $ | 1.00 | | $ | 1.00 | |
| | | | | | | | | | | |
ADVISORY CLASS: | | | | | | | | | | | |
Net Assets | | $ | 107,266 | | $ | 165,524 | | $ | 101,464 | | $ | 171,387 | | $ | 22,330 | |
Shares Outstanding $0.01 par value shares of beneficial interest (unlimited number of shares authorized) (not in 000’s) | | 107,266,331 | | 165,523,461 | | 101,463,560 | | 171,387,064 | | 22,329,597 | |
Net Asset Value, Offering and Redemption Price Per Share | | $ | 1.00 | | $ | 1.00 | | $ | 1.00 | | $ | 1.00 | | $ | 1.00 | |
| | | | | | | | | | | |
PARTICIPANT CLASS: | | | | | | | | | | | |
Net Assets | | $ | 100 | | $ | 100 | | $ | 100 | | $ | 524 | | $ | 100 | |
Shares Outstanding $0.01 par value shares of beneficial interest (unlimited number of shares authorized) (not in 000’s) | | 100,000 | | 100,000 | | 100,000 | | 523,124 | | 100,000 | |
Net Asset Value, Offering and Redemption Price Per Share | | $ | 1.00 | | $ | 1.00 | | $ | 1.00 | | $ | 1.00 | | $ | 1.00 | |
| | | | | | | | | | | |
CASH MANAGEMENT CLASS: | | | | | | | | | | | |
Net Assets | | $ | 193,369 | | $ | — | | $ | — | | $ | 5,080 | | $ | 214,767 | |
Shares Outstanding $0.01 par value shares of beneficial interest (unlimited number of shares authorized) (not in 000’s) | | 193,369,475 | | — | | — | | 5,079,650 | | 214,766,872 | |
Net Asset Value, Offering and Redemption Price Per Share | | $ | 1.00 | | $ | — | | $ | — | | $ | 1.00 | | $ | 1.00 | |
@ Amount is less than $500.
The accompanying notes are an integral part of the financial statements.
30
| 2007 Semi-Annual Report |
| |
| April 30, 2007 (unaudited) |
Statements of Operations
For the Six Months Ended April 30, 2007
| | Money Market
Portfolio
(000) | | Prime
Portfolio
(000) | | Government
Portfolio
(000) | | Treasury
Portfolio
(000) | | Tax-Exempt
Portfolio
(000) | |
Investment Income: | | | | | | | | | | | |
Interest | | $ | 182,942 | | $ | 678,336 | | $ | 89,124 | | $ | 3,047 | | $ | 20,185 | |
Expenses: | | | | | | | | | | | |
Investment Advisory Fees (Note B) | | 5,093 | | 18,913 | | 2,506 | | 86 | | 826 | |
Administration Fees (Note C) | | 1,701 | | 6,321 | | 838 | | 29 | | 276 | |
Registration and Filing Fees | | 284 | | 509 | | 268 | | 255 | | 273 | |
Custodian Fees (Note E) | | 53 | | 168 | | @— | | 10 | | 22 | |
Professional Fees | | 80 | | 279 | | 58 | | 27 | | 24 | |
Trustees’ Fees and Expenses | | 32 | | 122 | | 17 | | 1 | | 6 | |
Shareholder Reporting Fees | | 17 | | 61 | | 16 | | 5 | | 7 | |
Bank Overdraft Expense | | 24 | | 59 | | 15 | | 1 | | 7 | |
Shareholder Administration Plan Fees — Service Class (Note D) | | 1 | | 67 | | @— | | @— | | @— | |
Shareholder Administration Plan Fees — Investor Class (Note D) | | @— | | 6 | | 171 | | @— | | 2 | |
Shareholder Administration Plan Fees — Administrative Class (Note D) | | 4 | | 2 | | 30 | | 1 | | @— | |
Service and Shareholder Administration Plan Fees — Advisory Class (Note D) | | 40 | | 106 | | 185 | | 125 | | 22 | |
Distribution and Shareholder Service Plans Fees — Participant Class (Note D) | | 1 | | @— | | @— | | 1 | | @— | |
Distribution and Shareholder Service Plans Fees — Cash Management Class (Note D) | | 309 | | — | | — | | 1 | | 313 | |
Other Expenses | | 67 | | 277 | | 55 | | 23 | | 16 | |
Total Expenses | | 7,706 | | 26,890 | | 4,159 | | 565 | | 1,794 | |
Waiver of Investment Advisory Fees (Note B) | | (3,364 | ) | (11,520 | ) | (1,831 | ) | (86 | ) | (826 | ) |
Expenses Reimbursed by Adviser (Note B) | | — | | — | | — | | (316 | ) | (55 | ) |
Expense Offset (Note E) | | (37 | ) | @— | | @— | | (5 | ) | (19 | ) |
Net Expenses | | 4,305 | | 15,370 | | 2,328 | | 158 | | 894 | |
Net Investment Income (Loss) | | 178,637 | | 662,966 | | 86,796 | | 2,889 | | 19,291 | |
Realized Gain (Loss): | | | | | | | | | | | |
Investments | | (8 | ) | (13 | ) | @— | | @— | | 2 | |
Net Increase (Decrease) in Net Assets Resulting from Operations | | $ | 178,629 | | $ | 662,953 | | $ | 86,796 | | $ | 2,889 | | $ | 19,293 | |
@ Amount is less than $500.
The accompanying notes are an integral part of the financial statements.
31
2007 Semi-Annual Report |
|
April 30, 2007 |
Statements of Changes in Net Assets
| | Money Market
Portfolio | | Prime
Portfolio | |
| | Six Months
Ended
April 30,
2007
(unaudited)
(000) | | Year Ended
October 31,
2006
(000) | | Six Months
Ended
April 30,
2007
(unaudited)
(000) | | Year Ended
October 31,
2006
(000) | |
Increase (Decrease) in Net Assets Operations: | | | | | | | | | |
Net Investment Income | | $ | 178,637 | | $ | 194,495 | | $ | 662,966 | | $ | 794,614 | |
Net Realized Gain (Loss) | | (8 | ) | 12 | | (13 | ) | 108 | |
Net Increase (Decrease) in Net Assets Resulting from Operations | | 178,629 | | 194,507 | | 662,953 | | 794,722 | |
Distributions from and/or in Excess of: | | | | | | | | | |
Institutional Class: | | | | | | | | | |
Net Investment Income | | (172,472 | ) | (192,913 | ) | (653,469 | ) | (789,089 | ) |
Net Realized Gain | | — | | (12 | ) | (8 | ) | (68 | ) |
Service Class: | | | | | | | | | |
Net Investment Income | | (89 | ) | (14 | ) | (6,983 | ) | (2,333 | ) |
Net Realized Gain | | — | | @— | | @— | | @— | |
Investor Class: | | | | | | | | | |
Net Investment Income | | (7 | ) | (8 | ) | (318 | ) | (609 | ) |
Net Realized Gain | | — | | @— | | @— | | @— | |
Administrative Class: | | | | | | | | | |
Net Investment Income | | (139 | ) | (5 | ) | (62 | ) | (5 | ) |
Net Realized Gain | | — | | @— | | @— | | @— | |
Advisory Class: | | | | | | | | | |
Net Investment Income | | (810 | ) | (430 | ) | (2,131 | ) | (2,576 | ) |
Net Realized Gain | | — | | @— | | @— | | @— | |
Participant Class: | | | | | | | | | |
Net Investment Income | | (5 | ) | (7 | ) | (2 | ) | (4 | ) |
Net Realized Gain | | — | | @— | | @— | | @— | |
Cash Management Class: | | | | | | | | | |
Net Investment Income | | (5,115 | ) | (1,118 | ) | — | | — | |
Net Realized Gain | | — | | @— | | — | | — | |
Total Distributions | | (178,637 | ) | (194,507 | ) | (662,973 | ) | (794,684 | ) |
Capital Share Transactions:(1) | | | | | | | | | |
Institutional Class: | | | | | | | | | |
Subscribed | | 31,502,351 | | 39,416,745 | | 127,363,288 | | 172,593,201 | |
Distributions Reinvested | | 134,976 | | 98,400 | | 291,846 | | 369,603 | |
Redeemed | | (28,298,233 | ) | (37,050,961 | ) | (117,609,973 | ) | (169,386,266 | ) |
Service Class: | | | | | | | | | |
Subscribed | | 18,045 | | 2,202 | | 1,083,336 | | 1,913,894 | |
Distributions Reinvested | | 87 | | — | | 6,653 | | 29 | |
Redeemed | | (8,100 | ) | (2,202 | ) | (928,488 | ) | (1,738,937 | ) |
Investor Class: | | | | | | | | | |
Subscribed | | 54 | | 249 | | 108,465 | | 85,351 | |
Distributions Reinvested | | 6 | | 3 | | 350 | | 640 | |
Redeemed | | (74 | ) | (64 | ) | (97,727 | ) | (100,491 | ) |
Administrative Class: | | | | | | | | | |
Subscribed | | 18,061 | | — | | 12,031 | | — | |
Distributions Reinvested | | 136 | | — | | 59 | | — | |
Redeemed | | (61 | ) | — | | (6,541 | ) | — | |
Advisory Class: | | | | | | | | | |
Subscribed | | 880,123 | | 251,006 | | 1,205,916 | | 493,671 | |
Distributions Reinvested | | 107 | | 4 | | 870 | | 1,401 | |
Redeemed | | (784,605 | ) | (239,448 | ) | (1,103,806 | ) | (501,729 | ) |
Participant Class: | | | | | | | | | |
Subscribed | | 210 | | 1,971 | | — | | — | |
Distributions Reinvested | | 3 | | @— | | — | | — | |
Redeemed | | (384 | ) | (1,800 | ) | — | | — | |
| | | | | | | | | | | | | |
The accompanying notes are an integral part of the financial statements.
32
| 2007 Semi-Annual Report |
| |
| April 30, 2007 |
Statements of Changes in Net Assets (cont’d)
| | Money Market
Portfolio | | Prime
Portfolio | |
| | Six Months
Ended
April 30,
2007
(unaudited)
(000) | | Year Ended
October 31,
2006
(000) | | Six Months
Ended
April 30,
2007
(unaudited)
(000) | | Year Ended
October 31,
2006
(000) | |
| | | | | | | | | |
Cash Management Class: | | | | | | | | | |
Subscribed | | 259,098 | | 285,485 | | — | | — | |
Distributions Reinvested | | 6,016 | | 179 | | — | | — | |
Redeemed | | (293,249 | ) | (64,261 | ) | — | | — | |
Net Increase (Decrease) in Net Assets Resulting from Capital Share Transactions | | 3,434,567 | | 2,697,508 | | 10,326,279 | | 3,730,367 | |
Total Increase (Decrease) in Net Assets | | 3,434,559 | | 2,697,508 | | 10,326,259 | | 3,730,405 | |
Net Assets: | | | | | | | | | |
Beginning of Period | | 5,780,322 | | 3,082,814 | | 17,795,763 | | 14,065,358 | |
End of Period | | $ | 9,214,881 | | $ | 5,780,322 | | $ | 28,122,022 | | $ | 17,795,763 | |
Undistributed (Distributions in Excess of) Net Investment Income Included in End of Period Net Assets | | $ | @— | | $ | @— | | $ | 4 | | $ | 2 | |
(1) Capital Share Transactions: | | | | | | | | | |
Institutional Class: | | | | | | | | | |
Shares Subscribed | | 31,502,351 | | 39,416,745 | | 127,363,288 | | 172,593,196 | |
Shares Issued on Distributions Reinvested | | 134,976 | | 98,400 | | 291,846 | | 369,603 | |
Shares Redeemed | | (28,298,230 | ) | (37,050,959 | ) | (117,609,973 | ) | (169,386,261 | ) |
Net Increase (Decrease) in Institutional Class Shares Outstanding | | 3,339,097 | | 2,464,186 | | 10,045,161 | | 3,576,538 | |
Service Class: | | | | | | | | | |
Shares Subscribed | | 18,045 | | 2,202 | | 1,083,336 | | 1,913,894 | |
Shares Issued on Distributions Reinvested | | 87 | | — | | 6,653 | | 29 | |
Shares Redeemed | | (8,100 | ) | (2,202 | ) | (928,488 | ) | (1,738,937 | ) |
Net Increase (Decrease) in Service Class Shares Outstanding | | 10,032 | | — | | 161,501 | | 174,986 | |
Investor Class: | | | | | | | | | |
Shares Subscribed | | 54 | | 249 | | 108,465 | | 85,351 | |
Shares Issued on Distributions Reinvested | | 6 | | 3 | | 350 | | 640 | |
Shares Redeemed | | (74 | ) | (64 | ) | (97,727 | ) | (100,491 | ) |
Net Increase (Decrease) in Investor Class Shares Outstanding | | (14 | ) | 188 | | 11,088 | | (14,500 | ) |
Administrative Class: | | | | | | | | | |
Shares Subscribed | | 18,061 | | — | | 12,031 | | — | |
Shares Issued on Distributions Reinvested | | 136 | | — | | 59 | | — | |
Shares Redeemed | | (61 | ) | — | | (6,541 | ) | — | |
Net Increase (Decrease) in Administrative Class Shares Outstanding | | 18,136 | | — | | 5,549 | | — | |
Advisory Class: | | | | | | | | | |
Shares Subscribed | | 880,123 | | 251,006 | | 1,205,916 | | 493,671 | |
Shares Issued on Distributions Reinvested | | 107 | | 4 | | 870 | | 1,401 | |
Shares Redeemed | | (784,605 | ) | (239,448 | ) | (1,103,806 | ) | (501,729 | ) |
Net Increase (Decrease) in Advisory Class Shares Outstanding | | 95,625 | | 11,562 | | 102,980 | | (6,657 | ) |
Participant Class: | | | | | | | | | |
Shares Subscribed | | 210 | | 1,971 | | — | | — | |
Shares Issued on Distributions Reinvested | | 3 | | @— | | — | | — | |
Shares Redeemed | | (384 | ) | (1,800 | ) | — | | — | |
Net Increase (Decrease) in Participant Class Shares Outstanding | | (171 | ) | 171 | | — | | — | |
Cash Management Class: | | | | | | | | | |
Shares Subscribed | | 259,098 | | 285,485 | | — | | — | |
Shares Issued on Distributions Reinvested | | 6,016 | | 179 | | — | | — | |
Shares Redeemed | | (293,248 | ) | (64,261 | ) | — | | — | |
Net Increase (Decrease) in Cash Management Class Shares Outstanding | | (28,134 | ) | 221,403 | | — | | — | |
@ Amount is less than $500 or 500 shares.
The accompanying notes are an integral part of the financial statements.
33
2007 Semi-Annual Report |
|
April 30, 2007 |
Statements of Changes in Net Assets (cont’d)
| | Government | | Treasury | | Tax-Exempt | |
| | Portfolio | | Portfolio | | Portfolio | |
| | Six Months | | | | Six Months | | | | Six Months | | | |
| | Ended | | | | Ended | | | | Ended | | | |
| | April 30, | | Year Ended | | April 30, | | Year Ended | | April 30, | | Year Ended | |
| | 2007 | | October 31, | | 2007 | | October 31, | | 2007 | | October 31, | |
| | (unaudited) | | 2006 | | (unaudited) | | 2006 | | (unaudited) | | 2006 | |
| | (000) | | (000) | | (000) | | (000) | | (000) | | (000) | |
Increase (Decrease) in Net Assets | | | | | | | | | | | | | |
Operations: | | | | | | | | | | | | | |
Net Investment Income | | $ | 86,796 | | $ | 161,165 | | $ | 2,889 | | $ | 1,816 | | $ | 19,291 | | $ | 26,940 | |
Net Realized Gain (Loss) | | @— | | 4 | | @— | | (1 | ) | 2 | | (9 | ) |
Net Increase (Decrease) in Net Assets Resulting from Operations | | 86,796 | | 161,169 | | 2,889 | | 1,815 | | 19,293 | | 26,931 | |
Distributions from and/or in Excess of: | | | | | | | | | | | | | |
Institutional Class: | | | | | | | | | | | | | |
Net Investment Income | | (73,362 | ) | (136,224 | ) | (327 | ) | (444 | ) | (15,526 | ) | (25,847 | ) |
Service Class: | | | | | | | | | | | | | |
Net Investment Income | | (3 | ) | (21 | ) | (3 | ) | (5 | ) | (2 | ) | (3 | ) |
Investor Class: | | | | | | | | | | | | | |
Net Investment Income | | (8,750 | ) | (16,462 | ) | (2 | ) | (5 | ) | (63 | ) | (8 | ) |
Administrative Class: | | | | | | | | | | | | | |
Net Investment Income | | (1,005 | ) | (1,580 | ) | (39 | ) | (4 | ) | (2 | ) | (3 | ) |
Advisory Class: | | | | | | | | | | | | | |
Net Investment Income | | (3,674 | ) | (6,873 | ) | (2,499 | ) | (1,347 | ) | (294 | ) | (496 | ) |
Participant Class: | | | | | | | | | | | | | |
Net Investment Income | | (2 | ) | (5 | ) | (11 | ) | (7 | ) | (2 | ) | (3 | ) |
Cash Management Class: | | | | | | | | | | | | | |
Net Investment Income | | — | | — | | (8 | ) | (4 | ) | (3,402 | ) | (580 | ) |
Total Distributions | | (86,796 | ) | (161,165 | ) | (2,889 | ) | (1,816 | ) | (19,291 | ) | (26,940 | ) |
Capital Share Transactions:(1) | | | | | | | | | | | | | |
Institutional Class: | | | | | | | | | | | | | |
Subscribed | | 12,283,368 | | 29,866,102 | | 196,026 | | 159,544 | | 5,318,452 | | 8,285,785 | |
Distributions Reinvested | | 43,097 | | 88,615 | | 303 | | 485 | | 13,428 | | 21,519 | |
Redeemed | | (11,585,690 | ) | (29,885,619 | ) | (167,761 | ) | (227,925 | ) | (4,919,947 | ) | (8,765,270 | ) |
Service Class: | | | | | | | | | | | | | |
Subscribed | | — | | — | | — | | — | | — | | — | |
Distributions Reinvested | | @— | | 17 | | — | | — | | — | | — | |
Redeemed | | — | | (385 | ) | — | | — | | — | | — | |
Investor Class: | | | | | | | | | | | | | |
Subscribed | | 3,825,889 | | 7,654,990 | | — | | — | | 5,000 | | 2,948 | |
Distributions Reinvested | | 3,743 | | 5,315 | | — | | — | | 66 | | — | |
Redeemed | | (4,339,826 | ) | (7,393,641 | ) | — | | — | | (8,000 | ) | @— | |
Administrative Class: | | | | | | | | | | | | | |
Subscribed | | 275,778 | | 986,708 | | 10,029 | | — | | — | | — | |
Distributions Reinvested | | 623 | | 588 | | 36 | | — | | — | | — | |
Redeemed | | (302,872 | ) | (948,796 | ) | — | | — | | — | | — | |
Advisory Class: | | | | | | | | | | | | | |
Subscribed | | 488,541 | | 1,455,160 | | 206,657 | | 174,566 | | 46,542 | | 177,722 | |
Distributions Reinvested | | 1,408 | | 2,481 | | 1,537 | | 373 | | 107 | | 424 | |
Redeemed | | (515,246 | ) | (1,462,394 | ) | (113,889 | ) | (115,432 | ) | (56,461 | ) | (244,828 | ) |
Participant Class: | | | | | | | | | | | | | |
Subscribed | | — | | — | | 202 | | 333 | | — | | @— | |
Distributions Reinvested | | — | | @— | | 10 | | 2 | | — | | @— | |
Redeemed | | — | | (47 | ) | (19 | ) | (105 | ) | — | | (2 | ) |
Cash Management Class: | | | | | | | | | | | | | |
Subscribed | | — | | — | | 6,075 | | — | | 635,703 | | 274,332 | |
Distributions Reinvested | | — | | — | | 6 | | — | | 3,885 | | 94 | |
Redeemed | | — | | — | | (1,101 | ) | — | | (613,561 | ) | (85,786 | ) |
Net Increase (Decrease) in Net Assets Resulting from Capital Share Transactions | | 178,813 | | 369,094 | | 138,111 | | (8,159 | ) | 425,214 | | (333,062 | ) |
Total Increase (Decrease) in Net Assets | | 178,813 | | 369,098 | | 138,111 | | (8,160 | ) | 425,216 | | (333,071 | ) |
| | | | | | | | | | | | | | | | | | | |
The accompanying notes are an integral part of the financial statements.
34
| 2007 Semi-Annual Report |
| |
| April 30, 2007 |
Statements of Changes in Net Assets (cont’d)
| | Government | | Treasury | | Tax-Exempt | |
| | Portfolio | | Portfolio | | Portfolio | |
| | Six Months | | | | Six Months | | | | Six Months | | | |
| | Ended | | | | Ended | | | | Ended | | | |
| | April 30, | | Year Ended | | April 30, | | Year Ended | | April 30, | | Year Ended | |
| | 2007 | | October 31, | | 2007 | | October 31, | | 2007 | | October 31, | |
| | (unaudited) | | 2006 | | (unaudited) | | 2006 | | (unaudited) | | 2006 | |
| | (000) | | (000) | | (000) | | (000) | | (000) | | (000) | |
Net Assets: | | | | | | | | | | | | | |
Beginning of Period | | 2,987,642 | | 2,618,544 | | 80,002 | | 88,162 | | 896,747 | | 1,229,818 | |
End of Period | | $ | 3,166,455 | | $ | 2,987,642 | | $ | 218,113 | | $ | 80,002 | | $ | 1,321,963 | | $ | 896,747 | |
Undistributed (Distributions in Excess of) Net Investment Income Included in End of Period Net Assets | | $ | 4 | | $ | 4 | | $ | 1 | | $ | 1 | | $ | — | | $ | — | |
(1) Capital Share Transactions: | | | | | | | | | | | | | |
Institutional Class: | | | | | | | | | | | | | |
Shares Subscribed | | 12,283,368 | | 29,866,102 | | 196,026 | | 159,544 | | 5,318,452 | | 8,285,785 | |
Shares Issued on Distributions Reinvested | | 43,097 | | 88,615 | | 303 | | 485 | | 13,428 | | 21,519 | |
Shares Redeemed | | (11,585,690 | ) | (29,885,619 | ) | (167,761 | ) | (227,925 | ) | (4,919,947 | ) | (8,765,270 | ) |
Net Increase (Decrease) in Institutional Class Shares Outstanding | | 740,775 | | 69,098 | | 28,568 | | (67,896 | ) | 411,933 | | (457,966 | ) |
Service Class: | | | | | | | | | | | | | |
Shares Subscribed | | — | | — | | — | | — | | — | | — | |
Shares Issued on Distributions Reinvested | | @— | | 17 | | — | | — | | — | | — | |
Shares Redeemed | | — | | (385 | ) | — | | — | | — | | — | |
Net Increase (Decrease) in Service Class Shares Outstanding | | @— | | (368 | ) | — | | — | | — | | — | |
Investor Class: | | | | | | | | | | | | | |
Shares Subscribed | | 3,825,890 | | 7,654,990 | | — | | — | | 5,000 | | 2,948 | |
Shares Issued on Distributions Reinvested | | 3,743 | | 5,315 | | — | | — | | 66 | | — | |
Shares Redeemed | | (4,339,826 | ) | (7,393,641 | ) | — | | — | | (8,000 | ) | @— | |
Net Increase (Decrease) in Investor Class Shares Outstanding | | (510,193 | ) | 266,664 | | — | | — | | (2,934 | ) | 2,948 | |
Administrative Class: | | | | | | | | | | | | | |
Shares Subscribed | | 275,777 | | 986,708 | | 10,029 | | — | | — | | — | |
Shares Issued on Distributions Reinvested | | 623 | | 588 | | 36 | | — | | — | | — | |
Shares Redeemed | | (302,872 | ) | (948,796 | ) | — | | — | | — | | — | |
Net Increase (Decrease) in Administrative Class Shares Outstanding | | (26,472 | ) | 38,500 | | 10,065 | | — | | — | | — | |
Advisory Class: | | | | | | | | | | | | | |
Shares Subscribed | | 488,541 | | 1,455,160 | | 206,657 | | 174,566 | | 46,543 | | 177,722 | |
Shares Issued on Distributions Reinvested | | 1,408 | | 2,481 | | 1,537 | | 373 | | 107 | | 424 | |
Shares Redeemed | | (515,246 | ) | (1,462,394 | ) | (113,889 | ) | (115,432 | ) | (56,461 | ) | (244,828 | ) |
Net Increase (Decrease) in Advisory Class Shares Outstanding | | (25,297 | ) | (4,753 | ) | 94,305 | | 59,507 | | (9,811 | ) | (66,682 | ) |
Participant Class: | | | | | | | | | | | | | |
Shares Subscribed | | — | | — | | 202 | | 333 | | — | | @— | |
Shares Issued on Distributions Reinvested | | — | | @— | | 10 | | 2 | | — | | @— | |
Shares Redeemed | | — | | (47 | ) | (19 | ) | (105 | ) | — | | (2 | ) |
Net Increase (Decrease) in Participant Class Shares Outstanding | | — | | (47 | ) | 193 | | 230 | | — | | (2 | ) |
Cash Management Class: | | | | | | | | | | | | | |
Shares Subscribed | | — | | — | | 6,075 | | — | | 635,703 | | 274,332 | |
Shares Issued on Distributions Reinvested | | — | | — | | 6 | | — | | 3,885 | | 94 | |
Shares Redeemed | | — | | — | | (1,101 | ) | — | | (613,561 | ) | (85,786 | ) |
Net Increase (Decrease) in Cash Management Class Shares Outstanding | | — | | — | | 4,980 | | — | | 26,027 | | 188,640 | |
@ Amount is less than $500 or 500 shares.
The accompanying notes are an integral part of the financial statements.
35
2007 Semi-Annual Report |
| |
April 30, 2007 (unaudited) |
Financial Highlights
| | Net Asset
Value,
Beginning
of Period | | Net
Investment
Income | | Net
Realized and
Unrealized Gain
(Loss) on
Investments | | Distributions
From Net
Investment
Income | | Distributions
From Net
Realized Gain | | Net Asset
Value,
End of
Period | |
Money Market Portfolio: | | | | | | | | | | | | | |
Institutional Class | | | | | | | | | | | | | |
Six Months Ended 4/30/07 (unaudited) | | $ | 1.000 | | $ | 0.026 | | — | | $ | (0.026 | ) | — | | $ | 1.000 | |
Year Ended 10/31/06 | | 1.000 | | 0.048 | | $ | 0.000 | ^ | (0.048 | ) | $ | (0.000 | )^ | 1.000 | |
Year Ended 10/31/05 | | 1.000 | | 0.028 | | — | | (0.028 | ) | — | | 1.000 | |
2/2/04** through 10/31/04 | | 1.000 | | 0.009 | | — | | (0.009 | ) | — | | 1.000 | |
Service Class | | | | | | | | | | | | | |
Six Months Ended 4/30/07 (unaudited) | | $ | 1.000 | | $ | 0.026 | | — | | $ | (0.026 | ) | — | | $ | 1.000 | |
Year Ended 10/31/06 | | 1.000 | | 0.047 | | $ | 0.000 | ^ | (0.047 | ) | $ | (0.000 | )^ | 1.000 | |
Year Ended 10/31/05 | | 1.000 | | 0.028 | | — | | (0.028 | ) | — | | 1.000 | |
Investor Class | | | | | | | | | | | | | |
Six Months Ended 4/30/07 (unaudited) | | $ | 1.000 | | $ | 0.026 | | — | | $ | (0.026 | ) | — | | $ | 1.000 | |
Year Ended 10/31/06 | | 1.000 | | 0.047 | | $ | 0.000 | ^ | (0.047 | ) | $ | (0.000 | )^ | 1.000 | |
Year Ended 10/31/051 | | 1.000 | | 0.027 | | — | | (0.027 | ) | — | | 1.000 | |
Administrative Class | | | | | | | | | | | | | |
Six Months Ended 4/30/07 (unaudited) | | $ | 1.000 | | $ | 0.025 | | — | | $ | (0.025 | ) | — | | $ | 1.000 | |
Year Ended 10/31/06 | | 1.000 | | 0.046 | | $ | 0.000 | ^ | (0.046 | ) | $ | (0.000 | )^ | 1.000 | |
Year Ended 10/31/05 | | 1.000 | | 0.027 | | — | | (0.027 | ) | — | | 1.000 | |
Advisory Class | | | | | | | | | | | | | |
Six Months Ended 4/30/07 (unaudited) | | $ | 1.000 | | $ | 0.025 | | — | | $ | (0.025 | ) | — | | $ | 1.000 | |
Year Ended 10/31/06 | | 1.000 | | 0.045 | | $ | 0.000 | ^ | (0.045 | ) | $ | (0.000 | )^ | 1.000 | |
Year Ended 10/31/05 | | 1.000 | | 0.026 | | — | | (0.026 | ) | — | | 1.000 | |
2/6/04** through 10/31/04 | | 1.000 | | 0.008 | | — | | (0.008 | ) | — | | 1.000 | |
Participant Class | | | | | | | | | | | | | |
Six Months Ended 4/30/07 (unaudited) | | $ | 1.000 | | $ | 0.024 | | — | | $ | (0.024 | ) | — | | $ | 1.000 | |
Year Ended 10/31/06 | | 1.000 | | 0.043 | | $ | 0.000 | ^ | (0.043 | ) | $ | (0.000 | )^ | 1.000 | |
Year Ended 10/31/05 | | 1.000 | | 0.024 | | — | | (0.024 | ) | — | | 1.000 | |
Cash Management Class | | | | | | | | | | | | | |
Six Months Ended 4/30/07 (unaudited) | | $ | 1.000 | | $ | 0.025 | | — | | $ | (0.025 | ) | — | | $ | 1.000 | |
Year Ended 10/31/06 | | 1.000 | | 0.046 | | $ | 0.000 | ^ | (0.046 | ) | $ | (0.000 | )^ | 1.000 | |
8/15/05** through 10/31/05 | | 1.000 | | 0.008 | | — | | (0.008 | ) | — | | 1.000 | |
| | | | | | | | | | | | | |
Prime Portfolio: | | | | | | | | | | | | | |
Institutional Class | | | | | | | | | | | | | |
Six Months Ended 4/30/07 (unaudited) | | $ | 1.000 | | $ | 0.026 | | $ | 0.000 | ^ | $ | (0.026 | ) | $ | (0.000 | )^ | $ | 1.000 | |
Year Ended 10/31/06 | | 1.000 | | 0.047 | | 0.000 | ^ | (0.047 | ) | (0.000 | )^ | 1.000 | |
Year Ended 10/31/05 | | 1.000 | | 0.028 | | — | | (0.028 | ) | — | | 1.000 | |
2/2/04** through 10/31/04 | | 1.000 | | 0.009 | | — | | (0.009 | ) | — | | 1.000 | |
Service Class | | | | | | | | | | | | | |
Six Months Ended 4/30/07 (unaudited) | | $ | 1.000 | | $ | 0.026 | | $ | 0.000 | ^ | $ | (0.026 | ) | $ | (0.000 | )^ | $ | 1.000 | |
Year Ended 10/31/06 | | 1.000 | | 0.047 | | 0.000 | ^ | (0.047 | ) | (0.000 | )^ | 1.000 | |
Year Ended 10/31/05 | | 1.000 | | 0.028 | | — | | (0.028 | ) | — | | 1.000 | |
Investor Class | | | | | | | | | | | | | |
Six Months Ended 4/30/07 (unaudited) | | $ | 1.000 | | $ | 0.026 | | $ | 0.000 | ^ | $ | (0.026 | ) | $ | (0.000 | )^ | $ | 1.000 | |
Year Ended 10/31/06 | | 1.000 | | 0.046 | | 0.000 | ^ | (0.046 | ) | (0.000 | )^ | 1.000 | |
Year Ended 10/31/05 | | 1.000 | | 0.027 | | — | | (0.027 | ) | — | | 1.000 | |
Administrative Class | | | | | | | | | | | | | |
Six Months Ended 4/30/07 (unaudited) | | $ | 1.000 | | $ | 0.025 | | $ | 0.000 | ^ | $ | (0.025 | ) | $ | (0.000 | )^ | $ | 1.000 | |
Year Ended 10/31/06 | | 1.000 | | 0.046 | | 0.000 | ^ | (0.046 | ) | (0.000 | )^ | 1.000 | |
Year Ended 10/31/05 | | 1.000 | | 0.027 | | — | | (0.027 | ) | — | | 1.000 | |
Advisory Class | | | | | | | | | | | | | |
Six Months Ended 4/30/07 (unaudited) | | $ | 1.000 | | $ | 0.025 | | $ | 0.000 | ^ | $ | (0.025 | ) | $ | (0.000 | )^ | $ | 1.000 | |
Year Ended 10/31/06 | | 1.000 | | 0.045 | | 0.000 | ^ | (0.045 | ) | (0.000 | )^ | 1.000 | |
Year Ended 10/31/05 | | 1.000 | | 0.026 | | — | | (0.026 | ) | — | | 1.000 | |
4/29/04** through 10/31/04 | | 1.000 | | 0.006 | | — | | (0.006 | ) | — | | 1.000 | |
Participant Class | | | | | | | | | | | | | |
Six Months Ended 4/30/07 (unaudited) | | $ | 1.000 | | $ | 0.024 | | $ | 0.000 | ^ | $ | (0.024 | ) | $ | (0.000 | )^ | $ | 1.000 | |
Year Ended 10/31/06 | | 1.000 | | 0.043 | | 0.000 | ^ | (0.043 | ) | (0.000 | )^ | 1.000 | |
Year Ended 10/31/05 | | 1.000 | | 0.024 | | — | | (0.024 | ) | — | | 1.000 | |
The accompanying notes are an integral part of the financial statements.
36
| 2007 Semi-Annual Report |
| |
| April 30, 2007 |
Financial Highlights (cont’d)
| | Total
Return | | Net
Assets
End of
Period
(000) | | Ratio of
Expenses to
Average Net
Assets | | Ratio of
Expenses to Average
Net Assets
(Before Waivers/
Reimbursement) | | Ratio of Net
Investment
Income to
Average Net
Assets | | Ratio of Net
Investment Income
to Average
Net Assets
(Before Waivers/
Reimbursement) | |
Money Market Portfolio: | | | | | | | | | | | | | |
Institutional Class | | | | | | | | | | | | | |
Six Months Ended 4/30/07 (unaudited) | | 2.65 | %‡ | $ | 8,885,503 | | 0.12 | %* | 0.22 | %* | 5.27 | %* | 5.17 | %* |
Year Ended 10/31/06 | | 4.89 | % | 5,546,418 | | 0.09 | % | 0.22 | % | 4.89 | % | 4.77 | % |
Year Ended 10/31/05 | | 2.87 | % | 3,082,234 | | 0.10 | % | 0.22 | % | 2.85 | % | 2.73 | % |
2/2/04** through 10/31/04 | | 0.95 | %‡ | 3,077,029 | | 0.07 | %*† | 0.24 | %*† | 1.41 | %* | 1.24 | %* |
Service Class | | | | | | | | | | | | | |
Six Months Ended 4/30/07 (unaudited) | | 2.62 | %‡ | $ | 10,132 | | 0.17 | %* | 0.27 | %* | 5.22 | %* | 5.12 | %* |
Year Ended 10/31/06 | | 4.84 | % | 100 | | 0.14 | % | 0.27 | % | 5.04 | % | 4.92 | % |
Year Ended 10/31/05 | | 2.82 | % | 100 | | 0.15 | % | 0.27 | % | 2.78 | % | 2.66 | % |
Investor Class | | | | | | | | | | | | | |
Six Months Ended 4/30/07 (unaudited) | | 2.60 | %‡ | $ | 274 | | 0.22 | %* | 0.32 | %* | 5.17 | %* | 5.07 | %* |
Year Ended 10/31/06 | | 4.79 | % | 288 | | 0.19 | % | 0.32 | % | 4.83 | % | 4.70 | % |
Year Ended 10/31/051 | | 2.76 | % | 100 | | 0.20 | % | 0.32 | % | 2.73 | % | 2.61 | % |
Administrative Class | | | | | | | | | | | | | |
Six Months Ended 4/30/07 (unaudited) | | 2.57 | %‡ | $ | 18,237 | | 0.27 | %* | 0.37 | %* | 5.12 | %* | 5.02 | %* |
Year Ended 10/31/06 | | 4.73 | % | 100 | | 0.24 | % | 0.37 | % | 4.63 | % | 4.50 | % |
Year Ended 10/31/05 | | 2.71 | % | 100 | | 0.25 | % | 0.37 | % | 2.68 | % | 2.56 | % |
Advisory Class | | | | | | | | | | | | | |
Six Months Ended 4/30/07 (unaudited) | | 2.52 | %‡ | $ | 107,266 | | 0.37 | %* | 0.46 | %*†† | 5.02 | %* | 4.92 | %* |
Year Ended 10/31/06 | | 4.63 | % | 11,642 | | 0.35 | %†† | 0.46 | %†† | 4.90 | % | 4.78 | % |
Year Ended 10/31/05 | | 2.61 | % | 80 | | 0.35 | % | 0.47 | % | 2.52 | % | 2.40 | % |
2/6/04** through 10/31/04 | | 0.76 | %‡ | 1,504 | | 0.31 | %*† | 0.50 | %*† | 1.12 | %* | 0.93 | %* |
Participant Class | | | | | | | | | | | | | |
Six Months Ended 4/30/07 (unaudited) | | 2.39 | %‡ | $ | 100 | | 0.61 | %*†† | 0.72 | %* | 4.78 | %* | 4.67 | %* |
Year Ended 10/31/06 | | 4.40 | % | 271 | | 0.57 | %†† | 0.70 | %†† | 4.48 | % | 4.35 | % |
Year Ended 10/31/05 | | 2.46 | % | 100 | | 0.50 | % | 0.62 | % | 2.43 | % | 2.31 | % |
Cash Management Class | | | | | | | | | | | | | |
Six Months Ended 4/30/07 (unaudited) | | 2.50 | %‡ | $ | 193,369 | | 0.42 | %* | 0.52 | %* | 4.97 | %* | 4.87 | %* |
Year Ended 10/31/06 | | 4.70 | % | 221,503 | | 0.40 | %†† | 0.53 | %†† | 4.98 | % | 4.85 | % |
8/15/05** through 10/31/05 | | 0.77 | %‡ | 100 | | 0.15 | %* | 0.27 | %* | 3.58 | %* | 3.46 | %* |
| | | | | | | | | | | | | |
Prime Portfolio: | | | | | | | | | | | | | |
Institutional Class | | | | | | | | | | | | | |
Six Months Ended 4/30/07 (unaudited) | | 2.64 | %‡ | $ | 27,587,218 | | 0.12 | %* | 0.21 | %* | 5.26 | %* | 5.17 | %* |
Year Ended 10/31/06 | | 4.86 | % | 17,542,077 | | 0.12 | % | 0.21 | % | 4.75 | % | 4.66 | % |
Year Ended 10/31/05 | | 2.87 | % | 13,965,500 | | 0.11 | % | 0.22 | % | 2.85 | % | 2.74 | % |
2/2/04** through 10/31/04 | | 0.94 | %‡ | 8,732,862 | | 0.08 | %* | 0.24 | %* | 1.41 | %* | 1.25 | %* |
Service Class | | | | | | | | | | | | | |
Six Months Ended 4/30/07 (unaudited) | | 2.62 | %‡ | $ | 346,943 | | 0.17 | %* | 0.26 | %* | 5.21 | %* | 5.12 | %* |
Year Ended 10/31/06 | | 4.81 | % | 185,442 | | 0.17 | % | 0.26 | % | 4.83 | % | 4.74 | % |
Year Ended 10/31/05 | | 2.82 | % | 10,457 | | 0.16 | % | 0.27 | % | 3.54 | % | 3.43 | % |
Investor Class | | | | | | | | | | | | | |
Six Months Ended 4/30/07 (unaudited) | | 2.59 | %‡ | $ | 16,588 | | 0.22 | %* | 0.31 | %* | 5.16 | %* | 5.07 | %* |
Year Ended 10/31/06 | | 4.75 | % | 5,500 | | 0.22 | % | 0.31 | % | 4.61 | % | 4.52 | % |
Year Ended 10/31/05 | | 2.77 | % | 20,000 | | 0.21 | % | 0.32 | % | 2.67 | % | 2.56 | % |
Administrative Class | | | | | | | | | | | | | |
Six Months Ended 4/30/07 (unaudited) | | 2.57 | %‡ | $ | 5,649 | | 0.27 | %* | 0.36 | %* | 5.11 | %* | 5.02 | %* |
Year Ended 10/31/06 | | 4.70 | % | 100 | | 0.27 | % | 0.36 | % | 4.60 | % | 4.51 | % |
Year Ended 10/31/05 | | 2.72 | % | 100 | | 0.26 | % | 0.37 | % | 2.68 | % | 2.57 | % |
Advisory Class | | | | | | | | | | | | | |
Six Months Ended 4/30/07 (unaudited) | | 2.51 | %‡ | $ | 165,524 | | 0.37 | %* | 0.46 | %* | 5.01 | %* | 4.92 | %* |
Year Ended 10/31/06 | | 4.60 | % | 62,544 | | 0.37 | % | 0.46 | % | 4.43 | % | 4.34 | % |
Year Ended 10/31/05 | | 2.62 | % | 69,201 | | 0.36 | % | 0.47 | % | 2.73 | % | 2.62 | % |
4/29/04** through 10/31/04 | | 0.57 | %‡ | 16,350 | | 0.33 | %* | 0.49 | %* | 1.14 | %* | 0.98 | %* |
Participant Class | | | | | | | | | | | | | |
Six Months Ended 4/30/07 (unaudited) | | 2.39 | %‡ | $ | 100 | | 0.62 | %* | 0.71 | %* | 4.76 | %* | 4.67 | %* |
Year Ended 10/31/06 | | 4.37 | % | 100 | | 0.59 | %†† | 0.68 | %†† | 4.28 | % | 4.19 | % |
Year Ended 10/31/05 | | 2.47 | % | 100 | | 0.51 | % | 0.62 | % | 2.43 | % | 2.32 | % |
The accompanying notes are an integral part of the financial statements.
37
2007 Semi-Annual Report |
| |
April 30, 2007 |
Financial Highlights (cont’d)
| | Net Asset
Value,
Beginning
of Period | | Net
Investment
Income | | Distributions
From Net
Investment Income | | Net Asset
Value,
End of
Period | |
Government Portfolio: | | | | | | | | | |
Institutional Class | | | | | | | | | |
Six Months Ended 4/30/07 (unaudited) | | $ | 1.000 | | $ | 0.026 | | $ | (0.026 | ) | $ | 1.000 | |
Year Ended 10/31/06 | | 1.000 | | 0.048 | | (0.048 | ) | 1.000 | |
Year Ended 10/31/05 | | 1.000 | | 0.029 | | (0.029 | ) | 1.000 | |
8/9/04** through 10/31/04 | | 1.000 | | 0.004 | | (0.004 | ) | 1.000 | |
Service Class | | | | | | | | | |
Six Months Ended 4/30/07 (unaudited) | | $ | 1.000 | | $ | 0.026 | | $ | (0.026 | ) | $ | 1.000 | |
Year Ended 10/31/06 | | 1.000 | | 0.047 | | (0.047 | ) | 1.000 | |
Year Ended 10/31/05 | | 1.000 | | 0.028 | | (0.028 | ) | 1.000 | |
Investor Class | | | | | | | | | |
Six Months Ended 4/30/07 (unaudited) | | $ | 1.000 | | $ | 0.025 | | $ | (0.025 | ) | $ | 1.000 | |
Year Ended 10/31/06 | | 1.000 | | 0.047 | | (0.047 | ) | 1.000 | |
Year Ended 10/31/05 | | 1.000 | | 0.028 | | (0.028 | ) | 1.000 | |
8/9/04** through 10/31/04 | | 1.000 | | 0.004 | | (0.004 | ) | 1.000 | |
Administrative Class | | | | | | | | | |
Six Months Ended 4/30/07 (unaudited) | | $ | 1.000 | | $ | 0.025 | | $ | (0.025 | ) | $ | 1.000 | |
Year Ended 10/31/06 | | 1.000 | | 0.046 | | (0.046 | ) | 1.000 | |
Year Ended 10/31/05 | | 1.000 | | 0.027 | | (0.027 | ) | 1.000 | |
Advisory Class | | | | | | | | | |
Six Months Ended 4/30/07 (unaudited) | | $ | 1.000 | | $ | 0.025 | | $ | (0.025 | ) | $ | 1.000 | |
Year Ended 10/31/06 | | 1.000 | | 0.045 | | (0.045 | ) | 1.000 | |
Year Ended 10/31/05 | | 1.000 | | 0.026 | | (0.026 | ) | 1.000 | |
10/1/04** through 10/31/04 | | 1.000 | | 0.001 | | (0.001 | ) | 1.000 | |
Participant Class | | | | | | | | | |
Six Months Ended 4/30/07 (unaudited) | | $ | 1.000 | | $ | 0.023 | | $ | (0.023 | ) | $ | 1.000 | |
Year Ended 10/31/06 | | 1.000 | | 0.043 | | (0.043 | ) | 1.000 | |
Year Ended 10/31/05 | | 1.000 | | 0.025 | | (0.025 | ) | 1.000 | |
| | | | | | | | | |
Treasury Portfolio: | | | | | | | | | |
Institutional Class | | | | | | | | | |
Six Months Ended 4/30/07 (unaudited) | | $ | 1.000 | | $ | 0.026 | | $ | (0.026 | ) | $ | 1.000 | |
Year Ended 10/31/06 | | 1.000 | | 0.047 | | (0.047 | ) | 1.000 | |
Year Ended 10/31/05 | | 1.000 | | 0.028 | | (0.028 | ) | 1.000 | |
8/9/04** through 10/31/04 | | 1.000 | | 0.004 | | (0.004 | ) | 1.000 | |
Service Class | | | | | | | | | |
Six Months Ended 4/30/07 (unaudited) | | $ | 1.000 | | $ | 0.026 | | $ | (0.026 | ) | $ | 1.000 | |
Year Ended 10/31/06 | | 1.000 | | 0.047 | | (0.047 | ) | 1.000 | |
Year Ended 10/31/05 | | 1.000 | | 0.027 | | (0.027 | ) | 1.000 | |
Investor Class | | | | | | | | | |
Six Months Ended 4/30/07 (unaudited) | | $ | 1.000 | | $ | 0.025 | | $ | (0.025 | ) | $ | 1.000 | |
Year Ended 10/31/06 | | 1.000 | | 0.046 | | (0.046 | ) | 1.000 | |
Year Ended 10/31/05 | | 1.000 | | 0.027 | | (0.027 | ) | 1.000 | |
Administrative Class | | | | | | | | | |
Six Months Ended 4/30/07 (unaudited) | | $ | 1.000 | | $ | 0.025 | | $ | (0.025 | ) | $ | 1.000 | |
Year Ended 10/31/06 | | 1.000 | | 0.046 | | (0.046 | ) | 1.000 | |
Year Ended 10/31/05 | | 1.000 | | 0.026 | | (0.026 | ) | 1.000 | |
Advisory Class | | | | | | | | | |
Six Months Ended 4/30/07 (unaudited) | | $ | 1.000 | | $ | 0.025 | | $ | (0.025 | ) | $ | 1.000 | |
Year Ended 10/31/06 | | 1.000 | | 0.045 | | (0.045 | ) | 1.000 | |
Year Ended 10/31/05 | | 1.000 | | 0.025 | | (0.025 | ) | 1.000 | |
8/9/04** through 10/31/04 | | 1.000 | | 0.003 | | (0.003 | ) | 1.000 | |
Participant Class | | | | | | | | | |
Six Months Ended 4/30/07 (unaudited) | | $ | 1.000 | | $ | 0.023 | | $ | (0.023 | ) | $ | 1.000 | |
Year Ended 10/31/06 | | 1.000 | | 0.042 | | (0.042 | ) | 1.000 | |
Year Ended 10/31/05 | | 1.000 | | 0.024 | | (0.024 | ) | 1.000 | |
Cash Management Class | | | | | | | | | |
Six Months Ended 4/30/07 (unaudited) | | $ | 1.000 | | $ | 0.024 | | $ | (0.024 | ) | $ | 1.000 | |
Year Ended 10/31/06 | | 1.000 | | 0.045 | | (0.045 | ) | 1.000 | |
8/15/05** through 10/31/05 | | 1.000 | | 0.008 | | (0.008 | ) | 1.000 | |
The accompanying notes are an integral part of the financial statements.
38
| 2007 Semi-Annual Report |
| |
| April 30, 2007 (unaudited) |
Financial Highlights (cont’d)
| | Total
Return | | Net
Assets,
End of
Period
(000) | | Ratio of
Expenses to
Average Net
Assets | | Ratio of
Expenses to Average
Net Assets
(Before Waivers/
Reimbursement) | | Ratio of Net
Investment
Income to
Average Net
Assets | | Ratio of Net
Investment Income
to Average
Net Assets
(Before Waivers/
Reimbursement) | |
Government Portfolio: | | | | | | | | | | | | | |
Institutional Class | | | | | | | | | | | | | |
Six Months Ended 4/30/07 (unaudited) | | 2.62 | %‡ | $ | 3,006,387 | | 0.12 | %* | 0.23 | %* | 5.22 | %* | 5.11 | %* |
Year Ended 10/31/06 | | 4.87 | % | 2,265,613 | | 0.09 | % | 0.21 | % | 4.76 | % | 4.64 | % |
Year Ended 10/31/05 | | 2.91 | % | 2,196,511 | | 0.05 | % | 0.25 | % | 3.07 | % | 2.87 | % |
8/9/04** through 10/31/04 | | 0.38 | %‡ | 414,567 | | 0.05 | %*† | 0.37 | %*† | 1.73 | %* | 1.41 | %* |
Service Class | | | | | | | | | | | | | |
Six Months Ended 4/30/07 (unaudited) | | 2.60 | %‡ | $ | 117 | | 0.17 | %* | 0.28 | %* | 5.17 | %* | 5.06 | %* |
Year Ended 10/31/06 | | 4.81 | % | 116 | | 0.13 | %†† | 0.26 | % | 4.67 | % | 4.54 | % |
Year Ended 10/31/05 | | 2.86 | % | 484 | | 0.10 | % | 0.30 | % | 2.65 | % | 2.45 | % |
Investor Class | | | | | | | | | | | | | |
Six Months Ended 4/30/07 (unaudited) | | 2.57 | %‡ | $ | 35,482 | | 0.22 | %* | 0.33 | %* | 5.12 | %* | 5.01 | %* |
Year Ended 10/31/06 | | 4.76 | % | 545,676 | | 0.19 | % | 0.31 | % | 4.72 | % | 4.60 | % |
Year Ended 10/31/05 | | 2.81 | % | 279,012 | | 0.15 | % | 0.35 | % | 2.91 | % | 2.71 | % |
8/9/04** through 10/31/04 | | 0.35 | %‡ | 109,776 | | 0.15 | %*† | 0.53 | %*† | 1.53 | %* | 1.15 | %* |
Administrative Class | | | | | | | | | | | | | |
Six Months Ended 4/30/07 (unaudited) | | 2.54 | %‡ | $ | 22,905 | | 0.27 | %* | 0.38 | %* | 5.07 | %* | 4.96 | %* |
Year Ended 10/31/06 | | 4.71 | % | 49,377 | | 0.24 | % | 0.36 | % | 4.79 | % | 4.67 | % |
Year Ended 10/31/05 | | 2.76 | % | 10,877 | | 0.20 | % | 0.40 | % | 2.60 | % | 2.39 | % |
Advisory Class | | | | | | | | | | | | | |
Six Months Ended 4/30/07 (unaudited) | | 2.49 | %‡ | $ | 101,464 | | 0.37 | %* | 0.48 | %* | 4.97 | %* | 4.86 | %* |
Year Ended 10/31/06 | | 4.60 | % | 126,760 | | 0.34 | % | 0.47 | %†† | 4.53 | % | 4.40 | % |
Year Ended 10/31/05 | | 2.65 | % | 131,513 | | 0.30 | % | 0.50 | % | 3.12 | % | 2.92 | % |
10/1/04** through 10/31/04 | | 0.13 | %‡ | 23,750 | | 0.30 | %*† | 0.55 | %*† | 1.53 | %* | 1.28 | %* |
Participant Class | | | | | | | | | | | | | |
Six Months Ended 4/30/07 (unaudited) | | 2.37 | %‡ | $ | 100 | | 0.62 | %* | 0.73 | %* | 4.72 | %* | 4.61 | %* |
Year Ended 10/31/06 | | 4.38 | % | 100 | | 0.55 | %†† | 0.67 | %†† | 4.24 | % | 4.12 | % |
Year Ended 10/31/05 | | 2.50 | % | 147 | | 0.45 | % | 0.65 | % | 2.53 | % | 2.33 | % |
| | | | | | | | | | | | | |
Treasury Portfolio: | | | | | | | | | | | | | |
Institutional Class | | | | | | | | | | | | | |
Six Months Ended 4/30/07 (unaudited) | | 2.63 | %‡ | $ | 30,757 | | 0.05 | %* | 0.97 | %*† | 5.23 | %* | 4.31 | %* |
Year Ended 10/31/06 | | 4.82 | % | 2,189 | | 0.05 | % | 0.52 | % | 4.29 | % | 3.82 | % |
Year Ended 10/31/05 | | 2.79 | % | 70,087 | | 0.05 | % | 0.49 | %† | 2.61 | % | 2.17 | % |
8/9/04** through 10/31/04 | | 0.36 | %‡ | 187,770 | | 0.05 | %*† | 0.35 | %*† | 1.57 | %* | 1.27 | %* |
Service Class | | | | | | | | | | | | | |
Six Months Ended 4/30/07 (unaudited) | | 2.61 | %‡ | $ | 100 | | 0.10 | %* | 0.76 | %*† | 5.19 | %* | 4.53 | %* |
Year Ended 10/31/06 | | 4.77 | % | 100 | | 0.10 | % | 0.95 | %†† | 4.66 | % | 3.81 | % |
Year Ended 10/31/05 | | 2.74 | % | 100 | | 0.10 | % | 0.53 | %† | 2.70 | % | 2.27 | % |
Investor Class | | | | | | | | | | | | | |
Six Months Ended 4/30/07 (unaudited) | | 2.58 | %‡ | $ | 100 | | 0.15 | %* | 0.81 | %*† | 5.14 | %* | 4.48 | %* |
Year Ended 10/31/06 | | 4.71 | % | 100 | | 0.15 | % | 1.00 | %†† | 4.61 | % | 3.76 | % |
Year Ended 10/31/05 | | 2.69 | % | 100 | | 0.15 | % | 0.58 | %† | 2.65 | % | 2.22 | % |
Administrative Class | | | | | | | | | | | | | |
Six Months Ended 4/30/07 (unaudited) | | 2.55 | %‡ | $ | 10,165 | | 0.20 | %* | 0.61 | %*† | 5.07 | %* | 4.66 | %* |
Year Ended 10/31/06 | | 4.66 | % | 100 | | 0.20 | % | 1.05 | %†† | 4.56 | % | 3.71 | % |
Year Ended 10/31/05 | | 2.64 | % | 100 | | 0.20 | % | 0.63 | %† | 2.60 | % | 2.17 | % |
Advisory Class | | | | | | | | | | | | | |
Six Months Ended 4/30/07 (unaudited) | | 2.50 | %‡ | $ | 171,387 | | 0.30 | %* | 0.99 | %*† | 4.99 | %* | 4.30 | %* |
Year Ended 10/31/06 | | 4.56 | % | 77,083 | | 0.30 | % | 0.98 | %†† | 4.54 | % | 3.86 | % |
Year Ended 10/31/05 | | 2.53 | % | 17,575 | | 0.30 | % | 0.64 | % | 2.92 | % | 2.58 | % |
8/9/04** through 10/31/04 | | 0.30 | %‡ | 2,207 | | 0.30 | %*† | 0.67 | %*† | 1.30 | %* | 0.93 | %* |
Participant Class | | | | | | | | | | | | | |
Six Months Ended 4/30/07 (unaudited) | | 2.38 | %‡ | $ | 524 | | 0.55 | %* | 1.22 | %*† | 4.74 | %* | 4.07 | %* |
Year Ended 10/31/06 | | 4.33 | % | 330 | | 0.53 | %†† | 1.20 | %†† | 4.41 | % | 3.75 | % |
Year Ended 10/31/05 | | 2.38 | % | 100 | | 0.45 | % | 0.88 | %† | 2.35 | % | 1.92 | % |
Cash Management Class | | | | | | | | | | | | | |
Six Months Ended 4/30/07 (unaudited) | | 2.48 | %‡ | $ | 5,080 | | 0.35 | %* | 1.11 | %*† | 4.89 | %* | 4.13 | %* |
Year Ended 10/31/06 | | 4.63 | % | 100 | | 0.23 | %†† | 1.08 | %†† | 4.53 | % | 3.68 | % |
8/15/05** through 10/31/05 | | 0.76 | %‡ | 100 | | 0.10 | %* | 0.43 | %*† | 3.52 | %* | 3.19 | %* |
The accompanying notes are an integral part of the financial statements.
39
2007 Semi-Annual Report |
| |
April 30, 2007 |
Financial Highlights (cont’d)
| | Net Asset
Value,
Beginning
of Period | | Net
Investment
Income | | Distributions
From Net
Investment Income | | Net Asset
Value,
End of
Period | |
| | | | | | | | | |
Tax-Exempt Portfolio: | | | | | | | | | |
Institutional Class | | | | | | | | | |
Six Months Ended 4/30/07 (unaudited) | | $ | 1.000 | | $ | 0.018 | | $ | (0.018 | ) | $ | 1.000 | |
Year Ended 10/31/06 | | 1.000 | | 0.032 | | (0.032 | ) | 1.000 | |
Year Ended 10/31/05 | | 1.000 | | 0.022 | | (0.022 | ) | 1.000 | |
2/2/04** through 10/31/04 | | 1.000 | | 0.008 | | (0.008 | ) | 1.000 | |
Service Class | | | | | | | | | |
Six Months Ended 4/30/07 (unaudited) | | $ | 1.000 | | $ | 0.017 | | $ | (0.017 | ) | $ | 1.000 | |
Year Ended 10/31/06 | | 1.000 | | 0.032 | | (0.032 | ) | 1.000 | |
Year Ended 10/31/05 | | 1.000 | | 0.021 | | (0.021 | ) | 1.000 | |
Investor Class | | | | | | | | | |
Six Months Ended 4/30/07 (unaudited) | | $ | 1.000 | | $ | 0.017 | | $ | (0.017 | ) | $ | 1.000 | |
Year Ended 10/31/06 | | 1.000 | | 0.031 | | (0.031 | ) | 1.000 | |
Year Ended 10/31/05 | | 1.000 | | 0.020 | | (0.020 | ) | 1.000 | |
6/8/04** through 10/31/04 | | 1.000 | | 0.005 | | (0.005 | ) | 1.000 | |
Administrative Class | | | | | | | | | |
Six Months Ended 4/30/07 (unaudited) | | $ | 1.000 | | $ | 0.017 | | $ | (0.017 | ) | $ | 1.000 | |
Year Ended 10/31/06 | | 1.000 | | 0.031 | | (0.031 | ) | 1.000 | |
Year Ended 10/31/05 | | 1.000 | | 0.020 | | (0.020 | ) | 1.000 | |
Advisory Class | | | | | | | | | |
Six Months Ended 4/30/07 (unaudited) | | $ | 1.000 | | $ | 0.016 | | $ | (0.016 | ) | $ | 1.000 | |
Year Ended 10/31/06 | | 1.000 | | 0.030 | | (0.030 | ) | 1.000 | |
Year Ended 10/31/05 | | 1.000 | | 0.019 | | (0.019 | ) | 1.000 | |
6/15/04** through 10/31/04(2) | | 1.000 | | 0.002 | | (0.002 | ) | 1.000 | |
Participant Class | | | | | | | | | |
Six Months Ended 4/30/07 (unaudited) | | $ | 1.000 | | $ | 0.015 | | $ | (0.015 | ) | $ | 1.000 | |
Year Ended 10/31/06 | | 1.000 | | 0.027 | | (0.027 | ) | 1.000 | |
Year Ended 10/31/05 | | 1.000 | | 0.018 | | (0.018 | ) | 1.000 | |
Cash Management Class | | | | | | | | | |
Six Months Ended 4/30/07 (unaudited) | | $ | 1.000 | | $ | 0.016 | | $ | (0.016 | ) | $ | 1.000 | |
Year Ended 10/31/06 | | 1.000 | | 0.030 | | (0.030 | ) | 1.000 | |
8/15/05** through 10/31/05 | | 1.000 | | 0.005 | | (0.005 | ) | 1.000 | |
* | Annualized |
** | Commencement of Operations |
‡ | Not Annualized |
^ | Amount is less than $0.0005 per share. |
(1) | The Money Market Portfolio’s Investor Share Class commenced offering on June 16, 2004. There were no Investor shares outstanding during the period July 28, 2004 to October 31, 2004. |
(2) | The Tax-Exempt Portfolio’s Advisory Share Class had no shares outstanding during the periods June 30, 2004 to July 22, 2004, July 30, 2004 to August 9, 2004, August 30, 2004 to August 31, 2004 and September 2, 2004 to September 21, 2004. |
† | Ratios of Expenses to Average Net Assets before and after Expense Limitations may vary among share classes by more or less than the service, shareholder administration and/or distribution plans’ fees due to different periods of operation for each share class, as well as fluctuations in daily net asset amounts. |
†† | Ratios of Expenses to Average Net Assets before and after Expense Limitations may vary among share classes by more or less than the service, shareholder administration and/or distribution plans’ fees due to changes in the plans’ fees during the period for each share class, as well as changes in the Portfolios’ expense caps during the year. |
The accompanying notes are an integral part of the financial statements.
40
| 2007 Semi-Annual Report |
| |
| April 30, 2007 (unaudited) |
Financial Highlights (cont’d)
| | | | | | | | | | | | Ratio of Net | |
| | | | Net | | | | Ratio of | | Ratio of Net | | Investment Income | |
| | | | Assets, | | Ratio of | | Expenses to Average | | Investment | | to Average | |
| | | | End of | | Expenses to | | Net Assets | | Income to | | Net Assets | |
| | Total | | Period | | Average Net | | (Before Waivers/ | | Average Net | | (Before Waivers/ | |
| | Return | | (000) | | Assets | | Reimbursement) | | Assets | | Reimbursement) | |
| | | | | | | | | | | | | |
Tax-Exempt Portfolio: | | | | | | | | | | | | | |
Institutional Class | | | | | | | | | | | | | |
Six Months Ended 4/30/07 (unaudited) | | 1.78 | %‡ | $ | 1,084,448 | | 0.10 | %* | 0.27 | %*† | 3.56 | %* | 3.40 | %* |
Year Ended 10/31/06 | | 3.27 | % | 672,514 | | 0.10 | % | 0.23 | % | 3.14 | % | 3.01 | % |
Year Ended 10/31/05 | | 2.17 | % | 1,130,489 | | 0.09 | % | 0.32 | %† | 2.35 | % | 2.12 | % |
2/2/04** through 10/31/04 | | 0.84 | %‡ | 109,292 | | 0.06 | %*† | 0.35 | %*† | 1.19 | %* | 0.90 | %* |
Service Class | | | | | | | | | | | | | |
Six Months Ended 4/30/07 (unaudited) | | 1.75 | %‡ | $ | 100 | | 0.15 | %* | 0.31 | %*† | 3.51 | %* | 3.35 | %* |
Year Ended 10/31/06 | | 3.21 | % | 100 | | 0.15 | % | 0.29 | %†† | 3.16 | % | 3.02 | % |
Year Ended 10/31/05 | | 2.12 | % | 100 | | 0.14 | % | 0.40 | %† | 2.10 | % | 1.84 | % |
Investor Class | | | | | | | | | | | | | |
Six Months Ended 4/30/07 (unaudited) | | 1.73 | %‡ | $ | 118 | | 0.20 | %* | 0.36 | %*† | 3.46 | %* | 3.30 | %* |
Year Ended 10/31/06 | | 3.16 | % | 3,052 | | 0.20 | % | 0.31 | %†† | 3.26 | % | 3.15 | % |
Year Ended 10/31/05 | | 2.07 | % | 104 | | 0.19 | % | 0.45 | %† | 2.01 | % | 1.75 | % |
6/8/04** through 10/31/04 | | 0.45 | %‡ | 1,121 | | 0.17 | %*† | 0.38 | %*† | 1.06 | %* | 0.85 | %* |
Administrative Class | | | | | | | | | | | | | |
Six Months Ended 4/30/07 (unaudited) | | 1.70 | %‡ | $ | 100 | | 0.25 | %* | 0.41 | %*† | 3.41 | %* | 3.25 | %* |
Year Ended 10/31/06 | | 3.11 | % | 100 | | 0.25 | % | 0.39 | %†† | 3.06 | % | 2.92 | % |
Year Ended 10/31/05 | | 2.02 | % | 100 | | 0.24 | % | 0.50 | %† | 2.00 | % | 1.74 | % |
Advisory Class | | | | | | | | | | | | | |
Six Months Ended 4/30/07 (unaudited) | | 1.65 | %‡ | $ | 22,330 | | 0.35 | %* | 0.53 | %*† | 3.30 | %* | 3.13 | %* |
Year Ended 10/31/06 | | 3.01 | % | 32,141 | | 0.35 | % | 0.48 | % | 2.76 | % | 2.63 | % |
Year Ended 10/31/05 | | 1.92 | % | 98,823 | | 0.34 | % | 0.62 | %† | 1.86 | % | 1.58 | % |
6/15/04** through 10/31/04(2) | | 0.24 | %‡ | 56,000 | | 0.33 | %*† | 0.55 | %*† | 1.32 | %* | 1.10 | %* |
Participant Class | | | | | | | | | | | | | |
Six Months Ended 4/30/07 (unaudited) | | 1.53 | %‡ | $ | 100 | | 0.60 | %* | 0.76 | %*† | 3.06 | %* | 2.90 | %* |
Year Ended 10/31/06 | | 2.78 | % | 100 | | 0.57 | %†† | 0.70 | %†† | 2.74 | % | 2.61 | % |
Year Ended 10/31/05 | | 1.77 | % | 102 | | 0.49 | % | 0.75 | %† | 1.76 | % | 1.49 | % |
Cash Management Class | | | | | | | | | | | | | |
Six Months Ended 4/30/07 (unaudited) | | 1.63 | %‡ | $ | 214,767 | | 0.40 | %* | 0.56 | %*† | 3.26 | %* | 3.10 | %* |
Year Ended 10/31/06 | | 3.08 | % | 188,740 | | 0.40 | %†† | 0.51 | %†† | 3.17 | % | 3.06 | % |
8/15/05** through 10/31/05 | | 0.53 | %‡ | 100 | | 0.14 | %* | 0.30 | %*† | 2.47 | %* | 2.30 | %* |
The accompanying notes are an integral part of the financial statements.
41
2007 Semi-Annual Report |
| |
April 30, 2007 (unaudited) |
Notes to Financial Statements
Morgan Stanley Institutional Liquidity Funds (the “Fund”) is registered under the Investment Company Act of 1940 (the “1940 Act”), as amended, as a Massachusetts business trust. The Fund is comprised of five separate, active, diversified portfolios (individually referred to as a “Portfolio”, collectively as the “Portfolios”). The Fund offers up to seven different classes of shares for certain Portfolios - Institutional Class, Service Class, Investor Class, Administrative Class, Advisory Class, Participant Class and Cash Management Class. All classes of shares have identical voting rights (except that shareholders of a Class have exclusive voting rights regarding any matter relating solely to that Class of shares), dividend, liquidation and other rights.
For detailed descriptions of the investment objectives of each of the Portfolios and other related information, please refer to the Prospectuses of the Fund. Generally, the investment objective of the Portfolios is to seek preservation of capital, daily liquidity and maximum current income (exempt from federal income tax in the case of Tax-Exempt Portfolio).
A. Accounting Policies: The following significant accounting policies are in conformity with U.S. generally accepted accounting principles. Such policies are consistently followed by the Fund in the preparation of the financial statements. U.S. generally accepted accounting principles may require management to make estimates and assumptions that affect the reported amounts and disclosures in the financial statements. Actual results may differ from those estimates.
1. Security Valuation: Securities owned by the Portfolios are stated at amortized cost which approximates market value.
2. Repurchase Agreements: Certain Portfolios may enter into repurchase agreements under which a Portfolio lends excess cash and takes possession of securities with an agreement that the counterparty will repurchase such securities. In connection with transactions in repurchase agreements, a bank as custodian for the Fund takes possession of the underlying securities which are held as collateral, with a market value at least equal to the amount of the repurchase transaction, including principal and accrued interest. To the extent that any repurchase transaction exceeds one business day, the value of the collateral is marked-to-market on a daily basis to determine the adequacy of the collateral. In the event of default on the obligation to repurchase, the Fund has the right to liquidate the collateral and apply the proceeds in satisfaction of the obligation. In the event of default or bankruptcy by the counterparty to the agreement, realization and/or retention of the collateral or proceeds may be subject to legal proceedings. The Portfolios, along with other affiliated investment companies, may utilize a joint trading account for the purpose of entering into repurchase agreements.
3. New Accounting Pronouncements: In July 2006, the Financial Accounting Standards Board issued Interpretation No. 48, “Accounting for Uncertainty in Income Taxes — an Interpretation of FASB Statement No. 109” (the “Interpretation”). The Interpretation establishes for all entities, including pass-through entities such as the Portfolios, a minimum threshold for financial statement recognition of the benefit of positions taken in filing tax returns (including whether an entity is taxable in a particular jurisdiction), and requires certain expanded tax disclosures. The Interpretation is effective for fiscal years beginning after December 15, 2006, and is to be applied to all open tax years as of the date of effectiveness. Management has recently begun to evaluate the application of the Interpretation to the Portfolios, and is not in a position at this time to estimate the significance of its impact, if any, on the Portfolios’ financial statements.
4. Other: Security transactions are accounted for on the date the securities are purchased or sold. Realized gains and losses on the sale of investment securities are determined on a “first-in-first-out” basis. Interest income is recognized on the accrual basis except where collection is in doubt. Discounts and premiums on securities purchased are amortized over their respective lives. Most expenses of the Fund can be directly attributed to a particular Portfolio. Expenses which cannot be directly attributed are apportioned among the Portfolios based upon relative net assets. Income, expenses (other than class specific expenses) and realized and unrealized gains or losses are allocated to each class of shares based upon their relative net assets. Dividends to the shareholders of the Portfolios are accrued daily and are distributed on the last business day of each month.
B. Investment Advisory Fees: Morgan Stanley Investment Management Inc. (the “Adviser” or “MS Investment Management”), a wholly-owned subsidiary of Morgan Stanley, provides the Fund with investment advisory services under the terms of an Investment Advisory Agreement (the “Agreement”) at the annual rates of average daily net assets indicated below. The Adviser has voluntarily agreed to reduce its advisory fee and/or absorb other expenses, after giving effect to custody fee offsets, so that total annual operating expenses of each share class will not exceed the amounts noted below. This fee and expense waiver may be discontinued at any time.
| | Advisory | |
Portfolio | | Fee | |
Money Market | | 0.15 | % |
Prime | | 0.15 | |
Government | | 0.15 | |
Treasury | | 0.15 | |
Tax-Exempt | | 0.15 | |
42
| 2007 Semi-Annual Report |
| |
| April 30, 2007 (unaudited) |
Notes to Financial Statements (cont’d)
| | Maximum | |
| | Expense Ratio | |
| | Money | | | | | | | | Tax- | |
Class | | Market | | Prime | | Government | | Treasury | | Exempt | |
Institutional Class | | 0.20 | % | 0.20 | % | 0.20 | % | 0.20 | % | 0.20 | % |
Service Class | | 0.25 | | 0.25 | | 0.25 | | 0.25 | | 0.25 | |
Investor Class | | 0.30 | | 0.30 | | 0.30 | | 0.30 | | 0.30 | |
Administrative Class | | 0.35 | | 0.35 | | 0.35 | | 0.35 | | 0.35 | |
Advisory Class | | 0.45 | | 0.45 | | 0.45 | | 0.45 | | 0.45 | |
Participant Class | | 0.70 | | 0.70 | | 0.70 | | 0.70 | | 0.70 | |
Cash Management Class | | 0.50 | | — | | — | | 0.50 | | 0.50 | |
The Ratio of Expenses to Average Net Assets disclosed in the Portfolios’ Financial Highlights may be lower than the maximum ratios indicated in the table above due to additional voluntary expense limitations imposed by the Adviser. The Adviser may terminate these additional voluntary limitations at any time at its sole discretion.
The Adviser has entered into a Sub-Advisory Agreement with Morgan Stanley Investment Advisors Inc. (the “Sub-Adviser”), a wholly-owned subsidiary of Morgan Stanley. The Sub- Adviser, subject to the control and supervision of the Fund, its officers, Trustees and the Adviser, and in accordance with the investment objectives, policies and restrictions of the Portfolios, makes day-to-day investment decisions for the Portfolios and places the Portfolios’ purchase and sales orders. The Adviser pays the Sub-Adviser on a monthly basis a portion of the net advisory fees the Adviser receives from the Portfolios.
C. Administration Fees: MS Investment Management (the “Administrator”) also serves as Administrator to the Fund pursuant to an Administration Agreement. Under the agreement, MS Investment Management receives an annual fee, accrued daily and payable monthly, of 0.05% of each Portfolio’s average daily net assets, plus reimbursement of out-of-pocket expenses. JPMorgan Investor Services Co. (“JPMIS”), a corporate affiliate of JPMorgan Chase Bank, N.A., provides fund accounting and other services pursuant to a sub-administration agreement with MS Investment Management and receives compensation for these services from MS Investment Management. JPMIS also serves as the Transfer Agent to the Fund pursuant to a Transfer Agency Agreement. An employee of JPMIS is an officer of the Fund.
D. Distribution and Service and Shareholder Administration Plan Fees:
Morgan Stanley Distribution, Inc. (the “Distributor”), a wholly-owned subsidiary of MS Investment Management, and an indirect subsidiary of Morgan Stanley, serves as the distributor of the Fund. The Fund has entered into an Administration Plan with respect to its Service Class, Investor Class and Administrative Class shares pursuant to which each class of shares will pay the Distributor a monthly or quarterly fee at an annual rate of up to 0.05%, 0.10% and 0.15%, of the average daily net assets of each such class of shares, respectively to compensate certain financial intermediaries who provide administrative services to shareholders.
The Fund has also entered into a Service and Shareholder Administration Plan with respect to its Advisory Class shares pursuant to which its Advisory Class shares pays the Distributor a monthly or quarterly fee at an annual rate of up to 0.25% of the average daily net assets of such class of shares, to compensate certain financial intermediaries who provide administrative services, personal and account maintenance services to shareholders.
The Fund has also entered into a Shareholder Service Plan and a Distribution Plan with respect to its Participant Class shares. Pursuant to the Shareholder Service Plan, the Participant Class shares will pay the Distributor a monthly or quarterly fee at an annual rate of up to 0.25% of the average daily net assets of such class of shares, to compensate certain financial intermediaries who provide administrative services, personal and account maintenance services. Pursuant to the Distribution Plan, the Participant Class shares will pay the Distributor a monthly or quarterly fee at an annual rate of up to 0.25% of the average daily net assets of such class of shares (prior to February 6, 2006, the annual rate was 0.15%), to compensate for any activities or expenses primarily intended to result in the sale of such class of shares.
The Fund has also entered into a Shareholder Service Plan with respect to its Cash Management Class shares to pay the Distributor to compensate Service Organizations who provide administrative services to shareholders. Pursuant to the Shareholder Service Plan, the Cash Management Class shares will pay the Distributor a monthly or quarterly service fee at an annual rate of 0.05% of the average daily net assets of such class of shares, to compensate Service Organizations for staffing and maintaining call centers and answering inquiries and addressing issues related to the Cash Management Class shares.
The Fund has also entered into a Distribution Plan with respect to its Cash Management Class shares pursuant to which its Cash Management Class shares pays the Distributor a monthly or quarterly fee at an annual rate of up to 0.25% of the average daily net assets of such class of shares (prior to April 25, 2006, the annual rate was 0.05%), to compensate certain financial intermediaries who provide any activities or expenses primarily intended to result in the sale of such class of shares.
E. Custodian Fees: JPMorgan Chase Bank, N.A. (the “Custodian”) serves as Custodian for the Fund in accordance with a custodian agreement. The Custodian holds cash, securities, and other assets of the Fund as required by the 1940 Act.
The Fund has entered into an arrangement with its Custodian whereby credits realized on uninvested cash balances were used to offset a portion of each applicable Portfolio’s expenses. These custodian credits are shown as “Expense Offset” on the Statements of Operations.
43
2007 Semi-Annual Report |
| |
April 30, 2007 (unaudited) |
Notes to Financial Statements (cont’d)
F. Federal Income Taxes: It is each Portfolio’s intention to qualify as a regulated investment company and distribute all of its taxable and tax-exempt income. Accordingly, no provision for Federal income taxes is required in the financial statements.
The tax character of distributions paid may differ from the character of distributions shown on the Statements of Changes in Net Assets due to short-term capital gains being treated as ordinary income for tax purposes. The tax character of distributions paid during fiscal 2006 and 2005 were as follows:
| | 2006 | | 2005 | |
| | Distributions | | Distributions | |
| | Paid From: | | Paid From: | |
Portfolio | | Ordinary
Income
(000) | | Long-term
Capital Gain
(000) | | Ordinary
Income
(000) | | Long-term
Capital Gain
(000) | |
Money Market | | $ | 194,507 | | $ | — | | $ | 95,455 | | $ | — | |
Prime | | 794,684 | | — | | 369,739 | | — | |
Government | | 161,163 | | 2 | | 44,911 | | — | |
Treasury | | 1,816 | | — | | 2,758 | | — | |
Tax-Exempt | | 26,940 | * | — | | 8,075 | * | — | |
| | | | | | | | | | | | | |
* Distributions are tax-exempt.
The amount and character of income and gains to be distributed are determined in accordance with income tax regulations which may differ from U.S. generally accepted accounting principles. The book/tax differences are either considered temporary or permanent in nature.
Temporary differences are primarily due to differing book and tax treatments in the timing of the recognition of distribution payable.
Permanent differences are generally due to distribution reclass. These resulted in the following reclassifications among the Portfolios’ components of net assets at October 31, 2006:
| | Undistributed | | | | | |
| | (Distributions in | | | | | |
| | Excess of) Net | | Accumulated Net | | | |
| | Investment | | Realized Gain | | Paid-in | |
| | Income | | (Loss) | | Capital | |
Portfolio | | (000) | | (000) | | (000) | |
Money Market | | $ | @— | | $ | @— | | $ | @— | |
Prime | | @— | | @— | | @— | |
Government | | 4 | | (4 | ) | @— | |
| | | | | | | | | | |
@ Amount is less than $500.
At October 31, 2006, the components of distributable earnings on a tax basis were as follows:
| | Undistributed | |
| | Ordinary | |
| | Income | |
Portfolio | | (000) | |
Money Market | | $ | 26,680 | |
Prime | | 76,133 | |
Government | | 12,752 | |
Treasury | | 235 | |
Tax-Exempt | | 2,157 | |
| | | | |
At April 30, 2007, cost for U.S. Federal income tax purposes for the investments of the Portfolios were as follows:
| | Cost | |
Portfolio | | (000) | |
Money Market | | $ | 9,260,836 | |
Prime | | 28,150,133 | |
Government | | 3,163,765 | |
Treasury | | 218,346 | |
Tax-Exempt | | 1,316,041 | |
| | | | |
At October 31, 2006, the Treasury Portfolio and Tax-Exempt Portfolio had capital loss carryforwards for U.S. Federal income tax purposes of approximately $1,000 and $9,000, respectively, available to offset future capital gains which will expire on October 31, 2014.
During the year ended October 31, 2006, the Prime Portfolio utilized capital loss carryforwards for U.S. Federal income tax purposes of approximately $10,000.
G. Contractual Obligations: The Fund enters into contracts that contain a variety of indemnifications. The Fund’s maximum exposure under these arrangements is unknown. However, the Fund has not had prior claims or losses pursuant to these contracts and expects the risk of loss to be remote.
H. Other: A portion of the securities of the Tax-Exempt Portfolio are insured by certain companies specializing in the insurance of municipal debt obligations. At April 30, 2007, approximately 25.5% of the net assets of the Tax-Exempt Portfolio are covered by such insurance. The insurers and their obligations are as follows:
| | Percentage of | |
Insurer | | Net Assets | |
AGC | | 1.8 | % |
Ambac | | 8.5 | |
CIFG | | 1.4 | |
FGIC | | 1.0 | |
FHA | | @— | |
FSA | | 5.7 | |
MBIA | | 2.4 | |
Radian | | 4.7 | |
@ Amount is less than 0.05%.
At April 30, 2007, certain Portfolios had otherwise unaffiliated record owners of 10% or greater. Investment activities of these shareholders could have a material impact on these Portfolios. These Portfolios and the aggregate percentage of such owners were as follows:
| | Percentage of Ownership | |
| | Money | | | | | | | | Tax- | |
Class | | Market | | Prime | | Government | | Treasury | | Exempt | |
Institutional Class | | 35.2 | % | 29.3 | % | 58.9 | % | 82.8 | % | 55.4 | % |
Service Class | | 99.0 | | 90.9 | | — | | — | | — | |
Investor Class | | 63.5 | | 72.4 | | 65.8 | | — | | 12.1 | |
Administrative Class | | 99.5 | | 98.2 | | 93.4 | | 99.0 | | — | |
Advisory Class | | 99.0 | | 86.9 | | 76.5 | | 94.7 | | 88.5 | |
Participant Class | | — | | — | | — | | 74.3 | | — | |
Cash Management Class | | — | | — | | — | | 98.0 | | — | |
44
| 2007 Semi-Annual Report |
| |
| April 30, 2007 (unaudited) |
Trustee and Officer Information
Trustees
Frank L. Bowman
Michael Bozic
Kathleen A. Dennis
James F. Higgins
Dr. Manuel H. Johnson
Joseph J. Kearns
Michael F. Klein
W.Allen Reed
Fergus Reid
Investment Adviser and Administrator
Morgan Stanley Investment Management Inc.
1221 Avenue of the Americas
New York, NY 10020
Distributor
Morgan Stanley Distribution, Inc.
One Tower Bridge Road
100 Front Street, Suite 1100
West Conshohocken, PA 19428-2899
Custodian
JPMorgan Chase Bank, N.A.
270 Park Avenue
New York, NY 10017
Legal Counsel
Clifford Chance US LLP
31 West 52nd Street
New York, NY 10019-6131
Independent Registered Public Accounting Firm
Ernst & Young LLP
200 Clarendon Street
Boston, MA 02116-5072
Officers
Michael E. Nugent
Chairman of the Board and Trustee
Ronald E. Robison
President and Principal Executive Officer
J. David Germany
Vice President
Dennis F. Shea
Vice President
Amy R. Doberman
Vice President
Carsten Otto
Chief Compliance Officer
Stefanie V. Chang Yu
Vice President
Mary E. Mullin
Secretary
James W. Garrett
Treasurer and Chief Financial Officer
Michael J. Leary
Assistant Treasurer
Reporting to Shareholders
Each Morgan Stanley Fund provides a complete schedule of portfolio holdings in its semi-annual and annual reports within 60 days of the end of the Fund’s second and fourth fiscal quarters. The semi-annual reports and the annual reports are filed electronically with the Securities and Exchange Commission (SEC) on Form N-CSRS and Form N-CSR, respectively. Morgan Stanley also delivers the semi-annual and annual reports to Fund shareholders and makes these reports available on its public website, www.morganstanley.com. Each Morgan Stanley Fund also files a complete schedule of portfolio holdings with the SEC for the Fund’s first and third fiscal quarters on Form N-Q. Morgan Stanley does not deliver the reports for the first and third fiscal quarters to shareholders, nor are the reports posted to the Morgan Stanley public website. You may, however, obtain the Form N-Q filings (as well as the Form N-CSR and NCSRS filings) by accessing the SEC’s website, http:/www.sec.gov. You may also review and copy them at the SEC’s public reference room in Washington, DC. Information on the operation of the SEC’s Public Reference Room may be obtained by calling the SEC at 1(800) SEC-0330. You can also request copies of these materials, upon payment of a duplicating fee, by electronic request at the SEC’s email address (publicinfo@sec.gov) or by writing the Public Reference section of the SEC, Washington, DC 20549-0102.
Proxy Voting Policies and Procedures and Proxy Voting Record
You may obtain a copy of the Fund’s Proxy Voting Policy and Procedures and information regarding how the Fund voted proxies relating to portfolio securities during the most recent twelve-month period ended June 30, without charge, upon request, by calling toll-free 1(888) 378-1630 or by visiting our website at www.morganstanley/com/im. This information is also available on the SEC’s website at http://www.sec.gov.
This report is authorized for distribution only when preceded or accompanied by the prospectus of the Morgan Stanley Institutional Liquidity Funds which describes in detail each Investment Portfolio’s investment policies, risks, fees and expenses. Please read the prospectus carefully before you invest or sendmoney. For additional information, including information regarding the investments comprising the Portfolio, please visit our website at www.morganstanley.com/im or call 1(888) 378-1630.
(This page has been left blank intentionally.)
(This page has been left blank intentionally.)
(This page has been left blank intentionally.)
Printed in U.S.A.
This Report has been prepared for shareholders and may be distributed to others only if preceded or accompanied by a current prospectus.
Morgan Stanley Investment Management Inc.
1221 Avenue of the Americas
New York, NY 10020
MSILF: (888) 378-1630
© 2007 Morgan Stanley
Morgan Stanley | MSILFSR IU07-01599P-Y04/07 |
Item 2. Code of Ethics.
Not applicable for semiannual reports.
Item 3. Audit Committee Financial Expert.
Not applicable for semiannual reports.
Item 4. Principal Accountant Fees and Services
Not applicable for semiannual reports.
Item 5. Audit Committee of Listed Registrants.
Not applicable for semiannual reports.
Item 6. Schedule of Investments
Refer to Item 1.
Item 7. Disclosure of Proxy Voting Policies and Procedures for Closed-End Management Investment Companies.
Not applicable for semiannual reports.
Item 8. Portfolio Managers of Closed-End Management Investment Companies
Applicable to annual reports filed by closed-end funds.
Item 9. Closed-End Fund Repurchases
Applicable to reports filed by closed-end funds.
Item 10. Submission of Matters to a Vote of Security Holders
Not applicable.
Item 11. Controls and Procedures
(a) The Fund’s principal executive officer and principal financial officer have concluded that the Fund’s disclosure controls and procedures are sufficient to ensure that information required to be disclosed by the Fund in this Form N-CSR was recorded, processed, summarized and reported within the time periods specified in the Securities and Exchange Commission’s rules and forms, based upon such officers’ evaluation of these controls and procedures as of a date within 90 days of the filing date of the report.
(b) There were no changes in the registrant’s internal control over financial reporting that occurred during the second fiscal quarter of the period that has materially affected, or is reasonably likely to materially affect, the registrant’s internal control over financial reporting.
Item 12. Exhibits
(a) Code of Ethics - - Not applicable for semiannual reports.
(b) A separate certification for each principal executive officer and principal financial officer of the registrant are attached hereto as part of EX-99.CERT.
SIGNATURES
Pursuant to the requirements of the Securities Exchange Act of 1934 and the Investment Company Act of 1940, the registrant has duly caused this report to be signed on its behalf by the undersigned, thereunto duly authorized.
Morgan Stanley Institutional Liquidity Funds
/s/ Ronald E. Robison | | | |
Ronald E. Robison | | |
Principal Executive Officer | | |
June 21, 2007 | | |
Pursuant to the requirements of the Securities Exchange Act of 1934 and the Investment Company Act of 1940, this report has been signed by the following persons on behalf of the registrant and in the capacities and on the dates indicated.
/s/ Ronald E. Robison | | | |
Ronald E. Robison | | |
Principal Executive Officer | | |
June 21, 2007 | | |
| | |
/s/ James Garrett | | | |
James Garrett | | |
Principal Financial Officer | | |
June 21, 2007 | | |
| | | | |