UNITED STATES SECURITIES AND EXCHANGE COMMISSION
Washington, D.C. 20549
FORM N-CSR
CERTIFIED SHAREHOLDER REPORT OF REGISTERED MANAGEMENT INVESTMENT
COMPANIES
COMPANIES
| Investment Company Act file number: | 811-21335 |
| Exact name of registrant as specified in charter: | Optimum Fund Trust |
| Address of principal executive offices: | 2005 Market Street |
| Philadelphia, PA 19103 | |
| Name and address of agent for service: | David F. Connor, Esq. |
| 2005 Market Street | |
| Philadelphia, PA 19103 | |
| Registrant’s telephone number, including area code: | (800) 523-1918 |
| Date of fiscal year end: | March 31 |
| Date of reporting period: | March 31, 2010 |
Item 1. Reports to Stockholders
| | ||
| Optimum Fund Trust | ||
| May 28, 2010 | ||
This brochure accompanies an annual report for the information of Optimum Fund Trust shareholders, but it may be used with prospective investors when preceded or accompanied by a current prospectus for Optimum Fund Trust. You should consider the investment objectives, risks, charges, and expenses of the investment company carefully before investing. The prospectus contains this and other important information about the Funds. Prospectuses for Optimum Fund Trust are available from your financial advisor, online at www.optimummutualfunds.com, or by phone at 800 914-0278. Please read the prospectus carefully before you invest or send money. The figures in the annual report for Optimum Fund Trust represent past results, which are not a guarantee of future results. The return and principal value of an investment in a Fund will fluctuate so that shares, when redeemed, may be worth more or less than their original cost. Current performance may be higher or lower than the performance data quoted. | ||
| | |||
| Optimum Fixed Income Fund | |||
| Optimum International Fund | |||
| Optimum Large Cap Growth Fund | |||
| Optimum Large Cap Value Fund | |||
| Optimum Small-Mid Cap Growth Fund | |||
| Optimum Small-Mid Cap Value Fund | |||
| Annual Report | |||
| March 31, 2010 | |||
Table of contents
| > Portfolio management review | |
| Optimum Fixed Income Fund | 1 |
| Optimum International Fund | 4 |
| Optimum Large Cap Growth Fund | 7 |
| Optimum Large Cap Value Fund | 10 |
| Optimum Small-Mid Cap Growth Fund | 13 |
| Optimum Small-Mid Cap Value Fund | 15 |
| > Performance summary | |
| Optimum Fixed Income Fund | 18 |
| Optimum International Fund | 22 |
| Optimum Large Cap Growth Fund | 24 |
| Optimum Large Cap Value Fund | 26 |
| Optimum Small-Mid Cap Growth Fund | 28 |
| Optimum Small-Mid Cap Value Fund | 30 |
| > Disclosure of Fund expenses | 32 |
| > Sector/Country allocations | |
| and top 10 holdings | 34 |
| > Financial statements | |
| Statements of net assets | 38 |
| Statements of assets and liabilities | 80 |
| Statements of operations | 81 |
| Statements of changes in net assets | 82 |
| Financial highlights | 85 |
| Notes to financial statements | 109 |
| > Report of independent | |
| registered public accounting firm | 126 |
| > Other fund information | 127 |
| > Board of trustees and officers addendum | 130 |
| > About the organization | 132 |
On January 4, 2010, Delaware Management Holdings, Inc., and its subsidiaries (collectively known by the marketing name of Delaware Investments) were sold by a subsidiary of Lincoln National Corporation to Macquarie Group Limited, a global provider of banking, financial, advisory, investment and funds management services. Please see your Funds’ prospectus and any supplements thereto for more complete information.
Investments in Optimum Fixed Income Fund, Optimum International Fund, Optimum Large Cap Growth Fund, Optimum Large Cap Value Fund, Optimum Small-Mid Cap Growth Fund, and Optimum Small-Mid Cap Value Fund are not and will not be deposits with or liabilities of Macquarie Bank Limited ABN 46 008 583 542 and its holding companies, including their subsidiaries or related companies, and are subject to investment risk, including possible delays in repayment and loss of income and capital invested. No Macquarie Group company guarantees or will guarantee the performance of the Funds, the repayment of capital from the Funds, or any particular rate of return.
Unless otherwise noted, the views expressed in this report are as of March 31, 2010, and are subject to change at any time. Holdings are as of the date indicated and subject to change.
Funds are not FDIC insured and are not guaranteed. It is possible to lose the principal amount invested.
Mutual fund advisory services provided by Delaware Management Company, a series of Delaware Management Business Trust, which is a registered investment advisor.
© 2010 Delaware Distributors, L.P.
All third-party trademarks are the property of their respective owners.
Portfolio management review
Optimum Fixed Income Fund
April 6, 2010
| Performance review (for the year ended March 31, 2010) | |||
| Optimum Fixed Income Fund (Class A shares) | 1-year return | +28.24% | |
| Optimum Fixed Income Fund (Institutional Class shares) | 1-year return | +28.73% | |
| Barclays Capital U.S. Aggregate Index (benchmark) | 1-year return | +7.69% |
Past performance does not guarantee future results.
For complete, annualized performance for Optimum Fixed Income Fund, please see the table on page 18.
The performance of Class A shares excludes the applicable sales charge and reflects the reinvestment of all distributions.
Index performance returns do not reflect any management fees, transaction costs, or expenses. Indices are unmanaged and one cannot invest directly in an index.
Advisor
Delaware Management Company (DMC)
Sub-advisor
Pacific Investment Management Company LLC (PIMCO)
On April 1, 2010, PIMCO replaced TCW Investment Management (TCW) as a sub-adviser to the Fund. TCW was the Fund’s sub-advisor for the entire year ending March 31, 2010. Please see the Supplement to the Fund’s prospectuses, dated March 23, 2010, for more information.
On the heels of a historically difficult prior fiscal period, the stage was set for a strong “snapback” recovery. Such a recovery came to fruition for the fixed income market (as well as the equity market) early in the fiscal year and was the defining element of the period. For example, investors’ apparent risk aversion seemingly eased within weeks of the start of the period — slowly at first, and more quickly as the year progressed. The robust market performance was significantly aided by the U.S. federal government, which acted aggressively to replace the private capital lost in the preceding year with public capital intended to prop up asset prices.
This aggressive action by the government seemed most evident in the mortgage and asset-backed sectors, which were at the epicenter of the meltdown and saw a defection of investors as security prices plunged in 2008. Programs such as the Term Asset-backed Loan Facility (TALF) and Public-Private Investment Program (PPIP) were fully ramped up during this period, employing government-provided leverage in the consumer asset-backed securities (ABS) and nonagency mortgage-backed securities (MBS) markets, respectively. This was aimed at attracting new investors into these largely abandoned sectors. It generally worked as intended, with asset prices recovering some of the ground lost during the previous year.
The Federal Reserve and U.S. Treasury completed their $1.5 billion agency MBS repurchase program at the end of March 2010. The end of the program was well telegraphed and expected by the market, yet some yields (which move inversely to prices) rose modestly in the last few days of March as the prospective departure of the sector’s largest purchaser did have some effects. Nonetheless, the small increase in yields did little to blunt the overall effectiveness of the program.
Somewhat surprisingly, the market recovery that occurred during the year took place despite economic data that were mixed at best. Unemployment remained near 10% for the entire period. Economic growth turned positive, but was characterized by relatively unsustainable increases in inventories rather than final demand. Home prices were roughly stable through the period as well, with lower-priced homes reaching a floor (thanks in part to the home buyer tax credit enacted by the federal government) while higher-priced homes continued to show modest declines. Softness was also seen across a wide variety of other data including consumer confidence, manufacturing output, consumer spending, and capacity utilization. While there was certainly improvement from the lows of 2008, nothing in the data suggested the kind of rebound seen in fixed income, equities, and most other financial assets.
(continues) 1
Portfolio management review
Optimum Fixed Income Fund
DMC
The portion of Optimum Fixed Income Fund managed by DMC employs a diversified “core plus” investment strategy. This means that DMC seeks to invest the core of its assets under management in U.S. investment grade securities, and then strategically allocates other assets to additional fixed income markets. These additional sectors include U.S. high yield bonds as well as established and emerging international markets.
As the reporting period began, investors’ previously deep level of pessimism shifted to a more optimistic outlook, as many investors rediscovered their appetite for risk. The bond market appeared to anticipate better times ahead as prices rose dramatically on virtually all assets across the risk spectrum. We believe the portion of the Fund managed by DMC was well positioned for the shift in investor sentiment, which contributed to the Fund’s overall outperformance of the benchmark.
Specifically, our overweight allocation to investment grade corporate bonds had relatively positive effects on results. Corporate bonds were among the asset classes previously most affected by the credit crisis, as yields on these securities soared to levels rarely seen before (source: Bloomberg). As credit conditions eased, however, investment grade corporate bonds experienced a massive and sustained rally. Within DMC’s portion of the Fund, security selection was a significant positive across many industries, including banking, basic industry, communications, consumer (both cyclicals and noncyclicals), and technology.
Our exposure to high yield and emerging-market debt, which are not included in the benchmark index, also helped the Fund’s relative performance for the year, as these sectors of the market outperformed. Our emphasis on higher-quality credits within the high yield asset class moderated the relative gains, as market returns were progressively stronger within the lower-quality credit categories.
Though we maintained a limited exposure to the sector, emerging-market bonds generally provided another source of strength for the Fund. Our emerging-market focus during the period was on countries that we believed had good fiscal policies in place prior to the downturn, less-distressed economies, or sufficiently flexible economic stimulus programs. These countries tended to experience more-vigorous economic recoveries. Examples include Indonesia, Brazil, and India, among others.
TCW
The portion of Optimum Fixed Income Fund previously managed by TCW was predominantly invested in a combination of agency and nonagency MBS, both of which posted strong results for the period. Given the extraordinarily difficult conditions that the fixed income markets experienced during the previous fiscal year, we were able to purchase many of these assets at attractive valuations.
Nonagency prime and alt-A (or just above subprime) MBS were the largest contributors to relative returns during the period. These assets were purchased at substantial discounts to par, and often enjoyed significant price appreciation. Further, our allocation to agency MBS also contributed to performance, as prices rose at least in part due to the large government purchase program.
Our overall strategy remained consistent over the course of the period, with an emphasis on nonagency MBS. However, we did implement some minor adjustments as market conditions developed. At the beginning of the period, our nonagency holdings were focused primarily in bonds backed by prime and higher-quality alt-A collateral. As was expected, those sectors were among the first to recover. As prices rose toward the end of 2009 and into 2010, we began to move our portion of the Fund out of those sectors and into lower-priced alt-A and subprime collateral that we believed offered better risk-return characteristics at that time.
2
While there were brief periods within the year that individual sectors underperformed, those periods tended to be short, and bond prices moved overwhelmingly higher across all sectors over the course of the year. Our specific holdings within each sector mattered less than simply investing in each sector and letting the proverbial rising tide lift the boat.
(continues) 3
Portfolio management review
Optimum International Fund
April 6, 2010
| Performance review (for the year ended March 31, 2010) | |||
| Optimum International Fund (Class A shares) | 1-year return | +50.29% | |
| Optimum International Fund (Institutional Class shares) | 1-year return | +50.88% | |
| MSCI EAFE Index (benchmark) (gross) | 1-year return | +55.20% | |
| MSCI EAFE Index (benchmark) (net) | 1-year return | +54.44% |
Past performance does not guarantee future results.
For complete, annualized performance for Optimum International Fund, please see the table on page 22.
The performance of Class A shares excludes the applicable sales charge and reflects the reinvestment of all distributions.
Index performance returns do not reflect any management fees, transaction costs, or expenses. Indices are unmanaged and one cannot invest directly in an index.
Advisor
Delaware Management Company (DMC)
Sub-advisors
BlackRock Advisors, LLC (BlackRock)
Mondrian Investments Partners Limited (Mondrian)
For the fiscal period, the Fund’s benchmark, the MSCI EAFE (Europe, Australasia, Far East) Index, advanced +54.44% (net) — an impressive gain on an absolute basis.
Every EAFE region rose by double digits during the Fund’s fiscal year. The United Kingdom rose by 59.5% as most economic indicators showed improvement in 2009. France rose by 50.8%, underperforming the benchmark, as did Germany and Switzerland, returning 51.4% and 54.0%, respectively.
Australia was up 86.7%, benefiting from strength in its financials and materials sectors, together with the strength of its currency. Singapore advanced impressively, driven by improvements in the external environment along with strength in its well-capitalized banking sector and price increases in its property market.
Japan had the worst performance among Asian countries, advancing by 37.9%. Greece experienced sharp underperformance (up just 24.2%) as the government’s near-term liquidity and longer-term solvency issues led to sovereign debt–related concerns that weighed heavily on the market.
Within broader equity markets, and in much more general terms, markets rose substantially during the period as investors began anticipating a recovery from a recession and financial crisis that have affected economies around the world. After bottoming in early March 2009, stocks experienced a significant rebound as risk appetite recovered from extremely pessimistic levels.
The recovery slowed as the year progressed, as investors began questioning the effects of eventual withdrawals of monetary and fiscal stimulus policies. At the same time, fears grew about the headwinds that massive budget deficits across the developed world could cause going forward.
As often happens after recessions and financial crises, stocks that suffered the most during the downturn dramatically outperformed when markets began to recover. Stocks in the financials and materials sectors were among the strongest examples. Once the financial world appeared to have been saved from implosion and an economic recovery seemed probable, the sector rallied. Materials advanced strongly as well driven by Asian demand. Weaker sectors included the more traditionally defensive sectors such as healthcare, telecommunications, and utilities.
BlackRock
For the Fund’s fiscal year, the Fund’s BlackRock sleeve outperformed the Fund’s benchmark, the MSCI EAFE Index. Stock selection was generally strong during the period, with the most significant contributions coming from holdings in the consumer discretionary and energy sectors. Some of our energy holdings (especially those related to the exploration and production of oil and gas) meaningfully outpaced their industry peers, as the demand outlook improved and capacity cuts helped
4
limit conditions of oversupply. Within the consumer discretionary space, we benefited from positions within consumer services, media, and retailing industries that saw strong returns as economic conditions improved.
From a sector point of view, our positioning was generally positive, especially from an overweight in the materials sector, which benefited from rising commodity prices. Underweights in the more defensive healthcare and utilities sectors also had positive effects. In contrast, our cash position (while small) detracted somewhat from total returns, and our overweight in the energy sector also hurt performance compared to that of the index.
Regionally, performance as measured against the benchmark index was positively influenced by our out-of-benchmark exposures to emerging markets and Canada, which outperformed most developed-market constituents of the MSCI EAFE Index. Our underweight in Japan for most of the period also had a positive effect on relative performance.
Turns in the market typically pose significant difficulties for fundamental managers and lead to wide disparities in relative returns immediately before and immediately after the market’s trough. One of the reasons we were able to navigate this environment more effectively than many of our peers was our recognition of oversold conditions and record-high valuation spreads, even as credit markets had already begun to heal. That meant carefully looking back to cyclical industries and stocks that seemed most severely punished in the downturn. This was based on the notion that such holdings were likely to lead the market recovery while offering the most compelling risk-reward opportunities.
Mondrian
The Fund’s Mondrian sleeve lagged the MSCI EAFE Index for the fiscal year. Being defensive value managers, we would not expect to outperform during such an unusually strong fiscal period.
While the effects of our currency holdings were positive, the effects of market selection and stock selection were negative. Our overweight position in the outperforming Singaporean market had a positive effect on performance relative to the index, as were the zero weightings in Greece and Ireland — two countries that underperformed the broader index. Our overweight position in the underperforming telecommunications services sector was unhelpful, as was the underweight position in the relatively strongly performing materials and financials sectors. The effects of stock selection in the financial sector were, however, supportive to our sleeve’s overall returns.
For the fiscal year, the strongest stocks were in Australia and Asia. They included the Australian conglomerate Wesfarmers (up by slightly more than 130%) and the Hong Kong ports and property company Wharf Holdings (gaining 131.1%).
Wesfarmers is a conglomerate with interests in coal, insurance, fertilizers, and chemicals. It also has the largest do-it-yourself chain in Australia. In 2007, it was transformed by its acquisition of the Coles Group in a deal that was finalized at the end of that year. In 2008, there were concerns that the company would not be able to roll over some of its debt refinancing. This was resolved with an equity issue that left its balance sheet in a very strong position. The share price recovered strongly in 2009, helped by commodity prices that helped the earnings of its coal division. There have also been positive signs of improvement in the Coles businesses, with improved sales and encouraging results from the new supermarkets Coles is rolling out. The company has also announced an expansion of its production of “coking coal,” which is used in the manufacture of other substances such as steel and iron.
Wharf Holdings’ principal activities involve the development and management of investment properties and the operation of container terminals. The steady cash flow from its property and ports businesses has allowed the group to increase the scale of its investments in China, particularly in property development. This is expected to become a significant portion of earnings over the next decade.
(continues) 5
Portfolio management review
Optimum International Fund
Stocks that lagged the benchmark during the Fund’s fiscal year included a number of Japanese stocks such as retailer Seven & I Holdings (up 13.3%), insurance company Tokio Marine Holdings (up 18.7%), and the telecommunications company KDDI (gaining 13.5%). Other relatively underperforming names included Chunghwa Telecom in Taiwan (+11.6%) and France Telecom in France (+13.6%). Hongkong Electric Holdings, another underperformer, rose by just 4.5% during the 12 months ending March 31, 2010.
Chunghwa Telecom is a dominant telecommunications operator in Taiwan and is primarily government owned. It has the largest fixed-line business and is the number one mobile operator in that country. It has a strong balance sheet and strong cash flows that support dividend payments. Despite anemic growth prospects, we believe the strong cash flow, high dividend payout, and low risk profile make the stock attractive, though it has underperformed due to the defensive nature of the company and the broader communications sector.
Seven & I Holdings is the fifth-largest retailer globally with more than 30,000 stores. It is the holding company for a comprehensive retail operation including Ito-Yokado (superstores), 7-Eleven Japan, and 7-Eleven Inc. (which also serves the United States). In common with other Japanese retail operators, the company has suffered under the deflationary environment in Japan, coupled with high levels of competition. With the exception of 7-Eleven Japan, the various businesses have generally achieved low profitability. However, we believe the company can translate the success of 7-Eleven across its other stores.
Going forward, we seek to continue managing our portion of the Fund according to the same style we always have: an active, value-oriented defensive style. We plan to seek out securities that show strong potential for long-term income flows. Dividend yield and future real growth will continue playing a central role in our investment decisions, and we believe the dividend component may likely be a meaningful portion of expected total return over time.
6
Optimum Large Cap Growth Fund
April 6, 2010
| Performance review (for the year ended March 31, 2010) | |||
| Optimum Large Cap Growth Fund (Class A shares) | 1-year return | +52.22% | |
| Optimum Large Cap Growth Fund (Institutional Class shares) | 1-year return | +52.87% | |
| Russell 1000® Growth Index (benchmark) | 1-year return | +49.75% |
Past performance does not guarantee future results.
For complete, annualized performance for Optimum Large Cap Growth Fund, please see the table on page 24.
The performance of Class A shares excludes the applicable sales charge and reflects the reinvestment of all distributions.
Index performance returns do not reflect any management fees, transaction costs, or expenses. Indices are unmanaged and one cannot invest directly in an index.
Advisor
Delaware Management Company (DMC)
Sub-advisors
Fred Alger Management, Inc. (Alger)
T. Rowe Price Associates, Inc. (T. Rowe Price)
Marsico Capital Management, LLC (Marsico)
Early during the fiscal year, the equity markets began to emerge from the deep losses experienced during calendar year 2008 and in the beginning of 2009. From March 2009 through March 2010, equity performance worldwide was remarkable, amid stronger-than-expected corporate earnings and signs of economic stabilization across the globe. While we believe the recession in the United States largely ended in the third quarter of 2009, a full economic recovery in the U.S. is far from complete. Risks remain, however, including a still notably weak housing market, the possibility of higher interest rates in 2010, and the lingering effects of the recession that continue to engender caution among individual investors and companies.
The Russell 1000 Growth Index gained nearly 50% for the 12-month period ending March 31, 2010, with the more cyclical sectors outperforming traditionally defensive sectors in the improving economy. Financials was by far the top-performing sector within the benchmark index, followed by the industrials, business services, and consumer discretionary sectors. The utilities sector was the worst performer, despite posting double-digit returns, followed by the healthcare and consumer staples sectors. Based on returns by Russell’s capitalization-size and investment-style indices, large-cap value stocks outperformed large-cap growth during the period, and among growth stocks, small-caps outperformed large-caps.
Alger
It was a strong year for stocks. In many cases, our analysts were able to identify companies undergoing “positive dynamic change,” where our fundamental outlook for their revenues, earnings, and cash flow exceeded consensus estimates.
Among the most important absolute contributors to our annual performance were Apple and BE Aerospace. Conversely, detracting from overall results were Cephalon and ITT Educational Services.
Apple was the leading absolute contributor to our portion of the Fund’s performance. The company continued to grow impressive revenues and margins during the period. Sales of Mac computers and iPhones primarily drove revenue growth, and we believe the introduction of the new iPad portable tablet computer should be a catalyst for future growth.
BE Aerospace is the leading manufacturer of commercial aircraft and business jet cabin interior products worldwide. The company’s shares declined sharply in 2008, but as the commercial airline business began to recover in 2009, the company received new orders to refurbish and upgrade the first-class and business-class sections of commercial wide-body aircraft. As a result, the shares were unusually strong performers during the past 12 months ending March 31, 2010, more than tripling in price.
Cephalon is a biopharmaceutical company that engages in the discovery, development, and commercialization of products for central nervous system, inflammatory disease, pain, and oncology therapeutic areas. The shares performed poorly as investors became more concerned
(continues) 7
Portfolio management review
Optimum Large Cap Growth Fund
about the success of the Nuvigil launch (follow-on product to Provigil) because of the likely onset of generic competition. As a result of this prospect, we exited the position.
ITT Educational Services provides accredited, technology-oriented undergraduate and graduate degree programs through its ITT Technical Institutes and Daniel Webster College. The negative impact of the ongoing recession and the continuing uncertainty surrounding government support programs (Pell Grants) caused the shares to underperform and detracted from Fund performance. We continued to hold the stock because we believe that enrollment metrics suggest continued strong demand for the company’s programs.
T. Rowe Price
In keeping with our investment strategy, we sought companies during the period that we thought had an above-average rate of earnings growth and the potential ability to pay increasing dividends through strong cash flow.
Stock selection contributed to our relative performance, while sector weightings generally detracted. The financials, industrials and business services, and telecommunication services sectors were our major detractors relative to the benchmark. The information technology, healthcare, and consumer staples sectors were our leading contributors.
Performance among our holdings in the financial sector, the top-performing sector in the benchmark, was the primary detractor from our relative performance. Shares of Northern Trust declined amid weakness in its wealth management, securities lending, and foreign exchange trading businesses. We like the company’s long-term growth outlook, which we believe should benefit when interest rates rise.
Moody’s, the second-largest credit rating agency, saw its stock decline under the weight of regulatory and legal risks. A low interest rate environment has resulted in increased bond issuances and refinancing, but rising costs have slowed earnings growth at the company. As a result, we exited the position during the period.
The industrials and business services sectors were significant detractors within our portion of the Fund, with results largely driven by Danaher, a manufacturer of tools for various professional, medical, industrial, and consumer markets. Danaher did not fully participate in the recent rally, as the company’s diversified end markets left it less leveraged to economic conditions. The fact that we believe the stock is less sensitive to cyclical conditions is the primary reason we continue to hold it in our portfolio.
Tencent Holdings was a leading contributor to performance within our portion of the Fund. The company, China’s largest internet provider, benefited from growing trends in online gaming and instant-messaging markets. Rapid growth of mobile users has also driven company growth. Shares of Baidu, China’s leading internet search provider with more than 60% of the market, increased significantly after Google announced it was leaving the market. Google refused to censor search results and sustained a cyber attack in January that was traced to China.
Pharmacy benefits manager Express Scripts was also a notable contributor within our portion of the Fund. The company benefited from an increasing demand for generic drugs. We believe that the trend toward mail-order prescriptions as a cost-cutting measure in the healthcare sector should further benefit the company.
Contributor to performance Intuitive Surgical, a maker of robotic surgery systems, has consistently met market expectations in a challenging capital equipment environment. A new system launch and a well-executed commercial strategy led to outstanding results for the firm in 2009.
Marsico
As market conditions improved during the Fund’s fiscal period, we continued to rigorously apply our investment strategy — analyzing the competitive landscape using a
8
top-down macroeconomic perspective while employing fundamental research to identify what we believe are high-quality companies with compelling potential for long-term capital appreciation.
We increased our exposure to the financial sector while decreasing our position in the healthcare sector. Stock selection in the diversified financials and banks industries contributed to our portion of the Fund’s performance during the period. JPMorgan Chase was among our largest individual contributors during the year, as it benefited from a consolidation in the investment banking space and less competition, a trend we believe should continue.
Additionally, stock choices in the materials sector were a source of outperformance. In particular, positions in Dow Chemical and BHP Billiton were notable contributors. Dow Chemical realized significant benefit in the period from its restructuring efforts, while BHP Billiton capitalized on emerging-market demand for natural resources.
Stocks in the healthcare sector were a source of underperformance. Positions in Roche Holding and Schering-Plough, both sold during the period, were the largest individual detractors within our portion of the Fund during the period. Both companies declined apparently due to investor concerns about the strength of their product pipelines.
Throughout the year, our portion of the Fund maintained an overweight position in the materials sector, which hampered performance as this turned out to be one of the weakest performing sectors in the benchmark index.
(continues) 9
Portfolio management review
Optimum Large Cap Value Fund
April 6, 2010
| Performance review (for the year ended March 31, 2010) | |||
| Optimum Large Cap Value Fund (Class A shares) | 1-year return | +49.92% | |
| Optimum Large Cap Value Fund (Institutional Class shares) | 1-year return | +50.47% | |
| Russell 1000® Value Index (benchmark) | 1-year return | +53.56% |
Past performance does not guarantee future results.
For complete, annualized performance for Optimum Large Cap Value Fund please see the table on page 26.
The performance of Class A shares excludes the applicable sales charge and reflects the reinvestment of all distributions.
Index performance returns do not reflect any management fees, transaction costs, or expenses. Indices are unmanaged and one cannot invest directly in an index.
Advisor
Delaware Management Company (DMC)
Sub-advisors
TCW Investment Management Company (TCW)
Massachusetts Financial Services Company (MFS)
The massive monetary and fiscal stimulus that mobilized in the fourth quarter of 2008, while much debated, eventually achieved the desired effect of stabilizing the U.S. and global monetary panic. The U.S. economy troughed in the first half of 2009, with gross domestic product declining more than 6% in the first quarter and receding 0.7% in the second quarter (source: U.S. Commerce Department).
While job recovery has been slow, the Bureau of Labor Statistics (BLS) just reported a gain of 162,000 jobs in March. Unemployment has stabilized at 9.7% and the BLS has reported a continuation of strong temporary employment activity with positive statistics since September (temporary employment has traditionally been a harbinger for an employment recovery). The equity markets have thus far sustained China’s credit tightening and the economic travails in Greece. Oil has remained stable with crude prices hovering around $80 a barrel, which has kept energy and gas prices relatively low.
The equity markets experienced one of the best bull markets in history, which began in early March 2009, just shy of the Fund’s fiscal year start. With the exception of October 2009 and January 2010, every month in the fiscal period had positive returns (source: Bloomberg). Both the Russell 1000 Value Index and the S&P 500 Index advanced approximately 50%. In general, lower-quality, lower-market-cap, and higher-beta (high risk) stocks outperformed during this period, as the market rose from multiyear lows.
Improved retail sales data was supported largely by the cash-for-clunkers program for much of summer 2009. However, the latter part of 2009 brought improvements without such overt government support. Several major retailers from across the price spectrum, including Target, TJX (parent company to TJ Maxx, Marshalls, and other discount stores), and luxury retailer Saks Fifth Avenue posted improved sales figures during the fourth quarter. In all, retail sales figures came in above Wall Street expectations in both October and November of 2009. (Source: Dow Jones.)
Additionally, the U.S. manufacturing sector further separated itself from previous lows, posting its seventh consecutive month of growth through February 2010 (as indicated by the Institute for Supply Management).
The first quarter of 2010 began on the heels of a nearly year-long “risk rally” during which both the equity and fixed income markets recovered much of the losses they experienced in 2008. The end of the Fund’s fiscal period demonstrated that investors could potentially achieve solid total returns despite their worries that the rally might fizzle in the new year.
TCW
The portion of the Fund managed by TCW benefited from all sector allocations, with the exception of our overweight in telecommunications, which was the worst-performing sector over the fiscal year. Security selection also contributed to outperformance, with large strides achieved in: materials, including United States Steel, MeadWestvaco, Packaging Corporation
10
of America, and E.I. du Pont de Nemours (DuPont); telecommunications, including Qwest Communications International; and information technology, including Tyco Electronics, KLA-Tencor, and LSI.
Cosmetic company Estée Lauder Companies and semiconductor company KLA-Tencor were completely sold, both realizing approximate gains of 50% from cost. ConocoPhillips was sold from our portion of the Fund, as it met our downside sell discipline and Mattel was sold on the upside as it outperformed relative to the market.
We acted on the attractive prices found in the battered financials sector by adding insurer MBIA and financial services company Morgan Stanley; however, stock selection in financials detracted from the Fund’s performance.
Additionally, as commodity prices fell, there were individual opportunities presented in the energy sector, including exploration and production company Devon Energy, oil service company Baker Hughes, and offshore contract drilling company, Ensco International. Additional initiations included CA and Textron in the information technology and industrials sectors, respectively.
Our underweight in the healthcare and consumer discretionary sectors contributed to our portion of the Fund’s performance. Our overweight in the poorly performing telecommunications sector detracted from performance as did our underweight in the outperforming industrials sector.
The two leading contributors to our section of the Fund’s performance over the fiscal year were Tyco Electronics in the technology sector and hospital company Tenet Healthcare, both of which posted impressive returns. Tyco Electronics outperformed its peers due to better execution and exposure to the rebuilding automotive sector. Tenet Healthcare benefited from a multiyear program meant to increase the quality of care while reducing costs and paying down debt.
The two worst-performing stocks affecting performance were integrated energy company Chevron, which is the second-largest energy company, and Regal Entertainment Group. Chevron’s return lagged the peer group and although it outperformed its largest competitor, Exxon Mobil, it could not keep pace with its smaller competitors. The cash-flow-rich movie theater owner and operator Regal Entertainment, typically a defensive play, lagged the more cyclically tied consumer discretionary stocks.
MFS
During the fiscal period, security selection and, to a lesser extent, an underweighted position in the financial services sector, dampened returns versus the Russell 1000 Value Index within our portion of the Fund. Our positioning in Bank of America detracted from relative performance. We added this stock to the Fund in late 2009, as our confidence in its balance sheet, normalized earnings, and future credit trends had improved from earlier in the year. Bank of America is a large holding within the benchmark index and while we’ve continued to increase our exposure, we remain underweighted.
An overweight position in Bank of New York Mellon, which underperformed the benchmark during the reporting period, hindered relative performance. We believe that shares in Bank of New York Mellon struggled — improvements in its revenue growth profile and its exposure to an improving credit environment was not as significant as other areas of financials, which attracted the interest of investors and performed better. In our opinion, the low interest rate environment is putting pressure on the company’s revenue growth, leading to below-normal earnings in the current period. However, we believe the company has an attractive mix of businesses, generates very good returns over time, has a good balance sheet, and trades for an attractive valuation; therefore, we continue to hold the stock.
Stock selection in the industrial goods and services sector also detracted from relative performance within our portion of the Fund, particularly our position in global security company Lockheed Martin. Lockheed Martin has a sustainable, durable business, a strong balance
(continues) 11
Portfolio management review
Optimum Large Cap Value Fund
sheet, and generates significant free cash flow. Its underperformance last year did not change our positive long-term view of the company and we continue to hold the name as our largest position, given our view of its high-quality characteristics and attractive valuation.
Our cash position was another detractor from relative performance within our portion of the Fund. The Fund holds cash to buy new holdings and provide liquidity. In a period when equity markets rose, as measured by the Fund’s benchmark index, holding cash hurt performance when compared against the benchmark, which had no cash position.
A combination of stock selection and an underweight position in the energy sector aided relative performance. Our underweight position in Exxon Mobil helped as this stock underperformed the benchmark during the fiscal period. Exxon Mobil, as well as integrated oil stocks as a group, underperformed the market significantly during the period as investors appeared to have rotated into less-defensive areas.
An underweighted position in the utilities and communications sector was another contributor, including our positioning in Verizon Communications, which bolstered relative performance. We sold Verizon during the quarter — its shares lagged the benchmark as we believe investors gravitated toward lower-quality, more-leveraged businesses, due in part to a growing optimism about the potential U.S. economic recovery.
MetLife was also a contributor to our portion of the Fund. A dramatic recovery in the credit markets in the spring of 2009 led to substantial upward revisions in the valuations for a number of MetLife’s investments. With a valuation below book value, the company’s share price reacted positively to these developments.
During the reporting period, our currency exposure was also a contributor to relative performance. All MFS investment decisions are driven by the fundamentals of each individual opportunity, and as such, it is common for us to have different currency exposure than that of the benchmark.
12
Optimum Small-Mid Cap Growth Fund
April 6, 2010
| Performance review (for the year ended March 31, 2010) | |||
| Optimum Small-Mid Cap Growth Fund (Class A shares) | 1-year return | +64.94% | |
| Optimum Small-Mid Cap Growth Fund (Institutional Class shares) | 1-year return | +65.36% | |
| Russell 2500™ Growth Index (benchmark) | 1-year return | +63.92% |
Past performance does not guarantee future results.
For complete, annualized performance for Optimum Small-Mid Cap Growth Fund, please see the table on page 28.
The performance of Class A shares excludes the applicable sales charge and reflects the reinvestment of all distributions.
Index performance returns do not reflect any management fees, transaction costs, or expenses. Indices are unmanaged and one cannot invest directly in an index.
Advisor
Delaware Management Company (DMC)
Sub-advisors
Wellington Management Company, LLP (Wellington)
Columbia Wanger Asset Management, L.P. (Columbia WAM)
After continuing their nosedive early in 2009, stocks bounced off their lows in March 2009 and managed one of the most impressive rallies in history. U.S. equities across all styles and capitalizations extended the remarkable rally as credit market conditions improved, corporate earnings were generally better than expected, and the economy showed signs that it was emerging from the longest and deepest recession since the Great Depression.
Substantial efforts to stimulate global economies over the fiscal year helped to avert a worst-case scenario. Among the most prominent measures in the United States was the Federal Reserve’s continued purchases of mortgage-backed securities issued by Fannie Mae, Freddie Mac, and Ginnie Mae. This helped keep mortgage rates near multidecade lows. The prospects for continuing low rates and healthier corporate earnings seemed to stimulate investors’ appetites for riskier assets, including stocks.
Government intervention — together with easy year-on-year comparisons, lean inventories and staffing, and muted expectations — led companies to post better-than-anticipated earnings. But the attendant seismic shift in sentiment from the extreme anxiety that ushered stocks to multiyear lows in March 2009, to the ebullience that propelled equities to close the fiscal year decisively higher, proved a significant navigational challenge.
While it was a remarkable period for U.S. equities, concerns remain that an extended period of extraordinary monetary and fiscal stimulus may have very severe implications for future inflation as the economy recovers.
Wellington
We adhered to our investment approach, even as company fundamentals seemingly took a back seat to macroeconomic forces in driving stock performance during much of this period. We kept our research resources focused on identifying companies able to sustain superior revenue and earnings growth by virtue of their advantaged market position. We also remained conservative in the assumptions we used to estimate companies’ future earnings and cash flows, as well as in the valuation metrics we employed to set target prices. Against this backdrop, our portion of the Fund experienced positive absolute and relative returns.
Top individual contributors for the period included technology hardware companies Seagate Technology and Jabil Circuit. Seagate, a manufacturer and distributor of disk drives, fixed a weak balance sheet earlier in the period. This removed significant risk to the company’s viability and allowed investors to focus on strong disk drive unit demand and the company’s significant cost-saving initiatives. Jabil Circuit, one of the largest electronic manufacturing services providers, benefited from improving conditions in several key end markets and a healthy relationship with Research In Motion.
Relative detractors included Corinthian Colleges and Advance Auto Parts. Corinthian Colleges is a postsecondary education services company with
(continues) 13
Portfolio management review
Optimum Small-Mid Cap Growth Fund
operations in the U.S. and Canada. Concerns about higher default rates among student borrowers and regulatory pressures weighed on the stock. As a result, we eliminated the position. Auto parts retailer Advance Auto Parts experienced sluggish sales growth, which caused the stock to lag the market. Concerns that spending on growth initiatives would create headwinds for the firm’s turnaround plans led us to sell the stock near the end of the period.
Columbia WAM
We believe the smallest and riskiest stocks tend to jump the most off a deep market bottom as many of these companies are hit the hardest during a bear market. With this in mind, we increased our investment in several of these types of stocks because we believed the potential gains were well worth the additional risk. We believe this approach was the primary driver of outperformance versus the benchmark in our portion of the Fund.
Energy stocks were strong performers during the period, particularly those of oil services providers. Stocks of these companies surged as oil prices rebounded sharply. Underwater well head manufacturer FMC Technologies and offshore drilling contractor Atwood Oceanics were both strong contributors to performance. Both companies are in long-lead-time businesses with large backlogs. The prior sag in oil prices didn’t hurt these stocks very much, and with oil prices rising, offshore drilling is likely to remain strong.
Telecom services stocks were also strong performers for the year. Crown Castle International, an owner of communications towers, was a key contributor to overall return within our portion of the Fund. We believe Crown Castle’s share price was overly depressed due to leverage on the balance sheet. The company was able to raise capital at reasonable rates to repair its balance sheet and therefore have solid revenue growth.
ITT Educational Services was a primary detractor from performance within our portion of the Fund. We have some concerns about the headwinds facing private education companies, which have been caused by regulatory issues. That being said, ITT’s education business has been particularly strong, with fourth-quarter revenues up 34% from the prior year and new student enrollment up 31%. We believe ITT’s private education business model is a strong one.
ESCO Technologies, a maker of electronic meter readers, was down on weaker-than-expected sales. Although the company lagged during the period, we believe its long-term outlook remains bright due to the growing interest in its meter-reading products from several international electric utilities. Additionally, we believe the potential for new U.S. contracts remains strong.
Myriad Genetics, a biotech company involved in genetic diagnostic testing, declined as the sluggish economy caused a sharp deceleration in its revenue growth. We sold our position because we were concerned that its core breast cancer diagnostic market was becoming saturated.
14
Optimum Small-Mid Cap Value Fund
April 6, 2010
| Performance review (for the year ended March 31, 2010) | |||
| Optimum Small-Mid Cap Value Fund (Class A shares) | 1-year return | +76.98% | |
| Optimum Small-Mid Cap Value Fund (Institutional Class shares) | 1-year return | +77.56% | |
| Russell 2500™ Value Index (benchmark) | 1-year return | +67.17% |
Past performance does not guarantee future results.
For complete, annualized performance for Optimum Small-Mid Cap Value Fund please see the table on page 30.
The performance of Class A shares excludes the applicable sales charge and reflects the reinvestment of all distributions.
Index performance returns do not reflect any management fees, transaction costs, or expenses. Indices are unmanaged and one cannot invest directly in an index.
Advisor
Delaware Management Company (DMC)
Sub-advisors
The Delafield Group, a division of Tocqueville Asset Management L.P. (Tocqueville)
The Killen Group, Inc. (Killen)
Westwood Management Corp. (Westwood)
The market made an astonishing recovery during the Fund’s fiscal year. Early in the reporting period, investors responded favorably to efforts by governments world-wide to stimulate the global economy, and as fears of a systemic failure of the world banking system dissipated and liquidity slowly improved, attention turned toward signs of recovery.
The rally began in March 2009 (just shy of the Fund’s fiscal year start) and carried into the spring and summer of 2009, producing impressive double-digit gains that were led by lower-quality, high-beta (high-risk) stocks. As the year progressed, continuing signs of economic recovery, better-than-expected corporate earnings growth, and improved balance sheets buoyed investor optimism, which led to a solid gain for the equity markets in the fourth quarter of 2009.
By this time, however, many investors seemed to lose their appetite for risk, as they began to price in the potential for less liquidity and higher interest rates in 2010. Specifically, investors began to rotate out of lower-quality, smaller-cap securities into higher-quality, larger-cap securities with sustainable earnings growth potential.
January 2010 began with a selloff in the broad market, as investors digested gains from 2009 and seemed to view sovereign debt problems in Europe and potentially slower economic growth in China as reasons for caution. In February, however, investor sentiment turned as global economic data continued to be supportive of a broad-based global recovery, and the Federal Reserve looked to maintain an accommodative interest rate policy — from zero to 0.25% — for an extended period. In addition, the U.S. Congress passed a healthcare reform bill in March 2010 that did not include a “public option” for healthcare coverage, removing uncertainty about the effect the bill could have on the market.
As of this writing, investors seem to continue to anticipate a smooth recovery, though unemployment in the United States continues to hover just below 10% and is only expected to improve at a modest pace, according to consensus estimates.
Tocqueville
Until Sept. 28, 2009, the Delafield Asset Management, a division of Reich & Tang Asset Management, LLC served as a sub-adviser to Optimum Small-Mid Cap Value Fund. On Sept. 28, 2009, the portfolio management team and certain support staff of Delafield joined Tocqueville Asset Management, L.P. Please see the supplement to the Fund’s prospectuses, dated Sept. 25, 2009, for more information.
We have constructed our portion of the Fund using a bottom-up approach; that is, we focus intently on valuation and analyze cash flows of individual companies in an attempt to invest at prices that we believe undervalue the underlying franchise. This is the strategy that we consistently employ — it also helped drive performance during the Fund’s fiscal year.
(continues) 15
Portfolio management review
Optimum Small-Mid Cap Value Fund
While we generally do not set sector or industry allocation targets for our portion of the Fund, we found several attractive investment opportunities in the materials sector and our relative overweight in that area benefited performance. We were also heavily weighted toward the industrials sector, which rebounded after being among the hardest-hit sectors in the previous fiscal year. We continued to avoid the energy and financial sectors, which hurt performance relative to the benchmark index because these sectors realized dramatic gains during the reporting period.
Flextronics International and Ashland were the leading contributors to performance in our portion of the Fund. Flextronics, with nearly $31 billion in 2009 revenue, is a leading provider of electronic manufacturing services. The company’s shares rebounded strongly during the year as substantial cost reductions contributed to improved performance, and liquidity fears eased. Ashland is a diversified company with specialty chemical, motor oil (Valvoline brand), and material distribution businesses. Its shares rose sharply as profitability strengthened and balance sheet worries diminished.
None of the stocks in our portion of the Fund turned in negative performance for the year. However, our investments in Dun & Bradstreet and Pharmaceutical Product Development generated below-market returns for the year and contributed only modestly to performance. We continue to maintain our Dun & Bradstreet position; however, we exited our Pharmaceutical Product Development position toward the end of the fiscal year because the turnaround we had envisioned did not occur.
Killen
Our contrarian style led us to become more aggressive heading into 2009, and while this did not help performance in the Fund’s previous fiscal year, it contributed to strong gains in this year’s sharp rebound. Our bottom-up philosophy prevented us from becoming overly defensive during the stock market’s weakness, and we were able to purchase solid companies at what we viewed as attractive prices. This enabled us to record attractive absolute and relative returns for the reporting period.
Our investment approach remains the same during both weak and strong markets: We emphasize companies that we believe exhibit a sound long-term operating strategy, strong management, and a solid financial structure, and that are selling at a deep discount to what we believe to be the true value of their business.
Given the broad market strength for the fiscal year, virtually every sector contributed to performance in our sleeve of the Fund. Areas of particular strength included information technology and energy. Both sectors struggled as the economic backdrop weakened in 2008 and early 2009, but when results proved not as bad as previously feared (and in some cases were actually quite healthy on an absolute basis), most of our stocks in these sectors experienced healthy gains.
The weakest sectors during the period were financials and utilities. Financials lagged while still being additive on an absolute basis. Despite low market valuations, the results of most companies in the sector have been strong and should support higher prices in the longer term. Utilities, a small piece of our portion of the Fund, lagged on an absolute basis as demand remained constrained due to economic weakness.
Two stocks that contributed to the Fund’s performance during the fiscal year were Dress Barn and Rudolph Technologies.
We purchased shares of retailer Dress Barn during the economic downturn in the fall of 2008. Dress Barn’s business held up quite well during the recession and the company had the financial ability to complete an attractive acquisition (Tween Brands) during the reporting period. As the economy rebounded, the combined entity performed above expectations and the stock responded in kind. Based on stock price, we began selling our Dress Barn position in the third quarter of the fiscal year. By the end of the fiscal year, we had eliminated the position from our portion of the Fund.
Rudolph Technologies is a semiconductor capital equipment provider. Its business dropped precipitously as the economy weakened and capital expenditures were
16
slashed. We owned the stock prior to the downturn and purchased additional shares as it fell. Our patience was validated as the demand for the company’s products rebounded, as did its stock price. We continue to hold a full position.
Two examples of stocks that underperformed were LaBranche and Granite Construction.
LaBranche is one of the largest specialist market-maker firms on the New York Stock Exchange. The company has been adjusting its business model for several years, trying to adapt to the new era dominated by electronic trading. Ultimately, the transition was unsuccessful as the company was unable to consistently generate profits. We sold the position during the year.
Granite Construction, a civil engineering contractor, has had to contend with state-budget shortfalls and increased competition from smaller contractors. We continue to believe the company should do well in the longer term despite the stock’s underperformance during the period. We maintained the position.
Westwood
With the rescue and stimulus packages instituted by the Fed and U.S. government in late 2008 and early 2009, investor sentiment quickly turned, and the worst-performing stocks of the 12 months prior to the reporting period became the best-performing stocks over the ensuing six months.
The portion of the Fund we manage produced strong absolute performance over the period but lagged the performance of the benchmark Russell 2500 Value Index, primarily because of the rally of high-beta, low-quality stocks that began in March 2009.
Because we do not change our investment approach, our portion of the Fund may underperform in environments in which growth-oriented strategies are in favor, or when high-risk investments perform strongly. However, we focus on high-quality companies with strong fundamental characteristics and visible earnings prospects. The low-quality bias during the period was most pronounced in the consumer discretionary, technology, and real estate investment trust (REIT) sectors.
With regard to specific sectors and holdings, performance relative to the benchmark was aided by our underweight in the relatively poor-performing utilities sector and by our security selection in the materials and processing sector. Utilities generally underperformed because investors sought out more economically sensitive securities. Our holdings in the materials and processing sector benefited from leverage to global commodity demand.
Relative performance was hindered by security selection in the technology sector and by security selection and an underweight in the consumer discretionary sector. These sectors were among the most negatively affected by the low-quality, high-beta rally. Subsequently, they had a large effect on the relative performance of our portion of the Fund because of our focus on high-quality stocks.
Among the best-performing securities in our portion of the Fund for the period were consumer products firm Tupperware Brands, which reported strong sales in Asian markets, and commodity and specialty chemical producer Eastman Chemical, which posted multiple quarterly earnings surprises and benefited from the global recovery.
Our worst-performing securities included computer hardware firm Novell, whose management disappointed investors with an unplanned acquisition. Part of our investment thesis was that the company would return cash to shareholders; however, when the acquisition was announced it became clear management had other ideas for deploying cash. We exited the position during the period.
Regional bank People’s United Financial was another poor performer. The stock declined due to growing concerns about potential losses in the company’s bank loan portfolios. In our opinion, the company has one of the best capitalization levels of all the regional banks in our universe, and we believe investor concerns about credit quality are inappropriate. We continue to hold the stock.
17
Performance summary
Optimum Fixed Income Fund
The performance data quoted represent past performance; past performance does not guarantee future results. Investment return and principal value will fluctuate so your shares, when redeemed, may be worth more or less than their original cost. Please obtain the performance data for the most recent month end by calling 800 914-0278 or visiting our Web site at www.optimummutualfunds.com. Current performance may be lower or higher than the performance data quoted.
You should consider the investment objectives, risks, charges, and expenses of the investment company carefully before investing. The Optimum Fixed Income Fund prospectus contains this and other important information about the investment company. Please request a prospectus through your financial advisor or by calling 800 914-0278 or visiting our Web site at www.optimummutualfunds.com. Read the prospectus carefully before you invest or send money.
| Fund performance | ||||
| Average annual total returns | ||||
| Through March 31, 2010 | 1 year | 3 years | 5 years | Lifetime |
| Class A (Est. Aug. 1, 2003) | ||||
| Excluding sales charge | +28.24% | +7.05% | +5.98% | +5.90% |
| Including sales charge | +22.39% | +5.41% | +5.01% | +5.17% |
| Class B (Est. Aug. 1, 2003) | ||||
| Excluding sales charge | +27.51% | +6.34% | +5.29% | +5.22% |
| Including sales charge | +23.51% | +5.68% | +5.04% | +5.22% |
| Class C (Est. Aug. 1, 2003) | ||||
| Excluding sales charge | +27.34% | +6.34% | +5.29% | +5.22% |
| Including sales charge | +26.34% | +6.34% | +5.29% | +5.22% |
| Institutional Class (Est. Aug. 1, 2003) | +28.73% | +7.40% | +6.34% | +6.26% |
Returns reflect the reinvestment of all distributions and any applicable sales charges as noted in the following paragraphs.
Performance for Class B and C shares, excluding sales charges, assumes either that contingent deferred sales charges did not apply or that the investment was not redeemed.
Expense limitations were in effect for all classes during the periods shown in the Fund performance chart and in the “Performance of a $10,000 Investment” chart. Note that all charts and graphs referred to in the “Performance summary” section of this report are found on pages 18 through 19. Performance would have been lower had the expense limitation not been in effect.
The Fund offers Class A, B, C, and Institutional Class shares. Class A shares are sold with a maximum front-end sales charge of up to 4.50%, and have an annual distribution and service fee of up to 0.35% of average daily net assets.
Class B shares may be purchased only through dividend reinvestment and certain permitted exchanges. Please see the most recent prospectus for additional information on Class B purchases and sales charges. As described in the prospectus, Class B shares have a contingent deferred sales charge that declines from 4.00% to zero depending on the period of time the shares are held.
Class B shares will automatically convert to Class A shares on a quarterly basis approximately eight years after purchase. They are also subject to an annual distribution and service fee of up to 1.00% of average daily net assets.
Class C shares are sold with a contingent deferred sales charge of 1.00% if redeemed during the first 12 months. They are also subject to an annual distribution and service fee of 1.00% of average daily net assets.
Institutional Class shares are sold without sales or asset-based distribution charges only to certain eligible institutional accounts.
The “Fund performance” table and the “Performance of a $10,000 Investment” graph do not reflect the deduction of taxes the shareholder would pay on Fund distributions or redemptions of Fund shares.
The Fund’s expense ratios, as described in the most recent prospectus, are disclosed in the following “Fund expense ratios” table. Delaware Management Company has voluntarily agreed to reimburse certain expenses and/or waive investment advisory fees in order to prevent total annual fund operating expenses from exceeding 1.00% of the Fund’s average daily net assets from Aug. 1, 2009 until the voluntary cap is discontinued. Please see the most recent prospectus for additional information on these fee waivers and/or reimbursements.
18
| Fund expense ratios | Class A | Class B | Class C | Institutional Class | |||
| Total annual operating expenses | |||||||
| (without fee waivers) | 1.47% | 2.12% | 2.12% | 1.12% | |||
| Net expenses | |||||||
| (including fee waivers, if any) | 1.35% | 2.00% | 2.00% | 1.00% | |||
| Type of waiver | Voluntary | Voluntary | Voluntary | Voluntary |
Fixed income securities and bond funds can lose value, and investors can lose principal, as interest rates rise. They also may be affected by economic conditions that hinder an issuer’s ability to make interest and principal payments on its debt.
The Fund may also be subject to prepayment risk, the risk that the principal of a fixed income security that is held by the Fund may be prepaid prior to maturity, potentially forcing the Fund to reinvest that money at a lower interest rate.
High yielding, noninvestment grade bonds (junk bonds) involve higher risk than investment grade bonds.
If and when we invest in forward foreign currency contracts or use other investments to hedge against currency risks, the Fund will be subject to special risks, including counterparty risk.
The Fund may invest in derivatives, which may involve additional expenses and are subject to risk, including the risk that an underlying security or securities index moves in the opposite direction from what the portfolio manager anticipated. A derivative transaction depends upon the counterparties’ ability to fulfill their contractual obligations.
The Fund may experience portfolio turnover in excess of 100%, which could result in higher transaction costs and tax liability.
Performance of a $10,000 Investment
Aug. 1, 2003 (Fund’s inception), through March 31, 2010
Aug. 1, 2003 (Fund’s inception), through March 31, 2010
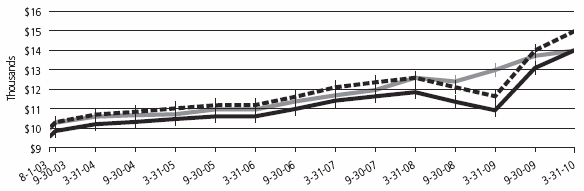
| Starting value (Aug. 1, 2003) | Ending value (Mar. 31, 2010) | |||||
| Optimum Fixed Income Fund — Institutional Class shares | $10,000 | $14,991 | ||||
| Barclays Capital U.S. Aggregate Index | $10,000 | $14,028 | ||||
| Optimum Fixed Income Fund — Class A shares | $9,550 | $13,995 | ||||
The chart assumes $10,000 invested in the Fund on Aug. 1, 2003, and includes the effect of a 4.50% front-end sales charge for Class A shares and the reinvestment of all distributions. Please note additional details on these fees in the “Performance summary” section of this report, which includes pages 18 through 19.
The chart also assumes $10,000 invested in the Barclays Capital U.S. Aggregate Index as of Aug. 1, 2003. The Barclays Capital U.S. Aggregate Index is a broad composite of more than 8,500 securities that tracks the investment grade domestic bond market.
(continues) 19
Performance summary
Index performance returns do not reflect any management fees, transaction costs or expenses. Indices are unmanaged and one cannot invest directly in an index. Past performance is not a guarantee of future results.
Performance of other Fund classes will vary due to different charges and expenses.
| Stock symbols and CUSIP numbers | ||
| Nasdaq symbols | CUSIPs | |
| Class A | OAFIX | 246118681 |
| Class B | OBFIX | 246118673 |
| Class C | OCFIX | 246118665 |
| Institutional Class | OIFIX | 246118657 |
20
Performance summary
Optimum International Fund
The performance data quoted represent past performance; past performance does not guarantee future results. Investment return and principal value will fluctuate so your shares, when redeemed, may be worth more or less than their original cost. Please obtain the performance data for the most recent month end by calling 800 914-0278 or visiting our Web site at www.optimummutualfunds.com. Current performance may be lower or higher than the performance data quoted.
You should consider the investment objectives, risks, charges, and expenses of the investment company carefully before investing. The Optimum International Fund prospectus contains this and other important information about the investment company. Please request a prospectus through your financial advisor or by calling 800 914-0278 or visiting our Web site at www.optimummutualfunds.com. Read the prospectus carefully before you invest or send money.
| Fund performance | ||||
| Average annual total returns | ||||
| Through March 31, 2010 | 1 year | 3 years | 5 years | Lifetime |
| Class A (Est. Aug. 1, 2003) | ||||
| Excluding sales charge | +50.29% | -8.33% | +2.90% | +7.34% |
| Including sales charge | +41.60% | -10.14% | +1.69% | +6.38% |
| Class B (Est. Aug. 1, 2003) | ||||
| Excluding sales charge | +49.42% | -8.93% | +2.24% | +6.64% |
| Including sales charge | +45.42% | -9.67% | +1.82% | +6.64% |
| Class C (Est. Aug. 1, 2003) | ||||
| Excluding sales charge | +49.20% | -8.95% | +2.22% | +6.64% |
| Including sales charge | +48.20% | -8.95% | +2.22% | +6.64% |
| Institutional Class (Est. Aug. 1, 2003) | +50.88% | -8.01% | +3.25% | +7.71% |
Returns reflect the reinvestment of all distributions and any applicable sales charges as noted in the following paragraphs.
Performance for Class B and C shares, excluding sales charges, assumes either that contingent deferred sales charges did not apply or that the investment was not redeemed.
Expense limitations were in effect for all classes during the periods shown in the Fund performance chart and in the “Performance of a $10,000 Investment” chart. Note that all charts and graphs referred to in the “Performance summary” section of this report are found on pages 22 through 23. Performance would have been lower had the expense limitation not been in effect.
The Fund offers Class A, B, C, and Institutional Class shares. Class A shares are sold with a maximum front-end sales charge of up to 5.75%, and have an annual distribution and service fee of up to 0.35% of average daily net assets.
Class B shares may be purchased only through dividend reinvestment and certain permitted exchanges. Please see the most recent prospectus for additional information on Class B purchases and sales charges. As described in the prospectus, Class B shares have a contingent deferred sales charge that declines from 4.00% to zero depending on the period of time the shares are held.
Class B shares will automatically convert to Class A shares on a quarterly basis approximately eight years after purchase. They are also subject to an annual distribution and service fee of up to 1.00% of average daily net assets.
Class C shares are sold with a contingent deferred sales charge of 1.00% if redeemed during the first 12 months. They are also subject to an annual distribution and service fee of 1.00% of average daily net assets.
Institutional Class shares are sold without sales or asset-based distribution charges only to certain eligible institutional accounts.
The “Fund performance” table and the “Performance of a $10,000 Investment” graph do not reflect the deduction of taxes the shareholder would pay on Fund distributions or redemptions of Fund shares.
The Fund’s expense ratios, as described in the most recent prospectus, are disclosed in the following “Fund expense ratios” table. Delaware Management Company has voluntarily agreed to reimburse certain expenses and/or waive investment advisory fees in order to prevent total annual fund operating expenses from exceeding 1.40% of the Fund’s average daily net assets from Aug. 1, 2009 until the voluntary cap is discontinued. Please see the most recent prospectus for additional information on these fee waivers and/or reimbursements.
22
| Fund expense ratios | Class A | Class B | Class C | Institutional Class | |||
| Total annual operating expenses | |||||||
| (without fee waivers) | 1.86% | 2.51% | 2.51% | 1.51% | |||
| Net expenses | |||||||
| (including fee waivers, if any) | 1.75% | 2.40% | 2.40% | 1.40% | |||
| Type of waiver | Voluntary | Voluntary | Voluntary | Voluntary |
International investments entail risks not ordinarily associated with U.S. investments including fluctuation in currency values, differences in accounting principles, or economic or political instability in other nations.
Investing in emerging markets can be riskier than investing in established foreign markets due to increased volatility and lower trading volume.
Performance of a $10,000 Investment
Aug. 1, 2003 (Fund’s inception), through March 31, 2010
Aug. 1, 2003 (Fund’s inception), through March 31, 2010

| Starting value (Aug. 1, 2003) | Ending value (Mar. 31, 2010) | |||||
| MSCI EAFE Index (gross) | $10,000 | $18,349 | ||||
| MSCI EAFE Index (net) | $10,000 | $17,834 | ||||
| Optimum International Fund — Institutional Class shares | $10,000 | $16,404 | ||||
| Optimum International Fund — Class A shares | $9,425 | $15,111 | ||||
The chart assumes $10,000 invested in the Fund on Aug. 1, 2003, and includes the effect of a 5.75% front-end sales charge for Class A share and the reinvestment of all distributions. Please note additional details on these fees in the “Performance summary” section of this report, which includes pages 22 through 23.
The chart also assumes $10,000 invested in the MSCI EAFE Index as of Aug. 1, 2003. The MSCI EAFE Index measures equity market performance across developed market countries in Europe, Australasia, and the Far East. Index “net” return approximates the minimum possible dividend reinvestment, after deduction of withholding tax at the highest possible rate. Index “gross” return reflects the maximum possible dividend reinvestment.
Index performance returns do not reflect any management fees, transaction costs or expenses. Indices are unmanaged and one cannot invest directly in an index. Past performance is not a guarantee of future results.
Performance of other Fund classes will vary due to different charges and expenses.
| Stock symbols and CUSIP numbers | ||
| Nasdaq symbols | CUSIPs | |
| Class A | OAIEX | 246118731 |
| Class B | OBIEX | 246118723 |
| Class C | OCIEX | 246118715 |
| Institutional Class | OIIEX | 246118699 |
(continues) 23
Performance summary
Optimum Large Cap Growth Fund
The performance data quoted represent past performance; past performance does not guarantee future results. Investment return and principal value will fluctuate so your shares, when redeemed, may be worth more or less than their original cost. Please obtain the performance data for the most recent month end by calling 800 914-0278 or visiting our Web site at www.optimummutualfunds.com. Current performance may be lower or higher than the performance data quoted.
You should consider the investment objectives, risks, charges, and expenses of the investment company carefully before investing. The Optimum Large Cap Growth Fund prospectus contains this and other important information about the investment company. Please request a prospectus through your financial advisor or by calling 800 914-0278 or visiting our Web site at www.optimummutualfunds.com. Read the prospectus carefully before you invest or send money.
| Fund performance | ||||
| Average annual total returns | ||||
| Through March 31, 2010 | 1 year | 3 years | 5 years | Lifetime |
| Class A (Est. Aug. 1, 2003) | ||||
| Excluding sales charge | +52.22% | -3.04% | +2.12% | +4.12% |
| Including sales charge | +43.40% | -4.93% | +0.92% | +3.20% |
| Class B (Est. Aug. 1, 2003) | ||||
| Excluding sales charge | +51.26% | -3.67% | +1.46% | +3.45% |
| Including sales charge | +47.26% | -4.54% | +1.03% | +3.45% |
| Class C (Est. Aug. 1, 2003) | ||||
| Excluding sales charge | +51.26% | -3.67% | +1.46% | +3.45% |
| Including sales charge | +50.26% | -3.67% | +1.46% | +3.45% |
| Institutional Class (Est. Aug. 1, 2003) | +52.87% | -2.70% | +2.47% | +4.49% |
Returns reflect the reinvestment of all distributions and any applicable sales charges as noted in the following paragraphs.
Performance for Class B and C shares, excluding sales charges, assumes either that contingent deferred sales charges did not apply or that the investment was not redeemed.
Expense limitations were in effect for all classes during the periods shown in the Fund performance chart and in the “Performance of a $10,000 Investment” chart. Note that all charts and graphs referred to in the “Performance summary” section of this report are found on pages 24 through 25. Performance would have been lower had the expense limitation not been in effect.
The Fund offers Class A, B, C, and Institutional Class shares. Class A shares are sold with a maximum front-end sales charge of up to 5.75%, and have an annual distribution and service fee of up to 0.35% of average daily net assets.
Class B shares may be purchased only through dividend reinvestment and certain permitted exchanges. Please see the most recent prospectus for additional information on Class B purchases and sales charges. As described in the prospectus, Class B shares have a contingent deferred sales charge that declines from 4.00% to zero depending on the period of time the shares are held.
Class B shares will automatically convert to Class A shares on a quarterly basis approximately eight years after purchase. They are also subject to an annual distribution and service fee of up to 1.00% of average daily net assets.
Class C shares are sold with a contingent deferred sales charge of 1.00% if redeemed during the first 12 months. They are also subject to an annual distribution and service fee of 1.00% of average daily net assets.
Institutional Class shares are sold without sales or asset-based distribution charges only to certain eligible institutional accounts.
The “Fund performance” table and the “Performance of a $10,000 Investment” graph do not reflect the deduction of taxes the shareholder would pay on Fund distributions or redemptions of Fund shares.
The Fund’s expense ratios, as described in the most recent prospectus, are disclosed in the following “Fund expense ratios” table. Delaware Management Company has voluntarily agreed to reimburse certain expenses and/or waive investment advisory fees in order to prevent total annual fund operating expenses from exceeding 1.25% of the Fund’s average daily net assets from Aug. 1, 2009 until the voluntary cap is discontinued. Please see the most recent prospectus for additional information on these fee waivers and/or reimbursements.
24
| Fund expense ratios | Class A | Class B | Class C | Institutional Class | ||||
| Total annual operating expenses | ||||||||
| (without fee waivers) | 1.64% | 2.29% | 2.29% | 1.29% | ||||
| Net expenses | ||||||||
| (including fee waivers, if any) | 1.60% | 2.25% | 2.25% | 1.25% | ||||
| Type of waiver | Voluntary | Voluntary | Voluntary | Voluntary |
The Fund will be affected primarily by changes in stock prices.
Performance of a $10,000 Investment
Aug. 1, 2003 (Fund’s inception), through March 31, 2010
Aug. 1, 2003 (Fund’s inception), through March 31, 2010
| Starting value (Aug. 1, 2003) | Ending value (Mar. 31, 2010) | |||||
| Russell 1000 Growth Index | $10,000 | $13,305 | ||||
| Optimum Large Cap Growth Fund — Institutional Class shares | $10,000 | $13,400 | ||||
| Optimum Large Cap Growth Fund — Class A shares | $9,425 | $12,336 | ||||
The chart assumes $10,000 invested in the Fund on Aug. 1, 2003, and includes the effect of a 5.75% front-end sales charge for Class A shares and the reinvestment of all distributions. Please note additional details on these fees in the “Performance Summary” section of this report, which includes pages 24 through 25.
The chart also assumes $10,000 invested in the Russell 1000 Growth Index as of Aug. 1, 2003. The Russell 1000 Growth Index measures the performance of the large-cap growth segment of the U.S. equity universe. It includes those Russell 1000 companies with higher price-to-book ratios and higher forecasted growth values.
Index performance returns do not reflect any management fees, transaction costs or expenses. Indices are unmanaged and one cannot invest directly in an index. Past performance is not a guarantee of future results.
Performance of other Fund classes will vary due to different charges and expenses.
| Stock symbols and CUSIP numbers | ||
| Nasdaq symbols | CUSIPs | |
| Class A | OALGX | 246118707 |
| Class B | OBLGX | 246118806 |
| Class C | OCLGX | 246118889 |
| Institutional Class | OILGX | 246118871 |
(continues) 25
Performance summary
Optimum Large Cap Value Fund
The performance data quoted represent past performance; past performance does not guarantee future results. Investment return and principal value will fluctuate so your shares, when redeemed, may be worth more or less than their original cost. Please obtain the performance data for the most recent month end by calling 800 914-0278 or visiting our Web site at www.optimummutualfunds.com. Current performance may be lower or higher than the performance data quoted.
You should consider the investment objectives, risks, charges, and expenses of the investment company carefully before investing. The Optimum Large Cap Value Fund prospectus contains this and other important information about the investment company. Please request a prospectus through your financial advisor or by calling 800 914-0278 or visiting our Web site at www.optimummutualfunds.com. Read the prospectus carefully before you invest or send money.
| Fund performance | ||||||||
| Average annual total returns | ||||||||
| Through March 31, 2010 | 1 year | 3 years | 5 years | Lifetime | ||||
| Class A (Est. Aug. 1, 2003) | ||||||||
| Excluding sales charge | +49.92% | -5.17% | +1.61% | +5.28% | ||||
| Including sales charge | +41.29% | -7.03% | +0.41% | +4.34% | ||||
| Class B (Est. Aug. 1, 2003) | ||||||||
| Excluding sales charge | +48.92% | -5.78% | +0.95% | +4.60% | ||||
| Including sales charge | +44.92% | -6.59% | +0.51% | +4.60% | ||||
| Class C (Est. Aug. 1, 2003) | ||||||||
| Excluding sales charge | +48.76% | -5.79% | +0.95% | +4.59% | ||||
| Including sales charge | +47.76% | -5.79% | +0.95% | +4.59% | ||||
| Institutional Class (Est. Aug. 1, 2003) | +50.47% | -4.83% | +1.98% | +5.65% |
Returns reflect the reinvestment of all distributions and any applicable sales charges as noted in the following paragraphs.
Performance for Class B and C shares, excluding sales charges, assumes either that contingent deferred sales charges did not apply or that the investment was not redeemed.
Expense limitations were in effect for all classes during the periods shown in the Fund performance chart and in the “Performance of a $10,000 Investment” chart. Note that all charts and graphs referred to in the “Performance summary” section of this report are found on pages 26 through 27. Performance would have been lower had the expense limitation not been in effect.
The Fund offers Class A, B, C, and Institutional Class shares. Class A shares are sold with a maximum front-end sales charge of up to 5.75%, and have an annual distribution and service fee of up to 0.35% of average daily net assets.
Class B shares may be purchased only through dividend reinvestment and certain permitted exchanges. Please see the most recent prospectus for additional information on Class B purchases and sales charges. As described in the prospectus, Class B shares have a contingent deferred sales charge that declines from 4.00% to zero depending on the period of time the shares are held.
Class B shares will automatically convert to Class A shares on a quarterly basis approximately eight years after purchase. They are also subject to an annual distribution and service fee of up to 1.00% of average daily net assets.
Class C shares are sold with a contingent deferred sales charge of 1.00% if redeemed during the first 12 months. They are also subject to an annual distribution and service fee of 1.00% of average daily net assets.
Institutional Class shares are sold without sales or asset-based distribution charges only to certain eligible institutional accounts.
The “Fund performance” table and the “Performance of a $10,000 Investment” graph do not reflect the deduction of taxes the shareholder would pay on Fund distributions or redemptions of Fund shares.
The Fund’s expense ratios, as described in the most recent prospectus, are disclosed in the following “Fund expense ratios” table. Delaware Management Company has voluntarily agreed to reimburse certain expenses and/or waive investment advisory fees in order to prevent total annual fund operating expenses from exceeding 1.26% of the Fund’s average daily net assets from Aug. 1, 2009 until the voluntary cap is discontinued. Please see the most recent prospectus for additional information on these fee waivers and/or reimbursements.
26
| Fund expense ratios | Class A | Class B | Class C | Institutional Class | ||||
| Total annual operating expenses | ||||||||
| (without fee waivers) | 1.60% | 2.25% | 2.25% | 1.25% | ||||
| Net expenses | ||||||||
| (including fee waivers, if any) | 1.60% | 2.25% | 2.25% | 1.25% | ||||
| Type of waiver | Voluntary | Voluntary | Voluntary | Voluntary |
The Fund will be affected primarily by changes in stock prices.
Performance of a $10,000 Investment
Aug. 1, 2003 (Fund’s inception), through March 31, 2010
Aug. 1, 2003 (Fund’s inception), through March 31, 2010
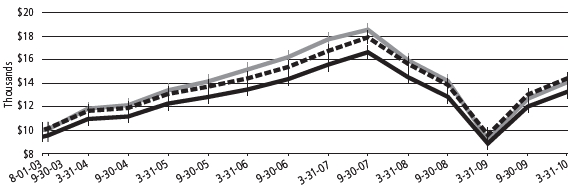
| Starting value (Aug. 1, 2003) | Ending value (Mar. 31, 2010) | ||||
| Optimum Large Cap Value Fund — Institutional Class shares | $10,000 | $14,428 | |||
| Russell 1000 Value Index | $10,000 | $14,105 | |||
| Optimum Large Cap Value Fund — Class A shares | $9,425 | $13,280 | |||
The chart assumes $10,000 invested in the Fund on Aug. 1, 2003, and includes the effect of a 5.75% front-end sales charge for Class A shares and the reinvestment of all distributions. Please note additional details on these fees in the “Performance summary” section of this report, which includes pages 26 through 27.
The chart also assumes $10,000 invested in the Russell 1000 Value Index as of Aug. 1, 2003. The Russell 1000 Value Index measures the performance of the large-cap value segment of the U.S. equity universe. It includes those Russell 1000 companies with lower price-to-book ratios and lower forecasted growth values.
Index performance returns do not reflect any management fees, transaction costs or expenses. Indices are unmanaged and one cannot invest directly in an index. Past performance is not a guarantee of future results.
Performance of other Fund classes will vary due to different charges and expenses.
| Stock symbols and CUSIP numbers | ||
| Nasdaq symbols | CUSIPs | |
| Class A | OALVX | 246118863 |
| Class B | OBLVX | 246118855 |
| Class C | OCLVX | 246118848 |
| Institutional Class | OILVX | 246118830 |
(continues) 27
Performance summary
Optimum Small-Mid Cap Growth Fund
The performance data quoted represent past performance; past performance does not guarantee future results. Investment return and principal value will fluctuate so your shares, when redeemed, may be worth more or less than their original cost. Please obtain the performance data for the most recent month end by calling 800 914-0278 or visiting our Web site at www.optimummutualfunds.com. Current performance may be lower or higher than the performance data quoted.
You should consider the investment objectives, risks, charges, and expenses of the investment company carefully before investing. The Optimum Small-Mid Cap Growth Fund prospectus contains this and other important information about the investment company. Please request a prospectus through your financial advisor or by calling 800 914-0278 or visiting our Web site at www.optimummutualfunds.com. Read the prospectus carefully before you invest or send money.
| Fund performance | ||||||||
| Average annual total returns | ||||||||
| Through March 31, 2010 | 1 year | 3 years | 5 years | Lifetime | ||||
| Class A (Est. Aug. 1, 2003) | ||||||||
| Excluding sales charge | +64.94% | -5.99% | +0.35% | +5.25% | ||||
| Including sales charge | +55.51% | -7.83% | -0.84% | +4.32% | ||||
| Class B (Est. Aug. 1, 2003) | ||||||||
| Excluding sales charge | +63.75% | -6.64% | -0.33% | +4.57% | ||||
| Including sales charge | +59.75% | -7.46% | -0.79% | +4.57% | ||||
| Class C (Est. Aug. 1, 2003) | ||||||||
| Excluding sales charge | +63.75% | -6.64% | -0.33% | +4.57% | ||||
| Including sales charge | +62.75% | -6.64% | -0.33% | +4.57% | ||||
| Institutional Class (Est. Aug. 1, 2003) | +65.36% | -5.69% | +0.67% | +5.60% |
Returns reflect the reinvestment of all distributions and any applicable sales charges as noted in the following paragraphs.
Performance for Class B and C shares, excluding sales charges, assumes either that contingent deferred sales charges did not apply or that the investment was not redeemed.
Expense limitations were in effect for all classes during the periods shown in the Fund performance chart and in the “Performance of a $10,000 Investment” chart. Note that all charts and graphs referred to in the “Performance summary” section of this report are found on pages 28 through 29. Performance would have been lower had the expense limitation not been in effect.
The Fund offers Class A, B, C, and Institutional Class shares. Class A shares are sold with a maximum front-end sales charge of up to 5.75%, and have an annual distribution and service fee of up to 0.35% of average daily net assets.
Class B shares may be purchased only through dividend reinvestment and certain permitted exchanges. Please see the most recent prospectus for additional information on Class B purchases and sales charges. As described in the prospectus, Class B shares have a contingent deferred sales charge that declines from 4.00% to zero depending on the period of time the shares are held.
Class B shares will automatically convert to Class A shares on a quarterly basis approximately eight years after purchase. They are also subject to an annual distribution and service fee of up to 1.00% of average daily net assets.
Class C shares are sold with a contingent deferred sales charge of 1.00% if redeemed during the first 12 months. They are also subject to an annual distribution and service fee of 1.00% of average daily net assets.
Institutional Class shares are sold without sales or asset-based distribution charges only to certain eligible institutional accounts.
The “Fund performance” table and the “Performance of a $10,000 Investment” graph do not reflect the deduction of taxes the shareholder would pay on Fund distributions or redemptions of Fund shares.
The Fund’s expense ratios, as described in the most recent prospectus, are disclosed in the following “Fund expense ratios” table. Delaware Management Company has voluntarily agreed to reimburse certain expenses and/or waive investment advisory fees in order to prevent total annual fund operating expenses from exceeding 1.55% of the Fund’s average daily net assets from Aug. 1, 2009 until the voluntary cap is discontinued. Please see the most recent prospectus for additional information on these fee waivers and/or reimbursements.
28
| Fund expense ratios | Class A | Class B | Class C | Institutional Class | ||||
| Total annual operating expenses | ||||||||
| (without fee waivers) | 2.26% | 2.91% | 2.91% | 1.91% | ||||
| Net expenses | ||||||||
| (including fee waivers, if any) | 1.90% | 2.55% | 2.55% | 1.55% | ||||
| Type of waiver | Voluntary | Voluntary | Voluntary | Voluntary |
The Fund will be affected primarily by changes in stock prices.
Investments in small and/or medium-sized companies typically exhibit greater risk and higher volatility than larger, more established companies.
Performance of a $10,000 Investment
Aug. 1, 2003 (Fund’s inception), through March 31, 2010

| Starting value (Aug. 1, 2003) | Ending value (Mar. 31, 2010) | ||||
| Russell 2500 Growth Index | $10,000 | $15,892 | |||
| Optimum Small-Mid Cap Growth Fund — Institutional Class shares | $10,000 | $14,384 | |||
| Optimum Small-Mid Cap Growth Fund — Class A shares | $9,425 | $13,260 | |||
The chart assumes $10,000 invested in the Fund on Aug. 1, 2003, and includes the effect of a 5.75% front-end sales charge for Class A shares and the reinvestment of all distributions. Please note additional details on these fees in the “Performance summary” section of this report, which includes pages 28 through 29.
The chart also assumes $10,000 invested in the Russell 2500 Growth Index as of Aug. 1, 2003. The Russell 2500 Growth Index measures the performance of the small- to mid-cap growth segment of the U.S. equity universe. It includes those Russell 2500 companies with higher price-to-book ratios and higher forecasted growth values.
Index performance returns do not reflect any management fees, transaction costs or expenses. Indices are unmanaged and one cannot invest directly in an index. Past performance is not a guarantee of future results.
Performance of other Fund classes will vary due to different charges and expenses.
| Stock symbols and CUSIP numbers | ||
| Nasdaq symbols | CUSIPs | |
| Class A | OASGX | 246118872 |
| Class B | OBSGX | 246118814 |
| Class C | OCSGX | 246118798 |
| Institutional Class | OISGX | 246118780 |
(continues) 29
Performance summary
Optimum Small-Mid Cap Value Fund
The performance data quoted represent past performance; past performance does not guarantee future results. Investment return and principal value will fluctuate so your shares, when redeemed, may be worth more or less than their original cost. Please obtain the performance data for the most recent month end by calling 800 914-0278 or visiting our Web site at www.optimummutualfunds.com. Current performance may be lower or higher than the performance data quoted.
You should consider the investment objectives, risks, charges, and expenses of the investment company carefully before investing. The Optimum Small-Mid Cap Value Fund prospectus contains this and other important information about the investment company. Please request a prospectus through your financial advisor or by calling 800 914-0278 or visiting our Web site at www.optimummutualfunds.com. Read the prospectus carefully before you invest or send money.
| Fund performance | ||||||||
| Average annual total returns | ||||||||
| Through March 31, 2010 | 1 year | 3 years | 5 years | Lifetime | ||||
| Class A (Est. Aug. 1, 2003) | ||||||||
| Excluding sales charge | +76.98% | -6.67% | +0.18% | +6.55% | ||||
| Including sales charge | +66.72% | -8.50% | -1.00% | +5.61% | ||||
| Class B (Est. Aug. 1, 2003) | ||||||||
| Excluding sales charge | +75.64% | -7.28% | -0.48% | +5.86% | ||||
| Including sales charge | +71.64% | -8.07% | -0.84% | +5.86% | ||||
| Class C (Est. Aug. 1, 2003) | ||||||||
| Excluding sales charge | +75.64% | -7.28% | -0.48% | +5.86% | ||||
| Including sales charge | +74.64% | -7.28% | -0.48% | +5.86% | ||||
| Institutional Class (Est. Aug. 1, 2003) | +77.56% | -6.32% | +0.55% | +6.92% |
Returns reflect the reinvestment of all distributions and any applicable sales charges as noted in the following paragraphs.
Performance for Class B and C shares, excluding sales charges, assumes either that contingent deferred sales charges did not apply or that the investment was not redeemed.
Expense limitations were in effect for all classes during the periods shown in the Fund performance chart and in the “Performance of a $10,000 Investment” chart. Note that all charts and graphs referred to in the “Performance summary” section of this report are found on pages 30 through 31. Performance would have been lower had the expense limitation not been in effect.
The Fund offers Class A, B, C, and Institutional Class shares. Class A shares are sold with a maximum front-end sales charge of up to 5.75%, and have an annual distribution and service fee of up to 0.35% of average daily net assets.
Class B shares may be purchased only through dividend reinvestment and certain permitted exchanges. Please see the most recent prospectus for additional information on Class B purchases and sales charges. As described in the prospectus, Class B shares have a contingent deferred sales charge that declines from 4.00% to zero depending on the period of time the shares are held.
Class B shares will automatically convert to Class A shares on a quarterly basis approximately eight years after purchase. They are also subject to an annual distribution and service fee of up to 1.00% of average daily net assets.
Class C shares are sold with a contingent deferred sales charge of 1.00% if redeemed during the first 12 months. They are also subject to an annual distribution and service fee of 1.00% of average daily net assets.
Institutional Class shares are sold without sales or asset-based distribution charges only to certain eligible institutional accounts.
The “Fund performance” table and the “Performance of a $10,000 Investment” graph do not reflect the deduction of taxes the shareholder would pay on Fund distributions or redemptions of Fund shares.
The Fund’s expense ratios, as described in the most recent prospectus, are disclosed in the following “Fund expense ratios” table. Delaware Management Company has voluntarily agreed to reimburse certain expenses and/or waive investment advisory fees in order to prevent total annual fund operating expenses from exceeding 1.50% of the Fund’s average daily net assets from Aug. 1, 2009 until the voluntary cap is discontinued. Please see the most recent prospectus for additional information on these fee waivers and/or reimbursements.
30
| Fund expense ratios | Class A | Class B | Class C | Institutional Class | ||||
| Total annual operating expenses | ||||||||
| (without fee waivers) | 2.22% | 2.87% | 2.87% | 1.87% | ||||
| Net expenses | ||||||||
| (including fee waivers, if any) | 1.85% | 2.50% | 2.50% | 1.50% | ||||
| Type of waiver | Voluntary | Voluntary | Voluntary | Voluntary |
The Fund will be affected primarily by changes in stock prices.
Investments in small and/or medium-sized companies typically exhibit greater risk and higher volatility than larger, more established companies.
Performance of a $10,000 Investment
Aug. 1, 2003 (Fund’s inception), through March 31, 2010
Aug. 1, 2003 (Fund’s inception), through March 31, 2010
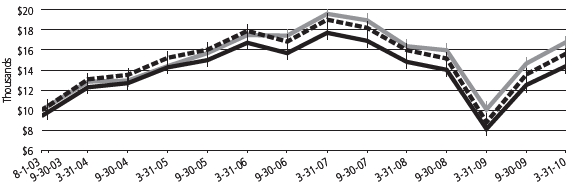
| Starting value (Aug. 1, 2003) | Ending value (Mar. 31, 2010) | ||||
| Russell 2500 Value Index | $10,000 | $16,700 | |||
| Optimum Small-Mid Cap Value Fund — Institutional Class shares | $10,000 | $15,624 | |||
| Optimum Small-Mid Cap Value Fund — Class A shares | $9,425 | $14,390 | |||
The chart assumes $10,000 invested in the Fund on Aug. 1, 2003, and includes the effect of a 5.75% front-end sales charge for Class A shares and the reinvestment of all distributions. Please note additional details on these fees in the “Performance summary” section of this report, which includes pages 30 through 31.
The chart also assumes $10,000 invested in the Russell 2500 Value Index as of Aug. 1, 2003. The Russell 2500 Value Index measures the performance of the small- to mid-cap value segment of the U.S. equity universe. It includes those Russell 2500 companies with lower price-to-book ratios and lower forecasted growth values.
Index performance returns do not reflect any management fees, transaction costs or expenses. Indices are unmanaged and one cannot invest directly in an index. Past performance is not a guarantee of future results.
Performance of other Fund classes will vary due to different charges and expenses.
| Stock symbols and CUSIP numbers | ||
| Nasdaq symbols | CUSIPs | |
| Class A | OASVX | 246118772 |
| Class B | OBSVX | 246118764 |
| Class C | OCSVX | 246118756 |
| Institutional Class | OISVX | 246118749 |
31
Disclosure of Fund expenses
For the period October 1, 2009 to March 31, 2010
As a shareholder of a Fund, you incur two types of costs: (1) transaction costs, including sales charges (loads) on purchase payments, reinvested dividends, or other distributions; redemption fees; and exchange fees; and (2) ongoing costs, including management fees; distribution and/or service (12b-1) fees; and other Fund expenses. These following examples are intended to help you understand your ongoing costs (in dollars) of investing in a Fund and to compare these costs with the ongoing costs of investing in other mutual funds.
The examples are based on an investment of $1,000 invested at the beginning of the period and held for the entire period October 1, 2009 to March 31, 2010.
Actual Expenses
The first section of the tables shown, “Actual Fund Return,” provides information about actual account values and actual expenses. You may use the information in this section of the table, together with the amount you invested, to estimate the expenses that you paid over the period. Simply divide your account value by $1,000 (for example, an $8,600 account value divided by $1,000 = 8.6), then multiply the result by the number in the first section under the heading entitled “Expenses Paid During Period” to estimate the expenses you paid on your account during this period.
Hypothetical Example for Comparison Purposes
The second section of the tables shown, “Hypothetical 5% Return,” provides information about hypothetical account values and hypothetical expenses based on the Funds’ actual expense ratios and an assumed rate of return of 5% per year before expenses, which is not the Funds’ actual return. The hypothetical account values and expenses may not be used to estimate the actual ending account balance or expenses you paid for the period. You may use this information to compare the ongoing costs of investing in each Fund and other funds. To do so, compare this 5% hypothetical example with the 5% hypothetical examples that appear in the shareholder reports of the other funds.
Please note that the expenses shown in the tables are meant to highlight your ongoing costs only and do not reflect any transactional costs, such as sales charges (loads), redemption fees, or exchange fees. Therefore, the second section of each table is useful in comparing ongoing costs only, and will not help you determine the relative total costs of owning different funds. In addition, if these transactional costs were included, your costs would have been higher. Each Fund’s expenses shown in the tables reflect fee waivers in effect. The expenses shown in each table assume reinvestment of all dividends and distributions.
Optimum Fixed Income Fund
Expense Analysis of an Investment of $1,000
Expense Analysis of an Investment of $1,000
| Expenses | |||||||||||||
| Beginning | Ending | Paid During | |||||||||||
| Account | Account | Annualized | Period | ||||||||||
| Value | Value | Expense | 10/1/09 to | ||||||||||
| 10/1/09 | 3/31/10 | Ratio | 3/31/10* | ||||||||||
| Actual Fund Return | |||||||||||||
| Class A | $ | 1,000.00 | $ | 1,069.70 | 1.35% | $ | 6.97 | ||||||
| Class B | 1,000.00 | 1,066.10 | 2.00% | 10.30 | |||||||||
| Class C | 1,000.00 | 1,066.10 | 2.00% | 10.30 | |||||||||
| Institutional Class | 1,000.00 | 1,071.20 | 1.00% | 5.16 | |||||||||
| Hypothetical 5% Return (5% return before expenses) | |||||||||||||
| Class A | $ | 1,000.00 | $ | 1,018.20 | 1.35% | $ | 6.79 | ||||||
| Class B | 1,000.00 | 1,014.96 | 2.00% | 10.05 | |||||||||
| Class C | 1,000.00 | 1,014.96 | 2.00% | 10.05 | |||||||||
| Institutional Class | 1,000.00 | 1,019.95 | 1.00% | 5.04 | |||||||||
Optimum International Fund
Expense Analysis of an Investment of $1,000
Expense Analysis of an Investment of $1,000
| Expenses | |||||||||||||
| Beginning | Ending | Paid During | |||||||||||
| Account | Account | Annualized | Period | ||||||||||
| Value | Value | Expense | 10/1/09 to | ||||||||||
| 10/1/09 | 3/31/10 | Ratio | 3/31/10* | ||||||||||
| Actual Fund Return | |||||||||||||
| Class A | $ | 1,000.00 | $ | 1,017.70 | 1.75% | $ | 8.80 | ||||||
| Class B | 1,000.00 | 1,014.10 | 2.40% | 12.05 | |||||||||
| Class C | 1,000.00 | 1,014.10 | 2.40% | 12.05 | |||||||||
| Institutional Class | 1,000.00 | 1,018.90 | 1.40% | 7.05 | |||||||||
| Hypothetical 5% Return (5% return before expenses) | |||||||||||||
| Class A | $ | 1,000.00 | $ | 1,016.21 | 1.75% | $ | 8.80 | ||||||
| Class B | 1,000.00 | 1,012.96 | 2.40% | 12.04 | |||||||||
| Class C | 1,000.00 | 1,012.96 | 2.40% | 12.04 | |||||||||
| Institutional Class | 1,000.00 | 1,017.95 | 1.40% | 7.04 | |||||||||
*“Expenses Paid During Period” are equal to a Fund’s annualized expense ratios, multiplied by the average account value over the period, multiplied by 182/365 (to reflect the one-half year period).
32
Optimum Large Cap Growth Fund
Expense Analysis of an Investment of $1,000
Expense Analysis of an Investment of $1,000
| Expenses | |||||||||||||
| Beginning | Ending | Paid During | |||||||||||
| Account | Account | Annualized | Period | ||||||||||
| Value | Value | Expense | 10/1/09 to | ||||||||||
| 10/1/09 | 3/31/10 | Ratio | 3/31/10* | ||||||||||
| Actual Fund Return | |||||||||||||
| Class A | $ | 1,000.00 | $ | 1,118.80 | 1.60% | $ | 8.45 | ||||||
| Class B | 1,000.00 | 1,115.00 | 2.25% | 11.86 | |||||||||
| Class C | 1,000.00 | 1,115.00 | 2.25% | 11.86 | |||||||||
| Institutional Class | 1,000.00 | 1,120.50 | 1.25% | 6.61 | |||||||||
| Hypothetical 5% Return (5% return before expenses) | |||||||||||||
| Class A | $ | 1,000.00 | $ | 1,016.95 | 1.60% | $ | 8.05 | ||||||
| Class B | 1,000.00 | 1,013.71 | 2.25% | 11.30 | |||||||||
| Class C | 1,000.00 | 1,013.71 | 2.25% | 11.30 | |||||||||
| Institutional Class | 1,000.00 | 1,018.70 | 1.25% | 6.29 | |||||||||
Optimum Large Cap Value Fund
Expense Analysis of an Investment of $1,000
Expense Analysis of an Investment of $1,000
| Expenses | |||||||||||||
| Beginning | Ending | Paid During | |||||||||||
| Account | Account | Annualized | Period | ||||||||||
| Value | Value | Expense | 10/1/09 to | ||||||||||
| 10/1/09 | 3/31/10 | Ratio | 3/31/10* | ||||||||||
| Actual Fund Return | |||||||||||||
| Class A | $ | 1,000.00 | $ | 1,105.70 | 1.61% | $ | 8.45 | ||||||
| Class B | 1,000.00 | 1,102.00 | 2.26% | 11.84 | |||||||||
| Class C | 1,000.00 | 1,100.90 | 2.26% | 11.84 | |||||||||
| Institutional Class | 1,000.00 | 1,107.70 | 1.26% | 6.62 | |||||||||
| Hypothetical 5% Return (5% return before expenses) | |||||||||||||
| Class A | $ | 1,000.00 | $ | 1,016.90 | 1.61% | $ | 8.10 | ||||||
| Class B | 1,000.00 | 1,013.66 | 2.26% | 11.35 | |||||||||
| Class C | 1,000.00 | 1,013.66 | 2.26% | 11.35 | |||||||||
| Institutional Class | 1,000.00 | 1,018.65 | 1.26% | 6.34 | |||||||||
*“Expenses Paid During Period” are equal to a Fund’s annualized expense ratios, multiplied by the average account value over the period, multiplied by 182/365 (to reflect the one-half year period).
Optimum Small-Mid Cap Growth Fund
Expense Analysis of an Investment of $1,000
Expense Analysis of an Investment of $1,000
| Expenses | |||||||||||||
| Beginning | Ending | Paid During | |||||||||||
| Account | Account | Annualized | Period | ||||||||||
| Value | Value | Expense | 10/1/09 to | ||||||||||
| 10/1/09 | 3/31/10 | Ratio | 3/31/10* | ||||||||||
| Actual Fund Return | |||||||||||||
| Class A | $ | 1,000.00 | $ | 1,136.60 | 1.90% | $ | 10.12 | ||||||
| Class B | 1,000.00 | 1,132.80 | 2.55% | 13.56 | |||||||||
| Class C | 1,000.00 | 1,132.80 | 2.55% | 13.56 | |||||||||
| Institutional Class | 1,000.00 | 1,138.70 | 1.55% | 8.26 | |||||||||
| Hypothetical 5% Return (5% return before expenses) | |||||||||||||
| Class A | $ | 1,000.00 | $ | 1,015.46 | 1.90% | $ | 9.55 | ||||||
| Class B | 1,000.00 | 1,012.22 | 2.55% | 12.79 | |||||||||
| Class C | 1,000.00 | 1,012.22 | 2.55% | 12.79 | |||||||||
| Institutional Class | 1,000.00 | 1,017.20 | 1.55% | 7.80 | |||||||||
Optimum Small-Mid Cap Value Fund
Expense Analysis of an Investment of $1,000
Expense Analysis of an Investment of $1,000
| Expenses | |||||||||||||
| Beginning | Ending | Paid During | |||||||||||
| Account | Account | Annualized | Period | ||||||||||
| Value | Value | Expense | 10/1/09 to | ||||||||||
| 10/1/09 | 3/31/10 | Ratio | 3/31/10* | ||||||||||
| Actual Fund Return | |||||||||||||
| Class A | $ | 1,000.00 | $ | 1,150.90 | 1.85% | $ | 9.92 | ||||||
| Class B | 1,000.00 | 1,145.80 | 2.50% | 13.37 | |||||||||
| Class C | 1,000.00 | 1,147.10 | 2.50% | 13.38 | |||||||||
| Institutional Class | 1,000.00 | 1,153.20 | 1.50% | 8.05 | |||||||||
| Hypothetical 5% Return (5% return before expenses) | |||||||||||||
| Class A | $ | 1,000.00 | $ | 1,015.71 | 1.85% | $ | 9.30 | ||||||
| Class B | 1,000.00 | 1,012.47 | 2.50% | 12.54 | |||||||||
| Class C | 1,000.00 | 1,012.47 | 2.50% | 12.54 | |||||||||
| Institutional Class | 1,000.00 | 1,017.45 | 1.50% | 7.54 | |||||||||
33
Sector allocations
Optimum Fixed Income Fund
As of March 31, 2010
As of March 31, 2010
Sector designations may be different than the sector designations presented in other Fund materials. The sector designations may represent the investment manager or sub-adviser’s internal sector classifications, which may result in the sector designations for one fund being different than another fund’s sector designations.
| Percentage | ||
| Sector | of Net Assets | |
| Agency Collateralized Mortgage Obligations | 11.42 | % |
| Agency Mortgage-Backed Securities | 10.30 | % |
| Commercial Mortgage-Backed Securities | 3.45 | % |
| Convertible Bonds | 1.92 | % |
| Corporate Bonds | 30.17 | % |
| Banking | 5.63 | % |
| Basic Industry | 2.03 | % |
| Brokerage | 1.75 | % |
| Capital Goods | 1.16 | % |
| Communications | 5.51 | % |
| Consumer Cyclical | 2.23 | % |
| Consumer Non-Cyclical | 2.74 | % |
| Electric | 2.18 | % |
| Energy | 3.42 | % |
| Finance Companies | 1.33 | % |
| Insurance | 0.59 | % |
| Natural Gas | 0.44 | % |
| Real Estate | 0.57 | % |
| Technology | 0.31 | % |
| Transportation | 0.28 | % |
| Municipal Bonds | 0.10 | % |
| Non-Agency Asset-Backed Securities | 2.96 | % |
| Non-Agency Collateralized Mortgage Obligations | 17.75 | % |
| Regional Authorities | 0.38 | % |
| Senior Secured Loans | 4.39 | % |
| Sovereign Agencies | 0.75 | % |
| Sovereign Debt | 3.43 | % |
| Percentage | ||
| Sector | of Net Assets | |
| Supranational Banks | 1.11 | % |
| U.S. Treasury Obligations | 5.89 | % |
| Common Stock | 0.07 | % |
| Convertible Preferred Stock | 0.04 | % |
| Preferred Stock | 0.16 | % |
| Warrant | 0.00 | % |
| Discount Notes | 8.99 | % |
| Securities Lending Collateral | 5.10 | % |
| Total Value of Securities | 108.38 | % |
| Obligation to Return Securities Lending Collateral | (5.25 | %) |
| Liabilities Net of Receivables and Other Assets | (3.13 | %) |
| Total Net Assets | 100.00 | % |
34
Country/Sector allocations
Optimum International Fund
As of March 31, 2010
As of March 31, 2010
Sector designations may be different than the sector designations presented in other Fund materials. The sector designations may represent the investment manager or sub-adviser’s internal sector classifications, which may result in the sector designations for one fund being different than another fund’s sector designations.
| Percentage | ||
| Country | of Net Assets | |
| Common Stock by Country | 96.31 | % |
| Australia | 5.00 | % |
| Belgium | 0.57 | % |
| Bermuda | 0.28 | % |
| Brazil | 1.46 | % |
| Canada | 4.62 | % |
| China | 3.51 | % |
| Denmark | 1.00 | % |
| Finland | 0.67 | % |
| France | 8.51 | % |
| Germany | 5.82 | % |
| Gibraltar | 0.12 | % |
| India | 0.33 | % |
| Indonesia | 0.21 | % |
| Ireland | 0.31 | % |
| Israel | 0.33 | % |
| Italy | 2.35 | % |
| Japan | 17.47 | % |
| Luxembourg | 0.49 | % |
| Malaysia | 0.62 | % |
| Mexico | 0.39 | % |
| Netherlands | 1.89 | % |
| New Zealand | 0.45 | % |
| Norway | 0.25 | % |
| Philippines | 0.23 | % |
| Republic of Korea | 1.76 | % |
| Russia | 0.21 | % |
| Singapore | 2.67 | % |
| South Africa | 0.83 | % |
| Spain | 3.76 | % |
| Sweden | 0.92 | % |
| Switzerland | 8.19 | % |
| Taiwan | 2.91 | % |
| Thailand | 0.37 | % |
| United Kingdom | 16.88 | % |
| United States | 0.93 | % |
| Percentage | ||
| Sector | of Net Assets | |
| Preferred Stock | 0.68 | % |
| Right | 0.00 | % |
| Warrant | 0.00 | % |
| Discount Notes | 1.77 | % |
| U.S. Treasury Obligations | 0.14 | % |
| Securities Lending Collateral | 12.01 | % |
| Total Value of Securities | 110.91 | % |
| Obligation to Return Securities Lending Collateral | (12.33 | %) |
| Receivables and Other Assets Net of Liabilities | 1.42 | % |
| Total Net Assets | 100.00 | % |
| Percentage | ||
| Common/Preferred Stock and Right by Sector | of Net Assets | |
| Automobiles & Components | 2.66 | % |
| Banking & Finance | 11.49 | % |
| Business Services | 0.58 | % |
| Capital Goods | 3.91 | % |
| Consumer Durables & Apparel | 0.34 | % |
| Consumer Services | 0.75 | % |
| Energy | 10.86 | % |
| Food & Staples Retailing | 8.32 | % |
| Food, Beverage & Tobacco | 3.61 | % |
| Insurance | 5.67 | % |
| Materials | 9.54 | % |
| Media | 1.91 | % |
| Pharmaceuticals & Biotechnology | 8.90 | % |
| Real Estate | 1.44 | % |
| Semiconductors | 2.50 | % |
| Technology & Equipment | 4.73 | % |
| Telecommunication Services | 10.12 | % |
| Transportation & Shipping | 4.54 | % |
| Utilities | 5.12 | % |
| Total | 96.99 | % |
(continues) 35
Sector allocations and top 10 holdings
Sector designations may be different than the sector designations presented in other Fund materials. The sector designations may represent the investment manager or sub-adviser’s internal sector classifications, which may result in the sector designations for one fund being different than another fund’s sector designations.
Optimum Large Cap Growth Fund
As of March 31, 2010
As of March 31, 2010
| Percentage | ||
| Sector | of Net Assets | |
| Common Stock² | 95.83 | % |
| Consumer Discretionary | 15.19 | % |
| Consumer Staples | 1.63 | % |
| Energy | 7.24 | % |
| Financial Services | 16.02 | % |
| Health Care | 10.25 | % |
| Materials & Processing | 6.92 | % |
| Producer Durables | 8.80 | % |
| Technology | 29.40 | % |
| Utilities | 0.38 | % |
| Limited Partnerships | 0.37 | % |
| Preferred Stock | 0.15 | % |
| Discount Notes | 2.88 | % |
| U.S. Treasury Obligations | 0.24 | % |
| Securities Lending Collateral | 7.03 | % |
| Total Value of Securities | 106.50 | % |
| Obligation to Return Securities Lending Collateral | (7.19 | %) |
| Receivables and Other Assets Net of Liabilities | 0.69 | % |
| Total Net Assets | 100.00 | % |
²Narrow industries are utilized for compliance purposes for diversification whereas broad sectors are used for financial reporting.
Holdings are for informational purposes only and are subject to change at any time. They are not a recommendation to buy, sell, or hold any security.
| Percentage | ||
| Top 10 Holdings | of Net Assets | |
| Apple | 5.37 | % |
| Google Class A | 3.20 | % |
| JPMorgan Chase | 2.43 | % |
| Hewlett-Packard | 2.00 | % |
| Amazon.com | 1.98 | % |
| Cisco Systems | 1.88 | % |
| MasterCard Class A | 1.74 | % |
| Visa Class A | 1.69 | % |
| McDonald’s | 1.67 | % |
| Intel | 1.51 | % |
Optimum Large Cap Value Fund
As of March 31, 2010
As of March 31, 2010
| Percentage | ||
| Sector | of Net Assets | |
| Common Stock | 98.49 | % |
| Consumer Discretionary | 9.86 | % |
| Consumer Staples | 10.33 | % |
| Energy | 12.14 | % |
| Financials | 18.68 | % |
| Health Care | 10.20 | % |
| Industrials | 12.99 | % |
| Information Technology | 9.71 | % |
| Materials | 6.26 | % |
| Telecommunications | 5.40 | % |
| Utilities | 2.92 | % |
| Discount Notes | 1.16 | % |
| U.S. Treasury Obligations | 0.09 | % |
| Securities Lending Collateral | 7.87 | % |
| Total Value of Securities | 107.61 | % |
| Obligation to Return Securities Lending Collateral | (8.04 | %) |
| Receivables and Other Assets Net of Liabilities | 0.43 | % |
| Total Net Assets | 100.00 | % |
Holdings are for informational purposes only and are subject to change at any time. They are not a recommendation to buy, sell, or hold any security.
| Percentage | ||
| Top 10 Holdings | of Net Assets | |
| JPMorgan Chase | 3.20 | % |
| AT&T | 2.65 | % |
| Chevron | 2.37 | % |
| International Business Machines | 2.30 | % |
| Pfizer | 2.19 | % |
| Travelers | 2.13 | % |
| Lockheed Martin | 2.11 | % |
| Intel | 1.78 | % |
| Phillip Morris International | 1.48 | % |
| Bank of New York Mellon | 1.47 | % |
36
Sector designations may be different than the sector designations presented in other Fund materials. The sector designations may represent the investment manager or sub-adviser’s internal sector classifications, which may result in the sector designations for one fund being different than another fund’s sector designations.
Optimum Small-Mid Cap Growth Fund
As of March 31, 2010
As of March 31, 2010
| Percentage | ||
| Sector | of Net Assets | |
| Common Stock² | 98.68 | % |
| Consumer Discretionary | 22.43 | % |
| Consumer Staples | 1.50 | % |
| Energy | 4.49 | % |
| Financial Services | 9.17 | % |
| Health Care | 15.27 | % |
| Materials & Processing | 2.78 | % |
| Producer Durables | 16.00 | % |
| Technology | 25.29 | % |
| Utilities | 1.75 | % |
| Warrants | 0.00 | % |
| Discount Notes | 1.55 | % |
| U.S. Treasury Obligations | 0.13 | % |
| Security Lending Collateral | 10.42 | % |
| Total Value of Securities | 110.78 | % |
| Obligation to Return Securities Lending Collateral | (10.64 | %) |
| Liabilities Net of Receivables and Other Assets | (0.14 | %) |
| Total Net Assets | 100.00 | % |
²Narrow industries are utilized for compliance purposes for diversification whereas broad sectors are used for financial reporting.
Holdings are for informational purposes only and are subject to change at any time. They are not a recommendation to buy, sell, or hold any security.
| Percentage | ||
| Top 10 Holdings | of Net Assets | |
| Informatica | 1.43 | % |
| Nordson | 1.35 | % |
| SBA Communications Class A | 1.34 | % |
| Crown Castle International | 1.32 | % |
| Polycom | 1.25 | % |
| tw telecom | 1.24 | % |
| Mettler-Toledo International | 1.18 | % |
| Hanesbrands | 1.07 | % |
| SXC Health Solutions | 1.01 | % |
| BE Aerospace | 0.99 | % |
Optimum Small-Mid Cap Value Fund
As of March 31, 2010
As of March 31, 2010
| Percentage | ||
| Sector | of Net Assets | |
| Common Stock | 91.54 | % |
| Basic Industry | 17.50 | % |
| Business Services | 4.75 | % |
| Capital Spending | 9.86 | % |
| Consumer Cyclical | 8.16 | % |
| Consumer Services | 5.57 | % |
| Consumer Staples | 2.47 | % |
| Energy | 5.72 | % |
| Financial Services | 11.26 | % |
| Health Care | 4.84 | % |
| Real Estate | 0.70 | % |
| Technology | 17.76 | % |
| Transportation | 1.23 | % |
| Utilities | 1.72 | % |
| Discount Notes | 6.64 | % |
| U.S. Treasury Obligations | 0.54 | % |
| Securities Lending Collateral | 6.75 | % |
| Total Value of Securities | 105.47 | % |
| Obligation to Return Securities Lending Collateral | (6.90 | %) |
| Receivables and Other Assets Net of Liabilities | 1.43 | % |
| Total Net Assets | 100.00 | % |
Holdings are for informational purposes only and are subject to change at any time. They are not a recommendation to buy, sell, or hold any security.
| Percentage | ||
| Top 10 Holdings | of Net Assets | |
| Ethan Allen Interiors | 1.90 | % |
| Flextronics International | 1.66 | % |
| Southern Union | 1.47 | % |
| Checkpoint Systems | 1.40 | % |
| Collective Brands | 1.38 | % |
| Albany International | 1.32 | % |
| Kennametal | 1.18 | % |
| Foot Locker | 1.15 | % |
| Eastman Chemical | 1.13 | % |
| Barnes Group | 1.12 | % |
37
Statements of net assets
Optimum Fixed Income Fund
March 31, 2010
March 31, 2010
| Principal | Value | ||||||||
| Amount° | (U.S. $) | ||||||||
| Agency Collateralized Mortgage Obligations – 11.42% | |||||||||
| Fannie Mae Grantor Trust | |||||||||
| · | Series 1999-T2 A1 | ||||||||
| 7.50% 1/19/39 | USD | 26,479 | $ | 28,357 | |||||
| Series 2001-T8 A2 | |||||||||
| 9.50% 7/25/41 | 14,068 | 15,207 | |||||||
| Series 2002-T4 A3 | |||||||||
| 7.50% 12/25/41 | 94,108 | 107,283 | |||||||
| Series 2004-T1 1A2 | |||||||||
| 6.50% 1/25/44 | 40,082 | 43,940 | |||||||
| Fannie Mae REMICs | |||||||||
| Series 1996-46 ZA | |||||||||
| 7.50% 11/25/26 | 25,176 | 27,627 | |||||||
| Series 1999-19 PH | |||||||||
| 6.00% 5/25/29 | 698,449 | 748,868 | |||||||
| Series 2001-14 Z | |||||||||
| 6.00% 5/25/31 | 50,323 | 54,658 | |||||||
| Series 2002-90 A1 | |||||||||
| 6.50% 6/25/42 | 18,337 | 20,102 | |||||||
| Series 2002-90 A2 | |||||||||
| 6.50% 11/25/42 | 72,040 | 78,974 | |||||||
| Series 2003-122 AJ | |||||||||
| 4.50% 2/25/28 | 86,745 | 89,817 | |||||||
| Series 2005-22 HE | |||||||||
| 5.00% 10/25/33 | 740,000 | 777,868 | |||||||
| Series 2005-29 QD | |||||||||
| 5.00% 8/25/33 | 816,000 | 857,920 | |||||||
| Series 2005-54 AK | |||||||||
| 4.50% 9/25/32 | 626,253 | 655,755 | |||||||
| Series 2005-94 YD | |||||||||
| 4.50% 8/25/33 | 1,480,000 | 1,519,530 | |||||||
| Series 2005-110 MB | |||||||||
| 5.50% 9/25/35 | 589,889 | 623,796 | |||||||
| Series 2007-30 OE | |||||||||
| 0.881% 4/25/37 | 10,677,476 | 9,065,902 | |||||||
| Series 2008-24 ZA | |||||||||
| 5.00% 4/25/38 | 16,574,120 | 15,918,189 | |||||||
| «· | Series 2009-2 AS | ||||||||
| 5.454% 2/25/39 | 36,199,756 | 2,686,876 | |||||||
| «· | Series 2009-68 SA | ||||||||
| 6.504% 9/25/39 | 5,374,179 | 518,966 | |||||||
| Series 2009-94 AC | |||||||||
| 5.00% 11/25/39 | 400,000 | 403,844 | |||||||
| Fannie Mae Whole Loan | |||||||||
| Series 2004-W4 A5 | |||||||||
| 5.50% 6/25/34 | 3,000,000 | 3,167,813 | |||||||
| Series 2004-W9 2A1 | |||||||||
| 6.50% 2/25/44 | 50,369 | 55,217 | |||||||
| Series 2004-W11 1A2 | |||||||||
| 6.50% 5/25/44 | 143,022 | 156,788 | |||||||
| Series 2004-W15 1A1 | |||||||||
| 6.00% 8/25/44 | 236,651 | 254,917 | |||||||
| Freddie Mac REMICs | |||||||||
| Series 1730 Z | |||||||||
| 7.00% 5/15/24 | 157,213 | 165,001 | |||||||
| Series 2165 PE | |||||||||
| 6.00% 6/15/29 | 730,333 | 789,102 | |||||||
| Series 2326 ZQ | |||||||||
| 6.50% 6/15/31 | 287,591 | 313,719 | |||||||
| Series 2497 BM | |||||||||
| 5.00% 2/15/22 | 100,806 | 103,589 | |||||||
| Series 2504 J | |||||||||
| 5.50% 5/15/16 | 324,689 | 326,944 | |||||||
| Series 2557 WE | |||||||||
| 5.00% 1/15/18 | 732,415 | 786,169 | |||||||
| Series 2662 MA | |||||||||
| 4.50% 10/15/31 | 145,012 | 150,857 | |||||||
| Series 2755 LE | |||||||||
| 4.00% 9/15/30 | 557,000 | 582,497 | |||||||
| Series 2762 LG | |||||||||
| 5.00% 9/15/32 | 2,000,000 | 2,119,025 | |||||||
| Series 2802 NE | |||||||||
| 5.00% 2/15/33 | 700,000 | 740,145 | |||||||
| Series 2827 TE | |||||||||
| 5.00% 4/15/33 | 1,335,000 | 1,409,461 | |||||||
| Series 2840 OE | |||||||||
| 5.00% 2/15/33 | 1,800,000 | 1,907,770 | |||||||
| Series 2864 PE | |||||||||
| 5.00% 6/15/33 | 1,095,000 | 1,157,963 | |||||||
| Series 2869 BG | |||||||||
| 5.00% 7/15/33 | 224,000 | 236,944 | |||||||
| Series 2881 TE | |||||||||
| 5.00% 7/15/33 | 1,080,000 | 1,141,763 | |||||||
| Series 2889 OG | |||||||||
| 5.00% 5/15/33 | 117,000 | 123,448 | |||||||
| Series 2890 PC | |||||||||
| 5.00% 7/15/30 | 265,000 | 281,997 | |||||||
| Series 2890 PD | |||||||||
| 5.00% 3/15/33 | 1,265,000 | 1,334,705 | |||||||
| Series 2893 PD | |||||||||
| 5.00% 2/15/33 | 65,000 | 68,603 | |||||||
| Series 2915 KD | |||||||||
| 5.00% 9/15/33 | 447,000 | 471,328 | |||||||
| Series 2938 ND | |||||||||
| 5.00% 10/15/33 | 1,050,000 | 1,112,496 | |||||||
| Series 2939 PD | |||||||||
| 5.00% 7/15/33 | 665,000 | 704,295 | |||||||
| Series 2941 XD | |||||||||
| 5.00% 5/15/33 | 2,690,000 | 2,842,361 | |||||||
| Series 2987 KG | |||||||||
| 5.00% 12/15/34 | 1,430,000 | 1,506,440 | |||||||
| Series 3022 MB | |||||||||
| 5.00% 12/15/28 | 260,000 | 272,675 | |||||||
| Series 3131 MC | |||||||||
| 5.50% 4/15/33 | 445,000 | 476,658 | |||||||
| Series 3143 BC | |||||||||
| 5.50% 2/15/36 | 8,000,000 | 8,382,316 | |||||||
| Series 3145 LN | |||||||||
| 4.50% 10/15/34 | 1,174,214 | 1,237,383 | |||||||
| «· | Series 3289 SA | ||||||||
| 6.52% 3/15/37 | 8,098,988 | 747,338 | |||||||
| Series 3337 PB | |||||||||
| 5.50% 7/15/30 | 505,000 | 529,234 | |||||||
38
| Principal | Value | ||||||||
| Amount° | (U.S. $) | ||||||||
| Agency Collateralized Mortgage Obligations (continued) | |||||||||
| Freddie Mac REMICs | |||||||||
| Series 3476 Z | |||||||||
| 5.50% 7/15/38 | USD | 10,957,699 | $ | 11,192,744 | |||||
| Series 3626 MA | |||||||||
| 5.00% 2/15/30 | 3,656,429 | 3,909,713 | |||||||
| t | Freddie Mac Structured Pass | ||||||||
| Through Securities | |||||||||
| Series T-54 2A | |||||||||
| 6.50% 2/25/43 | 31,856 | 34,923 | |||||||
| Series T-58 2A | |||||||||
| 6.50% 9/25/43 | 17,545 | 19,291 | |||||||
| «· | GNMA | ||||||||
| Series 2007-64 AI | |||||||||
| 6.31% 10/20/37 | 29,932,373 | 2,596,244 | |||||||
| Series 2008-65 SB | |||||||||
| 5.76% 8/20/38 | 10,594,544 | 933,964 | |||||||
| Series 2009-2 SE | |||||||||
| 5.58% 1/20/39 | 27,927,550 | 2,367,502 | |||||||
| Total Agency Collateralized | |||||||||
| Mortgage Obligations | |||||||||
| (cost $82,354,002) | 90,954,821 | ||||||||
| Agency Mortgage-Backed Securities – 10.30% | |||||||||
| Fannie Mae | |||||||||
| 5.50% 1/1/13 | 107,486 | 109,408 | |||||||
| 5.50% 3/1/37 | 611,249 | 641,057 | |||||||
| 5.50% 7/1/37 | 1,618,649 | 1,697,582 | |||||||
| 6.50% 8/1/17 | 76,547 | 82,566 | |||||||
| · | Fannie Mae ARM | ||||||||
| 3.044% 10/1/33 | 57,560 | 59,772 | |||||||
| 4.995% 8/1/35 | 225,067 | 237,366 | |||||||
| 5.139% 11/1/35 | 352,608 | 371,130 | |||||||
| 5.928% 8/1/37 | 512,754 | 538,680 | |||||||
| 6.026% 7/1/37 | 1,422,494 | 1,490,160 | |||||||
| Fannie Mae Relocation 30 yr | |||||||||
| 5.00% 11/1/33 | 25,033 | 25,646 | |||||||
| 5.00% 1/1/34 | 90,904 | 93,126 | |||||||
| 5.00% 2/1/34 | 27,142 | 27,806 | |||||||
| 5.00% 8/1/34 | 80,495 | 82,463 | |||||||
| 5.00% 11/1/34 | 134,355 | 137,641 | |||||||
| 5.00% 4/1/35 | 208,980 | 214,091 | |||||||
| 5.00% 10/1/35 | 159,176 | 163,069 | |||||||
| 5.00% 1/1/36 | 400,716 | 410,516 | |||||||
| Fannie Mae S.F. 15 yr | |||||||||
| 4.50% 8/1/18 | 646,457 | 680,604 | |||||||
| 4.50% 7/1/20 | 1,456,329 | 1,530,979 | |||||||
| 5.00% 5/1/21 | 171,721 | 182,932 | |||||||
| Fannie Mae S.F. 15 yr TBA | |||||||||
| 5.50% 4/1/25 | 3,865,000 | 4,133,737 | |||||||
| Fannie Mae S.F. 20 yr | |||||||||
| 5.50% 7/1/24 | 622,043 | 660,848 | |||||||
| 5.50% 10/1/24 | 194,640 | 206,782 | |||||||
| 5.50% 12/1/24 | 661,458 | 702,721 | |||||||
| Fannie Mae S.F. 30 yr | |||||||||
| 4.50% 3/1/39 | 423,091 | 424,575 | |||||||
| 5.00% 12/1/36 | 443,010 | 458,274 | |||||||
| 5.00% 12/1/37 | 350,699 | 362,270 | |||||||
| 5.00% 1/1/38 | 557,262 | 575,648 | |||||||
| 5.00% 2/1/38 | 262,684 | 271,351 | |||||||
| 5.50% 12/1/32 | 404,663 | 429,581 | |||||||
| 5.50% 7/1/33 | 1,022,010 | 1,084,623 | |||||||
| 5.50% 12/1/33 | 164,609 | 174,694 | |||||||
| 5.50% 4/1/34 | 2,415,877 | 2,560,806 | |||||||
| 5.50% 5/1/34 | 709,712 | 753,193 | |||||||
| 5.50% 6/1/34 | 852,182 | 902,527 | |||||||
| 5.50% 7/1/34 | 1,421,990 | 1,505,998 | |||||||
| 5.50% 2/1/35 | 4,158,537 | 4,410,808 | |||||||
| 5.50% 9/1/36 | 1,938,474 | 2,052,995 | |||||||
| 6.00% 9/1/36 | 451,372 | 481,775 | |||||||
| 6.00% 8/1/38 | 2,679,120 | 2,849,117 | |||||||
| 6.50% 11/1/33 | 32,484 | 35,809 | |||||||
| 6.50% 2/1/36 | 697,522 | 765,408 | |||||||
| 6.50% 3/1/36 | 1,277,036 | 1,387,799 | |||||||
| 6.50% 6/1/36 | 1,446,485 | 1,571,946 | |||||||
| 6.50% 8/1/36 | 959,909 | 1,043,166 | |||||||
| 6.50% 4/1/37 | 1,014,373 | 1,100,768 | |||||||
| 6.50% 2/1/38 | 1,650,782 | 1,791,030 | |||||||
| 7.00% 2/1/38 | 1,006,166 | 1,115,461 | |||||||
| 7.00% 3/1/38 | 1,116,162 | 1,237,405 | |||||||
| 7.50% 3/1/32 | 1,498 | 1,697 | |||||||
| 7.50% 4/1/32 | 6,409 | 7,263 | |||||||
| 7.50% 6/1/32 | 4,748 | 5,381 | |||||||
| Fannie Mae S.F. 30 yr TBA | |||||||||
| 4.00% 4/1/40 | 4,600,000 | 4,666,124 | |||||||
| 4.50% 4/1/40 | 1,135,000 | 1,177,208 | |||||||
| 4.50% 4/1/40 | 3,020,000 | 3,026,608 | |||||||
| · | Freddie Mac ARM | ||||||||
| 2.643% 12/1/33 | 116,853 | 120,923 | |||||||
| 3.417% 4/1/34 | 7,812 | 8,142 | |||||||
| 5.511% 2/1/38 | 1,416,543 | 1,501,287 | |||||||
| 5.693% 7/1/36 | 221,381 | 233,735 | |||||||
| 5.803% 5/1/37 | 931,867 | 985,715 | |||||||
| Freddie Mac Relocation 30 yr | |||||||||
| 5.00% 9/1/33 | 3,828 | 3,928 | |||||||
| Freddie Mac S.F. 15 yr | |||||||||
| 4.50% 5/1/20 | 827,449 | 869,734 | |||||||
| 5.00% 6/1/18 | 270,472 | 287,466 | |||||||
| Freddie Mac S.F. 15 yr TBA | |||||||||
| 5.00% 4/1/25 | 4,500,000 | 4,750,312 | |||||||
| Freddie Mac S.F. 20 yr | |||||||||
| 5.50% 10/1/23 | 501,120 | 533,388 | |||||||
| 5.50% 8/1/24 | 119,180 | 126,781 | |||||||
| Freddie Mac S.F. 30 yr | |||||||||
| 5.00% 4/1/35 | 488,152 | 507,412 | |||||||
| 5.00% 7/1/38 | 606,125 | 626,691 | |||||||
| 6.50% 11/1/33 | 65,069 | 71,617 | |||||||
| 6.50% 1/1/35 | 366,660 | 404,248 | |||||||
| 6.50% 5/1/37 | 45,776 | 49,839 | |||||||
| 6.50% 8/1/38 | 416,097 | 452,813 | |||||||
| 7.00% 1/1/38 | 407,428 | 452,971 | |||||||
(continues) 39
Statements of net assets
Optimum Fixed Income Fund
| Principal | Value | ||||||||
| Amount° | (U.S. $) | ||||||||
| Agency Mortgage-Backed Securities (continued) | |||||||||
| Freddie Mac S.F. 30 yr TBA | |||||||||
| 5.00% 4/1/40 | USD | 1,035,000 | $ | 1,068,638 | |||||
| 5.50% 4/1/40 | 4,260,000 | 4,498,296 | |||||||
| 6.00% 4/1/40 | 7,550,000 | 8,100,915 | |||||||
| 6.50% 4/1/40 | 2,755,000 | 2,994,770 | |||||||
| GNMA I S.F. 30 yr | |||||||||
| 7.00% 12/15/34 | 584,152 | 643,596 | |||||||
| GNMA II 6.00% 4/20/34 | 38,348 | 41,378 | |||||||
| Total Agency Mortgage- | |||||||||
| Backed Securities | |||||||||
| (cost $79,157,943) | 82,046,585 | ||||||||
| Commercial Mortgage-Backed Securities – 3.45% | |||||||||
| #American Tower Trust 144A | |||||||||
| Series 2007-1A AFX | |||||||||
| 5.42% 4/15/37 | 420,000 | 444,150 | |||||||
| Series 2007-1A D | |||||||||
| 5.957% 4/15/37 | 120,000 | 126,300 | |||||||
| Bank of America Commercial | |||||||||
| Mortgage Securities | |||||||||
| · | Series 2004-3 A5 | ||||||||
| 5.414% 6/10/39 | 415,000 | 435,368 | |||||||
| · | Series 2005-1 A5 | ||||||||
| 5.135% 11/10/42 | 1,620,000 | 1,692,531 | |||||||
| · | Series 2005-6 A4 | ||||||||
| 5.179% 9/10/47 | 1,615,000 | 1,681,004 | |||||||
| Series 2006-4 A4 | |||||||||
| 5.634% 7/10/46 | 595,000 | 603,249 | |||||||
| Bear Stearns Commercial | |||||||||
| Mortgage Securities | |||||||||
| · | Series 2005-PW10 A4 | ||||||||
| 5.405% 12/11/40 | 875,000 | 895,929 | |||||||
| · | Series 2005-T20 A4A | ||||||||
| 5.15% 10/12/42 | 1,835,000 | 1,896,205 | |||||||
| · | Series 2006-PW12 A4 | ||||||||
| 5.719% 9/11/38 | 895,000 | 934,883 | |||||||
| Series 2006-PW14 A4 | |||||||||
| 5.201% 12/11/38 | 1,000,000 | 999,615 | |||||||
| Series 2007-PW15 A4 | |||||||||
| 5.331% 2/11/44 | 630,000 | 606,997 | |||||||
| · | Series 2007-PW16 A4 | ||||||||
| 5.719% 6/11/40 | 320,000 | 315,875 | |||||||
| · | Commercial Mortgage | ||||||||
| Loan Trust Series | |||||||||
| 2008-LS1 A4B | |||||||||
| 6.02% 12/10/49 | 1,140,000 | 1,120,504 | |||||||
| t | Commercial Mortgage Pass | ||||||||
| Through Certificates | |||||||||
| ·# | Series 2001-J1A A2 | ||||||||
| 144A 6.457% 2/16/34 | 239,065 | 243,914 | |||||||
| · | Series 2005-C6 A5A | ||||||||
| 5.116% 6/10/44 | 550,000 | 568,625 | |||||||
| Series 2006-C7 A2 | |||||||||
| 5.69% 6/10/46 | 260,000 | 266,856 | |||||||
| · | Credit Suisse Mortgage | ||||||||
| Capital Certificates | |||||||||
| Series 2006-C1 AAB | |||||||||
| 5.549% 2/15/39 | 140,000 | 146,160 | |||||||
| # | Crown Castle Towers | ||||||||
| Series 2006-1A B 144A | |||||||||
| 5.362% 11/15/36 | 675,000 | 713,813 | |||||||
| General Electric Capital | |||||||||
| Commercial Mortgage | |||||||||
| Series 2002-1A A3 | |||||||||
| 6.269% 12/10/35 | 325,000 | 345,433 | |||||||
| Goldman Sachs Mortgage | |||||||||
| Securities II | |||||||||
| · | Series 2004-GG2 A6 | ||||||||
| 5.396% 8/10/38 | 570,000 | 594,496 | |||||||
| Series 2005-GG4 A4 | |||||||||
| 4.761% 7/10/39 | 510,000 | 506,114 | |||||||
| Series 2005-GG4 A4A | |||||||||
| 4.751% 7/10/39 | 1,215,000 | 1,226,706 | |||||||
| · | Series 2006-GG6 A4 | ||||||||
| 5.553% 4/10/38 | 500,000 | 502,516 | |||||||
| @·# | Series 2006-RR3 A1S | ||||||||
| 144A 5.661% 7/18/56 | 505,000 | 151,500 | |||||||
| ·# | Series 2007-GG10 J | ||||||||
| 144A 5.805% 8/10/45 | 1,956,000 | 34,230 | |||||||
| Greenwich Capital | |||||||||
| Commercial Funding | |||||||||
| · | Series 2004-GG1 A7 | ||||||||
| 5.317% 6/10/36 | 265,000 | 278,631 | |||||||
| · | Series 2006-GG7 A4 | ||||||||
| 5.886% 7/10/38 | 1,140,000 | 1,162,135 | |||||||
| Series 2007-GG9 A4 | |||||||||
| 5.444% 3/10/39 | 2,395,000 | 2,329,133 | |||||||
| JPMorgan Chase | |||||||||
| Commercial | |||||||||
| Mortgage Securities | |||||||||
| Series 2002-C1 A3 | |||||||||
| 5.376% 7/12/37 | 420,000 | 442,554 | |||||||
| Series 2002-C2 A2 | |||||||||
| 5.05% 12/12/34 | 465,000 | 488,403 | |||||||
| Series 2003-C1 A2 | |||||||||
| 4.985% 1/12/37 | 130,000 | 136,284 | |||||||
| · | Series 2005-LDP5 A4 | ||||||||
| 5.18% 12/15/44 | 670,000 | 693,586 | |||||||
| Series 2006-LDP9 A2 | |||||||||
| 5.134% 5/15/47 | 360,000 | 365,494 | |||||||
| * | Series 2007-LDPX A3 | ||||||||
| 5.42% 1/15/49 | 1,140,000 | 1,098,222 | |||||||
| Lehman Brothers-UBS | |||||||||
| Commercial | |||||||||
| Mortgage Trust | |||||||||
| Series 2002-C1 A4 | |||||||||
| 6.462% 3/15/31 | 245,000 | 262,059 | |||||||
| Series 2004-C1 A4 | |||||||||
| 4.568% 1/15/31 | 720,000 | 730,824 | |||||||
40
| Principal | Value | ||||||||
| Amount° | (U.S. $) | ||||||||
| Commercial Mortgage-Backed Securities (continued) | |||||||||
| · | Morgan Stanley Capital I | ||||||||
| # | Series 1999-FNV1 G | ||||||||
| 144A 6.12% 3/15/31 | USD | 85,642 | $ | 85,462 | |||||
| Series 2007-IQ14 A4 | |||||||||
| 5.692% 4/15/49 | 325,000 | 298,058 | |||||||
| Series 2007-T27 A4 | |||||||||
| 5.649% 6/11/42 | 1,310,000 | 1,354,653 | |||||||
| ·# | Morgan Stanley Dean | ||||||||
| Witter Capital I | |||||||||
| Series 2001-TOP1 E | |||||||||
| 144A 7.363% 2/15/33 | 100,000 | 100,962 | |||||||
| Wachovia Bank Commercial | |||||||||
| Mortgage Trust | |||||||||
| Series 2006-C28 A2 | |||||||||
| 5.50% 10/15/48 | 555,000 | 569,960 | |||||||
| Total Commercial Mortgage- | |||||||||
| Backed Securities | |||||||||
| (cost $27,771,846) | 27,449,393 | ||||||||
| Convertible Bonds – 1.92% | |||||||||
| Advanced Micro Devices | |||||||||
| 6.00% exercise price | |||||||||
| $28.08, expiration | |||||||||
| date 5/1/15 | 890,000 | 857,737 | |||||||
| Alaska Communications | |||||||||
| Systems Group | |||||||||
| 5.75% exercise price | |||||||||
| $12.90, expiration | |||||||||
| date 3/1/13 | 305,000 | 288,225 | |||||||
| Alcatel-Lucent USA | |||||||||
| 2.875% exercise price | |||||||||
| $15.35, expiration | |||||||||
| date 6/15/25 | 545,000 | 474,831 | |||||||
| * | Amgen 0.375% exercise | ||||||||
| price $79.48, expiration | |||||||||
| date 2/1/13 | 695,000 | 708,030 | |||||||
| ArvinMeritor | |||||||||
| 4.00% exercise price | |||||||||
| $26.73, expiration | |||||||||
| date 2/15/27 | 600,000 | 509,250 | |||||||
| Beazer Homes USA | |||||||||
| 4.625% exercise price | |||||||||
| $49.64, expiration | |||||||||
| date 6/15/24 | 172,000 | 167,700 | |||||||
| Bristow Group | |||||||||
| 3.00% exercise price | |||||||||
| $77.34, expiration | |||||||||
| date 6/14/38 | 379,000 | 339,205 | |||||||
| Century Aluminum | |||||||||
| 1.75% exercise price | |||||||||
| $30.54, expiration | |||||||||
| date 8/1/24 | 60,000 | 54,600 | |||||||
| * | Chesapeake Energy | ||||||||
| 2.25% exercise price | |||||||||
| $85.89, expiration | |||||||||
| date 12/15/38 | 559,000 | 409,468 | |||||||
| # | Corporate Office Properties | ||||||||
| 144A 3.50% exercise | |||||||||
| price $53.12, expiration | |||||||||
| date 9/15/26 | 552,000 | 548,550 | |||||||
| *# | Digital Realty Trust 144A | ||||||||
| 5.50% exercise price | |||||||||
| $43.00, expiration | |||||||||
| date 4/15/29 | 385,000 | 528,894 | |||||||
| Euronet Worldwide | |||||||||
| 3.50% exercise price | |||||||||
| $40.48, expiration | |||||||||
| date 10/15/25 | 85,000 | 80,325 | |||||||
| Ford Motor | |||||||||
| 4.25% exercise price | |||||||||
| $9.30, expiration | |||||||||
| date 11/15/16 | 160,000 | 240,200 | |||||||
| # | Gaylord Entertainment | ||||||||
| 144A 3.75% exercise | |||||||||
| price $27.25, expiration | |||||||||
| date 9/29/14 | 365,000 | 457,163 | |||||||
| Health Care REIT | |||||||||
| 4.75% exercise price | |||||||||
| $50.00, expiration | |||||||||
| date 7/15/27 | 395,000 | 443,881 | |||||||
| Φ | Hologic | ||||||||
| 2.00% exercise price | |||||||||
| $38.59, expiration | |||||||||
| date 12/15/37 | 1,001,000 | 900,899 | |||||||
| * | Intel | ||||||||
| 2.95% exercise price | |||||||||
| $31.14, expiration | |||||||||
| date 12/15/35 | 300,000 | 295,875 | |||||||
| # | International Game | ||||||||
| Technology 144A | |||||||||
| 3.25% exercise price | |||||||||
| $19.97, expiration | |||||||||
| date 5/1/14 | 672,000 | 802,199 | |||||||
| *Jefferies Group | |||||||||
| 3.875% exercise price | |||||||||
| $39.20, expiration | |||||||||
| date 11/1/29 | 542,000 | 541,323 | |||||||
| L-3 Communications | |||||||||
| Holdings 3.00% | |||||||||
| exercise price | |||||||||
| $100.14, expiration | |||||||||
| date 8/1/35 | 5,000 | 5,288 | |||||||
| * | Leap Wireless International | ||||||||
| 4.50% exercise price | |||||||||
| $93.21, expiration | |||||||||
| date 7/15/14 | 675,000 | 590,625 | |||||||
| Level 3 Communications | |||||||||
| 5.25% exercise price | |||||||||
| $3.98, expiration | |||||||||
| date 12/15/11 | 101,000 | 98,854 | |||||||
| # | Lexington Realty Trust | ||||||||
| 144A 6.00% exercise | |||||||||
| price $7.09, expiration | |||||||||
| date 1/15/30 | 320,000 | 340,243 | |||||||
(continues) 41
Statements of net assets
Optimum Fixed Income Fund
| Principal | Value | ||||||||
| Amount° | (U.S. $) | ||||||||
| Convertible Bonds (continued) | |||||||||
| Linear Technology | |||||||||
| 3.00% exercise price | |||||||||
| $46.12, expiration | |||||||||
| date 5/1/27 | USD | 508,000 | $ | 496,570 | |||||
| Medtronic | |||||||||
| 1.625% exercise price | |||||||||
| $54.79, expiration | |||||||||
| date 4/15/13 | 348,000 | 369,750 | |||||||
| National City | |||||||||
| 4.00% exercise price | |||||||||
| $482.51, expiration | |||||||||
| date 2/1/11 | 770,000 | 787,324 | |||||||
| National Retail Properties | |||||||||
| 5.125% exercise price | |||||||||
| $25.42, expiration | |||||||||
| date 6/15/28 | 415,000 | 454,425 | |||||||
| NII Holdings | |||||||||
| 3.125% exercise price | |||||||||
| $118.32, expiration | |||||||||
| date 6/15/12 | 525,000 | 498,094 | |||||||
| Qwest Communications | |||||||||
| International | |||||||||
| 3.50% exercise price | |||||||||
| $4.92, expiration | |||||||||
| date 11/15/25 | 9,000 | 10,170 | |||||||
| Rayonier TRS Holdings | |||||||||
| 3.75% exercise price | |||||||||
| $54.81, expiration | |||||||||
| date 10/15/12 | 124,000 | 135,935 | |||||||
| *# | Rayonier TRS Holdings | ||||||||
| 144A 4.50% exercise | |||||||||
| price $50.24, expiration | |||||||||
| date 8/15/15 | 335,000 | 397,813 | |||||||
| SanDisk | |||||||||
| 1.00% exercise price | |||||||||
| $82.35, expiration | |||||||||
| date 5/15/13 | 680,000 | 590,750 | |||||||
| # | SBA Communications 144A | ||||||||
| 4.00% exercise price | |||||||||
| $30.38, expiration | |||||||||
| date 10/1/14 | 203,000 | 276,588 | |||||||
| # | Sino-Forest 144A | ||||||||
| 5.00% exercise price | |||||||||
| $20.29, expiration | |||||||||
| date 8/1/13 | 343,000 | 415,888 | |||||||
| Transocean | |||||||||
| 1.50% exercise price | |||||||||
| $168.61, expiration | |||||||||
| date 12/15/37 | 198,000 | 194,288 | |||||||
| 1.625% exercise price | |||||||||
| $168.61, expiration | |||||||||
| date 12/15/37 | 290,000 | 290,363 | |||||||
| VeriSign | |||||||||
| 3.25% exercise price | |||||||||
| $34.37, expiration | |||||||||
| date 8/15/37 | 736,000 | 668,840 | |||||||
| Total Convertible Bonds | |||||||||
| (cost $14,238,978) | 15,270,163 | ||||||||
| Corporate Bonds – 30.17% | |||||||||
| Banking – 5.63% | |||||||||
| # | Achmea Hypotheekbank | ||||||||
| 144A 3.20% 11/3/14 | 2,120,000 | 2,149,309 | |||||||
| AgriBank 9.125% 7/15/19 | 800,000 | 911,590 | |||||||
| · | BAC Capital Trust XIV | ||||||||
| 5.63% 12/31/49 | 580,000 | 440,800 | |||||||
| @·# | Banco Mercantil 144A | ||||||||
| 6.862% 10/13/21 | 520,000 | 499,222 | |||||||
| # | Banco Santander Brasil 144A | ||||||||
| 4.50% 4/6/15 | 249,000 | 248,427 | |||||||
| Bank of America | |||||||||
| 4.50% 4/1/15 | 180,000 | 181,702 | |||||||
| 5.30% 3/15/17 | 1,040,000 | 1,030,974 | |||||||
| 5.75% 12/1/17 | 160,000 | 164,297 | |||||||
| 6.10% 6/15/17 | 1,380,000 | 1,422,500 | |||||||
| Bank of New York Mellon | |||||||||
| 4.95% 3/15/15 | 310,000 | 330,202 | |||||||
| Barclays Bank | |||||||||
| 6.75% 5/22/19 | 420,000 | 465,446 | |||||||
| # | Barclays Bank 144A | ||||||||
| 6.05% 12/4/17 | 2,525,000 | 2,607,925 | |||||||
| BB&T 5.25% 11/1/19 | 896,000 | 902,530 | |||||||
| BB&T Capital Trust II | |||||||||
| 6.75% 6/7/36 | 1,310,000 | 1,323,906 | |||||||
| Capital One Bank USA | |||||||||
| 8.80% 7/15/19 | 2,235,000 | 2,704,926 | |||||||
| Capital One Capital V | |||||||||
| 10.25% 8/15/39 | 850,000 | 1,009,622 | |||||||
| Capital One Capital VI | |||||||||
| 8.875% 5/15/40 | 580,000 | 636,425 | |||||||
| Citigroup 6.01% 1/15/15 | 1,475,000 | 1,551,193 | |||||||
| · | Citigroup Capital XXI | ||||||||
| 8.30% 12/21/57 | 200,000 | 203,500 | |||||||
| @# | CoBank 144A | ||||||||
| 7.875% 4/16/18 | 570,000 | 616,469 | |||||||
| Credit Suisse | |||||||||
| 5.40% 1/14/20 | 875,000 | 883,502 | |||||||
| Credit Suisse/New York | |||||||||
| 6.00% 2/15/18 | 560,000 | 593,848 | |||||||
| Export-Import Bank of Korea | |||||||||
| 5.875% 1/14/15 | 805,000 | 869,564 | |||||||
| # | Industrial Bank of Korea | ||||||||
| 144A 7.125% 4/23/14 | 279,000 | 313,379 | |||||||
| JPMorgan Chase Capital XVIII | |||||||||
| 6.95% 8/17/36 | 550,000 | 540,669 | |||||||
| JPMorgan Chase Capital XXII | |||||||||
| 6.45% 2/2/37 | 395,000 | 367,839 | |||||||
| JPMorgan Chase Capital XXV | |||||||||
| 6.80% 10/1/37 | 2,652,000 | 2,648,029 | |||||||
| KeyBank 6.95% 2/1/28 | 1,220,000 | 1,116,476 | |||||||
| Korea Development Bank | |||||||||
| * | 4.375% 8/10/15 | 255,000 | 259,119 | ||||||
| 5.30% 1/17/13 | 520,000 | 552,741 | |||||||
| # | Lloyds TSB Bank 144A | ||||||||
| 5.80% 1/13/20 | 1,925,000 | 1,881,649 | |||||||
42
| Principal | Value | ||||||||
| Amount° | (U.S. $) | ||||||||
| Corporate Bonds (continued) | |||||||||
| Banking (continued) | |||||||||
| # | National Agricultural | ||||||||
| Cooperative Federation | |||||||||
| 144A 5.00% 9/30/14 | USD | 373,000 | $ | 387,237 | |||||
| · | National City Bank | ||||||||
| 0.622% 6/7/17 | 325,000 | 290,059 | |||||||
| Nederlandse | |||||||||
| Waterschapsbank | |||||||||
| 3.00% 3/17/15 | 220,000 | 218,510 | |||||||
| PNC Bank 6.875% 4/1/18 | 470,000 | 522,047 | |||||||
| PNC Funding | |||||||||
| 5.125% 2/8/20 | 945,000 | 953,764 | |||||||
| 5.25% 11/15/15 | 150,000 | 157,874 | |||||||
| 5.625% 2/1/17 | 195,000 | 201,491 | |||||||
| ·# | PNC Preferred Funding | ||||||||
| Trust II 144A | |||||||||
| 6.113% 3/29/49 | 1,200,000 | 945,283 | |||||||
| ·# | Rabobank Nederland 144A | ||||||||
| 11.00% 12/29/49 | 1,390,000 | 1,793,977 | |||||||
| Regions Financial | |||||||||
| 7.75% 11/10/14 | 1,065,000 | 1,121,609 | |||||||
| Rentenbank | |||||||||
| 6.00% 7/15/14 | AUD | 526,000 | 480,213 | ||||||
| # | Russian Agricultural Bank | ||||||||
| 144A 6.299% 5/15/17 | USD | 507,000 | 528,497 | ||||||
| Silicon Valley Bank | |||||||||
| 5.70% 6/1/12 | 724,000 | 757,071 | |||||||
| 6.05% 6/1/17 | 250,000 | 234,509 | |||||||
| U.S. Bank North America | |||||||||
| 4.95% 10/30/14 | 250,000 | 266,421 | |||||||
| · | USB Capital IX | ||||||||
| 6.189% 4/15/49 | 1,255,000 | 1,085,575 | |||||||
| # | VTB Capital 144A | ||||||||
| 6.875% 5/29/18 | 345,000 | 360,956 | |||||||
| Wachovia 5.625% 10/15/16 | 465,000 | 490,707 | |||||||
| · | Wells Fargo Capital XIII | ||||||||
| 7.70% 12/29/49 | 3,501,000 | 3,632,287 | |||||||
| Zions Bancorp | |||||||||
| 5.50% 11/16/15 | 226,000 | 210,428 | |||||||
| 5.65% 5/15/14 | 206,000 | 188,658 | |||||||
| 6.00% 9/15/15 | 149,000 | 137,235 | |||||||
| * | 7.75% 9/23/14 | 405,000 | 408,873 | ||||||
| 44,801,061 | |||||||||
| Basic Industry – 2.03% | |||||||||
| # | Algoma Acquisition 144A | ||||||||
| 9.875% 6/15/15 | 339,000 | 313,575 | |||||||
| ArcelorMittal | |||||||||
| 9.85% 6/1/19 | 1,423,000 | 1,811,529 | |||||||
| Century Aluminum | |||||||||
| 8.00% 5/15/14 | 310,650 | 309,873 | |||||||
| # | Compass Minerals | ||||||||
| International 144A | |||||||||
| 8.00% 6/1/19 | 298,000 | 311,410 | |||||||
| Cytec Industries | |||||||||
| 8.95% 7/1/17 | 1,090,000 | 1,317,365 | |||||||
| Dow Chemical | |||||||||
| 8.55% 5/15/19 | 1,935,000 | 2,344,708 | |||||||
| # | Evraz Group 144A | ||||||||
| 9.50% 4/24/18 | 275,000 | 296,656 | |||||||
| # | FMG Finance 144A | ||||||||
| 10.625% 9/1/16 | 793,000 | 917,898 | |||||||
| # | Georgia-Pacific 144A | ||||||||
| 8.25% 5/1/16 | 118,000 | 129,210 | |||||||
| *# | Gerdau Holdings 144A | ||||||||
| 7.00% 1/20/20 | 209,000 | 221,540 | |||||||
| # | Hexion Finance Escrow | ||||||||
| 144A 8.875% 2/1/18 | 290,000 | 287,100 | |||||||
| * | Hexion US Finance | ||||||||
| 9.75% 11/15/14 | 390,000 | 399,750 | |||||||
| Huntsman International | |||||||||
| * | 7.375% 1/1/15 | 480,000 | 478,800 | ||||||
| 7.875% 11/15/14 | 279,000 | 283,185 | |||||||
| # | MacDermid 144A | ||||||||
| 9.50% 4/15/17 | 416,000 | 429,520 | |||||||
| * | #Momentive Performance | ||||||||
| Materials 144A | |||||||||
| 12.50% 6/15/14 | 7,000 | 7,945 | |||||||
| *# | NewPage 144A | ||||||||
| 11.375% 12/31/14 | 421,000 | 421,000 | |||||||
| · | Noranda Aluminum | ||||||||
| Acquisition PIK | |||||||||
| 5.274% 5/15/15 | 285,909 | 228,727 | |||||||
| Novelis | |||||||||
| 7.25% 2/15/15 | 282,000 | 273,540 | |||||||
| 11.50% 2/15/15 | 223,000 | 241,119 | |||||||
| # | PE Paper Escrow 144A | ||||||||
| 12.00% 8/1/14 | 100,000 | 113,193 | |||||||
| @= | Port Townsend | ||||||||
| 7.32% 8/27/12 | 86,471 | 62,691 | |||||||
| Reliance Steel & Aluminum | |||||||||
| 6.85% 11/15/36 | 520,000 | 457,289 | |||||||
| Ryerson | |||||||||
| · | 7.624% 11/1/14 | 137,000 | 128,095 | ||||||
| 12.00% 11/1/15 | 267,000 | 281,685 | |||||||
| # | Sappi Papier Holding 144A | ||||||||
| 6.75% 6/15/12 | 344,000 | 342,623 | |||||||
| Southern Copper | |||||||||
| 7.50% 7/27/35 | 799,000 | 834,623 | |||||||
| * | Steel Dynamics | ||||||||
| 7.75% 4/15/16 | 734,000 | 770,700 | |||||||
| Teck Resources | |||||||||
| 10.25% 5/15/16 | 117,000 | 139,815 | |||||||
| 10.75% 5/15/19 | 537,000 | 660,510 | |||||||
| Vale Overseas | |||||||||
| 6.875% 11/21/36 | 711,000 | 737,343 | |||||||
| 6.875% 11/10/39 | 595,000 | 619,483 | |||||||
| 16,172,500 | |||||||||
(continues) 43
Statements of net assets
Optimum Fixed Income Fund
| Principal | Value | ||||||||
| Amount° | (U.S. $) | ||||||||
| Corporate Bonds (continued) | |||||||||
| Brokerage – 1.75% | |||||||||
| · | Bear Stearns | ||||||||
| 4.63% 12/7/12 | AUD | 2,130,000 | $ | 1,913,666 | |||||
| # | Cemex Finance 144A | ||||||||
| 9.50% 12/14/16 | USD | 270,000 | 280,800 | ||||||
| Citigroup 6.375% 8/12/14 | 1,490,000 | 1,593,284 | |||||||
| E*Trade Financial PIK | |||||||||
| 12.50% 11/30/17 | 405,000 | 486,000 | |||||||
| Goldman Sachs Group | |||||||||
| 5.375% 3/15/20 | 2,315,000 | 2,297,958 | |||||||
| 5.95% 1/18/18 | 310,000 | 325,742 | |||||||
| 6.15% 4/1/18 | 390,000 | 413,303 | |||||||
| 6.25% 9/1/17 | 495,000 | 533,119 | |||||||
| Jefferies Group | |||||||||
| 6.25% 1/15/36 | 335,000 | 285,977 | |||||||
| 6.45% 6/8/27 | 1,146,000 | 1,026,150 | |||||||
| Lazard Group | |||||||||
| 6.85% 6/15/17 | 1,045,000 | 1,064,899 | |||||||
| 7.125% 5/15/15 | 42,000 | 44,147 | |||||||
| Morgan Stanley | |||||||||
| 5.375% 10/15/15 | 1,895,000 | 1,970,578 | |||||||
| 5.55% 4/27/17 | 110,000 | 112,665 | |||||||
| 6.00% 4/28/15 | 1,050,000 | 1,126,005 | |||||||
| 6.25% 8/28/17 | 435,000 | 457,253 | |||||||
| 13,931,546 | |||||||||
| Capital Goods – 1.16% | |||||||||
| Allied Waste North America | |||||||||
| 6.875% 6/1/17 | 645,000 | 704,049 | |||||||
| 7.125% 5/15/16 | 1,000,000 | 1,087,601 | |||||||
| AMH Holdings | |||||||||
| 11.25% 3/1/14 | 191,000 | 197,446 | |||||||
| Anixter 10.00% 3/15/14 | 111,000 | 130,148 | |||||||
| # | BAE Systems Holdings 144A | ||||||||
| 4.95% 6/1/14 | 230,000 | 241,550 | |||||||
| 5.20% 8/15/15 | 220,000 | 229,083 | |||||||
| BWAY 10.00% 4/15/14 | 228,000 | 246,240 | |||||||
| # | Case New Holland 144A | ||||||||
| 7.75% 9/1/13 | 183,000 | 190,778 | |||||||
| Casella Waste Systems | |||||||||
| 9.75% 2/1/13 | 304,000 | 305,520 | |||||||
| # | Casella Waste Systems 144A | ||||||||
| 11.00% 7/15/14 | 156,000 | 168,090 | |||||||
| Crown Americas | |||||||||
| 7.625% 11/15/13 | 166,000 | 171,810 | |||||||
| * | Graham Packaging | ||||||||
| 9.875% 10/15/14 | 547,000 | 570,247 | |||||||
| * | Graphic Packaging | ||||||||
| International | |||||||||
| 9.50% 8/15/13 | 430,000 | 442,900 | |||||||
| # | Greif 144A 7.75% 8/1/19 | 173,000 | 180,785 | ||||||
| Intertape Polymer US | |||||||||
| 8.50% 8/1/14 | 171,000 | 147,060 | |||||||
| JSG Funding 7.75% 4/1/15 | 217,000 | 213,745 | |||||||
| L-3 Communications | |||||||||
| * | 5.875% 1/15/15 | 4,000 | 4,090 | ||||||
| 6.125% 7/15/13 | 4,000 | 4,080 | |||||||
| NXP BV 9.50% 10/15/15 | 290,000 | 287,825 | |||||||
| Owens-Brockway | |||||||||
| Glass Container | |||||||||
| 7.375% 5/15/16 | 105,000 | 110,775 | |||||||
| # | Plastipak Holdings 144A | ||||||||
| 8.50% 12/15/15 | 218,000 | 222,905 | |||||||
| 10.625% 8/15/19 | 221,000 | 246,968 | |||||||
| Ply Gem Industries | |||||||||
| 11.75% 6/15/13 | 313,000 | 331,780 | |||||||
| # | Ply Gem Industries 144A | ||||||||
| 13.125% 7/15/14 | 447,000 | 465,998 | |||||||
| Pregis 12.375% 10/15/13 | 462,000 | 471,240 | |||||||
| RBS Global/Rexnord | |||||||||
| 9.50% 8/1/14 | 130,000 | 135,850 | |||||||
| * | 11.75% 8/1/16 | 232,000 | 249,980 | ||||||
| * | Solo Cup 8.50% 2/15/14 | 338,000 | 332,085 | ||||||
| Terex 8.00% 11/15/17 | 273,000 | 266,858 | |||||||
| Thermadyne Industries | |||||||||
| 11.50% 2/1/14 | 188,000 | 189,410 | |||||||
| # | Trimas 144A | ||||||||
| 9.75% 12/15/17 | 193,000 | 200,720 | |||||||
| # | USG 144A 9.75% 8/1/14 | 65,000 | 69,225 | ||||||
| # | Volvo-Votorantim Overseas | ||||||||
| Trading Operations | |||||||||
| 144A 6.625% 9/25/19 | 431,000 | 434,233 | |||||||
| 9,251,074 | |||||||||
| Communications – 5.51% | |||||||||
| Affinion Group | |||||||||
| 11.50% 10/15/15 | 132,000 | 135,960 | |||||||
| America Movil SAB de CV | |||||||||
| 5.625% 11/15/17 | 543,000 | 576,330 | |||||||
| American Tower | |||||||||
| 7.00% 10/15/17 | 1,015,000 | 1,139,338 | |||||||
| AT&T 6.50% 9/1/37 | 1,685,000 | 1,752,921 | |||||||
| # | Cablevision Systems 144A | ||||||||
| 8.625% 9/15/17 | 206,000 | 218,875 | |||||||
| CBS 5.75% 4/15/20 | 355,000 | 357,199 | |||||||
| CCH II 13.50% 11/30/16 | 436,000 | 526,470 | |||||||
| # | Cengage Learning | ||||||||
| Acquisitions 144A | |||||||||
| 10.50% 1/15/15 | 118,000 | 113,870 | |||||||
| # | Cequel Communications | ||||||||
| Holdings I 144A | |||||||||
| 8.625% 11/15/17 | 143,000 | 147,648 | |||||||
| # | Charter Communications | ||||||||
| Operating 144A | |||||||||
| 10.875% 9/15/14 | 145,000 | 162,944 | |||||||
| Cincinnati Bell | |||||||||
| 7.00% 2/15/15 | 364,000 | 355,810 | |||||||
| 8.25% 10/15/17 | 380,000 | 386,650 | |||||||
44
| Principal | Value | ||||||||
| Amount° | (U.S. $) | ||||||||
| Corporate Bonds (continued) | |||||||||
| Communications (continued) | |||||||||
| * | Citizens Communications | ||||||||
| 6.25% 1/15/13 | USD | 88,000 | $ | 89,320 | |||||
| * | Clear Channel | ||||||||
| Communications | |||||||||
| 10.75% 8/1/16 | 286,000 | 225,225 | |||||||
| # | Clearwire Communications | ||||||||
| 144A 12.00% 12/1/15 | 972,000 | 995,973 | |||||||
| *# | Columbus International | ||||||||
| 144A 11.50% 11/20/14 | 460,000 | 506,000 | |||||||
| Comcast | |||||||||
| 4.95% 6/15/16 | 655,000 | 683,751 | |||||||
| 5.15% 3/1/20 | 330,000 | 333,607 | |||||||
| 5.85% 11/15/15 | 385,000 | 422,372 | |||||||
| 6.50% 1/15/15 | 715,000 | 805,675 | |||||||
| 6.95% 8/15/37 | 230,000 | 249,611 | |||||||
| # | COX Communications 144A | ||||||||
| 5.875% 12/1/16 | 410,000 | 441,177 | |||||||
| 6.45% 12/1/36 | 410,000 | 414,401 | |||||||
| 6.95% 6/1/38 | 455,000 | 494,022 | |||||||
| * | Cricket Communications | ||||||||
| 9.375% 11/1/14 | 352,000 | 359,920 | |||||||
| *# | Cricket Communications | ||||||||
| 144A 7.75% 5/15/16 | 165,000 | 172,013 | |||||||
| * | Crown Castle International | ||||||||
| 9.00% 1/15/15 | 398,000 | 432,825 | |||||||
| CSC Holdings | |||||||||
| 6.75% 4/15/12 | 1,000 | 1,051 | |||||||
| # | Digicel 144A | ||||||||
| * | 8.25% 9/1/17 | 100,000 | 99,500 | ||||||
| 12.00% 4/1/14 | 305,000 | 346,938 | |||||||
| # | Digicel Group 144A | ||||||||
| 8.875% 1/15/15 | 410,000 | 404,875 | |||||||
| DirecTV Holdings | |||||||||
| 7.625% 5/15/16 | 3,050,000 | 3,457,709 | |||||||
| DISH DBS 7.875% 9/1/19 | 523,000 | 546,535 | |||||||
| # | GCI 144A 8.625% 11/15/19 | 133,000 | 136,159 | ||||||
| # | Global Crossing 144A | ||||||||
| 12.00% 9/15/15 | 358,000 | 399,170 | |||||||
| @ | Grupo Televisa | ||||||||
| 8.49% 5/11/37 | MXN | 7,400,000 | 514,466 | ||||||
| # | GXS Worldwide 144A | ||||||||
| 9.75% 6/15/15 | USD | 534,000 | 516,645 | ||||||
| Hughes Network | |||||||||
| Systems/Finance | |||||||||
| 9.50% 4/15/14 | 274,000 | 282,905 | |||||||
| Intelsat Bermuda PIK | |||||||||
| 11.50% 2/4/17 | 375 | 386 | |||||||
| Intelsat Jackson Holdings | |||||||||
| 11.25% 6/15/16 | 571,000 | 620,963 | |||||||
| # | Interpublic Group 144A | ||||||||
| 10.00% 7/15/17 | 58,000 | 65,903 | |||||||
| Lamar Media | |||||||||
| 6.625% 8/15/15 | 466,000 | 452,562 | |||||||
| Level 3 Financing | |||||||||
| 9.25% 11/1/14 | 73,000 | 71,540 | |||||||
| # | Level 3 Financing 144A | ||||||||
| 10.00% 2/1/18 | 233,000 | 223,680 | |||||||
| LIN Television | |||||||||
| 6.50% 5/15/13 | 62,000 | 60,760 | |||||||
| * | MetroPCS Wireless | ||||||||
| 9.25% 11/1/14 | 750,000 | 770,625 | |||||||
| # | NET Servicos de | ||||||||
| Comunicacao 144A | |||||||||
| 7.50% 1/27/20 | 346,000 | 366,760 | |||||||
| Nielsen Finance | |||||||||
| 10.00% 8/1/14 | 194,000 | 204,185 | |||||||
| 11.50% 5/1/16 | 140,000 | 158,900 | |||||||
| 11.625% 2/1/14 | 136,000 | 154,360 | |||||||
| Ω | 12.50% 8/1/16 | 204,000 | 194,820 | ||||||
| # | NII Capital 144A | ||||||||
| 10.00% 8/15/16 | 421,000 | 463,100 | |||||||
| # | Nordic Telephone Holdings | ||||||||
| 144A 8.875% 5/1/16 | 290,000 | 312,475 | |||||||
| * | PAETEC Holding | ||||||||
| 8.875% 6/30/17 | 307,000 | 316,978 | |||||||
| 9.50% 7/15/15 | 298,000 | 303,215 | |||||||
| # | Qwest 144A | ||||||||
| 8.375% 5/1/16 | 190,000 | 214,700 | |||||||
| Qwest Communications | |||||||||
| International | |||||||||
| 7.50% 2/15/14 | 350,000 | 357,875 | |||||||
| # | Rainbow National Services | ||||||||
| 144A 10.375% 9/1/14 | 123,000 | 130,226 | |||||||
| Rogers Cantel | |||||||||
| 7.50% 3/15/15 | 500,000 | 584,215 | |||||||
| Rogers Communications | |||||||||
| 6.68% 11/4/39 | CAD | 657,000 | 687,654 | ||||||
| Shaw Communications | |||||||||
| 6.75% 11/9/39 | CAD | 1,028,000 | 1,043,883 | ||||||
| # | Sinclair Television Group | ||||||||
| 144A 9.25% 11/1/17 | USD | 236,000 | 249,570 | ||||||
| * | Sirius XM Radio | ||||||||
| 9.625% 8/1/13 | 128,000 | 134,240 | |||||||
| # | Sirius XM Radio 144A | ||||||||
| 9.75% 9/1/15 | 50,000 | 54,250 | |||||||
| Sprint Capital | |||||||||
| 6.875% 11/15/28 | 265,000 | 214,650 | |||||||
| 8.75% 3/15/32 | 677,000 | 631,303 | |||||||
| *# | Telcordia Technologies | ||||||||
| 144A 10.00% 3/15/13 | 541,000 | 531,533 | |||||||
| Telecom Italia Capital | |||||||||
| 5.25% 10/1/15 | 3,285,000 | 3,367,469 | |||||||
| Telesat Canada | |||||||||
| 11.00% 11/1/15 | 507,000 | 566,573 | |||||||
| 12.50% 11/1/17 | 95,000 | 109,725 | |||||||
| # | Terremark Worldwide 144A | ||||||||
| 12.25% 6/15/17 | 206,000 | 237,930 | |||||||
(continues) 45
Statements of net assets
Optimum Fixed Income Fund
| Principal | Value | ||||||||
| Amount° | (U.S. $) | ||||||||
| Corporate Bonds (continued) | |||||||||
| Communications (continued) | |||||||||
| Time Warner Cable | |||||||||
| 8.25% 4/1/19 | USD | 1,075,000 | $ | 1,302,991 | |||||
| # | Univision Communications | ||||||||
| 144A 12.00% 7/1/14 | 229,000 | 251,900 | |||||||
| # | UPC Holding 144A | ||||||||
| 9.875% 4/15/18 | 170,000 | 179,350 | |||||||
| Verizon Communications | |||||||||
| 6.40% 2/15/38 | 525,000 | 546,504 | |||||||
| Videotron Ltee | |||||||||
| 6.375% 12/15/15 | 100,000 | 101,250 | |||||||
| # | Videotron Ltee 144A | ||||||||
| 7.125% 1/15/20 | 772,000 | 779,222 | |||||||
| Virgin Media Finance | |||||||||
| 8.375% 10/15/19 | 200,000 | 206,500 | |||||||
| 8.75% 4/15/14 | 34,000 | 34,978 | |||||||
| # | Vivendi 144A | ||||||||
| 5.75% 4/4/13 | 1,275,000 | 1,372,650 | |||||||
| * | 6.625% 4/4/18 | 935,000 | 1,014,376 | ||||||
| Vodafone Group | |||||||||
| 5.00% 12/16/13 | 185,000 | 199,832 | |||||||
| 5.00% 9/15/15 | 1,130,000 | 1,196,922 | |||||||
| 5.375% 1/30/15 | 2,200,000 | 2,362,599 | |||||||
| #Wind Acquisition | |||||||||
| Finance 144A | |||||||||
| 11.75% 7/15/17 | 450,000 | 499,500 | |||||||
| 12.00% 12/1/15 | 150,000 | 162,750 | |||||||
| Windstream | |||||||||
| 8.125% 8/1/13 | 213,000 | 224,183 | |||||||
| # | Windstream 144A | ||||||||
| 7.875% 11/1/17 | 3,000 | 2,970 | |||||||
| # | XM Satellite Radio 144A | ||||||||
| 13.00% 8/1/13 | 60,000 | 67,875 | |||||||
| XM Satellite Radio | |||||||||
| Holdings PIK | |||||||||
| 10.00% 6/1/11 | 288,000 | 290,880 | |||||||
| 43,860,100 | |||||||||
| Consumer Cyclical – 2.23% | |||||||||
| *# | Allison Transmission 144A | ||||||||
| 11.00% 11/1/15 | 535,000 | 572,450 | |||||||
| American Axle & | |||||||||
| Manufacturing | |||||||||
| * | 5.25% 2/11/14 | 344,000 | 315,620 | ||||||
| 7.875% 3/1/17 | 169,000 | 158,438 | |||||||
| * | ArvinMeritor | ||||||||
| 8.125% 9/15/15 | 493,000 | 478,210 | |||||||
| Beazer Homes USA | |||||||||
| 8.375% 4/15/12 | 9,000 | 9,023 | |||||||
| * | Burlington Coat Factory | ||||||||
| Investment Holdings | |||||||||
| 14.50% 10/15/14 | 783,000 | 833,894 | |||||||
| Corrections Corp. of America | |||||||||
| 7.75% 6/1/17 | 394,000 | 413,700 | |||||||
| t# | CVS Pass Through Trust | ||||||||
| 144A 8.353% 7/10/31 | 1,844,496 | 2,147,835 | |||||||
| *# | Equinox Holdings 144A | ||||||||
| 9.50% 2/1/16 | 50,000 | 50,625 | |||||||
| * | Ford Motor 7.45% 7/16/31 | 805,000 | 764,749 | ||||||
| Ford Motor Credit | |||||||||
| 7.80% 6/1/12 | 100,000 | 103,768 | |||||||
| 8.625% 11/1/10 | 8,000 | 8,195 | |||||||
| 12.00% 5/15/15 | 480,000 | 574,018 | |||||||
| # | Galaxy Entertainment | ||||||||
| Finance 144A | |||||||||
| 9.875% 12/15/12 | 395,000 | 413,763 | |||||||
| Global Cash Access/Finance | |||||||||
| 8.75% 3/15/12 | 158,000 | 158,988 | |||||||
| * | Goodyear Tire & Rubber | ||||||||
| 10.50% 5/15/16 | 378,000 | 410,130 | |||||||
| *# | Harrah’s Operating 144A | ||||||||
| 10.00% 12/15/18 | 474,000 | 394,605 | |||||||
| *# | Harrah’s Operating Escrow | ||||||||
| 144A 11.25% 6/1/17 | 119,000 | 128,818 | |||||||
| Interface 9.50% 2/1/14 | 56,000 | 57,960 | |||||||
| # | Interface 144A | ||||||||
| 11.375% 11/1/13 | 158,000 | 178,935 | |||||||
| International Game | |||||||||
| Technology | |||||||||
| 7.50% 6/15/19 | 485,000 | 550,262 | |||||||
| # | Invista 144A 9.25% 5/1/12 | 11,000 | 11,193 | ||||||
| K Hovnanian Enterprises | |||||||||
| 6.25% 1/15/15 | 153,000 | 121,635 | |||||||
| 7.50% 5/15/16 | 237,000 | 187,230 | |||||||
| # | K Hovnanian | ||||||||
| Enterprises 144A | |||||||||
| 10.625% 10/15/16 | 252,000 | 269,640 | |||||||
| # | Landry’s Restaurants 144A | ||||||||
| 11.625% 12/1/15 | 118,000 | 127,440 | |||||||
| M/I Homes 6.875% 4/1/12 | 102,000 | 99,450 | |||||||
| Macy’s Retail Holdings | |||||||||
| 6.65% 7/15/24 | 1,080,000 | 1,025,999 | |||||||
| * | 8.875% 7/15/15 | 247,000 | 280,345 | ||||||
| MGM MIRAGE | |||||||||
| * | 7.50% 6/1/16 | 370,000 | 309,875 | ||||||
| * | 7.625% 1/15/17 | 458,000 | 383,575 | ||||||
| 13.00% 11/15/13 | 173,000 | 202,410 | |||||||
| # | MGM MIRAGE 144A | ||||||||
| 11.125% 11/15/17 | 189,000 | 213,570 | |||||||
| * | 11.375% 3/1/18 | 394,000 | 382,180 | ||||||
| Mobile Mini | |||||||||
| 6.875% 5/1/15 | 181,000 | 169,688 | |||||||
| Mohawk Industries | |||||||||
| 6.875% 1/15/16 | 166,000 | 172,225 | |||||||
| Mohegan Tribal | |||||||||
| Gaming Authority | |||||||||
| 6.875% 2/15/15 | 196,000 | 149,450 | |||||||
| # | NCL 144A | ||||||||
| 11.75% 11/15/16 | 69,000 | 75,383 | |||||||
46
| Principal | Value | ||||||||
| Amount° | (U.S. $) | ||||||||
| Corporate Bonds (continued) | |||||||||
| Consumer Cyclical (continued) | |||||||||
| New Albertsons | |||||||||
| 7.25% 5/1/13 | USD | 76,000 | $ | 80,180 | |||||
| # | Norcraft 144A | ||||||||
| 10.50% 12/15/15 | 174,000 | 184,440 | |||||||
| * | Norcraft Holdings | ||||||||
| 9.75% 9/1/12 | 7,000 | 6,685 | |||||||
| OSI Restaurant Partners | |||||||||
| 10.00% 6/15/15 | 224,000 | 221,200 | |||||||
| Pinnacle Entertainment | |||||||||
| 7.50% 6/15/15 | 460,000 | 400,200 | |||||||
| *# | Pinnacle Entertainment | ||||||||
| 144A 8.625% 8/1/17 | 68,000 | 66,810 | |||||||
| @# | Pokagon Gaming | ||||||||
| Authority 144A | |||||||||
| 10.375% 6/15/14 | 6,000 | 6,330 | |||||||
| * | Quiksilver 6.875% 4/15/15 | 325,000 | 302,250 | ||||||
| Rite Aid 9.375% 12/15/15 | 271,000 | 234,415 | |||||||
| Royal Caribbean Cruises | |||||||||
| 6.875% 12/1/13 | 7,000 | 7,105 | |||||||
| 7.00% 6/15/13 | 280,000 | 284,900 | |||||||
| Ryland Group | |||||||||
| 8.40% 5/15/17 | 192,000 | 209,760 | |||||||
| * | Sally Holdings | ||||||||
| 10.50% 11/15/16 | 389,000 | 425,955 | |||||||
| # | Sealy Mattress 144A | ||||||||
| 10.875% 4/15/16 | 71,000 | 79,875 | |||||||
| # | Shingle Springs Tribal | ||||||||
| Gaming Authority 144A | |||||||||
| 9.375% 6/15/15 | 461,000 | 384,935 | |||||||
| Speedway Motorsports | |||||||||
| 8.75% 6/1/16 | 235,000 | 251,450 | |||||||
| # | Standard Pacific 144A | ||||||||
| 10.75% 9/15/16 | 278,000 | 297,113 | |||||||
| * | Tenneco 8.625% 11/15/14 | 473,000 | 482,460 | ||||||
| Toys R US 7.625% 8/1/11 | 3,000 | 3,120 | |||||||
| # | Toys R US Property 144A | ||||||||
| 10.75% 7/15/17 | 72,000 | 80,640 | |||||||
| # | TRW Automotive 144A | ||||||||
| 7.25% 3/15/17 | 205,000 | 198,850 | |||||||
| 8.875% 12/1/17 | 11,000 | 11,454 | |||||||
| # | Volvo Treasury 144A | ||||||||
| 5.95% 4/1/15 | 620,000 | 632,422 | |||||||
| 17,757,823 | |||||||||
| Consumer Non-Cyclical – 2.74% | |||||||||
| Accellent 10.50% 12/1/13 | 370,000 | 377,400 | |||||||
| # | Alliance One International | ||||||||
| 144A 10.00% 7/15/16 | 597,000 | 626,850 | |||||||
| ARAMARK 8.50% 2/1/15 | 452,000 | 464,430 | |||||||
| * | Bausch & Lomb | ||||||||
| 9.875% 11/1/15 | 260,000 | 276,250 | |||||||
| Beckman Coulter | |||||||||
| 6.00% 6/1/15 | 845,000 | 920,919 | |||||||
| 7.00% 6/1/19 | 380,000 | 427,657 | |||||||
| Biomet 11.625% 10/15/17 | 224,000 | 252,000 | |||||||
| Biomet PIK | |||||||||
| 10.375% 10/15/17 | 178,000 | 196,690 | |||||||
| # | Bio-Rad Laboratories 144A | ||||||||
| 8.00% 9/15/16 | 166,000 | 177,205 | |||||||
| # | Brambles USA 144A | ||||||||
| 3.95% 4/1/15 | 490,000 | 492,958 | |||||||
| 5.35% 4/1/20 | 490,000 | 493,577 | |||||||
| # | CareFusion 144A | ||||||||
| 6.375% 8/1/19 | 1,580,000 | 1,730,881 | |||||||
| Cornell 10.75% 7/1/12 | 63,000 | 64,024 | |||||||
| DJO Finance | |||||||||
| 10.875% 11/15/14 | 257,000 | 280,451 | |||||||
| # | Dole Food 144A | ||||||||
| 8.00% 10/1/16 | 143,000 | 147,290 | |||||||
| HCA 9.25% 11/15/16 | 228,000 | 242,963 | |||||||
| HCA PIK 9.625% 11/15/16 | 69,000 | 74,089 | |||||||
| Hospira 6.40% 5/15/15 | 1,795,000 | 1,992,909 | |||||||
| Ingles Markets | |||||||||
| 8.875% 5/15/17 | 216,000 | 226,800 | |||||||
| Inverness Medical | |||||||||
| Innovations | |||||||||
| 9.00% 5/15/16 | 375,000 | 383,438 | |||||||
| Iron Mountain | |||||||||
| 6.625% 1/1/16 | 76,000 | 75,810 | |||||||
| 8.00% 6/15/20 | 460,000 | 473,800 | |||||||
| Jarden | |||||||||
| 7.50% 1/15/20 | 30,000 | 30,450 | |||||||
| 8.00% 5/1/16 | 385,000 | 405,213 | |||||||
| # | JBS USA Finance 144A | ||||||||
| 11.625% 5/1/14 | 402,000 | 460,290 | |||||||
| Kraft Foods | |||||||||
| 5.375% 2/10/20 | 1,080,000 | 1,099,750 | |||||||
| Life Technologies | |||||||||
| 4.40% 3/1/15 | 115,000 | 115,927 | |||||||
| 6.00% 3/1/20 | 1,415,000 | 1,451,475 | |||||||
| Medco Health Solutions | |||||||||
| 7.125% 3/15/18 | 1,295,000 | 1,478,726 | |||||||
| # | National Money Mart 144A | ||||||||
| 10.375% 12/15/16 | 139,000 | 148,209 | |||||||
| # | Novasep Holding 144A | ||||||||
| 9.75% 12/15/16 | 485,000 | 473,178 | |||||||
| * | RSC Equipment Rental | ||||||||
| 9.50% 12/1/14 | 442,000 | 439,790 | |||||||
| *# | RSC Equipment | ||||||||
| Rental III 144A | |||||||||
| 10.25% 11/15/19 | 308,000 | 310,310 | |||||||
| Select Medical | |||||||||
| 7.625% 2/1/15 | 327,000 | 313,103 | |||||||
| Smithfield Foods | |||||||||
| 7.75% 5/15/13 | 218,000 | 221,270 | |||||||
| 7.75% 7/1/17 | 125,000 | 123,438 | |||||||
| # | Smithfield Foods 144A | ||||||||
| 10.00% 7/15/14 | 127,000 | 142,240 | |||||||
(continues) 47
Statements of net assets
Optimum Fixed Income Fund
| Principal | Value | ||||||||
| Amount° | (U.S. $) | ||||||||
| Corporate Bonds (continued) | |||||||||
| Consumer Non-Cyclical (continued) | |||||||||
| SUPERVALU | |||||||||
| 7.50% 11/15/14 | USD | 280,000 | $ | 285,600 | |||||
| * | 8.00% 5/1/16 | 324,000 | 329,670 | ||||||
| Tenet Healthcare | |||||||||
| 7.375% 2/1/13 | 208,000 | 211,120 | |||||||
| # | Tops Markets 144A | ||||||||
| 10.125% 10/15/15 | 137,000 | 143,165 | |||||||
| # | Tyson Foods 144A | ||||||||
| 10.50% 3/1/14 | 243,000 | 289,778 | |||||||
| Universal Hospital PIK | |||||||||
| 8.50% 6/1/15 | 166,000 | 166,000 | |||||||
| · | US Oncology Holdings PIK | ||||||||
| 6.643% 3/15/12 | 596,422 | 568,092 | |||||||
| Ventas Realty | |||||||||
| 6.50% 6/1/16 | 130,000 | 133,012 | |||||||
| Visant Holding | |||||||||
| 8.75% 12/1/13 | 171,000 | 176,130 | |||||||
| # | Viskase 144A | ||||||||
| 9.875% 1/15/18 | 262,000 | 266,585 | |||||||
| Yale University | |||||||||
| 2.90% 10/15/14 | 1,115,000 | 1,125,620 | |||||||
| * | Yankee Acquisition | ||||||||
| 9.75% 2/15/17 | 493,000 | 511,488 | |||||||
| 21,818,020 | |||||||||
| Electric – 2.18% | |||||||||
| AES | |||||||||
| 7.75% 3/1/14 | 32,000 | 32,880 | |||||||
| 8.00% 10/15/17 | 102,000 | 104,040 | |||||||
| 8.00% 6/1/20 | 679,000 | 679,849 | |||||||
| # | AES 144A 8.75% 5/15/13 | 53,000 | 54,060 | ||||||
| Ameren 8.875% 5/15/14 | 280,000 | 323,361 | |||||||
| # | American Transmission | ||||||||
| Systems 144A | |||||||||
| 5.25% 1/15/22 | 495,000 | 497,205 | |||||||
| # | Centrais Eletricas Brasileiras | ||||||||
| 144A 6.875% 7/30/19 | 2,280,000 | 2,496,600 | |||||||
| CMS Energy | |||||||||
| 6.55% 7/17/17 | 430,000 | 445,809 | |||||||
| Duquense Light Holdings | |||||||||
| 5.50% 8/15/15 | 756,000 | 751,277 | |||||||
| Dynegy Holdings | |||||||||
| 8.375% 5/1/16 | 5,000 | 4,175 | |||||||
| Edison Mission Energy | |||||||||
| * | 7.00% 5/15/17 | 144,000 | 101,160 | ||||||
| 7.20% 5/15/19 | 245,000 | 170,275 | |||||||
| * | 7.50% 6/15/13 | 6,000 | 5,235 | ||||||
| # | Electricite de France 144A | ||||||||
| 4.60% 1/27/20 | 605,000 | 597,539 | |||||||
| Elwood Energy | |||||||||
| 8.159% 7/5/26 | 296,716 | 282,270 | |||||||
| # | Enel Finance International | ||||||||
| 144A 3.875% 10/7/14 | 115,000 | 116,614 | |||||||
| Energy Future Holdings | |||||||||
| 5.55% 11/15/14 | 380,000 | 279,300 | |||||||
| Illinois Power | |||||||||
| 9.75% 11/15/18 | 2,195,000 | 2,817,885 | |||||||
| # | Majapahit Holding 144A | ||||||||
| 8.00% 8/7/19 | 706,000 | 779,248 | |||||||
| Midamerican Funding | |||||||||
| 6.75% 3/1/11 | 10,000 | 10,542 | |||||||
| * | Mirant Americas Generation | ||||||||
| 8.50% 10/1/21 | 530,000 | 500,850 | |||||||
| Mirant North America | |||||||||
| 7.375% 12/31/13 | 62,000 | 62,155 | |||||||
| NRG Energy | |||||||||
| 7.375% 2/1/16 | 288,000 | 286,560 | |||||||
| 7.375% 1/15/17 | 246,000 | 244,155 | |||||||
| Orion Power Holdings | |||||||||
| 12.00% 5/1/10 | 233,000 | 235,039 | |||||||
| # | Pedernales Electric | ||||||||
| Cooperative 144A | |||||||||
| 6.202% 11/15/32 | 620,000 | 536,961 | |||||||
| Pennsylvania Electric | |||||||||
| 5.20% 4/1/20 | 1,695,000 | 1,700,487 | |||||||
| PPL Electric Utilities | |||||||||
| 7.125% 11/30/13 | 435,000 | 503,857 | |||||||
| * | Public Service | ||||||||
| Company of Oklahoma | |||||||||
| 5.15% 12/1/19 | 1,410,000 | 1,425,083 | |||||||
| · | Puget Sound Energy | ||||||||
| 6.974% 6/1/67 | 335,000 | 299,360 | |||||||
| * | RRI Energy | ||||||||
| 7.625% 6/15/14 | 165,000 | 155,100 | |||||||
| Southwestern Electric Power | |||||||||
| 6.20% 3/15/40 | 295,000 | 295,305 | |||||||
| * | Texas Competitive | ||||||||
| Electric Holdings | |||||||||
| 10.25% 11/1/15 | 331,000 | 231,700 | |||||||
| TNB Capital | |||||||||
| 5.25% 5/5/15 | 333,000 | 351,863 | |||||||
| 17,377,799 | |||||||||
| Energy – 3.42% | |||||||||
| # | Adaro Indonesia 144A | ||||||||
| 7.625% 10/22/19 | 630,000 | 657,594 | |||||||
| # | Antero Resources Finance | ||||||||
| 144A 9.375% 12/1/17 | 132,000 | 136,620 | |||||||
| Berry Petroleum | |||||||||
| 10.25% 6/1/14 | 257,000 | 284,628 | |||||||
| Chesapeake Energy | |||||||||
| 6.625% 1/15/16 | 237,000 | 233,445 | |||||||
| 9.50% 2/15/15 | 630,000 | 688,275 | |||||||
| * | Complete Production Service | ||||||||
| 8.00% 12/15/16 | 341,000 | 339,295 | |||||||
| Copano Energy | |||||||||
| 7.75% 6/1/18 | 238,000 | 238,595 | |||||||
| * | Denbury Resources | ||||||||
| 9.75% 3/1/16 | 177,000 | 195,585 | |||||||
48
| Principal | Value | ||||||||
| Amount° | (U.S. $) | ||||||||
| Corporate Bonds (continued) | |||||||||
| Energy (continued) | |||||||||
| Enbridge Energy | |||||||||
| · | 8.05% 10/1/37 | USD | 725,000 | $ | 718,671 | ||||
| 9.875% 3/1/19 | 325,000 | 422,987 | |||||||
| Energy Transfer Partners | |||||||||
| 9.70% 3/15/19 | 1,090,000 | 1,381,861 | |||||||
| Forest Oil 7.25% 6/15/19 | 272,000 | 274,720 | |||||||
| # | Gaz Capital 144A | ||||||||
| 7.288% 8/16/37 | 193,000 | 194,206 | |||||||
| 9.25% 4/23/19 | 482,000 | 572,375 | |||||||
| Geophysique-Veritas | |||||||||
| 7.75% 5/15/17 | 294,000 | 295,470 | |||||||
| # | Gibson Energy 144A | ||||||||
| 10.00% 1/15/18 | 113,000 | 111,588 | |||||||
| # | Helix Energy Solutions | ||||||||
| Group 144A | |||||||||
| 9.50% 1/15/16 | 734,000 | 759,690 | |||||||
| *# | Hercules Offshore 144A | ||||||||
| 10.50% 10/15/17 | 354,000 | 354,885 | |||||||
| # | Hilcorp Energy I 144A | ||||||||
| 7.75% 11/1/15 | 170,000 | 168,725 | |||||||
| 9.00% 6/1/16 | 203,000 | 212,135 | |||||||
| # | Holly 144A | ||||||||
| 9.875% 6/15/17 | 237,000 | 245,295 | |||||||
| * | Key Energy Services | ||||||||
| 8.375% 12/1/14 | 469,000 | 476,621 | |||||||
| Kinder Morgan | |||||||||
| Energy Partners | |||||||||
| * | 6.85% 2/15/20 | 40,000 | 44,955 | ||||||
| 9.00% 2/1/19 | 1,320,000 | 1,649,602 | |||||||
| # | Linn Energy Finance 144A | ||||||||
| 8.625% 4/15/20 | 145,000 | 145,544 | |||||||
| # | Lukoil International Finance | ||||||||
| 144A 7.25% 11/5/19 | 230,000 | 242,650 | |||||||
| Mariner Energy | |||||||||
| 8.00% 5/15/17 | 308,000 | 304,150 | |||||||
| # | Midcontinent Express | ||||||||
| Pipeline 144A | |||||||||
| 5.45% 9/15/14 | 810,000 | 839,490 | |||||||
| 6.70% 9/15/19 | 410,000 | 432,707 | |||||||
| # | Murray Energy 144A | ||||||||
| 10.25% 10/15/15 | 182,000 | 187,460 | |||||||
| Nexen 7.50% 7/30/39 | 1,075,000 | 1,230,160 | |||||||
| # | NFR Energy Finance 144A | ||||||||
| 9.75% 2/15/17 | 35,000 | 35,088 | |||||||
| Noble Energy | |||||||||
| 8.25% 3/1/19 | 910,000 | 1,103,913 | |||||||
| OPTI Canada | |||||||||
| 7.875% 12/15/14 | 115,000 | 108,100 | |||||||
| 8.25% 12/15/14 | 205,000 | 193,725 | |||||||
| Petrobras International | |||||||||
| Finance | |||||||||
| 5.75% 1/20/20 | 75,000 | 77,212 | |||||||
| 5.875% 3/1/18 | 45,000 | 47,221 | |||||||
| Petrohawk Energy | |||||||||
| 7.875% 6/1/15 | 311,000 | 318,386 | |||||||
| # | Petrohawk Energy 144A | ||||||||
| 10.50% 8/1/14 | 113,000 | 125,289 | |||||||
| Petroleum Development | |||||||||
| 12.00% 2/15/18 | 187,000 | 199,155 | |||||||
| Plains All American Pipeline | |||||||||
| 5.75% 1/15/20 | 941,000 | 966,751 | |||||||
| 8.75% 5/1/19 | 950,000 | 1,160,865 | |||||||
| Plains Exploration | |||||||||
| & Production | |||||||||
| 8.625% 10/15/19 | 127,000 | 135,255 | |||||||
| Pride International | |||||||||
| 8.50% 6/15/19 | 1,060,000 | 1,203,100 | |||||||
| Quicksilver Resources | |||||||||
| 7.125% 4/1/16 | 388,000 | 370,540 | |||||||
| Range Resources | |||||||||
| 8.00% 5/15/19 | 312,000 | 334,620 | |||||||
| # | Ras Laffan Liquefied | ||||||||
| Natural Gas III 144A | |||||||||
| 5.832% 9/30/16 | 400,000 | 427,329 | |||||||
| # | Rockies Express Pipeline | ||||||||
| 144A 5.625% 4/15/20 | 970,000 | 956,787 | |||||||
| # | SandRidge Energy 144A | ||||||||
| 8.75% 1/15/20 | 324,000 | 317,520 | |||||||
| 9.875% 5/15/16 | 436,000 | 450,170 | |||||||
| · | TransCanada Pipelines | ||||||||
| 6.35% 5/15/67 | 1,310,000 | 1,248,201 | |||||||
| Weatherford International | |||||||||
| 9.625% 3/1/19 | 1,490,000 | 1,888,382 | |||||||
| # | Woodside Finance 144A | ||||||||
| 4.50% 11/10/14 | 800,000 | 820,494 | |||||||
| 5.00% 11/15/13 | 270,000 | 284,507 | |||||||
| * | 8.125% 3/1/14 | 340,000 | 389,731 | ||||||
| 27,202,325 | |||||||||
| Finance Companies – 1.33% | |||||||||
| # | CDP Financial 144A | ||||||||
| 4.40% 11/25/19 | 1,260,000 | 1,236,845 | |||||||
| 5.60% 11/25/39 | 880,000 | 858,563 | |||||||
| City National Capital Trust I | |||||||||
| 9.625% 2/1/40 | 900,000 | 1,002,569 | |||||||
| FTI Consulting | |||||||||
| 7.625% 6/15/13 | 205,000 | 208,588 | |||||||
| 7.75% 10/1/16 | 5,000 | 5,125 | |||||||
| General Electric Capital | |||||||||
| · | 2.34% 2/2/11 | NOK | 3,500,000 | 581,204 | |||||
| 6.00% 8/7/19 | USD | 2,200,000 | 2,328,838 | ||||||
| 6.75% 3/15/32 | 80,000 | 84,886 | |||||||
| · | General Electric Capital | ||||||||
| Australia Funding | |||||||||
| 4.383% 7/12/13 | AUD | 1,100,000 | 956,554 | ||||||
| 4.41% 8/17/12 | 600,000 | 532,616 | |||||||
| 4.417% 11/15/11 | 500,000 | 448,160 | |||||||
(continues) 49
Statements of net assets
Optimum Fixed Income Fund
| Principal | Value | ||||||||
| Amount° | (U.S. $) | ||||||||
| Corporate Bonds (continued) | |||||||||
| Finance Companies (continued) | |||||||||
| @ | General Electric Capital | ||||||||
| UK Funding | |||||||||
| 4.625% 1/18/16 | GBP | 226,000 | $ | 353,739 | |||||
| ·# | ILFC E-Capital Trust II 144A | ||||||||
| 6.25% 12/21/65 | USD | 405,000 | 315,900 | ||||||
| * | International Lease Finance | ||||||||
| 5.55% 9/5/12 | 198,000 | 192,937 | |||||||
| 6.625% 11/15/13 | 575,000 | 560,071 | |||||||
| Nuveen Investments | |||||||||
| 10.50% 11/15/15 | 449,000 | 437,775 | |||||||
| TNK-BP Finance | |||||||||
| 7.50% 7/18/16 | 263,000 | 288,643 | |||||||
| # | TNK-BP Finance 144A | ||||||||
| 7.25% 2/2/20 | 192,000 | 201,120 | |||||||
| @=‡t# | Twin Reefs Pass | ||||||||
| Through Trust 144A | |||||||||
| 0.449% 12/31/49 | 300,000 | 0 | |||||||
| 10,594,133 | |||||||||
| Insurance – 0.59% | |||||||||
| · | Chubb 6.375% 3/29/67 | 560,000 | 569,100 | ||||||
| FBL Financial Group | |||||||||
| 5.875% 3/15/17 | 720,000 | 588,204 | |||||||
| ·# | MetLife Capital Trust X | ||||||||
| 144A 9.25% 4/8/38 | 1,700,000 | 1,929,501 | |||||||
| # | NLV Financial 144A | ||||||||
| 6.50% 3/15/35 | 385,000 | 299,510 | |||||||
| Prudential Financial | |||||||||
| 3.875% 1/14/15 | 830,000 | 829,335 | |||||||
| ·# | Symetra Financial 144A | ||||||||
| 8.30% 10/15/37 | 515,000 | 463,500 | |||||||
| 4,679,150 | |||||||||
| Natural Gas – 0.44% | |||||||||
| AmeriGas Partners | |||||||||
| 7.125% 5/20/16 | 162,000 | 164,430 | |||||||
| Dynergy Holdings | |||||||||
| 7.75% 6/1/19 | 583,000 | 443,080 | |||||||
| El Paso | |||||||||
| * | 6.875% 6/15/14 | 98,000 | 100,489 | ||||||
| 7.00% 6/15/17 | 270,000 | 276,909 | |||||||
| 7.25% 6/1/18 | 23,000 | 23,849 | |||||||
| 8.25% 2/15/16 | 29,000 | 31,103 | |||||||
| # | El Paso Performance-Linked | ||||||||
| Trust 144A | |||||||||
| 7.75% 7/15/11 | 143,000 | 148,759 | |||||||
| Enterprise Products | |||||||||
| Operating | |||||||||
| · | 8.375% 8/1/66 | 875,000 | 889,205 | ||||||
| 9.75% 1/31/14 | 790,000 | 960,079 | |||||||
| Inergy Finance | |||||||||
| 8.25% 3/1/16 | 126,000 | 130,410 | |||||||
| # | Inergy Finance 144A | ||||||||
| 8.75% 3/1/15 | 35,000 | 36,794 | |||||||
| Regency Energy Partners | |||||||||
| 8.375% 12/15/13 | 109,000 | 113,633 | |||||||
| # | Regency Energy Partners | ||||||||
| 144A 9.375% 6/1/16 | 216,000 | 230,040 | |||||||
| 3,548,780 | |||||||||
| Real Estate – 0.57% | |||||||||
| Developers Diversified Realty | |||||||||
| 5.375% 10/15/12 | 231,000 | 230,877 | |||||||
| 7.50% 4/1/17 | 625,000 | 633,146 | |||||||
| 9.625% 3/15/16 | 165,000 | 184,783 | |||||||
| # | Digital Realty Trust 144A | ||||||||
| 5.875% 2/1/20 | 425,000 | 416,341 | |||||||
| ProLogis | |||||||||
| 6.875% 3/15/20 | 825,000 | 816,329 | |||||||
| 7.375% 10/30/19 | 960,000 | 987,145 | |||||||
| Regency Centers | |||||||||
| 5.875% 6/15/17 | 285,000 | 284,932 | |||||||
| ·# | USB Realty 144A | ||||||||
| 6.091% 12/22/49 | 1,200,000 | 979,500 | |||||||
| 4,533,053 | |||||||||
| Technology – 0.31% | |||||||||
| Broadridge Financial | |||||||||
| Solutions | |||||||||
| 6.125% 6/1/17 | 198,000 | 197,051 | |||||||
| * | Freescale Semiconductor | ||||||||
| 8.875% 12/15/14 | 102,000 | 97,920 | |||||||
| Jabil Circuit | |||||||||
| 7.75% 7/15/16 | 92,000 | 97,290 | |||||||
| National Semiconductor | |||||||||
| 3.95% 4/15/15 | 590,000 | 583,374 | |||||||
| * | Sanmina-SCI | ||||||||
| 8.125% 3/1/16 | 484,000 | 489,445 | |||||||
| SunGard Data Systems | |||||||||
| 9.125% 8/15/13 | 266,000 | 273,980 | |||||||
| * | 10.25% 8/15/15 | 436,000 | 460,525 | ||||||
| # | Unisys 144A | ||||||||
| 12.75% 10/15/14 | 232,000 | 271,730 | |||||||
| 2,471,315 | |||||||||
| Transportation – 0.28% | |||||||||
| # | Ashtead Capital 144A | ||||||||
| 9.00% 8/15/16 | 200,000 | 203,500 | |||||||
| Avis Budget Car Rental | |||||||||
| * | 7.625% 5/15/14 | 255,000 | 253,725 | ||||||
| 7.75% 5/15/16 | 257,000 | 253,145 | |||||||
| Hertz | |||||||||
| 8.875% 1/1/14 | 394,000 | 406,805 | |||||||
| * | 10.50% 1/1/16 | 136,000 | 146,710 | ||||||
| Kansas City Southern de | |||||||||
| Mexico 9.375% 5/1/12 | 225,000 | 231,750 | |||||||
| # | Kansas City Southern | ||||||||
| de Mexico 144A | |||||||||
| 8.00% 2/1/18 | 563,000 | 579,890 | |||||||
50
| Principal | Value | |||||||
| Amount° | (U.S. $) | |||||||
| Corporate Bonds (continued) | ||||||||
| Transportation (continued) | ||||||||
| Kansas City | ||||||||
| Southern Railway | ||||||||
| 13.00% 12/15/13 | USD | 3,000 | $ | 3,585 | ||||
| @‡ | Northwest Airlines | |||||||
| 10.00% 2/1/11 | 65,000 | 553 | ||||||
| # | United Air Lines 144A | |||||||
| 12.00% 11/1/13 | 162,000 | 168,480 | ||||||
| 2,248,143 | ||||||||
| Total Corporate Bonds | ||||||||
| (cost $226,219,868) | 240,246,822 | |||||||
| Municipal Bonds – 0.10% | ||||||||
| Oregon State | ||||||||
| Taxable Pension | ||||||||
| 5.892% 6/1/27 | 65,000 | 66,838 | ||||||
| · | Puerto Rico Sales | |||||||
| Tax Financing | ||||||||
| 5.00% 8/1/39 | 585,000 | 612,314 | ||||||
| Sacramento County, | ||||||||
| California Public | ||||||||
| Finance Authority | ||||||||
| Revenue (Housing Tax | ||||||||
| County Project) Series B | ||||||||
| 5.18% 12/1/13 | ||||||||
| (NATL-RE) (FGIC) | 80,000 | 80,450 | ||||||
| Total Municipal Bonds | ||||||||
| (cost $731,169) | 759,602 | |||||||
| Non-Agency Asset-Backed Securities – 2.96% | ||||||||
| ·# | AH Mortgage | |||||||
| Advance Trust Series | ||||||||
| 2009-ADV3 A1 144A | ||||||||
| 2.179% 10/6/21 | 610,000 | 608,475 | ||||||
| # | Bank of America | |||||||
| Auto Trust 144A | ||||||||
| Series 2009-2A A4 | ||||||||
| 3.03% 10/15/16 | 445,000 | 457,920 | ||||||
| Series 2009-3A A4 | ||||||||
| 2.67% 12/15/16 | 1,170,000 | 1,188,355 | ||||||
| · | Bank of America Credit | |||||||
| Card Trust | ||||||||
| Series 2006-A12 A12 | ||||||||
| 0.25% 3/15/14 | 1,000,000 | 993,239 | ||||||
| Series 2008-A5 A5 | ||||||||
| 1.43% 12/16/13 | 1,245,000 | 1,256,956 | ||||||
| # | Cabela’s Master Credit | |||||||
| Card Trust Series | ||||||||
| 2008-1A A1 144A | ||||||||
| 4.31% 12/16/13 | 715,000 | 727,920 | ||||||
| Capital Auto Receivables | ||||||||
| Asset Trust | ||||||||
| Series 2007-3 A3A | ||||||||
| 5.02% 9/15/11 | 337,466 | 340,848 | ||||||
| Series 2008-1 A3A | ||||||||
| 3.86% 8/15/12 | 463,204 | 471,640 | ||||||
| Capital One Multi-Asset | ||||||||
| Execution Trust | ||||||||
| Series 2007-A7 A7 | ||||||||
| 5.75% 7/15/20 | 1,115,000 | 1,241,223 | ||||||
| Caterpillar Financial | ||||||||
| Asset Trust | ||||||||
| Series 2007-A A3A | ||||||||
| 5.34% 6/25/12 | 60,169 | 60,895 | ||||||
| Series 2008-A A3 | ||||||||
| 4.94% 4/25/14 | 574,793 | 586,461 | ||||||
| Centex Home Equity | ||||||||
| Series 2002-A AF6 | ||||||||
| 5.54% 1/25/32 | 30,835 | 29,162 | ||||||
| Chase Issuance Trust | ||||||||
| Series 2005-A7 A7 | ||||||||
| 4.55% 3/15/13 | 405,000 | 417,541 | ||||||
| Series 2005-A10 A10 | ||||||||
| 4.65% 12/17/12 | 410,000 | 419,214 | ||||||
| Series 2008-A9 A9 | ||||||||
| 4.26% 5/15/13 | 270,000 | 280,391 | ||||||
| · | Citibank Credit Card | |||||||
| Issuance Trust | ||||||||
| Series 2009-A1 A1 | ||||||||
| 1.98% 3/17/14 | 455,000 | 467,494 | ||||||
| # | Citibank Omni Master Trust | |||||||
| Series 2009-A13 A13 | ||||||||
| 144A 5.35% 8/15/18 | 455,000 | 474,884 | ||||||
| Citicorp Residential | ||||||||
| Mortgage Securities | ||||||||
| Series 2006-3 A4 | ||||||||
| 5.703% 11/25/36 | 900,000 | 788,911 | ||||||
| Series 2006-3 A5 | ||||||||
| 5.948% 11/25/36 | 900,000 | 629,055 | ||||||
| CNH Equipment Trust | ||||||||
| Series 2008-A A3 | ||||||||
| 4.12% 5/15/12 | 88,141 | 89,165 | ||||||
| Series 2008-A A4A | ||||||||
| 4.93% 8/15/14 | 390,000 | 408,577 | ||||||
| Series 2008-B A3A | ||||||||
| 4.78% 7/16/12 | 205,758 | 209,340 | ||||||
| Series 2009-C A3 | ||||||||
| 1.85% 12/16/13 | 260,000 | 261,694 | ||||||
| Series 2009-C A4 | ||||||||
| 3.00% 8/17/15 | 775,000 | 784,778 | ||||||
| Series 2010-A A4 | ||||||||
| 2.49% 1/15/16 | 1,185,000 | 1,184,623 | ||||||
| · | Countrywide Asset-Backed | |||||||
| Certificates | ||||||||
| Series 2006-11 1AF6 | ||||||||
| 6.15% 9/25/46 | 1,422,854 | 650,761 | ||||||
| @# | Countrywide Asset-Backed | |||||||
| NIM Certificates Series | ||||||||
| 2004-BC1 Note 144A | ||||||||
| 5.50% 4/25/35 | 26 | 0 | ||||||
| Daimler Chrysler Auto Trust | ||||||||
| Series 2008-B A3A | ||||||||
| 4.71% 9/10/12 | 550,000 | 564,640 | ||||||
(continues) 51
Statements of net assets
Optimum Fixed Income Fund
| Principal | Value | |||||||
| Amount° | (U.S. $) | |||||||
| Non-Agency Asset-Backed Securities (continued) | ||||||||
| Discover Card Master Trust | ||||||||
| Series 2007-A1 A1 | ||||||||
| 5.65% 3/16/20 | USD | 450,000 | $ | 493,006 | ||||
| Series 2008-A4 A4 | ||||||||
| 5.65% 12/15/15 | 620,000 | 680,901 | ||||||
| # | Dunkin Securitization | |||||||
| Series 2006-1 A2 144A | ||||||||
| 5.779% 6/20/31 | 665,000 | 645,776 | ||||||
| # | Ford Credit Auto Lease | |||||||
| Trust Series 2010-A A2 | ||||||||
| 144A 1.04% 3/15/13 | 1,120,000 | 1,120,130 | ||||||
| · | Ford Credit Floorplan | |||||||
| Master Owner Trust | ||||||||
| Series 2009-2 A | ||||||||
| 1.78% 9/15/14 | 385,000 | 385,939 | ||||||
| #Series 2010-1 A 144A | ||||||||
| 1.88% 12/15/14 | 730,000 | 733,331 | ||||||
| General Electric Capital | ||||||||
| Credit Card | ||||||||
| Master Note Trust | ||||||||
| Series 2009-3 A | ||||||||
| 2.54% 9/15/14 | 590,000 | 597,810 | ||||||
| ·# | Golden Credit Card Trust | |||||||
| Series 2008-3 A 144A | ||||||||
| 1.23% 7/15/17 | 550,000 | 552,127 | ||||||
| Harley-Davidson | ||||||||
| Motorcycle Trust | ||||||||
| #Series 2006-1 A2 144A | ||||||||
| 5.04% 10/15/12 | 112,251 | 114,717 | ||||||
| Series 2008-1 A4 | ||||||||
| 4.90% 12/15/13 | 560,000 | 590,268 | ||||||
| Series 2009-4 A3 | ||||||||
| 1.87% 2/15/14 | 200,000 | 201,812 | ||||||
| · | HSI Asset | |||||||
| Securitization Trust | ||||||||
| Series 2006-HE1 2A1 | ||||||||
| 0.296% 10/25/36 | 327,050 | 223,641 | ||||||
| Hyundai Auto | ||||||||
| Receivables Trust | ||||||||
| Series 2007-A A3A | ||||||||
| 5.04% 1/17/12 | 58,679 | 59,454 | ||||||
| Series 2008-A A3 | ||||||||
| 4.93% 12/17/12 | 430,000 | 446,023 | ||||||
| · | MBNA Credit Card Master | |||||||
| Note Trust | ||||||||
| Series 2005-A4 A4 | ||||||||
| 0.27% 11/15/12 | 375,000 | 374,863 | ||||||
| · | Merrill Auto Trust | |||||||
| Securitization | ||||||||
| Series 2007-1 A4 | ||||||||
| 0.29% 12/15/13 | 195,000 | 193,786 | ||||||
| # | Mid-State Trust | |||||||
| Series 2006-1 A 144A | ||||||||
| 5.787% 10/15/40 | 119,885 | 119,218 | ||||||
| # | Securitized Asset-Backed | |||||||
| NIM Trust Series | ||||||||
| 2005-FR4 144A | ||||||||
| 6.00% 1/25/36 | 330,313 | 0 | ||||||
| · | Vanderbilt Mortgage | |||||||
| Finance Series 2001-A | ||||||||
| A4 7.235% 6/7/28 | 97,124 | 99,105 | ||||||
| World Omni Auto | ||||||||
| Receivables Trust | ||||||||
| Series 2008-A A3A | ||||||||
| 3.94% 10/15/12 | 337,187 | 343,844 | ||||||
| Total Non-Agency | ||||||||
| Asset-Backed Securities | ||||||||
| (cost $24,553,500) | 23,569,913 | |||||||
| Non-Agency Collateralized Mortgage Obligations – 17.75% | ||||||||
| · | ARM Trust | |||||||
| Series 2004-5 3A1 | ||||||||
| 4.939% 4/25/35 | 4,567,098 | 3,976,142 | ||||||
| Series 2005-10 3A11 | ||||||||
| 5.394% 1/25/36 | 515,814 | 440,057 | ||||||
| Series 2005-10 3A31 | ||||||||
| 5.394% 1/25/36 | 1,145,000 | 821,199 | ||||||
| Series 2006-2 1A4 | ||||||||
| 5.68% 5/25/36 | 1,440,000 | 899,847 | ||||||
| Bank of America | ||||||||
| Alternative | ||||||||
| Loan Trust | ||||||||
| Series 2003-2 B1 | ||||||||
| 5.75% 4/25/33 | 7,951,293 | 6,226,841 | ||||||
| Series 2004-2 1A1 | ||||||||
| 6.00% 3/25/34 | 50,205 | 48,808 | ||||||
| Series 2004-10 1CB1 | ||||||||
| 6.00% 11/25/34 | 179,255 | 145,589 | ||||||
| Series 2004-11 1CB1 | ||||||||
| 6.00% 12/25/34 | 1,640 | 1,315 | ||||||
| Series 2005-3 2A1 | ||||||||
| 5.50% 4/25/20 | 100,125 | 90,566 | ||||||
| Series 2005-5 2CB1 | ||||||||
| 6.00% 6/25/35 | 265,913 | 189,380 | ||||||
| Series 2005-6 7A1 | ||||||||
| 5.50% 7/25/20 | 317,452 | 295,082 | ||||||
| Series 2005-9 5A1 | ||||||||
| 5.50% 10/25/20 | 288,577 | 268,241 | ||||||
| Bank of America | ||||||||
| Funding Series | ||||||||
| 2006-5 2A10 | ||||||||
| 5.75% 9/25/36 | 1,150,000 | 890,631 | ||||||
| · | Bear Stearns ARM Trust | |||||||
| Series 2007-5 3A1 | ||||||||
| 5.903% 8/25/47 | 2,475,796 | 1,937,609 | ||||||
52
| Principal | Value | |||||||
| Amount° | (U.S. $) | |||||||
| Non-Agency Collateralized Mortgage Obligations (continued) | ||||||||
| Chase Mortgage Finance | ||||||||
| Series 2003-S8 A2 | ||||||||
| 5.00% 9/25/18 | USD | 218,744 | $ | 221,957 | ||||
| ·Series 2005-A1 3A1 | ||||||||
| 5.288% 12/25/35 | 614,815 | 538,748 | ||||||
| · | Chaseflex Trust | |||||||
| Series 2006-1 A4 | ||||||||
| 6.30% 6/25/36 | 420,000 | 287,650 | ||||||
| Citicorp Mortgage | ||||||||
| Securities | ||||||||
| Series 2004-1 1A1 | ||||||||
| 5.25% 1/25/34 | 277,514 | 275,595 | ||||||
| Series 2004-8 1A1 | ||||||||
| 5.50% 10/25/34 | 194,829 | 194,994 | ||||||
| Series 2006-4 3A1 | ||||||||
| 5.50% 8/25/21 | 277,415 | 268,963 | ||||||
| Citigroup Mortgage | ||||||||
| Loan Trust | ||||||||
| Series 2004-NCM2 1CB2 | ||||||||
| 6.75% 8/25/34 | 172,306 | 164,163 | ||||||
| ·Series 2004-UST1 A6 | ||||||||
| 5.073% 8/25/34 | 224,850 | 226,789 | ||||||
| ·Series 2006-AR7 1A4A | ||||||||
| 5.676% 11/25/36 | 2,367,872 | 1,765,242 | ||||||
| Countrywide Alternative | ||||||||
| Loan Trust | ||||||||
| Series 2003-21T1 A2 | ||||||||
| 5.25% 12/25/33 | 434,050 | 434,964 | ||||||
| Series 2004-1T1 A2 | ||||||||
| 5.50% 2/25/34 | 258,808 | 257,017 | ||||||
| Series 2004-14T2 A6 | ||||||||
| 5.50% 8/25/34 | 371,422 | 363,693 | ||||||
| Series 2004-J1 1A1 | ||||||||
| 6.00% 2/25/34 | 10,568 | 10,486 | ||||||
| Series 2004-J2 7A1 | ||||||||
| 6.00% 12/25/33 | 10,210 | 9,824 | ||||||
| Series 2007-5CB 1A2 | ||||||||
| 6.00% 4/25/37 | 10,000,000 | 6,478,820 | ||||||
| Series 2007-9T1 2A2 | ||||||||
| 6.00% 5/25/37 | 8,272,270 | 5,007,374 | ||||||
| ·Series 2007-AL1 A1 | ||||||||
| 0.496% 6/25/37 | 9,765,318 | 3,859,452 | ||||||
| Series 2008-2R 3A1 | ||||||||
| 6.00% 8/25/37 | 4,834,516 | 3,298,047 | ||||||
| t | Countrywide Home Loan | |||||||
| Mortgage Pass | ||||||||
| Through Trust | ||||||||
| ·Series 2003-21 A1 | ||||||||
| 4.051% 5/25/33 | 6,372 | 4,969 | ||||||
| Series 2005-29 A1 | ||||||||
| 5.75% 12/25/35 | 1,447,812 | 1,204,851 | ||||||
| Series 2006-1 A2 | ||||||||
| 6.00% 3/25/36 | 315,489 | 251,617 | ||||||
| @Series 2006-17 A5 | ||||||||
| 6.00% 12/25/36 | 113,186 | 103,132 | ||||||
| ·Series 2006-HYB1 3A1 | ||||||||
| 5.127% 3/20/36 | 421,698 | 256,562 | ||||||
| Series 2007-4 1A1 | ||||||||
| 6.00% 5/25/37 | 5,235,139 | 3,990,157 | ||||||
| ·Series 2007-HY1 1A1 | ||||||||
| 5.603% 4/25/37 | 1,534,899 | 967,079 | ||||||
| Credit Suisse First Boston | ||||||||
| Mortgage Securities | ||||||||
| Series 2003-29 5A1 | ||||||||
| 7.00% 12/25/33 | 8,238 | 8,228 | ||||||
| Series 2004-1 3A1 | ||||||||
| 7.00% 2/25/34 | 4,101 | 3,727 | ||||||
| Credit Suisse Mortgage | ||||||||
| Capital Certificates | ||||||||
| #Series 2005-1R 2A5 | ||||||||
| 144A 5.75% 12/26/35 | 6,433,119 | 3,924,202 | ||||||
| Series 2006-9 3A1 | ||||||||
| 6.00% 11/25/36 | 39,197 | 32,227 | ||||||
| Series 2007-1 5A14 | ||||||||
| 6.00% 2/25/37 | 1,241,755 | 1,017,319 | ||||||
| ·Series 2007-3 4A6 | ||||||||
| 0.496% 4/25/37 | 3,688,152 | 2,956,551 | ||||||
| «·Series 2007-3 4A12 | ||||||||
| 6.504% 4/25/37 | 3,688,152 | 522,151 | ||||||
| Series 2007-3 4A15 | ||||||||
| 5.50% 4/25/37 | 1,089,322 | 845,667 | ||||||
| Series 2007-5 1A11 | ||||||||
| 7.00% 8/25/37 | 6,367,255 | 3,876,067 | ||||||
| Series 2007-5 3A19 | ||||||||
| 6.00% 8/25/37 | 1,708,129 | 1,395,862 | ||||||
| Series 2007-5 10A2 | ||||||||
| 6.00% 4/25/29 | 739,417 | 604,242 | ||||||
| ·# | Deutsche Mortgage | |||||||
| Securities Series | ||||||||
| 2005-WF1 1A3 144A | ||||||||
| 5.173% 6/26/35 | 1,720,000 | 1,414,013 | ||||||
| · | First Horizon Asset Securities | |||||||
| Series 2004-AR5 4A1 | ||||||||
| 5.665% 10/25/34 | 44,751 | 43,429 | ||||||
| Series 2005-AR2 2A1 | ||||||||
| 5.051% 6/25/35 | 479,325 | 398,676 | ||||||
| GMAC Mortgage | ||||||||
| Loan Trust | ||||||||
| Series 2006-J1 A1 | ||||||||
| 5.75% 4/25/36 | 1,056,572 | 921,850 | ||||||
| # | GSMPS Mortgage Loan | |||||||
| Trust 144A | ||||||||
| ·Series 1998-3 A | ||||||||
| 7.75% 9/19/27 | 19,491 | 18,708 | ||||||
| ·Series 1999-3 A | ||||||||
| 8.00% 8/19/29 | 30,013 | 28,894 | ||||||
(continues) 53
Statements of net assets
Optimum Fixed Income Fund
| Principal | Value | |||||||
| Amount° | (U.S. $) | |||||||
| Non-Agency Collateralized Mortgage Obligations (continued) | ||||||||
| # | GSMPS Mortgage Loan | |||||||
| Trust 144A | ||||||||
| Series 2005-RP1 1A3 | ||||||||
| 8.00% 1/25/35 | USD | 287,510 | $ | 270,798 | ||||
| Series 2005-RP1 1A4 | ||||||||
| 8.50% 1/25/35 | 123,114 | 116,073 | ||||||
| Series 2006-RP1 1A2 | ||||||||
| 7.50% 1/25/36 | 319,288 | 296,847 | ||||||
| · | GSR Mortgage Loan Trust | |||||||
| Series 2006-AR1 3A1 | ||||||||
| 5.275% 1/25/36 | 283,437 | 237,112 | ||||||
| Series 2007-AR1 2A1 | ||||||||
| 5.889% 3/25/47 | 2,880,280 | 2,093,003 | ||||||
| Series 2007-AR2 1A1 | ||||||||
| 5.736% 5/25/47 | 923,253 | 660,271 | ||||||
| Series 2007-AR2 2A1 | ||||||||
| 5.412% 5/25/47 | 825,335 | 575,149 | ||||||
| · | Indymac INDA Mortgage | |||||||
| Loan Trust | ||||||||
| Series 2006-AR1 A1 | ||||||||
| 5.849% 8/25/36 | 785,850 | 766,004 | ||||||
| Series 2006-AR3 1A1 | ||||||||
| 5.159% 12/25/36 | 1,789,230 | 1,099,775 | ||||||
| Series 2007-AR1 1A2 | ||||||||
| 5.644% 3/25/37 | 1,819,835 | 1,323,139 | ||||||
| · | JPMorgan Mortgage Trust | |||||||
| Series 2005-A1 4A1 | ||||||||
| 4.771% 2/25/35 | 86,675 | 79,824 | ||||||
| Series 2005-A4 1A1 | ||||||||
| 5.383% 7/25/35 | 260,785 | 234,612 | ||||||
| Series 2006-A2 2A4 | ||||||||
| 5.761% 4/25/36 | 2,025,000 | 1,584,654 | ||||||
| Series 2006-A6 2A4L | ||||||||
| 5.544% 10/25/36 | 1,590,000 | 1,293,895 | ||||||
| Series 2006-A7 2A2 | ||||||||
| 5.75% 1/25/37 | 655,656 | 555,405 | ||||||
| Series 2007-A1 6A1 | ||||||||
| 4.779% 7/25/35 | 1,761,455 | 1,610,876 | ||||||
| Lehman Mortgage Trust | ||||||||
| Series 2005-2 2A3 | ||||||||
| 5.50% 12/25/35 | 182,218 | 164,848 | ||||||
| Series 2007-10 2A2 | ||||||||
| 6.50% 1/25/38 | 6,365,564 | 5,084,494 | ||||||
| MASTR Alternative | ||||||||
| Loans Trust | ||||||||
| Series 2003-6 3A1 | ||||||||
| 8.00% 9/25/33 | 8,023 | 7,945 | ||||||
| Series 2003-9 1A1 | ||||||||
| 5.50% 12/25/18 | 10,621 | 10,617 | ||||||
| Series 2004-3 8A1 | ||||||||
| 7.00% 4/25/34 | 7,955 | 7,229 | ||||||
| Series 2004-5 6A1 | ||||||||
| 7.00% 6/25/34 | 111,161 | 106,576 | ||||||
| · | MASTR ARM Trust | |||||||
| Series 2003-6 1A2 | ||||||||
| 3.825% 12/25/33 | 4,386 | 3,891 | ||||||
| Series 2005-6 7A1 | ||||||||
| 5.332% 6/25/35 | 191,256 | 157,666 | ||||||
| Series 2006-2 4A1 | ||||||||
| 4.981% 2/25/36 | 55,475 | 50,957 | ||||||
| MASTR Asset | ||||||||
| Securitization Trust | ||||||||
| Series 2003-9 2A7 | ||||||||
| 5.50% 10/25/33 | 348,098 | 352,938 | ||||||
| Series 2004-4 2A1 | ||||||||
| 5.00% 4/25/34 | 361,646 | 360,648 | ||||||
| # | MASTR Reperforming | |||||||
| Loan Trust 144A | ||||||||
| Series 2005-1 1A5 | ||||||||
| 8.00% 8/25/34 | 121,749 | 117,031 | ||||||
| Series 2005-2 1A4 | ||||||||
| �� 8.00% 5/25/35 | 368,988 | 354,920 | ||||||
| ·# | MASTR Specialized Loan | |||||||
| Trust Series 2005-2 A2 | ||||||||
| 144A 5.006% 7/25/35 | 179,799 | 158,624 | ||||||
| · | Merrill Lynch | |||||||
| Mortgage Investors | ||||||||
| Series 2005-A5 A2 | ||||||||
| 4.566% 6/25/35 | 460,000 | 410,119 | ||||||
| Series 2005-A9 2A1C | ||||||||
| 5.129% 12/25/35 | 2,435,000 | 1,675,414 | ||||||
| · | Opteum Mortgage | |||||||
| Acceptance Series | ||||||||
| 2006-1 2A1 | ||||||||
| 5.75% 4/25/36 | 5,748,956 | 4,595,706 | ||||||
| Prime Mortgage Trust | ||||||||
| Series 2004-CL1 1A1 | ||||||||
| 6.00% 2/25/34 | 23,066 | 23,577 | ||||||
| Residential Accredit Loans | ||||||||
| Series 2004-QS2 CB | ||||||||
| 5.75% 2/25/34 | 95,036 | 83,840 | ||||||
| Series 2006-QS18 3A1 | ||||||||
| 5.75% 12/25/21 | 1,472,866 | 1,217,062 | ||||||
| Residential Asset | ||||||||
| Mortgage Products | ||||||||
| Series 2004-SL1 A3 | ||||||||
| 7.00% 11/25/31 | 1,572 | 1,578 | ||||||
| Series 2004-SL4 A3 | ||||||||
| 6.50% 7/25/32 | 48,710 | 48,406 | ||||||
| Residential Asset | ||||||||
| Securitization Trust | ||||||||
| Series 2006-A2 A11 | ||||||||
| 6.00% 1/25/46 | 8,000,000 | 5,675,821 | ||||||
| Residential Funding | ||||||||
| Mortgage Securities I | ||||||||
| Series 2004-S9 2A1 | ||||||||
| 4.75% 12/25/19 | 1,327,965 | 1,302,947 | ||||||
| ·Series 2007-SA1 2A2 | ||||||||
| 5.605% 2/25/37 | 1,481,931 | 1,055,876 | ||||||
54
| Principal | Value | |||||||
| Amount° | (U.S. $) | |||||||
| Non-Agency Collateralized Mortgage Obligations (continued) | ||||||||
| · | Sequoia Mortgage Trust | |||||||
| Series 2007-1 4A1 | ||||||||
| 5.669% 9/20/46 | USD | 2,480,566 | $ | 2,023,976 | ||||
| · | Structured ARM Loan Trust | |||||||
| Series 2005-21 6A3 | ||||||||
| 5.40% 11/25/35 | 1,065,000 | 661,107 | ||||||
| Series 2005-22 1A4 | ||||||||
| 5.25% 12/25/35 | 2,120,000 | 785,512 | ||||||
| Series 2006-1 7A4 | ||||||||
| 5.62% 2/25/36 | 1,305,000 | 762,340 | ||||||
| Series 2006-5 5A4 | ||||||||
| 5.498% 6/25/36 | 17,867 | 2,913 | ||||||
| Structured Asset Securities | ||||||||
| ·Series 2002-22H 1A | ||||||||
| 6.94% 11/25/32 | 10,675 | 10,408 | ||||||
| Series 2004-12H 1A | ||||||||
| 6.00% 5/25/34 | 87,981 | 80,310 | ||||||
| Series 2005-6 4A1 | ||||||||
| 5.00% 5/25/35 | 353,356 | 339,774 | ||||||
| t | Washington Mutual | |||||||
| Alternative Mortgage | ||||||||
| Pass Through | ||||||||
| Certificates | ||||||||
| Series 2005-1 5A2 | ||||||||
| 6.00% 3/25/35 | 95,426 | 63,190 | ||||||
| t | Washington Mutual | |||||||
| Mortgage Pass | ||||||||
| Through Certificates | ||||||||
| Series 2004-CB3 1A | ||||||||
| 6.00% 10/25/34 | 163,501 | 157,319 | ||||||
| Series 2004-CB3 4A | ||||||||
| 6.00% 10/25/19 | 67,151 | 67,588 | ||||||
| ·Series 2005-AR16 1A3 | ||||||||
| 5.08% 12/25/35 | 1,225,000 | 924,647 | ||||||
| ·Series 2005-AR18 1A3A | ||||||||
| 5.229% 1/25/36 | 2,200,000 | 1,692,482 | ||||||
| ·Series 2006-AR16 1A1 | ||||||||
| 5.566% 12/25/36 | 1,410,689 | 1,016,487 | ||||||
| ·Series 2006-AR18 2A2 | ||||||||
| 5.476% 1/25/37 | 1,670,000 | 1,057,933 | ||||||
| ·Series 2007-HY1 1A1 | ||||||||
| 5.667% 2/25/37 | 1,018,455 | 737,280 | ||||||
| ·Series 2007-HY1 3A3 | ||||||||
| 5.854% 2/25/37 | 850,000 | 649,535 | ||||||
| ·Series 2007-HY2 1A1 | ||||||||
| 5.558% 12/25/36 | 3,302,468 | 2,308,428 | ||||||
| ·Series 2007-HY3 4A1 | ||||||||
| 5.313% 3/25/37 | 3,063,652 | 2,624,644 | ||||||
| ·Series 2007-HY7 4A1 | ||||||||
| 5.837% 7/25/37 | 2,418,060 | 1,872,896 | ||||||
| Wells Fargo | ||||||||
| Mortgage-Backed | ||||||||
| Securities Trust | ||||||||
| ·Series 2004-E A2 | ||||||||
| 4.50% 5/25/34 | 8,894 | 8,839 | ||||||
| ·Series 2004-T A1 | ||||||||
| 3.228% 9/25/34 | 68,128 | 66,621 | ||||||
| Series 2005-18 1A1 | ||||||||
| 5.50% 1/25/36 | 71,105 | 65,695 | ||||||
| ·Series 2005-AR13 A1 | ||||||||
| 5.304% 5/25/35 | 1,689,000 | 1,585,788 | ||||||
| ·Series 2005-AR16 4A2 | ||||||||
| 4.922% 10/25/35 | 2,140,000 | 1,775,706 | ||||||
| ·Series 2005-AR16 6A4 | ||||||||
| 4.936% 10/25/35 | 845,981 | 324,104 | ||||||
| Series 2006-1 A3 | ||||||||
| 5.00% 3/25/21 | 372,881 | 360,833 | ||||||
| Series 2006-2 3A1 | ||||||||
| 5.75% 3/25/36 | 365,854 | 337,386 | ||||||
| Series 2006-3 A1 | ||||||||
| 5.50% 3/25/36 | 631,200 | 576,027 | ||||||
| Series 2006-3 A11 | ||||||||
| 5.50% 3/25/36 | 308,000 | 291,847 | ||||||
| Series 2006-4 1A8 | ||||||||
| 5.75% 4/25/36 | 26,873 | 25,201 | ||||||
| Series 2006-4 2A3 | ||||||||
| 5.75% 4/25/36 | 156,165 | 56,561 | ||||||
| Series 2006-6 1A3 | ||||||||
| 5.75% 5/25/36 | 774,357 | 708,635 | ||||||
| ·Series 2006-AR5 2A1 | ||||||||
| 5.504% 4/25/36 | 199,661 | 157,197 | ||||||
| ·Series 2006-AR10 5A1 | ||||||||
| 5.497% 7/25/36 | 68,676 | 54,238 | ||||||
| ·Series 2006-AR10 5A6 | ||||||||
| 5.497% 7/25/36 | 1,935,211 | 1,553,324 | ||||||
| ·Series 2006-AR11 A6 | ||||||||
| 5.394% 8/25/36 | 2,330,000 | 1,953,948 | ||||||
| ·Series 2006-AR17 A1 | ||||||||
| 5.224% 10/25/36 | 1,932,495 | 1,452,786 | ||||||
| ·Series 2006-AR19 A1 | ||||||||
| 5.537% 12/25/36 | 802,037 | 699,094 | ||||||
| Series 2007-8 2A6 | ||||||||
| 6.00% 7/25/37 | 220,000 | 166,803 | ||||||
| Series 2007-10 1A18 | ||||||||
| 6.00% 7/25/37 | 10,609,933 | 6,755,152 | ||||||
| Series 2007-10 1A36 | ||||||||
| 6.00% 7/25/37 | 3,913,649 | 3,302,776 | ||||||
| Series 2007-13 A7 | ||||||||
| 6.00% 9/25/37 | 479,117 | 404,464 | ||||||
| Series 2007-13 A9 | ||||||||
| 6.00% 9/25/37 | 747,558 | 293,183 | ||||||
| Total Non-Agency | ||||||||
| Collateralized | ||||||||
| Mortgage Obligations | ||||||||
| (cost $165,006,391) | 141,326,409 | |||||||
(continues) 55
Statements of net assets
Optimum Fixed Income Fund
| Principal | Value | |||||||
| Amount° | (U.S. $) | |||||||
| Regional Authorities – 0.38%Δ | ||||||||
| Canada – 0.38% | ||||||||
| Province of Ontario | ||||||||
| 4.40% 3/8/16 | CAD | 1,427,000 | $ | 1,470,014 | ||||
| Quebec Province | ||||||||
| 4.50% 12/1/19 | USD | 96,000 | 95,891 | |||||
| 5.00% 12/1/15 | CAD | 1,367,000 | 1,451,860 | |||||
| Total Regional Authorities | ||||||||
| (cost $3,002,725) | 3,017,765 | |||||||
| «Senior Secured Loans – 4.39% | ||||||||
| AIG | ||||||||
| Term Tranche Loan 1 | ||||||||
| 6.75% 3/17/15 | USD | 63,462 | 65,326 | |||||
| Term Tranche Loan 2 | ||||||||
| 7.00% 3/7/16 | 46,538 | 47,306 | ||||||
| Allied Security Holdings | ||||||||
| 7.75% 2/23/15 | 1,046,929 | 1,056,090 | ||||||
| Allison Transmission | ||||||||
| Term Tranche Loan B | ||||||||
| 3.002% 8/7/14 | 535,000 | 511,000 | ||||||
| Anchor Glass | ||||||||
| 6.00% 3/2/16 | 485,618 | 485,011 | ||||||
| Aramark | ||||||||
| 2.155% 1/26/14 | 6,869 | 6,744 | ||||||
| Term Tranche Loan B | ||||||||
| 2.155% 1/26/14 | 103,497 | 101,599 | ||||||
| ATI Holdings | ||||||||
| 7.00% 2/18/16 | 370,000 | 361,059 | ||||||
| Avaya Term Tranche Loan | ||||||||
| B2 10.50% 10/27/14 | 49,000 | 49,919 | ||||||
| Avis Budget Car Rental | ||||||||
| 4.25% 4/21/14 | 188,366 | 189,148 | ||||||
| Bausch & Lomb | ||||||||
| Term Tranche Loan B | ||||||||
| 3.501% 4/11/15 | 371,880 | 364,049 | ||||||
| Term Tranche Loan DD | ||||||||
| 3.501% 4/11/15 | 90,189 | 88,290 | ||||||
| BE Aerospace | ||||||||
| 5.75% 7/28/14 | 386,523 | 391,837 | ||||||
| BioMet 3.25% 3/25/15 | 22,598 | 22,280 | ||||||
| Butler Schein Animal Health | ||||||||
| Term Tranche Loan B | ||||||||
| 5.50% 12/31/15 | 164,787 | 166,744 | ||||||
| Calpine 3.124% 3/31/14 | 669,775 | 650,553 | ||||||
| Cengage Learning | ||||||||
| 7.50% 7/3/14 | 137,000 | 139,226 | ||||||
| CF Industries Holdings | ||||||||
| Bridge Loan | ||||||||
| 10.00% 4/5/15 | 335,000 | 335,000 | ||||||
| Term Tranche Loan B | ||||||||
| 5.50% 4/5/15 | 185,000 | 183,150 | ||||||
| Charter Communications | ||||||||
| Operating Term | ||||||||
| Tranche Loan B | ||||||||
| 2.25% 3/6/14 | 453,832 | 438,034 | ||||||
| Community Health Systems | ||||||||
| Term Tranche Loan B | ||||||||
| 7.61% 7/25/14 | 34,650 | 33,838 | ||||||
| Term Tranche Loan DD | ||||||||
| 4.90% 7/25/14 | 677,496 | 660,657 | ||||||
| Dana Holding Term | ||||||||
| Tranche Loan B | ||||||||
| 9.00% 1/30/15 | 1,072,062 | 1,056,818 | ||||||
| Delta Air Lines | ||||||||
| 8.75% 9/16/13 | 879,737 | 894,582 | ||||||
| Discovery Communications | ||||||||
| Holdings Term | ||||||||
| Tranche Loan C | ||||||||
| 5.57% 5/14/14 | 274,307 | 277,308 | ||||||
| Energy Future Holdings | ||||||||
| Term Tranche Loan B2 | ||||||||
| 3.729% 10/10/14 | 1,936,068 | 1,595,165 | ||||||
| First Data Term | ||||||||
| Tranche Loan B2 | ||||||||
| 3.47% 9/24/14 | 1,620,844 | 1,436,781 | ||||||
| Flextronics International | ||||||||
| Term Tranche Loan B | ||||||||
| 2.501% 10/1/12 | 936,492 | 916,301 | ||||||
| Ford Motor Term | ||||||||
| Tranche Loan B | ||||||||
| 3.258% 12/15/13 | 3,130,570 | 3,036,105 | ||||||
| Freescale Semiconductor | ||||||||
| 1.979% 12/1/16 | 470,642 | 443,189 | ||||||
| Graham Packaging Term | ||||||||
| Tranche Loan C | ||||||||
| 6.75% 4/5/14 | 1,189,214 | 1,203,705 | ||||||
| Graphic Packaging | ||||||||
| International Term | ||||||||
| Tranche Loan C | ||||||||
| 3.00% 5/16/14 | 353,537 | 353,074 | ||||||
| Harrah’s Chester Downs | ||||||||
| 12.375% 12/31/16 | 633,625 | 674,844 | ||||||
| Harrah’s Operating Term | ||||||||
| Tranche Loan B | ||||||||
| 9.50% 10/31/16 | 818,450 | 836,542 | ||||||
| HealthSouth Term Tranche | ||||||||
| Loan B2 | ||||||||
| 4.01% 9/10/15 | 136,134 | 136,888 | ||||||
| Huntsman International | ||||||||
| Term Tranche Loan C | ||||||||
| 2.486% 6/23/16 | 64,350 | 62,165 | ||||||
| IMS Health Term Tranche | ||||||||
| Loan B 5.25% 11/9/16 | 95,000 | 95,843 | ||||||
56
| Principal | Value | |||||||
| Amount° | (U.S. $) | |||||||
| «Senior Secured Loans (continued) | ||||||||
| Intelsat | ||||||||
| Term Tranche Loan A3 | ||||||||
| 2.728% 7/3/12 | USD | 72,414 | $ | 71,020 | ||||
| Term Tranche Loan BA | ||||||||
| 5.29% 1/3/14 | 596,227 | 581,771 | ||||||
| Term Tranche Loan BB | ||||||||
| 5.29% 1/3/14 | 596,046 | 581,594 | ||||||
| Term Tranche Loan BC | ||||||||
| 5.29% 1/3/14 | 596,045 | 581,594 | ||||||
| Johnsondiversey Term | ||||||||
| Tranche Loan B | ||||||||
| 5.50% 11/24/15 | 260,000 | 262,763 | ||||||
| Knology 3.783% 6/2/14 | 85,000 | 84,221 | ||||||
| Language Line | ||||||||
| 5.50% 10/14/15 | 210,000 | 211,006 | ||||||
| Level 3 Communications | ||||||||
| Term Tranche Loan B | ||||||||
| 9.62% 3/13/14 | 80,000 | 87,600 | ||||||
| Levi Strauss Term | ||||||||
| Tranche Loan B | ||||||||
| 2.479% 3/27/14 | 100,000 | 93,563 | ||||||
| Lyondell Chemical | ||||||||
| 5.50% 3/14/16 | 400,000 | 404,314 | ||||||
| MacDermid Term | ||||||||
| Tranche Loan B | ||||||||
| 7.36% 4/12/14 | 134,700 | 125,944 | ||||||
| Mediacom Broadband | ||||||||
| Term Tranche Loan D | ||||||||
| 5.50% 3/31/17 | 1,000,000 | 1,008,500 | ||||||
| Nalco Holding | ||||||||
| 4.01% 5/6/16 | 630,000 | 637,481 | ||||||
| Nielsen Finance Term | ||||||||
| Tranche Loan B | ||||||||
| 3.979% 5/9/16 | 200,000 | 196,916 | ||||||
| NTELOS Term Tranche Loan B | ||||||||
| 5.75% 8/7/15 | 179,862 | 181,736 | ||||||
| Nuveen Investments | ||||||||
| 2nd Lien Term | ||||||||
| Tranche Loan | ||||||||
| 12.50% 7/9/15 | 90,000 | 96,638 | ||||||
| Term Tranche Loan B | ||||||||
| 3.102% 11/13/13 | 1,324,046 | 1,218,122 | ||||||
| Pilot Travel Centers Term | ||||||||
| Tranche Loan A | ||||||||
| 5.25% 11/18/12 | 415,000 | 418,113 | ||||||
| Pinnacle Foods Finance | ||||||||
| Term Tranche Loan C | ||||||||
| 7.50% 4/2/14 | 196,305 | 198,912 | ||||||
| PQ 6.73% 7/30/15 | 837,000 | 770,789 | ||||||
| RehabCare Group Term | ||||||||
| Tranche Loan B | ||||||||
| 6.00% 11/3/15 | 1,980,000 | 1,994,850 | ||||||
| Rental Services | ||||||||
| 2nd Lien Term | ||||||||
| Tranche Loan | ||||||||
| 3.817% 10/7/13 | 1,040,000 | 1,006,980 | ||||||
| Revlon Consumer Products | ||||||||
| 6.00% 3/11/15 | 115,000 | 114,066 | ||||||
| Reynolds Consumer Products | ||||||||
| 6.25% 11/5/15 | 510,000 | 516,214 | ||||||
| Rite Aid 9.50% 6/5/15 | 705,000 | 738,780 | ||||||
| Rockwood Specialties | ||||||||
| Group Term | ||||||||
| Tranche Loan H | ||||||||
| 6.00% 5/15/14 | 300,000 | 302,298 | ||||||
| Sinclair Television Group | ||||||||
| Term Tranche Loan B | ||||||||
| 6.50% 10/16/15 | 100,000 | 101,454 | ||||||
| Smurfit-Stone | ||||||||
| Container Enterprises | ||||||||
| 6.75% 1/2/16 | 235,000 | 235,881 | ||||||
| Solutia 4.75% 3/2/17 | 105,000 | 106,173 | ||||||
| SunGard Data Systems | ||||||||
| 6.75% 2/28/14 | 320,480 | 323,684 | ||||||
| Targa Resources | ||||||||
| 6.00% 7/6/16 | 215,000 | 216,410 | ||||||
| TASC Term Tranche Loan B | ||||||||
| 5.75% 12/19/14 | 100,000 | 100,750 | ||||||
| Telepacific 9.50% 8/17/15 | 320,000 | 322,600 | ||||||
| Telesat Canada | ||||||||
| Term Tranche Loan B | ||||||||
| 3.24% 10/31/14 | 51,808 | 51,161 | ||||||
| Term Tranche Loan II | ||||||||
| 3.24% 10/31/14 | 603,192 | 595,655 | ||||||
| Toys R US Term | ||||||||
| Tranche Loan B | ||||||||
| 4.479% 7/19/12 | 60,000 | 60,273 | ||||||
| TWCC Holding | ||||||||
| 5.00% 9/14/15 | 50,000 | 50,645 | ||||||
| Univision Communications | ||||||||
| Term Tranche Loan B | ||||||||
| 2.533% 9/29/14 | 1,088,000 | 972,900 | ||||||
| Total Senior Secured Loans | ||||||||
| (cost $33,460,014) | 34,989,541 | |||||||
| Sovereign Agencies – 0.75%Δ | ||||||||
| Brazil – 0.10% | ||||||||
| # | Banco Nacional de | |||||||
| Desenvolvimento | ||||||||
| Economico e | ||||||||
| Social 144A | ||||||||
| 5.50% 7/12/20 | 390,000 | 388,050 | ||||||
| 6.369% 6/16/18 | 350,000 | 372,750 | ||||||
| 760,800 | ||||||||
| Norway – 0.45% | ||||||||
| Eksportfinans | ||||||||
| 3.00% 11/17/14 | 1,000,000 | 1,004,916 | ||||||
| 5.50% 5/25/16 | 2,340,000 | 2,580,688 | ||||||
| 3,585,604 | ||||||||
(continues) 57
Statements of net assets
Optimum Fixed Income Fund
| Principal | Value | |||||||
| Amount° | (U.S. $) | |||||||
| Sovereign Agencies (continued) | ||||||||
| Republic of Korea – 0.04% | ||||||||
| # | Korea Expressway 144A | |||||||
| 4.50% 3/23/15 | USD | 350,000 | $ | 356,068 | ||||
| 356,068 | ||||||||
| Sweden – 0.16% | ||||||||
| Svensk Exportkredit | ||||||||
| 3.25% 9/16/14 | 1,235,000 | 1,262,995 | ||||||
| 1,262,995 | ||||||||
| Total Sovereign Agencies | ||||||||
| (cost $5,960,193) | 5,965,467 | |||||||
| Sovereign Debt – 3.43%Δ | ||||||||
| Australia – 0.59% | ||||||||
| * | Australian | |||||||
| Government Bond | ||||||||
| 6.25% 4/15/15 | AUD | 4,930,000 | 4,670,002 | |||||
| 4,670,002 | ||||||||
| Colombia – 0.16% | ||||||||
| Republic of Colombia | ||||||||
| 7.375% 9/18/37 | USD | 1,143,000 | 1,285,875 | |||||
| 1,285,875 | ||||||||
| Indonesia – 0.96% | ||||||||
| Indonesia Treasury Bond | ||||||||
| 9.50% 6/15/15 | IDR | 12,120,000,000 | 1,412,143 | |||||
| 10.50% 8/15/30 | 12,120,000,000 | 1,376,735 | ||||||
| 10.75% 5/15/16 | 11,661,000,000 | 1,427,889 | ||||||
| 11.00% 11/15/20 | 17,250,000,000 | 2,154,697 | ||||||
| 12.80% 6/15/21 | 9,000,000,000 | 1,246,329 | ||||||
| 7,617,793 | ||||||||
| Mexico – 0.51% | ||||||||
| Mexican Bonos | ||||||||
| 7.50% 6/3/27 | MXN | 32,177,600 | 2,453,699 | |||||
| 7.75% 12/14/17 | 16,310,000 | 1,346,876 | ||||||
| United Mexican States | ||||||||
| 5.125% 1/15/20 | USD | 304,000 | 308,560 | |||||
| 4,109,135 | ||||||||
| Norway – 0.86% | ||||||||
| Norwegian Government | ||||||||
| 4.50% 5/22/19 | NOK | 12,766,000 | 2,275,412 | |||||
| 5.00% 5/15/15 | 25,050,000 | 4,581,314 | ||||||
| 6,856,726 | ||||||||
| Poland – 0.25% | ||||||||
| Poland Government Bond | ||||||||
| 5.50% 10/25/19 | PLN | 5,710,000 | 2,003,763 | |||||
| 2,003,763 | ||||||||
| Republic of Korea – 0.04% | ||||||||
| Government of | ||||||||
| South Korea | ||||||||
| 4.25% 12/7/21 | EUR | 220,000 | 289,142 | |||||
| 289,142 | ||||||||
| Turkey – 0.06% | ||||||||
| Republic of Turkey | ||||||||
| 6.75% 5/30/40 | USD | 453,000 | 447,338 | |||||
| 447,338 | ||||||||
| Total Sovereign Debt | ||||||||
| (cost $26,398,152) | 27,279,774 | |||||||
| Supranational Banks – 1.11% | ||||||||
| Asian Development Bank | ||||||||
| 6.00% 1/20/15 | AUD | 417,000 | 382,051 | |||||
| European Bank for | ||||||||
| Reconstruction & | ||||||||
| Development | ||||||||
| 9.25% 9/10/12 | BRL | 1,035,000 | 582,248 | |||||
| European Investment Bank | ||||||||
| 6.125% 1/23/17 | AUD | 310,000 | 281,171 | |||||
| 9.00% 12/21/18 | ZAR | 8,200,000 | 1,125,913 | |||||
| ^10.902% 10/22/19 | BRL | 690,000 | 150,867 | |||||
| 11.25% 2/14/13 | 1,400,000 | 823,597 | ||||||
| # | European Investment Bank | |||||||
| 144A 4.00% 5/15/14 | NOK | 1,010,000 | 176,220 | |||||
| International Bank for | ||||||||
| Reconstruction & | ||||||||
| Development | ||||||||
| 5.375% 12/15/14 | NZD | 2,738,000 | 1,956,291 | |||||
| 5.75% 2/17/15 | AUD | 478,000 | 435,306 | |||||
| 5.75% 10/21/19 | 1,480,000 | 1,306,622 | ||||||
| 6.00% 2/15/17 | 530,000 | 479,408 | ||||||
| International Finance | ||||||||
| 5.75% 3/16/15 | 1,278,000 | 1,160,913 | ||||||
| Total Supranational Banks | ||||||||
| (cost $8,487,859) | 8,860,607 | |||||||
| U.S. Treasury Obligations – 5.89% | ||||||||
| U.S. Treasury Bill | ||||||||
| 0.10% 4/15/10 | USD | 3,255,363 | 3,255,195 | |||||
| 0.12% 4/22/10 | 2,604,291 | 2,604,085 | ||||||
| U.S. Treasury Inflation | ||||||||
| Index Notes | ||||||||
| *1.625% 1/15/15 | 3,608,696 | 3,773,906 | ||||||
| ¥2.00% 1/15/14 | 1,770,792 | 1,881,881 | ||||||
| 2.375% 1/15/17 | 1,697,694 | 1,835,235 | ||||||
| U.S. Treasury Notes | ||||||||
| *1.375% 3/15/13 | 11,570,000 | 11,505,821 | ||||||
| 2.50% 3/31/15 | 21,005,000 | 20,952,550 | ||||||
| *3.625% 2/15/20 | 1,152,000 | 1,132,741 | ||||||
| Total U.S. Treasury | ||||||||
| Obligations | ||||||||
| (cost $46,951,908) | 46,941,414 | |||||||
58
| Number of | Value | |||||||||
| Shares | (U.S. $) | |||||||||
| Common Stock – 0.07% | ||||||||||
| † | Alliance HealthCare Services | 26,414 | $ | 148,448 | ||||||
| Blackstone Group | 7,000 | 98,000 | ||||||||
| =† | Century Communications | 1,975,000 | 0 | |||||||
| † | Delta Air Lines | 11 | 160 | |||||||
| † | DIRECTV Class A | 4,300 | 145,383 | |||||||
| † | Flextronics International | 7,200 | 56,448 | |||||||
| † | GeoEye | 1,900 | 56,050 | |||||||
| † | Mirant | 121 | 1,314 | |||||||
| *† | Mobile Mini | 4,903 | 75,947 | |||||||
| ∏=† | PT Holdings | 295 | 3 | |||||||
| Total Common Stock | ||||||||||
| (cost $769,357) | 581,753 | |||||||||
| Convertible Preferred Stock – 0.04% | ||||||||||
| Freeport-McMoRan Copper | ||||||||||
| & Gold 6.75% exercise | ||||||||||
| price $72.91, expiration | ||||||||||
| date 5/1/10 | 2,431 | 281,996 | ||||||||
| Merck 6.00% exercise price | ||||||||||
| $52.85, expiration | ||||||||||
| date 8/13/10 | 98 | 24,647 | ||||||||
| Total Convertible Preferred Stock | ||||||||||
| (cost $272,697) | 306,643 | |||||||||
| Preferred Stock – 0.16% | ||||||||||
| *· | Bank of America 8.125% | 375,000 | 383,093 | |||||||
| · | PNC Funding 8.25% | 875,000 | 914,651 | |||||||
| = | Port Townsend | 59 | 0 | |||||||
| Total Preferred Stock | ||||||||||
| (cost $1,206,517) | 1,297,744 | |||||||||
| Warrant – 0.00% | ||||||||||
| =† | Port Townsend | 59 | 1 | |||||||
| Total Warrant (cost $1,416) | 1 | |||||||||
| Principal | ||||||||||
| Amount° | ||||||||||
| ≠Discount Notes – 8.99% | ||||||||||
| Federal Home Loan Bank | ||||||||||
| 0.001% 4/1/10 | USD | 52,085,817 | 52,085,817 | |||||||
| 0.01% 4/5/10 | 19,532,181 | 19,532,167 | ||||||||
| Total Discount Notes | ||||||||||
| (cost $71,617,984) | 71,617,984 | |||||||||
| Total Value of Securities | ||||||||||
| Before Securities | ||||||||||
| Lending Collateral – 103.28% | ||||||||||
| (cost $818,162,519) | 822,482,401 | |||||||||
| Number of | ||||||||||
| Shares | ||||||||||
| Securities Lending Collateral** – 5.10% | ||||||||||
| Investment Companies | ||||||||||
| Mellon GSL DBT II | ||||||||||
| Collateral Fund | 34,969,694 | 34,969,694 | ||||||||
| BNY Mellon SL DBT II | ||||||||||
| Liquidating Fund | 5,615,938 | 5,559,779 | ||||||||
| @† | Mellon GSL Reinvestment Trust II | 1,262,112 | 53,640 | |||||||
| Total Securities Lending Collateral | ||||||||||
| (cost $41,847,744) | 40,583,113 | |||||||||
| Total Value of Securities – 108.38% | ||||||||||
| (cost $860,010,263) | 863,065,514 | © | ||||||||
| Obligation to Return Securities | ||||||||||
| Lending Collateral** – (5.25%) | (41,847,744 | ) | ||||||||
| Liabilities Net of Receivables | ||||||||||
| and Other Assets – (3.13%) | (24,914,664 | ) | ||||||||
| Net Assets Applicable to | ||||||||||
| 85,747,704 Shares | ||||||||||
| Outstanding – 100.00% | $ | 796,303,106 | ||||||||
| Net Asset Value – Optimum Fixed Income Fund | ||||||||||
| Class A ($40,808,614 / 4,394,134 Shares) | $9.29 | |||||||||
| Net Asset Value – Optimum Fixed Income Fund | ||||||||||
| Class B ($5,586,931 / 601,984 Shares) | $9.28 | |||||||||
| Net Asset Value – Optimum Fixed Income Fund | ||||||||||
| Class C ($170,213,786 / 18,340,049 Shares) | $9.28 | |||||||||
| Net Asset Value – Optimum Fixed Income Fund | ||||||||||
| Institutional Class ($579,693,775 / 62,411,537 Shares) | $9.29 | |||||||||
| Components of Net Assets at March 31, 2010: | ||||||||||
| Shares of beneficial interest | ||||||||||
| (unlimited authorization – no par) | $ | 794,681,037 | ||||||||
| Undistributed net investment income | 15,471,348 | |||||||||
| Accumulated net realized loss on investments | (16,857,475 | ) | ||||||||
| Net unrealized appreciation of investments and | ||||||||||
| foreign currencies | 3,008,196 | |||||||||
| Total net assets | $ | 796,303,106 | ||||||||
(continues) 59
Statements of net assets
Optimum Fixed Income Fund
AUD — Australian Dollar
BRL — Brazilian Real
CAD — Canadian Dollar
CLP — Chilean Peso
EUR — European Monetary Unit
GBP — British Pound Sterling
IDR — Indonesia Rupiah
ILS — Israeli Shekel
INR — Indian Rupee
KRW — South Korean Won
MXN — Mexican Peso
MYR — Malaysian Ringgit
NOK — Norwegian Kroner
NZD — New Zealand Dollar
PLN — Polish Zloty
SGD — Singapore Dollar
TWD — Taiwan Dollar
USD — United States Dollar
ZAR — South African Rand
| · | Variable rate security. The rate shown is the rate as of March 31, 2010. |
| « | Interest only security. An interest only security is the interest only portion of a fixed income security which is separated and sold individually from the principal portion of the security. |
| t | Pass Through Agreement. Security represents the contractual right to receive a proportionate amount of underlying payments due to the counterparty pursuant to various agreements related to the rescheduling of obligations and the exchange of certain notes. |
| # | Security exempt from registration under Rule 144A of the Securities Act of 1933, as amended. At March 31, 2010, the aggregate amount of Rule 144A securities was $87,507,686, which represented 10.99% of the Fund’s net assets. See Note 9 in “Notes to financial statements.” |
| @ | Illiquid security. At March 31, 2010, the aggregate amount of illiquid securities was $2,361,742, which represented 0.30% of the Fund’s net assets. See Note 9 in “Notes to financial statements.” |
| * | Fully or partially on loan. |
| Φ | Step coupon bond. Coupon decreases periodically based on a predetermined schedule. Stated rate in effect at March 31, 2010. |
| = | Security is being fair valued in accordance with the Fund’s fair valuation policy. At March 31, 2010, the aggregate amount of fair valued securities was $62,695, which represented 0.01% of the Fund’s net assets. See Note 1 in “Notes to financial statements.” |
| Ω | Step coupon bond. Indicates security that has a zero coupon that remains in effect until a predetermined date at which time the stated interest rate becomes effective. |
| ‡ | Non-income producing security. Security is currently in default. |
| « | Senior Secured Loans generally pay interest at rates which are periodically redetermined by reference to a base lending rate plus a premium. These base lending rates are generally: (i) the prime rate offered by one or more United States banks, (ii) the lending rate offered by one or more European banks such as the London Inter-Bank Offered Rate (LIBOR), and (iii) the certificate of deposit rate. Senior Secured Loans may be subject to restrictions on resale. Stated rate in effect at March 31, 2010. |
| Δ | Securities have been classified by country of origin. |
| ¥ | Fully or partially pledged as collateral for financial futures contracts. |
| ^ | Zero coupon security. The rate shown is the yield at the time of purchase. |
| † | Non income producing security. |
| ∏ | Restricted Security. These investments are in securities not registered under the Securities Act of 1933, as amended and have certain restrictions on resale which may limit their liquidity. At March 31, 2010, the aggregate amount of restricted securities was $3 or 0.00% of the Fund’s net assets. See Note 9 in “Notes to financial statements.” |
| ≠ | The rate shown is the effective yield at the time of purchase. |
| ** | See Note 8 in “Notes to financial statements.” |
| © | Includes $44,267,956 of securities loaned. |
Summary of Abbreviations:
ARM — Adjustable Rate Mortgage
CDS — Credit Default Swap
FGIC — Insured by the Financial Guaranty Insurance Company
GNMA — Government National Mortgage Association
GSMPS — Goldman Sachs Reperforming Mortgage Securities
MASTR — Mortgage Asset Securitization Transactions, Inc.
NATL-RE — Insured by the National Public Finance Guarantee Corporation
NIM — Net Interest Margin
PIK — Pay-in-kind
REIT — Real Estate Investment Trust
REMIC — Real Estate Mortgage Investment Conduit
S.F. — Single Family
TBA — To be announced
yr — Year
| Net Asset Value and Offering Price Per Share — | ||
| Optimum Fixed Income Fund | ||
| Net asset value Class A (A) | $ | 9.29 |
| Sales charge (4.50% of offering price) (B) | 0.44 | |
| Offering price | $ | 9.73 |
| (A) | Net asset value per share, as illustrated, is the amount which would be paid upon redemption or repurchase of shares. | |
| (B) | See the current prospectus for purchases of $100,000 or more. | |
60
| 1 | The following foreign currency exchange contracts, futures contracts and swap contracts were outstanding at March 31, 2010: | |||||||||||||
Foreign Currency Exchange Contracts
| Unrealized | ||||||||||||||||
| Contracts to | Settlement | Appreciation | ||||||||||||||
| Receive (Deliver) | In Exchange For | Date | (Depreciation) | |||||||||||||
| AUD | (173,958 | ) | USD | 157,693 | 4/30/10 | $ | (1,403 | ) | ||||||||
| AUD | 1,194,953 | USD | (1,085,567 | ) | 4/30/10 | 7,299 | ||||||||||
| BRL | 3,800,000 | USD | (2,094,713 | ) | 4/30/10 | 28,429 | ||||||||||
| BRL | 5,041,305 | USD | (2,769,948 | ) | 4/30/10 | 46,738 | ||||||||||
| CAD | 1,075,256 | USD | (1,051,184 | ) | 4/30/10 | 7,654 | ||||||||||
| CAD | 2,281,026 | USD | (2,232,011 | ) | 4/30/10 | 14,185 | ||||||||||
| CAD | 1,707,502 | USD | (1,668,633 | ) | 4/30/10 | 12,797 | ||||||||||
| CLP | 43,023,075 | USD | (80,719 | ) | 4/30/10 | 1,410 | ||||||||||
| EUR | (204,921 | ) | USD | 276,241 | 4/30/10 | (563 | ) | |||||||||
| EUR | (1,839,071 | ) | USD | 2,488,000 | 4/30/10 | 3,803 | ||||||||||
| GBP | (226,290 | ) | USD | 337,104 | 4/30/10 | (6,262 | ) | |||||||||
| GBP | (1,588,616 | ) | USD | 2,386,371 | 4/30/10 | (24,154 | ) | |||||||||
| IDR | 5,191,256,000 | USD | (567,041 | ) | 4/30/10 | 962 | ||||||||||
| ILS | 3,077,893 | USD | (821,681 | ) | 4/30/10 | 10,914 | ||||||||||
| INR | 149,048,783 | USD | (3,202,000 | ) | 10/20/10 | 63,911 | ||||||||||
| KRW | 5,208,294,850 | USD | (4,558,284 | ) | 4/30/10 | 39,434 | ||||||||||
| KRW | 1,262,407,050 | USD | (1,105,629 | ) | 4/30/10 | 8,784 | ||||||||||
| MYR | 12,681,127 | USD | (3,796,745 | ) | 4/30/10 | 88,643 | ||||||||||
| MYR | 3,492,011 | USD | (1,046,295 | ) | 4/30/10 | 23,626 | ||||||||||
| NOK | (1,146,119 | ) | USD | 191,681 | 4/30/10 | (921 | ) | |||||||||
| NOK | (2,066,099 | ) | USD | 346,045 | 4/30/10 | (1,157 | ) | |||||||||
| NOK | 6,209,468 | USD | (1,041,027 | ) | 4/30/10 | 2,456 | ||||||||||
| NZD | (2,810,358 | ) | USD | 1,970,061 | 4/30/10 | (21,859 | ) | |||||||||
| PLN | 4,495,838 | USD | (1,540,990 | ) | 4/30/10 | 28,896 | ||||||||||
| PLN | (3,504,662 | ) | USD | 1,205,014 | 4/30/10 | (18,767 | ) | |||||||||
| SGD | 3,084,002 | USD | (2,197,209 | ) | 4/30/10 | 7,047 | ||||||||||
| SGD | 1,444,087 | USD | (1,028,816 | ) | 4/30/10 | 3,329 | ||||||||||
| TWD | 70,212,950 | USD | (2,212,477 | ) | 4/30/10 | (35 | ) | |||||||||
| TWD | 32,761,575 | USD | (1,031,536 | ) | 4/30/10 | 796 | ||||||||||
| ZAR | (9,167,917 | ) | USD | 1,230,692 | 4/30/10 | (20,218 | ) | |||||||||
| $ | 305,774 | |||||||||||||||
Futures Contracts
| Notional | Notional | Expiration | Unrealized | |||||||||||||
| Contracts to Buy | Cost | Value | Date | Appreciation | ||||||||||||
| 33 U.S. Treasury | ||||||||||||||||
| 5 yr Notes | $ | 3,788,705 | $ | 3,789,844 | 6/30/10 | $ | 1,139 | |||||||||
Swap Contracts
CDS Contracts
CDS Contracts
| Annual | Unrealized | ||||||||||||
| Counterparty & | Notional | Protection | Termination | Appreciation | |||||||||
| Referenced Obligation | Value | Payments | Date | (Depreciation) | |||||||||
| Protection Purchased: | |||||||||||||
| Barclays | |||||||||||||
| ITRAXX Europe | |||||||||||||
| Subordinate | |||||||||||||
| Financials 12.1 | |||||||||||||
| 5 yr CDS | $ | 3,800,000 | 1.00% | 12/20/14 | $ | (69,683 | ) | ||||||
| Kingdom of Spain | |||||||||||||
| 5 yr CDS | 580,000 | 1.00% | 3/20/15 | (7,509 | ) | ||||||||
| 5 yr CDS | 2,600,000 | 1.00% | 3/20/15 | (19,813 | ) | ||||||||
| JPMorgan Securities | |||||||||||||
| Donnelley (R.R.) | |||||||||||||
| & Sons | |||||||||||||
| 5 yr CDS | 2,000,000 | 5.00% | 6/20/14 | (331,299 | ) | ||||||||
| Penney (J.C.) | |||||||||||||
| 5 yr CDS | 895,000 | 1.00% | 3/20/15 | 3,692 | |||||||||
| 5 yr CDS | 540,000 | 1.00% | 3/20/15 | 3,914 | |||||||||
| 5 yr CDS | 360,000 | 1.00% | 3/20/15 | 988 | |||||||||
| Portuguese | |||||||||||||
| Republic | |||||||||||||
| 5 yr CDS | 1,648,000 | 1.00% | 6/20/15 | (416 | ) | ||||||||
| Sunoco 5 yr CDS | 630,000 | 1.00% | 3/20/15 | 20,825 | |||||||||
| $ | 13,053,000 | $ | (399,301 | ) | |||||||||
| Protection Sold: | |||||||||||||
| Citigroup Global | |||||||||||||
| Markets | |||||||||||||
| MetLife 5 yr CDS | $ | 350,000 | 5.00% | 9/20/14 | $ | 18,290 | |||||||
| JPMorgan Securities | |||||||||||||
| Macy’s | |||||||||||||
| 5 yr CDS | 895,000 | 1.00% | 3/20/15 | 6,953 | |||||||||
5 yr CDS | 540,000 | 1.00% | 3/20/15 | (1,113 | ) | ||||||||
| 5 yr CDS | 360,000 | 1.00% | 3/20/15 | 3,148 | |||||||||
| Valero Energy | |||||||||||||
| 5 yr CDS | 630,000 | 1.00% | 3/20/15 | (9,183 | ) | ||||||||
| $ | 2,775,000 | $ | 18,095 | ||||||||||
| Total | $ | (381,206 | ) | ||||||||||
The use of foreign currency exchange contracts, futures contracts and swap contracts involves elements of market risk and risks in excess of the amounts recognized in the financial statements. The notional values presented above represent the Fund’s total exposure in such contracts, whereas only the net unrealized appreciation (depreciation) is reflected in the Fund’s net assets.
1See Note 7 in “Notes to financial statements.”
See accompanying notes
(continues) 61
Statements of net assets
Optimum International Fund
March 31, 2010
| Number of | Value | ||||||
| Shares | (U.S. $) | ||||||
| Common Stock – 96.31%Δ | |||||||
| Australia – 5.00% | |||||||
| Amcor | 217,942 | $ | 1,277,825 | ||||
| Australia & New Zealand | |||||||
| Banking Group | 27,800 | 646,880 | |||||
| * | BHP Billiton ADR | 9,900 | 795,168 | ||||
| Commonwealth Bank of Australia | 12,100 | 624,952 | |||||
| CSL | 5,900 | 197,215 | |||||
| Foster’s Group | 291,121 | 1,413,055 | |||||
| National Australia Bank | 21,200 | 535,321 | |||||
| QBE Insurance Group | 73,416 | 1,403,168 | |||||
| Telstra | 730,823 | 2,004,994 | |||||
| Wesfarmers | 44,067 | 1,285,386 | |||||
| 10,183,964 | |||||||
| Belgium – 0.57% | |||||||
| Anheuser-Busch InBev | 16,300 | 821,132 | |||||
| Fortis | 93,313 | 332,248 | |||||
| t† | Fortis Strip VVPR | 48,482 | 131 | ||||
| 1,153,511 | |||||||
| Bermuda – 0.28% | |||||||
| † | Arch Capital Group | 5,000 | 381,250 | ||||
| Catlin Group | 33,639 | 183,635 | |||||
| 564,885 | |||||||
| Brazil – 1.46% | |||||||
| * | Banco Santander Brasil ADR | 19,700 | 244,871 | ||||
| BM&F Bovespa | 38,300 | 257,092 | |||||
| * | Cemig ADR | 32,050 | 533,311 | ||||
| AmBev ADR | 4,800 | 439,968 | |||||
| † | Hypermarcas | 43,600 | 531,902 | ||||
| † | Sid Nacional ADR | 11,500 | 459,195 | ||||
| Vale ADR | 16,000 | 515,040 | |||||
| 2,981,379 | |||||||
| Canada – 4.62% | |||||||
| Canadian National Railway | 10,500 | 637,341 | |||||
| Canadian Natural Resources | 9,200 | 681,008 | |||||
| Canadian Pacific Railway | 17,500 | 986,411 | |||||
| † | Eldorado Gold | 92,000 | 1,117,046 | ||||
| Enbridge | 21,000 | 1,001,713 | |||||
| EnCana | 20,100 | 623,703 | |||||
| † | Magna International Class A | 9,900 | 612,315 | ||||
| † | Pacific Rubiales Energy | 29,800 | 578,980 | ||||
| Pan American Silver | 34,700 | 803,305 | |||||
| Potash Corp. of Saskatchewan | 5,600 | 668,360 | |||||
| Toronto-Dominion Bank | 9,200 | 685,810 | |||||
| * | TransCanada | 27,800 | 1,018,923 | ||||
| 9,414,915 | |||||||
| nChina – 3.51% | |||||||
| Cheung Kong Holdings | 70,000 | 901,567 | |||||
| * | China Construction Bank Class H | 678,500 | 555,786 | ||||
| China Life Insurance Class H | 101,500 | 486,306 | |||||
| China Mobile | 50,800 | 488,748 | |||||
| *† | Focus Media Holding ADR | 26,600 | 485,716 | ||||
| Hang Seng Bank | 20,800 | 289,862 | |||||
| † | Hidili Industry International | ||||||
| Development | 501,800 | 546,120 | |||||
| Hong Kong Electric Holdings | 172,500 | 1,023,102 | |||||
| * | Industrial & Commercial Bank of | ||||||
| China Series H | 759,600 | 579,171 | |||||
| Jardine Matheson Holdings | 15,200 | 506,160 | |||||
| New World Development | 289,900 | 567,535 | |||||
| REXLot Holdings | 3,089,400 | 441,670 | |||||
| Wing Hang Bank | 31,900 | 291,709 | |||||
| 7,163,452 | |||||||
| Denmark – 1.00% | |||||||
| *† | A.P. Moller - Maersk | 60 | 457,242 | ||||
| FLSmidth | 16,000 | 1,110,156 | |||||
| TrygVesta | 7,300 | 481,872 | |||||
| 2,049,270 | |||||||
| Finland – 0.67% | |||||||
| * | Fortum | 27,100 | 662,922 | ||||
| * | UPM-Kymmene | 52,336 | 694,558 | ||||
| 1,357,480 | |||||||
| France – 8.51% | |||||||
| * | AXA | 20,100 | 447,162 | ||||
| * | BNP Paribas | 3,500 | 268,813 | ||||
| Cap Gemini | 11,400 | 561,585 | |||||
| * | Carrefour | 43,433 | 2,093,536 | ||||
| * | Compagnie de Saint-Gobain | 35,772 | 1,720,157 | ||||
| *† | Eramet | 3,100 | 1,067,140 | ||||
| France Telecom | 78,700 | 1,883,176 | |||||
| † | GDF Suez | 8,820 | 12 | ||||
| * | GDF Suez | 22,200 | 857,618 | ||||
| † | Renault | 10,300 | 482,772 | ||||
| * | Sanofi-Aventis | 10,504 | 783,051 | ||||
| * | Societe Generale | 23,771 | 1,495,141 | ||||
| *† | Total | 67,777 | 3,934,809 | ||||
| Unibail-Rodamco | 2,800 | 567,315 | |||||
| * | Vinci | 8,823 | 520,027 | ||||
| † | Vivendi | 24,300 | 650,392 | ||||
| 17,332,706 | |||||||
| Germany – 5.82% | |||||||
| † | Allianz | 3,000 | 376,657 | ||||
| Bayerische Motoren Werke | 10,900 | 503,901 | |||||
| * | Deutsche Boerse | 3,500 | 259,310 | ||||
| Deutsche Lufthansa | 70,100 | 1,160,396 | |||||
| * | Deutsche Telekom | 170,213 | 2,315,246 | ||||
| Fresenius Medical Care | 18,400 | 1,038,267 | |||||
| Gerry Weber International | 13,904 | 483,888 | |||||
| * | Merck | 7,900 | 640,255 | ||||
62
| Number of | Value | ||||
| Shares | (U.S. $) | ||||
| Common Stock (continued) | |||||
| Germany (continued) | |||||
| RWE | 39,103 | $ | 3,473,865 | ||
| Siemens | 12,800 | 1,283,753 | |||
| Software | 2,700 | 320,282 | |||
| 11,855,820 | |||||
| Gilbraltar – 0.12% | |||||
| † | PartyGaming | 51,000 | 247,758 | ||
| 247,758 | |||||
| India – 0.33% | |||||
| Sterlite Industries India ADR | 35,900 | 668,099 | |||
| 668,099 | |||||
| Indonesia – 0.21% | |||||
| Adaro Energy | 1,955,200 | 421,583 | |||
| 421,583 | |||||
| Ireland – 0.31% | |||||
| Covidien | 12,600 | 633,528 | |||
| 633,528 | |||||
| Israel – 0.33% | |||||
| Teva Pharmaceutical Industries ADR | 10,600 | 668,648 | |||
| 668,648 | |||||
| Italy – 2.35% | |||||
| † | Assicurazioni Generali | 1 | 24 | ||
| *† | Benetton Group | 39,500 | 327,597 | ||
| Enel | 105,300 | 588,849 | |||
| * | ENI | 30,100 | 706,222 | ||
| Fondiaria - Sai | 9,100 | 136,931 | |||
| † | Intesa Sanpaolo | 432,425 | 1,610,649 | ||
| Parmalat | 173,800 | 475,977 | |||
| † | UBI Banca | 21,200 | 286,073 | ||
| *† | UniCredit | 223,343 | 659,926 | ||
| 4,792,248 | |||||
| Japan – 17.47% | |||||
| * | Air Water | 42,800 | 489,849 | ||
| Amada | 106,100 | 889,747 | |||
| * | Asahi Breweries | 23,900 | 448,141 | ||
| * | Astellas Pharma | 45,200 | 1,636,560 | ||
| Bridgestone | 28,700 | 489,948 | |||
| Canon | 63,500 | 2,941,010 | |||
| Chiba Bank | 55,100 | 329,457 | |||
| DA Office Investment | 40 | 85,442 | |||
| Fujitsu | 96,500 | 631,704 | |||
| * | Hitachi High-Technologies | 21,700 | 497,877 | ||
| Honda Motor | 37,000 | 1,306,022 | |||
| * | HOYA | 25,500 | 700,711 | ||
| * | ITOCHU | 97,900 | 857,633 | ||
| Japan Prime Realty Investment | 100 | 222,591 | |||
| * | Japan Tobacco | 220 | 818,911 | ||
| Kamigumi | 54,000 | 434,357 | |||
| Kao | 84,900 | 2,152,241 | |||
| KDDI | 338 | 1,749,834 | |||
| Konica Minolta Holdings | 56,100 | 654,670 | |||
| Marubeni | 153,900 | 956,422 | |||
| * | Matsui Securities | 33,500 | 239,363 | ||
| * | Mitsubishi Heavy Industries | 179,500 | 743,037 | ||
| Mitsubishi UFJ Financial Group | 113,500 | 594,876 | |||
| * | Mitsui | 52,900 | 888,928 | ||
| * | Mizuho Securities | 124,000 | 392,598 | ||
| * | Nikon | 33,100 | 722,613 | ||
| * | Nitto Denko | 16,200 | 629,008 | ||
| * | Nomura Holdings | 82,900 | 610,954 | ||
| * | NSK | 136,000 | 1,073,569 | ||
| NTT Data | 100 | 333,191 | |||
| Panasonic | 36,600 | 559,825 | |||
| Sekisui House | 58,000 | 579,442 | |||
| * | Seven & I Holdings | 82,700 | 1,998,281 | ||
| * | Sumitomo Mitsui Financial Group | 8,000 | 264,413 | ||
| * | Takeda Pharmaceutical | 52,700 | 2,319,612 | ||
| Tokio Marine Holdings | 68,900 | 1,940,461 | |||
| * | Toyota Motor | 31,300 | 1,253,808 | ||
| West Japan Railway | 294 | 1,012,600 | |||
| * | Zeon | 196,700 | 1,148,767 | ||
| 35,598,473 | |||||
| Luxembourg – 0.49% | |||||
| ArcelorMittal | 22,800 | 1,000,598 | |||
| 1,000,598 | |||||
| Malaysia – 0.62% | |||||
| AMMB Holdings | 318,500 | 488,729 | |||
| CIMB Group Holdings | 181,500 | 783,161 | |||
| 1,271,890 | |||||
| Mexico – 0.39% | |||||
| Fomento Economico Mexicano ADR | 13,200 | 627,396 | |||
| Grupo Mexico Class B | 62,800 | 168,837 | |||
| 796,233 | |||||
| Netherlands – 1.89% | |||||
| † | Aegon | 99,600 | 682,091 | ||
| † | Corio | 2,300 | 153,581 | ||
| † | ING Groep CVA | 109,531 | 1,093,639 | ||
| Koninklijke | 36,200 | 573,564 | |||
| † | Reed Elsevier | 101,220 | 1,230,232 | ||
| † | Wereldhave | 1,300 | 124,604 | ||
| 3,857,711 | |||||
| New Zealand – 0.45% | |||||
| Telecom Corp. of New Zealand | 589,903 | 909,119 | |||
| 909,119 | |||||
| Norway – 0.25% | |||||
| Statoil | 22,100 | 511,726 | |||
| 511,726 | |||||
(continues) 63
Statements of net assets
Optimum International Fund
| Number of | Value | ||||
| Shares | (U.S. $) | ||||
| Common Stock (continued) | |||||
| Philippines – 0.23% | |||||
| Philippine Long Distance | |||||
| Telephone ADR | 9,000 | $ | 479,520 | ||
| 479,520 | |||||
| Republic of Korea – 1.76% | |||||
| † | Hynix Semiconductor | 30,800 | 726,820 | ||
| Hyosung | 8,594 | 616,760 | |||
| Korea Electric Power | 17,700 | 571,775 | |||
| Korea Zinc | 2,900 | 517,743 | |||
| Korean Air Lines | 1,530 | 89,924 | |||
| Samsung Electronics | 1,460 | 1,055,568 | |||
| 3,578,590 | |||||
| Russia – 0.21% | |||||
| Vimpel-Communications ADR | 23,000 | 423,430 | |||
| 423,430 | |||||
| Singapore – 2.67% | |||||
| CapitaLand | 113,200 | 321,255 | |||
| DBS Group Holdings | 45,000 | 460,004 | |||
| Oversea-Chinese Banking | 121,790 | 758,304 | |||
| Singapore Telecommunications | 773,100 | 1,751,896 | |||
| Straits Asia Resources | 251,900 | 388,951 | |||
| United Overseas Bank | 74,000 | 1,016,713 | |||
| * | Wilmar International | 153,900 | 737,101 | ||
| 5,434,224 | |||||
| South Africa – 0.83% | |||||
| MTN Group | 29,200 | 448,615 | |||
| Naspers | 12,200 | 529,671 | |||
| Sasol | 17,119 | 710,896 | |||
| 1,689,182 | |||||
| Spain – 3.76% | |||||
| Banco Bilbao Vizcaya Argentaria | 2 | 28 | |||
| Banco Santander | 158,610 | 2,108,146 | |||
| Iberdrola | 265,987 | 2,254,494 | |||
| * | Inditex | 8,000 | 527,387 | ||
| * | Telefonica | 116,897 | 2,769,542 | ||
| 7,659,597 | |||||
| Sweden – 0.92% | |||||
| Atlas Copco Class A | 34,700 | 538,309 | |||
| * | Nordea Bank | 57,200 | 564,501 | ||
| Svenska Cellulosa Class B | 54,900 | 774,112 | |||
| 1,876,922 | |||||
| Switzerland – 8.19% | |||||
| * | Adecco | 20,700 | 1,175,032 | ||
| Alcon | 4,000 | 646,240 | |||
| * | Clariant | 87,600 | 1,114,161 | ||
| Credit Suisse Group | 11,700 | 603,116 | |||
| * | GAM Holding | 10,800 | 132,650 | ||
| Givaudan | 700 | 614,122 | |||
| * | Julius Baer Group | 19,200 | 696,543 | ||
| * | Nestle | 25,200 | 1,290,654 | ||
| * | Novartis | 88,077 | 4,757,420 | ||
| Roche Holding | 7,300 | 1,183,952 | |||
| Sonova Holding | 5,200 | 646,085 | |||
| Swiss Reinsurance | 10,200 | 502,091 | |||
| Tyco Electronics | 26,500 | 728,220 | |||
| * | UBS | 27,300 | 443,801 | ||
| Zurich Financial Services | 8,367 | 2,145,019 | |||
| 16,679,106 | |||||
| Taiwan – 2.91% | |||||
| * | AU Optronics ADR | 59,223 | 670,998 | ||
| † | China Airlines | 1,393,466 | 509,229 | ||
| Chunghwa Telecom ADR | 55,882 | 1,085,788 | |||
| HON HAI Precision Industry | 116,000 | 502,481 | |||
| Mega Financial Holding | 611,600 | 354,523 | |||
| † | Polaris Securities | 565,200 | 293,795 | ||
| * | Siliconware Precision Industries ADR | 78,900 | 474,190 | ||
| Taiwan Semiconductor | |||||
| Manufacturing | 552,269 | 1,070,002 | |||
| Taiwan Semiconductor | |||||
| Manufacturing ADR | 67,401 | 707,036 | |||
| Yuanta Financial Holding | 422,400 | 253,500 | |||
| 5,921,542 | |||||
| Thailand – 0.37% | |||||
| Bangkok Bank Public | 76,600 | 311,565 | |||
| Banpu Public | 23,800 | 449,057 | |||
| 760,622 | |||||
| United Kingdom – 16.88% | |||||
| Aegis Group | 149,300 | 288,443 | |||
| † | Anglo American | 15,500 | 675,950 | ||
| Antofagasta | 43,900 | 692,898 | |||
| * | ARM Holdings | 167,900 | 607,220 | ||
| Aviva | 84,825 | 495,628 | |||
| Barclays | 151,900 | 830,603 | |||
| BG Group | 146,743 | 2,539,945 | |||
| † | BP | 394,639 | 3,733,691 | ||
| *† | British Airways | 312,200 | 1,151,833 | ||
| Britvic | 108,700 | 765,289 | |||
| Compass Group | 212,503 | 1,696,377 | |||
| * | Domino’s Pizza | 87,000 | 445,488 | ||
| GlaxoSmithKline | 161,817 | 3,106,607 | |||
| HSBC Holdings | 115,107 | 1,167,118 | |||
| Imperial Tobacco Group | 42,500 | 1,296,453 | |||
| † | Inchcape | 1,101,200 | 493,015 | ||
| * | Intercontinental Hotels Group | 31,000 | 485,997 | ||
| International Power | 97,600 | 472,215 | |||
| Johnson Matthey | 26,100 | 691,998 | |||
| Next | 13,200 | 433,522 | |||
| Prudential | 55,600 | 461,566 | |||
| Royal Dutch Shell Class A | 147,526 | 4,267,384 | |||
| Standard Chartered | 5,100 | 139,165 | |||
| Tesco | 121,100 | 800,119 | |||
64
| Number of | Value | ||||||
| Shares | (U.S. $) | ||||||
| Common Stock (continued) | |||||||
| United Kingdom (continued) | |||||||
| Unilever | 100,243 | $ | 2,945,310 | ||||
| * | Vodafone Group | 1,060,910 | 2,448,142 | ||||
| Vodafone Group ADR | 23,400 | 544,986 | |||||
| WPP Group | 68,400 | 709,004 | |||||
| 34,385,966 | |||||||
| United States – 0.93% | |||||||
| *† | Amkor Technology | 64,900 | 458,843 | ||||
| Mosaic | 9,000 | 546,930 | |||||
| † | NII Holdings | 12,100 | 504,086 | ||||
| † | ResMed | 59,000 | 378,948 | ||||
| 1,888,807 | |||||||
| Total Common Stock | |||||||
| (cost $188,989,507) | 196,212,504 | ||||||
| Preferred Stock – 0.68% | |||||||
| Brazil – 0.31% | |||||||
| Usinas Siderurgicas de Minas | |||||||
| Gerais Class A | 18,400 | 633,384 | |||||
| 633,384 | |||||||
| Germany – 0.37% | |||||||
| * | Volkswagen | 7,700 | 706,212 | ||||
| = | Volkswagen | 600 | 55,030 | ||||
| 761,242 | |||||||
| Total Preferred Stock (cost $1,317,965) | 1,394,626 | ||||||
| Right – 0.00% | |||||||
| Volkswagen | 7,700 | 4,940 | |||||
| Total Right (cost $0) | 4,940 | ||||||
| Warrant – 0.00% | |||||||
| † | Unione di Banchi Italiano | 20,000 | 989 | ||||
| Total Warrant (cost $0) | 989 | ||||||
| Principal | |||||||
| Amount (U.S. $) | |||||||
| ≠Discount Notes – 1.77% | |||||||
| Federal Home Loan Bank | |||||||
| 0.001% 4/1/10 | $5,235,257 | 2,617,629 | |||||
| 0.01% 4/5/10 | 1,963,222 | 981,609 | |||||
| Total Discount Notes (cost $3,599,238) | 3,599,238 | ||||||
| US Treasury Obligations – 0.14% | |||||||
| U.S. Treasury Bill | |||||||
| 0.10% 4/15/10 | 327,204 | 163,592 | |||||
| 0.12% 4/22/10 | 261,763 | 130,871 | |||||
| Total US Treasury Obligations | |||||||
| (cost $294,468) | 294,463 | ||||||
| Total Value of Securities Before Securities | |||||||
| Lending Collateral – 98.90% | |||||||
| (cost $194,201,178) | 201,506,760 | ||||||
| Number of | |||||||
| Shares | |||||||
| Securities Lending Collateral** – 12.01% | |||||||
| Investment Companies | |||||||
| Mellon GSL DBT II Collateral Fund | 21,740,544 | 21,740,544 | |||||
| BNY Mellon SL DB II | |||||||
| Liquidating Fund | 2,733,696 | 2,706,359 | |||||
| †@ | Mellon GSL Reinvestment Trust II | 653,686 | 27,782 | ||||
| Total Securities Lending Collateral | |||||||
| (cost $25,127,926) | 24,474,685 | ||||||
| Total Value of Securities – 110.91% | |||||||
| (cost $219,329,104) | 225,981,445 | © | |||||
| Obligation to Return Securities | |||||||
| Lending Collateral** – (12.33%) | (25,127,926 | ) | |||||
| Receivables and Other Assets | |||||||
| Net of Liabilities – 1.42% | 2,887,299 | ||||||
| Net Assets Applicable to 19,691,463 | |||||||
| Shares Outstanding – 100.00% | $ | 203,740,818 | |||||
| Net Asset Value – Optimum International Fund | |||||||
| Class A ($12,082,289 / 1,169,001 Shares) | $10.34 | ||||||
| Net Asset Value – Optimum International Fund | |||||||
| Class B ($2,242,897 / 222,176 Shares) | $10.10 | ||||||
| Net Asset Value – Optimum International Fund | |||||||
| Class C ($43,259,990 / 4,282,480 Shares) | $10.10 | ||||||
| Net Asset Value – Optimum International Fund | |||||||
| Institutional Class ($146,155,642 / 14,017,806 Shares) | $10.43 | ||||||
| Components of Net Assets at March 31, 2010: | |||||||
| Shares of beneficial interest | |||||||
| (unlimited authorization – no par) | $ | 255,673,364 | |||||
| Undistributed net investment income | 2,708,008 | ||||||
| Accumulated net realized loss on investments | (61,330,285 | ) | |||||
| Net unrealized appreciation of investments | |||||||
| and foreign currencies | 6,689,731 | ||||||
| Total net assets | $ | 203,740,818 | |||||
| Δ | Securities have been classified by country of origin. Classification by type of business has been presented on page 35 in “Country/Sector allocations.” |
| * | Fully or partially on loan. |
| t | Dividend coupon which when presented with the corresponding coupon of the share benefits from a reduced withholding tax of 15% (rather than 25%) on dividends paid. |
| † | Non income producing security. |
| n | Securities listed and traded on the Hong Kong Stock Exchange. These securities have significant business operations in China. |
| = | Security is being fair valued in accordance with the Fund’s fair valuation policy. At March 31, 2010, the aggregate amount of fair valued securities was $55,030, which represented 0.03% of the Fund’s net assets. See Note 1 in ”Notes to financial statements.” |
| ≠ | The rate shown is the effective yield at the time of purchase. |
| ** | See Note 8 in “Notes to financial statements.” |
| @ | Illiquid security. At March 31, 2010, the aggregate amount of illiquid securities was $27,782, which represented 0.01% of the Fund’s net assets. See Note 9 in ”Notes to financial statements.” |
| © | Includes $23,169,345 of securities loaned. |
(continues) 65
Statements of net assets
Optimum International Fund
| Summary of Abbreviations: |
| ADR — American Depositary Receipts |
| AUD — Australian Dollar |
| CAD — Canadian Dollar |
| CHF — Swiss Franc |
| CVA — Dutch Certificate |
| DKK — Danish Krone |
| EUR — European Monetary Unit |
| HKD — Hong Kong Dollar |
| JPY — Japanese Yen |
| MXN — Mexican Peso |
| NOK — Norwegian Kroner |
| SEK — Swedish Krona |
| SGD — Singapore Dollar |
| STRIP VVPR — Dividend Coupon |
| USD — United States Dollar |
| ZAR — South African Rand |
| Net Asset Value and Offering Price Per Share – | ||
| Optimum International Fund | ||
| Net asset value Class A (A) | $ | 10.34 |
| Sales charge (5.75% of offering price) (B) | 0.63 | |
| Offering price | $ | 10.97 |
| (A) | Net asset value per share, as illustrated, is the amount which would be paid upon redemption or repurchase of shares. | |
| (B) | See the current prospectus for purchases of $75,000 or more. |
| 1The following foreign currency exchange contracts were outstanding at March 31, 2010: |
| Foreign Currency Exchange Contracts | ||||||||||||||||||
| Unrealized | ||||||||||||||||||
| Contracts to | Appreciation | |||||||||||||||||
| Receive (Deliver) | In Exchange For | Settlement Date | (Depreciation) | |||||||||||||||
| AUD | 1,570,000 | USD | (1,421,070 | ) | 4/7/10 | $ | 18,389 | |||||||||||
| CAD | 2,919,000 | USD | (2,845,032 | ) | 4/7/10 | 29,411 | ||||||||||||
| CHF | (77,948 | ) | USD | 73,342 | 4/1/10 | (588 | ) | |||||||||||
| CHF | 367,000 | USD | (344,507 | ) | 4/1/10 | 3,577 | ||||||||||||
| CHF | 92,000 | USD | (87,403 | ) | 4/6/10 | (141 | ) | |||||||||||
| CHF | (3,468,000 | ) | USD | 3,292,557 | 4/27/10 | 2,584 | ||||||||||||
| DKK | (5,823,000 | ) | USD | 1,062,202 | 4/7/10 | 5,703 | ||||||||||||
| EUR | (59,360 | ) | USD | 80,160 | 4/6/10 | (21 | ) | |||||||||||
| EUR | 1,268,000 | USD | (1,722,180 | ) | 4/7/10 | (9,416 | ) | |||||||||||
| EUR | (170,000 | ) | USD | 228,772 | 4/27/10 | (861 | ) | |||||||||||
| HKD | (878,412 | ) | USD | 113,130 | 4/7/10 | (11 | ) | |||||||||||
| HKD | 4,546,000 | USD | (585,779 | ) | 4/7/10 | (244 | ) | |||||||||||
| JPY | (6,678,143 | ) | USD | 72,188 | 4/1/10 | 756 | ||||||||||||
| JPY | 53,229,000 | USD | (573,094 | ) | 4/1/10 | (3,736 | ) | |||||||||||
| JPY | (6,554,323 | ) | USD | 70,804 | 4/5/10 | 695 | ||||||||||||
| JPY | 32,662,000 | USD | (349,480 | ) | 4/5/10 | (107 | ) | |||||||||||
| JPY | 108,443,000 | USD | (1,183,461 | ) | 4/7/10 | (23,473 | ) | |||||||||||
| JPY | (85,891,000 | ) | USD | 922,674 | 4/2710 | 3,817 | ||||||||||||
| MXN | 1,080,000 | USD | (87,704 | ) | 4/6/10 | (404 | ) | |||||||||||
| NOK | 10,191,000 | USD | (1,719,661 | ) | 4/7/10 | (5,290 | ) | |||||||||||
| SEK | (2,121,000 | ) | USD | 293,942 | 4/27/10 | 144 | ||||||||||||
| SGD | (779,000 | ) | USD | 556,869 | 4/7/10 | 22 | ||||||||||||
| ZAR | (336,000 | ) | USD | 45,157 | 4/7/10 | (876 | ) | |||||||||||
| $ | 19,930 | |||||||||||||||||
The use of foreign currency exchange contracts involves elements of market risk and risks in excess of the amount recognized in the financial statements. The notional values presented above represent the Fund’s total exposure in such contracts, whereas only the unrealized appreciation (depreciation) is reflected in the Fund’s net assets.
1See Note 7 in “Notes to financial statements.”
See accompanying notes
66
Optimum Large Cap Growth Fund
March 31, 2010
| Number of | Value | ||||
| Shares | (U.S. $) | ||||
| Common Stock – 95.83%² | |||||
| Consumer Discretionary – 15.19% | |||||
| † | Amazon.com | 103,022 | $ | 13,983,175 | |
| †* | AutoZone | 8,200 | 1,419,338 | ||
| † | CarMax | 37,900 | 952,048 | ||
| Carnival | 10,500 | 408,240 | |||
| * | Coach | 38,100 | 1,505,712 | ||
| Costco Wholesale | 22,500 | 1,343,475 | |||
| † | DIRECTV Class A | 50,877 | 1,720,151 | ||
| Disney (Walt) | 52,900 | 1,846,739 | |||
| †* | DreamWorks Animation Class A | 35,300 | 1,390,467 | ||
| † | eBay | 210,550 | 5,674,323 | ||
| * | Expedia | 157,550 | 3,932,448 | ||
| * | Fastenal | 26,200 | 1,257,338 | ||
| †* | Hertz Global Holdings | 58,650 | 585,914 | ||
| †* | IAC/InterActiveCorp | 156,450 | 3,557,673 | ||
| †* | ITT Educational Services | 6,650 | 747,992 | ||
| † | Kohl’s | 70,100 | 3,840,078 | ||
| †* | Lamar Advertising Class A | 11,550 | 396,743 | ||
| †* | Las Vegas Sands | 56,350 | 1,191,803 | ||
| † | Lear | 15,700 | 1,245,795 | ||
| † | Liberty Media Interactive Class A | 92,500 | 1,416,175 | ||
| Lowe’s | 203,450 | 4,931,628 | |||
| * | Marriott International Class A | 56,280 | 1,773,946 | ||
| McDonald’s | 176,665 | 11,787,088 | |||
| McGraw-Hill | 70,800 | 2,524,020 | |||
| †* | MGM MIRAGE | 29,300 | 351,600 | ||
| NIKE Class B | 117,254 | 8,618,168 | |||
| * | Nordstrom | 39,374 | 1,608,428 | ||
| †* | O’Reilly Automotive | 15,800 | 659,018 | ||
| * | Polo Ralph Lauren | 12,991 | 1,104,755 | ||
| †* | priceline.com | 13,094 | 3,338,970 | ||
| * | Regal Entertainment Group Class A | 99,650 | 1,750,851 | ||
| † | Starbucks | 93,300 | 2,264,391 | ||
| * | Starwood Hotels & Resorts Worldwide | 23,300 | 1,086,712 | ||
| Target | 45,050 | 2,369,630 | |||
| Tiffany & Co | 41,667 | 1,978,766 | |||
| †* | TRW Automotive Holdings | 43,650 | 1,247,517 | ||
| Wal-Mart Stores | 104,900 | 5,832,439 | |||
| * | Western Union | 38,800 | 658,048 | ||
| * | Wyndham Worldwide | 69,250 | 1,781,803 | ||
| Wynn Resorts | 43,897 | 3,328,710 | |||
| 107,412,115 | |||||
| Consumer Staples – 1.63% | |||||
| PepsiCo | 77,400 | 5,120,784 | |||
| Philip Morris International | 94,300 | 4,918,688 | |||
| Procter & Gamble | 22,852 | 1,445,846 | |||
| 11,485,318 | |||||
| Energy – 7.24% | |||||
| † | Cameron International | 29,500 | 1,264,370 | ||
| Chevron | 122,000 | 9,251,260 | |||
| Devon Energy | 56,500 | 3,640,295 | |||
| EOG Resources | 73,195 | 6,802,743 | |||
| † | FMC Technologies | 8,600 | 555,818 | ||
| Murphy Oil | 15,400 | 865,326 | |||
| Nexen (Canada) | 204,998 | 5,065,501 | |||
| Peabody Energy | 89,400 | 4,085,580 | |||
| Petroleo Brasiliero ADR | 56,000 | 2,217,040 | |||
| † | Plains Exploration & Production | 115,250 | 3,456,348 | ||
| * | Schlumberger | 42,400 | 2,690,704 | ||
| Suncor Energy (Canada) | 55,100 | 1,792,954 | |||
| † | Transocean (Switzerland) | 109,818 | 9,486,078 | ||
| 51,174,017 | |||||
| Financial Services – 16.02% | |||||
| American Express | 133,613 | 5,512,872 | |||
| Assured Guaranty (Bermuda) | 94,850 | 2,083,855 | |||
| Banco Santander ADR | 29,650 | 368,550 | |||
| Bank of America | 345,700 | 6,170,745 | |||
| BlackRock | 2,500 | 544,400 | |||
| BM&F Bovespa (Brazil) | 251,250 | 1,686,535 | |||
| CME Group | 5,000 | 1,580,550 | |||
| Franklin Resources | 18,200 | 2,018,380 | |||
| † | Genworth Financial | 106,800 | 1,958,712 | ||
| Goldman Sachs Group | 57,173 | 9,755,429 | |||
| Hartford Financial Services Group | 107,950 | 3,067,939 | |||
| † | IntercontinentalExchange | 14,100 | 1,581,738 | ||
| Invesco | 151,200 | 3,312,792 | |||
| JPMorgan Chase | 383,225 | 17,149,319 | |||
| * | MasterCard Class A | 48,475 | 12,312,650 | ||
| MetLife | 29,700 | 1,287,198 | |||
| Morgan Stanley | 60,700 | 1,777,903 | |||
| Northern Trust | 26,300 | 1,453,338 | |||
| PNC Financial Services Group | 89,803 | 5,361,239 | |||
| Schwab (Charles) | 68,700 | 1,284,003 | |||
| Sun Life Financial (Canada) | 27,900 | 897,581 | |||
| TFS Financial | 46,000 | 614,100 | |||
| Travelers | 64,600 | 3,484,524 | |||
| U.S. Bancorp | 218,463 | 5,653,822 | |||
| * | Visa Class A | 130,870 | 11,913,096 | ||
| * | Wells Fargo | 335,265 | 10,433,447 | ||
| 113,264,717 | |||||
| Health Care – 10.25% | |||||
| Abbott Laboratories | 100,600 | 5,299,608 | |||
| Allergan | 33,500 | 2,188,220 | |||
| † | Amgen | 62,850 | 3,755,916 | ||
| †* | Auxilium Pharmaceuticals | 79,500 | 2,477,220 | ||
| Baxter International | 100,850 | 5,869,470 | |||
| † | Celgene | 34,600 | 2,143,816 | ||
| † | Community Health Systems | 16,250 | 600,113 | ||
| Covidien (Ireland) | 111,300 | 5,596,164 | |||
| † | Express Scripts | 41,400 | 4,212,864 | ||
| † | Gilead Sciences | 104,991 | 4,774,991 | ||
| † | Health Management Associates Class A | 135,000 | 1,161,000 | ||
| †* | Human Genome Sciences | 46,400 | 1,401,280 | ||
| †* | Illumina | 17,200 | 669,080 | ||
| †* | Insulet | 69,000 | 1,041,210 | ||
(continues) 67
Statements of net assets
Optimum Large Cap Growth Fund
| Number of | Value | ||||
| Shares | (U.S. $) | ||||
| Common Stock (continued) | |||||
| Health Care (continued) | |||||
| †* | Intuitive Surgical | 4,600 | $ | 1,601,398 | |
| †* | Inverness Medical Innovation | 13,350 | 521,051 | ||
| Johnson & Johnson | 68,082 | 4,438,946 | |||
| † | Life Technologies | 31,050 | 1,622,984 | ||
| McKesson | 23,800 | 1,564,136 | |||
| † | Medco Health Solutions | 81,300 | 5,248,728 | ||
| Merck | 116,024 | 4,333,496 | |||
| Pfizer | 360,534 | 6,183,157 | |||
| * | Stryker | 25,500 | 1,459,110 | ||
| † | Thermo Fisher Scientific | 30,300 | 1,558,632 | ||
| †* | Vertex Pharmaceuticals | 13,300 | 543,571 | ||
| † | WellPoint | 34,100 | 2,195,358 | ||
| 72,461,519 | |||||
| Materials & Processing – 6.92% | |||||
| Agnico-Eagle Mines (Canada) | 7,800 | 434,226 | |||
| Ashland | 19,550 | 1,031,654 | |||
| BHP Billiton ADR | 114,010 | 7,801,704 | |||
| BHP Billiton (Australia) | 37,350 | 1,493,851 | |||
| * | Cliffs Natural Resources | 52,600 | 3,731,970 | ||
| Dow Chemical | 272,506 | 8,058,002 | |||
| FMC | 51,450 | 3,114,783 | |||
| Monsanto | 10,300 | 735,626 | |||
| Mosaic | 22,200 | 1,349,094 | |||
| † | Owens-Illinois | 53,700 | 1,908,498 | ||
| Potash Corp. of Saskatchewan | |||||
| (Canada) | 26,256 | 3,133,654 | |||
| * | PPG Industries | 54,156 | 3,541,802 | ||
| Praxair | 100,881 | 8,373,123 | |||
| Precision Castparts | 16,900 | 2,141,399 | |||
| Yamana Gold (Canada) | 208,800 | 2,056,680 | |||
| 48,906,066 | |||||
| Producer Durables – 8.80% | |||||
| 3M | 14,800 | 1,236,836 | |||
| Automatic Data Processing | 23,700 | 1,053,939 | |||
| * | Bucyrus International Class A | 13,500 | 890,865 | ||
| Cummins | 14,050 | 870,398 | |||
| * | Danaher | 84,175 | 6,726,424 | ||
| Deere | 12,300 | 731,358 | |||
| Expeditors International of Washington | 32,200 | 1,188,824 | |||
| FedEx | 79,075 | 7,385,605 | |||
| General Dynamics | 132,992 | 10,266,981 | |||
| * | Lockheed Martin | 14,450 | 1,202,529 | ||
| † | McDermott International | 44,550 | 1,199,286 | ||
| Norfolk Southern | 50,086 | 2,799,307 | |||
| * | PACCAR | 27,100 | 1,174,514 | ||
| Republic Services | 26,600 | 771,932 | |||
| Rockwell Automation | 15,000 | 845,400 | |||
| Stanley Black & Decker | 13,100 | 752,071 | |||
| Towers Watson Class A | 16,750 | 795,625 | |||
| Tyco International (Switzerland) | 142,900 | 5,465,925 | |||
| Union Pacific | 125,167 | 9,174,741 | |||
| United Parcel Service Class B | 68,950 | 4,441,070 | |||
| * | United Technologies | 44,100 | 3,246,201 | ||
| 62,219,831 | |||||
| Technology – 29.40% | |||||
| Accenture (Bermuda) | 42,700 | 1,791,265 | |||
| * | Activision Blizzard | 374,050 | 4,511,043 | ||
| † | Adobe Systems | 83,000 | 2,935,710 | ||
| †* | Akamai Technologies | 26,300 | 826,083 | ||
| † | American Tower Class A | 146,186 | 6,228,985 | ||
| † | Apple | 161,673 | 37,981,837 | ||
| ASML Holding | 22,900 | 810,660 | |||
| † | Autodesk | 26,300 | 773,746 | ||
| †* | Baidu ADR | 14,339 | 8,560,383 | ||
| Broadcom Class A | 28,200 | 935,676 | |||
| † | Brocade Communications Systems | 235,200 | 1,342,992 | ||
| †* | Cisco Systems | 510,456 | 13,287,169 | ||
| †* | Crown Castle International | 137,342 | 5,250,585 | ||
| † | Dell | 54,050 | 811,291 | ||
| †* | Dolby Laboratories Class A | 29,500 | 1,730,765 | ||
| †* | EMC | 329,911 | 5,951,594 | ||
| †* | Focus Media Holding ADR | 28,850 | 526,801 | ||
| † | Google Class A | 39,876 | 22,610,090 | ||
| †* | GSI Commerce | 119,800 | 3,314,866 | ||
| Hewlett-Packard | 266,250 | 14,151,187 | |||
| Intel | 478,400 | 10,649,183 | |||
| International Business Machines | 25,100 | 3,219,075 | |||
| †* | Juniper Networks | 63,100 | 1,935,908 | ||
| † | Lam Research | 79,750 | 2,976,270 | ||
| † | Marvell Technology Group (Bermuda) | 498,300 | 10,155,354 | ||
| † | McAfee | 30,100 | 1,207,913 | ||
| †* | Micron Technology | 179,350 | 1,863,447 | ||
| Microsoft | 290,900 | 8,514,643 | |||
| † | NICE Systems ADR | 17,750 | 563,563 | ||
| †* | Novellus Systems | 64,250 | 1,606,250 | ||
| †* | NVIDIA | 51,100 | 888,118 | ||
| †* | ON Semiconductor | 218,750 | 1,750,000 | ||
| Oracle | 86,850 | 2,231,177 | |||
| † | QUALCOMM | 177,050 | 7,434,330 | ||
| † | Research in Motion (Canada) | 21,278 | 1,573,508 | ||
| †* | salesforce.com | 7,100 | 528,595 | ||
| Samsung Electronics | |||||
| (Republic of Korea) | 649 | 469,205 | |||
| Seagate Technology | 75,600 | 1,380,456 | |||
| †* | Sina (China) (Hong Kong Exchange) | 96,150 | 3,623,894 | ||
| †* | Skyworks Solutions | 159,850 | 2,493,660 | ||
| † | Synopsys | 54,100 | 1,210,217 | ||
| * | Tencent Holdings (China) | ||||
| (Hong Kong Exchange) | 101,300 | 2,032,719 | |||
| Texas Instruments | 17,400 | 425,778 | |||
| † | Yahoo | 290,550 | 4,802,792 | ||
| 207,868,783 | |||||
68
| Number of | Value | ||||||
| Shares | (U.S. $) | ||||||
| Common Stock (continued) | |||||||
| Utilities – 0.38% | |||||||
| †* | Leap Wireless International | 20,300 | $ | 332,108 | |||
| †* | MetroPCS Communications | 39,900 | 282,492 | ||||
| † | NII Holdings | 48,800 | 2,033,008 | ||||
| 2,647,608 | |||||||
| Total Common Stock | |||||||
| (cost $577,641,434) | 677,439,974 | ||||||
| Limited Partnerships – 0.37% | |||||||
| Lazard Class A (Bermuda) | 34,700 | 1,238,790 | |||||
| * | Magellan Midstream Partners | 29,707 | 1,411,974 | ||||
| Total Limited Partnerships | |||||||
| (cost $2,217,646) | 2,650,764 | ||||||
| Preferred Stock – 0.15% | |||||||
| Wells Fargo 8.00% | 38,550 | 1,052,415 | |||||
| Total Preferred Stock | |||||||
| (cost $741,030) | 1,052,415 | ||||||
| Principal | |||||||
| Amount (U.S. $) | |||||||
| ≠Discount Notes – 2.88% | |||||||
| Federal Home Loan Bank | |||||||
| 0.001% 4/1/10 | $ | 14,815,256 | 14,815,256 | ||||
| 0.01% 4/5/10 | 5,555,715 | 5,555,715 | |||||
| Total Discount Notes | |||||||
| (cost $20,370,971) | 20,370,971 | ||||||
| U.S. Treasury Obligations – 0.24% | |||||||
| U.S. Treasury Bill | |||||||
| 0.10% 4/15/10 | 925,917 | 925,901 | |||||
| 0.12% 4/22/10 | 740,711 | 740,702 | |||||
| Total U.S. Treasury Obligations | |||||||
| (cost $1,666,628) | 1,666,603 | ||||||
| Total Value of Securities Before Securities | |||||||
| Lending Collateral – 99.47% | |||||||
| (cost $602,637,709) | 703,180,727 | ||||||
| Number of | |||||||
| Shares | |||||||
| Securities Lending Collateral** – 7.03% | |||||||
| Investment Companies | |||||||
| Mellon GSL DBT II Collateral Fund | 42,238,336 | 42,238,336 | |||||
| BNY Mellon SL DBT II | |||||||
| Liquidating Fund | 7,535,474 | 7,460,119 | |||||
| @† | Mellon GSL Reinvestment Trust II | 1,053,295 | 44,765 | ||||
| Total Securities Lending Collateral | |||||||
| (cost $50,827,105) | 49,743,220 | ||||||
| Total Value of Securities – 106.50% | |||||
| (cost $653,464,814) | $ | 752,923,947 | © | ||
| Obligation to Return Securities | |||||
| Lending Collateral** – (7.19%) | (50,827,105 | ) | |||
| Receivables and Other Assets | |||||
| Net of Liabilities – 0.69% | 4,850,606 | ||||
| Net Assets Applicable to 65,906,541 | |||||
| Shares Outstanding – 100.00% | $ | 706,947,448 | |||
| Net Asset Value – Optimum Large Cap Growth Fund | |||||
| Class A ($36,288,205 / 3,409,366 Shares) | $10.64 | ||||
| Net Asset Value – Optimum Large Cap Growth Fund | |||||
| Class B ($6,134,815 / 602,354 Shares) | $10.18 | ||||
| Net Asset Value – Optimum Large Cap Growth Fund | |||||
| Class C ($132,242,389 / 12,987,543 Shares) | $10.18 | ||||
| Net Asset Value – Optimum Large Cap Growth Fund | |||||
| Institutional Class ($532,282,039 / 48,907,278 Shares) | $10.88 | ||||
| Components of Net Assets at March 31, 2010: | |||||
| Shares of beneficial interest | |||||
| (unlimited authorization – no par) | $ | 789,001,690 | |||
| Accumulated net investment loss | (21,830 | ) | |||
| Accumulated net realized loss on investments | (181,512,485 | ) | |||
| Net unrealized appreciation of investments | |||||
| and foreign currencies | 99,480,073 | ||||
| Total net assets | $ | 706,947,448 | |||
| ² | Narrow industries are utilized for compliance purposes for diversification whereas broad sectors are used for financial reporting. |
| † | Non income producing security. |
| * | Fully or partially on loan. |
| ≠ | The rate shown is the effective yield at the time of purchase. |
| ** | See Note 8 in “Notes to financial statements.“ |
| @ | Illiquid security. At March 31, 2010, the aggregate amount of illiquid securities was $44,765, which represented 0.01% of the Fund’s net assets. See Note 9 in “Notes to financial statements.“ |
| © | Includes $49,557,111 of securities loaned. |
| ADR — American Depositary Receipts | |
| Net Asset Value and Offering Price Per Share – | ||
| Optimum Large Cap Growth Fund | ||
| Net asset value Class A (A) | $ | 10.64 |
| Sales charge (5.75% of offering price) (B) | 0.65 | |
| Offering price | $ | 11.29 |
| (A) | Net asset value per share, as illustrated, is the amount which would be paid upon redemption or repurchase of shares | |
| (B) | See the current prospectus for purchases of $75,000 or more. |
See accompanying notes
(continues) 69
Statements of net assets
Optimum Large Cap Value Fund
March 31, 2010
| Number of | Value | ||||
| Shares | (U.S. $) | ||||
| Common Stock – 98.49% | |||||
| Consumer Discretionary – 9.86% | |||||
| * | Advance Auto Parts | 38,430 | $ | 1,610,986 | |
| † | Apollo Group Class A | 8,800 | 539,352 | ||
| Comcast Class A | 307,700 | 5,790,914 | |||
| * | Disney (Walt) | 150,270 | 5,245,926 | ||
| Foot Locker | 99,800 | 1,500,992 | |||
| Gap | 308,200 | 7,122,501 | |||
| Hasbro | 35,680 | 1,365,830 | |||
| Home Depot | 282,930 | 9,152,785 | |||
| Johnson Controls | 33,910 | 1,118,691 | |||
| Lennar Class A | 321,712 | 5,536,664 | |||
| NIKE Class B | 65,010 | 4,778,235 | |||
| * | Omnicom Group | 91,700 | 3,558,877 | ||
| †* | Pulte Homes | 117,250 | 1,319,063 | ||
| Regal Entertainment Group | |||||
| Class A | 381,400 | 6,701,197 | |||
| * | Sherwin-Williams | 46,420 | 3,141,706 | ||
| Staples | 51,030 | 1,193,592 | |||
| Time Warner | 65,800 | 2,057,566 | |||
| Wal-Mart Stores | 37,200 | 2,068,320 | |||
| 63,803,197 | |||||
| Consumer Staples – 10.33% | |||||
| Altria Group | 32,400 | 664,848 | |||
| * | Campbell Soup | 17,730 | 626,756 | ||
| CVS Caremark | 202,941 | 7,419,523 | |||
| Diageo (United Kingdom) | 244,366 | 4,101,734 | |||
| General Mills | 25,140 | 1,779,661 | |||
| * | Kellogg | 82,560 | 4,411,181 | ||
| Kimberly-Clark | 145,710 | 9,162,245 | |||
| Kraft Foods Class A | 304,450 | 9,206,568 | |||
| Kroger | 59,700 | 1,293,102 | |||
| Lorillard | 5,970 | 449,183 | |||
| * | Nestle (Switzerland) | 90,730 | 4,646,863 | ||
| PepsiCo | 49,500 | 3,274,920 | |||
| Philip Morris International | 183,710 | 9,582,313 | |||
| Procter & Gamble | 49,476 | 3,130,317 | |||
| * | Sara Lee | 412,700 | 5,748,911 | ||
| Smucker (J.M.) | 22,200 | 1,337,772 | |||
| 66,835,897 | |||||
| Energy – 12.14% | |||||
| * | Anadarko Petroleum | 35,000 | 2,549,050 | ||
| Apache | 46,450 | 4,714,675 | |||
| * | Baker Hughes | 127,100 | 5,953,364 | ||
| * | BP ADR | 50,300 | 2,870,621 | ||
| Chevron | 202,462 | 15,352,694 | |||
| ConocoPhillips | 27,920 | 1,428,666 | |||
| Devon Energy | 129,500 | 8,343,685 | |||
| Ensco International (United Kingdom) | 128,800 | 5,767,664 | |||
| EOG Resources | 28,250 | 2,625,555 | |||
| Exxon Mobil | 89,940 | 6,024,181 | |||
| Hess | 66,790 | 4,177,715 | |||
| Marathon Oil | 125,200 | 3,961,328 | |||
| National Oilwell Varco | 59,390 | 2,410,046 | |||
| Occidental Petroleum | 27,160 | 2,296,106 | |||
| Total ADR | 111,940 | 6,494,759 | |||
| * | Valero Energy | 181,800 | 3,581,460 | ||
| 78,551,569 | |||||
| Financials – 18.68% | |||||
| Allstate | 129,020 | 4,168,636 | |||
| American Express | 81,000 | 3,342,060 | |||
| Ameriprise Financial | 98,010 | 4,445,734 | |||
| Annaly Mortgage Management | 221,100 | 3,798,498 | |||
| Aon | 62,610 | 2,674,073 | |||
| Bank of America | 201,270 | 3,592,670 | |||
| Bank of New York Mellon | 307,896 | 9,507,827 | |||
| Blackstone Group | 201,150 | 2,816,100 | |||
| Chubb | 39,670 | 2,056,890 | |||
| Goldman Sachs Group | 48,640 | 8,299,443 | |||
| JPMorgan Chase | 462,077 | 20,677,945 | |||
| * | MasterCard Class A | 800 | 203,200 | ||
| † | MBIA | 310,700 | 1,948,089 | ||
| MetLife | 211,980 | 9,187,213 | |||
| Morgan Stanley | 195,800 | 5,734,982 | |||
| New York Community Bancorp | 285,900 | 4,728,786 | |||
| Northern Trust | 22,210 | 1,227,325 | |||
| PNC Financial Services Group | 52,160 | 3,113,952 | |||
| Prudential Financial | 60,790 | 3,677,795 | |||
| Regions Financial | 127,750 | 1,002,838 | |||
| State Street | 96,160 | 4,340,662 | |||
| Travelers | 255,323 | 13,772,122 | |||
| Wells Fargo | 209,930 | 6,533,022 | |||
| 120,849,862 | |||||
| Health Care – 10.20% | |||||
| Abbott Laboratories | 122,170 | 6,435,916 | |||
| Becton, Dickinson | 36,990 | 2,912,223 | |||
| † | Boston Scientific | 141,800 | 1,023,796 | ||
| * | Bristol-Myers Squibb | 241,000 | 6,434,700 | ||
| GlaxoSmithKline (United Kingdom) | 70,600 | 1,355,398 | |||
| Johnson & Johnson | 141,830 | 9,247,315 | |||
| Medtronic | 98,390 | 4,430,502 | |||
| Merck | 41,860 | 1,563,471 | |||
| Pfizer | 824,235 | 14,135,629 | |||
| Roche Holding (Switzerland) | 6,730 | 1,091,507 | |||
| † | St. Jude Medical | 46,640 | 1,914,572 | ||
| †* | Tenet Healthcare | 523,030 | 2,991,732 | ||
| † | Thermo Fisher Scientific | 79,220 | 4,075,077 | ||
| † | Waters | 22,840 | 1,542,614 | ||
| †* | Watson Pharmaceuticals | 163,700 | 6,837,749 | ||
| 65,992,201 | |||||
| Industrials – 12.99% | |||||
| 3M | 39,100 | 3,267,587 | |||
| * | Avery Dennison | 155,000 | 5,643,550 | ||
| Canadian National Railway | 25,240 | 1,529,292 | |||
| CSX | 30,600 | 1,557,540 | |||
70
| Number of | Value | ||||||
| Shares | (U.S. $) | ||||||
| Common Stock (continued) | |||||||
| Industrials (continued) | |||||||
| Danaher | 20,290 | $ | 1,621,374 | ||||
| * | Eaton | 27,190 | 2,060,186 | ||||
| General Electric | 320,400 | 5,831,280 | |||||
| * | Grainger (W.W.) | 5,950 | 643,314 | ||||
| Honeywell International | 191,100 | 8,651,097 | |||||
| * | Lockheed Martin | 163,860 | 13,636,429 | ||||
| * | Northrop Grumman | 111,600 | 7,317,612 | ||||
| Stanley Black & Decker | 27,358 | 1,570,594 | |||||
| * | Textron | 163,500 | 3,471,105 | ||||
| Tyco Electronics | 314,100 | 8,631,468 | |||||
| Tyco International | 195,100 | 7,462,575 | |||||
| United Technologies | 95,170 | 7,005,464 | |||||
| * | Waste Management | 118,900 | 4,093,727 | ||||
| 83,994,194 | |||||||
| Information Technology – 9.71% | |||||||
| Accenture Class A | 150,680 | 6,321,026 | |||||
| Analog Devices | 59,800 | 1,723,436 | |||||
| Block (H&R) | 174,610 | 3,108,058 | |||||
| CA | 163,600 | 3,839,692 | |||||
| † | Cisco Systems | 37,100 | 965,713 | ||||
| †* | Dell | 222,500 | 3,339,725 | ||||
| Dun & Bradstreet | 25,180 | 1,873,896 | |||||
| Hewlett-Packard | 81,820 | 4,348,733 | |||||
| Intel | 517,000 | 11,508,420 | |||||
| International Business Machines | 115,880 | 14,861,610 | |||||
| † | Motorola | 635,900 | 4,464,018 | ||||
| Oracle | 179,490 | 4,611,098 | |||||
| Western Union | 107,240 | 1,818,790 | |||||
| 62,784,215 | |||||||
| Materials – 6.26% | |||||||
| Air Products & Chemicals | 36,510 | 2,699,915 | |||||
| * | Alcoa | 358,300 | 5,102,192 | ||||
| * | duPont (E.I.) deNemours | 251,600 | 9,369,584 | ||||
| MeadWestvaco | 202,300 | 5,168,765 | |||||
| * | Packaging Corp. of America | 359,300 | 8,842,373 | ||||
| * | PPG Industries | 49,080 | 3,209,832 | ||||
| * | United States Steel | 95,850 | 6,088,392 | ||||
| 40,481,053 | |||||||
| Telecommunications – 5.40% | |||||||
| AT&T | 662,800 | 17,126,753 | |||||
| * | Qwest Communications International | 1,596,500 | 8,333,730 | ||||
| Vodafone Group (United Kingdom) | 2,163,017 | 4,991,349 | |||||
| * | Windstream | 408,200 | 4,445,298 | ||||
| 34,897,130 | |||||||
| Utilities – 2.92% | |||||||
| American Electric Power | 161,530 | 5,521,094 | |||||
| Dominion Resources | 102,346 | 4,207,444 | |||||
| * | Entergy | 15,510 | 1,261,739 | ||||
| FPL Group | 32,870 | 1,588,607 | |||||
| * | PG&E | 65,840 | 2,792,933 | ||||
| PPL | 53,770 | 1,489,967 | |||||
| Public Service Enterprise Group | 67,840 | 2,002,637 | |||||
| 18,864,421 | |||||||
| Total Common Stock | |||||||
| (cost $604,246,665) | 637,053,739 | ||||||
| Principal | |||||||
| Amount (U.S. $) | |||||||
| ≠Discount Notes – 1.16% | |||||||
| Federal Home Loan Bank | |||||||
| 0.001% 4/1/10 | $5,433,907 | 5,433,906 | |||||
| 0.01% 4/5/10 | 2,037,715 | 2,037,713 | |||||
| Total Discount Notes | |||||||
| (cost $7,471,619) | 7,471,619 | ||||||
| U.S. Treasury Obligations – 0.09% | |||||||
| U.S. Treasury Bill | |||||||
| 0.10% 4/15/10 | 339,619 | 339,600 | |||||
| 0.12% 4/22/10 | 271,695 | 271,673 | |||||
| Total U.S. Treasury Obligations | |||||||
| (cost $611,282) | 611,273 | ||||||
| Total Value of Securities Before Securities | |||||||
| Lending Collateral – 99.74% | |||||||
| (cost $612,329,566) | 645,136,631 | ||||||
| Number of | |||||||
| Shares | |||||||
| Securities Lending Collateral** – 7.87% | |||||||
| Investment Companies | |||||||
| Mellon GSL DBT II | |||||||
| Collateral Fund | 45,641,493 | 45,641,493 | |||||
| BNY Mellon SL DBT II | |||||||
| Liquidating Fund | 5,310,396 | 5,257,292 | |||||
| @† | Mellon GSL Reinvestment Trust II | 1,049,762 | 44,615 | ||||
| Total Securities Lending Collateral | |||||||
| (cost $52,001,651) | 50,943,400 | ||||||
| Total Value of Securities – 107.61% | |||||||
| (cost $664,331,217) | 696,080,031 | © | |||||
| Obligation to Return Securities | |||||||
| Lending Collateral** – (8.04%) | (52,001,651 | ) | |||||
| Receivables and Other Assets | |||||||
| Net of Liabilities – 0.43% | 2,755,115 | ||||||
| Net Assets Applicable to 65,786,658 | |||||||
| Shares Outstanding – 100.00% | $ | 646,833,495 | |||||
(continues) 71
Statements of net assets
Optimum Large Cap Value Fund
| Net Asset Value – Optimum Large Cap Value Fund | |||||
| Class A ($34,167,162 / 3,476,034 Shares) | $9.83 | ||||
| Net Asset Value – Optimum Large Cap Value Fund | |||||
| Class B ($5,943,175 / 611,564 Shares) | $9.72 | ||||
| Net Asset Value – Optimum Large Cap Value Fund | |||||
| Class C ($125,961,318 / 12,966,871 Shares) | $9.71 | ||||
| Net Asset Value – Optimum Large Cap Value Fund | |||||
| Institutional Class ($480,761,840 / 48,732,189 Shares) | $9.87 | ||||
| Components of Net Assets at March 31, 2010: | |||||
| Shares of beneficial interest | |||||
| (unlimited authorization – no par) | $ | 798,536,318 | |||
| Undistributed net investment income | 8,651,825 | ||||
| Accumulated net realized loss on investments | (192,119,139 | ) | |||
| Net unrealized appreciation of investments | |||||
| and foreign currencies | 31,764,491 | ||||
| Total net assets | $ | 646,833,495 | |||
| * | Fully or partially on loan. |
| † | Non income producing security. |
| ≠ | The rate shown is the effective yield at the time of purchase. |
| ** | See Note 8 in “Notes to financial statements.” |
| @ | Illiquid security. At March 31, 2010, the aggregate amount of illiquid securities was $44,615, which represented 0.01% of the Fund’s net assets. See Note 9 in “Notes to financial statements.” |
| © | Includes $50,673,156 of securities loaned. |
ADR — American Depositary Receipts
| Net Asset Value and Offering Price Per Share – | ||
| Optimum Large Cap Value Fund | ||
| Net asset value Class A (A) | $ | 9.83 |
| Sales charge (5.75% of offering price) (B) | 0.60 | |
| Offering price | $ | 10.43 |
| (A) | Net asset value per share, as illustrated, is the amount which would be paid upon redemption or repurchase of shares. | |
| (B) | See the current prospectus for purchases of $75,000 or more. |
See accompanying notes
72
Optimum Small-Mid Cap Growth Fund
March 31, 2010
| Number of | |||||
| Shares | Value | ||||
| Common Stock – 98.68%² | |||||
| Consumer Discretionary – 22.43% | |||||
| * | Aaron’s | 15,000 | $ | 500,100 | |
| * | Abercrombie & Fitch Class A | 29,000 | 1,323,560 | ||
| *† | AnnTaylor Stores | 23,000 | 476,100 | ||
| *† | ArvinMeritor | 96,800 | 1,292,280 | ||
| *† | Avis Budget Group | 31,300 | 359,950 | ||
| *† | Bally Technologies | 28,500 | 1,155,390 | ||
| bebe Stores | 10,300 | 91,670 | |||
| * | Brunswick | 45,700 | 729,829 | ||
| *† | Carter’s | 55,890 | 1,685,642 | ||
| † | Cavco Industries | 37,600 | 1,283,664 | ||
| *† | Central European Distribution | 23,310 | 816,083 | ||
| † | Charming Shoppes | 42,000 | 229,320 | ||
| *† | Cheesecake Factory | 37,800 | 1,022,868 | ||
| Chico’s FAS | 75,500 | 1,088,710 | |||
| *† | Coldwater Creek | 33,700 | 233,878 | ||
| † | Constant Contact | 4,900 | 113,778 | ||
| † | Dick’s Sporting Goods | 37,040 | 967,114 | ||
| † | DreamWorks Animation Class A | 34,800 | 1,370,772 | ||
| † | Drew Industries | 19,600 | 431,592 | ||
| *† | Focus Media Holding ADR | 95,410 | 1,742,187 | ||
| *† | Gaylord Entertainment | 60,500 | 1,772,045 | ||
| * | Gentex | 66,100 | 1,283,662 | ||
| *† | Grand Canyon Education | 37,000 | 967,180 | ||
| *† | Hanesbrands | 90,670 | 2,522,438 | ||
| *† | Hertz Global Holdings | 100,210 | 1,001,098 | ||
| *† | ITT Educational Services | 9,500 | 1,068,560 | ||
| † | J. Crew Group | 22,500 | 1,032,750 | ||
| * | Jarden | 64,920 | 2,161,187 | ||
| *† | Life Time Fitness | 22,400 | 629,440 | ||
| Localiza Rent a Car | 68,410 | 719,194 | |||
| *† | Lululemon Athletica | 31,600 | 1,311,400 | ||
| Navitas | 140,908 | 659,380 | |||
| † | P.F. Chang’s China Bistro | 4,500 | 198,585 | ||
| † | Penn National Gaming | 40,960 | 1,138,688 | ||
| † | Pier 1 Imports | 37,500 | 238,875 | ||
| *† | Pinnacle Entertainment | 74,500 | 725,630 | ||
| * | Pool | 67,500 | 1,528,200 | ||
| † | Rush Enterprises Class A | 95,790 | 1,265,386 | ||
| *† | Saks | 67,500 | 580,500 | ||
| † | Shutterfly | 10,500 | 252,945 | ||
| † | Sonic | 33,300 | 367,965 | ||
| * | Strayer Education | 4,400 | 1,071,488 | ||
| *† | Talbots | 46,000 | 596,160 | ||
| † | Team Health Holdings | 39,581 | 664,961 | ||
| † | Tempur-Pedic International | 46,560 | 1,404,250 | ||
| *† | Texas Roadhouse | 16,200 | 225,018 | ||
| * | Thor Industries | 30,600 | 924,426 | ||
| *† | TiVo | 49,000 | 838,880 | ||
| *† | True Religion Apparel | 24,500 | 743,820 | ||
| Tupperware Brands | 21,430 | 1,033,355 | |||
| *† | Urban Outfitters | 31,750 | 1,207,453 | ||
| *† | Vail Resorts | 13,500 | 541,215 | ||
| † | VistaPrint | 27,500 | 1,574,375 | ||
| † | Vitacost.com | 10,000 | 120,500 | ||
| † | Wet Seal Class A | 37,900 | 180,404 | ||
| * | Williams-Sonoma | 60,640 | 1,594,226 | ||
| † | Winnebago Industries | 9,600 | 140,256 | ||
| † | WMS Industries | 6,000 | 251,640 | ||
| * | Wyndham Worldwide | 61,880 | 1,592,172 | ||
| 53,044,194 | |||||
| Consumer Staples – 1.50% | |||||
| * | Diamond Foods | 16,000 | 672,640 | ||
| † | Green Mountain Coffee Roasters | 20,240 | 1,959,637 | ||
| Herbalife | 19,850 | 915,482 | |||
| 3,547,759 | |||||
| Energy – 4.49% | |||||
| † | Atwood Oceanics | 65,000 | 2,250,950 | ||
| *† | Carrizo Oil & Gas | 54,000 | 1,239,300 | ||
| Core Laboratories | 8,500 | 1,111,800 | |||
| † | Dresser-Rand Group | 31,000 | 974,020 | ||
| *† | FMC Technologies | 32,500 | 2,100,475 | ||
| * | Houston America Energy | 30,000 | 544,500 | ||
| Massey Energy | 16,330 | 853,896 | |||
| *† | Northern Oil & Gas | 9,000 | 142,650 | ||
| † | Oceaneering International | 12,000 | 761,880 | ||
| *† | Quicksilver Resources | 31,200 | 438,984 | ||
| † | Rosetta Resources | 5,000 | 117,750 | ||
| † | Tesco | 6,700 | 78,189 | ||
| 10,614,394 | |||||
| Financial Services – 9.17% | |||||
| *† | AmeriCredit | 24,900 | 591,624 | ||
| Associated Banc-Corp | 13,000 | 179,400 | |||
| Assured Guaranty | 48,660 | 1,069,060 | |||
| Berkshire Hills Bancorp | 25,500 | 467,415 | |||
| * | BioMed Realty Trust | 92,000 | 1,521,680 | ||
| * | Corporate Office Properties Trust | 27,500 | 1,103,575 | ||
| DCT Industrial Trust | 46,000 | 240,580 | |||
| * | Extra Space Storage | 47,600 | 603,568 | ||
| First Busey | 72,800 | 321,776 | |||
| * | Global Payments | 4,500 | 204,975 | ||
| † | Guaranty Bancorp | 63,000 | 100,170 | ||
| K-Fed Bancorp | 76,000 | 677,920 | |||
| Kite Realty Group Trust | 170,000 | 804,100 | |||
| Lakeland Financial | 18,700 | 356,235 | |||
| * | Macerich | 26,307 | 1,007,821 | ||
| MB Financial | 55,000 | 1,239,150 | |||
| *† | MF Global Holdings | 96,200 | 776,334 | ||
| Rossi Residencial | 122,430 | 846,600 | |||
| Sandy Spring Bancorp | 31,100 | 466,500 | |||
| SL Green Realty | 29,500 | 1,689,465 | |||
| † | Stifel Financial | 18,345 | 986,044 | ||
| † | SVB Financial Group | 27,500 | 1,283,150 | ||
| TCF Financial | 38,300 | 610,502 | |||
| Tower Group | 15,000 | 332,550 | |||
| Trico Bancshares | 22,000 | 437,800 | |||
| Valley National Bancorp | 87,000 | 1,337,190 | |||
(continues) 73
Statements of net assets
Optimum Small-Mid Cap Growth Fund
| Number of | |||||
| Shares | Value | ||||
| Common Stock (continued) | |||||
| Financial Services (continued) | |||||
| ViewPoint Financial Group | 50,500 | $ | 818,605 | ||
| Waddell & Reed Financial Class A | 24,400 | 879,376 | |||
| Whitney Holding | 20,000 | 275,800 | |||
| Wilmington Trust | 15,300 | 253,521 | |||
| *† | World Acceptance | 6,000 | 216,480 | ||
| 21,698,966 | |||||
| Health Care – 15.27% | |||||
| † | Acorda Therapeutics | 15,000 | 513,000 | ||
| † | Affymax | 27,000 | 632,610 | ||
| † | Alexion Pharmaceuticals | 21,500 | 1,168,955 | ||
| *† | Alkermes | 50,520 | 655,244 | ||
| *† | Allos Therapeutics | 65,500 | 486,665 | ||
| *† | AMAG Pharmaceuticals | 20,720 | 723,335 | ||
| *† | American Medical System Holdings | 76,000 | 1,412,080 | ||
| *† | Anthera Pharmaceuticals | 20,000 | 139,800 | ||
| *† | Auxilium Pharmaceuticals | 51,050 | 1,590,718 | ||
| *† | BioMarin Pharmaceuticals | 16,600 | 387,942 | ||
| *† | Cepheid | 23,000 | 402,040 | ||
| † | Coventry Health Care | 47,500 | 1,174,200 | ||
| † | Cubist Pharmaceuticals | 31,480 | 709,559 | ||
| † | Cyberonics | 14,000 | 268,240 | ||
| † | eResearch Technology | 31,300 | 216,283 | ||
| † | Fleury | 81,300 | 877,103 | ||
| *† | Gen-Probe | 5,000 | 250,000 | ||
| † | Health Net | 71,380 | 1,775,221 | ||
| *† | HealthSouth | 46,030 | 860,761 | ||
| † | Human Genome Sciences | 21,500 | 649,300 | ||
| † | ICON ADR | 30,300 | 799,920 | ||
| *† | IDEXX Laboratories | 9,000 | 517,950 | ||
| *† | Illumina | 10,600 | 412,340 | ||
| *† | Immucor | 15,000 | 335,850 | ||
| *† | Incyte | 60,300 | 841,788 | ||
| † | InterMune | 9,500 | 423,415 | ||
| *† | Ironwood Pharmaceuticals | 6,500 | 87,880 | ||
| † | Isis Pharmaceuticals | 15,900 | 173,628 | ||
| † | King Pharmaceuticals | 44,300 | 520,968 | ||
| *† | Lincare Holdings | 34,600 | 1,552,848 | ||
| * | Masimo | 15,600 | 414,180 | ||
| † | Mednax | 4,000 | 232,760 | ||
| *† | Micromet | 27,250 | 220,180 | ||
| *† | Nanosphere | 20,000 | 95,800 | ||
| *† | Nektar Therapeutics | 18,000 | 273,780 | ||
| † | NPS Pharmaceuticals | 51,100 | 257,544 | ||
| *† | Onyx Pharmaceuticals | 27,020 | 818,166 | ||
| † | Orthofix International | 16,000 | 582,080 | ||
| * | Owens & Minor | 27,920 | 1,295,209 | ||
| *† | Parexel International | 62,770 | 1,463,169 | ||
| Pharmaceutical Product Development | 38,200 | 907,250 | |||
| † | Pharmasset | 14,900 | 399,320 | ||
| *† | PSS World Medical | 34,000 | 799,340 | ||
| * | Quality Systems | 7,500 | 460,800 | ||
| † | Regeneron Pharmaceuticals | 33,860 | 896,951 | ||
| *† | Salix Pharmaceuticals | 22,460 | 836,635 | ||
| *† | Seattle Genetics | 84,890 | 1,013,587 | ||
| † | Sirona Dental Systems | 9,000 | 342,270 | ||
| † | SXC Health Solutions | 35,530 | 2,390,458 | ||
| *† | United Therapeutics | 4,500 | 248,985 | ||
| † | Volcano | 66,609 | 1,609,273 | ||
| 36,117,380 | |||||
| Materials & Processing – 2.78% | |||||
| * | Acuity Brands | 28,500 | 1,202,985 | ||
| Albemarle | 10,600 | 451,878 | |||
| *† | Beacon Roofing Supply | 83,760 | 1,602,329 | ||
| Greif Class A | 9,200 | 505,264 | |||
| Huabao International Holdings | 252,740 | 303,708 | |||
| * | Kaydon | 13,300 | 500,080 | ||
| Lennox International | 6,650 | 294,728 | |||
| Silgan Holdings | 23,190 | 1,396,734 | |||
| *† | Trex | 15,170 | 322,969 | ||
| 6,580,675 | |||||
| Producer Durables – 16.00% | |||||
| Albany International | 10,000 | 215,300 | |||
| † | Allegiant Travel | 10,500 | 607,530 | ||
| AMETEK | 37,000 | 1,534,020 | |||
| † | Argon | 19,700 | 524,217 | ||
| † | BE Aerospace | 77,060 | 2,346,477 | ||
| † | Bristow Group | 12,000 | 452,760 | ||
| † | CAI International | 38,300 | 471,856 | ||
| *† | Continental Airlines Class B | 87,470 | 1,921,716 | ||
| Copa Holdings Class A | 18,230 | 1,108,384 | |||
| *† | Corrections Corp. of America | 77,730 | 1,543,718 | ||
| Donaldson | 48,900 | 2,206,368 | |||
| ESCO Technologies | 11,200 | 356,272 | |||
| † | ExlService Holdings | 32,000 | 533,760 | ||
| * | GATX | 30,700 | 879,555 | ||
| *† | GrafTech International | 35,000 | 478,450 | ||
| † | H&E Equipment Services | 74,500 | 803,110 | ||
| † | Hansen Transmissions International | 48,148 | 65,984 | ||
| * | Heartland Express | 42,000 | 693,000 | ||
| Herman Miller | 53,300 | 962,598 | |||
| * | Hunt (J.B.) Transport Services | 54,360 | 1,950,437 | ||
| * | Knoll | 126,260 | 1,420,425 | ||
| *† | Lexmark International Class A | 33,760 | 1,218,061 | ||
| McGrath Rentcorp | 12,000 | 290,760 | |||
| † | Mettler-Toledo International | 25,500 | 2,784,599 | ||
| † | Moog Class A | 19,600 | 694,232 | ||
| * | Nordson | 47,000 | 3,192,239 | ||
| † | Oshkosh | 20,500 | 826,970 | ||
| * | Overseas Shipholding Group | 24,360 | 955,643 | ||
| Pentair | 17,000 | 605,540 | |||
| *† | Quanta Services | 38,300 | 733,828 | ||
| * | Regal-Beloit | 20,350 | 1,208,994 | ||
| † | SYKES Enterprises | 61,346 | 1,401,143 | ||
| * | Toro | 11,500 | 565,455 | ||
| *† | US Airways Group | 159,940 | 1,175,559 | ||
74
| Number of | ||||||
| Shares | Value | |||||
| Common Stock (continued) | ||||||
| Producer Durables (continued) | ||||||
| †=@∏ | Vermillion PIPE | 8,111 | $ | 209,872 | ||
| * | World Fuel Services | 16,500 | 439,560 | |||
| † | Zebra Technologies | 16,000 | 473,600 | |||
| 37,851,992 | ||||||
| Technology – 25.29% | ||||||
| † | AboveNet | 3,500 | 177,555 | |||
| † | Actuate | 50,000 | 279,500 | |||
| † | Acxiom | 14,000 | 251,160 | |||
| Amphenol Class A | 28,400 | 1,198,196 | ||||
| † | ANSYS | 39,000 | 1,682,460 | |||
| † | Applied Micro Circuits | 105,400 | 909,602 | |||
| † | Art Technology Group | 105,000 | 463,050 | |||
| *† | Atheros Communications | 41,230 | 1,596,013 | |||
| † | Atmel | 45,000 | 226,350 | |||
| *† | Blackboard | 8,000 | 333,280 | |||
| *† | Blue Coat Systems | 35,000 | 1,086,400 | |||
| † | Celestica | 109,820 | 1,200,333 | |||
| *† | Concur Technologies | 48,700 | 1,997,187 | |||
| † | Crown Castle International | 81,500 | 3,115,745 | |||
| *† | Cypress Semiconductor | 74,130 | 852,495 | |||
| † | Entegris | 82,500 | 415,800 | |||
| † | Entravision Communications Clasa A | 50,000 | 138,000 | |||
| *† | Equinix | 20,850 | 2,029,539 | |||
| † | Finisar | 73,900 | 1,160,969 | |||
| *† | FLIR Systems | 26,000 | 733,200 | |||
| *† | GSI Commerce | 34,500 | 954,615 | |||
| † | Hackett Group | 30,500 | 84,790 | |||
| *† | II-VI | 34,800 | 1,177,632 | |||
| *† | Informatica | 126,180 | 3,389,194 | |||
| † | Integrated Device Technology | 127,000 | 778,510 | |||
| † | IPG Photonics | 71,000 | 1,050,800 | |||
| Jabil Circuit | 60,420 | 978,200 | ||||
| † | Microsemi | 67,000 | 1,161,780 | |||
| † | Monolithic Power Systems | 34,000 | 758,200 | |||
| *† | Netezza | 60,172 | 769,600 | |||
| † | NETGEAR | 16,000 | 417,600 | |||
| † | NetLogic Microsystems | 20,000 | 588,600 | |||
| † | NICE Systems ADR | 11,000 | 349,250 | |||
| *† | ON Semiconductor | 164,000 | 1,312,000 | |||
| † | Plexus | 47,640 | 1,716,469 | |||
| *† | Polycom | 96,600 | 2,954,028 | |||
| Power Integrations | 14,380 | 592,456 | ||||
| *† | QLogic | 70,230 | 1,425,669 | |||
| *† | Rackspace Hosting | 45,180 | 846,221 | |||
| † | Red Hat | 34,290 | 1,003,668 | |||
| † | RF Micro Devices | 127,920 | 637,042 | |||
| † | Riverbed Technology | 47,110 | 1,337,924 | |||
| *† | Rovi | 22,620 | 839,881 | |||
| † | Salem Communications Class A | 33,000 | 118,140 | |||
| † | Sanmina-SCI | 112,910 | 1,863,015 | |||
| *† | SBA Communications Class A | 87,840 | 3,168,389 | |||
| † | Seagate Technology | 70,380 | 1,285,139 | |||
| *† | Skyworks Solutions | 92,250 | 1,439,100 | |||
| † | SRA International Class A | 39,500 | 821,205 | |||
| † | Stratasys | 18,000 | 438,840 | |||
| *† | Supertex | 41,000 | 1,049,190 | |||
| † | Switch & Data Facilities | 29,000 | 515,040 | |||
| *† | Trimble Navigation | 27,600 | 792,672 | |||
| † | TriQuint Semiconductor | 94,700 | 662,900 | |||
| *† | Tyler Technologies | 14,000 | 262,640 | |||
| † | Viasat | 9,300 | 321,873 | |||
| *† | Virtusa | 85,411 | 880,587 | |||
| † | Websense | 54,310 | 1,236,639 | |||
| 59,826,332 | ||||||
| Utilities – 1.75% | ||||||
| † | PAETEC Holding | 255,000 | 1,193,400 | |||
| *† | tw telecom Class A | 162,000 | 2,940,300 | |||
| 4,133,700 | ||||||
| Total Common Stock | ||||||
| (cost $194,694,389) | 233,415,392 | |||||
| Warrants – 0.00% | ||||||
| †= | Isoray, exercise price $5.00, | |||||
| expiration date 3/22/11 | 28,000 | 0 | ||||
| †=#@ | Medicure PIPE 144A | 74,014 | 0 | |||
| Total Warrants (cost $0) | 0 | |||||
| Principal | ||||||
| Amount | ||||||
| ≠Discount Notes – 1.55% | ||||||
| Federal Home Loan Bank | ||||||
| 0.001% 4/1/10 | $ | 5,339,690 | 2,669,845 | |||
| 0.01% 4/5/10 | 2,002,384 | 1,001,191 | ||||
| Total Discount Notes | ||||||
| (cost $3,671,036) | 3,671,036 | |||||
| U.S. Treasury Obligations – 0.13% | ||||||
| U.S. Treasury Bill | ||||||
| 0.10% 4/15/10 | 333,731 | 166,856 | ||||
| 0.12% 4/22/10 | 266,985 | 133,481 | ||||
| Total U.S. Treasury Obligations | ||||||
| (cost $300,342) | 300,337 | |||||
| Total Value of Securities Before Securities | ||||||
| Lending Collateral – 100.35% | ||||||
| (cost $198,665,767) | 237,386,765 | |||||
(continues) 75
Statements of net assets
Optimum Small-Mid Cap Growth Fund
| Number of | |||||||
| Shares | Value | ||||||
| Securities Lending Collateral** – 10.42% | |||||||
| Investment Companies | |||||||
| Mellon GSL DBT II | |||||||
| Collateral Fund | 21,581,610 | $ | 21,581,610 | ||||
| BNY Mellon SL DBT II | |||||||
| Liquidating Fund | 3,078,003 | 3,047,223 | |||||
| @† | Mellon GSL Reinvestment Trust II | 510,265 | 21,686 | ||||
| Total Securities Lending Collateral | |||||||
| (cost $25,169,878) | 24,650,519 | ||||||
| Total Value of Securities – 110.78% | |||||||
| (cost $223,835,645) | 262,037,284 | © | |||||
| Obligation to Return Securities | |||||||
| Lending Collateral** – (10.64%) | (25,169,878 | ) | |||||
| Liabilities Net of Receivables and | |||||||
| Other Assets – (0.14%) | (321,799 | ) | |||||
| Net Assets Applicable to 20,903,897 | |||||||
| Shares Outstanding – 100.00% | $ | 236,545,607 | |||||
| Net Asset Value – Optimum Small-Mid Cap Growth Fund | |||||||
| Class A ($6,735,812 / 604,086 Shares) | $11.15 | ||||||
| Net Asset Value – Optimum Small-Mid Cap Growth Fund | |||||||
| Class B ($1,142,899 / 107,227 Shares) | $10.66 | ||||||
| Net Asset Value – Optimum Small-Mid Cap Growth Fund | |||||||
| Class C ($23,823,951 / 2,235,657 Shares) | $10.66 | ||||||
| Net Asset Value – Optimum Small-Mid Cap Growth Fund | |||||||
| Institutional Class ($204,842,945 / 17,956,927 Shares) | $11.41 | ||||||
| Components of Net Assets at March 31, 2010: | |||||||
| Shares of beneficial interest | |||||||
| (unlimited authorization – no par) | $ | 219,347,212 | |||||
| Accumulated net investment loss | (13,721 | ) | |||||
| Accumulated net realized loss on investments | (20,989,703 | ) | |||||
| Net unrealized appreciation of investments | 38,201,819 | ||||||
| Total net assets | $ | 236,545,607 | |||||
| ² | Narrow industries are utilized for compliance purposes for diversification whereas broad sectors are used for financial reporting. |
| * | Fully or partially on loan. |
| † | Non income producing security. |
| = | Security is being fair valued in accordance with the Fund’s fair valuation policy. At March 31, 2010, the aggregate amount of fair valued securities was $209,872, which represented 0.09% of the Fund’s net assets. See Note 1 in “Notes to financial statements.” |
| @ | Illiquid security. At March 31, 2010, the aggregate amount of illiquid securities was $231,558, which represented 0.10% of the Fund’s net assets. See Note 9 in “Notes to financial statements.” |
| ∏ | Restricted Security. These investments are in securities not registered under the Securities Act of 1933, as amended and have certain restrictions on resale which may limit their liquidity. At March 31, 2010, the aggregate amount of restricted securities was $209,872 or 0.09% of the Fund’s net assets. See Note 9 in “Notes to financial statements.” |
| # | Security exempt from registration under Rule 144A of the Securities Act of 1933, as amended. At March 31, 2010, the aggregate amount of Rule 144A securities was $0, which represented 0.00% of the Fund’s net assets. See Note 9 in “Notes to financial statements.” |
| ≠ | The rate shown is the effective yield at the time of purchase. |
| ** | See Note 8 in “Notes to financial statements.” |
| © | Includes $24,547,662 of securities loaned. |
Summary of Abbreviations:
ADR — American Depositary Receipts
PIPE — Private Investment in Public Equity
ADR — American Depositary Receipts
PIPE — Private Investment in Public Equity
| Net Asset Value and Offering Price Per Share – | ||
| Optimum Small-Mid Cap Growth Fund | ||
| Net asset value Class A (A) | $ | 11.15 |
| Sales charge (5.75% of offering price) (B) | 0.68 | |
| Offering price | $ | 11.83 |
| (A) | Net asset value per share, as illustrated, is the amount which would be paid upon redemption or repurchase of shares. | |
| (B) | See the current prospectus for purchases of $75,000 or more. |
See accompanying notes
76
Optimum Small-Mid Cap Value Fund
March 31, 2010
| Number of | |||||
| Shares | Value | ||||
| Common Stock – 91.54% | |||||
| Basic Industry – 17.50% | |||||
| * | AAON | 59,325 | $ | 1,341,932 | |
| Airgas | 19,300 | 1,227,866 | |||
| Albany International | 117,400 | 2,527,621 | |||
| Albemarle | 34,000 | 1,449,420 | |||
| AMETEK | 23,500 | 974,310 | |||
| Aptargroup | 33,900 | 1,333,965 | |||
| Ashland | 24,000 | 1,266,480 | |||
| * | Brady Class A | 28,800 | 896,256 | ||
| Carlisle | 21,300 | 811,530 | |||
| * | Cliffs Natural Resources | 20,400 | 1,447,380 | ||
| Crane | 44,800 | 1,590,400 | |||
| Cytec Industries | 27,800 | 1,299,372 | |||
| Dover | 34,000 | 1,589,500 | |||
| * | Eastman Chemical | 33,800 | 2,152,384 | ||
| † | Ferro | 189,600 | 1,666,584 | ||
| FMC | 27,000 | 1,634,580 | |||
| *† | Griffon | 84,100 | 1,047,886 | ||
| * | Kaiser Aluminum | 18,500 | 713,545 | ||
| † | KapStone Paper & Packaging | 109,800 | 1,303,326 | ||
| † | Owens-Illnois | 33,000 | 1,172,820 | ||
| Packaging Corp. of America | 27,200 | 669,392 | |||
| Quanex Building Products | 26,000 | 429,780 | |||
| † | Solutia | 23,000 | 370,530 | ||
| Sonoco Products | 59,400 | 1,828,926 | |||
| Temple-Inland | 30,800 | 629,244 | |||
| *† | Trex | 36,800 | 783,472 | ||
| † | Trimas | 900 | 5,841 | ||
| US Ecology | 78,457 | 1,263,158 | |||
| 33,427,500 | |||||
| Business Services – 4.75% | |||||
| Courier | 56,260 | 928,853 | |||
| Deluxe | 22,000 | 427,240 | |||
| Donnelley (R.R.) & Sons | 74,800 | 1,596,980 | |||
| Dun & Bradstreet | 12,300 | 915,366 | |||
| Ennis | 79,890 | 1,299,810 | |||
| FactSet Research Systems | 8,900 | 652,993 | |||
| * | Fair Isaac | 55,050 | 1,394,967 | ||
| † | School Specialty | 7,000 | 158,970 | ||
| † | WESCO International | 48,800 | 1,693,848 | ||
| 9,069,027 | |||||
| Capital Spending – 9.86% | |||||
| * | Acuity Brands | 39,500 | 1,667,295 | ||
| † | Advanced Energy Industries | 88,325 | 1,462,662 | ||
| *† | AGCO | 42,700 | 1,531,649 | ||
| Gardner Denver | 17,300 | 761,892 | |||
| Gorman-Rupp | 18,500 | 470,640 | |||
| * | Graham | 74,689 | 1,343,655 | ||
| * | Granite Construction | 42,700 | 1,290,394 | ||
| * | Hubbell Class B | 21,300 | 1,074,159 | ||
| IDEX | 26,700 | 883,770 | |||
| * | Kennametal | 80,100 | 2,252,413 | ||
| * | Stanley Black & Decker | 34,200 | 1,963,422 | ||
| Tennant | 36,988 | 1,013,101 | |||
| Tyco International | 26,700 | 1,021,275 | |||
| † | URS | 26,800 | 1,329,548 | ||
| *† | Wabash National | 110,330 | 773,413 | ||
| 18,839,288 | |||||
| Consumer Cyclical – 8.16% | |||||
| Alberto-Culver | 44,100 | 1,153,215 | |||
| * | Barnes Group | 110,000 | 2,140,600 | ||
| * | †BorgWarner | 35,600 | 1,359,208 | ||
| * | Ethan Allen Interiors | 175,700 | 3,624,691 | ||
| *† | Exide Technologies | 180,890 | 1,040,118 | ||
| * | Hooker Furniture | 94,752 | 1,523,612 | ||
| * | Knoll | 118,000 | 1,327,500 | ||
| † | Lear | 8,900 | 706,215 | ||
| * | Leggett & Platt | 27,000 | 584,280 | ||
| † | Navistar International | 34,000 | 1,520,820 | ||
| Tupperware Brands | 12,600 | 607,572 | |||
| 15,587,831 | |||||
| Consumer Services – 5.57% | |||||
| † | BJ’s Wholesale Club | 36,300 | 1,342,737 | ||
| † | Collective Brands | 115,800 | 2,633,292 | ||
| * | Foot Locker | 145,600 | 2,189,824 | ||
| *† | Genesco | 26,500 | 821,765 | ||
| † | Jos. A. Bank Clothiers | 26,500 | 1,448,225 | ||
| PETsMART | 8,100 | 258,876 | |||
| *† | RSC Holdings | 36,000 | 286,560 | ||
| † | Rush Enterprises Class A | 52,800 | 697,488 | ||
| * | Sturm Ruger | 80,792 | 968,696 | ||
| 10,647,463 | |||||
| Consumer Staples – 2.47% | |||||
| † | Chiquita Brands International | 81,373 | 1,279,997 | ||
| Dr Pepper Snapple Group | 36,700 | 1,290,739 | |||
| Molson Coors Brewing Class B | 20,800 | 874,848 | |||
| Smucker (J.M.) | 21,200 | 1,277,512 | |||
| 4,723,096 | |||||
| Energy – 5.72% | |||||
| Cabot Oil & Gas | 28,800 | 1,059,840 | |||
| * | Frontier Oil | 27,000 | 364,500 | ||
| Gulf Island Fabrication | 49,460 | 1,075,755 | |||
| Laclede Group | 36,198 | 1,220,597 | |||
| † | Newpark Resources | 321,850 | 1,689,713 | ||
| † | Plains Exploration & Production | 36,100 | 1,082,639 | ||
| *† | Rowan | 55,900 | 1,627,249 | ||
| Southern Union | 110,500 | 2,803,385 | |||
| 10,923,678 | |||||
| Financial Services – 11.26% | |||||
| American Equity Investment | |||||
| Life Holding | 173,120 | 1,843,727 | |||
| Aspen Insurance Holdings | 23,000 | 663,320 | |||
| AXIS Capital Holdings | 40,800 | 1,275,408 | |||
| Commerce Bancshares | 32,655 | 1,343,427 | |||
(continues) 77
Statements of net assets
Optimum Small-Mid Cap Value Fund
| Number of | ||||||
| Shares | Value | |||||
| Common Stock (continued) | ||||||
| Financial Services (continued) | ||||||
| Dime Community Bancshares | 122,750 | $ | 1,550,333 | |||
| Eaton Vance | 42,000 | 1,408,680 | ||||
| Everest Re Group | 900 | 72,837 | ||||
| First Niagara Financial Group | 46,400 | 659,808 | ||||
| † | FPIC Insurance Group | 52,373 | 1,419,818 | |||
| HCC Insurance Holdings | 46,900 | 1,294,440 | ||||
| Horace Mann Educators | 106,950 | 1,610,667 | ||||
| Hudson City Bancorp | 98,800 | 1,399,008 | ||||
| Lazard Class A | 34,800 | 1,242,360 | ||||
| Old National Bancorp | 63,650 | 760,618 | ||||
| People’s United Financial | 73,700 | 1,152,668 | ||||
| Safety Insurance Group | 17,500 | 659,225 | ||||
| * | Suffolk Bancorp | 49,645 | 1,524,598 | |||
| Transatlantic Holdings | 11,200 | 591,360 | ||||
| Willis Group Holdings | 33,300 | 1,041,957 | ||||
| 21,514,259 | ||||||
| Health Care – 4.84% | ||||||
| *† | Charles River Laboratories International | 10,700 | 420,617 | |||
| † | Conmed | 28,700 | 683,347 | |||
| * | DENTSPLY International | 38,600 | 1,345,210 | |||
| *† | Laboratory Corp. of America Holdings | 17,500 | 1,324,925 | |||
| † | LifePoint Hospitals | 37,720 | 1,387,342 | |||
| *† | Natus Medical | 18,100 | 287,971 | |||
| *† | RehabCare Group | 49,326 | 1,345,120 | |||
| † | Talecris Biotherapeutics Holdings | 61,500 | 1,225,080 | |||
| Universal Health Services Class B | 35,000 | 1,228,150 | ||||
| 9,247,762 | ||||||
| Real Estate – 0.70% | ||||||
| * | Equity Lifestyle Properties | 13,100 | 705,828 | |||
| * | Healthcare Realty Trust | 27,400 | 638,146 | |||
| 1,343,974 | ||||||
| Technology – 17.76% | ||||||
| *† | Alliant Techsystems | 16,100 | 1,308,930 | |||
| * | Altera | 26,200 | 636,922 | |||
| Amphenol Class A | 15,100 | 637,069 | ||||
| *† | CACI International Class A | 24,700 | 1,206,595 | |||
| † | Checkpoint Systems | 120,600 | 2,667,671 | |||
| Cohu | 90,748 | 1,249,600 | ||||
| *† | CommScope | 52,200 | 1,462,644 | |||
| Diebold | 24,600 | 781,296 | ||||
| Ducommun | 59,970 | 1,259,970 | ||||
| † | Esterline Technologies | 38,000 | 1,878,340 | |||
| † | Fairchild Semiconductor International | 91,800 | 977,670 | |||
| † | Flextronics International | 405,599 | 3,179,895 | |||
| * | Gentex | 68,900 | 1,338,038 | |||
| Harris | 25,600 | 1,215,744 | ||||
| *† | InterDigital | 8,000 | 222,880 | |||
| † | Intermec | 79,000 | 1,120,220 | |||
| † | LeCroy | 50,000 | 248,500 | |||
| † | McAfee | 30,600 | 1,227,978 | |||
| Methode Electronics | 112,562 | 1,114,364 | ||||
| † | Rudolph Technologies | 178,072 | 1,526,077 | |||
| *† | STEC | 54,400 | 651,712 | |||
| † | Stratasys | 31,800 | 775,284 | |||
| *† | Sybase | 28,300 | 1,319,346 | |||
| *† | Teradyne | 72,600 | 810,942 | |||
| † | Thermo Fisher Scientific | 35,800 | 1,841,552 | |||
| *† | VASCO Data Security International | 187,478 | 1,546,694 | |||
| *† | Vishay Intertechnology | 168,700 | 1,725,801 | |||
| 33,931,734 | ||||||
| Transportation – 1.23% | ||||||
| * | Alexander & Baldwin | 35,500 | 1,173,275 | |||
| * | SkyWest | 82,860 | 1,183,241 | |||
| 2,356,516 | ||||||
| Utilities – 1.72% | ||||||
| DPL | 45,400 | 1,234,426 | ||||
| DTE Energy | 16,600 | 740,360 | ||||
| Wisconsin Energy | 26,400 | 1,304,424 | ||||
| 3,279,210 | ||||||
| Total Common Stock | ||||||
| (cost $138,193,915) | 174,891,338 | |||||
| Principal | ||||||
| Amount | ||||||
| ≠Discount Notes – 6.64% | ||||||
| Federal Home Loan Bank | ||||||
| 0.001% 4/1/10 | $ | 9,221,295 | 9,221,295 | |||
| 0.01% 4/5/10 | 3,457,982 | 3,457,982 | ||||
| Total Discount Notes | ||||||
| (cost $12,679,277) | 12,679,277 | |||||
| U.S. Treasury Obligations – 0.54% | ||||||
| U.S. Treasury Bill | ||||||
| 0.10% 4/15/10 | 576,309 | 576,298 | ||||
| 0.12% 4/22/10 | 461,032 | 461,027 | ||||
| Total U.S. Treasury Obligations | ||||||
| (cost $1,037,341) | 1,037,325 | |||||
| Total Value of Securities Before Securities | ||||||
| Lending Collateral – 98.72% | ||||||
| (cost $151,910,533) | 188,607,940 | |||||
| Number of | ||||||
| Shares | ||||||
| Securities Lending Collateral** – 6.75% | ||||||
| Investment Companies | ||||||
| Mellon GSL DBT II | ||||||
| Collateral Fund | 11,052,683 | 11,052,683 | ||||
| BNY Mellon SL DBT II | ||||||
| Liquidating Fund | 1,859,653 | 1,841,056 | ||||
| @† | Mellon GSL Reinvestment Trust II | 263,528 | 11,200 | |||
| Total Securities Lending Collateral | ||||||
| (cost $13,175,864) | 12,904,939 | |||||
78
| Total Value of Securities – 105.47% | ||||
| (cost $165,086,397) | $ | 201,512,879 | © | |
| Obligation to Return Securities | ||||
| Lending Collateral** – (6.90%) | (13,175,864 | ) | ||
| Receivables and Other Assets | ||||
| Net of Liabilities – 1.43% | 2,720,366 | |||
| Net Assets Applicable to 18,719,949 | ||||
| Shares Outstanding – 100.00% | $ | 191,057,381 | ||
| Net Asset Value – Optimum Small-Mid Cap Value Fund | ||||
| Class A ($5,917,796 / 587,872 Shares) | $10.07 | |||
| Net Asset Value – Optimum Small-Mid Cap Value Fund | ||||
| Class B ($1,113,820 / 116,089 Shares) | $ 9.59 | |||
| Net Asset Value – Optimum Small-Mid Cap Value Fund | ||||
| Class C ($22,163,642 / 2,311,128 Shares) | $ 9.59 | |||
| Net Asset Value – Optimum Small-Mid Cap Value Fund | ||||
| Institutional Class ($161,862,123 / 15,704,860 Shares) | $10.31 | |||
| Components of Net Assets at March 31, 2010: | ||||
| Shares of beneficial interest | ||||
| (unlimited authorization – no par) | $ | 189,030,276 | ||
| Accumulated net realized loss on investments | (34,399,377 | ) | ||
| Net unrealized appreciation of investments | 36,426,482 | |||
| Total net assets | $ | 191,057,381 | ||
| * | Fully or partially on loan. |
| † | Non income producing security. |
| ≠ | The rate shown is the effective yield at the time of purchase. |
| ** | See Note 8 in “Notes to financial statements.” |
| @ | Illiquid security. At March 31, 2010, the aggregate amount of illiquid securities was $11,200, which represented 0.01% of the Fund’s net assets. See Note 9 in “Notes to financial statements.” |
| © | Includes $13,062,137 of securities loaned. |
| Net Asset Value and Offering Price Per Share – | |
| Optimum Small-Mid Cap Value Fund | |
| Net asset value Class A (A) | $10.07 |
| Sales charge (5.75% of offering price) (B) | 0.61 |
| Offering price | $10.68 |
| (A) | Net asset value per share, as illustrated, is the amount which would be paid upon redemption or repurchase of shares. |
| (B) | See the current prospectus for purchases of $75,000 or more. |
See accompanying notes
79
Statements of assets and liabilities
Optimum Fund Trust
March 31, 2010
| Optimum | Optimum | Optimum | Optimum | Optimum | Optimum | ||||||||||||
| Fixed Income | International | Large Cap | Large Cap | Small-Mid Cap | Small-Mid Cap | ||||||||||||
| Fund | Fund | Growth Fund | Value Fund | Growth Fund | Value Fund | ||||||||||||
| Assets: | |||||||||||||||||
| Investments, at value1 | $ | 745,005,137 | $ | 197,613,059 | $ | 681,143,153 | $ | 637,053,739 | $ | 233,415,392 | $ | 174,891,338 | |||||
| Short-term investments, at value | 77,477,264 | 3,893,701 | 22,037,574 | 8,082,892 | 3,971,373 | 13,716,602 | |||||||||||
| Short-term investments held as collateral | |||||||||||||||||
| for loaned securities, at value | 40,583,113 | 24,474,685 | 49,743,220 | 50,943,400 | 24,650,519 | 12,904,939 | |||||||||||
| Cash | 14,332,357 | 776,618 | 4,153,679 | 1,722,446 | 846,038 | 2,550,844 | |||||||||||
| Restricted cash | 80,000 | — | — | — | — | — | |||||||||||
| Foreign currencies, at value | 1,289,817 | 1,773,305 | 8,407 | 4,635 | — | — | |||||||||||
| Receivables for fund shares sold | 2,615,850 | 378,230 | 1,583,918 | 1,459,383 | 602,825 | 428,744 | |||||||||||
| Receivables for securities sold | 6,663,129 | 3,029,299 | 9,647,104 | 1,048,618 | 376,149 | 1,297,328 | |||||||||||
| Foreign currency forward contracts, at value | 311,512 | 19,930 | — | — | — | — | |||||||||||
| Dividends and interest receivable | 7,729,970 | 723,594 | 620,114 | 1,184,084 | 84,398 | 163,124 | |||||||||||
| Securities lending income receivable | 7,393 | 9,731 | 5,801 | 4,117 | 4,079 | 1,480 | |||||||||||
| Credit default swap contracts, at value | |||||||||||||||||
| (including up front payments received $239,940) | 161,226 | — | — | — | — | — | |||||||||||
| Other assets | 1,578 | — | — | — | — | — | |||||||||||
| Total assets | 896,258,346 | 232,692,152 | 768,942,970 | 701,503,314 | 263,950,773 | 205,954,399 | |||||||||||
| Liabilities: | |||||||||||||||||
| Payables for securities purchased | 56,585,004 | 3,311,928 | 9,712,150 | 1,319,010 | 1,643,194 | 1,258,373 | |||||||||||
| Payables for fund shares redeemed | 366,799 | 164,596 | 526,110 | 495,309 | 227,340 | 185,077 | |||||||||||
| Variation margin payable on futures contracts | 8,271 | — | — | — | — | — | |||||||||||
| Foreign currency forward contracts, at value | 5,738 | — | — | — | — | — | |||||||||||
| Obligation to return securities lending collateral | 41,847,744 | 25,127,926 | 50,827,105 | 52,001,651 | 25,169,878 | 13,175,864 | |||||||||||
| Annual protection payments on credit default swaps | 5,059 | — | — | — | — | — | |||||||||||
| Credit default swap contracts, at value | |||||||||||||||||
| (including up front payments received $71,318) | 231,174 | — | — | — | — | — | |||||||||||
| Due to manager and affiliates | 770,778 | 253,635 | 837,711 | 765,194 | 304,765 | 223,362 | |||||||||||
| Other accrued expenses | 134,673 | 82,690 | 91,310 | 87,288 | 59,244 | 53,694 | |||||||||||
| Other liabilities | — | 10,559 | 1,136 | 1,367 | 745 | 648 | |||||||||||
| Total liabilities | 99,955,240 | 28,951,334 | 61,995,522 | 54,669,819 | 27,405,166 | 14,897,018 | |||||||||||
| Total Net Assets | $ | 796,303,106 | $ | 203,740,818 | $ | 706,947,448 | $ | 646,833,495 | $ | 236,545,607 | $ | 191,057,381 | |||||
| Investments, at cost | $ | 742,720,605 | $ | 190,307,472 | $ | 580,600,110 | $ | 604,246,665 | $ | 194,694,389 | $ | 138,193,915 | |||||
| Short-term investments, at cost | 75,441,914 | 3,893,706 | 22,037,599 | 8,082,901 | 3,971,378 | 13,716,618 | |||||||||||
| Short-term investments held as collateral | |||||||||||||||||
| for loaned securities, at cost | 41,847,744 | 25,127,926 | 50,827,105 | 52,001,651 | 25,169,878 | 13,175,864 | |||||||||||
| Foreign currencies, at cost | 1,270,902 | 1,795,551 | 8,365 | 4,611 | — | — | |||||||||||
| 1including securities on loaned | 44,267,956 | 23,169,345 | 49,557,111 | 50,673,156 | 24,547,662 | 13,062,137 | |||||||||||
See accompanying notes
80
Statements of operations
Optimum Fund Trust
Year Ended March 31, 2010
| Optimum | Optimum | Optimum | Optimum | Optimum | Optimum | ||||||||||||||||||
| Fixed Income | International | Large Cap | Large Cap | Small-Mid Cap | Small-Mid Cap | ||||||||||||||||||
| Fund | Fund | Growth Fund | Value Fund | Growth Fund | Value Fund | ||||||||||||||||||
| Investment Income: | |||||||||||||||||||||||
| Dividends | $ | 255,478 | $ | 5,636,205 | $ | 8,269,975 | $ | 17,182,221 | $ | 949,192 | $ | 2,070,019 | |||||||||||
| Interest | 61,972,795 | 1,774 | 9,807 | 5,210 | 2,453 | 7,606 | |||||||||||||||||
| Securities lending income | 102,267 | 194,821 | 223,001 | 115,086 | 85,706 | 54,380 | |||||||||||||||||
| Foreign tax withheld | — | (463,757 | ) | (102,908 | ) | (75,504 | ) | (1,762 | ) | — | |||||||||||||
| 62,330,540 | 5,369,043 | 8,399,875 | 17,227,013 | 1,035,589 | 2,132,005 | ||||||||||||||||||
| Expenses: | |||||||||||||||||||||||
| Management fees | 4,203,791 | 1,430,022 | 4,851,966 | 4,249,705 | 1,900,901 | 1,472,477 | |||||||||||||||||
| Distribution expenses – Class A | 142,275 | 42,052 | 119,026 | 113,276 | 21,230 | 18,781 | |||||||||||||||||
| Distribution expenses – Class B | 56,836 | 22,503 | 58,065 | 56,635 | 10,402 | 9,998 | |||||||||||||||||
| Distribution expenses – Class C | 1,668,091 | 432,586 | 1,236,790 | 1,192,124 | 213,457 | 198,707 | |||||||||||||||||
| Dividend disbursing and transfer agent | |||||||||||||||||||||||
| fees and expenses | 1,847,002 | 614,640 | 1,690,602 | 1,575,369 | 609,832 | 543,141 | |||||||||||||||||
| Administration expenses | 1,115,511 | 290,341 | 1,010,035 | 939,485 | 285,135 | 234,421 | |||||||||||||||||
| Accounting fees | 282,730 | 70,313 | 252,624 | 232,488 | 69,042 | 56,764 | |||||||||||||||||
| Reports and statements to shareholders | 105,913 | 71,728 | 70,851 | 66,340 | 17,531 | 99,559 | |||||||||||||||||
| Registration fees | 104,313 | 38,057 | 103,417 | 99,734 | 34,885 | 41,175 | |||||||||||||||||
| Professional fees | 102,432 | 44,441 | 85,159 | 80,348 | 44,346 | 41,750 | |||||||||||||||||
| Trustees’ fees | 98,750 | 23,641 | 84,101 | 78,300 | 23,482 | 18,998 | |||||||||||||||||
| Insurance fees | 58,103 | 11,793 | 48,018 | 42,833 | 9,274 | 8,311 | |||||||||||||||||
| Pricing fees | 56,387 | 23,588 | 2,544 | 1,581 | 2,225 | 1,004 | |||||||||||||||||
| Custodian fees | 38,001 | 173,499 | 26,604 | 20,509 | 21,465 | 3,276 | |||||||||||||||||
| Other | 14,515 | 10,652 | 15,948 | 12,199 | 7,358 | 7,302 | |||||||||||||||||
| 9,894,650 | 3,299,856 | 9,655,750 | 8,760,926 | 3,270,565 | 2,755,664 | ||||||||||||||||||
| Less fees waived | (1,200,609 | ) | (330,336 | ) | (302,770 | ) | (214,726 | ) | (349,788 | ) | (434,076 | ) | |||||||||||
| Total operating expenses | 8,694,041 | 2,969,520 | 9,352,980 | 8,546,200 | 2,920,777 | 2,321,588 | |||||||||||||||||
| Net Investment Income (Loss) | 53,636,499 | 2,399,523 | (953,105 | ) | 8,680,813 | (1,885,188 | ) | (189,583 | ) | ||||||||||||||
| Net Realized and Unrealized Gain (Loss) on | |||||||||||||||||||||||
| Investments and Foreign Currencies: | |||||||||||||||||||||||
| Net realized gain (loss) on: | |||||||||||||||||||||||
| Investments | 19,970,718 | 10,606,766 | 80,651,222 | (57,389,541 | ) | 16,128,842 | 3,056,016 | ||||||||||||||||
| Futures contracts | 201,602 | 530,411 | — | — | — | — | |||||||||||||||||
| Swap contracts | (694,418 | ) | — | — | — | — | — | ||||||||||||||||
| Options written | 134 | — | — | — | — | — | |||||||||||||||||
| Foreign currencies | 1,659,911 | 934,882 | (47,747 | ) | (9,694 | ) | (28,821 | ) | — | ||||||||||||||
| Net realized gain (loss) | 21,137,947 | 12,072,059 | 80,603,475 | (57,399,235 | ) | 16,100,021 | 3,056,016 | ||||||||||||||||
| Net change in unrealized appreciation/depreciation | |||||||||||||||||||||||
| of investments and foreign currencies | 97,067,875 | 46,250,763 | 179,873,048 | 276,475,971 | 61,895,220 | 68,102,924 | |||||||||||||||||
| Net Realized and Unrealized Gain on | |||||||||||||||||||||||
| Investments and Foreign Currencies | 118,205,822 | 58,322,822 | 260,476,523 | 219,076,736 | 77,995,241 | 71,158,940 | |||||||||||||||||
| Net Increase in Net Assets | |||||||||||||||||||||||
| Resulting from Operations | $ | 171,842,321 | $ | 60,722,345 | $ | 259,523,418 | $ | 227,757,549 | $ | 76,110,053 | $ | 70,969,357 | |||||||||||
See accompanying notes
81
Statements of changes in net assets
Optimum Fund Trust
| Optimum Fixed Income Fund | Optimum International Fund | ||||||||||||||
| Year Ended | Year Ended | ||||||||||||||
| 3/31/10 | 3/31/09 | 3/31/10 | 3/31/09 | ||||||||||||
| Increase (Decrease) in Net Assets from Operations: | |||||||||||||||
| Net investment income | $ | 53,636,499 | $ | 45,259,747 | $ | 2,399,523 | $ | 5,709,309 | |||||||
| Net realized gain (loss) on investments and foreign currencies | 21,137,947 | (35,418,699 | ) | 12,072,059 | (71,368,918 | ) | |||||||||
| Net change in unrealized appreciation/depreciation of investments | |||||||||||||||
| and foreign currencies | 97,067,875 | (82,939,229 | ) | 46,250,763 | (63,546,680 | ) | |||||||||
| Net increase (decrease) in net assets resulting from operations | 171,842,321 | (73,098,181 | ) | 60,722,345 | (129,206,289 | ) | |||||||||
| Dividends and Distributions to Shareholders from: | |||||||||||||||
| Net investment income: | |||||||||||||||
| Class A | (2,704,699 | ) | (2,815,733 | ) | (210,267 | ) | (493,786 | ) | |||||||
| Class B | (348,148 | ) | (338,536 | ) | (36,894 | ) | (70,734 | ) | |||||||
| Class C | (10,367,571 | ) | (10,040,182 | ) | (708,469 | ) | (1,430,805 | ) | |||||||
| Institutional Class | (34,129,218 | ) | (32,218,868 | ) | (1,850,644 | ) | (4,568,363 | ) | |||||||
| Net realized gain on investments: | |||||||||||||||
| Class A | — | (185,122 | ) | — | (367,545 | ) | |||||||||
| Class B | — | (25,716 | ) | — | (67,937 | ) | |||||||||
| Class C | — | (760,332 | ) | — | (1,377,512 | ) | |||||||||
| Institutional Class | — | (1,866,977 | ) | — | (2,915,201 | ) | |||||||||
| (47,549,636 | ) | (48,251,466 | ) | (2,806,274 | ) | (11,291,883 | ) | ||||||||
| Capital Share Transactions: | |||||||||||||||
| Proceeds from shares sold: | |||||||||||||||
| Class A | 3,385,107 | 6,623,498 | 988,480 | 2,313,214 | |||||||||||
| Class B | 60,379 | 219,675 | 24,001 | 82,515 | |||||||||||
| Class C | 17,921,759 | 27,432,690 | 3,561,654 | 8,001,047 | |||||||||||
| Institutional Class | 194,426,459 | 184,532,148 | 60,448,982 | 42,881,265 | |||||||||||
| Net asset value of shares issued upon reinvestment of dividends | |||||||||||||||
| and distributions: | |||||||||||||||
| Class A | 2,644,452 | 2,946,630 | 206,977 | 846,619 | |||||||||||
| Class B | 336,730 | 347,873 | 36,076 | 136,079 | |||||||||||
| Class C | 10,126,943 | 10,523,332 | 699,187 | 2,774,434 | |||||||||||
| Institutional Class | 33,095,912 | 33,212,241 | 1,822,132 | 7,383,252 | |||||||||||
| 261,997,741 | 265,838,087 | 67,787,489 | 64,418,425 | ||||||||||||
| Cost of shares repurchased: | |||||||||||||||
| Class A | (11,854,007 | ) | (25,792,318 | ) | (3,052,859 | ) | (5,873,329 | ) | |||||||
| Class B | (1,319,233 | ) | (2,825,370 | ) | (383,458 | ) | (707,047 | ) | |||||||
| Class C | (44,582,487 | ) | (106,393,836 | ) | (11,030,505 | ) | (21,017,796 | ) | |||||||
| Institutional Class | (168,483,326 | ) | (300,003,025 | ) | (32,787,957 | ) | (57,589,007 | ) | |||||||
| (226,239,053 | ) | (435,014,549 | ) | (47,254,779 | ) | (85,187,179 | ) | ||||||||
| Increase (decrease) in net assets derived from capital share transactions | 35,758,688 | (169,176,462 | ) | 20,532,710 | (20,768,754 | ) | |||||||||
| Net Increase (Decrease) in Net Assets | 160,051,373 | (290,526,109 | ) | 78,448,781 | (161,266,926 | ) | |||||||||
| Net Assets: | |||||||||||||||
| Beginning of year | 636,251,733 | 926,777,842 | 125,292,037 | 286,558,963 | |||||||||||
| End of year | $ | 796,303,106 | $ | 636,251,733 | $ | 203,740,818 | $ | 125,292,037 | |||||||
| Undistributed net investment income | $ | 15,471,348 | $ | 7,470,433 | $ | 2,708,008 | $ | 1,631,936 | |||||||
See accompanying notes
82
| Optimum Large Cap Growth Fund | Optimum Large Cap Value Fund | ||||||||||||||
| Year Ended | Year Ended | ||||||||||||||
| 3/31/10 | 3/31/09 | 3/31/10 | 3/31/09 | ||||||||||||
| Increase (Decrease) in Net Assets from Operations: | |||||||||||||||
| Net investment income (loss) | $ | (953,105 | ) | $ | 938,691 | $ | 8,680,813 | $ | 13,717,159 | ||||||
| Net realized gain (loss) on investments and foreign currencies | 80,603,475 | (240,980,397 | ) | (57,399,235 | ) | (129,375,435 | ) | ||||||||
| Net change in unrealized appreciation/depreciation of investments | |||||||||||||||
| and foreign currencies | 179,873,048 | (133,409,382 | ) | 276,475,971 | (229,960,349 | ) | |||||||||
| Net increase (decrease) in net assets resulting from operations | 259,523,418 | (373,451,088 | ) | 227,757,549 | (345,618,625 | ) | |||||||||
| Dividends and Distributions to Shareholders from: | |||||||||||||||
| Net investment income: | |||||||||||||||
| Class A | — | — | (693,967 | ) | (134,409 | ) | |||||||||
| Class B | — | — | (82,375 | ) | (8,243 | ) | |||||||||
| Class C | — | — | (1,726,789 | ) | (181,720 | ) | |||||||||
| Institutional Class | (753,154 | ) | — | (11,111,005 | ) | (2,187,864 | ) | ||||||||
| Net realized gain on investments: | |||||||||||||||
| Class A | — | — | — | (662,775 | ) | ||||||||||
| Class B | — | — | — | (117,880 | ) | ||||||||||
| Class C | — | — | — | (2,598,600 | ) | ||||||||||
| Institutional Class | — | — | — | (8,022,167 | ) | ||||||||||
| (753,154 | ) | — | (13,614,136 | ) | (13,913,658 | ) | |||||||||
| Capital Share Transactions: | |||||||||||||||
| Proceeds from shares sold: | |||||||||||||||
| Class A | 2,642,285 | 7,422,542 | 2,529,348 | 6,566,676 | |||||||||||
| Class B | 96,636 | 378,005 | 107,433 | 308,821 | |||||||||||
| Class C | 10,516,228 | 24,408,305 | 10,384,597 | 22,022,257 | |||||||||||
| Institutional Class | 125,781,819 | 175,624,121 | 113,126,953 | 177,257,043 | |||||||||||
| Net asset value of shares issued upon reinvestment of dividends | |||||||||||||||
| and distributions: | |||||||||||||||
| Class A | — | — | 685,011 | 790,219 | |||||||||||
| Class B | — | — | 79,977 | 124,194 | |||||||||||
| Class C | — | — | 1,704,441 | 2,749,342 | |||||||||||
| Institutional Class | 741,206 | — | 10,938,799 | 10,086,689 | |||||||||||
| 139,778,174 | 207,832,973 | 139,556,559 | 219,905,241 | ||||||||||||
| Cost of shares repurchased: | |||||||||||||||
| Class A | (8,517,252 | ) | (14,146,760 | ) | (7,859,345 | ) | (13,441,430 | ) | |||||||
| Class B | (1,062,063 | ) | (1,682,655 | ) | (996,339 | ) | (1,682,955 | ) | |||||||
| Class C | (29,951,306 | ) | (52,996,172 | ) | (28,982,433 | ) | (53,211,184 | ) | |||||||
| Institutional Class | (190,004,307 | ) | (217,730,097 | ) | (158,033,296 | ) | (178,721,590 | ) | |||||||
| (229,534,928 | ) | (286,555,684 | ) | (195,871,413 | ) | (247,057,159 | ) | ||||||||
| Decrease in net assets derived from capital share transactions | (89,756,754 | ) | (78,722,711 | ) | (56,314,854 | ) | (27,151,918 | ) | |||||||
| Net Increase (Decrease) in Net Assets | 169,013,510 | (452,173,799 | ) | 157,828,559 | (386,684,201 | ) | |||||||||
| Net Assets: | |||||||||||||||
| Beginning of year | 537,933,938 | 990,107,737 | 489,004,936 | 875,689,137 | |||||||||||
| End of year | $ | 706,947,448 | $ | 537,933,938 | $ | 646,833,495 | $ | 489,004,936 | |||||||
| Undistributed (accumulated) net investment income (loss) | $ | (21,830 | ) | $ | 663,683 | $ | 8,651,825 | $ | 13,594,842 | ||||||
See accompanying notes
(continues) 83
Statements of changes in net assets
Optimum Fund Trust
| Optimum Small-Mid Cap Growth Fund | Optimum Small-Mid Cap Value Fund | ||||||||||||||
| Year Ended | Year Ended | ||||||||||||||
| 3/31/10 | 3/31/09 | 3/31/10 | 3/31/09 | ||||||||||||
| Increase (Decrease) in Net Assets from Operations: | |||||||||||||||
| Net investment income (loss) | $ | (1,885,188 | ) | $ | (1,007,593 | ) | $ | (189,583 | ) | $ | 182,207 | ||||
| Net realized gain (loss) on investments and foreign cuurencies | 16,100,021 | (34,407,162 | ) | 3,056,016 | (35,907,840 | ) | |||||||||
| Net change in unrealized appreciation/depreciation of investments | 61,895,220 | (19,400,809 | ) | 68,102,924 | (17,180,970 | ) | |||||||||
| Net increase (decrease) in net assets resulting from operations | 76,110,053 | (54,815,564 | ) | 70,969,357 | (52,906,603 | ) | |||||||||
| Dividends and Distributions to Shareholders from: | |||||||||||||||
| Net investment income: | |||||||||||||||
| Institutional Class | — | — | (88,032 | ) | — | ||||||||||
| Net realized gain on investments: | |||||||||||||||
| Class A | — | — | — | (15,258 | ) | ||||||||||
| Class B | — | — | — | (2,844 | ) | ||||||||||
| Class C | — | — | — | (57,073 | ) | ||||||||||
| Institutional Class | — | — | — | (115,421 | ) | ||||||||||
| Return of Capital: | |||||||||||||||
| Institutional Class | — | — | (92,374 | ) | — | ||||||||||
| — | — | (180,406 | ) | (190,596 | ) | ||||||||||
| Capital Share Transactions: | |||||||||||||||
| Proceeds from shares sold: | |||||||||||||||
| Class A | 539,025 | 1,537,008 | 412,951 | 1,328,927 | |||||||||||
| Class B | 35,605 | 76,663 | 25,862 | 70,326 | |||||||||||
| Class C | 2,091,719 | 4,919,070 | 1,722,368 | 4,307,673 | |||||||||||
| Institutional Class | 128,206,873 | 29,232,627 | 74,088,679 | 50,305,391 | |||||||||||
| Net asset value of shares issued upon reinvestment of dividends | |||||||||||||||
| and distributions: | |||||||||||||||
| Class A | — | — | — | 15,258 | |||||||||||
| Class B | — | — | — | 2,813 | |||||||||||
| Class C | — | — | — | 56,432 | |||||||||||
| Institutional Class | — | — | 177,262 | 113,479 | |||||||||||
| 130,873,222 | 35,765,368 | 76,427,122 | 56,200,299 | ||||||||||||
| Cost of shares repurchased: | |||||||||||||||
| Class A | (1,536,241 | ) | (2,529,586 | ) | (1,438,753 | ) | (2,789,717 | ) | |||||||
| Class B | (191,945 | ) | (294,311 | ) | (171,978 | ) | (296,932 | ) | |||||||
| Class C | (5,275,925 | ) | (9,494,543 | ) | (4,946,735 | ) | (8,872,916 | ) | |||||||
| Institutional Class | (39,161,101 | ) | (28,506,205 | ) | (27,361,397 | ) | (23,712,202 | ) | |||||||
| (46,165,212 | ) | (40,824,645 | ) | (33,918,863 | ) | (35,671,767 | ) | ||||||||
| Increase (decrease) in net assets derived from capital share transactions | 84,708,010 | (5,059,277 | ) | 42,508,259 | 20,528,532 | ||||||||||
| Net Increase (Decrease) in Net Assets | 160,818,063 | (59,874,841 | ) | 113,297,210 | (32,568,667 | ) | |||||||||
| Net Assets: | |||||||||||||||
| Beginning of year | 75,727,544 | 135,602,385 | 77,760,171 | 110,328,838 | |||||||||||
| End of year | $ | 236,545,607 | $ | 75,727,544 | $ | 191,057,381 | $ | 77,760,171 | |||||||
| Undistributed (accumulated) net investment income (loss) | $ | (13,721 | ) | $ | (949 | ) | $ | — | $ | 177,373 | |||||
See accompanying notes
84
Financial highlights
Optimum Fixed Income Fund Class A
Selected data for each share of the Fund outstanding throughout each period were as follows:
| Year Ended | |||||||||||||||||||||
| 3/31/10 | 3/31/09 | 3/31/08 | 3/31/07 | 3/31/06 | |||||||||||||||||
| Net asset value, beginning of period | $7.750 | $8.930 | $9.050 | $8.740 | $8.890 | ||||||||||||||||
| Income (loss) from investment operations: | |||||||||||||||||||||
| Net investment income1 | 0.661 | 0.449 | 0.402 | 0.399 | 0.316 | ||||||||||||||||
| Net realized and unrealized gain (loss) on investments | |||||||||||||||||||||
| and foreign currencies | 1.482 | (1.140 | ) | (0.066 | ) | 0.255 | (0.199 | ) | |||||||||||||
| Total from investment operations | 2.143 | (0.691 | ) | 0.336 | 0.654 | 0.117 | |||||||||||||||
| Less dividends and distributions from: | |||||||||||||||||||||
| Net investment income | (0.603 | ) | (0.462 | ) | (0.380 | ) | (0.344 | ) | (0.253 | ) | |||||||||||
| Net realized gain on investments | — | (0.027 | ) | (0.076 | ) | — | (0.014 | ) | |||||||||||||
| Total dividends and distributions | (0.603 | ) | (0.489 | ) | (0.456 | ) | (0.344 | ) | (0.267 | ) | |||||||||||
| Net asset value, end of period | $9.290 | $7.750 | $8.930 | $9.050 | $8.740 | ||||||||||||||||
| Total return2 | 28.24% | (7.82% | ) | 3.78% | 7.58% | 1.31% | |||||||||||||||
| Ratios and supplemental data: | |||||||||||||||||||||
| Net assets, end of period (000 omitted) | $40,808 | $39,299 | $63,262 | $58,691 | $47,956 | ||||||||||||||||
| Ratio of expenses to average net assets | 1.31% | 1.24% | 1.24% | 1.25% | 1.25% | ||||||||||||||||
| Ratio of expenses to average net assets | |||||||||||||||||||||
| prior to fees waived and expense paid indirectly | 1.48% | 1.47% | 1.43% | 1.61% | 1.67% | ||||||||||||||||
| Ratio of net investment income to average net assets | 7.49% | 5.38% | 4.44% | 4.48% | 3.55% | ||||||||||||||||
| Ratio of net investment income to average net assets | |||||||||||||||||||||
| prior to fees waived and expense paid indirectly | 7.32% | 5.15% | 4.25% | 4.12% | 3.13% | ||||||||||||||||
| Portfolio turnover | 134% | 158% | 256% | 238% | 298% | ||||||||||||||||
| 1 The average shares outstanding method has been applied for per share information. | |
| 2 Total investment return is based on the change in net asset value of a share during the period and assumes reinvestment of dividends and distributions at net asset value and does not reflect the impact of a sales charge. Total investment return during all of the periods shown reflects a waiver by the manager. Performance would have been lower had the waiver not been in effect. |
See accompanying notes
(continues) 85
Financial highlights
Optimum Fixed Income Fund Class B
Selected data for each share of the Fund outstanding throughout each period were as follows:
| Year Ended | |||||||||||||||||||||
| 3/31/10 | 3/31/09 | 3/31/08 | 3/31/07 | 3/31/06 | |||||||||||||||||
| Net asset value, beginning of period | $7.750 | $8.930 | $9.060 | $8.740 | $8.900 | ||||||||||||||||
| Income (loss) from investment operations: | |||||||||||||||||||||
| Net investment income1 | 0.604 | 0.395 | 0.343 | 0.342 | 0.258 | ||||||||||||||||
| Net realized and unrealized gain (loss) on investments | |||||||||||||||||||||
| and foreign currencies | 1.486 | (1.140 | ) | (0.076 | ) | 0.264 | (0.209 | ) | |||||||||||||
| Total from investment operations | 2.090 | (0.745 | ) | 0.267 | 0.606 | 0.049 | |||||||||||||||
| Less dividends and distributions from: | |||||||||||||||||||||
| Net investment income | (0.560 | ) | (0.408 | ) | (0.321 | ) | (0.286 | ) | (0.195 | ) | |||||||||||
| Net realized gain on investments | — | (0.027 | ) | (0.076 | ) | — | (0.014 | ) | |||||||||||||
| Total dividends and distributions | (0.560 | ) | (0.435 | ) | (0.397 | ) | (0.286 | ) | (0.209 | ) | |||||||||||
| Net asset value, end of period | $9.280 | $7.750 | $8.930 | $9.060 | $8.740 | ||||||||||||||||
| Total return2 | 27.51% | (8.42% | ) | 2.99% | 7.01% | 0.54% | |||||||||||||||
| Ratios and supplemental data: | |||||||||||||||||||||
| Net assets, end of period (000 omitted) | $5,587 | $5,483 | $8,788 | $9,568 | $9,278 | ||||||||||||||||
| Ratio of expenses to average net assets | 1.96% | 1.89% | 1.89% | 1.90% | 1.90% | ||||||||||||||||
| Ratio of expenses to average net assets | |||||||||||||||||||||
| prior to fees waived and expense paid indirectly | 2.13% | 2.12% | 2.08% | 2.26% | 2.32% | ||||||||||||||||
| Ratio of net investment income to average net assets | 6.84% | 4.73% | 3.79% | 3.83% | 2.90% | ||||||||||||||||
| Ratio of net investment income to average net assets | |||||||||||||||||||||
| prior to fees waived and expense paid indirectly | 6.67% | 4.50% | 3.60% | 3.47% | 2.48% | ||||||||||||||||
| Portfolio turnover | 134% | 158% | 256% | 238% | 298% | ||||||||||||||||
| 1 The average shares outstanding method has been applied for per share information. | |
| 2 Total investment return is based on the change in net asset value of a share during the period and assumes reinvestment of dividends and distributions at net asset value and does not reflect the impact of a sales charge. Total investment return during all of the periods shown reflects a waiver by the manager. Performance would have been lower had the waiver not been in effect. |
See accompanying notes
86
Optimum Fixed Income Fund Class C
Selected data for each share of the Fund outstanding throughout each period were as follows:
| Year Ended | |||||||||||||||||||||
| 3/31/10 | 3/31/09 | 3/31/08 | 3/31/07 | 3/31/06 | |||||||||||||||||
| Net asset value, beginning of period | $7.760 | $8.940 | $9.060 | $8.750 | $8.900 | ||||||||||||||||
| Income (loss) from investment operations: | |||||||||||||||||||||
| Net investment income1 | 0.604 | 0.395 | 0.343 | 0.341 | 0.258 | ||||||||||||||||
| Net realized and unrealized gain (loss) on investments | |||||||||||||||||||||
| and foreign currencies | 1.476 | (1.140 | ) | (0.066 | ) | 0.255 | (0.199 | ) | |||||||||||||
| Total from investment operations | 2.080 | (0.745 | ) | 0.277 | 0.596 | 0.059 | |||||||||||||||
| Less dividends and distributions from: | |||||||||||||||||||||
| Net investment income | (0.560 | ) | (0.408 | ) | (0.321 | ) | (0.286 | ) | (0.195 | ) | |||||||||||
| Net realized gain on investments | — | (0.027 | ) | (0.076 | ) | — | (0.014 | ) | |||||||||||||
| Total dividends and distributions | (0.560 | ) | (0.435 | ) | (0.397 | ) | (0.286 | ) | (0.209 | ) | |||||||||||
| Net asset value, end of period | $9.280 | $7.760 | $8.940 | $9.060 | $8.750 | ||||||||||||||||
| Total return2 | 27.34% | (8.41% | ) | 3.11% | 6.88% | 0.65% | |||||||||||||||
| Ratios and supplemental data: | |||||||||||||||||||||
| Net assets, end of period (000 omitted) | $170,214 | $157,185 | $257,340 | $227,036 | $186,869 | ||||||||||||||||
| Ratio of expenses to average net assets | 1.96% | 1.89% | 1.89% | 1.90% | 1.90% | ||||||||||||||||
| Ratio of expenses to average net assets | |||||||||||||||||||||
| prior to fees waived and expense paid indirectly | 2.13% | 2.12% | 2.08% | 2.26% | 2.32% | ||||||||||||||||
| Ratio of net investment income to average net assets | 6.84% | 4.73% | 3.79% | 3.83% | 2.90% | ||||||||||||||||
| Ratio of net investment income to average net assets | |||||||||||||||||||||
| prior to fees waived and expense paid indirectly | 6.67% | 4.50% | 3.60% | 3.47% | 2.48% | ||||||||||||||||
| Portfolio turnover | 134% | 158% | 256% | 238% | 298% | ||||||||||||||||
| 1 The average shares outstanding method has been applied for per share information. | |
| 2 Total investment return is based on the change in net asset value of a share during the period and assumes reinvestment of dividends and distributions at net asset value and does not reflect the impact of a sales charge. Total investment return during all of the periods shown reflects a waiver by the manager. Performance would have been lower had the waiver not been in effect. |
See accompanying notes
(continues) 87
Financial highlights
Optimum Fixed Income Fund Institutional Class
Selected data for each share of the Fund outstanding throughout each period were as follows:
| Year Ended | |||||||||||||||||||||
| 3/31/10 | 3/31/09 | 3/31/08 | 3/31/07 | 3/31/06 | |||||||||||||||||
| Net asset value, beginning of period | $7.740 | $8.920 | $9.050 | $8.730 | $8.890 | ||||||||||||||||
| Income (loss) from investment operations: | |||||||||||||||||||||
| Net investment income1 | 0.692 | 0.479 | 0.434 | 0.431 | 0.348 | ||||||||||||||||
| Net realized and unrealized gain (loss) on investments | |||||||||||||||||||||
| and foreign currencies | 1.484 | (1.141 | ) | (0.076 | ) | 0.265 | (0.209 | ) | |||||||||||||
| Total from investment operations | 2.176 | (0.662 | ) | 0.358 | 0.696 | 0.139 | |||||||||||||||
| Less dividends and distributions from: | |||||||||||||||||||||
| Net investment income | (0.626 | ) | (0.491 | ) | (0.412 | ) | (0.376 | ) | (0.285 | ) | |||||||||||
| Net realized gain on investments | — | (0.027 | ) | (0.076 | ) | — | (0.014 | ) | |||||||||||||
| Total dividends and distributions | (0.626 | ) | (0.518 | ) | (0.488 | ) | (0.376 | ) | (0.299 | ) | |||||||||||
| Net asset value, end of period | $9.290 | $7.740 | $8.920 | $9.050 | $8.730 | ||||||||||||||||
| Total return2 | 28.73% | (7.51% | ) | 4.04% | 8.09% | 1.56% | |||||||||||||||
| Ratios and supplemental data: | |||||||||||||||||||||
| Net assets, end of period (000 omitted) | $579,694 | $434,285 | $597,388 | $454,154 | $309,363 | ||||||||||||||||
| Ratio of expenses to average net assets | 0.96% | 0.89% | 0.89% | 0.90% | 0.90% | ||||||||||||||||
| Ratio of expenses to average net assets | |||||||||||||||||||||
| prior to fees waived and expense paid indirectly | 1.13% | 1.12% | 1.08% | 1.26% | 1.32% | ||||||||||||||||
| Ratio of net investment income to average net assets | 7.84% | 5.73% | 4.79% | 4.83% | 3.90% | ||||||||||||||||
| Ratio of net investment income to average net assets | |||||||||||||||||||||
| prior to fees waived and expense paid indirectly | 7.67% | 5.50% | 4.60% | 4.47% | 3.48% | ||||||||||||||||
| Portfolio turnover | 134% | 158% | 256% | 238% | 298% | ||||||||||||||||
| 1 The average shares outstanding method has been applied for per share information. | |
| 2 Total investment return is based on the change in net asset value of a share during the period and assumes reinvestment of dividends and distributions at net asset value. Total investment return during all of the periods shown reflects a waiver by the manager. Performance would have been lower had the waiver not been in effect. |
See accompanying notes
88
Optimum International Fund Class A
Selected data for each share of the Fund outstanding throughout each period were as follows:
| Year Ended | |||||||||||||||||||||
| 3/31/10 | 3/31/09 | 3/31/08 | 3/31/07 | 3/31/06 | |||||||||||||||||
| Net asset value, beginning of period | $7.010 | $13.840 | $15.490 | $13.470 | $11.660 | ||||||||||||||||
| Income (loss) from investment operations: | |||||||||||||||||||||
| Net investment income1 | 0.124 | 0.280 | 0.262 | 0.112 | 0.180 | ||||||||||||||||
| Net realized and unrealized gain (loss) on investments | |||||||||||||||||||||
| and foreign currencies | 3.366 | (6.557 | ) | (0.798 | ) | 2.661 | 2.456 | ||||||||||||||
| Total from investment operations | 3.490 | (6.277 | ) | (0.536 | ) | 2.773 | 2.636 | ||||||||||||||
| Less dividends and distributions from: | |||||||||||||||||||||
| Net investment income | (0.160 | ) | (0.326 | ) | (0.116 | ) | (0.172 | ) | (0.074 | ) | |||||||||||
| Net realized gain on investments | — | (0.227 | ) | (0.998 | ) | (0.581 | ) | (0.752 | ) | ||||||||||||
| Total dividends and distributions | (0.160 | ) | (0.553 | ) | (1.114 | ) | (0.753 | ) | (0.826 | ) | |||||||||||
| Net asset value, end of period | $10.340 | $7.010 | $13.840 | $15.490 | $13.470 | ||||||||||||||||
| Total return2 | 50.29% | (46.64% | ) | (3.96% | ) | 21.26% | 23.54% | ||||||||||||||
| Ratios and supplemental data: | |||||||||||||||||||||
| Net assets, end of period (000 omitted) | $12,082 | $9,578 | $22,971 | $25,523 | $20,247 | ||||||||||||||||
| Ratio of expenses to average net assets | 1.75% | 1.77% | 1.75% | 1.96% | 1.96% | ||||||||||||||||
| Ratio of expenses to average net assets | |||||||||||||||||||||
| prior to fees waived and expense paid indirectly | 1.94% | 1.86% | 1.75% | 1.96% | 2.20% | ||||||||||||||||
| Ratio of net investment income to average net assets | 1.30% | 2.66% | 1.69% | 0.78% | 1.47% | ||||||||||||||||
| Ratio of net investment income to average net assets | |||||||||||||||||||||
| prior to fees waived and expense paid indirectly | 1.11% | 2.57% | 1.69% | 0.78% | 1.23% | ||||||||||||||||
| Portfolio turnover | 91% | 58% | 19% | 18% | 68% | ||||||||||||||||
| 1 The average shares outstanding method has been applied for per share information. |
| 2 Total investment return is based on the change in net asset value of a share during the period and assumes reinvestment of dividends and distributions at net asset value and does not reflect the impact of a sales charge. Total investment return during some of the periods shown reflects a waiver by the manager. Performance would have been lower had the waiver not been in effect. |
See accompanying notes
(continues) 89
Financial highlights
Optimum International Fund Class B
Selected data for each share of the Fund outstanding throughout each period were as follows:
| Year Ended | |||||||||||||||||||||
| 3/31/10 | 3/31/09 | 3/31/08 | 3/31/07 | 3/31/06 | |||||||||||||||||
| Net asset value, beginning of period | $6.880 | $13.580 | $15.240 | $13.290 | $11.530 | ||||||||||||||||
| Income (loss) from investment operations: | |||||||||||||||||||||
| Net investment income1 | 0.064 | 0.213 | 0.163 | 0.021 | 0.102 | ||||||||||||||||
| Net realized and unrealized gain (loss) on investments | |||||||||||||||||||||
| and foreign currencies | 3.304 | (6.436 | ) | (0.787 | ) | 2.614 | 2.426 | ||||||||||||||
| Total from investment operations | 3.368 | (6.223 | ) | (0.624 | ) | 2.635 | 2.528 | ||||||||||||||
| Less dividends and distributions from: | |||||||||||||||||||||
| Net investment income | (0.148 | ) | (0.250 | ) | (0.038 | ) | (0.104 | ) | (0.016 | ) | |||||||||||
| Net realized gain on investments | — | (0.227 | ) | (0.998 | ) | (0.581 | ) | (0.752 | ) | ||||||||||||
| Total dividends and distributions | (0.148 | ) | (0.477 | ) | (1.036 | ) | (0.685 | ) | (0.768 | ) | |||||||||||
| Net asset value, end of period | $10.100 | $6.880 | $13.580 | $15.240 | $13.290 | ||||||||||||||||
| Total return2 | 49.42% | (47.02% | ) | (4.59% | ) | 20.44% | 22.81% | ||||||||||||||
| Ratios and supplemental data: | |||||||||||||||||||||
| Net assets, end of period (000 omitted) | $2,243 | $1,764 | $4,203 | $5,031 | $4,594 | ||||||||||||||||
| Ratio of expenses to average net assets | 2.40% | 2.42% | 2.40% | 2.61% | 2.61% | ||||||||||||||||
| Ratio of expenses to average net assets | |||||||||||||||||||||
| prior to fees waived and expense paid indirectly | 2.59% | 2.51% | 2.40% | 2.61% | 2.85% | ||||||||||||||||
| Ratio of net investment income to average net assets | 0.65% | 2.01% | 1.04% | 0.13% | 0.82% | ||||||||||||||||
| Ratio of net investment income to average net assets | |||||||||||||||||||||
| prior to fees waived and expense paid indirectly | 0.46% | 1.92% | 1.04% | 0.13% | 0.58% | ||||||||||||||||
| Portfolio turnover | 91% | 58% | 19% | 18% | 68% | ||||||||||||||||
| 1 The average shares outstanding method has been applied for per share information. |
| 2 Total investment return is based on the change in net asset value of a share during the period and assumes reinvestment of dividends and distributions at net asset value and does not reflect the impact of a sales charge. Total investment return during some of the periods shown reflects a waiver by the manager. Performance would have been lower had the waiver not been in effect. |
See accompanying notes
90
Optimum International Fund Class C
Selected data for each share of the Fund outstanding throughout each period were as follows:
| Year Ended | |||||||||||||||||||||
| 3/31/10 | 3/31/09 | 3/31/08 | 3/31/07 | 3/31/06 | |||||||||||||||||
| Net asset value, beginning of period | $6.890 | $13.590 | $15.250 | $13.290 | $11.540 | ||||||||||||||||
| Income (loss) from investment operations: | |||||||||||||||||||||
| Net investment income1 | 0.064 | 0.213 | 0.163 | 0.021 | 0.102 | ||||||||||||||||
| Net realized and unrealized gain (loss) on investments | |||||||||||||||||||||
| and foreign currencies | 3.294 | (6.436 | ) | (0.787 | ) | 2.624 | 2.416 | ||||||||||||||
| Total from investment operations | 3.358 | (6.223 | ) | (0.624 | ) | 2.645 | 2.518 | ||||||||||||||
| Less dividends and distributions from: | |||||||||||||||||||||
| Net investment income | (0.148 | ) | (0.250 | ) | (0.038 | ) | (0.104 | ) | (0.016 | ) | |||||||||||
| Net realized gain on investments | — | (0.227 | ) | (0.998 | ) | (0.581 | ) | (0.752 | ) | ||||||||||||
| Total dividends and distributions | (0.148 | ) | (0.477 | ) | (1.036 | ) | (0.685 | ) | (0.768 | ) | |||||||||||
| Net asset value, end of period | $10.100 | $6.890 | $13.590 | $15.250 | $13.290 | ||||||||||||||||
| Total return2 | 49.20% | (46.98% | ) | (4.59% | ) | 20.51% | 22.69% | ||||||||||||||
| Ratios and supplemental data: | |||||||||||||||||||||
| Net assets, end of period (000 omitted) | $43,260 | $34,520 | $84,431 | $91,696 | $70,828 | ||||||||||||||||
| Ratio of expenses to average net assets | 2.40% | 2.42% | 2.40% | 2.61% | 2.61% | ||||||||||||||||
| Ratio of expenses to average net assets | |||||||||||||||||||||
| prior to fees waived and expense paid indirectly | 2.59% | 2.51% | 2.40% | 2.61% | 2.85% | ||||||||||||||||
| Ratio of net investment income to average net assets | 0.65% | 2.01% | 1.04% | 0.13% | 0.82% | ||||||||||||||||
| Ratio of net investment income to average net assets | |||||||||||||||||||||
| prior to fees waived and expense paid indirectly | 0.46% | 1.92% | 1.04% | 0.13% | 0.58% | ||||||||||||||||
| Portfolio turnover | 91% | 58% | 19% | 18% | 68% | ||||||||||||||||
| 1 The average shares outstanding method has been applied for per share information. |
| 2 Total investment return is based on the change in net asset value of a share during the period and assumes reinvestment of dividends and distributions at net asset value and does not reflect the impact of a sales charge. Total investment return during some of the periods shown reflects a waiver by the manager. Performance would have been lower had the waiver not been in effect. |
See accompanying notes
(continues) 91
Financial highlights
Optimum International Fund Institutional Class
Selected data for each share of the Fund outstanding throughout each period were as follows:
| Year Ended | ||||||||||||||||
| 3/31/10 | 3/31/09 | 3/31/08 | 3/31/07 | 3/31/06 | ||||||||||||
| Net asset value, beginning of period | $7.050 | $13.940 | $15.590 | $13.550 | $11.720 | |||||||||||
| Income (loss) from investment operations: | ||||||||||||||||
| Net investment income1 | 0.157 | 0.317 | 0.317 | 0.162 | 0.224 | |||||||||||
| Net realized and unrealized gain (loss) on investments | ||||||||||||||||
| and foreign currencies | 3.393 | (6.611 | ) | (0.797 | ) | 2.679 | 2.464 | |||||||||
| Total from investment operations | 3.550 | (6.294 | ) | (0.480 | ) | 2.841 | 2.688 | |||||||||
| Less dividends and distributions from: | ||||||||||||||||
| Net investment income | (0.170 | ) | (0.369 | ) | (0.172 | ) | (0.220 | ) | (0.106 | ) | ||||||
| Net realized gain on investments | — | (0.227 | ) | (0.998 | ) | (0.581 | ) | (0.752 | ) | |||||||
| Total dividends and distributions | (0.170 | ) | (0.596 | ) | (1.170 | ) | (0.801 | ) | (0.858 | ) | ||||||
| Net asset value, end of period | $10.430 | $7.050 | $13.940 | $15.590 | $13.550 | |||||||||||
| Total return2 | 50.88% | (46.49% | ) | (3.59% | ) | 21.68% | 23.91% | |||||||||
| Ratios and supplemental data: | ||||||||||||||||
| Net assets, end of period (000 omitted) | $146,156 | $79,430 | $174,954 | $154,198 | $99,733 | |||||||||||
| Ratio of expenses to average net assets | 1.40% | 1.42% | 1.40% | 1.61% | 1.61% | |||||||||||
| Ratio of expenses to average net assets | ||||||||||||||||
| prior to fees waived and expense paid indirectly | 1.59% | 1.51% | 1.40% | 1.61% | 1.85% | |||||||||||
| Ratio of net investment income to average net assets | 1.65% | 3.01% | 2.04% | 1.13% | 1.82% | |||||||||||
| Ratio of net investment income to average net assets | ||||||||||||||||
| prior to fees waived and expense paid indirectly | 1.46% | 2.92% | 2.04% | 1.13% | 1.58% | |||||||||||
| Portfolio turnover | 91% | 58% | 19% | 18% | 68% | |||||||||||
| 1 The average shares outstanding method has been applied for per share information. | |
| 2 Total investment return is based on the change in net asset value of a share during the period and assumes reinvestment of dividends and distributions at net asset value. Total investment return during some of the periods shown reflects a waiver by the manager. Performance would have been lower had the waiver not been in effect. |
See accompanying notes
92
Optimum Large Cap Growth Fund Class A
Selected data for each share of the Fund outstanding throughout each period were as follows:
| Year Ended | ||||||||||||||||
| 3/31/10 | 3/31/09 | 3/31/08 | 3/31/07 | 3/31/06 | ||||||||||||
| Net asset value, beginning of period | $6.990 | $11.220 | $11.980 | $11.540 | $10.020 | |||||||||||
| Income (loss) from investment operations: | ||||||||||||||||
| Net investment loss1 | (0.025 | ) | (0.001 | ) | (0.021 | ) | (0.047 | ) | (0.057 | ) | ||||||
| Net realized and unrealized gain (loss) on investments | ||||||||||||||||
| and foreign currencies | 3.675 | (4.229 | ) | (0.406 | ) | 0.692 | 1.577 | |||||||||
| Total from investment operations | 3.650 | (4.230 | ) | (0.427 | ) | 0.645 | 1.520 | |||||||||
| Less dividends and distributions from: | ||||||||||||||||
| Net investment income | — | — | (0.296 | ) | (0.205 | ) | — | |||||||||
| Return of capital | — | — | (0.037 | ) | — | — | ||||||||||
| Total dividends and distributions | — | — | (0.333 | ) | (0.205 | ) | — | |||||||||
| Net asset value, end of period | $10.640 | $6.990 | $11.220 | $11.980 | $11.540 | |||||||||||
| Total return2 | 52.22% | (37.70% | ) | (3.86% | ) | 5.75% | 15.17% | |||||||||
| Ratios and supplemental data: | ||||||||||||||||
| Net assets, end of period (000 omitted) | $36,288 | $28,347 | $54,022 | $56,088 | $47,283 | |||||||||||
| Ratio of expenses to average net assets | 1.61% | 1.61% | 1.60% | 1.69% | 1.69% | |||||||||||
| Ratio of expenses to average net assets | ||||||||||||||||
| prior to fees waived and expense paid indirectly | 1.66% | 1.64% | 1.60% | 1.77% | 1.84% | |||||||||||
| Ratio of net investment loss to average net assets | (0.28% | ) | (0.01% | ) | (0.17% | ) | (0.41% | ) | (0.52% | ) | ||||||
| Ratio of net investment loss to average net assets | ||||||||||||||||
| prior to fees waived and expense paid indirectly | (0.33% | ) | (0.04% | ) | (0.17% | ) | (0.49% | ) | (0.67% | ) | ||||||
| Portfolio turnover | 145% | 164% | 59% | 37% | 48% | |||||||||||
| 1 The average shares outstanding method has been applied for per share information. | |
| 2 Total investment return is based on the change in net asset value of a share during the period and assumes reinvestment of dividends and distributions at net asset value and does not reflect the impact of a sales charge. Total investment return during some of the periods shown reflects a waiver by the manager. Performance would have been lower had the waiver not been in effect. |
See accompanying notes
(continues) 93
Financial highlights
Optimum Large Cap Growth Fund Class B
Selected data for each share of the Fund outstanding throughout each period were as follows:
| Year Ended | ||||||||||||||||
| 3/31/10 | 3/31/09 | 3/31/08 | 3/31/07 | 3/31/06 | ||||||||||||
| Net asset value, beginning of period | $6.730 | $10.870 | $11.700 | $11.340 | $9.910 | |||||||||||
| Income (loss) from investment operations: | ||||||||||||||||
| Net investment loss1 | (0.081 | ) | (0.059 | ) | (0.100 | ) | (0.119 | ) | (0.126 | ) | ||||||
| Net realized and unrealized gain (loss) on investments | ||||||||||||||||
| and foreign currencies | 3.531 | (4.081 | ) | (0.397 | ) | 0.684 | 1.556 | |||||||||
| Total from investment operations | 3.450 | (4.140 | ) | (0.497 | ) | 0.565 | 1.430 | |||||||||
| Less dividends and distributions from: | ||||||||||||||||
| Net investment income | — | — | (0.296 | ) | (0.205 | ) | — | |||||||||
| Return of capital | — | — | (0.037 | ) | — | — | ||||||||||
| Total dividends and distributions | — | — | (0.333 | ) | (0.205 | ) | — | |||||||||
| Net asset value, end of period | $10.180 | $6.730 | $10.870 | $11.700 | $11.340 | |||||||||||
| Total return2 | 51.26% | (38.09% | ) | (4.56% | ) | 5.14% | 14.43% | |||||||||
| Ratios and supplemental data: | ||||||||||||||||
| Net assets, end of period (000 omitted) | $6,135 | $4,780 | $9,345 | $10,819 | $10,168 | |||||||||||
| Ratio of expenses to average net assets | 2.26% | 2.26% | 2.25% | 2.34% | 2.34% | |||||||||||
| Ratio of expenses to average net assets | ||||||||||||||||
| prior to fees waived and expense paid indirectly | 2.31% | 2.29% | 2.25% | 2.42% | 2.49% | |||||||||||
| Ratio of net investment loss to average net assets | (0.93% | ) | (0.66% | ) | (0.82% | ) | (1.06% | ) | (1.17% | ) | ||||||
| Ratio of net investment loss to average net assets | ||||||||||||||||
| prior to fees waived and expense paid indirectly | (0.98% | ) | (0.69% | ) | (0.82% | ) | (1.14% | ) | (1.32% | ) | ||||||
| Portfolio turnover | 145% | 164% | 59% | 37% | 48% | |||||||||||
| 1 The average shares outstanding method has been applied for per share information. | |
| 2 Total investment return is based on the change in net asset value of a share during the period and assumes reinvestment of dividends and distributions at net asset value and does not reflect the impact of a sales charge. Total investment return during some of the periods shown reflects a waiver by the manager. Performance would have been lower had the waiver not been in effect. |
See accompanying notes
94
Optimum Large Cap Growth Fund Class C
Selected data for each share of the Fund outstanding throughout each period were as follows:
| Year Ended | ||||||||||||||||
| 3/31/10 | 3/31/09 | 3/31/08 | 3/31/07 | 3/31/06 | ||||||||||||
| Net asset value, beginning of period | $6.730 | $10.870 | $11.700 | $11.340 | $9.910 | |||||||||||
| Income (loss) from investment operations: | ||||||||||||||||
| Net investment loss1 | (0.081 | ) | (0.059 | ) | (0.100 | ) | (0.119 | ) | (0.126 | ) | ||||||
| Net realized and unrealized gain (loss) on investments | ||||||||||||||||
| and foreign currencies | 3.531 | (4.081 | ) | (0.397 | ) | 0.684 | 1.556 | |||||||||
| Total from investment operations | 3.450 | (4.140 | ) | (0.497 | ) | 0.565 | 1.430 | |||||||||
| Less dividends and distributions from: | ||||||||||||||||
| Net investment income | — | — | (0.296 | ) | (0.205 | ) | — | |||||||||
| Return of capital | — | — | (0.037 | ) | — | — | ||||||||||
| Total dividends and distributions | — | — | (0.333 | ) | (0.205 | ) | — | |||||||||
| Net asset value, end of period | $10.180 | $6.730 | $10.870 | $11.700 | $11.340 | |||||||||||
| Total return2 | 51.26% | (38.09% | ) | (4.56% | ) | 5.14% | 14.43% | |||||||||
| Ratios and supplemental data: | ||||||||||||||||
| Net assets, end of period (000 omitted) | $132,242 | $102,233 | $203,394 | $203,591 | $164,995 | |||||||||||
| Ratio of expenses to average net assets | 2.26% | 2.26% | 2.25% | 2.34% | 2.34% | |||||||||||
| Ratio of expenses to average net assets | ||||||||||||||||
| prior to fees waived and expense paid indirectly | 2.31% | 2.29% | 2.25% | 2.42% | 2.49% | |||||||||||
| Ratio of net investment loss to average net assets | (0.93% | ) | (0.66% | ) | (0.82% | ) | (1.06% | ) | (1.17% | ) | ||||||
| Ratio of net investment loss to average net assets | ||||||||||||||||
| prior to fees waived and expense paid indirectly | (0.98% | ) | (0.69% | ) | (0.82% | ) | (1.14% | ) | (1.32% | ) | ||||||
| Portfolio turnover | 145% | 164% | 59% | 37% | 48% | |||||||||||
| 1 The average shares outstanding method has been applied for per share information. | |
| 2 Total investment return is based on the change in net asset value of a share during the period and assumes reinvestment of dividends and distributions at net asset value and does not reflect the impact of a sales charge. Total investment return during some of the periods shown reflects a waiver by the manager. Performance would have been lower had the waiver not been in effect. |
See accompanying notes
(continues) 95
Financial highlights
Optimum Large Cap Growth Fund Institutional Class
Selected data for each share of the Fund outstanding throughout each period were as follows:
| Year Ended | ||||||||||||||||
| 3/31/10 | 3/31/09 | 3/31/08 | 3/31/07 | 3/31/06 | ||||||||||||
| Net asset value, beginning of period | $7.130 | $11.410 | $12.140 | $11.650 | $10.080 | |||||||||||
| Income (loss) from investment operations: | ||||||||||||||||
| Net investment income (loss)1 | 0.007 | 0.032 | 0.023 | (0.006 | ) | (0.019 | ) | |||||||||
| Net realized and unrealized gain (loss) on investments | ||||||||||||||||
| and foreign currencies | 3.758 | (4.312 | ) | (0.420 | ) | 0.701 | 1.589 | |||||||||
| Total from investment operations | 3.765 | (4.280 | ) | (0.397 | ) | 0.695 | 1.570 | |||||||||
| Less dividends and distributions from: | ||||||||||||||||
| Net investment income | (0.015 | ) | — | (0.296 | ) | (0.205 | ) | — | ||||||||
| Return of capital | — | — | (0.037 | ) | — | — | ||||||||||
| Total dividends and distributions | (0.015 | ) | — | (0.333 | ) | (0.205 | ) | — | ||||||||
| Net asset value, end of period | $10.880 | $7.130 | $11.410 | $12.140 | $11.650 | |||||||||||
| Total return2 | 52.87% | (37.51% | ) | (3.56% | ) | 6.13% | 15.57% | |||||||||
| Ratios and supplemental data: | ||||||||||||||||
| Net assets, end of period (000 omitted) | $532,282 | $402,574 | $723,347 | $518,509 | $355,961 | |||||||||||
| Ratio of expenses to average net assets | 1.26% | 1.26% | 1.25% | 1.34% | 1.34% | |||||||||||
| Ratio of expenses to average net assets | ||||||||||||||||
| prior to fees waived and expense paid indirectly | 1.31% | 1.29% | 1.25% | 1.42% | 1.49% | |||||||||||
| Ratio of net investment income (loss) to average net assets | 0.07% | 0.34% | 0.18% | (0.06% | ) | (0.17% | ) | |||||||||
| Ratio of net investment income (loss) to average net assets | ||||||||||||||||
| prior to fees waived and expense paid indirectly | 0.02% | 0.31% | 0.18% | (0.14% | ) | (0.32% | ) | |||||||||
| Portfolio turnover | 145% | 164% | 59% | 37% | 48% | |||||||||||
| 1 The average shares outstanding method has been applied for per share information. | |
| 2 Total investment return is based on the change in net asset value of a share during the period and assumes reinvestment of dividends and distributions at net asset value. Total investment return during some of the periods shown reflects a waiver by the manager. Performance would have been lower had the waiver not been in effect. |
See accompanying notes
96
Optimum Large Cap Value Fund Class A
Selected data for each share of the Fund outstanding throughout each period were as follows:
| Year Ended | ||||||||||||||||
| 3/31/10 | 3/31/09 | 3/31/08 | 3/31/07 | 3/31/06 | ||||||||||||
| Net asset value, beginning of period | $6.710 | $11.170 | $12.730 | $11.320 | $10.840 | |||||||||||
| Income (loss) from investment operations: | ||||||||||||||||
| Net investment income1 | 0.118 | 0.165 | 0.138 | 0.128 | 0.092 | |||||||||||
| Net realized and unrealized gain (loss) on investments | ||||||||||||||||
| and foreign currencies | 3.181 | (4.453 | ) | (0.931 | ) | 1.614 | 0.947 | |||||||||
| Total from investment operations | 3.299 | (4.288 | ) | (0.793 | ) | 1.742 | 1.039 | |||||||||
| Less dividends and distributions from: | ||||||||||||||||
| Net investment income | (0.179 | ) | (0.029 | ) | (0.134 | ) | (0.104 | ) | (0.065 | ) | ||||||
| Net realized gain on investments | — | (0.143 | ) | (0.633 | ) | (0.228 | ) | (0.494 | ) | |||||||
| Total dividends and distributions | (0.179 | ) | (0.172 | ) | (0.767 | ) | (0.332 | ) | (0.559 | ) | ||||||
| Net asset value, end of period | $9.830 | $6.710 | $11.170 | $12.730 | $11.320 | |||||||||||
| Total return2 | 49.92% | (38.97% | ) | (6.80% | ) | 15.65% | 9.82% | |||||||||
| Ratios and supplemental data: | ||||||||||||||||
| Net assets, end of period (000 omitted) | $34,167 | $26,901 | $53,097 | $58,161 | $45,666 | |||||||||||
| Ratio of expenses to average net assets | 1.58% | 1.54% | 1.54% | 1.55% | 1.55% | |||||||||||
| Ratio of expenses to average net assets | ||||||||||||||||
| prior to fees waived and expense paid indirectly | 1.62% | 1.60% | 1.56% | 1.73% | 1.83% | |||||||||||
| Ratio of net investment income to average net assets | 1.38% | 1.82% | 1.09% | 1.07% | 0.83% | |||||||||||
| Ratio of net investment income to average net assets | ||||||||||||||||
| prior to fees waived and expense paid indirectly | 1.34% | 1.76% | 1.07% | 0.89% | 0.55% | |||||||||||
| Portfolio turnover | 28% | 37% | 30% | 22% | 52% | |||||||||||
| 1 The average shares outstanding method has been applied for per share information. | |
| 2 Total investment return is based on the change in net asset value of a share during the period and assumes reinvestment of dividends and distributions at net asset value and does not reflect the impact of a sales charge. Total investment return during all of the periods shown reflects a waiver by the manager. Performance would have been lower had the waiver not been in effect. |
See accompanying notes
(continues) 97
Financial highlights
Optimum Large Cap Value Fund Class B
Selected data for each share of the Fund outstanding throughout each period were as follows:
| Year Ended | ||||||||||||||||
| 3/31/10 | 3/31/09 | 3/31/08 | 3/31/07 | 3/31/06 | ||||||||||||
| Net asset value, beginning of period | $6.630 | $11.090 | $12.640 | $11.240 | $10.780 | |||||||||||
| Income (loss) from investment operations: | ||||||||||||||||
| Net investment income1 | 0.063 | 0.106 | 0.056 | 0.052 | 0.021 | |||||||||||
| Net realized and unrealized gain (loss) on investments | ||||||||||||||||
| and foreign currencies | 3.147 | (4.413 | ) | (0.923 | ) | 1.606 | 0.933 | |||||||||
| Total from investment operations | 3.210 | (4.307 | ) | (0.867 | ) | 1.658 | 0.954 | |||||||||
| Less dividends and distributions from: | ||||||||||||||||
| Net investment income | (0.120 | ) | (0.010 | ) | (0.050 | ) | (0.030 | ) | — | |||||||
| Net realized gain on investments | — | (0.143 | ) | (0.633 | ) | (0.228 | ) | (0.494 | ) | |||||||
| Total dividends and distributions | (0.120 | ) | (0.153 | ) | (0.683 | ) | (0.258 | ) | (0.494 | ) | ||||||
| Net asset value, end of period | $9.720 | $6.630 | $11.090 | $12.640 | $11.240 | |||||||||||
| Total return2 | 48.92% | (39.37% | ) | (7.38% | ) | 14.97% | 9.05% | |||||||||
| Ratios and supplemental data: | ||||||||||||||||
| Net assets, end of period (000 omitted) | $5,943 | $4,664 | $9,454 | $11,403 | $10,103 | |||||||||||
| Ratio of expenses to average net assets | 2.23% | 2.19% | 2.19% | 2.20% | 2.20% | |||||||||||
| Ratio of expenses to average net assets | ||||||||||||||||
| prior to fees waived and expense paid indirectly | 2.27% | 2.25% | 2.21% | 2.38% | 2.48% | |||||||||||
| Ratio of net investment income to average net assets | 0.73% | 1.17% | 0.44% | 0.42% | 0.18% | |||||||||||
| Ratio of net investment income to average net assets | ||||||||||||||||
| prior to fees waived and expense paid indirectly | 0.69% | 1.11% | 0.42% | 0.24% | (0.10% | ) | ||||||||||
| Portfolio turnover | 28% | 37% | 30% | 22% | 52% | |||||||||||
| 1 The average shares outstanding method has been applied for per share information. | |
| 2 Total investment return is based on the change in net asset value of a share during the period and assumes reinvestment of dividends and distributions at net asset value and does not reflect the impact of a sales charge. Total investment return during all of the periods shown reflects a waiver by the manager. Performance would have been lower had the waiver not been in effect. |
See accompanying notes
98
Optimum Large Cap Value Fund Class C
Selected data for each share of the Fund outstanding throughout each period were as follows:
| Year Ended | ||||||||||||||||
| 3/31/10 | 3/31/09 | 3/31/08 | 3/31/07 | 3/31/06 | ||||||||||||
| Net asset value, beginning of period | $6.630 | $11.080 | $12.630 | $11.240 | $10.780 | |||||||||||
| Income (loss) from investment operations: | ||||||||||||||||
| Net investment income1 | 0.063 | 0.106 | 0.057 | 0.051 | 0.021 | |||||||||||
| Net realized and unrealized gain (loss) on investments | ||||||||||||||||
| and foreign currencies | 3.137 | (4.403 | ) | (0.924 | ) | 1.597 | 0.933 | |||||||||
| Total from investment operations | 3.200 | (4.297 | ) | (0.867 | ) | 1.648 | 0.954 | |||||||||
| Less dividends and distributions from: | ||||||||||||||||
| Net investment income | (0.120 | ) | (0.010 | ) | (0.050 | ) | (0.030 | ) | — | |||||||
| Net realized gain on investments | — | (0.143 | ) | (0.633 | ) | (0.228 | ) | (0.494 | ) | |||||||
| Total dividends and distributions | (0.120 | ) | (0.153 | ) | (0.683 | ) | (0.258 | ) | (0.494 | ) | ||||||
| Net asset value, end of period | $9.710 | $6.630 | $11.080 | $12.630 | $11.240 | |||||||||||
| Total return2 | 48.76% | (39.31% | ) | (7.39% | ) | 14.88% | 9.16% | |||||||||
| Ratios and supplemental data: | ||||||||||||||||
| Net assets, end of period (000 omitted) | $125,961 | $98,881 | $205,501 | $216,527 | $163,876 | |||||||||||
| Ratio of expenses to average net assets | 2.23% | 2.19% | 2.19% | 2.20% | 2.20% | |||||||||||
| Ratio of expenses to average net assets | ||||||||||||||||
| prior to fees waived and expense paid indirectly | 2.27% | 2.25% | 2.21% | 2.38% | 2.48% | |||||||||||
| Ratio of net investment income to average net assets | 0.73% | 1.17% | 0.44% | 0.42% | 0.18% | |||||||||||
| Ratio of net investment income to average net assets | ||||||||||||||||
| prior to fees waived and expense paid indirectly | 0.69% | 1.11% | 0.42% | 0.24% | (0.10% | ) | ||||||||||
| Portfolio turnover | 28% | 37% | 30% | 22% | 52% | |||||||||||
| 1 The average shares outstanding method has been applied for per share information. | |
| 2 Total investment return is based on the change in net asset value of a share during the period and assumes reinvestment of dividends and distributions at net asset value and does not reflect the impact of a sales charge. Total investment return during all of the periods shown reflects a waiver by the manager. Performance would have been lower had the waiver not been in effect. |
See accompanying notes
(continues) 99
Financial highlights
Optimum Large Cap Value Fund Institutional Class
Selected data for each share of the Fund outstanding throughout each period were as follows:
| Year Ended | ||||||||||||||||
| 3/31/10 | 3/31/09 | 3/31/08 | 3/31/07 | 3/31/06 | ||||||||||||
| Net asset value, beginning of period | $6.740 | $11.190 | $12.750 | $11.330 | $10.860 | |||||||||||
| Income (loss) from investment operations: | ||||||||||||||||
| Net investment income1 | 0.148 | 0.197 | 0.183 | 0.170 | 0.131 | |||||||||||
| Net realized and unrealized gain (loss) on investments | ||||||||||||||||
| and foreign currencies | 3.193 | (4.465 | ) | (0.931 | ) | 1.623 | 0.936 | |||||||||
| Total from investment operations | 3.341 | (4.268 | ) | (0.748 | ) | 1.793 | 1.067 | |||||||||
| Less dividends and distributions from: | ||||||||||||||||
| Net investment income | (0.211 | ) | (0.039 | ) | (0.179 | ) | (0.145 | ) | (0.103 | ) | ||||||
| Net realized gain on investments | — | (0.143 | ) | (0.633 | ) | (0.228 | ) | (0.494 | ) | |||||||
| Total dividends and distributions | (0.211 | ) | (0.182 | ) | (0.812 | ) | (0.373 | ) | (0.597 | ) | ||||||
| Net asset value, end of period | $9.870 | $6.740 | $11.190 | $12.750 | $11.330 | |||||||||||
| Total return2 | 50.47% | (38.76% | ) | (6.46% | ) | 16.12% | 10.19% | |||||||||
| Ratios and supplemental data: | ||||||||||||||||
| Net assets, end of period (000 omitted) | $480,762 | $358,559 | $607,637 | $508,000 | $319,857 | |||||||||||
| Ratio of expenses to average net assets | 1.23% | 1.19% | 1.19% | 1.20% | 1.20% | |||||||||||
| Ratio of expenses to average net assets | ||||||||||||||||
| prior to fees waived and expense paid indirectly | 1.27% | 1.25% | 1.21% | 1.38% | 1.48% | |||||||||||
| Ratio of net investment income to average net assets | 1.73% | 2.17% | 1.44% | 1.42% | 1.18% | |||||||||||
| Ratio of net investment income to average net assets | ||||||||||||||||
| prior to fees waived and expense paid indirectly | 1.69% | 2.11% | 1.42% | 1.24% | 0.90% | |||||||||||
| Portfolio turnover | 28% | 37% | 30% | 22% | 52% | |||||||||||
| 1 The average shares outstanding method has been applied for per share information. | |
| 2 Total investment return is based on the change in net asset value of a share during the period and assumes reinvestment of dividends and distributions at net asset value. Total investment return during all of the periods shown reflects a waiver by the manager. Performance would have been lower had the waiver not been in effect. |
See accompanying notes
100
Optimum Small-Mid Cap Growth Fund Class A
Selected data for each share of the Fund outstanding throughout each period were as follows:
| Year Ended | ||||||||||||||||
| 3/31/10 | 3/31/09 | 3/31/08 | 3/31/07 | 3/31/06 | ||||||||||||
| Net asset value, beginning of period | $6.760 | $11.280 | $14.070 | $14.340 | $11.750 | |||||||||||
| Income (loss) from investment operations: | ||||||||||||||||
| Net investment loss1 | (0.123 | ) | (0.092 | ) | (0.177 | ) | (0.155 | ) | (0.176 | ) | ||||||
| Net realized and unrealized gain (loss) on investments | ||||||||||||||||
| and foreign currencies | 4.513 | (4.428 | ) | (1.952 | ) | 0.188 | 2.766 | |||||||||
| Total from investment operations | 4.390 | (4.520 | ) | (2.129 | ) | 0.033 | 2.590 | |||||||||
| Less dividends and distributions from: | ||||||||||||||||
| Net realized gain on investments | — | — | (0.651 | ) | (0.303 | ) | — | |||||||||
| Return of capital | — | — | (0.010 | ) | — | — | ||||||||||
| Total dividends and distributions | — | — | (0.661 | ) | (0.303 | ) | — | |||||||||
| Net asset value, end of period | $11.150 | $6.760 | $11.280 | $14.070 | $14.340 | |||||||||||
| Total return2 | 64.94% | (40.07% | ) | (15.96% | ) | 0.37% | 22.04% | |||||||||
| Ratios and supplemental data: | ||||||||||||||||
| Net assets, end of period (000 omitted) | $6,736 | $4,814 | $9,282 | $12,088 | $11,984 | |||||||||||
| Ratio of expenses to average net assets | 1.90% | 1.90% | 1.92% | 1.95% | 1.95% | |||||||||||
| Ratio of expenses to average net assets | ||||||||||||||||
| prior to fees waived and expense paid indirectly | 2.10% | 2.26% | 2.11% | 2.32% | 2.46% | |||||||||||
| Ratio of net investment loss to average net assets | (1.30% | ) | (0.96% | ) | (1.27% | ) | (1.15% | ) | (1.38% | ) | ||||||
| Ratio of net investment loss to average net assets | ||||||||||||||||
| prior to fees waived and expense paid indirectly | (1.50% | ) | (1.32% | ) | (1.46% | ) | (1.52% | ) | (1.89% | ) | ||||||
| Portfolio turnover | 100% | 119% | 46% | 46% | 47% | |||||||||||
| 1 The average shares outstanding method has been applied for per share information. | |
| 2 Total investment return is based on the change in net asset value of a share during the period and assumes reinvestment of dividends and distributions at net asset value and does not reflect the impact of a sales charge. Total investment return during all of the periods shown reflects a waiver by the manager. Performance would have been lower had the waiver not been in effect. |
See accompanying notes
(continues) 101
Financial highlights
Optimum Small-Mid Cap Growth Fund Class B
Selected data for each share of the Fund outstanding throughout each period were as follows:
| Year Ended | ||||||||||||||||
| 3/31/10 | 3/31/09 | 3/31/08 | 3/31/07 | 3/31/06 | ||||||||||||
| Net asset value, beginning of period | $6.510 | $10.930 | $13.750 | $14.110 | $11.640 | |||||||||||
| Income (loss) from investment operations: | ||||||||||||||||
| Net investment loss1 | (0.179 | ) | (0.152 | ) | (0.265 | ) | (0.240 | ) | (0.257 | ) | ||||||
| Net realized and unrealized gain (loss) on investments | ||||||||||||||||
| and foreign currencies | 4.329 | (4.268 | ) | (1.894 | ) | 0.183 | 2.727 | |||||||||
| Total from investment operations | 4.150 | (4.420 | ) | (2.159 | ) | (0.057 | ) | 2.470 | ||||||||
| Less dividends and distributions from: | ||||||||||||||||
| Net realized gain on investments | — | — | (0.651 | ) | (0.303 | ) | — | |||||||||
| Return of capital | — | — | (0.010 | ) | — | — | ||||||||||
| Total dividends and distributions | — | — | (0.661 | ) | (0.303 | ) | — | |||||||||
| Net asset value, end of period | $10.660 | $6.510 | $10.930 | $13.750 | $14.110 | |||||||||||
| Total return2 | 63.75% | (40.44% | ) | (16.56% | ) | (0.27% | ) | 21.22% | ||||||||
| Ratios and supplemental data: | ||||||||||||||||
| Net assets, end of period (000 omitted) | $1,143 | $807 | $1,620 | $2,187 | $2,285 | |||||||||||
| Ratio of expenses to average net assets | 2.55% | 2.55% | 2.57% | 2.60% | 2.60% | |||||||||||
| Ratio of expenses to average net assets | ||||||||||||||||
| prior to fees waived and expense paid indirectly | 2.75% | 2.91% | 2.76% | 2.97% | 3.11% | |||||||||||
| Ratio of net investment loss to average net assets | (1.95% | ) | (1.61% | ) | (1.92% | ) | (1.80% | ) | (2.03% | ) | ||||||
| Ratio of net investment loss to average net assets | ||||||||||||||||
| prior to fees waived and expense paid indirectly | (2.15% | ) | (1.97% | ) | (2.11% | ) | (2.17% | ) | (2.54% | ) | ||||||
| Portfolio turnover | 100% | 119% | 46% | 46% | 47% | |||||||||||
| 1 The average shares outstanding method has been applied for per share information. | |
| 2 Total investment return is based on the change in net asset value of a share during the period and assumes reinvestment of dividends and distributions at net asset value and does not reflect the impact of a sales charge. Total investment return during all of the periods shown reflects a waiver by the manager. Performance would have been lower had the waiver not been in effect. |
See accompanying notes
102
Optimum Small-Mid Cap Growth Fund Class C
Selected data for each share of the Fund outstanding throughout each period were as follows:
| Year Ended | ||||||||||||||||
| 3/31/10 | 3/31/09 | 3/31/08 | 3/31/07 | 3/31/06 | ||||||||||||
| Net asset value, beginning of period | $6.510 | $10.930 | $13.750 | $14.110 | $11.640 | |||||||||||
| Income (loss) from investment operations: | ||||||||||||||||
| Net investment loss1 | (0.179 | ) | (0.152 | ) | (0.264 | ) | (0.240 | ) | (0.257 | ) | ||||||
| Net realized and unrealized gain (loss) on investments | ||||||||||||||||
| and foreign currencies | 4.329 | (4.268 | ) | (1.895 | ) | 0.183 | 2.727 | |||||||||
| Total from investment operations | 4.150 | (4.420 | ) | (2.159 | ) | (0.057 | ) | 2.470 | ||||||||
| Less dividends and distributions from: | ||||||||||||||||
| Net realized gain on investments | — | — | (0.651 | ) | (0.303 | ) | — | |||||||||
| Return of capital | — | — | (0.010 | ) | — | — | ||||||||||
| Total dividends and distributions | — | — | (0.661 | ) | (0.303 | ) | — | |||||||||
| Net asset value, end of period | $10.660 | $6.510 | $10.930 | $13.750 | $14.110 | |||||||||||
| Total return2 | 63.75% | (40.44% | ) | (16.56% | ) | (0.27% | ) | 21.22% | ||||||||
| Ratios and supplemental data: | ||||||||||||||||
| Net assets, end of period (000 omitted) | $23,824 | $16,863 | $34,086 | $40,324 | $36,537 | |||||||||||
| Ratio of expenses to average net assets | 2.55% | 2.55% | 2.57% | 2.60% | 2.60% | |||||||||||
| Ratio of expenses to average net assets | ||||||||||||||||
| prior to fees waived and expense paid indirectly | 2.75% | 2.91% | 2.76% | 2.97% | 3.11% | |||||||||||
| Ratio of net investment loss to average net assets | (1.95% | ) | (1.61% | ) | (1.92% | ) | (1.80% | ) | (2.03% | ) | ||||||
| Ratio of net investment loss to average net assets | ||||||||||||||||
| prior to fees waived and expense paid indirectly | (2.15% | ) | (1.97% | ) | (2.11% | ) | (2.17% | ) | (2.54% | ) | ||||||
| Portfolio turnover | 100% | 119% | 46% | 46% | 47% | |||||||||||
| 1 The average shares outstanding method has been applied for per share information. | |
| 2 Total investment return is based on the change in net asset value of a share during the period and assumes reinvestment of dividends and distributions at net asset value and does not reflect the impact of a sales charge. Total investment return during all of the periods shown reflects a waiver by the manager. Performance would have been lower had the waiver not been in effect. |
See accompanying notes
(continues) 103
Financial highlights
Optimum Small-Mid Cap Growth Fund Institutional Class
Selected data for each share of the Fund outstanding throughout each period were as follows:
| Year Ended | ||||||||||||||||
| 3/31/10 | 3/31/09 | 3/31/08 | 3/31/07 | 3/31/06 | ||||||||||||
| Net asset value, beginning of period | $6.900 | $11.470 | $14.250 | $14.470 | $11.820 | |||||||||||
| Income (loss) from investment operations: | ||||||||||||||||
| Net investment loss1 | (0.091 | ) | (0.059 | ) | (0.128 | ) | (0.108 | ) | (0.131 | ) | ||||||
| Net realized and unrealized gain (loss) on investments | ||||||||||||||||
| and foreign currencies | 4.601 | (4.511 | ) | (1.991 | ) | 0.191 | 2.781 | |||||||||
| Total from investment operations | 4.510 | (4.570 | ) | (2.119 | ) | 0.083 | 2.650 | |||||||||
| Less dividends and distributions from: | ||||||||||||||||
| Net realized gain on investments | — | — | (0.651 | ) | (0.303 | ) | — | |||||||||
| Return of capital | — | — | (0.010 | ) | — | — | ||||||||||
| Total dividends and distributions | — | — | (0.661 | ) | (0.303 | ) | — | |||||||||
| Net asset value, end of period | $11.410 | $6.900 | $11.470 | $14.250 | $14.470 | |||||||||||
| Total return2 | 65.36% | (39.84% | ) | (15.68% | ) | 0.72% | 22.42% | |||||||||
| Ratios and supplemental data: | ||||||||||||||||
| Net assets, end of period (000 omitted) | $204,843 | $53,244 | $90,614 | $84,934 | $67,466 | |||||||||||
| Ratio of expenses to average net assets | 1.55% | 1.55% | 1.57% | 1.60% | 1.60% | |||||||||||
| Ratio of expenses to average net assets | ||||||||||||||||
| prior to fees waived and expense paid indirectly | 1.75% | 1.91% | 1.76% | 1.97% | 2.11% | |||||||||||
| Ratio of net investment loss to average net assets | (0.95% | ) | (0.61% | ) | (0.92% | ) | (0.80% | ) | (1.03% | ) | ||||||
| Ratio of net investment loss to average net assets | ||||||||||||||||
| prior to fees waived and expense paid indirectly | (1.15% | ) | (0.97% | ) | (1.11% | ) | (1.17% | ) | (1.54% | ) | ||||||
| Portfolio turnover | 100% | 119% | 46% | 46% | 47% | |||||||||||
| 1 The average shares outstanding method has been applied for per share information. | |
| 2 Total investment return is based on the change in net asset value of a share during the period and assumes reinvestment of dividends and distributions at net asset value. Total investment return during all of the periods shown reflects a waiver by the manager. Performance would have been lower had the waiver not been in effect. |
See accompanying notes
104
Optimum Small-Mid Cap Value Fund Class A
Selected data for each share of the Fund outstanding throughout each period were as follows:
| Year Ended | ||||||||||||||||
| 3/31/10 | 3/31/09 | 3/31/08 | 3/31/07 | 3/31/06 | ||||||||||||
| Net asset value, beginning of period | $5.690 | $10.380 | $13.540 | $13.590 | $12.410 | |||||||||||
| Income (loss) from investment operations: | ||||||||||||||||
| Net investment income (loss)1 | (0.027 | ) | 0.011 | (0.025 | ) | (0.020 | ) | (0.022 | ) | |||||||
| Net realized and unrealized gain (loss) on investments | 4.407 | (4.683 | ) | (2.102 | ) | 0.759 | 2.043 | |||||||||
| Total from investment operations | 4.380 | (4.672 | ) | (2.127 | ) | 0.739 | 2.021 | |||||||||
| Less dividends and distributions from: | ||||||||||||||||
| Net realized gain on investments | — | (0.018 | ) | (1.033 | ) | (0.789 | ) | (0.841 | ) | |||||||
| Total dividends and distributions | — | (0.018 | ) | (1.033 | ) | (0.789 | ) | (0.841 | ) | |||||||
| Net asset value, end of period | $10.070 | $5.690 | $10.380 | $13.540 | $13.590 | |||||||||||
| Total return2 | 76.98% | (45.09% | ) | (16.34% | ) | 5.93% | 17.17% | |||||||||
| Ratios and supplemental data: | ||||||||||||||||
| Net assets, end of period (000 omitted) | $5,918 | $4,045 | $9,145 | $12,721 | $13,300 | |||||||||||
| Ratio of expenses to average net assets | 1.82% | 1.75% | 1.76% | 1.76% | 1.76% | |||||||||||
| Ratio of expenses to average net assets | ||||||||||||||||
| prior to fees waived and expense paid indirectly | 2.13% | 2.22% | 2.09% | 2.32% | 2.58% | |||||||||||
| Ratio of net investment income (loss) to average net assets | (0.32% | ) | 0.15% | (0.20% | ) | (0.16% | ) | (0.17% | ) | |||||||
| Ratio of net investment loss to average net assets | ||||||||||||||||
| prior to fees waived and expense paid indirectly | (0.63% | ) | (0.32% | ) | (0.53% | ) | (0.72% | ) | (0.99% | ) | ||||||
| Portfolio turnover | 40% | 86% | 53% | 49% | 42% | |||||||||||
| 1 The average shares outstanding method has been applied for per share information. | |
| 2 Total investment return is based on the change in net asset value of a share during the period and assumes reinvestment of dividends and distributions at net asset value and does not reflect the impact of a sales charge. Total investment return during all of the periods shown reflects a waiver by the manager. Performance would have been lower had the waiver not been in effect. |
See accompanying notes
(continues) 105
Financial highlights
Optimum Small-Mid Cap Value Fund Class B
Selected data for each share of the Fund outstanding throughout each period were as follows:
| Year Ended | |||||||||||||||
| 3/31/10 | 3/31/09 | 3/31/08 | 3/31/07 | 3/31/06 | |||||||||||
| Net asset value, beginning of period | $5.460 | $10.030 | $13.190 | $13.350 | $12.280 | ||||||||||
| Income (loss) from investment operations: | |||||||||||||||
| Net investment loss1 | (0.077 | ) | (0.042 | ) | (0.102 | ) | (0.101 | ) | (0.102 | ) | |||||
| Net realized and unrealized gain (loss) on investments | 4.207 | (4.510 | ) | (2.025 | ) | 0.730 | 2.013 | ||||||||
| Total from investment operations | 4.130 | (4.552 | ) | (2.127 | ) | 0.629 | 1.911 | ||||||||
| Less dividends and distributions from: | |||||||||||||||
| Net realized gain on investments | — | (0.018 | ) | (1.033 | ) | (0.789 | ) | (0.841 | ) | ||||||
| Total dividends and distributions | — | (0.018 | ) | (1.033 | ) | (0.789 | ) | (0.841 | ) | ||||||
| Net asset value, end of period | $9.590 | $5.460 | $10.030 | $13.190 | $13.350 | ||||||||||
| Total return2 | 75.64% | (45.47% | ) | (16.79% | ) | 5.27% | 16.35% | ||||||||
| Ratios and supplemental data: | |||||||||||||||
| Net assets, end of period (000 omitted) | $1,114 | $731 | $1,636 | $2,239 | $2,359 | ||||||||||
| Ratio of expenses to average net assets | 2.47% | 2.40% | 2.41% | 2.41% | 2.41% | ||||||||||
| Ratio of expenses to average net assets | |||||||||||||||
| prior to fees waived and expense paid indirectly | 2.78% | 2.87% | 2.74% | 2.97% | 3.23% | ||||||||||
| Ratio of net investment loss to average net assets | (0.97% | ) | (0.50% | ) | (0.85% | ) | (0.81% | ) | (0.82% | ) | |||||
| Ratio of net investment loss to average net assets | |||||||||||||||
| prior to fees waived and expense paid indirectly | (1.28% | ) | (0.97% | ) | (1.18% | ) | (1.37% | ) | (1.64% | ) | |||||
| Portfolio turnover | 40% | 86% | 53% | 49% | 42% | ||||||||||
| 1 The average shares outstanding method has been applied for per share information. | |
| 2 Total investment return is based on the change in net asset value of a share during the period and assumes reinvestment of dividends and distributions at net asset value and does not reflect the impact of a sales charge. Total investment return during all of the periods shown reflects a waiver by the manager. Performance would have been lower had the waiver not been in effect. |
See accompanying notes
106
Optimum Small-Mid Cap Value Fund Class C
Selected data for each share of the Fund outstanding throughout each period were as follows:
| Year Ended | |||||||||||||||
| 3/31/10 | 3/31/09 | 3/31/08 | 3/31/07 | 3/31/06 | |||||||||||
| Net asset value, beginning of period | $5.460 | $10.020 | $13.190 | $13.350 | $12.280 | ||||||||||
| Income (loss) from investment operations: | |||||||||||||||
| Net investment loss1 | (0.076 | ) | (0.042 | ) | (0.102 | ) | (0.101 | ) | (0.102 | ) | |||||
| Net realized and unrealized gain (loss) on investments | 4.206 | (4.500 | ) | (2.035 | ) | 0.730 | 2.013 | ||||||||
| Total from investment operations | 4.130 | (4.542 | ) | (2.137 | ) | 0.629 | 1.911 | ||||||||
| Less dividends and distributions from: | |||||||||||||||
| Net realized gain on investments | — | (0.018 | ) | (1.033 | ) | (0.789 | ) | (0.841 | ) | ||||||
| Total dividends and distributions | — | (0.018 | ) | (1.033 | ) | (0.789 | ) | (0.841 | ) | ||||||
| Net asset value, end of period | $9.590 | $5.460 | $10.020 | $13.190 | $13.350 | ||||||||||
| Total return2 | 75.64% | (45.42% | ) | (16.79% | ) | 5.27% | 16.35% | ||||||||
| Ratios and supplemental data: | |||||||||||||||
| Net assets, end of period (000 omitted) | $22,163 | $14,811 | $32,891 | $41,622 | $38,782 | ||||||||||
| Ratio of expenses to average net assets | 2.47% | 2.40% | 2.41% | 2.41% | 2.41% | ||||||||||
| Ratio of expenses to average net assets | |||||||||||||||
| prior to fees waived and expense paid indirectly | 2.78% | 2.87% | 2.74% | 2.97% | 3.23% | ||||||||||
| Ratio of net investment loss to average net assets | (0.97% | ) | (0.50% | ) | (0.85% | ) | (0.81% | ) | (0.82% | ) | |||||
| Ratio of net investment loss to average net assets | |||||||||||||||
| prior to fees waived and expense paid indirectly | (1.28% | ) | (0.97% | ) | (1.18% | ) | (1.37% | ) | (1.64% | ) | |||||
| Portfolio turnover | 40% | 86% | 53% | 49% | 42% | ||||||||||
| 1 The average shares outstanding method has been applied for per share information. | |
| 2 Total investment return is based on the change in net asset value of a share during the period and assumes reinvestment of dividends and distributions at net asset value and does not reflect the impact of a sales charge. Total investment return during all of the periods shown reflects a waiver by the manager. Performance would have been lower had the waiver not been in effect. |
See accompanying notes
(continues) 107
Financial highlights
Optimum Small-Mid Cap Value Fund Institutional Class
Selected data for each share of the Fund outstanding throughout each period were as follows:
| Year Ended | |||||||||||||||
| 3/31/10 | 3/31/09 | 3/31/08 | 3/31/07 | 3/31/06 | |||||||||||
| Net asset value, beginning of period | $5.820 | $10.580 | $13.720 | $13.720 | $12.470 | ||||||||||
| Income (loss) from investment operations: | |||||||||||||||
| Net investment income1 | 0.002 | 0.041 | 0.018 | 0.025 | 0.023 | ||||||||||
| Net realized and unrealized gain (loss) on investments | 4.505 | (4.783 | ) | (2.125 | ) | 0.764 | 2.068 | ||||||||
| Total from investment operations | 4.507 | (4.742 | ) | (2.107 | ) | 0.789 | 2.091 | ||||||||
| Less dividends and distributions from: | |||||||||||||||
| Net investment income | (0.008 | ) | — | — | — | — | |||||||||
| Net realized gain on investments | — | (0.018 | ) | (1.033 | ) | (0.789 | ) | (0.841 | ) | ||||||
| Return of capital | (0.009 | ) | — | — | — | — | |||||||||
| Total dividends and distributions | (0.017 | ) | (0.018 | ) | (1.033 | ) | (0.789 | ) | (0.841 | ) | |||||
| Net asset value, end of period | $10.310 | $5.820 | $10.580 | $13.720 | $13.720 | ||||||||||
| Total return2 | 77.56% | (44.90% | ) | (15.97% | ) | 6.24% | 17.66% | ||||||||
| Ratios and supplemental data: | |||||||||||||||
| Net assets, end of period (000 omitted) | $161,862 | $58,173 | $66,657 | $71,387 | $54,803 | ||||||||||
| Ratio of expenses to average net assets | 1.47% | 1.40% | 1.41% | 1.41% | 1.41% | ||||||||||
| Ratio of expenses to average net assets | |||||||||||||||
| prior to fees waived and expense paid indirectly | 1.78% | 1.87% | 1.74% | 1.97% | 2.23% | ||||||||||
| Ratio of net investment income to average net assets | 0.03% | 0.50% | 0.15% | 0.19% | 0.18% | ||||||||||
| Ratio of net investment income (loss) to average net assets | |||||||||||||||
| prior to fees waived and expense paid indirectly | (0.28% | ) | 0.03% | (0.18% | ) | (0.37% | ) | (0.64% | ) | ||||||
| Portfolio turnover | 40% | 86% | 53% | 49% | 42% | ||||||||||
| 1 The average shares outstanding method has been applied for per share information. | |
| 2 Total investment return is based on the change in net asset value of a share during the period and assumes reinvestment of dividends and distributions at net asset value. Total investment return during all of the periods shown reflects a waiver by the manager. Performance would have been lower had the waiver not been in effect. |
See accompanying notes
108
Notes to financial statements
Optimum Fund Trust
March 31, 2010
March 31, 2010
Optimum Fund Trust (Trust) is organized as a Delaware statutory trust and offers six series: Optimum Fixed Income Fund, Optimum International Fund, Optimum Large Cap Growth Fund, Optimum Large Cap Value Fund, Optimum Small-Mid Cap Growth Fund, and Optimum Small-Mid Cap Value Fund, (each, a Fund, or collectively, the Funds). The Trust is an open-end investment company. The Funds are considered diversified under the Investment Company Act of 1940, as amended, and offer Class A, Class B, Class C and Institutional Class shares. Class A shares are sold with a maximum front-end sales charge of 5.75% for Optimum International Fund, Optimum Large Cap Growth Fund, Optimum Large Cap Value Fund, Optimum Small-Mid Cap Growth Fund, and Optimum Small-Mid Cap Value Fund and 4.50% for Optimum Fixed Income Fund. Class A share purchases of $1,000,000 or more will incur a contingent deferred sales charge (CDSC) of 1% if redeemed during the first year and 0.50% during the second year, provided that Delaware Distributors L.P. (DDLP) paid a financial advisor a commission on the purchase of those shares. Class B shares may be purchased only through dividend reinvestment and certain permitted exchanges. Prior to August 1, 2007, Class B shares were sold with a CDSC that declined from 4% to zero depending upon the period of time the shares were held. Class B shares will automatically convert to Class A shares on a quarterly basis approximately eight years after purchase. Class C shares are sold with a CDSC of 1%, if redeemed during the first 12 months. Institutional Class shares are not subject to a sales charge and are offered for sale exclusively to certain eligible investors.
The investment objective of Optimum Fixed Income Fund is to seek a high level of income. The Fund may also seek growth of capital.
The investment objective of Optimum International Fund is to seek long-term growth of capital. The Fund may also seek income.
The investment objective of Optimum Large Cap Growth Fund is to seek long-term growth of capital.
The investment objective of Optimum Large Cap Value Fund is to seek long-term growth of capital. The Fund may also seek income.
The investment objective of Optimum Small-Mid Cap Growth Fund is to seek long-term growth of capital.
The investment objective of Optimum Small-Mid Cap Value Fund is to seek long-term growth of capital.
1. Significant Accounting Policies
The following accounting policies are in accordance with U.S. generally accepted accounting principles (U.S. GAAP) and are consistently followed by the Trust.
Security Valuation — Equity securities, except those traded on the Nasdaq Stock Market, Inc. (Nasdaq), are valued at the last quoted sales price as of the time of the regular close of the New York Stock Exchange (NYSE) on the valuation date. Securities traded on the Nasdaq are valued in accordance with the Nasdaq Official Closing Price, which may not be the last sales price. If on a particular day an equity security does not trade, then the mean between the bid and ask prices will be used. Securities listed on a foreign exchange are valued at the last quoted sales price on the valuation date. Short-term debt securities are valued at market value. U.S. government and agency securities are valued at the mean between the bid and ask prices. Other debt securities, credit default swap (CDS) contracts and interest rate swap contracts are valued by an independent pricing service or broker. To the extent current market prices are not available, the pricing service may take into account developments related to the specific security, as well as transactions in comparable securities. Investment companies are valued at net asset value per share. Foreign currency exchange contracts and foreign cross currency exchange contracts are valued at the mean between the bid and ask prices. Interpolated values are derived when the settlement date of the contract is an interim date for which quotations are not available. Futures contracts and options on futures contracts are valued at the daily quoted settlement prices. Exchange-traded options are valued at the last reported sale price or, if no sales are reported, at the mean between the last reported bid and ask prices. Generally, index swap contracts and other securities and assets for which market quotations are not readily available are valued at fair value as determined in good faith under the direction of the Funds’ Board of Trustees (Board). In determining whether market quotations are readily available or fair valuation will be used, various factors will be taken into consideration, such as market closures or suspension of trading in a security. Each Fund may use fair value pricing more frequently for securities traded primarily in non-U.S. markets because, among other things, most foreign markets close well before each Fund values its securities at 4:00 p.m. Eastern time. The earlier close of these foreign markets gives rise to the possibility that significant events, including broad market moves, government actions or pronouncements, aftermarket trading, or news events may have occurred in the interim. To account for this, the Funds may frequently value foreign securities using fair value prices based on third-party vendor modeling tools (international fair value pricing).
Federal Income Taxes — No provision for federal income taxes has been made as each Fund intends to continue to qualify for federal income tax purposes as a regulated investment company under Subchapter M of the Internal Revenue Code of 1986, as amended, and make the requisite distributions to shareholders. The Funds evaluate tax positions taken or expected to be taken in the course of preparing the Funds’ tax returns to determine whether the tax positions are “more-likely-than-not” of being sustained by the applicable tax authority. Tax positions not deemed to meet the more-likely-than-not threshold are recorded as a tax benefit or expense in the current year. Management has analyzed the Funds’ tax positions taken on federal income tax returns for all open tax years (March 31, 2007 – March 31, 2010), and has concluded that no provision for federal income tax is required in the Funds’ financial statements.
(continues) 109
Notes to financial statements
Optimum Fund Trust
1. Significant Accounting Policies (continued)
Class Accounting — Investment income, common expenses and realized and unrealized gain (loss) on investments are allocated to the various classes of each Fund on the basis of daily net assets of each class. Distribution expenses relating to a specific class are charged directly to that class.
Repurchase Agreements — Each Fund may invest in a pooled cash account along with other members of the Delaware Investments® Family of Funds pursuant to an exemptive order issued by the Securities and Exchange Commission. The aggregate daily balance of the pooled cash account is invested in repurchase agreements secured by obligations of the U.S. government. The respective collateral is held by each Fund’s custodian bank until the maturity of the respective repurchase agreements. Each repurchase agreement is at least 102% collateralized. However, in the event of default or bankruptcy by the counterparty to the agreement, realization of the collateral may be subject to legal proceedings. At March 31, 2010, the Funds held no investments in repurchase agreements.
Foreign Currency Transactions — Transactions denominated in foreign currencies are recorded at the prevailing exchange rates on the valuation date. The value of all assets and liabilities denominated in foreign currencies is translated into U.S. dollars at the exchange rate of such currencies against the U.S. dollar daily. Transaction gains or losses resulting from changes in exchange rates during the reporting period or upon settlement of the foreign currency transaction are reported in operations for the current period. The Funds isolate that portion of realized gains and losses on investments in debt securities which is due to changes in foreign exchange rates from that which are due to changes in market prices of debt securities. For foreign equity securities, these changes are included in realized gains (losses) on investments. The Funds report certain foreign currency related transactions as components of realized gains (losses) for financial reporting purposes, whereas such components are treated as ordinary income (loss) for federal income tax purposes.
Use of Estimates — The preparation of financial statements in conformity with U.S. GAAP requires management to make estimates and assumptions that affect the reported amounts of assets and liabilities at the date of the financial statements and the reported amounts of revenues and expenses during the reporting period. Actual results could differ from those estimates.
Other — Expenses directly attributable to a Fund are charged directly to that Fund. Other expenses common to various funds within the Trust are generally allocated amongst such funds on the basis of average net assets. Management fees and some other expenses are paid monthly. Security transactions are recorded on the date the securities are purchased or sold (trade date) for financial reporting purposes. Costs used in calculating realized gains and losses on the sale of investment securities are those of the specific securities sold. Dividend income is recorded on the ex-dividend date and interest income is recorded on the accrual basis. Discounts and premiums on non-convertible bonds are amortized to interest income over the lives of the respective securities. Realized gains (losses) on paydowns of mortgage- and asset-backed securities are classified as interest income. Distributions received from investments in Real Estate Investment Trusts (REITs) are recorded as dividend income on the ex-dividend date, subject to reclassification upon notice of the character of such distributions by the issuer. Foreign dividends are also recorded on the ex-dividend date or as soon after the ex-dividend date that the Funds are aware of such dividends, net of all non-rebatable tax withholdings. Withholding taxes on foreign dividends have been recorded in accordance with each Fund’s understanding of the applicable country’s tax rules and rates.
Each Fund expects to declare and pay dividends from net investment income, if any, annually. Each Fund expects to declare and pay distributions from net realized gain on investments, if any, at least annually, and may distribute net investment income and net capital gains more frequently, if necessary for tax purposes.
The Funds may receive earnings credits from their custodian when positive cash balances are maintained, which are used to offset custody fees. There were no earnings credits for the year ended March 31, 2010.
On July 1, 2009, the Financial Accounting Standards Board (FASB) issued the FASB Accounting Standards Codification (Codification). The Codification became the single source of authoritative nongovernmental U.S. GAAP, superseding existing literature of the FASB, American Institute of Certified Public Accountants, Emerging Issues Task Force and other sources. The Codification is effective for interim and annual periods ending after September 15, 2009. The Funds adopted the Codification for the year ended March 31, 2010. There was no impact to financial statements as the Codification requirements are disclosure-only in nature.
2. Investment Management, Administration Agreements and Other Transactions with Affiliates
Delaware Management Company (DMC), a series of Delaware Management Business Trust, furnishes investment management services to each Fund and has full discretion and responsibility, subject to the overall supervision of the Trust’s Board, to select and contract with one or more investment sub-advisers to manage the investment operations and composition of each Fund, and to render investment advice for each Fund, including the purchase, retention, and dispositions of investments, securities and cash contained in each Fund. The investment management agreement obligates DMC to implement decisions with respect to the allocation or reallocation of each Fund’s assets among one or more current or additional sub-advisers, and to monitor the sub-advisers’ compliance with the relevant Fund’s investment objective, policies and restrictions. DMC pays the sub-advisers out of its fees.
110
In accordance with the terms of its respective investment management agreement, DMC is entitled to receive an annual fee equal to the following percentage rates of the average daily net assets of each Fund:
| Optimum Fixed Income Fund | 0.7000% of net assets up to $25 million | |
| 0.6500% of net assets from $25 million to $100 million | ||
| 0.6000% of net assets from $100 million to $500 million | ||
| 0.5500% of net assets from $500 million to $1 billion | ||
| 0.5000% of net assets over $1 billion | ||
| Optimum International Fund | 0.8750% of net assets up to $50 million | |
| 0.8000% of net assets from $50 million to $100 million | ||
| 0.7800% of net assets from $100 million to $300 million | ||
| 0.7650% of net assets from $300 million to $400 million | ||
| 0.7300% of net assets over $400 million | ||
| Optimum Large Cap Growth Fund | 0.8000% of net assets up to $250 million | |
| 0.7875% of net assets from $250 million to $300 million | ||
| 0.7625% of net assets from $300 million to $400 million | ||
| 0.7375% of net assets from $400 million to $500 million | ||
| 0.7250% of net assets from $500 million to $1 billion | ||
| 0.7100% of net assets from $1 billion to $1.5 billion | ||
| 0.7000% of net assets over $1.5 billion | ||
| Optimum Large Cap Value Fund | 0.8000% of net assets up to $100 million | |
| 0.7375% of net assets from $100 million to $250 million | ||
| 0.7125% of net assets from $250 million to $500 million | ||
| 0.6875% of net assets from $500 million to $1 billion | ||
| 0.6675% of net assets from $1 billion to $1.5 billion | ||
| 0.6475% of net assets over $1.5 billion | ||
| Optimum Small-Mid Cap Growth Fund | 1.1000% of net assets | |
| Optimum Small-Mid Cap Value Fund | 1.0500% of net assets up to $75 million | |
| 1.0250% of net assets from $75 million to $150 million | ||
| 1.0000% of net assets over $150 million |
DMC has entered into sub-advisory agreements for the Trust as follows: Optimum Fixed Income Fund – effective April 1, 2010, Pacific Investment Management Company, LLC (PIMCO) replaced TCW Investment Management Company (TCW) as the Fund’s sub-advisor; Optimum International Fund – Mondrian Investment Partners Limited and BlackRock Advisors, LLC (BlackRock); Optimum Large Cap Growth Fund – Marsico Capital Management, LLC, T. Rowe Price Associates, Inc. (T. Rowe Price), and Fred Alger Management, Inc.; Optimum Large Cap Value Fund – Massachusetts Financial Services Company and TCW; Optimum Small-Mid Cap Growth Fund – Columbia Wanger Asset Management, L.P. and Wellington Management Company, LLP (Wellington Management); Optimum Small-Mid Cap Value Fund – The Killen Group, Inc., Westwood Management Corp. (Westwood) and effective September 28, 2009, The Delafield Group, a division of Tocqueville Asset Management L.P. (Tocqueville). (Tocqueville replaced Delafield Asset Management, a division of Reich & Tang Asset Management, LLC as a sub-advisor).
For the year ended March 31, 2010, DMC paid the following sub-advisory fees:
| Optimum | Optimum | Optimum | Optimum | Optimum | Optimum | ||||||
| Fixed Income | International | Large Cap | Large Cap | Small-Mid Cap | Small-Mid Cap | ||||||
| Fund | Fund | Growth Fund | Value Fund | Growth Fund | Value Fund | ||||||
| $834,373 | $703,857 | $2,661,134 | $2,315,770 | $1,296,069 | $1,067,723 |
(continues) 111
Notes to financial statements
Optimum Fund Trust
2. Investment Management, Administration Agreements and Other Transactions with Affiliates (continued)
Effective August 1, 2009, DMC has voluntarily agreed to waive all or a portion of its investment advisory fees and/or reimburse expenses for each Fund to the extent necessary to prevent total annual operating expenses (excluding any 12b-1 plan expenses, taxes, interest, inverse floater program expenses, brokerage fees, short sale and dividend interest expenses, certain insurance costs, and nonroutine expenses or costs, including, but not limited to, those relating to reorganizations, litigation, conducting shareholder meetings, and liquidations (collectively, nonroutine expenses)) from exceeding the specified percentages of average daily net assets until such time as the voluntary expense cap is discontinued as shown below. For purposes of these waivers and reimbursements, nonroutine expenses may also include such additional costs and expenses, as may be agreed upon from time to time by the Funds’ Board and DMC. These fee waivers and expense reimbursements apply only to expenses paid directly by each Fund, and may be discontinued at any time because they are voluntary.
| Optimum | Optimum | Optimum | Optimum | Optimum | Optimum | |||||||
| Fixed Income | International | Large Cap | Large Cap | Small-Mid Cap | Small-Mid Cap | |||||||
| Fund | Fund | Growth Fund | Value Fund | Growth Fund | Value Fund | |||||||
| Effective August 1, 2009, | ||||||||||||
| operating expense limitation as | ||||||||||||
| a percentage of average | ||||||||||||
| daily net assets (per annum) | 1.00% | 1.40% | 1.25% | 1.26% | 1.55% | 1.50% |
Prior to August 1, 2009, DMC had contractually agreed to waive all or a portion of its investment advisory fees and/or reimburse expenses for each Fund to the extent necessary to prevent total annual operating expenses (excluding any 12b-1 plan expenses, taxes, interest, inverse floater program expenses, brokerage fees, short sale and dividend interest expenses, certain insurance costs, and nonroutine expenses or costs, including, but not limited to, those relating to reorganizations, litigation, conducting shareholder meetings, and liquidations (collectively, nonroutine expenses)) from exceeding the specified percentages of average daily net assets from August 1, 2008 through July 31, 2009 as shown below. For purposes of these waivers and reimbursements, nonroutine expenses included such additional costs and expenses as was agreed upon from time to time by the Funds’ Board and DMC. These fee waivers and expense reimbursements applied only to expenses paid directly by each Fund.
| Optimum | Optimum | Optimum | Optimum | Optimum | Optimum | |||||||
| Fixed Income | International | Large Cap | Large Cap | Small-Mid Cap | Small-Mid Cap | |||||||
| Fund | Fund | Growth Fund | Value Fund | Growth Fund | Value Fund | |||||||
| Through July 31, 2009, | ||||||||||||
| operating expense limitation as | ||||||||||||
| a percentage of average | ||||||||||||
| daily net assets (per annum) | 0.89% | 1.42% | 1.27% | 1.19% | 1.55% | 1.40% |
Delaware Service Company, Inc. (DSC), an affiliate of DMC, provides fund accounting oversight services to the Trust. For these services, the Trust pays DSC fees based on the aggregate daily net assets of the Trust at the following annual rate: 0.0050% of the first $3 billion; 0.0045% of the next $2 billion; 0.0040% of the next $2.5 billion; 0.0030% of the next $2.5 billion; and 0.0025% of aggregate average daily net assets in excess of $10 billion. The fees payable to DSC under the service agreement described above are allocated among all Funds in the Trust on a relative net asset value basis. For the year ended March 31, 2010, each Fund was charged for these services as follows:
| Optimum | Optimum | Optimum | Optimum | Optimum | Optimum | |||||||
| Fixed Income | International | Large Cap | Large Cap | Small-Mid Cap | Small-Mid Cap | |||||||
| Fund | Fund | Growth Fund | Value Fund | Growth Fund | Value Fund | |||||||
| $35,375 | $8,798 | $31,608 | $29,089 | $8,640 | $7,104 |
DSC also provides the Trust with administrative services including financial and tax reporting, corporate governance, and preparation of materials and reports for the Board. For administrative services, each Fund pays DSC a fee at an annual rate (plus out-of-pocket expenses) of 0.165% of assets up to $500 million of the Fund’s average daily net assets; 0.140% of assets from $500 million to $1 billion; and 0.115% of assets over $1 billion. DSC also serves as the shareholder servicing, dividend disbursing, and transfer agent for each Fund. For such services, the Trust pays DSC a fee at an annual rate of 0.235% of the Trust’s total average daily net assets, subject to certain minimums, plus out-of-pocket expenses.
DDLP, an affiliate of DMC, serves as the national distributor of each Fund’s shares pursuant to a Distribution Agreement. Pursuant to the Distribution Agreement and Rule 12b-1 plan, each Fund pays DDLP an annual fee of 0.35% of the average daily net assets of the Class A shares and 1.00% of the average daily net assets of the Class B and C shares. Institutional Class shares pay no distribution expenses.
112
At March 31, 2010, each Fund had liabilities payable to affiliates as follows:
| Optimum | Optimum | Optimum | Optimum | Optimum | Optimum | |||||||||||||||||||||||||
| Fixed Income | International | Large Cap | Large Cap | Small-Mid Cap | Small-Mid Cap | |||||||||||||||||||||||||
| Fund | Fund | Growth Fund | Value Fund | Growth Fund | Value Fund | |||||||||||||||||||||||||
| Investment management | ||||||||||||||||||||||||||||||
| fee payable to DMC | $ | 315,717 | $ | 131,424 | $ | 448,617 | $ | 402,689 | $ | 189,055 | $ | 126,772 | ||||||||||||||||||
| Dividend disbursing, transfer agent and fund | ||||||||||||||||||||||||||||||
| accounting oversight fees, administration | ||||||||||||||||||||||||||||||
| fees and other expenses payable to DSC | 265,938 | 73,128 | 237,937 | 219,188 | 84,410 | 68,519 | ||||||||||||||||||||||||
| Distribution fees payable to DDLP | 161,808 | 42,027 | 126,898 | 121,054 | 23,113 | 21,464 | ||||||||||||||||||||||||
| Other expenses payable | ||||||||||||||||||||||||||||||
| to DMC and affiliates* | 27,315 | 7,056 | 24,259 | 22,263 | 8,187 | 6,607 | ||||||||||||||||||||||||
*DMC, as part of its administrative services, pays operating expenses on behalf of each Fund and is reimbursed on a periodic basis. Such expenses include items such as printing of shareholder reports, fees for audit, legal and tax services, registration fees and trustees’ fees.
For the year ended March 31, 2010, DDLP earned commissions on sales of Class A shares for each Fund as follows:
| Optimum | Optimum | Optimum | Optimum | Optimum | Optimum | |||||||
| Fixed Income | International | Large Cap | Large Cap | Small-Mid Cap | Small-Mid Cap | |||||||
| Fund | Fund | Growth Fund | Value Fund | Growth Fund | Value Fund | |||||||
| $12,915 | $4,024 | $26,986 | $25,152 | $2,060 | $1,837 |
For the year ended March 31, 2010, DDLP received gross CDSC commissions on redemptions of each Fund’s Class A, Class B and Class C shares, and these commissions were entirely used to offset up-front commissions previously paid by DDLP to broker/dealers on sales of those shares. The amounts received were as follows:
| Optimum | Optimum | Optimum | Optimum | Optimum | Optimum | |||||||||||||||||||||||||
| Fixed Income | International | Large Cap | Large Cap | Small-Mid Cap | Small-Mid Cap | |||||||||||||||||||||||||
| Fund | Fund | Growth Fund | Value Fund | Growth Fund | Value Fund | |||||||||||||||||||||||||
| Class A | $ | — | $ | — | $ | — | $ | — | $ | — | $ | — | ||||||||||||||||||
| Class B | 9,683 | 4,606 | 14,721 | 12,598 | 2,564 | 1,989 | ||||||||||||||||||||||||
| Class C | 13,084 | 2,440 | 7,385 | 7,334 | 1,194 | 1,085 | ||||||||||||||||||||||||
DMC, DSC and DDLP are indirect, wholly owned subsidiaries of Delaware Management Holdings, Inc.
Certain officers of DMC, DSC and DDLP are officers and/or Trustees of the Trust. These officers and Trustees are paid no compensation by the Funds.
3. Investments
For the year ended March 31, 2010, the Funds made purchases and sales of investment securities other than short-term investments as follows:
| Optimum | Optimum | Optimum | Optimum | Optimum | Optimum | |||||||||||||||||
| Fixed Income | International | Large Cap | Large Cap | Small-Mid Cap | Small-Mid Cap | |||||||||||||||||
| Fund | Fund | Growth Fund | Value Fund | Growth Fund | Value Fund | |||||||||||||||||
| Purchases other than U.S. government securities | $ | 725,187,107 | $ | 174,351,372 | $ | 887,828,748 | $ | 159,598,098 | $ | 248,084,646 | $ | 82,347,410 | ||||||||||
| Purchases of U.S. government securities | 198,702,287 | — | — | — | — | — | ||||||||||||||||
| Sales other than U.S. government securities | 749,704,431 | 153,878,852 | 982,765,293 | 227,855,803 | 167,010,724 | 51,567,554 | ||||||||||||||||
| Sales of U.S. government securities | 159,655,326 | — | — | — | — | — | ||||||||||||||||
(continues) 113
Notes to financial statements
Optimum Fund Trust
3. Investments (continued)
At March 31, 2010, the cost of investments and unrealized appreciation (depreciation) for federal income tax purposes for each Fund were as follows:
| Optimum | Optimum | Optimum | Optimum | Optimum | Optimum | |||||||||||||||||||
| Fixed Income | International | Large Cap | Large Cap | Small-Mid Cap | Small-Mid Cap | |||||||||||||||||||
| Fund | Fund | Growth Fund | Value Fund | Growth Fund | Value Fund | |||||||||||||||||||
| Cost of investments | $ | 860,522,660 | $ | 221,854,823 | $ | 677,321,916 | $678,792,770 | $224,898,712 | $166,928,619 | |||||||||||||||
| Aggregate unrealized appreciation | $ | 36,984,234 | $ | 19,027,077 | $ | 86,577,797 | $ 62,439,620 | $ 43,525,961 | $ 36,687,309 | |||||||||||||||
| Aggregate unrealized depreciation | (34,441,380 | ) | (14,900,455 | ) | (10,975,766 | ) | (45,152,359 | ) | (6,387,389 | ) | (2,103,049 | ) | ||||||||||||
| Net unrealized appreciation | $ | 2,542,854 | $ | 4,126,622 | $ | 75,602,031 | $ 17,287,261 | $ 37,138,572 | $ 34,584,260 | |||||||||||||||
U.S. GAAP defines fair value as the price that the Funds would receive to sell an asset or pay to transfer a liability in an orderly transaction between market participants at the measurement date under current market conditions. A three level hierarchy for fair value measurements has been established based upon the transparency of inputs to the valuation of an asset or liability. Inputs may be observable or unobservable and refer broadly to the assumptions that market participants would use in pricing the asset or liability. Observable inputs reflect the assumptions market participants would use in pricing the asset or liability based on market data obtained from sources independent of the reporting entity. Unobservable inputs reflect the reporting entity’s own assumptions about the assumptions that market participants would use in pricing the asset or liability developed based on the best information available under the circumstances. Each Fund’s investment in its entirety is assigned a level based upon the observability of the inputs which are significant to the overall valuation. The three level hierarchy of inputs is summarized below.
Level 1 – inputs are quoted prices in active markets
Level 2 – inputs are observable, directly or indirectly
Level 3 – inputs are unobservable and reflect assumptions on the part of the reporting entity
The following table summarizes the valuation of each Fund’s investments by fair value hierarchy levels as of March 31, 2010:
| Optimum Fixed Income Fund | ||||||||||||||
| Level 1 | Level 2 | Level 3 | Total | |||||||||||
| Asset-Backed & Mortgage-Backed Securities | $ | — | $ | 358,926,194 | $ | 6,420,927 | $ | 365,347,121 | ||||||
| Corporate Debt | — | 289,170,068 | 1,643,101 | 290,813,169 | ||||||||||
| Foreign Debt | — | 43,566,901 | 1,556,712 | 45,123,613 | ||||||||||
| Common Stock | 581,750 | — | 3 | 581,753 | ||||||||||
| Municipal Bonds | — | 759,602 | — | 759,602 | ||||||||||
| U.S. Treasury Obligations | 46,941,414 | — | — | 46,941,414 | ||||||||||
| Short-Term Investments | — | 71,617,984 | — | 71,617,984 | ||||||||||
| Securities Lending Collateral | 34,969,694 | 5,559,779 | 53,640 | 40,583,113 | ||||||||||
| Other | — | 1,297,744 | 1 | 1,297,745 | ||||||||||
| Total | $ | 82,492,858 | $ | 770,898,272 | $ | 9,674,384 | $ | 863,065,514 | ||||||
| Foreign Currency Contracts | $ | — | $ | 305,774 | $ | — | $ | 305,774 | ||||||
| Futures Contracts | $ | — | $ | 1,139 | $ | — | $ | 1,139 | ||||||
| Swap Contracts | $ | — | $ | (381,206 | ) | $ | — | $ | (381,206 | ) | ||||
| Optimum International Fund | ||||||||||||||
| Level 1 | Level 2 | Level 3 | Total | |||||||||||
| Common Stock | $ | 196,212,504 | $ | — | $ | — | $ | 196,212,504 | ||||||
| U.S. Treasury Obligations | 294,463 | 294,463 | ||||||||||||
| Short-Term Investments | — | 3,599,238 | — | 3,599,238 | ||||||||||
| Securities Lending Collateral | 21,740,544 | 2,706,359 | 27,782 | 24,474,685 | ||||||||||
| Other | 1,345,525 | — | 55,030 | 1,400,555 | ||||||||||
| Total | $ | 219,593,036 | $ | 6,305,597 | $ | 82,812 | $ | 225,981,445 | ||||||
| Foreign Currency Contracts | $ | — | $ | 19,930 | $ | — | $ | 19,930 | ||||||
114
| Optimum Large Cap Growth Fund | ||||||||||||
| Level 1 | Level 2 | Level 3 | Total | |||||||||
| Common Stock | $ | 680,090,738 | $ | $ | $ | 680,090,738 | ||||||
| U.S. Treasury Obligations | 1,666,603 | — | — | 1,666,603 | ||||||||
| Short-Term Investments | — | 20,370,971 | — | 20,370,971 | ||||||||
| Securities Lending Collateral | 42,238,336 | 7,460,119 | 44,765 | 49,743,220 | ||||||||
| Preferred Stock | — | 1,052,415 | — | 1,052,415 | ||||||||
| Total | $ | 723,995,677 | $ | 28,883,505 | $ | 44,765 | $ | 752,923,947 | ||||
| Optimum Large Cap Value Fund | ||||||||||||
| Level 1 | Level 2 | Level 3 | Total | |||||||||
| Common Stock | $ | 637,053,739 | $ | — | $ | — | $ | 637,053,739 | ||||
| U.S. Treasury Obligations | 611,273 | — | — | 611,273 | ||||||||
| Short-Term Investments | — | 7,471,619 | — | 7,471,619 | ||||||||
| Securities Lending Collateral | 45,641,493 | 5,257,292 | 44,615 | 50,943,400 | ||||||||
| Total | $ | 683,306,505 | $ | 12,728,911 | $ | 44,615 | $ | 696,080,031 | ||||
| Optimum Small-Mid Cap Growth Fund | ||||||||||||
| Level 1 | Level 2 | Level 3 | Total | |||||||||
| Common Stock | $ | 233,205,520 | $ | — | $ | 209,872 | $ | 233,415,392 | ||||
| U.S. Treasury Obligations | 300,337 | — | — | 300,337 | ||||||||
| Short-Term Investments | — | 3,671,036 | — | 3,671,036 | ||||||||
| Securities Lending Collateral | 21,581,610 | 3,047,223 | 21,686 | 24,650,519 | ||||||||
| Total | $ | 255,087,467 | $ | 6,718,259 | $ | 231,558 | $ | 262,037,284 | ||||
| Optimum Small-Mid Cap Value Fund | ||||||||||||
| Level 1 | Level 2 | Level 3 | Total | |||||||||
| Common Stock | $ | 174,891,338 | $ | — | $ | — | $ | 174,891,338 | ||||
| U.S. Treasury Obligations | 1,037,325 | — | — | 1,037,325 | ||||||||
| Short-Term Investments | — | 12,679,277 | — | 12,679,277 | ||||||||
| Securities Lending Collateral | 11,052,683 | 1,841,056 | 11,200 | 12,904,939 | ||||||||
| Total | $ | 186,981,346 | $ | 14,520,333 | $ | 11,200 | $ | 201,512,879 | ||||
The following is a reconciliation of investments in which significant unobservable inputs (Level 3) were used in determining fair value:
| Optimum Fixed Income Fund | |||||||||||||||||||||||||
| Asset Backed and | Securities | ||||||||||||||||||||||||
| Mortgage-Backed | Corporate | Foreign | Common | Lending | |||||||||||||||||||||
| Securities | Debt | Debt | Stock | Collateral | Other | Total | |||||||||||||||||||
| Balance as of 3/31/09 | $ | 12,661,309 | $ | 135,810 | $ | 3,018,152 | $ | 3 | $ | 126 | $ | 1 | $ | 15,815,401 | |||||||||||
| Net realized gain (loss) | 172,288 | 1,040 | (6,530 | ) | — | — | — | 166,798 | |||||||||||||||||
| Purchases | 1,794,623 | 1,420,701 | 717,625 | — | — | — | 3,932,949 | ||||||||||||||||||
| Sales | (1,060,354 | ) | (132,892 | ) | (2,911,696 | ) | — | — | — | (4,104,942 | ) | ||||||||||||||
| Transfers into Level 3 | — | 437,229 | — | — | — | — | 437,229 | ||||||||||||||||||
| Transfers out of Level 3 | (11,130,975 | ) | — | (85,266 | ) | — | — | — | (11,216,241 | ) | |||||||||||||||
| Net change in unrealized | |||||||||||||||||||||||||
| appreciation/depreciation | 3,984,036 | (218,787 | ) | 824,427 | — | 53,514 | — | 4,643,190 | |||||||||||||||||
| Balance as of 3/31/10 | $ | 6,420,927 | $ | 1,643,101 | $ | 1,556,712 | $ | 3 | $ | 53,640 | $ | 1 | $ | 9,674,384 | |||||||||||
| Net change in unrealized appreciation/ | |||||||||||||||||||||||||
| depreciation from investments still held | |||||||||||||||||||||||||
| as of 3/31/10 | $ | 667,829 | $ | (257,426 | ) | $ | 232,084 | $ | — | $ | 53,514 | $ | — | $ | 696,001 | ||||||||||
(continues) 115
Notes to financial statements
Optimum Fund Trust
3. Investments (continued)
| Optimum | Optimum | ||||||||||||||||||||||
| Large Cap | Large Cap | ||||||||||||||||||||||
| Optimum International Fund | Growth Fund | Value Fund | |||||||||||||||||||||
| Securities | Securities | Securities | |||||||||||||||||||||
| Lending | Lending | Lending | |||||||||||||||||||||
| Collateral | Other | Total | Collateral | Collateral | |||||||||||||||||||
| Balance as of 3/31/09 | $ | 65 | $ | — | $ | 65 | $ | 105 | $ | 105 | |||||||||||||
| Purchases | — | 52,342 | 52,342 | — | — | ||||||||||||||||||
| Net change in unrealized | |||||||||||||||||||||||
| appreciation/depreciation | |||||||||||||||||||||||
| from investments | 27,717 | 2,688 | 30,405 | 44,660 | 44,510 | ||||||||||||||||||
| Balance as of 3/31/10 | $ | 27,782 | $ | 55,030 | $ | 82,812 | $ | 44,765 | $ | 44,615 | |||||||||||||
| Net change in unrealized appreciation/ | |||||||||||||||||||||||
| depreciation from investments still held | |||||||||||||||||||||||
| as of 3/31/10 | $ | 27,717 | $ | 2,688 | $ | 30,405 | $ | 44,660 | $ | 44,510 | |||||||||||||
| Optimum Small-Mid Cap Growth Fund | Optimum Small-Mid Cap Value Fund | ||||||||||||
| Securities | Securities | ||||||||||||
| Lending | Common | Lending | |||||||||||
| Collateral | Stock | Total | Collateral | ||||||||||
| Balance as of 3/31/09 | $ | 51 | $ | — | $ | 51 | $ | 26 | |||||
| Purchases | — | 149,998 | 149,998 | — | |||||||||
| Net change in unrealized | |||||||||||||
| appreciation/depreciation | 21,635 | 59,874 | 81,509 | 11,174 | |||||||||
| Balance as of 3/31/10 | $ | 21,686 | $ | 209,872 | $ | 231,558 | $ | 11,200 | |||||
| Net change in unrealized appreciation/ | |||||||||||||
| depreciation from investments still held | |||||||||||||
| as of 3/31/10 | $ | 21,635 | $ | 59,874 | $ | 81,509 | $ | 11,174 | |||||
In January 2010, the FASB issued an Accounting Standards Update, Improving Disclosures about Fair Value Measurements, which introduces new disclosure requirements and clarifies certain existing disclosure requirements around fair value measurements currently presented above. The new disclosures and clarifications of existing disclosures are generally effective for each Fund’s year ending March 31, 2011 and interim periods therein. Management is evaluating the impact of this update on its current disclosures.
4. Dividend and Distribution Information
Income and long-term capital gain distributions are determined in accordance with federal income tax regulations, which may differ from U.S. GAAP. Additionally, distributions from net gains on foreign currency transactions and net short-term gains on sales of investment securities are treated as ordinary income for federal income tax purposes. The tax character of dividends and distributions paid during the years ended March 31, 2010 and 2009 was as follows:
Year Ended March 31, 2010
| Optimum | Optimum | Optimum | Optimum | Optimum | ||||||||||||||||||
| Fixed Income | International | Large Cap | Large Cap | Small-Mid Cap | ||||||||||||||||||
| Fund | Fund | Growth Fund | Value Fund | Value Fund | ||||||||||||||||||
| Ordinary income | $ | 47,549,636 | $ | 2,806,274 | $ | 750,120 | $ | 13,614,136 | $ | 88,032 | ||||||||||||
| Return of capital | — | — | 3,034 | — | 92,374 | |||||||||||||||||
| Total | $ | 47,549,636 | $ | 2,806,274 | $ | 753,154 | $ | 13,614,136 | $ | 180,406 | ||||||||||||
Optimum Small-Mid Cap Growth Fund did not make any distributions during the year ended March 31, 2010.
116
Year Ended March 31, 2009
| Optimum | Optimum | Optimum | Optimum | ||||||||||
| Fixed Income | International | Large Cap | Small-Mid Cap | ||||||||||
| Fund | Fund | Value Fund | Value Fund | ||||||||||
| Ordinary income | $ | 48,251,466 | $ | 6,821,438 | $ | 2,572,090 | $ | 4,834 | |||||
| Long-term capital gain | — | 4,470,445 | 11,341,568 | 185,762 | |||||||||
| Total | $ | 48,251,466 | $ | 11,291,883 | $ | 13,913,658 | $ | 190,596 | |||||
Optimum Large Cap Growth Fund and Optimum Small-Mid Cap Growth Fund did not make any distributions during the year ended March 31, 2009.
5. Components of Net Assets on a Tax Basis
As of March 31, 2010, the components of net assets on a tax basis were as follows:
| Optimum | Optimum | Optimum | |||||||||
| Fixed Income | International | Large Cap | |||||||||
| Fund | Fund | Growth Fund | |||||||||
| Share of beneficial interest | $ | 794,681,037 | $ | 255,673,364 | $ | 789,001,690 | |||||
| Undistributed ordinary income | 15,564,989 | 3,200,462 | — | ||||||||
| Capital loss carryforwards | (16,132,020 | ) | (58,963,241 | ) | (157,655,383 | ) | |||||
| Other temporary differences | (363,722 | ) | — | — | |||||||
| Post-October losses | (211,919 | ) | — | — | |||||||
| Post-October currency losses | — | (315,989 | ) | (21,830 | ) | ||||||
| Unrealized appreciation of investments, swap contracts and foreign currencies | 2,764,741 | 4,146,222 | 75,622,971 | ||||||||
| Net assets | $ | 796,303,106 | $ | 203,740,818 | $ | 706,947,448 | |||||
| Optimum | Optimum | Optimum | |||||||||
| Large Cap | Small-Mid Cap | Small-Mid Cap | |||||||||
| Value Fund | Growth Fund | Value Fund | |||||||||
| Share of beneficial interest | $ | 798,536,318 | $ | 219,347,212 | $ | 189,030,276 | |||||
| Undistributed ordinary income | 8,658,416 | — | — | ||||||||
| Undistributed long-term capital gain | — | — | — | ||||||||
| Capital loss carryforwards | (175,020,048 | ) | (19,926,636 | ) | (32,557,155 | ) | |||||
| Post October losses | (2,637,538 | ) | — | — | |||||||
| Post-October currency losses | (6,591 | ) | (13,721 | ) | — | ||||||
| Unrealized appreciation on investments and foreign currencies | 17,302,938 | 37,138,752 | 34,584,260 | ||||||||
| Net assets | $ | 646,833,495 | $ | 236,545,607 | $ | 191,057,381 | |||||
The differences between book basis and tax basis components of net assets are primarily attributable to tax deferral of losses on wash sales, tax deferral of losses on straddles, mark-to-market on foreign currency contracts, mark-to-market on financial futures contracts, tax recognition of unrealized gain on passive foreign investment companies, and tax treatment of contingent payment on debt instruments and CDS contracts.
Post-October losses represent losses realized on investment and foreign currency transactions from November 1, 2009 through March 31, 2010 that, in accordance with federal income tax regulations, each Fund has elected to defer and treat as having arisen in the following fiscal year.
(continues) 117
Notes to financial statements
Optimum Fund Trust
5. Components of Net Assets on a Tax Basis (continued)
For financial reporting purposes, capital accounts are adjusted to reflect the tax character of permanent book/tax differences. Reclassifications are primarily due to tax treatment of net operating losses, dividends and distributions, passive foreign investment companies, gain (loss) on foreign currency transactions and foreign future contracts, CDS contracts and paydown gains (losses) of mortgage- and asset-backed securities. Results of operations and net assets were not affected by these reclassifications. For the year ended March 31, 2010, the Funds recorded the following reclassifications:
| Optimum | Optimum | Optimum | Optimum | Optimum | Optimum | ||||||||||||||||||
| Fixed Income | International | Large Cap | Large Cap | Small-Mid Cap | Small-Mid Cap | ||||||||||||||||||
| Fund | Fund | Growth Fund | Value Fund | Growth Fund | Value Fund | ||||||||||||||||||
| Undistributed (accumulated) net | |||||||||||||||||||||||
| investment income (loss) | $ | 1,914,052 | $ | 1,482,823 | $ | 1,017,712 | $(9,694 | ) | $ | 1,872,416 | $ | 100,242 | |||||||||||
| Accumulated net realized gain (loss) | (1,914,052 | ) | (1,482,823 | ) | 47,747 | 9,694 | 28,821 | — | |||||||||||||||
| Paid-in capital | — | (1,065,459 | ) | — | (1,901,237 | ) | (100,242 | ) | |||||||||||||||
For federal income tax purposes, capital loss carryforwards may be carried forward and applied against future capital gains. In 2010, the Optimum Fixed Income Fund utilized capital loss carryforwards as follows:
| Capital loss | ||
| carryforwards | ||
| utilized | ||
| Optimum Fixed Income Fund | $ | 7,167,754 |
Capital loss carryforwards remaining at March 31, 2010 will expire as follows:
| Optimum | Optimum | Optimum | Optimum | Optimum | Optimum | |||||||||||||
| Year of | Fixed Income | International | Large Cap | Large Cap | Small-Mid Cap | Small-Mid Cap | ||||||||||||
| Expiration | Fund | Fund | Growth Fund | Value Fund | Growth Fund | Value Fund | ||||||||||||
| 3/31/17 | $ | 16,132,020 | $ | 2,202,347 | $ | 77,826,014 | $ | 55,991,912 | $ | 15,427,746 | $ | 4,705,463 | ||||||
| 3/31/18 | — | 56,760,894 | 79,829,369 | 119,028,136 | 4,498,890 | 27,851,692 | ||||||||||||
6. Capital Shares
Transactions in capital shares were as follows:
| Optimum | Optimum | Optimum | |||||||||||||||
| Fixed Income | International | Large Cap | |||||||||||||||
| Fund | Fund | Growth Fund | |||||||||||||||
| Year Ended | Year Ended | Year Ended | |||||||||||||||
| 3/31/10 | 3/31/09 | 3/31/10 | 3/31/09 | 3/31/10 | 3/31/09 | ||||||||||||
| Shares sold: | |||||||||||||||||
| Class A | 380,500 | 798,189 | 104,636 | 242,685 | 291,768 | 885,616 | |||||||||||
| Class B | 6,894 | 26,655 | 2,855 | 10,442 | 12,315 | 54,134 | |||||||||||
| Class C | 2,021,942 | 3,265,872 | 390,232 | 857,615 | 1,222,043 | 2,995,447 | |||||||||||
| Institutional Class | 21,802,020 | 22,071,648 | 6,025,380 | 4,143,084 | 13,430,954 | 18,489,123 | |||||||||||
| 24,211,356 | 26,162,364 | 6,523,103 | 5,253,826 | 14,957,080 | 22,424,320 | ||||||||||||
| Shares issued upon reinvestment of dividends | |||||||||||||||||
| and distributions: | |||||||||||||||||
| Class A | 302,381 | 366,124 | 24,437 | 79,853 | — | — | |||||||||||
| Class B | 38,541 | 43,312 | 4,341 | 12,776 | — | — | |||||||||||
| Class C | 1,158,140 | 1,308,953 | 84,037 | 260,307 | — | — | |||||||||||
| Institutional Class | 3,778,982 | 4,131,070 | 212,753 | 704,245 | 89,194 | — | |||||||||||
| 5,278,044 | 5,849,459 | 325,568 | 1,057,181 | 89,194 | — | ||||||||||||
| Shares repurchased: | |||||||||||||||||
| Class A | (1,361,901 | ) | (3,179,018 | ) | (326,529 | ) | (616,141 | ) | (938,322 | ) | (1,646,026 | ) | |||||
| Class B | (150,573 | ) | (346,667 | ) | (41,188 | ) | (76,621 | ) | (120,037 | ) | (203,574 | ) | |||||
| Class C | (5,106,580 | ) | (13,108,708 | ) | (1,203,369 | ) | (2,321,094 | ) | (3,425,748 | ) | (6,513,939 | ) | |||||
| Institutional Class | (19,275,823 | ) | (37,075,680 | ) | (3,481,196 | ) | (6,140,986 | ) | (21,042,002 | ) | (25,459,674 | ) | |||||
| (25,894,877 | ) | (53,710,073 | ) | (5,052,282 | ) | (9,154,842 | ) | (25,526,109 | ) | (33,823,213 | ) | ||||||
| Net increase (decrease) | 3,594,523 | (21,698,250 | ) | 1,796,389 | (2,843,835 | ) | (10,479,835 | ) | (11,398,893 | ) | |||||||
118
| Optimum | Optimum | Optimum | |||||||||||||||
| Large Cap | Small-Mid Cap | Small-Mid Cap | |||||||||||||||
| Value Fund | Growth Fund | Value Fund | |||||||||||||||
| Year Ended | Year Ended | Year Ended | |||||||||||||||
| 3/31/10 | 3/31/09 | 3/31/10 | 3/31/09 | 3/31/10 | 3/31/09 | ||||||||||||
| Shares sold: | |||||||||||||||||
| Class A | 299,064 | 783,512 | 59,618 | 180,877 | 52,233 | 179,239 | |||||||||||
| Class B | 13,622 | 43,273 | 4,461 | 10,952 | 3,755 | 11,691 | |||||||||||
| Class C | 1,244,236 | 2,627,527 | 245,545 | 608,544 | 234,992 | 613,573 | |||||||||||
| Institutional Class | 13,146,430 | 19,865,887 | 14,215,293 | 3,105,271 | 8,887,279 | 6,869,104 | |||||||||||
| 14,703,352 | 23,320,199 | 14,524,917 | 3,905,644 | 9,178,259 | 7,673,607 | ||||||||||||
| Shares issued upon reinvestment of dividends | |||||||||||||||||
| and distributions: | |||||||||||||||||
| Class A | 89,427 | 72,889 | — | — | — | 1,401 | |||||||||||
| Class B | 10,509 | 11,542 | — | — | — | 267 | |||||||||||
| Class C | 223,973 | 255,515 | — | — | — | 5,364 | |||||||||||
| Institutional Class | 1,426,180 | 928,793 | — | — | 24,450 | 10,191 | |||||||||||
| 1,750,089 | 1,268,739 | — | — | 24,450 | 17,223 | ||||||||||||
| Shares repurchased: | |||||||||||||||||
| Class A | (920,206 | ) | (1,602,665 | ) | (167,898 | ) | (291,537 | ) | (174,801 | ) | (350,921 | ) | |||||
| Class B | (116,086 | ) | (204,119 | ) | (21,246 | ) | (35,085 | ) | (21,432 | ) | (41,364 | ) | |||||
| Class C | (3,421,119 | ) | (6,505,876 | ) | (601,165 | ) | (1,134,798 | ) | (636,236 | ) | (1,187,514 | ) | |||||
| Institutional Class | (19,036,670 | ) | (21,917,080 | ) | (3,978,501 | ) | (3,284,227 | ) | (3,198,117 | ) | (3,188,352 | ) | |||||
| (23,494,081 | ) | (30,229,740 | ) | (4,768,810 | ) | (4,745,647 | ) | (4,030,586 | ) | (4,768,151 | ) | ||||||
| Net increase (decrease) | (7,040,640 | ) | (5,640,802 | ) | 9,756,107 | (840,003 | ) | 5,172,123 | 2,922,679 | ||||||||
7. Derivatives
U.S. GAAP requires enhanced disclosures that enable investors to understand: 1) how and why an entity uses derivatives, 2) how they are accounted for, and 3) how they affect an entity’s results of operations and financial position.
Foreign Currency Exchange Contracts —The Optimum Fixed Income Fund, Optimum International Fund, Optimum Large Cap Growth Fund and Optimum Large Cap Value Fund may enter into foreign currency exchange contracts and foreign cross currency exchange contracts as a way of managing foreign exchange rate risk. Each Fund may enter into these contracts to fix the U.S. dollar value of a security that it has agreed to buy or sell for the period between the date the trade was entered into and the date the security is delivered and paid for. The Funds may also use these contracts to hedge the U.S. dollar value of securities they already own that are denominated in foreign currencies. The change in value is recorded as an unrealized gain or loss. When the contract is closed, a realized gain or loss is recorded equal to the difference between the value of the contract at the time it was opened and the value at the time it was closed.
The use of foreign currency exchange contracts and foreign cross currency exchange contracts does not eliminate fluctuations in the underlying prices of the securities, but does establish a rate of exchange that can be achieved in the future. Although foreign currency exchange contracts and foreign cross currency exchange contracts limit the risk of loss due to a decline in the value of the hedged currency, they also limit any potential gain that might result should the value of the currency increase. In addition, the Funds could be exposed to risks if the counterparties to the contracts are unable to meet the terms of their contracts. The Funds’ maximum risk of loss from counterparty credit risk is the value of their currency exchanged with the counterparty. The risk is generally mitigated by having a netting arrangement between the Funds and the counterparty and by the posting of collateral by the counterparty to the Funds to cover the Funds’ exposure to the counterparty.
Futures Contracts —A futures contract is an agreement in which the writer (or seller) of the contract agrees to deliver to the buyer an amount of cash or securities equal to a specific dollar amount times the difference between the value of a specific security or index at the close of the last trading day of the contract and the price at which the agreement is made. The Optimum Fixed Income Fund and Optimum International Fund may use futures in the normal course of pursuing their investment objectives. The Optimum Fixed Income Fund may invest in futures contracts to hedge its existing portfolio securities against fluctuations in fair value caused by changes in prevailing market interest rates. The Optimum International Fund may use financial futures contracts to a limited extent, with the objectives of maintaining full exposure to the stock market, enhancing returns, maintaining liquidity and minimizing costs. Upon entering into a financial futures contract, the Funds deposit cash or pledge U.S. government securities to a broker, equal to the minimum “initial margin” requirements of the exchange on which the contract is traded. Subsequent payments are received from the broker or paid to the broker each day, based on the daily fluctuation in the market value of the contract. These receipts or payments are known as “variation margin” and are recorded daily by each Fund as unrealized gains or losses until the contracts are closed. When the contracts are closed, each Fund records a realized gain or loss equal to the difference between the value of the contract at the time it was opened and the value at the time it was closed. Risks of entering
(continues) 119
Notes to financial statements
Optimum Fund Trust
7. Derivatives (continued)
into futures contracts include potential imperfect correlation between the futures contracts and the underlying securities and the possibility of an illiquid secondary market for these instruments. When investing in futures, there is minimal counterparty credit risk to a Fund because futures are exchange-traded and the exchange’s clearinghouse, as counterparty to all exchange-traded futures, guarantees against default.
Options Contracts — During the year ended March 31, 2010, the Optimum Fixed Income Fund entered into options contracts in the normal course of pursuing its investment objective. The Fund may buy or write options contracts for any number of reasons, including: to manage the Fund’s exposure to changes in securities prices and foreign currencies; as an efficient mean of adjusting the Fund’s overall exposure to certain markets; to protect the value of portfolio securities; and as a cash management tool. The Fund may buy or write call or put options on securities, financial indices, and foreign currencies. When the Fund buys an option, a premium is paid and an asset is recorded and adjusted on a daily basis to reflect the current market value of the options purchased. When the Fund writes an option, a premium is received and a liability is recorded and adjusted on a daily basis to reflect the current market value of the options written. Premiums received from writing options that expire unexercised are treated by the Fund on the expiration date as realized gains. The difference between the premium received and the amount paid on effecting a closing purchase transaction, including brokerage commissions, is treated as realized gain or loss. If a call option is exercised, the premium is added to the proceeds from the sale of the underlying security in determining whether the Fund has a realized gain or loss. If a put option is exercised, the premium reduces the cost basis of the securities purchased by the Fund. The Fund, as writer of an option, bears the market risk of an unfavorable change in the price of the security underlying the written option. When writing options, the Fund is subject to minimal counterparty credit risk because the counterparty is only obligated to pay premiums and does not bear the market risk of an unfavorable market change.
Transactions in written options during the year ended March 31, 2010 for the Optimum Fixed Income Fund were as follows:
| Number of contracts | Premiums | ||||||||
| Options outstanding at March 31, 2009 | 7,153 | $ | 7,013 | ||||||
| Options written | 6 | 9,911 | |||||||
| Options expired | (7,153 | ) | (7,013 | ) | |||||
| Options terminated in closing purchase transactions | (6 | ) | (9,911 | ) | |||||
| Options outstanding at March 31, 2010 | — | $ | — | ||||||
Swap Contracts — The Optimum Fixed Income Fund may enter into interest rate swap contracts, index swap contracts and CDS contracts in the normal course of pursuing its investment objective. The Fund may use interest rate swaps to adjust the Fund’s sensitivity to interest rates or to hedge against changes in interest rates. Index swaps may be used to gain exposure to markets that the Fund invests in, such as the corporate bond market. The Fund may also use index swaps as a substitute for futures or options contracts if such contracts are not directly available to the Fund on favorable terms. The Fund may enter into CDS contracts in order to hedge against a credit event, to enhance total return or to gain exposure to certain securities or markets.
Interest Rate Swaps. An interest rate swap contract is an exchange of interest rates between counterparties. In one instance, an interest rate swap involves payments received by the Fund from another party based on a variable or floating interest rate, in return for making payments based on a fixed interest rate. An interest rate swap can also work in reverse with the Fund receiving payments based on a fixed interest rate and making payments based on a variable or floating interest rate. Interest rate swaps may be used to adjust the Fund’s sensitivity to interest rates or to hedge against changes in interest rates. Periodic payments on such contracts are accrued daily and recorded as unrealized appreciation/depreciation on swap contracts. Upon periodic payment/receipt or termination of the contract, such amounts are recorded as realized gains or losses on swap contracts. The Fund’s maximum risk of loss from counterparty credit risk is the discounted net value of the cash flows to be received from/paid to the counterparty over the interest rate swap contract’s remaining life, to the extent that the amount is positive. This risk is mitigated by having a netting arrangement between the Fund and the counterparty and by the posting of collateral by the counterparty to the Fund to cover the Fund’s exposure to the counterparty.
Index Swaps. Index swaps involve commitments to pay interest in exchange for a market linked return based on a notional amount. To the extent the total return of the security, instrument or basket of instruments underlying the transaction exceeds the offsetting interest obligation, the Fund will receive a payment from the counterparty. To the extent the total return of the security, instrument or basket of instruments underlying the transaction falls short of the offsetting interest obligation, the Fund will make a payment to the counterparty. The change in value of swap contracts outstanding, if any, is recorded as unrealized appreciation or depreciation daily. A realized gain or loss is recorded on maturity or termination of the swap contract. The Fund’s maximum risk of loss from counterparty credit risk is the discounted net value of the cash flows to be received from/paid to the counterparty over the index swap contract’s remaining life, to the extent that the amount is positive. This risk is mitigated by having a netting arrangement between the Fund and the counterparty and by the posting of collateral by the counterparty to the Fund to cover the Fund’s exposure to the counterparty.
120
Credit Default Swaps. A CDS contract is a risk-transfer instrument through which one party (purchaser of protection) transfers to another party (seller of protection) the financial risk of a credit event (as defined in the CDS agreement), as it relates to a particular reference security or basket of securities (such as an index). In exchange for the protection offered by the seller of protection, the purchaser of protection agrees to pay the seller of protection a periodic amount at a stated rate that is applied to the referenced notional amount of the CDS contract. In addition, an upfront payment may be made or received by the Fund in connection with an unwinding or assignment of a CDS contract. Upon the occurrence of a credit event, the seller of protection would pay the par (or other agreed-upon) value of the referenced security (or basket of securities) to the counterparty. Credit events generally include, among others, bankruptcy, failure to pay, and obligation default.
During the year ended March 31, 2010, the Optimum Fixed Income Fund entered into CDS contracts as a purchaser and seller of protection. Periodic payments (receipts) on such contracts are accrued daily and recorded as unrealized losses (gains) on swap contracts. Upon payment (receipt), such amounts are recorded as realized losses (gains) on swap contracts. Upfront payments made or received in connection with CDS contracts are amortized over the expected life of the CDS contracts as unrealized losses (gains) on swap contracts. The change in value of CDS contracts is recorded as unrealized appreciation or depreciation daily. A realized gain or loss is recorded upon a credit event (as defined in the CDS agreement) or the maturity or termination of the agreement. At March 31, 2010, the aggregate unrealized depreciation of CDS was $381,206. The Fund had posted $80,000 as collateral, net of collateral received, for certain open derivatives, which is presented as restricted cash on the Statements of assets and liabilities. If a credit event had occurred for all referenced notionals where collateral posting was required as of March 31, 2010, the contracts’ credit-risk-related contingent features would have been triggered and the Fund would have received net amount of $10,278,000 less the value of the contracts’ referenced obligations.
As disclosed in the footnotes to the Statements of net assets, at March 31, 2010, the notional value of the protection sold was $2,775,000, which reflects the maximum potential amount the Fund would have been required to pay as a seller of credit protection if a credit event had occurred. The quoted market prices and resulting market values for CDS agreements on securities and credit indices serve as an indicator of the current status of the payment/performance risk and represent the likelihood of an expected liability (or profit) for the credit derivative if the swap agreement has been closed/sold as of the period end. Increasing market values, in absolute terms when compared to the notional amount of the swap, represent a deterioration of the reference entity’s credit soundness and a greater likelihood of risk of default or other credit event occurring as defined under the terms of the agreement. At March 31, 2010, the net unrealized appreciation of the protection sold was $18,095.
CDS may involve greater risks than when the Fund had invested in the reference obligation directly. CDS are subject to general market risk, liquidity risk, counterparty risk and credit risk. The Fund’s maximum risk of loss from counterparty credit risk, either as the seller of protection or the buyer of protection, is the fair value of the contract. This risk is mitigated by having a netting arrangement between the Fund and the counterparty and by the posting of collateral by the counterparty to the Fund to cover the Fund’s exposure to the counterparty.
Swaps Generally. Because there is no organized market for swap contracts, the value of open swaps may differ from that which would be realized in the event the Fund terminated its position in the agreement. Risks of entering into these contracts include the potential inability of the counterparty to meet the terms of the contracts. This type of risk is generally limited to the amount of favorable movement in the value of the underlying security, instrument or basket of instruments, if any, at the day of default. Risks also arise from potential losses from adverse market movements and such losses could exceed the unrealized amounts shown on the Statements of net assets.
Fair values of derivative instruments as of March 31, 2010 were as follows:
| Optimum Fixed Income Fund | |||||||||||||
| Asset Derivatives | Liability Derivatives | ||||||||||||
| Statements of | Statements of | ||||||||||||
| Assets and Liabilities Location | Fair Value | Assets and Liabilities Location | Fair Value | ||||||||||
| Foreign exchange contracts (Forward Currency Contracts) | Receivables | Payables/Net Assets | |||||||||||
| $ | 311,512 | unrealized depreciation | $ | (5,738 | ) | ||||||||
| Interest rate contracts (Futures) | Receivables | Payables/Net Assets | |||||||||||
| 1,139 | * | unrealized depreciation | — | ||||||||||
| Credit contracts (Swaps) | Receivables | Payables/Net Assets | |||||||||||
| 18,290 | unrealized depreciation | (399,496 | ) | ||||||||||
| Total | $ | 330,941 | $ | (405,234 | ) | ||||||||
*Includes cumulative appreciation of futures contracts as reported in the notes to the Statements of net assets. Only current day variation margin is reported with the Fund’s assets and liabilities.
(continues) 121
Notes to financial statements
Optimum Fund Trust
7. Derivatives (continued)
Statements of operations
The effect of derivative instruments on the statements of operations for the year ended March 31, 2010 was as follows:
| Optimum Fixed Income Fund | ||||||||||||||
| Change in Unrealized | ||||||||||||||
| Realized Gain or Loss on | Appreciation or | |||||||||||||
| Location of Gain or Loss on | Derivatives Recognized in | Depreciation on Derivatives | ||||||||||||
| Derivatives Recognized in Income | Income | Recognized in Income | ||||||||||||
| Foreign exchange contracts (Forward Currency Contracts) | Net realized gain on foreign | |||||||||||||
| currencies and net change | ||||||||||||||
| in unrealized appreciation/ | ||||||||||||||
| depreciation of investments and | ||||||||||||||
| foreign currencies | $ | 906,718 | $ | 352,539 | ||||||||||
| Interest rate contracts (Futures) | Net realized gain on futures | |||||||||||||
| contracts and net change | ||||||||||||||
| in unrealized appreciation/ | ||||||||||||||
| depreciation of investments and | ||||||||||||||
| foreign currencies | 201,602 | (179,917 | ) | |||||||||||
| Options contracts (Options) | Net realized gain on options | |||||||||||||
| written and net change in | ||||||||||||||
| unrealized appreciation/ | ||||||||||||||
| depreciation of investments and | ||||||||||||||
| foreign currencies | 134 | (5,559 | ) | |||||||||||
| Credit contracts (Swaps) | Net realized loss on swap | |||||||||||||
| contracts and net change | ||||||||||||||
| in unrealized appreciation/ | ||||||||||||||
| depreciation of investments and | ||||||||||||||
| foreign currencies | (694,418 | ) | (803,117 | ) | ||||||||||
| Total | $ | 414,036 | $ | (636,054 | ) | |||||||||
8. Securities Lending
The Funds may lend their securities pursuant to a security lending agreement (Lending Agreement) with The Bank of New York Mellon (BNY Mellon). With respect to each loan, if the aggregate market value of securities collateral held plus cash collateral received on any business day is less than the aggregate market value of the securities which are the subject of such loan, the borrower will be notified to provide additional collateral not less than the applicable collateral requirements. Cash collateral received is generally invested in the BNY Mellon Securities Lending Overnight Fund (Collective Trust) established by BNY Mellon for the purpose of investment on behalf of clients participating in its securities lending programs. The Collective Trust may only hold cash and high quality assets with a maturity of one business day or less (Cash/Overnight Assets). The Funds also have cash collateral invested in the BNY Mellon SL DBT II Liquidating Fund (Liquidating Fund), which generally holds the portfolio securities of each Fund’s previous cash pool other than its Cash/Overnight Assets. The Liquidating Fund invests in fixed income securities, with a weighted average maturity not to exceed 90 days, rated in one of the top three tiers by Standard & Poor’s Ratings Group (S&P) or Moody’s Investors Service, Inc. (Moody’s) or repurchase agreements collateralized by such securities. Each Fund will not make additional investments of cash collateral in the Liquidating Fund; each Fund’s exposure to the Liquidating Fund is expected to decrease as the Liquidating Fund’s assets mature or are sold. Both the Collective Trust and the Liquidating Trust seek to maintain a net asset value per unit of $1.00, but there can be no assurance that it will always be able to do so. The Funds may incur investment losses as a result of investing securities lending collateral in the Collective Trust and the Liquidating Fund. This could occur if an investment in the Collective Trust or the Liquidating Fund defaulted or if it were necessary to liquidate assets in the Collective Trust or the Liquidating Fund to meet returns on outstanding security loans at a time when their net asset value per unit was less than $1.00. Under those circumstances, the Funds may not receive an amount from the Collective Trust or the Liquidating Fund that is equal in amount to the collateral the Funds would be required to return to the borrower of the securities and the Funds would be required to make up for this shortfall. In October 2008, BNY Mellon transferred certain distressed securities from the Collective Trust into the Mellon GSL Reinvestment Trust II. The Funds can also accept U.S. government securities and letters of credit (non-cash collateral) in connection with securities loans. In the event of default or bankruptcy by the lending agent, realization and/or retention of the collateral may be subject to legal proceedings. In the event the borrower fails to return loaned securities and the collateral received is insufficient to cover the value of the loaned securities and provided such collateral shortfall is not the result of investment losses, the lending agent has agreed to pay the amount of the shortfall to the Funds, or at the discretion of the lending agent, replace the loaned securities. The Funds continue to record
122
dividends or interest, as applicable, on the securities loaned and are subject to change in value of the securities loaned that may occur during the term of the loan. The Funds have the right under the Lending Agreement to recover the securities from the borrower on demand. With respect to security loans collateralized by non-cash collateral, the Funds receive loan premiums paid by the borrower. With respect to security loans collateralized by cash collateral, the earnings from the collateral investments are shared among the Funds, the security lending agent and the borrower. The Funds record security lending income net of amount allocated to the security lending agent and the borrower.
At March 31, 2010, the values of securities on loan and the values of invested collateral for each Fund are presented below, for which the Funds received collateral, comprised of securities collateral and cash collateral. Investments purchased with cash collateral are presented on the statement of net assets under the caption “Securities Lending Collateral”.
| Optimum | Optimum | Optimum | Optimum | Optimum | Optimum | |||||||||||||
| Fixed Income | International | Large Cap | Large Cap | Small-Mid Cap | Small-Mid Cap | |||||||||||||
| Fund | Fund | Growth Fund | Value Fund | Growth Fund | Value Fund | |||||||||||||
| Values of securities on loan | $ | 44,267,956 | $ | 23,169,345 | $ | 49,557,111 | $ | 50,673,156 | $ | 24,547,662 | $ | 13,062,137 | ||||||
| Securities collateral | 3,480,753 | — | 1,096,012 | — | 30,404 | 197,160 | ||||||||||||
| Cash collateral | 41,847,744 | 25,127,926 | 50,827,105 | 52,001,650 | 25,169,878 | 13,175,864 | ||||||||||||
| Value of invested collateral | 40,583,113 | 24,474,685 | 49,743,220 | 50,493,400 | 24,650,519 | 12,904,939 | ||||||||||||
9. Credit and Market Risk
Some countries in which the Optimum Fixed Income Fund, Optimum International Fund, Optimum Large Cap Growth Fund, Optimum Large Cap Value Fund and Optimum Small-Mid Cap Growth Fund may invest require governmental approval for the repatriation of investment income, capital or the proceeds of sales of securities by foreign investors. In addition, if there is deterioration in a country’s balance of payments or for other reasons, a country may impose temporary restrictions on foreign capital remittances abroad.
The securities exchanges of certain foreign markets are substantially smaller, less liquid and more volatile than the major securities markets in the United States. Consequently, acquisition and disposition of securities by the Funds may be inhibited. In addition, a significant portion of the aggregate market value of securities listed on the major securities exchanges in emerging markets is held by a smaller number of investors. This may limit the number of shares available for acquisition or disposition by the Funds.
The Optimum Fixed Income Fund invests a portion of its assets in high yield fixed income securities, which carry ratings of BB or lower by S&P and/or Ba or lower by Moody’s. Investments in these high yield securities are generally accompanied by a greater degree of credit risk than higher rated securities. Additionally, lower rated securities may be more susceptible to adverse economic and competitive industry conditions than investment grade securities.
The Optimum Fixed Income Fund invests in fixed income securities whose value is derived from an underlying mortgages or consumer loans. The value of these securities is sensitive to changes in economic conditions, including delinquencies and/or defaults, and may be adversely affected by shifts in the market’s perception of the issuers and changes in interest rates. Investors receive principal and interest payments as the underlying mortgages and consumer loans are paid back. Some of these securities are collateralized mortgage obligations (CMOs). CMOs are debt securities issued by U.S. government agencies or by financial institutions and other mortgage lenders, which are collateralized by a pool of mortgages held under an indenture. Prepayment of mortgages may shorten the stated maturity of the obligations and can result in a loss of premium, if any has been paid. Certain of these securities may be stripped (securities which provide only the principal or interest feature of the underlying security). The yield to maturity on an interest-only CMO is extremely sensitive not only to changes in prevailing interest rates, but also to the rate of principal payments (including prepayments) on the related underlying mortgage assets. A rapid rate of principal payments may have a material adverse effect on the Fund’s yield to maturity. If the underlying mortgage assets experience greater than anticipated prepayments of principal, the Fund may fail to fully recoup its initial investment in these securities even if the securities are rated in the highest rating categories.
The Optimum Small-Mid Cap Growth Fund and Optimum Small-Mid Cap Value Fund invest a significant portion of its assets in small- and mid- sized companies and may be subject to certain risks associated with ownership of securities of such companies. Investments in small- or mid-sized companies may be more volatile than investments in larger companies for a number of reasons, which include more limited financial resources or a dependence on narrow product lines.
The Optimum Large Cap Value Fund, Optimum Small-Mid Cap Growth Fund and Optimum Small-Mid Cap Value Fund invest in REITs and are subject to some of the risks associated with that industry. If the Funds hold real estate directly as a result of defaults or receives rental income directly from real estate holdings, its tax status as a regulated investment company may be jeopardized. There were no direct real estate holdings during the year ended March 31, 2010. The Funds’ REIT holdings are also affected by interest rate changes, particularly if the REITs they hold use floating rate debt to finance their ongoing operations.
(continues) 123
Notes to financial statements
Optimum Fund Trust
9. Credit and Market Risk (continued)
Each Fund may invest up to 15% of its net assets in illiquid securities, which may include securities with contractual restrictions on resale, securities exempt from registration under Rule 144A of the Securities Act of 1933, as amended, and other securities which may not be readily marketable. The relative illiquidity of these securities may impair each Fund from disposing of them in a timely manner and at a fair price when it is necessary or desirable to do so. While maintaining oversight, the Funds’ Board has delegated to DMC the day-to-day functions of determining whether individual securities are liquid for purposes of the Funds’ limitation on investments in illiquid assets. Securities eligible for resale pursuant to Rule 144A, which are determined to be liquid, are not subject to the Funds’ 15% limit on investments in illiquid securities. Rule 144A and illiquid securities have been identified on the Statements of net assets.
10. Contractual Obligations
The Funds enter into contracts in the normal course of business that contain a variety of indemnifications. The Funds’ maximum exposure under these arrangements is unknown. However, the Funds have not had any prior claims or losses pursuant to these contracts. Management has reviewed the Funds’ existing contracts and expects the risk of loss to be remote.
11. Sale of Delaware Investments to Macquarie Group
On August 18, 2009, Lincoln National Corporation (former parent company of Delaware Investments) and Macquarie Group (Macquarie) entered into an agreement pursuant to which Delaware Investments, including DMC, DDLP and DSC, would be acquired by Macquarie, an Australia-based global provider of banking, financial, advisory, investment and funds management services (Transaction). The Transaction was completed on January 4, 2010. DMC, DDLP and DSC are now wholly owned subsidiaries of Macquarie.
The Transaction resulted in a change of control of DMC which, in turn, caused the termination of the investment management agreement between DMC and the Funds. On January 4, 2010, the new investment management agreement between DMC and the Funds that was approved by the shareholders became effective.
12. Tax Information (Unaudited)
The information set forth below is for each Fund’s fiscal year as required by federal laws (Optimum Small-Mid Cap Growth Fund did not make any distributions). Shareholders, however, must report distributions on a calendar year basis for income tax purposes, which may include distributions for portions of two fiscal years of a fund. Accordingly, the information needed by shareholders for income tax purposes will be sent to them in January of each year. Please consult your tax advisor for proper treatment of this information.
| (A) | (B) | ||||||||||||||||||
| Long-Term | Ordinary | (C) | |||||||||||||||||
| Capital Gains | Income | Return of | Total | (D) | |||||||||||||||
| Distributions | Distributions* | Capital | Distributions | Qualifying | |||||||||||||||
| (Tax Basis) | (Tax Basis) | (Tax Basis) | (Tax Basis) | Dividends1 | |||||||||||||||
| Optimum Fixed Income Fund | — | 100 | % | — | 100% | — | |||||||||||||
| Optimum International Fund | — | 100 | % | — | 100% | 2 | % | ||||||||||||
| Optimum Large Cap Growth Fund | — | 100 | % | — | 100% | 100 | % | ||||||||||||
| Optimum Large Cap Value Fund | — | 100 | % | — | 100% | 100 | % | ||||||||||||
| Optimum Small-Mid Cap Value Fund | — | 49 | % | 51 | % | 100% | 49 | % | |||||||||||
(A), (B) and (C) are based on a percentage of each Fund’s total distributions.
(D) is based on a percentage of each Fund’s ordinary income distributions.
1Qualifying dividends represent dividends which qualify for the corporate dividends received deduction.
*For the fiscal year ended March 31, 2010, certain dividends paid by the Funds may be subject to a maximum tax rate of 15%, as provided for by the Jobs and Growth Tax Relief Reconciliation Act of 2003. The Funds intend to designate the following amounts to be taxed at a maximum rate of 15%. Complete information will be computed and reported in conjunction with your 2009 or 2010 Form 1099-DIV, as applicable.
124
| Maximum amount to be | |||||
| taxed at a maximum rate of 15% | |||||
| Optimum Fixed Income Fund | $ | 147,759 | |||
| Optimum International Fund | 2,806,274 | ||||
| Optimum Large Cap Growth Fund | 753,154 | ||||
| Optimum Large Cap Value Fund | 13,614,136 | ||||
| Optimum Small-Mid Cap Value Fund | 180,406 | ||||
The Optimum International Fund intends to pass through foreign tax credits in the maximum amount of $329,856. The gross foreign source income earned during the fiscal year 2010 by the Optimum International Fund was $5,427,066. Complete information will be computed and reported in conjunction with your 2010 Form 1099-DIV.
For the fiscal year ended March 31, 2010, certain ordinary income paid by the Funds, determined to be Qualified Interest Income, may be subject to relief from U.S. withholding for foreign shareholders, as provided by the American Jobs Creation Act of 2004. For the fiscal year ended March 31, 2010, each Fund has designated maximum Qualified Interest Income distributions as follows:
| Maximum Distribution of | |||||
| Qualified Interest Income | |||||
| Optimum Fixed Income Fund | $ | 47,549,636 | |||
| Optimum International Fund | 956 | ||||
| Optimum Large Cap Value Fund | 2,316 | ||||
13. Subsequent Event
Management has determined no material events or transactions occurred subsequent to March 31, 2010 that would require recognition or disclosure in the Funds’ financial statements.
125
Report of independent
registered public accounting firm
registered public accounting firm
The Shareholders and Board of Trustees of Optimum Fund Trust
We have audited the accompanying statements of net assets and statements of assets and liabilities of Optimum Fund Trust (comprising, respectively, the Optimum Fixed Income Fund, Optimum International Fund, Optimum Large Cap Growth Fund, Optimum Large Cap Value Fund, Optimum Small Mid-Cap Growth Fund, Optimum Small-Mid Cap Value Fund (“Funds”)) as of March 31, 2010, and the related statements of operations for the year then ended, the statements of changes in net assets for each of the two years in the period then ended, and the financial highlights for each of the five years in the period then ended. These financial statements and financial highlights are the responsibility of the Funds’ management. Our responsibility is to express an opinion on these financial statements and financial highlights based on our audits.
We conducted our audits in accordance with the standards of the Public Company Accounting Oversight Board (United States). Those standards require that we plan and perform the audit to obtain reasonable assurance about whether the financial statements and financial highlights are free of material misstatement. We were not engaged to perform an audit of the Funds’ internal control over financial reporting. Our audits included consideration of internal control over financial reporting as a basis for designing audit procedures that are appropriate in the circumstances, but not for the purpose of expressing an opinion on the effectiveness of the Funds’ internal control over financial reporting. Accordingly, we express no such opinion. An audit also includes examining, on a test basis, evidence supporting the amounts and disclosures in the financial statements and financial highlights, assessing the accounting principles used and significant estimates made by management, and evaluating the overall financial statement presentation. Our procedures included confirmation of securities owned as of March 31, 2010, by correspondence with the custodian and brokers, or by other appropriate auditing procedures where replies from brokers were not received. We believe that our audits provide a reasonable basis for our opinion.
In our opinion, the financial statements and financial highlights referred to above present fairly, in all material respects, the financial position of each of the respective Funds constituting Optimum Fund Trust at March 31, 2010, the results of their operations for the year then ended, the changes in their net assets for each of the two years in the period then ended, and their financial highlights for each of the five years in the period then ended in conformity with U.S. generally accepted accounting principles.

Philadelphia, Pennsylvania
May 21, 2010
May 21, 2010
126
Other Fund information
(Unaudited)
(Unaudited)
Optimum Fund Trust
Change in Independent Registered Public Accounting Firm
Due to independence matters under the Securities and Exchange Commission’s auditor independence rules relating to the January 4, 2010 acquisition of Delaware Investments (including DMC, DDLP and DSC) by Macquarie Group, Ernst & Young LLP (“E&Y”) will resign as the independent registered public accounting firm for Optimum Fund Trust (the “Fund”)) effective May 27, 2010. At a meeting held on March 17, 2010, the Board of Trustees of the Fund, upon recommendation of the Audit Committee, selected PricewaterhouseCoopers LLC (“PwC”) to serve as the independent registered public accounting firm for the Fund for the fiscal year ending March 31, 2011. During the fiscal years ended March 31, 2010 and 2009, E&Y’s audit reports on the financial statements of the Fund did not contain any adverse opinion or disclaimer of opinion, nor were they qualified or modified as to uncertainty, audit scope, or accounting principles. In addition, there were no disagreements between the Fund and E&Y on accounting principles, financial statements disclosures or audit scope, which, if not resolved to the satisfaction of E&Y, would have caused them to make reference to the disagreement in their reports. Neither the Fund nor anyone on its behalf has consulted with PwC at any time prior to their selection with respect to the application of accounting principles to a specified transaction, either completed or proposed or the type of audit opinion that might be rendered on the Fund’s financial statements.
Proxy Results
A. Optimum Fund Trust
| Proposals | All Shareholders | |||
| For | Withhold | |||
| Proposal 1: Election of Trustees | ||||
| Mark S. Casady | 1,328,516,250.12 | 29,661,033.39 | ||
| Robert J. Christian | 1,328,645,345.97 | 29,531,937.54 | ||
| Nicholas D. Constan | 1,328,811,290.72 | 29,365,992.79 | ||
| Durant Adams Hunter | 1,328,608,641.76 | 29,568,641.75 | ||
| Stephen P. Mullin | 1,328,823,664.37 | 29,353,619.14 | ||
| Robert A. Rudell | 1,328,672,025.66 | 29,505,257.85 | ||
| Theodore K. Smith | 1,328,680,441.91 | 29,496,841.60 | ||
| Jon E. Socolofsky | 1,328,677,443.19 | 29,499,840.32 | ||
B. Optimum Large Cap Growth Fund
| All Shareholders | ||||||||
| For | Against | Abstain | Broker Non-Votes | |||||
| Proposal 2: Approval of New Investment | ||||||||
| Advisory Agreement | 265,024,194.95 | 4,255,519.91 | 6,940,354.89 | 78,405,257.57 | ||||
| C. Optimum Large Cap Value Fund | ||||||||
| All Shareholders | ||||||||
| For | Against | Abstain | Broker Non-Votes | |||||
| Proposal 2: Approval of New Investment | ||||||||
| Advisory Agreement | 234,887,273.59 | 3,818,607.78 | 6,286,296.97 | 75,672,048.05 | ||||
| D. Optimum Small-Mid Cap Growth Fund | ||||||||
| All Shareholders | ||||||||
| For | Against | Abstain | Broker Non-Votes | |||||
| Proposal 2: Approval of New Investment | ||||||||
| Advisory Agreement | 73,359,707.14 | 1,189,494.62 | 1,790, 689.49 | 18,076,373.39 | ||||
(continues) 127
Other Fund information
(Unaudited)
(Unaudited)
Optimum Fund Trust
Proxy Results (continued)
| E. Optimum Small-Mid Cap Value Fund | ||||||||
| All Shareholders | ||||||||
| For | Against | Abstain | Broker Non-Votes | |||||
| Proposal 2: Approval of New Investment | ||||||||
| Advisory Agreement | 58,768, 889.72 | 970,479.05 | 1,486,943.10 | 16,469,943.10 | ||||
| F. Optimum International Fund | ||||||||
| All Shareholders | ||||||||
| For | Against | Abstain | Broker Non-Votes | |||||
| Proposal 2: Approval of New Investment | ||||||||
| Advisory Agreement | 67,235,832.33 | 1,099,534.01 | 1,706, 013.64 | 27,170,768.50 | ||||
| G. Optimum Fixed Income Fund | ||||||||
| All Shareholders | ||||||||
| For | Against | Abstain | Broker Non-Votes | |||||
| Proposal 2: Approval of New Investment | ||||||||
| Advisory Agreement | 307,698,346.08 | 4,979,572.97 | 9,166,551.57 | 91,719,306.91 | ||||
Board Consideration of Certain Optimum Fund Trust
Sub-Advisory Agreements
Sub-Advisory Agreements
At a meeting held on March 18, 2010, the Board of Trustees, including a majority of non-interested or independent Trustees, approved new Sub-Advisory Agreements (the “Sub-Advisory Agreements”) between Delaware Management Company (the “Manager” or “DMC”) and each of Pacific Investment Management Company LLC (“PIMCO”; for the Optimum Fixed Income Fund) and Columbia Wanger Asset Management, L.P. (“CWAM”; for the Optimum Small-Mid Cap Growth Fund). PIMCO and CWAM may be referred to below as the “Sub-Adviser(s)”. PIMCO replaced TCW Investment Management Company (“TCW”) as a sub-adviser to the Fund on April 1, 2010. In reaching the decision to approve the PIMCO Sub-Advisory Agreement (the “PIMCO Agreement”), the Board considered and reviewed information about PIMCO, including its personnel, operations and financial condition, which had been provided by PIMCO. The Board also reviewed material furnished by DMC (with the assistance of its consultant, LPL Financial Corporation (“LPL”)), including: a memorandum from DMC reviewing the PIMCO Agreement and the various services proposed to be rendered by PIMCO; research and analysis concerning DMC’s proposal of PIMCO; a description of PIMCO’s proposed sub-advisory fees under the PIMCO Agreement; information concerning PIMCO’s organizational structure and the experience of its investment management personnel; a “due diligence” report describing various material items in relation to PIMCO’s personnel, organization and policies; copies of PIMCO’s compliance policies and procedures and its Code of Ethics; and a copy of the PIMCO Agreement.
The need for approval of a new Sub-Advisory Agreement for CWAM (the “CWAM Agreement”) arose from a pending change in control of CWAM arising out of the plans of Ameriprise Financial, Inc. to acquire CWAM from Bank of America, N.A. (the “Transaction”). The CWAM Agreement became effective on May 1, 2010 after completion of the Transaction. Because CWAM was an existing sub-adviser to the Optimum Small-Mid Cap Growth Fund, the Board took into account information furnished and discussed throughout the year at quarterly Board meetings when discussing the CWAM Agreement, as well as information furnished specifically for the contract approval considerations being conducted at the Board meeting. Information furnished at Board meetings throughout the year included: an analysis by DMC (with the assistance of LPL) of the investment performance of CWAM and the sleeve of the Fund it sub-advised; a report prepared by Lipper Inc. (“Lipper”) comparing the Fund’s investment performance and expenses with certain other mutual funds deemed comparable (“Lipper Report”); and compliance reports and related certifications furnished by CWAM and DMC. Material furnished specifically in connection with the review of the CWAM Agreement included: materials similar to the information provided to the Board in connection with the approval of the PIMCO Agreement; and materials specifically discussing the Transaction.
In considering such information and materials, the independent Trustees received assistance from and met separately with independent counsel. The materials prepared by Management specifically in connection with the approval of the Sub-Advisory Agreements were sent to the independent Trustees in advance of the meeting. While attention was given to all information furnished, the following discusses under separate headings the primary factors taken into account by the Board in its consideration of the Sub-Advisory Agreements.
128
Nature, Extent and Quality of Services. In considering the nature, extent and quality of the services to be provided by PIMCO, the Board specifically considered that the PIMCO Agreement contains substantially similar provisions to those in the prior TCW sub-advisory agreement except for the provisions relating to the fees. The Board reviewed materials provided by PIMCO regarding the experience and qualifications of personnel who will be responsible for managing PIMCO’s portion of the Optimum Fixed Income Fund, and placed weight on PIMCO’s performance in managing an existing account (the “PIMCO Account”) in a similar investment strategy to the one they would employ for the Fund. The Board also considered that PIMCO would co-manage the Optimum Fixed Income Fund with another adviser, DMC. The Board considered the compatibility of the two advisers’ investment philosophies and methodologies.
In considering the nature, extent and quality of the services to be provided by CWAM, the Board specifically considered that the CWAM Agreement contains substantially similar provisions to those in the prior CWAM sub-advisory agreement for the Optimum Small-Mid Cap Growth Fund. The Board reviewed materials provided by CWAM regarding its experience and the qualifications of its personnel, and placed weight on CWAM’s representation that there are no planned changes with respect to CWAM’s personnel responsible for security selection and portfolio management of the portion of the Optimum Small-Mid Cap Growth Fund managed by CWAM after the completion of the Transaction. The quality of the services of CWAM was considered primarily in respect to the investment performance of its sleeve of the Fund. The Board was also satisfied with the adherence by CWAM with the investment policies and restrictions of the Fund, as well as their adherence to various compliance and other procedures based on personal presentations made by representatives of CWAM and DMC reports of its discussions with CWAM, as well as certificates and materials furnished at Board meetings and in connection with the approval of the CWAM Agreement. Based upon these considerations, the Board determined that the nature, extent and quality of the services to be provided by PIMCO and CWAM under the Sub-Advisory Agreements were satisfactory.
Investment Performance. In regards to PIMCO, the Board reviewed information on the performance of the PIMCO Account over various time periods. The Board also reviewed an analysis showing the projected composite investment performance of the Optimum Fixed Income Fund that would have resulted from combining the performance of PIMCO in managing the PIMCO Account with the performance of DMC in managing its portion of the Fund over various time periods measured in several different ways. In respect to such analysis, the Board noted that PIMCO’s fixed income style seemed a good complement to that followed by DMC. In regards to CWAM, the Board placed significant emphasis on CWAM’s prior investment performance on its sleeve of the Optimum Small-Mid Cap Growth Fund. While consideration was given to performance reports and discussions throughout the year (including the Lipper Report described above), particular attention in assessing performance was given to CWAM’s performance on its portion of the Fund to date relative to the Fund’s peers and benchmark. The Board was satisfied with such performance. In addition, the Board placed weight on CWAM’s representation that there are no planned changes with respect to the CWAM personnel currently responsible for security selection and portfolio management of its portion of the Fund after the completion of the Transaction. The Board believed such information and analysis evidenced the benefits to the Funds and high quality of portfolio management services expected to be provided by PIMCO and CWAM under their respective Sub-Advisory Agreements.
Sub-Advisory Fee; Profitability; and Economies of Scale. The Board noted that the fees to be paid to PIMCO under the PIMCO Agreement were slightly higher than those charged by TCW at higher assets under management levels, but would be paid out of the fee paid to DMC in its role as investment manager and would result in no increase in costs to the Optimum Fixed Income Fund. The Board was provided with a description of fees to be charged by CWAM under the CWAM Agreement which showed them to be identical to the sub-advisory fees from the prior CWAM sub-advisory agreement for the Optimum Small-Mid Cap Growth Fund. The Board also was provided with information showing that each Sub-Adviser’s fees were competitive with those charged by the Sub-Advisers’ to other comparable investment companies or accounts. The Board was informed that the Sub-Advisers may receive certain fall-out benefits in connection with their relationship with the Funds, such as soft-dollar arrangements. The Board also noted that the management fee paid by the Funds to DMC would stay the same at current asset levels, and that DMC’s profitability would remain the same following the transition to the Sub-Advisers at current asset levels. Information about PIMCO’s estimated profitability from its relationship with the Optimum Fixed Income Fund was not available because it had not begun to provide services to the Fund, but the Board had previously been provided with profitability from CWAM on its portion of the Optimum Small-Mid Cap Growth Fund. The investment management fees for the Optimum Fixed Income Fund contained breakpoints with the Fund’s asset size being at a high enough level to benefit from such breakpoints and to the extent economies of scale may be realized in the management of any of these Funds, the Trustees believed such schedule of fees provided a sharing of benefits with the Fund and its shareholders. The Optimum Small-Mid Cap Growth Fund had approximately $225 million in net assets at February 28, 2010. The Trustees believed at such asset levels and taking into account the nature of the Fund and extent to which certain of its expenses are borne by DMC, that no meaningful economies of scale existed. Based upon such facts, the Board believed that the fees to be charged by the Sub-Advisers under the Sub-Advisory Agreements were fair and reasonable in relation to the services being provided.
129
Board of trustees and officers addendum
Optimum Fund Trust
A mutual fund is governed by a Board of Trustees which has oversight responsibility for the management of a fund’s business affairs. Trustees establish procedures and oversee and review the performance of the investment manager, the distributor and others that perform services for the fund. The independent fund trustees, in particular, are advocates for shareholder interests. The following is a list of the Trustees and Officers of the Trust with certain background and related information.
| Number of | |||||
| Portfolios in Fund | Other | ||||
| Name, | Complex1 Overseen | Directorships | |||
| Address | Position(s) | Length of | Principal Occupation(s) | by Trustee | Held by |
| and Age | Held with Fund(s) | Time Served | During Past 5 Years | or Officer | Trustee or Officer |
| Interested Trustees | |||||
| Mark S. Casady2 | Trustee | April 21, | Chairman and | 6 | Director and Chair – |
| 2005 Market Street | 2003 to | Chief Executive Officer – | LPL Investment | ||
| Philadelphia, PA | present | LPL Financial Corporation | Holding Inc. | ||
| 19103 | (2005 – Present) | (2005 – Present) | |||
| Age 49 | President and Chief Executive | ||||
| Officer – LPL Financial Corporation | |||||
| (2004 – 2005) | |||||
| Theodore K. Smith2 | Trustee, President | June 12, 2008 | Executive Vice President | 6 | None |
| 2005 Market Street | and Chief | to present | Retail Product Sales and Marketing | ||
| Philadelphia, PA | Executive Officer | Delaware Investments | |||
| 19103 | (2006 – Present) | ||||
| Age 41 | Head of Strategic Partner | ||||
| Account Management | |||||
| Lincoln Financial Distributors | |||||
| (2005 – 2006) | |||||
| Vice President | |||||
| Head of Managed Accounts | |||||
| Delaware Investments | |||||
| (2002 – 2005) | |||||
| Independent Trustees | |||||
| Robert J. Christian | Trustee | November 1, 2007 | Private Investor | 6 | Trustee – Wilmington Funds |
| 2005 Market Street | and Chairman | to present | (2006 – Present) | (24 mutual funds) | |
| Philadelphia, PA | (1998 – Present) | ||||
| 19103 | |||||
| Age 61 | Chief Investment Officer | Trustee – FundVantage Trust | |||
| Wilmington Trust Corporation | (7 mutual funds) | ||||
| (Trust Bank) | (2007 - Present) | ||||
| (1996 – 2006) | |||||
| Nicholas D. Constan | Trustee | July 17, 2003 | Adjunct Professor – | 6 | None |
| 2005 Market Street | to present | University of Pennsylvania | |||
| Philadelphia, PA | (1972 – Present) | ||||
| 19103 | |||||
| Age 71 | |||||
| Durant Adams Hunter | Trustee | July 17, 2003 | Principal-Ridgeway Partners | 6 | None |
| 2005 Market Street | to present | (Executive Recruiting) | |||
| Philadelphia, PA | (2004 – Present) | ||||
| 19103 | |||||
| Age 61 | |||||
130
| Number of | |||||
| Portfolios in Fund | Other | ||||
| Name, | Complex1 Overseen | Directorships | |||
| Address | Position(s) | Length of | Principal Occupation(s) | by Trustee | Held by |
| and Age | Held with Fund(s) | Time Served | During Past 5 Years | or Officer | Trustee or Officer |
| Independent Trustees (continued) | |||||
| Stephen Paul Mullin | Trustee | July 17, 2003 | Senior Vice President – | 6 | None |
| 2005 Market Street | to present | Econsult Corporation | |||
| Philadelphia, PA | (Economic Consulting) | ||||
| 19103 | (2000 – Present) | ||||
| Age 54 | |||||
| Robert A. Rudell | Trustee | July 17, 2003 | Private Investor | 6 | Director and Chair, |
| 2005 Market Street | to present | (2002 – Present) | Compensation Committee – | ||
| Philadelphia, PA | Medtox Scientific, Inc. | ||||
| 19103 | (Medical devices/Clinical lab) | ||||
| (2002 – Present) | |||||
| Age 61 | |||||
| Director and | |||||
| Independent Chairman– | |||||
| Heartland Funds | |||||
| (3 mutual funds) | |||||
| (2005 – Present) | |||||
| Director – | |||||
| Vantagepoint | |||||
| (27 mutual funds) | |||||
| (2007 – Present) | |||||
| Jon Edward Socolofsky | Trustee | July 17, 2003 | Private Investor | 6 | None |
| 2005 Market Street | to present | (2002 – Present) | |||
| Philadelphia, PA | |||||
| 19103 | |||||
| Age 64 | |||||
| Officers | |||||
| David F. Connor | Vice President, | Vice President since | Mr. Connor has served as | 6 | None4 |
| 2005 Market Street | Deputy General | July 17, 2003 | Vice President and Deputy | ||
| Philadelphia, PA | Counsel, and Secretary | and Secretary | General Counsel of | ||
| 19103 | since | Delaware Investments3 since 2000. | |||
| December 6, 2005 | |||||
| Age 45 | |||||
| David P. O’Connor | Senior Vice President, | October 25, 2005 | Mr. O’Connor has served in | 6 | None4 |
| 2005 Market Street | General Counsel, | to present | various executive and legal | ||
| Philadelphia, PA | and Chief | capacities at different times at | |||
| 19103 | Legal Officer | Delaware Investments. | |||
| Age 43 | |||||
| Daniel Geatens | Vice President | September 20, 2007 | Mr. Geatens has served in | 6 | None4 |
| 2005 Market Street | and Treasurer | to present | various capacities at | ||
| Philadelphia, PA | Delaware Investments. | ||||
| 19103 | |||||
| Age 37 | |||||
| Richard Salus | Senior | January 1, 2006 | Mr. Salus has served in | 6 | None4 |
| 2005 Market Street | Vice President | to present | various executive capacities | ||
| Philadelphia, PA | and | at different times at | |||
| 19103 | Chief Financial | Delaware Investments. | |||
| Officer | |||||
| Age 45 | |||||
| 1 The term “Fund Complex” refers to the Funds in the Optimum Fund Trust. |
| 2 “Interested persons” of the Funds by virtue of their executive and management positions or relationships with the Fund’s service providers or sub-service providers. |
| 3 Delaware Investments is the marketing name for Delaware Management Holdings, Inc. and its subsidiaries, including the Trust’s manager, principal underwriter and service agent. |
| 4 Messrs Connor, O’Connor, Geatens and Salus also serve in similar capacities for the Delaware Investments Family of Funds, a fund complex also managed and distributed by Delaware Investments with 83 funds. |
The Statement of Additional Information for the Fund(s) includes additional information about the Trustees and Officers and is available, without charge, upon request by calling your financial advisor or 800 914-0278.
131
About the organization
This annual report is for the information of Optimum Fund Trust shareholders, but it may be used with prospective investors when preceded or accompanied by a current prospectus for Optimum Fund Trust and the Fact Sheet for the most recently completed calendar quarter. The prospectus sets forth details about charges, expenses, investment objectives, and operating policies of the investment company. You should read the prospectus carefully before you invest. The figures in this report represent past results that are not a guarantee of future results. The return and principal value of an investment in the investment company will fluctuate so that shares, when redeemed, may be worth more or less than their original cost.
Board of trustees Mark S. Casady Chairman and Chief Executive Officer LPL Financial Corporation Theodore K. Smith Executive Vice President Delaware Investments Robert J. Christian Private Investor Nicholas D. Constan Adjunct Professor — University of Pennsylvania Durant Adams Hunter Principal — Ridgeway Partners Stephen Paul Mullin Senior Vice President — Econsult Corporation Robert A. Rudell Private Investor Jon Edward Socolofsky Private Investor | Affiliated officers David F. Connor Vice President, Deputy General Counsel and Secretary Optimum Fund Trust Philadelphia, PA Daniel V. Geatens Vice President and Treasurer Optimum Fund Trust Philadelphia, PA David P. O’Connor Senior Vice President, General Counsel and Chief Legal Officer Optimum Fund Trust Philadelphia, PA Richard Salus Senior Vice President and Chief Financial Officer Optimum Fund Trust Philadelphia, PA | Contact information Investment manager Delaware Management Company, a series of Delaware Management Business Trust Philadelphia, PA National distributor Delaware Distributors, L.P. Philadelphia, PA Shareholder servicing, dividend disbursing, and transfer agent Delaware Service Company, Inc. 2005 Market Street Philadelphia, PA 19103-7094 For shareholders 800 914-0278 For securities dealers and financial institutions representatives only 800 362-7500 Web site www.optimummutualfunds.com |
Each Fund files its complete schedule of portfolio holdings with the Securities and Exchange Commission (SEC) for the first and third quarters of each fiscal year on Forms N-Q. Each Fund’s Forms N-Q, as well as a description of the policies and procedures that each Fund uses to determine how to vote proxies (if any) relating to portfolio securities is available without charge (i) upon request, by calling 800 914-0278; (ii) on the Fund’s Web site at www.optimummutualfunds.com ; and (iii) on the SEC’s Web site at www.sec.gov. Each Fund’s Forms N-Q may be reviewed and copied at the SEC’s Public Reference Room in Washington, D.C.; information on the operation of the Public Reference Room may be obtained by calling 800 SEC-0330.
Information (if any) regarding how each Fund voted proxies relating to portfolio securities during the most recently disclosed 12-month period ended June 30 is available without charge (i) through the Fund’s Web site at www.optimummutualfunds.com; and (ii) on the SEC’s Web site at www.sec.gov.
132
Item 2. Code of Ethics
The registrant has adopted a code of ethics that applies to the registrant’s principal executive officer, principal financial officer, principal accounting officer or controller, or persons performing similar functions, regardless of whether these individuals are employed by the registrant or a third party. A copy of the registrant’s Code of Business Ethics has been posted on the Delaware Investments Internet Web site at www.delawareinvestments.com. Any amendments to the Code of Business Ethics, and information on any waiver from its provisions granted by the registrant, will also be posted on this Web site within five business days of such amendment or waiver and will remain on the Web site for at least 12 months.
Item 3. Audit Committee Financial Expert
The registrant’s Board of Trustees/Directors has determined that each member of the registrant’s Audit Committee is an audit committee financial expert, as defined below. For purposes of this item, an “audit committee financial expert” is a person who has the following attributes:
a. An understanding of generally accepted accounting principles and financial statements;
b. The ability to assess the general application of such principles in connection with the accounting for estimates, accruals, and reserves;
c. Experience preparing, auditing, analyzing, or evaluating financial statements that present a breadth and level of complexity of accounting issues that are generally comparable to the breadth and complexity of issues that can reasonably be expected to be raised by the registrant’s financial statements, or experience actively supervising one or more persons engaged in such activities;
d. An understanding of internal controls and procedures for financial reporting; and
e. An understanding of audit committee functions.
An “audit committee financial expert” shall have acquired such attributes through:
a. Education and experience as a principal financial officer, principal accounting officer, controller, public accountant, or auditor or experience in one or more positions that involve the performance of similar functions;
b. Experience actively supervising a principal financial officer, principal accounting officer, controller, public accountant, auditor, or person performing similar functions;
c. Experience overseeing or assessing the performance of companies or public accountants with respect to the preparation, auditing, or evaluation of financial statements; or
d. Other relevant experience.
The registrant’s Board of Trustees/Directors has also determined that each member of the registrant’s Audit Committee is independent. In order to be “independent” for purposes of this item, the Audit Committee member may not: (i) other than in his or her capacity as a member of the Board of Trustees/Directors or any committee thereof, accept directly or indirectly any consulting, advisory or other compensatory fee from the issuer; or (ii) be an “interested person” of the registrant as defined in Section 2(a)(19) of the Investment Company Act of 1940.
The names of the audit committee financial experts on the registrant’s Audit Committee are set forth below:
Robert J. Christian
Robert A. Rudell
Jon E. Socolofsky
Robert A. Rudell
Jon E. Socolofsky
Item 4. Principal Accountant Fees and Services
(a) Audit fees.
The aggregate fees billed for services provided to the registrant by its independent auditors for the audit of the registrant’s annual financial statements and for services normally provided by the independent auditors in connection with statutory and regulatory filings or engagements were $134,830 for the fiscal year ended March 31, 2010.
The aggregate fees billed for services provided to the registrant by its independent auditors for the audit of the registrant’s annual financial statements and for services normally provided by the independent auditors in connection with statutory and regulatory filings or engagements were $154,500 for the fiscal year ended March 31, 2009.
(b) Audit-related fees.
The aggregate fees billed by the registrant’s independent auditors for services relating to the performance of the audit of the registrant’s financial statements and not reported under paragraph (a) of this Item were $0 for the fiscal year ended March 31, 2010.
The aggregate fees billed by the registrant’s independent auditors for services relating to the performance of the audit of the financial statements of the registrant’s investment adviser and other service providers under common control with the adviser and that relate directly to the operations or financial reporting of the registrant were $19,074 for the registrant’s fiscal year ended March 31, 2010. The percentage of these fees relating to services approved by the registrant’s Audit Committee pursuant to the de minimis exception from the pre-approval requirement in Rule 2-01(c)(7)(i)(C) of Regulation S-X was 0%. These audit-related services were as follows: issuance of report concerning transfer agent’s system of internal accounting control pursuant to Rule 17Ad-13 of the Securities Exchange Act.
The aggregate fees billed by the registrant’s independent auditors for services relating to the performance of the audit of the registrant’s financial statements and not reported under paragraph (a) of this Item were $0 for the fiscal year ended March 31, 2009.
The aggregate fees billed by the registrant’s independent auditors for services relating to the performance of the audit of the financial statements of the registrant’s investment adviser and other service providers under common control with the adviser and that relate directly to the operations or financial reporting of the registrant were $19,074 for the registrant’s fiscal year ended March 31, 2009. The percentage of these fees relating to services approved by the registrant’s Audit Committee pursuant to the de minimis exception from the pre-approval requirement in Rule 2-01(c)(7)(i)(C) of Regulation S-X was 0%. These audit-related services were as follows: issuance of report concerning transfer agent’s system of internal accounting control pursuant to Rule 17Ad-13 of the Securities Exchange Act.
(c) Tax fees.
The aggregate fees billed by the registrant’s independent auditors for tax-related services provided to the registrant were $47,086 for the fiscal year ended March 31, 2010. The percentage of these fees relating to services approved by the registrant’s Audit Committee pursuant to the de minimis exception from the pre-approval requirement in Rule 2-01(c)(7)(i)(C) of Regulation S-X was 0%. These tax-related services were as follows: review of income tax return, review of annual excise distribution calculations, and tax compliance services related to investments in foreign securities.
The aggregate fees billed by the registrant’s independent auditors for tax-related services provided to the registrant’s investment adviser and other service providers under common control with the adviser and that relate directly to the operations or financial reporting of the registrant were $0 for the registrant’s fiscal year ended March 31, 2010.
The aggregate fees billed by the registrant’s independent auditors for tax-related services provided to the registrant were $45,620 for the fiscal year ended March 31, 2009. The percentage of these fees relating to services approved by the registrant’s Audit Committee pursuant to the de minimis exception from the pre-approval requirement in Rule 2-01(c)(7)(i)(C) of Regulation S-X was 0%. These tax-related services were as follows: review of income tax returns and review of annual excise distribution calculations.
The aggregate fees billed by the registrant’s independent auditors for tax-related services provided to the registrant’s adviser and other service providers under common control with the adviser and that relate directly to the operations or financial reporting of the registrant were $0 for the registrant’s fiscal year ended March 31, 2009.
(d) All other fees.
The aggregate fees billed for all services provided by the independent auditors to the registrant other than those set forth in paragraphs (a), (b) and (c) of this Item were $0 for the fiscal year ended March 31, 2010.
The aggregate fees billed for all services other than those set forth in paragraphs (b) and (c) of this Item provided by the registrant’s independent auditors to the registrant’s adviser and other service providers under common control with the adviser and that relate directly to the operations or financial reporting of the registrant were $0 for the registrant’s fiscal year ended March 31, 2010.
The aggregate fees billed for all services provided by the independent auditors to the registrant other than those set forth in paragraphs (a), (b) and (c) of this Item were $0 for the fiscal year ended March 31, 2009.
The aggregate fees billed for all services other than those set forth in paragraphs (b) and (c) of this Item provided by the registrant’s independent auditors to the registrant’s adviser and other service providers under common control with the adviser and that relate directly to the operations or financial reporting of the registrant were $0 for the registrant’s fiscal year ended March 31, 2009.
(e) Not applicable.
(f) Not applicable.
(g) The aggregate non-audit fees billed by the registrant’s independent auditors for services rendered to the registrant and to its investment adviser and other service providers under common control with the adviser were $246,800 and $294,734 for the registrant’s fiscal years ended March 31, 2010 and March 31, 2009, respectively.
(h) In connection with its selection of the independent auditors, the registrant’s Audit Committee has considered the independent auditors’ provision of non-audit services to the registrant’s investment adviser and other service providers under common control with the adviser that were not required to be pre-approved pursuant to Rule 2-01(c)(7)(ii) of Regulation S-X. The Audit Committee has determined that the independent auditors’ provision of these services is compatible with maintaining the auditors’ independence.
Item 5. Audit Committee of Listed Registrants
Not applicable.
Item 6. Investments
(a) Included as part of report to shareholders filed under Item 1 of this Form N-CSR.
(b) Divestment of securities in accordance with Section 13(c) of the Investment Company Act of 1940.
Not applicable.
Item 7. Disclosure of Proxy Voting Policies and Procedures for Closed-End Management Investment Companies
Not applicable.
Item 8. Portfolio Managers of Closed-End Management Investment Companies
Not applicable.
Item 9. Purchases of Equity Securities by Closed-End Management Investment Company and Affiliated Purchasers
Not applicable.
Item 10. Submission of Matters to a Vote of Security Holders
Not applicable.
Item 11. Controls and Procedures
The registrant’s principal executive officer and principal financial officer have evaluated the registrant’s disclosure controls and procedures within 90 days of the filing of this report and have concluded that they are effective in providing reasonable assurance that the information required to be disclosed by the registrant in its reports or statements filed under the Securities Exchange Act of 1934 is recorded, processed, summarized and reported within the time periods specified in the rules and forms of the Securities and Exchange Commission.
There were no significant changes in the registrant’s internal control over financial reporting that occurred during the second fiscal quarter of the period covered by the report to stockholders included herein (i.e., the registrant’s fourth fiscal quarter) that have materially affected, or are reasonably likely to materially affect, the registrant’s internal control over financial reporting.
Item 12. Exhibits
| (a) | (1) Code of Ethics | |
| Not applicable. | ||
| (2) Certifications of Principal Executive Officer and Principal Financial Officer pursuant to Rule 30a-2 under the Investment Company Act of 1940 are attached hereto as Exhibit 99.CERT. | ||
| (3) Written solicitations to purchase securities pursuant to Rule 23c-1 under the Securities Exchange Act of 1934. | ||
Not applicable. | ||
| (b) | Certifications pursuant to Section 906 of the Sarbanes-Oxley Act of 2002 are furnished herewith as Exhibit 99.906CERT. |
SIGNATURES
Pursuant to the requirements of the Securities Exchange Act of 1934 and the Investment Company Act of 1940, the registrant has duly caused this report to be signed on its behalf, by the undersigned, thereunto duly authorized.
Name of Registrant: Optimum Fund Trust
| /s/ THEODORE K. SMITH | |
| By: | Theodore K. Smith |
| Title: | Chief Executive Officer |
| Date: | June 4, 2010 |
Pursuant to the requirements of the Securities Exchange Act of 1934 and the Investment Company Act of 1940, this report has been signed below by the following persons on behalf of the registrant and in the capacities and on the dates indicated.
| /s/ THEODORE K. SMITH | |
| By: | Theodore K. Smith |
| Title: | Chief Executive Officer |
| Date: | June 4, 2010 |
| /s/ RICHARD SALUS | |
| By: | Richard Salus |
| Title: | Chief Financial Officer |
| Date: | June 4, 2010 |