UNITED STATES SECURITIES AND EXCHANGE COMMISSION
Washington, D.C. 20549
FORM N-CSR
CERTIFIED SHAREHOLDER REPORT OF REGISTERED MANAGEMENT
INVESTMENT COMPANIES
INVESTMENT COMPANIES
| Investment Company Act file number: | 811-21335 |
| Exact name of registrant as specified in charter: | Optimum Fund Trust |
| Address of principal executive offices: | 2005 Market Street |
| Philadelphia, PA 19103 | |
| Name and address of agent for service: | David F. Connor, Esq. |
| 2005 Market Street | |
| Philadelphia, PA 19103 | |
| Registrant’s telephone number, including area code: | (800) 523-1918 |
| Date of fiscal year end: | March 31 |
| Date of reporting period: | March 31, 2011 |
Item 1. Reports to Stockholders
| | |||
Optimum Fixed Income Fund | |||
Optimum International Fund | |||
| Optimum Large Cap Growth Fund | |||
| Optimum Large Cap Value Fund | |||
| Optimum Small-Mid Cap Growth Fund | |||
| Optimum Small-Mid Cap Value Fund | |||
| Annual Report | |||
| March 31, 2011 | |||
Carefully consider the Funds’ investment objectives, risk factors, charges, and expenses before investing. This and other information can be found in the Funds’ prospectus and, if available, their summary prospectus, which may be obtained by visiting www.optimummutualfunds.com or calling 800 914-0278. Investors should read the prospectus and, if available, the summary prospectus carefully before investing.
Table of contents
| Portfolio management review | |||
| Optimum Fixed Income Fund | 1 | ||
| Optimum International Fund | 3 | ||
| Optimum Large Cap Growth Fund | 6 | ||
| Optimum Large Cap Value Fund | 9 | ||
| Optimum Small-Mid Cap Growth Fund | 12 | ||
| Optimum Small-Mid Cap Value Fund | 15 | ||
| Performance summary | |||
| Optimum Fixed Income Fund | 20 | ||
| Optimum International Fund | 24 | ||
| Optimum Large Cap Growth Fund | 26 | ||
| Optimum Large Cap Value Fund | 28 | ||
| Optimum Small-Mid Cap Growth Fund | 30 | ||
| Optimum Small-Mid Cap Value Fund | 32 | ||
| Disclosure of Fund expenses | 34 | ||
| Security type/sector/country allocations | |||
| and top 10 equity holdings | 36 | ||
| Financial statements | |||
| Statements of net assets | 40 | ||
| Statements of assets and liabilities | 84 | ||
| Statements of operations | 85 | ||
| Statements of changes in net assets | 86 | ||
| Financial highlights | 89 | ||
| Notes to financial statements | 113 | ||
| Report of independent | |||
| registered public accounting firm | 130 | ||
| Other Fund information | 131 | ||
| Board of trustees and officers addendum | 132 | ||
| About the organization | 134 | ||
Investments in Optimum Fixed Income Fund, Optimum International Fund, Optimum Large Cap Growth Fund, Optimum Large Cap Value Fund, Optimum Small-Mid Cap Growth Fund, and Optimum Small-Mid Cap Value Fund are not and will not be deposits with or liabilities of Macquarie Bank Limited ABN 46 008 583 542 and its holding companies, including their subsidiaries or related companies, and are subject to investment risk, including possible delays in repayment and loss of income and capital invested. No Macquarie Group company guarantees or will guarantee the performance of the Funds, the repayment of capital from the Funds, or any particular rate of return.
Unless otherwise noted, the views expressed in this report are as of March 31, 2011, and are subject to change at any time. Holdings are as of the date indicated and subject to change.
Funds are not FDIC insured and are not guaranteed. It is possible to lose the principal amount invested.
Mutual fund advisory services provided by Delaware Management Company, a series of Delaware Management Business Trust, which is a registered investment advisor. Delaware Investments, a member of Macquarie Group, refers to Delaware Management Holdings, Inc. and its subsidiaries, including the Funds’ distributor, Delaware Distributors, L.P. Macquarie Group refers to Macquarie Group Limited and its subsidiaries and affiliates worldwide.
All third-party trademarks cited are the property of their respective owners.
© 2011 Delaware Distributors, L.P.
Portfolio management review
Optimum Fixed Income Fund
April 12, 2011
April 12, 2011
| Performance review (for the year ended March 31, 2011) | ||||
| Optimum Fixed Income Fund (Class A shares) | 1-year return | +7.01% | ||
| Optimum Fixed Income Fund (Institutional Class shares) | 1-year return | +7.39% | ||
| Barclays Capital U.S. Aggregate Index (benchmark) | 1-year return | +5.12% |
Past performance does not guarantee future results.
For complete, annualized performance for Optimum Fixed Income Fund, please see the table on page 20.
The performance of Class A shares excludes the applicable sales charge and reflects the reinvestment of all distributions.
Institutional Class shares are available without sales or asset-based distribution charges only to certain eligible institutional accounts.
Index performance returns do not reflect any management fees, transaction costs, or expenses. Indices are unmanaged and one cannot invest directly in an index.
Advisor
Delaware Management Company (DMC)
Sub-advisor
Pacific Investment Management Company LLC (PIMCO)
Delaware Management Company (DMC)
Market overview
Over the past 12 months, global markets have generally been shaped by the effects of quantitative easing worldwide and shaken by sovereign debt challenges in Europe. Additionally, currency posturing in China, political instability in the Middle East, and the strongest earthquake on record in Japan, among other factors, helped undermine market stability during the Fund’s fiscal year. In the U.S., we believe active management allowed Optimum Fixed Income Fund to assess and adjust to meaningful policy developments (such as the $600 billion second round of quantitative easing, or QE2), major changes in Congress, and new healthcare legislation. Other developments that factored into many investors’ market assessment and economic outlook late in the year were the extension of tax cuts initially implemented by President George W. Bush, the payroll tax holiday, and the extension of unemployment benefits. The 10-year Treasury yield fell 0.36 percentage points over the 12-month period (ended March 31, 2011) to 3.47%, and the yield curve between the 2-year and 30-year flattened by 0.02 percentage points.
Fund performance
Investments in sectors outside of the Barclays Capital U.S. Aggregate Index, including international and high yield bonds, helped Optimum Fixed Income Fund outperform its benchmark index for the fiscal year.
DMC
The portion of Optimum Fixed Income Fund managed by DMC employs a diversified “core plus” investment strategy. This means that DMC seeks to invest the core of its assets under management in U.S. investment grade securities, and then strategically allocates other assets to additional fixed income markets. These additional sectors include U.S. high yield bonds as well as established and emerging international markets.
During the Fund’s fiscal year, DMC believed the most attractive parts of the market (on a risk-reward basis) were in the higher-beta, or riskier, asset classes and attempted to position the portfolio to benefit from such a dynamic. This positioning generally helps to explain the strong showing within the portion of the Fund managed by DMC.
For example, DMC slightly increased its portion of the Fund’s allocation to both international and emerging market bonds during the course of its fiscal year. DMC generally tended to shy away from those countries facing sovereign debt concerns, and instead focused on what we viewed as healthier, commodity-exporting or higher-yielding countries such as Norway, Canada, and Australia among developed nations, and Brazil, Indonesia, and Poland among emerging markets. These positions significantly boosted DMC’s portion of the Fund’s relative returns during the fiscal year.
DMC’s hefty position in corporate bonds, both investment grade and high yield, also notably contributed to the Fund’s return during the Fund’s fiscal year. Corporate bonds generally benefited from a strong fundamental
(continues) 1
Portfolio management review
Optimum Fixed Income Fund
picture that featured declining default rates and improving corporate balance sheets, plus a positive technical backdrop in which demand for corporate risk remained relatively strong through most of the Fund’s fiscal year. Among investment grade U.S. corporates, DMC believed that the BBB- and A-rated areas generally offered the best risk-reward trade-off and emphasized positions in those categories. Though these bonds, which are considered medium-grade, experienced down periods during the year when many investors moved toward higher-quality bonds, they proved helpful over the entire fiscal period.
It’s important to note that returns within the high yield category were moderated by DMC’s emphasis on higher-quality bonds within the high yield sector during a period when total returns from lower-rated credits generally beat their higher-quality cousins.
In general, DMC pursued the aforementioned asset classes (international and corporate bonds) at the expense of U.S. government securities (both Treasurys and agencies). DMC’s underweight to this area also aided performance through the fiscal period on the whole. However, at limited times during the year — such as during the euro zone crisis and the resulting so-called “global flight to quality” — this underweight position detracted from returns.
PIMCO
PIMCO believes one of the key characteristics for its portion of Optimum Fixed Income Fund, amid the market volatility during the annual period, was a broad opportunity set. PIMCO was able to identify relatively attractive risk-adjusted returns or “safe spread” sectors, which emphasized credit as opposed to duration risk, and strategically rotate into those sectors during the 12-month period (ended March 31, 2011). With respect to interest rate strategies in PIMCO’s portion of the Fund, U.S. duration positioning added to performance (including an overweight position during the second quarter of 2010 as rates fell), as did exposure to non-U.S. duration, including Canada, as yields fell in that country.
An overweight to agency and nonagency mortgage-backed securities (MBS) added to performance as MBS outperformed Treasurys with similar durations and nonagency MBS benefited from investor demand for higher yielding assets in the face of limited supply. Tactical coupon positioning within the mortgage sector also contributed to returns.
Corporate bond positioning, including an underweight position during the second calendar quarter of 2010 (a period when the sector underperformed) and an overweight during the opening months of 2011 (when the sector outperformed) contributed to returns within PIMCO’s portion of the Fund. Also contributing were corporate subsector positioning (as financials outperformed the broader investment grade sector during the period). Emerging markets exposure, where corporate and quasi-sovereign bonds with strong fundamentals and higher yields than their developed market counterparts added to performance. Examples included Russian Railways and Gazprom. Modest exposure to taxable Build America Bonds (BABs) also added to performance as the sector outperformed Treasurys during the Fund’s fiscal year.
Exposure to select emerging-market currencies (versus developed-market currencies such as the Japanese yen and the euro) detracted from performance.
2
Optimum International Fund
April 12, 2011
April 12, 2011
| Performance review (for the year ended March 31, 2011) | ||||
| Optimum International Fund (Class A shares) | 1-year return | +10.19% | ||
| Optimum International Fund (Institutional Class shares) | 1-year return | +10.55% | ||
| MSCI EAFE Index (gross) (benchmark) | 1-year return | +10.89% | ||
| MSCI EAFE Index (net) (benchmark) | 1-year return | +10.42% |
Past performance does not guarantee future results.
For complete, annualized performance for Optimum International Fund, please see the table on page 24.
The performance of Class A shares excludes the applicable sales charge and reflects the reinvestment of all distributions.
Institutional Class shares are available without sales or asset-based distribution charges only to certain eligible institutional accounts.
Index performance returns do not reflect any management fees, transaction costs, or expenses. Indices are unmanaged and one cannot invest directly in an index.
Advisor
Delaware Management Company (DMC)
Sub-advisors
BlackRock Advisors, LLC (BlackRock)
Mondrian Investment Partners Limited (Mondrian)
Market overview
Despite the recent escalating geopolitical risk in North Africa and the Middle East, as well as the historic earthquake in Japan (the consequences of which are likely to reverberate for some time), equity markets (as measured by major securities indices) rose over the fiscal year ended March 31, 2011. Additionally, a partial alleviation of sovereign debt tensions within the euro zone during the first quarter of 2011 — as European policy makers further developed the apparatus for responding to debt crises — was supportive.
Though the broader international markets appreciated during the Fund’s fiscal year, performance was not necessarily consistent; instead, markets were characterized by pronounced reversals of range-bound, “risk on/risk off” trading patterns. In this environment, sub-industry and company fundamentals were seemingly marginalized in comparison to the idiosyncratic economic shocks that affected investor sentiment. As an example of market reaction to the uncertainty, the MSCI EAFE Index experienced approximately 13 price reversals of greater than 5% — four of them by 10% or more. Yet, that index posted a gain over the full time period. The index’s grind higher suggests to us that the market is still very much searching for a consistent, sustainable trend.
Government-related deficit spending and zero-interest-rate policies in the developed world have helped cultivate positive global momentum; however, talks of austerity and exit strategies have entered the public policy lexicon amid the potential for more exogenous risks tied to the sovereign debt crisis and inflation. In a nutshell, market clarity remained elusive.
(Unless otherwise noted, regional performance cited below is based on each region’s respective MSCI index.)
Fund performance
Optimum International Fund generally performed in line with its benchmark index, with A shares trailing the MSCI EAFE Index (both gross and net figures) and Institutional Class shares slightly outperforming the MSCI EAFE Index (net) but trailing the gross index return.
The slightly negative bias to Fund returns was due primarily to performance in the Mondrian portion of the Fund.
BlackRock
For the trailing 12 months (ended March 31, 2011), the BlackRock portion of the Fund outperformed the Fund’s benchmark, the MSCI EAFE Index. As a result of the investment team’s fundamental “label agnostic” sub-industry/company research process, the flexibility BlackRock has to invest across all market capitalization ranges and geographies proved generally beneficial, especially as small companies and emerging markets outperformed. Additionally, the positive effects of strong stock selection in traditionally cyclical parts of the market
(continues) 3
Portfolio management review
Optimum International Fund
such as materials, consumer discretionary, information technology, and energy were sources of meaningful relative strength.
BlackRock’s portion of the Fund maintained a low-risk profile versus the Fund’s benchmark through the recent market environment, aiming to balance exposure to stable-growth businesses alongside stocks possessing more-cyclical earnings streams. The positive effect of stock selection in the latter group was one of the strongest factors for positive performance in BlackRock’s portion of the Fund. More specifically, BlackRock’s portion of the Fund performed strongly in sub-industries that included diversified metals and mining, automobile manufacturers, semiconductors, oil exploration and production, and coal mining.
Regionally, BlackRock’s portion of the Fund’s outperformance versus its benchmark index was positively influenced by out-of-benchmark exposures to emerging markets and Canada, which outperformed many developed market constituents of the Fund’s benchmark index. In contrast, relative performance was hindered by an underweight allocation to stocks in developed Europe and Asia ex-Japan.
At the individual security level, notable contributors to return included copper miners Grupo Mexico SAB de CV and Xstrata, both sizable outperformers in a copper market that was boosted by high demand and limited supply. Conversely, BlackRock’s portion of the Fund’s overweight allocations to certain Japanese capital goods exporters, such as Sumitomo Heavy Industries and SMC, hurt relative performance as disruptions from the country’s massive earthquake caused investor sentiment to quickly sour.
Mondrian
The Mondrian portion of the Fund lagged its benchmark index for the fiscal year (ended March 31, 2011). When measured across the entire portfolio, the negative effects of stock selection hampered returns slightly during the Fund’s fiscal year.
At the sector level, Mondrian’s overweight allocation to the telecommunications and energy sectors, as well as an underweight position in the financials sector, all resulted in positive performance versus the Fund’s benchmark. Both the telecommunications and energy sectors were among the strongest performers within the index for the year. This positive performance was more than offset by the negative effects of Mondrian’s portion of the Fund’s overweight positioning in the weaker-performing healthcare sector and an underweight position in the materials and industrials sectors. The materials sector was particularly strong when compared with other sectors for the Fund’s fiscal year.
The overall country allocations across the Mondrian portion of the Fund had positive effects on performance relative to the benchmark. In Europe, returns were supported by an overweight position in France and the Netherlands, though these positive effects were partially offset by an underweight exposure to the strongly performing German market. The Fund benefited from Mondrian’s underweight position in Japan, as well as an overweight exposure to the Singaporean market.
At the individual security level, the strongest stocks in the Mondrian portion of the Fund included the Asia-based conglomerate Jardine Matheson Holdings and the Australian packaging company Amcor. Jardine’s stock performed well over the Fund’s fiscal period — due primarily to the company’s portfolio of businesses, which benefited from fast-growing southeast Asian markets. Amcor has a full suite of packaging products that include cardboard, aluminum, and glass. Mondrian believes the stock benefited from its acquisition of Alcan, which has made it one of the dominant players in its industry.
Among the notable detractors to Mondrian’s portion of the Fund’s relative returns were RWE, the German utility, and BP. RWE has been a restructuring story during the past five or six years, as the company has transformed from a conglomerate to a focused electricity and gas utility. However, the company was negatively affected in two key areas during the Fund’s fiscal year: (1) falling power prices and (2) new German taxes on nuclear revenues.
4
BP’s drilling rig Deepwater Horizon, which was drilling an exploratory well in the Gulf of Mexico, exploded on April 20, 2010, causing the loss of 11 lives and harm to the environment. As a result of the accident, it is estimated that approximately 4 million barrels of oil entered Gulf waters.
The company has made provisions of $32.2 billion pretax ($22.2 billion after tax) toward the expected costs of the spill. As part of this, it has established an escrow fund of $20 billion. While the escrow fund does not cap the company’s liabilities, it does provide an element of structure around the future disbursement of funds, and it has eased the political rhetoric, enabling the company to return to the financial markets. Mondrian continues to hold the position in our portion of the Fund’s portfolio.
(continues) 5
Portfolio management review
Optimum Large Cap Growth Fund
April 12, 2011
April 12, 2011
| Performance review (for the year ended March 31, 2011) | ||||
| Optimum Large Cap Growth Fund (Class A shares) | 1-year return | +16.82% | ||
| Optimum Large Cap Growth Fund (Institutional Class shares) | 1-year return | +17.28% | ||
| Russell 1000® Growth Index (benchmark) | 1-year return | +18.26% |
Past performance does not guarantee future results.
For complete, annualized performance for Optimum Large Cap Growth Fund, please see the table on page 26.
The performance of Class A shares excludes the applicable sales charge and reflects the reinvestment of all distributions.
Institutional Class shares are available without sales or asset-based distribution charges only to certain eligible institutional accounts.
Index performance returns do not reflect any management fees, transaction costs, or expenses. Indices are unmanaged and one cannot invest directly in an index.
Advisor
Delaware Management Company (DMC)
Sub-advisors
Marsico Capital Management, LLC (Marsico)
T. Rowe Price Associates, Inc. (T. Rowe Price)
Fred Alger Management, Inc. (Alger)
Market overview
During the Fund’s fiscal year ended March 31, 2011, the market environment was positive overall. As the fiscal year began, however, adverse events captured many investors’ attention and soured their sentiment. Those events included the European sovereign debt crisis, BP’s oil spill in the Gulf of Mexico, and the uncertainty of U.S. financial and healthcare reform. During the summer of 2010, many investors became increasingly concerned with a potential “double dip” recession (that is, a return to recession after a short period of growth) and deflation, causing an increase in market volatility. In early July 2010, the broad-market S&P 500 Index hit its low for the year, finishing down more than 12% from the beginning of the Fund’s fiscal year (source: Bloomberg).
Ultimately, the S&P 500 Index rallied almost 21% from Sept. 1, 2010, through the end of 2010. The 18% cumulative fiscal year return of the Russell 1000 Growth Index is well above average historical performance and far exceeded the expectations of many U.S. equity investors. (Source: FactSet.)
The Russell 1000 Growth Index posted double-digit positive returns for the Fund’s fiscal year (ended March 31, 2011) as all sectors delivered positive results.
In general, cyclical sectors outperformed traditionally defensive ones, as the market continued to show signs of improvement. The energy, industrial, business services, and material sectors were the leading contributors. Healthcare was the worst-performing sector, while the financial sector trailed the Fund’s benchmark index as well. Growth stocks outperformed value stocks throughout all market caps, as measured by various Russell indices. Overall, mid-cap and small-cap stocks outperformed large-caps during the Fund’s fiscal year.
Fund performance
Optimum Large Cap Growth Fund lagged its benchmark index for the fiscal year, due in part to underweight positions in the energy sector by two of the Fund’s three sub-advisors. Underperformance in the industrials sector by two sub-advisors also detracted from performance.
Alger
Alger’s strategy, to invest in companies that it believed were undergoing positive dynamic change, led Alger to attempt to invest in high-quality domestic growth stocks that generate strong free cash flow. Although these types of companies underperformed during 2011, Alger remains enthusiastic about investing in these companies.
The most significant contributors to Alger’s portion of the Fund were the energy and materials sectors. The rise in global economic activity, particularly consumption in emerging markets, positively affected both sectors. Stock selection in both sectors contributed to performance.
6
The most significant detractors to Alger’s portion of the Fund were the healthcare and industrial sectors. In both instances stock selection led to disappointing performance.
Apple was the leading absolute contributor to Alger’s portion of the Fund’s performance. With its introduction of another innovative product, the iPad, Apple continues to shape how consumers use technology. This groundbreaking introduction, along with continuing share gains in computers, telephones, and music players, has continued to drive impressive earnings and cash flow growth.
Sina, another contributor to Alger’s portion of performance, operates a high-traffic internet Chinese portal and enjoys a significant share of the country’s online advertising spending. Its accelerating revenue growth is fueled by increasing Chinese internet usage, an increase in advertising spending, and online market share gains within the Chinese advertising market.
Hewlett-Packard (HP) was the leading absolute detractor to Alger’s portion of the Fund. When Alger purchased the shares, Alger thought many investors were underestimating the company’s market share gains in printing and margin expansion potential. Also, Alger thought HP’s recent acquisition of 3Com was advantageous as it enabled the company to pursue the networking market, which carries much higher margins compared with its corporate average. Alger continues to hold this stock because it believes in the potential upside of HP.
Marvell Technology Group, another significant detractor, is a leading global semiconductor company with a broad product portfolio that includes devices for data storage, data switching, handheld cellular, wireless networking, PC connectivity, video-image processing, and power management. With 50% exposure to the hard-disk drive market, Marvell experienced disappointing sales in the mobile and wireless segment while also facing a slowdown in PC sales related to the hard-disk drive segment. The company’s end market and customer concentrations have caused the stock price performance to underperform its peers. For these reasons, Alger sold the stock during the Fund’s fiscal year.
T. Rowe Price
For T. Rowe Price’s portion of the Fund, stock selection in information technology was the primary contributor to strong performance during the Fund’s fiscal year. Baidu, owner of China’s most popular online search engine, strongly surpassed analyst earnings estimates as the company apparently benefited from increased advertising spending and expanded use of social networking sites. The company’s new keyword advertising system also lifted revenues, and reports of new Web-browsing software along with a mobile device operating system boosted share prices to a record level in the period. Additionally, Apple reported record sales for its iPhone and computing devices sales during the holiday season, including strong sales of its new iPad tablet. After an initial exclusive affiliation with AT&T, the iPhone launched on the Verizon network in February 2011, indicating that the popular device could expand to other networks in the future.
In terms of stock selection for T. Rowe Price’s portion of the Fund, the consumer discretionary sector outperformed all other sectors during the Fund’s fiscal year. Internet retailer Amazon.com was among the leading overall portfolio contributors for the Fund’s fiscal year. Boosted by positive reception of its new Kindle e-reader device and gains in online retailing market share, the company posted strong earnings during the year. Starbucks was another top overall portfolio contributor, reporting notable sales growth. The coffee company announced plans to more than triple the number of stores in China over the next five years, which would make China its largest non-U.S. market.
T. Rowe Price’s underweight allocation to energy, the top-performing sector in the benchmark, detracted from relative results for the period. Brazilian oil producer Petroleo Brasileiro lagged its peers primarily due to concerns about production growth, as well as political uncertainties tied to the government-controlled company. Consequently, T. Rowe Price sold its position.
(continues) 7
Portfolio management review
Optimum Large Cap Growth Fund
Marsico
Marsico’s investment approach emphasizes owning stocks of high-quality companies with, in its view, compelling potential for long-term capital appreciation. Marsico combines top-down macroeconomic and industry analysis with bottom-up (security by security) stock selection. A fundamental aspect of its approach is that Marsico internally formulates an investment hypothesis and then rigorously test that hypothesis through multipronged, hands-on analysis and research.
During the Fund’s fiscal year, stock selection in the information technology sector boosted performance results. While Marsico generally prefers to hold stocks that are beneficiaries of technology (rather than technology companies because the barriers around those businesses are generally more durable), Marsico became more positive about enterprise technology, as a variety of megatrends, from cloud computing to increased data consumption, drove increased technology spending. Apple and Chinese internet search engine Baidu were among the largest individual contributors to Marsico’s portion of the Fund during its fiscal year. Marsico believes that a long-term, secular growth theme is the emergence of a middle class in the developing world. Additionally, in calendar year 2010 the more affluent U.S. consumer began spending again. As a result, names such as priceline.com and Amazon.com benefited from this trend and were material individual contributors.
Demand for the world’s natural resources remained strong due to a rebounding global economy — this helped Marsico’s materials positions during the fiscal year. In particular, positions in Monsanto and Dow Chemical contributed to results. Additionally, Marsico’s portion of the Fund benefited from an overweight posture in the strong-performing materials sector. Marsico’s portion of the Fund also benefited from an underweight posture in the weak-performing healthcare sector.
Throughout the fiscal year, Marsico’s portion of the Fund maintained an overweight posture in the financials sector (one of the weakest-performing sectors of its benchmark, the Russell 1000 Growth Index), which hampered performance. Additionally, stock selection in the financials sector was also a source of underperformance for Marsico’s segment of the Fund as positions in stocks such as JPMorgan Chase lagged the sector return in the benchmark. (JPMorgan Chase was sold out of Marsico’s portion of the Fund during the fiscal year.) U.S. financials entered 2011 with improved balance sheets and capital ratios. The strongest financial institutions announced the resumption of dividends and share buybacks near the end of the Fund’s fiscal year. Furthermore, the sector has benefited from tremendous consolidation, leading to share gains for the stocks we own at attractive valuations.
While Marsico’s positions in the industrials sector posted a positive return during the Fund’s fiscal year, they trailed the benchmark’s sector return, which hurt the Fund’s relative performance. In particular, positions in FedEx and Norfolk Southern detracted from returns. (Norfolk Southern was sold during the fiscal year.) Marsico’s portion of the Fund also suffered by maintaining an underweight position in the energy sector as that was the strongest-performing sector within the Fund’s benchmark for its fiscal year.
8
Optimum Large Cap Value Fund
April 12, 2011
April 12, 2011
| Performance review (for the year ended March 31, 2011) | ||||
| Optimum Large Cap Value Fund (Class A shares) | 1-year return | +14.00% | ||
| Optimum Large Cap Value Fund (Institutional Class shares) | 1-year return | +14.42% | ||
| Russell 1000® Value Index (benchmark) | 1-year return | +15.15% |
Past performance does not guarantee future results.
For complete, annualized performance for Optimum Large Cap Value Fund, please see the table on page 28.
The performance of Class A shares excludes the applicable sales charge and reflects the reinvestment of all distributions.
Institutional Class shares are available without sales or asset-based distribution charges only to certain eligible institutional accounts.
Index performance returns do not reflect any management fees, transaction costs, or expenses. Indices are unmanaged and one cannot invest directly in an index.
Advisor
Delaware Management Company (DMC)
Sub-advisors
Massachusetts Financial Services Company (MFS)
Herndon Capital Management, LLC (Herndon)
The Board of Trustees of the Fund approved the appointment of Herndon to replace TCW Investment Management Company as a sub-advisor to Optimum Large Cap Value Fund and the transition took place on Nov. 1, 2010. Please see the supplement to the Fund’s prospectus, dated Sept. 27, 2010, for more information.
Market overview
The overall market environment during the Fund’s fiscal year was challenging as many investors attempted to reconcile gradual fundamental improvement with better stock market performance. Cyclical securities gained more prominence, as markets became increasingly more positive in spite of macroeconomic headwinds.
At the beginning of the Fund’s fiscal year, financial markets continued to rebound along with macroeconomic conditions that had begun to improve in early 2009. Primary drivers of the recovery included a slowing of the inventory destocking that took place earlier, the production of manufacturing and capital goods, as well as massive fiscal and monetary stimulus.
During the second and third calendar quarters of 2010, heightened risk surrounding the public-debt profiles of several European countries (such as Ireland, Portugal, and Greece) hurt market sentiment. At the same time, the improving trend in global macroeconomic data began to weaken somewhat. These two dynamics caused asset prices to retrench significantly as many investors questioned the durability of the global recovery.
Toward the middle of the Fund’s fiscal year, the U.S. Federal Reserve indicated that further monetary loosening was forthcoming if macroeconomic activity did not show signs of improvement. Another round of quantitative easing (QE2) generally improved market sentiment and drove risk-asset prices higher. The December 2010 agreement by the U.S. Congress to enact an expansionary fiscal package in the United States also boosted investor sentiment, leading markets higher in the final months of the period.
Fund performance
Underperformance versus the benchmark index by Optimum Large Cap Value Fund was due primarily to poor returns by several high-profile holdings in the Fund. The names, which represented a number of sectors and were held by different sub-advisors for the Fund, included Cisco Systems, Lockheed Martin, Bank of New York Mellon, U.S. Steel, and Alcoa.
Herndon
Herndon’s approach in this market environment has been to seek out value-creating opportunities at the individual stock level and aggregate the individual stock information to determine the sector’s weighting.
The energy sector was a notable contributor to performance during the Fund’s fiscal year for Herndon’s portion of the Fund. Increased energy demand without a corresponding rise in supply continued to make this sector attractive. Herndon believes the energy sector is also supported by increased speculation that unrest in the
Portfolio management review
Optimum Large Cap Value Fund
Middle East may lead to supply disruptions. In addition, while China’s initial response to lower overall demand for oil was to raise interest rates, many investors have grown more comfortable with the fact that lower economic growth in China is not the same as low economic growth. Growth could still be a net positive, and Herndon believes it should continue to drive demand for commodities such as oil.
The sectors that detracted from Herndon’s performance the most were industrials and technology. Herndon’s portion of the Fund was underweight in industrials, which outperformed the Fund’s benchmark. This sector has been driven by cyclical securities that Herndon finds unattractive from a valuation perspective. Herndon’s portion of the Fund was overweight in technology, with less emphasis on the “nouveau technology companies” and more emphasis on mature companies such as Microsoft and IBM, which, Herndon believes, trade at modest valuations versus their earnings and cash flow generation capabilities.
CF Industries Holdings was a key contributor to positive performance in Herndon’s portion of the Fund. Herndon purchased the stock because, in its view, the market was underestimating the fundamental value of the company. The company, a manufacturer and distributor of nitrogen and phosphate fertilizer products in North America, benefited from a robust agricultural environment that had a level of underlying growth driven by demand for crop products worldwide. This company, once a takeover target, has become an acquirer, purchasing Terra Industries in April 2010.
In terms of laggards, Dean Foods hurt performance due to concerns regarding underlying fundamentals and execution. The company, a dairy producer, was negatively affected by consumers’ preference for lower-priced private-label products, which strained operating margins and caused several quarters of disappointing earnings. Herndon believes this trend may be longer-lasting than initially thought and, in its view, the company’s prospects were diminished by having to compete in a more commoditized arena. As a result, Herndon no longer holds this stock in the Fund.
MFS
MFS’s investment philosophy and approach remain consistent in all market environments as MFS believes focusing on investing in high-quality, undervalued stocks gives it the best potential for delivering long-term, strong risk-adjusted returns. Therefore, MFS did not make any changes to its approach. MFS’s performance for the Fund’s fiscal year was driven primarily by stock selection. Security selection decisions in the energy and healthcare sectors in particular detracted from relative returns, while MFS’s positions in the consumer staples and the special products and services sectors contributed to performance.
MFS’s position in weak-performing network equipment company Cisco Systems dampened relative performance in MFS’s portion of the Fund. Cisco Systems faced stock price performance challenges over the last several quarters of the period, as its growth slowed. MFS still holds the stock, however, because its valuation is at historically cheap levels.
Elsewhere, holdings of defense contractor Lockheed Martin dampened relative returns. The stock traded at a significant discount to the market on earnings and cash flows, and MFS believes the company has a very strong balance sheet, and an attractive dividend yield. In MFS’s opinion, these factors made the stock an attractive risk-reward opportunity.
MFS’s position in global financial services provider Bank of New York Mellon (BNY) was another relative detractor to its portion of the Fund. BNY is a provider of trust and custody services to the financial services industry. Given its limited capital intensity, the company generates higher-than-average returns relative to financial companies. As of the Fund’s fiscal year end, MFS continued to hold the stock because it believed BNY was trading at an inexpensive valuation. MFS also believes transitory factors have kept the share price down, namely a low interest rate environment and uncertainty related to the ongoing financial services reform initiatives.
MFS’s ownership in shares of tobacco company Philip Morris International aided returns in its portion
10
of the Fund. MFS believes the company has a strong collection of brands, above-average growth prospects, a strong balance sheet, and an attractive valuation and dividend yield.
An underweight position in poor-performing household products maker Procter & Gamble also benefited relative performance for MFS’s portion of the Fund. Despite its poor performance, MFS continues to believe Procter & Gamble is a sustainable and durable franchise, which has generated above-average returns over time.
MFS’s ownership in the strongly performing management consulting firm Accenture aided relative results. Accenture is a leading global information technology service company that traded at a discounted valuation to the market, has a great balance sheet, generates good cash flows, and has a management team that MFS believes are good stewards of capital.
During the Fund’s fiscal year, MFS’s portion of the Fund’s currency exposure was a contributor to relative performance. All of MFS’s investment decisions are driven by the fundamentals of each individual opportunity, and as such, it is common for MFS’s portfolio to have different currency exposure than the Fund’s benchmark.
TCW
For the seven-month period ended Oct. 31, 2010 (when TCW was replaced as the Fund’s sub-advisor), TCW’s portion of the Fund benefited from an overweight in telecommunications, materials, and consumer discretionary sectors, as well as an underweight in healthcare. TCW’s portion of the Fund’s underweight in the traditionally defensive consumer staples and utilities sectors was a drag on overall performance.
Security selection was strong in financials — MBIA and Annaly Capital Management were among the strongest performing stocks within this area — while Motorola and Tyco Electronics (now known as TE Connectivity) were the strongest contributors within the information technology sector. Stocks within the consumer discretionary sector faltered due primarily to Regal Entertainment Group, Gap, and Lennar. United States Steel and Alcoa detracted within the materials sector.
Within TCW’s portion of the Fund, the two strongest contributors to performance over the period from April 1, 2010, to Oct. 31, 2010, were MBIA ( 79%) and EI du Pont de Nemours (DuPont) (30%). MBIA, a financial insurer that guarantees timely payment of interest and principal of municipal bonds and structured products, has cumulatively recognized a recovery of $2.1 billion since the second calendar quarter of 2009 from inaccurate or potentially fraudulent representations and warranties by the financial institutions that sold them putative AAA-rated securities. Chemical company DuPont reported better-than-expected results throughout 2010, gained market share in the agriculture and nutrition business, implemented cost savings initiatives, and generally benefited from higher volumes for titanium dioxide products.
The two weakest performers affecting performance for TCW’s portion of the Fund (during the period from April 1, 2010 through Oct. 31, 2010) were U.S. Steel and Regal Entertainment, returning -31% and 21%, respectively. Steel producer U.S. Steel’s underperformance began when the company missed consensus second quarter 2011 estimates and lowered guidance for the third quarter due to lower volumes and higher raw material costs. The country’s largest theater operator, Regal Entertainment, typically a defensive player, lagged the more cyclically tied consumer discretionary sector. The stock declined after weak box office sales versus expectations of single-digit box office growth.
(continues) 11
Portfolio management review
Optimum Small-Mid Cap Growth Fund
April 12, 2011
| Performance review (for the year ended March 31, 2011) | |||
| Optimum Small-Mid Cap Growth Fund (Class A shares) | 1-year return | +24.66% | |
| Optimum Small-Mid Cap Growth Fund (Institutional Class shares) | 1-year return | +25.07% | |
| Russell 2500™ Growth Index (benchmark) | 1-year return | +30.08% |
Past performance does not guarantee future results.
For complete, annualized performance for Optimum Small-Mid Cap Growth Fund, please see the table on page 30.
The performance of Class A shares excludes the applicable sales charge and reflects the reinvestment of all distributions.
Institutional Class shares are available without sales or asset-based distribution charges only to certain eligible institutional accounts.
Index performance returns do not reflect any management fees, transaction costs, or expenses. Indices are unmanaged and one cannot invest directly in an index.
Advisor
Delaware Management Company (DMC)
Sub-advisors
Columbia Wanger Asset Management, LLC (Columbia WAM) Wellington Management Company, LLP (Wellington)
Market overview
World equity markets were generally volatile during the Fund’s fiscal year. The period began on a sour note as many U.S. investors feared that the massive monetary and fiscal stimulus that followed the 2007-2009 downturn was running out of steam and could potentially lead to a double-dip recession. Investor concerns were short-lived, however; U.S. equity markets rallied off their July 2010 low point as corporate earnings powered ahead and investors came back to stocks in force. Furthermore, a constructive backdrop for markets was provided by additional government debt purchases by the U.S. Federal Reserve, the extension of tax cuts in the United States, and generally improving economic data.
The first quarter of 2011 brought a series of geopolitical and economic crises. The devastating earthquake and tsunami in Japan, continued unrest in the Middle East, and renewed fears of a European debt crisis all made headlines. We also witnessed commodity price increases, and their potential effects on corporate margins and consumer behavior. However, many investors demonstrated incredible resiliency in shrugging off these concerns, generally pushing up stock prices through this period.
Fund performance
Underperformance by Optimum Small-Mid Cap Growth Fund was due primarily to poor returns by several well-known holdings in the portfolios of both sub-advisors, including Hanesbrands, Talbots, and ITT Educational Services.
Wellington
During the Fund’s fiscal year, Wellington adhered to its traditional investment approach, which focuses on company fundamentals. As such, Wellington remained committed to identifying investment opportunities with company-specific growth catalysts that are not dependent on macroeconomic influences. Wellington’s research continued focusing on emerging companies that have the opportunity to accelerate revenue and earnings growth, and Wellington also remained committed to uncovering companies that have the potential to re-emerge as growth leaders.
While Wellington encountered periods of expanding premiums for growth, it remained grounded in its long-standing valuation discipline. Against this backdrop, Wellington’s portion of the Fund experienced strong absolute gains, but lagged its benchmark, the Russell 2500 Growth Index.
Holdings in the consumer staples and consumer discretionary sectors contributed to relative performance for the Fund’s fiscal year, owing to the positive effects of strong security selection. Relative detractors included holdings in the industrials and information technology sectors, where Wellington’s portion of the Fund underperformed due to weak security selection.
12
At the individual security level, strong contributors for the period included beverage company Green Mountain Coffee Roasters and capital goods company United Rentals. Green Mountain is a leading provider of single-cup brewers and portion packs for coffee and other beverages. Shares soared after the company announced it formed a strategic relationship with Starbucks and Tazo tea. Wellington expects the new Starbucks relationship could help accelerate sales of Green Mountain’s K-Cup portion packs and Keurig brewing systems (the Keurig business being a subsidiary of Green Mountain).
United Rentals is the world’s largest equipment rental company. The company delivered strong results, posting better-than-expected profits. In addition, Wellington believes that secular growth of heavy equipment rentals, together with higher equipment utilization rates, should create pricing power and further margin expansion.
Relative detractors from performance in Wellington’s portion of the Fund included technology hardware company Sanmina-SCI and consumer durables company Hanesbrands. Sanmina is a leading electronic manufacturing service provider. The company’s shares came under pressure due to general concerns about technology end markets and earnings results that modestly missed expectations. The position was ultimately eliminated from Wellington’s portion of the Fund. Hanesbrands, an apparel firm with a portfolio of innerwear, outerwear, and hosiery brands, faced concerns that inflationary pressures on input costs (including cotton, labor, and freight) would weigh on gross margins. Going forward, Wellington continues to look for the company to post solid revenue growth, supported by price increases, acquisitions, new business relationships, and shelf-space gains.
Columbia WAM
Columbia WAM’s portion of the Fund employs a low-turnover, bottom-up, fundamental strategy. Its team of analysts works to identify reasonably priced growth companies that Columbia WAM believes are positioned to grow over the next three to five years.
At the margin, Columbia WAM added to technology and industrial companies and slightly lowered its consumer discretionary weighting in its portion of the Fund.
At the sector level, its portion of the Fund’s industrial and financial companies were strong performers during the period. Small and midsize industrial companies did an outstanding job cutting costs during the recession and have shown tremendous operating leverage now that the economy is growing again. In addition, several industrial companies held by Columbia WAM’s portion of the Fund have been able to export their products to higher-growth areas outside the United States, further helping their sales.
Columbia WAM’s decision to underweight financials proved beneficial to its portion of the Fund during the Fund’s fiscal year. Many small banks are still impaired and working through the effects of the credit crisis. Columbia WAM largely avoided insurance companies, a space in which it did not find many differentiated business models. Columbia WAM’s portion of the Fund also benefited from buying real estate securities at low valuations.
Consumer discretionary and telecommunications stocks detracted from Columbia WAM’s portion of the Fund’s relative performance during the Fund’s fiscal year. Its portion of the Fund remained overweight in the consumer discretionary sector (an allocation that has been in place for years), owning several retailers and select leisure companies. Columbia WAM added several women’s retailers after they were punished coming out of the recession. Columbia WAM overstayed its welcome, however, when the stocks subsequently declined in value. A few holdings in the gaming space also detracted, as an anticipated replacement cycle for slot machines has taken longer to materialize than originally expected.
Within the telecommunications sector, Columbia WAM’s portion of the Fund continued owning cellular communications towers (a preference it has held for several years). Columbia WAM likes the long-term potential for these companies as data usage on mobile devices continues to expand.
(continues) 13
Portfolio management review
Optimum Small-Mid Cap Growth Fund
At the individual security level, top contributors to performance for the Fund’s fiscal year included Nordson and Lululemon Athletica. Nordson makes precision dispensing systems for adhesives and coatings. Strong global demand for the company’s factory automation products and excellent execution led to record profits. Lululemon’s premium active apparel brand was discovered and embraced by consumers, resulting in strong sales and profits that were above investor expectations.
Detractors for the period included Talbots and ITT Educational Services. Women’s specialty retailer Talbots’ apparent turnaround stalled when its merchandise did not resonate with consumers, causing profits to miss expectations. ITT is a for-profit, postsecondary education company. New regulations imposed by the Department of Education reduced student enrollment, and the company’s stock price subsequently suffered.
14
Optimum Small-Mid Cap Value Fund
April 12, 2011
| Performance review (for the year ended March 31, 2011) | |||
| Optimum Small-Mid Cap Value Fund (Class A shares) | 1-year return | +25.22% | |
| Optimum Small-Mid Cap Value Fund (Institutional Class shares) | 1-year return | +25.70% | |
| Russell 2500™ Value Index (benchmark) | 1-year return | +22.67% |
For complete, annualized performance for Optimum Small-Mid Cap Value Fund please see the table on page 32.
The performance of Class A shares excludes the applicable sales charge and reflects the reinvestment of all distributions.
Institutional Class shares are available without sales or asset-based distribution charges only to certain eligible institutional accounts.
Index performance returns do not reflect any management fees, transaction costs, or expenses. Indices are unmanaged and one cannot invest directly in an index.
Advisor
Delaware Management Company (DMC)
Sub-advisors
The Delafield Group, a division of Tocqueville Asset Management, L.P. (Tocqueville)
The Killen Group, Inc. (Killen)
Westwood Management Corp. (Westwood)
Market overview
The broad market recovery that began back in March 2009 continued during the Fund’s fiscal year ended March 31, 2011. The Fund’s fiscal year began on a weak note, however, with investors focusing their attention on the high levels of sovereign debt across the developed world (particularly in Greece) and fearing that reductions in government spending could exacerbate declining economic growth. A possible slowdown in Chinese economic growth, the effects of the BP oil spill in the Gulf of Mexico, and a decline in U.S. economic indicators compounded the worsening market backdrop.
In July 2010, there was a general improvement in investor sentiment regarding global economic growth followed by a decline in risk aversion. The equity markets subsequently sold off in August 2010 on fears of a double-dip recession (that is, a return to recession after a short period of growth) and the potential for deflation. However, September’s stronger-than-expected economic data, along with the realization that stocks had reached attractive valuation levels, spurred a strong rally. Improvements in sentiment about the euro-zone economies as well as signs that Chinese growth was stabilizing were also contributing factors.
The belief that additional stimulus (in the form of another round of quantitative easing by the U.S. Federal Reserve, or QE2), the extension of the Bush tax cuts, and the reduction in payroll tax would lead to stronger economic growth in the United States was a key factor in the strong returns posted by the Fund’s benchmark, the Russell 2500 Value Index, in the third quarter of the Fund’s fiscal year. The strongest holiday retail sales in five years and a rotation out of bonds amid a sharp rise in 10-year bond yields were also catalysts for the market’s robust advance at the end of 2010.
Although calendar year 2011 began well with strong earnings and economic reports, violence in the Middle East, rising crude oil prices, and the tragic earthquake and tsunami in Japan ultimately caused a brief correction in the market. Stocks rebounded, however, as many investors seemed to remain positive about the prospects for continued global economic growth.
Yet, global political and economic uncertainties remain. These include continued weakness in U.S. housing values and unemployment rates, the viability of some European banks, particularly those in Ireland, Portugal, and Spain, and the eventual possibility of substantially higher interest rates.
Fund performance
Investments in the information technology and industrials sectors by two of Optimum Small-Mid Cap Value Fund’s three sub-advisors contributed to outperformance versus the Fund’s benchmark.
(continues) 15
Portfolio management review
Optimum Small-Mid Cap Value Fund
Tocqueville
Tocqueville’s portion of the Fund is built using a bottom-up approach; that is, it remains focused on identifying individual companies where its analytical insight suggests a largely unanticipated improvement in operations. Tocqueville focuses intently on valuation and analyze cash flows and attempts to invest at prices that it believes undervalue the underlying franchise. Tocqueville consistently employs this strategy, and it helped drive Fund performance during the fiscal year.
Tocqueville does not set industry allocation targets when constructing its portion of the Fund. However, its overweight allocations in the industrials and materials sectors, as a result of investment opportunities Tocqueville uncovered in those areas, benefited performance as these sectors were among the top-returning categories within the benchmark index. Tocqueville continued to avoid the energy and financials sectors — with less than 2% exposure to energy and no exposure to financials in its portion of the Fund — which hurt relative performance as these two sectors generated strong total returns for the fiscal year.
Ferro and Wesco International were the top contributors to performance for Tocqueville’s portion of the Fund. Ferro produces specialty materials and chemicals for a wide variety of manufacturers worldwide. The shares responded favorably to news of improved earnings through the year. Tocqueville believes the prospects for increasing demand and profits in the company’s fast-growing solar panel metallic paste business are solid. In addition, the company completed a large restructuring of its more mature business segments, which could yield better incremental margins and free cash flow generation. Wesco, with more than $5 billion in sales, is engaged in the distribution of electrical products. The company’s shares were up sharply as margins demonstrated substantial improvement on early-cycle demand growth. Tocqueville believes that results could continue to improve with recovering end markets and it expects the company to use its solid balance sheet to fund accretive acquisitions.
By contrast, Tocqueville’s School Specialty and Supervalu holdings detracted from its Fund performance during the fiscal year. School Specialty is a provider of K–12 basic school supplies and curriculum material to schools in the United States. Cuts to state and local education budgets were more drastic than expected and the shares declined. Supervalu is a grocery store operator and supplier that Tocqueville believed was initiating a compelling turnaround. Sluggish sales trends continued during the year, however, with results lagging expectations. Tocqueville sold both positions during the fiscal year.
Killen
Killen’s strategy to purchase securities that it believes are trading at a significant discount to their long-term earnings power remains consistent from year to year. This strategy typically leads it to purchase small-caps that are either underfollowed or are generally viewed as unattractive.
Consequently, Killen’s portion of the Fund achieved a solid return for the fiscal year as several companies that the market viewed as unattractive showed significant improvement in earnings. This led the market to revalue them and resulted in higher prices.
Killen’s strategy remains driven by a bottom-up, or “stock-by-stock,” research approach. This approach takes into account, but does not emphasize, macro-oriented factors such as the global economy, consumer confidence, and energy prices. Instead, Killen looks purely at whether a business is, in its opinion, fairly valued or trading at a large discount to its fair value. Killen’s cash level in its portion of the Fund is a result of its inability to find stocks that it believes are inexpensive, and is not an indicative statement concerning the overall attractiveness or future direction of the stock market.
Overall, every economic sector had a positive effect on Killen’s portion of the Fund’s performance during its fiscal year. However, Killen’s holdings in the energy and information technology sectors contributed most to returns. The general rebound in economic demand,
16
and the resulting rise in oil and gas prices, helped drive the performance of our energy holdings, which had been depressed due to the cyclical nature of energy demand. Frontier Oil, for example, benefited from a general rebound in industry profit margins. The refining industry had suffered from a drop in margins over the past few years due to reduced demand and capacity additions put in place before the recession. Through a combination of demand rebounding and the industry rationalizing capacity, margins have rebounded. Frontier saw improved earnings as a result. Late in the Fund’s fiscal year Frontier agreed to merge with Holly Corporation, another refiner. Killen sold its position in the Fund upon the announcement.
Performance within the information technology sector was much more stock specific, as certain holdings had very strong operating results during the Fund’s fiscal year with correspondingly strong moves in their stock prices. Each of the large movers showed solid growth in revenue and improvement in margins. InterDigital is one example. InterDigital is a high-technology company that owns a patent portfolio relating to wireless communications. The company has seen solid growth in demand in recent years as a result of the move toward smartphones and tablets. In addition to this growth, the company signed up new patent licensees, such as Casio, during the year. InterDigital’s growth in earnings, combined with the low valuation at the time of Killen’s purchase, led to a solid total return over the 12-month period.
Overall, Killen’s holdings in the financials sector showed the smallest gain. Several of Killen’s financials holdings in the Fund experienced some positive moves, but the Fund also experienced negative results in a few of the banks and insurance companies. In two cases, Killen sold the underperformers, while in another scenario, Killen held a relatively new holding that it still believes has the potential to fulfill its initial price targets.
On a stock-specific level, two stocks that detracted from performance during the year were Courier and Ethan Allen Interiors. Both stocks were hurt by the recession of 2008 and have struggled to regain past levels of profitability. Courier, a publisher of books and magazines, has struggled due to a poor acquisition. Ethan Allen, along with the entire furniture industry, has been laboring due to lower demand and too much capacity. The industry has been hit hard from foreign competition on top of the decline in the housing market. Killen sold both stocks in its portion of the Fund when it found more attractive opportunities to pursue.
Westwood
During the Fund’s fiscal year, Westwood continued to use the investment approach that it employs through all market environments; that is, Westwood focuses on high-quality companies with strong fundamental characteristics and visible earnings prospects. For the 12-month period (ended March 31, 2011), this approach led to strong performance for Westwood’s portion of the Fund.
Security selection in the economically sensitive consumer discretionary and technology sectors aided relative performance. An improved economic and employment outlook resulted in a more optimistic consumer and stronger retail sales, which boosted the performance of stocks in the consumer discretionary sector. Signs of rising demand for information technology (IT) products and services, as well as enhanced sentiment regarding the pace of global economic growth, were contributing factors to the performance of stocks in the technology sector.
Security selection in the energy and utilities sectors hindered performance. Although energy companies generally produced strong earnings growth during the period, stock performance was negatively affected as a result of the BP oil spill in the Gulf of Mexico, the potential impact from U.S. federal regulation on energy industries, and events in the Middle East and Japan. The utilities sector lagged as many investors sought out more economically sensitive securities in a rising market.
BorgWarner, an auto parts manufacturer, was among the best-performing securities in Westwood’s portion of the Fund during the Fund’s fiscal year. The company
(continues) 17
Portfolio management review
Optimum Small-Mid Cap Value Fund
announced strong fourth quarter results, owing in part to improved global demand for autos and, specifically, cars with fuel-efficient engines. Gardner Denver, an economically sensitive industrial supply firm, also contributed to Westwood’s portion of Fund performance, with the stock benefiting from strong demand for the company’s drilling and well stimulation pumps.
The worst-performing security in Westwood’s portion of the Fund during the Fund’s fiscal year was Hudson City Bancorp, which fell after the company reported lower net interest income and a decline in mortgage loans outstanding. Westwood continues to hold the stock in the Fund because it believes the company has a strong balance sheet. With Hudson’s emphasis on jumbo mortgages, good credit quality, and its low cost structure, Westwood believes Hudson is well positioned to grow at a rate above its peers.
Healthcare firm Conmed, which provides surgical equipment for minimally invasive procedures and monitoring, sold off throughout the Fund’s fiscal year as the company reported earnings and guidance that disappointed investors. Westwood exited the position during the Fund’s fiscal year because of a change in its outlook for the company. Its capital equipment business for surgical equipment failed to show the recovery expected and there was evidence that Conmed may have lost market share, further dampening sales.
18
Performance summary
Optimum Fixed Income Fund
The performance data quoted represent past performance; past performance does not guarantee future results. Investment return and principal value will fluctuate so your shares, when redeemed, may be worth more or less than their original cost. Please obtain the performance data for the most recent month end by calling 800 914-0278 or visiting our Web site at www.optimummutualfunds.com. Current performance may be lower or higher than the performance data quoted.
Fund performance1, 2
Average annual total returns
| Through March 31, 2011 | 1 year | 3 years | 5 years | Lifetime | |||||||||||
| Class A (Est. Aug. 1, 2003) | |||||||||||||||
| Excluding sales charge | +7.01% | +8.15% | +7.15% | +6.04% | |||||||||||
| Including sales charge | +2.17% | +6.51% | +6.17% | +5.41% | |||||||||||
| Class B (Est. Aug. 1, 2003) | |||||||||||||||
| Excluding sales charge | +6.32% | +7.48% | +6.47% | +5.36% | |||||||||||
| Including sales charge | +2.32% | +6.82% | +6.24% | +5.36% | |||||||||||
| Class C (Est. Aug. 1, 2003) | |||||||||||||||
| Excluding sales charge | +6.32% | +7.44% | +6.45% | +5.36% | |||||||||||
| Including sales charge | +5.32% | +7.44% | +6.45% | +5.36% | |||||||||||
| Institutional Class (Est. Aug. 1, 2003) | |||||||||||||||
| Excluding sales charge | +7.39% | +8.54% | +7.53% | +6.41% | |||||||||||
| Including sales charge | +7.39% | +8.54% | +7.53% | +6.41% |
1Returns reflect the reinvestment of all distributions and are presented both with and without the applicable sales charges described below. Returns do not reflect the deduction of taxes the shareholder would pay on Fund distributions or redemptions of Fund shares.
Expense limitations were in effect for certain classes during some or all of the periods shown in the “Fund performance” chart. The current expenses for each class are listed on the “Fund expense ratios” table on page 21. Performance would have been lower had expense limitations not been in effect.
Class A shares are sold with a maximum front-end sales charge of up to 4.50%, and have an annual distribution and service fee of up to 0.35% of average daily net assets. Performance for Class A shares, excluding sales charges, assumes that no front-end sales charge applied.
Class B shares may only be purchased through dividend reinvestment and certain permitted exchanges as described in the prospectus. Please see the prospectus for additional information on Class B shares. Class B shares have a contingent deferred sales charge that declines from 4.00% to zero depending on the period of time the shares are held. They are also subject to an annual distribution and service fee of up to 1.00% of average daily net assets. Class B shares will automatically convert to Class A shares on a quarterly basis approximately eight years after purchase.
Class C shares are sold with a contingent deferred sales charge of 1.00% if redeemed during the first 12 months. They are also subject to an annual distribution and service fee of up to 1.00% of average daily net assets.
Performance for Class B and C shares, excluding sales charges, assumes either that contingent deferred sales charges did not apply or that the investment was not redeemed.
Institutional Class shares are available without sales or asset-based distribution charges only to certain eligible institutional accounts.
The “Fund performance” table and the “Performance of a $10,000 investment” graph do not reflect the deduction of taxes the shareholder would pay on Fund distributions or redemptions of Fund shares.
2 The Fund’s expense ratios, as described in the most recent prospectus, are disclosed in the following “Fund expense ratios” table. Delaware Management Company has agreed to reimburse certain expenses and/or waive certain fees in order to prevent total fund operating expenses, (excluding any 12b-1 fees and certain other expenses) from exceeding 1.00% of the Fund’s average daily net assets from July 29, 2010, through July 29, 2011. Please see the most recent prospectus and any applicable supplement(s) for additional information on these fee waivers and/or reimbursements.
20
| Fund expense ratios | Class A | Class B | Class C | Institutional Class | |||
| Total annual operating expenses | |||||||
| (without fee waivers) | 1.48% | 2.13% | 2.13% | 1.13% | |||
| Net expenses | |||||||
| (including fee waivers, if any) | 1.35% | 2.00% | 2.00% | 1.00% | |||
| Type of waiver | Contractual | Contractual | Contractual | Contractual |
Fixed income securities and bond funds can lose value, and investors can lose principal, as interest rates rise. They also may be affected by economic conditions that hinder an issuer’s ability to make interest and principal payments on its debt.
The Fund may also be subject to prepayment risk, the risk that the principal of a fixed income security that is held by the Fund may be prepaid prior to maturity, potentially forcing the Fund to reinvest that money at a lower interest rate.
High yielding, noninvestment grade bonds (junk bonds) involve higher risk than investment grade bonds. The high yield secondary market is particularly susceptible to liquidity problems when institutional investors, such as mutual funds and certain other financial institutions, temporarily stop buying bonds for regulatory, financial, or other reasons. In addition, a less liquid secondary market makes it more difficult for the Fund to obtain precise valuations of the high yield securities in its portfolio.
If and when we invest in forward foreign currency contracts or use other investments to hedge against currency risks, the Fund will be subject to special risks, including counterparty risk.
The Fund may invest in derivatives, which may involve additional expenses and are subject to risk, including the risk that an underlying security or securities index moves in the opposite direction from what the portfolio manager anticipated. A derivative transaction depends upon the counterparties’ ability to fulfill their contractual obligations.
The Fund may experience portfolio turnover in excess of 100%, which could result in higher transaction costs and tax liability.
Performance of a $10,000 Investment1
Aug. 1, 2003 (Fund’s inception) through March 31, 2011
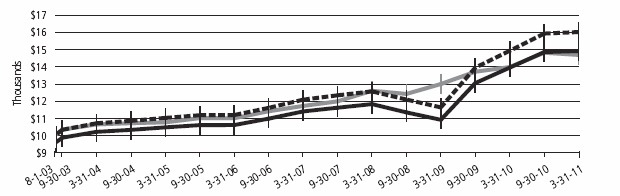
| Starting value (Aug. 1, 2003) | Ending value (Mar. 31, 2011) | |||||
| Optimum Fixed Income Fund — Institutional Class shares | $10,000 | $16,099 | ||||
| Optimum Fixed Income Fund — Class A shares | $9,550 | $14,976 | ||||
| Barclays Capital U.S. Aggregate Index | $10,000 | $14,745 |
1The “Performance of $10,000 investment” graph assumes $10,000 invested in Class A shares of the Fund on Aug. 1, 2003, and includes the effect of a 4.50% front-end sales charge and the reinvestment of all distributions. The graph does not reflect the deduction of taxes the shareholders would pay on Fund distributions or redemptions of Fund shares. Expense limitations were in effect for some or all of the periods shown. Performance would have been lower had expense limitations not been in effect. Current expenses are listed in the “Fund expense ratios” table above. Please note additional details on pages 20 through 22.
(continues) 21
Performance summary
Optimum Fixed Income Fund
The chart also assumes $10,000 invested in the Barclays Capital U.S. Aggregate Index as of Aug. 1, 2003. The Barclays Capital U.S. Aggregate Index is a broad composite of more than 8,000 securities that tracks the investment grade domestic bond market.
Index performance returns do not reflect any management fees, transaction costs or expenses. Indices are unmanaged and one cannot invest directly in an index. Past performance is not a guarantee of future results.
Performance of other Fund classes will vary due to different charges and expenses.
| Stock symbols and CUSIP numbers | ||||
| Nasdaq symbols | CUSIPs | |||
| Class A | OAFIX | 246118681 | ||
| Class B | OBFIX | 246118673 | ||
| Class C | OCFIX | 246118665 | ||
| Institutional Class | OIFIX | 246118657 |
22
Performance summary
Optimum International Fund
The performance data quoted represent past performance; past performance does not guarantee future results. Investment return and principal value will fluctuate so your shares, when redeemed, may be worth more or less than their original cost. Please obtain the performance data for the most recent month end by calling 800 914-0278 or visiting our Web site at www.optimummutualfunds.com. Current performance may be lower or higher than the performance data quoted.
Fund performance
Average annual total returns
| Through March 31, 2011 | 1 year | 3 years | 5 years | Lifetime | |||||||||||
| Class A (Est. Aug. 1, 2003) | |||||||||||||||
| Excluding sales charge | +10.19% | -4.04% | +0.58% | +7.70% | |||||||||||
| Including sales charge | +3.87% | -5.90% | -0.60% | +6.87% | |||||||||||
| Class B (Est. Aug. 1, 2003) | |||||||||||||||
| Excluding sales charge | +9.49% | -4.65% | -0.08% | +7.01% | |||||||||||
| Including sales charge | +5.49% | -5.47% | -0.45% | +7.01% | |||||||||||
| Class C (Est. Aug. 1, 2003) | |||||||||||||||
| Excluding sales charge | +9.59% | -4.65% | -0.06% | +7.02% | |||||||||||
| Including sales charge | +8.59% | -4.65% | -0.06% | +7.02% | |||||||||||
| Institutional Class (Est. Aug. 1, 2003) | |||||||||||||||
| Excluding sales charge | +10.55% | -3.72% | +0.92% | +8.07% | |||||||||||
| Including sales charge | +10.55% | -3.72% | +0.92% | +8.07% |
1Returns reflect the reinvestment of all distributions and are presented both with and without the applicable sales charges described below. Returns do not reflect the deduction of taxes the shareholder would pay on Fund distributions or redemptions of Fund shares.
Expense limitations were in effect for certain classes during some or all of the periods shown in the “Fund performance” chart. The current expenses for each class are listed on the “Fund expense ratios” table on page 25. Performance would have been lower had expense limitations not been in effect.
Class A shares are sold with a maximum front-end sales charge of up to 5.75%, and have an annual distribution and service fee of up to 0.35% of average daily net assets. Performance for Class A shares, excluding sales charges, assumes that no front-end sales charge applied.
Class B shares may only be purchased through dividend reinvestment and certain permitted exchanges as described in the prospectus. Please see the prospectus for additional information on Class B shares. Class B shares have a contingent deferred sales charge that declines from 4.00% to zero depending on the period of time the shares are held. They are also subject to an annual distribution and service fee of up to 1.00% of average daily net assets. Class B shares will automatically convert to Class A shares on a quarterly basis approximately eight years after purchase.
Class C shares are sold with a contingent deferred sales charge of 1.00% if redeemed during the first 12 months. They are also subject to an annual distribution and service fee of up to 1.00% of average daily net assets.
Performance for Class B and C shares, excluding sales charges, assumes either that contingent deferred sales charges did not apply or that the investment was not redeemed.
Institutional Class shares are available without sales or asset-based distribution charges only to certain eligible institutional accounts.
The “Fund performance” table and the “Performance of a $10,000 investment” graph do not reflect the deduction of taxes the shareholder would pay on Fund distributions or redemptions of Fund shares.
2The Fund’s expense ratios, as described in the most recent prospectus, are disclosed in the following “Fund expense ratios” table. Delaware Management Company has agreed to reimburse certain expenses and/or waive certain fees in order to prevent total fund operating expenses, (excluding any 12b-1 fees and certain other expenses) from exceeding 1.40% of the Fund’s average daily net assets from July 29, 2010, through July 29, 2011. Please see the most recent prospectus and any applicable supplement(s) for additional information on these fee waivers and/or reimbursements.
24
| Fund expense ratios | Class A | Class B | Class C | Institutional Class | |||
| Total annual operating expenses | |||||||
| (without fee waivers) | 1.94% | 2.59% | 2.59% | 1.59% | |||
| Net expenses | |||||||
| (including fee waivers, if any) | 1.75% | 2.40% | 2.40% | 1.40% | |||
| Type of waiver | Contractual | Contractual | Contractual | Contractual |
International investments entail risks not ordinarily associated with U.S. investments including fluctuation in currency values, differences in accounting principles, or economic or political instability in other nations. Investing in emerging markets can be riskier than investing in established foreign markets due to increased volatility and lower trading volume.
Performance of a $10,000 Investment1
Aug. 1, 2003 (Fund’s inception) through March 31, 2011
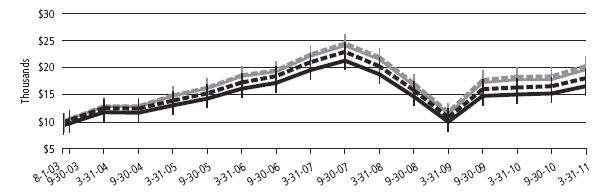
| Starting value (Aug. 1, 2003) | Ending value (Mar. 31, 2011) | |||||
| MSCI EAFE Index (gross) | $10,000 | $20,347 | ||||
| MSCI EAFE Index (net) | $10,000 | $19,692 | ||||
| Optimum International Fund — Institutional Class shares | $10,000 | $18,135 | ||||
| Optimum International Fund — Class A shares | $9,425 | $16,651 |
1The “Performance of $10,000 investment” graph assumes $10,000 invested in Class A shares of the Fund on Aug. 1, 2003, and includes the effect of a 5.75% front-end sales charge and the reinvestment of all distributions. The graph does not reflect the deduction of taxes the shareholders would pay on Fund distributions or redemptions of Fund shares. Expense limitations were in effect for some or all of the periods shown. Performance would have been lower had expense limitations not been in effect. Current expenses are listed in the “Fund expense ratios” table above. Please note additional details on pages 24 and 25.
The chart also assumes $10,000 invested in the MSCI EAFE Index as of Aug. 1, 2003. The MSCI EAFE Index measures equity market performance across developed market countries in Europe, Australasia, and the Far East. Index “gross” return approximates the maximum possible dividend reinvestment. Index “net” return approximates the minimum possible dividend reinvestment, after deduction of withholding tax at the highest possible rate.
Index performance returns do not reflect any management fees, transaction costs or expenses. Indices are unmanaged and one cannot invest directly in an index. Past performance is not a guarantee of future results.
Performance of other Fund classes will vary due to different charges and expenses.
| Stock symbols and CUSIP numbers | ||||
| Nasdaq symbols | CUSIPs | |||
| Class A | OAIEX | 246118731 | ||
| Class B | OBIEX | 246118723 | ||
| Class C | OCIEX | 246118715 | ||
| Institutional Class | OIIEX | 246118699 |
(continues) 25
Performance summary
Optimum Large Cap Growth Fund
The performance data quoted represent past performance; past performance does not guarantee future results. Investment return and principal value will fluctuate so your shares, when redeemed, may be worth more or less than their original cost. Please obtain the performance data for the most recent month end by calling 800 914-0278 or visiting our Web site at www.optimummutualfunds.com. Current performance may be lower or higher than the performance data quoted.
Fund performance1, 2
Average annual total returns
| Through March 31, 2011 | 1 year | 3 years | 5 years | Lifetime | |||||||||||
| Class A (Est. Aug. 1, 2003) | |||||||||||||||
| Excluding sales charge | +16.82% | +3.47% | +2.41% | +5.69% | |||||||||||
| Including sales charge | +10.10% | +1.46% | +1.21% | +4.88% | |||||||||||
| Class B (Est. Aug. 1, 2003) | |||||||||||||||
| Excluding sales charge | +16.11% | +2.83% | +1.76% | +5.02% | |||||||||||
| Including sales charge | +12.11% | +1.96% | +1.34% | +5.02% | |||||||||||
| Class C (Est. Aug. 1, 2003) | |||||||||||||||
| Excluding sales charge | +16.11% | +2.83% | +1.76% | +5.02% | |||||||||||
| Including sales charge | +15.11% | +2.83% | +1.76% | +5.02% | |||||||||||
| Institutional Class (Est. Aug. 1, 2003) | |||||||||||||||
| Excluding sales charge | +17.28% | +3.86% | +2.77% | +6.07% | |||||||||||
| Including sales charge | +17.28% | +3.86% | +2.77% | +6.07% |
1Returns reflect the reinvestment of all distributions and are presented both with and without the applicable sales charges described below. Returns do not reflect the deduction of taxes the shareholder would pay on Fund distributions or redemptions of Fund shares.
Expense limitations were in effect for certain classes during some or all of the periods shown in the “Fund performance” chart. The current expenses for each class are listed on the “Fund expense ratios” table on page 27. Performance would have been lower had expense limitations not been in effect.
Class A shares are sold with a maximum front-end sales charge of up to 5.75%, and have an annual distribution and service fee of up to 0.35% of average daily net assets. Performance for Class A shares, excluding sales charges, assumes that no front-end sales charge applied.
Class B shares may only be purchased through dividend reinvestment and certain permitted exchanges as described in the prospectus. Please see the prospectus for additional information on Class B shares. Class B shares have a contingent deferred sales charge that declines from 4.00% to zero depending on the period of time the shares are held. They are also subject to an annual distribution and service fee of up to 1.00% of average daily net assets. Class B shares will automatically convert to Class A shares on a quarterly basis approximately eight years after purchase.
Class C shares are sold with a contingent deferred sales charge of 1.00% if redeemed during the first 12 months. They are also subject to an annual distribution and service fee of up to 1.00% of average daily net assets.
Performance for Class B and C shares, excluding sales charges, assumes either that contingent deferred sales charges did not apply or that the investment was not redeemed.
Institutional Class shares are available without sales or asset-based distribution charges only to certain eligible institutional accounts.
The “Fund performance” table and the “Performance of a $10,000 investment” graph do not reflect the deduction of taxes the shareholder would pay on Fund distributions or redemptions of Fund shares.
2The Fund’s expense ratios, as described in the most recent prospectus, are disclosed in the following “Fund expense ratios” table. Delaware Management Company has agreed to reimburse certain expenses and/or waive certain fees in order to prevent total fund operating expenses, (excluding any 12b-1 fees and certain other expenses) from exceeding 1.27% of the Fund’s average daily net assets from July 29, 2010, through July 29, 2011. Please see the most recent prospectus and any applicable supplement(s) for additional information on these fee waivers and/or reimbursements.
26
| Fund expense ratios | Class A | Class B | Class C | Institutional Class | ||||
| Total annual operating expenses | ||||||||
| (without fee waivers) | 1.66% | 2.31% | 2.31% | 1.31% | ||||
| Net expenses | ||||||||
| (including fee waivers, if any) | 1.62% | 2.27% | 2.27% | 1.27% | ||||
| Type of waiver | Contractual | Contractual | Contractual | Contractual |
Performance of a $10,000 Investment1
Aug. 1, 2003 (Fund’s inception) through March 31, 2011
Aug. 1, 2003 (Fund’s inception) through March 31, 2011
| Starting value (Aug. 1, 2003) | Ending value (Mar. 31, 2011) | |||
| Russell 1000 Growth Index | $10,000 | $15,970 | ||
| Optimum Large Cap Growth Fund — Institutional Class shares | $10,000 | $15,716 | ||
| Optimum Large Cap Growth Fund — Class A shares | $9,425 | $14,412 | ||
1The “Performance of $10,000 investment” graph assumes $10,000 invested in Class A shares of the Fund on Aug. 1, 2003, and includes the effect of a 5.75% front-end sales charge and the reinvestment of all distributions. The graph does not reflect the deduction of taxes the shareholders would pay on Fund distributions or redemptions of Fund shares. Expense limitations were in effect for some or all of the periods shown. Performance would have been lower had expense limitations not been in effect. Current expenses are listed in the “Fund expense ratios” table above. Please note additional details on pages 26 and 27.
The chart also assumes $10,000 invested in the Russell 1000 Growth Index as of Aug. 1, 2003. The Russell 1000 Growth Index measures the performance of the large-cap growth segment of the U.S. equity universe. It includes those Russell 1000 companies with higher price-to-book ratios and higher forecasted growth values.
Index performance returns do not reflect any management fees, transaction costs or expenses. Indices are unmanaged and one cannot invest directly in an index. Past performance is not a guarantee of future results.
Performance of other Fund classes will vary due to different charges and expenses.
| Stock symbols and CUSIP numbers | ||||
| Nasdaq symbols | CUSIPs | |||
| Class A | OALGX | 246118707 | ||
| Class B | OBLGX | 246118806 | ||
| Class C | OCLGX | 246118889 | ||
| Institutional Class | OILGX | 246118871 |
(continues) 27
Performance summary
Optimum Large Cap Value Fund
The performance data quoted represent past performance; past performance does not guarantee future results. Investment return and principal value will fluctuate so your shares, when redeemed, may be worth more or less than their original cost. Please obtain the performance data for the most recent month end by calling 800 914-0278 or visiting our Web site at www.optimummutualfunds.com. Current performance may be lower or higher than the performance data quoted.
| Fund performance1, 2 | ||||||||||||||||
| Average annual total returns | ||||||||||||||||
| Through March 31, 2011 | 1 year | 3 years | 5 years | Lifetime | ||||||||||||
| Class A (Est. Aug. 1, 2003) | ||||||||||||||||
| Excluding sales charge | +14.00% | +1.41% | +2.37% | +6.38% | ||||||||||||
| Including sales charge | +7.44% | -0.57% | +1.16% | +5.56% | ||||||||||||
| Class B (Est. Aug. 1, 2003) | ||||||||||||||||
| Excluding sales charge | +13.25% | +0.75% | +1.72% | +5.69% | ||||||||||||
| Including sales charge | +9.25% | -0.15% | +1.31% | +5.69% | ||||||||||||
| Class C (Est. Aug. 1, 2003) | ||||||||||||||||
| Excluding sales charge | +13.37% | +0.78% | +1.72% | +5.69% | ||||||||||||
| Including sales charge | +12.37% | +0.78% | +1.72% | +5.69% | ||||||||||||
| Institutional Class (Est. Aug. 1, 2003) | ||||||||||||||||
| Excluding sales charge | +14.42% | +1.78% | +2.75% | +6.76% | ||||||||||||
| Including sales charge | +14.42% | +1.78% | +2.75% | +6.76% | ||||||||||||
1Returns reflect the reinvestment of all distributions and are presented both with and without the applicable sales charges described below. Returns do not reflect the deduction of taxes the shareholder would pay on Fund distributions or redemptions of Fund shares.
Expense limitations were in effect for certain classes during some or all of the periods shown in the “Fund performance” chart. The current expenses for each class are listed on the “Fund expense ratios” table on page 29. Performance would have been lower had expense limitations not been in effect.
Class A shares are sold with a maximum front-end sales charge of up to 5.75%, and have an annual distribution and service fee of up to 0.35% of average daily net assets. Performance for Class A shares, excluding sales charges, assumes that no front-end sales charge applied.
Class B shares may only be purchased through dividend reinvestment and certain permitted exchanges as described in the prospectus. Please see the prospectus for additional information on Class B shares. Class B shares have a contingent deferred sales charge that declines from 4.00% to zero depending on the period of time the shares are held. They are also subject to an annual distribution and service fee of up to 1.00% of average daily net assets. Class B shares will automatically convert to Class A shares on a quarterly basis approximately eight years after purchase.
Class C shares are sold with a contingent deferred sales charge of 1.00% if redeemed during the first 12 months. They are also subject to an annual distribution and service fee of up to 1.00% of average daily net assets.
Performance for Class B and C shares, excluding sales charges, assumes either that contingent deferred sales charges did not apply or that the investment was not redeemed.
Institutional Class shares are available without sales or asset-based distribution charges only to certain eligible institutional accounts.
The “Fund performance” table and the “Performance of a $10,000 investment” graph do not reflect the deduction of taxes the shareholder would pay on Fund distributions or redemptions of Fund shares.
2 The Fund’s expense ratios, as described in the most recent prospectus, are disclosed in the following “Fund expense ratios” table. Delaware Management Company has agreed to reimburse certain expenses and/or waive certain fees in order to prevent total fund operating expenses, (excluding any 12b-1 fees and certain other expenses) from exceeding 1.23% of the Fund’s average daily net assets from July 29, 2010, through July 29, 2011. Please see the most recent prospectus and any applicable supplement(s) for additional information on these fee waivers and/or reimbursements.
28
| Fund expense ratios | Class A | Class B | Class C | Institutional Class | ||||
| Total annual operating expenses | ||||||||
| (without fee waivers) | 1.62% | 2.27% | 2.27% | 1.27% | ||||
| Net expenses | ||||||||
| (including fee waivers, if any) | 1.58% | 2.23% | 2.23% | 1.23% | ||||
| Type of waiver | Contractual | Contractual | Contractual | Contractual |
Performance of a $10,000 Investment1
Aug. 1, 2003 (Fund’s inception) through March 31, 2011
Aug. 1, 2003 (Fund’s inception) through March 31, 2011
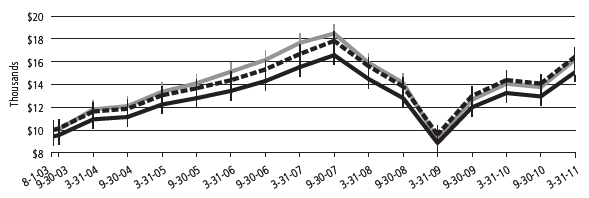
| Starting value (Aug. 1, 2003) | Ending value (Mar. 31, 2011) | |||
| Optimum Large Cap Value Fund — Institutional Class shares | $10,000 | $16,508 | ||
| Russell 1000 Value Index | $10,000 | $16,243 | ||
| Optimum Large Cap Value Fund — Class A shares | $9,425 | $15,139 | ||
1The “Performance of $10,000 investment” graph assumes $10,000 invested in Class A shares of the Fund on Aug. 1, 2003, and includes the effect of a 5.75% front-end sales charge and the reinvestment of all distributions. The graph does not reflect the deduction of taxes the shareholders would pay on Fund distributions or redemptions of Fund shares. Expense limitations were in effect for some or all of the periods shown. Performance would have been lower had expense limitations not been in effect. Current expenses are listed in the “Fund expense ratios” table above. Please note additional details on pages 28 and 29.
The chart also assumes $10,000 invested in the Russell 1000 Value Index as of Aug. 1, 2003. The Russell 1000 Value Index measures the performance of the large-cap value segment of the U.S. equity universe. It includes those Russell 1000 companies with lower price-to-book ratios and lower forecasted growth values.
Index performance returns do not reflect any management fees, transaction costs or expenses. Indices are unmanaged and one cannot invest directly in an index. Past performance is not a guarantee of future results.
Performance of other Fund classes will vary due to different charges and expenses.
| Stock symbols and CUSIP numbers | ||||
| Nasdaq symbols | CUSIPs | |||
| Class A | OALVX | 246118863 | ||
| Class B | OBLVX | 246118855 | ||
| Class C | OCLVX | 246118848 | ||
| Institutional Class | OILVX | 246118830 |
(continues) 29
Performance summary
Optimum Small-Mid Cap Growth Fund
The performance data quoted represent past performance; past performance does not guarantee future results. Investment return and principal value will fluctuate so your shares, when redeemed, may be worth more or less than their original cost. Please obtain the performance data for the most recent month end by calling 800 914-0278 or visiting our Web site at www.optimummutualfunds.com. Current performance may be lower or higher than the performance data quoted.
| Fund performance1, 2 | ||||||||||||||||
| Average annual total returns | ||||||||||||||||
| Through March 31, 2011 | 1 year | 3 years | 5 years | Lifetime | ||||||||||||
| Class A (Est. Aug. 1, 2003) | ||||||||||||||||
| Excluding sales charge | +24.66% | +7.21% | +0.78% | +7.60% | ||||||||||||
| Including sales charge | +17.50% | +5.11% | -0.40% | +6.77% | ||||||||||||
| Class B (Est. Aug. 1, 2003) | ||||||||||||||||
| Excluding sales charge | +23.83% | +6.49% | +0.10% | +6.90% | ||||||||||||
| Including sales charge | +19.83% | +5.68% | -0.32% | +6.90% | ||||||||||||
| Class C (Est. Aug. 1, 2003) | ||||||||||||||||
| Excluding sales charge | +23.83% | +6.49% | +0.10% | +6.90% | ||||||||||||
| Including sales charge | +22.83% | +6.49% | +0.10% | +6.90% | ||||||||||||
| Institutional Class (Est. Aug. 1, 2003) | ||||||||||||||||
| Excluding sales charge | +25.07% | +7.55% | +1.11% | +7.96% | ||||||||||||
| Including sales charge | +25.07% | +7.55% | +1.11% | +7.96% | ||||||||||||
1Returns reflect the reinvestment of all distributions and are presented both with and without the applicable sales charges described below. Returns do not reflect the deduction of taxes the shareholder would pay on Fund distributions or redemptions of Fund shares.
Expense limitations were in effect for certain classes during some or all of the periods shown in the “Fund performance” chart. The current expenses for each class are listed on the “Fund expense ratios” table on page 31. Performance would have been lower had expense limitations not been in effect.
Class A shares are sold with a maximum front-end sales charge of up to 5.75%, and have an annual distribution and service fee of up to 0.35% of average daily net assets. Performance for Class A shares, excluding sales charges, assumes that no front-end sales charge applied.
Class B shares may only be purchased through dividend reinvestment and certain permitted exchanges as described in the prospectus. Please see the prospectus for additional information on Class B shares. Class B shares have a contingent deferred sales charge that declines from 4.00% to zero depending on the period of time the shares are held. They are also subject to an annual distribution and service fee of up to 1.00% of average daily net assets. Class B shares will automatically convert to Class A shares on a quarterly basis approximately eight years after purchase.
Class C shares are sold with a contingent deferred sales charge of 1.00% if redeemed during the first 12 months. They are also subject to an annual distribution and service fee of up to 1.00% of average daily net assets.
Performance for Class B and C shares, excluding sales charges, assumes either that contingent deferred sales charges did not apply or that the investment was not redeemed.
Institutional Class shares are available without sales or asset-based distribution charges only to certain eligible institutional accounts.
Instances of high double-digit returns are unusual, cannot be sustained, and were primarily achieved during favorable market conditions.
The “Fund performance” table and the “Performance of a $10,000 investment” graph do not reflect the deduction of taxes the shareholder would pay on Fund distributions or redemptions of Fund shares.
2The Fund’s expense ratios, as described in the most recent prospectus, are disclosed in the following “Fund expense ratios” table. Delaware Management Company has agreed to reimburse certain expenses and/or waive certain fees in order to prevent total fund operating expenses, (excluding any 12b-1 fees and certain other expenses) from exceeding 1.55% of the Fund’s average daily net assets from July 29, 2010, through July 29, 2011. Please see the most recent prospectus and any applicable supplement(s) for additional information on these fee waivers and/or reimbursements.
30
| Fund expense ratios | Class A | Class B | Class C | Institutional Class | ||||
| Total annual operating expenses | ||||||||
| (without fee waivers) | 2.10% | 2.75% | 2.75% | 1.75% | ||||
| Net expenses | ||||||||
| (including fee waivers, if any) | 1.90% | 2.55% | 2.55% | 1.55% | ||||
| Type of waiver | Contractual | Contractual | Contractual | Contractual |
Investments in small and/or medium-sized companies typically exhibit greater risk and higher volatility than larger, more established companies.
Performance of a $10,000 Investment1
Aug. 1, 2003 (Fund’s inception) through March 31, 2011
Aug. 1, 2003 (Fund’s inception) through March 31, 2011
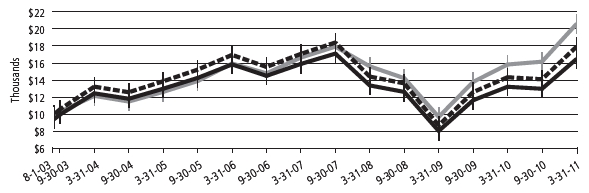
| Starting value (Aug. 1, 2003) | Ending value (Mar. 31, 2011) | |||
| Russell 2500 Growth Index | $10,000 | $20,672 | ||
| Optimum Small-Mid Cap Growth Fund — Institutional Class shares | $10,000 | $17,989 | ||
| Optimum Small-Mid Cap Growth Fund — Class A shares | $9,425 | $16,531 | ||
1The “Performance of $10,000 investment” graph assumes $10,000 invested in Class A shares of the Fund on Aug. 1, 2003, and includes the effect of a 5.75% front-end sales charge and the reinvestment of all distributions. The graph does not reflect the deduction of taxes the shareholders would pay on Fund distributions or redemptions of Fund shares. Expense limitations were in effect for some or all of the periods shown. Performance would have been lower had expense limitations not been in effect. Current expenses are listed in the “Fund expense ratios” table above. Please note additional details on pages 30 and 31.
The chart also assumes $10,000 invested in the Russell 2500 Growth Index as of Aug. 1, 2003. The Russell 2500 Growth Index measures the performance of the small- to mid-cap growth segment of the U.S. equity universe. It includes those Russell 2500 companies with higher price-to-book ratios and higher forecasted growth values.
Index performance returns do not reflect any management fees, transaction costs or expenses. Indices are unmanaged and one cannot invest directly in an index. Past performance is not a guarantee of future results.
Performance of other Fund classes will vary due to different charges and expenses.
| Stock symbols and CUSIP numbers | ||||
| Nasdaq symbols | CUSIPs | |||
| Class A | OASGX | 246118822 | ||
| Class B | OBSGX | 246118814 | ||
| Class C | OCSGX | 246118798 | ||
| Institutional Class | OISGX | 246118780 |
(continues) 31
Performance summary
Optimum Small-Mid Cap Value Fund
The performance data quoted represent past performance; past performance does not guarantee future results. Investment return and principal value will fluctuate so your shares, when redeemed, may be worth more or less than their original cost. Please obtain the performance data for the most recent month end by calling 800 914-0278 or visiting our Web site at www.optimummutualfunds.com. Current performance may be lower or higher than the performance data quoted.
| Fund performance1, 2 | ||||||||||||||||
| Average annual total returns | ||||||||||||||||
| Through March 31, 2011 | 1 year | 3 years | 5 years | Lifetime | ||||||||||||
| Class A (Est. Aug. 1, 2003) | ||||||||||||||||
| Excluding sales charge | +25.22% | +6.76% | +1.52% | +8.82% | ||||||||||||
| Including sales charge | +18.07% | +4.68% | +0.32% | +7.98% | ||||||||||||
| Class B (Est. Aug. 1, 2003) | ||||||||||||||||
| Excluding sales charge | +24.50% | +6.04% | +0.88% | +8.12% | ||||||||||||
| Including sales charge | +20.50% | +5.22% | +0.48% | +8.12% | ||||||||||||
| Class C (Est. Aug. 1, 2003) | ||||||||||||||||
| Excluding sales charge | +24.40% | +6.01% | +0.86% | +8.11% | ||||||||||||
| Including sales charge | +23.40% | +6.01% | +0.86% | +8.11% | ||||||||||||
| Institutional Class (Est. Aug. 1, 2003) | ||||||||||||||||
| Excluding sales charge | +25.70% | +7.14% | +1.89% | +9.20% | ||||||||||||
| Including sales charge | +25.70% | +7.14% | +1.89% | +9.20% | ||||||||||||
1Returns reflect the reinvestment of all distributions and are presented both with and without the applicable sales charges described below. Returns do not reflect the deduction of taxes the shareholder would pay on Fund distributions or redemptions of Fund shares.
Expense limitations were in effect for certain classes during some or all of the periods shown in the “Fund performance” chart. The current expenses for each class are listed on the “Fund expense ratios” table on page 33. Performance would have been lower had expense limitations not been in effect.
Class A shares are sold with a maximum front-end sales charge of up to 5.75%, and have an annual distribution and service fee of up to 0.35% of average daily net assets. Performance for Class A shares, excluding sales charges, assumes that no front-end sales charge applied.
Class B shares may only be purchased through dividend reinvestment and certain permitted exchanges as described in the prospectus. Please see the prospectus for additional information on Class B shares. Class B shares have a contingent deferred sales charge that declines from 4.00% to zero depending on the period of time the shares are held. They are also subject to an annual distribution and service fee of up to 1.00% of average daily net assets. Class B shares will automatically convert to Class A shares on a quarterly basis approximately eight years after purchase.
Class C shares are sold with a contingent deferred sales charge of 1.00% if redeemed during the first 12 months. They are also subject to an annual distribution and service fee of up to 1.00% of average daily net assets.
Performance for Class B and C shares, excluding sales charges, assumes either that contingent deferred sales charges did not apply or that the investment was not redeemed.
Institutional Class shares are available without sales or asset-based distribution charges only to certain eligible institutional accounts.
Instances of high double-digit returns are unusual, cannot be sustained, and were primarily achieved during favorable market conditions.
The “Fund performance” table and the “Performance of a $10,000 investment” graph do not reflect the deduction of taxes the shareholder would pay on Fund distributions or redemptions of Fund shares.
2The Fund’s expense ratios, as described in the most recent prospectus, are disclosed in the following “Fund expense ratios” table. Delaware Management Company has agreed to reimburse certain expenses and/or waive certain fees in order to prevent total fund operating expenses, (excluding any 12b-1 fees and certain other expenses) from exceeding 1.45% of the Fund’s average daily net assets from July 29, 2010, through July 29, 2011. Please see the most recent prospectus and any applicable supplement(s) for additional information on these fee waivers and/or reimbursements.
32
| Fund expense ratios | Class A | Class B | Class C | Institutional Class | ||||
| Total annual operating expenses | ||||||||
| (without fee waivers) | 2.13% | 2.78% | 2.78% | 1.78% | ||||
| Net expenses | ||||||||
| (including fee waivers, if any) | 1.80% | 2.45% | 2.45% | 1.45% | ||||
| Type of waiver | Contractual | Contractual | Contractual | Contractual |
Investments in small and/or medium-sized companies typically exhibit greater risk and higher volatility than larger, more established companies.
Performance of a $10,000 Investment1
Aug. 1, 2003 (Fund’s inception) through March 31, 2011
Aug. 1, 2003 (Fund’s inception) through March 31, 2011
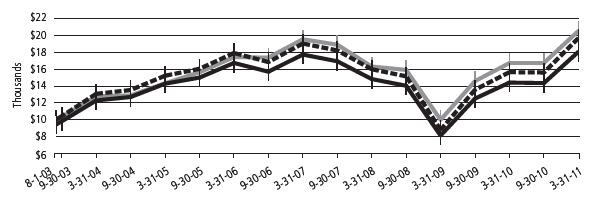
| Starting value (Aug. 1, 2003) | Ending value (Mar. 31, 2011) | |||
| Russell 2500 Value Index | $10,000 | $20,486 | ||
| Optimum Small-Mid Cap Value Fund — Institutional Class shares | $10,000 | $19,640 | ||
| Optimum Small-Mid Cap Value Fund — Class A shares | $9,425 | $18,020 | ||
1The “Performance of $10,000 investment” graph assumes $10,000 invested in Class A shares of the Fund on Aug. 1, 2003, and includes the effect of a 5.75% front-end sales charge and the reinvestment of all distributions. The graph does not reflect the deduction of taxes the shareholders would pay on Fund distributions or redemptions of Fund shares. Expense limitations were in effect for some or all of the periods shown. Performance would have been lower had expense limitations not been in effect. Current expenses are listed in the “Fund expense ratios” table above. Please note additional details on pages 32 and 33.
The chart also assumes $10,000 invested in the Russell 2500 Value Index as of Aug. 1, 2003. The Russell 2500 Value Index measures the performance of the small- to mid-cap value segment of the U.S. equity universe. It includes those Russell 2500 companies with lower price-to-book ratios and lower forecasted growth values.
Index performance returns do not reflect any management fees, transaction costs or expenses. Indices are unmanaged and one cannot invest directly in an index. Past performance is not a guarantee of future results.
Performance of other Fund classes will vary due to different charges and expenses.
| Stock symbols and CUSIP numbers | ||||
| Nasdaq symbols | CUSIPs | |||
| Class A | OASVX | 246118772 | ||
| Class B | OBSVX | 246118764 | ||
| Class C | OCSVX | 246118756 | ||
| Institutional Class | OISVX | 246118749 |
33
Disclosure of Fund expenses
For the six-month period October 1, 2010 to March 31, 2011
As a shareholder of a Fund, you incur two types of costs: (1) transaction costs, including sales charges (loads) on purchase payments, reinvested dividends, or other distributions; redemption fees; and exchange fees; and (2) ongoing costs, including management fees; distribution and/or service (12b-1) fees; and other Fund expenses. These following examples are intended to help you understand your ongoing costs (in dollars) of investing in a Fund and to compare these costs with the ongoing costs of investing in other mutual funds.
The examples are based on an investment of $1,000 invested at the beginning of the period and held for the entire six-month period from October 1, 2010 to March 31, 2011.
Actual Expenses
The first section of the tables shown, “Actual Fund Return,” provides information about actual account values and actual expenses. You may use the information in this section of the table, together with the amount you invested, to estimate the expenses that you paid over the period. Simply divide your account value by $1,000 (for example, an $8,600 account value divided by $1,000 = 8.6), then multiply the result by the number in the first section under the heading entitled “Expenses Paid During Period” to estimate the expenses you paid on your account during this period.
Hypothetical Example for Comparison Purposes
The second section of the tables shown, “Hypothetical 5% Return,” provides information about hypothetical account values and hypothetical expenses based on the Funds’ actual expense ratios and an assumed rate of return of 5% per year before expenses, which is not the Funds’ actual return. The hypothetical account values and expenses may not be used to estimate the actual ending account balance or expenses you paid for the period. You may use this information to compare the ongoing costs of investing in each Fund and other funds. To do so, compare this 5% hypothetical example with the 5% hypothetical examples that appear in the shareholder reports of the other funds.
Please note that the expenses shown in the tables are meant to highlight your ongoing costs only and do not reflect any transactional costs, such as sales charges (loads), redemption fees, or exchange fees. Therefore, the second section of each table is useful in comparing ongoing costs only, and will not help you determine the relative total costs of owning different funds. In addition, if these transactional costs were included, your costs would have been higher. Each Fund’s expenses shown in the tables reflect fee waivers in effect. The expenses shown in each table assume reinvestment of all dividends and distributions.
Optimum Fixed Income Fund
Expense Analysis of an Investment of $1,000
Expense Analysis of an Investment of $1,000
| Expenses | ||||||||||
| Beginning | Ending | Paid During | ||||||||
| Account | Account | Annualized | Period | |||||||
| Value | Value | Expense | 10/1/10 to | |||||||
| 10/1/10 | 3/31/11 | Ratio | 3/31/11* | |||||||
| Actual Fund Return | ||||||||||
| Class A | $1,000.00 | $1,004.10 | 1.35% | $ | 6.75 | |||||
| Class B | 1,000.00 | 1,001.20 | 2.00% | 9.98 | ||||||
| Class C | 1,000.00 | 1,001.20 | 2.00% | 9.98 | ||||||
| Institutional Class | 1,000.00 | 1,005.70 | 1.00% | 5.00 | ||||||
| Hypothetical 5% Return (5% return before expenses) | ||||||||||
| Class A | $1,000.00 | $1,018.20 | 1.35% | $ | 6.79 | |||||
| Class B | 1,000.00 | 1,014.96 | 2.00% | 10.05 | ||||||
| Class C | 1,000.00 | 1,014.96 | 2.00% | 10.05 | ||||||
| Institutional Class | 1,000.00 | 1,019.95 | 1.00% | 5.04 | ||||||
Optimum International Fund
Expense Analysis of an Investment of $1,000
Expense Analysis of an Investment of $1,000
| Expenses | ||||||||||
| Beginning | Ending | Paid During | ||||||||
| Account | Account | Annualized | Period | |||||||
| Value | Value | Expense | 10/1/10 to | |||||||
| 10/1/10 | 3/31/11 | Ratio | 3/31/11* | |||||||
| Actual Fund Return | ||||||||||
| Class A | $1,000.00 | $1,088.40 | 1.75% | $ | 9.11 | |||||
| Class B | 1,000.00 | 1,085.30 | 2.40% | 12.48 | ||||||
| Class C | 1,000.00 | 1,085.20 | 2.40% | 12.48 | ||||||
| Institutional Class | 1,000.00 | 1,089.70 | 1.40% | 7.29 | ||||||
| Hypothetical 5% Return (5% return before expenses) | ||||||||||
| Class A | $1,000.00 | $1,016.21 | 1.75% | $ | 8.80 | |||||
| Class B | 1,000.00 | 1,012.96 | 2.40% | 12.04 | ||||||
| Class C | 1,000.00 | 1,012.96 | 2.40% | 12.04 | ||||||
| Institutional Class | 1,000.00 | 1,017.95 | 1.40% | 7.04 | ||||||
*“Expenses Paid During Period” are equal to the Funds’ annualized expense ratio, multiplied by the average account value over the period, multiplied by 182/365 (to reflect the one-half year period).
34
Optimum Large Cap Growth Fund
Expense Analysis of an Investment of $1,000
Expense Analysis of an Investment of $1,000
| Expenses | ||||||||||
| Beginning | Ending | Paid During | ||||||||
| Account | Account | Annualized | Period | |||||||
| Value | Value | Expense | 10/1/10 to | |||||||
| 10/1/10 | 3/31/11 | Ratio | 3/31/11* | |||||||
| Actual Fund Return | ||||||||||
| Class A | $1,000.00 | $1,186.10 | 1.62% | $ | 8.83 | |||||
| Class B | 1,000.00 | 1,182.00 | 2.27% | 12.35 | ||||||
| Class C | 1,000.00 | 1,183.20 | 2.27% | 12.36 | ||||||
| Institutional Class | 1,000.00 | 1,189.20 | 1.27% | 6.93 | ||||||
| Hypothetical 5% Return (5% return before expenses) | ||||||||||
| Class A | $1,000.00 | $1,016.85 | 1.62% | $ | 8.15 | |||||
| Class B | 1,000.00 | 1,013.61 | 2.27% | 11.40 | ||||||
| Class C | 1,000.00 | 1,013.61 | 2.27% | 11.40 | ||||||
| Institutional Class | 1,000.00 | 1,018.60 | 1.27% | 6.39 | ||||||
Optimum Large Cap Value Fund
Expense Analysis of an Investment of $1,000
Expense Analysis of an Investment of $1,000
| Expenses | ||||||||||
| Beginning | Ending | Paid During | ||||||||
| Account | Account | Annualized | Period | |||||||
| Value | Value | Expense | 10/1/10 to | |||||||
| 10/1/10 | 3/31/11 | Ratio | 3/31/11* | |||||||
| Actual Fund Return | ||||||||||
| Class A | $1,000.00 | $1,166.70 | 1.58% | $ | 8.54 | |||||
| Class B | 1,000.00 | 1,162.80 | 2.23% | 12.02 | ||||||
| Class C | 1,000.00 | 1,164.00 | 2.23% | 12.03 | ||||||
| Institutional Class | 1,000.00 | 1,169.50 | 1.23% | 6.65 | ||||||
| Hypothetical 5% Return (5% return before expenses) | ||||||||||
| Class A | $1,000.00 | $1,017.05 | 1.58% | $ | 7.95 | |||||
| Class B | 1,000.00 | 1,013.81 | 2.23% | 11.20 | ||||||
| Class C | 1,000.00 | 1,013.81 | 2.23% | 11.20 | ||||||
| Institutional Class | 1,000.00 | 1,018.80 | 1.23% | 6.19 | ||||||
*“Expenses Paid During Period” are equal to the Funds’ annualized expense ratio, multiplied by the average account value over the period, multiplied by 182/365 (to reflect the one-half year period).
Optimum Small-Mid Cap Growth Fund
Expense Analysis of an Investment of $1,000
Expense Analysis of an Investment of $1,000
| Expenses | ||||||||||
| Beginning | Ending | Paid During | ||||||||
| Account | Account | Annualized | Period | |||||||
| Value | Value | Expense | 10/1/10 to | |||||||
| 10/1/10 | 3/31/11 | Ratio | 3/31/11* | |||||||
| Actual Fund Return | ||||||||||
| Class A | $1,000.00 | $1,269.40 | 1.90% | $ | 10.75 | |||||
| Class B | 1,000.00 | 1,265.60 | 2.55% | 14.40 | ||||||
| Class C | 1,000.00 | 1,265.60 | 2.55% | 14.40 | ||||||
| Institutional Class | 1,000.00 | 1,271.80 | 1.55% | 8.78 | ||||||
| Hypothetical 5% Return (5% return before expenses) | ||||||||||
| Class A | $1,000.00 | $1,015.46 | 1.90% | $ | 9.55 | |||||
| Class B | 1,000.00 | 1,012.22 | 2.55% | 12.79 | ||||||
| Class C | 1,000.00 | 1,012.22 | 2.55% | 12.79 | ||||||
| Institutional Class | 1,000.00 | 1,017.20 | 1.55% | 7.80 | ||||||
Optimum Small-Mid Cap Value Fund
Expense Analysis of an Investment of $1,000
Expense Analysis of an Investment of $1,000
| Expenses | ||||||||||
| Beginning | Ending | Paid During | ||||||||
| Account | Account | Annualized | Period | |||||||
| Value | Value | Expense | 10/1/10 to | |||||||
| 10/1/10 | 3/31/11 | Ratio | 3/31/11* | |||||||
| Actual Fund Return | ||||||||||
| Class A | $1,000.00 | $1,257.20 | 1.80% | $ | 10.13 | |||||
| Class B | 1,000.00 | 1,252.90 | 2.45% | 13.76 | ||||||
| Class C | 1,000.00 | 1,253.20 | 2.45% | 13.76 | ||||||
| Institutional Class | 1,000.00 | 1,260.70 | 1.45% | 8.17 | ||||||
| Hypothetical 5% Return (5% return before expenses) | ||||||||||
| Class A | $1,000.00 | $1,015.96 | 1.80% | $ | 9.05 | |||||
| Class B | 1,000.00 | 1,012.72 | 2.45% | 12.29 | ||||||
| Class C | 1,000.00 | 1,012.72 | 2.45% | 12.29 | ||||||
| Institutional Class | 1,000.00 | 1,017.70 | 1.45% | 7.29 | ||||||
35
Security type/sector allocations
Optimum Fixed Income Fund
As of March 31, 2011
As of March 31, 2011
Sector designations may be different than the sector designations presented in other Fund materials. The sector designations may represent the investment manager or sub-adviser’s internal sector classifications, which may result in the sector designations for one fund being different than another fund’s sector designations.
| Percentage | ||
| Security type/sector | of Net Assets | |
| Agency Collateralized Mortgage Obligations | 10.67 | % |
| Agency Mortgage-Backed Securities | 8.04 | % |
| Collateralized debt obligation | 0.15 | % |
| Commercial Mortgage-Backed Securities | 3.26 | % |
| Convertible Bonds | 1.13 | % |
| Corporate Bonds | 43.16 | % |
| Banking | 9.65 | % |
| Basic Industry | 3.61 | % |
| Brokerage | 1.07 | % |
| Capital Goods | 1.44 | % |
| Communications | 4.52 | % |
| Consumer Cyclical | 2.46 | % |
| Consumer Non-Cyclical | 4.85 | % |
| Electric | 3.54 | % |
| Energy | 5.14 | % |
| Finance Companies | 3.37 | % |
| Insurance | 1.08 | % |
| Natural Gas | 0.18 | % |
| Real Estate | 1.08 | % |
| Technology | 0.37 | % |
| Transportation | 0.80 | % |
| Municipal Bonds | 0.72 | % |
| Non-Agency Asset-Backed Securities | 1.24 | % |
| Non-Agency Collateralized Mortgage Obligations | 6.21 | % |
| Regional Bonds | 0.37 | % |
| Securities Sold Short | (0.54 | %) |
| Senior Secured Loans | 3.34 | % |
| Sovereign Bonds | 8.73 | % |
| Supranational Banks | 0.32 | % |
| U.S. Treasury Obligations | 6.64 | % |
| Common Stock | 0.00 | % |
| Convertible Preferred Stock | 0.09 | % |
| Preferred Stock | 0.37 | % |
| Warrant | 0.00 | % |
| Short-Term Investments | 10.18 | % |
| Securities Lending Collateral | 5.39 | % |
| Total Value of Securities | 109.47 | % |
| Obligation to Return Securities Lending Collateral | (5.52 | %) |
| Liabilities Net of Receivables and Other Assets | (3.95 | %) |
| Total Net Assets | 100.00 | % |
36
Security type/country/sector allocations
Optimum International Fund
As of March 31, 2011
As of March 31, 2011
Sector designations may be different than the sector designations presented in other Fund materials. The sector designations may represent the investment manager or sub-adviser’s internal sector classifications, which may result in the sector designations for one fund being different than another fund’s sector designations.
| Percentage | ||
| Security type/country | of Net Assets | |
| Common Stock by Country | 94.89 | % |
| Australia | 5.25 | % |
| Austria | 0.49 | % |
| Belgium | 0.42 | % |
| Brazil | 1.03 | % |
| Canada | 3.18 | % |
| China/Hong Kong | 3.65 | % |
| Colombia | 0.34 | % |
| Denmark | 0.88 | % |
| France | 10.11 | % |
| Germany | 6.30 | % |
| Gibraltar | 0.06 | % |
| India | 1.02 | % |
| Ireland | 0.98 | % |
| Italy | 2.70 | % |
| Japan | 16.40 | % |
| Luxembourg | 0.22 | % |
| Malaysia | 0.60 | % |
| Mexico | 0.47 | % |
| Netherlands | 4.51 | % |
| New Zealand | 0.16 | % |
| Norway | 0.45 | % |
| Republic of Korea | 2.44 | % |
| Russia | 0.59 | % |
| Singapore | 2.34 | % |
| South Africa | 0.45 | % |
| Spain | 3.68 | % |
| Switzerland | 5.04 | % |
| Taiwan | 2.73 | % |
| Thailand | 0.70 | % |
| United Kingdom | 17.45 | % |
| United States | 0.25 | % |
| Preferred Stock | 1.15 | % |
| Warrant | 0.00 | % |
| Short-Term Investments | 2.76 | % |
| Securities Lending Collateral | 9.82 | % |
| Total Value of Securities | 108.62 | % |
| Obligation to Return Securities Lending Collateral | (10.05 | %) |
| Receivables and Other Assets Net of Liabilities | 1.43 | % |
| Total Net Assets | 100.00 | % |
| Percentage | ||
| Common Stock, Preferred Stock and Warrant by Sector | of Net Assets | |
| Automobiles & Components | 2.99 | % |
| Banking & Finance | 12.43 | % |
| Capital Goods | 6.49 | % |
| Consumer Durables & Apparel | 1.71 | % |
| Consumer Services | 2.40 | % |
| Energy | 11.37 | % |
| Food & Staples Retailing | 8.30 | % |
| Food, Beverage & Tobacco | 3.64 | % |
| Insurance | 6.04 | % |
| Materials | 8.02 | % |
| Media | 1.76 | % |
| Pharmaceuticals & Biotechnology | 8.42 | % |
| Real Estate | 1.39 | % |
| Semiconductors | 1.66 | % |
| Technology & Equipment | 3.08 | % |
| Telecommunication Services | 11.05 | % |
| Transportation & Shipping | 1.81 | % |
| Utilities | 3.48 | % |
| Total | 96.04 | % |
(continues) 37
Security type/sector allocations and top 10 equity holdings
Sector designations may be different than the sector designations presented in other Fund materials. The sector designations may represent the investment manager or sub-adviser’s internal sector classifications, which may result in the sector designations for one fund being different than another fund’s sector designations.
Optimum Large Cap Growth Fund
As of March 31, 2011
As of March 31, 2011
| Percentage | ||
| Security type/sector | of Net Assets | |
| Common Stock² | 97.95 | % |
| Consumer Discretionary | 21.12 | % |
| Consumer Staples | 1.78 | % |
| Energy | 10.73 | % |
| Financial Services | 9.91 | % |
| Healthcare | 6.17 | % |
| Materials & Processing | 9.59 | % |
| Producer Durables | 13.60 | % |
| Technology | 25.05 | % |
| Exchange-Traded Funds | 0.32 | % |
| Preferred Stock | 0.14 | % |
| Short-Term Investments | 1.33 | % |
| Securities Lending Collateral | 9.21 | % |
| Total Value of Securities | 108.95 | % |
| Obligation to Return Securities Lending Collateral | (9.35 | %) |
| Receivables and Other Assets Net of Liabilities | 0.40 | % |
| Total Net Assets | 100.00 | % |
²Narrow industries are utilized for compliance purposes for diversification whereas broad sectors are used for financial reporting.
Holdings are for informational purposes only and are subject to change at any time. They are not a recommendation to buy, sell, or hold any security.
| Percentage | ||
| Top 10 Equity Holdings | of Net Assets | |
| Apple | 6.12 | % |
| Oracle | 2.60 | % |
| Amazon.com | 2.48 | % |
| Google Class A | 2.09 | % |
| Baidu ADR | 1.89 | % |
| Praxair | 1.65 | % |
| Danaher | 1.40 | % |
| QUALCOMM | 1.36 | % |
| Dow Chemical | 1.32 | % |
| priceline.com | 1.28 | % |
Optimum Large Cap Value Fund
As of March 31, 2011
As of March 31, 2011
| Percentage | ||
| Security type/sector | of Net Assets | |
| Common Stock | 98.03 | % |
| Consumer Discretionary | 8.79 | % |
| Consumer Staples | 12.89 | % |
| Energy | 12.60 | % |
| Financials | 21.09 | % |
| Healthcare | 14.12 | % |
| Industrials | 10.32 | % |
| Information Technology | 8.99 | % |
| Materials | 3.65 | % |
| Telecommunications | 2.86 | % |
| Utilities | 2.72 | % |
| Convertible Preferred Stock | 0.16 | % |
| Short-Term Investments | 1.73 | % |
| Securities Lending Collateral | 6.27 | % |
| Total Value of Securities | 106.19 | % |
| Obligation to Return Securities Lending Collateral | (6.41 | %) |
| Receivables and Other Assets Net of Liabilities | 0.22 | % |
| Total Net Assets | 100.00 | % |
Holdings are for informational purposes only and are subject to change at any time. They are not a recommendation to buy, sell, or hold any security.
| Percentage | ||
| Top 10 Equity Holdings | of Net Assets | |
| Exxon Mobil | 2.80 | % |
| Philip Morris International | 2.77 | % |
| Goldman Sachs Group | 2.40 | % |
| Chevron | 2.37 | % |
| Johnson & Johnson | 2.29 | % |
| International Business Machines | 2.09 | % |
| Lockheed Martin | 1.88 | % |
| PepsiCo | 1.68 | % |
| TJX | 1.63 | % |
| 3M | 1.55 | % |
38
Sector designations may be different than the sector designations presented in other Fund materials. The sector designations may represent the investment manager or sub-adviser’s internal sector classifications, which may result in the sector designations for one fund being different than another fund’s sector designations.
Optimum Small-Mid Cap Growth Fund
As of March 31, 2011
As of March 31, 2011
| Percentage | ||
| Security type/sector | of Net Assets | |
| Common Stock² | 96.97 | % |
| Consumer Discretionary | 20.98 | % |
| Consumer Staples | 2.30 | % |
| Energy | 6.08 | % |
| Financial Services | 7.43 | % |
| Healthcare | 12.96 | % |
| Materials & Processing | 1.96 | % |
| Producer Durables | 17.34 | % |
| Technology | 26.94 | % |
| Utilities | 0.98 | % |
| Exchange-Traded Fund | 0.39 | % |
| Warrant | 0.00 | % |
| Short-Term Investments | 3.56 | % |
| Securities Lending Collateral | 24.59 | % |
| Total Value of Securities | 125.51 | % |
| Obligation to Return Securities Lending Collateral | (24.73 | %) |
| Liabilities Net of Receivables and Other Assets | (0.78 | %) |
| Total Net Assets | 100.00 | % |
²Narrow industries are utilized for compliance purposes for diversification whereas broad sectors are used for financial reporting.
Holdings are for informational purposes only and are subject to change at any time. They are not a recommendation to buy, sell, or hold any security.
| Percentage | ||
| Top 10 Equity Holdings | of Net Assets | |
| Polycom | 1.55 | % |
| Green Mountain Coffee Roasters | 1.40 | % |
| Mettler-Toledo International | 1.30 | % |
| Nordson | 1.30 | % |
| Tempur-Pedic International | 1.17 | % |
| Jabil Circuit | 1.17 | % |
| IPG Photonics | 0.99 | % |
| Gen-Probe | 0.95 | % |
| Rosetta Resources | 0.92 | % |
| Atwood Oceanics | 0.90 | % |
Optimum Small-Mid Cap Value Fund
As of March 31, 2011
As of March 31, 2011
| Percentage | ||
| Security type/sector | of Net Assets | |
| Common Stock | 90.00 | % |
| Basic Industry | 19.16 | % |
| Business Services | 2.85 | % |
| Capital Spending | 11.65 | % |
| Consumer Cyclical | 7.37 | % |
| Consumer Services | 7.04 | % |
| Consumer Staples | 2.87 | % |
| Energy | 5.84 | % |
| Financial Services | 10.89 | % |
| Healthcare | 4.10 | % |
| Real Estate | 1.03 | % |
| Technology | 14.86 | % |
| Transportation | 0.71 | % |
| Utilities | 1.63 | % |
| Short-Term Investments | 10.27 | % |
| Securities Lending Collateral | 18.42 | % |
| Total Value of Securities | 118.69 | % |
| Obligation to Return Securities Lending Collateral | (18.51 | %) |
| Liabilities Net of Receivables and Other Assets | (0.18 | %) |
| Total Net Assets | 100.00 | % |
Holdings are for informational purposes only and are subject to change at any time. They are not a recommendation to buy, sell, or hold any security.
| Percentage | ||
| Top 10 Equity Holdings | of Net Assets | |
| Plexus | 1.37 | % |
| Albany International | 1.21 | % |
| Collective Brands | 1.20 | % |
| VASCO Data Security International | 1.19 | % |
| Harsco | 1.17 | % |
| Kennametal | 1.15 | % |
| Flextronics International | 1.14 | % |
| Eastman Chemical | 1.12 | % |
| Stanley Black & Decker | 1.07 | % |
| Ferro | 1.03 | % |
39
Statements of net assets
Optimum Fixed Income Fund
March 31, 2011
March 31, 2011
| Principal | Value | |||||||
| Amount° | (U.S. $) | |||||||
| Agency Collateralized Mortgage Obligations – 10.67% | ||||||||
| Fannie Mae Grantor Trust | ||||||||
| • | Series 1999-T2 A1 | |||||||
| 7.50% 1/19/39 | USD | 23,591 | $ | 26,377 | ||||
| Series 2001-T8 A2 | ||||||||
| 9.50% 7/25/41 | 12,526 | 14,636 | ||||||
| Series 2002-T4 A3 | ||||||||
| 7.50% 12/25/41 | 86,853 | 99,311 | ||||||
| Series 2004-T1 1A2 | ||||||||
| 6.50% 1/25/44 | 36,526 | 38,911 | ||||||
| Fannie Mae REMICs | ||||||||
| Series 1996-46 ZA | ||||||||
| 7.50% 11/25/26 | 20,560 | 22,859 | ||||||
| Series 1999-19 PH | ||||||||
| 6.00% 5/25/29 | 523,835 | 568,775 | ||||||
| Series 2001-14 Z | ||||||||
| 6.00% 5/25/31 | 38,540 | 42,283 | ||||||
| Series 2002-90 A1 | ||||||||
| 6.50% 6/25/42 | 16,739 | 19,389 | ||||||
| Series 2002-90 A2 | ||||||||
| 6.50% 11/25/42 | 61,863 | 71,655 | ||||||
| Series 2003-26 AT | ||||||||
| 5.00% 11/25/32 | 1,165,000 | 1,238,999 | ||||||
| Series 2003-122 AJ | ||||||||
| 4.50% 2/25/28 | 60,225 | 62,451 | ||||||
| Series 2005-22 HE | ||||||||
| 5.00% 10/25/33 | 740,000 | 791,219 | ||||||
| Series 2005-29 QD | ||||||||
| 5.00% 8/25/33 | 816,000 | 872,896 | ||||||
| Series 2005-54 AK | ||||||||
| 4.50% 9/25/32 | 358,773 | 375,257 | ||||||
| Series 2005-94 YD | ||||||||
| 4.50% 8/25/33 | 1,480,000 | 1,550,491 | ||||||
| Series 2005-110 | ||||||||
| MB 5.50% 9/25/35 | 476,336 | 517,841 | ||||||
| @ | Series 2007-30 OE | |||||||
| ^ | 0.00% 4/25/37 | 9,452,991 | 7,782,509 | |||||
| Series 2008-24 ZA | ||||||||
| 5.00% 4/25/38 | 17,422,083 | 17,714,079 | ||||||
| •@ | Series 2009-2 AS | |||||||
| 5.405% 2/25/39 | 18,235,485 | 2,119,457 | ||||||
| •@ | Series 2009-68 SA | |||||||
| 6.501% 9/25/39 | 2,265,032 | 330,349 | ||||||
| Series 2009-94 AC | ||||||||
| 5.00% 11/25/39 | 400,000 | 416,655 | ||||||
| Series 2010-41 PN | ||||||||
| 4.50% 4/25/40 | 475,000 | 472,963 | ||||||
| Series 2010-96 DC | ||||||||
| 4.00% 9/25/25 | 900,000 | 894,866 | ||||||
| • | Series 2010-123 FE | |||||||
| 0.73% 11/25/40 | 11,719,321 | 11,711,789 | ||||||
| Fannie Mae Whole Loan | ||||||||
| Series 2004-W4 A5 | ||||||||
| 5.50% 6/25/34 | 3,000,000 | 3,298,125 | ||||||
| Series 2004-W9 2A1 | ||||||||
| 6.50% 2/25/44 | 45,706 | 49,969 | ||||||
| Series 2004-W11 1A2 | ||||||||
| 6.50% 5/25/44 | 130,932 | 148,382 | ||||||
| Series 2004-W15 1A1 | ||||||||
| 6.00% 8/25/44 | 181,528 | 200,135 | ||||||
| Freddie Mac REMICs | ||||||||
| Series 1730 Z | ||||||||
| 7.00% 5/15/24 | 130,159 | 144,344 | ||||||
| Series 2165 PE | ||||||||
| 6.00% 6/15/29 | 544,748 | 598,759 | ||||||
| Series 2326 ZQ | ||||||||
| 6.50% 6/15/31 | 231,555 | 256,711 | ||||||
| Series 2497 BM | ||||||||
| 5.00% 2/15/22 | 6,844 | 6,850 | ||||||
| Series 2557 WE | ||||||||
| 5.00% 1/15/18 | 732,415 | 789,940 | ||||||
| Series 2662 MA | ||||||||
| 4.50% 10/15/31 | 60,754 | 63,089 | ||||||
| Series 2755 LE | ||||||||
| 4.00% 9/15/30 | 557,000 | 580,117 | ||||||
| Series 2762 LG | ||||||||
| 5.00% 9/15/32 | 2,000,000 | 2,136,555 | ||||||
| Series 2802 NE | ||||||||
| 5.00% 2/15/33 | 700,000 | 748,491 | ||||||
| Series 2827 TE | ||||||||
| 5.00% 4/15/33 | 1,335,000 | 1,430,957 | ||||||
| Series 2840 OE | ||||||||
| 5.00% 2/15/33 | 1,800,000 | 1,927,737 | ||||||
| Series 2864 PE | ||||||||
| 5.00% 6/15/33 | 1,095,000 | 1,170,711 | ||||||
| Series 2869 BG | ||||||||
| 5.00% 7/15/33 | 224,000 | 238,904 | ||||||
| Series 2881 TE | ||||||||
| 5.00% 7/15/33 | 1,080,000 | 1,164,610 | ||||||
| Series 2889 OG | ||||||||
| 5.00% 5/15/33 | 117,000 | 124,927 | ||||||
| Series 2890 PC | ||||||||
| 5.00% 7/15/30 | 265,000 | 276,657 | ||||||
| Series 2890 PD | ||||||||
| 5.00% 3/15/33 | 1,265,000 | 1,352,806 | ||||||
| Series 2893 PD | ||||||||
| 5.00% 2/15/33 | 65,000 | 69,548 | ||||||
| Series 2915 KD | ||||||||
| 5.00% 9/15/33 | 447,000 | 478,260 | ||||||
| Series 2938 ND | ||||||||
| 5.00% 10/15/33 | 1,050,000 | 1,121,551 | ||||||
| Series 2939 PD | ||||||||
| 5.00% 7/15/33 | 665,000 | 717,005 | ||||||
| Series 2941 XD | ||||||||
| 5.00% 5/15/33 | 2,690,000 | 2,872,140 | ||||||
| Series 2987 KG | ||||||||
| 5.00% 12/15/34 | 1,430,000 | 1,531,057 | ||||||
| Series 3022 MB | ||||||||
| 5.00% 12/15/28 | 166,743 | 170,787 | ||||||
| Series 3131 MC | ||||||||
| 5.50% 4/15/33 | 445,000 | 483,125 | ||||||
40
| Principal | Value | |||||||
| Amount° | (U.S. $) | |||||||
| Agency Collateralized Mortgage Obligations (continued) | ||||||||
| Freddie Mac REMICs (continued) | ||||||||
| Series 3143 BC | ||||||||
| 5.50% 2/15/36 | USD | 8,000,000 | $ | 8,612,500 | ||||
| Series 3145 LN | ||||||||
| 4.50% 10/15/34 | 1,004,737 | 1,060,067 | ||||||
| •@ | Series 3289 SA | |||||||
| 6.495% 3/15/37 | 5,983,793 | 599,356 | ||||||
| Series 3337 PB | ||||||||
| 5.50% 7/15/30 | 505,000 | 516,218 | ||||||
| Series 3476 Z | ||||||||
| 5.50% 7/15/38 | 11,575,800 | 12,154,199 | ||||||
| Series 3626 MA | ||||||||
| 5.00% 2/15/30 | 3,249,665 | 3,433,045 | ||||||
| Series 3656 PM | ||||||||
| 5.00% 4/15/40 | 770,000 | 801,779 | ||||||
| w | Freddie Mac Structured Pass | |||||||
| Through Securities | ||||||||
| Series T-54 2A | ||||||||
| 6.50% 2/25/43 | 29,415 | 32,035 | ||||||
| Series T-58 2A | ||||||||
| 6.50% 9/25/43 | 16,113 | 18,675 | ||||||
| GNMA | ||||||||
| •@ | Series 2007-64 AI | |||||||
| 6.297% 10/20/37 | 20,772,499 | 2,482,779 | ||||||
| •@ | Series 2008-65 SB | |||||||
| 5.747% 8/20/38 | 7,400,384 | 813,726 | ||||||
| •@ | Series 2009-2 SE | |||||||
| 5.567% 1/20/39 | 19,293,982 | 2,312,918 | ||||||
| Series 2010-113 KE | ||||||||
| 4.50% 9/20/40 | 1,170,000 | 1,165,320 | ||||||
| NCUA Guaranteed Notes | ||||||||
| Series 2010-C1 A2 | ||||||||
| 2.90% 10/29/20 | 390,000 | 379,688 | ||||||
| Total Agency Collateralized | ||||||||
| Mortgage Obligations | ||||||||
| (cost $97,879,496) | 106,290,571 | |||||||
| Agency Mortgage-Backed Securities – 8.04% | ||||||||
| Fannie Mae | ||||||||
| 5.50% 1/1/13 | 49,007 | 50,543 | ||||||
| 5.50% 3/1/37 | 416,171 | 441,899 | ||||||
| 5.50% 7/1/37 | 1,064,232 | 1,130,023 | ||||||
| 6.50% 8/1/17 | 52,143 | 57,081 | ||||||
| • | Fannie Mae ARM | |||||||
| 2.402% 10/1/33 | 41,879 | 43,780 | ||||||
| 4.994% 8/1/35 | 103,708 | 109,972 | ||||||
| 5.142% 11/1/35 | 249,853 | 265,771 | ||||||
| 5.83% 7/1/37 | 374,032 | 398,036 | ||||||
| 5.917% 8/1/37 | 451,634 | 486,148 | ||||||
| Fannie Mae Relocation 30 yr | ||||||||
| 5.00% 11/1/33 | 15,136 | 15,702 | ||||||
| 5.00% 1/1/34 | 57,962 | 59,850 | ||||||
| 5.00% 2/1/34 | 26,423 | 27,411 | ||||||
| 5.00% 8/1/34 | 36,288 | 37,646 | ||||||
| 5.00% 11/1/34 | 98,134 | 101,805 | ||||||
| 5.00% 4/1/35 | 128,035 | 132,825 | ||||||
| 5.00% 10/1/35 | 108,615 | 112,678 | ||||||
| 5.00% 1/1/36 | 251,858 | 261,280 | ||||||
| Fannie Mae S.F. 15 yr | ||||||||
| 4.00% 7/1/25 | 1,897,717 | 1,953,759 | ||||||
| 4.00% 8/1/25 | 2,600,285 | 2,677,075 | ||||||
| 4.00% 11/1/25 | 2,709,976 | 2,792,969 | ||||||
| 4.50% 8/1/18 | 461,546 | 488,720 | ||||||
| 4.50% 7/1/20 | 1,071,511 | 1,132,590 | ||||||
| 5.00% 5/1/21 | 123,817 | 132,493 | ||||||
| Fannie Mae S.F. 15 yr TBA | ||||||||
| 3.50% 4/1/26 | 4,500,000 | 4,511,249 | ||||||
| 4.50% 4/1/26 | 1,135,000 | 1,189,445 | ||||||
| 5.50% 4/1/26 | 3,865,000 | 4,180,237 | ||||||
| Fannie Mae S.F. 20 yr | ||||||||
| 5.50% 7/1/24 | 462,755 | 503,827 | ||||||
| 5.50% 10/1/24 | 139,572 | 151,820 | ||||||
| 5.50% 12/1/24 | 468,221 | 509,310 | ||||||
| 5.50% 8/1/28 | 2,203,605 | 2,363,934 | ||||||
| Fannie Mae S.F. 30 yr | ||||||||
| 4.00% 7/1/40 | 1,482,629 | 1,460,187 | ||||||
| 4.00% 10/1/40 | 184,163 | 181,412 | ||||||
| 4.50% 3/1/39 | 312,607 | 318,868 | ||||||
| 5.00% 12/1/36 | 315,300 | 331,824 | ||||||
| 5.00% 12/1/37 | 217,640 | 228,094 | ||||||
| 5.00% 2/1/38 | 169,085 | 177,154 | ||||||
| 5.00% 7/1/40 | 1,426,714 | 1,495,243 | ||||||
| 5.50% 12/1/32 | 261,971 | 282,259 | ||||||
| 5.50% 7/1/33 | 734,045 | 790,435 | ||||||
| 5.50% 12/1/33 | 120,058 | 129,281 | ||||||
| 5.50% 4/1/34 | 1,736,229 | 1,870,928 | ||||||
| 5.50% 5/1/34 | 524,273 | 564,548 | ||||||
| 5.50% 6/1/34 | 650,386 | 699,536 | ||||||
| 5.50% 7/1/34 | 1,061,041 | 1,141,224 | ||||||
| 5.50% 2/1/35 | 3,169,856 | 3,417,836 | ||||||
| 5.50% 9/1/36 | 1,406,332 | 1,512,608 | ||||||
| 6.00% 9/1/36 | 301,566 | 330,156 | ||||||
| 6.00% 8/1/38 | 1,200,086 | 1,307,134 | ||||||
| 6.50% 11/1/33 | 25,605 | 28,966 | ||||||
| 6.50% 2/1/36 | 475,369 | 537,307 | ||||||
| 6.50% 3/1/36 | 800,363 | 904,645 | ||||||
| 6.50% 6/1/36 | 944,508 | 1,067,572 | ||||||
| 6.50% 2/1/38 | 1,133,296 | 1,280,958 | ||||||
| 7.00% 2/1/38 | 249,276 | 284,968 | ||||||
| 7.00% 3/1/38 | 556,771 | 636,491 | ||||||
| 7.50% 3/1/32 | 1,275 | 1,482 | ||||||
| 7.50% 4/1/32 | 5,072 | 5,895 | ||||||
| 7.50% 6/1/32 | 2,088 | 2,427 | ||||||
| Fannie Mae S.F. 30 yr TBA | ||||||||
| 4.00% 4/1/41 | 3,205,000 | 3,151,919 | ||||||
| 6.00% 4/1/41 | 22,630,000 | 21,347,624 | ||||||
| • | Freddie Mac ARM | |||||||
| 2.467% 12/1/33 | 96,685 | 101,365 | ||||||
| 2.821% 4/1/34 | 7,227 | 7,598 | ||||||
(continues) 41
Statements of net assets
Optimum Fixed Income Fund
| Principal | Value | |||||||
| Amount° | (U.S. $) | |||||||
| Agency Mortgage-Backed Securities (continued) | ||||||||
| • | Freddie Mac ARM (continued) | |||||||
| 5.514% 2/1/38 | USD | 985,381 | $ | 1,056,227 | ||||
| 5.676% 7/1/36 | 157,395 | 165,092 | ||||||
| 5.712% 5/1/37 | 642,604 | 681,549 | ||||||
| Freddie Mac Relocation 30 yr | ||||||||
| 5.00% 9/1/33 | 2,238 | 2,322 | ||||||
| Freddie Mac S.F. 15 yr | ||||||||
| 4.50% 5/1/20 | 546,503 | 577,399 | ||||||
| 5.00% 6/1/18 | 196,440 | 210,239 | ||||||
| Freddie Mac S.F. 20 yr | ||||||||
| 5.50% 10/1/23 | 355,745 | 384,407 | ||||||
| 5.50% 8/1/24 | 82,709 | 89,869 | ||||||
| Freddie Mac S.F. 30 yr | ||||||||
| 5.00% 7/1/38 | 388,101 | 405,697 | ||||||
| 6.50% 11/1/33 | 55,584 | 62,817 | ||||||
| 6.50% 1/1/35 | 298,819 | 340,695 | ||||||
| 6.50% 8/1/38 | 181,214 | 203,003 | ||||||
| 7.00% 1/1/38 | 258,293 | 295,011 | ||||||
| Freddie Mac S.F. 30 yr | ||||||||
| TBA 6.50% 4/1/41 | 2,755,000 | 3,083,016 | ||||||
| GNMA I S.F. 30 yr | ||||||||
| 7.00% 12/15/34 | 495,570 | 562,457 | ||||||
| GNMA II | ||||||||
| 6.00% 4/20/34 | 28,138 | 30,942 | ||||||
| Total Agency Mortgage- | ||||||||
| Backed Securities | ||||||||
| (cost $77,875,017) | 80,068,564 | |||||||
| Collateralized Debt Obligation – 0.15% | ||||||||
| •@# | Landmark CDO Series | |||||||
| 2005-1A A1L 144A | ||||||||
| 0.611% 6/1/17 | 1,577,211 | 1,524,799 | ||||||
| Total Collateralized | ||||||||
| Debt Obligation | ||||||||
| (cost $1,500,548) | 1,524,799 | |||||||
| Commercial Mortgage-Backed Securities – 3.26% | ||||||||
| # | American Tower Trust Series | |||||||
| 2007-1A AFX 144A | ||||||||
| 5.42% 4/15/37 | 420,000 | 450,415 | ||||||
| Bank of America Commercial | ||||||||
| Mortgage Securities | ||||||||
| • | Series 2004-3 A5 | |||||||
| 5.45% 6/10/39 | 415,000 | 446,788 | ||||||
| • | Series 2005-1 A5 | |||||||
| 5.167% 11/10/42 | 1,620,000 | 1,737,225 | ||||||
| • | Series 2005-6 A4 | |||||||
| 5.196% 9/10/47 | 1,615,000 | 1,741,833 | ||||||
| Series 2006-4 A4 | ||||||||
| 5.634% 7/10/46 | 1,070,000 | 1,152,521 | ||||||
| •# | Bank of America Large Loan | |||||||
| Series 2009-UB2 A4AA | ||||||||
| 144A 5.679% 2/24/51 | 2,200,000 | 2,338,211 | ||||||
| Bear Stearns Commercial | ||||||||
| Mortgage Securities | ||||||||
| • | Series 2005-PW10 A4 | |||||||
| 5.405% 12/11/40 | 875,000 | 935,999 | ||||||
| • | Series 2005-T20 A4A | |||||||
| 5.149% 10/12/42 | 1,835,000 | 1,976,454 | ||||||
| • | Series 2006-PW12 A4 | |||||||
| 5.723% 9/11/38 | 895,000 | 981,732 | ||||||
| Series 2006-PW14 A4 | ||||||||
| 5.201% 12/11/38 | 1,000,000 | 1,054,554 | ||||||
| Series 2007-PW15 A4 | ||||||||
| 5.331% 2/11/44 | 630,000 | 659,980 | ||||||
| • | Citigroup/Deutsche Bank | |||||||
| Commercial Mortgage | ||||||||
| Trust Series 2005-CD1 A4 | ||||||||
| 5.222% 7/15/44 | 400,000 | 429,976 | ||||||
| w | Commercial Mortgage Pass | |||||||
| Through Certificates | ||||||||
| • | Series 2005-C6 A5A | |||||||
| 5.116% 6/10/44 | 550,000 | 586,859 | ||||||
| Series 2006-C7 A2 | ||||||||
| 5.69% 6/10/46 | 109,893 | 110,042 | ||||||
| # | Series 2010-C1 A1 144A | |||||||
| 3.156% 7/10/46 | 516,190 | 514,661 | ||||||
| Credit Suisse Mortgage | ||||||||
| Capital Certificates | ||||||||
| • | Series 2006-C1 AAB | |||||||
| 5.441% 2/15/39 | 136,440 | 143,959 | ||||||
| # | Series 2010-UD1 A 144A | |||||||
| 5.95% 6/18/17 | 2,200,000 | 2,388,691 | ||||||
| •# | DBUBS Mortgage Trust Series | |||||||
| 2011-LC1A C 144A | ||||||||
| 5.557% 11/10/46 | 515,000 | 515,636 | ||||||
| #FDIC Structured Sale | ||||||||
| Guaranteed Notes | ||||||||
| Series 2010-C1 A 144A | ||||||||
| 2.98% 12/6/20 | 543,451 | 542,140 | ||||||
| Goldman Sachs Mortgage | ||||||||
| Securities II | ||||||||
| •* | Series 2004-GG2 A6 | |||||||
| 5.396% 8/10/38 | 570,000 | 610,562 | ||||||
| Series 2005-GG4 A4 | ||||||||
| 4.761% 7/10/39 | 822,500 | 857,946 | ||||||
| Series 2005-GG4 A4A | ||||||||
| 4.751% 7/10/39 | 1,215,000 | 1,278,395 | ||||||
| • | Series 2006-GG6 A4 | |||||||
| 5.553% 4/10/38 | 900,000 | 965,196 | ||||||
| •# | Series 2007-GG10 J 144A | |||||||
| 5.808% 8/10/45 | 1,956,000 | 27,384 | ||||||
| # | Series 2010-C1 A2 144A | |||||||
| 4.592% 9/1/40 | 915,000 | 919,555 | ||||||
| •# | Series 2010-C1 C 144A | |||||||
| 5.635% 8/10/43 | 695,000 | 698,552 | ||||||
42
| Principal | Value | |||||||
| Amount° | (U.S. $) | |||||||
| Commercial Mortgage-Backed Securities (continued) | ||||||||
| • | Greenwich Capital | |||||||
| Commercial Funding | ||||||||
| Series 2005-GG5 A5 | ||||||||
| 5.224% 4/10/37 | USD | 1,155,000 | $ | 1,229,823 | ||||
| Series 2006-GG7 A4 | ||||||||
| 5.89% 7/10/38 | 1,140,000 | 1,247,156 | ||||||
| JPMorgan Chase Commercial | ||||||||
| Mortgage Securities | ||||||||
| Series 2002-C2 A2 | ||||||||
| 5.05% 12/12/34 | 465,000 | 484,834 | ||||||
| • | Series 2005-LDP5 A4 | |||||||
| 5.202% 12/15/44 | 750,000 | 803,720 | ||||||
| Series 2007-LDPX A3 | ||||||||
| 5.42% 1/15/49 | 1,140,000 | 1,202,288 | ||||||
| Lehman Brothers-UBS | ||||||||
| Commercial Mortgage | ||||||||
| Trust Series 2004-C1 A4 | ||||||||
| 4.568% 1/15/31 | 720,000 | 755,663 | ||||||
| • | Morgan Stanley Capital I | |||||||
| Series 2007-T27 A4 | ||||||||
| 5.646% 6/11/42 | 1,310,000 | 1,438,659 | ||||||
| •# | Morgan Stanley Dean | |||||||
| Witter Capital I Series | ||||||||
| 2001-TOP1 E 144A | ||||||||
| 7.327% 2/15/33 | 100,000 | 98,334 | ||||||
| # | OBP Depositor Trust Series | |||||||
| 2010-OBP A 144A | ||||||||
| 4.646% 7/15/45 | 585,000 | 594,013 | ||||||
| # | Timberstar Trust Series | |||||||
| 2006-1A A 144A | ||||||||
| 5.668% 10/15/36 | 515,000 | 550,518 | ||||||
| Total Commercial Mortgage- | ||||||||
| Backed Securities | ||||||||
| (cost $32,103,677) | 32,470,274 | |||||||
| Convertible Bonds – 1.13% | ||||||||
| AAR 1.75% exercise price | ||||||||
| $29.43, expiration | ||||||||
| date 1/1/26 | 181,000 | 204,304 | ||||||
| Advanced Micro Devices | ||||||||
| 6.00% exercise price | ||||||||
| $28.08, expiration | ||||||||
| date 4/30/15 | 226,000 | 234,193 | ||||||
| Alaska Communications | ||||||||
| Systems Group | ||||||||
| 5.75% exercise price | ||||||||
| $12.90, expiration | ||||||||
| date 3/1/13 | 339,000 | 363,154 | ||||||
| Alcatel-Lucent USA | ||||||||
| 2.875% exercise price | ||||||||
| $15.35, expiration | ||||||||
| date 6/15/25 | 415,000 | 403,588 | ||||||
| Alere 3.00% exercise price | ||||||||
| $43.98, expiration | ||||||||
| date 5/15/16 | 176,000 | 199,320 | ||||||
| # | Altra Holdings 144A | |||||||
| 2.75% exercise price | ||||||||
| $27.70, expiration | ||||||||
| date 3/1/31 | 125,000 | 136,250 | ||||||
| *# | Ares Capital 144A | |||||||
| 5.75% exercise price | ||||||||
| $19.13, expiration | ||||||||
| date 2/1/16 | 174,000 | 186,398 | ||||||
| ArvinMeritor 4.00% exercise | ||||||||
| price $26.73, expiration | ||||||||
| date 2/15/27 | 320,000 | 317,200 | ||||||
| Chesapeake Energy | ||||||||
| 2.25% exercise price | ||||||||
| $85.89, expiration | ||||||||
| date 12/15/38 | 264,000 | 243,870 | ||||||
| # | Clearwire Communications | |||||||
| 144A 8.25% exercise | ||||||||
| price $7.08, expiration | ||||||||
| date 12/1/40 | 175,000 | 193,594 | ||||||
| Dendreon 2.875% exercise | ||||||||
| price $51.24, expiration | ||||||||
| date 1/15/16 | 144,000 | 152,280 | ||||||
| # | Digital Realty Trust 144A | |||||||
| 5.50% exercise price | ||||||||
| $42.49, expiration | ||||||||
| date 4/15/29 | 115,000 | 167,469 | ||||||
| Equinix 4.75% exercise price | ||||||||
| $84.32 expiration | ||||||||
| date 6/15/16 | 264,000 | 356,070 | ||||||
| Euronet Worldwide | ||||||||
| 3.50% exercise price | ||||||||
| $40.48, expiration | ||||||||
| date 10/15/25 | 219,000 | 218,726 | ||||||
| # | Gaylord Entertainment 144A | |||||||
| 3.75% exercise price | ||||||||
| $27.25, expiration | ||||||||
| date 10/1/14 | 275,000 | 392,906 | ||||||
| ϕ | General Cable | |||||||
| 4.50% exercise price | ||||||||
| $36.75, expiration | ||||||||
| date 11/15/29 | 152,000 | 212,990 | ||||||
| * | Health Care REIT | |||||||
| 3.00% exercise price | ||||||||
| $51.08, expiration | ||||||||
| date 12/1/29 | 213,000 | 243,086 | ||||||
| ϕ | Hologic 2.00% exercise price | |||||||
| $38.59, expiration | ||||||||
| date 12/15/37 | 591,000 | 573,269 | ||||||
| Intel 2.95% exercise price | ||||||||
| $30.75, expiration | ||||||||
| date 12/15/35 | 300,000 | 310,125 | ||||||
| * | International Game | |||||||
| Technology 3.25% | ||||||||
| exercise price $19.97, | ||||||||
| expiration date 5/1/14 | 267,000 | 307,718 | ||||||
(continues) 43
Statements of net assets
Optimum Fixed Income Fund
| Principal | Value | |||||||
| Amount° | (U.S. $) | |||||||
| Convertible Bonds (continued) | ||||||||
| * | Jefferies Group | |||||||
| 3.875% exercise price | ||||||||
| $38.72, expiration | ||||||||
| date 11/1/29 | USD | 307,000 | $ | 320,431 | ||||
| * | Leap Wireless International | |||||||
| 4.50% exercise price | ||||||||
| $93.21, expiration | ||||||||
| date 7/15/14 | 660,000 | 640,199 | ||||||
| # | Lexington Realty Trust 144A | |||||||
| 6.00% exercise price | ||||||||
| $7.09, expiration | ||||||||
| date 1/15/30 | 320,000 | 446,000 | ||||||
| LifePoint Hospitals | ||||||||
| 3.50% exercise price | ||||||||
| $51.79, expiration date | ||||||||
| 5/15/14 | 353,000 | 377,710 | ||||||
| Linear Technology | ||||||||
| 3.00% exercise price | ||||||||
| $44.72, expiration | ||||||||
| date 5/1/27 | 508,000 | 548,004 | ||||||
| Live Nation Entertainment | ||||||||
| 2.875% exercise price | ||||||||
| $27.14, expiration | ||||||||
| date 7/15/27 | 430,000 | 391,300 | ||||||
| National Retail Properties | ||||||||
| 5.125% exercise price | ||||||||
| $25.42, expiration | ||||||||
| date 6/15/28 | 415,000 | 485,031 | ||||||
| * | NII Holdings 3.125% exercise | |||||||
| price $118.32, expiration | ||||||||
| date 6/15/12 | 245,000 | 247,450 | ||||||
| # | Owens-Brockway Glass | |||||||
| Container 144A | ||||||||
| 3.00% exercise price | ||||||||
| $47.47, expiration | ||||||||
| date 6/1/15 | 229,000 | 233,294 | ||||||
| Peabody Energy | ||||||||
| 4.75% exercise price | ||||||||
| $58.40, expiration | ||||||||
| date 12/15/41 | 134,000 | 178,220 | ||||||
| # | Rayonier TRS Holdings 144A | |||||||
| 4.50% exercise price | ||||||||
| $50.24, expiration | ||||||||
| date 8/15/15 | 191,000 | 258,328 | ||||||
| Rovi 2.625% exercise price | ||||||||
| $47.36, expiration | ||||||||
| date 2/15/40 | 191,000 | 253,791 | ||||||
| SanDisk 1.50% exercise price | ||||||||
| $52.37, expiration | ||||||||
| date 8/15/17 | 245,000 | 278,688 | ||||||
| SBA Communications | ||||||||
| 4.00% exercise price | ||||||||
| $30.38, expiration | ||||||||
| date 10/1/14 | 132,000 | 193,380 | ||||||
| # | Sino-Forest 144A | |||||||
| 5.00% exercise price | ||||||||
| $20.29, expiration | ||||||||
| date 8/1/13 | 305,000 | 430,431 | ||||||
| * | Transocean 1.50% exercise | |||||||
| price $168.61, expiration | ||||||||
| date 12/15/37 | 190,000 | 187,863 | ||||||
| VeriSign 3.25% exercise | ||||||||
| price $34.37, expiration | ||||||||
| date 8/15/37 | 269,000 | 325,490 | ||||||
| Total Convertible Bonds | ||||||||
| (cost $9,887,268) | 11,212,120 | |||||||
| Corporate Bonds – 43.16% | ||||||||
| Banking – 9.65% | ||||||||
| AgriBank 9.125% 7/15/19 | 1,095,000 | 1,309,270 | ||||||
| Banco do Brasil | ||||||||
| 2.265% 2/14/14 | 3,400,000 | 3,398,143 | ||||||
| # | Banco do Brasil 144A | |||||||
| 6.00% 1/22/20 | 3,000,000 | 3,165,000 | ||||||
| # | Banco Mercantil del Norte 144A | |||||||
| 4.375% 7/19/15 | 400,000 | 406,000 | ||||||
| •@ | 6.862% 10/13/21 | 520,000 | 533,650 | |||||
| *# | Banco Santander Chile 144A | |||||||
| 3.75% 9/22/15 | 2,200,000 | 2,198,093 | ||||||
| # | Banco Votorantim 144A | |||||||
| • | 3.309% 3/28/14 | 2,000,000 | 2,008,060 | |||||
| @* | 5.25% 2/11/16 | 2,300,000 | 2,374,750 | |||||
| Bank of America | ||||||||
| 5.30% 3/15/17 | 840,000 | 863,493 | ||||||
| 6.10% 6/15/17 | 785,000 | 835,875 | ||||||
| 6.50% 8/1/16 | 690,000 | 764,437 | ||||||
| # | Bank of Montreal 144A | |||||||
| 2.85% 6/9/15 | 605,000 | 610,795 | ||||||
| BB&T 5.25% 11/1/19 | 1,146,000 | 1,174,394 | ||||||
| BB&T Capital Trust II | ||||||||
| 6.75% 6/7/36 | 1,310,000 | 1,328,066 | ||||||
| # | Canadian Imperial Bank | |||||||
| of Commerce 144A | ||||||||
| 2.60% 7/2/15 | 605,000 | 608,963 | ||||||
| Capital One Capital V | ||||||||
| 10.25% 8/15/39 | 990,000 | 1,080,338 | ||||||
| Citigroup | ||||||||
| •* | 1.753% 1/13/14 | 500,000 | 508,310 | |||||
| • | 2.312% 8/13/13 | 1,800,000 | 1,854,167 | |||||
| 4.587% 12/15/15 | 200,000 | 207,027 | ||||||
| 6.125% 5/15/18 | 2,500,000 | 2,730,735 | ||||||
| 8.50% 5/22/19 | 1,900,000 | 2,347,954 | ||||||
| * | City National 5.25% 9/15/20 | 755,000 | 748,223 | |||||
| @# | CoBank 144A | |||||||
| 7.875% 4/16/18 | 570,000 | 644,408 | ||||||
| Depfa ACS Bank | ||||||||
| 3.25% 2/15/12 | EUR | 3,100,000 | 4,370,825 | |||||
| Export-Import Bank of Korea | ||||||||
| * | 5.125% 3/16/15 | USD | 200,000 | 213,929 | ||||
| 5.125% 6/29/20 | 1,500,000 | 1,518,707 | ||||||
| 5.50% 10/17/12 | 300,000 | 315,986 | ||||||
44
| Principal | Value | |||||||
| Amount° | (U.S. $) | |||||||
| Corporate Bonds (continued) | ||||||||
| Banking (continued) | ||||||||
| # | Export-Import Bank of | |||||||
| Korea 144A | ||||||||
| •@ | 1.36% 3/13/12 | USD | 2,500,000 | $ | 2,499,475 | |||
| 5.25% 2/10/14 | 820,000 | 877,953 | ||||||
| * | Fifth Third Bancorp | |||||||
| 3.625% 1/25/16 | 2,060,000 | 2,060,437 | ||||||
| • | Fifth Third Capital Trust IV | |||||||
| 6.50% 4/15/37 | 405,000 | 397,406 | ||||||
| Goldman Sachs Group | ||||||||
| •* | 0.703% 7/22/15 | 200,000 | 194,477 | |||||
| •* | 0.759% 3/22/16 | 300,000 | 289,597 | |||||
| • | 0.803% 1/12/15 | 700,000 | 692,927 | |||||
| • | 1.383% 2/4/13 | 800,000 | 1,123,400 | |||||
| 3.625% 2/7/16 | 1,590,000 | 1,576,708 | ||||||
| * | 3.70% 8/1/15 | 900,000 | 907,540 | |||||
| 5.15% 1/15/14 | 2,000,000 | 2,147,942 | ||||||
| 5.375% 3/15/20 | 1,060,000 | 1,078,155 | ||||||
| 6.25% 2/1/41 | 1,045,000 | 1,044,172 | ||||||
| # | HSBC Bank 144A | |||||||
| 1.625% 8/12/13 | 2,300,000 | 2,299,402 | ||||||
| * | ICICI Bank 5.50% 3/25/15 | 2,100,000 | 2,191,407 | |||||
| # | ICICI Bank 144A | |||||||
| 5.50% 3/25/15 | 2,000,000 | 2,087,050 | ||||||
| # | Intesa Sanpaolo 144A | |||||||
| 3.625% 8/12/15 | 1,900,000 | 1,838,071 | ||||||
| JPMorgan Chase | ||||||||
| 4.40% 7/22/20 | 180,000 | 174,271 | ||||||
| JPMorgan Chase Capital XXV | ||||||||
| 6.80% 10/1/37 | 1,668,000 | 1,681,706 | ||||||
| KeyBank 6.95% 2/1/28 | 1,220,000 | 1,296,124 | ||||||
| KeyCorp 5.10% 3/24/21 | 620,000 | 617,364 | ||||||
| * | Korea Development Bank | |||||||
| 8.00% 1/23/14 | 1,200,000 | 1,370,473 | ||||||
| •* | Lloyds TSB Bank | |||||||
| 2.653% 1/24/14 | 2,300,000 | 2,359,667 | ||||||
| Morgan Stanley | ||||||||
| 5.75% 1/25/21 | 1,285,000 | 1,299,359 | ||||||
| • | National City Bank | |||||||
| 0.68% 6/7/17 | 325,000 | 306,900 | ||||||
| •# | Nordea Bank 144A | |||||||
| 1.203% 1/14/14 | 3,000,000 | 3,031,242 | ||||||
| PNC Bank 6.875% 4/1/18 | 1,415,000 | 1,606,714 | ||||||
| PNC Funding | ||||||||
| 5.25% 11/15/15 | 150,000 | 161,472 | ||||||
| 5.625% 2/1/17 | 195,000 | 211,780 | ||||||
| •# | PNC Preferred Funding Trust II | |||||||
| 144A 6.113% 3/29/49 | 1,600,000 | 1,336,290 | ||||||
| Rabobank Nederland | ||||||||
| 2.125% 10/13/15 | 315,000 | 304,260 | ||||||
| •# | Rabobank Nederland 144A | |||||||
| 11.00% 12/29/49 | 2,985,000 | 3,899,496 | ||||||
| Silicon Valley Bank | ||||||||
| 5.70% 6/1/12 | 724,000 | 742,881 | ||||||
| 6.05% 6/1/17 | 250,000 | 262,330 | ||||||
| SunTrust Banks | ||||||||
| 3.60% 4/15/16 | 780,000 | 776,232 | ||||||
| • | SunTrust Capital VIII | |||||||
| 6.10% 12/15/36 | 1,105,000 | 1,080,812 | ||||||
| SVB Financial Group | ||||||||
| 5.375% 9/15/20 | 190,000 | 187,232 | ||||||
| UBS | ||||||||
| • | 0.453% 4/18/16 | 800,000 | 799,899 | |||||
| 2.25% 1/28/14 | 1,900,000 | 1,904,860 | ||||||
| 5.875% 12/20/17 | 2,000,000 | 2,186,962 | ||||||
| US Bank 4.95% 10/30/14 | 1,000,000 | 1,089,136 | ||||||
| • | USB Capital IX | |||||||
| 6.189% 10/29/49 | 2,155,000 | 1,826,363 | ||||||
| Wachovia | ||||||||
| • | 0.673% 10/15/16 | 255,000 | 247,462 | |||||
| 5.25% 8/1/14 | 210,000 | 224,760 | ||||||
| Wachovia Bank | ||||||||
| 5.60% 3/15/16 | 595,000 | 646,400 | ||||||
| Wells Fargo 4.60% 4/1/21 | 830,000 | 822,419 | ||||||
| • | Wells Fargo Capital XIII | |||||||
| 7.70% 12/29/49 | 1,860,000 | 1,925,100 | ||||||
| Zions Bancorp | ||||||||
| 5.65% 5/15/14 | 186,000 | 189,776 | ||||||
| 7.75% 9/23/14 | 150,000 | 163,026 | ||||||
| 96,158,485 | ||||||||
| Basic Industry – 3.61% | ||||||||
| * | AK Steel 7.625% 5/15/20 | 120,000 | 123,000 | |||||
| Alcoa | ||||||||
| 5.55% 2/1/17 | 200,000 | 211,754 | ||||||
| 5.72% 2/23/19 | 799,000 | 832,210 | ||||||
| * | 6.15% 8/15/20 | 170,000 | 179,964 | |||||
| 6.75% 7/15/18 | 200,000 | 221,767 | ||||||
| # | Algoma Acquisition 144A | |||||||
| 9.875% 6/15/15 | 304,000 | 281,200 | ||||||
| ArcelorMittal | ||||||||
| 5.50% 3/1/21 | 735,000 | 725,641 | ||||||
| 9.85% 6/1/19 | 1,285,000 | 1,632,760 | ||||||
| Celulosa Arauco y | ||||||||
| Constitucion | ||||||||
| 7.25% 7/29/19 | 1,100,000 | 1,271,964 | ||||||
| # | Celulosa Arauco y | |||||||
| Constitucion 144A | ||||||||
| 5.00% 1/21/21 | 1,000,000 | 990,467 | ||||||
| Century Aluminum | ||||||||
| 8.00% 5/15/14 | 279,000 | 290,858 | ||||||
| CF Industries 7.125% 5/1/20 | 260,000 | 295,750 | ||||||
| Cliffs Natural Resources | ||||||||
| 4.875% 4/1/21 | 1,125,000 | 1,111,836 | ||||||
| 5.90% 3/15/20 | 390,000 | 416,648 | ||||||
| # | CODELCO 144A | |||||||
| 3.75% 11/4/20 | 332,000 | 311,698 | ||||||
| Compass Minerals | ||||||||
| International | ||||||||
| 8.00% 6/1/19 | 268,000 | 293,460 | ||||||
(continues) 45
Statements of net assets
Optimum Fixed Income Fund
| Principal | Value | |||||||
| Amount° | (U.S. $) | |||||||
| Corporate Bonds (continued) | ||||||||
| Basic Industry (continued) | ||||||||
| CSN Resources | ||||||||
| 6.50% 7/21/20 | USD | 600,000 | $ | 642,000 | ||||
| *# | CSN Resources 144A | |||||||
| 6.50% 7/21/20 | 3,400,000 | 3,637,999 | ||||||
| Dow Chemical | ||||||||
| 4.25% 11/15/20 | 397,000 | 380,622 | ||||||
| 8.55% 5/15/19 | 1,932,000 | 2,445,880 | ||||||
| * | duPont (E.I.) deNemours | |||||||
| 3.625% 1/15/21 | 1,795,000 | 1,707,993 | ||||||
| # | FMG Resources August 2006 | |||||||
| 144A 7.00% 11/1/15 | 275,000 | 286,688 | ||||||
| # | Georgia-Pacific 144A | |||||||
| 5.40% 11/1/20 | 1,720,000 | 1,701,589 | ||||||
| 8.25% 5/1/16 | 108,000 | 122,310 | ||||||
| *# | Gerdau Trade 144A | |||||||
| 5.75% 1/30/21 | 4,300,000 | 4,375,249 | ||||||
| Hexion US Finance | ||||||||
| 8.875% 2/1/18 | 260,000 | 276,250 | ||||||
| * | International Paper | |||||||
| 9.375% 5/15/19 | 1,500,000 | 1,933,635 | ||||||
| # | Lyondell Chemical 144A | |||||||
| 8.00% 11/1/17 | 200,000 | 221,000 | ||||||
| # | MacDermid 144A | |||||||
| 9.50% 4/15/17 | 251,000 | 267,943 | ||||||
| * | Momentive Performance | |||||||
| Materials | ||||||||
| 11.50% 12/1/16 | 435,000 | 468,713 | ||||||
| • | Noranda Aluminum | |||||||
| Acquisition PIK | ||||||||
| 5.193% 5/15/15 | 270,526 | 261,734 | ||||||
| # | Novelis 144A | |||||||
| 8.75% 12/15/20 | 770,000 | 850,850 | ||||||
| =@ | Port Townsend | |||||||
| 12.431% 8/27/12 | 86,471 | 39,344 | ||||||
| Reliance Steel & Aluminum | ||||||||
| 6.85% 11/15/36 | 425,000 | 417,165 | ||||||
| Ryerson | ||||||||
| • | 7.679% 11/1/14 | 127,000 | 122,238 | |||||
| 12.00% 11/1/15 | 237,000 | 258,330 | ||||||
| Smurfit Kappa Funding | ||||||||
| 7.75% 4/1/15 | 217,000 | 222,968 | ||||||
| Southern Copper | ||||||||
| 7.50% 7/27/35 | 375,000 | 406,043 | ||||||
| Steel Dynamics | ||||||||
| 7.75% 4/15/16 | 404,000 | 432,280 | ||||||
| Teck Resources | ||||||||
| 9.75% 5/15/14 | 431,000 | 524,008 | ||||||
| Vale Overseas | ||||||||
| 6.875% 11/10/39 | 4,400,000 | 4,725,137 | ||||||
| 35,918,945 | ||||||||
| Brokerage – 1.07% | ||||||||
| Bear Stearns | ||||||||
| • | 5.39% 12/7/12 | AUD | 2,130,000 | 2,179,260 | ||||
| 7.25% 2/1/18 | USD | 2,000,000 | 2,333,474 | |||||
| E Trade Financial PIK | ||||||||
| 12.50% 11/30/17 | 370,000 | 443,075 | ||||||
| Jefferies Group | ||||||||
| 6.25% 1/15/36 | 335,000 | 310,581 | ||||||
| 6.45% 6/8/27 | 1,146,000 | 1,153,313 | ||||||
| Lazard Group 6.85% 6/15/17 | 1,087,000 | 1,158,596 | ||||||
| Merrill Lynch | ||||||||
| * | 5.45% 2/5/13 | 500,000 | 530,261 | |||||
| 6.875% 4/25/18 | 2,325,000 | 2,586,007 | ||||||
| 10,694,567 | ||||||||
| Capital Goods – 1.44% | ||||||||
| Allied Waste | ||||||||
| 6.875% 6/1/17 | 1,155,000 | 1,260,539 | ||||||
| 7.125% 5/15/16 | 505,000 | 527,656 | ||||||
| Anixter 10.00% 3/15/14 | 101,000 | 116,908 | ||||||
| # | Berry Plastics 144A | |||||||
| 9.75% 1/15/21 | 260,000 | 258,700 | ||||||
| Case New Holland | ||||||||
| 7.75% 9/1/13 | 163,000 | 178,281 | ||||||
| Casella Waste Systems | ||||||||
| 11.00% 7/15/14 | 6,000 | 6,825 | ||||||
| •# | Cemex 144A | |||||||
| 5.301% 9/30/15 | 501,000 | 498,808 | ||||||
| *# | Cemex Espana Luxembourg | |||||||
| 144A 9.25% 5/12/20 | 100,000 | 104,125 | ||||||
| *# | Cemex Finance 144A | |||||||
| 9.50% 12/14/16 | 270,000 | 292,275 | ||||||
| Graham Packaging | ||||||||
| 8.25% 10/1/18 | 125,000 | 134,688 | ||||||
| * | 9.875% 10/15/14 | 232,000 | 240,990 | |||||
| # | Meccanica Holdings USA | |||||||
| 144A 6.25% 7/15/19 | 1,305,000 | 1,371,109 | ||||||
| * | NXP Funding | |||||||
| 9.50% 10/15/15 | 365,000 | 388,725 | ||||||
| # | Plastipak Holdings 144A | |||||||
| 10.625% 8/15/19 | 201,000 | 230,145 | ||||||
| Ply Gem Industries | ||||||||
| 13.125% 7/15/14 | 397,000 | 440,670 | ||||||
| Pregis 12.375% 10/15/13 | 262,000 | 259,708 | ||||||
| * | RBS Global/Rexnord | |||||||
| 11.75% 8/1/16 | 212,000 | 228,430 | ||||||
| Temple Inland | ||||||||
| 6.875% 1/15/18 | 570,000 | 617,980 | ||||||
| TriMas 9.75% 12/15/17 | 173,000 | 191,381 | ||||||
| Tyco Electronics Group | ||||||||
| 6.00% 10/1/12 | 4,500,000 | 4,798,426 | ||||||
| Tyco International Finance | ||||||||
| 3.75% 1/15/18 | 2,200,000 | 2,205,660 | ||||||
| 14,352,029 | ||||||||
| Communications – 4.52% | ||||||||
| # | Affinion Group 144A | |||||||
| 7.875% 12/15/18 | 315,000 | 297,675 | ||||||
| America Movil | ||||||||
| 5.00% 3/30/20 | 720,000 | 745,988 | ||||||
| 6.125% 3/30/40 | 250,000 | 262,621 | ||||||
46
| Principal | Value | |||||||
| Amount° | (U.S. $) | |||||||
| Corporate Bonds (continued) | ||||||||
| Communications (continued) | ||||||||
| # | AT&T 144A 5.35% 9/1/40 | USD | 1,195,000 | $ | 1,074,152 | |||
| *# | Avaya 144A 7.00% 4/1/19 | 500,000 | 490,000 | |||||
| # | Charter Communications | |||||||
| Operating 144A | ||||||||
| 10.875% 9/15/14 | 360,000 | 405,000 | ||||||
| Cincinnati Bell | ||||||||
| 7.00% 2/15/15 | 99,000 | 100,733 | ||||||
| Citizens Communications | ||||||||
| 6.25% 1/15/13 | 78,000 | 82,680 | ||||||
| # | Clear Channel | |||||||
| Communications 144A | ||||||||
| 9.00% 3/1/21 | 150,000 | 150,375 | ||||||
| # | Clearwire Communications | |||||||
| 144A 12.00% 12/1/15 | 1,312,000 | 1,423,520 | ||||||
| # | Columbus International | |||||||
| 144A 11.50% 11/20/14 | 460,000 | 532,450 | ||||||
| Comcast 5.70% 5/15/18 | 1,000,000 | 1,090,121 | ||||||
| * | Cricket Communications | |||||||
| 7.75% 10/15/20 | 300,000 | 303,000 | ||||||
| Crown Castle International | ||||||||
| 9.00% 1/15/15 | 80,000 | 88,600 | ||||||
| # | Crown Castle Towers 144A | |||||||
| 4.883% 8/15/20 | 1,920,000 | 1,924,900 | ||||||
| * | CSC Holdings | |||||||
| 6.75% 4/15/12 | 1,000 | 1,040 | ||||||
| Deutsche Telekom | ||||||||
| International Finance | ||||||||
| 4.25% 7/13/22 | EUR | 850,000 | 1,162,125 | |||||
| # | Digicel 144A | |||||||
| 8.25% 9/1/17 | USD | 100,000 | 106,500 | |||||
| 12.00% 4/1/14 | 305,000 | 359,138 | ||||||
| # | Digicel Group 144A | |||||||
| 8.875% 1/15/15 | 170,000 | 177,905 | ||||||
| DIRECTV Holdings | ||||||||
| 5.00% 3/1/21 | 1,450,000 | 1,457,924 | ||||||
| DISH DBS 7.875% 9/1/19 | 268,000 | 291,450 | ||||||
| Entravision Communications | ||||||||
| 8.75% 8/1/17 | 120,000 | 128,400 | ||||||
| Global Crossing | ||||||||
| 12.00% 9/15/15 | 318,000 | 364,110 | ||||||
| * | GXS Worldwide | |||||||
| 9.75% 6/15/15 | 514,000 | 525,565 | ||||||
| Hughes Network Systems | ||||||||
| 9.50% 4/15/14 | 244,000 | 253,150 | ||||||
| Intelsat Bermuda | ||||||||
| 11.25% 2/4/17 | 420,000 | 460,950 | ||||||
| Intelsat Bermuda PIK | ||||||||
| 11.50% 2/4/17 | 410 | 452 | ||||||
| Intelsat Jackson Holdings | ||||||||
| 11.25% 6/15/16 | 156,000 | 167,115 | ||||||
| # | Intelsat Jackson Holdings | |||||||
| 144A 7.25% 10/15/20 | 195,000 | 195,975 | ||||||
| Lamar Media | ||||||||
| 6.625% 8/15/15 | 140,000 | 143,500 | ||||||
| * | 6.625% 8/15/15 | 209,000 | 214,748 | |||||
| Level 3 Financing | ||||||||
| 9.25% 11/1/14 | 63,000 | 64,733 | ||||||
| 10.00% 2/1/18 | 213,000 | 214,331 | ||||||
| LIN Television 6.50% 5/15/13 | 52,000 | 52,195 | ||||||
| * | MetroPCS Wireless | |||||||
| 6.625% 11/15/20 | 150,000 | 150,188 | ||||||
| # | MTS International Funding | |||||||
| 144A 8.625% 6/22/20 | 390,000 | 447,993 | ||||||
| # | NBC Universal 144A | |||||||
| 4.375% 4/1/21 | 2,195,000 | 2,105,654 | ||||||
| Nielsen Finance | ||||||||
| 11.50% 5/1/16 | 130,000 | 153,725 | ||||||
| 11.625% 2/1/14 | 82,000 | 96,965 | ||||||
| NII Capital 10.00% 8/15/16 | 316,000 | 361,820 | ||||||
| PAETEC Holding | ||||||||
| 8.875% 6/30/17 | 157,000 | 169,953 | ||||||
| * | 9.50% 7/15/15 | 268,000 | 282,070 | |||||
| Qwest 8.375% 5/1/16 | 1,990,000 | 2,378,049 | ||||||
| # | Rainbow National Services | |||||||
| 144A 10.375% 9/1/14 | 113,000 | 117,520 | ||||||
| # | Sinclair Television Group | |||||||
| 144A 9.25% 11/1/17 | 216,000 | 241,920 | ||||||
| # | Sirius XM Radio 144A | |||||||
| * | 8.75% 4/1/15 | 250,000 | 282,500 | |||||
| 9.75% 9/1/15 | 40,000 | 45,250 | ||||||
| Sprint Capital 8.75% 3/15/32 | 397,000 | 424,294 | ||||||
| Symantec 4.20% 9/15/20 | 2,585,000 | 2,437,277 | ||||||
| # | Telcordia Technologies 144A | |||||||
| 11.00% 5/1/18 | 120,000 | 134,100 | ||||||
| Telecom Italia Capital | ||||||||
| 6.999% 6/4/18 | 2,150,000 | 2,341,276 | ||||||
| Telefonica Emisiones | ||||||||
| 6.421% 6/20/16 | 1,190,000 | 1,323,802 | ||||||
| Telesat Canada | ||||||||
| 11.00% 11/1/15 | 467,000 | 522,456 | ||||||
| 12.50% 11/1/17 | 85,000 | 101,788 | ||||||
| Time Warner 4.75% 3/29/21 | 700,000 | 696,749 | ||||||
| Time Warner Cable | ||||||||
| * | 4.125% 2/15/21 | 200,000 | 187,253 | |||||
| 6.75% 7/1/18 | 1,500,000 | 1,706,511 | ||||||
| 8.25% 4/1/19 | 780,000 | 951,661 | ||||||
| # | UPC Holding 144A | |||||||
| 9.875% 4/15/18 | 170,000 | 188,700 | ||||||
| Verizon Communications | ||||||||
| 4.60% 4/1/21 | 885,000 | 882,961 | ||||||
| 8.75% 11/1/18 | 3,600,000 | 4,612,704 | ||||||
| Viacom 3.50% 4/1/17 | 1,355,000 | 1,335,831 | ||||||
| Videotron 6.375% 12/15/15 | 90,000 | 93,150 | ||||||
| Virgin Media Finance | ||||||||
| 8.375% 10/15/19 | 200,000 | 226,000 | ||||||
| * | Virgin Media Secured Finance | |||||||
| 6.50% 1/15/18 | 1,365,000 | 1,498,088 | ||||||
| # | Virgin Media Secured Finance | |||||||
| 144A 5.25% 1/15/21 | 1,005,000 | 1,010,338 | ||||||
(continues) 47
Statements of net assets
Optimum Fixed Income Fund
| Principal | Value | |||||||
| Amount° | (U.S. $) | |||||||
| Corporate Bonds (continued) | ||||||||
| Communications (continued) | ||||||||
| # | Vivendi 144A 6.625% 4/4/18 | USD | 1,275,000 | $ | 1,429,680 | |||
| # | Wind Acquisition Finance | |||||||
| 144A 11.75% 7/15/17 | 360,000 | 415,800 | ||||||
| Windstream | ||||||||
| 7.875% 11/1/17 | 3,000 | 3,233 | ||||||
| 8.125% 8/1/13 | 103,000 | 113,558 | ||||||
| # | XM Satellite Radio 144A | |||||||
| 13.00% 8/1/13 | 220,000 | 262,350 | ||||||
| 45,046,288 | ||||||||
| Consumer Cyclical – 2.46% | ||||||||
| *# | Allison Transmission 144A | |||||||
| 11.00% 11/1/15 | 354,000 | 385,860 | ||||||
| American Axle & | ||||||||
| Manufacturing | ||||||||
| 7.875% 3/1/17 | 234,000 | 238,680 | ||||||
| # | Ameristar Casinos 144A | |||||||
| 7.50% 4/15/21 | 335,000 | 335,000 | ||||||
| ArvinMeritor | ||||||||
| 8.125% 9/15/15 | 443,000 | 462,935 | ||||||
| # | Beazer Homes USA 144A | |||||||
| 9.125% 5/15/19 | 140,000 | 142,275 | ||||||
| Best Buy 5.50% 3/15/21 | 415,000 | 407,972 | ||||||
| * | CKE Restaurants | |||||||
| 11.375% 7/15/18 | 260,000 | 287,950 | ||||||
| w# | CVS Pass Through Trust 144A | |||||||
| 5.773% 1/10/33 | 263,998 | 267,091 | ||||||
| Daimler International Finance | ||||||||
| 7.75% 3/26/12 | EUR | 3,100,000 | 4,619,654 | |||||
| Dave & Buster’s | ||||||||
| 11.00% 6/1/18 | USD | 75,000 | 81,750 | |||||
| *# | Dunkin Finance 144A | |||||||
| 9.625% 12/1/18 | 225,000 | 230,344 | ||||||
| # | Equinox Holdings 144A | |||||||
| 9.50% 2/1/16 | 40,000 | 43,250 | ||||||
| Family Dollar Stores | ||||||||
| 5.00% 2/1/21 | 1,055,000 | 1,038,448 | ||||||
| Ford Motor 7.45% 7/16/31 | 655,000 | 712,385 | ||||||
| Ford Motor Credit | ||||||||
| * | 8.70% 10/1/14 | 3,800,000 | 4,316,890 | |||||
| 12.00% 5/15/15 | 480,000 | 604,662 | ||||||
| * | Hanesbrands | |||||||
| 6.375% 12/15/20 | 740,000 | 725,200 | ||||||
| * | Harrah’s Operating | |||||||
| 10.00% 12/15/18 | 564,000 | 517,470 | ||||||
| * | K Hovnanian Enterprises | |||||||
| 10.625% 10/15/16 | 162,000 | 172,935 | ||||||
| Macy’s 5.90% 12/1/16 | 763,000 | 824,040 | ||||||
| # | M/I Homes 144A | |||||||
| 8.625% 11/15/18 | 225,000 | 225,844 | ||||||
| *# | Marina District Finance 144A | |||||||
| 9.875% 8/15/18 | 200,000 | 210,250 | ||||||
| * | MGM MIRAGE | |||||||
| 11.375% 3/1/18 | 679,000 | 757,085 | ||||||
| * | Mobile Mini 6.875% 5/1/15 | 161,000 | 166,635 | |||||
| Mohawk Industries | ||||||||
| 6.125% 1/15/16 | 146,000 | 157,315 | ||||||
| NCL 11.75% 11/15/16 | 59,000 | 68,440 | ||||||
| New Albertsons | ||||||||
| 7.25% 5/1/13 | 66,000 | 67,485 | ||||||
| Norcraft 10.50% 12/15/15 | 154,000 | 165,358 | ||||||
| Norcraft Holdings | ||||||||
| 9.75% 9/1/12 | 138,000 | 137,310 | ||||||
| * | OSI Restaurant Partners | |||||||
| 10.00% 6/15/15 | 159,000 | 167,348 | ||||||
| # | Pinafore 144A | |||||||
| 9.00% 10/1/18 | 350,000 | 381,500 | ||||||
| Pinnacle Entertainment | ||||||||
| 8.75% 5/15/20 | 415,000 | 433,675 | ||||||
| # | Pokagon Gaming Authority | |||||||
| 144A 10.375% 6/15/14 | 6,000 | 6,240 | ||||||
| Quiksilver 6.875% 4/15/15 | 325,000 | 321,750 | ||||||
| Royal Caribbean Cruises | ||||||||
| 7.00% 6/15/13 | 250,000 | 267,500 | ||||||
| * | Ryland Group | |||||||
| 8.40% 5/15/17 | 172,000 | 191,780 | ||||||
| Sally Holdings | ||||||||
| 10.50% 11/15/16 | 229,000 | 250,183 | ||||||
| # | Sealy Mattress 144A | |||||||
| 10.875% 4/15/16 | 61,000 | 69,388 | ||||||
| # | Sears Holdings 144A | |||||||
| 6.625% 10/15/18 | 270,000 | 263,250 | ||||||
| Standard Pacific | ||||||||
| 10.75% 9/15/16 | 248,000 | 290,160 | ||||||
| # | Volkswagen International | |||||||
| Finance 144A | ||||||||
| 1.625% 8/12/13 | 2,800,000 | 2,812,572 | ||||||
| Wyndham Worldwide | ||||||||
| 5.625% 3/1/21 | 450,000 | 446,606 | ||||||
| * | 5.75% 2/1/18 | 275,000 | 285,342 | |||||
| 24,557,807 | ||||||||
| Consumer Non-Cyclical – 4.85% | ||||||||
| Alere 9.00% 5/15/16 | 170,000 | 181,900 | ||||||
| Altria Group 9.70% 11/10/18 | 1,000,000 | 1,316,994 | ||||||
| Amgen 3.45% 10/1/20 | 1,600,000 | 1,508,674 | ||||||
| Anheuser-Busch | ||||||||
| 5.00% 3/1/19 | 490,000 | 517,759 | ||||||
| Anheuser-Busch InBev | ||||||||
| Worldwide | ||||||||
| •* | 0.854% 1/27/14 | 3,800,000 | 3,832,839 | |||||
| 5.00% 4/15/20 | 430,000 | 450,515 | ||||||
| 5.375% 11/15/14 | 1,180,000 | 1,301,407 | ||||||
| 5.375% 1/15/20 | 1,000,000 | 1,075,190 | ||||||
| Archer-Daniels-Midland | ||||||||
| 5.765% 3/1/41 | 435,000 | 446,986 | ||||||
| Biomet 11.625% 10/15/17 | 204,000 | 228,480 | ||||||
| Biomet PIK | ||||||||
| 10.375% 10/15/17 | 158,000 | 174,393 | ||||||
| Bio-Rad Laboratories | ||||||||
| * | 4.875% 12/15/20 | 2,100,000 | 2,076,374 | |||||
| 8.00% 9/15/16 | 146,000 | 162,425 | ||||||
48
| Principal | Value | |||||||
| Amount° | (U.S. $) | |||||||
| Corporate Bonds (continued) | ||||||||
| Consumer Non-Cyclical (continued) | ||||||||
| # | Blue Merger 144A | |||||||
| 7.625% 2/15/19 | USD | 445,000 | $ | 453,344 | ||||
| # | Brambles USA 144A | |||||||
| 3.95% 4/1/15 | 1,660,000 | 1,671,270 | ||||||
| 5.35% 4/1/20 | 320,000 | 321,698 | ||||||
| # | Bumble Bee Acquisition | |||||||
| 144A 9.00% 12/15/17 | 440,000 | 459,800 | ||||||
| CareFusion 6.375% 8/1/19 | 2,085,000 | 2,334,513 | ||||||
| Celgene | ||||||||
| 2.45% 10/15/15 | 640,000 | 620,045 | ||||||
| 3.95% 10/15/20 | 1,460,000 | 1,380,417 | ||||||
| # | Cencosud 144A | |||||||
| 5.50% 1/20/21 | 329,000 | 325,686 | ||||||
| Coca-Cola Enterprises | ||||||||
| 3.50% 9/15/20 | 270,000 | 255,486 | ||||||
| 4.50% 9/1/21 | 930,000 | 939,573 | ||||||
| Corrections Corp. of America | ||||||||
| 7.75% 6/1/17 | 354,000 | 386,303 | ||||||
| Covidien International | ||||||||
| Finance 4.20% 6/15/20 | 1,875,000 | 1,863,738 | ||||||
| Delhaize Group | ||||||||
| 5.70% 10/1/40 | 1,328,000 | 1,217,680 | ||||||
| # | DJO Finance 144A | |||||||
| 9.75% 10/15/17 | 100,000 | 105,500 | ||||||
| # | Dole Food 144A | |||||||
| 8.00% 10/1/16 | 123,000 | 131,149 | ||||||
| Genzyme 3.625% 6/15/15 | 1,585,000 | 1,648,161 | ||||||
| # | Geo Group 144A | |||||||
| 6.625% 2/15/21 | 145,000 | 144,275 | ||||||
| *# | HCA Holdings 144A | |||||||
| 7.75% 5/15/21 | 260,000 | 272,350 | ||||||
| HCA PIK 9.625% 11/15/16 | 59,000 | 63,720 | ||||||
| # | Health Care Services 144A | |||||||
| 4.70% 1/15/21 | 770,000 | 774,441 | ||||||
| Hospira 6.40% 5/15/15 | 1,795,000 | 2,017,125 | ||||||
| Ingles Markets | ||||||||
| 8.875% 5/15/17 | 196,000 | 211,435 | ||||||
| Jarden | ||||||||
| * | 6.125% 11/15/22 | 215,000 | 211,238 | |||||
| 7.50% 1/15/20 | 30,000 | 31,650 | ||||||
| Kraft Foods | ||||||||
| 6.125% 8/23/18 | 225,000 | 252,001 | ||||||
| 6.50% 8/11/17 | 200,000 | 228,372 | ||||||
| Laboratory Corp. of | ||||||||
| America Holdings | ||||||||
| 4.625% 11/15/20 | 1,680,000 | 1,685,104 | ||||||
| Life Technologies | ||||||||
| 6.00% 3/1/20 | 650,000 | 701,310 | ||||||
| McKesson 4.75% 3/1/21 | 1,305,000 | 1,326,085 | ||||||
| Medco Health Solutions | ||||||||
| 4.125% 9/15/20 | 1,605,000 | 1,550,075 | ||||||
| 7.125% 3/15/18 | 520,000 | 607,285 | ||||||
| Merck 3.875% 1/15/21 | 740,000 | 725,765 | ||||||
| # | Multiplan 144A | |||||||
| 9.875% 9/1/18 | 280,000 | 301,000 | ||||||
| # | Mylan 144A 6.00% 11/15/18 | 210,000 | 211,050 | |||||
| PHH 9.25% 3/1/16 | 860,000 | 938,650 | ||||||
| Quest Diagnostics | ||||||||
| 4.70% 4/1/21 | 1,480,000 | 1,467,746 | ||||||
| * | 4.75% 1/30/20 | 135,000 | 135,716 | |||||
| Radnet Management | ||||||||
| 10.375% 4/1/18 | 125,000 | 127,031 | ||||||
| # | Reynolds Group Issuer 144A | |||||||
| 9.00% 4/15/19 | 370,000 | 384,800 | ||||||
| * | RSC Equipment Rental | |||||||
| 10.25% 11/15/19 | 278,000 | 318,310 | ||||||
| * | Safeway 3.95% 8/15/20 | 855,000 | 810,264 | |||||
| # | Scotts Miracle-Gro 144A | |||||||
| 6.625% 12/15/20 | 125,000 | 128,906 | ||||||
| Smithfield Foods | ||||||||
| 10.00% 7/15/14 | 63,000 | 74,498 | ||||||
| * | Supervalu 8.00% 5/1/16 | 144,000 | 144,720 | |||||
| Tops Markets | ||||||||
| 10.125% 10/15/15 | 117,000 | 126,360 | ||||||
| Tyson Foods 10.50% 3/1/14 | 213,000 | 256,665 | ||||||
| # | Viskase 144A | |||||||
| 9.875% 1/15/18 | 322,000 | 348,565 | ||||||
| # | Votorantim Cimentos 144A | |||||||
| 7.25% 4/5/41 | 1,180,000 | 1,172,861 | ||||||
| Yale University | ||||||||
| 2.90% 10/15/14 | 1,115,000 | 1,152,759 | ||||||
| Yankee Candle | ||||||||
| 9.75% 2/15/17 | 258,000 | 275,738 | ||||||
| Zimmer Holdings | ||||||||
| 4.625% 11/30/19 | 1,640,000 | 1,701,502 | ||||||
| 48,267,671 | ||||||||
| Electric – 3.54% | ||||||||
| AES | ||||||||
| 7.75% 3/1/14 | 29,000 | 31,465 | ||||||
| * | 8.00% 6/1/20 | 133,000 | 144,305 | |||||
| * | Ameren Illinois | |||||||
| 9.75% 11/15/18 | 2,195,000 | 2,835,350 | ||||||
| # | American Transmission | |||||||
| Systems 144A | ||||||||
| 5.25% 1/15/22 | 1,225,000 | 1,275,164 | ||||||
| * | Appalachian Power | |||||||
| 7.95% 1/15/20 | 1,000,000 | 1,237,224 | ||||||
| # | Calpine 144A | |||||||
| 7.875% 7/31/20 | 225,000 | 240,188 | ||||||
| CMS Energy | ||||||||
| * | 4.25% 9/30/15 | 1,465,000 | 1,476,412 | |||||
| 6.25% 2/1/20 | 145,000 | 152,161 | ||||||
| 6.55% 7/17/17 | 310,000 | 339,579 | ||||||
| 8.75% 6/15/19 | 600,000 | 719,056 | ||||||
| Commonwealth Edison | ||||||||
| * | 4.00% 8/1/20 | 215,000 | 208,007 | |||||
| 5.80% 3/15/18 | 400,000 | 442,530 | ||||||
| * | Dominion Resources | |||||||
| 4.45% 3/15/21 | 990,000 | 983,769 | ||||||
(continues) 49
Statements of net assets
Optimum Fixed Income Fund
| Principal | Value | |||||||
| Amount° | (U.S. $) | |||||||
| Corporate Bonds (continued) | ||||||||
| Electric (continued) | ||||||||
| Duquense Light Holdings | ||||||||
| 5.50% 8/15/15 | USD | 756,000 | $ | 774,880 | ||||
| Dynegy Holdings | ||||||||
| 7.75% 6/1/19 | 288,000 | 225,000 | ||||||
| * | 8.375% 5/1/16 | 5,000 | 4,213 | |||||
| Elwood Energy | ||||||||
| 8.159% 7/5/26 | 269,559 | 268,211 | ||||||
| # | Enel Finance International | |||||||
| 144A 6.25% 9/15/17 | 1,140,000 | 1,250,096 | ||||||
| Energy Future Intermediate | ||||||||
| Holding 10.00% 12/1/20 | 245,000 | 260,845 | ||||||
| Entergy | ||||||||
| 3.625% 9/15/15 | 215,000 | 212,985 | ||||||
| * | 5.125% 9/15/20 | 4,400,000 | 4,302,029 | |||||
| Exelon Generation | ||||||||
| 4.00% 10/1/20 | 1,100,000 | 1,007,607 | ||||||
| Florida Power 5.65% 6/15/18 | 280,000 | 313,651 | ||||||
| *# | GenOn Escrow 144A | |||||||
| 9.875% 10/15/20 | 160,000 | 168,000 | ||||||
| Jersey Central Power & Light | ||||||||
| 5.625% 5/1/16 | 80,000 | 88,399 | ||||||
| 7.35% 2/1/19 | 1,000,000 | 1,189,065 | ||||||
| # | LG&E & KU Energy 144A | |||||||
| 3.75% 11/15/20 | 745,000 | 689,160 | ||||||
| * | Mirant Americas | |||||||
| 8.50% 10/1/21 | 305,000 | 318,725 | ||||||
| Nisource Finance | ||||||||
| 5.45% 9/15/20 | 765,000 | 795,333 | ||||||
| 6.40% 3/15/18 | 620,000 | 694,619 | ||||||
| 6.80% 1/15/19 | 470,000 | 538,519 | ||||||
| NRG Energy 7.375% 2/1/16 | 213,000 | 220,988 | ||||||
| Oncor Electric Delivery | ||||||||
| 7.00% 9/1/22 | 400,000 | 461,000 | ||||||
| # | Oncor Electric Delivery 144A | |||||||
| 5.00% 9/30/17 | 650,000 | 675,288 | ||||||
| 5.25% 9/30/40 | 180,000 | 165,546 | ||||||
| @# | Pedernales Electric | |||||||
| Cooperative 144A | ||||||||
| 6.202% 11/15/32 | 620,000 | 573,702 | ||||||
| * | Pennsylvania Electric | |||||||
| 5.20% 4/1/20 | 1,695,000 | 1,734,202 | ||||||
| PPL Electric Utilities | ||||||||
| 7.125% 11/30/13 | 435,000 | 496,189 | ||||||
| Public Service Oklahoma | ||||||||
| 5.15% 12/1/19 | 1,170,000 | 1,234,339 | ||||||
| # | Puget Energy 144A | |||||||
| 6.50% 12/15/20 | 3,300,000 | 3,314,902 | ||||||
| • | Puget Sound Energy | |||||||
| 6.974% 6/1/67 | 685,000 | 670,397 | ||||||
| Southern California Edison | ||||||||
| 5.50% 8/15/18 | 1,250,000 | 1,399,836 | ||||||
| # | Tampa Electric 144A | |||||||
| 5.40% 5/15/21 | 715,000 | 777,136 | ||||||
| • | Wisconsin Energy | |||||||
| 6.25% 5/15/67 | 350,000 | 351,754 | ||||||
| 35,261,826 | ||||||||
| Energy – 5.14% | ||||||||
| Anadarko Petroleum | ||||||||
| 5.95% 9/15/16 | 905,000 | 985,233 | ||||||
| Antero Resources Finance | ||||||||
| 9.375% 12/1/17 | 122,000 | 133,590 | ||||||
| Berry Petroleum | ||||||||
| 10.25% 6/1/14 | 227,000 | 264,455 | ||||||
| BP Capital Markets | ||||||||
| •* | 0.45% 4/11/11 | 1,000,000 | 1,000,033 | |||||
| 2.375% 12/14/11 | 300,000 | 303,242 | ||||||
| 2.75% 2/27/12 | 100,000 | 101,641 | ||||||
| 3.625% 5/8/14 | 500,000 | 519,684 | ||||||
| 4.75% 3/10/19 | 160,000 | 166,769 | ||||||
| Buckeye Partners | ||||||||
| 4.875% 2/1/21 | 1,150,000 | 1,144,558 | ||||||
| Chesapeake Energy | ||||||||
| * | 6.125% 2/15/21 | 220,000 | 227,425 | |||||
| 9.50% 2/15/15 | 175,000 | 217,875 | ||||||
| # | CNOOC Finance 2011 144A | |||||||
| 4.25% 1/26/21 | 1,267,000 | 1,238,201 | ||||||
| Complete Production | ||||||||
| Services 8.00% 12/15/16 | 301,000 | 319,060 | ||||||
| Comstock Resources | ||||||||
| 7.75% 4/1/19 | 65,000 | 66,219 | ||||||
| Copano Energy | ||||||||
| 7.75% 6/1/18 | 218,000 | 228,900 | ||||||
| Ecopetrol 7.625% 7/23/19 | 892,000 | 1,032,490 | ||||||
| El Paso | ||||||||
| 6.875% 6/15/14 | 88,000 | 98,734 | ||||||
| 7.00% 6/15/17 | 240,000 | 269,808 | ||||||
| # | El Paso Performance-Linked | |||||||
| Trust 144A | ||||||||
| 7.75% 7/15/11 | 123,000 | 125,370 | ||||||
| •* | Enbridge Energy | |||||||
| 8.05% 10/1/37 | 860,000 | 913,975 | ||||||
| Energy Transfer Partners | ||||||||
| 9.70% 3/15/19 | 2,240,000 | 2,928,041 | ||||||
| *# | ENI 144A 4.15% 10/1/20 | 1,085,000 | 1,019,193 | |||||
| ENSCO 4.70% 3/15/21 | 1,030,000 | 1,024,396 | ||||||
| Enterprise Products | ||||||||
| Operating | ||||||||
| • | 7.034% 1/15/68 | 1,360,000 | 1,412,894 | |||||
| 9.75% 1/31/14 | 1,005,000 | 1,205,009 | ||||||
| EOG Resources | ||||||||
| 4.10% 2/1/21 | 1,460,000 | 1,416,340 | ||||||
| Forest Oil 7.25% 6/15/19 | 207,000 | 217,350 | ||||||
| * | Gazprom 10.50% 3/25/14 | 1,500,000 | 1,806,900 | |||||
| # | Gazprom 144A | |||||||
| 8.146% 4/11/18 | 100,000 | 118,370 | ||||||
| # | Headwaters 144A | |||||||
| 7.625% 4/1/19 | 180,000 | 180,900 | ||||||
| # | Helix Energy Solutions Group | |||||||
| 144A 9.50% 1/15/16 | 639,000 | 677,340 | ||||||
| *# | Hercules Offshore 144A | |||||||
| 10.50% 10/15/17 | 289,000 | 297,670 | ||||||
50
| Principal | Value | |||||||
| Amount° | (U.S. $) | |||||||
| Corporate Bonds (continued) | ||||||||
| Energy (continued) | ||||||||
| # | Hilcorp Energy I 144A | |||||||
| 7.625% 4/15/21 | USD | 100,000 | $ | 105,250 | ||||
| 7.75% 11/1/15 | 150,000 | 156,000 | ||||||
| Holly 9.875% 6/15/17 | 217,000 | 246,295 | ||||||
| International Coal Group | ||||||||
| 9.125% 4/1/18 | 230,000 | 262,200 | ||||||
| # | IPIC GMTN 144A | |||||||
| 5.00% 11/15/20 | 736,000 | 716,611 | ||||||
| Kinder Morgan | ||||||||
| Energy Partners | ||||||||
| 5.95% 2/15/18 | 1,000,000 | 1,102,680 | ||||||
| 9.00% 2/1/19 | 1,350,000 | 1,715,912 | ||||||
| # | Linn Energy 144A | |||||||
| 8.625% 4/15/20 | 125,000 | 139,375 | ||||||
| # | Murray Energy 144A | |||||||
| 10.25% 10/15/15 | 237,000 | 255,960 | ||||||
| *# | NFR Energy 144A | |||||||
| 9.75% 2/15/17 | 190,000 | 189,050 | ||||||
| # | NGPL PipeCo 144A | |||||||
| 6.514% 12/15/12 | 2,000,000 | 2,143,344 | ||||||
| Noble Energy 8.25% 3/1/19 | 1,180,000 | 1,486,821 | ||||||
| OPTI Canada | ||||||||
| * | 7.875% 12/15/14 | 105,000 | 56,044 | |||||
| * | 8.25% 12/15/14 | 185,000 | 99,669 | |||||
| *# | OPTI Canada 144A | |||||||
| 9.00% 12/15/12 | 235,000 | 239,994 | ||||||
| Pemex Project Funding | ||||||||
| Master Trust | ||||||||
| 6.625% 6/15/35 | 440,000 | 443,570 | ||||||
| Petrobras International | ||||||||
| Finance | ||||||||
| 5.375% 1/27/21 | 1,115,000 | 1,123,940 | ||||||
| 5.75% 1/20/20 | 410,000 | 425,020 | ||||||
| 5.875% 3/1/18 | 45,000 | 47,891 | ||||||
| Petrohawk Energy | ||||||||
| 7.875% 6/1/15 | 281,000 | 299,265 | ||||||
| # | Petrohawk Energy 144A | |||||||
| 7.25% 8/15/18 | 45,000 | 46,575 | ||||||
| Petroleum Development | ||||||||
| 12.00% 2/15/18 | 167,000 | 190,171 | ||||||
| # | Petronas Global Sukuk 144A | |||||||
| 4.25% 8/12/14 | 230,000 | 242,065 | ||||||
| Plains All American Pipeline | ||||||||
| 8.75% 5/1/19 | 1,365,000 | 1,710,271 | ||||||
| Pride International | ||||||||
| 6.875% 8/15/20 | 595,000 | 677,556 | ||||||
| Quicksilver Resources | ||||||||
| 7.125% 4/1/16 | 162,000 | 160,785 | ||||||
| Range Resources | ||||||||
| 8.00% 5/15/19 | 157,000 | 173,878 | ||||||
| @ | Ras Laffan Liquefied Natural | |||||||
| Gas II 5.298% 9/30/20 | 2,883,900 | 3,006,466 | ||||||
| # | Ras Laffan Liquefied | |||||||
| Natural Gas III 144A | ||||||||
| 5.832% 9/30/16 | 356,880 | 383,468 | ||||||
| # | Rockies Express Pipeline 144A | |||||||
| 6.25% 7/15/13 | 1,000,000 | 1,068,666 | ||||||
| 6.85% 7/15/18 | 500,000 | 545,639 | ||||||
| *# | SandRidge Energy 144A | |||||||
| 9.875% 5/15/16 | 396,000 | 441,540 | ||||||
| TNK-BP Finance | ||||||||
| 7.50% 3/13/13 | 3,000,000 | 3,288,750 | ||||||
| • | TransCanada PipeLines | |||||||
| 6.35% 5/15/67 | 1,800,000 | 1,809,599 | ||||||
| Transocean 6.50% 11/15/20 | 1,310,000 | 1,446,945 | ||||||
| Weatherford International | ||||||||
| 9.625% 3/1/19 | 795,000 | 1,013,972 | ||||||
| Williams 8.75% 3/15/32 | 165,000 | 214,125 | ||||||
| Williams Partners Finance | ||||||||
| 7.25% 2/1/17 | 580,000 | 680,089 | ||||||
| # | Woodside Finance 144A | |||||||
| 4.50% 11/10/14 | 800,000 | 848,014 | ||||||
| 8.125% 3/1/14 | 320,000 | 367,839 | ||||||
| 51,232,969 | ||||||||
| Finance Companies – 3.37% | ||||||||
| American Express | ||||||||
| 7.00% 3/19/18 | 7,900,000 | 9,245,915 | ||||||
| # | BM&FBovespa 144A | |||||||
| 5.50% 7/16/20 | 200,000 | 205,592 | ||||||
| # | CDP Financial 144A | |||||||
| 4.40% 11/25/19 | 1,260,000 | 1,273,579 | ||||||
| 5.60% 11/25/39 | 880,000 | 910,281 | ||||||
| # | ERAC USA Finance 144A | |||||||
| 5.25% 10/1/20 | 1,365,000 | 1,408,116 | ||||||
| * | FTI Consulting | |||||||
| 7.75% 10/1/16 | 5,000 | 5,250 | ||||||
| # | FTI Consulting 144A | |||||||
| 6.75% 10/1/20 | 230,000 | 234,025 | ||||||
| General Electric Capital | ||||||||
| • | 1.153% 1/7/14 | 7,400,000 | 7,466,459 | |||||
| 4.375% 9/16/20 | 340,000 | 331,043 | ||||||
| 5.30% 2/11/21 | 720,000 | 732,677 | ||||||
| 6.00% 8/7/19 | 2,245,000 | 2,455,069 | ||||||
| International Lease Finance | ||||||||
| • | 0.633% 7/1/11 | 100,000 | 99,894 | |||||
| 4.75% 1/13/12 | 300,000 | 304,500 | ||||||
| * | 5.75% 6/15/11 | 400,000 | 403,500 | |||||
| 8.25% 12/15/20 | 180,000 | 197,550 | ||||||
| Nuveen Investments | ||||||||
| 10.50% 11/15/15 | 354,000 | 365,505 | ||||||
| # | Nuveen Investments 144A | |||||||
| 10.50% 11/15/15 | 185,000 | 190,088 | ||||||
| SLM | ||||||||
| 5.375% 5/15/14 | 1,400,000 | 1,452,819 | ||||||
| 6.25% 1/25/16 | 1,300,000 | 1,356,654 | ||||||
| @# | Stone Street Trust 144A | |||||||
| 5.902% 12/15/15 | 2,300,000 | 2,398,840 | ||||||
(continues) 51
Statements of net assets
Optimum Fixed Income Fund
| Principal | Value | |||||||
| Amount° | (U.S. $) | |||||||
| Corporate Bonds (continued) | ||||||||
| Finance Companies (continued) | ||||||||
| *# | UPCB Finance III 144A | |||||||
| 6.625% 7/1/20 | USD | 520,000 | $ | 512,200 | ||||
| Waha Aerospace | ||||||||
| 3.925% 7/28/20 | 1,995,000 | 1,999,988 | ||||||
| 33,549,544 | ||||||||
| Insurance – 1.08% | ||||||||
| American International Group | ||||||||
| 5.45% 5/18/17 | 720,000 | 741,023 | ||||||
| 8.25% 8/15/18 | 1,600,000 | 1,876,562 | ||||||
| # | American International | |||||||
| Group 144A | ||||||||
| 3.75% 11/30/13 | 600,000 | 611,187 | ||||||
| • | Chubb 6.375% 3/29/67 | 820,000 | 867,149 | |||||
| • | Genworth Financial | |||||||
| 6.15% 11/15/66 | 330,000 | 263,175 | ||||||
| •# | ILFC E-Capital Trust I 144A | |||||||
| 5.97% 12/21/65 | 100,000 | 83,721 | ||||||
| •# | ILFC E-Capital Trust II 144A | |||||||
| 6.25% 12/21/65 | 405,000 | 342,225 | ||||||
| • | ING Groep 5.775% 12/29/49 | 280,000 | 260,400 | |||||
| •# | Liberty Mutual Group 144A | |||||||
| 7.00% 3/15/37 | 180,000 | 173,355 | ||||||
| MetLife 6.817% 8/15/18 | 500,000 | 578,985 | ||||||
| # | MetLife Capital Trust X 144A | |||||||
| 9.25% 4/8/38 | 1,400,000 | 1,697,499 | ||||||
| @# | NLV Financial 144A | |||||||
| 6.50% 3/15/35 | 385,000 | 298,931 | ||||||
| Prudential Financial | ||||||||
| 3.875% 1/14/15 | 830,000 | 858,978 | ||||||
| 4.50% 11/15/20 | 345,000 | 338,581 | ||||||
| •# | Symetra Financial 144A | |||||||
| 8.30% 10/15/37 | 515,000 | 526,588 | ||||||
| =‡w@# | Twin Reefs Pass | |||||||
| Through Trust 144A | ||||||||
| 0.00% 12/31/49 | 300,000 | 0 | ||||||
| •∏ | XL Group 6.50% 12/29/49 | 275,000 | 255,063 | |||||
| •# | ZFS Finance USA Trust II | |||||||
| 144A 6.45% 12/15/65 | 500,000 | 515,000 | ||||||
| •# | ZFS Finance USA Trust IV | |||||||
| 144A 5.875% 5/9/32 | 500,000 | 500,021 | ||||||
| 10,788,443 | ||||||||
| Natural Gas – 0.18% | ||||||||
| AmeriGas Partners | ||||||||
| 6.50% 5/20/21 | 170,000 | 174,675 | ||||||
| 7.125% 5/20/16 | 66,000 | 68,805 | ||||||
| CenterPoint Energy | ||||||||
| 5.95% 2/1/17 | 690,000 | 751,896 | ||||||
| # | Inergy Finance 144A | |||||||
| 6.875% 8/1/21 | 125,000 | 130,469 | ||||||
| * | Sempra Energy | |||||||
| 6.15% 6/15/18 | 580,000 | 652,277 | ||||||
| 1,778,122 | ||||||||
| Real Estate – 1.08% | ||||||||
| Brandywine Operating | ||||||||
| Partnership | ||||||||
| 4.95% 4/15/18 | 755,000 | 746,163 | ||||||
| Developers Diversified Realty | ||||||||
| 4.75% 4/15/18 | 310,000 | 302,201 | ||||||
| 5.375% 10/15/12 | 531,000 | 550,544 | ||||||
| 7.50% 4/1/17 | 625,000 | 705,808 | ||||||
| 7.875% 9/1/20 | 100,000 | 114,860 | ||||||
| 9.625% 3/15/16 | 145,000 | 176,824 | ||||||
| Digital Realty Trust | ||||||||
| 5.25% 3/15/21 | 505,000 | 497,808 | ||||||
| 5.875% 2/1/20 | 425,000 | 444,349 | ||||||
| HCP 5.375% 2/1/21 | 2,300,000 | 2,327,134 | ||||||
| Health Care REIT | ||||||||
| 5.25% 1/15/22 | 1,235,000 | 1,207,389 | ||||||
| Host Marriott | ||||||||
| 6.375% 3/15/15 | 245,000 | 251,431 | ||||||
| Qatari Diar Finance | ||||||||
| 3.50% 7/21/15 | 2,100,000 | 2,110,501 | ||||||
| # | Qatari Diar Finance 144A | |||||||
| 5.00% 7/21/20 | 486,000 | 482,302 | ||||||
| Regency Centers | ||||||||
| 4.80% 4/15/21 | 420,000 | 410,948 | ||||||
| 5.875% 6/15/17 | 285,000 | 312,719 | ||||||
| Ventas Realty 6.50% 6/1/16 | 120,000 | 124,192 | ||||||
| 10,765,173 | ||||||||
| Technology – 0.37% | ||||||||
| * | Amkor Technology | |||||||
| 7.375% 5/1/18 | 125,000 | 130,000 | ||||||
| Analog Devices | ||||||||
| 3.00% 4/15/16 | 555,000 | 552,413 | ||||||
| Fidelity National Information | ||||||||
| Services 7.875% 7/15/20 | 75,000 | 82,313 | ||||||
| First Data | ||||||||
| 9.875% 9/24/15 | 230,000 | 236,900 | ||||||
| 11.25% 3/31/16 | 160,000 | 160,200 | ||||||
| Jabil Circuit 7.75% 7/15/16 | 82,000 | 93,480 | ||||||
| National Semiconductor | ||||||||
| 6.60% 6/15/17 | 1,150,000 | 1,267,074 | ||||||
| * | Sanmina-SCI 8.125% 3/1/16 | 319,000 | 331,760 | |||||
| # | Seagate Technology | |||||||
| International 144A | ||||||||
| 10.00% 5/1/14 | 580,000 | 678,600 | ||||||
| # | Unisys 144A | |||||||
| 12.75% 10/15/14 | 142,000 | 169,335 | ||||||
| 3,702,075 | ||||||||
| Transportation – 0.80% | ||||||||
| w | American Airlines 2011-1 | |||||||
| Class A Pass Through | ||||||||
| Trust 5.25% 1/31/21 | 600,000 | 582,000 | ||||||
| # | Ashtead Capital 144A | |||||||
| 9.00% 8/15/16 | 200,000 | 211,500 | ||||||
52
| Principal | Value | ||||||
| Amount° | (U.S. $) | ||||||
| Corporate Bonds (continued) | |||||||
| Transportation (continued) | |||||||
| Burlington Northern Santa Fe | |||||||
| 3.60% 9/1/20 | USD | 165,000 | $ | 156,813 | |||
| 4.70% 10/1/19 | 1,095,000 | 1,145,293 | |||||
| 5.65% 5/1/17 | 380,000 | 423,674 | |||||
| 5.75% 3/15/18 | 60,000 | 66,955 | |||||
| Canadian Pacific Railway | |||||||
| 4.45% 3/15/23 | 1,305,000 | 1,263,923 | |||||
| w | Continental Airlines 2009-2 | ||||||
| Class A Pass Through | |||||||
| Trust 7.25% 5/10/21 | 875,137 | 945,148 | |||||
| w | Delta Air Lines 2007-1 Class A | ||||||
| Pass Through Trust | |||||||
| 6.821% 8/10/22 | 392,449 | 405,203 | |||||
| w | Delta Air Lines 2010-1 Class | ||||||
| A Pass Through Trust | |||||||
| 6.20% 7/2/18 | 494,146 | 512,677 | |||||
| Kansas City Southern Railway | |||||||
| 13.00% 12/15/13 | 2,000 | 2,395 | |||||
| @ | Northwest Airlines | ||||||
| 10.00% 2/1/11 | 65,000 | 559 | |||||
| Russian Railways | |||||||
| 5.739% 4/3/17 | 1,000,000 | 1,045,950 | |||||
| w | UAL 2009-1 Pass Through | ||||||
| Trust 10.40% 11/1/16 | 472,153 | 540,616 | |||||
| w | UAL 2009-2A Pass Through | ||||||
| Trust 9.75% 1/15/17 | 276,856 | 315,615 | |||||
| # | United Air Lines 144A | ||||||
| 12.00% 11/1/13 | 282,000 | 307,733 | |||||
| 7,926,054 | |||||||
| Total Corporate Bonds | |||||||
| (cost $420,577,733) | 429,999,998 | ||||||
| Municipal Bonds – 0.72% | |||||||
| Bay Area Toll | |||||||
| Authority California | |||||||
| 6.918% 4/1/40 | 800,000 | 817,008 | |||||
| 7.043% 4/1/50 | 3,000,000 | 3,103,500 | |||||
| California State | |||||||
| 7.30% 10/1/39 | 200,000 | 213,046 | |||||
| Los Angeles, California | |||||||
| Community College | |||||||
| District Revenue | |||||||
| Build America Bonds | |||||||
| 6.60% 8/1/42 | 800,000 | 838,200 | |||||
| New York City Transitional | |||||||
| Finance Authority | |||||||
| 5.508% 8/1/37 | 700,000 | 681,730 | |||||
| New York State | |||||||
| Urban Development | |||||||
| 5.77% 3/15/39 | 800,000 | 808,880 | |||||
| Oregon State Taxable Pension | |||||||
| 5.892% 6/1/27 | 65,000 | 67,629 | |||||
| •§ | Puerto Rico Sales Tax | ||||||
| Financing 1st Subordinate | |||||||
| Series B 5.00% 8/1/39-11 | 585,000 | 594,220 | |||||
| Sacramento County, | |||||||
| California Public Finance | |||||||
| Authority Revenue | |||||||
| (Housing Tax County | |||||||
| Project) Series B | |||||||
| 5.18% 12/1/13 | |||||||
| (NATL-RE) (FGIC) | 60,000 | 60,500 | |||||
| Total Municipal Bonds | |||||||
| (cost $7,083,582) | 7,184,713 | ||||||
| Non-Agency Asset-Backed Securities – 1.24% | |||||||
| • | Ally Master Owner Trust | ||||||
| Series 2011-1 A1 | |||||||
| 1.125% 1/15/16 | 730,000 | 732,459 | |||||
| • | American Express Credit | ||||||
| Account Master | |||||||
| Trust Series 2010-1 B | |||||||
| 0.855% 11/16/15 | 405,000 | 405,005 | |||||
| • | Bank of America Credit | ||||||
| Card Trust | |||||||
| Series 2006-A12 A12 | |||||||
| 0.275% 3/15/14 | 1,000,000 | 998,731 | |||||
| Series 2008-A5 A5 | |||||||
| 1.455% 12/16/13 | 1,245,000 | 1,248,779 | |||||
| Capital Auto Receivables | |||||||
| Asset Trust Series 2008-1 | |||||||
| A3A 3.86% 8/15/12 | 106,616 | 107,210 | |||||
| Capital One Multi-Asset | |||||||
| Execution Trust | |||||||
| Series 2007-A7 A7 | |||||||
| 5.75% 7/15/20 | 685,000 | 774,676 | |||||
| Centex Home Equity | |||||||
| Series 2002-A AF6 | |||||||
| 5.54% 1/25/32 | 26,012 | 26,008 | |||||
| # | CIT Equipment Collateral 144A | ||||||
| Series 2009-VT1 A3 | |||||||
| 3.07% 8/15/16 | 360,495 | 363,191 | |||||
| Series 2010-VT1A A3 | |||||||
| 2.41% 5/15/13 | 350,000 | 352,508 | |||||
| • | Citibank Credit Card Issuance | ||||||
| Trust Series 2004-C1 C1 | �� | ||||||
| 0.905% 7/15/13 | 460,000 | 459,462 | |||||
| Citicorp Residential | |||||||
| Mortgage Securities | |||||||
| Series 2006-3 A4 | |||||||
| 5.703% 11/25/36 | 900,000 | 890,131 | |||||
| Series 2006-3 A5 | |||||||
| 5.948% 11/25/36 | 900,000 | 726,614 | |||||
| CNH Equipment Trust | |||||||
| Series 2008-A A4A | |||||||
| 4.93% 8/15/14 | 227,888 | 232,351 | |||||
| Series 2009-C A3 | |||||||
| 1.85% 12/16/13 | 226,270 | 227,442 | |||||
| • | Countrywide Asset-Backed | ||||||
| Certificates Series 2006-11 | |||||||
| 1AF6 5.938% 9/25/46 | 1,343,457 | 886,553 | |||||
(continues) 53
Statements of net assets
Optimum Fixed Income Fund
| Principal | Value | ||||||
| Amount° | (U.S. $) | ||||||
| Non-Agency Asset-Backed Securities (continued) | |||||||
| Discover Card Master Trust | |||||||
| Series 2007-A1 A1 | |||||||
| 5.65% 3/16/20 | USD | 450,000 | $ | 504,759 | |||
| # | Ford Auto Securitization Trust | ||||||
| Series 2011-R1A A3 144A | |||||||
| 3.02% 2/15/16 | CAD | 340,000 | 350,239 | ||||
| Ford Credit Auto Owner | |||||||
| Trust Series 2010-B B | |||||||
| 2.54% 2/15/16 | USD | 350,000 | 350,641 | ||||
| • | Ford Credit Floorplan | ||||||
| Master Owner Trust | |||||||
| Series 2009-2 A | |||||||
| 1.805% 9/15/14 | 385,000 | 390,184 | |||||
| Harley-Davidson | |||||||
| Motorcycle Trust | |||||||
| Series 2008-1 A4 | |||||||
| 4.90% 12/15/13 | 560,000 | 576,100 | |||||
| Series 2009-4 A3 | |||||||
| 1.87% 2/17/14 | 200,000 | 201,237 | |||||
| • | HSI Asset Securitization Trust | ||||||
| Series 2006-HE1 2A1 | |||||||
| 0.30% 10/25/36 | 126,852 | 99,275 | |||||
| • | MBNA Credit Card Master | ||||||
| Note Trust Series 2002-C3 | |||||||
| C3 1.605% 10/15/14 | 520,000 | 522,066 | |||||
| • | Merrill Auto Trust | ||||||
| Securitization | |||||||
| Series 2007-1 A4 | |||||||
| 0.315% 12/15/13 | 84,051 | 84,000 | |||||
| • | SLM Student Loan Trust | ||||||
| Series 2005-4 A2 | |||||||
| 0.383% 4/26/21 | 715,355 | 713,034 | |||||
| • | Vanderbilt Mortgage Finance | ||||||
| Series 2001-A A4 | |||||||
| 7.235% 6/7/28 | 78,228 | 82,348 | |||||
| World Omni Auto | |||||||
| Receivables Trust | |||||||
| Series 2008-A A3A | |||||||
| 3.94% 10/15/12 | 42,349 | 42,496 | |||||
| Total Non-Agency | |||||||
| Asset-Backed Securities | |||||||
| (cost $12,678,662) | 12,347,499 | ||||||
| Non-Agency Collateralized Mortgage Obligations – 6.21% | |||||||
| • | ARM Trust | ||||||
| Series 2004-5 3A1 | |||||||
| 4.856% 4/25/35 | 3,328,466 | 3,150,210 | |||||
| Series 2005-10 3A11 | |||||||
| 5.286% 1/25/36 | 400,215 | 349,572 | |||||
| Series 2005-10 3A31 | |||||||
| 5.286% 1/25/36 | 1,145,000 | 1,005,983 | |||||
| Series 2006-2 1A4 | |||||||
| 5.516% 5/25/36 | 1,440,000 | 1,130,956 | |||||
| Bank of America Alternative | |||||||
| Loan Trust | |||||||
| Series 2004-11 1CB1 | |||||||
| 6.00% 12/25/34 | 1,494 | 1,460 | |||||
| Series 2005-3 2A1 | |||||||
| 5.50% 4/25/20 | 82,748 | 79,883 | |||||
| Series 2005-6 7A1 | |||||||
| 5.50% 7/25/20 | 267,300 | 256,470 | |||||
| Series 2005-9 5A1 | |||||||
| 5.50% 10/25/20 | 247,212 | 238,509 | |||||
| Bank of America Funding | |||||||
| Series 2006-5 2A10 | |||||||
| 5.75% 9/25/36 | 1,066,558 | 1,066,016 | |||||
| Chase Mortgage Finance | |||||||
| Series 2003-S8 A2 | |||||||
| 5.00% 9/25/18 | 132,003 | 136,331 | |||||
| •Series 2005-A1 3A1 | |||||||
| 5.293% 12/25/35 | 482,690 | 439,213 | |||||
| • | Chaseflex Trust Series 2006-1 | ||||||
| A4 6.237% 6/25/36 | 420,000 | 343,988 | |||||
| Citicorp Mortgage Securities | |||||||
| Series 2006-4 3A1 | |||||||
| 5.50% 8/25/21 | 131,021 | 132,057 | |||||
| • | Citigroup Mortgage Loan | ||||||
| Trust Series 2004-UST1 | |||||||
| A6 5.074% 8/25/34 | 149,487 | 153,569 | |||||
| Countrywide Alternative | |||||||
| Loan Trust | |||||||
| Series 2003-21T1 A2 | |||||||
| 5.25% 12/25/33 | 261,996 | 265,268 | |||||
| Series 2004-1T1 A2 | |||||||
| 5.50% 2/25/34 | 63,175 | 63,076 | |||||
| Series 2004-14T2 A6 | |||||||
| 5.50% 8/25/34 | 229,412 | 231,528 | |||||
| Series 2004-J1 1A1 | |||||||
| 6.00% 2/25/34 | 7,829 | 8,035 | |||||
| Series 2004-J2 7A1 | |||||||
| 6.00% 12/25/33 | 8,788 | 8,764 | |||||
| Series 2008-2R 3A1 | |||||||
| 6.00% 8/25/37 | 3,830,380 | 3,178,717 | |||||
| w | Countrywide Home Loan | ||||||
| Mortgage Pass | |||||||
| Through Trust | |||||||
| •Series 2003-21 A1 | |||||||
| 2.916% 5/25/33 | 5,356 | 4,657 | |||||
| Series 2006-1 A2 | |||||||
| 6.00% 3/25/36 | 267,079 | 238,936 | |||||
| Series 2006-17 A5 | |||||||
| 6.00% 12/25/36 | 369 | 365 | |||||
| •Series 2006-HYB1 3A1 | |||||||
| 2.803% 3/20/36 | 394,281 | 244,596 | |||||
| Series 2007-4 1A1 | |||||||
| 6.00% 5/25/37 | 4,551,031 | 3,753,508 | |||||
| Credit Suisse First Boston | |||||||
| Mortgage Securities | |||||||
| Series 2004-1 3A1 | |||||||
| 7.00% 2/25/34 | 3,659 | 3,826 | |||||
54
| Principal | Value | ||||||
| Amount° | (U.S. $) | ||||||
| Non-Agency Collateralized Mortgage Obligations (continued) | |||||||
| Credit Suisse Mortgage | |||||||
| Capital Certificates | |||||||
| #Series 2005-1R 2A5 144A | |||||||
| 5.75% 12/26/35 | USD | 5,797,340 | $ | 4,180,752 | |||
| Series 2007-1 5A14 | |||||||
| 6.00% 2/25/37 | 987,423 | 846,481 | |||||
| •Series 2007-3 4A6 | |||||||
| 0.50% 4/25/37 | 2,273,267 | 2,000,403 | |||||
| •@Series 2007-3 4A12 | |||||||
| 6.501% 4/25/37 | 2,273,267 | 278,870 | |||||
| Series 2007-3 4A15 | |||||||
| 5.50% 4/25/37 | 849,013 | 769,588 | |||||
| Series 2007-5 3A19 | |||||||
| 6.00% 8/25/37 | 1,600,070 | 1,423,795 | |||||
| Series 2007-5 10A2 | |||||||
| 6.00% 4/25/29 | 673,813 | 656,729 | |||||
| •# | Deutsche Mortgage | ||||||
| Securities Series | |||||||
| 2005-WF1 1A3 144A | |||||||
| 5.217% 6/26/35 | 1,720,000 | 1,660,094 | |||||
| • | First Horizon Asset Securities | ||||||
| Series 2005-AR2 2A1 | |||||||
| 2.869% 6/25/35 | 414,606 | 351,855 | |||||
| GMAC Mortgage Loan | |||||||
| Trust Series 2006-J1 A1 | |||||||
| 5.75% 4/25/36 | 702,483 | 676,409 | |||||
| # | GSMPS Mortgage Loan | ||||||
| Trust 144A | |||||||
| •Series 1998-3 A | |||||||
| 7.75% 9/19/27 | 16,624 | 16,812 | |||||
| •Series 1999-3 A | |||||||
| 8.00% 8/19/29 | 26,640 | 26,750 | |||||
| Series 2005-RP1 1A3 | |||||||
| 8.00% 1/25/35 | 267,480 | 267,409 | |||||
| Series 2005-RP1 1A4 | |||||||
| 8.50% 1/25/35 | 114,370 | 112,032 | |||||
| • | GSR Mortgage Loan Trust | ||||||
| Series 2006-AR1 3A1 | |||||||
| 5.124% 1/25/36 | 246,648 | 215,692 | |||||
| • | Indymac INDA Mortgage | ||||||
| Loan Trust Series 2006- | |||||||
| AR1 A1 5.64% 8/25/36 | 608,344 | 585,362 | |||||
| • | JPMorgan Mortgage Trust | ||||||
| Series 2006-A6 2A4L | |||||||
| 5.445% 10/25/36 | 1,590,000 | 1,325,879 | |||||
| Series 2006-A7 2A2 | |||||||
| 5.653% 1/25/37 | 382,735 | 279,999 | |||||
| Series 2007-A1 6A1 | |||||||
| 4.784% 7/25/35 | 1,239,473 | 1,167,180 | |||||
| Lehman Mortgage Trust | |||||||
| Series 2005-2 2A3 | |||||||
| 5.50% 12/25/35 | 81,990 | 80,045 | |||||
| Series 2007-10 2A2 | |||||||
| 6.50% 1/25/38 | 5,602,577 | 4,936,152 | |||||
| MASTR Alternative Loans Trust | |||||||
| Series 2004-3 8A1 | |||||||
| 7.00% 4/25/34 | 6,392 | 6,093 | |||||
| Series 2004-5 6A1 | |||||||
| 7.00% 6/25/34 | 102,886 | 101,223 | |||||
| • | MASTR ARM Trust | ||||||
| Series 2003-6 1A2 | |||||||
| 2.575% 12/25/33 | 4,216 | 4,083 | |||||
| Series 2005-6 7A1 | |||||||
| 5.368% 6/25/35 | 147,776 | 127,699 | |||||
| Series 2006-2 4A1 | |||||||
| 4.972% 2/25/36 | 39,387 | 37,077 | |||||
| MASTR Asset | |||||||
| Securitization Trust | |||||||
| Series 2003-9 2A7 | |||||||
| 5.50% 10/25/33 | 257,907 | 265,298 | |||||
| Series 2004-4 2A1 | |||||||
| 5.00% 4/25/34 | 33,092 | 33,074 | |||||
| # | MASTR Reperforming Loan | ||||||
| Trust Series 2005-1 1A5 | |||||||
| 144A 8.00% 8/25/34 | 113,091 | 115,239 | |||||
| •# | MASTR Specialized Loan | ||||||
| Trust Series 2005-2 A2 | |||||||
| 144A 5.006% 7/25/35 | 120,440 | 119,842 | |||||
| • | Merrill Lynch Mortgage | ||||||
| Investors Series 2005-A5 | |||||||
| A2 2.753% 6/25/35 | 460,000 | 424,156 | |||||
| • | Opteum Mortgage | ||||||
| Acceptance Series 2006-1 | |||||||
| 2A1 5.75% 4/25/36 | 4,820,814 | 4,368,704 | |||||
| Residential Accredit Loans | |||||||
| Series 2004-QS2 CB | |||||||
| 5.75% 2/25/34 | 84,047 | 84,528 | |||||
| Residential Funding | |||||||
| Mortgage Securities I | |||||||
| Series 2004-S9 2A1 | |||||||
| 4.75% 12/25/19 | 857,972 | 870,493 | |||||
| • | Sequoia Mortgage Trust | ||||||
| Series 2007-1 4A1 | |||||||
| 5.486% 9/20/46 | 2,138,795 | 1,829,951 | |||||
| • | Structured ARM Loan Trust | ||||||
| Series 2005-22 1A4 | |||||||
| 2.569% 12/25/35 | 2,120,000 | 926,959 | |||||
| Series 2006-1 7A4 | |||||||
| 5.62% 2/25/36 | 1,305,000 | 856,131 | |||||
| Series 2006-5 5A4 | |||||||
| 5.423% 6/25/36 | 14,457 | 3,779 | |||||
| Structured Asset Securities | |||||||
| Series 2005-6 4A1 | |||||||
| 5.00% 5/25/35 | 240,015 | 236,050 | |||||
| w | Washington Mutual | ||||||
| Alternative Mortgage | |||||||
| Pass Through Certificates | |||||||
| Series 2005-1 5A2 | |||||||
| 6.00% 3/25/35 | 88,540 | 55,324 | |||||
(continues) 55
Statements of net assets
Optimum Fixed Income Fund
| Principal | Value | ||||||||
| Amount° | (U.S. $) | ||||||||
| Non-Agency Collateralized Mortgage Obligations (continued) | |||||||||
| w | Washington Mutual | ||||||||
| Mortgage Pass | |||||||||
| Through Certificates | |||||||||
| Series 2004-CB3 1A | |||||||||
| 6.00% 10/25/34 | USD | 148,848 | $ | 154,710 | |||||
| •Series 2005-AR16 1A3 | |||||||||
| 2.589% 12/25/35 | 1,225,000 | 965,592 | |||||||
| •Series 2007-HY1 3A3 | |||||||||
| 5.709% 2/25/37 | 850,000 | 727,069 | |||||||
| •Series 2007-HY7 4A1 | |||||||||
| 5.695% 7/25/37 | 2,039,765 | 1,719,422 | |||||||
| Wells Fargo Mortgage- | |||||||||
| Backed Securities Trust | |||||||||
| Series 2005-18 1A1 | |||||||||
| 5.50% 1/25/36 | 57,917 | 56,719 | |||||||
| •Series 2005-AR13 A1 | |||||||||
| 5.261% 5/25/35 | 1,216,520 | 1,195,999 | |||||||
| Series 2006-2 3A1 | |||||||||
| 5.75% 3/25/36 | 386,666 | 380,096 | |||||||
| Series 2006-3 A1 | |||||||||
| 5.50% 3/25/36 | 428,739 | 432,382 | |||||||
| Series 2006-3 A11 | |||||||||
| 5.50% 3/25/36 | 305,562 | 301,500 | |||||||
| Series 2006-4 1A8 | |||||||||
| 5.75% 4/25/36 | 19,540 | 19,618 | |||||||
| Series 2006-6 1A3 | |||||||||
| 5.75% 5/25/36 | 535,195 | 528,078 | |||||||
| •Series 2006-AR5 2A1 | |||||||||
| 3.202% 4/25/36 | 161,844 | 131,986 | |||||||
| •Series 2006-AR11 A6 | |||||||||
| 5.217% 8/25/36 | 2,330,000 | 2,038,836 | |||||||
| •Series 2006-AR17 A1 | |||||||||
| 4.852% 10/25/36 | 1,555,369 | 1,289,702 | |||||||
| •Series 2006-AR19 A1 | |||||||||
| 5.476% 12/25/36 | 657,674 | 617,840 | |||||||
| Series 2007-10 1A36 | |||||||||
| 6.00% 7/25/37 | 1,890,631 | 1,840,113 | |||||||
| Series 2007-13 A7 | |||||||||
| 6.00% 9/25/37 | 365,629 | 354,594 | |||||||
| Series 2007-13 A9 | |||||||||
| 6.00% 9/25/37 | 570,485 | 286,489 | |||||||
| Total Non-Agency Collateralized | |||||||||
| Mortgage Obligations | |||||||||
| (cost $63,740,805) | 61,850,229 | ||||||||
| Regional Bonds – 0.37%Δ | |||||||||
| Australia – 0.08% | |||||||||
| New South Wales Treasury | |||||||||
| Inflation-Linked | |||||||||
| 2.75% 11/20/25 | AUD | 717,000 | 780,373 | ||||||
| 780,373 | |||||||||
| Canada – 0.29% | |||||||||
| Ontario Province | |||||||||
| 4.40% 6/2/19 | CAD | 2,650,000 | 2,841,671 | ||||||
| 2,841,671 | |||||||||
| Total Regional Bonds | |||||||||
| (cost $3,302,249) | 3,622,044 | ||||||||
| Securities Sold Short – (0.54%) | |||||||||
| Agency Mortgage-Backed Securities – (0.54%) | |||||||||
| Fannie Mae S.F. 30 yr TBA | |||||||||
| 5.50% 4/1/41 | USD | (1,865,000 | ) | (1,994,134 | ) | ||||
| 6.50% 4/1/41 | (3,000,000 | ) | (3,362,343 | ) | |||||
| Total Securities Sold Short | |||||||||
| (proceeds $5,414,049) | (5,356,477 | ) | |||||||
| «Senior Secured Loans – 3.34% | |||||||||
| Advantage Sales & Marketing | |||||||||
| 5.25% 11/29/17 | 294,263 | 295,365 | |||||||
| Affinion Group Tranche B | |||||||||
| 5.00% 10/7/16 | 197,952 | 198,076 | |||||||
| Alliance HealthCare Services | |||||||||
| 5.50% 6/1/16 | 253,115 | 254,223 | |||||||
| Allied Security Holdings | |||||||||
| Tranche B | |||||||||
| 5.00% 1/21/17 | 150,000 | 151,156 | |||||||
| Tranche 2L | |||||||||
| 8.50% 1/21/18 | 330,000 | 335,775 | |||||||
| Anchor Glass Container | |||||||||
| 6.00% 2/3/16 | 320,715 | 324,323 | |||||||
| Aspect Software Tranche B | |||||||||
| 6.25% 5/7/16 | 138,950 | 140,513 | |||||||
| ATI Holdings 7.75% 3/12/16 | 203,040 | 205,197 | |||||||
| Attachmate 6.50% 11/21/16 | 650,000 | 646,480 | |||||||
| AutoTrader.com Tranche B | |||||||||
| 4.75% 11/16/16 | 100,000 | 100,709 | |||||||
| AZ Chem US | |||||||||
| 4.75% 11/19/16 | 160,106 | 161,057 | |||||||
| BNY ConvergEx Group | |||||||||
| 5.25% 11/29/16 | 229,425 | 231,218 | |||||||
| 8.75% 11/29/17 | 340,000 | 350,200 | |||||||
| Bresnan Broadband Holdings | |||||||||
| 4.50% 12/6/17 | 428,925 | 432,172 | |||||||
| Brickman Group | |||||||||
| Holdings Tranche B | |||||||||
| 7.25% 10/14/16 | 174,563 | 178,299 | |||||||
| Brock Holdings III | |||||||||
| 10.00% 2/15/18 | 215,000 | 221,450 | |||||||
| Tranche B | |||||||||
| 6.00% 2/15/17 | 110,000 | 110,344 | |||||||
| Burlington Coat Factory | |||||||||
| Warehouse Tranche B | |||||||||
| 6.25% 2/10/17 | 305,000 | 301,950 | |||||||
| Butler Animal Health | |||||||||
| Supply Tranche B | |||||||||
| 5.50% 12/31/15 | 102,606 | 102,927 | |||||||
| BWAY Holding Tranche B | |||||||||
| 4.50% 2/9/18 | 177,758 | 178,800 | |||||||
| Caesars Entertainment | |||||||||
| Operating Tranche B1 | |||||||||
| 3.30% 1/28/15 | 535,000 | 498,470 | |||||||
| Calpine Tranche B | |||||||||
| 4.50% 3/1/18 | 480,000 | 482,585 | |||||||
56
| Principal | Value | ||||||
| Amount° | (U.S. $) | ||||||
| «Senior Secured Loans (continued) | |||||||
| Cengage Learning | |||||||
| Acquisitions | |||||||
| 2.55% 7/3/14 | USD | 99,742 | $ | 95,739 | |||
| 7.50% 7/7/14 | 246,325 | 248,481 | |||||
| Charter Communications | |||||||
| Operating Tranche B | |||||||
| 8.50% 3/6/14 | 341,823 | 347,762 | |||||
| Chester Downs & Marina | |||||||
| 12.38% 12/31/16 | 270,244 | 276,549 | |||||
| CIT Group Tranche 3-DD | |||||||
| 6.25% 8/11/15 | 2,000,000 | 2,035,000 | |||||
| Citadel Broadcasting Tranche B | |||||||
| 4.25% 11/29/16 | 193,050 | 193,411 | |||||
| CityCenter Holdings | |||||||
| 7.50% 1/10/15 | 95,000 | 96,223 | |||||
| Clear Channel | |||||||
| Communications Tranche B | |||||||
| 3.91% 1/29/16 | 404,891 | 357,407 | |||||
| CommScope Tranche B | |||||||
| 5.00% 1/3/18 | 234,000 | 236,173 | |||||
| Community Health Systems | |||||||
| 3.81% 1/25/17 | 466,728 | 466,614 | |||||
| Darling International Tranche B | |||||||
| 5.14% 11/9/16 | 125,333 | 126,509 | |||||
| DaVita Tranche B | |||||||
| 4.50% 10/20/16 | 498,750 | 502,044 | |||||
| Del Monte Foods Tranche B | |||||||
| 4.50% 11/26/17 | 370,000 | 371,003 | |||||
| Delos Aircraft Tranche 2 | |||||||
| 7.00% 3/17/16 | 59,231 | 60,157 | |||||
| Delta Air Lines 4.25% 2/22/16 | 180,499 | 179,409 | |||||
| DineEquity Tranche B | |||||||
| 4.25% 10/31/17 | 272,035 | 274,415 | |||||
| Dunkin Brands Tranche B | |||||||
| 4.25% 11/23/17 | 299,250 | 301,463 | |||||
| Fifth Third Processing | |||||||
| Solutions | |||||||
| 8.50% 11/3/17 | 415,000 | 423,508 | |||||
| Tranche B 5.50% 11/3/16 | 204,488 | 205,638 | |||||
| First Data Tranche B2 | |||||||
| 3.00% 9/24/14 | 500,000 | 480,000 | |||||
| Ford Motor Tranche B | |||||||
| 3.01% 12/15/13 | 1,314,839 | 1,316,002 | |||||
| Fresenius Medical Care | |||||||
| Tranche B 1.68% 3/31/13 | 2,000,000 | 1,998,130 | |||||
| GenOn Energy Tranche B | |||||||
| 6.00% 6/20/17 | 149,250 | 151,190 | |||||
| Getty Images 5.25% 11/4/16 | 164,175 | 165,699 | |||||
| Goodman Global Tranche B | |||||||
| 5.75% 10/28/16 | 174,125 | 175,104 | |||||
| Graham Packaging | |||||||
| Tranche C 6.75% 4/5/14 | 483,715 | 487,890 | |||||
| Tranche D 6.00% 9/23/16 | 144,275 | 145,808 | |||||
| Gray Television Tranche B | |||||||
| 3.76% 12/31/14 | 491,625 | 488,211 | |||||
| Grifols Tranche B | |||||||
| 6.00% 6/4/16 | 465,000 | 469,155 | |||||
| HCA | |||||||
| Tranche B | |||||||
| 3.55% 11/18/13 | 1,000,000 | 997,065 | |||||
| Tranche B2 | |||||||
| 3.54% 3/31/17 | 545,000 | 544,700 | |||||
| HGI Holdings 6.75% 7/27/17 | 311,025 | 313,746 | |||||
| Houghton International | |||||||
| Tranche B 6.75% 1/11/16 | 233,992 | 236,187 | |||||
| ICL Industrial Contrainers | |||||||
| Tranche C 4.50% 2/9/18 | 15,782 | 15,874 | |||||
| infoGROUP Tranche B | |||||||
| 6.25% 3/30/16 | 223,875 | 226,114 | |||||
| Intelsat Jackson Holding | |||||||
| Tranche B 5.25% 4/3/18 | 590,000 | 594,947 | |||||
| International Lease Finance | |||||||
| Tranche 1 6.75% 3/17/15 | 80,769 | 81,325 | |||||
| Isle of Capri Casinos | |||||||
| 4.75% 3/1/17 | 170,000 | 171,097 | |||||
| Jo-Ann Stores Tranche B | |||||||
| 4.75% 12/23/17 | 145,000 | 143,868 | |||||
| JohnsonDiversey Tranche B | |||||||
| 5.50% 11/24/15 | 239,559 | 241,056 | |||||
| Knology Tranche B | |||||||
| 4.00% 8/8/17 | 295,000 | 295,329 | |||||
| Level 3 Financing Tranche B | |||||||
| 11.50% 3/13/14 | 174,000 | 186,528 | |||||
| Live Nation Entertainment | |||||||
| Tranche B 4.50% 11/6/16 | 277,900 | 279,290 | |||||
| MedAssets Tranche B | |||||||
| 5.25% 11/15/16 | 144,638 | 145,700 | |||||
| Mediacom Illinois Tranche D | |||||||
| 5.50% 3/31/17 | 314,303 | 314,814 | |||||
| MGM MIRAGE Tranche E | |||||||
| 7.00% 2/21/14 | 288,314 | 284,152 | |||||
| Multiplan 4.75% 8/26/17 | 540,000 | 541,755 | |||||
| NBTY Tranche B | |||||||
| 4.25% 10/1/17 | 315,000 | 315,984 | |||||
| NRG Energy Credit Linked | |||||||
| Deposit 2.05% 2/1/13 | 2,000,000 | 1,994,290 | |||||
| Nuveen Investments | |||||||
| 5.80% 5/13/17 | 251,991 | 253,125 | |||||
| 2nd Lien 12.50% 7/9/15 | 143,000 | 153,904 | |||||
| Tranche B 3.30% 11/13/14 | 98,009 | 94,316 | |||||
| OSI Restaurant Partners | |||||||
| 2.63% 6/14/13 | 9,692 | 9,448 | |||||
| 2.63% 6/13/14 | 319,991 | 311,946 | |||||
| Pinnacle Foods Finance | |||||||
| Tranche D 6.00% 4/2/14 | 95,732 | 96,769 | |||||
| PQ 6.77% 7/30/15 | 937,000 | 926,693 | |||||
| Prime Healthcare Services | |||||||
| Tranche B 7.25% 4/28/15 | 401,963 | 396,938 | |||||
| RadNet Management Tranche B | |||||||
| 5.75% 4/2/16 | 218,090 | 219,180 | |||||
(continues) 57
Statements of net assets
Optimum Fixed Income Fund
| Principal | Value | ||||||
| Amount° | (U.S. $) | ||||||
| «Senior Secured Loans (continued) | |||||||
| Remy International Tranche B | |||||||
| 6.25% 12/16/16 | USD | 89,775 | $ | 91,122 | |||
| Reynolds & Reynolds | |||||||
| 5.25% 4/21/17 | 164,464 | 164,649 | |||||
| Rockwood Specialties Group | |||||||
| Tranche B 3.75% 1/25/18 | 180,000 | 181,294 | |||||
| Roundy’s Supermarkets | |||||||
| 10.00% 4/16/16 | 96,000 | 97,500 | |||||
| Sinclair Television | |||||||
| Group Tranche B | |||||||
| 4.00% 10/29/16 | 409,091 | 410,185 | |||||
| Smurfit-Stone Container | |||||||
| 6.75% 6/30/16 | 228,753 | 229,696 | |||||
| Texas Competitive Electric | |||||||
| Holdings Tranche B2 | |||||||
| 3.79% 10/10/14 | 696,294 | 587,766 | |||||
| Toys R Us Tranche B | |||||||
| 6.00% 9/1/16 | 328,350 | 330,854 | |||||
| TransDigm 1st Lien | |||||||
| 4.00% 2/3/17 | 209,475 | 211,139 | |||||
| Univision Communications | |||||||
| 4.51% 3/29/17 | 718,917 | 702,878 | |||||
| US TelePacific 5.75% 2/10/17 | 485,333 | 486,849 | |||||
| Viking Acquisition Tranche B | |||||||
| 6.00% 11/5/16 | 204,488 | 205,254 | |||||
| Visant 5.25% 12/31/16 | 458,850 | 458,605 | |||||
| Walter Industries Tranche B | |||||||
| 4.00% 2/3/18 | 155,000 | 156,201 | |||||
| Total Senior Secured Loans | |||||||
| (cost $32,627,954) | 33,276,115 | ||||||
| Sovereign Bonds – 8.73%Δ | |||||||
| Australia – 1.46% | |||||||
| Australian Government Bond | |||||||
| 4.50% 4/15/20 | AUD | 11,874,000 | 11,461,346 | ||||
| 6.00% 2/15/17 | AUD | 2,110,000 | 2,260,261 | ||||
| Australian Inflation-Linked | |||||||
| Bond 3.00% 9/20/25 | AUD | 717,000 | 806,973 | ||||
| 14,528,580 | |||||||
| Belgium – 0.11% | |||||||
| Belgium Government Bond | |||||||
| 4.25% 9/28/21 | EUR | 753,400 | 1,062,305 | ||||
| 1,062,305 | |||||||
| Brazil – 1.61% | |||||||
| *# | Banco Nacional de | ||||||
| Desenvolvimento | |||||||
| Economico e Social 144A | |||||||
| 6.369% 6/16/18 | USD | 1,500,000 | 1,638,750 | ||||
| 6.50% 6/10/19 | 2,500,000 | 2,737,500 | |||||
| Brazil Notas do Tesouro | |||||||
| Nacional Series F | |||||||
| 10.00% 1/1/17 | BRL | 15,800,000 | 8,609,526 | ||||
| Brazilian Government | |||||||
| International Bond | |||||||
| 7.125% 1/20/37 | USD | 820,000 | 973,750 | ||||
| 8.875% 10/14/19 | 820,000 | 1,084,450 | |||||
| 10.25% 1/10/28 | BRL | 894,000 | 547,693 | ||||
| *12.50% 1/5/22 | BRL | 660,000 | 471,053 | ||||
| 16,062,722 | |||||||
| Canada – 0.57% | |||||||
| Canada Housing | |||||||
| Trust No. 1 | |||||||
| 2.45% 12/15/15 | CAD | 3,500,000 | 3,544,220 | ||||
| Canadian | |||||||
| Government Bond | |||||||
| 3.75% 6/1/19 | CAD | 1,137,000 | 1,217,842 | ||||
| 4.00% 6/1/41 | CAD | 837,000 | 904,678 | ||||
| 5,666,740 | |||||||
| Chile – 0.11% | |||||||
| Chile Government | |||||||
| International Bond | |||||||
| 5.50% 8/5/20 | CLP | 544,000,000 | 1,122,548 | ||||
| 1,122,548 | |||||||
| Colombia – 0.17% | |||||||
| Colombia Government | |||||||
| International Bond | |||||||
| 7.75% 4/14/21 | COP | 1,182,000,000 | 684,379 | ||||
| *10.375% 1/28/33 | USD | 310,000 | 467,325 | ||||
| Republic of Colombia | |||||||
| 9.85% 6/28/27 | COP | 900,000,000 | 581,982 | ||||
| 1,733,686 | |||||||
| Croatia – 0.09% | |||||||
| Croatia Government | |||||||
| International Bond | |||||||
| 6.625% 7/14/20 | USD | 181,000 | 187,109 | ||||
| # | Croatia Government | ||||||
| International | |||||||
| Bond 144A | |||||||
| *6.375% 3/24/21 | 414,000 | 415,275 | |||||
| *6.75% 11/5/19 | 287,000 | 301,122 | |||||
| 903,506 | |||||||
| France – 0.09% | |||||||
| France Government | |||||||
| Bond O.A.T. | |||||||
| 3.75% 4/25/17 | EUR | 590,000 | 862,635 | ||||
| 862,635 | |||||||
| Germany – 0.02% | |||||||
| Deutschland Republic | |||||||
| 2.25% 9/4/20 | EUR | 192,000 | 249,158 | ||||
| 249,158 | |||||||
58
| Principal | Value | ||||||
| Amount° | (U.S. $) | ||||||
| Sovereign Bonds (continued) | |||||||
| Indonesia – 0.20% | |||||||
| Indonesia Treasury Bond | |||||||
| 10.50% 8/15/30 | IDR | 2,594,000,000 | $ | 330,377 | |||
| 11.00% 11/15/20 | IDR | 11,954,000,000 | 1,645,591 | ||||
| 1,975,968 | |||||||
| Italy – 0.10% | |||||||
| Italy Buoni Poliennali | |||||||
| Del Tesoro | |||||||
| 4.25% 3/1/20 | EUR | 706,000 | 974,310 | ||||
| 974,310 | |||||||
| Lithuania – 0.05% | |||||||
| *# | Lithuania Government | ||||||
| International | |||||||
| Bond 144A | |||||||
| 6.125% 3/9/21 | USD | 467,000 | 479,142 | ||||
| 479,142 | |||||||
| Mexico – 0.40% | |||||||
| Mexican Bonos | |||||||
| 7.50% 6/3/27 | MXN | 13,073,000 | 1,038,733 | ||||
| 7.75% 12/14/17 | MXN | 18,165,000 | 1,579,824 | ||||
| 8.50% 12/13/18 | MXN | 10,731,400 | 967,341 | ||||
| Mexico Government | |||||||
| International Bond | |||||||
| 5.95% 3/19/19 | USD | 332,000 | 371,674 | ||||
| 3,957,572 | |||||||
| New Zealand – 0.05% | |||||||
| New Zealand | |||||||
| Government Bond | |||||||
| 6.00% 5/15/21 | NZD | 610,000 | 477,464 | ||||
| 477,464 | |||||||
| Norway – 1.22% | |||||||
| Norway | |||||||
| Government Bond | |||||||
| 3.75% 5/25/21 | NOK | 2,484,000 | 446,668 | ||||
| 4.50% 5/22/19 | NOK | 29,886,000 | 5,700,421 | ||||
| 5.00% 5/15/15 | NOK | 25,050,000 | 4,823,195 | ||||
| 6.50% 5/15/13 | NOK | 6,000,000 | 1,165,829 | ||||
| 12,136,113 | |||||||
| Panama – 0.18% | |||||||
| Panama Government | |||||||
| International Bond | |||||||
| 6.70% 1/26/36 | USD | 302,000 | 340,505 | ||||
| 7.125% 1/29/26 | 340,000 | 405,110 | |||||
| 7.25% 3/15/15 | 355,000 | 414,463 | |||||
| 8.875% 9/30/27 | 451,000 | 611,105 | |||||
| 1,771,183 | |||||||
| Peru – 0.18% | |||||||
| Peruvian Government | |||||||
| International Bond | |||||||
| *7.125% 3/30/19 | 1,218,000 | 1,443,330 | |||||
| 7.35% 7/21/25 | 299,000 | 356,857 | |||||
| 1,800,187 | |||||||
| Philippines – 0.32% | |||||||
| Philippine Government | |||||||
| International Bond | |||||||
| 4.95% 1/15/21 | PHP | 56,000,000 | 1,269,757 | ||||
| 6.25% 1/14/36 | PHP | 14,000,000 | 306,535 | ||||
| 6.375% 10/23/34 | USD | 680,000 | 719,100 | ||||
| 6.50% 1/20/20 | 400,000 | 454,500 | |||||
| 9.375% 1/18/17 | 333,000 | 429,154 | |||||
| 3,179,046 | |||||||
| Poland – 0.25% | |||||||
| Poland | |||||||
| Government Bond | |||||||
| 5.00% 10/24/13 | PLN | 540,000 | 189,617 | ||||
| 5.50% 4/25/15 | PLN | 1,770,000 | 620,528 | ||||
| 5.50% 10/25/19 | PLN | 2,725,000 | 917,847 | ||||
| Poland Government | |||||||
| International Bond | |||||||
| 6.375% 7/15/19 | USD | 715,000 | 799,184 | ||||
| 2,527,176 | |||||||
| Qatar – 0.29% | |||||||
| Qatar Government | |||||||
| International Bond | |||||||
| 4.00% 1/20/15 | 2,800,000 | 2,905,000 | |||||
| 2,905,000 | |||||||
| Republic of Korea – 0.10% | |||||||
| @ | Korea Treasury Inflation- | ||||||
| Linked Bond | |||||||
| 2.75% 6/10/20 | KRW | 683,361,954 | 701,386 | ||||
| Republic of Korea | |||||||
| 4.25% 12/7/21 | EUR | 220,000 | 287,948 | ||||
| 989,334 | |||||||
| Russia – 0.21% | |||||||
| Russia Eurobond | |||||||
| 7.50% 3/31/30 | USD | 899,600 | 1,050,850 | ||||
| # | Russia Eurobond 144A | ||||||
| 7.50% 3/31/30 | 296,245 | 347,644 | |||||
| # | Russian Eurobond 144A | ||||||
| 7.85% 3/10/18 | RUB | 20,000,000 | 719,534 | ||||
| 2,118,028 | |||||||
| South Africa – 0.26% | |||||||
| South Africa | |||||||
| Government Bond | |||||||
| 7.25% 1/15/20 | ZAR | 9,048,000 | 1,225,364 | ||||
| South Africa | |||||||
| Government Bond | |||||||
| Inflation-Linked | |||||||
| 2.75% 1/31/22 | ZAR | 3,638,705 | 542,986 | ||||
| South Africa | |||||||
| Government | |||||||
| International Bond | |||||||
| 5.50% 3/9/20 | USD | 304,000 | 323,380 | ||||
| 6.50% 6/2/14 | 495,000 | 555,638 | |||||
| 2,647,368 | |||||||
(continues) 59
Statements of net assets
Optimum Fixed Income Fund
| Principal | Value | ||||||
| Amount° | (U.S. $) | ||||||
| Sovereign Bonds (continued) | |||||||
| Sweden – 0.18% | |||||||
| Sweden | |||||||
| Government Bond | |||||||
| 5.00% 12/1/20 | SEK | 9,910,000 | $ | 1,780,838 | |||
| 1,780,838 | |||||||
| Turkey – 0.17% | |||||||
| Turkey | |||||||
| Government Bond | |||||||
| 4.00% 4/29/15 | TRY | 1,396,032 | 972,229 | ||||
| Turkey Government | |||||||
| International Bond | |||||||
| 5.625% 3/30/21 | USD | 720,000 | 738,000 | ||||
| 1,710,229 | |||||||
| United Kingdom – 0.25% | |||||||
| United Kingdom Gilt | |||||||
| 4.50% 3/7/19 | GBP | 515,000 | 887,102 | ||||
| 4.75% 3/7/20 | GBP | 910,500 | 1,589,348 | ||||
| 2,476,450 | |||||||
| Uruguay – 0.09% | |||||||
| Uruguay Government | |||||||
| International Bond | |||||||
| 8.00% 11/18/22 | USD | 724,000 | 905,000 | ||||
| 905,000 | |||||||
| Total Sovereign Bonds | |||||||
| (cost $84,354,357) | 87,002,288 | ||||||
| Supranational Banks – 0.32% | |||||||
| European | |||||||
| Investment Bank | |||||||
| 9.00% 12/21/18 | ZAR | 8,200,000 | 1,210,768 | ||||
| International Bank for | |||||||
| Reconstruction & | |||||||
| Development | |||||||
| 3.375% 4/30/15 | NOK | 3,970,000 | 707,589 | ||||
| 3.625% 6/22/20 | NOK | 4,020,000 | 696,402 | ||||
| 6.00% 2/15/17 | AUD | 530,000 | 553,842 | ||||
| Total Supranational Banks | |||||||
| (cost $2,812,455) | 3,168,601 | ||||||
| U.S. Treasury Obligations – 6.64% | |||||||
| ∞ | U.S. Treasury Bond | ||||||
| 4.25% 11/15/40 | USD | 420,000 | 401,756 | ||||
| U.S. Treasury Inflation | |||||||
| Index Notes | |||||||
| 0.50% 4/15/15 | 1,209,278 | 1,256,705 | |||||
| 2.375% 4/15/11 | 776,657 | 779,388 | |||||
| 3.00% 7/15/12 | 489,928 | 525,142 | |||||
| 3.375% 1/15/12 | 620,120 | 650,254 | |||||
| U.S. Treasury Notes | |||||||
| *1.25% 3/15/14 | 135,000 | 134,979 | |||||
| 2.25% 3/31/16 | 39,070,000 | 39,121,845 | |||||
| *2.625% 11/15/20 | 5,900,000 | 5,506,358 | |||||
| 3.625% 8/15/19 | 7,100,000 | 7,340,733 | |||||
| 3.625% 2/15/20 | 6,200,000 | 6,369,533 | |||||
| *3.625% 2/15/21 | 3,990,000 | 4,047,356 | |||||
| Total U.S. Treasury Obligations | |||||||
| (cost $66,353,874) | 66,134,049 | ||||||
| Number of | |||||||
| Shares | |||||||
| Common Stock – 0.00% | |||||||
| =† | Century Communications | 1,975,000 | 0 | ||||
| † | Delta Air Lines | 23 | 225 | ||||
| † | GenOn Energy | 343 | 1,307 | ||||
| =∏† | PT Holdings | 295 | 3 | ||||
| Total Common Stock | |||||||
| (cost $253,205) | 1,535 | ||||||
| Convertible Preferred Stock – 0.09% | |||||||
| * | Apache 6.00% exercise | ||||||
| price $109.12, expiration | |||||||
| date 8/1/13 | 4,000 | 283,440 | |||||
| Bank of America | |||||||
| 7.25% exercise price | |||||||
| $50.00, expiration | |||||||
| date 12/31/49 | 135 | 136,553 | |||||
| # | Chesapeake Energy 144A | ||||||
| 5.75% exercise price | |||||||
| $27.94, expiration | |||||||
| date 12/31/49 | 158 | 213,695 | |||||
| HealthSouth 6.50% exercise | |||||||
| price $30.50, expiration | |||||||
| date 12/31/49 | 241 | 254,014 | |||||
| Total Convertible Preferred | |||||||
| Stock (cost $845,538) | 887,702 | ||||||
| Preferred Stock – 0.37% | |||||||
| Alabama Power 5.625% | 19,190 | 456,962 | |||||
| • | Ally Financial 8.25% | 10,000 | 249,615 | ||||
| # | GMAC 144A 7.00% | 1,900 | 1,768,068 | ||||
| • | GMAC Capital Trust I | ||||||
| 8.125% | 12,000 | 306,618 | |||||
| † | PNC Financial Services | ||||||
| Group 8.25% | 875,000 | 932,285 | |||||
| =† | PT Holdings | 59 | 0 | ||||
| Total Preferred Stock | |||||||
| (cost $3,717,413) | 3,713,548 | ||||||
| Warrant – 0.00% | |||||||
| =∏@† | Port Townsend | 59 | 1 | ||||
| Total Warrant (cost $1,416) | 1 | ||||||
60
| Principal | Value | ||||||||
| Amount° | (U.S. $) | ||||||||
| ≠Short-Term Investments – 10.18% | |||||||||
| Discount Notes – 7.09% | |||||||||
| Federal Home Loan Bank | |||||||||
| 0.001% 4/1/11 | USD | 4,427,676 | $ | 4,427,676 | |||||
| 0.001% 4/1/11 | 28,343,817 | 28,343,817 | |||||||
| 0.001% 4/14/11 | 2,282,499 | 2,282,490 | |||||||
| 0.01% 4/18/11 | 1,460,799 | 1,460,792 | |||||||
| 0.02% 4/27/11 | 11,037,023 | 11,036,946 | |||||||
| 0.03% 5/3/11 | 4,564,998 | 4,564,833 | |||||||
| 0.037% 5/23/11 | 5,843,197 | 5,842,858 | |||||||
| 0.04% 5/9/11 | 3,743,298 | 3,743,141 | |||||||
| 0.05% 5/16/11 | 4,564,998 | 4,564,769 | |||||||
| 0.06% 6/7/11 | 4,336,748 | 4,336,102 | |||||||
| 70,603,424 | |||||||||
| U.S. Treasury Obligations – 3.09% | |||||||||
| U.S. Treasury Bills | |||||||||
| 0.00% 4/28/11 | 4,716,556 | 4,716,404 | |||||||
| 0.09% 4/14/11 | 300,000 | 299,997 | |||||||
| 0.13% 4/15/11 | 800,000 | 799,992 | |||||||
| 0.16% 4/7/11 | 700,000 | 699,998 | |||||||
| 0.16% 9/1/11 | 1,100,000 | 1,099,370 | |||||||
| 0.16% 9/15/11 | 21,500,000 | 21,485,057 | |||||||
| 0.26% 9/22/11 | 1,700,000 | 1,698,727 | |||||||
| 30,799,545 | |||||||||
| Total Short-Term Investments | |||||||||
| (cost $101,402,799) | 101,402,969 | ||||||||
| Total Value of Securities | |||||||||
| Before Securities | |||||||||
| Lending Collateral – 104.08% | |||||||||
| (cost $1,013,583,999) | 1,036,801,142 | ||||||||
| Number of | |||||||||
| Shares | |||||||||
| Securities Lending Collateral** – 5.39% | |||||||||
| Investment Companies | |||||||||
| BNY Mellon SL DBT II | |||||||||
| Liquidating Fund | 549,788 | 531,590 | |||||||
| Delaware Investments | |||||||||
| Collateral Fund No.1 | 53,188,267 | 53,188,267 | |||||||
| †@Mellon GSL Reinvestment | |||||||||
| Trust II | 1,198,247 | 0 | |||||||
| Total Securities Lending Collateral | |||||||||
| (cost $54,936,302) | 53,719,857 | ||||||||
| Total Value of Securities – 109.47% | |||||||||
| (cost $1,068,520,301) | 1,090,520,999 | © | |||||||
| Obligation to Return Securities | |||||||||
| Lending Collateral** – (5.52%) | (54,936,302 | ) | |||||||
| Liabilities Net of Receivables | |||||||||
| and Other Assets – (3.95%) | (39,370,118 | ) | |||||||
| Net Assets Applicable to | |||||||||
| 104,336,922 Shares | |||||||||
| Outstanding – 100.00% | $ | 996,214,579 | |||||||
| Net Asset Value – Optimum Fixed Income Fund | |||||||||
| Class A ($39,758,018 / 4,163,802 Shares) | $9.55 | ||||||||
| Net Asset Value – Optimum Fixed Income Fund | |||||||||
| Class B ($4,714,329 / 494,027 Shares) | $9.54 | ||||||||
| Net Asset Value – Optimum Fixed Income Fund | |||||||||
| Class C ($159,758,741 / 16,741,497 Shares) | $9.54 | ||||||||
| Net Asset Value – Optimum Fixed Income Fund | |||||||||
| Institutional Class ($791,983,491 / 82,937,596 Shares) | $9.55 | ||||||||
| Components of Net Assets at March 31, 2011: | |||||||||
| Shares of beneficial interest | |||||||||
| (unlimited authorization – no par) | $ | 970,655,311 | |||||||
| Undistributed net investment income | 12,498,004 | ||||||||
| Accumulated net realized loss on investments | (7,720,181 | ) | |||||||
| Net unrealized appreciation of investments and | |||||||||
| foreign currencies | 20,781,445 | ||||||||
| Total net assets | $ | 996,214,579 | |||||||
°Principal amount shown is stated in the currency in which each security is denominated.
AUD — Australian Dollar
BRL — Brazilian Real
CAD — Canadian Dollar
CHF — Swiss Franc
CLP — Chilean Peso
CNY — China Renminbi
COP — Colombian Peso
EUR — European Monetary Unit
GBP — British Pound Sterling
IDR — Indonesian Rupiah
INR — Indian Rupee
JPY — Japanese Yen
KRW — South Korean Won
MXN — Mexican Peso
MYR — Malaysian Ringgit
NOK — Norwegian Kroner
NZD — New Zealand Dollar
PHP — Philippine Peso
PLN — Polish Zloty
RUB — Russian Ruble
SEK — Swedish Krona
SGD — Singapore Dollar
TRY — Turkish Lira
TWD — Taiwan Dollar
USD — United States Dollar
ZAR — South African Rand
(continues) 61
Statements of net assets
Optimum Fixed Income Fund
| • | Variable rate security. The rate shown is the rate as of March 31, 2011. Interest rates reset periodically. |
| ^ | Zero coupon security. The rate shown is the yield at the time of purchase. |
| @ | Illiquid security. At March 31, 2011, the aggregate amount of illiquid securities was $31,316,275, which represented 3.14% of the Fund’s net assets. See Note 9 in “Notes to financial statements.” |
| # | Security exempt from registration under Rule 144A of the Securities Act of 1933, as amended. At March 31, 2011, the aggregate amount of Rule 144A securities was $136,949,787, which represented 13.75% of the Fund’s net assets. See Note 9 in ”Notes to financial statements.” |
| w | Pass Through Agreement. Security represents the contractual right to receive a proportionate amount of underlying payments due to the counterparty pursuant to various agreements related to the rescheduling of obligations and the exchange of certain notes. |
| * | Fully or partially on loan. |
| ϕ | Step coupon bond. Coupon increases or decreases periodically based on a predetermined schedule. Stated rate in effect at March 31, 2011. |
| = | Security is being fair valued in accordance with the Fund’s fair valuation policy. At March 31, 2011, the aggregate amount of fair valued securities was $39,348, which represented 0.00% of the Fund’s net assets. See Note 1 in “Notes to financial statements.” |
| ‡ | Non-income producing security. Security is currently in default. |
| ∏ | Restricted Security. These investments are in securities not registered under the Securities Act of 1933, as amended and have certain restrictions on resale which may limit their liquidity. At March 31, 2011, the aggregate amount of restricted securities was $255,067, which represented 0.03% of the Fund’s net assets. See Note 9 in “Notes to financial statements.” |
| § | Pre-Refunded bonds. Municipal bonds that are generally backed or secured by U.S. Treasury bonds. For Pre-Refunded bonds, the stated maturity is followed by the year in which the bond is pre-refunded. |
| Δ | Securities have been classified by country of origin. |
| « | Senior Secured Loans generally pay interest at rates which are periodically redetermined by reference to a base lending rate plus a premium. These base lending rates are generally: (i) the prime rate offered by one or more United States banks, (ii) the lending rate offered by one or more European banks such as the London Inter-Bank Offered Rate (LIBOR), and (iii) the certificate of deposit rate. Senior Secured Loans may be subject to restrictions on resale. Stated rate in effect at March 31, 2011. |
| ∞ | Fully or partially pledged as collateral for futures contracts. |
| † | Non income producing security. |
| ≠ | The rate shown is the effective yield at the time of purchase. |
| ** | See Note 8 in “Notes to financial statements.” |
| © | Includes $55,412,328 of securities loaned. |
Summary of Abbreviations:
ARM — Adjustable Rate Mortgage
BAML — Bank of America Merrill Lynch
BCLY — Barclays Bank
CDS — Credit Default Swap
CDO — Collateralized Debt Obligation
CITI — Citigroup Global Markets
FDIC — Federal Deposit Insurance Corporation
FGIC — Insured by the Financial Guaranty Insurance Company
GNMA — Government National Mortgage Association
GSC — Goldman Sachs & Co.
GSMPS — Goldman Sachs Reperforming Mortgage Securities
HSBC — Hong Kong Shanghai Bank
HY — High Yield
JPMC — JPMorgan Chase Bank
MASTR — Mortgage Asset Securitization Transactions, Inc.
MSC — Morgan Stanley Capital
NATL-RE — Insured by National Public Finance Guarantee Corporation
NCUA — National Credit Union Administration
O.A.T — Obligations Assimilables du Trésor
PIK — Pay-in-kind
REIT — Real Estate Investment Trust
REMIC — Real Estate Mortgage Investment Conduit
S.F. — Single Family
TBA — To be announced
yr — Year
| Net Asset Value and Offering Price Per Share – | ||
| Optimum Fixed Income Fund | ||
| Net asset value Class A (A) | $ | 9.55 |
| Sales charge (4.50% of offering price) (B) | 0.45 | |
| Offering price | $ | 10.00 |
| (A) | Net asset value per share, as illustrated, is the amount which would be paid upon redemption or repurchase of shares. | |
| (B) | See the current prospectus for purchases of $100,000 or more. |
62
| 1 The following foreign currency exchange contracts, futures contracts and swap contracts were outstanding at March 31, 2011: | |||||||||||||||||||
| Foreign Currency Exchange Contracts | |||||||||||||||||||
| Unrealized | |||||||||||||||||||
| Contracts to | Settlement | Appreciation | |||||||||||||||||
| Counterparty | Receive (Deliver) | In Exchange For | Date | (Depreciation) | |||||||||||||||
| BAML | AUD | (2,648,848 | ) | USD | 2,610,000 | 4/8/11 | $ | (129,113 | ) | ||||||||||
| BAML | EUR | (631,234 | ) | USD | 873,217 | 4/8/11 | (21,234 | ) | |||||||||||
| BAML | MXN | 2,476,787 | USD | (204,185 | ) | 4/8/11 | 3,843 | ||||||||||||
| BCLY | EUR | (748,425 | ) | USD | 1,035,423 | 4/8/11 | (25,086 | ) | |||||||||||
| CITI | AUD | (107,000 | ) | USD | 110,445 | 4/1/11 | (296 | ) | |||||||||||
| CITI | AUD | (4,124,624 | ) | USD | 4,147,000 | 4/8/11 | (118,179 | ) | |||||||||||
| CITI | AUD | 107,000 | USD | (110,064 | ) | 4/29/11 | 296 | ||||||||||||
| CITI | BRL | 2,521,645 | USD | (1,509,063 | ) | 4/4/11 | 34,599 | ||||||||||||
| CITI | BRL | (3,131,305 | ) | USD | 1,848,574 | 6/2/11 | (43,602 | ) | |||||||||||
| CITI | EUR | 30,879 | USD | (43,608 | ) | 4/1/11 | 154 | ||||||||||||
| CITI | EUR | (20,409,000 | ) | USD | 27,560,193 | 4/19/11 | (1,353,144 | ) | |||||||||||
| CITI | EUR | 7,800,000 | USD | (11,064,066 | ) | 5/2/11 | (16,580 | ) | |||||||||||
| CITI | IDR | 19,538,840,000 | USD | (2,188,000 | ) | 7/27/11 | 10,372 | ||||||||||||
| CITI | IDR | 18,916,900,000 | USD | (2,084,966 | ) | 1/31/12 | (26,880 | ) | |||||||||||
| CITI | INR | 51,186,580 | USD | (1,092,843 | ) | 8/12/11 | 27,593 | ||||||||||||
| CITI | JPY | 77,620,704 | USD | (948,317 | ) | 4/8/11 | (15,053 | ) | |||||||||||
| CITI | JPY | (371,000,000 | ) | USD | 4,511,214 | 4/14/11 | 50,381 | ||||||||||||
| CITI | KRW | 5,006,545,519 | USD | (4,452,241 | ) | 8/12/11 | 75,851 | ||||||||||||
| CITI | MYR | 4,710,000 | USD | (1,527,184 | ) | 8/11/11 | 14,728 | ||||||||||||
| CITI | NOK | (10,990,000 | ) | USD | 1,987,737 | 5/5/11 | 4,175 | ||||||||||||
| GSC | GBP | (1,267,950 | ) | USD | 2,068,369 | 4/8/11 | 34,628 | ||||||||||||
| HSBC | AUD | (4,219,963 | ) | USD | 4,147,000 | 4/8/11 | (216,767 | ) | |||||||||||
| HSBC | EUR | (1,404,792 | ) | USD | 1,943,319 | 4/8/11 | (47,255 | ) | |||||||||||
| JPMC | AUD | (3,000,000 | ) | USD | 2,963,829 | 4/29/11 | (130,380 | ) | |||||||||||
| JPMC | BRL | (2,521,645 | ) | USD | 1,483,321 | 4/4/11 | (60,342 | ) | |||||||||||
| JPMC | BRL | (11,817,350 | ) | USD | 6,928,965 | 6/2/11 | (211,989 | ) | |||||||||||
| JPMC | CAD | (3,615,000 | ) | USD | 3,699,868 | 6/20/11 | (21,458 | ) | |||||||||||
| JPMC | CLP | 385,515,000 | USD | (807,361 | ) | 4/8/11 | 152 | ||||||||||||
| JPMC | EUR | (1,071,867 | ) | USD | 1,480,570 | 4/8/11 | (38,253 | ) | |||||||||||
| JPMC | EUR | (4,101,000 | ) | USD | 5,677,629 | 4/19/11 | (132,240 | ) | |||||||||||
| JPMC | IDR | 893,187,000 | USD | (97,308 | ) | 7/27/11 | 3,187 | ||||||||||||
| JPMC | INR | (50,652,200 | ) | USD | 1,094,000 | 8/12/11 | (14,730 | ) | |||||||||||
| JPMC | JPY | (651,904,000 | ) | USD | 7,819,126 | 4/14/11 | (19,242 | ) | |||||||||||
| JPMC | JPY | 230,000,000 | USD | (2,771,285 | ) | 5/6/11 | (5,445 | ) | |||||||||||
| JPMC | MYR | 8,894,719 | USD | (2,915,345 | ) | 4/8/11 | 22,047 | ||||||||||||
| JPMC | MYR | 2,321,200 | USD | (753,831 | ) | 8/11/11 | 6,061 | ||||||||||||
| JPMC | NOK | 70,598,000 | USD | (12,385,916 | ) | 5/5/11 | 356,168 | ||||||||||||
| JPMC | SGD | 5,673,066 | USD | (4,354,518 | ) | 6/9/11 | 146,590 | ||||||||||||
| JPMC | SGD | 171,484 | USD | (133,879 | ) | 9/9/11 | 2,213 | ||||||||||||
| JPMC | TWD | 62,634,000 | USD | (2,200,000 | ) | 1/11/12 | (50,812 | ) | |||||||||||
| MSC | AUD | 1,300,377 | USD | (1,275,215 | ) | 4/8/11 | 69,475 | ||||||||||||
| MSC | CHF | 897,722 | USD | (966,684 | ) | 4/8/11 | 10,743 | ||||||||||||
| MSC | CNY | 49,500 | USD | (7,437 | ) | 9/14/11 | 182 | ||||||||||||
| MSC | CNY | 55,270,000 | USD | (8,600,000 | ) | 9/8/15 | 580,660 | ||||||||||||
| MSC | EUR | (1,086,504 | ) | USD | 1,500,157 | 4/8/11 | (39,405 | ) | |||||||||||
| MSC | JPY | 72,804,550 | USD | (910,000 | ) | 4/8/11 | (34,642 | ) | |||||||||||
| MSC | KRW | 1,211,659,950 | USD | (1,081,138 | ) | 4/8/11 | 23,363 | ||||||||||||
| MSC | MXN | 2,142,936 | USD | (176,605 | ) | 4/8/11 | 3,382 | ||||||||||||
| MSC | MYR | (3,615,339 | ) | USD | 1,185,240 | 4/8/11 | (8,689 | ) | |||||||||||
| $ | (1,299,973 | ) | |||||||||||||||||
| Futures Contract | ||||||||
| Unrealized | ||||||||
| Notional | Notional | Expiration | Appreciation | |||||
| Contract to Buy | Cost | Value | Date | (Depreciation) | ||||
| 11 Euro-Bond | $1,856,983 | $1,890,658 | 6/8/11 | $33,675 |
| Swap Contracts | ||||||||||||||||
| CDS Contracts | ||||||||||||||||
| Annual | Unrealized | |||||||||||||||
| Swap | Notional | Protection | Termination | Appreciation | ||||||||||||
| Counterparty | Referenced Obligation | Value | Payments | Date | (Depreciation) | |||||||||||
| Protection Purchased: | ||||||||||||||||
| BAML | CDX.NA.HY.16 | $ | 705,000 | 5.00% | 6/20/16 | $ | 1,788 | |||||||||
| BAML | Kingdom of Spain | |||||||||||||||
| 5 yr CDS | 1,951,000 | 1.00% | 12/20/15 | (87,197 | ) | |||||||||||
| BCLY | CDX.NA.HY.16 | 395,000 | 5.00% | 6/20/16 | (227 | ) | ||||||||||
| BCLY | ITRAXX Europe | |||||||||||||||
| Subordinate | ||||||||||||||||
| Financials | ||||||||||||||||
| 15.1 5 yr CDS | 3,960,000 | 1.00% | 6/20/16 | 22,497 | ||||||||||||
| Kingdom of Spain | ||||||||||||||||
| BCLY | 5 yr CDS | 1,462,000 | 1.00% | 3/20/15 | (18,466 | ) | ||||||||||
| BCLY | 5 yr CDS | 730,000 | 1.00% | 3/21/16 | (30,953 | ) | ||||||||||
| United States of | ||||||||||||||||
| America | ||||||||||||||||
| BCLY | 5 yr CDS | 1,706,000 | 0.25% | 3/20/16 | (8,239 | ) | ||||||||||
| CITI | CDX.NA.HY.16 | 745,000 | 5.00% | 6/20/16 | (427 | ) | ||||||||||
| CITI | Sara Lee 5 yr CDS | 450,000 | 1.00% | 3/20/16 | (28,370 | ) | ||||||||||
| GSC | CDX.NA.HY.16 | 395,000 | 5.00% | 6/20/16 | 262 | |||||||||||
| JPMC | CDX.NA.HY.16 | 215,000 | 5.00% | 6/20/16 | (123 | ) | ||||||||||
| JPMC | ITRAXX Europe | |||||||||||||||
| Subordinate | ||||||||||||||||
| Financials | ||||||||||||||||
| 15.1 5 yr CDS | 5,605,000 | 1.00% | 6/20/16 | 31,842 | ||||||||||||
| JPMC | Penny (J.C.) | |||||||||||||||
| 5 yr CDS | 715,000 | 1.00% | 3/20/15 | 4,333 | ||||||||||||
| JPMC | Portuguese Republic | |||||||||||||||
| 5 yr CDS | 1,648,000 | 1.00% | 6/20/15 | 78,174 | ||||||||||||
| JPMC | Viacom 5 yr CDS | 1,225,000 | 1.00% | 9/20/15 | (16,474 | ) | ||||||||||
| MSC | CDX.NA.HY.16 | 285,000 | 5.00% | 6/20/16 | (164 | ) | ||||||||||
| Kingdom of Spain | ||||||||||||||||
| MSC | 5 yr CDS | 521,000 | 1.00% | 6/20/16 | — | |||||||||||
| $ | 22,713,000 | $ | (51,744 | ) | ||||||||||||
| Protection Sold/Moody’s Rating: | ||||||||||||||||
| CITI | MetLife 5 yr CDS/A | $ | 350,000 | 5.00% | 9/20/14 | $ | 25,065 | |||||||||
| JPMC | Comcast 5 yr CDS/Baa | 1,225,000 | 1.00% | 9/20/15 | 20,954 | |||||||||||
| JPMC | Tyson Foods CDS/Ba | 735,000 | 1.00% | 3/20/16 | 14,152 | |||||||||||
| $ | 2,310,000 | $ | 60,171 | |||||||||||||
| Total | $ | 8,427 | ||||||||||||||
(continues) 63
Statements of net assets
Optimum Fixed Income Fund
| Interest Rate Swap Contract | ||||||||||
| Fixed | Unrealized | |||||||||
| Notional | Deal Receive | Maturity | Appreciation | |||||||
| Counterparty | Swap Referenced | Amount | Rate | Date | (Depreciation) | |||||
| CITI | 6-Month LIBOR | AUD 3,000,000 | 6.00% | 6/15/11 | $(4,150) | |||||
The use of foreign currency exchange contracts, futures contracts and swap contracts involves elements of market risk and risks in excess of the amounts recognized in the financial statements. The notional values presented above represent the Fund’s total exposure in such contracts, whereas only the net unrealized appreciation (depreciation) is reflected in the Fund’s net assets.
1See Note 7 in “Notes to financial statements.”
See accompanying notes, which are an integral part of the financial statements.
64
Optimum International Fund
March 31, 2011
| Number of | Value | ||||
| Shares | (U.S. $) | ||||
| Common Stock – 94.89%Δ | |||||
| Australia – 5.25% | |||||
| Amcor | 274,676 | $ | 2,007,279 | ||
| AMP | 43,973 | 247,154 | |||
| Australia & New Zealand | |||||
| Banking Group | 47,900 | 1,180,531 | |||
| BHP Billiton | 38,700 | 1,865,118 | |||
| Foster’s Group | 91,153 | 539,696 | |||
| *† | Lynas | 316,000 | 735,956 | ||
| Newcrest Mining | 29,600 | 1,220,043 | |||
| QBE Insurance Group | 127,500 | 2,332,003 | |||
| Telstra | 972,518 | 2,838,762 | |||
| Wesfarmers | 51,780 | 1,703,328 | |||
| 14,669,870 | |||||
| Austria – 0.49% | |||||
| Erste Group Bank | 9,800 | 494,502 | |||
| Voestalpine | 18,900 | 887,390 | |||
| 1,381,892 | |||||
| Belgium – 0.42% | |||||
| w† | Ageas Strip VVPR | 48,482 | 137 | ||
| Anheuser-Busch InBev | 20,600 | 1,173,466 | |||
| 1,173,603 | |||||
| Brazil – 1.03% | |||||
| BM&F Bovespa | 105,200 | 763,720 | |||
| Cemig ADR | 38,355 | 739,101 | |||
| † | HRT Participacoes eM Petroleo | 700 | 731,606 | ||
| † | Hypermarcas | 48,900 | 644,091 | ||
| 2,878,518 | |||||
| Canada – 3.18% | |||||
| Barrick Gold | 39,100 | 2,032,022 | |||
| Canadian National Railway | 18,300 | 1,380,616 | |||
| * | Canadian Natural Resources | 14,500 | 716,925 | ||
| Magna International | 9,000 | 431,190 | |||
| * | Manulife Financial | 47,300 | 838,092 | ||
| * | Royal Bank of Canada | 12,900 | 798,134 | ||
| * | Sun Life Financial | 25,100 | 788,776 | ||
| Suncor Energy | 25,100 | 1,125,565 | |||
| * | Toronto-Dominion Bank | 8,600 | 761,015 | ||
| 8,872,335 | |||||
| China/Hong Kong – 3.65% | |||||
| † | AIA Group | 327,100 | 1,007,089 | ||
| China Construction Bank Class H | 1,736,300 | 1,627,173 | |||
| * | China Merchants Bank Class H | 336,000 | 930,826 | ||
| China Merchants Holdings | |||||
| International | 194,700 | 822,211 | |||
| China Mobile | 55,600 | 512,121 | |||
| China Resources Enterprise | 120,600 | 489,910 | |||
| China Unicom Hong Kong | 326,300 | 541,953 | |||
| CNOOC ADR | 900 | 227,736 | |||
| Hang Seng Bank | 22,400 | 361,676 | |||
| Hong Kong Exchanges & Clearing | 32,700 | 710,422 | |||
| † | Lentuo International ADR | 19,800 | 96,624 | ||
| *† | Melco Crown Entertainment ADR | 88,000 | 668,800 | ||
| New World Development | 315,600 | 557,450 | |||
| * | REXLot Holdings | 3,195,100 | 353,236 | ||
| * | Sinopharm Group Class H | 33,700 | 119,570 | ||
| Tencent Holdings | 16,900 | 411,697 | |||
| Wharf Holdings | 111,400 | 768,310 | |||
| 10,206,804 | |||||
| Colombia – 0.34% | |||||
| Petrominerales | 25,500 | 966,244 | |||
| 966,244 | |||||
| Denmark – 0.88% | |||||
| * | Carlsberg Class B | 6,700 | 721,423 | ||
| FLSmidth | 13,100 | 1,115,985 | |||
| † | Pandora | 12,100 | 617,511 | ||
| 2,454,919 | |||||
| France – 10.11% | |||||
| * | BNP Paribas | 20,900 | 1,528,661 | ||
| Cap Gemini | 12,500 | 726,049 | |||
| * | Carrefour | 68,737 | 3,043,216 | ||
| Cie de Saint-Gobain | 32,899 | 2,014,410 | |||
| Danone | 18,700 | 1,221,593 | |||
| * | France Telecom | 153,384 | 3,436,711 | ||
| * | GDF Suez | 24,100 | 981,942 | ||
| w† | GDF Suez Strip VVPR | 8,820 | 13 | ||
| LVMH Moet Hennessy Louis Vuitton | 4,900 | 775,676 | |||
| * | Sanofi-Aventis | 54,205 | 3,800,636 | ||
| * | Societe Generale | 38,111 | 2,476,400 | ||
| Technip | 13,900 | 1,482,356 | |||
| * | Total | 64,776 | 3,943,291 | ||
| Unibail-Rodamco | 3,000 | 649,857 | |||
| * | Vinci | 34,761 | 2,172,265 | ||
| 28,253,076 | |||||
| Germany – 6.30% | |||||
| BASF | 10,900 | 944,304 | |||
| Bayer | 11,600 | 902,530 | |||
| Bayerische Motoren Werke | 12,200 | 1,017,680 | |||
| Deutsche Bank | 18,900 | 1,116,402 | |||
| Deutsche Telekom | 228,783 | 3,524,393 | |||
| Fresenius Medical Care | 20,400 | 1,374,712 | |||
| Gerry Weber International | 13,504 | 788,480 | |||
| K+S | 13,800 | 1,046,319 | |||
| † | Kabel Deutschland Holding | 18,200 | 961,049 | ||
| Metro | 10,600 | 725,278 | |||
| RWE | 38,527 | 2,467,122 | |||
| SAP ADR | 17,700 | 1,086,072 | |||
| Siemens | 11,900 | 1,631,489 | |||
| 17,585,830 | |||||
| Gilbraltar – 0.06% | |||||
| *† | PartyGaming | 53,100 | 170,355 | ||
| 170,355 | |||||
(continues) 65
Statements of net assets
Optimum International Fund
| Number of | Value | |||||
| Shares | (U.S. $) | |||||
| Common Stock (continued) | ||||||
| India – 1.02% | ||||||
| HDFC Bank | 15,900 | $ | 837,332 | |||
| Housing Development Finance | 47,400 | 746,142 | ||||
| ICICI Bank | 31,600 | 791,827 | ||||
| Infosys Technologies | 6,400 | 465,694 | ||||
| 2,840,995 | ||||||
| Ireland – 0.98% | ||||||
| Covidien | 23,600 | 1,225,784 | ||||
| Experian | 121,519 | 1,504,849 | ||||
| 2,730,633 | ||||||
| Italy – 2.70% | ||||||
| Enel | 124,800 | 786,702 | ||||
| ENI | 135,935 | 3,338,574 | ||||
| Intesa Sanpaolo | 1,153,217 | 3,412,500 | ||||
| 7,537,776 | ||||||
| Japan – 16.40% | ||||||
| * | Astellas Pharma | 85,700 | 3,173,502 | |||
| Bridgestone | 46,100 | 966,063 | ||||
| Canon | 79,200 | 3,446,996 | ||||
| Chiba Bank | 124,200 | 695,849 | ||||
| * | Daiwa Office Investment | 90 | 312,390 | |||
| Dena | 16,800 | 606,961 | ||||
| * | Honda Motor | 36,200 | 1,360,084 | |||
| * | IHI | 645,400 | 1,575,187 | |||
| * | ITOCHU | 69,800 | 730,938 | |||
| Japan Prime Realty Investment | 110 | 297,036 | ||||
| Japan Tobacco | 330 | 1,192,245 | ||||
| JGC | 42,000 | 983,156 | ||||
| * | JSR | 50,400 | 1,011,333 | |||
| * | Kao | 128,200 | 3,198,257 | |||
| * | KDDI | 282 | 1,746,078 | |||
| * | Komatsu | 16,200 | 550,225 | |||
| * | Kubota | 119,000 | 1,121,683 | |||
| Marubeni | 112,300 | 808,749 | ||||
| * | Matsui Securities | 23,200 | 126,076 | |||
| Mitsubishi Chemical Holdings | 88,800 | 558,370 | ||||
| Mitsui Fudosan | 38,800 | 640,486 | ||||
| ORIX | 7,800 | 730,532 | ||||
| * | Secom | 5,600 | 260,222 | |||
| Sekisui Chemical | 82,600 | 646,500 | ||||
| Seven & I Holdings | 133,700 | 3,411,018 | ||||
| Shin-Etsu Chemical | 8,400 | 417,601 | ||||
| SMC | 5,100 | 839,423 | ||||
| * | Softbank | 24,800 | 989,913 | |||
| Sumitomo Heavy Industries | 201,700 | 1,316,779 | ||||
| * | Sumitomo Mitsui Financial Group | 21,700 | 674,676 | |||
| * | Takeda Pharmaceutical | 72,000 | 3,358,702 | |||
| Teijin | 137,200 | 613,627 | ||||
| Tokio Marine Holdings | 73,700 | 1,970,650 | ||||
| * | Toray Industries | 108,500 | 789,210 | |||
| Toyota Motor | 54,100 | 2,178,960 | ||||
| * | Trend Micro | 11,600 | 308,915 | |||
| Yamato Holdings | 42,500 | 659,152 | ||||
| * | Zeon | 165,900 | 1,529,850 | |||
| 45,797,394 | ||||||
| Luxembourg – 0.22% | ||||||
| * | ArcelorMittal | 17,100 | 618,165 | |||
| 618,165 | ||||||
| Malaysia – 0.60% | ||||||
| CIMB Group Holdings | 395,500 | 1,071,568 | ||||
| † | Petronas Chemicals Group | 248,700 | 594,941 | |||
| 1,666,509 | ||||||
| Mexico – 0.47% | ||||||
| Fomento Economico Mexicano ADR | 14,300 | 839,410 | ||||
| Grupo Modelo Class C | 78,400 | 471,174 | ||||
| 1,310,584 | ||||||
| Netherlands – 4.51% | ||||||
| † | Aegon | 119,800 | 897,120 | |||
| Corio | 2,400 | 167,887 | ||||
| † | ING Groep CVA | 260,837 | 3,301,418 | |||
| Koninklijke Ahold | 221,495 | 2,972,031 | ||||
| Koninklijke DSM | 10,900 | 669,725 | ||||
| Koninklijke KPN | 39,500 | 672,872 | ||||
| † | Randstad Holding | 22,500 | 1,253,159 | |||
| Reed Elsevier | 156,771 | 2,017,357 | ||||
| VimpelCom ADR | 33,700 | 475,844 | ||||
| Wereldhave | 1,500 | 160,200 | ||||
| 12,587,613 | ||||||
| New Zealand – 0.16% | ||||||
| Telecom Corp. of New Zealand | 282,341 | 433,006 | ||||
| 433,006 | ||||||
| Norway – 0.45% | ||||||
| Aker Solutions | 25,200 | 579,158 | ||||
| Yara International | 13,300 | 673,863 | ||||
| 1,253,021 | ||||||
| Republic of Korea – 2.44% | ||||||
| GS Engineering & Construction | 9,100 | 954,400 | ||||
| Hyundai Engineering & Construction | 19,900 | 1,437,373 | ||||
| Hyundai Marine & Fire Insurance | 39,400 | 1,099,535 | ||||
| Kia Motors | 15,300 | 962,791 | ||||
| KT ADR | 36,000 | 703,080 | ||||
| Samsung Electronics | 1,060 | 900,976 | ||||
| Samsung Life Insurance | 8,000 | 751,482 | ||||
| 6,809,637 | ||||||
| Russia – 0.59% | ||||||
| LUKOIL ADR | 14,700 | 1,053,255 | ||||
| =#@† | Mail.ru Group 144A GDR | 2,900 | 86,855 | |||
| Rosneft Oil GDR | 54,500 | 497,858 | ||||
| 1,637,968 | ||||||
66
| Number of | Value | |||||
| Shares | (U.S. $) | |||||
| Common Stock (continued) | ||||||
| Singapore – 2.34% | ||||||
| CapitaLand | 122,000 | $ | 319,384 | |||
| Jardine Matheson Holdings | 31,200 | 1,389,648 | ||||
| Singapore Telecommunications | 1,014,100 | 2,429,560 | ||||
| Straits Asia Resources | 304,500 | 606,319 | ||||
| United Overseas Bank | 120,482 | 1,796,884 | ||||
| 6,541,795 | ||||||
| South Africa – 0.45% | ||||||
| MTN Group | 34,300 | 692,445 | ||||
| Naspers Class N | 10,700 | 575,732 | ||||
| 1,268,177 | ||||||
| Spain – 3.68% | ||||||
| * | Banco Santander | 102,250 | 1,187,092 | |||
| * | Iberdrola | 424,965 | 3,695,470 | |||
| Telefonica | 215,993 | 5,407,349 | ||||
| 10,289,911 | ||||||
| Switzerland – 5.04% | ||||||
| Adecco | 12,900 | 848,296 | ||||
| Cie Financiere Richemont Class A | 9,300 | 537,142 | ||||
| Julius Baer Group | 20,900 | 906,994 | ||||
| Novartis | 90,878 | 4,929,278 | ||||
| Roche Holding | 5,200 | 742,776 | ||||
| Swiss Reinsurance | 18,200 | 1,041,274 | ||||
| TE Connectivity | 18,600 | 647,652 | ||||
| Xstrata | 78,500 | 1,834,681 | ||||
| Zurich Financial Services | 9,247 | 2,588,355 | ||||
| 14,076,448 | ||||||
| Taiwan – 2.73% | ||||||
| AU Optronics ADR | 64,423 | 565,634 | ||||
| Catcher Technology | 295,600 | 1,462,670 | ||||
| † | Chunghwa Telecom ADR | 22,070 | 687,701 | |||
| Hon Hai Precision Industry | 188,164 | 659,102 | ||||
| Mega Financial Holding | 665,600 | 524,014 | ||||
| Siliconware Precision Industries ADR | 116,600 | 704,264 | ||||
| Taiwan Semiconductor | ||||||
| Manufacturing | 819,269 | 1,967,026 | ||||
| Taiwan Semiconductor | ||||||
| Manufacturing ADR | 87,700 | 1,068,186 | ||||
| 7,638,597 | ||||||
| Thailand – 0.70% | ||||||
| Bangkok Bank Public | 142,500 | 810,382 | ||||
| Banpu Public | 28,900 | 728,114 | ||||
| Banpu Public Class F | 16,400 | 416,439 | ||||
| 1,954,935 | ||||||
| United Kingdom – 17.45% | ||||||
| Aegis Group | 261,300 | 598,967 | ||||
| Barclays | 257,300 | 1,145,546 | ||||
| † | Barratt Developments | 113,100 | 199,748 | |||
| Bellway | 16,000 | 178,633 | ||||
| BG Group | 155,172 | 3,860,616 | ||||
| BP | 344,543 | 2,509,174 | ||||
| Britvic | 131,500 | 834,264 | ||||
| † | Cairn Energy | 74,100 | 549,270 | |||
| Carnival | 17,000 | 668,653 | ||||
| Compass Group | 276,477 | 2,485,799 | ||||
| Cookson Group | 104,300 | 1,153,586 | ||||
| GKN | 134,900 | 434,734 | ||||
| GlaxoSmithKline | 251,223 | 4,793,528 | ||||
| HSBC Holdings | 244,407 | 2,513,061 | ||||
| Imperial Tobacco Group | 46,300 | 1,431,180 | ||||
| Inchcape | 95,420 | 530,211 | ||||
| *† | International Consolidated | |||||
| Airlines Group | 311,900 | 1,135,724 | ||||
| Kazakhmys | 29,600 | 661,890 | ||||
| National Grid | 108,800 | 1,036,685 | ||||
| Persimmon | 23,100 | 164,893 | ||||
| * | Royal Dutch Shell Class A | 189,758 | 6,896,582 | |||
| Subsea 7 | 31,100 | 785,612 | ||||
| † | Taylor Wimpey | 330,800 | 215,544 | |||
| Tesco | 546,003 | 3,336,963 | ||||
| Tullow Oil | 56,900 | 1,321,637 | ||||
| Unilever | 131,257 | 4,000,438 | ||||
| Vodafone Group | 1,309,451 | 3,707,365 | ||||
| Vodafone Group ADR | 28,600 | 822,250 | ||||
| WPP Group | 62,500 | 770,469 | ||||
| 48,743,022 | ||||||
| United States – 0.25% | ||||||
| † | NII Holdings | 16,800 | 700,056 | |||
| 700,056 | ||||||
| Total Common Stock | ||||||
| (cost $246,719,407) | 265,049,688 | |||||
| Preferred Stock – 1.15% | ||||||
| Brazil – 0.79% | ||||||
| Banco Bradesco 2.90% | 60,000 | 1,226,246 | ||||
| Gol Linhas Aereas | ||||||
| Inteligentes 3.36% | 71,600 | 962,825 | ||||
| 2,189,071 | ||||||
| Germany – 0.36% | ||||||
| † | Volkswagen | 6,242 | 1,013,770 | |||
| 1,013,770 | ||||||
| Total Preferred Stock | ||||||
| (cost $2,866,898) | 3,202,841 | |||||
| Warrant – 0.00% | ||||||
| Unione di Banche Italiane | ||||||
| SCpA CW11 | 20,000 | 26 | ||||
| Total Warrant (cost $0) | 26 | |||||
(continues) 67
Statements of net assets
Optimum International Fund
| Principal | Value | |||||||
| Amount (U.S. $) | (U.S. $) | |||||||
| ≠Short-Term Investments – 2.76% | ||||||||
| Discount Notes – 2.60% | ||||||||
| Federal Home Loan Bank | ||||||||
| 0.001% 4/1/11 | $ | 3,275,448 | $ | 3,275,448 | ||||
| 0.001% 4/1/11 | 372,526 | 372,526 | ||||||
| 0.001% 4/14/11 | 218,363 | 218,362 | ||||||
| 0.010% 4/18/11 | 139,752 | 139,752 | ||||||
| 0.020% 4/27/11 | 1,055,895 | 1,055,888 | ||||||
| 0.030% 5/3/11 | 436,726 | 436,711 | ||||||
| 0.037% 5/23/11 | 559,010 | 558,977 | ||||||
| 0.040% 5/9/11 | 358,116 | 358,101 | ||||||
| 0.050% 5/16/11 | 436,726 | 436,705 | ||||||
| 0.060% 6/7/11 | 414,890 | 414,828 | ||||||
| 7,267,298 | ||||||||
| U.S. Treasury Obligation – 0.16% | ||||||||
| U.S. Treasury Bill 0.00% 4/28/11 | 451,226 | 451,211 | ||||||
| 451,211 | ||||||||
| Total Short-Term Investments | ||||||||
| (cost $7,718,551) | 7,718,509 | |||||||
| Total Value of Securities Before Securities | ||||||||
| Lending Collateral – 98.80% | ||||||||
| (cost $257,304,856) | 275,971,064 | |||||||
| Number of | ||||||||
| Shares | ||||||||
| Securities Lending Collateral** – 9.82% | ||||||||
| Investment Companies | ||||||||
| BNY Mellon SL DBT II | ||||||||
| Liquidating Fund | 267,623 | 258,765 | ||||||
| Delaware Investments | ||||||||
| Collateral Fund No.1 | 27,166,216 | 27,166,216 | ||||||
| @†Mellon GSL Reinvestment Trust II | 620,609 | 0 | ||||||
| Total Securities Lending Collateral | ||||||||
| (cost $28,054,448) | 27,424,981 | |||||||
| Total Value of Securities – 108.62% | ||||||||
| (cost $285,359,304) | 303,396,045 | © | ||||||
| Obligation to Return Securities | ||||||||
| Lending Collateral** – (10.05%) | (28,054,448 | ) | ||||||
| Receivables and Other Assets | ||||||||
| Net of Liabilities – 1.43% | 3,989,888 | |||||||
| Net Assets Applicable to 24,841,645 | ||||||||
| Shares Outstanding – 100.00% | $ | 279,331,485 | ||||||
| Net Asset Value – Optimum International Fund | |||||
| Class A ($11,189,390 / 999,081 Shares) | $ 11.20 | ||||
| Net Asset Value – Optimum International Fund | |||||
| Class B ($1,868,226 / 170,781 Shares) | $ 10.94 | ||||
| Net Asset Value – Optimum International Fund | |||||
| Class C ($39,761,560 / 3,632,843 Shares) | $ 10.95 | ||||
| Net Asset Value – Optimum International Fund | |||||
| Institutional Class ($226,512,309 / 20,038,940 Shares) | $ 11.30 | ||||
| Components of Net Assets at March 31, 2011: | |||||
| Shares of beneficial interest | |||||
| (unlimited authorization – no par) | $ | 311,851,587 | |||
| Undistributed net investment income | 2,625,593 | ||||
| Accumulated net realized loss on investments | (53,281,660 | ) | |||
| Net unrealized appreciation of investments | |||||
| and foreign currencies | 18,135,965 | ||||
| Total net assets | $ | 279,331,485 | |||
| Δ | Securities have been classified by country of origin. Classification by type of business has been presented in page 37 in “Security type/country/sector allocations.” |
| * | Fully or partially on loan. |
| † | Non income producing security. |
| w | Dividend coupon which when presented with the corresponding coupon of the share benefits from a reduced withholding tax of 15% (rather than 25%) on dividends paid. |
| = | Security is being fair valued in accordance with the Fund’s fair valuation policy. At March 31, 2011, the aggregate amount of fair valued securities was $86,855, which represented 0.03% of the Fund’s net assets. See Note 1 in “Notes to financial statements.” |
| # | Security exempt from registration under Rule 144A of the Securities Act of 1933, as amended. At March 31, 2011, the aggregate amount of Rule 144A securities was $86,855, which represented 0.03% of the Fund’s net assets. See Note 9 in “Notes to financial statements.” |
| @ | Illiquid security. At March 31, 2011, the aggregate amount of illiquid securities was $86,855, which represented 0.03% of the Fund’s net assets. See Note 9 in “Notes to financial statements.” |
| ≠ | The rate shown is the effective yield at the time of purchase. |
| ** | See Note 8 in “Notes to financial statements.” |
| © | Includes $26,012,247 of securities loaned. |
68
ADR — American Depositary Receipts
AUD — Australian Dollar
BRL — Brazilian Real
CITI — Citigroup Global Markets
CVA — Dutch Certificate
DB — Deutsche Bank
EUR — European Monetary Unit
GBP — British Pound Sterling
GDR — Global Depositary Receipts
HKD — Hong Kong Dollar
JPY — Japanese Yen
MNB — Mellon National Bank
MSC — Morgan Stanley Capital
NOK — Norwegian Kroner
SCpA — Italian Joint Stock Company
SEK — Swedish Krona
STRIP VVPR — Dividend Coupon
USD — United States Dollar
| Net Asset Value and Offering Price Per Share – | |||
| Optimum International Fund | |||
| Net asset value Class A (A) | $ | 11.20 | |
| Sales charge (5.75% of offering price) (B) | 0.68 | ||
| Offering price | $ | 11.88 |
| (A) | Net asset value per share, as illustrated, is the amount which would be paid upon redemption or repurchase of shares. | |
| (B) | See the current prospectus for purchases of $75,000 or more. |
| The following foreign currency exchange contracts were outstanding at March 31, 20111: |
Foreign Currency Exchange Contracts
| Unrealized | ||||||||||||||
| Contracts to | Settle | Appreciation | ||||||||||||
| Counterparty | Receive (Deliver) | In Exchange For | Date | (Depreciation) | ||||||||||
| CITI | AUD | 1,510,000 | USD | (1,498,909) | 4/14/11 | $ | 61,392 | |||||||
| CITI | EUR | 255,000 | USD | (359,189 | ) | 4/1/11 | 2,190 | |||||||
| CITI | EUR | 179,000 | USD | (252,788 | ) | 4/4/11 | 872 | |||||||
| CITI | GBP | (500,000 | ) | USD | 802,927 | 4/4/11 | 912 | |||||||
| CITI | JPY | (36,439,000 | ) | USD | 442,600 | 4/1/11 | 4,497 | |||||||
| CITI | JPY | (12,996,000 | ) | USD | 156,542 | 4/4/11 | 290 | |||||||
| CITI | JPY | (16,147,000 | ) | USD | 194,919 | 4/5/11 | 780 | |||||||
| CITI | JPY | (300,583,900 | ) | USD | 3,708,658 | 4/14/11 | 94,495 | |||||||
| CITI | NOK | (1,010,000 | ) | USD | 182,867 | 4/5/11 | 284 | |||||||
| CITI | SEK | (4,601,000 | ) | USD | 730,101 | 4/5/11 | 1,480 | |||||||
| DB | EUR | (149,000 | ) | USD | 209,912 | 4/1/11 | (1,247 | ) | ||||||
| DB | NOK | (499,000 | ) | USD | 88,857 | 4/1/11 | (1,369 | ) | ||||||
| DB | NOK | (1,890,000 | ) | USD | 339,105 | 4/4/11 | (2,578 | ) | ||||||
| DB | SEK | (2,025,000 | ) | USD | 320,350 | 4/4/11 | (347 | ) | ||||||
| MNB | AUD | (66,243 | ) | USD | 68,251 | 4/4/11 | (283 | ) | ||||||
| MNB | AUD | 77,619 | USD | (80,258 | ) | 4/5/11 | 36 | |||||||
| MNB | AUD | (2,223,500 | ) | USD 2,211,982 | 4/28/11 | (81,624 | ) | |||||||
| MNB | BRL | 145,655 | USD | (89,535 | ) | 4/1/11 | (319 | ) | ||||||
| MNB | BRL | 285,053 | USD | (175,872 | ) | 4/4/11 | (1,372 | ) | ||||||
| MNB | JPY | 11,082,763 | USD | (134,909 | ) | 4/1/11 | (1,662 | ) | ||||||
| MNB | JPY | 7,403,706 | USD | (89,105 | ) | 4/4/11 | (89 | ) | ||||||
| MSC | HKD | 1,504,000 | USD | (193,153 | ) | 4/1/11 | 192 | |||||||
| MSC | HKD | (1,800,000 | ) | USD | 231,301 | 4/4/11 | (102 | ) | ||||||
| MSC | JPY | (2,818,000 | ) | USD | 34,812 | 4/14/11 | 929 | |||||||
| $ | 77,357 | |||||||||||||
The use of foreign currency exchange contracts involves elements of market risk and risks in excess of the amounts recognized in the financial statements. The notional values presented above represent the Fund’s total exposure in such contracts, whereas only the net unrealized appreciation (depreciation) is reflected in the Fund’s net assets.
1See Note 7 in “Notes to financial statements.”
See accompanying notes, which are an integral part of the financial statements.
See accompanying notes, which are an integral part of the financial statements.
(continues) 69
Statements of net assets
Optimum Large Cap Growth Fund
March 31, 2011
March 31, 2011
| Number of | Value | |||||
| Shares | (U.S. $) | |||||
| Common Stock – 97.95%² | ||||||
| Consumer Discretionary – 21.12% | ||||||
| Abercrombie & Fitch Class A | 16,800 | $ | 986,160 | |||
| † | Amazon.com | 104,137 | 18,758,197 | |||
| *† | AutoZone | 2,300 | 629,188 | |||
| BMW ADR | 174,100 | 4,842,592 | ||||
| † | CarMax | 37,800 | 1,213,380 | |||
| Carnival (United Kingdom) | 28,600 | 1,124,910 | ||||
| CBS Class B | 41,400 | 1,036,656 | ||||
| *† | Chipotle Mexican Grill | 3,700 | 1,007,769 | |||
| Cie Financiere Richemont ADR | 861,220 | 4,994,043 | ||||
| Coach | 42,500 | 2,211,700 | ||||
| Costco Wholesale | 19,200 | 1,407,744 | ||||
| *† | Discovery Communications Class A | 14,600 | 582,540 | |||
| Disney (Walt) | 79,550 | 3,427,810 | ||||
| † | eBay | 122,900 | 3,814,816 | |||
| Estee Lauder Class A | 35,956 | 3,464,720 | ||||
| * | Expedia | 81,550 | 1,847,923 | |||
| * | Fastenal | 32,000 | 2,074,560 | |||
| *† | Focus Media Holding ADR | 199,225 | 6,110,231 | |||
| † | Fossil | 4,300 | 402,695 | |||
| † | General Motors | 20,700 | 642,321 | |||
| † | Hanesbrands | 11,750 | 317,720 | |||
| *† | Hertz Global Holdings | 211,100 | 3,299,493 | |||
| * | Home Depot | 43,050 | 1,595,433 | |||
| *† | IAC/InterActiveCorp | 32,050 | 990,025 | |||
| Johnson Controls | 18,700 | 777,359 | ||||
| Kohl’s | 45,300 | 2,402,712 | ||||
| † | Las Vegas Sands | 23,400 | 987,948 | |||
| Lear | 30,700 | 1,500,309 | ||||
| Li & Fung (China) | ||||||
| (Hong Kong Exchange) | 278,000 | 1,424,147 | ||||
| † | Liberty Media Interactive Class A | 67,300 | 1,079,492 | |||
| Lowe’s | 229,950 | 6,077,579 | ||||
| * | Marriott International Class A | 49,380 | 1,756,940 | |||
| McDonald’s | 93,334 | 7,101,783 | ||||
| *† | MGM Resorts International | 17,400 | 228,810 | |||
| *† | NetFlix | 1,000 | 237,330 | |||
| * | NIKE Class B | 107,587 | 8,144,335 | |||
| † | O’Reilly Automotive | 12,000 | 689,520 | |||
| Phillips-Van Heusen | 51,550 | 3,352,297 | ||||
| † | priceline.com | 19,096 | 9,670,977 | |||
| Ross Stores | 9,900 | 704,088 | ||||
| *† | Royal Caribbean Cruises | 20,900 | 862,334 | |||
| Starbucks | 177,682 | 6,565,350 | ||||
| * | Starwood Hotels & | |||||
| Resorts Worldwide | 24,600 | 1,429,752 | ||||
| * | Tiffany & Co | 68,815 | 4,227,994 | |||
| Time Warner | 137,934 | 4,924,244 | ||||
| TJX | 124,642 | 6,198,447 | ||||
| *† | United Continental Holdings | 114,350 | 2,628,907 | |||
| † | VistaPrint (Netherlands) | 33,600 | 1,743,840 | |||
| Wal-Mart Stores | 41,300 | 2,149,665 | ||||
| † | Warnaco Group | 4,950 | 283,091 | |||
| Western Union | 62,300 | 1,293,971 | ||||
| Wyndham Worldwide | 104,800 | 3,333,688 | ||||
| Wynn Resorts | 48,405 | 6,159,536 | ||||
| Yum Brands | 97,073 | 4,987,611 | ||||
| 159,706,682 | ||||||
| Consumer Staples – 1.78% | ||||||
| CVS Caremark | 82,000 | 2,814,240 | ||||
| *† | Green Mountain Coffee Roasters | 13,100 | 846,391 | |||
| PepsiCo | 53,550 | 3,449,156 | ||||
| Philip Morris International | 34,400 | 2,257,672 | ||||
| Procter & Gamble | 57,602 | 3,548,283 | ||||
| Whole Foods Market | 8,600 | 566,740 | ||||
| 13,482,482 | ||||||
| Energy – 10.73% | ||||||
| † | Alpha Natural Resources | 8,000 | 474,960 | |||
| † | Anadarko Petroleum | 92,955 | 7,614,874 | |||
| Baker Hughes | 76,950 | 5,650,439 | ||||
| *† | Cameron International | 28,600 | 1,633,060 | |||
| Chevron | 20,600 | 2,213,058 | ||||
| Cimarex Energy | 6,900 | 795,156 | ||||
| ConocoPhillips | 101,600 | 8,113,775 | ||||
| *† | Continental Resources | 40,121 | 2,867,448 | |||
| Devon Energy | 40,900 | 3,753,393 | ||||
| EOG Resources | 67,734 | 8,027,156 | ||||
| *† | FMC Technologies | 16,200 | 1,530,576 | |||
| Halliburton | 166,989 | 8,322,731 | ||||
| National Oilwell Varco | 22,650 | 1,795,466 | ||||
| Nexen (Canada) | 138,448 | 3,450,124 | ||||
| Occidental Petroleum | 37,644 | 3,933,422 | ||||
| Peabody Energy | 74,100 | 5,332,236 | ||||
| *† | Petrohawk Energy | 17,300 | 424,542 | |||
| Royal Dutch Shell ADR | 90,700 | 6,608,402 | ||||
| Schlumberger | 36,300 | 3,385,338 | ||||
| Suncor Energy (Canada) | 48,200 | 2,161,288 | ||||
| Walter Energy | 3,700 | 501,091 | ||||
| Williams | 81,100 | 2,528,698 | ||||
| 81,117,233 | ||||||
| Financial Services – 9.91% | ||||||
| American Express | 53,300 | 2,409,160 | ||||
| BlackRock | 18,350 | 3,688,534 | ||||
| BM&FBovespa (Brazil) | 224,450 | 1,629,439 | ||||
| † | CB Richard Ellis Group Class A | 24,400 | 651,480 | |||
| † | Citigroup | 1,855,422 | 8,200,965 | |||
| CME Group | 6,750 | 2,035,463 | ||||
| Discover Financial Services | 22,500 | 542,700 | ||||
| Franklin Resources | 22,600 | 2,826,808 | ||||
| Goldman Sachs Group | 42,539 | 6,741,155 | ||||
| † | Hutchison Port Holdings | |||||
| Trust (Singapore) | 3,400,000 | 3,366,000 | ||||
| † | IntercontinentalExchange | 12,500 | 1,544,250 | |||
| Invesco | 63,100 | 1,612,836 | ||||
70
| Number of | Value | |||||
| Shares | (U.S. $) | |||||
| Common Stock (continued) | ||||||
| Financial Services (continued) | ||||||
| JPMorgan Chase | 154,300 | $ | 7,113,230 | |||
| Lazard Class A (Bermuda) | 35,950 | 1,494,801 | ||||
| MasterCard Class A | 23,300 | 5,865,076 | ||||
| MetLife | 73,700 | 3,296,601 | ||||
| Northern Trust | 17,900 | 908,425 | ||||
| PNC Financial Services Group | 86,355 | 5,439,501 | ||||
| U.S. Bancorp | 346,479 | 9,157,439 | ||||
| † | Verisk Analytics Class A | 29,400 | 963,144 | |||
| Visa Class A | 27,000 | 1,987,740 | ||||
| Wells Fargo | 109,788 | 3,480,280 | ||||
| 74,955,027 | ||||||
| Healthcare – 6.17% | ||||||
| Aetna | 117,450 | 4,396,154 | ||||
| † | Alexion Pharmaceuticals | 3,300 | 325,644 | |||
| Allergan | 56,900 | 4,041,038 | ||||
| AmerisourceBergen | 12,300 | 486,588 | ||||
| *† | Auxilium Pharmaceuticals | 25,300 | 543,191 | |||
| † | Celgene | 12,300 | 707,619 | |||
| CIGNA | 41,450 | 1,835,406 | ||||
| * | Covidien (Ireland) | 91,950 | 4,775,882 | |||
| † | Edwards Lifesciences | 11,300 | 983,100 | |||
| † | Express Scripts | 85,950 | 4,779,679 | |||
| *† | Human Genome Sciences | 111,000 | 3,046,950 | |||
| *† | Illumina | 13,900 | 973,973 | |||
| *† | Insulet | 58,950 | 1,215,549 | |||
| McKesson | 50,950 | 4,027,598 | ||||
| Mead Johnson Nutrition | 34,877 | 2,020,425 | ||||
| Pfizer | 150,034 | 3,047,191 | ||||
| * | Stryker | 20,300 | 1,234,240 | |||
| † | Thermo Fisher Scientific | 103,650 | 5,757,757 | |||
| Universal Health Services Class B | 50,050 | 2,472,971 | ||||
| 46,670,955 | ||||||
| Materials & Processing – 9.59% | ||||||
| Agnico-Eagle Mines (Canada) | 8,600 | 570,610 | ||||
| Air Products & Chemicals | 9,300 | 838,674 | ||||
| BHP Billiton ADR | 24,647 | 1,961,901 | ||||
| BHP Billiton (Australia) | 39,750 | 1,915,722 | ||||
| Celanese Class A | 37,300 | 1,655,001 | ||||
| * | Cliffs Natural Resources | 37,050 | 3,641,274 | |||
| Dow Chemical | 263,546 | 9,948,862 | ||||
| Freeport-McMoRan Copper & Gold | 128,977 | 7,164,672 | ||||
| International Paper | 7,350 | 221,823 | ||||
| *† | Molycorp | 46,900 | 2,814,938 | |||
| Monsanto | 114,553 | 8,277,600 | ||||
| Mosaic | 32,600 | 2,567,250 | ||||
| Potash Corp. of Saskatchewan | ||||||
| (Canada) | 19,600 | 1,155,028 | ||||
| * | PPG Industries | 71,696 | 6,826,176 | |||
| Praxair | 122,456 | 12,441,529 | ||||
| Precision Castparts | 46,185 | 6,797,508 | ||||
| † | Stillwater Mining | 99,100 | 2,272,363 | |||
| Yamana Gold (Canada) | 115,550 | 1,422,421 | ||||
| 72,493,352 | ||||||
| Producer Durables – 13.60% | ||||||
| 3M | 46,250 | 4,324,375 | ||||
| † | Agilent Technologies | 52,052 | 2,330,889 | |||
| † | Babcock & Wilcox | 17,100 | 570,798 | |||
| Boeing | 21,400 | 1,582,102 | ||||
| Caterpillar | 41,200 | 4,587,620 | ||||
| Cooper Industries | 12,500 | 811,250 | ||||
| CSX | 58,300 | 4,582,380 | ||||
| Cummins | 74,069 | 8,119,444 | ||||
| Danaher | 203,629 | 10,568,344 | ||||
| Deere | 29,800 | 2,887,322 | ||||
| Eaton | 85,443 | 4,736,960 | ||||
| Emerson Electric | 20,100 | 1,174,443 | ||||
| Expeditors International of Washington | 23,100 | 1,158,234 | ||||
| FedEx | 67,550 | 6,319,303 | ||||
| Fluor | 8,062 | 593,847 | ||||
| General Dynamics | 61,090 | 4,677,050 | ||||
| Goodrich | 23,000 | 1,967,190 | ||||
| * | Grainger (W.W.) | 7,800 | 1,073,904 | |||
| * | Ingersoll-Rand (Ireland) | 89,250 | 4,311,668 | |||
| Joy Global | 10,700 | 1,057,267 | ||||
| † | McDermott International | 33,900 | 860,721 | |||
| * | PACCAR | 21,800 | 1,141,230 | |||
| * | Republic Services | 70,350 | 2,113,314 | |||
| * | Rockwell Automation | 34,092 | 3,226,808 | |||
| Rockwell Collins | 28,200 | 1,828,206 | ||||
| Roper Industries | 10,300 | 890,538 | ||||
| Stanley Black & Decker | 22,250 | 1,704,350 | ||||
| * | Textron | 23,500 | 643,665 | |||
| Towers Watson Class A | 27,000 | 1,497,420 | ||||
| Tyco International (Switzerland) | 103,750 | 4,644,888 | ||||
| Union Pacific | 92,784 | 9,123,450 | ||||
| United Parcel Service Class B | 104,250 | 7,747,860 | ||||
| 102,856,840 | ||||||
| Technology – 25.05% | ||||||
| Accenture Class A (Ireland) | 36,700 | 2,017,399 | ||||
| *† | Acme Packet | 16,478 | 1,169,279 | |||
| Altera | 44,350 | 1,952,287 | ||||
| † | American Tower Class A | 88,000 | 4,560,160 | |||
| † | Apple | 132,823 | 46,282,173 | |||
| † | Autodesk | 7,900 | 348,469 | |||
| Avago Technologies (Singapore) | 50,500 | 1,570,550 | ||||
| † | Baidu ADR | 103,878 | 14,315,427 | |||
| Broadcom Class A | 72,000 | 2,835,360 | ||||
| *† | Ciena | 15,650 | 406,274 | |||
| Cisco Systems | 62,250 | 1,067,588 | ||||
| Corning | 202,500 | 4,177,575 | ||||
(continues) 71
Statements of net assets
Optimum Large Cap Growth Fund
| Number of | Value | |||||||
| Shares | (U.S. $) | |||||||
| Common Stock (continued) | ||||||||
| Technology (continued) | ||||||||
| † | Crown Castle International | 89,100 | $ | 3,791,205 | ||||
| *† | Ctrip.com International ADR | 25,500 | 1,057,995 | |||||
| *† | Dolby Laboratories Class A | 27,500 | 1,353,275 | |||||
| *† | EMC | 234,000 | 6,212,700 | |||||
| † | F5 Networks | 21,365 | 2,191,408 | |||||
| =@† | Facebook Class B | 26,801 | 670,025 | |||||
| † | Google Class A | 26,900 | 15,769,048 | |||||
| *† | GSI Commerce | 107,400 | 3,143,598 | |||||
| Hewlett-Packard | 176,550 | 7,233,254 | ||||||
| International Business Machines | 34,500 | 5,625,915 | ||||||
| † | Juniper Networks | 65,500 | 2,756,240 | |||||
| † | Lam Research | 50,900 | 2,883,994 | |||||
| =@#† | Mail.ru Group 144A GDR | 6,600 | 197,670 | |||||
| † | Marvell Technology Group (Bermuda) | 82,450 | 1,282,098 | |||||
| † | Mentor Graphics | 12,750 | 186,533 | |||||
| † | NetApp | 19,900 | 958,782 | |||||
| † | NICE Systems ADR | 45,250 | 1,671,535 | |||||
| † | Nuance Communications | 3,600 | 70,416 | |||||
| † | NXP Semiconductors (Netherlands) | 72,700 | 2,178,456 | |||||
| *† | ON Semiconductor | 80,500 | 794,535 | |||||
| Oracle | 589,025 | 19,655,763 | ||||||
| QUALCOMM | 187,000 | 10,253,210 | ||||||
| † | Red Hat | 9,800 | 444,822 | |||||
| *† | Rovi | 20,100 | 1,078,365 | |||||
| *† | salesforce.com | 32,077 | 4,284,846 | |||||
| Samsung Electronics (Republic | ||||||||
| of Korea) | 971 | 825,328 | ||||||
| † | SanDisk | 10,300 | 474,727 | |||||
| *† | Sina (China) (Hong Kong | |||||||
| Exchange) | 16,950 | 1,814,328 | ||||||
| *† | Skyworks Solutions | 55,050 | 1,784,721 | |||||
| * | Tencent Holdings (China) (Hong | |||||||
| Kong Exchange) | 67,500 | 1,644,352 | ||||||
| Texas Instruments | 104,000 | 3,594,240 | ||||||
| † | Trimble Navigation | 14,700 | 742,938 | |||||
| † | Yahoo | 77,350 | 1,287,878 | |||||
| *† | Youku.com ADR | 15,689 | 745,384 | |||||
| 189,362,125 | ||||||||
| Total Common Stock | ||||||||
| (cost $595,077,782) | 740,644,696 | |||||||
| Exchange-Traded Funds – 0.32% | ||||||||
| † | ETFS Palladium Trust | 38 | 2,889 | |||||
| *† | SPDR Gold Trust | 17,250 | 2,411,895 | |||||
| Total Exchange-Traded Funds | ||||||||
| (cost $2,084,423) | 2,414,784 | |||||||
| Preferred Stock – 0.14% | ||||||||
| Wells Fargo 8.00% | 38,550 | 1,082,484 | ||||||
| Total Preferred Stock | ||||||||
| (cost $741,030) | 1,082,484 | |||||||
| Principal | ||||||||
| Amount (U.S. $) | ||||||||
| ≠Short-Term Investments – 1.33% | ||||||||
| Discount Notes – 1.25% | ||||||||
| Federal Home Loan Bank | ||||||||
| 0.001% 4/1/11 | $ | 4,277,790 | 4,277,790 | |||||
| 0.001% 4/1/11 | 418,322 | 418,322 | ||||||
| 0.001% 4/14/11 | 285,186 | 285,185 | ||||||
| 0.010% 4/18/11 | 182,519 | 182,518 | ||||||
| 0.020% 4/27/11 | 1,379,017 | 1,379,007 | ||||||
| 0.030% 5/3/11 | 570,372 | 570,352 | ||||||
| 0.037% 5/23/11 | 730,076 | 730,034 | ||||||
| 0.040% 5/9/11 | 467,705 | 467,685 | ||||||
| 0.050% 5/16/11 | 570,372 | 570,344 | ||||||
| 0.060% 6/7/11 | 541,853 | 541,773 | ||||||
| 9,423,010 | ||||||||
| U.S. Treasury Obligation – 0.08% | ||||||||
| U.S. Treasury Bill 0.00% 4/28/11 | 589,308 | 589,290 | ||||||
| 589,290 | ||||||||
| Total Short-Term Investments | ||||||||
| (cost $10,012,353) | 10,012,300 | |||||||
| Total Value of Securities Before Securities | ||||||||
| Lending Collateral – 99.74% | ||||||||
| (cost $607,915,588) | 754,154,264 | |||||||
| Number of | ||||||||
| Shares | ||||||||
| Securities Lending Collateral** – 9.21% | ||||||||
| Investment Companies | ||||||||
| BNY Mellon SL DBT II | ||||||||
| Liquidating Fund | 737,706 | 713,288 | ||||||
| Delaware Investments | ||||||||
| Collateral Fund No.1 | 68,937,066 | 68,937,066 | ||||||
| @†Mellon GSL Reinvestment Trust II | 999,997 | 0 | ||||||
| Total Securities Lending Collateral | ||||||||
| (cost $70,674,769) | 69,650,354 | |||||||
| Total Value of Securities – 108.95% | ||||||||
| (cost $678,590,357) | 823,804,618 | © | ||||||
| Obligation to Return Securities | ||||||||
| Lending Collateral** – (9.35%) | (70,674,769 | ) | ||||||
| Receivables and Other Assets | ||||||||
| Net of Liabilities – 0.40% | 3,006,868 | |||||||
| Net Assets Applicable to 60,170,233 | ||||||||
| Shares Outstanding – 100.00% | $ | 756,136,717 | ||||||
| Net Asset Value – Optimum Large Cap Growth Fund | ||||||||
| Class A ($35,359,358 / 2,843,727 Shares) | $12.43 | |||||||
| Net Asset Value – Optimum Large Cap Growth Fund | ||||||||
| Class B ($5,380,483 / 455,143 Shares) | $11.82 | |||||||
| Net Asset Value – Optimum Large Cap Growth Fund | ||||||||
| Class C ($128,256,424 / 10,852,645 Shares) | $11.82 | |||||||
| Net Asset Value – Optimum Large Cap Growth Fund | ||||||||
| Institutional Class ($587,140,452 / 46,018,718 Shares) | $12.76 | |||||||
72
| Components of Net Assets at March 31, 2011: | |||
| Shares of beneficial interest | |||
| (unlimited authorization – no par) | $ | 717,849,287 | |
| Accumulated net investment loss | (19,646 | ) | |
| Accumulated net realized loss on investments | (106,955,338 | ) | |
| Net unrealized appreciation of investments | |||
| and foreign currencies | 145,262,414 | ||
| Total net assets | $ | 756,136,717 |
| ² | Narrow industries are utilized for compliance purposes for diversification whereas broad sectors are used for financial reporting. |
| † | Non income producing security. |
| * | Fully or partially on loan. |
| = | Security is being fair valued in accordance with the Fund’s fair valuation policy. At March 31, 2011, the aggregate amount of fair valued securities was $867,695, which represented 0.11% of the Fund’s net assets. See Note 1 in “Notes to financial statements.” |
| @ | Illiquid security. At March 31, 2011, the aggregate amount of illiquid securities was $867,695, which represented 0.11% of the Fund’s net assets. See Note 9 in “Notes to financial statements.” |
| # | Security exempt from registration under Rule 144A of the Securities Act of 1933, as amended. At March 31, 2011, the aggregate amount of Rule 144A securities was $197,670, which represented 0.03% of the Fund’s net assets. See Note 9 in “Notes to financial statements.” |
| ≠ | The rate shown is the effective yield at the time of purchase. |
| ** | See Note 8 in “Notes to financial statements.” |
| © | Includes $68,686,482 of securities loaned. |
Summary of Abbreviations:
ADR — American Depositary Receipts
GDR — Global Depositary Receipts
HKD — Hong Kong Dollar
MNB — Mellon National Bank
USD — United States Dollar
ADR — American Depositary Receipts
GDR — Global Depositary Receipts
HKD — Hong Kong Dollar
MNB — Mellon National Bank
USD — United States Dollar
| Net Asset Value and Offering Price Per Share – | ||
| Optimum Large Cap Growth Fund | ||
| Net asset value Class A (A) | $ | 12.43 |
| Sales charge (5.75% of offering price) (B) | 0.76 | |
| Offering price | $ | 13.19 |
| (A) | Net asset value per share, as illustrated, is the amount which would be paid upon redemption or repurchase of shares. |
| (B) | See the current prospectus for purchases of $75,000 or more. |
| The following foreign currency exchange contract was outstanding at March 31, 20111: | ||||||||||
| Foreign Currency Exchange Contract | ||||||||||
| Unrealized | ||||||||||
| Contract to | Settlement | Appreciation | ||||||||
| Counterparty | Receive | In Exchange For | Date | (Depreciation) | ||||||
| MNB | HKD 2,767,407 | USD | (355,434) | 4/1/11 | $327 | |||||
The use of foreign currency exchange contracts involves elements of market risk and risks in excess of the amount recognized in the financial statements. The notional value presented above represents the Fund’s total exposure in such contracts, whereas only the net unrealized appreciation (depreciation) is reflected in the Fund’s net assets.
1See Note 7 in “Notes to financial statements.”
See accompanying notes, which are an integral part of the financial statements.
See accompanying notes, which are an integral part of the financial statements.
(continues) 73
Statements of net assets
Optimum Large Cap Value Fund
March 31, 2011
March 31, 2011
| Number of | Value | |||||
| Shares | (U.S. $) | |||||
| Common Stock – 98.03% | ||||||
| Consumer Discretionary – 8.79% | ||||||
| * | Advance Auto Parts | 23,370 | $ | 1,533,539 | ||
| Coach | 171,265 | 8,912,631 | ||||
| Copa Holdings Class A (Panama) | 181,852 | 9,601,786 | ||||
| Disney (Walt) | 118,970 | 5,126,417 | ||||
| † | General Motors | 17,370 | 538,991 | |||
| Hasbro | 43,900 | 2,056,276 | ||||
| Johnson Controls | 51,680 | 2,148,338 | ||||
| Kohl’s | 23,380 | 1,240,075 | ||||
| McDonald’s | 23,070 | 1,755,396 | ||||
| * | Omnicom Group | 73,570 | 3,609,344 | |||
| *† | Pulte Group | 115,730 | 856,402 | |||
| Sherwin-Williams | 38,590 | 3,241,174 | ||||
| Staples | 65,320 | 1,268,514 | ||||
| * | Strayer Education | 22,264 | 2,905,229 | |||
| Target | 79,510 | 3,976,295 | ||||
| TJX | 232,920 | 11,583,113 | ||||
| Viacom Class B | 42,570 | 1,980,356 | ||||
| 62,333,876 | ||||||
| Consumer Staples – 12.89% | ||||||
| Altria Group | 401,487 | 10,450,707 | ||||
| Avon Products | 231,310 | 6,254,622 | ||||
| Colgate-Palmolive | 69,907 | 5,645,689 | ||||
| CVS Caremark | 58,701 | 2,014,618 | ||||
| Diageo (United Kingdom) | 233,823 | 4,444,644 | ||||
| † | Energizer Holdings | 100,890 | 7,179,332 | |||
| General Mills | 134,230 | 4,906,107 | ||||
| * | Kellogg | 159,642 | 8,617,475 | |||
| Nestle (Switzerland) | 72,742 | 4,169,697 | ||||
| PepsiCo | 185,144 | 11,925,125 | ||||
| Philip Morris International | 299,718 | 19,670,492 | ||||
| Procter & Gamble | 34,186 | 2,105,858 | ||||
| Reynolds American | 52,870 | 1,878,471 | ||||
| Smucker (J.M.) | 21,410 | 1,528,460 | ||||
| Walgreen | 16,220 | 651,071 | ||||
| 91,442,368 | ||||||
| Energy – 12.60% | ||||||
| Apache | 41,890 | 5,484,239 | ||||
| *† | Atwood Oceanics | 195,553 | 9,079,526 | |||
| Chevron | 156,773 | 16,842,123 | ||||
| * | Consol Energy | 144,952 | 7,773,776 | |||
| EOG Resources | 25,560 | 3,029,116 | ||||
| Exxon Mobil | 236,374 | 19,886,144 | ||||
| Hess | 46,490 | 3,961,413 | ||||
| Marathon Oil | 163,324 | 8,706,802 | ||||
| Occidental Petroleum | 28,770 | 3,006,177 | ||||
| Sunoco | 196,020 | 8,936,552 | ||||
| *† | Transocean (Switzerland) | 33,780 | 2,633,151 | |||
| 89,339,019 | ||||||
| Financials – 21.09% | ||||||
| ACE (Switzerland) | 34,510 | 2,232,797 | ||||
| † | Affiliated Managers Group | 81,117 | 8,871,766 | |||
| AFLAC | 141,371 | 7,461,561 | ||||
| Allstate | 15,710 | 499,264 | ||||
| American Express | 181,229 | 8,191,551 | ||||
| Annaly Capital Management | 398,684 | 6,957,036 | ||||
| Aon | 71,600 | 3,791,936 | ||||
| Bank of America | 420,870 | 5,610,197 | ||||
| Bank of New York Mellon | 294,796 | 8,805,557 | ||||
| BlackRock | 5,478 | 1,101,133 | ||||
| Chubb | 38,020 | 2,331,006 | ||||
| Eaton Vance | 260,166 | 8,387,752 | ||||
| Federated Investors Class B | 318,241 | 8,512,947 | ||||
| Goldman Sachs Group | 107,426 | 17,023,799 | ||||
| JPMorgan Chase | 215,910 | 9,953,451 | ||||
| MasterCard Class A | 11,790 | 2,967,779 | ||||
| MetLife | 189,330 | 8,468,731 | ||||
| PNC Financial Services Group | 44,890 | 2,827,621 | ||||
| Prudential Financial | 83,290 | 5,128,998 | ||||
| † | SLM | 357,631 | 5,471,754 | |||
| State Street | 74,160 | 3,332,750 | ||||
| SunTrust Banks | 22,730 | 655,533 | ||||
| Travelers | 70,630 | 4,201,072 | ||||
| Waddell & Reed Financial Class A | 235,411 | 9,560,041 | ||||
| Wells Fargo | 228,240 | 7,235,208 | ||||
| 149,581,240 | ||||||
| Healthcare – 14.12% | ||||||
| Abbott Laboratories | 130,820 | 6,416,721 | ||||
| Becton, Dickinson | 40,410 | 3,217,444 | ||||
| † | Endo Pharmaceuticals Holdings | 250,980 | 9,577,397 | |||
| † | Forest Laboratories | 189,169 | 6,110,159 | |||
| † | Gilead Sciences | 93,261 | 3,957,997 | |||
| GlaxoSmithKline (United Kingdom) | 67,660 | 1,291,005 | ||||
| * | Herbalife (Cayman Islands) | 92,825 | 7,552,242 | |||
| Johnson & Johnson | 273,679 | 16,215,480 | ||||
| † | Kinetic Concepts | 196,020 | 10,667,408 | |||
| * | Lilly (Eli) | 55,739 | 1,960,341 | |||
| Medtronic | 119,650 | 4,708,228 | ||||
| Merck | 39,010 | 1,287,720 | ||||
| Pfizer | 420,025 | 8,530,708 | ||||
| Quest Diagnostics | 33,100 | 1,910,532 | ||||
| Roche Holding (Switzerland) | 10,547 | 1,506,550 | ||||
| St. Jude Medical | 68,860 | 3,529,764 | ||||
| † | Thermo Fisher Scientific | 28,440 | 1,579,842 | |||
| *† | Waters | 116,460 | 10,120,374 | |||
| 100,139,912 | ||||||
| Industrials – 10.32% | ||||||
| 3M | 117,950 | 11,028,325 | ||||
| *† | Babcock & Wilcox | 172,666 | 5,763,591 | |||
| Canadian National Railway (Canada) | 24,250 | 1,825,298 | ||||
| Danaher | 68,790 | 3,570,201 | ||||
| Eaton | 52,190 | 2,893,414 | ||||
| Fluor | 10,090 | 743,229 | ||||
| * | Garmin (Switzerland) | 165,504 | 5,603,965 | |||
| Honeywell International | 91,560 | 5,467,048 | ||||
74
| Number of | Value | |||||||
| Shares | (U.S. $) | |||||||
| Common Stock (continued) | ||||||||
| Industrials (continued) | ||||||||
| † | Huntington Ingalls Industries | 10,883 | $ | 451,658 | ||||
| * | Lockheed Martin | 165,470 | 13,303,788 | |||||
| † | McDermott International | 293,797 | 7,459,506 | |||||
| Northrop Grumman | 65,300 | 4,094,963 | ||||||
| Stanley Black & Decker | 38,017 | 2,912,102 | ||||||
| United Technologies | 95,520 | 8,085,768 | ||||||
| 73,202,856 | ||||||||
| Information Technology – 8.99% | ||||||||
| Accenture Class A (Ireland) | 154,960 | 8,518,151 | ||||||
| Cisco Systems | 141,500 | 2,426,725 | ||||||
| Corning | 332,720 | 6,864,014 | ||||||
| * | Dun & Bradstreet | 24,180 | 1,940,203 | |||||
| Hewlett-Packard | 50,940 | 2,087,012 | ||||||
| Intel | 216,340 | 4,363,578 | ||||||
| International Business Machines | 91,046 | 14,846,871 | ||||||
| Microsoft | 198,823 | 5,042,151 | ||||||
| Oracle | 211,760 | 7,066,431 | ||||||
| † | Western Digital | 226,069 | 8,430,113 | |||||
| Western Union | 103,050 | 2,140,349 | ||||||
| 63,725,598 | ||||||||
| Materials – 3.65% | ||||||||
| Air Products & Chemicals | 39,570 | 3,568,423 | ||||||
| CF Industries Holdings | 42,505 | 5,814,259 | ||||||
| * | Cliffs Natural Resources | 72,554 | 7,130,606 | |||||
| † | Owens-Illinois | 159,587 | 4,817,932 | |||||
| * | PPG Industries | 47,880 | 4,558,655 | |||||
| 25,889,875 | ||||||||
| Telecommunications – 2.86% | ||||||||
| AT&T | 322,710 | 9,874,926 | ||||||
| Vodafone Group (United Kingdom) | 1,712,741 | 4,849,175 | ||||||
| * | Windstream | 434,701 | 5,594,602 | |||||
| 20,318,703 | ||||||||
| Utilities – 2.72% | ||||||||
| † | AES | 569,844 | 7,407,973 | |||||
| Dominion Resources | 36,706 | 1,640,758 | ||||||
| PG&E | 80,730 | 3,566,651 | ||||||
| PPL | 40,930 | 1,035,529 | ||||||
| Public Service Enterprise Group | 59,910 | 1,887,764 | ||||||
| UGI | 113,346 | 3,729,083 | ||||||
| 19,267,758 | ||||||||
| Total Common Stock | ||||||||
| (cost $599,776,979) | 695,241,205 | |||||||
| Convertible Preferred Stock – 0.16% | ||||||||
| * | Apache 6.00% exercise price $109.12, | |||||||
| expiration date 8/01/13 | 9,150 | 648,369 | ||||||
| PPL 9.50% exercise price $28.80, | ||||||||
| expiration date 12/31/49 | 9,830 | 520,007 | ||||||
| Total Convertible Preferred Stock | ||||||||
| (cost $959,120) | 1,168,376 | |||||||
| Principal | ||||||||
| Amount (U.S. $) | ||||||||
| ≠Short-Term Investments – 1.73% | ||||||||
| Discount Notes – 1.63% | ||||||||
| Federal Home Loan Bank | ||||||||
| 0.001% 4/1/11 | $ | 5,207,454 | 5,207,454 | |||||
| 0.001% 4/1/11 | 625,362 | 625,362 | ||||||
| 0.001% 4/14/11 | 347,164 | 347,162 | ||||||
| 0.010% 4/18/11 | 222,185 | 222,184 | ||||||
| 0.020% 4/27/11 | 1,678,710 | 1,678,698 | ||||||
| 0.030% 5/3/11 | 694,327 | 694,302 | ||||||
| 0.037% 5/23/11 | 888,739 | 888,687 | ||||||
| 0.040% 5/9/11 | 569,348 | 569,324 | ||||||
| 0.050% 5/16/11 | 694,327 | 694,292 | ||||||
| 0.060% 6/7/11 | 659,611 | 659,513 | ||||||
| 11,586,978 | ||||||||
| U.S. Treasury Obligation – 0.10% | ||||||||
| U.S. Treasury Bill 0.00% 4/28/11 | 717,379 | 717,356 | ||||||
| 717,356 | ||||||||
| Total Short-Term Investments | ||||||||
| (cost $12,304,400) | 12,304,334 | |||||||
| Total Value of Securities Before Securities | ||||||||
| Lending Collateral – 99.92% | ||||||||
| (cost $613,040,499) | 708,713,915 | |||||||
| Number of | ||||||||
| Shares | ||||||||
| Securities Lending Collateral** – 6.27% | ||||||||
| Investment Companies | ||||||||
| BNY Mellon SL DBT II | ||||||||
| Liquidating Fund | 519,876 | 502,668 | ||||||
| Delaware Investments | ||||||||
| Collateral Fund No.1 | 43,954,778 | 43,954,778 | ||||||
| @†Mellon GSL Reinvestment Trust II | 996,642 | 0 | ||||||
| Total Securities Lending Collateral | ||||||||
| (cost $45,471,296) | 44,457,446 | |||||||
| Total Value of Securities – 106.19% | ||||||||
| (cost $658,511,795) | 753,171,361 | © | ||||||
| Obligation to Return Securities | ||||||||
| Lending Collateral** – (6.41%) | (45,471,296 | ) | ||||||
| Receivables and Other Assets | ||||||||
| Net of Liabilities – 0.22% | 1,538,888 | |||||||
| Net Assets Applicable to 64,052,965 | ||||||||
| Shares Outstanding – 100.00% | $ | 709,238,953 | ||||||
(continues) 75
Statements of net assets
Optimum Large Cap Value Fund
| Net Asset Value – Optimum Large Cap Value Fund | ||||
| Class A ($33,891,869 / 3,063,398 Shares) | $11.06 | |||
| Net Asset Value – Optimum Large Cap Value Fund | ||||
| Class B ($5,135,280 / 469,642 Shares) | $10.93 | |||
| Net Asset Value – Optimum Large Cap Value Fund | ||||
| Class C ($119,899,245 / 10,971,698 Shares) | $10.93 | |||
| Net Asset Value – Optimum Large Cap Value Fund | ||||
| Institutional Class ($550,312,559 / 49,548,227 Shares) | $11.11 | |||
| Components of Net Assets at March 31, 2011: | ||||
| Shares of beneficial interest | ||||
| (unlimited authorization – no par) | $ | 777,330,832 | ||
| Undistributed net investment income | 6,037,066 | |||
| Accumulated net realized loss on investments | (168,822,167 | ) | ||
| Net unrealized appreciation of investments | ||||
| and foreign currencies | 94,693,222 | |||
| Total net assets | $ | 709,238,953 | ||
| * | Fully or partially on loan. |
| † | Non income producing security. |
| ≠ | The rate shown is the effective yield at the time of purchase. |
| ** | See Note 8 in “Notes to financial statements.” |
| @ | Illiquid security. At March 31, 2011, the aggregate amount of illiquid securities was $0, which represented 0.00% of the Fund’s net assets. See Note 9 in “Notes to financial statements.” |
| © | Includes $45,232,840 of securities loaned. |
| Net Asset Value and Offering Price Per Share – | ||
| Optimum Large Cap Value Fund | ||
| Net asset value Class A (A) | $ | 11.06 |
| Sales charge (5.75% of offering price) (B) | 0.67 | |
| Offering price | $ | 11.73 |
| (A) | Net asset value per share, as illustrated, is the amount which would be paid upon redemption or repurchase of shares. |
| (B) | See the current prospectus for purchases of $75,000 or more. |
See accompanying notes, which are an integral part of the financial statements.
76
Optimum Small-Mid Cap Growth Fund
March 31, 2011
March 31, 2011
| Number of | Value | |||||
| Shares | (U.S. $) | |||||
| Common Stock – 96.97%² | ||||||
| Consumer Discretionary – 20.98% | ||||||
| * | Aaron’s | 38,499 | $ | 976,335 | ||
| Abercrombie & Fitch Class A | 42,900 | 2,518,230 | ||||
| † | AerCap Holdings (Netherlands) | 20,080 | 252,406 | |||
| *† | Avis Budget Group | 60,170 | 1,077,645 | |||
| *† | Bally Technologies | 58,000 | 2,195,300 | |||
| † | Big Lots | 46,690 | 2,027,747 | |||
| * | Brunswick | 81,550 | 2,073,817 | |||
| *† | Cheesecake Factory | 45,880 | 1,380,529 | |||
| * | Chico’s FAS | 41,000 | 610,900 | |||
| *† | Children’s Place Retail Stores | 14,280 | 711,572 | |||
| * | Cinemark Holdings | 85,340 | 1,651,329 | |||
| * | Columbia Sportswear | 25,020 | 1,486,688 | |||
| † | Commercial Vehicle Group | 60,455 | 1,078,517 | |||
| *† | Constant Contact | 14,700 | 513,030 | |||
| † | Deckers Outdoor | 8,250 | 710,738 | |||
| *† | Dick’s Sporting Goods | 43,360 | 1,733,533 | |||
| *† | Domino’s Pizza | 65,660 | 1,210,114 | |||
| Domino’s Pizza UK & IRL | ||||||
| (United Kingdom) | 193,851 | 1,330,582 | ||||
| * | Drew Industries | 25,600 | 571,648 | |||
| Estacio Participacoes (Brazil) | 115,310 | 1,890,397 | ||||
| *† | Gaylord Entertainment | 57,500 | 1,994,100 | |||
| *† | Green Dot Class A | 15,420 | 661,672 | |||
| *† | Hanesbrands | 101,450 | 2,743,208 | |||
| HEICO Class A | 26,500 | 1,191,970 | ||||
| *† | Hertz Global Holdings | 56,500 | 883,095 | |||
| *† | ITT Educational Services | 10,300 | 743,145 | |||
| * | Jarden | 33,000 | 1,173,810 | |||
| *† | Life Time Fitness | 28,400 | 1,059,604 | |||
| *† | LKQ | 118,900 | 2,865,490 | |||
| Localiza Rent a Car (Brazil) | 112,130 | 1,787,430 | ||||
| *† | Lululemon Athletica | 31,600 | 2,813,980 | |||
| *† | Lumber Liquidators Holdings | 50,570 | 1,263,744 | |||
| *† | Meritor | 109,820 | 1,863,645 | |||
| † | Penn National Gaming | 23,000 | 852,380 | |||
| *† | Pier 1 Imports | 103,000 | 1,045,450 | |||
| *† | Pinnacle Entertainment | 74,500 | 1,014,690 | |||
| * | Pool | 45,000 | 1,084,950 | |||
| *† | Rush Enterprises Class A | 81,160 | 1,606,968 | |||
| *† | Saks | 67,500 | 763,425 | |||
| *† | Shutterfly | 47,400 | 2,481,864 | |||
| *† | Talbots | 49,000 | 295,960 | |||
| *† | Tempur-Pedic International | 77,960 | 3,949,453 | |||
| * | Thor Industries | 77,660 | 2,591,514 | |||
| *† | True Religion Apparel | 20,800 | 488,176 | |||
| *† | Ulta Salon Cosmetics & Fragrance | 36,890 | 1,775,516 | |||
| *† | Under Armour Class A | 26,300 | 1,789,715 | |||
| *† | Vail Resorts | 13,500 | 658,260 | |||
| † | WABCO Holdings | 13,000 | 801,320 | |||
| *† | Warnaco Group | 17,000 | 972,230 | |||
| Weight Watchers International | 9,200 | 644,920 | ||||
| *† | WMS Industries | 22,000 | 777,700 | |||
| 70,640,441 | ||||||
| Consumer Staples – 2.30% | ||||||
| * | Diamond Foods | 37,000 | 2,064,600 | |||
| *† | Fresh Market | 25,150 | 949,161 | |||
| *† | Green Mountain Coffee Roasters | 73,170 | 4,727,514 | |||
| 7,741,275 | ||||||
| Energy – 6.08% | ||||||
| *† | Atwood Oceanics | 65,000 | 3,017,950 | |||
| * | Cabot Oil & Gas | 45,400 | 2,404,838 | |||
| *† | Carrizo Oil & Gas | 18,000 | 664,740 | |||
| * | Core Laboratories (Netherlands) | 17,000 | 1,736,890 | |||
| *† | FMC Technologies | 29,000 | 2,739,920 | |||
| *† | Global Industries | 107,300 | 1,050,467 | |||
| *† | Hornbeck Offshore Services | 26,610 | 820,919 | |||
| * | Houston America Energy | 30,000 | 462,300 | |||
| *† | James River Coal | 38,100 | 920,877 | |||
| *† | Northern Oil & Gas | 19,000 | 507,300 | |||
| *† | Oasis Petroleum | 3,300 | 104,346 | |||
| *† | Quicksilver Resources | 49,200 | 704,052 | |||
| † | Real Goods Solar Class A | 150,000 | 397,500 | |||
| *† | Rosetta Resources | 64,900 | 3,085,346 | |||
| * | SM Energy | 19,000 | 1,409,610 | |||
| *† | Swift Energy | 7,000 | 298,760 | |||
| † | Tesco (Canada) | 6,700 | 147,065 | |||
| 20,472,880 | ||||||
| Financial Services – 7.43% | ||||||
| † | Advent Software | 20,000 | 573,400 | |||
| Associated Banc-Corp | 42,100 | 625,185 | ||||
| Associated Estates Realty | 97,200 | 1,543,536 | ||||
| Berkshire Hills Bancorp | 25,500 | 531,675 | ||||
| * | BioMed Realty Trust | 105,000 | 1,997,099 | |||
| * | Corporate Office Properties Trust | 23,500 | 849,290 | |||
| * | DuPont Fabros Technology | 55,000 | 1,333,750 | |||
| Evercore Partners Class A | 34,530 | 1,184,034 | ||||
| * | Extra Space Storage | 63,600 | 1,317,156 | |||
| First Busey | 177,800 | 903,224 | ||||
| † | Green Bancshares | 22,000 | 61,380 | |||
| Hancock Holdings | 4,000 | 131,360 | ||||
| † | Justice Holdings (United Kingdom) | 76,511 | 1,211,972 | |||
| * | Kaiser Federal Financial Group | 54,674 | 672,490 | |||
| * | Kilroy Realty | 15,000 | 582,450 | |||
| Kite Realty Group Trust | 245,000 | 1,300,950 | ||||
| Lakeland Financial | 19,300 | 437,724 | ||||
| MB Financial | 54,000 | 1,131,840 | ||||
| *† | MF Global Holdings | 86,500 | 716,220 | |||
| Pacific Continental | 53,997 | 550,229 | ||||
| Sandy Spring Bancorp | 32,400 | 598,104 | ||||
| SEI Investments | 35,000 | 835,800 | ||||
| † | Stifel Financial | 325 | 23,332 | |||
| † | Summit Hotel Properties | 12,000 | 119,280 | |||
| † | SVB Financial Group | 27,500 | 1,565,575 | |||
| TCF Financial | 38,300 | 607,438 | ||||
| Trico Bancshares | 27,350 | 446,079 | ||||
| Valley National Bancorp | 91,350 | 1,275,246 | ||||
| ViewPoint Financial Group | 63,600 | 826,800 | ||||
(continues) 77
Statements of net assets
Optimum Small-Mid Cap Growth Fund
| Number of | Value | |||||
| Shares | (U.S. $) | |||||
| Common Stock (continued) | ||||||
| Financial Services (continued) | ||||||
| Whitney Holding | 51,000 | $ | 694,620 | |||
| *† | World Acceptance | 5,500 | 358,600 | |||
| 25,005,838 | ||||||
| Healthcare – 12.96% | ||||||
| † | ABIOMED | 61,940 | 899,988 | |||
| *† | Akorn | 55,900 | 322,543 | |||
| † | Alexion Pharmaceuticals | 15,500 | 1,529,540 | |||
| *† | Alimera Sciences | 14,400 | 112,320 | |||
| *† | Allos Therapeutics | 37,600 | 119,192 | |||
| † | Allscripts Healthcare Solutions | 55,070 | 1,155,919 | |||
| *† | Anthera Pharmaceuticals | 20,000 | 135,200 | |||
| *† | Ardea Biosciences | 18,480 | 530,191 | |||
| *† | Array BioPharma | 40,000 | 122,400 | |||
| *† | Auxilium Pharmaceuticals | 50,000 | 1,073,500 | |||
| *† | BioMarin Pharmaceuticals | 51,000 | 1,281,630 | |||
| *† | Cepheid | 32,900 | 921,858 | |||
| *† | Chelsea Therapeutics International | 72,000 | 280,800 | |||
| † | Community Health Systems | 47,000 | 1,879,530 | |||
| *† | eResearch Technology | 31,300 | 211,901 | |||
| *† | Exelixis | 71,400 | 806,820 | |||
| *† | Gen-Probe | 47,960 | 3,182,147 | |||
| *† | HeartWare International | 15,800 | 1,351,374 | |||
| *† | Idenix Pharmaceuticals | 50,700 | 168,324 | |||
| *† | IDEXX Laboratories | 9,000 | 694,980 | |||
| *† | Incyte | 53,970 | 855,425 | |||
| *† | InterMune | 13,000 | 613,470 | |||
| *† | Isis Pharmaceuticals | 59,000 | 533,360 | |||
| *† | Micromet | 100,000 | 561,000 | |||
| *† | Nabi Biopharmaceuticals | 29,400 | 170,814 | |||
| *† | Nanosphere | 5,012 | 16,289 | |||
| *† | Nektar Therapeutics | 10,200 | 96,594 | |||
| † | NPS Pharmaceuticals | 74,000 | 708,180 | |||
| *† | NuVasive | 33,060 | 837,079 | |||
| *† | ONYX Pharmaceuticals | 42,680 | 1,501,482 | |||
| *† | Pacific Biosciences of California | 20,000 | 281,000 | |||
| *† | Parexel International | 53,370 | 1,328,913 | |||
| * | Patterson | 33,000 | 1,062,270 | |||
| Pharmaceutical Product Development | 100,570 | 2,786,795 | ||||
| *† | Pharmasset | 15,820 | 1,245,192 | |||
| * | Quality Systems | 7,500 | 625,050 | |||
| *† | Regeneron Pharmaceuticals | 36,860 | 1,656,488 | |||
| *† | Salix Pharmaceuticals | 32,560 | 1,140,577 | |||
| *† | Savient Pharmaceuticals | 20,000 | 212,000 | |||
| *† | Seattle Genetics | 109,410 | 1,703,514 | |||
| *† | Sequenom | 1,267 | 8,020 | |||
| † | Sirona Dental Systems | 27,000 | 1,354,320 | |||
| † | SXC Health Solutions | 39,790 | 2,180,492 | |||
| *† | United Therapeutics | 5,500 | 368,610 | |||
| *† | Volcano | 54,639 | 1,398,758 | |||
| † | WellCare Health Plans | 53,190 | 2,231,321 | |||
| † | Zoll Medical | 31,000 | 1,389,110 | |||
| 43,646,280 | ||||||
| Materials & Processing – 1.96% | ||||||
| * | Acuity Brands | 26,000 | 1,520,740 | |||
| Albemarle | 17,000 | 1,016,090 | ||||
| *† | Augusta Resource (Canada) | 16,000 | 82,080 | |||
| Greif Class A | 4,700 | 307,427 | ||||
| Kaydon | 13,300 | 521,227 | ||||
| *† | LSB Industries | 5,200 | 206,128 | |||
| Methanex | 61,470 | 1,919,709 | ||||
| *† | Trex | 21,870 | 713,399 | |||
| *† | United States Lime & Minerals | 8,000 | 324,080 | |||
| 6,610,880 | ||||||
| Producer Durables – 17.34% | ||||||
| † | Advisory Board | 800 | 41,200 | |||
| † | Aecom Technology | 79,810 | 2,213,131 | |||
| AMETEK | 55,500 | 2,434,785 | ||||
| *† | Bristow Group | 12,000 | 567,600 | |||
| *† | CAI International | 38,300 | 990,438 | |||
| * | Con-Way | 37,130 | 1,458,838 | |||
| Copa Holdings Class A (Panama) | 32,640 | 1,723,392 | ||||
| † | Corrections Corp. of America | 54,750 | 1,335,900 | |||
| † | Dice Holdings | 69,000 | 1,042,590 | |||
| * | Donaldson | 48,900 | 2,997,081 | |||
| * | ESCO Technologies | 54,200 | 2,067,730 | |||
| † | ExlService Holdings | 39,000 | 824,850 | |||
| † | Foster Wheeler (Switzerland) | 27,050 | 1,017,621 | |||
| *† | Geo Group | 58,176 | 1,491,633 | |||
| *† | GrafTech International | 31,500 | 649,845 | |||
| † | Gulfmark Offshore | 30,210 | 1,344,647 | |||
| * | Herman Miller | 37,000 | 1,017,130 | |||
| * | Hunt (J.B.) Transport Services | 56,950 | 2,586,669 | |||
| * | Kennametal | 35,000 | 1,365,000 | |||
| * | Knoll | 50,600 | 1,060,576 | |||
| † | Mettler-Toledo International | 25,500 | 4,386,000 | |||
| † | Moog Class A | 26,000 | 1,193,660 | |||
| Nalco Holding | 43,000 | 1,174,330 | ||||
| * | Nordson | 38,000 | 4,372,280 | |||
| † | Old Dominion Freight Line | 57,924 | 2,032,553 | |||
| † | Oshkosh | 40,000 | 1,415,200 | |||
| * | Pentair | 40,000 | 1,511,600 | |||
| *† | Quanta Services | 38,300 | 859,069 | |||
| † | RSC Holdings | 72,000 | 1,035,360 | |||
| † | Sauer-Danfoss | 17,700 | 901,461 | |||
| *† | SYKES Enterprises | 74,866 | 1,480,101 | |||
| * | Tidewater | 32,230 | 1,928,966 | |||
| Toro | 11,500 | 761,530 | ||||
| *† | TrueBlue | 13,000 | 218,270 | |||
| *† | United Rentals | 85,580 | 2,848,102 | |||
| * | Werner Enterprises | 60,020 | 1,588,729 | |||
| * | World Fuel Services | 36,500 | 1,482,265 | |||
| *† | Zebra Technologies | 24,000 | 941,760 | |||
| 58,361,892 | ||||||
78
| Number of | Value | |||||
| Shares | (U.S. $) | |||||
| Common Stock (continued) | ||||||
| Technology – 26.94% | ||||||
| AAC Acoustic Technologies | ||||||
| Holdings (China) | 457,800 | $ | 1,235,882 | |||
| *† | AboveNet | 20,000 | 1,297,200 | |||
| *† | Acme Packet | 23,580 | 1,673,237 | |||
| * | Adtran | 37,120 | 1,576,115 | |||
| Amphenol Class A | 28,400 | 1,544,676 | ||||
| † | Ancestry.com | 31,530 | 1,117,739 | |||
| † | ANSYS | 35,000 | 1,896,650 | |||
| *† | Applied Micro Circuits | 118,490 | 1,229,926 | |||
| *† | Ariba | 52,750 | 1,800,885 | |||
| *† | Aruba Networks | 45,360 | 1,534,982 | |||
| † | Atmel | 155,000 | 2,112,650 | |||
| *† | Blackboard | 25,800 | 934,992 | |||
| *† | Blue Coat Systems | 10,000 | 281,600 | |||
| *† | BroadSoft | 30,700 | 1,464,083 | |||
| *† | Cadence Design Systems | 204,490 | 1,993,778 | |||
| *† | Cavium Networks | 48,780 | 2,191,685 | |||
| † | CommVault Systems | 28,730 | 1,145,752 | |||
| *† | Concur Technologies | 51,130 | 2,835,159 | |||
| *† | Crown Castle International | 50,000 | 2,127,500 | |||
| *† | Cymer | 29,496 | 1,668,884 | |||
| † | Cypress Semiconductor | 68,690 | 1,331,212 | |||
| *† | Demand Media | 52,170 | 1,228,604 | |||
| † | DigitalGlobe | 44,680 | 1,252,380 | |||
| *† | Entegris | 124,500 | 1,091,865 | |||
| *† | Equinix | 3,400 | 309,740 | |||
| *† | Finisar | 85,220 | 2,096,412 | |||
| *† | Fortinet | 17,880 | 786,720 | |||
| *† | Gartner | 23,600 | 983,412 | |||
| † | Hackett Group | 30,500 | 117,120 | |||
| † | hiSoft Technology International ADR | 40,800 | 764,184 | |||
| † | II-VI | 31,000 | 1,542,250 | |||
| *† | Infinera | 60,000 | 503,400 | |||
| † | Informatica | 50,000 | 2,611,500 | |||
| *† | IPG Photonics | 58,000 | 3,345,440 | |||
| *† | Ixia | 35,000 | 555,800 | |||
| Jabil Circuit | 192,440 | 3,931,548 | ||||
| † | JDS Uniphase | 45,830 | 955,097 | |||
| † | LivePerson | 23,300 | 294,512 | |||
| † | MICROS Systems | 17,000 | 840,310 | |||
| † | Microsemi | 60,000 | 1,242,600 | |||
| *† | NETGEAR | 25,000 | 811,000 | |||
| † | NICE Systems ADR | 11,000 | 406,340 | |||
| *† | ON Semiconductor | 130,000 | 1,283,100 | |||
| *† | Parametric Technology | 59,420 | 1,336,356 | |||
| *† | Plexus | 30,500 | 1,069,330 | |||
| *† | Polycom | 100,330 | 5,202,110 | |||
| † | Quest Software | 30,880 | 784,043 | |||
| *† | QuinStreet | 80,070 | 1,819,991 | |||
| *† | RealD | 50,300 | 1,376,208 | |||
| † | RealPage | 42,510 | 1,178,802 | |||
| *† | SBA Communications Class A | 42,000 | 1,666,560 | |||
| *† | Skyworks Solutions | 66,580 | 2,158,524 | |||
| † | SPS Commerce | 80,000 | 1,240,800 | |||
| *† | Stratasys | 18,000 | 846,000 | |||
| *† | SuccessFactors | 75,140 | 2,937,223 | |||
| Syntel | 22,000 | 1,149,060 | ||||
| *† | TIBCO Software | 79,050 | 2,154,113 | |||
| Totvs (Brazil) | 63,600 | 1,215,659 | ||||
| † | Trimble Navigation | 6,000 | 303,240 | |||
| *† | TriQuint Semiconductor | 95,000 | 1,226,450 | |||
| † | Velti (Ireland) | 116,587 | 1,467,830 | |||
| *† | Virtusa | 85,411 | 1,599,748 | |||
| 90,679,968 | ||||||
| Utilities – 0.98% | ||||||
| † | PAETEC Holding | 255,000 | 851,700 | |||
| *† | tw telecom Class A | 128,000 | 2,457,600 | |||
| 3,309,300 | ||||||
| Total Common Stock | ||||||
| (cost $247,244,566) | 326,468,754 | |||||
| Exchange-Traded Fund – 0.39% | ||||||
| * | iShares Russell 2000 | |||||
| Growth Index Fund | 14,000 | 1,334,760 | ||||
| Total Exchange-Traded Fund | ||||||
| (cost $1,122,913) | 1,334,760 | |||||
| Warrant – 0.00% | ||||||
| =#@† | Medicure PIPE 144A | 74,014 | 0 | |||
| Total Warrant (cost $0) | 0 | |||||
| Principal | ||||||
| Amount (U.S. $) | ||||||
| ≠Short-Term Investments – 3.56% | ||||||
| Discount Notes – 3.35% | ||||||
| Federal Home Loan Bank | ||||||
| 0.001% 4/1/11 | $ | 625,776 | 625,776 | |||
| 0.001% 4/1/11 | 5,065,664 | 5,065,663 | ||||
| 0.001% 4/14/11 | 337,711 | 337,710 | ||||
| 0.010% 4/18/11 | 216,135 | 216,134 | ||||
| 0.020% 4/27/11 | 1,633,001 | 1,632,990 | ||||
| 0.030% 5/3/11 | 675,422 | 675,397 | ||||
| 0.037% 5/23/11 | 864,540 | 864,490 | ||||
| 0.040% 5/9/11 | 553,846 | 553,823 | ||||
| 0.050% 5/16/11 | 675,422 | 675,388 | ||||
| 0.060% 6/7/11 | 641,651 | 641,555 | ||||
| 11,288,926 | ||||||
(continues) 79
Statements of net assets
Optimum Small-Mid Cap Growth Fund
| Principal | Value | ||||||
| Amount | (U.S. $) | ||||||
| ≠Short-Term Investments (continued) | |||||||
| U.S. Treasury Obligation – 0.21% | |||||||
| U.S. Treasury Bill 0.00% 4/28/11 | $ | 697,846 | $ | 697,823 | |||
| 697,823 | |||||||
| Total Short-Term Investments | |||||||
| (cost $11,986,813) | 11,986,749 | ||||||
| Total Value of Securities Before Securities | |||||||
| Lending Collateral – 100.92% | |||||||
| (cost $260,354,292) | 339,790,263 | ||||||
| Number of | |||||||
| Shares | |||||||
| Securities Lending Collateral** – 24.59% | |||||||
| Investment Companies | |||||||
BNY Mellon SL DBT II | |||||||
Liquidating Fund | 301,329 | 291,355 | |||||
Delaware Investments | |||||||
Collateral Fund No.1 | 82,487,204 | 82,487,204 | |||||
@†Mellon GSL Reinvestment Trust II | 484,445 | 0 | |||||
| Total Securities Lending Collateral | |||||||
| (cost $83,272,978) | 82,778,559 | ||||||
| Total Value of Securities – 125.51% | |||||||
| (cost $343,627,270) | 422,568,822 | © | |||||
| Obligation to Return Securities | |||||||
| Lending Collateral** – (24.73%) | (83,272,978 | ) | |||||
| Liabilities Net of Receivables and | |||||||
| Other Assets – (0.78%) | (2,624,016 | ) | |||||
| Net Assets Applicable to 23,755,010 | |||||||
| Shares Outstanding – 100.00% | $ | 336,671,828 | |||||
| Net Asset Value – Optimum Small-Mid Cap Growth Fund | |||||||
| Class A ($6,866,086 / 494,070 Shares) | $13.90 | ||||||
| Net Asset Value – Optimum Small-Mid Cap Growth Fund | |||||||
| Class B ($1,063,071 / 80,544 Shares) | $13.20 | ||||||
| Net Asset Value – Optimum Small-Mid Cap Growth Fund | |||||||
| Class C ($24,336,798 / 1,844,363 Shares) | $13.20 | ||||||
| Net Asset Value – Optimum Small-Mid Cap Growth Fund | |||||||
| Institutional Class ($304,405,873 / 21,336,033 Shares) | $14.27 | ||||||
| Components of Net Assets at March 31, 2011: | |||||||
| Shares of beneficial interest | |||||||
| (unlimited authorization – no par) | $ | 255,454,281 | |||||
| Accumulated net investment loss | (89,705 | ) | |||||
| Undistributed net realized gain on investments | 2,365,484 | ||||||
| Net unrealized appreciation of investments | |||||||
| and foreign currencies | 78,941,768 | ||||||
| Total net assets | $ | 336,671,828 | |||||
| ² | Narrow industries are utilized for compliance purposes for diversification whereas broad sectors are used for financial reporting. |
| * | Fully or partially on loan. |
| † | Non income producing security. |
| = | Security is being fair valued in accordance with the Fund’s fair valuation policy. At March 31, 2011, the aggregate amount of fair valued securities was $0, which represented 0.00% of the Fund’s net assets. See Note 1 in “Notes to financial statements.” |
| # | Security exempt from registration under Rule 144A of the Securities Act of 1933, as amended. At March 31, 2011, the aggregate amount of Rule 144A securities was $0, which represented 0.00% of the Fund’s net assets. See Note 9 in “Notes to financial statements.” |
| @ | Illiquid security. At March 31, 2011, the aggregate amount of illiquid securities was $0, which represented 0.00% of the Fund’s net assets. See Note 9 in “Notes to financial statements.” |
| ≠ | The rate shown is the effective yield at the time of purchase. |
| ** | See Note 8 in “Notes to financial statements.” |
| © | Includes $81,734,086 of securities loaned. |
Summary of Abbreviations:
ADR — American Depositary Receipts
GBP — British Pound Sterling
HKD — Hong Kong Dollar
MNB — Mellon National Bank
PIPE — Private Investment in Public Equity
USD — United States Dollar
ADR — American Depositary Receipts
GBP — British Pound Sterling
HKD — Hong Kong Dollar
MNB — Mellon National Bank
PIPE — Private Investment in Public Equity
USD — United States Dollar
| Net Asset Value and Offering Price Per Share – | |||
| Optimum Small-Mid Cap Growth Fund | |||
| Net asset value Class A (A) | $ | 13.90 | |
| Sales charge (5.75% of offering price) (B) | 0.85 | ||
| Offering price | $ | 14.75 |
| (A) | Net asset value per share, as illustrated, is the amount which would be paid upon redemption or repurchase of shares. | |
| (B) | See the current prospectus for purchases of $75,000 or more. |
The following foreign currency exchange contracts were outstanding at March 31, 20111:
| Foreign Currency Exchange Contracts | |||||||||||||||
| Contracts | Unrealized | ||||||||||||||
| to Receive | Settlement | Appreciation | |||||||||||||
| Counterparty | (Deliver) | In Exchange For | Date | (Depreciation) | |||||||||||
| MNB | GBP | (8,608 | ) | USD | 13,793 | 4/1/11 | $ (15 | ) | |||||||
| MNB | HKD | 365,041 | USD | (46,908 | ) | 4/4/11 | 21 | ||||||||
| $ 6 | |||||||||||||||
The use of foreign currency exchange contracts involves elements of market risk and risks in excess of the amounts recognized in the financial statements. The notional values presented above represent the Fund’s total exposure in such contracts, whereas only the net unrealized appreciation (depreciation) is reflected in the Fund’s net assets.
1See Note 7 in “Notes to financial statements.”
See accompanying notes, which are an integral part of the financial statements.
80
Optimum Small-Mid Cap Value Fund
March 31, 2011
March 31, 2011
| Number of | Value | |||||
| Shares | (U.S. $) | |||||
| Common Stock – 90.00% | ||||||
| Basic Industry – 19.16% | ||||||
| * | AAON | 74,333 | $ | 2,445,556 | ||
| Airgas | 15,700 | 1,042,794 | ||||
| Albany International | 148,400 | 3,695,159 | ||||
| Albemarle | 36,900 | 2,205,513 | ||||
| AMETEK | 35,250 | 1,546,418 | ||||
| Aptargroup | 41,400 | 2,075,382 | ||||
| Ashland | 29,700 | 1,715,472 | ||||
| Brady Class A | 43,300 | 1,545,377 | ||||
| Carlisle | 38,200 | 1,701,810 | ||||
| Celanese Class A | 25,500 | 1,131,435 | ||||
| Crane | 42,900 | 2,077,647 | ||||
| Cytec Industries | 34,800 | 1,892,076 | ||||
| Dover | 38,700 | 2,544,138 | ||||
| Eastman Chemical | 34,300 | 3,406,676 | ||||
| * | Federal Signal | 200,000 | 1,302,000 | |||
| † | Ferro | 188,300 | 3,123,897 | |||
| FMC | 29,500 | 2,505,435 | ||||
| *† | Griffon | 118,300 | 1,553,279 | |||
| * | Ingersoll-Rand (Ireland) | 62,500 | 3,019,375 | |||
| *† | KapStone Paper & Packaging | 64,800 | 1,112,616 | |||
| * | KMG Chemicals | 65,722 | 1,292,095 | |||
| † | Kraton Performance Polymers | 26,100 | 998,325 | |||
| Lubrizol | 4,000 | 535,840 | ||||
| Minerals Technologies | 43,400 | 2,973,768 | ||||
| † | Owens-Illinois | 79,400 | 2,397,086 | |||
| Packaging Corp. of America | 37,200 | 1,074,708 | ||||
| * | Sonoco Products | 77,600 | 2,811,448 | |||
| Temple-Inland | 47,400 | 1,109,160 | ||||
| *† | Trex | 41,800 | 1,363,516 | |||
| * | US Ecology | 121,753 | 2,122,155 | |||
| 58,320,156 | ||||||
| Business Services – 2.85% | ||||||
| Donnelley (R.R.) & Sons | 92,100 | 1,742,532 | ||||
| Ennis | 127,890 | 2,177,967 | ||||
| * | Fair Isaac | 88,050 | 2,783,260 | |||
| *† | WESCO International | 31,800 | 1,987,500 | |||
| 8,691,259 | ||||||
| Capital Spending – 11.65% | ||||||
| * | Acuity Brands | 42,800 | 2,503,372 | |||
| *† | Advanced Energy Industries | 155,325 | 2,539,564 | |||
| *† | AGCO | 19,200 | 1,055,424 | |||
| Encore Wire | 92,510 | 2,251,693 | ||||
| Gardner Denver | 13,200 | 1,029,996 | ||||
| * | Graham | 117,757 | 2,819,103 | |||
| * | Granite Construction | 78,700 | 2,211,470 | |||
| Harsco | 100,700 | 3,553,702 | ||||
| Hubbell Class B | 23,400 | 1,662,102 | ||||
| IDEX | 30,700 | 1,340,055 | ||||
| *† | Insituform Technologies Class A | 70,000 | 1,872,500 | |||
| Kennametal | 89,600 | 3,494,400 | ||||
| Stanley Black & Decker | 42,500 | 3,255,500 | ||||
| * | Tennant | 30,988 | 1,302,736 | |||
| Timken | 20,400 | 1,066,920 | ||||
| Tyco International (Switzerland) | 33,400 | 1,495,318 | ||||
| † | URS | 44,000 | 2,026,200 | |||
| 35,480,055 | ||||||
| Consumer Cyclical – 7.37% | ||||||
| * | Barnes Group | 110,000 | 2,296,799 | |||
| *† | BorgWarner | 26,300 | 2,095,847 | |||
| * | Ethan Allen Interiors | 90,000 | 1,971,000 | |||
| * | Hooker Furniture | 165,333 | 1,977,383 | |||
| * | Knoll | 103,000 | 2,158,880 | |||
| Lear | 43,300 | 2,116,071 | ||||
| * | Leggett & Platt | 69,200 | 1,695,400 | |||
| *† | Navistar International | 29,600 | 2,052,168 | |||
| Spartan Motors | 276,373 | 1,895,919 | ||||
| Tupperware Brands | 34,700 | 2,071,937 | ||||
| † | Visteon | 33,600 | 2,099,664 | |||
| 22,431,068 | ||||||
| Consumer Services – 7.04% | ||||||
| † | BJ’s Wholesale Club | 39,800 | 1,943,036 | |||
| * | Brinker International | 79,700 | 2,016,410 | |||
| *† | Collective Brands | 169,100 | 3,649,178 | |||
| Foot Locker | 111,600 | 2,200,752 | ||||
| *† | GameStop Class A | 33,000 | 743,160 | |||
| *† | Genesco | 24,500 | 984,900 | |||
| *† | Jos. A. Bank Clothiers | 49,750 | 2,531,280 | |||
| † | Kirkland’s | 33,000 | 509,520 | |||
| PETsMART | 24,800 | 1,015,560 | ||||
| † | Rush Enterprises Class A | 57,300 | 1,134,540 | |||
| † | Signet Jewelers (Bermuda) | 47,600 | 2,190,552 | |||
| * | Sturm Ruger | 109,103 | 2,506,096 | |||
| 21,424,984 | ||||||
| Consumer Staples – 2.87% | ||||||
| *† | Chiquita Brands International | 154,373 | 2,368,082 | |||
| Dr Pepper Snapple Group | 25,400 | 943,864 | ||||
| Molson Coors Brewing Class B | 23,400 | 1,097,226 | ||||
| * | Sanderson Farms | 51,000 | 2,341,920 | |||
| Smucker (J.M.) | 27,900 | 1,991,781 | ||||
| 8,742,873 | ||||||
| Energy – 5.84% | ||||||
| Cabot Oil & Gas | 38,700 | 2,049,939 | ||||
| † | Cloud Peak Energy | 46,400 | 1,001,776 | |||
| El Paso | 50,000 | 900,000 | ||||
| * | Gulf Island Fabrication | 67,629 | 2,175,625 | |||
| * | Laclede Group | 50,198 | 1,912,544 | |||
| *† | Newpark Resources | 210,850 | 1,657,281 | |||
| † | Plains Exploration & Production | 56,700 | 2,054,241 | |||
| † | Rowan | 24,100 | 1,064,738 | |||
| * | Southern Union | 55,500 | 1,588,410 | |||
| † | Swift Energy | 24,400 | 1,041,392 | |||
| † | Vaalco Energy | 300,503 | 2,331,903 | |||
| 17,777,849 | ||||||
(continues) 81
Statements of net assets
Optimum Small-Mid Cap Value Fund
| Number of | Value | |||||
| Shares | (U.S. $) | |||||
| Common Stock (continued) | ||||||
| Financial Services – 10.89% | ||||||
| American Equity Investment | ||||||
| Life Holding | 160,265 | $ | 2,102,677 | |||
| Aspen Insurance Holdings (Bermuda) | 75,200 | 2,072,512 | ||||
| AXIS Capital Holdings (Bermuda) | 60,400 | 2,109,168 | ||||
| * | BankUnited | 66,100 | 1,897,731 | |||
| City Holding | 38,979 | 1,378,297 | ||||
| Dime Community Bancshares | 163,750 | 2,416,950 | ||||
| East West Bancorp | 90,300 | 1,982,988 | ||||
| Eaton Vance | 31,800 | 1,025,232 | ||||
| First Financial Bancorp | 64,200 | 1,071,498 | ||||
| First Niagara Financial Group | 138,100 | 1,875,398 | ||||
| † | Hallmark Financial Services | 234,499 | 1,965,102 | |||
| HCC Insurance Holdings | 65,200 | 2,041,412 | ||||
| Horace Mann Educators | 126,350 | 2,122,680 | ||||
| Hudson City Bancorp | 99,500 | 963,160 | ||||
| Lazard Class A (Bermuda) | 49,800 | 2,070,684 | ||||
| † | Nara Bancorp | 52,100 | 501,202 | |||
| Safety Insurance Group | 21,400 | 986,754 | ||||
| Suffolk Bancorp | 20,010 | 419,810 | ||||
| † | SVB Financial Group | 18,200 | 1,036,126 | |||
| Transatlantic Holdings | 21,700 | 1,056,139 | ||||
| Willis Group Holdings (United Kingdom) | 24,600 | 992,856 | ||||
| Wintrust Financial | 28,700 | 1,054,725 | ||||
| 33,143,101 | ||||||
| Healthcare – 4.10% | ||||||
| † | CareFusion | 89,200 | 2,515,440 | |||
| * | DENTSPLY International | 27,400 | 1,013,526 | |||
| † | Hologic | 90,700 | 2,013,540 | |||
| *† | Laboratory Corp. of America Holdings | 11,000 | 1,013,430 | |||
| *† | LifePoint Hospitals | 36,720 | 1,475,410 | |||
| *† | Natus Medical | 31,800 | 534,240 | |||
| † | Orthofix International (Curacao) | 14,500 | 470,670 | |||
| Teleflex | 24,800 | 1,437,904 | ||||
| Universal Health Services Class B | 40,600 | 2,006,046 | ||||
| 12,480,206 | ||||||
| Real Estate – 1.03% | ||||||
| * | Digital Realty Trust | 35,900 | 2,087,226 | |||
| Equity Lifestyle Properties | 18,000 | 1,037,700 | ||||
| 3,124,926 | ||||||
| Technology – 14.86% | ||||||
| *† | Cabot Microelectronics | 21,100 | 1,102,475 | |||
| *† | CACI International Class A | 17,300 | 1,060,836 | |||
| † | Checkpoint Systems | 135,100 | 3,037,048 | |||
| * | Ducommun | 88,147 | 2,106,713 | |||
| † | Fairchild Semiconductor International | 114,100 | 2,076,620 | |||
| † | Flextronics International (Singapore) | 462,699 | 3,456,362 | |||
| * | Gentex | 35,200 | 1,064,800 | |||
| Global Payments | 52,100 | 2,548,732 | ||||
| * | Harris | 39,600 | 1,964,160 | |||
| * | InterDigital | 51,000 | 2,433,210 | |||
| † | LTX-Credence | 102,300 | 933,999 | |||
| Methode Electronics | 182,928 | 2,209,770 | ||||
| *† | Plexus | 118,800 | 4,165,128 | |||
| † | Rudolph Technologies | 236,982 | 2,592,583 | |||
| *† | Stratasys | 33,021 | 1,551,987 | |||
| *† | Teradyne | 72,600 | 1,293,006 | |||
| † | Thermo Fisher Scientific | 38,800 | 2,155,340 | |||
| *† | Universal Technical Institute | 55,700 | 1,083,365 | |||
| *† | VASCO Data Security International | 264,478 | 3,631,283 | |||
| *† | Veeco Instruments | 40,300 | 2,048,852 | |||
| † | Western Digital | 72,800 | 2,714,712 | |||
| 45,230,981 | ||||||
| Transportation – 0.71% | ||||||
| SkyWest | 128,160 | 2,168,467 | ||||
| 2,168,467 | ||||||
| Utilities – 1.63% | ||||||
| * | DPL | 73,300 | 2,009,153 | |||
| DTE Energy | 19,600 | 959,616 | ||||
| * | Wisconsin Energy | 65,600 | 2,000,800 | |||
| 4,969,569 | ||||||
| Total Common Stock | ||||||
| (cost $205,429,568) | 273,985,494 | |||||
| Principal | ||||||
| Amount (U.S. $) | ||||||
| ≠Short-Term Investments – 10.27% | ||||||
| Discount Notes – 9.67% | ||||||
| Federal Home Loan Bank | ||||||
| 0.001% 4/1/11 | $ | 1,633,444 | 1,633,444 | |||
| 0.001% 4/1/11 | 13,209,249 | 13,209,249 | ||||
| 0.001% 4/14/11 | 880,617 | 880,613 | ||||
| 0.010% 4/18/11 | 563,595 | 563,592 | ||||
| 0.020% 4/27/11 | 4,258,222 | 4,258,192 | ||||
| 0.030% 5/3/11 | 1,761,233 | 1,761,170 | ||||
| 0.037% 5/23/11 | 2,254,379 | 2,254,248 | ||||
| 0.040% 5/9/11 | 1,444,211 | 1,444,151 | ||||
| 0.050% 5/16/11 | 1,761,233 | 1,761,145 | ||||
| 0.060% 6/7/11 | 1,673,172 | 1,672,922 | ||||
| 29,438,726 | ||||||
| U.S. Treasury Obligation – 0.60% | ||||||
| U.S. Treasury Bill 0.00% 4/28/11 | 1,819,706 | 1,819,648 | ||||
| 1,819,648 | ||||||
| Total Short-Term Investments | ||||||
| (cost $31,258,540) | 31,258,374 | |||||
| Total Value of Securities Before Securities | ||||||
| Lending Collateral – 100.27% | ||||||
| (cost $236,688,108) | 305,243,868 | |||||
82
| Number of | Value | ||||||
| Shares | (U.S. $) | ||||||
| Securities Lending Collateral** – 18.42% | |||||||
| Investment Companies | |||||||
BNY Mellon SL DBT II | |||||||
Liquidating Fund | 182,056 | $ | 176,030 | ||||
Delaware Investments | |||||||
Collateral Fund No. 1 | 55,897,125 | 55,897,125 | |||||
@†Mellon GSL Reinvestment Trust II | 250,193 | 0 | |||||
| Total Securities Lending Collateral | |||||||
| (cost $56,329,374) | 56,073,155 | ||||||
| Total Value of Securities – 118.69% | |||||||
| (cost $293,017,482) | 361,317,023 | © | |||||
| Obligation to Return Securities | |||||||
| Lending Collateral** – (18.51%) | (56,329,374 | ) | |||||
| Liabilities Net of Receivables and | |||||||
| Other Assets – (0.18%) | (555,733 | ) | |||||
| Net Assets Applicable to 23,669,080 | |||||||
| Shares Outstanding – 100.00% | $ | 304,431,916 | |||||
| Net Asset Value – Optimum Small-Mid Cap Value Fund | |||||||
| Class A ($6,101,647 / 483,891 Shares) | $12.61 | ||||||
| Net Asset Value – Optimum Small-Mid Cap Value Fund | |||||||
| Class B ($1,037,602 / 86,895 Shares) | $11.94 | ||||||
| Net Asset Value – Optimum Small-Mid Cap Value Fund | |||||||
| Class C ($22,797,538 / 1,910,160 Shares) | $11.93 | ||||||
| Net Asset Value – Optimum Small-Mid Cap Value Fund | |||||||
| Institutional Class ($274,495,129 / 21,188,134 Shares) | $12.96 | ||||||
| Components of Net Assets at March 31, 2011: | |||||||
| Shares of beneficial interest | |||||||
| (unlimited authorization – no par) | $ | 247,543,962 | |||||
| Accumulated net realized loss on investments | (11,411,587 | ) | |||||
| Net unrealized appreciation of investments | 68,299,541 | ||||||
| Total net assets | $ | 304,431,916 | |||||
| * | Fully or partially on loan. |
| † | Non income producing security. |
| ≠ | The rate shown is the effective yield at the time of purchase. |
| ** | See Note 8 in “Notes to financial statements.” |
| @ | Illiquid security. At March 31, 2011, the aggregate amount of illiquid securities was $0, which represented 0.00% of the Fund’s net assets. See Note 9 in “Notes to financial statements.” |
| © | Includes $55,092,827 of securities loaned. |
| Net Asset Value and Offering Price Per Share – | |||
| Optimum Small-Mid Cap Value Fund | |||
| Net asset value Class A (A) | $ | 12.61 | |
| Sales charge (5.75% of offering price) (B) | 0.77 | ||
| Offering price | $ | 13.38 |
| (A) | Net asset value per share, as illustrated, is the amount which would be paid upon redemption or repurchase of shares. | |
| (B) | See the current prospectus for purchases of $75,000 or more. |
See accompanying notes, which are an integral part of the financial statements.
83
Statements of assets and liabilities
Optimum Fund Trust
March 31, 2011
March 31, 2011
| Optimum | Optimum | Optimum | Optimum | Optimum | Optimum | |||||||||||||||||
| Fixed Income | International | Large Cap | Large Cap | Small-Mid Cap | Small-Mid Cap | |||||||||||||||||
| Fund | Fund | Growth Fund | Value Fund | Growth Fund | Value Fund | |||||||||||||||||
| Assets: | ||||||||||||||||||||||
| Investments, at value1 | $ | 935,398,173 | $ | 268,252,555 | $ | 744,141,964 | $ | 696,409,581 | $ | 327,803,514 | $ | 273,985,494 | ||||||||||
| Short-term investments, at value | 101,402,969 | 7,718,509 | 10,012,300 | 12,304,334 | 11,986,749 | 31,258,374 | ||||||||||||||||
| Short-term investments held as collateral | ||||||||||||||||||||||
| for loaned securities, at value | 53,719,857 | 27,424,981 | 69,650,354 | 44,457,446 | 82,778,559 | 56,073,155 | ||||||||||||||||
| Cash | — | 158,429 | — | 205,034 | 29,414 | 49,336 | ||||||||||||||||
| Restricted cash | 1,295,405 | — | — | — | — | — | ||||||||||||||||
| Foreign currencies, at value | 605,227 | — | — | 7,311 | 13,809 | — | ||||||||||||||||
| Receivables for fund shares sold | 4,143,543 | 1,053,794 | 1,881,154 | 1,864,796 | 1,212,000 | 1,268,519 | ||||||||||||||||
| Receivables for securities sold | 29,779,408 | 5,931,660 | 15,532,898 | — | 1,729,442 | 289,036 | ||||||||||||||||
| Foreign currency exchange contracts, at value | 639,697 | 168,211 | 327 | — | 6 | — | ||||||||||||||||
| Dividends and interest receivable | 9,520,503 | 946,953 | 587,717 | 1,325,660 | 93,096 | 194,468 | ||||||||||||||||
| Securities lending income receivable | 9,106 | 5,087 | 14,219 | 25,720 | 15,397 | 10,851 | ||||||||||||||||
| Credit default swap contracts, at value (including | ||||||||||||||||||||||
| up front payments received $1,550,676) | 1,559,103 | — | — | — | — | — | ||||||||||||||||
| Other assets | 1,650 | — | — | — | — | — | ||||||||||||||||
| Total assets | 1,138,074,641 | 311,660,179 | 841,820,933 | 756,599,882 | 425,661,986 | 363,129,233 | ||||||||||||||||
| Liabilities: | ||||||||||||||||||||||
| Cash overdraft | 3,448,503 | — | 175,856 | — | — | — | ||||||||||||||||
| Payables for securities purchased | 79,598,152 | 3,488,090 | 12,676,184 | — | 4,928,170 | 1,668,732 | ||||||||||||||||
| Payables for fund shares redeemed | 778,972 | 245,870 | 1,121,213 | 947,153 | 319,069 | 291,670 | ||||||||||||||||
| Foreign currencies, at value | — | 36,436 | — | — | — | — | ||||||||||||||||
| Variation margin receivable on futures contracts | 28 | — | — | — | — | — | ||||||||||||||||
| Foreign currency exchange contracts, at value | 1,939,670 | 90,854 | — | — | — | — | ||||||||||||||||
| Obligation to return securities lending collateral | 54,936,302 | 28,054,448 | 70,674,769 | 45,471,296 | 83,272,978 | 56,329,374 | ||||||||||||||||
| Annual protection payments on swap contracts | 10,027 | — | — | — | — | — | ||||||||||||||||
| Interest rate swap contracts, at value | ||||||||||||||||||||||
| (including up front payments paid $3,852) | 8,002 | — | — | — | — | — | ||||||||||||||||
| Due to manager and affiliates | 945,374 | 296,597 | 909,966 | 824,406 | 405,048 | 345,601 | ||||||||||||||||
| Other accrued expenses | 167,364 | 109,766 | 126,228 | 118,074 | 64,148 | 61,292 | ||||||||||||||||
| Other liabilities | 27,668 | 6,633 | — | — | 745 | 648 | ||||||||||||||||
| Total liabilities | 141,860,062 | 32,328,694 | 85,684,216 | 47,360,929 | 88,990,158 | 58,697,317 | ||||||||||||||||
| Total Net Assets | $ | 996,214,579 | $ | 279,331,485 | $ | 756,136,717 | $ | 709,238,953 | $ | 336,671,828 | $ | 304,431,916 | ||||||||||
| Investments, at cost | $ | 912,181,200 | $ | 249,586,305 | $ | 597,903,235 | $ | 600,736,099 | $ | 248,367,479 | $ | 205,429,568 | ||||||||||
| Short-term investments, at cost | 101,402,799 | 7,718,551 | 10,012,353 | 12,304,400 | 11,986,813 | 31,258,540 | ||||||||||||||||
| Short-term investments held as collateral | ||||||||||||||||||||||
| for loaned securities, at cost | 54,936,302 | 28,054,448 | 70,674,769 | 45,471,296 | 83,272,978 | 56,329,374 | ||||||||||||||||
| Foreign currencies, at cost | 600,486 | (40,086 | ) | — | 7,299 | 13,841 | — | |||||||||||||||
| 1Including securities on loan | 55,412,328 | 26,012,247 | 68,686,482 | 45,232,840 | 81,734,086 | 55,092,827 | ||||||||||||||||
See accompanying notes, which are an integral part of the financial statements.
84
Statements of operations
Optimum Fund Trust
Year Ended March 31, 2011
| Optimum | Optimum | Optimum | Optimum | Optimum | Optimum | |||||||||||||||||||||
| Fixed Income | International | Large Cap | Large Cap | Small-Mid Cap | Small-Mid Cap | |||||||||||||||||||||
| Fund | Fund | Growth Fund | Value Fund | Growth Fund | Value Fund | |||||||||||||||||||||
| Investment Income: | ||||||||||||||||||||||||||
| Interest | $ | 48,932,946 | $ | 6,513 | $ | 24,857 | $ | 8,146 | $ | 4,579 | $ | 16,359 | ||||||||||||||
| Dividends | 107,719 | 6,948,817 | 7,381,437 | 15,474,284 | 1,415,153 | 2,541,712 | ||||||||||||||||||||
| Securities lending income | 95,818 | 182,015 | 83,951 | 151,277 | 108,124 | 46,644 | ||||||||||||||||||||
| Foreign tax withheld | (204,625 | ) | (537,682 | ) | (17,300 | ) | (57,506 | ) | (6,697 | ) | — | |||||||||||||||
| 48,931,858 | 6,599,663 | 7,472,945 | 15,576,201 | 1,521,159 | 2,604,715 | |||||||||||||||||||||
| Expenses: | ||||||||||||||||||||||||||
| Management fees | 5,249,690 | 1,767,775 | 5,492,182 | 4,792,020 | 2,772,223 | 2,183,724 | ||||||||||||||||||||
| Dividend disbursing and transfer | ||||||||||||||||||||||||||
| agent fees and expenses | 2,308,200 | 726,639 | 1,913,519 | 1,773,168 | 805,540 | 718,812 | ||||||||||||||||||||
| Distribution expenses – Class A | 140,887 | 38,481 | 116,777 | 110,011 | 21,842 | 19,538 | ||||||||||||||||||||
| Distribution expenses – Class B | 52,784 | 19,946 | 55,613 | 53,151 | 10,411 | 10,222 | ||||||||||||||||||||
| Distribution expenses – Class C | 1,671,885 | 398,518 | 1,236,339 | 1,164,311 | 224,794 | 211,953 | ||||||||||||||||||||
| Administration expenses | 1,381,739 | 361,789 | 1,133,663 | 1,049,920 | 415,833 | 351,033 | ||||||||||||||||||||
| Accounting fees | 355,484 | 86,797 | 285,288 | 261,603 | 99,779 | 84,218 | ||||||||||||||||||||
| Reports and statements to shareholders | 145,310 | 32,743 | 110,562 | 108,844 | 45,654 | 31,844 | ||||||||||||||||||||
| Professional fees | 131,964 | 55,528 | 95,804 | 90,020 | 46,216 | 42,268 | ||||||||||||||||||||
| Trustees’ fees | 130,193 | 33,934 | 110,449 | 99,717 | 38,363 | 32,157 | ||||||||||||||||||||
| Custodian fees | 96,606 | 206,210 | 28,249 | 17,971 | 19,870 | 7,219 | ||||||||||||||||||||
| Registration fees | 87,420 | 56,536 | 66,461 | 66,640 | 59,187 | 56,019 | ||||||||||||||||||||
| Pricing fees | 43,182 | 11,980 | 1,468 | 1,008 | 1,609 | 628 | ||||||||||||||||||||
| Insurance fees | 40,427 | 9,267 | 33,672 | 30,277 | 10,284 | 8,381 | ||||||||||||||||||||
| Other | 6,270 | 9,920 | 10,474 | 8,278 | 4,651 | 6,539 | ||||||||||||||||||||
| 11,842,041 | 3,816,063 | 10,690,520 | 9,626,939 | 4,576,256 | 3,764,555 | |||||||||||||||||||||
| Less fees waived | (1,006,300 | ) | (291,289 | ) | (191,067 | ) | (119,386 | ) | (418,901 | ) | (412,527 | ) | ||||||||||||||
| Less expense paid indirectly | (699 | ) | (746 | ) | (775 | ) | (773 | ) | (755 | ) | (773 | ) | ||||||||||||||
| Total operating expenses | 10,835,042 | 3,524,028 | 10,498,678 | 9,506,780 | 4,156,600 | 3,351,255 | ||||||||||||||||||||
| Net Investment Income (Loss) | 38,096,816 | 3,075,635 | (3,025,733 | ) | 6,069,421 | (2,635,441 | ) | (746,540 | ) | |||||||||||||||||
| Net Realized and Unrealized Gain (Loss) on | ||||||||||||||||||||||||||
| Investments and Foreign Currencies: | ||||||||||||||||||||||||||
| Net realized gain (loss) on: | ||||||||||||||||||||||||||
| Investments | 8,489,054 | 7,964,578 | 74,557,147 | 23,296,972 | 23,355,187 | 22,987,790 | ||||||||||||||||||||
| Foreign currencies | 1,908,888 | 153,691 | (114,736 | ) | 1,185 | (167,001 | ) | — | ||||||||||||||||||
| Foreign currency exchange contracts | (5,912,887 | ) | (142,881 | ) | (46,600 | ) | 18,289 | (106,619 | ) | — | ||||||||||||||||
| Futures contracts | 850,966 | 124,390 | — | — | — | — | ||||||||||||||||||||
| Options written | 644,275 | — | — | — | — | — | ||||||||||||||||||||
| Swap contracts | (1,665,750 | ) | — | — | — | — | — | |||||||||||||||||||
| Net realized gain | 4,314,546 | 8,099,778 | 74,395,811 | 23,316,446 | 23,081,567 | 22,987,790 | ||||||||||||||||||||
| Net change in unrealized appreciation/depreciation | ||||||||||||||||||||||||||
| of investments and foreign currencies | 17,773,249 | 11,446,234 | 45,782,341 | 62,928,731 | 40,739,949 | 31,873,059 | ||||||||||||||||||||
| Net Realized and Unrealized Gain on | ||||||||||||||||||||||||||
| Investments and Foreign Currencies | 22,087,795 | 19,546,012 | 120,178,152 | 86,245,177 | 63,821,516 | 54,860,849 | ||||||||||||||||||||
| Net Increase in Net Assets | ||||||||||||||||||||||||||
| Resulting from Operations | $ | 60,184,611 | $ | 22,621,647 | $ | 117,152,419 | $ | 92,314,598 | $ | 61,186,075 | $ | 54,114,309 | ||||||||||||||
See accompanying notes, which are an integral part of the financial statements.
85
Statements of changes in net assets
Optimum Fund Trust
| Optimum Fixed Income Fund | Optimum International Fund | ||||||||||||||
| Year Ended | Year Ended | ||||||||||||||
| 3/31/11 | 3/31/10 | 3/31/11 | 3/31/10 | ||||||||||||
| Increase in Net Assets from Operations: | |||||||||||||||
| Net investment income | $ | 38,096,816 | $ | 53,636,499 | $ | 3,075,635 | $ | 2,399,523 | |||||||
| Net realized gain on investments and foreign currencies | 4,314,546 | 21,137,947 | 8,099,778 | 12,072,059 | |||||||||||
| Net change in unrealized appreciation/depreciation of investments | |||||||||||||||
| and foreign currencies | 17,773,249 | 97,067,875 | 11,446,234 | 46,250,763 | |||||||||||
| Net increase in net assets resulting from operations | 60,184,611 | 171,842,321 | 22,621,647 | 60,722,345 | |||||||||||
| Dividends and Distributions to Shareholders from: | |||||||||||||||
| Net investment income: | |||||||||||||||
| Class A | (1,580,182 | ) | (2,704,699 | ) | (174,283 | ) | (210,267 | ) | |||||||
| Class B | (176,801 | ) | (348,148 | ) | (20,118 | ) | (36,894 | ) | |||||||
| Class C | (5,530,649 | ) | (10,367,571 | ) | (399,968 | ) | (708,469 | ) | |||||||
| Institutional Class | (28,959,780 | ) | (34,129,218 | ) | (2,614,834 | ) | (1,850,644 | ) | |||||||
| (36,247,412 | ) | (47,549,636 | ) | (3,209,203 | ) | (2,806,274 | ) | ||||||||
| Capital Share Transactions: | |||||||||||||||
| Proceeds from shares sold: | |||||||||||||||
| Class A | 6,361,932 | 3,385,107 | 1,004,512 | 988,480 | |||||||||||
| Class B | 140,931 | 60,379 | 13,384 | 24,001 | |||||||||||
| Class C | 20,924,263 | 17,921,759 | 2,593,727 | 3,561,654 | |||||||||||
| Institutional Class | 311,193,996 | 194,426,459 | 98,523,741 | 60,448,982 | |||||||||||
| Net asset value of shares issued upon reinvestment of dividends | |||||||||||||||
| and distributions: | |||||||||||||||
| Class A | 1,536,790 | 2,644,452 | 171,047 | 206,977 | |||||||||||
| Class B | 167,095 | 336,730 | 19,701 | 36,076 | |||||||||||
| Class C | 5,405,852 | 10,126,943 | 395,170 | 699,187 | |||||||||||
| Institutional Class | 28,157,880 | 33,095,912 | 2,580,351 | 1,822,132 | |||||||||||
| 373,888,739 | 261,997,741 | 105,301,633 | 67,787,489 | ||||||||||||
| Cost of shares repurchased: | |||||||||||||||
| Class A | (10,149,128 | ) | (11,854,007 | ) | (2,906,788 | ) | (3,052,859 | ) | |||||||
| Class B | (1,337,919 | ) | (1,319,233 | ) | (554,797 | ) | (383,458 | ) | |||||||
| Class C | (41,735,014 | ) | (44,582,487 | ) | (9,569,069 | ) | (11,030,505 | ) | |||||||
| Institutional Class | (144,692,404 | ) | (168,483,326 | ) | (36,092,756 | ) | (32,787,957 | ) | |||||||
| (197,914,465 | ) | (226,239,053 | ) | (49,123,410 | ) | (47,254,779 | ) | ||||||||
| Increase in net assets derived from capital share transactions | 175,974,274 | 35,758,688 | 56,178,223 | 20,532,710 | |||||||||||
| Net Increase in Net Assets | 199,911,473 | 160,051,373 | 75,590,667 | 78,448,781 | |||||||||||
| Net Assets: | |||||||||||||||
| Beginning of year | 796,303,106 | 636,251,733 | 203,740,818 | 125,292,037 | |||||||||||
| End of year | $ | 996,214,579 | $ | 796,303,106 | $ | 279,331,485 | $ | 203,740,818 | |||||||
| Undistributed net investment income | $ | 12,498,004 | $ | 15,471,348 | $ | 2,625,593 | $ | 2,708,008 | |||||||
See accompanying notes, which are an integral part of the financial statements.
86
| Optimum Large Cap Growth Fund | Optimum Large Cap Value Fund | |||||||||||||||
| Year Ended | Year Ended | |||||||||||||||
| 3/31/11 | 3/31/10 | 3/31/11 | 3/31/10 | |||||||||||||
| Increase (Decrease) in Net Assets from Operations: | ||||||||||||||||
| Net investment income (loss) | $ | (3,025,733 | ) | $ | (953,105 | ) | $ | 6,069,421 | $ | 8,680,813 | ||||||
| Net realized gain (loss) on investments and foreign currencies | 74,395,811 | 80,603,475 | 23,316,446 | (57,399,235 | ) | |||||||||||
| Net change in unrealized appreciation/depreciation of investments | ||||||||||||||||
| and foreign currencies | 45,782,341 | 179,873,048 | 62,928,731 | 276,475,971 | ||||||||||||
| Net increase in net assets resulting from operations | 117,152,419 | 259,523,418 | 92,314,598 | 227,757,549 | ||||||||||||
| Dividends and Distributions to Shareholders from: | ||||||||||||||||
| Net investment income: | ||||||||||||||||
| Class A | — | — | (397,086 | ) | (693,967 | ) | ||||||||||
| Class B | — | — | (36,673 | ) | (82,375 | ) | ||||||||||
| Class C | — | — | (808,084 | ) | (1,726,789 | ) | ||||||||||
| Institutional Class | — | (753,154 | ) | (7,461,811 | ) | (11,111,005 | ) | |||||||||
| — | (753,154 | ) | (8,703,654 | ) | (13,614,136 | ) | ||||||||||
| Capital Share Transactions: | ||||||||||||||||
| Proceeds from shares sold: | ||||||||||||||||
| Class A | 2,880,833 | 2,642,285 | 3,699,946 | 2,529,348 | ||||||||||||
| Class B | 27,050 | 96,636 | 19,398 | 107,433 | ||||||||||||
| Class C | 7,733,548 | 10,516,228 | 7,643,883 | 10,384,597 | ||||||||||||
| Institutional Class | 157,827,455 | 125,781,819 | 152,059,465 | 113,126,953 | ||||||||||||
| Net asset value of shares issued upon reinvestment of dividends | ||||||||||||||||
| and distributions: | ||||||||||||||||
| Class A | — | — | 391,381 | 685,011 | ||||||||||||
| Class B | — | — | 36,248 | 79,977 | ||||||||||||
| Class C | — | — | 797,769 | 1,704,441 | ||||||||||||
| Institutional Class | — | 741,206 | 7,362,691 | 10,938,799 | ||||||||||||
| 168,468,886 | 139,778,174 | 172,010,781 | 139,556,559 | |||||||||||||
| Cost of shares repurchased: | ||||||||||||||||
| Class A | (8,883,133 | ) | (8,517,252 | ) | (8,008,532 | ) | (7,859,345 | ) | ||||||||
| Class B | (1,581,843 | ) | (1,062,063 | ) | (1,454,201 | ) | (996,339 | ) | ||||||||
| Class C | (29,884,245 | ) | (29,951,306 | ) | (27,843,973 | ) | (28,982,433 | ) | ||||||||
| Institutional Class | (196,082,815 | ) | (190,004,307 | ) | (155,909,561 | ) | (158,033,296 | ) | ||||||||
| (236,432,036 | ) | (229,534,928 | ) | (193,216,267 | ) | (195,871,413 | ) | |||||||||
| Decrease in net assets derived from capital share transactions | (67,963,150 | ) | (89,756,754 | ) | (21,205,486 | ) | (56,314,854 | ) | ||||||||
| Net Increase in Net Assets | 49,189,269 | 169,013,510 | 62,405,458 | 157,828,559 | ||||||||||||
| Net Assets: | ||||||||||||||||
| Beginning of year | 706,947,448 | 537,933,938 | 646,833,495 | 489,004,936 | ||||||||||||
| End of year | $ | 756,136,717 | $ | 706,947,448 | $ | 709,238,953 | $ | 646,833,495 | ||||||||
| Undistributed (accumulated) net investment income (loss) | $ | (19,646 | ) | $ | (21,830 | ) | $ | 6,037,066 | $ | 8,651,825 | ||||||
See accompanying notes, which are an integral part of the financial statements.
(continues) 87
Statements of changes in net assets
Optimum Fund Trust
| Optimum Small-Mid Cap Growth Fund | Optimum Small-Mid Cap Value Fund | |||||||||||||||||||
| Year Ended | Year Ended | |||||||||||||||||||
| 3/31/11 | 3/31/10 | 3/31/11 | 3/31/10 | |||||||||||||||||
| Increase (Decrease) in Net Assets from Operations: | ||||||||||||||||||||
| Net investment loss | $ | (2,635,441 | ) | $ | (1,885,188 | ) | $ | (746,540 | ) | $ | (189,583 | ) | ||||||||
| Net realized gain on investments and foreign currencies | 23,081,567 | 16,100,021 | 22,987,790 | 3,056,016 | ||||||||||||||||
| Net change in unrealized appreciation/depreciation of investments | ||||||||||||||||||||
| and foreign currencies | 40,739,949 | 61,895,220 | 31,873,059 | 68,102,924 | ||||||||||||||||
| Net increase in net assets resulting from operations | 61,186,075 | 76,110,053 | 54,114,309 | 70,969,357 | ||||||||||||||||
| Dividends and Distributions to Shareholders from: | ||||||||||||||||||||
| Net investment income: | ||||||||||||||||||||
| Institutional Class | — | — | — | (88,032 | ) | |||||||||||||||
| Return of Capital: | ||||||||||||||||||||
| Institutional Class | — | — | — | (92,374 | ) | |||||||||||||||
| — | — | — | (180,406 | ) | ||||||||||||||||
| Capital Share Transactions: | ||||||||||||||||||||
| Proceeds from shares sold: | ||||||||||||||||||||
| Class A | 514,239 | 539,025 | 430,872 | 412,951 | ||||||||||||||||
| Class B | 5,887 | 35,605 | 293 | 25,862 | ||||||||||||||||
| Class C | 1,358,229 | 2,091,719 | 1,363,672 | 1,722,368 | ||||||||||||||||
| Institutional Class | 104,724,111 | 128,206,873 | 104,115,451 | 74,088,679 | ||||||||||||||||
| Net asset value of shares issued upon reinvestment of dividends | ||||||||||||||||||||
| and distributions: | ||||||||||||||||||||
| Institutional Class | — | — | — | 177,262 | ||||||||||||||||
| 106,602,466 | 130,873,222 | 105,910,288 | 76,427,122 | |||||||||||||||||
| Cost of shares repurchased: | ||||||||||||||||||||
| Class A | (1,760,162 | ) | (1,536,241 | ) | (1,518,111 | ) | (1,438,753 | ) | ||||||||||||
| Class B | (305,695 | ) | (191,945 | ) | (297,186 | ) | (171,978 | ) | ||||||||||||
| Class C | (5,679,529 | ) | (5,275,925 | ) | (5,411,146 | ) | (4,946,735 | ) | ||||||||||||
| Institutional Class | (59,916,934 | ) | (39,161,101 | ) | (39,423,619 | ) | (27,361,397 | ) | ||||||||||||
| (67,662,320 | ) | (46,165,212 | ) | (46,650,062 | ) | (33,918,863 | ) | |||||||||||||
| Increase in net assets derived from capital share transactions | 38,940,146 | 84,708,010 | 59,260,226 | 42,508,259 | ||||||||||||||||
| Net Increase in Net Assets | 100,126,221 | 160,818,063 | 113,374,535 | 113,297,210 | ||||||||||||||||
| Net Assets: | ||||||||||||||||||||
| Beginning of year | 236,545,607 | 75,727,544 | 191,057,381 | 77,760,171 | ||||||||||||||||
| End of year | $ | 336,671,828 | $ | 236,545,607 | $ | 304,431,916 | $ | 191,057,381 | ||||||||||||
| Accumulated net investment loss | $ | (89,705 | ) | $ | (13,721 | ) | $ | — | $ | — | ||||||||||
See accompanying notes, which are an integral part of the financial statements.
88
Financial highlights
Optimum Fixed Income Fund Class A
Selected data for each share of the Fund outstanding throughout each period were as follows:
| Year Ended | |||||||||||||||||||||
| 3/31/11 | 3/31/10 | 3/31/09 | 3/31/08 | 3/31/07 | |||||||||||||||||
| Net asset value, beginning of period | $9.290 | $7.750 | $8.930 | $9.050 | $8.740 | ||||||||||||||||
| Income (loss) from investment operations: | |||||||||||||||||||||
| Net investment income1 | 0.391 | 0.661 | 0.449 | 0.402 | 0.399 | ||||||||||||||||
| Net realized and unrealized gain (loss) on investments | |||||||||||||||||||||
| and foreign currencies | 0.247 | 1.482 | (1.140 | ) | (0.066 | ) | 0.255 | ||||||||||||||
| Total from investment operations | 0.638 | 2.143 | (0.691 | ) | 0.336 | 0.654 | |||||||||||||||
| Less dividends and distributions from: | |||||||||||||||||||||
| Net investment income | (0.378 | ) | (0.603 | ) | (0.462 | ) | (0.380 | ) | (0.344 | ) | |||||||||||
| Net realized gain on investments | — | — | (0.027 | ) | (0.076 | ) | — | ||||||||||||||
| Total dividends and distributions | (0.378 | ) | (0.603 | ) | (0.489 | ) | (0.456 | ) | (0.344 | ) | |||||||||||
| Net asset value, end of period | $9.550 | $9.290 | $7.750 | $8.930 | $9.050 | ||||||||||||||||
| Total return2 | 7.01% | 28.24% | (7.82% | ) | 3.78% | 7.58% | |||||||||||||||
| Ratios and supplemental data: | |||||||||||||||||||||
| Net assets, end of period (000 omitted) | $39,758 | $40,808 | $39,299 | $63,262 | $58,691 | ||||||||||||||||
| Ratio of expenses to average net assets | 1.35% | 1.31% | 1.24% | 1.24% | 1.25% | ||||||||||||||||
| Ratio of expenses to average net assets | |||||||||||||||||||||
| prior to fees waived and expense paid indirectly | 1.46% | 1.48% | 1.47% | 1.43% | 1.61% | ||||||||||||||||
| Ratio of net investment income to average net assets | 4.10% | 7.49% | 5.38% | 4.44% | 4.48% | ||||||||||||||||
| Ratio of net investment income to average net assets | |||||||||||||||||||||
| prior to fees waived and expense paid indirectly | 3.99% | 7.32% | 5.15% | 4.25% | 4.12% | ||||||||||||||||
| Portfolio turnover | 273% | 134% | 158% | 256% | 238% | ||||||||||||||||
| 1 The average shares outstanding method has been applied for per share information. |
| 2 Total investment return is based on the change in net asset value of a share during the period and assumes reinvestment of dividends and distributions at net asset value and does not reflect the impact of a sales charge. Total investment return during all of the periods shown reflects a waiver by the manager. Performance would have been lower had the waiver not been in effect. |
See accompanying notes, which are an integral part of the financial statements.
(continues) 89
Financial highlights
Optimum Fixed Income Fund Class B
Selected data for each share of the Fund outstanding throughout each period were as follows:
| Year Ended | |||||||||||||||||||||
| 3/31/11 | 3/31/10 | 3/31/09 | 3/31/08 | 3/31/07 | |||||||||||||||||
| Net asset value, beginning of period | $9.280 | $7.750 | $8.930 | $9.060 | $8.740 | ||||||||||||||||
| Income (loss) from investment operations: | |||||||||||||||||||||
| Net investment income1 | 0.328 | 0.604 | 0.395 | 0.343 | 0.342 | ||||||||||||||||
| Net realized and unrealized gain (loss) on investments | |||||||||||||||||||||
| and foreign currencies | 0.248 | 1.486 | (1.140 | ) | (0.076 | ) | 0.264 | ||||||||||||||
| Total from investment operations | 0.576 | 2.090 | (0.745 | ) | 0.267 | 0.606 | |||||||||||||||
| Less dividends and distributions from: | |||||||||||||||||||||
| Net investment income | (0.316 | ) | (0.560 | ) | (0.408 | ) | (0.321 | ) | (0.286 | ) | |||||||||||
| Net realized gain on investments | — | — | (0.027 | ) | (0.076 | ) | — | ||||||||||||||
| Total dividends and distributions | (0.316 | ) | (0.560 | ) | (0.435 | ) | (0.397 | ) | (0.286 | ) | |||||||||||
| Net asset value, end of period | $9.540 | $9.280 | $7.750 | $8.930 | $9.060 | ||||||||||||||||
| Total return2 | 6.32% | 27.51% | (8.42% | ) | 2.99% | 7.01% | |||||||||||||||
| Ratios and supplemental data: | |||||||||||||||||||||
| Net assets, end of period (000 omitted) | $4,714 | $5,587 | $5,483 | $8,788 | $9,568 | ||||||||||||||||
| Ratio of expenses to average net assets | 2.00% | 1.96% | 1.89% | 1.89% | 1.90% | ||||||||||||||||
| Ratio of expenses to average net assets | |||||||||||||||||||||
| prior to fees waived and expense paid indirectly | 2.11% | 2.13% | 2.12% | 2.08% | 2.26% | ||||||||||||||||
| Ratio of net investment income to average net assets | 3.45% | 6.84% | 4.73% | 3.79% | 3.83% | ||||||||||||||||
| Ratio of net investment income to average net assets | |||||||||||||||||||||
| prior to fees waived and expense paid indirectly | 3.34% | 6.67% | 4.50% | 3.60% | 3.47% | ||||||||||||||||
| Portfolio turnover | 273% | 134% | 158% | 256% | 238% | ||||||||||||||||
| 1 The average shares outstanding method has been applied for per share information. |
| 2 Total investment return is based on the change in net asset value of a share during the period and assumes reinvestment of dividends and distributions at net asset value and does not reflect the impact of a sales charge. Total investment return during all of the periods shown reflects a waiver by the manager. Performance would have been lower had the waiver not been in effect. |
See accompanying notes, which are an integral part of the financial statements.
90
Optimum Fixed Income Fund Class C
Selected data for each share of the Fund outstanding throughout each period were as follows:
| Year Ended | |||||||||||||||||||||
| 3/31/11 | 3/31/10 | 3/31/09 | 3/31/08 | 3/31/07 | |||||||||||||||||
| Net asset value, beginning of period | $9.280 | $7.760 | $8.940 | $9.060 | $8.750 | ||||||||||||||||
| Income (loss) from investment operations: | |||||||||||||||||||||
| Net investment income1 | 0.329 | 0.604 | 0.395 | 0.343 | 0.341 | ||||||||||||||||
| Net realized and unrealized gain (loss) on investments | |||||||||||||||||||||
| and foreign currencies | 0.247 | 1.476 | (1.140 | ) | (0.066 | ) | 0.255 | ||||||||||||||
| Total from investment operations | 0.576 | 2.080 | (0.745 | ) | 0.277 | 0.596 | |||||||||||||||
| Less dividends and distributions from: | |||||||||||||||||||||
| Net investment income | (0.316 | ) | (0.560 | ) | (0.408 | ) | (0.321 | ) | (0.286 | ) | |||||||||||
| Net realized gain on investments | — | — | (0.027 | ) | (0.076 | ) | — | ||||||||||||||
| Total dividends and distributions | (0.316 | ) | (0.560 | ) | (0.435 | ) | (0.397 | ) | (0.286 | ) | |||||||||||
| Net asset value, end of period | $9.540 | $9.280 | $7.760 | $8.940 | $9.060 | ||||||||||||||||
| Total return2 | 6.32% | 27.34% | (8.41% | ) | 3.11% | 6.88% | |||||||||||||||
| Ratios and supplemental data: | |||||||||||||||||||||
| Net assets, end of period (000 omitted) | $159,759 | $170,214 | $157,185 | $257,340 | $227,036 | ||||||||||||||||
| Ratio of expenses to average net assets | 2.00% | 1.96% | 1.89% | 1.89% | 1.90% | ||||||||||||||||
| Ratio of expenses to average net assets | |||||||||||||||||||||
| prior to fees waived and expense paid indirectly | 2.11% | 2.13% | 2.12% | 2.08% | 2.26% | ||||||||||||||||
| Ratio of net investment income to average net assets | 3.45% | 6.84% | 4.73% | 3.79% | 3.83% | ||||||||||||||||
| Ratio of net investment income to average net assets | |||||||||||||||||||||
| prior to fees waived and expense paid indirectly | 3.34% | 6.67% | 4.50% | 3.60% | 3.47% | ||||||||||||||||
| Portfolio turnover | 273% | 134% | 158% | 256% | 238% | ||||||||||||||||
| 1 The average shares outstanding method has been applied for per share information. |
| 2 Total investment return is based on the change in net asset value of a share during the period and assumes reinvestment of dividends and distributions at net asset value and does not reflect the impact of a sales charge. Total investment return during all of the periods shown reflects a waiver by the manager. Performance would have been lower had the waiver not been in effect. |
See accompanying notes, which are an integral part of the financial statements.
(continues) 91
Financial highlights
Optimum Fixed Income Fund Institutional Class
Selected data for each share of the Fund outstanding throughout each period were as follows:
| Year Ended | |||||||||||||||||||||
| 3/31/11 | 3/31/10 | 3/31/09 | 3/31/08 | 3/31/07 | |||||||||||||||||
| Net asset value, beginning of period | $9.290 | $7.740 | $8.920 | $9.050 | $8.730 | ||||||||||||||||
| Income (loss) from investment operations: | |||||||||||||||||||||
| Net investment income1 | 0.424 | 0.692 | 0.479 | 0.434 | 0.431 | ||||||||||||||||
| Net realized and unrealized gain (loss) on investments | |||||||||||||||||||||
| and foreign currencies | 0.247 | 1.484 | (1.141 | ) | (0.076 | ) | 0.265 | ||||||||||||||
| Total from investment operations | 0.671 | 2.176 | (0.662 | ) | 0.358 | 0.696 | |||||||||||||||
| Less dividends and distributions from: | |||||||||||||||||||||
| Net investment income | (0.411 | ) | (0.626 | ) | (0.491 | ) | (0.412 | ) | (0.376 | ) | |||||||||||
| Net realized gain on investments | — | — | (0.027 | ) | (0.076 | ) | — | ||||||||||||||
| Total dividends and distributions | (0.411 | ) | (0.626 | ) | (0.518 | ) | (0.488 | ) | (0.376 | ) | |||||||||||
| Net asset value, end of period | $9.550 | $9.290 | $7.740 | $8.920 | $9.050 | ||||||||||||||||
| Total return2 | 7.39% | 28.73% | (7.51% | ) | 4.04% | 8.09% | |||||||||||||||
| Ratios and supplemental data: | |||||||||||||||||||||
| Net assets, end of period (000 omitted) | $791,984 | $579,694 | $434,285 | $597,388 | $454,154 | ||||||||||||||||
| Ratio of expenses to average net assets | 1.00% | 0.96% | 0.89% | 0.89% | 0.90% | ||||||||||||||||
| Ratio of expenses to average net assets | |||||||||||||||||||||
| prior to fees waived and expense paid indirectly | 1.11% | 1.13% | 1.12% | 1.08% | 1.26% | ||||||||||||||||
| Ratio of net investment income to average net assets | 4.45% | 7.84% | 5.73% | 4.79% | 4.83% | ||||||||||||||||
| Ratio of net investment income to average net assets | |||||||||||||||||||||
| prior to fees waived and expense paid indirectly | 4.34% | 7.67% | 5.50% | 4.60% | 4.47% | ||||||||||||||||
| Portfolio turnover | 273% | 134% | 158% | 256% | 238% | ||||||||||||||||
| 1 The average shares outstanding method has been applied for per share information. |
| 2 Total investment return is based on the change in net asset value of a share during the period and assumes reinvestment of dividends and distributions at net asset value. Total investment return during all of the periods shown reflects a waiver by the manager. Performance would have been lower had the waiver not been in effect. |
See accompanying notes, which are an integral part of the financial statements.
92
Optimum International Fund Class A
Selected data for each share of the Fund outstanding throughout each period were as follows:
| Year Ended | ||||||||||||||||
| 3/31/11 | 3/31/10 | 3/31/09 | 3/31/08 | 3/31/07 | ||||||||||||
| Net asset value, beginning of period | $10.340 | $7.010 | $13.840 | $15.490 | $13.470 | |||||||||||
| Income (loss) from investment operations: | ||||||||||||||||
| Net investment income1 | 0.129 | 0.124 | 0.280 | 0.262 | 0.112 | |||||||||||
| Net realized and unrealized gain (loss) on investments | ||||||||||||||||
| and foreign currencies | 0.887 | 3.366 | (6.557 | ) | (0.798 | ) | 2.661 | |||||||||
| Total from investment operations | 1.016 | 3.490 | (6.277 | ) | (0.536 | ) | 2.773 | |||||||||
| Less dividends and distributions from: | ||||||||||||||||
| Net investment income | (0.156 | ) | (0.160 | ) | (0.326 | ) | (0.116 | ) | (0.172 | ) | ||||||
| Net realized gain on investments | — | — | (0.227 | ) | (0.998 | ) | (0.581 | ) | ||||||||
| Total dividends and distributions | (0.156 | ) | (0.160 | ) | (0.553 | ) | (1.114 | ) | (0.753 | ) | ||||||
| Net asset value, end of period | $11.200 | $10.340 | $7.010 | $13.840 | $15.490 | |||||||||||
| Total return2 | 10.19% | 50.29% | (46.64%) | (3.96% | ) | 21.26% | ||||||||||
| Ratios and supplemental data: | ||||||||||||||||
| Net assets, end of period (000 omitted) | $11,189 | $12,082 | $9,578 | $22,971 | $25,523 | |||||||||||
| Ratio of expenses to average net assets | 1.75% | 1.75% | 1.77% | 1.75% | 1.96% | |||||||||||
| Ratio of expenses to average net assets | ||||||||||||||||
| prior to fees waived and expense paid indirectly | 1.88% | 1.94% | 1.86% | 1.75% | 1.96% | |||||||||||
| Ratio of net investment income to average net assets | 1.26% | 1.30% | 2.66% | 1.69% | 0.78% | |||||||||||
| Ratio of net investment income to average net assets | ||||||||||||||||
| prior to fees waived and expense paid indirectly | 1.13% | 1.11% | 2.57% | 1.69% | 0.78% | |||||||||||
| Portfolio turnover | 95% | 91% | 58% | 19% | 18% | |||||||||||
| 1 The average shares outstanding method has been applied for per share information. |
| 2 Total investment return is based on the change in net asset value of a share during the period and assumes reinvestment of dividends and distributions at net asset value and does not reflect the impact of a sales charge. Total investment return during some of the periods shown reflects a waiver by the manager. Performance would have been lower had the waiver not been in effect. |
See accompanying notes, which are an integral part of the financial statements.
(continues) 93
Financial highlights
Optimum International Fund Class B
Selected data for each share of the Fund outstanding throughout each period were as follows:
| Year Ended | ||||||||||||||||
| 3/31/11 | 3/31/10 | 3/31/09 | 3/31/08 | 3/31/07 | ||||||||||||
| Net asset value, beginning of period | $10.100 | $6.880 | $13.580 | $15.240 | $13.290 | |||||||||||
| Income (loss) from investment operations: | ||||||||||||||||
| Net investment income1 | 0.061 | 0.064 | 0.213 | 0.163 | 0.021 | |||||||||||
| Net realized and unrealized gain (loss) on investments | ||||||||||||||||
| and foreign currencies | 0.875 | 3.304 | (6.436 | ) | (0.787 | ) | 2.614 | |||||||||
| Total from investment operations | 0.936 | 3.368 | (6.223 | ) | (0.624 | ) | 2.635 | |||||||||
| Less dividends and distributions from: | ||||||||||||||||
| Net investment income | (0.096 | ) | (0.148 | ) | (0.250 | ) | (0.038 | ) | (0.104 | ) | ||||||
| Net realized gain on investments | — | — | (0.227 | ) | (0.998 | ) | (0.581 | ) | ||||||||
| Total dividends and distributions | (0.096 | ) | (0.148 | ) | (0.477 | ) | (1.036 | ) | (0.685 | ) | ||||||
| Net asset value, end of period | $10.940 | $10.100 | $6.880 | $13.580 | $15.240 | |||||||||||
| Total return2 | 9.49% | 49.42% | (47.02% | ) | (4.59% | ) | 20.44% | |||||||||
| Ratios and supplemental data: | ||||||||||||||||
| Net assets, end of period (000 omitted) | $1,868 | $2,243 | $1,764 | $4,203 | $5,031 | |||||||||||
| Ratio of expenses to average net assets | 2.40% | 2.40% | 2.42% | 2.40% | 2.61% | |||||||||||
| Ratio of expenses to average net assets | ||||||||||||||||
| prior to fees waived and expense paid indirectly | 2.53% | 2.59% | 2.51% | 2.40% | 2.61% | |||||||||||
| Ratio of net investment income to average net assets | 0.61% | 0.65% | 2.01% | 1.04% | 0.13% | |||||||||||
| Ratio of net investment income to average net assets | ||||||||||||||||
| prior to fees waived and expense paid indirectly | 0.48% | 0.46% | 1.92% | 1.04% | 0.13% | |||||||||||
| Portfolio turnover | 95% | 91% | 58% | 19% | 18% | |||||||||||
| 1 The average shares outstanding method has been applied for per share information. |
| 2 Total investment return is based on the change in net asset value of a share during the period and assumes reinvestment of dividends and distributions at net asset value and does not reflect the impact of a sales charge. Total investment return during some of the periods shown reflects a waiver by the manager. Performance would have been lower had the waiver not been in effect. |
See accompanying notes, which are an integral part of the financial statements.
94
Optimum International Fund Class C
Selected data for each share of the Fund outstanding throughout each period were as follows:
| Year Ended | ||||||||||||||||
| 3/31/11 | 3/31/10 | 3/31/09 | 3/31/08 | 3/31/07 | ||||||||||||
| Net asset value, beginning of period | $10.100 | $6.890 | $13.590 | $15.250 | $13.290 | |||||||||||
| Income (loss) from investment operations: | ||||||||||||||||
| Net investment income1 | 0.061 | 0.064 | 0.213 | 0.163 | 0.021 | |||||||||||
| Net realized and unrealized gain (loss) on investments | ||||||||||||||||
| and foreign currencies | 0.885 | 3.294 | (6.436 | ) | (0.787 | ) | 2.624 | |||||||||
| Total from investment operations | 0.946 | 3.358 | (6.223 | ) | (0.624 | ) | 2.645 | |||||||||
| Less dividends and distributions from: | ||||||||||||||||
| Net investment income | (0.096 | ) | (0.148 | ) | (0.250 | ) | (0.038 | ) | (0.104 | ) | ||||||
| Net realized gain on investments | — | — | (0.227 | ) | (0.998 | ) | (0.581 | ) | ||||||||
| Total dividends and distributions | (0.096 | ) | (0.148 | ) | (0.477 | ) | (1.036 | ) | (0.685 | ) | ||||||
| Net asset value, end of period | $10.950 | $10.100 | $6.890 | $13.590 | $15.250 | |||||||||||
| Total return2 | 9.59% | 49.20% | (46.98% | ) | (4.59% | ) | 20.51% | |||||||||
| Ratios and supplemental data: | ||||||||||||||||
| Net assets, end of period (000 omitted) | $39,762 | $43,260 | $34,520 | $84,431 | $91,696 | |||||||||||
| Ratio of expenses to average net assets | 2.40% | 2.40% | 2.42% | 2.40% | 2.61% | |||||||||||
| Ratio of expenses to average net assets | ||||||||||||||||
| prior to fees waived and expense paid indirectly | 2.53% | 2.59% | 2.51% | 2.40% | 2.61% | |||||||||||
| Ratio of net investment income to average net assets | 0.61% | 0.65% | 2.01% | 1.04% | 0.13% | |||||||||||
| Ratio of net investment income to average net assets | ||||||||||||||||
| prior to fees waived and expense paid indirectly | 0.48% | 0.46% | 1.92% | 1.04% | 0.13% | |||||||||||
| Portfolio turnover | 95% | 91% | 58% | 19% | 18% | |||||||||||
| 1 The average shares outstanding method has been applied for per share information. | |
| 2 Total investment return is based on the change in net asset value of a share during the period and assumes reinvestment of dividends and distributions at net asset value and does not reflect the impact of a sales charge. Total investment return during some of the periods shown reflects a waiver by the manager. Performance would have been lower had the waiver not been in effect. |
(continues) 95
Financial highlights
Optimum International Fund Institutional Class
Selected data for each share of the Fund outstanding throughout each period were as follows:
| Year Ended | ||||||||||||||||
| 3/31/11 | 3/31/10 | 3/31/09 | 3/31/08 | 3/31/07 | ||||||||||||
| Net asset value, beginning of period | $10.430 | $7.050 | $13.940 | $15.590 | $13.550 | |||||||||||
| Income (loss) from investment operations: | ||||||||||||||||
| Net investment income1 | 0.168 | 0.157 | 0.317 | 0.317 | 0.162 | |||||||||||
| Net realized and unrealized gain (loss) on investments | ||||||||||||||||
| and foreign currencies | 0.887 | 3.393 | (6.611 | ) | (0.797 | ) | 2.679 | |||||||||
| Total from investment operations | 1.055 | 3.550 | (6.294 | ) | (0.480 | ) | 2.841 | |||||||||
| Less dividends and distributions from: | ||||||||||||||||
| Net investment income | (0.185 | ) | (0.170 | ) | (0.369 | ) | (0.172 | ) | (0.220 | ) | ||||||
| Net realized gain on investments | — | — | (0.227 | ) | (0.998 | ) | (0.581 | ) | ||||||||
| Total dividends and distributions | (0.185 | ) | (0.170 | ) | (0.596 | ) | (1.170 | ) | (0.801 | ) | ||||||
| Net asset value, end of period | $11.300 | $10.430 | $7.050 | $13.940 | $15.590 | |||||||||||
| Total return2 | 10.55% | 50.88% | (46.49% | ) | (3.59% | ) | 21.68% | |||||||||
| Ratios and supplemental data: | ||||||||||||||||
| Net assets, end of period (000 omitted) | $226,512 | $146,156 | $79,430 | $174,954 | $154,198 | |||||||||||
| Ratio of expenses to average net assets | 1.40% | 1.40% | 1.42% | 1.40% | 1.61% | |||||||||||
| Ratio of expenses to average net assets | ||||||||||||||||
| prior to fees waived and expense paid indirectly | 1.53% | 1.59% | 1.51% | 1.40% | 1.61% | |||||||||||
| Ratio of net investment income to average net assets | 1.61% | 1.65% | 3.01% | 2.04% | 1.13% | |||||||||||
| Ratio of net investment income to average net assets | ||||||||||||||||
| prior to fees waived and expense paid indirectly | 1.48% | 1.46% | 2.92% | 2.04% | 1.13% | |||||||||||
| Portfolio turnover | 95% | 91% | 58% | 19% | 18% | |||||||||||
| 1 The average shares outstanding method has been applied for per share information. | |
| 2 Total investment return is based on the change in net asset value of a share during the period and assumes reinvestment of dividends and distributions at net asset value. Total investment return during some of the periods shown reflects a waiver by the manager. Performance would have been lower had the waiver not been in effect. |
See accompanying notes, which are an integral part of the financial statements.
96
Optimum Large Cap Growth Fund Class A
Selected data for each share of the Fund outstanding throughout each period were as follows:
| Year Ended | ||||||||||||||||
| 3/31/11 | 3/31/10 | 3/31/09 | 3/31/08 | 3/31/07 | ||||||||||||
| Net asset value, beginning of period | $10.640 | $6.990 | $11.220 | $11.980 | $11.540 | |||||||||||
| Income (loss) from investment operations: | ||||||||||||||||
| Net investment loss1 | (0.062 | ) | (0.025 | ) | (0.001 | ) | (0.021 | ) | (0.047 | ) | ||||||
| Net realized and unrealized gain (loss) on investments | ||||||||||||||||
| and foreign currencies | 1.852 | 3.675 | (4.229 | ) | (0.406 | ) | 0.692 | |||||||||
| Total from investment operations | 1.790 | 3.650 | (4.230 | ) | (0.427 | ) | 0.645 | |||||||||
| Less dividends and distributions from: | ||||||||||||||||
| Net investment income | — | — | — | (0.296 | ) | (0.205 | ) | |||||||||
| Return of capital | — | — | — | (0.037 | ) | — | ||||||||||
| Total dividends and distributions | — | — | — | (0.333 | ) | (0.205 | ) | |||||||||
| Net asset value, end of period | $12.430 | $10.640 | $6.990 | $11.220 | $11.980 | |||||||||||
| Total return2 | 16.82% | 52.22% | (37.70% | ) | (3.86%) | 5.75% | ||||||||||
| Ratios and supplemental data: | ||||||||||||||||
| Net assets, end of period (000 omitted) | $35,359 | $36,288 | $28,347 | $54,022 | $56,088 | |||||||||||
| Ratio of expenses to average net assets | 1.61% | 1.61% | 1.61% | 1.60% | 1.69% | |||||||||||
| Ratio of expenses to average net assets | ||||||||||||||||
| prior to fees waived and expense paid indirectly | 1.64% | 1.66% | 1.64% | 1.60% | 1.77% | |||||||||||
| Ratio of net investment loss to average net assets | (0.57% | ) | (0.28% | ) | (0.01% | ) | (0.17%) | (0.41% | ) | |||||||
| Ratio of net investment loss to average net assets | ||||||||||||||||
| prior to fees waived and expense paid indirectly | (0.60% | ) | (0.33% | ) | (0.04% | ) | (0.17% | ) | (0.49% | ) | ||||||
| Portfolio turnover | 117% | 145% | 164% | 59% | 37% | |||||||||||
| 1 The average shares outstanding method has been applied for per share information. | |
| 2 Total investment return is based on the change in net asset value of a share during the period and assumes reinvestment of dividends and distributions at net asset value and does not reflect the impact of a sales charge. Total investment return during some of the periods shown reflects a waiver by the manager. Performance would have been lower had the waiver not been in effect. |
See accompanying notes, which are an integral part of the financial statements.
(continues) 97
Financial highlights
Optimum Large Cap Growth Fund Class B
Selected data for each share of the Fund outstanding throughout each period were as follows:
| Year Ended | ||||||||||||||||
| 3/31/11 | 3/31/10 | 3/31/09 | 3/31/08 | 3/31/07 | ||||||||||||
| Net asset value, beginning of period | $10.180 | $6.730 | $10.870 | $11.700 | $11.340 | |||||||||||
| Income (loss) from investment operations: | ||||||||||||||||
| Net investment loss1 | (0.127 | ) | (0.081 | ) | (0.059 | ) | (0.100 | ) | (0.119 | ) | ||||||
| Net realized and unrealized gain (loss) on investments | ||||||||||||||||
| and foreign currencies | 1.767 | 3.531 | (4.081 | ) | (0.397 | ) | 0.684 | |||||||||
| Total from investment operations | 1.640 | 3.450 | (4.140 | ) | (0.497 | ) | 0.565 | |||||||||
| Less dividends and distributions from: | ||||||||||||||||
| Net investment income | — | — | — | (0.296 | ) | (0.205 | ) | |||||||||
| Return of capital | — | — | — | (0.037 | ) | — | ||||||||||
| Total dividends and distributions | — | — | — | (0.333 | ) | (0.205 | ) | |||||||||
| Net asset value, end of period | $11.820 | $10.180 | $6.730 | $10.870 | $11.700 | |||||||||||
| Total return2 | 16.11% | 51.26% | (38.09% | ) | (4.56% | ) | 5.14% | |||||||||
| Ratios and supplemental data: | ||||||||||||||||
| Net assets, end of period (000 omitted) | $5,381 | $6,135 | $4,780 | $9,345 | $10,819 | |||||||||||
| Ratio of expenses to average net assets | 2.26% | 2.26% | 2.26% | 2.25% | 2.34% | |||||||||||
| Ratio of expenses to average net assets | ||||||||||||||||
| prior to fees waived and expense paid indirectly | 2.29% | 2.31% | 2.29% | 2.25% | 2.42% | |||||||||||
| Ratio of net investment loss to average net assets | (1.22% | ) | (0.93% | ) | (0.66% | ) | (0.82% | ) | (1.06% | ) | ||||||
| Ratio of net investment loss to average net assets | ||||||||||||||||
| prior to fees waived and expense paid indirectly | (1.25% | ) | (0.98% | ) | (0.69% | ) | (0.82% | ) | (1.14% | ) | ||||||
| Portfolio turnover | 117% | 145% | 164% | 59% | 37% | |||||||||||
| 1 The average shares outstanding method has been applied for per share information. | |
| 2 Total investment return is based on the change in net asset value of a share during the period and assumes reinvestment of dividends and distributions at net asset value and does not reflect the impact of a sales charge. Total investment return during some of the periods shown reflects a waiver by the manager. Performance would have been lower had the waiver not been in effect. |
See accompanying notes, which are an integral part of the financial statements.
98
Optimum Large Cap Growth Fund Class C
Selected data for each share of the Fund outstanding throughout each period were as follows:
| Year Ended | ||||||||||||||||
| 3/31/11 | 3/31/10 | 3/31/09 | 3/31/08 | 3/31/07 | ||||||||||||
| Net asset value, beginning of period | $10.180 | $6.730 | $10.870 | $11.700 | $11.340 | |||||||||||
| Income (loss) from investment operations: | ||||||||||||||||
| Net investment loss1 | (0.127 | ) | (0.081 | ) | (0.059 | ) | (0.100 | ) | (0.119 | ) | ||||||
| Net realized and unrealized gain (loss) on investments | ||||||||||||||||
| and foreign currencies | 1.767 | 3.531 | (4.081 | ) | (0.397 | ) | 0.684 | |||||||||
| Total from investment operations | 1.640 | 3.450 | (4.140 | ) | (0.497 | ) | 0.565 | |||||||||
| Less dividends and distributions from: | ||||||||||||||||
| Net investment income | — | — | — | (0.296 | ) | (0.205 | ) | |||||||||
| Return of capital | — | — | — | (0.037 | ) | — | ||||||||||
| Total dividends and distributions | — | — | — | (0.333 | ) | (0.205 | ) | |||||||||
| Net asset value, end of period | $11.820 | $10.180 | $6.730 | $10.870 | $11.700 | |||||||||||
| Total return2 | 16.11% | 51.26% | (38.09% | ) | (4.56% | ) | 5.14% | |||||||||
| Ratios and supplemental data: | ||||||||||||||||
| Net assets, end of period (000 omitted) | $128,256 | $132,242 | $102,233 | $203,394 | $203,591 | |||||||||||
| Ratio of expenses to average net assets | 2.26% | 2.26% | 2.26% | 2.25% | 2.34% | |||||||||||
| Ratio of expenses to average net assets | ||||||||||||||||
| prior to fees waived and expense paid indirectly | 2.29% | 2.31% | 2.29% | 2.25% | 2.42% | |||||||||||
| Ratio of net investment loss to average net assets | (1.22% | ) | (0.93% | ) | (0.66% | ) | (0.82% | ) | (1.06% | ) | ||||||
| Ratio of net investment loss to average net assets | ||||||||||||||||
| prior to fees waived and expense paid indirectly | (1.25% | ) | (0.98% | ) | (0.69% | ) | (0.82% | ) | (1.14% | ) | ||||||
| Portfolio turnover | 117% | 145% | 164% | 59% | 37% | |||||||||||
| 1 The average shares outstanding method has been applied for per share information. | |
| 2 Total investment return is based on the change in net asset value of a share during the period and assumes reinvestment of dividends and distributions at net asset value and does not reflect the impact of a sales charge. Total investment return during some of the periods shown reflects a waiver by the manager. Performance would have been lower had the waiver not been in effect. |
See accompanying notes, which are an integral part of the financial statements.
(continues) 99
Financial highlights
Optimum Large Cap Growth Fund Institutional Class
Selected data for each share of the Fund outstanding throughout each period were as follows:
| Year Ended | ||||||||||||||||
| 3/31/11 | 3/31/10 | 3/31/09 | 3/31/08 | 3/31/07 | ||||||||||||
| Net asset value, beginning of period | $10.880 | $7.130 | $11.410 | $12.140 | $11.650 | |||||||||||
| Income (loss) from investment operations: | ||||||||||||||||
| Net investment income (loss)1 | (0.025 | ) | 0.007 | 0.032 | 0.023 | (0.006 | ) | |||||||||
| Net realized and unrealized gain (loss) on investments | ||||||||||||||||
| and foreign currencies | 1.905 | 3.758 | (4.312 | ) | (0.420 | ) | 0.701 | |||||||||
| Total from investment operations | 1.880 | 3.765 | (4.280 | ) | (0.397 | ) | 0.695 | |||||||||
| Less dividends and distributions from: | ||||||||||||||||
| Net investment income | — | (0.015 | ) | — | (0.296 | ) | (0.205 | ) | ||||||||
| Return of capital | — | — | — | (0.037 | ) | — | ||||||||||
| Total dividends and distributions | — | (0.015 | ) | — | (0.333 | ) | (0.205 | ) | ||||||||
| Net asset value, end of period | $12.760 | $10.880 | $7.130 | $11.410 | $12.140 | |||||||||||
| Total return2 | 17.28% | 52.87% | (37.51% | ) | (3.56% | ) | 6.13% | |||||||||
| Ratios and supplemental data: | ||||||||||||||||
| Net assets, end of period (000 omitted) | $587,141 | $532,282 | $402,574 | $723,347 | $518,509 | |||||||||||
| Ratio of expenses to average net assets | 1.26% | 1.26% | 1.26% | 1.25% | 1.34% | |||||||||||
| Ratio of expenses to average net assets | ||||||||||||||||
| prior to fees waived and expense paid indirectly | 1.29% | 1.31% | 1.29% | 1.25% | 1.42% | |||||||||||
| Ratio of net investment income (loss) to average net assets | (0.22% | ) | 0.07% | 0.34% | 0.18% | (0.06% | ) | |||||||||
| Ratio of net investment income (loss) to average net assets | ||||||||||||||||
| prior to fees waived and expense paid indirectly | (0.25% | ) | 0.02% | 0.31% | 0.18% | (0.14% | ) | |||||||||
| Portfolio turnover | 117% | 145% | 164% | 59% | 37% | |||||||||||
| 1 The average shares outstanding method has been applied for per share information. | |
| 2 Total investment return is based on the change in net asset value of a share during the period and assumes reinvestment of dividends and distributions at net asset value. Total investment return during some of the periods shown reflects a waiver by the manager. Performance would have been lower had the waiver not been in effect. |
See accompanying notes, which are an integral part of the financial statements.
100
Optimum Large Cap Value Fund Class A
Selected data for each share of the Fund outstanding throughout each period were as follows:
| Year Ended | ||||||||||||||||
| 3/31/11 | 3/31/10 | 3/31/09 | 3/31/08 | 3/31/07 | ||||||||||||
| Net asset value, beginning of period | $9.830 | $6.710 | $11.170 | $12.730 | $11.320 | |||||||||||
| Income (loss) from investment operations: | ||||||||||||||||
| Net investment income1 | 0.075 | 0.118 | 0.165 | 0.138 | 0.128 | |||||||||||
| Net realized and unrealized gain (loss) on investments | ||||||||||||||||
| and foreign currencies | 1.274 | 3.181 | (4.453 | ) | (0.931 | ) | 1.614 | |||||||||
| Total from investment operations | 1.349 | 3.299 | (4.288 | ) | (0.793 | ) | 1.742 | |||||||||
| Less dividends and distributions from: | ||||||||||||||||
| Net investment income | (0.119 | ) | (0.179 | ) | (0.029 | ) | (0.134 | ) | (0.104 | ) | ||||||
| Net realized gain on investments | — | — | (0.143 | ) | (0.633 | ) | (0.228 | ) | ||||||||
| Total dividends and distributions | (0.119 | ) | (0.179 | ) | (0.172 | ) | (0.767 | ) | (0.332 | ) | ||||||
| Net asset value, end of period | $11.060 | $9.830 | $6.710 | $11.170 | $12.730 | |||||||||||
| Total return2 | 14.00% | 49.92% | (38.97% | ) | (6.80% | ) | 15.65% | |||||||||
| Ratios and supplemental data: | ||||||||||||||||
| Net assets, end of period (000 omitted) | $33,892 | $34,167 | $26,901 | $53,097 | $58,161 | |||||||||||
| Ratio of expenses to average net assets | 1.59% | 1.58% | 1.54% | 1.54% | 1.55% | |||||||||||
| Ratio of expenses to average net assets | ||||||||||||||||
| prior to fees waived and expense paid indirectly | 1.61% | 1.62% | 1.60% | 1.56% | 1.73% | |||||||||||
| Ratio of net investment income to average net assets | 0.77% | 1.38% | 1.82% | 1.09% | 1.07% | |||||||||||
| Ratio of net investment income to average net assets | ||||||||||||||||
| prior to fees waived and expense paid indirectly | 0.75% | 1.34% | 1.76% | 1.07% | 0.89% | |||||||||||
| Portfolio turnover | 82% | 28% | 37% | 30% | 22% | |||||||||||
| 1 The average shares outstanding method has been applied for per share information. |
| 2 Total investment return is based on the change in net asset value of a share during the period and assumes reinvestment of dividends and distributions at net asset value and does not reflect the impact of a sales charge. Total investment return during all of the periods shown reflects a waiver by the manager. Performance would have been lower had the waiver not been in effect. |
See accompanying notes, which are an integral part of the financial statements.
(continues) 101
Financial highlights
Optimum Large Cap Value Fund Class B
Selected data for each share of the Fund outstanding throughout each period were as follows:
| Year Ended | ||||||||||||||||
| 3/31/11 | 3/31/10 | 3/31/09 | 3/31/08 | 3/31/07 | ||||||||||||
| Net asset value, beginning of period | $9.720 | $6.630 | $11.090 | $12.640 | $11.240 | |||||||||||
| Income (loss) from investment operations: | ||||||||||||||||
| Net investment income1 | 0.012 | 0.063 | 0.106 | 0.056 | 0.052 | |||||||||||
| Net realized and unrealized gain (loss) on investments | ||||||||||||||||
| and foreign currencies | 1.262 | 3.147 | (4.413 | ) | (0.923 | ) | 1.606 | |||||||||
| Total from investment operations | 1.274 | 3.210 | (4.307 | ) | (0.867 | ) | 1.658 | |||||||||
| Less dividends and distributions from: | ||||||||||||||||
| Net investment income | (0.064 | ) | (0.120 | ) | (0.010 | ) | (0.050 | ) | (0.030 | ) | ||||||
| Net realized gain on investments | — | — | (0.143 | ) | (0.633 | ) | (0.228 | ) | ||||||||
| Total dividends and distributions | (0.064 | ) | (0.120 | ) | (0.153 | ) | (0.683 | ) | (0.258 | ) | ||||||
| Net asset value, end of period | $10.930 | $9.720 | $6.630 | $11.090 | $12.640 | |||||||||||
| Total return2 | 13.25% | 48.92% | (39.37% | ) | (7.38% | ) | 14.97% | |||||||||
| Ratios and supplemental data: | ||||||||||||||||
| Net assets, end of period (000 omitted) | $5,135 | $5,943 | $4,664 | $9,454 | $11,403 | |||||||||||
| Ratio of expenses to average net assets | 2.24% | 2.23% | 2.19% | 2.19% | 2.20% | |||||||||||
| Ratio of expenses to average net assets | ||||||||||||||||
| prior to fees waived and expense paid indirectly | 2.26% | 2.27% | 2.25% | 2.21% | 2.38% | |||||||||||
| Ratio of net investment income to average net assets | 0.12% | 0.73% | 1.17% | 0.44% | 0.42% | |||||||||||
| Ratio of net investment income to average net assets | ||||||||||||||||
| prior to fees waived and expense paid indirectly | 0.10% | 0.69% | 1.11% | 0.42% | 0.24% | |||||||||||
| Portfolio turnover | 82% | 28% | 37% | 30% | 22% | |||||||||||
| 1 The average shares outstanding method has been applied for per share information. | |
| 2 Total investment return is based on the change in net asset value of a share during the period and assumes reinvestment of dividends and distributions at net asset value and does not reflect the impact of a sales charge. Total investment return during all of the periods shown reflects a waiver by the manager. Performance would have been lower had the waiver not been in effect. |
See accompanying notes, which are an integral part of the financial statements.
102
Optimum Large Cap Value Fund Class C
Selected data for each share of the Fund outstanding throughout each period were as follows:
| Year Ended | ||||||||||||||||
| 3/31/11 | 3/31/10 | 3/31/09 | 3/31/08 | 3/31/07 | ||||||||||||
| Net asset value, beginning of period | $9.710 | $6.630 | $11.080 | $12.630 | $11.240 | |||||||||||
| Income (loss) from investment operations: | ||||||||||||||||
| Net investment income1 | 0.012 | 0.063 | 0.106 | 0.057 | 0.051 | |||||||||||
| Net realized and unrealized gain (loss) on investments | ||||||||||||||||
| and foreign currencies | 1.272 | 3.137 | (4.403 | ) | (0.924 | ) | 1.597 | |||||||||
| Total from investment operations | 1.284 | 3.200 | (4.297 | ) | (0.867 | ) | 1.648 | |||||||||
| Less dividends and distributions from: | ||||||||||||||||
| Net investment income | (0.064 | ) | (0.120 | ) | (0.010 | ) | (0.050 | ) | (0.030 | ) | ||||||
| Net realized gain on investments | — | — | (0.143 | ) | (0.633 | ) | (0.228 | ) | ||||||||
| Total dividends and distributions | (0.064 | ) | (0.120 | ) | (0.153 | ) | (0.683 | ) | (0.258 | ) | ||||||
| Net asset value, end of period | $10.930 | $9.710 | $6.630 | $11.080 | $12.630 | |||||||||||
| Total return2 | 13.37% | 48.76% | (39.31% | ) | (7.39% | ) | 14.88% | |||||||||
| Ratios and supplemental data: | ||||||||||||||||
| Net assets, end of period (000 omitted) | $119,899 | $125,961 | $98,881 | $205,501 | $216,527 | |||||||||||
| Ratio of expenses to average net assets | 2.24% | 2.23% | 2.19% | 2.19% | 2.20% | |||||||||||
| Ratio of expenses to average net assets | ||||||||||||||||
| prior to fees waived and expense paid indirectly | 2.26% | 2.27% | 2.25% | 2.21% | 2.38% | |||||||||||
| Ratio of net investment income to average net assets | 0.12% | 0.73% | 1.17% | 0.44% | 0.42% | |||||||||||
| Ratio of net investment income to average net assets | ||||||||||||||||
| prior to fees waived and expense paid indirectly | 0.10% | 0.69% | 1.11% | 0.42% | 0.24% | |||||||||||
| Portfolio turnover | 82% | 28% | 37% | 30% | 22% | |||||||||||
| 1 The average shares outstanding method has been applied for per share information. |
| 2 Total investment return is based on the change in net asset value of a share during the period and assumes reinvestment of dividends and distributions at net asset value and does not reflect the impact of a sales charge. Total investment return during all of the periods shown reflects a waiver by the manager. Performance would have been lower had the waiver not been in effect. |
(continues) 103
Financial highlights
Optimum Large Cap Value Fund Institutional Class
Selected data for each share of the Fund outstanding throughout each period were as follows:
| Year Ended | ||||||||||||||||
| 3/31/11 | 3/31/10 | 3/31/09 | 3/31/08 | 3/31/07 | ||||||||||||
| Net asset value, beginning of period | $9.870 | $6.740 | $11.190 | $12.750 | $11.330 | |||||||||||
| Income (loss) from investment operations: | ||||||||||||||||
| Net investment income1 | 0.110 | 0.148 | 0.197 | 0.183 | 0.170 | |||||||||||
| Net realized and unrealized gain (loss) on investments | ||||||||||||||||
| and foreign currencies | 1.279 | 3.193 | (4.465 | ) | (0.931 | ) | 1.623 | |||||||||
| Total from investment operations | 1.389 | 3.341 | (4.268 | ) | (0.748 | ) | 1.793 | |||||||||
| Less dividends and distributions from: | ||||||||||||||||
| Net investment income | (0.149 | ) | (0.211 | ) | (0.039 | ) | (0.179 | ) | (0.145 | ) | ||||||
| Net realized gain on investments | — | — | (0.143 | ) | (0.633 | ) | (0.228 | ) | ||||||||
| Total dividends and distributions | (0.149 | ) | (0.211 | ) | (0.182 | ) | (0.812 | ) | (0.373 | ) | ||||||
| Net asset value, end of period | $11.110 | $9.870 | $6.740 | $11.190 | $12.750 | |||||||||||
| Total return2 | 14.42% | 50.47% | (38.76%) | (6.46% | ) | 16.12% | ||||||||||
| Ratios and supplemental data: | ||||||||||||||||
| Net assets, end of period (000 omitted) | $550,313 | $480,762 | $358,559 | $607,637 | $508,000 | |||||||||||
| Ratio of expenses to average net assets | 1.24% | 1.23% | 1.19% | 1.19% | 1.20% | |||||||||||
| Ratio of expenses to average net assets | ||||||||||||||||
| prior to fees waived and expense paid indirectly | 1.26% | 1.27% | 1.25% | 1.21% | 1.38% | |||||||||||
| Ratio of net investment income to average net assets | 1.12% | 1.73% | 2.17% | 1.44% | 1.42% | |||||||||||
| Ratio of net investment income to average net assets | ||||||||||||||||
| prior to fees waived and expense paid indirectly | 1.10% | 1.69% | 2.11% | 1.42% | 1.24% | |||||||||||
| Portfolio turnover | 82% | 28% | 37% | 30% | 22% | |||||||||||
| 1 The average shares outstanding method has been applied for per share information. |
| 2 Total investment return is based on the change in net asset value of a share during the period and assumes reinvestment of dividends and distributions at net asset value. Total investment return during all of the periods shown reflects a waiver by the manager. Performance would have been lower had the waiver not been in effect. |
See accompanying notes, which are an integral part of the financial statements.
104
Optimum Small-Mid Cap Growth Fund Class A
Selected data for each share of the Fund outstanding throughout each period were as follows:
| Year Ended | ||||||||||||||||
| 3/31/11 | 3/31/10 | 3/31/09 | 3/31/08 | 3/31/07 | ||||||||||||
| Net asset value, beginning of period | $11.150 | $6.760 | $11.280 | $14.070 | $14.340 | |||||||||||
| Income (loss) from investment operations: | ||||||||||||||||
| Net investment loss1 | (0.149 | ) | (0.123 | ) | (0.092 | ) | (0.177 | ) | (0.155 | ) | ||||||
| Net realized and unrealized gain (loss) on investments | ||||||||||||||||
| and foreign currencies | 2.899 | 4.513 | (4.428 | ) | (1.952 | ) | 0.188 | |||||||||
| Total from investment operations | 2.750 | 4.390 | (4.520 | ) | (2.129 | ) | 0.033 | |||||||||
| Less dividends and distributions from: | ||||||||||||||||
| Net realized gain on investments | — | — | — | (0.651 | ) | (0.303 | ) | |||||||||
| Return of capital | — | — | — | (0.010 | ) | — | ||||||||||
| Total dividends and distributions | — | — | — | (0.661 | ) | (0.303 | ) | |||||||||
| Net asset value, end of period | $13.900 | $11.150 | $6.760 | $11.280 | $14.070 | |||||||||||
| Total return2 | 24.66% | 64.94% | (40.07% | ) | (15.96% | ) | 0.37% | |||||||||
| Ratios and supplemental data: | ||||||||||||||||
| Net assets, end of period (000 omitted) | $6,866 | $6,736 | $4,814 | $9,282 | $12,088 | |||||||||||
| Ratio of expenses to average net assets | 1.90% | 1.90% | 1.90% | 1.92% | 1.95% | |||||||||||
| Ratio of expenses to average net assets | ||||||||||||||||
| prior to fees waived and expense paid indirectly | 2.07% | 2.10% | 2.26% | 2.11% | 2.32% | |||||||||||
| Ratio of net investment loss to average net assets | (1.29% | ) | (1.30% | ) | (0.96% | ) | (1.27% | ) | (1.15% | ) | ||||||
| Ratio of net investment loss to average net assets | ||||||||||||||||
| prior to fees waived and expense paid indirectly | (1.46% | ) | (1.50% | ) | (1.32% | ) | (1.46% | ) | (1.52% | ) | ||||||
| Portfolio turnover | 86% | 100% | 119% | 46% | 46% | |||||||||||
| 1 The average shares outstanding method has been applied for per share information. |
| 2 Total investment return is based on the change in net asset value of a share during the period and assumes reinvestment of dividends and distributions at net asset value and does not reflect the impact of a sales charge. Total investment return during all of the periods shown reflects a waiver by the manager. Performance would have been lower had the waiver not been in effect. |
See accompanying notes, which are an integral part of the financial statements.
(continues) 105
Financial highlights
Optimum Small-Mid Cap Growth Fund Class B
Selected data for each share of the Fund outstanding throughout each period were as follows:
| Year Ended | ||||||||||||||||
| 3/31/11 | 3/31/10 | 3/31/09 | 3/31/08 | 3/31/07 | ||||||||||||
| Net asset value, beginning of period | $10.660 | $6.510 | $10.930 | $13.750 | $14.110 | |||||||||||
| Income (loss) from investment operations: | ||||||||||||||||
| Net investment loss1 | (0.213 | ) | (0.179 | ) | (0.152 | ) | (0.265 | ) | (0.240 | ) | ||||||
| Net realized and unrealized gain (loss) on investments | ||||||||||||||||
| and foreign currencies | 2.753 | 4.329 | (4.268 | ) | (1.894 | ) | 0.183 | |||||||||
| Total from investment operations | 2.540 | 4.150 | (4.420 | ) | (2.159 | ) | (0.057 | ) | ||||||||
| Less dividends and distributions from: | ||||||||||||||||
| Net realized gain on investments | — | — | — | (0.651 | ) | (0.303 | ) | |||||||||
| Return of capital | — | — | — | (0.010 | ) | — | ||||||||||
| Total dividends and distributions | — | — | — | (0.661 | ) | (0.303 | ) | |||||||||
| Net asset value, end of period | $13.200 | $10.660 | $6.510 | $10.930 | $13.750 | |||||||||||
| Total return2 | 23.83% | 63.75% | (40.44% | ) | (16.56% | ) | (0.27% | ) | ||||||||
| Ratios and supplemental data: | ||||||||||||||||
| Net assets, end of period (000 omitted) | $1,063 | $1,143 | $807 | $1,620 | $2,187 | |||||||||||
| Ratio of expenses to average net assets | 2.55% | 2.55% | 2.55% | 2.57% | 2.60% | |||||||||||
| Ratio of expenses to average net assets | ||||||||||||||||
| prior to fees waived and expense paid indirectly | 2.72% | 2.75% | 2.91% | 2.76% | 2.97% | |||||||||||
| Ratio of net investment loss to average net assets | (1.94% | ) | (1.95% | ) | (1.61% | ) | (1.92% | ) | (1.80% | ) | ||||||
| Ratio of net investment loss to average net assets | ||||||||||||||||
| prior to fees waived and expense paid indirectly | (2.11% | ) | (2.15% | ) | (1.97% | ) | (2.11% | ) | (2.17% | ) | ||||||
| Portfolio turnover | 86% | 100% | 119% | 46% | 46% | |||||||||||
| 1 The average shares outstanding method has been applied for per share information. | |
| 2 Total investment return is based on the change in net asset value of a share during the period and assumes reinvestment of dividends and distributions at net asset value and does not reflect the impact of a sales charge. Total investment return during all of the periods shown reflects a waiver by the manager. Performance would have been lower had the waiver not been in effect. |
106
Optimum Small-Mid Cap Growth Fund Class C
Selected data for each share of the Fund outstanding throughout each period were as follows:
| Year Ended | ||||||||||||||||
| 3/31/11 | 3/31/10 | 3/31/09 | 3/31/08 | 3/31/07 | ||||||||||||
| Net asset value, beginning of period | $10.660 | $ 6.510 | $10.930 | $13.750 | $14.110 | |||||||||||
| Income (loss) from investment operations: | ||||||||||||||||
| Net investment loss1 | (0.213 | ) | (0.179 | ) | (0.152 | ) | (0.264 | ) | (0.240 | ) | ||||||
| Net realized and unrealized gain (loss) on investments | ||||||||||||||||
| and foreign currencies | 2.753 | 4.329 | (4.268 | ) | (1.895 | ) | 0.183 | |||||||||
| Total from investment operations | 2.540 | 4.150 | (4.420 | ) | (2.159 | ) | (0.057 | ) | ||||||||
| Less dividends and distributions from: | ||||||||||||||||
| Net realized gain on investments | — | — | — | (0.651 | ) | (0.303 | ) | |||||||||
| Return of capital | — | — | — | (0.010 | ) | — | ||||||||||
| Total dividends and distributions | — | — | — | (0.661 | ) | (0.303 | ) | |||||||||
| Net asset value, end of period | $13.200 | $10.660 | $6.510 | $10.930 | $13.750 | |||||||||||
| Total return2 | 23.83% | 63.75% | (40.44% | ) | (16.56% | ) | (0.27% | ) | ||||||||
| Ratios and supplemental data: | ||||||||||||||||
| Net assets, end of period (000 omitted) | $24,337 | $23,824 | $16,863 | $34,086 | $40,324 | |||||||||||
| Ratio of expenses to average net assets | 2.55% | 2.55% | 2.55% | 2.57% | 2.60% | |||||||||||
| Ratio of expenses to average net assets | ||||||||||||||||
| prior to fees waived and expense paid indirectly | 2.72% | 2.75% | 2.91% | 2.76% | 2.97% | |||||||||||
| Ratio of net investment loss to average net assets | (1.94% | ) | (1.95% | ) | (1.61% | ) | (1.92% | ) | (1.80% | ) | ||||||
| Ratio of net investment loss to average net assets | ||||||||||||||||
| prior to fees waived and expense paid indirectly | (2.11% | ) | (2.15% | ) | (1.97% | ) | (2.11% | ) | (2.17% | ) | ||||||
| Portfolio turnover | 86% | 100% | 119% | 46% | 46% | |||||||||||
1 The average shares outstanding method has been applied for per share information. |
2 Total investment return is based on the change in net asset value of a share during the period and assumes reinvestment of dividends and distributions at net asset value and does not reflect the impact of a sales charge. Total investment return during all of the periods shown reflects a waiver by the manager. Performance would have been lower had the waiver not been in effect. |
See accompanying notes, which are an integral part of the financial statements.
(continues) 107
Financial highlights
Optimum Small-Mid Cap Growth Fund Institutional Class
Selected data for each share of the Fund outstanding throughout each period were as follows:
| Year Ended | ||||||||||||||||
| 3/31/11 | 3/31/10 | 3/31/09 | 3/31/08 | 3/31/07 | ||||||||||||
| Net asset value, beginning of period | $11.410 | $ 6.900 | $11.470 | $14.250 | $14.470 | |||||||||||
| Income (loss) from investment operations: | ||||||||||||||||
| Net investment loss1 | (0.112 | ) | (0.091 | ) | (0.059 | ) | (0.128 | ) | (0.108 | ) | ||||||
| Net realized and unrealized gain (loss) on investments | ||||||||||||||||
| and foreign currencies | 2.972 | 4.601 | (4.511 | ) | (1.991 | ) | 0.191 | |||||||||
| Total from investment operations | 2.860 | 4.510 | (4.570 | ) | (2.119 | ) | 0.083 | |||||||||
| Less dividends and distributions from: | ||||||||||||||||
| Net realized gain on investments | — | — | — | (0.651 | ) | (0.303 | ) | |||||||||
| Return of capital | — | — | — | (0.010 | ) | — | ||||||||||
| Total dividends and distributions | — | — | — | (0.661 | ) | (0.303 | ) | |||||||||
| Net asset value, end of period | $14.270 | $11.410 | $ 6.900 | $11.470 | $14.250 | |||||||||||
| Total return2 | 25.07% | 65.36% | (39.84% | ) | (15.68% | ) | 0.72% | |||||||||
| Ratios and supplemental data: | ||||||||||||||||
| Net assets, end of period (000 omitted) | $304,406 | $204,843 | $53,244 | $90,614 | $84,934 | |||||||||||
| Ratio of expenses to average net assets | 1.55% | 1.55% | 1.55% | 1.57% | 1.60% | |||||||||||
| Ratio of expenses to average net assets | ||||||||||||||||
| prior to fees waived and expense paid indirectly | 1.72% | 1.75% | 1.91% | 1.76% | 1.97% | |||||||||||
| Ratio of net investment loss to average net assets | (0.94% | ) | (0.95% | ) | (0.61% | ) | (0.92% | ) | (0.80% | ) | ||||||
| Ratio of net investment loss to average net assets | ||||||||||||||||
| prior to fees waived and expense paid indirectly | (1.11% | ) | (1.15% | ) | (0.97% | ) | (1.11% | ) | (1.17% | ) | ||||||
| Portfolio turnover | 86% | 100% | 119% | 46% | 46% | |||||||||||
1 The average shares outstanding method has been applied for per share information. |
2 Total investment return is based on the change in net asset value of a share during the period and assumes reinvestment of dividends and distributions at net asset value. Total investment return during all of the periods shown reflects a waiver by the manager. Performance would have been lower had the waiver not been in effect. |
See accompanying notes, which are an integral part of the financial statements.
108
Optimum Small-Mid Cap Value Fund Class A
Selected data for each share of the Fund outstanding throughout each period were as follows:
| Year Ended | ||||||||||||||||
| 3/31/11 | 3/31/10 | 3/31/09 | 3/31/08 | 3/31/07 | ||||||||||||
| Net asset value, beginning of period | $10.070 | $ 5.690 | $10.380 | $13.540 | $13.590 | |||||||||||
| Income (loss) from investment operations: | ||||||||||||||||
| Net investment income (loss)1 | (0.062 | ) | (0.027 | ) | 0.011 | (0.025 | ) | (0.020 | ) | |||||||
| Net realized and unrealized gain (loss) on investments | 2.602 | 4.407 | (4.683 | ) | (2.102 | ) | 0.759 | |||||||||
| Total from investment operations | 2.540 | 4.380 | (4.672 | ) | (2.127 | ) | 0.739 | |||||||||
| Less dividends and distributions from: | ||||||||||||||||
| Net realized gain on investments | — | — | (0.018 | ) | (1.033 | ) | (0.789 | ) | ||||||||
| Total dividends and distributions | — | — | (0.018 | ) | (1.033 | ) | (0.789 | ) | ||||||||
| Net asset value, end of period | $12.610 | $10.070 | $ 5.690 | $10.380 | $13.540 | |||||||||||
| Total return2 | 25.22% | 76.98% | (45.09% | ) | (16.34% | ) | 5.93% | |||||||||
| Ratios and supplemental data: | ||||||||||||||||
| Net assets, end of period (000 omitted) | $6,102 | $5,918 | $4,045 | $9,145 | $12,721 | |||||||||||
| Ratio of expenses to average net assets | 1.81% | 1.82% | 1.75% | 1.76% | 1.76% | |||||||||||
| Ratio of expenses to average net assets | ||||||||||||||||
| prior to fees waived and expense paid indirectly | 2.00% | 2.13% | 2.22% | 2.09% | 2.32% | |||||||||||
| Ratio of net investment income (loss) to average net assets | (0.59% | ) | (0.32% | ) | 0.15% | (0.20% | ) | (0.16% | ) | |||||||
| Ratio of net investment loss to average net assets | ||||||||||||||||
| prior to fees waived and expense paid indirectly | (0.78% | ) | (0.63% | ) | (0.32% | ) | (0.53% | ) | (0.72% | ) | ||||||
| Portfolio turnover | 43% | 40% | 86% | 53% | 49% | |||||||||||
1 The average shares outstanding method has been applied for per share information. |
2 Total investment return is based on the change in net asset value of a share during the period and assumes reinvestment of dividends and distributions at net asset value and does not reflect the impact of a sales charge. Total investment return during all of the periods shown reflects a waiver by the manager. Performance would have been lower had the waiver not been in effect. |
See accompanying notes, which are an integral part of the financial statements.
(continues) 109
Financial highlights
Optimum Small-Mid Cap Value Fund Class B
Selected data for each share of the Fund outstanding throughout each period were as follows:
| Year Ended | ||||||||||||||||
| 3/31/11 | 3/31/10 | 3/31/09 | 3/31/08 | 3/31/07 | ||||||||||||
| Net asset value, beginning of period | $ 9.590 | $5.460 | $10.030 | $13.190 | $13.350 | |||||||||||
| Income (loss) from investment operations: | ||||||||||||||||
| Net investment loss1 | (0.123 | ) | (0.077 | ) | (0.042 | ) | (0.102 | ) | (0.101 | ) | ||||||
| Net realized and unrealized gain (loss) on investments | 2.473 | 4.207 | (4.510 | ) | (2.025 | ) | 0.730 | |||||||||
| Total from investment operations | 2.350 | 4.130 | (4.552 | ) | (2.127 | ) | 0.629 | |||||||||
| Less dividends and distributions from: | ||||||||||||||||
| Net realized gain on investments | — | — | (0.018 | ) | (1.033 | ) | (0.789 | ) | ||||||||
| Total dividends and distributions | — | — | (0.018 | ) | (1.033 | ) | (0.789 | ) | ||||||||
| Net asset value, end of period | $11.940 | $9.590 | $ 5.460 | $10.030 | $13.190 | |||||||||||
| Total return2 | 24.50% | 75.64% | (45.47% | ) | (16.79% | ) | 5.27% | |||||||||
| Ratios and supplemental data: | ||||||||||||||||
| Net assets, end of period (000 omitted) | $1,038 | $1,114 | $731 | $1,636 | $2,239 | |||||||||||
| Ratio of expenses to average net assets | 2.46% | 2.47% | 2.40% | 2.41% | 2.41% | |||||||||||
| Ratio of expenses to average net assets | ||||||||||||||||
| prior to fees waived and expense paid indirectly | 2.65% | 2.78% | 2.87% | 2.74% | 2.97% | |||||||||||
| Ratio of net investment loss to average net assets | (1.24% | ) | (0.97% | ) | (0.50% | ) | (0.85% | ) | (0.81% | ) | ||||||
| Ratio of net investment loss to average net assets | ||||||||||||||||
| prior to fees waived and expense paid indirectly | (1.43% | ) | (1.28% | ) | (0.97% | ) | (1.18% | ) | (1.37% | ) | ||||||
| Portfolio turnover | 43% | 40% | 86% | 53% | 49% | |||||||||||
1 The average shares outstanding method has been applied for per share information. |
2 Total investment return is based on the change in net asset value of a share during the period and assumes reinvestment of dividends and distributions at net asset value and does not reflect the impact of a sales charge. Total investment return during all of the periods shown reflects a waiver by the manager. Performance would have been lower had the waiver not been in effect. |
See accompanying notes, which are an integral part of the financial statements.
110
Optimum Small-Mid Cap Value Fund Class C
Selected data for each share of the Fund outstanding throughout each period were as follows:
| Year Ended | ||||||||||||||||
| 3/31/11 | 3/31/10 | 3/31/09 | 3/31/08 | 3/31/07 | ||||||||||||
| Net asset value, beginning of period | $ 9.590 | $5.460 | $10.020 | $13.190 | $13.350 | |||||||||||
| Income (loss) from investment operations: | ||||||||||||||||
| Net investment loss1 | (0.124 | ) | (0.076 | ) | (0.042 | ) | (0.102 | ) | (0.101 | ) | ||||||
| Net realized and unrealized gain (loss) on investments | 2.464 | 4.206 | (4.500 | ) | (2.035 | ) | 0.730 | |||||||||
| Total from investment operations | 2.340 | 4.130 | (4.542 | ) | (2.137 | ) | 0.629 | |||||||||
| Less dividends and distributions from: | ||||||||||||||||
| Net realized gain on investments | — | — | (0.018 | ) | (1.033 | ) | (0.789 | ) | ||||||||
| Total dividends and distributions | — | — | (0.018 | ) | (1.033 | ) | (0.789 | ) | ||||||||
| Net asset value, end of period | $11.930 | $9.590 | $ 5.460 | $10.020 | $13.190 | |||||||||||
| Total return2 | 24.40% | 75.64% | (45.42% | ) | (16.79% | ) | 5.27% | |||||||||
| Ratios and supplemental data: | ||||||||||||||||
| Net assets, end of period (000 omitted) | $22,797 | $22,163 | $14,811 | $32,891 | $41,622 | |||||||||||
| Ratio of expenses to average net assets | 2.46% | 2.47% | 2.40% | 2.41% | 2.41% | |||||||||||
| Ratio of expenses to average net assets | ||||||||||||||||
| prior to fees waived and expense paid indirectly | 2.65% | 2.78% | 2.87% | 2.74% | 2.97% | |||||||||||
| Ratio of net investment loss to average net assets | (1.24% | ) | (0.97% | ) | (0.50% | ) | (0.85% | ) | (0.81% | ) | ||||||
| Ratio of net investment loss to average net assets | ||||||||||||||||
| prior to fees waived and expense paid indirectly | (1.43% | ) | (1.28% | ) | (0.97% | ) | (1.18% | ) | (1.37% | ) | ||||||
| Portfolio turnover | 43% | 40% | 86% | 53% | 49% | |||||||||||
1 The average shares outstanding method has been applied for per share information. |
2 Total investment return is based on the change in net asset value of a share during the period and assumes reinvestment of dividends and distributions at net asset value and does not reflect the impact of a sales charge. Total investment return during all of the periods shown reflects a waiver by the manager. Performance would have been lower had the waiver not been in effect. |
See accompanying notes, which are an integral part of the financial statements.
(continues) 111
Financial highlights
Optimum Small-Mid Cap Value Fund Institutional Class
Selected data for each share of the Fund outstanding throughout each period were as follows:
| Year Ended | ||||||||||||||||
| 3/31/11 | 3/31/10 | 3/31/09 | 3/31/08 | 3/31/07 | ||||||||||||
| Net asset value, beginning of period | $10.310 | $ 5.820 | $10.580 | $13.720 | $13.720 | |||||||||||
| Income (loss) from investment operations: | ||||||||||||||||
| Net investment income (loss)2 | (0.026 | ) | 0.002 | 0.041 | 0.018 | 0.025 | ||||||||||
| Net realized and unrealized gain (loss) on investments | 2.676 | 4.505 | (4.783 | ) | (2.125 | ) | 0.764 | |||||||||
| Total from investment operations | 2.650 | 4.507 | (4.742 | ) | (2.107 | ) | 0.789 | |||||||||
| Less dividends and distributions from: | ||||||||||||||||
| Net investment income | — | (0.008 | ) | — | — | — | ||||||||||
| Net realized gain on investments | — | — | (0.018 | ) | (1.033 | ) | (0.789 | ) | ||||||||
| Return of capital | — | (0.009 | ) | — | — | — | ||||||||||
| Total dividends and distributions | — | (0.017 | ) | (0.018 | ) | (1.033 | ) | (0.789 | ) | |||||||
| Net asset value, end of period | $12.960 | $10.310 | $ 5.820 | $10.580 | $13.720 | |||||||||||
| Total return3 | 25.70% | 77.56% | (44.90% | ) | (15.97% | ) | 6.24% | |||||||||
| Ratios and supplemental data: | ||||||||||||||||
| Net assets, end of period (000 omitted) | $274,495 | $161,862 | $58,173 | $66,657 | $71,387 | |||||||||||
| Ratio of expenses to average net assets | 1.46% | 1.47% | 1.40% | 1.41% | 1.41% | |||||||||||
| Ratio of expenses to average net assets | ||||||||||||||||
| prior to fees waived and expense paid indirectly | 1.65% | 1.78% | 1.87% | 1.74% | 1.97% | |||||||||||
| Ratio of net investment income (loss) to average net assets | (0.24% | ) | 0.03% | 0.50% | 0.15% | 0.19% | ||||||||||
| Ratio of net investment income (loss) to average net assets | ||||||||||||||||
| prior to fees waived and expense paid indirectly | (0.43% | ) | (0.28% | ) | 0.03% | (0.18% | ) | (0.37% | ) | |||||||
| Portfolio turnover | 43% | 40% | 86% | 53% | 49% | |||||||||||
1 The average shares outstanding method has been applied for per share information. |
2 Total investment return is based on the change in net asset value of a share during the period and assumes reinvestment of dividends and distributions at net asset value. Total investment return during all of the periods shown reflects a waiver by the manager. Performance would have been lower had the waiver not been in effect. |
See accompanying notes, which are an integral part of the financial statements.
112
Notes to financial statements
Optimum Fund Trust
March 31, 2011
Optimum Fund Trust (Trust) is organized as a Delaware statutory trust and offers six series: Optimum Fixed Income Fund, Optimum International Fund, Optimum Large Cap Growth Fund, Optimum Large Cap Value Fund, Optimum Small-Mid Cap Growth Fund, and Optimum Small-Mid Cap Value Fund, (each, a Fund, or collectively, the Funds). The Trust is an open-end investment company. The Funds are considered diversified under the Investment Company Act of 1940, as amended, and offer Class A, Class B, Class C and Institutional Class shares. Class A shares are sold with a maximum front-end sales charge of 4.50% for Optimum Fixed Income Fund and 5.75% for Optimum International Fund, Optimum Large Cap Growth Fund, Optimum Large Cap Value Fund, Optimum Small-Mid Cap Growth Fund, and Optimum Small-Mid Cap Value Fund. Class A share purchases of $1,000,000 or more will incur a contingent deferred sales charge (CDSC) of 1% if redeemed during the first year and 0.50% during the second year, provided that Delaware Distributors L.P. (DDLP) paid a financial advisor a commission on the purchase of those shares. Class B shares may be purchased only through dividend reinvestment and certain permitted exchanges. Prior to August 1, 2007, Class B shares were sold with a CDSC that declined from 4% to zero depending upon the period of time the shares were held. Class B shares will automatically convert to Class A shares on a quarterly basis approximately eight years after purchase. Class C shares are sold with a CDSC of 1%, if redeemed during the first 12 months. Institutional Class shares are not subject to a sales charge and are offered for sale exclusively to certain eligible investors.
The investment objective of Optimum Fixed Income Fund is to seek a high level of income. The Fund may also seek growth of capital.
The investment objective of Optimum International Fund is to seek long-term growth of capital. The Fund may also seek income.
The investment objective of Optimum Large Cap Growth Fund is to seek long-term growth of capital.
The investment objective of Optimum Large Cap Value Fund is to seek long-term growth of capital. The Fund may also seek income.
The investment objective of Optimum Small-Mid Cap Growth Fund is to seek long-term growth of capital.
The investment objective of Optimum Small-Mid Cap Value Fund is to seek long-term growth of capital.
1. Significant Accounting Policies
The following accounting policies are in accordance with U.S. generally accepted accounting principles (U.S. GAAP) and are consistently followed by the Trust.
Security Valuation — Equity securities, except those traded on the Nasdaq Stock Market, Inc. (Nasdaq), are valued at the last quoted sales price as of the time of the regular close of the New York Stock Exchange (NYSE) on the valuation date. Securities traded on the Nasdaq are valued in accordance with the Nasdaq Official Closing Price, which may not be the last sales price. If on a particular day an equity security does not trade, then the mean between the bid and ask prices will be used. Securities listed on a foreign exchange are valued at the last quoted sales price on the valuation date. Short-term debt securities are valued at market value. U.S. government and agency securities are valued at the mean between the bid and ask prices. Other debt securities, credit default swap (CDS) contracts and interest rate swap contracts are valued by an independent pricing service or broker. To the extent current market prices are not available, the pricing service may take into account developments related to the specific security, as well as transactions in comparable securities. Investment company securities are valued at net asset value per share. Open-end investment companies are valued at their published net asset value. Foreign currency exchange contracts are valued at the mean between the bid and ask prices. Interpolated values are derived when the settlement date of the contract is an interim date for which quotations are not available. Futures contracts and options on futures contracts are valued at the daily quoted settlement prices. Exchange-traded options are valued at the last reported sale price or, if no sales are reported, at the mean between the last reported bid and ask prices. Generally, other securities and assets for which market quotations are not readily available are valued at fair value as determined in good faith under the direction of the Funds’ Board of Trustees (Board). In determining whether market quotations are readily available or fair valuation will be used, various factors will be taken into consideration, such as market closures or suspension of trading in a security. Each Fund may use fair value pricing more frequently for securities traded primarily in non-U.S. markets because, among other things, most foreign markets close well before each Fund values its securities generally as of 4:00 p.m. Eastern time. The earlier close of these foreign markets gives rise to the possibility that significant events, including broad market moves, government actions or pronouncements, aftermarket trading, or news events may have occurred in the interim. To account for this, the Funds may frequently value foreign securities using fair value prices based on third-party vendor modeling tools (international fair value pricing).
Federal Income Taxes — No provision for federal income taxes has been made as each Fund intends to continue to qualify for federal income tax purposes as a regulated investment company under Subchapter M of the Internal Revenue Code of 1986, as amended, and make the requisite distributions to shareholders. The Funds evaluate tax positions taken or expected to be taken in the course of preparing the Funds’ tax returns to determine whether the tax positions are “more-likely-than-not” of being sustained by the applicable tax authority. Tax positions not deemed to meet the more-likely-than-not threshold are recorded as a tax benefit or expense in the current year. Management has analyzed the Funds’ tax positions taken on federal income tax returns for all open tax years (March 31, 2008–March 31, 2011), and has concluded that no provision for federal income tax is required in the Funds’ financial statements.
Class Accounting — Investment income, common expenses and realized and unrealized gain (loss) on investments are allocated to the various classes of the Funds on the basis of daily net assets of each class. Distribution expenses relating to a specific class are charged directly to that class.
(continues) 113
Notes to financial statements
Optimum Fund Trust
1. Significant Accounting Policies (continued)
Repurchase Agreements — Each Fund may invest in a pooled cash account along with other members of the Delaware Investments® Family of Funds pursuant to an exemptive order issued by the Securities and Exchange Commission. The aggregate daily balance of the pooled cash account is invested in repurchase agreements secured by obligations of the U.S. government. The respective collateral is held by each Fund’s custodian bank until the maturity of the respective repurchase agreements. Each repurchase agreement is at least 102% collateralized. However, in the event of default or bankruptcy by the counterparty to the agreement, realization of the collateral may be subject to legal proceedings. At March 31, 2011, the Funds held no investments in repurchase agreements.
To Be Announced Trades — The Optimum Fixed Income Fund may contract to purchase securities for a fixed price at a transaction date beyond the customary settlement period (e.g., “when issued,” “delayed delivery,” “forward commitment,” or “TBA transactions”) consistent with the Fund’s ability to manage its investment portfolio and meet redemption requests. These transactions involve a commitment by the Fund to purchase securities for a predetermined price or yield with payment and delivery taking place more than three days in the future, or after a period longer than the customary settlement period for that type of security. No interest will be earned by the Fund on such purchases until the securities are delivered; however the market value may change prior to delivery.
Mortgage Dollar Rolls — The Optimum Fixed Income Fund may enter into mortgage “dollar rolls” in which the Fund sells mortgage-backed securities for delivery in the current month and simultaneously contracts to repurchase substantially similar (same type, coupon, and maturity) securities on a specified future date. Any difference between the sale price and the purchase price is netted against the interest income foregone on the securities to arrive at an implied borrowing (reverse repurchase) rate. Alternatively, the sale and purchase transactions which constitute the dollar roll can be executed at the same price, with the Fund being paid a fee as consideration for entering into the commitment to purchase. Dollar rolls may be renewed prior to cash settlement and initially may involve only a firm commitment agreement by the Fund to buy a security. The Fund accounts for mortgage-dollar-roll transactions as purchases and sales, these transactions may increase the Fund’s portfolio turnover rate.
Foreign Currency Transactions — Transactions denominated in foreign currencies are recorded at the prevailing exchange rates on the valuation date in accordance with the Funds’ prospectus. The value of all assets and liabilities denominated in foreign currencies is translated into U.S. dollars at the exchange rate of such currencies against the U.S. dollar daily. Transaction gains or losses resulting from changes in exchange rates during the reporting period or upon settlement of the foreign currency transaction are reported in operations for the current period. The Funds generally isolate that portion of realized gains and losses on investments in debt securities, which are due to changes in the foreign exchange rates from that which are due to changes in market prices of debt securities. For foreign equity securities, these changes are included in net realized and unrealized gain or loss on investments. The Funds report certain foreign currency related transactions as components of realized gains (losses) for financial reporting purposes, whereas such components are treated as ordinary income (loss) for federal income tax purposes.
Use of Estimates — The preparation of financial statements in conformity with U.S. GAAP requires management to make estimates and assumptions that affect the reported amounts of assets and liabilities and disclosure of contingent assets and liabilities at the date of the financial statements and the reported amounts of revenues and expenses during the reporting period. Actual results could differ from those estimates and the differences could be material.
Other — Expenses directly attributable to the Funds are charged directly to the Funds. Other expenses common to various funds within the Trust are generally allocated amongst such funds on the basis of average net assets. Management fees and some other expenses are paid monthly. Security transactions are recorded on the date the securities are purchased or sold (trade date) for financial reporting purposes. Costs used in calculating realized gains and losses on the sale of investment securities are those of the specific securities sold. Dividend income is recorded on the ex-dividend date and interest income is recorded on the accrual basis. Discounts and premiums on non-convertible bonds are amortized to interest income over the lives of the respective securities. Realized gains (losses) on paydowns of mortgage- and asset-backed securities are classified as interest income. Distributions received from investments in Real Estate Investment Trusts (REITs) are recorded as dividend income on the ex-dividend date, subject to reclassification upon notice of the character of such distributions by the issuer. Foreign dividends are also recorded on the ex-dividend date or as soon after the ex-dividend date that the Funds are aware of such dividends, net of all non-rebatable tax withholdings. Withholding taxes on foreign dividends and interest have been recorded in accordance with the Funds’ understanding of the applicable country’s tax rules and rates.
Each Fund expects to declare and pay dividends from net investment income, if any, annually. Each Fund expects to declare and pay distributions from net realized gain on investments, if any, at least annually, and may distribute net investment income and net capital gains more frequently, if necessary for tax purposes.
The Funds may receive earnings credits from their custodian when positive cash balances are maintained, which are used to offset custody fees. There were no earnings credits for the year ended March 31, 2011.
114
The Funds receive earnings credits from their transfer agent when positive cash balances are maintained, which are used to offset transfer agent fees. The expense paid under this arrangement is included in dividend disbursing and transfer agent fees and expenses on the statements of operations with the corresponding expense offset shown as “expense paid indirectly.” For the year ended March 31, 2011, the Funds earned the following amounts under this agreement:
| Optimum | Optimum | Optimum | Optimum | Optimum | Optimum | ||||||
| Fixed Income | International | Large Cap | Large Cap | Small-Mid Cap | Small-Mid Cap | ||||||
| Fund | Fund | Growth Fund | Value Fund | Growth Fund | Value Fund | ||||||
| $699 | $746 | $775 | $773 | $755 | $773 |
2. Investment Management, Administration Agreements and Other Transactions with Affiliates
Delaware Management Company (DMC), a series of Delaware Management Business Trust, furnishes investment management services to each Fund and has full discretion and responsibility, subject to the overall supervision of the Trust’s Board, to select and contract with one or more investment sub-advisers to manage the investment operations and composition of each Fund, and to render investment advice for each Fund, including the purchase, retention, and dispositions of investments, securities and cash contained in each Fund. The investment management agreement obligates DMC to implement decisions with respect to the allocation or reallocation of each Fund’s assets among one or more current or additional sub-advisers, and to monitor the sub-advisers’ compliance with the relevant Fund’s investment objective, policies and restrictions. DMC pays the sub-advisers out of its fees.
In accordance with the terms of its respective investment management agreement, DMC is entitled to receive an annual fee equal to the following percentage rates of the average daily net assets of each Fund:
| Optimum Fixed Income Fund | 0.7000% of net assets up to $25 million | |
| 0.6500% of net assets from $25 million to $100 million | ||
| 0.6000% of net assets from $100 million to $500 million | ||
| 0.5500% of net assets from $500 million to $1 billion | ||
| 0.5000% of net assets over $1 billion | ||
| Optimum International Fund | 0.8750% of net assets up to $50 million | |
| 0.8000% of net assets from $50 million to $100 million | ||
| 0.7800% of net assets from $100 million to $300 million | ||
| 0.7650% of net assets from $300 million to $400 million | ||
| 0.7300% of net assets over $400 million | ||
| Optimum Large Cap Growth Fund | 0.8000% of net assets up to $250 million | |
| 0.7875% of net assets from $250 million to $300 million | ||
| 0.7625% of net assets from $300 million to $400 million | ||
| 0.7375% of net assets from $400 million to $500 million | ||
| 0.7250% of net assets from $500 million to $1 billion | ||
| 0.7100% of net assets from $1 billion to $1.5 billion | ||
| 0.7000% of net assets over $1.5 billion | ||
| Optimum Large Cap Value Fund | 0.8000% of net assets up to $100 million | |
| 0.7375% of net assets from $100 million to $250 million | ||
| 0.7125% of net assets from $250 million to $500 million | ||
| 0.6875% of net assets from $500 million to $1 billion | ||
| 0.6675% of net assets from $1 billion to $1.5 billion | ||
| 0.6475% of net assets over $1.5 billion | ||
| Optimum Small-Mid Cap Growth Fund | 1.1000% of net assets | |
| Optimum Small-Mid Cap Value Fund | 1.0500% of net assets up to $75 million | |
| 1.0250% of net assets from $75 million to $150 million | ||
| 1.0000% of net assets over $150 million | ||
(continues) 115
Notes to financial statements
Optimum Fund Trust
2. Investment Management, Administration Agreements and Other Transactions with Affiliates (continued)
DMC has entered into sub-advisory agreements for the Trust as follows: Optimum Fixed Income Fund – Pacific Investment Management Company LLC (PIMCO); Optimum International Fund – Mondrian Investment Partners Limited and BlackRock Advisors, LLC (BlackRock); Optimum Large Cap Growth Fund – Marsico Capital Management, LLC, T. Rowe Price Associates, Inc. (T. Rowe Price), and Fred Alger Management, Inc.; Optimum Large Cap Value Fund – Massachusetts Financial Services Company and effective November 1, 2010, Herndon Capital Management, LLC (Herndon). Herndon replaced TCW Investment Management Company as a sub-adviser; Optimum Small-Mid Cap Growth Fund – Columbia Wanger Asset Management, L.P. and Wellington Management Company, LLP (Wellington Management); Optimum Small-Mid Cap Value Fund – The Killen Group, Inc., Westwood Management Corp. (Westwood) and The Delafield Group, a division of Tocqueville Asset Management L.P.
For the year ended March 31, 2011, DMC paid the following sub-advisory fees:
| Optimum | Optimum | Optimum | Optimum | Optimum | Optimum | ||||||
| Fixed Income | International | Large Cap | Large Cap | Small-Mid Cap | Small-Mid Cap | ||||||
| Fund | Fund | Growth Fund | Value Fund | Growth Fund | Value Fund | ||||||
| $1,011,917 | $877,064 | $3,033,727 | $2,396,958 | $1,890,152 | $1,284,632 |
Effective July 29, 2010, DMC has contractually agreed to waive all or a portion of its investment advisory fees and/or reimburse expenses for each Fund to the extent necessary to prevent total annual operating expenses (excluding any 12b-1 plan and certain other expenses) from exceeding the specified percentages of average daily net assets through July 29, 2011 as shown below. These waivers and reimbursements may be terminated only by agreement of the manager and each Fund.
| Optimum | Optimum | Optimum | Optimum | Optimum | Optimum | ||||||
| Fixed Income | International | Large Cap | Large Cap | Small-Mid Cap | Small-Mid Cap | ||||||
| Fund | Fund | Growth Fund | Value Fund | Growth Fund | Value Fund | ||||||
| Effective July 29, 2010, | |||||||||||
| operating expense limitation as | |||||||||||
| a percentage of average | |||||||||||
| daily net assets (per annum) | 1.00% | 1.40% | 1.27% | 1.23% | 1.55% | 1.45% |
Prior to July 29, 2010, DMC had voluntarily agreed to waive all or a portion of its investment advisory fees and/or reimburse expenses for each Fund to the extent necessary to prevent total annual operating expenses (excluding any 12b-1 plan and certain other expenses) from exceeding the specified percentages of average daily net assets from August 1, 2009 through July 28, 2010 as shown below. For purposes of these waivers and reimbursements, nonroutine expenses also included such additional costs and expenses, as may be agreed upon from time to time by the Funds’ Board and DMC. These waivers and reimbursements applied only to expenses paid directly by each Fund.
| Optimum | Optimum | Optimum | Optimum | Optimum | Optimum | |||||||
| Fixed Income | International | Large Cap | Large Cap | Small-Mid Cap | Small-Mid Cap | |||||||
| Fund | Fund | Growth Fund | Value Fund | Growth Fund | Value Fund | |||||||
| Through July 28, 2010, | ||||||||||||
| operating expense limitation as | ||||||||||||
| a percentage of average | ||||||||||||
| daily net assets (per annum) | 1.00% | 1.40% | 1.25% | 1.26% | 1.55% | 1.50% |
Delaware Service Company, Inc. (DSC), an affiliate of DMC, provides fund accounting oversight services to the Trust. For these services, the Trust pays DSC fees based on the aggregate daily net assets of the Trust at the following annual rate: 0.0050% of the first $3 billion; 0.0045% of the next $2 billion; 0.0040% of the next $2.5 billion; 0.0030% of the next $2.5 billion; and 0.0025% of aggregate average daily net assets in excess of $10 billion. The fees payable to DSC under the service agreement described above are allocated among all Funds in the Trust on a relative net asset value basis. For the year ended March 31, 2011, each Fund was charged for these services as follow:
| Optimum | Optimum | Optimum | Optimum | Optimum | Optimum | ||||||
| Fixed Income | International | Large Cap | Large Cap | Small-Mid Cap | Small-Mid Cap | ||||||
| Fund | Fund | Growth Fund | Value Fund | Growth Fund | Value Fund | ||||||
| $44,769 | $10,392 | $35,929 | $32,946 | $12,566 | $10,607 |
DSC also provides the Trust with administrative services including financial and tax reporting, corporate governance, and preparation of materials and reports for the Board. For administrative services, each Fund pays DSC a fee at an annual rate (plus out-of-pocket expenses) of 0.165% of assets up to $500 million of the Funds’ average daily net assets; 0.140% of assets from $500 million to $1 billion; and 0.115% of assets over $1 billion. DSC also serves as the shareholder servicing, dividend disbursing and transfer agent for each Fund. For these services, the Trust pays DSC a fee at an annual rate of 0.235% of the Trust’s total average daily net assets, subject to certain minimums, plus out-of-pocket expenses.
116
DDLP, an affiliate of DMC, serves as the national distributor of each Fund’s shares pursuant to a Distribution Agreement. Pursuant to the Distribution Agreement and Rule 12b-1 plan, each Fund pays DDLP an annual fee of 0.35% of the average daily net assets of the Class A shares and 1.00% of the average daily net assets of the Class B and Class C shares. Institutional Class shares pay no distribution expenses.
At March 31, 2011, each Fund had liabilities payable to affiliates as follows:
| Optimum | Optimum | Optimum | Optimum | Optimum | Optimum | |||||||||||||
| Fixed Income | International | Large Cap | Large Cap | Small-Mid Cap | Small-Mid Cap | |||||||||||||
| Fund | Fund | Growth Fund | Value Fund | Growth Fund | Value Fund | |||||||||||||
| Investment management | ||||||||||||||||||
| fee payable to DMC | $426,948 | $152,387 | $503,921 | $443,087 | $261,484 | $215,901 | ||||||||||||
| Dividend disbursing, transfer agent and fund | ||||||||||||||||||
| accounting oversight fees, administration | ||||||||||||||||||
| fees and other expenses payable to DSC | 326,226 | 92,210 | 256,884 | 241,037 | 106,721 | 95,288 | ||||||||||||
| Distribution fees payable to DDLP | 151,816 | 38,652 | 122,254 | 114,876 | 22,987 | 21,530 | ||||||||||||
| Other expenses payable | ||||||||||||||||||
| to DMC and affiliates* | 40,384 | 13,347 | 26,908 | 25,406 | 13,856 | 12,881 | ||||||||||||
*DMC, as part of its administrative services, pays operating expenses on behalf of each Fund and is reimbursed on a periodic basis. Expenses include items such as printing of shareholder reports, fees for audit, legal and tax services, registration fees and trustees’ fees.
For the year ended March 31, 2011, DDLP earned commissions on sales of Class A shares for each Fund as follows:
| Optimum | Optimum | Optimum | Optimum | Optimum | Optimum | ||||||
| Fixed Income | International | Large Cap | Large Cap | Small-Mid Cap | Small-Mid Cap | ||||||
| Fund | Fund | Growth Fund | Value Fund | Growth Fund | Value Fund | ||||||
| $19,668 | $5,676 | $17,820 | $17,208 | $3,087 | $2,722 |
For the year ended March 31, 2011, DDLP received gross CDSC commissions on redemptions of each Fund’s Class A, Class B and Class C shares, and these commissions were entirely used to offset up-front commissions previously paid by DDLP to broker/dealers on sales of those shares. The amounts received were as follows:
| Optimum | Optimum | Optimum | Optimum | Optimum | Optimum | ||||||||||||||||||||||||
| Fixed Income | International | Large Cap | Large Cap | Small-Mid Cap | Small-Mid Cap | ||||||||||||||||||||||||
| Fund | Fund | Growth Fund | Value Fund | Growth Fund | Value Fund | ||||||||||||||||||||||||
| Class A | $ | 0 | $ | 0 | $ | 0 | $ | 0 | $ | 0 | $ | 0 | |||||||||||||||||
| Class B | 4,801 | 3,025 | 9,914 | 9,102 | 2,087 | 1,712 | |||||||||||||||||||||||
| Class C | 15,191 | 2,751 | 7,819 | 7,632 | 1,464 | 1,302 | |||||||||||||||||||||||
DMC, DSC and DDLP are indirect, wholly owned subsidiaries of Delaware Management Holdings, Inc.
Certain officers of DMC, DSC and DDLP are officers and/or Trustees of the Trust. These officers and Trustees are paid no compensation by the Funds.
3. Investments
For the year ended March 31, 2011, the Funds made purchases and sales of investment securities other than short-term investments as follows:
| Optimum | Optimum | Optimum | Optimum | Optimum | Optimum | ||||||
| Fixed Income | International | Large Cap | Large Cap | Small-Mid Cap | Small-Mid Cap | ||||||
| Fund | Fund | Growth Fund | Value Fund | Growth Fund | Value Fund | ||||||
| Purchases other than U.S. government securities | $ 1,981,691,351 | $250,602,405 | $807,291,548 | $531,375,835 | $243,144,991 | $128,916,275 | |||||
| Purchases of U.S. government securities | 590,478,044 | — | — | — | — | — | |||||
| Sales other than U.S. government securities | 1,842,533,985 | 199,628,578 | 864,432,045 | 558,016,505 | 212,587,261 | 84,572,903 | |||||
| Sales of U.S. government securities | 571,248,740 | — | — | — | — | — |
(continues) 117
Notes to financial statements
Optimum Fund Trust
3. Investments (continued)
At March 31, 2011, the cost of investments and unrealized appreciation (depreciation) for federal income tax purposes for each Fund were as follows:
| Optimum | Optimum | Optimum | Optimum | Optimum | Optimum | |||||||||||||||||||||
| Fixed Income | International | Large Cap | Large Cap | Small-Mid Cap | Small-Mid Cap | |||||||||||||||||||||
| Fund | Fund | Growth Fund | Value Fund | Growth Fund | Value Fund | |||||||||||||||||||||
| Cost of investments | $ | 1,069,721,264 | $ | 289,163,742 | $ | 690,843,183 | $ | 670,200,925 | $ | 344,205,800 | $ | 294,481,128 | ||||||||||||||
| Aggregate unrealized appreciation | $ | 39,338,106 | $ | 32,689,074 | $ | 150,129,222 | $ | 105,749,892 | $ | 82,816,299 | $ | 69,882,469 | ||||||||||||||
| Aggregate unrealized depreciation | (18,538,371 | ) | (18,456,771 | ) | (17,167,787 | ) | (22,779,456 | ) | (4,453,277 | ) | (3,046,574 | ) | ||||||||||||||
| Net unrealized appreciation | $ | 20,799,735 | $ | 14,232,303 | $ | 132,961,435 | $ | 82,970,436 | $ | 78,363,022 | $ | 66,835,895 | ||||||||||||||
U.S. GAAP defines fair value as the price that each Fund would receive to sell an asset or pay to transfer a liability in an orderly transaction between market participants at the measurement date under current market conditions. A three level hierarchy for fair value measurements has been established based upon the transparency of inputs to the valuation of an asset or liability. Inputs may be observable or unobservable and refer broadly to the assumptions that market participants would use in pricing the asset or liability. Observable inputs reflect the assumptions market participants would use in pricing the asset or liability based on market data obtained from sources independent of the reporting entity. Unobservable inputs reflect the reporting entity’s own assumptions about the assumptions that market participants would use in pricing the asset or liability developed based on the best information available under the circumstances. Each Fund’s investment in its entirety is assigned a level based upon the observability of the inputs which are significant to the overall valuation. The three level hierarchy of inputs is summarized below.
| Level 1 – | inputs are quoted prices in active markets for identical investments (e.g., equity securities, open-end investment companies, futures contracts, options contracts) |
| Level 2 – | other observable inputs (including, but not limited to: quoted prices for similar assets or liabilities in markets that are active, quoted prices for identical or similar assets or liabilities in markets that are not active, inputs other than quoted prices that are observable for the assets or liabilities (such as interest rates, yield curves, volatilities, prepayment speeds, loss severities, credit risks and default rates) or other market-corroborated inputs) (e.g., debt securities, government securities, swap contracts, foreign currency exchange contracts, foreign securities utilizing international fair value pricing) |
| Level 3 – | inputs are significant unobservable inputs (including each Fund’s own assumptions used to determine the fair value of investments) (e.g., broker-quoted securities, fair valued securities) |
The following table summarizes the valuation of each Fund’s investments by fair value hierarchy levels as of March 31, 2011:
| Optimum Fixed Income Fund | ||||||||||||||
| Level 1 | Level 2 | Level 3 | Total | |||||||||||
| Agency, Asset-Backed & Mortgage-Backed Securities | $ | — | $ | 284,664,468 | $ | 4,530,991 | $ | 289,195,459 | ||||||
| Corporate Debt | — | 475,336,591 | 39,344 | 475,375,935 | ||||||||||
| Foreign Debt | — | 84,482,022 | 9,310,911 | 93,792,933 | ||||||||||
| Municipal Bonds | — | 7,184,713 | — | 7,184,713 | ||||||||||
| U.S. Treasury Obligations | — | 66,134,049 | — | 66,134,049 | ||||||||||
| Short-Term Investments | — | 101,402,969 | — | 101,402,969 | ||||||||||
| Securities Lending Collateral | — | 53,719,857 | — | 53,719,857 | ||||||||||
| Other | 1,532 | 3,713,548 | 4 | 3,715,084 | ||||||||||
| Total | $ | 1,532 | $ | 1,076,638,217 | $ | 13,881,250 | $ | 1,090,520,999 | ||||||
| Foreign Currency Exchange Contracts | $ | — | $ | (1,299,973 | ) | $ | — | $ | (1,299,973 | ) | ||||
| Futures Contract | $ | 33,675 | $ | — | $ | — | $ | 33,675 | ||||||
| Swap Contracts | $ | — | $ | 4,277 | $ | — | $ | 4,277 | ||||||
| Optimum International Fund | ||||||||||||||
| Level 1 | Level 2 | Level 3 | Total | |||||||||||
| Common Stock | $ | 264,962,833 | $ | — | $ | 86,855 | $ | 265,049,688 | ||||||
| Other | 3,202,867 | — | — | 3,202,867 | ||||||||||
| Short-Term Investments | — | 7,718,509 | — | 7,718,509 | ||||||||||
| Securities Lending Collateral | — | 27,424,981 | — | 27,424,981 | ||||||||||
| Total | $ | 268,165,700 | $ | 35,143,490 | $ | 86,855 | $ | 303,396,045 | ||||||
| Foreign Currency Exchange Contracts | $ | — | $ | 77,357 | $ | — | $ | 77,357 | ||||||
118
| Optimum Large Cap Growth Fund | ||||||||||||
| Level 1 | Level 2 | Level 3 | Total | |||||||||
| Common Stock | $ | 729,940,367 | $ | 9,836,634 | $ | 867,695 | $ | 740,644,696 | ||||
| Exchange-Traded Funds | 2,414,784 | — | — | 2,414,784 | ||||||||
| Preferred Stock | 1,082,484 | — | — | 1,082,484 | ||||||||
| Short-Term Investments | — | 10,012,300 | — | 10,012,300 | ||||||||
| Securities Lending Collateral | — | 69,650,354 | — | 69,650,354 | ||||||||
| Total | $ | 733,437,635 | $ | 89,499,288 | $ | 867,695 | $ | 823,804,618 | ||||
| Foreign Currency Exchange Contract | $ | — | $ | 327 | $ | — | $ | 327 | ||||
| Optimum Large Cap Value Fund | ||||||||||||
| Level 1 | Level 2 | Level 3 | Total | |||||||||
| Common Stock | $ | 695,241,205 | $ | — | $ | — | $ | 695,241,205 | ||||
| Convertible Preferred Stock | — | 1,168,376 | — | 1,168,376 | ||||||||
| Short-Term Investments | — | 12,304,334 | — | 12,304,334 | ||||||||
| Securities Lending Collateral | — | 44,457,446 | — | 44,457,446 | ||||||||
| Total | $ | 695,241,205 | $ | 57,930,156 | $ | — | $ | 753,171,361 | ||||
| Optimum Small-Mid Cap Growth Fund | ||||||||||||
| Level 1 | Level 2 | Level 3 | Total | |||||||||
| Common Stock | $ | 326,468,754 | $ | — | $ | — | $ | 326,468,754 | ||||
| Exchange-Traded Fund | 1,334,760 | — | — | 1,334,760 | ||||||||
| Short-Term Investments | — | 11,986,749 | — | 11,986,749 | ||||||||
| Securities Lending Collateral | — | 82,778,559 | — | 82,778,559 | ||||||||
| Total | $ | 327,803,514 | $ | 94,765,308 | $ | — | $ | 422,568,822 | ||||
| Foreign Currency Exchange Contracts | $ | — | $ | 6 | $ | — | $ | 6 | ||||
| Optimum Small-Mid Cap Value Fund | ||||||||||||
| Level 1 | Level 2 | Level 3 | Total | |||||||||
| Common Stock | $ | 273,985,494 | $ | — | $ | — | $ | 273,985,494 | ||||
| Short-Term Investments | — | 31,258,374 | — | 31,258,374 | ||||||||
| Securities Lending Collateral | — | 56,073,155 | — | 56,073,155 | ||||||||
| Total | $ | 273,985,494 | $ | 87,331,529 | $ | — | $ | 361,317,023 | ||||
The following is a reconciliation of investments in which significant unobservable inputs (Level 3) were used in determining fair value:
| Optimum Fixed Income Fund | |||||||||||||||||||||||
| Agency, Asset-Backed | Securities | ||||||||||||||||||||||
| and Mortgage-Backed | Corporate | Foreign | Lending | ||||||||||||||||||||
| Securities | Debt | Debt | Collateral | Other | Total | ||||||||||||||||||
| Balance as of 3/31/10 | $ | 6,420,927 | $ | 1,643,101 | $ | 1,556,712 | $ | 53,640 | $ | 4 | $ | 9,674,384 | |||||||||||
| Purchases | 345,774 | 291 | 8,918,206 | — | — | 9,264,271 | |||||||||||||||||
| Sales | (3,053,456 | ) | (1,266,669 | ) | (1,504,865 | ) | (63,865 | ) | — | (5,888,855 | ) | ||||||||||||
| Net realized gain (loss) | (200,867 | ) | 49,208 | 6,832 | — | — | (144,827 | ) | |||||||||||||||
| Transfers out of Level 3 | — | (320,000 | ) | — | — | — | (320,000 | ) | |||||||||||||||
| Net unrealized appreciation/depreciation | 1,018,613 | (66,587 | ) | 334,026 | 10,225 | — | 1,296,277 | ||||||||||||||||
| Balance as of 3/31/11 | $ | 4,530,991 | $ | 39,344 | $ | 9,310,911 | $ | — | $ | 4 | $ | 13,881,250 | |||||||||||
| Net change in unrealized appreciation/ | |||||||||||||||||||||||
| depreciation from investments still held as of 3/31/11 | $ | 653,832 | $ | (23,638 | ) | $ | 394,752 | $ | (50,926 | ) | $ | — | $ | 974,020 | |||||||||
(continues) 119
Notes to financial statements
Optimum Fund Trust
| Optimum International Fund | ||||||||||||||||
| Securities | ||||||||||||||||
| Common | Lending | |||||||||||||||
| Stock | Collateral | Other | Total | |||||||||||||
| Balance as of 3/31/10 | $ | — | $ | 27,782 | $ | 55,030 | $ | 82,812 | ||||||||
| Purchases | 85,870 | — | — | 85,870 | ||||||||||||
| Sales | (7,509 | ) | (66,155 | ) | — | (73,664 | ) | |||||||||
| Net realized gain | 1,969 | 33,078 | — | 35,047 | ||||||||||||
| Transfer out of Level 3 | — | (62,342 | ) | (62,342 | ) | |||||||||||
| Net change in unrealized | ||||||||||||||||
| appreciation/depreciation | 6,525 | 5,295 | 7,312 | 19,132 | ||||||||||||
| Balance as of 3/31/11 | $ | 86,855 | $ | — | $ | — | $ | 86,855 | ||||||||
| Net change in unrealized appreciation/ | ||||||||||||||||
| depreciation from investments still held as of 3/31/11 | $ | 6,525 | $ | (26,376 | ) | $ | — | $ | (19,851 | ) | ||||||
| Optimum Large Cap Growth Fund | ||||||||||||
| Securities | ||||||||||||
| Common | Lending | |||||||||||
| Stock | Collateral | Total | ||||||||||
| Balance as of 3/31/10 | $ | — | $ | 44,765 | $ | 44,765 | ||||||
| Purchases | 1,090,378 | — | 1,090,378 | |||||||||
| Sales | (215,434 | ) | (53,298 | ) | (268,732 | ) | ||||||
| Net realized gain | 38,155 | — | 38,155 | |||||||||
| Net change in unrealized | ||||||||||||
| appreciation/depreciation | (45,404 | ) | 8,533 | (36,871 | ) | |||||||
| Balance as of 3/31/11 | $ | 867,695 | $ | — | $ | 867,695 | ||||||
| Net change in unrealized appreciation/ | ||||||||||||
| depreciation from investments still held as of 3/31/11 | $ | (45,404 | ) | $ | (42,500 | ) | $ | (87,904 | ) | |||
| Optimum Large Cap Value Fund | ||||||||||||
| Securities | ||||||||||||
| Lending | ||||||||||||
| Collateral | ||||||||||||
| Balance as of 3/31/10 | $ | 44,615 | ||||||||||
| Sales | (53,120 | ) | ||||||||||
| Net change in unrealized | ||||||||||||
| appreciation/depreciation | 8,505 | |||||||||||
| Balance as of 3/31/11 | $ | — | ||||||||||
| Net change in unrealized appreciation/ | ||||||||||||
| depreciation from investments still held as of 3/31/11 | $ | (42,357 | ) | |||||||||
| Optimum Small-Mid Cap Growth Fund | ||||||||||||
| Securities | ||||||||||||
| Common | Lending | |||||||||||
| Stock | Collateral | Total | ||||||||||
| Balance as of 3/31/10 | $ | 209,872 | $ | 21,686 | $ | 231,558 | ||||||
| Sales | — | (25,820 | ) | (25,820 | ) | |||||||
| Transfer out of Level 3 | (149,998 | ) | — | (149,998 | ) | |||||||
| Net change in unrealized | ||||||||||||
| appreciation/depreciation | (59,874 | ) | 4,134 | (55,740 | ) | |||||||
| Balance as of 3/31/11 | $ | — | $ | — | $ | — | ||||||
| Net change in unrealized appreciation/ | ||||||||||||
| depreciation from investments still held as of 3/31/11 | $ | — | $ | (20,589 | ) | $ | (20,589 | ) | ||||
120
| Optimum Small-Mid Cap Value Fund | |||||
| Securities | |||||
| Lending | |||||
| Collateral | |||||
| Balance as of 3/31/10 | $ | 11,200 | |||
| Sales | (13,335 | ) | |||
| Net change in unrealized | |||||
| appreciation/depreciation | 2,135 | ||||
| Balance as of 3/31/11 | $ | — | |||
| Net change in unrealized appreciation/ | |||||
| depreciation from investments still held as of 3/31/11 | $ | (10,633 | ) | ||
During the year ended March 31, 2011, transfers out of Level 3 investments into Level 1 investments were made in the amount of $149,998 for the Optimum Small-Mid Cap Growth Fund and transfers out of Level 3 investments into Level 2 investments were made in the amount of $320,000 and $62,342 for the Optimum Fixed Income Fund and Optimum International Fund, respectively. These were due to the Funds’ pricing vendor being able to supply a matrix price for an investment that had been utilizing a broker quoted price.
During the year ended March 31, 2011, there were no transfers between Level 1 investments and Level 2 investments that had a material impact to the Funds. This does not include transfers between Level 1 investments and Level 2 investments due to the Funds utilizing international fair value pricing during the year.
4. Dividend and Distribution Information
Income and long-term capital gain distributions are determined in accordance with federal income tax regulations, which may differ from U.S. GAAP. Additionally, distributions from net gains on foreign currency transactions and net short-term gains on sales of investment securities are treated as ordinary income for federal income tax purposes. The tax character of dividends and distributions paid during the years ended March 31, 2011 and 2010 was as follows:
Year Ended March 31, 2011
| Optimum | Optimum | Optimum | ||||
| Fixed Income | International | Large Cap | ||||
| Fund | Fund | Value Fund | ||||
| Ordinary income | $36,247,412 | $3,209,203 | $8,703,654 |
Optimum Large Cap Growth Fund, Optimum Small-Mid Cap Growth Fund and Optimum Small-Mid Cap Value Fund did not make any distributions during the year ended March 31, 2011.
Year Ended March 31, 2010
| Optimum | Optimum | Optimum | Optimum | Optimum | |||||||||||||||||||||
| Fixed Income | International | Large Cap | Large Cap | Small-Mid Cap | |||||||||||||||||||||
| Fund | Fund | Growth Fund | Value Fund | Value Fund | |||||||||||||||||||||
| Ordinary income | $ | 47,549,636 | $ | 2,806,274 | $ | 750,120 | $ | 13,614,136 | $ | 88,032 | |||||||||||||||
| Return of capital | — | — | 3,034 | — | 92,374 | ||||||||||||||||||||
| Total | $ | 47,549,636 | $ | 2,806,274 | $ | 753,154 | $ | 13,614,136 | $ | 180,406 | |||||||||||||||
Optimum Small-Mid Cap Growth Fund did not make any distributions during the year ended March 31, 2010.
(continues) 121
Notes to financial statements
Optimum Fund Trust
5. Components of Net Assets on a Tax Basis
As of March 31, 2011, the components of net assets on a tax basis were as follows:
| Optimum | Optimum | Optimum | |||||||||||||
| Fixed Income | International | Large Cap | |||||||||||||
| Fund | Fund | Growth Fund | |||||||||||||
| Share of beneficial interest | $ | 970,655,311 | $ | 311,851,587 | $ | 717,849,287 | |||||||||
| Undistributed ordinary income | 14,989,936 | 3,299,007 | — | ||||||||||||
| Capital loss carryforwards | (6,818,431 | ) | (49,949,013 | ) | (94,702,512 | ) | |||||||||
| Other temporary differences | (3,279,589 | ) | — | — | |||||||||||
| Post-October currency losses | (340,434 | ) | (122,665 | ) | (19,646 | ) | |||||||||
| Unrealized appreciation of investments, swap contracts and foreign currencies | 21,007,786 | 14,252,569 | 133,009,588 | ||||||||||||
| Net assets | $ | 996,214,579 | $ | 279,331,485 | $ | 756,136,717 | |||||||||
| Optimum | Optimum | Optimum | |||||||||||||
| Large Cap | Small-Mid Cap | Small-Mid Cap | |||||||||||||
| Value Fund | Growth Fund | Value Fund | |||||||||||||
| Share of beneficial interest | $ | 777,330,832 | $ | 255,454,281 | $ | 247,543,962 | |||||||||
| Undistributed ordinary income | 6,037,066 | — | — | ||||||||||||
| Undistributed long-term capital gains | — | 2,944,014 | — | ||||||||||||
| Capital loss carryforwards | (157,133,037 | ) | — | (9,947,941 | ) | ||||||||||
| Post-October currency losses | — | (89,705 | ) | — | |||||||||||
| Unrealized appreciation on investments and foreign currencies | 83,004,092 | 78,363,238 | 66,835,895 | ||||||||||||
| Net assets | $ | 709,238,953 | $ | 336,671,828 | $ | 304,431,916 | |||||||||
The differences between book basis and tax basis components of net assets are primarily attributable to tax deferral of losses on wash sales, tax deferral of losses on straddles, mark-to-market of foreign currency exchange contracts, mark-to-market of futures contracts, tax recognition of unrealized gain on passive foreign investment companies, tax treatment of contingent payment on debt instruments, return of capital on investments and CDS contracts.
Post-October currency losses represent losses realized on foreign currency transactions from November 1, 2010 through March 31, 2011 that, in accordance with federal income tax regulations, each Fund has elected to defer and treat as having arisen in the following fiscal year.
For financial reporting purposes, capital accounts are adjusted to reflect the tax character of permanent book/tax differences. Reclassifications are primarily due to tax treatment of net operating losses, passive foreign investment companies, gain (loss) on foreign currency transactions, contingent payment on debt instruments, foreign capital gain taxes, foreign futures contracts, CDS contracts and paydown gains (losses) of mortgage- and asset-backed securities. Results of operations and net assets were not affected by these reclassifications. For the year ended March 31, 2011, the Funds recorded the following reclassifications:
| Optimum | Optimum | Optimum | Optimum | Optimum | Optimum | |||||||||||||||||||
| Fixed Income | International | Large Cap | Large Cap | Small-Mid Cap | Small-Mid Cap | |||||||||||||||||||
| Fund | Fund | Growth Fund | Value Fund | Growth Fund | Value Fund | |||||||||||||||||||
| Undistributed (accumulated) net | ||||||||||||||||||||||||
| investment income (loss) | $ | (4,822,748 | ) | $ | 51,153 | $ | 3,027,917 | $ | 19,474 | $ | 2,559,457 | $ | 746,540 | |||||||||||
| Accumulated net realized gain (loss) | 4,822,748 | (51,153 | ) | 161,336 | (19,474 | ) | 273,620 | — | ||||||||||||||||
| Paid-in capital | — | — | (3,189,253 | ) | — | (2,833,077 | ) | (746,540 | ) | |||||||||||||||
For federal income tax purposes, capital loss carryforwards may be carried forward and applied against future capital gains. In 2011, the Funds utilized capital loss carryforwards as follows:
| Capital loss | |||
| carryforwards | |||
| utilized | |||
| Optimum Fixed Income Fund | $ | 9,313,589 | |
| Optimum International Fund | 9,014,228 | ||
| Optimum Large Cap Growth Fund | 62,952,871 | ||
| Optimum Large Cap Value Fund | 17,887,011 | ||
| Optimum Small-Mid Cap Growth Fund | 19,926,636 | ||
| Optimum Small-Mid Cap Value Fund | 22,609,214 | ||
122
Capital loss carryforwards remaining at March 31, 2011 will expire as follows:
| Optimum | Optimum | Optimum | Optimum | Optimum | |||||||||||||||||||||
| Year of | Fixed Income | International | Large Cap | Large Cap | Small-Mid Cap | ||||||||||||||||||||
| Expiration | Fund | Fund | Growth Fund | Value Fund | Value Fund | ||||||||||||||||||||
| 3/31/17 | $ | 6,818,431 | $ | — | $ | 14,873,143 | $ | 38,104,901 | $ | — | |||||||||||||||
| 3/31/18 | — | 49,949,013 | 79,829,369 | 119,028,136 | 9,947,941 | ||||||||||||||||||||
| Total | $ | 6,818,431 | $ | 49,949,013 | $ | 94,702,512 | $ | 157,133,037 | $ | 9,947,941 | |||||||||||||||
6. Capital Shares
Transactions in capital shares were as follows:
| Optimum | Optimum | Optimum | ||||||||||||||||
| Fixed Income | International | Large Cap | ||||||||||||||||
| Fund | Fund | Growth Fund | ||||||||||||||||
| Year Ended | Year Ended | Year Ended | ||||||||||||||||
| 3/31/11 | 3/31/10 | 3/31/11 | 3/31/10 | 3/31/11 | 3/31/10 | |||||||||||||
| Shares sold: | ||||||||||||||||||
| Class A | 668,845 | 380,500 | 98,203 | 104,636 | 263,299 | 291,768 | ||||||||||||
| Class B | 14,845 | 6,894 | 1,265 | 2,855 | 2,753 | 12,315 | ||||||||||||
| Class C | 2,198,457 | 2,021,942 | 257,286 | 390,232 | 747,705 | 1,222,043 | ||||||||||||
| Institutional Class | 32,665,979 | 21,802,020 | 9,197,950 | 6,025,380 | 14,150,435 | 13,430,954 | ||||||||||||
| 35,548,126 | 24,211,356 | 9,554,704 | 6,523,103 | 15,164,192 | 14,957,080 | |||||||||||||
| Shares issued upon reinvestment of dividends | ||||||||||||||||||
| and distributions: | ||||||||||||||||||
| Class A | 165,039 | 302,381 | 19,005 | 24,437 | — | — | ||||||||||||
| Class B | 17,942 | 38,541 | 2,229 | 4,341 | — | — | ||||||||||||
| Class C | 580,410 | 1,158,140 | 44,652 | 84,037 | — | — | ||||||||||||
| Institutional Class | 3,024,744 | 3,778,982 | 284,807 | 212,753 | — | 89,194 | ||||||||||||
| 3,788,135 | 5,278,044 | 350,693 | 325,568 | — | 89,194 | |||||||||||||
| Shares repurchased: | ||||||||||||||||||
| Class A | (1,064,216 | ) | (1,361,901 | ) | (287,128 | ) | (326,529 | ) | (828,938 | ) | (938,322 | ) | ||||||
| Class B | (140,744 | ) | (150,573 | ) | (54,889 | ) | (41,188 | ) | (149,964 | ) | (120,037 | ) | ||||||
| Class C | (4,377,419 | ) | (5,106,580 | ) | (951,575 | ) | (1,203,369 | ) | (2,882,603 | ) | (3,425,748 | ) | ||||||
| Institutional Class | (15,164,664 | ) | (19,275,823 | ) | (3,461,623 | ) | (3,481,196 | ) | (17,038,995 | ) | (21,042,002 | ) | ||||||
| (20,747,043 | ) | (25,894,877 | ) | (4,755,215 | ) | (5,052,282 | ) | (20,900,500 | ) | (25,526,109 | ) | |||||||
| Net increase (decrease) | 18,589,218 | 3,594,523 | 5,150,182 | 1,796,389 | (5,736,308 | ) | (10,479,835 | ) | ||||||||||
(continues) 123
Notes to financial statements
Optimum Fund Trust
6. Capital Shares (continued)
| Optimum | Optimum | Optimum | ||||||||||||||||
| Large Cap | Small-Mid Cap | Small-Mid Cap | ||||||||||||||||
| Value Fund | Growth Fund | Value Fund | ||||||||||||||||
| Year Ended | Year Ended | Year Ended | ||||||||||||||||
| 3/31/11 | 3/31/10 | 3/31/11 | 3/31/10 | 3/31/11 | 3/31/10 | |||||||||||||
| Shares sold: | ||||||||||||||||||
| Class A | 370,267 | 299,064 | 44,155 | 59,618 | 40,638 | 52,233 | ||||||||||||
| Class B | 2,052 | 13,622 | 575 | 4,461 | 28 | 3,755 | ||||||||||||
| Class C | 786,822 | 1,244,236 | 123,804 | 245,545 | 134,424 | 234,992 | ||||||||||||
| Institutional Class | 15,358,661 | 13,146,430 | 8,456,356 | 14,215,293 | 9,084,213 | 8,887,279 | ||||||||||||
| 16,517,802 | 14,703,352 | 8,624,890 | 14,524,917 | 9,259,303 | 9,178,259 | |||||||||||||
| Shares issued upon reinvestment of | ||||||||||||||||||
| dividends and distributions: | ||||||||||||||||||
| Class A | 43,343 | 89,427 | — | — | — | — | ||||||||||||
| Class B | 4,041 | 10,509 | — | — | — | — | ||||||||||||
| Class C | 88,937 | 223,973 | — | — | — | — | ||||||||||||
| Institutional Class | 814,457 | 1,426,180 | — | — | — | 24,450 | ||||||||||||
| 950,778 | 1,750,089 | — | — | — | 24,450 | |||||||||||||
| Shares repurchased: | ||||||||||||||||||
| Class A | (826,246 | ) | (920,206 | ) | (154,171 | ) | (167,898 | ) | (144,619 | ) | (174,801 | ) | ||||||
| Class B | (148,015 | ) | (116,086 | ) | (27,258 | ) | (21,246 | ) | (29,222 | ) | (21,432 | ) | ||||||
| Class C | (2,870,932 | ) | (3,421,119 | ) | (515,098 | ) | (601,165 | ) | (535,392 | ) | (636,236 | ) | ||||||
| Institutional Class | (15,357,080 | ) | (19,036,670 | ) | (5,077,250 | ) | (3,978,501 | ) | (3,600,939 | ) | (3,198,117 | ) | ||||||
| (19,202,273 | ) | (23,494,081 | ) | (5,773,777 | ) | (4,768,810 | ) | (4,310,172 | ) | (4,030,586 | ) | |||||||
| Net increase (decrease) | (1,733,693 | ) | (7,040,640 | ) | 2,851,113 | 9,756,107 | 4,949,131 | 5,172,123 | ||||||||||
7. Derivatives
U.S. GAAP requires enhanced disclosures that enable investors to understand: 1) how and why an entity uses derivatives; 2) how they are accounted for; and 3) how they affect an entity’s results of operations and financial position.
Foreign Currency Exchange Contracts — Each Fund may enter into foreign currency exchange contracts as a way of managing foreign exchange rate risk. Each Fund may enter into these contracts to fix the U.S. dollar value of a security that it has agreed to buy or sell for the period between the date the trade was entered into and the date the security is delivered and paid for. Each Fund may also use these contracts to hedge the U.S. dollar value of securities it already owns that are denominated in foreign currencies. The change in value is recorded as an unrealized gain or loss. When the contract is closed, a realized gain or loss is recorded equal to the difference between the value of the contract at the time it was opened and the value at the time it was closed.
The use of foreign currency exchange contracts does not eliminate fluctuations in the underlying prices of the securities, but does establish a rate of exchange that can be achieved in the future. Although foreign currency exchange contracts limit the risk of loss due to an unfavorable change in the value of the hedged currency, they also limit any potential gain that might result should the value of the currency change favorably. In addition, the Funds could be exposed to risks if the counterparties to the contracts are unable to meet the terms of their contracts. The Funds’ maximum risk of loss from counterparty credit risk is the value of their currency exchanged with the counterparty. The risk is generally mitigated by having a netting arrangement between the Funds and the counterparty and by the posting of collateral by the counterparty to the Funds to cover the Funds’ exposure to the counterparty.
Futures Contracts — A futures contract is an agreement in which the writer (or seller) of the contract agrees to deliver to the buyer an amount of cash or securities equal to a specific dollar amount times the difference between the value of a specific security or index at the close of the last trading day of the contract and the price at which the agreement is made. The Optimum Fixed Income Fund and Optimum International Fund may use futures in the normal course of pursuing their investment objectives. The Optimum Fixed Income Fund may invest in futures contracts to hedge its existing portfolio securities against fluctuations in fair value caused by changes in prevailing market interest rates. The Optimum International Fund may use futures contracts to a limited extent, with the objectives of maintaining full exposure to the stock market, enhancing returns, maintaining liquidity and minimizing costs. Upon entering into a futures contract, each Fund deposits cash or pledges U.S. government securities to a broker, equal to the minimum “initial margin” requirements of the exchange on which the contract is traded. Subsequent payments are received from the broker or paid to the broker each day, based on the daily fluctuation in the market value of the contract. These receipts or payments are known as “variation margin” and are recorded daily by each Fund as unrealized gains or losses until the contracts are closed. When the contracts are closed, each Fund records a
124
realized gain or loss equal to the difference between the value of the contract at the time it was opened and the value at the time it was closed. Risks of entering into futures contracts include potential imperfect correlation between the futures contracts and the underlying securities and the possibility of an illiquid secondary market for these instruments. When investing in futures, there is minimal counterparty credit risk to a Fund because futures are exchange-traded and the exchange’s clearinghouse, as counterparty to all exchange-traded futures, guarantees against default.
Options Contracts — During the year ended March 31, 2011, the Optimum Fixed Income Fund entered into options contracts in the normal course of pursuing its investment objective. The Fund may buy or write options contracts for any number of reasons, including without limitation: to manage the Fund’s exposure to changes in securities prices and foreign currencies; as an efficient means of adjusting the Fund’s overall exposure to certain markets; to protect the value of portfolio securities; and as a cash management tool. The Fund may buy or write call or put options on securities, futures, swaps “swaptions”, financial indices, and foreign currencies. When the Fund buys an option, a premium is paid and an asset is recorded and adjusted on a daily basis to reflect the current market value of the options purchased. When the Fund writes an option, a premium is received and a liability is recorded and adjusted on a daily basis to reflect the current market value of the options written. Premiums received from writing options that expire unexercised are treated by the Fund on the expiration date as realized gains. The difference between the premium received and the amount paid on effecting a closing purchase transaction, including brokerage commissions, is treated as realized gain or loss. If a call option is exercised, the premium is added to the proceeds from the sale of the underlying security in determining whether the Fund has a realized gain or loss. If a put option is exercised, the premium reduces the cost basis of the securities purchased by the Fund. The Fund, as writer of an option, bears the market risk of an unfavorable change in the price of the security underlying the written option. When writing options, the Fund is subject to minimal counterparty risk because the counterparty is only obligated to pay premiums and does not bear the market risk of an unfavorable market change.
Transactions in options written during the year ended March 31, 2011 for the Optimum Fixed Income Fund were as follows:
| Number of contracts | Premiums | |||||||
| Options outstanding at March 31, 2010 | — | $ | — | |||||
| Options written | 127,000,704 | 565,400 | ||||||
| Options expired | (126,000,704 | ) | (563,300 | ) | ||||
| Options terminated in closing purchase transactions | (1,000,000 | ) | (2,100 | ) | ||||
| Options outstanding at March 31, 2011 | — | $ | — | |||||
Swap Contracts — The Optimum Fixed Income Fund may enter into interest rate swap contracts, index swap contracts and CDS contracts in the normal course of pursuing its investment objective. The Fund may use interest rate swaps to adjust the Fund’s sensitivity to interest rates or to hedge against changes in interest rates. Index swaps may be used to gain exposure to markets that the Fund invests in, such as the corporate bond market. The Fund may also use index swaps as a substitute for futures or options contracts if such contracts are not directly available to the Fund on favorable terms. The Fund may enter into CDS contracts in order to hedge against a credit event, to enhance total return or to gain exposure to certain securities or markets.
Interest Rate Swaps. An interest rate swap contract is an exchange of interest rates between counterparties. In one instance, an interest rate swap involves payments received by the Fund from another party based on a variable or floating interest rate, in return for making payments based on a fixed interest rate. An interest rate swap can also work in reverse with the Fund receiving payments based on a fixed interest rate and making payments based on a variable or floating interest rate. Interest rate swaps may be used to adjust the Fund’s sensitivity to interest rates or to hedge against changes in interest rates. Periodic payments on such contracts are accrued daily and recorded as unrealized appreciation/depreciation on swap contracts. Upon periodic payment/receipt or termination of the contract, such amounts are recorded as realized gains or losses on swap contracts. The Fund’s maximum risk of loss from counterparty credit risk is the discounted net value of the cash flows to be received from/paid to the counterparty over the interest rate swap contract’s remaining life, to the extent that the amount is positive. This risk is mitigated by having a netting arrangement between the Fund and the counterparty and by the posting of collateral by the counterparty to the Fund to cover the Fund’s exposure to the counterparty.
Index Swaps. Index swaps involve commitments to pay interest in exchange for a market linked return based on a notional amount. To the extent the total return of the security, instrument or basket of instruments underlying the transaction exceeds the offsetting interest obligation, the Fund will receive a payment from the counterparty. To the extent the total return of the security, instrument or basket of instruments underlying the transaction falls short of the offsetting interest obligation, the Fund will make a payment to the counterparty. The change in value of swap contracts outstanding, if any, is recorded as unrealized appreciation or depreciation daily. A realized gain or loss is recorded on maturity or termination of the swap contract. The Fund’s maximum risk of loss from counterparty credit risk is the discounted net value of the cash flows to be received from/paid to the counterparty over the index swap contract’s remaining life, to the extent that the amount is positive. This risk is mitigated by having a netting arrangement between the Fund and the counterparty and by the posting of collateral by the counterparty to the Fund to cover the Fund’s exposure to the counterparty.
(continues) 125
Notes to financial statements
Optimum Fund Trust
7. Derivatives (continued)
Credit Default Swaps. A CDS contract is a risk-transfer instrument through which one party (purchaser of protection) transfers to another party (seller of protection) the financial risk of a credit event (as defined in the CDS agreement), as it relates to a particular reference security or basket of securities (such as an index). In exchange for the protection offered by the seller of protection, the purchaser of protection agrees to pay the seller of protection a periodic amount at a stated rate that is applied to the notional amount of the CDS contract. In addition, an upfront payment may be made or received by the Fund in connection with an unwinding or assignment of a CDS contract. Upon the occurrence of a credit event, the seller of protection would pay the par (or other agreed-upon) value of the reference security (or basket of securities) to the counterparty. Credit events generally include, among others, bankruptcy, failure to pay, and obligation default.
During the year ended March 31, 2011, the Optimum Fixed Income Fund entered into CDS contracts as a purchaser and seller of protection. Periodic payments (receipts) on such contracts are accrued daily and recorded as unrealized losses (gains) on swap contracts. Upon payment (receipt), such amounts are recorded as realized losses (gains) on swap contracts. Upfront payments made or received in connection with CDS contracts are amortized over the expected life of the CDS contracts as unrealized losses (gains) on swap contracts. The change in value of CDS contracts is recorded as unrealized appreciation or depreciation daily. A realized gain or loss is recorded upon a credit event (as defined in the CDS agreement) or the maturity or termination of the agreement. At March 31, 2011, the net unrealized appreciation of credit default swaps was $8,427. The Fund had posted $1,295,405 as collateral, net of collateral received for open swap contracts, which is presented as restricted cash on the statements of assets and liabilities. If a credit event had occurred for all swap transactions where collateral posting was required as of March 31, 2011, the swaps’ credit-risk-related contingent features would have been triggered and the Fund would have received $20,403,000 less the value of the contracts’ related reference obligations. The Fund received $1,264,000 in securities collateral for open swap contracts.
As disclosed in the footnotes to the statements of net assets, at March 31, 2011, the notional value of the protection sold was $2,310,000, which reflects the maximum potential amount the Fund would have been required to make as a seller of credit protection if a credit event had occurred. The quoted market prices and resulting market values for credit default swap agreements on securities and credit indices serve as an indicator of the current status of the payment/performance risk and represent the likelihood of an expected liability (or profit) for the credit derivative if the swap agreement has been closed/sold as of the period end. Increasing market values, in absolute terms when compared to the notional amount of the swap, represent a deterioration of the reference entity’s credit soundness and a greater likelihood of risk of default or other credit event occurring as defined under the terms of the agreement. At March 31, 2011, the net unrealized appreciation of the protection sold was $60,171.
CDS contracts may involve greater risks than if the Fund had invested in the reference obligation directly. CDS contracts are subject to general market risk, liquidity risk, counterparty risk and credit risk. The Fund’s maximum risk of loss from counterparty credit risk, either as the seller of protection or the buyer of protection, is the fair value of the contract. This risk is mitigated by having a netting arrangement between the Fund and the counterparty and by the posting of collateral by the counterparty to the Fund to cover the Fund’s exposure to the counterparty.
Swaps Generally. Because there is no organized market for swap contracts, the value of open swaps may differ from that which would be realized in the event the Fund terminated its position in the agreement. Risks of entering into these contracts include the potential inability of the counterparty to meet the terms of the contracts. This type of risk is generally limited to the amount of favorable movement in the value of the underlying security, instrument or basket of instruments, if any, at the day of default. Risks also arise from potential losses from adverse market movements and such losses could exceed the unrealized amounts shown on the statements of net assets.
Fair values of derivative instruments as of March 31, 2011 were as follows:
| Optimum Fixed Income Fund | ||||||||||||||
| Asset Derivatives | Liability Derivatives | |||||||||||||
| Statements of | Statements of | |||||||||||||
| Assets and Liabilities Location | Fair Value | Assets and Liabilities Location | Fair Value | |||||||||||
| Foreign currency exchange contracts | Foreign currency exchange | Foreign currency exchange | ||||||||||||
| (Forward currency exchange contracts) | contracts, at value | $ | 639,697 | contracts, at value | $ | (1,939,670 | ) | |||||||
| Interest rate contracts (Futures contracts) | Variation margin receivable | Variation margin receivable | ||||||||||||
| on futures contracts | 33,675 | * | on futures contracts | — | ||||||||||
| Interest rate contracts (Interest rate swap contracts) | Interest rate swap contracts, | Interest rate swap contracts, | ||||||||||||
| at value | — | at value | (4,150 | ) | ||||||||||
| Credit contracts (Swap contracts) | Credit default swap | Credit default swap | ||||||||||||
| contracts, at value | 133,121 | contracts, at value | (124,694 | ) | ||||||||||
| Total | $ | 806,493 | $ | (2,068,514 | ) | |||||||||
*Includes cumulative appreciation of futures contracts from the date the contracts are opened at March 31, 2011. Only current day variation margin is reported on the Fund’s statements of assets and liabilities.
126
The effect of derivative instruments on the statements of operations for the year ended March 31, 2011 was as follows:
| Optimum Fixed Income Fund | ||||||||||||
| Change in Unrealized | ||||||||||||
| Realized Gain or Loss on | Appreciation or | |||||||||||
| Location of Gain or Loss on | Derivatives Recognized in | Depreciation on Derivatives | ||||||||||
| Derivatives Recognized in Income | Income | Recognized in Income | ||||||||||
| Foreign currency exchange contracts | Net realized loss on foreign | |||||||||||
| (Forward currency exchange contracts) | currency exchange contracts | |||||||||||
| and net change in unrealized | ||||||||||||
| appreciation/depreciation | ||||||||||||
| of investments and foreign | ||||||||||||
| currencies | $ | (5,912,887 | ) | $ | (1,605,747 | ) | ||||||
| Interest rate contracts (Futures contracts) | Net realized gain on futures | |||||||||||
| contracts and net change | ||||||||||||
| in unrealized appreciation/ | ||||||||||||
| depreciation of investments and | ||||||||||||
| foreign currencies | 850,966 | 32,536 | ||||||||||
| Interest rate contracts (Options contracts) | Net realized gain on options | |||||||||||
| contracts and net change | ||||||||||||
| in unrealized appreciation/ | ||||||||||||
| depreciation of investments and | ||||||||||||
| foreign currencies | 644,275 | — | ||||||||||
| Credit contracts (Swap contracts) | Net realized loss on swap | |||||||||||
| contracts and net change | ||||||||||||
| in unrealized appreciation/ | ||||||||||||
| depreciation of investments and | ||||||||||||
| foreign currencies | (1,665,750 | ) | 385,483 | |||||||||
| Total | $ | (6,083,396 | ) | $ | (1,187,728 | ) | ||||||
The volume of derivative transactions varies throughout the year. Information about derivative transactions reflected as of the date of this report is generally indicative of the type and volume of derivative activity for the year ended March 31, 2011.
8. Securities Lending
The Funds may lend their securities pursuant to a security lending agreement (Lending Agreement) with The Bank of New York Mellon (BNY Mellon). With respect to each loan, if on any business day the aggregate market value of securities collateral plus cash collateral held is less than the aggregate market value of the securities which are the subject of such loan, the borrower will be notified to provide additional collateral by the end of the following business day which, together with the collateral already held, will be not less than the applicable collateral requirements for such security loan. If the aggregate market value of securities collateral and cash collateral held with respect to a security loan exceeds the applicable collateral requirement, upon the request of the borrower BNY Mellon must return enough collateral to the borrower by the end of the following business day to reduce the value of the remaining collateral to the applicable collateral requirement for such security loan. As a result of the foregoing, the value of the collateral held with respect to a loaned security may be temporarily more or less than the value of the security on loan.
Cash collateral received is generally invested in the Delaware Investments Collateral Fund No. 1 (Collective Trust) established by BNY Mellon for the purpose of investment on behalf of funds managed by DMC that participate in BNY Mellon’s securities lending program. The Collective Trust may invest in U.S. government securities and high quality corporate debt, asset-backed and other money market securities and in repurchase agreements collateralized by such securities, provided that the Collective Trust will generally have a dollar-weighted average portfolio maturity of 60 days or less. The Collective Trust seeks to maintain a net asset value per unit of $1.00, but there can be no assurance that it will always be able to do so. The Funds may incur investment losses as a result of investing securities lending collateral in the Collective Trust or another collateral investment pool. This could occur if an investment in a collateral investment pool defaulted or if it were necessary to liquidate assets in the collateral investment pool to meet returns on outstanding security loans at a time when the collateral investment pool’s net asset value per unit was less than $1.00. Under those circumstances, the Funds may not receive an amount from the collateral investment pool that is equal in amount to the collateral the Funds would be required to return to the borrower of the securities and the Funds would be required to make up for this shortfall. Effective April 20, 2009, BNY Mellon transferred the assets of the Funds’ previous collateral investment pool other than cash and assets with a maturity of one business day or less to the BNY Mellon SL DBT II Liquidating Fund (Liquidating Fund), effectively bifurcating the previous collateral investment pool. The Funds’ exposure to the Liquidating Fund is expected to decrease as the Liquidating Fund’s assets mature or are sold. In October 2008, BNY Mellon transferred certain distressed securities from the previous collateral investment pool into the Mellon
(continues) 127
Notes to financial statements
Optimum Fund Trust
8. Securities Lending (continued)
GSL Reinvestment Trust II. The Funds can also accept U.S. government securities and letters of credit (non-cash collateral) in connection with securities loans. In the event of default or bankruptcy by the lending agent, realization and/or retention of the collateral may be subject to legal proceedings. In the event the borrower fails to return loaned securities and the collateral received is insufficient to cover the value of the loaned securities and provided such collateral shortfall is not the result of investment losses, the lending agent has agreed to pay the amount of the shortfall to the Funds or, at the discretion of the lending agent, replace the loaned securities. The Funds continue to record dividends or interest, as applicable, on the securities loaned and are subject to changes in value of the securities loaned that may occur during the term of the loan. The Funds have the right under the Lending Agreement to recover the securities from the borrower on demand. With respect to security loans collateralized by non-cash collateral, the Funds receive loan premiums paid by the borrower. With respect to security loans collateralized by cash collateral, the earnings from the collateral investments are shared among the Funds, the security lending agent and the borrower. The Funds record security lending income net of allocations to the security lending agent and the borrower.
At March 31, 2011, the values of securities on loan and the values of invested collateral for each Fund are presented below, for which the Funds received collateral, comprised of securities collateral and cash collateral. Investments purchased with cash collateral are presented on the statements of net assets under the caption “Securities Lending Collateral”.
| Optimum | Optimum | Optimum | Optimum | Optimum | Optimum | |||||||||||||||||
| Fixed Income | International | Large Cap | Large Cap | Small-Mid Cap | Small-Mid Cap | |||||||||||||||||
| Fund | Fund | Growth Fund | Value Fund | Growth Fund | Value Fund | |||||||||||||||||
| Values of securities on loan | $ | 55,412,328 | $ | 26,012,247 | $ | 68,686,482 | $ | 45,232,840 | $ | 81,734,086 | $ | 55,092,827 | ||||||||||
| Securities collateral | 4,319,891 | — | 425,450 | 583,331 | 66,013 | — | ||||||||||||||||
| Cash collateral | 54,936,302 | 28,054,448 | 70,674,769 | 45,471,296 | 83,272,978 | 56,329,374 | ||||||||||||||||
| Value of invested collateral | 53,719,857 | 27,424,981 | 69,650,354 | 44,457,446 | 82,778,559 | 56,073,155 | ||||||||||||||||
9. Credit and Market Risk
Some countries in which the Funds may invest require governmental approval for the repatriation of investment income, capital or the proceeds of sales of securities by foreign investors. In addition, if there is deterioration in a country’s balance of payments or for other reasons, a country may impose temporary restrictions on foreign capital remittances abroad.
The securities exchanges of certain foreign markets are substantially smaller, less liquid and more volatile than the major securities markets in the United States. Consequently, acquisition and disposition of securities by the Funds may be inhibited. In addition, a significant portion of the aggregate market value of equity securities listed on the major securities exchanges in emerging markets is held by a smaller number of investors. This may limit the number of shares available for acquisition or disposition by the Funds.
The Optimum Fixed Income Fund invests a portion of its assets in high yield fixed income securities, which are rated BB or lower by Standard & Poor’s (S&P) and Ba or lower by Moody’s Investor Services (Moody’s), or similarly rated by another nationally recognized statistical rating organization. Investments in these higher yielding securities are generally accompanied by a greater degree of credit risk than higher rated securities. Additionally, lower rated securities may be more susceptible to adverse economic and competitive industry conditions than investment grade securities.
The Optimum Fixed Income Fund invests in fixed income securities whose value is derived from an underlying pool of mortgages or consumer loans. The value of these securities is sensitive to changes in economic conditions, including delinquencies and/or defaults, and may be adversely affected by shifts in the market’s perception of the issuers and changes in interest rates. Investors receive principal and interest payments as the underlying mortgages and consumer loans are paid back. Some of these securities are collateralized mortgage obligations (CMOs). CMOs are debt securities issued by U.S. government agencies or by financial institutions and other mortgage lenders, which are collateralized by a pool of mortgages held under an indenture. Prepayment of mortgages may shorten the stated maturity of the obligations and can result in a loss of premium, if any has been paid. Certain of these securities may be stripped (securities which provide only the principal or interest feature of the underlying security). The yield to maturity on an interest-only CMO is extremely sensitive not only to changes in prevailing interest rates, but also to the rate of principal payments (including prepayments) on the related underlying mortgage assets. A rapid rate of principal payments may have a material adverse effect on the Fund’s yield to maturity. If the underlying mortgage assets experience greater than anticipated prepayments of principal, the Fund may fail to fully recoup its initial investment in these securities even if the securities are rated in the highest rating categories.
The Optimum Small-Mid Cap Growth Fund and Optimum Small-Mid Cap Value Fund invest a significant portion of their assets in small- and mid-sized companies. Investments in small- or mid-sized companies may be more volatile than investments in larger companies for a number of reasons, which include more limited financial resources or a dependence on narrow product lines.
The Optimum Large Cap Growth Fund, Optimum Large Cap Value Fund, Optimum Small-Mid Cap Growth Fund and Optimum Small-Mid Cap Value Fund invest in REITs and are subject to the risks associated with that industry. If the Funds hold real estate directly as a result of defaults or receives rental income directly from real estate holdings, their tax status as a regulated investment company may be jeopardized. There were no direct real estate holdings during the year ended March 31, 2011. The Funds’ REIT holdings are also affected by interest rate changes, particularly if the REITs they hold use floating rate debt to finance their ongoing operations.
128
Each Fund may invest up to 15% of its net assets in illiquid securities, which may include securities with contractual restrictions on resale, securities exempt from registration under Rule 144A of the Securities Act of 1933, as amended, and other securities which may not be readily marketable. The relative illiquidity of these securities may impair the Funds from disposing of them in a timely manner and at a fair price when it is necessary or desirable to do so. While maintaining oversight, the Funds’ Board has delegated to DMC the day-to-day functions of determining whether individual securities are liquid for purposes of the Funds’ limitation on investments in illiquid assets. Securities eligible for resale pursuant to Rule 144A, which are determined to be liquid, are not subject to the Funds’ 15% limit on investments in illiquid securities. Rule 144A and illiquid securities have been identified on the statements of net assets.
10. Contractual Obligations
Each Fund enters into contracts in the normal course of business that contain a variety of indemnifications. Each Fund’s maximum exposure under these arrangements is unknown. However, each Fund has not had prior claims or losses pursuant to these contracts. Management has reviewed each Fund’s existing contracts and expects the risk of loss to be remote.
11. Subsequent Events
Management has determined no material events or transactions occurred subsequent to March 31, 2011 that would require recognition or disclosure in the Funds’ financial statements.
12. Tax Information (Unaudited)
The information set forth below is for each Fund’s fiscal year as required by federal income tax laws (Optimum Large Cap Growth Fund, Optimum Small-Mid Cap Growth Fund and Optimum Small-Mid Cap Value Fund did not make any distributions). Shareholders, however, must report distributions on a calendar year basis for income tax purposes, which may include distributions for portions of two fiscal years of a fund. Accordingly, the information needed by shareholders for income tax purposes will be sent to them in January of each year. Please consult your tax advisor for proper treatment of this information.
| (A) | (B) | ||||||||
| Long-Term | Ordinary | ||||||||
| Capital Gains | Income | Total | (C) | ||||||
| Distributions | Distributions* | Distributions | Qualifying | ||||||
| (Tax Basis) | (Tax Basis) | (Tax Basis) | Dividends1 | ||||||
| Optimum Fixed Income Fund | — | 100% | 100% | — | |||||
| Optimum International Fund | — | 100% | 100% | — | |||||
| Optimum Large Cap Value Fund | — | 100% | 100% | 100 | % | ||||
(A) and (C) are based on a percentage of each Fund’s total distributions.
(C) is based on a percentage of each Fund’s ordinary income distributions.
1Qualifying dividends represent dividends which qualify for the corporate dividends received deduction.
*For the fiscal year ended March 31, 2011, certain dividends paid by the Funds may be subject to a maximum tax rate of 15%, as provided for by the Jobs and Growth Tax Relief Reconciliation Act of 2003. The Funds intend to designate the following amounts to be taxed at a maximum rate of 15%. Complete information will be computed and reported in conjunction with your 2011 Form 1099-DIV, as applicable.
| Maximum amount to be | |||||
| taxed at a maximum rate of 15% | |||||
| Optimum Fixed Income Fund | $ | 107,565 | |||
| Optimum International Fund | 227,554 | ||||
| Optimum Large Cap Value Fund | 8,703,654 | ||||
The Optimum International Fund intends to pass through foreign tax credits in the maximum amount of $393,216. The gross foreign source income earned during the fiscal year 2011 by the Optimum International Fund was $6,947,847. Complete information will be computed and reported in conjunction with your 2011 Form 1099-DIV.
For the fiscal year ended March 31, 2011, certain ordinary income paid by the Funds, determined to be Qualified Interest Income, may be subject to relief from U.S. withholding for foreign shareholders, as provided by the American Jobs Creation Act of 2004. For the fiscal year ended March 31, 2011, each Fund has designated maximum distributions of Qualified Interest Income distributions as follows:
| Maximum Distribution of | |||||
| Qualified Interest Income | |||||
| Optimum Fixed Income Fund | $ | 35,308,075 | |||
| Optimum International Fund | 3,342 | ||||
| Optimum Large Cap Value Fund | 3,179 | ||||
129
Report of independent
registered public accounting firm
registered public accounting firm
To the Board of Trustees of Optimum Fund Trust and the Shareholders of Optimum Fixed Income Fund, Optimum International Fund, Optimum Large Cap Growth Fund, Optimum Large Cap Value Fund, Optimum Small-Mid Cap Growth Fund and Optimum Small-Mid Cap Value Fund:
In our opinion, the accompanying statements of net assets and the related statements of operations and of changes in net assets and the financial highlights present fairly, in all material respects, the financial position of Optimum Fixed Income Fund, Optimum International Fund, Optimum Large Cap Growth Fund, Optimum Large Cap Value Fund, Optimum Small-Mid Cap Growth Fund and Optimum Small-Mid Cap Value Fund (constituting Optimum Fund Trust, hereafter referred to as the “Funds”) at March 31, 2011, and the results of their operations, the changes in each of their net assets and the financial highlights for the year then ended, in conformity with accounting principles generally accepted in the United States of America. These financial statements and financial highlights (hereafter referred to as “financial statements”) are the responsibility of the Funds’ management; our responsibility is to express an opinion on these financial statements based on our audits. We conducted our audits of these financial statements in accordance with the standards of the Public Company Accounting Oversight Board (United States). Those standards require that we plan and perform the audit to obtain reasonable assurance about whether the financial statements are free of material misstatement. An audit includes examining, on a test basis, evidence supporting the amounts and disclosures in the financial statements, assessing the accounting principles used and significant estimates made by management, and evaluating the overall financial statement presentation. We believe that our audits, which included confirmation of securities at March 31, 2011 by correspondence with the custodian and brokers, provide a reasonable basis for our opinion. The statement of changes in net assets for the year ended March 31, 2010 and the financial highlights for each of the four years in the period ended March 31, 2010 were audited by other independent accountants whose report dated May 19, 2010 expressed an unqualified opinion on those statements.
PricewaterhouseCoopers LLP
Philadelphia, Pennsylvania
May 20, 2011
Philadelphia, Pennsylvania
May 20, 2011
130
Other Fund information
(Unaudited)
(Unaudited)
Optimum Fund Trust
Change in Independent Registered Public Accounting Firm
Due to independence matters under the Securities and Exchange Commission’s auditor independence rules relating to the January 4, 2010 acquisition of Delaware Investments (including DMC, DDLP and DSC) by Macquarie Group, Ernst & Young LLP (E&Y) has resigned as the independent registered public accounting firm for Optimum Fund Trust (the Trust) effective May 27, 2010. At a meeting held on March 17, 2010, the Board of Trustees of the Trust, upon recommendation of the Audit Committee, selected PricewaterhouseCoopers LLP (PwC) to serve as the independent registered public accounting firm for the Trust for the fiscal year ended March 31, 2011. During the fiscal years ended March 31, 2010 and 2009, E&Y’s audit reports on the financial statements of the Trust did not contain any adverse opinion or disclaimer of opinion, nor were they qualified or modified as to uncertainty, audit scope, or accounting principles. In addition, there were no disagreements between the Trust and E&Y on accounting principles, financial statements disclosures or audit scope, which, if not resolved to the satisfaction of E&Y, would have caused them to make reference to the disagreement in their reports. Neither the Trust nor anyone on its behalf has consulted with PwC at any time prior to their selection with respect to the application of accounting principles to a specified transaction, either completed or proposed or the type of audit opinion that might be rendered on the Trust’s financial statements.
(continues) 131
Board of trustees and officers addendum
Optimum Fund Trust
A mutual fund is governed by a Board of Trustees which has oversight responsibility for the management of a fund’s business affairs. Trustees establish procedures and oversee and review the performance of the investment manager, the distributor and others that perform services for the fund. The independent fund trustees, in particular, are advocates for shareholder interests. The following is a list of the Trustees and Officers of the Trust with certain background and related information.
| Number of | |||||
| Portfolios in Fund | Other | ||||
| Name, | Complex1 Overseen | Directorships | |||
| Address | Position(s) | Length of | Principal Occupation(s) | by Trustee | Held by |
| and Age | Held with Fund(s) | Time Served | During Past 5 Years | or Officer | Trustee or Officer |
| Interested Trustees | |||||
| Robert J. Moore2 | Trustee | June 10, | Chief Financial Officer — | 6 | Independent Board |
| 2005 Market Street | 2010 to | LPL Financial LLC | Member — Legal and | ||
| Philadelphia, PA | present | (2008 – Present) | General Investment | ||
| 19103 | Management America | ||||
| (Investment Adviser) | |||||
| Age 50 | Chief Executive Officer and | (2008–Present) | |||
| Chief Financial Officer — | |||||
| ABN AMRO North America | |||||
| (2006 – 2007) | |||||
| Chief Financial Officer — | |||||
| Diageo PLC, Europe and Great Britain | |||||
| (2001 – 2006) | |||||
| Theodore K. Smith2 | Trustee, President | June 12, 2008 | Executive Vice President | 6 | None |
| 2005 Market Street | and Chief | to present | Retail Product Sales and Marketing | ||
| Philadelphia, PA | Executive Officer | Delaware Investments | |||
| 19103 | (2006 – Present) | ||||
| Age 42 | Head of Strategic Partner | ||||
| Account Management | |||||
| Lincoln Financial Distributors | |||||
| (2005 – 2006) | |||||
| Vice President | |||||
| Head of Managed Accounts | |||||
| Delaware Investments | |||||
| (2002 – 2005) | |||||
| Independent Trustees | |||||
| Robert J. Christian | Trustee | November 1, 2007 | Private Investor | 6 | Trustee – Wilmington Funds |
| 2005 Market Street | and Chairman | to present | (2006 – Present) | (24 mutual funds) | |
| Philadelphia, PA | (1998 – Present) | ||||
| 19103 | |||||
| Age 62 | Chief Investment Officer | Trustee – FundVantage Trust | |||
| Wilmington Trust Corporation | (7 mutual funds) | ||||
| (Trust Bank) | (2007 - Present) | ||||
| (1996 – 2006) | |||||
| Nicholas D. Constan | Trustee | July 17, 2003 | Adjunct Professor – | 6 | None |
| 2005 Market Street | to present | University of Pennsylvania | |||
| Philadelphia, PA | (1972 – Present) | ||||
| 19103 | |||||
| Age 72 | |||||
| Durant Adams Hunter | Trustee | July 17, 2003 | Principal-Ridgeway Partners | 6 | None |
| 2005 Market Street | to present | (Executive Recruiting) | |||
| Philadelphia, PA | (2004 – Present) | ||||
| 19103 | |||||
| Age 62 | |||||
132
| Number of | |||||
| Portfolios in Fund | Other | ||||
| Name, | Complex1 Overseen | Directorships | |||
| Address | Position(s) | Length of | Principal Occupation(s) | by Trustee | Held by |
| and Age | Held with Fund(s) | Time Served | During Past 5 Years | or Officer | Trustee or Officer |
| Independent Trustees (continued) | |||||
| Stephen Paul Mullin | Trustee | July 17, 2003 | Senior Vice President – | 6 | None |
| 2005 Market Street | to present | Econsult Corporation | |||
| Philadelphia, PA | (Economic Consulting) | ||||
| 19103 | (2000 – Present) | ||||
| Age 55 | |||||
| Robert A. Rudell | Trustee | July 17, 2003 | Private Investor | 6 | Director and Chair, |
| 2005 Market Street | to present | (2002 – Present) | Compensation Committee – | ||
| Philadelphia, PA | Medtox Scientific, Inc. | ||||
| 19103 | (Medical devices/Clinical lab) | ||||
| (2002 – Present) | |||||
| Age 62 | |||||
| Director and | |||||
| Independent Chairman– | |||||
| Heartland Funds | |||||
| (3 mutual funds) | |||||
| (2005 – Present) | |||||
| Director – | |||||
| Vantagepoint | |||||
| (27 mutual funds) | |||||
| (2007 – Present) | |||||
| Jon Edward Socolofsky | Trustee | July 17, 2003 | Private Investor | 6 | None |
| 2005 Market Street | to present | (2002 – Present) | |||
| Philadelphia, PA | |||||
| 19103 | |||||
| Age 65 | |||||
| Officers | |||||
| David F. Connor | Vice President, | Vice President since | Mr. Connor has served as | 6 | None4 |
| 2005 Market Street | Deputy General | July 17, 2003 | Vice President and Deputy | ||
| Philadelphia, PA | Counsel, and Secretary | and Secretary | General Counsel of | ||
| 19103 | since | Delaware Investments3 since 2000. | |||
| December 6, 2005 | |||||
| Age 46 | |||||
| David P. O’Connor | Senior Vice President, | October 25, 2005 | Mr. O’Connor has served in | 6 | None4 |
| 2005 Market Street | General Counsel, | to present | various executive and legal | ||
| Philadelphia, PA | and Chief | capacities at different times at | |||
| 19103 | Legal Officer | Delaware Investments. | |||
| Age 44 | |||||
| Daniel Geatens | Vice President | September 20, 2007 | Mr. Geatens has served in | 6 | None4 |
| 2005 Market Street | and Treasurer | to present | various capacities at | ||
| Philadelphia, PA | Delaware Investments. | ||||
| 19103 | |||||
| Age 38 | |||||
| Richard Salus | Senior | January 1, 2006 | Mr. Salus has served in | 6 | None4 |
| 2005 Market Street | Vice President | to present | various executive capacities | ||
| Philadelphia, PA | and | at different times at | |||
| 19103 | Chief Financial | Delaware Investments. | |||
| Officer | |||||
| Age 46 | |||||
| 1 The term “Fund Complex” refers to the Funds in the Optimum Fund Trust. |
| 2 “Interested persons” of the Funds by virtue of their executive and management positions or relationships with the Fund’s service providers or sub-service providers. |
| 3 Delaware Investments is the marketing name for Delaware Management Holdings, Inc. and its subsidiaries, including the Trust’s manager, principal underwriter and service agent. |
| 4 Messrs Connor, O’Connor, Geatens and Salus also serve in similar capacities for the Delaware Investments Family of Funds, a fund complex also managed and distributed by Delaware Investments with 77 funds. |
The Statement of Additional Information for the Fund(s) includes additional information about the Trustees and Officers and is available, without charge, upon request by calling your financial advisor or 800 914-0278.
133
About the organization
This annual report is for the information of Optimum Fund Trust shareholders, but it may be used with prospective investors when preceded or accompanied by a current prospectus for Optimum Fund Trust and the fact sheet for the most recently completed calendar quarter. The prospectus sets forth details about charges, expenses, investment objectives, and operating policies of the investment company. You should read the prospectus carefully before you invest. The figures in this report represent past results that are not a guarantee of future results. The return and principal value of an investment in the investment company will fluctuate so that shares, when redeemed, may be worth more or less than their original cost.
Board of trustees Robert J. Moore Chief Financial Officer LPL Financial LLC Theodore K. Smith Executive Vice President Delaware Investments Robert J. Christian Private Investor Nicholas D. Constan Adjunct Professor — University of Pennsylvania Durant Adams Hunter Principal — Ridgeway Partners Stephen Paul Mullin Senior Vice President — Econsult Corporation Robert A. Rudell Private Investor Jon Edward Socolofsky Private Investor | Affiliated officers David F. Connor Vice President, Deputy General Counsel and Secretary Optimum Fund Trust Philadelphia, PA Daniel V. Geatens Vice President and Treasurer Optimum Fund Trust Philadelphia, PA David P. O’Connor Senior Vice President, General Counsel and Chief Legal Officer Optimum Fund Trust Philadelphia, PA Richard Salus Senior Vice President and Chief Financial Officer Optimum Fund Trust Philadelphia, PA | Contact information Investment manager Delaware Management Company, a series of Delaware Management Business Trust Philadelphia, PA National distributor Delaware Distributors, L.P. Philadelphia, PA Shareholder servicing, dividend disbursing, and transfer agent Delaware Service Company, Inc. 2005 Market Street Philadelphia, PA 19103-7094 For shareholders 800 914-0278 For securities dealers and financial institutions representatives only 800 362-7500 Web site www.optimummutualfunds.com |
Each Fund files its complete schedule of portfolio holdings with the Securities and Exchange Commission (SEC) for the first and third quarters of each fiscal year on Forms N-Q. Each Fund’s Forms N-Q, as well as a description of the policies and procedures that each Fund uses to determine how to vote proxies (if any) relating to portfolio securities is available without charge (i) upon request, by calling 800 914-0278; (ii) on the Fund’s Web site at www.optimummutualfunds.com ; and (iii) on the SEC’s Web site at www.sec.gov. Each Fund’s Forms N-Q may be reviewed and copied at the SEC’s Public Reference Room in Washington, D.C.; information on the operation of the Public Reference Room may be obtained by calling 800 SEC-0330.
Information (if any) regarding how each Fund voted proxies relating to portfolio securities during the most recently disclosed 12-month period ended June 30 is available without charge (i) through the Fund’s Web site at www.optimummutualfunds.com; and (ii) on the SEC’s Web site at www.sec.gov.
134
Item 2. Code of Ethics
The registrant has adopted a code of ethics that applies to the registrant’s principal executive officer, principal financial officer, principal accounting officer or controller, or persons performing similar functions, regardless of whether these individuals are employed by the registrant or a third party. A copy of the registrant’s Code of Business Ethics has been posted on the Delaware Investments Internet Web site at www.delawareinvestments.com. Any amendments to the Code of Business Ethics, and information on any waiver from its provisions granted by the registrant, will also be posted on this Web site within five business days of such amendment or waiver and will remain on the Web site for at least 12 months.
Item 3. Audit Committee Financial Expert
The registrant’s Board of Trustees/Directors has determined that each member of the registrant’s Audit Committee is an audit committee financial expert, as defined below. For purposes of this item, an “audit committee financial expert” is a person who has the following attributes:
a. An understanding of generally accepted accounting principles and financial statements;
b. The ability to assess the general application of such principles in connection with the accounting for estimates, accruals, and reserves;
c. Experience preparing, auditing, analyzing, or evaluating financial statements that present a breadth and level of complexity of accounting issues that are generally comparable to the breadth and complexity of issues that can reasonably be expected to be raised by the registrant’s financial statements, or experience actively supervising one or more persons engaged in such activities;
d. An understanding of internal controls and procedures for financial reporting; and
e. An understanding of audit committee functions.
An “audit committee financial expert” shall have acquired such attributes through:
a. Education and experience as a principal financial officer, principal accounting officer, controller, public accountant, or auditor or experience in one or more positions that involve the performance of similar functions;
b. Experience actively supervising a principal financial officer, principal accounting officer, controller, public accountant, auditor, or person performing similar functions;
c. Experience overseeing or assessing the performance of companies or public accountants with respect to the preparation, auditing, or evaluation of financial statements; or
d. Other relevant experience.
The registrant’s Board of Trustees/Directors has also determined that each member of the registrant’s Audit Committee is independent. In order to be “independent” for purposes of this item, the Audit Committee member may not: (i) other than in his or her capacity as a member of the Board of Trustees/Directors or any committee thereof, accept directly or indirectly any consulting, advisory or other compensatory fee from the issuer; or (ii) be an “interested person” of the registrant as defined in Section 2(a)(19) of the Investment Company Act of 1940.
The names of the audit committee financial experts on the registrant’s Audit Committee are set forth below:
Robert J. Christian
Robert A. Rudell
Jon E. Socolofsky
Robert A. Rudell
Jon E. Socolofsky
Item 4. Principal Accountant Fees and Services
(a) Audit fees.
The aggregate fees billed for services provided to the registrant by its independent auditors for the audit of the registrant’s annual financial statements and for services normally provided by the independent auditors in connection with statutory and regulatory filings or engagements were $120,000 for the fiscal year ended March 31, 2011.
The aggregate fees billed for services provided to the registrant by its independent auditors for the audit of the registrant’s annual financial statements and for services normally provided by the independent auditors in connection with statutory and regulatory filings or engagements were $134,830 for the fiscal year ended March 31, 2010.
(b) Audit-related fees.
The aggregate fees billed by the registrant’s independent auditors for services relating to the performance of the audit of the registrant’s financial statements and not reported under paragraph (a) of this Item were $0 for the fiscal year ended March 31, 2011.
The aggregate fees billed by the registrant’s independent auditors for services relating to the performance of the audit of the financial statements of the registrant’s investment adviser and other service providers under common control with the adviser and that relate directly to the operations or financial reporting of the registrant were $593,000 for the registrant’s fiscal year ended March 31, 2011. The percentage of these fees relating to services approved by the registrant’s Audit Committee pursuant to the de minimis exception from the pre-approval requirement in Rule 2-01(c)(7)(i)(C) of Regulation S-X was 0%. These audit-related services were as follows: audit procedures performed for both the reporting up on Delaware Investments’ balances for its consolidation into the parent company, Macquarie. Also, included are the fees for each of the statutory audits performed on the advisor and its affiliates/subsidiaries.
The aggregate fees billed by the registrant’s independent auditors for services relating to the performance of the audit of the registrant’s financial statements and not reported under paragraph (a) of this Item were $0 for the fiscal year ended March 31, 2010.
The aggregate fees billed by the registrant’s independent auditors for services relating to the performance of the audit of the financial statements of the registrant’s investment adviser and other service providers under common control with the adviser and that relate directly to the operations or financial reporting of the registrant were $19,074 for the registrant’s fiscal year ended March 31, 2010. The percentage of these fees relating to services approved by the registrant’s Audit Committee pursuant to the de minimis exception from the pre-approval requirement in Rule 2-01(c)(7)(i)(C) of Regulation S-X was 0%. These audit-related services were as follows: issuance of report concerning transfer agent's system of internal accounting control pursuant to Rule 17Ad-13 of the Securities Exchange Act.
(c) Tax fees.
The aggregate fees billed by the registrant’s independent auditors for tax-related services provided to the registrant were $25,000 for the fiscal year ended March 31, 2011. The percentage of these fees relating to services approved by the registrant’s Audit Committee pursuant to the de minimis exception from the pre-approval requirement in Rule 2-01(c)(7)(i)(C) of Regulation S-X was 0%. These tax-related services were as follows: review of income tax returns and review of annual excise distribution calculations.
The aggregate fees billed by the registrant’s independent auditors for tax-related services provided to the registrant’s investment adviser and other service providers under common control with the adviser and that relate directly to the operations or financial reporting of the registrant were $10,000 for the registrant’s fiscal year ended March 31, 2011. The percentage of these fees relating to services approved by the registrant’s Audit Committee pursuant to the de minimis exception from the pre-approval requirement in Rule 2-01(c)(7)(i)(C) of Regulation S-X was 0%. These tax-related services were as follows: state and local tax services.
The aggregate fees billed by the registrant’s independent auditors for tax-related services provided to the registrant were $47,086 for the fiscal year ended March 31, 2010. The percentage of these fees relating to services approved by the registrant’s Audit Committee pursuant to the de minimis exception from the pre-approval requirement in Rule 2-01(c)(7)(i)(C) of Regulation S-X was 0%. These tax-related services were as follows: review of income tax returns, review of annual excise distribution calculations, and tax compliance services with respect to investments in foreign securities.
The aggregate fees billed by the registrant’s independent auditors for tax-related services provided to the registrant’s investment adviser and other service providers under common control with the adviser and that relate directly to the operations or financial reporting of the registrant were $0 for the registrant’s fiscal year ended March 31, 2010.
(d) All other fees.
The aggregate fees billed for all services provided by the independent auditors to the registrant other than those set forth in paragraphs (a), (b) and (c) of this Item were $0 for the fiscal year ended March 31, 2011.
The aggregate fees billed for all services other than those set forth in paragraphs (b) and (c) of this Item provided by the registrant’s independent auditors to the registrant’s adviser and other service providers under common control with the adviser and that relate directly to the operations or financial reporting of the registrant were $0 for the registrant’s fiscal year ended March 31, 2011.
The aggregate fees billed for all services provided by the independent auditors to the registrant other than those set forth in paragraphs (a), (b) and (c) of this Item were $0 for the fiscal year ended March 31, 2010.
The aggregate fees billed for all services other than those set forth in paragraphs (b) and (c) of this Item provided by the registrant’s independent auditors to the registrant’s adviser and other service providers under common control with the adviser and that relate directly to the operations or financial reporting of the registrant were $0 for the registrant’s fiscal year ended March 31, 2010.
(e) The registrant’s Audit Committee has established pre-approval policies and procedures as permitted by Rule 2-01(c)(7)(i)(B) of Regulation S-X (the “Pre-Approval Policy”) with respect to services provided by the registrant’s independent auditors. Pursuant to the Pre-Approval Policy, the Audit Committee has pre-approved the services set forth in the table below with respect to the registrant up to the specified fee limits. Certain fee limits are based on aggregate fees to the registrant and other registrants within the Delaware Investments Family of Funds.
| Service | Range of Fees |
| Audit Services | |
| Statutory audits or financial audits for new Funds | up to $25,000 per Fund |
| Services associated with SEC registration statements (e.g., Form N-1A, Form N-14, etc.), periodic reports and other documents filed with the SEC or other documents issued in connection with securities offerings (e.g., comfort letters for closed-end Fund offerings, consents), and assistance in responding to SEC comment letters | up to $10,000 per Fund |
| Consultations by Fund management as to the accounting or disclosure treatment of transactions or events and/or the actual or potential impact of final or proposed rules, standards or interpretations by the SEC, FASB, or other regulatory or standard-setting bodies (Note: Under SEC rules, some consultations may be considered “audit-related services” rather than “audit services”) | up to $25,000 in the aggregate |
| Audit-Related Services | |
| Consultations by Fund management as to the accounting or disclosure treatment of transactions or events and/or the actual or potential impact of final or proposed rules, standards or interpretations by the SEC, FASB, or other regulatory or standard-setting bodies (Note: Under SEC rules, some consultations may be considered “audit services” rather than “audit-related services”) | up to $25,000 in the aggregate |
| Tax Services | |
| U.S. federal, state and local and international tax planning and advice (e.g., consulting on statutory, regulatory or administrative developments, evaluation of Funds’ tax compliance function, etc.) | up to $25,000 in the aggregate |
| U.S. federal, state and local tax compliance (e.g., excise distribution reviews, etc.) | up to $5,000 per Fund |
| Review of federal, state, local and international income, franchise and other tax returns | up to $5,000 per Fund |
Under the Pre-Approval Policy, the Audit Committee has also pre-approved the services set forth in the table below with respect to the registrant’s investment adviser and other entities controlling, controlled by or under common control with the investment adviser that provide ongoing services to the registrant (the “Control Affiliates”) up to the specified fee limit. This fee limit is based on aggregate fees to the investment adviser and its Control Affiliates.
| Service | Range of Fees |
| Non-Audit Services | |
| Services associated with periodic reports and other documents filed with the SEC and assistance in responding to SEC comment letters | up to $10,000 in the aggregate |
The Pre-Approval Policy requires the registrant’s independent auditors to report to the Audit Committee at each of its regular meetings regarding all services initiated since the last such report was rendered, including those services authorized by the Pre-Approval Policy.
(f) Not applicable.
(g) The aggregate non-audit fees billed by the registrant’s independent auditors for services rendered to the registrant and to its investment adviser and other service providers under common control with the adviser were $25,000 and $246,800 for the registrant’s fiscal years ended March 31, 2011 and March 31, 2010, respectively.
(h) In connection with its selection of the independent auditors, the registrant’s Audit Committee has considered the independent auditors’ provision of non-audit services to the registrant’s investment adviser and other service providers under common control with the adviser that were not required to be pre-approved pursuant to Rule 2-01(c)(7)(ii) of Regulation S-X. The Audit Committee has determined that the independent auditors’ provision of these services is compatible with maintaining the auditors’ independence.
Item 5. Audit Committee of Listed Registrants
Not applicable.
Item 6. Investments
(a) Included as part of report to shareholders filed under Item 1 of this Form N-CSR.
(b) Divestment of securities in accordance with Section 13(c) of the Investment Company Act of 1940.
Not applicable.
Item 7. Disclosure of Proxy Voting Policies and Procedures for Closed-End Management Investment Companies
Not applicable.
Item 8. Portfolio Managers of Closed-End Management Investment Companies
Not applicable.
Item 9. Purchases of Equity Securities by Closed-End Management Investment Company and Affiliated Purchasers
Not applicable.
Item 10. Submission of Matters to a Vote of Security Holders
Not applicable.
Item 11. Controls and Procedures
The registrant’s principal executive officer and principal financial officer have evaluated the registrant’s disclosure controls and procedures within 90 days of the filing of this report and have concluded that they are effective in providing reasonable assurance that the information required to be disclosed by the registrant in its reports or statements filed under the Securities Exchange Act of 1934 is recorded, processed, summarized and reported within the time periods specified in the rules and forms of the Securities and Exchange Commission.
There were no significant changes in the registrant’s internal control over financial reporting that occurred during the second fiscal quarter of the period covered by the report to stockholders included herein (i.e., the registrant’s fourth fiscal quarter) that have materially affected, or are reasonably likely to materially affect, the registrant’s internal control over financial reporting.
Item 12. Exhibits
| (a) | (1) Code of Ethics | |
| Not applicable. | ||
| (2) Certifications of Principal Executive Officer and Principal Financial Officer pursuant to Rule 30a-2 under the Investment Company Act of 1940 are attached hereto as Exhibit 99.CERT. | ||
| (3) Written solicitations to purchase securities pursuant to Rule 23c-1 under the Securities Exchange Act of 1934. | ||
| Not applicable. | ||
| (b) | Certifications pursuant to Section 906 of the Sarbanes-Oxley Act of 2002 are furnished herewith as Exhibit 99.906CERT. |
SIGNATURES
Pursuant to the requirements of the Securities Exchange Act of 1934 and the Investment Company Act of 1940, the registrant has duly caused this report to be signed on its behalf, by the undersigned, thereunto duly authorized.
Name of Registrant: OPTIMUM FUND TRUST
| /s/ THEODORE K. SMITH | |
| By: | Theodore K. Smith |
| Title: | Chief Executive Officer |
| Date: | June 3, 2011 |
Pursuant to the requirements of the Securities Exchange Act of 1934 and the Investment Company Act of 1940, this report has been signed below by the following persons on behalf of the registrant and in the capacities and on the dates indicated.
| /s/ THEODORE K. SMITH | |
| By: | Theodore K. Smith |
| Title: | Chief Executive Officer |
| Date: | June 3, 2011 |
| /s/ RICHARD SALUS | |
| By: | Richard Salus |
| Title: | Chief Financial Officer |
| Date: | June 3, 2011 |