UNITED STATES
SECURITIES AND EXCHANGE COMMISSION
Washington, D.C. 20549
FORM N-CSR
CERTIFIED SHAREHOLDER REPORT OF REGISTERED MANAGEMENT INVESTMENT COMPANIES
Investment Company Act file number 811-21359
Managed Duration Investment Grade Municipal Fund
(Exact name of registrant as specified in charter)
2455 Corporate West Drive, Lisle, IL 60532
(Address of principal executive offices) (Zip code)
Amy J. Lee
2455 Corporate West Drive, Lisle, IL 60532
(Name and address of agent for service)
Registrant's telephone number, including area code: (630) 505-3700
Date of fiscal year end: July 31
Date of reporting period: August 1, 2013 through January 31, 2014
Item 1. Reports to Stockholders.
The registrant's annual report transmitted to shareholders pursuant to Rule 30e-1 under the Investment Company Act of 1940, as amended (the “Investment Company Act”), is as follows:
GUGGENHEIMINVESTMENTS.COM/MZF
. . .YOUR WINDOW TO THE LATEST, MOST UP-TO-DATE INFORMATION ABOUT THE MANAGED
DURATION INVESTMENT GRADE MUNICIPAL FUND
The shareholder report you are reading right now is just the beginning of the story. Online at guggenheiminvestments.com/mzf, you will find:
| · | Daily, weekly and monthly data on share prices, distributions and more |
| · | Portfolio overviews and performance analyses |
| · | Announcements, press releases and special notices and tax characteristics |
Cutwater Investor Services Corp. and Guggenheim Investments are continually updating and expanding shareholder information services on the Fund’s website, in an ongoing effort to provide you with the most current information about how your Fund’s assets are managed, and the results of our efforts. It is just one more way we are working to keep you better informed about your investment in the Fund.
DEAR SHAREHOLDER
We thank you for your investment in Managed Duration Investment Grade Municipal Fund (the “Fund”). This report covers performance for the semiannual period ended January 31, 2014.
The Fund’s investment objective is to provide high current income exempt from regular federal income tax while seeking to protect the value of the Fund’s assets during periods of interest rate volatility. Under normal market conditions, the Fund seeks to achieve this objective by investing substantially all of its assets in municipal bonds of investment-grade quality.
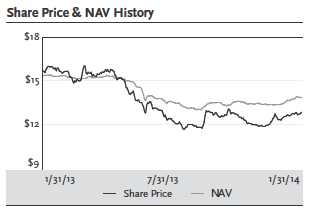
All Fund returns cited—whether based on net asset value (“NAV”) or market price—assume the reinvestment of all distributions. For the six-month period ended January 31, 2014, the Fund provided a total return based on market price of 7.12% and a total return of 5.53% based on NAV. Past performance is not a guarantee of future results. As of January 31, 2014, the Fund’s last closing market price of $12.89 represented a discount of 7.33% to NAV of $13.91. As of July 31, 2013, the Fund’s last closing market price of $12.46 represented a discount of 8.45% to NAV of $13.61. The market value and NAV of the Fund’s shares fluctuate from time to time, and the Fund’s market value may be higher or lower than its NAV. The Fund’s NAV performance data reflects fees and expenses of the Fund.
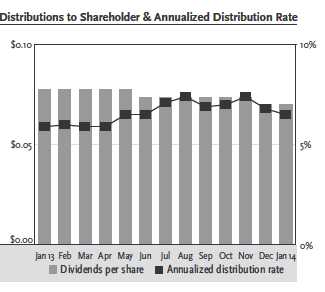
Distributions of $0.0735 were paid in each month from August 2013 through November 2013, and $0.0700 from December 2013 through January 2014. The current distribution represents an annualized distribution rate of 6.52% based on the last closing market price of $12.89 on January 31, 2014.
Cutwater Investor Services Corp. (“Cutwater”) serves as the Fund’s Investment Adviser. With approximately $24 billion in assets under management as of January 31, 2014, Cutwater Asset Management is one of the largest institutional fixed income investment managers in the world. Cutwater’s parent company, MBIA Inc., is listed on the New York Stock Exchange.
Guggenheim Funds Distributors, LLC (“GFD”) serves as the Servicing Agent to the Fund. GFD is part of Guggenheim Investments. Guggenheim Investments represents the investment management division of Guggenheim Partners, LLC.
We encourage shareholders to consider the opportunity to reinvest their distributions from the Fund through the Dividend Reinvestment Plan (“DRIP”), which is described in detail on page 25 of this report. When shares trade at a discount to NAV, the DRIP takes advantage of the discount by reinvesting the monthly dividend distribution in common shares of the Fund purchased in the market at a price less than NAV. Conversely, when the market price of the Fund’s common shares is at a premium above NAV, the DRIP reinvests participants’ dividends in newly-issued common shares at the greater of NAV per share or 95% of the market price per share. The DRIP provides a cost-effective means to accumulate additional shares and enjoy the benefits of compounding returns over time. Since the Fund endeavors to maintain a steady monthly distribution rate, the DRIP effectively provides an income averaging technique, which causes shareholders to accumulate a larger number of Fund shares when the market price is depressed than when the price is higher.
To learn more about the Fund’s performance, we encourage you to read the Questions & Answers section of this report, which begins on page 4 of this report. You will find information about how the Fund is managed, what affected the performance of the Fund during the six-month period ended January 31, 2014, and Cutwater’s views on the market environment.
We appreciate your investment, and we look forward to serving your investment needs in the future. For the most up-to-date information on your investment, please visit the Fund’s website at guggenheiminvestments.com/mzf.
Sincerely,
Clifford D. Corso
President and Chief Executive Officer
Managed Duration Investment Grade Municipal Fund
February 28, 2014
MZF l MANAGED DURATION INVESTMENT GRADE MUNICIPAL FUND SEMIANNUAL REPORT l 3
QUESTIONS & ANSWERS | January 31, 2014 |
Clifford D. Corso
Portfolio Manager
Mr. Corso joined the firm in 1994, establishing the company’s asset management platform and building it into one of the largest fixed income managers in the world. With a staff of 85 people, he now oversees the investment of over $24 billion in assets as of January 31, 2014, and directs the investment strategies of Cutwater’s clients, including pension funds, global banks, corporations, Taft Hartley and insurance companies as well as hundreds of municipalities across the U.S. Mr. Corso also initiated and managed the expansion of the asset manager’s international asset management business from a principal office in London, now a multi-billion dollar platform.
Prior to joining the firm, Mr. Corso served as co-head of a fixed income division at Alliance Capital Management. In his 28-year career, he has held positions as a credit analyst, restructuring specialist, trader and portfolio manager. Mr. Corso graduated from Yale University with a degree in economics and earned an MBA from Columbia University. He has lectured on topics from leadership to finance at many academic institutions, including Columbia University and New York University, where he taught a course on financial derivatives.
James B. DiChiaro
Portfolio Manager
Mr. DiChiaro joined Cutwater in 1999 and is a director. He currently manages Cutwater’s municipal assets under management (taxable and tax-exempt) and has extensive experience managing money-market portfolios. He constructs and implements portfolio strategies for a diverse client base including insurance companies, separately managed accounts and closed-end bond funds. Mr. DiChiaro began his career at Cutwater working with the conduit group structuring medium-term notes for Meridian Funding Company and performing the treasury role for an MBIA sponsored asset-backed commercial paper conduit, Triple-A One Funding Corporation.
Prior to joining Cutwater he worked for Merrill Lynch supporting their asset-backed securities trading desk. Mr. DiChiaro has a bachelor’s degree from Fordham University and a master’s degree from Pace University.
Matthew J. Bodo
Portfolio Manager
Mr. Bodo joined the firm in 2002 and is a vice president in Cutwater’s portfolio management group. He participates in biweekly corporate credit and portfolio strategy meetings and supports the portfolio managers’ implementation of those strategies for Cutwater’s third-party accounts. As part of his daily responsibilities, Mr. Bodo actively manages the local government investment pool portfolios, specializing in high-grade commercial paper, investment grade corporates, U.S. Treasury and instrumentality bonds. Prior to this role, Mr. Bodo served as an investment accountant performing accounting related functions for mutual funds and MBIA insurance portfolios. He has a bachelor’s degree from the State University of New York at Albany.
In the following interview Portfolio Managers Clifford D. Corso, James B. DiChiaro and Matthew J. Bodo discuss the market environment and the performance of the Managed Duration Investment Grade Municipal Fund (the “Fund”) for the semiannual period ended January 31, 2014.
Please provide an overview of the economy and the municipal market during the six-month period ended January 31, 2014.
U.S. economic growth is accelerating, as evidenced by annualized gross domestic product growth of 4.1% in the third quarter, then 2.4% in the fourth quarter. The unemployment rate dipped to 6.7% and domestic equity markets rose to near-record levels in December 2013, and the Federal Reserve (Fed) was sufficiently encouraged by positive economic data that it began tapering its monthly bond purchases.
The tone of markets changed suddenly in January 2014, which many analysts attributed to extreme winter weather in much of the U.S. Concerns about the health of emerging markets and some weaker U.S. economic data contributed to a fall in equity markets for the month, while fixed income markets served as a safe haven and prices rose.
Despite some improvement in employment and consumer spending, many inflation indicators remain benign, perhaps due to a low velocity of money. The Federal Open Market Committee (FOMC) has cited well-anchored long-term inflation expectations as a reason that the target federal funds rate will remain at its exceptionally accommodative level of 0% to 0.25% for an extended period. Inflation, as measured by the Consumer Price Index, has been consistently below the FOMC’s 2% target level. The housing market, which had been a drag on economic growth, improved meaningfully in 2013. Price appreciation was helped by low inventories and low interest rates.
Municipal finances improved during the period as tax revenues increased alongside improvement in the labor market. Municipalities have faced unprecedented budgetary stresses in recent years and reacted by reducing payrolls, issuing far less debt, and reducing other expenses. Having behaved in a fiscally conservative manner, the improving economy is giving many municipalities a rapid turnaround in their finances.
Gross supply for 2013 came in short of many analyst estimates and amounted to approximately $330 billion, a decline of approximately 12% from 2012. The spike in interest rates in mid-2013 appears to have deterred some issuers from refinancing their debt.
Mutual fund cash flows, which are indicative of retail activity and tend to be a leading indicator of tax-exempt rate movements, will be watched closely by municipal bond investors. Tax-exempt mutual funds saw redemptions in excess of $60 billion during 2013, spurred by negative headlines about Detroit and Puerto Rico, rising interest rates, and potential changes to the tax code. These fund redemptions pressured credit spreads wider on lower rated tax-exempt bonds as well.
The Fed’s decision to begin tapering bond purchases implies confidence that the U.S. is in the midst of a sustainable economic recovery—and fixed income markets have reacted accordingly. Over the summer, fixed income market participants began to anticipate a winding down of quantitative easing, which resulted in an acute spike in interest rates. It had been no secret that the trajectory of interest rates was likely upward, but investors’
4 l MZF l MANAGED DURATION INVESTMENT GRADE MUNICIPAL FUND SEMIANNUAL REPORT
QUESTIONS & ANSWERS continued | January 31, 2014 |
focus became avoiding the segments of the interest rate curve most likely to be penalized. Since the December 2013 taper announcement, the 3 to 5-year part of the interest rate curve has experienced the largest rate rise.
The second half of 2013 saw modestly positive total returns for the tax-exempt market, even though major indices were down for all of 2013. For the six-month period ended January 31, 2014, the Barclays Municipal Bond Index, a widely used measure of the municipal bond market as a whole, returned 2.99%. For comparison, the broader Barclays U.S. Aggregate Bond Index returned 1.78%.
How did the Fund perform in this market environment?
All Fund returns cited—whether based on net asset value (“NAV”) or market price—assume the reinvestment of all distributions. For the six-month period ended January 31, 2014, the Fund provided a total return based on market price of 7.12% and a total return of 5.53% based on NAV. Past performance is not a guarantee of future results. As of January 31, 2014, the Fund’s last closing market price of $12.89 represented a discount of 7.33% to NAV of $13.91. As of July 31, 2013, the Fund’s last closing market price of $12.46 represented a discount of 8.45% to NAV of $13.61.
The market value and NAV of the Fund’s shares fluctuate from time to time, and the Fund’s market value may be higher or lower than its NAV. The Fund’s NAV performance data reflects fees and expenses of the Fund.
Distributions of $0.0735 were paid in each month from August 2013 through November 2013, and $0.0700 from December 2013 through January 2014. The current distribution represents an annualized distribution rate of 6.52% based on the last closing market price of $12.89 on January 31, 2014.
How is the Fund’s portfolio structured, and what has that structure meant for performance?
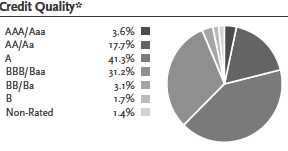
The Fund has a high quality portfolio that is diversified across issuers, sectors and states. In selecting securities for the portfolio, the portfolio management team is supported by Cutwater’s team of credit analysts, who evaluate the credit quality of sectors and individual issuers, going far beyond the bond ratings provided by rating agencies. Cutwater’s proprietary quantitative models help to evaluate the risk of individual securities as well as the overall portfolio, supplementing the judgment of the experienced team. Thorough quantitative and qualitative analysis helps ensure that the desired level of credit quality is maintained in the Fund’s portfolio while yield is added, as appropriate, by buying higher-yielding bonds at what are considered to be attractive prices.
The relatively high average credit quality of the Fund’s portfolio has helped the Fund maintain a high distribution rate while outperforming its benchmark, the Barclays Capital Municipal Bond Index, which has a higher quality profile. In recent months, the average quality has been increased, with increases to AAA-rated bonds as a result of certain securities having been prerefunded and economically defeased with U.S. Treasury securities. Investments in AA bonds also increased as selective exposures to high quality healthcare corporations were added, while positions in single-A and BBB-rated bonds decreased modestly.
The improvement in the credit quality of the portfolio was achieved in part from a reduction in exposure to Puerto Rico. Puerto Rico has been under scrutiny given the Commonwealth’s severely underfunded pension and six-year-old recession. The Fund’s non-investment grade exposure to Puerto Rico’s aqueduct and sewer authority was liquidated in early 2014.
Also contributing to the Fund’s higher average credit quality was the liquidation of a position in California’s general obligation bonds. California was put on positive outlook by a Nationally Recognized Statistical Credit Rating Organization (NRSRO) during the period, which resulted in a compression of credit spreads for its issues, beyond what was justified by their fundamental improvement. We viewed this as an opportune time to liquidate the Fund’s holdings.
There were no significant changes to the Fund’s sector composition, although there were meaningful rotations within certain sectors. We maintained an approximately 18% exposure to healthcare but chose to migrate up in quality within this sector, as the roll out of the Affordable Care Act may pressure hospital revenues due to lower reimbursement rates. This may have a more profound impact on smaller hospitals with lower operating margins.
Exposure to higher education was increased during the period and is now nearly 11% of the Fund. Credit spreads have widened for this sector, given rising tuition costs, lower endowments and robust competition. We selectively added high quality investments within this sector at what are historically high yields.
The Fund’s investment in transportation-related securities also increased during the period from 4.8% to 7.1%. Transportation is a sector that exhibits cyclical characteristics and stands to perform well given Cutwater’s thesis for sustainable growth of the U.S. economy. Increased business spending, business travel, and lower unemployment should help increase the revenues of toll roads and mass transit systems.
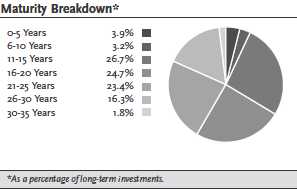
The Fund’s duration decreased from 8.10 to 7.72 during the period, and the Fund maintained a shorter duration than the index throughout the period. Some of this shortening was a function of lower interest rates inferring a greater probability of a bond option being exercised, but the majority of the shortening was intentional. Cutwater has structured this Fund with a barbelled-duration positioning versus the index meaning that the Fund has more exposure to the short (less than 2 years) and long (over eight years) end of the curve versus the index. We have selectively added an approximately 10% exposure to floating-rate securities, which should benefit the performance of the Fund as interest rates begin to rise, and we also increased the Fund’s exposure to the 30-year part of the curve, which we expect will outperform the belly of the curve given our rate forecast.
The Fund outperformed its benchmark during the period. Our duration call was accurate but our overweight to BBB-rated securities detracted from performance during the period. The municipal bond market underwent a two standard deviation rise in rates during May and June, which resulted in a “sell everything” attitude among retail investors. Over $60 billion was redeemed from the tax-exempt market during 2013, possibly attributable to the fear that rising rates could erode fixed income asset values. This overreaction dried up dealer liquidity, resulting in widening credit spreads despite improving fundamentals. The Detroit bankruptcy and financial stress facing Puerto Rico also pressured credit spreads, driving them wider throughout the period. The market improved in January as relative value seekers have seemingly returned to the market.
MZF l MANAGED DURATION INVESTMENT GRADE MUNICIPAL FUND SEMIANNUAL REPORT l 5
QUESTIONS & ANSWERS continued | January 31, 2014 |
The Fund holds $2 million par in City of Detroit water and sewer bonds. What is the status of the bonds?
The Fund’s exposure to the City of Detroit resides in two securities issued by the City of Detroit’s Water and Sewer Department (DWSD). The City of Detroit recently filed a Plan of Adjustment (the “Plan”) that must ultimately be approved by the U.S. Bankruptcy court. The Plan classifies securities issued from the DSWD as “secured” with no proposed haircut for investors and to be paid in full (100 percent recovery). However these securities could be subjected to a restructuring that may have adverse ramifications for the current holders. These secured DWSD bonds are backed by revenues from the City (one-third) and surrounding suburbs (two-thirds). The bonds continue to perform, continue to pay interest, and have not been impaired, thus continuing to benefit shareholders. We expect that DWSD creditors will continue to receive timely interest payments and will receive 100% of the principal owed to investors despite fluctuations in the market value of these securities in reaction to the volatile events surrounding the bankruptcy. We importantly point out that the Fund’s DWSD bonds benefit from a financial guarantee in the form of an insurance policy provided by a monoline insurer whose rating was recently upgraded from AA- to AA. This insurance policy guarantees the timely payment of principal and interest on the Fund’s DWSD securities (regardless of a restructuring) and serves to mitigate the risk of default on a DWSD security, thus insulating the Fund from the bankruptcy.
A potentially market-changing part of the Plan is the classification of unlimited-tax and limited-tax general obligation bonds as “unsecured.” General Obligation bonds have long been regarded as the safest of investments within the municipal bond asset glass and senior to other creditors of a state or locality. Detroit’s Plan gives preferential treatment to pensioners who are proposed to receive a 90 percent recovery compared with an expected 20 percent recovery for unsecured General Obligation bond holders. The Fund does not hold General Obligation Bonds issued from the City of Detroit.
In addition, while the Plan considers water and sewer creditors as “secured,” it provides for two alternatives on restructuring the Detroit Water and Sewer Department: the first alternative is to permit Detroit to continue to own the DWSD and then either reinstate outstanding bonds or issue new bonds with equal principal but perhaps a lower interest rate; the second is to establish a regional water and sewer authority to replace DWSD that would lease and operate Detroit’s water and sewer assets in exchange for annual payments. The resultant restructuring of water/sewer debt may also require that bondholders accept a subordinated position to lease payments made by the water/sewer authority to the City’s general fund.
We expect the proposals detailed within the Plan to be widely and lengthily contested, and indeed the U.S. bankruptcy judge recently postponed the trial of the Plan by a month to give creditors more time to prepare their case.
However, as developments continue to be disseminated, market participants should expect volatility among Detroit related credits, whether secured or unsecured municipal bonds. The complex situation confronting Detroit will be widely followed as the outcome of this bankruptcy, particularly regarding potential preferential treatment of pensioners, may set a precedent for the municipal market.
Please explain the Fund’s leverage strategy and its effect on Fund returns.
The Fund utilizes leverage (borrowing) as part of its investment strategy, to finance the purchase of additional securities that provide increased income and potentially greater appreciation potential to common shareholders than could be achieved from a portfolio that is not leveraged. Leverage adds to performance only when the cost of leverage is less than the total return generated by investments. The use of financial leverage creates an opportunity for increased income and capital appreciation but, at the same time, creates special risks. There can be no assurance that a leveraging strategy will be utilized or will be successful. Financial leverage may cause greater changes in the Fund’s net asset value and returns than if financial leverage had not been used.
As of January 31, 2014, the Fund had $69.45 million of leverage outstanding in the form of Auction Market Preferred Shares (“AMPS”). Since the Fund’s NAV return was greater than the cost of leverage during the period, leverage was a contributor to the Fund’s total return.
Management and the Board of Trustees of the Fund (the “Board of Trustees”) review the AMPS on a regular basis and continuously evaluate alternative forms of leverage. To date, after analyzing various alternatives, Management and the Board of Trustees have not found a more viable form of leverage to replace the AMPS. Management and the Board of Trustees will continue to examine leverage alternatives to replace the AMPS, which are consistent with the investment objectives of the Fund and in the best interests of shareholders.
Index Definitions
All indices are unmanaged. It is not possible to invest in an index.
The Barclays Municipal Bond Index is a rules-based, market-value weighted index engineered for the long-term tax-exempt bond market. To be included in the index, bonds must be rated investment-grade (Baa3/BBB- or higher) by at least two of the following ratings agencies: Moody’s Investor Services, Inc., Standard & Poor’s Rating Group or Fitch Ratings, Inc.
The Barclays U.S. Aggregate Bond Index represents securities that are U.S. domestic, taxable, and dollar denominated. The index covers the U.S. investment grade fixed rate bond market, with index components for government and corporate securities, mortgage pass-through securities, and asset-backed securities.
Risks And Other Considerations
The views expressed in this report reflect those of the portfolio managers only through the report period as stated on the cover. These views are subject to change at any time, based on market and other conditions, and should not be construed as a recommendation of any kind. The material may also include forward looking statements that involve risk and uncertainty, and there is no guarantee that any predictions will come to pass.
There can be no assurance that the Fund will achieve its investment objectives. The value of the Fund will fluctuate with the value of the underlying securities. Closed-end funds often trade at a discount to their net asset value. There can be no assurance that the Fund will achieve its investment objectives.
Risk is inherent in all investing, including the loss of your entire principal. Therefore, before investing you should consider the risks carefully. Please see guggenheiminvestments.com/mzf for a detailed discussion of the Fund’s risks and considerations.
6 l MZF l MANAGED DURATION INVESTMENT GRADE MUNICIPAL FUND SEMIANNUAL REPORT
FUND SUMMARY (Unaudited) | January 31, 2014 |
Fund Information | |
Symbol on New York Stock Exchange: | MZF |
Initial Offering Date: | August 27, 2003 |
Closing Market Price as of 1/31/14: | $12.89 |
Net Asset Value as of 1/31/14: | $13.91 |
Yield on Closing Market Price as of 1/31/14: | 6.52% |
Taxable Equivalent Yield on Closing Market Price
as of 1/31/141: | 11.51% |
Monthly Distribution Per Common Share2: | $0.0700 |
Leverage as of 1/31/143: | 43% |
Percentage of total investments subject to alternative minimum tax as of 1/31/14: | 18.2% |
1 Taxable equivalent yield is calculated assuming a 43.4% federal income tax bracket.
2 Monthly distribution is subject to change.
3 As a percentage of total investments.
Total Returns | | |
(Inception 8/27/03) | Market | NAV |
Six Month | 7.12% | 5.53% |
One Year | -12.45% | -3.81% |
Three Year - average annual | 7.61% | 9.20% |
Five Year - average annual | 12.54% | 11.39% |
Ten Year - average annual | 4.65% | 5.38% |
Since Inception - average annual | 4.70% | 5.54% |
Performance data quoted represents past performance, which is no guarantee of future results and current performance may be lower or higher than the figures shown. NAV total returns reflect fees and expenses of the Fund. For the most recent month-end performance figures, please visit guggenheiminvestments.com/mzf. The investment return and principal value of an investment will fluctuate with changes in the market conditions and other factors so that an investor’s shares, when sold, may be worth more or less than their original cost.
*Ratings shown are assigned by one or more Nationally Recognized Statistical Credit Rating Organizations (“NRSRO”), such as S&P, Moody’s and Fitch. The ratings are an indication of an issuer’s creditworthiness and typically range from AAA or Aaa (highest) to D (lowest). When two or more ratings are available, the lower rating is used; and when only one is available, that rating is used. The Non-Rated category consists of securities that have not been rated by an NRSRO. US Treasury securities and US Government Agency securities are not rated but deemed to be equivalent to securities rated AA+/Aaa.
MZF l MANAGED DURATION INVESTMENT GRADE MUNICIPAL FUND SEMIANNUAL REPORT l 7
PORTFOLIO OF INVESTMENTS (Unaudited) | January 31, 2014 |
| | Description | Rating* | Coupon | Maturity | Optional Call
Provisions** | Value |
| | | Long-Term Investments – 171.2%*** | | | | | |
| | | Municipal Bonds – 169.3% | | | | | |
| | | Alabama – 2.9% | | | | | |
$ 845,000 | | Courtland Industrial Development Board, AMT, Series B | BBB | 6.250% | 08/01/2025 | 08/01/14 @ 100 | $ 847,417 |
1,890,000 | | Courtland Industrial Development Board, AMT | Baa3 | 6.000% | 08/01/2029 | 08/01/14 @ 100 | 1,891,871 |
| | | | | | | | 2,739,288 |
| | | Alaska – 0.9% | | | | | |
750,000 | | Alaska Municipal Bond Bank Authority, General Obligation, Series 1 | AA+ | 5.750% | 09/01/2033 | 09/01/18 @ 100 | 835,792 |
| | | Arizona – 6.6% | | | | | |
2,500,000 | | Arizona Health Facilities Authority(a) | AA– | 0.975% | 01/01/2037 | 01/01/17 @ 100 | 1,949,850 |
2,000,000 | | Arizona Health Facilities Authority, Series A3(a) | BBB+ | 1.890% | 02/01/2048 | 08/05/22 @ 100 | 1,944,120 |
1,250,000 | | Glendale Municipal Property Corp., General Obligation, Series B | AA+ | 5.000% | 07/01/2033 | 01/01/23 @ 100 | 1,314,125 |
1,000,000 | | Industrial Development Authority of the city of Phoenix | A+ | 5.250% | 06/01/2034 | 06/01/22 @ 100 | 1,030,510 |
| | | | | | | | 6,238,605 |
| | | California – 16.4% | | | | | |
1,000,000 | | Bay Area Toll Authority, Series A(a) | AA | 1.290% | 04/01/2036 | 10/01/26 @ 100 | 996,910 |
1,500,000 | | California Health Facilities Financing Authority, Series B | AA– | 5.875% | 08/15/2031 | 08/15/20 @ 100 | 1,703,460 |
1,000,000 | | California Pollution Control Financing Authority, AMT(b) | Baa3 | 5.000% | 07/01/2030 | 07/01/22 @ 100 | 948,440 |
2,500,000 | | California Statewide Communities Development Authority(a) | A+ | 0.943% | 04/01/2036 | 02/21/14 @ 100 | 1,871,000 |
2,500,000 | | City of Chula Vista CA, AMT, Series B | A | 5.500% | 12/01/2021 | 06/02/14 @ 102 | 2,567,650 |
1,000,000 | | Los Angeles County Public Works Financing Authority | AA | 4.000% | 08/01/2042 | 08/01/22 @ 100 | 855,470 |
2,525,000 | | Los Angeles Unified School District, Series F | AA– | 5.000% | 01/01/2034 | 07/01/19 @ 100 | 2,739,751 |
3,500,000 | | Sacramento County Sanitation Districts Financing Authority, Series B, (AGC-ICC FGIC)(a) | AA | 0.690% | 12/01/2035 | 06/01/17 @ 100 | 2,714,530 |
1,000,000 | | San Bernardino City Unified School District, Series A, (AGM) | AA– | 5.000% | 08/01/2028 | 08/01/23 @ 100 | 1,080,770 |
| | | | | | | | 15,477,981 |
| | | Colorado – 2.2% | | | | | |
1,000,000 | | City & County of Denver CO Airport System Revenue, Series B | A | 5.000% | 11/15/2043 | 11/15/23 @ 100 | 1,013,830 |
1,000,000 | | Colorado Health Facilities Authority, Series A | A+ | 5.250% | 01/01/2045 | 01/01/23 @ 100 | 1,017,740 |
| | | | | | | | 2,031,570 |
| | | Connecticut – 1.8% | | | | | |
1,750,000 | | Connecticut Housing Finance Authority, Series D 2 | AAA | 4.000% | 11/15/2034 | 05/15/21 @ 100 | 1,699,355 |
| | | Delaware – 1.7% | | | | | |
1,500,000 | | Delaware State Economic Development Authority | BBB+ | 5.400% | 02/01/2031 | 08/01/20 @ 100 | 1,598,670 |
| | | District of Columbia – 2.1% | | | | | |
2,000,000 | | District of Columbia Housing Finance Agency, AMT, (FHA) | Aaa | 5.100% | 06/01/2037 | 06/01/15 @ 102 | 2,011,380 |
| | | Florida – 11.9% | | | | | |
1,000,000 | | County of Broward FL, AMT, Series A, (AGM) | AA– | 5.000% | 04/01/2038 | 04/01/23 @ 100 | 999,930 |
2,200,000 | | County of Miami-Dade FL, Aviation Revenue, AMT, Series A, (CIFG) | A | 5.000% | 10/01/2038 | 10/01/15 @ 100 | 2,202,618 |
1,500,000 | | JEA Water & Sewer System Revenue, Series B | AA | 4.000% | 10/01/2041 | 10/01/17 @ 100 | 1,359,870 |
2,000,000 | | Miami-Dade County Educational Facilities Authority, Series A | A– | 5.000% | 04/01/2042 | 04/01/23 @ 100 | 2,008,620 |
1,500,000 | | Miami-Dade County School Board Foundation, Inc., Series A, (Assured Gty) | AA– | 5.375% | 02/01/2034 | 02/01/19 @ 100 | 1,592,445 |
1,000,000 | | Seminole Tribe of Florida, Inc., Series A(b) | BBB– | 5.250% | 10/01/2027 | 10/01/17 @ 100 | 1,024,280 |
1,000,000 | | Tampa-Hillsborough County Expressway Authority, Series B | A | 5.000% | 07/01/2042 | 07/01/22 @ 100 | 1,024,780 |
1,000,000 | | Town of Davie FL, Series A | BBB | 6.000% | 04/01/2042 | 04/01/23 @ 100 | 1,052,400 |
| | | | | | | | 11,264,943 |
| | | Hawaii – 1.1% | | | | | |
1,000,000 | | Hawaii Pacific Health, Series B | A– | 5.625% | 07/01/2030 | 07/01/20 @ 100 | 1,074,620 |
See notes to financial statements. | | | | | |
8 l MZF l MANAGED DURATION INVESTMENT GRADE MUNICIPAL FUND SEMIANNUAL REPORT | | | | | |
PORTFOLIO OF INVESTMENTS (Unaudited) continued | January 31, 2014 |
Principal
Amount | | Description | Rating* | Coupon | Maturity | Optional Call
Provisions** | Value |
| | | Illinois – 12.5% | | | | | |
$ 1,000,000 | | Chicago Board of Education, General Obligation, Series A | A+ | 5.000% | 12/01/2041 | 12/01/21 @ 100 | $ 967,830 |
1,750,000 | | Chicago O’Hare International Airport, Series C | A– | 5.500% | 01/01/2031 | 01/01/21 @ 100 | 1,879,657 |
2,000,000 | | Illinois Finance Authority, Roosevelt University Revenue | Baa3 | 5.500% | 04/01/2037 | 04/01/17 @ 100 | 1,899,520 |
1,000,000 | | Illinois Finance Authority, Rush University Medical Center Revenue, Series C | A | 6.375% | 11/01/2029 | 05/01/19 @ 100 | 1,134,410 |
760,000 | | Illinois Housing Development Authority, AMT, Series A-2 | AA | 5.000% | 08/01/2036 | 02/01/16 @ 100 | 763,618 |
2,000,000 | | Metropolitan Pier & Exposition Authority, Series A | AAA | 5.000% | 06/15/2042 | 06/15/22 @ 100 | 2,035,440 |
1,000,000 | | Railsplitter Tobacco Settlement Authority | A– | 6.000% | 06/01/2028 | 06/01/21 @ 100 | 1,117,730 |
2,000,000 | | State of Illinois, General Obligation, Series A | A– | 5.000% | 03/01/2028 | 03/07/14 @ 100 | 2,002,760 |
| | | | | | | | 11,800,965 |
| | | Indiana – 1.1% | | | | | |
1,000,000 | | Indiana Finance Authority | BB– | 6.000% | 12/01/2026 | 06/01/20 @ 100 | 1,014,060 |
| | | Iowa – 6.2% | | | | | |
1,090,000 | | Iowa Finance Authority | A+ | 5.000% | 08/15/2029 | 08/15/22 @ 100 | 1,146,364 |
1,650,000 | | Iowa Finance Authority | BBB– | 4.750% | 08/01/2042 | 08/01/22 @ 100 | 1,422,168 |
1,500,000 | | Iowa Higher Education Loan Authority | BB | 5.500% | 09/01/2025 | 09/01/20 @ 100 | 1,540,665 |
2,000,000 | | Iowa Tobacco Settlement Authority, Series B | B+ | 5.600% | 06/01/2034 | 06/01/17 @ 100 | 1,721,800 |
| | | | | | | | 5,830,997 |
| | | Kentucky – 2.2% | | | | | |
1,000,000 | | County of Owen KY, Waterworks System Revenue, Series B | A– | 5.625% | 09/01/2039 | 09/01/19 @ 100 | 1,024,170 |
1,000,000 | | Kentucky Economic Development Finance Authority, Series A | A2 | 5.625% | 08/15/2027 | 08/15/18 @ 100 | 1,081,730 |
| | | | | | | | 2,105,900 |
| | | Louisiana – 10.1% | | | | | |
1,000,000 | | East Baton Rouge Sewerage Commission, Series A | AA– | 5.250% | 02/01/2034 | 02/01/19 @ 100 | 1,075,200 |
3,000,000 | | Louisiana Local Government Environmental Facilities & Community | | | | | |
| | | Development Authority | BBB | 6.750% | 11/01/2032 | 11/01/17 @ 100 | 3,209,400 |
1,000,000 | | Louisiana Public Facilities Authority, Hospital Revenue | A3 | 5.250% | 11/01/2030 | 05/01/20 @ 100 | 1,025,020 |
1,000,000 | | Parish of DeSoto LA, AMT, Series A | BBB | 5.850% | 11/01/2027 | 11/01/14 @ 100 | 1,000,140 |
1,500,000 | | Parish of St John the Baptist LA, Series A | BBB | 5.125% | 06/01/2037 | 06/01/17 @ 100 | 1,503,105 |
1,600,000 | | State of Louisiana Gasoline & Fuels Tax Revenue, Series C1 | AA | 5.000% | 05/01/2043 | 05/01/23 @ 100 | 1,689,552 |
| | | | | | | | 9,502,417 |
| | | Maryland – 0.6% | | | | | |
500,000 | | Maryland Economic Development Corp. | BB | 5.750% | 09/01/2025 | 09/01/20 @ 100 | 524,760 |
| | | Massachusetts – 5.9% | | | | | |
1,800,000 | | Commonwealth of Massachusetts, General Obligation, (BHAC-CR FGIC)(a) | AA+ | 0.729% | 05/01/2037 | 05/01/17 @ 100 | 1,556,460 |
970,000 | | Massachusetts Educational Financing Authority, AMT | AA | 5.375% | 07/01/2025 | 07/01/21 @ 100 | 1,019,169 |
955,000 | | Massachusetts Educational Financing Authority, AMT | AA | 4.700% | 07/01/2026 | 07/01/21 @ 100 | 962,086 |
1,000,000 | | Massachusetts Health & Educational Facilities Authority, Series A | BBB | 6.250% | 07/01/2030 | 07/01/19 @ 100 | 1,083,090 |
950,000 | | Massachusetts Housing Finance Agency, AMT | AA– | 5.100% | 12/01/2027 | 06/01/17 @ 100 | 965,913 |
| | | | | | | | 5,586,718 |
| | | Michigan – 5.0% | | | | | |
1,000,000 | | City of Detroit MI, Sewer Disposal Revenue, Series B, (AGM) | AA– | 7.500% | 07/01/2033 | 07/01/19 @ 100 | 1,077,360 |
1,000,000 | | City of Detroit MI, Water Supply System Revenue, (AGM) | AA– | 7.000% | 07/01/2036 | 07/01/19 @ 100 | 1,061,590 |
500,000 | | Detroit Wayne County Stadium Authority, (AGM) | AA– | 5.000% | 10/01/2026 | 10/01/22 @ 100 | 518,455 |
1,000,000 | | Michigan Finance Authority Revenue | AA– | 5.000% | 12/01/2031 | 12/01/21 @ 100 | 1,056,220 |
1,000,000 | | Michigan Strategic Fund, Series B-1 | A-2 | 6.250% | 06/01/2014 | N/A | 1,016,070 |
| | | | | | | | 4,729,695 |
See notes to financial statements. | | | | | |
| | | MZF l MANAGED DURATION INVESTMENT GRADE MUNICIPAL FUND SEMIANNUAL REPORT l 9 |
PORTFOLIO OF INVESTMENTS (Unaudited) continued | January 31, 2014 |
| | Description | Rating* | Coupon | Maturity | Optional Call
Provisions** | Value |
| | | Minnesota – 1.3% | | | | | |
$ 1,500,000 | | St. Paul Port Authority, AMT | BBB– | 4.500% | 10/01/2037 | 10/01/22 @ 100 | $ 1,182,495 |
| | | Mississippi – 1.2% | | | | | |
1,000,000 | | County of Warren MS, Series A | BBB | 6.500% | 09/01/2032 | 09/01/18 @ 100 | 1,091,260 |
| | | Nevada – 1.6% | | | | | |
1,435,000 | | Las Vegas Valley Water District, Series C | AA+ | 5.000% | 06/01/2031 | 06/01/21 @ 100 | 1,545,050 |
| | | New Hampshire – 1.0% | | | | | |
1,000,000 | | New Hampshire Health and Education Facilities Authority Act | BBB | 5.000% | 01/01/2034 | 01/01/22 @ 100 | 990,010 |
| | | New Jersey – 7.8% | | | | | |
3,000,000 | | New Jersey Economic Development Authority, Series I(a) | A+ | 1.640% | 03/01/2028 | 03/01/23 @ 100 | 2,981,280 |
500,000 | | New Jersey Economic Development Authority, Series C | BBB– | 5.000% | 07/01/2032 | 07/01/22 @ 100 | 468,515 |
1,500,000 | | New Jersey Health Care Facilities Financing Authority, (Prerefunded @ 7/1/2019)(c) | Baa2 | 5.750% | 07/01/2039 | 07/01/19 @ 100 | 1,842,930 |
2,000,000 | | New Jersey Transportation Trust Fund Authority, Series A | A+ | 5.000% | 06/15/2042 | 06/15/22 @ 100 | 2,057,700 |
| | | | | | | | 7,350,425 |
| | | New York – 12.1% | | | | | |
1,895,000 | | City of New York NY, Series J, (Prerefunded @ 5/15/2014)(c) | NR | 5.000% | 05/15/2023 | 05/15/14 @ 100 | 1,920,620 |
2,750,000 | | Long Island Power Authority, Series A, (Prerefunded @ 9/1/2014)(c) | A– | 5.100% | 09/01/2029 | 09/01/14 @ 100 | 2,827,330 |
2,000,000 | | Metropolitan Transportation Authority, Series E | A | 5.000% | 11/15/2043 | 11/15/23 @ 100 | 2,062,280 |
300,000 | | New York City Industrial Development Agency, American Airlines, | | | | | |
| | | JFK International Airport, AMT | NR | 7.500% | 08/01/2016 | N/A | 318,810 |
1,000,000 | | New York State Dormitory Authority, Series A | BBB | 5.000% | 07/01/2032 | 07/01/22 @ 100 | 1,022,680 |
700,000 | | New York State Dormitory Authority, Series B | A– | 5.250% | 07/01/2024 | 07/01/17 @ 100 | 749,672 |
1,500,000 | | Suffolk County Industrial Development Agency, AMT | A– | 5.250% | 06/01/2027 | 06/01/14 @ 100 | 1,510,470 |
1,000,000 | | Troy Industrial Development Authority | A– | 5.000% | 09/01/2031 | 09/01/21 @ 100 | 1,048,760 |
| | | | | | | | 11,460,622 |
| | | Ohio – 4.3% | | | | | |
2,000,000 | | American Municipal Power, Inc., Series B | A | 5.000% | 02/15/2042 | 02/15/22 @ 100 | 2,047,760 |
1,000,000 | | Ohio Air Quality Development Authority | BBB– | 5.625% | 06/01/2018 | N/A | 1,085,750 |
1,000,000 | | Ohio Air Quality Development Authority, Series A | BBB– | 5.700% | 2/1/14 | N/A | 1,000,000 |
| | | | | | | | 4,133,510 |
| | | Oklahoma – 1.1% | | | | | |
1,000,000 | | Oklahoma Development Finance Authority | A+ | 5.000% | 02/15/2034 | 02/15/22 @ 100 | 1,038,140 |
| | | Pennsylvania – 7.8% | | | | | |
1,110,000 | | City of Philadelphia PA, General Obligation, Series A, (Assured Gty) | AA– | 5.375% | 08/01/2030 | 08/01/19 @ 100 | 1,190,764 |
1,100,000 | | City of Philadelphia PA, General Obligation | A+ | 5.875% | 08/01/2031 | 08/01/16 @ 100 | 1,158,256 |
1,000,000 | | County of Lehigh PA | A+ | 4.000% | 07/01/2043 | 07/01/22 @ 100 | 837,540 |
1,500,000 | | Delaware River Port Authority | BBB | 5.000% | 01/01/2027 | 01/01/23 @ 100 | 1,552,245 |
1,000,000 | | Pennsylvania Higher Educational Facilities Authority, Series A | BBB | 5.000% | 05/01/2037 | 11/01/17 @ 100 | 998,560 |
1,000,000 | | Pennsylvania Higher Educational Facilities Authority, Series B | AA– | 6.000% | 08/15/2026 | 08/15/18 @ 100 | 1,150,790 |
500,000 | | State Public School Building Authority | A+ | 5.000% | 04/01/2032 | 04/01/22 @ 100 | 514,815 |
| | | | | | | | 7,402,970 |
| | | Puerto Rico – 1.0% | | | | | |
1,215,000 | | Puerto Rico Sales Tax Financing Corp., General Obligation | AA– | 5.250% | 08/01/2040 | 08/01/21 @ 100 | 960,336 |
| | | Rhode Island – 1.5% | | | | | |
1,300,000 | | Rhode Island Convention Center Authority, Series A, (Assured Gty) | AA– | 5.500% | 05/15/2027 | 05/15/19 @ 100 | 1,412,476 |
See notes to financial statements. | | | | | |
10 l MZF l MANAGED DURATION INVESTMENT GRADE MUNICIPAL FUND SEMIANNUAL REPORT | | | | | |
PORTFOLIO OF INVESTMENTS (Unaudited) continued | January 31, 2014 |
| | Description | Rating* | Coupon | Maturity | Optional Call
Provisions** | Value |
| | | South Carolina – 4.8% | | | | | |
$ 2,500,000 | | County of Florence SC, Series A, (AGM) | AA– | 5.250% | 11/01/2027 | 11/01/14 @ 100 | $ 2,550,300 |
1,000,000 | | County of Georgetown SC, AMT, Series A | BBB | 5.300% | 03/01/2028 | 03/01/15 @ 100 | 1,000,130 |
1,000,000 | | South Carolina State Public Service Authority, Series E | AA– | 5.000% | 12/01/2048 | 12/01/23 @ 100 | 1,023,320 |
| | | | | | | | 4,573,750 |
| | | South Dakota – 1.3% | | | | | |
1,200,000 | | South Dakota Health & Educational Facilities Authority, Series A | A+ | 5.250% | 11/01/2034 | 11/01/14 @ 100 | 1,206,204 |
| | | Tennessee – 3.4% | | | | | |
2,500,000 | | Knox County Health Educational & Housing Facility Board | BBB+ | 5.250% | 04/01/2027 | 04/01/17 @ 100 | 2,556,650 |
650,000 | | Metropolitan Nashville Airport Authority | Baa3 | 5.200% | 07/01/2026 | 07/01/20 @ 100 | 677,255 |
| | | | | | | | 3,233,905 |
| | | Texas – 13.4% | | | | | |
1,000,000 | | Fort Bend County Industrial Development Corp., Series B | Baa3 | 4.750% | 11/01/2042 | 11/01/22 @ 100 | 893,550 |
2,000,000 | | Lower Colorado River Authority | A | 6.250% | 05/15/2028 | 05/15/18 @ 100 | 2,285,800 |
2,315,000 | | Matagorda County Navigation District No. 1, AMT, (AMBAC) | A | 5.125% | 11/01/2028 | N/A | 2,464,341 |
2,000,000 | | North Texas Tollway Authority, Series A | A– | 5.625% | 01/01/2033 | 01/01/18 @ 100 | 2,148,520 |
2,100,000 | | San Leanna Educational Facilities Corp. | BBB+ | 5.125% | 06/01/2036 | 06/01/17 @ 100 | 2,105,880 |
720,000 | | Tarrant County Cultural Education Facilities Finance Corp., (Assured Gty) | AA– | 5.750% | 07/01/2018 | N/A | 796,766 |
2,000,000 | | Tarrant County Cultural Education Facilities Finance Corp. | AA– | 5.000% | 10/01/2043 | 10/01/23 @ 100 | 2,016,640 |
| | | | | | | | 12,711,497 |
| | | Vermont – 2.9% | | | | | |
2,800,000 | | Vermont Student Assistance Corp., AMT, Series B-A2(a) | A | 3.238% | 12/03/2035 | 03/03/14 @ 100 | 2,778,776 |
| | | Virginia – 1.5% | | | | | |
1,250,000 | | Washington County Industrial Development Authority, Series C | BBB+ | 7.500% | 07/01/2029 | 01/01/19 @ 100 | 1,426,925 |
| | | Washington – 3.3% | | | | | |
1,000,000 | | Spokane Public Facilities District, Series A | A+ | 5.000% | 12/01/2038 | 06/01/23 @ 100 | 1,036,120 |
1,000,000 | | Tes Properties | AA+ | 5.625% | 12/01/2038 | 06/01/19 @ 100 | 1,063,840 |
1,000,000 | | Washington Higher Education Facilities Authority, Series A | A3 | 5.250% | 04/01/2043 | 04/01/23 @ 100 | 1,034,460 |
| | | | | | | | 3,134,420 |
| | | Wisconsin – 2.5% | | | | | |
1,250,000 | | Wisconsin Health & Educational Facilities Authority, Series A | AA+ | 5.000% | 11/15/2036 | 11/15/16 @ 100 | 1,271,613 |
1,000,000 | | WPPI Energy, Series A | A | 5.000% | 07/01/2037 | 07/01/23 @ 100 | 1,043,420 |
| | | | | | | | 2,315,033 |
| | | Wyoming – 4.3% | | | | | |
4,000,000 | | County of Sweetwater WY, AMT | A– | 5.600% | 12/01/2035 | 12/01/15 @ 100 | 4,056,280 |
| | | Total Municipal Bonds – 169.3% | | | | | |
| | | (Cost $156,007,347) | | | | | 160,071,800 |
| | | Preferred Shares – 2.2% | | | | | |
| | | Diversified Financial Services – 2.2% | | | | | |
$ 2,000,000 | | Centerline Equity Issuer Trust(b) | Aaa | 5.750% | 05/15/2015 | N/A | 2,084,780 |
| | | (Cost $2,000,000) | | | | | |
| | | Total Long-Term Investments – 171.5% | | | | | |
| | | (Cost $158,007,347) | | | | | 162,156,580 |
See notes to financial statements. | | | | | |
| | MZF l MANAGED DURATION INVESTMENT GRADE MUNICIPAL FUND SEMIANNUAL REPORT l 11 |
PORTFOLIO OF INVESTMENTS (Unaudited) continued | January 31, 2014 |
| | Description | Value |
| | | Money Market – 0.1% | |
86,499 | | JPMorgan Tax Free Money Market | $ 86,499 |
| | | (Cost $86,499) | |
| | | Total Investments – 171.6% | |
| | | (Cost $158,093,846) | 162,243,079 |
| | | Other Assets in excess of Liabilities – 1.8% | 1,772,538 |
| | | Preferred Shares, at redemption value – (-73.4% of Net Assets | |
| | | Applicable to Common Shareholders or -42.8% of Total Investments) | (69,450,000) |
| | | Net Assets Applicable to Common Shareholders – 100.0% | $ 94,565,617 |
AGM – Insured by Assured Guaranty Municipal Corporation |
AMBAC – Insured by Ambac Assurance Corporation |
AMT – Income from this security is a preference item under the Alternative Minimum Tax. |
Assured Gty – Insured by Assured Guaranty Corporation |
CIFG – Insured by CIFG Assurance North America, Inc. |
FHA – Guaranteed by Federal Housing Administration |
N/A – Not Applicable |
| * | Ratings shown are per Standard & Poor’s Rating Group (“S&P”), Moody’s Investor Services, Inc. (“Moody”) or Fitch Ratings (“Fitch”). Securities classified as NR are not rated. (For securities not rated by S&P, the rating by Moody’s is provided. Likewise, for securities not rated by S&P and Moody’s the rating by Fitch is provided.) All ratings are unaudited. The ratings apply to the credit worthiness of the issuers of the underlying securities and not to the Fund or its shares. |
| ** | Date and price of the earliest optional call or put provision. There may be other call provisions at varying prices at later dates. |
| *** | All percentages shown in the Portfolio of Investments are based on Net Assets Applicable to Common Shareholders, unless otherwise noted. |
| (a) | Floating or variable rate coupon. The rate shown is as of January 31, 2014. |
| (b) | Securities are exempt from registration under Rule 144A of the Securities Act of 1933. These securities may be resold in transactions exempt from registration, normally to qualified institutional buyers. At January 31, 2014 these securities amounted to $4,057,500, which represents 4.3% of net assets applicable to common shares. |
| (c) | The bond is prerefunded. U.S. government or U.S. government agency securities, held in escrow, are used to pay interest on this security, as well as to retire the bond in full at the date and price indicated under the Optional Call Provisions. |
See notes to financial statements.
12 l MZF l MANAGED DURATION INVESTMENT GRADE MUNICIPAL FUND SEMIANNUAL REPORT
PORTFOLIO OF INVESTMENTS continued | January 31, 2014 |
Portfolio composition and holdings are subject to change daily. For more information, please visit guggenheiminvestments.com/mzf. The above summaries are provided for informational purposes only and should not be viewed as recommendations. Past performance does not guarantee future results.
See notes to financial statements.
MZF l MANAGED DURATION INVESTMENT GRADE MUNICIPAL FUND SEMIANNUAL REPORT l 13
STATEMENT OF ASSETS AND LIABILITIES (Unaudited) | January 31, 2014 |
Assets | | | |
Investments, at value (cost $158,093,846) | | $ | 162,243,079 | |
Interest receivable | | | 1,980,062 | |
Other assets | | | 16,125 | |
Total assets | | | 164,239,266 | |
Liabilities | | | | |
Investment advisory fee payable | | | 41,447 | |
Servicing agent fee payable | | | 27,591 | |
Distributions payable - preferred shareholders | | | 14,886 | |
Administration fee payable | | | 3,409 | |
Custodian bank | | | 242 | |
Accrued expenses and other liabilities | | | 136,074 | |
Total liabilities | | | 223,649 | |
Preferred Shares, at redemption value | | | | |
$.001 par value per share; 2,778 Auction Market Preferred Shares authorized, | | | | |
issued and outstanding at $25,000 per share liquidation preference | | | 69,450,000 | |
Net Assets Applicable to Common Shareholders | | $ | 94,565,617 | |
Composition of Net Assets Applicable to Common Shareholders | | | | |
Common stock, $.001 par value per share; unlimited number of shares authorized, | | | | |
6,800,476 shares issued and outstanding | | $ | 6,800 | |
Additional paid-in capital | | | 95,864,447 | |
Net unrealized appreciation on investments | | | 4,149,233 | |
Accumulated undistributed net investment income | | | 57,783 | |
Accumulated net realized loss on investments | | | (5,512,646 | ) |
Net Assets Applicable to Common Shareholders | | $ | 94,565,617 | |
Net Asset Value Applicable to Common Shareholders (based on 6,800,476 common shares outstanding) | | $ | 13.91 | |
See notes to financial statements.
14 l MZF l MANAGED DURATION INVESTMENT GRADE MUNICIPAL FUND SEMIANNUAL REPORT
STATEMENT OF OPERATIONS For the six months ended January 31, 2014 (Unaudited) | January 31, 2014 |
Investment Income | | |
Interest | | $ 3,988,889 |
Expenses | | |
Investment advisory fee | $ 316,514 | |
Servicing agent fee | 211,009 | |
Auction agent fees - preferred shares | 60,100 | |
Professional fees | 58,790 | |
Fund accounting | 32,793 | |
Trustees’ fees and expenses | 22,549 | |
Administrative fee | 22,318 | |
Printing expenses | 17,693 | |
NYSE listing fee | 10,672 | |
Transfer agent fee | 9,482 | |
Insurance | 9,069 | |
Custodian fee | 3,834 | |
Line of credit fee | 416 | |
Miscellaneous | 3,498 | |
Total expenses | | 778,737 |
Investment advisory fee waived | | (73,042) |
Servicing agent fee waived | | (48,694) |
Net expenses | | 657,001 |
Net investment income | | 3,331,888 |
Realized and Unrealized Gain on Investments | | |
Net realized gain | | 108,983 |
Net change in unrealized appreciation | | 1,936,192 |
Net realized and unrealized gain on investments | | 2,045,175 |
Distributions to Auction Market Preferred Shareholders from | | |
Net investment income | | (433,515) |
Net Increase in Net Assets Applicable to Common Shareholders Resulting from Operations | | $ 4,943,548 |
See notes to financial statements.
MZF l MANAGED DURATION INVESTMENT GRADE MUNICIPAL FUND SEMIANNUAL REPORT l 15
STATEMENTS OF CHANGES IN NET ASSETS | January 31, 2014 |
| | | For the
Six Months Ended
January 31, 2014
(Unaudited) | | | For the
Year Ended
July 31, 2013 | |
Increase (decrease) in Net Assets Applicable to Common
Shareholders Resulting from Operations: | | | | | | |
Net investment income | | $ | 3,331,888 | | | $ | 6,912,678 | |
Net realized gain on investments | | | 108,983 | | | | 1,224,194 | |
Net change in unrealized appreciation (depreciation) on investments | | | 1,936,192 | | | | (13,043,021 | ) |
Distributions to auction market preferred shareholders from net investment income | | | (433,515 | ) | | | (942,583 | ) |
Net increase (decrease) in net assets applicable to common shareholders
resulting from operations | | | 4,943,548 | | | | (5,848,732 | ) |
Distributions to common shareholders from | | | | | | | | |
Net investment income | | | (2,951,407 | ) | | | (6,400,922 | ) |
Capital share transactions | | | | | | | | |
Reinvestment of dividends | | | – | | | | 200,761 | |
Total change in net assets applicable to common shareholders | | | 1,992,141 | | | | (12,048,893 | ) |
Net assets applicable to common shareholders: | | | | | | | | |
Beginning of period | | | 92,573,476 | | | | 104,622,369 | |
End of period (including undistributed net investment income
of $57,783 and $110,817, respectively) | | $ | 94,565,617 | | | $ | 92,573,476 | |
See notes to financial statements.
16 l MZF l MANAGED DURATION INVESTMENT GRADE MUNICIPAL FUND SEMIANNUAL REPORT
FINANCIAL HIGHLIGHTS | January 31, 2014 |
Per share operating performance for one common
share outstanding throughout each period | | For the
Six Months Ended
January 31, 2014
(Unaudited) | | | | | | | | | | | | | | | | |
Net asset value, beginning of period | | $ | 13.61 | | | $ | 15.41 | | | $ | 14.02 | | | $ | 14.40 | | | $ | 12.73 | | | $ | 13.17 | |
Investment operations | | | | | | | | | | | | | | | | | | | | | | | | |
Net investment income (a) | | | 0.49 | | | | 1.02 | | | | 1.09 | | | | 1.12 | | | | 1.06 | | | | 1.02 | |
Net realized and unrealized gain/(loss) on investments | | | 0.30 | | | | (1.74 | ) | | | 1.43 | | | | (0.36 | ) | | | 1.72 | | | | (0.49 | ) |
Distributions to preferred shareholders from net investment income (common share equivalent basis) | | | (0.06 | ) | | | (0.14 | ) | | | (0.14 | ) | | | (0.15 | ) | | | (0.14 | ) | | | (0.24 | ) |
Total from investment operations | | | 0.73 | | | | (0.86 | ) | | | 2.38 | | | | 0.61 | | | | 2.64 | | | | 0.29 | |
Distributions to common shareholders from net investment income | | | (0.43 | ) | | | (0.94 | ) | | | (0.99 | ) | | | (0.99 | ) | | | (0.97 | ) | | | (0.73 | ) |
Net asset value, end of period | | $ | 13.91 | | | $ | 13.61 | | | $ | 15.41 | | | $ | 14.02 | | | $ | 14.40 | | | $ | 12.73 | |
Market value, end of period | | $ | 12.89 | | | $ | 12.46 | | | $ | 16.21 | | | $ | 13.48 | | | $ | 14.53 | | | $ | 11.87 | |
Total investment return (b) | | | | | | | | | | | | | | | | | | | | | | | | |
Net asset value | | | 5.53 | % | | | -6.01 | % | | | 17.50 | % | | | 4.57 | % | | | 21.21 | % | | | 2.83 | % |
Market value | | | 7.12 | % | | | -18.13 | % | | | 28.56 | % | | | -0.32 | % | | | 31.45 | % | | | 8.65 | % |
Ratios and supplemental data | | | | | | | | | | | | | | | | | | | | | | | | |
Net assets, end of period (thousands) | | $ | 94,566 | | | $ | 92,573 | | | $ | 104,622 | | | $ | 94,913 | | | $ | 97,190 | | | $ | 101,016 | |
Ratio of expenses to average net assets (excluding interest expense and net of fee waivers) (d) | | | 1.42 | %(c) | | | 1.33 | % | | | 1.36 | % | | | 1.46 | % | | | 1.35 | % | | | 1.54 | % |
Ratio of expenses to average net assets (excluding
interest expense and excluding fee waivers) (d) | | | 1.69 | %(c) | | | 1.58 | % | | | 1.62 | % | | | 1.72 | % | | | 1.69 | % | | | 1.91 | % |
Ratio of expenses to average net assets (including
interest expense and net of fee waivers) (d) | | | 1.42 | %(c) | | | 1.33 | % | | | 1.36 | % | | | 1.46 | % | | | 1.35 | % | | | 1.54 | % |
Ratio of expenses to average net assets (including
interest expense and excluding fee waivers) (d) | | | 1.69 | %(c) | | | 1.58 | % | | | 1.62 | % | | | 1.72 | % | | | 1.69 | % | | | 1.91 | % |
Ratio of net investment income to average net assets (d) | | | 7.22 | %(c) | | | 6.70 | % | | | 7.38 | % | | | 8.09 | % | | | 7.68 | % | | | 8.65 | % |
Portfolio turnover | | | 11 | % | | | 23 | % | | | 15 | % | | | 8 | % | | | 6 | % | | | 21 | % |
Preferred shares, at redemption value ($25,000 per share liquidation preference) (thousands) | | $ | 69,450 | | | $ | 69,450 | | | $ | 69,450 | | | $ | 69,450 | | | $ | 69,450 | | | $ | 69,450 | |
Preferred shares asset coverage per share | | $ | 59,041 | | | $ | 58,324 | | | $ | 62,661 | | | $ | 59,166 | | | $ | 59,986 | | | $ | 61,363 | |
| (a) | Based on average shares outstanding during the period. |
| (b) | Total investment return is calculated assuming a purchase of a common share at the beginning of the period and a sale on the last day of the period reported either at net asset value (NAV) or market price per share. Dividends and distributions are assumed to be reinvested at NAV for returns at NAV or in accordance with the Fund’s dividend reinvestment plan for returns at market value. Total investment return does not reflect brokerage commissions. A return calculated for a period of less than one year is not annualized. |
| (c) | Annualized. |
| (d) | Calculated on the basis of income and expenses applicable to both common and preferred shares relative to average net assets of common shareholders. |
See notes to financial statements.
MZF l MANAGED DURATION INVESTMENT GRADE MUNICIPAL FUND SEMIANNUAL REPORT l 17
NOTES TO FINANCIAL STATEMENTS (Unaudited) | January 31, 2014 |
Note 1 – Organization:
The Managed Duration Investment Grade Municipal Fund (the “Fund”) was organized as a Delaware statutory trust on May 20, 2003. The Fund is registered as a diversified, closed-end management investment company under the Investment Company Act of 1940, as amended. The Fund’s investment objective is to provide its common shareholders with high current income exempt from regular federal income tax while seeking to protect the value of the Fund’s assets during periods of interest rate volatility. Prior to commencing operations on August 27, 2003, the Fund had no operations other than matters relating to its organization and registration and the sale and issuance of 6,981 common shares of beneficial interest to MBIA Capital Management Corp. (now known as Cutwater Investor Services Corp.).
Note 2 – Accounting Policies:
The preparation of financial statements in accordance with US generally accepted accounting principles (“GAAP”) requires management to make estimates and assumptions that affect the reported amounts and disclosures in the financial statements. Actual results could differ from those estimates.
The following is a summary of significant accounting policies followed by the Fund.
(a) Valuation of Investments: The municipal bonds and preferred shares in which the Fund invests are traded primarily in the over-the-counter markets. In determining net asset value, the Fund uses the valuations of portfolio securities furnished by a pricing service approved by the Board of Trustees. The pricing service typically values portfolio securities at the bid price or the yield equivalent when quotations are readily available. Securities for which quotations are not readily available are valued at fair market value on a consistent basis as determined by the pricing service using a matrix system to determine valuations. The procedures of the pricing service and its valuations are reviewed by the officers of the Fund under the general supervision of the Board of Trustees. Positions in futures contracts, interest rate swaps and options on interest rate swaps (“swaptions”) are valued at closing prices for such contracts established by the exchange or dealer market on which they are traded.
For those securities where quotations or prices are not available, the valuations are determined in accordance with procedures established in good faith by management and approved by the Board of Trustees. Valuations in accordance with these procedures are intended to reflect each security’s (or asset’s) “fair value”. Fair value is defined as the price that the Fund would receive to sell an investment or pay to transfer a liability in an orderly transaction with an independent buyer in the principal market, or in the absence of a principal market, the most advantageous market for the investment or liability. Each such determination should be based on a consideration of all relevant factors, which are likely to vary from one pricing context to another. Examples of such factors may include, but are not limited to: (i) the type of security, (ii) the initial cost of the security, (iii) the existence of any contractual restrictions on the security’s disposition, (iv) the price and extent of public trading in similar securities of the issuer or of comparable issuers, (v) quotations or evaluated prices from broker-dealers and/or pricing services, (vi) information obtained from the issuer, analysts, and/or the appropriate stock exchange (for exchange traded securities), (vii) an analysis of the company’s financial statements, and (viii) an evaluation of the forces that influence the issuer and the market(s) in which the security is purchased and sold (e.g. the existence of pending merger activity, public offerings or tender offers that might affect the value of the security).
There are three different categories for valuations. Level 1 valuations are those based upon quoted prices in active markets. Level 2 valuations are those based upon quoted prices in inactive markets or based upon significant observable inputs (e.g. yield curves; benchmark interest rates; indices). Level 3 valuations are those based upon unobservable inputs (e.g. discounted cash flow analysis; non-market based methods used to determine fair valuation).
The Fund values Level 1 securities using readily available market quotations in active markets. Money market funds are valued at net asset value. The Fund values Level 2 fixed income securities using independent pricing providers who employ matrix pricing models utilizing market prices, broker quotes and prices of securities with comparable maturities and qualities. The Fund values Level 2 equity securities using various observable market inputs as described above. The Fund did not have any Level 3 securities during the period ended January 31, 2014.
Transfers between valuation levels, if any, are in comparison to the valuation levels at the end of the previous fiscal year, and are effective using the fair value as of the end of the current fiscal period.
The following table represents the Fund’s investments carried on the Statement of Assets and Liabilities by caption and by level within the fair value hierarchy as of January 31, 2014:
Valuations (in $000s) | | Level 1 | | | Level 2 | | | Level 3 | | | Total | |
Description | | | | | | | | | | | | |
Assets: | | | | | | | | | | | | |
Municipal Bonds | | $ | – | | | $ | 160,072 | | | $ | – | | | $ | 160,072 | |
Preferred Shares | | | – | | | | 2,085 | | | | – | | | | 2,085 | |
Money Market | | | 86 | | | | – | | | | – | | | | 86 | |
Total | | $ | 86 | | | $ | 162,157 | | | $ | – | | | $ | 162,243 | |
There were no transfers between levels for the six months ended January 31, 2014.
(b) Investment Transactions and Investment Income: Investment transactions are accounted for on the trade date. Realized gains and losses on investments are determined on the identified cost basis. Interest income and expenses are accrued daily. All discounts/premiums are accreted/amortized for financial reporting purposes over the life of each security.
(c) Dividends and Distributions: The Fund declares and pays on a monthly basis dividends from net investment income to common shareholders. Distributions of net realized capital gains, if any, will be paid at least annually. Dividends and distributions to shareholders are recorded on the ex-dividend date. Dividends and distributions to preferred shareholders are accrued and determined as described in Note 6.
18 l MZF l MANAGED DURATION INVESTMENT GRADE MUNICIPAL FUND SEMIANNUAL REPORT
NOTES TO FINANCIAL STATEMENTS (Unaudited) continued | January 31, 2014 |
(d) Inverse Floating Rate Investments and Floating Rate Note Obligations: Inverse floating rate instruments are notes whose coupon rate fluctuates inversely to a predetermined interest rate index. These instruments typically involve greater risks than a fixed rate municipal bond. In particular, the holder of these inverse floating rate instruments retain all credit and interest rate risk associated with the full underlying bond and not just the par value of the inverse floating rate instrument. As such, these instruments should be viewed as having inherent leverage and therefore involve many of the risks associated with leverage. Leverage is a speculative technique that may expose the Fund to greater risk and increased costs. Leverage may cause the Fund’s net asset value to be more volatile than if it had not been leveraged because leverage tends to magnify the effect of any increases or decreases in the value of the Fund’s portfolio securities. The use of leverage may also cause the Fund to liquidate portfolio positions when it may not be advantageous to do so in order to satisfy its obligations with respect to inverse floating rate instruments.
The Fund may invest in inverse floating rate securities through either a direct purchase or through the transfer of bonds to a dealer trust in exchange for cash and/or residual interests in the dealer trust. For those inverse floating rate securities purchased directly, the instrument is included in the Portfolio of Investments with income recognized on an accrual basis. The Fund did not invest in inverse floating rate securities during the period ended January 31, 2014.
Note 3 – Agreements:
Pursuant to an Investment Advisory Agreement (the “Advisory Agreement”) between Cutwater Investor Services Corp. (the “Adviser” or “Cutwater”) and the Fund, the Adviser is responsible for the daily management of the Fund’s portfolio, which includes buying and selling securities for the Fund, as well as investment research, subject to the direction of the Fund’s Board of Trustees. The Adviser is a subsidiary of Cutwater Holdings, LLC which, in turn, is a wholly-owned subsidiary of MBIA, Inc. The Advisory Agreement provides that the Fund shall pay to the Adviser a monthly fee for its services at the annual rate of 0.39% of the sum of the Fund’s average daily managed assets. (“Managed Assets” represent the Fund’s total assets including the assets attributable to the proceeds from any financial leverage but excluding the assets attributable to floating rate note obligations, minus liabilities, other than debt representing financial leverage.) The Adviser contractually agreed to waive a portion of the management fees it is entitled to receive from the Fund at the annual rate of 0.09% of the Fund’s average daily Managed Assets for a one-year period set to expire June 30, 2014.
Pursuant to a Servicing Agreement, Guggenheim Funds Distributors, LLC (the “Servicing Agent”) acts as servicing agent to the Fund. The Servicing Agent receives an annual fee from the Fund, payable monthly in arrears, in an amount equal to 0.26% of the average daily value of the Fund’s Managed Assets. The Servicing Agent contractually agreed to waive a portion of the servicing fee it is entitled to receive from the Fund at the annual rate of 0.06% of the average daily value of the Fund’s Managed Assets for a one-year period set to expire June 30, 2014.
Prior to May 14, 2013, under a separate Fund Administration Agreement, (“the Administration Agreement”) Guggenheim Funds Investment Advisors, LLC (“GFIA”), an affiliate of the Servicing Agent, provided Fund Administration services to the Fund. Effective May 14, 2013, the Board of Trustees approved Rydex Fund Services, LLC (“RFS”) to replace GFIA as the Administrator of the Fund. Both RFS and GFIA are affiliates of Guggenheim Partners, LLC, a global diversified financial services firm. There is no impact to the Fund as a result of this change. As compensation for services under the Administration Agreement, GFIA previously received and RFS currently receives a fund administration fee payable monthly at the annual rate set forth below as a percentage of the average daily managed assets of the Fund:
Managed Assets | Rate |
First $200,000,000 | 0.0275% |
Next $300,000,000 | 0.0200% |
Next $500,000,000 | 0.0150% |
Over $1,000,000,000 | 0.0100% |
The Bank of New York Mellon (“BNY”) acts as the Fund’s custodian, accounting agent and auction agent. As custodian, BNY is responsible for the custody of the Fund’s assets. As accounting agent, BNY is responsible for maintaining the books and records of the Fund. As auction agent, BNY is responsible for conducting the auction of the preferred shares.
Certain officers and/or trustees of the Fund are officers and/or directors of the Adviser and the Servicing Agent. The Fund does not compensate its officers or trustees who are officers, directors and/or employees of the aforementioned firms.
Note 4 – Federal Income Taxes:
The Fund intends to comply with the requirements of Subchapter M of the Internal Revenue Code of 1986, as amended, applicable to regulated investment companies. Accordingly, no provision for US federal income taxes is required. In addition, by distributing substantially all of its ordinary income and long-term capital gains, if any, during each calendar year, the Fund intends not to be subject to U.S. federal excise tax.
Information on the tax components of investments as of January 31, 2014 is as follows:
| | | |
$158,127,056 | $7,559,650 | $(3,443,627) | $4,116,023 |
The difference between book and tax basis cost of investments is due to book/tax differences on the recognition of partnership/trust income.
As of July 31, 2013 (the most recent fiscal year end for federal income tax purposes), the components of accumulated earnings/(losses) on a tax basis were as follows:
| | | | | |
2013 | $159,169 | $0 | $(5,636,771) | $2,179,831 |
MZF l MANAGED DURATION INVESTMENT GRADE MUNICIPAL FUND SEMIANNUAL REPORT l 19
NOTES TO FINANCIAL STATEMENTS (Unaudited) continued | January 31, 2014 |
The cumulative timing differences under tax basis accumulated capital and other losses as of July 31, 2013 are due to investments in partnerships/trusts.
As of July 31, 2013 (the most recent fiscal year end for federal income tax purposes), the Fund had a capital loss carryforward of $5,636,771 available to offset possible future capital gains. The capital loss carryforward is set to expire as follows: $625,460 on July 31, 2014, $4,772,269 on July 31, 2017. Additionally, the Fund has available long-term capital losses of $239,042 that do not have an expiration. Per the Regulated Investment Company Modernization Act of 2010, capital loss carryforwards generated in taxable years beginning after December 22, 2010 must be fully used before capital loss carryforwards generated in taxable years prior to December 22, 2010, therefore, under certain circumstances, capital loss carryforwards available as of the report date may expire unused.
Distributions paid to shareholders during the tax years ended July 31, 2013 (the most recent fiscal year end for federal income tax purposes), were characterized as follows:
| | | | |
2013 | $7,336,722 | $6,783 | $7,343,505 |
For all open tax years and all major jurisdictions, management of the Fund has concluded that there are no significant uncertain tax positions that would require recognition in the financial statements. Uncertain tax positions are tax positions taken or expected to be taken in the course of preparing the Fund’s tax returns that would not meet a more-likely-than-not threshold of being sustained by the applicable tax authority and would be recorded as a tax expense in the current year. Open tax years are those years that are open for examination by taxing authorities (i.e. generally the last four tax year ends and the interim tax period since then). Furthermore, management of the Fund is also not aware of any tax positions for which it is reasonably possible that the total amounts of unrecognized tax benefits will significantly change in the next twelve months.
Note 5 – Investment Transactions:
Purchases and sales of investment securities, excluding short-term investments, for the six months ended January 31, 2014, aggregated $17,405,682 and $17,517,739, respectively.
Note 6 – Capital:
There are an unlimited number of $.001 par value common shares of beneficial interest authorized and 6,800,476 common shares outstanding at January 31, 2014, of which the Adviser owned 13,102 shares.
Transactions in common shares were as follows: | |
| | Six Months Ended January 31, 2014 | |
Beginning shares | 6,800,476 | 6,787,494 |
Shares issued through dividend reinvestment | – | 12,982 |
Ending shares | 6,800,476 | 6,800,476 |
On October 27, 2003, the Fund issued 1,389 shares of Auction Market Preferred Shares (“AMPS”), Series M7 and 1,389 shares of Auction Market Preferred Shares, Series W28. The preferred shares have a liquidation value of $25,000 per share plus any accumulated unpaid dividends. As of January 31, 2014, the Fund had 1,389 shares each of AMPS, Series M7 and W28, outstanding. Dividends on the preferred shares are cumulative at a rate that is set by auction procedures. Distributions of net realized capital gains, if any, are made annually.
The broad auction-rate preferred securities market, including the Fund’s AMPS, has experienced considerable disruption since mid-February 2008. The result has been failed auctions on nearly all auction-rate preferred shares, including the Fund’s AMPS. A failed auction is not a default, nor does it require the redemption of the Fund’s AMPS.
Provisions in the AMPS offering documents establish a maximum rate in the event of a failed auction. The AMPS reference rate is the higher of LIBOR or 90% of the taxable equivalent of the short-term municipal bond rate. The maximum rate, for auctions for which the Fund has not given notice that the auction will consist of net capital gains or other taxable income, is the higher of the reference rate times 110% or the reference rate plus 1.10%.
Previously, the taxable equivalent of the short-term municipal bond rate was calculated based on an index called the S&P Weekly High Grade Index. In October 2012, the Fund was notified that the Standard & Poor’s Evaluation Services was discontinuing the publication of the S&P Weekly High Grade Index effective December 31, 2012. After evaluating various indices as a potential successor to the S&P Weekly High Grade Index, the Advisor and Servicing Agent determined that an index called the S&P Municipal Bond 7-Day High Grade Rate Index most closely resembled the S&P Weekly High Grade Index and would be the least disruptive selection to the Fund’s current AMPS holders. After analyzing various alternatives, the Board of Trustees approved the Fund to utilize the S&P Municipal Bond 7-Day High Grade Rate Index as the successor to the S&P Weekly High Grade Index.
Management will continue to monitor events in the marketplace and continue to evaluate the Fund’s leverage as well as any alternative that may be available.
The range of dividend rates on the Fund’s AMPS for the six months ended January 31, 2014, were as follows:
Series | Low | High | At 1/31/14 | |
M7 | 1.218% | 1.252% | 1.218% | 2/3/14 |
W28 | 1.218% | 1.258% | 1.218% | 2/19/14 |
The Fund is subject to certain limitations and restrictions while the AMPS are outstanding. Failure to comply with these limitations and restrictions could preclude the Fund from declaring any dividends or distributions to common shareholders or repurchasing common shares and/or could trigger the mandatory redemption of AMPS at their liquidation value plus any accrued dividends.
20 l MZF l MANAGED DURATION INVESTMENT GRADE MUNICIPAL FUND SEMIANNUAL REPORT
NOTES TO FINANCIAL STATEMENTS (Unaudited) continued | January 31, 2014 |
On July 12, 2012, Moody’s Investors Service, Inc. (“Moody’s”) notified the Servicing Agent and Cutwater that Moody’s downgraded the Fund’s AMPS from ’Aaa’ to ’Aa1’. This downgrade was a result of Moody’s new methodology for rating debt and preferred stock issued by closed-end funds and in line with downgrades experienced by other tax-exempt national municipal closed-end funds. On August 21, 2012, the Board of Trustees approved the termination of Moody’s as a rating agency with regard to rating both series of the Fund’s AMPS. On December 21, 2012, Moody’s withdrew its Aa1 rating assigned to the Fund’s AMPS.
The Fund’s AMPS, which are entitled to one vote per share, generally vote with the common shares but vote separately as a class to elect two Trustees and on any matters affecting the rights of the Fund’s AMPS.
Note 7 – Borrowings:
The Fund has an uncommitted $2,000,000 line of credit with BNY. Interest on the amount borrowed is based on the Federal Funds Rate plus a spread on outstanding balances. At January 31, 2014, there was a $0 balance in connection with the Fund’s uncommitted line of credit. The average daily amount of borrowings during the six months ended January 31, 2014 was $96,957 with a related weighted average interest rate of 0.84%. The maximum amount outstanding during the six months ended January 31, 2014, was $950,000.
Note 8 – Indemnifications:
In the normal course of business, the Fund enters into contracts that contain a variety of representations, which provide general indemnifications. The Fund’s maximum exposure under these arrangements is unknown, as this would require future claims that may be made against the Fund that have not yet occurred. However, the Fund expects the risk of loss to be remote.
Note 9 – Subsequent Events:
The Fund evaluated subsequent events through the date the financial statements were available for issue and determined there were no additional material events that would require disclosure in the Fund’s financial statements, except as noted below.
Dividend Declarations – Common Shareholders
The Fund has declared the following dividends to common shareholders:
| | | | |
$0.0700 | 2/03/14 | 2/12/14 | 2/14/14 | 2/28/14 |
$0.0700 | 3/03/14 | 3/12/14 | 3/14/14 | 3/31/14 |
MZF l MANAGED DURATION INVESTMENT GRADE MUNICIPAL FUND SEMIANNUAL REPORT l 21
SUPPLEMENTAL INFORMATION (Unaudited) | January 31, 2014 |
Results of Shareholder Votes
A shareholder meeting was held on November 6, 2013 and reconvened on December 18, 2013 for the purpose of electing two Class III Trustees of the Fund by holders of the Fund’s common shares and the Fund’s AMPS, voting together as a single class and one each of a Class I and Class II Trustee by holders of the Fund’s AMPS, voting as a single class.
With regard to the November 6, 2013 meeting relating to the election of the following Class I, Class II and Class III Trustees by shareholders of the Fund:
| | In Favor Of | Withheld |
Randall C. Barnes (Class III) | 6,354,608 | 66,335 |
Clifford D. Corso (Class III) | 6,353,690 | 67,253 |
Ronald A. Nyberg (Class I) | 436 | 38 |
Ronald E. Toupin, Jr. (Class II) | 436 | 38 |
With regard to the December 18, 2013 meeting relating to the election of the following Class I, Class II and Class III Trustees by preferred shareholders of the Fund:
| | In Favor Of | Withheld |
Randall C. Barnes (Class III) | 436 | 41 |
Clifford D. Corso (Class III) | 436 | 41 |
Ronald A. Nyberg (Class I) | 436 | 41 |
Ronald E. Toupin, Jr. (Class II) | 436 | 41 |
As a result, Randall C. Barnes and Clifford D. Corso were elected to serve as Class III Trustees until 2016 or the election of their successor by a majority of the holders of the Fund’s common shares and the Fund’s AMPS. A quorum was not reached and a shareholder vote did not occur with regards to the Fund’s Class I Trustee, Ronald A. Nyberg, and Ronald E. Toupin, Jr., a Class II Trustee. Messrs. Nyberg and Toupin are expected to stand for re-election again at the Fund’s 2014 annual meeting of shareholders.
The other Trustee of the Fund whose term did not expire in 2013 is Donald C. Cacciapaglia.
Trustees
The Trustees of the Managed Duration Investment Grade Municipal Fund and their principal occupations during the past five years:
Name, Address*, Year
of Birth and Position(s)
Held with Registrant | Term of Office**
and Length
of Time Served | Principal Occupations during the Past Five Years
and Other Affiliations | Number of
Portfolios in the
Fund Complex***
Overseen by Trustee | Other Directorships
Held by Trustee |
Independent Trustees: | | | | |
Randall C. Barnes
Year of Birth: 1951
Trustee | Since 2006 | Private Investor (2001-present). Formerly, Senior Vice President and Treasurer, PepsiCo, Inc. (1993-1997), President, Pizza Hut International (1991-1993) and Senior Vice President, Strategic Planning and New Business Development of PepsiCo, Inc. (1987-1990). | 50 | None |
Ronald A. Nyberg
Year of Birth: 1953
Trustee | Since 2003 | Partner of Nyberg & Cassioppi, LLC, a law firm specializing in corporate law, estate planning and business transactions (2000-present). Formerly, Executive Vice President, General Counsel and Corporate Secretary of Van Kampen Investments (1982-1999). | 52 | None |
Ronald E. Toupin, Jr.
Year of Birth: 1958
Trustee, Chairman | Since 2003 | Portfolio Consultant (2010-present). Formerly, Vice President, Manager and Portfolio Manager of Nuveen Asset Management (1998-1999), Vice President of Nuveen Investment Advisory Corp. (1992-1999), Vice President and Manager of Nuveen Unit Investment Trusts (1991-1999), and Assistant Vice President and Portfolio Manager of Nuveen Unit Investment Trusts (1988-1999), each of John Nuveen & Co., Inc. (1982-1999). | 49 | Trustee, Bennett Group of Funds (2011-September 2013). |
22 l MZF l MANAGED DURATION INVESTMENT GRADE MUNICIPAL FUND SEMIANNUAL REPORT
SUPPLEMENTAL INFORMATION (Unaudited) continued | January 31, 2014 |
Name, Address*, Year
of Birth and Position(s)
Held with Registrant | Term of Office**
and Length
of Time Served | Principal Occupations during the Past Five Years
and Other Affiliations | Number of
Portfolios in the
Fund Complex***
Overseen by Trustee | Other Directorships
Held by Trustee |
Interested Trustees: | | | | |
Donald C. Cacciapaglia†
Year of Birth: 1951
Trustee | Since 2012 | Senior Managing Director of Guggenheim Investments (2010-present); Chief Executive Officer of Guggenheim Funds Services, LLC (2012-present); Chief Executive Officer (2012-present) and President (2010-present), Guggenheim Funds Distributors, LLC and Guggenheim Funds Investment Advisors, LLC; Chief Executive Officer of certain funds in the Fund Complex (2012-present); President and Director of SBL Fund, Security Equity Fund, Security Income Fund, Security Large Cap Value Fund, and Security Mid Cap Growth Fund (2012-present); President, CEO and Trustee of Rydex Dynamic Funds, Rydex ETF Trust, Rydex Series Funds and Rydex Variable Trust (2012-present). Formerly, Chairman and CEO of Channel Capital Group Inc. and Channel Capital Group LLC (2002-2010). | 211 | Trustee, Rydex Dynamic Funds, Rydex ETF Trust, Rydex Series Funds and Rydex Variable Trust (2012-present); Independent Board Member, Equitrust Life Insurance Company, Guggenheim Life and Annuity Company, and Paragon Life Insurance Company of Indiana (2011-present). |
Clifford D. Corso††
113 King Street
Armonk, NY 10504
Year of Birth: 1961
Trustee, Chief
Executive Officer
and President | Since 2003 | President of Cutwater Investor Services Corp.; Chief Investment Officer, MBIA Insurance Corp. | 1 | None |
| * | The business address of each Trustee unless otherwise noted is c/o Managed Duration Investment Grade Municipal Fund, 2455 Corporate West Drive, Lisle, IL 60532. |
| ** | Each Trustee is expected to serve a three-year term concurrent with the class of Trustees for which he serves: |
-Mr. Donald Cacciapaglia is a Class II Trustee. A Class II Trustee is expected to stand for re-election at the Fund’s annual meeting of shareholders for fiscal year ending July 31, 2015.
-Messrs. Barnes and Corso are Class III Trustees. Class III Trustees are expected to stand for re-election at the Fund’s annual meeting of shareholders for fiscal year ending July 31, 2016.
-Due to the fact that there was not a quorum at the 2013 shareholder meetings, Mr. Nyberg, as a holdover Class I Trustee, and Mr. Toupin, as a holdover Class II Trustee, are expected to stand for re-election at the Fund’s annual meeting of shareholders for fiscal year ending July 31, 2014.
| *** | As of period end. The Guggenheim Investments Fund Complex consists of U.S. registered investment companies advised or serviced by Guggenheim Funds Investment Advisors, LLC or Guggenheim Funds Distributors, LLC and/or affiliates of such entities. The Guggenheim Investments Fund Complex is overseen by multiple Boards of Trustees. |
| † | Mr. Donald C. Cacciapaglia is an “interested person” (as defined in Section 2(a)(19) of the 1940 Act) (“Interested Trustee”) of the Fund because of his position as an officer of Guggenheim Funds Distributors, LLC, the Fund’s Servicing Agent and certain of its affiliates. |
| †† | Mr. Clifford D. Corso is an “interested person” (as defined in Section 2(a)(19) of the 1940 Act) (“Interested Trustee”) of the Fund because of his position as an officer of Cutwater Investor Services Corp., the Fund’s Investment Adviser. |
MZF l MANAGED DURATION INVESTMENT GRADE MUNICIPAL FUND SEMIANNUAL REPORT l 23
SUPPLEMENTAL INFORMATION (Unaudited) continued | January 31, 2014 |
Executive Officers
The executive officers of the Managed Duration Investment Grade Municipal Fund and their principal occupations during the past five years
Name, Address*, Year of Birth and Position(s) Held with Registrant | Term of Office** and Length of Time Served | Principal Occupations During the Past Five Years and Other Affiliations |
Officers: | | |
Amy J. Lee
Year of Birth: 1961
Chief Legal Officer | Since 2013 | Managing Director, Guggenheim Investments (2012-present); Senior Vice President & Secretary, Security Investors, LLC (2010-present); Secretary & Chief Compliance Officer, Security Distributors, Inc. (1987-2012); Vice President, Associate General Counsel & Assistant Secretary, Security Benefit Life Insurance Company and Security Benefit Corporation (1987-2012); Vice President & Secretary, Rydex Series Funds, Rydex ETF Trust, Rydex Dynamic Funds, and Rydex Variable Trust (2008-present). Officer of certain funds in the Fund Complex (2012-present). |
John L. Sullivan
Year of Birth: 1955
Chief Financial Officer,
Chief Accounting Officer
and Treasurer | Since 2011 | Senior Managing Director – Fund Administration, Guggenheim Investments (2010-present). Chief Financial Officer, Chief Accounting Officer and Treasurer of certain funds in the Fund Complex. Formerly, Chief Compliance Officer, Van Kampen Funds (2004-2010). Head of Fund Accounting, Morgan Stanley Investment Management (2002-2004). Chief Financial Officer, Treasurer, Van Kampen Funds (1996-2004). |
Joanna M. Catalucci
Year of birth: 1966
Chief Compliance Officer | Since 2012 | Managing Director of Compliance and Fund Board Relations, Guggenheim Investments (2012-present). Formerly, Chief Compliance Officer & Secretary, SBL Fund; Security Equity Fund; Security Income Fund; Security Large Cap Value Fund & Security Mid Cap Growth Fund; Vice President, Rydex Holdings, LLC; Vice President, Security Benefit Asset Management Holdings, LLC; and Senior Vice President & Chief Compliance Officer, Security Investors, LLC (2010-2012); Security Global Investors, LLC, Senior Vice President (2010-2011); Rydex Advisors, LLC (f/k/a PADCO Advisors, Inc.) and Rydex Advisors II, LLC (f/k/a PADCO Advisors II, Inc.), Chief Compliance Officer and Senior Vice President (2010-2011); Rydex Capital Partners I, LLC & Rydex Capital Partners II, LLC, Chief Compliance Officer (2006-2007); and Rydex Fund Services, LLC (f/k/a Rydex Fund Services, Inc.), Vice President (2001-2006). Chief Compliance Officer of certain funds in the Fund Complex. |
Mark E. Mathiasen
Year of Birth: 1978
Secretary | Since 2007 | Director; Associate General Counsel of Guggenheim Funds Services, LLC (2007-present). Secretary of certain funds in the Fund Complex. |
Stevens T. Kelly
Year of Birth: 1982
Assistant Secretary | Since 2012 | Assistant General Counsel of Guggenheim Funds Services, LLC (2011 to present). Assistant Secretary of certain other funds in the Fund Complex. Previously, associate at K&L Gates LLP (2008-2011). |
| * | The business address of each officer, unless otherwise noted, is c/o Managed Duration Investment Grade Municipal Fund, 2455 Corporate West Drive, Lisle, IL 60532. |
| ** | Officers serve at the pleasure of the Board of Trustees and until his or her successor is appointed and qualified or until his or her earlier resignation or removal. |
24 l MZF l MANAGED DURATION INVESTMENT GRADE MUNICIPAL FUND SEMIANNUAL REPORT
DIVIDEND REINVESTMENT PLAN (Unaudited) | January 31, 2014 |
Pursuant to the Fund’s Automatic Dividend Reinvestment Plan (the “Plan”), unless a shareholder is ineligible or elects otherwise, all dividend and capital gains distributions are automatically reinvested by Computershare Shareowner Services LLC (“the Plan Administrator”), as agent for shareholders in administering the Plan (the “Plan Agent”), in additional common shares of the Fund. Shareholders whose shares are held in the name of a broker or nominee should contact such broker or nominee to confirm that they are eligible to participate in the Plan. Shareholders who are ineligible or who elect not to participate in the Plan will receive all dividends and distributions in cash paid by check mailed directly to the shareholder of record (or, if the shares are held in street or other nominee name, then to such nominee) by the Plan Administrator, as dividend paying agent. Such shareholders may elect not to participate in the Plan and to receive all distributions of dividends and capital gains in cash by sending written instructions to the Plan Administrator, as dividend paying agent, at the address set forth below. Participation in the Plan is completely voluntary and may be terminated or resumed at any time without penalty by written notice if received by the Plan Agent not less than ten days prior to any dividend record date; otherwise, such termination will be effective with respect to any subsequently declared dividend or capital gains distribution.
Whenever the Fund declares an ordinary income dividend or a capital gain dividend (collectively referred to as “dividends”) payable in cash, nonparticipants in the Plan will receive cash, and participants in the Plan will receive the equivalent in common shares. The shares are acquired by the Plan Agent for the participant’s account, depending upon the circumstances described below, either (i) through receipt of additional unissued but authorized common shares from the Fund (“newly issued shares”) or (ii) by purchase of outstanding common shares on the open market (“open-market purchases”) on the New York Stock Exchange or elsewhere. If, on the dividend payment date, the market price per common share plus estimated brokerage commissions is greater than the net asset value per common share (such condition being referred to herein as “market premium”), the Plan Agent will invest the dividend amount in newly issued shares on behalf of the participant. The number of newly issued common shares to be credited to the participant’s account will be determined by dividing the dollar amount of the dividend by the net asset value per share on the payment date, provided that, if the net asset value per share is less than or equal to 95% of the market price per share on the payment date, the dollar amount of the dividend will be divided by 95% of the market price per share on the payment date. If on the dividend payment date the net asset value per share is greater than the market value plus estimated brokerage commissions (such condition being referred to herein as “market discount”), the Plan Agent will invest the dividend amount in shares acquired on behalf of the participant in open-market purchases.
If, before the Plan Agent has completed its open-market purchases, the market price of the common shares exceeds the net asset value per share, the average per share purchase price paid by the Plan Agent may exceed the net asset value of the Fund’s shares, resulting in the acquisition of fewer shares than if the dividend had been paid in newly issued shares on the dividend payment date. Because of the foregoing difficulty with respect to open-market purchases, the Plan provides that if the Plan Agent is unable to invest the full dividend amount in open-market purchases during the purchase period or if the market discount shifts to a market premium during the purchase period, the Plan Agent may cease making open-market purchases and may invest the uninvested portion of the dividend amount in newly issued shares at the net asset value per share at the close of business on the last purchase date; provided that, if the net asset value per share is less than 95% of the market price per share on the payment date, the dollar amount of the dividend will be divided by 95% of the market price per share on the payment date.
The Plan Agent maintains all shareholders’ accounts in the Plan and furnishes written confirmation of all transactions in the account, including information needed by shareholders for tax records. Shares in the account of each Plan participant will be held by the Plan Agent in the name of the participant, and each shareholder’s proxy will include those shares purchased or received pursuant to the Plan. The Plan Agent will forward all proxy solicitation materials to participants and vote proxies for shares held pursuant to the Plan in accordance with the instructions of the participants.
There will be no brokerage charges with respect to shares issued directly by the Fund as a result of dividends or capital gains distributions payable either in shares or in cash. However, each participant will pay a pro rata share of brokerage commissions incurred with respect to the Plan Agent’s open-market purchases in connection with the reinvestment of dividends. The automatic reinvestment of dividends and distributions will not relieve participants of any Federal, state or local income tax that may be payable (or required to be withheld) on such dividends.
The Fund reserves the right to amend or terminate the Plan. There is no direct service charge to participants in the Plan; however, the Fund reserves the right to amend the Plan to include a service charge payable by the participants. All questions and correspondence concerning the Plan should be directed to the Plan Administrator, Computershare Shareowner Services LLC, P.O. Box 30170, College Station, TX 77842-3170; Attention Shareholder Services Department, Phone Number: (866) 488-3559.
MZF l MANAGED DURATION INVESTMENT GRADE MUNICIPAL FUND SEMIANNUAL REPORT l 25
This Page Intentionally Left Blank.
FUND INFORMATION | January 31, 2014 |
Board of Trustees | Executive Officers | Investment Adviser | Accounting Agent, |
Randall C. Barnes | Clifford D. Corso | Cutwater Investor | Custodian and |
| | President and Chief | Services Corp. | Auction Agent |
Donald C. Cacciapaglia* | Executive Officer | Armonk, New York | The Bank of New York |
| | | | Mellon |
Clifford D. Corso** | Amy J. Lee | Servicing Agent | |
| | Chief Legal Officer | Guggenheim Funds | |
Ronald A. Nyberg | | Distributors, LLC | Legal Counsel |
| | John L. Sullivan | Lisle, Illinois | Simpson Thacher & |
Ronald E. Toupin, Jr., | Chief Financial Officer, | | Bartlett LLP |
| Chairperson | Chief Accounting Officer | Administrator | New York, New York |
| | and Treasurer | Rydex Fund Services, LLC | |
* Trustee is an “interested | | Rockville, Maryland | Independent Registered |
person” (as defined in | Joanna M. Catalucci | | Public Accounting Firm |
section 2 (a) (19) of the | Chief Compliance Officer | | Ernst & Young LLP |
1940 Act) (“Interested | | | Chicago, Illinois |
Trustee”) of the Fund | Mark E. Mathiasen | | |
because of his position as | Secretary | | |
an officer of the Fund’s | | | |
Servicing Agent and | Stevens T. Kelly | | |
certain of its affiliates. | Assistant Secretary | | |
| |
**Trustee is an “interested | | | |
person” (as defined in | | | |
section 2 (a) (19) of the | | | |
1940 Act) (“Interested | | | |
Trustee”) of the Fund | | | |
because of his position as | | | |
an officer of the Fund’s | | | |
Investment Adviser. | | | |
Privacy Principles of Managed Duration Investment Grade Municipal Fund for Shareholders
The privacy of your personal financial information is extremely important to us. When you open an account with us, we collect a significant amount of information from you in order to properly invest and administer your account. We take very seriously the obligation to keep that information private and confidential, and we want you to know how we protect that important information.
We collect nonpublic personal information about you from applications or other forms you complete and from your transactions with us and our affiliates. We do not disclose information about you, or our former clients, to our affiliates or to service providers or third parties, except as permitted by law. We share only the minimum information required to properly administer your accounts, which enables us to send transaction confirmations, monthly or quarterly statements, financial and tax forms. Even within Cutwater and its affiliated entities, only a limited number of people who actually service accounts will ever have access to your personal financial information. Further, we do not share information about our current or former clients with any outside marketing groups or sales entities.
To ensure the highest degree of security and confidentiality, Cutwater and its affiliates maintain various physical, electronic and procedural safeguards to protect your personal information. We also apply special measures for authentication of information you request or submit to us on our website- www.Cutwater.com.
Questions concerning your shares of Managed Duration Investment Grade Municipal Fund:
| · | If your shares are held in a Brokerage Account, contact your Broker. |
| · | If you have physical possession of your shares in certificate form, contact the Fund’s Transfer Agent: |
| | Computershare Shareowner Services LLC, P.O. Box 30170, College Station, TX 77842-3170; (866) 488-3559 |
This report is sent to shareholders of Managed Duration Investment Grade Municipal Fund for their information. It is not a Prospectus, circular or representation intended for use in the purchase or sale of shares of the Fund or of any securities mentioned in this report.
The Fund has adopted the Adviser’s proxy voting policies and procedures to govern the voting of proxies relating to the voting securities of the Fund. A description of the Adviser’s proxy voting policies and procedures related to portfolio securities is available without charge, upon request, by calling the Fund at (866) 819-5301.
Information regarding how the Fund voted proxies for portfolio securities, if applicable, during the most recent 12-month period ended June 30, is also available, without charge and upon request by calling (866) 819-5301 or by accessing the Fund’s Form N-PX on the US Securities and Exchange Commission’s (“SEC”) website at www.sec.gov.
The Fund files its complete schedule of portfolio holdings with the SEC for the first and third quarters of each fiscal year on Form N-Q. The Fund’s Form N-Q is available on the SEC website at www.sec.gov or by visiting the Fund’s website at guggenheiminvestments.com/mzf. The Fund’s Form N-Q may also be viewed and copied at the SEC’s Public Reference Room in Washington, DC. Information on the operation of the Public Reference Room may be obtained by calling (800) SEC-0330 or at www.sec.gov .
Notice to Shareholders
Notice is hereby given in accordance with Section 23(c) of the Investment Company Act of 1940, as amended, that the Fund from time to time may purchase shares of its common and preferred stock in the open market or in private transactions.
MZF l MANAGED DURATION INVESTMENT GRADE MUNICIPAL FUND SEMIANNUAL REPORT l 27
Cutwater Investor Services Corp.
Cutwater Investor Services Corp. (“Cutwater”), the Fund’s Investment Adviser, is based in Armonk, New York and was created in 1991 to provide fixed-income investment products and services to institutional and retail clients. The firm specializes in the management of fixed-income securities and provides expertise in investment-grade municipal bond investing. Cutwater is a wholly-owned subsidiary of MBIA, Inc., which is listed on the New York Stock Exchange. Additional information can be found at cutwater.com.
Investment Philosophy
Cutwater Investor Services Corp.’s philosophy is anchored in the conviction that a high quality municipal portfolio diversified among maturities will provide favorable risk-adjusted performance over time and through a variety of market cycles. Cutwater Investor Services Corp. believes that security selection is enhanced by its large and dedicated staff of credit analysts. Each analyst has a thorough understanding of the broad market, but focuses research on a particular segment of the larger market.
Investment Process
Investment strategy, including credit quality, yield curve positioning and duration targets, is set for portfolios at regular strategy meetings with the firm’s chief investment officer, portfolio managers and sector specialists. Credit quality decisions are based on credit bands established for each of the portfolios and the current relative value of securities within each of the credit bands. Duration target decisions are based on duration bands which direct the overall risk profile of portfolios relative to their benchmarks and the consensus outlook on the term structure of interest rates. Duration management is extended to each of the individual market sectors. Using the guidelines established in the strategy meetings, the municipal portfolio managers work closely with research analysts. Cutwater’s rigorous bottom-up process is rooted in fundamental credit analysis and Cutwater’s proprietary research.
Cutwater Investor Services Corp. | Guggenheim Funds Distributors, LLC |
113 King Street | 2455 Corporate West Drive |
Armonk, NY 10504 | Lisle, IL 60532 |
(03/14) | Member FINRA/SIPC |
| | (03/14) |
| | NOT FDIC-INSURED l NOT BANK-GUARANTEED l MAY LOSE VALUE | CEF-MZF-SAR-0114 |
Item 2. Code of Ethics.
Not applicable for a semi-annual reporting period.
Item 3. Audit Committee Financial Expert.
Not applicable for a semi-annual reporting period.
Item 4. Principal Accountant Fees and Services
Not applicable for a semi-annual reporting period.
Item 5. Audit Committee of Listed Registrant.
Not applicable for a semi-annual reporting period.
Item 6. Schedule of Investments.
The Schedule of Investments is included as part of Item 1.
Item 7. Disclosure of Proxy Voting Policies and Procedures for Closed-End Management Investment Companies.
Not applicable for a semi-annual reporting period.
Item 8. Portfolio Managers of Closed-End Management Investment Companies.
Not applicable for a semi-annual reporting period.
Item 9. Purchases of Equity Securities by Closed-End Management Investment Company and Affiliated Purchasers.
None.
Item 10. Submission of Matters to a Vote of Security Holders.
The Registrant has not made any material changes to the procedures by which shareholders may recommend nominees to the registrant’s Board of Trustees.
Item 11. Controls and Procedures.
(a) The registrant's principal executive officer and principal financial officer have evaluated the registrant's disclosure controls and procedures (as defined in Rule 30a-3(c) under the Investment Company Act) as of a date within 90 days of this filing and have concluded based on such evaluation as required by Rule 30a-3(b) under the Investment Company Act, that the registrant's disclosure controls and procedures were effective as of that date in ensuring that information required to be disclosed by the registrant in this Form N-CSR was recorded, processed, summarized, and reported within the time periods specified in the Securities and Exchange Commission’s rules and forms.
(b) There were no changes in the registrant’s internal control over financial reporting (as defined in Rule 30a-3(d) under the Investment Company Act) that occurred during the registrant’s second fiscal quarter of the period covered by this report that have materially affected, or are reasonably likely to materially affect, the registrant’s internal control over financial reporting.
Item 12. Exhibits.
| (a)(1) | Not applicable. |
| | |
| (a)(2) | Certifications of principal executive officer and principal financial officer pursuant to Rule 30a-2(a) of the Investment Company Act. |
| | |
| (b) | Certifications of principal executive officer and principal financial officer pursuant to Rule 30a-2(b) of the Investment Company Act and Section 906 of the Sarbanes-Oxley Act of 2002. |
| | |
| (c) | Not applicable. |
SIGNATURES
Pursuant to the requirements of the Securities Exchange Act of 1934 and the Investment Company Act of 1940, the registrant has duly caused this report to be signed on its behalf by the undersigned, thereunto duly authorized.
(Registrant) Managed Duration Investment Grade Municipal Fund
By: Clifford D. Corso
Name: Clifford D. Corso
Title: President and Chief Executive Officer
Date: April 4, 2014
Pursuant to the requirements of the Securities Exchange Act of 1934 and the Investment Company Act of 1940, this report has been signed by the following persons on behalf of the registrant and in the capacities and on the dates indicated.
By: /s/ Clifford D. Corso
Name: Clifford D. Corso
Title: President and Chief Executive Officer
Date: April 4, 2014
By: /s/ John L. Sullivan
Name: John L. Sullivan
Title: Chief Financial Officer, Chief Accounting Officer and Treasurer
Date: April 4, 2014