UNITED STATES
SECURITIES AND EXCHANGE COMMISSION
Washington, D.C. 20549
FORM N-CSR
CERTIFIED ANNUAL SHAREHOLDER REPORT OF REGISTERED MANAGEMENT
INVESTMENT COMPANIES
Investment Company Act file number 811-21410
The Weitz Funds
(Exact name of registrant as specified in charter)
Suite 200
1125 South 103 Street
Omaha, NE 68124-1071
(Address of principal executive offices) (Zip code)
Wallace R. Weitz & Company
The Weitz Funds
Suite 200
1125 South 103 Street
Omaha, NE 68124-1071
(Name and address of agent for service)
Registrant’s telephone number, including area code: 402-391-1980
Date of fiscal year end: March 31
Date of reporting period: March 31, 2012
Form N-CSR is to be used by management investment companies to file reports with the Commission not later than 10 days after the transmission to stockholders of any report that is required to be transmitted to stockholders under Rule 30e-1 under the Investment Company Act of 1940 (17 CFR 270.30e-1). The Commission may use the information provided on Form N-CSR in its regulatory, disclosure review, inspection, and policymaking roles.
A registrant is required to disclose the information specified by Form N-CSR, and the Commission will make this information public. A registrant is not required to respond to the collection of information contained in Form N-CSR unless the Form displays a currently valid Office of Management and Budget ("OMB") control number. Please direct comments concerning the accuracy of the information collection burden estimate and any suggestions for reducing the burden to Secretary, Securities and Exchange Commission, 450 Fifth Street, NW, Washington, DC 20549-0609. The OMB has reviewed this collection of information under the clearance requirements of 44 U.S.C. § 3507.
Item 1. Report to Stockholders.


WEITZ INVESTMENT PHILOSOPHY
Over the 25+ year history of Weitz Funds, we have seen many changes. Advancements in technology combined with economic, political and global events have continued to shape investors’ thoughts and actions.
Our mission has remained constant— we have an unwavering commitment to our shareholders and a focus on finding strong, well-managed companies priced significantly below their true business value.
We “eat our own cooking.”
We believe in putting our money where our mouth is. All of our employees and trustees have significant personal investments in our “family” of funds. This does not guarantee that the Funds will go up, but it does mean that we win or lose together and that shareholders definitely have our full attention.
We are patient, long-term investors.
When we analyze potential equity investments, we think about the business behind the stock. We buy shares only when we believe they are selling at a large discount to the company’s underlying business value. Ideally, the business value rises over time, and the stock price follows. This often allows us to hold the stock for many years.
Knowing what you don’t know is important in all aspects of life, but it is crucial in investing.
We think our odds of investment success are much higher when we invest in securities of companies we understand and where we may have an edge over other investors. As a result, our portfolios are not diversified among all the various sectors of the economy. Instead, we expect to have a deeper knowledge and understanding of the industries and companies in which we do invest. Our experienced research team has a broad “circle of competence,” and we believe in staying within it.
We worry about permanent loss of capital—not price volatility.
Our Funds are designed for long-term shareholders. We believe concentrating our portfolios in the most attractive investment ideas, although it may cause short-term price volatility, is the best way to earn consistent returns over the long term.
We believe in being flexible and using common sense.
We are often contrarian and do not pay attention to benchmarks when making investment decisions. We also believe that cash is sometimes the most attractive investment.
Our goal is to earn good absolute investment returns over long
periods of time without exposing our clients’ and our own
capital to undue risk.
2 Weitz Funds
TABLE OF CONTENTS
| | Performance Summary | 4 | |
| | | | |
| | Letter to Shareholders | 5 | |
| | | | |
| | Analyst Corner | 8 | |
| | | | |
| | Value Fund | 9 | |
| | | | |
| | Partners Value Fund | 13 | |
| | | | |
| | Partners III Opportunity Fund | 18 | |
| | | | |
| | Research Fund | 23 | |
| | | | |
| | Hickory Fund | 27 | |
| | | | |
| | Balanced Fund | 31 | |
| | | | |
| | Short-Intermediate Income Fund | 36 | |
| | | | |
| | Nebraska Tax-Free Income Fund | 44 | |
| | | | |
| | Government Money Market Fund | 50 | |
| | | | |
| | Financial Statements | 52 | |
| | | | |
| | Notes to Financial Statements | 63 | |
| | | | |
| | Report of Independent Registered Public Accounting Firm | 76 | |
| | | | |
| | Actual and Hypothetical Expenses for Comparison Purposes | 77 | |
| | | | |
| | Other Information | 78 | |
| | | | |
| | Information About the Trustees and Officers | 80 | |
| | | | |
| | Index Descriptions | 82 | |
| | Coming Soon – Redesigned weitzfunds.com We are pleased to announce that our website is currently undergoing a major redesign. We are updating our look and adding new functionality to enhance your online experience. Visit weitzfunds.com soon. |
| | | | |
| | The management of Weitz Funds has chosen paper for the 80 page body of this financial report from a paper manufacturer certified under the Sustainable Forestry Initiative standard. | | |
Portfolio composition is subject to change at any time and references to specific securities, industries, and sectors referenced in this report are not recommendations to purchase or sell any particular security. Current and future portfolio holdings are subject to risk. See the Schedules of Investments included in this report for the percent of assets in each of the Funds invested in particular industries or sectors.
weitzfunds.com 3
PERFORMANCE SUMMARY
MARCH 31, 2012
| | | | | | | Total Returns | | | Average Annual Total Returns | |
| | | | Inception | | | | | | | | | | | | | | | | | | | | | | | | | | Since |
| Fund Name | | | Date | | 3 Mos. | | 1 Year | | 3 Year | | 5 Year | | 10 Year | | 15 Year | | 20 Year | | 25 Year | | Inception |
| Value | | | 5/09/86 | | | 9.5 | % | | 9.9 | % | | 25.2 | % | | -1.0 | % | | 3.3 | % | | 8.8 | % | | 10.3 | % | | 10.4 | % | | 10.4 | % |
| Russell 1000 | | | | | | | | | | | | 24.0 | | | 2.2 | | | 4.5 | | | | | | | | | | | | N/A | |
| Russell 1000 Value | | | | | | | | | | | | | | | | | | | | | | | | | | | | | | N/A | |
Partners Value(a) | | | 6/01/83 | | | 10.5 | | | 5.4 | | | 25.5 | | | 1.3 | | | 4.4 | | | 9.7 | | | 11.3 | | | 11.0 | | | 12.4 | |
Partners III Opportunity(a) | | | 6/01/83 | | | | | | | | | | | | | | | | | | | | | | | | | | | | |
| Institutional Class | | | | | | | | | | | | | | | | | | | | | | | | | | | | | | 13.2 | |
Investor Class(b) | | | | | | | | | | | | | | | | | | | | | | | | | | | | | | 13.2 | |
Research(a)(c) | | | 4/01/05 | | | 11.9 | | | 12.3 | | | 28.0 | | | 4.9 | | | — | | | — | | | — | | | — | | | 7.0 | |
| Russell 3000 | | | | | | | | | | | | | | | | | | | | | | | | | | | | | | — | |
| Russell 3000 Value | | | | | | | | | | | | | | | | | | | | | | | | | | | | | | — | |
| Hickory | | | 4/01/93 | | | 10.3 | | | 3.4 | | | 29.2 | | | 1.6 | | | 5.1 | | | 8.4 | | | — | | | — | | | 10.2 | |
| Russell 2500 | | | | | | | | | | | | | | | | | | | | | | | | | | | | | | 9.9 | |
| Russell 2500 Value | | | | | | | | | | | | | | | | | | | | | | | | — | | | | | | 10.5 | |
| S&P 500 | | | | | | | | | | | | | | | | | | | | | | | | | | | | | | — | |
| Balanced | | | 10/01/03 | | | 7.5 | | | 6.2 | | | 18.2 | | | 2.5 | | | — | | | — | | | — | | | — | | | 5.1 | |
| Blended Index | | | | | | | | | | | | | | | | | | — | | | — | | | — | | | | | | 5.6 | |
| Short-Intermediate Income | | | 12/23/88 | | | | | | | | | | | | | | | | | | | | | | | | | | | | |
| Institutional Class | | | | | | | | | | | | | | | | | | | | | | | | | | | | | | 6.0 | |
Investor Class(b) | | | | | | | | | | | | | | | | | | | | | | | | | | | | | | 6.0 | |
| Barclays Intermediate Credit | | | | | | 0.6 | | | | | | | | | | | | | | | | | | | | | | | | 6.7 | |
NebraskaTax-Free Income(a) | | | 10/01/85 | | | 0.5 | | | 6.1 | | | 4.3 | | | 3.9 | | | 4.1 | | | 4.4 | | | 4.8 | | | 5.0 | | | 5.4 | |
| Barclays 5-Year Muni. Bond | | | | | | | | | | | | | | | | | | | | | | | | | | | — | | | — | |
These performance numbers reflect the deduction of each Fund’s annual operating expenses. Annual operating expenses for each Fund, as stated in the most recent Prospectus, and expressed as a percentage of each Fund’s net assets, are: Value, 1.21%; Partners Value, 1.21%; Partners III Opportunity -Institutional Class, 1.53%; Partners III Opportunity - Investor Class, 1.74% (estimated gross); Research, 1.81% (estimated gross); Hickory, 1.28%; Balanced, 1.15%; Short-Intermediate Income - Institutional Class, 0.65%; Short-Intermediate Income - Investor Class, 0.84% (estimated gross); and Nebraska Tax-Free Income, 0.74%. The returns assume redemption at the end of each period and reinvestment of dividends. Total returns shown include fee waivers and expense reimbursements, if any; total returns would have been lower had there been no waiver of fees and/or reimbursement of expenses by the Adviser. This information represents past performance and past performance does not guarantee future results. The investment return and the principal value of an investment in any of the Funds will fluctuate so that an investor’s shares, when redeemed, may be worth more or less than the original cost. Current performance may be higher or lower than the performance data quoted above. Performance data current to the most recent month end may be obtained at www.weitzfunds.com/performance/monthly.asp.
Index performance is hypothetical and is shown for illustrative purposes only. See page 82 for a description of all indices.
| (a) | Performance of the Partners Value and Partners III Opportunity Funds is measured from June 1, 1983, the inception of Weitz Partners II Limited Partnership (“Partners II”) and Weitz Partners III Limited Partnership (“Partners III”), respectively. Performance of the Research Fund is measured from April 1, 2005, the inception of Weitz Research Fund, L.P. (“Research L.P.”). Performance of the Nebraska Tax-Free Income Fund is measured from October 1, 1985, the inception of Weitz Income Partners Limited Partnership (“Income Partners”). On the last business day of December 1993, 2005, 2006 and 2010, the Partners Value, Partners III Opportunity, Nebraska Tax-Free Income and Research Funds (the “Funds”) succeeded to substantially all of the assets of Partners II, Partners III, Income Partners and Research L.P. (the “Partnerships”), respectively. The investment objectives, policies and restrictions of the Funds are materially equivalent to those of the respective Partnerships and the Partnerships were managed at all times with full investment authority by Wallace R. Weitz & Company. The performance information includes performance for the period before the Funds became investment companies registered with the Securities and Exchange Commission. During these periods, none of the Partnerships were registered under the Investment Company Act of 1940 and therefore were not subject to certain investment or other restrictions or requirements imposed by the 1940 Act or the Internal Revenue Code. If any of the Partnerships had been registered under the 1940 Act during these periods, the respective Partnerships’ performance might have been adversely affected. |
| (b) | Investor Class shares first became available for sale on August 1, 2011. For performance prior to that date, this table includes the actual performance of the Fund’s Institutional Class (and uses the actual expenses of the Fund’s Institutional Class, for such period of time), without any adjustments. For any such period of time, the performance of the Fund’s Investor Class would have been substantially similar to, yet lower than, the performance of the Fund’s Institutional Class, because the shares of both classes are invested in the same portfolio of securities, but the classes bear different expenses. |
| (c) | Starting January 1, 2011, these performance numbers reflect the deduction of the Research Fund’s actual operating expenses. For periods of time prior to January 1, 2011, the performance numbers reflect the deduction of annual pro forma operating expenses of 1.50%. Annual operating expenses for the Research Fund, as stated in the Research Fund’s Prospectus, are 1.81% (estimated gross) and 0.91% (net) of the Fund’s net assets. The investment adviser has agreed, in writing, to limit the total annual fund operating expenses (excluding taxes, interest, brokerage commissions, and acquired fund fees and expenses) to 0.90% of the Fund’s average daily net assets through July 31, 2012. |
| N/A | Indicates information is not available. |
LETTER TO SHAREHOLDERS
APRIL 3, 2012
Dear Fellow Shareholder:
The first calendar quarter of 2012 was a very good one for the stock market. Our stock funds earned total returns ranging from +7.8% (Partners III) to +11.9% (Research). The market has rallied very strongly from its lows of last October, and we have become more cautious as the average price to value of the stocks in our portfolios has risen from roughly 60% to 75-80%.
When our stocks approach full value, we trim our positions. As we sold into rallies, our cash levels rose from 10-15% last October to 20-25% at quarter end. In a strong market, cash dampens returns, and we trailed our benchmarks in the quarter. We would prefer to beat all the market indexes all the time, but we are content to celebrate the good absolute returns and wait patiently for our chance to redeploy our cash reserves.
The short table below shows results for our stock funds for the past 3 months and 12 months. The table on the page opposite this letter gives more comprehensive information for each of the funds and their respective benchmarks. As usual, I would suggest that the longer-term results are more meaningful.
| | | | Period Ended 3/31/2012 |
| | | | Quarter | | Fiscal Year |
| Value | | | 9.5 | % | | 9.9 | % |
| Partners Value | | | 10.5 | | | 5.4 | |
| Partners III – | | | | | | | |
| Institutional Class | | | 7.8 | | | 4.9 | |
| Research | | | 11.9 | | | 12.3 | |
| Hickory | | | 10.3 | | | 3.4 | |
| S&P 500 | | | 12.6 | | | 8.5 | |
The Balanced Fund turned in excellent results for the quarter (+7.5%). The Balanced Fund invests in both stocks and bonds. A “neutral” allocation would be 60% stocks and 40% bonds. Brad has shifted Balanced to a more defensive posture and still generated a return that would be pretty good for a full year.
Our bond funds remain very defensive. Short-Intermediate has eschewed the “fear trade” in Treasuries and has kept quality high and duration short. Yet Tom managed a +1.5% return for the quarter for the Institutional Class. Going forward, as we have said every quarter for some time, the environment for bond investing is very negative. We will remain very cautious and while we believe we can deliver positive returns over time, bond investors should keep their expectations low.
As usual, there are several pages of detail on each Fund later in this report. We encourage shareholders to read these sections for each of the Funds they own.
“Uncertainty” is a Permanent Condition
The U.S. economy continues to recover slowly. The problems of excess housing supply and unserviceable mortgage debt are slowly being resolved. Companies have been slow to rehire during the recovery as they have found ways to increase productivity among their remaining workers. Depressed tax receipts have led to austerity measures at the state and local levels while highly stimulative national fiscal and monetary policies seem to be losing their effectiveness. Investors are impatient for growth but also concerned about future inflation.
Europe is struggling with similar issues of excess private and public sector debt and over-built real estate markets. Problems are distributed unevenly among European countries and the Euro Zone’s hybrid governance structure—a common currency but separate, and often conflicting, fiscal policies—makes it very difficult to devise good solutions.
Asian and Latin American “emerging markets” are generally growing much faster than U.S. and European markets. A number of our U.S. based companies are earning a growing share of their profits in emerging markets. Dynamic changes in these rapidly growing markets inspire both hope and anxiety among economists and investors.
Global economic cross-currents always make it difficult to make broad generalizations and sweeping predictions. Investors hate “uncertainty” and both individuals and professional investors are anxious for definitive answers. The financial press confuses the issue, as usual, with its cacophony of pronouncements based on isolated data points.
Uncertainty will always be part of investing. However, sensible and creative management teams are aware of the political and economic trends that affect their businesses. They can develop strategies to avoid serious disruptions and can sometimes take advantage of the situation. For example, Wells Fargo has made bulk purchases of European bank loans secured by U.S. assets at bargain prices. As conditions change, companies with global businesses make adjustments as to where they source raw materials and sell finished product. As citizens, we have serious concerns about the state of the country and the world, but as investors, we feel reasonably confident that we own companies that can generate good returns on our investments under most conditions.
A Short Look at History
Human nature leads investors to focus on the recent past when making current investment decisions. The mortgage crisis and severe bear market are fresh in investors’ minds. Many are fearful—especially if they had a similar bad experience with the technology stock
weitzfunds.com 5
bubble and 2000-2002 bear market. They observe that bonds performed better than stocks over the past 10-12 years and have shifted hundreds of billions of dollars from stock mutual funds to bond funds.
To put the current period in better perspective, it might be helpful to look at a much longer period of stock market history. Between 1932 and 2000, the S&P 500 index rose from about 5 to 1550. This period can be divided into four periods of 16-17 years each during which the S&P alternately (a) moved erratically sideways and (b) rose sharply in a major bull market. This period saw war and depression, deflation and inflation. We would assert, though, that GDP growth and the growth in corporate earning power generally rose over the entire period in a path that was much less volatile than the stock market.
There are many reasons for the differences between the “facts” of gradually increasing company earnings and the “opinions” that drive wildly volatile stock prices. We believe the most powerful single factor is investor psychology. Unfortunately for investors, they always seem to get more enthusiastic about buying stocks as prices move higher. Conversely, when prices fall, making good businesses cheaper to own, they tend to become fearful and sell more shares.
Each of the four periods provides a similar lesson, but we will focus on the most recent. As the S&P 500 index rose from about 100 in 1982 to 1550 in 2000 (+1450%), company earnings roughly tripled, but the price-earnings multiple (P/E) placed on S&P stocks more than quadrupled from a low of 7 times to a high of 31 times. In short, the companies’ values increased, but their stocks’ valuations increased even more.
This illustrates the core concept of our investment approach—stock prices fluctuate widely around a company’s business value. Ideally, we buy at a discount to business value, the business value grows, and we sell at or near business value. Easier said than done, but success depends on measuring value and being price-sensitive in our buying and selling—NOT on waiting for ideal macroeconomic conditions or an absence of “uncertainty.”
Back to the Future
So where are we now? The market peaked in March of 2000 (with the S&P 500 at about 1550) as tech stock valuations reached absurd levels. During the intervening twelve years, many of the growth favorites of the day, both tech-oriented and others, have experienced strong business growth while their stock prices have languished. Microsoft, Dell and Wal-Mart have each roughly tripled earnings per share, but their stock prices have nothing to show for it. Value rose, but valuation (the price people were willing to pay for those earnings) shrank.
Five years ago, the S&P 500 peaked again around 1550. This time the most extreme over-valuations were to be found in housing and mortgage finance. It turned out that we had over-built the housing stock—borrowing demand from future years—and over-borrowed to finance the houses. Demand for houses, construction materials and furnishings evaporated and triggered a serious recession. Liquidity issues in the financial sector triggered by the devaluation of mortgage-related assets compounded the problem.
The revaluation process for stocks in general that started in 2000 may have about run its course. The deleveraging of personal and bank balance sheets may have many more years to run (although we would guess that the worst is over). It would be too much of a coincidence to expect that the current sideways market which is twelve years old would end in exactly 4-5 years to conform to the 16-17 year pattern of the last eighty years, but it may very well continue for some time.
A few more years of subdued stock market behavior does not have to be a terrible thing for investors. It would be nice to enjoy the double-digit annual returns of the 1990’s—and from the right valuation base—that can happen again. In the meantime, over the past twelve years, while the S&P produced a total return of 1.4% per year, Value, Partners Value and Partners III have earned average annual total returns of 4.6%, 5.4%, and 10.6%, respectively. These are not sexy numbers, but thanks to compounding, they mean shareholder capital has grown by 71%, 87% and 234% in the Funds vs. 18% for the S&P 500.
An Improving Value Equation
In spite of the muted recovery and the various headwinds affecting global economic growth, we are still finding interesting investments for our Funds. Volatility of prices of existing positions allows us to buy extra shares on dips and earn trading profits when the shares rebound. This is not our primary focus, but it can add some incremental return in a sideways market. The more interesting additions are companies our analysts uncover and that appear to be cheap for temporary reasons.
FLIR Systems (FLIR—$25) makes infrared and thermal imaging equipment for military and commercial use. It is a leader in a secularly expanding industry and earns high returns on capital. It has a history of thoughtful capital deployment and sells at a 35% discount to our current estimate of its business value ($39). Fears of cutbacks in defense spending (which we think are over-stated for FLIR’s products) and underestimation of the prospects for FLIR’s commercial business caused the stock to decline sharply last summer and to tread water ever since. The combination of future earnings per share growth (which we expect to average at least 15% per year) and a higher
6 Weitz Funds
valuation for those earnings could make FLIR an excellent long-term holding for several of our Funds.
Range Resources (RRC—$58) is a domestic natural gas exploration and production company. Its “crown jewel” is in the Southwest Pennsylvania portion of the Marcellus field. New techniques for producing oil and gas from shale have led to a several-fold increase in the U.S.’s estimated gas reserves and a temporary glut in available gas across the country. As a result, gas prices have plunged to 10+ year lows and gas producers’ stocks are out of favor. Range has a very low cost of production, is increasing its natural gas liquids and oil production, and can continue to reinvest at attractive returns, even at today’s very low gas prices. For a variety of both supply-and demand-related reasons, we would expect gas prices to rise from today’s depressed $2.15 per mcf in future years. Change happens slowly for both producers and consumers of energy, but over the next 5-10 years, we believe Range can produce very good returns for us. (We also own Southwestern Energy (SWN—$31), a stock with a similar investment thesis.)
Americans and American businesses are pretty resilient. We think there are reasons to be hopeful that the current period of consolidation and revaluation in the stock market in general will give way to a more positive market environment.
| (1) | Housing starts in the U.S. fell by 73% from 2005 (2.073 million) to 2009 (0.553 million) and were only 0.611 million in 2011. Starts had been greater than one million each year for the past 50 years, until 2008. But, household formation continues, some of the housing stock needs to be replaced each year, and personal interest in home ownership is alive and well. Eventually, the number of homes being built (and furnished) will rise significantly. Aside from the direct impact on the economy and employment, stabilizing of home prices should have a positive impact on consumer confidence; |
| | |
| (2) | A stronger economy should revive tax receipts at all levels. State and local governments should be able to relax the austerity measures that have been a drag on the economy. At the Federal level, higher tax receipts and lower demands on safety net programs should decrease the quantity of new government bonds that must be sold (leaving more capital for investment in stocks). We could hope that Congress addresses the longer-term issues of funding Medicare and Medicaid, but that would be an unexpected bonus; |
| | |
| (3) | Some years ago, the price of natural gas fluctuated wildly as supplies were just slightly too big in a warm winter and just slightly too small in a cold one. Many industry observers believed that the supply of gas was in secular decline in the U.S. Now, thanks to new (albeit controversial) technology, gas is being produced from sources previously considered inaccessible. Some think we now have a 100-year supply of natural gas and that it could bring the U.S. a measure of energy independence. There are problems of production, distribution and conversion of facilities to use gas, but most individuals and thousands of companies will be direct beneficiaries of this cheap and abundant fuel; |
| | |
| (4) | Finally, as investors’ memories of recession and collapsing home prices fade, we may find that some of the hundreds of billions (trillions?) of dollars that had been “hiding” in U.S. Treasuries and other “safe” assets may find their way back into the stock market. The incremental demand could make a significant difference in stock valuations. |
Great! But When?
We are optimistic about the long-term outlook for our stock portfolios. Human nature does not seem to change over time and the reasons that assets are sometimes mis-priced are rooted in human behavior. We still need to do our part in analyzing and measuring value and in exercising the patience and discipline to take advantage of investment opportunities—that is, keeping our own “human natures” under control.
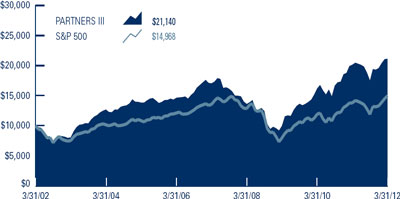
The 28+ year history of our Firm has spanned most of the 1982-2000 bull market and all of the 2000-March 2012 period of consolidation. The two Funds which (including their predecessor partnerships) span our entire history, Partners Value and Partners III, have returned 12.4% and 13.2% per year, respectively, on an annualized basis (after deducting fees and expenses) vs. 10.5% for the S&P 500. These 2% and 3% margins sound insignificant, but on a cumulative basis they make a big difference. Ten thousand dollars invested on June 1, 1983 would have grown to $178,496 in the S&P 500, $295,119 if invested in Partners Value, and $361,967 if invested in Partners III-Institutional Class.
We live in an uncertain world, but having learned some lessons and having added several bright young people to our investment team over the years, we are hopeful that we can build on this record.
Sincerely,
| | | |
| | |
| Wallace R. Weitz | | Bradley P. Hinton |
| wally@weitzfunds.com | | brad@weitzfunds.com |
weitzfunds.com 7
ANALYST CORNER
A PERSPECTIVE ON AON
By Barton Hooper, CFA
Aon is one of the world’s largest commercial insurance and reinsurance brokers (60% of revenue) as well as a leader in human resources consulting (40% of revenue). The company has added significant scale in recent years with the acquisition of reinsurance brokerage Benfield in 2008 and Hewitt Associates in 2010. We believe both industries in which Aon competes have attractive structural characteristics. The placement of insurance is a necessity for any business and is very complicated; this circumstance allows insurance brokers to act as a toll booth for this vital product. An insurance brokerage requires little capital and involves no underwriting risk. Aon is one of only three brokers who can place risk on a global basis.
Businesses, both large and small, need expert advice in designing and implementing comprehensive HR programs. The human resources consulting industry addresses the many complexities businesses face in setting benefit, retirement and incentive compensation policies. Multinational companies have additional challenges in setting policies and programs that adhere to the varying legal and regulatory requirements of different countries. Similar to its insurance brokerage operation, Aon is one of the few global-scale industry participants.
Several Catalysts
Since the arrival of CEO Greg Case in 2005, Aon has substantially improved its operating profit margin as it shed unprofitable businesses, cut costs and improved productivity. However, there is still room for Aon’s margins to improve as it has publicly stated that its insurance brokerage unit can deliver margins of 25% (22% in 2011) and achieve margins of 22% (18%) in the HR consulting business. While we count on more conservative margins in our estimate of business value, we are confident that Aon has the capability to deliver on its goals. The company has provided several examples of margin enhancing programs such as the Global Risk Insight Platform (GRIP) in brokerage and the Aon Hewitt integration plan in the human resources segment.
In addition, Aon and other insurance brokers will benefit if short-term interest rates rise above today’s minuscule levels. The company collects fiduciary interest income on client funds held prior to remittance to insurers for in force policies. While Aon does not hold these funds very long, there is a significant volume of this “float” that is material at reasonable interest levels.
Aon recently moved its place of incorporation to the United Kingdom from the United States which will provide its senior management team more direct access to the globally important London insurance placement market. The move should also result in a lower corporate tax rate and greater capital flexibility with respect to cash generated from its overseas operations. Aon estimates that the move immediately freed up $300 million of capital held internationally that it can deploy for buybacks, dividends or acquisitions.
Valuation and Margin of Safety
Aon generates significant cash flow but the company’s per share earnings are optically obscured due to significant non-cash intangible amortization expenses generated from the Benfield and Hewitt acquisitions. We do not believe this accounting amortization reflects a charge for future reinvestment and therefore Aon’s cash generating capabilities are undervalued. With a price of just over $49, Aon trades for approximately 11x our estimate of 2012 cash earnings. Our estimate of intrinsic value is above $70 and as such we believe the company’s shares represent an attractive investment for our shareholders.
| |
| Barton Hooper, CFA, joined Weitz in 2007. He graduated from the University of Missouri and previously spent four years as a research analyst at Oak Value Capital Management and Trilogy Capital Management. Barton has been a CFA charterholder since 1999. |
| |
8 Weitz Funds
VALUE FUND
PORTFOLIO MANAGERS’ DISCUSSION & ANALYSIS
Co-Portfolio Managers:
Wallace R. Weitz, CFA; Bradley P. Hinton, CFA; & David A. Perkins, CFA
The Value Fund returned +9.5% in the first calendar quarter, compared to a +12.6% gain for the S&P 500 and a +12.9% gain for the Russell 1000. Wells Fargo, Microsoft and Comcast were the three largest positive contributors to performance during the quarter, each generating total returns of approximately 25%. Wells benefitted from improving investor sentiment around the U.S. economy, a relatively clean bill of health from the Federal Reserve’s so called “stress test,” and the beginning of a much-anticipated boost in capital returns to shareholders. Long-time holding Microsoft continued to see relatively strong business adoption of its Windows 7 platform, along with anticipation of a strong 2012 product line (including the upcoming launch of Windows 8). Comcast announced very strong fourth quarter results in mid-February. Positive trends in basic video subscriber losses continued with the company reporting its lowest rate of attrition in 5 years, while broadband, phone and advertising continued to show good growth. Management also meaningfully boosted the company’s dividend and announced a new $6.5 billion share repurchase authorization. The two largest detractors from first quarter performance were two of our newest holdings – Hewlett-Packard and Range Resources (which we discuss in more detail below).
For the fiscal year ended March 31, 2012, the Fund increased +9.9% compared to an +8.5% gain for the S&P 500 and a +7.9% return for the Russell 1000. Microsoft, Valeant Pharmaceuticals, Wells Fargo and Tyco International were key full year performance drivers, each chipping in roughly a full percentage point to solid fiscal 2012 returns. We are pleased Microsoft’s stock is beginning to receive some past-due credit for the operating results it has generated over the past couple of years. While most of the company’s $52B cash hoard is held outside the United States (and thus taxable if brought back to the U.S.), we would happily cheer any move to unlock this value on behalf of shareholders. Valeant rebounded nicely following an unwarranted selloff last August. We continue to believe its shares are undervalued and anticipate further value creation via future acquisitions and thoughtful capital deployment. Finally, Tyco International closed our fiscal year on a high note proposing a value-enhancing combination of its Flow Control segment with similarly focused industrial Pentair.
First quarter portfolio activity was relatively light. We closed a successful multi-year investment in ConocoPhillips near our estimate of intrinsic value and redeployed the proceeds into independent natural gas producer Range Resources (ticker: RRC). We have admired Range and its culture for some time. Abnormally mild winter weather across much of the U.S. pushed natural gas prices – and investor sentiment – to fresh lows during the first quarter, giving us an opportunity to pick up shares of the company at a significant discount. We believe Range is worth in excess of $90 per share assuming domestic natural gas prices eventually return to $4/mcf and oil prices remain above $70 per barrel (and oil prices are at $100+ today). For context, many industry experts believe the marginal cost of supply for natural gas is significantly higher than $4. We are not banking on it given continued advancements in technology and the proclivity of producers to operate at or below cash costs. Regardless, Range’s core assets in the Marcellus shale and Mississippi Lime formation generate attractive returns on investment even at today’s depressed gas prices. As a result, management can grow the company’s net asset value with internally generated cash flows in an environment when most domestic gas producers are forced to retrench.
As of quarter end, residual cash stood at 21% of Fund net assets, relatively unchanged versus three months ago. As we have written in the past, our cash position is simply a reflection of our perception of the present opportunity set -the fewer the bargains, the higher our reserves, and vice versa. While our fully-researched “on deck” list includes a significant number of larger company ideas, our valuation discipline has more recently kept us on the sidelines awaiting greater margins of safety. Borderline investments in the name of activity are the kinds of opportunity cost we seek to avoid. Our goal, as always, is to remain patient, fair-minded, and focused in our pursuit of above-average long-term returns.
The Value Fund invests in our best larger company ideas. The Fund’s weighted average market cap is approximately $60 billion, reflecting its mix of large-cap and mega-cap stocks. The Fund remains relatively concentrated with its top twenty holdings representing approximately two-thirds of net assets.
| | New and Eliminated Securities for Quarter Ended March 31, 2012 | |
| New Purchases ($mil) | | | | | Eliminations ($mil) | | | | |
| Range Resources | | | $ | 22.0 | | ConocoPhillips | | | $ | 14.9 | |
weitzfunds.com 9
VALUE FUND
PERFORMANCE • (UNAUDITED)
| | | | Total Returns | | | | | | Average Annual Total Returns | |
| | | | 3 Mos. | | 1 Year | | 3 Year | | 5 Year | | 10 Year | | 15 Year | | 20 Year | | 25 Year |
| Value | | | 9.5 | % | | 9.9 | % | | 25.2 | % | | -1.0 | % | | 3.3 | % | | 8.8 | % | | 10.3 | % | | 10.4 | % |
| S&P 500 | | | 12.6 | | | 8.5 | | | 23.4 | | | 2.0 | | | 4.1 | | | 6.1 | | | 8.6 | | | 8.9 | |
| Russell 1000 | | | 12.9 | | | 7.9 | | | 24.0 | | | 2.2 | | | 4.5 | | | 6.4 | | | 8.8 | | | 9.1 | |
| Russell 1000 Value | | | 11.1 | | | 4.8 | | | 22.8 | | | -0.8 | | | 4.6 | | | 6.8 | | | 9.4 | | | 9.3 | |
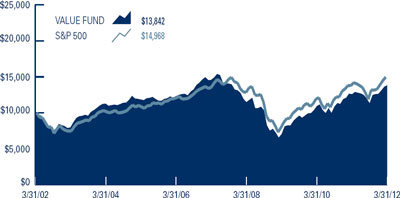
Growth of $10,000
This chart depicts the change in the value of a $10,000 investment in the Value Fund for the period March 31 2002 through March 31, 2012, as compared with the growth of the Standard & Poor’s 500 Index during the same period. Index performance is hypothetical and is shown for illustrative purposes only.
| | | | Value | | | S&P 500 | | | Relative | |
| Year | | | (1) | | | (2) | | | Results (1)-(2) | |
| 1986 (5/9/86) | | | 3.5 | % | | 4.1 | % | | -0.6 | % |
| 1987 | | | -0.5 | | | 5.1 | | | -5.6 | |
| 1988 | | | 16.4 | | | 16.6 | | | -0.2 | |
| 1989 | | | 22.1 | | | 31.7 | | | -9.6 | |
| 1990 | | | -5.2 | | | -3.1 | | | -2.1 | |
| 1991 | | | 27.6 | | | 30.5 | | | -2.9 | |
| 1992 | | | 13.6 | | | 7.6 | | | 6.0 | |
| 1993 | | | 20.0 | | | 10.1 | | | 9.9 | |
| 1994 | | | -9.8 | | | 1.3 | | | -11.1 | |
| 1995 | | | 38.4 | | | 37.6 | | | 0.8 | |
| 1996 | | | 18.7 | | | 23.0 | | | -4.3 | |
| 1997 | | | 38.9 | | | 33.4 | | | 5.5 | |
| 1998 | | | 28.9 | | | 28.6 | | | 0.3 | |
| 1999 | | | 21.0 | | | 21.0 | | | 0.0 | |
| 2000 | | | 19.6 | | | -9.1 | | | 28.7 | |
| 2001 | | | 0.2 | | | -11.9 | | | 12.1 | |
| 2002 | | | -17.1 | | | -22.1 | | | 5.0 | |
| 2003 | | | 28.7 | | | 28.7 | | | 0.0 | |
| 2004 | | | 15.7 | | | 10.9 | | | 4.8 | |
| 2005 | | | -2.8 | | | 4.9 | | | -7.7 | |
| 2006 | | | 21.8 | | | 15.8 | | | 6.0 | |
| 2007 | | | -10.3 | | | 5.5 | | | -15.8 | |
| 2008 | | | -40.7 | | | -37.0 | | | -3.7 | |
| 2009 | | | 27.6 | | | 26.5 | | | 1.1 | |
| 2010 | | | 19.9 | | | 15.1 | | | 4.8 | |
| 2011 | | | 6.1 | | | 2.1 | | | 4.0 | |
| 2012 (3/31/12) | | | 9.5 | | | 12.6 | | | -3.1 | |
| Since Inception: | | | | | | | | | | |
| Cumulative Return | | | 1,183.6 | | | 974.8 | | | 208.8 | |
| Avg. Annual Return | | | 10.4 | | | 9.6 | | | 0.8 | |
These performance numbers reflect the deduction of the Fund’s annual operating expenses which as stated in its most recent Prospectus are 1.21% of the Fund’s net assets. The returns assume redemption at the end of each period and reinvestment of dividends. Total returns shown include fee waivers and expense reimbursements, if any; total returns would have been lower had there been no waiver of fees and/or reimbursement of expenses by the Adviser. This information represents past performance and past performance does not guarantee future results. The investment return and the principal value of an investment in this Fund will fluctuate so that an investor’s shares, when redeemed, may be worth more or less than the original cost. Current performance may be lower or higher than the performance data quoted. Performance data current to the most recent month-end may be obtained at www.weitzfunds.com/performance/monthly.asp.
See page 4 for additional performance disclosures. See page 82 for a description of all indices.
Performance information does not reflect the deduction of taxes that a shareholder would pay on Fund distributions or the redemption of Fund shares.
10 Weitz Funds
VALUE FUND
PORTFOLIO PROFILE • (UNAUDITED)
| Top Ten Stocks | |
| Berkshire Hathaway, Inc. - CL B | | | 4.7 | % |
| Wells Fargo & Co. | | | 4.3 | |
| Aon Corp. | | | 4.1 | |
| Google, Inc. - CL A | | | 4.1 | |
| Valeant Pharmaceuticals International, Inc. | | | 4.0 | |
| Tyco International Ltd. | | | 3.7 | |
| Comcast Corp. - CL A Special | | | 3.5 | |
| Texas Instruments, Inc. | | | 3.5 | |
| United Parcel Service, Inc. - CL B | | | 3.2 | |
| Hewlett-Packard Co. | | | 3.2 | |
| % of Net Assets | | | 38.3 | % |
| Industry Sectors |
| Information Technology | | | 17.7 | % |
| Consumer Discretionary | | | 17.0 | |
| Financials | | | 13.1 | |
| Consumer Staples | | | 8.9 | |
| Industrials | | | 8.4 | |
| Materials | | | 5.2 | |
| Energy | | | 4.9 | |
| Health Care | | | 4.0 | |
| Short-Term Securities/Other | | | 20.8 | |
| Net Assets | | | 100.0 | % |
| Top Performers for Quarter Ended March 31, 2012 |
| | | | QTD Return | | Average Weight | | Contribution to |
| Security Name | | | of Security | | in Portfolio | | Fund Performance |
| Wells Fargo & Co. | | | 24.7 | % | | 4.4 | % | | 1.01 | % |
| Microsoft Corp. | | | 25.1 | | | 3.8 | | | 0.97 | |
| Comcast Corp. - CL A Special | | | 25.3 | | | 3.2 | | | 0.74 | |
| Tyco International Ltd. | | | 20.9 | | | 3.4 | | | 0.68 | |
| Liberty Global, Inc. - Series C | | | 21.2 | | | 3.1 | | | 0.66 | |
Contributions to Fund performance are based on actual daily holdings. Securities may have been bought or sold during the quarter.
Source: FactSet Portfolio Analytics
| Bottom Performers for Quarter Ended March 31, 2012 | |
| | | | QTD Return | | Average Weight | | Contribution to |
| Security Name | | | of Security | | in Portfolio | | Fund Performance |
| Hewlett-Packard Co. | | | (7.0 | )% | | 3.3 | % | | (0.25 | )% |
| Range Resources Corp. | | | (6.1 | ) | | 0.6 | | | (0.16 | ) |
| Google, Inc. - CL A | | | (0.7 | ) | | 4.0 | | | (0.07 | ) |
| Southwestern Energy Co. | | | (4.2 | ) | | 2.1 | | | (0.04 | ) |
Contributions to Fund performance are based on actual daily holdings. Securities may have been bought or sold during the quarter.
Source: FactSet Portfolio Analytics
weitzfunds.com 11
VALUE FUND
SCHEDULE OF INVESTMENTS • MARCH 31, 2012
| COMMON STOCKS — 79.2% | | | Shares | | Value | |
| Information Technology — 17.7% | | | | | | | |
| Computers & Peripherals — 6.0% | | | | | | | |
| Hewlett-Packard Co. | | | 1,350,000 | | $ | 32,170,500 | |
| Dell, Inc.* | | | 1,700,000 | | | 28,220,000 | |
| | | | | | | 60,390,500 | |
| Internet Software & Services — 4.1% | | | | | | | |
| Google, Inc. - CL A* | | | 65,000 | | | 41,680,600 | |
| Semiconductors — 3.5% | | | | | | | |
| Texas Instruments, Inc. | | | 1,050,000 | | | 35,290,500 | |
| Software — 2.8% | | | | | | | |
| Microsoft Corp. | | | 900,000 | | | 29,025,000 | |
| IT Services — 1.3% | | | | | | | |
| Accenture plc - CL A | | | 200,000 | | | 12,900,000 | |
| | | | | | | 179,286,600 | |
| Consumer Discretionary — 17.0% | | | | | | | |
| Cable & Satellite — 6.3% | | | | | | | |
| Comcast Corp. - CL A Special | | | 1,200,000 | | | 35,412,000 | |
| Liberty Global, Inc. - Series C* | | | 600,000 | | | 28,734,000 | |
| | | | | | | 64,146,000 | |
| Multiline Retail — 3.1% | | | | | | | |
| Target Corp. | | | 530,000 | | | 30,883,100 | |
| Internet & Catalog Retail — 3.0% | | | | | | | |
| Liberty Interactive Corp. - Series A* | | | 1,600,000 | | | 30,544,000 | |
| Advertising — 2.9% | | | | | | | |
| Omnicom Group, Inc. | | | 575,000 | | | 29,123,750 | |
| Movies and Entertainment — 1.7% | | | | | | | |
| The Walt Disney Co. | | | 400,000 | | | 17,512,000 | |
| | | | | | | 172,208,850 | |
| Financials — 13.1% | | | | | | | |
| Property & Casualty Insurance — 4.7% | | | | | | | |
| Berkshire Hathaway, Inc. - CL B* | | | 590,000 | | | 47,878,500 | |
| Commercial Banks — 4.3% | | | | | | | |
| Wells Fargo & Co. | | | 1,275,000 | | | 43,528,500 | |
| Insurance Brokers — 4.1% | | | | | | | |
| Aon Corp. | | | 850,000 | | | 41,701,000 | |
| | | | | | | 133,108,000 | |
| Consumer Staples — 8.9% | | | | | | | |
| Beverages — 4.5% | | | | | | | |
| Anheuser-Busch InBev SA/NV - | | | | | | | |
| Sponsored ADR | | | 400,000 | | | 29,088,000 | |
| Diageo plc - Sponsored ADR | | | 175,000 | | | 16,887,500 | |
| | | | | | | 45,975,500 | |
| Food & Staples Retailing — 4.4% | | | | | | | |
| CVS Caremark Corp. | | | 580,000 | | | 25,984,000 | |
| Wal-Mart Stores, Inc. | | | 300,000 | | | 18,360,000 | |
| | | | | | | 44,344,000 | |
| | | | | | | 90,319,500 | |
| | | | Principal | | | |
| | | | amount | | | |
| | | | or shares | | Value | |
| Industrials — 8.4% | | | | | | | |
| Industrial Conglomerates — 3.7% | | | | | | | |
| Tyco International Ltd. | | | 660,000 | | $ | 37,078,800 | |
| Air Freight & Logistics — 3.2% | | | | | | | |
| United Parcel Service, Inc. - CL B | | | 402,500 | | | 32,489,800 | |
| Aerospace & Defense — 1.5% | | | | | | | |
| Lockheed Martin Corp. | | | 170,000 | | | 15,276,200 | |
| | | | | | | 84,844,800 | |
| Materials — 5.2% | | | | | | | |
| Construction Materials — 3.1% | | | | | | | |
| Martin Marietta Materials, Inc. | | | 360,000 | | | 30,826,800 | |
| Industrial Gases — 1.4% | | | | | | | |
| Praxair, Inc. | | | 125,000 | | | 14,330,000 | |
| Fertilizers & Agricultural Chemicals — 0.7% | | | | | | | |
| The Mosaic Co. | | | 125,000 | | | 6,911,250 | |
| | | | | | | 52,068,050 | |
| Energy — 4.9% | | | | | | | |
| Oil & Gas Exploration & Production — 4.9% | | | | | | | |
| Southwestern Energy Co.* | | | 675,000 | | | 20,655,000 | |
| Range Resources Corp. | | | 350,000 | | | 20,349,000 | |
| Apache Corp. | | | 80,000 | | | 8,035,200 | |
| | | | | | | 49,039,200 | |
| Health Care — 4.0% | | | | | | | |
| Pharmaceuticals — 4.0% | | | | | | | |
| Valeant Pharmaceuticals International, Inc.* | | | 750,000 | | | 40,267,500 | |
| Other — 0.0% | | | | | | | |
| Adelphia Recovery Trust, | | | | | | | |
Series ACC-7* # | | | 3,535,000 | | | — | |
| Total Common Stocks | | | | | | | |
| (Cost $603,351,202) | | | | | | 801,142,500 | |
| SHORT-TERM SECURITIES — 21.3% | | | | | | | |
| Wells Fargo Advantage Government Money Market Fund - | | | | | | | |
Institutional Class 0.01%(a) | | | 5,432,596 | | | 5,432,596 | |
| U.S. Treasury Bills, 0.01% to 0.09%, | | | | | | | |
4/19/12 to 5/31/12(b) | | $ | 210,000,000 | | | 209,990,530 | |
| Total Short-Term Securities | | | | | | | |
| (Cost $215,425,736) | | | | | | 215,423,126 | |
| Total Investments in Securities | | | | | | | |
| (Cost $818,776,938) | | | | | | 1,016,565,626 | |
| Other Liabilities in Excess of Other Assets — (0.5%) | | | | | | (4,894,202 | ) |
| Net Assets — 100.0% | | | | | $ | 1,011,671,424 | |
| Net Asset Value Per Share | | | | | $ | 32.98 | |
| * | Non-income producing |
| # | Illiquid and/or restricted security that has been fair valued. |
| (a) | Rate presented represents the annualized 7-day yield at March 31, 2012. |
| (b) | Interest rates presented represent the yield to maturity at the date of purchase. |
| | The accompanying notes form an integral part of these financial statements. |
12 Weitz Funds
PARTNERS VALUE FUND
PORTFOLIO MANAGERS’ DISCUSSION & ANALYSIS
Co-Portfolio Managers:
Wallace R. Weitz, CFA & Bradley P. Hinton, CFA
The Partners Value Fund returned +10.5% in the first calendar quarter, compared to a +12.6% return for the S&P 500 and a +12.9% return for the Russell 3000. Stock gains were broad based in the quarter, and our companies on the whole have been doing well. Our cable providers (Comcast +25%, Liberty Global +21%), material producers (Eagle Materials +35%, Martin Marietta Materials +14%) and retailers (Liberty Interactive +18%, Target +14%) paced the Fund’s returns in the quarter. Other notable contributors included Wells Fargo (+25%), Microsoft (+25%) and Tyco (+21%). New holding Hewlett-Packard detracted from near-term results as we built our position on the stock’s weakness.
For the fiscal year ended March 31, 2012, the Fund gained 5.4% compared to an 8.5% gain for the S&P 500 and a 7.2% gain for the Russell 3000. Several large-cap companies delivered exceptional returns. Microsoft (+30%), Comcast (+30%), and Tyco (+28%) posted solid earnings growth while executing on their strategic plans. New additions Wells Fargo and Valeant Pharmaceuticals were also among the Fund’s largest contributors. Both remain core holdings with sound long-term prospects.
Smaller company results were more mixed for the fiscal year. Omnicare (+19%) made significant progress under John Figueroa’s refreshing leadership, and Grand Canyon Education (+22%) rebounded from depressed levels. On the other hand, SandRidge Energy (-39%) and Redwood Trust (-22%) detracted materially from the Fund’s results. SandRidge made several bold strategic moves that upgraded the company’s asset base, helped fund its ambitious drilling program, and improved its financial flexibility. While the stock is volatile, we think the company is taking the right steps to increase its ultimate potential value. Redwood is well positioned to play a large role when the government inevitably reduces its massive support of the residential mortgage market. The company trades for less than book value, is building a franchise for the long haul, and pays a healthy dividend while we wait for conditions to improve.
We bought one new stock during the quarter as Hewlett-Packard again pulled back into our buying range. HP faces near-term challenges as management reformulates its strategy and integrates the Autonomy acquisition. More importantly, it will take time for Meg Whitman and her team to rebuild customer (and investor) trust after a series of missteps under prior leadership. Still, we think HP’s portfolio includes a number of attractive and entrenched businesses that are not going away, and that are worth far more than six times earnings to owners with a long enough investing horizon.
On balance we were net sellers into the continuing rally. We sold Mohawk Industries as investors bid up housing-related stocks in anticipation of the long-awaited recovery. While we like Mohawk’s business outlook as housing conditions improve, the stock had already priced in much of the potential good news well in advance. We also eliminated ConocoPhillips at healthy gains while increasing our investment in out-of-favor natural gas producer Southwestern Energy. Finally, we trimmed a long list of positions as stocks continued to march higher and discounts to value on average narrowed. As a result, the Fund’s residual cash position rose from 16% in December to 21% at quarter end.
Partners Value is a flexible, multi-cap fund that invests in companies of all sizes. The portfolio remains tilted to larger companies with strong competitive positions, relatively stable cash flows, able managements and sturdy balance sheets. Roughly 60% of the Fund’s equity holdings are in large-cap companies (market capitalization greater than $10B), with the other 40% split between medium-sized and smaller businesses.
| New and Eliminated Securities for Quarter Ended March 31, 2012 | |
| New Purchases ($mil) | | Eliminations ($mil) | |
| Hewlett-Packard | | $ | 15.7 | | Mohawk Industries | | $ | 12.6 | |
| | | | | | ConocoPhillips | | | 7.3 | |
weitzfunds.com 13
PARTNERS VALUE FUND
PERFORMANCE • (UNAUDITED)
| | | | Total Returns | | | Average Annual Total Returns | |
| | | | 3 Mos. | | 1 Year | | 3 Year | | 5 Year | | 10 Year | | 15 Year | | 20 Year | | 25 Year |
| Partners Value | | | 10.5 | % | | 5.4 | % | | 25.5 | % | | 1.3 | % | | 4.4 | % | | 9.7 | % | | 11.3 | % | | 11.0 | % |
| S&P 500 | | | 12.6 | | | 8.5 | | | 23.4 | | | 2.0 | | | 4.1 | | | 6.1 | | | 8.6 | | | 8.9 | |
| Russell 3000 | | | 12.9 | | | 7.2 | | | 24.3 | | | 2.2 | | | 4.7 | | | 6.5 | | | 8.7 | | | 9.0 | |
| Russell 3000 Value | | | 11.2 | | | 4.3 | | | 23.0 | | | -0.8 | | | 4.7 | | | 6.9 | | | 9.5 | | | 9.4 | |
Growth of $10,000
This chart depicts the change in the value of a $10,000 investment in the Partners Value Fund for the period March 31, 2002 through March 31, 2012, as compared with the growth of the Standard & Poor’s 500 Index during the same period. Index performance is hypothetical and is shown for illustrative purposes only.

| | | | Partners | | | | | Relative |
| | | | Value | | S&P 500 | | Results |
| Year | | | (1) | | (2) | | (1)-(2) |
| 1983 (6/1/83) | | | 9.9 | % | | 4.2 | % | | 5.7 | % |
| 1984 | | | 14.5 | | | 6.1 | | | 8.4 | |
| 1985 | | | 40.7 | | | 31.6 | | | 9.1 | |
| 1986 | | | 11.1 | | | 18.6 | | | -7.5 | |
| 1987 | | | 4.3 | | | 5.1 | | | -0.8 | |
| 1988 | | | 14.9 | | | 16.6 | | | -1.7 | |
| 1989 | | | 20.3 | | | 31.7 | | | -11.4 | |
| 1990 | | | -6.3 | | | -3.1 | | | -3.2 | |
| 1991 | | | 28.1 | | | 30.5 | | | -2.4 | |
| 1992 | | | 15.1 | | | 7.6 | | | 7.5 | |
| 1993 | | | 23.0 | | | 10.1 | | | 12.9 | |
| 1994 | | | -9.0 | | | 1.3 | | | -10.3 | |
| 1995 | | | 38.7 | | | 37.6 | | | 1.1 | |
| 1996 | | | 19.1 | | | 23.0 | | | -3.9 | |
| 1997 | | | 40.6 | | | 33.4 | | | 7.2 | |
| 1998 | | | 29.1 | | | 28.6 | | | 0.5 | |
| 1999 | | | 22.1 | | | 21.0 | | | 1.1 | |
| 2000 | | | 21.1 | | | -9.1 | | | 30.2 | |
| 2001 | | | -0.9 | | | -11.9 | | | 11.0 | |
| 2002 | | | -17.0 | | | -22.1 | | | 5.1 | |
| 2003 | | | 25.4 | | | 28.7 | | | -3.3 | |
| 2004 | | | 15.0 | | | 10.9 | | | 4.1 | |
| 2005 | | | -2.4 | | | 4.9 | | | -7.3 | |
| 2006 | | | 22.5 | | | 15.8 | | | 6.7 | |
| 2007 | | | -8.5 | | | 5.5 | | | -14.0 | |
| 2008 | | | -38.1 | | | -37.0 | | | -1.1 | |
| 2009 | | | 31.3 | | | 26.5 | | | 4.8 | |
| 2010 | | | 27.5 | | | 15.1 | | | 12.4 | |
| 2011 | | | 2.2 | | | 2.1 | | | 0.1 | |
| 2012 (3/31/12) | | | 10.5 | | | 12.6 | | | -2.1 | |
| Since Inception: | | | | | | | | | | |
| Cumulative | | | | | | | | | | |
| Return | | | 2,851.2 | | | | | | 1,166.2 | |
| Avg. Annual | | | | | | | | | | |
| Return | | | 12.4 | | | 10.5 | | | 1.9 | |
These performance numbers reflect the deduction of the Fund’s annual operating expenses which as stated in its most recent Prospectus are 1.21% of the Fund’s net assets. The returns assume redemption at the end of each period and reinvestment of dividends. Total returns shown include fee waivers and expense reimbursements, if any; total returns would have been lower had there been no waiver of fees and/or reimbursement of expenses by the Adviser. This information represents past performance and past performance does not guarantee future results. The investment return and the principal value of an investment in this Fund will fluctuate so that an investor’s shares, when redeemed, may be worth more or less than the original cost. Current performance may be lower or higher than the performance data quoted. Performance data current to the most recent month-end may be obtained at www.weitzfunds.com/performance/monthly.asp.
See page 4 for additional performance disclosures. See page 82 for a description of all indices.
Performance information does not reflect the deduction of taxes that a shareholder would pay on Fund distributions or the redemption of Fund shares.
14 Weitz Funds
PARTNERS VALUE FUND
PORTFOLIO PROFILE • (UNAUDITED)
| Top Ten Stocks |
| Wells Fargo & Co. | | | 4.2 | % |
| Berkshire Hathaway, Inc. - CL B | | | 3.9 | |
| Aon Corp. | | | 3.8 | |
| Liberty Interactive Corp. - Series A | | | 3.5 | |
| Texas Instruments, Inc. | | | 3.4 | |
| Tyco International Ltd. | | | 3.2 | |
| Google, Inc. - CL A | | | 3.2 | |
| Redwood Trust, Inc. | | | 3.1 | |
| Liberty Global, Inc. - Series C | | | 3.0 | |
| SandRidge Energy, Inc. | | | 2.9 | |
| % of Net Assets | | | 34.2 | % |
| Industry Sectors |
| Consumer Discretionary | | | 23.0 | % |
| Information Technology | | | 17.3 | |
| Financials | | | 15.0 | |
| Health Care | | | 8.3 | |
| Energy | | | 5.4 | |
| Materials | | | 5.0 | |
| Industrials | | | 3.2 | |
| Consumer Staples | | | 1.9 | |
| Short-Term Securities/Other | | | 20.9 | |
| Net Assets | | | 100.0 | % |
| Top Performers for Quarter Ended March 31, 2012 |
| Security Name | | | QTD Return of Security | | Average Weight in Portfolio | | Contribution to Fund Performance |
| Wells Fargo & Co. | | | 24.7 | % | | 4.2 | % | | 0.96 | % |
| Microsoft Corp. | | | 25.1 | | | 3.7 | | | 0.93 | |
| Eagle Materials, Inc. | | | 35.4 | | | 2.0 | | | 0.73 | |
| Liberty Interactive Corp. - Series A | | | 17.8 | | | 4.0 | | | 0.72 | |
| Liberty Global, Inc. - Series C | | | 21.2 | | | 3.2 | | | 0.68 | |
Contributions to Fund performance are based on actual daily holdings. Securities may have been bought or sold during the quarter.
Source: FactSet Portfolio Analytics
| Bottom Performers for Quarter Ended March 31, 2012 | |
| | | | QTD Return | | Average Weight | | Contribution to |
| Security Name | | | of Security | | in Portfolio | | Fund Performance |
| Hewlett-Packard Co. | | | (7.0 | )% | | 1.1 | % | | (0.18 | )% |
| SandRidge Energy, Inc. | | | (4.0 | ) | | 3.1 | | | (0.12 | ) |
| Google, Inc. - CL A | | | (0.7 | ) | | 3.1 | | | (0.05 | ) |
| Southwestern Energy Co. | | | (4.2 | ) | | 2.0 | | | (0.02 | ) |
Contributions to Fund performance are based on actual daily holdings. Securities may have been bought or sold during the quarter.
Source: FactSet Portfolio Analytics
weitzfunds.com 15
PARTNERS VALUE FUND
SCHEDULE OF INVESTMENTS • MARCH 31, 2012
| COMMON STOCKS — 79.1% | | | Shares | | | Value | |
| Consumer Discretionary — 23.0% | | | | | | | |
| Cable & Satellite — 5.8% | | | | | | | |
| Liberty Global, Inc. - Series C* | | | 449,800 | | $ | 21,540,922 | |
| Comcast Corp. - CL A Special | | | 650,000 | | | 19,181,500 | |
| | | | | | | 40,722,422 | |
| Internet & Catalog Retail — 3.5% | | | | | | | |
| Liberty Interactive Corp. - Series A* | | | 1,300,000 | | | 24,817,000 | |
| Multiline Retail — 2.9% | | | | | | | |
| Target Corp. | | | 350,000 | | | 20,394,500 | |
| Hotels, Restaurants & Leisure — 2.6% | | | | | | | |
| Interval Leisure Group, Inc. | | | 1,050,000 | | | 18,270,000 | |
| Broadcasting — 2.6% | | | | | | | |
| Liberty Media Corp. - | | | | | | | |
| Liberty Capital - Series A* | | | 205,000 | | | 18,070,750 | |
| Movies & Entertainment — 2.0% | | | | | | | |
| Live Nation Entertainment, Inc.* | | | 1,525,100 | | | 14,335,940 | |
| Textiles, Apparel & Luxury Goods — 1.8% | | | | | | | |
| Iconix Brand Group, Inc.* | | | 750,000 | | | 13,035,000 | |
| Education Services — 0.9% | | | | | | | |
| Grand Canyon Education, Inc.* | | | 367,979 | | | 6,535,307 | |
| Specialized Consumer Services — 0.9% | | | | | | | |
Coinstar, Inc.* (c) | | | 100,000 | | | 6,355,000 | |
| | | | | | | 162,535,919 | |
| Information Technology — 17.3% | | | | | | | |
| Internet Software & Services — 4.5% | | | | | | | |
| Google, Inc. - CL A* | | | 34,800 | | | 22,315,152 | |
| XO Group, Inc.* | | | 1,000,000 | | | 9,390,000 | |
| | | | | | | 31,705,152 | |
| Computers & Peripherals — 4.4% | | | | | | | |
| Dell, Inc.* | | | 1,000,000 | | | 16,600,000 | |
| Hewlett-Packard Co. | | | 600,000 | | | 14,298,000 | |
| | | | | | | 30,898,000 | |
| Semiconductors — 3.4% | | | | | | | |
| Texas Instruments, Inc. | | | 725,000 | | | 24,367,250 | |
| Software — 2.9% | | | | | | | |
| Microsoft Corp. | | | 630,000 | | | 20,317,500 | |
| Electronic Equipment & Instruments — 2.1% | | | | | | | |
| FLIR Systems, Inc. | | | 600,000 | | | 15,186,000 | |
| | | | | | | 122,473,902 | |
| Financials — 15.0% | | | | | | | |
| Commercial Banks — 4.2% | | | | | | | |
| Wells Fargo & Co. | | | 860,000 | | | 29,360,400 | |
| Property & Casualty Insurance — 3.9% | | | | | | | |
| Berkshire Hathaway, Inc. - CL B* | | | 340,000 | | | 27,591,000 | |
| Insurance Brokers — 3.8% | | | | | | | |
| Aon Corp. | | | 550,000 | | | 26,983,000 | |
| Mortgage REIT’s — 3.1% | | | | | | | |
| Redwood Trust, Inc. | | | 1,950,000 | | | 21,840,000 | |
| | | | | | | 105,774,400 | |
| | | | Principal | | | | |
| | | | amount | | | | |
| | | | or shares | | | Value | |
| Health Care — 8.3% | | | | | | | |
| Health Care Services — 5.4% | | | | | | | |
| Laboratory Corp. of America Holdings* | | | 210,000 | | $ | 19,223,400 | |
| Omnicare, Inc. | | | 540,000 | | | 19,207,800 | |
| | | | | | | 38,431,200 | |
| Pharmaceuticals — 2.9% | | | | | | | |
| Valeant Pharmaceuticals International, Inc.* | | | 375,000 | | | 20,133,750 | |
| | | | | | | 58,564,950 | |
| Energy — 5.4% | | | | | | | |
| Oil & Gas Exploration & Production — 5.4% | | | | | | | |
| SandRidge Energy, Inc.* | | | 2,612,000 | | | 20,451,960 | |
| Southwestern Energy Co.* | | | 460,000 | | | 14,076,000 | |
| Apache Corp. | | | 40,000 | | | 4,017,600 | |
| | | | | | | 38,545,560 | |
| Materials — 5.0% | | | | | | | |
| Construction Materials — 5.0% | | | | | | | |
| Martin Marietta Materials, Inc. | | | 172,500 | | | 14,771,175 | |
| Eagle Materials, Inc. | | | 350,000 | | | 12,162,500 | |
| Texas Industries, Inc. | | | 250,000 | | | 8,752,500 | |
| | | | | | | 35,686,175 | |
| Industrials — 3.2% | | | | | | | |
| Industrial Conglomerates — 3.2% | | | | | | | |
| Tyco International Ltd. | | | 400,000 | | | 22,472,000 | |
| Consumer Staples — 1.9% | | | | | | | |
| Food & Staples Retailing — 1.9% | | | | | | | |
| CVS Caremark Corp. | | | 300,000 | | | 13,440,000 | |
| Other — 0.0% | | | | | | | |
| Adelphia Recovery Trust, | | | | | | | |
Series ACC-7* # | | | 2,310,000 | | | — | |
| Total Common Stocks | | | | | | | |
| (Cost $436,845,066) | | | | | | 559,492,906 | |
| | | | | | | | |
| SHORT-TERM SECURITIES — 21.5% | | | | | | | |
| Wells Fargo Advantage Government Money Market Fund - | | | | | | | |
Institutional Class 0.01%(a) | | | 3,798,678 | | | 3,798,678 | |
| U.S. Treasury Bills, 0.01% to 0.11%, | | | | | | | |
4/05/12 to 5/31/12(b) | | $ | 148,000,000 | | | 147,993,732 | |
| Total Short-Term Securities | | | | | | | |
| (Cost $151,792,345) | | | | | | 151,792,410 | |
| | | | | | | | |
| Total Investments in Securities | | | | | | | |
| (Cost $588,637,411) | | | | | | 711,285,316 | |
| Options Written — 0.0% | | | | | | (96,000 | ) |
| Other Liabilities in Excess of Other Assets — (0.6%) | | | | | | (4,014,999 | ) |
| Net Assets — 100.0% | | | | | $ | 707,174,317 | |
| Net Asset Value Per Share | | | | | $ | 23.25 | |
| 16 Weitz Funds | The accompanying notes form an integral part of these financial statements. |
| | | | Expiration | | | Shares | | | | |
| | | | date/ | | | subject | | | | |
| OPTIONS WRITTEN* | | | Strike price | | | to option | | | Value | |
| Covered Call Options | | | | | | | | | | |
| Coinstar, Inc. | | | April 2012 / $62.50 | | | 15,000 | | $ | (37,500 | ) |
| Coinstar, Inc. | | | July 2012 / $62.50 | | | 10,000 | | | (58,500 | ) |
| | | | | | | | | | | |
| Total Options Written | | | | | | | | | | |
| (premiums received $101,873) | | | | | | | | $ | (96,000 | ) |
| * | Non-income producing |
| # | Illiquid and/or restricted security that has been fair valued. |
| (a) | Rate presented represents the annualized 7-day yield at March 31, 2012. |
| (b) | Interest rates presented represent the yield to maturity at the date of purchase. |
| (c) | Fully or partially pledged on outstanding written options. |
| The accompanying notes form an integral part of these financial statements. | weitzfunds.com 17 |
PARTNERS III OPPORTUNITY FUND
PORTFOLIO MANAGER’S DISCUSSION & ANALYSIS
Portfolio Manager: Wallace R. Weitz, CFA
The Partners III Opportunity Fund-Institutional Class returned +7.8% in the first calendar quarter, compared to a +12.6% return for the S&P 500 and a +12.9% return for the Russell 3000. Stock gains were broad-based in the quarter, and our companies on the whole have been doing well. Notable contributors included Wells Fargo (+25%), Microsoft (+25%), and a slew of consumer discretionary companies such as Liberty Global (+21%), Interval Leisure (+29%) and National CineMedia (+25%). As expected in a strongly rising market, the Fund’s short positions posted negative returns. While Ascent Capital (-7%), Intelligent Systems (-9%) and a few other stocks declined, our conservative positioning was the primary reason that the Fund lagged the market during the quarter.
For the fiscal year ended March 31, 2012, the Fund’s Institutional Class gained 4.9% compared to an 8.5% gain for the S&P 500 and a 7.2% gain for the Russell 3000. A trio of stocks (Liberty Interactive +19%, Liberty Media +20%, Liberty Global +20%) chaired by one of our favorite partners, John Malone, helped drive the Fund’s positive absolute returns. New additions Wells Fargo and Valeant Pharmaceuticals were also among the Fund’s largest contributors. Long-time holding Microsoft (+30%) kept churning out cash flow, and investors finally started to take note. Finally, Omnicare (+19%) made significant strategic progress under John Figueroa’s refreshing leadership.
While most of our stocks rose, the Fund trailed the broader indices for the fiscal year. The Fund’s energy and financial holdings (other than Wells Fargo) detracted materially from results. SandRidge Energy (-39%) made several bold strategic moves that upgraded the company’s asset base, helped fund its ambitious drilling program, and improved its financial flexibility. While the stock is volatile, we think the company is taking the right steps to increase its ultimate potential value. Southwestern Energy (-29%) fell as prices for U.S. natural gas collapsed throughout the year. The near-term environment is challenging, yet we think this low-cost producer has a strong multi-year outlook.
Redwood Trust (-22%) is well positioned to play a large role when the government inevitably reduces its massive support of the residential mortgage market. Redwood trades for less than book value, is building a franchise for the long haul, and pays a healthy dividend while we wait for conditions to improve. Aon (-6%) continues to make slow but steady forward progress. The company should benefit over time from global economic growth and healthier insurance market pricing.
Range Resources was our only new purchase in the first quarter. Range is a domestic natural gas exploration and production company, with “crown jewel” acreage in the Southwest Pennsylvania portion of the Marcellus field. We also added significantly to our holdings of FLIR Systems. FLIR designs and manufactures infrared and thermal imaging equipment for commercial and military customers. Please see the Letter to Shareholders at the beginning of this report for more details on both Range and FLIR. Other notable position size increases included Target, Iconix Brand Group and Valeant Pharmaceuticals.
We sold a handful of small positions during the quarter. Mohawk Industries rose as investors bid up housing-related stocks in anticipation of the long-awaited recovery. While we like Mohawk’s business outlook as housing conditions improve, the stock had priced in much of the potential good news well in advance. We eliminated Energizer Holdings at a moderate gain as the stock approached our value estimate, and we exited Grand Canyon Education as education stocks rallied early in the quarter. Finally, we sold several exchange-traded funds (ETF’s), one that invested in home builders, one that invested in banks and one that shorted long Treasury bonds.
Partners III Opportunity has the broadest toolkit of our equity funds. The Fund invests in companies of all sizes, and typically maintains short positions to help manage risk. Partners III is approximately 73% “net long” at quarter end, relatively unchanged from December. Our long positions edged up to 91% of net assets, while we also increased our effective short positions to 18% of net assets. The Fund’s shorts include small-, mid- and large-cap stock ETF’s.
| New and Eliminated Securities for Quarter Ended March 31, 2012 | |
| New ($mil) | | Eliminations ($mil) | |
| Range Resources | | $ | 9.5 | | SPDR S&P Bank ETF | | $ | 4.3 | |
| | | | | | Grand Canyon Education | | | 4.1 | |
| | | | | | ProShares Short 20+ Year Treasury Fund | | | 3.8 | |
| | | | | | Energizer Holdings | | | 3.2 | |
| | | | | | Mohawk Industries | | | 1.7 | |
| | | | | | Ishares Dow Jones U.S. Home Construction Index Fund | | | 0.5 | |
18 Weitz Funds
PARTNERS III OPPORTUNITY FUND
PERFORMANCE • (UNAUDITED)
| | | | Total Returns | | | Average Annual Total Returns | |
| | | | 3 Mos. | | 1 Year | | 3 Year | | 5 Year | | 10 Year | 15 Year | | 20 Year | | 25 Year |
| Partners III – Institutional Class | | | 7.8 | % | | 4.9 | % | | 28.4 | % | | 4.4 | % | | 7.8 | % | | 11.3 | % | | 13.0 | % | | 12.2 | % |
| S&P 500 | | | 12.6 | | | 8.5 | | | 23.4 | | | 2.0 | | | 4.1 | | | 6.1 | | | 8.6 | | | 8.9 | |
| Russell 3000 | | | 12.9 | | | 7.2 | | | 24.3 | | | 2.2 | | | 4.7 | | | 6.5 | | | 8.7 | | | 9.0 | |
| Russell 3000 Value | | | 11.2 | | | 4.3 | | | 23.0 | | | -0.8 | | | 4.7 | | | 6.9 | | | 9.5 | | | 9.4 | |
Growth of $10,000
This chart depicts the change in the value of a $10,000 investment in Partners III – Institutional Class for the period March 31, 2002 through March 31, 2012, as compared with the growth of the Standard & Poor’s 500 Index during the same period. Index performance is hypothetical and is shown for illustrative purposes only.
| | | | Partners III | | S&P 500 | | Relative |
| Year | | | (1) | | (2) | | Results (1)-(2) |
| 1983 (6/1/83) | | | 8.6 | % | | 4.2 | % | | 4.4 | % |
| 1984 | | | 11.2 | | | 6.1 | | | 5.1 | |
| 1985 | | | 38.6 | | | 31.6 | | | 7.0 | |
| 1986 | | | 8.5 | | | 18.6 | | | -10.1 | |
| 1987 | | | -1.4 | | | 5.1 | | | -6.5 | |
| 1988 | | | 19.5 | | | 16.6 | | | 2.9 | |
| 1989 | | | 19.4 | | | 31.7 | | | -12.3 | |
| 1990 | | | -5.5 | | | -3.1 | | | -2.4 | |
| 1991 | | | 23.2 | | | 30.5 | | | -7.3 | |
| 1992 | | | 13.5 | | | 7.6 | | | 5.9 | |
| 1993 | | | 32.3 | | | 10.1 | | | 22.2 | |
| 1994 | | | -11.1 | | | 1.3 | | | -12.4 | |
| 1995 | | | 43.3 | | | 37.6 | | | 5.7 | |
| 1996 | | | 25.0 | | | 23.0 | | | 2.0 | |
| 1997 | | | 37.1 | | | 33.4 | | | 3.7 | |
| 1998 | | | 10.9 | | | 28.6 | | | -17.7 | |
| 1999 | | | 10.6 | | | 21.0 | | | -10.4 | |
| 2000 | | | 32.4 | | | -9.1 | | | 41.5 | |
| 2001 | | | 6.6 | | | -11.9 | | | 18.5 | |
| 2002 | | | -16.1 | | | -22.1 | | | 6.0 | |
| 2003 | | | 42.6 | | | 28.7 | | | 13.9 | |
| 2004 | | | 22.1 | | | 10.9 | | | 11.2 | |
| 2005 | | | -0.7 | | | 4.9 | | | -5.6 | |
| 2006 | | | 20.4 | | | 15.8 | | | 4.6 | |
| 2007 | | | -12.9 | | | 5.5 | | | -18.4 | |
| 2008 | | | -34.4 | | | -37.0 | | | 2.6 | |
| 2009 | | | 42.0 | | | 26.5 | | | 15.5 | |
| 2010 | | | 33.0 | | | 15.1 | | | 17.9 | |
| 2011 | | | 5.6 | | | 2.1 | | | 3.5 | |
| 2012 (3/31/12) | | | 7.8 | | | 12.6 | | | -4.8 | |
| Since Inception: | | | | | | | | | | |
| Cumulative | | | | | | | | | | |
| | | 3,519.7 | | | 1,685.0 | | | 1,834.7 | |
| Avg. Annual | | | | | | | | | | |
| Return | | | 13.2 | | | 10.5 | | | 2.7 | |
These performance numbers reflect the deduction of the Fund’s Institutional Class annual operating expenses which as stated in its most recent Prospectus are 1.53% of the Fund’s net assets. The returns assume redemption at the end of each period and reinvestment of dividends. Total returns shown include fee waivers and expense reimbursements, if any; total returns would have been lower had there been no waiver of fees and/or reimbursement of expenses by the Adviser. This information represents past performance and past performance does not guarantee future results. The investment return and the principal value of an investment in this Fund will fluctuate so that an investor’s shares, when redeemed, may be worth more or less than the original cost. Current performance may be lower or higher than the performance data quoted. Performance data current to the most recent month-end may be obtained at www.weitzfunds.com/performance/monthly.asp.
See page 4 for additional performance disclosures. See page 82 for a description of all indices.
Performance information does not reflect the deduction of taxes that a shareholder would pay on Fund distributions or the redemption of Fund shares.
weitzfunds.com 19
PARTNERS III OPPORTUNITY FUND
PORTFOLIO PROFILE • (UNAUDITED)
| Top Ten Stocks |
| Wells Fargo & Co. | | | 6.3 | % |
| SandRidge Energy, Inc. | | | 4.3 | |
| Liberty Media Corp. - Liberty Capital - Series A | | | 4.1 | |
| Redwood Trust, Inc. | | | 4.0 | |
| Berkshire Hathaway, Inc. - CL B | | | 3.9 | |
| Valeant Pharmaceuticals International, Inc. | | | 3.9 | |
| Liberty Interactive Corp. - Series A | | | 3.8 | |
| Live Nation Entertainment, Inc. | | | 3.7 | |
| Liberty Global, Inc. - Series C | | | 3.7 | |
| Texas Instruments, Inc. | | | 3.6 | |
| % of Net Assets | | | 41.3 | % |
| Industry Sectors |
| Consumer Discretionary | | | 27.0 | % |
| Financials | | | 19.0 | |
| Information Technology | | | 15.9 | |
| Health Care | | | 10.1 | |
| Energy | | | 8.8 | |
| Industrials | | | 5.2 | |
| Materials | | | 3.9 | |
| Consumer Staples | | | 0.4 | |
| Telecommunication Services | | | 0.1 | |
| Securities Sold Short | | | (11.7 | ) |
| Short Proceeds/Other | | | 21.3 | |
| Net Assets | | | 100.0 | % |
| Top Performers for Quarter Ended March 31, 2012 |
| | | | QTD Return | | Average Weight | | Contribution to |
| Security Name | | | of Security | | in Portfolio | | Fund Performance |
| Wells Fargo & Co. | | | 24.7 | % | | 5.8 | % | | 1.32 | % |
| Microsoft Corp. | | | 25.1 | | | 3.3 | | | 0.79 | |
| Liberty Global, Inc. - Series C | | | 21.2 | | | 3.7 | | | 0.74 | |
| Liberty Interactive Corp. - Series A | | | 17.8 | | | 4.1 | | | 0.70 | |
| Live Nation Entertainment, Inc. | | | 13.1 | | | 4.1 | | | 0.60 | |
Contributions to Fund performance are based on actual daily holdings. Securities may have been bought or sold during the quarter.
Source: FactSet Portfolio Analytics
| Bottom Performers for Quarter Ended March 31, 2012 |
| | | | QTD Return | | Average Weight | | Contribution to |
| Security Name | | | of Security | | in Portfolio | | Fund Performance |
| Ishares Russell 2000 Fund (short) | | | 12.8 | % | | (4.2 | )% | | (0.53 | )% |
| SPDR S&P 500 ETF Trust (short) | | | 12.6 | | | (3.2 | ) | | (0.41 | ) |
| Ishares Russell Midcap Fund (short) | | | 12.9 | | | (3.1 | ) | | (0.39 | ) |
| Ascent Capital Group, Inc. - CL A | | | (6.8 | ) | | 2.8 | | | (0.18 | ) |
| Ishares Russell 2000 Value Fund (short) | | | 11.6 | | | (1.5 | ) | | (0.17 | ) |
Contributions to Fund performance are based on actual daily holdings. Securities may have been bought or sold during the quarter.
Source: FactSet Portfolio Analytics
20 Weitz Funds
PARTNERS III OPPORTUNITY FUND
SCHEDULE OF INVESTMENTS • MARCH 31, 2012
| COMMON STOCKS — 90.4% | | | Shares | | | Value | |
| Consumer Discretionary — 27.0% | | | | | | | |
| Broadcasting — 5.3% | | | | | | | |
| Liberty Media Corp. - | | | | | | | |
Liberty Capital - Series A* (b) | | | 290,000 | | $ | 25,563,500 | |
| Cumulus Media, Inc. - CL A* | | | 2,070,000 | | | 7,224,300 | |
| | | | | | | 32,787,800 | |
| Cable & Satellite — 4.4% | | | | | | | |
Liberty Global, Inc. - Series C* (b) | | | 480,000 | | | 22,987,200 | |
| Knology, Inc.* | | | 250,000 | | | 4,550,000 | |
| | | | | | | 27,537,200 | |
| Internet & Catalog Retail — 3.8% | | | | | | | |
Liberty Interactive Corp. - Series A* (b) | | | 1,250,000 | | | 23,862,500 | |
| Movies & Entertainment — 3.7% | | | | | | | |
| Live Nation Entertainment, Inc.* | | | 2,461,100 | | | 23,134,340 | |
| Textiles, Apparel & Luxury Goods — 3.2% | | | | | | | |
| Iconix Brand Group, Inc.* | | | 1,150,000 | | | 19,987,000 | |
| Hotels, Restaurants & Leisure — 2.3% | | | | | | | |
| Interval Leisure Group, Inc. | | | 800,000 | | | 13,920,000 | |
| Multiline Retail — 1.9% | | | | | | | |
Target Corp.(b) | | | 200,000 | | | 11,654,000 | |
| Advertising — 1.9% | | | | | | | |
| National CineMedia, Inc. | | | 750,000 | | | 11,475,000 | |
| Specialized Consumer Services — 0.5% | | | | | | | |
Coinstar, Inc.* (b) | | | 53,000 | | | 3,368,150 | |
| | | | | | | 167,725,990 | |
| Financials — 19.0% | | | | | | | |
| Commercial Banks — 6.3% | | | | | | | |
Wells Fargo & Co.(b) | | | 1,150,000 | | | 39,261,000 | |
| Property & Casualty Insurance — 4.6% | | | | | | | |
Berkshire Hathaway, Inc. - CL B* (b) | | | 300,000 | | | 24,345,000 | |
| CNA Financial Corp. | | | 150,000 | | | 4,399,500 | |
| | | | | | | 28,744,500 | |
| Insurance Brokers — 4.1% | | | | | | | |
| Aon Corp. | | | 442,000 | | | 21,684,520 | |
| Willis Group Holdings Ltd. | | | 100,000 | | | 3,498,000 | |
| | | | | | | 25,182,520 | |
| Mortgage REIT’s — 4.0% | | | | | | | |
Redwood Trust, Inc.(b) | | | 2,200,000 | | | 24,640,000 | |
| | | | | | | 117,828,020 | |
| Information Technology — 15.9% | | | | | | | |
| Internet Software & Services — 3.9% | | | | | | | |
Google, Inc. - CL A* (b) | | | 25,000 | | | 16,031,000 | |
| XO Group, Inc.* | | | 840,000 | | | 7,887,600 | |
| | | | | | | 23,918,600 | |
| Computers & Peripherals — 3.7% | | | | | | | |
Dell, Inc.* (b) | | | 900,000 | | | 14,940,000 | |
Hewlett-Packard Co.(b) | | | 350,000 | | | 8,340,500 | |
| | | | | | | 23,280,500 | |
| Semiconductors — 3.6% | | | | | | | |
| Texas Instruments, Inc. | | | 660,000 | | | 22,182,600 | |
| Software — 2.9% | | | | | | | |
| Microsoft Corp. | | | 550,000 | | | 17,737,500 | |
| Electronic Equipment & Instruments — 1.8% | | | | | | | |
| FLIR Systems, Inc. | | | 450,000 | | | 11,389,500 | |
| | | | | | | 98,508,700 | |
| | | | Shares | | | Value | |
| Health Care — 10.1% | | | | | | | |
| Health Care Services — 6.2% | | | | | | | |
Omnicare, Inc.(b) | | | 620,000 | | $ | 22,053,400 | |
Laboratory Corp. of America Holdings* (b) | | | 180,000 | | | 16,477,200 | |
| | | | | | | 38,530,600 | |
| Pharmaceuticals — 3.9% | | | | | | | |
Valeant Pharmaceuticals International, Inc.* (b) | | | 450,000 | | | 24,160,500 | |
| | | | | | | 62,691,100 | |
| Energy — 8.8% | | | | | | | |
| Oil & Gas Exploration & Production — 8.8% | | | | | | | |
| SandRidge Energy, Inc.* | | | 3,428,278 | | | 26,843,417 | |
| Southwestern Energy Co.* | | | 400,000 | | | 12,240,000 | |
| Range Resources Corp. | | | 165,000 | | | 9,593,100 | |
Apache Corp.(b) | | | 60,000 | | | 6,026,400 | |
| | | | | | | 54,702,917 | |
| Industrials — 5.2% | | | | | | | |
| Commercial Services & Supplies — 2.6% | | | | | | | |
| Ascent Capital Group, Inc. - CL A* | | | 340,000 | | | 16,078,600 | |
| Industrial Conglomerates — 2.1% | | | | | | | |
| Tyco International Ltd. | | | 233,800 | | | 13,134,884 | |
| Machinery — 0.5% | | | | | | | |
Intelligent Systems Corp.* # † | | | 2,270,000 | | | 3,291,500 | |
| | | | | | | 32,504,984 | |
| Materials — 3.9% | | | | | | | |
| Construction Materials — 3.9% | | | | | | | |
Martin Marietta Materials, Inc.(b) | | | 130,000 | | | 11,131,900 | |
| Eagle Materials, Inc. | | | 215,000 | | | 7,471,250 | |
| Texas Industries, Inc. | | | 168,659 | | | 5,904,751 | |
| | | | | | | 24,507,901 | |
| Consumer Staples — 0.4% | | | | | | | |
| Personal Products — 0.4% | | | | | | | |
| Avon Products, Inc. | | | 140,000 | | | 2,710,400 | |
| Telecommunication Services — 0.1% | | | | | | | |
| Diversified Telecommunication Services — 0.1% | | | | | | | |
Continental Resources* # | | | 663 | | | 331,500 | |
| Total Common Stocks | | | | | | | |
| (Cost $438,403,893) | | | | | | 561,511,512 | |
| | | | | | | | |
| | | | Expiration | | | Shares | | | | |
| PUT | | | date/ | | | subject | | | | |
| OPTIONS* — 0.1% | | | Strike price | | | to option | | | Value | |
| Put Options | | | | | | | | | | |
| Ishares Russell | | | | | | | | | | |
| Midcap Fund | | | May 2012 / $109 | | | 100,000 | | | 207,500 | |
| S&P 100 Index | | | April 2012 / $620 | | | 20,000 | | | 48,000 | |
| S&P 100 Index | | | May 2012 / $635 | | | 30,000 | | | 336,000 | |
| | | | | | | | | | | |
| Total Put Options | | | | | | | | | | |
| (premiums paid $1,226,750) | | | | | | | | | 591,500 | |
| The accompanying notes form an integral part of these financial statements. | weitzfunds.com 21 |
PARTNERS III OPPORTUNITY FUND
SCHEDULE OF INVESTMENTS • (CONTINUED)
| SHORT-TERM SECURITIES — 12.3% | | | Shares | | | Value | |
| Wells Fargo Advantage Government Money Market Fund - | | | | | | | |
Institutional Class 0.01%(a) | | | | | | | |
| (Cost $76,089,356) | | | 76,089,356 | | $ | 76,089,356 | |
| Total Investments in Securities | | | | | | | |
| (Cost $515,719,999) | | | | | | 638,192,368 | |
Due From Broker(b) — 11.3% | | | | | | 70,378,726 | |
| Securities Sold Short — (11.1%) | | | | | | (68,592,500 | ) |
| Options Written — (0.6%) | | | | | | (3,960,390 | ) |
| Other Liabilities in Excess of Other Assets — (2.4%) | | | | | | (15,097,686 | ) |
| Net Assets — 100.0% | | | | | $ | 620,920,518 | |
| Net Asset Value Per Share - Institutional Class | | | | | $ | 12.93 | |
| Net Asset Value Per Share - Investor Class | | | | | $ | 12.90 | |
| | | | | | | | |
| SECURITIES SOLD SHORT — (11.1%) | | | | | | | |
| Ishares Russell 2000 Fund | | | 320,000 | | | (26,512,000 | ) |
| Ishares Russell 2000 Value Fund | | | 130,000 | | | (9,486,100 | ) |
| Ishares Russell Midcap Fund | | | 180,000 | | | (19,929,600 | ) |
| SPDR S&P 500 ETF Trust | | | 90,000 | | | (12,664,800 | ) |
| | | | | | | | |
| Total Securities Sold Short | | | | | | | |
| (proceeds $65,051,816) | | | | | $ | (68,592,500 | ) |
| | | | | | | Shares | | | | |
| | | | | | | subject | | | | |
| OPTIONS WRITTEN* | | | date/Strike price | | | to option | | | Value | |
Covered Call OptionsCall Options | | | | | | | | | | |
| Coinstar, Inc. | | | April 2012 / $47.50 | | | 36,700 | | $ | (587,200 | ) |
| Coinstar, Inc. | | | April 2012 / $50 | | | 16,300 | | | (224,940 | ) |
| Hewlett-Packard Co. | | | May 2012 / $27 | | | 25,000 | | | (2,250 | ) |
| Omnicare, Inc. | | | June 2012 / $34 | | | 100,000 | | | (285,000 | ) |
| Omnicare, Inc. | | | June 2012 / $37 | | | 100,000 | | | (127,500 | ) |
| Omnicare, Inc. | | | Sept. 2012 / $36 | | | 100,000 | | | (270,000 | ) |
| Target Corp. | | | July 2012 / $57.50 | | | 100,000 | | | (271,500 | ) |
| Wells Fargo & Co. | | | July 2012 / $33 | | | 200,000 | | | (493,000 | ) |
| Wells Fargo & Co. | | | July 2012 / $34 | | | 200,000 | | | (377,000 | ) |
| | | | | | | | | | (2,638,390 | ) |
| Uncovered Call Options | | | | | | | | | | |
| Ishares Russell | | | | | | | | | | |
| Midcap Fund | | | May 2012 / $109 | | | 100,000 | | | (375,000 | ) |
| S&P 100 Index | | | April 2012 / $620 | | | 20,000 | | | (470,000 | ) |
| S&P 100 Index | | | May 2012 / $635 | | | 30,000 | | | (474,000 | ) |
| | | | | | | | | | (1,319,000 | ) |
| Put Options | | | | | | | | | | |
| Coinstar, Inc. | | | April 2012 / $42.50 | | | 20,000 | | | (1,500 | ) |
| Coinstar, Inc. | | | April 2012 / $45 | | | 20,000 | | | (1,500 | ) |
| | | | | | | | | | (3,000 | ) |
| Total Options Written | | | | | | | | | | |
| (premiums received $3,141,375) | | | | | | | | $ | (3,960,390 | ) |
| * | Non-income producing |
| † | Controlled affiliate |
| # | Illiquid and/or restricted security that has been fair valued. |
| (a) | Rate presented represents the annualized 7-day yield at March 31, 2012. |
| (b) | Fully or partially pledged as collateral on securities sold short and outstanding written options. |
| 22 Weitz Funds | The accompanying notes form an integral part of these financial statements. |
RESEARCH FUND
PORTFOLIO MANAGERS’ DISCUSSION & ANALYSIS
Co-Portfolio Managers:
Jonathan Baker, CFA; Barton B. Hooper, CFA; David A. Perkins, CFA; & Andrew S. Weitz
The Research Fund returned +11.9% in the first calendar quarter, compared to a +12.6% return for the S&P 500 Index, a +12.9% return for the Russell 3000 Index, and a +11.2% return for the Russell 3000 Value Index. Coinstar, Inc. (+39%), the Fund’s largest holding at approximately 9% of net assets, continued its recent strong performance as excellent business results and the announcement of a streaming media joint venture with Verizon, Inc. alleviated some longer term concerns over declines in DVD rentals. Long-time holding Microsoft Corp. (+25%) benefited from continued business adoption of Windows 7 along with anticipation of a strong 2012 product line including the launch of Windows 8. Other contributors to Fund performance were National CineMedia (+25%), Eagle Materials (+27%) and Interval Leisure Group (+29%). New holding Hewlett-Packard (-7%), which returns to the Fund after a brief absence, was the most significant detractor to performance in the quarter. We are confident that the company will overcome its operational issues and is significantly undervalued relative to its future prospects.
For the fiscal year ended March 31, 2012, the Fund returned +12.3% compared to an +8.5% return for the S&P 500 Index, a +7.2% return for the Russell 3000 Index, and a +4.3% return for the Russell 3000 Value Index. Similar to the first calendar quarter, Coinstar (+38%) and Microsoft (+30%) were the largest contributors to Fund performance. Grand Canyon Education (+22%) was also a significant contributor as the Fund’s flexible structure allowed it to take advantage of considerable price volatility during the year. We believe that Grand Canyon is one of the better positioned companies in the For-Profit Education industry as management has anticipated many of the regulatory changes that occurred over the past two years and is ahead of its competitors in adapting its business model to the new environment. American Eagle Outfitters (-34%) and Texas Industries (-31%) were the largest detractors to fiscal year performance as both were buffeted by concerns about the economic recovery in the U.S.
Other than Hewlett-Packard, Redwood Trust was the only new purchase for the Fund during the quarter. Our confidence in Redwood’s ability to conservatively underwrite and profit from the nascent recovery in the securitization of “jumbo” mortgages combined with a healthy dividend yield (approximately 8.5%), made the company a compelling addition to the Fund.
During the quarter, the Fund’s holdings of Eagle Materials, Live Nation Entertainment, Omnicom Group and Brown & Brown were eliminated as the price of all four approached our estimate of business value. At 26% of net assets, the Fund’s cash remains at elevated levels as we wait for the prices of our “on-deck” companies to reflect an adequate margin of safety. We can’t predict when low prices will intersect with our margin of safety levels but are confident that our patience will result in ample opportunities over time.
Research is a focused, multi-cap equity fund that invests in companies of all sizes. The Fund is managed in a “sleeve” format, with each co-manager responsible for all decisions related to their portion of the portfolio’s assets. In addition to the unique portfolio management structure, the Fund has several characteristics that may further distinguish it from our other equity funds including potentially higher levels of concentration, position sizes, and turnover within the Fund.
| New and Eliminated Securities for Quarter Ended March 31, 2012 | |
| New Purchases ($000’s) | | Eliminations ($000’s) |
| Hewlett-Packard | | $ | 266 | | Eagle Materials | | $ | 520 | |
| Redwood Trust | | | 226 | | Live Nation Entertainment | | | 308 | |
| | | | | | Omnicom Group | | | 250 | |
| | | | | | Brown & Brown | | | 236 | |
weitzfunds.com 23
RESEARCH FUND
PERFORMANCE • (UNAUDITED)
| | | | Total Returns | | | Average Annual Total Returns |
| | | | | | | | | | | | | | | | Since |
| | | | 3 Mos. | | 1 Year | | 3 Year | | 5 Year | | Inception |
| Research | | | 11.9 | % | | 12.3 | % | | 28.0 | % | | 4.9 | % | | 7.0 | % |
| S&P 500 | | | 12.6 | | | 8.5 | | | 23.4 | | | 2.0 | | | 4.7 | |
| Russell 3000 | | | 12.9 | | | 7.2 | | | 24.3 | | | 2.2 | | | 5.1 | |
| Russell 3000 Value | | | 11.2 | | | 4.3 | | | 23.0 | | | -0.8 | | | 3.6 | |
Growth of $10,000
This chart depicts the change in the value of a $10,000 investment in the Research Fund for the period April 1, 2005 through March 31, 2012, as compared with the growth of the Standard & Poor’s 500 Index during the same period. Index performance is hypothetical and is shown for illustrative purposes only.
| | | | Research | | S&P 500 | | Relative |
| Year | | | (1) | | (2) | | Results (1)-(2) |
| 2005 (4/1/05) | | | 4.0 | % | | 7.2 | % | | -3.2 | % |
| 2006 | | | 21.8 | | | 15.8 | | | 6.0 | |
| 2007 | | | -13.4 | | | 5.5 | | | -18.9 | |
| 2008 | | | -30.7 | | | -37.0 | | | 6.3 | |
| 2009 | | | 38.8 | | | 26.5 | | | 12.3 | |
| 2010 | | | 30.3 | | | 15.1 | | | 15.2 | |
| 2011 | | | 4.2 | | | 2.1 | | | 2.1 | |
| 2012 (3/31/12) | | | 11.9 | | | 12.6 | | | -0.7 | |
| Since Inception: | | | | | | | | | | |
| Cumulative | | | | | | | | | | |
| Return | | | 60.3 | | | 38.0 | | | 22.3 | |
| Avg. Annual | | | | | | | | | | |
| Return | | | 7.0 | | | 4.7 | | | 2.3 | |
Starting January 1, 2011, these performance numbers reflect the deduction of the Fund’s actual operating expenses. For periods of time prior to January 1, 2011, the performance numbers reflect the deduction of annual pro forma operating expenses of 1.50%. Annual operating expenses for the Fund as stated in its most recent Prospectus are 1.81% (estimated gross) and 0.91% (net) of the Fund’s net assets. The investment adviser has agreed, in writing, to limit the total annual fund operating expenses (excluding taxes, interest, brokerage commissions, and acquired fund fees and expenses) to 0.90% of the Fund’s average daily net assets through July 31, 2012. The returns assume redemption at the end of each period and reinvestment of dividends. Total returns shown include fee waivers and expense reimbursements, if any; total returns would have been lower had there been no waiver of fees and/or reimbursement of expenses by the Adviser. This information represents past performance and past performance does not guarantee future results. The investment return and the principal value of an investment in this Fund will fluctuate so that an investor’s shares, when redeemed, may be worth more or less than the original cost. Current performance may be lower or higher than the performance data quoted. Performance data current to the most recent month-end may be obtained at www.weitzfunds.com/performance/monthly.asp.
See page 4 for additional performance disclosures. See page 82 for a description of all indices.
Performance information does not reflect the deduction of taxes that a shareholder would pay on Fund distributions or the redemption of Fund shares.
24 Weitz Funds
RESEARCH FUND
PORTFOLIO PROFILE • (UNAUDITED)
| Top Ten Stocks | |
| Coinstar, Inc. | | | 9.4 | % |
| Southwestern Energy Co. | | | 5.4 | |
| Google, Inc. - CL A | | | 4.8 | |
| Berkshire Hathaway, Inc. - CL B | | | 4.6 | |
| Microsoft Corp. | | | 4.4 | |
| National CineMedia, Inc. | | | 4.0 | |
| FLIR Systems, Inc. | | | 3.2 | |
| Aon Corp. | | | 2.5 | |
| Valeant Pharmaceuticals International, Inc. | | | 2.4 | |
| Interval Leisure Group, Inc. | | | 2.1 | |
| % of Net Assets | | | 42.8 | % |
| Industry Sectors | |
| Consumer Discretionary | | | 25.8 | % |
| Information Technology | | | 22.3 | |
| Financials | | | 8.6 | |
| Energy | | | 6.7 | |
| Health Care | | | 5.2 | |
| Industrials | | | 2.8 | |
| Consumer Staples | | | 2.8 | |
| Short-Term Securities/Other | | | 25.8 | |
| Net Assets | | | 100.0 | % |
| Top Performers for Quarter Ended March 31, 2012 |
| | | | QTD Return | Average Weight | Contribution to |
| Security Name | | | of Security | in Portfolio | | Fund Performance |
| Coinstar, Inc. | | | 39.2 | % | | 8.9 | % | | 3.14 | % |
| Microsoft Corp. | | | 25.1 | | | 4.4 | | | 1.04 | |
| National CineMedia, Inc. | | | 25.2 | | | 4.2 | | | 1.01 | |
| Eagle Materials, Inc. | | | 35.4 | | | 1.2 | | | 0.79 | |
| Interval Leisure Group, Inc. | | | 28.6 | | | 1.7 | | | 0.50 | |
Contributions to Fund performance are based on actual daily holdings. Securities may have been bought or sold during the quarter. Source: FactSet Portfolio Analytics
| Bottom Performers for Quarter Ended March 31, 2012 |
| | | | QTD Return | | Average Weight | | Contribution to |
| Security Name | | | of Security | | in Portfolio | | Fund Performance |
| Hewlett-Packard Co. | | | (7.0 | )% | | 0.8 | % | | (0.23 | )% |
| Google, Inc. - CL A | | | (0.7 | ) | | 4.5 | | | (0.05 | ) |
| SandRidge Energy, Inc. | | | (4.0 | ) | | 1.4 | | | (0.05 | ) |
Contributions to Fund performance are based on actual daily holdings. Securities may have been bought or sold during the quarter. Source: FactSet Portfolio Analytics
weitzfunds.com 25
RESEARCH FUND
SCHEDULE OF INVESTMENTS • MARCH 31, 2012
| COMMON STOCKS — 74.2% | | Shares | | Value | |
| Consumer Discretionary — 25.8% | | | | | | | |
| Specialized Consumer Services — 9.4% | | | | | | | |
| Coinstar, Inc.* | | | 24,168 | | $ | 1,535,877 | |
| Advertising — 4.0% | | | | | | | |
| National CineMedia, Inc. | | | 42,099 | | | 644,115 | |
| Cable & Satellite — 3.3% | | | | | | | |
| Knology, Inc.* | | | 15,660 | | | 285,012 | |
| Comcast Corp. - CL A | | | 8,500 | | | 255,085 | |
| | | | | | | 540,097 | |
| Education Services — 2.5% | | | | | | | |
| ITT Educational Services, Inc.* | | | 3,270 | | | 216,278 | |
| Grand Canyon Education, Inc.* | | | 10,730 | | | 190,565 | |
| | | | | | | 406,843 | |
| Hotels, Restaurants & Leisure — 2.1% | | | | | | | |
| Interval Leisure Group, Inc. | | | 19,911 | | | 346,451 | |
| Multiline Retail — 1.7% | | | | | | | |
| Target Corp. | | | 4,700 | | | 273,869 | |
| Movies & Entertainment — 1.4% | | | | | | | |
| The Walt Disney Co. | | | 5,300 | | | 232,034 | |
| Internet & Catalog Retail — 1.4% | | | | | | | |
| Liberty Interactive Corp. - Series A* | | | 11,900 | | | 227,171 | |
| | | | | | | 4,206,457 | |
| Information Technology — 22.3% | | | | | | | |
| Internet Software & Services — 6.4% | | | | | | | |
| Google, Inc. - CL A* | | | 1,219 | | | 781,672 | |
| XO Group, Inc.* | | | 28,628 | | | 268,817 | |
| | | | | | | 1,050,489 | |
| Software — 5.9% | | | | | | | |
| Microsoft Corp. | | | 22,329 | | | 720,110 | |
| Oracle Corp. | | | 7,989 | | | 232,959 | |
| | | | | | | 953,069 | |
| Electronic Equipment & Instruments — 3.2% | | | | | | | |
| FLIR Systems, Inc. | | | 20,410 | | | 516,577 | |
| Computers & Peripherals — 2.7% | | | | | | | |
| Hewlett-Packard Co. | | | 9,510 | | | 226,623 | |
| Dell, Inc.* | | | 12,700 | | | 210,820 | |
| | | | | | | 437,443 | |
| Communications Equipment — 1.4% | | | | | | | |
| Cisco Systems, Inc. | | | 11,064 | | | 234,004 | |
| Semiconductors — 1.4% | | | | | | | |
| Texas Instruments, Inc. | | | 6,700 | | | 225,187 | |
| IT Services — 1.3% | | | | | | | |
| Accenture plc - CL A | | | 3,300 | | | 212,850 | |
| | | | | | | 3,629,619 | |
| Financials — 8.6% | | | | | | | |
| Property & Casualty Insurance — 4.6% | | | | | | | |
| Berkshire Hathaway, Inc. - CL B* | | | 9,257 | | | 751,206 | |
| Insurance Brokers — 2.5% | | | | | | | |
| Aon Corp. | | | 8,181 | | | 401,360 | |
| Mortgage REIT's — 1.5% | | | | | | | |
| Redwood Trust, Inc. | | | 21,887 | | | 245,134 | |
| | | | | | | 1,397,700 | |
| | | | | | | | |
| | | Shares | | Value | |
| Energy — 6.7% | | | | | | | |
| Oil & Gas Exploration & Production — 6.7% | | | | | | | |
| Southwestern Energy Co.* | | | 28,969 | | $ | 886,451 | |
| SandRidge Energy, Inc.* | | | 25,898 | | | 202,781 | |
| | | | | | | 1,089,232 | |
| Health Care — 5.2% | | | | | | | |
| Health Care Services — 2.8% | | | | | | | |
| Laboratory Corp. of America Holdings* | | | 2,782 | | | 254,664 | |
| Omnicare, Inc. | | | 5,620 | | | 199,903 | |
| | | | | | | 454,567 | |
| Pharmaceuticals — 2.4% | | | | | | | |
| Valeant Pharmaceuticals International, Inc.* | | | 7,230 | | | 388,179 | |
| | | | | | | 842,746 | |
| Industrials — 2.8% | | | | | | | |
| Aerospace & Defense — 1.4% | | | | | | | |
| Lockheed Martin Corp. | | | 2,595 | | | 233,187 | |
| Commercial Services & Supplies — 1.4% | | | | | | | |
| Republic Services, Inc. | | | 7,500 | | | 229,200 | |
| | | | | | | 462,387 | |
| Consumer Staples — 2.8% | | | | | | | |
| Personal Products — 1.5% | | | | | | | |
| Avon Products, Inc. | | | 12,500 | | | 242,000 | |
| Food & Staples Retailing — 1.3% | | | | | | | |
| CVS Caremark Corp. | | | 4,810 | | | 215,488 | |
| | | | | | | 457,488 | |
| Total Common Stocks | | | | | | | |
| (Cost $10,023,269) | | | | | | 12,085,629 | |
| | | | | | | | |
| | | | | | | | |
| SHORT-TERM SECURITIES — 25.7% | | | | | | | |
| Wells Fargo Advantage Government Money Market Fund - | | | | | | | |
Institutional Class 0.01%(a) | | | | | | | |
| (Cost $4,196,815) | | | 4,196,815 | | | 4,196,815 | |
| Total Investments in Securities | | | | | | | |
| (Cost $14,220,084) | | | | | | 16,282,444 | |
| Other Assets Less Other Liabilities — 0.1% | | | | | | 16,275 | |
| Net Assets — 100.0% | | | | | $ | 16,298,719 | |
| Net Asset Value Per Share | | | | | $ | 11.07 | |
| * | Non-income producing |
| (a) | Rate presented represents the annualized 7-day yield at March 31, 2012. |
| 26 Weitz Funds | The accompanying notes form an integral part of these financial statements. |
HICKORY FUND
PORTFOLIO MANAGERS’ DISCUSSION & ANALYSIS
Co-Portfolio Managers:
Wallace R. Weitz, CFA & Andrew S. Weitz
The Hickory Fund returned +10.3% in the first calendar quarter, compared to a +13.0% return for the Russell 2500. Equities across the board enjoyed outsized gains as investors grew confident that an economic recovery in the United States had gained momentum. Although the Fund’s absolute performance was very good, our cash position created a headwind that we did not overcome on a relative basis. Consumer-exposed businesses were primary beneficiaries of investors’ enthusiasm, driving gains in several of the Fund’s top ten holdings including Liberty Media Corp. (+13%), Liberty Interactive Corp. (+18%), National CineMedia (+25%) and Liberty Global (+21%). Takeovers, real and rumored, drove shares of Knology (+28%), Kenneth Cole Productions (+52%) and Prestige Brands (+55%) higher. SandRidge Energy (-4%) and Ascent Capital Group (-7%) were the Fund’s largest detractors due to modest moves lower in a very strong overall market environment.
For the fiscal year ended March 31, 2012, the Fund increased +3.4% compared to a +1.3% gain for the Russell 2500. It was a busy year for top contributor Liberty Media and its related companies. Liberty began as a single corporate entity with three tracking stocks and ended as two separate, standalone companies: “new” Liberty Media (+20%, comprised of the former Starz and Capital trackers) and Liberty Interactive (+19%). Structural changes aside, the operational results of Liberty’s businesses have remained solid and business value has continued to grow. Shares of cable company Knology (+41%) rose thanks to a combination of solid execution and a recent rumor the company has hired bankers to explore a potential sale. Despite the run up in its stock price, we continue to feel that Knology shares are undervalued and trust that management will not execute a transaction that short-changes existing shareholders. Lastly, long-time holding Cabela’s (+53%) had a stellar year. CEO Tommy Milner, CFO Ralph Castner and the management team have put the company on a path of expanding margins and profitably revving up square footage growth. These positives have been rewarded by investors, and we reluctantly sold our remaining position as the discount to business value closed.
SandRidge Energy (-39%) and Redwood Trust (-22%) were the largest detractors to Fund performance during the fiscal year.
SandRidge is one of the Fund’s largest and most volatile holdings, landing it frequently at the top and bottom of the performance contribution table. Despite this price volatility, we continue to believe that underlying business value is growing thanks to management’s continued execution in transforming the business from a gas focus to an oil focus. Skeptics remain concerned that SandRidge will not meet its funding targets without dilutive equity raises via asset sales and other transactions, despite the company’s demonstrated ability to have satisfied its previous financing needs. Redwood Trust continues to make slow progress in restarting the securitization market for jumbo residential mortgages, having brought the only five such deals to the market since the financial crisis. Management has also prudently put investment capital to work, accepting credit risk only where they are offered an acceptable rate of return. The government remains heavily involved in the residential mortgage market, crowding out private capital’s opportunity to invest at reasonable rates. However, we do not believe this condition to be permanent. Redwood’s cautious stewardship of capital positions them well for a more normal environment.
In addition to Cabela’s, the quarter saw the elimination of four other holdings: Mohawk Industries, which rose in conjunction with newfound enthusiasm that housing may have bottomed; Grand Canyon Education, as its differentiated model in the for profit education space became more fully appreciated; Kenneth Cole Productions as its founder announced plans to take the company private; and our shares of Energizer were called away in February as call options we had written were exercised. There were no new positions initiated during the quarter.
The Fund has been a net seller as the rally that began in October continued through the first quarter of 2012. In addition to the eliminated positions above, our more meaningful reductions included Eagle Materials, Liberty Interactive, and Coinstar as their discounts to business values narrowed. Partially offsetting these sales, we continued adding to our holdings of FLIR Systems and Iconix Brand Group.
The Hickory Fund invests in our firm’s best smaller company ideas. The Fund’s weighted average market cap is approximately $4 billion, reflecting Hickory’s diverse mix of mid-cap and small-cap stocks. The Fund remains relatively concentrated, with the ten largest positions accounting for 39% of net assets. Hickory’s residual cash position was 25% of net assets at quarter end.
| New and Eliminated Securities for Quarter Ended March 31, 2012 | |
| New Purchases ($mil) | | Eliminations ($mil) | |
| None | | Mohawk Industries | $ | 5.1 | |
| | | Cabela’s | | 4.8 | |
| | | Grand Canyon Education | | 4.4 | |
| | | Energizer Holdings | | 4.0 | |
| | | Kenneth Cole Productions | | 1.7 | |
weitzfunds.com 27
HICKORY FUND
PERFORMANCE • (UNAUDITED)
| | | | Total Returns | | Average Annual Total Returns |
| | | | 3 Mos. | | 1 Year | | 3 Year | | 5 Year | | 10 Year | | 15 Year |
| Hickory | | | 10.3 | % | | 3.4 | % | | 29.2 | % | | 1.6 | % | | 5.1 | % | | 8.4 | % |
| Russell 2500 | | | 13.0 | | | 1.3 | | | 28.4 | | | 3.0 | | | 7.5 | | | 8.9 | |
| Russell 2500 Value | | | 11.5 | | | 0.1 | | | 27.1 | | | 1.0 | | | 7.5 | | | 9.5 | |
| S&P 500 | | | 12.6 | | | 8.5 | | | 23.4 | | | 2.0 | | | 4.1 | | | 6.1 | |
Growth of $10,000
This chart depicts the change in the value of a $10,000 investment in the Hickory Fund for the period March 31, 2002 through March 31, 2012, as compared with the growth of the Russell 2500 and Standard & Poor’s 500 Indices during the same period. Index performance is hypothetical and is shown for illustrative purposes only.
Effective June 30, 2008, the Hickory Fund adopted its current principal investment strategy of investing the majority of its assets in smaller and medium sized companies, those with a market capitalization of less than $10 billion at the time of purchase.
The following chart depicts the change in the value of $10,000 investment in the Hickory Fund for the period June 30, 2008 through March 31, 2012, as compared with the growth of the Russell 2500 Index during the same period.
| Year | | | Hickory (1) | | S&P 500 (2) | | Relative Results (1)-(2) |
| 1993 (4/1/93) | | | 20.3 | % | | 5.5 | % | | 14.8 | % |
| 1994 | | | -17.3 | | | 1.3 | | | -18.6 | |
| 1995 | | | 40.5 | | | 37.6 | | | 2.9 | |
| 1996 | | | 35.3 | | | 23.0 | | | 12.3 | |
| 1997 | | | 39.2 | | | 33.4 | | | 5.8 | |
| 1998 | | | 33.0 | | | 28.6 | | | 4.4 | |
| 1999 | | | 36.7 | | | 21.0 | | | 15.7 | |
| 2000 | | | -17.2 | | | -9.1 | | | -8.1 | |
| 2001 | | | -4.6 | | | -11.9 | | | 7.3 | |
| 2002 | | | -29.3 | | | -22.1 | | | -7.2 | |
| 2003 | | | 47.9 | | | 28.7 | | | 19.2 | |
| 2004 | | | 22.6 | | | 10.9 | | | 11.7 | |
| 2005 | | | -0.2 | | | 4.9 | | | -5.1 | |
| 2006 | | | 22.8 | | | 15.8 | | | 7.0 | |
| 2007 | | | -13.1 | | | 5.5 | | | -18.6 | |
| 2008 | | | -41.6 | | | -37.0 | | | -4.6 | |
| 2009 | | | 36.5 | | | 26.5 | | | 10.0 | |
| 2010 | | | 38.7 | | | 15.1 | | | 23.6 | |
| 2011 | | | 1.5 | | | 2.1 | | | -0.6 | |
| 2012 (3/31/12) | | | 10.3 | | | 12.6 | | | -2.3 | |
| Since Inception: | | | | | | | | | | |
| Cumulative | | | | | | | | | | |
| Return | | | 538.2 | | | 351.1 | | | 187.1 | |
| Avg. Annual | | | | | | | | | | |
| Return | | | 10.2 | | | 8.2 | | | 2.0 | |
| Year | | | Hickory (1) | | Russell 2500 (2) | | Relative Results (1)-(2) |
| 2008 (7/1/08) | | | -28.9 | % | | -31.2 | % | | 2.3 | % |
| 2009 | | | 36.5 | | | 34.4 | | | 2.1 | |
| 2010 | | | 38.7 | | | 26.7 | | | 12.0 | |
| 2011 | | | 1.5 | | | -2.5 | | | 4.0 | |
| 2012 (3/31/12) | | | 10.3 | | | 13.0 | | | -2.7 | |
| Since 7/1/08: | | | | | | | | | | |
| Cumulative | | | | | | | | | | |
| Return | | | 50.7 | | | 29.0 | | | 21.7 | |
| Avg. Annual | | | | | | | | | | |
| Return | | | 11.5 | | | 7.0 | | | 4.5 | |
These performance numbers reflect the deduction of the Fund’s annual operating expenses which as stated in its most recent Prospectus are 1.28% of the Fund’s net assets. The returns assume redemption at the end of each period and reinvestment of dividends. Total returns shown include fee waivers and expense reimbursements, if any; total returns would have been lower had there been no waiver of fees and/or reimbursement of expenses by the Adviser. This information represents past performance and past performance does not guarantee future results. The investment return and the principal value of an investment in this Fund will fluctuate so that an investor’s shares, when redeemed, may be worth more or less than the original cost. Current performance may be lower or higher than the performance data quoted. Performance data current to the most recent month-end may be obtained at www.weitzfunds.com/performance/monthly.asp.
See page 4 for additional performance disclosures. See page 82 for a description of all indices.
Performance information does not reflect the deduction of taxes that a shareholder would pay on Fund distributions or the redemption of Fund shares.
28 Weitz Funds
HICKORY FUND
PORTFOLIO PROFILE • (UNAUDITED)
| Top Ten Stocks | |
| Liberty Media Corp. - Liberty Capital - Series A | | | 5.1 | % |
| SandRidge Energy, Inc. | | | 4.6 | |
| Liberty Interactive Corp. - Series A | | | 3.9 | |
| Omnicare, Inc. | | | 3.8 | |
| Live Nation Entertainment, Inc. | | | 3.7 | |
| Redwood Trust, Inc. | | | 3.6 | |
| National CineMedia, Inc. | | | 3.5 | |
| Ascent Capital Group, Inc. - CL A | | | 3.5 | |
| Laboratory Corp. of America Holdings | | | 3.5 | |
| Liberty Global, Inc. - Series C | | | 3.3 | |
| % of Net Assets | | | 38.5 | % |
| Industry Sectors | |
| Consumer Discretionary | | | 32.2 | % |
| Financials | | | 11.7 | |
| Materials | | | 8.0 | |
| Health Care | | | 7.3 | |
| Energy | | | 4.6 | |
| Information Technology | | | 4.3 | |
| Industrials | | | 3.5 | |
| Consumer Staples | | | 2.5 | |
| Telecommunication Services | | | 0.7 | |
| Short-Term Securities/Other | | | 25.2 | |
| Net Assets | | | 100.0 | % |
| Top Performers for Quarter Ended March 31, 2012 |
| Security Name | | | QTD Return of Security | | Average Weight in Portfolio | | Contribution to Fund Performance |
| Eagle Materials, Inc. | | | 35.4 | % | | 2.3 | % | | 0.85 | % |
| National CineMedia, Inc. | | | 25.2 | | | 3.4 | | | 0.79 | |
| Liberty Interactive Corp. - Series A | | | 17.8 | | | 4.3 | | | 0.78 | |
| Knology, Inc. | | | 28.2 | | | 3.0 | | | 0.76 | |
| Liberty Media Corp. - Liberty Capital - Series A | | | 12.9 | | | 5.4 | | | 0.74 | |
Contributions to Fund performance are based on actual daily holdings. Securities may have been bought or sold during the quarter.
Source: FactSet Portfolio Analytics
| Bottom Performers for Quarter Ended March 31, 2012 |
| Security Name | | | QTD Return of Security | | Average Weight in Portfolio | | Contribution to Fund Performance |
| Ascent Capital Group, Inc. - CL A | | | (6.8 | )% | | 4.0 | % | | (0.24 | )% |
| SandRidge Energy, Inc. | | | (4.0 | ) | | 4.8 | | | (0.15 | ) |
| Willis Group Holdings Ltd. | | | (9.2 | ) | | 1.2 | | | (0.11 | ) |
Contributions to Fund performance are based on actual daily holdings. Securities may have been bought or sold during the quarter.
Source: FactSet Portfolio Analytics
HICKORY FUND
SCHEDULE OF INVESTMENTS • MARCH 31, 2012
| COMMON STOCKS — 74.8% | | Shares | | Value | |
| Consumer Discretionary — 32.2% | | | | | | | |
| Cable & Satellite — 6.9% | | | | | | | �� |
| Liberty Global, Inc. - Series C* | | | 230,000 | | $ | 11,014,700 | |
| Knology, Inc.* | | | 590,000 | | | 10,738,000 | |
CIBL, Inc.# | | | 1,005 | | | 1,180,875 | |
| | | | | | | 22,933,575 | |
| Broadcasting — 6.3% | | | | | | | |
| Liberty Media Corp. - | | | | | | | |
| Liberty Capital - Series A* | | | 190,000 | | | 16,748,500 | |
| Cumulus Media, Inc. - CL A* | | | 1,200,000 | | | 4,188,000 | |
| | | | | | | 20,936,500 | |
| Internet & Catalog Retail — 3.9% | | | | | | | |
| Liberty Interactive Corp. - Series A* | | | 670,000 | | | 12,790,300 | |
| Movies & Entertainment — 3.7% | | | | | | | |
| Live Nation Entertainment, Inc.* | | | 1,301,100 | | | 12,230,340 | |
| Advertising — 3.5% | | | | | | | |
| National CineMedia, Inc. | | | 750,000 | | | 11,475,000 | |
| Hotels, Restaurants & Leisure — 3.2% | | | | | | | |
| Interval Leisure Group, Inc. | | | 600,000 | | | 10,440,000 | |
| Textiles, Apparel & Luxury Goods — 2.8% | | | | | | | |
| Iconix Brand Group, Inc.* | | | 525,000 | | | 9,124,500 | |
| Specialized Consumer Services — 1.9% | | | | | | | |
Coinstar, Inc.* (c) | | | 100,000 | | | 6,355,000 | |
| | | | | | | 106,285,215 | |
| Financials — 11.7% | | | | | | | |
| Insurance Brokers — 5.5% | | | | | | | |
| Aon Corp. | | | 190,000 | | | 9,321,400 | |
| Brown & Brown, Inc. | | | 230,000 | | | 5,469,400 | |
| Willis Group Holdings Ltd. | | | 100,000 | | | 3,498,000 | |
| | | | | | | 18,288,800 | |
| Mortgage REIT's — 3.6% | | | | | | | |
| Redwood Trust, Inc. | | | 1,070,000 | | | 11,984,000 | |
| Property & Casualty Insurance — 2.1% | | | | | | | |
| CNA Financial Corp. | | | 230,000 | | | 6,745,900 | |
| Thrifts & Mortgage Finance — 0.5% | | | | | | | |
| Tree.com, Inc.* | | | 200,000 | | | 1,520,000 | |
| | | | | | | 38,538,700 | |
| Materials — 8.0% | | | | | | | |
| Construction Materials — 6.5% | | | | | | | |
| Martin Marietta Materials, Inc. | | | 110,000 | | | 9,419,300 | |
| Eagle Materials, Inc. | | | 175,000 | | | 6,081,250 | |
| Texas Industries, Inc. | | | 172,400 | | | 6,035,724 | |
| | | | | | | 21,536,274 | |
| Metals & Mining — 1.5% | | | | | | | |
| Compass Minerals International, Inc. | | | 70,000 | | | 5,021,800 | |
| | | | | | | 26,558,074 | |
| Health Care — 7.3% | | | | | | | |
| Health Care Services — 7.3% | | | | | | | |
| Omnicare, Inc. | | | 355,000 | | | 12,627,350 | |
| Laboratory Corp. of America Holdings* | | | 125,000 | | | 11,442,500 | |
| | | | | | | 24,069,850 | |
| Energy — 4.6% | | | | | | | |
| Oil & Gas Exploration & Production — 4.6% | | | | | | | |
| SandRidge Energy, Inc.* | | | 1,950,000 | | | 15,268,500 | |
| | | | | | | | |
| | | Principal | | | | |
| | | amount | | | | |
| | | or shares | | Value | |
| Information Technology — 4.3% | | | | | | | |
| Electronic Equipment & Instruments — 2.5% | | | | | | | |
| FLIR Systems, Inc. | | | 330,000 | | $ | 8,352,300 | |
| Internet Software & Services — 1.8% | | | | | | | |
| XO Group, Inc.* | | | 640,000 | | | 6,009,600 | |
| | | | | | | 14,361,900 | |
| Industrials — 3.5% | | | | | | | |
| Commercial Services & Supplies — 3.5% | | | | | | | |
| Ascent Capital Group, Inc. - CL A* | | | 242,500 | | | 11,467,825 | |
| Consumer Staples — 2.5% | | | | | | | |
| Personal Products — 2.5% | | | | | | | |
| Prestige Brands Holdings, Inc.* | | | 350,000 | | | 6,118,000 | |
| Avon Products, Inc. | | | 102,700 | | | 1,988,272 | |
| | | | | | | 8,106,272 | |
| Telecommunication Services — 0.7% | | | | | | | |
| Diversified Telecommunication Services — 0.7% | | | | | | | |
LICT Corp.* # | | | 1,005 | | | 2,160,750 | |
ICTC Group, Inc. - CL A* # | | | 13,065 | | | 146,328 | |
| | | | | | | 2,307,078 | |
| Total Common Stocks | | | | | | | |
| (Cost $188,950,367) | | | | | | 246,963,414 | |
| | | | | | | | |
| SHORT-TERM SECURITIES — 25.9% | | | | | | | |
| Wells Fargo Advantage Government Money Market Fund - | | | | | | | |
Institutional Class 0.01%(a) | | | 3,149,446 | | | 3,149,446 | |
| U.S. Treasury Bills, 0.01% to 0.11%, | | | | | | | |
4/05/12 to 5/31/12(b) | | $ | 82,500,000 | | | 82,495,870 | |
| Total Short-Term Securities | | | | | | | |
| (Cost $85,644,799) | | | | | | 85,645,316 | |
| Total Investments in Securities | | | | | | | |
| (Cost $274,595,166) | | | | | | 332,608,730 | |
| Options Written — (0.1%) | | | | | | (208,750 | ) |
| Other Liabilities in Excess of Other Assets — (0.6%) | | | | | | (2,143,043 | ) |
| Net Assets — 100.0% | | | | | $ | 330,256,937 | |
| Net Asset Value Per Share | | | | | $ | 42.53 | |
| OPTIONS WRITTEN* | | Expiration date/ Strike price | | Shares subject to option | | Value | |
| Covered Call Options | | | | | | | | | | |
| Coinstar, Inc. | | | April 2012 / $62.50 | | | 25,000 | | $ | (62,500 | ) |
| Coinstar, Inc. | | | July 2012 / $62.50 | | | 25,000 | | | (146,250 | ) |
| | | | | | | | | | | |
| Total Options Written | | | | | | | | | | |
| (premiums received $214,276) | | | | | | | | $ | (208,750 | ) |
| * | Non-income producing |
| # | Illiquid and/or restricted security that has been fair valued. |
| (a) | Rate presented represents the annualized 7-day yield at March 31, 2012. |
| (b) | Interest rates presented represent the yield to maturity at the date of purchase. |
| (c) | Fully or partially pledged on outstanding written options. |
| 30 Weitz Funds | The accompanying notes form an integral part of these financial statements. |
BALANCED FUND
PORTFOLIO MANAGER’S DISCUSSION & ANALYSIS
Portfolio Manager: Bradley P. Hinton, CFA
The Balanced Fund returned +7.5% in the first calendar quarter, compared to a +7.8% return for the Blended Index. Virtually all of our stocks rose during the quarter, most by more than ten percent. Top contributor Coinstar increased more than 30% on strong results at its Redbox division. We sold the stock as it approached our conservative value estimate after the solid quarterly report. Microsoft returned +25%, yet we think the company’s prospects remain underappreciated by investors. National CineMedia (+25%) bounced back as the 2012 advertising market outlook brightened. Eagle Materials (+35%) continued to recover as cement and wallboard volumes strengthened and prices firmed. Bonds posted lackluster returns as interest rates rose modestly, and our continued defensive positioning kept the Fund out of any trouble.
For the fiscal year ended March 31, 2012, the Fund gained 6.2% compared to a 7.5% gain for the Blended Index. Our stocks on balance materially outperformed the broader market. Consumer staples companies were among the Fund’s best performers. Global leaders Anheuser-Busch InBev (beer, +29% for the fiscal year) and Diageo (spirits, +31%) grew earnings and business value as their strong brands resonated around the world. We bought a few stocks during last summer’s market swoon that made an immediate impact. Walt Disney and Valeant Pharmaceuticals are each up roughly 40 percent from our average cost, and both remain core holdings. Other notable contributors for the fiscal year included Microsoft (+30%), CVS Caremark (+32%) and Comcast (+30%).
The Fund’s energy and financial stocks detracted from results for the fiscal year. Apache Corporation (-23%) declined in part due to concerns about its Egyptian natural gas operations. Despite the political upheaval, the globally diversified company has not experienced any operating disruptions to date. Southwestern Energy (-29%) fell as prices for U.S. natural gas collapsed throughout the year. While the near-term environment is challenging, we think both of these energy businesses have strong multi-year outlooks. In the financial sector, Redwood Trust (-22%) and the insurance brokers posted negative returns. Redwood is well positioned to play a large role when the government inevitably reduces its massive support of the residential mortgage market. Aon continued to make slow but steady forward progress. The company should benefit over time from global economic growth and healthier insurance market pricing. Finally, our bonds delivered muted returns in a relatively strong market due to our intentionally conservative positioning.
While we did not buy any new stocks in the first quarter, we did add significantly to our holdings of FLIR Systems. FLIR makes infrared and thermal imaging equipment for commercial and military customers. The company has an enviable combination of investment attributes. FLIR enjoys an excellent competitive position within growing end markets, the business generates very high margins, returns on capital and free cash flows, and the company is run by a management team with equal measures of operational expertise and capital allocation acumen. Defense spending cutbacks will dampen growth in 2012, but FLIR is one of our favorites over the next five years.
We were net sellers again during the quarter. As mentioned, we sold Coinstar as the stock approached our conservative value estimate. Paul Davis and his team have done a terrific job of building business value, and we thank them for turning Coinstar into one of the Fund’s top all-time contributors. We also eliminated Texas Industries late in the quarter as investors bid up most construction-related stocks. While Texas Industries still has tremendous upside potential, we are less comfortable with the company’s downside profile due to its financial leverage. Finally, we sold Grand Canyon Education at a modest gain. While Grand Canyon’s company-specific outlook is better than most, we are increasingly concerned about rising competitive intensity throughout the industry. We no longer have any investments in for-profit education in the Fund.
Our resulting asset allocation is increasingly cautious. The Fund’s equity weighting is 48%, the lowest it has been in some time. We have been playing offense for the better part of three years, and the Fund’s 18% annual returns over that time frame have bested the Blended Index and most peers. Now, we think it is time to be more selective as valuations are simply less compelling. Stocks are relatively more interesting than bonds, but they are not as absolutely cheap as they were in March 2009 or even October 2011. Can we still earn adequate longer-term returns on our investments from today’s price levels? Certainly, but we also believe that patience and discipline will be amply rewarded over time.
We have just 18% of the Fund invested in a portfolio of shorter maturity, higher quality bonds, with the heaviest weighting to corporate issues. New purchases included short-dated Wrigley and DIRECTV Holdings bonds. To use a baseball analogy, these bonds are akin to fouling off pitches while we look for more rewarding opportunities. Warren Buffett often writes of waiting for fat pitches. We will see fastballs down the middle again someday. When that time comes, we have cash and short-term reserves equal to 34% of net assets to take advantage.
| New and Eliminated Stocks for Quarter Ended March 31, 2012 |
| New Purchases ($mil) | | Eliminations ($mil) |
| | | | | | |
| None | | Coinstar | $ | 2.0 | |
| | | Texas Industries | | 1.4 | |
| | | Grand Canyon Education | | 1.1 | |
weitzfunds.com 31
BALANCED FUND
PERFORMANCE • (UNAUDITED)
| | | | Total Returns | | Average Annual Total Returns |
| | | | 3 Mos. | | 1 Year | | 3 Year | | 5 Year | | Since Inception |
| Balanced Fund | | | 7.5 | % | | 6.2 | % | | 18.2 | % | | 2.5 | % | | 5.1 | % |
| Blended Index | | | 7.8 | | | 7.5 | | | 16.4 | | | 3.5 | | | 5.6 | |
| S&P 500 | | | 12.6 | | | 8.5 | | | 23.4 | | | 2.0 | | | 6.3 | |
| Barclays Intermediate Credit | | | 0.6 | | | 6.1 | | | 5.9 | | | 5.7 | | | 4.5 | |
Growth of $10,000
This chart depicts the change in the value of a $10,000 investment in the Balanced Fund for the period October 1, 2003 through March 31, 2012, as compared with the growth of the Blended Index during the same period. Index performance is hypothetical and is shown for illustrative purposes only.
| Year | | | Balanced (1) | | Blended (2) | | Relative Results (1)-(2) |
| 2003 (10/1/03) | | | 3.8 | % | | 7.3 | % | | -3.5 | % |
| 2004 | | | 11.8 | | | 7.7 | | | 4.1 | |
| 2005 | | | 1.7 | | | 3.6 | | | -1.9 | |
| 2006 | | | 14.3 | | | 11.1 | | | 3.2 | |
| 2007 | | | -5.3 | | | 6.2 | | | -11.5 | |
| 2008 | | | -26.8 | | | -20.2 | | | -6.6 | |
| 2009 | | | 28.8 | | | 18.0 | | | 10.8 | |
| 2010 | | | 15.7 | | | 11.4 | | | 4.3 | |
| 2011 | | | 2.3 | | | 3.6 | | | -1.3 | |
| 2012 (3/31/12) | | | 7.5 | | | 7.8 | | | -0.3 | |
| Since Inception: | | | | | | | | | | |
| Cumulative | | | | | | | | | | |
| Return | | | 53.2 | | | 58.8 | | | -5.6 | |
| Avg. Annual | | | | | | | | | | |
| Return | | | 5.1 | | | 5.6 | | | -0.5 | |
These performance numbers reflect the deduction of the Fund’s annual operating expenses which as stated in its most recent Prospectus are 1.15% of the Fund’s net assets. The returns assume redemption at the end of each period and reinvestment of dividends. Total returns shown include fee waivers and expense reimbursements, if any; total returns would have been lower had there been no waiver of fees and/or reimbursement of expenses by the Adviser. This information represents past performance and past performance does not guarantee future results. The investment return and the principal value of an investment in this Fund will fluctuate so that an investor’s shares, when redeemed, may be worth more or less than the original cost. Current performance may be lower or higher than the performance data quoted. Performance data current to the most recent month-end may be obtained at www.weitzfunds.com/performance/monthly.asp.
See page 4 for additional performance disclosures. See page 82 for a description of all indices.
Performance information does not reflect the deduction of taxes that a shareholder would pay on Fund distributions or the redemption of Fund shares.
32 Weitz Funds
BALANCED FUND
PORTFOLIO PROFILE • (UNAUDITED)
| Top Ten Stocks |
| Berkshire Hathaway, Inc. - CL B | | | 2.5 | % |
| Valeant Pharmaceuticals International, Inc. | | | 2.4 | |
| Laboratory Corp. of America Holdings | | | 2.4 | |
| Anheuser-Busch InBev SA/NV - Sponsored ADR | | | 2.3 | |
| Aon Corp. | | | 2.2 | |
| Google, Inc. - CL A | | | 2.2 | |
| Martin Marietta Materials, Inc. | | | 2.0 | |
| FLIR Systems, Inc. | | | 2.0 | |
| Redwood Trust, Inc. | | | 1.9 | |
| United Parcel Service, Inc. - CL B | | | 1.8 | |
| % of Net Assets | | | 21.7 | % |
| | | | | |
| Industry Sectors |
| Information Technology | | | 9.1 | % |
| Consumer Discretionary | | | 8.8 | |
| Financials | | | 7.9 | |
| Consumer Staples | | | 6.3 | |
| Health Care | | | 6.0 | |
| Industrials | | | 3.8 | |
| Materials | | | 3.4 | |
| Energy | | | 2.3 | |
| Total Common Stocks | | | 47.6 | |
| Short-Term Securities/Other | | | 34.1 | |
| Corporate Bonds | | | 11.2 | |
| Mortgage-Backed & Asset-Backed Securities | | | 4.4 | |
| Government Agency | | | 2.3 | |
| Taxable Municipal Bonds | | | 0.4 | |
| Total Bonds & Short-Term Securities | | | 52.4 | |
| Net Assets | | | 100.0 | % |
| Top Performers for Quarter Ended March 31, 2012 |
| Security Name | | | QTD Return of Security | | Average Weight in Portfolio | | Contribution to Fund Performance |
| Coinstar, Inc. | | | 39.2 | % | | 1.2 | % | | 0.69 | % |
| Microsoft Corp. | | | 25.1 | | | 2.3 | | | 0.60 | |
| National CineMedia, Inc. | | | 25.2 | | | 2.0 | | | 0.51 | |
| Eagle Materials, Inc. | | | 35.4 | | | 1.2 | | | 0.44 | |
| Anheuser-Busch InBev SA/NV - Sponsored ADR | | | 19.2 | | | 2.4 | | | 0.43 | |
Contributions to Fund performance are based on actual daily holdings. Securities may have been bought or sold during the quarter.
Source: FactSet Portfolio Analytics
| Bottom Performers for Quarter Ended March 31, 2012 |
| Security Name | | | QTD Return of Security | | Average Weight in Portfolio | | Contribution to Fund Performance |
| Google, Inc. - CL A | | | (0.7 | )% | | 2.2 | % | | (0.03 | )% |
| Freddie Mac 3.44% 3/02/16 | | | (0.5 | ) | | 1.6 | | | (0.01 | ) |
| Fannie Mae 2.815% 2/24/15 | | | (0.3 | ) | | 1.8 | | | (0.01 | ) |
| Markel Corp. 6.8% 2/15/13 | | | (0.7 | ) | | 0.9 | | | (0.01 | ) |
| DIRECTV Holdings 7.625% 5/15/16 | | | (0.8 | ) | | 0.5 | | | (0.01 | ) |
Contributions to Fund performance are based on actual daily holdings. Securities may have been bought or sold during the quarter.
Source: FactSet Portfolio Analytics
weitzfunds.com 33
BALANCED FUND
SCHEDULE OF INVESTMENTS • MARCH 31, 2012
| | | | | | | | |
| COMMON STOCKS — 47.6% | | Shares | | Value | |
| Information Technology — 9.1% | | | | | | | |
| Internet Software & Services — 2.2% | | | | | | | |
| Google, Inc. - CL A* | | | 3,000 | | $ | 1,923,720 | |
| Electronic Equipment & Instruments — 2.0% | | | | | | | |
| FLIR Systems, Inc. | | | 70,000 | | | 1,771,700 | |
| Software — 1.5% | | | | | | | |
| Microsoft Corp. | | | 40,000 | | | 1,290,000 | |
| Semiconductors — 1.3% | | | | | | | |
| Texas Instruments, Inc. | | | 35,000 | | | 1,176,350 | |
| IT Services — 1.2% | | | | | | | |
| Accenture plc - CL A | | | 16,000 | | | 1,032,000 | |
| Computers & Peripherals — 0.9% | | | | | | | |
| Dell, Inc.* | | | 50,000 | | | 830,000 | |
| | | | | | | 8,023,770 | |
| Consumer Discretionary — 8.8% | | | | | | | |
| Advertising — 2.8% | | | | | | | |
| National CineMedia, Inc. | | | 100,000 | | | 1,530,000 | |
| Omnicom Group, Inc. | | | 20,000 | | | 1,013,000 | |
| | | | | | | 2,543,000 | |
| Movies and Entertainment — 1.6% | | | | | | | |
| The Walt Disney Co. | | | 32,000 | | | 1,400,960 | |
| Cable & Satellite — 1.5% | | | | | | | |
| Comcast Corp. - CL A Special | | | 45,000 | | | 1,327,950 | |
| Multiline Retail — 1.5% | | | | | | | |
| Target Corp. | | | 22,500 | | | 1,311,075 | |
| Internet & Catalog Retail — 1.4% | | | | | | | |
| Liberty Interactive Corp. - Series A* | | | 65,000 | | | 1,240,850 | |
| | | | | | | 7,823,835 | |
| Financials — 7.9% | | | | | | | |
| Property & Casualty Insurance — 2.5% | | | | | | | |
| Berkshire Hathaway, Inc. - CL B* | | | 27,000 | | | 2,191,050 | |
| Insurance Brokers — 2.2% | | | | | | | |
| Aon Corp. | | | 40,000 | | | 1,962,400 | |
| Mortgage REIT's — 1.9% | | | | | | | |
| Redwood Trust, Inc. | | | 150,000 | | | 1,680,000 | |
| Commercial Banks — 1.3% | | | | | | | |
| Wells Fargo & Co. | | | 35,000 | | | 1,194,900 | |
| | | | | | | 7,028,350 | |
| Consumer Staples — 6.3% | | | | | | | |
| Beverages — 3.8% | | | | | | | |
| Anheuser-Busch InBev SA/NV - | | | | | | | |
| Sponsored ADR | | | 27,500 | | | 1,999,800 | |
| Diageo plc - Sponsored ADR | | | 14,000 | | | 1,351,000 | |
| | | | | | | 3,350,800 | |
| Food & Staples Retailing — 2.5% | | | | | | | |
| CVS Caremark Corp. | | | 30,000 | | | 1,344,000 | |
| Wal-Mart Stores, Inc. | | | 14,000 | | | 856,800 | |
| | | | | | | 2,200,800 | |
| | | | | | | 5,551,600 | |
| Health Care — 6.0% | | | | | | | |
| Health Care Services — 3.6% | | | | | | | |
| Laboratory Corp. of America Holdings* | | | 23,000 | | | 2,105,420 | |
| Omnicare, Inc. | | | 30,000 | | | 1,067,100 | |
| | | | | | | 3,172,520 | |
| Pharmaceuticals — 2.4% | | | | | | | |
| Valeant Pharmaceuticals International, Inc.* | | | 40,000 | | | 2,147,600 | |
| | | | | | | 5,320,120 | |
| | | | | | | | |
| | | | Shares | | | Value | |
| Industrials — 3.8% | | | | | | | |
| Air Freight & Logistics — 1.8% | | | | | | | |
| United Parcel Service, Inc. - CL B | | | 20,000 | | $ | 1,614,400 | |
| Commercial Services & Supplies — 1.0% | | | | | | | |
| Republic Services, Inc. | | | 30,000 | | | 916,800 | |
| Aerospace & Defense — 1.0% | | | | | | | |
| Lockheed Martin Corp. | | | 10,000 | | | 898,600 | |
| | | | | | | 3,429,800 | |
| Materials — 3.4% | | | | | | | |
| Construction Materials — 3.0% | | | | | | | |
| Martin Marietta Materials, Inc. | | | 21,000 | | | 1,798,230 | |
| Eagle Materials, Inc. | | | 25,000 | | | 868,750 | |
| | | | | | | 2,666,980 | |
| Metals & Mining — 0.4% | | | | | | | |
| Compass Minerals International, Inc. | | | 5,000 | | | 358,700 | |
| | | | | | | 3,025,680 | |
| Energy — 2.3% | | | | | | | |
| Oil & Gas Exploration & Production — 2.3% | | | | | | | |
| Apache Corp. | | | 12,000 | | | 1,205,280 | |
| Southwestern Energy Co.* | | | 25,000 | | | 765,000 | |
| | | | | | | 1,970,280 | |
| Total Common Stocks | | | | | | | |
| (Cost $31,661,397) | | | | | | 42,173,435 | |
| | | | | | | |
| CORPORATE BONDS — 11.2% | | Principal amount | | Value | |
| American Express Credit Corp. | | | | | | | |
| 7.3% 8/20/13 | | $ | 650,000 | | | 703,604 | |
| Comcast Corp. | | | | | | | |
| 6.5% 1/15/15 | | | 300,000 | | | 342,539 | |
| 4.95% 6/15/16 | | | 193,000 | | | 216,991 | |
| 10.875% 11/15/16 | | | | | | | |
| (Universal City Development) | | | 200,000 | | | 239,017 | |
| Dell, Inc. | | | | | | | |
| 5.625% 4/15/14 | | | 250,000 | | | 274,231 | |
| DIRECTV Holdings | | | | | | | |
| 7.625% 5/15/16 | | | 500,000 | | | 524,210 | |
| Hewlett-Packard Co. | | | | | | | |
| 6.0% 8/01/13 | | | 670,000 | | | 712,292 | |
| 4.75% 6/02/14 | | | 750,000 | | | 802,739 | |
| JP Morgan Chase & Co. | | | | | | | |
| 4.75% 5/01/13 | | | 100,000 | | | 104,172 | |
| 1.65% 9/30/13 | | | 750,000 | | | 757,710 | |
| Liberty Interactive LLC | | | | | | | |
| 5.7% 5/15/13 | | | 750,000 | | | 780,000 | |
| Markel Corp. | | | | | | | |
| 6.8% 2/15/13 | | | 750,000 | | | 772,766 | |
| Mohawk Industries, Inc. | | | | | | | |
| 7.2% 4/15/12 | | | 500,000 | | | 500,625 | |
| Time Warner Cable, Inc. | | | | | | | |
| 5.4% 7/02/12 | | | 250,000 | | | 252,870 | |
| 7.5% 4/01/14 | | | 120,000 | | | 135,132 | |
| TE Connectivity Ltd. | | | | | | | |
| 5.95% 1/15/14 | | | 449,000 | | | 480,240 | |
| WellPoint, Inc. | | | | | | | |
| 6.0% 2/15/14 | | | 250,000 | | | 272,277 | |
| 34 Weitz Funds | The accompanying notes form an integral part of these financial statements. |
| | | | Principal | | | | |
| | | | amount | | | Value | |
| Wells Fargo & Co. | | | | | | | |
| 4.375% 1/31/13 | | | 750,000 | | $ | 773,245 | |
| 0.9171% 11/03/14 (Wachovia Bank) | | | | | | | |
| Floating Rate Security | | | 550,000 | | | 536,243 | |
| 0.7076% 5/16/16 Floating Rate Security | | | 250,000 | | | 238,419 | |
| WM Wrigley Jr. Co. | | | | | | | |
3.05% 6/28/13(d) | | | 500,000 | | | 507,343 | |
| Total Corporate Bonds | | | | | | | |
| (Cost $9,522,216) | | | | | | 9,926,665 | |
| | | | | | | | |
MORTGAGE-BACKED SECURITIES — 3.8% (c)(c) | | | | | | | |
| Federal Home Loan Mortgage Corporation — 0.5% | | | | | | | |
| Collateralized Mortgage Obligations — 0.5% | | | | | | | |
| 2831 CL AB — 5.0% 2018 (0.4 years) | | | 26,664 | | | 27,033 | |
| 2542 CL LD — 5.0% 2022 (0.5 years) | | | 85,100 | | | 86,390 | |
| 2926 CL AB — 5.0% 2019 (0.6 years) | | | 115,605 | | | 118,186 | |
| 2627 CL LE — 3.0% 2017 (0.9 years) | | | 168,582 | | | 171,493 | |
| | | | | | | 403,102 | |
| Federal National Mortgage Association — 1.7% | | | | | | | |
| Collateralized Mortgage Obligations — 1.0% | | | | | | | |
| 2005-59 CL PB — 5.5% 2028 (0.1 years) | | | 48,617 | | | 48,598 | |
| 2002-91 CL QG — 5.0% 2018 (1.9 years) | | | 390,769 | | | 419,909 | |
| 2003-9 CL DB — 5.0% 2018 (1.9 years) | | | 391,921 | | | 421,570 | |
| | | | | | | 890,077 | |
| Pass-Through Securities — 0.7% | | | | | | | |
| 995755 — 4.5% 2024 (2.7 years) | | | 192,766 | | | 206,498 | |
| AB1769 — 3.0% 2025 (3.7 years) | | | 422,356 | | | 439,628 | |
| | | | | | | 646,126 | |
| | | | | | | 1,536,203 | |
| Non-Government Agency — 1.6% | | | | | | | |
| Collateralized Mortgage Obligations — 1.6% | | | | | | | |
| CDMC 2003-7P CL A4 — 3.324837% 2017 | | | | | | | |
(Adjustable Rate) (0.1 years)(d) | | | 14,603 | | | 14,576 | |
| SEMT 2010-H1 CL A1 — 3.75% 2040 | | | | | | | |
| (0.9 years) | | | 548,150 | | | 561,749 | |
| SEMT 2011-1 CL A1 — 4.125% 2041 | | | | | | | |
| (1.2 years) | | | 240,508 | | | 246,820 | |
| Chase 2004-S1 CL A6 — 4.5% 2019 | | | | | | | |
| (1.7 years) | | | 107,278 | | | 102,721 | |
| SEMT 2012-1 CL 1A1 — 2.865% 2042 | | | | | | | |
| (4.4 years) | | | 492,532 | | | 500,380 | |
| | | | | | | 1,426,246 | |
| Total Mortgage-Backed Securities | | | | | | | |
| (Cost $3,226,018) | | | | | | 3,365,551 | |
| | | | | | | | |
| ASSET-BACKED SECURITIES — 0.6% | | | | | | | |
| Cabela's Master Credit Card Trust 2011-2A CL A2 | | | | | | | |
| 0.84175% 2019 Floating Rate Security | | | | | | | |
(4.2 years)(d) | | | 500,000 | | | 504,329 | |
| (Cost $500,000) | | | | | | | |
| | | | | | | | |
| | | | Principal | | | | |
| TAXABLE MUNICIPAL | | | amount | | | | |
| BONDS — 0.4% | | | or shares | | | Value | |
| University of California 4.85% 5/15/13 | | | | | | | |
| (Cost $299,513) | | | 300,000 | | $ | 314,406 | |
| | | | | | | | |
| GOVERNMENT AGENCY — 2.3% | | | | | | | |
| Fannie Mae | | | | | | | |
1.5% 6/18/14(e) | | | 2,000,000 | | | 2,004,610 | |
| (Cost $2,005,142) | | | | | | | |
| | | | | | | | |
| SHORT-TERM SECURITIES — 34.3% | | | | | | | |
| Wells Fargo Advantage Government Money Market Fund - | | | | | | | |
Institutional Class 0.01%(a) | | | 904,032 | | | 904,032 | |
| U.S. Treasury Bills, 0.02% to 0.09%, | | | | | | | |
4/05/12 to 5/31/12(b) | | $ | 29,500,000 | | | 29,499,148 | |
| Total Short-Term Securities | | | | | | | |
| (Cost $30,402,947) | | | | | | 30,403,180 | |
| Total Investments in Securities | | | | | | | |
| (Cost $77,617,233) | | | | | | 88,692,176 | |
| Other Liabilities in Excess of Other Assets — (0.2%) | | | | | | (161,051 | ) |
| Net Assets — 100.0% | | | | | $ | 88,531,125 | |
| Net Asset Value Per Share | | | | | $ | 12.39 | |
| * | Non-income producing |
| (a) | Rate presented represents the annualized 7-day yield at March 31, 2012. |
| (b) | Interest rates presented represent the yield to maturity at the date of purchase. |
| (c) | Number of years indicated represents estimated average life of mortgage-backed securities. |
| (d) | Security is exempt from registration under Rule 144A of the Securities Act of 1933. This security may be resold in transactions that are exempt from registration, normally to qualified institutional buyers. |
| (e) | Security is a “step-up” bond where the coupon rate increases or steps up at predetermined date. Coupon rate presented represents the rate at March 31, 2012. |
| The accompanying notes form an integral part of these financial statements. | weitzfunds.com 35 |
SHORT-INTERMEDIATE INCOME FUND
PORTFOLIO MANAGER’S DISCUSSION & ANALYSIS
Portfolio Manager: Thomas D. Carney, CFA
The Short-Intermediate Income Fund-Institutional Class returned +1.5% in the first calendar quarter, compared to a +0.6% return for the Barclays Capital Intermediate U.S. Government/Credit Index (BCIGC), our Fund’s primary benchmark. For the fiscal year ended March 31, 2012, the Short-Intermediate Income Fund-Institutional Class’ total return was +2.9%, compared to a +6.1% return for the BCIGC.
The performance page following this discussion shows returns for our Fund’s Institutional Class (after deducting fees and expenses) over various holding periods and returns for three Barclays Capital U.S. Government/Credit Indexes (Intermediate, 1-5 year and 1-3 year) for comparison purposes.
Fiscal 2012 Review
U.S. Treasury bonds were the performance champions in the past year despite a debt ceiling standoff that nearly shut down the government. This standoff was followed closely by a downgrade of the U.S.’s coveted AAA rating by Standard and Poor’s. These headlines were overshadowed, though, by continued concerns about the underlying health of the American economy and even larger fears of a Euro-Zone meltdown. These fears drove investors to the still “safe haven” of U.S. Government bonds. Record books were rewritten as Treasury yields established ever lower lows with the 10-year Treasury falling below 1.7% at one point in the past year. Jim Grant of Grant’s Interest Rate Observer cleverly described the state of the Treasury market in a recent newsletter titled “They ask for nothing.” Mr. Grant’s observation is most evident in the principal maturity range or opportunity set for our Fund of under five years where Treasury bonds yield less than one-percent at fiscal year end (March 31). While affording investors the comfort of return of principal (a key goal for our Fund), we continue to believe that “nothing percent” U.S. Treasury bonds have little investment merit.
Corporate bonds and other credit sensitive securities were buffeted throughout the year, principally by events in Europe. Overall results were quite positive as corporate bonds benefited from the strong rally in U.S. Government bonds. Corporate bonds were unable, however, to keep pace with their Treasury counterparts as spreads (the extra yield investors demand above U.S. Treasuries as compensation to own corporate bonds) widened over the course of the year. Credit spreads reached their widest point in the December quarter as the European crisis, centered on Greece, intensified. Spreads then narrowed in the last quarter of the fiscal year as European fears abated and in response to strengthening U.S. economic activity. A broad measure of corporate bond spreads composed by Merrill Lynch increased to 192 basis points as of March 31, up 42 basis points year over year (a basis point represents one one-hundredth of a percentage point).
Our portfolio performed reasonably well in the past fiscal year despite trailing the BCIGC, our Fund’s primary benchmark. Our Fund’s shorter average maturity and duration and lack of Treasury bond exposure greater than one year in maturity were the principal reasons for trailing the index results. Turning to portfolio metrics as compared to a year ago, the average maturity of our Fund has declined to 3.0 from 3.7 years. The duration has declined to 1.9 from 2.3 years, and the average coupon has increased to 4.1% from 3.9%.
Principal contributors to our Fund’s results came from every component of our corporate bond investments. The decline of U.S. Treasury yields (the base rate used to price corporate bonds) more than offset any year-over-year spread widening. The result was price gains for nearly all of our investments which added to the coupon income we earned on our bonds. Key contributors in the investment grade segment (the largest) of our Fund included bonds issued by Bank of America Corp., JP Morgan Chase, Wells Fargo, Swiss RE, Aon Corp., Willis North America and Vornado Realty. Our Fund’s non-investment grade holdings, currently about 9.4% of Fund net assets, also performed well as improving credit fundamentals of many of our investments continued to unfold. Key contributors in this segment included the bonds issued by Mohawk Industries, QVC Inc., Vulcan Materials, and USG Corporation. Overall, our corporate bond weighting increased to 41.1% from 34.5% a year ago.
Mortgage-Backed Securities (MBS), currently 35.4% of Fund net assets, also added to our results in the past year. Our mortgage investments are primarily focused in Fannie Mae and Freddie Mac MBS that we selected based on specific characteristics we believe mitigate the risk of higher prepayment levels. More importantly, we have also sought to minimize extension risk (the possibility the average life of our investments lengthens meaningfully beyond our original assumptions) with these investments should interest rates rise.
36 Weitz Funds
The first part of the current quarter witnessed the highest capital deployment as credit spreads remained near the widest of the past year. New investments to highlight include additions to the Fund’s floating rate note investments, now approximately 4% of Fund assets. Our floating rate investments primarily consist of 2- to 4-year notes issued by JP Morgan and Wells Fargo, two diversified financial service companies we believe possess conservative credit cultures and strong managements focused on profitable growth while protecting their companies’ balances sheets. Floating rate securities currently provide nearly all the coupon return of comparable fixed-rate securities while affording us cash return upside if/when short-term interest rates normalize. We hope to add similar investments should both credit metrics and price (i.e. spread) align. We also increased current portfolio holdings by adding Host Hotels 3-year, Met Life 3-year, Comcast 4-year and Wrigley 1- and 2-year bonds. New corporate investments to the Fund this quarter include Ford FUEL 4-year, BHP-Petrohawk 3-year, and Valeant Pharmaceuticals 4-year bonds.
In the mortgage-backed securities segment, we added very seasoned (mortgages originated greater than 6 years ago), higher coupon (5% and greater) securities issued by Fannie Mae and Freddie Mac that we believe will generate high quality cash flows at reasonable-to-good spreads over an estimated 2- to 5-year average life. Since mortgages can be prepaid at any time, some key considerations in selecting these investments were their ability to withstand high prepayment rates, especially those anticipated by recent regulatory efforts like the administration’s Home Affordable Refinance Program (HARP). As important, if not more so, we also perform stress tests on any MBS (mortgage-backed securities) investment in order to minimize extension risk.
In MBS, we also participated in two non-agency residential securitizations sponsored by Redwood Trust, whose common stock our Fund owns. Redwood Trust remains uniquely positioned to take advantage of the eventual decline of massive government support (currently over 90%) of the residential mortgage market. Redwood’s market opportunity is large (nearly $10 trillion) and they continue to build their franchise so as to play a large role in the private finance of residential mortgages. We expect our investments in Redwood’s MBS (issued under Sequoia Mortgage Trust) to generate high-quality cash flows over their expected 3- to 5-year average lives.
Outlook
Today’s investment landscape in fixed income remains increasingly challenging. Nominal interest rates on U.S. Treasuries, both short and long term, are being manipulated by monetary policy and remain artificially low. The benefit of spread compression for credit sensitive investments is, we believe, in the “late innings.” Inflation, the bond investor’s boogeyman, remains stubbornly above 2 percent, leaving little room for real (after inflation) returns. Whether our current commodity-based inflation leaks into the broader economy and investor expectations is currently debatable. We remain wary, though, of the inflationary implications of the continued enormous deficit spending to support the economic recovery. The eventual impact of unwinding the Federal Reserve’s massive balance sheet from multiple rounds of quantitative easing might also cause unintended inflationary consequences. Therefore, we expect to continue to position the Fund defensively relative to interest rate exposure while we patiently seek out areas of opportunity. We will continue to invest one security at a time, relying on a fundamental research-based investment approach and are well positioned to take advantage of any market weakness.
weitzfunds.com 37
SHORT-INTERMEDIATE INCOME FUND
PERFORMANCE • (UNAUDITED)
| | | | Total Return | | Average Annual Total Returns |
| | | | 3 Mos. | | 1 Year | | 3 Year | | 5 Year | | 10 Year | | 15 Year | | 20 Year |
Short-Intermediate Income Fund – Institutional Class | | | 1.5 | % | | 2.9 | % | | 5.6 | % | | 5.2 | % | | 4.6 | % | | 5.4 | % | | 5.5 | % |
| Barclays Capital Indexes: | | | | | | | | | | | | | | | | | | | | | | |
| Intermediate U.S. Government/Credit | | | 0.6 | | | 6.1 | | | 5.9 | | | 5.7 | | | 5.3 | | | 5.9 | | | 6.1 | |
| 1-5 Year U.S. Government/Credit | | | 0.5 | | | 3.4 | | | 3.9 | | | 4.6 | | | 4.4 | | | 5.2 | | | 5.4 | |
| 1-3 Year U.S. Government/Credit | | | 0.4 | | | 1.8 | | | 2.7 | | | 3.8 | | | 3.7 | | | 4.6 | | | 4.9 | |
Growth of $10,000
This chart depicts the change in the value of a $10,000 investment in the Short-Intermediate Income Fund – Institutional Class for the period March 31, 2002 through March 31, 2012, as compared with the growth of the Barclays Intermediate Index during the same period. Index performance is hypothetical and is shown for illustrative purposes only.
| Year | | | Short- Int. (1) | | Barclays Interm. (2) | | Relative Results (1)-(2) |
| 1988 (12/23/88) | | | N/A | % | | N/A | % | | N/A | % |
| 1989 | | | 9.1 | | | 12.8 | | | -3.7 | |
| 1990 | | | 9.1 | | | 9.2 | | | -0.1 | |
| 1991 | | | 11.2 | | | 14.6 | | | -3.4 | |
| 1992 | | | 5.5 | | | 7.2 | | | -1.7 | |
| 1993 | | | 8.1 | | | 8.8 | | | -0.7 | |
| 1994 | | | -2.4 | | | -1.9 | | | -0.5 | |
| 1995 | | | 15.7 | | | 15.3 | | | 0.4 | |
| 1996 | | | 4.4 | | | 4.0 | | | 0.4 | |
| 1997 | | | 8.6 | | | 7.9 | | | 0.7 | |
| 1998 | | | 6.8 | | | 8.4 | | | -1.6 | |
| 1999 | | | 0.9 | | | 0.4 | | | 0.5 | |
| 2000 | | | 9.7 | | | 10.1 | | | -0.4 | |
| 2001 | | | 8.5 | | | 9.0 | | | -0.5 | |
| 2002 | | | 4.2 | | | 9.8 | | | -5.6 | |
| 2003 | | | 6.3 | | | 4.3 | | | 2.0 | |
| 2004 | | | 2.6 | | | 3.0 | | | -0.4 | |
| 2005 | | | 1.6 | | | 1.6 | | | 0.0 | |
| 2006 | | | 4.0 | | | 4.1 | | | -0.1 | |
| 2007 | | | 6.1 | | | 7.4 | | | -1.3 | |
| 2008 | | | 2.3 | | | 5.1 | | | -2.8 | |
| 2009 | | | 10.8 | | | 5.2 | | | 5.6 | |
| 2010 | | | 4.7 | | | 5.9 | | | -1.2 | |
| 2011 | | | 2.1 | | | 5.8 | | | -3.7 | |
| 2012 (3/31/12) | | | 1.5 | | | 0.6 | | | 0.9 | |
| Since Inception: | | | | | | | | | | |
| Cumulative | | | | | | | | | | |
| Return | | | 288.9 | | | 355.7 | | | -66.8 | |
| Avg. Annual | | | | | | | | | | |
| Return | | | 6.0 | | | 6.7 | | | -0.7 | |
These performance numbers reflect the deduction of the Fund’s Institutional Class annual operating expenses which as stated in its most recent Prospectus are 0.65% of the Fund’s net assets. The returns assume redemption at the end of each period and reinvestment of dividends. Total returns shown include fee waivers and expense reimbursements, if any; total returns would have been lower had there been no waiver of fees and/or reimbursement of expenses by the Adviser. This information represents past performance and past performance does not guarantee future results. The investment return and the principal value of an investment in this Fund will fluctuate so that an investor’s shares, when redeemed, may be worth more or less than the original cost. Current performance may be lower or higher than the performance data quoted. Performance data current to the most recent month-end may be obtained at www.weitzfunds.com/performance/monthly.asp.
See page 4 for additional performance disclosures. See page 82 for a description of all indices.
Performance information does not reflect the deduction of taxes that a shareholder would pay on Fund distributions or the redemption of Fund shares.
38 Weitz Funds
SHORT-INTERMEDIATE INCOME FUND
PORTFOLIO PROFILE • (UNAUDITED)
Credit Quality(a) |
| U.S. Treasury | | | 14.1 | % |
U.S. Government Agency Mortgage Related Securities(b) | | | 32.5 | |
| Aaa/AAA | | | 3.5 | |
| Aa/AA | | | 7.1 | |
| A/A | | | 8.9 | |
| Baa/BBB | | | 21.4 | |
| Ba/BB | | | 6.6 | |
| B/B | | | 1.3 | |
| Common Stocks | | | 1.5 | |
| Cash & Other | | | 3.1 | |
| Net Assets | | | 100.0 | % |
| | | | | |
| Sector Breakdown |
| Corporate Bonds | | | 41.1 | % |
| Mortgage-Backed Securities | | | 35.4 | |
| Short-Term Securities/Other | | | 10.0 | |
| U.S. Treasury | | | 7.2 | |
| Government Agency | | | 3.0 | |
| Common Stocks | | | 1.5 | |
| Taxable Municipal Bonds | | | 1.1 | |
| Asset-Backed Securities | | | 0.7 | |
| Net Assets | | | 100.0 | % |
| | | | | |
| Financial Attributes |
| Average Maturity | | | 3.0 years | |
| Average Duration | | | 1.9 years | |
| Average Coupon | | | 4.1 | % |
| 30-Day SEC Yield at 3-31-12 - Institutional Class | | | 1.8 | % |
| 30-Day SEC Yield at 3-31-12 - Investor Class | | | 1.6 | % |
| | | | | |
Five Largest Corporate Issuers(c) |
| Wells Fargo & Co. | | | 3.6 | % |
| JP Morgan Chase & Co. | | | 3.4 | |
| Markel Corp. | | | 2.4 | |
| MetLife, Inc. | | | 2.2 | |
| Mohawk Industries, Inc. | | | 2.1 | |
| | | | | |
| Maturity Distribution |
| Short-Term Securities/Other | | | 10.0 | % |
| Less than 1 Year | | | 14.0 | |
| 1 to 3 Years | | | 39.5 | |
| 3 to 5 Years | | | 25.8 | |
| 5 to 7 Years | | | 6.4 | |
| 7 to 10 Years | | | 2.7 | |
| 10 Years or more | | | 0.1 | |
| Common Stocks | | | 1.5 | |
| Net Assets | | | 100.0 | % |
(a) The Fund receives credit quality ratings on underlying securities of the Fund when available from Moody's and S&P. The Fund will use one rating for an underlying security if that is all that is provided. Ratings and portfolio credit quality may change over time. The Fund itself has not been rated by an independent rating agency.
(b) Mortgage related securities issued and guaranteed by government-sponsored entities such as Fannie Mae and Freddie Mac are generally not rated by Moody’s and S&P. Securities which are not rated do not necessarily indicate low quality. Fannie Mae’s and Freddie Mac’s senior debentures are currently rated Aaa and AA+ by Moody’s & S&P, respectively.
(c) Percent of net assets
weitzfunds.com 39
SHORT-INTERMEDIATE INCOME FUND
SCHEDULE OF INVESTMENTS • MARCH 31, 2012
| | | Principal | | | | |
| CORPORATE BONDS — 41.1% | | amount | | Value | |
| American Express Co. | | | | | | | |
| Centurion Bank 5.55% 10/17/12 | | $ | 5,000,000 | | $ | 5,129,130 | |
| Credit Corp. 7.3% 8/20/13 | | | 3,782,000 | | | 4,093,890 | |
| FSB Bank 5.55% 10/17/12 | | | 1,609,000 | | | 1,651,042 | |
| FSB Bank 6.0% 9/13/17 | | | 2,500,000 | | | 2,929,087 | |
| 8.125% 5/20/19 | | | 1,000,000 | | | 1,309,152 | |
| Anheuser-Busch InBev SA/NV | | | | | | | |
| 4.125% 1/15/15 | | | 6,000,000 | | | 6,505,764 | |
| Aon Corp. | | | | | | | |
| 7.375% 12/14/12 | | | 10,879,000 | | | 11,333,960 | |
| 3.5% 9/30/15 | | | 5,000,000 | | | 5,244,455 | |
| AutoZone, Inc. | | | | | | | |
| 5.75% 1/15/15 | | | 1,250,000 | | | 1,385,769 | |
| Bank of America Corp. | | | | | | | |
| 5.375% 6/15/14 | | | 10,195,000 | | | 10,660,708 | |
| 5.125% 11/15/14 | | | 14,080,000 | | | 14,734,875 | |
| Berkshire Hathaway Finance Corp. | | | | | | | |
| 2.125% 2/11/13 | | | 3,000,000 | | | 3,043,989 | |
| 4.6% 5/15/13 | | | 3,000,000 | | | 3,135,306 | |
| 4.625% 10/15/13 | | | 2,129,000 | | | 2,255,552 | |
| 1.5% 1/10/14 | | | 500,000 | | | 508,045 | |
| 4.85% 1/15/15 | | | 1,500,000 | | | 1,663,593 | |
| 5.4% 5/15/18 | | | 5,000,000 | | | 5,914,570 | |
| 4.25% 1/15/21 | | | 1,000,000 | | | 1,081,932 | |
| Boston Properties LP | | | | | | | |
| 5.625% 4/15/15 | | | 2,000,000 | | | 2,223,942 | |
| 5.875% 10/15/19 | | | 4,000,000 | | | 4,591,836 | |
| Comcast Corp. | | | | | | | |
| 10.625% 7/15/12 | | | 2,000,000 | | | 2,045,944 | |
| 6.5% 1/15/15 | | | 2,081,000 | | | 2,376,075 | |
| 4.95% 6/15/16 | | | 8,590,000 | | | 9,657,806 | |
| 10.875% 11/15/16 | | | | | | | |
| (Universal City Development) | | | 10,825,000 | | | 12,936,773 | |
| 5.15% 3/01/20 | | | 3,000,000 | | | 3,457,176 | |
| Dell, Inc. | | | | | | | |
| 5.625% 4/15/14 | | | 1,250,000 | | | 1,371,154 | |
| Diageo Capital plc | | | | | | | |
| 4.85% 5/15/18 | | | 3,941,000 | | | 4,387,988 | |
| DIRECTV Holdings | | | | | | | |
| 4.75% 10/01/14 | | | 2,000,000 | | | 2,175,166 | |
| 7.625% 5/15/16 | | | 10,330,000 | | | 10,830,179 | |
| Expedia, Inc. | | | | | | | |
| 7.456% 8/15/18 | | | 13,000,000 | | | 14,738,334 | |
| FiServ, Inc. | | | | | | | |
| 3.125% 10/01/15 | | | 1,000,000 | | | 1,033,276 | |
| Flir Systems, Inc. | | | | | | | |
| 3.75% 9/01/16 | | | 10,000,000 | | | 10,204,830 | |
| Goldman Sachs Group, Inc. | | | | | | | |
| 5.95% 1/18/18 | | | 4,000,000 | | | 4,314,148 | |
| Hewlett-Packard Co. | | | | | | | |
| 1.55% 5/30/14 | | | 8,009,000 | | | 8,071,334 | |
| 4.75% 6/02/14 | | | 15,540,000 | | | 16,632,757 | |
| Host Hotels & Resorts LP | | | | | | | |
| 6.875% 11/01/14 | | | 7,000,000 | | | 7,175,000 | |
| 6.375% 3/15/15 | | | 5,000,000 | | | 5,112,500 | |
| JP Morgan Chase & Co. | | | | | | | |
| 1.22365% 5/02/14 Floating Rate Security | | | 5,000,000 | | | 5,011,580 | |
| 5.15% 10/01/15 | | | 5,500,000 | | | 5,988,081 | |
| 2.6% 1/15/16 | | | 15,000,000 | | | 15,190,620 | |
| 0.8831% 11/21/16 | | | | | | | |
| (Bear Stearns) Floating Rate Security | | | 15,000,000 | | | 14,368,590 | |
| 6.0% 7/05/17 | | | 5,000,000 | | | 5,672,460 | |
| 6.3% 4/23/19 | | | 2,500,000 | | | 2,892,975 | |
| | | Principal | | | | |
| | | amount | | Value | |
| Kraft Foods, Inc. | | | | | | | |
| 2.625% 5/08/13 | | $ | 1,000,000 | | $ | 1,019,479 | |
| Laboratory Corp. of America Holdings | | | | | | | |
| 3.125% 5/15/16 | | | 1,250,000 | | | 1,293,874 | |
| Liberty Interactive LLC | | | | | | | |
| 5.7% 5/15/13 | | | 13,240,000 | | | 13,769,600 | |
| Marathon Petroleum Corp. | | | | | | | |
| 3.5% 3/01/16 | | | 1,000,000 | | | 1,042,803 | |
| Markel Corp. | | | | | | | |
| 6.8% 2/15/13 | | | 18,175,000 | | | 18,726,702 | |
| 7.125% 9/30/19 | | | 4,566,000 | | | 5,137,677 | |
| 5.35% 6/01/21 | | | 10,000,000 | | | 10,446,020 | |
| Mead Johnson Nutrition Co. | | | | | | | |
| 3.5% 11/01/14 | | | 2,000,000 | | | 2,086,136 | |
| MetLife, Inc. | | | | | | | |
5.125% 4/10/13(d) | | | 9,100,000 | | | 9,514,405 | |
| 2.375% 2/06/14 | | | 1,000,000 | | | 1,025,299 | |
| 5.125% 8/15/14 | | | | | | | |
(Travelers Life & Annuity)(d) | | | 8,000,000 | | | 8,689,808 | |
2.0% 1/09/15(d) | | | 10,000,000 | | | 10,112,780 | |
3.125% 1/11/16(d) | | | 2,000,000 | | | 2,074,104 | |
| Mohawk Industries, Inc. | | | | | | | |
| 7.2% 4/15/12 | | | 2,500,000 | | | 2,503,125 | |
| 6.625% 1/15/16 | | | 25,905,000 | | | 28,754,550 | |
| NewMarket Corp. | | | | | | | |
| 7.125% 12/15/16 | | | 8,000,000 | | | 8,314,400 | |
| News America Holdings | | | | | | | |
| 9.25% 2/01/13 | | | 2,222,000 | | | 2,366,357 | |
| Omnicom Group, Inc. | | | | | | | |
| 5.9% 4/15/16 | | | 7,000,000 | | | 8,052,940 | |
| Petrohawk Energy Corp. | | | | | | | |
| 7.875% 6/01/15 | | | 16,750,000 | | | 17,671,250 | |
| 7.25% 8/15/18 | | | 4,000,000 | | | 4,595,000 | |
| QVC, Inc. | | | | | | | |
7.125% 4/15/17(d) | | | 9,600,000 | | | 10,272,000 | |
7.5% 10/01/19(d) | | | 4,000,000 | | | 4,410,000 | |
| Republic Services, Inc. (Allied Waste) | | | | | | | |
| 6.875% 6/01/17 | | | 14,885,000 | | | 15,553,024 | |
| 3.8% 5/15/18 | | | 5,000,000 | | | 5,376,000 | |
| Solvay SA (Rhodia) | | | | | | | |
6.875% 9/15/20(d) | | | 5,000,000 | | | 5,600,000 | |
| Texas Industries Inc. | | | | | | | |
| 9.25% 8/15/20 | | | 300,000 | | | 289,500 | |
| Time Warner Cable, Inc. | | | | | | | |
| 5.4% 7/02/12 | | | 2,000,000 | | | 2,022,964 | |
| 7.5% 4/01/14 | | | 1,700,000 | | | 1,914,367 | |
| Time Warner, Inc. | | | | | | | |
| 3.15% 7/15/15 | | | 500,000 | | | 529,921 | |
| UnitedHealth Group, Inc. | | | | | | | |
| 4.75% 2/10/14 | | | 178,000 | | | 190,533 | |
| U.S. Bancorp | | | | | | | |
| 1.125% 10/30/13 | | | 10,000,000 | | | 10,054,890 | |
| Valeant Pharmaceuticals | | | | | | | |
6.5% 7/15/16(d) | | | 5,000,000 | | | 5,112,500 | |
| Vornado Realty Trust | | | | | | | |
| 4.25% 4/01/15 | | | 14,315,000 | | | 15,019,684 | |
| Vulcan Materials Co. | | | | | | | |
| 6.5% 12/01/16 | | | 5,500,000 | | | 5,926,250 | |
| 6.4% 11/30/17 | | | 8,000,000 | | | 8,430,000 | |
| Washington Post Co. | | | | | | | |
| 7.25% 2/01/19 | | | 3,500,000 | | | 4,050,354 | |
| 40 Weitz Funds | The accompanying notes form an integral part of these financial statements. |
| | | | | | | | |
| | | Principal | | | | |
| | | amount | | Value | |
| WellPoint, Inc. | | | | | | | |
| 6.0% 2/15/14 | | $ | 2,000,000 | | $ | 2,178,216 | |
| Wells Fargo & Co. | | | | | | | |
| 4.8% 11/01/14 (Wachovia Bank) | | | 10,000,000 | | | 10,724,490 | |
| 0.9171% 11/03/14 (Wachovia Bank) | | | | | | | |
| Floating Rate Security | | | 21,585,000 | | | 21,045,116 | |
| 4.875% 2/01/15 (Wachovia Bank) | | | 6,070,000 | | | 6,546,671 | |
| 0.7076% 5/16/16 Floating Rate Security | | | 9,750,000 | | | 9,298,341 | |
| 0.74365% 6/15/17 (Wachovia Bank) | | | | | | | |
| Floating Rate Security | | | 5,000,000 | | | 4,742,455 | |
| Whirlpool Corp. | | | | | | | |
| 8.0% 5/01/12 | | | 1,000,000 | | | 1,005,107 | |
| Willis North America, Inc. | | | | | | | |
| 6.2% 3/28/17 | | | 14,477,000 | | | 16,217,164 | |
| WM Wrigley Jr. Co. | | | | | | | |
3.05% 6/28/13(d) | | | 8,792,000 | | | 8,921,128 | |
3.7% 6/30/14(d) | | | 9,626,000 | | | 9,988,130 | |
| Yum! Brands, Inc. | | | | | | | |
| 4.25% 9/15/15 | | | 1,000,000 | | | 1,085,684 | |
| Total Corporate Bonds | | | | | | | |
| (Cost $574,922,698) | | | | | | 598,742,141 | |
| | | | | | | | |
MORTGAGE-BACKED SECURITIES — 35.4%(c)(c(c) | | | | | | | |
| Federal Home Loan Mortgage Corporation — 15.7% | | | | | | | |
| Collateralized Mortgage Obligations — 11.1% | | | | | | | |
| 3098 CL HA — 5.5% 2023 (0.2 years) | | | 219,499 | | | 220,728 | |
| 2829 CL DJ — 4.5% 2018 (0.2 years) | | | 445,022 | | | 447,364 | |
| 3036 CL JH — 5.0% 2031 (0.3 years) | | | 543,519 | | | 547,741 | |
| 2831 CL AB — 5.0% 2018 (0.4 years) | | | 106,656 | | | 108,134 | |
| 2579 CL PC — 5.5% 2032 (0.4 years) | | | 431,840 | | | 437,879 | |
| 2947 CL B — 5.0% 2032 (0.5 years) | | | 397,725 | | | 404,111 | |
| 3042 CL HA — 5.5% 2029 (0.5 years) | | | 666,290 | | | 679,241 | |
| 2906 CL HK — 5.0% 2032 (0.6 years) | | | 1,159,221 | | | 1,180,133 | |
| R009 CL AJ — 5.75% 2018 (0.6 years) | | | 196,075 | | | 200,011 | |
| 2549 CL PD — 5.5% 2031 (0.6 years) | | | 1,259,586 | | | 1,285,924 | |
| R010 CL AB — 5.5% 2019 (0.8 years) | | | 1,243,630 | | | 1,279,537 | |
| 2627 CL LE — 3.0% 2017 (0.9 years) | | | 295,018 | | | 300,112 | |
| 3566 CL DB — 4.0% 2022 (1.0 years) | | | 2,806,157 | | | 2,890,076 | |
| R011 CL AB — 5.5% 2020 (1.0 years) | | | 537,894 | | | 554,368 | |
| 2937 CL HJ — 5.0% 2019 (1.3 years) | | | 1,491,632 | | | 1,566,074 | |
| 3562 CL KA — 4.0% 2022 (1.4 years) | | | 4,510,733 | | | 4,672,207 | |
| 3556 CL MA — 5.0% 2037 (1.5 years) | | | 1,551,600 | | | 1,647,257 | |
| 3229 CL HB — 5.0% 2025 (1.5 years) | | | 1,020,637 | | | 1,065,630 | |
| 2778 CL JD — 5.0% 2032 (1.5 years) | | | 4,985,071 | | | 5,239,306 | |
| 3170 CL EA — 4.5% 2020 (1.6 years) | | | 1,763,261 | | | 1,834,372 | |
| 2760 CL PD — 5.0% 2032 (1.6 years) | | | 8,696,731 | | | 9,157,395 | |
| 2574 CL JM — 5.0% 2022 (1.6 years) | | | 696,625 | | | 735,467 | |
| 2937 CL JG — 5.0% 2033 (1.6 years) | | | 11,106,000 | | | 11,727,190 | |
| 2934 CL KE — 5.0% 2033 (1.7 years) | | | 9,384,666 | | | 9,900,735 | |
| 2864 CL PE — 5.0% 2033 (1.7 years) | | | 34,022,237 | | | 35,896,923 | |
| 3544 CL KA — 4.5% 2023 (1.7 years) | | | 3,412,755 | | | 3,565,678 | |
| 2780 CL TE — 5.0% 2033 (1.7 years) | | | 10,178,000 | | | 10,768,876 | |
| 3815 CL AD — 4.0% 2025 (2.2 years) | | | 4,418,501 | | | 4,665,075 | |
| 3844 CL AG — 4.0% 2025 (2.2 years) | | | 11,627,781 | | | 12,286,215 | |
| 3840 CL KA — 5.0% 2029 (2.5 years) | | | 4,477,207 | | | 4,849,929 | |
| 3003 CL LD — 5.0% 2034 (2.6 years) | | | 16,503,529 | | | 17,855,658 | |
| 2952 CL PA — 5.0% 2035 (3.5 years) | | | 4,477,873 | | | 5,003,364 | |
| 3842 CL PH — 4.0% 2041 (3.6 years) | | | 7,971,963 | | | 8,471,026 | |
| | | | | | | 161,443,736 | |
| | | | | | | | |
| | | Principal | | | | |
| | | amount | | Value | |
| Pass-Through Securities — 4.6% | | | | | | | |
| EO1386 — 5.0% 2018 (2.0 years) | | $ | 133,648 | | $ | 143,313 | |
| G18190 — 5.5% 2022 (2.6 years) | | | 186,275 | | | 201,583 | |
| G13300 — 4.5% 2023 (2.7 years) | | | 1,358,284 | | | 1,451,216 | |
| G18296 — 4.5% 2024 (2.7 years) | | | 3,129,709 | | | 3,341,394 | |
| G13517 — 4.0% 2024 (2.7 years) | | | 5,006,904 | | | 5,291,577 | |
| G18308 — 4.0% 2024 (2.7 years) | | | 6,732,405 | | | 7,115,183 | |
| G18306 — 4.5% 2024 (2.8 years) | | | 6,194,773 | | | 6,613,771 | |
| J13949 — 3.5% 2025 (3.1 years) | | | 13,493,663 | | | 14,330,372 | |
| G01818 — 5.0% 2035 (3.3 years) | | | 13,820,520 | | | 14,909,529 | |
| E02804 — 3.0% 2025 (3.4 years) | | | 12,656,722 | | | 13,107,077 | |
| | | | | | | 66,505,015 | |
| | | | | | | 227,948,751 | |
| | | | | | | | |
| Federal National Mortgage Association — 16.8% | | | | | | | |
| Collateralized Mortgage Obligations — 6.5% | | | | | | | |
| 2005-59 CL PB — 5.5% 2028 (0.1 years) | | | 149,591 | | | 149,534 | |
| 2005-9 CL A — 5.0% 2031 (0.2 years) | | | 284,291 | | | 285,634 | |
| 2006-78 CL AV — 6.5% 2017 (0.3 years) | | | 954,421 | | | 964,635 | |
| 2009-27 CL JA — 5.0% 2036 (0.4 years) | | | 305,013 | | | 307,961 | |
| 2003-27 CL DW — 4.5% 2017 (0.4 years) | | | 294,677 | | | 297,745 | |
| 2006-9 CL GA — 5.5% 2033 (0.4 years) | | | 911,429 | | | 922,075 | |
| 2003-92 CL PD — 4.5% 2017 (0.4 years) | | | 601,548 | | | 608,500 | |
| 2006-22 CL DA — 5.5% 2033 (0.4 years) | | | 312,792 | | | 316,808 | |
| 2010-10 CL AD — 4.5% 2036 (0.7 years) | | | 5,764,866 | | | 5,856,539 | |
| 2005-91 CL DA — 4.5% 2020 (0.7 years) | | | 7,872,882 | | | 8,120,676 | |
| 2007-32 CL BA — 5.5% 2034 (0.8 years) | | | 2,067,760 | | | 2,125,308 | |
| 2008-54 CL EC — 5.0% 2035 (0.8 years) | | | 1,938,559 | | | 1,990,734 | |
| 2004-40 CL BA — 4.5% 2018 (0.8 years) | | | 1,042,831 | | | 1,066,634 | |
| 2006-21 CL CA — 5.5% 2029 (0.9 years) | | | 780,648 | | | 804,478 | |
| 2003-43 CL EX — 4.5% 2017 (0.9 years) | | | 195,946 | | | 200,738 | |
| 2010-61 CL EB — 4.5% 2037 (1.0 years) | | | 5,124,929 | | | 5,292,522 | |
| 2003-86 CL KT — 4.5% 2018 (1.1 years) | | | 858,076 | | | 882,871 | |
| 2003-37 CL QD — 5.0% 2032 (1.2 years) | | | 920,444 | | | 956,827 | |
| 2005-9 CL AC — 5.0% 2033 (1.2 years) | | | 6,570,395 | | | 6,828,397 | |
| 2005-1 CL KA — 5.0% 2033 (1.2 years) | | | 4,903,725 | | | 5,099,629 | |
| 2003-39 CL LC — 5.0% 2022 (1.2 years) | | | 239,731 | | | 248,296 | |
| 2010-9 CL CA — 5.0% 2037 (1.3 years) | | | 7,229,821 | | | 7,596,140 | |
| 2009-52 CL DC — 4.5% 2023 (1.5 years) | | | 820,086 | | | 849,973 | |
| 2004-78 CL AB — 5.0% 2032 (1.6 years) | | | 7,367,630 | | | 7,753,281 | |
| 2009-44 CL A — 4.5% 2023 (1.8 years) | | | 1,365,904 | | | 1,435,677 | |
| 2003-9 CL DB — 5.0% 2018 (1.9 years) | | | 783,842 | | | 843,140 | |
| 2007-42 CL YA — 5.5% 2036 (2.1 years) | | | 1,737,322 | | | 1,852,553 | |
| 2011-19 CL KA — 4.0% 2025 (2.1 years) | | | 11,788,506 | | | 12,416,553 | |
| 2010-145 CL PA — 4.0% 2024 (2.6 years) | | | 8,284,416 | | | 8,713,210 | |
| 2010-54 CL WA — 3.75% 2025 (2.7 years) | | | 8,725,164 | | | 9,224,787 | |
| | | | | | | 94,011,855 | |
| Pass-Through Securities — 10.3% | | | | | | | |
| 254863 — 4.0% 2013 (0.6 years) | | | 56,846 | | | 59,832 | |
| 255291 — 4.5% 2014 (0.9 years) | | | 131,079 | | | 140,431 | |
| 254907 — 5.0% 2018 (2.1 years) | | | 466,284 | | | 506,201 | |
| 357414 — 4.0% 2018 (2.1 years) | | | 1,601,193 | | | 1,709,494 | |
| 256982 — 6.0% 2017 (2.1 years) | | | 379,379 | | | 412,002 | |
| 251787 — 6.5% 2018 (2.1 years) | | | 14,768 | | | 16,548 | |
| 357985 — 4.5% 2020 (2.4 years) | | | 490,566 | | | 527,042 | |
| AD0629 — 5.0% 2024 (2.5 years) | | | 3,833,224 | | | 4,160,173 | |
| 888595 — 5.0% 2022 (2.6 years) | | | 996,284 | | | 1,081,261 | |
| 995960 — 5.0% 2023 (2.6 years) | | | 3,556,546 | | | 3,852,117 | |
| 995693 — 4.5% 2024 (2.6 years) | | | 5,941,650 | | | 6,368,594 | |
| 995692 — 4.5% 2024 (2.7 years) | | | 5,641,496 | | | 6,046,872 | |
| The accompanying notes form an integral part of these financial statements. | weitzfunds.com 41 |
SHORT-INTERMEDIATE INCOME FUND
SCHEDULE OF INVESTMENTS • (CONTINUED)
| | | Principal | | | | |
| | | amount | | Value | |
| AE0031 — 5.0% 2025 (2.7 years) | | $ | 5,540,053 | | $ | 5,993,541 | |
| 930667 — 4.5% 2024 (2.7 years) | | | 4,613,053 | | | 4,941,646 | |
| 995755 — 4.5% 2024 (2.7 years) | | | 9,445,556 | | | 10,118,373 | |
| 890112 — 4.0% 2024 (2.8 years) | | | 4,734,252 | | | 5,020,437 | |
| MA0043 — 4.0% 2024 (2.8 years) | | | 3,962,615 | | | 4,202,154 | |
| AA4315 — 4.0% 2024 (2.8 years) | | | 7,548,550 | | | 8,004,858 | |
| AA5510 — 4.0% 2024 (2.8 years) | | | 2,900,061 | | | 3,075,369 | |
| 931739 — 4.0% 2024 (2.8 years) | | | 2,002,637 | | | 2,123,696 | |
| AD7073 — 4.0% 2025 (2.9 years) | | | 6,414,460 | | | 6,802,212 | |
| AL0471 — 5.5% 2025 (2.9 years) | | | 19,543,898 | | | 21,326,446 | |
| 888439 — 5.5% 2022 (2.9 years) | | | 855,817 | | | 933,355 | |
| 725232 — 5.0% 2034 (3.3 years) | | | 1,674,493 | | | 1,813,305 | |
| 555531 — 5.5% 2033 (3.5 years) | | | 20,129,279 | | | 22,124,146 | |
| 995112 — 5.5% 2036 (3.6 years) | | | 8,599,857 | | | 9,437,345 | |
| AB1769 — 3.0% 2025 (3.7 years) | | | 9,714,188 | | | 10,111,448 | |
| AB2251 — 3.0% 2026 (3.8 years) | | | 9,016,511 | | | 9,396,510 | |
| | | | | | | 150,305,408 | |
| | | | | | | 244,317,263 | |
| | | | | | | | |
| Non-Government Agency — 2.9% | | | | | | | |
| Collateralized Mortgage Obligations — 2.9% | | | | | | | |
| CDMC 2003-7P CL A4 — 3.324837% 2017 | | | | | | | |
(Adjustable Rate) (0.1 years)(d) | | | 43,808 | | | 43,729 | |
| SEMT 2010-H1 CL A1 — 3.75% 2040 | | | | | | | |
| (0.9 years) | | | 7,410,772 | | | 7,594,623 | |
| WAMU 2003-S7 CL A1 — 4.5% 2018 | | | | | | | |
| (1.0 years) | | | 270,304 | | | 277,825 | |
| SEMT 2011-1 CL A1 — 4.125% 2041 | | | | | | | |
| (1.2 years) | | | 6,631,157 | | | 6,805,179 | |
| Chase 2004-S1 CL A6 — 4.5% 2019 | | | | | | | |
| (1.7 years) | | | 132,318 | | | 126,697 | |
| SEMT 2012-2 CL A2 — 3.5% 2042 | | | | | | | |
| (3.1 years) | | | 12,000,000 | | | 12,228,720 | |
| SEMT 2012-1 CL 1A1 — 2.865% 2042 | | | | | | | |
| (4.4 years) | | | 15,268,487 | | | 15,511,767 | |
| | | | | | | 42,588,540 | |
| Total Mortgage-Backed Securities | | | | | | | |
| (Cost $502,299,733) | | | | | | 514,854,554 | |
| | | | | | | | |
| ASSET-BACKED SECURITIES — 0.7% | | | | | | | |
| Ford Upgrade Exchange Linked Notes 2011-1 | | | | | | | |
4.207% 4/15/16(d) | | | 5,000,000 | | | 5,136,120 | |
| Cabela's Master Credit Card Trust 2011-2A CL A2 | | | | | | | |
| 0.84175% 2019 Floating Rate Security | | | | | | | |
(4.2 years)(d) | | | 4,500,000 | | | 4,538,956 | |
| Total Asset-Backed Securities | | | | | | | |
| (Cost $9,636,731) | | | | | | 9,675,076 | |
| | | | | | | | |
| | | Principal | | | | |
| TAXABLE MUNICIPAL | | amount | | | | |
| BONDS — 1.1% | | or shares | | Value | |
| University of California 4.85% 5/15/13 | | $ | 990,000 | | $ | 1,037,540 | |
| North Texas Tollway Authority Revenue | | | | | | | |
| 2.441% 9/01/13 | | | 4,000,000 | | | 4,099,960 | |
| Nebraska Public Power District | | | | | | | |
| 5.14% 1/01/14 | | | 1,000,000 | | | 1,076,350 | |
| Los Angeles, California Cmty Dev | | | | | | | |
| 6.0% 9/01/14 | | | 2,275,000 | | | 2,504,843 | |
| 6.0% 9/01/15 | | | 1,220,000 | | | 1,378,697 | |
| Menomonee Falls, Wisconsin | | | | | | | |
| 4.25% 11/01/14 | | | 2,000,000 | | | 2,083,400 | |
| Omaha, Nebraska Public Facilities Corp., | | | | | | | |
| Lease Revenue, Series B, Refunding | | | | | | | |
| 4.588% 6/01/17 | | | 815,000 | | | 926,003 | |
| 4.788% 6/01/18 | | | 1,000,000 | | | 1,148,890 | |
| Iowa State University Revenue | | | | | | | |
| 5.8% 7/01/22 | | | 1,335,000 | | | 1,429,171 | |
| Total Taxable Municipal Bonds | | | | | | | |
| (Cost $14,706,368) | | | | | | 15,684,854 | |
| | | | | | | | |
| U.S. TREASURY AND GOVERNMENT AGENCY — 10.2% | | | | | | | |
| U.S. Treasury — 7.2% | | | | | | | |
| U.S. Treasury Note | | | | | | | |
| 1.375% 4/15/12 | | | 15,000,000 | | | 15,008,790 | |
| 1.0% 4/30/12 | | | 20,000,000 | | | 20,016,420 | |
| 0.375% 9/30/12 | | | 15,000,000 | | | 15,018,165 | |
| 1.125% 12/15/12 | | | 15,000,000 | | | 15,100,200 | |
| 0.625% 1/31/13 | | | 20,000,000 | | | 20,072,660 | |
| 1.375% 2/15/13 | | | 20,000,000 | | | 20,203,920 | |
| | | | | | | 105,420,155 | |
| Government Agency — 3.0% | | | | | | | |
| Fannie Mae | | | | | | | |
1.5% 6/18/14(e) | | | 23,000,000 | | | 23,053,015 | |
| Freddie Mac | | | | | | | |
| 2.0% 2/27/17 | | | 20,000,000 | | | 20,130,380 | |
| | | | | | | 43,183,395 | |
| Total U.S. Treasury and Government Agency | | | | | | | |
| (Cost $148,597,433) | | | | | | 148,603,550 | |
| | | | | | | | |
| COMMON STOCKS — 1.5% | | | | | | | |
| Redwood Trust, Inc. | | | 1,867,409 | | | 20,914,981 | |
| Newcastle Investment Corp. | | | 200,000 | | | 1,256,000 | |
| | | | | | | | |
| Total Common Stocks | | | | | | | |
| (Cost $25,885,006) | | | | | | 22,170,981 | |
| 42 Weitz Funds | The accompanying notes form an integral part of these financial statements. |
| | | Principal | | | | |
| SHORT-TERM | | amount | | | | |
| SECURITIES — 9.2% | | or shares | | Value | |
| Wells Fargo Advantage Government Money Market Fund - | | | | | | | |
Institutional Class 0.01%(a) | | | 33,946,595 | | $ | 33,946,595 | |
| U.S. Treasury Bills, 0.02%, | | | | | | | |
5/17/12 to 5/24/12(b) | | $ | 100,000,000 | | | 99,993,750 | |
| | | | | | | | |
| Total Short-Term Securities | | | | | | | |
| (Cost $133,943,845) | | | | | | 133,940,345 | |
| | | | | | | | |
| Total Investments in Securities | | | | | | | |
| (Cost $1,409,991,814) | | | | | | 1,443,671,501 | |
| Other Assets Less Other Liabilities — 0.8% | | | | | | 11,924,109 | |
| Net Assets — 100.0% | | | | | $ | 1,455,595,610 | |
| Net Asset Value Per Share - Institutional Class | | | | | $ | 12.48 | |
| Net Asset Value Per Share - Investor Class | | | | | $ | 12.47 | |
| (a) | Rate presented represents the annualized 7-day yield at March 31, 2012. |
| (b) | Interest rates presented represent the yield to maturity at the date of purchase. |
| (c) | Number of years indicated represents estimated average life of mortgage-backed securities. |
| (d) | Security is exempt from registration under Rule 144A of the Securities Act of 1933. This security may be resold in transactions that are exempt from registration, normally to qualified institutional buyers. |
| (e) | Security is a “step-up” bond where the coupon rate increases or steps up at a predetermined date. Coupon rate presented represents the rate at March 31, 2012. |
| The accompanying notes form an integral part of these financial statements. | weitzfunds.com 43 |
NEBRASKA TAX-FREE INCOME FUND
PORTFOLIO MANAGER’S DISCUSSION & ANALYSIS
Portfolio Manager: Thomas D. Carney, CFA
The Nebraska Tax-Free Income Fund returned +0.5% in the first calendar quarter, compared to a +0.6% return for the Barclays Capital 5-Year Municipal Bond Index, our Fund’s primary benchmark. For the fiscal year ended March 31, 2012, the Nebraska Tax-Free Income Fund’s total return was +6.1%, compared to a +6.9% return for our Fund’s primary benchmark.
Fiscal 2012 Review
Municipal bonds generated positive results in every quarter in the past fiscal year, capping a year in which they were among the best performing asset classes in the world. Some of the overriding positives that contributed to the municipal bond market’s good performance included: the sharp decline in Treasury yields; the expectation that short-term yields would stay near zero for an extended period of time; a lower supply of new issue municipal bonds in the marketplace coupled with a large quantity of older bonds maturing or being called/retired; and, perhaps most importantly, the unwinding of a fear-induced feedback loop caused by dire predictions a year ago of “hundreds of billions of dollars’ worth of defaults” that didn’t come to fruition. The culmination of these factors led to rising bond prices (yields declined) across all maturities, with longer-term bonds experiencing the largest price increases.
The yield relationship between tax-free municipal bonds and taxable alternatives, like U.S. Treasuries, widened in the past year as municipal bonds generally underperformed their taxable government counterparts. High quality 5-year municipal bonds, for example, ended the current fiscal year (March 31) with a yield representing approximately 96% of U.S. Treasuries, compared to 77% a year ago. Similar to a year ago, most longer-term municipal bonds (beyond ten years) offer yields in excess of U.S. Treasuries as of March 31. Historically, municipal bonds yield less than taxable alternatives given the tax advantages (federally and, typically, state exempt) of municipal bonds. And while history may be less of a guide given today’s abnormally low interest-rate environment, municipal bonds are relatively more attractive than most taxable alternatives (especially U.S. Treasury bonds).
Our investment activity in the past year remained focused on bonds with shorter maturities (primarily under 7 years). Investment highlights during the year included additions in the public power and higher education segments of our portfolio (24.0% and 20.1%, respectively, as of March 31).
Turning to portfolio metrics, over the past year the average duration of our Fund declined to 2.9 from 3.5 years and the average maturity of our bonds fell to 3.6 from 6.5 years. Overall asset quality of our portfolio remains high as we continue to be focused on security selection and ongoing review of our investments’ fiscal position.
Outlook
Today’s investment landscape in fixed-income remains increasingly challenging. Nominal interest rates on U.S. Treasuries, both short and long term, are being manipulated by monetary policy and remain artificially low. Inflation, the bond investor’s boogeyman, remains stubbornly above 2 percent, leaving little room for real (after inflation) returns. Whether our current commodity based inflation leaks into the broader economy and investor expectations is currently debatable. We remain wary, though, of the inflationary implications of the continued enormous deficit spending to support the economic recovery. The eventual impact of unwinding the Federal Reserve’s massive balance sheet from multiple rounds of quantitative easing might also cause unintended inflationary consequences. Therefore, we expect to continue to position the Fund defensively relative to interest rate exposure while we patiently seek out areas of opportunity. We will continue to invest one security at a time, relying on a fundamental research-based investment approach and are well positioned to take advantage of any market weakness.
NEBRASKA TAX-FREE INCOME FUND
PERFORMANCE • (UNAUDITED)
| | | Total | | | | | | | | | | | | | | | | | | | |
| | | Return | | Average Annual Total Returns | |
| | | 1 Year | | 3 Year | | 5 Year | | 10 Year | | 15 Year | | 20 Year | | 25 Year | |
| Nebraska Tax-Free Income Fund | | 6.1 | % | | 4.3 | % | | 3.9 | % | | 4.1 | % | | 4.4 | % | | 4.8 | % | | 5.0 | % | |
| Barclays Capital 5-Year Municipal Bond Index | | 6.9 | | | 5.3 | | | 5.7 | | | 4.9 | | | 5.1 | | | 5.3 | | | N/A | | |
Growth of $10,000
This chart depicts the change in the value of a $10,000 investment in the NE Tax-Free Fund for the period March 31, 2002 through March 31, 2012, as compared with the growth of the Barclays 5-Yr Index during the same period. Index performance is hypothetical and is shown for illustrative purposes only.
| | | NE | | Barclays | | Relative | |
| | | Tax-Free | | 5-Yr* | | Results | |
| Year | | (1) | | (2) | | (1)-(2) | |
| 1985 (10/1/85) | | 3.5 | % | | N/A | % | | N/A | % | |
| 1986 | | 11.2 | | | N/A | | | N/A | | |
| 1987 | | 4.0 | | | N/A | | | N/A | | |
| 1988 | | 6.3 | | | N/A | | | N/A | | |
| 1989 | | 6.9 | | | 9.1 | | | -2.2 | | |
| 1990 | | 6.3 | | | 7.7 | | | -1.4 | | |
| 1991 | | 8.4 | | | 11.4 | | | -3.0 | | |
| 1992 | | 7.4 | | | 7.6 | | | -0.2 | | |
| 1993 | | 7.9 | | | 8.7 | | | -0.8 | | |
| 1994 | | -1.4 | | | -1.3 | | | -0.1 | | |
| 1995 | | 10.5 | | | 11.6 | | | -1.1 | | |
| 1996 | | 5.5 | | | 4.2 | | | 1.3 | | |
| 1997 | | 7.3 | | | 6.4 | | | 0.9 | | |
| 1998 | | 6.1 | | | 5.8 | | | 0.3 | | |
| 1999 | | -1.2 | | | 0.7 | | | -1.9 | | |
| 2000 | | 9.9 | | | 7.7 | | | 2.2 | | |
| 2001 | | 3.9 | | | 6.2 | | | -2.3 | | |
| 2002 | | 8.0 | | | 9.3 | | | -1.3 | | |
| 2003 | | 4.3 | | | 4.1 | | | 0.2 | | |
| 2004 | | 3.4 | | | 2.7 | | | 0.7 | | |
| 2005 | | 2.2 | | | 0.9 | | | 1.3 | | |
| 2006 | | 3.3 | | | 3.3 | | | 0.0 | | |
| 2007 | | 3.6 | | | 5.2 | | | -1.6 | | |
| 2008 | | 1.2 | | | 5.8 | | | -4.6 | | |
| 2009 | | 7.2 | | | 7.4 | | | -0.2 | | |
| 2010 | | 2.3 | | | 3.4 | | | -1.1 | | |
| 2011 | | 5.9 | | | 6.9 | | | -1.0 | | |
| 2012 (3/31/12) | | 0.5 | | | 0.6 | | | -0.1 | | |
| Since Inception: | | | | | | | | | | |
| Cumulative | | | | | | | | | | |
| Return | | 302.8 | | | N/A | | | N/A | | |
| Avg. Annual | | | | | | | | | | |
| Return | | 5.4 | | | N/A | | | N/A | | |
* The inception date of the Barclays 5-Yr was 1/29/88.
These performance numbers reflect the deduction of the Fund’s annual operating expenses which as stated in its most recent Prospectus are 0.74% of the Fund’s net assets. The returns assume redemption at the end of each period and reinvestment of dividends. Total returns shown include fee waivers and expense reimbursements, if any; total returns would have been lower had there been no waiver of fees and/or reimbursement of expenses by the Adviser. This information represents past performance and past performance does not guarantee future results. The investment return and the principal value of an investment in this Fund will fluctuate so that an investor’s shares, when redeemed, may be worth more or less than the original cost. Current performance may be lower or higher than the performance data quoted. Performance data current to the most recent month-end may be obtained at www.weitzfunds.com/performance/monthly.asp.
See page 4 for additional performance disclosures. See page 82 for a description of all indices.
Performance information does not reflect the deduction of taxes that a shareholder would pay on Fund distributions or the redemption of Fund shares.
weitzfunds.com 45
NEBRASKA TAX-FREE INCOME FUND
PORTFOLIO PROFILE • (UNAUDITED)
| State Breakdown |
| Nebraska | | | 83.7 | % |
| Commonwealth of Puerto Rico | | | 2.7 | |
| Illinois | | | 2.4 | |
| Florida | | | 2.4 | |
| Wisconsin | | | 1.7 | |
| Ohio | | | 1.2 | |
| Virginia | | | 1.2 | |
| Arizona | | | 1.1 | |
| Hawaii | | | 1.1 | |
| North Dakota | | | 0.9 | |
| Iowa | | | 0.7 | |
| Minnesota | | | 0.0 | |
| Short-Term Securities/Other | | | 0.9 | |
| Net Assets | | | 100.0 | % |
| | | | | |
| Financial Attributes |
| Average Maturity | | | 3.6 years | |
| Average Duration | | | 2.9 years | |
| Average Coupon | | | 4.0 | % |
| 30-Day SEC Yield at 3-31-12 | | | 1.5 | % |
| Municipals exempt from federal and | | | | |
| Nebraska income taxes | | | Approx. 86 | % |
| Municipals subject to alternative | | | | |
| minimum tax | | | Approx. 4 | % |
| | | | | |
| Sector Breakdown |
| Power | | | 24.0 | % |
| Higher Education | | | 20.1 | |
| Hospital | | | 9.4 | |
| Water/Sewer | | | 9.3 | |
| General | | | 6.6 | |
| Lease | | | 4.6 | |
| Airport/Transportation | | | 3.5 | |
| Housing | | | 1.2 | |
| Highway | | | 1.1 | |
| Total Revenue | | | 79.8 | |
| School District | | | 5.7 | |
| City/Subdivision | | | 5.4 | |
| County | | | 2.8 | |
| State/Commonwealth | | | 1.5 | |
| Total General Obligation | | | 15.4 | |
| Escrow/Pre-Refunded | | | 3.9 | |
| Short-Term Securities/Other | | | 0.9 | |
| Net Assets | | | 100.0 | % |
NEBRASKA TAX-FREE INCOME FUND
SCHEDULE OF INVESTMENTS • MARCH 31, 2012
| | | Principal | | | | |
| MUNICIPAL BONDS — 99.1% | | amount | | Value | |
| Arizona — 1.1% | | | | | | | |
| Mesa, Highway Project Advancement Notes, Revenue, Series 2009 | | | | | | | |
| 3.5%, 7/01/15 | | $ | 1,000,000 | | $ | 1,034,350 | |
| Florida — 2.4% | | | | | | | |
| Greater Orlando, Aviation Authority, Revenue, Series 2009A, AMT | | | | | | | |
| 6.0%, 10/01/16 | | | 1,000,000 | | | 1,170,720 | |
| Miami, Dade County, Aviation Revenue, Series 2010A | | | | | | | |
| 4.25%, 10/01/18 | | | 1,000,000 | | | 1,092,810 | |
| | | | | | | 2,263,530 | |
| Hawaii — 1.1% | | | | | | | |
| State of Hawaii, Airports System Revenue, Refunding, Series 2010B, AMT | | | | | | | |
| 3.0%, 7/01/12 | | | 1,000,000 | | | 1,006,930 | |
| Illinois — 2.4% | | | | | | | |
| Elgin, General Obligation, Refunding, Series 2003 | | | | | | | |
| 5.125%, 12/15/14 | | | 1,020,000 | | | 1,073,642 | |
| Illinois Finance Authority, Revenue, Series 2009A, | | | | | | | |
| Northwestern Memorial Hospital | | | | | | | |
| 5.0%, 8/15/17 | | | 245,000 | | | 286,344 | |
| Illinois Health Facility Authority, Revenue, Series A, Evangelical | | | | | | | |
| Hospital Corp., Escrowed to Maturity | | | | | | | |
| 6.75%, 4/15/12 | | | 40,000 | | | 40,108 | |
| Springfield, Water Revenue, Series 2004 | | | | | | | |
| 5.25%, 3/01/19 | | | 800,000 | | | 867,992 | |
| | | | | | | 2,268,086 | |
| Iowa — 0.7% | | | | | | | |
| Cedar Rapids Community School District, Infrastructure Sales, | | | | | | | |
| Services and Use Tax Revenue, Series 2011 | | | | | | | |
| 4.0%, 7/01/20 | | | 600,000 | | | 655,620 | |
| Minnesota — 0.0% | | | | | | | |
| Minnesota State Housing Financial Agency, Single Family | | | | | | | |
| Mortgage, Series D | | | | | | | |
| 6.0%, 1/01/16 | | | 10,000 | | | 10,030 | |
| Nebraska — 83.7% | | | | | | | |
| Adams County, Hospital Authority #1, Revenue, Mary Lanning | | | | | | | |
| Memorial Hospital Project, Radian Insured | | | | | | | |
| 4.25%, 12/15/16 | | | 250,000 | | | 270,735 | |
| 4.4%, 12/15/17 | | | 250,000 | | | 274,752 | |
| 5.3%, 12/15/18 | | | 700,000 | | | 701,113 | |
| Bellevue, Development Revenue, Bellevue University Project | | | | | | | |
| Series 2010A, 2.75%, 12/01/15 | | | 1,000,000 | | | 1,040,070 | |
| Blair, Water System Revenue, Bond Anticipation Notes, AMT | | | | | | | |
| Series B, 4.65%, 6/15/12 | | | 500,000 | | | 501,420 | |
| Cornhusker Public Power District, Electric Revenue, | | | | | | | |
| Refunding, Series 2010 | | | | | | | |
| 0.75%, 7/01/12 | | | 660,000 | | | 660,482 | |
| 2.4%, 7/01/17 | | | 400,000 | | | 413,308 | |
| Dawson County, Lexington Public School District #001, | | | | | | | |
| General Obligation, Refunding | | | | | | | |
| 1.75%, 12/15/12 | | | 355,000 | | | 357,382 | |
| 2.15%, 12/15/13 | | | 490,000 | | | 500,452 | |
| Dawson Public Power District, Electric Revenue, Series 2010B | | | | | | | |
| 2.25%, 12/15/17 | | | 125,000 | | | 128,660 | |
| 2.75%, 12/15/19 | | | 100,000 | | | 103,188 | |
| | | | | | | | |
| | | Principal | | | | |
| | | amount | | Value | |
| Douglas County, Educational Facility Revenue, | | | | | | | |
| Creighton University Project, | | | | | | | |
| Refunding, Series 2010A | | | | | | | |
| 5.0%, 7/01/16 | | $ | 430,000 | | $ | 480,839 | |
| 5.6%, 7/01/25 | | | 400,000 | | | 457,884 | |
| Series 2005A, FGIC Insured, 3.5%, 9/01/12 | | | 255,000 | | | 258,057 | |
| Douglas County, Hospital Authority #1, Revenue, Refunding, | | | | | | | |
| Alegent Health - Immanuel, AMBAC Insured | | | | | | | |
| 5.125%, 9/01/17 | | | 250,000 | | | 250,040 | |
| Quality Living Inc. Project | | | | | | | |
| 4.7%, 10/01/17 | | | 255,000 | | | 242,474 | |
| Douglas County, Hospital Authority #2, Revenue, | | | | | | | |
| Boys Town Project, Series 2008 | | | | | | | |
| 4.75%, 9/01/28 | | | 500,000 | | | 533,865 | |
| Nebraska Medical Center Project, Series 2003 | | | | | | | |
| 5.0%, 11/15/14 | | | 380,000 | | | 417,407 | |
| 5.0%, 11/15/15 | | | 295,000 | | | 331,604 | |
| Refunding, Children's Hospital Obligated Group, Series 2008B | | | | | | | |
| 4.5%, 8/15/15 | | | 230,000 | | | 248,694 | |
| 5.25%, 8/15/20 | | | 1,000,000 | | | 1,102,170 | |
| 5.5%, 8/15/21 | | | 1,430,000 | | | 1,576,260 | |
| Douglas County, Hospital Authority #3, Revenue, Refunding, | | | | | | | |
| Nebraska Methodist Health System | | | | | | | |
| 5.5%, 11/01/18 | | | 485,000 | | | 525,211 | |
| Douglas County, Elkhorn Public School District #10, Series 2010B | | | | | | | |
| 3.0%, 6/15/16 | | | 525,000 | | | 552,783 | |
| Douglas County, Millard Public School District #17, Refunding | | | | | | | |
| FSA Insured, 4.0%, 11/15/13 | | | 500,000 | | | 511,600 | |
| 4.0%, 6/15/17 | | | 750,000 | | | 798,548 | |
| Douglas County, Zoo Facility Revenue, Refunding, | | | | | | | |
| Omaha's Henry Doorly Zoo Project | | | | | | | |
| 4.2%, 9/01/16 | | | 600,000 | | | 636,924 | |
| 4.75%, 9/01/17 | | | 200,000 | | | 216,166 | |
| Grand Island, Electric Revenue, | | | | | | | |
| MBIA Insured, Series 2001 | | | | | | | |
| 5.0%, 8/15/14 | | | 500,000 | | | 501,205 | |
| 5.125%, 8/15/16 | | | 500,000 | | | 501,235 | |
| Refunding, Series 2012 | | | | | | | |
| 0.4%, 8/15/13 | | | 750,000 | | | 750,030 | |
| 1.25%, 8/15/16 | | | 1,000,000 | | | 1,001,700 | |
| Grand Island, Sanitary Sewer Revenue, Refunding, FSA Insured | | | | | | | |
| 3.3%, 4/01/13 | | | 870,000 | | | 872,227 | |
| 3.45%, 4/01/14 | | | 650,000 | | | 651,658 | |
| Hastings, Electric System Revenue, Refunding, Series 2011 | | | | | | | |
| 3.0%, 1/01/16 | | | 750,000 | | | 792,022 | |
| 3.25%, 1/01/17 | | | 500,000 | | | 534,290 | |
| La Vista, General Obligation, Refunding, Series 2009 | | | | | | | |
| 2.5%, 11/15/15 | | | 415,000 | | | 428,454 | |
| 3.0%, 11/15/17 | | | 640,000 | | | 659,168 | |
| Lancaster County, Hospital Authority #1, Revenue, Refunding, | | | | | | | |
| Bryan LGH Medical Center, | | | | | | | |
| Series 2006, 4.0%, 6/01/19 | | | 300,000 | | | 313,056 | |
| Series 2008A, 5.0%, 6/01/16 | | | 500,000 | | | 553,430 | |
| Series 2008A, 5.0%, 6/01/17 | | | 500,000 | | | 561,460 | |
| Lincoln, Certificates of Participation | | | | | | | |
| Series 2010A, 2.4%, 3/15/17 | | | 395,000 | | | 410,354 | |
| The accompanying notes form an integral part of these financial statements. | weitzfunds.com 47 |
NEBRASKA TAX-FREE INCOME FUND
SCHEDULE OF INVESTMENTS • (CONTINUED)
| | | Principal | | | | |
| | | amount | | Value | |
| Lincoln, Educational Facilities, Revenue, Refunding, | | | | | | | |
| Nebraska Wesleyan University Project, Series 2012 | | | | | | | |
| 2.25%, 4/01/19 | | $ | 645,000 | | $ | 648,464 | |
| 2.5%, 4/01/21 | | | 925,000 | | | 904,567 | |
| Lincoln, Electric System Revenue, Refunding | | | | | | | |
| 5.0%, 9/01/18 | | | 1,000,000 | | | 1,151,060 | |
| Lincoln, General Obligation, Highway Allocation Fund | | | | | | | |
| 4.0%, 5/15/23 | | | 1,000,000 | | | 1,074,660 | |
| Lincoln, Parking Revenue, Refunding, Series 2011 | | | | | | | |
| 3.25%, 8/15/18 | | | 440,000 | | | 481,395 | |
| Lincoln, Sanitary Sewer Revenue, Refunding, MBIA Insured | | | | | | | |
| 5.0%, 6/15/16 | | | 885,000 | | | 930,409 | |
| Lincoln, Water Revenue | | | | | | | |
| 5.0%, 8/15/22 | | | 800,000 | | | 812,032 | |
| Lincoln County, North Platte School District #001, | | | | | | | |
| General Obligation, Refunding | | | | | | | |
| 2.0%, 12/15/13 | | | 770,000 | | | 786,832 | |
| Municipal Energy Agency of Nebraska, Power Supply System Revenue, | | | | | | | |
| Refunding, | | | | | | | |
| 1993 Series A, AMBAC Insured, | | | | | | | |
| 5.0%, 4/01/13 | | | 380,000 | | | 380,049 | |
| 2009 Series A, BHAC Insured, | | | | | | | |
| 5.0%, 4/01/20 | | | 500,000 | | | 596,125 | |
| 2012 Series A, 5.0%, 4/01/18 | | | 100,000 | | | 117,663 | |
| Nebraska Educational Financial Authority, Revenue, Refunding | | | | | | | |
| Hastings College Project | | | | | | | |
| 5.05%, 12/01/23 | | | 500,000 | | | 506,310 | |
| Nebraska Wesleyan University Project, Series 2002, Radian Insured | | | | | | | |
| 5.0%, 4/01/16 | | | 100,000 | | | 100,013 | |
| 5.15%, 4/01/22 | | | 1,000,000 | | | 1,000,140 | |
| Nebraska Investment Finance Authority, Clean Water State | | | | | | | |
Revolving Fund, Series 2011† | | | | | | | |
| 0.6%, 6/15/12 | | | 1,505,000 | | | 1,505,000 | |
| Nebraska Investment Financial Authority, Revenue, Drinking Water | | | | | | | |
| State Revolving Fund, Series 2010A | | | | | | | |
| 4.0%, 7/01/25 | | | 750,000 | | | 790,837 | |
| Nebraska Investment Financial Authority, Health Facility Revenue, | | | | | | | |
| Hospital Revenue, Great Plains Regional Medical Center Project, | | | | | | | |
| Radian Insured | | | | | | | |
| 5.0%, 11/15/14 | | | 250,000 | | | 251,085 | |
| Nebraska Investment Financial Authority, Homeownership Revenue, | | | | | | | |
| 2011 Series A | | | | | | | |
| 2.4%, 9/01/17 | | | 500,000 | | | 511,075 | |
| Nebraska Investment Financial Authority, Single Family Housing | | | | | | | |
| Revenue, Series C, AMT | | | | | | | |
| 4.05%, 9/01/12 | | | 285,000 | | | 287,730 | |
| 4.125%, 3/01/13 | | | 305,000 | | | 310,533 | |
| Nebraska Public Power District, Revenue | | | | | | | |
| 2003 Series A, 5.0%, 1/01/20 | | | 230,000 | | | 243,236 | |
| 2005 Series A, 5.0%, 1/01/18 | | | 200,000 | | | 220,058 | |
| 2005 Series B-2, 5.0%, 1/01/16 | | | 1,000,000 | | | 1,109,190 | |
| 2007 Series B, 5.0%, 1/01/15 | | | 885,000 | | | 985,474 | |
| 2007 Series B, 5.0%, 1/01/21 | | | 1,000,000 | | | 1,133,900 | |
| 2008 Series B, 5.0%, 1/01/18 | | | 800,000 | | | 945,040 | |
| 2010 Series C, 4.25%, 1/01/17 | | | 500,000 | | | 566,280 | |
| 2011 Series A, 4.0%, 1/01/15 | | | 250,000 | | | 272,667 | |
| 2012 Series A, 4.0%, 1/01/21 | | | 500,000 | | | 562,385 | |
| 2012 Series A, 5.0%, 1/01/21 | | | 500,000 | | | 601,625 | |
| | | | | | | | |
| | | Principal | | | | |
| | | amount | | Value | |
| Nebraska State Colleges Facility Corp., Deferred Maintenance Revenue, | | | | | | | |
| MBIA Insured | | | | | | | |
| 4.25%, 7/15/15 | | $ | 405,000 | | $ | 445,516 | |
| 5.0%, 7/15/16 | | | 200,000 | | | 229,848 | |
| 4.0%, 7/15/17 | | | 200,000 | | | 219,114 | |
| Omaha Convention Hotel Corp., Revenue, Convention Center Hotel, | | | | | | | |
| First Tier, Refunding, Series 2007, AMBAC Insured | | | | | | | |
| 5.0%, 2/01/20 | | | 600,000 | | | 672,210 | |
| Omaha, General Obligation, Refunding | | | | | | | |
| 3.75%, 6/01/14 | | | 1,000,000 | | | 1,072,920 | |
| 5.25%, 10/15/19 | | | 250,000 | | | 308,733 | |
| Omaha, Public Facilities Corp., Lease Revenue, | | | | | | | |
| Omaha Baseball Stadium Project | | | | | | | |
| Series 2009, 5.0%, 6/01/23 | | | 770,000 | | | 888,341 | |
| Series 2010, 4.125%, 6/01/29 | | | 650,000 | | | 684,294 | |
| Rosenblatt Stadium Project, Series C | | | | | | | |
| 3.9%, 10/15/17 | | | 235,000 | | | 261,861 | |
| 3.95%, 10/15/18 | | | 240,000 | | | 264,432 | |
| Omaha Public Power District, Electric Revenue | | | | | | | |
| Series A, 4.25%, 2/01/18 | | | 1,650,000 | | | 1,721,165 | |
| Series A, 4.1%, 2/01/19 | | | 1,000,000 | | | 1,116,320 | |
| Series B, FGIC Insured, 4.75%, 2/01/36 | | | 1,000,000 | | | 1,040,090 | |
| Series C, 5.5%, 2/01/14 | | | 155,000 | | | 164,336 | |
| Omaha, Sanitary Sewer Revenue, MBIA Insured | | | | | | | |
| 4.0%, 11/15/12 | | | 520,000 | | | 532,064 | |
| 4.0%, 11/15/14 | | | 250,000 | | | 272,158 | |
| Omaha, Special Obligation, Revenue, Refunding, | | | | | | | |
| Riverfront Redevelopment Project, Series 2012, | | | | | | | |
| 2.0% , 2/01/13 | | | 250,000 | | | 253,288 | |
| Omaha, Special Tax, Revenue, | | | | | | | |
| Heritage Development Project, Series 2004, | | | | | | | |
| 5.0%, 10/15/17 | | | 1,090,000 | | | 1,200,101 | |
| Refunding, Downtown Northeast Redevelopment Project, | | | | | | | |
| Series 2012B, 2.0%, 11/01/12 | | | 240,000 | | | 242,297 | |
| Papillion-La Vista, Sarpy County School District #27, | | | | | | | |
| General Obligation, | | | | | | | |
| Refunding, Series 2009A | | | | | | | |
| 3.15%, 12/01/17 | | | 930,000 | | | 994,393 | |
| Series 2009, 5.0%, 12/01/28 | | | 500,000 | | | 547,980 | |
| Papillion, Water System Revenue, Bond Anticipation Notes | | | | | | | |
| Series 2010, 1.65%, 6/15/13 | | | 1,000,000 | | | 1,000,820 | |
| Plattsmouth, General Obligation, Promissory Notes, | | | | | | | |
| Series 2010, 0.9%, 9/15/12 | | | 445,000 | | | 445,111 | |
| Public Power Generation Agency, Revenue, Whelan Energy | | | | | | | |
| Center Unit 2, Series A | | | | | | | |
| AGC-ICC AMBAC Insured, 5.0%, 1/01/19 | | | 1,260,000 | | | 1,425,035 | |
| AMBAC Insured, 5.0%, 1/01/18 | | | 750,000 | | | 850,778 | |
| AMBAC Insured, 5.0%, 1/01/26 | | | 800,000 | | | 858,600 | |
| Sarpy County, Recovery Zone Facility Certificates of Participation, | | | | | | | |
| Series 2010 | | | | | | | |
| 2.35%, 12/15/18 | | | 155,000 | | | 161,530 | |
| 2.6%, 12/15/19 | | | 135,000 | | | 141,606 | |
| Southern Nebraska Public Power District, Electric System Revenue, | | | | | | | |
| AMBAC Insured | | | | | | | |
| 4.625%, 9/15/21 | | | 1,000,000 | | | 1,114,030 | |
| State of Nebraska, Certificates of Participation | | | | | | | |
| Series 2009B, 2.1%, 8/01/13 | | | 590,000 | | | 593,263 | |
| Series 2009C, 2.0%, 11/01/13 | | | 700,000 | | | 700,896 | |
| Series 2010B, 1.2%, 9/15/14 | | | 1,230,000 | | | 1,246,507 | |
| Series 2011A, 1.0%, 4/15/13 | | | 310,000 | | | 311,885 | |
| Series 2012A, 0.6%, 12/15/13 | | | 755,000 | | | 756,344 | |
| 48 Weitz Funds | The accompanying notes form an integral part of these financial statements. |
| | | Principal | | | | |
| | | amount | | Value | |
| University of Nebraska, Facilities Corp., | | | | | | | |
| Deferred Maintenance Revenue | | | | | | | |
| Series 2006, 5.0%, 7/15/18 | | $ | 830,000 | | $ | 957,505 | |
| Financing Agreement Revenue, UNMC Eye Institute, Series 2011 | | | | | | | |
| 2.0%, 3/01/15 | | | 525,000 | | | 546,814 | |
| Lease Rental Revenue | | | | | | | |
| NCTA Education Center/Student Housing Project, | | | | | | | |
| Series 2011, 3.75%, 6/15/19 | | | 285,000 | | | 318,157 | |
| UNMC OPPD Exchange Project, | | | | | | | |
| Series 2010, 2.75%, 2/15/16 | | | 1,185,000 | | | 1,271,244 | |
| University of Nebraska, University Revenue, | | | | | | | |
| Kearney Student Fees and Facilities, Series 2006 | | | | | | | |
| 4.75%, 7/01/25 | | | 330,000 | | | 364,785 | |
| Lincoln Memorial Stadium Project, Refunding, Series 2004A | | | | | | | |
| 5.0%, 11/01/19 | | | 2,160,000 | | | 2,327,184 | |
| Lincoln Parking Project, Refunding, Series 2005 | | | | | | | |
| 4.0%, 6/01/17 | | | 1,070,000 | | | 1,163,657 | |
| 4.5%, 6/01/20 | | | 500,000 | | | 539,040 | |
| Lincoln Student Fees and Facilities | | | | | | | |
| 4.6%, 7/01/17 | | | 570,000 | | | 585,515 | |
| 5.0%, 7/01/23 | | | 1,000,000 | | | 1,067,410 | |
| Omaha Health & Recreation Project | | | | | | | |
| 4.05%, 5/15/19 | | | 390,000 | | | 442,654 | |
| 5.0%, 5/15/33 | | | 700,000 | | | 763,455 | |
| Omaha Student Facilities Project | | | | | | | |
| 4.5%, 5/15/16 | | | 565,000 | | | 648,366 | |
| 5.0%, 5/15/27 | | | 800,000 | | | 904,696 | |
| Wheat Belt Public Power District, Electric System Revenue, | | | | | | | |
| Series 2009B | | | | | | | |
| 3.2%, 9/01/16 | | | 330,000 | | | 341,959 | |
| 3.4%, 9/01/17 | | | 415,000 | | | 429,612 | |
| York County, Hospital Authority #1, Revenue, Refunding, | | | | | | | |
| Hearthstone Project | | | | | | | |
| 2.2%, 6/01/12 | | | 200,000 | | | 200,408 | |
| 2.7%, 6/01/13 | | | 150,000 | | | 152,172 | |
| York County, York Public School District #12, Refunding, Series 2010 | | | | | | | |
| 0.75%, 12/15/12 | | | 220,000 | | | 220,154 | |
| | | | | | | 78,390,864 | |
| | | | | | | | |
| | | Principal | | | | |
| | | amount | | | | |
| | | or shares | | Value | |
| North Dakota — 0.9% | | | | | | | |
| Grand Forks, Sales Tax Revenue, Refunding, Series 2005A | | | | | | | |
| 5.0%, 12/15/21 | | $ | 795,000 | | $ | 889,001 | |
| Ohio — 1.2% | | | | | | | |
| Akron, General Obligation, Series 2003 | | | | | | | |
| 5.0%, 12/01/17 | | | 1,030,000 | | | 1,109,774 | |
| Puerto Rico — 2.7% | | | | | | | |
| Commonwealth, General Obligation, Refunding, | | | | | | | |
| Series A, Assured Guaranty Insured | | | | | | | |
| 5.0%, 7/01/15 | | | 845,000 | | | 920,408 | |
| Electric Power Authority Revenue, Series RR, FSA Insured | | | | | | | |
| 5.0%, 7/01/20 | | | 1,000,000 | | | 1,072,740 | |
| Municipal Finance Agency, General Obligation, 2002 Series A, | | | | | | | |
| FSA Insured, 5.25%, 8/01/16 | | | 500,000 | | | 504,615 | |
| | | | | | | 2,497,763 | |
| Virginia — 1.2% | | | | | | | |
| Chesterfield County, General Obligation, Refunding, Series 2005B | | | | | | | |
| 5.0%, 1/01/17 | | | 975,000 | | | 1,093,940 | |
| Wisconsin — 1.7% | | | | | | | |
| Milwaukee County, General Obligation, Refunding, Series 2005A | | | | | | | |
| 5.0%, 12/01/20 | | | 1,405,000 | | | 1,555,995 | |
| | | | | | | | |
| Total Municipal Bonds | | | | | | | |
| (Cost $88,705,527) | | | | | | 92,775,883 | |
| | | | | | | | |
| SHORT-TERM SECURITIES — 1.8% | | | | | | | |
| Wells Fargo National Advantage Tax-Free Money Market Fund - | | | | | | | |
Institutional Class 0.01%(a) | | | | | | | |
| (Cost $1,700,118) | | | 1,700,118 | | | 1,700,118 | |
| | | | | | | | |
| Total Investments in Securities | | | | | | | |
| (Cost $90,405,645) | | | | | | 94,476,001 | |
| Other Liabilities in Excess of Other Assets — (0.9%) | | | | | | (887,073 | ) |
| Net Assets — 100.0% | | | | | $ | 93,588,928 | |
| Net Asset Value Per Share | | | | | $ | 10.44 | |
| † | Illiquid and/or restricted security that has been fair valued. |
| (a) | Rate presented represents the annualized 7-day yield at March 31, 2012. |
| The accompanying notes form an integral part of these financial statements. | weitzfunds.com 49 |
GOVERNMENT MONEY MARKET FUND
PORTFOLIO MANAGER’S DISCUSSION & ANALYSIS
Portfolio Manager: Thomas D. Carney, CFA
The Government Money Market Fund ended the first calendar quarter with a 7-day effective and current yield of 0.05%. (An investment in the Fund is neither insured nor guaranteed by the U.S. Government. There can be no assurance that the Fund will be able to maintain a stable net asset value. Although the Fund seeks to preserve the value of your investment at $1.00 per share, it is possible to lose money by investing in the Fund.)
Investors and savers in money market funds or savings accounts received no reprieve in the first quarter from record low short-term interest rates that have persisted for over two years. Once again, returns to savers in investment vehicles like money market funds, bank savings accounts and short-term CDs remained frustratingly close to zero. Our Fund’s 7-day effective yield increased in the first quarter to 0.05% from 0.01% at December 31.
Despite continued evidence of economic stabilization (e.g. job gains in each of the last twelve months totaling more than 2 million, with the last six months being the best job growth since 2006), the Federal Open Market Committee (FOMC) of the Federal Reserve continues to keep the Fed Funds rate (the overnight lending rate between banks, which is controlled by the Federal Reserve) at “exceptionally low levels” as a means to further economic recovery. The Fed has maintained this target range for the Fed Funds rate at zero to 0.25% since December 2008 and intends to hold interest rates near zero through late 2014.
In the minutes released by the Federal Reserve subsequent to their periodic meetings to discuss interest rate policy (twice in the first quarter), Fed officials agreed that the U.S. economic recovery has strengthened moderately. Minutes also showed little interest for launching any additional measures, such as Quantitative Easing, to bolster the economy. One area of debate among committee members is whether there are still a lot of unused resources, or “slack,” in the economy to keep inflation from accelerating further. While acknowledging that recent increases in oil and gas prices would push up inflation temporarily, the Fed believes long-term inflation expectations remain stable. Time will tell if these expectations are accurate. Rising inflation data, particularly “core” inflation (exclusive of food and energy), could prompt the Fed to begin raising short-term interest rates to prevent inflation from becoming a hindrance to economic expansion.
The Fed Funds rate affects all investments within the opportunity set of our Fund. We invest in ultra-high quality, short-term investments (e.g. U.S. Treasury bills and government agency discount notes) that have a weighted average maturity of less than 60 days. As a result, our yield has invariably followed the path dictated by the Federal Reserve’s monetary policy as we frequently reinvest maturing bills and notes in these short-term instruments. As of March 31, 2012, 97% of our portfolio was invested in U.S. Treasury bills, the balance in high quality Wells Fargo government money market funds. The average life of our portfolio at March 31, 2012, was approximately 37 days.
When the Fed changes from its current course and begins to raise short-term rates, our Fund will quickly benefit as we frequently reinvest maturing securities. In the meantime, we will continue to seek opportunities to add incremental return to our Fund’s yield while maintaining our focus on high credit quality.
Despite today’s low-yield environment, our Fund remains a sensible option for those investors whose primary objective is the maintenance of liquidity and the preservation of capital.
| | | | | |
| Sector Breakdown | |
| | | | | |
| U.S Treasury | | | 96.9 | % |
| Government Money Market Fund | | | 2.9 | |
| Treasury Money Market Fund | | | 0.1 | |
| Other Assets Less Other Liabilities | | | 0.1 | |
| | | | 100.0 | % |
GOVERNMENT MONEY MARKET FUND
SCHEDULE OF INVESTMENTS • MARCH 31, 2012
| | | | | | | | |
| | | Principal | | | | |
U.S. TREASURY — 96.9%† | | amount | | Value | |
| U.S. Treasury Bill | | | | | | | |
| 0.02% 4/19/12 | | $ | 15,000,000 | | $ | 14,999,888 | |
| 0.05% 4/26/12 | | | 30,000,000 | | | 29,999,042 | |
| 0.02% 5/17/12 | | | 5,000,000 | | | 4,999,872 | |
| 0.09% 5/31/12 | | | 25,000,000 | | | 24,996,458 | |
| Total U.S. Treasury | | | | | | 74,995,260 | |
| | | | | | | | |
| SHORT-TERM | | | | | | | |
| SECURITIES — 3.0% | | Shares | | Value | |
| Wells Fargo Advantage Government Money Market Fund - | | | | | | | |
Institutional Class 0.01%(a) | | | 2,244,071 | | $ | 2,244,071 | |
| Wells Fargo Advantage 100% Treasury Money Market Fund - | | | | | | | |
Service Class 0.00%(a) | | | 52,556 | | | 52,556 | |
| | | | | | | | |
| Total Short-Term Securities | | | | | | 2,296,627 | |
| Total Investments in Securities | | | | | | | |
| (Cost $77,291,887) | | | | | | 77,291,887 | |
| Other Assets Less Other Liabilities — 0.1% | | | | | | 74,673 | |
| Net Assets — 100.0% | | | | | $ | 77,366,560 | |
| Net Asset Value Per Share | | | | | $ | 1.00 | |
| † | Interest rates presented represent the yield to maturity at the date of purchase. |
| (a) | Rate presented represents the annualized 7-day yield at March 31, 2012. |
| The accompanying notes form an integral part of these financial statements. | weitzfunds.com 51 |
STATEMENTS OF ASSETS AND LIABILITIES
MARCH 31, 2012
(In U.S. dollars except share data) | | | Value | | | Partners Value | | | Partners III | | | Research | | | Hickory | | | Balanced | | | Short -Intermediate Income | | | Nebraska Tax-Free Income | | | Government Money Market | |
| Assets: | | | | | | | | | | | | | | | | | | | | | | | | | | | | |
| Investments in securities at value: | | | | | | | | | | | | | | | | | | | | | | | | | | | | |
Unaffiliated issuers(a) | | | 1,016,565,626 | | | 711,285,316 | | | 634,900,868 | | | 16,282,444 | | | 332,608,730 | | | 88,692,176 | | | 1,443,671,501 | | | 94,476,001 | | | 77,291,887 | |
Controlled affiliates(a) | | | — | | | — | | | 3,291,500 | | | — | | | — | | | — | | | — | | | — | | | — | |
| | | | 1,016,565,626 | | | 711,285,316 | | | 638,192,368 | | | 16,282,444 | | | 332,608,730 | | | 88,692,176 | | | 1,443,671,501 | | | 94,476,001 | | | 77,291,887 | |
| Accrued interest and | | | | | | | | | | | | | | | | | | | | | | | | | | | | |
| dividends receivable | | | 649,121 | | | 165,070 | | | 137,638 | | | 4,742 | | | 87,064 | | | 187,995 | | | 10,728,816 | | | 941,693 | | | 28 | |
| Due from broker | | | — | | | — | | | 70,378,726 | | | — | | | — | | | — | | | — | | | — | | | — | |
| Receivable for securities sold | | | 2,564,242 | | | — | | | — | | | 23,847 | | | — | | | — | | | 5,633,613 | | | — | | | — | |
| Receivable for fund shares sold | | | 114,764 | | | 82,737 | | | 110,295 | | | — | | | 86,211 | | | 5,200 | | | 3,032,949 | | | — | | | 75,000 | |
| Total assets | | | 1,019,893,753 | | | 711,533,123 | | | 708,819,027 | | | 16,311,033 | | | 332,782,005 | | | 88,885,371 | | | 1,463,066,879 | | | 95,417,694 | | | 77,366,915 | |
| Liabilities: | | | | | | | | | | | | | | | | | | | | | | | | | | | | |
| Dividends payable on securities | | | | | | | | | | | | | | | | | | | | | | | | | | | | |
| sold short | | | — | | | — | | | 92,084 | | | — | | | — | | | — | | | — | | | — | | | — | |
| Due to adviser | | | 1,146,050 | | | 776,116 | | | 665,265 | | | 12,314 | | | 392,504 | | | 96,156 | | | 876,006 | | | 68,756 | | | — | |
Options written, at value(b) | | | — | | | 96,000 | | | 3,960,390 | | | — | | | 208,750 | | | — | | | — | | | — | | | — | |
| Payable for securities purchased | | | 5,764,255 | | | 2,545,500 | | | 13,869,208 | | | — | | | 1,717,198 | | | 254,550 | | | 5,618,142 | | | 1,757,610 | | | — | |
| Payable for fund shares redeemed | | | 1,312,024 | | | 941,190 | | | 716,256 | | | — | | | 206,616 | | | 3,540 | | | 974,667 | | | 2,400 | | | — | |
Securities sold short(c) | | | — | | | — | | | 68,592,500 | | | — | | | — | | | — | | | — | | | — | | | — | |
| Other | | | — | | | — | | | 2,806 | | | — | | | — | | | — | | | 2,454 | | | — | | | 355 | |
| Total liabilities | | | 8,222,329 | | | 4,358,806 | | | 87,898,509 | | | 12,314 | | | 2,525,068 | | | 354,246 | | | 7,471,269 | | | 1,828,766 | | | 355 | |
| Net assets | | | 1,011,671,424 | | | 707,174,317 | | | 620,920,518 | | | 16,298,719 | | | 330,256,937 | | | 88,531,125 | | | 1,455,595,610 | | | 93,588,928 | | | 77,366,560 | |
| Composition of net assets: | | | | | | | | | | | | | | | | | | | | | | | | | | | | |
| Paid-in capital | | | 974,761,592 | | | 714,630,327 | | | 497,381,873 | | | 13,793,064 | | | 327,898,064 | | | 81,283,182 | | | 1,421,547,475 | | | 89,487,510 | | | 77,366,419 | |
| Accumulated undistributed net | | | | | | | | | | | | | | | | | | | | | | | | | | | | |
| investment income (loss) | | | 977,263 | | | (426,224 | ) | | (612,251 | ) | | 1,514 | | | (281,577 | ) | | 74,195 | | | 87,101 | | | 30,607 | | | — | |
| Accumulated net realized gain (loss) | | | (161,856,119 | ) | | (129,683,564 | ) | | 6,038,226 | | | 441,781 | | | (55,378,640 | ) | | (3,901,195 | ) | | 281,347 | | | 455 | | | 141 | |
| Net unrealized appreciation | | | | | | | | | | | | | | | | | | | | | | | | | | | | |
| (depreciation) of investments | | | 197,788,688 | | | 122,653,778 | | | 118,112,670 | | | 2,062,360 | | | 58,019,090 | | | 11,074,943 | | | 33,679,687 | | | 4,070,356 | | | — | |
| Net assets | | | 1,011,671,424 | | | 707,174,317 | | | 620,920,518 | | | 16,298,719 | | | 330,256,937 | | | 88,531,125 | | | 1,455,595,610 | | | 93,588,928 | | | 77,366,560 | |
| Net assets - Institutional Class | | | | | | | | | 609,423,990 | | | | | | | | | | | | 1,402,505,145 | | | | | | | |
Shares outstanding(d)(e) | | | 30,677,264 | | | 30,420,788 | | | 47,138,001 | | | 1,472,432 | | | 7,765,466 | | | 7,144,981 | | | 112,339,461 | | | 8,966,180 | | | 77,366,419 | |
| Net asset value, offering and | | | | | | | | | | | | | | | | | | | | | | | | | | | | |
redemption price(d) | | | 32.98 | | | 23.25 | | | 12.93 | | | 11.07 | | | 42.53 | | | 12.39 | | | 12.48 | | | 10.44 | | | 1.00 | |
| Net assets - Investor Class | | | | | | | | | 11,496,528 | | | | | | | | | | | | 53,090,465 | | | | | | | |
Shares outstanding - Investor Class(e) | | | | | | | | | 891,181 | | | | | | | | | | | | 4,259,017 | | | | | | | |
| Net asset value, offering and | | | | | | | | | | | | | | | | | | | | | | | | | | | | |
| redemption price - Investor Class | | | | | | | | | 12.90 | | | | | | | | | | | | 12.47 | | | | | | | |
| | | | | | | | | | | | | | | | | | | | | | | | | | | | | |
(a) Cost of investments in securities: | | | | | | | | | | | | | | | | | | | | | | | | | | | | |
| Unaffiliated issuers | | | 818,776,938 | | | 588,637,411 | | | 512,820,620 | | | 14,220,084 | | | 274,595,166 | | | 77,617,233 | | | 1,409,991,814 | | | 90,405,645 | | | 77,291,887 | |
| Controlled affiliates | | | — | | | — | | | 2,899,379 | | | — | | | — | | | — | | | — | | | — | | | — | |
| | | | 818,776,938 | | | 588,637,411 | | | 515,719,999 | | | 14,220,084 | | | 274,595,166 | | | 77,617,233 | | | 1,409,991,814 | | | 90,405,645 | | | 77,291,887 | |
(b) Premiums from options written | | | — | | | 101,873 | | | 3,141,375 | | | — | | | 214,276 | | | — | | | — | | | — | | | — | |
(c) Proceeds from short sales | | | — | | | — | | | 65,051,816 | | | — | | | — | | | — | | | — | | | — | | | — | |
| (d) | Designated as Institutional Class for Partners III and Short-Intermediate Income Funds |
| (e) | Indefinite number of no par value shares authorized |
| 52 Weitz Funds | The accompanying notes form an integral part of these financial statements. |
STATEMENTS OF OPERATIONS
YEAR ENDED MARCH 31, 2012
| (In U.S. dollars) | | | Value | | | Partners Value | | | Partners III | | | Research | | | Hickory | | | Balanced | | | Short - Intermediate Income | | | Nebraska Tax-Free Income | | | Government Money Market | |
| Investment income: | | | | | | | | | | | | | | | | | | | | | | | | | | | | |
| Dividends: | | | | | | | | | | | | | | | | | | | | | | | | | | | | |
Unaffiliated issuers(a) | | | 12,137,143 | | | 5,930,236 | | | 4,516,784 | | | 137,310 | | | 1,916,590 | | | 806,746 | | | 739,468 | | | — | | | — | |
| Interest | | | 43,716 | | | 38,162 | | | 5,869 | | | 306 | | | 21,513 | | | 559,897 | | | 32,392,073 | | | 2,851,071 | | | 29,372 | |
| Total investment income | | | 12,180,859 | | | 5,968,398 | | | 4,522,653 | | | 137,616 | | | 1,938,103 | | | 1,366,643 | | | 33,131,541 | | | 2,851,071 | | | 29,372 | |
| Expenses: | | | | | | | | | | | | | | | | | | | | | | | | | | | | |
| Investment advisory fee | | | 9,335,681 | | | 6,738,298 | | | 5,210,212 | | | 131,430 | | | 3,103,081 | | | 665,400 | | | 5,406,375 | | | 362,622 | | | 343,028 | |
| Administrative fee | | | 1,129,292 | | | 913,672 | | | 672,907 | | | 33,143 | | | 456,258 | | | 153,110 | | | 2,153,248 | | | 166,617 | | | 153,635 | |
| Custodial fees | | | 17,948 | | | 14,978 | | | 14,450 | | | 4,866 | | | 10,622 | | | 6,563 | | | 22,611 | | | 2,692 | | | 3,435 | |
| Distribution fee - Investor Class | | | — | | | — | | | 18,421 | | | — | | | — | | | — | | | 35,333 | | | — | | | — | |
| Dividend expense on securities | | | | | | | | | | | | | | | | | | | | | | | | | | | | |
| sold short | | | — | | | — | | | 925,317 | | | — | | | — | | | — | | | — | | | — | | | — | |
| Interest expense | | | — | | | — | | | 594,838 | | | — | | | — | | | — | | | — | | | — | | | — | |
| Professional fees | | | 78,739 | | | 63,058 | | | 56,038 | | | 20,053 | | | 39,363 | | | 24,580 | | | 110,911 | | | 24,934 | | | 24,176 | |
| Registration fees | | | 48,098 | | | 49,904 | | | 72,763 | | | 17,685 | | | 42,251 | | | 22,158 | | | 84,737 | | | 5,246 | | | 25,813 | |
| Sub-transfer agent fees | | | 270,847 | | | 132,710 | | | 90,873 | | | 22,510 | | | 178,409 | | | 34,627 | | | 207,817 | | | 27,260 | | | 36,072 | |
| Trustees fees | | | 81,599 | | | 59,531 | | | 44,452 | | | 1,107 | | | 27,324 | | | 7,308 | | | 118,159 | | | 7,958 | | | 7,668 | |
| Other expenses | | | 233,859 | | | 144,909 | | | 77,558 | | | 9,362 | | | 79,126 | | | 32,074 | | | 189,903 | | | 49,806 | | | 26,527 | |
| | | | 11,196,063 | | | 8,117,060 | | | 7,777,829 | | | 240,156 | | | 3,936,434 | | | 945,820 | | | 8,329,094 | | | 647,135 | | | 620,354 | |
| Less expenses reimbursed | | | | | | | | | | | | | | | | | | | | | | | | | | | | |
| by investment adviser | | | — | | | — | | | (38,092 | ) | | (121,869 | ) | | — | | | — | | | (49,649 | ) | | — | | | (613,215 | ) |
| Net expenses | | | 11,196,063 | | | 8,117,060 | | | 7,739,737 | | | 118,287 | | | 3,936,434 | | | 945,820 | | | 8,279,445 | | | 647,135 | | | 7,139 | |
| Net investment income (loss) | | | 984,796 | | | (2,148,662 | ) | | (3,217,084 | ) | | 19,329 | | | (1,998,331 | ) | | 420,823 | | | 24,852,096 | | | 2,203,936 | | | 22,233 | |
| Realized and unrealized gain | | | | | | | | | | | | | | | | | | | | | | | | | | | | |
| (loss) on investments: | | | | | | | | | | | | | | | | | | | | | | | | | | | | |
| Net realized gain (loss): | | | | | | | | | | | | | | | | | | | | | | | | | | | | |
| Unaffiliated issuers | | | 28,181,792 | | | 14,082,777 | | | 10,676,810 | | | 941,406 | | | 11,454,215 | | | 4,194,668 | | | 5,237,115 | | | 467 | | | 141 | |
| Options written | | | 105,156 | | | 297,334 | | | 2,713,427 | | | — | | | 661,087 | | | 26,124 | | | 589,989 | | | — | | | — | |
| Securities sold short | | | — | | | — | | | (2,104,128 | ) | | — | | | — | | | — | | | — | | | — | | | — | |
| Net realized gain (loss) | | | 28,286,948 | | | 14,380,111 | | | 11,286,109 | | | 941,406 | | | 12,115,302 | | | 4,220,792 | | | 5,827,104 | | | 467 | | | 141 | |
| Net unrealized appreciation | | | | | | | | | | | | | | | | | | | | | | | | | | | | |
| (depreciation): | | | | | | | | | | | | | | | | | | | | | | | | | | | | |
| Unaffiliated issuers | | | 63,863,272 | | | 21,326,068 | | | 25,255,926 | | | 995,409 | | | (1,303,749 | ) | | 369,005 | | | 8,227,392 | | | 3,092,158 | | | — | |
| Controlled affiliates | | | — | | | — | | | (681,000 | ) | | — | | | — | | | — | | | — | | | — | | | — | |
| Options written | | | — | | | 5,873 | | | (965,232 | ) | | — | | | (140,691 | ) | | (2,874 | ) | | (142,488 | ) | | — | | | — | |
| Securities sold short | | | — | | | — | | | (905,084 | ) | | — | | | — | | | — | | | — | | | — | | | — | |
| Net unrealized appreciation | | | | | | | | | | | | | | | | | | | | | | | | | | | | |
| (depreciation) | | | 63,863,272 | | | 21,331,941 | | | 22,704,610 | | | 995,409 | | | (1,444,440 | ) | | 366,131 | | | 8,084,904 | | | 3,092,158 | | | — | |
| Net realized and unrealized | | | | | | | | | | | | | | | | | | | | | | | | | | | | |
| gain (loss) on investments | | | 92,150,220 | | | 35,712,052 | | | 33,990,719 | | | 1,936,815 | | | 10,670,862 | | | 4,586,923 | | | 13,912,008 | | | 3,092,625 | | | 141 | |
| Net increase (decrease) in | | | | | | | | | | | | | | | | | | | | | | | | | | | | |
| net assets resulting | | | | | | | | | | | | | | | | | | | | | | | | | | | | |
| from operations | | | 93,135,016 | | | 33,563,390 | | | 30,773,635 | | | 1,956,144 | | | 8,672,531 | | | 5,007,746 | | | 38,764,104 | | | 5,296,561 | | | 22,374 | |
| | | | | | | | | | | | | | | | | | | | | | | | | | | | | |
(a) Foreign taxes withheld | | | 20,297 | | | — | | | — | | | — | | | — | | | 3,625 | | | — | | | — | | | — | |
| The accompanying notes form an integral part of these financial statements. | weitzfunds.com 53 |
STATEMENTS OF CHANGES IN NET ASSETS
| (In U.S. dollars) | | Value | | Partners Value | | Partners III | | Research | |
| | | Year ended March 31, | | Year ended March 31, | | Year ended March 31, | | Year ended | | | Three months ended | |
| | | 2012 | | 2011 | | 2012 | | 2011 | | 2012 | | 2011 | | March 31, 2012 | | | March 31, 2011(a) | |
| Increase (decrease) in net assets: | | | | | | | | | | | | | | | | | | | | | | | | | |
| From operations: | | | | | | | | | | | | | | | | | | | | | | | | | |
| Net investment income (loss) | | | 984,796 | | | 2,151,515 | | | (2,148,662 | ) | | (1,689,494 | ) | | (3,217,084 | ) | | (2,075,236 | ) | | 19,329 | | | 313 | |
| Net realized gain (loss) | | | 28,286,948 | | | 105,486,353 | | | 14,380,111 | | | 66,236,373 | | | 11,286,109 | | | 49,010,322 | | | 941,406 | | | 175,075 | |
| Net unrealized appreciation | | | | | | | | | | | | | | | | | | | | | | | | | |
| (depreciation) | | | 63,863,272 | | | 22,534,343 | | | 21,331,941 | | | 60,658,173 | | | 22,704,610 | | | 29,213,172 | | | 995,409 | | | 217,099 | |
| Net increase (decrease) | | | | | | | | | | | | | | | | | | | | | | | | | |
| in net assets resulting | | | | | | | | | | | | | | | | | | | | | | | | | |
| from operations | | | 93,135,016 | | | 130,172,211 | | | 33,563,390 | | | 125,205,052 | | | 30,773,635 | | | 76,148,258 | | | 1,956,144 | | | 392,487 | |
| Distributions to shareholders from: | | | | | | | | | | | | | | | | | | | | | | | | | |
| Net investment income | | | (2,159,048 | ) | | — | | | — | | | — | | | — | | | — | | | (18,128 | ) | | — | |
| Net investment income - | | | | | | | | | | | | | | | | | | | | | | | | | |
| Institutional Class | | | — | | | — | | | — | | | — | | | — | | | — | | | — | | | — | |
| Net investment income - | | | | | | | | | | | | | | | | | | | | | | | | | |
| Investor Class | | | — | | | — | | | — | | | — | | | — | | | — | | | — | | | — | |
| Net realized gains | | | — | | | — | | | — | | | — | | | — | | | — | | | (654,243 | ) | | — | |
| Net realized gains - | | | | | | | | | | | | | | | | | | | | | | | | | |
| Institutional Class | | | — | | | — | | | — | | | — | | | (12,074,793 | ) | | — | | | — | | | — | |
| Net realized gains - Investor Class | | | — | | | — | | | — | | | — | | | — | | | — | | | — | | | — | |
| Total distributions | | | (2,159,048 | ) | | — | | | — | | | — | | | (12,074,793 | ) | | — | | | (672,371 | ) | | — | |
| Fund share transactions | | | (50,589,631 | ) | | (136,463,521 | ) | | (80,986,729 | ) | | 7,285,258 | | | — | | | — | | | 3,770,949 | | | 10,851,510 | |
| Fund share transactions - | | | | | | | | | | | | | | | | | | | | | | | | | |
| Institutional Class | | | — | | | — | | | — | | | — | | | 130,888,688 | | | 110,499,176 | | | — | | | — | |
| Fund share transactions - | | | | | | | | | | | | | | | | | | | | | | | | | |
| Investor Class | | | — | | | — | | | — | | | — | | | 9,892,753 | | | — | | | — | | | — | |
| Net increase (decrease) from | | | | | | | | | | | | | | | | | | | | | | | | | |
| fund share transactions | | | (50,589,631 | ) | | (136,463,521 | ) | | (80,986,729 | ) | | 7,285,258 | | | 140,781,441 | | | 110,499,176 | | | 3,770,949 | | | 10,851,510 | |
| Total increase (decrease) in | | | | | | | | | | | | | | | | | | | | | | | | | |
| net assets | | | 40,386,337 | | | (6,291,310 | ) | | (47,423,339 | ) | | 132,490,310 | | | 159,480,283 | | | 186,647,434 | | | 5,054,722 | | | 11,243,997 | |
| Net assets: | | | | | | | | | | | | | | | | | | | | | | | | | |
| Beginning of period | | | 971,285,087 | | | 977,576,397 | | | 754,597,656 | | | 622,107,346 | | | 461,440,235 | | | 274,792,801 | | | 11,243,997 | | | — | |
| End of period | | | 1,011,671,424 | | | 971,285,087 | | | 707,174,317 | | | 754,597,656 | | | 620,920,518 | | | 461,440,235 | | | 16,298,719 | | | 11,243,997 | |
| | | | | | | | | | | | | | | | | | | | | | | | | | |
| Undistributed net investment | | | | | | | | | | | | | | | | | | | | | | | | | |
| income (loss) | | | 977,263 | | | 2,151,515 | | | (426,224 | ) | | — | | | (612,251 | ) | | — | | | 1,514 | | | 313 | |
| (a) | Initial offering of shares on December 31, 2010 (See Note 1) |
| 54 Weitz Funds | The accompanying notes form an integral part of these financial statements. |
| | Hickory | | | Balanced | | | Short-Intermediate Income | | | Nebraska Tax-Free Income | | | Government Money Market | |
| | Year ended March 31, | | | Year ended March 31, | | | Year ended March 31, | | | Year ended March 31, | | | Year ended March 31, | |
| | 2012 | | | 2011 | | | 2012 | | | 2011 | | | 2012 | | | 2011 | | | 2012 | | | 2011 | | | 2012 | | | 2011 | |
| | | | | | | | | | | | | | | | | | | | | | | | | | | | | | |
| | (1,998,331) | | | (1,575,906 | ) | | 420,823 | | | 764,180 | | | 24,852,096 | | | 19,428,052 | | | 2,203,936 | | | 2,236,568 | | | 22,233 | | | 56,553 | |
| | 12,115,302 | | | 34,057,645 | | | 4,220,792 | | | 5,623,983 | | | 5,827,104 | | | 4,312,840 | | | 467 | | | 54,886 | | | 141 | | | 665 | |
| | | | | | | | | | | | | | | | | | | | | | | | | | | | | | |
| | (1,444,440) | | | 35,946,692 | | | 366,131 | | | 2,546,435 | | | 8,084,904 | | | 6,545,189 | | | 3,092,158 | | | (765,836 | ) | | — | | | — | |
| | | | | | | | | | | | | | | | | | | | | | | | | | | | | | |
| | 8,672,531 | | | 68,428,431 | | | 5,007,746 | | | 8,934,598 | | | 38,764,104 | | | 30,286,081 | | | 5,296,561 | | | 1,525,618 | | | 22,374 | | | 57,218 | |
| | | | | | | | | | | | | | | | | | | | | | | | | | | | | | |
| | — | | | — | | | (554,771 | ) | | (707,093 | ) | | — | | | — | | | (2,268,065 | ) | | (2,184,463 | ) | | (22,233 | ) | | (56,553 | ) |
| | | | | | | | | | | | | | | | | | | | | | | | | | | | | | |
| | — | | | — | | | — | | | — | | | (29,463,655 | ) | | (23,440,657 | ) | | — | | | — | | | — | | | — | |
| | | | | | | | | | | | | | | | | | | | | | | | | | | | | | |
| | — | | | — | | | — | | | — | | | (414,166 | ) | | — | | | — | | | — | | | — | | | — | |
| | — | | | — | | | — | | | — | | | — | | | — | | | (41,735 | ) | | — | | | (665 | ) | | (3,686 | ) |
| | | | | | | | | | | | | | | | | | | | | | | | | | | | | | |
| | — | | | — | | | — | | | — | | | — | | | — | | | — | | | — | | | — | | | — | |
| | — | | | — | | | — | | | — | | | — | | | — | | | — | | | — | | | — | | | — | |
| | — | | | — | | | (554,771 | ) | | (707,093 | ) | | (29,877,821 | ) | | (23,440,657 | ) | | (2,309,800 | ) | | (2,184,463 | ) | | (22,898 | ) | | (60,239 | ) |
| | (1,043,645) | | | 48,083,729 | | | (1,059,627 | ) | | (1,059,151 | ) | | — | | | — | | | 1,329,666 | | | 8,017,819 | | | (4,544,633 | ) | | (1,448,184 | ) |
| | | | | | | | | | | | | | | | | | | | | | | | | | | | | | |
| | — | | | — | | | — | | | — | | | 229,884,398 | | | 484,993,703 | | | — | | | — | | | — | | | — | |
| | | | | | | | | | | | | | | | | | | | | | | | | | | | | | |
| | — | | | — | | | — | | | — | | | 52,960,972 | | | — | | | — | | | — | | | — | | | — | |
| | | | | | | | | | | | | | | | | | | | | | | | | | | | | | |
| | (1,043,645) | | | 48,083,729 | | | (1,059,627 | ) | | (1,059,151 | ) | | 282,845,370 | | | 484,993,703 | | | 1,329,666 | | | 8,017,819 | | | (4,544,633 | ) | | (1,448,184 | ) |
| | | | | | | | | | | | | | | | | | | | | | | | | | | | | | |
| | 7,628,886 | | | 116,512,160 | | | 3,393,348 | | | 7,168,354 | | | 291,731,653 | | | 491,839,127 | | | 4,316,427 | | | 7,358,974 | | | (4,545,157 | ) | | (1,451,205 | ) |
| | | | | | | | | | | | | | | | | | | | | | | | | | | | | | |
| | 322,628,051 | | | 206,115,891 | | | 85,137,777 | | | 77,969,423 | | | 1,163,863,957 | | | 672,024,830 | | | 89,272,501 | | | 81,913,527 | | | 81,911,717 | | | 83,362,922 | |
| | 330,256,937 | | | 322,628,051 | | | 88,531,125 | | | 85,137,777 | | | 1,455,595,610 | | | 1,163,863,957 | | | 93,588,928 | | | 89,272,501 | | | 77,366,560 | | | 81,911,717 | |
| | | | | | | | | | | | | | | | | | | | | | | | | | | | | | |
| | (281,577) | | | — | | | 74,195 | | | 199,568 | | | 87,101 | | | 480,780 | | | 30,607 | | | 94,736 | | | — | | | — | |
| The accompanying notes form an integral part of these financial statements. | weitzfunds.com 55 |
STATEMENT OF CASH FLOWS
PARTNERS III OPPORTUNITY FUND
| Year Ended March 31, 2012 |
| Increase (decrease) in cash: | | | | |
| Cash flows from operating activities: | | | | |
| Net increase in net assets from operations | | $ | 30,773,635 | |
| Adjustments to reconcile net increase in net assets from operations | | | | |
| to net cash used in operating activities: | | | | |
| Purchases of investment securities | | | (322,803,274 | ) |
| Proceeds from sale of investment securities | | | 182,264,785 | |
| Proceeds from securities sold short | | | 35,386,216 | |
| Short positions covered | | | (34,757,529 | ) |
| Sale of short-term investment securities, net | | | 18,792,713 | |
| Decrease in accrued interest and dividends receivable | | | 158,538 | |
| Decrease in receivable for securities sold | | | 682,322 | |
| Decrease in receivable for fund shares sold | | | 937,433 | |
| Increase in other liabilities | | | 1,262 | |
| Decrease in payable for securities purchased | | | (4,988,268 | ) |
| Increase in payable for fund shares redeemed | | | 575,384 | |
| Increase in dividends payable on securities sold short | | | 92,084 | |
| Increase in due to adviser | | | 206,410 | |
| Net unrealized appreciation on investments, options and short sales | | | (22,704,610 | ) |
| Net realized gain on investments, options and short sales | | | (11,286,109 | ) |
| Net cash used in operating activities | | | (126,669,008 | ) |
| Cash flows from financing activities: | | | | |
| Proceeds from sales of fund shares | | | 238,081,602 | |
| Payments for redemptions of fund shares | | | (108,965,763 | ) |
| Cash distributions to shareholders | | | (409,191 | ) |
| Increase in due from broker | | | (2,037,640 | ) |
| Net cash provided by financing activities | | | 126,669,008 | |
| Net increase (decrease) in cash | | | — | |
| Cash: | | | | |
| Balance, beginning of period | | | — | |
| Balance, end of period | | $ | — | |
| Supplemental disclosure of cash flow information: | | | | |
| Cash payments for interest | | $ | 593,576 | |
| Noncash financing activities: | | | | |
| Reinvestment of shareholder distributions | | $ | 11,665,602 | |
| | | | | |
| 56 Weitz Funds | The accompanying notes form an integral part of these financial statements. |
FINANCIAL HIGHLIGHTS
The following financial information provides selected data for a share outstanding throughout the periods indicated.
| | | Year ended March 31, | |
| Value Fund | | | 2012 | | | 2011 | | | 2010 | | | 2009 | | | 2008 | |
| | | | | | | | | | | | | | | | | |
| Net asset value, beginning of period | | $ | 30.07 | | $ | 26.14 | | $ | 16.90 | | $ | 27.74 | | $ | 40.09 | |
| Income (loss) from investment operations: | | | | | | | | | | | | | | | | |
| Net investment income (loss) | | | 0.04 | | | 0.07 | | | (0.07 | ) | | 0.07 | | | 0.28 | |
| Net gain (loss) on securities (realized and unrealized) | | | 2.94 | | | 3.86 | | | 9.37 | | | (10.72 | ) | | (7.94 | ) |
| Total from investment operations | | | 2.98 | | | 3.93 | | | 9.30 | | | (10.65 | ) | | (7.66 | ) |
| Less distributions: | | | | | | | | | | | | | | | | |
| Dividends from net investment income | | | (0.07 | ) | | — | | | (0.06 | ) | | (0.19 | ) | | (0.28 | ) |
| Distributions from realized gains | | | — | | | — | | | — | | | — | | | (4.41 | ) |
| Total distributions | | | (0.07 | ) | | — | | | (0.06 | ) | | (0.19 | ) | | (4.69 | ) |
| Net asset value, end of period | | $ | 32.98 | | $ | 30.07 | | $ | 26.14 | | $ | 16.90 | | $ | 27.74 | |
| | | | | | | | | | | | | | | | | |
| Total return | | | 9.9 | % | | 15.0 | % | | 55.1 | % | | (38.6% | ) | | (21.2% | ) |
| Ratios/supplemental data: | | | | | | | | | | | | | | | | |
| Net assets, end of period ($000) | | | 1,011,671 | | | 971,285 | | | 977,576 | | | 762,093 | | | 1,767,828 | |
| Ratio of expenses to average net assets | | | 1.20 | % | | 1.21 | % | | 1.22 | % | | 1.20 | % | | 1.15 | % |
| Ratio of net investment income (loss) to average net assets | | | 0.11 | % | | 0.23 | % | | (0.29% | ) | | 0.20 | % | | 0.69 | % |
| Portfolio turnover rate | | | 31 | % | | 46 | % | | 19 | % | | 19 | % | | 22 | % |
| | | Year ended March 31, | |
| Partners Value Fund | | 2012 | | 2011 | | 2010 | | 2009 | | 2008 | |
| | | | | | | | | | | | | | | | | |
| Net asset value, beginning of period | | $ | 22.05 | | $ | 18.24 | | $ | 11.77 | | $ | 17.33 | | $ | 24.53 | |
| Income (loss) from investment operations: | | | | | | | | | | | | | | | | |
| Net investment income (loss) | | | (0.07 | ) | | (0.05 | ) | | (0.08 | ) | | 0.01 | | | 0.07 | |
| Net gain (loss) on securities (realized and unrealized) | | | 1.27 | | | 3.86 | | | 6.56 | | | (5.55 | ) | | (4.67 | ) |
| Total from investment operations | | | 1.20 | | | 3.81 | | | 6.48 | | | (5.54 | ) | | (4.60 | ) |
| Less distributions: | | | | | | | | | | | | | | | | |
| Dividends from net investment income | | | — | | | — | | | (0.01 | ) | | (0.02 | ) | | (0.10 | ) |
| Distributions from realized gains | | | — | | | — | | | — | | | — | | | (2.50 | ) |
| Total distributions | | | — | | | — | | | (0.01 | ) | | (0.02 | ) | | (2.60 | ) |
| Net asset value, end of period | | $ | 23.25 | | $ | 22.05 | | $ | 18.24 | | $ | 11.77 | | $ | 17.33 | |
| | | | | | | | | | | | | | | | | |
| Total return | | | 5.4 | % | | 20.9 | % | | 55.1 | % | | (32.0% | ) | | (20.7% | ) |
| Ratios/supplemental data: | | | | | | | | | | | | | | | | |
| Net assets, end of period ($000) | | | 707,174 | | | 754,598 | | | 622,107 | | | 431,071 | | | 1,220,445 | |
| Ratio of expenses to average net assets | | | 1.20 | % | | 1.21 | % | | 1.21 | % | | 1.19 | % | | 1.15 | % |
| Ratio of net investment income (loss) to average net assets | | | (0.32 | )% | | (0.26 | )% | | (0.52 | )% | | 0.05 | % | | 0.29 | % |
| Portfolio turnover rate | | | 31 | % | | 42 | % | | 30 | % | | 29 | % | | 24 | % |
| The accompanying notes form an integral part of these financial statements. | weitzfunds.com 57 |
FINANCIAL HIGHLIGHTS
The following financial information provides selected data for a share outstanding throughout the periods indicated.
| Partners III Opportunity Fund - | | Year ended March 31, | |
| Institutional Class | | | 2012 | | | 2011 | | | 2010 | | | 2009 | | | 2008 | |
| | | | | | | | | | | | | | | | | |
| Net asset value, beginning of period | | $ | 12.63 | | $ | 10.15 | | $ | 6.26 | | $ | 8.55 | | $ | 11.28 | |
| Income (loss) from investment operations: | | | | | | | | | | | | | | | | |
Net investment income (loss)(a) | | | (0.07 | ) | | (0.06 | ) | | (0.08 | ) | | (0.04 | ) | | 0.09 | |
| Net gain (loss) on securities (realized and unrealized) | | | 0.67 | | | 2.54 | | | 3.97 | | | (2.24 | ) | | (2.28 | ) |
| Total from investment operations | | | 0.60 | | | 2.48 | | | 3.89 | | | (2.28 | ) | | (2.19 | ) |
| Less distributions: | | | | | | | | | | | | | | | | |
| Dividends from net investment income | | | — | | | — | | | — | | | (0.01 | ) | | (0.10 | ) |
| Distributions from realized gains | | | (0.30 | ) | | — | | | — | | | — | | | (0.44 | ) |
| Total distributions | | | (0.30 | ) | | — | | | — | | | (0.01 | ) | | (0.54 | ) |
| Net asset value, end of period | | $ | 12.93 | | $ | 12.63 | | $ | 10.15 | | $ | 6.26 | | $ | 8.55 | |
| | | | | | | | | | | | | | | | | |
| Total return | | | 4.9 | % | | 24.4 | % | | 62.1 | % | | (26.7% | ) | | (20.1% | ) |
| Ratios/supplemental data: | | | | | | | | | | | | | | | | |
| Net assets, end of period ($000) | | | 609,424 | | | 461,440 | | | 274,793 | | | 154,909 | | | 259,079 | |
Ratio of expenses to average net assets(b) | | | 1.48 | % | | 1.51 | % | | 1.79 | % | | 1.81 | % | | 1.54 | % |
| Ratio of net investment income (loss) to average net assets | | | (0.61% | ) | | (0.64% | ) | | (1.02% | ) | | (0.43% | ) | | 0.86 | % |
| Portfolio turnover rate | | | 44 | % | | 64 | % | | 54 | % | | 58 | % | | 51 | % |
| Partners III Opportunity Fund -Investor Class | | Eight months ended March 31, 2012(c) | |
| Net asset value, beginning of period | | $ | 12.08 | |
| Income (loss) from investment operations: | | | | |
Net investment income (loss)(a) | | | (0.09 | ) |
| Net gain on securities (realized and unrealized) | | | 0.91 | |
| Total from investment operations | | | 0.82 | |
| Less distributions: | | | | |
| Dividends from net investment income | | | — | |
| Distributions from realized gains | | | — | |
| Total distributions | | | — | |
| Net asset value, end of period | | $ | 12.90 | |
| Total return | | | 6.8 | %† |
| Ratios/supplemental data: | | | | |
| Net assets, end of period ($000) | | | 11,497 | |
Ratio of net expenses to average net assets(d) | | | 1.80 | %* |
| Ratio of net investment income (loss) to average net assets | | | (1.06% | )* |
| Portfolio turnover rate | | | 44 | % |
| * | Annualized |
| † | Not Annualized |
| (a) | Based on average daily shares outstanding |
| (b) | Included in the expense ratio is 0.11%, 0.15%, 0.26%, 0.12% and 0.07% related to interest expense and 0.18%, 0.16%, 0.30%, 0.47% and 0.29% related to dividend expense on securities sold short for the periods ended March 31, 2012, 2011, 2010, 2009 and 2008, respectively. |
| (c) | Initial offering of shares on August 1, 2011 (See Note 1) |
| (d) | Included in the expense ratio is 0.12% related to interest expense and 0.24% related to dividend expense on securities sold short for the period ended March 31, 2012. Absent expenses assumed by the Adviser, the annualized expense ratio would have been 2.31% for the period ended March 31, 2012. |
| 58 Weitz Funds | The accompanying notes form an integral part of these financial statements. |
The following financial information provides selected data for a share outstanding throughout the periods indicated.
| Research Fund | | Year ended March 31, 2012 | | Three months ended March 31, 2011(a) | |
| Net asset value, beginning of period | | $ | 10.38 | | $ | 10.00 | |
| Income (loss) from investment operations: | | | | | | | |
| Net investment income | | | 0.01 | | | — | # |
| Net gain on securities (realized and unrealized) | | | 1.20 | | | 0.38 | |
| Total from investment operations | | | 1.21 | | | 0.38 | |
| Less distributions: | | | | | | | |
| Dividends from net investment income | | | (0.01 | ) | | — | |
| Distributions from realized gains | | | (0.51 | ) | | — | |
| Total distributions | | | (0.52 | ) | | — | |
| Net asset value, end of period | | $ | 11.07 | | $ | 10.38 | |
| Total return | | | 12.3 | % | | 3.8 | %† |
| Ratios/supplemental data: | | | | | | | |
| Net assets, end of period ($000) | | | 16,299 | | | 11,244 | |
Ratio of net expenses to average net assets(b) | | | 0.90 | % | | 0.90 | %* |
| Ratio of net investment income to average net assets | | | 0.15 | % | | 0.01 | %* |
| Portfolio turnover rate | | | 124 | % | | 12 | %† |
| | | Year ended March 31, | |
| Hickory Fund | | | 2012 | | | 2011 | | | 2010 | | | 2009 | | | 2008 | |
| | | | | | | | | | | | | | | | | |
| Net asset value, beginning of period | | $ | 41.12 | | $ | 31.77 | | $ | 19.72 | | $ | 30.53 | | $ | 39.69 | |
| Income (loss) from investment operations: | | | | | | | | | | | | | | | | |
| Net investment income (loss) | | | (0.26 | ) | | (0.20 | ) | | (0.21 | ) | | (0.04 | ) | | 0.30 | |
| Net gain (loss) on securities (realized and unrealized) | | | 1.67 | | | 9.55 | | | 12.26 | | | (10.74 | ) | | (9.11 | ) |
| Total from investment operations | | | 1.41 | | | 9.35 | | | 12.05 | | | (10.78 | ) | | (8.81 | ) |
| Less distributions: | | | | | | | | | | | | | | | | |
| Dividends from net investment income | | | — | | | — | | | — | | | (0.03 | ) | | (0.35 | ) |
| Distributions from realized gains | | | — | | | — | | | — | | | — | | | — | |
| Total distributions | | | — | | | — | | | — | | | (0.03 | ) | | (0.35 | ) |
| Net asset value, end of period | | $ | 42.53 | | $ | 41.12 | | $ | 31.77 | | $ | 19.72 | | $ | 30.53 | |
| | | | | | | | | | | | | | | | | |
| Total return | | | 3.4 | % | | 29.4 | % | | 61.1 | % | | (35.3% | ) | | (22.3% | ) |
| Ratios/supplemental data: | | | | | | | | | | | | | | | | |
| Net assets, end of period ($000) | | | 330,257 | | | 322,628 | | | 206,116 | | | 133,813 | | | 256,669 | |
| Ratio of expenses to average net assets | | | 1.27 | % | | 1.27 | % | | 1.29 | % | | 1.28 | % | | 1.21 | % |
| Ratio of net investment income (loss) to average net assets | | | (0.64% | ) | | (0.61% | ) | | (0.79% | ) | | (0.16% | ) | | 0.77 | % |
| Portfolio turnover rate | | | 38 | % | | 67 | % | | 61 | % | | 28 | % | | 31 | % |
| * | Annualized |
| † | Not Annualized |
| # | Amount less than $0.01 |
| (a) | Initial offering of shares on December 31, 2010 (See Note 1) |
| (b) | Absent expenses assumed by the Adviser, the expense ratio would have been 1.83% for the period ended March 31, 2012 and the annualized expense ratio would have been 2.89% for the period ended March 31, 2011. |
| The accompanying notes form an integral part of these financial statements. | weitzfunds.com 59 |
FINANCIAL HIGHLIGHTS
The following financial information provides selected data for a share outstanding throughout the periods indicated.
| | | Year ended March 31, | |
| Balanced Fund | | | 2012 | | | 2011 | | | 2010 | | | 2009 | | | 2008 | |
| Net asset value, beginning of period | | $ | 11.74 | | $ | 10.59 | | $ | 7.71 | | $ | 10.05 | | $ | 12.20 | |
| Income (loss) from investment operations: | | | | | | | | | | | | | | | | |
| Net investment income | | | 0.06 | | | 0.11 | | | 0.11 | | | 0.13 | | | 0.23 | |
| Net gain (loss) on securities (realized and unrealized) | | | 0.67 | | | 1.14 | | | 2.89 | | | (2.33 | ) | | (1.65 | ) |
| Total from investment operations | | | 0.73 | | | 1.25 | | | 3.00 | | | (2.20 | ) | | (1.42 | ) |
| Less distributions: | | | | | | | | | | | | | | | | |
| Dividends from net investment income | | | (0.08 | ) | | (0.10 | ) | | (0.12 | ) | | (0.14 | ) | | (0.24 | ) |
| Distributions from realized gains | | | — | | | — | | | — | | | — | | | (0.49 | ) |
| Total distributions | | | (0.08 | ) | | (0.10 | ) | | (0.12 | ) | | (0.14 | ) | | (0.73 | ) |
| Net asset value, end of period | | $ | 12.39 | | $ | 11.74 | | $ | 10.59 | | $ | 7.71 | | $ | 10.05 | |
| | | | | | | | | | | | | | | | | |
| Total return | | | 6.2 | % | | 11.8 | % | | 39.0 | % | | (21.9% | ) | | (12.3% | ) |
| Ratios/supplemental data: | | | | | | | | | | | | | | | | |
| Net assets, end of period ($000) | | | 88,531 | | | 85,138 | | | 77,969 | | | 52,149 | | | 76,199 | |
| Ratio of expenses to average net assets | | | 1.14 | % | | 1.15 | % | | 1.17 | % | | 1.17 | % | | 1.12 | % |
| Ratio of net investment income to average net assets | | | 0.51 | % | | 0.97 | % | | 1.14 | % | | 1.37 | % | | 1.97 | % |
| Portfolio turnover rate | | | 46 | % | | 47 | % | | 45 | % | | 61 | % | | 44 | % |
| 60 Weitz Funds | The accompanying notes form an integral part of these financial statements. |
The following financial information provides selected data for a share outstanding throughout the periods indicated.
| Short-Intermediate Income Fund - | | Year ended March 31, | |
| Institutional Class | | | 2012 | | | 2011 | | | 2010 | | | 2009 | | | 2008 | |
| Net asset value, beginning of period | | $ | 12.39 | | $ | 12.25 | | $ | 11.42 | | $ | 11.74 | | $ | 11.42 | |
| Income (loss) from investment operations: | | | | | | | | | | | | | | | | |
Net investment income(a) | | | 0.23 | | | 0.24 | | | 0.35 | | | 0.43 | | | 0.46 | |
| Net gain (loss) on securities (realized and unrealized) | | | 0.13 | | | 0.19 | | | 0.84 | | | (0.20 | ) | | 0.32 | |
| Total from investment operations | | | 0.36 | | | 0.43 | | | 1.19 | | | 0.23 | | | 0.78 | |
| Less distributions: | | | | | | | | | | | | | | | | |
| Dividends from net investment income | | | (0.27 | ) | | (0.29 | ) | | (0.36 | ) | | (0.45 | ) | | (0.46 | ) |
| Distributions from realized gains | | | — | | | — | | | — | | | (0.10 | ) | | — | |
| Total distributions | | | (0.27 | ) | | (0.29 | ) | | (0.36 | ) | | (0.55 | ) | | (0.46 | ) |
| Net asset value, end of period | | $ | 12.48 | | $ | 12.39 | | $ | 12.25 | | $ | 11.42 | | $ | 11.74 | |
| | | | | | | | | | | | | | | | | |
| Total return | | | 2.9 | % | | 3.5 | % | | 10.5 | % | | 2.1 | % | | 7.0 | % |
| Ratios/supplemental data: | | | | | | | | | | | | | | | | |
| Net assets, end of period ($000) | | | 1,402,505 | | | 1,163,864 | | | 672,025 | | | 182,016 | | | 127,102 | |
| Ratio of expenses to average net assets | | | 0.61 | % | | 0.64 | % | | 0.62 | % | | 0.69 | % | | 0.70 | % |
| Ratio of net investment income to average net assets | | | 1.84 | % | | 2.02 | % | | 3.17 | % | | 4.00 | % | | 3.94 | % |
| Portfolio turnover rate | | | 44 | % | | 38 | % | | 27 | % | | 25 | % | | 32 | % |
| Short-Intermediate Income Fund - Investor Class | | | Eight months ended March 31, 2012(b) | |
| Net asset value, beginning of period | | $ | 12.51 | |
| Income (loss) from investment operations: | | | | |
Net investment income(a) | | | 0.12 | |
| Net gain on securities (realized and unrealized) | | | 0.02 | |
| Total from investment operations | | | 0.14 | |
| Less distributions: | | | | |
| Dividends from net investment income | | | (0.18 | ) |
| Distributions from realized gains | | | — | |
| Total distributions | | | (0.18 | ) |
| Net asset value, end of period | | $ | 12.47 | |
| Total return | | | 1.1 | %† |
| Ratios/supplemental data: | | | | |
| Net assets, end of period ($000) | | | 53,090 | |
Ratio of net expenses to average net assets(c) | | | 0.80 | %* |
| Ratio of net investment income to average net assets | | | 1.58 | %* |
| Portfolio turnover rate | | | 44 | % |
| * | Annualized |
| † | Not Annualized |
| (a) | Based on average daily shares outstanding |
| (b) | Initial offering of shares on August 1, 2011 (See Note 1) |
| (c) | Absent expenses assumed by the Adviser, the annualized expense ratio would have been 1.15% for the period ended March 31, 2012. |
| The accompanying notes form an integral part of these financial statements. | weitzfunds.com 61 |
FINANCIAL HIGHLIGHTS
The following financial information provides selected data for a share outstanding throughout the periods indicated.
| | | Year ended March 31, | |
| Nebraska Tax-Free Income Fund | | | 2012 | | | 2011 | | | 2010 | | | 2009 | | | 2008 | |
| Net asset value, beginning of period | | $ | 10.09 | | $ | 10.15 | | $ | 9.94 | | $ | 9.95 | | $ | 10.01 | |
| Income (loss) from investment operations: | | | | | | | | | | | | | | | | |
| Net investment income | | | 0.25 | | | 0.26 | | | 0.29 | | | 0.35 | | | 0.36 | |
| Net gain (loss) on securities (realized and unrealized) | | | 0.36 | | | (0.07 | ) | | 0.21 | | | —^ | | | (0.06 | ) |
| Total from investment operations | | | 0.61 | | | 0.19 | | | 0.50 | | | 0.35 | | | 0.30 | |
| Less distributions: | | | | | | | | | | | | | | | | |
| Dividends from net investment income | | | (0.26 | ) | | (0.25 | ) | | (0.29 | ) | | (0.36 | ) | | (0.36 | ) |
| Distributions from realized gains | | | — | ^ | | — | | | — | | | — | | | — | |
| Total distributions | | | (0.26 | ) | | (0.25 | ) | | (0.29 | ) | | (0.36 | ) | | (0.36 | ) |
| Net asset value, end of period | | $ | 10.44 | | $ | 10.09 | | $ | 10.15 | | $ | 9.94 | | $ | 9.95 | |
| | | | | | | | | | | | | | | | | |
| Total return | | | 6.1 | % | | 1.9 | % | | 5.1 | % | | 3.6 | % | | 3.0 | % |
| Ratios/supplemental data: | | | | | | | | | | | | | | | | |
| Net assets, end of period ($000) | | | 93,589 | | | 89,273 | | | 81,914 | | | 60,587 | | | 55,685 | |
Ratio of net expenses to average net assets(a) | | | 0.71 | % | | 0.73 | % | | 0.75 | % | | 0.75 | % | | 0.75 | % |
| Ratio of net investment income to average net assets | | | 2.43 | % | | 2.49 | % | | 2.93 | % | | 3.56 | % | | 3.69 | % |
| Portfolio turnover rate | | | 8 | % | | 10 | % | | 13 | % | | 17 | % | | 8 | % |
| | | Year ended March 31, | |
| Government Money Market Fund | | | 2012 | | | 2011 | | | 2010 | | | 2009 | | | 2008 | |
| Net asset value, beginning of period | | $ | 1.00 | | $ | 1.00 | | $ | 1.00 | | $ | 1.00 | | $ | 1.00 | |
| Income (loss) from investment operations: | | | | | | | | | | | | | | | | |
| Net investment income | | | — | | | 0.001 | | | 0.002 | | | 0.013 | | | 0.042 | |
| Net realized gain on securities | | | — | | | — | | | — | | | — | | | — | |
| Total from investment operations | | | — | | | 0.001 | | | 0.002 | | | 0.013 | | | 0.042 | |
| Less distributions: | | | | | | | | | | | | | | | | |
| Dividends from net investment income | | | — | | | (0.001 | ) | | (0.001 | ) | | (0.013 | ) | | (0.042 | ) |
| Distributions from realized gains | | | — | | | — | | | (0.001 | ) | | — | | | — | |
| Total distributions | | | — | | | (0.001 | ) | | (0.002 | ) | | (0.013 | ) | | (0.042 | ) |
| Net asset value, end of period | | $ | 1.00 | | $ | 1.00 | | $ | 1.00 | | $ | 1.00 | | $ | 1.00 | |
| | | | | | | | | | | | | | | | | |
| | | | | | | | | | | | | | | | | |
| Total return | | | 0.03 | % | | 0.1 | % | | 0.2 | % | | 1.4 | % | | 4.4 | % |
| Ratios/supplemental data: | | | | | | | | | | | | | | | | |
| Net assets, end of period ($000) | | | 77,367 | | | 81,912 | | | 83,363 | | | 107,384 | | | 102,246 | |
Ratio of net expenses to average net assets(b) | | | 0.01 | % | | 0.07 | % | | 0.08 | % | | 0.10 | % | | 0.10 | % |
| Ratio of net investment income to average net assets | | | 0.03 | % | | 0.06 | % | | 0.11 | % | | 1.31 | % | | 4.23 | % |
| ^ | Amount less than $0.01 |
| # | Amount less than $0.001 |
| (a) | Absent expenses assumed by the Adviser, the expense ratio would have been 0.76%, 0.78% and 0.80% for the periods ended March 31, 2010, 2009 and 2008, respectively. |
| (b) | Absent expenses assumed by the Adviser, the expense ratio would have been, 0.72%, 0.73%, 0.76%, 0.75% and 0.71% for the periods ended March 31, 2012, 2011, 2010, 2009 and 2008, respectively. |
| 62 Weitz Funds | The accompanying notes form an integral part of these financial statements. |
NOTES TO FINANCIAL STATEMENTS
MARCH 31, 2012
(1) Organization
The Weitz Funds (the “Trust”) is registered under the Investment Company Act of 1940 as an open-end management investment company issuing shares in series, each series representing a distinct portfolio with its own investment objectives and policies. At March 31, 2012, the Trust had nine series in operation: Value Fund, Partners Value Fund, Partners III Opportunity Fund, Research Fund, Hickory Fund, Balanced Fund, Short-Intermediate Income Fund, Nebraska Tax-Free Income Fund and Government Money Market Fund (individually, a “Fund”, collectively, the “Funds”).
Each Fund offers one class of shares, except the Partners III Opportunity and Short-Intermediate Income Funds which each offer two classes of shares: Institutional Class and Investor Class shares. Each class of shares has identical rights and privileges, except with respect to certain class specific expenses such as administration and distribution (12b-1) fees, voting rights on matters affecting a single class of shares and exchange privileges. Income, realized and unrealized gains and losses, and expenses of the Funds not directly attributable to a specific class of shares are allocated to the two classes on the basis of daily net assets of each class. Fees and expenses relating to a specific class are charged directly to that share class.
The Research Fund was originally organized in April 2005 as a Delaware limited partnership (the “Partnership”). Effective as of the close of business on December 31, 2010, the Partnership was reorganized into a series of the Trust through a tax-free exchange of 883,662 shares of the Fund (valued at $10.00 per share) in exchange for the net assets of the Partnership. At the time of the exchange, the Partnership had net assets of $8,836,618 including net unrealized appreciation of $849,852.
The investment objective of the Value, Partners Value, Partners III Opportunity, Research and Hickory Funds (the “Weitz Equity Funds”) is capital appreciation. Each of the Weitz Equity Funds invests principally in common stocks and a variety of securities convertible into common stocks such as rights, warrants, convertible preferred stock and convertible bonds.
The investment objectives of the Balanced Fund are regular current income, capital preservation and long-term capital appreciation. The Fund invests principally in a portfolio of U.S. equity and fixed income securities.
The investment objective of the Short-Intermediate Income Fund is high current income consistent with the preservation of capital. Under normal market conditions, the Fund will invest at least 80% of its net assets, plus the amount of any borrowings for investment purposes, in fixed income securities such as U.S. Government and agency securities, corporate debt securities and mortgage-backed securities.
The investment objective of the Nebraska Tax-Free Income Fund is to provide a high level of current income that is exempt from both federal and Nebraska personal income taxes. The Fund under normal circumstances, invests at least 80% of its net assets, plus the amount of any borrowings for investment purposes, in municipal securities that generate income exempt from Nebraska state income tax and from federal income tax or in open or closed-end mutual funds which in turn invest in such assets.
The investment objective of the Government Money Market Fund is current income consistent with the preservation of capital and maintenance of liquidity. The Fund invests substantially all of its assets in debt obligations issued or guaranteed by the U.S. Government, its agencies and instrumentalities and repurchase agreements on such securities with remaining maturities not exceeding thirteen months. The Fund limits its average portfolio maturity to sixty days or less.
(2) Significant Accounting Policies
The following accounting policies are in accordance with accounting principles generally accepted in the United States.
(a) Valuation of Investments
Weitz Equity, Balanced, Short-Intermediate Income and Nebraska Tax-Free Income Funds
Investments are carried at value determined using the following valuation methods:
| • | Securities traded on a national or regional securities exchange are valued at the last sales price; if there were no sales on that day, securities are valued at the mean between the latest available and representative bid and ask prices; securities listed on the NASDAQ exchange are valued using the NASDAQ Official Closing Price (“NOCP”). Generally, the NOCP will be the last sales price unless the reported trade for the security is outside the range of the bid/ask price. In such cases, the NOCP will be normalized to the nearer of the bid or ask price. |
| | |
| • | Short sales traded on a national or regional securities exchange are valued at the last sales price; if there were no sales on that day, short sales are valued at the mean between the latest available and representative bid and ask prices. |
| | |
| • | Securities not listed on an exchange are valued at the mean between the latest available and representative bid and ask prices. |
| | |
| • | The value of certain debt securities for which market quotations are not readily available may be based upon current market prices of securities which are comparable in coupon, rating and maturity or an appropriate matrix utilizing similar factors. |
| | |
| • | The current market value of a traded option is the last sales price at which such option is traded, or, in the absence of a sale on or about the close of the exchange, the mean of the closing bid and ask prices. |
weitzfunds.com 63
| • | The value of securities for which market quotations are not readily available or are deemed unreliable, including restricted and not readily marketable securities, is determined in good faith in accordance with procedures approved by the Trust’s Board of Trustees. Such valuation procedures and methods for valuing securities may include, but are not limited to: multiple of earnings, multiple of book value, discount from value of a similar freely-traded security, purchase price, private transaction in the security or related securities, the nature and duration of restrictions on disposition of the security and a combination of these and other factors. |
Government Money Market Fund
Investment securities are carried at amortized cost, which approximates market value. Pursuant to Rule 2a-7 of the Investment Company Act of 1940, amortized cost, as defined, is a method of valuing securities at acquisition cost, adjusted for amortization of premium or accretion of discount.
(b) Option Transactions
The Funds, except for the Government Money Market Fund, may purchase put or call options. When a Fund purchases an option, an amount equal to the premium paid is recorded as an asset and is subsequently marked-to-market daily. Premiums paid for purchasing options that expire unexercised are recognized on the expiration date as realized losses. If an option is exercised, the premium paid is subtracted from the proceeds of the sale or added to the cost of the purchase to determine whether a Fund has realized a gain or loss on the related investment transaction. When a Fund enters into a closing transaction, a Fund will realize a gain or loss depending upon whether the amount from the closing transaction is greater or less than the premium paid.
The Funds, except for the Government Money Market Fund, may write put or call options. When a Fund writes an option, an amount equal to the premium received is recorded as a liability and is subsequently marked-to-market daily. Premiums received for writing options that expire unexercised are recognized on the expiration date as realized gains. If an option is exercised, the premium received is subtracted from the cost of purchase or added to the proceeds of the sale to determine whether a Fund has realized a gain or loss on the related investment transaction. When a Fund enters into a closing transaction, a Fund will realize a gain or loss depending upon whether the amount from the closing transaction is greater or less than the premium received.
The Funds attempt to limit market risk and enhance their income by writing (selling) covered call options. The risk in writing a covered call option is that a Fund gives up the opportunity of profit if the market price of the financial instrument increases. A Fund also has the additional risk of not being able to enter into a closing transaction if a liquid secondary market does not exist. The risk in writing a put option is that a Fund is obligated to purchase the financial instrument underlying the option at prices which may be significantly different than the current market price.
(c) Securities Sold Short
The Funds, except for the Government Money Market Fund, periodically engage in selling securities short, which obligates a Fund to replace a security borrowed by purchasing the same security at the current market value. A Fund would incur a loss if the price of the security increases between the date of the short sale and the date on which the Fund replaces the borrowed security. A Fund would realize a gain if the price of the security declines between those dates.
(d) Federal Income Taxes
It is the policy of each Fund to comply with all sections of the Internal Revenue Code applicable to regulated investment companies and to distribute all of its taxable income to shareholders; therefore, no provision for income or excise taxes is required.
Net investment income and net realized gains may differ for financial statement and tax purposes. The character of distributions made during the year from net investment income or net realized gains may differ from their ultimate characterization for Federal income tax purposes. Also, due to the timing of dividend distributions, the fiscal year in which amounts are distributed may differ from the year that the income or realized gains were recorded by the Funds.
The Funds have reviewed their tax positions taken on federal income tax returns, for each of the three open tax years and as of March 31, 2012 and have determined that no provisions for income taxes are required in the Funds’ financial statements.
The following permanent differences between net asset components for financial reporting and tax purposes were reclassified at the end of the fiscal year:
| | | | | | | | | | | | | | | Short- | |
| | | Partners | | | | | | | | | | | Intermediate | |
| | | Value | | Hickory | | Partners III | | Balanced | | | Income | |
| Paid-in capital | | $ | (1,722,438 | ) | $ | (1,716,754 | ) | $ | (2,604,833 | ) | $ | — | | $ | — | |
| Accumulated undistributed net investment income | | | 1,722,438 | | | 1,716,754 | | | 2,604,833 | | | 8,575 | | | 4,632,046 | |
| Accumulated net realized gain (loss) | | | — | | | — | | | — | | | (8,575 | ) | | (4,632,046 | ) |
The differences are due to net operating losses and principal paydown adjustments. These reclassifications have no impact on the net asset value of the Funds.
(e) Security Transactions
Security transactions are accounted for on the date the securities are purchased or sold (trade date). Realized gains or losses are determined by specifically identifying the security sold.
Income dividends less foreign tax withholding (if any), dividends on short positions and distributions to shareholders are recorded on the ex-dividend date. Interest, including amortization of discount or premium, is accrued as earned.
(f) Dividend Policy
The Funds declare and distribute income dividends and capital gains distributions as may be required to qualify as a regulated investment company under the Internal Revenue Code.
Generally, the Short-Intermediate Income and Nebraska Tax-Free Income Funds pay income dividends on a quarterly basis. The Government Money Market Fund declares dividends daily and pays dividends monthly. All dividends and distributions are reinvested automatically, unless the shareholder elects otherwise.
(g) Other
Expenses that are directly related to a Fund are charged directly to that Fund. Other operating expenses of the Trust are prorated to each Fund on the basis of relative net assets or another appropriate basis. Income, realized and unrealized gains and losses and expenses (other than class specific expenses) are allocated to each class of shares based on its relative net assets, except that each class separately bears expenses related specifically to that class, such as transfer agent fees, registration fees and 12b-1 fees.
(h) Use of Estimates
The preparation of financial statements in conformity with accounting principles generally accepted in the United States requires management to make estimates and assumptions that affect the reported amounts of assets and liabilities and disclosure of contingent assets and liabilities at the date of the financial statements and the reported amounts of increase and decrease in net assets from operations during the period. Actual results could differ from those estimates.
(3) Fund Share Transactions
| | | Year ended March 31, 2012 | | Year ended March 31, 2011 | |
| | | Shares | | Amount | | Shares | | Amount | |
| | | Value | | | | | | | |
| Sales | | | 4,917,919 | | $ | 147,910,893 | | | 2,057,373 | | $ | 55,309,056 | |
| Redemptions | | | (6,615,739 | ) | | (200,565,515 | ) | | (7,147,413 | ) | | (191,772,577 | ) |
| Reinvestment of distributions | | | 69,551 | | | 2,064,991 | | | — | | | — | |
| Net increase (decrease) | | | (1,628,269 | ) | $ | (50,589,631 | ) | | (5,090,040 | ) | $ | (136,463,521 | ) |
| Partners Value |
| Sales | | | 3,902,737 | | $ | 83,029,226 | | | 10,134,988 | | $ | 194,896,173 | |
| Redemptions | | | (7,699,763 | ) | | (164,015,955 | ) | | (10,029,129 | ) | | (187,610,915 | ) |
| Net increase (decrease) | | | (3,797,026 | ) | $ | (80,986,729 | ) | | 105,859 | | $ | 7,285,258 | |
| Partners III - Institutional Class |
| Sales | | | 17,587,485 | | $ | 213,748,413 | | | 13,093,455 | | $ | 148,377,615 | |
| Redemptions | | | (7,953,612 | ) | | (94,525,327 | ) | | (3,629,494 | ) | | (37,878,439 | ) |
| Reinvestment of distributions | | | 965,696 | | | 11,665,602 | | | — | | | — | |
| Net increase (decrease) | | | 10,599,569 | | $ | 130,888,688 | | | 9,463,961 | | $ | 110,499,176 | |
| Partners III - Investor Class* |
| Sales | | | 2,015,165 | | $ | 24,333,189 | | | | | | | |
| Redemptions | | | (1,123,984 | ) | | (14,440,436 | ) | | | | | | |
| Net increase (decrease) | | | 891,181 | | $ | 9,892,753 | | | | | | | |
Research† |
| Sales | | | 392,924 | | $ | 3,832,592 | | | 216,038 | | $ | 2,178,973 | |
| Issued in connection with reorganization | | | — | | | — | | | 883,662 | | | 8,836,618 | |
| Redemptions | | | (72,040 | ) | | (734,013 | ) | | (16,128 | ) | | (164,081 | ) |
| Reinvestment of distributions | | | 67,976 | | | 672,370 | | | — | | | — | |
| Net increase (decrease) | | | 388,860 | | $ | 3,770,949 | | | 1,083,572 | | $ | 10,851,510 | |
| Hickory |
| Sales | | | 2,188,072 | | $ | 86,439,301 | | | 3,834,573 | | $ | 132,202,914 | |
| Redemptions | | | (2,268,891 | ) | | (87,482,946 | ) | | (2,476,376 | ) | | (84,119,185 | ) |
| Net increase (decrease) | | | (80,819 | ) | $ | (1,043,645 | ) | | 1,358,197 | | $ | 48,083,729 | |
weitzfunds.com 65
| | | Year ended March 31, 2012 | | Year ended March 31, 2011 | |
| | | Shares | | Amount | | Shares | | Amount | |
| | | | Balanced | | | | | | | | | | |
| Sales | | | 536,043 | | $ | 6,288,234 | | | 773,461 | | $ | 8,484,280 | |
| Redemptions | | | (687,223 | ) | | (7,891,475 | ) | | (949,145 | ) | | (10,232,676 | ) |
| Reinvestment of distributions | | | 47,229 | | | 543,614 | | | 61,976 | | | 689,245 | |
| Net increase (decrease) | | | (103,951 | ) | $ | (1,059,627 | ) | | (113,708 | ) | $ | (1,059,151 | ) |
| Short-Intermediate Income - Institutional Class |
| Sales | | | 55,005,679 | | $ | 685,873,440 | | | 68,608,240 | | $ | 851,847,983 | |
| Redemptions | | | (38,884,939 | ) | | (484,358,800 | ) | | (31,346,052 | ) | | (389,407,165 | ) |
| Reinvestment of distributions | | | 2,283,922 | | | 28,369,758 | | | 1,820,686 | | | 22,552,885 | |
| Net increase (decrease) | | | 18,404,662 | | $ | 229,884,398 | | | 39,082,874 | | $ | 484,993,703 | |
| Short-Intermediate Income - Investor Class* |
| Sales | | | 5,002,466 | | $ | 62,232,397 | | | | | | | |
| Redemptions | | | (776,404 | ) | | (9,680,845 | ) | | | | | | |
| Reinvestment of distributions | | | 32,955 | | | 409,420 | | | | | | | |
| Net increase (decrease) | | | 4,259,017 | | $ | 52,960,972 | | | | | | | |
| NebraskaTax-Free Income |
| Sales | | | 963,294 | | $ | 10,040,958 | | | 2,157,493 | | $ | 22,173,798 | |
| Redemptions | | | (1,001,713 | ) | | (10,377,164 | ) | | (1,542,633 | ) | | (15,753,573 | ) |
| Reinvestment of distributions | | | 160,605 | | | 1,665,872 | | | 156,516 | | | 1,597,594 | |
| Net increase (decrease) | | | 122,186 | | $ | 1,329,666 | | | 771,376 | | $ | 8,017,819 | |
| Government Money Market |
| Sales | | | 71,926,923 | | $ | 71,926,923 | | | 89,161,977 | | $ | 89,161,977 | |
| Redemptions | | | (76,492,696 | ) | | (76,492,696 | ) | | (90,665,139 | ) | | (90,665,139 | ) |
| Reinvestment of distributions | | | 21,140 | | | 21,140 | | | 54,978 | | | 54,978 | |
| Net increase (decrease) | | | (4,544,633 | ) | $ | (4,544,633 | ) | | (1,448,184 | ) | $ | (1,448,184 | ) |
| * | Initial offering of shares on August 1, 2011 (See Note 1) |
| † | Initial offering of shares on December 31, 2010 (See Note 1) |
(4) Related Party Transactions
Each Fund has retained Wallace R. Weitz & Company (the “Adviser”) as its investment adviser. In addition, the Trust has an agreement with Weitz Securities, Inc. (the “Distributor”), a company under common control with the Adviser, to act as distributor for shares of the Trust. Certain officers of the Trust are also officers and directors of the Adviser and the Distributor.
Under the terms of management and investment advisory agreements, the Adviser is paid a monthly fee. The annual investment advisory fee schedule for each of the Weitz Equity Funds (including the Partners III Fund prior to August 1, 2011) is as follows:
Average Daily Net Assets Break Points
| | GreaterThan | | LessThan or EqualTo | | Rate | |
| | $ | 0 | | $ | 2,500,000,000 | | | 1.00 | % |
| | | 2,500,000,000 | | | 5,000,000,000 | | | 0.90 | % |
| | | 5,000,000,000 | | | | | | 0.80 | % |
Effective August 1, 2011, the annual investment advisory fee schedule for the Partners III Fund is as follows:
Average Daily Net Assets Break Points
| | GreaterThan | | LessThan or EqualTo | | Rate | |
| | $ | 0 | | $ | 1,000,000,000 | | | 1.00 | % |
| | | 1,000,000,000 | | | 2,000,000,000 | | | 0.95 | % |
| | | 2,000,000,000 | | | 3,000,000,000 | | | 0.90 | % |
| | | 3,000,000,000 | | | 5,000,000,000 | | | 0.85 | % |
| | | 5,000,000,000 | | | | | | 0.80 | % |
The Balanced Fund pays the Adviser, on a monthly basis, an annual advisory fee equal to 0.80% of the Fund’s average daily net assets.
The Short-Intermediate Income, Nebraska Tax-Free Income and Government Money Market Funds each pay the Adviser, on a monthly basis, an annual advisory fee equal to 0.40% of the respective Fund’s average daily net assets.
Under the terms of administration agreements, certain services are provided by the Adviser including the transfer of shares,
disbursement of dividends, fund accounting and related administrative services of the Trust.
Each Fund, or class in the case of Partners III and Short-Intermediate Income Funds, pays the Adviser a monthly administrative fee based on their average daily net assets, plus third party expenses directly related to providing such services.
The Partners III and Short-Intermediate Income Funds have adopted Service and Distribution plans effective August 1, 2011, which authorize the Funds to pay the Distributor a distribution fee payable monthly equal to 0.25% per annum, of the average daily net assets of each Fund’s respective Investor Class.
Through July 31, 2012, the Adviser has contractually agreed to reimburse the Research and Government Money Market Funds or to pay directly a portion of the Funds’ expenses to the extent that total expenses, excluding taxes, interest and brokerage commissions exceed 0.90% and 0.20%, respectively, of each Fund’s average daily net assets.
In addition, for the year ended March 31, 2012, the Adviser voluntarily reimbursed expenses to limit the expenses of the Government Money Market Fund to 0.02% of the Fund’s average daily net assets. The expenses reimbursed by the Adviser for the Research and Government Money Market Funds for the year ended March 31, 2012 were $121,869 and $613,215, respectively.
Through July 31, 2012, the Adviser has agreed in writing to limit the total class-specific operating expenses of the Investor Class shares of the Partners III and Short-Intermediate Income Funds to an amount no greater than 0.25% and 0.20% per annum, respectively, more than the total class-specific operating expenses of the Institutional Class shares of the respective Funds (in each case, as such expenses are expressed as a percentage of the average daily net assets of each Fund’s respective share class). The expenses reimbursed by the Adviser for the Investor Class shares of the Partners III and Short-Intermediate Income Funds for the period ended March 31, 2012 were $38,092 and $49,649, respectively.
As of March 31, 2012, the controlling shareholder of the Adviser held approximately 76% of the Research Fund, 41% of the Nebraska Tax-Free Income Fund, 39% of the Balanced Fund, 29% of the Partners III Fund, 15% of the Hickory Fund and 14% of the Government Money Market Fund.
(5) Distributions to Shareholders and Distributable Earnings
The tax character of distributions paid by the Funds are summarized as follows:
| | | Year ended March 31, | | Year ended March 31, | |
| Distributions paid from: | | 2012 | | 2011 | | 2012 | | 2011 | |
| | | Value | | Partners III | |
| Ordinary income | | $ | 2,159,048 | | $ | — | | $ | — | | $ | — | |
| Long-term capital gains | | | — | | | — | | | 12,074,793 | | | — | |
| Total distributions | | $ | 2,159,048 | | $ | — | | $ | 12,074,793 | | $ | — | |
| | | Research | | Balanced | |
| Ordinary income | | $ | 378,244 | | $ | — | | $ | 554,771 | | $ | 707,093 | |
| Long-term capital gains | | | 294,127 | | | — | | | — | | | — | |
| Total distributions | | $ | 672,371 | | $ | — | | $ | 554,771 | | $ | 707,093 | |
| | | Short-Intermediate Income | | Nebraska Tax-Free Income | |
| Ordinary income | | $ | 29,877,821 | | $ | 23,440,657 | | $ | 11,494 | | $ | 11,402 | |
| Tax exempt income | | | — | | | — | | | 2,256,571 | | | 2,173,061 | |
| Long-term capital gains | | | — | | | — | | | 41,735 | | | — | |
| Total distributions | | $ | 29,877,821 | | $ | 23,440,657 | | $ | 2,309,800 | | $ | 2,184,463 | |
| | | Government Money Market | | | |
| Ordinary income | | $ | 22,898 | | $ | 60,239 | | | |
As of March 31, 2012, the components of distributable earnings on a tax basis were as follows:
| | | | | | Partners | | | | | | | | | | |
| | | Value | | Value | | Partners III | | Research | | Hickory | |
| Undistributed ordinary income | | $ | 977,263 | | $ | — | | $ | — | | $ | 417,546 | | $ | — | |
| Qualified ordinary loss deferral | | | — | | | (426,224 | ) | | (612,251 | ) | | — | | | (281,577 | ) |
| Undistributed long-term gains | | | — | | | — | | | 8,523,996 | | | 92,921 | | | — | |
| Capital loss carryforwards | | | (161,856,119 | ) | | (127,177,310 | ) | | — | | | — | | | (53,422,102 | ) |
| Net unrealized appreciation (depreciation) | | | 197,788,688 | | | 120,147,524 | | | 115,626,900 | | | 1,995,188 | | | 56,062,552 | |
| | | $ | 36,909,832 | | $ | (7,456,010 | ) | $ | 123,538,645 | | $ | 2,505,655 | | $ | 2,358,873 | |
| | | | | | Short-Intermediate | | Nebraska | | Government | |
| | | Balanced | | Income | | Tax-Free Income | | Money Market | |
| Undistributed ordinary income | | $ | 74,195 | | $ | 87,101 | | $ | — | | $ | 496 | |
| Undistributed tax exempt income | | | — | | | — | | | 30,607 | | | — | |
| Undistributed long-term gains | | | — | | | 281,347 | | | 455 | | | — | |
| Capital loss carryforwards | | | (3,898,235 | ) | | — | | | — | | | — | |
| Net unrealized appreciation (depreciation) | | | 11,071,983 | | | 33,679,687 | | | 4,070,356 | | | — | |
| | | $ | 7,247,943 | | $ | 34,048,135 | | $ | 4,101,418 | | $ | 496 | |
The Partners Value, Partners III and Hickory Funds elected to defer ordinary losses arising after December 31, 2011. Such losses are treated for tax purposes as arising on April 1, 2012.
Capital loss carryforwards represent tax basis capital losses which may be carried over to offset future realized capital gains, if any. To the extent that carryforwards are used, no capital gains distributions will be made. During the fiscal year, the Funds utilized capital loss carryforwards to offset realized capital gains. The expirations and utilizations of the carryforwards are as follows:
| | | | | | | | | | | | | | | Short- | |
| | | | | | Partners | | | | | | | | Intermediate | |
| | | Value | | Value | | Hickory | | Balanced | | Income | |
| March 31, 2017 | | $ | — | | $ | (11,124,649 | ) | $ | (25,758,330 | ) | $ | — | | $ | — | |
| March 31, 2018 | | | (161,856,119 | ) | | (116,052,661 | ) | | (27,663,772 | ) | | (3,898,235 | ) | | — | |
| Total capital loss carryforwards | | $ | (161,856,119 | ) | $ | (127,177,310 | ) | $ | (53,422,102 | ) | $ | (3,898,235 | ) | $ | — | |
| Capital loss carryforwards utilized | | $ | 26,954,042 | | $ | 14,079,157 | | $ | 12,191,257 | | $ | 4,214,043 | | $ | 414,158 | |
On December 22, 2010, the Regulated Investment Company Modernization Act of 2010 (the “Act”) was enacted, which changed various technical rules governing the tax treatment of regulated investment companies. The changes are generally effective for taxable years beginning after the date of enactment. One of the more prominent changes addresses capital loss carryforwards. Under the Act, the Funds will be permitted to carry forward capital losses incurred in taxable years beginning after the date of enactment for an unlimited period. Additionally, post-enactment capital loss carryforwards will retain their character as either short-term or long-term capital losses rather than being considered all short-term as permitted under previous regulation.
(6) Securities Transactions
Purchases and proceeds from maturities or sales of investment securities of the Funds, other than short-term securities, are summarized as follows:
| | | | | | | | | | | | | | | | | | | | | Short- | | Nebraska | |
| | | | | | Partners | | | | | | | | | | | | | | Intermediate | | Tax-Free | |
| | | Value | | Value | | Partners III | | Research | | Hickory | | Balanced | | Income | | Income | |
| Purchases | | $ | 236,190,314 | | $ | 176,941,161 | | $ | 348,624,529 | | $ | 13,712,320 | | $ | 97,593,596 | | $ | 28,274,002 | | $ | 645,026,554 | | $ | 10,775,648 | |
| Proceeds | | | 345,960,148 | | | 238,877,433 | | | 204,273,785 | | | 12,958,155 | | | 91,303,225 | | | 40,605,127 | | | 434,947,565 | | | 6,950,000 | |
The cost of investments is the same for financial reporting and Federal income tax purposes for the Value, Short-Intermediate Income, Nebraska Tax-Free Income and Government Money Market Funds. The cost of investments for Federal income tax purposes for the Partners Value, Partners III, Research, Hickory and Balanced Funds is $591,143,665, $518,205,769, $14,287,256, $276,551,704 and $77,620,193, respectively.
At March 31, 2012, the aggregate gross unrealized appreciation and depreciation of investments, based on cost for Federal income tax purposes, are summarized as follows:
| | | | | | | | | | | | | | | | | | | | | Short- | | Nebraska | |
| | | | | | Partners | | | | | | | | | | | | | | Intermediate | | Tax-Free | |
| | | Value | | Value | | Partners III | | Research | | Hickory | | Balanced | | Income | | Income | |
| Appreciation | | $ | 205,214,246 | | $ | 134,954,960 | | $ | 129,746,118 | | $ | 2,063,299 | | $ | 66,297,767 | | $ | 11,247,288 | | $ | 37,948,452 | | $ | 4,133,817 | |
| Depreciation | | | (7,425,558 | ) | | (14,813,309 | ) | | (9,759,519 | ) | | (68,111 | ) | | (10,240,741 | ) | | (175,305 | ) | | (4,268,765 | ) | | (63,461 | ) |
| Net | | $ | 197,788,688 | | $ | 120,141,651 | | $ | 119,986,599 | | $ | 1,995,188 | | $ | 56,057,026 | | $ | 11,071,983 | | $ | 33,679,687 | | $ | 4,070,356 | |
(a) Illiquid and Restricted Securities
The Funds own certain securities which have a limited trading market and/or certain restrictions on trading and therefore may be illiquid and/or restricted. Such securities have been valued at fair value in accordance with the procedures described in Note (2)(a). Because of the inherent uncertainty of valuation, these values may differ from the values that would have been used had a ready market for these securities existed and these differences could be material. Illiquid and/or restricted securities owned at March 31, 2012, include the following:
| | | | | | | | | | | | | | | | | | Nebraska | |
| | | Acquisition | | | | | Partners | | | | | | | | Tax-Free | |
| | | Date | | Value | | Value | | Partners III | | Hickory | | Income | |
| Adelphia Recovery Trust, Series ACC-7 | | | 7/25/02 | | $ | 494,900 | | $ | 300,300 | | $ | — | | $ | — | | $ | — | |
| CIBL, Inc. | | | 9/09/96 | | | — | | | — | | | — | | | 94,596 | | | — | |
| Continental Resources | | | 1/28/87 | | | — | | | — | | | 41,437 | | | — | | | — | |
| ICTC Group, Inc. – CL A | | | 9/09/96 | | | — | | | — | | | — | | | 297,285 | | | — | |
| Intelligent Systems Corp. | | | 12/03/91 | | | — | | | — | | | 2,899,379 | | | — | | | — | |
| LICT Corp. | | | 9/09/96 | | | — | | | — | | | — | | | 2,228,509 | | | — | |
| Nebraska Investment Finance Authority, Clean Water State Revolving Bond, Series 2011, 0.6%, 6/15/12 | | | 8/31/11 | | | — | | | — | | | — | | | — | | | 1,505,000 | |
| Total cost of illiquid and/or restricted securities | | | | | $ | 494,900 | | $ | 300,300 | | $ | 2,940,816 | | $ | 2,620,390 | | $ | 1,505,000 | |
| Value at 3/31/12 | | | | | $ | — | | $ | — | | $ | 3,623,000 | | $ | 3,487,953 | | $ | 1,505,000 | |
| Percent of net assets at 3/31/12 | | | | | | 0.0 | % | | 0.0 | % | | 0.6 | % | | 1.1 | % | | 1.6 | % |
(b) Options Written
Transactions relating to options written for the year ended March 31, 2012 are summarized as follows:
| | | Value | | Partners Value | |
| | | Number of | | | | | Number of | | | | |
| | | Contracts | | Premiums | | Contracts | | Premiums | |
| Options outstanding, beginning of period | | | — | | $ | — | | | — | | $ | — | |
| Options written | | | 400 | | | 230,584 | | | 2,250 | | | 399,207 | |
| Options exercised | | | (200 | ) | | (125,428 | ) | | — | | | — | |
| Options expired | | | (200 | ) | | (105,156 | ) | | (2,000 | ) | | (297,334 | ) |
| Options outstanding, end of period | | | — | | $ | — | | | 250 | | $ | 101,873 | |
| | | Partners III | | Hickory | |
| | | Number of | | | | | Number of | | | | |
| | | Contracts | | Premiums | | Contracts | | Premiums | |
| Options outstanding, beginning of period | | | 1,000 | | $ | 173,717 | | | 1,000 | | $ | 173,717 | |
| Options written | | | 40,250 | | | 10,550,336 | | | 4,600 | | | 1,091,819 | |
| Options exercised | | | (6,920 | ) | | (1,439,644 | ) | | (1,500 | ) | | (390,173 | ) |
| Options expired | | | (11,400 | ) | | (1,850,676 | ) | | (3,600 | ) | | (661,087 | ) |
| Options closed | | | (12,250 | ) | | (4,292,358 | ) | | — | | | — | |
| Options outstanding, end of period | | | 10,680 | | $ | 3,141,375 | | | 500 | | $ | 214,276 | |
| | | Balanced | | Short-Intermediate Income | |
| | | Number of | | | | | Number of | | | | |
| | | Contracts | | Premiums | | Contracts | | Premiums | |
| Options outstanding, beginning of period | | | 50 | | $ | 26,124 | | | 5,000 | | $ | 589,988 | |
| Options written | | | 300 | | | 117,373 | | | 2,000 | | | 1,274,975 | |
| Options exercised | | | (300 | ) | | (117,373 | ) | | (2,000 | ) | | (1,274,975 | ) |
| Options expired | | | (50 | ) | | (26,124 | ) | | (5,000 | ) | | (589,988 | ) |
| Options outstanding, end of period | | | — | | $ | — | | | — | | | — | |
The locations in the Statements of Assets and Liabilities of the Funds’ derivative positions, none of which are designated as hedging instruments are as follows:
| | | | | | | | | | | | | | Average | | Gross Notional | |
| | | | | | | | Fair Value at March 31, 2012 | | Month-End | | Amount | |
| | | | | | | | Asset | | Liability | | Notional | | Outstanding | |
| Fund | Type of Derivative | | Location | | Derivatives | | Derivatives | | Amount | | March 31, 2012 | |
| Value | | Equity call options written | | | Options written, at value | | $ | — | | $ | — | | $ | 300,000 | | $ | — | |
| | | Equity put options written | | | Options written, at value | | | — | | | — | | | 283,333 | | | — | |
| Partners Value | | Equity call options written | | | Options written, at value | | | — | | | (96,000 | ) | | 1,213,542 | | | 1,562,500 | |
| Partners III | | Put options purchased | | | Investments in securities | | | 591,500 | | | — | | | 17,700,000 | | | 42,350,000 | |
| | | | | | at value | | | | | | | | | | | | | |
| | | Equity call options written | | | Options written, at value | | | — | | | (3,957,390 | ) | | 25,585,563 | | | 75,433,250 | |
| | | Put options written | | | Options written, at value | | | — | | | (3,000 | ) | | 5,918,750 | | | 1,750,000 | |
| Hickory | | Equity call options written | | | Options written, at value | | | — | | | (208,750 | ) | | 3,779,167 | | | 3,125,000 | |
| | | Equity put options written | | | Options written, at value | | | — | | | — | | | 1,000,000 | | | — | |
| Balanced | | Equity call options written | | | Options written, at value | | | — | | | — | | | 375,000 | | | — | |
| Short- | | Equity call options written | | | Options written, at value | | | — | | | — | | | 5,104,167 | | | — | |
| Intermediate | | | | | | | | | | | | | | | | | | |
| Income | | | | | | | | | | | | | | | | | | |
Derivative positions open during the year and at year end are reflected for each Fund in the table above.
Transactions in derivative instruments during the year ended March 31, 2012 by the Funds are recorded in the following locations in the Statements of Operations:
| | | | | | | | Realized | | | | | Change in | |
| | | | | | | | Gain | | | | | Unrealized | |
| Fund | Type of Derivative | | | Location | | (Loss) | | Location | | Gain (Loss) | |
| Value | | Equity call options written | | | Net realized gain (loss) - | | $ | 105,156 | | | Net unrealized appreciation | | $ | — | |
| | | | | | options written | | | | | | (depreciation) - options written | | | | |
| Partners Value | | Equity call options written | | | Net realized gain (loss) - | | | 297,334 | | | Net unrealized appreciation | | | 5,873 | |
| | | | | | options written | | | | | | (depreciation) - options written | | | | |
| Partners III | | Equity put options purchased | | | Net realized gain (loss) - | | | (1,135,411 | ) | | Net unrealized appreciation | | | (635,250 | ) |
| | | | | | unaffiliated issuers | | | | | | (depreciation) - unaffiliated issuers | | | | |
| | | Equity call options written | | | Net realized gain (loss) - | | | 1,206,670 | | | Net unrealized appreciation | | | (1,132,713 | ) |
| | | | | | options written | | | | | | (depreciation) - options written | | | | |
| | | Equity put options written | | | Net realized gain (loss) - | | | 1,506,757 | | | Net unrealized appreciation | | | 167,481 | |
| | | | | | options written | | | | | | (depreciation) - options written | | | | |
| Hickory | | Equity call options written | | | Net realized gain (loss) - | | | 661,087 | | | Net unrealized appreciation | | | (140,691 | ) |
| | | | | | options written | | | | | | (depreciation) - options written | | | | |
| Balanced | | Equity call options written | | | Net realized gain (loss) - | | | 26,124 | | | Net unrealized appreciation | | | (2,874 | ) |
| | | | | | options written | | | | | | (depreciation) - options written | | | | |
| Short- | | Equity call options written | | | Net realized gain (loss) - | | | 589,989 | | | Net unrealized appreciation | | | (142,488 | ) |
| Intermediate | | | | | options written | | | | | | (depreciation) - options written | | | | |
| Income | | | | | | | | | | | | | | | |
(7) Affiliated Issuers
Affiliated issuers, as defined under the Investment Company Act of 1940, are those in which a Fund’s holdings of an issuer represent 5% or more of the outstanding voting securities of the issuer. A summary of each Fund’s holdings in the securities of such issuers is set forth below:
| | | Number of | | | | | | | | Number of | | | | | | | | Realized | |
| | | Shares Held | | Gross | | Gross | | Shares Held | | Value | | Dividend | | Gains/ | |
| | | March 31, 2011 | | Additions | | Reductions | | March 31, 2012 | | March 31, 2012 | | Income | | (Losses) | |
| Partners III: | | | | | | | | | | | | | | | | | | | | | | |
Intelligent Systems Corp.† | | | 2,270,000 | | | — | | | — | | | 2,270,000 | | $ | 3,291,500 | | $ | — | | $ | — | |
† Controlled affiliate in which the Fund owns 25% or more of the outstanding voting securities.
(8) Contingencies
Each Fund indemnifies the Trust’s officers and trustees for certain liabilities that might arise from their performance of their duties to each of the Funds. Additionally, in the normal course of business the Funds enter into contracts that contain a variety of representations and warranties and which provide general indemnifications. The Funds’ maximum exposure under these arrangements is unknown, as this would involve future claims that may be made against the Funds that have not yet occurred. However, based on experience, the Funds expect the risk of loss to be remote.
(9) Financial Instruments With Off-Balance Sheet Risks
Option contracts written and securities sold short result in off-balance sheet risk as the Fund’s ultimate obligation to satisfy the terms of the contract or the sale of securities sold short may exceed the amount recognized in the Statements of Assets and Liabilities.
The Funds are required to maintain collateral in a segregated account to provide adequate margin as determined by the broker.
(10) Margin Borrowing Agreement
The Partners III Fund has a margin account with its prime broker, Merrill Lynch, under which the Fund may borrow against the value of its securities, subject to regulatory limitations. Interest accrues at the federal funds rate plus 0.625% (0.765% at March 31, 2012). Interest is accrued daily and paid monthly. The Partners III Fund held a cash balance of $70,378,726, with the broker at March 31, 2012.
The Partners III Fund is exposed to credit risk from its prime broker who effects transactions and extends credit pursuant to a prime brokerage agreement. The Adviser attempts to minimize the credit risk by monitoring credit exposure and the credit worthiness of the prime broker.
(11) Concentration of Credit Risk
Approximately 84% of the Nebraska Tax-Free Income Fund’s net assets are in obligations of political subdivisions of the State of Nebraska which are subject to the credit risk associated with the non-performance of such issuers.
(12) Fair Value Measurements
Various inputs are used in determining the value of the Fund’s investments. These inputs are used in determining the value of the Funds’ investments and are summarized in the following fair value hierarchy:
| • | Level 1 – quoted prices in active markets for identical securities |
| | |
| • | Level 2 – other significant observable inputs (including quoted prices for similar securities) |
| | |
| • | Level 3 – significant unobservable inputs (including the Funds’ own assumptions in determining the fair value of investments) |
The inputs or methodology used for valuing securities are not an indication of the risk associated with investing in those securities.
A description of the valuation techniques applied to the company’s major categories of assets and liabilities measured at fair value on a recurring basis follows.
| • | Equity securities (common and preferred stock). Securities traded on a national securities exchange (or reported on the NASDAQ national market) are stated at the last reported sales price on the day of valuation. To the extent these securities are actively traded and valuation adjustments are not applied, they are categorized in Level 1 of the fair value hierarchy. Preferred stock and other equities traded on inactive markets or valued by reference to similar instruments are categorized in Level 2. |
| | |
| • | Corporate and Municipal bonds. The fair value of corporate bonds is estimated using various techniques, which may consider recently executed transactions in securities of the issuer or comparable issuers, market price quotations (where observable), bond spreads and fundamental data relating to the issuer. Although most corporate and municipal bonds are categorized in Level 2 of the fair value hierarchy, in instances where lower relative weight is placed on transaction prices, quotations, or similar observable inputs, they are categorized in Level 3. |
| | |
| • | Asset backed securities. The fair value of asset backed securities (including non-government agency mortgage-backed securities) is estimated based on models that consider the estimated cash flows of each tranche of the entity, establishes a benchmark yield and develops an estimated tranche specific spread to the benchmark yield based on the unique attributes of the tranche. To the extent the inputs are observable and timely, the values would be categorized in Level 2 of the fair value hierarchy; otherwise they would be categorized as Level 3. |
| | |
| • | U.S. Government securities. U.S. Government securities are normally valued using a model that incorporates market observable data such as reported sales of similar securities, broker quotes, yields, bids, offers and reference data. Certain securities are valued principally using dealer quotations. U.S. Government securities are categorized in Level 1 or Level 2 of the fair value hierarchy depending on the inputs used and market activity levels for specific securities. |
| | |
| • | U.S. agency securities. U.S. agency securities are comprised of two main categories consisting of agency issued debt and mortgage-backed securities. Agency issued debt securities are generally valued in a manner similar to U.S. Government securities. |
Mortgage-backed securities include collateralized mortgage obligations, to-be-announced (TBA) securities and mortgage pass-through certificates. Mortgage-backed securities are generally valued using dealer quotations. Depending on market activity levels and whether quotations or other data are used, these securities are typically categorized in Level 2 of the fair value hierarchy.
| • | Restricted and/or illiquid securities. Restricted and/or illiquid securities for which quotations are not readily available are valued in accordance with procedures approved by the Trust’s Board of Trustees. Restricted securities issued by publicly traded companies are generally valued at a discount to similar publicly traded securities. Restricted or illiquid securities issued by nonpublic entities may be valued by reference to comparable public entities or fundamental data relating to the issuer or both. Depending on the relative significance of valuation inputs, these instruments may be classified in either Level 2 or Level 3 of the fair value hierarchy. |
| | |
| • | Derivative instruments. Listed derivatives, such as the Funds’ equity option contracts, that are valued based on closing prices from the exchange or the mean of the closing bid and ask prices are generally categorized in Level 2 of the fair value hierarchy. |
The following is a summary of the inputs used as of March 31, 2012, in valuing the Funds’ assets and liabilities carried at fair value:
| Value |
| | | Level 1 | | Level 2 | | Level 3 | | Total | |
| Assets: | | | | | | | | | | | | | |
| Investments in Securities: | | | | | | | | | | | | | |
| Common Stocks: | | | | | | | | | | | | | |
| Information Technology | | $ | 179,286,600 | | $ | — | | $ | — | | $ | 179,286,600 | |
| Consumer Discretionary | | | 172,208,850 | | | — | | | — | | | 172,208,850 | |
| Financials | | | 133,108,000 | | | — | | | — | | | 133,108,000 | |
| Consumer Staples | | | 90,319,500 | | | — | | | — | | | 90,319,500 | |
| Industrials | | | 84,844,800 | | | — | | | — | | | 84,844,800 | |
| Materials | | | 52,068,050 | | | — | | | — | | | 52,068,050 | |
| Energy | | | 49,039,200 | | | — | | | — | | | 49,039,200 | |
| Health Care | | | 40,267,500 | | | — | | | — | | | 40,267,500 | |
| Short-Term Securities | | | 215,423,126 | | | — | | | — | | | 215,423,126 | |
| Total Investments in Securities | | $ | 1,016,565,626 | | $ | — | | $ | — | | $ | 1,016,565,626 | |
| Partners Value |
| | | Level 1 | | Level 2 | | Level 3 | | Total | |
| Assets: | | | | | | | | | | | | | |
| Investments in Securities: | | | | | | | | | | | | | |
| Common Stocks: | | | | | | | | | | | | | |
| Consumer Discretionary | | $ | 162,535,919 | | $ | — | | $ | — | | $ | 162,535,919 | |
| Information Technology | | | 122,473,902 | | | — | | | — | | | 122,473,902 | |
| Financials | | | 105,774,400 | | | — | | | — | | | 105,774,400 | |
| Health Care | | | 58,564,950 | | | — | | | — | | | 58,564,950 | |
| Energy | | | 38,545,560 | | | — | | | — | | | 38,545,560 | |
| Materials | | | 35,686,175 | | | — | | | — | | | 35,686,175 | |
| Industrials | | | 22,472,000 | | | — | | | — | | | 22,472,000 | |
| Consumer Staples | | | 13,440,000 | | | — | | | — | | | 13,440,000 | |
| Short-Term Securities | | | 151,792,410 | | | — | | | — | | | 151,792,410 | |
| Total Investments in Securities | | $ | 711,285,316 | | $ | — | | $ | — | | $ | 711,285,316 | |
| Liabilities: | | | | | | | | | | | | | |
| Options Written | | $ | — | | $ | (96,000 | ) | $ | — | | $ | (96,000 | ) |
| Partners III |
| | | Level 1 | | Level 2 | | Level 3 | | Total | |
| Assets: | | | | | | | | | | | | | |
| Investments in Securities: | | | | | | | | | | | | | |
| Common Stocks: | | | | | | | | | | | | | |
| Consumer Discretionary | | $ | 167,725,990 | | $ | — | | $ | — | | $ | 167,725,990 | |
| Financials | | | 117,828,020 | | | — | | | — | | | 117,828,020 | |
| Information Technology | | | 98,508,700 | | | — | | | — | | | 98,508,700 | |
| Health Care | | | 62,691,100 | | | — | | | — | | | 62,691,100 | |
| Energy | | | 54,702,917 | | | — | | | — | | | 54,702,917 | |
| Industrials | | | 29,213,484 | | | 3,291,500 | | | — | | | 32,504,984 | |
| Materials | | | 24,507,901 | | | — | | | — | | | 24,507,901 | |
| Consumer Staples | | | 2,710,400 | | | — | | | — | | | 2,710,400 | |
| Telecommunication Services | | | — | | | — | | | 331,500 | | | 331,500 | |
| Put Options | | | — | | | 591,500 | | | — | | | 591,500 | |
| Short-Term Securities | | | 76,089,356 | | | — | | | — | | | 76,089,356 | |
| Total Investments in Securities | | $ | 633,977,868 | | $ | 3,883,000 | | $ | 331,500 | | $ | 638,192,368 | |
| Liabilities: | | | | | | | | | | | | | |
| Options Written | | $ | — | | $ | (3,960,390 | ) | $ | — | | $ | (3,960,390 | ) |
| Securities Sold Short | | | (68,592,500 | ) | | — | | | — | | | (68,592,500 | ) |
| Research |
| | | Level 1 | | Level 2 | | Level 3 | | Total | |
| Assets: | | | | | | | | | | | | | |
| Investments in Securities: | | | | | | | | | | | | | |
| Common Stocks: | | | | | | | | | | | | | |
| Consumer Discretionary | | $ | 4,206,457 | | $ | — | | $ | — | | $ | 4,206,457 | |
| Information Technology | | | 3,629,619 | | | — | | | — | | | 3,629,619 | |
| Financials | | | 1,397,700 | | | — | | | — | | | 1,397,700 | |
| Energy | | | 1,089,232 | | | — | | | — | | | 1,089,232 | |
| Health Care | | | 842,746 | | | — | | | — | | | 842,746 | |
| Industrials | | | 462,387 | | | — | | | — | | | 462,387 | |
| Consumer Staples | | | 457,488 | | | — | | | — | | | 457,488 | |
| Short-Term Securities | | | 4,196,815 | | | — | | | — | | | 4,196,815 | |
| Total Investments in Securities | | $ | 16,282,444 | | $ | — | | $ | — | | $ | 16,282,444 | |
| Hickory |
| | | | Level 1 | | | Level 2 | | | Level 3 | | | Total | |
| Assets: | | | | | | | | | | | | | |
| Investments in Securities: | | | | | | | | | | | | | |
| Common Stocks: | | | | | | | | | | | | | |
| Consumer Discretionary | | $ | 105,104,340 | | $ | — | | $ | 1,180,875 | | $ | 106,285,215 | |
| Financials | | | 38,538,700 | | | — | | | — | | | 38,538,700 | |
| Materials | | | 26,558,074 | | | — | | | — | | | 26,558,074 | |
| Health Care | | | 24,069,850 | | | — | | | — | | | 24,069,850 | |
| Energy | | | 15,268,500 | | | — | | | — | | | 15,268,500 | |
| Information Technology | | | 14,361,900 | | | — | | | — | | | 14,361,900 | |
| Industrials | | | 11,467,825 | | | — | | | — | | | 11,467,825 | |
| Consumer Staples | | | 8,106,272 | | | — | | | — | | | 8,106,272 | |
| Telecommunication Services | | | — | | | 2,160,750 | | | 146,328 | | | 2,307,078 | |
| Short-Term Securities | | | 85,645,316 | | | — | | | — | | | 85,645,316 | |
| Total Investments in Securities | | $ | 329,120,777 | | $ | 2,160,750 | | $ | 1,327,203 | | $ | 332,608,730 | |
| Liabilities: | | | | | | | | | | | | | |
| Options Written | | $ | — | | $ | (208,750 | ) | $ | — | | $ | (208,750 | ) |
| Balanced |
| | | | Level 1 | | | Level 2 | | | Level 3 | | | Total | |
| Assets: | | | | | | | | | | | | | |
| Investments in Securities: | | | | | | | | | | | | | |
| Common Stocks: | | | | | | | | | | | | | |
| Information Technology | | $ | 8,023,770 | | $ | — | | $ | — | | $ | 8,023,770 | |
| Consumer Discretionary | | | 7,823,835 | | | — | | | — | | | 7,823,835 | |
| Financials | | | 7,028,350 | | | — | | | — | | | 7,028,350 | |
| Consumer Staples | | | 5,551,600 | | | — | | | — | | | 5,551,600 | |
| Health Care | | | 5,320,120 | | | — | | | — | | | 5,320,120 | |
| Industrials | | | 3,429,800 | | | — | | | — | | | 3,429,800 | |
| Materials | | | 3,025,680 | | | — | | | — | | | 3,025,680 | |
| Energy | | | 1,970,280 | | | — | | | — | | | 1,970,280 | |
| Corporate Bonds | | | — | | | 9,926,665 | | | — | | | 9,926,665 | |
| Mortgage-Backed Securities | | | — | | | 3,365,551 | | | — | | | 3,365,551 | |
| Asset-Backed Securities | | | — | | | 504,329 | | | — | | | 504,329 | |
| Taxable Municipal Bonds | | | — | | | 314,406 | | | — | | | 314,406 | |
| Government Agency | | | — | | | 2,004,610 | | | — | | | 2,004,610 | |
| Short-Term Securities | | | 30,403,180 | | | — | | | — | | | 30,403,180 | |
| Total Investments in Securities | | $ | 72,576,615 | | $ | 16,115,561 | | $ | — | | $ | 88,692,176 | |
| Short-Intermediate Income |
| | | Level 1 | | Level 2 | | Level 3 | | Total | |
| Assets: | | | | | | | | | | | | | |
| Investments in Securities: | | | | | | | | | | | | | |
| Corporate Bonds | | $ | — | | $ | 598,742,141 | | $ | — | | $ | 598,742,141 | |
| Mortgage-Backed Securities | | | — | | | 514,854,554 | | | — | | | 514,854,554 | |
| Asset-Backed Securities | | | — | | | 9,675,076 | | | — | | | 9,675,076 | |
| Taxable Municipal Bonds | | | — | | | 15,684,854 | | | — | | | 15,684,854 | |
| U.S. Treasury and Government Agency | | | — | | | 148,603,550 | | | — | | | 148,603,550 | |
| Common Stocks | | | 22,170,981 | | | — | | | — | | | 22,170,981 | |
| Short-Term Securities | | | 133,940,345 | | | — | | | — | | | 133,940,345 | |
| Total Investments in Securities | | $ | 156,111,326 | | $ | 1,287,560,175 | | $ | — | | $ | 1,443,671,501 | |
| Nebraska Tax-Free Income |
| | | Level 1 | | Level 2 | | Level 3 | | Total | |
| Assets: | | | | | | | | | | | | | |
| Investments in Securities: | | | | | | | | | | | | | |
| Municipal Bonds: | | | | | | | | | | | | | |
| Arizona | | $ | — | | $ | 1,034,350 | | $ | — | | $ | 1,034,350 | |
| Florida | | | — | | | 2,263,530 | | | — | | | 2,263,530 | |
| Hawaii | | | — | | | 1,006,930 | | | — | | | 1,006,930 | |
| Illinois | | | — | | | 2,268,086 | | | — | | | 2,268,086 | |
| Iowa | | | — | | | 655,620 | | | — | | | 655,620 | |
| Minnesota | | | — | | | 10,030 | | | — | | | 10,030 | |
| Nebraska | | | — | | | 76,885,864 | | | 1,505,000 | | | 78,390,864 | |
| North Dakota | | | — | | | 889,001 | | | — | | | 889,001 | |
| Ohio | | | — | | | 1,109,774 | | | — | | | 1,109,774 | |
| Puerto Rico | | | — | | | 2,497,763 | | | — | | | 2,497,763 | |
| Virginia | | | — | | | 1,093,940 | | | — | | | 1,093,940 | |
| Wisconsin | | | — | | | 1,555,995 | | | — | | | 1,555,995 | |
| Short-Term Securities | | | 1,700,118 | | | — | | | — | | | 1,700,118 | |
| Total Investments in Securities | | $ | 1,700,118 | | $ | 91,270,883 | | $ | 1,505,000 | | $ | 94,476,001 | |
| Government Money Market |
| | | Level 1 | | Level 2 | | Level 3 | | Total | |
| Assets: | | | | | | | | | | | | | |
| Investments in Securities: | | | | | | | | | | | | | |
| U.S. Treasury | | $ | 74,995,260 | | $ | — | | $ | — | | $ | 74,995,260 | |
| Short-Term Securities | | | 2,296,627 | | | — | | | — | | | 2,296,627 | |
| Total Investments in Securities | | $ | 77,291,887 | | $ | — | | $ | — | | $ | 77,291,887 | |
For transfers between the levels within the fair value hierarchy, the Funds have adopted a policy of recognizing the transfers as of the date of the underlying event which caused the transfer.
At March 31, 2012, the reconciliation of assets in which significant unobservable inputs (Level 3) were used in determining the following Funds’ fair values were as follows:
| | | | | | | | | Nebraska | |
| | | | | | | | | Tax-Free | |
| | | Partners III | | Hickory | | Income | |
| Common Stocks: | | | | | | | | | | |
| Beginning balance, March 31, 2011 | | $ | 331,500 | | $ | 619,683 | | $ | — | |
| Net realized gain (loss) | | | — | | | — | | | — | |
| Net change in unrealized appreciation (depreciation) | | | — | | | 707,520 | | | — | |
| Net purchases (sales) | | | — | | | — | | | 1,505,000 | |
| Transfers in to Level 3 | | | — | | | — | | | — | |
| Transfers out of Level 3 | | | — | | | — | | | — | |
| Ending balance, March 31, 2012 | | $ | 331,500 | | $ | 1,327,203 | | $ | 1,505,000 | |
| Net change in unrealized appreciation (depreciation)attributable to assets still held at end of period | | $ | — | | $ | 707,520 | | $ | — | |
(13) Subsequent Events
Management has evaluated the impact of all subsequent events on the Funds through the date the financial statements were issued and has determined that there were no subsequent events requiring recognition or disclosure in the financial statements.
(14) New Accounting Pronouncement
In May 2011, the Financial Accounting Standards Board issued Accounting Standards Update (“ASU”) No. 2011-04 “Amendments to Achieve Common Fair Value Measurement and Disclosure Requirements in U.S. GAAP and IFRSs.” ASU 2011-04 includes common requirements for measurement of and disclosure about fair value between U.S. GAAP and International Financial Reporting Standards (“IFRS”). ASU 2011-04 will require reporting entities to disclose the following information for fair value measurements categorized within Level 3 of the fair value hierarchy: quantitative information about the unobservable inputs used in the fair value measurement, the valuation processes used by the reporting entity and a narrative description of the sensitivity of the fair value measurement to changes in unobservable inputs and the interrelationships between those unobservable inputs. In addition, ASU No. 2011-04 will require reporting entities to make disclosures about amounts and reasons for all transfers in and out of Level 1 and Level 2 fair value measurements. The new and revised disclosures are effective for interim and annual reporting periods beginning after December 15, 2011. Management is currently evaluating the implications of ASU No. 2011-04 and its impact on the financial statements has not been determined.
REPORT OF INDEPENDENT REGISTERED PUBLIC
ACCOUNTING FIRM
To the Board of Trustees and Shareholders of The Weitz Funds
We have audited the accompanying statements of assets and liabilities of The Weitz Funds, comprising the Value Fund, Partners Value Fund, Partners III Opportunity Fund, Research Fund, Hickory Fund, Balanced Fund, Short-Intermediate Income Fund, Nebraska Tax-Free Income Fund and Government Money Market Fund (collectively referred to as the “Funds”), including the schedules of investments, as of March 31, 2012, and the related statements of operations (and statement of cash flows for Partners III Opportunity Fund) for the year or period then ended, the statements of changes in net assets for each of the two years or periods in the period then ended, and the financial highlights for each of the five years or periods in the period then ended. These financial statements and financial highlights are the responsibility of the Funds’ management. Our responsibility is to express an opinion on these financial statements and financial highlights based on our audits.
We conducted our audits in accordance with standards of the Public Company Accounting Oversight Board (United States). Those standards require that we plan and perform the audits to obtain reasonable assurance about whether the financial statements and financial highlights are free of material misstatement. We were not engaged to perform an audit of the Funds’ internal control over financial reporting. Our audits included consideration of internal control over financial reporting as a basis for designing audit procedures that are appropriate in the circumstances, but not for the purpose of expressing an opinion on the effectiveness of the Funds’ internal control over financial reporting. Accordingly, we express no such opinion. An audit also includes examining, on a test basis, evidence supporting the amounts and disclosures in the financial statements and financial highlights, assessing the accounting principles used and significant estimates made by management, and evaluating the overall financial statement presentation. Our procedures included confirmation of securities owned as of March 31, 2012, by correspondence with the custodian and brokers. We believe that our audits provide a reasonable basis for our opinion.
In our opinion, the financial statements and financial highlights referred to above present fairly, in all material respects, the financial position of each of the respective Funds referred to above of The Weitz Funds as of March 31, 2012, the results of their operations (and cash flows for Partners III Opportunity Fund) for the year or period then ended, the changes in their net assets for each of the two years or periods in the period then ended, and their financial highlights for each of the five years or periods in the period then ended, in conformity with U.S. generally accepted accounting principles.
Cincinnati, Ohio
April 30, 2012
ACTUAL AND HYPOTHETICAL EXPENSES FOR
COMPARISON PURPOSES • (UNAUDITED)
Example
As a shareholder of one or more of the Funds, you incur two types of costs: (1) transaction costs, including any transaction fees that you may be charged if you purchase or redeem your Fund shares through certain financial institutions; and (2) ongoing costs, including management fees and other Fund expenses. This Example is intended to help you understand your ongoing costs (in dollars) of investing in the Funds and to compare these costs with the ongoing costs of investing in other mutual funds. The Example is based on an investment of $1,000 invested at the beginning of the period and held for the entire period from October 1, 2011 through March 31, 2012.
Actual Expenses
The first line for each Fund in the table below provides information about actual account values and actual expenses. You may use the information in this line, together with the amount you invested, to estimate the expenses that you paid over the period. Simply divide your account value by $1,000 (for example, an account value of $8,600 divided by $1,000 = 8.6), then multiply the result by the number in the first line under the heading entitled “Expenses Paid from 10/01/11 –3/31/12” to estimate the expenses you paid on your account during this period.
Hypothetical Example for Comparison Purposes
The second line for each Fund in the table below provides information about hypothetical account values and hypothetical expenses based on the actual expense ratio of each Fund and an assumed rate of return of 5% per year before expenses, which is not the actual return of the Fund. The hypothetical account values and expenses may not be used to estimate the actual ending account balance or expenses you paid for the period. You may use this information to compare the ongoing costs of investing in a specific Weitz Fund to other funds. To do so, compare this 5% hypothetical example with the 5% hypothetical examples that appear in the shareholder reports of the other funds.
Please note that the expenses shown in the table are meant to highlight your ongoing costs only and do not reflect any transactional costs charged by certain financial institutions. Therefore, the second line of the table is useful in comparing ongoing costs only, and will not help you determine the relative total costs of owning different funds. In addition, if you incurred transactional fees, your costs would have been higher. Actual and hypothetical expenses for each Fund are provided in this table.
| | | | | Beginning | Ending Account | Annualized | Expenses Paid |
| | | | | Account Value | Value | Expense | from 10/01/11 - |
| | | | | 10/01/11 | 3/31/12 | Ratio | 3/31/12(1) |
| Value | | | Actual | | $ | 1,000.00 | | $ | 1,220.58 | | | 1.19 | % | $ | 6.61 | |
| | | | Hypothetical(2) | | | 1,000.00 | | | 1,019.05 | | | 1.19 | % | | 6.01 | |
| Partners Value | | | Actual | | | 1,000.00 | | | 1,236.04 | | | 1.20 | % | | 6.71 | |
| | | | Hypothetical(2) | | | 1,000.00 | | | 1,019.00 | | | 1.20 | % | | 6.06 | |
| Partners III - | | | Actual | | | 1,000.00 | | | 1,205.03 | | | 1.55 | % | | 8.54 | |
| Institutional Class | | | Hypothetical(2) | | | 1,000.00 | | | 1,017.25 | | | 1.55 | % | | 7.82 | |
| Partners III - | | | Actual | | | 1,000.00 | | | 1,202.24 | | | 1.82 | % | | 10.02 | |
| Investor Class | | | Hypothetical(2) | | | 1,000.00 | | | 1,015.90 | | | 1.82 | % | | 9.17 | |
| Research | | | Actual | | | 1,000.00 | | | 1,250.32 | | | 0.90 | % | | 5.06 | |
| | | | Hypothetical(2) | | | 1,000.00 | | | 1,020.50 | | | 0.90 | % | | 4.55 | |
| Hickory | | | Actual | | | 1,000.00 | | | 1,241.75 | | | 1.28 | % | | 7.17 | |
| | | | Hypothetical(2) | | | 1,000.00 | | | 1,018.60 | | | 1.28 | % | | 6.46 | |
| Balanced | | | Actual | | | 1,000.00 | | | 1,166.27 | | | 1.14 | % | | 6.17 | |
| | | | Hypothetical(2) | | | 1,000.00 | | | 1,019.30 | | | 1.14 | % | | 5.76 | |
| Short-Intermediate Income - | | | Actual | | | 1,000.00 | | | 1,019.47 | | | 0.60 | % | | 3.03 | |
| Institutional Class | | | Hypothetical(2) | | | 1,000.00 | | | 1,022.00 | | | 0.60 | % | | 3.03 | |
| Short-Intermediate Income - | | | Actual | | | 1,000.00 | | | 1,018.43 | | | 0.80 | % | | 4.04 | |
| Investor Class | | | Hypothetical(2) | | | 1,000.00 | | | 1,021.00 | | | 0.80 | % | | 4.04 | |
| Nebraska Tax-Free | | | Actual | | | 1,000.00 | | | 1,018.36 | | | 0.70 | % | | 3.53 | |
| | | | Hypothetical(2) | | | 1,000.00 | | | 1,021.50 | | | 0.70 | % | | 3.54 | |
| Government | | | Actual | | | 1,000.00 | | | 1,000.10 | | | 0.00 | % | | 0.00 | |
| Money Market | | | Hypothetical(2) | | | 1,000.00 | | | 1,025.00 | | | 0.00 | % | | 0.00 | |
| (1) | Expenses are equal to the annualized expense ratio for the Fund, multiplied by the average account value over the period, multiplied by the number of days in the most recent fiscal half year (183/366). |
| (2) | Assumes 5% total return before expenses. |
OTHER INFORMATION
(UNAUDITED)
Proxy Voting Policy
A description of the Funds’ proxy voting policies and procedures is available without charge, upon request by (i) calling 800-304-9745, (ii) on the Funds’ website at http://www.weitzfunds.com; and (iii) on the SEC’s website at http://www.sec.gov.
Information on how each of the Funds (other than the Research Fund) voted proxies relating to portfolio securities during each twelve month period ended June 30 is available: (i) on the Funds’ website at http://www.weitzfunds.com, and (ii) on the SEC’s website at http://www.sec.gov.
Form N-Q
The Funds file complete schedules of their portfolio holdings with the Securities and Exchange Commission for the first and third quarters of each fiscal year on Form N-Q. The Funds’ Form N-Q is available on the SEC’s website at http://www.sec.gov and may be reviewed and copied at the SEC’s Public Reference Room in Washington DC.
Information on the operation of the Public Reference Room may be obtained by calling 800 SEC-0330. When filed, the Fund’s quarterly reports, including the information filed on Form N-Q will also be available on the Funds’ website at http://www.weitzfunds.com.
Tax Information
For the fiscal year ended March 31, 2012, certain dividends paid by the Funds may be subject to a maximum tax rate of 15%, as provided for by the Jobs and Growth Tax Relief Reconciliation Act of 2003. Of the distributions paid during the fiscal year, the amounts that may be considered qualified dividend income and for corporate shareholders, the amounts that may qualify for the corporate dividends received deduction, are summarized as follows:
| | | | | | | | | | | | Short- | |
| | | | | | | | | | | | Intermediate | |
| | | Value | | Research | | Balanced | | Income | |
| Qualified dividend income | | $ | 2,159,048 | | $ | 116,462 | | $ | 554,772 | | $ | 81,896 | |
| Corporate dividends received deduction | | | 2,159,048 | | | 117,673 | | | 554,772 | | | 81,896 | |
The information and distributions reported herein may differ from the information and distributions reported to shareholders for the calendar year ended December 31, 2011, which was reported in conjunction with your 2011 Form 1099-DIV.
This page has been left blank intentionally.
INFORMATION ABOUT THE TRUSTEES
AND OFFICERS • (UNAUDITED)
The individuals listed below serve as Trustees or Officers of the Trust. Each Trustee of the Weitz Funds serves until a successor is elected and qualified or until resignation. Each Officer of the Weitz Funds is elected annually by the Trustees.
The address of all Officers and Trustees is 1125 South 103rd Street, Suite 200, Omaha, Nebraska 68124.
| Interested Trustees* | | |
Wallace R. Weitz (Age: 62) Position(s) Held with Trust: President; Portfolio Manager; Trustee Length of Service (Beginning Date): Weitz Funds (and certain predecessor funds) – January 1986 Principal Occupation(s) During Past 5 Years: President, Wallace R. Weitz & Company, Weitz Funds (and certain predecessor funds) Number of Portfolios Overseen in Fund Complex: 9 Other Directorships: N/A | | Thomas R. Pansing (Age: 67) Position(s) Held with Trust: Trustee Length of Service (Beginning Date): Weitz Funds (and certain predecessor funds) - January 1986 Principal Occupation(s) During Past 5 Years: Partner, Pansing Hogan Ernst & Bachman LLP, a law firm Number of Portfolios Overseen in Fund Complex: 9 Other Directorships: N/A |
| * | Mr. Weitz is a Director and Officer of Wallace R. Weitz & Company, investment adviser to the Weitz Funds, and as such is considered an “interested person” of the Trust, as that term is defined in the Investment Company Act of 1940 (an “Interested Trustee”). Mr. Pansing performs certain legal services for the investment adviser and the Weitz Funds and, therefore, is also classified as an “Interested Trustee”. |
| Independent Trustees | | |
Lorraine Chang (Age: 61) Position(s) Held with Trust: Trustee; Chairman, Board of Trustees Length of Service (Beginning Date): Weitz Funds (and certain predecessor funds) - June 1997 Principal Occupation(s) During Past 5 Years: Independent Consultant - January 2009 to Present; Partner, The Public Strategies Group, a management consulting firm - January 1999 to December 2008 Number of Portfolios Overseen in Fund Complex: 9 Other Directorships: N/A | | John W. Hancock (Age: 64) Position(s) Held with Trust: Trustee Length of Service (Beginning Date): Weitz Funds (and certain predecessor funds) - January 1986 Principal Occupation(s) During Past 5 Years: Partner, Hancock & Dana, an accounting firm Number of Portfolios Overseen in Fund Complex: 9 Other Directorships: N/A |
Richard D. Holland (Age: 90) Position(s) Held with Trust: Trustee Length of Service (Beginning Date): Weitz Funds (and certain predecessor funds) - June 1995 Principal Occupation(s) During Past 5 Years: Retired Number of Portfolios Overseen in Fund Complex: 9 Other Directorships: N/A | | Delmer L. Toebben (Age: 81) Position(s) Held with Trust: Trustee Length of Service (Beginning Date): Weitz Funds (and certain predecessor funds) - July 1996 Principal Occupation(s) During Past 5 Years: Retired Number of Portfolios Overseen in Fund Complex: 9 Other Directorships: N/A |
| Independent Trustees (continued) | | |
| Roland J. Santoni (Age: 70) Position(s) Held with Trust: Trustee Length of Service (Beginning Date): Weitz Funds - February 2004 Principal Occupation(s) During Past 5 Years: Vice President, West Development, Inc., a development company; President, Gary and Mary West Foundation, 2007 to Present Number of Portfolios Overseen in Fund Complex: 9 | | Barbara W. Schaefer (Age: 58) Position(s) Held with Trust: Trustee Length of Service (Beginning Date): Weitz Funds - March 2005 Principal Occupation(s) During Past 5 Years: Senior Vice President-Human Resources and Corporate Secretary, Union Pacific Corporation Number of Portfolios Overseen in Fund Complex: 9 Other Directorships: N/A |
| Other Directorships: N/A | | |
| Justin B. Wender (Age: 42) Position(s) Held with Trust: Trustee Length of Service (Beginning Date): Weitz Funds - May 2009 Principal Occupation(s) During Past 5 Years: President, Stella Point Capital, LLC, a private equity firm - August 2010 to Present; President, Castle Harlan, Inc., a private equity firm - July 1993 to August 2010 Number of Portfolios Overseen in Fund Complex: 9 Other Directorships: N/A | | |
| | | |
| Officers | | |
| John R. Detisch (Age: 47) Position(s) Held with Trust: Vice President, Secretary and Chief Compliance Officer Length of Service (Beginning Date): Weitz Funds - January 2011 Principal Occupation(s) During Past 5 Years: Vice President and Chief Compliance Officer, Wallace R. Weitz & Company, Vice President and Chief Compliance Officer, Weitz Funds - January 2011 to | | Kenneth R. Stoll (Age: 50) Position(s) Held with Trust: Vice President and Chief Financial Officer Length of Service (Beginning Date): Weitz Funds - April 2004 Principal Occupation(s) During Past 5 Years: Vice President and Chief Operating Officer, Wallace R. Weitz & Company; Vice President and Chief Financial Officer, Weitz Funds |
| Present; Partner, Kutak Rock LLP, 1990 - January 2011 | | |
| Bradley P. Hinton (Age: 44) Position(s) Held with Trust: Vice President Length of Service (Beginning Date): Weitz Funds - August 2006 Principal Occupation(s) During Past 5 Years: Portfolio Manager; Director of Research, Wallace R. Weitz & Company; Vice President, Wallace R. Weitz & Company | | |
The Statement of Additional Information for the Weitz Funds, which can be obtained without charge by calling 800-304-9745, includes additional information about the Trustees and Officers of the Weitz Funds.
INDEX DESCRIPTIONS
| Russell 1000 | | The Russell 1000 is an unmanaged index of large capitalization common stocks. It consists of the 1,000 largest companies in the Russell 3000 Index. |
| | | |
| Russell 1000 Value | | The Russell 1000 Value is an unmanaged index of large capitalization common stocks. It consists of those Russell 1000 companies with lower price-to-book ratios and lower forecasted growth values. |
| | | |
| Russell 3000 | | The Russell 3000 is an unmanaged index of the 3,000 largest U.S. companies based on market capitalization. |
| | | |
| Russell 3000 Value | | The Russell 3000 Value is an unmanaged index of the largest capitalization common stocks. It consists of those Russell 3000 companies with lower price-to-book ratios and lower forecasted growth values. |
| | | |
| Russell 2500 | | The Russell 2500 is an unmanaged index of small to mid-capitalization common stocks. It consists of the 2,500 smallest companies in the Russell 3000 Index. |
| | | |
| Russell 2500 Value | | The Russell 2500 Value is an unmanaged index of small to mid-capitalization common stocks. It consists of those Russell 2500 companies with lower price-to-book ratios and lower forecasted growth values. |
| | | |
| S&P 500 | | The S&P 500 is an unmanaged index consisting of 500 companies generally representative of the market for the stocks of large-size U.S. companies. |
| | | |
| Blended | | The Blended Index is a blend of 60% S&P 500 and 40% Barclays Capital Intermediate U.S. Government/Credit Index. |
| | | |
Barclays Capital Intermediate
U.S. Government/Credit | | The Barclays Capital Intermediate U.S. Government/Credit Index (BCIGC) is a total return performance benchmark consisting of government securities and publicly issued corporate debt with maturities from one to ten years and rated at least BBB by Standard & Poor’s or Baa by Moody’s Investor Service. |
| | | |
Barclays Capital 5-Year Municipal Bond | | The Barclays Capital 5-Year Municipal Bond Index is an unmanaged index of long-term, fixed-rate, investment-grade, tax-exempt bonds representative of the municipal bond market. |
Board of Trustees Lorraine Chang John W. Hancock Richard D. Holland Thomas R. Pansing, Jr. Roland J. Santoni Barbara W. Schaefer Delmer L. Toebben Wallace R. Weitz Justin B. Wender Investment Adviser Wallace R. Weitz & Company 1125 South 103rd Street, Suite 200 Omaha, NE 68124-1071 (800) 304-9745 Custodian Wells Fargo Bank Minnesota, National Association | Officers Wallace R. Weitz, President John R. Detisch, Vice President, Secretary & Chief Compliance Officer Kenneth R. Stoll, Vice President & Chief Financial Officer Bradley P. Hinton, Vice President Distributor Weitz Securities, Inc. Transfer Agent and Dividend Paying Agent Wallace R. Weitz & Company Sub-Transfer Agent Boston Financial Data Services, Inc. NASDAQ symbols: Value Fund - WVALX Partners Value Fund - WPVLX Partners III Opportunity Fund Institutional Class - WPOPX Investor Class - WPOIX Research Fund - WRESX Hickory Fund - WEHIX Balanced Fund - WBALX Short-Intermediate Income Fund Institutional Class - WEFIX Investor Class - WSHNX Nebraska Tax-Free Income Fund - WNTFX Government Money Market Fund - WGMXX |
Help us conserve resources by receiving your report electronically. Visit us online at www.weitzfunds.com. Simply log in to Account Access and click the “Electronic Delivery” button. | |
An investor should consider carefully the investment objectives, risks, and charges and expenses of the Funds before investing. The Funds’ Prospectus contains this and other information about the Funds. The Prospectus should be read carefully before investing.
5/4/12
Item 2. Code of Ethics.
As of the end of the period covered by this report, the Registrant has adopted a code of ethics that applies to the Registrant’s principal executive officer, principal financial officer, principal accounting officer or controller, or persons performing similar functions, regardless of whether these individuals are employed by the Registrant or a third party (the “Code of Ethics”). During the period covered by this report, there were no amendments, nor did the Registrant grant any waivers, including any implicit waivers, from any provision of the Code of Ethics.
The Code of Ethics is attached hereto as Exhibit 12(a)(1).
Item 3. Audit Committee Financial Expert.
The Registrant’s board of trustees has determined that the Registrant has at least one “audit committee financial expert” (as defined in Item 3 of Form N-CSR) serving on its audit committee. John Hancock is an “audit committee financial expert” and is “independent” (as each term is defined in Item 3 of Form N-CSR).
Item 4. Principal Accountant Fees and Services.
| (a) | | Audit Fees. Fees for audit services provided to the Registrant were $268,054 and $259,200 for fiscal years ended March 31, 2012 and 2011, respectively. |
| | | |
| (b) | | Audit Related Fees. The aggregate fees billed in each of the last two fiscal years for audit related-services by the principal accountant that are reasonably related to the performance of the audit of the Registrant’s financial statements and are not reported under paragraph (a) of this item were $27,300 and $26,000 for fiscal years ended March 31, 2012 and 2011, respectively. The fees, paid by Wallace R. Weitz & Company, the Registrant’s investment adviser and transfer agent, were payment for the principal accountant performing internal control reviews of the Registrant’s transfer agent. |
| | | |
| (c) | | Tax Fees. Fees for tax services, which consisted of income and excise tax compliance services, were $38,592 and $36,400 for the fiscal years ended March 31, 2012 and 2011, respectively. |
| | | |
| (d) | | All Other Fees. Fees for all other services totaled $11,742 and $11,400 for fiscal years ended March 31, 2012 and 2011, respectively. |
| | | |
| (e) | (1) | The Registrant’s Audit Committee has adopted Pre-Approval Policies and Procedures. The Audit Committee must pre-approve all audit services and non-audit services that the principal accountant provides to the Registrant. The Audit Committee must also pre-approve any engagement of the principal accountant to provide non-audit services to the Registrant’s investment adviser, or any affiliate of the adviser that provides ongoing services to the Registrant, if such non-audit services directly impact the Registrant’s operations and financial reporting. |
| | | |
| (e) | (2) | No services described in items (b) were pre-approved by the Audit Committee pursuant to Rule 2-01(c)(7)(i)(c) of Regulation S-X. |
| | | |
| (f) | | All of the work in connection with the audit of the Registrant during the years ended March 31, 2012 and 2011 was performed by full-time employees of the Registrant’s principal accountant. |
| | | |
| (g) | | The aggregate fees billed by the principal accountant for non-audit services to the Registrant, the Registrant’s investment adviser and any entity controlling, controlled by, or under common control with the adviser that provides ongoing services to the Registrant were $118,334 and $144,500 for the years ended March 31, 2012 and 2011, respectively. |
| | | |
| (h) | | The Registrant’s Audit Committee has considered whether the provision of non-audit services that were rendered to the Registrant’s investment adviser, and any entity controlling, controlled by, or under common control with the adviser that provides ongoing services to the Registrant that were not pre-approved pursuant to paragraph (c)(7)(ii) of Rule 2-01 of Regulation S-X is compatible with maintaining the principal auditor’s independence. |
Item 5. Audit Committee of Listed Registrants.
Not applicable.
Item 6. Schedule of Investments.
The Schedule of Investments in securities of unaffiliated issuers is included as part of the Report to Shareholders.
Item 7. Disclosure of Proxy Voting Policies and Procedures for Closed-End Investment Companies.
Not applicable.
Item 8. Portfolio Managers of Closed-End Management Investment Companies
Not applicable
Item 9. Purchases of Equity Securities by Closed-End Management Investment Company and Affiliated Purchasers.
Not applicable.
Item 10. Submissions of Matters to a Vote of Security Holders.
Not applicable.
Item 11. Controls and Procedures.
(a) Based on an evaluation of the Disclosure Controls and Procedures (as defined in Rule 30a-3(c) under the Investment Company Act of 1940) (the "Disclosure Controls") as of a date within 90 days prior to the filing date (the "Filing Date") of this report on Form N-CSR (the "Report"), the Registrant's principal executive officer and financial officer have concluded that the Disclosure Controls are reasonably designed to ensure that information required to be disclosed by the Registrant in the Report is recorded, processed, summarized and reported by the Filing Date, including ensuring that information required to be disclosed in the Report is accumulated and communicated to the Registrant's management, including the Registrant's principal executive officer and principal financial officer, as appropriate to allow timely decisions regarding required disclosure.
(b) There were no significant changes in the Registrant's internal control over financial reporting (as defined in Rule 30a-3(d) under the Investment Company Act of 1940) that occurred during the Registrant's second fiscal half-year of the period covered by this report that has materially affected, or is reasonably likely to materially affect, the Registrant's internal control over financial reporting.
(a)(1) The Code of Ethics is attached hereto.
(a)(2) The certifications required by Rule 30a-2(a) of the Investment Company Act of 1940 are attached hereto.
(a)(3) Not applicable.
(b) The certifications required by Rule 30a-2(b) of the Investment Company Act of 1940 and Section 906 of the Sarbanes-Oxley Act of 2002 are attached hereto.
SIGNATURES
Pursuant to the requirements of the Securities Exchange Act of 1934 and the Investment Company Act of 1940, the Registrant has duly caused this report to be signed on its behalf by the undersigned, thereunto duly authorized.
The Weitz Funds
By (Signature and Title)* /s/ Wallace R. Weitz
Wallace R. Weitz, President
Date May 3, 2012
Pursuant to the requirements of the Securities Exchange Act of 1934 and the Investment Company Act of 1940, this report has been signed below by the following persons on behalf of the Registrant and in the capacities and on the dates indicated.
By (Signature and Title)* /s/ Wallace R. Weitz
Wallace R. Weitz, President
Date May 3, 2012
By (Signature and Title)* /s/ Kenneth R. Stoll
Kenneth R. Stoll, Chief Financial Officer
Date May 3, 2012
* Print the name and title of each signing officer under his or her signature.