UNITED STATES
SECURITIES AND EXCHANGE COMMISSION
Washington, D.C. 20549
FORM N-CSR
CERTIFIED ANNUAL SHAREHOLDER REPORT OF REGISTERED MANAGEMENT
INVESTMENT COMPANIES
Investment Company Act file number 811-21410
The Weitz Funds
(Exact name of registrant as specified in charter)
Suite 200
1125 South 103 Street
Omaha, NE 68124-1071
(Address of principal executive offices) (Zip code)
Wallace R. Weitz & Company
The Weitz Funds
Suite 200
1125 South 103 Street
Omaha, NE 68124-1071
(Name and address of agent for service)
Registrant’s telephone number, including area code: 402-391-1980
Date of fiscal year end: March 31
Date of reporting period: March 31, 2011
Form N-CSR is to be used by management investment companies to file reports with the Commission not later than 10 days after the transmission to stockholders of any report that is required to be transmitted to stockholders under Rule 30e-1 under the Investment Company Act of 1940 (17 CFR 270.30e-1). The Commission may use the information provided on Form N-CSR in its regulatory, disclosure review, inspection, and policymaking roles.
A registrant is required to disclose the information specified by Form N-CSR, and the Commission will make this information public. A registrant is not required to respond to the collection of information contained in Form N-CSR unless the Form displays a currently valid Office of Management and Budget ("OMB") control number. Please direct comments concerning the accuracy of the information collection burden estimate and any suggestions for reducing the burden to Secretary, Securities and Exchange Commission, 450 Fifth Street, NW, Washington, DC 20549-0609. The OMB has reviewed this collection of information under the clearance requirements of 44 U.S.C. § 3507.
Item 1. Report to Stockholders.


WEITZ INVESTMENT PHILOSOPHY
Over the 25+ year history of Weitz Funds, we have seen many changes. Advancements in technology combined with economic, political and global events have continued to shape investors’ thoughts and actions.
Our mission has remained constant— we have an unwavering commitment to our shareholders and a focus on finding strong, well-managed companies priced significantly below their true business value.
We “eat our own cooking.”
We believe in putting our money where our mouth is. All of our employees and trustees have significant personal investments in our “family” of funds. This does not guarantee that the Funds will go up, but it does mean that we win or lose together and that shareholders definitely have our full attention.
We are patient, long-term investors.
When we analyze potential equity investments, we think about the business behind the stock. We buy shares only when we believe they are selling at a large discount to the company’s underlying business value. Ideally, the business value rises over time, and the stock price follows. This often allows us to hold the stock for many years.
Knowing what you don’t know is important in all aspects of life, but it is crucial in investing.
We think our odds of investment success are much higher when we invest in securities of companies we understand and where we may have an edge over other investors. As a result, our portfolios are not diversified among all the various sectors of the economy. Instead, we expect to have a deeper knowledge and understanding of the industries and companies in which we do invest. Our experienced research team has a broad “circle of competence,” and we believe in staying within it.
We worry about permanent loss of capital—not price volatility.
Our Funds are designed for long-term shareholders. We believe concentrating our portfolios in the most attractive investment ideas, although it may cause short-term price volatility, is the best way to earn consistent returns over the long term.
We believe in being flexible and using common sense.
We are often contrarian and do not pay attention to benchmarks when making investment decisions. We also believe that cash is sometimes the most attractive investment.
Our goal is to earn good absolute investment returns over long periods of time without exposing our clients’ and our own capital to undue risk.
2 Weitz Funds
TABLE OF CONTENTS
| 4 |
| | |
| 5 |
| | |
| 8 |
| | |
| 9 |
| | |
| 13 |
| | |
| 18 |
| | |
| 23 |
| | |
| 27 |
| | |
| 32 |
| | |
| 37 |
| | |
| 44 |
| | |
| 50 |
| | |
| 52 |
| | |
| 62 |
| | |
| 74 |
| | |
| 75 |
| | |
| 76 |
| | |
| 80 |
| The management of Weitz Funds has chosen paper for the 80 page body of this financial report from a paper manufacturer certified under the Sustainable Forestry Initiative standard. | | |
Portfolio composition is subject to change at any time and references to specific securities, industries, and sectors referenced in this report are not recommendations to purchase or sell any particular security. Current and future portfolio holdings are subject to risk. See the Schedules of Investments included in this report for the percent of assets in each of the Funds invested in particular industries or sectors.
weitzfunds.com 3
MARCH 31, 2011
| | | | | | Total Returns | | Average Annual Total Returns |
| Fund Name | | Inception Date | | | 3 Mos. | | 1 Year | | 3 Year | | 5 Year | | 10 Year | | 15 Year | | 20 Year | | 25 Year | | Since Inception |
| Value | | 5/09/86 | | | 5.7 | % | | 15.0 | % | | 3.1 | % | | 0.4 | % | | 2.5 | % | | 9.0 | % | | 10.5 | % | | — | % | | 10.4 | % |
Russell 1000**(a) | | | | | 6.2 | | | 16.7 | | | 3.0 | | | 2.9 | | | 3.8 | | | 7.1 | | | N/A | | | — | | | N/A | |
Russell 1000 Value**(b) | | | | | 6.5 | | | 15.2 | | | 0.6 | | | 1.4 | | | 4.5 | | | 7.7 | | | N/A | | | — | | | N/A | |
| Partners Value* | | 6/01/83 | | | 7.1 | | | 20.9 | | | 8.4 | | | 3.8 | | | 3.8 | | | 10.3 | | | 11.7 | | | 11.2 | | | 12.7 | |
| Partners III Opportunity* | | 6/01/83 | | | 8.5 | | | 24.4 | | | 13.9 | | | 6.6 | | | 8.1 | | | 12.2 | | | 13.5 | | | 12.1 | | | 13.6 | |
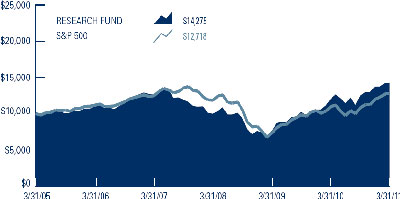
Research*(c) | | 4/01/05 | | | 3.8 | | | 18.5 | | | 12.7 | | | 5.4 | | | — | | | — | | | — | | | — | | | 6.1 | |
Russell 3000**(d) | | | | | 6.4 | | | 17.4 | | | 3.4 | | | 3.0 | | | 4.1 | | | 7.1 | | | N/A | | | N/A | | | N/A | |
Russell 3000 Value**(e) | | | | | 6.5 | | | 15.6 | | | 1.1 | | | 1.4 | | | 4.9 | | | 7.8 | | | N/A | | | N/A | | | N/A | |
| Hickory | | 4/01/93 | | | 8.3 | | | 29.4 | | | 10.5 | | | 4.1 | | | 5.4 | | | 10.0 | | | — | | | — | | | 10.6 | |
Russell 2500**(f) | | | | | 8.7 | | | 26.1 | | | 8.9 | | | 4.4 | | | 8.9 | | | 9.5 | | | — | | | — | | | N/A | |
Russell 2500 Value**(g) | | | | | 7.7 | | | 22.7 | | | 8.0 | | | 3.3 | | | 9.6 | | | 10.7 | | | — | | | — | | | N/A | |
| | | | | | | | | | | | | | | | | | | | | | | | | | | | | | | |
S&P 500**(h) | | | | | 5.9 | | | 15.7 | | | 2.4 | | | 2.6 | | | 3.3 | | | 6.8 | | | 8.7 | | | 9.6 | | | — | |
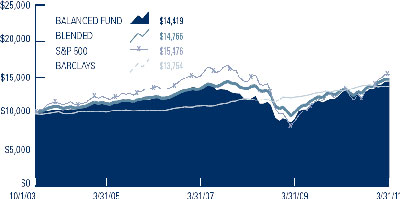
| Balanced | | 10/01/03 | | | 3.4 | | | 11.8 | | | 6.7 | | | 3.5 | | | — | | | — | | | — | | | — | | | 5.0 | |
Blended Index**(i) | | | | | 3.7 | | | 11.3 | | | 3.2 | | | 3.8 | | | — | | | — | | | — | | | — | | | 5.3 | |
| Short-Intermediate Income | | 12/23/88 | | | 0.6 | | | 3.5 | | | 5.3 | | | 5.7 | | | 4.8 | | | 5.5 | | | 5.8 | | | — | | | 6.1 | |
Barclays Intermediate Credit**(j) | | | | | 0.3 | | | 4.6 | | | 4.5 | | | 5.7 | | | 5.2 | | | 5.8 | | | 6.3 | | | — | | | 6.8 | |
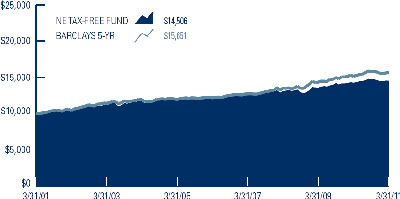
Nebraska Tax-Free Income* | | 10/01/85 | | | 0.3 | | | 1.9 | | | 3.5 | | | 3.5 | | | 3.8 | | | 4.4 | | | 4.8 | | | 5.1 | | | 5.4 | |
Barclays 5-Year Muni. Bond**(k) | | | | | 0.6 | | | 3.2 | | | 5.1 | | | 5.1 | | | 4.6 | | | 4.9 | | | 5.4 | | | — | | | — | |
These performance numbers reflect the deduction of each Fund’s annual operating expenses. Annual operating expenses for the Value, Partners Value, Partners III, Research, Hickory, Balanced, Short-Intermediate Income and Nebraska Tax-Free Income Funds, as stated in the most recent Prospectus are 1.25%, 1.26%, 1.80%, 1.50% (estimated gross), 1.33%, 1.19%, 0.71% and 0.78%, respectively, of each Fund’s net assets. The returns assume redemption at the end of each period and reinvestment of dividends. Total returns shown include fee waivers and expense reimbursements, if any; total returns would have been lower had there been no waiver of fees and/or reimbursement of expenses by the Adviser. This information represents past performance and past performance does not guarantee future results. The investment return and the principal value of an investment in any of the Funds will fluctuate so that an investor’s shares, when redeemed, may be worth more or less than the original cost. Current performance may be higher or lower than the performance data quoted above. Performance data current to the most recent month end may be obtained at www.weitzfunds.com/performance/monthly.asp.
| | |
| * | See pages 14, 19 and 45 for additional performance disclosures. |
| ** | Index performance is hypothetical and is shown for illustrative purposes only. |
| (a) | The Russell 1000 is an unmanaged index of large capitalization common stocks. It consists of the 1,000 largest companies in the Russell 3000 Index. |
| (b) | The Russell 1000 Value is an unmanaged index of large capitalization common stocks. It consists of those Russell 1000 companies with lower price-to-book ratios and lower forecasted growth values. |
| (c) | Annual operating expenses for the Research Fund, as stated in the Research Fund’s Prospectus, are 1.50% (estimated gross) and 0.90% (net) of the Fund’s net assets. The investment adviser has agreed, in writing, to limit the total annual fund operating expenses (excluding taxes, interest, brokerage commissions, and acquired fund fees and expenses) to 0.90% of the Fund’s average daily net assets through July 31, 2012. |
| (d) | The Russell 3000 is an unmanaged index of the 3,000 largest U.S. companies based on market capitalization. |
| (e) | The Russell 3000 Value is an unmanaged index of the largest capitalization common stocks. It consists of those Russell 3000 companies with lower price-to-book ratios and lower forecasted growth values. |
| (f) | The Russell 2500 is an unmanaged index of small to mid-capitalization common stocks. It consists of the 2,500 smallest companies in the Russell 3000 Index. |
| (g) | The Russell 2500 Value is an unmanaged index of small to mid-capitalization common stocks. It consists of those Russell 2500 companies with lower price-to-book ratios and lower forecasted growth values. |
| (h) | The S&P 500 is an unmanaged index consisting of 500 companies generally representative of the market for the stocks of large-size U.S. companies. |
| (i) | The Blended Index is a blend of 60% S&P 500 and 40% Barclays Capital Intermediate U.S. Government/Credit Index. |
| (j) | Barclays Capital Intermediate U.S. Government/Credit Index is a total return performance benchmark consisting of government securities and publicly issued corporate debt with maturities from one to ten years and rated at least BBB by Standard & Poor’s or Baa by Moody’s Investor Service. |
| (k) | Barclays Capital 5-Year Municipal Bond Index is an unmanaged index of long-term, fixed-rate, investment-grade, tax-exempt bonds representative of the municipal bond market. |
| N/A | Indicates information is not available. |
4 Weitz Funds
APRIL 11, 2011
Dear Fellow Shareholder:
In spite of a number of unsettling global events during the quarter, the market continued its recovery from the March 2009 lows. Our stock funds enjoyed a very good quarter, providing a strong finish to our March 31 fiscal year. The table below shows results for the stock funds for the quarter and year ended March 31.
| | | | | | | | |
| | | | Period Ended 3/31/2011 | |
| | | | Quarter | | | Fiscal Year | |
| | | | | | |
| Value | | | 5.7 | % | | 15.0 | % |
| Partners Value | | | 7.1 | | | 20.9 | |
| Partners III | | | 8.5 | | | 24.4 | |
| Research | | | 3.8 | | | 18.5 | |
| Hickory | | | 8.3 | | | 29.4 | |
| S&P 500 | | | 5.9 | | | 15.7 | |
Smaller company stocks continued to lead the recovery from the bear market lows, and the effect of that leadership is evident in the recent returns of our Funds. The Value Fund, which focuses on large- and mega-capitalization stocks, has kept pace with the S&P 500 (very large companies), but has trailed our other Funds that can own smaller companies. Partners Value and Partners III are “go-anywhere” or “all-cap” funds and their performance has been helped by their small- and mid-cap holdings. Hickory, which holds only small and medium-sized companies, has had the best numbers lately.
The popularity of various market sectors tends to rotate, and some of the cheapest stocks available in today’s market appear to be those of very large, high-quality companies, so we have no doubt that the Value Fund will eventually have its turn in the spotlight.
The Balanced Fund also had a good quarter as its stocks carried it to a gain of 3.4%. Bonds have been “priced for perfection” for some time and our bond funds—Short-Intermediate Income and Nebraska Tax-Free Income—generated modest positive returns of 0.6% and 0.3%, respectively, as we collected coupons and maintained very defensive portfolio positions.
The table on the page preceding this letter shows results for each of our Funds over various intervals since our firm was founded in 1983. It also shows comparative results for market indexes that some investors find relevant. There is additional information on each of the Funds in the pages following this letter.
Impact of Recent World Events
Our investment process focuses on the business values of individual companies, so we usually do not write much about macro-economic or geopolitical developments. Recently though, a number of major news stories have raised questions among our clients, and we thought we would address some of them in this letter.
North Africa and the Middle East
Dramatic changes are underway in a dozen or so countries in North Africa and the Middle East. From an historical point of view, this series of events may be the most significant, but it is too early to predict winners and losers or to draw conclusions. Optimists see the promise of new democratic governments, modernized societies, protection of human rights (especially for women), and the birth of new “emerging markets” that could increase economic opportunity both for these countries and their potential trading partners.
Pessimists see increased political instability in the region, ever-broadening military entanglements and skyrocketing oil prices. The only direct portfolio impact we have seen is strength in our energy company holdings. While we do not minimize the short-term impact of higher energy prices on worldwide economic growth, this part of the world does not figure prominently in our near term search for new investments.
Japan
The loss of life in the earthquake and tsunami in Japan was horrendous. The death toll is expected to top 20,000. Property losses have been estimated at $100-$200 billion or more. An element that makes this event different from other natural disasters is the damage to the nuclear reactors and the release of radiation that make recovery efforts vastly more complicated.
Japan’s economy has been stuck in a stagnant, slow-/no-growth mode for over 20 years and some think the rebuilding process will provide much-needed economic stimulation. Many Japanese stocks appeared to be very cheap statistically even before the earthquake. However, we have not devoted much research time to potential investments in Japanese companies, in part due to concerns about capital allocation and governance.
The impact on our U.S.-based companies is expected to be modest. While property damage is expected to reach into the hundreds of billions of dollars, Ajit Jain of Berkshire Hathaway has estimated that insured losses may be “only” $15-30 billion. Berkshire’s share of that is not expected to be significant. (Ajit also pointed out that business interruption insurance could be a significant and problematic wild card for some companies—not
weitzfunds.com 5
Berkshire—because the contract language can be vague and open to varying interpretation. He expects lawyers to be the major beneficiaries.)
Insurance brokers, like Aon, Willis and Brown & Brown (we own all three) could actually benefit from high insured losses for the industry since that may lead to higher premiums (and thus higher brokers’ commissions) in the future.
QVC (Liberty Interactive) earned 13% of its 2010 revenues from a joint venture in Japan. Studio damage was relatively minor and the station is back on the air. The more significant issue for QVC Japan, though, is that the Japanese viewers’ appetite for video shopping may be affected for some time.
A Texas Instruments plant was damaged and it will be several months before it is repaired and restored to full production. Manufacturing at two other plants is also being hampered by interruptions to electrical power supplies. The company estimates that its earnings could be impacted by 10-12 cents per share in 2011. This would not be a significant negative.
Sovereign Debt Crises in the Euro-Zone
A version of the real estate debt crisis that afflicted American banks a few years ago has surfaced in Europe. While the U.S. could borrow all the dollars it needed to provide liquidity to banks and stimulate the economy, members of the European Union use a common currency and cannot just borrow at will.
A year ago, it became clear that Greece would not be able to repay the government debt coming due in the next few years so the European Union arranged a “bailout” fund from which Greece could borrow when needed. In return, Greece agreed to cut government spending and make greater efforts to collect the taxes it levies. Needless to say, this was unpopular in Greece and its citizens are resisting the changes.
Later last year, Ireland’s major banks conceded that they could not repay their debt because of real estate-related credit issues, so the Irish government guaranteed that debt. It then became clear that Ireland would not be able to repay both its own debt and that of the banks and that it too would need to draw on the Euro-Zone bailout fund. The Irish people, and in turn their parliament, balked at the EU-ordered austerity measures and the Irish government fell. Resolution of the situation is pending.
Recently, Portugal has gone through a similar series of events and world financial markets fear that Spain, whose banks also have major real estate-related credit problems, will be next. Italy, the fifth member of the group of countries rudely referred to by the unfortunate acronym “P.I.I.G.S.,” has not been in the financial news lately (perhaps because its prime minister’s personal life has monopolized the headlines), but some believe it is only a matter of time before Italy’s national balance sheet comes in for uncomfortable scrutiny.
The members of the European Union face a serious dilemma. It seems fairly clear that some of these countries cannot repay their debt on schedule without a bailout by the stronger countries, primarily Germany and France. Citizens of the stronger countries do not like the idea of bearing the cost of the bailouts. The owners of the debt, which include banks and pension plans in EU countries, have their own strong opinions on the matter. It is conceivable that the European Union could come apart and that the common use of the Euro would give way to individual national currencies.
We do not have a prediction as to the outcome of this crisis. We do not believe we have invested in companies that are directly exposed to the risk of sovereign debt default. Nevertheless, it seems quite likely that business activity will be depressed to some extent by the austerity measures and uncertainty over the outcome. We do own some companies that have direct exposure to European markets—pay TV provider Liberty Global gets most of its cable revenues from Europe and many of our multinational companies have significant European interests—but at this point, we do not see major downside risk to our portfolio from Europe.
China—Inflation, Growth Rate and Currency
China is a complicated and confusing element in the mix. We read that China is concerned about inflation and is tightening credit to dampen economic activity and fight inflation. That raises concerns among the producers and traders of all sorts of commodities associated with the growth of the Chinese economy. Skeptics about the Chinese economy point to significant overbuilding of residential and commercial real estate and a growing problem of credit issues among the banks that have financed the construction. U.S. Treasury officials and a growing number of their counterparts in other countries accuse China of maintaining an undervalued currency that supports its exports at the expense of its trading partners. Business people from the U.S. and other countries complain bitterly about the problems of counterfeiting and the theft of trade secrets by Chinese business “partners.”
Several of our companies are doing business with Chinese companies and are cautiously exploring direct investment in China. One of our analysts, Barton Hooper, has traveled to China and is scheduled to make another trip in
6 Weitz Funds
late May. He has visited both U.S. companies’ Chinese operations and domestic Chinese companies.
The American companies we follow seem to be proceeding with a healthy dose of skepticism as they seek business relationships in a country in which it is hard for foreigners to do business. We are excited about the prospects of entering a market of 1.2 billion consumers, but we are very cautious about the profits and cash flows we expect our companies to generate in China.
U.S. Budget Battles and Municipal Finance
Regardless of one’s political leanings, it is hard to be proud of the spectacle of our political leaders doing their jobs in Washington or in their various municipal venues. At all levels, it seems that office holders of both parties are more interested in scoring political points than making progress in solving the nation’s budget problems.
The haggling over short-term spending cuts seems to miss the point that the country has tens of trillions of dollars of unfunded Social Security, Medicare and Medicaid liabilities. One wag likened the debate to arguing over the bar bill on the Titanic. Without addressing the rate of growth of entitlement spending, it would seem inevitable that (short of default) the solution to our national debt burden will have to be inflation that dilutes the value of the lenders’ claims.
Bond investors are concerned about both credit risk and rising interest rates. We believe that fears of mass defaults by cities and states are badly overstated, but we are being very careful about each of the individual credits in our Nebraska Tax-Free Income Fund.
On the interest rate front, we face two separate issues. The Fed is holding interest rates at artificially low levels to encourage an economic recovery. That policy will eventually change. Also, current and prospective levels of government spending seem likely to eventually lead to inflation and higher interest rates.
Given this negative outlook for interest rates, Tom Carney is keeping the average maturity length of our bond portfolios at extremely short (conservative) levels. Tom elaborates on this dilemma in his portfolio manager’s review of the bond funds later in this report.
The impact of inflation on stocks is more complicated. When interest rates rise, bonds present stiffer investment competition to stocks. All things being equal, that would lead to lower valuations for stocks. On the other hand, companies with pricing power can cope with inflation and perform well. Most of our businesses have enough control over both their input costs and their product pricing to deal with gradually rising price levels.
Outlook
In spite of the foregoing tales of economic woe, we are actually very upbeat about the outlook for our Funds. Stocks are not as cheap as they were a year or two ago, but they are “reasonably” priced. This leaves room for appreciation in line with business value growth.
To earn “unreasonably” good returns, we will have to take advantage of market dips. We have to be careful what we cheer for, but it seems pretty likely that something in the news will make investors nervous from time to time. If we can be patient until opportunities arise, then have the courage of our convictions, we should be able to generate good returns over the next several years.
Our annual meeting will be held at 4:30 pm on May 19th at the Scott Conference Center. As usual, the format will be primarily Q&A with the portfolio managers and analysts. We look forward to seeing you there.
Sincerely,
| | |
| |
| | |
| Wallace R. Weitz | Bradley P. Hinton |
| wally@weitzfunds.com | brad@weitzfunds.com |
Portfolio composition is subject to change at any time and references to specific securities, industries, and sectors referenced in this letter are not recommendations to purchase or sell any particular security. Current and future portfolio holdings are subject to risk. See the Schedules of Investments included in this report for the percent of assets in each of the Funds invested in particular industries or sectors.
weitzfunds.com 7
A PERSPECTIVE ON GRAND CANYON EDUCATION
By David Perkins
Grand Canyon Education is home to Grand Canyon University, a private, regionally-accredited provider of post-secondary education based in Phoenix, Arizona. Originally founded as a non-profit Baptist university in 1949, Grand Canyon was purchased by current Chairman Brent Richardson and his brother, Chris Richardson, in 2004 and subsequently converted to a for-profit institution. Grand Canyon operates a traditional 100-acre campus located in Phoenix, as well as a sizeable online platform focused on serving working adults across the country. As of the end of 2010, Grand Canyon had total enrollment of approximately 41,500 students, 91% of whom attended classes online.
Challenging Environment
Grand Canyon is a contrarian investment, and we recognize that education is an emotionally-charged subject. Still, the reality is that the United States faces hard choices. Taxpayer funding for higher education is under pressure. Traditional universities often do not meet the educational needs of a growing number of non-traditional students, especially working adults. Community colleges receive enormous taxpayer subsidies and, as a whole, deliver sub-par student outcomes. Status quo does not appear sustainable, leaving higher education ripe for disruptive change. We think investor-funded education, when operated sensibly and regulated appropriately, can serve to benefit society and investors. We also openly wonder how the current U.S. post-secondary platform might look if we could start from scratch today. Our sense is that it would be quite different, incorporating a hybrid model built upon the strengths of both the traditional classroom and online settings. Regulations could be focused on incenting and encouraging the best student outcomes regardless of funding mechanism. Higher education would embrace technology as means of improving efficiency as opposed to viewing it as a threat.
Change does not always occur smoothly. The for-profit education industry has attracted significant congressional, regulatory, and investor scrutiny over the past year. Many have called into question the value proposition afforded its students, and a Government Accountability Office investigation last fall uncovered examples of aggressive and dishonest recruiting practices at several publicly-traded institutions (Grand Canyon was not one of them). In response, the U.S. Department of Education has tightened regulation of the industry and proposed rules that would tie eligibility for federal student aid to graduate incomes and federal loan repayment rates. The Department’s goal is to “weed out” institutions that have not acted in the best interest of students. We applaud this effort and agree that “bad actors” should be dealt with swiftly and severely.
Slower growth, lower profitability and the fear of collateral regulatory damage have dampened investor enthusiasm for the group after a decade of significant growth. Enrollments at for-profit institutions have slowed abruptly over the past couple of quarters, further pressuring the group. While it is difficult to determine the exact drivers of the recent slowdown, the following factors appear to have contributed: company-specific operational responses to the above-mentioned regulatory changes, increased competition for students with stronger academic profiles, the improving economy, a general unwillingness to borrow for college in the face of high unemployment and future economic uncertainty, and possible industry-wide reputational damage from months of negative press. While Grand Canyon has fared better than many of its peers thus far, it has certainly not been immune as enrollment growth has slowed considerably of late.
Unique Strategy in an Industry Ripe for Change
Given the list of challenges, why do we find shares of Grand Canyon attractive today? Our thesis centers on the company’s unique positioning amongst its for-profit peers. In short, we do not believe all for-profits are the same. Grand Canyon offers an attractive combination of programmatic focus (education and nursing students account for just shy of three quarters of the university’s enrollment), degree offerings (roughly half of GCU students are pursuing graduate-level degrees), and low tuition rates. We think Grand Canyon offers good value to its students and do not believe that the university’s educational platform will be materially impacted by heightened regulation.
Grand Canyon’s management team, headed by CEO Brian Mueller, has significant industry experience. The team has been building the university’s brand in the southwest region of the U.S. by investing heavily in its traditional campus, continuing to focus on the university’s Christian heritage and pursuing a move to Division I athletics. Despite the rise of online education over the past 10 years, many students still gravitate toward institutions that offer the look and feel of a traditional college experience. Grand Canyon offers this unique combination of old and new which, together with successful student outcomes, should fare well given the large and fragmented working adult market in the United States.
The outlook for Grand Canyon over our 3-5 year investment horizon remains positive, despite more limited visibility into the company’s near-term earnings power. The growing ground campus in a geographically appealing location has the potential to reach annual enrollment levels between 10,000-15,000 students (versus 3,000 today). Online growth avenues include expansion of Grand Canyon’s doctorate-level degree offerings, as well as the possible addition of a fourth educational vertical in Information Technology. Grand Canyon’s balance sheet currently boasts cash equaling roughly 10% of the company’s market cap and $50 million in owned real estate. We think earnings can grow, albeit modestly in the near term, from last year’s reported $1.08 per share. At $13.50, we believe Grand Canyon’s stock has an attractive risk / reward profile with an underlying business value well north of $20 per share.
David Perkins, CFA, joined Weitz in 2004. He graduated from Taylor University in Upland, IN and previously spent 2 ½ years as an equity analyst at McCarthy Group Asset Management. In addition to covering Grand Canyon Education, David has an emphasis on the Health Care, Energy and Materials sectors. |
8 Weitz Funds
PORTFOLIO MANAGERS’ DISCUSSION & ANALYSIS
Co-Portfolio Managers:
Wallace R. Weitz & Bradley P. Hinton
The Value Fund returned +5.7% in the quarter, compared to a +5.9% return for the S&P 500 and a +6.2% return for the Russell 1000. ConocoPhillips (+18%) posted solid gains as upheaval in the Middle East and North Africa drove oil prices higher. Insurance broker Aon Corporation (+16%) continued to integrate the Hewitt acquisition and to execute on its plan to grind margins higher over the next few years. Global consultant Accenture plc (+13%) posted terrific quarterly results and raised its outlook again. Microsoft (-9%) was the largest detractor from performance during the quarter. The company reported strong results with a reasonably positive outlook, yet the stock’s valuation continued to lag. We remain optimistic about Microsoft’s potential to deliver acceptable or better returns for the Fund over the next few years.
For the fiscal year ended March 31, 2011, the Fund increased +15.0% compared to a +15.7% gain for the S&P 500 and a +16.7% return for the Russell 1000. ConocoPhillips, Texas Instruments and Liberty Global were three standout contributors to results. ConocoPhillips executed on its strategic plan to sell non-core assets and return capital to shareholders. Texas Instruments delivered solid operating results, and the analog chip maker increased its share repurchase program and boosted its dividend. European cable operator Liberty Global announced another large acquisition in Germany, providing additional scale in a key market. Comcast, United Parcel Service, Accenture plc and Omnicom Group also generated strong returns as the economy rebounded. Apollo Group detracted from results as for-profit education companies faced increased regulatory and competitive headwinds. We sold the position last year, and the Fund no longer has exposure to the industry.
We purchased three new stocks during the quarter. CVS Caremark marries a leading retail pharmacy chain with a large pharmacy benefit manager (“PBM”). The combined company is the largest purchaser of drugs in the world, providing unrivaled scale. CVS trades at a substantial discount to the potential market value of its component parts, largely because many investors are skeptical that these two businesses belong together. Either way, we like the company’s free cash flow generation, growth potential, and shareholder-friendly capital plan.
Target is the well-known, leading discount retailer headquartered in Minneapolis. The company’s “PFresh” initiative, which adds more grocery items to its general merchandise stores, is off to a strong start. The company also introduced a revamped Target REDCard, a store-brand credit card that provides a 5% discount on nearly all purchases. We expect these investments to drive incremental traffic and profitable sales. In addition, Target will soon bring its “Expect More, Pay Less” tagline to Canada as it re-brands a portfolio of recently acquired stores. The company generates more cash than it needs to run its business, and management is returning excess capital to shareholders via dividend and share repurchase.
Anheuser-Busch InBev NV is a leading global brewer headquartered in Belgium. The company has dominant positions in several attractive beer markets, and a portfolio that includes thirteen billion dollar brands. The beer business is very profitable with handsome margins and strong returns on equity. Management is disciplined and shareholder-friendly. The company should have an opportunity to increase dividends and repurchase shares with its growing free cash flow over the next several years. The stock trades at a reasonable valuation compared to current earnings and a very low multiple of potential free cash flow per share in 2012 and beyond.
The Value Fund tilts toward our best larger company ideas. We continued to tighten the Fund’s focus without sacrificing on price, as many world-class businesses traded at discounts to their underlying values. The Fund remains relatively concentrated, with the twenty largest positions representing more than 70% of net assets. The Fund’s residual cash position is relatively unchanged at 16% of net assets at quarter end.
| New and Eliminated Securities for Quarter Ended March 31, 2011 |
| New Purchases ($mil) | | | | | Eliminations ($mil) |
| Target | | $ | 15.2 | | None |
| CVS Caremark | | | 14.9 | | |
| Anheuser-Busch InBev | | | 5.5 | | |
weitzfunds.com 9
VALUE FUND
PERFORMANCE • (UNAUDITED)
| | Total Returns | Average Annual Total Returns |
| | 3 Mos. | 1 Year | 3 Year | 5 Year | 10 Year | 15 Year | 20 Year |
| Value | 5.7% | 15.0% | 3.1% | 0.4% | 2.5% | 9.0% | 10.5% |
| S&P 500 | 5.9 | 15.7 | 2.4 | 2.6 | 3.3 | 6.8 | 8.7 |
| Russell 1000 | 6.2 | 16.7 | 3.0 | 2.9 | 3.8 | 7.1 | N/A |
| Russell 1000 Value | 6.5 | 15.2 | 0.6 | 1.4 | 4.5 | 7.7 | N/A |
Growth of $10,000
This chart depicts the change in the value of a $10,000 investment in the Value Fund for the period March 31 2001 through March 31, 2011, as compared with the growth of the Standard & Poor’s 500 Index during the same period. Index performance is hypothetical and is shown for illustrative purposes only.
| | | | Value | | | S&P 500 | | | Relative | |
| Year | | | (1) | | | (2) | | | Results (1)-(2) | |
| | | | | | | | |
| 1986 (5/9/86) | | | 3.5 | % | | 4.1 | % | | -0.6 | % |
| 1987 | | | -0.5 | | | 5.1 | | | -5.6 | |
| 1988 | | | 16.4 | | | 16.6 | | | -0.2 | |
| 1989 | | | 22.1 | | | 31.7 | | | -9.6 | |
| 1990 | | | -5.2 | | | -3.1 | | | -2.1 | |
| 1991 | | | 27.6 | | | 30.5 | | | -2.9 | |
| 1992 | | | 13.6 | | | 7.6 | | | 6.0 | |
| 1993 | | | 20.0 | | | 10.1 | | | 9.9 | |
| 1994 | | | -9.8 | | | 1.3 | | | -11.1 | |
| 1995 | | | 38.4 | | | 37.6 | | | 0.8 | |
| 1996 | | | 18.7 | | | 23.0 | | | -4.3 | |
| 1997 | | | 38.9 | | | 33.4 | | | 5.5 | |
| 1998 | | | 28.9 | | | 28.6 | | | 0.3 | |
| 1999 | | | 21.0 | | | 21.0 | | | 0.0 | |
| 2000 | | | 19.6 | | | -9.1 | | | 28.7 | |
| 2001 | | | 0.2 | | | -11.9 | | | 12.1 | |
| 2002 | | | -17.1 | | | -22.1 | | | 5.0 | |
| 2003 | | | 28.7 | | | 28.7 | | | 0.0 | |
| 2004 | | | 15.7 | | | 10.9 | | | 4.8 | |
| 2005 | | | -2.8 | | | 4.9 | | | -7.7 | |
| 2006 | | | 21.8 | | | 15.8 | | | 6.0 | |
| 2007 | | | -10.3 | | | 5.5 | | | -15.8 | |
| 2008 | | | -40.7 | | | -37.0 | | | -3.7 | |
| 2009 | | | 27.6 | | | 26.5 | | | 1.1 | |
| 2010 | | | 19.9 | | | 15.1 | | | 4.8 | |
| 2011 (3/31/11) | | | 5.7 | | | 5.9 | | | -0.2 | |
| Since Inception: | | | | | | | | | | |
| Cumulative Return | | | 1,067.6 | | | 890.5 | | | 177.1 | |
| Avg. Annual Return | | | 10.4 | | | 9.6 | | | 0.8 | |
These performance numbers reflect the deduction of the Fund’s annual operating expenses which as stated in its most recent Prospectus are 1.25% of the Fund’s net assets. The returns assume redemption at the end of each period and reinvestment of dividends. Total returns shown include fee waivers and expense reimbursements, if any; total returns would have been lower had there been no waiver of fees and/or reimbursement of expenses by the Adviser. This information represents past performance and past performance does not guarantee future results. The investment return and the principal value of an investment in this Fund will fluctuate so that an investor’s shares, when redeemed, may be worth more or less than the original cost. Current performance may be lower or higher than the performance data quoted. Performance data current to the most recent month-end may be obtained at www.weitzfunds.com/performance/monthly.asp.
See page 4 for additional performance disclosures.
Performance information does not reflect the deduction of taxes that a shareholder would pay on Fund distributions or the redemption of Fund shares.
10 Weitz Funds
VALUE FUND
PORTFOLIO PROFILE • (UNAUDITED)
| Top Ten Stocks |
| Aon | | | 5.0 | % |
| Liberty Media - Interactive | | | 4.7 | |
| Microsoft | | | 4.7 | |
| Dell | | | 4.5 | |
| Texas Instruments | | | 4.3 | |
| ConocoPhillips | | | 4.1 | |
| Berkshire Hathaway | | | 4.1 | |
| United Parcel Service | | | 4.1 | |
| Omnicare | | | 4.0 | |
| Accenture | | | 4.0 | |
| % of Net Assets | | | 43.5 | % |
| Industry Sectors | |
| Information Technology | | | 20.9 | % |
| Consumer Discretionary | | | 15.6 | |
| Financials | | | 11.6 | |
| Industrials | | | 9.1 | |
| Materials | | | 7.9 | |
| Consumer Staples | | | 7.7 | |
| Energy | | | 5.9 | |
| Health Care | | | 5.8 | |
| Short-Term Securities/Other | | | 15.5 | |
| Net Assets | | | 100.0 | % |
| Top Five Performers for Quarter Ended March 31, 2011 |
| | QTD Return | Average Weight | Contribution to |
| Security Name | of Security | in Portfolio | Fund Performance |
| ConocoPhillips | 18.3% | 4.7% | 0.8% |
| Omnicare | 18.3 | 4.4 | 0.8 |
| Aon | 15.5 | 5.0 | 0.7 |
| Liberty Global | 18.0 | 3.4 | 0.6 |
| Accenture | 13.4 | 4.3 | 0.6 |
Source: FactSet Portfolio Analytics
| Bottom Five Performers for Quarter Ended March 31, 2011 |
| | QTD Return | Average Weight | Contribution to |
| Security Name | of Security | in Portfolio | Fund Performance |
| Microsoft | (8.6)% | 5.1% | (0.4)% |
| Martin Marietta Materials | (2.3) | 2.7 | (0.1) |
| Wal-Mart | (2.8) | 2.8 | (0.1) |
| Procter & Gamble | (3.5) | 1.4 | (0.1) |
| Google | (1.3) | 3.6 | 0.0 |
Source: FactSet Portfolio Analytics
weitzfunds.com 11
VALUE FUND
SCHEDULE OF INVESTMENTS • MARCH 31, 2011
| COMMON STOCKS — 84.5% | | Shares | | | Value | |
| Information Technology — 20.9% | | | | | | |
| Software — 4.7% | | | | | | |
| Microsoft Corp. | | | 1,800,000 | | | $ | 45,648,000 | |
| Computers & Peripherals — 4.5% | | | | | | | | |
| Dell, Inc.* | | | 3,000,000 | | | | 43,530,000 | |
| Semiconductors — 4.3% | | | | | | | | |
| Texas Instruments, Inc. | | | 1,200,000 | | | | 41,472,000 | |
| IT Services — 3.9% | | | | | | | | |
| Accenture plc - CL A | | | 700,000 | | | | 38,479,000 | |
| Internet Software & Services — 3.5% | | | | | | | | |
| Google, Inc. - CL A* | | | 58,000 | | | | 34,000,180 | |
| | | | | | | | 203,129,180 | |
| Consumer Discretionary — 15.6% | | | | | | | | |
| Cable & Satellite — 6.5% | | | | | | | | |
| Liberty Global, Inc. - Series C* | | | 850,000 | | | | 33,991,500 | |
| Comcast Corp. - CL A Special | | | 1,250,000 | | | | 29,025,000 | |
| | | | | | | | 63,016,500 | |
| Internet & Catalog Retail — 4.7% | | | | | | | | |
| Liberty Media Corp. - | | | | | | | | |
| Interactive - Series A* | | | 2,850,000 | | | | 45,714,000 | |
| Advertising — 2.9% | | | | | | | | |
| Omnicom Group, Inc. | | | 575,000 | | | | 28,209,500 | |
| Multiline Retail — 1.5% | | | | | | | | |
| Target Corp. | | | 300,000 | | | | 15,003,000 | |
| | | | | | | | 151,943,000 | |
| Financials — 11.6% | | | | | | | | |
| Insurance Brokers — 5.0% | | | | | | | | |
| Aon Corp. | | | 925,000 | | | | 48,988,000 | |
| Property & Casualty Insurance — 4.1% | | | | | | | | |
| Berkshire Hathaway, Inc. - CL B* | | | 475,000 | | | | 39,724,250 | |
| Mortgage REIT’s — 2.5% | | | | | | | | |
| Redwood Trust, Inc. | | | 1,541,322 | | | | 23,967,557 | |
| | | | | | | | 112,679,807 | |
| Industrials — 9.1% | | | | | | | | |
| Air Freight & Logistics — 4.0% | | | | | | | | |
| United Parcel Service, Inc. - CL B | | | 530,000 | | | | 39,389,600 | |
| Industrial Conglomerates — 3.2% | | | | | | | | |
| Tyco International Ltd. | | | 700,000 | | | | 31,339,000 | |
| Aerospace & Defense — 1.9% | | | | | | | | |
| Lockheed Martin Corp. | | | 225,000 | | | | 18,090,000 | |
| | | | | | | | 88,818,600 | |
| Materials — 7.9% | | | | | | | | |
| Construction Materials — 4.7% | | | | | | | | |
| Martin Marietta Materials, Inc. | | | 300,000 | | | | 26,901,000 | |
| Vulcan Materials Co. | | | 400,000 | | | | 18,240,000 | |
| | | | | | | | 45,141,000 | |
| Fertilizers & Agricultural Chemicals — 1.8% | | | | | | | | |
| Monsanto Co. | | | 240,000 | | | | 17,342,400 | |
| | | Principal | | | | |
| | | amount | | | | |
| | | or shares | | | Value | |
| Industrial Gases — 1.4% | | | | | | |
| Praxair, Inc. | | | 135,000 | | | $ | 13,716,000 | |
| | | | | | | | 76,199,400 | |
| Consumer Staples — 7.7% | | | | | | | | |
| Food & Staples Retailing — 4.2% | | | | | | | | |
| Wal-Mart Stores, Inc. | | | 500,000 | | | | 26,025,000 | |
| CVS Caremark Corp. | | | 450,000 | | | | 15,444,000 | |
| | | | | | | | 41,469,000 | |
| Beverages — 2.1% | | | | | | | | |
| Diageo plc - Sponsored ADR | | | 190,000 | | | | 14,481,800 | |
| Anheuser-Busch InBev SA/NV - | | | | | | | | |
| Sponsored ADR | | | 100,000 | | | | 5,717,000 | |
| | | | | | | | 20,198,800 | |
| Household Products — 1.4% | | | | | | | | |
| The Procter & Gamble Co. | | | 220,000 | | | | 13,552,000 | |
| | | | | | | | 75,219,800 | |
| Energy — 5.9% | | | | | | | | |
| Integrated Oil & Gas — 4.1% | | | | | | | | |
| ConocoPhillips | | | 500,000 | | | | 39,930,000 | |
| Oil & Gas Exploration & Production — 1.8% | | | | | | | | |
| Southwestern Energy Co.* | | | 402,653 | | | | 17,302,000 | |
| | | | | | | | 57,232,000 | |
| Health Care — 5.8% | | | | | | | | |
| Health Care Services — 4.0% | | | | | | | | |
| Omnicare, Inc. | | | 1,300,000 | | | | 38,987,000 | |
| Health Care Equipment — 1.8% | | | | | | | | |
| Baxter International, Inc. | | | 315,000 | | | | 16,937,550 | |
| | | | | | | | 55,924,550 | |
| Other — 0.0% | | | | | | | | |
| Other — 0.0% | | | | | | | | |
| Adelphia Recovery Trust, | | | | | | | | |
Series ACC-7* # | | | 3,535,000 | | | | — | |
| Total Common Stocks | | | | | | | | |
| (Cost $687,224,475) | | | | | | | 821,146,337 | |
| | | | | | | | | |
| SHORT-TERM SECURITIES — 13.7% | | | | | | | | |
| Wells Fargo Advantage Government Money Market Fund - | | | | | | | | |
Institutional Class 0.01%(a) | | | 11,578,635 | | | | 11,578,635 | |
| U.S. Treasury Bills, 0.06% to 0.14%, | | | | | | | | |
4/07/11 to 6/30/11(b) | | $ | 121,500,000 | | | | 121,491,312 | |
| Total Short-Term Securities | | | | | | | | |
| (Cost $133,066,393) | | | | | | | 133,069,947 | |
| Total Investments in Securities | | | | | | | | |
| (Cost $820,290,868) | | | | | | | 954,216,284 | |
| Other Assets Less Other Liabilities — 1.8% | | | | | | | 17,068,803 | |
| Net Assets — 100.0% | | | | | | $ | 971,285,087 | |
| Net Asset Value Per Share | | | | | | $ | 30.07 | |
| * | Non-income producing |
| # | Illiquid and/or restricted security that has been fair valued. |
| (a) | Rate presented represents the annualized 7-day yield at March 31, 2011. |
| (b) | Interest rates presented represent the yield to maturity at the date of purchase. |
The accompanying notes form an integral part of these financial statements.
12 Weitz Funds
PORTFOLIO MANAGERS’ DISCUSSION & ANALYSIS
Co-Portfolio Managers:
Wallace R. Weitz & Bradley P. Hinton
The Partners Value Fund returned +7.1% in the first calendar quarter, compared to a +5.9% return for the S&P 500 and a +6.4% return for the Russell 3000. Oil and gas companies SandRidge Energy (+75%) and ConocoPhillips (+18%) posted strong gains as upheaval in the Middle East and North Africa drove oil prices higher. Omnicare (+18%) rose as new CEO John Figueroa laid out an encouraging two-year road map for transforming the company into a more customer-centric and profitable organization. Insurance broker Aon Corporation (+16%) continued to integrate the Hewitt acquisition and to execute on its plan to grind margins higher over the next few years. Grand Canyon Education (-26%) was the largest detractor from results for the quarter and fiscal year. David Perkins describes our investment thesis in depth in this report’s Analyst Corner.
For the fiscal year ended March 31, 2011, the Fund increased +20.9% compared to a +15.7% gain for the S&P 500 and a +17.4% gain for the Russell 3000. SandRidge Energy and Coinstar were two standout contributors to results. SandRidge’s strategic asset sales have exceeded expectations, and the company’s acreage in the Horizontal Mississippian play has shown very promising early results. Coinstar continued to roll out Redbox DVD kiosks and take market share. We sold the stock in the low-$60’s late last year as it reached our value estimate. Other strong performers highlight the investment flexibility of the Fund. Large-cap bellwethers Accenture, ConocoPhillips and Texas Instruments delivered strong returns, as did smaller companies such as Nebraska-based retailer Cabela’s and software maker ACI Worldwide. For-profit education companies detracted from results as they faced regulatory and competitive headwinds during the fiscal year. We have focused our industry investment primarily in Grand Canyon, which we think has several unique attributes (see Analyst Corner for details).
We purchased three new stocks during the quarter. Southwestern Energy is a best-in-class, low-cost natural gas producer with attractive growth prospects. The company is the dominant player in the Fayetteville Shale, a large and prolific gas field in Arkansas. Southwestern generates solid all-in returns on capital in the Fayetteville, even at today’s low natural gas prices. While our thesis does not depend on it, we also think the stock provides a cheap option on higher natural gas prices over the next several years. CVS Caremark marries a leading retail pharmacy chain with a large pharmacy benefit manager (“PBM”). The combined company is the largest purchaser of drugs in the world, providing unrivaled scale. CVS trades at a substantial discount to the potential market value of its component parts, largely because many investors are skeptical that these two businesses belong together. Either way, we like the company’s free cash flow generation, growth potential, and shareholder-friendly capital plan. Finally, we purchased leading discount retailer Target at what we think is a compelling valuation.
We sold three stocks at substantial gains during the quarter. We eliminated Liberty Media – Starz near our value estimate as investors became excited about the potential for a more lucrative distribution agreement with Netflix. From today’s stock price, the investment thesis relies more on original programming success, which we feel less confident about our ability to predict. We also sold long-time holding Cabela’s when the stock spiked in February. We applaud the job that management has done over the years and would gladly partner with the Cabela’s team again at the right price. Finally, we eliminated short-time holding Iron Mountain as activist investors agitated for change, driving the stock up to our value estimate. While cage rattling may create incremental value over time, we are not willing to depend on it.
Partners Value is a flexible, multi-cap fund that invests in companies of all sizes. We have continued to tilt the portfolio towards larger and, we think, higher quality companies where we are finding the most value. New additions Southwestern Energy, CVS Caremark and Target are three examples. The Fund’s residual cash position remained unchanged at 22% of net assets.
| New and Eliminated Securities for Quarter Ended March 31, 2011 |
| New Purchases ($mil) | | Eliminations ($mil) |
| Target | | $ | 9.9 | | | Liberty Media - Starz | | $ | 11.5 | |
| Southwestern Energy | | | 7.9 | | | Cabela’s | | | 9.1 | |
| CVS Caremark | | | 7.4 | | | Iron Mountain | | | 6.2 | |
weitzfunds.com 13
PARTNERS VALUE FUND
PERFORMANCE • (UNAUDITED)
| | | | Total Returns | | Average Annual Total Returns |
| | | | 3 Mos. | | 1 Year | | 3 Year | | 5 Year | | 10 Year | | 15 Year | | 20 Year | | 25 Year |
| | Partners Value | | 7.1% | | 20.9% | | 8.4% | | 3.8% | | 3.8% | | 10.3% | | 11.7% | | 11.2% |
| | S&P 500 | | 5.9 | | 15.7 | | 2.4 | | 2.6 | | 3.3 | | 6.8 | | 8.7 | | 9.6 |
| | Russell 3000 | | 6.4 | | 17.4 | | 3.4 | | 3.0 | | 4.1 | | 7.1 | | N/A | | N/A |
| | Russell 3000 Value | | 6.5 | | 15.6 | | 1.1 | | 1.4 | | 4.9 | | 7.8 | | N/A | | N/A |
Growth of $10,000
This chart depicts the change in the value of a $10,000 investment in the Partners Value Fund for the period March 31, 2001 through March 31, 2011, as compared with the growth of the Standard & Poor’s 500 Index during the same period. Index performance is hypothetical and is shown for illustrative purposes only.

| | | | | Partners | | | | Relative |
| | | | | Value | | S&P 500 | | Results |
| | Year | | | (1) | | (2) | | (1)-(2) |
| | 1983 (6/1/83) | | | 9.9 | % | | 4.2 | % | | 5.7 | % |
| | 1984 | | | 14.5 | | | 6.1 | | | 8.4 | |
| | 1985 | | | 40.7 | | | 31.6 | | | 9.1 | |
| | 1986 | | | 11.1 | | | 18.6 | | | -7.5 | |
| | 1987 | | | 4.3 | | | 5.1 | | | -0.8 | |
| | 1988 | | | 14.9 | | | 16.6 | | | -1.7 | |
| | 1989 | | | 20.3 | | | 31.7 | | | -11.4 | |
| | 1990 | | | -6.3 | | | -3.1 | | | -3.2 | |
| | 1991 | | | 28.1 | | | 30.5 | | | -2.4 | |
| | 1992 | | | 15.1 | | | 7.6 | | | 7.5 | |
| | 1993 | | | 23.0 | | | 10.1 | | | 12.9 | |
| | 1994 | | | -9.0 | | | 1.3 | | | -10.3 | |
| | 1995 | | | 38.7 | | | 37.6 | | | 1.1 | |
| | 1996 | | | 19.1 | | | 23.0 | | | -3.9 | |
| | 1997 | | | 40.6 | | | 33.4 | | | 7.2 | |
| | 1998 | | | 29.1 | | | 28.6 | | | 0.5 | |
| | 1999 | | | 22.1 | | | 21.0 | | | 1.1 | |
| | 2000 | | | 21.1 | | | -9.1 | | | 30.2 | |
| | 2001 | | | -0.9 | | | -11.9 | | | 11.0 | |
| | 2002 | | | -17.0 | | | -22.1 | | | 5.1 | |
| | 2003 | | | 25.4 | | | 28.7 | | | -3.3 | |
| | 2004 | | | 15.0 | | | 10.9 | | | 4.1 | |
| | 2005 | | | -2.4 | | | 4.9 | | | -7.3 | |
| | 2006 | | | 22.5 | | | 15.8 | | | 6.7 | |
| | 2007 | | | -8.5 | | | 5.5 | | | -14.0 | |
| | 2008 | | | -38.1 | | | -37.0 | | | -1.1 | |
| | 2009 | | | 31.3 | | | 26.5 | | | 4.8 | |
| | 2010 | | | 27.5 | | | 15.1 | | | 12.4 | |
| | 2011 (3/31/11) | | | 7.1 | | | 5.9 | | | 1.2 | |
| | Since Inception: | | | | | | | | | | |
| | Cumulative | | | | | | | | | | |
| | Return | | | 2,698.9 | | | 1,545.1 | | | 1,153.8 | |
| | Avg. Annual | | | | | | | | | | |
| | Return | | | 12.7 | | | 10.6 | | | 2.1 | |
These performance numbers reflect the deduction of the Fund’s annual operating expenses which as stated in its most recent Prospectus are 1.26% of the Fund’s net assets. The returns assume redemption at the end of each period and reinvestment of dividends. Total returns shown include fee waivers and expense reimbursements, if any; total returns would have been lower had there been no waiver of fees and/or reimbursement of expenses by the Adviser. This information represents past performance and past performance does not guarantee future results. The investment return and the principal value of an investment in this Fund will fluctuate so that an investor’s shares, when redeemed, may be worth more or less than the original cost. Current performance may be lower or higher than the performance data quoted. Performance data current to the most recent month-end may be obtained at www.weitzfunds.com/performance/monthly.asp. See page 4 for additional performance disclosures.
Performance information does not reflect the deduction of taxes that a shareholder would pay on Fund distributions or the redemption of Fund shares.
Performance of the Partners Value Fund (the “Fund”) is measured from June 1, 1983, the inception of Weitz Partners II Limited Partnership (the “Partnership”). As of December 31, 1993, the Fund succeeded to substantially all of the assets of the Partnership. The investment objectives, policies and restrictions of the Fund are materially equivalent to those of the Partnership and the Partnership was managed at all times with full investment authority by Wallace R. Weitz & Company. The performance information includes performance for the period before the Fund became an investment company registered with the Securities and Exchange Commission. During this period, the Partnership was not registered under the Investment Company Act of 1940 and, therefore, was not subject to certain investment or other restrictions or requirements imposed by the 1940 Act or the Internal Revenue Code. If the Partnership had been registered under the 1940 Act during this period, the Partnership’s performance might have been adversely affected.
14 Weitz Funds
PARTNERS VALUE FUND
PORTFOLIO PROFILE • (UNAUDITED)
| Top Ten Stocks |
| Omnicare | | | 4.5 | % |
| Aon | | | 4.2 | |
| Microsoft | | | 4.2 | |
| SandRidge Energy | | | 4.1 | |
| Liberty Media - Interactive | | | 4.0 | |
| Berkshire Hathaway | | | 3.9 | |
| Dell | | | 3.7 | |
| Accenture | | | 3.4 | |
| Texas Instruments | | | 3.3 | |
| Redwood Trust | | | 3.3 | |
| % of Net Assets | | | 38.6 | % |
| Industry Sectors |
| Consumer Discretionary | | | 20.7 | % |
| Information Technology | | | 18.1 | |
| Financials | | | 13.7 | |
| Energy | | | 8.5 | |
| Health Care | | | 7.3 | |
| Materials | | | 6.5 | |
| Industrials | | | 2.2 | |
| Consumer Staples | | | 1.0 | |
| Short-Term Securities/Other | | | 22.0 | |
| Net Assets | | | 100.0 | % |
| Top Five Performers for Quarter Ended March 31, 2011 |
| | QTD Return | Average Weight | Contribution to |
| Security Name | of Security | in Portfolio | Fund Performance |
| SandRidge Energy | 74.9% | 3.6% | 2.1% |
| Omnicare | 18.3 | 4.7 | 0.8 |
| Aon | 15.5 | 3.9 | 0.6 |
| Liberty Global | 18.0 | 3.1 | 0.5 |
| ConocoPhillips | 18.3 | 3.0 | 0.5 |
Source: FactSet Portfolio Analytics
| Bottom Five Performers for Quarter Ended March 31, 2011 |
| | QTD Return | Average Weight | Contribution to |
| Security Name | of Security | in Portfolio | Fund Performance |
| Grand Canyon Education | (26.0)% | 2.3% | (0.7)% |
| Microsoft | (8.6) | 4.0 | (0.3) |
| Live Nation Entertainment | (12.4) | 1.9 | (0.3) |
| Martin Marietta Materials | (2.3) | 1.9 | (0.1) |
| Strayer Education | (13.6) | 0.3 | (0.1) |
Source: FactSet Portfolio Analytics
weitzfunds.com 15
PARTNERS VALUE FUND
SCHEDULE OF INVESTMENTS • MARCH 31, 2011
| COMMON STOCKS — 78.0% | | Shares | | | Value | |
| Consumer Discretionary — 20.7% | | | | | | |
| Cable & Satellite — 6.7% | | | | | | |
| Liberty Global, Inc. - Series C* | | | 585,000 | | | $ | 23,394,150 | |
| Comcast Corp. - CL A Special | | | 650,000 | | | | 15,093,000 | |
| Liberty Media Corp. - | | | | | | | | |
| Capital - Series A* | | | 160,000 | | | | 11,787,200 | |
| | | | | | | | 50,274,350 | |
| Internet & Catalog Retail — 4.0% | | | | | | | | |
| Liberty Media Corp. - | | | | | | | | |
| Interactive - Series A* | | | 1,900,000 | | | | 30,476,000 | |
| Education Services — 2.3% | | | | | | | | |
| Grand Canyon Education, Inc.* | | | 1,047,804 | | | | 15,193,158 | |
| Strayer Education, Inc. | | | 18,000 | | | | 2,348,820 | |
| | | | | | | | 17,541,978 | |
| Household Durables — 2.0% | | | | | | | | |
| Mohawk Industries, Inc.* | | | 250,000 | | | | 15,287,500 | |
| Movies & Entertainment — 1.9% | | | | | | | | |
| Live Nation Entertainment, Inc.* | | | 1,400,000 | | | | 14,000,000 | |
| Hotels, Restaurants & Leisure — 1.6% | | | | | | | | |
| Interval Leisure Group, Inc.* | | | 750,000 | | | | 12,262,500 | |
| Multiline Retail — 1.3% | | | | | | | | |
| Target Corp. | | | 200,000 | | | | 10,002,000 | |
| Publishing — 0.9% | | | | | | | | |
| The Washington Post Co. - CL B | | | 15,000 | | | | 6,563,400 | |
| | | | | | | | 156,407,728 | |
| Information Technology — 18.1% | | | | | | | | |
| Software — 4.5% | | | | | | | | |
| Microsoft Corp. | | | 1,250,000 | | | | 31,700,000 | |
| ACI Worldwide, Inc.* | | | 61,300 | | | | 2,010,640 | |
| | | | | | | | 33,710,640 | |
| Computers & Peripherals — 3.7% | | | | | | | | |
| Dell, Inc.* | | | 1,900,000 | | | | 27,569,000 | |
| IT Services — 3.3% | | | | | | | | |
| Accenture plc - CL A | | | 460,000 | | | | 25,286,200 | |
| Semiconductors — 3.3% | | | | | | | | |
| Texas Instruments, Inc. | | | 730,000 | | | | 25,228,800 | |
| Internet Software & Services — 3.3% | | | | | | | | |
| Google, Inc. - CL A* | | | 26,000 | | | | 15,241,460 | |
| The Knot, Inc.* | | | 802,691 | | | | 9,672,427 | |
| | | | | | | | 24,913,887 | |
| | | | | | | | 136,708,527 | |
| Financials — 13.7% | | | | | | | | |
| Insurance Brokers — 6.5% | | | | | | | | |
| Aon Corp. | | | 600,000 | | | | 31,776,000 | |
| Willis Group Holdings Ltd. | | | 300,000 | | | | 12,108,000 | |
| Brown & Brown, Inc. | | | 200,000 | | | | 5,160,000 | |
| | | | | | | | 49,044,000 | |
| Property & Casualty Insurance — 3.9% | | | | | | | | |
| Berkshire Hathaway, Inc. - CL B* | | | 350,000 | | | | 29,270,500 | |
| | | | | | | | | |
| | | Shares | | | Value | |
| Mortgage REIT’s — 3.3% | | | | | | | | |
| Redwood Trust, Inc. | | | 1,610,000 | | | $ | 25,035,500 | |
| | | | | | | | 103,350,000 | |
| Energy — 8.5% | | | | | | | | |
| Oil & Gas Exploration & Production — 5.3% | | | | | | | | |
| SandRidge Energy, Inc.* | | | 2,400,000 | | | | 30,720,000 | |
| Southwestern Energy Co.* | | | 212,100 | | | | 9,113,937 | |
| | | | | | | | 39,833,937 | |
| Integrated Oil & Gas — 3.2% | | | | | | | | |
| ConocoPhillips | | | 300,000 | | | | 23,958,000 | |
| | | | | | | | 63,791,937 | |
| Health Care — 7.3% | | | | | | | | |
| Health Care Services — 7.3% | | | | | | | | |
| Omnicare, Inc. | | | 1,134,700 | | | | 34,029,653 | |
| Laboratory Corp. of America Holdings* | | | 225,000 | | | | 20,729,250 | |
| | | | | | | | 54,758,903 | |
| Materials — 6.5% | | | | | | | | |
| Construction Materials — 4.7% | | | | | | | | |
| Eagle Materials, Inc. | | | 550,000 | | | | 16,643,000 | |
| Martin Marietta Materials, Inc. | | | 160,000 | | | | 14,347,200 | |
| Vulcan Materials Co. | | | 100,000 | | | | 4,560,000 | |
| | | | | | | | 35,550,200 | |
| Fertilizers & Agricultural Chemicals — 1.3% | | | | | | | | |
| Monsanto Co. | | | 140,000 | | | | 10,116,400 | |
| Metals & Mining — 0.5% | | | | | | | | |
| Compass Minerals International, Inc. | | | 40,700 | | | | 3,806,671 | |
| | | | | | | | 49,473,271 | |
| Industrials — 2.2% | | | | | | | | |
| Industrial Conglomerates — 2.2% | | | | | | | | |
| Tyco International Ltd. | | | 365,000 | | | | 16,341,050 | |
| Consumer Staples — 1.0% | | | | | | | | |
| Food & Staples Retailing — 1.0% | | | | | | | | |
| CVS Caremark Corp. | | | 225,000 | | | | 7,722,000 | |
| Other — 0.0% | | | | | | | | |
| Other — 0.0% | | | | | | | | |
| Adelphia Recovery Trust, | | | | | | | | |
Series ACC-7* # | | | 2,310,000 | | | | — | |
| Total Common Stocks | | | | | | | | |
| (Cost $487,236,158) | | | | | | | 588,553,416 | |
The accompanying notes form an integral part of these financial statements.
16 Weitz Funds
| | | Principal | | | | |
| SHORT-TERM | | amount | | | | |
| SECURITIES — 22.7% | | or shares | | | Value | |
| Wells Fargo Advantage Government Money Market Fund - | | | | | | |
Institutional Class 0.01%(a) | | | 12,870,700 | | | $ | 12,870,700 | |
| U.S. Treasury Bills, 0.06% to 0.14%, | | | | | | | | |
4/07/11 to 6/30/11(b) | | $ | 158,500,000 | | | | 158,490,195 | |
| Total Short-Term Securities | | | | | | | | |
| (Cost $171,356,316) | | | | | | | 171,360,895 | |
| Total Investments in Securities | | | | | | | | |
| (Cost $658,592,474) | | | | | | | 759,914,311 | |
| Other Liabilities in Excess of Other Assets — (0.7%) | | | | | | | (5,316,655 | ) |
| Net Assets — 100.0% | | | | | | $ | 754,597,656 | |
| Net Asset Value Per Share | | | | | | $ | 22.05 | |
| * | Non-income producing |
| # | Illiquid and/or restricted security that has been fair valued. |
| (a) | Rate presented represents the annualized 7-day yield at March 31, 2011. |
| (b) | Interest rates presented represent the yield to maturity at the date of purchase. |
The accompanying notes form an integral part of these financial statements.
weitzfunds.com 17
PORTFOLIO MANAGER’S DISCUSSION & ANALYSIS
Portfolio Manager: Wallace R. Weitz
The Partners III Opportunity Fund returned +8.5% in the quarter, compared to a +5.9% return for the S&P 500 and a +6.4% return for the Russell 3000. Oil and gas companies SandRidge Energy (+75%) and ConocoPhillips (+18%) posted strong gains as upheaval in the Middle East and North Africa drove oil prices higher. Omnicare (+18%) rose as new CEO John Figueroa laid out an encouraging two-year road map for transforming the company into a more customer-centric and profitable organization. Ascent Media (+26%) continued its climb as investors digested the company’s strategic shift into the security-monitoring business. Grand Canyon Education (-26%) was the largest individual detractor from results for the quarter and fiscal year. David Perkins describes our investment thesis in depth in this report’s Analyst Corner.
For the fiscal year ended March 31, 2011, the Fund increased +24.4% compared to a +15.7% gain for the S&P 500 and a +17.4% gain for the Russell 3000. SandRidge Energy, Liberty Media – Capital and Coinstar were three standout contributors to results. SandRidge’s strategic asset sales have exceeded expectations, and the company’s acreage in the Horizontal Mississippian play has shown very promising early results. Liberty Media – Capital’s investment in Sirius XM Radio has been the gift that keeps giving. While Liberty Capital’s stock more than doubled during the fiscal year, our value estimate for the company rose dramatically as well. Coinstar continued to roll out Redbox DVD kiosks and take market share. We sold the stock in the low-$60’s late last year as it reached our value estimate. Other strong performers included recent portfolio additions Texas Instruments, Aon Corporation and Accenture plc. In addition to Grand Canyon, software giant Microsoft and the Fund’s short positions were the weakest performers for the fiscal year.
We purchased three new stocks during the quarter. Target is the well-known, leading discount retailer headquartered in Minneapolis. The company’s “PFresh” initiative, which adds more grocery items to its general merchandise stores, is off to a strong start. The company also introduced a revamped Target REDCard, a store-brand credit card that provides a 5% discount on nearly all purchases. We expect these investments to drive incremental traffic and profitable sales. Target generates more cash than it needs to run its business, and management is returning excess capital to shareholders via dividend and share repurchase. Texas Industries is a regional cement, aggregates and concrete company based in Dallas. We think the company’s strategic asset base is worth far more than today’s enterprise valuation. While the near-term outlook remains muted, patient investors have several possible ways to win over time. Finally, we purchased a small position in Knology, a cable operator in smaller markets in the Southeast and Midwest.
We sold three stocks at substantial gains during the quarter. We eliminated Liberty Media – Starz near our value estimate as investors became excited about the potential for a more lucrative distribution agreement with Netflix. From today’s stock price, the investment thesis depends more on original programming success, which we feel less confident about our ability to predict. We also sold long-time holding Cabela’s when the stock spiked in February. We applaud the job that management has done over the years, and we would gladly own the stock again at the right price. Finally, we eliminated short-time holding Iron Mountain as activist investors agitated for change, driving the stock up to our value estimate. While cage rattling may create incremental value over time, we are not willing to depend on it.
Partners III Opportunity has the broadest toolkit of our equity funds. The Fund invests in companies of all sizes, and typically maintains short positions to help manage risk. Partners III is 68% “net long” at quarter end. Long positions are 82% of net assets, while short positions are 14% of net assets. The Fund’s short positions remain tilted to broad-based small and mid-cap stock ETF’s.
| New and Eliminated Securities for Quarter Ended March 31, 2011 |
| New Purchases ($mil) | | Eliminations ($mil) |
| Target | | $ | 7.5 | | | Liberty Media - Starz | | $ | 7.0 | |
| Texas Industries | | | 2.4 | | | Cabela’s | | | 3.7 | |
| Knology | | | 0.4 | | | Iron Mountain | | | 3.1 | |
18 Weitz Funds
PARTNERS III OPPORTUNITY FUND
PERFORMANCE • (UNAUDITED)
| | | Total Returns | | | | Average Annual Total Returns |
| | | 3 Mos. | | 1Year | | 3Year | | 5Year | | 10Year | | 15Year | | 20Year | | 25Year |
| Partners III | | 8.5% | | 24.4% | | 13.9% | | 6.6% | | 8.1% | | 12.2% | | 13.5% | | 12.1% |
| S&P 500 | | 5.9 | | 15.7 | | 2.4 | | 2.6 | | 3.3 | | 6.8 | | 8.7 | | 9.6 |
| Russell 3000 | | 6.4 | | 17.4 | | 3.4 | | 3.0 | | 4.1 | | 7.1 | | N/A | | N/A |
| Russell 3000 Value | | 6.5 | | 15.6 | | 1.1 | | 1.4 | | 4.9 | | 7.8 | | N/A | | N/A |
Growth of $10,000
This chart depicts the change in the value of a $10,000 investment in Partners III for the period March 31, 2001 through March 31, 2011, as compared with the growth of the Standard & Poor’s 500 Index during the same period. Index performance is hypothetical and is shown for illustrative purposes only.

| | | | | Partners III | | S&P 500 | | Relative |
| | Year | | | (1) | | (2) | | Results (1)-(2) |
| | 1983 (6/1/83) | | | 8.6 | % | | 4.2 | % | | 4.4 | % |
| | 1984 | | | 11.2 | | | 6.1 | | | 5.1 | |
| | 1985 | | | 38.6 | | | 31.6 | | | 7.0 | |
| | 1986 | | | 8.5 | | | 18.6 | | | -10.1 | |
| | 1987 | | | -1.4 | | | 5.1 | | | -6.5 | |
| | 1988 | | | 19.5 | | | 16.6 | | | 2.9 | |
| | 1989 | | | 19.4 | | | 31.7 | | | -12.3 | |
| | 1990 | | | -5.5 | | | -3.1 | | | -2.4 | |
| | 1991 | | | 23.2 | | | 30.5 | | | -7.3 | |
| | 1992 | | | 13.5 | | | 7.6 | | | 5.9 | |
| | 1993 | | | 32.3 | | | 10.1 | | | 22.2 | |
| | 1994 | | | -11.1 | | | 1.3 | | | -12.4 | |
| | 1995 | | | 43.3 | | | 37.6 | | | 5.7 | |
| | 1996 | | | 25.0 | | | 23.0 | | | 2.0 | |
| | 1997 | | | 37.1 | | | 33.4 | | | 3.7 | |
| | 1998 | | | 10.9 | | | 28.6 | | | -17.7 | |
| | 1999 | | | 10.6 | | | 21.0 | | | -10.4 | |
| | 2000 | | | 32.4 | | | -9.1 | | | 41.5 | |
| | 2001 | | | 6.6 | | | -11.9 | | | 18.5 | |
| | 2002 | | | -16.1 | | | -22.1 | | | 6.0 | |
| | 2003 | | | 42.6 | | | 28.7 | | | 13.9 | |
| | 2004 | | | 22.1 | | | 10.9 | | | 11.2 | |
| | 2005 | | | -0.7 | | | 4.9 | | | -5.6 | |
| | 2006 | | | 20.4 | | | 15.8 | | | 4.6 | |
| | 2007 | | | -12.9 | | | 5.5 | | | -18.4 | |
| | 2008 | | | -34.4 | | | -37.0 | | | 2.6 | |
| | 2009 | | | 42.0 | | | 26.5 | | | 15.5 | |
| | 2010 | | | 33.0 | | | 15.1 | | | 17.9 | |
| | 2011 (3/31/11) | | | 8.5 | | | 5.9 | | | 2.6 | |
| | Since Inception: | | | | | | | | | | |
| | Cumulative | | | | | | | | | | |
| | Return | | | 3,350.0 | | | 1,545.1 | | | 1,804.9 | |
| | Avg. Annual | | | | | | | | | | |
| | Return | | | 13.6 | | | 10.6 | | | 3.0 | |
These performance numbers reflect the deduction of the Fund’s annual operating expenses which as stated in its most recent Prospectus are 1.80% of the Fund’s net assets. The returns assume redemption at the end of each period and reinvestment of dividends. Total returns shown include fee waivers and expense reimbursements, if any; total returns would have been lower had there been no waiver of fees and/or reimbursement of expenses by the Adviser. This information represents past performance and past performance does not guarantee future results. The investment return and the principal value of an investment in this Fund will fluctuate so that an investor’s shares, when redeemed, may be worth more or less than the original cost. Current performance may be lower or higher than the performance data quoted. Performance data current to the most recent month-end may be obtained at www.weitzfunds.com/performance/monthly.asp. See page 4 for additional performance disclosures.
Performance information does not reflect the deduction of taxes that a shareholder would pay on Fund distributions or the redemption of Fund shares.
Performance of the Partners III Opportunity Fund (“the Fund “) is measured from June 1, 1983, the inception of Weitz Partners III Limited Partnership (the “Partnership”). As of December 30, 2005, the Fund succeeded to substantially all of the assets of the Partnership. The investment objectives, policies and restrictions of the Fund are materially equivalent to those of the Partnership and the Partnership was managed at all times with full investment authority by Wallace R. Weitz & Company. The performance information includes performance for the period before the Fund became an investment company registered with the Securities and Exchange Commission. During this period, the Partnership was not registered under the Investment Company Act of 1940 and, therefore, was not subject to certain investment or other restrictions or requirements imposed by the 1940 Act or the Internal Revenue Code. If the Partnership had been registered under the 1940 Act during this period, the Partnership’s performance might have been adversely affected.
weitzfunds.com 19
PARTNERS III OPPORTUNITY FUND
PORTFOLIO PROFILE • (UNAUDITED)
| Top Ten Stocks |
| Omnicare | | | 5.2 | % |
| Microsoft | | | 4.9 | |
| SandRidge Energy | | | 4.9 | |
| Aon | | | 4.6 | |
| Liberty Media - Interactive | | | 4.5 | |
| Dell | | | 3.8 | |
| Ascent Media | | | 3.7 | |
| Liberty Global | | | 3.6 | |
| Berkshire Hathaway | | | 3.6 | |
| Texas Instruments | | | 3.6 | |
| % of Net Assets | | | 42.4 | % |
| Industry Sectors |
| Consumer Discretionary | | | 23.4 | % |
| Information Technology | | | 18.7 | |
| Financials | | | 12.2 | |
| Energy | | | 10.0 | |
| Health Care | | | 7.4 | |
| Industrials | | | 6.4 | |
| Materials | | | 3.8 | |
| Consumer Staples | | | 0.5 | |
| Telecommunication Services | | | 0.1 | |
| Total Long Positions | | | 82.5 | |
| Securities Sold Short | | | (14.1 | ) |
| Net Long Positions | | | 68.4 | |
| Short Proceeds/Other | | | 31.6 | |
| Net Assets | | | 100.0 | % |
| Top Five Performers for Quarter Ended March 31, 2011 |
| | QTD Return | Average Weight | Contribution to |
| Security Name | of Security | in Portfolio | Fund Performance |
| SandRidge Energy | 74.9% | 4.6% | 2.7% |
| Omnicare | 18.3 | 5.5 | 1.0 |
| Ascent Media | 26.0 | 3.7 | 0.8 |
| Aon | 15.5 | 4.5 | 0.7 |
| Liberty Global | 18.0 | 3.6 | 0.7 |
Source: FactSet Portfolio Analytics
| Bottom Five Performers for Quarter Ended March 31, 2011 |
| | QTD Return | Average Weight | Contribution to |
| Security Name | of Security | in Portfolio | Fund Performance |
| Short Positions (ETFs) | 21.7% | (11.0)% | (0.8)% |
| Grand Canyon Education | (26.0) | 2.2 | (0.7) |
| Microsoft | (8.6) | 4.1 | (0.4) |
| Live Nation Entertainment | (12.4) | 2.6 | (0.3) |
| Martin Marietta Materials | (2.3) | 1.8 | (0.1) |
Source: FactSet Portfolio Analytics
20 Weitz Funds
PARTNERS III OPPORTUNITY FUND
SCHEDULE OF INVESTMENTS • MARCH 31, 2011
| COMMON STOCKS — 82.5% | | Shares | | Value | |
| Consumer Discretionary — 23.4% | | | | | | | |
| Cable & Satellite — 6.4% | | | | | | | |
Liberty Global, Inc. - Series C* (a) | | | 420,011 | | $ | 16,796,240 | |
| Liberty Media Corp. - | | | | | | | |
Capital - Series A* (a) | | | 170,000 | | | 12,523,900 | |
| Knology, Inc.* | | | 27,600 | | | 356,316 | |
| | | | | | | 29,676,456 | |
| Internet & Catalog Retail — 4.5% | | | | | | | |
| Liberty Media Corp. - | | | | | | | |
Interactive - Series A* (a) | | | 1,300,000 | | | 20,852,000 | |
| Broadcasting — 3.8% | | | | | | | |
Discovery Communications, Inc. - CL C* (a) | | | 330,000 | | | 11,619,300 | |
| Cumulus Media, Inc. - CL A* | | | 1,340,000 | | | 5,815,600 | |
| | | | | | | 17,434,900 | |
| Movies & Entertainment — 2.5% | | | | | | | |
| Live Nation Entertainment, Inc.* | | | 1,148,300 | | | 11,483,000 | |
| Education Services — 1.8% | | | | | | | |
Grand Canyon Education, Inc.* (a) | | | 558,900 | | | 8,104,050 | |
| Multiline Retail — 1.6% | | | | | | | |
| Target Corp. | | | 150,000 | | | 7,501,500 | |
| Hotels, Restaurants & Leisure — 1.4% | | | | | | | |
| Interval Leisure Group, Inc.* | | | 400,000 | | | 6,540,000 | |
| Household Durables — 1.4% | | | | | | | |
| Mohawk Industries, Inc.* | | | 103,600 | | | 6,335,140 | |
| | | | | | | 107,927,046 | |
| Information Technology — 18.7% | | | | | | | |
| Software — 5.2% | | | | | | | |
| Microsoft Corp. | | | 900,000 | | | 22,824,000 | |
| ACI Worldwide, Inc.* | | | 40,800 | | | 1,338,240 | |
| | | | | | | 24,162,240 | |
| Computers & Peripherals — 3.8% | | | | | | | |
Dell, Inc.* (a) | | | 1,200,000 | | | 17,412,000 | |
| Internet Software & Services — 3.7% | | | | | | | |
Google, Inc. - CL A* (a) | | | 15,000 | | | 8,793,150 | |
| The Knot, Inc.* | | | 701,300 | | | 8,450,665 | |
| | | | | | | 17,243,815 | |
| Semiconductors — 3.6% | | | | | | | |
| Texas Instruments, Inc. | | | 475,000 | | | 16,416,000 | |
| IT Services — 2.4% | | | | | | | |
| Accenture plc - CL A | | | 200,000 | | | 10,994,000 | |
| | | | | | | 86,228,055 | |
| Financials — 12.2% | | | | | | | |
| Insurance Brokers — 5.5% | | | | | | | |
| Aon Corp. | | | 400,000 | | | 21,184,000 | |
| Willis Group Holdings Ltd. | | | 100,000 | | | 4,036,000 | |
| | | | | | | 25,220,000 | |
| Property & Casualty Insurance — 3.6% | | | | | | | |
Berkshire Hathaway, Inc. - CL B* (a) | | | 200,000 | | | 16,726,000 | |
| Mortgage REIT’s — 3.1% | | | | | | | |
Redwood Trust, Inc.(a) | | | 930,000 | | | 14,461,500 | |
| | | | | | | 56,407,500 | |
| | | | | | |
| | | Shares | | Value | |
| Energy — 10.0% | | | | | | | |
| Oil & Gas Exploration & Production — 6.7% | | | | | | | |
| SandRidge Energy, Inc.* | | | 1,750,000 | | $ | 22,400,000 | |
| Southwestern Energy Co.* | | | 200,000 | | | 8,594,000 | |
| | | | | | | 30,994,000 | |
| Integrated Oil & Gas — 3.3% | | | | | | | |
ConocoPhillips(a) | | | 190,000 | | | 15,173,400 | |
| | | | | | | 46,167,400 | |
| Health Care — 7.4% | | | | | | | |
| Health Care Services — 7.4% | | | | | | | |
Omnicare, Inc.(a) | | | 800,000 | | | 23,992,000 | |
Laboratory Corp. of America Holdings* (a) | | | 110,000 | | | 10,134,300 | |
| | | | | | | 34,126,300 | |
| Industrials — 6.4% | | | | | | | |
| Commercial Services & Supplies — 3.7% | | | | | | | |
| Ascent Media Corp. - CL A* | | | 350,000 | | | 17,097,500 | |
| Industrial Conglomerates — 1.8% | | | | | | | |
| Tyco International Ltd. | | | 190,000 | | | 8,506,300 | |
| Machinery — 0.9% | | | | | | | |
Intelligent Systems Corp.* # † | | | 2,270,000 | | | 3,972,500 | |
| | | | | | | 29,576,300 | |
| Materials — 3.8% | | | | | | | |
| Construction Materials — 3.8% | | | | | | | |
Martin Marietta Materials, Inc.(a) | | | 100,000 | | | 8,967,000 | |
| Eagle Materials, Inc. | | | 200,000 | | | 6,052,000 | |
| Texas Industries, Inc. | | | 60,000 | | | 2,713,800 | |
| | | | | | | 17,732,800 | |
| Consumer Staples — 0.5% | | | | | | | |
| Household Products — 0.5% | | | | | | | |
| Energizer Holdings, Inc.* | | | 30,000 | | | 2,134,800 | |
| Telecommunication Services — 0.1% | | | | | | | |
| Diversified Telecommunication Services — 0.1% | | | | | | | |
Continental Resources* # | | | 663 | | | 331,500 | |
| Total Common Stocks | | | | | | | |
| (Cost $282,734,258) | | | | | | 380,631,701 | |
| SHORT-TERM SECURITIES — 20.6% | | | | | | | |
| Wells Fargo Advantage Government Money Market Fund - | | | | | | | |
Institutional Class 0.01%(b) | | | | | | | |
| (Cost $94,882,069) | | | 94,882,069 | | | 94,882,069 | |
| Total Investments in Securities | | | | | | | |
| (Cost $377,616,327) | | | | | | 475,513,770 | |
Due From Broker(a) — 14.8% | | | | | | 68,341,086 | |
| Securities Sold Short — (14.1%) | | | | | | (64,954,600 | ) |
| Options Written — 0.0% | | | | | | (27,500 | ) |
| Other Liabilities in Excess of Other Assets — (3.8%) | | | | | | (17,432,521 | ) |
| Net Assets — 100.0% | | | | | $ | 461,440,235 | |
| Net Asset Value Per Share | | | | | $ | 12.63 | |
| The accompanying notes form an integral part of these financial statements. | weitzfunds.com 21 |
PARTNERS III OPPORTUNITY FUND
SCHEDULE OF INVESTMENTS • (CONTINUED)
| SECURITIES SOLD SHORT — (14.1%) | | Shares | | Value | |
| Discovery Communications, Inc. - CL A | | | 320,000 | | $ | (12,768,000 | ) |
| Ishares Russell 2000 Fund | | | 400,000 | | | (33,668,000 | ) |
| Ishares Russell 2000 Value Fund | | | 130,000 | | | (9,799,400 | ) |
| Ishares Russell Midcap Fund | | | 80,000 | | | (8,719,200 | ) |
| Total Securities Sold Short | | | | | | | |
| (proceeds $62,319,000) | | | | | $ | (64,954,600 | ) |
| OPTIONS WRITTEN* | | Expiration date/ Strike price | | Shares subject to option | | | |
| Covered Call Options | | | | | | | | | | |
| Grand Canyon | | | | | | | | | | |
| Education, Inc. | | | June 2011 / $17.50 | | | 100,000 | | $ | (27,500 | ) |
| Total Options Written | | | | | | | | | | |
| (premiums received $173,717) | | | | | | | | $ | (27,500 | ) |
| * | Non-income producing |
| † | Controlled affiliate |
| # | Illiquid and/or restricted security that has been fair valued. |
| (a) | Fully or partially pledged as collateral on securities sold short and outstanding written options. |
| (b) | Rate presented represents the annualized 7-day yield at March 31, 2011. |
| 22 Weitz Funds | The accompanying notes form an integral part of these financial statements. |
PORTFOLIO MANAGERS’ DISCUSSION & ANALYSIS
Co-Portfolio Managers:
Jonathan Baker, Barton Hooper, David Perkins,
Andrew Weitz & Bradley P. Hinton
The Research Fund returned +3.8% in the first calendar quarter, compared to a +5.9% return for the S&P 500, a +6.4% return for the Russell 3000 Index, and a +6.5% return for the Russell 3000 Value Index. The Fund’s energy holdings (SandRidge Energy +75%, ConocoPhillips +18%, and new holding Southwestern Energy) were strong contributors to the Fund’s performance. Unrest in oil-rich areas of the Middle East and North Africa has generated a great deal of uncertainty around the world’s global oil infrastructure, sending prices higher for energy-related commodities and energy stocks. Other strong performers in the quarter included Iron Mountain (+25%), The Knot (+22%), and Omnicare (+18%).
Companies in the for-profit education sector received poor marks during the quarter. In addition to increased regulatory scrutiny, companies are facing a much more competitive environment as they try to attract the strongest students to their institutions. Grand Canyon Education (-26%) was both the Fund’s largest position and the largest detractor from overall performance. We continue to have strong conviction in our investment given the company’s focus on high-quality students, low tuition rates, academic programs focused on in-demand fields like education and nursing, a strategy of operating both online and a traditional ground campus, and the highly qualified and experienced management team led by Brian Mueller. This quarter, David Perkins has profiled Grand Canyon in our Analyst Corner for those interested in a more in-depth review of our investment. Our holdings of Strayer Education (-14%) also fell, but the impact was largely offset by profits realized from the sale of our ITT Educational Services position.
We initiated six new positions during the quarter. The largest of these purchases was Southwestern Energy (5.8% of net assets.) Southwestern is a low-cost natural gas producer with a dominant acreage position in the prolific Fayetteville gas shale in Arkansas. The company earns very attractive returns on invested capital (even at today’s low gas prices) and given the size of its land holdings in the Fayetteville, we believe Southwestern can sustainably grow its production at high rates without the need for external capital. The company also maintains acreage in the Marcellus Shale in Pennsylvania and other areas, providing additional opportunities for growth. Although our investment thesis does not require natural gas prices to increase, a move higher would obviously benefit the company’s earnings and increase the value of its proven reserves.
Other new purchases include specialty apparel retailer American Eagle Outfitters, retail pharmacy and pharmacy benefit manager CVS Caremark, medical testing service company Laboratory Corp. of America, and discount retailer Target. Additionally we repurchased shares of former holding Coinstar, purveyor of the eponymous coin counting machines and Redbox DVD rental kiosks. In addition to ITT Educational Services, we eliminated three other positions during the quarter: Iron Mountain, Liberty Media – Starz, and Skechers. Iron Mountain and Liberty Starz were both successful investments and were sold as their stock prices approached our estimates of business value. We also made the decision to sell our shares of Skechers at a profit while the company continues to work through an oversized inventory position.
Research is a focused, multi-cap equity fund that invests in companies of all sizes. The Fund is managed in a “sleeve” format, with each co-manager responsible for all decisions related to their portion of the portfolio’s assets. In addition to the unique portfolio management structure, the Fund has several characteristics that may further distinguish it from our other equity funds including potentially higher levels of concentration, position sizes, and turnover within the Fund.
| | | | | | | | | | | |
| New and Eliminated Securities for Quarter Ended March 31, 2011 | |
| New Purchases ($000’s) | | | Eliminations ($000’s) | |
| Southwestern Energy | | $ | 557 | | | ITT Educational Services | | $ | 291 | |
| Coinstar | | | 263 | | | Sketchers U.S.A. | | | 215 | |
| Target | | | 213 | | | Iron Mountain | | | 173 | |
| Laboratory Corp. of America | | | 187 | | | Liberty Media - Starz | | | 151 | |
| CVS Caremark | | | 155 | | | | | | | |
| American Eagle Outfitters | | | 141 | | | | | | | |
weitzfunds.com 23
RESEARCH FUND
PERFORMANCE • (UNAUDITED)
| | | Total Returns | | Average Annual Total Returns | |
| | | | | | | | | | | | | | | Since | |
| | | 3 Mos. | | 1 Year | | 3 Year | | 5 Year | | Inception | |
| Research | | 3.8 | % | | 18.5 | % | | 12.7 | % | | 5.4 | % | | 6.1 | % | |
| S&P 500 | | 5.9 | | | 15.7 | | | 2.4 | | | 2.6 | | | 4.1 | | |
| Russell 3000 | | 6.4 | | | 17.4 | | | 3.4 | | | 3.0 | | | 4.8 | | |
| Russell 3000 Value | | 6.5 | | | 15.6 | | | 1.1 | | | 1.4 | | | 3.5 | | |
Growth of $10,000
This chart depicts the change in the value of a $10,000 investment in the Research Fund for the period April 1, 2005 through March 31, 2011, as compared with the growth of the Standard & Poor’s 500 Index during the same period. Index performance is hypothetical and is shown for illustrative purposes only.
| | | | Research | | S&P 500 | | Relative | |
| | Year | | (1) | | (2) | | Results (1)-(2) | |
| | 2005 (4/1/05) | | 4.0 | % | | 7.2 | % | | -3.2 | % | |
| | 2006 | | 21.8 | | | 15.8 | | | 6.0 | | |
| | 2007 | | -13.4 | | | 5.5 | | | -18.9 | | |
| | 2008 | | -30.7 | | | -37.0 | | | 6.3 | | |
| | 2009 | | 38.8 | | | 26.5 | | | 12.3 | | |
| | 2010 | | 30.3 | | | 15.1 | | | 15.2 | | |
| | 2011 (3/31/11) | | 3.8 | | | 5.9 | | | -2.1 | | |
| | Since Inception: | | | | | | | | | | |
| | Cumulative | | | | | | | | | | |
| | Return | | 42.7 | | | 27.2 | | | 15.5 | | |
| | Avg. Annual | | | | | | | | | | |
| | Return | | 6.1 | | | 4.1 | | | 2.0 | | |
These performance numbers reflect the deduction of the Fund’s annual pro forma operating expenses of 1.50%. Annual operating expenses for the Fund as stated in the Initial Prospectus are 1.50% (estimated gross) and 0.90% (net) of the Fund’s net assets. The investment adviser has agreed, in writing, to limit the total annual fund operating expenses (excluding taxes, interest, brokerage commissions, and acquired fund fees and expenses) to 0.90% of the Fund’s average daily net assets through July 31, 2012. The returns assume redemption at the end of each period and reinvestment of dividends. Total returns shown include fee waivers and expense reimbursements, if any; total returns would have been lower had there been no waiver of fees and/or reimbursement of expenses by the Adviser. This information represents past performance and past performance does not guarantee future results. The investment return and the principal value of an investment in this Fund will fluctuate so that an investor’s shares, when redeemed, may be worth more or less than the original cost. Current performance may be lower or higher than the performance data quoted. Performance data current to the most recent month-end may be obtained at www.weitzfunds.com/performance/monthly.asp. See page 4 for additional performance disclosures.
Performance information does not reflect the deduction of taxes that a shareholder would pay on Fund distributions or the redemption of Fund shares.
Performance of the Research Fund (the “Fund”) is measured from April 1, 2005, the inception of Weitz Research Fund LP (the “Partnership”). As of December 31, 2010, the Fund succeeded to substantially all of the assets of the Partnership. The investment objectives, policies and restrictions of the Fund are materially equivalent to those of the Partnership and the Partnership was managed at all times with full investment authority by Wallace R. Weitz & Company. The performance information includes performance for the period before the Fund became an investment company registered with the Securities and Exchange Commission. During this period, the Partnership was not registered under the Investment Company Act of 1940 and, therefore, was not subject to certain investment or other restrictions or requirements imposed by the 1940 Act or the Internal Revenue Code. If the Partnership had been registered under the 1940 Act during this period, the Partnership’s performance might have been adversely affected.
24 Weitz Funds
RESEARCH FUND
PORTFOLIO PROFILE • (UNAUDITED)
| Top Ten Stocks | |
| Grand Canyon Education | | | 8.2 | % |
| Microsoft | | | 7.0 | |
| Southwestern Energy | | | 5.8 | |
| Aon | | | 5.1 | |
| Dell | | | 3.9 | |
| Accenture | | | 3.6 | |
| Google | | | 3.5 | |
| The Knot | | | 3.5 | |
| Omnicare | | | 3.5 | |
| Interval Leisure Group | | | 3.2 | |
| % of Net Assets | | | 47.3 | % |
| | |
| Industry Sectors | |
| Consumer Discretionary | | | 29.3 | % |
| Information Technology | | | 23.1 | |
| Energy | | | 10.1 | |
| Financials | | | 7.7 | |
| Health Care | | | 6.3 | |
| Materials | | | 4.5 | |
| Consumer Staples | | | 1.4 | |
| Industrials | | | 1.1 | |
| Short-Term Securities/Other | | | 16.5 | |
| Net Assets | | | 100.0 | % |
| Top Five Performers for Quarter Ended March 31, 2011 | |
| Security Name | | QTD Return of Security | | Average Weight in Portfolio | | Contribution to Fund Performance | |
| Southwestern Energy | | 16.4 | % | | 2.7 | % | | 0.9 | % | |
| SandRidge Energy | | 74.9 | | | 1.4 | | | 0.9 | | |
| Aon | | 15.5 | | | 4.6 | | | 0.7 | | |
| The Knot | | 22.0 | | | 3.2 | | | 0.7 | | |
| Omnicare | | 18.3 | | | 3.5 | | | 0.6 | | |
Source: FactSet Portfolio Analytics
| Bottom Five Performers for Quarter Ended March 31, 2011 | |
| Security Name | | QTD Return of Security | | Average Weight in Portfolio | | Contribution to Fund Performance | |
| Grand Canyon Education | | (26.0 | )% | | 8.9 | % | | (2.7 | )% | |
| Microsoft | | (8.6 | ) | | 7.3 | | | (0.6 | ) | |
| Strayer Education | | (13.6 | ) | | 2.9 | | | (0.4 | ) | |
| Knology | | (17.4 | ) | | 1.3 | | | (0.2 | ) | |
| Target | | (4.4 | ) | | 0.5 | | | (0.1 | ) | |
Source: FactSet Portfolio Analytics
weitzfunds.com 25
RESEARCH FUND
SCHEDULE OF INVESTMENTS • MARCH 31, 2011
| COMMON STOCKS — 83.5% | | Shares | | Value | |
| Consumer Discretionary — 29.3% | | | | | | | |
| Education Services — 10.9% | | | | | | | |
| Grand Canyon Education, Inc.* | | | 63,882 | | $ | 926,289 | |
| Strayer Education, Inc. | | | 2,329 | | | 303,911 | |
| | | | | | | 1,230,200 | |
| Hotels, Restaurants & Leisure — 3.2% | | | | | | | |
| Interval Leisure Group, Inc.* | | | 21,797 | | | 356,381 | |
| Internet & Catalog Retail — 3.1% | | | | | | | |
| Liberty Media Corp. - | | | | | | | |
| Interactive - Series A* | | | 22,001 | | | 352,896 | |
| Cable & Satellite — 3.0% | | | | | | | |
| Comcast Corp. - CL A | | | 7,300 | | | 180,456 | |
| Knology, Inc.* | | | 11,960 | | | 154,404 | |
| | | | | | | 334,860 | |
| Specialized Consumer Services — 2.6% | | | | | | | |
| Coinstar, Inc.* | | | 6,300 | | | 289,296 | |
| Advertising — 2.0% | | | | | | | |
| Omnicom Group, Inc. | | | 4,496 | | | 220,574 | |
| Multiline Retail — 1.8% | | | | | | | |
| Target Corp. | | | 4,100 | | | 205,041 | |
| Specialty Retail — 1.4% | | | | | | | |
| American Eagle Outfitters, Inc. | | | 10,000 | | | 158,900 | |
| Movies & Entertainment — 1.3% | | | | | | | |
| Viacom, Inc. - CL B | | | 3,200 | | | 148,864 | |
| | | | | | | 3,297,012 | |
| Information Technology — 23.1% | | | | | | | |
| Internet Software & Services — 7.0% | | | | | | | |
| Google, Inc. - CL A* | | | 673 | | | 394,519 | |
| The Knot, Inc.* | | | 32,610 | | | 392,951 | |
| | | | | | | 787,470 | |
| Software — 7.0% | | | | | | | |
| Microsoft Corp. | | | 30,983 | | | 785,729 | |
| Computers & Peripherals — 5.5% | | | | | | | |
| Dell, Inc.* | | | 29,869 | | | 433,399 | |
| Apple, Inc.* | | | 519 | | | 180,846 | |
| | | | | | | 614,245 | |
| IT Services — 3.6% | | | | | | | |
| Accenture plc - CL A | | | 7,390 | | | 406,228 | |
| | | | | | | 2,593,672 | |
| Energy — 10.1% | | | | | | | |
| Oil & Gas Exploration & Production — 7.3% | | | | | | | |
| Southwestern Energy Co.* | | | 15,172 | | | 651,941 | |
| SandRidge Energy, Inc.* | | | 13,624 | | | 174,387 | |
| | | | | | | 826,328 | |
| Integrated Oil & Gas — 2.8% | | | | | | | |
| ConocoPhillips | | | 3,899 | | | 311,374 | |
| | | | | | | 1,137,702 | |
| | | Principal | | | | |
| | | amount | | | | |
| | | or shares | | Value | |
| Financials — 7.7% | | | | | | | |
| Insurance Brokers — 6.4% | | | | | | | |
| Aon Corp. | | | 10,741 | | $ | 568,843 | |
| Willis Group Holdings Ltd. | | | 3,882 | | | 156,678 | |
| | | | | | | 725,521 | |
| Property & Casualty Insurance — 1.3% | | | | | | | |
| Berkshire Hathaway, Inc. - CL B* | | | 1,700 | | | 142,171 | |
| | | | | | | 867,692 | |
| Health Care — 6.3% | | | | | | | |
| Health Care Services — 5.2% | | | | | | | |
| Omnicare, Inc. | | | 13,033 | | | 390,860 | |
| Laboratory Corp. of America Holdings* | | | 2,135 | | | 196,697 | |
| | | | | | | 587,557 | |
| Health Care Equipment — 1.1% | | | | | | | |
| Baxter International, Inc. | | | 2,290 | | | 123,133 | |
| | | | | | | 710,690 | |
| Materials — 4.5% | | | | | | | |
| Construction Materials — 2.1% | | | | | | | |
| Eagle Materials, Inc. | | | 4,170 | | | 126,184 | |
| Martin Marietta Materials, Inc. | | | 1,275 | | | 114,329 | |
| | | | | | | 240,513 | |
| Fertilizers & Agricultural Chemicals — 1.2% | | | | | | | |
| Monsanto Co. | | | 1,892 | | | 136,716 | |
| Metals & Mining — 1.2% | | | | | | | |
| Compass Minerals International, Inc. | | | 1,390 | | | 130,007 | |
| | | | | | | 507,236 | |
| Consumer Staples — 1.4% | | | | | | | |
| Food & Staples Retailing — 1.4% | | | | | | | |
| CVS Caremark Corp. | | | 4,710 | | | 161,647 | |
| Industrials — 1.1% | | | | | | | |
| Aerospace & Defense — 1.1% | | | | | | | |
| Lockheed Martin Corp. | | | 1,480 | | | 118,992 | |
| Total Common Stocks | | | | | | | |
| (Cost $8,327,697) | | | | | | 9,394,643 | |
| SHORT-TERM SECURITIES — 16.5% | | | | | | | |
| Wells Fargo Advantage Government Money Market Fund - | | | | | | | |
Institutional Class 0.01%(a) | | | 1,251,888 | | | 1,251,888 | |
U.S. Treasury Bill, 0.06%, 4/14/11(b) | | $ | 600,000 | | | 599,993 | |
| Total Short-Term Securities | | | | | | | |
| (Cost $1,851,876) | | | | | | 1,851,881 | |
| Total Investments in Securities | | | | | | | |
| (Cost $10,179,573) | | | | | | 11,246,524 | |
| Other Liabilities in Excess of Other Assets — 0.0% | | | | | | (2,527 | ) |
| Net Assets — 100.0% | | | | | $ | 11,243,997 | |
| Net Asset Value Per Share | | | | | $ | 10.38 | |
| * | Non-income producing |
| (a) | Rate presented represents the annualized 7-day yield at March 31, 2011. |
| (b) | Interest rate presented represents the yield to maturity at the date of purchase. |
| 26 Weitz Funds | The accompanying notes form an integral part of these financial statements. |
PORTFOLIO MANAGER’S DISCUSSION & ANALYSIS
Portfolio Manager: Wallace R. Weitz
The Hickory Fund returned +8.3% in the quarter, compared to a +5.9% return for the S&P 500 and a +8.7% return for the Russell 2500. SandRidge Energy (+75%) posted strong gains as upheaval in the Middle East and North Africa drove oil prices higher. Omnicare (+18%) rose as new CEO John Figueroa laid out an encouraging two-year road map for transforming the company into a more customer-centric and profitable organization. Ascent Media (+26%) continued its climb as investors digested the company’s strategic shift into the security-monitoring business. Grand Canyon Education (-26%) was the largest detractor from results for the quarter and fiscal year. David Perkins describes our investment thesis in depth in this report’s Analyst Corner.
For the fiscal year ended March 31, 2011, the Fund increased +29.4% compared to a +15.7% gain for the S&P 500 and a +26.1% gain for the Russell 2500. Small company stocks continued to lead the recovery from the bear market lows. SandRidge Energy, Liberty Media – Capital and Coinstar were three standout contributors to results. SandRidge’s strategic asset sales have exceeded expectations, and the company’s acreage in the Horizontal Mississippian play has shown very promising early results. Liberty Media – Capital’s investment in Sirius XM Radio has been the gift that keeps giving. While Liberty Capital’s stock more than doubled during the fiscal year, our value estimate for the company rose dramatically as well. Coinstar continued to roll out Redbox DVD kiosks and take market share. We sold the stock in the low-$60’s late last year as it reached our value estimate, then rebuilt a modest position in the low-$40’s in March. For-profit education companies detracted from results as they faced regulatory and competitive headwinds during the fiscal year. We have focused our industry investment primarily in Grand Canyon, which we think has several unique attributes (see Analyst Corner for details).
We purchased two other new stocks during the quarter. Texas Industries is a regional cement, aggregates and concrete company based in Dallas. We think the company’s strategic asset base is worth far more than today’s enterprise valuation. While the near-term outlook remains muted, patient investors have several possible ways to win over time. American Eagle Outfitters is a specialty apparel retailer catering to teens and young adults. The company is working through a turnaround of its core brand. While customers have continued to shop “AE” stores for the basics, the company’s fashion items have been more hit-or-miss. The stock is depressed compared to the company’s free cash flow, and the healthy dividend yield and solid balance sheet provide additional support.
We were net sellers into the ongoing small-cap rally. We eliminated TD Ameritrade as the stock neared our conservative appraisal. We also sold the vast majority of our holdings in Liberty Media – Starz and Cabela’s at substantial gains. Investors in Starz became excited about the potential for a more lucrative distribution agreement with Netflix. From today’s stock price, the investment thesis depends more on original programming success, which we feel less confident about our ability to predict. While we applaud the job that Cabela’s management has done over the years, we thought the stock was ahead of business fundamentals when it spiked in February. Finally, we exited a small position in Skechers U.S.A. as we decided to monitor the company’s progress with its excess inventory from the sidelines.
The Hickory Fund invests in our firm’s best smaller company ideas. The Fund’s weighted average market cap is just under $5 billion, reflecting Hickory’s diverse mix of mid-cap and small-cap stocks. The Fund remains relatively concentrated, with the ten largest positions accounting for 42% of net assets. Hickory’s residual cash position was 28% of net assets at quarter end.
| New and Eliminated Securities for Quarter Ended March 31, 2011 | |
| New Purchases ($mil) | | | Eliminations ($mil) | |
| Texas Industries | | $ | 1.6 | | | TD Ameritrade | | $ | 1.7 | |
| Coinstar | | | 1.3 | | | Skechers U.S.A. | | | 1.4 | |
| American Eagle Outfitters | | | 0.7 | | | | | | | |
weitzfunds.com 27
HICKORY FUND
PERFORMANCE • (UNAUDITED)
| | | | Total Returns | | | Average Annual Total Returns | |
| | | | 3 Mos. | | 1 Year | | 3 Year | | 5 Year | | 10 Year | | 15 Year | |
| | Hickory | | 8.3 | % | | 29.4 | % | | 10.5 | % | | 4.1 | % | | 5.4 | % | | 10.0 | % | |
| | S&P 500 | | 5.9 | | | 15.7 | | | 2.4 | | | 2.6 | | | 3.3 | | | 6.8 | | |
| | Russell 2500 | | 8.7 | | | 26.1 | | | 8.9 | | | 4.4 | | | 8.9 | | | 9.5 | | |
| | Russell 2500 Value | | 7.7 | | | 22.7 | | | 8.0 | | | 3.3 | | | 9.6 | | | 10.7 | | |
Growth of $10,000
This chart depicts the change in the value of a $10,000 investment in the Hickory Fund for the period March 31, 2001 through March 31, 2011, as compared with the growth of the Standard & Poor’s 500 Index during the same period. Index performance is hypothetical and is shown for illustrative purposes only.
| | | | Hickory | | S&P 500 | | Relative | |
| | Year | | (1) | | (2) | | Results (1)-(2) | |
| | 1993 (4/1/93) | | 20.3 | % | | 5.5 | % | | 14.8 | % | |
| | 1994 | | -17.3 | | | 1.3 | | | -18.6 | | |
| | 1995 | | 40.5 | | | 37.6 | | | 2.9 | | |
| | 1996 | | 35.3 | | | 23.0 | | | 12.3 | | |
| | 1997 | | 39.2 | | | 33.4 | | | 5.8 | | |
| | 1998 | | 33.0 | | | 28.6 | | | 4.4 | | |
| | 1999 | | 36.7 | | | 21.0 | | | 15.7 | | |
| | 2000 | | -17.2 | | | -9.1 | | | -8.1 | | |
| | 2001 | | -4.6 | | | -11.9 | | | 7.3 | | |
| | 2002 | | -29.3 | | | -22.1 | | | -7.2 | | |
| | 2003 | | 47.9 | | | 28.7 | | | 19.2 | | |
| | 2004 | | 22.6 | | | 10.9 | | | 11.7 | | |
| | 2005 | | -0.2 | | | 4.9 | | | -5.1 | | |
| | 2006 | | 22.8 | | | 15.8 | | | 7.0 | | |
| | 2007 | | -13.1 | | | 5.5 | | | -18.6 | | |
| | 2008 | | -41.6 | | | -37.0 | | | -4.6 | | |
| | 2009 | | 36.5 | | | 26.5 | | | 10.0 | | |
| | 2010 | | 38.7 | | | 15.1 | | | 23.6 | | |
| | 2011 (3/31/11) | | 8.3 | | | 5.9 | | | 2.4 | | |
| | Since Inception: | | | | | | | | | | |
| | Cumulative | | | | | | | | | | |
| | Return | | 517.1 | | | 315.7 | | | 201.4 | | |
| | Avg. Annual | | | | | | | | | | |
| | Return | | 10.6 | | | 8.2 | | | 2.4 | | |
These performance numbers reflect the deduction of the Fund’s annual operating expenses which as stated in its most recent Prospectus are 1.33% of the Fund’s net assets. The returns assume redemption at the end of each period and reinvestment of dividends. Total returns shown include fee waivers and expense reimbursements, if any; total returns would have been lower had there been no waiver of fees and/or reimbursement of expenses by the Adviser. This information represents past performance and past performance does not guarantee future results. The investment return and the principal value of an investment in this Fund will fluctuate so that an investor’s shares, when redeemed, may be worth more or less than the original cost. Current performance may be lower or higher than the performance data quoted. Performance data current to the most recent month-end may be obtained at www.weitzfunds.com/performance/monthly.asp.
See page 4 for additional performance disclosures.
Performance information does not reflect the deduction of taxes that a shareholder would pay on Fund distributions or the redemption of Fund shares.
28 Weitz Funds
HICKORY FUND
PORTFOLIO PROFILE • (UNAUDITED)
| Top Ten Stocks | |
| Omnicare | | | 5.6 | % |
| SandRidge Energy | | | 5.2 | |
| Liberty Media - Interactive | | | 5.0 | |
| Aon | | | 4.4 | |
| Liberty Global | | | 4.1 | |
| Ascent Media | | | 4.1 | |
| Redwood Trust | | | 3.7 | |
| Liberty Media - Capital | | | 3.7 | |
| Laboratory Corp. of America | | | 3.1 | |
| Mohawk Industries | | | 3.0 | |
| % of Net Assets | | | 41.9 | % |
| | | | | |
| Industry Sectors | |
| Consumer Discretionary | | | 28.4 | % |
| Financials | | | 11.3 | |
| Health Care | | | 8.7 | |
| Materials | | | 6.5 | |
| Energy | | | 5.2 | |
| Industrials | | | 5.1 | |
| Information Technology | | | 3.9 | |
| Consumer Staples | | | 1.9 | |
| Telecommunication Services | | | 0.7 | |
| Short-Term Securities/Other | | | 28.3 | |
| Net Assets | | | 100.0 | % |
| Top Five Performers for Quarter Ended March 31, 2011 | |
| Security Name | | QTD Return of Security | | Average Weight in Portfolio | | Contribution to Fund Performance | |
| SandRidge Energy | | 74.9 | % | | 5.2 | % | | 3.1 | % | |
| Omnicare | | 18.3 | | | 5.9 | | | 1.0 | | |
| Ascent Media | | 26.0 | | | 3.9 | | | 1.0 | | |
| Liberty Global | | 18.0 | | | 4.1 | | | 0.7 | | |
| Aon | | 15.5 | | | 4.4 | | | 0.7 | | |
Source: FactSet Portfolio Analytics
| Bottom Five Performers for Quarter Ended March 31, 2011 | |
| Security Name | | QTD Return of Security | | Average Weight in Portfolio | | Contribution to Fund Performance | |
| Grand Canyon Education | | (26.0 | )% | | 2.6 | % | | (0.8 | )% | |
| Live Nation Entertainment | | (12.4 | ) | | 3.0 | | | (0.4 | ) | |
| Knology | | (17.4 | ) | | 1.1 | | | (0.2 | ) | |
| LICT | | (14.2 | ) | | 0.9 | | | (0.1 | ) | |
| Strayer Education | | (13.6 | ) | | 0.4 | | | (0.1 | ) | |
| | | | | | | | | | | |
| Source: FactSet Portfolio Analytics | | | | | | | | | | |
weitzfunds.com 29
HICKORY FUND
SCHEDULE OF INVESTMENTS • MARCH 31, 2011
| COMMON STOCKS — 71.7% | | Shares | | Value | |
| Consumer Discretionary — 28.4% | | | | | | | |
| Cable & Satellite — 9.2% | | | | | | | |
| Liberty Global, Inc. - Series C* | | | 329,989 | | $ | 13,196,260 | |
| Liberty Media Corp. - | | | | | | | |
| Capital - Series A* | | | 160,000 | | | 11,787,200 | |
| Knology, Inc.* | | | 327,700 | | | 4,230,607 | |
CIBL, Inc.# | | | 1,005 | | | 473,355 | |
| | | | | | | 29,687,422 | |
| Internet & Catalog Retail — 5.0% | | | | | | | |
| Liberty Media Corp. - | | | | | | | |
| Interactive - Series A* | | | 1,000,000 | | | 16,040,000 | |
| Household Durables — 3.0% | | | | | | | |
| Mohawk Industries, Inc.* | | | 160,000 | | | 9,784,000 | |
| Movies & Entertainment — 3.0% | | | | | | | |
| Live Nation Entertainment, Inc.* | | | 965,600 | | | 9,656,000 | |
| Education Services — 2.7% | | | | | | | |
Grand Canyon Education, Inc.* (c) | | | 499,300 | | | 7,239,850 | |
| Strayer Education, Inc. | | | 10,000 | | | 1,304,900 | |
| | | | | | | 8,544,750 | |
| Hotels, Restaurants & Leisure — 2.0% | | | | | | | |
| Interval Leisure Group, Inc.* | | | 401,228 | | | 6,560,078 | |
| Broadcasting — 1.1% | | | | | | | |
| Cumulus Media, Inc. - CL A* | | | 620,000 | | | 2,690,800 | |
| Liberty Media Corp. - | | | | | | | |
| Starz - Series A* | | | 10,000 | | | 776,000 | |
| | | | | | | 3,466,800 | |
| Textiles, Apparel & Luxury Goods — 1.1% | | | | | | | |
| Iconix Brand Group, Inc.* | | | 160,000 | | | 3,436,800 | |
| Publishing — 0.5% | | | | | | | |
| The Washington Post Co. - CL B | | | 4,000 | | | 1,750,240 | |
| Specialized Consumer Services — 0.4% | | | | | | | |
| Coinstar, Inc.* | | | 30,000 | | | 1,377,600 | |
| Specialty Retail — 0.4% | | | | | | | |
| American Eagle Outfitters, Inc. | | | 50,000 | | | 794,500 | |
| Cabela’s, Inc. - CL A* | | | 20,000 | | | 500,200 | |
| | | | | | | 1,294,700 | |
| | | | | | | 91,598,390 | |
| Financials — 11.3% | | | | | | | |
| Insurance Brokers — 7.3% | | | | | | | |
| Aon Corp. | | | 270,000 | | | 14,299,200 | |
| Willis Group Holdings Ltd. | | | 100,000 | | | 4,036,000 | |
| Brown & Brown, Inc. | | | 150,000 | | | 3,870,000 | |
| eHealth, Inc.* | | | 100,000 | | | 1,330,000 | |
| | | | | | | 23,535,200 | |
| Mortgage REIT’s — 3.7% | | | | | | | |
| Redwood Trust, Inc. | | | 771,100 | | | 11,990,605 | |
| Thrifts & Mortgage Finance — 0.2% | | | | | | | |
| Tree.com, Inc.* | | | 96,900 | | | 571,710 | |
| Real Estate Services — 0.1% | | | | | | | |
| Kennedy-Wilson Holdings, Inc.* | | | 30,000 | | | 325,800 | |
| Kennedy-Wilson Holdings, Inc. - | | | | | | | |
| Warrants, expiration date 11/14/14* | | | 10,000 | | | 16,000 | |
| | | | | | | 341,800 | |
| | | | | | | 36,439,315 | |
| | | | | | | | |
| Health Care — 8.7% | | | | | | | |
| Health Care Services — 8.7% | | | | | | | |
| Omnicare, Inc. | | | 600,000 | | $ | 17,994,000 | |
| Laboratory Corp. of America Holdings* | | | 110,000 | | | 10,134,300 | |
| | | | | | | 28,128,300 | |
| Materials — 6.5% | | | | | | | |
| Construction Materials — 5.5% | | | | | | | |
| Martin Marietta Materials, Inc. | | | 80,000 | | | 7,173,600 | |
| Eagle Materials, Inc. | | | 210,000 | | | 6,354,600 | |
| Vulcan Materials Co. | | | 50,000 | | | 2,280,000 | |
| Texas Industries, Inc. | | | 40,000 | | | 1,809,200 | |
| | | | | | | 17,617,400 | |
| Metals & Mining — 1.0% | | | | | | | |
| Compass Minerals International, Inc. | | | 35,000 | | | 3,273,550 | |
| | | | | | | 20,890,950 | |
| Energy — 5.2% | | | | | | | |
| Oil & Gas Exploration & Production — 5.2% | | | | | | | |
| SandRidge Energy, Inc.* | | | 1,300,000 | | | 16,640,000 | |
| Industrials — 5.1% | | | | | | | |
| Commercial Services & Supplies — 5.1% | | | | | | | |
| Ascent Media Corp. - CL A* | | | 270,000 | | | 13,189,500 | |
| Iron Mountain, Inc. | | | 100,000 | | | 3,123,000 | |
| | | | | | | 16,312,500 | |
| Information Technology — 3.9% | | | | | | | |
| Internet Software & Services — 2.3% | | | | | | | |
| The Knot, Inc.* | | | 631,300 | | | 7,607,165 | |
| Software — 0.7% | | | | | | | |
| ACI Worldwide, Inc.* | | | 66,300 | | | 2,174,640 | |
| IT Services — 0.6% | | | | | | | |
| SAIC, Inc.* | | | 110,000 | | | 1,861,200 | |
| Electronic Equipment & Instruments — 0.3% | | | | | | | |
| FLIR Systems, Inc. | | | 30,000 | | | 1,038,300 | |
| | | | | | | 12,681,305 | |
| Consumer Staples — 1.9% | | | | | | | |
| Personal Products — 1.0% | | | | | | | |
| Prestige Brands Holdings, Inc.* | | | 300,000 | | | 3,450,000 | |
| Household Products — 0.9% | | | | | | | |
| Energizer Holdings, Inc.* | | | 40,000 | | | 2,846,400 | |
| | | | | | | 6,296,400 | |
| Telecommunication Services — 0.7% | | | | | | | |
| Diversified Telecommunication Services — 0.7% | | | | | | | |
LICT Corp.* # | | | 1,005 | | | 2,283,862 | |
ICTC Group, Inc. - CL A* # | | | 13,065 | | | 146,328 | |
| | | | | | | 2,430,190 | |
| Total Common Stocks | | | | | | | |
| (Cost $172,102,306) | | | | | | 231,417,350 | |
| 30 Weitz Funds | The accompanying notes form an integral part of these financial statements. |
SHORT-TERM SECURITIES — 29.2% | | Principal amount or shares | | | Value | |
Wells Fargo Advantage Government Money Market Fund -Institutional Class 0.01%(a) | | | 8,683,285 | | | $ | 8,683,285 | |
U.S. Treasury Bills, 0.07% to 0.09%, 4/21/11 to 6/23/11(b) | | $ | 85,400,000 | | | | 85,395,938 | |
| Total Short-Term Securities | | | | | | | | |
| (Cost $94,076,954) | | | | | | | 94,079,223 | |
| Total Investments in Securities | | | | | | | | |
| (Cost $266,179,260) | | | | | | | 325,496,573 | |
| Options Written — 0.0% | | | | | | | (27,500 | ) |
| Other Liabilities in Excess of Other Assets — (0.9%) | | | | | | | (2,841,022 | ) |
| Net Assets — 100.0% | | | | | | $ | 322,628,051 | |
| Net Asset Value Per Share | | | | | | $ | 41.12 | |
| OPTIONS WRITTEN* | | Expiration date/ Strike price | | Shares
subject
to option | | Value | |
| Covered Call Options | | | | | | | |
| Grand Canyon Education, Inc. | | | June 2011 / $17.50 | | | 100,000 | | $ | (27,500 | ) |
| Total Options Written | | | | | | | | | | |
| (premiums received $173,717) | | | | | | | | $ | (27,500 | ) |
| * | Non-income producing |
| # | Illiquid and/or restricted security that has been fair valued. |
| (a) | Rate presented represents the annualized 7-day yield at March 31, 2011. |
| (b) | Interest rates presented represent the yield to maturity at the date of purchase. |
| (c) | Fully or partially pledged on outstanding written options. |
| The accompanying notes form an integral part of these financial statements. | weitzfunds.com 31 |
PORTFOLIO MANAGER’S DISCUSSION & ANALYSIS
Portfolio Manager: Bradley P. Hinton
The Balanced Fund returned +3.4% in the quarter, compared to a +3.7% return for the Blended Index. Omnicare (+18%) rose as new CEO John Figueroa laid out an encouraging two-year road map for transforming the company into a more customer-centric and profitable organization. Insurance broker Aon Corporation (+16%) continued to integrate the Hewitt acquisition and to execute on its plan to grind margins higher over the next few years. Global consultant Accenture plc (+13%) posted terrific quarterly results and raised its outlook again. Grand Canyon Education (-26%) was the largest detractor from results for the quarter and fiscal year. David Perkins describes our investment thesis in depth in this report’s Analyst Corner.
For the fiscal year ended March 31, 2011, the Fund increased +11.8% compared to an +11.3% gain for the Blended Index. Coinstar and ConocoPhillips were two standout contributors to results. Coinstar continued to roll out Redbox DVD kiosks and take market share. We sold the stock in the high-$50’s late last year as it reached our value estimate. ConocoPhillips executed on its strategic plan to sell non-core assets and return capital to shareholders. Insurance brokers Aon, Brown & Brown and Willis Group also posted strong gains despite a soft market for risk units and pricing. For-profit education companies detracted from results as they faced regulatory and competitive headwinds during the fiscal year. We have focused our industry investment primarily in Grand Canyon, which we think has several unique attributes (see Analyst Corner for details).
We bought three new stocks during the quarter. Texas Industries is a regional cement, aggregates and concrete company based in Dallas. We think the company’s strategic asset base is worth far more than today’s enterprise valuation. While the near-term outlook remains muted, patient investors have several possible ways to win over time. CVS Caremark marries a leading retail pharmacy chain with a large pharmacy benefit manager (“PBM”). CVS trades at a substantial discount to the potential market value of its component parts, largely because many investors are skeptical that these two businesses belong together. Either way, we like the company’s free cash flow generation, growth potential, and shareholder-friendly capital plan. Anheuser-Busch InBev NV is a leading global brewer headquartered in Belgium. The company has dominant positions in several attractive beer markets, a disciplined and shareholder-friendly management team, and a business with excellent financial characteristics. The stock trades at a low multiple of potential free cash flow per share in 2012 and beyond.
We sold three stocks at healthy gains during the quarter. With mixed emotions we exited long-time holding Cabela’s when the stock spiked in February. We have owned the company since the inception of the Fund, when the “World’s Foremost Outfitter” was still a private company. We applaud the job that management has done over the years and would gladly partner with the Cabela’s team again at the right price. We also sold short-time holding Iron Mountain as activist investors agitated for change, driving the stock up to our value estimate. While cage rattling may create incremental value over time, we are not willing to depend on it. Finally, we eliminated our small remaining position in Live Nation.
Bonds posted relatively dull results in the first quarter as slightly higher interest rates generally offset coupon income. High yield was an exception as the two-year rally in lower quality credit continued. We “hit the bid” in bond parlance, selling most of our high yield bonds at substantial gains in February. While time will tell if we sold too early, it appears clear that the easiest (and juiciest) returns are well behind us. The Fund’s average maturity remained very short at less than one year, and our residual cash position was 25% of net assets at quarter end.
| New and Eliminated Securities for Quarter Ended March 31, 2011 |
| New Purchases ($000’s) | | Eliminations ($000’s) |
| Anheuser-Busch InBev | $ | 962 | | Iron Mountain | $ | 1,164 |
| Texas Industries | | 871 | | Cabela’s | | 596 |
| CVS Caremark | | 815 | | Live Nation Entertainment | | 284 |
32 Weitz Funds
BALANCED FUND
PERFORMANCE • (UNAUDITED)
| | | Total Returns | | Average Annual Total Returns | |
| | | 3 Mos. | | 1 Year | | 3 Year | | 5 Year | | Since Inception | |
| Balanced Fund | | 3.4 | % | | 11.8 | % | | 6.7 | % | | 3.5 | % | | 5.0 | % | |
| Blended Index | | 3.7 | | | 11.3 | | | 3.2 | | | 3.8 | | | 5.3 | | |
| S&P 500 | | 5.9 | | | 15.7 | | | 2.4 | | | 2.6 | | | 6.0 | | |
| Barclays Intermediate Credit | | 0.3 | | | 4.6 | | | 4.5 | | | 5.7 | | | 4.3 | | |
Growth of $10,000
This chart depicts the change in the value of a $10,000 investment in the Balanced Fund for the period October 1, 2003 through March 31, 2011, as compared with the growth of the Blended Index during the same period. Index performance is hypothetical and is shown for illustrative purposes only.
| | Year | | Balanced (1) | | Blended (2) | | Relative Results (1)-(2) | |
| | 2003 (10/1/03) | | 3.8 | % | | 7.3 | % | | -3.5 | % | |
| | 2004 | | 11.8 | | | 7.7 | | | 4.1 | | |
| | 2005 | | 1.7 | | | 3.6 | | | -1.9 | | |
| | 2006 | | 14.3 | | | 11.1 | | | 3.2 | | |
| | 2007 | | -5.3 | | | 6.2 | | | -11.5 | | |
| | 2008 | | -26.8 | | | -20.2 | | | -6.6 | | |
| | 2009 | | 28.8 | | | 18.0 | | | 10.8 | | |
| | 2010 | | 15.7 | | | 11.4 | | | 4.3 | | |
| | 2011 (3/31/11) | | 3.4 | | | 3.7 | | | -0.3 | | |
| | Since Inception: | | | | | | | | | | |
| | Cumulative | | | | | | | | | | |
| | Return | | 44.2 | | | 47.7 | | | -3.5 | | |
| | Avg. Annual | | | | | | | | | | |
| | Return | | 5.0 | | | 5.3 | | | -0.3 | | |
These performance numbers reflect the deduction of the Fund’s annual operating expenses which as stated in its most recent Prospectus are 1.19% of the Fund’s net assets. The returns assume redemption at the end of each period and reinvestment of dividends. Total returns shown include fee waivers and expense reimbursements, if any; total returns would have been lower had there been no waiver of fees and/or reimbursement of expenses by the Adviser. This information represents past performance and past performance does not guarantee future results. The investment return and the principal value of an investment in this Fund will fluctuate so that an investor’s shares, when redeemed, may be worth more or less than the original cost. Current performance may be lower or higher than the performance data quoted. Performance data current to the most recent month-end may be obtained at www.weitzfunds.com/performance/monthly.asp.
See page 4 for additional performance disclosures.
Performance information does not reflect the deduction of taxes that a shareholder would pay on Fund distributions or the redemption of Fund shares.
weitzfunds.com 33
BALANCED FUND
PORTFOLIO PROFILE • (UNAUDITED)
| Top Ten Stocks |
| Microsoft | | | 3.0 | % |
| Accenture | | | 2.7 | |
| Aon | | | 2.7 | |
| Omnicare | | | 2.6 | |
| United Parcel Service | | | 2.4 | |
| Laboratory Corp. of America | | | 2.4 | |
| Grand Canyon Education | | | 2.3 | |
| Dell | | | 2.1 | |
| Martin Marietta Materials | | | 2.1 | |
| Redwood Trust | | | 1.9 | |
| % of Net Assets | | | 24.2 | % |
| Industry Sectors |
| Information Technology | | | 11.4 | % |
| Consumer Discretionary | | | 10.7 | |
| Financials | | | 9.3 | |
| Materials | | | 9.2 | |
| Consumer Staples | | | 6.2 | |
| Health Care | | | 6.1 | |
| Industrials | | | 4.5 | |
| Energy | | | 4.0 | |
| Total Common Stocks | | | 61.4 | |
| Short-Term Securities/Other | | | 25.3 | |
| Corporate Bonds | | | 6.5 | |
| Mortgage-Backed Securities | | | 6.4 | |
| Taxable Municipal Bonds | | | 0.4 | |
| Total Bonds & Short-Term Securities | | | 38.6 | |
| Net Assets | | | 100.0 | % |
| Top Five Performers for Quarter Ended March 31, 2011 |
| Security Name | | QTD Return
of Security | | Average Weight
in Portfolio | | Contribution to Fund Performance | |
| Omnicare | | 18.3 | % | | 2.7 | % | | 0.4 | % | |
| Aon | | 15.5 | | | 2.6 | | | 0.4 | | |
| Accenture | | 13.4 | | | 2.6 | | | 0.3 | | |
| Iron Mountain | | 25.3 | | | 1.1 | | | 0.3 | | |
| ConocoPhillips | | 18.3 | | | 1.6 | | | 0.3 | | |
Source: FactSet Portfolio Analytics
| Bottom Five Performers for Quarter Ended March 31, 2011 |
| Security Name | | QTD Return
of Security | | Average Weight
in Portfolio | | Contribution to Fund Performance | |
| Grand Canyon Education | | (26.0 | )% | | 2.2 | % | | (0.6 | )% | |
| Microsoft | | (8.6 | ) | | 3.1 | | | (0.3 | ) | |
| Target | | (16.4 | ) | | 0.9 | | | (0.2 | ) | |
| Strayer Education | | (13.6 | ) | | 0.8 | | | (0.1 | ) | |
| Martin Marietta Materials | | (2.3 | ) | | 2.1 | | | (0.1 | ) | |
Source: FactSet Portfolio Analytics
34 Weitz Funds
BALANCED FUND
SCHEDULE OF INVESTMENTS • MARCH 31, 2011
| COMMON STOCKS — 61.4% | Shares | | Value | |
| Information Technology — 11.4% | | | | | |
| Software — 3.0% | | | | | |
| Microsoft Corp. | 100,000 | | $ | 2,536,000 | |
| IT Services — 2.8% | | | | | |
| Accenture plc - CL A | 42,500 | | | 2,336,225 | |
| Computers & Peripherals — 2.1% | | | | | |
| Dell, Inc.* | 125,000 | | | 1,813,750 | |
| Semiconductors — 1.3% | | | | | |
| Texas Instruments, Inc. | 32,500 | | | 1,123,200 | |
| Electronic Equipment & Instruments — 1.2% | | | | | |
| FLIR Systems, Inc. | 30,000 | | | 1,038,300 | |
| Internet Software & Services — 1.0% | | | | | |
| Google, Inc. - CL A* | 1,500 | | | 879,315 | |
| | | | | 9,726,790 | |
| Consumer Discretionary — 10.7% | | | | | |
| Education Services — 3.1% | | | | | |
| Grand Canyon Education, Inc.* | 135,000 | | | 1,957,500 | |
| Strayer Education, Inc. | 5,000 | | | 652,450 | |
| | | | | 2,609,950 | |
| Internet & Catalog Retail — 1.9% | | | | | |
| Liberty Media Corp. -Interactive - Series A* | 100,000 | | | 1,604,000 | |
| Advertising — 1.7% | | | | | |
| Omnicom Group, Inc. | 30,000 | | | 1,471,800 | |
| Multiline Retail — 1.5% | | | | | |
| Target Corp. | 25,000 | | | 1,250,250 | |
| Cable & Satellite — 1.4% | | | | | |
| Comcast Corp. - CL A Special | 52,500 | | | 1,219,050 | |
| Household Durables — 1.1% | | | | | |
| Mohawk Industries, Inc.* | 15,000 | | | 917,250 | |
| | | | | 9,072,300 | |
| Financials — 9.3% | | | | | |
| Insurance Brokers — 5.9% | | | | | |
| Aon Corp. | 44,000 | | | 2,330,240 | |
| Willis Group Holdings Ltd. | 35,000 | | | 1,412,600 | |
| Brown & Brown, Inc. | 50,000 | | | 1,290,000 | |
| | | | | 5,032,840 | |
| Mortgage REIT’s — 1.9% | | | | | |
| Redwood Trust, Inc. | 105,000 | | | 1,632,750 | |
| Property & Casualty Insurance — 1.5% | | | | | |
| Berkshire Hathaway, Inc. - CL B* | 15,000 | | | 1,254,450 | |
| | | | | 7,920,040 | |
| Materials — 9.2% | | | | | |
| Construction Materials — 5.2% | | | | | |
| Martin Marietta Materials, Inc. | 20,000 | | | 1,793,400 | |
| Texas Industries, Inc. | 22,000 | | | 995,060 | |
| Eagle Materials, Inc. | 27,500 | | | 832,150 | |
| Vulcan Materials Co. | 17,500 | | | 798,000 | |
| | | | | 4,418,610 | |
| Industrial Gases — 1.8% | | | | | |
| Praxair, Inc. | 15,000 | | | 1,524,000 | |
| | Shares | | Value | |
| Fertilizers & Agricultural Chemicals — 1.1% | | | | | |
| Monsanto Co. | 13,500 | | $ | 975,510 | |
| Metals & Mining — 1.1% | | | | | |
| Compass Minerals International, Inc. | 10,000 | | | 935,300 | |
| | | | | 7,853,420 | |
| Consumer Staples — 6.2% | | | | | |
| Beverages — 3.0% | | | | | |
| Diageo plc - Sponsored ADR | 20,000 | | | 1,524,400 | |
| Anheuser-Busch InBev SA/NV -Sponsored ADR | 17,500 | | | 1,000,475 | |
| | | | | 2,524,875 | |
| Food & Staples Retailing — 2.5% | | | | | |
| Wal-Mart Stores, Inc. | 25,000 | | | 1,301,250 | |
| CVS Caremark Corp. | 25,000 | | | 858,000 | |
| | | | | 2,159,250 | |
| Household Products — 0.7% | | | | | |
| The Procter & Gamble Co. | 10,000 | | | 616,000 | |
| | | | | 5,300,125 | |
| Health Care — 6.1% | | | | | |
| Health Care Services — 5.0% | | | | | |
| Omnicare, Inc. | 72,500 | | | 2,174,275 | |
| Laboratory Corp. of America Holdings* | 22,000 | | | 2,026,860 | |
| | | | | 4,201,135 | |
| Health Care Equipment — 1.1% | | | | | |
| Baxter International, Inc. | 17,500 | | | 940,975 | |
| | | | | 5,142,110 | |
| Industrials — 4.5% | | | | | |
| Air Freight & Logistics — 2.4% | | | | | |
| United Parcel Service, Inc. - CL B | 27,500 | | | 2,043,800 | |
| Aerospace & Defense — 1.1% | | | | | |
| Lockheed Martin Corp. | 12,000 | | | 964,800 | |
| Commercial Services & Supplies — 1.0% | | | | | |
| Republic Services, Inc. | 27,500 | | | 826,100 | |
| | | | | 3,834,700 | |
| Energy — 4.0% | | | | | |
| Oil & Gas Exploration & Production — 2.6% | | | | | |
| Apache Corp. | 5,000 | | | 654,600 | |
| Southwestern Energy Co.* | 15,000 | | | 644,550 | |
EOG Resources, Inc.(e) | 5,000 | | | 592,550 | |
| Devon Energy Corp. | 3,500 | | | 321,195 | |
| | | | | 2,212,895 | |
| Integrated Oil & Gas — 1.4% | | | | | |
| ConocoPhillips | 15,000 | | | 1,197,900 | |
| | | | | 3,410,795 | |
| Total Common Stocks | | | | | |
| (Cost $42,213,016) | | | | 52,260,280 | |
| The accompanying notes form an integral part of these financial statements. | weitzfunds.com 35 |
BALANCED FUND
SCHEDULE OF INVESTMENTS • (CONTINUED)
| CORPORATE BONDS — 6.5% | | Principal amount or shares | | | Value | |
| American Express Credit Corp. | | | | | | |
| 7.3% 8/20/13 | | $ | 650,000 | | | $ | 727,208 | |
| Comcast Corp. | | | | | | | | |
| 6.5% 1/15/15 | | | 300,000 | | | | 339,790 | |
| 4.95% 6/15/16 | | | 193,000 | | | | 206,594 | |
| Dell, Inc. | | | | | | | | |
| 5.625% 4/15/14 | | | 250,000 | | | | 276,042 | |
| JP Morgan Chase & Co. | | | | | | | | |
| 4.75% 5/01/13 | | | 100,000 | | | | 106,283 | |
| 1.65% 9/30/13 | | | 750,000 | | | | 749,153 | |
| Liberty Media LLC | | | | | | | | |
| 5.7% 5/15/13 | | | 750,000 | | | | 786,562 | |
| Markel Corp. | | | | | | | | |
| 6.8% 2/15/13 | | | 500,000 | | | | 537,133 | |
| Time Warner Cable, Inc. | | | | | | | | |
| 5.4% 7/02/12 | | | 250,000 | | | | 262,961 | |
| 7.5% 4/01/14 | | | 120,000 | | | | 137,639 | |
| Valmont Industries, Inc. | | | | | | | | |
| 6.875% 5/01/14 | | | 350,000 | | | | 358,750 | |
| WellPoint, Inc. | | | | | | | | |
| 6.0% 2/15/14 | | | 250,000 | | | | 277,260 | |
| Wells Fargo & Co. | | | | | | | | |
| 4.375% 1/31/13 | | | 750,000 | | | | 790,326 | |
| Total Corporate Bonds | | | | | | | | |
| (Cost $5,066,080) | | | | | | | 5,555,701 | |
| | | | | | | | | |
MORTGAGE-BACKED SECURITIES — 6.4%(c) | | | | | | | | |
| Federal Home Loan Mortgage Corporation — 1.3% | | | | | | | | |
| Collateralized Mortgage Obligations — 1.3% | | | | | | | | |
| 2945 CL PC — 5.5% 2028 (0.1 years) | | | 48,468 | | | | 48,523 | |
| 3200 CL AD — 5.5% 2029 (0.3 years) | | | 60,259 | | | | 60,792 | |
| R001 CL AE — 4.375% 2015 (0.5 years) | | | 80,977 | | | | 82,069 | |
| 2831 CL AB — 5.0% 2018 (1.0 years) | | | 82,959 | | | | 85,978 | |
| 2542 CL LD — 5.0% 2022 (1.1 years) | | | 238,032 | | | | 246,237 | |
| 2926 CL AB — 5.0% 2019 (1.2 years) | | | 231,681 | | | | 240,929 | |
| 2627 CL LE — 3.0% 2017 (1.4 years) | | | 307,362 | | | | 314,908 | |
| | | | | | | | 1,079,436 | |
| Federal National Mortgage Association — 2.9% | | | | | | | | |
| Collateralized Mortgage Obligations — 2.0% | | | | | | | | |
| 2003-4 CL PD — 5.0% 2016 (0.0 years) | | | 2,287 | | | | 2,287 | |
| 2003-83 CL VA — 5.5% 2014 (0.4 years) | | | 164,097 | | | | 167,243 | |
| 2005-59 CL PB — 5.5% 2028 (0.5 years) | | | 391,019 | | | | 399,138 | |
| 2002-91 CL QG — 5.0% 2018 (2.3 years) | | | 580,964 | | | | 620,110 | |
| 2003-9 CL DB — 5.0% 2018 (2.7 years) | | | 500,000 | | | | 536,841 | |
| | | | | | | | 1,725,619 | |
| Pass-Through Securities — 0.9% | | | | | | | | |
| 995755 — 4.5% 2024 (3.2 years) | | | 309,228 | | | | 324,826 | |
| AB1769 — 3.0% 2025 (5.2 years) | | | 487,998 | | | | 476,235 | |
| | | | | | | | 801,061 | |
| | | | | | | | 2,526,680 | |
| | | Principal amount or shares | | | Value | |
| Non-Government Agency — 2.2% | | | | | | |
| Collateralized Mortgage Obligations — 2.2% | | | | | | |
| CDMC 2003-7P CL A4 — 3.37% 2017 | | | | | | |
(Adjustable Rate) (0.5 years)(d) | | $ | 188,739 | | | $ | 188,764 | |
| SEMT 2010-H1 CL A1 — 3.75% 2040 | | | | | | | | |
| (0.9 years) | | | 1,153,151 | | | | 1,171,378 | |
| Chase 2004-S1 CL A6 — 4.5% 2019 | | | | | | | | |
| (1.9 years) | | | 170,353 | | | | 160,012 | |
| SEMT 2011-1 CL A1 — 4.125% 2041 | | | | | | | | |
| (3.8 years) | | | 343,977 | | | | 345,087 | |
| | | | | | | | 1,865,241 | |
| Total Mortgage-Backed Securities | | | | | | | | |
| (Cost $5,324,635) | | | | | | | 5,471,357 | |
| | | | | | | | | |
| TAXABLE MUNICIPAL BONDS — 0.4% | | | | | | | | |
| University of California 4.85% 5/15/13 | | | | | | | | |
| (Cost $299,101) | | | 300,000 | | | | 320,802 | |
| | | | | | | | | |
| SHORT-TERM SECURITIES — 25.7% | | | | | | | | |
| Wells Fargo Advantage Government Money Market Fund - | | | | | | | | |
Institutional Class 0.01%(a) | | | 351,508 | | | | 351,508 | |
| U.S. Treasury Bills, 0.07% to 0.12%, | | | | | | | | |
4/07/11 to 6/30/11(b) | | $ | 21,500,000 | | | | 21,498,221 | |
| Total Short-Term Securities | | | | | | | | |
| (Cost $21,849,099) | | | | | | | 21,849,729 | |
| Total Investments in Securities | | | | | | | | |
| (Cost $74,751,931) | | | | | | | 85,457,869 | |
| Options Written — 0.0% | | | | | | | (23,250 | ) |
| Other Liabilities in Excess of Other Assets — (0.4%) | | | | | | | (296,842 | ) |
| Net Assets — 100.0% | | | | | | $ | 85,137,777 | |
| Net Asset Value Per Share | | | | | | $ | 11.74 | |
| OPTIONS WRITTEN* | Expiration date/ Strike price | | Shares subject to option | | | |
| Covered Call Options | | | | | | | |
| EOG Resources, Inc. | May 2011 / $120 | | 5,000 | | $ | (23,250 | ) |
| Total Options Written | | | | | | | |
| (premiums received $26,124) | | | | | $ | (23,250 | ) |
| * | Non-income producing |
| (a) | Rate presented represents the annualized 7-day yield at March 31, 2011. |
| (b) | Interest rates presented represent the yield to maturity at the date of purchase. |
| (c) | Number of years indicated represents estimated average life of mortgage-backed securities. |
| (d) | Security is exempt from registration under Rule 144A of the Securities Act of 1933. This security may be resold in transactions that are exempt from registration, normally to qualified institutional buyers. |
| (e) | Fully or partially pledged on outstanding written options. |
| 36 Weitz Funds | The accompanying notes form an integral part of these financial statements. |
PORTFOLIO MANAGER’S DISCUSSION & ANALYSIS
Portfolio Manager: Thomas D. Carney
The Short-Intermediate Income Fund returned +0.6% in the first calendar quarter, compared to a +0.3% return for the Barclays Capital Intermediate U.S. Government/Credit Index (BCIGC), our Fund’s primary benchmark. For the fiscal year ended March 31, 2011, the Short-Intermediate Income Fund’s total return was +3.5%, compared to a +4.6% return for the BCIGC. The performance page following this discussion shows returns for our Fund (after deducting fees and expenses) over various holding periods and returns for three Barclays Capital U.S. Government/Credit Indexes (Intermediate, 1-5 year and 1-3 year) for comparison purposes.
Fiscal 2011 Review
Risk assets were the performance winners despite a host of possible headwinds for investors in the past year (please see Wally’s letter at the beginning of this report for a good overview). Corporate bonds and other credit sensitive securities continued to be solid performers in the fiscal year that ended March 31, 2011. Further evidence of economic recovery and steady inflows into fixed-income funds helped to narrow credit spreads even more in the past year. A broad measure of corporate bond spreads (the incremental return investors demand above U.S. Treasury bonds for owning corporate debt) composed by Merrill Lynch declined to 150 basis points as of March 31, down 10 basis points year over year (a basis point represents one one-hundredth of a percentage point). Within the corporate bond segment, high-yield or non-investment grade bonds experienced the sharpest price gains. Overall, the continued re-pricing of credit risk in fiscal 2011 and the extended rally in corporate bond prices helped to generate good returns for investors, our Fund included.
U.S. Treasury bonds also generated positive returns in the past year, avoiding a repeat of the large price declines experienced in 2009. U.S. Treasury interest rates declined across the entire yield curve with the greatest impact in the 7 to 10 year area, where yields declined approximately 35 basis points. The U.S. Treasury has likely been a beneficiary of the many issues facing the global marketplace. The tenuousness of the U.S. recovery as evidenced by continued high unemployment has also helped support the Treasury market.
Our portfolio performed reasonably well in the past fiscal year despite trailing the BCIGC, our Fund’s primary benchmark. Our Fund’s shorter average maturity and duration were the principal reasons for trailing the index results. Turning to portfolio metrics as compared to a year ago, the average maturity of our Fund has declined to 3.7 from 3.9 years. The duration has increased to 2.3 from 1.9 years, and the average coupon has fallen to 3.9% from 4.3%. The average credit quality of our portfolio remains high with approximately 62% of the portfolio invested in AAA-rated securities, U.S. Treasury, U.S. government agency-guaranteed Mortgage-Backed Securities (MBS) and cash.
Principal contributors to our Fund’s results came from every component of our corporate bond investments as the decline of credit spreads favorably impacted the prices of nearly all of our investments and added to the coupon income we earned on our bonds. Key contributors in the investment-grade segment (the largest) of our Fund included bonds issued by Aon Corporation, Boston Properties, Diageo Capital, Swiss RE, Willis North America and Vornado Realty. Our Fund’s non-investment grade holdings, currently about 8.5% of total net assets, appreciated the most in the past year. This segment was led by double digit returns of the bonds issued by Liberty Media, Level 3 Financing, Leucadia National Corp., Mohawk Industries, QVC Inc., Host Hotels and Resorts, and USG Corporation. Overall, our corporate bond weighting remained unchanged from a year ago at approximately 35%.
Mortgage-Backed Securities (MBS), currently 36% of Fund net assets, also added to our results in the past year. Our mortgage investments are primarily focused in Fannie Mae and Freddie Mac MBS that we have selected based on specific characteristics that we believe mitigate the risk of higher prepayment levels. More importantly, we also seek to minimize extension risk (the possibility the average life of our investments lengthen meaningfully beyond our original assumptions) should interest rates rise.
New investments to highlight in the current quarter include the Fund’s first floating rate note investment. The Fund added an approximately 1% position in the 3-year notes issued by Wells Fargo, a diversified financial services company that managed its business well through the credit crisis. It seems plausible that the Fed is within a year of normalizing short-term interest rates. Floating
weitzfunds.com 37
rate notes would be beneficiaries should this occur. In the meantime, the Fund will earn a good return compared to cash alternatives. We hope to add similar investments as this Wells Fargo bond should both credit metrics and price (i.e. spread) align.
In the equity-oriented portion of our Fund, we initiated an approximately 1% position in Microsoft Corporation via a ‘buy/write’ strategy by buying the stock and writing covered calls. Historically, we have allocated a small portion of the Fund to convertible bonds and common and preferred stock that we believed provided favorable risk/reward characteristics. Microsoft is one of the highest conviction, cheapest investments (on a price-to-value basis) owned in many of the Weitz equity funds. The company’s shares trade at approximately 10 times earnings and less than 10 times free cash flow. Microsoft’s current dividend of approximately 2.5% is higher than the company’s 5-year debt. We believe the stock investment represents a compelling opportunity independent of the call options. However, the call options provide modest protection to a declining stock price and provide our Fund the opportunity to earn 3-6% holding period returns over a 3-month investment horizon if Microsoft remains above $25.
Fund Strategy Review
Given the increased number of new shareholders in the Fund in the past year, we thought it might be helpful to review the Fund’s investment strategy. Longtime shareholders may wish to skip this section or read it as a review.
Our investment approach consists primarily of investing in a portfolio of mostly high quality, short-to-intermediate-term bonds where we believe we can capture most of the “coupon” returns of long-term bonds with materially less interest-rate risk. We do not and will not try to mimic any particular index as we construct our portfolio. We select assets for our portfolio one security at a time based on our view of opportunities in the marketplace. Our corporate bond research is supplemented by credit work we do on companies and industries in the course of our equity analysis.
Over the years, our portfolio has often been constructed with a shorter average life (i.e. duration) and higher quality than the BCIGC. We chose this benchmark to highlight that we could periodically invest longer term and/or lower quality bonds when conditions warrant. The effect over time of our portfolio construction (typically shorter average life) has been a penalty when interest rates fall but a boost to relative performance when rates rise.
For a small portion of our portfolio (currently about 11% but never greater than 15%), we may also invest in other fixed-income related investments that have favorable risk/reward characteristics (such as high-yield and convertible bonds, preferred and convertible preferred stock, or high dividend paying common stock). These types of investments have generally enhanced our Fund’s historical returns.
Overall, we strive to be adequately compensated for the risks assumed in order to maximize our investment (or reinvestment) yield and avoid making interest rate “bets,” particularly ones that depend on interest rates going down. We are willing to trade some upside potential in a rapidly falling interest-rate environment in exchange for enhanced capital preservation.
Outlook
Today’s investment landscape in fixed-income has become increasingly challenging. Nominal interest rates on U.S. Treasuries remain quite low and the benefit of spread compression is, we believe, in the “late innings.” Inflation, the bond investor’s boogeyman, has certainly arrived for anyone who eats or drives. Whether this commodity-based inflation leaks into the broader economy and investor expectations is currently debatable. Our leaders in Washington exercised modest spending restraint in their recent agreement to keep the government funded for the remainder of fiscal 2011 ending September 30. We remain wary, though, of the inflationary implications of the continued enormous deficit spending to support the economic recovery. Consequently, we expect to continue to position the Fund defensively relative to interest rate exposure while we patiently seek out areas of opportunity. We will continue to invest one security at a time, relying on a fundamental research-based investment approach and are well positioned to take advantage of any market weakness.
38 Weitz Funds
SHORT-INTERMEDIATE INCOME FUND
PERFORMANCE • (UNAUDITED)
| | | | Total Return | | Average Annual Total Returns | |
| | | | 1 Year | | 3 Year | | 5 Year | | 10 Year | | 15 Year | | 20 Year | |
| | Short-Intermediate Income Fund | | 3.5 | % | | 5.3 | % | | 5.7 | % | | 4.8 | % | | 5.5 | % | | 5.8 | % | |
| | Barclays Capital Indexes: | | | | | | | | | | | | | | | | | | | |
| | Intermediate U.S. Government/Credit | | 4.6 | | | 4.5 | | | 5.7 | | | 5.2 | | | 5.8 | �� | | 6.3 | | |
| | 1-5 Year U.S. Government/Credit | | 3.1 | | | 3.7 | | | 5.1 | | | 4.6 | | | 5.3 | | | 5.8 | | |
| | 1-3 Year U.S. Government/Credit | | 2.1 | | | 3.0 | | | 4.5 | | | 4.1 | | | 4.9 | | | 5.3 | | |
Growth of $10,000
This chart depicts the change in the value of a $10,000 investment in the Short-Intermediate Income Fund for the period March 31, 2001 through March 31, 2011, as compared with the growth of the Barclays Intermediate Index during the same period. Index performance is hypothetical and is shown for illustrative purposes only.
| | Year | | Short Int. (1) | | Barclays Interm. (2) | | Relative Results (1)-(2) | |
| | 1988 (12/23/88) | | N/A | % | | N/A | % | | N/A | % | |
| | 1989 | | 9.1 | | | 12.8 | | | -3.7 | | |
| | 1990 | | 9.1 | | | 9.2 | | | -0.1 | | |
| | 1991 | | 11.2 | | | 14.6 | | | -3.4 | | |
| | 1992 | | 5.5 | | | 7.2 | | | -1.7 | | |
| | 1993 | | 8.1 | | | 8.8 | | | -0.7 | | |
| | 1994 | | -2.4 | | | -1.9 | | | -0.5 | | |
| | 1995 | | 15.7 | | | 15.3 | | | 0.4 | | |
| | 1996 | | 4.4 | | | 4.0 | | | 0.4 | | |
| | 1997 | | 8.6 | | | 7.9 | | | 0.7 | | |
| | 1998 | | 6.8 | | | 8.4 | | | -1.6 | | |
| | 1999 | | 0.9 | | | 0.4 | | | 0.5 | | |
| | 2000 | | 9.7 | | | 10.1 | | | -0.4 | | |
| | 2001 | | 8.5 | | | 9.0 | | | -0.5 | | |
| | 2002 | | 4.2 | | | 9.8 | | | -5.6 | | |
| | 2003 | | 6.3 | | | 4.3 | | | 2.0 | | |
| | 2004 | | 2.6 | | | 3.0 | | | -0.4 | | |
| | 2005 | | 1.6 | | | 1.6 | | | 0.0 | | |
| | 2006 | | 4.0 | | | 4.1 | | | -0.1 | | |
| | 2007 | | 6.1 | | | 7.4 | | | -1.3 | | |
| | 2008 | | 2.3 | | | 5.1 | | | -2.8 | | |
| | 2009 | | 10.8 | | | 5.2 | | | 5.6 | | |
| | 2010 | | 4.7 | | | 5.9 | | | -1.2 | | |
| | 2011 (3/31/11) | | 0.6 | | | 0.3 | | | 0.3 | | |
| | Since Inception: | | | | | | | | | | |
| | Cumulative | | | | | | | | | | |
| | Return | | 277.8 | | | 329.6 | | | -51.8 | | |
| | Avg. Annual | | | | | | | | | | |
| | Return | | 6.1 | | | 6.8 | | | -0.7 | | |
These performance numbers reflect the deduction of the Fund’s annual operating expenses which as stated in its most recent Prospectus are 0.71% of the Fund’s net assets. The returns assume redemption at the end of each period and reinvestment of dividends. Total returns shown include fee waivers and expense reimbursements, if any; total returns would have been lower had there been no waiver of fees and/or reimbursement of expenses by the Adviser. This information represents past performance and past performance does not guarantee future results. The investment return and the principal value of an investment in this Fund will fluctuate so that an investor’s shares, when redeemed, may be worth more or less than the original cost. Current performance may be lower or higher than the performance data quoted. Performance data current to the most recent month-end may be obtained at www.weitzfunds.com/performance/monthly.asp.
See page 4 for additional performance disclosures.
Performance information does not reflect the deduction of taxes that a shareholder would pay on Fund distributions or the redemption of Fund shares.
weitzfunds.com 39
SHORT-INTERMEDIATE INCOME FUND
PORTFOLIO PROFILE • (UNAUDITED)
| Credit Quality Ratings | |
| U.S. Treasury | | | 7.2 | % |
| U.S. Government Agency Mortgage Related Securities | | | 33.8 | |
| Aaa/AAA | | | 6.4 | |
| Aa/AA | | | 5.1 | |
| A/A | | | 6.9 | |
| Baa/BBB | | | 15.3 | |
| Ba/BB | | | 6.2 | |
| B/B | | | 1.8 | |
| Caa/CCC | | | 0.5 | |
| Common Stocks | | | 2.6 | |
| Short-Term Securities/Other | | | 14.2 | |
| Net Assets | | | 100.0 | % |
| Sector Breakdown | |
| Mortgage-Backed Securities | | | 36.2 | % |
| Corporate Bonds | | | 34.5 | |
| Short-Term Securities/Other | | | 14.2 | |
| U.S. Treasury | | | 7.2 | |
| Government Agency | | | 4.0 | |
| Common Stocks | | | 2.6 | |
| Taxable Municipal Bonds | | | 1.3 | |
| Net Assets | | | 100.0 | % |
| Financial Attributes | |
| Average Maturity | | 3.7 years | |
| Average Duration | | 2.3 years | |
| Average Coupon | | | 3.9 | % |
| 30-Day SEC Yield at 3-31-11 | | | 2.0 | % |
| Maturity Distribution | |
| Short-Term Securities/Other | | | 14.2 | % |
| Less than 1 Year | | | 6.3 | |
| 1 to 3 Years | | | 27.5 | |
| 3 to 5 Years | | | 29.7 | |
| 5 to 7 Years | | | 13.8 | |
| 7 to 10 Years | | | 5.8 | |
| 10 Years or more | | | 0.1 | |
| Common Stocks | | | 2.6 | |
| Net Assets | | | 100.0 | % |
40 Weitz Funds
SHORT-INTERMEDIATE INCOME FUND
SCHEDULE OF INVESTMENTS • MARCH 31, 2011
| CORPORATE BONDS — 34.5% | | Principal amount | | | Value | |
| American Express Co. | | | | | | |
| Centurion Bank 5.55% 10/17/12 | | $ | 2,000,000 | | | $ | 2,120,250 | |
| Credit Corp. 7.3% 8/20/13 | | | 3,260,000 | | | | 3,647,229 | |
| FSB Bank 5.55% 10/17/12 | | | 1,609,000 | | | | 1,705,741 | |
| FSB Bank 6.0% 9/13/17 | | | 2,500,000 | | | | 2,773,808 | |
| 8.125% 5/20/19 | | | 1,000,000 | | | | 1,249,610 | |
| Anheuser-Busch InBev SA/NV | | | | | | | | |
| 4.125% 1/15/15 | | | 6,000,000 | | | | 6,343,092 | |
| Aon Corp. | | | | | | | | |
| 7.375% 12/14/12 | | | 10,879,000 | | | | 11,882,261 | |
| 3.5% 9/30/15 | | | 5,000,000 | | | | 5,022,680 | |
| AutoZone, Inc. | | | | | | | | |
| 5.75% 1/15/15 | | | 1,250,000 | | | | 1,379,960 | |
| Berkshire Hathaway Finance Corp. | | | | | | | | |
| 2.125% 2/11/13 | | | 3,000,000 | | | | 3,065,154 | |
| 4.6% 5/15/13 | | | 3,000,000 | | | | 3,206,451 | |
| 4.625% 10/15/13 | | | 2,129,000 | | | | 2,297,647 | |
| 1.5% 1/10/14 | | | 500,000 | | | | 499,015 | |
| 4.85% 1/15/15 | | | 1,500,000 | | | | 1,637,937 | |
| 5.4% 5/15/18 | | | 5,000,000 | | | | 5,513,260 | |
| 4.25% 1/15/21 | | | 1,000,000 | | | | 1,001,617 | |
| Boston Properties LP | | | | | | | | |
| 5.625% 4/15/15 | | | 2,000,000 | | | | 2,193,696 | |
| 5.875% 10/15/19 | | | 4,000,000 | | | | 4,350,700 | |
| Comcast Corp. | | | | | | | | |
| 10.625% 7/15/12 | | | 2,000,000 | | | | 2,232,208 | |
| 6.5% 1/15/15 | | | 2,081,000 | | | | 2,357,007 | |
| 4.95% 6/15/16 | | | 675,000 | | | | 722,542 | |
| 5.15% 3/01/20 | | | 3,000,000 | | | | 3,128,457 | |
| Dell, Inc. | | | | | | | | |
| 5.625% 4/15/14 | | | 1,250,000 | | | | 1,380,209 | |
| Diageo Capital plc | | | | | | | | |
| 4.85% 5/15/18 | | | 3,941,000 | | | | 4,115,247 | |
| DIRECTV Holdings | | | | | | | | |
| 4.75% 10/01/14 | | | 2,000,000 | | | | 2,155,282 | |
| 6.375% 6/15/15 | | | 8,000,000 | | | | 8,310,000 | |
| 7.625% 5/15/16 | | | 7,000,000 | | | | 7,725,725 | |
| Expedia, Inc. | | | | | | | | |
| 7.456% 8/15/18 | | | 13,000,000 | | | | 14,690,000 | |
| 5.95% 8/15/20 | | | 1,000,000 | | | | 1,013,750 | |
| FiServ, Inc. | | | | | | | | |
| 3.125% 10/01/15 | | | 1,000,000 | | | | 996,263 | |
| General Dynamics Corp. | | | | | | | | |
| 1.8% 7/15/11 | | | 12,000,000 | | | | 12,061,716 | |
| Goldman Sachs Group, Inc. | | | | | | | | |
| 5.95% 1/18/18 | | | 4,000,000 | | | | 4,301,232 | |
| Host Hotels & Resorts LP | | | | | | | | |
| 6.875% 11/01/14 | | | 5,000,000 | | | | 5,200,000 | |
| JP Morgan Chase & Co. | | | | | | | | |
| 5.15% 10/01/15 | | | 5,500,000 | | | | 5,897,546 | |
| 2.6% 1/15/16 | | | 15,000,000 | | | | 14,497,800 | |
| 6.0% 7/05/17 | | | 5,000,000 | | | | 5,499,070 | |
| 6.3% 4/23/19 | | | 2,500,000 | | | | 2,771,635 | |
| Kraft Foods, Inc. | | | | | | | | |
| 2.625% 5/08/13 | | | 1,000,000 | | | | 1,023,966 | |
| Laboratory Corp. of America Holdings | | | | | | | | |
| 3.125% 5/15/16 | | | 1,250,000 | | | | 1,245,946 | |
| Leucadia National Corp. | | | | | | | | |
| 7.125% 3/15/17 | | | 9,000,000 | | | | 9,495,000 | |
| Level 3 Financing, Inc. | | | | | | | | |
| 9.25% 11/01/14 | | | 2,000,000 | | | | 2,055,000 | |
| Liberty Media LLC | | | | | | | | |
| 5.7% 5/15/13 | | | 11,240,000 | | | | 11,787,950 | |
| Marathon Petroleum Corp. | | | | | | | | |
3.5% 3/01/16(d) | | | 1,000,000 | | | | 1,003,747 | |
| | | Principal amount | | | Value | |
| Markel Corp. | | | | | | |
| 6.8% 2/15/13 | | $ | 15,555,000 | | | $ | 16,710,223 | |
| 7.125% 9/30/19 | | | 4,566,000 | | | | 5,103,427 | |
| Mead Johnson Nutrition Co. | | | | | | | | |
| 3.5% 11/01/14 | | | 2,000,000 | | | | 2,073,464 | |
| MetLife, Inc. | | | | | | | | |
| 2.375% 2/06/14 | | | 1,000,000 | | | | 1,002,036 | |
| 5.125% 8/15/14 (Travelers | | | | | | | | |
Life & Annuity)(d) | | | 8,000,000 | | | | 8,712,904 | |
3.125% 1/11/16(d) | | | 2,000,000 | | | | 1,984,820 | |
| Mohawk Industries, Inc. | | | | | | | | |
| 6.875% 1/15/16 | | | 21,155,000 | | | | 22,794,513 | |
| News America Holdings | | | | | | | | |
| 9.25% 2/01/13 | | | 2,222,000 | | | | 2,530,320 | |
| Omnicare, Inc. | | | | | | | | |
| 6.125% 6/01/13 | | | 5,894,000 | | | | 5,945,573 | |
| Omnicom Group, Inc. | | | | | | | | |
| 5.9% 4/15/16 | | | 7,000,000 | | | | 7,836,129 | |
| QVC, Inc. | | | | | | | | |
7.125% 4/15/17(d) | | | 6,600,000 | | | | 6,963,000 | |
7.5% 10/01/19(d) | | | 4,000,000 | | | | 4,220,000 | |
| Republic Services, Inc. (Allied Waste) | | | | | | | | |
| 7.125% 5/15/16 | | | 16,545,000 | | | | 17,287,258 | |
| 6.875% 6/01/17 | | | 3,050,000 | | | | 3,328,697 | |
| Swiss Re (General Electric Global Insurance) | | | | | | | | |
| 6.45% 3/01/19 | | | 5,000,000 | | | | 5,369,655 | |
| Target Corp. | | | | | | | | |
| 8.6% 1/15/12 | | | 3,000,000 | | | | 3,185,136 | |
| Time Warner Cable, Inc. | | | | | | | | |
| 5.4% 7/02/12 | | | 2,000,000 | | | | 2,103,690 | |
| 7.5% 4/01/14 | | | 1,700,000 | | | | 1,949,888 | |
| Time Warner, Inc. | | | | | | | | |
| 3.15% 7/15/15 | | | 500,000 | | | | 506,874 | |
| UnitedHealth Group, Inc. | | | | | | | | |
| 4.75% 2/10/14 | | | 178,000 | | | | 191,077 | |
| USG Corp. | | | | | | | | |
| 6.3% 11/15/16 | | | 3,800,000 | | | | 3,591,000 | |
| Valmont Industries, Inc. | | | | | | | | |
| 6.875% 5/01/14 | | | 6,240,000 | | | | 6,396,000 | |
| Vornado Realty Trust | | | | | | | | |
| 4.25% 4/01/15 | | | 9,315,000 | | | | 9,546,776 | |
| Vulcan Materials Co. | | | | | | | | |
| 6.4% 11/30/17 | | | 5,000,000 | | | | 5,021,095 | |
| Washington Post Co. | | | | | | | | |
| 7.25% 2/01/19 | | | 3,500,000 | | | | 3,996,822 | |
| WellPoint, Inc. | | | | | | | | |
| 6.0% 2/15/14 | | | 2,000,000 | | | | 2,218,080 | |
| Wells Fargo & Co. | | | | | | | | |
| 4.375% 1/31/13 | | | 4,000,000 | | | | 4,215,072 | |
| 3.75% 10/01/14 | | | 11,385,000 | | | | 11,938,994 | |
| 0.69% 11/03/14 (Wachovia Bank) | | | | | | | | |
| Floating Rate Security | | | 10,000,000 | | | | 9,759,140 | |
| 4.875% 2/01/15 (Wachovia Bank) | | | 6,070,000 | | | | 6,469,151 | |
| Whirlpool Corp. | | | | | | | | |
| 8.0% 5/01/12 | | | 1,000,000 | | | | 1,065,970 | |
| Willis North America, Inc. | | | | | | | | |
| 6.2% 3/28/17 | | | 14,477,000 | | | | 15,448,045 | |
| WM Wrigley Jr. Co. | | | | | | | | |
3.05% 6/28/13(d) | | | 7,500,000 | | | | 7,625,888 | |
3.7% 6/30/14(d) | | | 7,500,000 | | | | 7,676,835 | |
| Yum! Brands, Inc. | | | | | | | | |
| 4.25% 9/15/15 | | | 1,000,000 | | | | 1,052,699 | |
| Total Corporate Bonds | | | | | | | | |
| (Cost $383,770,324) | | | | | | | 401,377,657 | |
| The accompanying notes form an integral part of these financial statements. | weitzfunds.com 41 |
SHORT-INTERMEDIATE INCOME FUND
SCHEDULE OF INVESTMENTS • (CONTINUED)
MORTGAGE-BACKED SECURITIES — 36.2%(c) | | Principal amount | | | Value | |
| Federal Home Loan Mortgage Corporation — 11.8% | | | | | | |
| Collateralized Mortgage Obligations — 6.1% | | | | | | |
| 2945 CL PC — 5.5% 2028 (0.1 years) | | $ | 193,870 | | | $ | 194,091 | |
| 2587 CL UD — 5.5% 2031 (0.1 years) | | | 286,538 | | | | 286,778 | |
| 3200 CL NA — 5.5% 2032 (0.2 years) | | | 226,441 | | | | 227,995 | |
| 3200 CL AD — 5.5% 2029 (0.3 years) | | | 1,024,404 | | | | 1,033,460 | |
| R001 CL AE — 4.375% 2015 (0.5 years) | | | 485,863 | | | | 492,414 | |
| 2999 CL NB — 4.5% 2017 (0.5 years) | | | 2,099,987 | | | | 2,132,834 | |
| 2829 CL DJ — 4.5% 2018 (0.8 years) | | | 1,856,389 | | | | 1,903,838 | |
| 3098 CL HA — 5.5% 2023 (0.9 years) | | | 1,172,683 | | | | 1,210,414 | |
| R009 CL AJ — 5.75% 2018 (0.9 years) | | | 431,228 | | | | 450,123 | |
| 3036 CL JH — 5.0% 2031 (1.0 years) | | | 2,003,648 | | | | 2,071,112 | |
| 2831 CL AB — 5.0% 2018 (1.0 years) | | | 331,837 | | | | 343,913 | |
| 3042 CL HA — 5.5% 2029 (1.1 years) | | | 1,518,573 | | | | 1,587,348 | |
| 2579 CL PC — 5.5% 2032 (1.1 years) | | | 1,451,467 | | | | 1,518,016 | |
| 2549 CL PD — 5.5% 2031 (1.1 years) | | | 2,781,598 | | | | 2,912,138 | |
| 2947 CL B — 5.0% 2032 (1.2 years) | | | 947,727 | | | | 988,007 | |
| 2906 CL HK — 5.0% 2032 (1.2 years) | | | 2,448,879 | | | | 2,554,549 | |
| R010 CL AB — 5.5% 2019 (1.3 years) | | | 2,314,614 | | | | 2,428,417 | |
| 2627 CL LE — 3.0% 2017 (1.4 years) | | | 537,884 | | | | 551,090 | |
| R011 CL AB — 5.5% 2020 (1.5 years) | | | 919,857 | | | | 968,745 | |
| 2937 CL HJ — 5.0% 2019 (1.8 years) | | | 2,336,226 | | | | 2,470,020 | |
| 3566 CL DB — 4.0% 2022 (1.8 years) | | | 5,372,726 | | | | 5,604,844 | |
| 3556 CL MA — 5.0% 2037 (1.8 years) | | | 2,161,029 | | | | 2,277,290 | |
| 3562 CL KA — 4.0% 2022 (2.0 years) | | | 6,856,217 | | | | 7,160,412 | |
| 3170 CL EA — 4.5% 2020 (2.1 years) | | | 2,715,761 | | | | 2,859,226 | |
| 3229 CL HB — 5.0% 2025 (2.1 years) | | | 1,667,202 | | | | 1,761,363 | |
| 2574 CL JM — 5.0% 2022 (2.2 years) | | | 1,103,119 | | | | 1,166,105 | |
| 3544 CL KA — 4.5% 2023 (2.5 years) | | | 5,581,781 | | | | 5,918,289 | |
| 2778 CL JD — 5.0% 2032 (2.8 years) | | | 6,110,000 | | | | 6,522,719 | |
| 2760 CL PD — 5.0% 2032 (3.0 years) | | | 10,331,000 | | | | 11,044,434 | |
| | | | | | | | 70,639,984 | |
| Pass-Through Securities — 5.7% | | | | | | | | |
| EO1386 — 5.0% 2018 (2.4 years) | | | 187,086 | | | | 200,257 | |
| G18190 — 5.5% 2022 (2.9 years) | | | 275,117 | | | | 297,326 | |
| G18296 — 4.5% 2024 (3.1 years) | | | 5,064,525 | | | | 5,314,442 | |
| G18306 — 4.5% 2024 (3.1 years) | | | 9,440,096 | | | | 9,905,932 | |
| G13300 — 4.5% 2023 (3.3 years) | | | 2,336,066 | | | | 2,453,533 | |
| G13517 — 4.0% 2024 (3.6 years) | | | 8,269,413 | | | | 8,516,203 | |
| G18308 — 4.0% 2024 (3.6 years) | | | 10,223,355 | | | | 10,528,458 | |
| J13949 — 3.5% 2025 (4.9 years) | | | 14,710,180 | | | | 14,781,016 | |
| E02804 — 3.0% 2025 (5.5 years) | | | 14,786,000 | | | | 14,438,823 | |
| | | | | | | | 66,435,990 | |
| | | | | | | | 137,075,974 | |
| Federal National Mortgage Association — 21.8% | | | | | | | | |
| Collateralized Mortgage Obligations — 9.8% | | | | | | | | |
| 2003-16 CL PD — 5.0% 2016 (0.4 years) | | | 984,892 | | | | 995,776 | |
| 2004-81 CL KC — 4.5% 2017 (0.4 years) | | | 668,342 | | | | 675,681 | |
| 2005-59 CL PB — 5.5% 2028 (0.5 years) | | | 1,203,136 | | | | 1,228,117 | |
| 2003-27 CL DW — 4.5% 2017 (0.9 years) | | | 747,882 | | | | 768,541 | |
| 2006-9 CL GA — 5.5% 2033 (0.9 years) | | | 2,514,748 | | | | 2,603,924 | |
| 2003-92 CL PD — 4.5% 2017 (0.9 years) | | | 1,593,505 | | | | 1,639,598 | |
| 2005-9 CL A — 5.0% 2031 (0.9 years) | | | 1,338,988 | | | | 1,380,606 | |
| 2006-22 CL DA — 5.5% 2033 (1.0 years) | | | 895,244 | | | | 930,467 | |
| 2006-78 CL AV — 6.5% 2017 (1.2 years) | | | 1,533,635 | | | | 1,631,836 | |
| | | Principal amount | | | Value | |
| 2006-21 CL CA — 5.5% 2029 (1.3 years) | | $ | 1,319,798 | | | $ | 1,387,095 | |
| 2007-32 CL BA — 5.5% 2034 (1.3 years) | | | 4,032,661 | | | | 4,236,993 | |
| 2004-40 CL BA — 4.5% 2018 (1.4 years) | | | 1,854,477 | | | | 1,933,393 | |
| 2009-27 CL JA — 5.0% 2036 (1.4 years) | | | 1,588,235 | | | | 1,663,133 | |
| 2003-43 CL EX — 4.5% 2017 (1.5 years) | | | 325,739 | | | | 339,930 | |
| 2008-54 CL EC — 5.0% 2035 (1.6 years) | | | 3,766,648 | | | | 3,958,669 | |
| 2003-39 CL LC — 5.0% 2022 (1.6 years) | | | 423,990 | | | | 444,006 | |
| 2007-42 CL YA — 5.5% 2036 (1.8 years) | | | 2,451,269 | | | | 2,620,335 | |
| 2003-37 CL QD — 5.0% 2032 (1.8 years) | | | 1,995,370 | | | | 2,102,251 | |
| 2003-86 CL KT — 4.5% 2018 (1.9 years) | | | 1,104,797 | | | | 1,159,847 | |
| 2005-9 CL AC — 5.0% 2033 (2.0 years) | | | 10,914,822 | | | | 11,517,407 | |
| 2004-78 CL AB — 5.0% 2032 (2.0 years) | | | 10,791,848 | | | | 11,407,574 | |
| 2005-1 CL KA — 5.0% 2033 (2.0 years) | | | 8,279,897 | | | | 8,738,852 | |
| 2010-10 CL AD — 4.5% 2036 (2.1 years) | | | 11,740,779 | | | | 12,077,431 | |
| 2010-9 CL CA — 5.0% 2037 (2.1 years) | | | 11,398,837 | | | | 12,154,558 | |
| 2009-52 CL DC — 4.5% 2023 (2.3 years) | | | 1,524,291 | | | | 1,593,557 | |
| 2005-91 CL DA — 4.5% 2020 (2.4 years) | | | 10,754,821 | | | | 11,201,109 | |
| 2010-61 CL EB — 4.5% 2037 (2.5 years) | | | 9,460,916 | | | | 9,926,598 | |
| 2009-44 CL A — 4.5% 2023 (2.5 years) | | | 2,256,306 | | | | 2,371,005 | |
| 2003-9 CL DB — 5.0% 2018 (2.7 years) | | | 1,000,000 | | | | 1,073,683 | |
| | | | | | | | 113,761,972 | |
| Pass-Through Securities — 12.0% | | | | | | | | |
| 254863 — 4.0% 2013 (1.0 years) | | | 135,893 | | | | 141,674 | |
| 255291 — 4.5% 2014 (1.4 years) | | | 234,960 | | | | 248,991 | |
| 256982 — 6.0% 2017 (2.2 years) | | | 548,005 | | | | 593,965 | |
| 251787 — 6.5% 2018 (2.3 years) | | | 20,102 | | | | 22,133 | |
| 254907 — 5.0% 2018 (2.5 years) | | | 623,993 | | | | 668,204 | |
| 357414 — 4.0% 2018 (2.7 years) | | | 2,462,763 | | | | 2,578,975 | |
| 888595 — 5.0% 2022 (2.8 years) | | | 1,414,177 | | | | 1,509,956 | |
| 888439 — 5.5% 2022 (2.9 years) | | | 1,229,894 | | | | 1,332,636 | |
| 357985 — 4.5% 2020 (3.0 years) | | | 704,620 | | | | 744,125 | |
| AD0629 — 5.0% 2024 (3.0 years) | | | 5,732,610 | | | | 6,120,865 | |
| 995960 — 5.0% 2023 (3.0 years) | | | 5,528,977 | | | | 5,884,433 | |
| AE0031 — 5.0% 2025 (3.1 years) | | | 8,233,285 | | | | 8,754,883 | |
| 995692 — 4.5% 2024 (3.2 years) | | | 9,020,242 | | | | 9,478,046 | |
| 930667 — 4.5% 2024 (3.2 years) | | | 7,382,459 | | | | 7,754,833 | |
| 995755 — 4.5% 2024 (3.2 years) | | | 15,152,178 | | | | 15,916,460 | |
| 995693 — 4.5% 2024 (3.3 years) | | | 9,577,463 | | | | 10,066,540 | |
| 890112 — 4.0% 2024 (3.6 years) | | | 7,700,718 | | | | 7,938,959 | |
| MA0043 — 4.0% 2024 (3.6 years) | | | 6,061,096 | | | | 6,241,035 | |
| AA4315 — 4.0% 2024 (3.7 years) | | | 10,728,460 | | | | 11,046,961 | |
| AA5510 — 4.0% 2024 (3.7 years) | | | 6,736,980 | | | | 6,936,984 | |
| 931739 — 4.0% 2024 (3.8 years) | | | 2,889,164 | | | | 2,974,936 | |
| AD7073 — 4.0% 2025 (4.2 years) | | | 9,169,982 | | | | 9,443,649 | |
| 725232 — 5.0% 2034 (4.2 years) | | | 2,271,443 | | | | 2,394,743 | |
| AB1769 — 3.0% 2025 (5.2 years) | | | 11,223,957 | | | | 10,953,403 | |
| AB2251 — 3.0% 2026 (5.4 years) | | | 9,887,745 | | | | 9,658,670 | |
| | | | | | | | 139,406,059 | |
| | | | | | | | 253,168,031 | |
| Government National Mortgage Association — 0.2% | | | | | | | | |
| Collateralized Mortgage Obligations — 0.2% | | | | | | | | |
| GNR 2004-80 CL GC — 5.0% 2031 | | | | | | | | |
| (0.3 years) | | | 2,953,388 | | | | 2,980,226 | |
| Non-Government Agency — 2.4% | | | | | | | | |
| Collateralized Mortgage Obligations — 2.4% | | | | | | | | |
| GMACM 2003-J4 CL 3A1 — 4.75% 2018 | | | | | | | | |
| (0.4 years) | | | 1,088,480 | | | | 1,112,205 | |
| 42 Weitz Funds | The accompanying notes form an integral part of these financial statements. |
| | | Principal amount | | | Value | |
| CDMC 2003-7P CL A4 — 3.37% 2017 | | | | | | |
| (Adjustable Rate) (0.5 years)(d) | | $ | 566,217 | | | $ | 566,293 | |
| SEMT 2010-H1 CL A1 — 3.75% 2040 | | | | | | | | |
| (0.9 years) | | | 15,590,145 | | | | 15,836,563 | |
| WAMU 2003-S7 CL A1 — 4.5% 2018 | | | | | | | | |
| (1.2 years) | | | 434,399 | | | | 445,962 | |
| Chase 2004-S1 CL A6 — 4.5% 2019 | | | | | | | | |
| (1.9 years) | | | 210,116 | | | | 197,360 | |
| SEMT 2011-1 CL A1 — 4.125% 2041 | | | | | | | | |
| (3.8 years) | | | 9,483,928 | | | | 9,514,547 | |
| | | | | | | | 27,672,930 | |
| Total Mortgage-Backed Securities | | | | | | | | |
| (Cost $415,412,146) | | | | | | | 420,897,161 | |
| | | | | | | | | |
| TAXABLE MUNICIPAL BONDS — 1.3% | | | | | | | | |
| Fond Du Lac Cnty, Wisconsin | | | | | | | | |
| 3.0% 9/01/12 | | | 2,900,000 | | | | 2,962,495 | |
| Stratford, Connecticut 6.55% 2/15/13 | | | 500,000 | | | | 505,635 | |
| University of California 4.85% 5/15/13 | | | 990,000 | | | | 1,058,647 | |
| Nebraska Public Power District | | | | | | | | |
| 5.14% 1/01/14 | | | 1,000,000 | | | | 1,070,800 | |
| Los Angeles, California Cmty Dev | | | | | | | | |
| 6.0% 9/01/14 | | | 2,275,000 | | | | 2,487,371 | |
| 6.0% 9/01/15 | | | 1,220,000 | | | | 1,336,169 | |
| Menomonee Falls, Wisconsin | | | | | | | | |
| 4.25% 11/01/14 | | | 2,000,000 | | | | 2,101,300 | |
| Omaha, Nebraska Public Facilities Corp., | | | | | | | | |
| Lease Revenue, Series B, Refunding | | | | | | | | |
| 4.588% 6/01/17 | | | 815,000 | | | | 832,840 | |
| 4.788% 6/01/18 | | | 1,000,000 | | | | 1,014,340 | |
| Iowa State University Revenue | | | | | | | | |
| 5.8% 7/01/22 | | | 1,335,000 | | | | 1,322,918 | |
| Total Taxable Municipal Bonds | | | | | | | | |
| (Cost $14,159,612) | | | | | | | 14,692,515 | |
| | | | | | | | | |
| U.S. TREASURY AND GOVERNMENT AGENCY — 11.2% | | | | | | | | |
| U.S. Treasury — 7.2% | | | | | | | | |
| U.S. Treasury Note | | | | | | | | |
| 1.125% 12/15/11 | | | 15,000,000 | | | | 15,095,505 | |
| 1.375% 4/15/12 | | | 15,000,000 | | | | 15,162,900 | |
| 1.0% 4/30/12 | | | 20,000,000 | | | | 20,141,340 | |
| 2.625% 4/30/16 | | | 6,000,000 | | | | 6,106,878 | |
| 3.0% 8/31/16 | | | 5,000,000 | | | | 5,156,250 | |
| 3.0% 9/30/16 | | | 6,000,000 | | | | 6,181,410 | |
| 3.125% 10/31/16 | | | 6,000,000 | | | | 6,212,346 | |
| 3.125% 5/15/19 | | | 10,000,000 | | | | 10,000,780 | |
| | | | | | | | 84,057,409 | |
| | | Principal amount or shares | | | Value | |
| Government Agency — 4.0% | | | | | | |
| Fannie Mae | | | | | | |
| 2.0% 6/24/13 | | $ | 7,000,000 | | | $ | 7,022,386 | |
| Federal Home Loan Banks | | | | | | | | |
1% 3/30/16(e) | | | 13,750,000 | | | | 13,735,686 | |
1% 1/27/17(e) | | | 10,000,000 | | | | 9,998,500 | |
| Freddie Mac | | | | | | | | |
| 5.5% 9/15/11 | | | 1,000,000 | | | | 1,024,510 | |
| 2.75% 4/29/14 | | | 15,000,000 | | | | 15,029,145 | |
| | | | | | | | 46,810,227 | |
| Total U.S. Treasury and Government Agency | | | | | | | | |
| (Cost $129,651,626) | | | | | | | 130,867,636 | |
| | | | | | | | | |
| COMMON STOCKS — 2.6% | | | | | | | | |
| Redwood Trust, Inc. | | | 1,090,974 | | | | 16,964,646 | |
Microsoft Corp.(f) | | | 500,000 | | | | 12,680,000 | |
| Newcastle Investment Corp.* | | | 45,000 | | | | 271,800 | |
| Total Common Stocks | | | | | | | | |
| (Cost $29,311,424) | | | | | | | 29,916,446 | |
| SHORT-TERM SECURITIES — 14.2% | | | | | | | | |
| Wells Fargo Advantage Government Money Market Fund - | | | | | | | | |
Institutional Class 0.01%(a) | | | 1,997,122 | | | | 1,997,122 | |
| U.S. Treasury Bills, 0.09% to 0.13%, | | | | | | | | |
4/07/11 to 7/28/11(b) | | $ | 164,000,000 | | | | 163,976,966 | |
| Total Short-Term Securities | | | | | | | | |
| (Cost $165,968,076) | | | | | | | 165,974,088 | |
| Total Investments in Securities | | | | | | | | |
| (Cost $1,138,273,208) | | | | | | | 1,163,725,503 | |
| Options Written — 0.0% | | | | | | | (447,500 | ) |
| Other Assets Less Other Liabilities — 0.0% | | | | | | | 585,954 | |
| Net Assets — 100.0% | | | | | | $ | 1,163,863,957 | |
| Net Asset Value Per Share | | | | | | $ | 12.39 | |
| OPTIONS WRITTEN* | | Expiration date/ Strike price | | Shares subject to option | | Value | |
| Covered Call Options | | | | | | | | | | |
| Microsoft Corp. | | | May 2011 / $25 | | | 250,000 | | | (265,000 | ) |
| Microsoft Corp. | | | June 2011 / $26 | | | 250,000 | | | (182,500 | ) |
| Total Options Written | | | | | | | | | | |
| (premiums received $589,988) | | | | | | | | | (447,500 | ) |
| * | Non-income producing |
| (a) | Rate presented represents the annualized 7-day yield at March 31, 2011. |
| (b) | Interest rates presented represent the yield to maturity at the date of purchase. |
| (c) | Number of years indicated represents estimated average life of mortgage-backed securities. |
| (d) | Security is exempt from registration under Rule 144A of the Securities Act of 1933. This security may be resold in transactions that are exempt from registration, normally to qualified institutional buyers. |
| (e) | Security is a “step-up” bond where the coupon rate increases or steps up at a predetermined date. Coupon rate presented represents the rate at March 31, 2011. |
| (f) | Fully or partially pledged on outstanding written options. |
| The accompanying notes form an integral part of these financial statements. | weitzfunds.com 43 |
PORTFOLIO MANAGER’S DISCUSSION & ANALYSIS
Portfolio Manager: Thomas D. Carney
The Nebraska Tax-Free Income Fund returned +0.3% in the first calendar quarter, compared to a +0.6% return for the Barclays Capital 5-Year Municipal Bond Index, our Fund’s primary benchmark. For the fiscal year ended March 31, 2011, the Nebraska Tax-Free Income Fund’s total return was +1.9%, compared to a +3.2% return for our Fund’s primary benchmark.
Fiscal 2011 Review
Solid results during the first half of the past fiscal year in the municipal bond marketplace were nearly erased by meaningful bond price weakness (negative returns) in the quarter ended December 31 and almost flat returns in the quarter ended March 31. Rising Treasury yields (lower prices), the end of an important funding mechanism for the municipal marketplace (Build America Bonds), and growing concerns about municipal bond creditworthiness were the key culprits for the downturn in returns in the second half. We discussed these issues in depth in our last quarterly report for anyone interested in a more lengthy review.
Despite the wide quarter-to-quarter performance gyrations in the past year, municipal bond yields were generally unchanged for bonds maturing between one and ten years. Therefore, most of the return for investors in short- to intermediate-term maturities came from the interest earned on their bonds. Longer-term bonds, however, were the most impacted from the events mentioned above. Yields increased by as much as 50 basis points (a basis point represents one one-hundredth of a percentage point) on longer-term bonds (maturities greater than ten years). The result was price declines for this segment of the municipal marketplace.
The yield relationship between tax-free municipal bonds and taxable alternatives, like U.S. Treasuries, widened in the past year as municipal bonds generally underperformed their taxable counterparts. High quality 5-year municipal bonds, for example, ended the current fiscal year (March 31) with a yield representing approximately 77% of U.S. Treasuries, compared to 70% a year ago. Longer-term municipal bonds experienced the worst price impact from the events of the past year with their yields rising above taxable alternatives. This underperformance has resulted in most municipal bonds with a maturity beyond ten years to have yields in excess of U.S. Treasuries at quarter end. Historically, municipal bonds yield less than taxable alternatives given municipal bonds tax advantages (federally and, typically, state exempt). The repricing of longer-term municipal bond yields to levels above taxable alternatives highlights the uneasiness of investors about the issues facing the broader municipal bond marketplace.
Our investment activity in the past year was once again focused on bonds with shorter maturities (primarily under 7 years). Investment highlights during the year included additions in the public power and higher education segments of our portfolio (22.0% and 20.1%, respectively, as of March 31).
We also invested approximately 10% of Fund assets in higher coupon bonds that contain a short-term call provision. These premium (a bond that has a higher-than-market coupon interest rate) callable bonds are often called ‘cushion’ or ‘kicker’ in industry parlance. They are typically offered in the market at prices which assume they will be redeemed at an upcoming call date in advance of its final maturity. If the call feature is not exercised by the issuer at the call date, the yield we receive increases or “kicks up” based on holding the high coupon bond for a longer time period, possibly to its final maturity. Should interest rates stay low and our investments are redeemed on their shorter-term call dates, we will earn a higher return than we could on other short-term alternatives. If interest rates rise and these investments are not called on their call dates, we will be partially ‘cushioned’ from any rate rise, particularly compared to non-called alternatives, since we will likely receive our higher coupon cash flow for a longer period of time.
Turning to portfolio metrics, over the past year the average duration of our Fund was unchanged at 3.5 years and the average maturity of our bonds fell to 6.5 from 7.0 years. Overall asset quality of our portfolio remains high as we continue to be focused on security selection and ongoing review of our investments’ fiscal position.
Outlook
Today’s investment landscape in fixed-income has become increasingly challenging. Nominal interest rates remain quite low and inflation, the bond investor’s boogeyman, has certainly arrived for anyone who eats or drives. Whether this commodity-based inflation leaks into the broader economy and investor expectations is currently debatable. Our leaders in Washington exercised modest spending restraint in their recent agreement to keep the federal government funded through September 30, 2011. We remain wary, though, of the inflationary implications of the enormous deficit spending in support of economic recovery. Consequently, we continue to be defensively positioned relative to interest rate exposure while we patiently seek out areas of opportunity. We will continue to invest one security at a time, relying on a fundamental research-based investment approach and are well positioned to take advantage of any market weakness.
44 Weitz Funds
NEBRASKA TAX-FREE INCOME FUND
PERFORMANCE • (UNAUDITED)
| | | Total Return | | Average Annual Total Returns | |
| | | 1 Year | | 3 Year | | 5 Year | | 10 Year | | 15 Year | | 20 Year | | 25 Year | |
| Nebraska Tax-Free Income Fund | | 1.9 | % | | 3.5 | % | | 3.5 | % | | 3.8 | % | | 4.4 | % | | 4.8 | % | | 5.1 | % | |
| Barclays Capital 5-Year Municipal Bond Index | | 3.2 | | | 5.1 | | | 5.1 | | | 4.6 | | | 4.9 | | | 5.4 | | | N/A | | |
Growth of $10,000
This chart depicts the change in the value of a $10,000 investment in the NE Tax-Free Fund for the period March 31, 2001 through March 31, 2011, as compared with the growth of the Barclays 5-Yr Index during the same period. Index performance is hypothetical and is shown for illustrative purposes only.
| | Year | | NE Tax-Free (1) | | Barclays 5-Yr* (2) | | Relative Results (1)-(2) | |
| | 1985 (10/1/85) | | 3.5 | % | | N/A | % | | N/A | % | |
| | 1986 | | 11.2 | | | N/A | | | N/A | | |
| | 1987 | | 4.0 | | | N/A | | | N/A | | |
| | 1988 | | 6.3 | | | N/A | | | N/A | | |
| | 1989 | | 6.9 | | | 9.1 | | | -2.2 | | |
| | 1990 | | 6.3 | | | 7.7 | | | -1.4 | | |
| | 1991 | | 8.4 | | | 11.4 | | | -3.0 | | |
| | 1992 | | 7.4 | | | 7.6 | | | -0.2 | | |
| | 1993 | | 7.9 | | | 8.7 | | | -0.8 | | |
| | 1994 | | -1.4 | | | -1.3 | | | -0.1 | | |
| | 1995 | | 10.5 | | | 11.6 | | | -1.1 | | |
| | 1996 | | 5.5 | | | 4.2 | | | 1.3 | | |
| | 1997 | | 7.3 | | | 6.4 | | | 0.9 | | |
| | 1998 | | 6.1 | | | 5.8 | | | 0.3 | | |
| | 1999 | | -1.2 | | | 0.7 | | | -1.9 | | |
| | 2000 | | 9.9 | | | 7.7 | | | 2.2 | | |
| | 2001 | | 3.9 | | | 6.2 | | | -2.3 | | |
| | 2002 | | 8.0 | | | 9.3 | | | -1.3 | | |
| | 2003 | | 4.3 | | | 4.1 | | | 0.2 | | |
| | 2004 | | 3.4 | | | 2.7 | | | 0.7 | | |
| | 2005 | | 2.2 | | | 0.9 | | | 1.3 | | |
| | 2006 | | 3.3 | | | 3.3 | | | 0.0 | | |
| | 2007 | | 3.6 | | | 5.2 | | | -1.6 | | |
| | 2008 | | 1.2 | | | 5.8 | | | -4.6 | | |
| | 2009 | | 7.2 | | | 7.4 | | | -0.2 | | |
| | 2010 | | 2.3 | | | 3.4 | | | -1.1 | | |
| | 2011 (3/31/11) | | 0.3 | | | 0.6 | | | -0.3 | | |
| | Since Inception: | | | | | | | | | | |
| | Cumulative | | | | | | | | | | |
| | Return | | 279.5 | | | N/A | | | N/A | | |
| | Avg. Annual | | | | | | | | | | |
| | Return | | 5.4 | | | N/A | | | N/A | | |
* The inception date of the Barclays 5-Yr was 1/29/88.
These performance numbers reflect the deduction of the Fund’s annual operating expenses which as stated in its most recent Prospectus are 0.78% of the Fund’s net assets. The returns assume redemption at the end of each period and reinvestment of dividends. Total returns shown include fee waivers and expense reimbursements, if any; total returns would have been lower had there been no waiver of fees and/or reimbursement of expenses by the Adviser. This information represents past performance and past performance does not guarantee future results. The investment return and the principal value of an investment in this Fund will fluctuate so that an investor’s shares, when redeemed, may be worth more or less than the original cost. Current performance may be lower or higher than the performance data quoted. Performance data current to the most recent month-end may be obtained at www.weitzfunds.com/performance/monthly.asp.
See page 4 for additional performance disclosures.
Performance information does not reflect the deduction of taxes that a shareholder would pay on Fund distributions or the redemption of Fund shares.
Performance of the Nebraska Tax-Free Income Fund (the “Fund”) is measured from October 1, 1985, the inception of Weitz Income Partners Limited Partnership (the “Partnership”). As of December 29, 2006, the Fund succeeded to substantially all of the assets of the Partnership. The investment objectives, policies and restrictions of the Fund are materially equivalent to those of the Partnership and the Partnership was managed at all times with full investment authority by Wallace R. Weitz & Company. The performance information includes performance for the period before the Fund became an investment company registered with the Securities and Exchange Commission. During this period, the Partnership was not registered under the Investment Company Act of 1940 and, therefore, was not subject to certain investment or other restrictions or requirements imposed by the 1940 Act or the Internal Revenue Code. If the Partnership had been registered under the 1940 Act during this period, the Partnership’s performance might have been adversely affected.
weitzfunds.com 45
NEBRASKA TAX-FREE INCOME FUND
PORTFOLIO PROFILE • (UNAUDITED)
| Sector Breakdown | |
| Power | | | 22.0 | % |
| Higher Education | | | 20.1 | |
| Water/Sewer | | | 11.2 | |
| Hospital | | | 8.8 | |
| General | | | 7.0 | |
| Lease | | | 3.6 | |
| Airport/Transportation | | | 3.6 | |
| Highway | | �� | 1.1 | |
| Housing | | | 0.9 | |
| Total Revenue | | | 78.3 | |
| City/Subdivision | | | 7.7 | |
| School District | | | 5.8 | |
| County | | | 2.9 | |
| State/Commonwealth | | | 2.7 | |
| Total General Obligation | | | 19.1 | |
| Escrow/Pre-Refunded | | | 0.2 | |
| Short-Term Securities/Other | | | 2.4 | |
| Net Assets | | | 100.0 | % |
| State Breakdown | |
| Nebraska | | | 81.4 | % |
| Commonwealth of Puerto Rico | | | 3.9 | |
| Illinois | | | 2.6 | |
| Florida | | | 2.4 | |
| Wisconsin | | | 1.7 | |
| Ohio | | | 1.2 | |
| Virginia | | | 1.2 | |
| Arizona | | | 1.2 | |
| Hawaii | | | 1.1 | |
| North Dakota | | | 0.9 | |
| Minnesota | | | 0.0 | |
| Short-Term Securities/Other | | | 2.4 | |
| Net Assets | | | 100.0 | % |
| Financial Attributes | |
| Average Maturity | | 6.5 years | |
| Average Duration | | 3.5 years | |
| Average Coupon | | | 4.1% | |
| 30-Day SEC Yield at 3-31-11 | | | 2.2% | |
| Municipals exempt from federal and Nebraska income taxes | | Approx. 85% | |
| Municipals subject to alternative minimum tax | | Approx. 4% | |
46 Weitz Funds
NEBRASKA TAX-FREE INCOME FUND
SCHEDULE OF INVESTMENTS • MARCH 31, 2011
| MUNICIPAL BONDS — 97.6% | | Principal amount | | | Value | |
| Arizona — 1.2% | | | | | | |
| Mesa, Highway Project Advancement Notes, Revenue, Series 2009 | | | | | | |
| 3.5%, 7/01/15 | | $ | 1,000,000 | | | $ | 1,027,580 | |
| Florida — 2.4% | | | | | | | | |
| Greater Orlando, Aviation Authority, Revenue, Series 2009A, AMT | | | | | | | | |
| 6.0%, 10/01/16 | | | 1,000,000 | | | | 1,136,410 | |
| Miami, Dade County, Aviation Revenue, Series 2010A | | | | | | | | |
| 4.25%, 10/01/18 | | | 1,000,000 | | | | 1,024,210 | |
| | | | | | | | 2,160,620 | |
| Hawaii — 1.1% | | | | | | | | |
| State of Hawaii, Airports System Revenue, Refunding, Series 2010B, AMT | | | | | | | | |
| 3.0%, 7/01/12 | | | 1,000,000 | | | | 1,020,010 | |
| Illinois — 2.6% | | | | | | | | |
| Elgin, General Obligation, Refunding, Series 2003 | | | | | | | | |
| 5.125%, 12/15/14 | | | 1,020,000 | | | | 1,084,831 | |
| Illinois Finance Authority, Revenue, Series 2009A, | | | | | | | | |
| Northwestern Memorial Hospital | | | | | | | | |
| 5.0%, 8/15/17 | | | 245,000 | | | | 270,529 | |
| Illinois Health Facility Authority, Revenue, Series A, Evangelical | | | | | | | | |
| Hospital Corp., Escrowed to Maturity | | | | | | | | |
| 6.75%, 4/15/12 | | | 85,000 | | | | 87,547 | |
| Springfield, Water Revenue, Series 2004 | | | | | | | | |
| 5.25%, 3/01/19 | | | 800,000 | | | | 839,616 | |
| | | | | | | | 2,282,523 | |
| Minnesota — 0.0% | | | | | | | | |
| Minnesota State Housing Financial Agency, Single Family | | | | | | | | |
| Mortgage, Series D | | | | | | | | |
| 6.0%, 1/01/16 | | | 15,000 | | | | 15,035 | |
| Nebraska —81.4% | | | | | | | | |
| Adams County, Hospital Authority #1, Revenue, Mary Lanning | | | | | | | | |
| Memorial Hospital Project, Radian Insured | | | | | | | | |
| 4.25%, 12/15/16 | | | 250,000 | | | | 255,632 | |
| 4.4%, 12/15/17 | | | 250,000 | | | | 255,080 | |
| 5.3%, 12/15/18 | | | 700,000 | | | | 700,308 | |
| Bellevue, Development Revenue, Bellevue University Project | | | | | | | | |
| Refunding, Series 2010B, 0.7%, 6/01/11 | | | 600,000 | | | | 599,964 | |
| Series 2010A, 2.75%, 12/01/15 | | | 1,000,000 | | | | 1,014,610 | |
| Blair, Water System Revenue, Bond Anticipation Notes, AMT | | | | | | | | |
| Series B, 4.65%, 6/15/12 | | | 500,000 | | | | 501,240 | |
| Cornhusker Public Power District, Electric Revenue, | | | | | | | | |
| Refunding, Series 2010 | | | | | | | | |
| 0.75%, 7/01/12 | | | 660,000 | | | | 659,703 | |
| 2.4%, 7/01/17 | | | 400,000 | | | | 394,496 | |
| Dawson County, Lexington Public School District #001, | | | | | | | | |
| General Obligation, Refunding | | | | | | | | |
| 1.75%, 12/15/12 | | | 355,000 | | | | 357,797 | |
| 2.15%, 12/15/13 | | | 490,000 | | | | 498,619 | |
| Dawson Public Power District, Electric Revenue, Series 2010B | | | | | | | | |
| 2.25%, 12/15/17 | | | 125,000 | | | | 121,404 | |
| 2.75%, 12/15/19 | | | 100,000 | | | | 95,543 | |
| Douglas County, Educational Facility Revenue, | | | | | | | | |
| Creighton University Project | | | | | | | | |
| Refunding, Series 2010A, 5.0% 7/01/16 | | | 430,000 | | | | 464,950 | |
| Series 2005A, FGIC Insured, 3.5%, 9/01/12 | | | 255,000 | | | | 262,964 | |
| Douglas County, Hospital Authority #1, Revenue, Refunding, | | | | | | | | |
| Alegent Health - Immanuel, AMBAC Insured | | | | | | | | |
| 5.125%, 9/01/17 | | | 250,000 | | | | 245,638 | |
| Quality Living Inc. Project | | | | | | | | |
| 4.7%, 10/01/17 | | | 255,000 | | | | 208,582 | |
| | | Principal amount | | | Value | |
| Douglas County, Hospital Authority #2, Revenue, | | | | | | |
| Boys Town Project | | | | | | |
| 4.75%, 9/01/28 | | $ | 500,000 | | | $ | 486,690 | |
| Children’s Hospital Obligated Group | | | | | | | | |
| 5.25%, 8/15/20 | | | 1,000,000 | | | | 1,036,050 | |
| 5.5%, 8/15/21 | | | 1,430,000 | | | | 1,487,486 | |
| Nebraska Medical Center Project | | | | | | | | |
| 5.0%, 11/15/14 | | | 380,000 | | | | 408,025 | |
| 5.0%, 11/15/15 | | | 295,000 | | | | 317,544 | |
| Douglas County, Hospital Authority #3, Revenue, Refunding | | | | | | | | |
| Nebraska Methodist Health System | | | | | | | | |
| 5.5%, 11/01/18 | | | 500,000 | | | | 533,125 | |
| Douglas County, Elkhorn Public School District #10, Series 2010B | | | | | | | | |
| 3.0%, 6/15/16 | | | 525,000 | | | | 540,572 | |
| Douglas County, Millard Public School District #17, Refunding | | | | | | | | |
| FSA Insured, 4.0%, 11/15/13 | | | 500,000 | | | | 524,635 | |
| 4.0%, 6/15/17 | | | 750,000 | | | | 785,183 | |
| Douglas County, Zoo Facility Revenue, Refunding, | | | | | | | | |
| Omaha’s Henry Doorly Zoo Project | | | | | | | | |
| 4.2%, 9/01/16 | | | 600,000 | | | | 629,952 | |
| 4.75%, 9/01/17 | | | 200,000 | | | | 211,408 | |
| Grand Island, Electric Revenue, MBIA Insured | | | | | | | | |
| 5.0%, 8/15/14 | | | 500,000 | | | | 504,745 | |
| 5.125%, 8/15/16 | | | 500,000 | | | | 504,895 | |
| Grand Island, Public Safety, Tax Anticipation Bonds, AMBAC Insured | | | | | | | | |
| 4.1%, 9/01/14 | | | 480,000 | | | | 486,878 | |
| Grand Island, Sanitary Sewer Revenue, Refunding, FSA Insured | | | | | | | | |
| 3.3%, 4/01/13 | | | 870,000 | | | | 871,836 | |
| 3.45%, 4/01/14 | | | 650,000 | | | | 651,261 | |
| Hastings, Electric System Revenue, Refunding, FSA Insured | | | | | | | | |
| 5.0%, 1/01/19 | | | 750,000 | | | | 752,490 | |
| La Vista, General Obligation, Refunding, Series 2009 | | | | | | | | |
| 2.5%, 11/15/15 | | | 415,000 | | | | 418,660 | |
| 3.0%, 11/15/17 | | | 640,000 | | | | 636,602 | |
| Lancaster County, Hospital Authority #1, Revenue, Refunding, | | | | | | | | |
| Bryan LGH Medical Center | | | | | | | | |
| Series A, 5.0%, 6/01/16 | | | 500,000 | | | | 522,580 | |
| Series A, 5.0%, 6/01/17 | | | 500,000 | | | | 517,000 | |
| Lincoln, Certificates of Participation | | | | | | | | |
| Series 2010A, 2.4%, 3/15/17 | | | 395,000 | | | | 392,606 | |
| Lincoln, Electric System Revenue, Refunding | | | | | | | | |
| 5.0%, 9/01/18 | | | 1,000,000 | | | | 1,104,010 | |
| Lincoln, General Obligation, Highway Allocation Fund | | | | | | | | |
| 4.0%, 5/15/23 | | | 1,000,000 | | | | 1,014,310 | |
| Lincoln, Parking Revenue, Refunding, Series 2011 | | | | | | | | |
| 3.25%, 8/15/18 | | | 440,000 | | | | 446,402 | |
| Lincoln, Sanitary Sewer Revenue, Refunding, MBIA Insured | | | | | | | | |
| 5.0%, 6/15/16 | | | 885,000 | | | | 951,649 | |
| Lincoln, Water Revenue | | | | | | | | |
| 5.0%, 8/15/22 | | | 800,000 | | | | 814,280 | |
| Lincoln County, North Platte School District #001, | | | | | | | | |
| General Obligation, Refunding | | | | | | | | |
| 2.0%, 12/15/13 | | | 770,000 | | | | 784,199 | |
| Municipal Energy Agency of Nebraska, Power Supply System Revenue, | | | | | | | | |
| Refunding, Series A | | | | | | | | |
| AMBAC Insured, 5.0%, 4/01/13 | | | 380,000 | | | | 393,783 | |
| BHAC Insured, 5.0%, 4/01/20 | | | 500,000 | | | | 550,220 | |
| Nebraska Educational Financial Authority, Revenue, Refunding | | | | | | | | |
| Hastings College Project | | | | | | | | |
| 5.05%, 12/01/23 | | | 500,000 | | | | 498,575 | |
| Nebraska Wesleyan University Project, Series 2002, Radian Insured | | | | | | | | |
| 5.0%, 4/01/16 | | | 100,000 | | | | 101,108 | |
| 5.15%, 4/01/22 | | | 1,000,000 | | | | 969,800 | |
| The accompanying notes form an integral part of these financial statements. | weitzfunds.com 47 |
NEBRASKA TAX-FREE INCOME FUND
SCHEDULE OF INVESTMENTS • (CONTINUED)
| | | Principal amount | | | Value | |
| Nebraska Investment Finance Authority, Clean Water State | | | | | | |
Revolving Fund, Series 2010# | | | | | | |
| 0.7%, 6/15/11 | | $ | 2,085,000 | | | $ | 2,085,000 | |
| Nebraska Investment Financial Authority, Revenue, | | | | | | | | |
| Drinking Water State Revolving Fund | | | | | | | | |
| Series 2001A, 5.15%, 1/01/16 | | | 200,000 | | | | 201,564 | |
| Series 2010A, 4.0%, 7/01/25 | | | 750,000 | | | | 730,853 | |
| Nebraska Investment Financial Authority, Health Facility Revenue, | | | | | | | | |
| Hospital Revenue, Great Plains Regional Medical Center Project, | | | | | | | | |
| Radian Insured | | | | | | | | |
| 5.0%, 11/15/14 | | | 250,000 | | | | 256,498 | |
| Nebraska Investment Financial Authority, Single Family Housing | | | | | | | | |
| Revenue, Series C, AMT | | | | | | | | |
| 4.05%, 3/01/12 | | | 235,000 | | | | 238,635 | |
| 4.05%, 9/01/12 | | | 285,000 | | | | 291,250 | |
| 4.125%, 3/01/13 | | | 305,000 | | | | 312,713 | |
| Nebraska Public Power District, Revenue | | | | | | | | |
| 2003 Series A, 5.0%, 1/01/20 | | | 230,000 | | | | 240,258 | |
| 2005 Series B-2, 5.0%, 1/01/16 | | | 1,000,000 | | | | 1,102,120 | |
| 2007 Series B, 5.0%, 1/01/15 | | | 885,000 | | | | 981,111 | |
| 2007 Series B, 5.0%, 1/01/21 | | | 1,000,000 | | | | 1,073,050 | |
| 2008 Series B, 5.0%, 1/01/18 | | | 800,000 | | | | 890,352 | |
| 2010 Series C, 4.25%, 1/01/17 | | | 500,000 | | | | 538,515 | |
| Nebraska State Colleges Facility Corp., Deferred Maintenance Revenue, | | | | | | | | |
| MBIA Insured | | | | | | | | |
| 4.25%, 7/15/15 | | | 405,000 | | | | 436,554 | |
| 5.0%, 7/15/16 | | | 200,000 | | | | 222,866 | |
| 4.0%, 7/15/17 | | | 200,000 | | | | 209,638 | |
| Nebraska Utilities Corp., Revenue, University of Nebraska | | | | | | | | |
| Lincoln Project | | | | | | | | |
| 5.25%, 1/01/19 | | | 750,000 | | | | 777,495 | |
| Omaha, General Obligation, Refunding | | | | | | | | |
| 3.75%, 6/01/14 | | | 1,000,000 | | | | 1,084,520 | |
| 5.25%, 10/15/19 | | | 250,000 | | | | 289,525 | |
| Omaha, Public Facilities Corp., Lease Revenue, | | | | | | | | |
| Omaha Baseball Stadium Project | | | | | | | | |
| Series 2009, 5.0%, 6/01/23 | | | 770,000 | | | | 817,809 | |
| Series 2010, 4.125%, 6/01/29 | | | 650,000 | | | | 580,873 | |
| Rosenblatt Stadium Project, Series C | | | | | | | | |
| 3.9%, 10/15/17 | | | 235,000 | | | | 248,907 | |
| 3.95%, 10/15/18 | | | 240,000 | | | | 250,519 | |
| Omaha Public Power District, Electric Revenue | | | | | | | | |
| Series A, Escrowed to Maturity | | | | | | | | |
| 7.625%, 2/01/12 | | | 115,000 | | | | 121,023 | |
| Series A, 4.25%, 2/01/18 | | | 1,650,000 | | | | 1,736,922 | |
| Series A, 4.1%, 2/01/19 | | | 1,000,000 | | | | 1,047,670 | |
| Series B, FGIC Insured, 4.75%, 2/01/36 | | | 1,000,000 | | | | 927,070 | |
| Series C, 5.5%, 2/01/14 | | | 220,000 | | | | 232,643 | |
| Omaha, Sanitary Sewer Revenue, MBIA Insured | | | | | | | | |
| 4.0%, 11/15/12 | | | 520,000 | | | | 547,830 | |
| 4.0%, 11/15/14 | | | 250,000 | | | | 272,765 | |
| Omaha, Special Tax, Revenue, Heritage Development Project, | | | | | | | | |
| Series 2004 | | | | | | | | |
| 5.0%, 10/15/17 | | | 1,090,000 | | | | 1,201,485 | |
| Papillion-La Vista, Sarpy County School District #27, | | | | | | | | |
| General Obligation | | | | | | | | |
| Refunding, Series 2009A, | | | | | | | | |
| 3.15%, 12/01/17 | | | 930,000 | | | | 949,353 | |
| Series 2009, 5.0%, 12/01/28 | | | 500,000 | | | | 508,565 | |
| | | Principal amount | | | Value | |
| Papillion, Water System Revenue, Bond Anticipation Notes | | | | | | |
| Series C, 3.0%, 6/15/11 | | $ | 500,000 | | | $ | 500,995 | |
| Series 2010, 1.65%, 6/15/13 | | | 1,000,000 | | | | 1,000,770 | |
| Plattsmouth, General Obligation, Promissory Notes, | | | | | | | | |
| Series 2010 | | | | | | | | |
| 0.9%, 9/15/12 | | | 445,000 | | | | 444,306 | |
| Public Power Generation Agency, Revenue, Whelan Energy | | | | | | | | |
| Center Unit 2, Series A | | | | | | | | |
| AGC-ICC AMBAC Insured, 5.0%, 1/01/19 | | | 1,260,000 | | | | 1,354,198 | |
| AMBAC Insured, 5.0%, 1/01/18 | | | 750,000 | | | | 795,255 | |
| AMBAC Insured, 5.0%, 1/01/26 | | | 800,000 | | | | 791,712 | |
| Sarpy County, Recovery Zone Facility Certificates of Participation, | | | | | | | | |
| Series 2010 | | | | | | | | |
| 2.35%, 12/15/18 | | | 155,000 | | | | 145,464 | |
| 2.6%, 12/15/19 | | | 135,000 | | | | 124,812 | |
| Sarpy County, General Obligation, Sanitary & Improvement | | | | | | | | |
| District #111, Stoneybrook | | | | | | | | |
| 5.9%, 3/15/13 | | | 300,000 | | | | 300,651 | |
| Southern Nebraska Public Power District, Electric System Revenue, | | | | | | | | |
| AMBAC Insured | | | | | | | | |
| 4.625%, 9/15/21 | | | 1,000,000 | | | | 1,041,330 | |
| State of Nebraska, Certificates of Participation | | | | | | | | |
| Series 2009B, 2.1%, 8/01/13 | | | 590,000 | | | | 597,829 | |
| Series 2009C, 2.0%, 11/01/13 | | | 700,000 | | | | 703,213 | |
| Series 2010B, 1.2%, 9/15/14 | | | 1,230,000 | | | | 1,215,892 | |
| Series 2011A, 1.0%, 4/15/13 | | | 310,000 | | | | 309,027 | |
| University of Nebraska, Facilities Corp. | | | | | | | | |
| Deferred Maintenance Revenue | | | | | | | | |
| Series 2006, 5.0%, 7/15/18 | | | 830,000 | | | | 919,408 | |
| Series 2009, 2.0%, 7/15/11 | | | 1,000,000 | | | | 1,005,050 | |
| Lease Rental Revenue | | | | | | | | |
| NCTA Education Center/Student Housing Project, | | | | | | | | |
| Series 2011, 3.75%, 6/15/2019 | | | 285,000 | | | | 290,788 | |
| UNMC OPPD Exchange Project, | | | | | | | | |
| Series 2010, 2.75%, 2/15/16 | | | 1,185,000 | | | | 1,221,474 | |
| UNMC Research Center Project, | | | | | | | | |
| Series 2002, 5.0%, 2/15/15 | | | 500,000 | | | | 516,805 | |
| UNMC Sorell Center Project, | | | | | | | | |
| Series 2006, 4.0%, 4/15/11 | | | 1,000,000 | | | | 1,001,450 | |
| University of Nebraska, University Revenue, | | | | | | | | |
| Lincoln Memorial Stadium Project, Refunding, Series 2004A | | | | | | | | |
| 5.0%, 11/01/19 | | | 2,160,000 | | | | 2,297,786 | |
| Lincoln Parking Project, Refunding, Series 2005 | | | | | | | | |
| 4.0%, 6/01/17 | | | 1,070,000 | | | | 1,136,115 | |
| 4.5%, 6/01/20 | | | 500,000 | | | | 522,605 | |
| Lincoln Student Fees and Facilities | | | | | | | | |
| 4.6%, 7/01/17 | | | 570,000 | | | | 591,255 | |
| 5.0%, 7/01/23 | | | 1,000,000 | | | | 1,053,370 | |
| Omaha Health & Recreation Project | | | | | | | | |
| 4.05%, 5/15/19 | | | 390,000 | | | | 414,274 | |
| 5.0%, 5/15/33 | | | 700,000 | | | | 701,624 | |
| Omaha Student Facilities Project | | | | | | | | |
| 4.5%, 5/15/16 | | | 565,000 | | | | 632,936 | |
| 5.0%, 5/15/27 | | | 800,000 | | | | 824,176 | |
| Wheat Belt Public Power District, Electric System Revenue, | | | | | | | | |
| Series 2009B | | | | | | | | |
| 3.2%, 9/01/16 | | | 330,000 | | | | 334,108 | |
| 3.4%, 9/01/17 | | | 415,000 | | | | 418,096 | |
| 48 Weitz Funds | The accompanying notes form an integral part of these financial statements. |
| | | Principal amount | | | Value | |
| York County, Hospital Authority #1, Revenue, Refunding, | | | | | | |
| Hearthstone Project | | | | | | |
| 2.2%, 6/01/12 | | $ | 200,000 | | | $ | 201,916 | |
| 2.7%, 6/01/13 | | | 150,000 | | | | 152,146 | |
| York County, York Public School District #12, Refunding, Series 2010 | | | | | | | | |
| 0.75%, 12/15/12 | | | 220,000 | | | | 218,513 | |
| | | | | | | | 72,670,389 | |
| North Dakota — 0.9% | | | | | | | | |
| Grand Forks, Sales Tax Revenue, Refunding, Series 2005A | | | | | | | | |
| 5.0%, 12/15/21 | | | 795,000 | | | | 818,405 | |
| Ohio — 1.2% | | | | | | | | |
| Akron, General Obligation, Series 2003 | | | | | | | | |
| 5.0%, 12/01/17 | | | 1,030,000 | | | | 1,108,960 | |
| Puerto Rico — 3.9% | | | | | | | | |
| Commonwealth, General Obligation, Refunding | | | | | | | | |
| FGIC Insured, 5.5%, 7/01/11 | | | 990,000 | | | | 1,000,850 | |
| Series A, Assured Guaranty Insured | | | | | | | | |
| 5.0%, 7/01/15 | | | 845,000 | | | | 904,429 | |
| Electric Power Authority Revenue, Series RR, FSA Insured | | | | | | | | |
| 5.0%, 7/01/20 | | | 1,000,000 | | | | 1,021,790 | |
| Municipal Finance Agency, General Obligation, 2002 Series A, | | | | | | | | |
| FSA Insured, 5.25%, 8/01/16 | | | 500,000 | | | | 510,115 | |
| | | | | | | | 3,437,184 | |
| | | Principal amount | | | Value | |
| Virginia — 1.2% | | | | | | |
| Chesterfield County, General Obligation, Refunding, Series 2005B | | | | | | |
| 5.0%, 1/01/17 | | $ | 975,000 | | | $ | 1,086,121 | |
| Wisconsin — 1.7% | | | | | | | | |
| Milwaukee County, General Obligation, Refunding, Series 2005A | | | | | | | | |
| 5.0%, 12/01/20 | | | 1,405,000 | | | | 1,496,578 | |
| Total Municipal Bonds | | | | | | | | |
| (Cost $86,145,207) | | | | | | | 87,123,405 | |
| SHORT-TERM SECURITIES — 1.7% | Shares | | Value | |
| Wells Fargo National Advantage Tax-Free Money Market Fund - | | | | | |
Institutional Class 0.09%(a) | | | | | |
| (Cost $1,515,332) | 1,515,332 | | | 1,515,332 | |
| Total Investments in Securities | | | | | |
| (Cost $87,660,539) | | | | 88,638,737 | |
| Other Assets Less Other Liabilities — 0.7% | | | | 633,764 | |
| Net Assets — 100.0% | | | $ | 89,272,501 | |
| Net Asset Value Per Share | | | $ | 10.09 | |
| # | Illiquid and/or restricted security that has been fair valued. |
| (a) | Rate presented represents the annualized 7-day yield at March 31, 2011. |
| The accompanying notes form an integral part of these financial statements. | weitzfunds.com 49 |
PORTFOLIO MANAGER’S DISCUSSION & ANALYSIS
Portfolio Manager: Thomas D. Carney
The Government Money Market Fund ended the first quarter with a 7-day effective yield of 0.02%. (An investment in the Fund is neither insured nor guaranteed by the U.S. Government. There can be no assurance that the Fund will be able to maintain a stable net asset value. Although the Fund seeks to preserve the value of your investment at $1.00 per share, it is possible to lose money by investing in the Fund.)
Investors and savers in money market funds or savings accounts received no reprieve in the first quarter from record low short-term interest rates that have persisted for over two years running. Once again, returns to savers in investment vehicles like money market funds, bank savings accounts and short-term CDs remained frustratingly close to zero. Our Fund’s 7-day effective yield declined in the first quarter to 0.02% from 0.06% at December 31.
Despite continued evidence of economic stabilization (e.g. continued job gains in each of the last six months after nearly 2 years of job losses), the Federal Open Market Committee (FOMC) of the Federal Reserve continues to keep the Fed Funds rate (the overnight lending rate between banks, which is controlled by the Federal Reserve) at “exceptionally low levels” as a means to further economic recovery. The Fed has maintained this target range for the Fed Funds rate at zero to 0.25% since December 2008.
In the minutes released by the Federal Reserve subsequent to their periodic meetings to discuss interest rate policy (twice in the first quarter), it appears the Fed is becoming incrementally more confident in the recovery and a little more concerned about inflation. Commodity prices have risen dramatically as everyone’s grocery and gas expenses can attest. At the moment it appears the Fed views commodity price inflation as “transitory” but will be monitoring inflation statistics and consumer inflation expectations over the next several months. Rising inflation data, particularly “core” inflation (exclusive of food and energy), could prompt the Fed to begin raising short-term interest rates to prevent inflation from becoming a hindrance to economic expansion.
The Fed Funds rate affects all investments within the opportunity set of our Fund. We invest in ultra-high quality, short-term investments (e.g. U.S. Treasury bills and government agency discount notes) that have a weighted average maturity of less than 60 days (down from 90 days since June 30, 2010). As a result, our yield has invariably followed the path dictated by the Federal Reserve’s monetary policy as we frequently reinvest maturing bills and notes in these short-term instruments. As of December 31, 2010, 99% of our portfolio was invested in U.S. Treasury bills. The average life of our portfolio at March 31, 2011, was approximately 53 days.
When the Fed changes from its current course and begins to raise short-term rates, our Fund will quickly benefit as we frequently reinvest maturing securities. In the meantime, we will continue to seek opportunities to add incremental return to our Fund’s yield while maintaining our focus on high credit quality.
Despite today’s low yield environment, our Fund remains a sensible option for those investors whose primary objective is the maintenance of liquidity and the preservation of capital.
| Sector Breakdown | |
| U.S. Treasury | | | 98.9 | % |
| Government Money Market Fund | | | 0.9 | |
| Treasury Money Market Fund | | | 0.1 | |
| Other Assets Less Other Liabilities | | | 0.1 | |
| | | | 100.0 | % |
50 Weitz Funds
GOVERNMENT MONEY MARKET FUND
SCHEDULE OF INVESTMENTS • MARCH 31, 2011
U.S. TREASURY — 98.9%%† | | Principal amount | | Value | |
| U.S. Treasury Bill | | | | | | | |
| 0.14% 4/07/11 | | $ | 6,000,000 | | $ | 5,999,865 | |
| 0.10% 4/21/11 | | | 25,000,000 | | | 24,998,611 | |
| 0.07% 4/28/11 | | | 10,000,000 | | | 9,999,475 | |
| 0.09% 6/23/11 | | | 18,000,000 | | | 17,996,265 | |
| 0.10% 6/30/11 | | | 22,000,000 | | | 21,994,500 | |
| Total U.S. Treasury | | | | | | 80,988,716 | |
| SHORT-TERM | | | | | |
| SECURITIES — 1.0% | | Shares | | Value | |
| Wells Fargo Advantage Government Money Market Fund - | | | | | | | |
Institutional Class 0.01%(a) | | | 779,557 | | $ | 779,557 | |
| Wells Fargo Advantage 100% Treasury Money Market Fund - | | | | | | | |
Service Class 0.01%(a) | | | 52,556 | | | 52,556 | |
| Total Short-Term Securities | | | | | | 832,113 | |
| Total Investments in Securities | | | | | | | |
| (Cost $81,820,829) | | | | | | 81,820,829 | |
| Other Assets Less Other Liabilities — 0.1% | | | | | | 90,888 | |
| Net Assets — 100.0% | | | | | $ | 81,911,717 | |
| Net Asset Value Per Share | | | | | $ | 1.00 | |
| † | Interest rates presented represent the yield to maturity at the date of purchase. |
| (a) | Rate presented represents the annualized 7-day yield at March 31, 2011. |
| The accompanying notes form an integral part of these financial statements. | weitzfunds.com 51 |
MARCH 31, 2011
(In U.S. dollars, except share data) | | Value | | Partners Value | | Partners III | | Research | | Hickory | | Balanced | | Short - Intermediate Income | | Nebraska Tax-Free Income | | Government Money Market | |
| Assets: | | | | | | | | | | | | | | | | | | | | | | | | | | | | |
| Investments in securities at value: | | | | | | | | | | | | | | | | | | | | | | | | | | | | |
| Unaffiliated issuers* | | | 954,216,284 | | | 759,914,311 | | | 471,541,270 | | | 11,246,524 | | | 325,496,573 | | | 85,457,869 | | | 1,163,725,503 | | | 88,638,737 | | | 81,820,829 | |
| Controlled affiliates* | | | — | | | — | | | 3,972,500 | | | — | | | — | | | — | | | — | | | — | | | — | |
| | | | 954,216,284 | | | 759,914,311 | | | 475,513,770 | | | 11,246,524 | | | 325,496,573 | | | 85,457,869 | | | 1,163,725,503 | | | 88,638,737 | | | 81,820,829 | |
| Accrued interest and | | | | | | | | | | | | | | | | | | | | | | | | | | | | |
| dividends receivable | | | 1,001,658 | | | 573,093 | | | 296,176 | | | 5,846 | | | 279,294 | | | 183,718 | | | 8,378,744 | | | 962,583 | | | 7 | |
| Due from broker | | | — | | | — | | | 68,341,086 | | | — | | | — | | | — | | | — | | | — | | | — | |
| Receivable for securities sold | | | 23,944,225 | | | 5,115,963 | | | 682,322 | | | — | | | 1,238,814 | | | — | | | — | | | — | | | — | |
| Receivable for fund shares sold | | | 4,655,322 | | | 1,219,053 | | | 1,047,728 | | | — | | | 181,721 | | | 14 | | | 2,866,112 | | | 40,000 | | | 115,500 | |
| Total assets | | | 983,817,489 | | | 766,822,420 | | | 545,881,082 | | | 11,252,370 | | | 327,196,402 | | | 85,641,601 | | | 1,174,970,359 | | | 89,641,320 | | | 81,936,336 | |
| Liabilities: | | | | | | | | | | | | | | | | | | | | | | | | | | | | |
| Due to adviser | | | 1,103,022 | | | 831,633 | | | 458,855 | | | 8,373 | | | 367,617 | | | 91,974 | | | 725,026 | | | 66,469 | | | 23,927 | |
Options written, at value† | | | — | | | — | | | 27,500 | | | — | | | 27,500 | | | 23,250 | | | 447,500 | | | — | | | — | |
| Payable for securities purchased | | | 9,977,988 | | | 10,884,752 | | | 18,857,476 | | | — | | | 4,105,926 | | | 370,994 | | | 8,719,086 | | | — | | | — | |
| Payable for fund shares redeemed | | | 1,451,392 | | | 508,379 | | | 140,872 | | | — | | | 67,308 | | | 17,606 | | | 1,214,790 | | | 302,350 | | | 560 | |
Securities sold short# | | | — | | | — | | | 64,954,600 | | | — | | | — | | | — | | | — | | | — | | | — | |
| Other | | | — | | | — | | | 1,544 | | | — | | | — | | | — | | | — | | | — | | | 132 | |
| Total liabilities | | | 12,532,402 | | | 12,224,764 | | | 84,440,847 | | | 8,373 | | | 4,568,351 | | | 503,824 | | | 11,106,402 | | | 368,819 | | | 24,619 | |
| Net assets applicable to | | | | | | | | | | | | | | | | | | | | | | | | | | | | |
| shares outstanding | | | 971,285,087 | | | 754,597,656 | | | 461,440,235 | | | 11,243,997 | | | 322,628,051 | | | 85,137,777 | | | 1,163,863,957 | | | 89,272,501 | | | 81,911,717 | |
| Composition of net assets: | | | | | | | | | | | | | | | | | | | | | | | | | | | | |
| Paid-in capital | | | 1,025,351,223 | | | 797,339,494 | | | 359,205,265 | | | 10,022,115 | | | 330,658,463 | | | 82,342,809 | | | 1,138,702,105 | | | 88,157,844 | | | 81,911,052 | |
| Accumulated undistributed net | | | | | | | | | | | | | | | | | | | | | | | | | | | | |
| investment income (loss) | | | 2,151,515 | | | — | | | — | | | 313 | | | — | | | 199,568 | | | 480,780 | | | 94,736 | | | — | |
| Accumulated net realized gain (loss) | | | (190,143,067 | ) | | (144,063,675 | ) | | 6,826,910 | | | 154,618 | | | (67,493,942 | ) | | (8,113,412 | ) | | (913,711 | ) | | 41,723 | | | 665 | |
| Net unrealized appreciation | | | | | | | | | | | | | | | | | | | | | | | | | | | | |
| (depreciation) of investments | | | 133,925,416 | | | 101,321,837 | | | 95,408,060 | | | 1,066,951 | | | 59,463,530 | | | 10,708,812 | | | 25,594,783 | | | 978,198 | | | — | |
| Total net assets applicable to | | | | | | | | | | | | | | | | | | | | | | | | | | | | |
| shares outstanding | | | 971,285,087 | | | 754,597,656 | | | 461,440,235 | | | 11,243,997 | | | 322,628,051 | | | 85,137,777 | | | 1,163,863,957 | | | 89,272,501 | | | 81,911,717 | |
| Total shares outstanding | | | | | | | | | | | | | | | | | | | | | | | | | | | | |
| (indefinite number of no par | | | | | | | | | | | | | | | | | | | | | | | | | | | | |
| value shares authorized) | | | 32,305,533 | | | 34,217,814 | | | 36,538,432 | | | 1,083,572 | | | 7,846,285 | | | 7,248,932 | | | 93,934,799 | | | 8,843,994 | | | 81,911,052 | |
| Net asset value, offering and | | | | | | | | | | | | | | | | | | | | | | | | | | | | |
| redemption price per share | | | | | | | | | | | | | | | | | | | | | | | | | | | | |
| of shares outstanding | | | 30.07 | | | 22.05 | | | 12.63 | | | 10.38 | | | 41.12 | | | 11.74 | | | 12.39 | | | 10.09 | | | 1.00 | |
| * Cost of investments in securities: | | | | | | | | | | | | | | | | | | | | | | | | | | | | |
| Unaffiliated issuers | | | 820,290,868 | | | 658,592,474 | | | 374,716,948 | | | 10,179,573 | | | 266,179,260 | | | 74,751,931 | | | 1,138,273,208 | | | 87,660,539 | | | 81,820,829 | |
| Controlled affiliates | | | — | | | — | | | 2,899,379 | | | — | | | — | | | — | | | — | | | — | | | — | |
| | | | 820,290,868 | | | 658,592,474 | | | 377,616,327 | | | 10,179,573 | | | 266,179,260 | | | 74,751,931 | | | 1,138,273,208 | | | 87,660,539 | | | 81,820,829 | |
† Premiums from options written | | | — | | | — | | | 173,717 | | | — | | | 173,717 | | | 26,124 | | | 589,988 | | | — | | | — | |
# Proceeds from short sales | | | — | | | — | | | 62,319,000 | | | — | | | — | | | — | | | — | | | — | | | — | |
| 52 Weitz Funds | The accompanying notes form an integral part of these financial statements. |
STATEMENTS OF OPERATIONS
YEAR ENDED MARCH 31, 2011
| (In U.S. dollars) | | Value | | Partners Value | | Partners III | | Research(a) | | Hickory | | Balanced | | Short - Intermediate Income | | Nebraska Tax-Free Income | | Government Money Market | |
| Investment income: | | | | | | | | | | | | | | | | | | | | | | | | | | | | |
| Dividends: | | | | | | | | | | | | | | | | | | | | | | | | | | | | |
| Unaffiliated issuers* | | | 12,762,501 | | | 6,028,855 | | | 2,707,992 | | | 23,329 | | | 1,661,991 | | | 775,434 | | | 839,929 | | | — | | | — | |
| Interest | | | 631,216 | | | 122,164 | | | 84,213 | | | 206 | | | 63,691 | | | 899,320 | | | 24,733,774 | | | 2,891,436 | | | 125,240 | |
| Total investment income | | | 13,393,717 | | | 6,151,019 | | | 2,792,205 | | | 23,535 | | | 1,725,682 | | | 1,674,754 | | | 25,573,703 | | | 2,891,436 | | | 125,240 | |
| Expenses: | | | | | | | | | | | | | | | | | | | | | | | | | | | | |
| Investment advisory fee | | | 9,301,659 | | | 6,484,642 | | | 3,214,012 | | | 25,802 | | | 2,596,560 | | | 632,876 | | | 3,838,730 | | | 359,554 | | | 370,229 | |
| Administrative fee | | | 1,082,823 | | | 837,316 | | | 421,661 | | | 6,478 | | | 383,194 | | | 146,423 | | | 1,424,426 | | | 163,479 | | | 164,721 | |
| Custodial fees | | | 21,612 | | | 17,348 | | | 12,766 | | | 870 | | | 13,078 | | | 5,558 | | | 17,494 | | | 3,015 | | | 4,075 | |
| Dividend expense on securities | | | | | | | | | | | | | | | | | | | | | | | | | | | | |
| sold short | | | — | | | — | | | 522,797 | | | — | | | — | | | — | | | — | | | — | | | — | |
| Interest expense | | | — | | | — | | | 477,021 | | | — | | | — | | | — | | | — | | | — | | | — | |
| Professional fees | | | 89,127 | | | 67,913 | | | 50,756 | | | 26,599 | | | 38,411 | | | 25,112 | | | 96,346 | | | 26,032 | | | 45,120 | |
| Registration fees | | | 48,411 | | | 50,191 | | | 28,174 | | | 3,426 | | | 34,708 | | | 22,273 | | | 197,492 | | | 15,403 | | | 20,613 | |
| Sub-transfer agent fees | | | 279,521 | | | 121,443 | | | 51,739 | | | 7,788 | | | 131,732 | | | 34,075 | | | 143,695 | | | 27,673 | | | 35,621 | |
| Trustees fees | | | 93,677 | | | 64,722 | | | 31,341 | | | 239 | | | 25,201 | | | 7,973 | | | 96,799 | | | 9,244 | | | 9,286 | |
| Other expenses | | | 325,372 | | | 196,938 | | | 57,174 | | | 3,583 | | | 78,704 | | | 36,284 | | | 330,669 | | | 50,468 | | | 29,084 | |
| | | | 11,242,202 | | | 7,840,513 | | | 4,867,441 | | | 74,785 | | | 3,301,588 | | | 910,574 | | | 6,145,651 | | | 654,868 | | | 678,749 | |
| Less expenses reimbursed | | | | | | | | | | | | | | | | | | | | | | | | | | | | |
| by investment adviser | | | — | | | — | | | — | | | (51,563 | ) | | — | | | — | | | — | | | — | | | (610,062 | ) |
| Net expenses | | | 11,242,202 | | | 7,840,513 | | | 4,867,441 | | | 23,222 | | | 3,301,588 | | | 910,574 | | | 6,145,651 | | | 654,868 | | | 68,687 | |
| Net investment income (loss) | | | 2,151,515 | | | (1,689,494 | ) | | (2,075,236 | ) | | 313 | | | (1,575,906 | ) | | 764,180 | | | 19,428,052 | | | 2,236,568 | | | 56,553 | |
| Realized and unrealized gain | | | | | | | | | | | | | | | | | | | | | | | | | | | | |
| (loss) on investments: | | | | | | | | | | | | | | | | | | | | | | | | | | | | |
| Net realized gain (loss): | | | | | | | | | | | | | | | | | | | | | | | | | | | | |
| Unaffiliated issuers | | | 102,983,432 | | | 64,608,327 | | | 44,524,603 | | | 175,075 | | | 33,434,855 | | | 5,592,026 | | | 4,312,840 | | | 54,886 | | | 665 | |
| Options written | | | 2,502,921 | | | 1,628,046 | | | 696,531 | | | — | | | 622,790 | | | 31,957 | | | — | | | — | | | — | |
| Securities sold short | | | — | | | — | | | 3,789,188 | | | — | | | — | | | — | | | — | | | — | | | — | |
| Net realized gain (loss) | | | 105,486,353 | | | 66,236,373 | | | 49,010,322 | | | 175,075 | | | 34,057,645 | | | 5,623,983 | | | 4,312,840 | | | 54,886 | | | 665 | |
| Net unrealized appreciation | | | | | | | | | | | | | | | | | | | | | | | | | | | | |
| (depreciation): | | | | | | | | | | | | | | | | | | | | | | | | | | | | |
| Unaffiliated issuers | | | 23,124,807 | | | 60,765,606 | | | 40,075,274 | | | 217,099 | | | 35,804,222 | | | 2,543,561 | | | 6,402,701 | | | (765,836 | ) | | — | |
| Controlled affiliates | | | — | | | — | | | 1,180,400 | | | — | | | — | | | — | | | — | | | — | | | — | |
| Options written | | | (590,464 | ) | | (107,433 | ) | | 133,082 | | | — | | | 142,470 | | | 2,874 | | | 142,488 | | | — | | | — | |
| Securities sold short | | | — | | | — | | | (12,175,584 | ) | | — | | | — | | | — | | | — | | | — | | | — | |
| Net unrealized appreciation | | | | | | | | | | | | | | | | | | | | | | | | | | | | |
| (depreciation) | | | 22,534,343 | | | 60,658,173 | | | 29,213,172 | | | 217,099 | | | 35,946,692 | | | 2,546,435 | | | 6,545,189 | | | (765,836 | ) | | — | |
| Net realized and unrealized | | | | | | | | | | | | | | | | | | | | | | | | | | | | |
| gain (loss) on investments | | | 128,020,696 | | | 126,894,546 | | | 78,223,494 | | | 392,174 | | | 70,004,337 | | | 8,170,418 | | | 10,858,029 | | | (710,950 | ) | | 665 | |
| Net increase (decrease) in | | | | | | | | | | | | | | | | | | | | | | | | | | | | |
| net assets resulting | | | | | | | | | | | | | | | | | | | | | | | | | | | | |
| from operations | | | 130,172,211 | | | 125,205,052 | | | 76,148,258 | | | 392,487 | | | 68,428,431 | | | 8,934,598 | | | 30,286,081 | | | 1,525,618 | | | 57,218 | |
| * Foreign taxes withheld | | | 1,650 | | | — | | | — | | | — | | | — | | | — | | | — | | | — | | | — | |
| (a) | Initial offering of shares on December 31, 2010 (See Note 1). |
| The accompanying notes form an integral part of these financial statements. | weitzfunds.com 53 |
STATEMENTS OF CHANGES IN NET ASSETS
(In U.S. dollars, except share data) | | Value | | Partners Value | | Partners III | | Research | |
| | | Year ended March 31, | | Year ended March 31, | | Year ended March 31, | | Three months ended March 31, | |
| | | 2011 | | 2010 | | 2011 | | 2010 | | 2011 | | 2010 | | 2011(a) | |
| Increase (decrease) in net assets: | | | | | | | | | | | | | | | | | | | | | | |
| From operations: | | | | | | | | | | | | | | | | | | | | | | |
| Net investment income (loss) | | | 2,151,515 | | | (2,691,083 | ) | | (1,689,494 | ) | | (2,851,516 | ) | | (2,075,236 | ) | | (2,151,940 | ) | | 313 | |
| Net realized gain (loss) | | | 105,486,353 | | | (130,524,291 | ) | | 66,236,373 | | | (43,975,020 | ) | | 49,010,322 | | | (6,920,327 | ) | | 175,075 | |
| Net unrealized appreciation | | | | | | | | | | | | | | | | | | | | | | |
| (depreciation) | | | 22,534,343 | | | 524,860,429 | | | 60,658,173 | | | 277,100,619 | | | 29,213,172 | | | 108,281,364 | | | 217,099 | |
| Net increase (decrease) | | | | | | | | | | | | | | | | | | | | | | |
| in net assets resulting | | | | | | | | | | | | | | | | | | | | | | |
| from operations | | | 130,172,211 | | | 391,645,055 | | | 125,205,052 | | | 230,274,083 | | | 76,148,258 | | | 99,209,097 | | | 392,487 | |
| Distributions to shareholders from: | | | | | | | | | | | | | | | | | | | | | | |
| Net investment income | | | — | | | (2,460,543 | ) | | — | | | (402,905 | ) | | — | | | — | | | — | |
| Net realized gains | | | — | | | — | | | — | | | — | | | — | | | — | | | — | |
| Total distributions | | | — | | | (2,460,543 | ) | | — | | | (402,905 | ) | | — | | | — | | | — | |
| Fund share transactions:* | | | | | | | | | | | | | | | | | | | | | | |
| Proceeds from sales | | | 55,309,056 | | | 54,261,130 | | | 194,896,173 | | | 61,041,848 | | | 148,377,615 | | | 29,270,519 | | | 2,178,973 | |
| Proceeds from shares | | | | | | | | | | | | | | | | | | | | | | |
| issued in connection | | | | | | | | | | | | | | | | | | | | | | |
with reorganization(a) | | | — | | | — | | | — | | | — | | | — | | | — | | | 8,836,618 | |
| Payments for redemptions | | | (191,772,577 | ) | | (230,303,133 | ) | | (187,610,915 | ) | | (100,223,215 | ) | | (37,878,439 | ) | | (8,596,125 | ) | | (164,081 | ) |
| Reinvestment of distributions | | | — | | | 2,340,752 | | | — | | | 346,346 | | | — | | | — | | | — | |
| Net increase (decrease) from | | | | | | | | | | | | | | | | | | | | | | |
| fund share transactions | | | (136,463,521 | ) | | (173,701,251 | ) | | 7,285,258 | | | (38,835,021 | ) | | 110,499,176 | | | 20,674,394 | | | 10,851,510 | |
| Total increase (decrease) in | | | | | | | | | | | | | | | | | | | | | | |
| net assets | | | (6,291,310 | ) | | 215,483,261 | | | 132,490,310 | | | 191,036,157 | | | 186,647,434 | | | 119,883,491 | | | 11,243,997 | |
| Net assets: | | | | | | | | | | | | | | | | | | | | | | |
| Beginning of period | | | 977,576,397 | | | 762,093,136 | | | 622,107,346 | | | 431,071,189 | | | 274,792,801 | | | 154,909,310 | | | — | |
| End of period | | | 971,285,087 | | | 977,576,397 | | | 754,597,656 | | | 622,107,346 | | | 461,440,235 | | | 274,792,801 | | | 11,243,997 | |
| Undistributed net investment | | | | | | | | | | | | | | | | | | | | | | |
| income (loss) | | | 2,151,515 | | | — | | | — | | | (27,820 | ) | | — | | | (11,440 | ) | | 313 | |
| *Transactions in fund shares: | | | | | | | | | | | | | | | | | | | | | | |
| Shares issued | | | 2,057,373 | | | 2,500,036 | | | 10,134,988 | | | 3,959,200 | | | 13,093,455 | | | 3,355,546 | | | 216,038 | |
| Shares issued in connection | | | | | | | | | | | | | | | | | | | | | | |
with reorganization(a) | | | — | | | — | | | — | | | — | | | — | | | — | | | 883,662 | |
| Shares redeemed | | | (7,147,413 | ) | | (10,307,156 | ) | | (10,029,129 | ) | | (6,495,709 | ) | | (3,629,494 | ) | | (1,029,772 | ) | | (16,128 | ) |
| Reinvested dividends | | | — | | | 119,365 | | | — | | | 25,392 | | | — | | | — | | | — | |
| Net increase (decrease) in | | | | | | | | | | | | | | | | | | | | | | |
| shares outstanding | | | (5,090,040 | ) | | (7,687,755 | ) | | 105,859 | | | (2,511,117 | ) | | 9,463,961 | | | 2,325,774 | | | 1,083,572 | |
| (a) | Initial offering of shares on December 31, 2010 (See Note 1). |
| 54 Weitz Funds | The accompanying notes form an integral part of these financial statements. |
| Hickory | | | Balanced | | | Short-Intermediate Income | | | Nebraska Tax-Free Income | | | Government Money Market | |
| Year ended March 31, | | | Year ended March 31, | | | Year ended March 31, | | | Year ended March 31, | | | Year ended March 31, | |
| 2011 | | | 2010 | | | 2011 | | | 2010 | | | 2011 | | | 2010 | | | 2011 | | | 2010 | | | 2011 | | | 2010 | |
| | | | | | | | | | | | | | | | | | | | | | | | | | | | | |
| (1,575,906) | | | (1,367,478) | | | 764,180 | | | 754,691 | | | 19,428,052 | | | 12,795,145 | | | 2,236,568 | | | 2,088,429 | | | 56,553 | | | 93,304 | |
| 34,057,645 | | | (18,045,167) | | | 5,623,983 | | | (1,904,511) | | | 4,312,840 | | | 2,164,813 | | | 54,886 | | | 51,876 | | | 665 | | | 3,686 | |
| | | | | | | | | | | | | | | | | | | | | | | | | | | | | |
| 35,946,692 | | | 99,341,106 | | | 2,546,435 | | | 21,847,362 | | | 6,545,189 | | | 18,323,578 | | | (765,836) | | | 1,243,536 | | | — | | | — | |
| | | | | | | | | | | | | | | | | | | | | | | | | | | | | |
| 68,428,431 | | | 79,928,461 | | | 8,934,598 | | | 20,697,542 | | | 30,286,081 | | | 33,283,536 | | | 1,525,618 | | | 3,383,841 | | | 57,218 | | | 96,990 | |
| | | | | | | | | | | | | | | | | | | | | | | | | | | | | |
| — | | | — | | | (707,093) | | | (802,894) | | | (23,440,657) | | | (13,111,833) | | | (2,184,463) | | | (2,078,079) | | | (56,553) | | | (93,304) | |
| — | | | — | | | — | | | — | | | — | | | — | | | — | | | — | | | (3,686) | | | (74,672) | |
| — | | | — | | | (707,093) | | | (802,894) | | | (23,440,657) | | | (13,111,833) | | | (2,184,463) | | | (2,078,079) | | | (60,239) | | | (167,976) | |
| | | | | | | | | | | | | | | | | | | | | | | | | | | | | |
| 132,202,914 | | | 15,094,154 | | | 8,484,280 | | | 12,582,722 | | | 851,847,983 | | | 590,503,439 | | | 22,173,798 | | | 25,025,504 | | | 89,161,977 | | | 58,555,267 | |
| | | | | | | | | | | | | | | | | | | | | | | | | | | | | |
| — | | | — | | | — | | | — | | | — | | | — | | | — | | | — | | | — | | | — | |
| (84,119,185) | | | (22,719,496) | | | (10,232,676) | | | (7,437,919) | | | (389,407,165) | | | (132,616,357) | | | (15,753,573) | | | (6,717,487) | | | (90,665,139) | | | (82,660,884) | |
| — | | | — | | | 689,245 | | | 780,979 | | | 22,552,885 | | | 11,949,596 | | | 1,597,594 | | | 1,712,320 | | | 54,978 | | | 155,428 | |
| | | | | | | | | | | | | | | | | | | | | | | | | | | | | |
| 48,083,729 | | | (7,625,342) | | | (1,059,151) | | | 5,925,782 | | | 484,993,703 | | | 469,836,678 | | | 8,017,819 | | | 20,020,337 | | | (1,448,184) | | | (23,950,189) | |
| | | | | | | | | | | | | | | | | | | | | | | | | | | | | |
| 116,512,160 | | | 72,303,119 | | | 7,168,354 | | | 25,820,430 | | | 491,839,127 | | | 490,008,381 | | | 7,358,974 | | | 21,326,099 | | | (1,451,205) | | | (24,021,175) | |
| | | | | | | | | | | | | | | | | | | | | | | | | | | | | |
| 206,115,891 | | | 133,812,772 | | | 77,969,423 | | | 52,148,993 | | | 672,024,830 | | | 182,016,449 | | | 81,913,527 | | | 60,587,428 | | | 83,362,922 | | | 107,384,097 | |
| 322,628,051 | | | 206,115,891 | | | 85,137,777 | | | 77,969,423 | | | 1,163,863,957 | | | 672,024,830 | | | 89,272,501 | | | 81,913,527 | | | 81,911,717 | | | 83,362,922 | |
| | | | | | | | | | | | | | | | | | | | | | | | | | | | | |
| — | | | (11,372) | | | 199,568 | | | 132,638 | | | 480,780 | | | 479,688 | | | 94,736 | | | 42,631 | | | — | | | — | |
| | | | | | | | | | | | | | | | | | | | | | | | | | | | | |
| 3,834,573 | | | 561,795 | | | 773,461 | | | 1,319,377 | | | 68,608,240 | | | 48,857,849 | | | 2,157,493 | | | 2,466,888 | | | 89,161,977 | | | 58,555,267 | |
| — | | | — | | | — | | | — | | | — | | | — | | | — | | | — | | | — | | | — | |
| (2,476,376) | | | (859,995) | | | (949,145) | | | (798,960) | | | (31,346,052) | | | (10,936,010) | | | (1,542,633) | | | (660,037) | | | (90,665,139) | | | (82,660,884) | |
| — | | | — | | | 61,976 | | | 80,836 | | | 1,820,686 | | | 989,375 | | | 156,516 | | | 169,215 | | | 54,978 | | | 155,428 | |
| | | | | | | | | | | | | | | | | | | | | | | | | | | | | |
| 1,358,197 | | | (298,200) | | | (113,708) | | | 601,253 | | | 39,082,874 | | | 38,911,214 | | | 771,376 | | | 1,976,066 | | | (1,448,184) | | | (23,950,189) | |
| The accompanying notes form an integral part of these financial statements. | weitzfunds.com 55 |
STATEMENT OF CASH FLOWS
PARTNERS III OPPORTUNITY FUND
| | Year Ended March 31, 2011 | |
| | Increase (decrease) in cash: | | | | |
| | Cash flows from operating activities: | | | | |
| | Net increase in net assets from operations | | $ | 76,148,258 | |
| | Adjustments to reconcile net increase in net assets from operations | | | | |
| | to net cash used in operating activities: | | | | |
| | Purchases of investment securities | | | (208,482,784 | ) |
| | Proceeds from sale of investment securities | | | 173,273,494 | |
| | Proceeds from securities sold short | | | 22,134,987 | |
| | Short positions covered | | | (13,713,783 | ) |
| | Purchase of short-term investment securities, net | | | (76,161,115 | ) |
| | Decrease in accrued interest and dividends receivable | | | 62,007 | |
| | Increase in receivable for securities sold | | | (333,522 | ) |
| | Decrease in receivable for fund shares sold | | | 1,250,464 | |
| | Decrease in other liabilities | | | (425 | ) |
| | Increase in payable for securities purchased | | | 13,604,431 | |
| | Increase in payable for fund shares redeemed | | | 120,872 | |
| | Increase in due to adviser | | | 161,898 | |
| | Net unrealized appreciation on investments, options and short sales | | | (29,213,172 | ) |
| | Net realized gain on investments, options and short sales | | | (49,010,322 | ) |
| | Net cash used in operating activities | | | (90,158,712 | ) |
| | Cash flows from financing activities: | | | | |
| | Proceeds from sales of fund shares | | | 148,377,615 | |
| | Payments for redemptions of fund shares | | | (37,878,439 | ) |
| | Increase in due from broker | | | (20,340,464 | ) |
| | Net cash provided by financing activities | | | 90,158,712 | |
| | Net increase (decrease) in cash | | | — | |
| | Cash: | | | | |
| | Balance, beginning of period | | | — | |
| | Balance, end of period | | $ | — | |
| | Supplemental disclosure of cash flow information: | | | | |
| | Cash payments for interest | | $ | 477,446 | |
| | | | | | |
| 56 Weitz Funds | The accompanying notes form an integral part of these financial statements. |
FINANCIAL HIGHLIGHTS
The following financial information provides selected data for a share outstanding throughout the periods indicated.
| | | | Year ended March 31, | |
| | Value Fund | | 2011 | | 2010 | | 2009 | | 2008 | | 2007 | |
| | Net asset value, beginning of period | | | $ | 26.14 | | | $ | 16.90 | | | $ | 27.74 | | | $ | 40.09 | | | $ | 36.33 | |
| | Income (loss) from investment operations: | | | | | | | | | | | | | | | | | | | | | |
| | Net investment income (loss) | | | | 0.07 | | | | (0.07 | ) | | | 0.07 | | | | 0.28 | | | | 0.28 | |
| | Net gain (loss) on securities (realized and unrealized) | | | | 3.86 | | | | 9.37 | | | | (10.72 | ) | | | (7.94 | ) | | | 6.31 | |
| | Total from investment operations | | | | 3.93 | | | | 9.30 | | | | (10.65 | ) | | | (7.66 | ) | | | 6.59 | |
| | Less distributions: | | | | | | | | | | | | | | | | | | | | | |
| | Dividends from net investment income | | | | — | | | | (0.06 | ) | | | (0.19 | ) | | | (0.28 | ) | | | (0.28 | ) |
| | Distributions from realized gains | | | | — | | | | — | | | | — | | | | (4.41 | ) | | | (2.55 | ) |
| | Total distributions | | | | — | | | | (0.06 | ) | | | (0.19 | ) | | | (4.69 | ) | | | (2.83 | ) |
| | Net asset value, end of period | | | $ | 30.07 | | | $ | 26.14 | | | $ | 16.90 | | | $ | 27.74 | | | $ | 40.09 | |
| | Total return | | | | 15.0 | % | | | 55.1 | % | | | (38.6% | ) | | | (21.2% | ) | | | 18.3 | % |
| | Ratios/supplemental data: | | | | | | | | | | | | | | | | | | | | | |
| | Net assets, end of period ($000) | | | | 971,285 | | | | 977,576 | | | | 762,093 | | | | 1,767,828 | | | | 3,121,782 | |
| | Ratio of expenses to average net assets | | | | 1.21 | % | | | 1.22 | % | | | 1.20 | % | | | 1.15 | % | | | 1.13 | % |
| | Ratio of net investment income (loss) to average net assets | | | | 0.23 | % | | | (0.29% | ) | | | 0.20 | % | | | 0.69 | % | | | 0.71 | % |
| | Portfolio turnover rate | | | | 46 | % | | | 19 | % | | | 19 | % | | | 22 | % | | | 29 | % |
| | | | | | | | | | | | | | | | | | | | | | | |
| | | | Year ended March 31, | |
| | Partners Value Fund | | 2011 | | 2010 | | 2009 | | 2008 | | 2007 | |
| | Net asset value, beginning of period | | | $ | 18.24 | | | $ | 11.77 | | | $ | 17.33 | | | $ | 24.53 | | | $ | 23.52 | |
| | Income (loss) from investment operations: | | | | | | | | | | | | | | | | | | | | | |
| | Net investment income (loss) | | | | (0.05 | ) | | | (0.08 | ) | | | 0.01 | | | | 0.07 | | | | 0.10 | |
| | Net gain (loss) on securities (realized and unrealized) | | | | 3.86 | | | | 6.56 | | | | (5.55 | ) | | | (4.67 | ) | | | 4.24 | |
| | Total from investment operations | | | | 3.81 | | | | 6.48 | | | | (5.54 | ) | | | (4.60 | ) | | | 4.34 | |
| | Less distributions: | | | | | | | | | | | | | | | | | | | | | |
| | Dividends from net investment income | | | | — | | | | (0.01 | ) | | | (0.02 | ) | | | (0.10 | ) | | | (0.14 | ) |
| | Distributions from realized gains | | | | — | | | | — | | | | — | | | | (2.50 | ) | | | (3.19 | ) |
| | Total distributions | | | | — | | | | (0.01 | ) | | | (0.02 | ) | | | (2.60 | ) | | | (3.33 | ) |
| | Net asset value, end of period | | | $ | 22.05 | | | $ | 18.24 | | | $ | 11.77 | | | $ | 17.33 | | | $ | 24.53 | |
| | Total return | | | | 20.9 | % | | | 55.1 | % | | | (32.0% | ) | | | (20.7% | ) | | | 19.1 | |
| | Ratios/supplemental data: | | | | | | | | | | | | | | | | | | | | | |
| | Net assets, end of period ($000) | | | | 754,598 | | | | 622,107 | | | | 431,071 | | | | 1,220,445 | | | | 2,023,837 | |
| | Ratio of expenses to average net assets | | | | 1.21 | % | | | 1.21 | % | | | 1.19 | % | | | 1.15 | % | | | 1.14 | % |
| | Ratio of net investment income (loss) to average net assets | | | | (0.26% | ) | | | (0.52% | ) | | | 0.05 | % | | | 0.29 | % | | | 0.39 | % |
| | Portfolio turnover rate | | | | 42 | % | | | 30 | % | | | 29 | % | | | 24 | % | | | 31 | % |
| | | | | | | | | | | | | | | | | | | | | | | |
| The accompanying notes form an integral part of these financial statements. | weitzfunds.com 57 |
FINANCIAL HIGHLIGHTS
The following financial information provides selected data for a share outstanding throughout the periods indicated.
| | | | Year ended March 31, | |
| | Partners III Opportunity Fund | | 2011 | | 2010 | | 2009 | | 2008 | | 2007 | |
| | Net asset value, beginning of period | | | $ | 10.15 | | | $ | 6.26 | | | $ | 8.55 | | | $ | 11.28 | | | $ | 10.25 | |
| | Income (loss) from investment operations: | | | | | | | | | | | | | | | | | | | | | |
| | Net investment income (loss) | | | | (0.06 | ) | | | (0.08 | ) | | | (0.04 | ) | | | 0.09 | | | | 0.09 | |
| | Net gain (loss) on securities (realized and unrealized) | | | | 2.54 | | | | 3.97 | | | | (2.24 | ) | | | (2.28 | ) | | | 1.58 | |
| | Total from investment operations | | | | 2.48 | | | | 3.89 | | | | (2.28 | ) | | | (2.19 | ) | | | 1.67 | |
| | Less distributions: | | | | | | | | | | | | | | | | | | | | | |
| | Dividends from net investment income | | | | — | | | | — | | | | (0.01 | ) | | | (0.10 | ) | | | (0.09 | ) |
| | Distributions from realized gains | | | | — | | | | — | | | | — | | | | (0.44 | ) | | | (0.55 | ) |
| | Total distributions | | | | — | | | | — | | | | (0.01 | ) | | | (0.54 | ) | | | (0.64 | ) |
| | Net asset value, end of period | | | $ | 12.63 | | | $ | 10.15 | | | $ | 6.26 | | | $ | 8.55 | | | $ | 11.28 | |
| | Total return | | | | 24.4 | % | | | 62.1 | % | | | (26.7% | ) | | | (20.1% | ) | | | 16.4 | % |
| | Ratios/supplemental data: | | | | | | | | | | | | | | | | | | | | | |
| | Net assets, end of period ($000) | | | | 461,440 | | | | 274,793 | | | | 154,909 | | | | 259,079 | | | | 323,238 | |
| | Ratio of expenses to average net assets(a) | | | | 1.51 | % | | | 1.79 | % | | | 1.81 | % | | | 1.54 | % | | | 1.57 | % |
| | Ratio of net investment income (loss) to average net assets | | | | (0.64% | ) | | | (1.02% | ) | | | (0.43% | ) | | | 0.86 | % | | | 0.83 | % |
| | Portfolio turnover rate | | | | 64 | % | | | 54 | % | | | 58 | % | | | 51 | % | | | 41 | % |
| | | | | | | | | | | | | | | | | | | | | | | |
| | Research Fund | | | Three months ended March 31, 2011(b) | | |
| | | | | | | |
| | Net asset value, beginning of period | | | $ | 10.00 | | |
| | Income (loss) from investment operations: | | | | | | |
| | Net investment income | | | | — | # | |
| | Net gain on securities (realized and unrealized) | | | | 0.38 | | |
| | Total from investment operations | | | | 0.38 | | |
| | Less distributions: | | | | | | |
| | Dividends from net investment income | | | | — | | |
| | Distributions from realized gains | | | | — | | |
| | Total distributions | | | | — | | |
| | Net asset value, end of period | | | $ | 10.38 | | |
| | Total return | | | | 3.8 | %† | |
| | Ratios/supplemental data: | | | | | | |
| | Net assets, end of period ($000) | | | | 11,244 | | |
| | Ratio of net expenses to average net assets(c) | | | | 0.90 | %* | |
| | Ratio of net investment income to average net assets | | | | 0.01 | %* | |
| | Portfolio turnover rate | | | | 12 | %† | |
| | | | | | | | |
| * | Annualized |
| † | Not Annualized |
| # | Amount less than $0.01 |
| (a) | Included in the expense ratio is 0.15%, 0.26%, 0.12%, 0.07% and 0.14% related to interest expense and 0.16%, 0.30%, 0.47%, 0.29% and 0.22% related to dividend expense on securities sold short for the periods ended March 31, 2011, 2010, 2009, 2008 and 2007, respectively. |
| (b) | Initial offering of shares on December 31, 2010 (See Note 1). |
| (c) | Absent expenses assumed by the Adviser, the annualized expense ratio would have been 2.89% for the period ended March 31, 2011. |
| 58 Weitz Funds | The accompanying notes form an integral part of these financial statements. |
The following financial information provides selected data for a share outstanding throughout the periods indicated.
| | | | Year ended March 31, | |
| | Hickory Fund | | 2011 | | 2010 | | 2009 | | 2008 | | 2007 | |
| | Net asset value, beginning of period | | | $ | 31.77 | | | $ | 19.72 | | | $ | 30.53 | | | $ | 39.69 | | | $ | 34.21 | |
| | Income (loss) from investment operations: | | | | | | | | | | | | | | | | | | | | | |
| | Net investment income (loss) | | | | (0.20 | ) | | | (0.21 | ) | | | (0.04 | ) | | | 0.30 | | | | 0.27 | |
| | Net gain (loss) on securities (realized and unrealized) | | | | 9.55 | | | | 12.26 | | | | (10.74 | ) | | | (9.11 | ) | | | 5.42 | |
| | Total from investment operations | | | | 9.35 | | | | 12.05 | | | | (10.78 | ) | | | (8.81 | ) | | | 5.69 | |
| | Less distributions: | | | | | | | | | | | | | | | | | | | | | |
| | Dividends from net investment income | | | | — | | | | — | | | | (0.03 | ) | | | (0.35 | ) | | | (0.21 | ) |
| | Distributions from realized gains | | | | — | | | | — | | | | — | | | | — | | | | — | |
| | Total distributions | | | | — | | | | — | | | | (0.03 | ) | | | (0.35 | ) | | | (0.21 | ) |
| | Net asset value, end of period | | | $ | 41.12 | | | $ | 31.77 | | | $ | 19.72 | | | $ | 30.53 | | | $ | 39.69 | |
| | Total return | | | | 29.4 | % | | | 61.1 | % | | | (35.3% | ) | | | (22.3% | ) | | | 16.6 | % |
| | Ratios/supplemental data: | | | | | | | | | | | | | | | | | | | | | |
| | Net assets, end of period ($000) | | | | 322,628 | | | | 206,116 | | | | 133,813 | | | | 256,669 | | | | 386,062 | |
| | Ratio of expenses to average net assets | | | | 1.27 | % | | | 1.29 | % | | | 1.28 | % | | | 1.21 | % | | | 1.20 | % |
| | Ratio of net investment income (loss) to average net assets | | | | (0.61% | ) | | | (0.79% | ) | | | (0.16% | ) | | | 0.77 | % | | | 0.74 | % |
| | Portfolio turnover rate | | | | 67 | % | | | 61 | % | | | 28 | % | | | 31 | % | | | 42 | % |
| | | | | | | | | | | | | | | | | | | | | | | |
| | | | Year ended March 31, | |
| | Balanced Fund | | 2011 | | 2010 | | 2009 | | 2008 | | 2007 | |
| | Net asset value, beginning of period | | | $ | 10.59 | | | $ | 7.71 | | | $ | 10.05 | | | $ | 12.20 | | | $ | 11.30 | |
| | Income (loss) from investment operations: | | | | | | | | | | | | | | | | | | | | | |
| | Net investment income | | | | 0.11 | | | | 0.11 | | | | 0.13 | | | | 0.23 | | | | 0.16 | |
| | Net gain (loss) on securities (realized and unrealized) | | | | 1.14 | | | | 2.89 | | | | (2.33 | ) | | | (1.65 | ) | | | 1.15 | |
| | Total from investment operations | | | | 1.25 | | | | 3.00 | | | | (2.20 | ) | | | (1.42 | ) | | | 1.31 | |
| | Less distributions: | | | | | | | | | | | | | | | | | | | | | |
| | Dividends from net investment income | | | | (0.10 | ) | | | (0.12 | ) | | | (0.14 | ) | | | (0.24 | ) | | | (0.15 | ) |
| | Distributions from realized gains | | | | — | | | | — | | | | — | | | | (0.49 | ) | | | (0.26 | ) |
| | Total distributions | | | | (0.10 | ) | | | (0.12 | ) | | | (0.14 | ) | | | (0.73 | ) | | | (0.41 | ) |
| | Net asset value, end of period | | | $ | 11.74 | | | $ | 10.59 | | | $ | 7.71 | | | $ | 10.05 | | | $ | 12.20 | |
| | Total return | | | | 11.8 | % | | | 39.0 | % | | | (21.9% | ) | | | (12.3% | ) | | | 11.8 | % |
| | Ratios/supplemental data: | | | | | | | | | | | | | | | | | | | | | |
| | Net assets, end of period ($000) | | | | 85,138 | | | | 77,969 | | | | 52,149 | | | | 76,199 | | | | 87,962 | |
| | Ratio of expenses to average net assets | | | | 1.15 | % | | | 1.17 | % | | | 1.17 | % | | | 1.12 | % | | | 1.13 | % |
| | Ratio of net investment income to average net assets | | | | 0.97 | % | | | 1.14 | % | | | 1.37 | % | | | 1.97 | % | | | 1.53 | % |
| | Portfolio turnover rate | | | | 47 | % | | | 45 | % | | | 61 | % | | | 44 | % | | | 33 | % |
| | | | | | | | | | | | | | | | | | | | | | | |
| The accompanying notes form an integral part of these financial statements. | weitzfunds.com 59 |
FINANCIAL HIGHLIGHTS
The following financial information provides selected data for a share outstanding throughout the periods indicated.
| | | | Year ended March 31, | |
| | Short-Intermediate Income Fund | | 2011 | | 2010 | | 2009 | | 2008 | | 2007 | |
| | Net asset value, beginning of period | | | $ | 12.25 | | | $ | 11.42 | | | $ | 11.74 | | | $ | 11.42 | | | $ | 11.26 | |
| | Income (loss) from investment operations: | | | | | | | | | | | | | | | | | | | | | |
| | Net investment income | | | | 0.24 | | | | 0.35 | | | | 0.43 | | | | 0.46 | | | | 0.47 | |
| | Net gain (loss) on securities (realized and unrealized) | | | | 0.19 | | | | 0.84 | | | | (0.20 | ) | | | 0.32 | | | | 0.16 | |
| | Total from investment operations | | | | 0.43 | | | | 1.19 | | | | 0.23 | | | | 0.78 | | | | 0.63 | |
| | Less distributions: | | | | | | | | | | | | | | | | | | | | | |
| | Dividends from net investment income | | | | (0.29 | ) | | | (0.36 | ) | | | (0.45 | ) | | | (0.46 | ) | | | (0.47 | ) |
| | Distributions from realized gains | | | | — | | | | — | | | | (0.10 | ) | | | — | | | | — | |
| | Total distributions | | | | (0.29 | ) | | | (0.36 | ) | | | (0.55 | ) | | | (0.46 | ) | | | (0.47 | ) |
| | Net asset value, end of period | | | $ | 12.39 | | | $ | 12.25 | | | $ | 11.42 | | | $ | 11.74 | | | $ | 11.42 | |
| | Total return | | | | 3.5 | % | | | 10.5 | % | | | 2.1 | % | | | 7.0 | % | | | 5.7 | % |
| | Ratios/supplemental data: | | | | | | | | | | | | | | | | | | | | | |
| | Net assets, end of period ($000) | | | | 1,163,864 | | | | 672,025 | | | | 182,016 | | | | 127,102 | | | | 121,293 | |
| | Ratio of expenses to average net assets | | | | 0.64 | % | | | 0.62 | % | | | 0.69 | % | | | 0.70 | % | | | 0.71 | % |
| | Ratio of net investment income to average net assets | | | | 2.02 | % | | | 3.17 | % | | | 4.00 | % | | | 3.94 | % | | | 3.90 | % |
| | Portfolio turnover rate | | | | 38 | % | | | 27 | % | | | 25 | % | | | 32 | % | | | 7 | % |
| | | | | | | | | | | | | | | | | | | | | | | |
| | | | Year ended March 31, | | Three months ended |
| | Nebraska Tax-Free Income Fund | | 2011 | | 2010 | | 2009 | | 2008 | | March 31, 2007(a) |
| | Net asset value, beginning of period | | | $ | 10.15 | | | $ | 9.94 | | | $ | 9.95 | | | $ | 10.01 | | | $ | 10.00 | |
| | Income (loss) from investment operations: | | | | | | | | | | | | | | | | | | | | | |
| | Net investment income | | | | 0.26 | | | | 0.29 | | | | 0.35 | | | | 0.36 | | | | 0.09 | |
| | Net gain (loss) on securities (realized and unrealized) | | | | (0.07 | ) | | | 0.21 | | | | — | # | | | (0.06 | ) | | | — | # |
| | Total from investment operations | | | | 0.19 | | | | 0.50 | | | | 0.35 | | | | 0.30 | | | | 0.09 | |
| | Less distributions: | | | | | | | | | | | | | | | | | | | | | |
| | Dividends from net investment income | | | | (0.25 | ) | | | (0.29 | ) | | | (0.36 | ) | | | (0.36 | ) | | | (0.08 | ) |
| | Distributions from realized gains | | | | — | | | | — | | | | — | | | | — | | | | — | |
| | Total distributions | | | | (0.25 | ) | | | (0.29 | ) | | | (0.36 | ) | | | (0.36 | ) | | | (0.08 | ) |
| | Net asset value, end of period | | | $ | 10.09 | | | $ | 10.15 | | | $ | 9.94 | | | $ | 9.95 | | | $ | 10.01 | |
| | Total return | | | | 1.9 | % | | | 5.1 | % | | | 3.6 | % | | | 3.0 | % | | | 0.9 | %† |
| | Ratios/supplemental data: | | | | | | | | | | | | | | | | | | | | | |
| | Net assets, end of period ($000) | | | | 89,273 | | | | 81,914 | | | | 60,587 | | | | 55,685 | | | | 45,460 | |
| | Ratio of net expenses to average net assets(b) | | | | 0.73 | % | | | 0.75 | % | | | 0.75 | % | | | 0.75 | % | | | 0.75 | %* |
| | Ratio of net investment income to average net assets | | | | 2.49 | % | | | 2.93 | % | | | 3.56 | % | | | 3.69 | % | | | 3.74 | %* |
| | Portfolio turnover rate | | | | 10 | % | | | 13 | % | | | 17 | % | | | 8 | % | | | 2 | %† |
| | | | | | | | | | | | | | | | | | | | | | | |
| * | Annualized |
| † | Not Annualized |
| # | Amount less than $0.01 |
| (a) | Initial offering of shares on December 29, 2006. |
| (b) | Absent expenses assumed by the Adviser, the expense ratio would have been 0.76%, 0.78%, 0.80% and 1.02% for the periods ended March 31, 2010, 2009, 2008 and 2007, respectively. |
| 60 Weitz Funds | The accompanying notes form an integral part of these financial statements. |
The following financial information provides selected data for a share outstanding throughout the periods indicated.
| | | | Year ended March 31, | |
| | Government Money Market Fund | | 2011 | | 2010 | | 2009 | | 2008 | | 2007 | |
| | Net asset value, beginning of period | | | $ | 1.00 | | | $ | 1.00 | | | $ | 1.00 | | | $ | 1.00 | | | $ | 1.00 | |
| | Income (loss) from investment operations: | | | | | | | | | | | | | | | | | | | | | |
| | Net investment income | | | | 0.001 | | | | 0.002 | | | | 0.013 | | | | 0.042 | | | | 0.047 | |
| | Net realized gain on securities | | | | — | # | | | — | # | | | — | # | | | — | | | | — | |
| | Total from investment operations | | | | 0.001 | | | | 0.002 | | | | 0.013 | | | | 0.042 | | | | 0.047 | |
| | Less distributions: | | | | | | | | | | | | | | | | | | | | | |
| | Dividends from net investment income | | | | (0.001 | ) | | | (0.001 | ) | | | (0.013 | ) | | | (0.042 | ) | | | (0.047 | ) |
| | Distributions from realized gains | | | | — | # | | | (0.001 | ) | | | — | | | | — | | | | — | |
| | Total distributions | | | | (0.001 | ) | | | (0.002 | ) | | | (0.013 | ) | | | (0.042 | ) | | | (0.047 | ) |
| | Net asset value, end of period | | | $ | 1.00 | | | $ | 1.00 | | | $ | 1.00 | | | $ | 1.00 | | | $ | 1.00 | |
| | Total return | | | | 0.1 | % | | | 0.2 | % | | | 1.4 | % | | | 4.4 | % | | | 4.8 | % |
| | Ratios/supplemental data: | | | | | | | | | | | | | | | | | | | | | |
| | Net assets, end of period ($000) | | | | 81,912 | | | | 83,363 | | | | 107,384 | | | | 102,246 | | | | 79,066 | |
| | Ratio of net expenses to average net assets(a) | | | | 0.07 | % | | | 0.08 | % | | | 0.10 | % | | | 0.10 | % | | | 0.22 | % |
| | Ratio of net investment income to average net assets | | | | 0.06 | % | | | 0.11 | % | | | 1.31 | % | | | 4.23 | % | | | 4.74 | % |
| | | | | | | | | | | | | | | | | | | | | | | |
| # | Amount less than $0.001 |
| (a) | Absent expenses assumed by the Adviser, the expense ratio would have been 0.73%, 0.76%, 0.75%, 0.71% and 0.78% for the periods ended March 31, 2011, 2010, 2009, 2008 and 2007, respectively. |
| The accompanying notes form an integral part of these financial statements. | weitzfunds.com 61 |
MARCH 31, 2011
(1) Organization
The Weitz Funds (the “Trust”) is registered under the Investment Company Act of 1940 as an open-end management investment company issuing shares in series, each series representing a distinct portfolio with its own investment objectives and policies. At March 31, 2011, the Trust had nine series in operation: Value Fund, Partners Value Fund, Partners III Opportunity Fund, Research Fund, Hickory Fund, Balanced Fund, Short-Intermediate Income Fund, Nebraska Tax-Free Income Fund and Government Money Market Fund (individually, a “Fund”, collectively, the “Funds”).
The Research Fund was originally organized in April 2005 as a Delaware limited partnership (the “Partnership”). Effective as of the close of business on December 31, 2010, the Partnership was reorganized into a series of the Trust through a tax-free exchange of 883,662 shares of the Fund (valued at $10.00 per share) in exchange for the net assets of the Partnership. At the time of the exchange, the Partnership had net assets of $8,836,618 including net unrealized appreciation of $849,852.
The investment objective of the Value, Partners Value, Partners III Opportunity, Research and Hickory Funds (the “Weitz Equity Funds”) is capital appreciation. Each of the Weitz Equity Funds invests principally in common stocks and a variety of securities convertible into common stocks such as rights, warrants, convertible preferred stock and convertible bonds.
The investment objectives of the Balanced Fund are regular current income, capital preservation and long-term capital appreciation. The Fund invests principally in a portfolio of U.S. equity and fixed income securities.
The investment objective of the Short-Intermediate Income Fund is high current income consistent with the preservation of capital. Under normal market conditions, the Fund will invest at least 80% of its net assets, plus the amount of any borrowings for investment purposes, in fixed income securities such as U.S. Government and agency securities, corporate debt securities and mortgage-backed securities.
The investment objective of the Nebraska Tax-Free Income Fund is to provide a high level of current income that is exempt from both federal and Nebraska personal income taxes. The Fund under normal circumstances, invests at least 80% of its net assets, plus the amount of any borrowings for investment purposes, in municipal securities that generate income exempt from Nebraska state income tax and from federal income tax or in open or closed-end mutual funds which in turn invest in such assets.
The investment objective of the Government Money Market Fund is current income consistent with the preservation of capital and maintenance of liquidity. The Fund invests substantially all of its assets in debt obligations issued or guaranteed by the U.S. Government, its agencies and instrumentalities and repurchase agreements on such securities with remaining maturities not exceeding thirteen months. The Fund limits its average portfolio maturity to sixty days or less.
(2) Significant Accounting Policies
The following accounting policies are in accordance with accounting principles generally accepted in the United States.
(a) Valuation of Investments
Weitz Equity, Balanced, Short-Intermediate Income and Nebraska Tax-Free Income Funds
Investments are carried at value determined using the following valuation methods:
| | |
| • | Securities traded on a national or regional securities exchange are valued at the last sales price; if there were no sales on that day, securities are valued at the mean between the latest available and representative bid and ask prices; securities listed on the NASDAQ exchange are valued using the NASDAQ Official Closing Price (“NOCP”). Generally, the NOCP will be the last sales price unless the reported trade for the security is outside the range of the bid/ask price. In such cases, the NOCP will be normalized to the nearer of the bid or ask price. |
| | |
| • | Short sales traded on a national or regional securities exchange are valued at the last sales price; if there were no sales on that day, short sales are valued at the mean between the latest available and representative bid and ask prices. |
| | |
| • | Securities not listed on an exchange are valued at the mean between the latest available and representative bid and ask prices. |
62 Weitz Funds
| | |
| • | The value of certain debt securities for which market quotations are not readily available may be based upon current market prices of securities which are comparable in coupon, rating and maturity or an appropriate matrix utilizing similar factors. |
| | |
| • | The current market value of a traded option is the last sales price at which such option is traded, or, in the absence of a sale on or about the close of the exchange, the mean of the closing bid and ask prices. |
| | |
| • | The value of securities for which market quotations are not readily available or are deemed unreliable, including restricted and not readily marketable securities, is determined in good faith in accordance with procedures approved by the Trust’s Board of Trustees. Such valuation procedures and methods for valuing securities may include, but are not limited to: multiple of earnings, multiple of book value, discount from value of a similar freely-traded security, purchase price, private transaction in the security or related securities, the nature and duration of restrictions on disposition of the security and a combination of these and other factors. |
Government Money Market Fund
Investment securities are carried at amortized cost, which approximates market value. Pursuant to Rule 2a-7 of the Investment Company Act of 1940, amortized cost, as defined, is a method of valuing securities at acquisition cost, adjusted for amortization of premium or accretion of discount.
(b) Option Transactions
The Funds, except for the Government Money Market Fund, may purchase put or call options. When a Fund purchases an option, an amount equal to the premium paid is recorded as an asset and is subsequently marked-to-market daily. Premiums paid for purchasing options that expire unexercised are recognized on the expiration date as realized losses. If an option is exercised, the premium paid is subtracted from the proceeds of the sale or added to the cost of the purchase to determine whether a Fund has realized a gain or loss on the related investment transaction. When a Fund enters into a closing transaction, a Fund will realize a gain or loss depending upon whether the amount from the closing transaction is greater or less than the premium paid.
The Funds, except for the Government Money Market Fund, may write put or call options. When a Fund writes an option, an amount equal to the premium received is recorded as a liability and is subsequently marked-to-market daily. Premiums received for writing options that expire unexercised are recognized on the expiration date as realized gains. If an option is exercised, the premium received is subtracted from the cost of purchase or added to the proceeds of the sale to determine whether a Fund has realized a gain or loss on the related investment transaction. When a Fund enters into a closing transaction, a Fund will realize a gain or loss depending upon whether the amount from the closing transaction is greater or less than the premium received.
The Funds attempt to limit market risk and enhance their income by writing (selling) covered call options. The risk in writing a covered call option is that a Fund gives up the opportunity of profit if the market price of the financial instrument increases. A Fund also has the additional risk of not being able to enter into a closing transaction if a liquid secondary market does not exist. The risk in writing a put option is that a Fund is obligated to purchase the financial instrument underlying the option at prices which may be significantly different than the current market price.
(c) Securities Sold Short
The Funds, except for the Government Money Market Fund, periodically engage in selling securities short, which obligates a Fund to replace a security borrowed by purchasing the same security at the current market value. A Fund would incur a loss if the price of the security increases between the date of the short sale and the date on which the Fund replaces the borrowed security. A Fund would realize a gain if the price of the security declines between those dates.
(d) Federal Income Taxes
It is the policy of each Fund to comply with all sections of the Internal Revenue Code applicable to regulated investment companies and to distribute all of its taxable income to shareholders; therefore, no provision for income or excise taxes is required.
Net investment income and net realized gains may differ for financial statement and tax purposes. The character of distributions made during the year from net investment income or net realized gains may differ from their ultimate characterization for Federal income tax purposes. Also, due to the timing of dividend distributions, the fiscal year in which amounts are distributed may differ from the year that the income or realized gains were recorded by the Funds.
The Funds have reviewed their tax positions taken on federal income tax returns, for each of the three open tax years and as of March 31, 2011 and have determined that no provisions for income taxes are required in the Funds’ financial statements.
weitzfunds.com 63
The following permanent differences between net asset components for financial reporting and tax purposes were reclassified at the end of the fiscal year:
| | | Partners Value | | Hickory | | Partners III | | Balanced | | | Short- Intermediate Income | | |
| | | | | | | | | | | | | | |
| | Paid-in capital | | $ | (1,717,314 | ) | | $ | (1,587,278 | ) | | $ | (2,086,676 | ) | | $ | — | | | $ | — | | |
| | Accumulated undistributed | | | | | | | | | | | | | | | | | | | | | |
| | net investment income | | | 1,717,314 | | | | 1,587,278 | | | | 2,086,676 | | | | 9,843 | | | | 4,013,697 | | |
| | Accumulated net realized gain (loss) | | | — | | | | — | | | | — | | | | (9,843 | ) | | | (4,013,697 | ) | |
The differences are due to net operating losses and principal paydown adjustments. These reclassifications have no impact on the net asset value of the Funds.
(e) Security Transactions
Security transactions are accounted for on the date the securities are purchased or sold (trade date). Realized gains or losses are determined by specifically identifying the security sold.
Income dividends less foreign tax withholding (if any), dividends on short positions and distributions to shareholders are recorded on the ex-dividend date. Interest, including amortization of discount or premium, is accrued as earned.
(f) Dividend Policy
The Funds declare and distribute income dividends and capital gains distributions as may be required to qualify as a regulated investment company under the Internal Revenue Code.
Generally, the Short-Intermediate Income and Nebraska Tax-Free Income Funds pay income dividends on a quarterly basis. The Government Money Market Fund declares dividends daily and pays dividends monthly. All dividends and distributions are reinvested automatically, unless the shareholder elects otherwise.
(g) Use of Estimates
The preparation of financial statements in conformity with accounting principles generally accepted in the United States requires management to make estimates and assumptions that affect the reported amounts of assets and liabilities and disclosure of contingent assets and liabilities at the date of the financial statements and the reported amounts of increase and decrease in net assets from operations during the period. Actual results could differ from those estimates.
(3) Related Party Transactions
Each Fund has retained Wallace R. Weitz & Company (the “Adviser”) as its investment adviser. In addition, the Trust has an agreement with Weitz Securities, Inc. (the “Distributor”), a company under common control with the Adviser, to act as distributor for shares of the Trust. The Distributor receives no compensation for the distribution of shares of the Trust. Certain officers of the Trust are also officers and directors of the Adviser and the Distributor.
Under the terms of a management and investment advisory agreement, the Adviser is paid a monthly fee. The annual investment advisory fee schedule for each of the Weitz Equity Funds is as follows:
Average Daily Net Assets Break Points
| Greater Than | | Less Than or Equal To | | Rate | |
| $ | 0 | | | $ 2,500,000,000 | | | 1.00 | % | |
| | 2,500,000,000 | | | 5,000,000,000 | | | 0.90 | % | |
| | 5,000,000,000 | | | | | | 0.80 | % | |
The Balanced Fund pays the Adviser, on a monthly basis, an annual advisory fee equal to 0.80% of the Fund’s average daily net assets.
The Short-Intermediate Income, Nebraska Tax-Free Income and Government Money Market Funds each pay the Adviser, on a monthly basis, an annual advisory fee equal to 0.40% of the respective Fund’s average daily net assets.
Under the terms of an administration agreement, certain services are provided by the Adviser including the transfer of shares, disbursement of dividends, fund accounting and related administrative services of the Trust for which the Adviser is paid a monthly fee. The annual administrative fee for each Fund is a combination of the following:
(a) an annual fee based upon the following average daily net assets in each Fund:
Average Daily Net Assets Break Points
| | Less Than | | | | |
| Greater Than | or Equal to | Rate | | Minimum | |
| $ | 0 | | $ | 25,000,000 | | 0.25 | % | | $ 25,000 | | |
| | 25,000,000 | | | 100,000,000 | | 0.15 | % | | | | |
| | 100,000,000 | | | 300,000,000 | | 0.10 | % | | | | |
| | 300,000,000 | | | | | 0.05 | % | | | | |
and;
(b) an annual fee equal to 0.10% of the average monthly net assets of each Fund’s shares held through a financial intermediary that receives compensation from the Adviser in the form of either asset-based fees, account-based fees or similar remuneration.
The Adviser has voluntarily agreed to reimburse the Weitz Equity (excluding the Partners III Fund), Balanced, Short-Intermediate Income and Nebraska Tax-Free Income Funds or to pay directly a portion of the respective Fund’s expenses to the extent that total expenses, excluding taxes, interest and brokerage commissions exceed 1.50%, 1.25%, 0.75% and
64 Weitz Funds
0.75%, of the respective Fund’s average daily net assets. The expenses incurred by the Weitz Equity, Balanced, Short-Intermediate Income and Nebraska Tax-Free Income Funds did not exceed the percentage limitation during the year ended March 31, 2011. Through July 31, 2012, the Adviser has contractually agreed to reimburse the Research Fund or to pay directly a portion of the Fund’s expenses to the extent that total expenses, excluding taxes, interest and brokerage commissions exceed 0.90% of the Fund’s average daily net assets. Through July 31, 2011, the Adviser has contractually agreed to reimburse the Government Money Market Fund or to pay directly a portion of the Fund’s expenses to the extent that total expenses, excluding taxes, interest and brokerage commissions exceed 0.20% of the Fund’s average daily net assets.
In addition, for the year ended March 31, 2011, the Adviser voluntarily reimbursed expenses to limit the expenses of the Government Money Market Fund to 0.07% of the Fund’s average daily net assets. The expenses reimbursed by the Adviser for the Research and Government Money Market Funds for the year ended March 31, 2011 were $51,563 and $616,062, respectively.
As of March 31, 2011, the controlling shareholder of the Adviser held approximately 79% of the Research Fund, 41% of the Nebraska Tax-Free Income Fund, 38% of the Balanced Fund, 37% of the Partners III Fund, 27% of the Government Money Market Fund and 15% of the Hickory Fund.
(4) Distributions to Shareholders and Distributable Earnings
The tax character of distributions paid by the Funds are summarized as follows:
| | | Value | | Partners Value | |
| | | Year ended March 31, | | Year ended March 31, | |
| | Distributions paid from: | 2011 | | 2010 | | 2011 | | 2010 | |
| | Ordinary income | | $ | — | | | $ | 2,460,543 | | | $ | — | | | $ | 402,905 | |
| | | Balanced | | Short-Intermediate Income | |
| | | Year ended March 31, | | Year ended March 31, | |
| | Distributions paid from: | 2011 | | 2010 | | 2011 | | 2010 | |
| | Ordinary income | | $ | 707,093 | | | $ | 802,894 | | | $ | 23,440,657 | | | $ | 13,111,833 | |
| | | Nebraska Tax-Free Income | | Government Money Market | |
| | | Year ended March 31, | | Year ended March 31, | |
| | Distributions paid from: | 2011 | | 2010 | | 2011 | | 2010 | |
| | Ordinary income | | $ | 11,402 | | | $ | 11,287 | | | $ | 60,239 | | | $ | 167,976 | |
| | Tax exempt income | | | 2,173,061 | | | | 2,066,792 | | | | — | | | | — | |
| | Total distributions | | $ | 2,184,463 | | | $ | 2,078,079 | | | $ | 60,239 | | | $ | 167,976 | |
As of March 31, 2011, the components of distributable earnings on a tax basis were as follows:
| | | | Value | | | Partners Value | | | Partners III | | | Research | | | Hickory | |
| | Undistributed ordinary income | | $ | 2,151,515 | | | $ | — | | | $ | — | | | $ | 127,714 | | | $ | — | |
| | Undistributed long-term gains | | | — | | | | — | | | | 9,315,966 | | | | 47,674 | | | | — | |
| | Capital loss carryforwards | | | (188,810,161 | ) | | | (141,256,467 | ) | | | — | | | | — | | | | (65,613,359 | ) |
| | Net unrealized appreciation (depreciation) | | | 132,592,510 | | | | 98,514,629 | | | | 92,919,004 | | | | 1,046,494 | | | | 57,582,947 | |
| | | | $ | (54,066,136 | ) | | $ | (42,741,838 | ) | | $ | 102,234,970 | | | $ | 1,221,882 | | | $ | (8,030,412 | ) |
weitzfunds.com 65
| | | | Balanced | | | Short-Intermediate Income | | | Nebraska Tax-Free Income | | | Government Money Market | |
| | Undistributed ordinary income | | $ | 199,568 | | | $ | 480,780 | | | $ | — | | | $ | 797 | |
| | Undistributed tax exempt income | | | — | | | | — | | | | 94,736 | | | | — | |
| | Undistributed long-term gains | | | — | | | | — | | | | 41,723 | | | | — | |
| | Capital loss carryforwards | | | (8,112,278 | ) | | | (414,158 | ) | | | — | | | | — | |
| | Post October capital loss deferral | | | — | | | | (499,553 | ) | | | — | | | | — | |
| | Net unrealized appreciation (depreciation) | | | 10,707,678 | | | | 25,594,783 | | | | 978,198 | | | | — | |
| | | | $ | 2,794,968 | | | $ | 25,161,852 | | | $ | 1,114,657 | | | $ | 797 | |
Capital loss carryforwards represent tax basis capital losses which may be carried over to offset future realized capital gains, if any. To the extent that carryforwards are used, no capital gains distributions will be made. During the fiscal year, the Funds utilized capital loss carryforwards to offset realized capital gains. The expiration and utilization of the carryforwards are as follows:
| | | | Value | | | Partners Value | | | Partners III | | | Hickory | | | Balanced | | | Short-Intermediate Income | | | Nebraska Tax-Free Income | |
| | March 31, 2012 | | $ | — | | | $ | — | | | $ | — | | | $ | (553,829 | ) | | $ | — | | | $ | — | | | $ | — | |
| | March 31, 2017 | | | (12,822,006 | ) | | | (25,203,806 | ) | | | — | | | | (37,395,758 | ) | | | (85,423 | ) | | | (414,158 | ) | | | — | |
| | March 31, 2018 | | | (175,988,155 | ) | | | (116,052,661 | ) | | | — | | | | (27,663,772 | ) | | | (8,026,855 | ) | | | — | | | | — | |
| | Total capital loss | | | | | | | | | | | | | | | | | | | | | | | | | | | | |
| | carryforwards | | $ | (188,810,161 | ) | | $ | (141,256,467 | ) | | $ | — | | | $ | (65,613,359 | ) | | $ | (8,112,278 | ) | | $ | (414,158 | ) | | $ | — | |
| | Capital loss | | | | | | | | | | | | | | | | | | | | | | | | | | | | |
| | carryforwards | | | | | | | | | | | | | | | | | | | | | | | | | | | | |
| | utilized | | $ | 100,787,392 | | | $ | 66,261,335 | | | $ | 39,540,056 | | | $ | 34,057,180 | | | $ | 5,549,752 | | | $ | 798,696 | | | $ | 13,163 | |
The Short-Intermediate Fund elected to defer realized capital losses arising after October 1, 2010. Such losses are treated for tax purposes as arising on April 1, 2011.
(5) Securities Transactions
Purchases and proceeds from maturities or sales of investment securities of the Funds, other than short-term securities, are summarized as follows:
| | | | Value | | | Partners Value | | | Partners III | | | Research | | | Hickory | | | Balanced | | | Short-Intermediate Income | | | Nebraska Tax-Free Income | |
| | Purchases | | $ | 363,276,647 | | | $ | 229,244,184 | | | $ | 221,323,568 | | | $ | 2,643,200 | | | $ | 136,889,573 | | | $ | 28,653,243 | | | $ | 673,823,740 | | | $ | 19,630,347 | |
| | Proceeds | | | 443,029,652 | | | | 273,858,270 | | | | 193,770,278 | | | | 976,292 | | | | 138,076,190 | | | | 31,736,986 | | | | 290,555,825 | | | | 8,181,235 | |
The cost of investments is the same for financial reporting and Federal income tax purposes for the Short-Intermediate Income, Nebraska Tax-Free Income and Government Money Market Funds. The cost of investments for Federal income tax purposes for the Value, Partners Value, Partners III, Research, Hickory and Balanced Funds is $821,623,774, $661,399,681, $380,089,230, $10,200,030, $268,059,842 and $74,753,066, respectively.
At March 31, 2011, the aggregate gross unrealized appreciation and depreciation of investments, based on cost for Federal income tax purposes, are summarized as follows:
| | | | Value | | | Partners Value | | | Partners III | | | Research | | | Hickory | | | Balanced | | | Short-Intermediate Income | | | Nebraska Tax-Free Income | |
| | Appreciation | | $ | 160,429,604 | | | $ | 121,179,920 | | | $ | 100,765,251 | | | $ | 1,313,197 | | | $ | 66,105,128 | | | $ | 11,680,389 | | | $ | 27,318,615 | | | $ | 1,558,735 | |
| | Depreciation | | | (27,837,094 | ) | | | (22,665,290 | ) | | | (5,340,711 | ) | | | (266,703 | ) | | | (8,668,397 | ) | | | (975,586 | ) | | | (1,866,320 | ) | | | (580,537 | ) |
| | Net | | $ | 132,592,510 | | | $ | 98,514,630 | | | $ | 95,424,540 | | | $ | 1,046,494 | | | $ | 57,436,731 | | | $ | 10,704,803 | | | $ | 25,452,295 | | | $ | 978,198 | |
66 Weitz Funds
(a) Illiquid and Restricted Securities
The Funds own certain securities which have a limited trading market and/or certain restrictions on trading and therefore may be illiquid and/or restricted. Such securities have been valued at fair value in accordance with the procedures described in Note (2)(a). Because of the inherent uncertainty of valuation, these values may differ from the values that would have been used had a ready market for these securities existed and these differences could be material. Illiquid and/or restricted securities owned at March 31, 2011, include the following:
| | | | Acquisition
Date | | | Value | | | Partners Value | | | Partners III | | | Hickory | | | Nebraska Tax-Free Income | |
| | Adelphia Recovery Trust, Series ACC-7 | | 7/25/02 | | | $ | 494,900 | | | $ | 300,300 | | | $ | — | | | $ | — | | | $ | — | |
| | CIBL, Inc. | | 9/09/96 | | | | — | | | | — | | | | — | | | | 94,596 | | | | — | |
| | Continental Resources | | 1/28/87 | | | | — | | | | — | | | | 41,437 | | | | — | | | | — | |
| | ICTC Group, Inc. – CL A | | 9/09/96 | | | | — | | | | — | | | | — | | | | 297,285 | | | | — | |
| | Intelligent Systems Corp. | | 12/03/91 | | | | — | | | | — | | | | 2,899,379 | | | | — | | | | — | |
| | LICT Corp. | | 9/09/96 | | | | — | | | | — | | | | — | | | | 2,228,509 | | | | — | |
| | Nebraska Investment Finance Authority, | | | | | | | | | | | | | | | | | | | | | | | |
| | Clean Water State Revolving Bond, | | | | | | | | | | | | | | | | | | | | | | | |
| | Series 2010, 0.7%, 6/15/11 | | 8/18/10 | | | | — | | | | — | | | | — | | | | — | | | | 2,085,000 | |
| | Total cost of illiquid and/or | | | | | | | | | | | | | | | | | | | | | | | |
| | restricted securities | | | | | | $ | 494,900 | | | $ | 300,300 | | | $ | 2,940,816 | | | $ | 2,620,390 | | | $ | 2,085,000 | |
| | Value at 3/31/11 | | | | | | $ | — | | | $ | — | | | $ | 4,304,000 | | | $ | 2,903,545 | | | $ | 2,085,000 | |
| | Percent of net assets at 3/31/11 | | | | | | | 0.0 | % | | | 0.0 | % | | | 0.9 | % | | | 0.9 | % | | | 2.3 | % |
(b) Options Written
Transactions relating to options written for the year ended March 31, 2011 are summarized as follows:
| | | | Value | | | Partners Value | |
| | | | Number of Contracts | | | Premiums | | | Number of Contracts | | | Premiums | |
| | Options outstanding, beginning of period | | | 7,700 | | | $ | 2,845,164 | | | | 2,250 | | | $ | 944,933 | |
| | Options written | | | — | | | | — | | | | 1,750 | | | | 713,613 | |
| | Options exercised | | | (1,500 | ) | | | (281,243 | ) | | | — | | | | — | |
| | Options expired | | | (4,200 | ) | | | (1,767,791 | ) | | | (3,000 | ) | | | (1,260,481 | ) |
| | Options closed | | | (2,000 | ) | | | (796,130 | ) | | | (1,000 | ) | | | (398,065 | ) |
| | Options outstanding, end of period | | | — | | | $ | — | | | | — | | | $ | — | |
| | | Partners III | | Hickory | |
| | | Number of Contracts | | Premiums | | Number of Contracts | | Premiums | |
| | Options outstanding, beginning of period | | | 1,200 | | | $ | 528,135 | | | | 500 | | | $ | 218,747 | |
| | Options written | | | 3,400 | | | | 1,025,104 | | | | 1,900 | | | | 577,760 | |
| | Options expired | | | (1,000 | ) | | | (437,493 | ) | | | (1,400 | ) | | | (622,790 | ) |
| | Options closed | | | (2,600 | ) | | | (942,029 | ) | | | — | | | | — | |
| | Options outstanding, end of period | | | 1,000 | | | $ | 173,717 | | | | 1,000 | | | $ | 173,717 | |
| | | | Balanced | | | Short-Intermediate Income | |
| | | | Number of Contracts | | | Premiums | | | Number of Contracts | | | Premiums | |
| | Options outstanding, beginning of period | | | — | | | $ | — | | | | — | | | $ | — | |
| | Options written | | | 215 | | | | 90,606 | | | | 5,000 | | | | 589,988 | |
| | Options exercised | | | (90 | ) | | | (32,525 | ) | | | — | | | | — | |
| | Options expired | | | (75 | ) | | | (31,957 | ) | | | — | | | | — | |
| | Options outstanding, end of period | | | 50 | | | $ | 26,124 | | | | 5,000 | | | $ | 589,988 | |
weitzfunds.com 67
The locations in the Statements of Assets and Liabilities of the Funds’ derivative positions, none of which are designated as hedging instruments are as follows:
| | | | | | | | | | | Fair Value | | | | | |
| | Fund | | Type of Derivative | | | Location | | | | Asset Derivatives | | | | Liability Derivatives | | | | Gross Notional Amount Outstanding March. 31, 2011 | |
| | Partners III | | Equity call options written | | | Options written, at value | | | $ | — | | | $ | (27,500) | | | $ | 1,750,000 | |
| | Hickory | | Equity call options written | | | Options written, at value | | | | — | | | | (27,500) | | | | 1,750,000 | |
| | Balanced | | Equity call options written | | | Options written, at value | | | | — | | | | (23,250) | | | | 600,000 | |
| | Short- | | | | | | | | | | | | | | | | | | |
| | Intermediate | | | | | | | | | | | | | | | | | | |
| | Income | | Equity call options written | | | Options written, at value | | | | — | | | | (447,500) | | | | 12,750,000 | |
The gross notional amount of options outstanding (both purchased and written) is indicative of the volume of each Fund’s derivative activity for the year ended March 31, 2011.
Transactions in derivative instruments during the year ended March 31, 2011 by the Funds are recorded in the following locations in the Statements of Operations:
| | Fund | | Type of Derivative | | | Location | | | | Realized Gain (Loss) | | | Location | | | | Change in Unrealized Gain (Loss) | |
| | Value | | Equity call options written | | | Net realized gain (loss) - | | | $ | 2,502,921 | | | Net unrealized appreciation | | | $ | (590,464) | |
| | | | | | | options written | | | | | | | (depreciation) - options written | | | | | |
| | Partners Value | | Equity call options written | | | Net realized gain (loss) - | | | | 1,628,046 | | | Net unrealized appreciation | | | | (107,433) | |
| | | | | | | options written | | | | | | | (depreciation) - options written | | | | | |
| | Partners III | | Equity put options purchased | | | Net realized gain (loss) - | | | | 47,047 | | | Net unrealized appreciation | | | | 40,450 | |
| | | | | | | unaffiliated issuers | | | | | | | (depreciation) - unaffiliated issuers | | | | | |
| | | | Equity call options written | | | Net realized gain (loss) - | | | | 696,531 | | | Net unrealized appreciation | | | | 133,082 | |
| | | | | | | options written | | | | | | | (depreciation) - options written | | | | | |
| | Hickory | | Equity call options written | | | Net realized gain (loss) - | | | | 622,790 | | | Net unrealized appreciation | | | | 142,470 | |
| | | | | | | options written | | | | | | | (depreciation) - options written | | | | | |
| | Balanced | | Equity call options written | | | Net realized gain (loss) - | | | | 31,957 | | | Net unrealized appreciation | | | | 2,874 | |
| | | | | | | options written | | | | | | | (depreciation) - options written | | | | | |
| | Short- | | Equity call options written | | | Net realized gain (loss) - | | | | — | | | Net unrealized appreciation | | | | 142,488 | |
| | Intermediate Income | | | | | options written | | | | | | | (depreciation) - options written | | | | | |
(6) Affiliated Issuers
Affiliated issuers, as defined under the Investment Company Act of 1940, are those in which a Fund’s holdings of an issuer represent 5% or more of the outstanding voting securities of the issuer. A summary of each Fund’s holdings in the securities of such issuers is set forth below:
| | | | Number of Shares Held March 31, 2010 | | | Gross Additions | | | Gross Reductions | | | Number of Shares Held March. 31, 2011 | | | Value March 31, 2011 | | | Dividend Income | | | Realized Gains/(Losses) | |
| | Partners III: | | | | | | | | | | | | | | | | | | | | | | | | | | | | |
| | Intelligent Systems | | | | | | | | | | | | | | | | | | | | | | | | | | | | |
| | Corp.† | | | 2,270,000 | | | | — | | | | — | | | | 2,270,000 | | | $ | 3,972,500 | | | $ | — | | | $ | — | |
† Controlled affiliate in which the Fund owns 25% or more of the outstanding voting securities.
68 Weitz Funds
(7) Contingencies
Each Fund indemnifies the Trust’s officers and trustees for certain liabilities that might arise from their performance of their duties to each of the Funds. Additionally, in the normal course of business the Funds enter into contracts that contain a variety of representations and warranties and which provide general indemnifications. The Funds’ maximum exposure under these arrangements is unknown, as this would involve future claims that may be made against the Funds that have not yet occurred. However, based on experience, the Funds expect the risk of loss to be remote.
(8) Financial Instruments With Off-Balance Sheet Risks
Option contracts written and securities sold short result in off-balance sheet risk as the Fund’s ultimate obligation to satisfy the terms of the contract or the sale of securities sold short may exceed the amount recognized in the Statements of Assets and Liabilities.
The Funds are required to maintain collateral in a segregated account to provide adequate margin as determined by the broker.
(9) Margin Borrowing Agreement
The Partners III Fund has a margin account with its prime broker, Merrill Lynch, under which the Partners III Fund may borrow against the value of its securities, subject to regulatory limitations. Interest accrues at the federal funds rate plus 0.625% (0.755% at March 31, 2011). Interest is accrued daily and paid monthly. The Partners III Fund held a cash balance of $68,341,086 with the broker at March 31, 2011.
The Partners III Fund is exposed to credit risk from its prime broker who effects transactions and extends credit pursuant to a prime brokerage agreement. The Adviser attempts to minimize the credit risk by monitoring credit exposure and the credit worthiness of the prime broker.
(10) Concentration of Credit Risk
Approximately 81% of the Nebraska Tax-Free Income Fund’s net assets are in obligations of political subdivisions of the State of Nebraska which are subject to the credit risk associated with the non-performance of such issuers.
(11) Fair Value Measurements
Various inputs are used in determining the value of the Fund’s investments. These inputs are used in determining the value of the Funds’ investments and are summarized in the following fair value hierarchy:
| | |
| • | Level 1 – quoted prices in active markets for identical securities |
| | |
| • | Level 2 – other significant observable inputs (including quoted prices for similar securities) |
| | |
| • | Level 3 – significant unobservable inputs (including the Funds’ own assumptions in determining the fair value of investments) |
The inputs or methodology used for valuing securities are not an indication of the risk associated with investing in those securities.
A description of the valuation techniques applied to the company’s major categories of assets and liabilities measured at fair value on a recurring basis follows.
| | |
| • | Equity securities (common and preferred stock). Securities traded on a national securities exchange (or reported on the NASDAQ national market) are stated at the last reported sales price on the day of valuation. To the extent these securities are actively traded and valuation adjustments are not applied, they are categorized in Level 1 of the fair value hierarchy. Preferred stock and other equities traded on inactive markets or valued by reference to similar instruments are categorized in Level 2. |
| | |
| • | Corporate bonds. The fair value of corporate bonds is estimated using various techniques, which may consider recently executed transactions in securities of the issuer or comparable issuers, market price quotations (where observable), bond spreads and fundamental data relating to the issuer. Although most corporate bonds are categorized in Level 2 of the fair value hierarchy, in instances where lower relative weight is placed on transaction prices, quotations, or similar observable inputs, they are categorized in Level 3. |
| | |
| • | Asset backed securities. The fair value of asset backed securities is estimated based on models that consider the estimated cash flows of each tranche of the entity, establishes a benchmark yield and develops an estimated tranche specific spread to the benchmark yield based on the unique attributes of the tranche. To the extent the inputs are observable and timely, the values would be categorized in Level 2 of the fair value hierarchy; otherwise they would be categorized as Level 3. |
| | |
| • | U.S. Government securities. U.S. Government securities are normally valued using a model that incorporates market observable data such as reported sales of similar securities, broker quotes, yields, bids, offers and reference data. Certain securities are valued principally using dealer quotations. U.S. Government securities are categorized in Level 1 or Level 2 of the fair value hierarchy depending on the inputs used and market activity levels for specific securities. |
| | |
| • | U.S. agency securities. U.S. agency securities are comprised of two main categories consisting of agency issued debt and mortgage pass-throughs. Agency issued debt securities are generally valued in a manner similar to U.S. Government securities. Mortgage pass- |
weitzfunds.com 69
| | throughs include to-be-announced (TBA) securities and mortgage pass-through certificates. TBA securities and mortgage pass-throughs are generally valued using dealer quotations. Depending on market activity levels and whether quotations or other data are used, these securities are typically categorized in Level 1 or Level 2 of the fair value hierarchy. |
| | |
| • | Restricted and/or illiquid securities. Restricted and/or illiquid securities for which quotations are not readily available are valued in accordance with procedures approved by the Trust’s Board of Trustees. Restricted securities issued by publicly traded companies are generally valued at a discount to similar publicly traded securities. Restricted or illiquid securities issued by nonpublic entities may be valued by reference to comparable public entities or fundamental data relating to the issuer or both. Depending on the relative significance of valuation inputs, these instruments may be classified in either Level 2 or Level 3 of the fair value hierarchy. |
| | |
| • | Derivative instruments. Listed derivatives, such as the Funds’ equity option contracts, that are valued based on closing prices from the exchange or the mean of the closing bid and ask prices are generally categorized in Level 2 of the fair value hierarchy. |
The following is a summary of the inputs used as of March 31, 2011, in valuing the Funds’ assets and liabilities carried at fair value:
| | Value |
| | | | Level 1 | | | Level 2 | | | Level 3 | | | Total | |
| | Assets: | | | | | | | | | | | | |
| | Investments in Securities: | | | | | | | | | | | | |
| | Common Stocks: | | | | | | | | | | | | |
| | Information Technology | | $ | 203,129,180 | | | $ | — | | | $ | — | | | $ | 203,129,180 | |
| | Consumer Discretionary | | | 151,943,000 | | | | — | | | | — | | | | 151,943,000 | |
| | Financials | | | 112,679,807 | | | | — | | | | — | | | | 112,679,807 | |
| | Industrials | | | 88,818,600 | | | | — | | | | — | | | | 88,818,600 | |
| | Materials | | | 76,199,400 | | | | — | | | | — | | | | 76,199,400 | |
| | Consumer Staples | | | 75,219,800 | | | | — | | | | — | | | | 75,219,800 | |
| | Energy | | | 57,232,000 | | | | — | | | | — | | | | 57,232,000 | |
| | Health Care | | | 55,924,550 | | | | — | | | | — | | | | 55,924,550 | |
| | Short-Term Securities | | | 133,069,947 | | | | — | | | | — | | | | 133,069,947 | |
| | Total Investments in Securities | | $ | 954,216,284 | | | $ | — | | | $ | — | | | $ | 954,216,284 | |
| | Partners Value |
| | | | Level 1 | | | Level 2 | | | Level 3 | | | Total | |
| | Assets: | | | | | | | | | | | | |
| | Investments in Securities: | | | | | | | | | | | | |
| | Common Stocks: | | | | | | | | | | | | |
| | Consumer Discretionary | | $ | 156,407,728 | | | $ | — | | | $ | — | | | $ | 156,407,728 | |
| | Information Technology | | | 136,708,527 | | | | — | | | | — | | | | 136,708,527 | |
| | Financials | | | 103,350,000 | | | | — | | | | — | | | | 103,350,000 | |
| | Energy | | | 63,791,937 | | | | — | | | | — | | | | 63,791,937 | |
| | Health Care | | | 54,758,903 | | | | — | | | | — | | | | 54,758,903 | |
| | Materials | | | 49,473,271 | | | | — | | | | — | | | | 49,473,271 | |
| | Industrials | | | 16,341,050 | | | | — | | | | — | | | | 16,341,050 | |
| | Consumer Staples | | | 7,722,000 | | | | — | | | | — | | | | 7,722,000 | |
| | Short-Term Securities | | | 171,360,895 | | | | — | | | | — | | | | 171,360,895 | |
| | Total Investments in Securities | | $ | 759,914,311 | | | $ | — | | | $ | — | | | $ | 759,914,311 | |
70 Weitz Funds
| | Partners III |
| | | | Level 1 | | | Level 2 | | | Level 3 | | | Total | |
| | Assets: | | | | | | | | | | | | |
| | Investments in Securities: | | | | | | | | | | | | |
| | Common Stocks: | | | | | | | | | | | | |
| | Consumer Discretionary | | $ | 107,927,046 | | | $ | — | | | $ | — | | | $ | 107,927,046 | |
| | Information Technology | | | 86,228,055 | | | | — | | | | — | | | | 86,228,055 | |
| | Financials | | | 56,407,500 | | | | — | | | | — | | | | 56,407,500 | |
| | Energy | | | 46,167,400 | | | | — | | | | — | | | | 46,167,400 | |
| | Health Care | | | 34,126,300 | | | | — | | | | — | | | | 34,126,300 | |
| | Industrials | | | 25,603,800 | | | | 3,972,500 | | | | — | | | | 29,576,300 | |
| | Materials | | | 17,732,800 | | | | — | | | | — | | | | 17,732,800 | |
| | Consumer Staples | | | 2,134,800 | | | | — | | | | — | | | | 2,134,800 | |
| | Telecommunication Services | | | — | | | | — | | | | 331,500 | | | | 331,500 | |
| | Short-Term Securities | | | 94,882,069 | | | | — | | | | — | | | | 94,882,069 | |
| | Total Investments in Securities | | $ | 471,209,770 | | | $ | 3,972,500 | | | $ | 331,500 | | | $ | 475,513,770 | |
| | Liabilities: | | | | | | | | | | | | | | | | |
| | Options Written | | $ | — | | | $ | (27,500 | ) | | $ | — | | | $ | (27,500 | ) |
| | Securities Sold Short | | | (64,954,600 | ) | | | — | | | | — | | | | (64,954,600 | ) |
| | Research |
| | | | Level 1 | | | Level 2 | | | Level 3 | | | Total | |
| | Assets: | | | | | | | | | | | | |
| | Investments in Securities: | | | | | | | | | | | | |
| | Common Stocks: | | | | | | | | | | | | |
| | Consumer Discretionary | | $ | 3,297,012 | | | $ | — | | | $ | — | | | $ | 3,297,012 | |
| | Information Technology | | | 2,593,672 | | | | — | | | | — | | | | 2,593,672 | |
| | Energy | | | 1,137,702 | | | | — | | | | — | | | | 1,137,702 | |
| | Financials | | | 867,692 | | | | — | | | | — | | | | 867,692 | |
| | Health Care | | | 710,690 | | | | — | | | | — | | | | 710,690 | |
| | Materials | | | 507,236 | | | | — | | | | — | | | | 507,236 | |
| | Consumer Staples | | | 161,647 | | | | — | | | | — | | | | 161,647 | |
| | Industrials | | | 118,992 | | | | — | | | | — | | | | 118,992 | |
| | Short-Term Securities | | | 1,851,881 | | | | — | | | | — | | | | 1,851,881 | |
| | Total Investments in Securities | | $ | 11,246,524 | | | $ | — | | | $ | — | | | $ | 11,246,524 | |
| | Hickory |
| | | | Level 1 | | | Level 2 | | | Level 3 | | | Total | |
| | Assets: | | | | | | | | | | | | |
| | Investments in Securities: | | | | | | | | | | | | |
| | Common Stocks: | | | | | | | | | | | | |
| | Consumer Discretionary | | $ | 91,125,035 | | | $ | — | | | $ | 473,355 | | | $ | 91,598,390 | |
| | Financials | | | 36,439,315 | | | | — | | | | — | | | | 36,439,315 | |
| | Health Care | | | 28,128,300 | | | | — | | | | — | | | | 28,128,300 | |
| | Materials | | | 20,890,950 | | | | — | | | | — | | | | 20,890,950 | |
| | Energy | | | 16,640,000 | | | | — | | | | — | | | | 16,640,000 | |
| | Industrials | | | 16,312,500 | | | | — | | | | — | | | | 16,312,500 | |
| | Information Technology | | | 12,681,305 | | | | — | | | | — | | | | 12,681,305 | |
| | Consumer Staples | | | 6,296,400 | | | | — | | | | — | | | | 6,296,400 | |
| | Telecommunication Services | | | — | | | | 2,283,862 | | | | 146,328 | | | | 2,430,190 | |
| | Short-Term Securities | | | 94,079,223 | | | | — | | | | — | | | | 94,079,223 | |
| | Total Investments in Securities | | $ | 322,593,028 | | | $ | 2,283,862 | | | $ | 619,683 | | | $ | 325,496,573 | |
| | Liabilities: | | | | | | | | | | | | | | | | |
| | Options Written | | $ | — | | | $ | (27,500 | ) | | $ | — | | | $ | (27,500 | ) |
weitzfunds.com 71
| | Balanced |
| | | | Level 1 | | | Level 2 | | | Level 3 | | | Total | |
| | Assets: | | | | | | | | | | | | |
| | Investments in Securities: | | | | | | | | | | | | |
| | Common Stocks: | | | | | | | | | | | | |
| | Information Technology | | $ | 9,726,790 | | | $ | — | | | $ | — | | | $ | 9,726,790 | |
| | Consumer Discretionary | | | 9,072,300 | | | | — | | | | — | | | | 9,072,300 | |
| | Financials | | | 7,920,040 | | | | — | | | | — | | | | 7,920,040 | |
| | Materials | | | 7,853,420 | | | | — | | | | — | | | | 7,853,420 | |
| | Consumer Staples | | | 5,300,125 | | | | — | | | | — | | | | 5,300,125 | |
| | Health Care | | | 5,142,110 | | | | — | | | | — | | | | 5,142,110 | |
| | Industrials | | | 3,834,700 | | | | — | | | | — | | | | 3,834,700 | |
| | Energy | | | 3,410,795 | | | | — | | | | — | | | | 3,410,795 | |
| | Corporate Bonds | | | — | | | | 5,555,701 | | | | — | | | | 5,555,701 | |
| | Mortgage-Backed Securities | | | — | | | | 5,471,357 | | | | — | | | | 5,471,357 | |
| | Taxable Municipal Bonds | | | — | | | | 320,802 | | | | — | | | | 320,802 | |
| | Short-Term Securities | | | 21,849,729 | | | | — | | | | — | | | | 21,849,729 | |
| | Total Investments in Securities | | $ | 74,110,009 | | | $ | 11,347,860 | | | $ | — | | | $ | 85,457,869 | |
| | Liabilities: | | | | | | | | | | | | | | | | |
| | Options Written | | $ | — | | | $ | (23,250 | ) | | $ | — | | | $ | (23,250 | ) |
| | Short-Intermediate Income |
| | | | Level 1 | | | Level 2 | | | Level 3 | | | Total | |
| | Assets: | | | | | | | | | | | | |
| | Investments in Securities: | | | | | | | | | | | | |
| | Corporate Bonds | | $ | — | | | $ | 401,377,657 | | | $ | — | | | $ | 401,377,657 | |
| | Mortgage-Backed Securities | | | — | | | | 420,897,161 | | | | — | | | | 420,897,161 | |
| | Taxable Municipal Bonds | | | — | | | | 14,692,515 | | | | — | | | | 14,692,515 | |
| | U.S. Treasury and Government Agency | | | — | | | | 130,867,636 | | | | — | | | | 130,867,636 | |
| | Common Stocks | | | 29,916,446 | | | | — | | | | — | | | | 29,916,446 | |
| | Short-Term Securities | | | 165,974,088 | | | | — | | | | — | | | | 165,974,088 | |
| | Total Investments in Securities | | $ | 195,890,534 | | | $ | 967,834,969 | | | $ | — | | | $ | 1,163,725,503 | |
| | Liabilities: | | | | | | | | | | | | | | | | |
| | Options Written | | $ | — | | | $ | (447,500 | ) | | $ | — | | | $ | (447,500 | ) |
| | Nebraska Tax-Free Income |
| | | | Level 1 | | | Level 2 | | | Level 3 | | | Total | |
| | Assets: | | | | | | | | | | | | |
| | Investments in Securities: | | | | | | | | | | | | |
| | Municipal Bonds: | | | | | | | | | | | | |
| | Arizona | | $ | — | | | $ | 1,027,580 | | | $ | — | | | $ | 1,027,580 | |
| | Florida | | | — | | | | 2,160,620 | | | | — | | | | 2,160,620 | |
| | Hawaii | | | — | | | | 1,020,010 | | | | — | | | | 1,020,010 | |
| | Illinois | | | — | | | | 2,282,523 | | | | — | | | | 2,282,523 | |
| | Minnesota | | | — | | | | 15,035 | | | | — | | | | 15,035 | |
| | Nebraska | | | — | | | | 72,670,389 | | | | — | | | | 72,670,389 | |
| | North Dakota | | | — | | | | 818,405 | | | | — | | | | 818,405 | |
| | Ohio | | | — | | | | 1,108,960 | | | | — | | | | 1,108,960 | |
| | Puerto Rico | | | — | | | | 3,437,184 | | | | — | | | | 3,437,184 | |
| | Virginia | | | — | | | | 1,086,121 | | | | — | | | | 1,086,121 | |
| | Wisconsin | | | — | | | | 1,496,578 | | | | — | | | | 1,496,578 | |
| | Short-Term Securities | | | 1,515,332 | | | | — | | | | — | | | | 1,515,332 | |
| | Total Investments in Securities | | $ | 1,515,332 | | | $ | 87,123,405 | | | $ | — | | | $ | 88,638,737 | |
72 Weitz Funds
| | Government Money Market |
| | | | Level 1 | | | Level 2 | | | Level 3 | | | Total | |
| | Assets: | | | | | | | | | | | | |
| | Investments in Securities: | | | | | | | | | | | | |
| | U.S. Treasury | | $ | 80,988,716 | | | $ | — | | | $ | — | | | $ | 80,988,716 | |
| | Short-Term Securities | | | 832,113 | | | | — | | | | — | | | | 832,113 | |
| | Total Investments in Securities | | $ | 81,820,829 | | | $ | — | | | $ | — | | | $ | 81,820,829 | |
For transfers between the levels within the fair value hierarchy, the Funds have adopted a policy of recognizing the transfers as of the date of the underlying event which caused the transfer.
The transfer shown below in the Hickory Fund was the result of a spin-off from a Level 2 security.
At March 31, 2011, the reconciliation of assets in which significant unobservable inputs (Level 3) were used in determining the following Funds’ fair values were as follows:
| | | | Partners III | | | Hickory | |
| | Common Stocks: | | | | | | |
| | Beginning balance, March 31, 2010 | | $ | 280,000 | | | $ | 341,700 | |
| | Net realized gain (loss) | | | 15,817 | | | | — | |
| | Net change in unrealized appreciation (depreciation) | | | 53,813 | | | | 131,655 | |
| | Net purchases (sales) | | | (18,130 | ) | | | — | |
| | Transfers in to Level 3 | | | — | | | | 146,328 | |
| | Transfers out of Level 3 | | | — | | | | — | |
| | Ending balance, March 31, 2011 | | $ | 331,500 | | | $ | 619,683 | |
| | Net change in unrealized appreciation (depreciation) | | | | | | | | |
| | attributable to assets still held at end of period | | $ | 53,813 | | | $ | 131,655 | |
(12) Subsequent Events
Management has evaluated the impact of all subsequent events on the Funds through the date the financial statements were issued and has determined that there were no subsequent events requiring recognition or disclosure in the financial statements.
weitzfunds.com 73
To the Board of Trustees and Shareholders of
The Weitz Funds
We have audited the accompanying statements of assets and liabilities of The Weitz Funds, comprising the Value Fund, Partners Value Fund, Partners III Opportunity Fund, Research Fund, Hickory Fund, Balanced Fund, Short-Intermediate Income Fund, Nebraska Tax-Free Income Fund and Government Money Market Fund (collectively referred to as the “Funds”), including the schedules of investments, as of March 31, 2011, and the related statements of operations (and statement of cash flows for Partners III Opportunity Fund) for the year or period then ended, the statements of changes in net assets for each of the two years or periods in the period then ended, and the financial highlights for each of the five years or periods in the period then ended. These financial statements and financial highlights are the responsibility of the Funds’ management. Our responsibility is to express an opinion on these financial statements and financial highlights based on our audits.
We conducted our audits in accordance with standards of the Public Company Accounting Oversight Board (United States). Those standards require that we plan and perform the audits to obtain reasonable assurance about whether the financial statements and financial highlights are free of material misstatement. We were not engaged to perform an audit of the Funds’ internal control over financial reporting. Our audits included consideration of internal control over financial reporting as a basis for designing audit procedures that are appropriate in the circumstances, but not for the purpose of expressing an opinion on the effectiveness of the Funds’ internal control over financial reporting. Accordingly, we express no such opinion. An audit also includes examining, on a test basis, evidence supporting the amounts and disclosures in the financial statements and financial highlights, assessing the accounting principles used and significant estimates made by management, and evaluating the overall financial statement presentation. Our procedures included confirmation of securities owned as of March 31, 2011, by correspondence with the custodian and brokers. We believe that our audits provide a reasonable basis for our opinion.
In our opinion, the financial statements and financial highlights referred to above present fairly, in all material respects, the financial position of each of the respective Funds referred to above of The Weitz Funds as of March 31, 2011, the results of their operations (and cash flows for Partners III Opportunity Fund) for the year or period then ended, the changes in their net assets for each of the two years or period in the period then ended, and their financial highlights for each of the five years or periods in the period then ended, in conformity with U.S. generally accepted accounting principles.

Cincinnati, Ohio
May 2, 2011
74 Weitz Funds
COMPARISON PURPOSES • (UNAUDITED)
Example
As a shareholder of one or more of the Funds, you incur two types of costs: (1) transaction costs, including any transaction fees that you may be charged if you purchase or redeem your Fund shares through certain financial institutions; and (2) ongoing costs, including management fees and other Fund expenses. This Example is intended to help you understand your ongoing costs (in dollars) of investing in the Funds and to compare these costs with the ongoing costs of investing in other mutual funds. The Example is based on an investment of $1,000 invested at the beginning of the period and held for the entire period from October 1, 2010 through March 31, 2011.
Actual Expenses
The first line for each Fund in the table below provides information about actual account values and actual expenses. You may use the information in this line, together with the amount you invested, to estimate the expenses that you paid over the period. Simply divide your account value by $1,000 (for example, an account value of $8,600 divided by $1,000 = 8.6), then multiply the result by the number in the first line under the heading entitled “Expenses Paid from 10/01/10 –3/31/11” to estimate the expenses you paid on your account during this period.
Hypothetical Example for Comparison Purposes
The second line for each Fund in the table below provides information about hypothetical account values and hypothetical expenses based on the actual expense ratio of each Fund and an assumed rate of return of 5% per year before expenses, which is not the actual return of the Fund. The hypothetical account values and expenses may not be used to estimate the actual ending account balance or expenses you paid for the period. You may use this information to compare the ongoing costs of investing in a specific Weitz Fund to other funds. To do so, compare this 5% hypothetical example with the 5% hypothetical examples that appear in the shareholder reports of the other funds.
Please note that the expenses shown in the table are meant to highlight your ongoing costs only and do not reflect any transactional costs charged by certain financial institutions. Therefore, the second line of the table is useful in comparing ongoing costs only, and will not help you determine the relative total costs of owning different funds. In addition, if you incurred transactional fees, your costs would have been higher. Actual and hypothetical expenses for each Fund are provided in this table.
| | | | | | Beginning Account Value 10/01/10 | | | Ending Account Value 3/31/11 | | | Annualized Expense Ratio | | | Expenses Paid from 10/01/10- 3/31/11(1) | |
| Value | | | Actual | | $ | 1,000.00 | | | | $ | 1,159.21 | | | | | 1.20 | % | | | $ | 6.44 | | |
| | | | Hypothetical(2) | | | 1,000.00 | | | | | 1,019.02 | | | | | 1.20 | % | | | | 6.02 | | |
| Partners Value | | | Actual | | | 1,000.00 | | | | | 1,185.48 | | | | | 1.21 | % | | | | 6.58 | | |
| | | | Hypothetical(2) | | | 1,000.00 | | | | | 1,018.97 | | | | | 1.21 | % | | | | 6.08 | | |
| Partners III | | | Actual | | | 1,000.00 | | | | | 1,209.77 | | | | | 1.48 | % | | | | 8.16 | | |
| | | | Hypothetical(2) | | | 1,000.00 | | | | | 1,017.60 | | | | | 1.48 | % | | | | 7.45 | | |
| Research | | | Actual(3) | | | 1,000.00 | | | | | 1,038.00 | | | | | 0.90 | % | | | | 2.26 | | |
| | | | Hypothetical(2) | | | 1,000.00 | | | | | 1,020.50 | | | | | 0.90 | % | | | | 4.53 | | |
| Hickory | | | Actual | | | 1,000.00 | | | | | 1,218.01 | | | | | 1.28 | % | | | | 7.06 | | |
| | | | Hypothetical(2) | | | 1,000.00 | | | | | 1,018.62 | | | | | 1.28 | % | | | | 6.42 | | |
| Balanced | | | Actual | | | 1,000.00 | | | | | 1,109.07 | | | | | 1.15 | % | | | | 6.03 | | |
| | | | Hypothetical(2) | | | 1,000.00 | | | | | 1,019.27 | | | | | 1.15 | % | | | | 5.77 | | |
| Short-Intermediate | | | Actual | | | 1,000.00 | | | | | 1,006.47 | | | | | 0.67 | % | | | | 3.34 | | |
| Income | | | Hypothetical(2) | | | 1,000.00 | | | | | 1,021.66 | | | | | 0.67 | % | | | | 3.37 | | |
| Nebraska Tax-Free | | | Actual | | | 1,000.00 | | | | | 985.52 | | | | | 0.73 | % | | | | 3.61 | | |
| | | | Hypothetical(2) | | | 1,000.00 | | | | | 1,021.36 | | | | | 0.73 | % | | | | 3.67 | | |
| Government Money | | | Actual | | | 1,000.00 | | | | | 1,000.30 | | | | | 0.08 | % | | | | 0.39 | | |
| Market | | | Hypothetical(2) | | | 1,000.00 | | | | | 1,024.61 | | | | | 0.08 | % | | | | 0.40 | | |
| (1) | Expenses are equal to the annualized expense ratio for the Fund, multiplied by the average account value over the period, multiplied by the number of days in the most recent fiscal half year (182/365). |
| (2) | Assumes 5% total return before expenses. |
| (3) | Fund commenced operations on December 31, 2010. The Beginning Account Value and Expenses Paid are from January 1, 2011 through March 31, 2011. |
weitzfunds.com 75
(UNAUDITED)
Tax Information
For the fiscal year ended March 31, 2011, none of the dividends paid by the Funds were considered long-term capital gains that may be subject to a maximum tax rate of 15%, as provided for by the Jobs and Growth Tax Relief Reconciliation Act of 2003. Of the distributions paid during the fiscal year, only the Balanced Fund had amounts that may be considered qualified dividend income and for corporate shareholders, amounts that may qualify for the corporate dividends received deduction. The amounts that may be considered qualified dividend income and that may qualify for the corporate dividends received deduction were $595,292 and $595,292, respectively.
The information and distributions reported herein may differ from the information and distributions reported to shareholders for the calendar year ended December 31, 2010, which was reported in conjunction with your 2010 Form 1099-DIV.
Proxy Voting Policy
A description of the Funds’ proxy voting policies and procedures is available without charge, upon request by (i) calling 800-304-9745, (ii) on the Funds’ website at http://www.weitzfunds.com; and (iii) on the SEC’s website at http://www.sec.gov.
Information on how each of the Funds (other than the Research Fund) voted proxies relating to portfolio securities during each twelve month period ended June 30 is available: (i) on the Funds’ website at http://www.weitzfunds.com, and (ii) on the SEC’s website at http://www.sec.gov.
Form N-Q
The Funds file complete schedules of their portfolio holdings with the Securities and Exchange Commission for the first and third quarters of each fiscal year on Form N-Q. The Funds’ Form N-Q is available on the SEC’s website at http://www.sec.gov and may be reviewed and copied at the SEC’s Public Reference Room in Washington DC.Information on the operation of the Public Reference Room may be obtained by calling 800 SEC-0330. When filed, the Fund’s quarterly reports, including the information filed on Form N-Q will also be available on the Funds’ website at http://www.weitzfunds.com.
Factors Considered by the Board of Trustees of Weitz Funds (the “Trust”) in Approving the Adoption of the Management and Investment Advisory Agreement with Wallace R. Weitz & Company for the Research Fund (the “Fund”)
In accordance with the Investment Company Act of 1940, the Board of Trustees of the Trust is required to consider the initial adoption of the Management and Investment Advisory Agreement (the “Agreement”) for the Fund with Wallace R. Weitz & Company (“Weitz & Co.”). The relevant provisions of the Investment Company Act of 1940 specifically provide that it is the duty of the Board to request and evaluate such information as the Board determines is necessary to allow them to properly consider the adoption of the Agreement, and it is the duty of Weitz & Co. to furnish the Trustees with such information that is responsive to their request. Accordingly, in determining whether to approve the initial adoption of the Agreement between the Fund and Weitz & Co., the Board of Trustees requested, and Weitz & Co. provided, information and data relevant to the Board’s consideration. This included materials prepared by Weitz & Co. for the Board that provided them with information regarding the investment performance of the Fund’s predecessor partnership, the Weitz Research Fund, L.P. (the “Predecessor Partnership”), and information regarding the proposed fees and expenses of the Fund. As part of its deliberations, the Board also considered and relied upon the information about the Trust and Weitz & Co. that had been provided to them throughout the year in connection with their regular Board meetings at which they engage in the ongoing oversight of the Trust and its operations.
The Board of Trustees met and considered the initial adoption of the Agreement at an in-person meeting held on November 9, 2010. At this meeting the Board engaged in a thorough review process in connection with determining whether or not to approve the adoption of the Agreement. The Board met during the meeting directly with representatives of Weitz & Co. and reviewed various factors with them concerning the proposed adoption of the Agreement.
Among the factors the Board considered was the overall performance of the Predecessor Partnership relative to its
76 Weitz Funds
applicable benchmark indices since its inception on April 1, 2005. The Board took into consideration the investment expertise and the investment strategies utilized by Weitz & Co. with respect to each of the equity funds in the Trust. The Board discussed with management the fact that Weitz & Co. maintains a particular focus on long-term investment performance results. In connection with this, the Board took note of management’s stated position that achieving favorable long-term investment results is a primary objective of the firm. The Board also took into consideration the fact that the performance results achieved by Weitz & Co. for the equity funds in the Trust has been generally favorable on a short-term basis and on a longer-term basis and that Weitz & Co. produced these results in a manner consistent with the stated investment objective and policies of these Funds.
In addition, the Board compared proposed expenses of the Fund to the expenses of its peers, noting that the proposed expenses for the Fund compare favorably with industry averages for other funds of similar projected size and investment objective following the application of proposed expense limitation arrangements. The Board also considered the fact that the advisory fees for the Fund are subject to breakpoints which result in reduced investment advisory fees as assets increase, and the Board agreed that this type of fee structure is reasonable and fair to shareholders. They noted the range of investment advisory and administrative services to be provided by Weitz & Co. to the Fund and the level and quality of these services, and in particular, they noted the quality of the personnel that would be providing these services.
In connection with their consideration of the adoption of the Agreement for the Fund, the Board took into consideration the contractual expense limitation agreement proposed by Weitz & Co. for use with the Fund covering the period from the commencement of operations of the Fund through July 31, 2012, and the Board determined that the contractual expense limitation agreement was beneficial for the Fund and its shareholders.
The Board then considered various factors in addition to the proposed fees and expenses of the Fund and the performance of the Predecessor Partnership. The Board took note of the long-term relationship between Weitz & Co. and each of the other Funds in the Trust and the efforts that have been undertaken by Weitz & Co. to foster the growth and development of the Trust since the inception of each of the Funds. They also took note of the fact that the Fund will not be subject to sales charges or Rule 12b-1 fees and that Weitz & Co. intends to conduct marketing efforts on behalf of the Fund out of their own resources. The Board also reviewed financial information concerning Weitz & Co. relating to its operation of the Trust, noting the overall financial soundness of Weitz & Co. as demonstrated by the financial information provided and reached a finding that the level of profitability expected to be realized by Weitz & Co. with respect to the Fund was consistent with relevant industry averages.
The Board further reviewed Weitz & Co.’s brokerage practices, including its soft dollar arrangements and best-execution procedures, and noted that these were reasonable and consistent with standard industry practice. The Board took note of the portfolio managers for the Fund, noting their research expertise and experience and their involvement with the Predecessor Partnership. The Board also considered that Weitz & Co. does not currently provide investment management services to any other investment accounts or investment vehicles that are similar to the advisory services provided to the Fund.
In considering information regarding the investment management fees proposed to be paid by the Fund to Weitz & Co. under the Agreement, the Board also took note of the administrative fees that are proposed to be paid by the Fund to Weitz & Co. under the terms of the Trust’s Administration Agreement with Weitz & Co. The Board reviewed the proposed fees payable by the Fund under the Administration Agreement and the Board considered the types of administrative services that are expected to be incurred by the Fund and the Board determined that the proposed administrative fees were reasonable and advisable based upon the types of services to be provided. In considering the Fund’s addition to the Administration Agreement, the Board members indicated that they had considered various factors with respect to the administrative fees, including the level and amount of these fees and the services to be provided by Weitz & Co. in connection with the Administration Agreement, in determining the reasonableness of the total fees to be paid by the Fund to Weitz & Co. for the overall level of services that Weitz & Co. will be providing to the Fund and its shareholders. The Board also took into consideration the fact that an affiliate of Weitz & Co., Weitz Securities, Inc., will be providing underwriting and distribution services to the Fund and that Weitz Securities, Inc. receives no compensation for the services that it will be providing to the Fund. The Board noted that Weitz Securities, Inc. is expected to provide useful services to the Fund in a manner that it anticipates will benefit the Fund and its shareholders.
In reaching their conclusion with respect to the initial adoption of the Agreement, the Trustees did not identify any one single factor as being controlling, rather, the Board took note of a combination of factors that influenced their decision making process. The Board did, however, identify
weitzfunds.com 77
the favorable performance of the Predecessor Partnership since its inception in 2005, the commitment of Weitz & Co. to the successful operation of the Fund, and the proposed level of expenses of the Fund, as being important elements of their consideration, as well as Weitz & Co.’s willingness to contractually agree to waive fees and/or reimburse expenses of the Fund in order to limit the Fund’s overall operating expenses during its initial period of operations. They noted the overall level and quality of the investment advisory, administration and distribution services proposed to be provided by Weitz & Co. and its affiliates to the Fund and they found that these services are expected to benefit the shareholders of the Fund and reflected management’s overall commitment to the anticipated successful growth and development of the Fund. Based upon their review and consideration of these factors and other matters deemed relevant by the Board in reaching an informed business judgment, a majority of the Board of Trustees, including a majority of the Independent Trustees, concluded that the terms of the Management and Investment Advisory Agreement for the Fund are fair and reasonable and the Board voted to adopt the Agreement for an initial one-year period.
78 Weitz Funds
This page has been left blank intentionally.
weitzfunds.com 79
AND OFFICERS • (UNAUDITED)
The individuals listed below serve as Trustees or Officers of the Trust. Each Trustee of the Weitz Funds serves until a successor is elected and qualified or until resignation. Each Officer of the Weitz Funds is elected annually by the Trustees.
The address of all Officers and Trustees is 1125 South 103rd Street, Suite 200, Omaha, Nebraska 68124.
Interested Trustees*
Wallace R. Weitz (Age: 61) Position(s) Held with Trust: President; Portfolio Manager; Trustee Length of Service (Beginning Date): Weitz Funds (and certain predecessor funds) – January 1986 Principal Occupation(s) During Past 5 Years: President, Wallace R. Weitz & Company, Weitz Funds (and certain predecessor funds) Number of Portfolios Overseen in Fund Complex: 9 Other Directorships: N/A | | Thomas R. Pansing (Age: 66) Position(s) Held with Trust: Trustee Length of Service (Beginning Date): Weitz Funds (and certain predecessor funds) - January 1986 Principal Occupation(s) During Past 5 Years: Partner, Pansing Hogan Ernst & Bachman LLP, a law firm Number of Portfolios Overseen in Fund Complex: 9 Other Directorships: N/A |
| |
| |
| |
| |
| |
| |
| | |
| * | Mr. Weitz is a Director and Officer of Wallace R. Weitz & Company, investment adviser to the Weitz Funds, and as such is considered an “interested person” of the Trust, as that term is defined in the Investment Company Act of 1940 (an “Interested Trustee”). Mr. Pansing performs certain legal services for the investment adviser and the Weitz Funds and, therefore, is also classified as an “Interested Trustee”. |
Independent Trustees
Lorraine Chang (Age: 60)Position(s) Held with Trust: Trustee; Chairman, Board of Trustees Length of Service (Beginning Date): Weitz Funds (and certain predecessor funds) - June 1997 Principal Occupation(s) During Past 5 Years: Independent Consultant - January 2009 to Present; Partner, The Public Strategies Group, a management consulting firm - January 1999 to December 2008 Number of Portfolios Overseen in Fund Complex: 9Other Directorships: N/A | | John W. Hancock (Age: 63)Position(s) Held with Trust: TrusteeLength of Service (Beginning Date): Weitz Funds (and certain predecessor funds) - January 1986 Principal Occupation(s) During Past 5 Years: Partner, Hancock & Dana, an accounting firm Number of Portfolios Overseen in Fund Complex: 9Other Directorships: N/A |
Richard D. Holland (Age: 89)Position(s) Held with Trust: TrusteeLength of Service (Beginning Date): Weitz Funds (and certain predecessor funds) - June 1995 Principal Occupation(s) During Past 5 Years: RetiredNumber of Portfolios Overseen in Fund Complex: 9Other Directorships: N/A | | Delmer L. Toebben (Age: 80)Position(s) Held with Trust: TrusteeLength of Service (Beginning Date): Weitz Funds (and certain predecessor funds) - July 1996 Principal Occupation(s) During Past 5 Years: RetiredNumber of Portfolios Overseen in Fund Complex: 9Other Directorships: N/A |
80 Weitz Funds
Independent Trustees (continued)
Roland J. Santoni (Age: 69) | | Barbara W. Schaefer (Age: 57) |
| Position(s) Held with Trust: Trustee | | Position(s) Held with Trust: Trustee |
| Length of Service (Beginning Date): Weitz Funds - February 2004 | | Length of Service (Beginning Date): Weitz Funds - March 2005 |
| Principal Occupation(s) During Past 5 Years: Vice President, West Development, Inc., a development company; President, Gary and Mary West Foundation, 2007 to Present | | Principal Occupation(s) During Past 5 Years: Senior Vice President-Human Resources and Corporate Secretary, Union Pacific Corporation, 2004 to Present |
| Number of Portfolios Overseen in Fund Complex: 9 | | Number of Portfolios Overseen in Fund Complex: 9 |
| Other Directorships: N/A | | Other Directorships: N/A |
| Justin B. Wender (Age: 41) | | |
| Position(s) Held with Trust: Trustee | | |
| Length of Service (Beginning Date): Weitz Funds - May 2009 | | |
| Principal Occupation(s) During Past 5 Years: President, Stella Point Capital, LLC, a private equity firm - August 2010 to Present; President, Castle Harlan, Inc., a private equity firm - July 1993 to August 2010 | | |
| Number of Portfolios Overseen in Fund Complex: 9 | | |
| Other Directorships: N/A | | |
Officers
| John R. Detisch (Age: 46) | | Kenneth R. Stoll (Age: 49) |
| Position(s) Held with Trust: Vice President, Secretary and Chief Compliance Officer | | Position(s) Held with Trust: Vice President and Chief Financial Officer |
| Length of Service (Beginning Date): Weitz Funds - January 2011 | | Length of Service (Beginning Date): Weitz Funds - April 2004 |
| Principal Occupation(s) During Past 5 Years: Vice President and Chief Compliance Officer, Wallace R. Weitz & Company, Vice President and Chief Compliance Officer, Weitz Funds - January 2011 to | | Principal Occupation(s) During Past 5 Years: Vice President and Chief Operating Officer, Wallace R. Weitz & Company; Vice President and Chief Financial Officer, Weitz Funds |
| Present; Partner, Kutak Rock LLP, 1990 - | | |
| January 2011 | | |
| Bradley P. Hinton (Age: 43) | | |
| Position(s) Held with Trust: Vice President | | |
| Length of Service (Beginning Date): Weitz Funds - August 2006 | | |
| Principal Occupation(s) During Past 5 Years: Portfolio Manager; Director of Research, Wallace R. Weitz & Company; Vice President, Wallace R. Weitz & Company - August 2006 to Present | | |
The Statement of Additional Information for the Weitz Funds, which can be obtained without charge by calling 800-304-9745, includes additional information about the Trustees and Officers of the Weitz Funds.
www.weitzfunds.com 81
This page has been left blank intentionally.
82 Weitz Funds
Board of Trustees Lorraine Chang John W. Hancock Richard D. Holland Thomas R. Pansing, Jr. Roland J. Santoni Barbara W. Schaefer Delmer L. Toebben Wallace R. Weitz Justin B. Wender Investment Adviser Wallace R. Weitz & Company 1125 South 103rd Street, Suite 200 Omaha, NE 68124-1071 (800) 304-9745 Custodian Wells Fargo Bank Minnesota, National Association | Officers Wallace R. Weitz, President John R. Detisch, Vice President, Secretary & Chief Compliance Officer Kenneth R. Stoll, Vice President & Chief Financial Officer Bradley P. Hinton, Vice President Distributor Weitz Securities, Inc. Transfer Agent and Dividend Paying Agent Wallace R. Weitz & Company Sub-Transfer Agent Boston Financial Data Services, Inc. NASDAQ symbols: Value Fund - WVALX Partners Value Fund - WPVLX Partners III Opportunity Fund - WPOPX Research Fund - WRESX Hickory Fund - WEHIX Balanced Fund - WBALX Short-Intermediate Income Fund - WEFIX Nebraska Tax-Free Income Fund - WNTFX Government Money Market Fund - WGMXX |
Help us conserve resources by receiving your report electronically. Visit us online at www.weitzfunds.com. Simply log in to Account Access and click the “Electronic Delivery” button. | |
An investor should consider carefully the investment objectives, risks, and charges and expenses of the Funds before investing. The Funds’ Prospectus contains this and other information about the Funds. The Prospectus should be read carefully before investing.
5/06/11
weitzfunds.com 83
Item 2. Code of Ethics.
As of the end of the period covered by this report, the Registrant has adopted a code of ethics that applies to the Registrant’s principal executive officer, principal financial officer, principal accounting officer or controller, or persons performing similar functions, regardless of whether these individuals are employed by the Registrant or a third party (the “Code of Ethics”). During the period covered by this report, there were no amendments, nor did the Registrant grant any waivers, including any implicit waivers, from any provision of the Code of Ethics.
The Code of Ethics is attached hereto as Exhibit 12(a)(1).
Item 3. Audit Committee Financial Expert.
The Registrant’s board of trustees has determined that the Registrant has at least one “audit committee financial expert” (as defined in Item 3 of Form N-CSR) serving on its audit committee. John Hancock is an “audit committee financial expert” and is “independent” (as each term is defined in Item 3 of Form N-CSR).
Item 4. Principal Accountant Fees and Services.
| (a) | Audit Fees. Fees for audit services provided to the Registrant were $259,200 and $237,700 for fiscal years ended March 31, 2011 and 2010, respectively. |
| | | |
| (b) | Audit Related Fees. The aggregate fees billed in each of the last two fiscal years for audit related-services by the principal accountant that are reasonably related to the performance of the audit of the Registrant’s financial statements and are not reported under paragraph (a) of this item were $26,000 and $26,000 for fiscal years ended March 31, 2011 and 2010, respectively. The fees, paid by Wallace R. Weitz & Company, the Registrant’s investment adviser and transfer agent, were payment for the principal accountant performing internal control reviews of the Registrant’s transfer agent. |
| | | |
| (c) | Tax Fees. Fees for tax services, which consisted of income and excise tax compliance services, were $36,400 and $38,300 for the fiscal years ended March 31, 2011 and 2010, respectively. |
| | | |
| (d) | All Other Fees. Fees for all other services totaled $11,400 and $11,400 for fiscal years ended March 31, 2011 and 2010, respectively. |
| | | |
| (e) | (1) | The Registrant’s Audit Committee has adopted Pre-Approval Policies and Procedures. The Audit Committee must pre-approve all audit services and non-audit services that the principal accountant provides to the Registrant. The Audit Committee must also pre-approve any engagement of the principal accountant to provide non-audit services to the Registrant’s investment adviser, or any affiliate of the adviser that provides ongoing services to the Registrant, if such non-audit services directly impact the Registrant’s operations and financial reporting. |
| | | |
| | (2) | No services described in items (b) were pre-approved by the Audit Committee pursuant to Rule 2-01(c)(7)(i)(c) of Regulation S-X. |
| | | |
| (f) | All of the work in connection with the audit of the Registrant during the years ended March 31, 2011 and 2010 was performed by full-time employees of the Registrant’s principal accountant. |
| | | |
| (g) | The aggregate fees billed by the principal accountant for non-audit services to the Registrant, the Registrant’s investment adviser and any entity controlling, controlled by, or under common control with the adviser that provides ongoing services to the Registrant were $144,500 and $101,400 for the years ended March 31, 2011 and 2010, respectively. |
| | | |
| (h) | The Registrant’s Audit Committee has considered whether the provision of non-audit services that were rendered to the Registrant’s investment adviser, and any entity controlling, controlled by, or under common control with the adviser that provides ongoing services to the Registrant that were not pre-approved pursuant to paragraph (c)(7)(ii) of Rule 2-01 of Regulation S-X is compatible with maintaining the principal auditor’s independence. |
Item 5. Audit Committee of Listed Registrants.
Not applicable.
Item 6. Schedule of Investments.
The Schedule of Investments in securities of unaffiliated issuers is included as part of the Report to Shareholders.
Item 7. Disclosure of Proxy Voting Policies and Procedures for Closed-End Investment Companies.
Not applicable.
Item 8. Portfolio Managers of Closed-End Management Investment Companies
Not applicable
Item 9. Purchases of Equity Securities by Closed-End Management Investment Company and Affiliated Purchasers.
Not applicable.
Item 10. Submissions of Matters to a Vote of Security Holders.
Not applicable.
Item 11. Controls and Procedures.
(a) Based on an evaluation of the Disclosure Controls and Procedures (as defined in Rule 30a-3(c) under the Investment Company Act of 1940) (the "Disclosure Controls") as of a date within 90 days prior to the filing date (the "Filing Date") of this report on Form N-CSR (the "Report"), the Registrant's principal executive officer and financial officer have concluded that the Disclosure Controls are reasonably designed to ensure that information required to be disclosed by the Registrant in the Report is recorded, processed, summarized and reported by the Filing Date, including ensuring that information required to be disclosed in the Report is accumulated and communicated to the Registrant's management, including the Registrant's principal executive officer and principal financial officer, as appropriate to allow timely decisions regarding required disclosure.
(b) There were no significant changes in the Registrant's internal control over financial reporting (as defined in Rule 30a-3(d) under the Investment Company Act of 1940) that occurred during the Registrant's second fiscal half-year of the period covered by this report that has materially affected, or is reasonably likely to materially affect, the Registrant's internal control over financial reporting.
(a)(1) The Code of Ethics is attached hereto.
(a)(2) The certifications required by Rule 30a-2(a) of the Investment Company Act of 1940 are attached hereto.
(a)(3) Not applicable.
(b) The certifications required by Rule 30a-2(b) of the Investment Company Act of 1940 and Section 906 of the Sarbanes-Oxley Act of 2002 are attached hereto.
SIGNATURES
Pursuant to the requirements of the Securities Exchange Act of 1934 and the Investment Company Act of 1940, the Registrant has duly caused this report to be signed on its behalf by the undersigned, thereunto duly authorized.
The Weitz Funds
By (Signature and Title)* /s/ Wallace R. Weitz
Wallace R. Weitz, President
Date May 13, 2011
Pursuant to the requirements of the Securities Exchange Act of 1934 and the Investment Company Act of 1940, this report has been signed below by the following persons on behalf of the Registrant and in the capacities and on the dates indicated.
By (Signature and Title)* /s/ Wallace R. Weitz
Wallace R. Weitz, President
Date May 13, 2011
By (Signature and Title)* /s/ Kenneth R. Stoll
Kenneth R. Stoll, Chief Financial Officer
Date May 13, 2011
* Print the name and title of each signing officer under his or her signature.