Charles Dickens came to mind in trying to describe the events of the past year in the fixed-income marketplace —“It was the best of times, it was the worst of times”. The best of times were had by owning U.S. Treasury bonds, as yields fell dramatically (prices rose). The latter half of the fiscal year, particularly, was marked by rising turbulence in the financial markets. This led to increased risk aversion and a dramatic ‘flight to quality’, primarily U.S. Treasury securities.
The worst of times were also an unfortunate experience last year. The storm that began in the subprime segment of the mortgage market took on crisis-like qualities as summer turned to fall and began to have a broader effect on the economy. Business and consumer confidence fell. Transparency and liquidity, key components of healthy capital markets, were periodically unavailable as worries of large, but yet-to-be disclosed, losses pervaded the stock and bond markets. These concerns and events led to a radical, and belated, reassessment of risk by investors who had been willing to accept yields that, in retrospect, provided insufficient compensation given the risks involved.
The monetary (Federal Reserve) and fiscal (Congressional) response to the unfolding credit crisis has been dramatic and historic. Actions not used since the Great Depression, and a few new ones, have been (or will be) implemented to alleviate the stress in the financial markets. Here is a recap of some of the actions taken to date:
These dramatic actions, and others, may succeed in lessening the impact of the current credit crisis. They also have the capacity to create unintended consequences, the most troubling of which could be a meaningful rise in the long-term inflation level. Since inflation is a genie best left in the bottle, we will be particularly focused on what implications this should have on the Fund’s portfolio allocations.
Portfolio Review
The Short-Intermediate Income Fund had a total return of 7.0% in fiscal 2008, compared to 8.9% for the Lehman Brothers Intermediate U.S. Government/Credit Index (LBIGC), our Fund’s primary benchmark. Most of this difference can be attributed to unrealized price declines in the Fund’s corporate bond and common and preferred stock segments. It’s also worth noting that, over the years, our portfolio has almost always been constructed with a shorter average life (i.e. duration) and of higher quality than the LBIGC. We chose this benchmark to highlight that we could periodically invest longer term and/or lower quality when conditions warranted. The effect over time of our portfolio construction (typically shorter average life) has been a penalty in bull markets for Treasury bonds (like now), but a boost to performance when interest rates rise.
Compared to a year ago, the average maturity of our Fund was unchanged at 3.0 years. The duration declined to 1.7 from 2.6 years, and the average coupon decreased to 4.2% from 4.4%. The overall credit quality of our portfolio remains very high with approximately 89% of the portfolio invested in AAA rated securities (not BBB-rated bonds masquerading as AAA, but true AAA) or U.S. Treasury, U.S. government agency-guaranteed Mortgage-Backed Securities (MBS) and cash.
U.S. Treasury bonds account for approximately 6% of our Fund, down from 34% a year ago. This segment added materially to our performance last year. Given the rapid decline in yields that U.S. Treasury bonds have experienced, the risk/reward now appears particularly unfavorable. The 5-year Treasury yield at March 31 was 2.4%. Inflation would have to fall materially from its current pace of 4% (as measured by the Consumer Price Index) to leave any purchasing power (or ‘real’) return for investors buying Treasuries with today’s low yields.
MBS exposure increased the most in the past year, to approximately 49% of our Fund from 37% a year ago. The risk aversion that has gripped the marketplace in the past year has even affected the high-quality, agency-guaranteed mortgage-backed securities market. At one point, yield spreads for Fannie Mae and Freddie Mac MBS increased to over 300 basis points to the Treasury curve versus a more normal 100-150 basis point spread. Much of this spread widening occurred as leveraged investors were forced to liquidate assets to meet margin calls from their lenders. This disruption gave us the opportunity to redeploy some of the proceeds from Treasury bond sales into much higher yielding instruments while assuming minimal incremental risk. In addition, we have been monitoring and studying the developments in the subprime and Alt-A (loans made to borrowers above subprime) segments of the mortgage market, but have yet to commit any Fund capital to this area.
Corporate bond, convertible bond and preferred or common stock exposure remains a small segment of our Fund (less than 10%). We have written in the past that our rationale for this low weighting, particularly in corporate bonds, was a lack of compensation (i.e. incremental yield over U.S. Treasury bonds) for taking on the added credit risk. The past year’s blowout of credit spreads (rise in yields and price declines of lower quality bonds compared to higher quality) certainly affirms this decision. Sometimes the best investments are those not made. However, our small exposure still detracted from our results as Newcastle Investment Corp. and Redwood Trust common shares, Six Flags convertible preferred stock and Harrah’s bonds all declined.
The rise in credit spreads has allowed us to invest on more favorable terms than have been available in some time. An example is our investment in the USG Corporation 6.30% senior unsecured bonds maturing in 2016. USG is a leading manufacturer and distributor of building materials, maybe best known for its SHEETROCK® Brand gypsum wallboard panels. We were able to purchase these bonds at a meaningful (20 point) discount to where they were issued in May of last year. While the housing contraction has impacted USG’s near-term business prospects, we believe the market has mispriced the company’s modest leverage, strong management and attractive long-term outlook. Our near-10% yield at cost should generate attractive interest income for our Fund with possible appreciation potential as economic conditions improve.
55
Fund Strategy Review
Our investment approach consists primarily of investing in a portfolio of high quality, short-to-intermediate-term bonds where we believe we can capture most of the “coupon” returns of long-term bonds with materially less interest-rate risk. Overall, we strive to maximize our investment (or reinvestment) yield while avoiding making interest rate “bets”, particularly ones that depend on interest rates going down. We are willing to trade some upside in a rapidly falling interest-rate environment in exchange for enhanced capital preservation.
For a small portion of our portfolio, we also search for other fixed-income related investments that have favorable risk/reward characteristics (such as high-yield and convertible bonds, preferred and convertible preferred stock, or high dividend paying common stock). Despite the disappointing results of the past year, these types of investments (like the USG bonds) have enhanced our Fund’s historical returns.
Outlook
The divergence in inflation and interest rates over the past year is reason for caution, we believe. Inflation measures (both consumer and producer) have risen meaningfully while interest rates (U.S. Treasury) have fallen even more. The Consumer Price Index, for example, has risen 4% in the past year, up from a 2.8% rise a year ago. Five-year Treasury bond yields, on the other hand, have declined by nearly half to 2.4% at March 31. High inflation is not the friend of the bond investor as it erodes the purchasing power of interest returns. While it’s plausible that a recession (if one occurs in the U.S.) could lower inflationary pressures in the economy, we believe U.S. Treasury rates are still abnormally low. The tremendous ‘flight to quality’ by investors fearful of further cataclysmic events certainly explains much of this decline in Treasury rates. Therefore, we expect to maintain our shorter portfolio duration compared to that of our Fund’s primary benchmark (1.7 years versus 3.8 years for the LBIGC at fiscal year end) while we continue searching for qualifying investments with more favorable terms for investors.
Government Money Market Fund Overview
The Government Money Market Fund closed the first quarter with a 7-day effective yield of 2.14%. (An investment in the Fund is neither insured nor guaranteed by the U.S. Government. There can be no assurance that the Fund will be able to maintain a stable net asset value. Although the Fund seeks to preserve the value of your investment at $1.00 per share, it is possible to lose money by investing in the Fund.)
In the past year the Fund’s 7-day effective yield has declined meaningfully (by 3.05%), coinciding almost exactly with the 3% year-over-year decline in the Fed Funds rate (the overnight lending rate between banks controlled by the Federal Reserve). Most of this decline, nearly two thirds, has occurred in 2008 as the Fed has acted in historic fashion in response to a growing credit crisis.
As we have mentioned in previous letters, the Fed Funds rate exerts an effect similar to a gravitational pull on the investment universe for our Fund. The past year has been no exception. Since we invest in ultra high-quality short-term investments (e.g. U.S. Treasury bills and government agency discount notes) that have a weighted average maturity of less than ninety days, our yield has invariably followed the path dictated by the Federal Reserve’s monetary policy as we frequently reinvest maturing bills and notes in these short-term instruments.
As we proceed through the balance of 2008, it seems increasingly plausible that our yield will continue to drift lower. The Fed seems poised to continue lowering the Fed Funds rate as a tool to address the ongoing turmoil in the financial markets. In anticipation of this possibility, and in reaction to the overall ‘flight to quality’, investors have already pushed Treasury bill yields meaningfully below the current Fed Funds rate. While we have limited control over the longer term direction of our Fund’s yield, which will rise and fall with changes in the Fed Funds rate, credit quality will remain high.
If you have any questions about the mechanics of either Fund or our investment strategy, please call or email. As always, we welcome your comments and questions.
56
Annual Shareholder Information Meeting – Tuesday, May 27, 2008
Please plan to join us at the Scott Conference Center in Omaha at 4:30 p.m. on May 27. The center is located at 6450 Pine Street on the Aksarben campus. There will be no formal business to conduct, so we can devote the entire meeting to answering your questions. Maps and driving directions are available from our client service representatives. Thanks for your continued support, and we look forward to seeing you there.
| |
| Best Regards, |
| |
| 
|
| |
| Thomas D. Carney |
| Portfolio Manager |
| tom@weitzfunds.com |
Portfolio composition is subject to change at any time and references to specific securities, industries and sectors referenced in this letter are not recommendations to purchase or sell any particular security. See the Schedules of Investments in Securities included in this report for the percent of assets in each of the Funds invested in particular industries or sectors.
57
| |
FUND PERFORMANCE — SHORT-INTERMEDIATE INCOME FUND | |
(Unaudited) | |
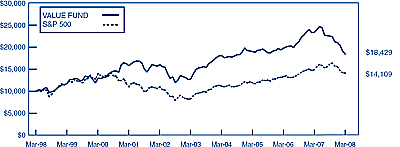
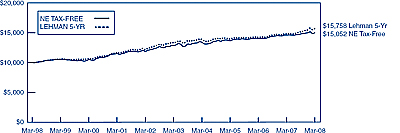
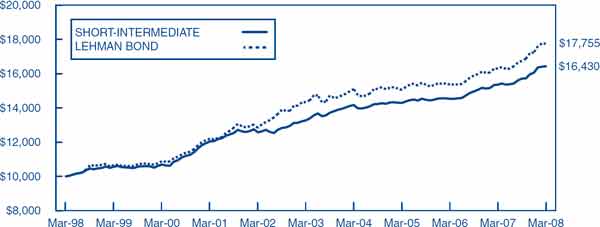
The chart below depicts the change in the value of a $10,000 investment for the period March 31, 1998, through March 31, 2008 for the Short-Intermediate Income Fund as compared with the growth of the Lehman Brothers Intermediate U.S. Government/Credit Index during the same period. The Lehman Brothers Intermediate U.S. Government/Credit Index is an unmanaged index consisting of government securities and publicly issued corporate debt with maturities from one to ten years. Index performance is hypothetical and is shown for illustrative purposes only. A $10,000 investment in the Short-Intermediate Income Fund on March 31, 1998 would have been valued at $16,430 on March 31, 2008.
| | | | |
| | | |
| Total
Return | | Average Annual
Total Returns |
|
| |
|
| 1-Year | | 5-Year | 10-Year |
|
| |
|
|
Short-Intermediate Income Fund | 7.0% | | 4.4% | 5.1% |
Lehman Brothers Intermediate U.S. Government/Credit Index | 8.9 | | 4.4 | 5.9 |
These performance numbers reflect the deduction of the Fund’s annual operating expenses, which as stated in its most recent Prospectus are 0.67% of the Fund’s net assets. The returns assume redemption at the end of each period and reinvestment of dividends. This information represents past performance and past performance does not guarantee future results. The investment return and the principal value of an investment in this Fund will fluctuate so that an investor’s shares, when redeemed, may be worth more or less than the original cost. Current performance may be lower or higher than the performance data quoted. Performance data current to the most recent month-end may be obtained at www.weitzfunds.com/performance/monthly.asp.
Performance information does not reflect the deduction of taxes that a shareholder would pay on Fund distributions or the redemption of Fund shares.
58
|
PORTFOLIO PROFILE — SHORT-INTERMEDIATE INCOME FUND |
(Unaudited) |
Credit Quality Ratings
| | | | | |
U.S. Treasury | | | 6.4 | % | |
U.S. Government Agency Mortgage Related Securities | | | 46.2 | | |
Aaa/AAA | | | 14.0 | | |
Aa/AA | | | 3.6 | | |
A/A | | | 1.5 | | |
Baa/BBB | | | 0.7 | | |
Ba/BB | | | 1.0 | | |
B/B, below, and non-rated | | | 4.1 | | |
Cash Equivalents | | | 22.5 | | |
| |
|
| | |
| | | 100.0 | % | |
| |
|
| | |
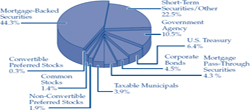
Sector Breakdown
| | | | | |
Mortgage-Backed Securities | | | 44.3 | % |
Short-Term Securities/Other | | | 22.5 | |
Government Agency | | | 10.5 | |
U.S. Treasury | | | 6.4 | |
Corporate Bonds | | | 4.5 | |
Mortgage Pass-Through Securities | | | 4.3 | |
Taxable Municipal Bonds | | | 3.9 | |
Non-Convertible Preferred Stocks | | | 1.9 | |
Common Stocks | | | 1.4 | |
Convertible Preferred Stocks | | | 0.3 | |
| |
|
| |
| | | 100.0 | % |
| |
|
| |
|
PORTFOLIO PROFILE — GOVERNMENT MONEY MARKET FUND |
(Unaudited) |
Sector Breakdown
| | | | | |
Government Agency | | | 75.3 | % | |
Treasury Money Market Funds | | | 23.2 | | |
Other Assets Less Other Liabilities | | | 1.5 | | |
| |
|
| | |
| | | 100.0 | % | |
| |
|
| | |
59
|
SHORT-INTERMEDIATE INCOME FUND |
Schedule of Investments in Securities
March 31, 2008
| | | | | | | |
| | Principal
amount | | Value | |
| |
| |
| |
CORPORATE BONDS — 4.5% | | | | | | | |
| | | | | | | |
Liberty Media Corp. 7.875% 7/15/09 | | $ | 500,000 | | $ | 504,236 | |
Berkshire Hathaway Finance Corp. 4.2% 12/15/10 | | | 375,000 | | | 386,601 | |
Countrywide Home Loans, Inc. 4.0% 3/22/11 | | | 1,000,000 | | | 892,452 | |
Berkshire Hathaway Finance Corp. 4.625% 10/15/13 | | | 1,000,000 | | | 1,045,232 | |
Harrah’s Operating Co., Inc. 5.375% 12/15/13 | | | 750,000 | | | 487,500 | |
Berkshire Hathaway Finance Corp. 4.85% 1/15/15 | | | 1,500,000 | | | 1,565,660 | |
USG Corp. 6.3% 11/15/16 | | | 1,000,000 | | | 795,000 | |
| | | | |
|
| |
Total Corporate Bonds (Cost $5,893,883) | | | | | | 5,676,681 | |
| | | | | | | |
| | | | | | | |
MORTGAGE-BACKED SECURITIES — 44.3%(b) | | | | | | | |
| | | | | | | |
Federal Home Loan Mortgage Corporation — 25.3% | | | | | | | |
| | | | | | | |
2498 CL PD — 5.5% 2016 (0.2 years) | | | 296,895 | | | 297,494 | |
3125 CL A — 5.125% 2013 (0.3 years) | | | 562,196 | | | 563,741 | |
2878 CL TB — 5.5% 2024 (0.8 years) | | | 1,973,800 | | | 1,995,619 | |
2665 CL WY — 4.5% 2027 (1.3 years) | | | 4,000,000 | | | 4,013,023 | |
2765 CL JN — 4.0% 2019 (1.4 years) | | | 1,648,349 | | | 1,657,138 | |
2548 CL HB — 4.5% 2010 (1.6 years) | | | 4,250,000 | | | 4,320,338 | |
2692 CL QT — 4.5% 2018 (1.6 years) | | | 2,000,000 | | | 2,027,228 | |
2921 CL A — 5.5% 2018 (1.6 years) | | | 1,765,556 | | | 1,800,372 | |
2743 CL HC — 4.5% 2015 (1.9 years) | | | 3,000,000 | | | 3,052,078 | |
2831 CL AB — 5.0% 2018 (2.5 years) | | | 1,374,847 | | | 1,416,459 | |
R011 CL AB— 5.5% 2020 (2.9 years) | | | 2,656,131 | | | 2,701,785 | |
2627 CL LE — 3.0% 2017 (2.9 years) | | | 1,547,725 | | | 1,509,516 | |
2975 CL OD — 5.5% 2027 (3.1 years) | | | 2,700,000 | | | 2,778,392 | |
2999 CL NB — 4.5% 2017 (3.3 years) | | | 4,000,000 | | | 4,064,412 | |
| | | | |
|
| |
| | | | | | 32,197,595 | |
Federal National Mortgage Association — 16.6% | | | | | | | |
| | | | | | | |
2003-87 CL JA — 4.25% 2033 (0.3 years) | | | 175,450 | | | 175,404 | |
2003-81 CL NX — 3.5% 2013 (0.5 years) | | | 664,026 | | | 663,697 | |
2002-74 CL TC — 5.0% 2015 (0.5 years) | | | 250,244 | | | 251,480 | |
2003-87 CL TE — 4.0% 2013 (0.5 years) | | | 1,221,796 | | | 1,225,582 | |
2003-20 CL QC — 5.0% 2027 (1.0 years) | | | 799,372 | | | 804,551 | |
2002-74 CL TD — 5.0% 2015 (1.5 years) | | | 4,000,000 | | | 4,078,596 | |
2003-113 CL PC — 4.0% 2015 (1.6 years) | | | 1,010,000 | | | 1,019,434 | |
2006-78 CL AV — 6.5% 2017 (2.3 years) | | | 2,101,229 | | | 2,204,439 | |
The accompanying notes form an integral part of these financial statements.
60
|
SHORT-INTERMEDIATE INCOME FUND |
Schedule of Investments in Securities, Continued |
| | | | | | | |
| | Principal
amount | | Value | |
| |
| |
| |
Federal National Mortgage Association — 16.6% (continued) | | | | | | | |
2004-81 CL KC — 4.5% 2017 (2.4 years) | | $ | 3,000,000 | | $ | 3,054,957 | |
2003-39 CL LC — 5.0% 2022 (2.5 years) | | | 1,188,311 | | | 1,221,901 | |
2003-43 CL EX — 4.5% 2017 (2.7 years) | | | 814,715 | | | 825,572 | |
2005-59 CL PB — 5.5% 2028 (3.2 years) | | | 2,000,000 | | | 2,055,595 | |
2003-92 CL PD — 4.5% 2017 (3.4 years) | | | 2,500,000 | | | 2,537,923 | |
2003-27 CL DW — 4.5% 2017 (3.6 years) | | | 1,000,000 | | | 1,011,686 | |
| | | | |
|
| |
| | | | | | 21,130,817 | |
Other — 2.4% | | | | | | | |
CDMC 2003-7P CL A4 — 3.376% 2017 (3.3 years)(c) | | | 2,738,169 | | | 2,572,844 | |
Chase MTG 2004-S1 CL A6 — 4.5% 2019 (4.6 years) | | | 441,305 | | | 423,319 | |
| | | | |
|
| |
| | | | | | 2,996,163 | |
| | | | |
|
| |
Total Mortgage-Backed Securities (Cost $55,244,247) | | | | | | 56,324,575 | |
| | | | | | | |
| | | | | | | |
MORTGAGE PASS-THROUGH SECURITIES — 4.3%(b) | | | | | | | |
| | | | | | | |
Federal National Mortgage Association — 3.3% | | | | | | | |
| | | | | | | |
254863 — 4.0% 2013 (2.2 years) | | | 549,802 | | | 553,254 | |
255291 — 4.5% 2014 (2.5 years) | | | 723,740 | | | 735,774 | |
251787 — 6.5% 2018 (3.2 years) | | | 37,022 | | | 38,743 | |
254907 — 5.0% 2018 (3.6 years) | | | 1,285,857 | | | 1,304,283 | |
357985 — 4.5% 2020 (4.3 years) | | | 1,502,670 | | | 1,497,939 | |
| | | | |
|
| |
| | | | | | 4,129,993 | |
Federal Home Loan Mortgage Corporation — 1.0% | | | | | | | |
| | | | | | | |
1386 — 5.0% 2018 (3.4 years) | | | 413,961 | | | 420,376 | |
18190 — 5.5% 2022 (3.7 years) | | | 878,800 | | | 897,314 | |
| | | | |
|
| |
| | | | | | 1,317,690 | |
| | | | |
|
| |
Total Mortgage Pass-Through Securities (Cost $5,348,173) | | | | | | 5,447,683 | |
| | | | | | | |
| | | | | | | |
TAXABLE MUNICIPAL BONDS — 3.9% | | | | | | | |
| | | | | | | |
Topeka, Kansas 4.5% 8/15/09 | | | 1,135,000 | | | 1,144,534 | |
Stratford, Connecticut 6.55% 2/15/13 | | | 500,000 | | | 528,525 | |
University of California 4.85% 5/15/13 | | | 990,000 | | | 1,006,988 | |
Nebraska Public Power District 5.14% 1/01/14 | | | 1,000,000 | | | 1,007,830 | |
Iowa State University Revenue 5.8% 7/01/22 | | | 1,335,000 | | | 1,334,867 | |
| | | | |
|
| |
Total Taxable Municipal Bonds (Cost $4,959,509) | | | | | | 5,022,744 | |
The accompanying notes form an integral part of these financial statements.
61
|
SHORT-INTERMEDIATE INCOME FUND |
Schedule of Investments in Securities, Continued |
| | | | | | | |
| | Principal
amount
or shares | | Value | |
| |
| |
| |
U.S. TREASURY AND GOVERNMENT AGENCY — 16.9% | | | | | | | |
| | | | | | | |
U.S. Treasury — 6.4% | | | | | | | |
| | | | | | | |
U.S. Treasury Note 3.0% 2/15/09 | | $ | 5,000,000 | | $ | 5,063,675 | |
U.S. Treasury Note 2.625% 3/15/09 | | | 3,000,000 | | | 3,031,641 | |
| | | | |
|
| |
| | | | | | 8,095,316 | |
| | | | | | | |
Government Agency — 10.5% | | | | | | | |
| | | | | | | |
Freddie Mac 4.0% 4/28/09 | | | 240,000 | | | 244,450 | |
Freddie Mac 3.25% 7/09/09 | | | 1,000,000 | | | 1,012,582 | |
Federal Home Loan Banks 4.16% 12/08/09 | | | 1,500,000 | | | 1,547,793 | |
Fannie Mae 4.125% 4/28/10 | | | 2,000,000 | | | 2,073,904 | |
Freddie Mac 4.125% 6/16/10 | | | 1,000,000 | | | 1,038,162 | |
Freddie Mac 5.5% 9/15/11 | | | 1,000,000 | | | 1,089,244 | |
Federal Home Loan Banks 5.2% 5/21/12 | | | 1,000,000 | | | 1,034,853 | |
Fannie Mae 4.375% 7/17/13 | | | 2,000,000 | | | 2,100,834 | |
Freddie Mac 5.0% 11/13/14 | | | 3,000,000 | | | 3,237,363 | |
| | | | |
|
| |
| | | | | | 13,379,185 | |
| | | | |
|
| |
Total U.S. Treasury and Government Agency (Cost $20,650,107) | | | | | | 21,474,501 | |
| | | | | | | |
| | | | | | | |
COMMON STOCKS — 1.4% | | | | | | | |
| | | | | | | |
Redwood Trust, Inc. | | | 38,000 | | | 1,381,300 | |
Newcastle Investment Corp. | | | 45,000 | | | 371,700 | |
| | | | |
|
| |
Total Common Stocks (Cost $2,483,048) | | | | | | 1,753,000 | |
| | | | | | | |
| | | | | | | |
CONVERTIBLE PREFERRED STOCKS — 0.3% | | | | | | | |
| | | | | | | |
Six Flags, Inc. 7.25% 8/15/09 (Cost $814,492) | | | 35,000 | | | 418,600 | |
The accompanying notes form an integral part of these financial statements.
62
|
SHORT-INTERMEDIATE INCOME FUND |
Schedule of Investments in Securities, Continued |
| | | | | | | |
| | Shares | | Value | |
| |
| |
| |
NON-CONVERTIBLE PREFERRED STOCKS — 1.9% | | | | | | | |
| | | | | | | |
Fannie Mae 8.25% 12/13/10 | | | 50,000 | | $ | 1,202,500 | |
Freddie Mac 8.375% 12/31/12 | | | 50,000 | | | 1,220,000 | |
| | | | |
|
| |
Total Non-Convertible Preferred Stocks (Cost $2,496,935) | | | | | | 2,422,500 | |
| | | | | | | |
| | | | | | | |
SHORT-TERM SECURITIES — 22.1% | | | | | | | |
| | | | | | | |
Wells Fargo Advantage Government Money Market Fund 2.4%(a)
(Cost $28,036,568) | | | 28,036,568 | | | 28,036,568 | |
| | | | |
|
| |
Total Investments in Securities (Cost $125,926,962) | | | | | | 126,576,852 | |
Other Assets Less Other Liabilities — 0.4% | | | | | | 524,681 | |
| | | | |
|
| |
Net Assets — 100% | | | | | $ | 127,101,533 | |
| | | | |
|
| |
Net Asset Value Per Share | | | | | $ | 11.74 | |
| | | | |
|
| |
| |
(a) | Rate presented represents the annualized 7-day yield at March 31, 2008. |
| |
(b) | Number of years indicated represents estimated average life of mortgage-backed securities. |
| |
(c) | Security is exempt from registration under Rule 144A of the Securities Act of 1933. This security may be resold in transactions that are exempt from registration, normally to qualified institutional buyers. |
The accompanying notes form an integral part of these financial statements.
63
|
GOVERNMENT MONEY MARKET FUND |
Schedule of Investments in Securities
March 31, 2008 |
| | | | | | | |
| | Principal
amount or
shares | | Value | |
| |
| |
| |
GOVERNMENT AGENCY — 75.3† | | | | | | | |
| | | | | | | |
Federal Farm Credit Banks Discount Note 1.8% 4/07/08 | | $ | 37,000,000 | | $ | 36,988,900 | |
Federal Home Loan Banks Discount Note 2.5% 4/09/08 | | | 25,000,000 | | | 24,986,528 | |
Federal Home Loan Banks Discount Note 2.8% 4/25/08 | | | 15,000,000 | | | 14,972,600 | |
| | | | |
|
| |
| | | | | | 76,948,028 | |
| | | | | | | |
| | | | | | | |
SHORT-TERM SECURITIES — 23.2% | | | | | | | |
| | | | | | | |
Wells Fargo Advantage 100% Treasury Money Market Fund 1.4%(a) | | | 13,762,243 | | | 13,762,243 | |
Milestone Treasury Obligations Portfolio 1.4%(a) | | | 10,000,388 | | | 10,000,388 | |
| | | | |
|
| |
Total Short-Term Securities | | | | | | 23,762,631 | |
| | | | |
|
| |
Total Investments in Securities (Cost $100,710,659) | | | | | | 100,710,659 | |
Other Assets Less Other Liabilities —1.5% | | | | | | 1,535,791 | |
| | | | |
|
| |
Net Assets — 100% | | | | | $ | 102,246,450 | |
| | | | |
|
| |
Net Asset Value Per Share | | | | | $ | 1.00 | |
| | | | |
|
| |
| |
† | Interest rates presented represent the yield to maturity at the date of purchase. |
| |
(a) | Rate presented represents the annualized 7-day yield at March 31, 2008. |
The accompanying notes form an integral part of these financial statements.
64
(This page has been left blank intentionally.)
65
|
THE WEITZ FUNDS |
Statements of Assets and Liabilities |
March 31, 2008 |