Despite increased volatility in the March quarter, our fiscal year ending March 31, 2007 was a very good one. Our four stock funds earned total returns ranging from 16.4% to 19.1% compared to gains of 11.8% for the S&P 500, 5.9% for the Russell 2000 and 4.2% for the Nasdaq Composite.
The table below shows returns, after fees and expenses, for each of our equity Funds and for the S&P 500 (larger companies), the Russell 2000 (smaller companies) and the Nasdaq Composite (a proxy for technology companies).
Profits last year came from all corners of the portfolio. A wide variety of companies that fall under the category of “media content and distribution” enjoyed strong rebounds from depressed levels. Within the Liberty Media “complex,” Liberty Global rose 55%, Discovery Holdings was up 28%, and Liberty Media, which was split into two companies, Liberty Interactive and Liberty Capital, appreciated 40%.
Financial services stocks were well-represented in the “contributor” column, despite the problems in the subprime mortgage sector. Redwood Trust, a holding since 1994 when we provided some of their initial capital, earned a total return of 34% and is better positioned than ever for future growth. Newcastle, another company we have owned since its founding in the late 1990’s, returned 27%. Newcastle has done an excellent job of investing opportunistically in many areas of mortgage finance. We think that they, like Redwood, have the access to capital, the expertise, and the discipline to take advantage of the credit and liquidity problems that are beginning to emerge in world financial markets. Berkshire Hathaway (our largest holding in 3 of 4 funds) was +21% as its operations and investments performed very well and Warren Buffett was able to make several significant acquisitions. Fannie Mae (+9%), Freddie Mac (+1%), and Countrywide (-7%) were not major factors.
Other important contributions came from Tyco (+19%), Cabela’s (+21%), and Telephone and Data Systems. Investors love to criticize management of Telephone and Data Systems (which controls the company with super-voting shares) for being too conservative—refusing to use more leverage to do larger stock buybacks. Yet the company continues to add profitable wireless subscribers and to generate strong cash flows from its rural wireline business. Periodically, investors recognize the company’s achievements, and this year the stock was up 49%.
During the year, we added several new stocks to the portfolios. The number of new positions is partly a function of changing market conditions, but it also reflects the maturing of our staff of young analysts (and the willingness of an old portfolio manager to admit they are very good at what they do).
Dell is a direct marketer of computers and other electronic equipment that we have discussed in previous letters. Our bet is that Dell’s self-inflicted problems are fixable and that its highly efficient business model is not broken.
Apollo is a leader in for-profit higher education. Apollo’s (and its peers’) earnings growth rate has slowed, but it still generates a growing stream of free cash flow which it can use for expansion and share buybacks. We believe that Apollo sells at a discount to its private market value. We would be happy to own it for many years and to participate in the growth in the value of the business, but the company might also find its way into a private equity portfolio at a healthy premium to its current price.
Mohawk and USG (formerly U.S. Gypsum, when companies had names that meant something) are building materials companies that hold dominant positions in their industries (flooring and wallboard, respectively). Both are diversified among new home, remodel, and commercial construction markets, but are clearly cyclical businesses. Their stocks are depressed because of the current slowdown in residential construction and fears of a recession that would affect commercial construction. Both have demonstrated the ability to earn high returns and increase market share over the course of a business cycle.
TD Ameritrade is a leading online discount brokerage firm based in Omaha. Their recent merger with TD Waterhouse helps diversify their business, adds meaningful scale, and provides the opportunity for significant cost savings in consolidation. We believe the stock is very cheap based on post-merger earnings power.
American Express returned to our portfolios this year. Amex is a great business with a dominant payments franchise, a wonderful consumer brand, and an entrenched competitive position. The business earns over 30% on equity, has high-return reinvestment opportunities and returns substantial amounts of cash to shareholders through dividends and share repurchases.
UPS is another wonderful business that we have admired for a long time. UPS dominates the U.S. ground parcel market and has a growing global transportation and logistics network that would be nearly impossible for a new entrant to replicate. The company continues to invest in that network (at high rates of return) to help cement its competitive advantage. The stock has declined lately due to a temporary slowdown in earnings, and while not quite cheap enough to take a full position, we have bought a modest number of shares and are hopeful that near-term economic weakness may give us the opportunity to buy more.
We have also eliminated several positions we have held for many years. We hate to see them go, but we had to make room for other holdings with more attractive valuations. Our US Bancorp position has its roots in an early
5
1990’s purchase of Omaha National Bank stock when its price was depressed due to (unfounded) fears of credit problems in its commercial loan portfolio. Host and Harrah’s date back to the late 1990’s and we lived through real estate recessions and 9/11 with them. Both have terrific managements and have been wonderful investments for us. With luck we’ll be able to own them again.
Finally, a review of fiscal 2007 would not be complete without a comment on the subprime mortgage crisis that was brewing all year and has recently hit the front pages. We have been concerned about credit quality in the mortgage markets for several years and have focused our holdings on players that we believe have the sophistication, discipline and financial strength to participate profitably. (More on this later in the letter.) In the section that follows, we will explain some of the terms and practices that have been in the news lately. There are plenty of risks associated with borrowing and lending, but some of the press coverage has been incomplete, at best. Hopefully, some clarification and context will be helpful to concerned shareholders.
Subprime Mortgage Meltdown—What’s really going on here?
Many people think of bankers and other lenders as dour curmudgeons who will lend only to those who do not need a loan—who are more concerned with the return “of” their capital than the return “on” their capital. There are still some lenders who fit this mold, and they are the ones we like to invest with. However, loans are “earning assets” that have value and the creators of these assets (“originators”) can get greedy, sloppy, or just plain over-zealous in their work, especially if they are paid by the loan and do not plan to keep the loans on their own balance sheets.
In the subprime arena, the care with which many originators “underwrite” their loans has deteriorated over the past few years. Careful study of the prospective borrower’s job history and income level gave way to “stated income” loans (cynically nicknamed “liar loans”). Lenders offered to lend higher percentages of the purchase price (“loan to value” ratio or LTV) and the quality of the appraisal of the home’s value received less scrutiny. Adjustable rate mortgages (ARMs) were extended to borrowers who could (barely) afford the initial “teaser” interest rates but not the higher rates that would take effect when the interest rate “reset.”
The buyers of these loans are typically financial institutions and other investors who depend on the “representations and warranties” of the originators that the loans have been properly underwritten. If it turns out that the originator misrepresented the quality of the loans, the buyer may “put” the loans back to the originator. The originator repurchases the loans at the buyer’s cost, then recovers whatever he can through sale of the loan (at a discount from face value) or through foreclosure.
The recent series of bankruptcies has occurred among mortgage brokers that did not have, and could not borrow, the capital necessary to buy back all the loans that were put to them. These firms depended on banks and securities firms for both the warehouse loans used to fund the mortgages they originated and for the secondary markets into which they sold the loans they made. When either or both ends of this chain disappeared, the broker/originators were out of luck.
The burning questions on the minds of our shareholders are, “How much worse will the credit problems get?” and “What does this mean for our Funds’ portfolios?” We regularly reassess both the financial strength of our portfolio companies and the evolution of their business models. In some cases, we have sold entire positions, in others we have gradually reduced them, and in a few, we have added to our holdings on weakness. Here are a few examples of our tactical approach over the past few years.
We participated in the recapitalization of a subprime mortgage company after it faced a liquidity crisis in 1998 and we made roughly 10-20 times our money over the next five years as it recovered and prospered. We sold the last of our stock in 2004 as industry lending terms became more aggressive and the housing market became more speculative.
6
We first bought Countrywide Financial and Washington Mutual (WaMu) in the early 1990’s. Countrywide has gained market share through internal growth and very efficient operations. Washington Mutual grew through acquisitions, and while it was not as strong as Countrywide from an operating perspective, it grew steadily and treated shareholders well with a combination of generous dividends and stock buybacks. Both have been very good investments for us. We sold our WaMu in the first quarter of (calendar) 2007 because of its exposure to subprime and Alt-A (what some refer to as “the mysterious middle ground between subprime and prime”) and because we had less confidence in management’s ability to successfully cope with a crisis in the mortgage industry.
Since rising interest rates hurt Countrywide’s origination volumes, earnings have been on a plateau around $4 per share for three years. The stock has traded between $30 and $45 during that time and we have regularly bought more shares in the low-to-mid $30’s and reduced our position in the $40’s. As fears deepen and the possibility of a temporary, but severe, hit to Countrywide’s earnings looms, we have chosen to hold our position. Our rationale is that we do not know that it will go much lower, and we strongly believe that it should sell at much higher levels in the future. The alternative is to sell our position now with the hope of avoiding some temporary markdowns but risk missing our chance to repurchase the position before the stock recovers. Stocks have a way of bottoming long before the bad news is over and the good news appears. We sold some Berkshire Hathaway A shares in the 1970’s at $510 per share for some short-term reason, and with the stock now at $109,800 per share we’re beginning to think we are not going to get it back for $510.
Fannie Mae and Freddie Mac have some subprime exposure, but primarily in the form of AAA bonds backed by subprime mortgages. Both have strong balance sheets and in a crisis, they should be able to buy assets at very attractive prices. Also, if a capital shortage were to develop in the mortgage markets, Freddie and Fannie would be able to provide liquidity to the market and thus score points with a Congress that has recently been inclined to restrain the growth of their businesses. This could help reduce the “political” risk that causes these stocks to sell at depressed valuations.
Redwood and Newcastle, as mentioned earlier, are nimble, entrepreneurial companies that are well-positioned to take advantage of any distress in the mortgage markets—subprime or otherwise. Rising foreclosures and forced home sales will affect all residential mortgage investors, but on balance, we expect Redwood and Newcastle to be beneficiaries of any resulting liquidity crisis. These are positions we might want to add to if generalized concerns cause their stocks to fall. (For readers who are interested in learning more about how a sophisticated mortgage investor approaches its work, we highly recommend the Redwood Review, available quarterly on Redwood Trust’s web site.)
Outlook
Subprime loans occupy a small corner of the world’s financial markets. They happen to be in the spotlight at the moment, but the same availability of credit, derivative and structured finance technology, and human motivations that led to subprime mortgage problems will probably cause other financial accidents from time to time. There is also a reasonable chance that the slowdown in the housing industry will spill over into other areas of the economy and cause corporate earnings disappointments, if not a recession. This does not mean that we should withdraw to the sidelines and wait for “normal” times—financial markets will always be subject to these uncertainties. It does mean that common sense and investing discipline are more important than ever.
We believe that our companies are very well positioned to withstand adversity, and that many of them have the excess liquidity necessary to take market share and make acquisitions in a period of stress in the economy or financial markets. We have no idea what the stock market will do over the next several quarters, but we feel very good about the businesses we own and their prospects for growth in value over the next few years.
7
Annual Shareholder Information Meeting—Tuesday, May 22, 2007.
Please plan to join us at the Scott Conference Center in Omaha at 4:30 p.m. on May 22. The center is located at 6450 Pine Street on the Aksarben campus. There will be no formal business to conduct, so we can devote the entire meeting to answering your questions. Maps and driving directions are available from our client service representatives. We look forward to seeing you there.
| |
Sincerely, | |
| |

| 
|
| |
Wallace R. Weitz | Bradley P. Hinton |
Co-manager Value and Partners Value | Co-manager Value and Partners Value |
Portfolio Manager Hickory and Partners III | |
Portfolio composition is subject to change at any time and references to specific securities, industries, and sectors referenced in this letter are not recommendations to purchase or sell any particular security. See the Schedules of Investments in Securities included in this report for the percent of assets in each of the Funds invested in particular industries or sectors.
8
(This page has been left blank intentionally.)
9
FUND PERFORMANCE — VALUE FUND
(Unaudited)
The following table summarizes performance information for the Fund as compared to the S&P 500 over the periods indicated.
| | | | | | | | | | | | | |
Period Ended | | Value Fund | | S&P 500 | | Difference
Value Fund – S&P 500 | |
| |
| |
| |
| |
Dec. 31, 1997 | | | 38.9 | % | | | 33.4 | % | | | 5.5 | % | |
Dec. 31, 1998 | | | 28.9 | | | | 28.6 | | | | 0.3 | | |
Dec. 31, 1999 | | | 21.0 | | | | 21.0 | | | | 0.0 | | |
Dec. 31, 2000 | | | 19.6 | | | | –9.1 | | | | 28.7 | | |
Dec. 31, 2001 | | | 0.2 | | | | –11.8 | | | | 12.0 | | |
Dec. 31, 2002 | | | –17.1 | | | | –22.1 | | | | 5.0 | | |
Dec. 31, 2003 | | | 28.7 | | | | 28.7 | | | | 0.0 | | |
Dec. 31, 2004 | | | 15.7 | | | | 10.9 | | | | 4.8 | | |
Dec. 31, 2005 | | | –2.8 | | | | 4.9 | | | | –7.7 | | |
Dec. 31, 2006 | | | 21.8 | | | | 15.8 | | | | 6.0 | | |
Mar. 31, 2007 (3 months) | | | –0.4 | | | | 0.6 | | | | –1.0 | | |
| | | | | | | | | | | | | |
10-Year Cumulative Return ended Mar. 31, 2007 | | | 271.4 | | | | 119.9 | | | | 151.5 | | |
10-Year Average Annual Compound Return ended Mar. 31, 2007 | | | 14.0 | | | | 8.2 | | | | 5.8 | | |
This chart depicts the change in the value of a $10,000 investment in the Value Fund for the period March 31, 1997, through March 31, 2007, as compared with the growth of the Standard & Poor’s 500 Index during the same period. Index performance is hypothetical and is shown for illustrative purposes only.
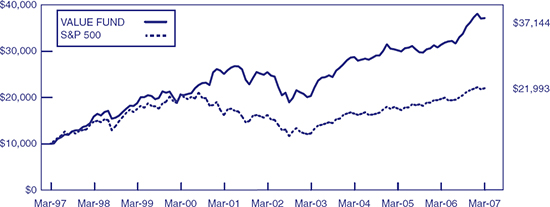
The Fund’s average annual total return for the one, five and ten year periods ended March 31, 2007 was 18.3%, 7.8% and 14.0%, respectively. These performance numbers reflect the deduction of the Fund’s annual operating expenses, which as stated in its most recent prospectus are 1.12% of the Fund’s net assets. The returns assume redemption at the end of each period and reinvestment of dividends. This information represents past performance and past performance does not guarantee future results. The investment return and the principal value of an investment in this Fund will fluctuate so that an investor’s shares, when redeemed, may be worth more or less than the original cost. Current performance may be lower or higher than the performance data quoted. Performance data current to the most recent month-end may be obtained at www.weitzfunds.com/performance/monthly.asp.
Performance information does not reflect the deduction of taxes that a shareholder would pay on Fund distributions or the redemption of Fund shares.
10
PORTFOLIO PROFILE — VALUE FUND
(Unaudited)
Top Ten Stocks*
| | | | |
Berkshire Hathaway | | | 7.3 | % |
Countrywide Financial | | | 6.2 | |
UnitedHealth Group | | | 5.6 | |
Tyco International | | | 4.9 | |
Liberty Media - Interactive | | | 4.7 | |
Liberty Media - Capital | | | 4.6 | |
Liberty Global | | | 4.5 | |
Wal-Mart | | | 4.2 | |
Washington Post | | | 4.0 | |
American International Group | | | 4.0 | |
| |
|
| |
| | | 50.0 | % |
| |
|
| |
Industry Sectors*
| | | | |
Media Content and Distribution | | | 19.5 | % |
Mortgage Services | | | 16.6 | |
Consumer Products and Services | | | 14.4 | |
Financial Services | | | 13.6 | |
Healthcare | | | 9.8 | |
Diversified Industries | | | 4.9 | |
Telecommunications | | | 3.4 | |
Technology | | | 2.4 | |
Building and Construction Products | | | 1.1 | |
Transportation | | | 1.0 | |
Gaming, Lodging and Leisure | | | 0.3 | |
Short-Term Securities/Other | | | 13.0 | |
| |
|
| |
| | | 100.0 | % |
| |
|
| |
Largest Net Purchases and Sales for Year Ended March 31, 2007
Net Purchases ($mil)
| | | | |
UnitedHealth Group | | $ | 150 | |
Dell (new) | | | 76 | |
American Express (new) | | | 71 | |
Apollo Group (new) | | | 65 | |
WellPoint | | | 57 | |
| |
|
| |
| | $ | 419 | |
| |
|
| |
Net Sales ($mil)
| | | | |
Comcast | | $ | 149 | |
Washington Mutual (eliminated) | | | 101 | |
Host Hotels & Resorts (eliminated) | | | 89 | |
News Corp. | | | 76 | |
Tyco International | | | 64 | |
Other (net) | | | 226 | |
| |
|
| |
| | $ | 705 | |
| |
|
| |
| | | | |
Net Portfolio Sales | | $ | 286 | |
| |
|
| |
Largest Net Contributions to Investment Results for Year Ended March 31, 2007
Positive ($mil)
| | | | |
| | | | |
Liberty Media - Interactive & Capital # | | $ | 83 | |
Liberty Global | | | 59 | |
Comcast | | | 53 | |
Telephone & Data Systems | | | 46 | |
Berkshire Hathaway | | | 43 | |
Other (net) | | | 237 | |
| |
|
| |
| | $ | 521 | |
| |
|
| |
| | | | |
Net Portfolio Gains | | $ | 504 | |
| |
|
| |
Negative ($mil)
| | | | |
Countrywide Financial | | $ | (8 | ) |
Six Flags | | | (3 | ) |
Opteum | | | (3 | ) |
Cumulus Media | | | (2 | ) |
USG Corp. | | | (1 | ) |
| |
|
| |
| | $ | (17 | ) |
| |
|
| |
| |
# | For presentation purposes, securities combined due to merger and/or spin-off during the year |
11
VALUE FUND
Schedule of Investments in Securities
March 31, 2007
| | | | | | | |
| | Shares | | Value | |
| |
| |
| |
COMMON STOCKS — 87.0% | | | | | | | |
| | | | | | | |
Media Content and Distribution — 19.5% | | | | | | | |
| | | | | | | |
Newspaper, Television, Radio and Programming — 12.5% | | | | | | | |
Liberty Media Corp. - Capital - Series A* | | | 1,285,000 | | $ | 142,108,150 | |
The Washington Post Co. - CL B | | | 164,060 | | | 125,259,810 | |
Discovery Holding Co. - Series A* | | | 2,480,000 | | | 47,442,400 | |
CBS Corp. - CL B | | | 1,409,400 | | | 43,113,546 | |
News Corp. - CL A | | | 800,000 | | | 18,496,000 | |
Cumulus Media, Inc. - CL A* | | | 1,500,000 | | | 14,070,000 | |
| | | | |
|
| |
| | | | | | 390,489,906 | |
Cable Television — 7.0% | | | | | | | |
Liberty Global, Inc. - Series C* | | | 3,435,157 | | | 105,253,210 | |
Liberty Global, Inc. - Series A* | | | 1,062,520 | | | 34,988,784 | |
Comcast Corp. - CL A* | | | 3,050,000 | | | 79,147,500 | |
Adelphia Recovery Trust, Series ACC-7* # | | | 3,535,000 | | | 70,700 | |
| | | | |
|
| |
| | | | | | 219,460,194 | |
| | | | |
|
| |
| | | | | | 609,950,100 | |
Mortgage Services — 16.6% | | | | | | | |
| | | | | | | |
Originating and Investing — 11.8% | | | | | | | |
Countrywide Financial Corp. | | | 5,750,000 | | | 193,430,000 | |
Redwood Trust, Inc.† | | | 2,345,000 | | | 122,362,100 | |
Newcastle Investment Corp. | | | 1,100,000 | | | 30,503,000 | |
CBRE Realty Finance, Inc.# | | | 1,350,000 | | | 17,860,500 | |
Opteum, Inc. | | | 700,000 | | | 3,150,000 | |
| | | | |
|
| |
| | | | | | 367,305,600 | |
Government Agency — 4.8% | | | | | | | |
Fannie Mae | | | 2,084,000 | | | 113,744,720 | |
Freddie Mac | | | 588,700 | | | 35,021,763 | |
| | | | |
|
| |
| | | | | | 148,766,483 | |
| | | | |
|
| |
| | | | | | 516,072,083 | |
| | | | | | | |
Consumer Products and Services — 14.4% | | | | | | | |
| | | | | | | |
Retailing — 12.2% | | | | | | | |
Liberty Media Corp. - Interactive - Series A* | | | 6,205,000 | | | 147,803,100 | |
Wal-Mart Stores, Inc. | | | 2,760,000 | | | 129,582,000 | |
IAC/InterActiveCorp* | | | 1,450,000 | | | 54,679,500 | |
Expedia, Inc.* | | | 2,100,000 | | | 48,678,000 | |
| | | | |
|
| |
| | | | | | 380,742,600 | |
The accompanying notes form an integral part of these financial statements.
12
VALUE FUND
Schedule of Investments in Securities, Continued
| | | | | | | |
| | Shares | | Value | |
| |
| |
| |
Education — 2.2% | | | | | | | |
Apollo Group, Inc. - CL A* | | | 1,550,000 | | $ | 68,045,000 | |
| | | | | | | |
Consumer Goods — 0.0% | | | | | | | |
Mohawk Industries, Inc.* | | | 21,500 | | | 1,764,075 | |
| | | | |
|
| |
| | | | | | 450,551,675 | |
| | | | | | | |
Financial Services — 13.6% | | | | | | | |
| | | | | | | |
Insurance — 11.3% | | | | | | | |
Berkshire Hathaway, Inc. - CL B* | | | 63,000 | | | 229,320,000 | |
American International Group, Inc. | | | 1,850,000 | | | 124,357,000 | |
| | | | |
|
| |
| | | | | | 353,677,000 | |
Consumer Finance — 2.3% | | | | | | | |
American Express Co. | | | 1,250,000 | | | 70,500,000 | |
| | | | |
|
| |
| | | | | | 424,177,000 | |
| | | | | | | |
Healthcare — 9.8% | | | | | | | |
| | | | | | | |
Managed Care — 8.3% | | | | | | | |
UnitedHealth Group, Inc. | | | 3,300,000 | | | 174,801,000 | |
WellPoint, Inc.* | | | 1,013,000 | | | 82,154,300 | |
| | | | |
|
| |
| | | | | | 256,955,300 | |
Suppliers and Distributors — 1.5% | | | | | | | |
Omnicare, Inc. | | | 1,200,000 | | | 47,724,000 | |
| | | | |
|
| |
| | | | | | 304,679,300 | |
| | | | | | | |
Diversified Industries — 4.9% | | | | | | | |
| | | | | | | |
Tyco International Ltd. | | | 4,860,000 | | | 153,333,000 | |
| | | | | | | |
| | | | | | | |
Telecommunications — 3.4% | | | | | | | |
| | | | | | | |
Telephone and Data Systems, Inc. - Special | | | 1,647,700 | | | 92,106,430 | |
Telephone and Data Systems, Inc. | | | 250,000 | | | 14,905,000 | |
| | | | |
|
| |
| | | | | | 107,011,430 | |
| | | | | | | |
Technology — 2.4% | | | | | | | |
| | | | | | | |
Dell, Inc.* | | | 3,240,000 | | | 75,200,400 | |
The accompanying notes form an integral part of these financial statements.
13
VALUE FUND
Schedule of Investments in Securities, Continued
| | | | | | | |
| | Principal
amount
or shares | | Value | |
| |
| |
| |
Building and Construction Products — 1.1% | | | | | | | |
| | | | | | | |
USG Corp.* | | | 723,000 | | $ | 33,749,640 | |
| | | | | | | |
Transportation — 1.0% | | | | | | | |
| | | | | | | |
United Parcel Service, Inc. | | | 450,000 | | | 31,545,000 | |
| | | | | | | |
Gaming, Lodging and Leisure — 0.3% | | | | | | | |
| | | | | | | |
Six Flags, Inc.* | | | 1,574,500 | | | 9,462,745 | |
| | | | |
|
| |
Total Common Stocks (Cost $2,012,697,027) | | | | | | 2,715,732,373 | |
| | | | | | | |
SHORT-TERM SECURITIES — 13.7% | | | | | | | |
| | | | | | | |
Wells Fargo Advantage Government Money Market Fund 5.3%(a) | | | 102,272,569 | | | 102,272,569 | |
Milestone Treasury Obligations Portfolio 5.2%(a) | | | 46,014,565 | | | 46,014,565 | |
Federal Home Loan Bank Discount Notes, 5.2% to 5.3%,
4/04/07 to 6/27/07(b) | | $ | 182,000,000 | | | 180,542,186 | |
U.S. Treasury Bill 5.0% 6/21/07(b) | | | 100,000,000 | | | 98,912,200 | |
| | | | |
|
| |
Total Short-Term Securities (Cost $427,685,162) | | | | | | 427,741,520 | |
| | | | |
|
| |
Total Investments in Securities (Cost $2,440,382,189) | | | | | | 3,143,473,893 | |
Other Liabilities in Excess of Other Assets — (0.7%) | | | | | | (21,692,301 | ) |
| | | | |
|
| |
Net Assets — 100% | | | | | $ | 3,121,781,592 | |
| | | | |
|
| |
Net Asset Value Per Share | | | | | $ | 40.09 | |
| | | | |
|
| |
| |
* | Non-income producing |
| |
† | Non-controlled affiliate |
| |
# | Illiquid and/or restricted security that has been fair valued. |
| |
(a) | Rate presented represents the annualized 7-day yield at March 31, 2007. |
| |
(b) | Interest rate presented represents the yield to maturity at the date of purchase. |
The accompanying notes form an integral part of these financial statements.
14
(This page has been left blank intentionally.)
15
FUND PERFORMANCE — PARTNERS VALUE FUND
(Unaudited)
The following table summarizes performance information for the Fund as compared to the S&P 500 over the periods indicated.
| | | | | | | | | | |
Period Ended | | Partners Value Fund | | S&P 500 | | Difference
Partners Value – S&P 500 | |
| |
| |
| |
| |
Dec. 31, 1997 | | 40.6 | % | | 33.4 | % | | 7.2 | % | |
Dec. 31, 1998 | | 29.1 | | | 28.6 | | | 0.5 | | |
Dec. 31, 1999 | | 22.1 | | | 21.0 | | | 1.1 | | |
Dec. 31, 2000 | | 21.1 | | | –9.1 | | | 30.2 | | |
Dec. 31, 2001 | | –0.9 | | | –11.8 | | | 10.9 | | |
Dec. 31, 2002 | | –17.0 | | | –22.1 | | | 5.1 | | |
Dec. 31, 2003 | | 25.4 | | | 28.7 | | | –3.3 | | |
Dec. 31, 2004 | | 15.0 | | | 10.9 | | | 4.1 | | |
Dec. 31, 2005 | | –2.4 | | | 4.9 | | | –7.3 | | |
Dec. 31, 2006 | | 22.5 | | | 15.8 | | | 6.7 | | |
Mar. 31, 2007 (3 months) | | 0.4 | | | 0.6 | | | –0.2 | | |
| | | | | | | | | | |
10-Year Cumulative Return ended Mar. 31, 2007 | | 275.5 | | | 119.9 | | | 155.6 | | |
10-Year Average Annual Compound Return ended Mar. 31, 2007 | | 14.1 | | | 8.2 | | | 5.9 | | |
This chart depicts the change in the value of a $10,000 investment in the Partners Value Fund for the period March 31, 1997, through March 31, 2007, as compared with the growth of the Standard & Poor’s 500 Index during the same period. Index performance is hypothetical and is shown for illustrative purposes only.
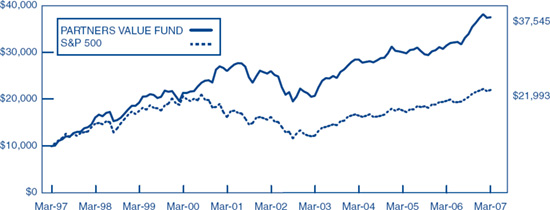
The Fund’s average annual total return for the one, five and ten year periods ended March 31, 2007 was 19.1%, 7.6% and 14.1%, respectively. These performance numbers reflect the deduction of the Fund’s annual operating expenses which as stated in its most recent prospectus are 1.14% of the Fund’s net assets. The returns assume redemption at the end of each period and reinvestment of dividends. This information represents past performance and past performance does not guarantee future results. The investment return and the principal value of an investment in this Fund will fluctuate so that an investor’s shares, when redeemed, may be worth more or less than the original cost. Current performance may be lower or higher than the performance data quoted. Performance data current to the most recent month-end may be obtained at www.weitzfunds.com/performance/monthly.asp.
Performance information does not reflect the deduction of taxes that a shareholder would pay on Fund distributions or the redemption of Fund shares.
16
PORTFOLIO PROFILE — PARTNERS VALUE FUND
(Unaudited)
Top Ten Stocks*
| | | | |
Berkshire Hathaway | | | 7.4 | % |
Countrywide Financial | | | 6.2 | |
UnitedHealth Group | | | 5.6 | |
Tyco International | | | 4.9 | |
Liberty Media - Interactive | | | 4.6 | |
Liberty Media - Capital | | | 4.5 | |
Liberty Global | | | 4.4 | |
Wal-Mart | | | 4.2 | |
Telephone & Data Systems | | | 4.1 | |
American International Group | | | 4.0 | |
| |
|
| |
| | | 49.9 | % |
| |
|
| |
Industry Sectors*
| | | | |
Media Content and Distribution | | | 18.9 | % |
Consumer Products and Services | | | 17.9 | |
Financial Services | | | 13.5 | |
Mortgage Services | | | 13.2 | |
Healthcare | | | 9.9 | |
Diversified Industries | | | 4.9 | |
Telecommunications | | | 4.1 | |
Technology | | | 2.4 | |
Building and Construction Products | | | 1.1 | |
Transportation | | | 1.0 | |
Commercial Services | | | 0.7 | |
Gaming, Lodging and Leisure | | | 0.2 | |
Short-Term Securities/Other | | | 12.2 | |
| |
|
| |
| | | 100.0 | % |
| |
|
| |
Largest Net Purchases and Sales for Year Ended March 31, 2007
Net Purchases ($mil)
| | | | |
UnitedHealth Group (new) | | $ | 99 | |
Dell (new) | | | 49 | |
American Express (new) | | | 46 | |
WellPoint (new) | | | 45 | |
Apollo Group (new) | | | 42 | |
| |
|
| |
| | $ | 281 | |
| |
|
| |
Net Sales ($mil)
| | | | |
Comcast | | $ | 105 | |
Washington Mutual (eliminated) | | | 65 | |
Host Hotels & Resorts (eliminated) | | | 56 | |
News Corp. | | | 48 | |
Tyco International | | | 41 | |
Other (net) | | | 195 | |
| |
|
| |
| | $ | 510 | |
| |
|
| |
| | | | |
Net Portfolio Sales | | $ | 229 | |
| |
|
| |
Largest Net Contributions to Investment Results for Year Ended March 31, 2007
Positive ($mil)
| | | | |
Liberty Media - Interactive & Capital# | | $ | 53 | |
Liberty Global | | | 37 | |
Comcast | | | 35 | |
Telephone & Data Systems | | | 29 | |
Berkshire Hathaway | | | 28 | |
Other (net) | | | 170 | |
| |
|
| |
| | $ | 352 | |
| |
|
| |
| | | | |
Net Portfolio Gains | | $ | 342 | |
| |
|
| |
Negative ($mil)
| | | | |
Countrywide Financial | | $ | (6 | ) |
Six Flags | | | (2 | ) |
Laboratory Corp. of America | | | (2 | ) |
| |
|
| |
| | $ | (10 | ) |
| |
|
| |
| |
# | For presentation purposes, securities combined due to merger and/or spin-off during the year |
17
PARTNERS VALUE FUND
Schedule of Investments in Securities
March 31, 2007
| | | | | | | |
| | Shares | | Value | |
| |
| |
| |
COMMON STOCKS — 87.8% | | | | | | | |
| | | | | | | |
Media Content and Distribution — 18.9% | | | | | | | |
| | | | | | | |
Newspaper, Television, Radio and Programming — 12.3% | | | | | | | |
Liberty Media Corp. - Capital - Series A* | | | 815,000 | | $ | 90,130,850 | |
The Washington Post Co. - CL B | | | 105,540 | | | 80,579,790 | |
Discovery Holding Co. - Series A* | | | 1,844,758 | | | 35,290,220 | |
CBS Corp. - CL B | | | 914,000 | | | 27,959,260 | |
News Corp. - CL A | | | 500,000 | | | 11,560,000 | |
Daily Journal Corp.* † | | | 116,000 | | | 4,699,160 | |
| | | | |
|
| |
| | | | | | 250,219,280 | |
Cable Television — 6.6% | | | | | | | |
Liberty Global, Inc. - Series C* | | | 2,410,168 | | | 73,847,548 | |
Liberty Global, Inc. - Series A* | | | 491,996 | | | 16,201,428 | |
Comcast Corp. - CL A* | | | 1,650,000 | | | 42,817,500 | |
Adelphia Recovery Trust, Series ACC-7* # | | | 2,310,000 | | | 46,200 | |
| | | | |
|
| |
| | | | | | 132,912,676 | |
| | | | |
|
| |
| | | | | | 383,131,956 | |
| | | | | | | |
Consumer Products and Services — 17.9% | | | | | | | |
| | | | | | | |
Retailing — 13.7% | | | | | | | |
Liberty Media Corp. - Interactive - Series A* | | | 3,935,000 | | | 93,731,700 | |
Wal-Mart Stores, Inc. | | | 1,800,000 | | | 84,510,000 | |
IAC/InterActiveCorp* | | | 921,000 | | | 34,730,910 | |
Cabela’s, Inc. - CL A* | | | 1,350,000 | | | 33,493,500 | |
Expedia, Inc.* | | | 1,350,000 | | | 31,293,000 | |
| | | | |
|
| |
| | | | | | 277,759,110 | |
Education — 2.2% | | | | | | | |
Apollo Group, Inc. - CL A* | | | 1,000,000 | | | 43,900,000 | |
| | | | | | | |
Consumer Goods — 2.0% | | | | | | | |
Mohawk Industries, Inc.* | | | 500,000 | | | 41,025,000 | |
| | | | |
|
| |
| | | | | | 362,684,110 | |
| | | | | | | |
Financial Services — 13.5% | | | | | | | |
| | | | | | | |
Insurance — 11.3% | | | | | | | |
Berkshire Hathaway, Inc. - CL B* | | | 31,900 | | | 116,116,000 | |
Berkshire Hathaway, Inc. - CL A* | | | 300 | | | 32,697,000 | |
American International Group, Inc. | | | 1,200,000 | | | 80,664,000 | |
| | | | |
|
| |
| | | | | | 229,477,000 | |
The accompanying notes form an integral part of these financial statements.
18
PARTNERS VALUE FUND
Schedule of Investments in Securities, Continued
| | | | | | | |
| | Shares | | Value | |
| |
| |
| |
Consumer Finance — 2.2% | | | | | | | |
American Express Co. | | | 800,000 | | $ | 45,120,000 | |
| | | | |
|
| |
| | | | | | 274,597,000 | |
| | | | | | | |
Mortgage Services — 13.2% | | | | | | | |
| | | | | | | |
Originating and Investing — 9.1% | | | | | | | |
Countrywide Financial Corp. | | | 3,725,000 | | | 125,309,000 | |
Redwood Trust, Inc. | | | 1,110,000 | | | 57,919,800 | |
| | | | |
|
| |
| | | | | | 183,228,800 | |
Government Agency — 4.1% | | | | | | | |
Fannie Mae | | | 1,327,000 | | | 72,427,660 | |
Freddie Mac | | | 192,300 | | | 11,439,927 | |
| | | | |
|
| |
| | | | | | 83,867,587 | |
| | | | |
|
| |
| | | | | | 267,096,387 | |
| | | | | | | |
Healthcare — 9.9% | | | | | | | |
| | | | | | | |
Managed Care — 8.2% | | | | | | | |
UnitedHealth Group, Inc. | | | 2,140,000 | | | 113,355,800 | |
WellPoint, Inc.* | | | 647,000 | | | 52,471,700 | |
| | | | |
|
| |
| | | | | | 165,827,500 | |
Suppliers and Distributors — 1.7% | | | | | | | |
Omnicare, Inc. | | | 860,000 | | | 34,202,200 | |
| | | | |
|
| |
| | | | | | 200,029,700 | |
| | | | | | | |
Diversified Industries — 4.9% | | | | | | | |
| | | | | | | |
Tyco International Ltd. | | | 3,140,000 | | | 99,067,000 | |
| | | | | | | |
Telecommunications — 4.1% | | | | | | | |
| | | | | | | |
Telephone and Data Systems, Inc. - Special | | | 1,473,300 | | | 82,357,470 | |
| | | | | | | |
Technology — 2.4% | | | | | | | |
| | | | | | | |
Dell, Inc.* | | | 2,070,000 | | | 48,044,700 | |
| | | | | | | |
Building and Construction Products — 1.1% | | | | | | | |
| | | | | | | |
USG Corp.* | | | 468,800 | | | 21,883,584 | |
The accompanying notes form an integral part of these financial statements.
19
PARTNERS VALUE FUND
Schedule of Investments in Securities, Continued
| | | | | | | |
| | Principal
amount
or shares | | Value | |
| |
| |
| |
Transportation — 1.0% | | | | | | | |
| | | | | | | |
United Parcel Service, Inc. | | | 300,000 | | $ | 21,030,000 | |
| | | | | | | |
Commercial Services — 0.7% | | | | | | | |
| | | | | | | |
Coinstar, Inc.* | | | 432,900 | | | 13,549,770 | |
| | | | | | | |
Gaming, Lodging and Leisure — 0.2% | | | | | | | |
| | | | | | | |
Six Flags, Inc.* | | | 564,600 | | | 3,393,246 | |
| | | | |
|
| |
Total Common Stocks (Cost $1,308,924,516) | | | | | | 1,776,864,923 | |
| | | | | | | |
SHORT-TERM SECURITIES — 12.4% | | | | | | | |
| | | | | | | |
Wells Fargo Advantage Government Money Market Fund 5.3%(a) | | | 75,801,130 | | | 75,801,130 | |
Milestone Treasury Obligations Portfolio 5.2%(a) | | | 46,100,867 | | | 46,100,867 | |
Federal Home Loan Bank Discount Notes, 5.2% to 5.3%, 4/04/07 to 6/01/07(b) | | $ | 70,000,000 | | | 69,775,345 | |
U.S. Treasury Bill 5.0% 6/21/07(b) | | | 60,000,000 | | | 59,347,320 | |
| | | | |
|
| |
Total Short-Term Securities (Cost $251,001,790) | | | | | | 251,024,662 | |
| | | | |
|
| |
Total Investments in Securities (Cost $1,559,926,306) | | | | | | 2,027,889,585 | |
Other Liabilities in Excess of Other Assets — (0.2%) | | | | | | (4,052,412 | ) |
| | | | |
|
| |
Net Assets — 100% | | | | | $ | 2,023,837,173 | |
| | | | |
|
| |
Net Asset Value Per Share | | | | | $ | 24.53 | |
| | | | |
|
| |
| |
* | Non-income producing |
| |
† | Non-controlled affiliate |
| |
# | Illiquid and/or restricted security that has been fair valued. |
| |
(a) | Rate presented represents the annualized 7-day yield at March 31, 2007. |
| |
(b) | Interest rate presented represents the yield to maturity at the date of purchase. |
The accompanying notes form an integral part of these financial statements.
20
(This page has been left blank intentionally.)
21
FUND PERFORMANCE — HICKORY FUND
(Unaudited)
The following table summarizes performance information for the Fund as compared to the S&P 500 over the periods indicated.
| | | | | | | | | | |
Period Ended | | Hickory Fund | | S&P 500 | | Difference
Hickory Fund – S&P 500 | |
| |
| |
| |
| |
Dec. 31, 1997 | | 39.2 | % | | 33.4 | % | | 5.8 | % | |
Dec. 31, 1998 | | 33.0 | | | 28.6 | | | 4.4 | | |
Dec. 31, 1999 | | 36.7 | | | 21.0 | | | 15.7 | | |
Dec. 31, 2000 | | –17.2 | | | –9.1 | | | –8.1 | | |
Dec. 31, 2001 | | –4.6 | | | –11.8 | | | 7.2 | | |
Dec. 31, 2002 | | –29.3 | | | –22.1 | | | –7.2 | | |
Dec. 31, 2003 | | 47.9 | | | 28.7 | | | 19.2 | | |
Dec. 31, 2004 | | 22.6 | | | 10.9 | | | 11.7 | | |
Dec. 31, 2005 | | –0.2 | | | 4.9 | | | –5.1 | | |
Dec. 31, 2006 | | 22.8 | | | 15.8 | | | 7.0 | | |
Mar. 31, 2007 (3 months) | | –0.7 | | | 0.6 | | | –1.3 | | |
| | | | | | | | | | |
10-Year Cumulative Return ended Mar. 31, 2007 | | 209.9 | | | 119.9 | | | 90.0 | | |
10-Year Average Annual Compound Return ended Mar. 31, 2007 | | 12.0 | | | 8.2 | | | 3.8 | | |
This chart depicts the change in the value of a $10,000 investment in the Hickory Fund for the period March 31, 1997, through March 31, 2007, as compared with the growth of the Standard & Poor’s 500 Index during the same period. Index performance is hypothetical and is shown for illustrative purposes only.
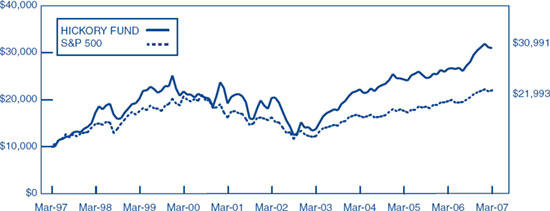
The Fund’s average annual total return for the one, five and ten year periods ended March 31, 2007 was 16.6%, 8.7% and 12.0%, respectively. These performance numbers reflect the deduction of the Fund’s annual operating expenses which as stated in its most recent prospectus are 1.20% of the Fund’s net assets. The returns assume redemption at the end of each period and reinvestment of dividends. This information represents past performance and past performance does not guarantee future results. The investment return and the principal value of an investment in this Fund will fluctuate so that an investor’s shares, when redeemed, may be worth more or less than the original cost. Current performance may be lower or higher than the performance data quoted. Performance data current to the most recent month-end may be obtained at www.weitzfunds.com/performance/monthly.asp.
Performance information does not reflect the deduction of taxes that a shareholder would pay on Fund distributions or the redemption of Fund shares.
22
PORTFOLIO PROFILE — HICKORY FUND
(Unaudited)
Top Ten Stocks*
| | | | |
Countrywide Financial | | | 6.1 | % |
Redwood Trust | | | 6.1 | |
Berkshire Hathaway | | | 5.9 | |
UnitedHealth Group | | | 5.2 | |
Tyco International | | | 4.5 | |
Liberty Media - Interactive | | | 4.3 | |
Liberty Media - Capital | | | 4.2 | |
Liberty Global | | | 3.7 | |
Coinstar | | | 3.6 | |
American International Group | | | 3.5 | |
| | |
| |
| | | 47.1 | % |
| | |
| |
Industry Sectors*
| | | | |
Consumer Products and Services | | | 19.0 | % |
Mortgage Services | | | 18.5 | |
Media Content and Distribution | | | 13.2 | |
Financial Services | | | 12.5 | |
Healthcare | | | 9.4 | |
Diversified Industries | | | 4.5 | |
Commercial Services | | | 3.9 | |
Telecommunications | | | 3.2 | |
Gaming, Lodging and Leisure | | | 2.1 | |
Technology | | | 1.5 | |
Building and Construction Products | | | 0.9 | |
Short-Term Securities/Other | | | 11.3 | |
| | |
| |
| | | 100.0 | % |
| | |
| |
* As of March 31, 2007
Largest Net Purchases and Sales for Year Ended March 31, 2007
Net Purchases ($mil)
| | | | |
UnitedHealth Group (new) | | $ | 17.8 | |
American International Group (new) | | | 12.7 | |
Omnicare (new) | | | 10.0 | |
Mohawk Industries (new) | | | 8.8 | |
Six Flags | | | 7.5 | |
| |
|
| |
| | $ | 56.8 | |
| |
|
| |
Net Sales ($mil)
| | | | |
Comcast | | $ | 16.1 | |
IAC/InterActiveCorp | | | 9.5 | |
Cabela’s | | | 9.4 | |
Wal-Mart | | | 9.1 | |
Berkshire Hathaway | | | 8.3 | |
Other (net) | | | 24.6 | |
| |
|
| |
| | $ | 77.0 | |
| |
|
| |
| | | | |
Net Portfolio Sales | | $ | 20.2 | |
| |
|
| |
Largest Net Contributions to Investment Results for Year Ended March 31, 2007
Positive ($mil)
| | | | |
Liberty Media - Interactive & Capital# | | $ | 9.5 | |
Redwood Trust | | | 8.6 | |
Liberty Global | | | 6.1 | |
Comcast | | | 4.4 | |
Berkshire Hathaway | | | 4.1 | |
Other (net) | | | 29.4 | |
| |
|
| |
| | $ | 62.1 | |
| |
|
| |
| | | | |
Net Portfolio Gains | | $ | 54.9 | |
| |
|
| |
Negative ($mil)
| | | | |
Cumulus Media | | $ | (2.3 | ) |
Career Education | | | (1.9 | ) |
Convera | | | (1.8 | ) |
Countrywide Financial | | | (0.8 | ) |
Cost Plus | | | (0.4 | ) |
| |
|
| |
| | $ | (7.2 | ) |
| |
|
| |
# For presentation purposes, securities combined due to merger and/or spin-off during the year
23
HICKORY FUND
Schedule of Investments in Securities
March 31, 2007
| | | | | | | |
| | Shares | | Value | |
| |
| |
| |
COMMON STOCKS — 88.7% | | | | | | | |
| | | | | | | |
Consumer Products and Services — 19.0% | | | | | | | |
| | | | | | | |
Retailing— 12.5% | | | | | | | |
Liberty Media Corp. - Interactive - Series A* | | | 700,000 | | $ | 16,674,000 | |
Cabela’s, Inc. - CL A* | | | 450,000 | | | 11,164,500 | |
Wal-Mart Stores, Inc. | | | 150,000 | | | 7,042,500 | |
AutoZone, Inc.* (b) | | | 50,000 | | | 6,407,000 | |
Expedia, Inc.* | | | 230,000 | | | 5,331,400 | |
IAC/InterActiveCorp* (b) | | | 40,200 | | | 1,515,942 | |
| | | | |
|
| |
| | | | | | 48,135,342 | |
Education — 4.0% | | | | | | | |
Apollo Group, Inc. - CL A* | | | 200,000 | | | 8,780,000 | |
Corinthian Colleges, Inc.* | | | 475,600 | | | 6,539,500 | |
| | | | |
|
| |
| | | | | | 15,319,500 | |
Consumer Goods — 2.5% | | | | | | | |
Mohawk Industries, Inc.* | | | 120,000 | | | 9,846,000 | |
| | | | |
|
| |
| | | | | | 73,300,842 | |
| | | | | | | |
Mortgage Services — 18.5% | | | | | | | |
| | | | | | | |
Originating and Investing — 16.0% | | | | | | | |
Countrywide Financial Corp. | | | 700,000 | | | 23,548,000 | |
Redwood Trust, Inc. | | | 450,400 | | | 23,501,872 | |
CBRE Realty Finance, Inc.# | | | 450,000 | | | 5,953,500 | |
CBRE Realty Finance, Inc. | | | 255,400 | | | 3,378,942 | |
Newcastle Investment Corp. | | | 195,700 | | | 5,426,761 | |
| | | | |
|
| |
| | | | | | 61,809,075 | |
Government Agency — 2.5% | | | | | | | |
Fannie Mae | | | 180,000 | | | 9,824,400 | |
| | | | |
|
| |
| | | | | | 71,633,475 | |
| | | | | | | |
Media Content and Distribution — 13.2% | | | | | | | |
| | | | | | | |
Newspaper, Television, Radio and Programming — 8.7% | | | | | | | |
Liberty Media Corp. - Capital - Series A* | | | 145,000 | | | 16,035,550 | |
Cumulus Media, Inc. - CL A* | | | 1,387,000 | | | 13,010,060 | |
CBS Corp. - CL B | | | 145,000 | | | 4,435,550 | |
| | | | |
|
| |
| | | | | | 33,481,160 | |
Cable Television — 4.5% | | | | | | | |
Liberty Global, Inc. - Series C* | | | 461,852 | | | 14,151,145 | |
Comcast Corp. - CL A Special* | | | 125,000 | | | 3,183,750 | |
| | | | |
|
| |
| | | | | | 17,334,895 | |
| | | | |
|
| |
| | | | | | 50,816,055 | |
The accompanying notes form an integral part of these financial statements.
24
HICKORY FUND
Schedule of Investments in Securities, Continued
| | | | | | | |
| | Shares | | Value | |
| |
| |
| |
Financial Services — 12.5% | | | | | | | |
| | | | | | | |
Insurance — 9.4% | | | | | | | |
Berkshire Hathaway, Inc. - CL A* | | | 210 | | $ | 22,887,900 | |
American International Group, Inc. | | | 200,000 | | | 13,444,000 | |
| | | | |
|
| |
| | | | | | 36,331,900 | |
Consumer Finance — 2.1% | | | | | | | |
SLM Corp.(b) | | | 100,000 | | | 4,090,000 | |
American Express Co. | | | 70,000 | | | 3,948,000 | |
| | | | |
|
| |
| | | | | | 8,038,000 | |
Brokers — 1.0% | | | | | | | |
TD Ameritrade Holding Corp.* | | | 255,000 | | | 3,794,400 | |
| | | | |
|
| |
| | | | | | 48,164,300 | |
| | | | | | | |
Healthcare — 9.4% | | | | | | | |
| | | | | | | |
Managed Care — 6.8% | | | | | | | |
UnitedHealth Group, Inc. | | | 380,000 | | | 20,128,600 | |
WellPoint, Inc.* | | | 75,000 | | | 6,082,500 | |
| | | | |
|
| |
| | | | | | 26,211,100 | |
Suppliers and Distributors — 2.6% | | | | | | | |
Omnicare, Inc. | | | 250,000 | | | 9,942,500 | |
| | | | |
|
| |
| | | | | | 36,153,600 | |
| | | | | | | |
Diversified Industries — 4.5% | | | | | | | |
| | | | | | | |
Tyco International Ltd. | | | 550,000 | | | 17,352,500 | |
| | | | | | | |
Commercial Services — 3.9% | | | | | | | |
| | | | | | | |
Coinstar, Inc.* | | | 440,000 | | | 13,772,000 | |
Convera Corp.* | | | 370,000 | | | 1,161,800 | |
| | | | |
|
| |
| | | | | | 14,933,800 | |
| | | | | | | |
Telecommunications — 3.2% | | | | | | | |
| | | | | | | |
Telephone and Data Systems, Inc. - Special | | | 160,000 | | | 8,944,000 | |
LICT Corp.* # | | | 1,005 | | | 3,386,850 | |
| | | | |
|
| |
| | | | | | 12,330,850 | |
| | | | | | | |
Gaming, Lodging and Leisure — 2.1% | | | | | | | |
| | | | | | | |
Six Flags, Inc.* | | | 1,350,000 | | | 8,113,500 | |
The accompanying notes form an integral part of these financial statements.
25
HICKORY FUND
Schedule of Investments in Securities, Continued
| | | | | | | |
| | Shares | | Value | |
| |
| |
| |
Technology — 1.5% | | | | | | | |
| | | | | | | |
Dell, Inc.* | | | 250,000 | | $ | 5,802,500 | |
| | | | | | | |
| | | | | | | |
Building and Construction Products — 0.9% | | | | | | | |
| | | | | | | |
USG Corp.* | | | 78,000 | | | 3,641,040 | |
| | | | |
|
| |
Total Common Stocks (Cost $289,118,538) | | | | | | 342,242,462 | |
| | | | | | | |
| | | | | | | |
SHORT-TERM SECURITIES — 13.1% | | | | | | | |
| | | | | | | |
Wells Fargo Advantage Government Money Market Fund 5.3%(a)
(Cost $50,777,748) | | | 50,777,748 | | | 50,777,748 | |
| | | | |
|
| |
Total Investments in Securities (Cost $339,896,286) | | | | | | 393,020,210 | |
Options Written — (0.1%) | | | | | | (372,770 | ) |
Other Liabilities in Excess of Other Assets — (1.7%) | | | | | | (6,585,925 | ) |
| | | | |
|
| |
Net Assets — 100% | | | | | $ | 386,061,515 | |
| | | | |
|
| |
Net Asset Value Per Share | | | | | $ | 39.69 | |
| | | | |
|
| |
| | | | | | | | | | |
| | Expiration date/
Strike price | | Shares
subject
to option | | Value | |
| |
| |
| |
| |
OPTIONS WRITTEN* | | | | | | | | | | |
| | | | | | | | | | |
Covered Call Options | | | | | | | | | | |
| | | | | | | | | | |
AutoZone, Inc. | | | June 2007 / $125 | | | 25,000 | | $ | (187,500 | ) |
IAC/InterActiveCorp | | | July 2007 / $40 | | | 40,000 | | | (48,000 | ) |
SLM Corp. | | | July 2007 / $45 | | | 51,800 | | | (46,620 | ) |
| | | | | | | |
|
| |
| | | | | | | | | (282,120 | ) |
Put Options | | | | | | | | | | |
| | | | | | | | | | |
SLM Corp. | | | July 2007 / $40 | | | 51,800 | | | (90,650 | ) |
| | | | | | | |
|
| |
Total Options Written (premiums received $511,289) | | | | | | | | $ | (372,770 | ) |
| | | | | | | |
|
| |
| |
* | Non-income producing |
| |
# | Illiquid and/or restricted security that has been fair valued. |
| |
(a) | Rate presented represents the annualized 7-day yield at March 31, 2007. |
| |
(b) | Fully or partially pledged as collateral on outstanding written options. |
The accompanying notes form an integral part of these financial statements.
26
(This page has been left blank intentionally.)
27
FUND PERFORMANCE — PARTNERS III OPPORTUNITY FUND
(Unaudited)
The following table summarizes performance information for the Partners III Opportunity Fund (“Partners III”) and its predecessor, Weitz Partners III-Limited Partnership (the “Partnership”). Partners III succeeded to substantially all of the assets of the Partnership, a Nebraska investment limited partnership as of December 30, 2005. The investment objectives, policies, guidelines and restrictions of Partners III are materially equivalent to those of the Partnership and the Partnership was managed at all times with full investment authority by Wallace R. Weitz & Company.
| | | | | | | | | | |
Period Ended | | Partners III | | S&P 500 | | Difference
Partners III – S&P 500 | |
| |
| |
| |
| |
Dec. 31, 1997 | | 37.1 | % | | 33.4 | % | | 3.7 | % | |
Dec. 31, 1998 | | 10.9 | | | 28.6 | | | –17.7 | | |
Dec. 31, 1999 | | 10.6 | | | 21.0 | | | –10.4 | | |
Dec. 31, 2000 | | 32.4 | | | –9.1 | | | 41.5 | | |
Dec. 31, 2001 | | 6.6 | | | –11.8 | | | 18.4 | | |
Dec. 31, 2002 | | –16.1 | | | –22.1 | | | 6.0 | | |
Dec. 31, 2003 | | 42.6 | | | 28.7 | | | 13.9 | | |
Dec. 31, 2004 | | 22.1 | | | 10.9 | | | 11.2 | | |
Dec. 31, 2005 | | –0.7 | | | 4.9 | | | -5.6 | | |
Dec. 31, 2006 | | 20.4 | | | 15.8 | | | 4.6 | | |
Mar. 31, 2007 (3 months) | | –0.9 | | | 0.6 | | | –1.5 | | |
| | | | | | | | | | |
10-Year Cumulative Return ended Mar. 31, 2007 | | 302.3 | | | 119.9 | | | 182.4 | | |
10-Year Average Annual Compound Return ended Mar. 31, 2007 | | 14.9 | | | 8.2 | | | 6.7 | | |
This chart depicts the change in the value of a $500,000 investment in Partners III for the period March 31, 1997, through March 31, 2007 as compared with the growth of the Standard & Poor’s 500 Index during the same period. Index performance is hypothetical and is shown for illustrative purposes only.
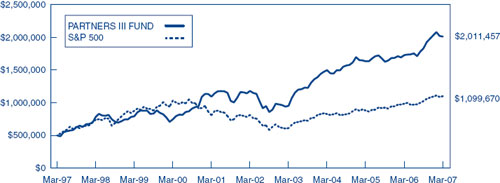
The average annual total return of Partners III for the one, five and ten year periods ended March 31, 2007 was 16.4%, 11.3% and 14.9%, respectively. These performance numbers reflect the deduction of the Fund’s annual operating expenses which as stated in its most recent prospectus are 1.56% of the Fund’s net assets. The returns assume redemption at the end of each period and reinvestment of dividends. This information represents past performance and past performance does not guarantee future results. The investment return and the principal value of an investment in Partners III will fluctuate so that an investor’s shares, when redeemed, may be worth more or less than the original cost. Current performance may be lower or higher than the performance data quoted. The performance data presented includes performance for the period before Partners III became an investment company registered with the Securities and Exchange Commission. During this time, Partners III was not registered under the Investment Company Act of 1940 and therefore was not subject to certain investment restrictions imposed by the 1940 Act. If Partners III had been registered under the 1940 Act during this time period, the performance of Partners III might have been adversely affected. Performance data current to the most recent month-end may be obtained at www.weitzfunds.com/performance/monthly.asp.
Performance information does not reflect the deduction of taxes that a shareholder would pay on Fund distributions or the redemption of Fund shares.
28
PORTFOLIO PROFILE — PARTNERS III OPPORTUNITY FUND
(Unaudited)
Top Ten Stocks*
| | | | |
Berkshire Hathaway | | | 7.8 | % |
Redwood Trust | | | 6.5 | |
Countrywide Financial | | | 6.2 | |
UnitedHealth Group | | | 5.4 | |
Tyco International | | | 4.8 | |
Cabela’s | | | 4.6 | |
Liberty Media - Interactive | | | 4.1 | |
Liberty Global | | | 4.0 | |
Coinstar | | | 3.6 | |
Fannie Mae | | | 3.5 | |
| |
|
| |
| | | 50.5 | % |
| |
|
| |
| | | | |
Industry Sectors* |
| | | | |
Consumer Products and Services | | | 22.9 | % |
Mortgage Services | | | 17.7 | |
Media Content and Distribution | | | 15.6 | |
Financial Services | | | 14.2 | |
Healthcare | | | 10.0 | |
Commercial Services | | | 5.1 | |
Diversified Industries | | | 4.8 | |
Telecommunications | | | 3.1 | |
Gaming, Lodging and Leisure | | | 2.3 | |
Technology | | | 2.2 | |
Building and Construction Products | | | 0.9 | |
| |
|
| |
Total Long Positions | | | 98.8 | |
Securities Sold Short | | | (16.5 | ) |
| |
|
| |
Net Long Positions | | | 82.3 | |
Short Proceeds/Other | | | 17.7 | |
| |
|
| |
| | | 100.0 | % |
| |
|
| |
| |
* | Percentage of net assets as of March 31, 2007 |
Largest Net Purchases and Sales for Year Ended March 31, 2007
| | | | |
Net Purchases ($mil) |
| | | | |
UnitedHealth Group | | $ | 13.5 | |
Omnicare (new) | | | 10.0 | |
Mohawk Industries (new) | | | 7.3 | |
Six Flags | | | 7.2 | |
Dell (new) | | | 6.7 | |
Other (net) | | | 2.7 | |
| |
|
| |
| | $ | 47.4 | |
| |
|
| |
| | | | |
Net Portfolio Purchases | | $ | 7.9 | |
| |
|
| |
| | | | |
Net Sales ($mil) |
| | | | |
Hudson City Bancorp (eliminated) | | $ | 11.0 | |
Comcast | | | 9.9 | |
IAC/InterActiveCorp | | | 6.6 | |
Liberty Global | | | 6.6 | |
Host Hotels & Resorts (eliminated) | | | 5.4 | |
| |
|
| |
| | $ | 39.5 | |
| |
|
| |
Largest Net Contributions to Investment Results for Year Ended March 31, 2007
| | | | |
Positive ($mil) |
| | | | |
Redwood Trust | | $ | 7.4 | |
Liberty Media - Interactive & Capital# | | | 6.2 | |
Liberty Global | | | 5.5 | |
Comcast | | | 4.5 | |
Telephone & Data Systems | | | 3.4 | |
Other (net) | | | 27.8 | |
| |
|
| |
| | $ | 54.8 | |
| |
|
| |
| | | | |
Net Portfolio Gains | | $ | 45.3 | |
| |
|
| |
| | | | |
Negative ($mil) |
| | | | |
Short Positions | | $ | (4.3 | ) |
Cumulus Media | | | (1.9 | ) |
Career Education | | | (1.1 | ) |
Countrywide Financial | | | (1.1 | ) |
Convera | | | (1.1 | ) |
| |
|
| |
| | $ | (9.5 | ) |
| |
|
| |
| |
# | For presentation purposes, securities combined due to merger and/or spin-off during the year |
29
PARTNERS III OPPORTUNITY FUND
Schedule of Investments in Securities
March 31, 2007
| | | | | | | |
| | Shares | | Value | |
| |
| |
| |
COMMON STOCKS — 98.8% | | | | | | | |
| | | | | | | |
Consumer Products and Services — 22.9% | | | | | | | |
| | | | | | | |
Retailing — 17.0% | | | | | | | |
Cabela’s, Inc. - CL A*(b) | | | 600,000 | | $ | 14,886,000 | |
Liberty Media Corp. - Interactive - Series A* | | | 560,000 | | | 13,339,200 | |
Wal-Mart Stores, Inc. | | | 240,000 | | | 11,268,000 | |
Expedia, Inc.* | | | 300,000 | | | 6,954,000 | |
AutoZone, Inc.*(b) | | | 50,000 | | | 6,407,000 | |
IAC/InterActiveCorp*(b) | | | 55,000 | | | 2,074,050 | |
| | | | |
|
| |
| | | | | | 54,928,250 | |
Education — 3.4% | | | | | | | |
Apollo Group, Inc. - CL A* | | | 150,000 | | | 6,585,000 | |
Corinthian Colleges, Inc.* | | | 310,600 | | | 4,270,750 | |
| | | | |
|
| |
| | | | | | 10,855,750 | |
Consumer Goods — 2.5% | | | | | | | |
Mohawk Industries, Inc.* | | | 100,000 | | | 8,205,000 | |
| | | | |
|
| |
| | | | | | 73,989,000 | |
| | | | | | | |
Mortgage Services — 17.7% | | | | | | | |
| | | | | | | |
Originating and Investing — 14.2% | | | | | | | |
Redwood Trust, Inc. | | | 400,000 | | | 20,872,000 | |
Countrywide Financial Corp. | | | 600,000 | | | 20,184,000 | |
Newcastle Investment Corp. | | | 176,000 | | | 4,880,480 | |
| | | | |
|
| |
| | | | | | 45,936,480 | |
Government Agency — 3.5% | | | | | | | |
Fannie Mae | | | 209,000 | | | 11,407,220 | |
| | | | |
|
| |
| | | | | | 57,343,700 | |
| | | | | | | |
Media Content and Distribution — 15.6% | | | | | | | |
| | | | | | | |
Newspaper, Television, Radio and Programming — 9.7% | | | | | | | |
Cumulus Media, Inc. - CL A* | | | 1,187,000 | | | 11,134,060 | |
Liberty Media Corp. - Capital - Series A* | | | 92,000 | | | 10,174,280 | |
The Washington Post Co. - CL B | | | 7,000 | | | 5,344,500 | |
CBS Corp. - CL B | | | 150,000 | | | 4,588,500 | |
| | | | |
|
| |
| | | | | | 31,241,340 | |
Cable Television — 5.9% | | | | | | | |
Liberty Global, Inc. - Series C* | | | 419,865 | | | 12,864,663 | |
Comcast Corp. - - CL A* | | | 245,000 | | | 6,357,750 | |
| | | | |
|
| |
| | | | | | 19,222,413 | |
| | | | |
|
| |
| | | | | | 50,463,753 | |
The accompanying notes form an integral part of these financial statements.
30
PARTNERS III OPPORTUNITY FUND
Schedule of Investments in Securities, Continued
| | | | | | | |
| | Shares | | Value | |
| |
| |
| |
Financial Services — 14.2% | | | | | | | |
| | | | | | | |
Insurance — 10.9% | | | | | | | |
Berkshire Hathaway, Inc. - CL A* | | | 130 | | $ | 14,168,700 | |
Berkshire Hathaway, Inc. - CL B* | | | 3,000 | | | 10,920,000 | |
American International Group, Inc. | | | 150,000 | | | 10,083,000 | |
| | | | |
|
| |
| | | | | | 35,171,700 | |
Consumer Finance — 2.3% | | | | | | | |
SLM Corp.(b) | | | 100,000 | | | 4,090,000 | |
American Express Co. | | | 60,000 | | | 3,384,000 | |
| | | | |
|
| |
| | | | | | 7,474,000 | |
Brokers — 1.0% | | | | | | | |
TD Ameritrade Holding Corp.* | | | 212,000 | | | 3,154,560 | |
| | | | |
|
| |
| | | | | | 45,800,260 | |
| | | | | | | |
Healthcare — 10.0% | | | | | | | |
| | | | | | | |
Managed Care — 6.9% | | | | | | | |
UnitedHealth Group, Inc. | | | 330,000 | | | 17,480,100 | |
WellPoint, Inc.* | | | 60,000 | | | 4,866,000 | |
| | | | |
|
| |
| | | | | | 22,346,100 | |
Suppliers and Distributors — 3.1% | | | | | | | |
Omnicare, Inc. | | | 250,000 | | | 9,942,500 | |
| | | | |
|
| |
| | | | | | 32,288,600 | |
| | | | | | | |
Commercial Services — 5.1% | | | | | | | |
| | | | | | | |
Coinstar, Inc.* | | | 370,000 | | | 11,581,000 | |
Intelligent Systems Corp.* # † | | | 883,999 | | | 3,801,196 | |
Convera Corp.* | | | 300,000 | | | 942,000 | |
Continental Resources# | | | 700 | | | 140,000 | |
| | | | |
|
| |
| | | | | | 16,464,196 | |
| | | | | | | |
Diversified Industries — 4.8% | | | | | | | |
| | | | | | | |
Tyco International Ltd. | | | 490,000 | | | 15,459,500 | |
| | | | | | | |
| | | | | | | |
Telecommunications — 3.1% | | | | | | | |
| | | | | | | |
Telephone and Data Systems, Inc. - Special | | | 180,000 | | | 10,062,000 | |
The accompanying notes form an integral part of these financial statements.
31
PARTNERS III OPPORTUNITY FUND
Schedule of Investments in Securities, Continued
| | | | | | | |
| | Shares | | Value | |
| |
| |
| |
Gaming, Lodging and Leisure — 2.3% | | | | | | | |
| | | | | | | |
Six Flags, Inc.* | | | 1,250,000 | | $ | 7,512,500 | |
| | | | | | | |
| | | | | | | |
Technology — 2.2% | | | | | | | |
| | | | | | | |
Dell, Inc.* | | | 300,000 | | | 6,963,000 | |
| | | | | | | |
| | | | | | | |
Building and Construction Products — 0.9% | | | | | | | |
| | | | | | | |
USG Corp.* | | | 65,000 | | | 3,034,200 | |
| | | | |
|
| |
Total Common Stocks (Cost $252,456,282) | | | | | | 319,380,709 | |
| | | | | | | |
SHORT-TERM SECURITIES — 1.5% | | | | | | | |
| | | | | | | |
Wells Fargo Advantage Government Money Market Fund 5.3%(a)
(Cost $4,878,163) | | | 4,878,163 | | | 4,878,163 | |
| | | | |
|
| |
Total Investments in Securities (Cost $257,334,445) | | | | | | 324,258,872 | |
Due From Broker(b) — 17.2% | | | | | | 55,669,765 | |
Securities Sold Short — (16.3%) | | | | | | (52,791,200 | ) |
Options Written — (0.2%) | | | | | | (515,035 | ) |
Other Liabilities in Excess of Other Assets — (1.0%) | | | | | | (3,384,777 | ) |
| | | | |
|
| |
Net Assets — 100% | | | | | $ | 323,237,625 | |
| | | | |
|
| |
Net Asset Value Per Share | | | | | $ | 11.28 | |
| | | | |
|
| |
| | | | | | | |
SECURITIES SOLD SHORT | | | | | | | |
| | | | | | | |
Ishares Russell 2000 | | | 420,000 | | $ | (33,373,200 | ) |
Ishares Russell 2000 Value | | | 30,000 | | | (2,428,500 | ) |
Midcap SPDR Trust Series 1 | | | 110,000 | | | (16,989,500 | ) |
| | | | |
|
| |
Total Securities Sold Short (proceeds $48,455,301) | | | | | $ | (52,791,200 | ) |
| | | | |
|
| |
The accompanying notes form an integral part of these financial statements.
32
PARTNERS III OPPORTUNITY FUND
Schedule of Investments in Securities, Continued
| | | | | | | | | | |
| | Expiration date/
Strike price | | Shares
subject
to option | | Value | |
| |
| |
| |
| |
OPTIONS WRITTEN* | | | | | | | | | | |
| | | | | | | | | | |
Covered Call Options | | | | | | | | | | |
| | | | | | | | | | |
AutoZone, Inc. | | June 2007 / $125 | | | 25,000 | | $ | (187,500 | ) |
Cabela’s, Inc. - CL A | | June 2007 / $25 | | | 100,000 | | | (130,000 | ) |
IAC/InterActiveCorp | | July 2007 / $40 | | | 50,000 | | | (60,000 | ) |
SLM Corp. | | July 2007 / $45 | | | 51,900 | | | (46,710 | ) |
| | | | | | | |
|
| |
| | | | | | | | | (424,210 | ) |
| | | | | | | |
|
| |
| | | | | | | | | | |
Put Options | | | | | | | | | | |
| | | | | | | | | | |
SLM Corp. | | July 2007 / $40 | | | 51,900 | | | (90,825 | ) |
| | | | | | | |
|
| |
Total Options Written
(premiums received $727,917) | | | | | | | | $ | (515,035 | ) |
| | | | | | | |
|
| |
| |
* | Non-income producing |
| |
† | Non-controlled affiliate |
| |
# | Illiquid and/or restricted security that has been fair valued. |
| |
(a) | Rate presented represents the annualized 7-day yield at March 31, 2007. |
| |
(b) | Fully or partially pledged as collateral on securities sold short and outstanding written options
(see Note 9). |
The accompanying notes form an integral part of these financial statements.
33
BALANCED FUND
March 31, 2007
Dear Fellow Shareholder:
The Balanced Fund had a solid fiscal year ended March 31, 2007, with a total return of 11.8% versus 9.5% for our primary benchmark, the Blended Index†. For the first calendar quarter both the Fund and the Blended Index† posted modest positive returns.
The table below shows the results of the Balanced Fund over various time periods through March 31, 2007, along with the Blended Index†, the S&P 500 (stocks) and the Lehman Brothers Intermediate U.S. Government/Credit Index (bonds).
| | | | | | | | | | | | | | | | |
| | Total Returns* | | Average Annual
Total Returns* | |
| |
| |
| |
| | 3-Mos. | | 1-Year. | | 2-Year | | 3-Year | | Since
Inception | |
| |
| |
| |
| |
| |
| |
| | | | | | | | | | | | | | | | |
Balanced Fund | | 0.3 | % | | 11.8 | % | | 8.9 | % | | 8.8 | % | | 9.0 | % | |
| | | | | | | | | | | | | | | | |
Blended Index†# | | 1.0 | | | 9.5 | | | 8.7 | | | 7.1 | | | 8.8 | | |
S&P 500# | | 0.6 | | | 11.8 | | | 11.8 | | | 10.1 | | | 12.7 | | |
Lehman Brothers Intermediate U.S. Government/Credit Index# | | 1.6 | | | 6.1 | | | 4.1 | | | 2.6 | | | 3.0 | | |
These performance numbers reflect the deduction of the Fund’s annual operating expenses which as stated in its most recent Prospectus are 1.15% of the Fund’s net assets. This information represents past performance and past performance does not guarantee future results. The investment return and the principal value of an investment in the Fund will fluctuate so that an investor’s shares, when redeemed, may be worth more or less than the original cost. Current performance may be higher or lower than the performance data quoted above. Performance data current to the most recent month end may be obtained at www.weitzfunds.com/performance/monthly.asp.
| |
* | Fund inception date: October 1, 2003. All performance numbers assume reinvestment of dividends. |
| |
† | The Blended Index reflects an unmanaged portfolio of 60% of the S&P 500, which is an unmanaged index of common stock prices, and 40% of the Lehman Brothers Intermediate U.S. Government/Credit Index, which is an unmanaged index consisting of government securities and publicly issued corporate debt with maturities from one to ten years. |
| |
# | Index performance is hypothetical and is for illustrative purposes only. |
Fiscal 2007 in Review
By all measures it was a very good fiscal year. The Balanced Fund posted strong double-digit returns, outpacing the Blended Index† by a comfortable margin and nearly matching the return of the all-stock S&P 500. Relatively broad-based gains in the Fund’s stocks accounted for the vast majority of our returns. Bonds contributed modestly to results as we maintained our conservative stance on interest rate and credit risk.
Several media and retail companies were among the Fund’s biggest gainers for the fiscal year. Cable companies Comcast and Liberty Global rose 49% and 55%, respectively, as both grew cash flow at healthy double-digit rates and their stocks rebounded from severely depressed levels. Liberty Media issued two tracking stocks that both had good years, yet remain cheap. Together their combined return was 40% for the fiscal year. Retailers AutoZone (+29%), Cabela’s (+21%) and IAC/InterActiveCorp (+28%) all grew business values at least in line with expectations. After a year of strong gains, we trimmed our aggregate exposure to media and consumer stocks from 30% of the portfolio a year ago to 20% today.
34
Redwood Trust (+34%) was another of the Fund’s best performers despite the recent turmoil in the mortgage markets. The company has navigated difficult industry conditions extremely well to date, limiting exposure to the most at-risk corners of the mortgage market and building excess capital. Redwood’s existing investments will not be immune if housing conditions materially worsen. Still, we think the company should have the staying power to ride out storms, and the firepower to opportunistically purchase new assets as warranted. We have concentrated our mortgage-related investments in companies like Redwood that we think may find ways to benefit over the long term from market disruptions.
Other companies that contributed to the Fund’s results ranged from the very large (Berkshire Hathaway +21%) to the very small (Coinstar +21%). Tyco International quietly returned 19% as management prepared to split the business into three separate companies next quarter. Telephone and Data Systems continued to grow wireless subscribers and collect cash from its rural wireline customers. Along the way, investors rediscovered telecom services and sent the stock up 49% for the year.
In the midst of this mostly upbeat news, we did book a permanent loss on our investment in Career Education Corporation. Our initial investment thesis overestimated the resilience of the company’s business in the face of intense competitive and regulatory pressures. When this became clear we sold the stock, which has since rebounded, at a loss. Fortunately, the tuition for this humbling experience was modest.
Portfolio Update
Last month our research group had the unique opportunity to spend a full day offsite with the Fund’s Board of Trustees. The centerpiece of the day was an investment discussion highlighting the work of our analysts. Our aim was to provide the Board with a better understanding of the often behind-the-scenes efforts that help form our investment decisions. Analysts presented a diverse collection of company case studies, which underscored the wide-ranging contributions of our talented team. The following snapshots of our recent purchases provide a flavor for the group’s latest efforts.
David Perkins is the primary analyst on American Express, this quarter’s largest addition to the portfolio at 1.6% of assets. Amex is among the best businesses we own. The company has a dominant payments franchise, a gold-plated consumer brand and a solidly entrenched competitive position. The company’s largely fee-based, spend-centric business is less capital intensive and more stable than the more common lend-centric credit model. Amex’s closed loop architecture also allows it to collect complete transaction data, information that is useful both to Amex and its merchants in tailoring rewards and customer offers. The overall business has a greater than 30% return on equity and generates substantial cash flow. American Express returns roughly two-thirds of capital generated to shareholders via share repurchases and dividends. The company is reinvesting the other third in three segments with even better financial returns, which is uncommon for a company of this size. We think the three- to five-year total return potential for this unique and durable business is exceptional.
Dave is also the primary analyst for TD Ameritrade, a leading online discount broker headquartered here in Omaha. The company has strong brand recognition, scale in a business where it matters, tremendous operating leverage and a business that throws off cash flow. While the trading platform is still the company’s calling card, last year’s merger with TD Waterhouse helped diversify the business mix. The deal added a sizable pool of long-term investor accounts and assets, a physical branch network and a platform to serve the back-office needs of independent financial advisors. We believe the combined company has significant revenue growth prospects in attractive markets, plus additional cost saving opportunities from integrating operations. The stock appears to be very cheap compared to earnings potential looking out a year or two, and in the meantime the company continues to use its cash flow to buy back stock.
35
Since last summer our team has spent quite a bit of time sifting through a variety of housing-related companies. The current residential housing environment is depressed, and the pain may last longer and cut deeper than people anticipate. Still, demographic trends combined with our nation’s aging housing stock seem to point to the possibility of a more favorable long-term outlook. Our approach has been to focus strictly on top-tier businesses, those with strong market positions, high returns on capital through cycles and abundant reinvestment opportunities. Two in particular have compelling multi-year prospects that we think should trump the near-term challenges reflected in their stock prices.
Peter Supino has done excellent work in building the investment case for both Lowe’s Companies and USG Corporation. Lowe’s is the well-known national home improvement retailer. The company has an ingrained service culture that attracts a relatively more affluent and loyal customer. This culture is nurtured by a capable, long-tenured management team with an excellent track record operating the business and allocating capital. Lowe’s has a relatively young store base with strong store-level economics. The company continues to take market share from other channels, and we believe it may still have a significant opportunity to expand its footprint at attractive returns over the next decade. We think this growth opportunity may allow the company to power through any sales weakness over the next year or two, resulting in plenty of upside potential with limited permanent risk to capital.
USG is the largest manufacturer of gypsum wallboard used in home construction. The company is also a leading manufacturer of ceiling tiles and a growing distributor of construction materials through its L&W subsidiary. While consolidation has improved wallboard’s industry structure, it remains a highly cyclical business. Weak demand is driving selling prices lower, virtually ensuring a substantial falloff from the record operating results of recent years. Our investment thesis depends on the company’s ability to earn strong returns on capital through the industry’s cycles, continue to gain share in its regional markets over time, and extend L&W’s lead in the fragmented distribution business through acquisitions and organic growth. USG also has an experienced, shareholder-friendly management team that has consistently taken the long view in both good and difficult times.
Jon Baker is our longest tenured analyst and deserves credit for several of the Fund’s strongest performing stocks over the past few years (for example, Coinstar and AutoZone). His passion for exceptional companies has pushed the group to think more broadly about the value of a truly durable business. We believe United Parcel Service fits that bill. UPS dominates the U.S. ground parcel market and has a global transportation and logistics network that would be nearly impossible for a new entrant to replicate. The company continues to invest in that network at high returns to help cement its competitive advantage. UPS isn’t terribly cheap, so our initial stake is modest, but we would be happy to own a very large position if near-term results are further impacted by economic weakness.
Outlook
The Fund’s asset allocation is little changed at 55% stocks and 45% bonds and short-term securities. Portfolio activity, on the other hand, was relatively high during the quarter. We sold News Corporation, Harrah’s, AutoZone, Expedia and Discovery at healthy gains to make room for the companies profiled above. We think this capital recycling has further enhanced the long-term potential of the portfolio. The Fund’s stable of world-class companies with good upside potential and superior downside protection continues to grow. We also still hold substantial reserves to add to existing positions or fund new ones as warranted.
36
Annual Shareholder Information Meeting – Tuesday, May 22, 2007
Please plan to join us at the Scott Conference Center in Omaha at 4:30 p.m. on May 22. The center is located at 6450 Pine Street on the Aksarben campus. There will be no formal business to conduct, so we can devote the entire meeting to answering your questions. Maps and driving directions are available from our client service representatives. Thanks for your continued support, and we look forward to seeing you there.
| |
| Regards, |
| |
| 
|
| |
| Bradley P. Hinton |
| Portfolio Manager |
Portfolio composition is subject to change at any time and references to specific securities, industries, and sectors referenced in this letter are not recommendations to purchase or sell any particular security. See the Schedule of Investments in Securities included in this report for the percent of assets of the Fund invested in particular industries or sectors.
37
FUND PERFORMANCE — BALANCED FUND
(Unaudited)
The chart below depicts the change in the value of a $10,000 investment for the period since inception of the Balanced Fund (October 1, 2003) through March 31, 2007, as compared with the growth of the Blended Index during the same period. The Blended Index reflects an unmanaged portfolio of 60% of the S&P 500 (“S&P 500”), which is an unmanaged index of common stock prices, and 40% of the Lehman Brothers Intermediate U.S. Government/Credit Index (“Lehman Index”), which is an unmanaged index consisting of government securities and publicly issued corporate debt with maturities from one to ten years. The chart also includes information about the growth of the S&P 500 and the Lehman Index for the period. Index performance is hypothetical and is shown for illustrative purposes only. A $10,000 investment in the Balanced Fund on October 1, 2003, would have been valued at $13,543 on March 31, 2007.
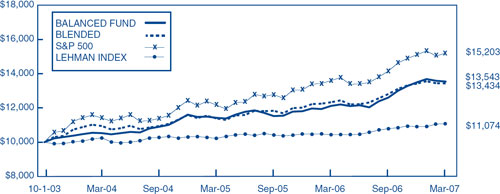
| | | | | | | | | | | | | |
| | Total
Return | | Average Annual Total Returns | |
| |
| |
| |
| | 1-Year | | 2-Year | | 3-Year | | Since
Inception
(Oct. 1, 2003) | |
| |
| |
| |
| |
| |
| | | | | | | | | | | | | |
Balanced Fund | | 11.8 | % | | 8.9 | % | | 8.8 | % | | 9.0 | % | |
Blended Index | | 9.5 | | | 8.7 | | | 7.1 | | | 8.8 | | |
S&P 500 Index | | 11.8 | | | 11.8 | | | 10.1 | | | 12.7 | | |
Lehman Index | | 6.1 | | | 4.1 | | | 2.6 | | | 3.0 | | |
These performance numbers reflect the deduction of the Fund’s annual operating expenses which as stated in its most recent prospectus are 1.15% of the Fund’s net assets. The returns assume redemption at the end of each period and reinvestment of dividends. This information represents past performance and past performance does not guarantee future results. The investment return and the principal value of an investment in this Fund will fluctuate so that an investor’s shares, when redeemed, may be worth more or less than the original cost. Current performance may be lower or higher than the performance data quoted. Performance data current to the most recent month-end may be obtained at www.weitzfunds.com/performance/monthly.asp.
Performance information does not reflect the deduction of taxes that a shareholder would pay on Fund distributions or the redemption of Fund shares
38
PORTFOLIO PROFILE — BALANCED FUND
(Unaudited)
Top Ten Stocks*
| | | | |
Berkshire Hathaway | | | 2.9 | % |
Countrywide Financial | | | 2.8 | |
UnitedHealth Group | | | 2.5 | |
Wal-Mart | | | 2.2 | |
American International Group | | | 2.1 | |
Coinstar | | | 2.1 | |
Liberty Media - Interactive | | | 2.0 | |
Tyco International | | | 1.9 | |
Redwood Trust | | | 1.9 | |
WellPoint | | | 1.9 | |
| |
|
| |
| | | 22.3 | % |
| |
|
| |
Industry Sectors*
| | | | |
Consumer Products and Services | | | 13.0 | % |
Financial Services | | | 9.7 | |
Mortgage Services | | | 8.8 | |
Healthcare | | | 7.8 | |
Media Content and Distribution | | | 7.1 | |
Commercial Services | | | 2.1 | |
Diversified Industries | | | 1.9 | |
Telecommunications | | | 1.3 | |
Building and Construction Products | | | 1.1 | |
Transportation | | | 1.0 | |
Technology | | | 1.0 | |
| |
|
| |
Total Common Stocks | | | 54.8 | % |
| |
|
| |
| | | | |
Short-Term Securities/Other | | | 19.7 | % |
U.S. Treasury and Government Agency | | | 16.5 | |
Mortgage-Backed Securities | | | 5.8 | |
Corporate Bonds | | | 2.1 | |
Convertible Preferred Stocks | | | 0.8 | |
Taxable Municipal Bonds | | | 0.3 | |
| |
|
| |
Total Bonds & Short-Term Securities | | | 45.2 | % |
| |
|
| |
Largest Net Contributions to Investment Results for Year Ended March 31, 2007
Positive (000’s)
| | | | |
Liberty Media - Interactive & Capital# | | $ | 832 | |
Liberty Global | | | 618 | |
Redwood Trust | | | 617 | |
Comcast | | | 556 | |
Berkshire Hathaway | | | 445 | |
Other (net) | | | 5,248 | |
| |
|
| |
| | $ | 8,316 | |
| |
|
| |
| | | | |
Net Portfolio Gains | | $ | 7,383 | |
| |
|
| |
Negative (000’s)
| | | | |
Career Education | | $ | (420 | ) |
Cumulus Media | | | (167 | ) |
Countrywide Financial | | | (129 | ) |
USG Corp. | | | (111 | ) |
TD Ameritrade | | | (106 | ) |
| |
|
| |
| | $ | (933 | ) |
| |
|
| |
| |
# | For presentation purposes, securities combined due to merger and/or spin-off during the year |
39
BALANCED FUND
Schedule of Investments in Securities
March 31, 2007
| | | | | | | |
| | Shares | | Value | |
| |
| |
| |
COMMON STOCKS — 54.8% | | | | | | | |
| | | | | | | |
Consumer Products and Services — 13.0% | | | | | | | |
| | | | | | | |
Retailing — 8.0% | | | | | | | |
Wal-Mart Stores, Inc. | | | 41,000 | | $ | 1,924,950 | |
Liberty Media Corp. - Interactive - Series A* | | | 75,000 | | | 1,786,500 | |
Cabela’s, Inc. - CL A* | | | 60,000 | | | 1,488,600 | |
Lowes Companies, Inc. | | | 30,000 | | | 944,700 | |
IAC/InterActiveCorp* | | | 25,000 | | | 942,750 | |
| | | | |
|
| |
| | | | | | 7,087,500 | |
Education — 2.6% | | | | | | | |
Apollo Group, Inc - CL A* | | | 29,000 | | | 1,273,100 | |
Corinthian Colleges, Inc.* | | | 75,000 | | | 1,031,250 | |
| | | | |
|
| |
| | | | | | 2,304,350 | |
Consumer Goods — 2.4% | | | | | | | |
Mohawk Industries, Inc.* | | | 18,000 | | | 1,476,900 | |
Diageo PLC - Sponsored ADR | | | 7,500 | | | 607,125 | |
| | | | |
|
| |
| | | | | | 2,084,025 | |
| | | | |
|
| |
| | | | | | 11,475,875 | |
Financial Services — 9.7% | | | | | | | |
| | | | | | | |
Insurance — 5.0% | | | | | | | |
Berkshire Hathaway, Inc. - CL B* | | | 700 | | | 2,548,000 | |
American International Group, Inc. | | | 28,000 | | | 1,882,160 | |
| | | | |
|
| |
| | | | | | 4,430,160 | |
Banking — 1.8% | | | | | | | |
Citigroup, Inc. | | | 15,000 | | | 770,100 | |
Wells Fargo & Co. | | | 22,000 | | | 757,460 | |
| | | | |
|
| |
| | | | | | 1,527,560 | |
Consumer Finance — 1.6% | | | | | | | |
American Express Co. | | | 25,000 | | | 1,410,000 | |
| | | | | | | |
Brokers — 1.3% | | | | | | | |
TD Ameritrade Holding Corp.* | | | 77,000 | | | 1,145,760 | |
| | | | |
|
| |
| | | | | | 8,513,480 | |
The accompanying notes form an integral part of these financial statements.
40
BALANCED FUND
Schedule of Investments in Securities, Continued
| | | | | | | |
| | Shares | | Value | |
| |
| |
| |
Mortgage Services — 8.8% | | | | | | | |
| | | | | | | |
Originating and Investing — 6.9% | | | | | | | |
Countrywide Financial Corp. | | | 72,000 | | $ | 2,422,080 | |
Redwood Trust, Inc. | | | 32,000 | | | 1,669,760 | |
CBRE Realty Finance, Inc. | | | 100,000 | | | 1,323,000 | |
Newcastle Investment Corp. | | | 24,000 | | | 665,520 | |
| | | | |
|
| |
| | | | | | 6,080,360 | |
Government Agency — 1.9% | | | | | | | |
Fannie Mae | | | 15,500 | | | 845,990 | |
Freddie Mac | | | 13,000 | | | 773,370 | |
| | | | |
|
| |
| | | | | | 1,619,360 | |
| | | | |
|
| |
| | | | | | 7,699,720 | |
Healthcare — 7.8% | | | | | | | |
| | | | | | | |
Managed Care — 4.4% | | | | | | | |
UnitedHealth Group, Inc. | | | 41,500 | | | 2,198,255 | |
WellPoint, Inc.* | | | 20,500 | | | 1,662,550 | |
| | | | |
|
| |
| | | | | | 3,860,805 | |
Providers — 1.8% | | | | | | | |
Pediatrix Medical Group, Inc.* | | | 15,000 | | | 855,900 | |
Laboratory Corporation of America Holdings* | | | 10,500 | | | 762,615 | |
| | | | |
|
| |
| | | | | | 1,618,515 | |
Suppliers and Distributors — 1.6% | | | | | | | |
Omnicare, Inc. | | | 35,000 | | | 1,391,950 | |
| | | | |
|
| |
| | | | | | 6,871,270 | |
| | | | | | | |
Media Content and Distribution — 7.1% | | | | | | | |
| | | | | | | |
Newspaper, Television, Radio and Programming — 4.5% | | | | | | | |
Liberty Media Corp. - Capital - Series A* | | | 13,000 | | | 1,437,670 | |
Cumulus Media, Inc. - CL A* | | | 100,000 | | | 938,000 | |
The Washington Post Co. - CL B | | | 1,200 | | | 916,200 | |
CBS Corp. - CL B | | | 23,000 | | | 703,570 | |
| | | | |
|
| |
| | | | | | 3,995,440 | |
Cable Television — 2.6% | | | | | | | |
Liberty Global, Inc. - Series C* | | | 46,987 | | | 1,439,681 | |
Comcast Corp. - - CL A* | | | 32,625 | | | 846,619 | |
| | | | |
|
| |
| | | | | | 2,286,300 | |
| | | | |
|
| |
| | | | | | 6,281,740 | |
Commercial Services — 2.1% | | | | | | | |
| | | | | | | |
Coinstar, Inc.* | | | 60,000 | | | 1,878,000 | |
The accompanying notes form an integral part of these financial statements.
41
BALANCED FUND
Schedule of Investments in Securities, Continued
| | | | | | | |
| | Principal
amount
or shares | | Value | |
| |
| |
| |
Diversified Industries — 1.9% | | | | | | | |
| | | | | | | |
Tyco International Ltd. | | | 53,000 | | $ | 1,672,150 | |
| | | | | | | |
Telecommunications — 1.3% | | | | | | | |
| | | | | | | |
Telephone and Data Systems, Inc. - Special | | | 20,000 | | | 1,118,000 | |
| | | | | | | |
Building and Construction Products — 1.1% | | | | | | | |
| | | | | | | |
USG Corp.* | | | 20,000 | | | 933,600 | |
| | | | | | | |
Transportation — 1.0% | | | | | | | |
| | | | | | | |
United Parcel Service, Inc. | | | 12,500 | | | 876,250 | |
| | | | | | | |
Technology — 1.0% | | | | | | | |
| | | | | | | |
Dell, Inc.* | | | 37,000 | | | 858,770 | |
| | | | |
|
| |
Total Common Stocks (Cost $41,911,173) | | | | | | 48,178,855 | |
| | | | | | | |
CONVERTIBLE PREFERRED STOCKS — 0.8% | | | | | | | |
| | | | | | | |
Six Flags, Inc. 7.25% 8/15/09 (Cost $698,995) | | | 30,000 | | | 702,000 | |
| | | | | | | |
CORPORATE BONDS — 2.1% | | | | | | | |
| | | | | | | |
Wells Fargo & Co. 4.125% 3/10/08 | | $ | 600,000 | | | 593,334 | |
The Washington Post Co. 5.5% 2/15/09 | | | 755,000 | | | 760,091 | |
Berkshire Hathaway Finance Corp. 4.2% 12/15/10 | | | 300,000 | | | 291,850 | |
Harrah’s Operating Co., Inc. 5.375% 12/15/13 | | | 250,000 | | | 221,905 | |
| | | | |
|
| |
Total Corporate Bonds (Cost $1,898,569) | | | | | | 1,867,180 | |
The accompanying notes form an integral part of these financial statements.
42
BALANCED FUND
Schedule of Investments in Securities, Continued
| | | | | | | |
| | Principal
amount | | Value | |
| |
| |
| |
MORTGAGE-BACKED SECURITIES — 5.8%(c) | | | | | | | |
| | | | | | | |
Federal Agency CMO and REMIC — 5.8% | | | | | | | |
| | | | | | | |
Fannie Mae 4.25% 6/25/33 (0.8 years) | | $ | 105,262 | | $ | 104,176 | |
Freddie Mac 4.5% 7/15/27 (2.4 years) | | | 750,000 | | | 738,234 | |
Fannie Mae 4.5% 11/25/14 (2.4 years) | | | 460,000 | | | 454,880 | |
Freddie Mac 4.5% 1/15/10 (2.7 years) | | | 750,000 | | | 739,234 | |
Freddie Mac 5.0% 1/15/18 (3.0 years) | | | 432,609 | | | 430,642 | |
Freddie Mac 5.0% 1/15/19 (3.2 years) | | | 994,261 | | | 989,205 | |
Fannie Mae 6.5% 5/25/17 (3.4 years) | | | 716,860 | | | 738,097 | |
Freddie Mac 5.0% 8/15/17 (5.7 years) | | | 959,547 | | | 947,943 | |
| | | | |
|
| |
Total Mortgage-Backed Securities (Cost $5,122,610) | | | | | | 5,142,411 | |
| | | | | | | |
TAXABLE MUNICIPAL BONDS — 0.3% | | | | | | | |
| | | | | | | |
University of California 4.85% 5/15/13 (Cost $297,645) | | | 300,000 | | | 294,699 | |
| | | | | | | |
U.S. TREASURY AND GOVERNMENT AGENCY — 16.5% | | | | | | | |
| | | | | | | |
U.S. Treasury — 13.6% | | | | | | | |
| | | | | | | |
U.S. Treasury Note 3.625% 6/30/07 | | | 2,000,000 | | | 1,993,516 | |
U.S. Treasury Note 3.0% 11/15/07 | | | 300,000 | | | 296,414 | |
U.S. Treasury Note 3.375% 2/15/08 | | | 1,250,000 | | | 1,233,741 | |
U.S. Treasury Note 3.75% 5/15/08 | | | 1,250,000 | | | 1,235,499 | |
U.S. Treasury Note 3.125% 10/15/08 | | | 300,000 | | | 293,051 | |
U.S. Treasury Note 3.0% 2/15/09 | | | 400,000 | | | 388,422 | |
U.S. Treasury Note 2.625% 3/15/09 | | | 1,500,000 | | | 1,445,978 | |
U.S. Treasury Note 3.625% 7/15/09 | | | 500,000 | | | 489,903 | |
U.S. Treasury Note 6.5% 2/15/10 | | | 400,000 | | | 420,828 | |
U.S. Treasury Note 4.0% 3/15/10 | | | 1,750,000 | | | 1,724,914 | |
U.S. Treasury Note 5.0% 2/15/11 | | | 400,000 | | | 406,984 | |
U.S. Treasury Note 5.0% 8/15/11 | | | 500,000 | | | 509,844 | |
U.S. Treasury Note 4.375% 8/15/12 | | | 1,000,000 | | | 994,024 | |
U.S. Treasury Inflation-Indexed Note 2.0% 1/15/14 | | | 547,630 | | | 542,453 | |
| | | | |
|
| |
| | | | | | 11,975,571 | |
The accompanying notes form an integral part of these financial statements.
43
BALANCED FUND
Schedule of Investments in Securities, Continued
| | | | | | | |
| | Principal
amount
or shares | | Value | |
| |
| |
| |
Government Agency — 2.9% | | | | | | | |
| | | | | | | |
Fannie Mae 4.25% 12/21/07 | | $ | 400,000 | | $ | 397,475 | |
Federal Home Loan Bank 3.55% 4/15/08 | | | 500,000 | | | 492,655 | |
Freddie Mac 4.0% 4/28/09 | | | 240,000 | | | 236,016 | |
Federal Home Loan Bank 4.16% 12/08/09 | | | 400,000 | | | 393,608 | |
Federal Home Loan Bank 4.6% 10/15/10 | | | 1,000,000 | | | 986,805 | |
| | | | |
|
| |
| | | | | | 2,506,559 | |
| | | | |
|
| |
Total U.S. Treasury and Government Agency (Cost $14,599,660) | | | | | | 14,482,130 | |
| | | | | | | |
SHORT-TERM SECURITIES — 19.2% | | | | | | | |
| | | | | | | |
Wells Fargo Advantage Government Money Market Fund 5.3%(a) | | | 3,993,773 | | | 3,993,773 | |
U.S. Treasury Bill 5.0% 6/21/07(b) | | $ | 8,000,000 | | | 7,912,976 | |
Federal Home Loan Bank Discount Note 5.3% 6/27/07(b) | | | 5,000,000 | | | 4,939,260 | |
| | | | |
|
| |
Total Short-Term Securities (Cost $16,843,409) | | | | | | 16,846,009 | |
| | | | |
|
| |
Total Investments in Securities (Cost $81,372,061) | | | | | | 87,513,284 | |
Other Assets Less Other Liabilities — 0.5% | | | | | | 448,411 | |
| | | | |
|
| |
Net Assets — 100% | | | | | $ | 87,961,695 | |
| | | | |
|
| |
Net Asset Value Per Share | | | | | $ | 12.20 | |
| | | | |
|
| |
| |
* | Non-income producing |
| |
(a) | Rate presented represents the annualized 7-day yield at March 31, 2007. |
| |
(b) | Interest rate presented represents the yield to maturity at the date of purchase. |
| |
(c) | Number of years indicated represents estimated average life of mortgage-backed securities. |
The accompanying notes form an integral part of these financial statements.
44
(This page has been left blank intentionally.)
45
SHORT-INTERMEDIATE INCOME FUND AND
GOVERNMENT MONEY MARKET FUND
April 10, 2007
Dear Fellow Shareholder:
Short-Intermediate Income Fund Overview
The Short-Intermediate Income Fund’s total return for the first quarter of 2007 was +1.5%, which consisted of approximately +1.2% from net interest and dividend income (after deducting fees and expenses) and +0.3% from (net realized and unrealized) appreciation of our bonds and other investments. Our first quarter return was less than the 1.6% return of the Lehman Brothers Intermediate U.S. Government/Credit Index, our Fund’s primary benchmark. For the fiscal year ended, March 31, 2007, our total return was +5.7%.
The table below shows the results of the Short-Intermediate Income Fund over various time periods through March 31, 2007, along with the Lehman Brothers Intermediate U.S. Government / Credit Index and two additional Lehman Brothers Indexes with a shorter average maturity (1-3 and 1-5 year) which more closely resemble the historical average life of our Fund.
| | | | | | | | | | | | | |
| | Total Return** | | Average Annual
Total Returns** | |
| |
| |
| |
| | 1-Year | | 3-Year | | 5-Year | | 10-Year | |
| |
| |
| |
| |
| |
Short-Intermediate Income Fund | | 5.7 | % | | 2.7 | % | | 4.1 | % | | 5.5 | % | |
Lehman Brothers Intermediate U.S. Government/Credit Index *# | | 6.1 | | | 2.6 | | | 4.9 | | | 6.0 | | |
Lehman Brothers 1-5 Year U.S. Government/Credit
Index *# | | 5.7 | | | 2.4 | | | 4.1 | | | 5.5 | | |
Lehman Brothers 1-3 Year U.S. Government/Credit Index*# | | 5.3 | | | 2.5 | | | 2.7 | | | 5.1 | | |
These performance numbers reflect the deduction of the Fund’s annual operating expenses which as stated in its most recent Prospectus are 0.64% of the Fund’s net assets. This information represents past performance and past performance does not guarantee future results. The investment return and the principal value of an investment in the Fund will fluctuate so that an investor’s shares, when redeemed, may be worth more or less than the original cost. Current performance may be higher or lower than the performance data quoted above. Performance data current to the most recent month end may be obtained at www.weitzfunds.com/performance/monthly.asp.
| |
* | Source: Lehman Brothers, Inc. |
| |
** | All Fund performance numbers assume reinvestment of dividends. |
| |
# | Index performance is hypothetical and is for illustrative purposes only. |
The following table and chart show a profile of our portfolio and asset allocation as of March 31:
| | | | |
Average Maturity | | | 3.0 years | |
Average Duration | | | 2.6 years | |
Average Coupon | | | 4.4% | |
30-Day SEC Yield at 3-31-07 | | | 4.1% | |
Average Rating | | | AAA | |
46
Fiscal Year in Review
The Short-Intermediate Income Fund had a total return of 5.7% in fiscal 2007, compared to 6.1% for the Lehman Brothers Intermediate U.S. Government/Credit Index (LBIGC). Last year’s improved bond market results helped investors break out of a difficult two-year period when ultra low nominal interest rates and Federal Reserve rate hikes sapped investment returns. We were pleased with our results for last year considering that our portfolio duration, a measure of price sensitivity to changes in interest rates, was meaningfully shorter (approximately 25%) than the LBIGC Index. The primary reasons for our Fund’s more defensive posture are the still low nominal interest rates when compared to inflation expectations and a yield curve that remains flat-to-inverted, where short-term interest rates are the same or higher than longer-term rates.
Our Fund’s total return in fiscal 2007 can be primarily attributed to income earned over the course of the year. Realized and unrealized price appreciation of our portfolio, most notably high dividend paying common stock positions also enhanced results.
Bond yields moved higher (prices lower) early last year as economic growth continued to be strong and inflation rose. But an early summer slowdown resulting from a deceleration in the residential property market, cresting energy prices and the Fed’s decision to curtail short-term rate increases sparked a mild rally (prices up, yields down) in the latter part of the fiscal year. U.S. Treasury yields, for example, declined approximately 25 basis points year-over-year for bonds maturing from 2 to 10 years.
Portfolio Review
The average maturity and duration of our Fund declined to 3.0 and 2.6 years, respectively, in the past twelve months while the average coupon increased to 4.4%. The overall credit quality of our portfolio remains very high with more than 90% of the portfolio invested in AAA rated securities or U.S. Treasury and U.S. government agency-guaranteed Mortgage-Backed Securities (MBS).
U.S. Treasury bonds account for approximately 34% of our Fund, down from 36% a year ago. Most of this segment is weighted toward bonds maturing in five years or less. This segment added materially to our performance last year as the largest decline in interest rates occurred in this portion of the yield curve
MBS increased to approximately 37% of our Fund, up from 30% a year ago. MBS provide investors a high-quality coupon return with an imbedded call option that the mortgage borrower holds. This imbedded call option allows the mortgage borrower to prepay their mortgage at any time and can cause principal cash flows to vary widely for the investor (namely us). In periods of falling interest rates, homeowners refinance their mortgages early (and maybe often), while in periods of rising interest rates prepayments tend to slow (which is currently happening).
The U.S. agency-guaranteed mortgage-backed securities that the Fund holds offer attractive incremental yield (upwards of 1.0%) when compared to U.S. Treasuries and other highly rated securities. We continue to focus our MBS investments in defensively structured securities, or those with limited “extension” risk. Our goal is to find MBS that have attributes which enhance our portfolio returns while minimizing any inherent negative surprises, especially those that will cause the expected maturity of the security to extend dramatically. Overall, this portion of our portfolio provided strong performance in the wake of stable prepayments and rising valuations.
Of note, our Fund has zero direct exposure to the types of mortgages (sub-prime, negative amortization, interest-only and Alt-A loans) that have filled the headlines since early this year. For a thorough discussion on this subject please see the segment “Subprime Mortgage Meltdown – What’s really going on here?” earlier in this report from Wally and Brad (co-managers of the Value Fund and Partners Value Fund).
Our corporate bond, convertible bond and preferred or common stock exposure remains small (less than 10%) but provided a significant source of incremental return to the Fund in the past year. The Fund’s holding of Century/Adelphia Communications bonds appreciated approximately 29% (prior to being sold) as the company completed its emergence from bankruptcy. High-dividend-paying common stock positions in Redwood Trust and
47
Newcastle Investment Corp also appreciated meaningfully (40% and 31%, respectively) from depressed levels a year ago. Detracting from Fund performance, a leveraged buy out of Harrah’s caused investors to sell Harrah’s bonds, fearing additional leverage that will result from the LBO. This resulted in price declines of approximately 7% in the Harrah’s bonds held in our portfolio. The interest income we earned on the bonds meaningfully offset this price decline, however, resulting in a modest unrealized loss on the year. We continue to believe the bonds remain credit worthy and expect to recover this unrealized loss at maturity, if not before. In the aggregate, however, our Fund benefited meaningfully from our holdings in these categories of securities.
Fund Strategy Revisited
Our investment approach consists of investing in a portfolio of mostly high quality, short-to-intermediate-term bonds where we believe we can capture most of the “coupon” returns of long-term bonds with materially less interest-rate risk. Given today’s flat yield curve, this approach is particularly applicable. Overall, we strive to maximize our investment (or reinvestment) yield while avoiding making interest rate “bets”, particularly ones that depend on interest rates going down. In other words, capital preservation takes precedence over current yield.
For a small portion of our portfolio, we also search for other fixed-income related investments that have favorable risk/reward characteristics (such as high-yield and convertible bonds, preferred and convertible preferred stock, or high dividend paying common stock). These types of investments have enhanced historical returns and have the potential to increase our Fund’s yield and overall return without incurring undue, or uncompensated, risks.
Looking Forward
Despite growing weakness in the housing market, U.S. and worldwide economic growth appears healthy. Corporate profits have been strong, labor markets are tight (i.e. unemployment is low) and incomes and spending have been rising. This has helped to keep headline and core inflation (excluding food and energy) above the Federal Reserve’s comfort zone of 1-2%. And given the flat-to-inverted yield curve where nominal rates on U.S. Treasuries from 2-10 years are all within 10 basis points of 4.65%, return possibilities (especially longer-term bonds) appear modest after factoring in inflation expectations. Therefore, we expect to maintain our shorter portfolio duration compared to that of our Fund’s primary benchmark (2.6 years versus 3.7 years for the LBIGC at fiscal year end) while we continue searching for qualifying investments with more favorable terms for investors.
Government Money Market Fund Overview
The Government Money Market Fund closed the first quarter with a 7-day effective yield of 5.19%. (An investment in the Fund is neither insured nor guaranteed by the U.S. Government. There can be no assurance that the Fund will be able to maintain a stable net asset value. Although the Fund seeks to preserve the value of your investment at $1.00 per share, it is possible to lose money by investing in the Fund.)
In the past year the Fund’s yield has increased by 1.07%, more than the 1/2% increase in the Fed Funds rate (the overnight lending rate between banks controlled by the Federal Reserve). Most of the increase in the yield resulted from the investment adviser’s decision to lower the cap on the Fund’s expenses to 0.1% from 0.5% through July 2007. This rate cap will be reviewed annually, but we expect it to be renewed for at least another year. Asset selection, including certain higher yielding securities, and increasing the Fund’s average portfolio maturity also contributed to the increase of the Fund’s yield.
The Fed’s decision to stop raising short-term interest rates last summer has resulted in a flattening of reinvestment opportunities for our Fund. Since we invest in ultra high-quality short-term instruments (e.g. U.S. Treasury bills and government agency discount notes) that have a weighted average maturity of less than ninety days, our yield will invariably follow the path dictated by the Federal Reserve’s monetary policy. Given a seemingly balanced economic picture (higher inflation readings on one hand offset by a housing market correction on the other),
48
it appears likely the Fed will continue to leave short-term rates unchanged. Therefore we expect to maintain an average portfolio maturity closer to the ninety day limit to continue to take advantage of today’s higher yields.
If you have any questions about the mechanics of either Fund or our investment strategy, please call. As always, we welcome your comments and questions.
Annual Shareholder Information Meeting – Tuesday, May 22, 2007
Please plan to join us at the Scott Conference Center in Omaha at 4:30 p.m. on May 22. The center is located at 6450 Pine Street on the Aksarben campus. There will be no formal business to conduct, so we can devote the entire meeting to answering your questions. Maps and driving directions are available from our client service representatives. Thanks for your continued support, and we look forward to seeing you there.
| |
| Best Regards, |
|
| 
|
| Thomas D. Carney
Portfolio Manager |
Portfolio composition is subject to change at any time and references to specific securities, industries and sectors referenced in this letter are not recommendations to purchase or sell any particular security. See the Schedules of Investments in Securities included in this report for the percent of assets in each of the Funds invested in particular industries or sectors.
49
FUND PERFORMANCE — SHORT-INTERMEDIATE INCOME FUND
(Unaudited)
The chart below depicts the change in the value of a $10,000 investment for the period March 31, 1997, through March 31, 2007 for the Short-Intermediate Income Fund as compared with the growth of the Lehman Brothers Intermediate U.S. Government/Credit Index during the same period. The Lehman Brothers Intermediate U.S. Government/Credit Index is an unmanaged index consisting of government securities and publicly issued corporate debt with maturities from one to ten years. Index performance is hypothetical and is shown for illustrative purposes only. A $10,000 investment in the Short-Intermediate Income Fund on March 31, 1997 would have been valued at $17,004 on March 31, 2007.
| | | | | | | | | | |
| | Total
Return | | Average Annual
Total Returns | |
| |
| |
| |
| | 1-Year | | 5-Year | | 10-Year | |
Short-Intermediate Income Fund | | 5.7 | % | | 4.1 | % | | 5.5 | % | |
Lehman Brothers Intermediate U.S. Government/Credit Index | | 6.1 | | | 4.9 | | | 6.0 | | |
These performance numbers reflect the deduction of the Fund’s annual operating expenses which as stated in its most recent prospectus are 0.64% of the Fund’s net assets. The returns assume redemption at the end of each period and reinvestment of dividends. This information represents past performance and past performance does not guarantee future results. The investment return and the principal value of an investment in this Fund will fluctuate so that an investor’s shares, when redeemed, may be worth more or less than the original cost. Current performance may be lower or higher than the performance data quoted. Performance data current to the most recent month-end may be obtained at www.weitzfunds.com/performance/monthly.asp.
Performance information does not reflect the deduction of taxes that a shareholder would pay on Fund distributions or the redemption of Fund shares.
50
PORTFOLIO PROFILE — SHORT-INTERMEDIATE INCOME FUND
(Unaudited)
Credit Quality Ratings
| | | | |
U.S. Treasury and Mortgage-Backed Securities | | | 70.7 | % |
Aaa/AAA | | | 21.9 | |
Aa/AA | | | 1.2 | |
A/A | | | 0.8 | |
Ba/BB | | | 1.8 | |
B/B, below, and non-rated | | | 0.7 | |
Cash Equivalents | | | 2.9 | |
| |
|
| |
| | | 100.0 | % |
| |
|
| |
Sector Breakdown
| | | | |
Mortgage-Backed Securities | | | 36.9 | % |
U.S. Treasury | | | 33.8 | |
Government Agency | | | 17.0 | |
Corporate Bonds | | | 6.1 | |
Short-Term Securities/Other | | | 2.9 | |
Taxable Municipal Bonds | | | 2.6 | |
Convertible Preferred Stocks | | | 0.7 | |
| |
|
| |
| | | 100.0 | % |
| |
|
| |
PORTFOLIO PROFILE — GOVERNMENT MONEY MARKET FUND
(Unaudited)
Sector Breakdown
| | | | |
U.S. Treasury | | | 31.3 | % |
Government Agency | | | 48.9 | |
Treasury Money Market Funds | | | 19.9 | |
Other Liabilities in Excess of Other Assets | | | (0.1 | ) |
| |
|
| |
| | | 100.0 | % |
| |
|
| |
51
SHORT-INTERMEDIATE INCOME FUND
Schedule of Investments in Securities
March 31, 2007
| | | | | | | |
| | Principal
amount | | Value | |
| |
| |
| |
CORPORATE BONDS — 6.1% | | | | | | | |
| | | | | | | |
Hilton Hotels Corp. Sr. Notes 7.95% 4/15/07 | | $ | 1,000,000 | | $ | 1,000,000 | |
Wells Fargo & Co. 4.125% 3/10/08 | | | 1,500,000 | | | 1,483,337 | |
Liberty Media Corp. 7.875% 7/15/09 | | | 500,000 | | | 527,050 | |
Berkshire Hathaway Finance Corp. 4.2% 12/15/10 | | | 375,000 | | | 364,812 | |
Countrywide Home Loans, Inc. 4.0% 3/22/11 | | | 1,000,000 | | | 948,799 | |
Berkshire Hathaway Finance Corp. 4.625% 10/15/13 | | | 1,000,000 | | | 968,850 | |
Harrah’s Operating Co., Inc. 5.375% 12/15/13 | | | 750,000 | | | 665,714 | |
Berkshire Hathaway Finance Corp. 4.85% 1/15/15 | | | 1,500,000 | | | 1,458,533 | |
| | | | |
|
| |
Total Corporate Bonds (Cost $7,552,720) | | | | | | 7,417,095 | |
| | | | | | | |
MORTGAGE-BACKED SECURITIES — 36.9%(b) | | | | | | | |
| | | | | | | |
Federal Agency CMO and REMIC — 33.9% | | | | | | | |
| | | | | | | |
Fannie Mae 5.5% 12/25/26 (0.1 years) | | | 66,359 | | | 66,164 | |
Freddie Mac 5.5% 2/15/16 (0.7 years) | | | 1,144,424 | | | 1,143,548 | |
Fannie Mae 4.25% 6/25/33 (0.8 years) | | | 444,207 | | | 439,621 | |
Freddie Mac 5.125% 12/15/13 (0.9 years) | | | 1,369,424 | | | 1,363,899 | |
Fannie Mae 5.0% 3/25/15 (1.0 years) | | | 511,450 | | | 508,823 | |
Fannie Mae 3.5% 10/25/13 (1.0 years) | | | 1,328,933 | | | 1,306,375 | |
Fannie Mae 4.0% 11/25/13 (1.1 years) | | | 2,000,000 | | | 1,979,627 | |
Fannie Mae 5.0% 9/25/27 (1.6 years) | | | 1,141,941 | | | 1,134,317 | |
Freddie Mac 5.5% 4/15/24 (1.7 years) | | | 2,000,000 | | | 2,003,706 | |
Freddie Mac 4.0% 5/15/19 (1.9 years) | | | 2,296,848 | | | 2,252,916 | |
Freddie Mac 4.5% 7/15/27 (2.4 years) | | | 4,000,000 | | | 3,937,247 | |
Fannie Mae 5.0% 12/25/15 (2.6 years) | | | 4,000,000 | | | 3,977,540 | |
Freddie Mac 5.5% 4/15/18 (2.6 years) | | | 1,894,250 | | | 1,901,222 | |
Freddie Mac 4.5% 1/15/10 (2.7 years) | | | 4,250,000 | | | 4,188,990 | |
Freddie Mac 4.5% 12/15/15 (2.9 years) | | | 3,000,000 | | | 2,954,102 | |
Freddie Mac 5.0% 1/15/18 (3.0 years) | | | 1,730,434 | | | 1,722,569 | |
Fannie Mae 4.5% 10/25/17 (3.2 years) | | | 998,930 | | | 978,844 | |
Fannie Mae 4.5% 4/25/17 (3.3 years) | | | 3,000,000 | | | 2,943,681 | |
Fannie Mae 6.5% 5/25/17 (3.4 years) | | | 2,267,189 | | | 2,334,355 | |
Freddie Mac 4.5% 7/15/17 (4.3 years) | | | 4,000,000 | | | 3,909,388 | |
| | | | |
|
| |
| | | | | | 41,046,934 | |
The accompanying notes form an integral part of these financial statements.
52
SHORT-INTERMEDIATE INCOME FUND
Schedule of Investments in Securities, Continued
| | | | | | | |
| | Principal
amount | | Value | |
| |
| |
| |
Federal Agency Mortgage Pass-Through — 3.0% | | | | | | | |
| | | | | | | |
Fannie Mae 4.0% 8/01/13 (2.6 years) | | $ | 715,510 | | $ | 695,597 | |
Fannie Mae 4.5% 6/01/14 (2.9 years) | | | 932,427 | | | 916,511 | |
Fannie Mae 6.5% 6/01/18 (3.8 years) | | | 47,113 | | | 48,749 | |
Freddie Mac 5.0% 6/01/18 (3.9 years) | | | 490,653 | | | 485,423 | |
Fannie Mae 5.0% 10/01/18 (4.1 years) | | | 1,546,922 | | | 1,530,114 | |
| | | | |
|
| |
| | | | | | 3,676,394 | |
| | | | |
|
| |
Total Mortgage-Backed Securities (Cost $45,178,058) | | | | | | 44,723,328 | |
| | | | | | | |
TAXABLE MUNICIPAL BONDS — 2.6% | | | | | | | |
| | | | | | | |
Topeka, Kansas 4.5% 8/15/09 | | | 1,135,000 | | | 1,126,919 | |
Stratford, Connecticut 6.55% 2/15/13 | | | 500,000 | | | 527,845 | |
University of California 4.85% 5/15/13 | | | 990,000 | | | 972,506 | |
King County, Washington 8.12% 12/01/16 | | | 500,000 | | | 518,710 | |
| | | | |
|
| |
Total Taxable Municipal Bonds (Cost $3,151,879) | | | | | | 3,145,980 | |
| | | | | | | |
U.S. TREASURY AND GOVERNMENT AGENCY — 50.8% | | | | | | | |
| | | | | | | |
U.S. Treasury — 33.8% | | | | | | | |
| | | | | | | |
U.S. Treasury Note 3.375% 2/15/08 | | | 2,000,000 | | | 1,973,986 | |
U.S. Treasury Note 3.75% 5/15/08 | | | 3,000,000 | | | 2,965,197 | |
U.S. Treasury Note 4.125% 8/15/08 | | | 2,000,000 | | | 1,983,752 | |
U.S. Treasury Note 3.0% 2/15/09 | | | 5,000,000 | | | 4,855,275 | |
U.S. Treasury Note 2.625% 3/15/09 | | | 3,000,000 | | | 2,891,955 | |
U.S. Treasury Note 3.625% 7/15/09 | | | 3,000,000 | | | 2,939,415 | |
U.S. Treasury Note 4.0% 3/15/10 | | | 10,000,000 | | | 9,856,650 | |
U.S. Treasury Note 5.0% 8/15/11 | | | 1,500,000 | | | 1,529,532 | |
U.S. Treasury Note 4.375% 8/15/12 | | | 5,000,000 | | | 4,970,120 | |
U.S. Treasury Inflation-Indexed Note 2.0% 1/15/14 | | | 2,190,520 | | | 2,169,813 | |
U.S. Treasury Note 4.25% 8/15/14 | | | 5,000,000 | | | 4,889,260 | |
| | | | |
|
| |
| | | | | | 41,024,955 | |
The accompanying notes form an integral part of these financial statements.
53
SHORT-INTERMEDIATE INCOME FUND
Schedule of Investments in Securities, Continued
| | | | | | | |
| | Principal
amount
or shares | | Value | |
| |
| |
| |
Government Agency — 17.0% | | | | | | | |
| | | | | | | |
Fannie Mae 4.25% 12/21/07 | | $ | 2,000,000 | | $ | 1,987,376 | |
Federal Home Loan Bank 3.55% 4/15/08 | | | 3,095,000 | | | 3,049,534 | |
Fannie Mae 4.08% 6/06/08 | | | 4,000,000 | | | 3,957,704 | |
Freddie Mac 4.0% 4/28/09 | | | 240,000 | | | 236,016 | |
Freddie Mac 3.25% 7/09/09 | | | 1,000,000 | | | 966,199 | |
Federal Home Loan Bank 4.16% 12/08/09 | | | 1,500,000 | | | 1,476,032 | |
Fannie Mae 4.125% 4/28/10 | | | 2,000,000 | | | 1,963,578 | |
Freddie Mac 4.125% 6/16/10 | | | 1,000,000 | | | 980,707 | |
Freddie Mac 5.5% 9/15/11 | | | 1,000,000 | | | 1,026,947 | |
Fannie Mae 4.375% 7/17/13 | | | 2,000,000 | | | 1,939,712 | |
Freddie Mac 5.0% 11/13/14 | | | 3,000,000 | | | 3,014,220 | |
| | | | |
|
| |
| | | | | | 20,598,025 | |
| | | | |
|
| |
Total U.S. Treasury and Government Agency (Cost $62,277,883) | | | | | | 61,622,980 | |
| | | | | | | |
CONVERTIBLE PREFERRED STOCKS — 0.7% | | | | | | | |
| | | | | | | |
Six Flags, Inc. 7.25% 8/15/09 (Cost $814,492) | | | 35,000 | | | 819,000 | |
| | | | | | | |
| | | | | | | |
SHORT-TERM SECURITIES — 2.3% | | | | | | | |
| | | | | | | |
Wells Fargo Advantage Government Money Market Fund 5.3%(a)
(Cost $2,843,826) | | | 2,843,826 | | | 2,843,826 | |
| | | | |
|
| |
Total Investments in Securities (Cost $121,818,858) | | | | | | 120,572,209 | |
Other Assets Less Other Liabilities — 0.6% | | | | | | 720,592 | |
| | | | |
|
| |
Net Assets — 100% | | | | | $ | 121,292,801 | |
| | | | |
|
| |
Net Asset Value Per Share | | | | | $ | 11.42 | |
| | | | |
|
| |
| |
(a) | Rate presented represents the annualized 7-day yield at March 31, 2007. |
| |
(b) | Number of years indicated represents estimated average life of mortgage-backed securities. |
The accompanying notes form an integral part of these financial statements.
54
GOVERNMENT MONEY MARKET FUND
Schedule of Investments in Securities
March 31, 2007
| | | | | | | |
| | Principal
amount or
shares | | Value | |
| |
| |
| |
U.S. TREASURY AND GOVERNMENT AGENCY — 80.2%† | | | | | | | |
| | | | | | | |
U.S. Treasury — 31.3% | | | | | | | |
| | | | | | | |
U.S. Treasury Bill 5.1% 5/10/07 | | $ | 5,000,000 | | $ | 4,972,917 | |
U.S. Treasury Bill 5.0% 6/21/07 | | | 20,000,000 | | | 19,778,937 | |
| | | | |
|
| |
| | | | | | 24,751,854 | |
| | | | | | | |
Government Agency — 48.9% | | | | | | | |
| | | | | | | |
Federal Home Loan Bank Discount Note 5.2% 4/04/07 | | | 7,000,000 | | | 6,997,007 | |
Federal Home Loan Bank Discount Note 5.3% 6/01/07 | | | 7,000,000 | | | 6,939,022 | |
Federal Farm Credit Banks Discount Note 5.2% 6/26/07 | | | 14,000,000 | | | 13,829,099 | |
Federal Home Loan Bank Discount Note 5.3% 6/27/07 | | | 11,000,000 | | | 10,863,734 | |
| | | | |
|
| |
| | | | | | 38,628,862 | |
| | | | |
|
| |
Total U.S. Treasury and Government Agency | | | | | | 63,380,716 | |
| | | | | | | |
SHORT-TERM SECURITIES — 19.9% | | | | | | | |
| | | | | | | |
Wells Fargo Advantage 100% Treasury Money Market Fund 4.7%(a) | | | 528,039 | | | 528,039 | |
Milestone Treasury Obligations Portfolio 5.2%(a) | | | 15,221,285 | | | 15,221,285 | |
| | | | |
|
| |
Total Short-Term Securities | | | | | | 15,749,324 | |
| | | | |
|
| |
Total Investments in Securities (Cost $79,130,040) | | | | | | 79,130,040 | |
Other Liabilities in Excess of Other Assets (0.1%) | | | | | | (63,860 | ) |
| | | | |
|
| |
Net Assets — 100% | | | | | $ | 79,066,180 | |
| | | | |
|
| |
Net Asset Value Per Share | | | | | $ | 1.00 | |
| | | | |
|
| |
| |
† | Interest rates presented represent the yield to maturity at the date of purchase. |
| |
(a) | Rate presented represents the annualized 7-day yield at March 31, 2007. |
The accompanying notes form an integral part of these financial statements.
55
THE WEITZ FUNDS
Statements of Assets and Liabilities
March 31, 2007
| | | | | | | |
| | Value | | Partners
Value | |
| |
| |
| |
Assets: | | | | | | | |
Investments in securities at value: | | | | | | | |
Unaffiliated issuers* | | $ | 3,021,111,793 | | $ | 2,023,190,425 | |
Non-controlled affiliates* | | | 122,362,100 | | | 4,699,160 | |
| |
|
| |
|
| |
| | | 3,143,473,893 | | | 2,027,889,585 | |
Accrued interest and dividends receivable | | | 4,963,935 | | | 2,232,099 | |
Due from broker | | | — | | | — | |
Receivable for securities sold | | | — | | | — | |
Receivable for fund shares sold | | | 903,461 | | | 479,930 | |
Other | | | — | | | 10,495 | |
| |
|
| |
|
| |
Total assets | | | 3,149,341,289 | | | 2,030,612,109 | |
| |
|
| |
|
| |
| | | | | | | |
Liabilities: | | | | | | | |
Dividends payable on securities sold short | | | — | | | — | |
Due to adviser | | | 3,190,403 | | | 2,048,472 | |
Options written, at value† | | | — | | | — | |
Payable for securities purchased | | | 8,023,139 | | | 2,787,477 | |
Payable for fund shares redeemed | | | 16,346,155 | | | 1,938,987 | |
Securities sold short# | | | — | | | — | |
Other expenses | | | — | | | — | |
| |
|
| |
|
| |
Total liabilities | | | 27,559,697 | | | 6,774,936 | |
| |
|
| |
|
| |
| | | | | | | |
Net assets applicable to shares outstanding | | $ | 3,121,781,592 | | $ | 2,023,837,173 | |
| |
|
| |
|
| |
| | | | | | | |
Composition of net assets: | | | | | | | |
Paid-in capital | | $ | 2,262,717,687 | | $ | 1,462,567,760 | |
Accumulated undistributed net investment income | | | 13,423,123 | | | 3,580,535 | |
Accumulated net realized gain (loss) | | | 142,549,078 | | | 89,725,599 | |
Net unrealized appreciation (depreciation) of investments | | | 703,091,704 | | | 467,963,279 | |
| |
|
| |
|
| |
Total net assets applicable to shares outstanding | | $ | 3,121,781,592 | | $ | 2,023,837,173 | |
| |
|
| |
|
| |
| | | | | | | |
Net asset value, offering and redemption price per share of shares outstanding | | $ | 40.09 | | $ | 24.53 | |
| |
|
| |
|
| |
| | | | | | | |
Total shares outstanding
(indefinite number of no par value shares authorized) | | | 77,875,644 | | | 82,491,160 | |
| |
|
| |
|
| |
| | | | | | | |
* Cost of investments in securities: | | | | | | | |
Unaffiliated issuers | | $ | 2,369,397,855 | | $ | 1,556,930,348 | |
Non-controlled affiliates | | | 70,984,334 | | | 2,995,958 | |
| |
|
| |
|
| |
| | $ | 2,440,382,189 | | $ | 1,559,926,306 | |
| |
|
| |
|
| |
| | | | | | | |
† Premiums from options written | | $ | — | | $ | — | |
| |
|
| |
|
| |
| | | | | | | |
# Proceeds from securities sold short | | $ | — | | $ | — | |
| |
|
| |
|
| |
The accompanying notes form an integral part of these financial statements.
56
| | | | | | | | | | | | | | | | |
| | Hickory | | Partners III | | Balanced | | Short-Intermediate
Income | | Government
Money Market | |
| |
| |
| |
| |
| |
| |
Assets: | | | | | | | | | | | | | | | | |
Investments in securities at value: | | | | | | | | | | | | | | | | |
Unaffiliated issuers* | | $ | 393,020,210 | | $ | 320,457,676 | | $ | 87,513,284 | | $ | 120,572,209 | | $ | 79,130,040 | |
Non-controlled affiliates* | | | — | | | 3,801,196 | | | — | | | — | | | — | |
| |
|
| |
|
| |
|
| |
|
| |
|
| |
| | | 393,020,210 | | | 324,258,872 | | | 87,513,284 | | | 120,572,209 | | | 79,130,040 | |
Accrued interest and dividends receivable | | | 1,007,824 | | | 609,765 | | | 283,572 | | | 808,878 | | | 9,165 | |
Due from broker | | | — | | | 55,669,765 | | | — | | | — | | | — | |
Receivable for securities sold | | | — | | | — | | | 500,000 | | | — | | | — | |
Receivable for fund shares sold | | | 238,179 | | | 25,000 | | | 94,346 | | | 64,254 | | | — | |
Other | | | — | | | — | | | — | | | — | | | — | |
| |
|
| |
|
| |
|
| |
|
| |
|
| |
Total assets | | | 394,266,213 | | | 380,563,402 | | | 88,391,202 | | | 121,445,341 | | | 79,139,205 | |
| |
|
| |
|
| |
|
| |
|
| |
|
| |
| | | | | | | | | | | | | | | | |
Liabilities: | | | | | | | | | | | | | | | | |
Dividends payable on securities sold short | | | — | | | 67,485 | | | — | | | — | | | — | |
Due to adviser | | | 430,557 | | | 334,541 | | | 92,827 | | | 85,543 | | | 19,185 | |
Options written, at value† | | | 372,770 | | | 515,035 | | | — | | | — | | | — | |
Payable for securities purchased | | | 7,104,550 | | | 3,617,516 | | | 336,680 | | | — | | | — | |
Payable for fund shares redeemed | | | 296,821 | | | — | | | — | | | 66,997 | | | 52,595 | |
Securities sold short# | | | — | | | 52,791,200 | | | — | | | — | | | — | |
Other expenses | | | — | | | — | | | — | | | — | | | 1,245 | |
| |
|
| |
|
| |
|
| |
|
| |
|
| |
Total liabilities | | | 8,204,698 | | | 57,325,777 | | | 429,507 | | | 152,540 | | | 73,025 | |
| |
|
| |
|
| |
|
| |
|
| |
|
| |
| | | | | | | | | | | | | | | | |
Net assets applicable to shares outstanding | | $ | 386,061,515 | | $ | 323,237,625 | | $ | 87,961,695 | | $ | 121,292,801 | | $ | 79,066,180 | |
| |
|
| |
|
| |
|
| |
|
| |
|
| |
| | | | | | | | | | | | | | | | |
Composition of net assets: | | | | | | | | | | | | | | | | |
Paid-in capital | | $ | 382,700,241 | | $ | 255,410,183 | | $ | 79,428,610 | | $ | 122,532,676 | | $ | 79,067,817 | |
Accumulated undistributed net investment income | | | 765,571 | | | 557,211 | | | 348,854 | | | 187,153 | | | — | |
Accumulated net realized gain (loss) | | | (50,666,740 | ) | | 4,468,821 | | | 2,043,008 | | | (180,379 | ) | | (1,637 | ) |
Net unrealized appreciation (depreciation) of investments | | | 53,262,443 | | | 62,801,410 | | | 6,141,223 | | | (1,246,649 | ) | | — | |
| |
|
| |
|
| |
|
| |
|
| |
|
| |
Total net assets applicable to shares outstanding | | $ | 386,061,515 | | $ | 323,237,625 | | $ | 87,961,695 | | $ | 121,292,801 | | $ | 79,066,180 | |
| |
|
| |
|
| |
|
| |
|
| |
|
| |
| | | | | | | | | | | | | | | | |
Net asset value, offering and redemption price per share of shares outstanding | | $ | 39.69 | | $ | 11.28 | | $ | 12.20 | | $ | 11.42 | | $ | 1.000 | |
| |
|
| |
|
| |
|
| |
|
| |
|
| |
| | | | | | | | | | | | | | | | |
Total shares outstanding
(indefinite number of no par value shares authorized) | | | 9,726,462 | | | 28,645,239 | | | 7,211,710 | | | 10,619,009 | | | 79,067,817 | |
| |
|
| |
|
| |
|
| |
|
| |
|
| |
| | | | | | | | | | | | | | | | |
* Cost of investments in securities: | | | | | | | | | | | | | | | | |
Unaffiliated issuers | | $ | 339,896,286 | | $ | 255,399,899 | | $ | 81,372,061 | | $ | 121,818,858 | | $ | 79,130,040 | |
Non-controlled affiliates | | | — | | | 1,934,546 | | | — | | | — | | | — | |
| |
|
| |
|
| |
|
| |
|
| |
|
| |
| | $ | 339,896,286 | | $ | 257,334,445 | | $ | 81,372,061 | | $ | 121,818,858 | | $ | 79,130,040 | |
| |
|
| |
|
| |
|
| |
|
| |
|
| |
| | | | | | | | | | | | | | | | |
† Premiums from options written | | $ | 511,289 | | $ | 727,917 | | $ | — | | $ | — | | $ | — | |
| |
|
| |
|
| |
|
| |
|
| |
|
| |
| | | | | | | | | | | | | | | | |
# Proceeds from securities sold short | | $ | — | | $ | 48,455,301 | | $ | — | | $ | — | | $ | — | |
| |
|
| |
|
| |
|
| |
|
| |
|
| |
The accompanying notes form an integral part of these financial statements.
57
THE WEITZ FUNDS
Statements of Operations
Year Ended March 31, 2007
| | | | | | | |
| | Value | | Partners
Value | |
| |
| |
| |
Investment income: | | | | | | | |
Dividends: | | | | | | | |
Unaffiliated issuers* | | $ | 23,806,579 | | $ | 19,909,790 | |
Non-controlled affiliates | | | 15,021,000 | | | — | |
| |
|
| |
|
| |
| | | 38,827,579 | | | 19,909,790 | |
Interest | | | 15,480,583 | | | 9,253,059 | |
| |
|
| |
|
| |
Total investment income | | | 54,308,162 | | | 29,162,849 | |
| |
|
| |
|
| |
| | | | | | | |
Expenses: | | | | | | | |
Investment advisory fee | | | 29,060,455 | | | 19,055,856 | |
Administrative fee | | | 3,032,414 | | | 1,986,837 | |
Custodial fees | | | 64,387 | | | 44,009 | |
Dividend expense on securities sold short | | | — | | | — | |
Interest expense | | | — | | | — | |
Registration fees | | | 74,036 | | | 46,802 | |
Sub-transfer agent fees | | | 360,493 | | | 130,894 | |
Trustees fees | | | 151,047 | | | 98,099 | |
Other expenses | | | 718,066 | | | 392,956 | |
| |
|
| |
|
| |
Total expenses | | | 33,460,898 | | | 21,755,453 | |
Less expenses reimbursed by investment adviser | | | — | | | — | |
| |
|
| |
|
| |
Net expenses | | | 33,460,898 | | | 21,755,453 | |
| |
|
| |
|
| |
Net investment income | | | 20,847,264 | | | 7,407,396 | |
| |
|
| |
|
| |
| | | | | | | |
Realized and unrealized gain (loss) on investments: | | | | | | | |
Net realized gain (loss): | | | | | | | |
Unaffiliated issuers | | $ | 310,452,990 | | $ | 269,508,798 | |
Non-controlled affiliates | | | — | | | — | |
Options written | | | 515,288 | | | 257,653 | |
Securities sold short | | | — | | | — | |
| |
|
| |
|
| |
Net realized gain (loss) | | | 310,968,278 | | | 269,766,451 | |
Net unrealized appreciation (depreciation): | | | | | | | |
Unaffiliated issuers | | | 133,489,757 | | | 48,791,988 | |
Non-controlled affiliates | | | 20,795,963 | | | 1,160 | |
Options written | | | (510,288 | ) | | 3,378,004 | |
Securities sold short | | | — | | | — | |
| |
|
| |
|
| |
Net unrealized appreciation (depreciation) | | | 153,775,432 | | | 52,171,152 | |
| |
|
| |
|
| |
Net realized and unrealized gain (loss) on investments | | | 464,743,710 | | | 321,937,603 | |
| |
|
| |
|
| |
Net increase (decrease) in net assets resulting from operations | | $ | 485,590,974 | | $ | 329,344,999 | |
| |
|
| |
|
| |
| | | | | | | |
* Foreign taxes withheld | | $ | — | | $ | — | |
| |
|
| |
|
| |
The accompanying notes form an integral part of these financial statements.
58
| | | | | | | | | | | | | | | | |
| | Hickory | | Partners III | | Balanced | | Short-Intermediate
Income | | Government
Money Market | |
| |
| |
| |
| |
| |
| |
Investment income: | | | | | | | | | | | | | | | | |
Dividends: | | | | | | | | | | | | | | | | |
Unaffiliated issuers* | | $ | 5,397,601 | | $ | 4,671,263 | | $ | 658,045 | | $ | 167,078 | | $ | — | |
Non-controlled affiliates | | | — | | | — | | | — | | | — | | | — | |
| |
|
| |
|
| |
|
| |
|
| |
|
| |
| | | 5,397,601 | | | 4,671,263 | | | 658,045 | | | 167,078 | | | — | |
Interest | | | 1,391,106 | | | 2,348,409 | | | 1,243,652 | | | 6,033,153 | | | 3,228,218 | |
| |
|
| |
|
| |
|
| |
|
| |
|
| |
Total investment income | | | 6,788,707 | | | 7,019,672 | | | 1,901,697 | | | 6,200,231 | | | 3,228,218 | |
| |
|
| |
|
| |
|
| |
|
| |
|
| |
| | | | | | | | | | | | | | | | |
Expenses: | | | | | | | | | | | | | | | | |
Investment advisory fee | | | 3,483,416 | | | 2,914,354 | | | 571,202 | | | 586,767 | | | 279,825 | |
Administrative fee | | | 429,593 | | | 372,687 | | | 131,202 | | | 215,820 | | | 119,998 | |
Custodial fees | | | 12,896 | | | 12,119 | | | 6,079 | | | 5,770 | | | 4,515 | |
Dividend expense on securities sold short | | | — | | | 651,774 | | | — | | | — | | | — | |
Interest expense | | | — | | | 414,048 | | | — | | | — | | | — | |
Registration fees | | | 27,797 | | | 28,682 | | | 18,775 | | | 27,138 | | | 29,520 | |
Sub-transfer agent fees | | | 109,989 | | | 31,614 | | | 31,700 | | | 34,353 | | | 31,782 | |
Trustees fees | | | 17,844 | | | 14,906 | | | 3,643 | | | 7,018 | | | 3,136 | |
Other expenses | | | 112,168 | | | 153,279 | | | 45,548 | | | 81,396 | | | 40,291 | |
| |
|
| |
|
| |
|
| |
|
| |
|
| |
Total expenses | | | 4,193,703 | | | 4,593,463 | | | 808,149 | | | 958,262 | | | 509,067 | |
Less expenses reimbursed by investment adviser | | | — | | | — | | | — | | | — | | | (364,751 | ) |
| |
|
| |
|
| |
|
| |
|
| |
|
| |
Net expenses | | | 4,193,703 | | | 4,593,463 | | | 808,149 | | | 958,262 | | | 144,316 | |
| |
|
| |
|
| |
|
| |
|
| |
|
| |
Net investment income | | | 2,595,004 | | | 2,426,209 | | | 1,093,548 | | | 5,241,969 | | | 3,083,902 | |
| |
|
| |
|
| |
|
| |
|
| |
|
| |
| | | | | | | | | | | | | | | | |
Realized and unrealized gain (loss) on investments: | | | | | | | | | | | | | | | | |
Net realized gain (loss): | | | | | | | | | | | | | | | | |
Unaffiliated issuers | | $ | 15,273,294 | | $ | 17,216,178 | | $ | 2,585,109 | | $ | (62,291 | ) | $ | 245 | |
Non-controlled affiliates | | | — | | | — | | | — | | | — | | | — | |
Options written | | | 387,567 | | | 500,676 | | | — | | | — | | | — | |
Securities sold short | | | — | | | (1,935,694 | ) | | — | | | — | | | — | |
| |
|
| |
|
| |
|
| |
|
| |
|
| |
Net realized gain (loss) | | | 15,660,861 | | | 15,781,160 | | | 2,585,109 | | | (62,291 | ) | | 245 | |
| | | | | | | | | | | | | | | | |
Net unrealized appreciation (depreciation): | | | | | | | | | | | | | | | | |
Unaffiliated issuers | | | 33,823,770 | | | 25,140,070 | | | 3,867,320 | | | 2,163,335 | | | — | |
Non-controlled affiliates | | | — | | | 1,776,838 | | | — | | | — | | | — | |
Options written | | | 57,574 | | | 290,253 | | | 18,938 | | | — | | | — | |
Securities sold short | | | — | | | (1,670,602 | ) | | — | | | — | | | — | |
| |
|
| |
|
| |
|
| |
|
| |
|
| |
Net unrealized appreciation (depreciation) | | | 33,881,344 | | | 25,536,559 | | | 3,886,258 | | | 2,163,335 | | | — | |
| |
|
| |
|
| |
|
| |
|
| |
|
| |
Net realized and unrealized gain (loss) on investments | | | 49,542,205 | | | 41,317,719 | | | 6,471,367 | | | 2,101,044 | | | 245 | |
| |
|
| |
|
| |
|
| |
|
| |
|
| |
Net increase (decrease) in net assets resulting from operations | | $ | 52,137,209 | | $ | 43,743,928 | | $ | 7,564,915 | | $ | 7,343,013 | | $ | 3,084,147 | |
| |
|
| |
|
| |
|
| |
|
| |
|
| |
| | | | | | | | | | | | | | | | |
* Foreign taxes withheld | | $ | — | | $ | — | | $ | 1,935 | | $ | — | | $ | — | |
| |
|
| |
|
| |
|
| |
|
| |
|
| |
The accompanying notes form an integral part of these financial statements.
59
THE WEITZ FUNDS
Statements of Changes in Net Assets
| | | | | | | |
| | Value | |
| |
| |
|
| | Year ended March 31, | |
| | 2007 | | 2006 | |
| |
| |
| |
Increase (decrease) in net assets: | | | | | | | |
From operations: | | | | | | | |
Net investment income (loss) | | $ | 20,847,264 | | $ | 22,876,488 | |
Net realized gain (loss) | | | 310,968,278 | | | 212,102,638 | |
Net unrealized appreciation (depreciation) | | | 153,775,432 | | | (104,427,028 | ) |
| |
|
| |
|
| |
Net increase (decrease) in net assets resulting from operations | | | 485,590,974 | | | 130,552,098 | |
| |
|
| |
|
| |
| | | | | | | |
Distributions to shareholders from: | | | | | | | |
Net investment income | | | (21,241,301 | ) | | (38,615,019 | ) |
Net realized gains | | | (189,247,059 | ) | | (77,981,582 | ) |
| |
|
| |
|
| |
Total distributions | | | (210,488,360 | ) | | (116,596,601 | ) |
| |
|
| |
|
| |
| | | | | | | |
Fund share transactions:* | | | | | | | |
Proceeds from sales | | | 459,271,293 | | | 265,452,306 | |
Proceeds from shares issued in connection with reorganization(a) | | | — | | | — | |
Payments for redemptions | | | (713,503,239 | ) | | (1,599,923,250 | ) |
Reinvestment of distributions | | | 190,685,772 | | | 106,247,320 | |
| |
|
| |
|
| |
Net increase (decrease) from fund share transactions | | | (63,546,174 | ) | | (1,228,223,624 | ) |
| |
|
| |
|
| |
Total increase (decrease) in net assets | | | 211,556,440 | | | (1,214,268,127 | ) |
| |
|
| |
|
| |
| | | | | | | |
| | | | | | | |
Net assets: | | | | | | | |
Beginning of period | | $ | 2,910,225,152 | | $ | 4,124,493,279 | |
| |
|
| |
|
| |
| | | | | | | |
End of period | | $ | 3,121,781,592 | | $ | 2,910,225,152 | |
| |
|
| |
|
| |
| | | | | | | |
Undistributed net investment income | | $ | 13,423,123 | | $ | 13,817,160 | |
| |
|
| |
|
| |
| | | | | | | |
*Transactions in fund shares: | | | | | | | |
Shares issued | | | 11,537,045 | | | 7,347,742 | |
Shares issued in connection with reorganization(a) | | | — | | | — | |
Shares redeemed | | | (18,560,901 | ) | | (44,350,073 | ) |
Reinvested dividends | | | 4,799,641 | | | 2,969,722 | |
| |
|
| |
|
| |
Net increase (decrease) in shares outstanding | | | (2,224,215 | ) | | (34,032,609 | ) |
| |
|
| |
|
| |
| |
(a) | Fund commenced operations on January 1, 2006 (See Note 1) |
The accompanying notes form an integral part of these financial statements.
60
| | | | | | | | | | | | | | | | | | | |
| | Partners Value | | Hickory | | Partners III | |
| |
| |
| |
| |
| | Year ended March 31, | | Year ended March 31, | | Year ended | | Three months
ended | |
| | 2007 | | 2006 | | 2007 | | 2006 | | March 31, 2007 | | March 31, 2006(a) | |
| |
| |
| |
| |
| |
| |
| |
Increase (decrease) in net assets: | | | | | | | | | | | | | | | | | | | |
From operations: | | | | | | | | | | | | | | | | | | | |
Net investment income (loss) | | $ | 7,407,396 | | $ | 11,190,101 | | $ | 2,595,004 | | $ | 945,863 | | $ | 2,426,209 | | $ | 455,853 | |
Net realized gain (loss) | | | 269,766,451 | | | 152,109,068 | | | 15,660,861 | | | 44,659,604 | | | 15,781,160 | | | 3,549,398 | |
Net unrealized appreciation (depreciation) | | | 52,171,152 | | | (67,208,748 | ) | | 33,881,344 | | | (15,566,511 | ) | | 25,536,559 | | | 2,236,856 | |
| |
|
| |
|
| |
|
| |
|
| |
|
| |
|
| |
Net increase (decrease) in net assets resulting from operations | | | 329,344,999 | | | 96,090,421 | | | 52,137,209 | | | 30,038,956 | | | 43,743,928 | | | 6,242,107 | |
| |
|
| |
|
| |
|
| |
|
| |
|
| |
|
| |
| | | | | | | | | | | | | | | | | | | |
Distributions to shareholders from: | | | | | | | | | | | | | | | | | | | |
Net investment income | | | (10,524,431 | ) | | (15,444,421 | ) | | (1,987,488 | ) | | (787,808 | ) | | (2,324,851 | ) | | — | |
Net realized gains | | | (242,439,968 | ) | | (36,291,188 | ) | | — | | | — | | | (14,529,358 | ) | | — | |
| |
|
| |
|
| |
|
| |
|
| |
|
| |
|
| |
Total distributions | | | (252,964,399 | ) | | (51,735,609 | ) | | (1,987,488 | ) | | (787,808 | ) | | (16,854,209 | ) | | — | |
| |
|
| |
|
| |
|
| |
|
| |
|
| |
|
| |
| | | | | | | | | | | | | | | | | | | |
Fund share transactions:* | | | | | | | | | | | | | | | | | | | |
Proceeds from sales | | | 229,009,536 | | | 114,393,025 | | | 74,553,956 | | | 58,062,029 | | | 24,857,070 | | | 16,186,028 | |
Proceeds from shares issued in connection with reorganization(a) | | | — | | | — | | | — | | | — | | | — | | | 242,754,985 | |
Payments for redemptions | | | (396,511,045 | ) | | (959,145,846 | ) | | (70,235,193 | ) | | (86,759,522 | ) | | (9,731,102 | ) | | (561,900 | ) |
Reinvestment of distributions | | | 233,952,755 | | | 47,790,017 | | | 1,710,051 | | | 692,865 | | | 16,600,718 | | | — | |
| |
|
| |
|
| |
|
| |
|
| |
|
| |
|
| |
Net increase (decrease) from fund share transactions | | | 66,451,246 | | | (796,962,804 | ) | | 6,028,814 | | | (28,004,628 | ) | | 31,726,686 | | | 258,379,113 | |
| |
|
| |
|
| |
|
| |
|
| |
|
| |
|
| |
Total increase (decrease) in net assets | | | 142,831,846 | | | (752,607,992 | ) | | 56,178,535 | | | 1,246,520 | | | 58,616,405 | | | 264,621,220 | |
| |
|
| |
|
| |
|
| |
|
| |
|
| |
|
| |
| | | | | | | | | | | | | | | | | | | |
Net assets: | | | | | | | | | | | | | | | | | | | |
Beginning of period | | $ | 1,881,005,327 | | $ | 2,633,613,319 | | $ | 329,882,980 | | $ | 328,636,460 | | $ | 264,621,220 | | $ | — | |
| |
|
| |
|
| |
|
| |
|
| |
|
| |
|
| |
| | | | | | | | | | | | | | | | | | | |
End of period | | $ | 2,023,837,173 | | $ | 1,881,005,327 | | $ | 386,061,515 | | $ | 329,882,980 | | $ | 323,237,625 | | $ | 264,621,220 | |
| |
|
| |
|
| |
|
| |
|
| |
|
| |
|
| |
| | | | | | | | | | | | | | | | | | | |
Undistributed net investment income | | $ | 3,580,535 | | $ | 6,697,570 | | $ | 765,571 | | $ | 158,055 | | $ | 557,211 | | $ | 455,853 | |
| |
|
| |
|
| |
|
| |
|
| |
|
| |
|
| |
| | | | | | | | | | | | | | | | | | | |
*Transactions in fund shares: | | | | | | | | | | | | | | | | | | | |
Shares issued | | | 9,272,428 | | | 4,954,881 | | | 1,963,588 | | | 1,781,250 | | | 2,242,244 | | | 1,592,861 | |
Shares issued in connection with reorganization(a) | | | — | | | — | | | — | | | — | | | — | | | 24,275,498 | |
Shares redeemed | | | (16,470,331 | ) | | (41,673,834 | ) | | (1,922,957 | ) | | (2,638,627 | ) | | (904,899 | ) | | (55,249 | ) |
Reinvested dividends | | | 9,703,067 | | | 2,086,366 | | | 43,190 | | | 21,143 | | | 1,494,784 | | | — | |
| |
|
| |
|
| |
|
| |
|
| |
|
| |
|
| |
Net increase (decrease) in shares outstanding | | | 2,505,164 | | | (34,632,587 | ) | | 83,821 | | | (836,234 | ) | | 2,832,129 | | | 25,813,110 | |
| |
|
| |
|
| |
|
| |
|
| |
|
| |
|
| |
The accompanying notes form an integral part of these financial statements.
61
THE WEITZ FUNDS
Statements of Changes in Net Assets, Continued
| | | | | | | |
| | Balanced | |
| |
| |
| | | |
| | Year ended March 31, | |
| | 2007 | | 2006 | |
| |
| |
| |
Increase (decrease) in net assets: | | | | | | | |
From operations: | | | | | | | |
Net investment income (loss) | | $ | 1,093,548 | | $ | 776,356 | |
Net realized gain (loss) | | | 2,585,109 | | | 2,374,215 | |
Net unrealized appreciation (depreciation) | | | 3,886,258 | | | 362,650 | |
| |
|
| |
|
| |
Net increase (decrease) in net assets resulting from operations | | | 7,564,915 | | | 3,513,221 | |
| |
|
| |
|
| |
| | | | | | | |
Distributions to shareholders from: | | | | | | | |
Net investment income | | | (964,071 | ) | | (681,026 | ) |
Net realized gains | | | (1,547,204 | ) | | (2,251,834 | ) |
| |
|
| |
|
| |
Total distributions | | | (2,511,275 | ) | | (2,932,860 | ) |
| |
|
| |
|
| |
| | | | | | | |
Fund share transactions:* | | | | | | | |
Proceeds from sales | | | 24,275,214 | | | 15,263,151 | |
Payments for redemptions | | | (8,670,585 | ) | | (8,076,634 | ) |
Reinvestment of distributions | | | 2,453,555 | | | 2,848,846 | |
| |
|
| |
|
| |
Net increase (decrease) from fund share transactions | | | 18,058,184 | | | 10,035,363 | |
| |
|
| |
|
| |
Total increase (decrease) in net assets | | | 23,111,824 | | | 10,615,724 | |
| |
|
| |
|
| |
| | | | | | | |
Net assets: | | | | | | | |
Beginning of period | | $ | 64,849,871 | | $ | 54,234,147 | |
| |
|
| |
|
| |
| | | | | | | |
End of period | | $ | 87,961,695 | | $ | 64,849,871 | |
| |
|
| |
|
| |
| | | | | | | |
Undistributed net investment income | | $ | 348,854 | | $ | 217,863 | |
| |
|
| |
|
| |
| | | | | | | |
*Transactions in fund shares: | | | | | | | |
Shares issued | | | 2,005,301 | | | 1,351,891 | |
Shares redeemed | | | (744,692 | ) | | (720,534 | ) |
Reinvested dividends | | | 210,847 | | | 255,706 | |
| |
|
| |
|
| |
Net increase (decrease) in shares outstanding | | | 1,471,456 | | | 887,063 | |
| |
|
| |
|
| |
The accompanying notes form an integral part of these financial statements.
62
| | | | | | | | | | | | | |
| | Short-Intermediate Income | | Government Money Market | |
| |
| |
| |
| | Year ended March 31, | | Year ended March 31, | |
| | 2007 | | 2006 | | 2007 | | 2006 | |
| |
| |
| |
| |
| |
Increase (decrease) in net assets: | | | | | | | | | | | | | |
From operations: | | | | | | | | | | | | | |
Net investment income (loss) | | $ | 5,241,969 | | $ | 5,443,803 | | $ | 3,083,902 | | $ | 1,463,592 | |
Net realized gain (loss) | | | (62,291 | ) | | 161,483 | | | 245 | | | (1,412 | ) |
Net unrealized appreciation (depreciation) | | | 2,163,335 | | | (2,876,508 | ) | | — | | | — | |
| |
|
| |
|
| |
|
| |
|
| |
Net increase (decrease) in net assets resulting from operations | | | 7,343,013 | | | 2,728,778 | | | 3,084,147 | | | 1,462,180 | |
| |
|
| |
|
| |
|
| |
|
| |
| | | | | | | | | | | | | |
Distributions to shareholders from: | | | | | | | | | | | | | |
Net investment income | | | (5,308,508 | ) | | (5,617,635 | ) | | (3,083,902 | ) | | (1,463,592 | ) |
Net realized gains | | | — | | | (628,361 | ) | | — | | | — | |
| |
|
| |
|
| |
|
| |
|
| |
Total distributions | | | (5,308,508 | ) | | (6,245,996 | ) | | (3,083,902 | ) | | (1,463,592 | ) |
| |
|
| |
|
| |
|
| |
|
| |
| | | | | | | | | | | | | |
Fund share transactions:* | | | | | | | | | | | | | |
Proceeds from sales | | | 27,625,026 | | | 68,607,713 | | | 147,038,660 | | | 171,467,179 | |
Payments for redemptions | | | (70,365,512 | ) | | (71,588,203 | ) | | (132,006,799 | ) | | (152,548,064 | ) |
Reinvestment of distributions | | | 5,088,798 | | | 6,012,601 | | | 3,026,373 | | | 1,400,603 | |
| |
|
| |
|
| |
|
| |
|
| |
Net increase (decrease) from fund share transactions | | | (37,651,688 | ) | | 3,032,111 | | | 18,058,234 | | | 20,319,718 | |
| |
|
| |
|
| |
|
| |
|
| |
Total increase (decrease) in net assets | | | (35,617,183 | ) | | (485,107 | ) | | 18,058,479 | | | 20,318,306 | |
| |
|
| |
|
| |
|
| |
|
| |
| | | | | | | | | | | | | |
Net assets: | | | | | | | | | | | | | |
Beginning of period | | $ | 156,909,984 | | $ | 157,395,091 | | $ | 61,007,701 | | $ | 40,689,395 | |
| |
|
| |
|
| |
|
| |
|
| |
| | | | | | | | | | | | | |
End of period | | $ | 121,292,801 | | $ | 156,909,984 | | $ | 79,066,180 | | $ | 61,007,701 | |
| |
|
| |
|
| |
|
| |
|
| |
| | | | | | | | | | | | | |
Undistributed net investment income | | $ | 187,153 | | $ | 167,435 | | $ | — | | $ | — | |
| |
|
| |
|
| |
|
| |
|
| |
| | | | | | | | | | | | | |
*Transactions in fund shares: | | | | | | | | | | | | | |
Shares issued | | | 2,430,425 | | | 5,966,002 | | | 147,038,660 | | | 171,467,179 | |
Shares redeemed | | | (6,200,086 | ) | | (6,243,380 | ) | | (132,006,799 | ) | | (152,548,064 | ) |
Reinvested dividends | | | 449,114 | | | 527,062 | | | 3,026,373 | | | 1,400,603 | |
| |
|
| |
|
| |
|
| |
|
| |
Net increase (decrease) in shares outstanding | | | (3,320,547 | ) | | 249,684 | | | 18,058,234 | | | 20,319,718 | |
| |
|
| |
|
| |
|
| |
|
| |
The accompanying notes form an integral part of these financial statements.
63
THE WEITZ FUNDS
Partners III Opportunity Fund
Statement of Cash Flows
Year Ended March 31, 2007
| | | | |
Increase (decrease) in cash: | | | | |
Cash flows from operating activities: | | | | |
Net increase in net assets from operations | | $ | 43,743,928 | |
Adjustments to reconcile net increase in net assets from operations to net cash used in operating activities: | | | | |
Purchase of investment securities | | | (107,181,806 | ) |
Proceeds from sale of investment securities | | | 98,274,936 | |
Proceeds from securities sold short | | | 22,276,827 | |
Short positions covered | | | (19,765,923 | ) |
Purchase of short-term investment securities, net | | | (4,878,163 | ) |
Increase in accrued interest and dividends receivable | | | (30,380 | ) |
Decrease in receivable for securities sold | | | 622,912 | |
Increase in receivable for fund shares sold | | | (25,000 | ) |
Increase in dividends payable on securities sold short | | | 28,009 | |
Increase in payable for securities purchased | | | 3,612,623 | |
Increase in due to adviser and other expenses | | | 40,984 | |
Net unrealized appreciation on investments, options and short sales | | | (25,536,559 | ) |
Net realized gain on investments, options and short sales | | | (15,781,160 | ) |
| |
|
| |
| | | | |
Net cash used in operating activities | | | (4,598,772 | ) |
| |
|
| |
| | | | |
Cash flows from financing activities: | | | | |
Proceeds from sales of fund shares | | | 24,857,070 | |
Payments for redemptions of fund shares | | | (9,731,102 | ) |
Cash distributions to shareholders | | | (253,491 | ) |
Increase in due from broker | | | (8,578,451 | ) |
Decrease in due to custodian | | | (1,695,254 | ) |
| |
|
| |
| | | | |
Net cash provided by financing activities | | | 4,598,772 | |
| |
|
| |
| | | | |
Net increase in cash | | | — | |
| | | | |
Cash: | | | | |
Balance, beginning of period | | | — | |
| |
|
| |
Balance, end of period | | $ | — | |
| |
|
| |
| | | | |
Supplemental disclosure of cash flow information: | | | | |
Cash payments for interest | | $ | 414,126 | |
| |
|
| |
| | | | |
Noncash financing activities: | | | | |
Reinvestment of shareholder distributions | | $ | 16,600,718 | |
| |
|
| |
The accompanying notes form an integral part of these financial statements.
64
THE WEITZ FUNDS
Value Fund
Financial Highlights
The following financial information provides selected data for a share of the Value Fund outstanding throughout the periods indicated.
| | | | | | | | | | | | | | | | |
| | Year ended March 31, | |
| |
| |
| | 2007 | | 2006 | | 2005 | | 2004 | | 2003 | |
| |
| |
| |
| |
| |
| |
Net asset value, beginning of period | | $ | 36.33 | | $ | 36.14 | | $ | 37.78 | | $ | 26.85 | | $ | 34.25 | |
| |
|
| |
|
| |
|
| |
|
| |
|
| |
| | | | | | | | | | | | | | | | |
Income (loss) from investment operations: | | | | | | | | | | | | | | | | |
Net investment income | | | 0.28 | | | 0.29 | | | 0.36 | | | 0.19 | | | 0.23 | |
Net gain (loss) on securities (realized and unrealized) | | | 6.31 | | | 1.14 | | | 1.51 | | | 10.89 | | | (7.12 | ) |
| |
|
| |
|
| |
|
| |
|
| |
|
| |
Total from investment operations | | | 6.59 | | | 1.43 | | | 1.87 | | | 11.08 | | | (6.89 | ) |
| |
|
| |
|
| |
|
| |
|
| |
|
| |
| | | | | | | | | | | | | | | | |
Less distributions: | | | | | | | | | | | | | | | | |
Dividends from net investment income | | | (0.28 | ) | | (0.37 | ) | | (0.21 | ) | | (0.15 | ) | | (0.20 | ) |
Distributions from realized gains | | | (2.55 | ) | | (0.87 | ) | | (3.30 | ) | | — | | | (0.31 | ) |
| |
|
| |
|
| |
|
| |
|
| |
|
| |
Total distributions | | | (2.83 | ) | | (1.24 | ) | | (3.51 | ) | | (0.15 | ) | | (0.51 | ) |
| |
|
| |
|
| |
|
| |
|
| |
|
| |
| | | | | | | | | | | | | | | | |
Net asset value, end of period | | $ | 40.09 | | $ | 36.33 | | $ | 36.14 | | $ | 37.78 | | $ | 26.85 | |
| |
|
| |
|
| |
|
| |
|
| |
|
| |
| | | | | | | | | | | | | | | | |
Total return | | | 18.3 | % | | 4.0 | % | | 5.1 | % | | 41.3 | % | | (20.2 | %) |
| | | | | | | | | | | | | | | | |
Ratios/supplemental data: | | | | | | | | | | | | | | | | |
Net assets, end of period ($000) | | | 3,121,782 | | | 2,910,225 | | | 4,124,493 | | | 4,409,206 | | | 3,018,999 | |
| | | | | | | | | | | | | | | | |
Ratio of expenses to average net assets | | | 1.13 | % | | 1.12 | % | | 1.10 | % | | 1.11 | % | | 1.08 | % |
| | | | | | | | | | | | | | | | |
Ratio of net investment income to average net assets | | | 0.71 | % | | 0.64 | % | | 0.95 | % | | 0.57 | % | | 0.76 | % |
| | | | | | | | | | | | | | | | |
Portfolio turnover rate | | | 29 | % | | 40 | % | | 26 | % | | 12 | % | | 18 | % |
The accompanying notes form an integral part of these financial statements.
65
THE WEITZ FUNDS
Partners Value Fund
Financial Highlights
The following financial information provides selected data for a share of the Partners Value Fund outstanding throughout the periods indicated.
| | | | | | | | | | | | | | | | |
| | Year ended March 31, | |
| |
| |
| | 2007 | | 2006 | | 2005 | | 2004 | | 2003 | |
| |
| |
| |
| |
| |
| |
Net asset value, beginning of period | | $ | 23.52 | | $ | 22.98 | | $ | 22.52 | | $ | 16.41 | | $ | 20.79 | |
| |
|
| |
|
| |
|
| |
|
| |
|
| |
| | | | | | | | | | | | | | | | |
Income (loss) from investment operations: | | | | | | | | | | | | | | | | |
Net investment income | | | 0.10 | | | 0.14 | | | 0.15 | | | 0.03 | | | 0.06 | |
Net gain (loss) on securities (realized and unrealized) | | | 4.24 | | | 0.95 | | | 1.09 | | | 6.10 | | | (4.27 | ) |
| |
|
| |
|
| |
|
| |
|
| |
|
| |
Total from investment operations | | | 4.34 | | | 1.09 | | | 1.24 | | | 6.13 | | | (4.21 | ) |
| |
|
| |
|
| |
|
| |
|
| |
|
| |
| | | | | | | | | | | | | | | | |
Less distributions: | | | | | | | | | | | | | | | | |
Dividends from net investment income | | | (0.14 | ) | | (0.15 | ) | | (0.08 | ) | | (0.02 | ) | | (0.05 | ) |
Distributions from realized gains | | | (3.19 | ) | | (0.40 | ) | | (0.70 | ) | | — | | | (0.12 | ) |
| |
|
| |
|
| |
|
| |
|
| |
|
| |
Total distributions | | | (3.33 | ) | | (0.55 | ) | | (0.78 | ) | | (0.02 | ) | | (0.17 | ) |
| |
|
| |
|
| |
|
| |
|
| |
|
| |
| | | | | | | | | | | | | | | | |
Net asset value, end of period | | $ | 24.53 | | $ | 23.52 | | $ | 22.98 | | $ | 22.52 | | $ | 16.41 | |
| |
|
| |
|
| |
|
| |
|
| |
|
| |
| | | | | | | | | | | | | | | | |
Total return | | | 19.1 | % | | 4.8 | % | | 5.5 | % | | 37.4 | % | | (20.3 | %) |
| | | | | | | | | | | | | | | | |
Ratios/supplemental data: | | | | | | | | | | | | | | | | |
Net assets, end of period ($000) | | | 2,023,837 | | | 1,881,005 | | | 2,633,613 | | | 2,936,054 | | | 2,203,585 | |
| | | | | | | | | | | | | | | | |
Ratio of expenses to average net assets | | | 1.14 | % | | 1.14 | % | | 1.13 | % | | 1.13 | % | | 1.10 | % |
| | | | | | | | | | | | | | | | |
Ratio of net investment income to average net assets | | | 0.39 | % | | 0.49 | % | | 0.61 | % | | 0.16 | % | | 0.35 | % |
| | | | | | | | | | | | | | | | |
Portfolio turnover rate | | | 31 | % | | 36 | % | | 22 | % | | 11 | % | | 20 | % |
The accompanying notes form an integral part of these financial statements.
66
THE WEITZ FUNDS
Hickory Fund
Financial Highlights
The following financial information provides selected data for a share of the Hickory Fund outstanding throughout the periods indicated.
| | | | | | | | | | | | | | | | |
| | Year ended March 31, |
| |
| |
| | 2007 | | 2006 | | 2005 | | 2004 | | 2003 | |
| |
| |
| |
| |
| |
| |
Net asset value, beginning of period | | $ | 34.21 | | $ | 31.36 | | $ | 28.86 | | $ | 17.97 | | $ | 27.01 | |
| |
|
| |
|
| |
|
| |
|
| |
|
| |
| | | | | | | | | | | | | | | | |
Income (loss) from investment operations: | | | | | | | | | | | | | | | | |
Net investment income | | | 0.27 | | | 0.09 | | | 0.19 | | | 0.25 | | | 0.17 | |
Net gain (loss) on securities (realized and unrealized) | | | 5.42 | | | 2.84 | | | 2.54 | | | 10.90 | | | (9.07 | ) |
| |
|
| |
|
| |
|
| |
|
| |
|
| |
Total from investment operations | | | 5.69 | | | 2.93 | | | 2.73 | | | 11.15 | | | (8.90 | ) |
| |
|
| |
|
| |
|
| |
|
| |
|
| |
| | | | | | | | | | | | | | | | |
Less distributions: | | | | | | | | | | | | | | | | |
Dividends from net investment income | | | (0.21 | ) | | (0.08 | ) | | (0.23 | ) | | (0.26 | ) | | (0.14 | ) |
Distributions from realized gains | | | — | | | — | | | — | | | — | | | — | |
| |
|
| |
|
| |
|
| |
|
| |
|
| |
Total distributions | | | (0.21 | ) | | (0.08 | ) | | (0.23 | ) | | (0.26 | ) | | (0.14 | ) |
| |
|
| |
|
| |
|
| |
|
| |
|
| |
| | | | | | | | | | | | | | | | |
Net asset value, end of period | | $ | 39.69 | | $ | 34.21 | | $ | 31.36 | | $ | 28.86 | | $ | 17.97 | |
| |
|
| |
|
| |
|
| |
|
| |
|
| |
| | | | | | | | | | | | | | | | |
Total return | | | 16.6 | % | | 9.3 | % | | 9.4 | % | | 62.2 | % | | (33.0 | %) |
| | | | | | | | | | | | | | | | |
Ratios/supplemental data: | | | | | | | | | | | | | | | | |
Net assets, end of period ($000) | | | 386,062 | | | 329,883 | | | 328,636 | | | 274,991 | | | 178,528 | |
| | | | | | | | | | | | | | | | |
Ratio of expenses to average net assets | | | 1.20 | % | | 1.20 | % | | 1.21 | % | | 1.30 | % | | 1.32 | % |
| | | | | | | | | | | | | | | | |
Ratio of net investment income to average net assets | | | 0.74 | % | | 0.28 | % | | 0.65 | % | | 0.96 | % | | 0.78 | % |
| | | | | | | | | | | | | | | | |
Portfolio turnover rate | | | 42 | % | | 65 | % | | 58 | % | | 50 | % | | 64 | % |
The accompanying notes form an integral part of these financial statements.
67
THE WEITZ FUNDS
Partners III Opportunity Fund
Financial Highlights
The following financial information provides selected data for a share of the Partners III Opportunity Fund outstanding throughout the periods indicated.
| | | | | | | | | | | |
| | Year ended
March 31, 2007 | | Three months
ended
March 31, 2006(a) | |
| |
| |
| |
Net asset value, beginning of period | | | $ | 10.25 | | | | $ | 10.00 | | |
| | |
|
| | | |
|
| | |
| | | | | | | | | | | |
Income from investment operations: | | | | | | | | | | | |
Net investment income | | | | 0.09 | | | | | 0.02 | | |
Net gain on securities (realized and unrealized) | | | | 1.58 | | | | | 0.23 | | |
| | |
|
| | | |
|
| | |
Total from investment operations | | | | 1.67 | | | | | 0.25 | | |
| | |
|
| | | |
|
| | |
| | | | | | | | | | | |
Less distributions: | | | | | | | | | | | |
Dividends from net investment income | | | | (0.09 | ) | | | | — | | |
Distributions from realized gains | | | | (0.55 | ) | | | | — | | |
| | |
|
| | | |
|
| | |
Total distributions | | | | (0.64 | ) | | | | — | | |
| | |
|
| | | |
|
| | |
| | | | | | | | | | | |
Net asset value, end of period | | | $ | 11.28 | | | | $ | 10.25 | | |
| | |
|
| | | |
|
| | |
| | | | | | | | | | | |
Total return | | | | 16.4 | % | | | | 2.5 | %† | |
| | | | | | | | | | | |
Ratios/supplemental data: | | | | | | | | | | | |
Net assets, end of period ($000) | | | | 323,238 | | | | | 264,621 | | |
| | | | | | | | | | | |
Ratio of net expenses to average net assets(c) | | | | 1.57 | % | | | | 1.52 | %*(b) | |
| | | | | | | | | | | |
Ratio of net investment income to average net assets | | | | 0.83 | % | | | | 0.72 | %* | |
| | | | | | | | | | | |
Portfolio turnover rate | | | | 41 | % | | | | 32 | %† | |
| |
* | Annualized |
| |
† | Not Annualized |
| |
(a) | Fund commenced operations on January 1, 2006 (See Note 1) |
| |
(b) | Absent expenses assumed by the Adviser, the annualized expense ratio would have been 1.56% for the period ended March 31, 2006. |
| |
(c) | Included in the expense ratio is 0.14% and 0.12% related to interest expense and 0.22% and 0.20% related to dividend expense on securities sold short for the periods ended March 31, 2007 and March 31, 2006, respectively. |
The accompanying notes form an integral part of these financial statements.
68
THE WEITZ FUNDS
Balanced Fund
Financial Highlights
The following financial information provides selected data for a share of the Balanced Fund outstanding throughout the periods indicated.
| | | | | | | | | | | | | | | |
| | Year ended March 31, | | Six months
ended
March 31, 2004(a) | |
| |
| | |
| | 2007 | | 2006 | | 2005 | | |
| |
| |
| |
| |
| |
Net asset value, beginning of period | | $ | 11.30 | | $ | 11.17 | | $ | 10.52 | | | $ | 10.00 | | |
| |
|
| |
|
| |
|
| | |
|
| | |
| | | | | | | | | | | | | | | |
Income from investment operations: | | | | | | | | | | | | | | | |
Net investment income | | | 0.16 | | | 0.14 | | | 0.09 | | | | 0.01 | | |
Net gain on securities (realized and unrealized) | | | 1.15 | | | 0.53 | | | 0.80 | | | | 0.52 | | |
| |
|
| |
|
| |
|
| | |
|
| | |
Total from investment operations | | | 1.31 | | | 0.67 | | | 0.89 | | | | 0.53 | | |
| |
|
| |
|
| |
|
| | |
|
| | |
| | | | | | | | | | | | | | | |
Less distributions: | | | | | | | | | | | | | | | |
Dividends from net investment income | | | (0.15 | ) | | (0.12 | ) | | (0.06 | ) | | | (0.01 | ) | |
Distributions from realized gains | | | (0.26 | ) | | (0.42 | ) | | (0.18 | ) | | | — | # | |
| |
|
| |
|
| |
|
| | |
|
| | |
Total distributions | | | (0.41 | ) | | (0.54 | ) | | (0.24 | ) | | | (0.01 | ) | |
| |
|
| |
|
| |
|
| | |
|
| | |
| | | | | | | | | | | | | | | |
Net asset value, end of period | | $ | 12.20 | | $ | 11.30 | | $ | 11.17 | | | $ | 10.52 | | |
| |
|
| |
|
| |
|
| | |
|
| | |
| | | | | | | | | | | | | | | |
Total return | | | 11.8 | % | | 6.1 | % | | 8.5 | % | | | 5.3 | %† | |
| | | | | | | | | | | | | | | |
Ratios/supplemental data: | | | | | | | | | | | | | | | |
Net assets, end of period ($000) | | | 87,962 | | | 64,850 | | | 54,234 | | | | 23,129 | | |
| | | | | | | | | | | | | | | |
Ratio of net expenses to average net assets | | | 1.13 | % | | 1.15 | % | | 1.21 | % | | | 1.25 | %*†† | |
| | | | | | | | | | | | | | | |
Ratio of net investment income to average net assets | | | 1.53 | % | | 1.28 | % | | 0.89 | % | | | 0.09 | %* | |
| | | | | | | | | | | | | | | |
Portfolio turnover rate | | | 33 | % | | 36 | % | | 50 | % | | | 5 | %† | |
| |
* | Annualized |
| |
† | Not Annualized |
| |
# | Amount rounds to less than $0.01 |
| |
†† | Absent waivers and expenses assumed by the Adviser, the annualized expense ratio would have been 1.74% for the period ended March 31, 2004. |
| |
(a) | Fund commenced operations on October 1, 2003. |
The accompanying notes form an integral part of these financial statements.
69
THE WEITZ FUNDS
Short-Intermediate Income Fund
Financial Highlights
The following financial information provides selected data for a share of the Short-Intermediate Income Fund outstanding throughout the periods indicated.
| | | | | | | | | | | | | | | | |
| | Year ended March 31, | |
| |
| |
| | 2007 | | 2006 | | 2005 | | 2004 | | 2003 | |
| |
| |
| |
| |
| |
| |
Net asset value, beginning of period | | $ | 11.26 | | $ | 11.50 | | $ | 11.71 | | $ | 11.29 | | $ | 11.17 | |
| |
|
| |
|
| |
|
| |
|
| |
|
| |
| | | | | | | | | | | | | | | | |
Income (loss) from investment operations: | | | | | | | | | | | | | | | | |
Net investment income | | | 0.47 | | | 0.38 | | | 0.26 | | | 0.30 | | | 0.43 | |
Net gain (loss) on securities (realized and unrealized) | | | 0.16 | | | (0.19 | ) | | (0.16 | ) | | 0.45 | | | 0.18 | |
| |
|
| |
|
| |
|
| |
|
| |
|
| |
Total from investment operations | | | 0.63 | | | 0.19 | | | 0.10 | | | 0.75 | | | 0.61 | |
| |
|
| |
|
| |
|
| |
|
| |
|
| |
| | | | | | | | | | | | | | | | |
Less distributions: | | | | | | | | | | | | | | | | |
Dividends from net investment income | | | (0.47 | ) | | (0.39 | ) | | (0.31 | ) | | (0.33 | ) | | (0.49 | ) |
Distributions from realized gains | | | — | | | (0.04 | ) | | — | | | — | | | — | |
| |
|
| |
|
| |
|
| |
|
| |
|
| |
Total distributions | | | (0.47 | ) | | (0.43 | ) | | (0.31 | ) | | (0.33 | ) | | (0.49 | ) |
| |
|
| |
|
| |
|
| |
|
| |
|
| |
| | | | | | | | | | | | | | | | |
Net asset value, end of period | | $ | 11.42 | | $ | 11.26 | | $ | 11.50 | | $ | 11.71 | | $ | 11.29 | |
| |
|
| |
|
| |
|
| |
|
| |
|
| |
| | | | | | | | | | | | | | | | |
Total return | | | 5.7 | % | | 1.7 | % | | 0.9 | % | | 6.7 | % | | 5.6 | % |
| | | | | | | | | | | | | | | | |
Ratios/supplemental data: | | | | | | | | | | | | | | | | |
Net assets, end of period ($000) | | | 121,293 | | | 156,910 | | | 157,395 | | | 95,733 | | | 52,984 | |
| | | | | | | | | | | | | | | | |
Ratio of net expenses to average net assets | | | 0.71 | % | | 0.74 | % | | 0.75 | %# | | 0.75 | %# | | 0.75 | %# |
| | | | | | | | | | | | | | | | |
Ratio of net investment income to average net assets | | | 3.90 | % | | 3.29 | % | | 2.51 | % | | 2.72 | % | | 3.90 | % |
| | | | | | | | | | | | | | | | |
Portfolio turnover rate | | | 7 | % | | 24 | % | | 41 | % | | 48 | % | | 31 | % |
| |
# | Absent voluntary waivers, the expense ratio would have been 0.76%, 0.88% and 0.91% for the years ended March 31, 2005, 2004 and 2003, respectively. |
The accompanying notes form an integral part of these financial statements.
70
THE WEITZ FUNDS
Government Money Market Fund
Financial Highlights
The following financial information provides selected data for a share of the Government Money Market Fund outstanding throughout the periods indicated.
| | | | | | | | | | | | | | | | |
| | Year ended March 31, | |
| |
| |
| | 2007 | | 2006 | | 2005 | | 2004 | | 2003 | |
| |
| |
| |
| |
| |
| |
Net asset value, beginning of period | | $ | 1.000 | | $ | 1.000 | | $ | 1.000 | | $ | 1.000 | | $ | 1.000 | |
| |
|
| |
|
| |
|
| |
|
| |
|
| |
| | | | | | | | | | | | | | | | |
Income from investment operations: | | | | | | | | | | | | | | | | |
Net investment income | | | 0.047 | | | 0.030 | | | 0.010 | | | 0.005 | | | 0.010 | |
| |
|
| |
|
| |
|
| |
|
| |
|
| |
| | | | | | | | | | | | | | | | |
Less distributions: | | | | | | | | | | | | | | | | |
Dividends from net investment income | | | (0.047 | ) | | (0.030 | ) | | (0.010 | ) | | (0.005 | ) | | (0.010 | ) |
| |
|
| |
|
| |
|
| |
|
| |
|
| |
| | | | | | | | | | | | | | | | |
Net asset value, end of period | | $ | 1.000 | | $ | 1.000 | | $ | 1.000 | | $ | 1.000 | | $ | 1.000 | |
| |
|
| |
|
| |
|
| |
|
| |
|
| |
| | | | | | | | | | | | | | | | |
Total return | | | 4.8 | % | | 2.9 | % | | 1.0 | % | | 0.5 | % | | 1.0 | % |
| | | | | | | | | | | | | | | | |
Ratios/supplemental data: | | | | | | | | | | | | | | | | |
Net assets, end of period ($000) | | | 79,066 | | | 61,008 | | | 40,689 | | | 49,103 | | | 70,732 | |
| | | | | | | | | | | | | | | | |
Ratio of net expenses to average net assets# | | | 0.22 | % | | 0.50 | % | | 0.50 | % | | 0.50 | % | | 0.50 | % |
| | | | | | | | | | | | | | | | |
Ratio of net investment income to average net assets | | | 4.74 | % | | 2.96 | % | | 1.00 | % | | 0.48 | % | | 1.02 | % |
| |
# | Absent voluntary waivers, the expense ratio would have been 0.78%, 0.89%, 0.90%, 0.91% and 0.91% for the years ended March 31, 2007, 2006, 2005, 2004 and 2003, respectively. |
The accompanying notes form an integral part of these financial statements.
71
THE WEITZ FUNDS
Notes to Financial Statements
March 31, 2007
| | | | |
(1) | Organization |
| |
| The Weitz Funds (the “Trust”) is registered under the Investment Company Act of 1940 as an open-end management investment company issuing shares in series, each series representing a distinct portfolio with its own investment objectives and policies. At March 31, 2007, the Trust had eight series in operation: Value Fund, Partners Value Fund, Hickory Fund, Partners III Opportunity Fund, Balanced Fund, Short-Intermediate Income Fund (formerly, Fixed Income Fund), Government Money Market Fund (individually, a “Fund”, collectively, the “Funds”) and Nebraska Tax-Free Income Fund. The accompanying financial statements present the financial position and results of operations of each of the above series, except Nebraska Tax-Free Income Fund whose financial statements are presented separately. The Balanced Fund was the Trust’s initial series and it commenced operations on October 1, 2003. Each of the other Funds in the Trust (other than the Balanced Fund, Partners III Opportunity Fund and Nebraska Tax-Free Income Fund) is a successor in interest to certain funds having the same names and investment objectives that were included as series of two other investment companies previously managed by Wallace R. Weitz & Company (the “Adviser”), namely, The Weitz Series Fund, Inc. and The Weitz Partners Fund, Inc. (the “Predecessor Funds”). At shareholder meetings in March, 2004, the shareholders of each of the Predecessor Funds approved the reorganization of the Predecessor Funds with and into the Trust and effective April 1, 2004, the assets and liabilities of the Predecessor Funds were transferred to the Trust in exchange for shares of each of the applicable Funds. The Partners III Opportunity Fund was originally organized in June 1983 as a Nebraska limited partnership (the “Partnership”). Effective as of the close of business on December 30, 2005, the Partnership was reorganized into a series of the Trust through a tax-free exchange of 24,275,498 shares of the Fund (valued at $10.00 per share) in exchange for the net assets of the Partnership. At the time of the exchange, the Partnership had net assets of $242,754,985 including net unrealized appreciation of $35,027,995. |
| |
| The investment objective of the Value Fund, Partners Value Fund, Hickory Fund and Partners III Opportunity Fund (the “Weitz Equity Funds”) is capital appreciation. Each of the Weitz Equity Funds invests principally in common stocks and a variety of securities convertible into common stocks such as rights, warrants, convertible preferred stocks and convertible bonds. |
| |
| The investment objectives of the Balanced Fund are regular current income, capital preservation and long-term capital appreciation. The Fund invests principally in a portfolio of U.S. equity and fixed income securities. |
| |
| The investment objective of the Short-Intermediate Income Fund is high current income consistent with preservation of capital. Under normal market conditions, the Fund will invest at least 80% of the value of its total assets in fixed income securities such as U.S. government and agency securities, corporate debt securities, mortgage-backed securities, preferred stocks and taxable municipal bonds. |
| |
| The investment objective of the Government Money Market Fund is current income consistent with the preservation of capital and maintenance of liquidity. The Fund invests principally in debt obligations issued or guaranteed by the U.S. Government, its agencies and instrumentalities and repurchase agreements on such securities with remaining maturities not exceeding thirteen months. |
| |
(2) | Significant Accounting Policies |
| |
| The following accounting policies are in accordance with accounting principles generally accepted in the United States. |
| |
| (a) | Valuation of Investments |
| | |
| | Weitz Equity Funds, Balanced Fund and Short-Intermediate Income Fund |
| | |
| | Investments are carried at value determined using the following valuation methods: |
| | |
| | | • | Securities traded on a national or regional securities exchange are valued at the last sales price; if there were no sales on that day, securities are valued at the mean between the latest available and representative bid and ask prices; securities listed on the Nasdaq exchange are valued using the Nasdaq Official Closing Price (“NOCP”). Generally, the NOCP will be the last sales price unless the reported trade for the security is outside the range of the bid/ask price. In such cases, the NOCP will be normalized to the nearer of the bid or ask price. |
72
| | | | |
| | | • | Short sales traded on a national or regional securities exchange are valued at the last sales price; if there were no sales on that day, short sales are valued at the mean between the latest available and representative bid and ask prices. |
| | | | |
| | | • | Securities not listed on an exchange are valued at the mean between the latest available and representative bid and ask prices. |
| | | | |
| | | • | The value of certain debt securities for which market quotations are not readily available may be based upon current market prices of securities which are comparable in coupon, rating and maturity or an appropriate matrix utilizing similar factors. |
| | | | |
| | | • | The current market value of a traded option is the last sales price at which such option is traded, or, in the absence of a sale on or about the close of the exchange, the mean of the closing bid and ask prices. |
| | | | |
| | | • | The value of securities for which market quotations are not readily available or are deemed unreliable, including restricted and not readily marketable securities, is determined in good faith in accordance with procedures approved by the Trust’s Board of Trustees. Such valuation procedures and methods for valuing securities may include, but are not limited to: multiple of earnings, multiple of book value, discount from value of a similar freely-traded security, purchase price, private transaction in the security or related securities, the nature and duration of restrictions on disposition of the security and a combination of these and other factors. |
| | | | |
| Government Money Market Fund |
| |
| Investment securities are carried at amortized cost, which approximates market value. Pursuant to Rule 2a-7 of the Investment Company Act of 1940, amortized cost, as defined, is a method of valuing securities at acquisition cost, adjusted for amortization of premium or accretion of discount. |
| |
(b) | Option Transactions |
| |
| The Funds, except for the Government Money Market Fund, may purchase put or call options. When a Fund purchases an option, an amount equal to the premium paid is recorded as an asset and is subsequently marked-to-market. Premiums paid for purchasing options that expire unexercised are recognized on the expiration date as realized losses. If an option is exercised, the premium paid is subtracted from the proceeds of the sale or added to the cost of the purchase to determine whether a Fund has realized a gain or loss on the related investment transaction. When a Fund enters into a closing transaction, a Fund will realize a gain or loss depending upon whether the amount from the closing transaction is greater or less than the premium paid. |
| |
| The Funds, except for the Government Money Market Fund, may write put or call options. When a Fund writes an option, an amount equal to the premium received is recorded as a liability and is subsequently marked-to-market. Premiums received for writing options that expire unexercised are recognized on the expiration date as realized gains. If an option is exercised, the premium received is subtracted from the cost of purchase or added to the proceeds of the sale to determine whether a Fund has realized a gain or loss on the related investment transaction. When a Fund enters into a closing transaction, a Fund will realize a gain or loss depending upon whether the amount from the closing transaction is greater or less than the premium received. |
| |
| The Funds attempt to limit market risk and enhance their income by writing (selling) covered call options. The risk in writing a covered call option is that a Fund gives up the opportunity of profit if the market price of the financial instrument increases. A Fund also has the additional risk of not being able to enter into a closing transaction if a liquid secondary market does not exist. The risk in writing a put option is that a Fund is obligated to purchase the financial instrument underlying the option at prices which may be significantly different than the current market price. |
| |
(c) | Securities Sold Short |
| |
| The Funds, except for the Government Money Market Fund, periodically engage in selling securities short, which obligates a Fund to replace a security borrowed by purchasing the same security at the current market value. A Fund would incur a loss if the price of the security increases between the date of the short sale and the date on which the Fund replaces the borrowed security. A Fund would realize a gain if the price of the security declines between those dates. |
| |
(d) | Federal Income Taxes |
| |
| It is the policy of each Fund to comply with all sections of the Internal Revenue Code applicable to regulated investment companies and to distribute all of its taxable income to shareholders; therefore, no provision for income or excise taxes is required. |
| |
| Net investment income and net realized gains may differ for financial statement and tax purposes. The character of distributions made during the year from net investment income or net realized gains may differ from their ultimate characterization for Federal income tax purposes. Also, due to the timing of dividend |
73
| | |
| | distributions, the fiscal year in which amounts are distributed may differ from the year that the income or realized gains were recorded by the Funds. |
| | |
| | The following permanent differences between net asset components for financial reporting and tax purposes were reclassified at the end of the fiscal year: |
| | | | | | | |
| | Balanced | | Short-
Intermediate
Income | |
| |
| |
| |
Accumulated undistributed net investment income | | $ | 1,514 | | $ | 86,257 | |
Accumulated net realized gain (loss) | | | (1,514 | ) | | (86,257 | ) |
| | The differences are due to the tax treatment of principal paydown adjustments and the disposition of certain debt obligations. These reclassifications have no impact on the net asset value of the Funds. |
| | |
| (e) | Security Transactions |
| | |
| | Security transactions are accounted for on the date the securities are purchased or sold (trade date). Realized gains or losses are determined by specifically identifying the security sold. |
| | |
| | Income dividends, dividends on short positions and distributions to shareholders are recorded on the ex-dividend date. Interest, including amortization of discount or premium, is accrued as earned. |
| | |
| (f) | Dividend Policy |
| | |
| | The Funds declare and distribute income dividends and capital gains distributions as may be required to qualify as a regulated investment company under the Internal Revenue Code. |
| | |
| | Generally, the Short-Intermediate Income Fund pays income dividends on a quarterly basis. The Government Money Market Fund declares dividends daily and pays dividends monthly. All dividends and distributions are reinvested automatically, unless the shareholder elects otherwise. |
| | |
| (g) | Use of Estimates |
| | |
| | The preparation of financial statements in conformity with accounting principles generally accepted in the United States requires management to make estimates and assumptions that affect the reported amounts of assets and liabilities and disclosure of contingent assets and liabilities at the date of the financial statements and the reported amounts of increase and decrease in net assets from operations during the period. Actual results could differ from those estimates. |
| | |
| (i) | New Accounting Pronouncements |
| | |
| | In July 2006, the Financial Accounting Standards Board (“FASB”) issued FASB Interpretation No. 48 (“FIN 48”), “Accounting for Uncertainty in Income Taxes,” effective for fiscal years beginning after December 15, 2006. This pronouncement provides guidance on the recognition, measurement, classification and disclosures related to uncertain tax positions, along with any related interest and penalties. The Funds do not believe that the impact of the adoption of FIN 48 will be material to the financial statements. |
| | |
| | In September 2006, FASB issued Statement on Financial Accounting Standards No. 157 (“SFAS 157”), “Fair Value Measurements,” effective for fiscal years beginning after November 15, 2007 and interim periods within those fiscal years. This standard establishes a single authoritative definition of fair value, sets out a framework for measuring fair value and requires additional disclosures about fair value measurements. SFAS 157 applies to fair value measurements already required or permitted by existing standards. The Funds do not believe that the impact of the adoption of SFAS 157 will be material to the financial statements. |
| | |
(3) | Related Party Transactions |
| |
| Each Fund has retained the Adviser as its investment adviser. In addition, the Trust has an agreement with Weitz Securities, Inc. (the “Distributor”), a company under common control with the Adviser, to act as distributor for shares of the Trust. The Distributor receives no compensation for the distribution of shares of the Trust. Certain officers of the Trust are also officers and directors of the Adviser and the Distributor. |
| |
| Under the terms of a management and investment advisory agreement, the Adviser is paid a monthly fee. The annual investment advisory fee schedule for the Weitz Equity Funds is as follows: |
Average Daily Net Assets Break Points
| | | | | | | | |
Greater Than | | Less Than or
Equal To | | Rate | |
| |
| |
| |
$ | 0 | | $ | 2,500,000,000 | | 1.00 | % | |
| 2,500,000,000 | | | 5,000,000,000 | | 0.90 | % | |
| 5,000,000,000 | | | | | 0.80 | % | |
74
| |
| The Balanced Fund pays the Adviser, on a monthly basis, an annual advisory fee equal to 0.80% of the Fund’s average daily net assets. |
| |
| The Short-Intermediate Income Fund and the Government Money Market Fund pay the Adviser, on a monthly basis, an annual advisory fee. Prior to August 1, 2006, the annual advisory fee was equal to 0.50% of the respective Fund’s average daily net assets. Effective August 1, 2006, the annual advisory fee is equal to 0.40% of the respective Fund’s average daily net assets. |
| |
| Under the terms of an administration agreement, certain services are provided by the Adviser including the transfer of shares, disbursement of dividends, fund accounting and related administrative services of the Trust for which the Adviser is paid a monthly fee. The annual administrative fee schedule for each Fund is as follows: |
Average Daily Net Assets Break Points
| | | | | | | | |
Greater Than | | Less Than or
Equal To | | Rate | |
| |
| |
| |
$ | 0 | | $ | 25,000,000 | | 0.200 | % | |
| 25,000,000 | | | 100,000,000 | | 0.175 | % | |
| 100,000,000 | | | | | 0.100 | % | |
| |
| The Adviser has voluntarily agreed to reimburse the Weitz Equity Funds (excluding the Partners III Fund), Balanced Fund and Short-Intermediate Income Fund or to pay directly a portion of the respective Fund’s expenses to the extent that total expenses exceed 1.50%, 1.25% and 0.75%, of the respective Fund’s average daily net assets. The expenses incurred by the Weitz Equity Funds, Balanced Fund and Short-Intermediate Income Fund did not exceed the percentage limitation during the year ended March 31, 2007. Through July 31, 2007, the Adviser has contractually agreed to reimburse the Government Money Market Fund or to pay directly a portion of the Fund’s expenses to the extent that the total annual fund operating expenses, excluding taxes, interest and brokerage commissions exceed 0.10% of the Fund’s average daily net assets. The fees waived by the Adviser for the Government Money Market Fund for the year ended March 31, 2007 were $364,751. During the year, the Adviser reimbursed the Value and Partners Value Funds for a loss on a security transaction that was executed in error. The amount of the loss to each Fund and the amount reimbursed by the Adviser was $41,440. |
| |
| As of March 31, 2007, the controlling shareholder of the Adviser held approximately 62% of the Government Money Market Fund, 38% of the Partners III Fund, 30% of the Balanced Fund and 10% of the Hickory Fund. |
| |
(4) | Distributions to Shareholders and Distributable Earnings |
| |
| The tax character of distributions paid by the Funds are summarized as follows: |
| | | | | | | | | | | | | |
| | Value | | Partners Value | |
| |
| |
| |
| | Year ended March 31, | | Year ended March 31, | |
| | 2007 | | 2006 | | 2007 | | 2006 | |
| |
| |
| |
| |
| |
Distributions paid from: | | | | | | | | | | | | | |
Ordinary income | | $ | 41,103,769 | | $ | 73,129,201 | | $ | 22,951,561 | | $ | 29,803,971 | |
Long-term capital gains | | | 169,384,591 | | | 43,467,400 | | | 230,012,838 | | | 21,931,638 | |
| |
|
| |
|
| |
|
| |
|
| |
Total distributions | | $ | 210,488,360 | | $ | 116,596,601 | | $ | 252,964,399 | | $ | 51,735,609 | |
| |
|
| |
|
| |
|
| |
|
| |
| | | | | | | | | | | | | |
| | Hickory | | Partners III | |
| |
| |
| |
| | | | | | | | | | | Three months
ended
March 31, 2006 (a) | |
| | Year ended March 31, | | Years ended
March 31, 2007 | | |
| | 2007 | | 2006 | | | |
| |
| |
| |
| |
| |
Distributions paid from: | | | | | | | | | | | | | |
Ordinary income | | $ | 1,987,488 | | $ | 787,808 | | $ | 2,324,851 | | $ | — | |
Long-term capital gains | | | — | | | — | | | 14,529,358 | | | — | |
| |
|
| |
|
| |
|
| |
|
| |
Total distributions | | $ | 1,987,488 | | $ | 787,808 | | $ | 16,854,209 | | $ | — | |
| |
|
| |
|
| |
|
| |
|
| |
75
| | | | | | | | | | | | | |
| | Balanced | | Short-Intermediate
Income | |
| |
| |
| |
| | Year ended March 31, | | Year ended March 31, | |
| | 2007 | | 2006 | | 2007 | | 2006 | |
| |
| |
| |
| |
| |
Distributions paid from: | | | | | | | | | | | | | |
Ordinary income | | $ | 1,314,769 | | $ | 1,904,615 | | $ | 5,308,508 | | $ | 5,617,635 | |
Long-term capital gains | | | 1,196,506 | | | 1,028,245 | | | — | | | 628,361 | |
| |
|
| |
|
| |
|
| |
|
| |
Total distributions | | $ | 2,511,275 | | $ | 2,932,860 | | $ | 5,308,508 | | $ | 6,245,996 | |
| |
|
| |
|
| |
|
| |
|
| |
| | |
| (a) | Fund commenced operations on January 1, 2006 (See Note 1) |
| | |
| The distributions paid by the Government Money Market Fund for the years ended March 31, 2007 and 2006, were all from ordinary income. |
| |
| As of March 31, 2007, the components of distributable earnings on a tax basis were as follows: |
| | | | | | | | | | |
| | Value | | Partners
Value | | Hickory | |
| |
| |
| |
| |
Undistributed ordinary income | | $ | 18,446,506 | | $ | 6,750,228 | | $ | 765,571 | |
Undistributed long-term gains | | | 137,762,887 | | | 88,041,902 | | | — | |
Capital loss carryforwards | | | — | | | — | | | (50,457,010 | ) |
Post October capital loss deferral | | | — | | | — | | | — | |
Net unrealized appreciation (depreciation) | | | 702,854,512 | | | 466,477,283 | | | 53,052,713 | |
| |
|
| |
|
| |
|
| |
| | $ | 859,063,905 | | $ | 561,269,413 | | $ | 3,361,274 | |
| |
|
| |
|
| |
|
| |
| | | | | | | | | | |
| | Partners
III | | Balanced | | Short-
Intermediate
Income | |
| |
| |
| |
| |
Undistributed ordinary income | | $ | 557,211 | | $ | 861,131 | | $ | 187,153 | |
Undistributed long-term gains | | | 4,771,213 | | | 1,535,339 | | | — | |
Capital loss carryforwards | | | — | | | — | | | (99,192 | ) |
Post October capital loss deferral | | | — | | | — | | | (81,187 | ) |
Net unrealized appreciation (depreciation) | | | 62,499,018 | | | 6,136,615 | | | (1,246,649 | ) |
| |
|
| |
|
| |
|
| |
| | $ | 67,827,442 | | $ | 8,533,085 | | $ | (1,239,875 | ) |
| |
|
| |
|
| |
|
| |
| |
| Capital loss carryforwards represent tax basis capital losses which may be carried over to offset future realized capital gains, if any. To the extent that the carryforwards are used, no capital gains distributions will be made. The Hickory Fund’s carryforward expires on March 31, 2012. During the fiscal year the Hickory Fund utilized capital loss carryforwards of $15,568,199 to offset realized capital gains. The Short-Intermediate Income Fund’s carryforward expires on March 31, 2015. The Government Money Market Fund has a capital loss carryforward of $1,637 which expires as follows: March 31, 2013 – $225 and March 31, 2014 – $1,412. During the fiscal year the Government Money Market Fund utilized capital loss carryforwards of $245 to offset realized capital gains. The Short-Intermediate Income Fund elected to defer realized capital losses arising after October 31, 2006. Such losses are treated for tax purposes as arising on April 1, 2007. |
| |
(5) | Securities Transactions |
| |
| Purchases and proceeds from maturities or sales of investment securities of the Funds, other than short-term securities, are summarized as follows: |
| | | | | | | | | | | | | | | | | | | |
| | Value | | Partners
Value | | Hickory | | Partners III | | Balanced | | Short-
Intermediate
Income | |
| |
| |
| |
| |
| |
| |
| |
Purchases | | $ | 774,785,688 | | $ | 534,499,941 | | $ | 134,380,752 | | $ | 126,188,393 | | $ | 28,177,088 | | $ | 8,600,533 | |
Proceeds | | | 1,060,927,589 | | | 767,332,612 | | | 154,751,492 | | | 118,708,822 | | | 21,180,791 | | | 35,549,656 | |
76
| |
| The cost of investments is the same for financial reporting and Federal income tax purposes for the Short-Intermediate Income and Government Money Market Funds. The cost of investments for Federal income tax purposes for the Value, Partners Value, Hickory, Partners III and Balanced Funds is $2,440,619,381, $1,561,412,302, $340,106,016, $257,636,837 and $81,376,669, respectively. |
| |
| At March 31, 2007, the aggregate gross unrealized appreciation and depreciation of investments, based on cost for Federal income tax purposes, are summarized as follows: |
| | | | | | | | | | | | | | | | | | | |
| | Value | | Partners
Value | | Hickory | | Partners III | | Balanced | | Short-
Intermediate
Income | |
| |
| |
| |
| |
| |
| |
| |
Appreciation | | $ | 721,434,143 | | $ | 469,854,769 | | $ | 59,812,849 | | $ | 70,529,140 | | $ | 6,984,938 | | $ | 232,869 | |
Depreciation | | | (18,579,631 | ) | | (3,377,486 | ) | | (6,898,655 | ) | | (3,907,105 | ) | | (848,323 | ) | | (1,479,518 | ) |
| |
|
| |
|
| |
|
| |
|
| |
|
| |
|
| |
|
Net | | $ | 702,854,512 | | $ | 466,477,283 | | $ | 52,914,194 | | $ | 66,622,035 | | $ | 6,136,615 | | $ | (1,246,649 | ) |
| |
|
| |
|
| |
|
| |
|
| |
|
| |
|
| |
| | |
| (a) | Illiquid and Restricted Securities |
| | |
| | The Funds own certain securities which have a limited trading market and/or certain restrictions on trading and therefore may be illiquid and/or restricted. Such securities have been valued at fair value in accordance with the procedures described in Note (2)(a). Because of the inherent uncertainty of valuation, these values may differ from the values that would have been used had a ready market for these securities existed and these differences could be material. Illiquid and/or restricted securities owned at March 31, 2007, include the following: |
| | | | | | | | | | | | | | | | |
| | Acquisition
Date | | Value | | Partners
Value | | Hickory | | Partners III | |
| |
| |
| |
| |
| |
| |
Adelphia Recovery Trust, Series ACC-7 | | | 7/25/02 | | $ | 494,900 | | $ | 300,300 | | $ | — | | $ | — | |
CBRE Realty Finance, Inc. | | | 6/02/05 | | | 20,250,000 | | | — | | | 6,750,000 | | | — | |
Continental Resources | | | 1/28/87 | | | — | | | — | | | — | | | 43,750 | |
Intelligent Systems Corp. | | | 12/03/91 | | | — | | | — | | | — | | | 1,934,546 | |
LICT Corp. | | | 9/09/96 | | | — | | | — | | | 2,620,390 | | | — | |
| | | | |
|
| |
|
| |
|
| |
|
| |
Total cost of illiquid and/or restricted securities | | | | | $ | 20,744,900 | | $ | 300,300 | | $ | 9,370,390 | | $ | 1,978,296 | |
| | | | |
|
| |
|
| |
|
| |
|
| |
Value | | | | | $ | 17,931,200 | | $ | 46,200 | | $ | 9,340,350 | | $ | 3,941,196 | |
| | | | |
|
| |
|
| |
|
| |
|
| |
Percent of net assets | | | | | | 0.6 | % | | 0.0 | % | | 2.4 | % | | 1.2 | % |
| | | | |
|
| |
|
| |
|
| |
|
| |
| | |
| (b) | Options Written |
| | |
| | Transactions relating to options written for the year ended March 31, 2007 are summarized as follows: |
| | | | | | | | | | | | | |
| | Value | | Partners Value | |
| |
| |
| |
| | Numbers of
Contracts | | Premiums | | Numbers of
Contracts | | Premiums | |
| |
| |
| |
| |
| |
Options outstanding, beginning of period | | | 2,000 | | $ | 515,288 | | | 9,000 | | $ | 3,624,496 | |
Options written | | | — | | | — | | | — | | | — | |
Options exercised | | | — | | | — | | | (8,000 | ) | | (3,366,843 | ) |
Options expired | | | (2,000 | ) | | (515,288 | ) | | (1,000 | ) | | (257,653 | ) |
Options closed | | | — | | | — | | | — | | | — | |
| |
|
| |
|
| |
|
| |
|
| |
Options outstanding, end of period | | | — | | $ | — | | | — | | $ | — | |
| |
|
| |
|
| |
|
| |
|
| |
77
| | | | | | | | | | | | | |
| | Hickory | | Partners III | |
| |
| |
| |
| | Numbers of
Contracts | | Premiums | | Numbers of
Contracts | | Premiums | |
| |
| |
| |
| |
| |
Options outstanding, beginning of period | | | 1,650 | | $ | 615,775 | | | 1,700 | | $ | 657,509 | |
Options written | | | 3,086 | | | 970,535 | | | 4,888 | | | 1,330,421 | |
Options exercised | | | (500 | ) | | (182,244 | ) | | (900 | ) | | (377,236 | ) |
Options expired | | | (500 | ) | | (130,246 | ) | | (1,200 | ) | | (273,504 | ) |
Options closed | | | (2,050 | ) | | (762,531 | ) | | (1,700 | ) | | (609,273 | ) |
| |
|
| |
|
| |
|
| |
|
| |
Options outstanding, end of period | | | 1,686 | | $ | 511,289 | | | 2,788 | | $ | 727,917 | |
| |
|
| |
|
| |
|
| |
|
| |
| | | | | | | | | | | | | |
| | Balanced | | | | | | | |
| |
| | | | | | | |
| | Numbers of
Contracts | | Premiums | | | | | | | |
| |
| |
| | | | | | | |
Options outstanding, beginning of period | | | 25 | | $ | 14,937 | | | | | | | |
Options split | | | 25 | | | — | | | | | | | |
Options exercised | | | (50 | ) | | (14,937 | ) | | | | | | |
Options expired | | | — | | | — | | | | | | | |
Options closed | | | — | | | — | | | | | | | |
| |
|
| |
|
| | | | | | | |
Options outstanding, end of period | | | — | | $ | — | | | | | | | |
| |
|
| |
|
| | | | | | | |
| |
(6) | Affiliated Issuers |
| |
| Affiliated issuers, as defined under the Investment Company Act of 1940, are those in which a Fund’s holdings of an issuer represent 5% or more of the outstanding voting securities of the issuer. A summary of each Fund’s holdings in the securities of such issuers is set forth below: |
| | | | | | | | | | | | | | | | | | | | | | |
Value | |
| |
Name of Issuer | | Number of
Shares Held
March 31, 2006 | | Gross
Additions | | Gross
Reductions | | Number of
Shares Held
March 31, 2007 | | Value
March 31, 2007 | | Dividend
Income | | Realized
Gains/
(Losses) | |
| |
| |
| |
| |
| |
| |
| |
| |
CBRE Realty Finance, Inc* | | | 1,350,000 | | | — | | | — | | | 1,350,000 | | $ | 17,860,500 | | $ | 1,390,500 | | $ | — | |
Redwood Trust, Inc. | | | 2,250,000 | | | 95,000 | | | — | | | 2,345,000 | | | 122,362,100 | | | 13,630,500 | | | — | |
| | | | | | | | | | | | | |
|
| |
|
| |
|
| |
Totals | | | | | | | | | | | | | | $ | 140,222,600 | | $ | 15,021,000 | | $ | — | |
| | | | | | | | | | | | | |
|
| |
|
| |
|
| |
| | | | | | | | | | | | | | | | | | | | | | |
Partners Value | |
| |
Name of Issuer | | Number of
Shares Held
March 31, 2006 | | Gross
Additions | | Gross
Reductions | | Number of
Shares Held
March 31, 2007 | | Value
March 31, 2007 | | Dividend
Income | | Realized
Gains/
(Losses) | |
| |
| |
| |
| |
| |
| |
| |
| |
Daily Journal Corp. | | | 116,000 | | | — | | | — | | | 116,000 | | $ | 4,699,160 | | $ | — | | $ | — | |
| | | | | | | | | | | | | | | | | | | | | | |
Partners III | |
| |
Name of Issuer | | Number of
Shares Held
March 31, 2006 | | Gross
Additions | | Gross
Reductions | | Number of
Shares Held
March 31, 2007 | | Value
March 31, 2007 | | Dividend
Income | | Realized
Gains/
(Losses) | |
| |
| |
| |
| |
| |
| |
| |
| |
Intelligent Systems Corp. | | | 883,999 | | | — | | | — | | | 883,999 | | $ | 3,801,196 | | $ | — | | $ | — | |
| |
* | Company was considered a non-controlled affiliate at March 31, 2006, but as of March 31, 2007, they are no longer a non-controlled affiliate. |
| |
(7) | Contingencies |
| |
| Each Fund indemnifies the Trust’s officers and trustees for certain liabilities that might arise from their performance of their duties to each of the Funds. Additionally, in the normal course of business the Funds enter into contracts that contain a variety of representations and warranties and which provide general indemnifications. The Funds’ maximum exposure under these arrangements is unknown, as this would involve future claims that may be made against the Funds that have not yet occurred. However, based on experience, the Funds expect the risk of loss to be remote. |
78
| |
(8) | Financial Instruments With Off-Balance Sheet Risks |
| |
| Option contracts written and securities sold short result in off-balance sheet risk as the Fund’s ultimate obligation to satisfy the terms of the contract or the sale of securities sold short may exceed the amount recognized in the Statement of Assets and Liabilities. |
| |
| The Funds are required to maintain collateral in a segregated account to provide adequate margin as determined by the broker. |
| |
(9) | Margin Borrowing Agreement |
| |
| The Partners III Fund has a margin account with its prime broker, Merrill Lynch, under which the Fund may borrow against the value of its securities, subject to regulatory limitations. Interest accrues at the federal funds rate plus 0.625% (4.79% at March 31, 2007). Interest is accrued daily and paid monthly. The Fund held a cash balance of $55,669,765 with the broker at March 31, 2007. |
| |
| The Fund is exposed to credit risk from its prime broker who effects transactions and extends credit pursuant to a prime brokerage agreement. The Adviser attempts to minimize the Fund’s credit risk by monitoring credit exposure and the credit worthiness of the prime broker. |
79
(This page has been left blank intentionally.)
80
REPORT OF INDEPENDENT REGISTERED
PUBLIC ACCOUNTING FIRM
To the Board of Trustees and Shareholders of
The Weitz Funds
We have audited the accompanying statements of assets and liabilities of The Weitz Funds, comprising the Value Fund, Partners Value Fund, Hickory Fund, Partners III Opportunity Fund, Balanced Fund, Short-Intermediate Income Fund (formerly, Fixed Income Fund), and Government Money Market Fund (collectively referred to as the “Funds”), including the schedules of investments in securities, as of March 31, 2007, and the related statements of operations (and statement of cash flows for Partners III Opportunity Fund) for the year then ended, the statements of changes in net assets for each of the two years or periods in the period then ended and the financial highlights for each of the four years or periods in the period then ended. These financial statements and financial highlights are the responsibility of the Funds’ management. Our responsibility is to express an opinion on these financial statements and financial highlights based on our audits. The financial highlights presented herein for the year ended March 31, 2003 were audited by other auditors whose report dated April 18, 2003, expressed an unqualified opinion on those financial highlights.
We conducted our audits in accordance with standards of the Public Company Accounting Oversight Board (United States). Those standards require that we plan and perform the audits to obtain reasonable assurance about whether the financial statements and financial highlights are free of material misstatement. We were not engaged to perform an audit of the Funds’ internal control over financial reporting. Our audits included consideration of internal control over financial reporting as a basis for designing audit procedures that are appropriate in the circumstances, but not for the purpose of expressing an opinion on the effectiveness of the Funds’ internal control over financial reporting. Accordingly, we express no such opinion. An audit also includes examining, on a test basis, evidence supporting the amounts and disclosures in the financial statements and financial highlights, assessing the accounting principles used and significant estimates made by management, and evaluating the overall financial statement presentation. Our procedures included confirmation of securities owned as of March 31, 2007, by correspondence with the custodian and brokers. We believe that our audits provide a reasonable basis for our opinion.
In our opinion, the financial statements and financial highlights referred to above present fairly, in all material respects, the financial position of each of the respective Funds referred to above of The Weitz Funds as of March 31, 2007, the results of their operations (and cash flows for Partners III Opportunity Fund) for the year then ended, the statements of changes in their net assets for each of the two years or periods in the period then ended and their financial highlights for each of the four years or periods in the period then ended, in conformity with U.S. generally accepted accounting principles.

Cincinnati, Ohio
April 25, 2007
81
ACTUAL AND HYPOTHETICAL EXPENSES FOR COMPARISON PURPOSES
(Unaudited)
Example
As a shareholder of one or more of the Funds, you incur two types of costs: (1) transaction costs, including any transaction fees that you may be charged if you purchase or redeem your Fund through certain financial institutions; and (2) ongoing costs, including management fees and other Fund expenses. This Example is intended to help you understand your ongoing costs (in dollars) of investing in the Funds and to compare these costs with the ongoing costs of investing in other mutual funds. The Example is based on an investment of $1,000 invested at the beginning of the period and held for the entire period from October 1, 2006 through March 31, 2007.
Actual Expenses
The first line for each Fund in the table below provides information about actual account values and actual expenses. You may use the information in this line, together with the amount you invested, to estimate the expenses that you paid over the period. Simply divide your account value by $1,000 (for example, an account value of $10,000 divided by $1,000 = 10), then multiply the result by the number in the first line under the heading entitled “Expenses Paid from 10/1/06 – 3/31/07” to estimate the expenses you paid on your account during this period.
Hypothetical Example for Comparison Purposes
The second line for each Fund in the table below provides information about hypothetical account values and hypothetical expenses based on the actual expense ratio of each Fund and an assumed rate of return of 5% per year before expenses, which is not the actual return of the Fund. The hypothetical account values and expenses may not be used to estimate the actual ending account balance or expenses you paid for the period. You may use this information to compare the ongoing costs of investing in a specific Weitz Fund to other funds. To do so, compare this 5% hypothetical example with the 5% hypothetical examples that appear in the shareholder reports of the other funds.
Please note that the expenses shown in the table are meant to highlight your ongoing costs only and do not reflect any transactional costs charged by certain financial institutions. Therefore, the second line of the table is useful in comparing ongoing costs only, and will not help you determine the relative total costs of owning different funds. In addition, if you incurred transactional fees, your costs would have been higher. Actual and hypothetical expenses for each Fund are provided in this table.
| | | | | | | | | | | | | |
| | | | Beginning | | Ending | | | | Expenses |
| | | | Account Value | | Account Value | | Annualized | | Paid from |
| | | | 10/1/06 | | 3/31/07 | | Expense Ratio | | 10/1/06 - 3/31/07(1) |
| | | |
| |
| |
| |
|
Value | | Actual | | $ | 1,000.00 | | $ | 1,100.53 | | 1.12% | | $ | 5.87 |
| | Hypothetical(2) | | | 1,000.00 | | | 1,019.40 | | 1.12% | | | 5.64 |
| | | | | | | | | | | | | |
Partners Value | | Actual | | | 1,000.00 | | | 1,105.22 | | 1.14% | | | 5.98 |
| | Hypothetical(2) | | | 1,000.00 | | | 1,019.30 | | 1.14% | | | 5.74 |
| | | | | | | | | | | | | |
Hickory | | Actual | | | 1,000.00 | | | 1,105.88 | | 1.19% | | | 6.25 |
| | Hypothetical(2) | | | 1,000.00 | | | 1,019.05 | | 1.19% | | | 5.99 |
| | | | | | | | | | | | | |
Partners III | | Actual | | | 1,000.00 | | | 1,097.75 | | 1.50% | | | 7.85 |
| | Hypothetical(2) | | | 1,000.00 | | | 1,017.50 | | 1.50% | | | 7.54 |
| | | | | | | | | | | | | |
Balanced | | Actual | | | 1,000.00 | | | 1,074.51 | | 1.12% | | | 5.79 |
| | Hypothetical(2) | | | 1,000.00 | | | 1,019.40 | | 1.12% | | | 5.64 |
| | | | | | | | | | | | | |
Short-Intermediate | | Actual | | | 1,000.00 | | | 1,025.65 | | 0.68% | | | 3.43 |
Income | | Hypothetical(2) | | | 1,000.00 | | | 1,021.60 | | 0.68% | | | 3.43 |
| | | | | | | | | | | | | |
Government | | Actual | | | 1,000.00 | | | 1,024.95 | | 0.10% | | | 0.50 |
Money Market | | Hypothetical(2) | | | 1,000.00 | | | 1,024.50 | | 0.10% | | | 0.50 |
| |
(1) | Expenses are equal to the annualized expense ratio for the Fund, multiplied by the average account value over the period, multiplied by the number of days in the most recent fiscal half year (182/365) |
| |
(2) | Assumes 5% total return before expenses. |
82
OTHER INFORMATION
(Unaudited)
Tax Information
For the fiscal year ended March 31, 2007, certain dividends paid by the Funds may be subject to a maximum tax rate of 15%, as provided for by the Jobs and Growth Tax Relief Reconciliation Act of 2003. Of the distributions paid during the fiscal year, the amounts designated as long-term capital gain, the amounts that may be considered qualified dividend income and for corporate shareholders, the amounts that may qualify for the corporate dividends received deduction, are summarized as follows:
| | | | | | | | | | | | | | | | | | | | | |
| | Value | | Partners
Value | | Hickory | | Partners III | | Balanced | | Short-
Intermediate
Income | |
| |
| |
| |
| |
| |
| |
| |
Long-term capital gain distribution | | $ | 169,384,591 | | $ | 230,012,838 | | $ | — | | $ | 14,529,358 | | $ | 1,196,506 | | | $ | — | | |
Qualified dividend income | | | 21,430,124 | | | 14,454,185 | | | 1,410,034 | | | 1,565,223 | | | 354,460 | | | | 46,219 | | |
Corporate dividends received deduction | | | 21,430,124 | | | 14,454,185 | | | 1,410,034 | | | 1,565,223 | | | 354,460 | | | | 46,219 | | |
The information and distributions reported herein may differ from the information and distributions reported to shareholders for the calendar year ended December 31, 2006, which was reported in conjunction with your 2006 Form 1099-DIV.
Proxy Voting Policy
A description of the Fund’s proxy voting policies and procedures is available without charge, upon request by (i) calling 800-304-9745, (ii) on the Funds’ website at http://www.weitzfunds.com; and (iii) on the SEC’s website at http://www.sec.gov.
Information on how each of the Funds (other than the Government Money Market Fund) voted proxies relating to portfolio securities during each twelve month period ended June 30 is available: (i) on the Funds’ website at http://www.weitzfunds.com, and (ii) on the SEC’s website at http://www.sec.gov.
Form N-Q
The Funds file complete schedules of their portfolio holdings with the Securities and Exchange Commission for the first and third quarters of each fiscal year on Form N-Q. The Funds’ Form N-Q is available on the SEC’s website at http://www.sec.gov and may be reviewed and copied at the SEC’s Public Reference Room in Washington DC. Information on the operation of the Public Reference Room may be obtained by calling 800 SEC-0330. When filed, the Fund’s quarterly reports, including the information filed on Form N-Q will also available on the Funds’ website at http://www.weitzfunds.com.
83
INFORMATION ABOUT THE TRUSTEES
AND OFFICERS OF THE WEITZ FUNDS
(Unaudited)
The individuals listed below serve as Trustees or Officers of The Weitz Funds (the “Weitz Funds”). Each Trustee of the Weitz Funds serves until a successor is elected and qualified or until resignation. Each Officer of the Weitz Funds is elected annually by the Trustees.
The address of all Officers and Trustees is 1125 South 103rd Street, Suite 600, Omaha, Nebraska 68124.
|
Interested Trustees* |
|
Wallace R. Weitz (Age: 57) |
Position(s) Held with Trust: President; Portfolio Manager;
Trustee |
Length of Service (Beginning Date): The Weitz Funds (and
certain predecessor funds) – January, 1986 |
Principal Occupation(s) During Past 5 Years: President,
Wallace R. Weitz & Company, The Weitz Funds (and
certain predecessor funds) |
Number of Portfolios Overseen in Fund Complex: 8 |
Other Directorships: N/A |
|
Thomas R. Pansing (Age: 62) |
Position(s) Held with Trust: Trustee |
Length of Service (Beginning Date): The Weitz Funds (and
certain predecessor funds) - January, 1986 |
Principal Occupation(s) During Past 5 Years: Partner,
Pansing Hogan Ernst & Bachman LLP, a law firm |
Number of Portfolios Overseen in Fund Complex: 8 |
Other Directorships: N/A |
|
| |
* | Mr. Weitz is a Director and Officer of Wallace R. Weitz & Company, investment adviser to The Weitz Funds, and as such is considered an “interested person” of the Trust, as that term is defined in the Investment Company Act of 1940 (an “Interested Trustee”). Mr. Pansing performs certain legal services for the investment adviser and The Weitz Funds and, therefore, is also classified as an “Interested Trustee”. |
|
Independent Trustees |
|
Lorraine Chang (Age: 56) |
Position(s) Held with Trust: Trustee |
Length of Service (Beginning Date): The Weitz Funds (and
certain predecessor funds) - June, 1997 |
Principal Occupation(s) During Past 5 Years: Partner,
The Public Strategies Group, a management consulting
firm, 1999-Present |
Number of Portfolios Overseen in Fund Complex: 8 |
Other Directorships: N/A |
|
Richard D. Holland (Age: 85) |
Position(s) Held with Trust: Trustee |
Length of Service (Beginning Date): The Weitz Funds (and
certain predecessor funds) - June, 1995 |
Principal Occupation(s) During Past 5 Years: Retired |
Number of Portfolios Overseen in Fund Complex: 8 |
Other Directorships: N/A |
|
Roland J. Santoni (Age: 65) |
Position(s) Held with Trust: Trustee |
Length of Service (Beginning Date): The Weitz Funds -
February, 2004 |
Principal Occupation(s) During Past 5 Years: Vice President,
West Development, Inc., a development company,
June 2003-Present; Professor of Law, Creighton University,
1977-2003; Of Counsel, Erickson & Sederstrom, a law
firm, 1978-2003 |
Number of Portfolios Overseen in Fund Complex: 8 |
Other Directorships: Transgenomic, Inc. |
|
John W. Hancock (Age: 59) |
Position(s) Held with Trust: Trustee |
Length of Service (Beginning Date): The Weitz Funds (and
certain predecessor funds) - January, 1986 |
Principal Occupation(s) During Past 5 Years: Partner,
Hancock & Dana, an accounting firm |
Number of Portfolios Overseen in Fund Complex: 8 |
Other Directorships: N/A |
|
Delmer L. Toebben (Age: 76) |
Position(s) Held with Trust: Trustee |
Length of Service (Beginning Date): The Weitz Funds (and
certain predecessor funds) - July, 1996 |
Principal Occupation(s) During Past 5 Years: Retired |
Number of Portfolios Overseen in Fund Complex: 8 |
Other Directorships: N/A |
|
Barbara W. Schaefer (Age: 53) |
Position(s) Held with Trust: Trustee |
Length of Service (Beginning Date): The Weitz Funds -
March, 2005 |
Principal Occupation(s) During Past 5 Years: Senior Vice
President-Human Resources and Corporate Secretary,
Union Pacific Corporation, 2004-Present; Senior Vice
President-Human Resources, Union Pacific Corporation,
1997-2004 |
Number of Portfolios Overseen in Fund Complex: 8 |
Other Directorships: N/A |
|
84
|
Officers |
|
Mary K. Beerling (Age: 66) |
Position(s) Held with Trust: Vice President, Secretary and
Chief Compliance Officer |
Length of Service (Beginning Date): The Weitz Funds (and
certain predecessor funds) - July, 1994 |
Principal Occupation(s) During Past 5 Years: Vice President
and Chief Compliance Officer, Wallace R. Weitz &
Company, Vice President and Chief Compliance Officer,
The Weitz Funds (and certain predecessor funds) |
|
Bradley P. Hinton (Age: 39) |
Position(s) Held with Trust: Vice President |
Length of Service (Beginning Date): The Weitz Funds -
August, 2006 |
Principal Occupation(s) During Past 5 Years: Vice President,
Director of Research and Portfolio Manager,
Wallace R. Weitz & Company; Vice President,
The Weitz Funds - August, 2006 to Present |
|
Kenneth R. Stoll (Age: 45) |
Position(s) Held with Trust: Vice President and Chief
Financial Officer |
Length of Service (Beginning Date): The Weitz Funds -
April, 2004 |
Principal Occupation(s) During Past 5 Years: Vice President
and Chief Operating Officer, Wallace R. Weitz &
Company; Vice President and Chief Financial Officer,
The Weitz Funds - April 2004 to Present; Partner,
PricewaterhouseCoopers LLP, an accounting firm,
1999- 2004 |
|
The Statement of Additional Information for The Weitz Funds, which can be obtained without charge by calling 800-304-9745, includes additional information about the Trustees and Officers of The Weitz Funds.
85
(This page has been left blank intentionally.)
86
(This page has been left blank intentionally.)
87
|
Board of Trustees |
Lorraine Chang |
John W. Hancock |
Richard D. Holland |
Thomas R. Pansing, Jr. |
Roland J. Santoni |
Barbara W. Schaefer |
Delmer L. Toebben |
Wallace R. Weitz |
|
Investment Adviser |
Wallace R. Weitz & Company |
|
Custodian |
Wells Fargo Bank Minnesota, |
National Association |
|
Officers |
Wallace R. Weitz, President |
Mary K. Beerling, Vice President, Secretary & |
Chief Compliance Officer |
Kenneth R. Stoll, Vice President & Chief |
Financial Officer |
Bradley P. Hinton, Vice President |
|
Distributor |
Weitz Securities, Inc. |
|
Transfer Agent and Dividend Paying Agent |
Wallace R. Weitz & Company |
|
Sub-Transfer Agent |
Boston Financial Data Services, Inc. |
NASDAQ symbols:
Value Fund – WVALX
Partners Value Fund – WPVLX
Hickory Fund – WEHIX
Partners III Opportunity Fund – WPOPX
Balanced Fund – WBALX
Short-Intermediate Income Fund – WEFIX
Government Money Market Fund – WGMXX
An investor should consider carefully the investment objectives, risks, and charges and expenses of the Funds before investing. The Funds’ Prospectus contains this and other information about the Funds. The Prospectus should be read carefully before investing.
| |
5/4/07 | 
|
| | |

| THE WEITZ FUNDS | |
Nebraska Tax-Free Income Fund
ANNUAL REPORT
March 31, 2007
One Pacific Place, Suite 600 • 1125 South 103 Street • Omaha, Nebraska, 68124-6008
402-391-1980 800-304-9745 402-391-2125 FAX
www.weitzfunds.com
THE WEITZ FUNDS
Eight Funds—One Investment Philosophy
Our small “family” of Funds is designed to offer a range of investment options for investors with different objectives and temperaments. There are bond funds, stock funds and a balanced fund. There are differences in fund size, portfolio concentration, volatility, and tax sensitivity. But there are certain common threads which run through all eight of the Funds.
“We eat our own cooking.” All of our investment professionals have a majority of their families’ liquid net worth invested in our Funds. Our Trustees each have at least $100,000 invested in our family of Funds—some considerably more. This does not guarantee that the Funds will go up, but it means that we win or lose together and that shareholders definitely have our attention.
We are patient, long-term investors. When we analyze potential equity investments, we think about the business behind the stock and try to buy shares at a large discount to the company’s underlying business value. Ideally, the business value rises over time and the stock price follows. This often allows us to hold the stock for many years, minimizing transaction costs, taxes, and the need for new investment ideas.
We try to stay within our “circle of competence.” “Knowing what you don’t know” is important in all aspects of life, but it is crucial in investing. We think our odds of investment success are much higher when we invest in securities of companies we understand and ideally, where we may have an edge over other investors. As a result, our portfolios are not diversified among all the various sectors of the economy and thus may often be out of step with the general stock market.
Risk—we worry about permanent loss of capital—not price volatility. We believe in concentrating our portfolio in the most attractive investment ideas and this can cause short-term price volatility of our portfolios.
We think “benchmark risk” is part of investment life. Our firm’s goal is to earn good absolute investment returns over long periods of time without exposing our clients’ capital to undue risk. We do not think about any particular index when we make investment decisions. We also believe that cash is sometimes the most attractive investment. We know this approach causes headaches for some of our favorite consultants and plan sponsors, but we think flexibility and common sense will continue to serve our clients well over the years.
2
TABLE OF CONTENTS
3
NEBRASKA TAX-FREE INCOME FUND
April 17, 2007
Dear Fellow Shareholder:
As this is the inaugural quarterly report for the Nebraska Tax-Free Income Fund, we welcome both our new shareholders and our long-time partners who helped make the transition to a mutual fund possible. For the quarter, our total return was positive at +0.9% with net interest income providing all of our return as bond yields were stable.
The table below shows the results of the Nebraska Tax-Free Income Fund over various time periods through March 31, 2007, along with the Lehman Brothers 5-Year Municipal Bond Index, our primary benchmark. The key measures of the Fund’s portfolio (average maturity and duration) have most closely resembled this Lehman Brothers index. As a reminder, we don’t manage the Fund to mimic any particular index but thought it would be informative to provide an example of a broadly constructed unmanaged index whose credit quality and maturity composition were similar to the Fund.
| | | | | | | | | | | | | | | | | | | |
| | Total Return* | | Average Annual Total Returns* | |
| |
| |
| |
| | 1-Year | | 3-Year | | 5-Year | | 10-Year | | 15-Year | | 20-Year | |
| |
| |
| |
| |
| |
| |
| |
Nebraska Tax-Free
Income Fund** | | | 4.1 | % | | | 2.9 | % | | | 4.3 | % | | | 4.7 | % | | | 5.0 | % | | | 5.3 | % | |
| | | | | | | | | | | | | | | | | | | | | | | | | |
Lehman Brothers 5-Year
Municipal Bond Index# | | | 4.3 | | | | 2.2 | | | | 4.1 | | | | 4.8 | | | | 5.2 | | | | N/A | | |
These performance numbers reflect the deduction of the Fund’s annual operating expenses. The current annual operating expenses for the Nebraska Tax-Free Income Fund (the “Fund”), as stated in its most recent Prospectus are 0.71% of the Fund’s net assets. This information represents past performance and past performance does not guarantee future results. The investment return and the principal value of an investment in the Fund will fluctuate so that an investor’s shares, when redeemed, may be worth more or less than the original cost. Current performance may be higher or lower than the performance data quoted above. Performance data current to the most recent month end may be obtained at www.weitzfunds.com/performance/monthly.asp.
| |
* | All performance numbers assume reinvestment of dividends and/or income. |
| |
** | As of December 29, 2006, the Fund succeeded to substantially all of the assets of Weitz Income Partners Limited Partnership (the “Partnership”). The investment objectives, policies and restrictions of the Fund are materially equivalent to those of the Partnership and the Partnership was managed at all times with full investment authority by Wallace R. Weitz & Company. The performance information includes performance for the period before the Fund became an investment company registered with the Securities and Exchange Commission. During these periods, the Partnership was not registered under the Investment Company Act of 1940 and therefore was not subject to certain investment restrictions imposed by the 1940 Act. If the Partnership had been registered under the 1940 Act during these periods, the Partnership’s performance might have been adversely affected. |
| |
# | Index performance is hypothetical and is for illustrative purposes only. |
The following table shows a profile of our portfolio as of March 31:
| | | |
| Average Maturity | | 8.5 years |
| Average Duration | | 3.5 years |
| 30-Day SEC Yield at 3-31-07 | | 3.5% |
| Average Rating | | AA+ |
| Income from municipals exempt from federal and Nebraska income taxes | | Over 80% |
| Income subject to alternative minimum tax | | Less than 5% |
4
Overview
Despite turbulence in other segments of the fixed income marketplace (particularly subprime mortgage-backed securities), the municipal market was notable for its calmness in the first quarter. U.S. Treasury yields declined modestly (prices increased) as investors sought a “safe haven” from the softening housing market. Investors also sensed that housing weakness might spread to the rest of the economy and cause the Fed to lower interest rates. Municipal yields, however, hardly budged during the quarter giving investors (including our Fund) solid, but unexciting, income returns.
As the table at the beginning of this letter illustrates, our portfolio ended the quarter with an average life of 8.5 years, duration of 3.5 years and an average rating of AA+. The Fund is a high-credit-quality municipal bond portfolio focused on generating a significant portion of its income that is exempt from both federal and Nebraska personal income taxes. At quarter end, we owned a well-diversified, high-quality portfolio of 82 different bond investments that financed projects from Scottsbluff to Omaha in Nebraska, and from Alaska to Puerto Rico. We also own bonds that have financed needed improvements for universities such as Creighton and Wesleyan and hospitals in Hastings and Lincoln.
A recent purchase illustrates the types of tax-free municipal bonds the Fund owns. In the first quarter, the Public Power Generation Agency, a new bond issuer in the state of Nebraska issued approximately $500 million of tax-free bonds. The bonds were issued to fund a 220 megawatt low-sulfur coal-fired power project in Hastings, Nebraska (The Whelan Energy Center Unit 2 Project) to meet the power needs of five participants (the utilities of Grand Island, Hastings and Nebraska City, and two wholesale power providers). The bonds will be paid from revenues generated from payments made by the five participants and from excess power sales. The bonds have the highest credit rating (AAA) due to a municipal bond insurance policy and have a solid A rating independent of insurance. Overall, we believe the bonds the Fund owns should generate attractive tax-free income for our shareholders.
Taxable Equivalent Yields Defined
For many investors the following discussion may be elementary (if so, please skip this section), but we thought it would be helpful to discuss a way to compare yields of tax-exempt municipal bonds and taxable bonds on a pre-tax basis.
Municipal bonds have long been attractive to investors because of their tax-advantaged nature. Namely, interest income from municipal bonds is exempt from federal income taxation and, in most cases, state taxation as well. Because of that tax advantage, municipal bonds typically pay a lower interest rate than comparable (quality and maturity) taxable alternatives. Since investors get to shield most (if not all) municipal interest income from taxes, the lower interest rate on municipal bonds is equivalent to a higher paying taxable alternative. Computing a Taxable Equivalent Yield (TEY) allows investors to compare “apples to apples”.
For illustration purposes, the table below portrays the taxable equivalent yield an investor would need to equal a municipal bond investment that offered a 3.5% yield free from federal taxes (the table includes various federal tax rates). The table points out how the seemingly low yield (3.5%) for the hypothetical municipal bond would require a considerably higher taxable coupon to net 3.5% after federal taxes.
| | | | | | | | | | | | | | |
| Assumed Federal Tax Rate | | | 25 | % | | 28 | % | | 33 | % | | 35 | % |
| Taxable Equivalent Yield on 3.5% Tax-Free Yield | | | 4.67 | % | | 4.86 | % | | 5.22 | % | | 5.38 | % |
A shareholder who is also subject to Nebraska state income taxes would need an even higher taxable equivalent yield to match the 3.5% tax-free yield. If you would like to know more about tax equivalent yields, please contact one of our client service representatives.
5
Looking Forward
Despite growing weakness in the housing market, U.S. and worldwide economic growth appears healthy. Corporate profits have been strong, labor markets are tight (i.e. unemployment is low) and incomes and spending have been rising. This has helped to keep headline and core inflation (excluding food and energy) above the Federal Reserve’s comfort zone of 1-2%. And given the flat-to-inverted yield curve where, for example, nominal rates on U.S. Treasuries from 2-10 years are all within 10 basis points of 4.65%, return possibilities (especially longer-term bonds) appear modest after factoring in inflation expectations.
Our overall strategy has been and will continue to be one of attempting to produce reasonable returns over time without exposing the portfolio to excessive credit or interest-rate risks. By keeping the overall maturity of our portfolio short to intermediate-term, we should continue to earn most of the “coupon” returns of longer-term bonds with lower overall interest-rate risk.
We are excited about the opportunity to leverage the firm’s 20+ years of investment experience in municipal bonds. The investor advantages we’ve enjoyed through the Partnership (professional credit analysis and portfolio management, diversification and minimization of transaction costs) will be enhanced by the additional advantage of the mutual fund format (daily liquidity – the ability to add or withdraw capital any business day). We welcome any questions you may have and appreciate the confidence in and support of the Fund and our firm.
Annual Shareholder Information Meeting – Tuesday, May 22, 2007
Please plan to join us at the Scott Conference Center in Omaha at 4:30 p.m. on May 22. The center is located at 6450 Pine Street on the Aksarben campus. There will be no formal business to conduct, so we can devote the entire meeting to answering your questions. Maps and driving directions are available from our client service representatives. Thanks for your continued support, and we look forward to seeing you there.
| |
| Best Regards, |
|
|
|
|
| Thomas D. Carney
Portfolio Manager |
Portfolio composition is subject to change at any time and references to specific securities, industries and sectors referenced in this letter are not recommendations to purchase or sell any particular security. See the Schedule of Investments in Securities included in this report for the percent of assets in the Fund invested in a particular state.
6
(This page has been left blank intentionally.)
7
FUND PERFORMANCE - NEBRASKA TAX-FREE INCOME FUND
(Unaudited)
The following table summarizes performance information for the Nebraska Tax-Free Income Fund (the “Fund”) and its predecessor, Weitz Income Partners Limited Partnership (the “Partnership”). The Fund succeeded to substantially all of the assets of the Partnership, a Nebraska investment limited partnership as of December 29, 2006. The investment objectives, policies, guidelines and restrictions of the Fund are materially equivalent to those of the Partnership and the Partnership was managed at all times with full investment authority by Wallace R. Weitz & Company.
| | | | | | | | | | | |
Period Ended | | NE Tax-Free | | Lehman
5-Yr | | Difference
NE Tax-Free -
Lehman 5-Yr | |
| |
| |
| |
| |
Dec. 31, 1997 | | | 7.3 | % | | 6.4 | % | | 0.9 | % | |
Dec. 31, 1998 | | | 6.1 | | | 5.8 | | | 0.3 | | |
Dec. 31, 1999 | | | -1.2 | | | 0.7 | | | -1.9 | | |
Dec. 31, 2000 | | | 9.9 | | | 7.7 | | | 2.2 | | |
Dec. 31, 2001 | | | 3.9 | | | 6.2 | | | -2.3 | | |
Dec. 31, 2002 | | | 8.0 | | | 9.3 | | | -1.3 | | |
Dec. 31, 2003 | | | 4.3 | | | 4.1 | | | 0.2 | | |
Dec. 31, 2004 | | | 3.4 | | | 2.7 | | | 0.7 | | |
Dec. 31, 2005 | | | 2.2 | | | 0.9 | | | 1.3 | | |
Dec. 31, 2006 | | | 3.3 | | | 3.3 | | | 0.0 | | |
Mar. 31, 2007 (3 months) | | | 0.9 | | | 0.9 | | | 0.0 | | |
| | | | | | | | | | | |
10-Year Cumulative Return ended Mar. 31, 2007 | | 58.2 | | | 59.7 | | | -1.5 | | |
10-Year Average Annual Compound Return ended Mar. 31, 2007 | | 4.7 | | | 4.8 | | | -0.1 | | |
This chart depicts the change in the value of a $10,000 investment in the Fund for the period March 31, 1997, through March 31, 2007 as compared with the growth of the Lehman Brothers 5-Year Municipal Bond Index (“Lehman 5-Yr”) during the same period. Index performance is hypothetical and is shown for illustrative purposes only.
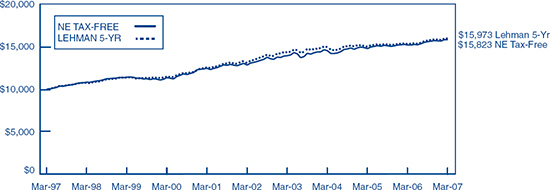
The average annual total return of the Fund for the one, five and ten year periods ended March 31, 2007 was 4.1%, 4.3% and 4.7%, respectively. These performance numbers reflect the deduction of the Fund’s annual operating expenses, which as stated in its most recent prospectus are 0.71% of the Fund’s net assets. The returns assume redemption at the end of each period and reinvestment of dividends. This information represents past performance and past performance does not guarantee future results. The investment return and the principal value of an investment in the Fund will fluctuate so that an investor’s shares, when redeemed, may be worth more or less than the original cost. Current performance may be lower or higher than the performance data quoted. The performance data presented includes performance for the period before the Fund became an investment company registered with the Securities and Exchange Commission. During this time, the Fund was not registered under the Investment Company Act of 1940 and therefore was not subject to certain investment restrictions imposed by the 1940 Act. If the Fund had been registered under the 1940 Act during this time period, the performance of the Fund might have been adversely affected. Performance data current to the most recent month-end may be obtained at www.weitzfunds.com/performance/monthly.asp.
Performance information does not reflect the deduction of taxes that a shareholder would pay on Fund distributions or the redemption of Fund shares.
8
PORTFOLIO PROFILE — NEBRASKA TAX-FREE INCOME FUND
(Unaudited)
State Breakdown
| | | |
Nebraska | | 78.5 | % |
Washington | | 5.6 | |
Illinois | | 5.0 | |
Commonwealth of Puerto Rico | | 4.5 | |
Texas | | 1.9 | |
Missouri | | 1.7 | |
Alaska | | 1.1 | |
Minnesota | | 0.1 | |
Short-Term Securities/Other | | 1.6 | |
| |
| |
| | 100.0 | % |
| |
| |
Sector Breakdown
| | | |
Power | | 20.9 | % |
Higher Education | | 13.9 | |
Hospital | | 12.8 | |
Water/Sewer | | 10.4 | |
General | | 8.2 | |
Student Loan | | 1.1 | |
| |
| |
Total Revenue | | 67.3 | |
| | | |
City/Subdivision | | 8.4 | |
State/Commonwealth | | 7.9 | |
School District | | 5.6 | |
County | | 2.3 | |
| |
| |
Total General Obligation | | 24.2 | |
| | | |
Escrow/Pre-Refunded | | 6.9 | |
Short-Term Securities/Other | | 1.6 | |
| |
| |
| | 100.0 | % |
| |
| |
9
NEBRASKA TAX-FREE INCOME FUND
Schedule of Investments in Securities
March 31, 2007
| | | | | | | |
| | Principal
amount | | Value | |
| |
| |
| |
MUNICIPAL BONDS — 98.4% | | | | | | | |
| | | | | | | |
Alaska — 1.1% | | | | | | | |
University of Alaska, University Revenue, Series J, FSA Insured,
5.0%, 10/01/17 | | $ | 500,000 | | $ | 509,415 | |
| | | | | | | |
Illinois — 5.0% | | | | | | | |
Cook County, General Obligation, Refunding, Series A, 5.0%, 11/15/16 | | | 1,000,000 | | | 1,029,700 | |
Illinois Health Facility Authority, Revenue, Series A, Evangelical Hospital Corp., Escrowed to Maturity, 6.75%, 4/15/12 | | | 185,000 | | | 201,311 | |
Illinois State, General Obligation, FGIC Insured, 5.0%, 3/01/19 | | | 500,000 | | | 515,550 | |
Illinois State, Sales Tax Revenue, Series Z, 5.0%, 6/15/19 | | | 500,000 | | | 517,490 | |
| | | | |
|
| |
| | | | | | 2,264,051 | |
Minnesota — 0.1% | | | | | | | |
Minnesota State Housing Financial Agency, Single Family Mortgage, Series D, 6.0%, 1/01/16 | | | 45,000 | | | 45,513 | |
| | | | | | | |
Missouri — 1.7% | | | | | | | |
Joplin, Industrial Development Authority, Revenue, Series A, Catholic Health Initiatives, 5.125%, 12/01/15 | | | 750,000 | | | 762,832 | |
| | | | | | | |
Nebraska — 78.5% | | | | | | | |
Adams County, Hospital Authority #1, Revenue, Mary Lanning Memorial Hospital Project, Radian Insured, 5.3%, 12/15/18 | | | 700,000 | | | 712,068 | |
Douglas County, Educational Facility Revenue, Series A, Creighton University Project, FGIC Insured, 3.5%, 9/01/12 | | | 255,000 | | | 252,634 | |
Douglas County, Hospital Authority #1, Revenue, Refunding, | | | | | | | |
Alegent Health - - Immanuel, AMBAC Insured, 5.125%, 9/01/17 | | | 250,000 | | | 256,167 | |
Quality Living Inc. Project, 4.7%, 10/01/17 | | | 255,000 | | | 258,996 | |
Douglas County, Hospital Authority #2, Revenue, | | | | | | | |
Lakeside Village Project, 5.125%, 12/15/22 | | | 500,000 | | | 513,510 | |
Nebraska Medical Center Project, 5.0%, 11/15/14 | | | 380,000 | | | 399,718 | |
Nebraska Medical Center Project, 5.0% 11/15/15 | | | 295,000 | | | 310,889 | |
Douglas County, Millard School District #17, Refunding, | | | | | | | |
FSA Insured, 4.0%, 11/15/13 | | | 500,000 | | | 507,535 | |
MBIA Insured, 4.3%, 11/15/14 | | | 500,000 | | | 507,085 | |
4.75%, 6/15/17 | | | 490,000 | | | 490,921 | |
Douglas County, Ralston Public School District #54, FSA Insured, | | | | | | | |
5.125%, 12/15/21 | | | 500,000 | | | 526,655 | |
5.2%, 12/15/26 | | | 500,000 | | | 524,615 | |
Douglas County, Sanitary & Improvement District #206, Eldorado/Farmington, 5.75%, 12/01/14 | | | 195,000 | | | 195,222 | |
The accompanying notes form an integral part of these financial statements.
10
NEBRASKA TAX-FREE INCOME FUND
Schedule of Investments in Securities, Continued
| | | | | | | |
| | Principal
amount | | Value | |
| |
| |
| |
Nebraska — 78.5% (continued) | | | | | | | |
Douglas County, Zoo Facility Revenue, Refunding, Omaha’s Henry Doorly Zoo Project, | | | | | | | |
4.2%, 9/01/16 | | $ | 600,000 | | $ | 597,858 | |
4.75%, 9/01/17 | | | 200,000 | | | 206,374 | |
Gage County, Hospital Authority #1, Revenue, Beatrice Community Hospital & Health Project, 5.35%, 5/01/19 | | | 500,000 | | | 505,340 | |
Grand Island, Electric Revenue, MBIA Insured, | | | | | | | |
5.0%, 8/15/14 | | | 500,000 | | | 524,670 | |
5.125%, 8/15/16 | | | 500,000 | | | 527,100 | |
Grand Island, Public Safety, Tax Anticipation Bonds, AMBAC Insured,
4.1%, 9/01/14 | | | 480,000 | | | 487,296 | |
Grand Island, Sanitary Sewer Revenue, Refunding, FSA Insured, | | | | | | | |
3.3%, 4/01/13 | | | 870,000 | | | 843,387 | |
3.45%, 4/01/14 | | | 650,000 | | | 634,718 | |
Hastings, Electric System Revenue, Refunding, FSA Insured, 5.0%, 1/01/19 | | | 750,000 | | | 784,027 | |
Lancaster County, Hospital Authority #1, Revenue, Bryan LGH Medical Center, Series A-1, AMBAC Insured, 3.649%, 6/01/31
(Auction Rated Security) | | | 500,000 | | | 500,000 | |
Lincoln, Airport Authority Revenue, Refunding, 5.2%, 7/01/19 | | | 200,000 | | | 203,684 | |
Lincoln, Electric System Revenue, Refunding, 5.0%, 9/01/10 | | | 500,000 | | | 522,320 | |
Lincoln, General Obligation, Highway Allocation Fund, 4.0%, 5/15/23 | | | 1,000,000 | | | 970,990 | |
Lincoln, Parking Revenue, Refunding, Series A, 5.375%, 8/15/14 | | | 250,000 | | | 258,907 | |
Lincoln, Sanitary Sewer Revenue, Refunding, MBIA Insured, 5.0%, 6/15/16 | | | 885,000 | | | 944,198 | |
Lincoln, Water Revenue, 5.0%, 8/15/22 | | | 800,000 | | | 839,888 | |
NEBHELP, Inc., Revenue, Series A-5A, 6.2%, 6/01/13 | | | 475,000 | | | 493,306 | |
Nebraska Educational Financial Authority, Revenue, Refunding, | | | | | | | |
Hastings College Project, 5.05%, 12/01/23 | | | 500,000 | | | 519,085 | |
Nebraska Wesleyan University Project, Radian Insured, | | | | | | | |
5.15%, 4/01/22 | | | 1,000,000 | | | 1,036,980 | |
York College Project, 6.0%, 4/01/21 | | | 500,000 | | | 515,870 | |
Nebraska Educational Telecommunications Commission, Revenue, DTV Project, 6.0%, 2/01/10 | | | 600,000 | | | 627,306 | |
Nebraska Investment Financial Authority, Revenue, Series A, Drinking Water State Revolving Fund, 5.15%, 1/01/16 | | | 200,000 | | | 203,674 | |
Nebraska Investment Financial Authority, | | | | | | | |
Health Facility Revenue, Childrens Healthcare Services, 5.5%, 8/15/17 | | | 500,000 | | | 516,505 | |
Hospital Revenue, Great Plains Regional Medical Center Project, Radian Insured, 5.0%, 11/15/14 | | | 250,000 | | | 261,153 | |
Hospital Revenue, Great Plains Regional Medical Center Project, Radian Insured, 5.45%, 11/15/17 | | | 455,000 | | | 462,981 | |
Nebraska Public Power District, Revenue, Series A, | | | | | | | |
3.75%, 1/01/08 | | | 950,000 | | | 950,798 | |
5.0%, 1/01/17, Pre-Refunded 1/01/09 @ 101 | | | 1,000,000 | | | 1,032,400 | |
5.125%, 1/01/18, Pre-Refunded 1/01/09 @ 101 | | | 425,000 | | | 439,662 | |
The accompanying notes form an integral part of these financial statements.
11
NEBRASKA TAX-FREE INCOME FUND
Schedule of Investments in Securities, Continued
| | | | | | | |
| | Principal
amount | | Value | |
| |
| |
| |
Nebraska — 78.5% (continued) | | | | | | | |
Nebraska State Colleges Facility Corp., Deferred Maintenance Revenue, MBIA Insured, | | | | | | | |
4.25%, 7/15/15 | | $ | 405,000 | | $ | 418,977 | |
5.0%, 7/15/16 | | | 200,000 | | | 218,450 | |
4.0%, 7/15/17 | | | 200,000 | | | 201,212 | |
Nebraska Utilities Corp., Revenue, University of Nebraska Lincoln Project, 5.25%, 1/01/19 | | | 750,000 | | | 797,175 | |
Omaha, Douglas County, General Obligation, Public Building Commission, 5.1%, 5/01/20 | | | 750,000 | | | 786,848 | |
Omaha, General Obligation, Refunding, 4.5%, 12/15/17 | | | 250,000 | | | 257,170 | |
Omaha, Public Facilities Corp., Lease Revenue, Series C, Rosenblatt Stadium Project, | | | | | | | |
3.9%, 10/15/17 | | | 235,000 | | | 233,151 | |
3.95%, 10/15/18 | | | 240,000 | | | 237,190 | |
Omaha Public Power District, Electric Revenue, | | | | | | | |
Series A, 4.3%, 2/01/12, Pre-Refunded 2/01/10 @ 100 | | | 500,000 | | | 508,660 | |
Series A, 5.0%, 2/01/17, Pre-Refunded 2/01/10 @ 100 | | | 400,000 | | | 414,404 | |
Series A, Escrowed to Maturity, 7.625%, 2/01/12 | | | 495,000 | | | 545,213 | |
Series A, 4.25%, 2/01/18 | | | 900,000 | | | 908,577 | |
Series C, 5.5%, 2/01/14 | | | 280,000 | | | 303,313 | |
Omaha, Sanitary Sewer Revenue, MBIA Insured, | | | | | | | |
4.0%, 11/15/12 | | | 520,000 | | | 529,162 | |
4.0%, 11/15/14 | | | 250,000 | | | 254,485 | |
Papillion, General Obligation, Bond Anticipation Notes, Series A,
3.7%, 6/01/09 | | | 700,000 | | | 698,068 | |
Platte County, Hospital Authority #1, Revenue, Columbus Community Hospital Project, Radian Insured, 5.9%, 5/01/15 | | | 250,000 | | | 265,490 | |
Public Power Generation Agency, Revenue, Whelan Energy Center Unit 2, Series A, AMBAC Insured, 5.0%, 1/01/18 | | | 750,000 | | | 811,920 | |
Sarpy County, General Obligation, Sanitary & Improvement District #111, Stoneybrook, 5.9%, 3/15/13 | | | 300,000 | | | 300,351 | |
Sarpy County, General Obligation, Sanitary & Improvement District #112, Leawood Oaks III, 6.2%, 2/15/14 | | | 105,000 | | | 105,147 | |
Scottsbluff County, Hospital Authority #1, Revenue, Regional West Medical Center, 6.375%, 12/15/08 | | | 75,000 | | | 75,109 | |
Southern Nebraska Public Power District, Electric System Revenue, | | | | | | | |
AMBAC Insured, 4.625%, 9/15/21 | | | 1,000,000 | | | 1,035,220 | |
Bond Anticipation Notes, 4.0%, 12/15/08 | | | 1,000,000 | | | 1,003,890 | |
University of Nebraska, Facilities Corp., Lease Rental Revenue, UNMC Sorell Center Project, 4.0%, 4/15/11 | | | 1,000,000 | | | 1,013,780 | |
University of Nebraska, University Revenue, | | | | | | | |
Lincoln Student Fees and Facilities, 4.6%, 7/01/17 | | | 570,000 | | | 585,498 | |
Refunding, Lincoln Parking Project, 4.0%, 6/01/17 | | | 1,070,000 | | | 1,072,322 | |
The accompanying notes form an integral part of these financial statements.
12
NEBRASKA TAX-FREE INCOME FUND
Schedule of Investments in Securities, Continued
| | | | | | | |
| | Principal
amount
or shares | | Value | |
| |
| |
| |
Nebraska — 78.5% (continued) | | | | | | | |
York County, Rural Public Power District, Electric System Revenue, Refunding, FSA Insured, 5.0%, 1/01/13 | | $ | 260,000 | | $ | 260,268 | |
| | | | |
|
| |
| | | | | | 35,707,542 | |
Puerto Rico — 4.5% | | | | | | | |
Commonwealth, | | | | | | | |
Refunding, Series B4, FSA Insured, 3.3%, 7/01/28
(Auction Rate Security) | | | 1,000,000 | | | 1,000,000 | |
General Obligation, Refunding, FGIC Insured, 5.5%, 7/01/11 | | | 990,000 | | | 1,063,498 | |
| | | | |
|
| |
| | | | | | 2,063,498 | |
Texas — 1.9% | | | | | | | |
San Antonio, Electric & Gas Revenue, | | | | | | | |
Refunding, Series A, 5.0%, 2/01/18 | | | 500,000 | | | 515,095 | |
Series A, 5.25%, 2/01/14 | | | 320,000 | | | 331,702 | |
| | | | |
|
| |
| | | | | | 846,797 | |
Washington — 5.6% | | | | | | | |
Tacoma, Electric System Revenue, Refunding, AMBAC Insured, 5.5%, 1/01/14 | | | 1,000,000 | | | 1,020,750 | |
Vancouver, Water & Sewer Revenue, Refunding, MBIA Insured, 4.75%, 6/01/16 | | | 500,000 | | | 505,300 | |
Washington State, General Obligation, Variable Purpose, Series B, 5.0%, 1/01/19 | | | 1,000,000 | | | 1,020,450 | |
| | | | |
|
| |
| | | | | | 2,546,500 | |
| | | | |
|
| |
Total Municipal Bonds (Cost $43,831,139) | | | | | | 44,746,148 | |
| | | | | | | |
| | | | | | | |
SHORT-TERM SECURITIES — 2.8% | | | | | | | |
| | | | | | | |
Wells Fargo Advantage Tax-Free Money Market Fund 3.3% (a)
(Cost $1,265,885) | | | 1,265,885 | | | 1,265,885 | |
| | | | |
|
| |
Total Investments in Securities (Cost $45,097,024) | | | | | $ | 46,012,033 | |
Other Liabilities in Excess of Other Assets — (1.2%) | | | | | | (551,685 | ) |
| | | | |
|
| |
Net Assets — 100.0% | | | | | $ | 45,460,348 | |
| | | | |
|
| |
Net Asset Value Per Share | | | | | $ | 10.01 | |
| | | | |
|
| |
| |
(a) | Rate presented represents the annualized 7-day yield at March 31, 2007. |
The accompanying notes form an integral part of these financial statements.
13
NEBRASKA TAX-FREE INCOME FUND
Statement of Assets and Liabilities
March 31, 2007
| | | | |
Assets: | | | | |
Investments in securities at value: | | | | |
Unaffiliated issuers* | | $ | 46,012,033 | |
Accrued interest and dividends receivable | | | 537,090 | |
Receivable for fund shares sold | | | 54,400 | |
| |
|
| |
Total assets | | | 46,603,523 | |
| |
|
| |
| | | | |
Liabilities: | | | | |
Due to adviser | | | 39,145 | |
Payable for securities purchased | | | 1,004,030 | |
Payable for fund shares redeemed | | | 100,000 | |
| |
|
| |
Total liabilities | | | 1,143,175 | |
| |
|
| |
| | | | |
Net assets applicable to shares outstanding | | $ | 45,460,348 | |
| |
|
| |
| | | | |
Composition of net assets: | | | | |
Paid-in capital | | $ | 44,501,195 | |
Accumulated undistributed net investment income | | | 48,637 | |
Accumulated net realized gain (loss) | | | (4,493 | ) |
Net unrealized appreciation (depreciation) of investments | | | 915,009 | |
| |
|
| |
Total net assets applicable to shares outstanding | | $ | 45,460,348 | |
| |
|
| |
| | | | |
Net asset value, offering and redemption price per share of shares outstanding | | $ | 10.01 | |
| |
|
| |
| | | | |
Total shares outstanding | | | 4,542,016 | |
(indefinite number of no par value shares authorized) | | | | |
| |
|
| |
| | | | |
* Cost of investments in securities: | | | | |
Unaffiliated issuers | | $ | 45,097,024 | |
| |
|
| |
The accompanying notes form an integral part of these financial statements.
14
NEBRASKA TAX-FREE INCOME FUND
Statement of Operations
Three Months Ended March 31, 2007(a)
| | | | |
Investment income: | | | | |
Interest | | $ | 491,712 | |
| |
|
| |
Total investment income | | | 491,712 | |
| |
|
| |
| | | | |
Expenses: | | | | |
Investment advisory fee | | | 43,754 | |
Administrative fee | | | 20,684 | |
Audit fees | | | 32,300 | |
Custodial fees | | | 618 | |
Sub-transfer agent fees | | | 6,526 | |
Trustees fees | | | 527 | |
Other expenses | | | 7,556 | |
| |
|
| |
Total expenses | | | 111,965 | |
Less expenses reimbursed by investment adviser | | | (29,926 | ) |
| |
|
| |
Net expenses | | | 82,039 | |
| |
|
| |
Net investment income | | | 409,673 | |
| |
|
| |
| | | | |
Realized and unrealized gain (loss) on investments: | | | | |
Net realized gain (loss): | | | | |
Unaffiliated issuers | | $ | (4,493 | ) |
Net unrealized appreciation (depreciation): | | | | |
Unaffiliated issuers | | | (11,689 | ) |
| |
|
| |
Net realized and unrealized gain (loss) on investments | | | (16,182 | ) |
| |
|
| |
Net increase (decrease) in net assets resulting from operations | | $ | 393,491 | |
| |
|
| |
| |
(a) | Fund commenced operations on January 1, 2007 (See Note 1) |
The accompanying notes form an integral part of these financial statements.
15
NEBRASKA TAX-FREE INCOME FUND
Statement of Changes in Net Assets
Three Months Ended March 31, 2007(a)
| | | | |
Increase (decrease) in net assets: | | | | |
From operations: | | | | |
Net investment income (loss) | | $ | 409,673 | |
Net realized gain (loss) | | | (4,493 | ) |
Net unrealized appreciation (depreciation) | | | (11,689 | ) |
| |
|
| |
Net increase (decrease) in net assets resulting from operations | | | 393,491 | |
| |
|
| |
| | | | |
Distributions to shareholders from: | | | | |
Net investment income | | | (361,003 | ) |
Net realized gains | | | — | |
| |
|
| |
Total distributions | | | (361,003 | ) |
| |
|
| |
| | | | |
Fund share transactions:* | | | | |
Proceeds from sales | | | 2,478,219 | |
Proceeds from shares issued in connection with reorganization(a) | | | 43,255,162 | |
Payments for redemptions | | | (643,907 | ) |
Reinvestment of distributions | | | 338,386 | |
| |
|
| |
Net increase (decrease) from fund share transactions | | | 45,427,860 | |
| |
|
| |
Total increase (decrease) in net assets | | | 45,460,348 | |
| |
|
| |
| | | | |
Net assets: | | | | |
Beginning of period | | $ | — | |
| |
|
| |
| | | | |
End of period | | $ | 45,460,348 | |
| |
|
| |
| | | | |
Undistributed net investment income | | $ | 48,637 | |
| |
|
| |
| | | | |
* Transactions in fund shares: | | | | |
Shares issued | | | 247,025 | |
Shares issued in connection with reorganization(a) | | | 4,325,516 | |
Shares redeemed | | | (64,330 | ) |
Reinvested dividends | | | 33,805 | |
| |
|
| |
Net increase (decrease) in shares outstanding | | | 4,542,016 | |
| |
|
| |
| |
(a) | Fund commenced operations on January 1, 2007 (See Note 1) |
The accompanying notes form an integral part of these financial statements.
16
NEBRASKA TAX-FREE INCOME FUND
Financial Highlights
Three Months Ended March 31, 2007(a)
The following financial information provides selected data for a share of the Nebraska Tax-Free Income Fund outstanding throughout the period indicated.
| | | | |
Net asset value, beginning of period | | $ | 10.00 | |
| |
|
| |
| | | | |
Income (loss) from investment operations: | | | | |
Net investment income | | | 0.09 | |
Net gain (loss) on securities (realized and unrealized) | | | — | # |
| |
|
| |
Total from investment operations | | | 0.09 | |
| |
|
| |
| | | | |
Less distributions: | | | | |
Dividends from net investment income | | | (0.08 | ) |
Distributions from realized gains | | | — | |
| |
|
| |
Total distributions | | | (0.08 | ) |
| |
|
| |
| | | | |
Net asset value, end of period | | $ | 10.01 | |
| |
|
| |
| | | | |
Total return | | | 0.9 | %† |
| | | | |
Ratios/supplemental data: | | | | |
Net assets, end of period ($000) | | | 45,460 | |
| | | | |
Ratio of net expenses to average net assets(b) | | | 0.75 | %* |
| | | | |
Ratio of net investment income to average net assets | | | 3.74 | %* |
| | | | |
Portfolio turnover rate | | | 2 | %† |
| |
* | Annualized |
| |
† | Not Annualized |
| |
# | Amount rounds to less than $0.01. |
| |
(a) | Fund commenced operations on January 1, 2007 (See Note 1) |
| |
(b) | Absent expenses assumed by the Adviser, the annualized expense ratio would have been 1.02% for the period ended March 31, 2007. |
The accompanying notes form an integral part of these financial statements.
17
NEBRASKA TAX-FREE INCOME FUND
Notes to Financial Statements
March 31, 2007
| | |
(1) | Organization |
| | |
| The Weitz Funds (the “Trust”), is registered under the Investment Company Act of 1940 as an open-end management investment company issuing shares in series, each series representing a distinct portfolio with its own investment objectives and policies. At March 31, 2007, the Trust had eight series in operation: Nebraska Tax-Free Income Fund (the “Fund”), Value Fund, Partners Value Fund, Hickory Fund, Partners III Opportunity Fund, Balanced Fund, Short-Intermediate Income Fund and Government Money Market Fund. The accompanying financial statements present the financial position and results of operations of only the Fund. The Fund’s investment objective is to provide a high level of current income that is exempt from both federal and Nebraska personal income taxes. The Fund under normal circumstances, invests at least 80% of its net assets in municipal securities that generate income exempt from Nebraska state income tax and from federal income tax, including the alternative minimum tax. |
| | |
| The Fund was originally organized in October 1985 as a Nebraska limited partnership (the “Partnership”). Effective as of the close of business on December 29, 2006, the Partnership was reorganized into a series of the Trust through a tax-free exchange of 4,325,516 shares of the Fund (valued at $10.00 per share) in exchange for the net assets of the Partnership. At the time of the exchange, the Partnership had net assets of $43,255,162 including net unrealized appreciation of $926,180. |
| | |
(2) | Significant Accounting Policies |
| | |
| The following accounting policies are in accordance with accounting principles generally accepted in the United States. |
| | |
| (a) | Valuation of Investments |
| | |
| | Investments are carried at value determined using the following valuation methods: |
| | |
| • | Securities traded on a national or regional securities exchange are valued at the last sales price; if there were no sales on that day, securities are valued at the mean between the latest available and representative bid and ask prices; securities listed on the Nasdaq exchange are valued using the Nasdaq Official Closing Price (“NOCP”). Generally, the NOCP will be the last sales price unless the reported trade for the security is outside the range of the bid/ask price. In such cases, the NOCP will be normalized to the nearer of the bid or ask price. |
| | |
| • | Securities not listed on an exchange are valued at the mean between the latest available and representative bid and ask prices. |
| | |
| • | The value of certain debt securities for which market quotations are not readily available may be based upon current market prices of securities which are comparable in coupon, rating and maturity or an appropriate matrix utilizing similar factors. |
| | |
| • | The value of securities for which market quotations are not readily available or are deemed unreliable, including restricted and not readily marketable securities, is determined in good faith in accordance with procedures approved by the Trust’s Board of Trustees. Such valuation procedures and methods for valuing securities may include, but are not limited to: multiple of earnings, multiple of book value, discount from value of a similar freely-traded security, purchase price, private transaction in the security or related securities, the nature and duration of restrictions on disposition of the security and a combination of these and other factors. |
| | |
| (b) | Federal Income Taxes |
| | |
| | It is the policy of the Fund to comply with all sections of the Internal Revenue Code applicable to regulated investment companies and to distribute all of its taxable income to shareholders; therefore, no provision for income or excise taxes is required. |
18
| | |
| | Net investment income and net realized gains may differ for financial statement and tax purposes. The character of distributions made during the year from net investment income or net realized gains may differ from their ultimate characterization for Federal income tax purposes. Also, due to the timing of dividend distributions, the fiscal year in which amounts are distributed may differ from the year that the income or realized gains were recorded by the Fund. |
| | |
| (c) | Security Transactions |
| | |
| | Security transactions are accounted for on the date the securities are purchased or sold (trade date). Realized gains or losses are determined by specifically identifying the security sold. |
| | |
| | Distributions to shareholders are recorded on the ex-dividend date. Interest, including amortization of discount or premium, is accrued as earned. |
| | |
| (d) | Dividend Policy |
| | The Fund declares and distributes income dividends and capital gains distributions as may be required to qualify as a regulated investment company under the Internal Revenue Code. |
| | |
| | Generally, the Fund pays income dividends on a quarterly basis. All dividends and distributions are reinvested automatically, unless the shareholder elects otherwise. |
| | |
| (e) | Use of Estimates |
| | |
| | The preparation of financial statements in conformity with accounting principles generally accepted in the United States requires management to make estimates and assumptions that affect the reported amounts of assets and liabilities and disclosure of contingent assets and liabilities at the date of the financial statements and the reported amounts of increase and decrease in net assets from operations during the period. Actual results could differ from those estimates. |
| | |
| (f) | New Accounting Pronouncements |
| | |
| | In July 2006, the Financial Accounting Standards Board (“FASB”) issued FASB Interpretation No. 48 (“FIN 48”), “Accounting for Uncertainty in Income Taxes,” effective for fiscal years beginning after December 15, 2006. This pronouncement provides guidance on the recognition, measurement, classification and disclosures related to uncertain tax positions, along with any related interest and penalties. The Fund does not believe that the impact of the adoption of FIN 48 will be material to its financial statements. |
| | |
| | In September 2006, FASB issued Statement on Financial Accounting Standards No. 157 (“SFAS 157”), “Fair Value Measurements,” effective for fiscal years beginning after November 15, 2007 and interim periods within those fiscal years. This standard establishes a single authoritative definition of fair value, sets out a framework for measuring fair value and requires additional disclosures about fair value measurements. SFAS 157 applies to fair value measurements already required or permitted by existing standards. The Fund does not believe that the impact of the adoption of SFAS 157 will be material to its financial statements. |
| | |
(3) | Related Party Transactions |
| | |
| The Fund has retained Wallace R. Weitz & Company (the “Adviser”) as its investment adviser. In addition, the Trust has an agreement with Weitz Securities, Inc. (the “Distributor”), a company under common control with the Adviser, to act as distributor for shares of the Trust. The Distributor receives no compensation for the distribution of shares of the Trust. Certain officers of the Trust are also officers and directors of the Adviser and the Distributor. |
| | |
| Under the terms of a management and investment advisory agreement, the Adviser is paid a monthly fee. The annual investment advisory fee is equal to 0.40% of the average daily net assets of the Fund. |
| | |
| Under the terms of an administration agreement, certain services are provided by the Adviser including the transfer of shares, disbursement of dividends, fund accounting and related administrative services of the Trust for which the Adviser is paid a monthly fee. The annual administrative fee schedule for the Fund is as follows: |
Average Daily Net Assets Break Points
| | | | | | | | |
| Greater Than | | Less Than or
Equal To | | Rate | |
| |
| |
| |
$ | 0 | | $ | 25,000,000 | | | 0.200% | |
| 25,000,000 | | | 100,000,000 | | | 0.175% | |
| 100,000,000 | | | | | | 0.100% | |
19
| |
| The Adviser has voluntarily agreed to reimburse the Fund or to pay directly a portion of the Fund’s expenses to the extent that the total annual Fund operating expenses exceed 0.75% of the Fund’s average daily net assets. The fees waived by the Adviser for the three months ended March 31, 2007 were $29,926. |
| |
| As of March 31, 2007, the controlling shareholder of the Adviser held approximately 57% of the Fund. |
| |
(4) | Distributions to Shareholders and Distributable Earnings |
| |
| The tax character of distributions paid by the Fund during the three months ended March 31, 2007 are summarized as follows: |
| | | | |
Distributions paid from: | | | | |
Tax exempt income | | $ | 358,524 | |
Ordinary income | | | 2,479 | |
| |
|
| |
Total distributions | | $ | 361,003 | |
| |
|
| |
As of March 31, 2007, the components of distributable earnings on a tax basis were as follows:
| | | | |
Undistributed tax exempt income | | $ | 48,637 | |
Capital loss carryforward | | | (4,493 | ) |
Net unrealized appreciation | | | 915,009 | |
| |
|
| |
| | $ | 959,153 | |
| |
|
| |
| |
| Capital loss carryforwards represent tax basis capital losses which may be carried over to offset future realized capital gains, if any. To the extent that the carryforwards are used, no capital gains distributions will be made. The Fund’s carryforward expires on March 31, 2015. |
| |
(5) | Securities Transactions |
| |
| Purchases and proceeds from maturities or sales of investment securities of the Fund, other than short-term securities, are summarized as follows: |
| | | | |
Purchases | | $ | 2,510,034 | |
Proceeds | | | 901,736 | |
| |
| The cost of investments is the same for financial reporting and Federal income tax purposes. |
| |
| At March 31, 2007, the aggregate gross unrealized appreciation and depreciation of investments, based on cost for Federal income tax purposes, are summarized as follows: |
| | | | |
Appreciation | | $ | 984,278 | |
Depreciation | | | (69,269 | ) |
| |
|
| |
Net | | $ | 915,009 | |
| |
|
| |
| |
(6) | Contingencies |
| |
| The Fund indemnifies the Trust’s officers and trustees for certain liabilities that might arise from their performance of their duties to the Fund. Additionally, in the normal course of business the Fund enters into contracts that contain a variety of representations and warranties and which provide general indemnifications. The maximum exposure of the Fund under these arrangements is unknown, as this would involve future claims that may be made against the Fund that have not yet occurred. However, based on experience, the Fund expects the risk of loss to be remote. |
| |
(7) | Concentration of Credit Risk |
| |
| Approximately 79% of the Fund’s net assets are in obligations of political subdivisions of the State of Nebraska which are subject to the credit risk associated with the non-performance of such issuers. |
20
REPORT OF INDEPENDENT REGISTERED
PUBLIC ACCOUNTING FIRM
To the Shareholders of the Nebraska Tax-Free Income Fund
and the Board of Trustees of The Weitz Funds
We have audited the accompanying statement of assets and liabilities of the Nebraska Tax-Free Income Fund (“the Fund”) (one of the portfolios comprising The Weitz Funds), including the schedule of investments in securities, as of March 31, 2007, and the related statement of operations, statement of changes in net assets and financial highlights from January 1, 2007 (commencement of operations) to March 31, 2007. These financial statements and financial highlights are the responsibility of the Fund’s management. Our responsibility is to express an opinion on these financial statements and financial highlights based on our audit.
We conducted our audit in accordance with the standards of the Public Company Accounting Oversight Board (United States). Those standards require that we plan and perform the audit to obtain reasonable assurance about whether the financial statements and financial highlights are free of material misstatement. We were not engaged to perform an audit of the Fund’s internal control over financial reporting. Our audit included consideration of internal control over financial reporting as a basis for designing audit procedures that are appropriate in the circumstances, but not for the purpose of expressing an opinion on the effectiveness of the Fund’s internal control over financial reporting. Accordingly, we express no such opinion. An audit also includes examining, on a test basis, evidence supporting the amounts and disclosures in the financial statements and financial highlights, assessing the accounting principles used and significant estimates made by management, and evaluating the overall financial statement presentation. Our procedures included confirmation of securities owned as of March 31, 2007, by correspondence with the custodian and brokers. We believe that our audit provides a reasonable basis for our opinion.
In our opinion, the financial statements and financial highlights referred to above present fairly, in all material respects, the financial position of the Nebraska Tax-Free Income Fund of The Weitz Funds as of March 31, 2007, and the results of its operations, changes in its net assets and its financial highlights from January 1, 2007 (commencement of operations) to March 31, 2007, in conformity with U.S. generally accepted accounting principles.
Cincinnati, Ohio
April 25, 2007
21
ACTUAL AND HYPOTHETICAL EXPENSES FOR COMPARISON PURPOSES
(Unaudited)
Example
As a shareholder of the Fund, you incur two types of costs: (1) transaction costs, including any transaction fees that you may be charged if you purchase or redeem the Fund through certain financial institutions; and (2) ongoing costs, including management fees and other Fund expenses. This Example is intended to help you understand your ongoing costs (in dollars) of investing in the Fund and to compare these costs with the ongoing costs of investing in other mutual funds. The Example is based on an investment of $1,000 invested at the beginning of the period and held for the entire period from January 1, 2007 through March 31, 2007. (The hypothetical example in the table below assumes a six-month holding period.)
Actual Expenses
The first line in the table below provides information about actual account values and actual expenses. You may use the information in this line, together with the amount you invested, to estimate the expenses that you paid over the period. Simply divide your account value by $1,000 (for example, an account value of $10,000 divided by $1,000 = 10), then multiply the result by the number in the first line under the heading entitled “Expenses Paid from 1/1/07 - 3/31/07” to estimate the expenses you paid on your account during this period.
Hypothetical Example for Comparison Purposes
The second line in the table below provides information about hypothetical account values and hypothetical expenses based on the actual expense ratio of the Fund and an assumed rate of return of 5% per year before expenses, which is not the actual return of the Fund. The hypothetical account values and expenses may not be used to estimate the actual ending account balance or expenses you paid for the period. You may use this information to compare the ongoing costs of investing in this Fund to other funds. To do so, compare this 5% hypothetical example with the 5% hypothetical examples that appear in the shareholder reports of other funds.
Please note that expenses shown in the table are meant to highlight your ongoing costs only and do not reflect any transactional costs charged by certain financial institutions. Therefore, the second line of the table is useful in comparing ongoing costs only, and will not help you determine the relative total costs of owning different funds. In addition, if you incurred transactional fees, your costs would have been higher. Actual and hypothetical expenses for the Fund are provided in this table.
| | | | | | | | | | | | | |
| | Beginning
Account Value
1/1/07 | | Ending
Account Value
3/31/07 | | Annualized
Expense Ratio | | Expenses
Paid from
1/1/07 - 3/31/07 (1) | |
| |
| |
| |
| |
| |
Actual | | $ | 1,000.00 | | $ | 1,009.00 | | | 0.75% | | $ | 1.86 | |
| | | | | | | | | | | | | |
| | Beginning
Account Value
10/1/06 | | Ending
Account Value
3/31/07 | | Annualized
Expense Ratio | | Expenses
Paid from
10/1/06 - 3/31/07 (2) | |
| |
| |
| |
| |
| |
Hypothetical(3) | | $ | 1,000.00 | | $ | 1,021.25 | | | 0.75% | | $ | 3.78 | |
| |
(1) | Expenses are equal to the annualized expense ratio for the Fund, multiplied by the average account value over the period, multiplied by the number of days in its initial reporting period (90/365). |
| |
(2) | Expenses are equal to the annualized expense ratio for the Fund, multiplied by the average account value over the period, multiplied by the number of days in the most recent fiscal half year (182/365). |
| |
(3) | Assumes 5% total return before expenses. |
22
OTHER INFORMATION
(Unaudited)
Proxy Voting Policy
A description of the Fund’s proxy voting policies and procedures is available without charge, upon request by (i) calling 800-304-9745, (ii) on the Fund’s website at http://www.weitzfunds.com; and (iii) on the SEC’s website at http://www.sec.gov.
Information on how the Fund voted proxies relating to portfolio securities during each twelve month period ended June 30 will be available: (i) on the Fund’s website at http://www.weitzfunds.com, and (ii) on the SEC’s website at http://www.sec.gov.
Form N-Q
The Fund files a complete schedule of its portfolio holdings with the Securities and Exchange Commission for the first and third quarters of each fiscal year on Form N-Q. The Fund’s Form N-Q is available on the SEC’s website at http://www.sec.gov and may be reviewed and copied at the SEC’s Public Reference Room in Washington DC. Information on the operation of the Public Reference Room may be obtained by calling 800 SEC-0330. When filed, the Fund’s quarterly report, including the information filed on Form N-Q will also be available on the Fund’s website at http://www.weitzfunds.com.
23
INFORMATION ABOUT THE TRUSTEES
AND OFFICERS OF THE WEITZ FUNDS
(Unaudited)
The individuals listed below serve as Trustees or Officers of The Weitz Funds (the “Weitz Funds”). Each Trustee of the Weitz Funds serves until a successor is elected and qualified or until resignation. Each Officer of the Weitz Funds is elected annually by the Trustees.
The address of all Officers and Trustees is 1125 South 103rd Street, Suite 600, Omaha, Nebraska 68124.
Interested Trustees*
|
|
Wallace R. Weitz (Age: 57) |
Position(s) Held with Trust: President; Portfolio Manager;
Trustee |
Length of Service (Beginning Date): The Weitz Funds (and
certain predecessor funds) – January, 1986 |
Principal Occupation(s) During Past 5 Years: President,
Wallace R. Weitz & Company, The Weitz Funds (and
certain predecessor funds) |
Number of Portfolios Overseen in Fund Complex: 8
Other Directorships: N/A |
|
Thomas R. Pansing (Age: 62)
Position(s) Held with Trust: Trustee |
Length of Service (Beginning Date): The Weitz Funds (and
certain predecessor funds) - January, 1986 |
Principal Occupation(s) During Past 5 Years: Partner,
Pansing Hogan Ernst & Bachman LLP, a law firm |
Number of Portfolios Overseen in Fund Complex: 8
Other Directorships: N/A |
|
| |
* | Mr. Weitz is a Director and Officer of Wallace R. Weitz & Company, investment adviser to The Weitz Funds, and as such is considered an “interested person” of the Trust, as that term is defined in the Investment Company Act of 1940 (an “Interested Trustee”). Mr. Pansing performs certain legal services for the investment adviser and The Weitz Funds and, therefore, is also classified as an “Interested Trustee”. |
Independent Trustees
|
|
Lorraine Chang (Age: 56) |
Position(s) Held with Trust: Trustee |
Length of Service (Beginning Date): The Weitz Funds (and
certain predecessor funds) - June, 1997 |
Principal Occupation(s) During Past 5 Years: Partner,
The Public Strategies Group, a management consulting
firm, 1999-Present |
Number of Portfolios Overseen in Fund Complex: 8
Other Directorships: N/A |
|
Richard D. Holland (Age: 85)
Position(s) Held with Trust: Trustee |
Length of Service (Beginning Date): The Weitz Funds (and
certain predecessor funds) - June, 1995 |
Principal Occupation(s) During Past 5 Years: Retired
Number of Portfolios Overseen in Fund Complex: 8
Other Directorships: N/A |
|
Roland J. Santoni (Age: 65)
Position(s) Held with Trust: Trustee |
Length of Service (Beginning Date): The Weitz Funds -
February, 2004 |
Principal Occupation(s) During Past 5 Years: Vice President,
West Development, Inc., a development company,
June 2003-Present; Professor of Law, Creighton University,
1977-2003; Of Counsel, Erickson & Sederstrom, a law
firm, 1978-2003 |
Number of Portfolios Overseen in Fund Complex: 8
Other Directorships: Transgenomic, Inc. |
|
John W. Hancock (Age: 59)
Position(s) Held with Trust: Trustee |
Length of Service (Beginning Date): The Weitz Funds (and
certain predecessor funds) - January, 1986 |
Principal Occupation(s) During Past 5 Years: Partner,
Hancock & Dana, an accounting firm |
Number of Portfolios Overseen in Fund Complex: 8
Other Directorships: N/A |
|
Delmer L. Toebben (Age: 76)
Position(s) Held with Trust: Trustee |
Length of Service (Beginning Date): The Weitz Funds (and
certain predecessor funds) - July, 1996 |
Principal Occupation(s) During Past 5 Years: Retired
Number of Portfolios Overseen in Fund Complex: 8
Other Directorships: N/A |
|
Barbara W. Schaefer (Age: 53)
Position(s) Held with Trust: Trustee |
Length of Service (Beginning Date): The Weitz Funds -
March, 2005 |
Principal Occupation(s) During Past 5 Years: Senior Vice
President-Human Resources and Corporate Secretary,
Union Pacific Corporation, 2004-Present; Senior Vice
President-Human Resources, Union Pacific Corporation,
1997-2004 |
Number of Portfolios Overseen in Fund Complex: 8
Other Directorships: N/A |
|
24
|
Officers |
|
|
Mary K. Beerling (Age: 66) |
Position(s) Held with Trust: Vice President, Secretary and
Chief Compliance Officer |
Length of Service (Beginning Date): The Weitz Funds (and
certain predecessor funds) - July, 1994 |
Principal Occupation(s) During Past 5 Years: Vice President
and Chief Compliance Officer, Wallace R. Weitz &
Company, Vice President and Chief Compliance Officer,
The Weitz Funds (and certain predecessor funds) |
|
Bradley P. Hinton (Age: 39) |
Position(s) Held with Trust: Vice President |
Length of Service (Beginning Date): The Weitz Funds -
August, 2006 |
Principal Occupation(s) During Past 5 Years: Vice President,
Director of Research and Portfolio Manager,
Wallace R. Weitz & Company; Vice President,
The Weitz Funds - August, 2006 to Present |
|
Kenneth R. Stoll (Age: 45) |
Position(s) Held with Trust: Vice President and Chief
Financial Officer |
Length of Service (Beginning Date): The Weitz Funds -
April, 2004 |
Principal Occupation(s) During Past 5 Years: Vice President
and Chief Operating Officer, Wallace R. Weitz &
Company; Vice President and Chief Financial Officer,
The Weitz Funds - April 2004 to Present; Partner,
PricewaterhouseCoopers LLP, an accounting firm,
1999- 2004 |
|
The Statement of Additional Information for The Weitz Funds, which can be obtained without charge by calling 800-304-9745, includes additional information about the Trustees and Officers of The Weitz Funds.
25
(This page has been left blank intentionally.)
26
(This page has been left blank intentionally.)
27
|
Board of Trustees |
Lorraine Chang |
John W. Hancock
Richard D. Holland |
Thomas R. Pansing, Jr.
Roland J. Santoni |
Barbara W. Schaefer |
Delmer L. Toebben |
Wallace R. Weitz |
|
Investment Adviser |
Wallace R. Weitz & Company |
|
Custodian |
Wells Fargo Bank Minnesota, |
National Association |
|
Officers |
Wallace R. Weitz, President |
Mary K. Beerling, Vice President, Secretary &
Chief Compliance Officer |
Kenneth R. Stoll, Vice President & Chief
Financial Officer |
Bradley P. Hinton, Vice President |
|
Distributor |
Weitz Securities, Inc. |
|
Transfer Agent and Dividend Paying Agent |
Wallace R. Weitz & Company |
|
Sub-Transfer Agent |
Boston Financial Data Services, Inc. |
NASDAQ symbol:
Nebraska Tax-Free Income Fund – WNTFX
An investor should consider carefully the investment objectives, risks, and charges and expenses of the Fund before investing. The Fund’s Prospectus contains this and other information about the Fund. The Prospectus should be read carefully before investing.
| | |
5/4/07 | |
|
Item 2. Code of Ethics.
As of the end of the period covered by this report, the Registrant has adopted a code of ethics that applies to the Registrant’s principal executive officer, principal financial officer, principal accounting officer or controller, or persons performing similar functions, regardless of whether these individuals are employed by the Registrant or a third party (the “Code of Ethics”). During the period covered by this report, there were no amendments, nor did the Registrant grant any waivers, including any implicit waivers, from any provision of the Code of Ethics.
The Code of Ethics is attached hereto as Exhibit 12(a)(1).
Item 3. Audit Committee Financial Expert.
The Registrant’s board of trustees has determined that the Registrant has at least one “audit committee financial expert” (as defined in Item 3 of Form N-CSR) serving on its audit committee. John Hancock is an “audit committee financial expert” and is “independent” (as each term is defined in Item 3 of Form N-CSR).
Item 4. Principal Accountant Fees and Services.
| (a) | Audit Fees. Fees for audit services provided to the Registrant were $229,800 and $185,200 for fiscal years ended March 31, 2007 and 2006, respectively. |
| (b) | Audit Related Fees. The aggregate fees billed in each of the last two fiscal years for audit related-services by the principal accountant that are reasonably related to the performance of the audit of the Registrant’s financial statements and are not reported under paragraph (a) of this item were $23,600 and $22,300 for fiscal years ended March 31, 2007 and 2006, respectively. The fees, paid by Wallace R. Weitz & Company, the Registrant’s investment adviser and transfer agent, were payment for the principal accountant performing internal control reviews of the Registrant’s transfer agent. |
| (c) | Tax Fees. Fees for tax services, which consisted of income and excise tax compliance services, were $29,400 and $26,900 for the fiscal years ended March 31, 2007 and 2006, respectively. |
| (d) | All Other Fees. Fees for all other services totaled $10,100 and $9,500 for fiscal years ended March 31, 2007 and 2006, respectively. |
| (e) | (1) The Registrant’s Audit Committee has adopted Pre-Approval Policies and Procedures. The Audit Committee must pre-approve all audit services and non-audit services that the principal accountant provides to the Registrant. The Audit committee must also pre-approve any engagement of the principal accountant to provide non-audit services to the Registrant’s investment adviser, or any affiliate of the adviser that provides ongoing services to the Registrant, if such non-audit services directly impact the Registrant’s operations and financial reporting. |
| (2) | No services described in items (b) were pre-approved by the Audit Committee pursuant to Rule 2- |
01(c)(7)(i)(c) of Regulation S-X.
| (f) | All of the work in connection with the audit of the Registrant during the years ended March 31, 2007 and 2006 was performed by full-time employees of the Registrant’s principal accountant. |
| (g) | The aggregate fees billed by the principal accountant for non-audit services to the Registrant, the Registrant’s investment adviser and any entity controlling, controlled by, or under common control with the adviser that provides ongoing services to the Registrant were $86,100 and $58,700 for the years ended March 31, 2007 and 2006, respectively. |
| (h) | The Registrant’s Audit Committee has considered whether the provision of non-audit services that were rendered to the Registrant’s investment adviser, and any entity controlling, controlled by, or under common control with the adviser that provides ongoing services to the Registrant that were not pre-approved pursuant to paragraph (c)(7)(ii) of Rule 2-01 of Regulation S-X is compatible with maintaining the principal auditor’s independence. |
Item 5. Audit Committee of Listed Registrants.
Not applicable.
Item 6. Schedule of Investments.
The Schedule of Investments in securities of unaffiliated issuers is included as part of the Report to Shareholders.
Item 7. Disclosure of Proxy Voting Policies and Procedures for Closed-End Investment Companies.
Not applicable.
Item 8. Portfolio Managers of Closed-End Management Investment Companies
Not applicable
Item 9. Purchases of Equity Securities by Closed-End Management Investment Company and Affiliated Purchasers.
Not applicable.
Item 10. Submissions of Matters to a Vote of Security Holders.
Not applicable.
Item 11. Controls and Procedures.
(a) Based on an evaluation of the Disclosure Controls and Procedures (as defined in Rule 30a-3(c) under the Investment Company Act of 1940) (the "Disclosure Controls") as of a date within 90 days prior to the filing date (the "Filing Date") of this report on Form N-CSR (the "Report"), the Registrant's principal executive officer and financial officer have concluded that the Disclosure Controls are reasonably designed to ensure that information required to be disclosed by the Registrant in the Report is recorded, processed, summarized and reported by the Filing Date, including ensuring that information required to be disclosed in the Report is accumulated and communicated to the Registrant's management, including the Registrant's principal executive officer and principal financial officer, as appropriate to allow timely decisions regarding required disclosure.
(b) There were no significant changes in the Registrant's internal control over financial reporting (as defined in Rule 30a-3(d) under the Investment Company Act of 1940) that occurred during the Registrant's second fiscal half-year of the period covered by this report that has materially affected, or is reasonably likely to materially affect, the Registrant's internal control over financial reporting.
Item 12. Exhibits
(a)(1) The Code of Ethics is attached hereto.
(a)(2) The certifications required by Rule 30a-2(a) of the Investment Company Act of 1940 are attached hereto.
(a)(3) Not applicable.
(b) The certifications required by Rule 30a-2(b) of the Investment Company Act of 1940 and Section 906 of the Sarbanes-Oxley Act of 2002 are attached hereto.
SIGNATURES
Pursuant to the requirements of the Securities Exchange Act of 1934 and the Investment Company Act of 1940, the Registrant has duly caused this report to be signed on its behalf by the undersigned, thereunto duly authorized.
The Weitz Funds
By (Signature and Title)*/s/ Wallace R. Weitz
| Wallace R. Weitz, President |
Date May 4, 2007
Pursuant to the requirements of the Securities Exchange Act of 1934 and the Investment Company Act of 1940, this report has been signed below by the following persons on behalf of the Registrant and in the capacities and on the dates indicated.
By (Signature and Title)* /s/ Wallace R. Weitz
| Wallace R. Weitz, President |
Date May 4, 2007
By (Signature and Title)* /s/ Kenneth R. Stoll
Kenneth R. Stoll, Chief Financial Officer
Date May 4, 2007
* Print the name and title of each signing officer under his or her signature.