On December 30, 2005, Weitz Partners III Limited Partnership was converted to the Partners III Opportunity Fund (“Partners III”). As I explained in letters prior to the conversion, very little of economic substance has changed, but the disclosure requirements for mutual funds are different from those governing private investment partnerships. We have never been particularly secretive about our major holdings, but you will notice that this report provides more detailed information than previous reports.
Most of the additional information should be self-explanatory, especially for shareholders in our other Funds. However, since Partners III may borrow money and sell short, there are a few new wrinkles in the tables that may be confusing and I thought it might be helpful to add some commentary in this first report.
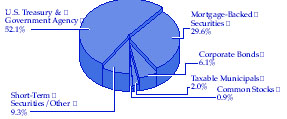
The “Portfolio Profile” on page 9 includes an “Industry Sector” table in the upper right corner. This table shows various percentage holdings adding up to “Total Long Positions” of 100.4%. This means that we have borrowed an amount equal to 0.4% of portfolio net assets to buy additional shares of our favorite stocks. Subtracting the market value of our short position (-17.9%) leaves “Net Long Positions” of 82.5%. If our long positions and short positions behaved identically (which they will not), this would be analogous to holding 82.5% of our assets in stocks and 17.5% in cash. “Short Proceeds/Other” (17.5%) represent cash proceeds from our short sales held as an offset to our short positions (-17.9%) minus the amount of our net loan (-0.4%). The details of our long and short positions are shown in the “Schedule of Investments” later in the report.
This may be much more than you wanted to hear about accounting, but I want to make sure confusion in reading the financial statements does not distract from the more important review of our investment results. If shareholders have questions about the mechanics of the report, please feel free to call Mary Bickels or me.
In the quarter ended March 31, 2006, Partners III was up +2.5% vs. +4.2% for the S&P 500. The Nasdaq Composite was +6.4% and the Russell 2000 continued to soar with a +13.9% quarter. Smaller capitalization stocks have dramatically out-performed larger company stocks over the past three years (see table below), and we have been premature in believing that the small caps are relatively over-valued. So far, our short sales of small-cap and mid-cap stock indexes have been expensive for our Fund, costing us over 2% in the March quarter.
The table below shows historical investment results through March 31, 2006 for Partners III (after deducting all expenses) and for the S&P 500 (larger companies accounting for the majority of U.S. stock market valuation), the Russell 2000 (smaller companies) and the Nasdaq Composite (a proxy for technology companies). As always, whether recent results are strong or weak, we believe that the longer the measuring period, the more meaningful the record.
| |
| | |
* | All performance numbers assume reinvestment of dividends (except for the 15 and 20-year Nasdaq numbers for which reinvestment of dividend information was not available) and all Fund performance numbers are calculated after deducting fees and expenses. |
| |
** | Performance of Partners III is measured from June 1, 1983, the inception of Weitz Partners III Limited Partnership (the “Partnership”). Partners III succeeded to substantially all of the assets of the Partnership as of December 30, 2005. Wallace R. Weitz was General Partner and portfolio manager for the Partnership and is portfolio manager for Partners III. The investment objectives, policies and restrictions of Partners III are materially equivalent to those of the Partnership. The performance data presented includes performance for the period before Partners III became an investment company registered with the Securities and Exchange Commission. During this time, Partners III was not registered under the Investment Company Act of 1940 and, therefore, was not subject to certain investment restrictions imposed by the 1940 Act. If Partners III had been registered during this time period, the performance of Partners III might have been adversely affected. |
Portfolio Review
We have added quite a few new companies to our portfolio over the past few quarters. Some made positive contributions within a short period (e.g. AIG, Janus and Centene) and others, we hope, fall into the category of “good ideas that have not worked yet” (e.g. Tyco, Wal-Mart and CBS). New investment ideas are, almost by definition, unpopular at the time we find them. We invest with the understanding that it will take some time for a company’s real problems to be solved and/or investor misconceptions reversed. If we have done our research well, these stocks will earn good returns for us over a period of years.
Most of the significant contributors to our results (both positive and negative) have been long-held positions in stocks we have written about regularly. In the last quarterly letter I wrote about six of our major holdings for which “business values went up while stock prices went down” in calendar year 2005. (The six were Fannie Mae, Comcast, Countrywide, Redwood, Tyco and Cabela’s, and while their average gain in the March quarter was +6.5%, they are probably as undervalued today as they were three months ago.) The overwhelming majority of our portfolio companies are doing a good job of growing the intrinsic values of their businesses, but their stories do not change enough quarter to quarter to merit regular reviews. For this report, I thought it might be helpful to talk about broader groups of companies—why we own them, why we are willing to hold them and buy more when they are out of favor for “obvious” reasons, and why we think they will perform for us over time. I’ll focus on three questions that our portfolio managers, analysts and client service representatives hear with some regularity.
Why do you still like “old media” stocks?
Even though television, radio and newspapers have lost some of their audience and face stiff competition from the Internet and other alternative advertising vehicles, they can still generate huge amounts of cash for their owners. Most of this cash is not needed in the business and management may make acquisitions or return the cash to shareholders through dividends or stock repurchases. Since these media businesses are generally growing slowly, if at all, it is critical that we invest with managers who understand and accept the new reality and whom we trust to allocate the free cash flow wisely.
Washington Post is an example of an “old media” company that has been successfully reinventing itself for many years. Its newspaper, television and magazine cash flow has been used to buy back a significant percentage of its shares and to build its Kaplan subsidiary from a modest test preparation business into an education business worth at least $2.5 billion (over $250 per share).
We believe that CBS, Liberty Media, Discovery Holding, Cumulus Media, Comcast and Liberty Global, each of which has been tagged with the “old media” label, have the cash generation capacity and the strong management required to grow the enterprise values, per share, of their companies even as some of their formerly great properties lose some of their luster. When investors are overly pessimistic about their prospects, these stocks can make very good investments.
Why are you buying “faded growth stocks” like Wal-Mart and AIG?
The answer to this question is similar to that of the “old media” question. These companies have become so large that they cannot possibly grow as fast in the future as they did in their prime. However, many historically great growth companies still have the market position, the brands, the financial strength, and the returns on incrementally
5
invested capital to continue to grow at meaningful rates. As with the media companies, assuming the underlying business is intact, it is essential to pay the right price for the stock. Paraphrasing Ben Graham, paying too high a price for a great business is speculating; paying a low enough price for a fair business is investing.
Many of the giants of American industry are selling at historically low valuations in today’s market. There are a variety of possible reasons for this, all of which involve capital flows out of these companies and into (currently) more popular sectors—energy, real estate, small capitalization stocks, etc. Whatever, the reasons, we believe we have had a rare opportunity to buy some great businesses at reasonable prices. If we are right, the companies will continue to grow in value and investors will eventually come back to them. If this happens, valuation levels will again reach levels that are too high for us, and we will reluctantly sell them back to the “growth” investors.
What’s so great about financial services stocks, especially with interest rates going up?
While media stocks face some difficult economic and competitive headwinds, financial services companies operate in an environment of growing aggregate financial assets. Thus, financial companies start with the advantage of a positive macro environment. If companies do a good job of managing interest rate, credit and liquidity risks, create innovative products, and treat their clients well, financial companies can show strong long-term growth in earnings and business values.
Countrywide Financial is one of our favorite companies but it is a perennial Rodney Dangerfield stock—it gets no respect from Wall Street. Countrywide has traded in a range of (roughly) $30-40 for about three years, as its earnings have ticked down slightly with the end of the most recent mortgage refinance cycle. However, during this three-year period, the mortgage market has grown by at least 8% per year and Countrywide has increased its share of both the origination and servicing markets. It has also grown its bank significantly. We believe its business is worth considerably more today than it was three years ago when the stock first reached $40. When we return to a more normal mortgage market environment, we expect Countrywide’s earnings to resume their double digit growth rate and for the stock to make up for lost time.
In spite of its recent lull, Countrywide’s stock has generated a total return of 23% per year over the past twenty years for the buy-and-hold investor. We believe that trying to trade in and out to avoid the occasional stock price dip is very likely to lead to lower total returns. In fact, we like to add to our positions when prices drop.
Redwood Trust offers another example of a cyclical growth business that is currently out of favor but which we think continues to have great potential. Our Funds were original investors in Redwood when it was started in 1994. We liked top management and their proposed business model then, and over the last twelve years, they have adapted to changing conditions and carried out their plan beautifully. In the process, they have created a wonderful dividend-paying machine. Their stock has produced a total return of over 19% per year since its initial public offering in 1995.
Redwood invests in (primarily) residential mortgages. Its management approaches the business as value investors. They understand credit risk, know how to measure it, and will invest in a mortgage or mortgage-backed security only when they believe that the price of the asset allows for a good return plus a margin of safety. They are careful to minimize interest-rate risk by matching the durations of their borrowings to the durations of their assets. They refuse to take “liquidity” risk—that is, they will not expose their balance sheet to the possibility of catastrophic loss, no matter how unlikely the disaster scenario.
Another distinguishing feature of management’s discipline is that they will hold cash rather than paying too high a price for assets. This echoes Warren Buffett’s refusal to write insurance policies if premiums are inadequate, but it means that Redwood will knowingly accept lower earnings in the short run in order to protect the long-term value of their business. We think this is terrific for two reasons. First, it is more likely that the company will maximize long-term total returns. Second, the inevitable disappointment on the part of short-term oriented investors often makes the stock go down and allows us to buy more shares at what we think will turn out to be bargain prices. (Another trait Redwood management shares with Warren Buffett is the conviction that an informed and realistic shareholder base is good for the company. As a result, Redwood provides detailed, but readable explanations of their investment results.
6
I recommend the “Redwood Review” available on the company website to serious investors who would like to learn more about the company.)
Our willingness, even eagerness, to average down when we believe in an investment is completely counter-intuitive to many investors. They are puzzled when we say, “Good news, our stocks are down.” Don’t get me wrong—we are after profits—but we really believe that buying good businesses when their stocks are depressed is the way to maximize profits in the long run. As long as the down-ticks are temporary, the lower the stocks go, the better. We will be out of step at times, and the past year has been one of those times, but we do not think we could have out-performed the S&P 500, Nasdaq Composite and Russell 2000 over the past 23+ years if we had chased short-term performance.
Outlook
We continue to believe that excessive credit creation and speculation in both real estate and securities markets will cause some anxious moments, at best, and possibly some serious financial distress for the stock market over the next few years. We are not cheering for trouble, but we think it is important to be prepared, just in case. So, we have continued to focus our portfolio on companies with strong balance sheets and managements that are flexible enough to deal with both favorable and hostile business environments. We offer no predictions about the next few quarters, but we feel very optimistic about the long-term prospects for the companies in our portfolio.
Annual Shareholder Information Meeting—Monday, May 22, 2006
Please join us at the Scott Conference Center in Omaha at 4:30 p.m. on May 22. The center is located at 6450 Pine Street on the Aksarben campus. There will be no formal business to conduct so we can devote the entire meeting to answering your questions. Maps and driving directions are available from our client service representatives. We look forward to seeing you there.
| |
| Sincerely, |
| 
|
| Wallace R. Weitz |
| Portfolio Manager |
Portfolio composition is subject to change at any time and references to specific securities, industries, and sectors referenced in this letter are not recommendations to purchase or sell any particular security. See the Schedule of Investments in Securities included in this report for the percent of assets in Partners III invested in particular industries or sectors.
7
|
FUND PERFORMANCE — PARTNERS III OPPORTUNITY FUND |
(Unaudited) |
The following table summarizes performance information for the Partners III Opportunity Fund (“Partners III”) and its predecessor, Weitz Partners III-Limited Partnership (the “Partnership”). Partners III succeeded to substantially all of the assets of the Partnership, a Nebraska investment limited partnership as of December 30, 2005. Wallace R. Weitz was General Partner and portfolio manager for the Partnership and is portfolio manager for Partners III. The investment objectives, policies, guidelines and restrictions of Partners III are materially equivalent to those of the Partnership.
| | | |
|---|
| Period Ended | | Partners III | | S&P 500 | | Difference
Partners III – S&P 500 | |
| |
| |
| |
| |
| Dec. 31, 1996 | | 25.0 | % | 22.9 | % | 2.1 | % |
| Dec. 31, 1997 | | 37.1 | | 33.4 | | 3.7 | |
| Dec. 31, 1998 | | 10.9 | | 28.6 | | –17.7 | |
| Dec. 31, 1999 | | 10.6 | | 21.0 | | –10.4 | |
| Dec. 31, 2000 | | 32.4 | | –9.1 | | 41.5 | |
| Dec. 31, 2001 | | 6.6 | | –11.8 | | 18.4 | |
| Dec. 31, 2002 | | –16.1 | | –22.1 | | 6.0 | |
| Dec. 31, 2003 | | 42.6 | | 28.7 | | 13.9 | |
| Dec. 31, 2004 | | 22.1 | | 10.9 | | 11.2 | |
| Dec. 31, 2005 | | –0.7 | | 4.9 | | –5.6 | |
| Mar. 31, 2006 (3 months) | | 2.5 | | 4.2 | | –1.7 | |
| | | | | | | | |
| 10-Year Cumulative Return ended Mar. 31, 2006 | | 311.4 | | 135.7 | | 175.7 | |
10-Year Average Annual Compound Return ended
Mar. 31, 2006 | | 15.2 | | 8.9 | | 6.3 | |
| | |
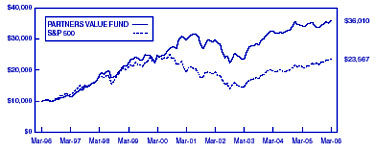
This chart depicts the change in the value of a $500,000 investment in Partners III for the period March 31, 1996, through March 31, 2006 as compared with the growth of the Standard & Poor’s 500 Index during the same period. | | 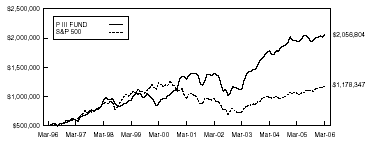
|
The average annual total return of Partners III for the one, five and ten year periods ended March 31, 2006 was 5.8%, 9.6% and 15.2%, respectively. The returns assume redemption at the end of each period and reinvestment of dividends. This information represents past performance and past performance does not guarantee future results. The investment return and the principal value of an investment in Partners III will fluctuate so that an investor's shares, when redeemed, may be worth more or less than the original cost. Current performance may be lower or higher than the performance data quoted. The performance data presented includes performance for the period before Partners III became an investment company registered with the Securities and Exchange Commission. During this time, Partners III was not registered under the Investment Company Act of 1940 and therefore was not subject to certain investment restrictions imposed by the 1940 Act. If Partners III had been registered under the 1940 Act during this time period, the performance of Partners III might have been adversely affected. Performance data current to the most recent month-end may be obtained at www.weitzfunds.com/performance/monthly.asp.
Performance information does not reflect the deduction of taxes that a shareholder would pay on Fund distributions or the redemption of Fund shares.
8
|
PORTFOLIO PROFILE — PARTNERS III OPPORTUNITY FUND |
| Top Ten Stocks* | | Industry Sectors* | | |
|---|
| | | | | |
| | | | |
| Countrywide Financial | | | 8.0 | % | | Media Content and Distribution | | | 23.3 | % |
| Berkshire Hathaway | | | 7.9 | | | Consumer Products and Services | | | 21.8 | |
| Redwood Trust | | | 6.6 | | | Mortgage Services | | | 21.3 | |
| Tyco International | | | 6.1 | | | Financial Services | | | 15.2 | |
| Liberty Media | | | 5.7 | | | Diversified Industries | | | 6.1 | |
| Liberty Global | | | 5.3 | | | Commercial Services | | | 4.1 | |
| Fannie Mae | | | 4.9 | | | Telecommunications | | | 3.9 | |
| Cabela’s | | | 4.8 | | | Gaming, Lodging and Leisure | | | 3.3 | |
| Comcast | | | 4.4 | | | Healthcare | | | 1.4 | |
| Wal-Mart | | | 4.3 | | | | |
| |
| | |
| | | Total Long Positions | | | 100.4 | |
| | | | 58.0 | % | | Securities Sold Short | | | (17.9 | ) |
| | |
| | | | |
| |
| | | | | | | Net Long Positions | | | 82.5 | |
| | | | | | | Short Proceeds/Other | | | 17.5 | |
| | | | | | | | |
| |
| | | | | | | | | | 100.0 | % |
| | | | | | | | |
| |
| | | | | | | | | | |
* Percentage of net assets as of March 31, 2006 | |
| | |
Largest Net Purchases and Sales for Three Months Ended March 31, 2006 (a) |
| |
| Net Purchases ($mil) | | Net Sales ($mil) | | |
|---|
| | | | | |
| | | | |
| Net Short Positions Covered | | $ | 15.9 | | | Qwest Communications | | $ | 8.2 | |
| Liberty Global | | | 6.6 | | | Pediatrix (eliminated) | | | 5.0 | |
| CBS Corp (new) | | | 5.1 | | | Fannie Mae | | | 5.0 | |
| Liberty Media | | | 2.8 | | | Centene (eliminated) | | | 2.9 | |
| Newcastle Investment | | | 2.7 | | | Six Flags | | | 2.6 | |
| Other (net) | | | 11.0 | | | | |
| |
| | |
| | | | | $ | 23.7 | |
| | | $ | 44.1 | | | | |
| |
| | |
| | | | | | |
| | | | | | | | | | | |
| Net Portfolio Purchases | | $ | 20.4 | | | | | | | |
| | |
| | | | | | | |
Largest Net Contributions to Investment Results for Three Months Ended March 31, 2006 (a) |
| |
| Positive ($mil) | | | | | | Negative ($mil) | | |
|---|
| | | | | |
| | | | |
| Cabela’s | | $ | 2.5 | | | Short Positions | | $ | (6.0 | ) |
| Countrywide Financial | | | 1.6 | | | Tyco International | | | (1.3 | ) |
| Qwest Communications | | | 1.3 | | | Cumulus Media | | | (0.9 | ) |
| Fannie Mae | | | 1.3 | | | Liberty Global | | | (0.5 | ) |
| Redwood Trust | | | 1.1 | | | UnitedHealth Group | | | (0.3 | ) |
| Other (net) | | | 7.9 | | | | |
| |
| | |
| | | | | $ | (9.0 | ) |
| | | $ | 15.7 | | | | |
| |
| | |
| | | | | |
| Net Portfolio Gains | | $ | 6.7 | | | | | | | |
| |
| | | | | |
| |
|
(a) Fund commenced operations on January 1, 2006 (See Note 1) |
|
PARTNERS III OPPORTUNITY FUND |
| |
| Schedule of Investments in Securities |
| March 31, 2006 |
| |
| | Shares | | Value | |
|---|
| |
| |
| |
| COMMON STOCKS — 100.4% | | | | | | | |
| |
| Media Content and Distribution — 23.3% | | | | | | | |
| | | |
| |
| Newspaper, Television, Radio and Programming — 13.6% | | | | | | | |
| Liberty Media Corp. - Series A* | | | 1,840,000 | | $ | 15,106,400 | |
| Cumulus Media, Inc. - CL A* | | | 776,000 | | | 8,737,760 | |
| The Washington Post Co. - CL B | | | 7,000 | | | 5,437,250 | |
| CBS Corp. - CL B | | | 200,000 | | | 4,796,000 | |
| Discovery Holding Co. - Series A* | | | 119,050 | | | 1,785,750 | |
| | |
| |
| | | | | | | 35,863,160 | |
| Cable Television — 9.7% | | | | | | | |
| Liberty Global, Inc. - Series C* | | | 600,000 | | | 11,850,000 | |
| Liberty Global, Inc. - Series A* | | | 100,000 | | | 2,047,000 | |
| Comcast Corp. - CL A* | | | 450,000 | | | 11,772,000 | |
| | |
| |
| | | | | | | 25,669,000 | |
| | |
| |
| | | | | | | 61,532,160 | |
| Consumer Products and Services — 21.8% | | | | | | | |
| | | |
| | | | | | | | |
| Retailing — 16.3% | | | | | | | |
| Cabela’s, Inc. - CL A* | | | 625,000 | | | 12,825,000 | |
| Wal-Mart Stores, Inc. | | | 240,000 | | | 11,337,600 | |
| Expedia, Inc.* | | | 374,256 | | | 7,586,169 | |
| IAC/InterActiveCorp* | | | 201,500 | | | 5,938,205 | |
| AutoZone, Inc.* | | | 40,000 | | | 3,987,600 | |
| Cost Plus, Inc.* | | | 90,000 | | | 1,539,000 | |
| | |
| |
| | | | | | | 43,213,574 | |
| Education — 5.5% | | | | | | | |
| ITT Educational Services, Inc.* (a) | | | 80,000 | | | 5,124,000 | |
| Corinthian Colleges, Inc.* | | | 310,600 | | | 4,472,640 | |
| Apollo Group, Inc. - CL A* | | | 51,000 | | | 2,678,010 | |
| Career Education Corp.* | | | 60,000 | | | 2,263,800 | |
| | |
| |
| | | | | | | 14,538,450 | |
| | |
| |
| | | | | | | 57,752,024 | |
| Mortgage Services — 21.3% | | | | | | | |
| | | |
| Originating and Investing — 16.4% | | | | | | | |
| Countrywide Financial Corp.(a) | | | 580,000 | | | 21,286,000 | |
| Redwood Trust, Inc. | | | 403,000 | | | 17,457,960 | |
| Newcastle Investment Corp. | | | 200,000 | | | 4,784,000 | |
| | |
| |
| | | | | | | 43,527,960 | |
| Government Agency — 4.9% | | | | | | |
| Fannie Mae | | | 250,000 | | | 12,850,000 | |
| | |
| |
| | | | | | | 56,377,960 | |
| | | | | | | | |
The accompanying notes form an integral part of these financial statements. |
|
PARTNERS III OPPORTUNITY FUND |
| |
| Schedule of Investments in Securities, Continued |
| |
| Shares | | Value | |
|---|
| |
| |
| |
| Financial Services — 15.2% | | | | | | | |
| | | |
| Insurance — 10.4% | | | | | | | |
| Berkshire Hathaway, Inc. - CL A* | | | 130 | | $ | 11,745,500 | |
| Berkshire Hathaway, Inc. - CL B* | | | 3,000 | | | 9,036,000 | |
| American International Group, Inc. | | | 100,000 | | | 6,609,000 | |
| | |
| |
| | | | | | | 27,390,500 | |
| Banking — 4.8% | | | | | | | |
| Hudson City Bancorp, Inc. | | | 800,000 | | | 10,632,000 | |
| Washington Mutual, Inc. | | | 50,000 | | | 2,131,000 | |
| | |
| |
| | | | | | | 12,763,000 | |
| | |
| |
| | | | | | | 40,153,500 | |
| Diversified Industries — 6.1% | | | | | | | |
| | | |
| Tyco International Ltd. | | | 600,000 | | | 16,128,000 | |
| | | |
| Commercial Services — 4.1% | | | | | | | |
| | | |
| Coinstar, Inc.* | | | 250,000 | | | 6,477,500 | |
| Convera Corp.* # (b) | | | 300,000 | | | 2,241,000 | |
| Intelligent Systems Corp.* # † | | | 883,999 | | | 2,024,358 | |
| Continental Resources* # | | | 700 | | | 140,000 | |
| | |
| |
| | | | | | | 10,882,858 | |
| | | |
| Telecommunications — 3.9% | | | | | | | |
| | | |
| Telephone and Data Systems, Inc. - Special | | | 202,500 | | | 7,644,375 | |
| Qwest Communications International, Inc.* | | | 236,000 | | | 1,604,800 | |
| Leap Wireless International, Inc.* | | | 26,000 | | | 1,133,340 | |
| | |
| |
| | | | | | | 10,382,515 | |
| | | |
| Gaming, Lodging and Leisure — 3.3% | | | | | | | |
| | | |
| Host Marriott Corp. | | | 240,000 | | | 5,136,000 | |
| Harrah’s Entertainment, Inc.(a) | | | 40,000 | | | 3,118,400 | |
| Six Flags, Inc.* | | | 51,400 | | | 523,252 | |
| | |
| |
| | | | | | | 8,777,652 | |
| | | | | | | | |
| The accompanying notes form an integral part of these financial statements. |
|
PARTNERS III OPPORTUNITY FUND |
| |
| Schedule of Investments in Securities, Continued |
| |
| Shares | | Value | |
|---|
| |
| |
| |
| Healthcare — Managed Care — 1.4% | | | | | | | |
| | | |
| UnitedHealth Group, Inc. | | | 40,000 | | $ | 2,234,400 | |
| WellPoint, Inc.* | | | 20,000 | | | 1,548,600 | |
| | |
| |
| | | | | | | 3,783,000 | |
| | |
| |
| Total Common Stocks (Cost $225,762,150) | | | | | | 265,769,669 | |
| | | |
| Securities Sold Short — (17.6%) | | | | | | (46,674,000 | ) |
| Options Written — (0.3%) | | | | | | (734,880 | ) |
| Other Assets Less Other Liabilities — 17.5% | | | | | | 46,260,431 | |
| | |
| |
| Net Assets — 100% | | | | | $ | 264,621,220 | |
| | |
| |
| Net Asset Value Per Share | | | | | $ | 10.25 | |
| | |
| |
| | | |
| SECURITIES SOLD SHORT | |
| | | |
| Ishares Russell 2000 | | | 200,000 | | $ | (15,180,000 | ) |
| Ishares Russell 2000 Value | | | 200,000 | | | (14,930,000 | ) |
| Midcap SPDR Trust Series 1 | | | 100,000 | | | (14,467,000 | ) |
| Nasdaq 100 Shares | | | 50,000 | | | (2,097,000 | ) |
| | |
| |
| Total Securities Sold Short (proceeds $44,008,703) | | | | | $ | (46,674,000 | ) |
| | | | | |
| |
| | | | | | | |
| The accompanying notes form an integral part of these financial statements. |
|
PARTNERS III OPPORTUNITY FUND |
| |
| Schedule of Investments in Securities, Continued |
| |
| Expiration date/
Strike price | | Shares
subject
to option | | Value | |
|---|
| | |
| |
| |
| |
| OPTIONS WRITTEN* | | | | | | | | | |
| |
| Covered Call Options | | | | | | | | | |
| |
| Countrywide Financial Corp. | | April 2006 / $35 | | | 25,000 | | $ | (52,500 | ) |
| Harrah’s Entertainment, Inc. | | May 2006 / $70 | | | 40,000 | | | (344,000 | ) |
| ITT Educational Services, Inc. | | July 2006 / $60 | | | 12,000 | | | (82,680 | ) |
| ITT Educational Services, Inc. | | July 2006 / $65 | | | 68,000 | | | (248,200 | ) |
| | | |
| |
| | | | | | | | | (727,380 | ) |
| Put Options | |
| |
| Countrywide Financial Corp. | | April 2006 / $35 | | | 25,000 | | | (7,500 | ) |
| | | |
| |
| Total Options Written (premiums received $657,509) | | | | | $ | (734,880 | ) |
| | | |
| |
| * | Non-income producing |
| | |
| † | Non-controlled affiliate (Note 6) |
| | |
| # | Illiquid and/or restricted security that has been fair valued (Note 5a). |
| | |
| (a) | Fully or partially pledged as collateral on outstanding written options. |
| | |
| (b) | Restricted security acquired in a private placement on February 23, 2006. The Fund will not bear the cost of registering the security. |
| | |
| The accompanying notes form an integral part of these financial statements. |
|
PARTNERS III OPPORTUNITY FUND |
| |
| Statement of Assets and Liabilities |
| March 31, 2006 |
| |
| | |
|---|
| Assets: | | | | |
| Investments in securities at value: | |
| Unaffiliated issuers* | | $ | 263,745,311 | |
| Non-controlled affiliates* | | | 2,024,358 | |
| |
| |
| | | | 265,769,669 | |
| Accrued interest and dividends receivable | | | 579,385 | |
| Due from broker | | | 47,091,314 | |
| Receivable for securities sold | | | 622,912 | |
| |
| |
| Total assets | | | 314,063,280 | |
| |
| |
| Liabilities: | |
| Dividends payable on securities sold short | | | 39,476 | |
| Due to adviser | | | 250,015 | |
| Due to custodian | | | 1,695,254 | |
| Options written, at value† | | | 734,880 | |
| Payable for securities purchased | | | 4,893 | |
| Securities sold short# | | | 46,674,000 | |
| Other expenses | | | 43,542 | |
| |
| |
| Total liabilities | | | 49,442,060 | |
| |
| |
| Net assets applicable to shares outstanding | | $ | 264,621,220 | |
| |
| |
| Composition of net assets: | |
| Paid-in capital | | $ | 223,683,497 | |
| Accumulated undistributed net investment income | | | 455,853 | |
| Accumulated net realized gain (loss) | | | 3,217,019 | |
| Net unrealized appreciation (depreciation) of investments | | | 37,264,851 | |
| |
| |
| Total net assets applicable to shares outstanding | | $ | 264,621,220 | |
| |
| |
| Net asset value, offering and redemption price per share of | |
| shares outstanding | | $ | 10.25 | |
| |
| |
| Total shares outstanding | | | 25,813,110 | |
| |
| |
| (indefinite number of no par value shares authorized) | |
| | |
| * Cost of investments in securities: | |
| Unaffiliated issuers | | $ | 223,827,604 | |
| Non-controlled affiliates | | | 1,934,546 | |
| |
| |
| | | $ | 225,762,150 | |
| |
| |
| | |
| † Premiums from options written | | $ | 657,509 | |
| |
| |
| | |
| # Proceeds from securities sold short | | $ | 44,008,703 | |
|
| |
| | | |
|
|
|
| The accompanying notes form an integral part of these financial statements. |
|
|
PARTNERS III OPPORTUNITY FUND |
| |
| Statement of Operations |
| Three Months Ended March 31, 2006(a) |
| |
| |
|---|
| Investment income: | | | | |
| Dividends: | |
| Unaffiliated issuers | | $ | 924,591 | |
| Interest | | | 490,619 | |
| |
| |
| Total investment income | | | 1,415,210 | |
| |
| |
| | |
| Expenses: | |
| Investment advisory fee | | | 632,364 | |
| Administrative fee | | | 83,271 | |
| Custodial fees | | | 2,049 | |
| Dividend expense on short sales | | | 124,405 | |
| Interest expense | | | 76,312 | |
| Registration fees | | | 3,561 | |
| Sub-transfer agent fees | | | 8,807 | |
| Trustees fees | | | 3,115 | |
| Other expenses | | | 55,460 | |
| |
| |
| Total expenses | | | 989,344 | |
| Less expenses assumed by investment adviser | | | (29,987 | ) |
| |
| |
| Net expenses | | | 959,357 | |
| |
| |
| Net investment income | | | 455,853 | |
| |
| |
| |
| Realized and unrealized gain (loss) on investments: | |
| Net realized gain (loss): | |
| Unaffiliated issuers | | $ | 7,873,443 | |
| Securities sold short | | | (4,324,045 | ) |
| |
| |
| Net realized gain (loss) | | | 3,549,398 | |
| Net unrealized appreciation (depreciation): | |
| Unaffiliated issuers | | | 3,637,226 | |
| Non-controlled affiliates | | | 83,057 | |
| Options written | | | 190,328 | |
| Securities sold short | | | (1,673,755 | ) |
| |
| |
| Net unrealized appreciation (depreciation) | | | 2,236,856 | |
| |
| |
| Net realized and unrealized gain (loss) on investments | | | 5,786,254 | |
| |
| |
| Net increase (decrease) in net assets resulting from operations | | $ | 6,242,107 | |
| | |
| |
| | | | |
| (a) Fund commenced operations on January 1, 2006 (See Note 1) | | | |
| | | | |
| The accompanying notes form an integral part of these financial statements. | |
|
PARTNERS III OPPORTUNITY FUND |
| |
| Statement of Changes in Net Assets |
| Three Months Ended March 31, 2006(a) |
| |
| |
|---|
| Increase (decrease) in net assets: | | | | |
| From operations: | |
| Net investment income (loss) | | $ | 455,853 | |
| Net realized gain (loss) | | | 3,549,398 | |
| Net unrealized appreciation (depreciation) | | | 2,236,856 | |
| |
| |
| Net increase (decrease) in net assets resulting from operations | | | 6,242,107 | |
| | |
| Distributions to shareholders from: | |
| Net investment income | | | — | |
| Net realized gains | | | — | |
| |
| |
| Total distributions | | | — | |
| | |
| Fund share transactions:* | |
| Proceeds from sales | | | 16,186,028 | |
| Proceeds from shares issued in connection with reorganization(a) | | | 242,754,985 | |
| Payments for redemptions | | | (561,900 | ) |
| |
| |
| Net increase (decrease) from fund share transactions | | | 258,379,113 | |
| |
| |
| Total increase (decrease) in net assets | | | 264,621,220 | |
| |
| |
| Net assets: | |
| Beginning of period | | $ | — | |
| |
| |
| | | | | |
| End of period | | $ | 264,621,220 | |
| |
| |
| | | | | |
| Undistributed net investment income | | $ | 455,853 | |
| |
| |
| | |
| *Transactions in fund shares: | |
| Shares issued | | | 1,592,861 | |
| Shares issued in connection with reorganization(a) | | | 24,275,498 | |
| Shares redeemed | | | (55,249 | ) |
| |
| |
| Net increase (decrease) in shares outstanding | | | 25,813,110 | |
| | |
| |
| | | | |
| (a) Fund commenced operations on January 1, 2006 (See Note 1) | | | |
| | | | |
| The accompanying notes form an integral part of these financial statements. | |
|
PARTNERS III OPPORTUNITY FUND |
| |
| Statement of Cash Flows |
| Three Months Ended March 31, 2006(a) |
| |
| |
|---|
| Increase (decrease) in cash: | | | | |
| Cash flows from operating activities: | |
| Net increase in net assets from operations | | $ | 6,242,107 | |
| Adjustments to reconcile net increase in net assets from operations | |
| to net cash used in operating activities: | |
| Purchase of investment securities | | | (53,190,576 | ) |
| Proceeds from sale of investment securities | | | 49,163,594 | |
| Proceeds from securities sold short | | | 36,212,981 | |
| Short positions covered | | | (52,131,981 | ) |
| Sale of short-term investment securities, net | | | 397 | |
| Increase in accrued interest and dividends receivable | | | (109,367 | ) |
| Decrease in receivable for securities sold | | | 12,879,973 | |
| Decrease in payable for dividends on securities sold short | | | (58,021 | ) |
| Decrease in due to adviser and other expenses | | | (197,667 | ) |
| Decrease in payable for securities purchased | | | (25,960,497 | ) |
| Net unrealized appreciation on investments, options and short sales | | | (2,236,856 | ) |
| Net realized gain on investments, options and short sales | | | (3,549,398 | ) |
| |
| |
| | | | | |
| Net cash used in operating activities | | | (32,935,311 | ) |
| |
| |
| | |
| Cash flows from financing activities: | |
| Proceeds from sales of fund shares | | | 16,186,028 | |
| Payments for redemptions of fund shares | | | (561,900 | ) |
| Decrease in due from broker | | | 15,615,929 | |
| Increase in due to custodian | | | 1,695,254 | |
| |
| |
| | | | | |
| Net cash provided by financing activities | | | 32,935,311 | |
| |
| |
| | |
| Net increase in cash | | | — | |
| | |
| Cash: | |
| Balance, beginning of period | | | — | |
| |
| |
| Balance, end of period | | $ | — | |
| |
| |
| Supplemental disclosure of cash flow information: | |
| Cash payments for interest | | $ | 88,738 | |
| |
| |
| Non-cash financing activities: | |
| Proceeds from shares issued in connection with reorganization(a) | | $ | 242,754,985 | |
| |
| |
| | |
| (a) Fund commenced operations on January 1, 2006 (See Note 1) | | |
| | |
| The accompanying notes form an integral part of these financial statements. | |
| |
| |
|
PARTNERS III OPPORTUNITY FUND |
| |
| Financial Highlights |
| Three Months Ended March 31, 2006(a) |
| |
The following financial information provides selected data for a share of the Partners III Opportunity Fund outstanding throughout the period indicated. |
| |
| | | |
|---|
| Net asset value, beginning of period | | $ | 10.00 | |
| |
| |
| | |
| Income (loss) from investment operations: | |
| Net investment income | | | 0.02 | |
| Net gain (loss) on securities (realized and unrealized) | | | 0.23 | |
| |
| |
| Total from investment operations | | | 0.25 | |
| |
| |
| | |
| Less distributions: | |
| Dividends from net investment income | | | — | |
| Distributions from realized gains | | | — | |
| |
| |
| Total distributions | | | — | |
| |
| |
| | | | | |
| Net asset value, end of period | | $ | 10.25 | |
| |
| |
| | | | | |
| Total return | | | 2.5 | %† |
| | |
| Ratios/supplemental data: | |
| Net assets, end of period ($000) | | | 264,621 | |
| | | | | |
| Ratio of expenses to average net assets (b) | | | 1.52 | %*(c) |
| | | | | |
| Ratio of net investment income to average net assets | | | 0.72 | %* |
| | | | | |
| Portfolio turnover rate | | | 32 | %† |
| * | Annualized |
| | |
| † | Not Annualized |
| | |
| (a) | Fund commenced operations on January 1, 2006 (See Note 1) |
| | |
| (b) | Absent expenses assumed by the Adviser, the annualized expense ratio would have been 1.56% for the period ended March 31, 2006. |
| | |
| (c) | Included in the expense ratio is 0.12% related to interest expense and 0.20% related to dividend expense on securities sold short. |
| |
| The accompanying notes form an integral part of these financial statements. |
| |
| (This page has been left blank intentionally.) |
|
|
| PARTNERS III OPPORTUNITY FUND |
Notes to Financial Statements |
| March 31, 2006 |
| | The Weitz Funds (the “Trust”), is registered under the Investment Company Act of 1940 as an open-end management investment company issuing shares in series, each series representing a distinct portfolio with its own investment objectives and policies. At March 31, 2006, the Trust had seven series in operation: Partners III Opportunity Fund (the “Fund”), Value Fund, Hickory Fund, Partners Value Fund, Balanced Fund, Fixed Income Fund and Government Money Market Fund. The accompanying financial statements present the financial position and results of operations of only the Fund. The Fund’s investment objective is capital appreciation. The Fund invests principally in common stocks and a variety of securities convertible into common stocks such as rights, warrants, convertible preferred stock and convertible bonds. |
| |
| | The Fund was originally organized in June 1983 as a Nebraska limited partnership (the “Partnership”). Effective as of the close of business on December 30, 2005, the Partnership was reorganized into a series of the Trust through a tax-free exchange of 24,275,498 shares of the Fund (valued at $10.00 per share) in exchange for the net assets of the Partnership. At the time of the exchange, the Partnership had net assets of $242,754,985 including net unrealized appreciation of $35,027,995. |
| |
(2) Significant Accounting Policies |
| |
| | The following accounting policies are in accordance with accounting principles generally accepted in the United States for the investment company industry. |
| |
| | (a) Valuation of Investments |
| |
| | Investments are carried at value determined using the following valuation methods: |
| |
| • | Securities traded on a national or regional securities exchange are valued at the last sales price; if there were no sales on that day, securities are valued at the mean between the latest available and representative bid and ask prices; securities listed on the Nasdaq exchange are valued using the Nasdaq Official Closing Price (“NOCP”). Generally, the NOCP will be the last sales price unless the reported trade for the security is outside the range of the bid/ask price. In such cases, the NOCP will be normalized to the nearer of the bid or ask price. |
| | |
| • | Short sales traded on a national or regional securities exchange are valued at the last sales price; if there were no sales on that day, short sales are valued at the mean between the latest available and representative bid and ask prices. |
| | |
| • | Securities not listed on an exchange are valued at the mean between the latest available and representative bid and ask prices. |
| | |
| • | The value of certain debt securities for which market quotations are not readily available may be based upon current market prices of securities which are comparable in coupon, rating and maturity or an appropriate matrix utilizing similar factors. |
| | |
| • | The current market value of a traded option is the last sales price at which such option is traded, or, in the absence of a sale on or about the close of the exchange, the mean of the closing bid and ask prices. |
| | |
| • | The value of securities for which market quotations are not readily available or are deemed to be unreliable, including restricted and not readily marketable securities, is determined in good faith in accordance with procedures approved by the Trust’s Board of Trustees. Such valuation procedures and methods for valuing securities may include, but are not limited to: multiple of earnings, multiple of book value, discount from value of a similar freely-traded security, purchase price, private transaction in the security or related securities, the nature and duration of restrictions on disposition of the security and a combination of these and other factors. |
| | The Fund may purchase put or call options. When the Fund purchases an option, an amount equal to the premium paid is recorded as an asset and is subsequently marked-to-market. Premiums paid for purchasing options that expire unexercised are recognized on the expiration date as realized losses. If an option is exercised, the premium paid is subtracted from the proceeds of the sale or added to the cost of the purchase to determine whether the Fund has realized a gain or loss on the related investment transaction. When the Fund enters into a closing transaction, the Fund will realize a gain or loss depending upon whether the amount from the closing transaction is greater or less than the premium paid. |
| | |
| | The Fund may write put or call options. When the Fund writes an option, an amount equal to the premium received is recorded as a liability and is subsequently marked-to-market. Premiums received for writing options that expire unexercised are recognized on the expiration date as realized gains. If an option is exercised, the premium received is subtracted from the cost of purchase or added to the proceeds of the sale to determine whether the Fund has realized a gain or loss on the related investment transaction. When the Fund enters into a closing transaction, the Fund will realize a gain or loss depending upon whether the amount from the closing transaction is greater or less than the premium received. |
| | |
| | The Fund attempts to limit market risk and enhance its income by writing (selling) covered call options. The risk in writing a covered call option is that the Fund gives up the opportunity of profit if the market price of the financial instrument increases. The Fund also has the additional risk of not being able to enter into a closing transaction if a liquid secondary market does not exist. The risk in writing a put option is that the Fund is obligated to purchase the financial instrument underlying the option at prices which may be significantly different than the current market price. |
| | |
| | (c) Securities Sold Short |
| | |
| | The Fund periodically engages in selling securities short, which obligates the Fund to replace a security borrowed by purchasing the same security at the current market value. The Fund would incur a loss if the price of the security increases between the date of the short sale and the date on which the Fund replaces the borrowed security. The Fund would realize a gain if the price of the security declines between those dates. |
| | |
| | It is the policy of the Fund to comply with all sections of the Internal Revenue Code applicable to regulated investment companies and to distribute all of its taxable income to shareholders; therefore, no provision for income or excise taxes is required. |
| | |
| | Net investment income and net realized gains may differ for financial statement and tax purposes. The character of distributions made during the year from net investment income or net realized gains may differ from their ultimate characterization for Federal income tax purposes. Also, due to the timing of dividend distributions, the fiscal year in which amounts are distributed may differ from the year that the income or realized gains were recorded by the Fund. |
| | |
| | The following permanent difference between net asset components for financial reporting and tax purposes was reclassified at the end of the fiscal year: |
| | |
| | Paid-in capital | | 29,987 | |
| | Accumulated net realized gain (loss) | | (29,987 | ) |
| | |
| | The reclassification resulted from the tax treatment of certain expense items and had no impact on the net asset value of the Fund (See Note 3). |
| | (e) Security Transactions |
| | |
| | Security transactions are accounted for on the date the securities are purchased or sold (trade date). Realized gains or losses are determined by specifically identifying the security sold. |
| | |
| | Income dividends, dividends on short positions and distributions to shareholders are recorded on the ex-dividend date. Interest, including amortization of discount or premium, is accrued as earned. |
| | |
| | The Fund declares and distributes income dividends and capital gains distributions as may be required to qualify as a regulated investment company under the Internal Revenue Code. |
| | |
| | All dividends and distributions are reinvested automatically, unless the shareholder elects otherwise. |
| | The preparation of financial statements in conformity with accounting principles generally accepted in the United States requires management to make estimates and assumptions that affect the reported amounts of assets and liabilities and disclosure of contingent assets and liabilities at the date of the financial statements and the reported amounts of increase and decrease in net assets from operations during the period. Actual results could differ from those estimates. |
| |
(3) Related Party Transactions |
| |
| | The Fund has retained Wallace R. Weitz & Company (the “Adviser”) as its investment adviser. In addition, the Trust has an agreement with Weitz Securities, Inc. (the “Distributor”), a company under common control with the Adviser, to act as distributor for shares of the Trust. The Distributor receives no compensation for the distribution of shares of the Trust. Certain officers of the Trust are also officers and directors of the Adviser and the Distributor. |
| | |
| | Under the terms of a management and investment advisory agreement, the Adviser is paid a monthly fee. The annual investment advisory fee schedule for the Fund is as follows: |
| | |
| | Average Daily Net Assets Break Points | |
| | | | | | | | | |
| | Greater Than | | Less Than or
Equal To
| | Rate | |
| |
| |
| |
| |
| | $ | 0 | | $ | 2,500,000,000 | | 1.00% | |
| | | 2,500,000,000 | | | 5,000,000,000 | | 0.90% | |
| | | 5,000,000,000 | | | | | 0.80% | |
| | |
| | Under the terms of an administration agreement, certain services are provided by the Adviser including the transfer of shares, disbursement of dividends, fund accounting and related administrative services of the Trust for which the Adviser is paid a monthly fee. The annual administrative fee schedule for the Fund is as follows: |
| | |
| | Average Daily Net Assets Break Points | |
| |
| | Greater Than | | Less Than or
Equal To
| | Rate | |
| |
| |
| |
| |
| | $ | 0 | | $ | 25,000,000 | | 0.200% | |
| | | 25,000,000 | | | 100,000,000 | | 0.175% | |
| | | 100,000,000 | | | | | 0.100% | |
| | |
| | Based on certain provisions of the Internal Revenue Code, the Fund was required to pay tax on certain unrealized gains at the time of the reorganization that were recognized during the year ended March 31, 2006. These taxes, which were reimbursed by the Adviser, amounted to $29,987 and are included in “Other expenses” on the Statement of Operations. |
| | |
| | As of March 31, 2006, the controlling shareholder of the Adviser held approximately 39% of the Fund. |
| |
(4) Distributions to Shareholders and Distributable Earnings |
| |
| | There were no distributions paid by the Fund during the three months ended March 31, 2006. |
| | |
| | As of March 31, 2006, the components of distributable earnings on a tax basis were as follows: |
| | |
| | Undistributed ordinary income | | $ | 455,853 | |
| | Undistributed long-term gains | | | 3,519,411 | |
| | Unrealized appreciation | | | 36,962,459 | |
| | | |
| |
| | | | $ | 40,937,723 | |
| | | |
| |
| |
(5) Securities Transactions |
| |
| | Purchases and proceeds from maturities or sales of investment securities of the Fund, other than short-term securities, are summarized as follows: |
| | |
| | Purchases | | $ | 104,958,747 | |
| | Proceeds | | | 84,942,267 | |
| | |
| | The cost of investments for Federal income tax purposes for the Fund is $226,064,542. |
| | |
| | At March 31, 2006, the aggregate gross unrealized appreciation and depreciation of investments, based on cost for Federal income tax purposes, are summarized as follows: |
| | |
| | Appreciation | | $ | 41,876,757 | |
| | Depreciation | | | (2,171,630 | ) |
| | | |
| |
| | Net | | $ | 39,705,127 | |
| | | |
| |
| | |
| | (a) Illiquid and Restricted Securities |
| | |
| | The Fund owns certain securities which have a limited trading market and/or certain restrictions on trading and therefore may be illiquid and/or restricted. Such securities have been valued at fair value in accordance with the procedures described in Note (2)(a). Because of the inherent uncertainty of valuation, these values may differ from the values that would have been used had a ready market for these securities existed and these differences could be material. Illiquid and/or restricted securities owned at March 31, 2006, include the following: |
| | |
| | | Acquisition
Date | | | | |
|---|
| | | |
| | | | |
| | Continental Resources | | 1/28/87 | | $ | 43,750 | |
| | Convera Corp. | | 2/23/06 | | | 2,250,000 | |
| | Intelligent Systems Corp. | | 12/03/91 | | | 1,934,546 | |
| | | | | |
| |
| | Total cost of illiquid and/or restricted securities | | | | $ | 4,228,296 | |
| | | | | |
| |
| | Value | | | | $ | 4,405,358 | |
| | | | | |
| |
| | Percent of net assets | | | | | 1.7 | % |
| | | | | |
| |
| | Transactions relating to options written for the three months ended March 31, 2006 are summarized as follows: |
| | |
| | Numbers of
Contracts | | | Premiums | |
|---|
| |
| |
| |
|---|
| | Options outstanding, beginning of period | | 1,030 | | $ | 558,802 | |
| | Options written | | 1,300 | | | 462,517 | |
| | Options exercised | | (630 | ) | | (363,810 | ) |
| | |
| |
| |
| | Options outstanding, end of period | | 1,700 | | $ | 657,509 | |
| | |
| |
| |
| | |
| | Option contracts written result in off-balance-sheet risk as the Fund’s ultimate obligation to satisfy the terms of the contract may exceed the amount recognized in the statement of assets and liabilities. |
| | Affiliated issuers, as defined under the Investment Company Act of 1940, are those in which a Fund’s holdings of an issuer represent 5% or more of the outstanding voting securities of the issuer. A summary of the Fund’s holdings in the securities of such issuers is set forth below: |
| | |
| | Name of Issuer | | Number of
Shares Held
Dec. 31, 2005 | | Gross
Additions | | Gross
Reductions | | Number of
Shares Held
March 31, 2006 | | Value
March 31,2006 | | Dividend
Income | | Realized
Gains/
(Losses) | |
|---|
| |
| |
| |
| |
| |
| |
| |
| |
| |
| | Intelligent Systems Corp | | | 728,090 | | | 155,909 | | | — | | | 883,999 | | $ | 2,024,358 | | $ | — | | $ | — | |
| | The Fund indemnifies the Trust’s officers and trustees for certain liabilities that might arise from their performance of their duties to the Fund. Additionally, in the normal course of business the Fund enters into contracts that contain a variety of representations and warranties and which provide general indemnifications. The maximum exposure of the Fund under these arrangements is unknown, as this would involve future claims that may be made against the Fund that have not yet occurred. However, based on experience, the Fund expects the risk of loss to be remote. |
| |
(8) Margin Borrowing Agreement |
| |
| | The Fund has a margin account with its prime broker under which the Fund may borrow against the value of its securities, subject to regulatory limitations. Interest accrues at the federal funds rate plus 0.625% (5.375% at March 31, 2006). Interest is accrued daily and paid monthly. The Fund held an asset balance of $47,091,314 with the broker at March 31,2006. |
| | |
| | The Fund is exposed to credit risk from its prime broker, Merrill Lynch, who effects transactions and extends credit pursuant to a prime brokerage agreement. The Adviser attempts to minimize the Fund’s credit risk by monitoring credit exposure and the credit worthiness of the prime broker. |
| |
| REPORT OF INDEPENDENT REGISTERED |
| PUBLIC ACCOUNTING FIRM |
| |
To the Board of Trustees of The Weitz Funds and the
Shareholders of the Partners III Opportunity Fund We have audited the accompanying statement of assets and liabilities of the Partners III Opportunity Fund (“the Fund”) (one of the portfolios comprising The Weitz Funds), including the schedule of investments in securities, as of March 31, 2006, and the related statement of operations, statement of cash flows, statement of changes in net assets, and financial highlights from January 1, 2006 (commencement of operations) to March 31, 2006. These financial statements and financial highlights are the responsibility of the Fund’s management. Our responsibility is to express an opinion on these financial statements and financial highlights based on our audit. We conducted our audit in accordance with the standards of the Public Company Accounting Oversight Board (United States). Those standards require that we plan and perform the audit to obtain reasonable assurance about whether the financial statements and financial highlights are free of material misstatement. We were not engaged to perform an audit of the Fund’s internal control over financial reporting. Our audit included consideration of internal control over financial reporting as a basis for designing audit procedures that are appropriate in the circumstances, but not for the purpose of expressing an opinion on the effectiveness of the Fund’s internal control over financial reporting. Accordingly, we express no such opinion. An audit also includes examining, on a test basis, evidence supporting the amounts and disclosures in the financial statements and financial highlights, assessing the accounting principles used and significant estimates made by management, and evaluating the overall financial statement presentation. Our procedures included confirmation of securities owned as of March 31, 2006, by correspondence with the custodian and brokers. We believe that our audit provides a reasonable basis for our opinion. In our opinion, the financial statements and financial highlights referred to above present fairly, in all material respects, the financial position of the Partners III Opportunity Fund of The Weitz Funds as of March 31, 2006, and the results of its operations, its cash flows, changes in its net assets, and its financial highlights from January 1, 2006 (commencement of operations) to March 31, 2006, in conformity with U.S. generally accepted accounting principles. |
| |
| |
 |
Cincinnati, Ohio
April 21, 2006 |
|
ACTUAL AND HYPOTHETICAL EXPENSES FOR COMPARISON PURPOSES |
| |
| As a shareholder of the Fund, you incur two types of costs: (1) transaction costs, including any transaction fees that you may be charged if you purchase or redeem the Fund through certain financial institutions; and (2) ongoing costs, including management fees and other Fund expenses. This Example is intended to help you understand your ongoing costs (in dollars) of investing in the Fund and to compare these costs with the ongoing costs of investing in other mutual funds. The Example is based on an investment of $1,000 invested at the beginning of the period and held for the entire period from January 1, 2006 through March 31, 2006. (The hypothetical example in the table below assumes a six-month holding period.) |
| |
Actual Expenses
The first line in the table below provides information about actual account values and actual expenses. You may use the information in this line, together with the amount you invested, to estimate the expenses that you paid over the period. Simply divide your account value by $1,000 (for example, an account value of $500,000 divided by $1,000 = 500), then multiply the result by the number in the first line under the heading entitled “Expenses Paid from 1/1/06 - 3/31/06” to estimate the expenses you paid on your account during this period. Hypothetical Example for Comparison Purposes The second line in the table below provides information about hypothetical account values and hypothetical expenses based on the actual expense ratio of the Fund and an assumed rate of return of 5% per year before expenses, which is not the actual return of the Fund. The hypothetical account values and expenses may not be used to estimate the actual ending account balance or expenses you paid for the period. You may use this information to compare the ongoing costs of investing in this Fund to other funds. To do so, compare this 5% hypothetical example with the 5% hypothetical examples that appear in the shareholder reports of other funds. Please note that expenses shown in the table are meant to highlight your ongoing costs only and do not reflect any transactional costs charged by certain financial institutions. Therefore, the second line of the table is useful in comparing ongoing costs only, and will not help you determine the relative total costs of owning different funds. In addition, if you incurred transactional fees, your costs would have been higher. Actual and hypothetical expenses for the Fund are provided in this table. |
| |
| | | Beginning
Account Value
1/1/06 | | Ending
Account Value
3/31/06 | | Annualized
Expense Ratio | | Expenses
Paid from
1/1/06 - 3/31/06(1) | |
|---|
| | |
| |
| |
| |
| |
| | Actual | $ | 1,000.00 | | $ | 1,025.00 | | | 1.52 | % | | $ | 3.79 | |
| | | Beginning
Account Value
10/1/05 | | Ending
Account Value
3/31/06 | | Annualized
Expense Ratio | | Expenses
Paid from
10/1/05 - 3/31/06(2) | |
|---|
| | |
| |
| |
| |
| |
| | Hypothetical(3) | $ | 1,000.00 | | $ | 1,017.40 | | | 1.52 | % | | $ | 7.65 | |
| | |
| (1) | Expenses are equal to the annualized expense ratio for the Fund, multiplied by the average account value over the period, multiplied by the number of days in its initial reporting period (90/365). |
| | |
| (2) | Expenses are equal to the annualized expense ratio for the Fund, multiplied by the average account value over the period, multiplied by the number of days in the most recent fiscal half year (182/365). |
| | |
| (3) | Assumes 5% total return before expenses. |
|
OTHER INFORMATION |
| (Unaudited) |
| |
Proxy Voting Policy A description of the Fund’s proxy voting policies and procedures is available without charge, upon request by (i) calling 800-304-9745, (ii) on the Fund’s website at http://www.weitzfunds.com; and (iii) on the SEC’s website at http://www.sec.gov. Information on how the Fund voted proxies relating to portfolio securities during each twelve month period ended June 30 will be available: (i) on the Fund’s website at http://www.weitzfunds.com, and (ii) on the SEC’s website at http://www.sec.gov.
Form N-QThe Fund files a complete schedule of its portfolio holdings with the Securities and Exchange Commission for the first and third quarters of each fiscal year on Form N-Q. The Fund’s Form N-Q is available on the SEC’s website at http://www.sec.gov and may be reviewed and copied at the SEC’s Public Reference Room in Washington DC. Information on the operation of the Public Reference Room may be obtained by calling 800 SEC-0330. When filed, the Fund’s quarterly report, including the information filed on Form N-Q will also be available on the Fund’s website at http://www.weitzfunds.com. |
|
INFORMATION ABOUT THE TRUSTEES
AND OFFICERS OF THE WEITZ FUNDS
|
| (Unaudited) |
| |
The individuals listed below serve as Trustees or Officers of The Weitz Funds (the “Weitz Funds”). Each Trustee of the Weitz Funds serves until a successor is elected and qualified or until resignation. Each Officer of the Weitz Funds is elected annually by the Trustees. The address of all Officers and Trustees is 1125 South 103rd Street, Suite 600, Omaha, Nebraska 68124. |
| | | |
| Interested Trustees* | | |
| |
|
Wallace R. Weitz (Age: 56)
Position(s) Held with Trust: President; Portfolio Manager; Trustee
Length of Service (Beginning Date): The Weitz Funds (and certain predecessor funds) – January, 1986
Principal Occupation(s) During Past 5 Years:
President, Wallace R. Weitz & Company, The
Weitz Funds (and certain predecessor funds)
Number of Portfolios Overseen in Fund Complex: 7
Other Directorships: N/A | | Thomas R. Pansing (Age: 61)
Position(s) Held with Trust: Trustee
Length of Service (Beginning Date): The Weitz Funds (and certain predecessor funds) - January, 1986
Principal Occupation(s) During Past 5 Years: Partner,
Pansing Hogan Ernst & Bachman LLP, a law firm
Number of Portfolios Overseen in Fund Complex: 7
Other Directorships: N/A |
| |
| * | Mr. Weitz is a Director and Officer of Wallace R. Weitz & Company, investment adviser to the Weitz Funds, and as such is considered an “interested person” of the Trust, as that term is defined in the Investment Company Act of 1940 (an “Interested Trustee”). Mr. Pansing performs certain legal services for the investment adviser and The Weitz Funds and, therefore, is also classified as an “Interested Trustee”. |
| | | |
| Independent Trustees | | |
| |
|
Lorraine Chang (Age: 55)
Position(s) Held with Trust: Trustee
Length of Service (Beginning Date): The Weitz Funds (and certain predecessor funds) - June, 1997
Principal Occupation(s) During Past 5 Years: Partner,
The Public Strategies Group, a management consulting firm, 1999-Present
Number of Portfolios Overseen in Fund Complex: 7
Other Directorships: N/A | | John W. Hancock (Age: 58)
Position(s) Held with Trust: Trustee
Length of Service (Beginning Date): The Weitz Funds (and certain predecessor funds) - January, 1986
Principal Occupation(s) During Past 5 Years: Partner,
Hancock & Dana, an accounting firm
Number of Portfolios Overseen in Fund Complex: 7
Other Directorships: N/A |
| |
|
Richard D. Holland (Age: 84)
Position(s) Held with Trust: Trustee
Length of Service (Beginning Date): The Weitz Funds (and certain predecessor funds) - June, 1995
Principal Occupation(s) During Past 5 Years: Retired
Number of Portfolios Overseen in Fund Complex: 7
Other Directorships: N/A | | Delmer L. Toebben (Age: 75)
Position(s) Held with Trust: Trustee
Length of Service (Beginning Date): The Weitz Funds (and certain predecessor funds) - July, 1996
Principal Occupation(s) During Past 5 Years: Retired
Number of Portfolios Overseen in Fund Complex: 7
Other Directorships: N/A |
| |
|
Roland J. Santoni (Age: 64)
Position(s) Held with Trust: Trustee
Length of Service (Beginning Date): The Weitz
Funds - February, 2004
Principal Occupation(s) During Past 5 Years: Vice President, West Development, Inc., a development company, June 2003-Present; Professor of Law, Creighton University, 1977-2003; Of Counsel, Erickson & Sederstrom, a law firm, 1978-2003
Number of Portfolios Overseen in Fund Complex: 7
Other Directorships: Transgenomic, Inc. | | Barbara W. Schaefer (Age: 52)
Position(s) Held with Trust: Trustee
Length of Service (Beginning Date): The Weitz
Funds - March, 2005
Principal Occupation(s) During Past 5 Years: Senior Vice President-Human Resources and Corporate Secretary, Union Pacific Corporation, 2004-Present; Senior Vice President-Human Resources, Union Pacific Corporation, 1997-2004
Number of Portfolios Overseen in Fund Complex: 7
Other Directorships: N/A |
| |
|
| |
Officers |
| |
|
Mary K. Beerling (Age: 65)
Position(s) Held with Trust: Vice President, Secretary and Chief Compliance Officer
Length of Service (Beginning Date): The Weitz Funds (and certain predecessor funds) - July, 1994
Principal Occupation(s) During Past 5 Years: Vice President and Chief Compliance Officer, Wallace R. Weitz & Company, Vice President and Chief Compliance Officer, The Weitz Funds (and certain predecessor funds) | | Kenneth R. Stoll (Age: 44)
Position(s) Held with Trust: Vice President and Chief
Financial Officer
Length of Service (Beginning Date): The Weitz
Funds - April, 2004
Principal Occupation(s) During Past 5 Years: Vice President and Chief Operating Officer, Wallace R. Weitz & Company; Vice President and Chief Financial Officer, The Weitz Funds - April 2004 to Present; Partner, PricewaterhouseCoopers LLP, an accounting firm, 1999- 2004 |
| |
|
| |
The Statement of Additional Information for The Weitz Funds, which can be obtained without charge by calling 800-232-4161, includes additional information about the Trustees and Officers of The Weitz Funds. |
| |
(This page has been left blank intentionally.) |
| |
| |
(This page has been left blank intentionally.) |
| |
| | | | | |
| Board of Trustees | | Officers |
| | Lorraine Chang | | | Wallace R. Weitz, President |
| | John W. Hancock | | | Mary K. Beerling, Vice President, Secretary & |
| | Richard D. Holland | | | Chief Compliance Officer |
| | Thomas R. Pansing, Jr. | | | Kenneth R. Stoll, Vice President & Chief |
| | Roland J. Santoni | | | Financial Officer |
| | Barbara W. Schaefer | | | |
| | Delmer L. Toebben | | Distributor |
| | Wallace R. Weitz | | | Weitz Securities, Inc. |
| | | | | |
| Investment Adviser | | Transfer Agent and Dividend Paying Agent |
| | Wallace R. Weitz & Company | | | Wallace R. Weitz & Company |
| | | | | |
| Custodian | | Sub-Transfer Agent |
| | Wells Fargo Bank Minnesota, | | | Boston Financial Data Services, Inc. |
| | National Association | | | |
| |
NASDAQ symbol:
Partners III Opportunity Fund – WPOPX |
| |
| | An investor should consider carefully the investment objectives, risks, and charges and expenses of the Fund before investing. The Fund’s Prospectus contains this and other information about the Fund. The Prospectus should be read carefully before investing.
4/28/06 |
Item 2. Code of Ethics. As of the end of the period covered by this report, the Registrant has adopted a code of ethics that applies to the Registrant’s principal executive officer, principal financial officer, principal accounting officer or controller, or persons performing similar functions, regardless of whether these individuals are employed by the Registrant or a third party (the “Code of Ethics”). During the period covered by this report, there were no amendments, nor did the Registrant grant any waivers, including any implicit waivers, from any provision of the Code of Ethics. The Code of Ethics is attached hereto as Exhibit 12(a)(1). Item 3. Audit Committee Financial Expert. The Registrant’s board of trustees has determined that the Registrant has at least one “audit committee financial expert” (as defined in Item 3 of Form N-CSR) serving on its audit committee. John Hancock is an “audit committee financial expert” and is “independent” (as each term is defined in Item 3 of Form N-CSR). Item 4. Principal Accountant Fees and Services. |
| |
| (a) | Audit Fees. Fees for audit services provided to the Registrant were $185,200 and $151,600 for fiscal years ended March 31, 2006 and 2005, respectively. |
| | |
| (b) | Audit Related Fees. The aggregate fees billed in each of the last two fiscal years for audit related-services by the principal accountant that are reasonably related to the performance of the audit of the Registrant’s financial statements and are not reported under paragraph (a) of this item were $22,300 and $41,000 for fiscal years ended March 31, 2006 and 2005, respectively. The fees, paid by Wallace R. Weitz & Company, the Registrant’s investment adviser and transfer agent, were payment for the principal accountant performing internal control reviews of the Registrant’s transfer agent. |
| | |
| (c) | Tax Fees. Fees for tax services, which consisted of income and excise tax compliance services, were $26,900 and $40,900 for the fiscal years ended March 31, 2006 and 2005, respectively. |
| | |
| (d) | All Other Fees. Fees for all other services totaled $9,500 and $9,000 for fiscal years ended March 31, 2006 and 2005, respectively. |
| | |
| (e) | (1) The Registrant’s Audit Committee has adopted Pre-Approval Policies and Procedures. The Audit Committee must pre-approve all audit services and non-audit services that the principal accountant provides to the Registrant. The Audit committee must also pre-approve any engagement of the principal accountant to provide non-audit services to the Registrant’s investment adviser, or any affiliate of the adviser that provides ongoing services to the Registrant, if such non-audit services directly impact the Registrant’s operations and financial reporting. |
| | |
| | (2) No services described in items (b) were pre-approved by the Audit Committee pursuant to Rule 2-01(c)(7)(i)(c) of Regulation S-X. |
| | |
| (f) | All of the work in connection with the audit of the Registrant during the years ended March 31, 2006 and 2005 was performed by full-time employees of the Registrant’s principal accountant. |
| | |
| (g) | The aggregate fees billed by the principal accountant for non-audit services to the Registrant, the Registrant’s investment adviser and any entity controlling, controlled by, or under common control with the adviser that provides ongoing services to the Registrant were $58,700 and $90,900 for the years ended March 31, 2006 and 2005, respectively. |
| | |
| (h) | The Registrant’s Audit Committee has considered whether the provision of non-audit services that were rendered to the Registrant’s investment adviser, and any entity controlling, controlled by, or under common control with the adviser that provides ongoing services to the Registrant that were not pre-approved pursuant to paragraph (c)(7)(ii) of Rule 2-01 of Regulation S-X is compatible with maintaining (h) the principal auditor’s independence. |
Item 5. Audit Committee of Listed Registrants. Not applicable. Item 6. Schedule of Investments. The Schedule of Investments in securities of unaffiliated issuers is included as part of the Report to Shareholders. Item 7. Disclosure of Proxy Voting Policies and Procedures for Closed-End Investment Companies. Not applicable. Item 8. Portfolio Managers of Closed-End Management Investment Companies Not applicable Item 9. Purchases of Equity Securities by Closed-End Management Investment Company and Affiliated Purchasers. Not applicable. Item 10. Submissions of Matters to a Vote of Security Holders. Not applicable. Item 11. Controls and Procedures. (a) Based on an evaluation of the Disclosure Controls and Procedures (as defined in Rule 30a-3(c) under the Investment Company Act of 1940) (the “Disclosure Controls”) as of a date within 90 days prior to the filing date (the “Filing Date”) of this report on Form N-CSR (the “Report”), the Registrant’s principal executive officer and financial officer have concluded that the Disclosure Controls are reasonably designed to ensure that information required to be disclosed by the Registrant in the Report is recorded, processed, summarized and reported by the Filing Date, including ensuring that information required to be disclosed in the Report is accumulated and communicated to the Registrant’s management, including the Registrant’s principal executive officer and principal financial officer, as appropriate to allow timely decisions regarding required disclosure. (b) There were no significant changes in the Registrant’s internal control over financial reporting (as defined in Rule 30a-3(d) under the Investment Company Act of 1940) that occurred during the Registrant’s second fiscal half-year of the period covered by this report that has materially affected, or is reasonably likely to materially affect, the Registrant’s internal control over financial reporting. Item 12. Exhibits (a)(1) The Code of Ethics is attached hereto. (a)(2) The certifications required by Rule 30a-2(a) of the Investment Company Act of 1940 are attached hereto. (a)(3) Not applicable. (b) The certifications required by Rule 30a-2(b) of the Investment Company Act of 1940 and Section 906 of the Sarbanes-Oxley Act of 2002 are attached hereto. |
SIGNATURES Pursuant to the requirements of the Securities Exchange Act of 1934 and the Investment Company Act of 1940, the Registrant has duly caused this report to be signed on its behalf by the undersigned, thereunto duly authorized. |
| |
| | The Weitz Funds |
| | |
| By (Signature and Title)* | /s/ Wallace R. Weitz |
| | | ———————————— |
| | Wallace R. Weitz, President |
| Date May 1, 2006 | |
| |
Pursuant to the requirements of the Securities Exchange Act of 1934 and the Investment Company Act of 1940, this report has been signed below by the following persons on behalf of the Registrant and in the capacities and on the dates indicated. |
| By (Signature and Title)* | /s/ Wallace R. Weitz |
| | | ———————————— |
| | Wallace R. Weitz, President |
| Date May 1, 2006 | |
| | |
| | |
| By (Signature and Title)* | //s/ Kenneth R. Stoll |
| | ———————————— |
| | Kenneth R. Stoll, Chief Financial Officer |
| Date May 1, 2006 | |
| |
* Print the name and title of each signing officer under his or her signature. |