UNITED STATES
SECURITIES AND EXCHANGE COMMISSION
Washington, D.C. 20549
FORM N-CSR
CERTIFIED ANNUAL SHAREHOLDER REPORT OF REGISTERED MANAGEMENT
INVESTMENT COMPANIES
Investment Company Act file number 811-21410
The Weitz Funds
(Exact name of registrant as specified in charter)
Suite 600
1125 South 103 Street
Omaha, NE 68124-6008
(Address of principal executive offices) (Zip code)
Wallace R. Weitz & Company
The Weitz Funds
Suite 600
1125 South 103 Street
Omaha, NE 68124-6008
(Name and address of agent for service)
Registrant’s telephone number, including area code: 402-391-1980
Date of fiscal year end: March 31
Date of reporting period: March 31, 2005
Form N-CSR is to be used by management investment companies to file reports with the Commission not later than 10 days after the transmission to stockholders of any report that is required to be transmitted to stockholders under Rule 30e-1 under the Investment Company Act of 1940 (17 CFR 270.30e-1). The Commission may use the information provided on Form N-CSR in its regulatory, disclosure review, inspection, and policymaking roles.
A registrant is required to disclose the information specified by Form N-CSR, and the Commission will make this information public. A registrant is not required to respond to the collection of information contained in Form N-CSR unless the Form displays a currently valid Office of Management and Budget (“OMB”) control number. Please direct comments concerning the accuracy of the information collection burden estimate and any suggestions for reducing the burden to Secretary, Securities and Exchange Commission, 450 Fifth Street, NW, Washington, DC 20549-0609. The OMB has reviewed this collection of information under the clearance requirements of 44 U.S.C. § 3507.
Item 1. Report to Stockholders.
Value Fund
Hickory Fund
Partners Value Fund
Balanced Fund
Fixed Income Fund
Government Money Market Fund
ANNUAL REPORT
March 31, 2005
One Pacific Place, Suite 600 • 1125 South 103 Street • Omaha, Nebraska, 68124-6008
402-391-1980 800-304-9745 402-391-2125 FAX
www.weitzfunds.com
Six Funds—One Investment Philosophy Our small “family” of Funds is designed to offer a range of investment options for investors with different objectives and temperaments. There are bond funds, stock funds and a balanced fund. There are differences in fund size, portfolio concentration, volatility, and tax sensitivity. But there are certain common threads which run through all six of the Funds. “We eat our own cooking.” All of our investment professionals have a majority of their families’ liquid net worth invested in our Funds. Our Trustees each have at least $100,000 invested in our family of Funds—some considerably more. This does not guarantee that the Funds will go up, but it means that we win or lose together and that shareholders definitely have our attention. We are patient, long-term investors. When we analyze potential equity investments, we think about the business behind the stock and try to buy shares at a large discount to the company’s underlying business value. Ideally, the business value rises over time and the stock price follows. This often allows us to hold the stock for many years, minimizing transaction costs, taxes, and the need for new investment ideas. We try to stay within our “circle of competence.” “Knowing what you don’t know” is important in all aspects of life, but it is crucial in investing. We think our odds of investment success are much higher when we invest in securities of companies we understand and ideally, where we may have an edge over other investors. As a result, our portfolios are not diversified among all the various sectors of the economy and thus may often be out of step with the general stock market. Risk—we worry about permanent loss of capital—not price volatility. We believe in concentrating our portfolio in the most attractive investment ideas and this can cause short-term price volatility of our portfolios. We think “benchmark risk” is part of investment life. Our firm’s goal is to earn good absolute investment returns over long periods of time without exposing our clients’ capital to undue risk. We do not think about any particular index when we make investment decisions. We also believe that cash is sometimes the most attractive investment. We know this approach causes headaches for some of our favorite consultants and plan sponsors, but we think flexibility and common sense will continue to serve our clients well over the years. |
2
Shareholder Information Meeting |
Please Mark Your Calendars — Our Annual Shareholder Information Meeting will be held on May 31st at the Scott Conference Center at 4:30 p.m.
|
3
(This page has been left blank intentionally.)
4
PORTFOLIO MANAGER LETTER – WEITZ EQUITY FUNDS |
April 13, 2005
Dear Fellow Shareholder:
The first quarter of calendar 2005 was a lackluster one for the stock market and for our Funds. As the table below shows, Value, Hickory and Partners Value were down 4.1%, 4.6%, and 3.8%, respectively, while the S&P500 was down 2.1%. The Russell 2000 and Nasdaq Composite were down 5.3% and 8.0%, respectively.
For the 12 months ended March 31, 2005 (our fiscal year), the Funds showed modest gains. The table below shows comparative results over various periods, up to 20 years, for the Funds (after deducting all expenses), the S&P 500 (larger companies), the Russell 2000 (smaller companies), and the Nasdaq Composite (a proxy for technology companies).
| | Average Annual Total Returns*
(Through 3/31/05) |
| | 1-Year | | 3-Year | | 5-Year | | 10-Year | | 15-Year | | 20-Year |
| |
| |
| |
| |
| |
| |
|
Value Fund | | 5.1 | % | 5.8 | % | 8.0 | % | 16.7 | % | 14.7 | % | N/A |
Hickory Fund | | 9.4 | | 6.0 | | 2.2 | | 15.9 | | N/A | | N/A |
Partners Value** | | 5.5 | | 4.9 | | 7.1 | | 16.6 | | 15.1 | | 14.6 |
S&P 500 | | 6.7 | | 2.7 | | -3.2 | | 10.8 | | 11.0 | | 12.6 |
Russell 2000 | | 5.4 | | 8.1 | | 4.0 | | 10.4 | | N/A | | N/A |
Nasdaq Composite | | 0.8 | | 3.2 | | -14.9 | | 9.8 | | 10.7 | | 10.3 |
This information represents past performance and past performance does not guarantee future results. The investment return and the principal value of an investment in any of the Funds will fluctuate so that an investor’s shares, when redeemed, may be worth more or less than the original cost. Current performance may be higher or lower than the performance data quoted above. Performance data current to the most recent month end may be obtained at www.weitzfunds.com/performance/monthly.asp.
* | All performance numbers are calculated after deducting fees and expenses, and all numbers assume reinvestment of dividends (except for the 15 and 20-year Nasdaq numbers for which reinvestment of dividend information was not available). |
** | The Fund succeeded to substantially all of the assets of Weitz Partners II Limited Partnership (the “Partnership”) as of December 31, 1993. Wallace R. Weitz was General Partner and portfolio manager for the Partnership and is portfolio manager for the Fund. The Fund’s investment objectives, policies and restrictions are materially equivalent to those of the Partnership. The performance information includes performance for the period before the Fund became an investment company registered with the Securities and Exchange Commission. During this time, the Fund was not registered under the Investment Company Act of 1940 and therefore was not subject to certain investment restrictions imposed by the 1940 Act. If the Fund had been registered under the 1940 Act during this time period, the Fund’s performance might have been adversely affected. |
The S&P 500, Russell 2000 and Nasdaq Composite track different segments of the investment universe. As certain industries or groups of industries come in and out of favor, the indices take turns out-performing each other, sometimes for years at a time. Smaller company stocks had a terrible time keeping up with the large- and mega-capitalization stocks in the second half of the 1990’s, and the small-caps have dramatically out-paced the large in the five years since the market top in 2000.
The swings in popularity may have rational roots, but are often carried to extremes by the “bandwagon” effect of investors pulling money out of the under-performing stocks to buy the ones that are “working.” As we have said before, we aim to beat all of the indices over the long run. However, paradoxically, we believe that the way to do that is to sell the popular stocks when their prices are inflated and buy the unpopular when they are temporarily depressed. The implications of this approach are that (1) we will buy stocks with different characteristics (large, small, low P/E, high P/E, etc.) in different periods, and (2) since we are acting in a contrary way, we will almost assuredly under-perform the “hot” sector of the day in the short run.
5
We do not try to anticipate which sectors will be strong or weak next, and there is no magic about 5-year blocks of time, but it may be that the swing from large-cap to small will be reversed in the next year or two. Some statistical studies show that small-cap stocks are as expensive relative to large-caps as they have been in over 20 years. We try not to have preconceived notions of where the next group of bargains will come from, but those who focus exclusively on small- and mid-cap stocks might want to consider broadening their horizons.
Fiscal 2005 in Review
Periodically, lots of stocks are cheap. For years after the bear markets of the 1930’s and early 1970’s, stock valuations were much lower than they are today. Bad memories of losing money in the bear markets made most people very cautious about investing. By the late 1990’s, the last cautious investor threw in the towel and joined the 25-year bull market. That is when the “tech bubble” burst.
We try hard not to have opinions about “the market.” We buy bargains when and where we find them, but after a short period in 2002 and early 2003 when pervasive fear made lots of stocks cheap, we are having trouble finding great bargains again. Thus, when you look at the new stocks that we have added to the portfolios, the only unifying “theme” is that they tend to be companies with good underlying business characteristics that have stumbled for some company- or industry-specific reason. It can be difficult to figure out how significant and how temporary the negative factor is—this is art, not science.
Sometimes the scare passes quickly so we get easy profits without much uncertainty. Real estate investment trusts dipped sharply last April and we were able to buy several old favorites (General Growth, Vornado, Avalon Bay and Capital Automotive). They rebounded almost immediately. It is nice to get a year or two of expected profit in a few months, but the move was too short-lived for us to establish really meaningful positions.
Many of the opportunities which present themselves these days involve “growth stocks” that report disappointing quarterly earnings news. We believe that earnings growth is an important factor in valuing a business, but “growth” investors are usually willing to pay a much higher price for a history of consistent earnings per share growth. When a company “misses its numbers” and shakes the faith of its followers, the stock may drop precipitously. If we can believe that a problem is temporary or that a stock is now under-valued despite an on-going problem, we will buy. InterActiveCorp, Omnicare, Pediatrix, Iron Mountain and Corinthian Colleges were among the growing businesses we’ve recently added to portfolios.
A much trickier situation involves alleged accounting irregularities and regulatory trouble. Integrity of management is non-negotiable, and in situations like Freddie Mac, Fannie Mae, Cardinal Health, etc., we must be convinced that the dishonest managers are gone and that the economics of the business are sound, regardless of the distortions of incorrect accounting. Again, this involves art as well as analysis of the numbers and the business, and we invest in these situations only after careful consideration.
Another category of investment that we keep coming back to are stocks that face the likelihood of cyclical downturn in their business. When the Federal Reserve is raising interest rates, investor reaction is usually negative out of all proportion to economic reality. We bought banks, thrifts and mortgage companies in 1990, 1994, and 1999 as investors followed conventional wisdom and sold them. These investments worked very well. Over the last 12 months, we added to Redwood Trust, Countrywide Financial, and other financial service stocks when they fell on fears of rising interest rates.
Finally, the prospect of a permanent fundamental change in a company’s business can frighten investors and create opportunity. Cardinal Health suffered from an inventory accounting problem, but the bigger problem they face is a change in the way drug distributors do business with drug companies. Inventory profits have historically been a major factor in distributor profitability, and as the industry shifts to a “fee for service” model, the smooth pattern of earnings increases has been interrupted. At our purchase prices in the high $30’s and low $40’s, we believed the stock was cheap enough to discount a period of adjustment to the new reality.
Freddie Mac and Fannie Mae, in addition to their “smoothing of earnings” accounting issues, face the risk that Congress may force dramatic changes to their business models. Increases in their cost of borrowing and capital
6
requirements, and limits on the size of their investment portfolios may cause both to evolve into very different companies. We believe that the economics of guaranteeing mortgage loans and investing in a leveraged portfolio of mortgages can be profitable for Freddie and Fannie, even in the extreme event that the companies are privatized. Others disagree, so the stocks are both depressed and, we think, very attractive.
Outlook
My normal approach to this section of the report is to say, (1) we cannot predict the future, (2) there are lots of things to worry about, and (3) we welcome volatility because it produces opportunities. This time, I’ll say the same thing (so you may stop here if you like), but in a little more detail.
| (1) | We start with the premise that stocks are generally fully-priced. We base this statement both on historical statistics and our own anecdotal evidence gathered in our search for stocks to buy. This does not mean that stocks in general will go down or that we think our stocks are not good investments. It does mean that the odds of earning good investment returns are higher when stock prices are lower. |
| (2) | Short-term interest rates have been rising because of Federal Reserve policy. Commodity inflation has picked up (oil, China, etc.), the dollar has been weak (budget and trade deficits), and it seems likely that long-term interest rates will move up over time. Higher interest rates raise the cost of doing business and mean that bonds provide stiffer investment competition to stocks. |
| (3) | Record low interest rates have made money readily available and very cheap. This money has flowed freely into consumer spending as well as “investments” such as stocks, bonds, hedge funds, new homes, vacation real estate, leveraged buyouts, leveraged mortgage portfolios, etc. It seems clear that there are some speculative excesses in most of these asset classes. |
| (4) | In spite of Greenspan’s uncharacteristically clear warnings that speculators and investors are taking bigger risks than they seem to recognize, human nature is such that the excesses are likely to continue to build until someone feels some real financial pain. |
We have no idea how the future will unfold. Securities and real estate markets may level off gracefully with no serious consequences. Or, financial markets could experience liquidity problems as they did in 1987 and 1998. Stock prices could move sideways or slowly upward while companies’ business values “grow into” their stocks’ prices. Or, the bear market that began in 2000 could resume with another down leg reminiscent of the 1973-74 decline that followed the 1970-72 bear market rally.
As we continue to hunt for bargains, we feel very comfortable holding relatively high amounts of cash. We honestly believe that our long-term investment results will be better if the stock and bond markets experience some shocks and volatility. It will be scary during the periods of uncertainty, but our approach to investing depends on Mr. Market’s periodic mood swings. Thanks for trusting us with your investment capital.
We hope you will join us for our annual shareholder information meeting on Tuesday, May 31. There will be no official business to conduct, so we can spend the whole time answering your questions about investments.
| | | Sincerely, |
| | | 
|
| | | Wallace R. Weitz
Portfolio Manager |
Portfolio composition is subject to change at any time and references to specific securities, industries, and sectors referenced in this letter are not recommendations to purchase or sell any particular security. See the Schedules of Investments in Securities included in this report for the percent of assets in each of the Funds invested in particular industries or sectors.
7
FUND PERFORMANCE — VALUE FUND |
The following table summarizes performance information for the Fund as compared to the S&P 500 over the periods indicated.
Period Ended | | Value Fund | | S&P 500 | | Difference
Value Fund – S&P 500 | |
| |
| |
| |
| |
Dec. 31, 1995 | | 38.4 | % | | 37.5 | % | | 0.9 | % | |
Dec. 31, 1996 | | 18.7 | | | 22.9 | | | –4.2 | | |
Dec. 31, 1997 | | 38.9 | | | 33.4 | | | 5.5 | | |
Dec. 31, 1998 | | 28.9 | | | 28.6 | | | 0.3 | | |
Dec. 31, 1999 | | 21.0 | | | 21.0 | | | 0.0 | | |
Dec. 31, 2000 | | 19.6 | | | –9.1 | | | 28.7 | | |
Dec. 31, 2001 | | 0.2 | | | –11.8 | | | 12.0 | | |
Dec. 31, 2002 | | –17.1 | | | –22.1 | | | 5.0 | | |
Dec. 31, 2003 | | 28.7 | | | 28.7 | | | 0.0 | | |
Dec. 31, 2004 | | 15.7 | | | 10.9 | | | 4.8 | | |
Mar. 31, 2005 (3 months) | | –4.1 | | | –2.1 | | | –2.0 | | |
| | | | | | | | | | |
10-Year Cumulative Return ended Mar. 31, 2005 | | 368.8 | | | 178.6 | | | 190.2 | | |
10-Year Average Annual Compound Return ended
Mar. 31, 2005 | | 16.7 | | | 10.8 | | | 5.9 | | |
This chart depicts the change in the value of a $25,000 investment in the Value Fund for the period March 31, 1995, through March 31, 2005, as compared with the growth of the Standard & Poor’s 500 Index during the same period.
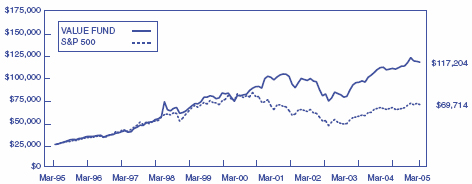
The Fund’s average annual total return for the one, five and ten year periods ended March 31, 2005 was 5.1%, 8.0% and 16.7%, respectively. The returns assume redemption at the end of each period and reinvestment of dividends. This information represents past performance and past performance does not guarantee future results. The investment return and the principal value of an investment in this Fund will fluctuate so that an investor’s shares, when redeemed, may be worth more or less than the original cost. Current performance may be lower or higher than the performance data quoted. Performance data current to the most recent month-end may be obtained at www.weitzfunds.com/performance/monthly.asp.
Performance information does not reflect the deduction of taxes that a shareholder would pay on Fund distributions or the redemption of Fund shares.
8
PORTFOLIO PROFILE – VALUE FUND |
Top Ten Stocks* | | | | | Industry Sectors* | | | |
|
|
| | |
|
|
| |
| | | | | | | | |
Berkshire Hathaway | | 6.7 | % | | Media Content and Distribution | | 19.4 | % |
Liberty Media Corp. | | 6.2 | | | Mortgage Services | | 14.6 | |
Comcast | | 6.1 | | | Banking and Insurance | | 9.8 | |
Fannie Mae | | 5.0 | | | Gaming, Lodging and Leisure | | 9.7 | |
Countrywide Financial | | 4.3 | | | Telecommunications | | 4.5 | |
Host Marriot | | 3.7 | | | Consumer Products and Services | | 3.2 | |
Washington Post | | 3.7 | | | Healthcare | | 2.6 | |
Caesars Entertainment | | 3.1 | | | Real Estate | | 1.3 | |
IAC/InterActiveCorp | | 2.9 | | | Commercial Services | | 0.4 | |
Telephone & Data Systems | | 2.9 | | | Corporate Bonds | | 0.1 | |
| |
| | | | | | |
| | 44.6 | % | | Government Agency Securities | | 0.1 | |
| |
| | | | | | |
| | | | | Short-Term Securities/Other | | 34.3 | |
| | | | | | |
| |
| | | | | | | 100.0 | % |
| | | | | | |
| |
* As of March 31, 2005
Largest Net Purchases and Sales for Year Ended March 31, 2005 |
|
Net Purchases ($mil) | | | | | Net Sales ($mil) | | | |
|
|
| | |
|
|
|
|
| | | | | | | | | | |
Fannie Mae | | $ | 170 | | | Caesars Entertainment | | $ | 177 | |
IAC/InterActiveCorp (new) | | | 119 | | | Citizens Communications | | | 158 | |
Cardinal Health (new) | | | 45 | | | Hilton Hotels | | | 69 | |
Liberty Media Corp. | | | 25 | | | Alltel (eliminated) | | | 68 | |
Liberty Media International (new) | | | 23 | | | Host Marriot | | | 62 | |
| |
|
| | | | |
|
| |
| | $ | 382 | | | | | $ | 534 | |
| |
|
| | | | |
|
| |
Largest Net Contributions to Investment Results for Year Ended March 31, 2005 |
|
Positive ($mil) | | | | | Negative ($mil) | | | |
|
|
| | |
|
|
|
|
| | | | | | | | | | |
Caesars Entertainment | | $ | 85 | | | Charter Communications | | $ | (54 | ) |
Liberty Media Corp. & International | | | 48 | | | Fannie Mae | | | (43 | ) |
Host Marriott | | | 47 | | | Berkshire Hathaway | | | (23 | ) |
Comcast | | | 43 | | | Six Flags | | | (21 | ) |
Citizens Communications | | | 34 | | | Novastar Financial | | | (15 | ) |
| |
|
| | | | |
|
| |
| | $ | 257 | | | | | $ | (156 | ) |
| |
|
| | | | |
|
| |
| | | | | | | | |
Net Portfolio Gains | | $ | 237 | | | | | | |
| |
|
| | | | | | |
| | | | | | | | | | | |
9
Schedule of Investments in Securities
March 31, 2005
| | Shares | | Value |
| |
| |
|
COMMON STOCKS — 65.5% | | | | | |
| | | | | |
Media Content and Distribution — 19.4% | | | | | |
| | | | | |
Newspaper, Television, Radio and Content — 9.9% | | | | | |
Liberty Media Corp. - A* | | 24,600,000 | | $ | 255,102,000 |
Washington Post Co. CL B | | 172,000 | | | 153,768,000 |
| | | |
|
|
| | | | | 408,870,000 |
Cable Television — 9.5% | | | | | |
Comcast Corp. - Special CL A* | | 7,500,000 | | | 250,500,000 |
Liberty Media International, Inc. - A* | | 1,820,328 | | | 79,621,147 |
Insight Communications Co.* | | 3,533,000 | | | 41,866,050 |
Charter Communications, Inc. CL A* | | 10,606,500 | | | 16,970,400 |
Adelphia Communications Corp. CL A* # | | 9,893,000 | | | 2,374,320 |
| | | |
|
|
| | | | | 391,331,917 |
| | | |
|
|
| | | | | 800,201,917 |
Mortgage Services — 14.6% | | | | | |
| | | | | |
Government Agency — 7.5% | | | | | |
Fannie Mae | | 3,800,000 | | | 206,910,000 |
Freddie Mac | | 1,600,000 | | | 101,120,000 |
| | | |
|
|
| | | | | 308,030,000 |
Originating and Investing — 7.1% | | | | | |
Countrywide Financial Corp. | | 5,500,000 | | | 178,530,000 |
Redwood Trust, Inc.† | | 2,000,000 | | | 102,360,000 |
Newcastle Investment Corp. | | 300,000 | | | 8,880,000 |
Bimini Mortgage Management, Inc. | | 400,000 | | | 5,540,000 |
Imperial Credit Industries, Inc.* | | 2,100,000 | | | 1,050 |
| | | |
|
|
| | | | | 295,311,050 |
| | | |
|
|
| | | | | 603,341,050 |
Banking and Insurance — 9.8% | | | | | |
| | | | | |
Insurance — 6.7% | | | | | |
Berkshire Hathaway, Inc. CL B* | | 67,000 | | | 191,352,000 |
Berkshire Hathaway, Inc. CL A* | | 1,000 | | | 87,000,000 |
| | | |
|
|
| | | | | 278,352,000 |
Banking — 3.1% | | | | | |
Washington Mutual, Inc. | | 2,340,000 | | | 92,430,000 |
U.S. Bancorp | | 1,200,000 | | | 34,584,000 |
| | | |
|
|
| | | | | 127,014,000 |
| | | |
|
|
| | | | | 405,366,000 |
The accompanying notes form an integral part of these financial statements.
10
Schedule of Investments in Securities, Continued
| | Shares | | Value |
| |
| |
|
Gaming, Lodging and Leisure — 9.7% | | | | | |
| | | | | |
Host Marriott Corp. | | 9,300,000 | | $ | 154,008,000 |
Caesars Entertainment, Inc.* | | 6,500,000 | | | 128,635,000 |
Hilton Hotels Corp. | | 2,400,000 | | | 53,640,000 |
Harrah’s Entertainment, Inc. | | 650,000 | | | 41,977,000 |
Six Flags, Inc.* † | | 5,150,000 | | | 21,218,000 |
| | | |
|
|
| | | | | 399,478,000 |
| | | | | |
Telecommunications — 4.5% | | | | | |
| | | | | |
Telephone and Data Systems, Inc. | | 1,450,000 | | | 118,320,000 |
Qwest Communications International, Inc.* | | 14,578,000 | | | 53,938,600 |
Citizens Communications Co. | | 1,064,300 | | | 13,772,042 |
| | | |
|
|
| | | | | 186,030,642 |
| | | | | |
Consumer Products and Services - Retailing — 3.2% | | | | | |
| | | | | |
IAC/InterActiveCorp* | | 5,400,000 | | | 120,258,000 |
Costco Wholesale Corp.(a) | | 300,000 | | | 13,254,000 |
| | | |
|
|
| | | | | 133,512,000 |
| | | | | |
Healthcare — 2.6% | | | | | |
| | | | | |
Suppliers and Distributors — 1.8% | | | | | |
Cardinal Health, Inc.(a) | | 1,200,000 | | | 66,960,000 |
Omnicare, Inc. | | 200,000 | | | 7,090,000 |
| | | |
|
|
| | | | | 74,050,000 |
Managed Care — 0.4% | | | | | |
WellPoint, Inc.* | | 90,000 | | | 11,281,500 |
UnitedHealth Group, Inc. | | 60,000 | | | 5,722,800 |
| | | |
|
|
| | | | | 17,004,300 |
Providers — 0.4% | | | | | |
Laboratory Corporation of America Holdings* | | 200,000 | | | 9,640,000 |
Triad Hospitals, Inc.* | | 100,000 | | | 5,010,000 |
| | | |
|
|
| | | | | 14,650,000 |
| | | |
|
|
| | | | | 105,704,300 |
Real Estate — 1.3% | | | | | |
| | | | | |
Construction and Development — 1.2% | | | | | |
Forest City Enterprises, Inc. CL A | | 771,200 | | | 49,202,560 |
| | | | | |
Property Ownership and Management — 0.1% | | | | | |
Capital Automotive REIT | | 150,000 | | | 4,968,000 |
| | | |
|
|
| | | | | 54,170,560 |
The accompanying notes form an integral part of these financial statements.
11
Schedule of Investments in Securities, Continued
| | Principal
amount
or shares | | | | Value | |
| |
| | | |
| |
Commercial Services — 0.4% | | | | | | | | | |
| | | | | | | | | |
Cenveo, Inc.* † | | | 2,601,800 | | | | $ | 14,674,152 | |
Intelligent Systems Corp.* | | | 32,835 | | | | | 76,177 | |
| | | | | | |
|
| |
| | | | | | | | 14,750,329 | |
| | | | | | |
|
| |
Total Common Stocks (Cost $2,050,588,880) | | | | | | | | 2,702,554,798 | |
| | | | | | | | | |
CORPORATE BONDS — 0.1% | | | | | | | | | |
| | | | | | | | | |
Charter Communications Holdings, LLC 10.75% 10/01/09 | | $ | 2,000,000 | | | | | 1,650,000 | |
Charter Communications Holdings, LLC 9.625% 11/15/09 | | | 3,000,000 | | | | | 2,362,500 | |
Charter Communications Holdings, LLC 9.92% 4/01/11 | | | 2,000,000 | | | | | 1,545,000 | |
| | | | | | |
|
| |
Total Corporate Bonds (Cost $4,938,264) | | | | | | | | 5,557,500 | |
| | | | | | | | | |
GOVERNMENT AGENCY SECURITIES — 0.1% | | | | | | | | | |
| | | | | | | | | |
Federal Home Loan Bank 6.04% 9/08/05 | | | 3,000,000 | | | | | 3,039,027 | |
Federal Home Loan Bank 6.44% 11/28/05 | | | 1,000,000 | | | | | 1,019,492 | |
| | | | | | |
|
| |
Total Government Agency Securities (Cost $4,000,125) | | | | | | | | 4,058,519 | |
| | | | | | | | | |
SHORT-TERM SECURITIES — 33.9% | | | | | | | | | |
| | | | | | | | | |
Milestone Treasury Obligations Portfolio | | | 42,294,426 | | | | | 42,294,426 | |
Wells Fargo Government Money Market Fund | | | 51,550,165 | | | | | 51,550,165 | |
Federal Home Loan Bank Discount Note 2.489% due 4/11/05(b) | | $ | 150,000,000 | | | | | 149,888,550 | |
U.S. Treasury Bills, 2.367% to 2.803%, due 4/07/05 to 6/30/05(b) | | | 1,155,000,000 | | | | | 1,152,066,253 | |
| | | | | | |
|
| |
Total Short-Term Securities (Cost $1,395,778,160) | | | | | | | | 1,395,799,394 | |
| | | | | | |
|
| |
Total Investments in Securities (Cost $3,455,305,429) | | | | | | | | 4,107,970,211 | |
Covered Call Options Written — (0.0%) | | | | | | | | (1,243,800 | ) |
Other Assets in Excess of Other Liabilities — 0.4% | | | | | | | | 17,766,868 | |
| | | | | | |
|
| |
Net Assets — 100% | | | | | | | $ | 4,124,493,279 | |
| | | | | | |
|
| |
Net Asset Value Per Share | | | | | | | $ | 36.14 | |
| | | | | | |
|
| |
The accompanying notes form an integral part of these financial statements.
12
Schedule of Investments in Securities, Continued
| | Expiration date/
Strike price | | Shares
subject
to option | | Value | |
| |
| |
| |
| |
COVERED CALL OPTIONS WRITTEN* | | | | | | | | |
| | | | | | | | |
Cardinal Health, Inc. | | June 2005 / $60 | | 374,000 | | $ | (448,800 | ) |
Costco Wholesale Corp. | | October 2005 / $45 | | 300,000 | | | (795,000 | ) |
| | | | | |
|
| |
Total Call Options Written
(premiums received $2,322,318) | | | | | | $ | (1,243,800 | ) |
| | | | | |
|
| |
| † | Non-controlled affiliate |
| # | Illiquid and/or restricted security that has been fair valued. |
| (a) | Fully or partially pledged as collateral on outstanding written options. |
| (b) | Interest rates presented for Treasury bills and discount notes represent the yield to maturity at the date of purchase. |
The accompanying notes form an integral part of these financial statements.
13
FUND PERFORMANCE — HICKORY FUND |
The following table summarizes performance information for the Fund as compared to the S&P 500 over the periods indicated.
Period Ended | | Hickory Fund | | S&P 500 | | Difference
Hickory Fund – S&P 500 |
| |
| |
| |
|
Dec. 31, 1995 | | 40.5 | % | | 37.5 | % | | 3.0 | % |
Dec. 31, 1996 | | 35.4 | | | 22.9 | | | 12.5 | |
Dec. 31, 1997 | | 39.2 | | | 33.4 | | | 5.8 | |
Dec. 31, 1998 | | 33.0 | | | 28.6 | | | 4.4 | |
Dec. 31, 1999 | | 36.7 | | | 21.0 | | | 15.7 | |
Dec. 31, 2000 | | –17.2 | | | –9.1 | | | –8.1 | |
Dec. 31, 2001 | | –4.6 | | | –11.8 | | | 7.2 | |
Dec. 31, 2002 | | –29.3 | | | –22.1 | | | –7.2 | |
Dec. 31, 2003 | | 47.9 | | | 28.7 | | | 19.2 | |
Dec. 31, 2004 | | 22.6 | | | 10.9 | | | 11.7 | |
Mar. 31, 2005 (3 months) | | –4.6 | | | –2.1 | | | –2.5 | |
| | | | | | | | | |
10-Year Cumulative Return ended Mar. 31, 2005 | | 337.9 | | | 178.6 | | | 159.3 | |
10-Year Average Annual Compound Return ended Mar. 31, 2005 | | 15.9 | | | 10.8 | | | 5.1 | |
This chart depicts the change in the value of a $25,000 investment in the Hickory Fund for the period March 31, 1995, through March 31, 2005, as compared with the growth of the Standard & Poor’s 500 Index during the same period.

The Fund’s average annual total return for the one, five and ten year periods ended March 31, 2005 was 9.4%, 2.2% and 15.9%, respectively. The returns assume redemption at the end of each period and reinvestment of dividends. This information represents past performance and past performance does not guarantee future results. The investment return and the principal value of an investment in this Fund will fluctuate so that an investor’s shares, when redeemed, may be worth more or less than the original cost. Current performance may be lower or higher than the performance data quoted. Performance data current to the most recent month-end may be obtained at www.weitzfunds.com/performance/monthly.asp.
Performance information does not reflect the deduction of taxes that a shareholder would pay on Fund distributions or the redemption of Fund shares.
14
PORTFOLIO PROFILE – HICKORY FUND |
Top Ten Stocks* | | | | | Industry Sectors* | | | |
|
|
|
| |
|
|
| |
Berkshire Hathaway | | 7.9 | % | | Mortgage Services | | 22.8 | % |
Fannie Mae | | 7.5 | | | Media Content and Distribution | | 19.4 | |
Liberty Media Corp. | | 6.9 | | | Consumer Products and Services | | 11.1 | |
Countrywide Financial | | 6.4 | | | Healthcare | | 8.9 | |
Comcast | | 6.1 | | | Banking and Insurance | | 8.2 | |
Redwood Trust | | 5.6 | | | Telecommunications | | 7.1 | |
IAC/InterActiveCorp | | 4.4 | | | Gaming, Lodging and Leisure | | 6.6 | |
Cabela’s | | 4.1 | | | Commercial Services | | 4.4 | |
Liberty Media International | | 3.5 | | | Short-Term Securities/Other | | 11.5 | |
| | 3.5 | | | | |
| |
Omnicare | |
| | | | | 100.0 | % |
| | 55.6 | % | | | |
| |
| |
| | | | | | |
| | | | | | | | |
* As of March 31, 2005
Largest Net Purchases and Sales for Year Ended March 31, 2005 | |
| |
Net Purchases ($mil) | | | Net Sales ($mil) | |
| | |
| |
Countrywide Financial (new) | | $ | 20.7 | | | Citizens Communications (eliminated) | | $ | 11.7 | |
Fannie Mae | | | 18.5 | | | Insurance Auto (eliminated) | | | 10.7 | |
IAC/InterActiveCorp (new) | | | 14.1 | | | Laboratory Corp. | | | 9.3 | |
Berkshire Hathaway | | | 12.8 | | | Caesars Entertainment | | | 8.9 | |
Qwest Communications (new) | | | 8.6 | | | First Health (eliminated) | | | 8.0 | |
| |
|
| | | | |
|
| |
| | $ | 74.7 | | | | | $ | 48.6 | |
| |
|
| | | | |
|
| |
Largest Net Contributions to Investment Results for Year Ended March 31, 2005 | |
|
|
|
| |
Positive ($mil) | | | Negative ($mil) | |
|
|
|
| | |
|
|
|
| |
Caesars Entertainment | | $ | 5.0 | | | Fannie Mae | | $ | (4.7) | |
Cabela’s | | | 4.6 | | | Six Flags | | | (3.5) | |
Liberty Media Corp. & International | | | 4.5 | | | Charter Communications | | | (3.0) | |
Corinthian Colleges | | | 3.3 | | | First Health | | | (1.9) | |
Comcast | | | 3.3 | | | Adelphia Communications | | | (1.1) | |
| |
|
| | | | |
|
| |
Net Portfolio Gains | | $ | 20.7 | | | | | $ | (14.2) | |
| |
|
| | | | |
|
| |
| | | | | | | | | | |
| | $ | 29.9 | | | | | | | |
| |
|
| | | | | | | |
15
Schedule of Investments in Securities
March 31, 2005
| | Shares | | Value | |
| |
| |
| |
COMMON STOCKS — 88.5% | | | | | | |
| | | | | | |
Mortgage Services — 22.8% | | | | | | |
| | | | | | |
Originating and Investing — 14.4% | | | | | | |
Countrywide Financial Corp. | | 650,000 | | $ | 21,099,000 | |
Redwood Trust, Inc. | | 360,000 | | | 18,424,800 | |
Newcastle Investment Corp. | | 140,000 | | | 4,144,000 | |
Bimini Mortgage Management, Inc. | | 250,000 | | | 3,462,500 | |
Imperial Credit Industries, Inc.* † | | 3,435,400 | | | 1,718 | |
| | | |
|
| |
| | | | | 47,132,018 | |
Government Agency — 8.4% | | | | | | |
Fannie Mae | | 450,000 | | | 24,502,500 | |
Freddie Mac | | 50,000 | | | 3,160,000 | |
| | | |
|
| |
| | | | | 27,662,500 | |
| | | |
|
| |
| | | | | 74,794,518 | |
Media Content and Distribution — 19.4% | | | | | | |
| | | | | | |
Cable Television — 10.5% | | | | | | |
Comcast Corp. - Special CLA* | | 600,000 | | | 20,040,000 | |
Liberty Media International, Inc. - A* | | 260,000 | | | 11,372,400 | |
Insight Communications Co.* | | 250,000 | | | 2,962,500 | |
Adelphia Communications Corp. CLA* # | | 800,000 | | | 192,000 | |
| | | |
|
| |
| | | | | 34,566,900 | |
Newspaper, Television, Radio and Content — 8.9% | | | | | | |
Liberty Media Corp. - A* | | 2,200,000 | | | 22,814,000 | |
Cumulus Media, Inc. - CLA* | | 450,000 | | | 6,412,500 | |
| | | |
|
| |
| | | | | 29,226,500 | |
| | | |
|
| |
| | | | | 63,793,400 | |
Consumer Products and Services — 11.1% | | | | | | |
| | | | | | |
Retailing — 10.1% | | | | | | |
IAC/InterActiveCorp* | | 650,000 | | | 14,475,500 | |
Cabela’s, Inc. CLA* # | | 660,600 | | | 13,628,178 | |
AutoZone, Inc.* | | 60,000 | | | 5,142,000 | |
| | | |
|
| |
| | | | | 33,245,678 | |
Education — 1.0% | | | | | | |
ITT Educational Services, Inc.* (a) | | 65,000 | | | 3,152,500 | |
| | | |
|
| |
| | | | | 36,398,178 | |
The accompanying notes form an integral part of these financial statements.
16
Schedule of Investments in Securities, Continued
| | Shares | | Value | |
| |
| |
| |
Healthcare — 8.9% | | | | | | |
| | | | | | |
Suppliers and Distributors — 4.9% | | | | | | |
Omnicare, Inc. | | 300,000 | | $ | 10,635,000 | |
Cardinal Health, Inc.(a) | | 100,000 | | | 5,580,000 | |
| | | |
|
| |
| | | | | 16,215,000 | |
Providers — 3.4% | | | | | | |
Pediatrix Medical Group, Inc.* | | 120,000 | | | 8,230,800 | |
Laboratory Corporation of America Holdings* | | 60,000 | | | 2,892,000 | |
| | | |
|
| |
| | | | | 11,122,800 | |
Managed Care — 0.6% | | | | | | |
WellPoint, Inc.* | | 15,000 | | | 1,880,250 | |
| | | |
|
| |
| | | | | 29,218,050 | |
| | | | | | |
Banking and Insurance — 8.2% | | | | | | |
| | | | | | |
Insurance — 8.0% | | | | | | |
Berkshire Hathaway, Inc. CLA* | | 300 | | | 26,100,000 | |
| | | | | | |
Banking — 0.2% | | | | | | |
People’s Bank | | 19,000 | | | 778,050 | |
| | | |
|
| |
| | | | | 26,878,050 | |
| | | | | | |
Telecommunications — 7.1% | | | | | | |
| | | | | | |
Qwest Communications International, Inc.* | | 2,209,000 | | | 8,173,300 | |
Telephone and Data Systems, Inc. | | 90,000 | | | 7,344,000 | |
Leap Wireless International, Inc.* | | 210,000 | | | 5,470,500 | |
Lynch Interactive Corp.* | | 100,000 | | | 2,400,000 | |
| | | |
|
| |
| | | | | 23,387,800 | |
| | | | | | |
Gaming, Lodging and Leisure — 6.6% | | | | | | |
| | | | | | |
Caesars Entertainment, Inc.* | | 396,000 | | | 7,836,840 | |
Host Marriott Corp. | | 400,000 | | | 6,624,000 | |
Harrah’s Entertainment, Inc. | | 70,000 | | | 4,520,600 | |
Six Flags, Inc.* | | 700,000 | | | 2,884,000 | |
| | | |
|
| |
| | | | | 21,865,440 | |
The accompanying notes form an integral part of these financial statements.
17
Schedule of Investments in Securities, Continued
| | Principal
amount
or shares | | Value | |
| |
| |
| |
Commercial Services — 4.4% | | | | | | | |
| | | | | | | |
Cenveo, Inc.* | | | 976,700 | | $ | 5,508,588 | |
Iron Mountain, Inc.* | | | 180,000 | | | 5,191,200 | |
Coinstar, Inc.* | | | 180,000 | | | 3,816,000 | |
| | | | |
|
| |
| | | | | | 14,515,788 | |
| | | | |
|
| |
Total Common Stocks (Cost $255,405,360) | | | | | | 290,851,224 | |
| | | | | | | |
| | | | | | | |
SHORT-TERM SECURITIES — 12.9% | | | | | | | |
| | | | | | | |
Wells Fargo Government Money Market Fund | | | 10,020,164 | | | 10,020,164 | |
Federal Home Loan Bank Discount Note 2.489% due 4/11/05(b) | | $ | 9,000,000 | | | 8,993,313 | |
U.S. Treasury Bills, 2.369% to 2.803%, due 4/07/05 to 6/30/05(b) | | | 23,500,000 | | | 23,438,862 | |
| | | | |
|
| |
Total Short-Term Securities (Cost $42,451,770) | | | | | | 42,452,339 | |
| | | | |
|
| |
Total Investments in Securities (Cost $297,857,130) | | | | | | 333,303,563 | |
Covered Call Options Written — (0.3%) | | | | | | (925,750 | ) |
Other Liabilities in Excess of Other Assets — (1.1%) | | | | | | (3,741,353 | ) |
| | | | |
|
| |
Net Assets — 100% | | | | | $ | 328,636,460 | |
| | | | |
|
| |
Net Asset Value Per Share | | | | | $ | 31.36 | |
| | | | |
|
| |
The accompanying notes form an integral part of these financial statements.
18
Schedule of Investments in Securities, Continued
| | Expiration date/
Strike price | | Shares
subject
to option | | Value | |
| |
| |
| |
| |
| | | | | | | | |
COVERED CALL OPTIONS WRITTEN* | | | | | | | | |
| | | | | | | | |
Cardinal Health, Inc. | | June 2005 / $60 | | 37,500 | | $ | (45,000 | ) |
ITT Educational Services, Inc. | | April 2005 / $35 | | 65,000 | | | (880,750 | ) |
| | | | | |
|
| |
Total Call Options Written | | | | | | $ | (925,750 | ) |
| | | | | |
|
| |
(premiums received $426,927) | | | | | | | | |
| † | Non-controlled affiliate |
| # | Illiquid and/or restricted security that has been fair valued. |
| (a) | Fully or partially pledged as collateral on outstanding written options. |
| (b) | Interest rates presented for Treasury bills and discount notes represent the yield to maturity at the date of purchase. |
The accompanying notes form an integral part of these financial statements.
19
FUND PERFORMANCE — PARTNERS VALUE FUND |
The following table summarizes performance information for the Fund as compared to the S&P 500 over the periods indicated.
Period Ended | | Partners Value Fund | | S&P 500 | | Difference
Partners Value – S&P 500 |
| |
| |
| |
|
Dec. 31, 1995 | | 38.7 | % | | 37.5 | % | | 1.2 | % |
Dec. 31, 1996 | | 19.2 | | | 22.9 | | | –3.7 | |
Dec. 31, 1997 | | 40.6 | | | 33.4 | | | 7.2 | |
Dec. 31, 1998 | | 29.1 | | | 28.6 | | | 0.5 | |
Dec. 31, 1999 | | 22.1 | | | 21.0 | | | 1.1 | |
Dec. 31, 2000 | | 21.1 | | | –9.1 | | | 30.2 | |
Dec. 31, 2001 | | –0.9 | | | –11.8 | | | 10.9 | |
Dec. 31, 2002 | | –17.0 | | | –22.1 | | | 5.1 | |
Dec. 31, 2003 | | 25.4 | | | 28.7 | | | –3.3 | |
Dec. 31, 2004 | | 15.0 | | | 10.9 | | | 4.1 | |
Mar. 31, 2005 (3 months) | | –3.8 | | | –2.1 | | | –1.7 | |
| | | | | | | | | |
10-Year Cumulative Return ended Mar. 31, 2005 | | 364.4 | | | 178.6 | | | 185.8 | |
10-Year Average Annual Compound Return ended Mar. 31, 2005 | | 16.6 | | | 10.8 | | | 5.8 | |
This chart depicts the change in the value of a $25,000 investment in the Partners Value Fund for the period March 31, 1995, through March 31, 2005, as compared with the growth of the Standard & Poor’s 500 Index during the same period.
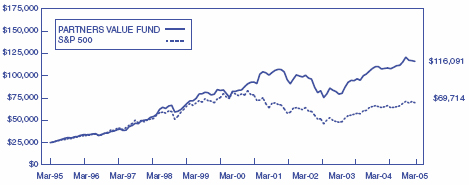
The Fund’s average annual total return for the one, five and ten year periods ended March 31, 2005 was 5.5%, 7.1% and 16.6%, respectively. The returns assume redemption at the end of each period and reinvestment of dividends. This information represents past performance and past performance does not guarantee future results. The investment return and the principal value of an investment in this Fund will fluctuate so that an investor’s shares, when redeemed, may be worth more or less than the original cost. Current performance may be lower or higher than the performance data quoted. Performance data current to the most recent month-end may be obtained at www.weitzfunds.com/performance/monthly.asp.
Performance information does not reflect the deduction of taxes that a shareholder would pay on Fund distributions or the redemption of Fund shares.
20
PORTFOLIO PROFILE – PARTNERS VALUE FUND |
Top Ten Stocks* | | | Industry Sectors* | |
| | |
| |
Berkshire Hathaway | | | 7.3 | % | | Media Content and Distribution | | | 20.5 | % |
Liberty Media Corp. | | | 6.4 | | | Mortgage Services | | | 13.8 | |
Comcast | | | 5.7 | | | Banking and Insurance | | | 12.2 | |
Fannie Mae | | | 5.0 | | | Gaming, Lodging and Leisure | | | 10.6 | |
Countrywide Financial | | | 4.4 | | | Telecommunications | | | 4.4 | |
Washington Post | | | 4.2 | | | Consumer Products and Services | | | 3.4 | |
Host Marriott | | | 4.0 | | | Healthcare | | | 3.3 | |
Caesars Entertainment | | | 3.8 | | | Real Estate | | | 0.9 | |
Telephone & Data Systems | | | 3.1 | | | Commercial Services | | | 0.5 | |
IAC/InterActiveCorp | | | 3.0 | | | Corporate Bonds | | | 0.1 | |
| | |
| | | Government Agency Securities | | | 0.1 | |
| | | 46.9 | % | | Short-Term Securities/Other | | | 30.2 | |
| | |
| | | | | |
| |
| | | | | | | | | 100.0 | % |
| | | | | | | | |
| |
| | | | | | | | | | |
| | | | | | | | | | |
* As of March 31, 2005
Largest Net Purchases and Sales for Year Ended March 31, 2005 | |
| |
Net Purchases ($mil) | | | Net Sales ($mil) | |
| | |
| |
Fannie Mae | | $ | 104 | | | Citizens Communications (eliminated) | | $ | 128 | |
IAC/InterActiveCorp (new) | | | 79 | | | Caesars Entertainment | | | 121 | |
Cardinal Health (new) | | | 31 | | | Greenpoint Financial | | | 54 | |
Liberty Media International (new) | | | 16 | | | Hilton Hotels | | | 50 | |
WellPoint (new) | | | 7 | | | Host Marriott | | | 48 | |
| |
|
| | | | |
|
| |
| | $ | 237 | | | | | $ | 401 | |
| |
|
| | | | |
|
| |
Largest Net Contributions to Investment Results for Year Ended March 31, 2005 | |
| |
Positive ($mil) | | | Negative ($mil) | |
| | |
| |
Caesars Entertainment | | $ | 60 | | | Charter Communications | | $ | (37 | ) |
Liberty Media Corp. & International | | | 32 | | | Fannie Mae | | | (27 | ) |
Host Marriott | | | 32 | | | Berkshire Hathaway | | | (16 | ) |
Comcast | | | 30 | | | Six Flags | | | (15 | ) |
Hilton Hotels | | | 22 | | | Qwest Communications | | | (8 | ) |
| |
|
| | | | |
|
| |
| | $ | 176 | | | | | $ | (103 | ) |
| |
|
| | | | |
|
| |
Net Portfolio Gains | | $ | 165 | | | | | | | |
| |
|
| | | | | | | |
| | | | | | | | | | |
21
Schedule of Investments in Securities
March 31, 2005
| | Shares | | Value |
| |
| |
|
COMMON STOCKS — 69.6% | | | | | |
| | | | | |
Media Content and Distribution — 20.5% | | | | | |
| | | | | |
Newspaper, Television, Radio and Content — 10.9% | | | | | |
Liberty Media Corp. - A* | | 16,300,000 | | $ | 169,031,000 |
Washington Post Co. CLB | | 125,000 | | | 111,750,000 |
Daily Journal Corp.* † | | 114,800 | | | 5,029,388 |
| | | |
|
|
| | | | | 285,810,388 |
Cable Television — 9.6% | | | | | |
Comcast Corp. - Special CLA* | | 4,500,000 | | | 150,300,000 |
Liberty Media International, Inc. - A* | | 1,320,000 | | | 57,736,800 |
Insight Communications Co.* | | 2,834,439 | | | 33,588,102 |
Charter Communications, Inc. CLA* | | 6,407,000 | | | 10,251,200 |
Adelphia Communications Corp. CLA* # | | 6,494,000 | | | 1,558,560 |
| | | |
|
|
| | | | | 253,434,662 |
| | | |
|
|
| | | | | 539,245,050 |
Mortgage Services — 13.8% | | | | | |
| | | | | |
Government Agency — 7.4% | | | | | |
Fannie Mae | | 2,400,000 | | | 130,680,000 |
Freddie Mac | | 1,000,000 | | | 63,200,000 |
| | | |
|
|
| | | | | 193,880,000 |
Originating and Investing — 6.4% | | | | | |
Countrywide Financial Corp. | | 3,580,000 | | | 116,206,800 |
Redwood Trust, Inc. | | 1,050,000 | | | 53,739,000 |
Imperial Credit Industries, Inc.* | | 1,486,500 | | | 743 |
| | | |
|
|
| | | | | 169,946,543 |
| | | |
|
|
| | | | | 363,826,543 |
Banking and Insurance — 12.2% | | | | | |
| | | | | |
Insurance — 7.3% | | | | | |
Berkshire Hathaway, Inc. CLB* | | 34,000 | | | 97,104,000 |
Berkshire Hathaway, Inc. CLA* | | 1,100 | | | 95,700,000 |
| | | |
|
|
| | | | | 192,804,000 |
Banking — 4.9% | | | | | |
Washington Mutual, Inc. | | 1,800,000 | | | 71,100,000 |
U.S. Bancorp | | 1,100,000 | | | 31,702,000 |
North Fork Bancorporation, Inc. | | 900,000 | | | 24,966,000 |
| | | |
|
|
| | | | | 127,768,000 |
| | | |
|
|
| | | | | 320,572,000 |
The accompanying notes form an integral part of these financial statements.
22
Schedule of Investments in Securities, Continued
| | Shares | | Value |
| |
| |
|
Gaming, Lodging and Leisure — 10.6% | | | | | |
| | | | | |
Host Marriott Corp. | | 6,300,000 | | $ | 104,328,000 |
Caesars Entertainment, Inc.* | | 5,000,000 | | | 98,950,000 |
Hilton Hotels Corp. | | 2,000,000 | | | 44,700,000 |
Harrah’s Entertainment, Inc. | | 250,000 | | | 16,145,000 |
Six Flags, Inc.* | | 3,700,000 | | | 15,244,000 |
| | | |
|
|
| | | | | 279,367,000 |
| | | | | |
Telecommunications — 4.4% | | | | | |
| | | | | |
Telephone and Data Systems, Inc. | | 1,010,000 | | | 82,416,000 |
Qwest Communications International, Inc.* | | 9,019,000 | | | 33,370,300 |
| | | |
|
|
| | | | | 115,786,300 |
| | | | | |
Consumer Products and Services — Retailing — 3.4% | | | | | |
| | | | | |
IAC/InterActiveCorp* | | 3,600,000 | | | 80,172,000 |
Costco Wholesale Corp.(a) | | 200,000 | | | 8,836,000 |
| | | |
|
|
| | | | | 89,008,000 |
| | | | | |
Healthcare — 3.3% | | | | | |
| | | | | |
Suppliers and Distributors — 1.8% | | | | | |
Cardinal Health, Inc.(a) | | 800,000 | | | 44,640,000 |
Omnicare, Inc. | | 100,000 | | | 3,545,000 |
| | | |
|
|
| | | | | 48,185,000 |
Providers — 1.1% | | | | | |
Laboratory Corporation of America Holdings* | | 400,000 | | | 19,280,000 |
Triad Hospitals, Inc.* | | 200,000 | | | 10,020,000 |
| | | |
|
|
| | | | | 29,300,000 |
Managed Care — 0.4 % | | | | | |
WellPoint, Inc.* | | 60,000 | | | 7,521,000 |
UnitedHealth Group, Inc. | | 40,000 | | | 3,815,200 |
| | | |
|
|
| | | | | 11,336,200 |
| | | |
|
|
| | | | | 88,821,200 |
The accompanying notes form an integral part of these financial statements.
23
Schedule of Investments in Securities, Continued
| | Principal
amount
or shares | | Value |
| |
| |
|
Real Estate — Construction and Development — 0.9% | | | | | | |
| | | | | | |
Forest City Enterprises, Inc. CLA | | | 360,000 | | $ | 22,968,000 |
| | | | | | |
| | | | | | |
Commercial Services — 0.5% | | | | | | |
| | | | | | |
Cenveo, Inc.* | | | 2,181,300 | | | 12,302,532 |
Intelligent Systems Corp.* | | | 130,409 | | | 302,549 |
| | | | |
|
|
| | | | | | 12,605,081 |
| | | | |
|
|
Total Common Stocks (Cost $1,350,059,417) | | | | | | 1,832,199,174 |
| | | | | | |
| | | | | | |
CORPORATE BONDS — 0.1% | | | | | | |
| | | | | | |
Charter Communications Holdings, LLC 10.75% 10/01/09 | | $ | 3,000,000 | | | 2,475,000 |
Charter Communications Holdings, LLC 9.92% 4/01/11 | | | 2,000,000 | | | 1,545,000 |
| | | | |
|
|
Total Corporate Bonds (Cost $3,944,018) | | | | | | 4,020,000 |
| | | | | | |
| | | | | | |
GOVERNMENT AGENCY SECURITIES — 0.1% | | | | | | |
| | | | | | |
Federal Home Loan Bank 6.44% 11/28/05 (Cost $2,500,312) | | | 2,500,000 | | | 2,548,730 |
The accompanying notes form an integral part of these financial statements.
24
Schedule of Investments in Securities, Continued
| | Principal
amount
or shares | | Value | |
| |
| |
| |
SHORT-TERM SECURITIES — 30.4% | | | | | | | |
| | | | | | | |
Milestone Treasury Obligations Portfolio | | | 42,373,751 | | $ | 42,373,751 | |
Wells Fargo Government Money Market Fund | | | 49,247,168 | | | 49,247,168 | |
Federal Home Loan Bank Discount Note 2.489% 4/11/05(b) | | $ | 69,000,000 | | | 68,948,733 | |
U.S. Treasury Bills, 2.355% to 2.803%, due 4/07/05 to 6/30/05(b) | | | 640,500,000 | | | 639,020,984 | |
| | | | |
|
| |
Total Short-Term Securities (Cost $799,573,226) | | | | | | 799,590,636 | |
| | | | |
|
| |
Total Investments in Securities (Cost $2,156,076,973) | | | | | | 2,638,358,540 | |
Covered Call Options Written — (0.0%) | | | | | | (829,400 | ) |
Other Liabilities in Excess of Other Assets — (0.2%) | | | | | | (3,915,821 | ) |
| | | | |
|
| |
Net Assets — 100% | | | | | $ | 2,633,613,319 | |
| | | | |
|
| |
Net Asset Value Per Share | | | | | $ | 22.98 | |
| | | | |
|
| |
| | Expiration date/
Strike price | | Shares
Subject
to option | | Value | |
| |
| |
| |
| |
COVERED CALL OPTIONS WRITTEN* | | | | | | | | |
| | | | | | | | |
Cardinal Health, Inc. | | June 2005 / $60 | | 249,500 | | $ | (299,400 | ) |
Costco Wholesale Corp. | | October 2005 / $45 | | 200,000 | | | (530,000 | ) |
| | | | | |
|
| |
Total Call Options Written | | | | | | $ | (829,400 | ) |
| | | | | |
|
| |
(premiums received $1,548,708) | | | | | | | | |
| † | Non-controlled affiliate |
| # | Illiquid and/or restricted security that has been fair valued. |
| (a) | Fully or partially pledged as collateral on outstanding written options. |
| (b) | Interest rates presented for Treasury bills and discount notes represent the yield to maturity at the date of purchase. |
The accompanying notes form an integral part of these financial statements.
25
PORTFOLIO MANAGER LETTER – WEITZ BALANCED FUND |
April 12, 2005
Dear Fellow Shareholder:
We are pleased to report very good results for the fiscal year ended March 31, 2005. The Balanced Fund’s total return for the fiscal year was 8.5% versus 3.9% for our primary benchmark, the Blended Index†. For the quarter, both the Balanced Fund and the Blended Index† declined 1.6%.
The table below shows the performance of the Balanced Fund, along with the Blended Index†, the S&P 500 (stocks) and the Lehman Brothers Intermediate U.S. Government/Credit Index (bonds).
| | Total Returns*
(Through 3/31/05) | |
| | 1st Quarter | | 1-Year | |
| |
| |
| |
Weitz Balanced Fund | | –1.6 | % | | 8.5 | % | |
| | | | | | | |
Blended Index† | | –1.6 | | | 3.9 | | |
S&P 500 | | –2.1 | | | 6.7 | | |
Lehman Brothers Intermediate U.S. Government/Credit Index | | –0.9 | | | –0.3 | | |
This information represents past performance and past performance does not guarantee future results. The investment return and the principal value of an investment in the Fund will fluctuate so that an investor’s shares, when redeemed, may be worth more or less than the original cost. Current performance may be higher or lower than the performance data quoted above. Performance data current to the most recent month end may be obtained at www.weitzfunds.com/performance/monthly.asp.
* | Fund inception date: October 1, 2003. All performance numbers are calculated after deducting fees and expenses, and all numbers assume reinvestment of dividends. |
† | The Blended Index reflects an unmanaged portfolio of 60% of the S&P 500, which is an unmanaged index of common stock prices, and 40% of the Lehman Brothers Intermediate U.S. Government/Credit Index, which is an unmanaged index consisting of government securities and publicly issued corporate debt with maturities from one to ten years. |
Portfolio Review
The Balanced Fund’s fiscal year performance was driven by gains in the stock portfolio. A healthy mix of recent investments and old favorites fueled the Fund’s returns. Among the former, the stand-outs were health care and consumer companies. Among the latter, media and gaming companies made significant contributions.
Five of the top ten contributors to overall Fund performance were health care companies (Triad Hospitals, Omnicare, Cardinal Health, Pediatrix Medical Group and Laboratory Corporation of America). Despite our initial success in the health care area, we continue to proceed with caution. Among other risks, the government’s role as a significant payer for many services presents unique analytical challenges. Health care valuations are less compelling today, and we have trimmed or eliminated several holdings. We remain optimistic about the business outlook for those we still own.
Consumer companies in the for-profit education, consumer goods and retail areas also contributed to Fund performance. We purchased ITT Educational and Corinthian Colleges at depressed prices in the face of negative headlines, and both rebounded quickly. Flooring company Mohawk Industries absorbed multiple increases in oil-based input costs without a hitch, but faces a similar stiff challenge this year. Premium spirits maker Diageo continues to generate free cash and return it to shareholders. Outdoor retailer Cabela’s should be a core holding as long as the stock price doesn’t get too far ahead of the business, while AutoZone is more likely to be a long-term trade.
26
Many of the old favorites had a very good year. Business value continued to build at our larger media holdings, and the stocks followed suit. Liberty Media and its spin-off Liberty Media International together accounted for the largest single contribution to Fund performance, and business prospects appear bright at both companies. Cable companies Comcast and Cox continued to deliver on the promise of growth through advanced services. The soon-to-close combination of gaming companies Harrah’s and Caesars also benefited the Fund. Interestingly, the bulk of our gains came from buying more Harrah’s in the mid-$40’s after the deal was announced.
On the negative side of the ledger, company-specific problems at Fannie Mae precipitated a 27% stock price decline. Management’s alleged misconduct and the company’s ongoing accounting challenges are disturbing. However, we continue to think that Fannie Mae’s underlying business will have substantial core earnings power under all but the most draconian, low probability scenarios. If we are correct, this earnings power should limit our permanent downside and support a much higher stock price in time.
Our defensive stance on bonds (high credit quality, short duration and low overall invested level) helped preserve capital without missing much, if any, upside. The Lehman Brothers Intermediate U.S. Government/Credit Index, our gauge for the bond market, actually declined slightly for the fiscal year. At the same time, returns on our cash reserves, while still low, increased throughout the year as the Federal Reserve hiked the Fed Funds target from 1.00% a year ago to 2.75% today.
Turning briefly to the topic of “what’s new” with the Fund, we added five companies to the stock portfolio and eliminated four others in the March quarter. The additions are managed care companies UnitedHealth Group and WellPoint, radio broadcaster Cumulus Media, records management provider Iron Mountain and commercial service provider Coinstar. We sold Triad Hospitals, HCA and Caesars Entertainment at healthy gains, and we eliminated Pfizer at a modest loss.
UnitedHealth and WellPoint may not look like typical Weitz investments at first glance. The stocks are up substantially since last fall’s election, and the companies trade at higher headline multiples than we typically pay. Still, both businesses are available at a discount to our underlying value estimate. In each case, the key driver of this discount is our above-average growth outlook for the next three to five years.
We think these businesses have the necessary ingredients to grow value per share rapidly. Both companies have entrenched market positions, good long-term demographic demand drivers, exceptional free cash flows, limited capital requirements and a demonstrated willingness to aggressively repurchase shares. In addition, UnitedHealth has multiple business lines that can thrive in different environments, while WellPoint has an ongoing opportunity to cut substantial costs after its recent merger with Anthem.
Outlook
The Balanced Fund remains conservatively positioned with an asset allocation of 41% stocks, 24% bonds and 35% cash and reserves. This allocation results from our bottom-up search for value, which remains challenging. We continue to focus on downside protection before turning our attention to an individual investment’s potential upside. We think a patient, well executed defense will create attractive offensive opportunities.
With the addition of two analysts in 2004, we now have more people looking for investment ideas in more places than ever before. Each brings a unique perspective to the process, but all are bound by the Weitz value investing philosophy. The analyst team sourced virtually all of our health care and consumer ideas over the past eighteen months, and we look forward to continued contributions from the group.
27
We hope you will join us for our annual shareholder information meeting on Tuesday, May 31. There will be no official business to conduct, so we can spend the whole time answering your questions about investments.
Regards, | | | |
| | | |

| | 
| |
| | | |
Bradley P. Hinton
Co-Portfolio Manager | | Wallace R. Weitz
Co-Portfolio Manager | |
Portfolio composition is subject to change at any time and references to specific securities, industries, and sectors referenced in this letter are not recommendations to purchase or sell any particular security. See the Schedule of Investments in Securities included in this report for the percent of assets of the Fund invested in particular industries or sectors.
Industry Sectors*
Media Content and Distribution | | 8.3 | % |
Mortgage Services | | 7.4 | |
Consumer Products and Services | | 7.0 | |
Healthcare | | 5.8 | |
Banking and Insurance | | 5.7 | |
Commercial Services | | 3.9 | |
Gaming, Lodging and Leisure | | 2.1 | |
Telecommunications | | 0.8 | |
Real Estate | | 0.3 | |
Corporate Bonds | | 2.2 | |
Mortgage-Backed Securities | | 0.7 | |
U.S. Treasury and Government Agency | | 20.7 | |
Short-Term Securities/Other | | 35.1 | |
| |
| |
| | 100.0 | % |
| |
| |
| | | |
*As of March 31, 2005 | | | |
28
FUND PERFORMANCE – BALANCED FUND |
The chart below depicts the change in the value of a $25,000 investment for the period since inception of the Balanced Fund (October 1, 2003) through March 31, 2005, as compared with the growth of the Blended Index during the same period. The Blended Index reflects an unmanaged portfolio of 60% of the S&P 500 (“S&P 500”), which is an unmanaged index of common stock prices, and 40% of the Lehman Brothers Intermediate U.S. Government/Credit Index (“Lehman Index”), which is an unmanaged index consisting of government securities and publicly issued corporate debt with maturities from one to ten years. The chart also includes information about the growth of the S&P 500 and the Lehman Index for the period. The information assumes reinvestment of dividends and capital gains distributions. A$25,000 investment in the Balanced Fund on October 1, 2003, would have been valued at $28,557 on March 31, 2005.

Average Annual Total Returns
| | 1-Year | | Since
Inception
(Oct. 1, 2003) |
| |
| |
|
Balanced Fund | | 8.5 | % | | 9.3 | % |
Blended Index | | 3.9 | | | 9.0 | |
S&P 500 Index | | 6.7 | | | 14.0 | |
Lehman Brothers Intermediate U.S. Government/Credit Index | | –0.3 | | | 1.5 | |
The returns assume redemption at the end of each period and reinvestment of dividends. This information represents past performance and past performance does not guarantee future results. The investment return and the principal value of an investment in this Fund will fluctuate so that an investor’s shares, when redeemed, may be worth more or less than the original cost. Current performance may be lower or higher than the performance data quoted. Performance data current to the most recent month-end may be obtained at www.weitzfunds.com/performance/monthly.asp.
Performance information does not reflect the deduction of taxes that a shareholder would pay on Fund distributions or the redemption of Fund shares.
29
Schedule of Investments in Securities
March 31, 2005
| | Shares | | Value |
| |
| |
|
COMMON STOCKS — 41.3% | | | | | |
| | | | | |
Media Content and Distribution — 8.3% | | | | | |
| | | | | |
Newspaper, Television, Radio and Content — 4.2% | | | | | |
Liberty Media Corp. - A* | | 150,000 | | $ | 1,555,500 |
Cumulus Media, Inc. - CLA* | | 50,000 | | | 712,500 |
| | | |
|
|
| | | | | 2,268,000 |
Cable Television — 4.1% | | | | | |
Comcast Corp. - Special CLA* | | 44,000 | | | 1,469,600 |
Liberty Media International, Inc. - A* | | 17,500 | | | 765,450 |
| | | |
|
|
| | | | | 2,235,050 |
| | | |
|
|
| | | | | 4,503,050 |
Mortgage Services — 7.4% | | | | | |
| | | | | |
Originating and Investing — 4.3% | | | | | |
Countrywide Financial Corp. | | 47,500 | | | 1,541,850 |
Redwood Trust, Inc. | | 15,000 | | | 767,700 |
| | | |
|
|
| | | | | 2,309,550 |
Government Agency — 3.1% | | | | | |
Fannie Mae | | 22,000 | | | 1,197,900 |
Freddie Mac | | 8,000 | | | 505,600 |
| | | |
|
|
| | | | | 1,703,500 |
| | | |
|
|
| | | | | 4,013,050 |
Consumer Products and Services — 7.0% | | | | | |
| | | | | |
Retailing — 4.2% | | | | | |
IAC/InterActiveCorp* | | 47,000 | | | 1,046,690 |
Cabela’s, Inc. CLA* | | 22,320 | | | 460,462 |
Cabela’s, Inc. CLA* # | | 14,680 | | | 302,848 |
AutoZone, Inc.* | | 5,500 | | | 471,350 |
| | | |
|
|
| | | | | 2,281,350 |
Consumer Goods — 1.9% | | | | | |
Mohawk Industries, Inc.* | | 7,000 | | | 590,100 |
Diageo PLC - Sponsored ADR | | 7,500 | | | 426,750 |
| | | |
|
|
| | | | | 1,016,850 |
Education — 0.9% | | | | | |
ITT Educational Services, Inc.* | | 10,000 | | | 485,000 |
| | | |
|
|
| | | | | 3,783,200 |
The accompanying notes form an integral part of these financial statements.
30
Schedule of Investments in Securities, Continued
| | Shares | | Value |
| |
| |
|
Healthcare — 5.8% | | | | | |
| | | | | |
Managed Care — 2.4% | | | | | |
UnitedHealth Group, Inc. | | 7,000 | | $ | 667,660 |
WellPoint, Inc.* | | 5,000 | | | 626,750 |
| | | | | 1,294,410 |
| | | |
|
|
Providers — 2.2% | | | | | |
Pediatrix Medical Group, Inc.* | | 9,500 | | | 651,605 |
Laboratory Corporation of America Holdings* | | 11,500 | | | 554,300 |
| | | |
|
|
| | | | | 1,205,905 |
Suppliers and Distributors — 1.2% | | | | | |
Omnicare, Inc. | | 18,500 | | | 655,825 |
| | | |
|
|
| | | | | 3,156,140 |
| | | | | |
Banking and Insurance — 5.7% | | | | | |
| | | | | |
Insurance — 3.0% | | | | | |
Berkshire Hathaway, Inc. CLB* | | 570 | | | 1,627,920 |
| | | | | |
Banking — 2.7% | | | | | |
Wells Fargo & Co. | | 9,000 | | | 538,200 |
Washington Mutual, Inc. | | 13,000 | | | 513,500 |
U.S. Bancorp | | 14,000 | | | 403,480 |
| | | |
|
|
| | | | | 1,455,180 |
| | | |
|
|
| | | | | 3,083,100 |
Commercial Services — 3.9% | | | | | |
| | | | | |
Coinstar, Inc.* | | 34,000 | | | 720,800 |
Iron Mountain, Inc.* | | 20,000 | | | 576,800 |
Republic Services, Inc. | | 13,000 | | | 435,240 |
First Data Corp. | | 10,500 | | | 412,755 |
| | | |
|
|
| | | | | 2,145,595 |
| | | | | |
Gaming, Lodging and Leisure — 2.1% | | | | | |
| | | | | |
Harrah’s Entertainment, Inc. | | 17,470 | | | 1,128,213 |
The accompanying notes form an integral part of these financial statements.
31
Schedule of Investments in Securities, Continued
| | Principal
amount
or shares | | Value |
| |
| |
|
Telecommunications — 0.8% | | | | | | |
| | | | | | |
Telephone and Data Systems, Inc. | | | 5,500 | | $ | 448,800 |
| | | | | | |
Real Estate — Property Ownership and Management — 0.3% | | | | | | |
| | | | | | |
Capital Automotive REIT | | | 5,000 | | | 165,600 |
| | | | |
|
|
Total Common Stocks (Cost $20,442,721) | | | | | | 22,426,748 |
| | | | | | |
CORPORATE BONDS — 2.2% | | | | | | |
| | | | | | |
Telephone and Data Systems, Inc. 7.0% 8/01/06 | | $ | 500,000 | | | 515,501 |
Liberty Media Corp. 3.5% 9/25/06 | | | 125,000 | | | 123,241 |
Berkshire Hathaway Finance Corp. 4.2% 12/15/10 | | | 300,000 | | | 291,706 |
Harrah’s Operating Co., Inc. 5.375% 12/15/13 | | | 250,000 | | | 248,267 |
| | | | |
|
|
Total Corporate Bonds (Cost $1,192,080) | | | | | | 1,178,715 |
| | | | | | |
MORTGAGE-BACKED SECURITIES — 0.7%(a) | | | | | | |
| | | | | | |
Federal Agency CMO and REMIC — 0.7% | | | | | | |
| | | | | | |
Freddie Mac 6.0% 4/15/27 (Estimated Average Life 0.8 years) | | | 94,468 | | | 94,829 |
Fannie Mae 4.25% 6/25/33 (Estimated Average Life 1.5 years) | | | 291,446 | | | 290,438 |
| | | | |
|
|
Total Mortgage-Backed Securities (Cost $392,708) | | | | | | 385,267 |
| | | | | | |
U.S. TREASURY AND GOVERNMENT AGENCY — 20.7% | | | | | | |
| | | | | | |
U.S. Treasury — 14.1% | | | | | | |
| | | | | | |
U.S. Treasury Note 1.625% 9/30/05 | | | 300,000 | | | 297,914 |
U.S. Treasury Note 3.5% 11/15/06 | | | 300,000 | | | 299,156 |
U.S. Treasury Note 3.75% 3/31/07 | | | 500,000 | | | 499,766 |
U.S. Treasury Note 3.0% 11/15/07 | | | 300,000 | | | 293,578 |
U.S. Treasury Note 3.375% 2/15/08 | | | 1,250,000 | | | 1,231,641 |
U.S. Treasury Note 3.125% 10/15/08 | | | 300,000 | | | 291,106 |
U.S. Treasury Note 3.0% 2/15/09 | | | 400,000 | | | 384,797 |
U.S. Treasury Note 2.625% 3/15/09 | | | 500,000 | | | 473,907 |
U.S. Treasury Note 3.625% 7/15/09 | | | 500,000 | | | 490,489 |
U.S. Treasury Note 6.5% 2/15/10 | | | 400,000 | | | 440,578 |
U.S. Treasury Note 4.0% 3/15/10 | | | 1,000,000 | | | 992,501 |
U.S. Treasury Note 5.0% 2/15/11 | | | 400,000 | | | 415,578 |
The accompanying notes form an integral part of these financial statements.
32
Schedule of Investments in Securities, Continued
| | Principal
amount
or shares | | Value |
| |
| |
|
U.S. Treasury — 14.1% (continued) | | | | | | |
| | | | | | |
U.S. Treasury Note 5.0% 8/15/11 | | $ | 500,000 | | $ | 519,609 |
U.S. Treasury Note 4.375% 8/15/12 | | | 500,000 | | | 501,329 |
U.S. Treasury Inflation-Indexed Note 2.0% 1/15/14 | | | 516,000 | | | 528,321 |
| | | | |
|
|
| | | | | | 7,660,270 |
| | | | | | |
Government Agency Securities — 6.6% | | | | | | |
| | | | | | |
Fannie Mae 4.0% 11/27/07 | | | 500,000 | | | 497,797 |
Fannie Mae 3.25% 12/21/07(b) | | | 400,000 | | | 397,255 |
Federal Home Loan Bank 3.55% 4/15/08 | | | 500,000 | | | 491,197 |
Freddie Mac 4.0% 4/28/09 | | | 240,000 | | | 236,641 |
Freddie Mac 4.7% 5/19/09 | | | 835,000 | | | 836,399 |
Fannie Mae 4.01% 10/21/09 | | | 400,000 | | | 392,594 |
Federal Home Loan Bank 4.16% 12/08/09 | | | 400,000 | | | 392,544 |
Fannie Mae 5.5% 7/18/12 | | | 300,000 | | | 301,897 |
| | | | |
|
|
| | | | | | 3,546,324 |
| | | | |
|
|
Total U.S. Treasury and Government Agency (Cost $11,278,821) | | | | | | 11,206,594 |
| | | | | | |
| | | | | | |
SHORT-TERM SECURITIES — 34.5% | | | | | | |
| | | | | | |
Wells Fargo Government Money Market Fund | | | 788,361 | | | 788,361 |
U.S. Treasury Bills, 2.369% to 2.803%, due 4/07/05 to 6/30/05(c) | | $ | 18,000,000 | | | 17,937,016 |
| | | | |
|
|
Total Short-Term Securities (Cost $18,724,056) | | | | | | 18,725,377 |
| | | | |
|
|
Total Investments in Securities (Cost $52,030,386) | | | | | | 53,922,701 |
Other Assets Less Other Liabilities — 0.6% | | | | | | 311,446 |
| | | | |
|
|
Net Assets — 100% | | | | | $ | 54,234,147 |
| | | | |
|
|
Net Asset Value Per Share | | | | | $ | 11.17 |
| | | | |
|
|
| # | Illiquid and/or restricted security that has been fair valued. |
| (a) | Estimated average life of mortgage-backed securities are unaudited. |
| (b) | Security is a “step-up” bond where the coupon rate increases or steps up at a predetermined date. Coupon rate disclosed represents rate as of March 31, 2005. |
| (c) | Interest rates presented for Treasury bills represent the yield to maturity at the date of purchase. |
The accompanying notes form an integral part of these financial statements.
33
PORTFOLIO MANAGER LETTER – FIXED INCOME FUND AND
GOVERNMENT MONEY MARKET FUND |
April 13, 2005
Dear Fellow Shareholder:
Fixed Income Fund Overview
The Fixed Income Fund’s total return for the first quarter of 2005 was -0.2%, which consisted of approximately +0.8% from net interest income (after deducting fees and expenses) and -1.0% from (net unrealized) depreciation of our bonds and other investments. Our first quarter return exceeded the -0.9% return of the Lehman Brothers Intermediate U.S. Government / Credit Index, our Fund’s primary benchmark.
Total returns for longer periods of time are listed in the table below. Two additional Lehman Brothers Indexes (1-3 and 1-5 year) are included in the table for added perspective, given our Fund’s defensive propensity (i.e. a shorter average life than the Lehman Intermediate Index).
| | Average Annual Total Returns**
(Through 3/31/05) | |
| | 1-Year | | 3-Year | | 5-Year | | 10-Year | |
| |
| |
| |
| |
| |
Fixed Income Fund | | 0.9 | % | | 4.4 | % | | 6.0 | % | | 6.2 | % | |
Lehman Brothers Intermediate U.S. Government/Credit Index * | | -0.3 | | | 5.5 | | | 6.7 | | | 6.6 | | |
Lehman Brothers 1-5 Year U.S. Government/Credit Index * | | -0.5 | | | 4.2 | | | 5.8 | | | 6.0 | | |
Lehman Brothers 1-3 Year U.S. Government/Credit Index* | | -0.2 | | | 3.3 | | | 5.1 | | | 5.6 | | |
This information represents past performance and past performance does not guarantee future results. The investment return and the principal value of an investment in the Fund will fluctuate so that an investor’s shares, when redeemed, may be worth more or less than the original cost. Current performance may be higher or lower than the performance data quoted above. Performance data current to the most recent month end may be obtained at www.weitzfunds.com/performance/monthly.asp.
* | Source: Lehman Brothers, Inc. |
** | All performance numbers are calculated after deducting fees and expenses, and all numbers assume reinvestment of dividends. |
The following table and chart shows a profile of our portfolio and asset allocation as of March 31:
| | | | 
| |
| | | | |
Average Maturity | | 2.8 years | | |
Average Duration | | 2.0 years | | |
Average Coupon | | 3.7% | | |
30-Day SEC Yield at 3-31-05 | | 2.7% | | |
Average Rating | | AAA | | |
34
Fiscal Year in Review
Over the past 12 months, a lead story for bond investors has been the Federal Reserve’s decision to gradually reverse the accommodative monetary policy which had brought short-term interest rates to multi-decade lows. Amid improving economic conditions and rising inflation statistics, the FOMC (Federal Open Market Committee) more than doubled the Fed Funds rate, the overnight lending rate between banking institutions, from 1% to 2.75%.
As a result, most fixed income investors experienced a year where returns were paltry or even modestly negative as earned income (coupon returns) was offset by price depreciation on their bonds. Our portfolio generated a return of 0.9% in the last fiscal year compared to -0.3% for the Lehman Brothers Intermediate U.S. Government / Credit Index.
The Fed’s decision to raise short-term interest rates caused a predictable increase in yields of short-maturity securities as they tend to be most directly influenced by changes in the Fed Funds rate. Unpredictably, longer-term interest rates declined as other forces helped to hold these rates in check. One significant influence on long-term rates over the past year came from foreign central banks recycling their trade surpluses back into dollar denominated securities, principally U.S. Treasuries.
Until recently the Fed said little about this narrowing spread between short and long-term interest rates (or flattening yield curve). But at a meeting before Congress in February, the Fed chairman, Alan Greenspan, referred to the divergent action between long and short-term interest rates as a “conundrum” – which was reminiscent of his “irrational exuberance” comment about the stock market in 1996 which turned out to be early, but on target. This statement coupled with incrementally strong economic news precipitated a minor sell off in the bond market towards the end of the fiscal year (March 31). The long and the short of it (no pun intended) was that short-term interest rates rose meaningfully in the past year while there was less change in longer-term rates (see table below for specifics).
| | 3/31/2004 | | 3/31/2005 | | Change | |
| |
| |
| |
| |
6 month Treasury Bill | | 1.0 | % | | 3.1 | % | | +2.1 | % | |
2-year Treasury Note | | 1.6 | | | 3.8 | | | +2.2 | | |
3-year Treasury Note | | 1.9 | | | 3.9 | | | +2.0 | | |
5-year Treasury Note | | 2.8 | | | 4.2 | | | +1.4 | | |
10-year Treasury Bond | | 3.8 | | | 4.5 | | | +0.7 | | |
26-year Treasury Bond | | 4.8 | | | 4.8 | | | unchanged | |
Source: Bloomberg L.P.
Portfolio Review
Despite meager absolute results, our portfolio performed well compared to the negative returns of the various indices included in the performance table on the prior page. Our results were enhanced by our willingness to remain defensively positioned.
Bond prices fall when interest rates rise (and vise versa), but shorter-term bonds tend to be less volatile than longer-term bonds. This helps explain why our shorter average-life portfolio out-performed the various indices. Our holdings of cash equivalent securities (those maturing in less than a year) declined in the past 12 months but continues to be a significant percentage of our portfolio (37% as of 3/31/05).
We also benefited from strong performance in the portion of our portfolio reserved for high dividend paying common or preferred stocks. Citizens Communications equity units, Pennsylvania REIT preferred and Redwood Trust were all sold in the last fiscal year but contributed meaningfully to our performance (as they did in previous years).
The corporate bond segment of our portfolio declined to approximately 6% from nearly 12% a year ago. Credit spreads (the extra yield above Treasuries investors receive for lending money to anyone except the U.S.
35
Government) have continued to contract over the past year, making an already unattractive risk/reward relationship even worse. With fewer attractive investment opportunities, we elected not to replace some maturing/called bonds (e.g. Ford Motor Credit and Citizens Communications) and have sold others as valuations appreciated (Anheuser Busch and Wal-Mart).
Our exposure to MBS (mortgage-backed securities) rose the most in the past year, increasing to almost 19% from 8%. Our strategy has been to invest in higher-coupon, defensively structured MBS securities and those with limited “extension” risk. As a reminder, MBS provide investors a high-quality coupon return with an imbedded call option. This imbedded call option results from the underlying creditors (homeowners) ability to repay their mortgage any time at par. This can cause principal cash flows to vary widely. In periods of falling interest rates, homeowners refinance their mortgage early (and maybe often), while in periods of rising interest rates prepayments tend to slow. Our goal is to hunt for MBS that have attributes which enhance our portfolio while minimizing any inherent negative surprises, especially those that will cause the expected maturity of the security to extend dramatically.
Looking Forward
We continue to have modest expectations for the total return potential for fixed income investors over the near-term. Primary reasons for this cautious outlook include:
| • | Inflation, the arch-enemy of fixed-income investors, has accelerated measurably over the past 12 months —the CPI, for example, has risen at a 3.0% annual rate recently compared to 1.7% a year ago. |
| • | Foreign investor’s willingness to continue backstopping our country’s growing current account deficit by investing their trade surplus back into dollar-denominated bonds or other investments may wane. |
| • | The financing of our growing budget deficit may also act to push interest rates up as the government is forced to issue more Treasury bonds to finance the deficit. |
Consequently, we remain defensively positioned despite having taken advantage of the rise in interest rates (especially short-term rates) to modestly extend the duration of our portfolio (currently at two years).
On a positive note, while today’s investment opportunities seem limited, the rise in short-term rates over the past year has lowered the cost of waiting. In exchange for minimal interest rate risk, investors today can earn a return on short-term securities that is twice what it was last year. And should rates continue to rise, we are well positioned to take advantage of any opportunities that may arise.
Government Money Market Fund Overview
Yields on short-term securities continued to rise in the first quarter as the Fed raised the Fed Funds rate two additional times in the first three months of the year. As of March 31st, the 7-day and 30-day yields of our portfolio were 1.9% and 1.8%, respectively. (An investment in the Fund is neither insured nor guaranteed by the U.S. Government. There can be no assurance that the Fund will be able to maintain a stable net asset value. Although the Fund seeks to preserve the value of your investment at $1.00 per share, it is possible to lose money by investing in the Fund.)
The past year has brought some welcome relief to money market investors. Near-zero returns have been replaced with still low, but rising returns. And while rising interest rates are invariably a bane to bond investors, higher short-term rates mean higher dividend income for investors in investment vehicles like money market funds or short-term CD’s.
The strategy in our Government Money Market Fund remains conservative. We invest in short-term government and government agency securities that have a weighted average maturity of less than 90 days. The types of securities we typically invest in consist of U.S. Treasury bills and government agency discount notes (such as the Federal Home Loan Bank and the Federal Farm Credit Bank).
The nature of any money market fund requires frequent reinvesting as securities mature. We have had the benefit of rising reinvestment opportunities in the past year as the Fed raised the Fed Funds rate seven times (which
36
impacts all short-term securities). It is plausible that the Fed will continue bringing short-term rates up to some “normal” level in 2005. Should this happen, the yield on our portfolio may continue to rise.
If you have any questions about the mechanics of either Fund or our investment strategy, please call. As always, we welcome your comments and questions.
We hope you will join us for our annual shareholder information meeting on Tuesday, May 31. There will be no official business to conduct, so we can spend the whole time answering your questions about investments.
| | | Best Regards, |
| | | 
|
| | | Thomas D. Carney
Portfolio Manager |
Portfolio composition is subject to change at any time and references to specific securities, industries and sectors referenced in this letter are not recommendations to purchase or sell any particular security. See the Schedules of Investments in Securities included in this report for the percent of assets in each of the Funds invested in particular industries or sectors.
37
FUND PERFORMANCE – FIXED INCOME FUND |
The chart below depicts the change in the value of a $25,000 investment for the period March 31, 1995, through March 31, 2005 for the Fixed Income Fund as compared with the growth of the Lehman Brothers Intermediate U.S. Government/Credit Index during the same period. The Lehman Brothers Intermediate U.S. Government/Credit Index is an unmanaged index consisting of government securities and publicly issued corporate debt with maturities from one to ten years. The information assumes reinvestment of dividends and capital gains distributions. A $25,000 investment in the Fixed Income Fund on March 31, 1995 would have been valued at $45,448 on March 31, 2005.
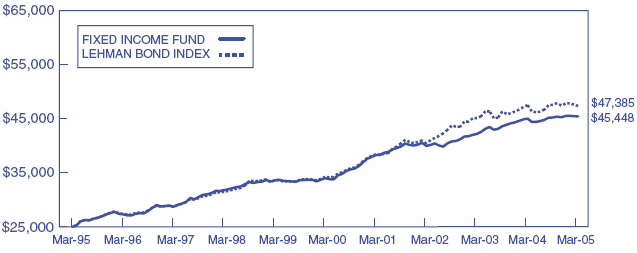
Average Annual Total Returns
| | 1-Year | | 5-Year | | 10-Year | |
| |
| |
| |
| |
Fixed Income Fund | | 0.9 | % | 6.0 | % | 6.2 | % |
Lehman Brothers Intermediate U.S. Government/Credit Index | | –0.3 | | 6.7 | | 6.6 | |
The returns assume redemption at the end of each period and reinvestment of dividends. This information represents past performance and past performance does not guarantee future results. The investment return and the principal value of an investment in this Fund will fluctuate so that an investor’s shares, when redeemed, may be worth more or less than the original cost. Current performance may be lower or higher than the performance data quoted. Performance data current to the most recent month-end may be obtained at www.weitzfunds.com/performance/monthly.asp.
Performance information does not reflect the deduction of taxes that a shareholder would pay on Fund distributions or the redemption of Fund shares.
38
PORTFOLIO PROFILE — FIXED INCOME FUND |
Credit Quality Ratings | | | |
| | | |
| | | |
U.S. Treasury and Mortgage-Backed Securities | | 61.7 | % |
Aaa/AAA | | 23.0 | |
Aa/AA | | 0.4 | |
A/A | | 1.2 | |
Baa/BBB | | 2.2 | |
Ba/BB | | 0.9 | |
B/B, below, and non-rated | | 0.7 | |
Cash Equivalents | | 9.9 | |
| |
| |
| | 100.0 | % |
| |
| |
| | | |
Sector Breakdown | | | |
| | | |
| | | |
U.S. Treasury and Government Agency | | 39.8 | % |
Short-Term Securities/Other | | 33.9 | |
Mortgage-Backed Securities | | 18.8 | |
Corporate Bonds | | 5.8 | |
Taxable Municipal Bonds | | 1.6 | |
Common Stocks | | 0.1 | |
| |
| |
| | 100.0 | % |
| |
| |
PORTFOLIO PROFILE — GOVERNMENT MONEY MARKET FUND |
Sector Breakdown | | | |
U.S. Treasury | | 98.0 | % |
Treasury Money Market Fund | | 4.4 | |
Liabilities in Excess of Other Assets | | (2.4 | ) |
| |
| |
| | 100.0 | % |
| |
| |
39
Schedule of Investments in Securities
March 31, 2005
| | Principal
amount | | Value |
| |
| |
|
CORPORATE BONDS — 5.8% | | | | | | |
| | | | | | |
Century Communications Sr. Notes 9.5% 3/01/05* | | $ | 750,000 | | $ | 780,000 |
General Motors Acceptance Corp. Debs. 6.625% 10/15/05 | | | 600,000 | | | 604,580 |
Telephone & Data Systems, Inc. 7.0% 8/01/06 | | | 985,000 | | | 1,015,537 |
Cox Communications, Inc. 7.75% 8/15/06 | | | 1,000,000 | | | 1,044,076 |
Liberty Media Corp. 3.5% 9/25/06 | | | 850,000 | | | 838,036 |
Hilton Hotels Corp. Sr. Notes 7.95% 4/15/07 | | | 1,000,000 | | | 1,067,888 |
HMH Properties, Inc. 7.875% 8/01/08 | | | 126,000 | | | 129,150 |
Liberty Media Corp. 7.875% 7/15/09 | | | 500,000 | | | 541,670 |
Berkshire Hathaway Finance Corp. 4.2% 12/15/10 | | | 375,000 | | | 364,633 |
Countrywide Home Loans, Inc. 4.0% 3/22/11 | | | 1,000,000 | | | 948,007 |
Berkshire Hathaway Finance Corp. 4.625% 10/15/13 | | | 1,000,000 | | | 974,856 |
Harrah’s Operating Co., Inc. 5.375% 12/15/13 | | | 750,000 | | | 744,802 |
Berkshire Hathaway, Inc. Debs. 9.75% 1/15/18 | | | 1,000 | | | 1,021 |
| | | | |
|
|
Total Corporate Bonds (Cost $8,907,612) | | | | | | 9,054,256 |
| | | | | | |
MORTGAGE-BACKED SECURITIES — 18.8%# | | | | | | |
| | | | | | |
Federal Agency CMO and REMIC — 15.2% | | | | | | |
| | | | | | |
Freddie Mac 3.5% 9/15/10 (Estimated Average Life 0.2 years) | | | 379,963 | | | 379,832 |
Freddie Mac 5.5% 3/15/14 (Estimated Average Life 0.4 years) | | | 467,892 | | | 469,012 |
Freddie Mac 6.0% 4/15/27 (Estimated Average Life 0.8 years) | | | 708,513 | | | 711,217 |
Fannie Mae 5.5% 12/25/26 (Estimated Average Life 1.1 years) | | | 1,834,444 | | | 1,854,890 |
Fannie Mae 4.25% 6/25/33 (Estimated Average Life 1.5 years) | | | 1,229,901 | | | 1,225,647 |
Fannie Mae 6.0% 5/25/31 (Estimated Average Life 2.1 years) | | | 2,496,062 | | | 2,547,372 |
Freddie Mac 5.5% 2/15/16 (Estimated Average Life 2.1 years) | | | 2,500,000 | | | 2,549,496 |
Fannie Mae 5.0% 3/25/15 (Estimated Average Life 2.2 years) | | | 1,000,000 | | | 1,010,151 |
Fannie Mae 5.0% 9/25/27 (Estimated Average Life 2.3 years) | | | 2,000,000 | | | 2,011,453 |
Fannie Mae 3.5% 10/25/13 (Estimated Average Life 2.4 years) | | | 2,150,000 | | | 2,113,516 |
Freddie Mac 4.0% 5/15/19 (Estimated Average Life 2.8 years) | | | 3,592,621 | | | 3,555,301 |
Fannie Mae 4.0% 11/25/13 (Estimated Average Life 3.1 years) | | | 2,000,000 | | | 1,995,390 |
Freddie Mac 5.5% 4/15/24 (Estimated Average Life 3.7 years) | | | 2,000,000 | | | 2,038,269 |
Fannie Mae 4.5% 10/25/17 (Estimated Average Life 3.8 years) | | | 1,488,421 | | | 1,476,168 |
| | | | |
|
|
| | | | | | 23,937,714 |
The accompanying notes form an integral part of these financial statements.
40
Schedule of Investments in Securities, Continued
| | Principal
amount | | Value |
| |
| |
|
Federal Agency Mortgage Pass-Through — 3.6% | | | | | | |
| | | | | | |
Fannie Mae 4.0% 8/01/13 (Estimated Average Life 3.4 years) | | $ | 1,135,067 | | $ | 1,117,343 |
Fannie Mae 6.5% 6/01/18 (Estimated Average Life 3.5 years) | | | 76,339 | | | 79,739 |
Fannie Mae 4.5% 6/01/14 (Estimated Average Life 3.9 years) | | | 1,425,450 | | | 1,411,599 |
Freddie Mac 5.0% 6/01/18 (Estimated Average Life 4.5 years) | | | 699,435 | | | 700,789 |
Fannie Mae 5.0% 10/01/18 (Estimated Average Life 4.6 years) | | | 2,308,175 | | | 2,310,155 |
| | | | |
|
|
| | | | | | 5,619,625 |
| | | | |
|
|
Total Mortgage-Backed Securities (Cost $29,904,930) | | | | | | 29,557,339 |
| | | | | | |
TAXABLE MUNICIPAL BONDS — 1.6% | | | | | | |
| | | | | | |
Baltimore, Maryland 7.25% 10/15/05 | | | 325,000 | | | 331,640 |
Topeka, Kansas 4.5% 8/15/09 | | | 1,135,000 | | | 1,142,536 |
Stratford, Connecticut 6.55% 2/15/13 | | | 500,000 | | | 542,940 |
King County, Washington 8.12% 12/01/16 | | | 500,000 | | | 559,025 |
| | | | |
|
|
Total Taxable Municipal Bonds (Cost $2,543,468) | | | | | | 2,576,141 |
| | | | | | |
U.S. TREASURY AND GOVERNMENT AGENCY — 39.8% | | | | | | |
| | | | | | |
U.S. Treasury — 18.9% | | | | | | |
| | | | | | |
U.S. Treasury Note 3.75% 3/31/07 | | | 3,000,000 | | | 2,998,596 |
U.S. Treasury Note 3.375% 2/15/08 | | | 3,000,000 | | | 2,955,939 |
U.S. Treasury Note 3.0% 2/15/09 | | | 5,000,000 | | | 4,809,965 |
U.S. Treasury Note 2.625% 3/15/09 | | | 3,000,000 | | | 2,843,439 |
U.S. Treasury Note 3.625% 7/15/09 | | | 3,000,000 | | | 2,942,931 |
U.S. Treasury Note 4.0% 3/15/10 | | | 6,000,000 | | | 5,955,006 |
U.S. Treasury Note 5.0% 8/15/11 | | | 3,000,000 | | | 3,117,657 |
U.S. Treasury Note 4.375% 8/15/12 | | | 2,000,000 | | | 2,005,314 |
U.S. Treasury Inflation-Indexed Note 2.0% 1/15/14 | | | 2,064,000 | | | 2,113,282 |
| | | | |
|
|
| | | | | | 29,742,129 |
Government Agency — 20.9% | | | | | | |
| | | | | | |
Federal Home Loan Bank 6.04% 9/08/05 | | | 2,000,000 | | | 2,026,018 |
Federal Home Loan Bank 6.44% 11/28/05 | | | 500,000 | | | 509,746 |
Federal Home Loan Bank 2.45% 3/23/07 | | | 2,000,000 | | | 1,943,086 |
Fannie Mae 4.0% 11/27/07 | | | 2,500,000 | | | 2,488,985 |
Fannie Mae 3.25% 12/21/07(a) | | | 2,000,000 | | | 1,986,274 |
Federal Home Loan Bank 3.55% 4/15/08 | | | 3,095,000 | | | 3,040,510 |
Freddie Mac 4.0% 4/28/09 | | | 240,000 | | | 236,641 |
Freddie Mac 4.7% 5/19/09 | | | 2,400,000 | | | 2,404,022 |
Freddie Mac 3.25% 7/09/09 | | | 1,000,000 | | | 955,654 |
Fannie Mae 4.01% 10/21/09 | | | 2,000,000 | | | 1,962,970 |
The accompanying notes form an integral part of these financial statements.
41
Schedule of Investments in Securities, Continued
| | Principal
amount
or shares | | Value |
| |
| |
|
Government Agency — 20.9% (continued) | | | | | | |
| | | | | | |
Federal Home Loan Bank 4.16% 12/08/09 | | $ | 1,500,000 | | $ | 1,472,040 |
Fannie Mae 4.125% 4/28/10 | | | 2,000,000 | | | 1,963,210 |
Freddie Mac 4.125% 6/16/10 | | | 1,000,000 | | | 981,162 |
Federal Home Loan Bank 3.0% 6/30/10(a) | | | 1,000,000 | | | 979,405 |
Freddie Mac 5.5% 9/15/11 | | | 1,000,000 | | | 1,047,690 |
Fannie Mae 5.5% 7/18/12 | | | 1,000,000 | | | 1,006,323 |
Fannie Mae 4.375% 7/17/13 | | | 2,000,000 | | | 1,919,036 |
Freddie Mac 5.125% 11/07/13 | | | 3,000,000 | | | 3,002,538 |
Freddie Mac 5.0% 11/13/14 | | | 3,000,000 | | | 2,985,531 |
| | | | |
|
|
| | | | | | 32,910,841 |
| | | | |
|
|
Total U.S. Treasury and Government Agency (Cost $63,064,387) | | | | | | 62,652,970 |
| | | | | | |
| | | | | | |
COMMON STOCKS — 0.1% | | | | | | |
| | | | | | |
Hanover Capital Mortgage Holdings, Inc. (Cost $115,312) | | | 15,000 | | | 159,150 |
| | | | | | |
| | | | | | |
SHORT-TERM SECURITIES — 36.8% | | | | | | |
| | | | | | |
Wells Fargo Government Money Market Fund | | | 20,038,692 | | | 20,038,692 |
U.S. Treasury Bills, 2.369% to 2.803%, due 4/07/05 to 6/30/05(b) | | $ | 38,000,000 | | | 37,871,090 |
| | | | |
|
|
Total Short-Term Securities (Cost $57,907,405) | | | | | | 57,909,782 |
| | | | |
|
|
Total Investments in Securities (Cost $162,443,114) | | | | | | 161,909,638 |
Other Liabilities in Excess of Other Assets — (2.9%) | | | | | | (4,514,547 |
| | | | |
|
|
Net Assets — 100% | | | | | $ | 157,395,091 |
| | | | |
|
|
Net Asset Value Per Share | | | | | $ | 11.50 |
| | | | |
|
|
| # | Estimated average life of mortgage-backed securities are unaudited. |
| * | Non-income producing – issuer in default. |
| (a) | Security is a “step-up” bond where the coupon rate increases or steps up at a predetermined date. Coupon rate disclosed represents rate as of March 31, 2005. |
| (b) | Interest rates presented for Treasury bills represent the yield to maturity at the date of purchase. |
The accompanying notes form an integral part of these financial statements.
42
GOVERNMENT MONEY MARKET FUND |
Schedule of Investments in Securities
March 31, 2005
| | Principal
amount
or shares | | Value | |
| |
| |
| |
U.S. TREASURY — 98.0%† | | | | | | | |
| | | | | | | |
U.S. Treasury Bill 2.369% 04/07/05 | | $ | 4,000,000 | | $ | 3,998,447 | |
U.S. Treasury Bill 2.677% 04/14/05 | | | 2,000,000 | | | 1,998,097 | |
U.S. Treasury Bill 2.379% 04/21/05 | | | 15,000,000 | | | 14,980,542 | |
U.S. Treasury Bill 2.725% 05/26/05 | | | 7,000,000 | | | 6,971,392 | |
U.S. Treasury Bill 2.803% 06/30/05 | | | 12,000,000 | | | 11,917,650 | |
| | | | |
|
| |
| | | | | | 39,866,128 | |
| | | | | | | |
SHORT-TERM SECURITIES — 4.4% | | | | | | | |
| | | | | | | |
Wells Fargo 100% Treasury Money Market Fund | | | 1,791,600 | | | 1,791,600 | |
| | | | |
|
| |
Total Investments in Securities (Cost $41,657,728) | | | | | | 41,657,728 | |
Other Liabilities in Excess of Other Assets — (2.4%) | | | | | | (968,333 | ) |
| | | | |
|
| |
Net Assets — 100% | | | | | $ | 40,689,395 | |
| | | | |
|
| |
| | | | | | | |
| † | Interest rates presented for Treasury bills represent the yield to maturity at the date of purchase. |
The accompanying notes form an integral part of these financial statements.
43
Statements of Assets and Liabilities
March 31, 2005
| | Value | | Hickory | |
| |
| |
| |
Assets: | | | | | | | |
Investments in securities at value: | | | | | | | |
Unaffiliated issuers* | | $ | 3,969,718,059 | | $ | 333,301,845 | |
Non-controlled affiliates* | | | 138,252,152 | | | 1,718 | |
| |
|
| |
|
| |
| | | 4,107,970,211 | | | 333,303,563 | |
Accrued interest and dividends receivable | | | 3,399,136 | | | 522,778 | |
Receivable for securities sold | | | 26,704,530 | | | — | |
Receivable for fund shares sold | | | 1,495,971 | | | 114,940 | |
Other | | | — | | | — | |
| |
|
| |
|
| |
Total assets | | | 4,139,569,848 | | | 333,941,281 | |
| |
|
| |
|
| |
| | | | | | | |
Liabilities: | | | | | | | |
Due to adviser | | | 3,786,047 | | | 317,074 | |
Options written, at value† | | | 1,243,800 | | | 925,750 | |
Payable for securities purchased | | | 5,182,016 | | | 3,254,165 | |
Payable for fund shares redeemed | | | 4,394,918 | | | 741,449 | |
Other expenses | | | 469,788 | | | 66,383 | |
| |
|
| |
|
| |
Total liabilities | | | 15,076,569 | | | 5,304,821 | |
| |
|
| |
|
| |
| | | | | | | |
Net assets applicable to shares outstanding | | $ | 4,124,493,279 | | $ | 328,636,460 | |
| |
|
| |
|
| |
| | | | | | | |
Composition of net assets: | | | | | | | |
Paid-in capital | | $ | 3,554,487,485 | | $ | 404,676,055 | |
Accumulated undistributed net investment income | | | 29,555,691 | | | — | |
Accumulated net realized gain (loss) | | | (113,293,197 | ) | | (110,987,205 | ) |
Net unrealized appreciation (depreciation) of investments | | | 653,743,300 | | | 34,947,610 | |
| |
|
| |
|
| |
Total net assets applicable to shares outstanding | | $ | 4,124,493,279 | | $ | 328,636,460 | |
| |
|
| |
|
| |
| | | | | | | |
Net asset value, offering and redemption price per share of shares outstanding | | $ | 36.14 | | $ | 31.36 | |
| |
|
| |
|
| |
| | | | | | | |
Total shares outstanding
(indefinite number of no par value shares authorized) | | | 114,132,468 | | | 10,478,875 | |
| |
|
| |
|
| |
| | | | | | | |
* Cost of investments in securities: | | | | | | | |
Unaffiliated issuers | | $ | 3,302,261,941 | | $ | 297,848,542 | |
Non-controlled affiliates | | | 153,043,488 | | | 8,588 | |
| |
|
| |
|
| |
| | $ | 3,455,305,429 | | $ | 297,857,130 | |
| |
|
| |
|
| |
| | | | | | | |
† Proceeds from options written | | $ | 2,322,318 | | $ | 426,927 | |
| |
|
| |
|
| |
The accompanying notes form an integral part of these financial statements.
44
| | Partners
Value | | Balanced | | Fixed
Income | | Government
Money Market | |
| |
| |
| |
| |
| |
Assets: | | | | | | | | | | | | | |
Investments in securities at value: | | | | | | | | | | | | | |
Unaffiliated issuers* | | $ | 2,633,329,152 | | $ | 53,922,701 | | $ | 161,909,638 | | $ | 41,657,728 | |
Non-controlled affiliates* | | | 5,029,388 | | | — | | | — | | | — | |
| |
|
| |
|
| |
|
| |
|
| |
| | | 2,638,358,540 | | | 53,922,701 | | | 161,909,638 | | | 41,657,728 | |
Accrued interest and dividends receivable | | | 1,963,002 | | | 131,721 | | | 844,594 | | | 17,319 | |
Receivable for securities sold | | | 29,416,132 | | | 588,989 | | | — | | | — | |
Receivable for fund shares sold | | | 580,450 | | | 441,385 | | | 376,413 | | | 160,541 | |
Other | | | 10,495 | | | — | | | — | | | — | |
| |
|
| |
|
| |
|
| |
|
| |
Total assets | | | 2,670,328,619 | | | 55,084,796 | | | 163,130,645 | | | 41,835,588 | |
| |
|
| |
|
| |
|
| |
|
| |
| | | | | | | | | | | | | |
Liabilities: | | | | | | | | | | | | | |
Due to adviser | | | 2,498,320 | | | 44,060 | | | 75,728 | | | 21,592 | |
Options written, at value† | | | 829,400 | | | — | | | — | | | — | |
Payable for securities purchased | | | 27,844,922 | | | 788,932 | | | 5,052,701 | | | — | |
Payable for fund shares redeemed | | | 5,316,409 | | | — | | | 577,729 | | | 1,105,669 | |
Other expenses | | | 226,249 | | | 17,657 | | | 29,396 | | | 18,932 | |
| |
|
| |
|
| |
|
| |
|
| |
Total liabilities | | | 36,715,300 | | | 850,649 | | | 5,735,554 | | | 1,146,193 | |
| |
|
| |
|
| |
|
| |
|
| |
| | | | | | | | | | | | | |
Net assets applicable to shares outstanding | | $ | 2,633,613,319 | | $ | 54,234,147 | | $ | 157,395,091 | | $ | 40,689,395 | |
| |
|
| |
|
| |
|
| |
|
| |
| | | | | | | | | | | | | |
Composition of net assets: | | | | | | | | | | | | | |
Paid-in capital | | $ | 2,193,079,318 | | $ | 51,335,063 | | $ | 157,152,253 | | $ | 40,689,865 | |
Accumulated undistributed net investment income | | | 10,951,890 | | | 118,819 | | | 205,591 | | | — | |
Accumulated net realized gain (loss) | | | (53,418,764 | ) | | 887,950 | | | 570,723 | | | (470 | ) |
Net unrealized appreciation (depreciation) of investments | | | 483,000,875 | | | 1,892,315 | | | (533,476 | ) | | — | |
| |
|
| |
|
| |
|
| |
|
| |
Total net assets applicable to shares outstanding | | $ | 2,633,613,319 | | $ | 54,234,147 | | $ | 157,395,091 | | $ | 40,689,395 | |
| |
|
| |
|
| |
|
| |
|
| |
| | | | | | | | | | | | | |
Net asset value, offering and redemption price per share of shares outstanding | | $ | 22.98 | | $ | 11.17 | | $ | 11.50 | | $ | 1.000 | |
| |
|
| |
|
| |
|
| |
|
| |
| | | | | | | | | | | | | |
Total shares outstanding
(indefinite number of no par value shares authorized) | | | 114,618,583 | | | 4,853,191 | | | 13,689,872 | | | 40,689,865 | |
| |
|
| |
|
| |
|
| |
|
| |
| | | | | | | | | | | | | |
* Cost of investments in securities: | | | | | | | | | | | | | |
Unaffiliated issuers | | $ | 2,153,124,092 | | $ | 52,030,386 | | $ | 162,443,114 | | $ | 41,657,728 | |
Non-controlled affiliates | | | 2,952,881 | | | — | | | — | | | — | |
| |
|
| |
|
| |
|
| |
|
| |
| | $ | 2,156,076,973 | | $ | 52,030,386 | | $ | 162,443,114 | | $ | 41,657,728 | |
| |
|
| |
|
| |
|
| |
|
| |
| | | | | | | | | | | | | |
† Proceeds from options written | | $ | 1,548,708 | | $ | — | | $ | — | | $ | — | |
| |
|
| |
|
| |
|
| |
|
| |
The accompanying notes form an integral part of these financial statements.
45
Statements of Operations
Year Ended March 31, 2005
| | Value | | Hickory | |
| |
| |
| |
Investment income: | | | | | | | |
Dividends: | | | | | | | |
Unaffiliated issuers* | | $ | 51,833,715 | | $ | 3,690,702 | |
Non-controlled affiliates | | | 11,744,233 | | | — | |
| |
|
| |
|
| |
| | | 63,577,948 | | | 3,690,702 | |
Interest | | | 24,957,606 | | | 1,983,255 | |
| |
|
| |
|
| |
Total investment income | | | 88,535,554 | | | 5,673,957 | |
| |
|
| |
|
| |
| | | | | | | |
Expenses: | | | | | | | |
Investment advisory fee | | | 41,197,621 | | | 3,039,939 | |
Administrative fee | | | 4,380,988 | | | 385,246 | |
Custodial fees | | | 101,842 | | | 13,945 | |
Registration fees | | | 90,574 | | | 32,210 | |
Sub-transfer agent fees | | | 419,073 | | | 112,291 | |
Trustees fees | | | 87,489 | | | 6,560 | |
Other expenses | | | 1,223,072 | | | 102,532 | |
| |
|
| |
|
| |
Total expenses | | | 47,500,659 | | | 3,692,723 | |
Less fees waived by investment adviser | | | — | | | — | |
| |
|
| |
|
| |
Net expenses | | | 47,500,659 | | | 3,692,723 | |
| |
|
| |
|
| |
Net investment income | | | 41,034,895 | | | 1,981,234 | |
| |
|
| |
|
| |
| | | | | | | |
Realized and unrealized gain (loss) on investments: | | | | | | | |
Net realized gain (loss): | | | | | | | |
Unaffiliated issuers | | $ | 101,352,830 | | $ | 35,648,435 | |
Non-controlled affiliates | | | (23,990,195 | ) | | — | |
Options written | | | (1,052,703 | ) | | 492,371 | |
| |
|
| |
|
| |
Net realized gain (loss) | | | 76,309,932 | | | 36,140,806 | |
Net unrealized appreciation (depreciation): | | | | | | | |
Unaffiliated issuers | | | 100,615,651 | | | (10,274,868 | ) |
Non-controlled affiliates | | | (5,715,713 | ) | | (6,870 | ) |
Options written | | | 876,465 | | | (421,798 | ) |
| |
|
| |
|
| |
Net unrealized appreciation (depreciation) | | | 95,776,403 | | | (10,703,536 | ) |
| |
|
| |
|
| |
Net realized and unrealized gain (loss) on investments | | | 172,086,335 | | | 25,437,270 | |
| |
|
| |
|
| |
Net increase (decrease) in net assets resulting from operations | | $ | 213,121,230 | | $ | 27,418,504 | |
| |
|
| |
|
| |
| | | | | | | |
* Foreign taxes withheld | | $ | — | | $ | — | |
| |
|
| |
|
| |
The accompanying notes form an integral part of these financial statements.
46
| | Partners
Value | | Balanced | | Fixed
Income | | Government
Money Market | |
| |
| |
| |
| |
| |
Investment income: | | | | | | | | | | | | | |
Dividends: | | | | | | | | | | | | | |
Unaffiliated issuers* | | $ | 32,985,604 | | $ | 286,534 | | $ | 131,388 | | $ | — | |
Non-controlled affiliates | | | — | | | — | | | — | | | — | |
| |
|
| |
|
| |
|
| |
|
| |
| | | 32,985,604 | | | 286,534 | | | 131,388 | | | — | |
Interest | | | 15,254,294 | | | 564,999 | | | 4,172,302 | | | 669,026 | |
| |
|
| |
|
| |
|
| |
|
| |
Total investment income | | | 48,239,898 | | | 851,533 | | | 4,303,690 | | | 669,026 | |
| |
|
| |
|
| |
|
| |
|
| |
| | | | | | | | | | | | | |
Expenses: | | | | | | | | | | | | | |
Investment advisory fee | | | 27,484,621 | | | 322,828 | | | 658,399 | | | 223,893 | |
Administrative fee | | | 2,857,321 | | | 76,853 | | | 212,772 | | | 84,613 | |
Custodial fees | | | 68,397 | | | 6,947 | | | 4,583 | | | 4,114 | |
Registration fees | | | 53,786 | | | 26,181 | | | 25,819 | | | 24,553 | |
Sub-transfer agent fees | | | 147,300 | | | 28,683 | | | 36,203 | | | 33,272 | |
Trustees fees | | | 56,100 | | | 964 | | | 2,911 | | | 631 | |
Other expenses | | | 696,246 | | | 26,994 | | | 60,611 | | | 31,243 | |
| |
|
| |
|
| |
|
| |
|
| |
Total expenses | | | 31,363,771 | | | 489,450 | | | 1,001,298 | | | 402,319 | |
Less fees waived by investment adviser | | | — | | | — | | | (11,896 | ) | | (178,426 | ) |
| |
|
| |
|
| |
|
| |
|
| |
Net expenses | | | 31,363,771 | | | 489,450 | | | 989,402 | | | 223,893 | |
| |
|
| |
|
| |
|
| |
|
| |
Net investment income | | | 16,876,127 | | | 362,083 | | | 3,314,288 | | | 445,133 | |
| |
|
| |
|
| |
|
| |
|
| |
| | | | | | | | | | | | | |
Realized and unrealized gain (loss) on investments: | | | | | | | | | | | | | |
Net realized gain (loss): | | | | | | | | | | | | | |
Unaffiliated issuers | | $ | 18,617,006 | | $ | 1,478,438 | | $ | 1,337,015 | | $ | (470 | ) |
Non-controlled affiliates | | | — | | | — | | | — | | | — | |
Options written | | | (602,307 | ) | | 54,623 | | | — | | | — | |
| |
|
| |
|
| |
|
| |
|
| |
Net realized gain (loss) | | | 18,014,699 | | | 1,533,061 | | | 1,337,015 | | | (470 | ) |
Net unrealized appreciation (depreciation): | | | | | | | | | | | | | |
Unaffiliated issuers | | | 111,584,049 | | | 1,337,414 | | | (3,252,969 | ) | | — | |
Non-controlled affiliates | | | 895,440 | | | — | | | — | | | — | |
Options written | | | 524,277 | | | 16,530 | | | — | | | — | |
| |
|
| |
|
| |
|
| |
|
| |
Net unrealized appreciation (depreciation) | | | 113,003,766 | | | 1,353,944 | | | (3,252,969 | | | — | |
| |
|
| |
|
| |
|
| |
|
| |
Net realized and unrealized gain (loss) on investments | | | 131,018,465 | | | 2,887,005 | | | (1,915,954 | ) | | (470 | ) |
| |
|
| |
|
| |
|
| |
|
| |
Net increase (decrease) in net assets resulting from operations | | $ | 147,894,592 | | $ | 3,249,088 | | $ | 1,398,334 | | $ | 444,663 | |
| |
|
| |
|
| |
|
| |
|
| |
| | | | | | | | | | | | | |
* Foreign taxes withheld | | $ | — | | $ | 1,037 | | $ | — | | $ | — | |
| |
|
| |
|
| |
|
| |
|
| |
The accompanying notes form an integral part of these financial statements.
47
Statements of Changes in Net Assets
| | | |
| | Value | |
| |
| |
| | Year ended March 31, | |
| | 2005 | | 2004 | |
| |
| |
| |
Increase (decrease) in net assets: | | | | | | | |
From operations: | | | | | | | |
Net investment income (loss) | | $ | 41,034,895 | | $ | 22,348,179 | |
Net realized gain (loss) | | | 76,309,932 | | | 301,940,647 | |
Net unrealized appreciation (depreciation) | | | 95,776,403 | | | 950,537,203 | |
| |
|
| |
|
| |
Net increase (decrease) in net assets resulting from operations | | | 213,121,230 | | | 1,274,826,029 | |
| | | | | | | |
Distributions to shareholders from: | | | | | | | |
Net investment income | | | (23,795,785 | ) | | (17,867,102 | ) |
Net realized gains | | | (380,183,615 | ) | | — | |
| |
|
| |
|
| |
Total distributions | | | (403,979,400 | ) | | (17,867,102 | ) |
| | | | | | | |
Fund share transactions:* | | | | | | | |
Proceeds from sales | | | 588,505,385 | | | 886,197,233 | |
Payments for redemptions | | | (1,051,553,296 | ) | | (769,266,507 | ) |
Reinvestment of distributions | | | 369,193,178 | | | 16,317,711 | |
| |
|
| |
|
| |
Net increase (decrease) from fund share transactions | | | (93,854,733 | ) | | 133,248,437 | |
| |
|
| |
|
| |
Total increase (decrease) in net assets | | | (284,712,903 | ) | | 1,390,207,364 | |
| |
|
| |
|
| |
| | | | | | | |
Net assets: | | | | | | | |
Beginning of period | | $ | 4,409,206,182 | | $ | 3,018,998,818 | |
| |
|
| |
|
| |
| | | | | | | |
End of period | | $ | 4,124,493,279 | | $ | 4,409,206,182 | |
| |
|
| |
|
| |
| | | | | | | |
Undistributed net investment income | | $ | 29,555,691 | | | 12,316,581 | |
| |
|
| |
|
| |
| | | | | | | |
*Transactions in fund shares: | | | | | | | |
Shares issued | | | 16,046,147 | | | 26,727,112 | |
Shares redeemed | | | (28,725,708 | ) | | (22,935,974 | ) |
Reinvested dividends | | | 10,109,290 | | | 480,038 | |
| |
|
| |
|
| |
Net increase (decrease) in shares outstanding | | | (2,570,271 | ) | | 4,271,176 | |
| |
|
| |
|
| |
The accompanying notes form an integral part of these financial statements.
48
| | | | | |
| | Hickory | | Partners Value | |
| |
| |
| |
| | Year ended March 31, | | Year ended March 31, | |
| | 2005 | | 2004 | | 2005 | | 2004 | |
| |
| |
| |
| |
| |
Increase (decrease) in net assets: | | | | | | | | | | | | | |
From operations: | | | | | | | | | | | | | |
Net investment income (loss) | | $ | 1,981,234 | | $ | 2,235,242 | | $ | 16,876,127 | | $ | 4,248,293 | |
Net realized gain (loss) | | | 36,140,806 | | | (27,167,302 | ) | | 18,014,699 | | | 57,975,960 | |
Net unrealized appreciation (depreciation) | | | (10,703,536 | ) | | 131,358,144 | | | 113,003,766 | | | 760,926,699 | |
| |
|
| |
|
| |
|
| |
|
| |
Net increase (decrease) in net assets resulting from operations | | | 27,418,504 | | | 106,426,084 | | | 147,894,592 | | | 823,150,952 | |
| | | | | | | | | | | | | |
Distributions to shareholders from: | | | | | | | | | | | | | |
Net investment income | | | (2,332,129 | ) | | (2,336,447 | ) | | (10,128,752 | ) | | (2,660,926 | ) |
Net realized gains | | | — | | | — | | | (83,610,438 | ) | | — | |
| |
|
| |
|
| |
|
| |
|
| |
Total distributions | | | (2,332,129 | ) | | (2,336,447 | ) | | (93,739,190 | ) | | (2,660,926 | ) |
| | | | | | | | | | | | | |
Fund share transactions:* | | | | | | | | | | | | | |
Proceeds from sales | | | 97,032,098 | | | 42,650,830 | | | 303,722,300 | | | 527,744,065 | |
Payments for redemptions | | | (70,542,119 | ) | | (52,365,496 | ) | | (747,895,280 | ) | | (618,217,757 | ) |
Reinvestment of distributions | | | 2,069,280 | | | 2,087,383 | | | 87,576,432 | | | 2,453,251 | |
| |
|
| |
|
| |
|
| |
|
| |
Net increase (decrease) from fund share transactions | | | 28,559,259 | | | (7,627,283 | ) | | (356,596,548 | ) | | (88,020,441 | ) |
| |
|
| |
|
| |
|
| |
|
| |
Total increase (decrease) in net assets | | | 53,645,634 | | | 96,462,354 | | | (302,441,146 | ) | | 732,469,585 | |
| |
|
| |
|
| |
|
| |
|
| |
| | | | | | | | | | | | | |
Net assets: | | | | | | | | | | | | | |
Beginning of period | | $ | 274,990,826 | | $ | 178,528,472 | | $ | 2,936,054,465 | | $ | 2,203,584,880 | |
| |
|
| |
|
| |
|
| |
|
| |
| | | | | | | | | | | | | |
End of period | | $ | 328,636,460 | | $ | 274,990,826 | | $ | 2,633,613,319 | | $ | 2,936,054,465 | |
| |
|
| |
|
| |
|
| |
|
| |
| | | | | | | | | | | | | |
Undistributed net investment income | | $ | — | | $ | 214,046 | | $ | 10,951,890 | | $ | 4,205,735 | |
| |
|
| |
|
| |
|
| |
|
| |
| | | | | | | | | | | | | |
*Transactions in fund shares: | | | | | | | | | | | | | |
Shares issued | | | 3,202,675 | | | 1,709,407 | | | 13,435,510 | | | 26,439,128 | |
Shares redeemed | | | (2,317,096 | ) | | (2,196,465 | ) | | (32,919,316 | ) | | (30,449,042 | ) |
Reinvested dividends | | | 63,757 | | | 79,344 | | | 3,717,233 | | | 126,652 | |
| |
|
| |
|
| |
|
| |
|
| |
Net increase (decrease) in shares outstanding | | | 949,336 | | | (407,714 | ) | | (15,766,573 | ) | | (3,883,262 | ) |
| |
|
| |
|
| |
|
| |
|
| |
The accompanying notes form an integral part of these financial statements.
49
Statements of Changes in Net Assets, Continued
| | Balanced | |
| |
| |
| | Year ended
March 31, 2005 | | Six months
ended
March 31, 2004(a) | |
| |
| |
| |
Increase (decrease) in net assets: | | | | | | | |
From operations: | | | | | | | |
Net investment income (loss) | | $ | 362,083 | | $ | 7,122 | |
Net realized gain (loss) | | | 1,533,061 | | | 74,634 | |
Net unrealized appreciation (depreciation) | | | 1,353,944 | | | 538,371 | |
| |
|
| |
|
| |
Net increase (decrease) in net assets resulting from operations | | | 3,249,088 | | | 620,127 | |
| | | | | | | |
Distributions to shareholders from: | | | | | | | |
Net investment income | | | (247,797 | ) | | (7,122 | ) |
Net realized gains | | | (711,214 | ) | | (3,998 | ) |
| |
|
| |
|
| |
Total distributions | | | (959,011 | ) | | (11,120 | ) |
| | | | | | | |
Fund share transactions:* | | | | | | | |
Proceeds from sales | | | 33,278,226 | | | 23,319,100 | |
Payments for redemptions | | | (5,395,550 | ) | | (809,419 | ) |
Reinvestment of distributions | | | 932,148 | | | 10,558 | |
| |
|
| |
|
| |
Net increase (decrease) from fund share transactions | | | 28,814,824 | | | 22,520,239 | |
| |
|
| |
|
| |
Total increase (decrease) in net assets | | | 31,104,901 | | | 23,129,246 | |
| |
|
| |
|
| |
| | | | | | | |
Net assets: | | | | | | | |
Beginning of period | | $ | 23,129,246 | | $ | — | |
| |
|
| |
|
| |
| | | | | | | |
End of period | | $ | 54,234,147 | | $ | 23,129,246 | |
| |
|
| |
|
| |
| | | | | | | |
Undistributed net investment income | | $ | 118,819 | | $ | — | |
| |
|
| |
|
| |
| | | | | | | |
* Transactions in fund shares: | | | | | | | |
Shares issued | | | 3,062,378 | | | 2,275,779 | |
Shares redeemed | | | (490,801 | ) | | (77,777 | ) |
Reinvested dividends | | | 82,593 | | | 1,019 | |
Net increase (decrease) in shares outstanding | | | 2,654,170 | | | 2,199,021 | |
| |
|
| |
|
| |
| (a) | Fund commenced operations on October 1, 2003. |
The accompanying notes form an integral part of these financial statements.
50
| | Fixed Income | | Government Money Market | |
| |
| |
| |
| | Year ended March 31, | | Year ended March 31, | |
| | | | | | | | | |
| | 2005 | | 2004 | | 2005 | | 2004 | |
| |
| |
| |
| |
| |
Increase (decrease) in net assets: | | | | | | | | | | | | | |
From operations: | | | | | | | | | | | | | |
Net investment income (loss) | | $ | 3,314,288 | | $ | 1,718,383 | | $ | 445,133 | | $ | 287,675 | |
Net realized gain (loss) | | | 1,337,015 | | | 1,017,050 | | | (470 | ) | | 3,417 | |
Net unrealized appreciation (depreciation) | | | (3,252,969 | ) | | 1,336,980 | | | — | | | — | |
| |
|
| |
|
| |
|
| |
|
| |
Net increase (decrease) in net assets resulting from operations | | | 1,398,334 | | | 4,072,413 | | | 444,663 | | | 291,092 | |
| | | | | | | | | | | | | |
Distributions to shareholders from: | | | | | | | | | | | | | |
Net investment income | | | (3,688,098 | ) | | (1,672,756 | ) | | (445,133 | ) | | (287,675 | ) |
Net realized gains | | | — | | | — | | | — | | | (3,417 | ) |
| |
|
| |
|
| |
|
| |
|
| |
Total distributions | | | (3,688,098 | ) | | (1,672,756 | ) | | (445,133 | ) | | (291,092 | ) |
| | | | | | | | | | | | | |
Fund share transactions:* | | | | | | | | | | | | | |
Proceeds from sales | | | 103,240,646 | | | 70,165,452 | | | 173,196,212 | | | 142,281,907 | |
Payments for redemptions | | | (42,800,884 | ) | | (31,367,706 | ) | | (182,044,937 | ) | | (164,193,069 | ) |
Reinvestment of distributions | | | 3,512,492 | | | 1,551,236 | | | 435,527 | | | 281,830 | |
| |
|
| |
|
| |
|
| |
|
| |
Net increase (decrease) from fund share transactions | | | 63,952,254 | | | 40,348,982 | | | (8,413,198 | ) | | (21,629,332 | ) |
| |
|
| |
|
| |
|
| |
|
| |
Total increase (decrease) in net assets | | | 61,662,490 | | | 42,748,639 | | | (8,413,668 | ) | | (21,629,332 | ) |
| |
|
| |
|
| |
|
| |
|
| |
| | | | | | | | | | | | | |
Net assets: | | | | | | | | | | | | | |
Beginning of period | | $ | 95,732,601 | | $ | 52,983,962 | | $ | 49,103,063 | | $ | 70,732,395 | |
| |
|
| |
|
| |
|
| |
|
| |
| | | | | | | | | | | | | |
End of period | | $ | 157,395,091 | | $ | 95,732,601 | | $ | 40,689,395 | | $ | 49,103,063 | |
| |
|
| |
|
| |
|
| |
|
| |
| | | | | | | | | | | | | |
| | | | | | | | | | | | | |
Undistributed net investment income | | $ | 205,591 | | $ | 396,843 | | $ | — | | $ | — | |
| |
|
| |
|
| |
|
| |
|
| |
* Transactions in fund shares: | | | | | | | | | | | | | |
Shares issued | | | 8,908,964 | | | 6,075,301 | | | 173,196,212 | | | 142,281,907 | |
Shares redeemed | | | (3,698,998 | ) | | (2,729,722 | ) | | (182,044,937 | ) | | (164,193,069 | ) |
Reinvested dividends | | | 304,319 | | | 135,677 | | | 435,527 | | | 281,830 | |
| |
|
| |
|
| |
|
| |
|
| |
Net increase (decrease) in shares outstanding | | | 5,514,285 | | | 3,481,256 | | | (8,413,198 | ) | | (21,629,332 | ) |
| |
|
| |
|
| |
|
| |
|
| |
The accompanying notes form an integral part of these financial statements.
51
Value Fund
Financial Highlights
The following financial information provides selected data for a share of the Value Fund outstanding throughout the periods indicated.
| | Year ended March 31, | |
| |
| |
| | 2005 | | 2004 | | 2003 | | 2002 | | 2001 | |
| |
| |
| |
| |
| |
| |
Net asset value, beginning of period | | $ | 37.78 | | $ | 26.85 | | $ | 34.25 | | $ | 34.73 | | $ | 32.00 | |
| |
|
| |
|
| |
|
| |
|
| |
|
| |
| | | | | | | | | | | | | | | | |
Income (loss) from investment operations: | | | | | | | | | | | | | | | | |
Net investment income | | | 0.36 | | | 0.19 | | | 0.23 | | | 0.27 | | | 0.50 | |
Net gain (loss) on securities (realized and unrealized) | | | 1.51 | | | 10.89 | | | (7.12 | ) | | 0.29 | | | 6.14 | |
| | |
| |
|
| |
|
| |
|
| |
|
| |
Total from investment operations | | | 1.87 | | | 11.08 | | | (6.89 | ) | | 0.56 | | | 6.64 | |
| | |
| |
|
| |
|
| |
|
| |
|
| |
| | | | | | | | | | | | | | | | |
Less distributions: | | | | | | | | | | | | | | | | |
Dividends from net investment income | | | (0.21 | ) | | (0.15 | ) | | (0.20 | ) | | (0.37 | ) | | (0.49 | ) |
Distributions from realized gains | | | (3.30 | ) | | — | | | (0.31 | ) | | (0.67 | ) | | (3.42 | ) |
| | |
| |
|
| |
|
| |
|
| |
|
| |
Total distributions | | | (3.51 | ) | | (0.15 | ) | | (0.51 | ) | | (1.04 | ) | | (3.91 | ) |
| | |
| |
|
| |
|
| |
|
| |
|
| |
| | | | | | | | | | | | | | | | |
Net asset value, end of period | | $ | 36.14 | | $ | 37.78 | | $ | 26.85 | | $ | 34.25 | | $ | 34.73 | |
| |
|
| |
|
| |
|
| |
|
| |
|
| |
| | | | | | | | | | | | | | | | |
Total return | | | 5.1 | % | | 41.3 | % | | (20.2 | %) | | 1.5 | % | | 21.9 | % |
| | | | | | | | | | | | | | | | |
Ratios/supplemental data: | | | | | | | | | | | | | | | | |
Net assets, end of period ($000) | | | 4,124,493 | | | 4,409,206 | | | 3,018,999 | | | 4,513,819 | | | 3,648,676 | |
| | | | | | | | | | | | | | | | |
Ratio of expenses to average net assets | | | 1.10 | % | | 1.11 | % | | 1.08 | % | | 1.06 | % | | 1.11 | % |
| | | | | | | | | | | | | | | | |
Ratio of net investment income to average net assets | | | 0.95 | % | | 0.57 | % | | 0.76 | % | | 0.87 | % | | 1.60 | % |
| | | | | | | | | | | | | | | | |
Portfolio turnover rate | | | 26 | % | | 12 | % | | 18 | % | | 13 | % | | 36 | % |
The accompanying notes form an integral part of these financial statements.
52
Hickory Fund
Financial Highlights
The following financial information provides selected data for a share of the Hickory Fund outstanding throughout the periods indicated.
| | Year Ended March 31, | |
| |
| |
| | 2005 | | 2004 | | 2003 | | 2002 | | 2001 | |
| |
| |
| |
| |
| |
| |
Net asset value, beginning of period | | $ | 28.86 | | $ | 17.97 | | $ | 27.01 | | $ | 25.39 | | $ | 34.32 | |
| |
|
| |
|
| |
|
| |
|
| |
|
| |
| | | | | | | | | | | | | | | | |
Income (loss) from investment operations: | | | | | | | | | | | | | | | | |
Net investment income (loss) | | | 0.19 | | | 0.25 | | | 0.17 | | | (0.02 | ) | | (0.09 | ) |
Net gain (loss) on securities (realized and unrealized) | | | 2.54 | | | 10.90 | | | (9.07 | ) | | 1.65 | | | (3.55 | ) |
| |
|
| |
|
| |
|
| |
|
| |
|
| |
Total from investment operations | | | 2.73 | | | 11.15 | | | (8.90 | ) | | 1.63 | | | (3.64 | ) |
| |
|
| |
|
| |
|
| |
|
| |
|
| |
| | | | | | | | | | | | | | | | |
Less distributions: | | | | | | | | | | | | | | | | |
Dividends from net investment income | | | (0.23 | ) | | (0.26 | ) | | (0.14 | ) | | — | | | — | |
Distributions from realized gains | | | — | | | — | | | — | | | (0.01 | ) | | (5.29 | ) |
| |
|
| |
|
| |
|
| |
|
| |
|
| |
Total distributions | | | (0.23 | ) | | (0.26 | ) | | (0.14 | ) | | (0.01 | ) | | (5.29 | ) |
| |
|
| |
|
| |
|
| |
|
| |
|
| |
| | | | | | | | | | | | | | | | |
Net asset value, end of period | | $ | 31.36 | | $ | 28.86 | | $ | 17.97 | | $ | 27.01 | | $ | 25.39 | |
| |
|
| |
|
| |
|
| |
|
| |
|
| |
| | | | | | | | | | | | | | | | |
Total return | | | 9.4 | % | | 62.2 | % | | (33.0 | %) | | 6.4 | % | | (11.9 | %) |
| | | | | | | | | | | | | | | | |
Ratios/supplemental data: | | | | | | | | | | | | | | | | |
Net assets, end of period ($000) | | | 328,636 | | | 274,991 | | | 178,528 | | | 346,654 | | | 415,865 | |
| | | | | | | | | | | | | | | | |
Ratio of net expenses to average net assets | | | 1.21 | % | | 1.30 | % | | 1.32 | % | | 1.25 | % | | 1.22 | % |
| | | | | | | | | | | | | | | | |
Ratio of net investment income (loss) to average net assets | | | 0.65 | % | | 0.96 | % | | 0.78 | % | | (0.08 | %) | | (0.27 | %) |
| | | | | | | | | | | | | | | | |
Portfolio turnover rate | | | 58 | % | | 50 | % | | 64 | % | | 18 | % | | 22 | % |
The accompanying notes form an integral part of these financial statements.
53
Partners Value Fund
Financial Highlights
The following financial information provides selected data for a share of the Partners Value Fund outstanding throughout the periods indicated.
| | Year ended March 31, | |
| |
| |
| | 2005 | | 2004 | | 2003 | | 2002 | | 2001 | |
| |
| |
| |
| |
| |
| |
Net asset value, beginning of period | | $ | 22.52 | | $ | 16.41 | | $ | 20.79 | | $ | 21.27 | | $ | 18.75 | |
| |
|
| |
|
| |
|
| |
|
| |
|
| |
| | | | | | | | | | | | | | | | |
Income (loss) from investment operations: | | | | | | | | | | | | | | | | |
Net investment income | | | 0.15 | | | 0.03 | | | 0.06 | | | 0.13 | | | 0.31 | |
Net gain (loss) on securities (realized and unrealized) | | | 1.09 | | | 6.10 | | | (4.27 | ) | | (0.14 | ) | | 3.67 | |
| |
|
| |
|
| |
|
| |
|
| |
|
| |
Total from investment operations | | | 1.24 | | | 6.13 | | | (4.21 | ) | | (0.01 | ) | | 3.98 | |
| |
|
| |
|
| |
|
| |
|
| |
|
| |
| | | | | | | | | | | | | | | | |
Less distributions: | | | | | | | | | | | | | | | | |
Dividends from net investment income | | | (0.08 | ) | | (0.02 | ) | | (0.05 | ) | | (0.21 | ) | | (0.30 | ) |
Distributions from realized gains | | | (0.70 | ) | | — | | | (0.12 | ) | | (0.26 | ) | | (1.16 | ) |
| |
|
| |
|
| |
|
| |
|
| |
|
| |
Total distributions | | | (0.78 | ) | | (0.02 | ) | | (0.17 | ) | | (0.47 | ) | | (1.46 | ) |
| |
|
| |
|
| |
|
| |
|
| |
|
| |
| | | | | | | | | | | | | | | | |
Net asset value, end of period | | $ | 22.98 | | $ | 22.52 | | $ | 16.41 | | $ | 20.79 | | $ | 21.27 | |
| |
|
| |
|
| |
|
| |
|
| |
|
| |
| | | | | | | | | | | | | | | | |
Total return | | | 5.5 | % | | 37.4 | % | | (20.3 | %) | | (0.1 | %) | | 21.9 | % |
| | | | | | | | | | | | | | | | |
Ratios/supplemental data: | | | | | | | | | | | | | | | | |
Net assets, end of period ($000) | | | 2,633,613 | | | 2,936,054 | | | 2,203,585 | | | 3,136,878 | | | 2,394,547 | |
| | | | | | | | | | | | | | | | |
Ratio of expenses to average net assets | | | 1.13 | % | | 1.13 | % | | 1.10 | % | | 1.08 | % | | 1.13 | % |
| | | | | | | | | | | | | | | | |
Ratio of net investment income to average net assets | | | 0.61 | % | | 0.16 | % | | 0.35 | % | | 0.69 | % | | 1.77 | % |
| | | | | | | | | | | | | | | | |
Portfolio turnover rate | | | 22 | % | | 11 | % | | 20 | % | | 10 | % | | 29 | % |
The accompanying notes form an integral part of these financial statements.
54
Balanced Fund
Financial Highlights
The following financial information provides selected data for a share of the Balanced Fund outstanding throughout the periods indicated.
| | Year ended
March 31, 2005 | | Six months ended
March 31, 2004(a) | |
| |
| |
| |
Net asset value, beginning of period | | | $ | 10.52 | | | | $ | 10.00 | | |
| | |
|
| | | |
|
| | |
| | | | | | | | | | | |
Income from investment operations: | | | | | | | | | | | |
Net investment income | | | | 0.09 | | | | | 0.01 | | |
Net gain on securities (realized and unrealized) | | | | 0.80 | | | | | 0.52 | | |
| | |
|
| | | |
|
| | |
Total from investment operations | | | | 0.89 | | | | | 0.53 | | |
| | |
|
| | | |
|
| | |
| | | | | | | | | | | |
Less distributions: | | | | | | | | | | | |
Dividends from net investment income | | | | (0.06 | ) | | | | (0.01 | ) | |
Distributions from realized gains | | | | (0.18 | ) | | | | — | # | |
| | |
|
| | | |
|
| | |
Total distributions | | | | (0.24 | ) | | | | (0.01 | ) | |
| | |
|
| | | |
|
| | |
| | | | | | | | | | | |
Net asset value, end of period | | | $ | 11.17 | | | | $ | 10.52 | | |
| | |
|
| | | |
|
| | |
| | | | | | | | | | | |
Total return | | | | 8.5 | % | | | | 5.3%† | | |
| | | | | | | | | | | |
Ratios/supplemental data: | | | | | | | | | | | |
Net assets, end of period ($000) | | | | 54,234 | | | | | 23,129 | | |
Ratio of net expenses to average net assets†† | | | | 1.21 | % | | | | 1.25%* | | |
Ratio of net investment income to average net assets | | | | 0.89 | % | | | | 0.09%* | | |
Portfolio turnover rate | | | | 50 | % | | | | 5%† | | |
# | Amount rounds to less than $0.01 |
†† | Absent waivers and expenses assumed by the Adviser, the annualized expense ratio would have been 1.74% for the period ended March 31, 2004. |
(a) | Fund commenced operations on October 1, 2003. |
The accompanying notes form an integral part of these financial statements.
55
Fixed Income Fund
Financial Highlights
The following financial information provides selected data for a share of the Fixed Income Fund outstanding throughout the periods indicated.
| | Year ended March 31, | |
| |
| |
| | 2005 | | 2004 | | 2003 | | 2002 | | 2001 | |
| |
| |
| |
| |
| |
| |
Net asset value, beginning of period | | $ | 11.71 | | $ | 11.29 | | $ | 11.17 | | $ | 11.24 | | $ | 10.68 | |
| |
|
| |
|
| |
|
| |
|
| |
|
| |
| | | | | | | | | | | | | | | | |
Income (loss) from investment operations: | | | | | | | | | | | | | | | | |
Net investment income | | | 0.26 | | | 0.30 | | | 0.43 | | | 0.53 | | | 0.71 | |
Net gain (loss) on securities (realized and unrealized) | | | (0.16 | ) | | 0.45 | | | 0.18 | | | (0.04 | ) | | 0.58 | |
| |
|
| |
|
| |
|
| |
|
| |
|
| |
Total from investment operations | | | 0.10 | | | 0.75 | | | 0.61 | | | 0.49 | | | 1.29 | |
| |
|
| |
|
| |
|
| |
|
| |
|
| |
| | | | | | | | | | | | | | | | |
Less distributions: | | | | | | | | | | | | | | | | |
Dividends from net investment income | | | (0.31 | ) | | (0.33 | ) | | (0.49 | ) | | (0.56 | ) | | (0.73 | ) |
| |
|
| |
|
| |
|
| |
|
| |
|
| |
| | | | | | | | | | | | | | | | |
Net asset value, end of period | | $ | 11.50 | | $ | 11.71 | | $ | 11.29 | | $ | 11.17 | | $ | 11.24 | |
| |
|
| |
|
| |
|
| |
|
| |
|
| |
| | | | | | | | | | | | | | | | |
Total return | | | 0.9 | % | | 6.7 | % | | 5.6 | % | | 4.4 | % | | 12.6 | % |
| | | | | | | | | | | | | | | | |
Ratios/supplemental data: | | | | | | | | | | | | | | | | |
Net assets, end of period ($000) | | | 157,395 | | | 95,733 | | | 52,984 | | | 47,692 | | | 33,071 | |
Ratio of net expenses to average net assets†† | | | 0.75 | % | | 0.75 | % | | 0.75 | % | | 0.75 | % | | 0.75 | % |
Ratio of net investment income to average net assets | | | 2.51 | % | | 2.72 | % | | 3.90 | % | | 5.08 | % | | 6.46 | % |
Portfolio turnover rate | | | 41 | % | | 48 | % | | 31 | % | | 16 | % | | 1 | % |
†† | Absent voluntary waivers, the expense ratio would have been 0.76%, 0.88%, 0.91%, 0.91% and 0.95% for the years ended March 31, 2005, 2004, 2003, 2002 and 2001, respectively. |
The accompanying notes form an integral part of these financial statements.
56
Government Money Market Fund
Financial Highlights
The following financial information provides selected data for a share of the Government Money Market Fund outstanding throughout the periods indicated.
| | Year ended March 31, | |
| |
| |
| | 2005 | | 2004 | | 2003 | | 2002 | | 2001 | |
| |
| |
| |
| |
| |
| |
Net asset value, beginning of period | | $ | 1.000 | | $ | 1.000 | | $ | 1.000 | | $ | 1.000 | | $ | 1.000 | |
| |
|
| |
|
| |
|
| |
|
| |
|
| |
Income from investment operations: | | | | | | | | | | | | | | | | |
Net investment income | | | 0.010 | | | 0.005 | | | 0.010 | | | 0.024 | | | 0.056 | |
| |
|
| |
|
| |
|
| |
|
| |
|
| |
Less distributions: | | | | | | | | | | | | | | | | |
Dividends from net investment income | | | (0.010 | ) | | (0.005 | ) | | (0.010 | ) | | (0.024 | ) | | (0.056 | ) |
| |
|
| |
|
| |
|
| |
|
| |
|
| |
| | | | | | | | | | | | | | | | |
Net asset value, end of period | | $ | 1.000 | | $ | 1.000 | | $ | 1.000 | | $ | 1.000 | | $ | 1.000 | |
| |
|
| |
|
| |
|
| |
|
| |
|
| |
| | | | | | | | | | | | | | | | |
Total return | | | 1.0 | % | | 0.5 | % | | 1.0 | % | | 2.5 | % | | 5.8 | % |
| | | | | | | | | | | | | | | | |
Ratios/supplemental data: | | | | | | | | | | | | | | | | |
Net assets, end of period ($000) | | | 40,689 | | | 49,103 | | | 70,732 | | | 40,763 | | | 39,511 | |
Ratio of net expenses to average net assets†† | | | 0.50 | % | | 0.50 | % | | 0.50 | % | | 0.50 | % | | 0.50 | % |
Ratio of net investment income to average net assets | | | 1.00 | % | | 0.48 | % | | 1.02 | % | | 2.40 | % | | 5.57 | % |
†† | Absent voluntary waivers, the expense ratio would have been 0.90%, 0.91%, 0.91%, 0.94% and 0.97% for the years ended March 31, 2005, 2004, 2003, 2002 and 2001, respectively. |
The accompanying notes form an integral part of these financial statements.
57
Notes to Financial Statements
March 31, 2005
The Weitz Funds (the “Trust”) is registered under the Investment Company Act of 1940 as an open-end management investment company issuing shares in series, each series representing a distinct portfolio with its own investment objectives and policies. At March 31, 2005, the Trust had six series in operation: Value Fund, Hickory Fund, Partners Value Fund, Balanced Fund, Fixed Income Fund and Government Money Market Fund. The accompanying financial statements present the financial position and results of operations of each of the above series (individually, a “Fund”, collectively, the “Funds”). The Balanced Fund was the Trust’s initial series and it commenced operations on October 1, 2003. Each of the other Funds in the Trust (other than the Balanced Fund) is a successor in interest to certain funds having the same names and investment objectives that were included as series of two other investment companies previously managed by Wallace R. Weitz & Company (the “Adviser”), namely, the Weitz Series Fund, Inc. and the Weitz Partners Fund, Inc. (the “Predecessor Funds”). At shareholder meetings in March, 2004, the shareholders of each of the Predecessor Funds approved the reorganization of the Predecessor Funds with and into the Trust and effective April 1, 2004, the assets and liabilities of the Predecessor Funds were transferred to the Trust in exchange for shares of each of the applicable Funds.
The investment objective of the Value Fund, Hickory Fund and Partners Value Fund (the “Weitz Equity Funds”) is capital appreciation. Each of the Weitz Equity Funds invests principally in common stocks, preferred stocks and a variety of securities convertible into equity such as rights, warrants, preferred stocks and convertible bonds.
The investment objectives of the Balanced Fund are regular current income, capital preservation and long-term capital appreciation. The Fund invests principally in a portfolio of U.S. equity and fixed income securities.
The investment objective of the Fixed Income Fund is high current income consistent with preservation of capital. Under normal market conditions, the Fund will invest at least 80% of the value of its total assets in fixed income securities such as U.S. government and agency securities, corporate debt securities, mortgage-backed securities, preferred stocks and taxable municipal bonds.
The investment objective of the Government Money Market Fund is current income consistent with the preservation of capital and maintenance of liquidity. The Fund invests principally in debt obligations issued or guaranteed by the U.S. Government, its agencies and instrumentalities and repurchase agreements thereon with maturities not exceeding thirteen months.
(2) | Significant Accounting Policies |
The following accounting policies are in accordance with accounting principles generally accepted in the United States.
| (a) | Valuation of Investments |
Weitz Equity Funds, Balanced Fund and Fixed Income Fund
Investments are carried at value determined using the following valuation methods:
| • | Securities traded on a national or regional securities exchange are valued at the last sales price; if there were no sales on that day, securities are valued at the mean between the latest available and representative bid and ask prices; securities listed on the Nasdaq exchange are valued using the Nasdaq Official Closing Price (“NOCP”). Generally, the NOCP will be the last sales price unless the reported trade for the security is outside the range of the bid/ask price. In such cases, the NOCP will be normalized to the nearer of the bid or ask price. |
| • | Securities not listed on an exchange are valued at the mean between the latest available and representative bid and ask prices. |
58
| • | The value of certain debt securities for which market quotations are not readily available may be based upon current market prices of securities which are comparable in coupon, rating and maturity or an appropriate matrix utilizing similar factors. |
| • | The current market value of a traded option is the last sales price at which such option is traded, or, in the absence of a sale on or about the close of the exchange, the mean of the closing bid and ask prices. |
| • | The value of securities for which market quotations are not readily available including restricted and not readily marketable securities, is determined in good faith under the supervision of the Trust’s Board of Trustees. |
Government Money Market Fund
Investment securities are carried at amortized cost, which approximates market value. Pursuant to Rule 2a-7 of the Investment Company Act of 1940, amortized cost, as defined, is a method of valuing securities at acquisition cost, adjusted for amortization of premium or accretion of discount.
The Funds, except for the Government Money Market Fund, may purchase put or call options. When a Fund purchases an option, an amount equal to the premium paid is recorded as an asset and is subsequently marked-to-market. Premiums paid for purchasing options that expire unexercised are recognized on the expiration date as realized losses. If an option is exercised, the premium paid is subtracted from the proceeds of the sale or added to the cost of the purchase to determine whether a Fund has realized a gain or loss on the related investment transaction. When a Fund enters into a closing transaction, a Fund will realize a gain or loss depending upon whether the amount from the closing transaction is greater or less than the premium paid.
The Funds, except for the Government Money Market Fund, may write put or call options. When a Fund writes an option, an amount equal to the premium received is recorded as a liability and is subsequently marked-to-market. Premiums received for writing options that expire unexercised are recognized on the expiration date as realized gains. If an option is exercised, the premium received is subtracted from the cost of purchase or added to the proceeds of the sale to determine whether a Fund has realized a gain or loss on the related investment transaction. When a Fund enters into a closing transaction, a Fund will realize a gain or loss depending upon whether the amount from the closing transaction is greater or less than the premium received.
The Funds attempt to limit market risk and enhance their income by writing (selling) covered call options. The risk in writing a covered call option is that a Fund gives up the opportunity of profit if the market price of the financial instrument increases. A Fund also has the additional risk of not being able to enter into a closing transaction if a liquid secondary market does not exist. The risk in writing a put option is that a Fund is obligated to purchase the financial instrument underlying the option at prices which may be significantly different than the current market price.
The Funds, except for the Government Money Market Fund, periodically engage in selling securities short, which obligates a Fund to replace a security borrowed by purchasing the same security at the current market value. A Fund would incur a loss if the price of the security increases between the date of the short sale and the date on which the Fund replaces the borrowed security. A Fund would realize a gain if the price of the security declines between those dates.
It is the policy of each Fund to comply with all sections of the Internal Revenue Code applicable to regulated investment companies and to distribute all of its taxable income to shareholders; therefore, no provision for income or excise taxes is required.
Net investment income and net realized gains may differ for financial statement and tax purposes. The character of distributions made during the year from net investment income or net realized gains may differ from their ultimate characterization for Federal income tax purposes. Also, due to the timing of dividend distributions, the fiscal year in which amounts are distributed may differ from the year that the income or realized gains were recorded by the Funds.
59
The following permanent differences between net asset components for financial reporting and tax purposes were reclassified at the end of the fiscal year:
| | Hickory | | Partners
Value | | Balanced | | Fixed
Income | |
| |
| |
| |
| |
| |
Paid-in capital | | $ | (136,849 | ) | $ | — | | $ | — | | $ | — | |
Accumulated undistributed net investment income | | | 136,849 | | | (1,220 | ) | | 4,533 | | | 182,558 | |
Accumulated net realized gain (loss) | | | — | | | 1,220 | | | (4,533 | ) | | (182,558 | ) |
The differences are due to the tax treatment of certain debt securities, the tax character of certain distributions, distributions in excess of net investment income and principal paydown adjustments. These reclassifications have no impact on the net asset value of the Funds.
Security transactions are accounted for on the date the securities are purchased or sold (trade date). Realized gains or losses are determined by specifically identifying the security sold.
Income dividends, dividends on short positions and distributions to shareholders are recorded on the ex-dividend date. Interest, including amortization of discount or premium, is accrued as earned.
The Funds declare and distribute income dividends and capital gains distributions as may be required to qualify as a regulated investment company under the Internal Revenue Code.
Generally, the Fixed Income Fund pays income dividends on a quarterly basis. The Government Money Market Fund declares dividends daily and pays dividends monthly. All dividends and distributions are reinvested automatically, unless the shareholder elects otherwise.
The preparation of financial statements in conformity with accounting principles generally accepted in the United States requires management to make estimates and assumptions that affect the reported amounts of assets and liabilities and disclosure of contingent assets and liabilities at the date of the financial statements and the reported amounts of increase and decrease in net assets from operations during the period. Actual results could differ from those estimates.
(3) | Related Party Transactions |
Each Fund has retained the Adviser as its investment adviser. In addition, the Trust has an agreement with Weitz Securities, Inc., a company under common control with the Adviser, to act as distributor for the Funds’ shares. Weitz Securities, Inc., as distributor, receives no compensation for the distribution of shares of the Funds. Certain officers of the Trust are also officers and directors of the Adviser and Weitz Securities, Inc.
Under the terms of a management and investment advisory agreement, the Adviser is paid a monthly fee. The annual investment advisory fee schedule for the Weitz Equity Funds is as follows:
Average Daily Net Assets Break Points
Greater Than | | Less Than or
Equal To | | Rate | |
| |
| |
| |
$ | 0 | | $2,500,000,000 | | 1.00 | % |
| 2,500,000,000 | | 5,000,000,000 | | 0.90 | % |
| 5,000,000,000 | | | | 0.80 | % |
The Balanced Fund pays the Adviser, on a monthly basis, an annual advisory fee equal to 0.80% of the Fund’s average daily net assets.
The Fixed Income Fund and the Government Money Market Fund pay the Adviser, on a monthly basis, an annual advisory fee equal to 0.50% of the respective Fund’s average daily net assets.
Under the terms of an administration agreement, certain services are provided by the Adviser including the transfer of shares, disbursement of dividends, fund accounting and related administrative services of the Trust for which the Adviser is paid a monthly fee. The annual administrative fee schedule for each Fund is as follows:
60
Average Daily Net Assets Break Points
Greater Than | | Less Than or
Equal To | | Rate | |
| |
| |
| |
$ | | 0 | | $ | | 25,000,000 | | | 0.200 | % | |
| | 25,000,000 | | | | 100,000,000 | | | 0.175 | % | |
| | 100,000,000 | | | | 100,000,000 | | | 0.100 | % | |
The Adviser has voluntarily agreed to reimburse the Weitz Equity Funds or to pay directly a portion of the respective Fund’s expenses up to the amount of advisory fees paid to the extent that total expenses exceed 1.50% of the respective Fund’s average daily net assets. Through July 31, 2005, the Adviser has contractually agreed to reimburse the Balanced Fund or to pay directly a portion of the Balanced Fund’s expenses, if total expenses exceed 1.25% of the Balanced Fund’s average daily net assets. For the year ended March 31, 2005, the Adviser has voluntarily capped fees and expenses for the Fixed Income and Government Money Market Funds at 0.75% and 0.50%, respectively, of the Funds’ average daily net assets. The fees waived by the Adviser for the Fixed Income and Government Money Market Funds are $11,896 and $178,426, respectively.
As of March 31, 2005, the controlling shareholder of the Adviser held approximately 45% of the Government Money Market Fund, 38% of the Balanced Fund and 8% of the Hickory Fund.
(4) | Distributions to Shareholders and Distributable Earnings |
The tax character of distributions paid by the Funds are summarized as follows:
| | | | | |
| | Value | | Hickory | |
| |
| |
| |
| | | Year ended March 31, | | Year ended March 31, | |
| | 2005 | | 2004 | | 2005 | | 2004 | |
| |
| |
| |
| |
| |
Distributions paid from: | | | | | | | | | | | | | |
Ordinary income | | $ | 32,349,685 | | $ | 17,867,102 | | $ | 2,332,129 | | $ | 2,336,447 | |
Long-term capital gains | | | 371,629,715 | | | — | | | — | | | — | |
| |
|
| |
|
| |
|
| |
|
| |
Total distributions | | $ | 403,979,400 | | $ | 17,867,102 | | $ | 2,332,129 | | $ | 2,336,447 | |
| |
|
| |
|
| |
|
| |
|
| |
| | Partners Value | | Balanced | |
| |
| |
| |
| | | Year ended March 31, | | Year ended March 31, 2005 | | Six months
ended March 31, 2004* | |
| | 2005 | | 2004 | |
| |
| |
| |
| |
| |
Distributions paid from: | | | | | | | | | | | | | |
Ordinary income | | $ | 13,699,009 | | $ | 2,660,926 | | $ | 831,311 | | $ | 11,120 | |
Long-term capital gains | | | 80,040,181 | | | — | | | 127,700 | | | — | |
| |
|
| |
|
| |
|
| |
|
| |
Total distributions | | $ | 93,739,190 | | $ | 2,660,926 | | $ | 959,011 | | $ | 11,120 | |
| |
|
| |
|
| |
|
| |
|
| |
| | Fixed Income | | Government
Money Market | |
| |
| |
| |
| | Year ended March 31, | | Year ended March 31, | |
| | |
|
|
| |
|
|
| |
| | 2005 | | 2004 | | 2005 | | 2004 | |
| |
| |
| |
| |
| |
Distributions paid from: | | | | | | | | | | | | | |
Ordinary income | | $ | 3,688,098 | | $ | 1,672,756 | | $ | 445,133 | | $ | 291,092 | |
Long-term capital gains | | | — | | | — | | | — | | | — | |
| |
|
| |
|
| |
|
| |
|
| |
Total distributions | | $ | 3,688,098 | | $ | 1,672,756 | | $ | 445,133 | | $ | 291,092 | |
| |
|
| |
|
| |
|
| |
|
| |
* Commenced operations on October 1, 2003.
61
As of March 31, 2005, the components of distributable earnings on a tax basis were as follows:
| | Value | | Hickory | | Partners
Value | | Balanced | | Fixed
Income | |
| |
| |
| |
| |
| |
| |
Undistributed ordinary income | | $ | 29,555,691 | | $ | — | | $ | 10,951,890 | | $ | 759,104 | | $ | 213,248 | |
Undistributed long-term gains | | | 1,637,190 | | | — | | | 662,120 | | | 247,665 | | | 570,723 | |
Capital loss carryforwards | | | — | | | (110,987,205 | ) | | — | | | — | | | — | |
Post October capital loss deferral | | | (114,818,736 | ) | | — | | | (49,933,205 | ) | | — | | | — | |
Net unrealized appreciation (depreciation) | | | 653,631,649 | | | 34,947,610 | | | 478,853,196 | | | 1,892,315 | | | (536,291 | ) |
| |
|
| |
|
| |
|
| |
|
| |
|
| |
| | $ | 570,005,794 | | $ | (76,039,595 | ) | $ | 440,534,001 | | $ | 2,899,084 | | $ | 247,680 | |
| |
|
| |
|
| |
|
| |
|
| |
|
| |
Capital loss carryforwards represent tax basis capital losses which may be carried over to offset future realized capital gains, if any. To the extent that the carryforwards are used, no capital gains distributions will be made. The Government Money Market Fund has a capital loss carryforward of $470 which expires on March 31, 2013. The Hickory Fund’s carryforward expires on March 31, 2012. During the fiscal year, the Hickory and Fixed Income Funds utilized capital loss carryforwards of $36,140,806 and $583,734, respectively, to offset realized capital gains. The Value and Partners Value Funds have elected to defer realized capital losses arising after October 31, 2004. Such losses are treated for tax purposes as arising on April 1, 2005.
(5) | Securities Transactions |
Purchases and proceeds from maturities or sales of investment securities of the Funds, other than short-term securities, are summarized as follows:
| | Value | | Hickory | | Partners
Value | | Balanced | | Fixed
Income | |
| |
| |
| |
| |
| |
| |
Purchases | | $ | 775,656,052 | | $ | 197,084,834 | | $ | 468,094,909 | | $ | 34,777,038 | | $ | 87,115,883 | |
Proceeds | | | 1,290,646,966 | | | 152,493,692 | | | 1,023,543,520 | | | 12,685,713 | | | 32,060,795 | |
The cost of investments is the same for financial reporting and Federal income tax purposes for the Hickory, Balanced and Government Money Market Funds. The cost of investments for Federal income tax purposes for the Value, Partners Value and Fixed Income Funds is $3,455,417,080, $2,160,224,652 and $162,445,929, respectively.
At March 31, 2005, the aggregate gross unrealized appreciation and depreciation of investments, based on cost for Federal income tax purposes, are summarized as follows:
| | Value | | Hickory | | Partners
Value | | Balanced | | Fixed
Income | |
| |
| |
| |
| |
| |
| |
Appreciation | | $ | 853,432,602 | | $ | 42,972,046 | | $ | 589,380,660 | | $ | 2,258,959 | | $ | 551,664 | |
Depreciation | | | 200,879,471 | | | 7,525,613 | | | 111,246,772 | | | 366,644 | | | 1,087,955 | |
| | (a) | Illiquid and Restricted Securities |
The Funds own certain securities which have a limited trading market and/or certain restrictions on trading and therefore may be illiquid and/or restricted. Such securities have been valued at fair value in accordance with the procedures described in Note (2)(a). Because of the inherent uncertainty of valuation, these values may differ from the values that would have been used had a ready market for these securities existed and these differences could be material. Illiquid and/or restricted securities owned at March 31, 2005, include the following:
| | Value | | Hickory | | Partners
Value | | Balanced | |
| |
| |
| |
| |
| |
Adelphia Communications Corp. CLA | | $ | 1,385,020 | | $ | 276,000 | | $ | 1,189,337 | | $ | — | |
Cabela’s, Inc. CLA | | | — | | | 9,072,000 | | | — | | | 201,600 | |
| |
|
| |
|
| |
|
| |
|
| |
Total cost of illiquid and/or restricted securities | | $ | 1,385,020 | | $ | 9,348,000 | | $ | 1,189,337 | | $ | 201,600 | |
| |
|
| |
|
| |
|
| |
|
| |
Value | | $ | 2,374,320 | | $ | 13,820,178 | | $ | 1,558,560 | | $ | 302,848 | |
| |
|
| |
|
| |
|
| |
|
| |
Percent of net assets | | | 0.1 | % | | 4.2 | % | | 0.1 | % | | 0.6 | % |
| |
|
| |
|
| |
|
| |
|
| |
62
Transactions relating to options written for the year ended March 31, 2005 are summarized as follows:
| | Value | | Hickory | |
| |
| |
| |
| | Numbers of
Contracts | | Premiums | | Numbers of
Contracts | | Premiums | |
| |
| |
| |
| |
| |
Options outstanding, beginning of period | | 4,000 | | $ | 1,099,553 | | 1,400 | | $ | 644,975 | |
Options split | | — | | | — | | 534 | | | — | |
Options written | | 13,240 | | | 4,921,007 | | 11,475 | | | 2,588,684 | |
Options exercised | | (500 | ) | | (213,745 | ) | (9,034 | ) | | (2,107,131 | ) |
Options expired | | (1,000 | ) | | (298,486 | ) | — | | | — | |
Options closed | | (9,000 | ) | | (3,186,011 | ) | (3,350 | ) | | (699,601 | ) |
| |
| |
|
| |
| |
|
| |
Options outstanding, end of period | | 6,740 | | $ | 2,322,318 | | 1,025 | | $ | 426,927 | |
| |
| |
|
| |
| |
|
| |
| | Partners | | Balanced | |
| |
| |
| |
| | Numbers of
Contracts | | Premiums | | Numbers of
Contracts | | Premiums | |
| |
| |
| |
| |
| |
Options outstanding, beginning of period | | 3,000 | | $ | 832,531 | | 610 | | $ | 111,620 | |
Options split | | — | | | — | | — | | | — | |
Options written | | 9,495 | | | 3,568,410 | | 100 | | | 43,749 | |
Options exercised | | (1,000 | ) | | (429,740 | ) | (360 | ) | | (87,396 | ) |
Options expired | | (1,000 | ) | | (298,486 | ) | (140 | ) | | (12,399 | ) |
Options closed | | (6,000 | ) | | (2,124,007 | ) | (210 | ) | | (55,574 | ) |
| |
| |
|
| |
| |
|
| |
Options outstanding, end of period | | 4,495 | | $ | 1,548,708 | | — | | $ | — | |
| |
| |
|
| |
| |
|
| |
Option contracts written result in off-balance-sheet risk as the Funds’ ultimate obligation to satisfy the terms of the contract may exceed the amount recognized in the statements of assets and liabilities.
Affiliated issuers, as defined under the Investment Company Act of 1940, are those in which a Fund’s holdings of an issuer represent 5% or more of the outstanding voting securities of the issuer. A summary of each Fund’s holdings in the securities of such issuers is set forth below:
Value | |
| |
Name of Issuer | | Number of
Shares Held
March 31, 2004 | | Gross
Additions | | Gross
Reductions | | Number of
Shares Held
March 31, 2005 | | Value
March 31, 2005 | | Dividend
Income | | Realized
Gains/
(Losses) | |
| |
| |
| |
| |
| |
| |
| |
| |
Bimini Mortgage Management, Inc.* | | 400,000 | | — | | — | | 400,000 | | $ | 5,540,000 | | $ | 844,000 | | $ | — | |
Caesars Entertainment, Inc.* | | 16,950,000 | | 1,528,000 | | (11,978,000 | ) | 6,500,000 | | | 128,635,000 | | | — | | | 77,950,597 | |
Cenveo, Inc. † | | 4,600,000 | | — | | (1,998,200 | ) | 2,601,800 | | | 14,674,152 | | | — | | | (16,349,046 | ) |
Hanover Capital Mortgage Holdings, Inc.* | | 425,000 | | — | | (425,000 | ) | — | | | — | | | 280,618 | | | 1,882,419 | |
Redwood Trust, Inc. | | 1,610,000 | | 450,000 | | (60,000 | ) | 2,000,000 | | | 102,360,000 | | | 11,744,233 | | | 5,780,076 | |
Six Flags, Inc. | | 5,800,000 | | — | | (650,000 | ) | 5,150,000 | | | 21,218,000 | | | — | | | (13,421,225 | ) |
| | | | | | | | | |
|
| |
|
| |
|
| |
Totals | | | | | | | | | | $ | 272,427,152 | | $ | 12,868,851 | | $ | 55,842,821 | |
| | | | | | | | | |
|
| |
|
| |
|
| |
63
Hickory | |
| |
Name of Issuer | | Number of
Shares Held
March 31, 2004 | | Gross
Additions | | Gross
Reductions | | Number of
Shares Held
March 31, 2005 | | Value
March 31, 2005 | | Dividend
Income | | Realized
Gains/
(Losses) | |
| |
| |
| |
| |
| |
| |
| |
| |
Bimini Mortgage Management, Inc.* | | 250,000 | | — | | — | | 250,000 | | $ | 3,462,500 | | $ | 260,000 | | $ | — | |
Imperial Credit Industries, Inc. | | 3,435,400 | | — | | — | | 3,435,400 | | | 1,718 | | | — | | | — | |
Insurance Auto Auctions, Inc.* | | 633,400 | | — | | 633,400 | | — | | | — | | | — | | | 2,848,194 | |
| | | | | | | | | |
|
| |
|
| |
|
| |
Totals | | | | | | | | | | $ | 3,464,218 | | $ | 260,000 | | $ | 2,848,194 | |
| | | | | | | | | |
|
| |
|
| |
|
| |
Partners Value | |
| |
Name of Issuer | | Number of
Shares Held
March 31, 2004 | | Gross
Additions | | Gross
Reductions | | Number of
Shares Held
March 31, 2005 | | Value
March 31, 2005 | | Dividend
Income | | Realized
Gains/
(Losses) | |
| |
| |
| |
| |
| |
| |
| |
| |
Daily Journal Corp. | | 114,800 | | — | | — | | 114,800 | | $ | 5,029,388 | | $ | — | | $ | — | |
Cenveo, Inc.*† | | 4,359,000 | | — | | (2,177,700 | ) | 2,181,300 | | | 12,302,532 | | | — | | | (8,416,409 | ) |
| | | | | | | | | |
|
| |
|
| |
|
| |
Totals | | | | | | | | | | $ | 17,331,920 | | $ | — | | $ | (8,416,409 | ) |
| | | | | | | | | |
|
| |
|
| |
|
| |
* | Company was considered a non-controlled affiliate at March 31, 2004, but as of March 31, 2005, they are no longer a noncontrolled affiliate. |
† | Mail-Well, Inc.’s name changed to Cenveo, Inc. during the period. |
While Insight Communications, Inc. (“Insight”), is not an affiliate of the Funds for the purposes of the Investment Company Act of 1940, the Value and Partners Value Funds own 6.9% and 5.6%, respectively, of the Class A shares of Insight which are included in the beneficial ownership of Insight reported by the Adviser on Schedule 13G filed in accordance with the requirements of Section 13(d) of the Securities Exchange Act of 1934.
Each Fund indemnifies the Trust’s officers and trustees for certain liabilities that might arise from their performance of their duties to each of the Funds. Additionally, in the normal course of business the Funds enter into contracts that contain a variety of representations and warranties and which provide general indemnifications. The Funds’ maximum exposure under these arrangements is unknown, as this would involve future claims that may be made against the Funds that have not yet occurred. However, based on experience, the Funds expect the risk of loss to be remote.
64
REPORT OF INDEPENDENT REGISTERED
PUBLIC ACCOUNTING FIRM
To the Board of Trustees and Shareholders of
The Weitz Funds
We have audited the accompanying statements of assets and liabilities of The Weitz Funds, comprising the Value Fund, Hickory Fund, Partners Value Fund, Balanced Fund, Fixed Income Fund, and Government Money Market Fund (collectively referred to as the “Funds”), including the schedules of investments in securities, as of March 31, 2005, and the related statements of operations for the year then ended and the statements of changes in net assets and financial highlights for each of the two years in the period then ended. These financial statements and financial highlights are the responsibility of the Funds’ management. Our responsibility is to express an opinion on these financial statements and financial highlights based on our audits. The financial highlights presented herein for each of the three years in the period ended March 31, 2003 were audited by other auditors whose report dated April 18, 2003, expressed an unqualified opinion on those financial highlights.
We conducted our audits in accordance with standards of the Public Company Accounting Oversight Board (United States). Those standards require that we plan and perform the audits to obtain reasonable assurance about whether the financial statements and financial highlights are free of material misstatement. We were not engaged to perform an audit of the Funds’ internal control over financial reporting. Our audits included consideration of internal control over financial reporting as a basis for designing audit procedures that are appropriate in the circumstances, but not for the purpose of expressing an opinion on the effectiveness of the Funds’ internal control over financial reporting. Accordingly we express no such opinion. An audit also includes examining, on a test basis, evidence supporting the amounts and disclosures in the financial statements and financial highlights, assessing the accounting principles used and significant estimates made by management, and evaluating the overall financial statement presentation. Our procedures included confirmation of securities owned as of March 31, 2005, by correspondence with the custodian and brokers. We believe that our audits provide a reasonable basis for our opinion.
In our opinion, the financial statements and financial highlights referred to above present fairly, in all material respects, the financial position of The Weitz Funds as of March 31, 2005, the results of their operations for the year then ended, and the statements of changes in their net assets and financial highlights for each of the two years in the period then ended, in conformity with U.S. generally accepted accounting principles.

Cincinnati, Ohio
April 21, 2005
65
ACTUAL AND HYPOTHETICAL EXPENSES FOR COMPARISON PURPOSES |
(Unaudited)
Example
As a shareholder of one or more of the Funds, you incur two types of costs: (1) transaction costs, including any transaction fees that you may be charged if you purchase or redeem your Fund through certain financial institutions; and (2) ongoing costs, including management fees and other Fund expenses. This Example is intended to help you understand your ongoing costs (in dollars) of investing in the Funds and to compare these costs with the ongoing costs of investing in other mutual funds. The Example is based on an investment of $1,000 invested at the beginning of the period and held for the entire period from October 1, 2004 through March 31, 2005.
Actual Expenses
The first line for each Fund in the table below provides information about actual account values and actual expenses. You may use the information in this line, together with the amount you invested, to estimate the expenses that you paid over the period. Simply divide your account value by $1,000 (for example, an account value of $25,000 divided by $1,000 = 25), then multiply the result by the number in the first line under the heading entitled “Expenses Paid from 10/1/04 through 3/31/05” to estimate the expenses you paid on your account during this period.
Hypothetical Example for Comparison Purposes
The second line for each Fund in the table below provides information about hypothetical account values and hypothetical expenses based on the actual expense ratio of each Fund and an assumed rate of return of 5% per year before expenses, which is not the actual return of the Fund. The hypothetical account values and expenses may not be used to estimate the actual ending account balance or expenses you paid for the period. You may use this information to compare the ongoing costs of investing in a specific Weitz Fund to other funds. To do so, compare this 5% hypothetical example with the 5% hypothetical examples that appear in the shareholder reports of the other funds.
Please note that the expenses shown in the table are meant to highlight your ongoing costs only and do not reflect any transactional costs charged by certain financial institutions. Therefore, the second line of the table is useful in comparing ongoing costs only, and will not help you determine the relative total costs of owning different funds. In addition, if you incurred transactional fees, your costs would have been higher. Actual and hypothetical expenses for each Fund are provided in this table.
| | | | Beginning
Account Value
10/1/04 | | Ending
Account Value
3/31/05 | | Annualized
Expense Ratio | | Expenses
Paid from
10/1/04 - 3/31/05 (1) |
| | | |
| |
| |
| |
|
Value | | Actual | | $ | 1,000 | | | $ | 1,040 | | | 1.11 | % | | $ | 5.65 | |
| | Hypothetical(2) | | | 1,000 | | | | 1,019 | | | 1.11 | | | | 5.59 | |
| | | | | | | | | | | | | | | | | |
Hickory | | Actual | | | 1,000 | | | | 1,052 | | | 1.20 | | | | 6.14 | |
| | Hypothetical(2) | | | 1,000 | | | | 1,019 | | | 1.20 | | | | 6.04 | |
| | | | | | | | | | | | | | | | | |
Partners Value | | Actual | | | 1,000 | | | | 1,044 | | | 1.13 | | | | 5.76 | |
| | Hypothetical(2) | | | 1,000 | | | | 1,019 | | | 1.13 | | | | 5.69 | |
| | | | | | | | | | | | | | | | | |
Balanced | | Actual | | | 1,000 | | | | 1,048 | | | 1.21 | | | | 6.18 | |
| | Hypothetical(2) | | | 1,000 | | | | 1,019 | | | 1.21 | | | | 6.09 | |
| | | | | | | | | | | | | | | | | |
Fixed Income | | Actual | | | 1,000 | | | | 1,004 | | | 0.75 | | | | 3.75 | |
| | Hypothetical(2) | | | 1,000 | | | | 1,021 | | | 0.75 | | | | 3.78 | |
| | | | | | | | | | | | | | | | | |
Government | | Actual | | | 1,000 | | | | 1,008 | | | 0.50 | | | | 2.50 | |
Money Market | | Hypothetical(2) | | | 1,000 | | | | 1,023 | | | 0.50 | | | | 2.52 | |
(1) | Expenses are equal to the annualized expense ratio for the Fund, multiplied by the average account value over the period, multiplied by the number of days in the most recent fiscal half year (182/365). |
(2) | Assumes 5% total return before expenses. |
66
INFORMATION ABOUT THE TRUSTEES
AND OFFICERS OF THE WEITZ FUNDS |
(Unaudited)
The individuals listed below serve as Trustees or Officers of The Weitz Funds (the “Weitz Funds”). Each Trustee of the Weitz Funds serves until a successor is elected and qualified or until resignation. Each Officer of the Weitz Funds is elected annually by the Trustees.
The address of all Officers and Trustees is 1125 South 103rd Street, Suite 600, Omaha, Nebraska 68124.
Interested Trustees* | | |
| |
|
Wallace R. Weitz (Age: 55) Position(s) Held with Trust: President; Portfolio Manager; Trustee Length of Service (Beginning Date): The Weitz Funds (and certain predecessor funds) – January, 1986 Principal Occupation(s) During Past 5 Years: President, Wallace R. Weitz & Company, The Weitz Funds (and certain Predecessor funds) Number of Portfolios Overseen in Fund Complex: 6 Other Directorships: N/A | | Thomas R. Pansing (Age: 60) Position(s) Held with Trust: Trustee Length of Service (Beginning Date): The Weitz Funds (and certain predecessor funds) - January, 1986, Principal Occupation(s) During Past 5 Years: Partner, Pansing Hogan Ernst & Bachman LLP, a law firm Number of Portfolios Overseen in Fund Complex: 6 Other Directorships: N/A |
| |
|
| | |
* | Mr. Weitz is a Director and Officer of Wallace R. Weitz & Company, investment adviser to the Weitz Funds, and as such is considered an “interested person” of the Trust, as that term is defined in the Investment Company Act of 1940 (an “Interested Trustee”). Mr. Pansing performs certain legal services for the investment adviser and The Weitz Funds and, therefore, is also classified as an “Interested Trustee”. |
Independent Trustees
| | |
| |
|
Lorraine Chang (Age: 54) Position(s) Held with Trust: Trustee Length of Service (Beginning Date): The We itz Funds (and Certain predecessor funds) - June, 1997 Principal Occupation(s) During Past 5 Years: Partner, The Public Strategies Group, a management consulting firm, 1999-Present; Independent Consultant 1995-1999 Number of Portfolios Overseen in Fund Complex: 6 Other Directorships: N/A | | John W. Hancock (Age: 57) Position(s) Held with Trust: Trustee Length of Service (Beginning Date): The Weitz Funds (and certain predecessor funds) - January, 1986 Principal Occupation(s) During Past 5 Years: Partner, Hancock & Dana, an accounting firm Number of Portfolios Overseen in Fund Complex: 6 Other Directorships: N/A |
| |
|
Richard D. Holland (Age: 83) Position(s) Held with Trust: Trustee Length of Service (Beginning Date): The Weitz Funds (and certain predecessor funds) - June, 1995 Principal Occupation(s) During Past 5 Years: Retired Number of Portfolios Overseen in Fund Complex: 6 Other Directorships: N/A | | Delmer L. Toebben (Age: 74) Position(s) Held with Trust: Trustee Length of Service (Beginning Date): The Weitz Funds (and certain predecessor funds) - July, 1996 Principal Occupation(s) During Past 5 Years: Retired, 1999-Present; President, Curzon Advertising & Display, Inc. 1977-1999 Number of Portfolios Overseen in Fund Complex: 6 Other Directorships: N/A |
| |
|
Roland J. Santoni (Age: 63) Position(s) Held with Trust: Trustee Length of Service (Beginning Date): The Weitz Funds - February, 2004 Principal Occupation(s) During Past 5 Years: Vice President, West Development, Inc., a development company, June 2003-Present; Professor of Law, Creighton University, 1977-2003; Of Counsel, Erickson & Sederstrom, a law firm, 1978-2003 Number of Portfolios Overseen in Fund Complex: 6 Other Directorships: Transgenomic, Inc. | | Barbara W. Schaefer (Age: 51) Position(s) Held with Trust: Trustee Length of Service (Beginning Date): The Weitz Funds - March 2005 Principal Occupation(s) During Past 5 Years: Senior Vice President-Human Resources and Corporate Secretary, Union Pacific Corporation, 2004-present; Senior Vice President-Human Resources, Union Pacific Corporation, 1997-2004 Number of Portfolios Overseen in Fund Complex: 6 Other Directorships: N/A |
| |
|
67
Officers | | |
| |
|
Mary K. Beerling (Age: 64) Position(s) Held with Trust: Vice President, Secretary and Chief Compliance Officer Length of Service (Beginning Date): The Weitz Funds (and certain predecessor funds) - July, 1994 Principal Occupation(s) During Past 5 Years: Vice President and Chief Compliance Officer, Wallace R. Weitz & Company, Vice President and Chief Compliance Officer, The Weitz Funds (and certain predecessor funds) | | Kenneth R. Stoll (Age: 43) Position(s) Held with Trust: Vice President and Chief Financial Officer Length of Service (Beginning Date): The Weitz Funds - April, 2004 Principal Occupation(s) During Past 5 Years: Vice President and Chief Operating Officer, Wallace R. Weitz & Company; Vice President and Chief Financial Officer, The Weitz Funds - April 2004 to Present; Partner, PricewaterhouseCoopers LLP, an accounting firm, 1999- 2004; Partner, McGladrey & Pullen LLP, an accounting firm, 1994-1999 |
| |
|
| | |
The Statement of Additional Information for The Weitz Funds, which can be obtained without charge by calling 800-232-4161, includes additional information about the Trustees and Officers of the Weitz Funds. |
68
PROXY VOTING POLICIES AND PROCEDURES
(Unaudited)
A description of the Fund’s proxy voting policies and procedures is available without charge, upon request by (i) calling 800-304-9745, (ii) on the Funds’ website at http://www.weitzfunds.com; and (iii) on the SEC’s website at http://www.sec.gov.
Information on how each of the Funds (other than the Government Money Market Fund) voted proxies relating to portfolio securities during the twelve month period ended June 30, 2004 is available: (i) on the Funds’ website at http://www.weitzfunds.com, and (ii) on the SEC’s website at http://www.sec.gov.
OTHER INFORMATION
(Unaudited)
For the fiscal year ended March 31, 2005, certain dividends paid by the Funds may be subject to a maximum tax rate of 15%, as provided for by the Jobs and Growth Tax Relief Reconciliation Act of 2003. Of the distributions paid during the fiscal year, the amounts designated long-term capital gain, the amounts that may be considered qualified dividend income and for corporate shareholders, the amounts that may qualify for the corporate dividends received deduction, are summarized as follows:
| | Value | | Hickory | | Partners
Value | | Balanced | | Fixed
Income | |
| |
| |
| |
| |
| |
| |
Long-term capital gain distribution | | $ | 371,629,715 | | $ | — | | $ | 80,040,181 | | $ | 127,700 | | $ | — | |
Qualified dividend income | | | 32,349,574 | | | 895,630 | | | 13,699,009 | | | 168,962 | | | — | |
Corporate dividends received deduction | | | 32,349,574 | | | 895,630 | | | 13,699,009 | | | 169,092 | | | — | |
The information and distributions reported herein may differ from the information and distributions reported to shareholders for the calendar year ended December 31, 2004, which was reported in conjunction with your 2004 Form 1099-DIV.
The Funds file complete schedules of their portfolio holdings with the Securities and Exchange Commission for the first and third quarters of each fiscal year on Form N-Q. The Funds’ Form N-Q is available on the SEC’s website at http://www.sec.gov and may be reviewed and copied at the SEC’s Public Reference Room in Washington DC. Information on the operation of the Public Reference Room may be obtained by calling 800 SEC-0330. When filed, the Fund’s quarterly reports, including the information filed on Form N-Q will also available on the Funds’ website at http://www.weitzfunds.com.
69
(This page has been left blank intentionally.)
70
(This page has been left blank intentionally.)
71
Board of Trustees | | Officers |
Lorraine Chang | | Wallace R. Weitz, President |
John W. Hancock | | Mary K. Beerling, Vice President, Secretary & Chief Compliance Officer |
Richard D. Holland | |
Thomas R. Pansing, Jr. | | Kenneth R. Stoll, Vice President & Chief Financial Officer |
Roland J. Santoni | |
Barbara W. Schaefer | | |
Delmer L. Toebben | | Distributor |
Wallace R. Weitz | | Weitz Securities, Inc. |
| | |
Investment Adviser | | Transfer Agent and Dividend Paying Agent |
Wallace R. Weitz & Company | | Wallace R. Weitz & Company |
| | |
Custodian | | Sub-Transfer Agent |
Wells Fargo Bank Minnesota, | | Boston Financial Data Services, Inc. |
National Association | | |
NASDAQ symbols:
Value Fund – WVALX
Hickory Fund – WEHIX
Partners Value Fund – WPVLX
Balanced Fund – WBALX
Fixed Income Fund – WEFIX
An investor should consider carefully the investment objectives, risks, and charges and expenses of the Funds before investing. The Funds’ Prospectus contains this and other information about the Funds. The Prospectus should be read carefully before investing. A current Prospectus is available at www.weitzfunds.com or by calling 800-304-9745.
Item 2. Code of Ethics.
As of the end of the period covered by this report, the Registrant has adopted a code of ethics that applies to the Registrant’s principal executive officer, principal financial officer, principal accounting officer or controller, or persons performing similar functions, regardless of whether these individuals are employed by the Registrant or a third party (the “Code of Ethics”). During the period covered by this report, there were no amendments, nor did the Registrant grant any waivers, including any implicit waivers, from any provision of the Code of Ethics.
The Code of Ethics is attached hereto as Exhibit 12(a)(1).
Item 3. Audit Committee Financial Expert.
The Registrant’s board of trustees has determined that the Registrant has at least one “audit committee financial expert” (as defined in Item 3 of Form N-CSR) serving on its audit committee. John Hancock is an “audit committee financial expert” and is “independent” (as each term is defined in Item 3 of Form N-CSR).
Item 4. Principal Accountant Fees and Services.
| | (a) | Audit Fees. Fees for audit services provided to the Registrant were $151,600 and $147,000 for fiscal years ended March 31, 2005 and 2004, respectively. |
| | (b) | Audit Related Fees. The aggregate fees billed in each of the last two fiscal years for audit related- services by the principal accountant that are reasonably related to the performance of the audit of the Registrant’s financial statements and are not reported under paragraph (a) of this item were $41,000 and $0 for 2005 and 2004, respectively. The fees, paid by Wallace R. Weitz & Company, the Registrant’s investment adviser and transfer agent, were payment for the principal accountant performing internal control reviews of the Registrant’s transfer agent. No audit related fees were billed to the Registrant in 2004 and 2005. |
| | (c) | Tax Fees. Fees for tax services, which consisted of income and excise tax compliance services, were $40,900 for the year ended March 31, 2005. The Registrant did not pay any tax fees during its 2004 fiscal year. |
| | (d) | All Other Fees. During the year ended March 31, 2005, the Registrant’s principal accountant received fees of $9,000 from the Registrant’s investment adviser for services in connection with the anti-money laundering compliance program of the Weitz fund complex. During the year ended March 31, 2004, the Registrant’s principal accountant received no fees for non-audit services from the Registrant or the Registrant’s adviser. |
| | (e) | (1) The Registrant’s Audit Committee has adopted Pre-Approval Policies and Procedures. The Audit Committee must pre-approve all audit services and non-audit services that the principal accountant provides to the Registrant. The Audit committee must also pre-approve any engagement of the principal accountant to provide non-audit services to the Registrant’s investment adviser, or any affiliate of the adviser that provides ongoing services to the Registrant, if such non-audit services directly impact the Registrant’s operations and financial reporting. |
| (2) No services described in items (b) were pre-approved by the Audit Committee pursuant to Rule 2- 01(c)(7)(i)(c) of Regulation S-X. |
| | (f) | All of the work in connection with the audit of the Registrant during the years ended March 31, 2005 and 2004 was performed by full-time employees of the Registrant’s principal accountant. |
| | (g) | The aggregate fees billed by the principal accountant for non-audit services to the Registrant, the Registrant’s investment adviser and any entity controlling, controlled by, or under common control with the adviser that provides ongoing services to the Registrant was $90,900 for the year ended March 31, 2005. There were no non-audit services performed by the principal accountant for the year ended March 31, 2004. |
| | (h) | The Registrant’s Audit Committee has considered whether the provision of non-audit services that were rendered to the Registrant’s investment adviser, and any entity controlling, controlled by, or under common control with the adviser that provides ongoing services to the Registrant that were not pre-approved pursuant to paragraph (c)(7)(ii) of Rule 2-01 of Regulation S-X is compatible with maintaining the principal auditor’s independence. |
Item 5. Audit Committee of Listed Registrants.
Not applicable.
Item 6. Schedule of Investments.
Not applicable.
Item 7. Disclosure of Proxy Voting Policies and Procedures for Closed-End Investment Companies.
Not applicable.
Item 8. Portfolio Managers of Closed-End Management Investment Companies.
Not applicable.
Item 9. Purchases of Equity Securities by Closed-End Management Investment Company and Affiliated Purchasers.
Not applicable.
Item 10. Submissions of Matters to a Vote of Security Holders.
Not applicable.
Item 11. Controls and Procedures.
(a) Based on an evaluation of the Disclosure Controls and Procedures (as defined in Rule 30a-3(c) under the Investment Company Act of 1940) (the “Disclosure Controls”) as of a date within 90 days prior to the filing date (the “Filing Date”) of this report on Form N-CSR (the “Report”), the Registrant’s principal executive officer and financial officer have concluded that the Disclosure Controls are reasonably designed to ensure that information required to be disclosed by the Registrant in the Report is recorded, processed, summarized and reported by the Filing Date, including ensuring that information required to be disclosed in the Report is accumulated and communicated to the Registrant’s management, including the Registrant’s principal executive officer and principal financial officer, as appropriate to allow timely decisions regarding required disclosure.
(b) There were no significant changes in the Registrant’s internal control over financial reporting (as defined in Rule 30a-3(d) under the Investment Company Act of 1940) that occurred during the Registrant’s second fiscal quarter of the period covered by this report that has materially affected, or is reasonably likely to materially affect, the Registrant’s internal control over financial reporting.
Item 12. Exhibits
(a)(1) The Code of Ethics is attached hereto.
(a)(2) The certifications required by Rule 30a-2(a) of the Investment Company Act of 1940 are attached hereto.
(a)(3) Not applicable.
(b) The certifications required by Rule 30a-2(b) of the Investment Company Act of 1940 and Section 906 of the Sarbanes-Oxley Act of 2002 are attached hereto.
SIGNATURES
Pursuant to the requirements of the Securities Exchange Act of 1934 and the Investment Company Act of 1940, the Registrant has duly caused this report to be signed on its behalf by the undersigned, thereunto duly authorized.
The Weitz Funds
By (Signature and Title)*/s/ Wallace R. Weitz
Wallace R. Weitz, President |
Date April 29, 2005
Pursuant to the requirements of the Securities Exchange Act of 1934 and the Investment Company Act of 1940, this report has been signed below by the following persons on behalf of the Registrant and in the capacities and on the dates indicated.
By (Signature and Title)* /s/ Wallace R. Weitz
Wallace R. Weitz, President |
Date April 29, 2005
By (Signature and Title)* /s/ Kenneth R. Stoll
Kenneth R. Stoll, Chief Financial Officer
Date April 29, 2005
* Print the name and title of each signing officer under his or her signature.