UNITED STATES
SECURITIES AND EXCHANGE COMMISSION
Washington, D.C. 20549
FORM N-CSR
CERTIFIED ANNUAL SHAREHOLDER REPORT OF REGISTERED MANAGEMENT
INVESTMENT COMPANIES
Investment Company Act file number 811-21410
The Weitz Funds
(Exact name of registrant as specified in charter)
Suite 200
1125 South 103 Street
Omaha, NE 68124-1071
(Address of principal executive offices) (Zip code)
Weitz Investment Management, Inc.
The Weitz Funds
Suite 200
1125 South 103 Street
Omaha, NE 68124-1071
(Name and address of agent for service)
Registrant’s telephone number, including area code: 402-391-1980
Date of fiscal year end: March 31
Date of reporting period: March 31, 2013
Form N-CSR is to be used by management investment companies to file reports with the Commission not later than 10 days after the transmission to stockholders of any report that is required to be transmitted to stockholders under Rule 30e-1 under the Investment Company Act of 1940 (17 CFR 270.30e-1). The Commission may use the information provided on Form N-CSR in its regulatory, disclosure review, inspection, and policymaking roles.
A registrant is required to disclose the information specified by Form N-CSR, and the Commission will make this information public. A registrant is not required to respond to the collection of information contained in Form N-CSR unless the Form displays a currently valid Office of Management and Budget ("OMB") control number. Please direct comments concerning the accuracy of the information collection burden estimate and any suggestions for reducing the burden to Secretary, Securities and Exchange Commission, 450 Fifth Street, NW, Washington, DC 20549-0609. The OMB has reviewed this collection of information under the clearance requirements of 44 U.S.C. § 3507.
Item 1. Report to Stockholders.


WEITZ INVESTMENT PHILOSOPHY
Over the 25+ year history of Weitz Funds, we have seen many changes. Advancements in technology combined with economic, political and global events have continued to shape investors’ thoughts and actions.
Our mission has remained constant— we have an unwavering commitment to our shareholders and a focus on finding strong, well-managed companies priced significantly below their true business value.
We “eat our own cooking.”
We believe in putting our money where our mouth is. All of our employees and trustees have significant personal investments in our “family” of funds. This does not guarantee that the Funds will go up, but it does mean that we win or lose together and that shareholders definitely have our full attention.
We are patient, long-term investors.
When we analyze potential equity investments, we think about the business behind the stock. We buy shares only when we believe they are selling at a large discount to the company’s underlying business value. Ideally, the business value rises over time, and the stock price follows. This often allows us to hold the stock for many years.
Knowing what you don’t know is important in all aspects of life, but it is crucial in investing.
We think our odds of investment success are much higher when we invest in securities of companies we understand and where we may have an edge over other investors. As a result, our portfolios are not diversified among all the various sectors of the economy. Instead, we expect to have a deeper knowledge and understanding of the industries and companies in which we do invest. Our experienced research team has a broad “circle of competence,” and we believe in staying within it.
We worry about permanent loss of capital—not price volatility.
Our Funds are designed for long-term shareholders. We believe concentrating our portfolios in the most attractive investment ideas, although it may cause short-term price volatility, is the best way to earn consistent returns over the long term.
We believe in being flexible and using common sense.
We are often contrarian and do not pay attention to benchmarks when making investment decisions. We also believe that cash is sometimes the most attractive investment.
Our goal is to earn good absolute investment returns over long
periods of time without exposing our clients’ and our own
capital to undue risk.
2 Weitz Funds
TABLE OF CONTENTS
| Performance Summary | 4 |
| | |
| Letter to Shareholders | 5 |
| | |
| Analyst Corner | 7 |
| | |
| Value Fund | 8 |
| | |
| Partners Value Fund | 12 |
| | |
| Partners III Opportunity Fund | 16 |
| | |
| Research Fund | 22 |
| | |
| Hickory Fund | 26 |
| | |
| Balanced Fund | 30 |
| | |
| Short-Intermediate Income Fund | 36 |
| | |
| Nebraska Tax-Free Income Fund | 44 |
| | |
| Government Money Market Fund | 50 |
| | |
| Financial Statements | 52 |
| | |
| Notes to Financial Statements | 63 |
| | |
| Report of Independent Registered Public Accounting Firm | 76 |
| | |
| Actual and Hypothetical Expenses for Comparison Purposes | 77 |
| | |
| Other Information | 78 |
| | |
| Information About the Trustees and Officers | 80 |
| | |
| Index Descriptions | 82 |
| The management of Weitz Funds has chosen paper for the 80 page body of this financial report from a paper manufacturer certified under the Sustainable Forestry Initiative standard. | | |
Portfolio composition is subject to change at any time and references to specific securities, industries, and sectors referenced in this report are not recommendations to purchase or sell any particular security. Current and future portfolio holdings are subject to risk. See the Schedules of Investments included in this report for the percent of assets in each of the Funds invested in particular industries or sectors.
weitzinvestments.com 3
PERFORMANCE SUMMARY
MARCH 31, 2013
| | | | Total Returns | | Average Annual Total Returns |
| | | Inception | | | | | | | | | | | | | | | | | | | | | | | | | | Since |
| Fund Name | | Date | | 3 Mos. | | 1 Year | | 3 Year | | 5 Year | | 10 Year | | 15 Year | | 20 Year | | 25 Year | | Inception |
| Value | | 5/09/86 | | 13.4 | % | | 17.2 | % | | 14.0 | % | | 7.1 | % | | 7.4 | % | | 6.6 | % | | 10.2 | % | | 11.0 | % | | 10.6 | % |
| Russell 1000 | | | | 11.0 | | | 14.4 | | | 12.9 | | | 6.2 | | | 9.0 | | | 4.6 | | | 8.7 | | | 10.1 | | | 9.8 | |
| Russell 1000 Value | | | | 12.3 | | | 18.8 | | | 12.7 | | | 4.8 | | | 9.2 | | | 5.3 | | | 9.2 | | | 10.3 | | | 10.3 | |
Partners Value(a) | | 6/01/83 | | 11.9 | | | 19.4 | | | 15.0 | | | 9.9 | | | 8.7 | | | 7.5 | | | 11.2 | | | 11.8 | | | 12.7 | |
Partners III Opportunity(a) | | 6/01/83 | | | | | | | | | | | | | | | | | | | | | | | | | | | |
| Institutional Class | | | | 13.8 | | | 19.2 | | | 15.9 | | | 13.1 | | | 12.1 | | | 9.3 | | | 13.1 | | | 13.1 | | | 13.4 | |
Investor Class(b) | | | | 13.6 | | | 18.8 | | | 15.7 | | | 13.0 | | | 12.0 | | | 9.3 | | | 13.0 | | | 13.1 | | | 13.4 | |
Research(a)(c) | | 4/01/05 | | 13.4 | | | 7.1 | | | 12.5 | | | 11.5 | | | — | | | — | | | — | | | — | | | 7.0 | |
| Russell 3000 | | | | 11.1 | | | 14.6 | | | 13.0 | | | 6.3 | | | 9.2 | | | 4.7 | | | 8.7 | | | 10.0 | | | — | |
| Russell 3000 Value | | | | 12.3 | | | 18.7 | | | 12.7 | | | 5.0 | | | 9.3 | | | 5.4 | | | 9.3 | | | 10.3 | | | — | |
| Hickory | | 4/01/93 | | 9.5 | | | 18.1 | | | 16.5 | | | 10.5 | | | 11.2 | | | 5.7 | | | 10.6 | | | — | | | 10.6 | |
| Russell 2500 | | | | 12.8 | | | 17.7 | | | 14.6 | | | 9.0 | | | 12.3 | | | 7.6 | | | 10.3 | | | — | | | 10.3 | |
| Russell 2500 Value | | | | 13.4 | | | 21.2 | | | 14.2 | | | 8.8 | | | 12.1 | | | 8.2 | | | 11.0 | | | — | | | 11.0 | |
| S&P 500 | | | | 10.6 | | | 14.0 | | | 12.7 | | | 5.8 | | | 8.5 | | | 4.3 | | | 8.5 | | | 9.9 | | | — | |
| Balanced | | 10/01/03 | | 6.6 | | | 10.0 | | | 9.3 | | | 7.2 | | | — | | | — | | | — | | | — | | | 5.6 | |
| Blended Index | | | | 6.4 | | | 9.8 | | | 9.7 | | | 5.8 | | | — | | | — | | | — | | | — | | | 6.3 | |
| Short-Intermediate Income | | 12/23/88 | | | | | | | | | | | | | | | | | | | | | | | | | | | |
| Institutional Class | | | | 1.1 | | | 3.7 | | | 3.4 | | | 4.5 | | | 4.4 | | | 4.9 | | | 5.3 | | | — | | | 5.9 | |
Investor Class(b) | | | | 1.1 | | | 3.5 | | | 3.3 | | | 4.4 | | | 4.4 | | | 4.9 | | | 5.2 | | | — | | | 5.9 | |
| Barclays Intermediate Credit | | | | 0.3 | | | 3.5 | | | 4.7 | | | 4.6 | | | 4.5 | | | 5.5 | | | 5.6 | | | — | | | 6.6 | |
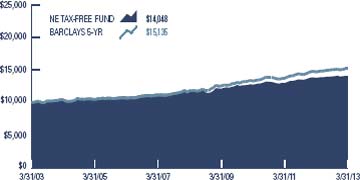
Nebraska Tax-Free Income(a) | | 10/01/85 | | 0.4 | | | 2.0 | | | 3.3 | | | 3.7 | | | 3.5 | | | 4.0 | | | 4.4 | | | 5.0 | | | 5.3 | |
| Barclays 5-Year Muni. Bond | | | | 0.8 | | | 3.2 | | | 4.4 | | | 5.1 | | | 4.2 | | | 4.8 | | | 5.0 | | | 5.6 | | | — | |
These performance numbers reflect the deduction of each Fund’s annual operating expenses. Annual operating expenses for each Fund, as stated in the most recent prospectus, and expressed as a percentage of each Fund’s net assets, are: Value, 1.20%; Partners Value, 1.20%; Partners III Opportunity –Institutional Class, 1.49%; Partners III Opportunity – Investor Class, 2.32% (gross); Research, 1.85% (gross); Hickory, 1.28%; Balanced, 1.14%; Short-Intermediate Income – Institutional Class, 0.62%; Short-Intermediate Income – Investor Class, 1.16% (gross); and Nebraska Tax-Free Income, 0.71%. The returns assume redemption at the end of each period and reinvestment of dividends. Total returns shown include fee waivers and expense reimbursements, if any; total returns would have been lower had there been no waiver of fees and/or reimbursement of expenses by the Adviser. This information represents past performance and past performance does not guarantee future results. The investment return and the principal value of an investment in any of the Funds will fluctuate so that an investor’s shares, when redeemed, may be worth more or less than the original cost. Current performance may be higher or lower than the performance data quoted above. Performance data current to the most recent month end may be obtained at www.weitzinvestments.com/funds_and_performance/fund_performance.fs.
Index performance is hypothetical and is shown for illustrative purposes only. See page 82 for a description of all indicies.
| (a) | Performance of the Partners Value and Partners III Opportunity Funds is measured from June 1, 1983, the inception of Weitz Partners II Limited Partnership (“Partners II”) and Weitz Partners III Limited Partnership (“Partners III”), respectively. Performance of the Research Fund is measured from April 1, 2005, the inception of Weitz Research Fund, L.P. (“Research L.P.”). Performance of the Nebraska Tax-Free Income Fund is measured from October 1, 1985, the inception of Weitz Income Partners Limited Partnership (“Income Partners”). On the last business day of December 1993, 2005, 2006 and 2010, the Partners Value, Partners III Opportunity, Nebraska Tax-Free Income and Research Funds (the “Funds”) succeeded to substantially all of the assets of Partners II, Partners III, Income Partners and Research L.P. (the “Partnerships”), respectively. The investment objectives, policies and restrictions of the Funds are materially equivalent to those of the respective Partnerships and the Partnerships were managed at all times with full investment authority by Weitz Investment Management, Inc. The performance information includes performance for the period before the Funds became investment companies registered with the Securities and Exchange Commission. During these periods, none of the Partnerships were registered under the Investment Company Act of 1940 and therefore were not subject to certain investment or other restrictions or requirements imposed by the 1940 Act or the Internal Revenue Code. If any of the Partnerships had been registered under the 1940 Act during these periods, the respective Partnerships’ performance might have been adversely affected. |
| (b) | Investor Class shares first became available for sale on August 1, 2011. For performance prior to that date, this table includes the actual performance of the Fund’s Institutional Class (and uses the actual expenses of the Fund’s Institutional Class, for such period of time), without any adjustments. For any such period of time, the performance of the Fund’s Investor Class would have been substantially similar to, yet lower than, the performance of the Fund’s Institutional Class, because the shares of both classes are invested in the same portfolio of securities, but the classes bear different expenses. |
| (c) | Starting January 1, 2011, these performance numbers reflect the deduction of the Research Fund’s actual operating expenses. For periods of time prior to January 1, 2011, the performance numbers reflect the deduction of annual pro forma operating expenses of 1.50%. Annual operating expenses for the Research Fund, as stated in the Research Fund’s Prospectus, are 1.85% (gross) and 0.92% (net) of the Fund’s net assets. The investment adviser has agreed, in writing, to limit the total annual fund operating expenses (excluding taxes, interest, brokerage commissions, and acquired fund fees and expenses) to 0.90% of the Fund’s average daily net assets through July 31, 2013. |
4 Weitz Funds
LETTER TO SHAREHOLDERS
APRIL 1, 2013
Dear Fellow Shareholder:
Calendar 2013 is off to an excellent start and the Funds’ fiscal year ending March 31 was a very good one. The capsule table below shows results for our stock funds for the quarter, trailing 12 months and 3 year periods compared to the S&P 500. The comparisons are gratifying.
| | | Period Ended 3/31/13 | |
| | | Qtr | | 1 Year | | 3 Year |
| | | | | | | | | | |
| Value | | 13.4 | % | | 17.2 | % | | 14.0 | % |
| Partners Value | | 11.9 | | | 19.4 | | | 15.0 | |
| Hickory | | 9.5 | | | 18.1 | | | 16.5 | |
| Partners III – | | | | | | | | | |
| Institutional | | | | | | | | | |
| Class | | 13.8 | | | 19.2 | | | 15.9 | |
| Research | | 13.4 | | | 7.1 | | | 12.5 | |
| S&P 500 | | 10.6 | | | 14.0 | | | 12.7 | |
The more complete table opposite this letter shows returns for all of our Funds over a number of time periods going back to 1983. We think the longer-term results are far more significant than the shorter (and we say this regardless of how good recent numbers have been). Past results don’t predict, but as we approach the 30th anniversary of our firm, we think it is fair to speculate that three decades of performance may indicate that our approach “has legs.” The two Funds that opened on June 1, 1983, have provided average annual returns of 12.7% and 13.4%, after fees and expenses, which are greater than the S&P 500’s return of 10.6% for the same time period. Thanks to the power of compounding, these modest incremental returns have made a big difference to investors over the past (nearly) 30 years:
| | | June 1, 1983 - March 31, 2013 | |
| | | Avg Ann. Return | | Cumulative Return | | $10,000 Grew To |
| Partners Value | | 12.7 | % | | 3,422.4 | % | | $352,240 | |
| Partners III – | | | | | | | | | |
| Institutional | | | | | | | | | |
| Class | | 13.4 | | | 4,213.3 | | | 431,330 | |
| S&P 500 | | 10.6 | | | 1,933.9 | | | 203,390 | |
Past performance does not guarantee future results.
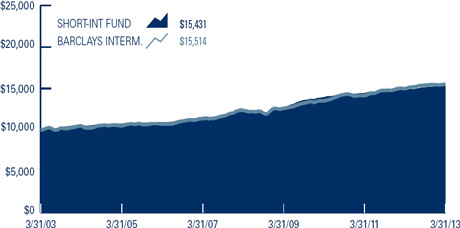
The Federal Reserve continues to manipulate interest rates through its current version of “quantitative easing.” This has created some opportunities for traders of longer-term bonds, but we have chosen to remain very conservatively positioned in our bond portfolios. As a result, we have earned our (very) modest coupon interest and little in the way of capital appreciation. The Short-Intermediate Income Fund-Institutional Class earned 1.1% in the first quarter and 3.7% over the past year, while the Nebraska Tax-Free Income Fund earned 0.4% and 2.0%, respectively, in those periods. And speaking of long-term records, Short-Intermediate Income Fund-Institutional Class has averaged 5.9% per year for 24 years (cumulative 303.3%) and Nebraska Tax-Free Income Fund has gained 5.3% over 28 years (cumulative of 310.9%). We applaud Tom Carney’s discipline in not chasing yield in this very difficult fixed income environment.
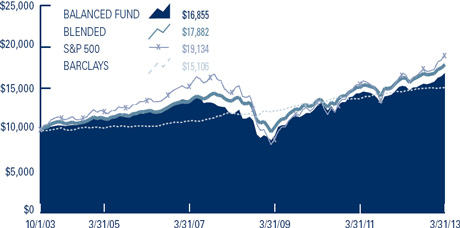
The Balanced Fund is invested in stocks, which showed similar excellent gains to those of the stock funds, and bonds (including cash equivalents) whose returns were muted by our very defensive fixed income positioning. In this difficult environment, the Balanced Fund earned very respectable returns of 6.6% in Q1 and 10.0% for the past year vs. 6.4% and 9.8%, respectively, for the “Blended Index.”
In the pages that follow, we offer detailed portfolio information and portfolio managers’ discussion for each Fund. This being the annual report for our March 31 fiscal year, there is a great deal of additional information on portfolio turnover, dividend distributions, etc. We hope you find this additional material helpful, and we welcome your questions.
Portfolio Review
Over the past several quarters, economic growth in the U.S. has been slow, Europe’s recession has deepened as it wrestles with saving the Euro-Zone, and China’s growth has slowed. Japan struggles to shake its two “lost decades” and the threat of “currency wars” has unsettled global trade. Nevertheless, most of our companies managed to show earnings growth and to grow the value of their businesses at least modestly. Their stocks generally rose.
The lists of contributors to both first quarter and fiscal year performance contain several familiar names. Liberty “offspring” (Media, Interactive, Global and Ventures) are prominent. Redwood Trust was particularly strong, and a few newer holdings like Valeant were helpful.
Several of our companies got boosts from positive investor reaction to acquisitions. Some were small—Iconix acquired licenses which will generate future royalty income. Some were larger—Liberty Media agreed to buy a 27% interest in Charter Communications, a major cable company. Liberty and John Malone certainly know cable and we expect this purchase to enhance the business value of Liberty Media. Liberty Global is buying Virgin Media, a major UK cable company, and Valeant bought Medicis, a major dermatology drug manufacturer and distributor. In each case, we believe our companies have paid reasonable prices for investments that will enhance the values of their businesses.
In one case, our stock went up because of what it didn’t do. DIRECTV was seriously considering the purchase of Vivendi’s Brazilian telecom assets. This would have been a very large acquisition and investors feared that it might cause DTV to curtail its stock repurchase program. When DTV pulled out of the bidding, relieved investors bid the stock up over 10%.
Michael Dell’s bid to take Dell private sparked a sharp rise in Dell shares. The stock, which had languished in the $8-10 range last fall, rose above the $13.65 takeover bid price. The proposal met with a firestorm of resistance from some long-time holders, but as the required analysis shifted from long-term business fundamentals to merger arbitrage, we were content to sell at a slight premium to the initial bid.
Another tarnished technology company, Hewlett-Packard, provided a more positive experience. We first bought HPQ in the low $20’s with the thought that a company with $3-4 per share earning power would trade considerably higher when negative news gave way to “adequate” news. Last fall, as investors chased Apple up to $700 per share on the assumption that iPads would replace PC’s and make printing obsolete, HPQ fell below $12. We believed that Meg Whitman was making progress in stabilizing the company and we bought more at various prices down into the $11’s. Over the past few months, we have enjoyed a strong rebound to $23 (Period ending 3/31/13), and we have taken profits in the majority of our shares. This is not our preferred type of investment—our first choice is the great (growing) business at a reasonable price—but we will occasionally indulge in this type of “deeper value” situation.
Other stocks participated in the rising market without apparent “catalysts.” Some of these may have gotten ahead of themselves, but their values are growing and we are happy to hold them for longer term gains.
Outlook
The results have been good and we expect our portfolios to continue to generate positive returns over time. There is little doubt, though, that stock prices have been rising faster than underlying business values. We do not try to “time” the market, but as individual stocks’ price-to-value ratios rise (i.e. the stocks get more expensive), we often trim our holdings. We have been doing some of this lately, and cash positions in our stock funds at March 31 range from 13% to 32%.
There are two related parts to our investing approach. (1) We want to buy the right companies at the right prices (deep discount to their “business value”). This is by far the most important part. (2) We also want to improve our odds by investing more aggressively when the valuations are favorable and to hold onto cash reserves when the opportunity set is less attractive. We believe that cash has “option” value—being able to respond quickly to buying opportunities has contributed to our results over the years. Today, we are optimistic about the long-term prospects for our companies but we have plenty of liquidity available if Europe, or some other “surprise,” sets off a market decline that we can take advantage of.
This year will mark our 30th anniversary. It has been a good 30 years and we are looking forward to the next 30. As another note in passing, on April 1st the name of our Adviser was changed from Wallace R. Weitz & Company to Weitz Investment Management, Inc. This is really a non-event for our shareholders. The change merely makes it clearer that we manage institutional separate accounts as well as mutual funds.
Sincerely,
| | |
| | | |
| Wallace R. Weitz | | Bradley P. Hinton |
| wally@weitzinvestments.com | | brad@weitzinvestments.com |
6 Weitz Funds
ANALYST CORNER
A PERSPECTIVE ON FIDELITY NATIONAL INFORMATION SERVICES
By Barton Hooper, CFA
Fidelity National Information Services (FIS) is the world’s largest global provider dedicated to banking and payments technologies. FIS serves as a processor of core banking functions and payments for more than 14,000 financial institutions of all sizes worldwide. Banking solutions, which consist of software and services technologies that assist banks in running the critical day-to-day operations, comprise approximately 44% of FIS’s revenue. Payment solutions, which represent the remainder of FIS’s revenue, encompass a wide spectrum of offerings including check processing, bill payment, ACH, ATM network management and credit and debit card issuance and processing.
Recurring Revenue Business
If a bank is open for business it will need to develop or hire a solutions provider such as FIS to build and run its internal systems. We estimate that over 80% of FIS’s revenue represents recurring revenue through a combination of 5 year contracts, per account and per transaction fees. As a result, FIS is more dependent on the number of accounts and transactions than the number of banks in existence. Historically, during bank consolidations FIS clients have been acquired at least as often as FIS clients have been the acquirers. Even if FIS loses a client to acquisition, large termination fees aid in the transition process. When financial institutions fail, it is important to note that the accounts of the bank often end up elsewhere in the banking system. As a result, during the great recession of 2008-2010, FIS’s revenue and earnings proved far more resilient that its banking customers’.
Emphasis on Global Organic Growth
FIS is the product of several acquisitions over the past 10 years which has allowed it to become a leader in providing banking and payment technologies to a global client base. In the past 24 months, management has made a concerted effort to integrate its sales teams, consolidate product offerings and emphasize innovation in order to gain new customers as well as increase its share of existing clients’ information technology spending.
In addition, FIS is the only provider of financial processing and payment technology to have a significant global presence. Fully 20 percent of company-wide revenue is derived outside the United States. In general, international banks are more likely to have older IT infrastructures and FIS is positioned to benefit as these firms modernize their systems.
Large Banks: Where the Money is
FIS is the market share leader with respect to large banking institutions. We estimate that FIS owns a 40% share of processing for banks with assets greater than $8b. FIS estimates that in total, large bank IT spending is as much as 5 times that of the small bank population. Much like FIS’ global competitors, large banks are battling increased regulation, lower profits and a more competitive environment with antiquated, proprietary IT systems that are often a product of several acquisitions over many years. These IT systems are no longer cost effective, require employees to learn outdated technology and make it difficult for banks to acquire customers and offer access to new products such as mobile banking. With its more modern, flexible and lower cost software and systems FIS is uniquely positioned to offer its large bank clients better outcomes.
Capital Allocation & Valuation
Since its acquisition of Metavante in 2009, FIS has aggressively repurchased its shares. During 2012, management was especially active, repurchasing 15% of its outstanding shares at a significant discount to our estimate of intrinsic value. In addition, the company has more than quadrupled its dividend to $.84 per share from $.20 per share in 2010. With a price of $39.62 FIS trades for approximately 11.5x our estimate of 2013 free cash flow per share. Our estimate of intrinsic value is above $50 and as such we believe the company’s shares represent an attractive investment for our shareholders.
Barton Hooper, CFA, joined Weitz in 2007. He graduated from the University of Missouri and previously spent four years as a research analyst at Oak Value Capital Management and Trilogy Capital Management. Barton has been a CFA charterholder since 1999. |
weitzinvestments.com 7
VALUE FUND
PORTFOLIO MANAGERS’ DISCUSSION & ANALYSIS
Co-Portfolio Managers:
Wallace R. Weitz, CFA; Bradley P. Hinton, CFA; &
David A. Perkins, CFA
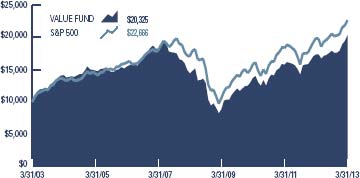
The Value Fund returned +13.4% during the first calendar quarter, compared to a +10.6% gain for the S&P 500 and a +11.0% increase for the Russell 1000. For the fiscal year ended March 31, 2013, the Fund increased +17.2% compared to a +14.0% gain for the S&P 500 and a +14.4% return for the Russell 1000. In recent weeks, the financial press has been replete with headlines celebrating new nominal highs for both the Dow Jones Industrial Average and S&P 500 Index. Many have cited this rise, among other data points, as “proof” that the U.S. economy is improving. We remain circumspect. Morgan Stanley recently noted the continued rise in stock prices has come despite consistent erosion in bottom-up earnings forecasts. In fact, the ratio of negative-to-positive quarterly earnings revisions hit its highest level since 2005 during Q1. Our bottom-up, fundamentally-driven internal dashboards also suggest stock prices may be getting a bit ahead of themselves. “Fighting the Fed” has been a loser’s game for over four years now, potentially muting individual investors’ sense of risk and increasing pressure on equity managers not to fall (in some cases, further) behind. As we have witnessed repeatedly in the past, stock prices can decouple from fundamentals for extended periods. As longer-term investors, we’re content to wait patiently for fat (absolute, not relative) pitches and, as always, will hold cash in the absence of opportunity.
Hewlett-Packard (+68%), Valeant Pharmaceuticals (+26%) and Berkshire Hathaway (+16%) were key contributors to the Value Fund’s first quarter performance, though price appreciation was broad-based. The shift in investor sentiment surrounding HP’s future prospects that began late last year accelerated through the first three months of 2013. After having increased the Fund’s holdings meaningfully in the mid- and low-teens, we sold roughly half of our shares north of $20 toward the end of the quarter. Valeant finished 2012 on a high note, generating strong organic sales and cash earnings per share growth. The company expects another busy year of business development activity with a particular focus on expanding its reach in Southeast Asia and Russia. Closer to home, Valeant recently announced its intention to acquire Obagi Medical Products. Finally, after a relatively quiet 2012, Berkshire Hathaway announced its first sizeable transaction since Lubrizol with an investment of approximately $12 billion in H.J. Heinz.
For the Fund’s fiscal year, Valeant (+40%) and Berkshire (+28%) were the two largest contributors, though AON (+27%), Liberty Global (+43%) and Range Resources (+40%) enjoyed notably strong performances as well. While AON’s operational progress has been muted by a tepid economic recovery in the U.S. and troubles in Europe, the company generated reasonable organic growth during 2012 and appears to be on track for significant margin expansion over the course of the next several years. Long-time core holding Liberty Global recorded another banner year. We increased our per share business value by ~35% thanks to its expanding scale and scope in Western Europe and an improved long-term growth outlook. And despite a difficult year for natural gas and natural gas liquids (NGL) prices, Range Resources drove a 17% increase in net asset value via capital-efficient reserve replacement and an industry-leading cost structure.
During the first quarter, we closed positions in Dell and Anheuser-Busch InBev (BUD). Wally’s shareholder letter walks through the circumstances surrounding our decision to sell Dell, but in total, the investment fell well short of our long-term goals for compounding capital. Anheuser-Busch, on the other hand, was a success. We continue to think very highly of both the business and management, but BUD shares traded through our business value estimate and we sold.
The Fund initiated two small new positions during the quarter – TransDigm (TDG) and Fidelity National Information Services (FIS) – and added to holdings in DIRECTV and Apache. TransDigm sells replacement (or “aftermarket”) components primarily to the commercial aerospace market. Roughly three quarters of its sales come from products where it is the only source of supply, providing attractive competitive insulation and above average pricing power. Global airline passenger traffic is expected to continue its strong secular growth in coming years, which should result in a nice tailwind for TransDigm’s business. Management is exemplary and appropriately leverages the company’s ample excess cash flow for M&A or special dividends when attractive acquisition opportunities are lacking. Core payment processor FIS boasts some similarities to TDG – a solid recurring revenue base, highly entrenched products and strong free cash flow generation. One important distinction between the businesses, however, is that after years of active M&A, Fidelity National has built out the platform on which it plans to grow. At a 30% discount to estimated value, FIS shares provide inexpensive, durable organic growth and an attractive risk-reward.
As of quarter end, residual cash stood at 25% of Fund assets, up ~4% from the end of calendar 2012. Entering the year, the price-to-value (P/V) ratio of the Value Fund was comfortably in the mid-70s, though it has crept up into the low 80s more recently. The Value Fund invests in our best larger company ideas. The Fund’s weighted average market cap is approximately $73B and its top twenty holdings represent approximately two-thirds of net assets.
| New and Eliminated Securities for Quarter Ended March 31, 2013 |
| New ($mil) | | | Eliminations ($mil) |
| TransDigm Group | $9.5 | | Dell | $27.5 |
| Fidelity National Information Services | 9.2 | | Anheuser-Busch InBev | 8.9 |
8 Weitz Funds
VALUE FUND
PERFORMANCE • (UNAUDITED)
| | | | | | | | |
| | | | Total Returns | | | Average Annual Total Returns | |
| | | | 3 Mos. | 1 Year | | 3 Year | 5 Year | 10 Year | 15 Year | 20 Year | 25 Year |
| Value | | | 13.4 | % | 17.2 | % | | 14.0 | % | 7.1 | % | 7.4 | % | 6.6 | % | 10.2 | % | 11.0 | % |
| S&P 500 | | | 10.6 | | 14.0 | | | 12.7 | | 5.8 | | 8.5 | | 4.3 | | 8.5 | | 9.9 | |
| Russell 1000 | | | 11.0 | | 14.4 | | | 12.9 | | 6.2 | | 9.0 | | 4.6 | | 8.7 | | 10.1 | |
| Russell 1000 Value | | | 12.3 | | 18.8 | | | 12.7 | | 4.8 | | 9.2 | | 5.3 | | 9.2 | | 10.3 | |
Growth of $10,000
This chart depicts the change in the value of a $10,000 investment in the Value Fund for the period March 31, 2003 through December 31, 2013, as compared with the growth of the Standard & Poor’s 500 Index during the same period. Index performance is hypothetical and is shown for illustrative purposes only.
| Year | | | Value (1) | S&P 500 (2) | Relative Results (1)-(2) |
| 1986 (5/9/86) | | | 3.5 | % | 4.1 | % | -0.6 | % |
| 1987 | | | -0.5 | | 5.1 | | -5.6 | |
| 1988 | | | 16.4 | | 16.6 | | -0.2 | |
| 1989 | | | 22.1 | | 31.7 | | -9.6 | |
| 1990 | | | -5.2 | | -3.1 | | -2.1 | |
| 1991 | | | 27.6 | | 30.5 | | -2.9 | |
| 1992 | | | 13.6 | | 7.6 | | 6.0 | |
| 1993 | | | 20.0 | | 10.1 | | 9.9 | |
| 1994 | | | -9.8 | | 1.3 | | -11.1 | |
| 1995 | | | 38.4 | | 37.6 | | 0.8 | |
| 1996 | | | 18.7 | | 23.0 | | -4.3 | |
| 1997 | | | 38.9 | | 33.4 | | 5.5 | |
| 1998 | | | 28.9 | | 28.6 | | 0.3 | |
| 1999 | | | 21.0 | | 21.0 | | 0.0 | |
| 2000 | | | 19.6 | | -9.1 | | 28.7 | |
| 2001 | | | 0.2 | | -11.9 | | 12.1 | |
| 2002 | | | -17.1 | | -22.1 | | 5.0 | |
| 2003 | | | 28.7 | | 28.7 | | 0.0 | |
| 2004 | | | 15.7 | | 10.9 | | 4.8 | |
| 2005 | | | -2.8 | | 4.9 | | -7.7 | |
| 2006 | | | 21.8 | | 15.8 | | 6.0 | |
| 2007 | | | -10.3 | | 5.5 | | -15.8 | |
| 2008 | | | -40.7 | | -37.0 | | -3.7 | |
| 2009 | | | 27.6 | | 26.5 | | 1.1 | |
| 2010 | | | 19.9 | | 15.1 | | 4.8 | |
| 2011 | | | 6.1 | | 2.1 | | 4.0 | |
| 2012 | | | 13.2 | | 16.0 | | -2.8 | |
| 2013 (3/31/13) | | | 13.4 | | 10.6 | | 2.8 | |
| Since Inception: | | | | | | | | |
| Cumulative | | | | | | | | |
| Return | | | 1,404.3 | | 1,124.6 | | 279.7 | |
| Avg. Annual | | | | | | | | |
| Return | | | 10.6 | | 9.8 | | 0.8 | |
These performance numbers reflect the deduction of the Fund’s annual operating expenses which as stated in its most recent prospectus are 1.20% of the Fund’s net assets. The returns assume redemption at the end of each period and reinvestment of dividends. Total returns shown include fee waivers and expense reimbursements, if any; total returns would have been lower had there been no waiver of fees and/or reimbursement of expenses by the Adviser. This information represents past performance and past performance does not guarantee future results. The investment return and the principal value of an investment in this Fund will fluctuate so that an investor’s shares, when redeemed, may be worth more or less than the original cost. Current performance may be lower or higher than the performance data quoted. Performance data current to the most recent month-end may be obtained at www.weitzinvestments.com/funds_and_performance/fund_performance.fs.
See page 4 for additional performance disclosures. See page 82 for a description of all indices.
Performance information does not reflect the deduction of taxes that a shareholder would pay on Fund distributions or the redemption of Fund shares.
weitzinvestments.com 9
VALUE FUND
PORTFOLIO PROFILE • (UNAUDITED)
| Top Ten Stocks | | | | |
| Valeant Pharmaceuticals International, Inc. | | | 6.3 | % |
| Berkshire Hathaway, Inc. - CL B | | | 5.4 | |
| Aon plc - CL A | | | 4.9 | |
| DIRECTV | | | 4.3 | |
| Texas Instruments, Inc. | | | 3.8 | |
| United Parcel Service, Inc. - CL B | | | 3.3 | |
| Liberty Global, Inc. - Series C | | | 3.1 | |
| Range Resources Corp. | | | 3.1 | |
| Wells Fargo & Co. | | | 3.1 | |
| Hewlett-Packard Co. | | | 3.1 | |
| % of Net Assets | | | 40.4 | % |
| Industry Sectors | | | | |
| Consumer Discretionary | | | 17.5 | % |
| Information Technology | | | 14.8 | |
| Financials | | | 13.4 | |
| Health Care | | | 8.7 | |
| Energy | | | 8.2 | |
| Materials | | | 4.9 | |
| Industrials | | | 4.3 | |
| Consumer Staples | | | 2.9 | |
| Cash Equivalents/Other | | | 25.3 | |
| Net Assets | | | 100.0 | % |
| Top Performers for Quarter Ended March 31, 2013 | |
| | | QTD Return | | Average Weight | | Contribution to |
| Security Name | | of Security | | in Portfolio | | Fund Performance |
| Hewlett-Packard Co. | | | 68.3 | % | | | 4.1 | % | | | 2.32 | % |
| Valeant Pharmaceuticals International, Inc. | | | 25.5 | | | | 6.0 | | | | 1.43 | |
| Berkshire Hathaway, Inc. - CL B | | | 16.2 | | | | 5.8 | | | | 0.96 | |
| Range Resources Corp. | | | 29.0 | | | | 3.2 | | | | 0.88 | |
| Dell, Inc. | | | 42.3 | | | | 1.6 | | | | 0.87 | |
Contributions to Fund performance are based on actual daily holdings. Securities may have been bought or sold during the quarter.
Source: FactSet Portfolio Analytics
| Bottom Performers for Quarter Ended March 31, 2013 |
| Security Name | | | QTD Return of Security | | Average Weight in Portfolio | | Contribution to Fund Performance |
| | | | | | | | | | | |
There were no negative performers during the quarter.
Contributions to Fund performance are based on actual daily holdings. Securities may have been bought or sold during the quarter.
Source: FactSet Portfolio Analytics
10 Weitz Funds
VALUE FUND
SCHEDULE OF INVESTMENTS • MARCH 31, 2013
| COMMON STOCKS — 74.7% | | Shares | | | Value | |
| Consumer Discretionary — 17.5% | | | | | | |
| Cable & Satellite — 7.4% | | | | | | |
| DIRECTV* | | | 760,000 | | | $ | 43,023,600 | |
| Liberty Global, Inc. - Series C* | | | 464,400 | | | | 31,871,772 | |
| | | | | | | | 74,895,372 | |
| Advertising — 2.9% | | | | | | | | |
| Omnicom Group, Inc. | | | 500,000 | | | | 29,450,000 | |
| Multiline Retail — 2.9% | | | | | | | | |
| Target Corp. | | | 430,000 | | | | 29,433,500 | |
| Internet & Catalog Retail — 2.5% | | | | | | | | |
| Liberty Interactive Corp. - Series A* | | | 1,200,000 | | | | 25,656,000 | |
| Movies & Entertainment — 1.8% | | | | | | | | |
| The Walt Disney Co. | | | 325,000 | | | | 18,460,000 | |
| | | | | | | | 177,894,872 | |
| Information Technology — 14.8% | | | | | | |
| Semiconductors — 3.8% | | | | | | |
| Texas Instruments, Inc. | | | 1,080,000 | | | | 38,318,400 | |
| Computers & Peripherals —3.1% | | | | | | | | |
| Hewlett-Packard Co. | | | 1,300,000 | | | | 30,992,000 | |
| Internet Software & Services — 2.9% | | | | | | | | |
| Google, Inc. - CL A* | | | 37,500 | | | | 29,776,125 | |
| Software — 2.5% | | | | | | | | |
| Microsoft Corp. | | | 900,000 | | | | 25,749,000 | |
| IT Services — 2.5% | | | | | | | | |
| Accenture plc - CL A | | | 200,000 | | | | 15,194,000 | |
| Fidelity National Information Services, Inc. | | | 250,000 | | | | 9,905,000 | |
| | | | | | | | 25,099,000 | |
| | | | | | | | 149,934,525 | |
| Financials — 13.4% | | | | | | |
| Property & Casualty Insurance — 5.4% | | | | | | |
| Berkshire Hathaway, Inc. - CL B* | | | 525,000 | | | | 54,705,000 | |
| Insurance Brokers — 4.9% | | | | | | | | |
| Aon plc - CL A | | | 800,000 | | | | 49,200,000 | |
| Commercial Banks — 3.1% | | | | | | | | |
| Wells Fargo & Co. | | | 850,000 | | | | 31,441,500 | |
| | | | | | | | 135,346,500 | |
| Health Care — 8.7% | | | | | | |
| Pharmaceuticals — 6.3% | | | | | | |
| Valeant Pharmaceuticals International, Inc.* | | | 850,000 | | | | 63,767,000 | |
| Health Care Services — 2.4% | | | | | | | | |
| Express Scripts Holding Co.* | | | 420,000 | | | | 24,213,000 | |
| | | | | | | | 87,980,000 | |
| Energy — 8.2% | | | | | | |
| Oil & Gas Exploration & Production — 8.2% | | | | | | |
| Range Resources Corp. | | | 390,000 | | | | 31,605,600 | |
| Apache Corp. | | | 401,000 | | | | 30,941,160 | |
| Southwestern Energy Co.* | | | 542,000 | | | | 20,194,920 | |
| | | | | | | | 82,741,680 | |
| | | Principal amount or shares | | | Value | |
| Materials — 4.9% | | | | | | |
| Construction Materials — 2.8% | | | | | | |
| Martin Marietta Materials, Inc. | | | 275,000 | | | $ | 28,055,500 | |
| Industrial Gases — 1.4% | | | | | | | | |
| Praxair, Inc. | | | 125,000 | | | | 13,942,500 | |
| Fertilizers & Agricultural Chemicals — 0.7% | | | | | | | | |
| The Mosaic Co. | | | 125,000 | | | | 7,451,250 | |
| | | | | | | | 49,449,250 | |
| Industrials — 4.3% | | | | | | | | |
| Air Freight & Logistics — 3.3% | | | | | | | | |
| United Parcel Service, Inc. - CL B | | | 390,000 | | | | 33,501,000 | |
| Aerospace & Defense — 1.0% | | | | | | | | |
| TransDigm Group, Inc. | | | 70,000 | | | | 10,704,400 | |
| | | | | | | | 44,205,400 | |
| Consumer Staples — 2.9% | | | | | | | | |
| Food & Staples Retailing — 1.5% | | | | | | | | |
| CVS Caremark Corp. | | | 270,000 | | | | 14,847,300 | |
| Beverages — 1.4% | | | | | | | | |
| Diageo plc - Sponsored ADR | | | 115,000 | | | | 14,471,600 | |
| | | | | | | | 29,318,900 | |
| Total Common Stocks | | | | | | | | |
| (Cost $509,739,132) | | | | | | | 756,871,127 | |
| | | | | | | | | |
| CASH EQUIVALENTS — 24.8% | | | | | | | | |
| Wells Fargo Advantage Government Money Market Fund - | | | | | | | | |
Institutional Class 0.01%(a) | | | 17,520,771 | | | | 17,520,771 | |
| U.S. Treasury Bills, 0.07% to 0.15%, | | | | | | | | |
4/11/13 to 9/12/13(b) | | $ | 234,000,000 | | | | 233,967,438 | |
| | | | | | | | | |
| Total Cash Equivalents | | | | | | | | |
| (Cost $251,475,996) | | | | | | | 251,488,209 | |
| Total Investments in Securities | | | | | | | | |
| (Cost $761,215,128) | | | | | | | 1,008,359,336 | |
| Other Assets Less Other Liabilities — 0.5% | | | | | | | 5,192,393 | |
| Net Assets — 100.0% | | | | | | $ | 1,013,551,729 | |
| Net Asset Value Per Share | | | | | | $ | 38.61 | |
| * | Non-income producing |
| (a) | Rate presented represents the annualized 7-day yield at March 31, 2013. |
| (b) | Interest rates presented represent the yield to maturity at the date of purchase. |
| The accompanying notes form an integral part of these financial statements. | weitzinvestments.com 11 |
PARTNERS VALUE FUND
PORTFOLIO MANAGERS’ DISCUSSION & ANALYSIS
Co-Portfolio Managers:
Wallace R. Weitz, CFA & Bradley P. Hinton, CFA
The Partners Value Fund returned +11.9% in the first calendar quarter, compared to +10.6% for the S&P 500 and +11.1% for the Russell 3000. Stock gains were broad-based, and our companies have been doing reasonably-to-very well. Mortgage investor Redwood Trust (+39%) provided the largest contribution to the Fund’s returns for the quarter. Redwood profitably completed four jumbo prime securitizations in the last three months alone, with another on the way. Dell and Hewlett-Packard delivered outsized percentage gains from depressed year-end price levels. Michael Dell and Silver Lake Partners made a highly publicized bid to take the company private. We sold our Dell stock when it traded above the discouraging bid price, which shifted the analysis from business fundamentals to merger arbitrage. We also eliminated our HP position at a small profit. We view the risk-reward profile as less skewed in our favor after the stock’s strong rally from the low teens. Finally, Valeant Pharmaceuticals (+26%) posted solid organic growth, made rapid strides in integrating the Medicis dermatology acquisition, and announced yet another potentially accretive deal in late March.
For the fiscal year ended March 31, 2013, the Fund gained 19.4% compared to a 14.0% increase for the S&P 500 and a 14.6% gain for the Russell 3000. Redwood Trust’s stock more than doubled over the past year. Management executed admirably on its residential and commercial strategies, building business value and attracting new investors. While Redwood has clear momentum and bright long-term prospects, the valuation is more comfortable than compelling after the stock’s strong run. Iconix Brand Group (+49%) added the Lee Cooper, Buffalo and Umbro brands to its portfolio during the fiscal year. The company licenses its brands to retailers around the world, driving predictable revenue and cash flow. Iconix has used this cash flow not only to buy more brands, but also to buy back its own stock at attractive valuations. Liberty Global (+43%) fired on all cylinders in its “Big Four” countries of Germany, Belgium, Switzerland and Holland. The company recently agreed to acquire Virgin Media, which will provide another anchor market in the United Kingdom. Global also announced plans to purchase a minority stake in Ziggo, a leading Dutch cable company with complementary assets. Other notable contributors for the fiscal year included Valeant (+40%), Berkshire Hathaway (+28%), Aon plc (+27%) and Google (+24%).
Our energy investments detracted modestly from results in an otherwise excellent year. We sold SandRidge Energy and added substantially to our Apache Corporation holdings during the year. Although we netted positive (albeit lumpy) returns on SandRidge over the last three years, the investment fell short of our standards. We have higher conviction in Apache’s ability to compound business value with its proven management team, extremely long-term investment focus and globally diverse portfolio of oil and gas assets.
We bought two new stocks during the quarter. Express Scripts is the largest pharmacy benefits manager (“PBM”) in the country. PBMs administer prescription drug benefits and help control related costs for large employers, insurance companies and public health plans. Express Scripts provides a necessary service in an industry with few true competitors. The company acquired Medco Health Solutions last year, providing cost saving opportunities and additional scale benefits. Other medium-term tailwinds include continued brand-to-generic drug conversions, potential membership growth from the Affordable Care Act, and solid prospects for managing more specialty drug spending. We think Express Scripts can compound free cash flow per share at a mid-teens rate over the next five years, which would provide plenty of upside potential. We also established a position in Fidelity National Information Services (“FIS”), a leading provider of core processing and payment processing services to financial institutions. FIS has a stable base of recurring revenue, strong market shares with large bank customers, and a healthy international business. After adding capabilities via acquisition for much of the past decade, the company is now focused on growing organically, expanding margins, generating cash flow and returning excess capital to shareholders. Barton Hooper describes our investment thesis in more detail in the Analyst Corner.
On balance we were modest net sellers during the quarter. Residual cash is 27% of net assets. Stock prices have generally been rising faster than underlying business values. While we have a sizeable on-deck list of companies that we would like to own, we are finding few compelling bargains. Our research approach is the same regardless of valuation levels. We continue to study businesses, visit companies, speak with management teams and attend industry conferences in our search for value. We look forward to updating you on our progress throughout the year.
Partners Value is a flexible, multi-cap fund that invests in companies of all sizes. The portfolio remains tilted to larger companies with strong competitive positions, relatively stable cash flows, able managements and sturdy balance sheets. Roughly two-thirds of the Fund’s equity holdings are in large-cap companies (market capitalization greater than $10B), with the remainder split between medium-sized and smaller businesses.
| New and Eliminated Securities for Quarter Ended March 31, 2013 |
| New ($mil) | | | Eliminations ($mil) |
| Express Scripts | $21.3 | | Hewlett-Packard | | $26.3 |
| Fidelity National Information Services | 9.7 | | Dell | | 20.7 |
| | | | SandRidge Energy | | 15.1 |
12 Weitz Funds
PARTNERS VALUE FUND
PERFORMANCE • (UNAUDITED)
| | | | Total Returns | | | Average Annual Total Returns | |
| | | | 3 Mos. | 1 Year | | 3 Year | 5 Year | 10 Year | 15 Year | 20 Year | 25 Year |
| Partners Value | | | 11.9 | % | 19.4 | % | | 15.0 | % | 9.9 | % | 8.7 | % | 7.5 | % | 11.2 | % | 11.8 | % |
| S&P 500 | | | 10.6 | | 14.0 | | | 12.7 | | 5.8 | | 8.5 | | 4.3 | | 8.5 | | 9.9 | |
| Russell 3000 | | | 11.1 | | 14.6 | | | 13.0 | | 6.3 | | 9.2 | | 4.7 | | 8.7 | | 10.0 | |
| Russell 3000 Value | | | 12.3 | | 18.7 | | | 12.7 | | 5.0 | | 9.3 | | 5.4 | | 9.3 | | 10.3 | |
Growth of $10,000
This chart depicts the change in the value of a $10,000 investment in the Partners Value Fund for the period March 31, 2003 through March 31, 2013, as compared with the growth of the Standard & Poor’s 500 Index during the same period. Index performance is hypothetical and is shown for illustrative purposes only.
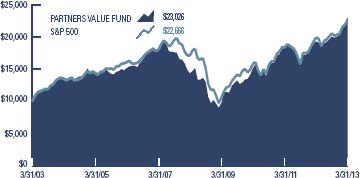
| Year | | | Partners Value (1) | S&P 500 (2) | Relative Results (1)-(2) |
| 1983 (6/1/83) | | | 9.9 | % | 4.2 | % | 5.7 | % |
| 1984 | | | 14.5 | | 6.1 | | 8.4 | |
| 1985 | | | 40.7 | | 31.6 | | 9.1 | |
| 1986 | | | 11.1 | | 18.6 | | -7.5 | |
| 1987 | | | 4.3 | | 5.1 | | -0.8 | |
| 1988 | | | 14.9 | | 16.6 | | -1.7 | |
| 1989 | | | 20.3 | | 31.7 | | -11.4 | |
| 1990 | | | -6.3 | | -3.1 | | -3.2 | |
| 1991 | | | 28.1 | | 30.5 | | -2.4 | |
| 1992 | | | 15.1 | | 7.6 | | 7.5 | |
| 1993 | | | 23.0 | | 10.1 | | 12.9 | |
| 1994 | | | -9.0 | | 1.3 | | -10.3 | |
| 1995 | | | 38.7 | | 37.6 | | 1.1 | |
| 1996 | | | 19.1 | | 23.0 | | -3.9 | |
| 1997 | | | 40.6 | | 33.4 | | 7.2 | |
| 1998 | | | 29.1 | | 28.6 | | 0.5 | |
| 1999 | | | 22.1 | | 21.0 | | 1.1 | |
| 2000 | | | 21.1 | | -9.1 | | 30.2 | |
| 2001 | | | -0.9 | | -11.9 | | 11.0 | |
| 2002 | | | -17.0 | | -22.1 | | 5.1 | |
| 2003 | | | 25.4 | | 28.7 | | -3.3 | |
| 2004 | | | 15.0 | | 10.9 | | 4.1 | |
| 2005 | | | -2.4 | | 4.9 | | -7.3 | |
| 2006 | | | 22.5 | | 15.8 | | 6.7 | |
| 2007 | | | -8.5 | | 5.5 | | -14.0 | |
| 2008 | | | -38.1 | | -37.0 | | -1.1 | |
| 2009 | | | 31.3 | | 26.5 | | 4.8 | |
| 2010 | | | 27.5 | | 15.1 | | 12.4 | |
| 2011 | | | 2.2 | | 2.1 | | 0.1 | |
| 2012 | | | 17.9 | | 16.0 | | 1.9 | |
| 2013 (3/31/13) | | | 11.9 | | 10.6 | | 1.3 | |
| Since Inception: | | | | | | | | |
| Cumulative | | | | | | | | |
| Return | | | 3,422.4 | | | | 1,488.5 | |
| Avg. Annual | | | | | | | | |
| Return | | | 12.7 | | 10.6 | | 2.1 | |
These performance numbers reflect the deduction of the Fund’s annual operating expenses which as stated in its most recent prospectus are 1.20% of the Fund’s net assets. The returns assume redemption at the end of each period and reinvestment of dividends. Total returns shown include fee waivers and expense reimbursements, if any; total returns would have been lower had there been no waiver of fees and/or reimbursement of expenses by the Adviser. This information represents past performance and past performance does not guarantee future results. The investment return and the principal value of an investment in this Fund will fluctuate so that an investor’s shares, when redeemed, may be worth more or less than the original cost. Current performance may be lower or higher than the performance data quoted. Performance data current to the most recent month-end may be obtained at www.weitzinvestments.com/funds_and_performance/fund_performance.fs.
See page 4 for additional performance disclosures. See page 82 for a description of all indices.
Performance information does not reflect the deduction of taxes that a shareholder would pay on Fund distributions or the redemption of Fund shares.
weitzinvestments.com 13
PARTNERS VALUE FUND
PORTFOLIO PROFILE • (UNAUDITED)
| Top Ten Stocks | | | | |
| DIRECTV | | | 4.4 | % |
| Berkshire Hathaway, Inc. - CL B | | | 4.2 | |
| Aon plc - CL A | | | 4.0 | |
| Valeant Pharmaceuticals International, Inc. | | | 4.0 | |
| Redwood Trust, Inc. | | | 3.9 | |
| Texas Instruments, Inc. | | | 3.5 | |
| FLIR Systems, Inc. | | | 3.3 | |
| Wells Fargo & Co. | | | 3.2 | |
| Liberty Global, Inc. - Series C | | | 3.1 | |
| Iconix Brand Group, Inc. | | | 3.1 | |
| % of Net Assets | | | 36.7 | % |
| Industry Sectors | | | | |
| Consumer Discretionary | | | 24.7 | % |
| Financials | | | 15.3 | |
| Information Technology | | | 13.7 | |
| Health Care | | | 11.4 | |
| Energy | | | 4.5 | |
| Materials | | | 2.1 | |
| Consumer Staples | | | 1.5 | |
| Cash Equivalents/Other | | | 26.8 | |
| Net Assets | | | 100.0 | % |
| Top Performers for Quarter Ended March 31, 2013 |
| Security Name | | | QTD Return of Security | Average Weight in Portfolio | Contribution to Fund Performance |
| Redwood Trust, Inc. | | | 38.9 | % | 3.8 | % | 1.38 | % |
| Hewlett-Packard Co. | | | 68.3 | | 2.1 | | 1.20 | |
| Valeant Pharmaceuticals International, Inc. | | | 25.5 | | 3.8 | | 0.91 | |
| Dell, Inc. | | | 42.3 | | 1.4 | | 0.78 | |
| Berkshire Hathaway, Inc. - CL B | | | 16.2 | | 4.2 | | 0.67 | |
Contributions to Fund performance are based on actual daily holdings. Securities may have been bought or sold during the quarter.
Source: FactSet Portfolio Analytics
| Bottom Performers for Quarter Ended March 31, 2013 |
| Security Name | | | QTD Return of Security | Average Weight in Portfolio | Contribution to Fund Performance |
| SandRidge Energy, Inc. | | | (17.0 | )% | | 1.7 | % | | (0.26 | )% |
Contributions to Fund performance are based on actual daily holdings. Securities may have been bought or sold during the quarter.
Source: FactSet Portfolio Analytics
14 Weitz Funds
PARTNERS VALUE FUND
SCHEDULE OF INVESTMENTS • MARCH 31, 2013
| COMMON STOCKS — 73.2% | | Shares | | | Value | |
| Consumer Discretionary — 24.7% | | | | | | |
| Cable & Satellite — 7.5% | | | | | | |
| DIRECTV* | | | 650,000 | | | $ | 36,796,500 | |
| Liberty Global, Inc. - Series C* | | | 380,000 | | | | 26,079,400 | |
| | | | | | | | 62,875,900 | |
| Internet & Catalog Retail — 3.1% | | | | | | | | |
| Liberty Interactive Corp. - Series A* | | | 950,000 | | | | 20,311,000 | |
| Liberty Ventures - Series A* | | | 80,705 | | | | 6,099,684 | |
| | | | | | | | 26,410,684 | |
| Textiles, Apparel & Luxury Goods — 3.1% | | | | | | | | |
| Iconix Brand Group, Inc.* | | | 1,000,000 | | | | 25,870,000 | |
| Multiline Retail — 2.6% | | | | | | | | |
| Target Corp. | | | 325,000 | | | | 22,246,250 | |
| Hotels, Restaurants & Leisure — 2.6% | | | | | | | | |
| Interval Leisure Group, Inc. | | | 1,000,000 | | | | 21,740,000 | |
| Movies & Entertainment — 2.1% | | | | | | | | |
Live Nation Entertainment, Inc.*(c) | | | 1,450,000 | | | | 17,936,500 | |
| Broadcasting — 2.0% | | | | | | | | |
| Liberty Media Corp. - Series A* | | | 155,000 | | | | 17,302,650 | |
| Specialized Consumer Services — 1.7% | | | | | | | | |
| Coinstar, Inc.* | | | 250,000 | | | | 14,605,000 | |
| | | | | | | | 208,986,984 | |
| Financials — 15.3% | | | | | | | | |
| Property & Casualty Insurance — 4.2% | | | | | | | | |
| Berkshire Hathaway, Inc. - CL B* | | | 340,000 | | | | 35,428,000 | |
| Insurance Brokers — 4.0% | | | | | | | | |
| Aon plc - CL A | | | 550,000 | | | | 33,825,000 | |
| Mortgage REIT’s — 3.9% | | | | | | | | |
| Redwood Trust, Inc. | | | 1,415,029 | | | | 32,800,372 | |
| Commercial Banks — 3.2% | | | | | | | | |
| Wells Fargo & Co. | | | 725,000 | | | | 26,817,750 | |
| | | | | | | | 128,871,122 | |
| Information Technology — 13.7% | | | | | | | | |
| Internet Software & Services — 3.8% | | | | | | | | |
| Google, Inc. - CL A* | | | 28,000 | | | | 22,232,840 | |
| XO Group, Inc.* | | | 1,000,000 | | | | 10,000,000 | |
| | | | | | | | 32,232,840 | |
| Semiconductors — 3.5% | | | | | | | | |
| Texas Instruments, Inc. | | | 825,000 | | | | 29,271,000 | |
| Electronic Equipment & Instruments — 3.3% | | | | | | | | |
| FLIR Systems, Inc. | | | 1,075,000 | | | | 27,960,750 | |
| Software — 1.9% | | | | | | | | |
| Microsoft Corp. | | | 575,000 | | | | 16,450,750 | |
| IT Services — 1.2% | | | | | | | | |
| Fidelity National Information Services, Inc. | | | 250,000 | | | | 9,905,000 | |
| | | | | | | | 115,820,340 | |
| Health Care — 11.4% | | | | | | | | |
| Health Care Services — 7.4% | | | | | | | | |
| Omnicare, Inc. | | | 540,000 | | | | 21,988,800 | |
| Express Scripts Holding Co.* | | | 375,000 | | | | 21,618,750 | |
| Laboratory Corp. of America Holdings* | | | 210,000 | | | | 18,942,000 | |
| | | | | | | | 62,549,550 | |
| Pharmaceuticals — 4.0% | | | | | | | | |
| Valeant Pharmaceuticals International, Inc.* | | | 450,000 | | | | 33,759,000 | |
| | | | | | | | 96,308,550 | |
| | | Principal | | | | |
| | | amount | | | | |
| | | or shares | | | Value | |
| Energy — 4.5% | | | | | | |
| Oil & Gas Exploration & Production — 4.5% | | | | | | |
| Apache Corp. | | | 275,000 | | | $ | 21,219,000 | |
| Southwestern Energy Co.* | | | 450,000 | | | | 16,767,000 | |
| | | | | | | | 37,986,000 | |
| Materials — 2.1% | | | | | | | | |
| Construction Materials — 2.1% | | | | | | | | |
| Martin Marietta Materials, Inc. | | | 172,500 | | | | 17,598,450 | |
| Consumer Staples — 1.5% | | | | | | | | |
| Food & Staples Retailing — 1.5% | | | | | | | | |
| CVS Caremark Corp. | | | 225,000 | | | | 12,372,750 | |
| Total Common Stocks | | | | | | | | |
| (Cost $422,129,988) | | | | | | | 617,944,196 | |
| | | | | | | | | |
| CASH EQUIVALENTS — 26.7% | | | | | | | | |
| Wells Fargo Advantage Government Money Market Fund - | | | | | | | | |
Institutional Class 0.01%(a) | | | 8,518,601 | | | | 8,518,601 | |
| U.S. Treasury Bills, 0.09% to 0.15%, | | | | | | | | |
4/11/13 to 9/12/13(b) | | $ | 217,000,000 | | | | 216,975,455 | |
| | | | | | | | | |
| Total Cash Equivalents | | | | | | | | |
| (Cost $225,481,728) | | | | | | | 225,494,056 | |
| | | | | | | | | |
| Total Investments in Securities | | | | | | | | |
| (Cost $647,611,716) | | | | | | | 843,438,252 | |
| Options Written — (0.1%) | | | | | | | (597,365 | ) |
| Other Assets Less Other Liabilities — 0.2% | | | | | | | 1,372,097 | |
| Net Assets — 100.0% | | | | | | $ | 844,212,984 | |
| Net Asset Value Per Share | | | | | | $ | 27.75 | |
| | | | | | | | | |
| OPTIONS WRITTEN* | Expiration date/ Strike price | | Shares subject to option | | Value | |
| Covered Call Options | | | | | | | |
| Live Nation | | | | | | |
| Entertainment, Inc. | April 2013 / $10 | | | 200,000 | | | $ | (495,000 | ) |
| Live Nation | | | | | | | | | |
| Entertainment, Inc. | April 2013 / $11 | | | 69,400 | | | | (102,365 | ) |
| Total Options Written | | | | | | | | | |
| (premiums received $185,608) | | | | | | | $ | (597,365 | ) |
| * | Non-income producing |
| (a) | Rate presented represents the annualized 7-day yield at March 31, 2013. |
| (b) | Interest rates presented represent the yield to maturity at the date of purchase. |
| (c) | Fully or partially pledged as collateral on outstanding written options. |
| The accompanying notes form an integral part of these financial statements. | weitzinvestments.com 15 |
PARTNERS III OPPORTUNITY FUNDUND
PORTFOLIO MANAGER’S DISCUSSION & ANALYSIS
Portfolio Manager: Wallace R. Weitz, CFA
The Partners III Opportunity Fund’s Institutional Class returned +13.8% in the first calendar quarter, compared to +10.6% for the S&P 500 and +11.1% for the Russell 3000. Our technology holdings significantly outperformed the broader tech sector and contributed to the Fund’s strong quarter. Dell and Hewlett-Packard delivered outsized percentage gains from depressed year-end price levels. Michael Dell and Silver Lake Partners made a highly publicized bid to take the company private. We sold our Dell stock when it traded above the discouraging bid price, which shifted the analysis from business fundamentals to merger arbitrage. We also trimmed most of our HP position, taking profits. We view the risk-reward profile as less skewed in our favor after the stock’s strong rally from the low teens. Finally, FLIR Systems (+17%) and Texas Instruments (+15%) posted solid gains in the quarter, and both remain core holdings. Outside of technology, Valeant Pharmaceuticals (+26%) was the strongest contributor. Valeant reported solid organic growth, made rapid strides in integrating the Medicis dermatology acquisition, and announced yet another potentially accretive deal in late March.
For the fiscal year ended March 31, 2013, the Fund’s Institutional Class gained 19.2% compared to a 14.0% increase for the S&P 500 and a 14.6% gain for the Russell 3000. Consumer and financial companies provided the strongest contributions. A gradually improving economy helped buoy the fiscal year results and outlooks for Iconix Brand Group (+49%), Live Nation Entertainment (+32%) and Interval Leisure Group (+28%). John Malone and his management teams delivered another year filled with solid fundamental progress (QVC and Sirius XM), spin-offs and restructurings (Starz, Liberty Ventures) and acquisition activity (Liberty Global and Liberty Media Corp). These value creating actions drove excellent investment returns at our Liberty-related holdings. Within financials, Redwood Trust was the standout as its stock more than doubled over the past year. Management executed admirably on its residential and commercial strategies, building business value and attracting new investors. While Redwood has clear momentum and bright long-term prospects, the valuation is more comfortable than compelling after the stock’s strong run. Other notable contributors for the fiscal year included Valeant (+40%), Berkshire Hathaway (+28%) and Aon plc (+27%).
SandRidge Energy (-33%) detracted from results in an otherwise excellent year. We have been discouraged by the pace of business value growth, and to date the investment has fallen short of our standards. We pared back our SandRidge position as we developed higher conviction in our other energy holdings. Our short positions also posted negative returns during the fiscal year, as expected in a rising market.
We purchased two new stocks during the quarter. CACI International is a consulting firm that primarily serves the Department of Defense (“DoD”) and other government clients. CACI’s service-oriented business model requires little capital and generates healthy free cash flow. The company prefers to use this cash flow to acquire companies, thereby adding capabilities and clients. When the deal landscape is barren, the company has opportunistically repurchased shares. The stock is cheap primarily because of fears over DoD funding. While such concerns are legitimate, we think the stock trades at a meaningful discount to value using conservative assumptions. TransDigm Group manufactures commercial aerospace components. The company benefits from high barriers to entry, attractive pricing power, very long product cycles and global demand tailwinds. Nick Howley and his team have used a private-equity mindset to build the company through acquisition. The industry remains fragmented, providing management with an extensive pipeline of potential niche opportunities. TransDigm pairs operating excellence with capital allocation expertise, all within a unique owner-operator culture. It is our kind of business, and we hope to build a larger position in the company over time.
Partners III Opportunity has the broadest toolkit of our equity funds. The Fund invests in companies of all sizes and typically maintains short positions. Partners III is approximately 70% “net long” at quarter end, down from 78% at calendar year end. Our long positions declined to 87% of net assets as we trimmed positions into the strong market, while our effective short positions represent 17% of net assets. The Fund’s shorts include small, mid and large-cap stock ETF’s.
| New and Eliminated Securities for Quarter Ended March 31, 2013 | | |
| New ($mil) | Eliminations ($mil) | | |
| CACI International | | $5.7 | | | Dell | | | $24.8 | | |
| TransDigm Group | | 4.2 | | | | | | | | |
| Starz – Liberty Capital* | | 0.6 | | | | | | | | |
*Starz – Liberty Capital shares were received as part of a spin-off transaction.
16 Weitz Funds
PARTNERS III OPPORTUNITY FUND
PERFORMANCE • (UNAUDITED)
| | Total Returns | | Average Annual Total Returns |
| | | | 3 Mos. | | 1 Year | | 3 Year | | 5 Year | | 10 Year | | 15 Year | | 20 Year | | 25 Year |
| Partners III – Institutional Class | | | 13.8 | % | | 19.2 | % | | 15.9 | % | | 13.1 | % | | 12.1 | % | | 9.3 | % | | 13.1 | % | | 13.1 | % |
| S&P 500 | | | 10.6 | | | 14.0 | | | 12.7 | | | 5.8 | | | 8.5 | | | 4.3 | | | 8.5 | | | 9.9 | |
| Russell 3000 | | | 11.1 | | | 14.6 | | | 13.0 | | | 6.3 | | | 9.2 | | | 4.7 | | | 8.7 | | | 10.0 | |
| Russell 3000 Value | | | 12.3 | | | 18.7 | | | 12.7 | | | 5.0 | | | 9.3 | | | 5.4 | | | 9.3 | | | 10.3 | |
Growth of $10,000
This chart depicts the change in the value of a $10,000 investment in Partners III – Institutional Class for the period March 31, 2003 through March 31, 2013, as compared with the growth of the Standard & Poor’s 500 Index during the same period. Index performance is hypothetical and is shown for illustrative purposes only.
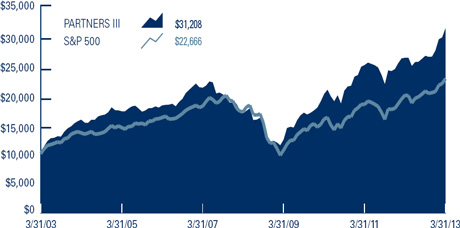
| Year | | | Partners III (1) | | S&P 500 (2) | | Relative Results (1)-(2) |
| 1983 (6/1/83) | | | 8.6 | % | | 4.2 | % | | 4.4 | % |
| 1984 | | | 11.2 | | | 6.1 | | | 5.1 | |
| 1985 | | | 38.6 | | | 31.6 | | | 7.0 | |
| 1986 | | | 8.5 | | | 18.6 | | | -10.1 | |
| 1987 | | | -1.4 | | | 5.1 | | | -6.5 | |
| 1988 | | | 19.5 | | | 16.6 | | | 2.9 | |
| 1989 | | | 19.4 | | | 31.7 | | | -12.3 | |
| 1990 | | | -5.5 | | | -3.1 | | | -2.4 | |
| 1991 | | | 23.2 | | | 30.5 | | | -7.3 | |
| 1992 | | | 13.5 | | | 7.6 | | | 5.9 | |
| 1993 | | | 32.3 | | | 10.1 | | | 22.2 | |
| 1994 | | | -11.1 | | | 1.3 | | | -12.4 | |
| 1995 | | | 43.3 | | | 37.6 | | | 5.7 | |
| 1996 | | | 25.0 | | | 23.0 | | | 2.0 | |
| 1997 | | | 37.1 | | | 33.4 | | | 3.7 | |
| 1998 | | | 10.9 | | | 28.6 | | | -17.7 | |
| 1999 | | | 10.6 | | | 21.0 | | | -10.4 | |
| 2000 | | | 32.4 | | | -9.1 | | | 41.5 | |
| 2001 | | | 6.6 | | | -11.9 | | | 18.5 | |
| 2002 | | | -16.1 | | | -22.1 | | | 6.0 | |
| 2003 | | | 42.6 | | | 28.7 | | | 13.9 | |
| 2004 | | | 22.1 | | | 10.9 | | | 11.2 | |
| 2005 | | | -0.7 | | | 4.9 | | | -5.6 | |
| 2006 | | | 20.4 | | | 15.8 | | | 4.6 | |
| 2007 | | | -12.9 | | | 5.5 | | | -18.4 | |
| 2008 | | | -34.4 | | | -37.0 | | | 2.6 | |
| 2009 | | | 42.0 | | | 26.5 | | | 15.5 | |
| 2010 | | | 33.0 | | | 15.1 | | | 17.9 | |
| 2011 | | | 5.6 | | | 2.1 | | | 3.5 | |
| 2012 | | | 12.9 | | | 16.0 | | | -3.1 | |
| 2013 (3/31/13) | | | 13.8 | | | 10.6 | | | 3.2 | |
| Since Inception: | | | | | | | | | | |
| Cumulative | | | | | | | | | | |
| Return | | | 4,213.3 | | | 1,933.9 | | | 2,279.4 | |
| Avg. Annual | | | | | | | | | | |
| Return | | | 13.4 | | | 10.6 | | | 2.8 | |
These performance numbers reflect the deduction of the Fund’s Institutional Class annual operating expenses which as stated in its most recent prospectus are 1.49% of the Fund’s net assets. The returns assume redemption at the end of each period and reinvestment of dividends. Total returns shown include fee waivers and expense reimbursements, if any; total returns would have been lower had there been no waiver of fees and/or reimbursement of expenses by the Adviser. This information represents past performance and past performance does not guarantee future results. The investment return and the principal value of an investment in this Fund will fluctuate so that an investor’s shares, when redeemed, may be worth more or less than the original cost. Current performance may be lower or higher than the performance data quoted. Performance data current to the most recent month-end may be obtained at www.weitzinvestments.com/funds_and_performance/fund_performance.fs.
See page 4 for additional performance disclosures. See page 82 for a description of all indices.
Performance information does not reflect the deduction of taxes that a shareholder would pay on Fund distributions or the redemption of Fund shares.
PARTNERS III OPPORTUNITY FUND
PORTFOLIO PROFILE • (UNAUDITED)
| Top Ten Stocks |
| Valeant Pharmaceuticals International, Inc. | | | 7.1 | % |
| DIRECTV | | | 5.8 | |
| Wells Fargo & Co. | | | 4.9 | |
| Live Nation Entertainment, Inc. | | | 4.5 | |
| Aon plc - CL A | | | 4.5 | |
| Berkshire Hathaway, Inc. - CL B | | | 4.4 | |
| Redwood Trust, Inc. | | | 3.9 | |
| Texas Instruments, Inc. | | | 3.9 | |
| Iconix Brand Group, Inc. | | | 3.8 | |
| Liberty Global, Inc. - Series C | | | 3.7 | |
| % of Net Assets | | | 46.5 | % |
| Industry Sectors |
| Consumer Discretionary | | | 32.0 | % |
| Financials | | | 17.7 | |
| Health Care | | | 13.3 | |
| Information Technology | | | 12.9 | |
| Energy | | | 7.0 | |
| Materials | | | 2.1 | |
| Industrials | | | 1.2 | |
| Securities Sold Short | | | (13.6 | ) |
| Short Proceeds/Other | | | 27.4 | |
| Net Assets | | | 100.0 | % |
| Top Performers for Quarter Ended March 31, 2013 |
| Security Name | | | QTD Return of Security | | Average Weight in Portfolio | | Contribution to Fund Performance |
| Hewlett-Packard Co. | | | 68.3 | % | | 3.6 | % | | 2.08 | % |
| Valeant Pharmaceuticals International, Inc. | | | 25.5 | | | 6.9 | | | 1.66 | |
| Redwood Trust, Inc. | | | 38.9 | | | 4.2 | | | 1.54 | |
| Live Nation Entertainment, Inc. | | | 32.9 | | | 4.4 | | | 1.32 | |
| Dell, Inc. | | | 42.3 | | | 2.1 | | | 1.20 | |
Contributions to Fund performance are based on actual daily holdings. Securities may have been bought or sold during the quarter.
Source: FactSet Portfolio Analytics
| Bottom Performers for Quarter Ended March 31, 2013 |
| Security Name | | | QTD Return of Security | | Average Weight in Portfolio | | Contribution to Fund Performance |
| Ishares Russell 2000 Fund (short) | | | 12.1 | % | | (4.6 | )% | | (0.57 | )% |
| SandRidge Energy, Inc. | | | (17.0 | ) | | 3.6 | | | (0.55 | ) |
| Ishares Russell Midcap Fund (short) | | | 12.9 | | | (3.5 | ) | | (0.45 | ) |
| SPDR S&P 500 ETF Trust (short) | | | 10.3 | | | (3.6 | ) | | (0.38 | ) |
| Ishares Russell 2000 Value Fund (short) | | | 11.4 | | | (1.7 | ) | | (0.19 | ) |
Contributions to Fund performance are based on actual daily holdings. Securities may have been bought or sold during the quarter.
Source: FactSet Portfolio Analytics
18 Weitz Funds
PARTNERS III OPPORTUNITY FUND
SCHEDULE OF INVESTMENTS • MARCH 31, 2013
| COMMON STOCKS — 86.2% | | | Shares | | | Value | |
| Consumer Discretionary — 32.0% | | | | | | | |
| Cable & Satellite — 10.1% | | | | | | | |
| DIRECTV* | | | 700,000 | | $ | 39,627,000 | |
Liberty Global, Inc. - Series C* (b) | | | 370,000 | | | 25,393,100 | |
Starz - Liberty Capital - Series A* (b) | | | 190,000 | | | 4,208,500 | |
| | | | | | | 69,228,600 | |
| Movies & Entertainment — 4.5% | | | | | | | |
Live Nation Entertainment, Inc.* (b) | | | 2,500,000 | | | 30,925,000 | |
| Broadcasting — 4.4% | | | | | | | |
Liberty Media Corp. - Series A* (b) | | | 210,000 | | | 23,442,300 | |
| Cumulus Media, Inc. - CL A* | | | 2,100,000 | | | 7,077,000 | |
| | | | | | | 30,519,300 | |
| Textiles, Apparel & Luxury Goods — 3.8% | | | | | | | |
| Iconix Brand Group, Inc.* | | | 1,000,000 | | | 25,870,000 | |
| Internet & Catalog Retail — 3.8% | | | | | | | |
Liberty Interactive Corp. - Series A* (b) | | | 850,000 | | | 18,173,000 | |
Liberty Ventures - Series A* (b) | | | 100,600 | | | 7,603,348 | |
| | | | | | | 25,776,348 | |
| Hotels, Restaurants & Leisure — 2.5% | | | | | | | |
| Interval Leisure Group, Inc. | | | 800,000 | | | 17,392,000 | |
| Advertising — 2.2% | | | | | | | |
| National CineMedia, Inc. | | | 950,000 | | | 14,991,000 | |
| Specialized Consumer Services — 0.7% | | | | | | | |
Coinstar, Inc.* (b) | | | 82,300 | | | 4,807,966 | |
| | | | | | | 219,510,214 | |
| Financials — 17.7% | | | | | | | |
| Commercial Banks — 4.9% | | | | | | | |
Wells Fargo & Co.(b) | | | 900,000 | | | 33,291,000 | |
| Insurance Brokers — 4.5% | | | | | | | |
Aon plc - CL A(b) | | | 500,000 | | | 30,750,000 | |
| Property & Casualty Insurance — 4.4% | | | | | | | |
Berkshire Hathaway, Inc. - CL B* (b) | | | 290,000 | | | 30,218,000 | |
| Mortgage REIT’s — 3.9% | | | | | | | |
Redwood Trust, Inc.(b) | | | 1,160,000 | | | 26,888,800 | |
| | | | | | | 121,147,800 | |
| Health Care — 13.3% | | | | | | | |
| Pharmaceuticals — 7.1% | | | | | | | |
Valeant Pharmaceuticals International, Inc.* (b) | | | 650,000 | | | 48,763,000 | |
| Health Care Services — 6.2% | | | | | | | |
Omnicare, Inc.(b) | | | 570,000 | | | 23,210,400 | |
Laboratory Corp. of America Holdings* (b) | | | 210,000 | | | 18,942,000 | |
| | | | | | | 42,152,400 | |
| | | | | | | 90,915,400 | |
| Information Technology — 12.9% | | | | | | | |
| Semiconductors — 3.9% | | | | | | | |
| Texas Instruments, Inc. | | | 750,000 | | | 26,610,000 | |
| Internet Software & Services — 3.0% | | | | | | | |
Google, Inc. - CL A* (b) | | | 15,000 | | | 11,910,450 | |
| XO Group, Inc.* | | | 850,000 | | | 8,500,000 | |
| | | | | | | 20,410,450 | |
| | | | Shares | | | Value | |
| Electronic Equipment & Instruments — 2.1% | | | | | | | |
| FLIR Systems, Inc. | | | 550,000 | | $ | 14,305,500 | |
| Software — 1.6% | | | | | | | |
| Microsoft Corp. | | | 380,000 | | | 10,871,800 | |
| Computers & Peripherals — 1.4% | | | | | | | |
| Hewlett-Packard Co. | | | 400,000 | | | 9,536,000 | |
| IT Services — 0.9% | | | | | | | |
| CACI International, Inc. - CL A* | | | 110,220 | | | 6,378,432 | |
| | | | | | | 88,112,182 | |
| Energy — 7.0% | | | | | | | |
| Oil & Gas Exploration & Production — 7.0% | | | | | | | |
Range Resources Corp.(b) | | | 220,000 | | | 17,828,800 | |
| SandRidge Energy, Inc.* | | | 2,500,000 | | | 13,175,000 | |
Apache Corp.(b) | | | 120,000 | | | 9,259,200 | |
| Southwestern Energy Co.* | | | 200,000 | | | 7,452,000 | |
| | | | | | | 47,715,000 | |
| Materials — 2.1% | | | | | | | |
| Construction Materials — 2.1% | | | | | | | |
Martin Marietta Materials, Inc.(b) | | | 140,000 | | | 14,282,800 | |
| Industrials — 1.2% | | | | | | | |
| Aerospace & Defense — 0.7% | | | | | | | |
TransDigm Group, Inc.(b) | | | 30,000 | | | 4,587,600 | |
| Machinery — 0.5% | | | | | | | |
Intelligent Systems Corp.* # † | | | 2,270,000 | | | 3,532,120 | |
| | | | | | | 8,119,720 | |
| Total Common Stocks | | | | | | | |
| (Cost $388,403,898) | | | | | | 589,803,116 | |
PUT OPTIONS* — 0.0% | | | Expiration date/Strike price | | | | | | Value | |
| Put Options | | | | | | | | | | |
| S&P 500 Index | | | May 2013 / $1,510 | | | 10,000 | | | 127,000 | |
| S&P 500 Index | | | June 2013 / $1,375 | | | 10,000 | | | 53,000 | |
| Total Put Options | | | | | | | | | | |
| (premiums paid $1,152,500) | | | | | | | | | 180,000 | |
| | | | | | | | | | | |
| CASH EQUIVALENTS — 13.2% | | | | | | Shares | | | Value | |
Wells Fargo Advantage Government Money Market Fund -Institutional Class 0.01%(a) | | | | | | | | | | |
| (Cost $90,037,532) | | | | | | 90,037,532 | | | 90,037,532 | |
| Total Investments in Securities | | | | | | | | | | |
| (Cost $479,593,930) | | | | | | | | | 680,020,648 | |
Due From Broker(b) — 12.9% | | | | | | | | | 88,359,086 | |
| Securities Sold Short — (12.8%) | | | | | | | | | (87,453,200 | ) |
| Options Written — (0.8%) | | | | | | | | | (5,211,520 | ) |
| Other Assets Less Other Liabilities — 1.3% | | | | | | | | | 8,756,820 | |
| Net Assets — 100.0% | | | | | | | | $ | 684,471,834 | |
| Net Asset Value Per Share - Institutional Class | | | | | | | | $ | 14.33 | |
| Net Asset Value Per Share - Investor Class | | | | | | | | $ | 14.26 | |
| The accompanying notes form an integral part of these financial statements. | weitzinvestments.com 19 |
PARTNERS III OPPORTUNITY FUND
SCHEDULE OF INVESTMENTS • (CONTINUED)
| SECURITIES SOLD SHORT — (12.8%) | | | Shares | | | Value | |
| Ishares Russell 2000 Fund | | | 320,000 | | $ | (30,163,200 | ) |
| Ishares Russell 2000 Value Fund | | | 130,000 | | | (10,895,300 | ) |
| Ishares Russell Midcap Fund | | | 180,000 | | | (22,912,200 | ) |
| SPDR S&P 500 ETF Trust | | | 150,000 | | | (23,482,500 | ) |
| Total Securities Sold Short | | | | | | | |
| (proceeds $73,023,229) | | | | | $ | (87,453,200 | ) |
| OPTIONS WRITTEN* | | | Expiration date/ Strike price | | Shares subject to option | | | Value | |
| Covered Call Options | | | | | | | | | | |
| Coinstar, Inc. | | | April 2013 / $50 | | | 32,300 | | $ | (272,935 | ) |
| Coinstar, Inc. | | | April 2013 / $52.50 | | | 50,000 | | | (300,000 | ) |
| Google, Inc. - CL A | | | April 2013 / $800 | | | 5,000 | | | (97,000 | ) |
| Live Nation | | | | | | | | | | |
| Entertainment, Inc. | | | April 2013 / $10 | | | 517,300 | | | (1,280,318 | ) |
| Live Nation | | | | | | | | | | |
| Entertainment, Inc. | | | April 2013 / $11 | | | 167,300 | | | (246,767 | ) |
| Valeant Pharmaceuticals | | | | | | | | | | |
| International, Inc. | | | July 2013 / $70 | | | 50,000 | | | (410,000 | ) |
| | | | | | | | | | (2,607,020 | ) |
| Uncovered Call Options | | | | | | | | | | |
| S&P 500 Index | | | May 2013 / $1,510 | | | 10,000 | | | (669,500 | ) |
| S&P 500 Index | | | June 2013 / $1,375 | | | 10,000 | | | (1,935,000 | ) |
| | | | | | | | | | (2,604,500 | ) |
| Total Options Written | | | | | | | | | | |
| (premiums received $2,350,130) | | | | | | | | $ | (5,211,520 | ) |
| * | Non-income producing |
| † | Controlled affiliate |
| # | Illiquid and/or restricted security that has been fair valued. |
| (a) | Rate presented represents the annualized 7-day yield at March 31, 2013. |
| (b) | Fully or partially pledged as collateral on securities sold short and outstanding written options. |
| 20 Weitz Funds | The accompanying notes form an integral part of these financial statements. |
This page has been left blank intentionally.
RESEARCH FUND
PORTFOLIO MANAGERS’ DISCUSSION & ANALYSIS
Co-Portfolio Managers:
Jonathan A. Baker, CFA; Barton B. Hooper, CFA;
David A. Perkins, CFA; & Andrew S. Weitz
The Research Fund returned +13.4% in the first calendar quarter, compared to a +10.6% return for the S&P 500 Index, a +11.1% return for the Russell 3000 Index and a +12.3% return for the Russell 3000 Value Index. Hewlett-Packard (+68%) was the top contributor to fund performance as investors assigned a higher value to the slow but incremental progress the company has made on its journey to restructure the business for long-term sustainability. Dell, Inc. (+42%) was another strong performer based on a takeout offer by CEO Michael Dell. The Fund exited the Dell position subsequent to Mr. Dell’s offer. Valeant Pharmaceuticals (+26%) and Flir Systems (+17%) were also top contributors as share price appreciation reflected the continued performance of these two high quality and well managed businesses. ITT Educational Services (-20%) was a significant underperformer as investors continue to question the long-term profitability of the for-profit education sector. We believe that the current price does not reflect ITT’s ultimate business value even under a scenario of significant permanent profit impairment and as such added to the Fund’s holdings during the quarter. Apple (-16%) moved from market darling to dud as investors questioned several aspects of the company’s business and capital allocation policy. While we agree that Apple’s capital allocation has been poor, the underlying business is still very sound and Apple continues to collect the majority of the profits in its chosen markets. The Fund added to its position in Apple during the quarter.
For the fiscal year ended March 31, 2013, the Fund returned +7.1% compared to a +14.0% return for the S&P 500 Index, a +14.6% return for the Russell 3000 Index and an +18.7% return for the Russell 3000 Value Index. Valeant (+40%) was the standout performer as investors rewarded the company for its strong cash earnings growth. Active portfolio management drove significant contributions in Hewlett-Packard and Coinstar. While Hewlett-Packard’s stock treaded water during the fiscal year, we reaped significant gains by buying shares aggressively in the low teens and participating in the stock’s subsequent recovery back into the $20’s. We sold most of our Coinstar shares when the stock rallied to more than $70 last summer, then rebuilt a large position when the stock declined back into the low $40’s in the fall. Coinstar remains the Fund’s largest holding, with a business value estimate that has grown to more than $90 per share. KIT digital and ITT Educational Services were the primary detractors from results in the fiscal year, each costing the Fund several percentage points of performance. In the fourth calendar quarter, we concluded that KIT digital would not be able to repair its damaged balance sheet and closed our disappointing investment. Conversely, despite ITT Educational’s discouraging outcome to date, we continue to believe the stock is significantly undervalued and have added to our position.
During the quarter the Fund added three companies to the portfolio that met our quality and valuation criteria: Express Scripts, CACI and Apache. Express Scripts is now the nation’s largest pharmacy benefit manager (PBM), handling roughly one-third of all prescription drugs dispensed each year. Express Scripts’ acquisition of Medco in 2012 effectively created a duopoly for Express Scripts and CVS Caremark in the large employer and large health plan segments. As importantly, Express Scripts’ business boasts attractive entry barriers, is highly capital efficient and is run by a talented and shareholder-friendly management team. CACI International is a consulting firm that primarily serves the Department of Defense and other government clients. Services firms typically are capital-lite business models that generate healthy amounts of free cash flow. CACI’s preference is to use its cash flow to buy additional businesses that add capabilities and clients to its stable, although the current environment has not been target rich. Instead, management aggressively acquired its own shares (which we believe are undervalued), buying in nearly 25% of the company in the last 18 months. Apache represents a collection of high-quality oil and gas resources that have more than discounted potential geopolitical risks from its Egyptian assets.
In addition to the Dell sale mentioned above, the Fund eliminated holdings in Southwestern Energy and CVS Caremark during the quarter as the price of each neared our estimate of business value. At 20% of net assets, the Fund’s cash position increased from the prior quarter’s 15%. The list of businesses we have fully researched continues to increase. Unfortunately the prices of the businesses on the aforementioned list continue to rise and therefore the list of those that also meet our valuation criteria continues to shrink. We will remain patient with Fund capital and are confident that adherence to our investing principles will be rewarded over time.
Research is a focused, multi-cap equity fund that invests in companies of all sizes. The Fund is managed in a “sleeve” format, with each co-manager responsible for all decisions related to their portion of the portfolio’s assets. In addition to the unique portfolio management structure, the Fund has several characteristics that may further distinguish it from our other equity funds, including potentially higher levels of concentration, position sizes and turnover within the Fund.
| New and Eliminated Securities for Quarter Ended March 31, 2013 |
| New ($000’s) | | | Eliminations ($000’s) |
| Apache | | $767 | | | Dell | | | $949 | | |
| CACI International | | 270 | | | Southwestern Energy | | | 755 | | |
| Express Scripts | | 245 | | | CVS Caremark | | | 253 | | |
RESEARCH FUND
PERFORMANCE • (UNAUDITED)
| | Total Returns | | | Average Annual Total Returns | |
| | | | | | | | | | | | | | | | Since |
| | | | 3 Mos. | | 1 Year | | 3 Year | | 5 Year | | Inception |
| Research | | | 13.4 | % | | 7.1 | % | | 12.5 | % | | 11.5 | % | | 7.0 | % |
| S&P 500 | | | 10.6 | | | 14.0 | | | 12.7 | | | 5.8 | | | 5.8 | |
| Russell 3000 | | | 11.1 | | | 14.6 | | | 13.0 | | | 6.3 | | | 6.2 | |
| Russell 3000 Value | | | 12.3 | | | 18.7 | | | 12.7 | | | 5.0 | | | 5.4 | |
Growth of $10,000
This chart depicts the change in the value of a $10,000 investment in the Research Fund for the period April 1, 2005 through March 31, 2013, as compared with the growth of the Standard & Poor’s 500 Index during the same period. Index performance is hypothetical and is shown for illustrative purposes only.
| Year | | | Research (1) | | S&P 500 (2) | | Relative Results (1)-(2) |
| 2005 (4/1/05) | | | 4.0 | % | | 7.2 | % | | -3.2 | % |
| 2006 | | | 21.8 | | | 15.8 | | | 6.0 | |
| 2007 | | | -13.4 | | | 5.5 | | | -18.9 | |
| 2008 | | | -30.7 | | | -37.0 | | | 6.3 | |
| 2009 | | | 38.8 | | | 26.5 | | | 12.3 | |
| 2010 | | | 30.3 | | | 15.1 | | | 15.2 | |
| 2011 | | | 4.2 | | | 2.1 | | | 2.1 | |
| 2012 | | | 5.7 | | | 16.0 | | | -10.3 | |
| 2013 (3/31/13) | | | 13.4 | | | 10.6 | | | 2.8 | |
| Since Inception: | | | | | | | | | | |
| Cumulative | | | | | | | | | | |
| Return | | | 71.7 | | | 57.2 | | | 14.5 | |
| Avg. Annual | | | | | | | | | | |
| Return | | | 7.0 | | | 5.8 | | | 1.2 | |
Starting January 1, 2011, these performance numbers reflect the deduction of the Fund’s actual operating expenses. For periods of time prior to January 1, 2011, the performance numbers reflect the deduction of annual pro forma operating expenses of 1.50%. Annual operating expenses for the Fund as stated in its most recent prospectus are 1.85% (gross) and 0.92% (net) of the Fund’s net assets. The investment adviser has agreed, in writing, to limit the total annual fund operating expenses (excluding taxes, interest, brokerage commissions, and acquired fund fees and expenses) to 0.90% of the Fund’s average daily net assets through July 31, 2013. The returns assume redemption at the end of each period and reinvestment of dividends. Total returns shown include fee waivers and expense reimbursements, if any; total returns would have been lower had there been no waiver of fees and/or reimbursement of expenses by the Adviser. This information represents past performance and past performance does not guarantee future results. The investment return and the principal value of an investment in this Fund will fluctuate so that an investor’s shares, when redeemed, may be worth more or less than the original cost. Current performance may be lower or higher than the performance data quoted. Performance data current to the most recent month-end may be obtained at www.weitzinvestments.com/funds_and_performance/fund_performance.fs.
See page 4 for additional performance disclosures. See page 82 for a description of all indices.
Performance information does not reflect the deduction of taxes that a shareholder would pay on Fund distributions or the redemption of Fund shares.
RESEARCH FUND
PORTFOLIO PROFILE • (UNAUDITED)
| Top Ten Stocks | | | | |
| Coinstar, Inc. | | | 10.7 | % |
| Microsoft Corp. | | | 7.1 | |
| FLIR Systems, Inc. | | | 5.5 | |
| Valeant Pharmaceuticals International, Inc. | | | 5.1 | |
| DIRECTV | | | 4.3 | |
| Berkshire Hathaway, Inc. - CL B | | | 4.2 | |
| Apache Corp. | | | 4.2 | |
| Hewlett-Packard Co. | | | 3.9 | |
| Aon plc - CL A | | | 2.9 | |
| XO Group, Inc. | | | 2.6 | |
| % of Net Assets | | | 50.5 | % |
| Industry Sectors | | | | |
| Information Technology | | | 30.7 | % |
| Consumer Discretionary | | | 25.6 | |
| Health Care | | | 7.7 | |
| Financials | | | 7.1 | |
| Energy | | | 4.2 | |
| Industrials | | | 2.3 | |
| Consumer Staples | | | 1.7 | |
| Cash Equivalents/Other | | | 20.7 | |
| Net Assets | | | 100.0 | % |
| Top Performers for Quarter Ended March 31, 2013 |
| Security Name | | | QTD Return of Security | | Average Weight in Portfolio | | Contribution to Fund Performance |
| Hewlett-Packard Co. | | | 68.3 | % | | 4.2 | % | | 2.4 | % |
| Dell, Inc. | | | 42.3 | | | 2.2 | | | 1.6 | |
| Valeant Pharmaceuticals International, Inc. | | | 25.5 | | | 5.3 | | | 1.3 | |
| FLIR Systems, Inc. | | | 17.0 | | | 6.3 | | | 1.2 | |
| Coinstar, Inc. | | | 12.3 | | | 10.0 | | | 1.2 | |
Contributions to Fund performance are based on actual daily holdings. Securities may have been bought or sold during the quarter.
Source: FactSet Portfolio Analytics
| Bottom Performers for Quarter Ended March 31, 2013 |
| Security Name | | | QTD Return of Security | | Average Weight in Portfolio | | Contribution to Fund Performance |
| ITT Educational Services, Inc. | | | (20.4 | )% | | 2.5 | % | | (0.7 | )% |
| Apple Inc. | | | (16.5 | ) | | 1.2 | | | (0.2 | ) |
Contributions to Fund performance are based on actual daily holdings. Securities may have been bought or sold during the quarter.
Source: FactSet Portfolio Analytics
24 Weitz Funds
RESEARCH FUND
SCHEDULE OF INVESTMENTS • MARCH 31, 2013
| COMMON STOCKS — 79.3% | | | Shares | | | Value | |
| Information Technology — 30.7% | | | | | | | |
| Software — 8.6% | | | | | | | |
| Microsoft Corp. | | | 47,078 | | $ | 1,346,901 | |
| Oracle Corp. | | | 9,000 | | | 291,060 | |
| | | | | | | 1,637,961 | |
| IT Services — 5.9% | | | | | | | |
| CACI International, Inc. - CL A* | | | 5,300 | | | 306,711 | |
| Sapient Corp.* | | | 24,000 | | | 292,560 | |
| Fidelity National Information Services, Inc. | | | 7,200 | | | 285,264 | |
| Accenture plc - CL A | | | 3,300 | | | 250,701 | |
| | | | | | | 1,135,236 | |
| Electronic Equipment & Instruments — 5.5% | | | | | | | |
| FLIR Systems, Inc. | | | 40,670 | | | 1,057,827 | |
| Computers & Peripherals — 5.3% | | | | | | | |
| Hewlett-Packard Co. | | | 31,130 | | | 742,139 | |
| Apple Inc. | | | 600 | | | 265,578 | |
| | | | | | | 1,007,717 | |
| Internet Software & Services — 3.8% | | | | | | | |
| Google, Inc. - CL A* | | | 300 | | | 238,209 | |
| XO Group, Inc.* | | | 48,778 | | | 487,780 | |
| | | | | | | 725,989 | |
| Semiconductors — 1.6% | | | | | | | |
| Texas Instruments, Inc. | | | 8,700 | | | 308,676 | |
| | | | | | | 5,873,406 | |
| Consumer Discretionary — 25.6% | | | | | | | |
| Specialized Consumer Services — 10.7% | | | | | | | |
| Coinstar, Inc.* | | | 35,029 | | | 2,046,394 | |
| Cable & Satellite — 4.3% | | | | | | | |
| DIRECTV* | | | 14,500 | | | 820,845 | |
| Education Services — 2.4% | | | | | | | |
| ITT Educational Services, Inc.* | | | 32,450 | | | 447,161 | |
| Hotels, Restaurants & Leisure — 2.0% | | | | | | | |
| Interval Leisure Group, Inc. | | | 17,412 | | | 378,537 | |
| Advertising — 1.9% | | | | | | | |
| National CineMedia, Inc. | | | 23,297 | | | 367,627 | |
| Textiles, Apparel & Luxury Goods — 1.5% | | | | | | | |
| Iconix Brand Group, Inc.* | | | 11,000 | | | 284,570 | |
| Multiline Retail — 1.4% | | | | | | | |
| Target Corp. | | | 4,000 | | | 273,800 | |
| Movies & Entertainment — 1.4% | | | | | | | |
| The Walt Disney Co. | | | 4,800 | | | 272,640 | |
| | | | | | | 4,891,574 | |
| Health Care — 7.7% | | | | | | | |
| Pharmaceuticals — 5.1% | | | | | | | |
| Valeant Pharmaceuticals International, Inc.* | | | 13,100 | | | 982,762 | |
| Health Care Services — 2.6% | | | | | | | |
| Express Scripts Holding Co.* | | | 4,500 | | | 259,425 | |
| Omnicare, Inc. | | | 5,620 | | | 228,846 | |
| | | | | | | 488,271 | |
| | | | | | | 1,471,033 | |
| | | | Shares | | | Value | |
| Financials — 7.1% | | | | | | | |
| Property & Casualty Insurance — 4.2% | | | | | | | |
| Berkshire Hathaway, Inc. - CL B* | | | 7,671 | | $ | 799,318 | |
| Insurance Brokers — 2.9% | | | | | | | |
| Aon plc - CL A | | | 8,930 | | | 549,195 | |
| | | | | | | 1,348,513 | |
| Energy — 4.2% | | | | | | | |
| Oil & Gas Exploration & Production — 4.2% | | | | | | | |
| Apache Corp. | | | 10,318 | | | 796,137 | |
| Industrials — 2.3% | | | | | | | |
| Research & Consulting Services — 2.3% | | | | | | | |
| FTI Consulting, Inc.* | | | 11,704 | | | 440,773 | |
| Consumer Staples — 1.7% | | | | | | | |
| Personal Products — 1.7% | | | | | | | |
| Avon Products, Inc. | | | 16,000 | | | 331,680 | |
| Total Common Stocks | | | | | | | |
| (Cost $12,393,769) | | | | | | 15,153,116 | |
| | | | | | | | |
| CASH EQUIVALENTS — 20.4% | | | | | | | |
Wells Fargo Advantage Government Money Market Fund -Institutional Class 0.01%(a) | | | | | | | |
| (Cost $3,901,704) | | | 3,901,704 | | | 3,901,704 | |
| Total Investments in Securities | | | | | | | |
| (Cost $16,295,473) | | | | | | 19,054,820 | |
Other Assets less Other Liabilities — 0.3% | | | | | $ | | |
| Net Assets — 100.0% | | | | | | | |
| Net Asset Value Per Share | | | | | $ | 10.83 | |
| * | Non-income producing |
| (a) | Rate presented represents the annualized 7-day yield at March 31, 2013. |
| The accompanying notes form an integral part of these financial statements. | weitzinvestments.com 25 |
HICKORY FUND
PORTFOLIO MANAGERS’ DISCUSSION & ANALYSIS
Co-Portfolio Managers:
Wallace R. Weitz, CFA & Andrew S. Weitz
The Hickory Fund returned +9.5% in the first calendar quarter of 2013 (an experience we might be pleased to report for an entire year rather than a single quarter), compared to a +12.8% return for the Russell 2500. For the fiscal year ended March 31, 2013, the Fund increased 18.1% compared to a 17.7% gain for the Russell 2500. We achieved these gains despite the Fund’s defensive posture, and most importantly by sticking to our disciplines.
In the quarter, most stock prices continued to increase faster than our business value estimates. Equities across the board enjoyed outsized gains, a narrative consistent with the full fiscal year. As the gap between price and value shrinks, so do potential prospective returns, and we have reduced our positions where appropriate. Our valuation driven approach resulted in a rising cash balance during the fiscal year (32% at fiscal year-end versus 25% one year ago.) This cash provides plenty of “dry powder” to make new investments as we find them or should (when) market volatility returns. We acknowledge that elevated cash levels act as a drag on performance in a rising market. However, we believe that risk is best defined as the potential for permanent capital loss and we do not worry about “being up less” in the short term.
The Fund benefited from the broad rally in equity prices during the first quarter. Liberty Media reinvented itself once again, splitting into two separate companies. The primary assets of “old” Liberty Media are its majority stake in Sirius XM Satellite Radio and investments in Live Nation Entertainment, Barnes and Noble and other assets. “Old” Liberty Media remains a large holding in the Fund. The newly separated Starz LLC operates premium pay TV channels and other modest-sized media businesses. Investors viewed Starz as a prime takeover target and the stock rose 57% from its opening price as a standalone entity. We sold our shares as they approached our estimate of business value. Other top contributors in the quarter included Redwood Trust (+39%), Live Nation Entertainment (+33%), Flir Systems (+17%) and Iconix (+16%).
SandRidge Energy (-17%) was the Fund’s largest detractor in the quarter. We are encouraged that the company has reached a settlement with its activist shareholder that includes an expanded board and strategic review. However, drilling results have remained below expectations and we have subsequently reduced both our estimate of business value and the size of our investment. We continue to believe its shares trade at a discount to our updated business value estimate and that investors will appreciate a leaner, more focused SandRidge moving forward.
Redwood Trust (+121%) was the standout performer of the fiscal year. Redwood’s investments in growing its relationships with high quality, jumbo mortgage originators are paying dividends. In the current yield-starved market, Redwood is the leading issuer of non-agency residential mortgage-backed securities. Redwood’s position allows them to select only mortgages that meet their high underwriting standards and secure advantageous terms from investment banks looking to help Redwood meet elevated investor demand. We have long admired the strategic orientation of Redwood’s leadership and are pleased to see their efforts paying off for the company and its shareholders. Other fiscal year winners included John Malone-related entities Liberty Media (+52%), Liberty Global (+43%) and Live Nation Entertainment (+32%), and Iconix Brand Group (+49%) rounded out the Fund’s top contributors.
SandRidge Energy and KIT digital were the largest detractors to Fund performance during the fiscal year. Both endured a tumultuous year. As mentioned above, we believe the expansion of SandRidge’s board and strategic review are positives for the company, allowing investors to focus on its core operations and assets. In the fourth calendar quarter, we came to the conclusion that KIT digital would not be able to repair its damaged balance sheet and closed our disappointing investment.
Portfolio activity was relatively balanced in the quarter and we did not purchase any new stocks. The Fund’s cash position was unchanged at 32% of net assets. The sale of Starz and trims of Redwood Trust, FLIR Systems and SandRidge Energy were nearly offset by additions to TransDigm Group, CACI International and a collection of modest additions across the portfolio trading at attractive valuations. For the fiscal year, the Fund has been a net seller. We remain ready and eager to deploy the Fund’s cash position in attractive investment opportunities as they surface.
The Hickory Fund invests in our firm’s best smaller company ideas. The Fund’s weighted average market cap is approximately $5.7 billion, reflecting Hickory’s diverse mix of mid-cap and small-cap stocks. The Fund remains relatively concentrated, with the ten largest positions accounting for 35% of net assets.
| New and Eliminated Securities for Quarter Ended March 31, 2013 |
| New ($mil) | | Eliminations ($mil) |
| None | | None |
26 Weitz Funds
HICKORY FUND
PERFORMANCE ��� (UNAUDITED)
| | Total Returns | | | Average Annual Total Returns | |
| | | | | | | | | | | | | | | | | | | | | | | |
| | | | 3 Mos. | | 1 Year | | 3 Year | | 5 Year | | 10 Year | | 15 Year | | 20 Year |
| Hickory | | | 9.5 | % | | 18.1 | % | | 16.5 | % | | 10.5 | % | | 11.2 | % | | 5.7 | % | | 10.6 | % |
| Russell 2500 | | | 12.8 | | | 17.7 | | | 14.6 | | | 9.0 | | | 12.3 | | | 7.6 | | | 10.3 | |
| Russell 2500 Value | | | 13.4 | | | 21.2 | | | 14.2 | | | 8.8 | | | 12.1 | | | 8.2 | | | 11.0 | |
| S&P 500 | | | 10.6 | | | 14.0 | | | 12.7 | | | 5.8 | | | 8.5 | | | 4.3 | | | 8.5 | |
Growth of $10,000
Effective June 30, 2008, the Hickory Fund adopted its current principal investment strategy of investing the majority of its assets in smaller and medium sized companies, those with a market capitalization of less than $10 billion at the time of purchase.
This chart depicts the change in the value of a $10,000 investment in the Hickory Fund for the period June 30, 2008 through March 31, 2013, as compared with the growth of the Russell 2500 Index during the same period. Index performance is hypothetical and is shown for illustrative purposes only.
The following chart depicts the change in the value of a $10,000 investment in the Hickory Fund for the period March 31, 2003 through March 31, 2013, as compared with the growth of the Russell 2500 and Standard & Poor’s 500 Indices during the same period.
| Year | | | Hickory (1) | | Russell 2500 (2) | | Relative Results (1)-(2) |
| 2008 (7/1/08) | | | -28.9 | % | | -31.2 | % | | 2.3 | % |
| 2009 | | | 36.5 | | | 34.4 | | | 2.1 | |
| 2010 | | | 38.7 | | | 26.7 | | | 12.0 | |
| 2011 | | | 1.5 | | | -2.5 | | | 4.0 | |
| 2012 | | | 19.0 | | | 17.9 | | | 1.1 | |
| 2013 (3/31/13) | | | 9.5 | | | 12.8 | | | -3.3 | |
| Since 7/1/08: | | | | | | | | | | |
| Cumulative | | | | | | | | | | |
| Return | | | 78.0 | | | 51.9 | | | 26.1 | |
| Avg. Annual | | | | | | | | | | |
| Return | | | 12.9 | | | 9.2 | | | 3.7 | |
| Year | | | Hickory (1) | | S&P 500 (2) | | Relative Results (1)-(2) |
| 1993 (4/1/93) | | | 20.3 | % | | 5.5 | % | | 14.8 | % |
| 1994 | | | -17.3 | | | 1.3 | | | -18.6 | |
| 1995 | | | 40.5 | | | 37.6 | | | 2.9 | |
| 1996 | | | 35.3 | | | 23.0 | | | 12.3 | |
| 1997 | | | 39.2 | | | 33.4 | | | 5.8 | |
| 1998 | | | 33.0 | | | 28.6 | | | 4.4 | |
| 1999 | | | 36.7 | | | 21.0 | | | 15.7 | |
| 2000 | | | -17.2 | | | -9.1 | | | -8.1 | |
| 2001 | | | -4.6 | | | -11.9 | | | 7.3 | |
| 2002 | | | -29.3 | | | -22.1 | | | -7.2 | |
| 2003 | | | 47.9 | | | 28.7 | | | 19.2 | |
| 2004 | | | 22.6 | | | 10.9 | | | 11.7 | |
| 2005 | | | -0.2 | | | 4.9 | | | -5.1 | |
| 2006 | | | 22.8 | | | 15.8 | | | 7.0 | |
| 2007 | | | -13.1 | | | 5.5 | | | -18.6 | |
| 2008 | | | -41.6 | | | -37.0 | | | -4.6 | |
| 2009 | | | 36.5 | | | 26.5 | | | 10.0 | |
| 2010 | | | 38.7 | | | 15.1 | | | 23.6 | |
| 2011 | | | 1.5 | | | 2.1 | | | -0.6 | |
| 2012 | | | 19.0 | | | 16.0 | | | 3.0 | |
| 2013 (3/31/13) | | | 9.5 | | | 10.6 | | | -1.1 | |
| Since Inception: | | | | | | | | | | |
| Cumulative | | | | | | | | | | |
| Return | | | 653.6 | | | 414.0 | | | 239.6 | |
| Avg. Annual | | | | | | | | | | |
| Return | | | 10.6 | | | 8.5 | | | 2.1 | |
These performance numbers reflect the deduction of the Fund’s annual operating expenses which as stated in its most recent prospectus are 1.28% of the Fund’s net assets. The returns assume redemption at the end of each period and reinvestment of dividends. Total returns shown include fee waivers and expense reimbursements, if any; total returns would have been lower had there been no waiver of fees and/or reimbursement of expenses by the Adviser. This information represents past performance and past performance does not guarantee future results. The investment return and the principal value of an investment in this Fund will fluctuate so that an investor’s shares, when redeemed, may be worth more or less than the original cost. Current performance may be lower or higher than the performance data quoted. Performance data current to the most recent month-end may be obtained at www.weitzinvestments.com/funds_and_performance/fund_performance.fs.
See page 4 for additional performance disclosures. See page 82 for a description of all indices.
Performance information does not reflect the deduction of taxes that a shareholder would pay on Fund distributions or the redemption of Fund shares.
HICKORY FUND
PORTFOLIO PROFILE • (UNAUDITED)
| Top Ten Stocks | | | | |
| Redwood Trust, Inc. | | | 4.0 | % |
| FLIR Systems, Inc. | | | 3.9 | |
| Live Nation Entertainment, Inc. | | | 3.9 | |
| Iconix Brand Group, Inc. | | | 3.7 | |
| Coinstar, Inc. | | | 3.4 | |
| Omnicare, Inc. | | | 3.4 | |
| National CineMedia, Inc. | | | 3.3 | |
| Laboratory Corp. of America Holdings | | | 3.1 | |
| Interval Leisure Group, Inc. | | | 3.0 | |
| Liberty Media Corp. - Series A | | | 3.0 | |
| % of Net Assets | | | 34.7 | % |
| Industry Sectors | | | | |
| Consumer Discretionary | | | 27.9 | % |
| Financials | | | 10.8 | |
| Information Technology | | | 10.0 | |
| Health Care | | | 6.5 | |
| Industrials | | | 4.7 | |
| Materials | | | 4.0 | |
| Energy | | | 1.9 | |
| Consumer Staples | | | 1.5 | |
| Telecommunication Services | | | 0.5 | |
| Cash Equivalents/Other | | | 32.2 | |
| Net Assets | | | 100.0 | % |
| Top Performers for Quarter Ended March 31, 2013 |
| Security Name | | | QTD Return of Security | | Average Weight in Portfolio | | Contribution to Fund Performance |
| Redwood Trust, Inc. | | | 38.9 | % | | 3.9 | % | | 1.40 | % |
| Live Nation Entertainment, Inc. | | | 32.9 | | | 3.7 | | | 1.12 | |
| FLIR Systems, Inc. | | | 17.0 | | | 4.4 | | | 0.80 | |
| Starz - Liberty Capital - Series A | | | 66.8 | | | 1.2 | | | 0.59 | |
| Iconix Brand Group, Inc. | | | 15.9 | | | 3.7 | | | 0.56 | |
Contributions to Fund performance are based on actual daily holdings. Securities may have been bought or sold during the quarter.
Source: FactSet Portfolio Analytics
| Bottom Performers for Quarter Ended March 31, 2013 |
| Security Name | | | QTD Return of Security | | Average Weight in Portfolio | | Contribution to Fund Performance |
| SandRidge Energy, Inc. | | | (17.0 | )% | | 3.2 | % | | (0.51 | )% |
| LICT Corp. | | | (11.7 | ) | | 0.6 | | | (0.07 | ) |
Contributions to Fund performance are based on actual daily holdings. Securities may have been bought or sold during the quarter.
Source: FactSet Portfolio Analytics
28 Weitz Funds
HICKORY FUND
SCHEDULE OF INVESTMENTS • MARCH 31, 2013
| COMMON STOCKS — 67.8% | | | Shares | | | Value | |
| Consumer Discretionary — 27.9% | | | | | | | |
| Broadcasting — 3.9% | | | | | | | |
| Liberty Media Corp. - Series A* | | | 115,000 | | $ | 12,837,450 | |
| Cumulus Media, Inc. - CL A* | | | 1,200,000 | | | 4,044,000 | |
| | | | | | | 16,881,450 | |
| Movies & Entertainment — 3.9% | | | | | | | |
Live Nation Entertainment, Inc.* (c) | | | 1,350,000 | | | 16,699,500 | |
| Internet & Catalog Retail — 3.8% | | | | | | | |
| Liberty Interactive Corp. - Series A* | | | 585,000 | | | 12,507,300 | |
| Liberty Ventures - Series A* | | | 55,000 | | | 4,156,900 | |
| | | | | | | 16,664,200 | |
| Textiles, Apparel & Luxury Goods — 3.7% | | | | | | | |
| Iconix Brand Group, Inc.* | | | 625,000 | | | 16,168,750 | |
| Specialized Consumer Services — 3.4% | | | | | | | |
| Coinstar, Inc.* | | | 250,000 | | | 14,605,000 | |
| Advertising — 3.3% | | | | | | | |
| National CineMedia, Inc. | | | 900,000 | | | 14,202,000 | |
| Hotels, Restaurants & Leisure — 3.0% | | | | | | | |
| Interval Leisure Group, Inc. | | | 600,000 | | | 13,044,000 | |
| Cable & Satellite — 2.9% | | | | | | | |
| Liberty Global, Inc. - Series C* | | | 180,000 | | | 12,353,400 | |
| | | | | | | 120,618,300 | |
| Financials — 10.8% | | | | | | | |
| Insurance Brokers — 5.1% | | | | | | | |
| Brown & Brown, Inc. | | | 310,000 | | | 9,932,400 | |
| Aon plc - CL A | | | 130,000 | | | 7,995,000 | |
| Willis Group Holdings Ltd. | | | 100,000 | | | 3,949,000 | |
| | | | | | | 21,876,400 | |
| Mortgage REIT’s — 4.0% | | | | | | | |
| Redwood Trust, Inc. | | | 739,000 | | | 17,130,020 | |
| Property & Casualty Insurance — 1.7% | | | | | | | |
| CNA Financial Corp. | | | 230,000 | | | 7,518,700 | |
| | | | | | | 46,525,120 | |
| Information Technology — 10.0% | | | | | | | |
| IT Services — 4.3% | | | | | | | |
| CACI International, Inc. - CL A* | | | 200,000 | | | 11,574,000 | |
| Sapient Corp.* | | | 550,000 | | | 6,704,500 | |
| | | | | | | 18,278,500 | |
| Electronic Equipment & Instruments — 3.9% | | | | | | | |
| FLIR Systems, Inc. | | | 650,000 | | | 16,906,500 | |
| Internet Software & Services — 1.8% | | | | | | | |
| XO Group, Inc.* | | | 785,000 | | | 7,850,000 | |
| | | | | | | 43,035,000 | |
| Health Care — 6.5% | | | | | | | |
| Health Care Services — 6.5% | | | | | | | |
| Omnicare, Inc. | | | 355,000 | | | 14,455,600 | |
| Laboratory Corp. of America Holdings* | | | 150,000 | | | 13,530,000 | |
| | | | | | | 27,985,600 | |
| Industrials — 4.7% | | | | | | | |
| Aerospace & Defense — 2.5% | | | | | | | |
| TransDigm Group, Inc. | | | 70,000 | | | 10,704,400 | |
| Research & Consulting Services — 1.2% | | | | | | | |
| FTI Consulting, Inc.* | | | 140,000 | | | 5,272,400 | |
| Commercial Services & Supplies — 1.0% | | | | | | | |
| Ascent Capital Group, Inc. - CL A* | | | 60,000 | | | 4,466,400 | |
| | | | | | | 20,443,200 | |
| | | | Principal amount or shares | | | Value | |
| Materials — 4.0% | | | | | | | |
| Construction Materials — 2.6% | | | | | | | |
| Martin Marietta Materials, Inc. | | | 110,000 | | $ | 11,222,200 | |
| Metals & Mining — 1.4% | | | | | | | |
| Compass Minerals International, Inc. | | | 80,000 | | | 6,312,000 | |
| | | | | | | 17,534,200 | |
| Energy — 1.9% | | | | | | | |
| Oil & Gas Exploration & Production — 1.9% | | | | | | | |
| SandRidge Energy, Inc.* | | | 1,600,000 | | | 8,432,000 | |
| Consumer Staples — 1.5% | | | | | | | |
| Personal Products — 1.5% | | | | | | | |
| Prestige Brands Holdings, Inc.* | | | 250,000 | | | 6,422,500 | |
| Telecommunication Services — 0.5% | | | | | | | |
| Diversified Telecommunication Services — 0.5% | | | | | | | |
LICT Corp.* # | | | 1,005 | | | 2,040,150 | |
| Total Common Stocks | | | | | | | |
| (Cost $201,605,689) | | | | | | 293,036,070 | |
| | | | | | | | |
| CASH EQUIVALENTS — 32.3% | | | | | | | |
| Wells Fargo Advantage Government Money Market Fund - | | | | | | | |
Institutional Class 0.01%(a) | | | 4,642,497 | | | 4,642,497 | |
| U.S. Treasury Bills, 0.09% to 0.14%, | | | | | | | |
4/25/13 to 9/12/13(b) | | $ | 135,000,000 | | | 134,986,580 | |
| Total Cash Equivalents | | | | | | | |
| (Cost $139,622,104) | | | | | | 139,629,077 | |
| Total Investments in Securities | | | | | | | |
| (Cost $341,227,793) | | | | | | 432,665,147 | |
| Options Written — (0.1%) | | | | | | (631,433 | ) |
| Other Assets Less Other Liabilities — 0.0% | | | | | | 52,177 | |
| Net Assets — 100.0% | | | | | $ | 432,085,891 | |
| Net Asset Value Per Share | | | | | $ | 50.22 | |
| OPTIONS WRITTEN* | | | Expiration date/ Strike price | | Shares subject to option | | | Value | |
| Covered Call Options | | | | | | | | | | |
| Live Nation | | | | | | | | | | |
| Entertainment, Inc. | | | April 2013 / $10 | | | 217,400 | | $ | (538,065 | ) |
| Live Nation | | | | | | | | | | |
| Entertainment, Inc. | | | April 2013 / $11 | | | 63,300 | | | (93,368 | ) |
| Total Options Written | | | | | | | | | | |
| (premiums received $196,394) | | | | | | | | $ | (631,433 | ) |
| * | Non-income producing |
| # | Illiquid and/or restricted security that has been fair valued. |
| (a) | Rate presented represents the annualized 7-day yield at March 31, 2013. |
| (b) | Interest rates presented represent the yield to maturity at the date of purchase. |
| (c) | Fully or partially pledged on outstanding written options. |
| The accompanying notes form an integral part of these financial statements. | weitzinvestments.com 29 |
BALANCED FUND
PORTFOLIO MANAGER’S DISCUSSION & ANALYSIS
Portfolio Manager: Bradley P. Hinton, CFA
The Balanced Fund returned +6.6% in the first calendar quarter, compared to a +6.4% return for the Blended Index. Stock gains were broad-based, and our companies have been doing reasonably-to-very well. Mortgage investor Redwood Trust (+39%) provided the largest contribution to the Fund’s returns for the quarter. Redwood profitably completed four jumbo prime securitizations in the last three months alone, with another on the way. Valeant Pharmaceuticals (+26%) reported solid organic growth, made rapid strides in integrating the Medicis dermatology acquisition, and announced yet another potential deal in late March. Finally, Dell delivered outsized percentage gains from depressed year-end price levels. Michael Dell and Silver Lake Partners made a highly publicized bid to take the company private. We sold our Dell stock when it traded above the discouraging bid price, which shifted the analysis from business fundamentals to merger arbitrage. In all, nineteen of our stocks posted double-digit returns during the quarter.
For the fiscal year ended March 31, 2013, the Fund gained 10.0% compared to a 9.8% gain for the Blended Index. Redwood Trust’s stock more than doubled over the past year. Management executed admirably on its residential and commercial strategies, building business value and attracting new investors. While Redwood has clear momentum and bright long-term prospects, the valuation is more comfortable than compelling after the stock’s strong run. Berkshire Hathaway (+28%) and Aon plc (+27%) also boosted the Fund’s returns from financial companies. Google (+24%) and Accenture (+20%) posted solid business results and strong stock gains as the broader technology sector languished. World-class consumer brands continued to resonate, as Walt Disney, Anheuser-Busch InBev and Diageo all generated greater than thirty percent returns during the fiscal year.
Apache Corporation (-23% for the fiscal year) declined as investors worried about the potential impact of Egypt’s political upheaval on the company’s oil and gas operations in the Western Desert. Apache has not experienced any production interruptions, and they continue to receive development lease approvals for their drilling program. Egypt is indeed significant, representing roughly 20% of Apache’s production, but at today’s stock price these operations are not being ascribed much, if any, value. The company also has missed short-term production goals elsewhere in the world. We are focused on management’s much longer track record of execution and value creation. We have added to our Apache holdings because the valuation seems far too cheap for this globally diverse collection of quality oil and gas assets, run by a proven management team that shares our extremely long-term investment focus.
We bought one new stock during the quarter. Fidelity National Information Services (“FIS”) is a leading provider of core processing and payment processing services to financial institutions. FIS has a stable base of recurring revenue, strong market shares with large bank customers, and a healthy international business. After adding capabilities via acquisition for much of the past decade, the company is now focused on growing organically, expanding margins, generating cash flow and returning excess capital to shareholders. Barton Hooper describes our investment thesis in more detail in the Analyst Corner.
We closed out two other stock positions during the quarter. We sold Anheuser-Busch InBev at a substantial gain after the stock exceeded our value estimate. The pending acquisition of Grupo Modelo is a strategic positive, and we expect the company to continue to compound value at a healthy rate over time. While the business has an advantaged outlook, we think the stock price reflects it. We also eliminated Republic Services at a moderate gain. The waste company’s business value has grown more slowly than expected. Volume and pricing have both been disappointing in the sluggish economic recovery. Nonetheless, the stock approached our business value estimate in anticipation of better times to come, so we sold it.
The Fund’s asset allocation is 45% stocks, 12% bonds and 43% residual cash. This positioning remains near the cautious end of the spectrum. Stock prices have generally been rising faster than underlying business values. While we have a large on-deck list of companies that we would like to own, we are finding few compelling bargains. Our bonds are maturing faster than we can responsibly replace them. Short and safe fixed-income cash flows are difficult to acquire at reasonable prices. As a result, cash levels are high. We continue to study businesses, visit companies, speak with management teams and attend industry conferences in our search for value. Our patient approach has served us well, and we believe that discipline will continue to be rewarded over time.
| New and Eliminated Stocks for Quarter Ended March 31, 2013 | |
| New ($mil) | | | Eliminations ($mil) | |
| Fidelity National Information Services | | | | Dell | | |
| | | | | Republic Services | 0.9 | |
| | | | | Anheuser-Busch | 0.9 | |
30 Weitz Funds
BALANCED FUND
PERFORMANCE • (UNAUDITED)
| | Total Returns | | Average Annual Total Returns |
| | | | 3 Mos. | | 1 Year | | 3 Year | | 5 Year | | Since Inception |
| Balanced Fund | | | 6.6 | % | | 10.0 | % | | 9.3 | % | | 7.2 | % | | 5.6 | % |
| Blended Index | | | 6.4 | | | 9.8 | | | 9.7 | | | 5.8 | | | 6.3 | |
| S&P 500 | | | 10.6 | | | 14.0 | | | 12.7 | | | 5.8 | | | 7.1 | |
| Barclays Intermediate Credit | | | 0.3 | | | 3.5 | | | 4.7 | | | 4.6 | | | 4.4 | |
Growth of $10,000
This chart depicts the change in the value of a $10,000 investment in the Balanced Fund for the period October 1, 2003 through March 31, 2013, as compared with the growth of the Blended Index during the same period. Index performance is hypothetical and is shown for illustrative purposes only.
| Year | | | Balanced (1) | | Blended (2) | | Relative Results (1)-(2) |
| 2003 (10/1/03) | | | 3.8 | % | | 7.2 | % | | -3.4 | % |
| 2004 | | | 11.8 | | | 7.8 | | | 4.0 | |
| 2005 | | | 1.7 | | | 3.7 | | | -2.0 | |
| 2006 | | | 14.3 | | | 11.0 | | | 3.3 | |
| 2007 | | | -5.3 | | | 6.4 | | | -11.7 | |
| 2008 | | | -26.8 | | | -22.1 | | | -4.7 | |
| 2009 | | | 28.8 | | | 18.1 | | | 10.7 | |
| 2010 | | | 15.7 | | | 11.8 | | | 3.9 | |
| 2011 | | | 2.3 | | | 3.8 | | | -1.5 | |
| 2012 | | | 10.9 | | | 11.1 | | | -0.2 | |
| 2013 (3/31/13) | | | 6.6 | | | 6.4 | | | 0.2 | |
| Since Inception: | | | | | | | | | | |
| Cumulative | | | | | | | | | | |
| Return | | | 68.5 | | | 78.8 | | | -10.3 | |
| Avg. Annual | | | | | | | | | | |
| Return | | | 5.6 | | | 6.3 | | | -0.7 | |
These performance numbers reflect the deduction of the Fund’s annual operating expenses which as stated in its most recent prospectus are 1.14% of the Fund’s net assets. The returns assume redemption at the end of each period and reinvestment of dividends. Total returns shown include fee waivers and expense reimbursements, if any; total returns would have been lower had there been no waiver of fees and/or reimbursement of expenses by the Adviser. This information represents past performance and past performance does not guarantee future results. The investment return and the principal value of an investment in this Fund will fluctuate so that an investor’s shares, when redeemed, may be worth more or less than the original cost. Current performance may be lower or higher than the performance data quoted. Performance data current to the most recent month-end may be obtained at www.weitzinvestments.com/funds_and_performance/fund_performance.fs.
See page 4 for additional performance disclosures. See page 82 for a description of all indices.
Performance information does not reflect the deduction of taxes that a shareholder would pay on Fund distributions or the redemption of Fund shares.
weitzinvestments.com 31
BALANCED FUND
PORTFOLIO PROFILE • (UNAUDITED)
| Top Ten Stocks | | | | |
| Valeant Pharmaceuticals International, Inc. | | | 3.2 | % |
| Berkshire Hathaway, Inc. - CL B | | | 2.9 | |
| Coinstar, Inc. | | | 2.7 | |
| FLIR Systems, Inc. | | | 2.7 | |
| Aon plc - CL A | | | 2.5 | |
| Laboratory Corp. of America Holdings | | | 2.1 | |
| Redwood Trust, Inc. | | | 2.0 | |
| Martin Marietta Materials, Inc. | | | 1.9 | |
| Google, Inc. - CL A | | | 1.9 | |
| Apache Corp. | | | 1.8 | |
| % of Net Assets | | | 23.7 | % |
| Industry Sectors | | | | |
| Information Technology | | | 10.1 | % |
| Consumer Discretionary | | | 8.6 | |
| Financials | | | 8.3 | |
| Health Care | | | 7.9 | |
| Industrials | | | 2.8 | |
| Energy | | | 2.7 | |
| Consumer Staples | | | 2.7 | |
| Materials | | | 2.3 | |
| Total Common Stocks | | | 45.4 | |
| Cash Equivalents/Other | | | 43.4 | |
| Corporate Bonds | | | 7.0 | |
| Mortgage-Backed Securities | | | 3.0 | |
| Asset-Backed & Commercial Mortgage-Backed Securities | | | 0.9 | |
| Taxable Municipal Bonds | | | 0.3 | |
| Total Bonds & Cash Equivalents | | | 54.6 | |
| Net Assets | | | 100.0 | % |
| Top Performers for Quarter Ended March 31, 2013 |
| Security Name | | | QTD Return of Security | | Average Weight in Portfolio | | Contribution to Fund Performance |
| Redwood Trust, Inc. | | | 38.9 | % | | 2.1 | % | | 0.8 | % |
| Valeant Pharmaceuticals International, Inc. | | | 25.5 | | | 3.0 | | | 0.7 | |
| Dell, Inc. | | | 42.3 | | | 1.0 | | | 0.5 | |
| Berkshire Hathaway, Inc. - CL B | | | 16.2 | | | 2.8 | | | 0.4 | |
| FLIR Systems, Inc. | | | 17.0 | | | 2.7 | | | 0.4 | |
Contributions to Fund performance are based on actual daily holdings. Securities may have been bought or sold during the quarter.
Source: FactSet Portfolio Analytics
| Bottom Performers for Quarter Ended March 31, 2013 |
| Security Name | | QTD Return of Security | | Average Weight in Portfolio | | Contribution to Fund Performance |
There were no negative performers during the quarter.
Contributions to Fund performance are based on actual daily holdings. Securities may have been bought or sold during the quarter.
Source: FactSet Portfolio Analytics
32 Weitz Funds
BALANCED FUND
SCHEDULE OF INVESTMENTS • MARCH 31, 2013
| COMMON STOCKS — 45.4% | | | Shares | | | Value | |
| Information Technology — 10.1% | | | | | | | |
| IT Services — 2.6% | | | | | | | |
| Fidelity National Information Services, Inc. | | | 35,000 | | $ | 1,386,700 | |
| Accenture plc - CL A | | | 16,000 | | | 1,215,520 | |
| | | | | | | 2,602,220 | |
| Electronic Equipment & Instruments — 2.7% | | | | | | | |
| FLIR Systems, Inc. | | | 100,000 | | | 2,601,000 | |
| Internet Software & Services — 1.9% | | | | | | | |
| Google, Inc. - CL A* | | | 2,300 | | | 1,826,269 | |
| Semiconductors — 1.8% | | | | | | | |
| Texas Instruments, Inc. | | | 50,000 | | | 1,774,000 | |
| Software — 1.1% | | | | | | | |
| Microsoft Corp. | | | 40,000 | | | 1,144,400 | |
| | | | | | | 9,947,889 | |
| Consumer Discretionary — 8.6% | | | | | | | |
| Specialized Consumer Services — 2.7% | | | | | | | |
| Coinstar, Inc.* | | | 45,000 | | | 2,628,900 | |
| Advertising — 2.7% | | | | | | | |
| National CineMedia, Inc. | | | 90,000 | | | 1,420,200 | |
| Omnicom Group, Inc. | | | 20,000 | | | 1,178,000 | |
| | | | | | | 2,598,200 | |
| Movies & Entertainment — 1.7% | | | | | | | |
| The Walt Disney Co. | | | 30,000 | | | 1,704,000 | |
| Multiline Retail — 1.5% | | | | | | | |
| Target Corp. | | | 21,500 | | | 1,471,675 | |
| | | | | | | 8,402,775 | |
| Financials — 8.3% | | | | | | | |
| Property & Casualty Insurance — 2.9% | | | | | | | |
| Berkshire Hathaway, Inc. - CL B* | | | 27,000 | | | 2,813,400 | |
| Insurance Brokers — 2.5% | | | | | | | |
| Aon plc - CL A | | | 40,000 | | | 2,460,000 | |
| Mortgage REIT’s — 2.0% | | | | | | | |
| Redwood Trust, Inc. | | | 85,000 | | | 1,970,300 | |
| Commercial Banks — 0.9% | | | | | | | |
| Wells Fargo & Co. | | | 25,000 | | | 924,750 | |
| | | | | | | 8,168,450 | |
| Health Care — 7.9% | | | | | | | |
| Health Care Services — 4.7% | | | | | | | |
| Laboratory Corp. of America Holdings* | | | 23,000 | | | 2,074,600 | |
| Express Scripts Holding Co.* | | | 22,500 | | | 1,297,125 | |
| Omnicare, Inc. | | | 30,000 | | | 1,221,600 | |
| | | | | | | 4,593,325 | |
| Pharmaceuticals — 3.2% | | | | | | | |
| Valeant Pharmaceuticals International, Inc.* | | | 42,000 | | | 3,150,840 | |
| | | | | | | 7,744,165 | |
Industrials — 2.8% | | | | | | | |
| Air Freight & Logistics — 1.7% | | | | | | | |
| United Parcel Service, Inc. - CL B | | | 20,000 | | | 1,718,000 | |
| Research & Consulting Services — 1.1% | | | | | | | |
| FTI Consulting, Inc.* | | | 27,500 | | | 1,035,650 | |
| | | | | | | 2,753,650 | |
| | | | Shares | | | Value | |
| Energy — 2.7% | | | | | | | |
| Oil & Gas Exploration & Production — 2.7% | | | | | | | |
| Apache Corp. | | | 23,000 | | $ | 1,774,680 | |
| Southwestern Energy Co.* | | | 25,000 | | | 931,500 | |
| | | | | | | 2,706,180 | |
| Consumer Staples — 2.7% | | | | | | | |
| Beverages — 1.5% | | | | | | | |
| Diageo plc - Sponsored ADR | | | 11,200 | | | 1,409,408 | |
| Food & Staples Retailing — 1.2% | | | | | | | |
| CVS Caremark Corp. | | | 22,000 | | | 1,209,780 | |
| | | | | | | 2,619,188 | |
| Materials — 2.3% | | | | | | | |
| Construction Materials — 1.9% | | | | | | | |
| Martin Marietta Materials, Inc. | | | 18,000 | | | 1,836,360 | |
| Metals & Mining — 0.4% | | | | | | | |
| Compass Minerals International, Inc. | | | 5,000 | | | 394,500 | |
| | | | | | | 2,230,860 | |
| Total Common Stocks | | | | | | | |
| (Cost $30,938,251) | | | | | | 44,573,157 | |
| | | | Principal | | | | |
| CORPORATE BONDS — 7.0% | | | amount | | | Value | |
| American Express Credit Corp. | | | | | | | |
| 7.3% 8/20/13 | | $ | 650,000 | | | 666,702 | |
| 1.75% 6/12/15 | | | 500,000 | | | 511,166 | |
| Comcast Corp. | | | | | | | |
| 6.5% 1/15/15 | | | 300,000 | | | 331,057 | |
| 4.95% 6/15/16 | | | 193,000 | | | 217,475 | |
| Dell, Inc. | | | | | | | |
| 5.625% 4/15/14 | | | 250,000 | | | 261,085 | |
| Hewlett-Packard Co. | | | | | | | |
| 6.0% 8/01/13 | | | 670,000 | | | 681,572 | |
| 4.75% 6/02/14 | | | 750,000 | | | 783,608 | |
| Liberty Interactive LLC | | | | | | | |
| 5.7% 5/15/13 | | | 750,000 | | | 754,687 | |
| Time Warner Cable, Inc. | | | | | | | |
| 7.5% 4/01/14 | | | 120,000 | | | 128,009 | |
| TE Connectivity Ltd. | | | | | | | |
| 5.95% 1/15/14 | | | 449,000 | | | 467,286 | |
| U.S. Bank N.A. | | | | | | | |
| 4.95% 10/30/14 | | | 500,000 | | | 532,890 | |
| WellPoint, Inc. | | | | | | | |
| 6.0% 2/15/14 | | | 250,000 | | | 261,692 | |
| Wells Fargo & Co. | | | | | | | |
| 0.678% 11/03/14 (Wachovia Bank) | | | | | | | |
| Floating Rate Security | | | 550,000 | | | 550,570 | |
| 0.5001% 5/16/16 Floating Rate Security | | | 250,000 | | | 246,103 | |
| WM Wrigley Jr. Co. | | | | | | | |
3.05% 6/28/13(d) | | | 500,000 | | | 502,321 | |
| | | | | | | | |
| Total Corporate Bonds | | | | | | | |
| (Cost $6,693,665) | | | | | | 6,896,223 | |
| The accompanying notes form an integral part of these financial statements. | weitzinvestments.com 33 |
BALANCED FUND
SCHEDULE OF INVESTMENTS • (CONTINUED)
| MORTGAGE-BACKED | | | Principal | | | | |
SECURITIES — 3.0%(c) | | | amount | | | Value | |
| Federal Home Loan Mortgage Corporation — 1.3% | | | | | | | |
| Collateralized Mortgage Obligations — 0.5% | | | | | | | |
| 2926 CL AB — 5.0% 2019 (0.1 years) | | $ | 13,161 | | $ | 13,199 | |
| 2627 CL LE — 3.0% 2017 (0.4 years) | | | 55,565 | | | 55,996 | |
| 3649 CL BW — 4.0% 2025 (3.1 years) | | | 354,742 | | | 377,488 | |
| | | | | | | 446,683 | |
| Pass-Through Securities — 0.8% | | | | | | | |
| J14649 — 3.5% 2026 (3.1 years) | | | 398,336 | | | 420,428 | |
| J16663 — 3.5% 2026 (3.2 years) | | | 385,023 | | | 406,376 | |
| | | | | | | 826,804 | |
| | | | | | | 1,273,487 | |
| Federal National Mortgage Association — 1.0% | | | | | | | |
| Collateralized Mortgage Obligations — 0.6% | | | | | | | |
| 2002-91 CL QG — 5.0% 2018 (1.7 years) | | | 248,869 | | | 266,068 | |
| 2003-9 CL DB — 5.0% 2018 (1.8 years) | | | 254,550 | | | 272,711 | |
| | | | | | | 538,779 | |
| Pass-Through Securities — 0.4% | | | | | | | |
| 995755 — 4.5% 2024 (2.9 years) | | | 100,558 | | | 108,237 | |
| AB1769 — 3.0% 2025 (3.0 years) | | | 306,553 | | | 325,502 | |
| | | | | | | 433,739 | |
| | | | | | | 972,518 | |
| Non-Government Agency — 0.7% | | | | | | | |
| Collateralized Mortgage Obligations — 0.7% | | | | | | | |
| Sequoia Mortgage Trust (SEMT) 2010-H1 | | | | | | | |
| CL A1 — 3.75% 2040 (0.2 years) | | | 217,457 | | | 219,831 | |
| Sequoia Mortgage Trust (SEMT) 2011-1 | | | | | | | |
| CL A1 — 4.125% 2041 (0.5 years) | | | 93,693 | | | 94,435 | |
| Sequoia Mortgage Trust (SEMT) 2012-1 | | | | | | | |
| CL 1A1 — 2.865% 2042 (1.3 years) | | | 314,230 | | | 322,583 | |
| Chase Mortgage Finance Corp. (Chase) | | | | | | | |
| 2004-S1 CL A6 — 4.5% 2019 | | | | | | | |
| (1.9 years) | | | 68,651 | | | 66,013 | |
| | | | | | | 702,862 | |
| Total Mortgage-Backed Securities | | | | | | | |
| (Cost $2,854,197) | | | | | | 2,948,867 | |
| | | | | | | | |
| COMMERCIAL MORTGAGE-BACKED SECURITIES — 0.4% | | | | | | | |
| Redwood Commercial Mortgage Corp. | | | | | | | |
| (RCMC) 2012-CRE1 CL A — 5.62346% | | | | | | | |
2044 (2.5 years)(d) | | | | | | | |
| (Cost $371,748) | | | 371,748 | | | 372,445 | |
| | | | | | | | |
| ASSET-BACKED SECURITIES — 0.5% | | | | | | | |
| Cabela’s Master Credit Card Trust (CABMT) | | | | | | | |
| 2011-2A CL A2 — 0.8032% 2019 Floating | | | | | | | |
Rate Security (3.2 years)(d) | | | | | | | |
| (Cost $500,000) | | | 500,000 | | | 504,540 | |
| | | | Principal | | | | |
| TAXABLE MUNICIPAL | | | amount | | | | |
| BONDS — 0.3% | | | or shares | | | Value | |
| University of California 4.85% 5/15/13 | | | | | | | |
| (Cost $299,945) | | $ | 300,000 | | $ | 301,590 | |
| | | | | | | | |
| CASH EQUIVALENTS — 43.1% | | | | | | | |
| Wells Fargo Advantage Government Money Market Fund - | | | | | | | |
Institutional Class 0.01%(a) | | | 1,238,097 | | | 1,238,097 | |
| U.S. Treasury Bills, 0.09% to 0.14%, | | | | | | | |
4/25/13 to 9/12/13(b) | | $ | 41,000,000 | | | 40,996,260 | |
| | | | | | | | |
| Total Cash Equivalents | | | | | | | |
| (Cost $42,232,004) | | | | | | 42,234,357 | |
| | | | | | | | |
| Total Investments in Securities | | | | | | | |
| (Cost $83,889,810) | | | | | | 97,831,179 | |
| Other Assets Less Other Liabilities — 0.3% | | | | | | 274,108 | |
| Net Assets — 100.0% | | | | | $ | 98,105,287 | |
| Net Asset Value Per Share | | | | | $ | 13.58 | |
| * | Non-income producing |
| (a) | Rate presented represents the annualized 7-day yield at March 31, 2013. |
| (b) | Interest rates presented represent the yield to maturity at the date of purchase. |
| (c) | Number of years indicated represents estimated average life of mortgage-backed securities. |
| (d) | Security is exempt from registration under Rule 144A of the Securities Act of 1933. This security may be resold in transactions that are exempt from registration, normally to qualified institutional buyers. |
| 34 Weitz Funds | The accompanying notes form an integral part of these financial statements. |
This page has been left blank intentionally.
weitzinvestments.com 35
SHORT-INTERMEDIATE INCOME FUND
PORTFOLIO MANAGER’S DISCUSSION & ANALYSIS
Portfolio Manager: Thomas D. Carney, CFA
The Short-Intermediate Income Fund-Institutional Class returned +1.1% in the first calendar quarter, compared to a +0.3% return for the Barclays Capital Intermediate U.S. Government/Credit Index (BCIGC), our Fund’s primary benchmark. For the fiscal year ended March 31, 2013, the Short-Intermediate Income Fund-Institutional Class’ total return was +3.7%, compared to a +3.5% return for the BCIGC.
The performance page following this discussion shows returns for our Fund’s Institutional Class (after deducting fees and expenses) over various holding periods and returns for three Barclays Capital U.S. Government/Credit Indexes (Intermediate, 1-5 year and 1-3 year) for comparison purposes.
Fiscal 2013 Review
U.S. Treasury bond yields continued their descent into uncharted territory over the past year with the 10-year Treasury hitting an all-time low of approximately 1.4% in July of 2012. Investors numbed to today’s miniscule interest rates might easily be excused for losing sight of how low today’s rates are when viewed over a large swath of history. Allow us to provide some perspective, courtesy of The Leuthold Group, an independent, contrarian-minded research firm in Minneapolis. The bull market in Treasury bonds, which marked its beginning in September 1981 when the 10-year Treasury peaked at nearly 16%, recorded the three lowest quarterly average yields in 90 years during calendar 2012. Current bond yields sit squarely in the first percentile, let alone decile, of this 9-decade group of historical observations. We understand that bond prices, particularly U.S. Treasury bonds, are set by investors’ future growth and inflation expectations. However, we continue to believe that monetary manipulation of asset prices via rounds of quantitative easing have left U.S. Treasury bonds with little-to-no investment merit.
Corporate bonds and other credit sensitive securities also had another strong year as they benefited from declining credit spreads and the gravitational pull of lower U.S. Treasury yields. Despite a modest uptick in the second quarter of 2012, credit spreads (the incremental return investors demand above U.S. Treasury bonds for owning corporate debt) marched lower over the past twelve months. A broad measure of corporate bond spreads composed by Merrill Lynch declined to 151 basis points as of March 31, down 41 basis points year over year (a basis point represents one one-hundredth of a percentage point).
Our portfolio performed well in the past fiscal year, modestly exceeding the BCIGC, our Fund’s primary benchmark. Overall portfolio metrics were largely unchanged compared to a year ago. The average maturity of our Fund was unmoved at 3.0 years. The duration has increased from 1.9 to 2.0 years, and the average coupon has decreased to 3.7% from 4.1%.
Nearly 90% of Fund investments contributed positively to results in the past fiscal year. Principal contributors came from substantially all of our corporate bond investments. Key contributors in the investment-grade segment (the largest) of our Fund included bonds issued by Markel Corp., BHP Petrohawk Energy Corp., Willis North America, Washington Post, Bank of America Corp., Comcast, JP Morgan Chase, Hewlett-Packard, FLIR Systems and Vornado Realty. Our Fund’s non-investment grade holdings (securities rated Ba/BB or below, see the Credit Quality table provided on the Portfolio Profile page), currently about 15% of Fund assets, also performed well as improving credit fundamentals of many of our investments continued to unfold. Key contributors in this segment included the bonds issued by Mohawk Industries, Expedia, Inc., Range Resources and Vulcan Materials. Overall, our corporate bond weighting increased modestly to 41.6% from 41.1% a year ago.
While corporate bonds, in aggregate, generated the largest contribution to Fund results in the past year, our approximately 3% investment in Redwood Trust (both common equity and convertible bonds) was a singular standout. More than 30% of the Fund’s fiscal year results are attributable to the performance of Redwood Trust’s common stock (+121%) and convertible bonds (+10%). Redwood’s management executed admirably on its residential and commercial strategies in the past year by building business value and attracting new investors. While Redwood has clear momentum and bright long-term prospects, today’s valuation is more comfortable than compelling after the stock’s strong run.
Mortgage-Backed Securities (MBS), currently 27.6% of Fund net assets, also added to our results in the past year. Our mortgage investments are primarily focused in Fannie Mae and Freddie Mac MBS that we selected based on specific characteristics we believe mitigate the risk of higher prepayment levels. More importantly, we have also sought to minimize extension risk (the possibility the average life of our investments lengthens meaningfully beyond our original assumptions) with these investments should interest rates rise. Approximately 3% of our Fund’s
36 Weitz Funds
MBS investments consist of non-agency residential securitizations sponsored by Redwood Trust. Redwood Trust remains uniquely positioned to take advantage of the eventual decline of massive government support (currently over 90%) of the residential mortgage market. Redwood’s market opportunity is large (nearly $10 trillion) and they continue to build their franchise so as to play a large role in the private financing of residential mortgages. We expect our investments in Redwood’s MBS (issued under Sequoia Mortgage Trust) to generate high-quality cash flows over their expected 3- to 5-year average lives.
The Fund’s cash holdings increased during the fiscal year, as the decrease in credit spreads reduced our investment opportunities and caused a decline in investment activity. Still, recent investments continue to highlight the meaningful contributions of fellow Fund credit analyst and Weitz teammate, Nolan Anderson. With Nolan’s help (particularly his expertise in commercial real estate), we have prudently expanded our Fund’s opportunity set in certain areas of the structured securities market. Our goal has been and will always remain to only invest in an asset when we believe we properly understand the risks and when the return prospects adequately discount those risks. Nolan’s comments in the following subheading outline the progress we have made in these new areas for our Fund.
Residential Non-Performing Loan (NPL) Securitizations
During the first calendar quarter, we purchased senior Class A notes in two residential non-performing loan (NPL) securitizations. In both cases, our senior Class A notes are backed by pools of residential NPL’s located throughout the U.S. A strong financial sponsor purchased the assets from various banks at significant discounts to face value. The sponsor continues to hold a significant equity position and the bonds are structured so that bondholders are repaid before any equity value can be extracted. To that end, the notes’ ultimate value will be determined by the sponsor’s ability to efficiently liquidate the collateral through foreclosure, perform loan modifications, or sell the loans on to third parties. Given our senior position in the capital structure and significant capital beneath us, our primary concern is extension risk. While past performance is no guarantee of future results, all five of the sponsor’s previous NPL transactions have performed above expectations, despite continued government interference in the residential housing market. On average, we expect to earn 2.75% based on a holding period of approximately 1.25 years.
Outlook
We believe today’s low nominal interest rate and average, at best, credit spread environment provide little protection against any inflationary shocks or potential re-pricing (higher) of credit risk. Consequently, we expect to continue to position the Fund defensively relative to interest rate exposure while we patiently seek out areas of opportunity, like those mentioned above. We will continue to invest one security at a time, relying on a fundamental research-based investment approach and are well positioned to take advantage of any market weakness.
weitzinvestments.com 37
SHORT-INTERMEDIATE INCOME FUND
PERFORMANCE • (UNAUDITED)
| | Total Returns | | | Average Annual Total Returns | |
| | | | 3 Mos. | | 1 Year | | 3 Year | | 5 Year | | 10 Year | | 15 Year | | 20 Year |
| Short-Intermediate Income Fund – Institutional Class | | | 1.1 | % | | 3.7 | % | | 3.4 | % | | 4.5 | % | | 4.4 | % | | 4.9 | % | | 5.3 | % |
| Barclays Capital Indexes: | | | | | | | | | | | | | | | | | | | | | | |
| Intermediate U.S. Government/Credit | | | 0.3 | | | 3.5 | | | 4.7 | | | 4.6 | | | 4.5 | | | 5.5 | | | 5.6 | |
| 1-5 Year U.S. Government/Credit | | | 0.3 | | | 2.0 | | | 2.8 | | | 3.3 | | | 3.6 | | | 4.8 | | | 5.0 | |
| 1-3 Year U.S. Government/Credit | | | 0.2 | | | 1.1 | | | 1.7 | | | 2.4 | | | 3.1 | | | 4.2 | | | 4.5 | |
Growth of $10,000
This chart depicts the change in the value of a $10,000 investment in the Short-Intermediate Income Fund – Institutional Class for the period March 31, 2003 through March 31, 2013, as compared with the growth of the Barclays Intermediate Index during the same period. Index performance is hypothetical and is shown for illustrative purposes only.
| Year | | | ShortInt. (1) | | Barclays Interm. (2) | | Relative Results (1)-(2) |
| 1988 (12/23/88) N/A% | | | N/A | % | | N/A | % | | | |
| 1989 | | | 9.1 | | | 12.8 | | | -3.7 | |
| 1990 | | | 9.1 | | | 9.2 | | | -0.1 | |
| 1991 | | | 11.2 | | | 14.6 | | | -3.4 | |
| 1992 | | | 5.5 | | | 7.2 | | | -1.7 | |
| 1993 | | | 8.1 | | | 8.8 | | | -0.7 | |
| 1994 | | | -2.4 | | | -1.9 | | | -0.5 | |
| 1995 | | | 15.7 | | | 15.3 | | | 0.4 | |
| 1996 | | | 4.4 | | | 4.0 | | | 0.4 | |
| 1997 | | | 8.6 | | | 7.9 | | | 0.7 | |
| 1998 | | | 6.8 | | | 8.4 | | | -1.6 | |
| 1999 | | | 0.9 | | | 0.4 | | | 0.5 | |
| 2000 | | | 9.7 | | | 10.1 | | | -0.4 | |
| 2001 | | | 8.5 | | | 9.0 | | | -0.5 | |
| 2002 | | | 4.2 | | | 9.8 | | | -5.6 | |
| 2003 | | | 6.3 | | | 4.3 | | | 2.0 | |
| 2004 | | | 2.6 | | | 3.0 | | | -0.4 | |
| 2005 | | | 1.6 | | | 1.6 | | | 0.0 | |
| 2006 | | | 4.0 | | | 4.1 | | | -0.1 | |
| 2007 | | | 6.1 | | | 7.4 | | | -1.3 | |
| 2008 | | | 2.3 | | | 5.1 | | | -2.8 | |
| 2009 | | | 10.8 | | | 5.2 | | | 5.6 | |
| 2010 | | | 4.7 | | | 5.9 | | | -1.2 | |
| 2011 | | | 2.1 | | | 5.8 | | | -3.7 | |
| 2012 | | | 4.0 | | | 3.9 | | | 0.1 | |
| 2013 (3/31/13) | | | 1.1 | | | 0.3 | | | 0.8 | |
| Since Inception: | | | | | | | | | | |
| Cumulative | | | | | | | | | | |
| Return | | | 303.3 | | | 371.8 | | | -68.5 | |
| Avg. Annual | | | | | | | | | | |
| Return | | | 5.9 | | | 6.6 | | | -0.7 | |
These performance numbers reflect the deduction of the Fund’s Institutional Class annual operating expenses which as stated in its most recent prospectus are 0.62% of the Fund’s net assets.The returns assume redemption at the end of each period and reinvestment of dividends. Total returns shown include fee waivers and expense reimbursements, if any; total returns would have been lower had there been no waiver of fees and/or reimbursement of expenses by the Adviser. This information represents past performance and past performance does not guarantee future results. The investment return and the principal value of an investment in this Fund will fluctuate so that an investor’s shares, when redeemed, may be worth more or less than the original cost. Current performance may be lower or higher than the performance data quoted. Performance data current to the most recent month-end may be obtained at www.weitzinvestments.com/funds_and_performance/fund_performance.fs.
See page 4 for additional performance disclosures. See page 82 for a description of all indices.
Performance information does not reflect the deduction of taxes that a shareholder would pay on Fund distributions or the redemption of Fund shares.
38 Weitz Funds
SHORT-INTERMEDIATE INCOME FUND
PORTFOLIO PROFILE • (UNAUDITED)
Credit Quality(a) | | | | |
| U.S. Treasury | | | 11.7 | % |
U.S. Government Agency Mortgage Related Securities(b) | | | 24.4 | |
| Aaa/AAA | | | 5.4 | |
| Aa/AA | | | 7.2 | |
| A/A | | | 13.0 | |
| Baa/BBB | | | 18.5 | |
| Ba/BB | | | 7.9 | |
| B/B | | | 2.0 | |
| Non-Rated | | | 3.0 | |
| Common Stocks | | | 2.0 | |
| Cash & Other | | | 4.9 | |
| Net Assets | | | 100.0 | % |
| Sector Breakdown | | | | |
| Corporate Bonds | | | 41.6 | % |
| Mortgage-Backed Securities | | | 27.6 | |
| U.S. Treasury | | | 8.4 | |
| Cash Equivalents/Other | | | 8.2 | |
| Asset-Backed Securities | | | 3.8 | |
| Government Agency | | | 3.0 | |
| Commercial Mortgage-Backed Securities | | | 2.4 | |
| Common Stocks | | | 2.0 | |
| Taxable Municipal Bonds | | | 1.7 | |
| Convertible Bonds | | | 1.3 | |
| Net Assets | | | 100.0 | % |
| Financial Attributes | | | | |
| Average Maturity | | | 3.0 years | |
| Average Effective Maturity | | | 2.4 years | |
| Average Duration | | | 2.0 years | |
| Average Coupon | | | 3.7% | |
| 30-Day SEC Yield at 3-31-13 - Institutional Class | | | 1.1% | |
| 30-Day SEC Yield at 3-31-13 - Investor Class | | | 0.9% | |
Five Largest Corporate Issuers(C) | | | | |
| Wells Fargo & Co. | | | 3.5 | % |
| JP Morgan Chase & Co. | | | 3.0 | |
| MetLife, Inc. | | | 2.1 | |
| Mohawk Industries, Inc. | | | 1.9 | |
| General Electric Capital Corp. | | | 1.9 | |
| Maturity Distribution | | | | |
| Cash Equivalents/Other | | | 8.2 | % |
| Less than 1 Year | | | 14.1 | |
| 1 to 3 Years | | | 36.1 | |
| 3 to 5 Years | | | 26.3 | |
| 5 to 7 Years | | | 10.6 | |
| 7 to 10 Years | | | 2.7 | |
| Common Stocks | | | 2.0 | |
| Net Assets | | | 100.0 | % |
(a) The Fund receives credit quality ratings on underlying securities of the Fund when available from Moody’s and S&P. The Fund will use one rating for an underlying security if that is all that is provided. Ratings and portfolio credit quality may change over time. The Fund itself has not been rated by an independent rating agency.
(b) Mortgage related securities issued and guaranteed by government-sponsored entities such as Fannie Mae and Freddie Mac are generally not rated by Moody’s and S&P. Securities which are not rated do not necessarily indicate low quality. Fannie Mae’s and Freddie Mac’s senior debentures are currently rated Aaa and AA+ by Moody’s & S&P, respectively.
(c) Percent of net assets
weitzinvestments.com 39
SHORT-INTERMEDIATE INCOME FUND
SCHEDULE OF INVESTMENTS • MARCH 31, 2013
| | | | Principal | | | | |
| CORPORATE BONDS — 41.6% | | | amount | | | Value | |
| Airgas, Inc. | | | | | | | |
| 7.125% 10/01/18 | | $ | 3,225,000 | | $ | 3,437,876 | |
| American Express Co. | | | | | | | |
| Credit Corp. 7.3% 8/20/13 | | | 3,782,000 | | | 3,879,182 | |
| FSB Bank 6.0% 9/13/17 | | | 2,500,000 | | | 2,987,873 | |
| 8.125% 5/20/19 | | | 1,000,000 | | | 1,346,896 | |
| Anheuser-Busch InBev SA/NV | | | | | | | |
| 4.125% 1/15/15 | | | 6,000,000 | | | 6,370,026 | |
| Aon plc | | | | | | | |
| 3.5% 9/30/15 | | | 5,000,000 | | | 5,291,475 | |
| AutoZone, Inc. | | | | | | | |
| 5.75% 1/15/15 | | | 1,250,000 | | | 1,357,436 | |
| Bank of America Corp. | | | | | | | |
| 5.125% 11/15/14 | | | 14,080,000 | | | 14,980,529 | |
| 4.5% 4/01/15 | | | 10,000,000 | | | 10,601,320 | |
| Berkshire Hathaway Finance Corp. | | | | | | | |
| 4.6% 5/15/13 | | | 3,000,000 | | | 3,016,089 | |
| 4.625% 10/15/13 | | | 1,634,000 | | | 1,670,481 | |
| 1.5% 1/10/14 | | | 500,000 | | | 504,631 | |
| 4.85% 1/15/15 | | | 1,500,000 | | | 1,615,941 | |
| 1.6% 5/15/17 | | | 1,000,000 | | | 1,020,879 | |
| 5.4% 5/15/18 | | | 5,000,000 | | | 5,981,405 | |
| 4.25% 1/15/21 | | | 1,000,000 | | | 1,126,515 | |
| Best Buy Co., Inc. | | | | | | | |
| 7.25% 7/15/13 | | | 6,449,000 | | | 6,577,980 | |
| Boston Properties LP | | | | | | | |
| 5.625% 4/15/15 | | | 2,000,000 | | | 2,186,950 | |
| 5.875% 10/15/19 | | | 8,250,000 | | | 9,940,722 | |
| Coinstar, Inc. | | | | | | | |
6.0% 3/15/19(d) | | | 200,000 | | | 205,000 | |
| Comcast Corp. | | | | | | | |
| 6.5% 1/15/15 | | | 2,081,000 | | | 2,296,433 | |
| 4.95% 6/15/16 | | | 8,590,000 | | | 9,679,324 | |
| 5.15% 3/01/20 | | | 3,000,000 | | | 3,559,401 | |
| DCP Midstream Operating, LP | | | | | | | |
| 2.5% 12/01/17 | | | 2,000,000 | | | 2,032,640 | |
| Dell, Inc. | | | | | | | |
| 5.625% 4/15/14 | | | 1,250,000 | | | 1,305,425 | |
| Diageo Capital plc | | | | | | | |
| 4.85% 5/15/18 | | | 3,941,000 | | | 4,521,813 | |
| DIRECTV Holdings | | | | | | | |
| 4.75% 10/01/14 | | | 2,000,000 | | | 2,116,478 | |
| DISH Network Corp. | | | | | | | |
| 7.0% 10/01/13 | | | 10,000,000 | | | 10,281,250 | |
| Expedia, Inc. | | | | | | | |
| 7.456% 8/15/18 | | | 13,000,000 | | | 15,551,861 | |
| FiServ, Inc. | | | | | | | |
| 3.125% 10/01/15 | | | 1,000,000 | | | 1,050,171 | |
| Flir Systems, Inc. | | | | | | | |
| 3.75% 9/01/16 | | | 10,000,000 | | | 10,446,480 | |
| Ford Motor Credit Co. LLC | | | | | | | |
| 4.207% 4/15/16 | | | 10,000,000 | | | 10,652,750 | |
| General Electric Capital Corp. | | | | | | | |
| 2.375% 6/30/15 | | | 10,000,000 | | | 10,351,200 | |
| 1.0% 9/23/15 Floating Rate Security | | | 11,992,000 | | | 12,063,352 | |
| 2.25% 11/09/15 | | | 6,181,000 | | | 6,396,389 | |
| Goldman Sachs Group, Inc. | | | | | | | |
| 5.95% 1/18/18 | | | 4,000,000 | | | 4,668,560 | |
| | | | Principal | | | | |
| | | | amount | | | Value | |
| Hewlett-Packard Co. | | | | | | | |
| 1.55% 5/30/14 | | $ | 8,009,000 | | $ | 8,043,783 | |
| 4.75% 6/02/14 | | | 15,540,000 | | | 16,236,363 | |
| JP Morgan Chase & Co. | | | | | | | |
| 1.0301% 5/02/14 Floating Rate Security | | | 5,000,000 | | | 5,032,225 | |
| 2.6% 1/15/16 | | | 15,000,000 | | | 15,590,205 | |
| 0.6791% 11/21/16 (Bear Stearns) | | | | | | | |
| Floating Rate Security | | | 15,000,000 | | | 14,878,335 | |
| 6.0% 7/05/17 | | | 5,000,000 | | | 5,860,910 | |
| 6.3% 4/23/19 | | | 2,500,000 | | | 3,057,478 | |
| Kraft Foods, Inc. | | | | | | | |
| 2.625% 5/08/13 | | | 1,000,000 | | | 1,001,960 | |
| Laboratory Corp. of America Holdings | | | | | | | |
| 3.125% 5/15/16 | | | 1,250,000 | | | 1,318,306 | |
| Liberty Interactive LLC | | | | | | | |
| 5.7% 5/15/13 | | | 13,240,000 | | | 13,322,750 | |
| Marathon Petroleum Corp. | | | | | | | |
| 3.5% 3/01/16 | | | 1,000,000 | | | 1,069,192 | |
| Markel Corp. | | | | | | | |
| 7.125% 9/30/19 | | | 4,566,000 | | | 5,636,133 | |
| 5.35% 6/01/21 | | | 10,000,000 | | | 11,437,290 | |
| 4.9% 7/01/22 | | | 2,000,000 | | | 2,225,094 | |
| Mead Johnson Nutrition Co. | | | | | | | |
| 3.5% 11/01/14 | | | 2,000,000 | | | 2,077,392 | |
| MetLife, Inc. | | | | | | | |
5.125% 4/10/13(d) | | | 9,100,000 | | | 9,108,609 | |
| 2.375% 2/06/14 | | | 1,000,000 | | | 1,016,154 | |
| 5.125% 8/15/14 | | | | | | | |
(Travelers Life & Annuity)(d) | | | 8,000,000 | | | 8,500,880 | |
2.0% 1/09/15(d) | | | 10,000,000 | | | 10,250,800 | |
3.125% 1/11/16(d) | | | 2,000,000 | | | 2,117,082 | |
| Mohawk Industries, Inc. | | | | | | | |
| 6.375% 1/15/16 | | | 25,905,000 | | | 29,013,600 | |
| Omnicom Group, Inc. | | | | | | | |
| 5.9% 4/15/16 | | | 7,000,000 | | | 7,932,484 | |
| 6.25% 7/15/19 | | | 6,181,000 | | | 7,468,805 | |
| Penske Truck Leasing | | | | | | | |
2.5% 3/15/16(d) | | | 14,945,000 | | | 15,318,371 | |
| Petrohawk Energy Corp. | | | | | | | |
| 7.875% 6/01/15 | | | 16,750,000 | | | 17,335,781 | |
| 7.25% 8/15/18 | | | 5,675,000 | | | 6,357,141 | |
| Plains Exploration & Production Co. | | | | | | | |
| 7.625% 6/01/18 | | | 3,100,000 | | | 3,245,312 | |
| QVC, Inc. | | | | | | | |
7.125% 4/15/17(d) | | | 9,600,000 | | | 9,944,448 | |
7.5% 10/01/19(d) | | | 4,000,000 | | | 4,422,212 | |
| Range Resources Corp. | | | | | | | |
| 7.25% 5/01/18 | | | 2,870,000 | | | 2,995,562 | |
| 8.0% 5/15/19 | | | 12,000,000 | | | 13,200,000 | |
| Republic Services, Inc. (Allied Waste) | | | | | | | |
| 3.8% 5/15/18 | | | 5,000,000 | | | 5,504,655 | |
| Safeway, Inc. | | | | | | | |
| 3.4% 12/01/16 | | | 5,000,000 | | | 5,276,855 | |
| Shale-Inland Holdings, LLC | | | | | | | |
8.75% 11/15/19(d) | | | 2,000,000 | | | 2,110,000 | |
| Solvay SA (Rhodia) | | | | | | | |
6.875% 9/15/20(d) | | | 5,680,000 | | | 6,434,435 | |
| Texas Industries, Inc. | | | | | | | |
| 9.25% 8/15/20 | | | 300,000 | | | 329,250 | |
| Time Warner Cable, Inc. | | | | | | | |
| 7.5% 4/01/14 | | | 1,700,000 | | | 1,813,458 | |
| 40 Weitz Funds | The accompanying notes form an integral part of these financial statements. |
| | | | Principal | | | | |
| | | | amount | | | Value | |
| Time Warner, Inc. | | | | | | | |
| 3.15% 7/15/15 | | $ | 500,000 | | $ | 526,867 | |
| TransDigm, Inc. | | | | | | | |
| 7.75% 12/15/18 | | | 5,000,000 | | | 5,512,500 | |
| UnitedHealth Group, Inc. | | | | | | | |
| 4.75% 2/10/14 | | | 178,000 | | | 184,007 | |
| U.S. Bancorp | | | | | | | |
| 1.125% 10/30/13 | | | 10,000,000 | | | 10,040,930 | |
| U.S. Bank N.A. | | | | | | | |
| 4.95% 10/30/14 | | | 4,500,000 | | | 4,796,005 | |
| Valeant Pharmaceuticals International, Inc. | | | | | | | |
6.5% 7/15/16(d) | | | 5,000,000 | | | 5,243,750 | |
| Vornado Realty Trust | | | | | | | |
| 4.25% 4/01/15 | | | 14,315,000 | | | 15,137,640 | |
| Vulcan Materials Co. | | | | | | | |
| 6.5% 12/01/16 | | | 5,500,000 | | | 6,187,500 | |
| 6.4% 11/30/17 | | | 8,000,000 | | | 8,960,000 | |
| Washington Post Co. | | | | | | | |
| 7.25% 2/01/19 | | | 8,500,000 | | | 10,119,301 | |
| WellPoint, Inc. | | | | | | | |
| 6.0% 2/15/14 | | | 2,000,000 | | | 2,093,540 | |
| Wells Fargo & Co. | | | | | | | |
| 4.8% 11/01/14 (Wachovia Bank) | | | 10,000,000 | | | 10,633,830 | |
| 0.678% 11/03/14 (Wachovia Bank) | | | | | | | |
| Floating Rate Security | | | 21,585,000 | | | 21,607,362 | |
| 4.875% 2/01/15 (Wachovia Bank) | | | 6,070,000 | | | 6,500,497 | |
| 0.5001% 5/16/16 Floating Rate Security | | | 9,750,000 | | | 9,598,027 | |
| 0.5501% 6/15/17 (Wachovia Bank) | | | | | | | |
| Floating Rate Security | | | 5,000,000 | | | 4,937,085 | |
| Willis North America, Inc. | | | | | | | |
| 6.2% 3/28/17 | | | 14,477,000 | | | 16,508,963 | |
| WM Wrigley Jr. Co. | | | | | | | |
3.05% 6/28/13(d) | | | 8,792,000 | | | 8,832,804 | |
3.7% 6/30/14(d) | | | 9,626,000 | | | 9,888,876 | |
| Yum! Brands, Inc. | | | | | | | |
| 4.25% 9/15/15 | | | 1,000,000 | | | 1,075,656 | |
| | | | | | | | |
| Total Corporate Bonds | | | | | | | |
| (Cost $595,067,586) | | | | | | 625,941,183 | |
| | | | | | | | |
| CONVERTIBLE BONDS — 1.3% | | | | | | | |
| Redwood Trust, Inc. | | | | | | | |
| 4.625% 4/15/18 | | | 17,000,000 | | | 18,806,250 | |
| (Cost $17,000,000) | | | | | | | |
MORTGAGE-BACKED SECURITIES — 27.6% (c) | | | | | | | |
| Federal Home Loan Mortgage Corporation — 14.5% | | | | | | | |
| Collateralized Mortgage Obligations — 7.1% | | | | | | | |
| R011 CL AB — 5.5% 2020 (0.2 years) | | | 62,475 | | | 62,795 | |
| 2627 CL LE — 3.0% 2017 (0.4 years) | | | 97,238 | | | 97,992 | |
| 3229 CL HB — 5.0% 2025 (0.8 years) | | | 473,671 | | | 489,598 | |
| 2778 CL JD — 5.0% 2032 (1.0 years) | | | 2,034,097 | | | 2,091,022 | |
| 2937 CL HJ — 5.0% 2019 (1.0 years) | | | 858,555 | | | 893,059 | |
| 2937 CL JG — 5.0% 2033 (1.0 years) | | | 4,638,661 | | | 4,763,207 | |
| 3556 CL MA — 5.0% 2037 (1.1 years) | | | 938,383 | | | 978,696 | |
| 2864 CL PE — 5.0% 2033 (1.1 years) | | | 13,124,319 | | | 13,524,984 | |
| 2934 CL KE — 5.0% 2033 (1.1 years) | | | 3,623,677 | | | 3,726,191 | |
| 2760 CL PD — 5.0% 2032 (1.1 years) | | | 3,876,307 | | | 3,999,706 | |
| | | | Principal | | | | |
| | | | amount | | | Value | |
| 3562 CL KA — 4.0% 2022 (1.1 years) | | $ | 2,342,179 | | $ | 2,401,170 | |
| 2780 CL TE — 5.0% 2033 (1.2 years) | | | 5,324,206 | | | 5,490,222 | |
| 3170 CL EA — 4.5% 2020 (1.3 years) | | | 1,036,465 | | | 1,075,637 | |
| 2574 CL JM — 5.0% 2022 (1.3 years) | | | 350,023 | | | 366,029 | |
| 3840 CL KA — 5.0% 2029 (1.3 years) | | | 3,435,109 | | | 3,568,419 | |
| 3544 CL KA — 4.5% 2023 (1.4 years) | | | 1,618,950 | | | 1,676,578 | |
| 3815 CL AD — 4.0% 2025 (2.1 years) | | | 2,162,225 | | | 2,240,689 | |
| 3844 CL AG — 4.0% 2025 (2.2 years) | | | 6,330,793 | | | 6,624,472 | |
| 3003 CL LD — 5.0% 2034 (2.6 years) | | | 8,744,871 | | | 9,424,116 | |
| 3649 CL BW — 4.0% 2025 (3.1 years) | | | 9,116,880 | | | 9,701,445 | |
| 3620 CL PA — 4.5% 2039 (3.2 years) | | | 6,975,588 | | | 7,415,818 | |
| 2952 CL PA — 5.0% 2035 (3.3 years) | | | 2,668,176 | | | 2,937,433 | |
| 3842 CL PH — 4.0% 2041 (3.3 years) | | | 5,574,820 | | | 5,891,612 | |
4107 CL LW — 1.75% 2027 (7.5 years)(f) | | | 7,370,758 | | | 7,234,344 | |
| 4107 CL LA — 2.5% 2031 (7.7 years) | | | 9,483,688 | | | 9,731,748 | |
| | | | | | | 106,406,982 | |
| Pass-Through Securities — 7.3% | | | | | | | |
| EO1386 — 5.0% 2018 (1.8 years) | | | 89,963 | | | 96,380 | |
| G18190 — 5.5% 2022 (2.9 years) | | | 115,796 | | | 124,552 | |
| G18296 — 4.5% 2024 (2.9 years) | | | 1,661,895 | | | 1,770,105 | |
| G18306 — 4.5% 2024 (2.9 years) | | | 3,583,767 | | | 3,817,115 | |
| G13517 — 4.0% 2024 (2.9 years) | | | 2,543,520 | | | 2,703,260 | |
| G18308 — 4.0% 2024 (3.0 years) | | | 3,622,805 | | | 3,850,328 | |
| G13300 — 4.5% 2023 (3.0 years) | | | 755,678 | | | 805,709 | |
| J13949 — 3.5% 2025 (3.0 years) | | | 11,397,244 | | | 12,346,313 | |
E02804 — 3.0% 2025 (3.0 years)(f) | | | 8,028,940 | | | 8,422,671 | |
| J14649 — 3.5% 2026 (3.1 years) | | | 10,982,704 | | | 11,591,797 | |
J16663 — 3.5% 2026 (3.2 years)(f) | | | 23,119,693 | | | 24,401,895 | |
| E03033 — 3.0% 2027 (3.3 years) | | | 11,040,194 | | | 11,591,943 | |
| E03048 — 3.0% 2027 (3.4 years) | | | 19,572,520 | | | 20,617,964 | |
| G01818 — 5.0% 2035 (3.4 years) | | | 7,823,920 | | | 8,415,441 | |
| | | | | | | 110,555,473 | |
| Interest Only Securities — 0.1% | | | | | | | |
| 3974 CL AI — 3.0% 2021 (2.1 years) | | | 19,715,703 | | | 1,179,973 | |
| | | | | | | 218,142,428 | |
| Federal National Mortgage Association — 9.5% | | | | | | | |
| Collateralized Mortgage Obligations — 2.1% | | | | | | | |
| 2007-32 CL BA — 5.5% 2034 (0.0 years) | | | 2,335 | | | 2,335 | |
| 2008-54 CL EC — 5.0% 2035 (0.1 years) | | | 98,375 | | | 98,459 | |
| 2010-61 CL EB — 4.5% 2037 (0.1 years) | | | 355,918 | | | 357,093 | |
| 2003-37 CL QD — 5.0% 2032 (0.2 years) | | | 74,778 | | | 75,048 | |
| 2006-21 CL CA — 5.5% 2029 (0.3 years) | | | 156,168 | | | 157,234 | |
| 2005-91 CL DA — 4.5% 2020 (0.4 years) | | | 1,321,794 | | | 1,339,544 | |
| 2004-40 CL BA — 4.5% 2018 (0.5 years) | | | 377,828 | | | 382,782 | |
| 2005-9 CL AC — 5.0% 2033 (0.5 years) | | | 2,003,906 | | | 2,035,854 | |
| 2005-1 CL KA — 5.0% 2033 (0.5 years) | | | 1,524,273 | | | 1,550,170 | |
| 2003-43 CL EX — 4.5% 2017 (0.6 years) | | | 90,418 | | | 92,279 | |
| 2010-9 CL CA — 5.0% 2037 (0.7 years) | | | 2,653,129 | | | 2,707,493 | |
| 2003-39 CL LC — 5.0% 2022 (0.7 years) | | | 103,467 | | | 105,786 | |
| 2004-78 CL AB — 5.0% 2032 (1.0 years) | | | 3,749,075 | | | 3,879,758 | |
| 2009-52 CL DC — 4.5% 2023 (1.0 years) | | | 311,180 | | | 319,096 | |
| 2007-42 CL YA — 5.5% 2036 (1.2 years) | | | 701,797 | | | 727,312 | |
| 2003-86 CL KT — 4.5% 2018 (1.3 years) | | | 572,843 | | | 591,537 | |
| 2009-44 CL A — 4.5% 2023 (1.5 years) | | | 734,880 | | | 766,540 | |
| 2003-9 CL DB — 5.0% 2018 (1.8 years) | | | 509,100 | | | 545,421 | |
| 2011-19 CL KA — 4.0% 2025 (2.0 years) | | | 6,674,541 | | | 6,953,747 | |
| 2010-145 CL PA — 4.0% 2024 (2.7 years) | | | 3,855,401 | | | 4,026,283 | |
| 2010-54 CL WA — 3.75% 2025 (2.8 years) | | | 4,970,951 | | | 5,289,989 | |
| | | | | | | 32,003,760 | |
| The accompanying notes form an integral part of these financial statements. | weitzinvestments.com 41 |
SHORT-INTERMEDIATE INCOME FUND
SCHEDULE OF INVESTMENTS • (CONTINUED)
| | | | Principal | | | | |
| | | | amount | | | Value | |
| Pass-Through Securities — 7.4% | | | | | | | |
| 254863 — 4.0% 2013 (0.2 years) | | $ | 8,708 | | $ | 8,734 | |
| 255291 — 4.5% 2014 (0.5 years) | | | 53,187 | | | 57,241 | |
| 256982 — 6.0% 2017 (1.7 years) | | | 257,811 | | | 272,330 | |
| 357414 — 4.0% 2018 (1.9 years) | | | 1,019,609 | | | 1,094,113 | |
| 254907 — 5.0% 2018 (1.9 years) | | | 328,321 | | | 355,186 | |
| 251787 — 6.5% 2018 (2.0 years) | | | 10,735 | | | 11,941 | |
| 357985 — 4.5% 2020 (2.4 years) | | | 326,406 | | | 351,892 | |
| 888595 — 5.0% 2022 (2.5 years) | | | 661,268 | | | 714,138 | |
| AD0629 — 5.0% 2024 (2.7 years) | | | 2,410,931 | | | 2,603,689 | |
| 995960 — 5.0% 2023 (2.7 years) | | | 2,123,434 | | | 2,293,206 | |
| 888439 — 5.5% 2022 (2.8 years) | | | 579,186 | | | 634,294 | |
| AL0471 — 5.5% 2025 (2.8 years) | | | 12,823,980 | | | 13,785,170 | |
| 995692 — 4.5% 2024 (2.9 years) | | | 3,151,518 | | | 3,392,668 | |
| 995693 — 4.5% 2024 (2.9 years) | | | 3,546,033 | | | 3,822,911 | |
| 930667 — 4.5% 2024 (2.9 years) | | | 2,578,687 | | | 2,775,602 | |
| 995755 — 4.5% 2024 (2.9 years) | | | 4,927,346 | | | 5,303,611 | |
| AE0031 — 5.0% 2025 (2.9 years) | | | 3,507,232 | | | 3,785,996 | |
| 890112 — 4.0% 2024 (3.0 years) | | | 2,476,151 | | | 2,657,088 | |
| MA0043 — 4.0% 2024 (3.0 years) | | | 2,212,846 | | | 2,369,702 | |
| AA5510 — 4.0% 2024 (3.0 years) | | | 1,165,127 | | | 1,247,716 | |
| AA4315 — 4.0% 2024 (3.0 years) | | | 4,666,417 | | | 4,997,192 | |
| AB1769 — 3.0% 2025 (3.0 years) | | | 7,050,723 | | | 7,486,544 | |
| 931739 — 4.0% 2024 (3.1 years) | | | 1,152,691 | | | 1,234,399 | |
| AB2251 — 3.0% 2026 (3.1 years) | | | 7,330,607 | | | 7,786,020 | |
| 725232 — 5.0% 2034 (3.1 years) | | | 1,061,873 | | | 1,157,231 | |
| AD7073 — 4.0% 2025 (3.2 years) | | | 3,766,420 | | | 4,032,223 | |
| 555531 — 5.5% 2033 (3.3 years) | | | 12,774,864 | | | 14,067,787 | |
| 995112 — 5.5% 2036 (3.4 years) | | | 5,602,128 | | | 6,181,364 | |
| MA0587 — 4.0% 2030 (3.9 years) | | | 15,053,683 | | | 16,171,420 | |
| | | | | | | 110,651,408 | |
| | | | | | | 142,655,168 | |
| Government National Mortgage Association — 0.4% | | | | | | | |
| Interest Only Securities — 0.4% | | | | | | | |
| 2012-61 CL BI — 4.5% 2038 (1.7 years) | | | 6,874,448 | | | 411,374 | |
| 2009-31 CL PI — 4.5% 2037 (2.4 years) | | | 8,336,619 | | | 604,334 | |
| 2010-66 CL IO — 1.39763% 2052 | | | | | | | |
| Floating Rate Security (5.5 years) | | | 80,469,477 | | | 5,513,004 | |
| | | | | | | 6,528,712 | |
| Non-Government Agency — 3.2% | | | | | | | |
| Collateralized Mortgage Obligations — 3.2% | | | | | | | |
| Sequoia Mortgage Trust (SEMT) 2010-H1 | | | | | | | |
| CL A1 — 3.75% 2040 (0.2 years) | | | 2,939,937 | | | 2,972,026 | |
| Washington Mutual, Inc. (WAMU) 2003-S7 | | | | | | | |
| CL A1 — 4.5% 2018 (0.4 years) | | | 156,437 | | | 158,790 | |
| Sequoia Mortgage Trust (SEMT) 2011-1 | | | | | | | |
| CL A1 — 4.125% 2041 (0.5 years) | | | 2,583,243 | | | 2,603,710 | |
| Sequoia Mortgage Trust (SEMT) 2012-2 | | | | | | | |
| CL A2 — 3.5% 2042 (0.9 years) | | | 7,323,848 | | | 7,535,232 | |
| Sequoia Mortgage Trust (SEMT) 2012-1 | | | | | | | |
| CL 1A1 — 2.865% 2042 (1.3 years) | | | 9,741,118 | | | 10,000,071 | |
| Chase Mortgage Finance Corp. (CHASE) | | | | | | | |
| 2004-S1 CL A6 — 4.5% 2019 (1.9 years) | | | 84,675 | | | 81,421 | |
| Sequoia Mortgage Trust (SEMT) 2013-4 | | | | | | | |
| CL A3 — 1.55% 2043 (3.0 years) | | | 15,000,000 | | | 14,913,278 | |
| Sequoia Mortgage Trust (SEMT) 2012-4 | | | | | | | |
| CL A1 — 3.5% 2042 (3.0 years) | | | 8,671,919 | | | 9,156,302 | |
| | | | | | | 47,420,830 | |
| Total Mortgage-Backed Securities | | | | | | | |
| (Cost $404,108,127) | | | | | | 414,747,138 | |
| COMMERCIAL MORTGAGE- | | | Principal | | | | |
| BACKED SECURITIES — 2.4% | | | amount | | | Value | |
| Oaktree Real Estate Investments/Sabal | | | | | | | |
| (ORES) 2012-LV1 CL A | | | | | | | |
4.0% 2044 (0.3 years)(d) | | $ | 2,865,943 | | $ | 2,869,017 | |
| SMA Portfolio (SMAP) 2012-LV1 CL A | | | | | | | |
3.5% 2025 (0.9 years)(d) | | | 2,478,387 | | | 2,490,926 | |
| LB-UBS Commercial Mortgage Trust | | | | | | | |
| (LBUBS) 2006-C4 CL AAB 5.840623% | | | | | | | |
| 2032 Floating Rate Security (0.9 years) | | | 10,029,851 | | | 10,471,515 | |
| Rialto Capital Management, LLC (RIAL) | | | | | | | |
| 2013-LT2 CL A 2.8331% 2028 | | | | | | | |
Floating Rate Security (1.3 years)(d) | | | 7,000,000 | | | 7,000,000 | |
| Redwood Commercial Mortgage Corp. | | | | | | | |
| (RCMC) 2012-CRE1 CL A 5.62346% | | | | | | | |
2044 (2.5 years)(d) | | | 13,332,752 | | | 13,357,758 | |
| | | | | | | | |
| Total Commercial Mortgage-Backed Securities | | | | | | | |
| (Cost $35,912,909) | | | | | | 36,189,216 | |
| | | | | | | | |
| ASSET-BACKED SECURITIES — 3.8% | | | | | | | |
| United Auto Credit Securitization Trust | | | | | | | |
| (UACST) 2012-1 CL A2 1.1% 2015 | | | | | | | |
(0.6 years)(d) | | | 3,000,000 | | | 3,001,050 | |
| Westlake Automobile Receivables Trust | | | | | | | |
| (WLAKE) 2012-1A CL A2 1.03% 2016 | | | | | | | |
(0.8 years)(d) | | | 5,000,000 | | | 5,010,100 | |
| Stanwich Mortgage Loan Co. (STWH) | | | | | | | |
| 2012-NPL5 CL A 2.9814% 2042 | | | | | | | |
(1.3 years)(d) | | | 16,089,594 | | | 16,114,694 | |
| Credit Acceptance Auto Loan Trust | | | | | | | |
| (CAALT) 2011-1 CL B 3.96% 2019 | | | | | | | |
(1.5 years)(d) | | | 7,500,000 | | | 7,764,341 | |
| Stanwich Mortgage Loan Co. (STWH) | | | | | | | |
| 2013-NPL1 CL A 2.9814% 2043 | | | | | | | |
(1.5 years)(d) | | | 9,843,998 | | | 9,850,199 | |
| CPS Auto Receivables Trust (CPS) | | | | | | | |
| 2013-A CL A 1.31% 2020 | | | | | | | |
(1.8 years)(d) | | | 5,000,000 | | | 4,999,363 | |
| Cabela’s Master Credit Card Trust (CABMT) | | | | | | | |
| 2011-2A CL A2 0.8032% 2019 Floating | | | | | | | |
Rate Security (3.2 years)(d) | | | 4,500,000 | | | 4,540,855 | |
| Cabela’s Master Credit Card Trust (CABMT) | | | | | | | |
| 2012-2A CL A2 0.6832% 2020 Floating | | | | | | | |
Rate Security (4.2 years)(d) | | | 6,000,000 | | | 6,019,179 | |
| | | | | | | | |
| Total Asset-Backed Securities | | | | | | | |
| (Cost $57,280,667) | | | | | | 57,299,781 | |
| | | | | | | | |
| TAXABLE MUNICIPAL BONDS — 1.7% | | | | | | | |
| University of California 4.85% 5/15/13 | | | 990,000 | | | 995,247 | |
| North Texas Tollway Authority Revenue | | | | | | | |
| 2.441% 9/01/13 | | | 4,000,000 | | | 4,032,000 | |
| Nebraska Public Power District | | | | | | | |
| 5.14% 1/01/14 | | | 10,000,000 | | | 10,358,100 | |
| Los Angeles, California Cmty Dev | | | | | | | |
| 6.0% 9/01/14 | | | 2,275,000 | | | 2,420,691 | |
| 6.0% 9/01/15 | | | 1,220,000 | | | 1,344,916 | |
| Menomonee Falls, Wisconsin | | | | | | | |
| 4.25% 11/01/14 | | | 2,000,000 | | | 2,006,240 | |
| 42 Weitz Funds | The accompanying notes form an integral part of these financial statements. |
| | | Principal | | | | |
| | | amount | | | | |
| | | or shares | | | Value | |
| Omaha, Nebraska Public Facilities Corp., | | | | | | |
| Lease Revenue, Series B, Refunding | | | | | | |
| 4.588% 6/01/17 | | $ | 815,000 | | | $ | 923,542 | |
| 4.788% 6/01/18 | | | 1,000,000 | | | | 1,156,770 | |
| Iowa State University Revenue | | | | | | | | |
| 5.8% 7/01/22 | | | 1,335,000 | | | | 1,485,601 | |
| Total Taxable Municipal Bonds | | | | | | | | |
| (Cost $23,963,608) | | | | | | | 24,723,107 | |
| U.S. TREASURY AND GOVERNMENT AGENCY — 11.4% | | | | | | | | |
| U.S. Treasury — 8.4% | | | | | | | | |
| U.S. Treasury Note | | | | | | | | |
| 3.125% 9/30/13 | | | 15,000,000 | | | | 15,225,000 | |
| 1.25% 2/15/14 | | | 30,000,000 | | | | 30,289,470 | |
| 1.25% 3/15/14 | | | 30,000,000 | | | | 30,314,070 | |
| 1.75% 3/31/14 | | | 30,000,000 | | | | 30,474,630 | |
| 0.875% 11/30/16 | | | 20,000,000 | | | | 20,278,120 | |
| | | | | | | | 126,581,290 | |
| Government Agency — 3.0% | | | | | | | | |
| Freddie Mac | | | | | | | | |
| 2.0% 8/14/17 | | | 25,000,000 | | | | 25,183,575 | |
| 3.0% 8/01/19 | | | 20,000,000 | | | | 20,180,840 | |
| | | | | | | | 45,364,415 | |
| Total U.S. Treasury and Government Agency | | | | | | | | |
| (Cost $171,761,243) | | | | | | | 171,945,705 | |
| | | | | | | | | |
| COMMON STOCKS — 2.0% | | | | | | | | |
| Redwood Trust, Inc. | | | | | | | | |
| (Cost $14,702,458) | | | 1,277,409 | | | | 29,610,341 | |
| | | Principal | | | | |
| | | amount | | | | |
| CASH EQUIVALENTS — 10.6% | | or shares | | | Value | |
| Wells Fargo Advantage Government Money Market Fund - | | | | | | |
Institutional Class 0.01%(a) | | | 109,868,045 | | | $ | 109,868,045 | |
U.S. Treasury Bill 0.07% 5/16/13(b) | | $ | 50,000,000 | | | | 49,996,550 | |
| Total Cash Equivalents | | | | | | | | |
| (Cost $159,863,982) | | | | | | | 159,864,595 | |
| Total Investments in Securities | | | | | | | | |
| (Cost $1,479,660,580) | | | | | | | 1,539,127,316 | |
| Other Liabilities in Excess of Other Assets — (2.4%) | | | | | | | (35,849,446 | ) |
| Net Assets — 100.0% | | | | | | $ | 1,503,277,870 | |
| Net Asset Value Per Share - Institutional Class | | | | | | $ | 12.68 | |
| Net Asset Value Per Share - Investor Class | | | | | | $ | 12.67 | |
| (a) | Rate presented represents the annualized 7-day yield at March 31, 2013. |
| (b) | Interest rates presented represent the yield to maturity at the date of purchase. |
| (c) | Number of years indicated represents estimated average life of mortgage-backed securities. |
| (d) | Security is exempt from registration under Rule 144A of the Securities Act of 1933. This security may be resold in transactions that are exempt from registration, normally to qualified institutional buyers. |
| (e) | Security is a “step-up” bond where the coupon rate increases or steps up at a predetermined date. Coupon rate presented represents the rate at March 31, 2013. |
| (f) | Security designated to cover an unsettled bond purchase. |
| The accompanying notes form an integral part of these financial statements. | weitzinvestments.com 43 |
NEBRASKA TAX-FREE INCOME FUND
PORTFOLIO MANAGER’S DISCUSSION & ANALYSIS
Portfolio Manager: Thomas D. Carney, CFA
The Nebraska Tax-Free Income Fund returned +0.4% in the first calendar quarter, compared to a +0.8% return for the Barclays Capital 5-Year Municipal Bond Index, our Fund’s primary benchmark. For the fiscal year ended March 31, 2013, the Nebraska Tax-Free Income Fund’s total return was +2.0%, compared to a +3.2% return for our Fund’s primary benchmark. While generating reasonable absolute returns, our Fund results lagged the benchmark as a result of more defensive portfolio positioning (i.e. shorter average life and duration) to protect against potential increased interest rates.
Fiscal 2013 Review
Municipal bonds generated positive results in the past fiscal year as they benefited from the strong performance of U.S. Treasury bonds, which tend to have a gravitational effect on all other fixed-income assets. Already low Treasury bond yields declined further in the past year with 5- and 10-year Treasury bond yields declining approximately 30 basis points each (a basis point equals 1/100 of a percent) to 0.77% and 1.85%, respectively.
While generating positive results in the past year, municipal bonds generally underperformed their taxable government counterparts as the yield relationship between tax-free municipal bonds and taxable alternatives, like U.S. Treasuries, widened. The underperformance was primarily caused by concerns that the safe haven, tax-free status of municipal bond interest might come under attack in Congressional negotiations surrounding the “fiscal cliff.” These concerns have proved unfounded to date but have left municipal bond yields as compared to Treasury bonds near the high point of the past year. High quality 5-year municipal bonds, for example, ended the current fiscal year (March 31) with a yield representing approximately 121% of U.S. Treasuries, compared to 96% a year ago. Similar to a year ago, most longer-term municipal bonds (beyond ten years) offer yields in excess of U.S. Treasuries as of March 31. Historically, municipal bonds have yielded less than taxable alternatives given their tax advantages (federally and, typically, state exempt). And while history may be less of a guide given today’s abnormally low interest-rate environment, municipal bonds are relatively more attractive than most taxable alternatives (especially U.S. Treasury bonds).
Our Fund’s results in the past year were reasonable considering our defensive positioning, with modest (unrealized) capital gains adding to our bonds’ interest income. Investment activity in the past year remained focused on bonds with shorter maturities (primarily under 7 years). Investment highlights during the year included additions in the public power revenue bond segment of our portfolio (27.1% as of March 31).
Turning to portfolio metrics, over the past year the average duration of our Fund was unchanged at 2.9 years and the average maturity of our bonds increased to 5.3 from 3.6 years. Although, even with this increase, our average maturity is still shorter than that of our benchmark. Overall asset quality of our portfolio remains high as we continue to be focused on security selection and ongoing review of our investments’ fiscal position. We expect to continue to position the Fund defensively relative to interest rate exposure while we patiently seek out areas of opportunity. We will continue to invest one security at a time, relying on a fundamental research-based investment approach and are well positioned to take advantage of any market weakness.
44 Weitz Funds
NEBRASKA TAX-FREE INCOME FUND
PERFORMANCE • (UNAUDITED)
| | | | | |
| | | Total Returns | | Average Annual Total Returns |
| | | 3 Mos. | 1 Year | 3 Year | 5 Year | 10 Year | 15 Year | 20 Year | 25 Year |
| Nebraska Tax-Free Income Fund | | | 0.4 | % | | 2.0 | % | | 3.3 | % | | 3.7 | % | | 3.5 | % | | 4.0 | % | | 4.4 | % | | 5.0 | % |
| Barclays Capital 5-Year | | | | | | | | | | | | | | | | | | | | | | | | | |
| Municipal Bond Index | | | 0.8 | | | 3.2 | | | 4.4 | | | 5.1 | | | 4.2 | | | 4.8 | | | 5.0 | | | 5.6 | |
Growth of $10,000
This chart depicts the change in the value of a $10,000 investment in the NE Tax-Free Fund for the period March 31, 2003 through March 31, 2013, as compared with the growth of the Barclays 5-Yr Index during the same period. Index performance is hypothetical and is shown for illustrative purposes only.
| | | | NE | | Barclays | | Relative |
| | | | Tax-Free | | 5-Yr* | | Results |
| Year | | | (1) | | (2) | | (1)-(2) |
| 1985 (10/1/85) | | | 3.5 | % | | N/A | % | | N/A | % |
| 1986 | | | 11.2 | | | N/A | | | N/A | |
| 1987 | | | 4.0 | | | N/A | | | N/A | |
| 1988 | | | 6.3 | | | N/A | | | N/A | |
| 1989 | | | 6.9 | | | 9.1 | | | -2.2 | |
| 1990 | | | 6.3 | | | 7.7 | | | -1.4 | |
| 1991 | | | 8.4 | | | 11.4 | | | -3.0 | |
| 1992 | | | 7.4 | | | 7.6 | | | -0.2 | |
| 1993 | | | 7.9 | | | 8.7 | | | -0.8 | |
| 1994 | | | -1.4 | | | -1.3 | | | -0.1 | |
| 1995 | | | 10.5 | | | 11.6 | | | -1.1 | |
| 1996 | | | 5.5 | | | 4.2 | | | 1.3 | |
| 1997 | | | 7.3 | | | 6.4 | | | 0.9 | |
| 1998 | | | 6.1 | | | 5.8 | | | 0.3 | |
| 1999 | | | -1.2 | | | 0.7 | | | -1.9 | |
| 2000 | | | 9.9 | | | 7.7 | | | 2.2 | |
| 2001 | | | 3.9 | | | 6.2 | | | -2.3 | |
| 2002 | | | 8.0 | | | 9.3 | | | -1.3 | |
| 2003 | | | 4.3 | | | 4.1 | | | 0.2 | |
| 2004 | | | 3.4 | | | 2.7 | | | 0.7 | |
| 2005 | | | 2.2 | | | 0.9 | | | 1.3 | |
| 2006 | | | 3.3 | | | 3.3 | | | 0.0 | |
| 2007 | | | 3.6 | | | 5.2 | | | -1.6 | |
| 2008 | | | 1.2 | | | 5.8 | | | -4.6 | |
| 2009 | | | 7.2 | | | 7.4 | | | -0.2 | |
| 2010 | | | 2.3 | | | 3.4 | | | -1.1 | |
| 2011 | | | 5.9 | | | 6.9 | | | -1.0 | |
| 2012 | | | 2.1 | | | 3.0 | | | -0.9 | |
| 2013 (3/31/13) | | | 0.4 | | | 0.8 | | | -0.4 | |
| Since Inception: | | | | | | | | | | |
| Cumulative | | | | | | | | | | |
| Return | | | 310.9 | | | N/A | | | N/A | |
| Avg. Annual | | | | | | | | | | |
| Return | | | 5.3 | | | N/A | | | N/A | |
* The inception date of the Barclays 5-Yr was 1/29/88.
These performance numbers reflect the deduction of the Fund’s annual operating expenses which as stated in its most recent prospectus are 0.71% of the Fund’s net assets. The returns assume redemption at the end of each period and reinvestment of dividends. Total returns shown include fee waivers and expense reimbursements, if any; total returns would have been lower had there been no waiver of fees and/or reimbursement of expenses by the Adviser. This information represents past performance and past performance does not guarantee future results. The investment return and the principal value of an investment in this Fund will fluctuate so that an investor’s shares, when redeemed, may be worth more or less than the original cost. Current performance may be lower or higher than the performance data quoted. Performance data current to the most recent month-end may be obtained at www.weitzinvestments.com/funds_and_performance/fund_performance.fs.
See page 4 for additional performance disclosures. See page 82 for a description of all indices.
Performance information does not reflect the deduction of taxes that a shareholder would pay on Fund distributions or the redemption of Fund shares.
weitzinvestments.com 45
NEBRASKA TAX-FREE INCOME FUND
PORTFOLIO PROFILE • (UNAUDITED)
| State Breakdown |
| Nebraska | | | 79.5 | % |
| Florida | | | 3.6 | |
| Arizona | | | 3.3 | |
| Puerto Rico | | | 2.4 | |
| Texas | | | 1.8 | |
| Wisconsin | | | 1.5 | |
| Georgia | | | 1.2 | |
| Illinois | | | 1.1 | |
| Virginia | | | 1.0 | |
| North Dakota | | | 0.8 | |
| Tennessee | | | 0.8 | |
| Iowa | | | 0.6 | |
| Cash Equivalents/Other | | | 2.4 | |
| Net Assets | | | 100.0 | % |
| Sector Breakdown |
| Power | | | 27.1 | % |
| Higher Education | | | 17.0 | |
| Hospital | | | 8.1 | |
| Water/Sewer | | | 6.1 | |
| Lease | | | 5.5 | |
| General | | | 4.7 | |
| Airport/Transportation | | | 2.2 | |
| Highway | | | 1.0 | |
| Housing | | | 0.5 | |
| Total Revenue | | | 72.2 | |
| City/Subdivision | | | 6.4 | |
| School District | | | 5.5 | |
| County | | | 2.7 | |
| State/Commonwealth | | | 2.5 | |
| Natural Resource District | | | 1.3 | |
| Total General Obligation | | | 18.4 | |
| Escrow/Pre-Refunded | | | 7.0 | |
| Cash Equivalents/Other | | | 2.4 | |
| Net Assets | | | 100.0 | % |
| Financial Attributes | |
| Average Maturity | | 5.3 years | |
| Average Effective Maturity | | 3.2 years | |
| Average Duration | | 2.9 years | |
| Average Coupon | | | 4.0% | |
| 30-Day SEC Yield at 3-31-13 | | | 1.0% | |
| Municipals exempt from federal and | | | | |
| Nebraska income taxes | | Approx. 82% | |
| Municipals subject to alternative | | | | |
| minimum tax | | Approx. 1% | |
Five Largest Issuers(b) |
| Nebraska Public Power District | | | 8.9 | % |
| University of Nebraska | | | 8.8 | |
| Omaha Public Power District | | | 4.5 | |
| State of Nebraska | | | 3.5 | |
| Public Power Generation Agency | | | 3.0 | |
Credit Quality(a) |
| Aaa/AAA | | | 6.2 | % |
| Aa/AA | | | 48.7 | |
| A/A | | | 36.2 | |
| Baa/BBB | | | 0.5 | |
| Non-Rated | | | 6.0 | |
| Cash Equivalents/Other | | | 2.4 | |
| Net Assets | | | 100.0 | % |
(a) The Fund receives credit quality ratings on underlying securities of the Fund when available from Moody’s and S&P. The Fund will use one rating for an underlying security if that is all that is provided. Ratings and portfolio credit quality may change over time. The Fund itself has not been rated by an independent rating agency. |
| (b) Percent of net assets |
46 Weitz Funds
NEBRASKA TAX-FREE INCOME FUND
SCHEDULE OF INVESTMENTS • MARCH 31, 2013
| | | Principal | | | | |
| MUNICIPAL BONDS — 97.6% | | amount | | | Value | |
| Arizona — 3.3% | | | | | | |
| Maricopa County, General Obligation, | | | | | | |
| Gilbert Unified School District No. 41, Refunding, Series 2012 | | | | | | |
| 5.0%, 7/01/18 | | $ | 400,000 | | | $ | 474,756 | |
| Peoria Unified School District No. 11, Series 2006 | | | | | | | | |
| 5.0% 7/01/24 | | | 950,000 | | | | 1,069,909 | |
| Mesa, Highway Project Advancement Notes, Revenue, Series 2009 | | | | | | | | |
| 3.5%, 7/01/15 | | | 1,000,000 | | | | 1,007,910 | |
| University of Arizona, System Revenue, Series 2005A | | | | | | | | |
| 5.0%, 6/01/19 | | | 810,000 | | | | 886,650 | |
| | | | | | | | 3,439,225 | |
| Florida — 3.6% | | | | | | | | |
| Greater Orlando, Aviation Authority, Revenue, Series 2009A, AMT | | | | | | | | |
| 6.0%, 10/01/16 | | | 1,000,000 | | | | 1,176,690 | |
| JEA, Electric System Revenue, Series Three 2009B | | | | | | | | |
| 5.0%, 10/01/28 | | | 300,000 | | | | 316,512 | |
| Miami, Dade County, Aviation Revenue, Series 2010A | | | | | | | | |
| 4.25%, 10/01/18 | | | 1,000,000 | | | | 1,139,640 | |
| Orlando Utilities Commission, Utility System Revenue, Refunding, | | | | | | | | |
| Series 2006, 5.0%, 10/01/17 | | | 1,000,000 | | | | 1,148,310 | |
| | | | | | | | 3,781,152 | |
| Georgia — 1.2% | | | | | | | | |
| State of Georgia, General Obligation, Refunding, Series 2005B | | | | | | | | |
| 5.0%, 7/01/17 | | | 1,100,000 | | | | 1,213,377 | |
| Illinois — 1.1% | | | | | | | | |
| Illinois Finance Authority, Revenue, Series 2009A, | | | | | | | | |
| Northwestern Memorial Hospital | | | | | | | | |
| 5.0%, 8/15/17 | | | 245,000 | | | | 285,329 | |
| Springfield, Water Revenue, Series 2004 | | | | | | | | |
| 5.25%, 3/01/19 | | | 800,000 | | | | 837,032 | |
| | | | | | | | 1,122,361 | |
| Iowa — 0.6% | | | | | | | | |
| Cedar Rapids Community School District, Infrastructure Sales, | | | | | | | | |
| Services and Use Tax Revenue, Series 2011 | | | | | | | | |
| 4.0%, 7/01/20 | | | 600,000 | | | | 656,184 | |
| Nebraska — 79.5% | | | | | | | | |
| Adams County, Hospital Authority #1, Revenue, Mary Lanning | | | | | | | | |
| Memorial Hospital Project, Radian Insured | | | | | | | | |
| 4.25%, 12/15/16 | | | 250,000 | | | | 273,865 | |
| 4.4%, 12/15/17 | | | 250,000 | | | | 280,472 | |
| 5.3%, 12/15/18 | | | 700,000 | | | | 701,435 | |
| Bellevue, Development Revenue, Bellevue University Project, | | | | | | | | |
| Series 2010A, 2.75%, 12/01/15 | | | 1,000,000 | | | | 1,029,040 | |
| Cornhusker Public Power District, Electric Revenue, Refunding, | | | | | | | | |
| Series 2010, 2.4%, 7/01/17 | | | 400,000 | | | | 412,360 | |
| Dawson County, Lexington Public School District #001, | | | | | | | | |
| General Obligation, Refunding | | | | | | | | |
| 2.15%, 12/15/13 | | | 490,000 | | | | 494,557 | |
| Dawson Public Power District, Electric Revenue, Series 2010B | | | | | | | | |
| 2.25%, 12/15/17 | | | 125,000 | | | | 128,676 | |
| 2.75%, 12/15/19 | | | 100,000 | | | | 103,265 | |
| Douglas County, Educational Facility Revenue, | | | | | | | | |
| Creighton University Project, Refunding, Series 2010A | | | | | | | | |
| 5.0%, 7/01/16 | | | 430,000 | | | | 474,208 | |
| 5.6%, 7/01/25 | | | 400,000 | | | | 461,160 | |
| Douglas County, Elkhorn Public School District #10, Series 2010B | | | | | | | | |
| 3.0%, 6/15/16 | | | 525,000 | | | | 545,475 | |
| | | Principal | | | | |
| | | amount | | | Value | |
| Douglas County, General Obligation, Refunding, Series 2011B | | | | | | |
| 3.0%, 12/15/19 | | $ | 1,155,000 | | | $ | 1,233,910 | |
| Douglas County, Hospital Authority #1, Revenue, Refunding, | | | | | | | | |
| Alegent Health - Immanuel, AMBAC Insured | | | | | | | | |
| 5.125%, 9/01/17 | | | 250,000 | | | | 250,282 | |
| Quality Living Inc. Project | | | | | | | | |
| 4.7%, 10/01/17 | | | 255,000 | | | | 255,005 | |
| Douglas County, Hospital Authority #2, Revenue, | | | | | | | | |
| Boys Town Project, Series 2008 | | | | | | | | |
| 4.75%, 9/01/28 | | | 500,000 | | | | 539,340 | |
| Nebraska Medical Center Project, Series 2003 | | | | | | | | |
| 5.0%, 11/15/14 | | | 380,000 | | | | 406,475 | |
| 5.0%, 11/15/15 | | | 295,000 | | | | 326,736 | |
| Refunding, Children’s Hospital Obligated Group, Series 2008B | | | | | | | | |
| 4.5%, 8/15/15 | | | 230,000 | | | | 247,238 | |
| 5.25%, 8/15/20 | | | 1,000,000 | | | | 1,121,260 | |
| 5.5%, 8/15/21 | | | 1,430,000 | | | | 1,601,114 | |
| Douglas County, Hospital Authority #3, Revenue, Refunding, | | | | | | | | |
| Nebraska Methodist Health System | | | | | | | | |
| 5.5%, 11/01/18 | | | 440,000 | | | | 477,277 | |
| Douglas County, Millard Public School District #17, | | | | | | | | |
| Certificates of Participation, Series 2012 | | | | | | | | |
| 0.8%, 6/15/14 | | | 420,000 | | | | 420,932 | |
| Refunding, Series 2009, 4.0%, 6/15/17 | | | 750,000 | | | | 777,705 | |
| Douglas County, Zoo Facility Revenue, Refunding, | | | | | | | | |
| Omaha’s Henry Doorly Zoo Project | | | | | | | | |
| 4.2%, 9/01/16 | | | 600,000 | | | | 633,648 | |
| 4.75%, 9/01/17 | | | 200,000 | | | | 212,118 | |
| Grand Island, Electric Revenue, Refunding, Series 2012 | | | | | | | | |
| 0.4%, 8/15/13 | | | 750,000 | | | | 750,315 | |
| 1.25%, 8/15/16 | | | 1,000,000 | | | | 1,011,290 | |
| Grand Island, Sanitary Sewer Revenue, Refunding, FSA Insured | | | | | | | | |
| 3.3%, 4/01/13 | | | 870,000 | | | | 870,226 | |
| 3.45%, 4/01/14 | | | 650,000 | | | | 651,755 | |
| Hastings, Combined Utility Revenue, Refunding, Series 2012 | | | | | | | | |
| 2.0%, 10/15/16 | | | 320,000 | | | | 332,867 | |
| 2.0%, 10/15/17 | | | 430,000 | | | | 447,467 | |
| Hastings, Electric System Revenue, Refunding, Series 2011 | | | | | | | | |
| 3.0%, 1/01/16 | | | 750,000 | | | | 789,862 | |
| 3.25%, 1/01/17 | | | 500,000 | | | | 536,025 | |
| La Vista, General Obligation, Refunding, Series 2009 | | | | | | | | |
| 2.5%, 11/15/15 | | | 415,000 | | | | 424,259 | |
| 3.0%, 11/15/17 | | | 640,000 | | | | 655,258 | |
| Lancaster County, Hospital Authority #1, Revenue, Refunding, | | | | | | | | |
| Bryan LGH Medical Center | | | | | | | | |
| Series 2006, 4.0%, 6/01/19 | | | 300,000 | | | | 320,340 | |
| Series 2008A, 5.0%, 6/01/16 | | | 500,000 | | | | 554,020 | |
| Series 2008A, 5.0%, 6/01/17 | | | 500,000 | | | | 566,845 | |
| Lincoln, Certificates of Participation, | | | | | | | | |
| Series 2010A, 2.4%, 3/15/17 | | | 395,000 | | | | 410,231 | |
| Series 2012, 3.0%, 6/01/13 | | | 485,000 | | | | 487,362 | |
| Series 2012, 3.0%, 6/01/14 | | | 830,000 | | | | 856,535 | |
| Lincoln, Educational Facilities, Revenue, Refunding, | | | | | | | | |
| Nebraska Wesleyan University Project, Series 2012 | | | | | | | | |
| 2.25%, 4/01/19 | | | 645,000 | | | | 664,918 | |
| 2.5%, 4/01/21 | | | 925,000 | | | | 934,259 | |
| Lincoln, Electric System Revenue, Refunding, | | | | | | | | |
| Series 2007B, 5.0%, 9/01/18 | | | 1,000,000 | | | | 1,142,490 | |
| Series 2012, 5.0%, 9/01/21 | | | 1,000,000 | | | | 1,252,390 | |
| The accompanying notes form an integral part of these financial statements. | weitzinvestments.com 47 |
NEBRASKA TAX-FREE INCOME FUND
SCHEDULE OF INVESTMENTS • (CONTINUED)
| | | Principal | | | | |
| | | amount | | | Value | |
| Lincoln, General Obligation, Highway Allocation Fund | | | | | | |
| 4.0%, 5/15/23 | | $ | 1,000,000 | | | $ | 1,070,810 | |
| Lincoln, Parking Revenue, Refunding, Series 2011 | | | | | | | | |
| 3.25%, 8/15/18 | | | 440,000 | | | | 486,156 | |
| Lincoln, Sanitary Sewer Revenue, Refunding, | | | | | | | | |
| Series 2003, MBIA Insured | | | | | | | | |
| 5.0%, 6/15/16 | | | 885,000 | | | | 894,142 | |
| Series 2012 | | | | | | | | |
| 1.5%, 6/15/17 | | | 440,000 | | | | 452,179 | |
| 1.75%, 6/15/18 | | | 425,000 | | | | 439,004 | |
| Lincoln, Water Revenue, Refunding, Series 2012 | | | | | | | | |
| 1.5% 8/15/16 | | | 450,000 | | | | 462,465 | |
| Lincoln County, North Platte School District #001, | | | | | | | | |
| General Obligation, Refunding | | | | | | | | |
| 2.0%, 12/15/13 | | | 770,000 | | | | 777,115 | |
| Municipal Energy Agency of Nebraska, Power Supply System Revenue, | | | | | | | | |
| Refunding, | | | | | | | | |
| 2009 Series A, BHAC Insured | | | | | | | | |
| 5.0%, 4/01/20 | | | 500,000 | | | | 596,385 | |
| 2012 Series A, 5.0%, 4/01/18 | | | 100,000 | | | | 118,204 | |
| 2013 Series A, 4.0%, 4/01/17 | | | 250,000 | | | | 280,633 | |
| Nebraska Educational Financial Authority, Revenue, Refunding, | | | | | | | | |
| Hastings College Project | | | | | | | | |
| 5.05%, 12/01/23 | | | 500,000 | | | | 508,560 | |
| Nebraska Investment Finance Authority, Clean Water State | | | | | | | | |
Revolving Fund, Series 2012# | | | | | | | | |
| 0.8%, 6/15/13 | | | 1,440,000 | | | | 1,440,000 | |
| Nebraska Investment Financial Authority, Revenue, Drinking Water | | | | | | | | |
| State Revolving Fund, Series 2010A | | | | | | | | |
| 4.0%, 7/01/25 | | | 750,000 | | | | 792,045 | |
| Nebraska Investment Financial Authority, Homeownership Revenue, | | | | | | | | |
| 2011 Series A, 2.4%, 9/01/17 | | | 475,000 | | | | 494,603 | |
| Nebraska Public Power District, Revenue, | | | | | | | | |
| 2003 Series A, 5.0%, 1/01/20 | | | 230,000 | | | | 232,868 | |
| 2005 Series A, 5.0%, 1/01/18 | | | 200,000 | | | | 220,422 | |
| 2005 Series B-2, 5.0%, 1/01/16 | | | 1,000,000 | | | | 1,078,490 | |
| 2007 Series B, 5.0%, 1/01/15 | | | 885,000 | | | | 953,322 | |
| 2007 Series B, 5.0%, 1/01/20 | | | 395,000 | | | | 456,944 | |
| 2007 Series B, 5.0%, 1/01/21 | | | 1,750,000 | | | | 2,028,390 | |
| 2008 Series B, 5.0%, 1/01/18 | | | 800,000 | | | | 946,688 | |
| 2008 Series B, 5.0%, 1/01/19 | | | 250,000 | | | | 291,788 | |
| 2010 Series C, 4.25%, 1/01/17 | | | 500,000 | | | | 563,735 | |
| 2011 Series A, 4.0%, 1/01/15 | | | 250,000 | | | | 265,753 | |
| 2012 Series A, 4.0%, 1/01/21 | | | 500,000 | | | | 571,910 | |
| 2012 Series A, 5.0%, 1/01/21 | | | 500,000 | | | | 607,685 | |
| 2012 Series B, 3.0%, 1/01/24 | | | 1,000,000 | | | | 1,022,970 | |
| Nebraska State Colleges Facility Corp., Deferred Maintenance Revenue, | | | | | | | | |
| MBIA Insured | | | | | | | | |
| 4.25%, 7/15/15 | | | 405,000 | | | | 436,950 | |
| 5.0%, 7/15/16 | | | 200,000 | | | | 226,166 | |
| 4.0%, 7/15/17 | | | 200,000 | | | | 218,286 | |
| Omaha Convention Hotel Corp., Revenue, Convention Center Hotel, | | | | | | | | |
| First Tier, Refunding, Series 2007, AMBAC Insured | | | | | | | | |
| 5.0%, 2/01/20 | | | 600,000 | | | | 673,794 | |
| Omaha, General Obligation, Refunding, | | | | | | | | |
| Series 2008 | | | | | | | | |
| 3.75%, 6/01/14 | | | 1,000,000 | | | | 1,040,640 | |
| 5.0%, 6/01/20 | | | 350,000 | | | | 416,903 | |
| 5.25%, 10/15/19 | | | 250,000 | | | | 303,340 | |
| Series 2012B, 4.0%, 11/15/17 | | | 500,000 | | | | 571,705 | |
| | | Principal | | | | |
| | | amount | | | Value | |
| Omaha, Public Facilities Corp., Lease Revenue, | | | | | | |
| Omaha Baseball Stadium Project, | | | | | | |
| Series 2009, 5.0%, 6/01/23 | | $ | 770,000 | | | $ | 905,543 | |
| Series 2010, 4.125%, 6/01/29 | | | 650,000 | | | | 691,249 | |
| Rosenblatt Stadium Project, Series C | | | | | | | | |
| 3.9%, 10/15/17 | | | 235,000 | | | | 262,730 | |
| 3.95%, 10/15/18 | | | 240,000 | | | | 268,742 | |
| Omaha Public Power District, | | | | | | | | |
| Electric System Revenue, | | | | | | | | |
| 1993 Series C, 5.5%, 2/01/14 | | | 80,000 | | | | 83,580 | |
| 2007 Series A, 4.1%, 2/01/19 | | | 1,000,000 | | | | 1,108,390 | |
| 2012 Series A, 5.0%, 2/01/24 | | | 2,000,000 | | | | 2,425,460 | |
| Electric System Subordinated Revenue, | | | | | | | | |
| 2006 Series B, FGIC Insured | | | | | | | | |
| 4.75%, 2/01/36 | | | 1,000,000 | | | | 1,080,360 | |
| Omaha, Sanitary Sewer Revenue, MBIA Insured | | | | | | | | |
| 4.0%, 11/15/14 | | | 250,000 | | | | 264,603 | |
| Omaha, Special Tax, Revenue, Heritage Development Project, | | | | | | | | |
| Series 2004, 5.0%, 10/15/17 | | | 1,090,000 | | | | 1,168,088 | |
| Papillion-La Vista, Sarpy County School District #27, | | | | | | | | |
| General Obligation, | | | | | | | | |
| Refunding, Series 2009A | | | | | | | | |
| 3.15%, 12/01/17 | | | 930,000 | | | | 992,840 | |
| Series 2009, 5.0%, 12/01/28 | | | 500,000 | | | | 563,395 | |
| Papillion, Water System Revenue, Bond Anticipation Notes, | | | | | | | | |
| Series 2010, 1.65%, 6/15/13 | | | 1,000,000 | | | | 1,000,880 | |
| Papio-Missouri River Natural Resources District, General Obligation, | | | | | | | | |
| Flood Protection and Water Quality Enhancement, Series 2013 | | | | | | | | |
| 3.0%, 12/15/16 | | | 400,000 | | | | 432,640 | |
| 3.0%, 12/15/17 | | | 385,000 | | | | 421,575 | |
| 3.0%, 12/15/18 | | | 500,000 | | | | 543,260 | |
| Public Power Generation Agency, Revenue, Whelan Energy | | | | | | | | |
| Center Unit 2, Series A, | | | | | | | | |
| AGC-ICC AMBAC Insured, 5.0%, 1/01/19 | | | 1,260,000 | | | | 1,405,366 | |
| AMBAC Insured, 5.0%, 1/01/18 | | | 750,000 | | | | 853,823 | |
| AMBAC Insured, 5.0%, 1/01/26 | | | 800,000 | | | | 899,120 | |
| Sarpy County, Recovery Zone Facility Certificates of Participation, | | | | | | | | |
| Series 2010 | | | | | | | | |
| 2.35%, 12/15/18 | | | 155,000 | | | | 164,390 | |
| 2.6%, 12/15/19 | | | 135,000 | | | | 144,030 | |
| Southern Nebraska Public Power District, Electric System Revenue, | | | | | | | | |
| AMBAC Insured | | | | | | | | |
| 4.625%, 9/15/21 | | | 1,000,000 | | | | 1,102,200 | |
| State of Nebraska, Certificates of Participation, | | | | | | | | |
| Series 2009B, 2.1%, 8/01/13 | | | 590,000 | | | | 590,909 | |
| Series 2009C, 2.0%, 11/01/13 | | | 700,000 | | | | 700,966 | |
| Series 2010B, 1.2%, 9/15/14 | | | 1,230,000 | | | | 1,243,284 | |
| Series 2011A, 1.0%, 4/15/13 | | | 310,000 | | | | 310,112 | |
| Series 2012A, 0.6%, 12/15/13 | | | 755,000 | | | | 756,842 | |
| University of Nebraska, Facilities Corp., | | | | | | | | |
| Deferred Maintenance Revenue, | | | | | | | | |
| Series 2006, 5.0%, 7/15/18 | | | 830,000 | | | | 941,959 | |
| Financing Agreement Revenue, UNMC Eye Institute, Series 2011 | | | | | | | | |
| 2.0%, 3/01/15 | | | 525,000 | | | | 541,091 | |
| Lease Rental Revenue, | | | | | | | | |
| NCTA Education Center/Student Housing Project, | | | | | | | | |
| Series 2011, 3.75%, 6/15/19 | | | 285,000 | | | | 322,218 | |
| UNMC OPPD Exchange Project, | | | | | | | | |
| Series 2010, 2.75%, 2/15/16 | | | 1,185,000 | | | | 1,262,558 | |
| 48 Weitz Funds | The accompanying notes form an integral part of these financial statements. |
| | | Principal | | | | |
| | | amount | | | Value | |
| University of Nebraska, University Revenue, | | | | | | |
| Kearney Student Fees and Facilities, Series 2006 | | | | | | |
| 4.75%, 7/01/25 | | $ | 330,000 | | | $ | 364,531 | |
| Lincoln Memorial Stadium Project, Refunding, Series 2004A | | | | | | | | |
| 5.0%, 11/01/19 | | | 2,160,000 | | | | 2,263,831 | |
| Lincoln Parking Project, Refunding, Series 2005 | | | | | | | | |
| 4.0%, 6/01/17 | | | 1,070,000 | | | | 1,144,247 | |
| 4.5%, 6/01/20 | | | 500,000 | | | | 537,405 | |
| Lincoln Student Fees and Facilities, | | | | | | | | |
| Refunding, Series 2012, 5.0%, 7/01/15 | | | 920,000 | | | | 1,010,878 | |
| Series 2003B, 5.0%, 7/01/23 | | | 1,000,000 | | | | 1,031,660 | |
| Omaha Health & Recreation Project | | | | | | | | |
| 4.05%, 5/15/19 | | | 390,000 | | | | 442,459 | |
| 5.0%, 5/15/33 | | | 700,000 | | | | 779,604 | |
| Omaha Student Facilities Project | | | | | | | | |
| 4.5%, 5/15/16 | | | 565,000 | | | | 633,292 | |
| 5.0%, 5/15/27 | | | 800,000 | | | | 910,040 | |
| Wheat Belt Public Power District, Electric System Revenue, | | | | | | | | |
| Series 2009B | | | | | | | | |
| 3.2%, 9/01/16 | | | 330,000 | | | | 338,705 | |
| 3.4%, 9/01/17 | | | 415,000 | | | | 426,213 | |
| York County, Hospital Authority #1, Revenue, Refunding, | | | | | | | | |
| Hearthstone Project | | | | | | | | |
| 2.7%, 6/01/13 | | | 150,000 | | | | 150,389 | |
| | | | | | | | 82,492,774 | |
| North Dakota — 0.8% | | | | | | | | |
| Grand Forks, Sales Tax Revenue, Refunding, Series 2005A | | | | | | | | |
| 5.0%, 12/15/21 | | | 795,000 | | | | 876,400 | |
| Puerto Rico — 2.4% | | | | | | | | |
| Commonwealth, General Obligation, Refunding, | | | | | | | | |
| Series A, Assured Guaranty Insured | | | | | | | | |
| 5.0%, 7/01/15 | | | 845,000 | | | | 895,590 | |
| Electric Power Authority Revenue, Series RR, FSA Insured | | | | | | | | |
| 5.0%, 7/01/20 | | | 1,000,000 | | | | 1,041,310 | |
| Municipal Finance Agency, General Obligation, 2002 Series A, | | | | | | | | |
| FSA Insured, 5.25%, 8/01/16 | | | 500,000 | | | | 501,495 | |
| | | | | | | | 2,438,395 | |
| Tennessee — 0.8% | | | | | | | | |
| Memphis, General Obligation, General Improvement, Series 2006A | | | | | | | | |
| 5.0%, 11/01/19 | | | 720,000 | | | | 800,611 | |
| | | Principal | | | | |
| | | amount | | | | |
| | | or shares | | | Value | |
| Texas — 1.8% | | | | | | |
| Harris County, General Obligation, Permanent Improvement, | | | | | | |
| Refunding, Series 2005A | | | | | | |
| 5.0%, 10/01/18 | | $ | 500,000 | | | $ | 554,820 | |
| San Antonio, General Obligation, Refunding, Series 2010 | | | | | | | | |
| 5.0%, 2/01/19 | | | 1,195,000 | | | | 1,337,946 | |
| | | | | | | | 1,892,766 | |
| Virginia — 1.0% | | | | | | | | |
| Chesterfield County, General Obligation, Refunding, Series 2005B | | | | | | | | |
| 5.0%, 1/01/17 | | | 975,000 | | | | 1,054,940 | |
| Wisconsin — 1.5% | | | | | | | | |
| Milwaukee County, General Obligation, Refunding, Series 2005A | | | | | | | | |
| 5.0%, 12/01/20 | | | 1,405,000 | | | | 1,515,658 | |
| | | | | | | | | |
| Total Municipal Bonds | | | | | | | | |
| (Cost $97,206,302) | | | | | | | 101,283,843 | |
| | | | | | | | | |
| | | | | | | | | |
| CASH EQUIVALENTS — 1.7% | | | | | | | | |
| Wells Fargo National Advantage Tax-Free Money Market Fund - | | | | | | | | |
Institutional Class 0.01%(a) | | | | | | | | |
| (Cost $1,731,845) | | | 1,731,845 | | | | 1,731,845 | |
| Total Investments in Securities | | | | | | | | |
| (Cost $98,938,147) | | | | | | | 103,015,688 | |
| Other Assets Less Other Liabilities — 0.7% | | | | | | | 748,777 | |
| Net Assets — 100.0% | | | | | | $ | 103,764,465 | |
| Net Asset Value Per Share | | | | | | $ | 10.44 | |
| # | Illiquid and/or restricted security that has been fair valued. |
| (a) | Rate presented represents the annualized 7-day yield at March 31, 2013. |
| The accompanying notes form an integral part of these financial statements. | weitzinvestments.com 49 |
GOVERNMENT MONEY MARKET FUND
PORTFOLIO MANAGER’S DISCUSSION & ANALYSIS
Portfolio Manager: Thomas D. Carney, CFA
The Government Money Market Fund ended the first calendar quarter with a 7-day effective and current yield of 0.01%. (An investment in the Fund is neither insured nor guaranteed by the U.S. Government. There can be no assurance that the Fund will be able to maintain a stable net asset value. Although the Fund seeks to preserve the value of your investment at $1.00 per share, it is possible to lose money by investing in the Fund.)
Investors and savers in money market funds or savings accounts received no reprieve in the first calendar quarter from record low short-term interest rates that have persisted for over four years. Returns to savers in investment vehicles like money market funds, bank savings accounts and short-term CDs remained frustratingly close to zero. Our Fund’s 7-day effective and current yield of 0.01% was unchanged in the first quarter compared to December 31.
Despite continued evidence of economic stabilization and moderate economic growth (e.g. labor market gains in each of the last twelve months totaling approximately 2 million and continued recovery in the housing sector), the Federal Open Market Committee (FOMC) of the Federal Reserve continues to keep the Fed Funds rate (the overnight lending rate between banks, which is controlled by the Federal Reserve) at an “exceptionally low range” as a means to further economic recovery. The Fed has maintained this target range for the Fed Funds rate at zero to 0.25% since December 2008 and intends to hold interest rates near zero at least as long as the unemployment rate remains above 6-1/2 percent, current inflation is less than 2-1/2 percent, and inflation expectations remain “well anchored.”
The Fed Funds rate affects all investments within the opportunity set of our Fund. We invest in ultra-high quality, short-term investments (e.g. U.S. Treasury bills and government agency discount notes) that have a weighted average maturity of less than 60 days. As a result, our yield has invariably followed the path dictated by the Federal Reserve’s monetary policy as we frequently reinvest maturing bills and notes in these short-term instruments. As of March 31, 2013, 90.8% of our portfolio was invested in U.S. Treasury bills, the balance in high quality Wells Fargo money market funds. The average life of our portfolio at March 31, 2013, was approximately 26 days.
When the Fed changes from its current course and begins to raise short-term rates, our Fund will quickly benefit as we frequently reinvest maturing securities. In the meantime, we will maintain our focus on high credit quality, preservation of capital and maintaining liquidity for our investors.
| Sector Breakdown |
| U.S. Treasury | | | 90.8 | % |
| Government & Treasury Money Market Funds | | | 9.1 | |
| Other Assets Less Other Liabilities | | | 0.1 | |
| | | | 100.0 | % |
50 Weitz Funds
GOVERNMENT MONEY MARKET FUND
SCHEDULE OF INVESTMENTS • MARCH 31, 2013
| | | Principal | | | | |
U.S. TREASURY — 90.8%† | | amount | | | Value | |
| U.S. Treasury Bill | | | | | | |
| 0.13% 4/25/13 | | $ | 50,000,000 | | | $ | 49,995,833 | |
| 0.09% 5/02/13 | | | 48,000,000 | | | | 47,996,363 | |
| Total U.S. Treasury | | | | | | | 97,992,196 | |
| CASH EQUIVALENTS — 9.1% | | Shares | | | Value | |
| Wells Fargo Advantage Government Money Market Fund - | | | | | | |
Institutional Class 0.01%(a) | | | 9,766,572 | | | $ | 9,766,572 | |
| Wells Fargo Advantage 100% Treasury Money Market Fund - | | | | | | | | |
Service Class 0.00%(a) | | | 52,556 | | | | 52,556 | |
| Total Cash Equivalents | | | | | | | 9,819,128 | |
| Total Investments in Securities | | | | | | | | |
| (Cost $107,811,324) | | | | | | | 107,811,324 | |
| Other Assets Less Other Liabilities — 0.1% | | | | | | | 106,685 | |
| Net Assets — 100.0% | | | | | | $ | 107,918,009 | |
| Net Asset Value Per Share | | | | | | $ | 1.00 | |
| † | Interest rates presented represent the yield to maturity at the date of purchase. |
| (a) | Rate presented represents the annualized 7-day yield at March 31, 2013. |
| The accompanying notes form an integral part of these financial statements. | weitzinvestments.com 51 |
STATEMENTS OF ASSETS AND LIABILITIES
MARCH 31, 2013
| | | | | | | | | | | | | | | | | | | | | Short - | | | Nebraska | | | Government | |
| (In U.S. dollars, | | | | | Partners | | | | | | | | | | | | | | | Intermediate | | | Tax-Free | | | Money | |
| except share data) | | Value | | | Value | | | Partners III | | | Research | | | Hickory | | | Balanced | | | Income | | | Income | | | Market | |
| Assets: | | | | | | | | | | | | | | | | | | | | | | | | | | | |
| Investments in securities at value: | | | | | | | | | | | | | | | | | | | | | | | | | | | |
Unaffiliated issuers(a) | | | 1,008,359,336 | | | | 843,438,252 | | | | 676,488,528 | | | | 19,054,820 | | | | 432,665,147 | | | | 97,831,179 | | | | 1,539,127,316 | | | | 103,015,688 | | | | 107,811,324 | |
Controlled affiliates(a) | | | — | | | | — | | | | 3,532,120 | | | | — | | | | — | | | | — | | | | — | | | | — | | | | — | |
| | | | 1,008,359,336 | | | | 843,438,252 | | | | 680,020,648 | | | | 19,054,820 | | | | 432,665,147 | | | | 97,831,179 | | | | 1,539,127,316 | | | | 103,015,688 | | | | 107,811,324 | |
| Accrued interest and | | | | | | | | | | | | | | | | | | | | | | | | | | | | | | | | | | | | |
| dividends receivable | | | 592,488 | | | | 105,747 | | | | 119,427 | | | | 7,834 | | | | 28,037 | | | | 121,853 | | | | 10,646,444 | | | | 1,055,874 | | | | 82 | |
| Due from broker | | | — | | | | — | | | | 88,359,086 | | | | — | | | | — | | | | — | | | | — | | | | — | | | | — | |
| Receivable for securities sold | | | 1,389,949 | | | | 5,094,084 | | | | 8,858,474 | | | | 68,803 | | | | 86,608 | | | | 167,818 | | | | — | | | | — | | | | — | |
| Receivable for fund shares sold | | | 4,854,141 | | | | 302,552 | | | | 1,864,599 | | | | — | | | | 328,922 | | | | 53,635 | | | | 4,771,571 | | | | — | | | | 125,000 | |
| Cash | | | 186,200 | | | | 475,000 | | | | 400,800 | | | | 1,584 | | | | 256,800 | | | | 37,300 | | | | 357,675 | | | | — | | | | — | |
| Total assets | | | 1,015,382,114 | | | | 849,415,635 | | | | 779,623,034 | | | | 19,133,041 | | | | 433,365,514 | | | | 98,211,785 | | | | 1,554,903,006 | | | | 104,071,562 | | | | 107,936,406 | |
| Liabilities: | | | | | | | | | | | | | | | | | | | | | | | | | | | | | | | | | | | | |
| Dividends payable on securities | | | | | | | | | | | | | | | | | | | | | | | | | | | | | | | | | | | | |
| sold short | | | — | | | | — | | | | 300,966 | | | | — | | | | — | | | | — | | | | — | | | | — | | | | — | |
| Due to adviser | | | 1,091,705 | | | | 891,162 | | | | 700,250 | | | | 14,273 | | | | 491,407 | | | | 103,596 | | | | 900,620 | | | | 74,372 | | | | 8,207 | |
Options written, at value(b) | | | — | | | | 597,365 | | | | 5,211,520 | | | | — | | | | 631,433 | | | | — | | | | — | | | | — | | | | — | |
| Payable for securities purchased | | | — | | | | 1,444,622 | | | | 1,150,634 | | | | — | | | | 112,728 | | | | — | | | | 49,247,684 | | | | — | | | | — | |
| Payable for fund shares redeemed | | | 738,680 | | | | 2,269,502 | | | | 322,916 | | | | — | | | | 44,055 | | | | 2,902 | | | | 1,476,832 | | | | 232,725 | | | | 10,000 | |
Securities sold short(c) | | | — | | | | — | | | | 87,453,200 | | | | — | | | | — | | | | — | | | | — | | | | — | | | | — | |
| Other | | | — | | | | — | | | | 11,714 | | | | — | | | | — | | | | — | | | | — | | | | — | | | | 190 | |
| Total liabilities | | | 1,830,385 | | | | 5,202,651 | | | | 95,151,200 | | | | 14,273 | | | | 1,279,623 | | | | 106,498 | | | | 51,625,136 | | | | 307,097 | | | | 18,397 | |
| Net assets | | | 1,013,551,729 | | | | 844,212,984 | | | | 684,471,834 | | | | 19,118,768 | | | | 432,085,891 | | | | 98,105,287 | | | | 1,503,277,870 | | | | 103,764,465 | | | | 107,918,009 | |
| Composition of net assets: | | | | | | | | | | | | | | | | | | | | | | | | | | | | | | | | | | | | |
| Paid-in capital | | | 828,262,772 | | | | 715,413,525 | | | | 495,604,961 | | | | 16,707,083 | | | | 364,790,177 | | | | 82,426,002 | | | | 1,446,136,607 | | | | 99,654,074 | | | | 107,917,917 | |
| Accumulated undistributed net | | | | | | | | | | | | | | | | | | | | | | | | | | | | | | | | | | | | |
| investment income (loss) | | | (516,651 | ) | | | (727,134 | ) | | | (909,955 | ) | | | 2,502 | | | | (487,168 | ) | | | 19,132 | | | | 246,450 | | | | 33,323 | | | | — | |
| Accumulated net realized gain (loss) | | | (61,338,600 | ) | | | (65,888,186 | ) | | | 6,641,471 | | | | (350,164 | ) | | | (23,219,433 | ) | | | 1,718,784 | | | | (2,571,923 | ) | | | (473 | ) | | | 92 | |
| Net unrealized appreciation | | | | | | | | | | | | | | | | | | | | | | | | | | | | | | | | | | | | |
| (depreciation) of investments | | | 247,144,208 | | | | 195,414,779 | | | | 183,135,357 | | | | 2,759,347 | | | | 91,002,315 | | | | 13,941,369 | | | | 59,466,736 | | | | 4,077,541 | | | | — | |
| Net assets | | | 1,013,551,729 | | | | 844,212,984 | | | | 684,471,834 | | | | 19,118,768 | | | | 432,085,891 | | | | 98,105,287 | | | | 1,503,277,870 | | | | 103,764,465 | | | | 107,918,009 | |
| Net assets - Institutional Class | | | | | | | | | | | 664,769,821 | | | | | | | | | | | | | | | | 1,424,859,646 | | | | | | | | | |
Shares outstanding(d)(e) | | | 26,251,219 | | | | 30,422,901 | | | | 46,377,527 | | | | 1,764,605 | | | | 8,604,209 | | | | 7,226,441 | | | | 112,327,714 | | | | 9,938,389 | | | | 107,917,917 | |
| Net asset value, offering and | | | | | | | | | | | | | | | | | | | | | | | | | | | | | | | | | | | | |
redemption price(d) | | | 38.61 | | | | 27.75 | | | | 14.33 | | | | 10.83 | | | | 50.22 | | | | 13.58 | | | | 12.68 | | | | 10.44 | | | | 1.00 | |
| Net assets - Investor Class | | | | | | | | | | | 19,702,013 | | | | | | | | | | | | | | | | 78,418,224 | | | | | | | | | |
Shares outstanding - Investor Class(e) | | | | | | | | | | | 1,381,407 | | | | | | | | | | | | | | | | 6,190,193 | | | | | | | | | |
Net asset value, offering and redemption price - Investor Class | | | | | | | | | | | 14.26 | | | | | | | | | | | | | | | | 12.67 | | | | | | | | | |
| | | | | | | | | | | | | | | | | | | | | | | | | | | | | | | | | | | | | |
(a) Cost of investments in securities: | | | | | | | | | | | | | | | | | | | | | | | | | | | | | | | | | | | | |
| Unaffiliated issuers | | | 761,215,128 | | | | 647,611,716 | | | | 476,694,551 | | | | 16,295,473 | | | | 341,227,793 | | | | 83,889,810 | | | | 1,479,660,580 | | | | 98,938,147 | | | | 107,811,324 | |
| Controlled affiliates | | | — | | | | — | | | | 2,899,379 | | | | — | | | | — | | | | — | | | | — | | | | — | | | | — | |
| | | | 761,215,128 | | | | 647,611,716 | | | | 479,593,930 | | | | 16,295,473 | | | | 341,227,793 | | | | 83,889,810 | | | | 1,479,660,580 | | | | 98,938,147 | | | | 107,811,324 | |
(b) Premiums from options written | | | — | | | | 185,608 | | | | 2,350,130 | | | | — | | | | 196,394 | | | | — | | | | — | | | | — | | | | — | |
(c) Proceeds from short sales | | | — | | | | — | | | | 73,023,229 | | | | — | | | | — | | | | — | | | | — | | | | — | | | | — | |
| (d) | Designated as Institutional Class for Partners III and Short-Intermediate Income Funds |
| (e) | Indefinite number of no par value shares authorized |
| 52 Weitz Funds | The accompanying notes form an integral part of these financial statements. |
STATEMENTS OF OPERATIONS
YEAR ENDED MARCH 31, 2013
| | | | | | | | | | | | | | | | | | | | | Short - | | | Nebraska | | | Government | |
| | | | | | Partners | | | | | | | | | | | | | | | Intermediate | | | Tax-Free | | | Money | |
| (In U.S. dollars) | | Value | | | Value | | | Partners III | | | Research | | | Hickory | | | Balanced | | | Income | | | Income | | | Market | |
| Investment income: | | | | | | | | | | | | | | | | | | | | | | | | | | | |
| Dividends: | | | | | | | | | | | | | | | | | | | | | | | | | | | |
Unaffiliated issuers(a) | | | 10,368,833 | | | | 6,697,145 | | | | 5,856,184 | | | | 166,579 | | | | 2,186,085 | | | | 738,109 | | | | 1,461,261 | | | | — | | | | — | |
| Interest | | | 208,937 | | | | 172,801 | | | | 3,999 | | | | 355 | | | | 104,137 | | | | 535,158 | | | | 30,184,806 | | | | 2,709,997 | | | | 67,077 | |
| Total investment income | | | 10,577,770 | | | | 6,869,946 | | | | 5,860,183 | | | | 166,934 | | | | 2,290,222 | | | | 1,273,267 | | | | 31,646,067 | | | | 2,709,997 | | | | 67,077 | |
| Expenses: | | | | | | | | | | | | | | | | | | | | | | | | | | | | | | | | | | | | |
| Investment advisory fees | | | 9,393,720 | | | | 7,263,863 | | | | 5,986,952 | | | | 167,471 | | | | 3,562,819 | | | | 718,872 | | | | 5,833,694 | | | | 405,220 | | | | 376,426 | |
| Administrative fees | | | 1,140,285 | | | | 966,053 | | | | 751,247 | | | | 42,199 | | | | 502,362 | | | | 164,349 | | | | 2,345,885 | | | | 181,523 | | | | 165,354 | |
| Custodial fees | | | 18,483 | | | | 16,014 | | | | 15,187 | | | | 2,366 | | | | 11,432 | | | | 3,794 | | | | 23,426 | | | | 3,438 | | | | 3,398 | |
| Distribution fees - Investor Class | | | — | | | | — | | | | 31,801 | | | | — | | | | — | | | | — | | | | 166,684 | | | | — | | | | — | |
| Dividends on securities sold short | | | — | | | | — | | | | 1,603,731 | | | | — | | | | — | | | | — | | | | — | | | | — | | | | — | |
| Interest | | | — | | | | — | | | | 847,685 | | | | — | | | | — | | | | — | | | | — | | | | — | | | | — | |
| Professional fees | | | 75,695 | | | | 62,506 | | | | 56,637 | | | | 20,401 | | | | 40,085 | | | | 24,558 | | | | 109,251 | | | | 25,266 | | | | 24,769 | |
| Registration fees | | | 51,968 | | | | 39,229 | | | | 50,308 | | | | 16,235 | | | | 43,353 | | | | 18,408 | | | | 101,868 | | | | 5,871 | | | | 24,483 | |
| Sub-transfer agent fees | | | 242,469 | | | | 124,664 | | | | 107,156 | | | | 22,565 | | | | 196,793 | | | | 32,961 | | | | 236,293 | | | | 25,957 | | | | 33,160 | |
| Trustees fees | | | 86,222 | | | | 65,599 | | | | 54,508 | | | | 1,515 | | | | 31,986 | | | | 8,168 | | | | 133,423 | | | | 9,297 | | | | 8,310 | |
| Other | | | 223,729 | | | | 136,958 | | | | 98,630 | | | | 12,576 | | | | 97,041 | | | | 33,096 | | | | 344,615 | | | | 53,646 | | | | 26,864 | |
| | | | 11,232,571 | | | | 8,674,886 | | | | 9,603,842 | | | | 285,328 | | | | 4,485,871 | | | | 1,004,206 | | | | 9,295,139 | | | | 710,218 | | | | 662,764 | |
| Less expenses reimbursed | | | | | | | | | | | | | | | | | | | | | | | | | | | | | | | | | | | | |
| by investment adviser | | | — | | | | — | | | | (50,517 | ) | | | (134,604 | ) | | | — | | | | — | | | | (101,675 | ) | | | — | | | | (621,845 | ) |
| Net expenses | | | 11,232,571 | | | | 8,674,886 | | | | 9,553,325 | | | | 150,724 | | | | 4,485,871 | | | | 1,004,206 | | | | 9,193,464 | | | | 710,218 | | | | 40,919 | |
| Net investment income (loss) | | | (654,801 | ) | | | (1,804,940 | ) | | | (3,693,142 | ) | | | 16,210 | | | | (2,195,649 | ) | | | 269,061 | | | | 22,452,603 | | | | 1,999,779 | | | | 26,158 | |
| Realized and unrealized gain | | | | | | | | | | | | | | | | | | | | | | | | | | | | | | | | | | | | |
| (loss) on investments: | | | | | | | | | | | | | | | | | | | | | | | | | | | | | | | | | | | | |
| Net realized gain (loss): | | | | | | | | | | | | | | | | | | | | | | | | | | | | | | | | | | | | |
| Unaffiliated issuers | | | 100,517,519 | | | | 63,739,629 | | | | 45,246,979 | | | | 646,482 | | | | 31,899,452 | | | | 5,630,135 | | | | 4,425,766 | | | | 43,328 | | | | 92 | |
| Options written | | | — | | | | 55,749 | | | | (531,376 | ) | | | — | | | | 259,755 | | | | — | | | | — | | | | — | | | | — | |
| Net realized gain (loss) | | | 100,517,519 | | | | 63,795,378 | | | | 44,715,603 | | | | 646,482 | | | | 32,159,207 | | | | 5,630,135 | | | | 4,425,766 | | | | 43,328 | | | | 92 | |
| Net unrealized appreciation | | | | | | | | | | | | | | | | | | | | | | | | | | | | | | | | | | | | |
| (depreciation): | | | | | | | | | | | | | | | | | | | | | | | | | | | | | | | | | | | | |
| Unaffiliated issuers | | | 49,355,520 | | | | 73,178,631 | | | | 77,713,729 | | | | 696,987 | | | | 33,423,790 | | | | 2,866,426 | | | | 25,787,049 | | | | 7,185 | | | | — | |
| Controlled affiliates | | | — | | | | — | | | | 240,620 | | | | — | | | | — | | | | — | | | | — | | | | — | | | | — | |
| Options written | | | — | | | | (417,630 | ) | | | (2,042,375 | ) | | | — | | | | (440,565 | ) | | | — | | | | — | | | | — | | | | — | |
| Securities sold short | | | — | | | | — | | | | (10,889,287 | ) | | | — | | | | — | | | | — | | | | — | | | | — | | | | — | |
| Net unrealized appreciation | | | | | | | | | | | | | | | | | | | | | | | | | | | | | | | | | | | | |
| (depreciation) | | | 49,355,520 | | | | 72,761,001 | | | | 65,022,687 | | | | 696,987 | | | | 32,983,225 | | | | 2,866,426 | | | | 25,787,049 | | | | 7,185 | | | | — | |
| Net realized and unrealized | | | | | | | | | | | | | | | | | | | | | | | | | | | | | | | | | | | | |
| gain (loss) on investments | | | 149,873,039 | | | | 136,556,379 | | | | 109,738,290 | | | | 1,343,469 | | | | 65,142,432 | | | | 8,496,561 | | | | 30,212,815 | | | | 50,513 | | | | 92 | |
| Net increase (decrease) in | | | | | | | | | | | | | | | | | | | | | | | | | | | | | | | | | | | | |
| net assets resulting | | | | | | | | | | | | | | | | | | | | | | | | | | | | | | | | | | | | |
| from operations | | | 149,218,238 | | | | 134,751,439 | | | | 106,045,148 | | | | 1,359,679 | | | | 62,946,783 | | | | 8,765,622 | | | | 52,665,418 | | | | 2,050,292 | | | | 26,250 | |
(a) Foreign taxes withheld | | | 88,289 | | | | — | | | | — | | | | — | | | | — | | | | 7,357 | | | | — | | | | — | | | | — | |
| The accompanying notes form an integral part of these financial statements. | weitzinvestments.com 53 |
STATEMENTS OF CHANGES IN NET ASSETS
| | | | | | | | | | | | | |
(In U.S. dollars) | | Value | | | Partners Value | | | Partners III | | | Research | |
| | | Year ended March 31, | | | Year ended March 31, | | | Year ended March 31, | | | Year ended March 31, | |
| | | 2013 | | | 2012 | | | 2013 | | | 2012 | | | 2013 | | | 2012 | | | 2013 | | | 2012 | |
| Increase (decrease) in net assets: | | | | | | | | | | | | | | | | | | | | | | | | |
| From operations: | | | | | | | | | | | | | | | | | | | | | | | | |
| Net investment income (loss) | | | (654,801 | ) | | | 984,796 | | | | (1,804,940 | ) | | | (2,148,662 | ) | | | (3,693,142 | ) | | | (3,217,084 | ) | | | 16,210 | | | | 19,329 | |
| Net realized gain (loss) | | | 100,517,519 | | | | 28,286,948 | | | | 63,795,378 | | | | 14,380,111 | | | | 44,715,603 | | | | 11,286,109 | | | | 646,482 | | | | 941,406 | |
| Net unrealized appreciation | | | | | | | | | | | | | | | | | | | | | | | | | | | | | | | | |
| (depreciation) | | | 49,355,520 | | | | 63,863,272 | | | | 72,761,001 | | | | 21,331,941 | | | | 65,022,687 | | | | 22,704,610 | | | | 696,987 | | | | 995,409 | |
| Net increase (decrease) | | | | | | | | | | | | | | | | | | | | | | | | | | | | | | | | |
| in net assets resulting | | | | | | | | | | | | | | | | | | | | | | | | | | | | | | | | |
| from operations | | | 149,218,238 | | | | 93,135,016 | | | | 134,751,439 | | | | 33,563,390 | | | | 106,045,148 | | | | 30,773,635 | | | | 1,359,679 | | | | 1,956,144 | |
| Distributions to shareholders from: | | | | | | | | | | | | | | | | | | | | | | | | | | | | | | | | |
| Net investment income | | | (977,442 | ) | | | (2,159,048 | ) | | | — | | | | — | | | | — | | | | — | | | | (15,222 | ) | | | (18,128 | ) |
| Net investment income: | | | | | | | | | | | | | | | | | | | | | | | | | | | | | | | | |
| Institutional Class | | | — | | | | — | | | | — | | | | — | | | | — | | | | — | | | | — | | | | — | |
| Investor Class | | | — | | | | — | | | | — | | | | — | | | | — | | | | — | | | | — | | | | — | |
| Net realized gains | | | — | | | | — | | | | — | | | | — | | | | — | | | | — | | | | (1,438,427 | ) | | | (654,243 | ) |
| Net realized gains: | | | | | | | | | | | | | | | | | | | | | | | | | | | | | | | | |
| Institutional Class | | | — | | | | — | | | | — | | | | — | | | | (39,932,550 | ) | | | (12,074,793 | ) | | | — | | | | — | |
| Investor Class | | | — | | | | — | | | | — | | | | — | | | | (959,756 | ) | | | — | | | | — | | | | — | |
| Total distributions | | | (977,442 | ) | | | (2,159,048 | ) | | | — | | | | — | | | | (40,892,306 | ) | | | (12,074,793 | ) | | | (1,453,649 | ) | | | (672,371 | ) |
| Fund share transactions | | | (146,360,491 | ) | | | (50,589,631 | ) | | | 2,287,228 | | | | (80,986,729 | ) | | | — | | | | — | | | | 2,914,019 | | | | 3,770,949 | |
| Fund share transactions: | | | | | | | | | | | | | | | | | | | | | | | | | | | | | | | | |
| Institutional Class | | | — | | | | — | | | | — | | | | — | | | | (8,044,129 | ) | | | 130,888,688 | | | | — | | | | — | |
| Investor Class | | | — | | | | — | | | | — | | | | — | | | | 6,442,603 | | | | 9,892,753 | | | | — | | | | — | |
| Net increase (decrease) from | | | | | | | | | | | | | | | | | | | | | | | | | | | | | | | | |
| fund share transactions | | | (146,360,491 | ) | | | (50,589,631 | ) | | | 2,287,228 | | | | (80,986,729 | ) | | | (1,601,526 | ) | | | 140,781,441 | | | | 2,914,019 | | | | 3,770,949 | |
| Total increase (decrease) in net assets | | | 1,880,305 | | | | 40,386,337 | | | | 137,038,667 | | | | (47,423,339 | ) | | | 63,551,316 | | | | 159,480,283 | | | | 2,820,049 | | | | 5,054,722 | |
| Net assets: | | | | | | | | | | | | | | | | | | | | | | | | | | | | | | | | |
| Beginning of period | | | 1,011,671,424 | | | | 971,285,087 | | | | 707,174,317 | | | | 754,597,656 | | | | 620,920,518 | | | | 461,440,235 | | | | 16,298,719 | | | | 11,243,997 | |
| End of period | | | 1,013,551,729 | | | | 1,011,671,424 | | | | 844,212,984 | | | | 707,174,317 | | | | 684,471,834 | | | | 620,920,518 | | | | 19,118,768 | | | | 16,298,719 | |
| Undistributed net investment income (loss) | | | (516,651 | ) | | | 977,263 | | | | (727,134 | ) | | | (426,224 | ) | | | (909,955 | ) | | | (612,251 | ) | | | 2,502 | | | | 1,514 | |
| 54 Weitz Funds | The accompanying notes form an integral part of these financial statements. |
| | | | | | | | | | | | | Short-Intermediate | | | Nebraska | | | Government | |
| Hickory | | | Balanced | | | Income | | | Tax-Free Income | | | Money Market | |
| Year ended March 31, | | | Year ended March 31, | | | Year ended March 31, | | | Year ended March 31, | | | Year ended March 31, | |
| 2013 | | | 2012 | | | 2013 | | | 2012 | | | 2013 | | | 2012 | | | 2013 | | | 2012 | | | 2013 | | | 2012 | |
| | | | | | | | | | | | | | | | | | | | | | | | | | | | | |
| | (2,195,649 | ) | | | (1,998,331 | ) | | | 269,061 | | | | 420,823 | | | | 22,452,603 | | | | 24,852,096 | | | | 1,999,779 | | | | 2,203,936 | | | | 26,158 | | | | 22,233 | |
| | 32,159,207 | | | | 12,115,302 | | | | 5,630,135 | | | | 4,220,792 | | | | 4,425,766 | | | | 5,827,104 | | | | 43,328 | | | | 467 | | | | 92 | | | | 141 | |
| | | | | | | | | | | | | | | | | | | | | | | | | | | | | | | | | | | | | | | |
| | 32,983,225 | | | | (1,444,440 | ) | | | 2,866,426 | | | | 366,131 | | | | 25,787,049 | | | | 8,084,904 | | | | 7,185 | | | | 3,092,158 | | | | — | | | | — | |
| | | | | | | | | | | | | | | | | | | | | | | | | | | | | | | | | | | | | | | |
| | | | | | | | | | | | | | | | | | | | | | | | | | | | | | | | | | | | | | | |
| | 62,946,783 | | | | 8,672,531 | | | | 8,765,622 | | | | 5,007,746 | | | | 52,665,418 | | | | 38,764,104 | | | | 2,050,292 | | | | 5,296,561 | | | | 26,250 | | | | 22,374 | |
| | | | | | | | | | | | | | | | | | | | | | | | | | | | | | | | | | | | | | | |
| | — | | | | — | | | | (334,280 | ) | | | (554,771 | ) | | | — | | | | — | | | | (1,997,063 | ) | | | (2,268,065 | ) | | | (26,158 | ) | | | (22,233 | ) |
| | | | | | | | | | | | | | | | | | | | | | | | | | | | | | | | | | | | | | | |
| | — | | | | — | | | | — | | | | — | | | | (28,047,220 | ) | | | (29,463,655 | ) | | | — | | | | — | | | | — | | | | — | |
| | — | | | | — | | | | — | | | | — | | | | (1,243,473 | ) | | | (414,166 | ) | | | — | | | | — | | | | — | | | | — | |
| | — | | | | — | | | | — | | | | — | | | | — | | | | — | | | | (44,256 | ) | | | (41,735 | ) | | | (141 | ) | | | (665 | ) |
| | | | | | | | | | | | | | | | | | | | | | | | | | | | | | | | | | | | | | | |
| | — | | | | — | | | | — | | | | — | | | | (269,010 | ) | | | — | | | | — | | | | — | | | | — | | | | — | |
| | — | | | | — | | | | — | | | | — | | | | (12,587 | ) | | | — | | | | — | | | | — | | | | — | | | | — | |
| | — | | | | — | | | | (334,280 | ) | | | (554,771 | ) | | | (29,572,290 | ) | | | (29,877,821 | ) | | | (2,041,319 | ) | | | (2,309,800 | ) | | | (26,299 | ) | | | (22,898 | ) |
| | 38,882,171 | | | | (1,043,645 | ) | | | 1,142,820 | | | | (1,059,627 | ) | | | — | | | | — | | | | 10,166,564 | | | | 1,329,666 | | | | 30,551,498 | | | | (4,544,633 | ) |
| | | | | | | | | | | | | | | | | | | | | | | | | | | | | | | | | | | | | | | |
| | — | | | | — | | | | — | | | | — | | | | 335,220 | | | | 229,884,398 | | | | — | | | | — | | | | — | | | | — | |
| | — | | | | — | | | | — | | | | — | | | | 24,253,912 | | | | 52,960,972 | | | | — | | | | — | | | | — | | | | — | |
| | | | | | | | | | | | | | | | | | | | | | | | | | | | | | | | | | | | | | | |
| | 38,882,171 | | | | (1,043,645 | ) | | | 1,142,820 | | | | (1,059,627 | ) | | | 24,589,132 | | | | 282,845,370 | | | | 10,166,564 | | | | 1,329,666 | | | | 30,551,498 | | | | (4,544,633 | ) |
| | | | | | | | | | | | | | | | | | | | | | | | | | | | | | | | | | | | | | | |
| | 101,828,954 | | | | 7,628,886 | | | | 9,574,162 | | | | 3,393,348 | | | | 47,682,260 | | | | 291,731,653 | | | | 10,175,537 | | | | 4,316,427 | | | | 30,551,449 | | | | (4,545,157 | ) |
| | | | | | | | | | | | | | | | | | | | | | | | | | | | | | | | | | | | | | | |
| | 330,256,937 | | | | 322,628,051 | | | | 88,531,125 | | | | 85,137,777 | | | | 1,455,595,610 | | | | 1,163,863,957 | | | | 93,588,928 | | | | 89,272,501 | | | | 77,366,560 | | | | 81,911,717 | |
| | 432,085,891 | | | | 330,256,937 | | | | 98,105,287 | | | | 88,531,125 | | | | 1,503,277,870 | | | | 1,455,595,610 | | | | 103,764,465 | | | | 93,588,928 | | | | 107,918,009 | | | | 77,366,560 | |
| | | | | | | | | | | | | | | | | | | | | | | | | | | | | | | | | | | | | | | |
| | | | | | | | | | | | | | | | | | | | | | | | | | | | | | | | | | | | | | | |
| | (487,168 | ) | | | (281,577 | ) | | | 19,132 | | | | 74,195 | | | | 246,450 | | | | 87,101 | | | | 33,323 | | | | 30,607 | | | | — | | | | — | |
| The accompanying notes form an integral part of these financial statements. | weitzinvestments.com 55 |
STATEMENT OF CASH FLOWS
| PARTNERS III OPPORTUNITY FUND | |
| Year Ended March 31, 2013 | |
| Increase (decrease) in cash: | | | | |
| Cash flows from operating activities: | | | | |
| Net increase in net assets from operations | | $ | 106,045,148 | |
| Adjustments to reconcile net increase in net assets from operations | | | | |
| to net cash provided by operating activities: | | | | |
| Purchases of investment securities | | | (207,360,496 | ) |
| Proceeds from sale of investment securities | | | 301,359,099 | |
| Proceeds from securities sold short | | | 7,971,413 | |
| Purchase of short-term investment securities, net | | | (13,948,176 | ) |
| Decrease in accrued interest and dividends receivable | | | 18,211 | |
| Increase in receivable for securities sold | | | (8,858,474 | ) |
| Increase in receivable for fund shares sold | | | (1,754,304 | ) |
| Increase in other liablilities | | | 8,908 | |
| Decrease in payable for securities purchased | | | (12,718,574 | ) |
| Decrease in payable for fund shares redeemed | | | (393,340 | ) |
| Increase in dividends payable on securities sold short | | | 208,882 | |
| Increase in due to adviser | | | 34,985 | |
| Net unrealized appreciation on investments, options and short sales | | | (65,022,687 | ) |
| Net realized gain on investments and options | | | (44,715,603 | ) |
| Net cash provided by operating activities | | | 60,874,992 | |
| Cash flows from financing activities: | | | | |
| Proceeds from sales of fund shares | | | 96,646,554 | |
| Payments for redemptions of fund shares | | | (127,426,503 | ) |
| Cash distributions to shareholders | | | (11,713,883 | ) |
| Increase in due from broker | | | (17,980,360 | ) |
| Net cash used in financing activities | | | (60,474,192 | ) |
| Net increase (decrease) in cash | | | 400,800 | |
| Cash: | | | | |
| Balance, beginning of period | | | — | |
| Balance, end of period | | $ | 400,800 | |
| Supplemental disclosure of cash flow information: | | | | |
| Cash payments for interest | | $ | 838,777 | |
| Noncash financing activities: | | | | |
| Reinvestment of shareholder distributions | | $ | 29,178,423 | |
| | | | | |
| 56 Weitz Funds | The accompanying notes form an integral part of these financial statements. |
FINANCIAL HIGHLIGHTS
The following financial information provides selected data for a share outstanding throughout the periods indicated.
| | | Year ended March 31, | |
| Value Fund | | 2013 | | | 2012 | | | 2011 | | | 2010 | | | 2009 | |
| Net asset value, beginning of period | | $ | 32.98 | | | $ | 30.07 | | | $ | 26.14 | | | $ | 16.90 | | | $ | 27.74 | |
| Income (loss) from investment operations: | | | | | | | | | | | | | | | | | | | | |
| Net investment income (loss) | | | (0.02 | ) | | | 0.04 | | | | 0.07 | | | | (0.07 | ) | | | 0.07 | |
Net gain (loss) on securities (realized and unrealized) | | | 5.68 | | | | 2.94 | | | | 3.86 | | | | 9.37 | | | | (10.72 | ) |
| Total from investment operations | | | 5.66 | | | | 2.98 | | | | 3.93 | | | | 9.30 | | | | (10.65 | ) |
| Less distributions: | | | | | | | | | | | | | | | | | | | | |
| Dividends from net investment income | | | (0.03 | ) | | | (0.07 | ) | | | — | | | | (0.06 | ) | | | (0.19 | ) |
| Distributions from realized gains | | | — | | | | — | | | | — | | | | — | | | | — | |
| Total distributions | | | (0.03 | ) | | | (0.07 | ) | | | — | | | | (0.06 | ) | | | (0.19 | ) |
| Net asset value, end of period | | $ | 38.61 | | | $ | 32.98 | | | $ | 30.07 | | | $ | 26.14 | | | $ | 16.90 | |
| | | | | | | | | | | | | | | | | | | | | |
| Total return | | | 17.2% | | | | 9.9% | | | | 15.0% | | | | 55.1% | | | | (38.6% | ) |
| Ratios/supplemental data: | | | | | | | | | | | | | | | | | | | | |
| Net assets, end of period ($000) | | | 1,013,552 | | | | 1,011,671 | | | | 971,285 | | | | 977,576 | | | | 762,093 | |
| Ratio of expenses to average net assets | | | 1.20% | | | | 1.20% | | | | 1.21% | | | | 1.22% | | | | 1.20% | |
| Ratio of net investment income (loss) to average net assets | | | (0.07% | ) | | | 0.11% | | | | 0.23% | | | | (0.29% | ) | | | 0.20% | |
| Portfolio turnover rate | | | 20% | | | | 31% | | | | 46% | | | | 19% | | | | 19% | |
| | | Year ended March 31, | |
| Partners Value Fund | | 2013 | | | 2012 | | | 2011 | | | 2010 | | | 2009 | |
| Net asset value, beginning of period | | $ | 23.25 | | | $ | 22.05 | | | $ | 18.24 | | | $ | 11.77 | | | $ | 17.33 | |
| Income (loss) from investment operations: | | | | | | | | | | | | | | | | | | | | |
| Net investment income (loss) | | | (0.06 | ) | | | (0.07 | ) | | | (0.05 | ) | | | (0.08 | ) | | | 0.01 | |
| Net gain (loss) on securities (realized and unrealized) | | | 4.56 | | | | 1.27 | | | | 3.86 | | | | 6.56 | | | | (5.55 | ) |
| Total from investment operations | | | 4.50 | | | | 1.20 | | | | 3.81 | | | | 6.48 | | | | (5.54 | ) |
| Less distributions: | | | | | | | | | | | | | | | | | | | | |
| Dividends from net investment income | | | — | | | | — | | | | — | | | | (0.01 | ) | | | (0.02 | ) |
| Distributions from realized gains | | | — | | | | — | | | | — | | | | — | | | | — | |
| Total distributions | | | — | | | | — | | | | — | | | | (0.01 | ) | | | (0.02 | ) |
| Net asset value, end of period | | $ | 27.75 | | | $ | 23.25 | | | $ | 22.05 | | | $ | 18.24 | | | $ | 11.77 | |
| Total return | | | 19.4% | | | | 5.4% | | | | 20.9% | | | | 55.1% | | | | (32.0% | ) |
| Ratios/supplemental data: | | | | | | | | | | | | | | | | | | | | |
| Net assets, end of period ($000) | | | 844,213 | | | | 707,174 | | | | 754,598 | | | | 622,107 | | | | 431,071 | |
| Ratio of expenses to average net assets | | | 1.19% | | | | 1.20% | | | | 1.21% | | | | 1.21% | | | | 1.19% | |
| Ratio of net investment income (loss) to average net assets | | | (0.25% | ) | | | (0.32% | ) | | | (0.26% | ) | | | (0.52% | ) | | | 0.05% | |
| Portfolio turnover rate | | | 24% | | | | 31% | | | | 42% | | | | 30% | | | | 29% | |
| The accompanying notes form an integral part of these financial statements. | weitzinvestments.com 57 |
FINANCIAL HIGHLIGHTS
The following financial information provides selected data for a share outstanding throughout the periods indicated.
| Partners III Opportunity Fund - | | Year ended March 31, | |
| Institutional Class | | 2013 | | | 2012 | | | 2011 | | | 2010 | | | 2009 | |
| Net asset value, beginning of period | | $ | 12.93 | | | $ | 12.63 | | | $ | 10.15 | | | $ | 6.26 | | | $ | 8.55 | |
| Income (loss) from investment operations: | | | | | | | | | | | | | | | | | | | | |
| Net investment income (loss) | | | (0.08 | )(a) | | | (0.07 | )(a) | | | (0.06 | ) | | | (0.08 | ) | | | (0.04 | ) |
| Net gain (loss) on securities (realized and unrealized) | | | 2.40 | | | | 0.67 | | | | 2.54 | | | | 3.97 | | | | (2.24 | ) |
| Total from investment operations | | | 2.32 | | | | 0.60 | | | | 2.48 | | | | 3.89 | | | | (2.28 | ) |
| Less distributions: | | | | | | | | | | | | | | | | | | | | |
| Dividends from net investment income | | | — | | | | — | | | | — | | | | — | | | | (0.01 | ) |
| Distributions from realized gains | | | (0.92 | ) | | | (0.30 | ) | | | — | | | | — | | | | — | |
| Total distributions | | | (0.92 | ) | | | (0.30 | ) | | | — | | | | — | | | | (0.01 | ) |
| Net asset value, end of period | | $ | 14.33 | | | $ | 12.93 | | | $ | 12.63 | | | $ | 10.15 | | | $ | 6.26 | |
| Total return | | | 19.1% | | | | 4.9% | | | | 24.4% | | | | 62.1% | | | | (26.7% | ) |
| Ratios/supplemental data: | | | | | | | | | | | | | | | | | | | | |
| Net assets, end of period ($000) | | | 664,770 | | | | 609,424 | | | | 461,440 | | | | 274,793 | | | | 154,909 | |
Ratio of expenses to average net assets(b) | | | 1.59% | | | | 1.48% | | | | 1.51% | | | | 1.79% | | | | 1.81% | |
| Ratio of net investment income (loss) to average net assets | | | (0.61% | ) | | | (0.61% | ) | | | (0.64% | ) | | | (1.02% | ) | | | (0.43% | ) |
| Portfolio turnover rate | | | 32% | | | | 44% | | | | 64% | | | | 54% | | | | 58% | |
| | | Year | | | Eight months | |
| Partners III Opportunity Fund - | | ended | | | ended | |
| Investor Class | | March 31, 2013 | | | March 31, 2012(c) | |
| Net asset value, beginning of period | | $ | 12.90 | | | $ | 12.08 | | |
| Income (loss) from investment operations: | | | | | | | | | |
Net investment income (loss)(a) | | | (0.12 | ) | | | (0.09 | ) | |
| Net gain on securities (realized and unrealized) | | | 2.40 | | | | 0.91 | | |
| Total from investment operations | | | 2.28 | | | | 0.82 | | |
| Less distributions: | | | | | | | | | |
| Dividends from net investment income | | | — | | | | — | | |
| Distributions from realized gains | | | (0.92 | ) | | | — | | |
| Total distributions | | | (0.92 | ) | | | — | | |
| Net asset value, end of period | | $ | 14.26 | | | $ | 12.90 | | |
| Total return | | | 18.8% | | | | 6.8% | † | |
| Ratios/supplemental data: | | | | | | | | | |
| Net assets, end of period ($000) | | | 19,702 | | | | 11,497 | | |
Ratio of net expenses to average net assets(d) | | | 1.85% | | | | 1.80% | * | |
| Ratio of net investment income (loss) to average net assets | | | (0.93% | ) | | | (1.06% | )* | |
| Portfolio turnover rate | | | 32% | | | | 44% | | |
| * | Annualized |
| † | Not Annualized |
| (a) | Based on average daily shares outstanding |
| (b) | Included in the expense ratio is 0.14%, 0.11%, 0.15%, 0.26% and 0.12% related to interest expense and 0.27%, 0.18%, 0.16%, 0.30% and 0.47% related to dividend expense on securities sold short for the periods ended March 31, 2013, 2012, 2011, 2010 and 2009, respectively. |
| (c) | Initial offering of shares on August 1, 2011 (See Note 1). |
| (d) | Included in the expense ratio is 0.14% and 0.12% related to interest expense and 0.28% and 0.24% related to dividend expense on securities sold short for the periods ended March 31, 2013 and 2012, respectively. Absent expenses assumed by the Adviser, the expense ratio would have been 2.25% and 2.31% for the periods ended March 31, 2013 and 2012, respectively. |
| 58 Weitz Funds | The accompanying notes form an integral part of these financial statements. |
The following financial information provides selected data for a share outstanding throughout the periods indicated.
| | | | | | | | | Three months | | |
| | | Year ended March 31, | | | ended | | |
| Research Fund | | 2013 | | | 2012 | | | March 31, 2011(a) | | |
| Net asset value, beginning of period | | $ | 11.07 | | | $ | 10.38 | | | $ | 10.00 | | |
| Income (loss) from investment operations: | | | | | | | | | | | | | |
| Net investment income | | | 0.01 | | | | 0.01 | | | | — | # | |
| Net gain on securities (realized and unrealized) | | | 0.65 | | | | 1.20 | | | | 0.38 | | |
| Total from investment operations | | | 0.66 | | | | 1.21 | | | | 0.38 | | |
| Less distributions: | | | | | | | | | | | | | |
| Dividends from net investment income | | | (0.01 | ) | | | (0.01 | ) | | | — | | |
| Distributions from realized gains | | | (0.89 | ) | | | (0.51 | ) | | | — | | |
| Total distributions | | | (0.90 | ) | | | (0.52 | ) | | | — | | |
| Net asset value, end of period | | $ | 10.83 | | | $ | 11.07 | | | $ | 10.38 | | |
| Total return | | | 7.0% | | | | 12.3% | | | | 3.8% | † | |
| Ratios/supplemental data: | | | | | | | | | | | | | |
| Net assets, end of period ($000) | | | 19,119 | | | | 16,299 | | | | 11,244 | | |
Ratio of net expenses to average net assets(b) | | | 0.90% | | | | 0.90% | | | | 0.90% | * | |
| Ratio of net investment income to average net assets | | | 0.10% | | | | 0.15% | | | | 0.01% | * | |
| Portfolio turnover rate | | | 97% | | | | 124% | | | | 12% | † | |
| | | Year ended March 31, | |
| Hickory Fund | | 2013 | | | 2012 | | | 2011 | | | 2010 | | | 2009 | |
| Net asset value, beginning of period | | $ | 42.53 | | | $ | 41.12 | | | $ | 31.77 | | | $ | 19.72 | | | $ | 30.53 | |
| Income (loss) from investment operations: | | | | | | | | | | | | | | | | | | | | |
| Net investment income (loss) | | | (0.25 | ) | | | (0.26 | ) | | | (0.20 | ) | | | (0.21 | ) | | | (0.04 | ) |
| Net gain (loss) on securities (realized and unrealized) | | | 7.94 | | | | 1.67 | | | | 9.55 | | | | 12.26 | | | | (10.74 | ) |
| Total from investment operations | | | 7.69 | | | | 1.41 | | | | 9.35 | | | | 12.05 | | | | (10.78 | ) |
| Less distributions: | | | | | | | | | | | | | | | | | | | | |
| Dividends from net investment income | | | — | | | | — | | | | — | | | | — | | | | (0.03 | ) |
| Distributions from realized gains | | | — | | | | — | | | | — | | | | — | | | | — | |
| Total distributions | | | — | | | | — | | | | — | | | | — | | | | (0.03 | ) |
| Net asset value, end of period | | $ | 50.22 | | | $ | 42.53 | | | $ | 41.12 | | | $ | 31.77 | | | $ | 19.72 | |
| Total return | | | 18.1% | | | | 3.4% | | | | 29.4% | | | | 61.1% | | | | (35.3% | ) |
| Ratios/supplemental data: | | | | | | | | | | | | | | | | | | | | |
| Net assets, end of period ($000) | | | 432,086 | | | | 330,257 | | | | 322,628 | | | | 206,116 | | | | 133,813 | |
| Ratio of expenses to average net assets | | | 1.26% | | | | 1.27% | | | | 1.27% | | | | 1.29% | | | | 1.28% | |
| Ratio of net investment income (loss) to average net assets | | | (0.62% | ) | | | (0.64% | ) | | | (0.61% | ) | | | (0.79% | ) | | | (0.16% | ) |
| Portfolio turnover rate | | | 32% | | | | 38% | | | | 67% | | | | 61% | | | | 28% | |
| * | Annualized |
| † | Not Annualized |
| # | Amount less than $0.01 |
| (a) | Initial offering of shares on December 31, 2010 (See Note 1) |
| (b) | Absent expenses assumed by the Adviser, the expense ratio would have been 1.70%, 1.83% and 2.89% for the periods ended March 31, 2013, 2012 and 2011, respectively. |
| The accompanying notes form an integral part of these financial statements. | weitzinvestments.com 59 |
FINANCIAL HIGHLIGHTS
The following financial information provides selected data for a share outstanding throughout the periods indicated.
| | | Year ended March 31, | |
| Balanced Fund | | 2013 | | | 2012 | | | 2011 | | | 2010 | | | 2009 | |
| Net asset value, beginning of period | | $ | 12.39 | | | $ | 11.74 | | | $ | 10.59 | | | $ | 7.71 | | | $ | 10.05 | |
| Income (loss) from investment operations: | | | | | | | | | | | | | | | | | | | | |
| Net investment income | | | 0.04 | | | | 0.06 | | | | 0.11 | | | | 0.11 | | | | 0.13 | |
| Net gain (loss) on securities (realized and unrealized) | | | 1.20 | | | | 0.67 | | | | 1.14 | | | | 2.89 | | | | (2.33 | ) |
| Total from investment operations | | | 1.24 | | | | 0.73 | | | | 1.25 | | | | 3.00 | | | | (2.20 | ) |
| Less distributions: | | | | | | | | | | | | | | | | | | | | |
| Dividends from net investment income | | | (0.05 | ) | | | (0.08 | ) | | | (0.10 | ) | | | (0.12 | ) | | | (0.14 | ) |
| Distributions from realized gains | | | — | | | | — | | | | — | | | | — | | | | — | |
| Total distributions | | | (0.05 | ) | | | (0.08 | ) | | | (0.10 | ) | | | (0.12 | ) | | | (0.14 | ) |
| Net asset value, end of period | | $ | 13.58 | | | $ | 12.39 | | | $ | 11.74 | | | $ | 10.59 | | | $ | 7.71 | |
| Total return | | | 10.0% | | | | 6.2% | | | | 11.8% | | | | 39.0% | | | | (21.9% | ) |
| Ratios/supplemental data: | | | | | | | | | | | | | | | | | | | | |
| Net assets, end of period ($000) | | | 98,105 | | | | 88,531 | | | | 85,138 | | | | 77,969 | | | | 52,149 | |
| Ratio of expenses to average net assets | | | 1.12% | | | | 1.14% | | | | 1.15% | | | | 1.17% | | | | 1.17% | |
| Ratio of net investment income to average net assets | | | 0.30% | | | | 0.51% | | | | 0.97% | | | | 1.14% | | | | 1.37% | |
| Portfolio turnover rate | | | 47% | | | | 46% | | | | 47% | | | | 45% | | | | 61% | |
| 60 Weitz Funds | The accompanying notes form an integral part of these financial statements. |
The following financial information provides selected data for a share outstanding throughout the periods indicated.
| Short-Intermediate Income | | Year ended March 31, | |
| Fund - Institutional Class | | 2013 | | | 2012 | | | 2011 | | | 2010 | | | 2009 | |
| Net asset value, beginning of period | | $ | 12.48 | | | $ | 12.39 | | | $ | 12.25 | | | $ | 11.42 | | | $ | 11.74 | |
| Income (loss) from investment operations: | | | | | | | | | | | | | | | | | | | | |
| Net investment income | | | 0.19 | (a) | | | 0.23 | (a) | | | 0.24 | | | | 0.35 | | | | 0.43 | |
| Net gain (loss) on securities (realized and unrealized) | | | 0.26 | | | | 0.13 | | | | 0.19 | | | | 0.84 | | | | (0.20 | ) |
| Total from investment operations | | | 0.45 | | | | 0.36 | | | | 0.43 | | | | 1.19 | | | | 0.23 | |
| Less distributions: | | | | | | | | | | | | | | | | | | | | |
| Dividends from net investment income | | | (0.25 | ) | | | (0.27 | ) | | | (0.29 | ) | | | (0.36 | ) | | | (0.45 | ) |
| Distributions from realized gains | | | — | # | | | — | | | | — | | | | — | | | | (0.10 | ) |
| Total distributions | | | (0.25 | ) | | | (0.27 | ) | | | (0.29 | ) | | | (0.36 | ) | | | (0.55 | ) |
| Net asset value, end of period | | $ | 12.68 | | | $ | 12.48 | | | $ | 12.39 | | | $ | 12.25 | | | $ | 11.42 | |
| Total return | | | 3.7% | | | | 2.9% | | | | 3.5% | | | | 10.5% | | | | 2.1% | |
| Ratios/supplemental data: | | | | | | | | | | | | | | | | | | | | |
| Net assets, end of period ($000) | | | 1,424,860 | | | | 1,402,505 | | | | 1,163,864 | | | | 672,025 | | | | 182,016 | |
| Ratio of expenses to average net assets | | | 0.62% | | | | 0.61% | | | | 0.64% | | | | 0.62% | | | | 0.69% | |
| Ratio of net investment income to average net assets | | | 1.55% | | | | 1.84% | | | | 2.02% | | | | 3.17% | | | | 4.00% | |
| Portfolio turnover rate | | | 37% | | | | 44% | | | | 38% | | | | 27% | | | | 25% | |
| | | Year | | | Eight months | | |
| Short-Intermediate Income | | ended | | | ended | | |
| Fund - Investor Class | | March 31, 2013 | | | March 31, 2012(b) | | |
| Net asset value, beginning of period | | $ | 12.47 | | | $ | 12.51 | | |
| Income (loss) from investment operations: | | | | | | | | | |
Net investment income(a) | | | 0.17 | | | | 0.12 | | |
| Net gain on securities (realized and unrealized) | | | 0.26 | | | | 0.02 | | |
| Total from investment operations | | | 0.43 | | | | 0.14 | | |
| Less distributions: | | | | | | | | | |
| Dividends from net investment income | | | (0.23 | ) | | | (0.18 | ) | |
| Distributions from realized gains | | | — | # | | | — | | |
| Total distributions | | | (0.23 | ) | | | (0.18 | ) | |
| Net asset value, end of period | | $ | 12.67 | | | $ | 12.47 | | |
| Total return | | | 3.5% | | | | 1.1% | † | |
| Ratios/supplemental data: | | | | | | | | | |
| Net assets, end of period ($000) | | | 78,418 | | | | 53,090 | | |
Ratio of net expenses to average net assets(c) | | | 0.82% | | | | 0.80% | * | |
| Ratio of net investment income to average net assets | | | 1.36% | | | | 1.58% | * | |
| Portfolio turnover rate | | | 37% | | | | 44% | | |
| * | Annualized |
| † | Not Annualized |
| # | Amount less than $0.01 |
| (a) | Based on average daily shares outstanding |
| (b) | Initial offering of shares on August 1, 2011 (See Note 1) |
| (c) | Absent expenses assumed by the Adviser, the expense ratio would have been 0.97% and 1.15% for the periods ended March 31, 2013 and 2012, respectively. |
| The accompanying notes form an integral part of these financial statements. | weitzinvestments.com 61 |
FINANCIAL HIGHLIGHTS
The following financial information provides selected data for a share outstanding throughout the periods indicated.
| | | Year ended March 31, | |
| Nebraska Tax-Free Income Fund | | 2013 | | | 2012 | | | 2011 | | | 2010 | | | 2009 | |
| Net asset value, beginning of period | | $ | 10.44 | | | $ | 10.09 | | | $ | 10.15 | | | $ | 9.94 | | | $ | 9.95 | |
| Income (loss) from investment operations: | | | | | | | | | | | | | | | | | | | | |
| Net investment income | | | 0.21 | | | | 0.25 | | | | 0.26 | | | | 0.29 | | | | 0.35 | |
| Net gain (loss) on securities (realized and unrealized) | | | 0.01 | | | | 0.36 | | | | (0.07 | ) | | | 0.21 | | | — | ^ |
| Total from investment operations | | | 0.22 | | | | 0.61 | | | | 0.19 | | | | 0.50 | | | | 0.35 | |
| Less distributions: | | | | | | | | | | | | | | | | | | | | |
| Dividends from net investment income | | | (0.21 | ) | | | (0.26 | ) | | | (0.25 | ) | | | (0.29 | ) | | | (0.36 | ) |
| Distributions from realized gains | | | (0.01 | ) | | — | ^ | | | — | | | | — | | | | — | |
| Total distributions | | | (0.22 | ) | | | (0.26 | ) | | | (0.25 | ) | | | (0.29 | ) | | | (0.36 | ) |
| Net asset value, end of period | | $ | 10.44 | | | $ | 10.44 | | | $ | 10.09 | | | $ | 10.15 | | | $ | 9.94 | |
| Total return | | | 2.0% | | | | 6.1% | | | | 1.9% | | | | 5.1% | | | | 3.6% | |
| Ratios/supplemental data: | | | | | | | | | | | | | | | | | | | | |
| Net assets, end of period ($000) | | | 103,764 | | | | 93,589 | | | | 89,273 | | | | 81,914 | | | | 60,587 | |
Ratio of net expenses to average net assets(a) | | | 0.70% | | | | 0.71% | | | | 0.73% | | | | 0.75% | | | | 0.75% | |
| Ratio of net investment income to average net assets | | | 1.97% | | | | 2.43% | | | | 2.49% | | | | 2.93% | | | | 3.56% | |
| Portfolio turnover rate | | | 14% | | | | 8% | | | | 10% | | | | 13% | | | | 17% | |
| | | Year ended March 31, | |
| Government Money Market Fund | | 2013 | | | 2012 | | | 2011 | | | 2010 | | | 2009 | |
| Net asset value, beginning of period | | $ | 1.00 | | | $ | 1.00 | | | $ | 1.00 | | | $ | 1.00 | | | $ | 1.00 | |
| Income (loss) from investment operations: | | | | | | | | | | | | | | | | | | | | |
| Net investment income | | | — | # | | | — | # | | | 0.001 | | | | 0.002 | | | | 0.013 | |
| Net realized gain on securities | | | — | # | | | — | # | | | — | # | | | — | # | | | — | # |
| Total from investment operations | | | — | # | | | — | # | | | 0.001 | | | | 0.002 | | | | 0.013 | |
| Less distributions: | | | | | | | | | | | | | | | | | | | | |
| Dividends from net investment income | | | — | # | | | — | # | | | (0.001 | ) | | | (0.001 | ) | | | (0.013 | ) |
| Distributions from realized gains | | | — | # | | | — | # | | | — | # | | | (0.001 | ) | | | — | |
| Total distributions | | | — | # | | | — | # | | | (0.001 | ) | | | (0.002 | ) | | | (0.013 | ) |
| Net asset value, end of period | | $ | 1.00 | | | $ | 1.00 | | | $ | 1.00 | | | $ | 1.00 | | | $ | 1.00 | |
| Total return | | | 0.03% | | | | 0.03% | | | | 0.1% | | | | 0.2% | | | | 1.4% | |
| Ratios/supplemental data: | | | | | | | | | | | | | | | | | | | | |
| Net assets, end of period ($000) | | | 107,918 | | | | 77,367 | | | | 81,912 | | | | 83,363 | | | | 107,384 | |
Ratio of net expenses to average net assets(b) | | | 0.04% | | | | 0.01% | | | | 0.07% | | | | 0.08% | | | | 0.10% | |
| Ratio of net investment income to average net assets | | | 0.03% | | | | 0.03% | | | | 0.06% | | | | 0.11% | | | | 1.31% | |
| ^ | Amount less than $0.01 |
| # | Amount less than $0.001 |
| (a) | Absent expenses assumed by the Adviser, the expense ratio would have been 0.76% and 0.78% for the periods ended March 31, 2010 and 2009, respectively. |
| (b) | Absent expenses assumed by the Adviser, the expense ratio would have been, 0.70%, 0.72%, 0.73%, 0.76% and 0.75% for the periods ended March 31, 2013, 2012, 2011, 2010 and 2009, respectively. |
| 62 Weitz Funds | The accompanying notes form an integral part of these financial statements. |
NOTES TO FINANCIAL STATEMENTS
MARCH 31, 2013
(1) Organization
The Weitz Funds (the “Trust”) is registered under the Investment Company Act of 1940 as an open-end management investment company issuing shares in series, each series representing a distinct portfolio with its own investment objectives and policies. At March 31, 2013, the Trust had nine series in operation: Value Fund, Partners Value Fund, Partners III Opportunity Fund, Research Fund, Hickory Fund, Balanced Fund, Short-Intermediate Income Fund, Nebraska Tax-Free Income Fund and Government Money Market Fund (individually, a “Fund”, collectively, the “Funds”).
Each Fund offers one class of shares, except the Partners III Opportunity and Short-Intermediate Income Funds which each offer two classes of shares: Institutional Class and Investor Class shares. Each class of shares has identical rights and privileges, except with respect to certain class specific expenses such as administration and distribution (12b-1) fees, voting rights on matters affecting a single class of shares and exchange privileges. Income, realized and unrealized gains and losses, and expenses of the Funds not directly attributable to a specific class of shares are allocated to the two classes on the basis of daily net assets of each class. Fees and expenses relating to a specific class are charged directly to that share class.
The Research Fund was originally organized in April 2005 as a Delaware limited partnership (the “Partnership”). Effective as of the close of business on December 31, 2010, the Partnership was reorganized into a series of the Trust through a tax-free exchange.
The investment objective of the Value, Partners Value, Partners III Opportunity, Research and Hickory Funds (the “Weitz Equity Funds”) is capital appreciation. Each of the Weitz Equity Funds invests principally in common stocks and a variety of securities convertible into common stocks such as rights, warrants, convertible preferred stock and convertible bonds.
The investment objectives of the Balanced Fund are regular current income, capital preservation and long-term capital appreciation. The Fund invests principally in a portfolio of U.S. equity and fixed income securities.
The investment objective of the Short-Intermediate Income Fund is high current income consistent with the preservation of capital. Under normal market conditions, the Fund will invest at least 80% of its net assets, plus the amount of any borrowings for investment purposes, in fixed income securities such as U.S. Government and agency securities, corporate debt securities and mortgage-backed securities.
The investment objective of the Nebraska Tax-Free Income Fund is to provide a high level of current income that is exempt from both federal and Nebraska personal income taxes. The Fund under normal circumstances, invests at least 80% of its net assets, plus the amount of any borrowings for investment purposes, in municipal securities that generate income exempt from Nebraska state income tax and from federal income tax or in open or closed-end mutual funds which in turn invest in such assets.
The investment objective of the Government Money Market Fund is current income consistent with the preservation of capital and maintenance of liquidity. The Fund invests substantially all of its assets in debt obligations issued or guaranteed by the U.S. Government, its agencies and instrumentalities and repurchase agreements on such securities with remaining maturities not exceeding thirteen months. The Fund limits its average portfolio maturity to sixty days or less.
(2) Significant Accounting Policies
The following accounting policies are in accordance with accounting principles generally accepted in the United States.
(a) Valuation of Investments
Investments are carried at value determined using the following valuation methods:
| | |
| • | Securities traded on a national or regional securities exchange are valued at the last sales price; if there were no sales on that day, securities are valued at the mean between the latest available and representative bid and ask prices; securities listed on the NASDAQ exchange are valued using the NASDAQ Official Closing Price (“NOCP”). Generally, the NOCP will be the last sales price unless the reported trade for the security is outside the range of the bid/ask price. In such cases, the NOCP will be normalized to the nearer of the bid or ask price. |
| | |
| • | Short sales traded on a national or regional securities exchange are valued at the last sales price; if there were no sales on that day, short sales are valued at the mean between the latest available and representative bid and ask prices. |
| | |
| • | Securities not listed on an exchange are valued at the mean between the latest available and representative bid and ask prices. |
| | |
| • | The value of certain debt securities for which market quotations are not readily available may be based upon current market prices of securities which are comparable in coupon, rating and maturity or an appropriate matrix utilizing similar factors. |
| | |
| • | The current market value of a traded option is the last sales price at which such option is traded, or, in the absence of a sale on or about the close of the exchange, the mean of the closing bid and ask prices. |
| | |
| • | Money market funds are valued at the quoted net asset value. Short-term securities are valued at amortized cost, which approximates current value. |
| | |
| • | The value of securities for which market quotations are not readily available or are deemed unreliable, including |
weitzinvestments.com 63
| | restricted and not readily marketable securities, is determined in good faith in accordance with procedures approved by the Trust’s Board of Trustees. Such valuation procedures and methods for valuing securities may include, but are not limited to: multiple of earnings, multiple of book value, discount from value of a similar freely-traded security, purchase price, private transaction in the security or related securities, the nature and duration of restrictions on disposition of the security and a combination of these and other factors. |
| | |
| • | Investment securities held by the Government Money Market Fund are carried at amortized cost, which approximates market value. Pursuant to Rule 2a-7 of the Investment Company Act of 1940, amortized cost, as defined, is a method of valuing securities at acquisition cost, adjusted for amortization of premium or accretion of discount. |
The Board of Trustees has delegated the supervision of the daily valuation process to the Pricing Committee of the Trust’s Administrator, Weitz Investment Management, Inc. The Pricing Committee provides oversight of the approved procedures, evaluates the effectiveness of the pricing policies and reports to the Board of Trustees. When determining the reliability of third party pricing information, the Pricing Committee, among other things, monitors the daily change in prices and reviews transactions among market participants.
(b) Option Transactions
The Funds, except for the Government Money Market Fund, may purchase put or call options. When a Fund purchases an option, an amount equal to the premium paid is recorded as an asset and is subsequently marked-to-market daily. Premiums paid for purchasing options that expire unexercised are recognized on the expiration date as realized losses. If an option is exercised, the premium paid is subtracted from the proceeds of the sale or added to the cost of the purchase to determine whether a Fund has realized a gain or loss on the related investment transaction. When a Fund enters into a closing transaction, a Fund will realize a gain or loss depending upon whether the amount from the closing transaction is greater or less than the premium paid.
The Funds, except for the Government Money Market Fund, may write put or call options. When a Fund writes an option, an amount equal to the premium received is recorded as a liability and is subsequently marked-to-market daily. Premiums received for writing options that expire unexercised are recognized on the expiration date as realized gains. If an option is exercised, the premium received is subtracted from the cost of purchase or added to the proceeds of the sale to determine whether a Fund has realized a gain or loss on the related investment transaction. When a Fund enters into a closing transaction, a Fund will realize a gain or loss depending upon whether the amount from the closing transaction is greater or less than the premium received.
The Funds attempt to limit market risk and enhance their income by writing (selling) covered call options. The risk in writing a covered call option is that a Fund gives up the opportunity of profit if the market price of the financial instrument increases. A Fund also has the additional risk of not being able to enter into a closing transaction if a liquid secondary market does not exist. The risk in writing a put option is that a Fund is obligated to purchase the financial instrument underlying the option at prices which may be significantly different than the current market price.
(c) Securities Sold Short
The Funds, except for the Government Money Market Fund, periodically engage in selling securities short, which obligates a Fund to replace a security borrowed by purchasing the same security at the current market value. A Fund would incur a loss if the price of the security increases between the date of the short sale and the date on which the Fund replaces the borrowed security. A Fund would realize a gain if the price of the security declines between those dates.
(d) Federal Income Taxes
It is the policy of each Fund to comply with all sections of the Internal Revenue Code applicable to regulated investment companies and to distribute all of its taxable income to shareholders; therefore, no provision for income or excise taxes is required.
Net investment income and net realized gains may differ for financial statement and tax purposes. The character of distributions made during the year from net investment income or net realized gains may differ from their ultimate characterization for Federal income tax purposes. Also, due to the timing of dividend distributions, the fiscal year in which amounts are distributed may differ from the year that the income or realized gains were recorded by the Funds.
The Funds have reviewed their tax positions taken on federal income tax returns, for each of the three open tax years and as of March 31, 2013 and have determined that no provisions for income taxes are required in the Funds’ financial statements.
The following permanent differences between net asset components for financial reporting and tax purposes were reclassified at the end of the fiscal year:
| | | | | | | | | | | | | | | | | | Short- | |
| | | | | | Partners | | | | | | | | | | | | Intermediate | |
| | | Value | | | Value | | | Partners III | | | Hickory | | | Balanced | | | Income | |
| Paid-in capital | | $ | (138,329 | ) | | $ | (1,504,030 | ) | | $ | (175,386 | ) | | $ | (1,990,058 | ) | | $ | — | | | $ | — | |
| Accumulated undistributed net investment income | | | 138,329 | | | | 1,504,030 | | | | 3,395,438 | | | | 1,990,058 | | | | 10,156 | | | | 6,997,939 | |
| Accumulated net realized gain (loss) | | | — | | | | — | | | | (3,220,052 | ) | | | — | | | | (10,156 | ) | | | (6,997,939 | ) |
The differences are primarily due to net operating losses and principal paydown adjustments. These reclassifications have no impact on the net asset value of the Funds.
64 Weitz Funds
(e) Security Transactions
Security transactions are accounted for on the date the securities are purchased or sold (trade date). Realized gains or losses are determined by specifically identifying the security sold.
Income dividends less foreign tax withholding (if any), dividends on short positions and distributions to shareholders are recorded on the ex-dividend date. Interest, including amortization of discount or premium, is accrued as earned.
(f) Dividend Policy
The Funds declare and distribute income dividends and capital gains distributions as may be required to qualify as a regulated investment company under the Internal Revenue Code.
Generally, the Short-Intermediate Income and Nebraska Tax-Free Income Funds pay income dividends on a quarterly basis. The Government Money Market Fund declares dividends daily and pays dividends monthly. All dividends and distributions are reinvested automatically, unless the shareholder elects otherwise.
(g) Other
Expenses that are directly related to a Fund are charged directly to that Fund. Other operating expenses of the Trust are prorated to each Fund on the basis of relative net assets or another appropriate basis. Income, realized and unrealized gains and losses and expenses (other than class specific expenses) are allocated to each class of shares based on its relative net assets, except that each class separately bears expenses related specifically to that class, such as transfer agent fees, registration fees and 12b-1 fees.
(h) Use of Estimates
The preparation of financial statements in conformity with accounting principles generally accepted in the United States requires management to make estimates and assumptions that affect the reported amounts of assets and liabilities and disclosure of contingent assets and liabilities at the date of the financial statements and the reported amounts of increase and decrease in net assets from operations during the period. Actual results could differ from those estimates.
(3) Fund Share Transactions
| | | Year ended March 31, 2013 | | | Year ended March 31, 2012 | |
| | | Shares | | | Amount | | | Shares | | | Amount | |
| Value |
| Sales | | | 2,510,646 | | | $ | 86,731,275 | | | | 4,917,919 | | | $ | 147,910,893 | |
| Redemptions | | | (6,966,059 | ) | | | (234,027,713 | ) | | | (6,615,739 | ) | | | (200,565,515 | ) |
| Reinvestment of distributions | | | 29,368 | | | | 935,947 | | | | 69,551 | | | | 2,064,991 | |
| Net increase (decrease) | | | (4,426,045 | ) | | $ | (146,360,491 | ) | | | (1,628,269 | ) | | $ | (50,589,631 | ) |
| Partners Value |
| Sales | | | 4,893,715 | | | $ | 119,694,545 | | | | 3,902,737 | | | $ | 83,029,226 | |
| Redemptions | | | (4,891,602 | ) | | | (117,407,317 | ) | | | (7,699,763 | ) | | | (164,015,955 | ) |
| Net increase (decrease) | | | 2,113 | | | $ | 2,287,228 | | | | (3,797,026 | ) | | $ | (80,986,729 | ) |
| Partners III - Institutional Class |
| Sales | | | 6,381,671 | | | $ | 83,711,169 | | | | 17,587,485 | | | $ | 213,748,413 | |
| Redemptions | | | (9,415,569 | ) | | | (120,064,762 | ) | | | (7,953,612 | ) | | | (94,525,327 | ) |
| Reinvestment of distributions | | | 2,273,424 | | | | 28,309,464 | | | | 965,696 | | | | 11,665,602 | |
| Net increase (decrease) | | | (760,474 | ) | | $ | (8,044,129 | ) | | | 10,599,569 | | | $ | 130,888,688 | |
| Partners III - Investor Class* |
| Sales | | | 996,312 | | | $ | 12,935,386 | | | | 2,015,165 | | | $ | 24,333,189 | |
| Redemptions | | | (575,904 | ) | | | (7,361,741 | ) | | | (1,123,984 | ) | | | (14,440,436 | ) |
| Reinvestment of distributions | | | 69,818 | | | | 868,958 | | | | — | | | | — | |
| Net increase (decrease) | | | 490,226 | | | $ | 6,442,603 | | | | 891,181 | | | $ | 9,892,753 | |
| Research |
| Sales | | | 218,528 | | | $ | 2,233,224 | | | | 392,924 | | | $ | 3,832,592 | |
| Redemptions | | | (75,584 | ) | | | (772,854 | ) | | | (72,040 | ) | | | (734,013 | ) |
| Reinvestment of distributions | | | 149,229 | | | | 1,453,649 | | | | 67,976 | | | | 672,370 | |
| Net increase (decrease) | | | 292,173 | | | $ | 2,914,019 | | | | 388,860 | | | $ | 3,770,949 | |
weitzinvestments.com 65
| | | Year ended March 31, 2013 | | | Year ended March 31, 2012 | |
| | | Shares | | | Amount | | | Shares | | | Amount | |
| Hickory |
| Sales | | | 2,634,378 | | | $ | 119,680,734 | | | | 2,188,072 | | | $ | 86,439,301 | |
| Redemptions | | | (1,795,635 | ) | | | (80,798,563 | ) | | | (2,268,891 | ) | | | (87,482,946 | ) |
| Net increase (decrease) | | | 838,743 | | | $ | 38,882,171 | | | | (80,819 | ) | | $ | (1,043,645 | ) |
| Balanced |
| Sales | | | 479,459 | | | $ | 6,121,587 | | | | 536,043 | | | $ | 6,288,234 | |
| Redemptions | | | (424,070 | ) | | | (5,306,331 | ) | | | (687,223 | ) | | | (7,891,475 | ) |
| Reinvestment of distributions | | | 26,071 | | | | 327,564 | | | | 47,229 | | | | 543,614 | |
| Net increase (decrease) | | | 81,460 | | | $ | 1,142,820 | | | | (103,951 | ) | | $ | (1,059,627 | ) |
| Short-Intermediate Income - Institutional Class |
| Sales | | | 33,782,734 | | | $ | 425,951,083 | | | | 55,005,679 | | | $ | 685,873,440 | |
| Redemptions | | | (35,961,118 | ) | | | (452,870,690 | ) | | | (38,884,939 | ) | | | (484,358,800 | ) |
| Reinvestment of distributions | | | 2,166,637 | | | | 27,254,827 | | | | 2,283,922 | | | | 28,369,758 | |
| Net increase (decrease) | | | (11,747 | ) | | $ | 335,220 | | | | 18,404,662 | | | $ | 229,884,398 | |
| Short-Intermediate Income - Investor Class* |
| Sales | | | 4,144,000 | | | $ | 52,088,297 | | | | 5,002,466 | | | $ | 62,232,397 | |
| Redemptions | | | (2,311,445 | ) | | | (29,073,166 | ) | | | (776,404 | ) | | | (9,680,845 | ) |
| Reinvestment of distributions | | | 98,621 | | | | 1,238,781 | | | | 32,955 | | | | 409,420 | |
| Net increase (decrease) | | | 1,931,176 | | | $ | 24,253,912 | | | | 4,259,017 | | | $ | 52,960,972 | |
| Nebraska Tax-Free Income |
| Sales | | | 2,813,544 | | | $ | 29,552,975 | | | | 963,294 | | | $ | 10,040,958 | |
| Redemptions | | | (1,973,139 | ) | | | (20,764,990 | ) | | | (1,001,713 | ) | | | (10,377,164 | ) |
| Reinvestment of distributions | | | 131,804 | | | | 1,378,579 | | | | 160,605 | | | | 1,665,872 | |
| Net increase (decrease) | | | 972,209 | | | $ | 10,166,564 | | | | 122,186 | | | $ | 1,329,666 | |
| Government Money Market |
| Sales | | | 120,739,989 | | | $ | 120,739,989 | | | | 71,926,923 | | | $ | 71,926,923 | |
| Redemptions | | | (90,210,689 | ) | | | (90,210,689 | ) | | | (76,492,696 | ) | | | (76,492,696 | ) |
| Reinvestment of distributions | | | 22,198 | | | | 22,198 | | | | 21,140 | | | | 21,140 | |
| Net increase (decrease) | | | 30,551,498 | | | $ | 30,551,498 | | | | (4,544,633 | ) | | $ | (4,544,633 | ) |
* Initial offering of shares on August 1, 2011 (See Note 1)
(4) Related Party Transactions
Each Fund has retained Weitz Investment Management, Inc. (formerly Wallace R. Weitz & Company, the “Adviser”) as its investment adviser. In addition, the Trust has an agreement with Weitz Securities, Inc. (the “Distributor”), a company under common control with the Adviser, to act as distributor for shares of the Trust. Certain officers of the Trust are also officers and directors of the Adviser and the Distributor.
Under the terms of management and investment advisory agreements, the Adviser is paid a monthly fee. The annual investment advisory fee schedule for each of the Weitz Equity Funds (other than the Partners III Fund) is as follows:
| Average Daily Net Assets Break Points |
| Greater Than | | | Less Than or Equal To | | | Rate | |
| $ | 0 | | | $ | 2,500,000,000 | | | | 1.00 | % |
| | 2,500,000,000 | | | | 5,000,000,000 | | | | 0.90 | % |
| | 5,000,000,000 | | | | | | | | 0.80 | % |
The annual investment advisory fee schedule for the Partners III Fund is as follows:
| Average Daily Net Assets Break Points |
| Greater Than | | | Less Than or Equal To | | | Rate | |
| $ | 0 | | | $ | 1,000,000,000 | | | | 1.00 | % |
| | 1,000,000,000 | | | | 2,000,000,000 | | | | 0.95 | % |
| | 2,000,000,000 | | | | 3,000,000,000 | | | | 0.90 | % |
| | 3,000,000,000 | | | | 5,000,000,000 | | | | 0.85 | % |
| | 5,000,000,000 | | | | | | | | 0.80 | % |
66 Weitz Funds
The Balanced Fund pays the Adviser, on a monthly basis, an annual advisory fee equal to 0.80% of the Fund’s average daily net assets.
The Short-Intermediate Income, Nebraska Tax-Free Income and Government Money Market Funds each pay the Adviser, on a monthly basis, an annual advisory fee equal to 0.40% of the respective Fund’s average daily net assets.
Under the terms of administration agreements, certain services are provided by the Adviser including the transfer of shares, disbursement of dividends, fund accounting and related administrative services of the Trust.
Each Fund, or class in the case of Partners III and Short-Intermediate Income Funds, pays the Adviser a monthly administrative fee based on their average daily net assets, plus third party expenses directly related to providing such services.
The Partners III and Short-Intermediate Income Funds have adopted Service and Distribution plans which authorize the Funds to pay the Distributor a distribution fee payable monthly equal to 0.25% per annum, of the average daily net assets of each Fund’s respective Investor Class.
Through July 31, 2013, the Adviser has contractually agreed to reimburse the Research and Government Money Market Funds or to pay directly a portion of the Funds’ expenses to the extent that total expenses, excluding taxes, interest and brokerage commissions exceed 0.90% and 0.20%, respectively, of each Fund’s average daily net assets.
In addition, for the year ended March 31, 2013, the Adviser voluntarily reimbursed expenses to limit the expenses of the Government Money Market Fund to 0.04% of the Fund’s average daily net assets. The expenses reimbursed by the Adviser for the Research and Government Money Market Funds for the year ended March 31, 2013 were $134,604 and $621,845, respectively.
Through July 31, 2013, the Adviser has agreed in writing to limit the total class-specific operating expenses of the Investor Class shares of the Partners III and Short-Intermediate Income Funds to an amount no greater than 0.25% and 0.20% per annum, respectively, more than the total class-specific operating expenses of the Institutional Class shares of the respective Funds (in each case, as such expenses are expressed as a percentage of the average daily net assets of each Fund’s respective share class). The expenses reimbursed by the Adviser for the Investor Class shares of the Partners III and Short-Intermediate Income Funds for the year ended March 31,2013 were $50,517 and $101,675, respectively.
As of March 31, 2013, the controlling shareholder of the Adviser held approximately 76% of the Research Fund, 39% of the Balanced Fund, 38% of the Nebraska Tax-Free Income Fund, 30% of the Partners III Fund, 14% of the Government Money Market Fund and 12% of the Hickory Fund.
(5) Distributions to Shareholders and Distributable Earnings
The tax character of distributions paid by the Funds are summarized as follows:
| | | Year ended March 31, | | | Year ended March 31, | |
| Distributions paid from: | | 2013 | | | 2012 | | | 2013 | | | 2012 | |
| | | Value | | | Partners III | |
| Ordinary income | | $ | 977,442 | | | $ | 2,159,048 | | | $ | — | | | $ | — | |
| Long-term capital gains | | | — | | | | — | | | | 40,892,306 | | | | 12,074,793 | |
| Total distributions | | $ | 977,442 | | | $ | 2,159,048 | | | $ | 40,892,306 | | | $ | 12,074,793 | |
| | | Research | | | Balanced | |
| Ordinary income | | $ | 561,288 | | | $ | 378,244 | | | $ | 334,280 | | | $ | 554,771 | |
| Long-term capital gains | | | 892,361 | | | | 294,127 | | | | — | | | | — | |
| Total distributions | | $ | 1,453,649 | | | $ | 672,371 | | | $ | 334,280 | | | $ | 554,771 | |
| | | Short-Intermediate Income | | | Nebraska Tax-Free Income | |
| Ordinary income | | $ | 29,290,943 | | | $ | 29,877,821 | | | $ | 9,650 | | | $ | 11,494 | |
| Tax exempt income | | | — | | | | — | | | | 1,987,413 | | | | 2,256,571 | |
| Long-term capital gains | | | 281,347 | | | | — | | | | 44,256 | | | | 41,735 | |
| Total distributions | | $ | 29,572,290 | | | $ | 29,877,821 | | | $ | 2,041,319 | | | $ | 2,309,800 | |
| | | Government Money Market | | | | |
| Ordinary income | | $ | 26,299 | | | $ | 22,898 | | | | |
weitzinvestments.com 67
As of March 31, 2013, the components of distributable earnings on a tax basis were as follows:
| | | | | | Partners | | | | | | | | | | |
| | | Value | | | Value | | | Partners III | | | Research | | | Hickory | |
| Undistributed ordinary income | | $ | — | | | $ | — | | | $ | — | | | $ | 2,502 | | | $ | — | |
| Qualified late year ordinary loss deferral | | | (516,651 | ) | | | (727,134 | ) | | | (909,955 | ) | | | — | | | | (487,168 | ) |
| Undistributed long-term gains | | | — | | | | — | | | | 4,172,743 | | | | — | | | | — | |
| Capital loss carryforwards | | | (61,338,600 | ) | | | (62,446,351 | ) | | | — | | | | — | | | | (21,163,050 | ) |
| Post October capital loss deferral | | | — | | | | (1,413,387 | ) | | | — | | | | (315,441 | ) | | | (1,979,422 | ) |
| Net unrealized appreciation (depreciation) | | | 247,144,208 | | | | 193,386,331 | | | | 185,604,085 | | | | 2,724,624 | | | | 90,925,354 | |
| | | $ | 185,288,957 | | | $ | 128,799,459 | | | $ | 188,866,873 | | | $ | 2,411,685 | | | $ | 67,295,714 | |
| | | | | | Short- | | | Nebraska | | | | |
| | | | | | Intermediate | | | Tax-Free | | | Government | |
| | | Balanced | | | Income | | | Income | | | Money Market | |
| Undistributed ordinary income | | $ | 19,132 | | | $ | 246,450 | | | $ | — | | | $ | 282 | |
| Undistributed tax exempt income | | | — | | | | — | | | | 33,323 | | | | — | |
| Undistributed long-term gains | | | 1,721,745 | | | | — | | | | — | | | | — | |
| Capital loss carryforwards | | | — | | | | (1,426,361 | ) | | | — | | | | — | |
| Post October capital loss deferral | | | — | | | | (1,145,562 | ) | | | (473 | ) | | | — | |
| Net unrealized appreciation (depreciation) | | | 13,938,408 | | | | 59,466,736 | | | | 4,077,541 | | | | — | |
| | | $ | 15,679,285 | | | $ | 57,141,263 | | | $ | 4,110,391 | | | $ | 282 | |
The Value, Partners Value, Partners III and Hickory Funds elected to defer ordinary losses arising after December 31, 2012. Such losses are treated for tax purposes as arising on April 1, 2013.
Capital loss carryforwards represent tax basis capital losses which may be carried over to offset future realized capital gains, if any. To the extent that carryforwards are used, no capital gains distributions will be made. During the fiscal year, the Funds utilized capital loss carryforwards to offset realized capital gains. The expiration, character and utilization of the carryforwards are as follows:
| | | | | | | | | | | | | | | Short- | |
| | | | | | Partners | | | | | | | | | Intermediate | |
| | | Value | | | Value | | | Hickory | | | Balanced | | | Income | |
| March 31, 2018 – Short term | | $ | (61,338,600 | ) | | $ | (62,446,351 | ) | | $ | (21,163,050 | ) | | $ | — | | | $ | — | |
| Indefinite – Short term | | | — | | | | — | | | | — | | | | — | | | | (1,426,361 | ) |
| Total capital loss carryforwards | | $ | (61,338,600 | ) | | $ | (62,446,351 | ) | | $ | (21,163,050 | ) | | $ | — | | | $ | (1,426,361 | ) |
| Capital loss carryforwards utilized | | $ | 100,517,519 | | | $ | 64,730,959 | | | $ | 32,259,052 | | | $ | 3,898,235 | | | $ | — | |
The Partners Value, Research, Hickory, Short-Intermediate Income and Nebraska Tax-Free Income Funds elected to defer realized capital losses arising after October 1, 2012. Such losses are treated for tax purposes as arising on April 1, 2013.
On December 22, 2010, the Regulated Investment Company Modernization Act of 2010 (the “Act”) was enacted, which changed various technical rules governing the tax treatment of regulated investment companies. The changes are generally effective for taxable years beginning after the date of enactment. One of the more prominent changes addresses capital loss carryforwards. Under the Act, the Funds will be permitted to carry forward capital losses incurred in taxable years beginning after the date of enactment for an unlimited period. Additionally, post-enactment capital loss carryforwards will retain their character as either short-term or long-term capital losses rather than being considered all short-term as permitted under previous regulation.
(6) Securities Transactions
Purchases and proceeds from maturities or sales of investment securities of the Funds, other than short-term securities, are summarized as follows:
| | | | | | | | | | | | | | | | | | | | | Short- | | | Nebraska | |
| | | | | | Partners | | | | | | | | | | | | | | | Intermediate | | | Tax-Free | |
| | | Value | | | Value | | | Partners III | | | Research | | | Hickory | | | Balanced | | | Income | | | Income | |
| Purchases | | $ | 142,652,229 | | | $ | 133,993,942 | | | $ | 181,313,511 | | | $ | 14,676,139 | | | $ | 77,356,829 | | | $ | 25,299,253 | | | $ | 473,636,455 | | | $ | 22,652,794 | |
| Proceeds | | | 313,299,906 | | | | 196,050,171 | | | | 284,821,326 | | | | 12,898,103 | | | | 90,865,761 | | | | 33,196,421 | | | | 445,773,108 | | | | 13,361,363 | |
68 Weitz Funds
The cost of investments is the same for financial reporting and Federal income tax purposes for the Value, Short-Intermediate Income, Nebraska Tax-Free Income and Government Money Market Funds. The cost of investments for Federal income tax purposes for the Partners Value, Partners III, Research, Hickory and Balanced Funds is $649,640,164, $479,612,702, $16,330,196, $341,304,754 and $83,892,771, respectively.
At March 31, 2013, the aggregate gross unrealized appreciation and depreciation of investments, based on cost for Federal income tax purposes, are summarized as follows:
| | | Value | | | Partners Value | | | Partners III | | | Research | | | Hickory | | | Balanced | | | Short Intermediate Income | | | Nebraska Tax-Free Income | |
| Appreciation | | $ | 250,108,539 | | | $ | 194,920,629 | | | $ | 203,440,124 | | | $ | 3,237,723 | | | $ | 91,668,875 | | | $ | 14,076,779 | | | $ | 60,598,757 | | | $ | 4,115,715 | |
| Depreciation | | | (2,964,331 | ) | | | (1,122,541 | ) | | | (3,032,178 | ) | | | (513,099 | ) | | | (308,482 | ) | | | (138,371 | ) | | | (1,132,021 | ) | | | (38,174 | ) |
| Net | | $ | 247,144,208 | | | $ | 193,798,088 | | | $ | 200,407,946 | | | $ | 2,724,624 | | | $ | 91,360,393 | | | $ | 13,938,408 | | | $ | 59,466,736 | | | $ | 4,077,541 | |
(a) Illiquid and Restricted Securities
The Funds own certain securities which have a limited trading market and/or certain restrictions on trading and therefore may be illiquid and/or restricted. Such securities have been valued at fair value in accordance with the procedures described in Note (2)(a). Because of the inherent uncertainty of valuation, these values may differ from the values that would have been used had a ready market for these securities existed and these differences could be material. Illiquid and/or restricted securities owned at March 31, 2013, include the following:
| | | Acquisition Date | | | | Partners III | | | | Hickory | | | | Nebraska Tax-Free Income | |
| Intelligent Systems Corp. | | 12/03/91 | | | $ | 2,899,379 | | | $ | — | | | $ | — | |
| LICT Corp. | | 9/09/96 | | | | — | | | | 2,228,509 | | | | — | |
| Nebraska Investment Finance Authority, Clean Water State | | | | | | | | | | | | | | | |
| Revolving Fund, Series 2012, 0.8%, 6/15/13 | | 7/25/12 | | | | — | | | | — | | | | 1,440,000 | |
| Total cost of illiquid and/or restricted securities | | | | | | $ | 2,899,379 | | | $ | 2,228,509 | | | $ | 1,440,000 | |
| Value at March 31, 2013 | | | | | | $ | 3,532,120 | | | $ | 2,040,150 | | | $ | 1,440,000 | |
| Percent of net assets at March 31, 2013 | | | | | | | 0.5% | | | | 0.5% | | | | 1.4% | |
(b) Options Written
Transactions relating to options written for the year ended March 31, 2013, are summarized as follows:
| | | Partners Value | | | Partners III | |
| | | Number of | | | | | | Number of | | | | |
| | | Contracts | | | Premiums | | | Contracts | | | Premiums | |
| Options outstanding, beginning of period | | | 250 | | | $ | 101,873 | | | | 10,680 | | | $ | 3,141,375 | |
| Options written | | | 2,694 | | | | 185,608 | | | | 37,446 | | | | 13,734,023 | |
| Options exercised | | | (150 | ) | | | (46,124 | ) | | | (2,733 | ) | | | (1,067,589 | ) |
| Options expired | | | (100 | ) | | | (55,749 | ) | | | (7,200 | ) | | | (3,335,748 | ) |
| Options closed | | | — | | | | — | | | | (29,774 | ) | | | (10,121,931 | ) |
| Options outstanding, end of period | | | 2,694 | | | $ | 185,608 | | | | 8,419 | | | $ | 2,350,130 | |
| Hickory | |
| | | Number of | | | | | | | |
| | | Contracts | | | Premiums | | | | |
| Options outstanding, beginning of period | | | 500 | | | $ | 214,276 | | | | |
| Options written | | | 3,057 | | | | 313,794 | | | | |
| Options exercised | | | (1 | ) | | | (559 | ) | | | |
| Options expired | | | (499 | ) | | | (256,504 | ) | | | |
| Options closed | | | (250 | ) | | | (74,613 | ) | | | |
| Options outstanding, end of period | | | 2,807 | | | $ | 196,394 | | | | |
weitzinvestments.com 69
The locations in the Statements of Assets and Liabilities of the Funds’ derivative positions, none of which are designated as hedging instruments are as follows:
| | | | | | | | | | | | | Average | | | Gross Notional | |
| | | | | | | | | Fair Value at March 31, 2013 | | | Month-End | | | Amount | |
| | | | | | | | | | Asset | | | Liability | | | Notional | | | Outstanding | |
| Fund | | | Type of Derivative | | | Location | | | Derivatives | | | Derivatives | | | Amount | | | March 31, 2013 | |
| Partners Value | | | Equity call options written | | | Options written, at value | | $ | — | | $ | (597,365) | | $ | 719,867 | | $ | 2,763,400 | |
| Partners III | | | Put options purchased | | | Investments in securities at value | | | 180,000 | | | — | | | 45,554,167 | | | 28,850,000 | |
| | | | Call options written | | | Options written, at value | | | — | | | (5,211,520) | | | 64,943,692 | | | 47,603,300 | |
| | | | Equity put options written | | | Options written, at value | | | — | | | — | | | 4,704,167 | | | — | |
| Hickory | | | Equity call options written | | | Options written, at value | | | — | | | (631,433) | | | 1,397,879 | | | 2,870,300 | |
Derivative positions open during the year and at period end are reflected for each Fund in the table above.
Transactions in derivative instruments during the year ended March 31, 2013 by the Funds are recorded in the following locations in the Statements of Operations:
| Fund | | Type of Derivative | | Location | | Realized Gain (Loss) | | Location | | Change in Unrealized Gain (Loss) |
| Partners Value | | Equity call options written | | Net realized gain (loss) - options written | | | | Net unrealized appreciation (depreciation) - options written | | $ (417,630) |
| | | | | | | | | | | |
| Partners III | | Put options purchased | | Net realized gain (loss) - unaffiliated issuers | | (2,863,808) | | Net unrealized appreciation (depreciation) - unaffiliated issuers | | (337,250) |
| | | | | | | | | | | |
| | | Call options written | | Net realized gain (loss) - options written | | (716,740) | | Net unrealized appreciation (depreciation) - options written | | (1,874,894) |
| | | | | | | | | | | |
| | | Equity put options written | | Net realized gain (loss) - options written | | 185,364 | | Net unrealized appreciation (depreciation) - options written | | (167,481) |
| | | | | | | | | | | |
| Hickory | | Equity call options written | | Net realized gain (loss) - options written | | 259,755 | | Net unrealized appreciation (depreciation) - options written | | (440,565) |
(7) Affiliated Issuers
Affiliated issuers, as defined under the Investment Company Act of 1940, are those in which a Fund’s holdings of an issuer represent 5% or more of the outstanding voting securities of the issuer. A summary of each Fund’s holdings in the securities of such issuers is set forth below:
| | | Number of | | | | | | Number of | | | | | | Realized |
| | | Shares Held | | Gross | | Gross | | Shares Held | | Value | | Dividend | | Gains/ |
| | | March 31, 2012 | | Additions | | Reductions | | March 31, 2013 | | March 31, 2013 | | Income | | (Losses) |
| Partners III: | | | | | | | | | | | | | | |
| Intelligent Systems | | | | | | | | | | | | | | |
Corp.† | | 2,270,000 | | — | | — | | 2,270,000 | | $ 3,532,120 | | $ — | | $ — |
† Controlled affiliate in which the Fund owns 25% or more of the outstanding voting securities.
(8) Contingencies
Each Fund indemnifies the Trust’s officers and trustees for certain liabilities that might arise from their performance of their duties to each of the Funds. Additionally, in the normal course of business the Funds enter into contracts that contain a variety of representations and warranties and which provide general indemnifications. The Funds’ maximum exposure under these arrangements is unknown, as this would involve future claims that may be made against the Funds that have not yet occurred. However, based on experience, the Funds expect the risk of loss to be remote.
(9) Financial Instruments With Off-Balance Sheet Risks
Option contracts written and securities sold short result in off-balance sheet risk as the Fund’s ultimate obligation to satisfy the terms of the contract or the sale of securities sold short may exceed the amount recognized in the Statements of Assets and Liabilities.
The Funds are required to maintain collateral in a segregated account to provide adequate margin as determined by the broker.
(10) Margin Borrowing Agreement
The Partners III Fund has a margin account with its prime broker, Merrill Lynch, under which the Fund may borrow against the value of its securities, subject to regulatory limitations. Interest accrues at the federal funds rate plus 0.625% (0.785% at March 31, 2013). Interest is accrued daily and paid monthly. The Partners III Fund held a cash balance of $88,359,086, with the broker at March 31, 2013.
The Partners III Fund is exposed to credit risk from its prime broker who effects transactions and extends credit pursuant to a prime brokerage agreement. The Adviser attempts to minimize the credit risk by monitoring credit exposure and the credit worthiness of the prime broker.
(11) Concentration of Credit Risk
Approximately 80% of the Nebraska Tax-Free Income Fund’s net assets are in obligations of political subdivisions of the State of Nebraska which are subject to the credit risk associated with the non-performance of such issuers.
(12) Fair Value Measurements
Various inputs are used in determining the value of the Fund’s investments. These inputs are used in determining the value of the Funds’ investments and are summarized in the following fair value hierarchy:
| • | Level 1 – quoted prices in active markets for identical securities; |
| • | Level 2 – other significant observable inputs (including quoted prices for similar securities); |
| • | Level 3 – significant unobservable inputs (including the Funds’ own assumptions in determining the fair value of investments). |
The inputs or methodology used for valuing securities are not an indication of the risk associated with investing in those securities.
A description of the valuation techniques applied to the company’s major categories of assets and liabilities measured at fair value on a recurring basis follows.
| • | Equity securities (common and preferred stock). Securities traded on a national securities exchange (or reported on the NASDAQ national market) are stated at the last reported sales price on the day of valuation. To the extent these securities are actively traded and valuation adjustments are not applied, they are categorized in Level 1 of the fair value hierarchy. Preferred stock and other equities traded on inactive markets or valued by reference to similar instruments are categorized in Level 2. |
| | |
| • | Corporate and Municipal bonds. The fair value of corporate and municipal bonds are estimated using various techniques, which may consider recently executed transactions in securities of the issuer or comparable issuers, market price quotations (where observable), bond spreads and fundamental data relating to the issuer. Although most corporate and municipal bonds are categorized in Level 2 of the fair value hierarchy, in instances where lower relative weight is placed on transaction prices, quotations, or similar observable inputs, they are categorized in Level 3. |
| | |
| • | Asset backed securities. The fair value of asset backed securities (including non-government agency mortgage-backed securities and interest-only securities) is estimated based on models that consider the estimated cash flows of each tranche of the entity, establishes a benchmark yield and develops an estimated tranche specific spread to the benchmark yield based on the unique attributes of the tranche. To the extent the inputs are observable and timely, the values would be categorized in Level 2 of the fair value hierarchy; otherwise they would be categorized as Level 3. |
| | |
| • | U.S. Government securities. U.S. Government securities are normally valued using a model that incorporates market observable data such as reported sales of similar securities, broker quotes, yields, bids, offers and reference data. Certain securities are valued principally using dealer quotations. U.S. Government securities are categorized in Level 1 or Level 2 of the fair value hierarchy depending on the inputs used and market activity levels for specific securities. |
| | |
| • | U.S. agency securities. U.S. agency securities are comprised of two main categories consisting of agency issued debt and mortgage-backed securities. Agency issued debt securities are generally valued in a manner similar to U.S. Government securities. Mortgage-backed securities include collateralized mortgage obligations, to-be-announced (TBA) securities and mortgage pass-through certificates. Mortgage-backed securities are generally valued using dealer quotations. Depending on market activity levels and whether quotations or other data are used, these securities are typically categorized in Level 2 of the fair value hierarchy. |
| | |
| • | Restricted and/or illiquid securities. Restricted and/or illiquid securities for which quotations are not readily available are valued in accordance with procedures approved by the Trust’s Board of Trustees. Restricted securities issued by publicly traded companies are generally valued at a discount to similar publicly traded securities. Restricted or illiquid securities issued by nonpublic entities may be valued by reference to |
weitzinvestments.com 71
| | comparable public entities or fundamental data relating to the issuer or both. Depending on the relative significance of valuation inputs, these instruments may be classified in either Level 2 or Level 3 of the fair value hierarchy. |
| | |
| • | Derivative instruments. Listed derivatives, such as the Funds’ equity option contracts, that are valued based on closing prices from the exchange or the mean of the closing bid and ask prices are generally categorized in Level 2 of the fair value hierarchy. |
The following is a summary of the inputs used as of March 31, 2013, in valuing the Funds’ assets and liabilities carried at fair value:
| Value | |
| | | Level 1 | | | Level 2 | | | Level 3 | | | Total | |
| Assets: | | | | | | | | | | | | |
| Investments in Securities: | | | | | | | | | | | | |
| Common Stocks: | | | | | | | | | | | | |
| Consumer Discretionary | | $ | 177,894,872 | | | $ | — | | | $ | — | | | $ | 177,894,872 | |
| Information Technology | | | 149,934,525 | | | | — | | | | — | | | | 149,934,525 | |
| Financials | | | 135,346,500 | | | | — | | | | — | | | | 135,346,500 | |
| Health Care | | | 87,980,000 | | | | — | | | | — | | | | 87,980,000 | |
| Energy | | | 82,741,680 | | | | — | | | | — | | | | 82,741,680 | |
| Materials | | | 49,449,250 | | | | — | | | | — | | | | 49,449,250 | |
| Industrials | | | 44,205,400 | | | | — | | | | — | | | | 44,205,400 | |
| Consumer Staples | | | 29,318,900 | | | | — | | | | — | | | | 29,318,900 | |
| Cash Equivalents | | | 251,488,209 | | | | — | | | | — | | | | 251,488,209 | |
| Total Investments in Securities | | $ | 1,008,359,336 | | | $ | — | | | $ | — | | | $ | 1,008,359,336 | |
| Partners Value | |
| | | Level 1 | | | Level 2 | | | Level 3 | | | Total | |
| Assets: | | | | | | | | | | | | |
| Investments in Securities: | | | | | | | | | | | | |
| Common Stocks: | | | | | | | | | | | | |
| Consumer Discretionary | | $ | 208,986,984 | | | $ | — | | | $ | — | | | $ | 208,986,984 | |
| Financials | | | 128,871,122 | | | | — | | | | — | | | | 128,871,122 | |
| Information Technology | | | 115,820,340 | | | | — | | | | — | | | | 115,820,340 | |
| Health Care | | | 96,308,550 | | | | — | | | | — | | | | 96,308,550 | |
| Energy | | | 37,986,000 | | | | — | | | | — | | | | 37,986,000 | |
| Materials | | | 17,598,450 | | | | — | | | | — | | | | 17,598,450 | |
| Consumer Staples | | | 12,372,750 | | | | — | | | | — | | | | 12,372,750 | |
| Cash Equivalents | | | 225,494,056 | | | | — | | | | — | | | | 225,494,056 | |
| Total Investments in Securities | | $ | 843,438,252 | | | $ | — | | | $ | — | | | $ | 843,438,252 | |
| Liabilities: | | | | | | | | | | | | | | | | |
| Options Written | | $ | — | | | $ | (597,365 | ) | | $ | — | | | $ | (597,365 | ) |
| Partners III |
| | | Level 1 | | | Level 2 | | | Level 3 | | | Total | |
| Assets: | | | | | | | | | | | | |
| Investments in Securities: | | | | | | | | | | | | |
| Common Stocks: | | | | | | | | | | | | |
| Consumer Discretionary | | $ | 219,510,214 | | | $ | — | | | $ | — | | | $ | 219,510,214 | |
| Financials | | | 121,147,800 | | | | — | | | | — | | | | 121,147,800 | |
| Health Care | | | 90,915,400 | | | | — | | | | — | | | | 90,915,400 | |
| Information Technology | | | 88,112,182 | | | | — | | | | — | | | | 88,112,182 | |
| Energy | | | 47,715,000 | | | | — | | | | — | | | | 47,715,000 | |
| Materials | | | 14,282,800 | | | | — | | | | — | | | | 14,282,800 | |
| Industrials | | | 4,587,600 | | | | 3,532,120 | | | | — | | | | 8,119,720 | |
| Put Options | | | — | | | | 180,000 | | | | — | | | | 180,000 | |
| Cash Equivalents | | | 90,037,532 | | | | — | | | | — | | | | 90,037,532 | |
| Total Investments in Securities | | $ | 676,308,528 | | | $ | 3,712,120 | | | $ | — | | | $ | 680,020,648 | |
| Liabilities: | | | | | | | | | | | | | | | | |
| Options Written | | $ | — | | | $ | (5,211,520 | ) | | $ | — | | | $ | (5,211,520 | ) |
| Securities Sold Short | | | (87,453,200 | ) | | | — | | | | — | | | | (87,453,200 | ) |
72 Weitz Funds
| Research | |
| | | Level 1 | | | Level 2 | | | Level 3 | | | Total | |
| Assets: | | | | | | | | | | | | |
| Investments in Securities: | | | | | | | | | | | | |
| Common Stocks: | | | | | | | | | | | | |
| Information Technology | | $ | 5,873,406 | | | $ | — | | | $ | — | | | $ | 5,873,406 | |
| Consumer Discretionary | | | 4,891,574 | | | | — | | | | — | | | | 4,891,574 | |
| Health Care | | | 1,471,033 | | | | — | | | | — | | | | 1,471,033 | |
| Financials | | | 1,348,513 | | | | — | | | | — | | | | 1,348,513 | |
| Energy | | | 796,137 | | | | — | | | | — | | | | 796,137 | |
| Industrials | | | 440,773 | | | | — | | | | — | | | | 440,773 | |
| Consumer Staples | | | 331,680 | | | | — | | | | — | | | | 331,680 | |
| Cash Equivalents | | | 3,901,704 | | | | — | | | | — | | | | 3,901,704 | |
| Total Investments in Securities | | $ | 19,054,820 | | | $ | — | | | $ | — | | | $ | 19,054,820 | |
| Hickory | |
| | | Level 1 | | | Level 2 | | | Level 3 | | | Total | |
| Assets: | | | | | | | | | | | | |
| Investments in Securities: | | | | | | | | | | | | |
| Common Stocks: | | | | | | | | | | | | |
| Consumer Discretionary | | $ | 120,618,300 | | | $ | — | | | $ | — | | | $ | 120,618,300 | |
| Financials | | | 46,525,120 | | | | — | | | | — | | | | 46,525,120 | |
| Information Technology | | | 43,035,000 | | | | — | | | | — | | | | 43,035,000 | |
| Health Care | | | 27,985,600 | | | | — | | | | — | | | | 27,985,600 | |
| Industrials | | | 20,443,200 | | | | — | | | | — | | | | 20,443,200 | |
| Materials | | | 17,534,200 | | | | — | | | | — | | | | 17,534,200 | |
| Energy | | | 8,432,000 | | | | — | | | | — | | | | 8,432,000 | |
| Consumer Staples | | | 6,422,500 | | | | — | | | | — | | | | 6,422,500 | |
| Telecommunication Services | | | — | | | | 2,040,150 | | | | — | | | | 2,040,150 | |
| Cash Equivalents | | | 139,629,077 | | | | — | | | | — | | | | 139,629,077 | |
| Total Investments in Securities | | $ | 430,624,997 | | | $ | 2,040,150 | | | $ | — | | | $ | 432,665,147 | |
| Liabilities: | | | | | | | | | | | | | | | | |
| Options Written | | $ | — | | | $ | (631,433 | ) | | $ | — | | | $ | (631,433 | ) |
| Balanced | |
| | | Level 1 | | | Level 2 | | | Level 3 | | | Total | |
| Assets: | | | | | | | | | | | | |
| Investments in Securities: | | | | | | | | | | | | |
| Common Stocks: | | | | | | | | | | | | |
| Information Technology | | $ | 9,947,889 | | | $ | — | | | $ | — | | | $ | 9,947,889 | |
| Consumer Discretionary | | | 8,402,775 | | | | — | | | | — | | | | 8,402,775 | |
| Financials | | | 8,168,450 | | | | — | | | | — | | | | 8,168,450 | |
| Health Care | | | 7,744,165 | | | | — | | | | — | | | | 7,744,165 | |
| Industrials | | | 2,753,650 | | | | — | | | | — | | | | 2,753,650 | |
| Energy | | | 2,706,180 | | | | — | | | | — | | | | 2,706,180 | |
| Consumer Staples | | | 2,619,188 | | | | — | | | | — | | | | 2,619,188 | |
| Materials | | | 2,230,860 | | | | — | | | | — | | | | 2,230,860 | |
| Corporate Bonds | | | — | | | | 6,896,223 | | | | — | | | | 6,896,223 | |
| Mortgage-Backed Securities | | | — | | | | 2,948,867 | | | | — | | | | 2,948,867 | |
| Commercial Mortgage-Backed Securities | | | — | | | | 372,445 | | | | — | | | | 372,445 | |
| Asset-Backed Securities | | | — | | | | 504,540 | | | | — | | | | 504,540 | |
| Taxable Municipal Bonds | | | — | | | | 301,590 | | | | — | | | | 301,590 | |
| Cash Equivalents | | | 42,234,357 | | | | — | | | | — | | | | 42,234,357 | |
| Total Investments in Securities | | $ | 86,807,514 | | | $ | 11,023,665 | | | $ | — | | | $ | 97,831,179 | |
weitzinvestments.com 73
| Short-Intermediate Income | |
| | | Level 1 | | | Level 2 | | | Level 3 | | | Total | |
| Assets: | | | | | | | | | | | | |
| Investments in Securities: | | | | | | | | | | | | |
| Corporate Bonds | | $ | — | | | $ | 625,941,183 | | | $ | — | | | $ | 625,941,183 | |
| Convertible Bonds | | | — | | | | 18,806,250 | | | | — | | | | 18,806,250 | |
| Mortgage-Backed Securities | | | — | | | | 414,747,138 | | | | — | | | | 414,747,138 | |
| Commercial Mortgage-Backed Securities | | | — | | | | 36,189,216 | | | | — | | | | 36,189,216 | |
| Asset-Backed Securities | | | — | | | | 57,299,781 | | | | — | | | | 57,299,781 | |
| Taxable Municipal Bonds | | | — | | | | 24,723,107 | | | | — | | | | 24,723,107 | |
| U.S. Treasury and Government Agency | | | — | | | | 171,945,705 | | | | — | | | | 171,945,705 | |
| Common Stocks | | | 29,610,341 | | | | — | | | | — | | | | 29,610,341 | |
| Cash Equivalents | | | 159,864,595 | | | | — | | | | — | | | | 159,864,595 | |
| Total Investments in Securities | | $ | 189,474,936 | | | $ | 1,349,652,380 | | | $ | — | | | $ | 1,539,127,316 | |
| Nebraska Tax-Free Income | |
| | | Level 1 | | | Level 2 | | | Level 3 | | | Total | |
| Assets: | | | | | | | | | | | | |
| Investments in Securities: | | | | | | | | | | | | |
| Municipal Bonds: | | | | | | | | | | | | |
| Arizona | | $ | — | | | $ | 3,439,225 | | | $ | — | | | $ | 3,439,225 | |
| Florida | | | — | | | | 3,781,152 | | | | — | | | | 3,781,152 | |
| Georgia | | | — | | | | 1,213,377 | | | | — | | | | 1,213,377 | |
| Illinois | | | — | | | | 1,122,361 | | | | — | | | | 1,122,361 | |
| Iowa | | | — | | | | 656,184 | | | | — | | | | 656,184 | |
| Nebraska | | | — | | | | 82,492,774 | | | | — | | | | 82,492,774 | |
| North Dakota | | | — | | | | 876,400 | | | | — | | | | 876,400 | |
| Puerto Rico | | | — | | | | 2,438,395 | | | | — | | | | 2,438,395 | |
| Tennessee | | | — | | | | 800,611 | | | | — | | | | 800,611 | |
| Texas | | | — | | | | 1,892,766 | | | | — | | | | 1,892,766 | |
| Virginia | | | — | | | | 1,054,940 | | | | — | | | | 1,054,940 | |
| Wisconsin | | | — | | | | 1,515,658 | | | | — | | | | 1,515,658 | |
| Cash Equivalents | | | 1,731,845 | | | | — | | | | — | | | | 1,731,845 | |
| Total Investments in Securities | | $ | 1,731,845 | | | $ | 101,283,843 | | | $ | — | | | $ | 103,015,688 | |
| Government Money Market | |
| | | Level 1 | | | Level 2 | | | Level 3 | | | Total | |
| Assets: | | | | | | | | | | | | |
| Investments in Securities: | | | | | | | | | | | | |
| U.S. Treasury | | $ | 97,992,196 | | | $ | — | | | $ | — | | | $ | 97,992,196 | |
| Cash Equivalents | | | 9,819,128 | | | | — | | | | — | | | | 9,819,128 | |
| Total Investments in Securities | | $ | 107,811,324 | | | $ | — | | | $ | — | | | $ | 107,811,324 | |
For transfers between the levels within the fair value hierarchy, the Funds have adopted a policy of recognizing the transfers as of the date of the underlying event which caused the transfer. During the year ended March 31, 2013, there were no transfers between Level 1 and Level 2.
At March 31, 2013, the reconciliation of assets in which significant unobservable inputs (Level 3) were used in determining the following Funds’ fair values were as follows:
| | | | | | | | | Nebraska | |
| | | | | | | | | Tax-Free | |
| | | Partners III | | | Hickory | | | Income | |
| Beginning balance, March 31, 2012 | | $ | 331,500 | | | $ | 1,327,203 | | | $ | 1,505,000 | |
| Net realized gain (loss) | | | — | | | | (6,589 | ) | | | — | |
| Net change in unrealized appreciation (depreciation) | | | — | | | | (200,808 | ) | | | — | |
| Net purchases (sales) | | | — | | | | (290,696 | ) | | | (65,000 | ) |
| Transfers into Level 3 (at market) | | | — | | | | — | | | | — | |
| Transfers out of Level 3 (at market) | | | (331,500 | ) | | | (829,110 | ) | | | (1,440,000 | ) |
| Ending balance, March 31, 2013 | | $ | — | | | $ | — | | | $ | — | |
| Net change in unrealized appreciation (depreciation) | | | | | | | | | | | | |
| attributable to assets still held as Level 3 at March 31, 2013 | | $ | — | | | $ | — | | | $ | — | |
The transfers out of Level 3 resulted from the availability of observable inputs, namely reliable market quotations in an inactive market for the equity securities held by the Partners III and Hickory Funds, and in the case of the holdings of the Nebraska Tax-Free Income Fund, a higher weighting was given to observable, comparable market prices for similar securities by the Pricing Committee.
(13) Subsequent Events
Management has evaluated the impact of all subsequent events on the Funds through the date the financial statements were issued and has determined that there were no subsequent events requiring recognition or disclosure in the financial statements.
(14) New Accounting Pronouncement
In December 2011, the Financial Accounting Standards Board (FASB) issued Accounting Standards Update (ASU) No. 2011-11, Balance Sheet (Topic 210): Disclosures about Offsetting Assets and Liabilities. The amendments in the ASU enhance disclosures about offsetting of financial assets and liabilities to enable investors to understand the effect of these arrangements on a fund’s financial position. In January 2013, FASB issued ASU No. 2013-01, Balance Sheet (Topic 210): Clarifying the Scope of Disclosures about Offsetting Assets and Liabilities. The amendments in ASU No. 2013-01 clarify the intended scope of disclosures required by ASU No. 2011-11. These ASUs are effective for interim and annual reporting periods beginning on or after January 1, 2013. Management believes the adoption of these ASUs will not have a material impact on the financial statements.
weitzinvestments.com 75
REPORT OF INDEPENDENT REGISTERED PUBLIC ACCOUNTING FIRM
To the Board of Trustees and Shareholders of The Weitz Funds
We have audited the accompanying statements of assets and liabilities of The Weitz Funds, comprising the Value Fund, Partners Value Fund, Partners III Opportunity Fund, Research Fund, Hickory Fund, Balanced Fund, Short-Intermediate Income Fund, Nebraska Tax-Free Income Fund and Government Money Market Fund (collectively referred to as the “Funds”), including the schedules of investments, as of March 31, 2013, and the related statements of operations (and statement of cash flows for Partners III Opportunity Fund) for the year then ended, the statements of changes in net assets for each of the two years in the period then ended, and the financial highlights for each of the five years or periods in the period then ended. These financial statements and financial highlights are the responsibility of the Funds’ management. Our responsibility is to express an opinion on these financial statements and financial highlights based on our audits.
We conducted our audits in accordance with standards of the Public Company Accounting Oversight Board (United States). Those standards require that we plan and perform the audits to obtain reasonable assurance about whether the financial statements and financial highlights are free of material misstatement. We were not engaged to perform an audit of the Funds’ internal control over financial reporting. Our audits included consideration of internal control over financial reporting as a basis for designing audit procedures that are appropriate in the circumstances, but not for the purpose of expressing an opinion on the effectiveness of the Funds’ internal control over financial reporting. Accordingly, we express no such opinion. An audit also includes examining, on a test basis, evidence supporting the amounts and disclosures in the financial statements and financial highlights, assessing the accounting principles used and significant estimates made by management, and evaluating the overall financial statement presentation. Our procedures included confirmation of securities owned as of March 31, 2013, by correspondence with the custodian and brokers or by other appropriate auditing procedures where replies from brokers were not received. We believe that our audits provide a reasonable basis for our opinion.
In our opinion, the financial statements and financial highlights referred to above present fairly, in all material respects, the financial position of each of the respective Funds referred to above of The Weitz Funds as of March 31, 2013, the results of their operations (and cash flows for Partners III Opportunity Fund) for the year then ended, the changes in their net assets for each of the two years in the period then ended, and their financial highlights for each of the five years or periods in the period then ended, in conformity with U.S. generally accepted accounting principles.
Cincinnati, Ohio
April 30, 2013
76 Weitz Funds
ACTUAL AND HYPOTHETICAL EXPENSES FOR
COMPARISON PURPOSES • (UNAUDITED)
Example
As a shareholder of one or more of the Funds, you incur two types of costs: (1) transaction costs, including any transaction fees that you may be charged if you purchase or redeem your Fund shares through certain financial institutions; and (2) ongoing costs, including management fees and other Fund expenses. This Example is intended to help you understand your ongoing costs (in dollars) of investing in the Funds and to compare these costs with the ongoing costs of investing in other mutual funds. The Example is based on an investment of $1,000 invested at the beginning of the period and held for the entire period from October 1, 2012 through March 31, 2013.
Actual Expenses
The first line for each Fund in the table below provides information about actual account values and actual expenses. You may use the information in this line, together with the amount you invested, to estimate the expenses that you paid over the period. Simply divide your account value by $1,000 (for example, an account value of $8,600 divided by $1,000 = 8.6), then multiply the result by the number in the first line under the heading entitled “Expenses Paid from 10/01/12 –3/31/13” to estimate the expenses you paid on your account during this period.
Hypothetical Example for Comparison Purposes
The second line for each Fund in the table below provides information about hypothetical account values and hypothetical expenses based on the actual expense ratio of each Fund and an assumed rate of return of 5% per year before expenses, which is not the actual return of the Fund. The hypothetical account values and expenses may not be used to estimate the actual ending account balance or expenses you paid for the period. You may use this information to compare the ongoing costs of investing in a specific Weitz Fund to other funds. To do so, compare this 5% hypothetical example with the 5% hypothetical examples that appear in the shareholder reports of the other funds.
Please note that the expenses shown in the table are meant to highlight your ongoing costs only and do not reflect any transactional costs charged by certain financial institutions. Therefore, the second line of the table is useful in comparing ongoing costs only, and will not help you determine the relative total costs of owning different funds. In addition, if you incurred transactional fees, your costs would have been higher. Actual and hypothetical expenses for each Fund are provided in this table.
| | | | | Beginning Account Value 10/01/12 | | | Ending Account Value 3/31/13 | | | Annualized Expense Ratio | | | Expenses Paid from 10/01/12 - 3/31/13(1) | |
| Value | | Actual | | $ | 1,000.00 | | | $ | 1,134.59 | | | | 1.20 | % | | $ | 6.39 | |
| | | Hypothetical(2) | | | 1,000.00 | | | | 1,019.00 | | | | 1.20 | | | | 6.04 | |
| Partners Value | | Actual | | | 1,000.00 | | | | 1,150.50 | | | | 1.19 | | | | 6.38 | |
| | | Hypothetical(2) | | | 1,000.00 | | | | 1,019.05 | | | | 1.19 | | | | 5.99 | |
| Partners III - | | Actual | | | 1,000.00 | | | | 1,176.42 | | | | 1.59 | | | | 8.63 | |
| Institutional Class | | Hypothetical(2) | | | 1,000.00 | | | | 1,017.05 | | | | 1.59 | | | | 8.00 | |
| Partners III - | | Actual | | | 1,000.00 | | | | 1,174.71 | | | | 1.85 | | | | 10.03 | |
| Investor Class | | Hypothetical(2) | | | 1,000.00 | | | | 1,015.75 | | | | 1.85 | | | | 9.30 | |
| Research | | Actual | | | 1,000.00 | | | | 1,108.60 | | | | 0.90 | | | | 4.73 | |
| | | Hypothetical(2) | | | 1,000.00 | | | | 1,020.50 | | | | 0.90 | | | | 4.53 | |
| Hickory | | Actual | | | 1,000.00 | | | | 1,133.89 | | | | 1.26 | | | | 6.70 | |
| | | Hypothetical(2) | | | 1,000.00 | | | | 1,018.70 | | | | 1.26 | | | | 6.34 | |
| Balanced | | Actual | | | 1,000.00 | | | | 1,081.77 | | | | 1.12 | | | | 5.81 | |
| | | Hypothetical(2) | | | 1,000.00 | | | | 1,019.40 | | | | 1.12 | | | | 5.64 | |
| Short-Intermediate Income - | | Actual | | | 1,000.00 | | | | 1,017.87 | | | | 0.62 | | | | 3.12 | |
| Institutional Class | | Hypothetical(2) | | | 1,000.00 | | | | 1,021.90 | | | | 0.62 | | | | 3.13 | |
| Short-Intermediate Income - | | Actual | | | 1,000.00 | | | | 1,017.25 | | | | 0.82 | | | | 4.12 | |
| Investor Class | | Hypothetical(2) | | | 1,000.00 | | | | 1,020.90 | | | | 0.82 | | | | 4.13 | |
| Nebraska Tax-Free | | Actual | | | 1,000.00 | | | | 1,003.32 | | | | 0.70 | | | | 3.50 | |
| | | Hypothetical(2) | | | 1,000.00 | | | | 1,021.50 | | | | 0.70 | | | | 3.53 | |
| Government | | Actual | | | 1,000.00 | | | | 1,000.09 | | | | 0.04 | | | | 0.20 | |
| Money Market | | Hypothetical(2) | | | 1,000.00 | | | | 1,024.80 | | | | 0.04 | | | | 0.20 | |
| (1) | Expenses are equal to the annualized expense ratio for the Fund, multiplied by the average account value over the period, multiplied by the number of days in the most recent fiscal half year (182/365). |
| (2) | Assumes 5% total return before expenses. |
weitzinvestments.com 77
OTHER INFORMATION
(UNAUDITED)
Proxy Voting Policy
A description of the Funds’ proxy voting policies and procedures is available without charge, upon request by (i) calling 800-304-9745, (ii) on the Funds’ website at http://www.weitzinvestments.com; and (iii) on the SEC’s website at http://www.sec.gov.
Information on how each of the Funds voted proxies relating to portfolio securities during each twelve month period ended June 30 is available: (i) on the Funds’ website at http://www.weitzinvestments.com, and (ii) on the SEC’s website at http://www.sec.gov.
Form N-Q
The Funds file complete schedules of their portfolio holdings with the Securities and Exchange Commission for the first and third quarters of each fiscal year on Form N-Q. The Funds’ Form N-Q is available on the SEC’s website at http://www.sec.gov and may be reviewed and copied at the SEC’s Public Reference Room in Washington DC. Information on the operation of the Public Reference Room may be obtained by calling 800 SEC-0330. When filed, the Fund’s quarterly reports, including the information filed on Form N-Q will also be available on the Funds’ website at http://www.weitzinvestments.com.
Tax Information
For the fiscal year ended March 31, 2013, certain dividends paid by the Funds may be subject to a maximum tax rate of 15%, as provided for by the Jobs and Growth Tax Relief Reconciliation Act of 2003. Of the distributions paid during the fiscal year, the amounts that may be considered qualified dividend income and for corporate shareholders, the amounts that may qualify for the corporate dividends received deduction, are summarized as follows:
| | | Value | | | Research | | | Balanced | |
| Qualified dividend income | | $ | 977,442 | | | $ | 152,769 | | | $ | 334,280 | |
| Corporate dividends received deduction | | | 977,442 | | | | 152,769 | | | | 334,280 | |
The information and distributions reported herein may differ from the information and distributions reported to shareholders for the calendar year ended December 31, 2012, which was reported in conjunction with your 2012 Form 1099-DIV.
78 Weitz Funds
This page has been left blank intentionally.
weitzinvestments.com 79
INFORMATION ABOUT THE TRUSTEES
AND OFFICERS • (UNAUDITED)
The individuals listed below serve as Trustees or Officers of the Trust. Each Trustee of the Weitz Funds serves until a successor is elected and qualified or until resignation. Each Officer of the Weitz Funds is elected annually by the Trustees.
The address of all Officers and Trustees is 1125 South 103rd Street, Suite 200, Omaha, Nebraska 68124.
| Interested Trustees* |
| Wallace R. Weitz (Age: 63) |
Position(s) Held with Trust: President; Portfolio Manager; Trustee |
Length of Service (Beginning Date): Weitz Funds (and certain predecessor funds) – January 1986 |
Principal Occupation(s) During Past 5 Years: President, Weitz Investment Management, Inc., Weitz Funds (and certain predecessor funds) |
| Number of Portfolios Overseen in Fund Complex: 9 |
| Other Directorships During Past 5 Years: N/A |
| |
| Thomas R. Pansing (Age: 68) |
| Position(s) Held with Trust: Trustee |
Length of Service (Beginning Date): Weitz Funds (and certain predecessor funds) - January 1986 |
Principal Occupation(s) During Past 5 Years: Partner, Pansing Hogan Ernst & Bachman LLP, a law firm |
| Number of Portfolios Overseen in Fund Complex: 9 |
| Other Directorships During Past 5 Years: N/A |
| * | Mr. Weitz is a Director and Officer of Weitz Investment Management, Inc., investment adviser to the Weitz Funds, and as such is considered an “interested person” of the Trust, as that term is defined in the Investment Company Act of 1940 (an “Interested Trustee”). Mr. Pansing performs certain legal services for the investment adviser and the Weitz Funds and, therefore, is also classified as an “Interested Trustee.” |
| Independent Trustees |
| Lorraine Chang (Age: 62) |
Position(s) Held with Trust: Trustee; Chairman, Board of Trustees |
Length of Service (Beginning Date): Weitz Funds (and certain predecessor funds) - June 1997 |
Principal Occupation(s) During Past 5 Years: Independent Consultant - January 2009 to Present; Partner, The Public Strategies Group, a management consulting firm - January 1999 to December 2008 |
| Number of Portfolios Overseen in Fund Complex: 9 |
| Other Directorships During Past 5 Years: N/A |
| |
| Delmer L. Toebben (Age: 82) |
| Position(s) Held with Trust: Trustee |
Length of Service (Beginning Date): Weitz Funds (and certain predecessor funds) - July 1996 |
| Principal Occupation(s) During Past 5 Years: Retired |
| Number of Portfolios Overseen in Fund Complex: 9 |
| Other Directorships During Past 5 Years: N/A |
| |
| John W. Hancock (Age: 65) |
| Position(s) Held with Trust: Trustee |
Length of Service (Beginning Date): Weitz Funds (and certain predecessor funds) - January 1986 |
Principal Occupation(s) During Past 5 Years: Partner, Hancock & Dana, an accounting firm |
| Number of Portfolios Overseen in Fund Complex: 9 |
| Other Directorships During Past 5 Years: N/A |
| |
| Roland J. Santoni (Age: 71) |
| Position(s) Held with Trust: Trustee |
Length of Service (Beginning Date): Weitz Funds - February 2004 |
Principal Occupation(s) During Past 5 Years: Vice President, West Development, Inc., a development company; President, Gary and Mary West Foundation, 2007 to Present |
| Number of Portfolios Overseen in Fund Complex: 9 |
| Other Directorships During Past 5 Years: N/A |
80 Weitz Funds
| Independent Trustees (continued) |
| Barbara W. Schaefer (Age: 59) |
| Position(s) Held with Trust: Trustee |
Length of Service (Beginning Date): Weitz Funds - March 2005 |
Principal Occupation(s) During Past 5 Years: Senior Vice President-Human Resources and Corporate Secretary, Union Pacific Corporation, 2004 to February 2013 |
| Number of Portfolios Overseen in Fund Complex: 9 |
| Other Directorships During Past 5 Years: N/A |
| |
| Justin B. Wender (Age: 43) |
| Position(s) Held with Trust: Trustee |
Length of Service (Beginning Date): Weitz Funds - May 2009 |
Principal Occupation(s) During Past 5 Years: President, Stella Point Capital, LLC, a private equity firm - August 2010 to Present; President, Castle Harlan, Inc., a private equity firm - July 1993 to August 2010 |
| Number of Portfolios Overseen in Fund Complex: 9 |
Other Directorships During Past 5 Years: Ames True Temper, Inc. - 2004 to 2010, Morton’s Restaurant Group, Inc. - 2002 to 2010 |
| Officers |
| John R. Detisch (Age: 48) |
Position(s) Held with Trust: Vice President, Secretary and Chief Compliance Officer |
Length of Service (Beginning Date): Weitz Funds - January 2011 |
Principal Occupation(s) During Past 5 Years: Vice President and Chief Compliance Officer, Weitz Investment Management, Inc.; Vice President and Chief Compliance Officer, Weitz Funds - January 2011 to Present; Partner, Kutak Rock LLP, 1990 - January 2011 |
| |
| Bradley P. Hinton (Age: 45) |
| Position(s) Held with Trust: Vice President |
Length of Service (Beginning Date): Weitz Funds - August 2006 |
Principal Occupation(s) During Past 5 Years: Vice President, Portfolio Manager and Director of Research, Weitz Investment Management, Inc.; Vice President, Weitz Funds |
| |
| Kenneth R. Stoll (Age: 51) |
Position(s) Held with Trust: Vice President and Chief Financial Officer |
Length of Service (Beginning Date): Weitz Funds - April 2004 |
Principal Occupation(s) During Past 5 Years: Vice President and Chief Operating Officer, Weitz Investment Mangement, Inc.; Vice President and Chief Financial Officer, Weitz Funds |
The Statement of Additional Information for the Weitz Funds, which can be obtained without charge by calling 800-304-9745, includes additional information about the Trustees and Officers of the Weitz Funds.
weitzinvestments.com 81
INDEX DESCRIPTIONS
| Russell 1000 | | The Russell 1000 is an unmanaged index of large capitalization common stocks. It consists of the 1,000 largest companies in the Russell 3000 Index. |
| | | |
| Russell 1000 Value | | The Russell 1000 Value is an unmanaged index of large capitalization common stocks. It consists of those Russell 1000 companies with lower price-to-book ratios and lower forecasted growth values. |
| | | |
| Russell 3000 | | The Russell 3000 is an unmanaged index of the 3,000 largest U.S. companies based on market capitalization. |
| | | |
| Russell 3000 Value | | The Russell 3000 Value is an unmanaged index of the largest capitalization common stocks. It consists of those Russell 3000 companies with lower price-to-book ratios and lower forecasted growth values. |
| | | |
| Russell 2500 | | The Russell 2500 is an unmanaged index of small to mid-capitalization common stocks. It consists of the 2,500 smallest companies in the Russell 3000 Index. |
| | | |
| Russell 2500 Value | | The Russell 2500 Value is an unmanaged index of small to mid-capitalization common stocks. It consists of those Russell 2500 companies with lower price-to-book ratios and lower forecasted growth values. |
| | | |
| S&P 500 | | The S&P 500 is an unmanaged index consisting of 500 companies generally representative of the market for the stocks of large-size U.S. companies. |
| | | |
| Blended | | The Blended Index blends the S&P 500 with the Barclays Capital Intermediate U.S. Government/Credit Index by weighting their total returns at 60% and 40%, respectively. The portfolio is rebalanced monthly. |
| | | |
| Barclays Capital Intermediate U.S. Government/Credit | | The Barclays Capital Intermediate U.S. Government/Credit Index (BCIGC) is a total return performance benchmark consisting of government securities and publicly issued corporate debt with maturities from one to ten years and rated at least BBB by Standard & Poor’s or Baa by Moody’s Investor Service. |
| | | |
| Barclays Capital 5-Year Municipal Bond | | The Barclays Capital 5-Year Municipal Bond Index is an unmanaged index of long-term, fixed-rate, investment-grade, tax-exempt bonds representative of the municipal bond market. |
82 Weitz Funds
| Board of Trustees | Officers |
| Lorraine Chang | Wallace R. Weitz, President |
| John W. Hancock | John R. Detisch, Vice President, Secretary & |
| Thomas R. Pansing, Jr. | Chief Compliance Officer |
| Roland J. Santoni | Kenneth R. Stoll, Vice President & Chief |
| Barbara W. Schaefer | Financial Officer |
| Delmer L. Toebben | Bradley P. Hinton, Vice President |
| Wallace R. Weitz | |
| Justin B. Wender | Distributor |
| | Weitz Securities, Inc. |
| | |
| Investment Adviser | Transfer Agent and Dividend Paying Agent |
| Weitz Investment Management, Inc. | Weitz Investment Management, Inc. |
| 1125 South 103rd Street, Suite 200 | |
| Sub-Transfer Agent |
| Boston Financial Data Services, Inc. |
| | |
| | NASDAQ symbols: |
| Custodian | Value Fund - WVALX |
| Wells Fargo Bank, N.A. | Partners Value Fund - WPVLX |
| | Partners III Opportunity Fund |
| | Institutional Class - WPOPX |
| | Investor Class - WPOIX |
| | Research Fund - WRESX |
| | Hickory Fund - WEHIX |
| | Balanced Fund - WBALX |
| | Short-Intermediate Income Fund |
| | Institutional Class - WEFIX |
| | Investor Class - WSHNX |
| | Nebraska Tax-Free Income Fund - WNTFX |
| | Government Money Market Fund - WGMXX |
| Help us conserve resources by receiving your report electronically. | | |
Visit us online at weitzinvestments.com. Simply log in to your account and select “Electronic Delivery.” | | |
An investor should consider carefully the investment objectives, risks, and charges and expenses of the Funds before investing. The Funds’ Prospectus contains this and other information about the Funds. The Prospectus should be read carefully before investing.
5/3/13
weitzinvestments.com 83
Item 2. Code of Ethics.
As of the end of the period covered by this report, the Registrant has adopted a code of ethics that applies to the Registrant’s principal executive officer, principal financial officer, principal accounting officer or controller, or persons performing similar functions, regardless of whether these individuals are employed by the Registrant or a third party (the “Code of Ethics”). During the period covered by this report, there were no amendments, nor did the Registrant grant any waivers, including any implicit waivers, from any provision of the Code of Ethics.
The Code of Ethics is attached hereto as Exhibit 12(a)(1).
Item 3. Audit Committee Financial Expert.
The Registrant’s board of trustees has determined that the Registrant has at least one “audit committee financial expert” (as defined in Item 3 of Form N-CSR) serving on its audit committee. John Hancock is an “audit committee financial expert” and is “independent” (as each term is defined in Item 3 of Form N-CSR).
Item 4. Principal Accountant Fees and Services.
| | |
| (a) | Audit Fees. Fees for audit services provided to the Registrant were $277,125and $268,054 for fiscal years ended March 31, 2013 and 2012, respectively. |
| | |
(b) | Audit Related Fees. The aggregate fees billed in each of the last two fiscal years for audit related-services by the principal accountant that are reasonably related to the performance of the audit of the Registrant’s financial statements and are not reported under paragraph (a) of this item were $27,845 and $27,300 for fiscal years ended March 31, 2013 and 2012, respectively. The fees, paid by Weitz Investment Management, Inc., the Registrant’s investment adviser and transfer agent, were payment for the principal accountant performing internal control reviews of the Registrant’s transfer agent. |
| | |
| (c) | Tax Fees. Fees for tax services, which consisted of income and excise tax compliance services, were $41,360 and $38,592 for the fiscal years ended March 31, 2013 and 2012, respectively. |
| | |
| (d) | All Other Fees. Fees for all other services totaled $11,742 and $11,742 for fiscal years ended March 31, 2013 and 2012, respectively. |
| | |
| (e) | (1) The Registrant’s Audit Committee has adopted Pre-Approval Policies and Procedures. The Audit Committee must pre-approve all audit services and non-audit services that the principal accountant provides to the Registrant. The Audit Committee must also pre-approve any engagement of the principal accountant to provide non-audit services to the Registrant’s investment adviser, or any affiliate of the adviser that provides ongoing services to the Registrant, if such non-audit services directly impact the Registrant’s operations and financial reporting. |
| | |
| | (2) No services described in items (b) were pre-approved by the Audit Committee pursuant to Rule 2-01(c)(7)(i)(c) of Regulation S-X. |
| | |
| | |
| (f) | All of the work in connection with the audit of the Registrant during the years ended March 31, 2013 and 2012 was performed by full-time employees of the Registrant’s principal accountant. |
| | |
| (g) | The aggregate fees billed by the principal accountant for non-audit services to the Registrant, the Registrant’s investment adviser and any entity controlling, controlled by, or under common control with the adviser that provides ongoing services to the Registrant were $121,647 and $118,334 for the years ended March 31, 2013 and 2012, respectively. |
| | |
(h) | The Registrant’s Audit Committee has considered whether the provision of non-audit services that were rendered to the Registrant’s investment adviser, and any entity controlling, controlled by, or under common control with the adviser that provides ongoing services to the Registrant that were not pre-approved pursuant to paragraph (c)(7)(ii) of Rule 2-01 of Regulation S-X is compatible with maintaining the principal auditor’s independence. |
Item 5. Audit Committee of Listed Registrants.
Not applicable.
Item 6. Schedule of Investments.
The Schedule of Investments in securities of unaffiliated issuers is included as part of the Report to Shareholders.
Item 7. Disclosure of Proxy Voting Policies and Procedures for Closed-End Investment Companies.
Not applicable.
Item 8. Portfolio Managers of Closed-End Management Investment Companies
Not applicable
Item 9. Purchases of Equity Securities by Closed-End Management Investment Company and Affiliated Purchasers.
Not applicable.
Item 10. Submissions of Matters to a Vote of Security Holders.
Not applicable.
Item 11. Controls and Procedures.
(a) Based on an evaluation of the Disclosure Controls and Procedures (as defined in Rule 30a-3(c) under the Investment Company Act of 1940) (the "Disclosure Controls") as of a date within 90 days prior to the filing date (the "Filing Date") of this report on Form N-CSR (the "Report"), the Registrant's principal executive officer and financial officer have concluded that the Disclosure Controls are reasonably designed to ensure that information required to be disclosed by the Registrant in the Report is recorded, processed, summarized and reported by the Filing Date, including ensuring that information required to be disclosed in the Report is accumulated and communicated to the Registrant's management, including the Registrant's principal executive officer and principal financial officer, as appropriate to allow timely decisions regarding required disclosure.
(b) There were no significant changes in the Registrant's internal control over financial reporting (as defined in Rule 30a-3(d) under the Investment Company Act of 1940) that occurred during the Registrant's second fiscal half-year of the period covered by this report that has materially affected, or is reasonably likely to materially affect, the Registrant's internal control over financial reporting.
(a)(1) The Code of Ethics is attached hereto.
(a)(2) The certifications required by Rule 30a-2(a) of the Investment Company Act of 1940 are attached hereto.
(a)(3) Not applicable.
(b) The certifications required by Rule 30a-2(b) of the Investment Company Act of 1940 and Section 906 of the Sarbanes-Oxley Act of 2002 are attached hereto.
SIGNATURES
Pursuant to the requirements of the Securities Exchange Act of 1934 and the Investment Company Act of 1940, the Registrant has duly caused this report to be signed on its behalf by the undersigned, thereunto duly authorized.
| | The Weitz Funds |
| | |
| | By (Signature and Title)* /s/ Wallace R. Weitz |
| | Wallace R. Weitz, President |
| | |
| | Date May 3, 2013 |
Pursuant to the requirements of the Securities Exchange Act of 1934 and the Investment Company Act of 1940, this report has been signed below by the following persons on behalf of the Registrant and in the capacities and on the dates indicated.
| | By (Signature and Title)* /s/ Wallace R. Weitz |
| | Wallace R. Weitz, President |
| | Date May 3, 2013 |
| | |
| | By (Signature and Title)* /s/ Kenneth R. Stoll |
| | Kenneth R. Stoll, Chief Financial Officer |
| | Date May 3, 2013 |
* Print the name and title of each signing officer under his or her signature.