UNITED STATES
SECURITIES AND EXCHANGE COMMISSION
Washington, D.C. 20549
FORM N-CSR
CERTIFIED ANNUAL SHAREHOLDER REPORT OF REGISTERED MANAGEMENT
INVESTMENT COMPANIES
Investment Company Act file number 811-21410
The Weitz Funds
(Exact name of registrant as specified in charter)
Suite 200
1125 South 103 Street
Omaha, NE 68124-1071
(Address of principal executive offices) (Zip code)
Weitz Investment Management, Inc.
The Weitz Funds
Suite 200
1125 South 103 Street
Omaha, NE 68124-1071
(Name and address of agent for service)
Registrant’s telephone number, including area code: 402-391-1980
Date of fiscal year end: March 31
Date of reporting period: March 31, 2015
Form N-CSR is to be used by management investment companies to file reports with the Commission not later than 10 days after the transmission to stockholders of any report that is required to be transmitted to stockholders under Rule 30e-1 under the Investment Company Act of 1940 (17 CFR 270.30e-1). The Commission may use the information provided on Form N-CSR in its regulatory, disclosure review, inspection, and policymaking roles.
A registrant is required to disclose the information specified by Form N-CSR, and the Commission will make this information public. A registrant is not required to respond to the collection of information contained in Form N-CSR unless the Form displays a currently valid Office of Management and Budget ("OMB") control number. Please direct comments concerning the accuracy of the information collection burden estimate and any suggestions for reducing the burden to Secretary, Securities and Exchange Commission, 450 Fifth Street, NW, Washington, DC 20549-0609. The OMB has reviewed this collection of information under the clearance requirements of 44 U.S.C. § 3507.
Item 1. Report to Stockholders.
THE WEITZ PHILOSOPHY
Value investing the Weitz Way.
There are no shortcuts in value investing. At Weitz, we dig. And dig some more. We look at hundreds of investment ideas. Our goal: find strong, well-managed but undervalued companies and bonds that offer reasonable risk-adjusted returns. It’s no easy task. We do the due diligence. Analyze. Ask tough questions and get the answers. We wait for the right opportunity. Then and only then do we invest your money. Welcome to the Weitz Way.
We’re in it with you:
Our employees have the majority of their investable assets in our mutual funds. This alignment of goals allows us to guarantee that we’re treating clients’ money as if it were our own.
We focus on what we know:
Each of our analysts is a generalist with ever-growing, defined circles of competence. They can spot opportunities anywhere and bring them to the team for consideration.
We think for ourselves:
Our philosophy of independent thinking and high-conviction portfolios enables us to take advantage of value-priced equities and bonds that offer reasonable risk-adjusted returns.
Today we are responsible for approximately $6 billion in investments for our shareholders – individuals, corporations, pension plans, foundations and endowments. And our commitment remains the same: to put our clients first. Always. We do so through our expertise, our flexibility, and our drive to uncover investments that can help them preserve and grow wealth.
Wally Weitz, CFA
President, Portfolio Manager
TABLE OF CONTENTS
| Value Matters | 4 |
| | |
| Performance Summary | 7 |
| | |
| Analyst Corner | 8 |
| | |
| Value Fund | 10 |
| | |
| Partners Value Fund | 12 |
| | |
| Partners III Opportunity Fund | 14 |
| | |
| Research Fund | 16 |
| | |
| Hickory Fund | 18 |
| | |
| Balanced Fund | 20 |
| | |
| Core Plus Income Fund | 22 |
| | |
| Short-Intermediate Income Fund | 25 |
| | |
| Nebraska Tax-Free Income Fund | 28 |
| | |
| Government Money Market Fund | 30 |
| | |
| Schedule of Investments | 32 |
| | |
| Financial Statements | 48 |
| | |
| Notes to Financial Statements | 58 |
| | |
| Report of Independent Registered Public Accounting Firm | 68 |
| | |
| Actual and Hypothetical Expenses for Comparison Purposes | 70 |
| | |
| Other Information | 71 |
| | |
| Information About the Trustees and Officers | 72 |
| | |
| Index Descriptions | 74 |
| The management of Weitz Funds has chosen paper for the 76 page Annual Report from a paper manufacturer certified under the Sustainable Forestry Initiative ® standard. |  |
Portfolio composition is subject to change at any time and references to specific securities, industries, and sectors referenced in this report are not recommendations to purchase or sell any particular security. Current and future portfolio holdings are subject to risk. See the Schedules of Investments included in this report for the percent of assets in each of the Funds invested in particular industries or sectors.
3 | Q1 2015 ANNUAL REPORT
VALUE MATTERS
April 9, 2015
Dear Fellow Investor,
The stock market moved roughly sideways during the first quarter of 2015. Our stock funds earned returns of roughly 3-4% vs. 1% for the S&P 500. The bond funds earned positive returns in spite of miniscule yields available on bonds. Results for the fiscal year ended March 31 were in the 7-12% range for the stock funds vs. 12.7% for the S&P 500 and bond fund returns were modest, but positive.
The table following this letter shows results over various time periods for all of our funds and their respective benchmarks. As usual, we would remind readers that investment performance data for short periods is not very meaningful, but we believe our 20- and 30-year numbers reflect the advantage that can accrue to patient value investors.
Market Commentary
Wall Street has been obsessed with the actions of the Federal Reserve for at least as long as the older of us has been investing.
On Thursday afternoons in the 1970’s, everyone watched the Dow Jones news wire for the money supply report that might hold clues about the Fed’s next policy move. More recently, the Fed has been extraordinarily “accommodative” in the six years since the financial crisis, and there is considerable investor anxiety about how stocks will react to a return to “normal” interest rates. It is almost comical to watch the stock market rally or swoon in response to every small bit of economic data. The logic seems to be that a sign of economic strength (good news) is “bad” because it might encourage the Fed to abandon its “zero interest rate policy” (ZIRP). Conversely, a sign of economic weakness often triggers a rally since it may discourage the Fed from tightening.
The Fed’s (and the Treasury’s) actions immediately after the Lehman failure were important and effective. In succeeding years, though, the creation of trillions of new dollars and their use to pump up asset prices (via “quantitative easing” or “QE”) may prove to have been counter-productive. It seems likely that we have “borrowed” investment gains from the future via QE. More importantly, to the extent speculators have used cheap, short-term credit to buy (riskier) higher yielding assets (“carry trades”), they face potential trading losses if rates rise suddenly. Their scramble to exit these trades could trigger market liquidity issues.
Another interesting result of aggressive central bank activity, in Europe and Japan as well as the U.S., is that a significant amount of sovereign debt (bonds issued by countries rather than companies) now carries negative interest rates. This is unprecedented. One might call it surreal. Berkshire Hathaway Vice Chairman Charlie Munger admits to being “flabbergasted” by the negative yields. He says, “…of course I’m confused. Anybody who is intelligent who is not confused doesn’t understand the situation very well. If you find it puzzling, your brain is working correctly.” (Forbes, 3/26/2015) Charlie has a way with words.
Interest rates are important to investors. When rates return to more normal (higher) levels, holders of longer-term bonds may suffer significant declines in the market value of their holdings. Higher bond yields also offer stiffer competition for stocks, and all things being equal, rising rates are negative for stock valuations. Higher rates can also depress corporate profits and companies’ enthusiasm for expansion.
Thus, we are very interested in how the general level of interest rates may change over a period of years. We want to know how our companies are preparing for a higher rate environment. However, we do not make any important investment decisions based on day to day actions or pronouncements of the Fed. We believe that obsessive “Fed-watching” is misplaced effort.
Portfolio Positioning
We often write about wanting to buy stocks at 50-60% of our estimate of business value. Today, we find ourselves (again) holding stocks that are more “fairly” priced—above our “buy” price but with room to appreciate over time.
Berkshire Hathaway is a concrete example of one of our “in-between” stocks. In the 2014 annual report, Warren Buffett was uncharacteristically specific about how he believes investors should think about Berkshire. He has long held that Berkshire’s business value, or “intrinsic value,” was considerably higher than its “book value.” He has stated that the company would be willing to buy back shares of Berkshire at up to 120% of book value since that would still represent a “significant discount” to intrinsic value.
4 | Q1 2015 ANNUAL REPORT
WEITZINVESTMENTS.COM
This year he suggested that Berkshire’s intrinsic value was very likely to rise over time and investors planning to hold shares for many years would probably earn good returns if they bought shares near the 120% of book value level. He went on to say if they paid twice book (200%), that it might be several years before they showed a profit (echoing Ben Graham, a stock may be a bargain at one price but an over-valued speculation at another). Finally, he warned that if investors intended to hold the stock for only a year or two, he could offer “no assurances, whatever the entry price.”
Berkshire’s book value per A share at March 31 is (very) roughly $150,000. Warren’s guidelines would suggest that a $180,000 purchase today (120% of book) should work out well over time and that a purchase at $300,000 (200% of book) might result in “dead money” for several years. At March 31, the stock was selling at $217,500 (about 145% of book). At this price, it trades at a modest discount to our estimate of intrinsic value. We are “comfortable” holding it but not “excited” about buying more. This is how we feel about many of our stocks.
So we face a common dilemma—stocks are not cheap and they face some headwinds. All eyes are on interest rates and they will rise eventually. Another tangible factor that is beginning to have an effect on company earnings is the strong dollar. A strengthening dollar makes U.S. exporters less competitive and depresses the reported earnings of global companies as profits earned in other currencies are converted into a smaller number of dollars. There are other things going on in the world that usually distract investors and it seems possible they will again.
Our game plan has been (1) to place extra emphasis on companies that can “make their own breaks” and continue to grow in a less benign environment, (2) to be disciplined about trimming holdings as prices approach “full value,” and (3) to continue to visit companies and build our “on deck” list for a time when stock prices are cheaper. As a result, some of our core positions sell at relatively high price-to-value (P/V) levels and our cash reserves remain higher than usual. (Trimming successful positions also means realizing some long-term capital gains that have been earned in past years.) This plan has worked reasonably well as the market has risen and we think it will help us deal with (but not be immune from) future volatility and market corrections.
Later in this report, our portfolio managers discuss the specific companies that have contributed to (or detracted from) their funds’ results. They provide capsule comments on portfolio additions and deletions and generally explain what worked and what didn’t. Thanks again for being a supportive group of shareholders.
Sincerely,
 |  |
| Wally Weitz | Brad Hinton |
| wally@weitzinvestments.com | brad@weitzinvestments.com |
As of March 31, 2015: Berkshire Hathaway, Inc. – Class B represented 4.7%, 4.6%, 7.6%, 2.7% and 2.3% of the Value, Partners Value, Partners III Opportunity, Research and Balanced Funds’ net assets, respectively.
5 | Q1 2015 ANNUAL REPORT
DISCLOSURES
These performance numbers reflect the deduction of annual operating expenses which as stated in the most recent prospectus, and expressed as a percentage of each Fund’s or Class’ net assets, are: Value – Investor Class, 1.21% (estimated gross); Value – Institutional Class, 1.11% (estimated gross); Partners Value – Investor Class, 1.22% (estimated gross); Partners Value – Institutional Class, 1.08% (estimated gross); Partners III Opportunity – Investor Class, 1.86%; Partners III Opportunity – Institutional Class – 1.45%; Research, 1.59% (gross); Hickory, 1.22%; Balanced, 1.10%; Core Plus Income – Investor Class, 0.97% (estimated gross); Core Plus Income – Institutional Class, 0.74% (estimated gross); Short-Intermediate Income – Investor Class, 0.92% (gross); Short-Intermediate Income – Institutional Class, 0.62%; and Nebraska Tax-Free Income, 0.73%. The returns assume redemption at the end of each period and reinvestment of dividends. Total returns shown include fee waivers and expense reimbursements, if any; total returns would have been lower had there been no waiver of fees and/or reimbursement of expenses. This information represents past performance and past performance does not guarantee future results. The investment return and the principal value of an investment in any of the Funds will fluctuate so that an investor’s shares, when redeemed, may be worth more or less than the original cost. Current performance may be higher or lower than the performance data quoted. Performance data current to the most recent month end may be obtained at www.weitzinvestments.com/funds_and_performance/fund_performance.fs. Index performance is hypothetical and is shown for illustrative purposes only. See page 74 for a description of all indices.
(a) Performance of the Partners Value and Partners III Opportunity Funds is measured from June 1, 1983, the inception of Weitz Partners II Limited Partnership (“Partners II”) and Weitz Partners III Limited Partnership (“Partners III”), respectively. Performance of the Research Fund is measured from April 1, 2005, the inception of Weitz Research Fund, L.P. (“Research L.P.”). Performance of the Nebraska Tax-Free Income Fund is measured from October 1, 1985, the inception of Weitz Income Partners Limited Partnership (“Income Partners”). On the last business day of December 1993, 2005, 2006 and 2010, the Partners Value, Partners III Opportunity, Nebraska Tax-Free Income and Research Funds (the “Funds”) succeeded to substantially all of the assets of Partners II, Partners III, Income Partners and Research L.P. (the“Partnerships”), respectively. The investment objectives, policies and restrictions of the Funds are materially equivalent to those of the respective Partnerships and the Partnerships were managed at all times with full investment authority by Weitz Investment Management, Inc. The performance information includes performance for the period before the Funds became investment companies registered with the Securities and Exchange Commission. During these periods, none of the Partnerships were registered under the Investment Company Act of 1940 and therefore were not subject to certain investment or other restrictions or requirements imposed by the 1940 Act or the Internal Revenue Code. If any of the Partnerships had been registered under the 1940 Act during these periods, the respective Partnerships’ performance might have been adversely affected.
(b) Institutional Class shares of the Value and Partners Value Funds became available for sale on July 31, 2014. For performance prior to that date, these tables include the actual performance of each Fund’s Investor Class (and use the actual expenses of each Fund’s Investor Class) without adjustment. For any such period of time, the performance of each Fund’s Institutional Class would have been similar to the performance of each Fund’s Investor Class, because the shares of both classes are invested in the same portfolio of securities, but the classes bear different expenses. The investment adviser has agreed in writing to limit the total annual fund operating expenses of the Investor and Institutional Class shares (excluding taxes, interest, portfolio transaction expenses, acquired fund fees and expenses and extraordinary expenses) to 1.18% and 0.99%, respectively, of each Class’ average daily net assets through July 31, 2015.
(c) Investor Class shares of the Partners III Opportunity and Short-Intermediate Income Funds became available for sale on August 1, 2011. For performance prior to that date, these tables include the actual performance of each Fund’s Institutional Class (and use the actual expenses of each Fund’s Institutional Class) without adjustment. For any such period of time, the performance of each Fund’s Investor Class would have been similar to the performance of each Fund’s Institutional Class, because the shares of both classes are invested in the same portfolio of securities, but the classes bear different expenses. The investment adviser has agreed in writing to limit the total annual fund operating expenses of the Short-Intermediate Income Fund – Investor Class shares (excluding taxes, interest, portfolio transaction expenses, acquired fund fees and expenses and extraordinary expenses) to 0.85% of the Class’ average daily net assets through July 31, 2015.
(d) Starting January 1, 2011, these tables reflect the deduction of the Research Fund’s actual operating expenses. For periods of time prior to January 1, 2011, these tables reflect the deduction of annual pro forma operating expenses of 1.50%. Annual operating expenses for the Research Fund, as stated in the Research Fund’s Prospectus, are 1.59% (gross) and 0.91% (net) of the Fund’s net assets. The investment adviser has agreed, in writing, to limit the total annual fund operating expenses (excluding taxes, interest, brokerage commissions, acquired fund fees and expenses and extraordinary expenses) to 0.90% of the Fund’s average daily net assets through July 31, 2015.
(e) The investment adviser has agreed in writing to limit the total annual fund operating expenses of the Core Plus Income Fund’s Investor and Institutional Class shares (excluding taxes, interest, portfolio transaction expenses, acquired fund fees and expenses and extraordinary expenses) to 0.85% and 0.65%, respectively, of each Class’ average daily net assets through July 31, 2015.
* Since inception performance for the Russell 1000 Value, Barclays Intermediate Credit and CPI +1% is from May 31, 1986; December 31, 1988; and December 31, 1988, respectively. The inception date of the Barclays 5-Year Muni. Bond was January 29, 1988.
6 | Q1 2015 ANNUAL REPORT
WEITZINVESTMENTS.COM
PERFORMANCE SUMMARY
| | | | Annualized | | | | | | |
| | | | | | | | | | | | | | | | Since Invest- | | | | | | | | | |
| | | | | | | | | | | | | | | | ment Style | | | | | | | | | |
| | Inception | | Since | | | | | | | | | | | Inception | | | | | | | | | |
| Fund Name | Date | | Inception | | 30-year | | 20-year | | 10-year | | (6/30/08) | | 5-year | | 1-year | | Quarter |
Value(b) | 5/09/86 | | | | | | | | | | | | | | | | | | | | | | | | |
| Investor | | | | 10.89 | % | | | — | % | | | 11.27 | % | | | 6.08 | % | | | 10.88 | % | | | 14.34 | % | | | 10.19 | % | | | 3.60 | % |
| Institutional | | | | 10.89 | | | | — | | | | 11.27 | | | | 6.09 | | | | 10.90 | | | | 14.37 | | | | 10.32 | | | | 3.64 | |
| Russell 1000 | | | | 10.31 | | | | — | | | | 9.63 | | | | 8.34 | | | | 9.94 | | | | 14.73 | | | | 12.73 | | | | 1.59 | |
| Russell 1000 Value* | | | | 10.44 | | | | — | | | | 9.97 | | | | 7.21 | | | | 8.90 | | | | 13.75 | | | | 9.33 | | | | (0.72 | ) |
| | | | | | | | | | | | | | | | | | | | | | | | | | | | | | | | | | |
Partners Value(a)(b) | 6/01/83 | | | | | | | | | | | | | | | | | | | | | | | | | | | | | | | | |
| Investor | | | | 12.77 | | | | 12.18 | | | | 11.99 | | | | 7.56 | | | | — | | | | 14.68 | | | | 8.99 | | | | 3.27 | |
| Institutional | | | | 12.77 | | | | 12.18 | | | | 11.99 | | | | 7.57 | | | | — | | | | 14.71 | | | | 9.11 | | | | 3.33 | |
| | | | | | | | | | | | | | | | | | | | | | | | | | | | | | | | | | |
| Partners III | | | | | | | | | | | | | | | | | | | | | | | | | | | | | | | | | |
Opportunity(a)(c) | 6/01/83 | | | | | | | | | | | | | | | | | | | | | | | | | | | | | | | | |
| Investor | | | | 13.36 | | | | 12.97 | | | | 13.57 | | | | 8.65 | | | | — | | | | 14.40 | | | | 7.38 | | | | 4.26 | |
| Institutional | | | | 13.40 | | | | 13.01 | | | | 13.63 | | | | 8.76 | | | | — | | | | 14.64 | | | | 7.76 | | | | 4.34 | |
| | | | | | | | | | | | | | | | | | | | | | | | | | | | | | | | | | |
Research(a)(d) | 4/01/05 | | | 8.86 | | | | — | | | | — | | | | 8.86 | | | | — | | | | 14.17 | | | | 12.22 | | | | 3.30 | |
| Russell 3000 | | | | — | | | | 10.99 | | | | 9.58 | | | | 8.38 | | | | — | | | | 14.71 | | | | 12.37 | | | | 1.80 | |
| Russell 3000 Value | | | | — | | | | 11.25 | | | | 10.01 | | | | 7.24 | | | | — | | | | 13.66 | | | | 8.94 | | | | (0.51 | ) |
| | | | | | | | | | | | | | | | | | | | | | | | | | | | | | | | | | |
| Hickory | 4/01/93 | | | 10.72 | | | | — | | | | 11.56 | | | | 7.37 | | | | 12.54 | | | | 14.56 | | | | 8.31 | | | | 4.50 | |
| Russell 2500 | | | | 10.87 | | | | — | | | | 11.09 | | | | 9.62 | | | | 11.40 | | | | 15.48 | | | | 10.07 | | | | 5.17 | |
| Russell 2500 Value | | | | 11.29 | | | | — | | | | 11.72 | | | | 8.46 | | | | 10.85 | | | | 14.06 | | | | 6.58 | | | | 3.02 | |
| | | | | | | | | | | | | | | | | | | | | | | | | | | | | | | | | | |
| S&P 500 | | | | — | | | | 11.03 | | | | 9.39 | | | | 8.01 | | | | 9.74 | | | | 14.47 | | | | 12.73 | | | | 0.95 | |
| | | | | | | | | | | | | | | | | | | | | | | | | | | | | | | | | | |
| Balanced | 10/01/03 | | | 5.84 | | | | — | | | | — | | | | 5.33 | | | | — | | | | 8.30 | | | | 3.73 | | | | 1.37 | |
| Blended Index | | | | 7.09 | | | | — | | | | — | | | | 6.82 | | | | — | | | | 10.20 | | | | 9.10 | | | | 1.23 | |
| | | | | | | | | | | | | | | | | | | | | | | | | | | | | | | | | | |
Core Plus Income(e) | 7/31/14 | | | | | | | | | | | | | | | | | | | | | | | | | | | | | | | | |
| Investor | | | | 2.90 | | | | — | | | | — | | | | — | | | | — | | | | — | | | | — | | | | 1.80 | |
| Institutional | | | | 2.96 | | | | — | | | | — | | | | — | | | | — | | | | — | | | | — | | | | 1.77 | |
| Barclays U.S. Aggregate Bond | | | 3.86 | | | | — | | | | — | | | | — | | | | — | | | | — | | | | — | | | | 1.61 | |
| | | | | | | | | | | | | | | | | | | | | | | | | | | | | | | | | |
| Short-Intermediate | | | | | | | | | | | | | | | | | | | | | | | | | | | | | | | | | |
Income(c) | 12/23/88 | | | | | | | | | | | | | | | | | | | | | | | | | | | | | | | | |
| Investor | | | | 5.51 | | | | — | | | | 4.99 | | | | 3.84 | | | | — | | | | 2.35 | | | | 1.64 | | | | 0.70 | |
| Institutional | | | | 5.55 | | | | — | | | | 5.03 | | | | 3.92 | | | | — | | | | 2.51 | | | | 1.88 | | | | 0.75 | |
| Barclays Intermediate Credit* | | | 6.22 | | | | — | | | | 5.46 | | | | 4.34 | | | | — | | | | 3.52 | | | | 3.58 | | | | 1.45 | |
| CPI + 1%* | | | | 3.62 | | | | — | | | | 3.27 | | | | 3.04 | | | | — | | | | 2.66 | | | | 0.93 | | | | 0.81 | |
| | | | | | | | | | | | | | | | | | | | | | | | | | | | | | | | | | |
| Nebraska Tax- | | | | | | | | | | | | | | | | | | | | | | | | | | | | | | | | | |
Free Income(a) | 10/01/85 | | | 4.99 | | | | — | | | | 4.16 | | | | 3.11 | | | | — | | | | 2.48 | | | | 2.14 | | | | 0.36 | |
| Barclays 5-Year Muni. Bond* | | | — | | | | — | | | | 4.73 | | | | 4.17 | | | | — | | | | 3.44 | | | | 2.95 | | | | 0.76 | |
7 | Q1 2015 ANNUAL REPORT | UNAUDITED
ANALYST CORNER
A Perspective On Range Resources
By David Perkins, CFA
Range Resources (RRC) is a domestic producer of natural gas and natural gas liquids (NGLs) based in Fort Worth, Texas. Range is the 14th largest natural gas producer in the continental United States, with average daily production of approximately 1.3 billion cubic feet of gas equivalent (BCFE). The company drilled its first discovery well in southwest Pennsylvania just over 10 years ago, discovering what is today North America’s most prolific natural gas field – the Marcellus shale. Range controls roughly 1.6 million acres in the Appalachian basin which include both the northeast and southwest portions of the Marcellus as well as the Upper Devonian and Utica shales in southwestern PA.
Why own any commodity business?
This is a thoughtful question, and one we often ask ourselves. Our answer in the vast majority of cases is “don’t bother.” However, we believe there are unique windows of opportunity to take advantage of volatility, whether with the commodity itself, producers’ stocks, or both. In energy in particular, we are often struck by the sharp difference in investment horizon between those we share meetings with on field trips and at industry conferences (6-9 months, in some cases even shorter) and our own (3-5 years). While this is often the case, it is perhaps most acute in energy. Our goal, in all sectors of the market, is to take advantage of volatility and inefficiencies that result in temporary mispricing. Crude oil, natural gas and NGLs have all suffered material declines in price over the past 9 months. With uncertainty around near-term price levels, the timing and ultimate pace of recovery, and where mid-cycle prices will settle for all three fuels, we believe portions of the public energy market are rife with opportunity for investors with a multi-year time horizon.
When analyzing energy producers, there are several structural questions we must answer before putting shareholder capital at risk:
1) Are the target company’s assets advantaged - do they sit at or near the low end of the industry cost curve and are they likely to stay there?
2) What does the company’s reinvestment runway look like? How much visibility do we have into where our capital will be going over the next 3, 5 and 10 years?
3) Do we know and understand the company’s capital structure and capital needs over our investment horizon?
4) Is management focused on debt-adjusted per share growth?
5) Do we have upside optionality with the commodity (is it trading below our notion of marginal cost)?
The answers to the first four questions eliminate the majority of exploration and production (E&P) businesses from consideration. The final question helps us frame risk in an inherently cyclical industry. At roughly $55/share, Range Resources looks particularly attractive through this lens.
Valuable Assets
As with any commodity business, a low cost position is both critical for survival and necessary if one hopes to earn better than average returns over time. Range’s cost position among North American natural gas and NGL producers is very attractive, owing largely to the quality of its leasehold acreage in the Marcellus. Range has driven overall production and cash operating costs down by 43% and 53% per thousand cubic feet of gas equivalent (MCFE), respectively, since 2008. We expect additional cost reductions in the coming years as the company continues to gain scale, enabling Range to generate top decile cash margins at or above $2.50/MCFE in all but the most dire price environments.
With the advent of unconventional production methods (i.e. fracking) in the U.S. and the repeatable nature of shale development, “resource potential” has become an important consideration for investors. It is effectively a company’s estimate of the reserves it has an opportunity to capitalize on in the future, including those beyond the five-year window the SEC allows for public reporting. Range estimates its resource potential to be somewhere between 66 and 87 trillion cubic feet of gas equivalent (TCFE), excluding the 400,000 acres it controls in the emerging Utica formation. For context, if all of these hydrocarbons were to become a reality, the company would be able to grow its current production base at a mid-teens compounded annual rate for the next 15-20 years. In short, we know where our capital is going to be reinvested well beyond five years from now.
8 | Q1 2015 ANNUAL REPORT
WEITZINVESTMENTS.COM
Having significant resource potential is great, but the quality of a company’s future runway is paramount. Per Credit Suisse, Range’s Marcellus “liquids rich” wells earn among the very highest returns available to a domestic E&P investor (35-40%) assuming West Texas Intermediate (WTI) oil prices stay at or below $70 going forward and domestic natural gas prices don’t reach $4.00/MCFE until 2018. In higher price environments, Range’s returns look even more compelling. As the company’s capital efficiency continues to improve via more optimal completions and greater penetration of pad drilling, we believe Range should sustain if not enhance its return profile over time. In addition, Range has consistently lowered the cost of replacing its existing reserves to industry-best levels ($0.54/MCFE), which allows the company to allocate more of its cash flow toward generating future growth.
Appalachian basin natural gas and NGL producers have fallen sharply out of favor with investors over the past several quarters, in many ways becoming victims of their own success. As supply has swelled in the northeast, transportation infrastructure has been unable to keep pace. A milder 2014/2015 winter season further exacerbated regional oversupply, driving gas and NGL prices materially lower. We see the beginnings of a more constructive backdrop emerging, however, especially for northeast producers like RRC. New regional pipeline capacity should begin to allow lower-cost Marcellus gas to displace declining higher-cost legacy gas production across a broad swath of the Midwest and Southeast. As well, the drop in crude oil prices and resulting decrease in oil-focused drilling activity should also lead to a decline in “associated gas” production beginning this fall. Long-awaited demand growth from LNG exports, Mexican exports, coal plant retirements and new industrial plants should begin this year and increase each year between now and 2019. A more balanced supply-demand picture should lead prices back toward our ~$4 marginal cost framework.
We believe the combination of rising per share production and reserves, higher natural gas and NGL prices, and improved cash flow and earnings will continue to drive Range’s valuation higher over the coming years. Successful delineation of the company’s Utica acreage over the next 12 months provides additional potential optionality. Any rebound in investor sentiment, which we believe is likely, only further enhances the stock’s present appeal. Our $100-105 base case intrinsic value estimate represents a blend of our internal net asset value scenarios and what we believe is a reasonable multiple of Range’s normalized cash flow in 2017 discounted back to today. We believe shares of Range Resources offer a compelling risk-reward to the patient investor.
As of March 31, 2015: Range Resources represented 3.7%, 2.8%, 1.4%, 7.0%, 1.7% and 2.1% of the Value, Partners Value, Partners III Opportunity, Research, Hickory and Balanced Funds’ net assets, respectively.
David Perkins, CFA®, joined Weitz |
| in January 2004. Dave is a Research |
| Analyst and a Co-Portfolio |
| Manager of the Value and Research |
| Funds. He graduated from Taylor |
| University in Upland, IN and |
| previously spent three years as an |
| equity analyst with McCarthy Group |
| Asset Management. Dave has been a |
CFA® charterholder since 2009. |
9 | Q1 2015 ANNUAL REPORT | UNAUDITED
VALUE FUND
Investment Style: Large-Cap Value
Co-Portfolio Managers: Wally Weitz, CFA; Brad Hinton, CFA; & Dave Perkins, CFA
Top Quarterly Contributors
Endo International – is a specialty healthcare company engaged in developing, manufacturing, marketing and distributing branded pharmaceutical and generic products as well as medical devices. In late January, management completed its previously announced $2.6 billion acquisition of Auxilium Pharmaceuticals. Auxilium strengthens Endo’s branded pharmaceutical platform, provides immediate scale in an attractive niche market (urology), and is roughly 10% accretive to our base case estimate of intrinsic value. Roughly a month later, the company agreed to sell the men’s health portion of its integrated medical systems surgical business to Boston Scientific for $1.6 billion. We anticipate the proceeds supporting future business development initiatives.
Martin Marietta Materials – is a producer of granite, limestone, sand, gravel and aggregates products for the construction industry. In February, management reported strong aggregates volume growth and price increases across each of its geographic markets and issued robust 2015 guidance. In addition, Martin increased its synergy target for the Texas Industries acquisition from $70 million to $100 million annually and announced a new share buyback plan. If the plan is completed it would represent approximately 30% of the company’s outstanding shares.
Top Fiscal Year Contributors
Valeant Pharmaceuticals International – is a specialty pharmaceutical and medical device company that develops, manufactures, and markets a range of generic and branded generic pharmaceuticals, over-the-counter products and medical devices. During an eventful fiscal year, Valeant’s strong underlying business performance carried the day as the company battled Allergan’s aggressive negative public relations campaign. Valeant’s dermatology business performed well ahead of our expectations, driven by broad-based strength across its portfolio as well as the successful launch of fungal treatment Jublia. In February, Valeant announced a definitive agreement to acquire Salix Pharmaceuticals for slightly over $15 billion. We anticipate Salix earning attractive high teens returns for Valeant over time. The combination of healthy double-digit organic sales growth and falling acquisition-related cash restructuring expenditures drove a noticeable increase in excess cash generation, creating the capacity for the company’s transaction with Salix.
Liberty Global – through its subsidiaries provides video, broadband internet, fixed-line telephone and mobile services across 14 countries. Liberty Global announced solid operational results in the Big 5 geographies: UK, Germany, Switzerland, Belgium and The Netherlands; and successfully closed the acquisition of their largest cable competitor in Holland, Ziggo. Additionally, Virgin Media in the UK (a subsidiary of Liberty Global as of June 2013) announced “Project Lightning.” Virgin intends to invest 3 billion pounds to connect four million additional homes to its network resulting in broadband speeds substantially faster than telco-based competitors. We believe the project represents a very good use of capital and should generate attractive future returns.
Endo International – Fiscal year results were driven by first quarter contributions as described above.
New Positions This Quarter
No new positions were added in the first quarter of 2015.
Top Quarterly Detractors
Twenty-First Century Fox – is a diversified media and entertainment company. Shares declined during the first quarter as management reduced 2016 earnings guidance. Reported ratings across the industry have been consistently negative as viewers transition to additional, unmeasured distribution methods and alternative content. Furthermore, Fox’s international channel is pressured on a reporting basis by headwinds from the strengthening of the U.S. dollar. We increased our position size as the stock price declined.
United Parcel Service – is a package delivery organization and a provider of supply chain management solutions. Despite significant investment during 2014 in anticipation of strong holiday e-commerce volumes, UPS’s peak shopping season struggles continued as e-commerce parcels once again crowded into a tight shipping window. We believe the company’s efforts toward a more streamlined holiday shopping experience will bear fruit in time, and we expect the company’s stock price will eventually reflect this stepped up commitment to its customers.
Top Fiscal Year Detractors
Range Resources – is a Texas-based independent natural gas, natural liquids, and oil company engaged in the exploration, development and acquisition of primarily gas properties. Falling domestic natural gas and natural gas liquids (NGL) prices in addition to regional oversupply in the northeast portion of the United States continue to be stiff headwinds for Range Resources in the near term. Absent a demand shock from a worsening U.S. economy, we expect the present supply/demand imbalance will work itself out over the next 18-24 months. In the interim, we believe Range will continue to grow per share production and reserves in a highly capital efficient manner.
Discovery Communications – is a world-class provider of non-fiction, global pay-tv programming. Weakness in U.S. television advertising, foreign currency headwinds and increased investments in niche European sports rights muted the company’s 2015 outlook and pressured Discovery’s shares during the quarter. We think the company’s investments are strategically sound and should earn solid returns over the next several years. We also believe that the core business will prove more resilient than many investors fear, especially overseas.
Apache Corporation – is an independent energy company that explores, develops and produces natural gas, crude oil and natural gas liquids. Apache shares suffered alongside most of the energy sector as oil and natural gas prices fell sharply. We sold our stake in Apache during the fourth quarter to focus our capital in two higher conviction producers, Range Resources and Pioneer Natural Resources, with better assets trading at similar discounts to our calculated intrinsic value.
Positions Eliminated This Quarter
Texas Instruments – Our sale of Texas Instruments was bittersweet, bringing to a close a very successful investment for the Fund. With a holding period just shy of five years, Texas Instruments generated an annualized internal rate of return of approximately 25% thanks in part to its “best in sector” capital allocation prowess. We continue to think favorably of its business, the company’s future prospects and its able management team, but sold when Texas Instruments shares rose above our estimate of intrinsic value.
DIRECTV – We have trimmed our DIRECTV position several times since the acquisition by AT&T was announced last May. We sold our remaining shares as the stock price approached our estimate of business value.
These performance numbers reflect the deduction of the Fund’s Investor and Institutional Class’ annual operating expenses which as stated in its most recent prospectus are 1.21% (estimated gross) and 1.11% (estimated gross), respectively, of each Class’ net assets. The returns assume redemption at the end of each period and reinvestment of dividends. Total returns shown include fee waivers and expense reimbursements, if any; total returns would have been lower had there been no waiver of fees and/or reimbursement of expenses. This information represents past performance and past performance does not guarantee future results. The investment return and the principal value of an investment in this Fund will fluctuate so that an investor’s shares, when redeemed, may be worth more or less than the original cost. Current performance may be lower or higher than the performance data quoted. Performance data current to the most recent month-end may be obtained at www.weitzinvestments.com/funds_and_performance/fund_performance.fs.
See page 6 for additional performance disclosures. See page 74 for a description of all indices.
Performance information does not reflect the deduction of taxes that a shareholder would pay on Fund distributions or the redemption of Fund shares.
10 | Q1 2015 ANNUAL REPORT
WEITZINVESTMENTS.COM
| Returns | | | | | | | | | | | | | | | | | | | | | | | | |
| | | Annualized | | | | | | |
| | | | | | | | | Since Investment | | | | | | | | | | | | |
| | | Since Inception | | | | | | | | | | | | | | | | | | | | |
| | | (5/9/1986) | | 20-year | | 10-year | | (6/30/08) | | 5-year | | 3-year | | 1-year | | Quarter |
| WVALX - Investor Class | | | 10.89 | % | | | 11.27 | % | | | 6.08 | % | | | 10.88 | % | | | 14.34 | % | | | 15.61 | % | | | 10.19 | % | | | 3.60 | % |
| WVAIX - Institutional Class | | 10.89 | | | | 11.27 | | | | 6.09 | | | | 10.90 | | | | 14.37 | | | | 15.66 | | | | 10.32 | | | | 3.64 | |
| S&P 500 | | | 10.25 | | | | 9.39 | | | | 8.01 | | | | 9.74 | | | | 14.47 | | | | 16.11 | | | | 12.73 | | | | 0.95 | |
| Russell 1000 | | | 10.31 | | | | 9.63 | | | | 8.34 | | | | 9.94 | | | | 14.73 | | | | 16.45 | | | | 12.73 | | | | 1.59 | |
| Russell 1000 Value | | | 10.44 | * | | | 9.97 | | | | 7.21 | | | | 8.90 | | | | 13.75 | | | | 16.44 | | | | 9.33 | | | | (0.72 | ) |
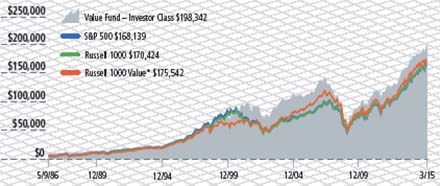
Growth of $10,000
This chart depicts the change in the value of a $10,000 investment in the Value Fund – Investor Class for the period since inception (5/9/86) through March 31, 2015, as compared with the growth of the Standard & Poor’s 500, Russell 1000 and Russell 1000 Value Indices during the same period. Index performance is hypothetical and is shown for illustrative purposes only.
* Since 5/31/1986
Capitalization
Top 10 Stock Holdings
| | | % of Net Assets |
| Liberty Global plc - Series C | | | 6.7 | |
| Valeant Pharmaceuticals International, Inc. | | | 5.9 | |
| Berkshire Hathaway, Inc. - Class B | | | 4.7 | |
| Liberty Interactive Corp. - Series A | | | 3.9 | |
| Range Resources Corp. | | | 3.7 | |
| Express Scripts Holding Co. | | | 3.6 | |
| Pioneer Natural Resources Co. | | | 3.2 | |
| Liberty Media Corp. - Series C | | | 3.2 | |
| Endo International plc | | | 3.1 | |
| Discovery Communications, Inc. - Class C | | | 3.0 | |
| | | | 41.0 | |
Industry Breakdown
| | | % of Net Assets |
| Consumer Discretionary | | | 24.5 | |
| Health Care | | | 16.7 | |
| Information Technology | | | 11.0 | |
| Financials | | | 9.4 | |
| Industrials | | | 7.1 | |
| Energy | | | 6.9 | |
| Materials | | | 3.3 | |
| Consumer Staples | | | 1.1 | |
| Cash Equivalents/Other | | | 20.0 | |
| | | | 100.0 | |
Top Performers
| | | | | | Average | | | | |
| Security Name | | Return | | | Weight | | | Contribution | |
| Valeant Pharmaceuticals International, Inc. | | | 38.8 | % | | | 6.4 | % | | | 2.19 | % |
| Endo International plc | | | 24.4 | | | | 3.0 | | | | 0.65 | |
| Martin Marietta Materials, Inc. | | | 27.1 | | | | 1.8 | | | | 0.44 | |
| Catamaran Corp. | | | 15.1 | | | | 2.4 | | | | 0.37 | |
| Pioneer Natural Resources Co. | | | 9.9 | | | | 3.1 | | | | 0.31 | |
Bottom Performers
| | | | | | Average | | | | |
| Security Name | | Return | | | Weight | | | Contribution | |
| Twenty-First Century Fox, Inc. - Class A | | | (11.5 | )% | | | 3.0 | % | | | (0.41 | )% |
| Discovery Communications, Inc. - Class C | | | (12.6 | ) | | | 3.0 | | | | (0.39 | ) |
| United Parcel Service, Inc. - Class B | | | (12.2 | ) | | | 2.0 | | | | (0.27 | ) |
| Precision Castparts Corp. | | | (12.8 | ) | | | 2.6 | | | | (0.25 | ) |
| Berkshire Hathaway, Inc. - Class B | | | (3.9 | ) | | | 5.0 | | | | (0.19 | ) |
Contributions to Fund performance are based on actual daily holdings. Securities may have been bought or sold during the quarter. Source: FactSet Portfolio Analytics
Return shown is the actual quarterly return of the security.
11 | Q1 2015 ANNUAL REPORT | UNAUDITED
PARTNERS VALUE FUND
Investment Style: Multi-Cap Value
Co-Portfolio Managers: Wally Weitz, CFA & Brad Hinton, CFA
Top Quarterly Contributors
Interval Leisure Group – is a provider of non-traditional lodging, encompassing a portfolio of leisure businesses from exchange and vacation rental to vacation ownership. Interval’s stock rebounded after the company posted solid quarterly results and issued encouraging 2015 guidance. Revenue per member is rising again as the company anniversaries the four large contract re-pricings from early last year. Management also better articulated plans for its recent timeshare acquisition, raised the dividend and increased its share repurchase authorization.
Martin Marietta Materials – is a producer of granite, limestone, sand, gravel and aggregates products for the construction industry. In February, management reported strong aggregates volume growth and price increases across each of its geographic markets and issued robust 2015 guidance. In addition, Martin increased its synergy target for the Texas Industries acquisition from $70 million to $100 million annually and announced a new share buyback plan. If the plan is completed it would represent approximately 30% of the company’s outstanding shares.
Top Fiscal Year Contributors
Valeant Pharmaceuticals International – is a specialty pharmaceutical and medical device company that develops, manufactures, and markets a range of generic and branded generic pharmaceuticals, over-the-counter products and medical devices. During an eventful fiscal year, Valeant’s strong underlying business performance carried the day as the company battled Allergan’s aggressive negative public relations campaign. Valeant’s dermatology business performed well ahead of our expectations, driven by broad-based strength across its portfolio as well as the successful launch of fungal treatment Jublia. In February, Valeant announced a definitive agreement to acquire Salix Pharmaceuticals for slightly over $15 billion. We anticipate Salix earning attractive high teens returns for Valeant over time. The combination of healthy double-digit organic sales growth and falling acquisition-related cash restructuring expenditures drove a noticeable increase in excess cash generation, creating the capacity for the company’s transaction with Salix.
Liberty Global – through its subsidiaries provides video, broadband internet, fixed-line telephone and mobile services across 14 countries. Liberty Global announced solid operational results in the Big 5 geographies: UK, Germany, Switzerland, Belgium and The Netherlands; and successfully closed the acquisition of their largest cable competitor in Holland, Ziggo. Additionally, Virgin Media in the UK (a subsidiary of Liberty Global as of June 2013) announced “Project Lightning.” Virgin intends to invest 3 billion pounds to connect four million additional homes to its network resulting in broadband speeds substantially faster than telco-based competitors. We believe the project represents a very good use of capital and should generate attractive future returns.
XO Group – is a life stage media company. It serves its audience with information, products, and services during critical life stages: planning a wedding, sharing life as a couple for the first time, and planning for the birth of a first child. In early 2014 new management announced a period of heightened infrastructure investment. Since then, management has clearly articulated the company’s intended path and investors have shown confidence in their plan.
New Positions This Quarter
No new positions were added in the first quarter of 2015.
Top Quarterly Detractors
Discovery Communications – is a world-class provider of non-fiction, global pay-tv programming. Weakness in U.S. television advertising, foreign currency headwinds and increased investments in niche European sports rights muted the company’s 2015 outlook and pressured Discovery’s shares during the quarter. We think the company’s investments are strategically sound and should earn solid returns over the next several years. We also believe that the core business will prove more resilient than many investors fear, especially overseas.
Redwood Trust – Redwood Trust’s fourth quarter earnings fell short of expectations due in part to lower commercial mortgage banking income and decreased valuations for mortgage servicing rights (MSR’s). The company’s 2015 volume expectations for jumbo residential, conforming residential and commercial lending point to increased earnings potential this year. In the meantime, Redwood pays a healthy dividend that yields more than 6% at the current stock price.
Top Fiscal Year Detractors
Range Resources – is a Texas-based independent natural gas, natural liquids, and oil company engaged in the exploration, development and acquisition of primarily gas properties. Falling domestic natural gas and natural gas liquids (NGL) prices in addition to regional oversupply in the northeast portion of the United States continue to be stiff headwinds for Range Resources in the near term. Absent a demand shock from a worsening U.S. economy, we expect the present supply/demand imbalance will work itself out over the next 18-24 months. In the interim, we believe Range will continue to grow per share production and reserves in a highly capital efficient manner.
Avon Products – is a manufacturer and marketer of beauty and related products. Last year, investors became quite concerned by worse-than-expected results in the company’s North American business as well as missteps in Brazil, which is Avon’s top market. Later in the year Avon demonstrated some progress in its long turnaround, but worries over the transactional impact of the rapid rise of the U.S. dollar against the Brazilian Real and the Russian Ruble erased the positives from the operational improvement.
Apache Corporation – is an independent energy company that explores, develops and produces natural gas, crude oil and natural gas liquids. Apache shares suffered alongside most of the energy sector as oil and natural gas prices fell sharply. We sold our stake in Apache during the fourth quarter to focus our capital in two higher conviction producers, Range Resources and Pioneer Natural Resources, with better assets trading at similar discounts to our calculated intrinsic value.
Positions Eliminated This Quarter
No positions were eliminated in the first quarter of 2015.
These performance numbers reflect the deduction of the Fund’s Investor and Institutional Class’ annual operating expenses which as stated in its most recent prospectus are 1.22% (estimated gross) and 1.08% (estimated gross), respectively, of each Class’ net assets. The returns assume redemption at the end of each period and reinvestment of dividends. Total returns shown include fee waivers and expense reimbursements, if any; total returns would have been lower had there been no waiver of fees and/or reimbursement of expenses. This information represents past performance and past performance does not guarantee future results. The investment return and the principal value of an investment in this Fund will fluctuate so that an investor’s shares, when redeemed, may be worth more or less than the original cost. Current performance may be lower or higher than the performance data quoted. Performance data current to the most recent month-end may be obtained at www.weitzinvestments.com/funds_and_performance/fund_performance.fs.
See page 6 for additional performance disclosures. See page 74 for a description of all indices.
Performance information does not reflect the deduction of taxes that a shareholder would pay on Fund distributions or the redemption of Fund shares.
12 | Q1 2015 ANNUAL REPORT
WEITZINVESTMENTS.COM
| Returns | | | | | | | | | | | | | | | | | | | | | |
| | | Annualized | | | | | | |
| | | Since Inception | | | | | | | | | | | | | | | | | | |
| | | (6/1/1983) | | 20-year | | 10-year | | 5-year | | 3-year | | 1-year | | Quarter |
| WPVLX - Investor Class | | | 12.77 | % | | | 11.99 | % | | | 7.56 | % | | | 14.68 | % | | | 15.89 | % | | | 8.99 | % | | | 3.27 | % |
| WPVIX - Institutional Class | | | 12.77 | | | | 11.99 | | | | 7.57 | | | | 14.71 | | | | 15.93 | | | | 9.11 | | | | 3.33 | |
| S&P 500 | | | 11.02 | | | | 9.39 | | | | 8.01 | | | | 14.47 | | | | 16.11 | | | | 12.73 | | | | 0.95 | |
| Russell 3000 | | | 10.84 | | | | 9.58 | | | | 8.38 | | | | 14.71 | | | | 16.43 | | | | 12.37 | | | | 1.80 | |
| Russell 3000 Value | | | 11.40 | | | | 10.01 | | | | 7.24 | | | | 13.66 | | | | 16.30 | | | | 8.94 | | | | (0.51 | ) |
Growth of $10,000
This chart depicts the change in the value of a $10,000 investment in the Partners Value Fund - Investor Class for the period since inception (6/1/83) through March 31, 2015, as compared with the growth of the Standard & Poor’s 500, Russell 3000 and Russell 3000 Value Indices during the same period. Index performance is hypothetical and is shown for illustrative purposes only.

Top 10 Stock Holdings
| | % of Net Assets |
| Liberty Global plc - Series C | | 5.4 | |
| Berkshire Hathaway, Inc. - Class B | | 4.6 | |
| Valeant Pharmaceuticals International, Inc. | | 4.5 | |
| Express Scripts Holding Co. | | 3.9 | |
| Liberty Media Corp. - Series C | | 3.4 | |
| Liberty Interactive Corp. - Series A | | 3.2 | |
| Range Resources Corp. | | 2.8 | |
| Redwood Trust, Inc. | | 2.7 | |
| Wells Fargo & Co. | | 2.7 | |
| Laboratory Corp. of America Holdings | | 2.6 | |
| | | 35.8 | |
Industry Breakdown
| | % of Net Assets |
| Consumer Discretionary | | 27.4 | |
| Financials | | 14.8 | |
| Health Care | | 13.0 | |
| Information Technology | | 12.7 | |
| Industrials | | 4.7 | |
| Energy | | 4.7 | |
| Materials | | 2.5 | |
| Consumer Staples | | 1.4 | |
| Cash Equivalents/Other | | 18.8 | |
| | | 100.0 | |
Top Performers
| | | | | Average | | | | |
| Security Name | Return | | | Weight | | | Contribution | |
| Valeant Pharmaceuticals International, Inc. | | 38.8 | % | | | 4.3 | % | | | 1.47 | % |
| Interval Leisure Group, Inc. | | 26.0 | | | | 2.3 | | | | 0.59 | |
| Martin Marietta Materials, Inc. | | 27.1 | | | | 2.3 | | | | 0.57 | |
| Laboratory Corp. of America Holdings | | 16.9 | | | | 2.5 | | | | 0.38 | |
| Liberty Media Corp. - Series C | | 9.0 | | | | 3.4 | | | | 0.32 | |
Bottom Performers
| | | | | Average | | | | |
| Security Name | Return | | | Weight | | | Contribution | |
| Discovery Communications, Inc. - Class C | | (12.6 | )% | | | 2.2 | % | | | (0.27 | )% |
| Avon Products, Inc. | | (14.3 | ) | | | 1.5 | | | | (0.26 | ) |
| Redwood Trust, Inc. | | (7.9 | ) | | | 3.0 | | | | (0.24 | ) |
| Twenty-First Century Fox, Inc. - Class A | | (11.5 | ) | | | 1.5 | | | | (0.20 | ) |
| Berkshire Hathaway, Inc. - Class B | | (3.9 | ) | | | 4.7 | | | | (0.18 | ) |
Contributions to Fund performance are based on actual daily holdings. Securities may have been bought or sold during the quarter. Source: FactSet Portfolio Analytics
Return shown is the actual quarterly return of the security.
13 | Q1 2015 ANNUAL REPORT | UNAUDITED
PARTNERS III OPPORTUNITY FUND
Investment Style: Multi-Cap Alternative
Portfolio Manager: Wally Weitz, CFA
Top Quarterly Contributors
Martin Marietta Materials – is a producer of granite, limestone, sand, gravel and aggregates products for the construction industry. In February, management reported strong aggregates volume growth and price increases across each of its geographic markets and issued robust 2015 guidance. In addition, Martin increased its synergy target for the Texas Industries acquisition from $70 million to $100 million annually and announced a new share buyback plan. If the plan is completed it would represent approximately 30% of the company’s outstanding shares.
Interval Leisure Group – is a provider of non-traditional lodging, encompassing a portfolio of leisure businesses from exchange and vacation rental to vacation ownership. Interval’s stock rebounded after the company posted solid quarterly results and issued encouraging 2015 guidance. Revenue per member is rising again as the company anniversaries the four large contract re-pricings from early last year. Management also better articulated plans for its recent timeshare acquisition, raised the dividend and increased its share repurchase authorization.
Top Fiscal Year Contributors
Valeant Pharmaceuticals International – is a specialty pharmaceutical and medical device company that develops, manufactures, and markets a range of generic and branded generic pharmaceuticals, over-the-counter products and medical devices. During an eventful fiscal year, Valeant’s strong underlying business performance carried the day as the company battled Allergan’s aggressive negative public relations campaign. Valeant’s dermatology business performed well ahead of our expectations, driven by broad-based strength across its portfolio as well as the successful launch of fungal treatment Jublia. In February, Valeant announced a definitive agreement to acquire Salix Pharmaceuticals for slightly over $15 billion. We anticipate Salix earning attractive high teens returns for Valeant over time. The combination of healthy double-digit organic sales growth and falling acquisition-related cash restructuring expenditures drove a noticeable increase in excess cash generation, creating the capacity for the company’s transaction with Salix.
TransDigm Group – is a designer, producer and supplier of engineered aircraft components for use on commercial and military aircraft in service. TransDigm enjoyed a strong year, capped by the acquisition of Telair Cargo Group from AAR Corp. The company’s core commercial aftermarket business generated healthy double-digit organic sales growth, fueling the cash flow engine that has proven to be a valuable shareholder wealth creator over time. The Telair deal looks tailor made for TransDigm, boasting a high percentage of proprietary, sole source aerospace components and systems with significant and reliable replacement demand.
Liberty Global – through its subsidiaries provides video, broadband internet, fixed-line telephone and mobile services across 14 countries. Liberty Global announced solid operational results in the Big 5 geographies: UK, Germany, Switzerland, Belgium and The Netherlands; and successfully closed the acquisition of their largest cable competitor in Holland, Ziggo. Additionally, Virgin Media in the UK (a subsidiary of Liberty Global as of June 2013) announced “Project Lightning.” Virgin intends to invest 3 billion pounds to connect four million additional homes to its network resulting in broadband speeds substantially faster than telco-based competitors. We believe the project represents a very good use of capital and should generate attractive future returns.
New Positions This Quarter
No new long positions were added in the first quarter of 2015.
Top Quarterly Detractors
Cumulus Media – is a radio broadcasting company. Cumulus reported lower than expected revenue and earnings, as political advertising revenues were weaker than the company’s expectation. Sales of non-core real estate appear to be taking longer to close than anticipated, though the company believes they remain on track. Furthermore, Cumulus declined to offer first quarter 2015 guidance, adding additional uncertainty to the mix.
Berkshire Hathaway – is a conglomerate holding company owning subsidiaries engaged in a number of business activities. Troubles at Berkshire’s BNSF Railroad subsidiary which has been plagued with congestion, confusion and delay caused some disappointment despite continued strong results in Berkshire’s Insurance units. BNSF is spending aggressively to fix its problems and remains a premier railroad in an excellent industry.
Top Fiscal Year Detractors
Cumulus Media – In addition to the political advertising challenges, Cumulus has seen declining ratings in four of its larger markets as these stations undergo generational transitions in on air talent. Such transitions are inevitable and management has successfully handled such changes in the past. Additionally, as advertisers have flocked toward digital and online platforms, investors fear that radio will disproportionately lose wallet share. Overall listening hours, however, have remained stable and we believe radio will continue to be a cost effective advertising medium, particularly for local businesses.
Avon Products – is a manufacturer and marketer of beauty and related products. Last year, investors became quite concerned by worse-than-expected results in the company’s North American business as well as missteps in Brazil, which is Avon’s top market. Later in the year Avon demonstrated some progress in its long turnaround, but worries over the transactional impact of the rapid rise of the U.S. dollar against the Brazilian Real and the Russian Ruble erased the positives from the operational improvement.
Range Resources – is a Texas-based independent natural gas, natural liquids, and oil company engaged in the exploration, development and acquisition of primarily gas properties. Falling domestic natural gas and natural gas liquids (NGL) prices in addition to regional oversupply in the northeast portion of the United States continue to be stiff headwinds for Range Resources in the near term. Absent a demand shock from a worsening U.S. economy, we expect the present supply/demand imbalance will work itself out over the next 18-24 months. In the interim, we believe Range will continue to grow per share production and reserves in a highly capital efficient manner.
Positions Eliminated This Quarter
Allison Transmission – We sold Allison at a gain as we were not able to build a meaningful position during October’s decline, and the stock rebounded quickly.
Motorola Solutions – We sold our modest holdings in Motorola Solutions as portfolio manager conviction was not strong enough to build a core position.
These performance numbers reflect the deduction of the Fund’s Investor and Institutional Class’ annual operating expenses which as stated in its most recent prospectus are 1.86% and 1.45%, respectively, of each Class’ net assets. The returns assume redemption at the end of each period and reinvestment of dividends. Total returns shown include fee waivers and expense reimbursements, if any; total returns would have been lower had there been no waiver of fees and/or reimbursement of expenses. This information represents past performance and past performance does not guarantee future results. The investment return and the principal value of an investment in this Fund will fluctuate so that an investor’s shares, when redeemed, may be worth more or less than the original cost. Current performance may be lower or higher than the performance data quoted. Performance data current to the most recent month-end may be obtained at www.weitzinvestments.com/funds_and_performance/fund_performance.fs.
See page 6 for additional performance disclosures. See page 74 for a description of all indices.
Performance information does not reflect the deduction of taxes that a shareholder would pay on Fund distributions or the redemption of Fund shares.
14 | Q1 2015 ANNUAL REPORT
WEITZINVESTMENTS.COM
| Returns | | | | | | | | | | | | | | | | | | | | | |
| | | Annualized | | | | | | |
| | | Since Inception | | | | | | | | | | | | | | | | | | |
| | | (6/1/1983) | | 20-year | | 10-year | | 5-year | | 3-year | | 1-year | | Quarter |
| WPOIX - Investor Class | | | 13.36 | % | | | 13.57 | % | | | 8.65 | % | | | 14.40 | % | | | 14.59 | % | | | 7.38 | % | | | 4.26 | % |
| WPOPX - Institutional Class | | | 13.40 | | | | 13.63 | | | | 8.76 | | | | 14.64 | | | | 14.90 | | | | 7.76 | | | | 4.34 | |
| S&P 500 | | | 11.02 | | | | 9.39 | | | | 8.01 | | | | 14.47 | | | | 16.11 | | | | 12.73 | | | | 0.95 | |
| Russell 3000 | | | 10.84 | | | | 9.58 | | | | 8.38 | | | | 14.71 | | | | 16.43 | | | | 12.37 | | | | 1.80 | |
| Russell 3000 Value | | | 11.40 | | | | 10.01 | | | | 7.24 | | | | 13.66 | | | | 16.30 | | | | 8.94 | | | | (0.51 | ) |
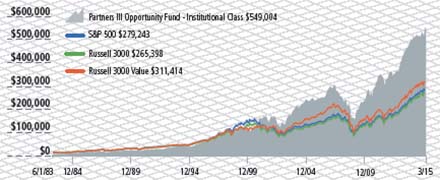
Growth of $10,000
This chart depicts the change in the value of a $10,000 investment in the Partners III Opportunity Fund - Institutional Class for the period since inception (6/1/83) through March 31, 2015, as compared with the growth of the Standard & Poor’s 500, Russell 3000 and Russell 3000 Value Indices during the same period. Index performance is hypothetical and is shown for illustrative purposes only.
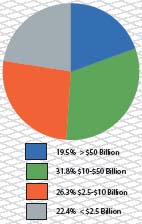
Capitalization
Top 10 Stock Holdings
| | % of Net Assets |
| Berkshire Hathaway, Inc. - Class B | | 7.6 | |
| Liberty Global plc - Series C | | 6.9 | |
| TransDigm Group, Inc. | | 5.0 | |
| Liberty Media Corp. - Series C | | 4.9 | |
| Valeant Pharmaceuticals International, Inc. | | 4.6 | |
| Liberty Interactive Corp. - Series A | | 3.6 | |
| Liberty Broadband Corp. - Series C | | 3.6 | |
| Wells Fargo & Co. | | 3.5 | |
| Wesco Aircraft Holdings, Inc. | | 3.3 | |
| Martin Marietta Materials, Inc. | | 3.0 | |
| | | 46.0 | |
Industry Breakdown
| | % of Net Assets |
| Consumer Discretionary | | 36.3 | |
| Financials | | 13.9 | |
| Industrials | | 13.0 | |
| Health Care | | 11.0 | |
| Information Technology | | 8.1 | |
| Energy | | 5.4 | |
| Materials | | 3.0 | |
| Consumer Staples | | 2.4 | |
| Securities Sold Short | | (25.3 | ) |
| Short Proceeds/Other | | 32.2 | |
| | | 100.0 | |
Top Performers
| | | | | | Average | | | | |
| Security Name | | Return | | | Weight | | | Contribution | |
| Valeant Pharmaceuticals International, Inc. | | | 38.8 | % | | | 5.0 | % | | | 1.74 | % |
| Martin Marietta Materials, Inc. | | | 27.1 | | | | 2.7 | | | | 0.67 | |
| Interval Leisure Group, Inc. | | | 26.0 | | | | 2.5 | | | | 0.61 | |
| TransDigm Group, Inc. | | | 11.4 | | | | 4.8 | | | | 0.54 | |
| Laboratory Corp. of America Holdings | | | 16.9 | | | | 2.5 | | | | 0.47 | |
Bottom Performers
| | | | | | Average | | | | |
| Security Name | | Return | | | Weight | | | Contribution | |
| Cumulus Media, Inc. - Class A | | | (41.6 | )% | | | 0.8 | % | | | (0.37 | )% |
| Avon Products, Inc. | | | (14.3 | ) | | | 2.3 | | | | (0.30 | ) |
| Berkshire Hathaway, Inc. - Class B | | | (3.9 | ) | | | 7.7 | | | | (0.30 | ) |
| Discovery Communications, Inc. - Class C | | | (12.6 | ) | | | 2.4 | | | | (0.30 | ) |
| Ishares Russell 2000 Fund (short) | | | 4.2 | | | | (6.7 | ) | | | (0.28 | ) |
Contributions to Fund performance are based on actual daily holdings. Securities may have been bought or sold during the quarter. Source: FactSet Portfolio Analytics
Return shown is the actual quarterly return of the security.
15 | Q1 2015 ANNUAL REPORT | UNAUDITED
RESEARCH FUND
Investment Style: Multi-Cap Value
Co-Portfolio Managers: Jon Baker, CFA; Barton Hooper, CFA; Dave Perkins, CFA; & Drew Weitz
Top Quarterly Contributors
Catamaran Corporation – is a provider of pharmacy benefit management services and healthcare IT solutions to the healthcare benefit management industry. On March 30th, UnitedHealth Group announced a definitive agreement to purchase Catamaran for $61.50 per share in cash. While we find the Catamaran board’s timing interesting in light of the company’s future growth opportunities, the price is consistent with our valuation work.
ADT Corporation – is engaged in providing monitored security, interactive home and business automation and related monitoring services in the United States and Canada. Management’s efforts to reduce overall costs and improve the quality of their new subscriber base, combined with improving customer attrition metrics, have driven better results at ADT, suggesting their business is more durable than skeptics believed. Furthermore, observers have begun to speculate how ADT could partner with other technology companies that feature DIY (Do-It-Yourself) home automation products to drive incremental business opportunities.
Top Fiscal Year Contributors
XO Group – is a life stage media company. It serves its audience with information, products, and services during critical life stages: planning a wedding, sharing life as a couple for the first time, and planning for the birth of a first child. In early 2014 new management announced a period of heightened infrastructure investment. Since then, management has clearly articulated the company’s intended path and investors have shown confidence in their plan.
ADT Corporation – After reporting disappointing earnings for the quarter ended December 31, 2013 (in January 2014) results have slowly but steadily improved as management’s actions to improve the quality of its new customers and lower overall costs have gained traction.
Valeant Pharmaceuticals International – is a specialty pharmaceutical and medical device company that develops, manufactures, and markets a range of generic and branded generic pharmaceuticals, over-the-counter products and medical devices. During an eventful fiscal year, Valeant’s strong underlying business performance carried the day as the company battled Allergan’s aggressive negative public relations campaign. Valeant’s dermatology business performed well ahead of our expectations, driven by broad-based strength across its portfolio as well as the successful launch of fungal treatment Jublia. In February, Valeant announced a definitive agreement to acquire Salix Pharmaceuticals for slightly over $15 billion. We anticipate Salix earning attractive high teens returns for Valeant over time. The combination of healthy double-digit organic sales growth and falling acquisition-related cash restructuring expenditures drove a noticeable increase in excess cash generation, creating the capacity for the company’s aforementioned transaction with Salix.
New Positions This Quarter
Swatch Group – Swatch Group AG manufactures and sells finished watches, jewelry, watch movements and components. As fear over the dominance of the Apple Watch mounts, Swatch’s stock price has declined. We believe these fears are overdone. Despite current economic slowdowns in China and the Middle East we believe these markets will provide continued growth opportunities for Swatch’s luxury watches over the longer term.
Discovery Communications – is a world-class provider of non-fiction, global pay-tv programming. Non-fiction content is a wonderful business. It is cheap to produce and portable across geographies positioned to benefit from the long-tailed wave of increasing pay-tv adoption outside the U.S. The company generally owns the full rights to its content, providing bargaining power as the distribution ecosystem evolves. From today’s prices, we think the stock’s return potential is adequate-to-exceptional with solid downside protection.
Core Laboratories – is a service provider to the oil and gas industry that helps producers identify resource potential and enhance production of existing reservoirs. Core Labs is a business of the highest quality regardless of industry. While its business will suffer as a result of the fall in oil prices, Core’s wide moat will continue to exist.
Top Quarterly Detractors
Twenty-First Century Fox – is a diversified media and entertainment company. Shares declined during the first quarter as management reduced 2016 earnings guidance. Reported ratings across the industry have been consistently negative as viewers transition to additional, unmeasured distribution methods and alternative content. Furthermore, Fox’s international channel is pressured on a reporting basis by headwinds from the strengthening of the U.S. dollar. We added to our position as the stock price declined.
MRC Global – along with its subsidiaries is an industrial distributor of pipe, valves and fittings and related products and services to the upstream, midstream and downstream energy industries. Global energy-related spending has fallen at an unprecedented rate during the first three months of 2015. We did not anticipate the depth of the present decline, nor the speed with which North American producers in particular would respond. As such, we were too early in buying MRC Global shares during the fourth quarter. At its present price, however, we believe MRC offers patient owners the potential for compelling returns over our three to five year investment horizon.
Top Fiscal Year Detractors
Angie’s List – operates a national local services consumer review service and marketplace. Angie’s List’s shares kept on a downward track for much of the past year as the lack of current earnings has increasingly tested investors’ resolve. Management has continued to focus on the acquisition of new consumer and corporate relationships. We continue to see a path to sustainably higher margins and positive reported earnings as a result.
Avon Products – is a manufacturer and marketer of beauty and related products. Last year, investors became quite concerned by worse-than-expected results in the company’s North American business as well as missteps in Brazil, which is Avon’s top market. Later in the year Avon demonstrated some progress in its long turnaround, but worries over the transactional impact of the rapid rise of the U.S. dollar against the Brazilian Real and the Russian Ruble erased the positives from the operational improvement.
MRC Global – This quarter’s performance was significant, as described above, and therefore detracted from the fiscal year returns.
Positions Eliminated This Quarter
World Fuel Services – We closed the position to focus on names with greater discounts between stock price and our estimate of intrinsic value.
Disney – We closed the position as the stock price exceeded our estimate of intrinsic value.
eBay – We closed the position for a modest gain and focused on names with greater discounts between stock price and our estimate of intrinsic value.
Oracle – We closed the position as the stock price approached our estimate of intrinsic value.
Omnicom – We closed the position as the stock price approached our estimate of intrinsic value.
DIRECTV – We have trimmed our DIRECTV position several times since the acquisition by AT&T was announced last May. We sold our remaining shares as the stock price approached our estimate of business value.
Annual operating expenses for the Fund as stated in its most recent prospectus are 1.59% (gross) and 0.91% (net) of the Fund’s net assets. The returns assume redemption at the end of each period and reinvestment of dividends. Total returns shown include fee waivers and expense reimbursements, if any; total returns would have been lower had there been no waiver of fees and/or reimbursement of expenses. Starting January 1, 2011, these performance numbers reflect the deduction of the Fund’s actual operating expenses. For periods of time prior to January 1, 2011, the performance numbers reflect the deduction of annual pro forma operating expenses of 1.50%. This information represents past performance and past performance does not guarantee future results. The investment return and the principal value of an investment in this Fund will fluctuate so that an investor’s shares, when redeemed, may be worth more or less than the original cost. Current performance may be lower or higher than the performance data quoted. Performance data current to the most recent month-end may be obtained at www.weitzinvestments.com/funds_and_performance/fund_performance.fs.
See page 6 for additional performance disclosures. See page 74 for a description of all indices.
Performance information does not reflect the deduction of taxes that a shareholder would pay on Fund distributions or the redemption of Fund shares.
16 | Q1 2015 ANNUAL REPORT
WEITZINVESTMENTS.COM
| Returns | | | | | | | | | | | | | | | |
| | | Annualized | | | | | | |
| | | Since Inception | | | | | | | | | | | | |
| | | (4/1/2005) | | 5-year | | 3-year | | 1-year | | Quarter |
| WRESX | | | 8.86 | % | | | 14.17 | % | | | 13.39 | % | | | 12.22 | % | | | 3.30 | % |
| S&P 500 | | | 8.01 | | | | 14.47 | | | | 16.11 | | | | 12.73 | | | | 0.95 | |
| Russell 3000 | | | 8.37 | | | | 14.71 | | | | 16.43 | | | | 12.37 | | | | 1.80 | |
| Russell 3000 Value | | | 7.23 | | | | 13.66 | | | | 16.30 | | | | 8.94 | | | | (0.51 | ) |
Growth of $10,000
This chart depicts the change in the value of a $10,000 investment in the Research Fund for the period since inception (4/1/05) through March 31, 2015, as compared with the growth of the Standard & Poor’s 500, Russell 3000 and Russell 3000 Value Indices during the same period. Index performance is hypothetical and is shown for illustrative purposes only.

Capitalization
Top 10 Stock Holdings
| | % of Net Assets |
| Range Resources Corp. | | 7.0 | |
| Catamaran Corp. | | 6.4 | |
| Liberty Global plc - Series C | | 6.2 | |
| Angie’s List, Inc. | | 5.7 | |
| The ADT Corp. | | 4.5 | |
| Liberty Interactive Corp. - Series A | | 4.3 | |
| National CineMedia, Inc. | | 3.9 | |
| Valeant Pharmaceuticals International, Inc. | | 3.8 | |
| Liberty Media Corp. - Series C | | 3.7 | |
| MRC Global Inc. | | 3.0 | |
| | | 48.5 | |
Industry Breakdown
| | % of Net Assets |
| Consumer Discretionary | | 31.1 | |
| Information Technology | | 13.5 | |
| Health Care | | 13.2 | |
| Energy | | 10.2 | |
| Industrials | | 7.5 | |
| Consumer Staples | | 4.8 | |
| Financials | | 4.1 | |
| Cash Equivalents/Other | | 15.6 | |
| | | 100.0 | |
Top Performers
| | | | | | Average | | | | |
| Security Name | | Return | | | Weight | | | Contribution | |
| Valeant Pharmaceuticals International, Inc. | | | 38.8 | % | | | 4.3 | % | | | 1.52 | % |
| Catamaran Corp. | | | 15.1 | | | | 5.7 | | | | 0.85 | |
| The ADT Corp. | | | 15.3 | | | | 4.4 | | | | 0.66 | |
| Interval Leisure Group, Inc. | | | 26.0 | | | | 2.1 | | | | 0.60 | |
| Liberty Media Corp. - Series C | | | 9.0 | | | | 3.7 | | | | 0.34 | |
Bottom Performers
| | | | | | Average | | | | |
| Security Name | | Return | | | Weight | | | Contribution | |
| Angie’s List, Inc. | | | (5.8 | )% | | | 5.8 | % | | | (0.45 | )% |
| Twenty-First Century Fox, Inc. - Class A | | | (11.5 | ) | | | 2.9 | | | | (0.41 | ) |
| MRC Global Inc. | | | (21.8 | ) | | | 2.8 | | | | (0.38 | ) |
| Avon Products, Inc. | | | (14.3 | ) | | | 2.2 | | | | (0.35 | ) |
| XO Group, Inc. | | | (3.0 | ) | | | 2.1 | | | | (0.17 | ) |
Contributions to Fund performance are based on actual daily holdings. Securities may have been bought or sold during the quarter. Source: FactSet Portfolio Analytics
Return shown is the actual quarterly return of the security.
17 | Q1 2015 ANNUAL REPORT | UNAUDITED
HICKORY FUND
Investment Style: Small- to Mid-Cap Value
Co-Portfolio Managers: Wally Weitz, CFA & Drew Weitz
Top Quarterly Contributors
Interval Leisure Group – is a provider of non-traditional lodging, encompassing a portfolio of leisure businesses from exchange and vacation rental to vacation ownership. Interval’s stock rebounded after the company posted solid quarterly results and issued encouraging 2015 guidance. Revenue per member is rising again as the company anniversaries the four large contract re-pricings from early last year. Management also better articulated plans for its recent timeshare acquisition, raised the dividend and increased its share repurchase authorization.
Martin Marietta Materials – is a producer of granite, limestone, sand, gravel and aggregates products for the construction industry. In February, management reported strong aggregates volume growth and price increases across each of its geographic markets and issued robust 2015 guidance. In addition, Martin increased its synergy target for the Texas Industries acquisition from $70 million to $100 million annually and announced a new share buyback plan. If the plan is completed it would represent approximately 30% of the company’s outstanding shares.
World Fuel Services – is a fuel logistics, transaction management and payment processing company. The company is engaged in the distribution of fuel and related products and services in the aviation, marine and land transportation industries. World Fuel’s stock has appreciated as investors anticipate the company will gain market share in the Marine business following the bankruptcy filing of its largest competitor. Additionally, recent fuel price volatility should create additional demand for higher margins services such as hedging strategies.
Top Fiscal Year Contributors
XO Group – is a life stage media company. It serves its audience with information, products, and services during critical life stages: planning a wedding, sharing life as a couple for the first time, and planning for the birth of a first child. In early 2014 new management announced a period of heightened infrastructure investment. Since then, management has clearly articulated the company’s intended path and investors have shown confidence in their plan.
ADT Corporation – is engaged in providing monitored security, interactive home and business automation and related monitoring services in the United States and Canada. After reporting disappointing earnings for the quarter ended December 31, 2013 (in January 2014) results have slowly but steadily improved as management’s actions to improve the quality of its new customers and lower overall costs have gained traction.
TransDigm Group – is a designer, producer and supplier of engineered aircraft components for use on commercial and military aircraft in service. TransDigm enjoyed a strong year, capped by the acquisition of Telair Cargo Group from AAR Corp. The company’s core commercial aftermarket business generated healthy double-digit organic sales growth, fueling the cash flow engine that has proven to be a valuable shareholder wealth creator over time. The Telair deal looks tailor made for TransDigm, boasting a high percentage of proprietary, sole source aerospace components and systems with significant and reliable replacement demand.
New Positions This Quarter
No new positions were added in the first quarter of 2015.
Top Quarterly Detractors
Cumulus Media – is a radio broadcasting company. Cumulus reported lower than expected revenue and earnings, as political advertising revenues were weaker than the company’s expectation. Sales of non-core real estate appear to be taking longer to close than anticipated, though the company believes they remain on track. Furthermore, Cumulus declined to offer first quarter 2015 guidance, adding additional uncertainty to the mix.
Ascent Capital Group – is a public holding company whose primary subsidiary, Monitronics International, Inc., provides security alarm monitoring and related services to residential and business subscribers in the United States and parts of Canada. Ascent’s Security Networks acquisition took focus away from evaluating potential bulk purchases of monitored security accounts, resulting in slow new account generation. This, combined with rising prices paid to Ascent’s network of affiliate dealers tempered account growth and led to slightly soggier results than anticipated.
Redwood Trust – operates as a real estate investment trust. The company, together with its subsidiaries, invests in mortgage – and other real estate-related assets and is engaged in residential and commercial mortgage banking activities. Redwood Trust’s fourth quarter earnings fell short of expectations due in part to lower commercial mortgage banking income and decreased valuations for mortgage servicing rights (MSR’s). The company’s 2015 volume expectations for jumbo residential, conforming residential and commercial lending point to increased earnings potential this year. In the meantime, Redwood pays a healthy dividend that yields more than 6% at the current stock price.
Top Fiscal Year Detractors
Avon Products – is a manufacturer and marketer of beauty and related products. Last year, investors became quite concerned by worse-than-expected results in the company’s North American business as well as missteps in Brazil, which is Avon’s top market. Later in the year Avon demonstrated some progress in its long turnaround, but worries over the transactional impact of the rapid rise of the U.S. dollar against the Brazilian Real and the Russian Ruble erased the positives from the operational improvement.
Cumulus Media – In addition to the political advertising challenges, Cumulus has seen declining ratings in four of its larger markets as these stations undergo generational transitions in on air talent. Such transitions are inevitable and management has successfully handled such changes in the past. Additionally, as advertisers have flocked toward digital and online platforms, investors fear that radio will disproportionately lose wallet share. Overall listening hours, however, have remained stable and we believe radio will continue to be a cost effective advertising medium, particularly for local businesses.
Angie’s List – operates a national local services consumer review service and marketplace. Angie’s List’s shares kept on a downward track for much of the 2014 as the lack of current earnings has increasingly tested investors’ resolve. Management has continued to invest in the acquisition of new consumer and corporate relationships. We continue to see a path to sustainably higher margins and positive reported earnings as a result.
Positions Eliminated This Quarter
No positions were eliminated in the first quarter of 2015.
These performance numbers reflect the deduction of the Fund’s annual operating expenses which as stated in its most recent prospectus are 1.22% of the Fund’s net assets. The returns assume redemption at the end of each period and reinvestment of dividends. Total returns shown include fee waivers and expense reimbursements, if any; total returns would have been lower had there been no waiver of fees and/or reimbursement of expenses. This information represents past performance and past performance does not guarantee future results. The investment return and the principal value of an investment in this Fund will fluctuate so that an investor’s shares, when redeemed, may be worth more or less than the original cost. Current performance may be lower or higher than the performance data quoted. Performance data current to the most recent month-end may be obtained at www.weitzinvestments.com/funds_and_performance/fund_performance.fs.
See page 6 for additional performance disclosures. See page 74 for a description of all indices.
Performance information does not reflect the deduction of taxes that a shareholder would pay on Fund distributions or the redemption of Fund shares.
18 | Q1 2015 ANNUAL REPORT
WEITZINVESTMENTS.COM
| Returns | | | | | | | | | | | | | | | | | | | | | | | | |
| | | Annualized | | | | | | |
| | | | | | | | | Since
Investment | | | | | | | | | | | | |
| | Since Inception | | | | | | | Style Inception | | | | | | | | | | | | |
| | | (4/1/1993) | | 20-year | | 10-year | | (6/30/08) | | 5-year | | 3-year | | 1-year | | Quarter |
| WEHIX | | | 10.72 | % | | | 11.56 | % | | | 7.37 | % | | | 12.54 | % | | | 14.56 | % | | | 13.80 | % | | | 8.31 | % | | | 4.50 | % |
| Russell 2500 | | | 10.87 | | | | 11.09 | | | | 9.62 | | | | 11.40 | | | | 15.48 | | | | 17.13 | | | | 10.07 | | | | 5.17 | |
| Russell 2500 Value | | | 11.29 | | | | 11.72 | | | | 8.46 | | | | 10.85 | | | | 14.06 | | | | 16.29 | | | | 6.58 | | | | 3.02 | |
| S&P 500 | | | 9.29 | | | | 9.39 | | | | 8.01 | | | | 9.74 | | | | 14.47 | | | | 16.11 | | | | 12.73 | | | | 0.95 | |
Growth of $10,000
This chart depicts the change in the value of a $10,000 investment in the Hickory Fund for the period since inception (4/1/93) through March 31, 2015, as compared with the growth of the Russell 2500, Russell 2500 Value and Standard & Poor’s 500 Indices during the same period. Index performance is hypothetical and is shown for illustrative purposes only.
Capitalization
Top 10 Stock Holdings
| | % of Net Assets |
| The ADT Corp. | | 4.2 | |
| Liberty Global plc - Series C | | 4.0 | |
| Brown & Brown, Inc. | | 3.9 | |
| Liberty Interactive Corp. - Series A | | 3.6 | |
| ACI Worldwide, Inc. | | 3.5 | |
| Martin Marietta Materials, Inc. | | 3.5 | |
| Iconix Brand Group, Inc. | | 3.3 | |
| National CineMedia, Inc. | | 3.2 | |
| TransDigm Group, Inc. | | 3.2 | |
| Redwood Trust, Inc. | | 3.1 | |
| | | 35.5 | |
Industry Breakdown
| | % of Net Assets |
| Consumer Discretionary | | 30.4 | |
| Information Technology | | 9.4 | |
| Financials | | 9.4 | |
| Industrials | | 9.4 | |
| Health Care | | 8.3 | |
| Energy | | 6.4 | |
| Materials | | 3.5 | |
| Consumer Staples | | 3.3 | |
| Telecommunication Services | | 1.2 | |
| Cash Equivalents/Other | | 18.7 | |
| | | 100.0 | |
Top Performers | | | | | | | | |
| | | | | Average | | | | |
| Security Name | Return | | | Weight | | | Contribution | |
| Interval Leisure Group, Inc . | | 26.0 | % | | | 3.5 | % | | | 0.95 | % |
| Martin Marietta Materials, Inc. | | 27.1 | | | | 3.3 | | | | 0.87 | |
| World Fuel Services Corp. | | 22.6 | | | | 3.0 | | | | 0.64 | |
| The ADT Corp. | | 15.3 | | | | 4.2 | | | | 0.63 | |
| Laboratory Corp. of America Holdings | | 16.9 | | | | 3.3 | | | | 0.60 | |
Bottom Performers | | | | | | | | |
| | | | | Average | | | | |
| Security Name | Return | | | Weight | | | Contribution | |
| Cumulus Media, Inc. - Class A | | (41.6 | )% | | | 1.0 | % | | | (0.48 | )% |
| Ascent Capital Group, Inc. - Class A | | (24.8 | ) | | | 1.4 | | | | (0.43 | ) |
| Avon Products, Inc. | | (14.3 | ) | | | 2.0 | | | | (0.30 | ) |
| Redwood Trust, Inc. | | (7.9 | ) | | | 3.4 | | | | (0.27 | ) |
| Angie’s List, Inc. | | (5.8 | ) | | | 2.0 | | | | (0.15 | ) |
Contributions to Fund performance are based on actual daily holdings. Securities may have been bought or sold during the quarter. Source: FactSet Portfolio Analytics
Return shown is the actual quarterly return of the security.
19 | Q1 2015 ANNUAL REPORT | UNAUDITED
BALANCED FUND
Investment Style: Moderate Allocation
Portfolio Manager: Brad Hinton, CFA
Top Quarterly Contributors
Martin Marietta Materials – is a producer of granite, limestone, sand, gravel and aggregates products for the construction industry. In February, management reported strong aggregates volume growth and price increases across each of its geographic markets and issued robust 2015 guidance. In addition, Martin increased its synergy target for the Texas Industries acquisition from $70 million to $100 million annually and announced a new share buyback plan. If the plan is completed it would represent approximately 30% of the company’s outstanding shares.
Valeant Pharmaceuticals International – is a specialty pharmaceutical and medical device company that develops, manufactures, and markets a range of generic and branded generic pharmaceuticals, over-the-counter products and medical devices. Management provided a better than expected outlook for its core business in early January, with strong organic sales growth and continued strength at Bausch + Lomb more than offsetting headwinds from the strengthening U.S. dollar. In February, Valeant announced a definitive agreement to acquire Salix Pharmaceuticals for slightly over $15 billion. We anticipate Salix earning attractive high teens returns for Valeant over time.
Top Fiscal Year Contributors
Valeant Pharmaceuticals International – During an eventful fiscal year, Valeant’s strong underlying business performance carried the day as the company battled Allergan’s aggressive negative public relations campaign. Valeant’s dermatology business performed well ahead of our expectations, driven by broad-based strength across its portfolio as well as the successful launch of fungal treatment Jublia. The combination of healthy double-digit organic sales growth and falling acquisition-related cash restructuring expenditures drove a noticeable increase in excess cash generation, creating the capacity for the company’s aforementioned transaction with Salix.
Laboratory Corp. – offers testing services used by the medical profession in core testing, patient diagnosis and in the monitoring and treatment of disease. Investor sentiment surrounding LabCorp’s purchase of Covance shifted meaningfully during the first quarter following a lukewarm initial reception. We continue to think highly of management and are constructive on the opportunities in front of the combined organization. At today’s price, LabCorp appears to be baking in a fair amount of the possible upside.
Catamaran Corporation – is a provider of pharmacy benefit management services and healthcare IT solutions to the healthcare benefit management industry. On March 30th, UnitedHealth Group announced a definitive agreement to purchase Catamaran for $61.50 per share in cash. While we find the Catamaran board’s timing interesting in light of the company’s future growth opportunities, the price is consistent with our valuation work.
New Positions This Quarter
No new equity positions were added in the first quarter of 2015.
Top Quarterly Detractors
Precision Castparts – is a manufacturer of complex metal components and products that provides investment castings, forgings and fasteners/fastener systems for critical aerospace and power applications. Precision Castparts’ stock declined due to lackluster fiscal third quarter operating results and a more muted outlook for fiscal 2016. A slower than expected ramp in the company’s core commercial aerospace profitability has been further buffeted by currency headwinds and the sharp drop in global oil and natural gas prices over the past six months.
United Parcel Service – is a package delivery organization and a provider of supply chain management solutions. Despite significant investment during 2014 in anticipation of strong holiday e-commerce volumes, UPS’s peak shopping season struggles continued as e-commerce parcels once again crowded into a tight shipping window. We believe the company’s efforts toward a more streamlined holiday shopping experience will bear fruit in time, and we expect the company’s stock price will eventually reflect this stepped up commitment to its customers.
Top Fiscal Year Detractors
Range Resources – is a Texas-based independent natural gas, natural liquids, and oil company engaged in the exploration, development and acquisition of primarily gas properties. Falling domestic natural gas and natural gas liquids (NGL) prices in addition to regional oversupply in the northeast portion of the United States continue to be stiff headwinds for Range Resources in the near term. Absent a demand shock from a worsening U.S. economy, we expect the present supply/demand imbalance will work itself out over the next 18-24 months. In the interim, we believe Range will continue to grow per share production and reserves in a highly capital efficient manner.
Discovery Communications – is a world-class provider of non-fiction, global pay-tv programming. Weakness in U.S. television advertising, foreign currency headwinds and increased investments in niche European sports rights muted the company’s 2015 outlook and pressured Discovery’s shares during the quarter. We think the company’s investments are strategically sound and should earn solid returns over the next several years. We also believe that the core business will prove more resilient than many investors fear, especially overseas.
MRC Global – along with its subsidiaries is an industrial distributor of pipe, valves and fittings and related products and services to the upstream, midstream and downstream energy industries. Global energy-related spending has fallen at an unprecedented rate during the first three months of 2015. We did not anticipate the depth of the present decline, nor the speed with which North American producers in particular would respond. As such, we were too early in buying MRC Global shares during the fourth quarter.
Positions Eliminated This Quarter
Valeant Pharmaceuticals – We sold Valeant as the stock approached our value estimate after the company agreed to acquire Salix Pharmaceuticals. While the deal makes financial and strategic sense, we were less comfortable with the company’s pro forma leverage profile for Balanced Fund owners.
Disney – We eliminated Walt Disney after the stock traded well above our value estimate on continued strong operating results. We would gladly own Disney again at the right price.
MRC Global – We eliminated MRC Global at a loss as the energy downturn intensified. We were able to add to other energy companies with sturdier balance sheets at substantial discounts. In our view, we upgraded the quality of our energy basket without sacrificing upside potential.
These performance numbers reflect the deduction of the Fund’s annual operating expenses which as stated in its most recent prospectus are 1.10% of the Fund’s net assets. The returns assume redemption at the end of each period and reinvestment of dividends. Total returns shown include fee waivers and expense reimbursements, if any; total returns would have been lower had there been no waiver of fees and/or reimbursement of expenses. This information represents past performance and past performance does not guarantee future results. The investment return and the principal value of an investment in this Fund will fluctuate so that an investor’s shares, when redeemed, may be worth more or less than the original cost. Current performance may be lower or higher than the performance data quoted. Performance data current to the most recent month-end may be obtained at www.weitzinvestments.com/funds_and_performance/fund_performance.fs.
See page 6 for additional performance disclosures. See page 74 for a description of all indices.
Performance information does not reflect the deduction of taxes that a shareholder would pay on Fund distributions or the redemption of Fund shares.
20 | Q1 2015 ANNUAL REPORT
WEITZINVESTMENTS.COM
| Returns | | | | | | | | | | | | | | | | | | |
| | | Annualized | | | | | | | |
| | | | | | | | | | | | | | | | | | | |
| | | Since | | | | | | | | | | | | | | | |
| | | Inception | | | | | | | | | | | | | | | |
| | | (10/1/2003) | | 10-year | | 5-year | | 3-year | | 1-year | | Quarter |
| WBALX | | | 5.84 | % | | | 5.33 | % | | | 8.30 | % | | | 7.83 | % | | | 3.73 | % | | | 1.37 | % |
| Blended | | | 7.09 | | | | 6.82 | | | | 10.20 | | | | 10.52 | | | | 9.10 | | | | 1.23 | |
| S&P 500 | | | 8.77 | | | | 8.01 | | | | 14.47 | | | | 16.11 | | | | 12.73 | | | | 0.95 | |
| Barclays | | | | | | | | | | | | | | | | | | | | | | | | |
| Intermediate | | | | | | | | | | | | | | | | | | | | | | | | |
| Credit | | | 3.96 | | | | 4.34 | | | | 3.52 | | | | 2.31 | | | | 3.58 | | | | 1.45 | |
Portfolio Make Up
Growth of $10,000
This chart depicts the change in the value of a $10,000 investment in the Balanced Fund for the period since inception (10/1/03) through March 31, 2015, as compared with the growth of the Blended, Standard & Poor’s 500 and Barclays Intermediate U.S. Government/Credit Indices during the same period. Index performance is hypothetical and is shown for illustrative purposes only.
Capitalization (Common Stocks)
Top 10 Stock Holdings
| | % of Net Assets |
| Liberty Global plc - Series C | | 2.6 | |
| Laboratory Corp. of America Holdings | | 2.4 | |
| Liberty Interactive Corp. - Series A | | 2.3 | |
| Berkshire Hathaway, Inc. - Class B | | 2.3 | |
| Express Scripts Holding Co. | | 2.2 | |
| Martin Marietta Materials, Inc. | | 2.2 | |
| Twenty-First Century Fox, Inc. - Class B | | 2.2 | |
| Discovery Communications, Inc. - Class C | | 2.1 | |
| Range Resources Corp. | | 2.1 | |
| Precision Castparts Corp. | | 2.0 | |
| | | 22.4 | |
Industry Breakdown
| | % of Net Assets |
| Consumer Discretionary | | 12.4 | |
| Information Technology | | 10.3 | |
| Financials | | 9.1 | |
| Health Care | | 6.5 | |
| Energy | | 5.2 | |
| Industrials | | 3.2 | |
| Consumer Staples | | 2.7 | |
| Materials | | 2.2 | |
| Total Common Stocks | | 51.6 | |
| Cash Equivalents/Other | | 18.6 | |
| U.S. Treasury Notes | | 17.2 | |
| Corporate Bonds | | 8.2 | |
| Mortgage-Backed Securities | | 3.4 | |
| Asset- & Commercial Mortgage-Backed Securities | | 1.0 | |
| Total Bonds & Cash Equivalents | | 48.4 | |
| | | 100.0 | |
Top Performers
| | | | | | Average | | | | |
| Security Name | | Return | | | Weight | | | Contribution | |
| Martin Marietta Materials, Inc. | | | 27.1 | % | | | 2.0 | % | | | 0.48 | % |
| Valeant Pharmaceuticals International, Inc. | | | 38.8 | | | | 0.9 | | | | 0.45 | |
| Laboratory Corp. of America Holdings | | | 16.9 | | | | 2.2 | | | | 0.34 | |
| Catamaran Corp. | | | 15.1 | | | | 1.6 | | | | 0.25 | |
| U.S. Silica Holdings, Inc. | | | 39.2 | | | | 0.7 | | | | 0.24 | |
Bottom Performers
| | | | | | Average | | | | |
| Security Name | | Return | | | Weight | | | Contribution | |
| Discovery Communications, Inc. - Class C | | | (12.6 | )% | | | 2.1 | % | | | (0.32 | )% |
| Precision Castparts Corp. | | | (12.8 | ) | | | 1.9 | | | | (0.17 | ) |
| United Parcel Service, Inc. - Class B | | | (12.2 | ) | | | 1.2 | | | | (0.16 | ) |
| Redwood Trust, Inc. | | | (7.9 | ) | | | 2.0 | | | | (0.15 | ) |
| MRC Global Inc. | | | (21.8 | ) | | | 0.2 | | | | (0.12 | ) |
Contributions to Fund performance are based on actual daily holdings. Securities may have been bought or sold during the quarter. Source: FactSet Portfolio Analytics
Return shown is the actual quarterly return of the security.
21 | Q1 2015 ANNUAL REPORT | UNAUDITED
CORE PLUS INCOME FUND
Investment Style: Intermediate Income
Co-Portfolio Managers: Tom Carney, CFA & Nolan Anderson
The Core Plus Income Fund’s Institutional Class returned +1.8% for the first calendar quarter, compared to +1.6% for the Barclays U.S. Aggregate Bond Index (Barclays U.S. Agg), our Fund’s primary benchmark. The Core Plus Income Fund’s Institutional Class returned +3.0%, compared to a +3.9% return for the Barclays U.S. Agg since inception (July 31, 2014). The relative underperformance was driven primarily by the Fund’s shorter average life (i.e. duration) than the Barclays U.S. Agg, which is a drag on performance when interest rates fall.
Since Inception Review
The bull market in U.S. Treasury bonds that began in September 1981 with 10-year Treasuries peaking around 16% and hitting a low of approximately 1.4% in July of 2012, reasserted itself this past year. The bond market had its own version of a “flash crash” in October when the yield of the 10-year Treasury bond, for example, fell 34 basis points in a matter of minutes (a basis point equals 1/100 of a percent). For the fiscal year, 5- and 10-year Treasury bond interest rates fell approximately 35 and 80 basis points to 1.4% and 1.9%, respectively. Declining interest rates resulted in price gains for existing bonds (bond prices and changes in interest rates are inversely related), adding to the coupon returns for most fixed-income investors, Core Plus Income Fund included.
Corporate bonds and other credit sensitive securities underperformed Treasury bonds in the past year as credit spreads (the incremental return investors demand above U.S. Treasury bonds for owning corporate debt) widened, particularly for non-investment grade or high-yield bonds. A broad measure of corporate bond spreads compiled by Merrill Lynch rose to 136 basis points as of March 31, up 17 basis points year over year. The repricing of credit risk in the high-yield market was more pronounced with spreads increasing by more than 100 basis points, or a full percent. While the overall marketplace remains expensive by historical standards (i.e. low absolute yield levels), last year’s credit repricing presented pockets of opportunity to invest favorably relative to ultra-low U.S. Treasury rates.
The portfolio lagged the Barclays U.S. Agg, the Fund’s primary benchmark, since inception but performed reasonably well given the rally in U.S. Treasury bonds and the fund’s lower duration profile (duration of 3.5 years vs. 5.5 years for the Barclays U.S. Agg). Overall portfolio metrics were largely unchanged compared to the prior quarter. The average maturity of the Fund decreased to 5.5 years from 5.6 years. The duration decreased from 3.6 years to 3.5 years, while the average coupon increased to 3.4% from 3.3%.
More than 95% of Fund investments contributed positively to results since inception. Overall, the combination of interest income and declining U.S. Treasury yields more than offset the negative impact of widening credit spreads. The sections below highlight the key contributors and detractors.
Top Contributors
U.S. Treasury bonds and government mortgage-backed securities (MBS) issued by Fannie Mae and Freddie Mac (32.6% of Fund net assets at 3/31/15 – since inception contribution to results – 46.0%) – U.S. Treasury bonds benefited from falling yields and rising prices despite widespread fears about the Fed’s intent on raising interest rates in 2015. Government MBS performed strongly in the past year as mortgage issuance declined meaningfully (2014 volume was down approximately 60% compared to 2013) and government purchase activity remained strong through the Fed’s reinvestment of principal payments back into the MBS marketplace. The result was tighter spreads and higher prices for MBS securities. The Fund’s MBS investments are created from pools of high-quality, government backed mortgages that are selected based on specific characteristics we believe mitigate the risks of prepayment, either too quickly or too slowly. In exchange for the embedded prepayment risks inherent in MBS, we believe there is often adequate compensation by higher coupon income (and therefore overall return) than we could otherwise receive in comparable quality corporate bonds. The Fund’s current government MBS weighting is small (~1.3% of Fund net assets) due to a lack of favorable investment opportunities since the Fund’s inception.
Non-convertible corporate debt (42.4% of Fund net assets at 3/31/15 – contribution to overall since inception results – 38.3%) – Despite the credit spread widening highlighted above, the Fund’s corporate investments performed well in the past year. Key contributors in the investment-grade segment included the bonds issued by Berkshire Hathaway, Prudential plc, Markel Corporation and Equity Commonwealth. Key non-investment grade contributors included the bonds issued by Cinemark Holdings and Range Resources.
Common Stocks (1.0% of Fund net assets at 3/31/15 – contribution to overall since inception results – 7.0%) – Our common stock investments punched their weight as the Fund’s average weighting of approximately 1.5% of Fund net assets contributed approximately 7% of the Fund’s performance. Our three holdings were Monmouth Real Estate Investment Corp., National CineMedia, and Redwood Trust. Although the business models vary, we believe all three companies generate reasonably stable cash flow of stable dividend income and potential for price appreciation. By purposely seeking out businesses with these attributes, we expect the range of outcomes, both on the upside and downside, to be relatively low.
Top Detractors
Of the three securities that detracted from our results, the most meaningful (contribution of minus 1.1%) was our position in DCP Midstream LLC corporate bonds. The bonds were downgraded to non-investment grade during the first calendar quarter of 2015 and suffered price declines as a result of investors’ perception of increased credit risk and forced investor selling from investors unable to own non-investment grade bonds. Based on our credit work, we believe DCP’s exposure to low natural gas and natural gas liquids (NGL’s) prices is manageable and that the company’s attractive asset base and strong sponsorship from investment grade companies Phillips 66 and Spectra Energy mitigate the perceived credit risk.
Investment Activity
Portfolio investment activity was active during the current calendar quarter as a result of net inflows into the Fund. Approximately 60% of new investment dollars were allocated to corporate bonds, as widening credit spreads allowed us to find reasonably attractive opportunities in both investment grade and high-yield securities. We invested approximately 5% of net assets in credit-sensitive residential and commercial mortgage-backed securities. The remaining proceeds were invested in 5-10 year U.S. Treasury bonds as Treasury rates temporarily trended higher during the quarter. Our balanced investment approach this quarter is consistent with our belief that absolute investment returns—a sufficient rate to offset future inflation plus credit spreads that compensate for risk of loss—are low by historical standards.
We made nine new corporate bond investments during the first calendar quarter and added to seven existing holdings. We also added to our structured securities holdings, including additional residential and commercial liquidating trust investments. Key investment highlights include:
Corporate Bonds – Midstream Infrastructure Master Limited Partnerships (MLP’s) – We have invested approximately 15% of Fund net assets in midstream infrastructure MLP’s, including positions in Boardwalk Pipeline Partners, DCP Midstream, Kinder Morgan, Rose Rock Midstream, SemGroup and Williams Partners. Taken together, these companies operate a network of transportation assets that earn primarily fee-based revenues for gathering, processing, transporting and storing crude oil and natural gas produced throughout the U.S. We like the physical nature of the assets, many of which have #1 or #2 positions in their respective basins, and limited direct commodity price exposure. Although we face the risk of falling production volume in the basins that our
22 | Q1 2015 ANNUAL REPORT
companies operate, E&P producers are cutting costs fast and furious, which may result in lower break-even production costs, which all things being equal, raises the marginal amount of production that would not otherwise occur.
Structured securities – 3-year Oak Hill (OHART) 4.0% and 0.8-year Varde/First City (VFCP) 2.75% – Oak Hill and Varde/First City are the latest in a series of residential and commercial liquidating trust investments the Fund has made. Oak Hill and Varde/First City are institutional investors with significant scale and expertise in resolving residential and commercial real estate loans. In both cases, our credit analysis suggests there is significant downside protection for our bonds should liquidation proceeds fail to meet current projections. Such as, both investors hold meaningful equity positions (“skin in the game”) that in most cases must remain until bondholders have been repaid.
The page following this discussion provides additional detail regarding the breakdown of our investment holdings by credit quality, sector and maturity distribution. Our investments may be wide-ranging, but our analysis is the same. We strive to only own those investments we believe compensate us for the incremental credit risk we assume. Our goal is to invest in a portfolio of bonds of varying maturities that we believe represent attractive risk-adjusted returns, taking into consideration the general level of interest rates and the credit quality of each investment.
Outlook
We still believe today’s low nominal interest rate and credit spread environment provide little protection against any inflationary shocks or potential re-pricing (higher) of credit risk. Bond investors have had the “wind at their backs” for some time now, thanks to the largesse of central banks worldwide. A stark example can be seen in Europe where some 5€ trillion of the 20€ trillion European bond market trades at negative yields due to action by the European Central Bank. Someday this munificence and disconnect between price and value will end. Consequently, we expect to continue to position the Fund defensively relative to interest rate exposure while we patiently seek out areas of opportunity, like those mentioned above. We will continue to invest one security at a time, relying on a fundamental research-based investment approach and are well positioned to take advantage of any market weakness.
These performance numbers reflect the deduction of the Fund’s Investor and Institutional Class’ annual operating expenses which as stated in its most recent prospectus are 0.97% (estimated gross) and 0.74% (estimated gross), respectively, of each Class’ net assets. The returns assume redemption at the end of each period and reinvestment of dividends. Total returns shown include fee waivers and expense reimbursements, if any; total returns would have been lower had there been no waiver of fees and/or reimbursement of expenses. This information represents past performance and past performance does not guarantee future results. The investment return and the principal value of an investment in this Fund will fluctuate so that an investor’s shares, when redeemed, may be worth more or less than the original cost. Current performance may be lower or higher than the performance data quoted. Performance data current to the most recent month-end may be obtained at www.weitzinvestments.com/funds_and_performance/fund_performance.fs.
See page 6 for additional performance disclosures. See page 74 for a description of all indices.
Performance information does not reflect the deduction of taxes that a shareholder would pay on Fund distributions or the redemption of Fund shares.
23 | Q1 2015 ANNUAL REPORT | UNAUDITED
CORE PLUS INCOME FUND (CONTINUED)
| Returns | | | | | | |
| | | Since Inception | | | |
| | | (7/31/2014) | | Quarter |
| WCPNX - Investor Class | | | 2.90 | % | | | 1.80 | % |
| WCPBX - Institutional Class | | | 2.96 | | | | 1.77 | |
| Barclays U.S. Aggregate Bond | | | 3.86 | | | | 1.61 | |
Growth of $10,000
This chart depicts the change in the value of a $10,000 investment in the Core Plus Income Fund – Institutional Class for the period since inception (7/31/14) through March 31, 2015, as compared with the growth of the Barclays U.S. Aggregate Bond Index during the same period. Index performance is hypothetical and is shown for illustrative purposes only.
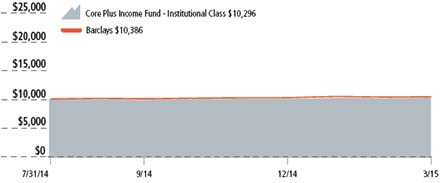
Credit Quality(a) | | | | |
| Underlying Securities | | | % of Securities | |
| U.S. Treasury | | | 31.3 | |
| U.S. Government Agency | | | | |
Mortgage Related Securities (b) | | | 1.3 | |
| Aa/AA | | | 0.8 | |
| A/A | | | 9.5 | |
| Baa/BBB | | | 20.7 | |
| Ba/BB | | | 7.2 | |
| B/B | | | 5.6 | |
| Non-Rated | | | 10.5 | |
| Common Stocks | | | 1.0 | |
| Cash Equivalents | | | 12.1 | |
| | | | 100.0 | |
| Portfolio Summary | | |
| Average Maturity | | 5.5 years |
| Average Effective Maturity | | 4.5 years |
| Average Duration | | 3.5 years |
| Average Effective Duration | | 3.7 years |
| Average Coupon | | 3.4% |
| 30-Day SEC Yield (3/31/15) - | | |
| Investor Class | | 1.32% |
| 30-Day SEC Yield (3/31/15) - | | |
| Institutional Class | | 1.52% |
Asset Allocation(c)
Maturity Distribution
| Maturity Type | % of Securities | |
| Cash Equivalents | | 12.1 | |
| Less than 1 Year | | 4.4 | |
| 1 - 3 Years | | 7.0 | |
| 3 - 5 Years | | 23.8 | |
| 5 - 7 Years | | 33.4 | |
| 7 - 10 Years | | 18.3 | |
| Common Stocks | | 1.0 | |
| | | 100.0 | |
(a) The Fund receives credit quality ratings on underlying securities of the Fund when available from Moody’s, S&P, Fitch and Kroll. The Fund will use one rating for an underlying security if that is all that is provided. Ratings and portfolio credit quality may change over time. The Fund itself has not been rated by an independent rating agency.
(b) Mortgage related securities issued and guaranteed by government-sponsored entities such as Fannie Mae and Freddie Mac are generally not rated by Moody’s, S&P and Fitch. Securities which are not rated do not necessarily indicate low quality. Fannie Mae’s and Freddie Mac’s senior long-term debt are currently rated Aaa, AA+ and AAA by Moody’s, S&P and Fitch, respectively.
(c) Percent of net assets
24 | Q1 2015 ANNUAL REPORT
WEITZINVESTMENTS.COM
SHORT-INTERMEDIATE INCOME FUND
Investment Style: Short-Intermediate Income
Portfolio Manager: Tom Carney, CFA
The Short-Intermediate Income Fund’s Institutional Class returned +0.8% in the first calendar quarter, compared to a +1.5% return for the Barclays Intermediate U.S. Government/Credit Index (BIGC), the Fund’s primary benchmark. For the fiscal year ended March 31, 2015, the Short-Intermediate Income Fund’s Institutional Class returned +1.9%, compared to a +3.6% return for the BIGC.
Fiscal 2015 Review
The bull market in U.S. Treasury bonds that began in September 1981 with 10-year Treasuries peaking around 16% and hitting a low of approximately 1.4% in July of 2012, reasserted itself this past year. The bond market had its own version of a “flash crash” in October when the yield of the 10-year Treasury bond, for example, fell 34 basis points in a matter of minutes (a basis point equals 1/100 of a percent). For the fiscal year, 5- and 10-year Treasury bond interest rates fell approximately 35 and 80 basis points to 1.4% and 1.9%, respectively. Declining interest rates resulted in price gains for existing bonds (bond prices and changes in interest rates are inversely related), adding to the coupon returns for most fixed-income investors, the Fund included.
Corporate bonds and other credit sensitive securities underperformed Treasury bonds in the past year as credit spreads (the incremental return investors demand above U.S. Treasury bonds for owning corporate debt) widened, particularly for non-investment grade or high-yield bonds. A broad measure of corporate bond spreads compiled by Merrill Lynch rose to 136 basis points as of March 31, up 17 basis points year-over-year. The repricing of credit risk in the high-yield market was more pronounced with spreads increasing by more than 100 basis points, or a full percent. While the overall marketplace remains expensive by historical standards (i.e. low absolute yield levels), last year’s credit repricing presented pockets of opportunity to invest favorably relative to ultra-low U.S. Treasury rates.
Our portfolio lagged the BIGC, the Fund’s primary benchmark, for the fiscal year but performed reasonably well given its defensive positioning. Overall portfolio metrics were largely unchanged compared to a year ago. The average maturity of the Fund increased to 3.6 from 2.9 years. The duration increased from 2.1 to 2.2 years, and the average coupon was unchanged at 3.2%.
More than 90% of Fund investments contributed positively to results in the past fiscal year. The sections below highlight the key contributors and detractors.
Top Fiscal Year Contributors
Government mortgage-backed securities (MBS) issued by Fannie Mae and Freddie Mac (19.0% of Fund net assets at 3/31/15 – fiscal year contribution to results – 30.6%) – Government MBS performed strongly in the past year as mortgage issuance declined meaningfully (2014 volume was down approximately 60% compared to 2013) and government purchase activity remained strong through the Fed’s reinvestment of principal payments back into the MBS marketplace. The result was tighter spreads and higher prices for MBS securities. The Fund’s MBS investments created from pools of high-quality, 15-year mortgages were key contributors to fiscal year results. Our government mortgage investments, historically a key part of Fund assets, are selected based on specific characteristics we believe mitigate the risks of prepayment, either too quickly or too slowly. In exchange for the embedded prepayment risks inherent in MBS, we believe there is often adequate compensation by higher coupon income (and therefore overall return) than we could otherwise receive in comparable quality corporate bonds. In the past year, the Fund’s government MBS weighting declined from 24% to 20% due to a lack of favorable investment opportunities.
Non-convertible corporate debt (37.2% of Fund net assets at 3/31/15 – contribution to overall fiscal year results – 37.6%) – Despite the credit spread widening highlighted above, the Fund’s corporate investments performed well in the past year. Key contributors in the investment-grade segment included the bonds issued by Boston Properties, Markel Corporation, and US Bank. Key non-investment grade contributors included the bonds issued by Expedia, Inc., Range Resources and Vulcan Materials. Overall, the Fund’s corporate bond weighting increased fractionally from a year ago.
Non-government mortgage-backed securities (MBS) (7.3% of Fund net assets at 3/31/15 – contribution to overall fiscal year results – 9.2%) – This segment includes bonds that have similar characteristics as the government MBS mentioned above – except issued by entities other than Fannie Mae, Freddie Mac or Ginnie Mae. This segment also includes the investments we’ve made in residential liquidating trusts which we have extensively covered in previous shareholder letters. Overall, with minor exceptions, our MBS investments in this segment performed well and within our original average life expectations.
Top Fiscal Year Detractors
MBS interest-only securities (0.1% of Fund net assets at 3/31/15 – contribution to overall fiscal year results – minus 1.1%) – Declining interest rates caused prepayment speeds to exceed original assumptions in this segment of Fund assets. Interest-only securities generally aid portfolio performance when interest rates rise and act as a headwind when rates fall. We do not expect this segment to ever be a significant part of Fund assets but we will continue to explore opportunities in this area as a means to protect investor capital from the eventual normalization (i.e. rise) of interest rates.
Investment Activity
Overall portfolio metrics were mostly unchanged on the year. Like a duck on the surface of the water, however, our proverbial investment feet were rigorously paddling beneath the surface to take advantage of often fleeting opportunities. It’s typical that a quarter to a third of Fund assets mature every year given the Fund requirement to maintain an average life within 2- to 5-years. Last year was no exception. Despite base rates (U.S. Treasury) that generally trended lower during the year, we were able to deploy capital when Treasury rates temporarily trended higher and when credit spreads widened sufficiently (sometimes dramatically) to compensate for the embedded risks. Examples include:
Corporate Bonds – Express Scripts Holding 2.25% and 7.25% maturing in 2019 – Express Scripts is a full service pharmacy benefit management (PBM) and specialty managed care company serving clients throughout North America. Subsequent to the company’s 2012 acquisition of Medco Health Solutions it became the largest PBM in the U.S. The company generates significant free cash flow, has a history of prudent capital allocation and intends to maintain a targeted leverage ratio that should help it retain a solid investment grade rating. These corporate bonds are an example of numerous investments the Fund entered into the past year. Namely, solid investment grade companies run by able capital allocators with bonds maturing in approximately 4 years. We believe these roughly 4-year bonds offer reasonable return opportunities (low 2 percent area) with minimal credit risk. These, and other investments, were made when the 5-year Treasury yielded 1.5% or greater.
Corporate Bonds – Kinder Morgan (Hiland Partners LP) 7.25% maturing in 2020, callable 2016 – Kinder Morgan is the largest energy infrastructure company in North America. They own an interest in or operate 80,000 miles of pipelines and 180 terminals. Their pipelines transport the lifeblood of the U.S. economy (crude oil, natural gas, carbon dioxide and more). Their terminals handle a variety of products and materials (gas, jet fuel, coal, steel and more). In most of their businesses, Kinder Morgan operates like a giant toll road, receiving fees for their services and generally avoiding commodity price risk. Our investment in the Kinder Morgan bonds above is an example of the opportunities we’ve identified in the energy space in the past year. The company has a long history of being good stewards of capital who have treated bondholders fairly and as partners in the business. Even accounting for the possibility, which we believe is low, of the company retiring a portion of our investment through an equity raise (“equity claw” in industry parlance, that expires in October of this year), we expect to earn attractive income returns to the 2016 call date or maturity, should they remain outstanding.
25 | Q1 2015 ANNUAL REPORT | UNAUDITED
SHORT-INTERMEDIATE INCOME FUND (CONTINUED)
Structured securities – Varde/First City (VFCP) Commercial Real Estate Liquidating Trust 2.75% with average life of 0.8 years – Varde/First City is the latest in a series of commercial liquidating trust investments the Fund has made since the third quarter of 2012. Varde/First City is an institutional investor with a proven track record of resolving commercial real estate loans through economic cycles. Our investment represents an interest in a pool of 361 seasoned commercial loans purchased from a commercial bank at a discount to the estimated market value, and the real estate collateral is located in a mix of geographies and tenant types. Our credit analysis includes factors such as our investment’s senior claim on the loan pool’s cash flows, the historical performance of the loan pool, and Varde/First City’s equity position (“skin in the game”), and we believe this represents yet another example of finding low credit risk opportunities in a marketplace where few exist.
Convertible Bonds – Redwood Trust 4.625% and 5.625% maturing in 2018 and 2019, respectively – Redwood Trust is a specialty finance company focused on engaging in residential and commercial mortgage banking activities and investing in mortgage and other real estate related assets. The company’s goal is to generate income from its mortgage banking activities and invest in real estate-related assets that have the potential to generate attractive cash flow returns over time. The company’s management team is owner-oriented with deep-seated industry experience. We believe Redwood is ideally positioned to benefit from private capital taking a larger role in the mortgage market over time. Pairing these positives with a conservative balance sheet and culture of full disclosure, we believe our 3- and 4-year bonds, purchased at par or less, will generate attractive coupon returns and equity upside should the company continue to execute as we project given the convertible feature in our investment.
We still believe today’s low nominal interest rate and credit spread environment provide little protection against any inflationary shocks or potential re-pricing (higher) of credit risk. Bond investors have had the “wind at their backs” for some time now, thanks to the largesse of central banks worldwide. A stark example can be seen in Europe where some 5€ trillion of the 20€ trillion European bond market trades at negative yields due to action by the European Central Bank. Someday this munificence and disconnect between price and value will end. Consequently, we expect to continue to position the Fund defensively relative to interest rate exposure while we patiently seek out areas of opportunity, like those mentioned above. We will continue to invest one security at a time, relying on a fundamental research-based investment approach and are well positioned to take advantage of any market weakness.
These performance numbers reflect the deduction of the Fund’s Investor and Institutional Class’ annual operating expenses which as stated in its most recent prospectus are 0.92% (gross) and 0.62%, respectively, of each Class’ net assets. The returns assume redemption at the end of each period and reinvestment of dividends. Total returns shown include fee waivers and expense reimbursements, if any; total returns would have been lower had there been no waiver of fees and/or reimbursement of expenses. This information represents past performance and past performance does not guarantee future results. The investment return and the principal value of an investment in this Fund will fluctuate so that an investor’s shares, when redeemed, may be worth more or less than the original cost. Current performance may be lower or higher than the performance data quoted. Performance data current to the most recent month-end may be obtained at www.weitzinvestments.com/funds_and_performance/fund_performance.fs.
See page 6 for additional performance disclosures. See page 74 for a description of all indices.
Performance information does not reflect the deduction of taxes that a shareholder would pay on Fund distributions or the redemption of Fund shares.
26 | Q1 2015 ANNUAL REPORT
WEITZINVESTMENTS.COM
| Returns | | | | | | | | |
| | Annualized | | | | | | |
| | Since Inception | | | | | | | | | | | | | | | | | | |
| | (12/23/1988 ) | | 20-year | | 10-year | | 5-year | | 3-year | | 1-year | | Quarter |
| WSHNX - Investor Class | | | 5.51 | % | | 4.99 | % | | 3.84 | % | | 2.35 | % | | 1.84 | % | | 1.64 | % | | 0.70 | % |
| WEFIX - Institutional Class | | | 5.55 | | | 5.03 | | | 3.92 | | | 2.51 | | | 2.04 | | | 1.88 | | | 0.75 | |
| Barclays U.S. Government/Credit | | | | | | | | | | | | | | | | | | | | | | |
| Intermediate | | | 6.22 | * | | 5.46 | | | 4.34 | | | 3.52 | | | 2.31 | | | 3.58 | | | 1.45 | |
| 1-5 Year | | | 5.58 | * | | 4.78 | | | 3.53 | | | 2.18 | | | 1.45 | | | 1.99 | | | 0.97 | |
| 1-3 Year | | | 5.07 | * | | 4.26 | | | 2.94 | | | 1.35 | | | 0.97 | | | 1.13 | | | 0.59 | |
| CPI + 1% | | | 3.62 | * | | 3.27 | | | 3.04 | | | 2.66 | | | 1.98 | | | 0.93 | | | 0.81 | |
| * Since 12/31/1988 | | | | | | | | | | | | | | | | | | | | | | |
Growth of $10,000
This chart depicts the change in the value of a $10,000 investment in the Short-Intermediate Income Fund -Institutional Class for the period March 31, 2005 through March 31, 2015, as compared with the growth of the Barclays Intermediate U.S. Government/Credit and CPI + 1% Indices during the same period. Index performance is hypothetical and is shown for illustrative purposes only.
Credit Quality(a)
| Underlying Securities | % of Securities | |
| U.S. Treasury | | | 20.8 | |
U.S. Government Agency Mortgage Related Securities(b) | | | 20.0 | |
| Aaa/AAA | | | 5.2 | |
| Aa/AA | | | 2.0 | |
| A/A | | | 13.6 | |
| Baa/BBB | | | 21.5 | |
| Ba/BB | | | 5.1 | |
| B/B | | | 0.4 | |
| Caa/CCC | | | 0.1 | |
| Non-Rated | | | 8.3 | |
| Common Stocks | | | 1.6 | |
| Cash Equivalents | | | 1.4 | |
| | | | 100.0 | |
Financial Attributes
| Portfolio Summary | | | |
| Average Maturity | | | 3.6 years |
| Average Effective Maturity | | | 2.5 years |
| Average Duration | | | 2.2 years |
| Average Effective Duration | | | 2.2 years |
| Average Coupon | | | 3.2% |
| 30-Day SEC Yield (3/31/15) - | | | |
| Investor Class | | | 1.26% |
| 30-Day SEC Yield (3/31/15) - | | | |
| Institutional Class | | | 1.51% |
Asset Allocation(c)
Maturity Distribution
| Maturity Type | % of Securities | |
| Cash Equivalents | | | 1.4 | |
| Less than 1 Year | | | 20.2 | |
| 1 - 3 Years | | | 29.9 | |
| 3 - 5 Years | | | 33.6 | |
| 5 - 7 Years | | | 11.9 | |
| 7 - 10 Years | | | 1.1 | |
| 10 Years or more | | | 0.3 | |
| Common Stocks | | | 1.6 | |
| | | | 100.0 | |
(a) The Fund receives credit quality ratings on underlying securities of the Fund when available from Moody’s, S&P, Fitch and Kroll. The Fund will use one rating for an underlying security if that is all that is provided. Ratings and portfolio credit quality may change over time. The Fund itself has not been rated by an independent rating agency.
(b) Mortgage related securities issued and guaranteed by government-sponsored entities such as Fannie Mae and Freddie Mac are generally not rated by Moody’s, S&P and Fitch. Securities which are not rated do not necessarily indicate low quality. Fannie Mae’s and Freddie Mac’s senior long-term debt are currently rated Aaa, AA+ and AAA by Moody’s, S&P and Fitch, respectively.
(c) Percent of net assets
27 | Q1 2015 ANNUAL REPORT | UNAUDITED
NEBRASKA TAX-FREE INCOME FUND
Investment Style: Municipal Income
Portfolio Manager: Tom Carney, CFA
The Nebraska Tax-Free Income Fund returned +0.4% in the first calendar quarter, compared to a +0.8% return for the Barclays 5-Year Municipal Bond Index, our Fund’s primary benchmark. For the fiscal year ended March 31, 2015, the Nebraska Tax-Free Income Fund’s total return was +2.1%, compared to a +3.0% return for the Fund’s primary benchmark.
Municipal bonds generated good results in the past fiscal year as they benefited from strong performance of U.S. Treasury bonds, which tend to have a gravitational effect on all other fixed-income assets. For example, Treasury bond interest rates declined in the past year with 5- and 10-year Treasury bond yields falling approximately 35 and 80 basis points (a basis point equals 1/100 of a percent) to 1.4% and 1.9%, respectively. Falling interest rates resulted in price gains for existing bonds (bond prices and changes in interest rates are inversely related), adding to the coupon returns for investors, the Fund included.
Despite the tailwind from declining Treasury interest rates, municipal bonds generally underperformed their taxable government counterparts as the yield relationship between tax-free municipal bonds and taxable alternatives, like U.S. Treasuries, widened in the past year. High quality 5-year municipal bonds, for example, ended the current fiscal year (March 31) with a yield representing approximately 95% of U.S. Treasuries, compared to 85% a year ago. Historically, municipal bonds have yielded less than taxable alternatives given the tax advantages (federally and, typically, state exempt) of municipal bonds. With municipal bonds yielding nearly as much as a comparable Treasury security, the relative value of municipals versus Treasuries has increased in the past year. However, the still abnormally low overall interest-rate environment leaves the municipal marketplace with little absolute value and even less than was present a year ago.
The Fund’s results in the past year were acceptable considering our defensive positioning. Income returns were modestly boosted by (unrealized) price gains from declining interest rates. Investment activity in the past year remained focused on bonds with shorter maturities (primarily under 7 years).
Turning to portfolio metrics, over the past year the average duration of our Fund declined to 2.3 from 2.7 years and the average maturity of our bonds decreased to 4.7 from 5.8 years. Overall asset quality of our portfolio remains high with approximately 88% rated A or better by Moody’s, Standard and Poor’s or Fitch. We continue to be focused on security selection and ongoing review of our investments’ fiscal position. We expect to continue to position the Fund defensively relative to interest rate exposure while we patiently seek out areas of opportunity. We will continue to invest one security at a time, relying on a fundamental research-based investment approach and are well positioned to take advantage of any market weakness.
The Fund seeks income that is exempt from federal and Nebraska personal income taxes, but income from the Fund may be subject to federal alternative minimum tax and capital gains taxes.
These performance numbers reflect the deduction of the Fund’s annual operating expenses which as stated in its most recent prospectus are 0.73% of the Fund’s net assets. The returns assume redemption at the end of each period and reinvestment of dividends. Total returns shown include fee waivers and expense reimbursements, if any; total returns would have been lower had there been no waiver of fees and/or reimbursement of expenses. This information represents past performance and past performance does not guarantee future results. The investment return and the principal value of an investment in this Fund will fluctuate so that an investor’s shares, when redeemed, may be worth more or less than the original cost. Current performance may be lower or higher than the performance data quoted. Performance data current to the most recent month-end may be obtained at www.weitzinvestments.com/funds_and_ performance/fund_performance.fs.
See page 6 for additional performance disclosures. See page 74 for a description of all indices.
Performance information does not reflect the deduction of taxes that a shareholder would pay on Fund distributions or the redemption of Fund shares.
28 | Q1 2015 ANNUAL REPORT
WEITZINVESTMENTS.COM
| Returns | | | | | | | | |
| | Annualized | | | | | | | |
| | Since Inception | | | | | | | | | | | | | | | | | | |
| | (10/01/1985) | | 20-year | | 10-year | | 5-year | | 3-year | | 1-year | | Quarter |
| WNTFX | | | 4.99 | % | | 4.16 | % | | 3.11 | % | | 2.48 | % | | 1.49 | % | | 2.14 | % | | 0.36 | % |
| Barclays 5-Year Municipal Bond | | | — | | | 4.73 | | | 4.17 | | | 3.44 | | | 2.38 | | | 2.95 | | | 0.76 | |
Growth of $10,000
This chart depicts the change in the value of a $10,000 investment in the Nebraska Tax-Free Income Fund for the period March 31, 2005 through March 31, 2015, as compared with the growth of the Barclays 5-Year Municipal Bond Index during the same period. Index performance is hypothetical and is shown for illustrative purposes only.
State Breakdown
| | % of Net Assets | |
| Nebraska | | | 79.4 | |
| Florida | | | 4.7 | |
| Texas | | | 2.0 | |
| Arizona | | | 1.4 | |
| Puerto Rico | | | 1.4 | |
| North Dakota | | | 1.2 | |
| Virginia | | | 1.1 | |
| Tennessee | | | 1.0 | |
| Iowa | | | 0.9 | |
| Illinois | | | 0.5 | |
| Cash Equivalents/Other | | | 6.4 | |
| | | | 100.0 | |
Financial Attributes
| Portfolio Summary | | | |
| Average Maturity | | | 4.7 years |
| Average Effective Maturity | | | 2.6 years |
| Average Duration | | | 2.3 years |
| Average Effective Duration | | | 2.4 years |
| Average Coupon | | | 4.1% |
| 30-Day SEC Yield at 3-31-15 | | | 1.09% |
| Municipals exempt from federal and Nebraska income taxes | | | Approx. 81% |
| Municipals subject to alternative minimum tax | | | Approx. 2% |
Maturity Distribution
| Maturity Type | % of Securities | |
| Cash Equivalents | | | 5.5 | |
| Less than 1 Year | | | 9.4 | |
| 1 - 3 Years | | | 27.7 | |
| 3 - 5 Years | | | 19.2 | |
| 5 - 7 Years | | | 16.2 | |
| 7 - 10 Years | | | 11.9 | |
| 10 Years or more | | | 10.1 | |
| | | | 100.0 | |
Credit Quality(a)
| Underlying Securities | % of Securities | |
| Aaa/AAA | | | 6.5 | |
| Aa/AA | | | 51.8 | |
| A/A | | | 29.8 | |
| Baa/BBB | | | 2.9 | |
| CC | | | 1.4 | |
| Non-Rated | | | 2.1 | |
| Cash Equivalents | | | 5.5 | |
| | | | 100.0 | |
Asset Allocation(b)
Sector Breakdown
| | % of Net Assets | |
| Power | | | 28.1 | |
| Higher Education | | | 13.5 | |
| Hospital | | | 8.2 | |
| Airport/Transportation | | | 4.2 | |
| Lease | | | 4.1 | |
| General | | | 4.0 | |
| Water/Sewer | | | 2.9 | |
| Housing | | | 0.6 | |
| Total Revenue | | | 65.6 | |
| County | | | 6.6 | |
| City/Subdivision | | | 5.1 | |
| School District | | | 3.7 | |
| Natural Resource District | | | 2.6 | |
| Total General Obligation | | | 18.0 | |
| Escrow/Pre-Refunded | | | 10.0 | |
| Cash Equivalents/Other | | | 6.4 | |
| | | | 100.0 | |
(a) The Fund receives credit quality ratings on underlying securities of the Fund when available from Moody’s, S&P and Fitch. The Fund will use one rating for an underlying security if that is all that is provided. Ratings and portfolio credit quality may change over time. The Fund itself has not been rated by an independent rating agency.
(b) Percent of net assets.
29 | Q1 2015 ANNUAL REPORT | UNAUDITED
GOVERNMENT MONEY MARKET FUND
Investment Style: Money Market
Portfolio Manager: Tom Carney, CFA
The Government Money Market Fund ended the first calendar quarter with a 7-day effective and current yield of 0.01%. (An investment in the Fund is neither insured nor guaranteed by the U.S. Government. There can be no assurance that the Fund will be able to maintain a stable net asset value. Although the Fund seeks to preserve the value of your investment at $1.00 per share, it is possible to lose money by investing in the Fund.)
Returns to savers in investment vehicles like money market funds, bank savings accounts and short-term CDs remained frustratingly close to zero in the past quarter and fiscal year. Our Fund’s 7-day effective yield of 0.01% was unchanged in the first quarter compared to December 31. And while investors and savers in money market funds or savings accounts received no reprieve in the first quarter from record low short-term interest rates that have persisted for over six years, there may be light at the end of the proverbial tunnel.
That light, however dim, would come courtesy of the Federal Open Market Committee (FOMC) of the Federal Reserve (the Fed) who regulates the Fed Funds rate (the overnight lending rate between banks). The Fed Funds rate affects all investments within the opportunity set of our Fund and has been kept “exceptionally low” since December 2008 in order to achieve maximum employment and 2 percent inflation. In recent meetings the Fed has hinted, by eliminating the word “patient” in its policy statements, that the time to raise its target range for the Fed Funds rate could happen in 2015.
Short-term investors anxiously awaiting an increase in short-term interest rates might easily see themselves in a scene from the cartoon Peanuts where Charlie Brown is hoping to kick the football Lucy is holding, but always yanks away at the last moment. 2015 may be the year that the Fed (playing Lucy) sets up the ball for savers in the form of higher short-term interest rates and doesn’t keep pushing that possibility further into the future by yanking it away at the last moment. Time, of course, will tell.
We invest in ultra-high quality, short-term investments (e.g. U.S. Treasury bills and government agency discount notes) that have a weighted average maturity of less than 60 days. As a result, our yield has invariably followed the path dictated by the Federal Reserve’s monetary policy as we frequently reinvest maturing bills and notes in these short-term instruments. As of March 31, 2015, 87.6% of our portfolio was invested in U.S. Treasury bills, with the balance in high quality Wells Fargo money market funds. The average life of our portfolio at March 31, 2015, was approximately 28 days.
When the Fed changes from its current course and begins to raise short-term rates, our Fund will quickly benefit as we frequently reinvest maturing securities. In the meantime, we will maintain our focus on high credit quality, preservation of capital and maintaining liquidity for our investors.
Sector Breakdown
| | % of Net Assets | |
| U.S. Treasury | | | 87.6 | |
| Government & Treasury Money Market Funds | | | 12.4 | |
| | | | 100.0 | |
30 | Q1 2015 ANNUAL REPORT
WEITZINVESTMENTS.COM
This page intentionally left blank
31 | Q1 2015 ANNUAL REPORT | UNAUDITED
VALUE FUND
Schedule of Investments
March 31, 2015
| Common Stocks – 80.0% | | | | | | | | | |
| | | % of Net | | | | | | | |
| Consumer Discretionary | | Assets | | | Shares | | | $ Value | |
| Cable & Satellite | | | 8.2 | | | | | | | |
Liberty Global plc - Series C* (c) | | | | | | | 1,545,000 | | | | 76,956,450 | |
| Liberty Broadband Corp. - Series C* | | | | | | | 289,451 | | | | 16,382,927 | |
| | | | | | | | | | | | | |
| Broadcasting | | | 6.2 | | | | | | | | | |
| Liberty Media Corp. - Series C* | | | | | | | 960,000 | | | | 36,672,000 | |
| Discovery Communications, Inc. - Class C* | | | | | | | 1,160,000 | | | | 34,191,000 | |
| | | | | | | | | | | | | |
| Movies & Entertainment | | | 4.4 | | | | | | | | | |
| Twenty-First Century Fox, Inc. | | | | | | | | | | | | |
| Class A | | | | | | | 975,000 | | | | 32,994,000 | |
| Class B | | | | | | | 508,000 | | | | 16,703,040 | |
| | | | | | | | | | | | | |
| Internet & Catalog Retail | | | 3.9 | | | | | | | | | |
| Liberty Interactive Corp. - Series A* | | | | | | | 1,540,000 | | | | 44,952,600 | |
| | | | | | | | | | | | | |
| Advertising | | | 1.8 | | | | | | | | | |
| Omnicom Group, Inc. | | | | | | | 260,500 | | | | 20,313,790 | |
| | | | 24.5 | | | | | | | | 279,165,807 | |
| Health Care | | | | | | | | | | | | |
| | | | | | | | | | | | | |
| Pharmaceuticals | | | 9.0 | | | | | | | | | |
Valeant Pharmaceuticals International, Inc.* (c) | | | | | | | 338,333 | | | | 67,199,700 | |
Endo International plc* (c) | | | | | | | 400,000 | | | | 35,880,000 | |
| | | | | | | | | | | | | |
| Health Care Services | | | 7.7 | | | | | | | | | |
| Express Scripts Holding Co.* | | | | | | | 470,000 | | | | 40,781,900 | |
Catamaran Corp.* (c) | | | | | | | 525,000 | | | | 31,258,500 | |
| Laboratory Corp. of America Holdings* | | | | | | | 125,000 | | | | 15,761,250 | |
| | | | 16.7 | | | | | | | | 190,881,350 | |
| Information Technology | | | | | | | | | | | | |
| | | | | | | | | | | | | |
| IT Services | | | 4.3 | | | | | | | | | |
Accenture plc - Class A(c) | | | | | | | 200,000 | | | | 18,738,000 | |
| Fidelity National Information Services, Inc. | | | | | | | 250,000 | | | | 17,015,000 | |
| MasterCard Inc. - Class A | | | | | | | 150,000 | | | | 12,958,500 | |
| | | | | | | | | | | | | |
| Software | | | 2.4 | | | | | | | | | |
| Oracle Corp. | | �� | | | | | 635,000 | | | | 27,400,250 | |
| | | | | | | | | | | | | |
| Internet Software & Services | | | 2.2 | | | | | | | | | |
| Google, Inc.* | | | | | | | | | | | | |
| Class A | | | | | | | 23,000 | | | | 12,758,100 | |
| Class C | | | | | | | 23,000 | | | | 12,604,000 | |
| | | | | | | | | | | | | |
| Communications Equipment | | | 2.1 | | | | | | | | | |
| Motorola Solutions, Inc. | | | | | | | 360,400 | | | | 24,027,868 | |
| | | | 11.0 | | | | | | | | 125,501,718 | |
| Financials | | | | | | | | | | | | |
| | | | | | | | | | | | | |
| Diversified Financial Services | | | 4.7 | | | | | | | | | |
| Berkshire Hathaway, Inc. - Class B* | | | | | | | 375,000 | | | | 54,120,000 | |
| Insurance Brokers | | | 2.7 | | | | | | | | | |
Aon plc - Class A(c) | | | | | | | 315,000 | | | | 30,277,800 | |
| Diversified Banks | | | 2.0 | | | | | | | | | |
| Wells Fargo & Co. | | | | | | | 415,000 | | | | 22,576,000 | |
| | | | 9.4 | | | | | | | | 106,973,800 | |
| | | | | | $ Principal | | | | |
| | | % of Net | | | Amount | | | | |
| Industrials | | Assets | | | or Shares | | | $ Value | |
| Aerospace & Defense | | | 5.3 | | | | | | | |
| Precision Castparts Corp. | | | | | | | 145,000 | | | | 30,450,000 | |
| TransDigm Group, Inc. | | | | | | | 135,000 | | | | 29,527,200 | |
| | | | | | | | | | | | | |
| Air Freight & Logistics | | | 1.8 | | | | | | | | | |
| United Parcel Service, Inc. - Class B | | | | | | | 215,000 | | | | 20,842,100 | |
| | | | 7.1 | | | | | | | | 80,819,300 | |
| Energy | | | | | | | | | | | | |
| | | | | | | | | | | | | |
| Oil & Gas Exploration & Production | | | 6.9 | | | | | | | | | |
| Range Resources Corp. | | | | | | | 820,000 | | | | 42,672,800 | |
| Pioneer Natural Resources Co. | | | | | | | 225,000 | | | | 36,789,750 | |
| | | | 6.9 | | | | | | | | 79,462,550 | |
| Materials | | | | | | | | | | | | |
| | | | | | | | | | | | | |
| Construction Materials | | | 1.9 | | | | | | | | | |
| Martin Marietta Materials, Inc. | | | | | | | 155,000 | | | | 21,669,000 | |
| | | | | | | | | | | | | |
| Industrial Gases | | | 1.4 | | | | | | | | | |
| Praxair, Inc. | | | | | | | 125,000 | | | | 15,092,500 | |
| | | | 3.3 | | | | | | | | 36,761,500 | |
| Consumer Staples | | | | | | | | | | | | |
| | | | | | | | | | | | | |
| Beverages | | | 1.1 | | | | | | | | | |
Diageo plc - Sponsored ADR(c) | | | | | | | 115,000 | | | | 12,715,550 | |
| Total Common Stocks (Cost $578,051,949) | | | | | | | | 912,281,575 | |
| | | | | | | | | | | | | |
| Cash Equivalents – 20.1% | | | | | | | | | | | | |
| | | | | | | | | | | | | |
| U.S. Treasury Bills, 0.01% to 0.05%, | | | | | | | | | | | | |
4/02/15 to 6/18/15(a) | | | | | | | 210,000,000 | | | | 209,996,732 | |
| Wells Fargo Advantage Government Money | | | | | | | | | |
Market Fund - Institutional Class 0.01%(b) | | | | | | | 19,763,598 | | | | 19,763,598 | |
| Total Cash Equivalents (Cost $229,757,422) | | | | | | | | 229,760,330 | |
Total Investments in Securities (Cost $807,809,371) | | | | | | | | 1,142,041,905 | |
| Other Liabilities in Excess of Other Assets - (0.1%) | | | | | | | | (1,142,202 | ) |
| Net Assets - 100% | | | | | | | | | | | 1,140,899,703 | |
| Net Asset Value Per Share - Investor Class | | | | | | | | 46.93 | |
| Net Asset Value Per Share - Institutional Class | | | | | | | | 46.99 | |
| * | Non-income producing |
| (a) | Interest rates presented represent the yield to maturity at the date of purchase. |
| (b) | Rate presented represents the annualized 7-day yield at March 31, 2015. |
| (c) | Foreign domiciled corporation. |
The accompanying notes form an integral part of these financial statements.
32 | Q1 2015 ANNUAL REPORT
PARTNERS VALUE FUND
Schedule of Investments
March 31, 2015
| Common Stocks – 81.2% | | | | | | | | | |
| | | % of Net | | | | | | | |
| Consumer Discretionary | | Assets | | | Shares | | | $ Value | |
| Cable & Satellite | | | 7.8 | | | | | | | |
Liberty Global plc - Series C* (c) | | | | | | | 1,205,000 | | | | 60,021,050 | |
| Liberty Broadband Corp.* | | | | | | | | | | | | |
| Series A | | | | | | | 165,000 | | | | 9,319,200 | |
| Series C | | | | | | | 300,000 | | | | 16,980,000 | |
| | | | | | | | | | | | | |
| Broadcasting | | | 7.1 | | | | | | | | | |
| Liberty Media Corp.* | | | | | | | | | | | | |
| Series A | | | | | | | 415,000 | | | | 15,998,250 | |
| Series C | | | | | | | 1,000,000 | | | | 38,200,000 | |
| Discovery Communications, Inc. - Class C* | | | | 825,000 | | | | 24,316,875 | |
| | | | | | | | | | | | | |
| Movies & Entertainment | | | 3.6 | | | | | | | | | |
| Twenty-First Century Fox, Inc. | | | | | | | | | | | | |
| Class A | | | | | | | 465,000 | | | | 15,735,600 | |
| Class B | | | | | | | 450,000 | | | | 14,796,000 | |
| Live Nation Entertainment, Inc.* | | | | | | | 400,000 | | | | 10,092,000 | |
| | | | | | | | | | | | | |
| Internet & Catalog Retail | | | 3.2 | | | | | | | | | |
| Liberty Interactive Corp. - Series A* | | | | | | | 1,200,000 | | | | 35,028,000 | |
| | | | | | | | | | | | | |
| Textiles, Apparel & Luxury Goods | | | 2.4 | | | | | | | | | |
| Iconix Brand Group, Inc.* | | | | | | | 800,000 | | | | 26,936,000 | |
| | | | | | | | | | | | | |
| Hotels, Restaurants & Leisure | | | 2.1 | | | | | | | | | |
| Interval Leisure Group, Inc. | | | | | | | 875,000 | | | | 22,933,750 | |
| | | | | | | | | | | | | |
| Auto Components | | | 1.2 | | | | | | | | | |
| Allison Transmission Holdings, Inc. | | | | | | | 423,099 | | | | 13,513,782 | |
| | | | 27.4 | | | | | | | | 303,870,507 | |
| Financials | | | | | | | | | | | | |
| | | | | | | | | | | | | |
| Insurance Brokers | | | 4.8 | | | | | | | | | |
Aon plc - Class A(c) | | | | | | | 260,000 | | | | 24,991,200 | |
Willis Group Holdings Ltd.(c) | | | | | | | 325,000 | | | | 15,658,500 | |
| Brown & Brown, Inc. | | | | | | | 375,000 | | | | 12,416,250 | |
| | | | | | | | | | | | | |
| Diversified Financial Services | | | 4.6 | | | | | | | | | |
| Berkshire Hathaway, Inc. - Class B* | | | | | | | 350,000 | | | | 50,512,000 | |
| | | | | | | | | | | | | |
| Mortgage REITs | | | 2.7 | | | | | | | | | |
| Redwood Trust, Inc. | | | | | | | 1,700,000 | | | | 30,379,000 | |
| | | | | | | | | | | | | |
| Diversified Banks | | | 2.7 | | | | | | | | | |
| Wells Fargo & Co. | | | | | | | 550,000 | | | | 29,920,000 | |
| | | | 14.8 | | | | | | | | 163,876,950 | |
| Health Care | | | | | | | | | | | | |
| | | | | | | | | | | | | |
| Health Care Services | | | 8.5 | | | | | | | | | |
| Express Scripts Holding Co.* | | | | | | | 500,000 | | | | 43,385,000 | |
| Laboratory Corp. of America Holdings* | | | | | | | 225,000 | | | | 28,370,250 | |
Catamaran Corp.* (c) | | | | | | | 375,000 | | | | 22,327,500 | |
| | | | | | | | | | | | | |
| Pharmaceuticals | | | 4.5 | | | | | | | | | |
Valeant Pharmaceuticals International, Inc.* (c) | | | | 250,000 | | | | 49,655,000 | |
| | | | 13.0 | | | | | | | | 143,737,750 | |
| Information Technology | | | | | | | | | | | | |
| | | | | | | | | | | | | |
| Internet Software & Services | | | 3.4 | | | | | | | | | |
| Google, Inc.* | | | | | | | | | | | | |
| Class A | | | | | | | 20,000 | | | | 11,094,000 | |
| Class C | | | | | | | 26,600 | | | | 14,576,800 | |
| XO Group, Inc.* | | | | | | | 645,175 | | | | 11,400,242 | |
| | | | | | | | | | | | | |
| Semiconductors & | | | | | | | | | | | | |
| Semiconductor Equipment | | | 2.1 | | | | | | | | | |
| Texas Instruments, Inc. | | | | | | | 400,000 | | | | 22,874,000 | |
| | �� | | | | $ Principal | | | | |
| | | % of Net | | | Amount | | | | |
| | | Assets | | | or Shares | | | $ Value | |
| Software | | | 2.0 | | | | | | | |
| Oracle Corp. | | | | | | | 525,000 | | | | 22,653,750 | |
| | | | | | | | | | | | | |
| Communications Equipment | | | 2.0 | | | | | | | | | |
| Motorola Solutions, Inc. | | | | | | | 338,000 | | | | 22,534,460 | |
| | | | | | | | | | | | | |
| Electronic Equipment, | | | | | | | | | | | | |
| Instruments & Components | | | 1.7 | | | | | | | | | |
| FLIR Systems, Inc. | | | | | | | 600,000 | | | | 18,768,000 | |
| | | | | | | | | | | | | |
| IT Services | | | 1.5 | | | | | | | | | |
| Fidelity National Information Services, Inc. | | | | | | | 250,000 | | | | 17,015,000 | |
| | | | 12.7 | | | | | | | | 140,916,252 | |
| Industrials | | | | | | | | | | | | |
| | | | | | | | | | | | | |
| Aerospace & Defense | | | 3.3 | | | | | | | | | |
| Precision Castparts Corp. | | | | | | | 100,000 | | | | 21,000,000 | |
| TransDigm Group, Inc. | | | | | | | 70,000 | | | | 15,310,400 | |
| | | | | | | | | | | | | |
| Commercial Services & Supplies | | | 1.4 | | | | | | | | | |
| The ADT Corp. | | | | | | | 375,000 | | | | 15,570,000 | |
| | | | 4.7 | | | | | | | | 51,880,400 | |
| Energy | | | | | | | | | | | | |
| | | | | | | | | | | | | |
| Oil & Gas Exploration & Production | | | 4.7 | | | | | | | | | |
| Range Resources Corp. | | | | | | | 600,000 | | | | 31,224,000 | |
| Pioneer Natural Resources Co. | | | | | | | 125,000 | | | | 20,438,750 | |
| | | | 4.7 | | | | | | | | 51,662,750 | |
| Materials | | | | | | | | | | | | |
| | | | | | | | | | | | | |
| Construction Materials | | | 2.5 | | | | | | | | | |
| Martin Marietta Materials, Inc. | | | | | | | 195,000 | | | | 27,261,000 | |
| | | | | | | | | | | | | |
| Consumer Staples | | | | | | | | | | | | |
| | | | | | | | | | | | | |
| Personal Products | | | 1.4 | | | | | | | | | |
| Avon Products, Inc. | | | | | | | 2,000,000 | | | | 15,980,000 | |
| Total Common Stocks (Cost $576,706,609) | | | | | | | | 899,185,609 | |
| | | | | | | | | | | | | |
| Cash Equivalents – 18.8% | | | | | | | | | | | | |
| | | | | | | | | | | | | |
| U.S. Treasury Bills, 0.01% to 0.04%, | | | | | | | | | | | | |
4/02/15 to 6/18/15(a) | | | | | | | 193,000,000 | | | | 192,997,016 | |
| Wells Fargo Advantage Government Money | | | | | | | | | | | | |
Market Fund - Institutional Class 0.01%(b) | | | | | | | 15,889,727 | | | | 15,889,727 | |
| Total Cash Equivalents (Cost $208,884,325) | | | | | | | | 208,886,743 | |
Total Investments in Securities (Cost $785,590,934) | | | | | | | | 1,108,072,352 | |
| Other Liabilities in Excess of Other Assets - 0.0% | | | | | | | | (246,304 | ) |
| | | | | | | | | | | | | |
| Net Assets - 100% | | | | | | | | | | | 1,107,826,048 | |
| Net Asset Value Per Share - Investor Class | | | | | | | | 35.05 | |
| Net Asset Value Per Share - Institutional Class | | | | | | | | 35.09 | |
| * | Non-income producing |
| (a) | Interest rates presented represent the yield to maturity at the date of purchase. |
| (b) | Rate presented represents the annualized 7-day yield at March 31, 2015. |
| (c) | Foreign domiciled corporation. |
The accompanying notes form an integral part of these financial statements.
33 | Q1 2015 ANNUAL REPORT | UNAUDITED
PARTNERS III OPPORTUNITY FUND
Schedule of Investments
| Common Stocks – 93.1% | | | | | | | | | |
| | | % of Net | | | | | | | |
| Consumer Discretionary | | Assets | | | Shares | | | $ Value | |
| Cable & Satellite | | | 11.2 | | | | | | | |
Liberty Global plc - Series C* (c) (d) | | | | | | | 1,500,000 | | | | 74,715,000 | |
Liberty Broadband Corp.* (c) | | | | | | | | | | | | |
| Series A | | | | | | | 135,000 | | | | 7,624,800 | |
| Series C | | | | | | | 680,000 | | | | 38,488,000 | |
| | | | | | | | | | | | | |
| Broadcasting | | | 9.8 | | | | | | | | | |
Liberty Media Corp.* (c) | | | | | | | | | | | | |
| Series A | | | | | | | 540,000 | | | | 20,817,000 | |
| Series C | | | | | | | 1,400,000 | | | | 53,480,000 | |
| Discovery Communications, Inc. - Class C* | | | | | | | 900,000 | | | | 26,527,500 | |
| Cumulus Media, Inc. - Class A* | | | | | | | 2,300,000 | | | | 5,681,000 | |
| | | | | | | | | | | | | |
| Internet & Catalog Retail | | | 6.2 | | | | | | | | | |
Liberty Interactive Corp. - Series A* (c) | | | | | | | 1,325,000 | | | | 38,676,750 | |
Liberty Ventures - Series A* (c) | | | | | | | 660,000 | | | | 27,726,600 | |
| | | | | | | | | | | | | |
| Textiles, Apparel & Luxury Goods | | | 2.8 | | | | | | | | | |
| Iconix Brand Group, Inc.* | | | | | | | 900,000 | | | | 30,303,000 | |
| | | | | | | | | | | | | |
| Hotels, Restaurants & Leisure | | | 2.5 | | | | | | | | | |
| Interval Leisure Group, Inc. | | | | | | | 1,040,000 | | | | 27,258,400 | |
| | | | | | | | | | | | | |
| Movies & Entertainment | | | 2.3 | | | | | | | | | |
| Live Nation Entertainment, Inc.* | | | | | | | 1,000,000 | | | | 25,230,000 | |
| | | | | | | | | | | | | |
| Advertising | | | 1.5 | | | | | | | | | |
| National CineMedia, Inc. | | | | | | | 1,100,000 | | | | 16,610,000 | |
| | | | 36.3 | | | | | | | | 393,138,050 | |
| Financials | | | | | | | | | | | | |
| | | | | | | | | | | | | |
| Diversified Financial Services | | | 7.6 | | | | | | | | | |
Berkshire Hathaway, Inc. - Class B* (c) | | | | | | | 570,000 | | | | 82,262,400 | |
| | | | | | | | | | | | | |
| Diversified Banks | | | 3.5 | | | | | | | | | |
Wells Fargo & Co.(c) | | | | | | | 700,000 | | | | 38,080,000 | |
| | | | | | | | | | | | | |
| Mortgage REITs | | | 2.8 | | | | | | | | | |
Redwood Trust, Inc.(c) | | | | | | | 1,700,000 | | | | 30,379,000 | |
| | | | 13.9 | | | | | | | | 150,721,400 | |
| Industrials | | | | | | | | | | | | |
| | | | | | | | | | | | | |
| Aerospace & Defense | | | 6.8 | | | | | | | | | |
TransDigm Group, Inc.(c) | | | | | | | 250,000 | | | | 54,680,000 | |
Precision Castparts Corp.(c) | | | | | | | 90,000 | | | | 18,900,000 | |
| | | | | | | | | | | | | |
| Transportation Infrastructure | | | 3.3 | | | | | | | | | |
| Wesco Aircraft Holdings, Inc.* | | | | | | | 2,320,000 | | | | 35,542,400 | |
| | | | | | | | | | | | | |
| Commercial Services & Supplies | | | 2.3 | | | | | | | | | |
| The ADT Corp. | | | | | | | 600,000 | | | | 24,912,000 | |
| | | | | | | | | | | | | |
| Machinery | | | 0.6 | | | | | | | | | |
Intelligent Systems Corp. * # † | | | | | | | 2,270,000 | | | | 6,537,600 | |
| | | | 13.0 | | | | | | | | 140,572,000 | |
| Health Care | | | | | | | | | | | | |
| | | | | | | | | | | | | |
| Pharmaceuticals | | | 6.5 | | | | | | | | | |
Valeant Pharmaceuticals International, Inc.* (c) (d) | | | | 250,000 | | | | 49,655,000 | |
Endo International plc* (c) (d) | | | | | | | 230,000 | | | | 20,631,000 | |
| | | | | | | | | | | | | |
| Health Care Services | | | 4.5 | | | | | | | | | |
Laboratory Corp. of America Holdings* (c) | | | | | | | 200,000 | | | | 25,218,000 | |
Express Scripts Holding Co.* (c) | | | | | | | 275,000 | | | | 23,861,750 | |
| | | | 11.0 | | | | | | | | 119,365,750 | |
| | | | | | $ Principal | | | | |
| | | % of Net | | | Amount or | | | | |
| Information Technology | | Assets | | | Shares | | | $ Value | |
| Internet Software & Services | | | 4.8 | | | | | | | |
Google, Inc.* (c) | | | | | | | | | | |
| Class A | | | | | | | 10,000 | | | | 5,547,000 | |
| Class C | | | | | | | 40,000 | | | | 21,920,000 | |
| XO Group, Inc.* | | | | | | | 700,000 | | | | 12,369,000 | |
| Angie’s List, Inc.* | | | | | | | 2,100,000 | | | | 12,327,000 | |
| | | | | | | | | | | | | |
| Semiconductors & | | | | | | | | | | | | |
| Semiconductor Equipment | | | 2.1 | | | | | | | | | |
Texas Instruments, Inc.(c) | | | | | | | 400,000 | | | | 22,874,000 | |
| | | | | | | | | | | | | |
| IT Services | | | 1.2 | | | | | | | | | |
MasterCard Inc. - Class A(c) | | | | | | | 150,000 | | | | 12,958,500 | |
| | | | 8.1 | | | | | | | | 87,995,500 | |
| Energy | | | | | | | | | | | | |
| | | | | | | | | | | | | |
| Oil & Gas Exploration & Production | | | 3.3 | | | | | | | | | |
| Pioneer Natural Resources Co. | | | | | | | 125,000 | | | | 20,438,750 | |
Range Resources Corp.(c) | | | | | | | 300,000 | | | | 15,612,000 | |
| | | | | | | | | | | | | |
| Oil & Gas Equipment & Services | | | 2.1 | | | | | | | | | |
Core Laboratories N.V.(c) (d) | | | | | | | 220,000 | | | | 22,987,800 | |
| | | | 5.4 | | | | | | | | 59,038,550 | |
| Materials | | | | | | | | | | | | |
| | | | | | | | | | | | | |
| Construction Materials | | | 3.0 | | | | | | | | | |
Martin Marietta Materials, Inc.(c) | | | | | | | 230,000 | | | | 32,154,000 | |
| | | | | | | | | | | | | |
| Consumer Staples | | | | | | | | | | | | |
| Personal Products | | | 2.4 | | | | | | | | | |
Avon Products, Inc.(c) | | | | | | | 3,200,000 | | | | 25,568,000 | |
| Total Common Stocks (Cost $666,357,370) | | | | | | | | 1,008,553,250 | |
| | | | | | | | | | | | | |
| Cash Equivalents – 6.3% | | | | | | | | | | | | |
| U.S. Treasury Bills, 0.05% to 0.06%, | | | | | | | | | | | | |
4/23/15 to 6/25/15(a) | | | | | | | 50,000,000 | | | | 49,999,160 | |
| Wells Fargo Advantage Government Money | | | | | | | | | |
Market Fund - Institutional Class 0.01%(b) | | | | | | | 17,716,177 | | | | 17,716,177 | |
| Total Cash Equivalents (Cost $67,712,840) | | | | | | | | 67,715,337 | |
Total Investments in Securities (Cost $734,070,210) | | | | | | | | 1,076,268,587 | |
Due From Broker(c) - 26.2% | | | | | | | | | | | 283,942,355 | |
| Securities Sold Short - (25.3%) | | | | | | | | | | | (273,625,100 | ) |
| Other Liabilities in Excess of Other Assets - (0.3%) | | | | | | | | (3,274,936 | ) |
| | | | | | | | | | | | | |
| Net Assets - 100% | | | | | | | | | | | 1,083,310,906 | |
| Net Asset Value Per Share - Investor Class | | | | | | | | 17.12 | |
| Net Asset Value Per Share - Institutional Class | | | | | | | | 17.31 | |
The accompanying notes form an integral part of these financial statements.
34 | Q1 2015 ANNUAL REPORT
Securities Sold Short – (25.3%)
| | | Shares | | | $ Value | |
| Ishares Russell 2000 Fund | | | 600,000 | | | | (74,610,000 | ) |
| Ishares Russell Midcap Fund | | | 430,000 | | | | (74,441,600 | ) |
| PowerShares QQQ Trust, Series 1 | | | 300,000 | | | | (31,680,000 | ) |
| SPDR S&P 500 ETF Trust | | | 450,000 | | | | (92,893,500 | ) |
| Total Securities Sold Short (proceeds $237,014,304) | | | | | | | (273,625,100 | ) |
| * | Non-income producing |
| † | Controlled affiliate |
| # | lliquid and/or restricted security. |
| (a) | Interest rates presented represent the yield to maturity at the date of purchase. |
| (b) | Rate presented represents the annualized 7-day yield at March 31, 2015. |
| (c) | Fully or partially pledged as collateral on securities sold short. |
| (d) | Foreign domiciled corporation. |
The accompanying notes form an integral part of these financial statements.
35 | Q1 2015 ANNUAL REPORT | UNAUDITED
RESEARCH FUND
Schedule of Investments
March 31, 2015
| Common Stocks – 84.4% | | | | | | | | | |
| | | % of Net | | | | | | | |
| Consumer Discretionary | | Assets | | | Shares | | | $ Value | |
| Cable & Satellite | | | 9.8 | | | | | | | |
Liberty Global plc - Series C* (b) | | | | | | | 31,650 | | | | 1,576,487 | |
| Liberty Broadband Corp. - Series C* | | | | | | | 10,268 | | | | 581,169 | |
| Comcast Corp. - Class A Special | | | | | | | 6,500 | | | | 364,422 | |
| | | | | | | | | | | | | |
| Broadcasting | | | 5.2 | | | | | | | | | |
| Liberty Media Corp. - Series C* | | | | | | | 25,050 | | | | 956,910 | |
| Discovery Communications, Inc. - Class C* | | | | | | | 12,500 | | | | 368,438 | |
| | | | | | | | | | | | | |
| Internet & Catalog Retail | | | 4.3 | | | | | | | | | |
| Liberty Interactive Corp. - Series A* | | | | | | | 37,820 | | | | 1,103,966 | |
| | | | | | | | | | | | | |
| Advertising | | | 3.9 | | | | | | | | | |
| National CineMedia, Inc. | | | | | | | 66,131 | | | | 998,578 | |
| | | | | | | | | | | | | |
| Movies & Entertainment | | | 3.0 | | | | | | | | | |
| Twenty-First Century Fox, Inc. | | | | | | | | | | | | |
| Class A | | | | | | | 20,540 | | | | 695,074 | |
| Class B | | | | | | | 2,240 | | | | 73,651 | |
| | | | | | | | | | | | | |
| Auto Components | | | 1.9 | | | | | | | | | |
| Allison Transmission Holdings, Inc. | | | | | | | 15,000 | | | | 479,100 | |
| | | | | | | | | | | | | |
| Hotels, Restaurants & Leisure | | | 1.5 | | | | | | | | | |
| Interval Leisure Group, Inc. | | | | | | | 15,213 | | | | 398,733 | |
| | | | | | | | | | | | | |
| Textiles, Apparel & Luxury Goods | | | 1.5 | | | | | | | | | |
The Swatch Group Ltd - Unsponsored ADR(b) | | | | | | | 18,000 | | | | 378,630 | |
| | | | 31.1 | | | | | | | | 7,975,158 | |
| | | | | | | | | | | | | |
| Information Technology | | | | | | | | | | | | |
| | | | | | | | | | | | | |
| Internet Software & Services | | | 9.0 | | | | | | | | | |
| Angie’s List, Inc.* | | | | | | | 249,362 | | | | 1,463,755 | |
| XO Group, Inc.* | | | | | | | 28,915 | | | | 510,928 | |
| Google, Inc.* | | | | | | | | | | | | |
| Class A | | | | | | | 300 | | | | 166,410 | |
| Class C | | | | | | | 300 | | | | 164,400 | |
| | | | | | | | | | | | | |
| Software | | | 1.7 | | | | | | | | | |
| ACI Worldwide, Inc.* | | | | | | | 20,000 | | | | 433,200 | |
| | | | | | | | | | | | | |
| Communications Equipment | | | 1.6 | | | | | | | | | |
| Motorola Solutions, Inc. | | | | | | | 6,000 | | | | 400,020 | |
| | | | | | | | | | | | | |
| IT Services | | | 1.2 | | | | | | | | | |
Accenture plc - Class A(b) | | | | | | | 3,300 | | | | 309,177 | |
| | | | 13.5 | | | | | | | | 3,447,890 | |
| | | �� | | | | | | | | | | |
| Health Care | | | | | | | | | | | | |
| | | | | | | | | | | | | |
| Health Care Services | | | 9.4 | | | | | | | | | |
Catamaran Corp.* (b) | | | | | | | 27,582 | | | | 1,642,232 | |
| Express Scripts Holding Co.* | | | | | | | 8,869 | | | | 769,563 | |
| | | | | | | | | | | | | |
| Pharmaceuticals | | | 3.8 | | | | | | | | | |
Valeant Pharmaceuticals International, Inc.* (b) | | | | | | 4,900 | | | | 973,238 | |
| | | | 13.2 | | | | | | | | 3,385,033 | |
| | | % of Net | | | | | | | |
| Energy | | Assets | | | Shares | | | $ Value | |
| Oil & Gas Exploration & Production | | | 8.8 | | | | | | | |
| Range Resources Corp. | | | | | | | 34,578 | | | | 1,799,439 | |
| Pioneer Natural Resources Co. | | | | | | | 2,796 | | | | 457,174 | |
| | | | | | | | | | | | | |
| Oil & Gas Equipment & Services | | | 1.4 | | | | | | | | | |
Core Laboratories N.V.(b) | | | | | | | 3,500 | | | | 365,715 | |
| | | | 10.2 | | | | | | | | 2,622,328 | |
| Industrials | | | | | | | | | | | | |
| | | | | | | | | | | | | |
| Commercial Services & Supplies | | | 4.5 | | | | | | | | | |
| The ADT Corp. | | | | | | | 27,500 | | | | 1,141,800 | |
| | | | | | | | | | | | | |
| Trading Companies & Distributors | | | 3.0 | | | | | | | | | |
| MRC Global Inc.* | | | | | | | 65,110 | | | | 771,553 | |
| | | | 7.5 | | | | | | | | 1,913,353 | |
| Consumer Staples | | | | | | | | | | | | |
| | | | | | | | | | | | | |
| Food Products | | | 2.8 | | | | | | | | | |
| Post Holdings, Inc.* | | | | | | | 15,000 | | | | 702,600 | |
| | | | | | | | | | | | | |
| Personal Products | | | 2.0 | | | | | | | | | |
| Avon Products, Inc. | | | | | | | 65,000 | | | | 519,350 | |
| | | | 4.8 | | | | | | | | 1,221,950 | |
| Financials | | | | | | | | | | | | |
| | | | | | | | | | | | | |
| Diversified Financial Services | | | 2.7 | | | | | | | | | |
| Berkshire Hathaway, Inc. - Class B* | | | | | | | 4,788 | | | | 691,004 | |
| | | | | | | | | | | | | |
| Insurance Brokers | | | 1.4 | | | | | | | | | |
| Brown & Brown, Inc. | | | | | | | 11,079 | | | | 366,826 | |
| | | | 4.1 | | | | | | | | 1,057,830 | |
| Total Common Stocks (Cost $18,918,083) | | | | | | | | 21,623,542 | |
| | | | | | | | | | | | | |
| Cash Equivalents – 15.6% | | | | | | | | | | | | |
| Wells Fargo Advantage Government Money | | | | | | | | | |
Market Fund - Institutional Class 0.01%(a) | | | | | | | | | | | 3,993,094 | |
| Total Cash Equivalents (Cost $3,993,094) | | | | | | | | 3,993,094 | |
Total Investments in Securities (Cost $22,911,177) | | | | | | | | 25,616,636 | |
| Other Liabilities in Excess of Other Assets - 0.0% | | | | | | | | (9,479 | ) |
| Net Assets - 100% | | | | | | | | | | | 25,607,157 | |
| Net Asset Value Per Share | | | | | | | | | | | 12.21 | |
| * | Non-income producing |
| (a) | Rate presented represents the annualized 7-day yield at March 31, 2015. |
| (b) | Foreign domiciled corporation. |
The accompanying notes form an integral part of these financial statements.
36 | Q1 2015 ANNUAL REPORT
HICKORY FUND
Schedule of Investments
March 31, 2015
| Common Stocks – 81.3% | | | | | | | | | |
| | | % of Net | | | | | | | |
| Consumer Discretionary | | Assets | | | Shares | | | $ Value | |
| Cable & Satellite | | | 6.3 | | | | | | | |
Liberty Global plc - Series C* (c) | | | | | | | 360,000 | | | | 17,931,600 | |
| Liberty Broadband Corp.* | | | | | | | | | | | | |
| Series A | | | | | | | 27,500 | | | | 1,553,200 | |
| Series C | | | | | | | 151,999 | | | | 8,603,143 | |
| | | | | | | | | | | | | |
| Internet & Catalog Retail | | | 5.5 | | | | | | | | | |
| Liberty Interactive Corp. - Series A* | | | | | | | 550,000 | | | | 16,054,500 | |
| Liberty Ventures - Series A* | | | | | | | 198,856 | | | | 8,353,940 | |
| | | | | | | | | | | | | |
| Broadcasting | | | 3.5 | | | | | | | | | |
| Liberty Media Corp.* | | | | | | | | | | | | |
| Series A | | | | | | | 110,000 | | | | 4,240,500 | |
| Series C | | | | | | | 220,000 | | | | 8,404,000 | |
| Cumulus Media, Inc. - Class A* | | | | | | | 1,200,000 | | | | 2,964,000 | |
| | | | | | | | | | | | | |
| Textiles, Apparel & Luxury Goods | | | 3.3 | | | | | | | | | |
| Iconix Brand Group, Inc.* | | | | | | | 440,000 | | | | 14,814,800 | |
| | | | | | | | | | | | | |
| Advertising | | | 3.2 | | | | | | | | | |
| National CineMedia, Inc. | | | | | | | 950,000 | | | | 14,345,000 | |
| | | | | | | | | | | | | |
| Hotels, Restaurants & Leisure | | | 2.8 | | | | | | | | | |
| Interval Leisure Group, Inc. | | | | | | | 482,051 | | | | 12,634,557 | |
| | | | | | | | | | | | | |
| Movies & Entertainment | | | 2.3 | | | | | | | | | |
| Live Nation Entertainment, Inc.* | | | | | | | 400,000 | | | | 10,092,000 | |
| | | | | | | | | | | | | |
| Auto Components | | | 2.2 | | | | | | | | | |
| Allison Transmission Holdings, Inc. | | | | | | | 310,000 | | | | 9,901,400 | |
| | | | | | | | | | | | | |
| Diversified Consumer Services | | | 1.3 | | | | | | | | | |
| Ascent Capital Group, Inc. - Class A* | | | | | | | 140,000 | | | | 5,573,400 | |
| | | | 30.4 | | | | | | | | 135,466,040 | |
| Information Technology | | | | | | | | | | | | |
| | | | | | | | | | | | | |
| Internet Software & Services | | | 4.9 | | | | | | | | | |
| XO Group, Inc.* | | | | | | | 725,000 | | | | 12,810,750 | |
| Angie’s List, Inc.* | | | | | | | 1,500,000 | | | | 8,805,000 | |
| | | | | | | | | | | | | |
| Software | | | 3.5 | | | | | | | | | |
| ACI Worldwide, Inc.* | | | | | | | 725,000 | | | | 15,703,500 | |
| | | | | | | | | | | | | |
| Electronic Equipment, Instruments | | | | | | | | | | | | |
| & Components | | | 1.0 | | | | | | | | | |
| FLIR Systems, Inc. | | | | | | | 150,000 | | | | 4,692,000 | |
| | | | 9.4 | | | | | | | | 42,011,250 | |
| Financials | | | | | | | | | | | | |
| | | | | | | | | | | | | |
| Insurance Brokers | | | 6.3 | | | | | | | | | |
| Brown & Brown, Inc. | | | | | | | 520,000 | | | | 17,217,200 | |
Willis Group Holdings Ltd.(c) | | | | | | | 225,000 | | | | 10,840,500 | |
| | | | | | | | | | | | | |
| Mortgage REITs | | | 3.1 | | | | | | | | | |
| Redwood Trust, Inc. | | | | | | | 775,000 | | | | 13,849,250 | |
| | | | 9.4 | | | | | | | | 41,906,950 | |
| Industrials | | | | | | | | | | | | |
| | | | | | | | | | | | | |
| Commercial Services & Supplies | | | 4.2 | | | | | | | | | |
| The ADT Corp. | | | | | | | 450,000 | | | | 18,684,000 | |
| | | | | | | | | | | | | |
| Aerospace & Defense | | | 3.2 | | | | | | | | | |
| TransDigm Group, Inc. | | | | | | | 65,000 | | | | 14,216,800 | |
| | | | | | | | | | | | | |
| Transportation Infrastructure | | | 2.0 | | | | | | | | | |
| Wesco Aircraft Holdings, Inc.* | | | | | | | 573,205 | | | | 8,781,501 | |
| | | | 9.4 | | | | | | | | 41,682,301 | |
| | | | | | $ Principal | | | | |
| | | % of Net | | | Amount | | | | |
| Health Care | | Assets | | | or Shares | | | $ Value | |
| Health Care Services | | | 4.5 | | | | | | | |
| Laboratory Corp. of America Holdings* | | | | | | | 105,000 | | | | 13,239,450 | |
Catamaran Corp.* (c) | | | | | | | 115,000 | | | | 6,847,100 | |
| | | | | | | | | | | | | |
| Pharmaceuticals | | | 3.8 | | | | | | | | | |
Endo International plc* (c) | | | | | | | 110,000 | | | | 9,867,000 | |
| Prestige Brands Holdings, Inc.* | | | | | | | 160,000 | | | | 6,862,400 | |
| | | | 8.3 | | | | | | | | 36,815,950 | |
| Energy | | | | | | | | | | | | |
| | | | | | | | | | | | | |
| Oil & Gas Refining & Marketing | | | 2.6 | | | | | | | | | |
| World Fuel Services Corp. | | | | | | | 200,000 | | | | 11,496,000 | |
| | | | | | | | | | | | | |
| Oil & Gas Equipment & Services | | | 2.1 | | | | | | | | | |
Core Laboratories N.V.(c) | | | | | | | 90,000 | | | | 9,404,100 | |
| | | | | | | | | | | | | |
| Oil & Gas Exploration & Production | | | 1.7 | | | | | | | | | |
| Range Resources Corp. | | | | | | | 150,000 | | | | 7,806,000 | |
| | | | 6.4 | | | | | | | | 28,706,100 | |
| Materials | | | | | | | | | | | | |
| | | | | | | | | | | | | |
| Construction Materials | | | 3.5 | | | | | | | | | |
| Martin Marietta Materials, Inc. | | | | | | | 110,000 | | | | 15,378,000 | |
| | | | | | | | | | | | | |
| Consumer Staples | | | | | | | | | | | | |
| | | | | | | | | | | | | |
| Personal Products | | | 2.0 | | | | | | | | | |
| Avon Products, Inc. | | | | | | | 1,100,000 | | | | 8,789,000 | |
| | | | | | | | | | | | | |
| Food Products | | | 1.3 | | | | | | | | | |
| Post Holdings, Inc.* | | | | | | | 130,000 | | | | 6,089,200 | |
| | | | 3.3 | | | | | | | | 14,878,200 | |
| Telecommunication Services | | | | | | | | | | | | |
| | | | | | | | | | | | | |
| Diversified Telecommunication | | | | | | | | | | | | |
| Services | | | 1.2 | | | | | | | | | |
LICT Corp.* # | | | | | | | 1,005 | | | | 5,276,240 | |
| Total Common Stocks (Cost $242,232,554) | | | | | | | | 362,121,031 | |
| | | | | | | | | | | | | |
| Cash Equivalents – 19.3% | | | | | | | | | | | | |
| U.S. Treasury Bills, 0.01% to 0.06%, | | | | | | | | | | | | |
4/02/15 to 6/18/15(a) | | | | | | | 75,000,000 | | | | 74,998,908 | |
| Wells Fargo Advantage Government Money | | | | | | | | | |
Market Fund - Institutional Class 0.01%(b) | | | | | | | 10,998,937 | | | | 10,998,937 | |
| Total Cash Equivalents (Cost $85,996,291) | | | | | | | | 85,997,845 | |
Total Investments in Securities (Cost $328,228,845) | | | | | | | | 448,118,876 | |
| Other Liabilities in Excess of Other Assets - (0.6%) | | | | | | | | (2,952,120 | ) |
| Net Assets - 100% | | | | | | | | | | | 445,166,756 | |
| Net Asset Value Per Share | | | | | | | | | | | 59.51 | |
| * | Non-income producing |
| # | lliquid and/or restricted security. |
| (a) | Interest rates presented represent the yield to maturity at the date of purchase. |
| (b) | Rate presented represents the annualized 7-day yield at March 31, 2015. |
| (c) | Foreign domiciled corporation. |
The accompanying notes form an integral part of these financial statements.
37 | Q1 2015 ANNUAL REPORT | UNAUDITED
BALANCED FUND
Schedule of Investments
March 31, 2015
| Common Stocks – 51.6% | | | | | | | | | |
| | | % of Net | | | | | | | |
| Consumer Discretionary | | Assets | | | Shares | | | $ Value | |
| Advertising | | | 3.2 | | | | | | | |
| National CineMedia, Inc. | | | | | | | 150,000 | | | | 2,265,000 | |
| Omnicom Group, Inc. | | | | | | | 22,500 | | | | 1,754,550 | |
| | | | | | | | | | | | | |
| Cable & Satellite | | | 2.6 | | | | | | | | | |
Liberty Global plc - Series C* (e) | | | | | | | 65,000 | | | | 3,237,650 | |
| | | | | | | | | | | | | |
| Internet & Catalog Retail | | | 2.3 | | | | | | | | | |
| Liberty Interactive Corp. - Series A* | | | | | | | 100,000 | | | | 2,919,000 | |
| | | | | | | | | | | | | |
| Movies & Entertainment | | | 2.2 | | | | | | | | | |
| Twenty-First Century Fox, Inc. - Class B | | | | | | | 85,000 | | | | 2,794,800 | |
| | | | | | | | | | | | | |
| Broadcasting | | | 2.1 | | | | | | | | | |
| Discovery Communications, Inc. - Class C* | | | | | | | 90,000 | | | | 2,652,750 | |
| | | | 12.4 | | | | | | | | 15,623,750 | |
| Information Technology | | | | | | | | | | | | |
| | | | | | | | | | | | | |
| IT Services | | | 3.1 | | | | | | | | | |
| Fidelity National Information Services, Inc. | | | | | | | 30,000 | | | | 2,041,800 | |
Accenture plc - Class A(e) | | | | | | | 20,000 | | | | 1,873,800 | |
| | | | | | | | | | | | | |
| Internet Software & Services | | | 1.6 | | | | | | | | | |
| Google, Inc. - Class C* | | | | | | | 3,800 | | | | 2,082,400 | |
| | | | | | | | | | | | | |
| Semiconductors & | | | | | | | | | | | | |
| Semiconductor Equipment | | | 1.5 | | | | | | | | | |
| Texas Instruments, Inc. | | | | | | | 32,500 | | | | 1,858,512 | |
| | | | | | | | | | | | | |
| Software | | | 1.4 | | | | | | | | | |
| Oracle Corp. | | | | | | | 40,000 | | | | 1,726,000 | |
| | | | | | | | | | | | | |
| Electronic Equipment, | | | | | | | | | | | | |
| Instruments & Components | | | 1.4 | | | | | | | | | |
| FLIR Systems, Inc. | | | | | | | 55,000 | | | | 1,720,400 | |
| | | | | | | | | | | | | |
| Communications Equipment | | | 1.3 | | | | | | | | | |
| Motorola Solutions, Inc. | | | | | | | 25,000 | | | | 1,666,751 | |
| | | | 10.3 | | | | | | | | 12,969,663 | |
| Financials | | | | | | | | | | | | |
| | | | | | | | | | | | | |
| Insurance Brokers | | | 4.9 | | | | | | | | | |
| Brown & Brown, Inc. | | | | | | | 75,000 | | | | 2,483,250 | |
Aon plc - Class A(e) | | | | | | | 20,000 | | | | 1,922,400 | |
Willis Group Holdings Ltd.(e) | | | | | | | 37,500 | | | | 1,806,750 | |
| | | | | | | | | | | | | |
| Diversified Financial Services | | | 2.3 | | | | | | | | | |
| Berkshire Hathaway, Inc. - Class B* | | | | | | | 20,000 | | | | 2,886,400 | |
| | | | | | | | | | | | | |
| Mortgage REITs | | | 1.9 | | | | | | | | | |
| Redwood Trust, Inc. | | | | | | | 130,000 | | | | 2,323,100 | |
| | | | 9.1 | | | | | | | | 11,421,900 | |
| Health Care | | | | | | | | | | | | |
| | | | | | | | | | | | | |
| Health Care Services | | | 6.5 | | | | | | | | | |
| Laboratory Corp. of America Holdings* | | | | | | | 23,500 | | | | 2,963,115 | |
| Express Scripts Holding Co.* | | | | | | | 32,500 | | | | 2,820,025 | |
Catamaran Corp.* (e) | | | | | | | 40,000 | | | | 2,381,600 | |
| | | | 6.5 | | | | | | | | 8,164,740 | |
| | | | | | $ Principal | | | | |
| | | % of Net | | | Amount | | | | |
| Energy | | Assets | | | or Shares | | | $ Value | |
| Oil & Gas Exploration & Production | | | 3.5 | | | | | | | |
| Range Resources Corp. | | | | | | | 50,000 | | | | 2,602,000 | |
| Pioneer Natural Resources Co. | | | | | | | 11,000 | | | | 1,798,610 | |
| | | | | | | | | | | | | |
| Oil & Gas Equipment & Services | | | 1.7 | | | | | | | | | |
| U.S. Silica Holdings, Inc. | | | | | | | 30,000 | | | | 1,068,300 | |
Core Laboratories N.V.(e) | | | | | | | 10,000 | | | | 1,044,900 | |
| | | | 5.2 | | | | | | | | 6,513,810 | |
| Industrials | | | | | | | | | | | | |
| | | | | | | | | | | | | |
| Aerospace & Defense | | | 2.0 | | | | | | | | | |
| Precision Castparts Corp. | | | | | | | 12,000 | | | | 2,520,000 | |
| | | | | | | | | | | | | |
| Air Freight & Logistics | | | 1.2 | | | | | | | | | |
| United Parcel Service, Inc. - Class B | | | | | | | 15,000 | | | | 1,454,100 | |
| | | | 3.2 | | | | | | | | 3,974,100 | |
| Consumer Staples | | | | | | | | | | | | |
| | | | | | | | | | | | | |
| Beverages | | | 2.7 | | | | | | | | | |
Diageo plc - Sponsored ADR(e) | | | | | | | 16,000 | | | | 1,769,120 | |
Anheuser-Busch InBev SA/NV - Sponsored ADR(e) | | | | 13,000 | | | | 1,584,830 | |
| | | | 2.7 | | | | | | | | 3,353,950 | |
| Materials | | | | | | | | | | | | |
| | | | | | | | | | | | | |
| Construction Materials | | | 2.2 | | | | | | | | | |
| Martin Marietta Materials, Inc. | | | | | | | 20,000 | | | | 2,796,000 | |
| Total Common Stocks (Cost $49,403,967) | | | | | | | | | | | 64,817,913 | |
| | | | | | | | | | | | | |
| Corporate Bonds – 7.4% | | | | | | | | | | | | |
| American Express Credit Corp. 1.75% 6/12/15 | | | | 500,000 | | | | 501,036 | |
| Berkshire Hathaway, Inc. (Finance Corp.) | | | | | | | | | | | | |
| 0.95% 8/15/16 | | | | | | | 1,000,000 | | | | 1,004,807 | |
| 2.0% 8/15/18 | | | | | | | 500,000 | | | | 512,979 | |
| Comcast Corp. 4.95% 6/15/16 | | | | | | | 193,000 | | | | 202,812 | |
| Markel Corp. 7.125% 9/30/19 | | | | | | | 1,014,000 | | | | 1,215,200 | |
| Range Resources Corp. 6.75% 8/01/20 | | | | | | | 975,000 | | | | 1,016,438 | |
| U.S. Bancorp 2.2% 11/15/16 | | | | | | | 750,000 | | | | 766,037 | |
| U.S. Bank, N.A. 3.778% 4/29/20 | | | | | | | 1,500,000 | | | | 1,502,733 | |
| Verizon Communications, Inc. 2.5% 9/15/16 | | | | | | | 857,000 | | | | 875,549 | |
| Wells Fargo & Co. 4.6% 4/01/21 | | | | | | | 1,250,000 | | | | 1,404,952 | |
| Wells Fargo Bank, N.A. 0.4671% 5/16/16 Floating Rate | | | | 250,000 | | | | 249,511 | |
| Total Corporate Bonds (Cost $9,136,969) | | | | | | | | | | | 9,252,054 | |
| | | | | | | | | | | | | |
| Corporate Convertible Bonds – 0.8% | | | | | | | | | |
Redwood Trust, Inc. 5.625% 11/15/19(d) (Cost $995,308) | | | | 1,000,000 | | | | 988,125 | |
| | | | | | | | | | | | | |
Asset-Backed Securities – 0.4%(c) | | | | | | | | | |
| Cabela’s Master Credit Card Trust (CABMT) | | | | | | | | | | | | |
| 2011-2A CL A2 — 0.7745% 2019 Floating Rate | | | | | | | | | |
(1.2 years)(d) (Cost $500,000) | | | | | | | 500,000 | | | | 501,333 | |
The accompanying notes form an integral part of these financial statements.
38 | Q1 2015 ANNUAL REPORT
Commercial Mortgage-Backed Securities – 0.6%(c) | | | | |
| | | $ Principal | | | | |
| | | Amount | | | $ Value | |
| Oaktree Real Estate Investments/Sabal (ORES) | | | | | | |
2014-LV3 CL A — 3.0% 2024 (0.4 years)(d) | | | 276,483 | | | | 276,483 | |
| Redwood Commercial Mortgage Corp. (RCMC) | | | | | | | | |
2012-CRE1 CL A — 5.62346% 2044 (1.3 years)(d) | | | 185,570 | | | | 190,516 | |
| Varde/First City (VFCP) | | | | | | | | |
2015-3 CL A — 2.75% 2031 (0.8 years)(d) | | | 250,000 | | | | 249,531 | |
| Total Commercial Mortgage-Backed Securities (Cost $711,584) | | | | 716,530 | |
| | | | | | | | | |
Mortgage-Backed Securities – 3.4%(c) | | | | | | | | |
| | | | | | | | | |
| Federal Home Loan Mortgage Corporation | | | | | | | | |
| Collateralized Mortgage Obligations | | | | | | | | |
| 3649 CL BW — 4.0% 2025 (3.1 years) | | | 181,136 | | | | 192,787 | |
| Pass-Through Securities | | | | | | | | |
| J14649 — 3.5% 2026 (3.5 years) | | | 225,433 | | | | 239,621 | |
| E02948 — 3.5% 2026 (3.6 years) | | | 386,971 | | | | 413,264 | |
| J16663 — 3.5% 2026 (3.6 years) | | | 216,412 | | | | 229,955 | |
| | | | | | | | 1,075,627 | |
| Federal National Mortgage Association | | | | | | | | |
| Collateralized Mortgage Obligations | | | | | | | | |
| 2002-91 CL QG — 5.0% 2018 (1.1 years) | | | 90,282 | | | | 93,936 | |
| 2003-9 CL DB — 5.0% 2018 (1.2 years) | | | 97,788 | | | | 102,043 | |
| | | | | | | | | |
| Pass-Through Securities | | | | | | | | |
| MA0464 — 3.5% 2020 (1.9 years) | | | 272,169 | | | | 288,903 | |
| 995755 — 4.5% 2024 (2.8 years) | | | 44,840 | | | | 48,346 | |
| AR8198 — 2.5% 2023 (2.8 years) | | | 350,977 | | | | 364,058 | |
| MA1502 — 2.5% 2023 (2.9 years) | | | 301,877 | | | | 313,090 | |
| AB1769 — 3.0% 2025 (3.4 years) | | | 204,827 | | | | 215,777 | |
| AB3902 — 3.0% 2026 (3.6 years) | | | 358,352 | | | | 376,444 | |
| AK3264 — 3.0% 2027 (3.7 years) | | | 280,729 | | | | 294,906 | |
| | | | | | | | 2,097,503 | |
| Government National Mortgage Association | | | | | | | | |
| Pass-Through Securities | | | | | | | | |
| G2 5255 — 3.0% 2026 (4.1 years) | | | 381,980 | | | | 403,096 | |
| | | | | | | | | |
| Non-Government Agency | | | | | | | | |
| Collateralized Mortgage Obligations | | | | | | | | |
| J.P. Morgan Mortgage Trust (JPMMT) | | | | | | | | |
2014-5 CL A1 — 3.0% 2029 (3.6 years)(d) | | | 466,464 | | | | 483,528 | |
| Sequoia Mortgage Trust (SEMT) | | | | | | | | |
| 2011-1 CL A1 — 4.125% 2041 (0.1 years) | | | 22,197 | | | | 22,464 | |
| 2010-H1 CL A1 — 1.9915% 2040 | | | | | | | | |
| Variable Rate (2.8 years) | | | 58,498 | | | | 58,186 | |
| 2012-1 CL 1A1 — 2.865% 2042 (2.9 years) | | | 133,152 | | | | 133,920 | |
| | | | | | | | 698,098 | |
| Total Mortgage-Backed Securities (Cost $4,121,293) | | | | | | | 4,274,324 | |
| U.S. Treasury Notes – 17.2% | | $ Principal | | | | |
| | | Amount or | | | | |
| Non-Government Agency | | Shares | | | $ Value | |
| U.S. Treasury Notes | | | | | | |
| 0.375% 2/15/16 | | | 2,500,000 | | | | 2,502,735 | |
| 1.0% 9/30/16 | | | 2,000,000 | | | | 2,017,344 | |
| 0.875% 2/28/17 | | | 2,000,000 | | | | 2,012,812 | |
| 0.625% 5/31/17 | | | 2,000,000 | | | | 2,000,312 | |
| 0.625% 8/31/17 | | | 2,000,000 | | | | 1,996,562 | |
| 0.625% 11/30/17 | | | 3,000,000 | | | | 2,987,577 | |
| 0.75% 2/28/18 | | | 2,000,000 | | | | 1,993,594 | |
| 1.0% 5/31/18 | | | 2,000,000 | | | | 2,002,500 | |
| 1.5% 8/31/18 | | | 2,000,000 | | | | 2,030,938 | |
| 1.25% 11/30/18 | | | 2,000,000 | | | | 2,009,688 | |
| Total U.S. Treasury Notes (Cost $21,407,921) | | | | | | | 21,554,062 | |
| | | | | | | | | |
| Cash Equivalents – 18.6% | | | | | | | | |
| U.S. Treasury Bills, 0.01% to 0.05%, | | | | | | | | |
4/23/15 to 6/18/15(a) | | | 22,000,000 | | | | 21,999,598 | |
| Wells Fargo Advantage Government Money | | | | | | | | |
Market Fund - Institutional Class 0.01%(b) | | | 1,408,263 | | | | 1,408,263 | |
| Total Cash Equivalents (Cost $23,407,549) | | | | | | | 23,407,861 | |
Total Investments in Securities (Cost $109,684,591) | | | | | | | 125,512,202 | |
| Other Assets Less Other Liabilities — 0.0% | | | | | | | 65,832 | |
| | | | | | | | | |
| Net Assets - 100% | | | | | | | 125,578,034 | |
| Net Asset Value Per Share | | | | | | | 14.07 | |
| * | Non-income producing |
| (a) | Interest rates presented represent the yield to maturity at the date of purchase. |
| (b) | Rate presented represents the annualized 7-day yield at March 31, 2015. |
| (c) | Number of years indicated represents estimated average life. |
| (d) | Security is exempt from registration under Rule 144A of the Securities Act of 1933. This security may be resold in transactions that are exempt from registration, normally to qualified institutional buyers. |
| (e) | Foreign domiciled corporation. |
The accompanying notes form an integral part of these financial statements.
39 | Q1 2015 ANNUAL REPORT | UNAUDITED
CORE PLUS INCOME FUND
Schedule of Investments
March 31, 2015
| Corporate Bonds – 42.4% | | | | | | |
| | | $ Principal | | | | |
| | | Amount | | | $ Value | |
| ADT Corp. 2.25% 7/15/17 | | | 175,000 | | | | 174,016 | |
| American Express Credit Corp. 2.25% 8/15/19 | | | 150,000 | | | | 152,268 | |
| Antero Resources Corp. 6.0% 12/01/20 | | | 100,000 | | | | 100,550 | |
| Berkshire Hathaway, Inc. | | | | | | | | |
| 2.1% 8/14/19 | | | 250,000 | | | | 255,961 | |
| 3.0% 5/15/22 (Finance Corp.) | | | 200,000 | | | | 208,339 | |
| Boardwalk Pipelines LLC 5.75% 9/15/19 | | | 170,000 | | | | 185,188 | |
| Boston Properties LP | | | | | | | | |
| 5.875% 10/15/19 | | | 170,000 | | | | 197,509 | |
| 3.125% 9/01/23 | | | 115,000 | | | | 116,081 | |
| Cinemark USA, Inc. 7.375% 6/15/21 | | | 310,000 | | | | 334,025 | |
DCP Midstream LLC 9.75% 3/15/19(c) | | | 375,000 | | | | 417,519 | |
| DCP Midstream Operating LP 2.5% 12/01/17 | | | 150,000 | | | | 141,822 | |
| Equity Commonwealth 5.875% 9/15/20 | | | 500,000 | | | | 556,133 | |
| Express Scripts Holding Co. 7.25% 6/15/19 | | | 250,000 | | | | 299,759 | |
| Flint Hills Resources LLC (Petrologistics) 6.25% 4/01/20 | | | 95,000 | | | | 102,244 | |
Kinder Morgan, Inc. (Hiland Partners) 7.25% 10/01/20(c) | | | 600,000 | | | | 649,500 | |
| Markel Corp. | | | | | | | | |
| 7.125% 9/30/19 | | | 125,000 | | | | 149,803 | |
| 3.625% 3/30/23 | | | 150,000 | | | | 154,949 | |
| Range Resources Corp. 6.75% 8/01/20 | | | 220,000 | | | | 229,350 | |
| Rose Rock Midstream LP 5.625% 7/15/22 | | | 200,000 | | | | 198,000 | |
| SemGroup Holdings LP 7.5% 6/15/21 | | | 155,000 | | | | 163,137 | |
Transocean Ltd 5.05% 12/15/16(d) | | | 70,000 | | | | 70,962 | |
| U.S. Bank, N.A. 3.778% 4/29/20 | | | 225,000 | | | | 225,410 | |
| Vornado Realty LP 2.5% 6/30/19 | | | 300,000 | | | | 302,705 | |
| Wells Fargo & Co. 4.6% 4/01/21 | | | 400,000 | | | | 449,585 | |
| Williams Partners LP (Access Midstream Partners) | | | | | | | | |
| 5.875% 4/15/21 | | | 600,000 | | | | 626,436 | |
| 6.125% 7/15/22 | | | 200,000 | | | | 211,989 | |
| Total Corporate Bonds (Cost $6,635,877) | | | | | | | 6,673,240 | |
| | | | | | | | | |
| Corporate Convertible Bonds – 3.9% | | | | | | | | |
| Redwood Trust, Inc. | | | | | | | | |
| 4.625% 4/15/18 | | | 475,000 | | | | 472,328 | |
5.625% 11/15/19(c) | | | 150,000 | | | | 148,219 | |
| Total Corporate Convertible Bonds (Cost $624,825) | | | | | | | 620,547 | |
| | | | | | | | | |
Asset-Backed Securities - 2.8%(b) | | | | | | | | |
| California Republic Auto Receivables Trust (CRART) | | | | | | | | |
2012-1 CL C — 3.0% 2020 (1.3 years)(c) | | | 150,000 | | | | 152,544 | |
| CarMax Auto Owner Trust (CARMX) | | | | | | | | |
| 2011-2 CL C — 2.62% 2017 (0.4 years) | | | 100,000 | | | | 100,927 | |
| DT Auto Owner Trust (DTAOT) | | | | | | | | |
2013-1A CL C — 2.73% 2019 (0.4 years)(c) | | | 100,000 | | | | 100,375 | |
| Flagship Credit Auto Trust (FCAT) | | | | | | | | |
2013-2 CL A — 1.94% 2019 (0.7 years)(c) | | | 58,455 | | | | 58,616 | |
| Santander Drive Auto Receivables Trust (SDART) | | | | | | | | |
| 2011-3 CL C — 3.09% 2017 (0.1 years) | | | 31,113 | | | | 31,212 | |
| Total Asset-Backed Securities (Cost $442,896) | | | | | | | 443,674 | |
| | | | | | | | | |
Commercial Mortgage-Backed Securities – 2.5%(b) | | | | | |
| Rialto Capital Management LLC (RIAL) | | | | | | | | |
2014-LT6 CL A — 2.75% 2024 (0.3 years)(c) | | | 92,530 | | | | 92,528 | |
| Varde/First City (VFCP) | | | | | | | | |
2014-2 CL A — 2.75% 2030 (0.3 years)(c) | | | 229,246 | | | | 229,272 | |
2015-3 CL A — 2.75% 2031 (0.8 years)(c) | | | 75,000 | | | | 74,860 | |
| Total Commercial Mortgage-Backed Securities (Cost $396,636) | | | | 396,660 | |
Mortgage-Backed Securities – 3.9%(b) | | $ Principal | | | | |
| | | Amount | | | | |
| Federal National Mortgage Association | | or Shares | | | $ Value | |
| Pass-Through Securities | | | | | | |
| 932836 — 3.0% 2025 (2.5 years) | | | 188,568 | | | | 197,960 | |
| | | | | | | | | |
| Non-Government Agency | | | | | | | | |
| Collateralized Mortgage Obligations | | | | | | | | |
| Oak Hills Advisors Residential Loan Trust (OHART) | | | | | | | | |
2014-NPL2 CL A2 — 4.0% 2054 (2.7 years)(c) | | | 150,000 | | | | 147,469 | |
2015-NPL1 CL A2 — 4.0% 2055 (3.0 years)(c) | | | 150,000 | | | | 145,935 | |
| Sunset Mortgage Loan Co. (SMLC) | | | 131,283 | | | | 130,714 | |
2014-NPL2 CL A — 3.721% 2044 (1.3 years)(c) | | | | | | | | |
| Total Mortgage-Backed Securities (Cost $616,185) | | | | | | | 622,078 | |
| | | | | | | | | |
| U.S. Treasury Notes – 31.3% | | | | | | | | |
| U.S. Treasury Notes | | | | | | | | |
| 0.75% 2/28/18 | | | 140,000 | | | | 139,551 | |
| 1.375% 6/30/18 | | | 210,000 | | | | 212,609 | |
| 1.625% 3/31/19 | | | 210,000 | | | | 213,560 | |
| 1.625% 6/30/19 | | | 325,000 | | | | 330,078 | |
| 1.625% 8/31/19 | | | 110,000 | | | | 111,616 | |
| 2.125% 8/31/20 | | | 410,000 | | | | 423,965 | |
| 2.125% 1/31/21 | | | 210,000 | | | | 216,694 | |
| 2.0% 5/31/21 | | | 210,000 | | | | 215,053 | |
| 2.25% 7/31/21 | | | 375,000 | | | | 388,916 | |
| 2.0% 2/15/22 | | | 660,000 | | | | 673,664 | |
| 2.0% 2/15/23 | | | 710,000 | | | | 721,593 | |
| 2.75% 11/15/23 | | | 210,000 | | | | 225,209 | |
| 2.5% 5/15/24 | | | 1,000,000 | | | | 1,050,547 | |
| Total U.S. Treasury Notes (Cost $4,799,706) | | | | | | | 4,923,055 | |
| | | | | | | | | |
| Common Stocks – 1.0% | | | | | | | | |
| Monmouth Real Estate Investment Corp. | | | 6,800 | | | | 75,548 | |
| National CineMedia, Inc. | | | 5,000 | | | | 75,500 | |
| Total Common Stocks (Cost $138,150) | | | | | | | 151,048 | |
| | | | | | | | | |
| Cash Equivalents – 12.1% | | | | | | | | |
| Wells Fargo Advantage Government Money | | | | | | | | |
Market Fund - Institutional Class 0.01%(a) | | | 1,902,736 | | | | 1,902,736 | |
| Total Cash Equivalents (Cost $1,902,736) | | | | | | | 1,902,736 | |
Total Investments in Securities (Cost $15,557,011) | | | | | | | 15,733,038 | |
| Other Assets Less Other Liabilities - 0.1% | | | | | | | 20,936 | |
| | | | | | | | | |
| Net Assets - 100% | | | | | | | 15,753,974 | |
| Net Asset Value Per Share - Investor Class | | | | | | | 10.21 | |
| Net Asset Value Per Share - Institutional Class | | | | | | | 10.20 | |
| (a) | Rate presented represents the annualized 7-day yield at March 31, 2015. |
| (b) | Number of years indicated represents estimated average life. |
| (c) | Security is exempt from registration under Rule 144A of the Securities Act of 1933. This security may be resold in transactions that are exempt from registration, normally to qualified institutional buyers. |
| (d) | Foreign domiciled corporation. |
The accompanying notes form an integral part of these financial statements.
40 | Q1 2015 ANNUAL REPORT
SHORT-INTERMEDIATE INCOME FUND
Schedule of Investments
March 31, 2015
| Corporate Bonds – 37.2% | | | | | | |
| | | $ Principal | | | | |
| | | Amount | | | $ Value | |
ACI Worldwide, Inc. 6.375% 8/15/20(c) | | | 250,000 | | | | 262,188 | |
| ADT Corp. 2.25% 7/15/17 | | | 5,000,000 | | | | 4,971,875 | |
| American Express Bank FSB 6.0% 9/13/17 | | | 2,500,000 | | | | 2,772,630 | |
| American Express Co. 8.125% 5/20/19 | | | 1,000,000 | | | | 1,237,468 | |
| American Express Credit Corp. 2.25% 8/15/19 | | | 11,042,000 | | | | 11,208,944 | |
Aon plc 3.5% 9/30/15(d) | | | 5,000,000 | | | | 5,068,415 | |
| Bank of America Corp. 4.5% 4/01/15 | | | 10,000,000 | | | | 10,000,000 | |
| Berkshire Hathaway, Inc. | | | | | | | | |
| 2.1% 8/14/19 | | | 2,750,000 | | | | 2,815,577 | |
| Finance Corp. | | | | | | | | |
| 0.95% 8/15/16 | | | 4,000,000 | | | | 4,019,228 | |
| 1.6% 5/15/17 | | | 10,000,000 | | | | 10,155,500 | |
| 5.4% 5/15/18 | | | 5,000,000 | | | | 5,634,075 | |
| 2.0% 8/15/18 | | | 2,500,000 | | | | 2,564,893 | |
| 2.9% 10/15/20 | | | 3,000,000 | | | | 3,172,521 | |
| 4.25% 1/15/21 | | | 1,000,000 | | | | 1,122,111 | |
| Boardwalk Pipelines LLC 5.75% 9/15/19 | | | 11,008,000 | | | | 11,991,477 | |
| Boston Properties LP 5.875% 10/15/19 | | | 13,180,000 | | | | 15,312,788 | |
| Cinemark USA, Inc. 7.375% 6/15/21 | | | 4,632,000 | | | | 4,990,980 | |
| Comcast Corp. | | | | | | | | |
| 4.95% 6/15/16 | | | 8,590,000 | | | | 9,026,716 | |
| 5.15% 3/01/20 | | | 3,000,000 | | | | 3,451,776 | |
| DCP Midstream Operating LP 2.5% 12/01/17 | | | 9,250,000 | | | | 8,745,690 | |
Diageo Capital plc 4.85% 5/15/18(d) | | | 3,941,000 | | | | 4,316,786 | |
| eBay, Inc. 2.2% 8/01/19 | | | 3,000,000 | | | | 3,006,417 | |
| Expedia, Inc. 7.456% 8/15/18 | | | 10,000,000 | | | | 11,579,900 | |
| Express Scripts Holding Co. | | | | | | | | |
| 7.25% 6/15/19 | | | 5,217,000 | | | | 6,255,366 | |
| 2.25% 6/15/19 | | | 5,000,000 | | | | 5,027,520 | |
| FiServ, Inc. 3.125% 10/01/15 | | | 1,000,000 | | | | 1,012,064 | |
| Flint Hills Resources LLC (Petrologistics) 6.25% 4/1/20 | | | 14,905,000 | | | | 16,041,506 | |
| Flir Systems, Inc. 3.75% 9/01/16 | | | 12,848,000 | | | | 13,244,155 | |
| Ford Motor Credit Co. LLC | | | | | | | | |
| 4.207% 4/15/16 | | | 10,000,000 | | | | 10,288,430 | |
| 2.145% 1/09/18 | | | 2,000,000 | | | | 2,024,198 | |
| General Electric Capital Corp. | | | | | | | | |
| 2.375% 6/30/15 | | | 10,000,000 | | | | 10,048,330 | |
| 1.0% 9/23/15 | | | 11,992,000 | | | | 12,032,065 | |
| 2.25% 11/09/15 | | | 6,181,000 | | | | 6,246,154 | |
| Goldman Sachs Group, Inc. 5.95% 1/18/18 | | | 4,000,000 | | | | 4,456,784 | |
| JP Morgan Chase & Co. | | | | | | | | |
| 2.6% 1/15/16 | | | 15,000,000 | | | | 15,210,045 | |
| 0.6515% 11/21/16 (Bear Stearns) Floating Rate | | | 15,000,000 | | | | 14,988,450 | |
| 6.3% 4/23/19 | | | 2,500,000 | | | | 2,905,672 | |
| JP Morgan Chase Bank, N.A. 6.0% 7/05/17 | | | 5,000,000 | | | | 5,504,280 | |
Kinder Morgan, Inc. (Hiland Partners) 7.25% 10/01/20(c) | | | 13,695,000 | | | | 14,824,838 | |
| Laboratory Corp. of America Holdings 3.125% 5/15/16 | | | 1,250,000 | | | | 1,278,161 | |
| Marathon Petroleum Corp. 3.5% 3/01/16 | | | 1,000,000 | | | | 1,022,064 | |
| Markel Corp. | | | | | | | | |
| 7.125% 9/30/19 | | | 11,859,000 | | | | 14,212,086 | |
| 5.35% 6/01/21 | | | 10,000,000 | | | | 11,340,380 | |
| 4.9% 7/01/22 | | | 2,000,000 | | | | 2,210,600 | |
| McKesson Corp. 1.4% 3/15/18 | | | 8,815,000 | | | | 8,811,492 | |
| MetLife Global Funding I | | | | | | | | |
3.125% 1/11/16(c) | | | 2,000,000 | | | | 2,040,574 | |
1.3% 4/10/17(c) | | | 1,000,000 | | | | 1,005,877 | |
1.875% 6/22/18(c) | | | 1,000,000 | | | | 1,012,688 | |
| Mohawk Industries, Inc. 6.125% 1/15/16 | | | 20,149,000 | | | | 20,919,639 | |
| Omnicom Group, Inc. | | | | | | | | |
| 5.9% 4/15/16 | | | 7,000,000 | | | | 7,329,084 | |
| 6.25% 7/15/19 | | | 6,181,000 | | | | 7,193,034 | |
| Outerwall, Inc. 6.0% 3/15/19 | | | 200,000 | | | | 195,000 | |
| | | $ Principal | | | | |
| | | Amount | | | $ Value | |
| Penske Truck Leasing | | | | | | |
2.5% 3/15/16(c) | | | 9,945,000 | | | | 10,091,361 | |
3.75% 5/11/17(c) | | | 5,000,000 | | | | 5,217,530 | |
| Range Resources Corp. 6.75% 8/01/20 | | | 18,167,000 | | | | 18,939,097 | |
| Republic Services, Inc. (Allied Waste) 3.8% 5/15/18 | | | 5,000,000 | | | | 5,305,000 | |
| Safeway, Inc. 3.4% 12/01/16 | | | 1,752,000 | | | | 1,756,380 | |
| SemGroup Holdings LP 7.5% 6/15/21 | | | 1,000,000 | | | | 1,052,500 | |
| Time Warner, Inc. 3.15% 7/15/15 | | | 500,000 | | | | 503,664 | |
Transocean Ltd. 5.05% 12/15/16(d) | | | 4,930,000 | | | | 4,997,787 | |
| U.S. Bancorp 2.2% 11/15/16 | | | 4,250,000 | | | | 4,340,878 | |
| U.S. Bank, N.A. 3.778% 4/29/20 | | | 25,829,000 | | | | 25,876,060 | |
| Verizon Communications, Inc. | | | | | | | | |
| 2.5% 9/15/16 | | | 7,370,000 | | | | 7,529,516 | |
| 1.35% 6/09/17 | | | 1,000,000 | | | | 1,001,190 | |
| 3.65% 9/14/18 | | | 2,000,000 | | | | 2,127,734 | |
| Vornado Realty LP 2.5% 6/30/19 | | | 7,660,000 | | | | 7,729,070 | |
| Vulcan Materials Co. | | | | | | | | |
| 6.5% 12/01/16 | | | 737,000 | | | | 803,183 | |
| 6.4% 11/30/17 | | | 8,000,000 | | | | 9,104,000 | |
| Washington Post Co. 7.25% 2/01/19 | | | 8,500,000 | | | | 9,618,812 | |
| Wells Fargo & Co. | | | | | | | | |
| 0.5406% 6/15/17 (Wachovia Bank) Floating Rate | | | 5,000,000 | | | | 4,990,815 | |
| 4.6% 4/01/21 | | | 5,745,000 | | | | 6,457,162 | |
| Williams Partners LP (Access Midstream Partners) | | | | | | | | |
| 5.875% 4/15/21 | | | 15,641,000 | | | | 16,330,142 | |
| 6.125% 7/15/22 | | | 4,953,000 | | | | 5,249,903 | |
| Willis North America, Inc. 6.2% 3/28/17 | | | 14,477,000 | | | | 15,493,039 | |
WM Wrigley Jr. Co. 1.4% 10/21/16(c) | | | 500,000 | | | | 502,025 | |
| Yum! Brands, Inc. 4.25% 9/15/15 | | | 1,000,000 | | | | 1,015,121 | |
| Total Corporate Bonds (Cost $507,137,844) | | | | | | | 522,140,460 | |
| | | | | | | | | |
| Corporate Convertible Bonds – 3.3% | | | | | | | | |
| Redwood Trust, Inc. | | | | | | | | |
| 4.625% 4/15/18 | | | 32,350,000 | | | | 32,168,031 | |
5.625% 11/15/19(c) | | | 14,850,000 | | | | 14,673,656 | |
| Total Corporate Convertible Bonds (Cost $47,124,248) | | | | 46,841,687 | |
| | | | | | | | | |
Asset-Backed Securities – 2.0%(b) | | | | | | | | |
| Americredit Automobile Receivables Trust (AMCAR) | | | | | | | | |
| 2013-5 CL A2A — 0.65% 2017 (0.1 years) | | | 1,048,837 | | | | 1,048,757 | |
| Cabela’s Master Credit Card Trust (CABMT) | | | | | | | | |
| 2011-2A CL A2 — 0.7745% 2019 Floating Rate | | | | | | | | |
(1.2 years)(c) | | | 4,500,000 | | | | 4,511,992 | |
| 2012-2A CL A2 — 0.6545% 2020 Floating Rate | | | | | | | | |
(2.2 years)(c) | | | 6,000,000 | | | | 6,019,002 | |
| CPS Auto Receivables Trust (CPS) | | | | | | | | |
2013-A CL A — 1.31% 2020 (1.5 years)(c) | | | 2,106,762 | | | | 2,092,638 | |
| Flagship Credit Auto Trust (FCAT) | | | | | | | | |
2013-2 CL A — 1.94% 2019 (0.7 years)(c) | | | 2,396,649 | | | | 2,403,254 | |
| Prestige Auto Receivables Trust (PART) | | | | | | | | |
2013-1A CL A2 — 1.09% 2018 (0.3 years)(c) | | | 933,104 | | | | 933,963 | |
2014-1A CL A2 — 0.97% 2018 (0.6 years)(c) | | | 2,522,384 | | | | 2,524,485 | |
| Santander Drive Auto Receivables Trust (SDART) | | | | | | | | |
| 2012-4 CL C — 2.94% 2017 (0.7 years) | | | 8,000,000 | | | | 8,113,980 | |
| Total Asset-Backed Securities (Cost $27,534,773) | | | | | | | 27,648,071 | |
The accompanying notes form an integral part of these financial statements.
41 | Q1 2015 ANNUAL REPORT
SHORT-INTERMEDIATE INCOME FUND (CONTINUED)
Commercial Mortgage-Backed Securities – 4.1%(b) | | | | |
| | | $ Principal | | | | |
| | | Amount | | | $ Value | |
| NLY Commercial Mortgage Trust (NLY) | | | | | | |
| 2014-FL1 CL B — 1.922% 2030 Floating Rate | | | | | | |
(1.1 years)(c) | | | 6,500,000 | | | | 6,502,369 | |
| Oaktree Real Estate Investments/Sabal (ORES) | | | | | | | | |
2013-LV2 CL A — 3.081% 2025 (0.2 years)(c) | | | 2,539,529 | | | | 2,538,742 | |
2014-LV3 CL A — 3.0% 2024 (0.4 years)(c) | | | 14,100,633 | | | | 14,100,633 | |
| Redwood Commercial Mortgage Corp. (RCMC) | | | | | | | | |
2012-CRE1 CL A — 5.62346% 2044 (1.3 years)(c) | | | 6,655,459 | | | | 6,832,861 | |
| Rialto Capital Management, LLC (RIAL) | | | | | | | | |
2014-LT6 CL A — 2.75% 2024 (0.3 years)(c) | | | 3,408,598 | | | | 3,408,533 | |
| TPG Opportunities Partners, LP (TOPRE) | | | | | | | | |
2013-LTR1 CL B — 4.25% 2028 (0.4 years)(c) | | | 4,068,714 | | | | 4,069,337 | |
| Varde/First City (VFCP) | | | | | | | | |
2014-2 CL A — 2.75% 2030 (0.3 years)(c) | | | 6,648,144 | | | | 6,648,898 | |
2015-3 CL A — 2.75% 2031 (0.8 years)(c) | | | 10,175,000 | | | | 10,155,922 | |
2014-2 CL B — 5.5% 2030 (1.3 years)(c) | | | 3,000,000 | | | | 3,001,164 | |
| Total Commercial Mortgage-Backed Securities (Cost $57,073,873) | | | | 57,258,459 | |
| | | | | | | | | |
Mortgage-Backed Securities – 27.6%(b) | | | | | | | | |
| | | | | | | | | |
| Federal Home Loan Mortgage Corporation | | | | | | | | |
| Collateralized Mortgage Obligations | | | | | | | | |
| 3229 CL HB — 5.0% 2025 (0.0 years) | | | 2,229 | | | | 2,229 | |
| 2937 CL HJ — 5.0% 2019 (0.1 years) | | | 33,881 | | | | 33,916 | |
| 2760 CL PD — 5.0% 2032 (0.1 years) | | | 217,925 | | | | 219,042 | |
| 3840 CL KA — 5.0% 2029 (0.2 years) | | | 342,549 | | | | 343,324 | |
| 2780 CL TE — 5.0% 2033 (0.2 years) | | | 451,651 | | | | 453,263 | |
| 3562 CL KA — 4.0% 2022 (0.3 years) | | | 410,280 | | | | 413,136 | |
| 2574 CL JM — 5.0% 2022 (0.4 years) | | | 60,517 | | | | 61,099 | |
| 3544 CL KA — 4.5% 2023 (0.4 years) | | | 282,669 | | | | 286,965 | |
| 3170 CL EA — 4.5% 2020 (0.5 years) | | | 227,116 | | | | 230,258 | |
| 3815 CL AD — 4.0% 2025 (1.5 years) | | | 838,409 | | | | 876,146 | |
| 3844 CL AG — 4.0% 2025 (1.7 years) | | | 2,689,991 | | | | 2,804,431 | |
| 2952 CL PA — 5.0% 2035 (2.8 years) | | | 1,240,797 | | | | 1,332,826 | |
| 4281 CL AG — 2.5% 2028 (3.0 years) | | | 3,546,110 | | | | 3,620,799 | |
| 3649 CL BW — 4.0% 2025 (3.1 years) | | | 4,655,197 | | | | 4,954,626 | |
| 3620 CL PA — 4.5% 2039 (3.2 years) | | | 3,148,636 | | | | 3,382,998 | |
| 3003 CL LD — 5.0% 2034 (3.6 years) | | | 3,036,766 | | | | 3,336,880 | |
| 3842 CL PH — 4.0% 2041 (3.6 years) | | | 2,873,626 | | | | 3,089,505 | |
| 4107 CL LA — 2.5% 2031 (9.2 years) | | | 6,957,726 | | | | 6,720,930 | |
| 4107 CL LW — 1.75% 2027 (10.8 years) | | | 3,920,605 | | | | 3,636,536 | |
| | | | | | | �� | 35,798,909 | |
| Pass-Through Securities | | | | | | | | |
| EO1386 — 5.0% 2018 (1.2 years) | | | 36,274 | | | | 38,121 | |
| G18190 — 5.5% 2022 (2.4 years) | | | 57,497 | | | | 63,497 | |
| G13300 — 4.5% 2023 (2.5 years) | | | 342,045 | | | | 367,062 | |
| G18296 — 4.5% 2024 (2.7 years) | | | 832,896 | | | | 893,526 | |
| G18306 — 4.5% 2024 (2.7 years) | | | 1,800,914 | | | | 1,942,122 | |
| G13517 — 4.0% 2024 (2.9 years) | | | 1,257,490 | | | | 1,337,917 | |
| G18308 — 4.0% 2024 (2.9 years) | | | 1,800,307 | | | | 1,916,868 | |
| E02804 — 3.0% 2025 (3.4 years) | | | 5,126,147 | | | | 5,374,490 | |
| J13949 — 3.5% 2025 (3.4 years) | | | 8,024,962 | | | | 8,626,422 | |
| J14649 — 3.5% 2026 (3.5 years) | | | 6,215,522 | | | | 6,606,685 | |
| E02948 — 3.5% 2026 (3.6 years) | | | 15,091,889 | | | | 16,117,339 | |
| E03033 — 3.0% 2027 (3.6 years) | | | 7,561,355 | | | | 7,932,698 | |
| J16663 — 3.5% 2026 (3.6 years) | | | 12,995,038 | | | | 13,808,244 | |
| E03048 — 3.0% 2027 (3.6 years) | | | 14,187,733 | | | | 14,885,138 | |
| G01818 — 5.0% 2035 (3.7 years) | | | 3,712,328 | | | | 4,128,281 | |
| | | | | | | | 84,038,410 | |
| Structured Agency Credit Risk Debt Notes | | | | | | | | |
| 2013-DN1 CL M1 — 3.57375% 2023 Floating Rate | | | | | | | | |
| (1.7 years) | | | 4,193,644 | | | | 4,342,129 | |
| | | $ Principal | | | | |
| | | Amount | | | $ Value | |
| Interest Only Securities | | | | | | |
| 3974 CL AI — 3.0% 2021 (1.7 years) | | | 9,132,747 | | | | 355,910 | |
| | | | | | | | 124,535,358 | |
| Federal National Mortgage Association | | | | | | | | |
| | | | | | | | | |
| Collateralized Mortgage Obligations | | | | | | | | |
| 2004-78 CL AB — 5.0% 2032 (0.0 years) | | | 50,180 | | | | 50,141 | |
| 2009-44 CL A — 4.5% 2023 (0.7 years) | | | 186,555 | | | | 190,121 | |
| 2003-86 CL KT — 4.5% 2018 (0.9 years) | | | 176,944 | | | | 182,494 | |
| 2003-9 CL DB — 5.0% 2018 (1.2 years) | | | 195,575 | | | | 204,086 | |
| 2011-19 CL KA — 4.0% 2025 (1.4 years) | | | 2,700,520 | | | | 2,800,766 | |
| 2010-145 CL PA — 4.0% 2024 (2.3 years) | | | 1,768,950 | | | | 1,872,683 | |
| 2010-54 CL WA — 3.75% 2025 (2.6 years) | | | 2,356,419 | | | | 2,491,938 | |
| | | | | | | | 7,792,229 | |
| Pass-Through Securities | | | | | | | | |
| 256982 — 6.0% 2017 (1.1 years) | | | 102,828 | | | | 107,616 | |
| 357414 — 4.0% 2018 (1.3 years) | | | 420,459 | | | | 444,396 | |
| 251787 — 6.5% 2018 (1.3 years) | | | 4,842 | | | | 5,561 | |
| 254907 — 5.0% 2018 (1.4 years) | | | 141,726 | | | | 148,994 | |
| MA0464 — 3.5% 2020 (1.9 years) | | | 4,291,898 | | | | 4,555,786 | |
| 357985 — 4.5% 2020 (1.9 years) | | | 167,331 | | | | 176,616 | |
| 888595 — 5.0% 2022 (2.1 years) | | | 336,003 | | | | 364,406 | |
| 888439 — 5.5% 2022 (2.3 years) | | | 302,728 | | | | 330,700 | |
| AD0629 — 5.0% 2024 (2.4 years) | | | 1,148,335 | | | | 1,247,418 | |
| AL0471 — 5.5% 2025 (2.4 years) | | | 5,571,564 | | | | 6,049,666 | |
| 995960 — 5.0% 2023 (2.4 years) | | | 984,734 | | | | 1,070,010 | |
| 995693 — 4.5% 2024 (2.6 years) | | | 1,749,018 | | | | 1,876,011 | |
| AE0031 — 5.0% 2025 (2.6 years) | | | 1,651,289 | | | | 1,803,543 | |
| 995692 — 4.5% 2024 (2.7 years) | | | 1,456,739 | | | | 1,563,402 | |
| 995755 — 4.5% 2024 (2.8 years) | | | 2,197,167 | | | | 2,368,965 | |
| AR8198 — 2.5% 2023 (2.8 years) | | | 10,281,914 | | | | 10,665,127 | |
| 930667 — 4.5% 2024 (2.8 years) | | | 1,356,572 | | | | 1,463,226 | |
| 890112 — 4.0% 2024 (2.8 years) | | | 1,187,575 | | | | 1,257,010 | |
| MA0043 — 4.0% 2024 (2.8 years) | | | 996,590 | | | | 1,055,256 | |
| AA4315 — 4.0% 2024 (2.9 years) | | | 2,366,523 | | | | 2,507,674 | |
| AA5510 — 4.0% 2024 (2.9 years) | | | 523,919 | | | | 555,035 | |
| MA1502 — 2.5% 2023 (2.9 years) | | | 8,754,419 | | | | 9,079,601 | |
| 931739 — 4.0% 2024 (2.9 years) | | | 605,657 | | | | 642,068 | |
| AD7073 — 4.0% 2025 (3.2 years) | | | 1,932,043 | | | | 2,054,737 | |
| AB1769 — 3.0% 2025 (3.4 years) | | | 4,711,021 | | | | 4,962,863 | |
| AH3429 — 3.5% 2026 (3.4 years) | | | 26,859,813 | | | | 28,802,016 | |
| 725232 — 5.0% 2034 (3.5 years) | | | 561,074 | | | | 626,652 | |
| AB2251 — 3.0% 2026 (3.5 years) | | | 5,387,941 | | | | 5,679,678 | |
| 555531 — 5.5% 2033 (3.5 years) | | | 6,455,516 | | | | 7,313,455 | |
| 995112 — 5.5% 2036 (3.6 years) | | | 2,854,439 | | | | 3,228,449 | |
| AB3902 — 3.0% 2026 (3.6 years) | | | 3,660,650 | | | | 3,845,464 | |
| AK3264 — 3.0% 2027 (3.7 years) | | | 9,151,751 | | | | 9,613,941 | |
| AB4482 — 3.0% 2027 (3.7 years) | | | 8,359,137 | | | | 8,781,164 | |
| MA0587 — 4.0% 2030 (4.2 years) | | | 9,212,667 | | | | 9,924,332 | |
| | | | | | | | 134,170,838 | |
| | | | | | | | 141,963,067 | |
| Government National Mortgage Association | | | | | | | | |
| | | | | | | | | |
| Interest Only Securities | | | | | | | | |
| 2009-31 CL PI — 4.5% 2037 (1.0 years) | | | 2,878,582 | | | | 88,085 | |
| 2012-61 CL BI — 4.5% 2038 (1.9 years) | | | 793,417 | | | | 58,827 | |
| 2010-66 CL IO — 0.60455% 2052 Floating Rate | | | | | | | | |
| (5.2 years) | | | 32,368,455 | | | | 776,212 | |
| | | | | | | | 923,124 | |
| Pass-Through Securities | | | | | | | | |
| G2 5255 — 3.0% 2026 (4.1 years) | | | 17,298,227 | | | | 18,254,498 | |
| | | | | | | | 19,177,622 | |
The accompanying notes form an integral part of these financial statements.
42 | Q1 2015 ANNUAL REPORT
| | | $ Principal | | | | |
| Non-Government Agency | | Amount | | | $ Value | |
| Collateralized Mortgage Obligations | | | | | | |
| Bayview Opportunity Master Fund IIa Trust (BOMFT) | | | | | | |
2014-18NPL CL A — 3.2282% 2034 (1.4 years)(c) | | | 8,376,786 | | | | 8,418,846 | |
| Citigroup Mortgage Loan Trust, Inc. (CMLTI) | | | | | | | | |
2014-A CL A — 4.0% 2035 (2.6 years)(c) | | | 4,701,274 | | | | 4,917,036 | |
| J.P. Morgan Mortgage Trust (JPMMT) | | | | | | | | |
2014-2 CL 2A2 — 3.5% 2029 (3.5 years)(c) | | | 8,172,511 | | | | 8,506,705 | |
2014-5 CL A1 — 3.0% 2029 (3.6 years)(c) | | | 13,527,459 | | | | 14,022,320 | |
| Oak Hill Advisors Residential Loan Trust (OHART) | | | | | | | | |
2014-NPL1 CL A — 2.8828% 2054 (1.3 years)(c) | | | 5,175,550 | | | | 5,198,380 | |
2014-NPL2 CL A1 — 3.3517% 2054 (1.5 years)(c) | | | 7,663,256 | | | | 7,696,446 | |
2015-NPL1 CL A1 — 3.4749% 2055 (1.7 years)(c) | | | 10,000,000 | | | | 10,024,300 | |
| Selene Non-Performing Loans LLC (SNPL) | | | | | | | | |
2014-1A CL A — 2.9814% 2054 (2.0 years)(c) | | | 1,870,997 | | | | 1,857,045 | |
| Sunset Mortgage Loan Co. (SMLC) | | | | | | | | |
2014-NPL2 CL A — 3.721% 2044 (1.3 years)(c) | | | 1,783,697 | | | | 1,775,974 | |
| Sequoia Mortgage Trust (SEMT) | | | | | | | | |
| 2011-1 CL A1 — 4.125% 2041 (0.1 years) | | | 612,005 | | | | 619,377 | |
| 2012-2 CL A2 — 3.5% 2042 (1.0 years) | | | 2,746,525 | | | | 2,792,941 | |
| 2010-H1 CL A1 — 1.9915% 2040 Variable Rate | | | | | | | | |
| (2.8 years) | | | 790,874 | | | | 786,653 | |
| 2012-1 CL 1A1 — 2.865% 2042 (2.9 years) | | | 4,127,714 | | | | 4,151,515 | |
| 2012-4 CL A1 — 3.5% 2042 (3.1 years) | | | 7,330,418 | | | | 7,478,232 | |
| 2013-4 CL A3 — 1.55% 2043 (4.9 years) | | | 12,638,000 | | | | 12,278,891 | |
| Stanwich Mortgage Loan Co. (STWH) | | | | | | | | |
2013-NPL1 CL A — 2.9814% 2043 (0.2 years)(c) | | | 1,359,973 | | | | 1,353,173 | |
2013-NPL2 CL A — 3.2282% 2059 (1.3 years)(c) | | | 4,969,494 | | | | 4,907,376 | |
| Vericrest Opportunity Loan Trust (VOLT) | | | | | | | | |
2014-NPL4 CL A1 — 3.125% 2054 (0.6 years)(c) | | | 5,848,155 | | | | 5,843,026 | |
| Washington Mutual, Inc. (WAMU) | | | | | | | | |
| 2003-S7 CL A1 — 4.5% 2018 (0.1 years) | | | 64,946 | | | | 65,690 | |
| | | | | | | | 102,693,926 | |
| Total Mortgage-Backed Securities (Cost $379,538,874) | | | | 388,369,973 | |
| | | | | | | | | |
| Taxable Municipal Bonds – 0.3% | | | | | | | | |
| Los Angeles, California Cmty Dev 6.0% 9/01/15 | | | 1,220,000 | | | | 1,246,706 | |
| Omaha, Nebraska Public Facilities Corp., Lease Revenue, | | | | | | | | |
| Series B, Refunding | | | | | | | | |
| 4.588% 6/01/17 | | | 815,000 | | | | 869,360 | |
| 4.788% 6/01/18 | | | 1,000,000 | | | | 1,090,600 | |
| Iowa State University Revenue 5.8% 7/01/22 | | | 1,335,000 | | | | 1,538,067 | |
| Total Taxable Municipal Bonds (Cost $4,372,481) | | | | | | | 4,744,733 | |
| | | | | | | | | |
| U.S. Treasury And Government Agency – 22.2% | | | | | |
| | | | | | |
| U.S. Treasury | | | | | | | | |
| U.S. Treasury Notes | | | | | | | | |
| 0.25% 12/31/15 | | | 25,000,000 | | | | 25,005,850 | |
| 0.375% 1/15/16 | | | 40,000,000 | | | | 40,050,000 | |
| 0.375% 2/15/16 | | | 55,000,000 | | | | 55,060,170 | |
| 0.875% 11/30/16 | | | 20,000,000 | | | | 20,137,500 | |
| 0.875% 1/31/17 | | | 25,000,000 | | | | 25,166,025 | |
| 0.75% 6/30/17 | | | 20,000,000 | | | | 20,042,180 | |
| 0.875% 1/31/18 | | | 20,000,000 | | | | 20,018,760 | |
| 1.375% 6/30/18 | | | 25,000,000 | | | | 25,310,550 | |
| 1.25% 1/31/19 | | | 15,000,000 | | | | 15,057,420 | |
| 1.625% 6/30/19 | | | 10,000,000 | | | | 10,156,250 | |
| 2.125% 8/31/20 | | | 15,000,000 | | | | 15,510,930 | |
| 2.0% 11/30/20 | | | 20,000,000 | | | | 20,520,320 | |
| | | | | | | | 292,035,955 | |
| | | $ Principal | | | | |
| | | Amount | | | | |
| Government Agency | | or Shares | | | $ Value | |
| Federal Home Loan Bank | | | | | | |
| 1.625% 4/28/17 | | | 20,000,000 | | | | 20,020,740 | |
| Total U.S. Treasury and Government Agency (Cost $309,339,011) | | | | 312,056,695 | |
| | | | | | | | | |
| Common Stocks – 1.6% | | | | | | | | |
| Redwood Trust, Inc. | | | 712,794 | | | | 12,737,629 | |
| National CineMedia, Inc. | | | 595,000 | | | | 8,984,500 | |
| Total Common Stocks (Cost $17,157,418) | | | | | | | 21,722,129 | |
| | | | | | | | | |
| Cash Equivalents – 1.4% | | | | | | | | |
| Wells Fargo Advantage Government Money | | | | | | | | |
Market Fund - Institutional Class 0.01%(a) | | | 20,011,689 | | | | 20,011,689 | |
| Total Cash Equivalents (Cost $20,011,689) | | | | | | | 20,011,689 | |
Total Investments in Securities (Cost $1,369,290,211) | | | | | | | 1,400,793,896 | |
| Other Assets Less Other Liabilities — 0.3% | | | | | | | 4,438,928 | |
| Net Assets - 100% | | | | | | | 1,405,232,824 | |
| Net Asset Value Per Share - Investor Class | | | | | | | 12.48 | |
| Net Asset Value Per Share - Institutional Class | | | | | | | 12.50 | |
| (a) | Rate presented represents the annualized 7-day yield at March 31, 2015. |
| (b) | Number of years indicated represents estimated average life. |
| (c) | Security is exempt from registration under Rule 144A of the Securities Act of 1933. This security may be resold in transactions that are exempt from registration, normally to qualified institutional buyers. |
| (d) | Foreign domiciled corporation. |
The accompanying notes form an integral part of these financial statements.
NEBRASKA TAX-FREE INCOME FUND
Schedule of Investments
March 31, 2015
| Municipal Bonds – 93.6% | | | | | | | | | |
| | | % of Net | | | $ Principal | | | | |
| | | Assets | | | Amount | | | $ Value | |
| Arizona | | | 1.4 | | | | | | | |
| Maricopa County, General Obligation, Peoria Unified | | | | | | | |
| School District No. 11, Series 2006, 5.0%, 7/01/24 | | | | 950,000 | | | | 1,004,853 | |
| | | | | | | | | | | | | |
| Florida | | | 4.7 | | | | | | | | | |
| Greater Orlando, Aviation Authority, Revenue, | | | | | | | | | |
| Series 2009A, AMT, 6.0%, 10/01/16 | | | | | | | 1,000,000 | | | | 1,081,930 | |
| Miami, Dade County, Aviation Revenue, | | | | | | | | | | | | |
| Series 2010A, 4.25%, 10/01/18 | | | | | | | 1,000,000 | | | | 1,103,860 | |
| Orlando Utilities Commission, Utility System Revenue, | | | | | | | | | |
| Refunding, Series 2006, 5.0%, 10/01/17 | | | | | | | 1,000,000 | | | | 1,071,800 | |
| | | | | | | | | | | | 3,257,590 | |
| Illinois | | | 0.5 | | | | | | | | | |
| Cook, Kane, Lake and McHenry Counties and State of Illinois, | | | | | | | | | |
| General Obligation, Community College District No. 512, | | | | | | | | | |
| Series 2009A, 5.0%, 12/01/23 | | | | | | | 100,000 | | | | 113,474 | |
| Illinois Finance Authority, Revenue, Series 2009A, | | | | | | | | | |
| Northwestern Memorial Hospital, 5.0%, 8/15/17 | | | | 245,000 | | | | 268,753 | |
| | | | | | | | | | | | 382,227 | |
| Iowa | | | 0.9 | | | | | | | | | |
| Cedar Rapids Community School District, Infrastructure Sales, | | | | | | | | | |
| Services and Use Tax Revenue, Series 2011 4.0%, 7/01/20 | | | | 600,000 | | | | 632,034 | |
| | | | | | | | | | | | | |
| Nebraska | | | 79.4 | | | | | | | | | |
| Adams County, Hospital Authority #1, Revenue, Mary | | | | | | | | | |
| Lanning Memorial Hospital Project, Radian Insured | | | | | | | | | |
| 4.25%, 12/15/16 | | | | | | | 250,000 | | | | 262,397 | |
| 4.4%, 12/15/17 | | | | | | | 250,000 | | | | 268,167 | |
| Cornhusker Public Power District, Electric System | | | | | | | | | |
| Revenue, Refunding | | | | | | | | | | | | |
| Series 2010, 2.4%, 7/01/17 | | | | | | | 400,000 | | | | 402,504 | |
| Series 2014, 2.25%, 7/01/22 | | | | | | | 260,000 | | | | 263,999 | |
| Dawson Public Power District, Electric Revenue, Series 2010B | | | | | | | | | |
| 2.25%, 12/15/17 | | | | | | | 125,000 | | | | 126,255 | |
| 2.75%, 12/15/19 | | | | | | | 100,000 | | | | 100,945 | |
| Douglas County, Educational Facility Revenue, | | | | | | | | | |
| Creighton University Project, Refunding, Series 2010A | | | | | | | | | |
| 5.0%, 7/01/16 | | | | | | | 430,000 | | | | 449,931 | |
| 5.6%, 7/01/25 | | | | | | | 400,000 | | | | 466,100 | |
| Douglas County, General Obligation, Refunding, | | | | | | | | | |
| Series 2011B, 3.0%, 12/15/19 | | | | | | | 1,155,000 | | | | 1,197,747 | |
| Douglas County, Hospital Authority #1, Revenue, Refunding, | | | | | | | | | |
| Alegent Health - Immanuel, AMBAC Insured, 5.125% 9/01/17 | | | | 160,000 | | | | 160,230 | |
| Douglas County, Hospital Authority #2, Revenue, | | | | | | | | | |
| Boys Town Project, Series 2008, 4.75%, 9/01/28 | | | | 500,000 | | | | 544,840 | |
| Nebraska Medical Center Project, Series 2003, | | | | | | | | | |
| 5.0%, 11/15/15 | | | | | | | 295,000 | | | | 303,363 | |
| Refunding, Children’s Hospital Obligated Group, | | | | | | | | | |
| Series 2008B | | | | | | | | | | | | |
| 4.5%, 8/15/15 | | | | | | | 230,000 | | | | 233,399 | |
| 5.25%, 8/15/20 | | | | | | | 1,000,000 | | | | 1,085,480 | |
| 5.5%, 8/15/21 | | | | | | | 815,000 | | | | 892,066 | |
| 5.5%, 8/15/21, Pre-Refunded 8/15/17 @ 100 | | | | 615,000 | | | | 684,446 | |
| Douglas County, Hospital Authority #3, Revenue, Refunding, | | | | | | | | | |
| Nebraska Methodist Health System, 5.5%, 11/01/18 | | | | 330,000 | | | | 348,992 | |
| Douglas County, Zoo Facility Revenue, Refunding, | | | | | | | | | |
| Omaha’s Henry Doorly Zoo Project | | | | | | | | | | | | |
| 4.2%, 9/01/16 | | | | | | | 600,000 | | | | 600,804 | |
| 4.75%, 9/01/17 | | | | | | | 200,000 | | | | 200,304 | |
| Fremont, Combined Utility Revenue, Series 2014B, | | | | | | | | | |
| 3.0%, 7/15/21 | | | | | | | 370,000 | | | | 395,486 | |
| Hastings, Combined Utility Revenue, Refunding, Series 2012 | | | | | | | | | |
| 2.0%, 10/15/16 | | | | | | | 320,000 | | | | 327,206 | |
| 2.0%, 10/15/17 | | | | | | | 430,000 | | | | 441,816 | |
| | | $ Principal | | | | |
| | | Amount | | | $ Value | |
| Lancaster County, Hospital Authority #1, Revenue, | | | | | | |
| Refunding, Bryan LGH Medical Center | | | | | | |
| Series 2006, 4.0%, 6/01/19 | | | 300,000 | | | | 308,226 | |
| Series 2008A, 5.0%, 6/01/16 | | | 500,000 | | | | 522,105 | |
| Series 2008A, 5.0%, 6/01/17 | | | 500,000 | | | | 536,735 | |
| Lincoln-Lancaster County, Public Building Commission, | | | | | | | | |
| Lease Revenue, Refunding, Series 2015 | | | | | | | | |
| 0.3%, 12/01/15 | | | 840,000 | | | | 841,008 | |
| 3.0%, 12/01/19 | | | 750,000 | | | | 807,825 | |
| Lincoln, Airport Authority, Revenue, | | | | | | | | |
| Tax-Exempt 2014 Series C | | | | | | | | |
| 2.0%, 7/01/17 | | | 185,000 | | | | 189,647 | |
| 2.0%, 7/01/18 | | | 185,000 | | | | 190,001 | |
| 2.0%, 7/01/19 | | | 190,000 | | | | 194,448 | |
| 2.0%, 7/01/21 | | | 195,000 | | | | 196,316 | |
| Lincoln, Certificates of Participation, Series 2010A, | | | | | | | | |
| 2.4%, 3/15/17 | | | 395,000 | | | | 398,176 | |
| Lincoln, Educational Facilities, Revenue, Refunding, | | | | | | | | |
| Nebraska Wesleyan University Project, Series 2012 | | | | | | | | |
| 2.25%, 4/01/19 | | | 645,000 | | | | 663,466 | |
| 2.5%, 4/01/21 | | | 925,000 | | | | 947,885 | |
| Lincoln, Electric System Revenue, Refunding | | | | | | | | |
| Series 2007B, 5.0%, 9/01/18 | | | 1,000,000 | | | | 1,066,750 | |
| Series 2012, 5.0%, 9/01/21 | | | 1,000,000 | | | | 1,202,250 | |
| Lincoln, General Obligation, Highway Allocation Fund, | | | | | | | | |
| 4.0%, 5/15/23 | | | 1,000,000 | | | | 1,054,750 | |
| Lincoln, Parking Revenue, Refunding, Series 2011, | | | | | | | | |
| 3.25%, 8/15/18 | | | 440,000 | | | | 470,782 | |
| Lincoln, Sanitary Sewer Revenue, Refunding, Series 2012, | | | | | | | | |
| 1.5%, 6/15/17 | | | 440,000 | | | | 447,766 | |
| Lincoln, General Obligation, West Haymarket Joint | | | | | | | | |
| Public Agency, Series 2011, 5.0%, 12/15/26 | | | 300,000 | | | | 359,238 | |
| Municipal Energy Agency of Nebraska, Power Supply | | | | | | | | |
| System Revenue, Refunding | | | | | | | | |
| 2009 Series A, BHAC Insured, 5.0%, 4/01/20 | | | 500,000 | | | | 567,490 | |
| 2012 Series A, 5.0%, 4/01/18 | | | 100,000 | | | | 111,495 | |
| 2013 Series A, 4.0%, 4/01/17 | | | 250,000 | | | | 266,513 | |
| Nebraska Investment Financial Authority, Revenue, Drinking | | | | | |
| Water State Revolving Fund, Series 2010A, 4.0%, 7/01/25 | | | 750,000 | | | | 795,225 | |
| Nebraska Investment Financial Authority, Homeownership | | | | | | | | |
| Revenue, 2011 Series A, 2.4%, 9/01/17 | | | 405,000 | | | | 417,486 | |
| Nebraska Public Power District, Revenue | | | | | | | | |
| 2005 Series A, 5.0%, 1/01/18, Pre-Refunded | | | | | | | | |
| 7/01/15 @ 100 | | | 200,000 | | | | 202,402 | |
| 2007 Series B, 5.0% | | | | | | | | |
| 1/01/20 | | | 300,000 | | | | 328,653 | |
| 1/01/20, Pre-Refunded 7/01/17 @ 100 | | | 95,000 | | | | 104,192 | |
| 1/01/21 | | | 1,340,000 | | | | 1,466,911 | |
| 1/01/21, Pre-Refunded 7/01/17 @ 100 | | | 410,000 | | | | 449,672 | |
| 2008 Series B, 5.0%, 1/01/19, Pre-Refunded | | | | | | | | |
| 1/01/18 @ 100 | | | 250,000 | | | | 277,920 | |
| 2010 Series C, 4.25%, 1/01/17 | | | 500,000 | | | | 532,170 | |
| 2012 Series A | | | | | | | | |
| 4.0%, 1/01/21 | | | 500,000 | | | | 561,565 | |
| 5.0%, 1/01/21 | | | 500,000 | | | | 590,910 | |
| 2012 Series B, 3.0%, 1/01/24 | | | 1,000,000 | | | | 1,050,140 | |
| 2012 Series C, 5.0% | | | | | | | | |
| 1/01/2019, Pre-Refunded 1/01/18 @ 100 | | | 500,000 | | | | 555,840 | |
| 1/01/25 | | | 750,000 | | | | 827,498 | |
| 2015 Series A-2, 5.0%, 1/01/24 | | | 250,000 | | | | 295,743 | |
| Nebraska State Colleges Facility Corp., Deferred | | | | | | | | |
| Maintenance Revenue, MBIA Insured | | | | | | | | |
| 4.25%, 7/15/15 | | | 405,000 | | | | 409,572 | |
| 5.0%, 7/15/16 | | | 200,000 | | | | 211,272 | |
| 4.0%, 7/15/17 | | | 200,000 | | | | 207,842 | |
| Ogallala, General Obligation, Street Improvement Bond, | | | | | | | | |
| Series 2014, 0.45%, 11/15/15 | | | 250,000 | | | | 250,013 | |
The accompanying notes form an integral part of these financial statements.
44 | Q1 2015 ANNUAL REPORT
| | | $ Principal | | | | |
| | | Amount | | | $ Value | |
| Omaha Convention Hotel Corp., Revenue, Convention | | | | | | |
| Center Hotel, First Tier, Refunding, Series 2007, AMBAC | | | | | | |
| Insured, 5.0%, 2/01/20 | | | 600,000 | | | | 642,510 | |
| Omaha-Douglas County, General Obligation, Public | | | | | | | | |
| Building Commission, Series 2014, 5.0%, 5/01/26 | | | 725,000 | | | | 867,811 | |
| Omaha, General Obligation, Refunding, Series 2008 | | | | | | | | |
| 5.0%, 6/01/20 | | | 350,000 | | | | 394,289 | |
| 5.25%, 10/15/19 | | | 250,000 | | | | 286,660 | |
| Omaha, Public Facilities Corp., Lease Revenue | | | | | | | | |
| Omaha Baseball Stadium Project | | | | | | | | |
| Series 2009 | | | | | | | | |
| 4.125%, 6/01/25 | | | 250,000 | | | | 267,743 | |
| 5.0%, 6/01/23 | | | 770,000 | | | | 880,919 | |
| Series 2010, 4.125%, 6/01/29 | | | 650,000 | | | | 687,609 | |
| Rosenblatt Stadium Project, Series C | | | | | | | | |
| 3.9%, 10/15/17, Pre-Refunded 10/15/16 @ 100 | | | 235,000 | | | | 247,457 | |
| 3.95%, 10/15/18, Pre-Refunded 10/15/16 @ 100 | | | 240,000 | | | | 252,905 | |
| Omaha Public Power District | | | | | | | | |
| Electric System Revenue | | | | | | | | |
| 2007 Series A, 4.1%, 2/01/19, Pre-Refunded | | | | | | | | |
| 2/01/17 @ 100 | | | 1,000,000 | | | | 1,064,000 | |
| 2012 Series A, 5.0%, 2/01/24 | | | 2,000,000 | | | | 2,386,660 | |
| 2015 Series B, 5.0%, 2/01/18 | | | 1,500,000 | | | | 1,674,390 | |
| Electric System Subordinated Revenue, | | | | | | | | |
| 2006 Series B, FGIC Insured, 4.75%, 2/01/36, | | | | | | | | |
| Pre-Refunded 2/01/16 @ 100 | | | 1,000,000 | | | | 1,037,560 | |
| Omaha, Sanitary Sewerage System Revenue, Series 2014 | | | | | | | | |
| 5.0%, 11/15/17 | | | 500,000 | | | | 554,520 | |
| 5.0%, 11/15/22 | | | 200,000 | | | | 244,178 | |
| Papillion-La Vista, General Obligation, Sarpy County | | | | | | | | |
| School District #27 | | | | | | | | |
| Refunding, Series 2009A, 3.15%, 12/01/17 | | | 930,000 | | | | 954,217 | |
| Series 2009, 5.0%, 12/01/28 | | | 500,000 | | | | 559,390 | |
| Papio-Missouri River Natural Resources District, | | | | | | | | |
| General Obligation, Flood Protection and Water | | | | | | | | |
| Quality Enhancement | | | | | | | | |
| Series 2013 | | | | | | | | |
| 3.0%, 12/15/16 | | | 400,000 | | | | 416,232 | |
| 3.0%, 12/15/17 | | | 385,000 | | | | 406,602 | |
| 3.0%, 12/15/18 | | | 500,000 | | | | 526,350 | |
| Series 2013B, 5.0%, 12/15/19 | | | 400,000 | | | | 446,948 | |
| Public Power Generation Agency, Revenue, Whelan | | | | | | | | |
| Energy Center Unit 2, Series A | | | | | | | | |
| AGC-ICC AMBAC Insured, 5.0%, 1/01/19 | | | 1,260,000 | | | | 1,343,777 | |
| AMBAC Insured, 5.0%, 1/01/18 | | | 750,000 | | | | 797,310 | |
| AMBAC Insured, 5.0%, 1/01/26 | | | 800,000 | | | | 849,744 | |
| Sarpy County, Recovery Zone Facility Certificates of | | | | | | | | |
| Participation, Series 2010 | | | | | | | | |
| 2.35%, 12/15/18 | | | 155,000 | | | | 161,338 | |
| 2.6%, 12/15/19 | | | 135,000 | | | | 142,096 | |
| Southern Nebraska Public Power District, Electric | | | | | | | | |
| System Revenue, AMBAC Insured, 4.625%, 9/15/21, | | | | | | | | |
| Pre-Refunded 3/15/16 @ 100 | | | 1,000,000 | | | | 1,041,660 | |
| University of Nebraska, Facilities Corp. | | | | | | | | |
| Deferred Maintenance Revenue, | | | | | | | | |
| Series 2006, 5.0%, 7/15/18 | | | 830,000 | | | | 880,447 | |
| Lease Rental Revenue, NCTA Education Center/Student | | | | | | | | |
| Housing Project, Series 2011, 3.75% 6/15/19 | | | 285,000 | | | | 312,711 | |
| University of Nebraska, University Revenue | | | | | | | | |
| Kearney Student Fees and Facilities, Series 2006 | | | | | | | | |
| 4.75%, 7/01/25, Pre-Refunded 1/01/16 @ 100 | | | 330,000 | | | | 341,220 | |
| Lincoln Parking Project, Refunding | | | | | | | | |
| Series 2005 | | | | | | | | |
| 4.0%, 6/01/17 | | | 1,070,000 | | | | 1,076,367 | |
| 4.5%, 6/01/20 | | | 500,000 | | | | 503,430 | |
| Series 2013, 2.0%, 6/01/16 | | | 310,000 | | | | 316,023 | |
| Omaha Health & Recreation Project | | | | | | | | |
| 4.05%, 5/15/19 | | | 390,000 | | | | 423,524 | |
| 5.0%, 5/15/33 | | | 700,000 | | | | 769,762 | |
| | | | | | $ Principal | | | | |
| | | % of Net | | | Amount | | | | |
| Energy | | Assets | | | or Shares | | | $ Value | |
| Omaha Student Facilities Project, Series 2007 | | | | | | | |
| 4.5%, 5/15/15 | | | | | | 310,000 | | | | 311,674 | |
| 5.0%, 5/15/27 | | | | | | 800,000 | | | | 864,584 | |
| | | | | | | | | | | 55,568,992 | |
| North Dakota | | | 1.2 | | | | | | | | | |
| Grand Forks, Sales Tax Revenue, Refunding, Series 2005A, | | | | | | | | | |
| 5.0%, 12/15/21 | | | | | | | 795,000 | | | | 821,116 | |
| | | | | | | | | | | | | |
| Puerto Rico | | | 1.4 | | | | | | | | | |
| Electric Power Authority Revenue, Series RR, FSA Insured, | | | | | | | | | |
| 5.0%, 7/01/20 | | | | | | | 1,000,000 | | | | 1,000,970 | |
| | | | | | | | | | | | | |
| Tennessee | | | 1.0 | | | | | | | | | |
| Memphis, General Obligation, General Improvement, | | | | | | | | | |
| Series 2006A, 5.0%, 11/01/19, Pre-Refunded | | | | | | | | | |
| 11/01/15 @ 100 | | | | | | | 720,000 | | | | 740,167 | |
| | | | | | | | | | | | | |
| Texas | | | 2.0 | | | | | | | | | |
| Harris County, Tax and Subordinate Lien Revenue, | | | | | | | | | |
| Refunding, Series 2009C, 5.0%, 8/15/23 | | | | | | | 110,000 | | | | 127,626 | |
| San Antonio, General Obligation, Refunding, Series 2010, | | | | | | | | | |
| 5.0%, 2/01/19 | | | | | | | 1,195,000 | | | | 1,242,955 | |
| | | | | | | | | | | | 1,370,581 | |
| Virginia | | | 1.1 | | | | | | | | | |
| Chesterfield County, General Obligation, Refunding, | | | | | | | | | |
| Series 2005B, 5.0%, 1/01/17 | | | | | | | 755,000 | | | | 758,035 | |
| Total Municipal Bonds (Cost $63,428,496) | | | | | | | | 65,536,565 | |
| | | | | | | | | | | | | |
| Cash Equivalents – 5.5% | | | | | | | | | | | | |
| Wells Fargo Advantage Tax-Free Money Market | | | | | | | | | |
Fund - Institutional Class 0.01%(a) | | | | | | | 3,824,314 | | | | 3,824,314 | |
| Total Cash Equivalents (Cost $3,824,314) | | | | | | | | 3,824,314 | |
Total Investments in Securities (Cost $67,252,810) | | | | | | | | 69,360,879 | |
| Other Assets Less Other Liabilities - 0.9% | | | | | | | | | | | 640,654 | |
| Net Assets - 100% | | | | | | | | | | | 70,001,533 | |
| Net Asset Value Per Share | | | | | | | | | | | 10.19 | |
(a) Rate presented represents the annualized 7-day yield at March 31, 2015.
The accompanying notes form an integral part of these financial statements.
45 | Q1 2015 ANNUAL REPORT
GOVERNMENT MONEY MARKET FUND
Schedule of Investments
March 31, 2015
| U.S. Treasury – 87.6%† | | $ Principal | | | | |
| | | Amount or | | | | |
| | | Shares | | | $ Value | |
| U.S. Treasury Bills | | | | | | |
| 0.03% 4/02/15 | | | 15,000,000 | | | | 14,999,987 | |
| 0.03% 4/23/15 | | | 40,000,000 | | | | 39,999,389 | |
| 0.01% 5/21/15 | | | 40,000,000 | | | | 39,999,278 | |
| Total U.S. Treasury | | | | | | | 94,998,654 | |
| | | | | | | | | |
| Money Market Funds – 12.4% | | | | | | | | |
| | | | | | | | | |
| Wells Fargo Advantage Money Market Funds | | | | | | | | |
Government - Institutional Class 0.01%(a) | | | 13,452,902 | | | | 13,452,902 | |
100% Treasury - Service Class 0.00%(a) | | | 52,556 | | | | 52,556 | |
| Total Money Market Funds | | | | | | | 13,505,458 | |
Total Investments in Securities (Cost $108,504,112) | | | | | | | 108,504,112 | |
| Other Liabilities in Excess of Other Assets - 0.0% | | | | | | | (50,873 | ) |
| Net Assets - 100% | | | | | | | 108,453,239 | |
| Net Asset Value Per Share | | | | | | | 1.00 | |
† Interest rates presented represent the yield to maturity at the date of purchase.
(a) Rate presented represents the annualized 7-day yield at March 31, 2015.
The accompanying notes form an integral part of these financial statements.
46 | Q1 2015 ANNUAL REPORT
This page intentionally left blank
47 | Q1 2015 ANNUAL REPORT
STATEMENTS OF ASSETS AND LIABILITIES
| | | | | | | | | | | | | | | | | | | | | | | | Short- | | | Nebraska | | | Government | |
| (In U.S. dollars, | | | | | Partners | | | Partners III | | | | | | | | | | | | Core Plus | | | Intermediate | | | Tax-Free | | | Money | |
| except share data) | | Value | | | Value | | | Opportunity | | | Research | | | Hickory | | | Balanced | | | Income | | | Income | | | Income | | | Market | |
| Assets: | | | | | | | | | | | | | | | | | | | | | | | | | | | | | | |
| Investments in securities at value: | | | | | | | | | | | | | | | | | | | | | | | | | | | | | | |
Unaffiliated issuers(a) | | | 1,142,041,905 | | | | 1,108,072,352 | | | | 1,069,730,987 | | | | 25,616,636 | | | | 448,118,876 | | | | 125,512,202 | | | | 15,733,038 | | | | 1,400,793,896 | | | | 69,360,879 | | | | 108,504,112 | |
Controlled affiliates(a) | | | — | | | | — | | | | 6,537,600 | | | | — | | | | — | | | | — | | | | — | | | | — | | | | — | | | | — | |
| | | | 1,142,041,905 | | | | 1,108,072,352 | | | | 1,076,268,587 | | | | 25,616,636 | | | | 448,118,876 | | | | 125,512,202 | | | | 15,733,038 | | | | 1,400,793,896 | | | | 69,360,879 | | | | 108,504,112 | |
Accrued interest and dividends receivable | | | 634,046 | | | | 344,602 | | | | 5,150 | | | | 7,226 | | | | 83,025 | | | | 212,700 | | | | 132,425 | | | | 8,704,798 | | | | 693,603 | | | | 157 | |
| Due from broker | | | — | | | | — | | | | 283,942,355 | | | | — | | | | — | | | | — | | | | — | | | | — | | | | — | | | | — | |
| Receivable for securities sold | | | — | | | | 1,547,637 | | | | — | | | | — | | | | 664,900 | | | | — | | | | — | | | | — | | | | — | | | | — | |
| Receivable for fund shares sold | | | 115,055 | | | | 413,525 | | | | 2,838,151 | | | | 3,384 | | | | 49,693 | | | | 5,366 | | | | 218 | | | | 1,351,185 | | | | — | | | | — | |
| Total assets | | | 1,142,791,006 | | | | 1,110,378,116 | | | | 1,363,054,243 | | | | 25,627,246 | | | | 448,916,494 | | | | 125,730,268 | | | | 15,865,681 | | | | 1,410,849,879 | | | | 70,054,482 | | | | 108,504,269 | |
| Liabilities: | | | | | | | | | | | | | | | | | | | | | | | | | | | | | | | | | | | | | | | | |
Dividends payable on securities sold short | | | — | | | | — | | | | 493,283 | | | | — | | | | — | | | | — | | | | — | | | | — | | | | — | | | | — | |
| Due to adviser | | | 1,201,000 | | | | 1,134,618 | | | | 1,184,450 | | | | 20,089 | | | | 532,443 | | | | 128,604 | | | | 9,460 | | | | 870,539 | | | | 52,949 | | | | 999 | |
| Payable for securities purchased | | | — | | | | — | | | | 4,166,136 | | | | — | | | | 230,201 | | | | — | | | | 102,247 | | | | 3,375,068 | | | | — | | | | — | |
| Payable for fund shares redeemed | | | 690,303 | | | | 1,417,450 | | | | 263,820 | | | | — | | | | 2,987,094 | | | | 23,630 | | | | — | | | | 1,371,448 | | | | — | | | | 50,000 | |
Securities sold short(b) | | | — | | | | — | | | | 273,625,100 | | | | — | | | | — | | | | — | | | | — | | | | — | | | | — | | | | — | |
| Other | | | — | | | | — | | | | 10,548 | | | | — | | | | — | | | | — | | | | — | | | | — | | | | — | | | | 31 | |
| Total liabilities | | | 1,891,303 | | | | 2,552,068 | | | | 279,743,337 | | | | 20,089 | | | | 3,749,738 | | | | 152,234 | | | | 111,707 | | | | 5,617,055 | | | | 52,949 | | | | 51,030 | |
| Net assets | | | 1,140,899,703 | | | | 1,107,826,048 | | | | 1,083,310,906 | | | | 25,607,157 | | | | 445,166,756 | | | | 125,578,034 | | | | 15,753,974 | | | | 1,405,232,824 | | | | 70,001,533 | | | | 108,453,239 | |
| Composition of net assets: | | | | | | | | | | | | | | | | | | | | | | | | | | | | | | | | | | | | | | | | |
| Paid-in capital | | | 736,083,010 | | | | 740,606,477 | | | | 702,555,622 | | | | 20,706,738 | | | | 292,401,640 | | | | 105,536,843 | | | | 15,569,934 | | | | 1,370,285,162 | | | | 67,856,302 | | | | 108,454,121 | |
Accumulated undistributed net investment income (loss) | | | (1,793,996 | ) | | | (1,116,085 | ) | | | (3,236,947 | ) | | | — | | | | (420,203 | ) | | | — | | | | 1,191 | | | | 172,518 | | | | 37,924 | | | | — | |
Accumulated net realized gain (loss) | | | 72,378,155 | | | | 45,854,238 | | | | 78,404,650 | | | | 2,194,960 | | | | 33,295,288 | | | | 4,213,580 | | | | 6,822 | | | | 3,271,459 | | | | (762 | ) | | | (882 | ) |
Net unrealized appreciation (depreciation) of investments | | | 334,232,534 | | | | 322,481,418 | | | | 305,587,581 | | | | 2,705,459 | | | | 119,890,031 | | | | 15,827,611 | | | | 176,027 | | | | 31,503,685 | | | | 2,108,069 | | | | — | |
| Net assets | | | 1,140,899,703 | | | | 1,107,826,048 | | | | 1,083,310,906 | | | | 25,607,157 | | | | 445,166,756 | | | | 125,578,034 | | | | 15,753,974 | | | | 1,405,232,824 | | | | 70,001,533 | | | | 108,453,239 | |
Net assets(c) : | | | | | | | | | | | | | | | | | | | | | | | | | | | | | | | | | | | | | | | | |
| Investor Class | | | 940,646,020 | | | | 789,852,846 | | | | 68,490,378 | | | | 25,607,157 | | | | 445,166,756 | | | | 125,578,034 | | | | 3,950,289 | | | | 113,708,587 | | | | 70,001,533 | | | | 108,453,239 | |
| Institutional Class | | | 200,253,683 | | | | 317,973,202 | | | | 1,014,820,528 | | | | | | | | | | | | | | | | 11,803,685 | | | | 1,291,524,237 | | | | | | | | | |
Shares outstanding(c) (d) : | | | | | | | | | | | | | | | | | | | | | | | | | | | | | | | | | | | | | | | | |
| Investor Class | | | 20,045,027 | | | | 22,535,953 | | | | 4,001,651 | | | | 2,096,526 | | | | 7,480,349 | | | | 8,923,455 | | | | 387,056 | | | | 9,114,016 | | | | 6,868,141 | | | | 108,454,121 | |
| Institutional Class | | | 4,262,068 | | | | 9,060,683 | | | | 58,631,815 | | | | | | | | | | | | | | | | 1,156,781 | | | | 103,328,517 | | | | | | | | | |
| Net asset value , offering and | | | | | | | | | | | | | | | | | | | | | | | | | | | | | | | | | | | | | | | | |
redemption price(c): | | | | | | | | | | | | | | | | | | | | | | | | | | | | | | | | | | | | | | | | |
| Investor Class | | | 46.93 | | | | 35.05 | | | | 17.12 | | | | 12.21 | | | | 59.51 | | | | 14.07 | | | | 10.21 | | | | 12.48 | | | | 10.19 | | | | 1.00 | |
| Institutional Class | | | 46.99 | | | | 35.09 | | | | 17.31 | | | | | | | | | | | | | | | | 10.20 | | | | 12.50 | | | | | | | | | |
(a) Cost of investments in securities: | | | | | | | | | | | | | | | | | | | | | | | | | | | | | | | | | | | | | | | | |
| Unaffiliated issuers | | | 807,809,371 | | | | 785,590,934 | | | | 731,170,831 | | | | 22,911,177 | | | | 328,228,845 | | | | 109,684,591 | | | | 15,557,011 | | | | 1,369,290,211 | | | | 67,252,810 | | | | 108,504,112 | |
| Controlled affiliates | | | — | | | | — | | | | 2,899,379 | | | | — | | | | — | | | | — | | | | — | | | | — | | | | — | | | | — | |
| | | | 807,809,371 | | | | 785,590,934 | | | | 734,070,210 | | | | 22,911,177 | | | | 328,228,845 | | | | 109,684,591 | | | | 15,557,011 | | | | 1,369,290,211 | | | | 67,252,810 | | | | 108,504,112 | |
| | | | | | | | | | | | | | | | | | | | | | | | | | | | | | | | | | | | | | | | | |
(b) Proceeds from short sales | | | — | | | | — | | | | 237,014,304 | | | | — | | | | — | | | | — | | | | — | | | | — | | | | — | | | | — | |
(c) Funds with a single share class are shown with the Investor Class
(d) Indefinite number of no par value shares authorized
The accompanying notes form an integral part of these financial statements.
48 | Q1 2015 ANNUAL REPORT
STATEMENTS OF OPERATIONS
Year Ended March 31, 2015
| | | | | | | | | | | | | | | | | | | | | | | | Short- | | | Nebraska | | | Government | |
| | | | | | Partners | | | Partners III | | | | | | | | | | | | Core Plus | | | Intermediate | | | Tax-Free | | | Money | |
| (In U.S. dollars) | | Value | | | Value | | | Opportunity | | | Research | | | Hickory | | | Balanced | | | Income(b) | | | Income | | | Income | | | Market | |
| Investment income: | | | | | | | | | | | | | | | | | | | | | | | | | | | | | | |
| Dividends: | | | | | | | | | | | | | | | | | | | | | | | | | | | | | | |
Unaffiliated issuers(a) | | | 6,492,471 | | | | 7,527,551 | | | | 7,904,329 | | | | 166,660 | | | | 3,174,357 | | | | 759,587 | | | | 3,686 | | | | 1,011,259 | | | | — | | | | — | |
| Interest | | | 107,584 | | | | 109,720 | | | | 30,866 | | | | 336 | | | | 41,677 | | | | 480,453 | | | | 126,171 | | | | 33,791,896 | | | | 2,020,202 | | | | 26,678 | |
| Total investment income | | | 6,600,055 | | | | 7,637,271 | | | | 7,935,195 | | | | 166,996 | | | | 3,216,034 | | | | 1,240,040 | | | | 129,857 | | | | 34,803,155 | | | | 2,020,202 | | | | 26,678 | |
Expenses: | | | | | | | | | | | | | | | | | | | | | | | | | | | | | | | | | | | | | | | | |
| Investment advisory fees | | | 10,573,029 | | | | 9,979,676 | | | | 11,481,363 | | | | 241,708 | | | | 4,646,926 | | | | 1,016,281 | | | | 23,292 | | | | 5,947,882 | | | | 279,767 | | | | 445,812 | |
| Administrative fees and expenses | | | 985,789 | | | | 966,813 | | | | 1,007,211 | | | | 71,063 | | | | 643,765 | | | | 258,202 | | | | 46,494 | | | | 1,512,340 | | | | 177,667 | | | | 199,786 | |
| Shareholder servicing fees: | | | | | | | | | | | | | | | | | | | | | | | | | | | | | | | | | | | | | | | | |
| Investor Class | | | 1,301,688 | | | | 1,295,912 | | | | 130,097 | | | | — | | | | — | | | | — | | | | 6,657 | | | | 239,151 | | | | — | | | | — | |
| Institutional Class | | | 17,103 | | | | 27,675 | | | | 429,764 | | | | — | | | | — | | | | — | | | | 6,657 | | | | 928,735 | | | | — | | | | — | |
| Distribution fees - Investor Class | | | — | | | | — | | | | 63,301 | | | | — | | | | — | | | | — | | | | — | | | | 98,537 | | | | — | | | | — | |
| Custodian fees | | | 21,032 | | | | 19,934 | | | | 25,912 | | | | 3,695 | | | | 12,026 | | | | 5,447 | | | | 998 | | | | 24,796 | | | | 2,144 | | | | 3,552 | |
| Dividends on securities sold short | | | — | | | | — | | | | 3,331,952 | | | | — | | | | — | | | | — | | | | — | | | | — | | | | — | | | | — | |
| Interest | | | — | | | | — | | | | 2,782,332 | | | | — | | | | — | | | | — | | | | — | | | | — | | | | — | | | | — | |
| Professional fees | | | 94,874 | | | | 92,198 | | | | 96,332 | | | | 20,742 | | | | 48,260 | | | | 27,122 | | | | 19,914 | | | | 115,004 | | | | 23,593 | | | | 26,031 | |
| Registration fees | | | 65,225 | | | | 71,728 | | | | 84,684 | | | | 16,916 | | | | 41,446 | | | | 22,400 | | | | 27,499 | | | | 75,875 | | | | 5,453 | | | | 20,451 | |
| Sub-transfer agent fees | | | 205,529 | | | | 145,715 | | | | 144,783 | | | | 23,533 | | | | 209,858 | | | | 32,450 | | | | 30,055 | | | | 144,064 | | | | 24,440 | | | | 30,375 | |
| Trustees fees | | | 78,910 | | | | 74,439 | | | | 80,955 | | | | 1,667 | | | | 33,072 | | | | 8,834 | | | | 406 | | | | 105,060 | | | | 4,928 | | | | 7,922 | |
| Other | | | 172,969 | | | | 131,655 | | | | 136,786 | | | | 4,186 | | | | 84,632 | | | | 15,642 | | | | 1,637 | | | | 214,440 | | | | 7,510 | | | | 14,425 | |
| | | | 13,516,148 | | | | 12,805,745 | | | | 19,795,472 | | | | 383,510 | | | | 5,719,985 | | | | 1,386,378 | | | | 163,609 | | | | 9,405,884 | | | | 525,502 | | | | 748,354 | |
Less expenses waived/reimbursed by investment adviser | | | (383,478 | ) | | | (546,549 | ) | | | (32,202 | ) | | | (165,973 | ) | | | — | | | | — | | | | (120,885 | ) | | | (64,237 | ) | | | — | | | | (733,949 | ) |
| Net expenses | | | 13,132,670 | | | | 12,259,196 | | | | 19,763,270 | | | | 217,537 | | | | 5,719,985 | | | | 1,386,378 | | | | 42,724 | | | | 9,341,647 | | | | 525,502 | | | | 14,405 | |
| Net investment income (loss) | | | (6,532,615 | ) | | | (4,621,925 | ) | | | (11,828,075 | ) | | | (50,541 | ) | | | (2,503,951 | ) | | | (146,338 | ) | | | 87,133 | | | | 25,461,508 | | | | 1,494,700 | | | | 12,273 | |
Realized and unrealized gain (loss) on investments: | | | | | | | | | | | | | | | | | | | | | | | | | | | | | | | | | | | | | | | | |
| Net realized gain (loss): | | | | | | | | | | | | | | | | | | | | | | | | | | | | | | | | | | | | | | | | |
| Unaffiliated issuers | | | 121,444,451 | | | | 76,976,576 | | | | 110,632,302 | | | | 4,035,656 | | | | 45,281,768 | | | | 7,973,661 | | | | 7,904 | | | | 5,732,257 | | | | 807 | | | | 114 | |
| Options written | | | — | | | | — | | | | (4,465,009 | ) | | | — | | | | — | | | | — | | | | — | | | | — | | | | — | | | | — | |
| Securities sold short | | | — | | | | — | | | | (12,630,486 | ) | | | — | | | | — | | | | — | | | | — | | | | — | | | | — | | | | — | |
| Net realized gain (loss) | | | 121,444,451 | | | | 76,976,576 | | | | 93,536,807 | | | | 4,035,656 | | | | 45,281,768 | | | | 7,973,661 | | | | 7,904 | | | | 5,732,257 | | | | 807 | | | | 114 | |
Net unrealized appreciation (depreciation): | | | | | | | | | | | | | | | | | | | | | | | | | | | | | | | | | | | | | | | | |
| Unaffiliated issuers | | | (4,923,228 | ) | | | 20,599,143 | | | | 1,596,712 | | | | (1,085,618 | ) | | | (7,802,251 | ) | | | (3,161,304 | ) | | | 176,027 | | | | (4,173,420 | ) | | | (19,341 | ) | | | — | |
| Controlled affiliates | | | — | | | | — | | | | 2,724,000 | | | | — | | | | — | | | | — | | | | — | | | | — | | | | — | | | | — | |
| Options written | | | — | | | | — | | | | 1,304,723 | | | | — | | | | — | | | | — | | | | — | | | | — | | | | — | | | | — | |
| Securities sold short | | | — | | | | — | | | | (5,626,970 | ) | | | — | | | | — | | | | — | | | | — | | | | — | | | | — | | | | — | |
Net unrealized appreciation (depreciation) | | | (4,923,228 | ) | | | 20,599,143 | | | | (1,535 | ) | | | (1,085,618 | ) | | | (7,802,251 | ) | | | (3,161,304 | ) | | | 176,027 | | | | (4,173,420 | ) | | | (19,341 | ) | | | — | |
Net realized and unrealized gain (loss) on investments | | | 116,521,223 | | | | 97,575,719 | | | | 93,535,272 | | | | 2,950,038 | | | | 37,479,517 | | | | 4,812,357 | | | | 183,931 | | | | 1,558,837 | | | | (18,534 | ) | | | 114 | |
Net increase (decrease) in net assets resulting from operations | | | 109,988,608 | | | | 92,953,794 | | | | 81,707,197 | | | | 2,899,497 | | | | 34,975,566 | | | | 4,666,019 | | | | 271,064 | | | | 27,020,345 | | | | 1,476,166 | | | | 12,387 | |
| | | | | | | | | | | | | | | | | | | | | | | | | | | | | | | | | | | | | | | | | |
(a) Foreign taxes withheld | | | — | | | | — | | | | 14,025 | | | | 289 | | | | 4,950 | | | | 7,565 | | | | — | | | | — | | | | — | | | | — | |
(b) Initial offering of shares on July 31, 2014 | | | | | | | | | | | | | | | | | | |
The accompanying notes form an integral part of these financial statements.
49 | Q1 2015 ANNUAL REPORT
STATEMENTS OF CHANGES IN NET ASSETS
| | | Value | | | Partners Value | | | Partners III Opportunity | | | Research | |
| | | Year ended March 31, | | | Year ended March 31, | | | Year ended March 31, | | | Year ended March 31, | |
| | | | | | | | | | | | | | | | | | | | | | | | | |
| (In U.S. dollars) | | 2015 | | | 2014 | | | 2015 | | | 2014 | | | 2015 | | | 2014 | | | 2015 | | | 2014 | |
| Increase (decrease) in net assets: | | | | | | | | | | | | | | | | | | | | | | | | |
| From operations: | | | | | | | | | | | | | | | | | | | | | | | | |
| Net investment income (loss) | | | (6,532,615 | ) | | | (4,366,148 | ) | | | (4,621,925 | ) | | | (4,472,756 | ) | | | (11,828,075 | ) | | | (7,643,276 | ) | | | (50,541 | ) | | | (61,535 | ) |
| Net realized gain (loss) | | | 121,444,451 | | | | 104,789,696 | | | | 76,976,576 | | | | 69,226,179 | | | | 93,536,807 | | | | 37,381,349 | | | | 4,035,656 | | | | 3,128,526 | |
Net unrealized appreciation (depreciation) | (4,923,228 | ) | | | 92,011,554 | | | | 20,599,143 | | | | 106,467,496 | | | | (1,535 | ) | | | 122,453,759 | | | | (1,085,618 | ) | | | 1,031,730 | |
Net increase (decrease) in net assets resulting from operations | | | 109,988,608 | | | | 192,435,102 | | | | 92,953,794 | | | | 171,220,919 | | | | 81,707,197 | | | | 152,191,832 | | | | 2,899,497 | | | | 4,098,721 | |
| Distributions to shareholders from: | | | | | | | | | | | | | | | | | | | | | | | | | | | | | | | | |
Net investment income(b): | | | | | | | | | | | | | | | | | | | | | | | | | | | | | | | | |
| Investor Class | | | — | | | | — | | | | — | | | | — | | | | — | | | | — | | | | — | | | | (2,502 | ) |
| Institutional Class | | | — | | | | — | | | | — | | | | — | | | | — | | | | — | | | | | | | | | |
Net realized gains(b): | | | | | | | | | | | | | | | | | | | | | | | | | | | | | | | | |
| Investor Class | | | (84,283,717 | ) | | | — | | | | (26,815,484 | ) | | | — | | | | (2,165,747 | ) | | | (1,132,015 | ) | | | (3,850,663 | ) | | | (697,747 | ) |
| Institutional Class | | | (8,233,675 | ) | | | — | | | | (7,644,847 | ) | | | — | | | | (33,312,240 | ) | | | (22,433,564 | ) | | | | | | | | |
| Total distributions | | | (92,517,392 | ) | | | — | | | | (34,460,331 | ) | | | — | | | | (35,477,987 | ) | | | (23,565,579 | ) | | | (3,850,663 | ) | | | (700,249 | ) |
Fund share transactions(b): | | | | | | | | | | | | | | | | | | | | | | | | | | | | | | | | |
| Investor Class | | | (54,054,283 | ) | | | (38,704,999 | ) | | | (71,265,185 | ) | | | 59,065,188 | | | | (12,571,692 | ) | | | 53,495,912 | | | | 2,300,271 | | | | 1,740,812 | |
| Institutional Class | | | 10,200,938 | | | | — | | | | 46,098,679 | | | | — | | | | (192,593,706 | ) | | | 375,653,095 | | | | | | | | | |
Net increase (decrease) from fund share transactions | | | (43,853,345 | ) | | | (38,704,999 | ) | | | (25,166,506 | ) | | | 59,065,188 | | | | (205,165,398 | ) | | | 429,149,007 | | | | 2,300,271 | | | | 1,740,812 | |
Total increase (decrease) in net assets | (26,382,129 | ) | | | 153,730,103 | | | | 33,326,957 | | | | 230,286,107 | | | | (158,936,188 | ) | | | 557,775,260 | | | | 1,349,105 | | | | 5,139,284 | |
| Net assets: | | | | | | | | | | | | | | | | | | | | | | | | | | | | | | | | |
| Beginning of period | | | 1,167,281,832 | | | | 1,013,551,729 | | | | 1,074,499,091 | | | | 844,212,984 | | | | 1,242,247,094 | | | | 684,471,834 | | | | 24,258,052 | | | | 19,118,768 | |
| End of period | | | 1,140,899,703 | | | | 1,167,281,832 | | | | 1,107,826,048 | | | | 1,074,499,091 | | | | 1,083,310,906 | | | | 1,242,247,094 | | | | 25,607,157 | | | | 24,258,052 | |
Undistributed net investment income (loss) | | | (1,793,996 | ) | | | (1,605,298 | ) | | | (1,116,085 | ) | | | (1,232,653 | ) | | | (3,236,947 | ) | | | (2,100,771 | ) | | | — | | | | (20,107 | ) |
(a) Initial offering of shares on July 31, 2014
(b) Funds with a single share class are shown with the Investor Class
The accompanying notes form an integral part of these financial statements.
50 | Q1 2015 ANNUAL REPORT
| | | | | | | | | | | | | Core Plus | | | Short-Intermediate | | | | | | Nebraska | | | Government | |
| Hickory | | | Balanced | | | Income | | | Income | | | Tax-Free Income | | | Money Market | |
| Year ended March 31, | | | Year ended March 31, | | | Eight months | | | Year ended March 31, | | | Year ended March 31, | | | Year ended March 31, | |
| | | | | | | | | | | | | ended | | | | | | | | | | | | | | | | | | | |
| 2015 | | | 2014 | | | 2015 | | | 2014 | March 31, 2015(a) | | | 2015 | | | 2014 | | | 2015 | | | 2014 | | | 2015 | | | 2014 | |
| | | | | | | | | | | | | | | | | | | | | | | | | | | | | | | | |
| | | | | | | | | | | | | | | | | | | | | | | | | | | | | | | | |
| | (2,503,951 | ) | | | (3,102,329 | ) | | | (146,338 | ) | | | (237,897 | ) | | | 87,133 | | | | 25,461,508 | | | | 26,169,801 | | | | 1,494,700 | | | | 1,633,856 | | | | 12,273 | | | | 11,261 | |
| | 45,281,768 | | | | 35,478,965 | | | | 7,973,661 | | | | 6,426,467 | | | | 7,904 | | | | 5,732,257 | | | | 5,550,066 | | | | 807 | | | | 360,245 | | | | 114 | | | | (996 | ) |
| | (7,802,251 | ) | | | 36,689,967 | | | | (3,161,304 | ) | | | 5,047,546 | | | | 176,027 | | | | (4,173,420 | ) | | | (23,789,631 | ) | | | (19,341 | ) | | | (1,950,131 | ) | | | — | | | | — | |
| | | | | | | | | | | | | | | | | | | | | | | | | | | | | | | | | | | | | | | | | | | |
| | 34,975,566 | | | | 69,066,603 | | | | 4,666,019 | | | | 11,236,116 | | | | 271,064 | | | | 27,020,345 | | | | 7,930,236 | | | | 1,476,166 | | | | 43,970 | | | | 12,387 | | | | 10,265 | |
| | | | | | | | | | | | | | | | | | | | | | | | | | | | | | | | | | | | | | | | | | | |
| | | | | | | | | | | | | | | | | | | | | | | | | | | | | | | | | | | | | | | | | | | |
| | — | | | | — | | | | — | | | | (19,778 | ) | | | (28,896 | ) | | | (2,006,049 | ) | | | (1,700,771 | ) | | | (1,475,000 | ) | | | (1,648,955 | ) | | | (12,273 | ) | | | (11,261 | ) |
| | | | | | | | | | | | | | | | | | (58,128 | ) | | | (25,491,139 | ) | | | (27,208,054 | ) | | | | | | | | | | | | | | | | |
| | | | | | | | | | | | | | | | | | | | | | | | | | | | | | | | | | | | | | | | | | | |
| | (24,246,012 | ) | | | — | | | | (6,054,129 | ) | | | (5,813,867 | ) | | | — | | | | (63,417 | ) | | | — | | | | — | | | | (361,341 | ) | | | — | | | | (92 | ) |
| | | | | | | | | | | | | | | | | | — | | | | (674,752 | ) | | | — | | | | | | | | | | | | | | | | | |
| | (24,246,012 | ) | | | — | | | | (6,054,129 | ) | | | (5,833,645 | ) | | | (87,024 | ) | | | (28,235,357 | ) | | | (28,908,825 | ) | | | (1,475,000 | ) | | | (2,010,296 | ) | | | (12,273 | ) | | | (11,353 | ) |
| | | | | | | | | | | | | | | | | | | | | | | | | | | | | | | | | | | | | | | | | | | |
| | (83,203,133 | ) | | | 16,487,841 | | | | 62,595 | | | | 23,395,791 | | | | 3,875,352 | | | | 2,183,525 | | | | 34,490,796 | | | | (267,726 | ) | | | (31,530,046 | ) | | | (15,705,328 | ) | | | 16,241,532 | |
| | | | | | | | | | | | | | | | | | 11,694,582 | | | | (134,447,746 | ) | | | 21,921,980 | | | | | | | | | | | | | | | | | |
| | | | | | | | | | | | | | | | | | | | | | | | | | | | | | | | | | | | | | | | | | | |
| | (83,203,133 | ) | | | 16,487,841 | | | | 62,595 | | | | 23,395,791 | | | | 15,569,934 | | | | (132,264,221 | ) | | | 56,412,776 | | | | (267,726 | ) | | | (31,530,046 | ) | | | (15,705,328 | ) | | | 16,241,532 | |
| | (72,473,579 | ) | | | 85,554,444 | | | | (1,325,515 | ) | | | 28,798,262 | | | | 15,753,974 | | | | (133,479,233 | ) | | | 35,434,187 | | | | (266,560 | ) | | | (33,496,372 | ) | | | (15,705,214 | ) | | | 16,240,444 | |
| | 517,640,335 | | | | 432,085,891 | | | | 126,903,549 | | | | 98,105,287 | | | | — | | | | 1,538,712,057 | | | | 1,503,277,870 | | | | 70,268,093 | | | | 103,764,465 | | | | 124,158,453 | | | | 107,918,009 | |
| | | | | | | | | | | | | | | | | | | | | | | | | | | | | | | | | | | | | | | | | | | |
| | 445,166,756 | | | | 517,640,335 | | | | 125,578,034 | | | | 126,903,549 | | | | 15,753,974 | | | | 1,405,232,824 | | | | 1,538,712,057 | | | | 70,001,533 | | | | 70,268,093 | | | | 108,453,239 | | | | 124,158,453 | |
| | (420,203 | ) | | | (502,802 | ) | | | — | | | | (48,591 | ) | | | 1,191 | | | | 172,518 | | | | 596,238 | | | | 37,924 | | | | 18,224 | | | | — | | | | — | |
The accompanying notes form an integral part of these financial statements.
51 | Q1 2015 ANNUAL REPORT
STATEMENT OF CASH FLOWS
Partners III Opportunity
| (In U.S. dollars) | Year Ended March 31, 2015 | |
| Increase (decrease) in cash: | | | |
| Cash flows from operating activities: | | | |
| Net increase in net assets from operations | | | 81,707,197 | |
| Adjustments to reconcile net increase in net assets from operations to net cash provided by operating activities: | | | | |
| Purchases of investment securities | | | (449,774,286 | ) |
| Proceeds from sale of investment securities | | | 494,028,134 | |
| Proceeds from securities sold short | | | 193,994,083 | |
| Short positions covered | | | (31,768,038 | ) |
| Sale of short-term investment securities, net | | | 233,008,082 | |
| Net unrealized depreciation on investments, options and short sales | | | 1,535 | |
| Net realized gain on investments, options and short sales | | | (93,536,807 | ) |
| Decrease in accrued interest and dividends receivable | | | 2,376 | |
| Increase in due from broker | | | (188,127,529 | ) |
| Increase in receivable for fund shares sold | | | (1,447,340 | ) |
| Increase in dividends payable on securities sold short | | | 369,591 | |
| Decrease in due to adviser | | | (94,830 | ) |
| Increase in payable for securities purchased | | | 2,861,863 | |
| Decrease in payable for fund shares redeemed | | | (588,253 | ) |
| Increase in other liabilities | | | 7,607 | |
| | | | | |
| Net cash provided by operating activities | | | 240,643,385 | |
| Cash flows from financing activities: | | | | |
| Proceeds from sales of fund shares | | | 202,517,354 | |
| Payments for redemptions of fund shares | | | (434,448,318 | ) |
| Cash distributions to shareholders | | | (8,712,421 | ) |
| Net cash used in financing activities | | | (240,643,385 | ) |
| | | | | |
| Net increase (decrease) in cash | | | — | |
| Cash: | | | | |
| Balance, beginning of period | | | — | |
| | | | | |
| Balance, end of period | | | — | |
| | | | | |
| Supplemental disclosure of cash flow information: | | | | |
| Cash payments for interest | | | 2,774,725 | |
| | | | | |
| Noncash financing activities: | | | | |
| Reinvestment of shareholder distributions | | | 26,765,566 | |
The accompanying notes form an integral part of these financial statements.
52 | Q1 2015 ANNUAL REPORT
This page intentionally left blank
53 | Q1 2015 ANNUAL REPORT
The following financial information provides selected data, in U.S. dollars, for a share outstanding throughout the periods indicated.
| | | | | | Income (loss) from Investment Operations | | | Distributions | |
| | | | | | | | | Net gain (loss) | | | | | | Dividends | | | | | | | |
| | | | | | | | | on securities | | | Total from | | | from net | | | Distributions | | | | |
| Years ended March 31, | | Net asset value, | | | Net investment | | | (realized | | | investment | | | investment | | | from | | | Total | |
| unless otherwise noted | | beginning of period | | | income (loss) | | | and unrealized) | | | operations | | | income | | | realized gains | | | distributions | |
| Value - Investor Class | | | | | | | | | | | | | | | | | | | | | |
| 2015 | | | 46.20 | | | | (0.24 | )(a) | | | 4.76 | | | | 4.52 | | | | — | | | | (3.79 | ) | | | (3.79 | ) |
| 2014 | | | 38.61 | | | | (0.17 | ) | | | 7.76 | | | | 7.59 | | | | — | | | | — | | | | — | |
| 2013 | | | 32.98 | | | | (0.02 | ) | | | 5.68 | | | | 5.66 | | | | (0.03 | ) | | | — | | | | (0.03 | ) |
| 2012 | | | 30.07 | | | | 0.04 | | | | 2.94 | | | | 2.98 | | | | (0.07 | ) | | | — | | | | (0.07 | ) |
| 2011 | | | 26.14 | | | | 0.07 | | | | 3.86 | | | | 3.93 | | | | — | | | | — | | | | — | |
| Value - Institutional Class | | | | | | | | | | | | | | | | | | | | | | | | | | | | |
Eight months ended 3/31/2015(b) | 44.80 | | | | (0.26 | )(a) | | | 4.50 | | | | 4.24 | | | | — | | | | (2.05 | ) | | | (2.05 | ) |
| Partners Value - Investor Class | | | | | | | | | | | | | | | | | | | | | | | | | | | | |
| 2015 | | | 33.20 | | | | (0.14 | )(a) | | | 3.09 | | | | 2.95 | | | | — | | | | (1.10 | ) | | | (1.10 | ) |
| 2014 | | | 27.75 | | | | (0.14 | ) | | | 5.59 | | | | 5.45 | | | | — | | | | — | | | | — | |
| 2013 | | | 23.25 | | | | (0.06 | ) | | | 4.56 | | | | 4.50 | | | | — | | | | — | | | | — | |
| 2012 | | | 22.05 | | | | (0.07 | ) | | | 1.27 | | | | 1.20 | | | | — | | | | — | | | | — | |
| 2011 | | | 18.24 | | | | (0.05 | ) | | | 3.86 | | | | 3.81 | | | | — | | | | — | | | | — | |
| Partners Value - Institutional Class | | | | | | | | | | | | | | | | | | | | | | | | | |
Eight months ended 3/31/2015(b) | 33.22 | | | | (0.11 | )(a) | | | 2.91 | | | | 2.80 | | | | — | | | | (0.93 | ) | | | (0.93 | ) |
| Partners III Opportunity - Investor Class | | | | | | | | | | | | | | | | | | | | | | | | | |
| 2015 | | | 16.43 | | | | (0.22 | )(a) | | | 1.41 | | | | 1.19 | | | | — | | | | (0.50 | ) | | | (0.50 | ) |
| 2014 | | | 14.26 | | | | (0.17 | )(a) | | | 2.71 | | | | 2.54 | | | | — | | | | (0.37 | ) | | | (0.37 | ) |
| 2013 | | | 12.90 | | | | (0.12 | )(a) | | | 2.40 | | | | 2.28 | | | | — | | | | (0.92 | ) | | | (0.92 | ) |
Eight months ended 3/31/2012(c) | 12.08 | | | | (0.09 | )(a) | | | 0.91 | | | | 0.82 | | | | — | | | | — | | | | — | |
| Partners III Opportunity - Institutional Class | | | | | | | | | | | | | | | | | | | | | | | | | |
| 2015 | | | 16.55 | | | | (0.17 | )(a) | | | 1.43 | | | | 1.26 | | | | — | | | | (0.50 | ) | | | (0.50 | ) |
| 2014 | | | 14.33 | | | | (0.12 | )(a) | | | 2.71 | | | | 2.59 | | | | — | | | | (0.37 | ) | | | (0.37 | ) |
| 2013 | | | 12.93 | | | | (0.08 | )(a) | | | 2.40 | | | | 2.32 | | | | — | | | | (0.92 | ) | | | (0.92 | ) |
| 2012 | | | 12.63 | | | | (0.07 | )(a) | | | 0.67 | | | | 0.60 | | | | — | | | | (0.30 | ) | | | (0.30 | ) |
| 2011 | | | 10.15 | | | | (0.06 | ) | | | 2.54 | | | | 2.48 | | | | — | | | | — | | | | — | |
| Research | | | | | | | | | | | | | | | | | | | | | | | | | | | | |
| 2015 | | | 12.76 | | | | (0.02 | ) | | | 1.46 | | | | 1.44 | | | | — | | | | (1.99 | ) | | | (1.99 | ) |
| 2014 | | | 10.83 | | | | (0.03 | ) | | | 2.35 | | | | 2.32 | | | | — | # | | | (0.39 | ) | | | (0.39 | ) |
| 2013 | | | 11.07 | | | | 0.01 | | | | 0.65 | | | | 0.66 | | | | (0.01 | ) | | | (0.89 | ) | | | (0.90 | ) |
| 2012 | | | 10.38 | | | | 0.01 | | | | 1.20 | | | | 1.21 | | | | (0.01 | ) | | | (0.51 | ) | | | (0.52 | ) |
Three months ended 3/31/2011(d) | 10.00 | | | | — | # | | | 0.38 | | | | 0.38 | | | | — | | | | — | | | | — | |
| * | Annualized |
| † | Not Annualized |
| # | Amount less than $0.01 |
| (a) | Based on average daily shares outstanding |
| (b) | Initial offering of shares on July 31, 2014 |
| (c) | Initial offering of shares on August 1, 2011 |
| (d) | Initial offering of shares on December 31, 2010 |
| (e) | Included in the expense ratio is 0.24%, 0.11%, 0.14% and 0.12% related to interest expense and 0.29%, 0.16%, 0.28% and 0.24% related to dividend expense on securities sold short for the periods ended March 31, 2015, 2014, 2013 and 2012, respectively. |
| (f) | Included in the expense ratio is 0.24%, 0.12%, 0.14%, 0.11% and 0.15% related to interest expense and 0.29%, 0.15%, 0.27%, 0.18% and 0.16% related to dividend expense on securities sold short for the periods ended March 31, 2015, 2014, 2013, 2012 and 2011, respectively. |
The accompanying notes form an integral part of these financial statements.
54 | Q1 2015 ANNUAL REPORT
| | | | Ratios/Supplemental Data | |
| | | | | | | | | | Ratio of expenses | | | | | | | |
| | | | | | | | | | to average net assets | | | | | | | |
| | | | | | | | | | | | | | | | Ratio of net | | | | |
| | | | | | | | | | | | | | | | investment income | | | Portfolio | |
| Net asset value, | | | | | | Net assets, end of | | | Prior to fee | | | Net of fee | | | (loss) to average | | | turnover | |
| end of period | | | Total Return (%) | | | period ($000) | | | waivers (%) | | | waivers (%) | | | net assets (%) | | | rate (%) | |
| | | | | | | | | | | | | | | | | | | | |
| | 46.93 | | | | 10.19 | | | | 940,646 | | | | 1.20 | | | | 1.18 | | | | (0.54 | ) | | | 36 | |
| | 46.20 | | | | 19.66 | | | | 1,167,282 | | | | 1.18 | | | | 1.18 | | | | (0.41 | ) | | | 19 | |
| | 38.61 | | | | 17.20 | | | | 1,013,552 | | | | 1.20 | | | | 1.20 | | | | (0.07 | ) | | | 20 | |
| | 32.98 | | | | 9.94 | | | | 1,011,671 | | | | 1.20 | | | | 1.20 | | | | 0.11 | | | | 31 | |
| | 30.07 | | | | 15.03 | | | | 971,285 | | | | 1.21 | | | | 1.21 | | | | 0.23 | | | | 46 | |
| | | | | | | | | | | | | | | | | | | | | | | | | | | |
| | 46.99 | | | | 9.57 | † | | | 200,254 | | | | 1.08 | * | | | 0.99 | * | | | (0.87 | ) | | | 36 | |
| | | | | | | | | | | | | | | | | | | | | | | | | | | |
| | 35.05 | | | | 8.99 | | | | 789,853 | | | | 1.23 | | | | 1.18 | | | | (0.42 | ) | | | 26 | |
| | 33.20 | | | | 19.64 | | | | 1,074,499 | | | | 1.18 | | | | 1.18 | | | | (0.46 | ) | | | 19 | |
| | 27.75 | | | | 19.35 | | | | 844,213 | | | | 1.19 | | | | 1.19 | | | | (0.25 | ) | | | 24 | |
| | 23.25 | | | | 5.44 | | | | 707,174 | | | | 1.20 | | | | 1.20 | | | | (0.32 | ) | | | 31 | |
| | 22.05 | | | | 20.89 | | | | 754,598 | | | | 1.21 | | | | 1.21 | | | | (0.26 | ) | | | 42 | |
| | | | | | | | | | | | | | | | | | | | | | | | | | | |
| | 35.09 | | | | 8.51 | † | | | 317,973 | | | | 1.05 | * | | | 0.99 | * | | | (0.49 | )* | | | 26 | |
| | | | | | | | | | | | | | | | | | | | | | | | | | | |
| | 17.12 | | | | 7.38 | | | | 68,490 | | | | 2.06 | *(e) | | | 2.02 | *(e) | | | (1.33 | ) | | | 45 | |
| | 16.43 | | | | 17.94 | | | | 78,586 | | | | 1.84 | (e) | | | 1.68 | (e) | | | (1.10 | ) | | | 20 | |
| | 14.26 | | | | 18.81 | | | | 19,702 | | | | 2.25 | (e) | | | 1.85 | (e) | | | (0.93 | ) | | | 32 | |
| | 12.90 | | | | 6.79 | † | | | 11,497 | | | | 2.31 | *(e) | | | 1.80 | *(e) | | | (1.06 | )* | | | 44 | |
| | | | | | | | | | | | | | | | | | | | | | | | | | | |
| | 17.31 | | | | 7.76 | | | | 1,014,821 | | | | 1.69 | *(f) | | | 1.69 | *(f) | | | (1.00 | ) | | | 45 | |
| | 16.55 | | | | 18.20 | | | | 1,163,661 | | | | 1.43 | (f) | | | 1.43 | (f) | | | (0.78 | ) | | | 20 | |
| | 14.33 | | | | 19.08 | | | | 664,770 | | | | 1.59 | (f) | | | 1.59 | (f) | | | (0.61 | ) | | | 32 | |
| | 12.93 | | | | 4.92 | | | | 609,424 | | | | 1.48 | (f) | | | 1.48 | (f) | | | (0.61 | ) | | | 44 | |
| | 12.63 | | | | 24.43 | | | | 461,440 | | | | 1.51 | (f) | | | 1.51 | (f) | | | (0.64 | ) | | | 64 | |
| | | | | | | | | | | | | | | | | | | | | | | | | | | |
| | 12.21 | | | | 12.22 | | | | 25,607 | | | | 1.59 | | | | 0.90 | | | | (0.21 | ) | | | 76 | |
| | 12.76 | | | | 21.40 | | | | 24,258 | | | | 1.58 | | | | 0.90 | | | | (0.28 | ) | | | 58 | |
| | 10.83 | | | | 7.02 | | | | 19,119 | | | | 1.70 | | | | 0.90 | | | | 0.10 | | | | 97 | |
| | 11.07 | | | | 12.32 | | | | 16,299 | | | | 1.83 | | | | 0.90 | | | | 0.15 | | | | 124 | |
| | 10.38 | | | | 3.80 | † | | | 11,244 | | | | 2.89 | * | | | 0.90 | * | | | 0.01 | * | | | 12 | † |
The accompanying notes form an integral part of these financial statements.
55 | Q1 2015 ANNUAL REPORT
FINANCIAL HIGHLIGHTS (CONTINUED)
The following financial information provides selected data, in U.S. dollars, for a share outstanding throughout the periods indicated.
| | | | | | Income (loss) from Investment Operations | | | Distributions | |
| | | | | | | | | Net gain (loss) | | | | | | Dividends | | | | | | | |
| | | | | | | | | on securities | | | Total from | | | from net | | | Distributions | | | | |
| Years ended March 31, | | Net asset value, | | | Net investment | | | (realized | | | investment | | | investment | | | from | | | Total | |
| unless otherwise noted | | beginning of period | | | income (loss) | | | and unrealized) | | | operations | | | income | | | realized gains | | | distributions | |
| Hickory | | | | | | | | | | | | | | | | | | | | | |
| 2015 | | | 57.87 | | | | (0.35 | ) | | | 5.00 | | | | 4.65 | | | | — | | | | (3.01 | ) | | | (3.01 | ) |
| 2014 | | | 50.22 | | | | (0.34 | ) | | | 7.99 | | | | 7.65 | | | | — | | | | — | | | | — | |
| 2013 | | | 42.53 | | | | (0.25 | ) | | | 7.94 | | | | 7.69 | | | | — | | | | — | | | | — | |
| 2012 | | | 41.12 | | | | (0.26 | ) | | | 1.67 | | | | 1.41 | | | | — | | | | — | | | | — | |
| 2011 | | | 31.77 | | | | (0.20 | ) | | | 9.55 | | | | 9.35 | | | | — | | | | — | | | | — | |
| | | | | | | | | | | | | | | | | | | | | | | | | | | | | |
| Balanced | | | | | | | | | | | | | | | | | | | | | | | | | | | | |
| 2015 | | | 14.22 | | | | (0.02 | ) | | | 0.54 | | | | 0.52 | | | | — | | | | (0.67 | ) | | | (0.67 | ) |
| 2014 | | | 13.58 | | | | (0.03 | ) | | | 1.34 | | | | 1.31 | | | | — | # | | | (0.67 | ) | | | (0.67 | ) |
| 2013 | | | 12.39 | | | | 0.04 | | | | 1.20 | | | | 1.24 | | | | (0.05 | ) | | | — | | | | (0.05 | ) |
| 2012 | | | 11.74 | | | | 0.06 | | | | 0.67 | | | | 0.73 | | | | (0.08 | ) | | | — | | | | (0.08 | ) |
| 2011 | | | 10.59 | | | | 0.11 | | | | 1.14 | | | | 1.25 | | | | (0.10 | ) | | | — | | | | (0.10 | ) |
| | | | | | | | | | | | | | | | | | | | | | | | | | | | | |
| Core Plus Income - Investor Class | | | | | | | | | | | | | | | | | | | | | | | | | | | | |
Eight months ended 3/31/2015(b) | | | 10.00 | | | | 0.09 | (a) | | | 0.20 | | | | 0.29 | | | | (0.08 | ) | | | — | | | | (0.08 | ) |
| | | | | | | | | | | | | | | | | | | | | | | | | | | | | |
| Core Plus Income - Institutional Class | | | | | | | | | | | | | | | | | | | | | | | | | |
Eight months ended 3/31/2015(b) | | | 10.00 | | | | 0.10 | (a) | | | 0.20 | | | | 0.30 | | | | (0.10 | ) | | | — | | | | (0.10 | ) |
| | | | | | | | | | | | | | | | | | | | | | | | | | | | | |
| Short-Intermediate Income - Investor Class | | | | | | | | | | | | | | | | | | | | | | | | | |
| 2015 | | | 12.49 | | | | 0.19 | (a) | | | 0.02 | | | | 0.21 | | | | (0.21 | ) | | | (0.01 | ) | | | (0.22 | ) |
| 2014 | | | 12.67 | | | | 0.19 | (a) | | | (0.15 | ) | | | 0.04 | | | | (0.22 | ) | | | — | | | | (0.22 | ) |
| 2013 | | | 12.47 | | | | 0.17 | (a) | | | 0.26 | | | | 0.43 | | | | (0.23 | ) | | | — | # | | | (0.23 | ) |
Eight months ended 3/31/2012(c) | | | 12.51 | | | | 0.12 | (a) | | | 0.02 | | | | 0.14 | | | | (0.18 | ) | | | — | | | | (0.18 | ) |
| | | | | | | | | | | | | | | | | | | | | | | | | | | | | |
| Short-Intermediate Income - Institutional Class | | | | | | | | | | | | | | | | | | | | | | | | | |
| 2015 | | | 12.51 | | | | 0.22 | (a) | | | 0.02 | | | | 0.24 | | | | (0.24 | ) | | | (0.01 | ) | | | (0.25 | ) |
| 2014 | | | 12.68 | | | | 0.22 | (a) | | | (0.15 | ) | | | 0.07 | | | | (0.24 | ) | | | — | | | | (0.24 | ) |
| 2013 | | | 12.48 | | | | 0.19 | (a) | | | 0.26 | | | | 0.45 | | | | (0.25 | ) | | | — | # | | | (0.25 | ) |
| 2012 | | | 12.39 | | | | 0.23 | (a) | | | 0.13 | | | | 0.36 | | | | (0.27 | ) | | | — | | | | (0.27 | ) |
| 2011 | | | 12.25 | | | | 0.24 | | | | 0.19 | | | | 0.43 | | | | (0.29 | ) | | | — | | | | (0.29 | ) |
| | | | | | | | | | | | | | | | | | | | | | | | | | | | | |
| Nebraska Tax-Free Income | | | | | | | | | | | | | | | | | | | | | | | | | | | | |
| 2015 | | | 10.19 | | | | 0.22 | | | | — | # | | | 0.22 | | | | (0.22 | ) | | | — | | | | (0.22 | ) |
| 2014 | | | 10.44 | | | | 0.23 | | | | (0.20 | ) | | | 0.03 | | | | (0.23 | ) | | | (0.05 | ) | | | (0.28 | ) |
| 2013 | | | 10.44 | | | | 0.21 | | | | 0.01 | | | | 0.22 | | | | (0.21 | ) | | | (0.01 | ) | | | (0.22 | ) |
| 2012 | | | 10.09 | | | | 0.25 | | | | 0.36 | | | | 0.61 | | | | (0.26 | ) | | | — | # | | | (0.26 | ) |
| 2011 | | | 10.15 | | | | 0.26 | | | | (0.07 | ) | | | 0.19 | | | | (0.25 | ) | | | — | | | | (0.25 | ) |
| | | | | | | | | | | | | | | | | | | | | | | | | | | | | |
| Government Money Market | | | | | | | | | | | | | | | | | | | | | | | | | | | | |
| 2015 | | | 1.00 | | | — | ^ | | — | ^ | | — | ^ | | — | ^ | | | — | | | — | ^ |
| 2014 | | | 1.00 | | | — | ^ | | — | ^ | | — | ^ | | — | ^ | | — | ^ | | — | ^ |
| 2013 | | | 1.00 | | | — | ^ | | — | ^ | | — | ^ | | — | ^ | | — | ^ | | — | ^ |
| 2012 | | | 1.00 | | | — | ^ | | — | ^ | | — | ^ | | — | ^ | | — | ^ | | — | ^ |
| 2011 | | | 1.00 | | | | 0.001 | | | — | ^ | | | 0.001 | | | | (0.001 | ) | | — | ^ | | | (0.001 | ) |
| * | Annualized |
| † | Not Annualized |
| # | Amount less than $0.01 |
| ^ | Amount less than $0.001 |
| (a) | Based on average daily shares outstanding |
| (b) | Initial offering of shares on July 31, 2014 |
| (c) | Initial offering of shares on August 1, 2011 |
The accompanying notes form an integral part of these financial statements.
56 | Q1 2015 ANNUAL REPORT
| | | | Ratios/Supplemental Data |
| | | | | | | | | | Ratio of expenses | | | | | | | |
| | | | | | | | | | to average net assets | | | | | | | |
| | | | | | | | | | | | | | | | Ratio of net | | | | |
| | | | | | | | | | | | | | | investment income | | | Portfolio | |
| Net asset value, | | | | | | Net assets, end of | | | Prior to fee | | | Net of fee | | | (loss) to average | | | turnover | |
| end of period | | | Total Return (%) | | | period ($000) | | | waivers (%) | | | waivers (%) | | | net assets (%) | | | rate (%) | |
| | | | | | | | | | | | | | | | | | | | |
| | 59.51 | | | | 8.31 | | | | 445,167 | | | | 1.23 | | | | 1.23 | | | | (0.54 | ) | | | 26 | |
| | 57.87 | | | | 15.23 | | | | 517,640 | | | | 1.22 | | | | 1.22 | | | | (0.62 | ) | | | 30 | |
| | 50.22 | | | | 18.08 | | | | 432,086 | | | | 1.26 | | | | 1.26 | | | | (0.62 | ) | | | 32 | |
| | 42.53 | | | | 3.43 | | | | 330,257 | | | | 1.27 | | | | 1.27 | | | | (0.64 | ) | | | 38 | |
| | 41.12 | | | | 29.43 | | | | 322,628 | | | | 1.27 | | | | 1.27 | | | | (0.61 | ) | | | 67 | |
| | | | | | | | | | | | | | | | | | | | | | | | | | | |
| | 14.07 | | | | 3.73 | | | | 125,578 | | | | 1.09 | | | | 1.09 | | | | (0.12 | ) | | | 37 | |
| | 14.22 | | | | 9.86 | | | | 126,904 | | | | 1.10 | | | | 1.10 | | | | (0.20 | ) | | | 36 | |
| | 13.58 | | | | 10.02 | | | | 98,105 | | | | 1.12 | | | | 1.12 | | | | 0.30 | | | | 47 | |
| | 12.39 | | | | 6.25 | | | | 88,531 | | | | 1.14 | | | | 1.14 | | | | 0.51 | | | | 46 | |
| | 11.74 | | | | 11.84 | | | | 85,138 | | | | 1.15 | | | | 1.15 | | | | 0.97 | | | | 47 | |
| | | | | | | | | | | | | | | | | | | | | | | | | | | |
| | 10.21 | | | | 2.90 | † | | | 3,950 | | | | 3.17 | * | | | 0.85 | * | | | 1.39 | * | | | 8 | † |
| | | | | | | | | | | | | | | | | | | | | | | | | | | |
| | 10.20 | | | | 2.96 | † | | | 11,804 | | | | 2.54 | * | | | 0.65 | * | | | 1.56 | * | | | 8 | † |
| | | | | | | | | | | | | | | | | | | | | | | | | | | |
| | 12.48 | | | | 1.64 | | | | 113,709 | | | | 0.89 | | | | 0.84 | | | | 1.51 | | | | 30 | |
| | 12.49 | | | | 0.35 | | | | 111,675 | | | | 0.91 | | | | 0.81 | | | | 1.55 | | | | 36 | |
| | 12.67 | | | | 3.46 | | | | 78,418 | | | | 0.97 | | | | 0.82 | | | | 1.36 | | | | 37 | |
| | 12.47 | | | | 1.11 | † | | | 53,090 | | | | 1.15 | * | | | 0.80 | * | | | 1.58 | * | | | 44 | |
| | | | | | | | | | | | | | | | | | | | | | | | | | | |
| | 12.50 | | | | 1.88 | | | | 1,291,524 | | | | 0.61 | | | | 0.61 | | | | 1.73 | | | | 30 | |
| | 12.51 | | | | 0.56 | | | | 1,427,037 | | | | 0.61 | | | | 0.61 | | | | 1.73 | | | | 36 | |
| | 12.68 | | | | 3.69 | | | | 1,424,860 | | | | 0.62 | | | | 0.62 | | | | 1.55 | | | | 37 | |
| | 12.48 | | | | 2.93 | | | | 1,402,505 | | | | 0.61 | | | | 0.61 | | | | 1.84 | | | | 44 | |
| | 12.39 | | | | 3.53 | | | | 1,163,864 | | | | 0.64 | | | | 0.64 | | | | 2.02 | | | | 38 | |
| | | | | | | | | | | | | | | | | | | | | | | | | | | |
| | 10.19 | | | | 2.14 | | | | 70,002 | | | | 0.75 | | | | 0.75 | | | | 2.14 | | | | 12 | |
| | 10.19 | | | | 0.33 | | | | 70,268 | | | | 0.73 | | | | 0.73 | | | | 2.11 | | | | 2 | |
| | 10.44 | | | | 2.02 | | | | 103,764 | | | | 0.70 | | | | 0.70 | | | | 1.97 | | | | 14 | |
| | 10.44 | | | | 6.14 | | | | 93,589 | | | | 0.71 | | | | 0.71 | | | | 2.43 | | | | 8 | |
| | 10.09 | | | | 1.87 | | | | 89,273 | | | | 0.73 | | | | 0.73 | | | | 2.49 | | | | 10 | |
| | | | | | | | | | | | | | | | | | | | | | | | | | | |
| | 1.00 | | | | 0.01 | | | | 108,453 | | | | 0.67 | | | | 0.01 | | | | 0.01 | | | | | |
| | 1.00 | | | | 0.01 | | | | 124,158 | | | | 0.67 | | | | 0.03 | | | | 0.01 | | | | | |
| | 1.00 | | | | 0.03 | | | | 107,918 | | | | 0.70 | | | | 0.04 | | | | 0.03 | | | | | |
| | 1.00 | | | | 0.03 | | | | 77,367 | | | | 0.72 | | | | 0.01 | | | | 0.03 | | | | | |
| | 1.00 | | | | 0.06 | | | | 81,912 | | | | 0.73 | | | | 0.07 | | | | 0.06 | | | | | |
The accompanying notes from an integral part of these financial statements.
57 | Q1 2015 ANNUAL REPORT
NOTES TO FINANCIAL STATEMENTS
March 31, 2015
(1) Organization
The Weitz Funds (the “Trust”) is registered under the Investment Company Act of 1940 as an open-end management investment company issuing shares in series, each series representing a distinct portfolio with its own investment objectives and policies. At March 31, 2015, the Trust had ten series in operation: Value Fund, Partners Value Fund, Partners III Opportunity Fund, Research Fund, Hickory Fund, Balanced Fund, Core Plus Income Fund (commenced investment operations on July 31, 2014), Short-Intermediate Income Fund, Nebraska Tax-Free Income Fund and Government Money Market Fund (individually, a “Fund”, collectively, the “Funds”).
On July 31, 2014, the Value and Partners Value Funds divided their outstanding shares whereby the shares held in accounts with balances exceeding $1.0 million were designated Institutional Class shares. In total, 4,039, 479 shares of Value Fund with a net asset value of $180,968,653 and 7,711,642 shares of Partners Value Fund with a net asset value of $256,180,756 were redesignated. All remaining shares that were not designated as new Institutional Class shares were renamed Investor Class shares.
Currently, the Value, Partners Value, Partners III Opportunity, Core Plus Income and Short-Intermediate Income Funds each offer two classes of shares: Institutional Class and Investor Class shares. Each class of shares has identical rights and privileges, except with respect to certain class specific expenses such as administration and shareholder servicing fees, voting rights on matters affecting a single class of shares and exchange privileges. Income, realized and unrealized gains and losses, and expenses of the Funds not directly attributable to a specific class of shares are allocated to the two classes on the basis of daily net assets of each class. Fees and expenses relating to a specific class are charged directly to that share class. All other Funds offer one class of shares.
The Research Fund was originally organized in April 2005 as a Delaware limited partnership (the “Partnership”). Effective as of the close of business on December 31, 2010, the Partnership was reorganized into a series of the Trust through a tax-free exchange.
The investment objective of the Value, Partners Value, Partners III Opportunity, Research and Hickory Funds (the “Weitz Equity Funds”) is capital appreciation. Each of the Weitz Equity Funds invests principally in common stocks and a variety of securities convertible into common stocks such as rights, warrants, convertible preferred stock and convertible bonds.
The investment objectives of the Balanced Fund are current income, capital preservation and long-term capital appreciation. The Fund invests principally in a portfolio of U.S. equity and fixed income securities.
The investment objective of both the Core Plus Income and Short-Intermediate Income Funds is current income consistent with the preservation of capital. Under normal circumstances, the Funds will invest at least 80% of their net assets in fixed income securities such as U.S. Government and agency securities, corporate debt securities and mortgage-backed securities. The Core Plus Income Fund has a more flexible strategy and will typically have a longer portfolio duration.
The investment objective of the Nebraska Tax-Free Income Fund is to provide a high level of current income that is exempt from both federal and Nebraska personal income taxes. The Fund under normal circumstances, invests at least 80% of its net assets in municipal securities that generate income exempt from Nebraska state income tax and from federal income tax or in open or closed-end mutual funds which in turn invest in such assets.
The investment objective of the Government Money Market Fund is current income consistent with the preservation of capital and maintenance of liquidity. The Fund invests substantially all of its assets in debt obligations issued or guaranteed by the U.S. Government, its agencies and instrumentalities and repurchase agreements on such securities with remaining maturities not exceeding thirteen months. The Fund limits its average portfolio maturity to sixty days or less.
(2) Significant Accounting Policies
The following accounting policies are in accordance with accounting principles generally accepted in the United States.
(a) Valuation of Investments
Investments are carried at value determined using the following valuation methods:
| • | Securities traded on a national or regional securities exchange are valued at the last sales price; if there were no sales on that day, securities are valued at the mean between the latest available and representative bid and ask prices; securities listed on the NASDAQ exchange are valued using the NASDAQ Official Closing Price (“NOCP”). Generally, the NOCP will be the last sales price unless the reported trade for the security is outside the range of the bid/ask price. In such cases, the NOCP will be normalized to the nearer of the bid or ask price. |
| • | Short sales traded on a national or regional securities exchange are valued at the last sales price; if there were no sales on that day, short sales are valued at the mean between the latest available and representative bid and ask prices. |
| • | Securities not listed on an exchange are valued at the mean between the latest available and representative bid and ask prices, if available. |
| • | The value of certain debt securities for which market quotations are not readily available may be based upon current market prices of securities which are comparable in coupon, rating and maturity or an appropriate matrix utilizing similar factors. |
| • | The value of a traded option is the last sales price at which such option is traded or, in the absence of a sale on or about the close of the exchange, the mean of the closing bid and ask prices. |
| • | Money market funds are valued at the quoted net asset value. Short-term securities are valued at amortized cost, which approximates current value. |
| • | The value of securities for which market quotations are not readily available or are deemed unreliable, including restricted and not readily marketable securities, is determined in good faith in accordance with procedures approved by the Trust’s Board of Trustees. Such valuation procedures and methods for valuing securities may include, but are not limited to: multiple of earnings, multiple of book value, discount from value of a similar freely-traded security, purchase price, private transaction in the security or related securities, the nature and duration of restrictions on disposition of the security and a combination of these and other factors. |
| • | Investment securities held by the Government Money Market Fund are carried at amortized cost, which approximates market value. Pursuant to Rule 2a-7 of the Investment Company Act of 1940, amortized cost, as defined, is a method of valuing securities at acquisition cost, adjusted for amortization of premium or accretion of discount. |
The Trust has established a Pricing Committee, composed of officers and employees of Weitz Investment Management, Inc., to supervise the daily valuation process. The Board of Trustees has also established a Valuation Committee, composed of the independent Trustees, to oversee the Pricing Committee and the valuation process. The Pricing Committee provides oversight of the approved procedures, evaluates the effectiveness of the pricing policies and reports to the Valuation Committee of the Board of Trustees. When determining the reliability of third party pricing information, the Pricing Committee, among other things, monitors the daily change in prices and reviews transactions among market participants.
58 | Q1 2015 ANNUAL REPORT
(b) Option Transactions
The Funds, except for the Government Money Market Fund, may purchase put or call options. When a Fund purchases an option, an amount equal to the premium paid is recorded as an asset and is subsequently marked-to-market daily. Premiums paid for purchasing options that expire unexercised are recognized on the expiration date as realized losses. If an option is exercised, the premium paid is subtracted from the proceeds of the sale or added to the cost of the purchase to determine whether a Fund has realized a gain or loss on the related investment transaction. When a Fund enters into a closing transaction, a Fund realizes a gain or loss depending upon whether the amount from the closing transaction is greater or less than the premium paid.
The Funds, except for the Government Money Market Fund, may write put or call options. When a Fund writes an option, an amount equal to the premium received is recorded as a liability and is subsequently marked-to-market daily. Premiums received for writing options that expire unexercised are recognized on the expiration date as realized gains. If an option is exercised, the premium received is subtracted from the cost of purchase or added to the proceeds of the sale to determine whether a Fund has realized a gain or loss on the related investment transaction. When a Fund enters into a closing transaction, a Fund realizes a gain or loss depending upon whether the amount from the closing transaction is greater or less than the premium received.
The Funds attempt to limit market risk and enhance their income by writing (selling) covered call options. The risk in writing a covered call option is that a Fund gives up the opportunity of profit if the market price of the financial instrument increases. A Fund also has the additional risk of not being able to enter into a closing transaction if a liquid secondary market does not exist. The risk in writing a put option is that a Fund is obligated to purchase the financial instrument underlying the option at prices which may be significantly different than the current market price.
(c) Securities Sold Short
The Funds, except for the Government Money Market Fund, may engage in selling securities short, which obligates a Fund to replace a security borrowed by purchasing the same security at the current market value. A Fund incurs a loss if the price of the security increases between the date of the short sale and the date on which the Fund replaces the borrowed security. A Fund realizes a gain if the price of the security declines between those dates.
(d) Federal Income Taxes
It is the policy of each Fund to comply with all sections of the Internal Revenue Code applicable to regulated investment companies and to distribute all of its taxable income to shareholders; therefore, no provision for income or excise taxes is required.
Net investment income and net realized gains may differ for financial statement and tax purposes. The character of distributions made during the year from net investment income or net realized gains may differ from their ultimate characterization for Federal income tax purposes. Also, due to the timing of dividend distributions, the fiscal year in which amounts are distributed may differ from the year that the income or realized gains were recorded by the Funds.
The Funds have reviewed their tax positions taken on federal income tax returns, for each of the three open tax years and as of March 31, 2015, and have determined that no provisions for income taxes are required in the Funds’ financial statements.
The following permanent differences between net asset components for financial reporting and tax purposes were reclassified at the end of the fiscal year (in U.S. dollars):
| | | | | | | | | | | | | | | | | | | | | | | | Short- | |
| | | | | | Partners | | | Partners III | | | | | | | | | | | | Core Plus | | | Intermediate | |
| | | Value | | | Value | | | Opportunity | | | Research | | | Hickory | | | Balanced | | | Income | | | Income | |
| Paid-in capital | | | (6,343,917 | ) | | | (4,738,493 | ) | | | (10,691,899 | ) | | | — | | | | (2,586,550 | ) | | | (179,949 | ) | | | — | | | | — | |
Accumulated undistributed net investment income | | | 6,343,917 | | | | 4,738,493 | | | | 10,691,899 | | | | 70,648 | | | | 2,586,550 | | | | 194,929 | | | | 1,082 | | | | 1,611,960 | |
Accumulated net realized gain (loss) | | | — | | | | — | | | | — | | | | (70,648 | ) | | | — | | | | (14,980 | ) | | | (1,082 | ) | | | (1,611,960 | ) |
The differences are primarily due to net operating losses and principal paydown adjustments. These reclassifications have no impact on the net asset value of the Funds.
(e) Securities Transactions
Security transactions are accounted for on the date the securities are purchased or sold (trade date). Realized gains or losses are determined by specifically identifying the security sold.
Income dividends less foreign tax withholding (if any), dividends on short positions and distributions to shareholders are recorded on the ex-dividend date. Interest, including amortization of discount or premium, is accrued as earned.
(f) Dividend Policy
The Funds declare and distribute income dividends and capital gains distributions as may be required to qualify as a regulated investment company under the Internal Revenue Code.
Generally, the Core Plus Income, Short-Intermediate Income and Nebraska Tax-Free Income Funds pay income dividends on a quarterly basis. The Government Money Market Fund declares dividends daily and pays dividends monthly. All dividends and distributions are reinvested automatically, unless the shareholder elects otherwise.
(g) Other
Expenses that are directly related to a Fund are charged directly to that Fund. Other operating expenses of the Trust are prorated to each Fund on the basis of relative net assets or another appropriate basis. Income, realized and unrealized gains and losses and expenses (other than class specific expenses) are allocated to each class of shares based on its relative net assets, except that each class separately bears expenses related specifically to that class, such as transfer agent fees and registration fees.
(h) Use of Estimates
The preparation of financial statements in conformity with accounting principles generally accepted in the United States requires management to make estimates and assumptions that affect the reported amounts of assets and liabilities and disclosure of contingent assets and liabilities at the date of the financial statements and the reported amounts of increase and decrease in net assets from operations during the period. Actual results could differ from those estimates.
59 | Q1 2015 ANNUAL REPORT
(3) Fund Share Transactions
| | | Year ended March 31, 2015 | | | Year ended March 31, 2014 | |
| | | Shares | | | $ Amount | | | Shares | | | $ Amount | |
| Value - Investor Class | | | | | | | | | | | | |
| Sales | | | 1,133,090 | | | | 52,127,484 | | | | 2,802,640 | | | | 120,124,813 | |
| Redemptions | | | (4,057,693 | ) | | | (185,618,749 | ) | | | (3,787,761 | ) | | | (158,829,812 | ) |
| Reinvestment of distributions | | | 1,743,011 | | | | 79,436,982 | | | | — | | | | — | |
| Net increase (decrease) | | | (1,181,592 | ) | | | (54,054,283 | ) | | | (985,121 | ) | | | (38,704,999 | ) |
| | | | | | | | | | | | | | | | | |
| Value - Institutional Class* | | | | | | | | | | | | | | | | |
| Sales | | | 458,935 | | | | 21,062,317 | | | | — | | | | — | |
| Redemptions | | | (394,304 | ) | | | (18,095,868 | ) | | | — | | | | — | |
| Reinvestment of distributions | | | 157,958 | | | | 7,234,489 | | | | — | | | | — | |
| Net increase (decrease) | | | 222,589 | | | | 10,200,938 | | | | — | | | | — | |
| | | | | | | | | | | | | | | | | |
| Partners Value - Investor Class | | | | | | | | | | | | | | | | |
| Sales | | | 2,688,703 | | | | 90,667,540 | | | | 5,913,437 | | | | 181,267,854 | |
| Redemptions | | | (5,548,979 | ) | | | (187,152,123 | ) | | | (3,967,534 | ) | | | (122,202,666 | ) |
| Reinvestment of distributions | | | 739,067 | | | | 25,219,398 | | | | — | | | | — | |
| Net increase (decrease) | | | (2,121,209 | ) | | | (71,265,185 | ) | | | 1,945,903 | | | | 59,065,188 | |
| | | | | | | | | | | | | | | | | |
| Partners Value - Institutional Class* | | | | | | | | | | | | | | | | |
| Sales | | | 1,314,169 | | | | 44,960,082 | | | | — | | | | — | |
| Redemptions | | | (124,000 | ) | | | (4,307,533 | ) | | | — | | | | — | |
| Reinvestment of distributions | | | 158,872 | | | | 5,446,130 | | | | — | | | | — | |
| Net increase (decrease) | | | 1,349,041 | | | | 46,098,679 | | | | — | | | | — | |
| | | | | | | | | | | | | | | | | |
| Partners III Opportunity - Investor Class | | | | | | | | | | | | | | | | |
| Sales | | | 1,826,997 | | | | 30,178,117 | | | | 4,689,214 | | | | 73,771,034 | |
| Redemptions | | | (2,736,959 | ) | | | (44,851,404 | ) | | | (1,354,406 | ) | | | (21,361,679 | ) |
| Reinvestment of distributions | | | 127,366 | | | | 2,101,595 | | | | 68,032 | | | | 1,086,557 | |
| Net increase (decrease) | | | (782,596 | ) | | | (12,571,692 | ) | | | 3,402,840 | | | | 53,495,912 | |
| | | | | | | | | | | | | | | | | |
| Partners III Opportunity - Institutional Class | | | | | | | | | | | | | | | | |
| Sales | | | 10,353,618 | | | | 172,339,237 | | | | 29,052,061 | | | | 457,337,859 | |
| Redemptions | | | (23,505,892 | ) | | | (389,596,914 | ) | | | (6,137,866 | ) | | | (97,888,939 | ) |
| Reinvestment of distributions | | | 1,481,055 | | | | 24,663,971 | | | | 1,011,312 | | | | 16,204,175 | |
| Net increase (decrease) | | | (11,671,219 | ) | | | (192,593,706 | ) | | | 23,925,507 | | | | 375,653,095 | |
| | | | | | | | | | | | | | | | | |
| Research | | | | | | | | | | | | | | | | |
| Sales | | | 189,211 | | | | 2,251,624 | | | | 192,271 | | | | 2,357,522 | |
| Redemptions | | | (86,672 | ) | | | (1,059,625 | ) | | | (109,832 | ) | | | (1,314,545 | ) |
| Reinvestment of distributions | | | 92,573 | | | | 1,108,272 | | | | 54,370 | | | | 697,835 | |
| Net increase (decrease) | | | 195,112 | | | | 2,300,271 | | | | 136,809 | | | | 1,740,812 | |
| | | | | | | | | | | | | | | | | |
| Hickory | | | | | | | | | | | | | | | | |
| Sales | | | 676,197 | | | | 38,467,653 | | | | 2,417,016 | | | | 131,447,425 | |
| Redemptions | | | (2,467,278 | ) | | | (140,383,046 | ) | | | (2,076,250 | ) | | | (114,959,584 | ) |
| Reinvestment of distributions | | | 326,455 | | | | 18,712,260 | | | | — | | | | — | |
| Net increase (decrease) | | | (1,464,626 | ) | | | (83,203,133 | ) | | | 340,766 | | | | 16,487,841 | |
| | | | | | | | | | | | | | | | | |
| Balanced | | | | | | | | | | | | | | | | |
| Sales | | | 908,440 | | | | 12,789,346 | | | | 2,948,907 | | | | 40,900,116 | |
| Redemptions | | | (1,194,282 | ) | | | (16,735,499 | ) | | | (1,662,161 | ) | | | (23,195,529 | ) |
| Reinvestment of distributions | | | 285,790 | | | | 4,008,748 | | | | 410,320 | | | | 5,691,204 | |
| Net increase (decrease) | | | (52 | ) | | | 62,595 | | | | 1,697,066 | | | | 23,395,791 | |
60 | Q1 2015 ANNUAL REPORT
| | | Year ended March 31, 2015 | | | Year ended March 31, 2014 | |
| | | Shares | | | $ Amount | | | Shares | | | $ Amount | |
| Core Plus Income - Investor Class* | | | | | | | | | | | | |
| Sales | | | 392,640 | | | | 3,931,860 | | | | — | | | | — | |
| Redemptions | | | (8,449 | ) | | | (85,404 | ) | | | — | | | | — | |
| Reinvestment of distributions | | | 2,865 | | | | 28,896 | | | | — | | | | — | |
| Net increase (decrease) | | | 387,056 | | | | 3,875,352 | | | | — | | | | — | |
| | | | | | | | | | | | | | | | | |
| Core Plus Income - Institutional Class* | | | | | | | | | | | | | | | | |
| Sales | | | 1,151,379 | | | | 11,639,923 | | | | — | | | | — | |
| Redemptions | | | (340 | ) | | | (3,470 | ) | | | — | | | | — | |
| Reinvestment of distributions | | | 5,742 | | | | 58,129 | | | | — | | | | — | |
| Net increase (decrease) | | | 1,156,781 | | | | 11,694,582 | | | | — | | | | — | |
| | | | | | | | | | | | | | | | | |
| Short-Intermediate Income - Investor Class | | | | | | | | | | | | | | | | |
| Sales | | | 4,526,659 | | | | 56,613,916 | | | | 6,563,608 | | | | 82,230,149 | |
| Redemptions | | | (4,520,740 | ) | | | (56,494,373 | ) | | | (3,946,341 | ) | | | (49,424,472 | ) |
| Reinvestment of distributions | | | 165,598 | | | | 2,063,982 | | | | 135,039 | | | | 1,685,119 | |
| Net increase (decrease) | | | 171,517 | | | | 2,183,525 | | | | 2,752,306 | | | | 34,490,796 | |
| | | | | | | | | | | | | | | | | |
| Short-Intermediate Income - Institutional Class | | | | | | | | | | | | | | | | |
| Sales | | | 21,718,694 | | | | 272,245,722 | | | | 38,169,791 | | | | 479,557,375 | |
| Redemptions | | | (34,451,441 | ) | | | (431,783,688 | ) | | | (38,534,041 | ) | | | (483,736,995 | ) |
| Reinvestment of distributions | | | 2,009,620 | | | | 25,090,220 | | | | 2,088,180 | | | | 26,101,600 | |
| Net increase (decrease) | | | (10,723,127 | ) | | | (134,447,746 | ) | | | 1,723,930 | | | | 21,921,980 | |
| | | | | | | | | | | | | | | | | |
| Nebraska Tax-Free Income | | | | | | | | | | | | | | | | |
| Sales | | | 802,733 | | | | 8,231,787 | | | | 828,402 | | | | 8,508,953 | |
| Redemptions | | | (892,272 | ) | | | (9,139,793 | ) | | | (4,039,268 | ) | | | (41,743,278 | ) |
| Reinvestment of distributions | | | 62,741 | | | | 640,280 | | | | 167,416 | | | | 1,704,279 | |
| Net increase (decrease) | | | (26,798 | ) | | | (267,726 | ) | | | (3,043,450 | ) | | | (31,530,046 | ) |
| | | | | | | | | | | | | | | | | |
| Government Money Market | | | | | | | | | | | | | | | | |
| Sales | | | 70,090,394 | | | | 70,090,394 | | | | 73,244,163 | | | | 73,244,163 | |
| Redemptions | | | (85,806,529 | ) | | | (85,806,529 | ) | | | (57,011,846 | ) | | | (57,011,846 | ) |
| Reinvestment of distributions | | | 10,807 | | | | 10,807 | | | | 9,215 | | | | 9,215 | |
| Net increase (decrease) | | | (15,705,328 | ) | | | (15,705,328 | ) | | | 16,241,532 | | | | 16,241,532 | |
* Initial offering of shares on July 31, 2014
4) Related Party Transactions
Each Fund has retained Weitz Investment Management, Inc. (the “Adviser”) as its investment adviser. In addition, the Trust has an agreement with Weitz Securities, Inc. (the “Distributor”), a company under common control with the Adviser, to act as distributor for shares of the Trust. Certain officers of the Trust are also officers and directors of the Adviser and the Distributor.
Under the terms of management and investment advisory agreements, the Adviser is paid a monthly fee based on average daily net assets. The annual investment advisory fee schedule for each of the Weitz Equity Funds is as follows:
Value and Partners Value Funds (effective July 31, 2014):
| | | Greater Than | | | Less Than or Equal To | | | Rate | |
| | | $ | 0 | | | $ | 1,000,000,000 | | | | 0.90 | % |
| | | | 1,000,000,000 | | | | 2,000,000,000 | | | | 0.85 | % |
| | | | 2,000,000,000 | | | | 3,000,000,000 | | | | 0.80 | % |
| | | | 3,000,000,000 | | | | 5,000,000,000 | | | | 0.75 | % |
| | | | 5,000,000,000 | | | | | | | | 0.70 | % |
| | | | | | | | |
| Partners III Opportunity Fund: | | | | | |
| | | Greater Than | | | Less Than or Equal To | | | Rate | |
| | | $ | 0 | | | $ | 1,000,000,000 | | | | 1.00 | % |
| | | | 1,000,000,000 | | | | 2,000,000,000 | | | | 0.95 | % |
| | | | 2,000,000,000 | | | | 3,000,000,000 | | | | 0.90 | % |
| | | | 3,000,000,000 | | | | 5,000,000,000 | | | | 0.85 | % |
| | | | 5,000,000,000 | | | | | | | | 0.80 | % |
Research and Hickory Funds (Value and Partners Value prior to July 31, 2014):
| | | Greater Than | | | Less Than or Equal To | | | Rate | |
| | | $ | 0 | | | $ | 2,500,000,000 | | | | 1.00 | % |
| | | | 2,500,000,000 | | | | 5,000,000,000 | | | | 0.90 | % |
| | | | 5,000,000,000 | | | | | | | | 0.80 | % |
The Balanced Fund pays the Adviser, on a monthly basis, an annual advisory fee equal to 0.80% of the Fund’s average daily net assets.
The Core Plus Income, Short-Intermediate Income, Nebraska Tax-Free Income and Government Money Market Funds each pay the Adviser, on a monthly basis, an annual advisory fee equal to 0.40% of the respective Fund’s average daily net assets.
The Adviser also provides administrative services, including shareholder administrative services, to each Fund pursuant to agreements which provide that the Funds will pay the Adviser a monthly fee based on the average daily net assets of each respective Fund and/or a fee per account, plus third party expenses directly related to providing such services.
Prior to July 31, 2014, the Partners III Opportunity and Short-Intermediate Income Funds had Service and Distribution plans which authorized the Funds to pay the Distributor a distribution fee payable monthly equal to 0.25% per annum, of the average daily net assets of each Fund’s respective Investor Class.
Through July 31, 2015, the Adviser has agreed in writing to reimburse the Research and Government Money Market Funds or to pay directly a portion of the Funds’ expenses to the extent that total expenses
61 | Q1 2015 ANNUAL REPORT
(excluding taxes, interest, brokerage commissions, acquired fund fees and expenses and extraordinary expenses) exceed 0.90% and 0.20%, respectively, of each Fund’s average daily net assets. In addition, for the year ended March 31, 2015, the Adviser voluntarily reimbursed expenses to limit the expenses of the Government Money Market Fund to 0.01% of the Fund’s average daily net assets. The expenses reimbursed by the Adviser for the Research and Government Money Market Funds for the year ended March 31, 2015, were $165,973 and $733,949, respectively.
Through July 31, 2015, the Adviser has agreed in writing to reimburse the Value and Partners Value Funds or to pay directly a portion of each Fund’s expenses to the extent that each Class’ total annual fund operating expenses (excluding taxes, interest, portfolio transaction expenses, acquired fund fees and expenses and extraordinary expenses) exceed 1.18% and 0.99% of the Investor and Institutional Class shares’ average daily net assets, respectively.
Through July 31, 2015, the Adviser has agreed in writing to reimburse the Core Plus Income Fund or to pay directly a portion of the Fund’s expenses to the extent that each Class’ total annual fund operating expenses (excluding taxes, interest, portfolio transaction expenses, acquired fund fees and expenses and extraordinary expenses) exceed 0.85% and 0.65% of the Investor and Institutional Class shares’ average daily net assets, respectively.
Through July 31, 2015, the Adviser has agreed in writing to reimburse the Short-Intermediate Income Fund or to pay directly a portion of the Fund’s Investor Class expenses to the extent that the Fund’s Investor Class total annual fund operating expenses (excluding taxes, interest, portfolio transaction expenses, acquired fund fees and expenses and extraordinary expenses) exceed 0.85% of the Investor Class shares average daily net assets.
The expenses reimbursed by the Adviser for the Value, Partners Value, Partners III Opportunity, Core Plus Income and Short-Intermediate Income Funds for the period ended March 31, 2015 were $272,025; $424,100; $32,202; $56,505; $64,237 for the Investor Class shares and $111,453; $122,449; $0; $64,380; $0 for the Institutional Class shares, respectively.
As of March 31, 2015, the controlling shareholder of the Adviser held shares totalling approximately 23%, 70%, 12%, 33%, 46%, 56% and 27% of the Partners III Opportunity, Research, Hickory, Balanced, Core Plus Income, Nebraska Tax-Free Income and Government Money Market Funds, respectively.
(5) Distributions to Shareholders and Distributable Earnings
The tax character of distributions paid by the Funds are summarized as follows (in U.S. dollars):
| | | Year ended March 31, | | | Year ended March 31, | | | Year ended March 31, | | | Year ended March 31, | |
| Distributions paid from: | | 2015 | | | 2014 | | | 2015 | | | 2014 | | | 2015 | | | 2014 | | | 2015 | | | 2014 | |
| | | Value | | Partners Value | | Partners III Opportunity | | | Research |
| Ordinary income | | | — | | | | — | | | | — | | | | — | | | | — | | | | — | | | | — | | | | 2,502 | |
| Long-term capital gains | | | 92,517,392 | | | | — | | | | 34,460,331 | | | | — | | | | 35,477,987 | | | | 23,565,579 | | | | 3,850,663 | | | | 697,747 | |
| Total distributions | | | 92,517,392 | | | | — | | | | 34,460,331 | | | | — | | | | 35,477,987 | | | | 23,565,579 | | | | 3,850,663 | | | | 700,249 | |
| | | | | | | | | | | | | | | | | | | | | | | | | | | | | | | | | |
| | | Hickory | | | Balanced | | | Core Plus Income | | | Short-Intermediate Income | |
| Ordinary income | | | — | | | | — | | | | — | | | | 19,132 | | | | 86,997 | | | | — | | | | 27,497,188 | | | | 28,908,825 | |
| Long-term capital gains | | | 24,246,012 | | | | — | | | | 6,054,129 | | | | 5,814,513 | | | | 27 | | | | — | | | | 738,169 | | | | — | |
| Total distributions | | | 24,246,012 | | | | — | | | | 6,054,129 | | | | 5,833,645 | | | | 87,024 | | | | — | | | | 28,235,357 | | | | 28,908,825 | |
| | | | | | | | | | | | | | | | | | | | | | | | | | | | | | | | | |
| | | Nebraska Tax-Free Income | | | Government Money Market | | | | | | | | | | | | | | | | | |
| Ordinary income | | | 30,838 | | | | 7,894 | | | | 12,273 | | | | 11,353 | | | | | | | | | | | | | | | | | |
| Tax exempt income | | | 1,444,162 | | | | 1,641,061 | | | | — | | | | — | | | | | | | | | | | | | | | | | |
| Long-term capital gains | | | — | | | | 361,341 | | | | — | | | | — | | | | | | | | | | | | | | | | | |
| Total distributions | | | 1,475,000 | | | | 2,010,296 | | | | 12,273 | | | | 11,353 | | | | | | | | | | | | | | | | | |
As of March 31, 2015, the components of distributable earnings on a tax basis were as follows (in U.S. dollars):
| | | | | | | | | Partners III | | | | | | | |
| | | Value | | | Partners Value | | | Opportunity | | | Research | | | Hickory | |
| Undistributed ordinary income | | | — | | | | — | | | | — | | | | 173,584 | | | | — | |
| Qualified late year ordinary loss deferral | | | (1,793,996 | ) | | | (1,116,085 | ) | | | (3,236,947 | ) | | | — | | | | (420,203 | ) |
| Undistributed long-term gains | | | 72,378,155 | | | | 47,865,182 | | | | 80,187,319 | | | | 2,031,580 | | | | 34,262,073 | |
| Net unrealized appreciation (depreciation) | | | 334,232,534 | | | | 320,470,474 | | | | 303,804,912 | | | | 2,695,255 | | | | 118,923,246 | |
| | | | 404,816,693 | | | | 367,219,571 | | | | 380,755,284 | | | | 4,900,419 | | | | 152,765,116 | |
| | | | | | | | | | | | | | | | | | | | | |
| | | | | | | | | | | Short-Intermediate | | | Nebraska Tax-Free | | | Government | |
| | | Balanced | | | Core Plus Income | | | Income | | | Income | | | Money Market | |
| Undistributed ordinary income | | | — | | | | 8,013 | | | | 172,518 | | | | — | | | | 31 | |
| Undistributed tax exempt income | | | — | | | | — | | | | — | | | | 37,924 | | | | — | |
| Undistributed long-term gains | | | 4,216,540 | | | | — | | | | 3,271,459 | | | | — | | | | — | |
| Capital loss carryforwards | | | — | | | | — | | | | — | | | | (762 | ) | | | (882 | ) |
| Net unrealized appreciation (depreciation) | | | 15,824,651 | | | | 176,027 | | | | 31,503,685 | | | | 2,108,069 | | | | — | |
| | | | 20,041,191 | | | | 184,040 | | | | 34,947,662 | | | | 2,145,231 | | | | (851 | ) |
62 | Q1 2015 ANNUAL REPORT
The Value, Partners Value, Partners III Opportunity and Hickory Funds elected to defer ordinary losses arising after December 31, 2014. Such losses are treated for tax purposes as arising on April 1, 2015.
Capital loss carryforwards represent tax basis capital losses that may be carried over to offset future realized capital gains, if any. To the extent that carryforwards are used, no capital gains distributions will be made. During the fiscal year, the Funds utilized capital loss carryforwards to offset realized capital gains. The character and utilization of the carryforwards are as follows (in U.S. dollars):
| | Short-Intermediate Income | Nebraska Tax-Free Income | Government Money Market | |
| Short term (no expiration) | — | — | (882) | |
| Long term (no expiration) | — | (762) | — | |
| Capital loss carryforwards utilized | 110,669 | — | 114 | |
The cost of investments is the same for financial reporting and Federal income tax purposes for the Value, Core Plus Income, Short-Intermediate Income, Nebraska Tax-Free Income and Government Money Market Funds. The cost of investments for Federal income tax purposes for the Partners Value, Partners III Opportunity, Research, Hickory and Balanced Funds is $787,601,878; $735,852,880; $22,921,381; $329,195,630 and $109,687,551 respectively.
At March 31, 2015, the aggregate gross unrealized appreciation and depreciation of investments, based on cost for Federal income tax purposes, are summarized as follows (in U.S. dollars):
| | | | | | | | | | | | | | | | | | | | | | | | Short- | | | | |
| | | | | | | | | Partners III | | | | | | | | | | | | Core Plus | | Intermediate | | Nebraska Tax- | |
| | | Value | | | Partners Value | | | Opportunity | | | Research | | | Hickory | | | Balanced | | | Income | | | Income | | | Free Income | |
| Appreciation | | | 349,056,505 | | | | 338,372,934 | | | | 365,940,984 | | | | 4,011,300 | | | | 136,424,800 | | | | 17,531,527 | | | | 194,755 | | | | 37,433,882 | | | | 2,147,482 | |
| Depreciation | | | (14,823,971 | ) | | | (17,902,460 | ) | | | (25,525,277 | ) | | | (1,316,045 | ) | | | (17,501,554 | ) | | | (1,706,876 | ) | | | (18,728 | ) | | | (5,930,197 | ) | | | (39,413 | ) |
| Net | | | 334,232,534 | | | | 320,470,474 | | | | 340,415,707 | | | | 2,695,255 | | | | 118,923,246 | | | | 15,824,651 | | | | 176,027 | | | | 31,503,685 | | | | 2,108,069 | |
(6) Securities Transactions
Purchases and proceeds from maturities or sales of investment securities of the Funds, excluding short-term securities and U.S. government obligations, are summarized as follows (in U.S. dollars):
| | | | | | | | | | | | | | | | | | | | | | | | Short- | | | Nebraska | |
| | | | | | Partners | | | Partners III | | | | | | | | | | | | Core Plus | | Intermediate | | | Tax-Free | |
| | | Value | | | Value | | | Opportunity | | | Research | | | Hickory | | | Balanced | | | Income | | | Income | | | Income | |
| Purchases | | | 314,583,903 | | | | 260,916,867 | | | | 457,309,725 | | | | 15,934,628 | | | | 96,328,181 | | | | 31,489,514 | | | | 9,038,716 | | | | 345,651,898 | | | | 7,835,227 | |
| Proceeds | | | 334,815,477 | | | | 213,791,292 | | | | 670,990,516 | | | | 16,425,396 | | | | 148,301,119 | | | | 26,487,159 | | | | 484,906 | | | | 465,873,233 | | | | 10,050,000 | |
(a) Illiquid and Restricted Securities
The Funds own certain securities that have a limited trading market and/or certain restrictions on trading and therefore may be illiquid and/or restricted. Such securities have been valued at fair value in accordance with the procedures described in Note (2)(a). Because of the inherent uncertainty of valuation, these values may differ from the values that would have been used had a ready market for these securities existed and these differences could be material. Illiquid and/or restricted securities owned at March 31, 2015, include the following:
| | Acquisition | | Partners III | | | | |
| | Date | | Opportunity | | | Hickory | |
| Intelligent Systems Corp. | 12/03/91 | | $ | 2,899,379 | | | $ | — | |
| LICT Corp. | 9/09/96 | | | — | | | | 2,228,509 | |
| Total cost of illiquid and/or restricted securities | | | | 2,899,379 | | | | 2,228,509 | |
| Value at March 31, 2015 | | | | 6,537,600 | | | | 5,276,240 | |
| Percent of net assets at March 31, 2015 | | | | 0.6% | | | | 1.2% | |
(b) Options Written
Transactions relating to options written for the year ended March 31, 2015, are summarized as follows:
| | | Partners III Opportunity |
| | | Number of Contracts | | | $ Premiums | |
| Options outstanding, beginning of period | | | 5,200 | | | | 4,690,777 | |
| Options written | | | 2,350 | | | | 7,243,519 | |
| Options exercised | | | (2,250 | ) | | | (5,597,634 | ) |
| Options expired | | | (2,200 | ) | | | (1,893,011 | ) |
| Options closed | | | (3,100 | ) | | | (4,443,651 | ) |
| Options outstanding, end of period | | | — | | | | — | |
63 | Q1 2015 ANNUAL REPORT
The locations in the Statements of Assets and Liabilities of the Funds’ derivative positions, none of which are designated as hedging instruments are as follows (in U.S. dollars):
| | | | | | Fair Value at March 31, 2015 | | | | | | | |
| | | | | | | | | | | | Average | | | Gross | |
| | | | | | | | | | | | Month-End | | | Notional Amount | |
| | | | | | | | | Liability | | | Notional | | | Outstanding | |
| Fund | | Type of Derivative | Location | | Asset Derivatives | | | Derivatives | | | Amount | | | March 31, 2015 | |
| Partners III | | Put options purchased | Investments in securities at value | | | — | | | | — | | | | 54,466,667 | | | | — | |
| Opportunity | | Call options written | Options written, at value | | | — | | | | — | | | | 56,566,667 | | | | — | |
Transactions in derivative instruments during the year ended March 31, 2015, by the Funds, are recorded in the following locations in the Statements of Operations (in U.S. dollars):
| | | | | | | | | Change in | |
| | | | | Realized | | | | Unrealized | |
| Fund | Type of Derivative | Location | | Gain (Loss) | | Location | | Gain (Loss) | |
| | | Net realized gain (loss) - | | | | Net unrealized appreciation | | | |
| Partners III | Put options purchased | unaffiliated issuers | | | (6,388,440 | ) | (depreciation) - unaffiliated issuers | | | 680,410 | |
| Opportunity | | Net realized gain (loss) - | | | | | Net unrealized appreciation | | | | |
| | Call options written | options written | | | (4,465,009 | ) | (depreciation) - options written | | | 1,304,723 | |
(7) Affiliated Issuers
Affiliated issuers, as defined under the Investment Company Act of 1940, are those in which a Fund’s holdings of an issuer represent 5% or more of the outstanding voting securities of the issuer. A summary of each Fund’s holdings in the securities of such issuers is set forth below:
| | | Number of | | | | | | | | | Number of Shares | | | | | | | | | | |
| | | Shares Held | | | Gross | | | Gross | | | Held | | | Value | | Dividend | | Realized | |
| | | March 31, 2014 | | | Additions | | | Reductions | | | March 31, 2015 | | | March 31, 2015 | | Income | | Gains/(Losses) | |
| Partners III Opportunity: | | | | | | | | | | | | | | | | | | | | | |
| Intelligent Systems Corp.† | | | 2,270,000 | | | | — | | | | — | | | | 2,270,000 | | | $ | 6,537,600 | | | $ | — | | | $ | — | |
†Controlled affiliate in which the Fund owns 25% or more of the outstanding voting securities.
(8) Contingencies
Each Fund indemnifies the Trust’s officers and trustees for certain liabilities that might arise from their performance of their duties to each of the Funds. Additionally, in the normal course of business the Funds enter into contracts that contain a variety of representations and warranties and which provide general indemnifications. The Funds’ maximum exposure under these arrangements is unknown, as this would involve future claims that may be made against the Funds that have not yet occurred. However, based on experience, the Funds expect the risk of loss to be remote.
(9) Financial Instruments With Off-Balance Sheet Risks
Option contracts written and securities sold short result in off-balance sheet risk as the Fund’s ultimate obligation to satisfy the terms of the contract or the sale of securities sold short may exceed the amount recognized in the Statements of Assets and Liabilities.
The Funds are required to maintain collateral in a segregated account to provide adequate margin as determined by the broker.
(10) Margin Borrowing Agreement
The Partners III Opportunity Fund has a margin account with its prime broker, Merrill Lynch, under which the Fund may borrow against the value of its securities, subject to regulatory limitations. Interest accrues at the federal funds rate plus 0.625% (0.655% at March 31, 2015). Interest is accrued daily and paid monthly. The Partners III Opportunity Fund held a cash balance of $283,942,355, with the broker at March 31, 2015.
The Partners III Opportunity Fund is exposed to credit risk from its prime broker who effects transactions and extends credit pursuant to a prime brokerage agreement. The Adviser attempts to minimize the credit risk by monitoring credit exposure and the creditworthiness of the prime broker.
(11) Concentration of Credit Risk
Approximately 79% of the Nebraska Tax-Free Income Fund’s net assets are in obligations of political subdivisions of the State of Nebraska, which are subject to the credit risk associated with the non-performance of such issuers.
(12) Fair Value Measurements
Various inputs are used in determining the value of the Fund’s investments. These inputs are used in determining the value of the Funds’ investments and are summarized in the following fair value hierarchy:
• Level 1 – quoted prices in active markets for identical securities;
• Level 2 – other significant observable inputs (including quoted prices for similar securities);
• Level 3 – significant unobservable inputs (including the Funds’ own assumptions in determining the fair value of investments).
64 | Q1 2015 ANNUAL REPORT
The inputs or methodology used for valuing securities are not an indication of the risk associated with investing in those securities.
A description of the valuation techniques applied to the Funds’ major categories of assets and liabilities measured at fair value on a recurring basis follows.
| • | Equity securities. Securities traded on a national securities exchange (or reported on the NASDAQ national market) are stated at the last reported sales price on the day of valuation. To the extent these securities are actively traded and valuation adjustments are not applied, they are categorized in Level 1 of the fair value hierarchy. Preferred stock and other equities traded on inactive markets or valued by reference to similar instruments are categorized in Level 2. |
| • | Corporate and Municipal bonds. The fair values of corporate and municipal bonds are estimated using various techniques, which may consider recently executed transactions in securities of the issuer or comparable issuers, market price quotations (where observable), bond spreads and fundamental data relating to the issuer. Although most corporate and municipal bonds are categorized in Level 2 of the fair value hierarchy, in instances where lower relative weight is placed on transaction prices, quotations, or similar observable inputs, they are categorized in Level 3. |
| • | Asset-backed securities. The fair values of asset-backed securities (including non-government agency mortgage- backed securities and interest-only securities) are generally estimated based on models that consider the estimated cash flows of each tranche of the entity, a benchmark yield and an estimated tranche specific spread to the benchmark yield based on the unique attributes of the tranche. Certain securities are valued principally using dealer quotations. To the extent the inputs are observable and timely, the values would be categorized in Level 2 of the fair value hierarchy; otherwise they would be categorized as Level 3. |
| • | U.S. Government securities. U.S. Government securities are normally valued using a model that incorporates market observable data such as reported sales of similar securities, broker quotes, yields, bids, offers and reference data. Certain securities are valued principally using dealer quotations. U.S. Government securities are categorized in Level 1 or Level 2 of the fair value hierarchy depending on the inputs used and market activity levels for specific securities. |
| • | U.S. agency securities. U.S. agency securities are comprised of two main categories consisting of agency issued debt and mortgage-backed securities. Agency issued debt securities are generally valued in a manner similar to U.S. Government securities. Mortgage-backed securities include collateralized mortgage obligations, to-be-announced (TBA) securities and mortgage pass-through certificates. Mortgage-backed securities are generally valued using dealer quotations. Depending on market activity levels and whether quotations or other data are used, these securities are typically categorized in Level 2 of the fair value hierarchy. |
| • | Restricted and/or illiquid securities. Restricted and/or illiquid securities for which quotations are not readily available are valued in accordance with procedures approved by the Trust’s Board of Trustees. Restricted securities issued by publicly traded companies are generally valued at a discount to similar publicly traded securities. Restricted or illiquid securities issued by nonpublic entities may be valued by reference to comparable public entities or fundamental data relating to the issuer or both. Depending on the relative significance of valuation inputs, these instruments may be classified in either Level 2 or Level 3 of the fair value hierarchy. |
| • | Derivative instruments. Listed derivatives, such as the Funds’ equity option contracts, that are valued based on closing prices from the exchange or the mean of the closing bid and ask prices are generally categorized in Level 2 of the fair value hierarchy. |
The following is a summary of inputs used, in U.S. dollars, as of March 31, 2015, in valuing the Funds’ assets and liabilities carried at fair value. The Schedule of Investments for each Fund provides a detailed breakdown of each category.
| | | Value | |
| | | Level 1 | | | Level 2 | | | Level 3 | | | Total | |
| Assets: | | | | | | | | | | | | |
| Investments in Securities: | | | | | | | | | | | | |
| Common Stocks | | | 912,281,575 | | | | — | | | | — | | | | 912,281,575 | |
| Cash Equivalents | | | 229,760,330 | | | | — | | | | — | | | | 229,760,330 | |
| | | | | | | | | | | | | | | | | |
| Total | | | | | | | | | | | | | | | | |
| Investments in | | | | | | | | | | | | | | | | |
| Securities | | | 1,142,041,905 | | | | — | | | | — | | | | 1,142,041,905 | |
| | | | | | | | | | | | | | | | | |
| | | | Partners Value | |
| | | Level 1 | | | Level 2 | | | Level 3 | | | Total | |
| Assets: | | | | | | | | | | | | | | | | |
| Investments in Securities: | | | | | | | | | | | | | | | | |
| Common Stocks | | | 899,185,609 | | | | — | | | | — | | | | 899,185,609 | |
| Cash Equivalents | | | 208,886,743 | | | | — | | | | — | | | | 208,886,743 | |
| Total | | | | | | | | | | | | | | | | |
| Investments in | | | | | | | | | | | | | | | | |
| Securities | | | 1,108,072,352 | | | | — | | | | — | | | | 1,108,072,352 | |
| | | | | | | | | | | | | | | | | |
| | | Partners III Opportunity | |
| | | Level 1 | | | Level 2 | | | Level 3 | | | Total | |
| Assets: | | | | | | | | | | | | | | | | |
| Investments in Securities: | | | | | | | | | | | | | | | | |
| Common Stocks | | | 1,002,015,650 | | | | 6,537,600 | | | | — | | | | 1,008,553,250 | |
| Cash Equivalents | | | 67,715,337 | | | | — | | | | — | | | | 67,715,337 | |
| Total | | | | | | | | | | | | | | | | |
| Investments in | | | | | | | | | | | | | | | | |
| Securities | | | 1,069,730,987 | | | | 6,537,600 | | | | — | | | | 1,076,268,587 | |
| | | | | | | | | | | | | | | | | |
| Liabilities: | | | | | | | | | | | | | | | | |
| Securities Sold | | | | | | | | | | | | | | | | |
| Short | | | (273,625,100 | ) | | | — | | | | — | | | | (273,625,100 | ) |
| | | | | | | | | | | | | | | | | |
| | | | Research | |
| | | Level 1 | | | Level 2 | | | Level 3 | | | Total | |
| Assets: | | | | | | | | | | | | | | | | |
| Investments in Securities: | | | | | | | | | | | | | | | | |
| Common Stocks | | | 21,623,542 | | | | — | | | | — | | | | 21,623,542 | |
| Cash Equivalents | | | 3,993,094 | | | | — | | | | — | | | | 3,993,094 | |
| Total | | | | | | | | | | | | | | | | |
| Investments in | | | | | | | | | | | | | | | | |
| Securities | | | 25,616,636 | | | | — | | | | — | | | | 25,616,636 | |
65 | Q1 2015 ANNUAL REPORT
| | | Hickory | |
| | | Level 1 | | | Level 2 | | | Level 3 | | | Total | |
| Assets: | | | | | | | | | | | | |
| Investments in Securities: | | | | | | | | | | | | |
| Common Stocks | | | 356,844,791 | | | | 5,276,240 | | | | — | | | | 362,121,031 | |
| Cash Equivalents | | | 85,997,845 | | | | — | | | | — | | | | 85,997,845 | |
| Total | | | | | | | | | | | | | | | | |
| Investments in | | | | | | | | | | | | | | | | |
| Securities | | | 442,842,636 | | | | 5,276,240 | | | | — | | | | 448,118,876 | |
| | | | | | | | | | | | | | | | | |
| | | | Balanced | |
| | | Level 1 | | | Level 2 | | | Level 3 | | | Total | |
| Assets: | | | | | | | | | | | | | | | | |
| Investments in Securities: | | | | | | | | | | | | | | | | |
| Common Stocks | | | 64,817,913 | | | | — | | | | — | | | | 64,817,913 | |
| Corporate Bonds | | | — | | | | 9,252,054 | | | | — | | | | 9,252,054 | |
| Corporate | | | | | | | | | | | | | | | | |
| Convertible | | | | | | | | | | | | | | | | |
| Bonds | | | — | | | | 988,125 | | | | — | | | | 988,125 | |
| Asset-Backed | | | | | | | | | | | | | | | | |
| Securities | | | — | | | | 501,333 | | | | — | | | | 501,333 | |
| Commercial | | | | | | | | | | | | | | | | |
| Mortgage- | | | | | | | | | | | | | | | | |
| Backed Securities | | | — | | | | 716,530 | | | | — | | | | 716,530 | |
| Mortgage- | | | | | | | | | | | | | | | | |
| Backed Securities | | | — | | | | 4,274,324 | | | | — | | | | 4,274,324 | |
| U.S. Treasury | | | | | | | | | | | | | | | | |
| Notes | | | — | | | | 21,554,062 | | | | — | | | | 21,554,062 | |
| Cash Equivalents | | | 23,407,861 | | | | — | | | | — | | | | 23,407,861 | |
| Total | | | | | | | | | | | | | | | | |
| Investments in | | | | | | | | | | | | | | | | |
| Securities | | | 88,225,774 | | | | 37,286,428 | | | | — | | | | 125,512,202 | |
| | | Core Plus Income | |
| | | Level 1 | | | Level 2 | | | Level 3 | | | Total | |
| Assets: | | | | | | | | | | | | |
| Investments in Securities: | | | | | | | | | | | | |
| Corporate Bonds | | | — | | | | 6,673,240 | | | | — | | | | 6,673,240 | |
| Corporate | | | | | | | | | | | | | | | | |
| Convertible | | | | | | | | | | | | | | | | |
| Bonds | | | — | | | | 620,547 | | | | — | | | | 620,547 | |
| Asset-Backed | | | | | | | | | | | | | | | | |
| Securities | | | — | | | | 443,674 | | | | — | | | | 443,674 | |
| Commercial | | | | | | | | | | | | | | | | |
| Mortgage- | | | | | | | | | | | | | | | | |
| Backed Securities | | | — | | | | 396,660 | | | | — | | | | 396,660 | |
| Mortgage- | | | | | | | | | | | | | | | | |
| Backed Securities | | | — | | | | 622,078 | | | | — | | | | 622,078 | |
| U.S. Treasury | | | | | | | | | | | | | | | | |
| Notes | | | — | | | | 4,923,055 | | | | — | | | | 4,923,055 | |
| Common Stocks | | | 151,048 | | | | — | | | | — | | | | 151,048 | |
| Cash Equivalents | | | 1,902,736 | | | | — | | | | — | | | | 1,902,736 | |
| Total | | | | | | | | | | | | | | | | |
| Investments in | | | | | | | | | | | | | | | | |
| Securities | | | 2,053,784 | | | | 13,679,254 | | | | — | | | | 15,733,038 | |
| | | Short-Intermediate Income |
| | | Level 1 | | | Level 2 | | | Level 3 | | | Total | |
| Assets: | | | | | | | | | | | | |
| Investments in Securities: | | | | | | | | | | | | |
| Corporate Bonds | | | — | | | | 522,140,460 | | | | — | | | | 522,140,460 | |
| Corporate | | | | | | | | | | | | | | | | |
| Convertible | | | | | | | | | | | | | | | | |
| Bonds | | | — | | | | 46,841,687 | | | | — | | | | 46,841,687 | |
| Asset-Backed | | | | | | | | | | | | | | | | |
| Securities | | | — | | | | 27,648,071 | | | | — | | | | 27,648,071 | |
| Commercial | | | | | | | | | | | | | | | | |
| Mortgage- | | | | | | | | | | | | | | | | |
| Backed Securities | | | — | | | | 57,258,459 | | | | — | | | | 57,258,459 | |
| Mortgage- | | | | | | | | | | | | | | | | |
| Backed Securities | | | — | | | | 388,369,973 | | | | — | | | | 388,369,973 | |
| Taxable | | | | | | | | | | | | | | | | |
| Municipal Bonds | | | — | | | | 4,744,733 | | | | — | | | | 4,744,733 | |
| U.S. Treasury and | | | | | | | | | | | | | | | | |
| Government | | | | | | | | | | | | | | | | |
| Agency | | | — | | | | 312,056,695 | | | | — | | | | 312,056,695 | |
| Common Stocks | | | 21,722,129 | | | | — | | | | — | | | | 21,722,129 | |
| Cash Equivalents | | | 20,011,689 | | | | — | | | | — | | | | 20,011,689 | |
| Total | | | | | | | | | | | | | | | | |
| Investments in | | | | | | | | | | | | | | | | |
| Securities | | | 41,733,818 | | | | 1,359,060,078 | | | | — | | | | 1,400,793,896 | |
66 | Q1 2015 ANNUAL REPORT
| | | Nebraska Tax-Free Income |
| | | Level 1 | | | Level 2 | | | Level 3 | | | Total | |
| Assets: | | | | | | | | | | | | |
| Investments in Securities: | | | | | | | | | | | | |
| Municipal Bonds | | | — | | | | 65,536,565 | | | | — | | | | 65,536,565 | |
| Cash Equivalents | | | 3,824,314 | | | | — | | | | — | | | | 3,824,314 | |
| Total Investments | | | | | | | | | | | | | | | | |
| in Securities | | | 3,824,314 | | | | 65,536,565 | | | | — | | | | 69,360,879 | |
| | | | | | | | | | | | | | | | | |
| | | Government Money Market | |
| | | Level 1 | | | Level 2 | | | Level 3 | | | Total | |
| Assets: | | | | | | | | | | | | | | | | |
| Investments in Securities: | | | | | | | | | | | | | | | | |
| U.S. Treasury | | | 94,998,654 | | | | — | | | | — | | | | 94,998,654 | |
| Money Market | | | | | | | | | | | | | | | | |
| Funds | | | 13,505,458 | | | | — | | | | — | | | | 13,505,458 | |
| Total Investments | | | | | | | | | | | | | | | | |
| in Securities | | | 108,504,112 | | | | — | | | | — | | | | 108,504,112 | |
For transfers between the levels within the fair value hierarchy, the Funds have adopted a policy of recognizing the transfers as of the date of the underlying event which caused the transfer. During the year ended March 31, 2015, there were no transfers between Level 1, Level 2 and Level 3.
During the year ended March 31, 2015, there were no assets in which significant unobservable inputs (Level 3) were used.
(13) Subsequent Events
Management has evaluated the impact of all subsequent events on the Funds through the date the financial statements were issued and has determined that there were no subsequent events requiring recognition or disclosure in the financial statements.
67 | Q1 2015 ANNUAL REPORT
REPORT OF INDEPENDENT REGISTERED
PUBLIC ACCOUNTING FIRM
The Board of Trustees and Shareholders of The Weitz Funds
We have audited the accompanying statements of assets and liabilities of The Weitz Funds, comprising the Value Fund, Partners Value Fund, Partners III Opportunity Fund, Research Fund, Hickory Fund, Balanced Fund, Core Plus Income Fund (commenced operations on July 31, 2014), Short-Intermediate Income Fund, Nebraska Tax-Free Income Fund, and Government Money Market Fund (collectively referred to as the “Funds”), including the schedules of investments, as of March 31, 2015, and the related statements of operations (and statement of cash flows for Partners III Opportunity Fund) for the year or period then ended, the statements of changes in net assets for each of the two years in the period then ended, and the financial highlights for each of the periods indicted therein. These financial statements and financial highlights are the responsibility of the Funds’ management. Our responsibility is to express an opinion on these financial statements and financial highlights based on our audits.
We conducted our audits in accordance with standards of the Public Company Accounting Oversight Board (United States). Those standards require that we plan and perform the audits to obtain reasonable assurance about whether the financial statements and financial highlights are free of material misstatement. We were not engaged to perform an audit of the Funds’ internal control over financial reporting. Our audits included consideration of internal control over financial reporting as a basis for designing audit procedures that are appropriate in the circumstances, but not for the purpose of expressing an opinion on the effectiveness of the Funds’ internal control over financial reporting. Accordingly, we express no such opinion. An audit also includes examining, on a test basis, evidence supporting the amounts and disclosures in the financial statements and financial highlights, assessing the accounting principles used and significant estimates made by management, and evaluating the overall financial statement presentation. Our procedures included confirmation of securities owned as of March 31, 2015, by correspondence with the custodian and brokers or by other appropriate auditing procedures where replies from brokers were not received. We believe that our audits provide a reasonable basis for our opinion.
In our opinion, the financial statements and financial highlights referred to above present fairly, in all material respects, the financial position of each of the respective Funds referred to above of The Weitz Funds as of March 31, 2015, the results of their operations (and cash flows for Partners III Opportunity Fund) for the year or period then ended, the changes in their net assets for each of the two years in the period then ended, and their financial highlights for the periods indicated therein, in conformity with U.S. generally accepted accounting principles.
Cincinnati, Ohio
May 8, 2015
68 | Q1 2015 ANNUAL REPORT
This page intentionally left blank
69 | Q1 2015 ANNUAL REPORT
ACTUAL AND HYPOTHETICAL EXPENSES
FOR COMPARISON PURPOSES
Example
As a shareholder of one or more of the Funds, you incur two types of costs: (1) transaction costs, including any transaction fees that you may be charged if you purchase or redeem your Fund shares through certain financial institutions; and (2) ongoing costs, including management fees and other Fund expenses. This Example is intended to help you understand your ongoing costs (in dollars) of investing in the Funds and to compare these costs with the ongoing costs of investing in other mutual funds. The Example is based on an investment of $1,000 invested at the beginning of the period and held for the entire period from October 1, 2014 through March 31, 2015.
Actual Expenses
The first line for each Fund in the table below provides information about actual account values and actual expenses. You may use the information in this line, together with the amount you invested, to estimate the expenses that you paid over the period. Simply divide your account value by $1,000 (for example, an account value of $8,600 divided by $1,000 = 8.6), then multiply the result by the number in the first line under the heading entitled “Expenses Paid from 10/01/14 – 3/31/15” to estimate the expenses you paid on your account during this period.
Hypothetical Example for Comparison Purposes
The second line for each Fund in the table below provides information about hypothetical account values and hypothetical expenses based on the actual expense ratio of each Fund and an assumed rate of return of 5% per year before expenses, which is not the actual return of the Fund. The hypothetical account values and expenses may not be used to estimate the actual ending account balance or expenses you paid for the period. You may use this information to compare the ongoing costs of investing in a specific Weitz Fund to other funds. To do so, compare this 5% hypothetical example with the 5% hypothetical examples that appear in the shareholder reports of the other funds.
Please note that the expenses shown in the table are meant to highlight your ongoing costs only and do not reflect any transactional costs charged by certain financial institutions. Therefore, the second line of the table is useful in comparing ongoing costs only, and will not help you determine the relative total costs of owning different funds. In addition, if you incurred transactional fees, your costs would have been higher. Actual and hypothetical expenses for each Fund are provided in this table.
| | | | Beginning Account | | | Ending Account | | | Annualized | | | Expenses Paid from | |
| | | | Value 10/01/14 | | | Value 3/31/15 | | | Expense Ratio | | | 10/01/14-3/31/15(1) | |
| Value - Investor Class | Actual | | $ | 1,000.00 | | | $ | 1,077.51 | | | | 1.18 | % | | $ | 6.11 | |
Hypothetical(2) | | | 1,000.00 | | | | 1,019.10 | | | | 1.18 | | | | 5.94 | |
| Value - Institutional Class | Actual | | | 1,000.00 | | | | 1,078.62 | | | | 0.99 | | | | 5.13 | |
Hypothetical(2) | | | 1,000.00 | | | | 1,020.05 | | | | 0.99 | | | | 4.99 | |
| Partners Value - Investor Class | Actual | | | 1,000.00 | | | | 1,083.53 | | | | 1.18 | | | | 6.13 | |
Hypothetical(2) | | | 1,000.00 | | | | 1,019.10 | | | | 1.18 | | | | 5.94 | |
| Partners Value - Institutional Class | Actual | | | 1,000.00 | | | | 1,084.09 | | | | 0.99 | | | | 5.14 | |
Hypothetical(2) | | | 1,000.00 | | | | 1,020.05 | | | | 0.99 | | | | 4.99 | |
| Partners III Opportunity - Investor Class | Actual | | | 1,000.00 | | | | 1,075.38 | | | | 2.02 | | | | 10.45 | |
Hypothetical(2) | | | 1,000.00 | | | | 1,014.90 | | | | 2.02 | | | | 10.15 | |
| Partners III Opportunity - | Actual | | | 1,000.00 | | | | 1,077.15 | | | | 1.69 | | | | 8.75 | |
| Institutional Class | Hypothetical(2) | | | 1,000.00 | | | | 1,016.55 | | | | 1.69 | | | | 8.50 | |
| Research | Actual | | | 1,000.00 | | | | 1,114.63 | | | | 0.90 | | | | 4.74 | |
Hypothetical(2) | | | 1,000.00 | | | | 1,020.50 | | | | 0.90 | | | | 4.53 | |
| Hickory | Actual | | | 1,000.00 | | | | 1,118.99 | | | | 1.23 | | | | 6.50 | |
Hypothetical(2) | | | 1,000.00 | | | | 1,018.85 | | | | 1.23 | | | | 6.19 | |
| Balanced | Actual | | | 1,000.00 | | | | 1,036.86 | | | | 1.09 | | | | 5.54 | |
Hypothetical(2) | | | 1,000.00 | | | | 1,019.55 | | | | 1.09 | | | | 5.49 | |
| Core Plus Income - Investor Class | Actual | | | 1,000.00 | | | | 1,031.07 | | | | 0.85 | | | | 4.30 | |
Hypothetical(2) | | | 1,000.00 | | | | 1,020.75 | | | | 0.85 | | | | 4.28 | |
| Core Plus Income - Institutional Class | Actual | | | 1,000.00 | | | | 1,031.69 | | | | 0.65 | | | | 3.29 | |
Hypothetical(2) | | | 1,000.00 | | | | 1,021.75 | | | | 0.65 | | | | 3.28 | |
| Short-Intermediate Income - | Actual | | | 1,000.00 | | | | 1,012.78 | | | | 0.84 | | | | 4.22 | |
| Investor Class | Hypothetical(2) | | | 1,000.00 | | | | 1,020.80 | | | | 0.84 | | | | 4.23 | |
| Short-Intermediate Income - | Actual | | | 1,000.00 | | | | 1,013.97 | | | | 0.61 | | | | 3.06 | |
| Institutional Class | Hypothetical(2) | | | 1,000.00 | | | | 1,021.95 | | | | 0.61 | | | | 3.08 | |
| Nebraska Tax-Free Income | Actual | | | 1,000.00 | | | | 1,005.98 | | | | 0.75 | | | | 3.75 | |
Hypothetical(2) | | | 1,000.00 | | | | 1,021.25 | | | | 0.75 | | | | 3.78 | |
| Government Money Market | Actual | | | 1,000.00 | | | | 1,000.06 | | | | 0.01 | | | | 0.05 | |
Hypothetical(2) | | | 1,000.00 | | | | 1,024.95 | | | | 0.01 | | | | 0.05 | |
| (1) | Expenses are equal to the annualized expense ratio for the Fund, multiplied by the average account value over the period, multiplied by the number of days in the most recent fiscal half year (182/365). |
| (2) | Assumes 5% total return before expenses. |
70 | Q1 2015 ANNUAL REPORT
OTHER INFORMATION
Proxy Voting Policy
A description of the Funds’ proxy voting policies and procedures is available without charge, upon request by (i) calling 800-304-9745, (ii) on the Funds’ website at weitzinvestments.com; and (iii) on the SEC’s website at sec.gov.
Information on how each of the Funds voted proxies relating to portfolio securities during each twelve month period ended June 30 is available: (i) on the Funds’ website at weitzinvestments.com and (ii) on the SEC’s website at sec.gov.
Form N-Q
The Funds file complete schedules of their portfolio holdings with the Securities and Exchange Commission for the first and third quarters of each fiscal year on Form N-Q. The Funds’ Form N-Q is available on the SEC’s website at sec.gov and may be reviewed and copied at the SEC’s Public Reference Room in Washington DC. Information on the operation of the Public Reference Room may be obtained by calling 800 SEC-0330. A list of the Funds’ quarter-end holdings is available on the Funds’ website at weitzinvestments.com within 15 days after the end of each quarter and remains available on the website until the list is updated in the subsequent quarter.
Tax Information
Of the distributions paid during the fiscal year, the amounts that may be considered qualified dividend income and for corporate shareholders, the amounts that may qualify for the corporate dividends received deduction, are summarized as follows:
| | | Core Plus Income | | | Short-Intermediate Income | |
| Qualified dividend income | | $ | 277 | | | $ | 100,365 | |
| Corporate dividends received deduction | | | 277 | | | | 100,365 | |
The information and distributions reported herein may differ from the information and distributions reported to shareholders for the calendar year ended December 31, 2014, which was reported in conjunction with your 2014 Form 1099-DIV.
71 | Q1 2015 ANNUAL REPORT | UNAUDITED
INFORMATION ABOUT THE TRUSTEES AND OFFICERS
The individuals listed below serve as Trustees or Officers of the Trust. Each Trustee of the Weitz Funds serves until a successor is elected and qualified or until resignation. Each Officer of the Weitz Funds is elected annually by the Trustees.
The address of all Officers and Trustees is 1125 South 103rd Street, Suite 200, Omaha, Nebraska 68124.
| Interested Trustees* | Roland J. Santoni (Age: 73) |
Wallace R. Weitz (Age: 65) | |
| | Position(s) Held with Trust: Trustee |
Position(s) Held with Trust: President; Portfolio Manager; Trustee | |
| | Length of Service (Beginning Date): 2004 |
Length of Service (Beginning Date): 1986 | |
| | Principal Occupation(s) During Past 5 Years: Managing Director |
Principal Occupation(s) During Past 5 Years: President, Weitz | (2010 to Present); President (2007 to 2010), Gary and Mary West |
| Funds; Chairman of the Board and Chief Investment Officer | |
| (2015 to Present), President (1983 to 2014), Weitz Investment | |
| Management, Inc. | Number of Portfolios Overseen in Fund Complex: 10 |
| | |
Number of Portfolios Overseen in Fund Complex: 10 | Other Directorships During Past 5 Years: N/A |
| | |
Other Directorships During Past 5 Years: N/A | |
| | Barbara W. Schaefer (Age: 61) |
| | |
Thomas R. Pansing (Age: 69) | Position(s) Held with Trust: Trustee |
| | |
Position(s) Held with Trust: Trustee | Length of Service (Beginning Date): 2005 |
| | |
Length of Service (Beginning Date): 1986 | Principal Occupation(s) During Past 5 Years: Retired (2013 to |
| | Present); Senior Vice President-Human Resources and Corporate |
Principal Occupation(s) During Past 5 Years: Partner, Pansing | Secretary, Union Pacific Corporation (2004 to 2013) |
| Hogan Ernst & Bachman LLP | |
| | Number of Portfolios Overseen in Fund Complex: 10 |
Number of Portfolios Overseen in Fund Complex: 10 | |
| | Other Directorships During Past 5 Years: N/A |
Other Directorships During Past 5 Years: N/A | |
| | |
| | Delmer L. Toebben (Age: 84) |
| | |
| * Mr. Weitz is a Director and Officer of Weitz Investment Management, | Position(s) Held with Trust: Trustee |
| Inc., investment adviser to the Weitz Funds, and as such is considered | |
| an “ interested person” of the Trust, as that term is defined in the | Length of Service (Beginning Date): 1996 |
| Investment Company Act of 1940 (an “Interested Trustee”). Mr. Pansing | |
| performs certain legal services for the investment adviser and the Weitz | Principal Occupation(s) During Past 5 Years: Retired |
| Funds and, therefore, is also classified as an “Interested Trustee.” | |
| | Number of Portfolios Overseen in Fund Complex: 10 |
| | |
| | Other Directorships During Past 5 Years: N/A |
| | |
| | |
| Independent Trustees | Justin B. Wender (Age: 45) |
Lorraine Chang (Age: 64) | |
| | Position(s) Held with Trust: Trustee |
Position(s) Held with Trust: Trustee; Chair, Board of Trustees | |
| | Length of Service (Beginning Date): 2009 |
Length of Service (Beginning Date): 1997 | |
| | Principal Occupation(s) During Past 5 Years: Managing Partner, |
Principal Occupation(s) During Past 5 Years: Independent | Stella Point Capital, LP (2010 to Present) |
| Management Consultant | |
| | Number of Portfolios Overseen in Fund Complex: 10 |
Number of Portfolios Overseen in Fund Complex: 10 | |
| | Other Directorships During Past 5 Years: Ames True Temper, Inc. |
Other Directorships During Past 5 Years: N/A | (2004 to 2010), Morton’s Restaurant Group, Inc. (2002 to 2010) |
| | |
| | |
John W. Hancock (Age: 67) | |
| | |
Position(s) Held with Trust: Trustee | |
| | |
Length of Service (Beginning Date): 1986 | |
| | |
Principal Occupation(s) During Past 5 Years: Partner, Hancock | |
| & Dana, PC | |
| | |
Number of Portfolios Overseen in Fund Complex: 10 | |
| | |
Other Directorships During Past 5 Years: N/A | |
72 | Q1 2015 ANNUAL REPORT
Officers
Thomas D. Carney (Age: 51)
Position(s) Held with Trust: Vice President
Length of Service (Beginning Date): 2015
Principal Occupation(s) During Past 5 Years: Vice President,
Weitz Funds (2015 to Present); Portfolio Manager, Weitz Investment
Management, Inc. (1996 to Present)
John R. Detisch (Age: 50)
Position(s) Held with Trust: Vice President, General Counsel,
Secretary and Chief Compliance Officer
Length of Service (Beginning Date): 2011
Principal Occupation(s) During Past 5 Years: Vice President,
General Counsel, Secretary and Chief Compliance Officer, Weitz
Funds; Vice President, General Counsel, Assistant Secretary and
Chief Compliance Officer, Weitz Investment Management, Inc. (2011
to Present); Partner, Kutak Rock LLP (1990 to 2011)
Bradley P. Hinton (Age: 47)
Position(s) Held with Trust: Vice President
Length of Service (Beginning Date): 2006
Principal Occupation(s) During Past 5 Years: Vice President, Weitz
Funds; Vice President, Portfolio Manager and Director of Research,
Weitz Investment Management, Inc.
Jo Ann Quinif (Age: 39)
Position(s) Held with Trust: Vice President
Length of Service (Beginning Date): 2015
Principal Occupation(s) During Past 5 Years: Vice President, Weitz
Funds (2015 to Present); Vice President (2015 to Present) and Director
of Marketing and Client Services (2008 to Present), Weitz Investment
Management, Inc.
Kenneth R. Stoll (Age: 53)
Position(s) Held with Trust: Vice President and Chief Financial Officer
Length of Service (Beginning Date): 2004
Principal Occupation(s) During Past 5 Years: Vice President and
Chief Financial Officer, Weitz Funds; President and Chief Financial
Officer (2015 to Present), Vice President and Chief Operating Officer
(2004 to 2014), Weitz Investment Management, Inc.
The Statement of Additional Information for the Weitz Funds, which can be obtained without charge by calling 800-304-9745, includes additional information about the Trustees and Officers of the Weitz Funds.
73 | Q1 2015 ANNUAL REPORT | UNAUDITED
INDEX DESCRIPTIONS
| Russell 1000 | | The Russell 1000 is an unmanaged index of large capitalization common stocks. It consists of the 1,000 largest companies in the Russell 3000 Index. |
| | | |
| Russell 1000 Value | | The Russell 1000 Value is an unmanaged index of large capitalization common stocks. It consists of those Russell 1000 companies with lower price-to-book ratios and lower forecasted growth values. |
| | | |
| Russell 3000 | | The Russell 3000 is an unmanaged index of the 3,000 largest U.S. companies based on market capitalization. |
| | | |
| Russell 3000 Value | | The Russell 3000 Value is an unmanaged index of the largest capitalization common stocks. It consists of those Russell 3000 companies with lower price-to-book ratios and lower forecasted growth values. |
| | | |
| Russell 2500 | | The Russell 2500 is an unmanaged index of small to mid-capitalization common stocks. It consists of the 2,500 smallest companies in the Russell 3000 Index. |
| | | |
| Russell 2500 Value | | The Russell 2500 Value is an unmanaged index of small to mid-capitalization common stocks. It consists of those Russell 2500 companies with lower price-to-book ratios and lower forecasted growth values. |
| | | |
| S&P 500 | | The S&P 500 is an unmanaged index consisting of 500 companies generally representative of the market for the stocks of large-size U.S. companies. |
| | | |
| Blended | | The Blended Index blends the S&P 500 with the Barclays Intermediate U.S. Government/Credit Index by weighting their total returns at 60% and 40%, respectively. The portfolio is rebalanced monthly. |
| | | |
Barclays U.S. Aggregate Bond | | The Barclays U.S. Aggregate Bond Index is a broad-based benchmark consisting of Treasuries, government-related and corporate securities, MBS (agency fixed-rate and hybrid ARM pass-throughs), ABS and CMBS (agency and non-agency) representative of the U.S. dollar- denominated, fixed-rate taxable bond market. |
| | | |
Barclays Intermediate U.S. Government Credit | | The Barclays Intermediate U.S. Government/Credit Index (BIGC) is a total return performance benchmark consisting of government securities and publicly issued corporate debt with maturities from one to ten years and rated at least BBB by Standard & Poor’s or Baa by Moody’s Investor Service. |
| | | |
| CPI + 1% | | The CPI + 1% benchmark is created by adding 1% to the annual percentage change in the Consumer Price Index (“CPI”). This index reflects non-seasonally adjusted returns. The Consumer Price Index is an unmanaged index representing the rate of inflation of the U.S. consumer prices as determined by the U.S. Department of Labor Statistics. There can be no guarantee that the CPI or other indices will reflect the exact level of inflation at any given time. |
| | | |
Barclays 5-Year Municipal Bond | | The Barclays 5-Year Municipal Bond Index is an unmanaged index of long-term, fixed-rate, investment-grade, tax-exempt bonds representative of the municipal bond market. |
74 | Q1 2015 ANNUAL REPORT
| Board of Trustees | Distributor |
| Lorraine Chang | Weitz Securities, Inc. |
| John W. Hancock | |
| Thomas R. Pansing, Jr. | Transfer Agent and Dividend |
| Roland J. Santoni | Paying Agent |
| Barbara W. Schaefer | Weitz Investment Management, Inc. |
| Delmer L. Toebben | |
| Wallace R. Weitz | |
| Justin B. Wender | Sub-Transfer Agent |
| | Boston Financial Data Services, Inc. |
| Investment Adviser | |
| Weitz Investment Management, Inc. | NASDAQ symbols: |
| 1125 South 103rd Street, Suite 200 | Value Fund |
| Omaha, NE 68124-1071 | Investor Class - WVALX |
| (800) 304-9745 | Institutional Class - WVAIX |
| | Partners Value Fund |
| | Investor Class - WPVLX |
| Custodian | Institutional Class - WPVIX |
| Wells Fargo Bank, N.A. | Partners III Opportunity Fund |
| | Investor Class - WPOIX |
| | Institutional Class - WPOPX |
| Officers | Research Fund - WRESX |
| Wallace R. Weitz, President | Hickory Fund - WEHIX |
| Thomas D. Carney, Vice President | Balanced Fund - WBALX |
| John R. Detisch, Vice President, General Counsel, | Core Plus Income Fund |
| Secretary & Chief Compliance Officer | Investor Class - WCPNX |
| Bradley P. Hinton, Vice President | Institutional Class - WCPBX |
| Jo Ann Quinif, Vice President | Short-Intermediate Income Fund |
| Kenneth R. Stoll, Vice President & Chief | Investor Class - WSHNX |
| Financial Officer | Institutional Class - WEFIX |
| | Nebraska Tax-Free Income Fund - WNTFX |
| | Government Money Market Fund - WGMXX |
Help us conserve resources by receiving your report electronically.
Visit us online at weitzinvestments.com.
Simply log in to your account and select “Electronic Delivery.”
An investor should consider carefully the investment objectives, risks, and charges and expenses of the Funds before investing. The Funds’ Prospectus contains this and other information about the Funds. The Prospectus should be read carefully before investing.
5/8/15
75 | Q1 2015 ANNUAL REPORT
Item 2. Code of Ethics.
As of the end of the period covered by this report, the Registrant has adopted a code of ethics that applies to the Registrant’s principal executive officer, principal financial officer, principal accounting officer or controller, or persons performing similar functions, regardless of whether these individuals are employed by the Registrant or a third party (the “Code of Ethics”). During the period covered by this report, there were no amendments, nor did the Registrant grant any waivers, including any implicit waivers, from any provision of the Code of Ethics.
The Code of Ethics is attached hereto as Exhibit 12(a)(1).
Item 3. Audit Committee Financial Expert.
The Registrant’s board of trustees has determined that the Registrant has at least one “audit committee financial expert” (as defined in Item 3 of Form N-CSR) serving on its audit committee. John Hancock is an “audit committee financial expert” and is “independent” (as each term is defined in Item 3 of Form N-CSR).
Item 4. Principal Accountant Fees and Services.
| (a) | Audit Fees. Fees for audit services provided to the Registrant were $315,920 and $292,919 for fiscal years ended March 31, 2015 and 2014, respectively. |
| (b) | Audit Related Fees. The aggregate fees billed in each of the last two fiscal years for audit related-services by the principal accountant that are reasonably related to the performance of the audit of the Registrant’s financial statements and are not reported under paragraph (a) of this item were $28,680 and $28,680 for fiscal years ended March 31, 2015 and 2014, respectively. The fees, paid by Weitz Investment Management, Inc., the Registrant’s investment adviser and transfer agent, were payment for the principal accountant performing internal control reviews of the Registrant’s transfer agent. |
(c) Tax Fees. Fees for tax services, which consisted of income and excise tax compliance services, were $49,000 and $44,400 for the fiscal years ended March 31, 2015 and 2014, respectively.
(d) All Other Fees. Fees for all other services totaled $12,095 and $12,095 for fiscal years ended March 31, 2015 and 2014, respectively.
| (e) | (1) The Registrant’s Audit Committee has adopted Pre-Approval Policies and Procedures. The Audit Committee must pre-approve all audit services and non-audit services that the principal accountant provides to the Registrant. The Audit Committee must also pre-approve any engagement of the principal accountant to provide non-audit services to the Registrant’s investment adviser, or any affiliate of the adviser that provides ongoing services to the Registrant, if such non-audit services directly impact the Registrant’s operations and financial reporting. |
(2) No services described in items (b) were pre-approved by the Audit Committee pursuant to Rule 2-01(c)(7)(i)(c) of Regulation S-X.
| | (f) | All of the work in connection with the audit of the Registrant during the years ended March 31, 2015 and 2014 was performed by full-time employees of the Registrant’s principal accountant. |
| (g) | The aggregate fees billed by the principal accountant for non-audit services to the Registrant, the Registrant’s investment adviser and any entity controlling, controlled by, or under common control with the adviser that provides ongoing services to the Registrant were $136,925 and $126,325 for the years ended March 31, 2015 and 2014, respectively. |
| (h) | The Registrant’s Audit Committee has considered whether the provision of non-audit services that were rendered to the Registrant’s investment adviser, and any entity controlling, controlled by, or under common control with the adviser that provides ongoing services to the Registrant that were not |
| | pre-approved pursuant to paragraph (c)(7)(ii) of Rule 2-01 of Regulation S-X is compatible with maintaining the principal auditor’s independence. |
Item 5. Audit Committee of Listed Registrants.
Not applicable.
Item 6. Schedule of Investments.
The Schedule of Investments in securities of unaffiliated issuers is included as part of the Report to Shareholders.
Item 7. Disclosure of Proxy Voting Policies and Procedures for Closed-End Investment Companies.
Not applicable.
Item 8. Portfolio Managers of Closed-End Management Investment Companies
Not applicable
Item 9. Purchases of Equity Securities by Closed-End Management Investment Company and Affiliated Purchasers.
Not applicable.
Item 10. Submissions of Matters to a Vote of Security Holders.
Not applicable.
Item 11. Controls and Procedures.
(a) Based on an evaluation of the Disclosure Controls and Procedures (as defined in Rule 30a-3(c) under the Investment Company Act of 1940) (the "Disclosure Controls") as of a date within 90 days prior to the filing date (the "Filing Date") of this report on Form N-CSR (the "Report"), the Registrant's principal executive officer and financial officer have concluded that the Disclosure Controls are reasonably designed to ensure that information required to be disclosed by the Registrant in the Report is recorded, processed, summarized and reported by the Filing Date, including ensuring that information required to be disclosed in the Report is accumulated and communicated to the Registrant's management, including the Registrant's principal executive officer and principal financial officer, as appropriate to allow timely decisions regarding required disclosure.
(b) There were no significant changes in the Registrant's internal control over financial reporting (as defined in Rule 30a-3(d) under the Investment Company Act of 1940) that occurred during the Registrant's second fiscal half-year of the period covered by this report that has materially affected, or is reasonably likely to materially affect, the Registrant's internal control over financial reporting.
(a)(1) The Code of Ethics is attached hereto.
(a)(2) The certifications required by Rule 30a-2(a) of the Investment Company Act of 1940 are attached hereto.
(a)(3) Not applicable.
(b) The certifications required by Rule 30a-2(b) of the Investment Company Act of 1940 and Section 906 of the Sarbanes-Oxley Act of 2002 are attached hereto.
SIGNATURES
Pursuant to the requirements of the Securities Exchange Act of 1934 and the Investment Company Act of 1940, the Registrant has duly caused this report to be signed on its behalf by the undersigned, thereunto duly authorized.
The Weitz Funds
By (Signature and Title)* /s/ Wallace R. Weitz
Wallace R. Weitz, President
Date May 19, 2015
Pursuant to the requirements of the Securities Exchange Act of 1934 and the Investment Company Act of 1940, this report has been signed below by the following persons on behalf of the Registrant and in the capacities and on the dates indicated.
By (Signature and Title)* /s/ Wallace R. Weitz
Wallace R. Weitz, President
Date May 19, 2015
By (Signature and Title)* /s/ Kenneth R. Stoll
Kenneth R. Stoll, Chief Financial Officer
Date May 19, 2015
* Print the name and title of each signing officer under his or her signature.