THE WEITZ PHILOSOPHY
Value investing the Weitz Way.
There are no shortcuts in value investing. At Weitz, we dig. And dig some more. We look at hundreds of investment ideas. Our goal: find strong, well-managed but undervalued companies and bonds that offer reasonable risk-adjusted returns. It's no easy task. We do the due diligence. Analyze. Ask tough questions and get the answers. We wait for the right opportunity. Then and only then do we invest your money. Welcome to the Weitz Way.
We're in it with you:
Our employees have the majority of their investable assets in our mutual funds. This alignment of goals allows us to guarantee that we're treating clients' money as if it were our own.
We focus on what we know:
Each of our analysts is a generalist with ever-growing, defined circles of competence. They can spot opportunities anywhere and bring them to the team for consideration.
We think for ourselves:
Our philosophy of independent thinking and high-conviction portfolios enables us to take advantage of value-priced equities and bonds that offer reasonable risk-adjusted returns.
Today we are responsible for over $4 billion in investments for our shareholders – individuals, corporations, pension plans, foundations and endowments. And our commitment remains the same: to put our clients first. Always. We do so through our expertise, our flexibility, and our drive to uncover investments that can help them preserve and grow wealth.
Wally Weitz, CFA
President, Portfolio Manager
2 | Q1 2017 ANNUAL REPORT
WEITZINVESTMENTS.COM
TABLE OF CONTENTS
| Value Matters | 4 |
| | |
| Performance Summary | 7 |
| | |
| Analyst Corner | 8 |
| | |
| Value Fund | 10 |
| | |
| Partners Value Fund | 12 |
| | |
| Partners III Opportunity Fund | 14 |
| | |
| Research Fund | 16 |
| | |
| Hickory Fund | 18 |
| | |
| Balanced Fund | 20 |
| | |
| Core Plus Income Fund | 22 |
| | |
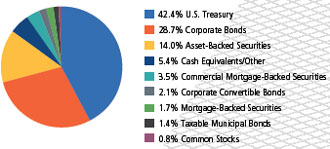
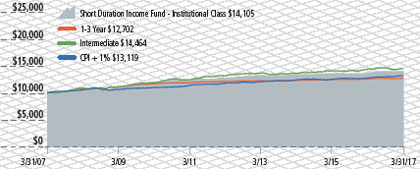
| Short Duration Income Fund | 25 |
| | |
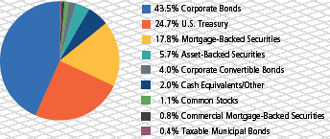
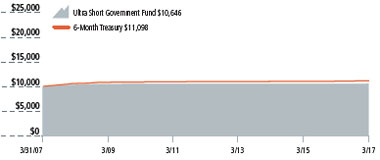
| Ultra Short Government Fund | 28 |
| | |
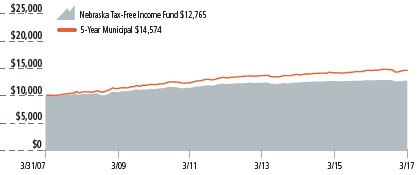
| Nebraska Tax-Free Income Fund | 29 |
| | |
| Schedule of Investments | 31 |
| | |
| Financial Statements | 46 |
| | |
| Notes to Financial Statements | 56 |
| | |
| Report of Independent Registered Public Accounting Firm | 66 |
| | |
| Actual and Hypothetical Expenses for Comparison Purposes | 68 |
| | |
| Other Information | 69 |
| | |
| Information About the Trustees and Officers | 70 |
| | |
| Index Descriptions | 74 |
| The management of Weitz Funds has chosen paper for the 76 page report from a paper manufacturer certified under the Sustainable Forestry Initiative ® standard. | |
Portfolio composition is subject to change at any time and references to specific securities, industries, and sectors referenced in this report are not recommendations to purchase or sell any particular security. Current and future portfolio holdings are subject to risk. See the Schedules of Investments included in this report for the percent of assets in each of the Funds invested in particular industries or sectors.
3 | Q1 2017 ANNUAL REPORT
VALUE MATTERS
April 3, 2017
Dear Fellow Investor:
News in the first quarter of 2017 was dominated by the initial activities of the new administration. Since the election in November, investors have been anticipating tax cuts, repatriation of stranded corporate profits, the announcement of massive infrastructure spending projects, and the dismantling of troublesome and expensive environmental and financial service regulations. The "Trump Bump" has propelled stocks higher, and our portfolios have participated.
As the quarter ended, however, a heated showdown between the newcomers and the DC establishment ended with a failure to "repeal and replace" Obamacare. Confidence was further shaken by foreign policy miscues and a widening investigation of Russian meddling in the U.S. election. Parts of the president's agenda will undoubtedly be enacted, but for now, confusion reigns.
Nevertheless, it was a good quarter for our funds. The five stock funds performed well. Our fixed income funds earned positive returns in a turbulent bond market. Core Plus is approaching its third anniversary and maintains its strong performance. Balanced Fund also turned in a strong quarter and continues to be a good alternative for individuals and institutions who want to delegate the stock/bond allocation decision.
The table following this letter shows performance of our funds over various measuring periods since our founding in 1983. We remind investors that we believe the longer measuring periods are more meaningful.
Valuation—the Gravitational Force
In our last letter, we showed a graph of aggregate U.S. stock market value as a percentage of GDP. This ratio offers a very rough proxy for stock valuation levels. At year end, the ratio was near the high end of its historical range, and after a strong first quarter, it is even higher. This does not mean that stock prices must go down tomorrow—as we said, this indicator is a very blunt instrument for making market timing decisions. Nevertheless, knowing that stocks are expensive on a historical basis gives us some perspective on the attractiveness of available opportunities.
Our investment philosophy is based on the idea that a company's business value "reality" is measurable and evolves gradually (hopefully upward) over time, while its stock price may fluctuate widely based on investors' hopes and fears about the future. We believe that in recent years, money creation by the Fed and extremely low interest rates have fostered excess investor enthusiasm. Hence the relatively high level of stock prices.
We like to buy stocks at 60-70% of our estimate of business value, but in today's market, our portfolios are closer to full value in the mid-80% range. We believe that a company's business value exerts a "gravitational pull" on its stock price, so when stocks are expensive, we tend to invest more defensively and hold cash reserves.
Our investment team of ten analysts and portfolio managers continues to read, travel and "kick tires" in search of new investment ideas. Even in a generally expensive market, there are always individual companies undergoing business and/or price changes that offer us opportunity. In the meantime, we will be patient and disciplined about deploying your (along with our) capital.
Indexing—Active vs. Passive InvestingOver the past few years, the financial press has been obsessed with the relative merits of active vs. passive investing. As a result, we have been receiving lots of questions about indexing and ETFs (exchange traded funds). So, in this letter we will address some of the pros and cons of passive investing.
To simplify, an active stock fund manager is trying to beat a market index (e.g., S&P 500), while a passive investor is trying to match the index returns. Actively managed funds generally have higher expense ratios than index funds or ETF's, so mathematically, to the extent active and passive managers both, as groups, produce average results, the passive group will outperform the active group over time by the amount of the expense differential. In an extended period of steadily rising stock prices, where cash holdings penalize active managers, index funds and index ETFs tend to show good relative performance and attract investors.
Index funds can be part of a sensible solution for the individual or institutional investor who is not willing or able to select securities or fund managers on their own. Warren Buffett, one of the greatest active managers of all time, has endorsed the S&P 500 index fund as a good alternative to hiring active managers to try to beat the index. In addition to expense savings, buying and holding any fund eliminates the likelihood of reducing returns by "chasing performance." Studies of mutual fund investors consistently show that the tendency to sell last year's "loser" to buy last year's "winner" can seriously detract from long-term results.
As active managers, we acknowledge the paradox of asking our clients to believe we can remain among the minority of managers who have beaten the S&P 500 over the past 30+ year period. In The Super Investors of Graham and Doddsville (available online—15 pages and we highly recommend it), Warren Buffett
4 | Q1 2017 ANNUAL REPORT
WEITZINVESTMENTS.COM
wrote about a group of professional investors who consistently beat the market. Their portfolios were very different from each other, but the common denominator among the group was that each had studied with, or had been heavily influenced by, Benjamin Graham. The idea that a patient investor could do well by buying shares of a business at a significant discount to its value ("margin of safety") to a long-term owner was the basis of their success. We do not claim to belong in the pantheon that Warren wrote about, but the common sense application of Graham's method has served us well for a long time.
As long as human nature does not change, we believe that there will always be opportunities for value investors to buy mispriced securities.
Indexing—Other Observations
In thinking about index funds and ETFs, there are a number of considerations that receive less coverage in the press:
| | | |
| | (1) | The discussion of index funds above focuses on broadly diversified indices, such as the S&P 500, and anticipates that an investor would hold the fund for a period of years. There are sector ETFs that contain a narrowly defined "basket" of stocks from one industry, such as banking, biotech, airlines, home building, etc. Trading among sector ETFs, or even trading in and out of a broader index, is not "passive" investing. It involves active investment decision-making. That is not good or bad, per se, but it is not the subject at hand; |
| | | |
| | (2) | To state the obvious, "matching" the index means losing money when the index goes down. A few years ago, the director of research for a large investment firm charged with creating active and passive fund models for his clients lamented to us, "Investors were surprised to find that in the 2008-09 bear market, indexing didn't protect them on the downside." Amazing. |
| | | |
| | (3) | The construction of stock index funds and ETFs can also create unintended consequences. The fund is a basket of stocks, and investor capital is allocated among the component securities in a fixed proportion (usually based on the relative market capitalizations of the component stocks). When new funds arrive to be invested, shares of each stock are purchased in those proportions. So the largest companies receive the lion's share of new money, making their market caps even larger. This structural phenomenon caused extreme distortions during the tech stock bubble, which ended in 2000. When mechanical buying and selling exacerbates mispricing of stocks, opportunities are created for active investors. |
| | | |
| | (4) | Another structural quirk of index funds or ETFs is that when investor buy or sell orders come to the fund sponsor, it must buy or sell shares of the component companies that day. The parties on the other sides of those trades can "see them coming" and may take advantage of the fund. In less liquid markets, the fund may get poor executions of their trades. This is not good for the index investor but can create opportunities for the active manager. |
Index funds are an important part of the investment landscape. They can be useful to investors who understand their virtues and limitations. Nevertheless, we believe there is a case to be made for active management, and we intend to continue to do our best to add some extra value to our clients' long term investment results.
Outlook
These are not normal times (!). The stock market has moved in one direction for the last eight years, with barely a 10% correction. Going forward, we expect more volatility and a market that makes meaningful moves in both directions. This should create buying opportunities for us, but we will be guided by valuation, not news headlines. We appreciate the patience our investors have shown over the past couple of years, and we look forward to rewarding that patience.
Sincerely,
| |
| | |
| Wally Weitz | Brad Hinton |
| wally@weitzinvestments.com | brad@weitzinvestments.com |
Included above is a reference to the term "margin of safety". This term refers to purchasing securities at a price that is less than our estimate of intrinsic value. A potential "margin of safety" may limit downside risk and optimize the potential for growth.
5 | Q1 2017 ANNUAL REPORT
DISCLOSURES
These performance numbers reflect the deduction of annual operating expenses which as stated in the most recent prospectus, and expressed as a percentage of each Fund's or Class's net assets, are: Value – Investor Class, 1.23%; Value – Institutional Class, 1.08% (gross); Partners Value – Investor Class, 1.26%; Partners Value – Institutional Class, 1.07% (gross); Partners III Opportunity – Investor Class, 2.33%; Partners III Opportunity – Institutional Class – 1.95%; Research, 1.64% (gross); Hickory, 1.24%; Balanced, 1.11%; Core Plus Income – Investor Class, 2.36% (gross); Core Plus Income – Institutional Class, 1.38% (gross); Short Duration Income – Investor Class, 0.92% (gross); Short Duration Income – Institutional Class, 0.63%; Ultra Short Government, 0.60% (gross); and Nebraska Tax-Free Income, 0.78%. The returns assume reinvestment of dividends and redemption at the end of each period. Total returns shown include fee waivers and expense reimbursements, if any; total returns would have been lower had there been no waivers and/or reimbursements. Past performance does not guarantee future results. The investment return and the principal value of an investment in any of the Funds will fluctuate so that an investor's shares, when redeemed, may be worth more or less than the original cost. Current performance may be higher or lower than the performance data quoted. Performance data current to the most recent month end may be obtained at www.weitzinvestments.com/ funds_and_performance/fund_performance.fs. Index performance is hypothetical and is shown for illustrative purposes only. See page 74 for a description of all indices.
(a) On the last business day of 1993, 2005, 2006 and 2010, the Partners Value, Partners III Opportunity, Nebraska Tax-Free Income and Research Funds (the "Funds") succeeded to substantially all of the assets of Weitz Partners II Limited Partnership, Weitz Partners III Limited Partnership, Weitz Income Partners Limited Partnership and Weitz Research Fund L.P. (the"Partnerships"), respectively. The investment objectives, policies and restrictions of the Funds are materially equivalent to those of their respective Partnership and the Partnerships were managed at all times with full investment authority by the investment adviser. The performance information includes performance for the Partnerships. The Partnerships were not registered under the Investment Company Act of 1940 and, therefore, were not subject to certain investment or other restrictions or requirements imposed by the 1940 Act or the Internal Revenue Code. If the Partnerships had been registered under the 1940 Act, the Partnerships' performance might have been adversely affected.
(b) Institutional Class shares of the Value and Partners Value Funds became available for sale on July 31, 2014. For performance prior to that date, these tables include the actual performance of each Fund's Investor Class (and use the actual expenses of each Fund's Investor Class) without adjustment. For any such period of time, the performance of each Fund's Institutional Class would have been similar to the performance of each Fund's Investor Class, because the shares of both classes are invested in the same portfolio of securities, but the classes bear different expenses. The investment adviser has agreed in writing to limit the total annual fund operating expenses of the Investor and Institutional Class shares (excluding taxes, interest, brokerage costs, acquired fund fees and expenses and extraordinary expenses) to 1.30% and 0.99%, respectively, of each Class's average daily net assets through July 31, 2017.
(c) Investor Class shares of the Partners III Opportunity and Short Duration Income Funds became available for sale on August 1, 2011. For performance prior to that date, these tables include the actual performance of each Fund's Institutional Class (and use the actual expenses of each Fund's Institutional Class) without adjustment. For any such period of time, the performance of each Fund's Investor Class would have been similar to the performance of each Fund's Institutional Class, because the shares of both classes are invested in the same portfolio of securities, but the classes bear different expenses. The investment adviser has agreed in writing to limit the total annual fund operating expenses of the Short Duration Income Fund's – Investor and Institutional Class shares (excluding taxes, interest, brokerage costs, acquired fund fees and expenses and extraordinary expenses) to 0.68% and 0.48%, respectively, of each Class's average daily net assets through July 31, 2018.
(d) Starting January 1, 2011, these tables reflect the deduction of the Research Fund's actual operating expenses. For periods of time prior to January 1, 2011, these tables reflect the deduction of annual pro forma operating expenses of 1.50%. Annual operating expenses for the Research Fund, as stated in the Research Fund's Prospectus, are 1.64% (gross) and 0.92% (net) of the Fund's net assets. The investment adviser has agreed, in writing, to limit the total annual fund operating expenses (excluding taxes, interest, brokerage costs, acquired fund fees and expenses and extraordinary expenses) to 0.90% of the Fund's average daily net assets through July 31, 2017.
(e) The investment adviser has agreed in writing to limit the total annual fund operating expenses of the Core Plus Income Fund's Investor and Institutional Class shares (excluding taxes, interest, brokerage costs, acquired fund fees and expenses and extraordinary expenses) to 0.60% and 0.40%, respectively, of each Class's average daily net assets through July 31, 2018.
(f) The Fund's past performance is not necessarily an indication of how the Fund will perform in the future. Effective December 16, 2016, the Fund revised its principal investment strategies and policies to permit the Fund to invest in a diversified portfolio of short-term debt securities and to have a fluctuating net asset value. Prior to December 16, 2016, the Fund operated as a "government money market fund" as defined under Rule 2a-7 of the Investment Company Act of 1940 and maintained a stable net asset value of $1.00 per share. The Fund's past performance reflects the Fund's prior principal investment strategies and policies. The investment adviser has agreed in writing to limit the total annual fund operating expenses of the Ultra Short Government Fund (excluding taxes, interest, brokerage costs, acquired fund fees and expenses and extraordinary expenses) to 0.20% of the Fund's average daily net assets through July 31, 2018.
(g) Since inception performance for the Russell 1000 Value, Bloomberg Barclays Intermediate U.S. Government/Credit and CPI +1% is from May 31, 1986; December 31, 1988; and December 31, 1988, respectively. The inception date of the Bloomberg Barclays U.S. Aggregate 1-3 Year and 5-Year Municipal Bond was December 31, 1992 and January 29, 1988, respectively.
6 | Q1 2017 ANNUAL REPORT
WEITZINVESTMENTS.COM
PERFORMANCE SUMMARY
| | | | | | | Annualized | | | | | |
| | | | | | | | | | | | | | | | | | | Since Invest- | | | | | | | | | |
| | | | | | | | | | | | | | | | | | | ment Style | | | | | | | | | |
| | | | Inception | | Since | | | | | | | | | | | Inception | | | | | | | | | |
| Fund Name | | | Date | | Inception | | 30-year | | 20-year | | 10-year | | (6/30/08) | | 5-year | | 1-year | | Quarter |
Value(b) | | | 5/09/86 | | | | | | | | | | | | | | | | | | | | | | | | | |
| Investor | | | | | | 10.18 | % | | 10.23 | % | | 8.90 | % | | 4.00 | % | | 8.41 | % | | 9.30 | % | | 9.81 | % | | 6.43 | % |
| Institutional | | | | | | 10.20 | | | 10.25 | | | 8.93 | | | 4.06 | | | 8.48 | | | 9.42 | | | 10.06 | | | 6.47 | |
| Russell 1000 | | | | | | 10.20 | | | 9.76 | | | 8.09 | | | 7.58 | | | 9.63 | | | 13.26 | | | 17.43 | | | 6.03 | |
Russell 1000 Value(g) | | | | | | 10.30 | | | 9.96 | | | 8.37 | | | 5.93 | | | 8.77 | | | 13.13 | | | 19.22 | | | 3.27 | |
Partners Value(a)(b) | | | 6/01/83 | | | | | | | | | | | | | | | | | | | | | | | | | |
| Investor | | | | | | 11.94 | | | 10.70 | | | 9.54 | | | 5.12 | | | — | | | 9.09 | | | 11.06 | | | 6.37 | |
| Institutional | | | | | | 11.96 | | | 10.72 | | | 9.57 | | | 5.18 | | | — | | | 9.22 | | | 11.39 | | | 6.48 | |
| Partners III | | | | | | | | | | | | | | | | | | | | | | | | | | | | |
Opportunity(a)(c) | | | 6/01/83 | | | | | | | | | | | | | | | | | | | | | | | | | |
| Investor | | | | | | 12.48 | | | 11.48 | | | 10.51 | | | 6.25 | | | — | | | 8.19 | | | 8.94 | | | 5.14 | |
| Institutional | | | | | | 12.54 | | | 11.55 | | | 10.62 | | | 6.46 | | | — | | | 8.57 | | | 9.52 | | | 5.24 | |
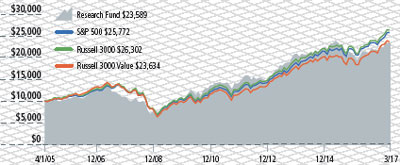
Research(a)(d) | | | 4/01/05 | | | 7.41 | | | — | | | — | | | 6.45 | | | — | | | 8.03 | | | 10.62 | | | 5.15 | |
| Russell 3000 | | | | | | — | | | 9.66 | | | 8.11 | | | 7.54 | | | — | | | 13.18 | | | 18.07 | | | 5.74 | |
| Russell 3000 Value | | | | | | — | | | 9.97 | | | 8.44 | | | 5.94 | | | — | | | 13.08 | | | 19.97 | | | 2.99 | |
| Hickory | | | 4/01/93 | | | 9.85 | | | — | | | 8.40 | | | 4.95 | | | 9.73 | | | 8.39 | | | 11.60 | | | 4.24 | |
| Russell 2500 | | | | | | 10.47 | | | — | | | 9.85 | | | 7.71 | | | 10.17 | | | 12.60 | | | 21.53 | | | 3.76 | |
| Russell 2500 Value | | | | | | 11.01 | | | — | | | 10.31 | | | 6.79 | | | 10.20 | | | 12.92 | | | 23.13 | | | 1.62 | |
| S&P 500 | | | | | | — | | | 9.65 | | | 7.86 | | | 7.51 | | | 9.61 | | | 13.30 | | | 17.17 | | | 6.07 | |
| Balanced | | | 10/01/03 | | | 5.36 | | | — | | | — | | | 4.11 | | | — | | | 5.75 | | | 6.32 | | | 3.89 | |
| Blended Index | | | | | | 6.94 | | | — | | | — | | | 6.30 | | | — | | | 8.74 | | | 10.25 | | | 3.94 | |
Core Plus Income(e) | | | 7/31/14 | | | | | | | | | | | | | | | | | | | | | | | | | |
| Investor | | | | | | 3.41 | | | — | | | — | | | — | | | — | | | — | | | 4.41 | | | 0.99 | |
| Institutional | | | | | | 3.61 | | | — | | | — | | | — | | | — | | | — | | | 4.61 | | | 1.04 | |
| U.S. Aggregate Bond | | | | | | 2.34 | | | — | | | — | | | — | | | — | | | — | | | 0.44 | | | 0.82 | |
| Short Duration | | | | | | | | | | | | | | | | | | | | | | | | | | | | |
Income(c) | | | 12/23/88 | | | | | | | | | | | | | | | | | | �� | | | | | | | |
| Investor | | | | | | 5.21 | | | — | | | 4.41 | | | 3.37 | | | — | | | 1.65 | | | 2.15 | | | 0.57 | |
| Institutional | | | | | | 5.26 | | | — | | | 4.47 | | | 3.50 | | | — | | | 1.86 | | | 2.38 | | | 0.62 | |
U.S. Aggregate 1-3 Year(g) | | | | | | — | | | — | | | 3.73 | | | 2.42 | | | — | | | 0.95 | | | 0.74 | | | 0.41 | |
Intermediate U.S. Govt/Credit(g) | | | | | | 5.86 | | | — | | | 4.87 | | | 3.76 | | | — | | | 1.88 | | | 0.42 | | | 0.78 | |
CPI + 1%(g) | | | | | | 3.55 | | | — | | | 3.15 | | | 2.75 | | | — | | | 2.24 | | | 3.41 | | | 1.23 | |
| Ultra Short | | | | | | | | | | | | | | | | | | | | | | | | | | | | |
Government(f) | | | 8/01/91 | | | 2.43 | | | — | | | 1.95 | | | 0.63 | | | — | | | 0.07 | | | 0.25 | | | 0.13 | |
| 6 Month Treasury | | | | | | 3.03 | | | — | | | 2.51 | | | 1.05 | | | — | | | 0.30 | | | 0.58 | | | 0.13 | |
| Nebraska Tax-Free | | | | | | | | | | | | | | | | | | | | | | | | | | | | |
Income(a) | | | 10/01/85 | | | 4.69 | | | — | | | 3.58 | | | 2.47 | | | — | | | 1.03 | | | (0.54 | ) | | 0.78 | |
5-Year Municipal Bond(g) | | | | | | — | | | — | | | 4.32 | | | 3.84 | | | — | | | 2.06 | | | 0.35 | | | 1.90 | |
7 | Q1 2017 ANNUAL REPORT
ANALYST CORNER
A Perspective on Dollar Tree, Inc.
By Dave Perkins, CFA
Dollar Tree operates a network of approximately 14,400 discount variety stores across the United States and Canada under the Dollar Tree, Dollar Tree Canada and Family Dollar brands. During the summer of 2015, Dollar Tree completed a transformational acquisition of competitor Family Dollar Stores for $8.8 billion and now operates under two distinct banners. The legacy Dollar Tree segment operates 6,400 stores, offering everyday basics, seasonal, closeout and promotional merchandise at a fixed $1 price point ($1.25 CAD in Canada). The Family Dollar segment operates approximately 8,000 general merchandise discount retail stores focused on providing customers basic necessities such as diapers, food and paper products as well as seasonal merchandise at prices between $1 and $10.
Value & Convenience
The dollar store model was born in the 1950s, targeting small ticket (typically less than $10), weekly "fill-in" visits between larger trips to the grocery store (and later, mass merchants like Wal-Mart). Small stores (6,000-10,000 square-feet) with a narrower selection of lower priced goods allowed dollar stores to operate economically in close proximity to customers. This combination of value and convenience resonated with lower- to middle-income American consumers, leading to a doubling in the number of dollar stores across the country since 2003. As their reach expanded, dollar stores generated sales comparable to that of grocers and mass merchants on the 7,000 items stocked, providing the opportunity to buy those same products at similar discounts. At the same time, low-cost, efficient store footprints allowed dollar stores to build local density, lowering logistics costs. As a result, dollar stores offer convenience at equal or lower prices versus their larger grocery and mass store competitors. They also match the relative ease of drug and convenience stores, but with 20-40% lower prices. These twin advantages have proven a durable niche, allowing dollar stores to generate consistent growth, attractive returns on capital and significant excess cash flow.
The Giving Tree
The legacy Dollar Tree banner is the last remaining true dollar store where every item is a dollar. Dollar Tree prides itself on being a 'variety store,' aiming to strike a balance between consumables such as food and toilet paper and more discretionary items such as toys, stationery, party supplies and holiday décor. Dollar Tree describes its core customer as "a woman on the go, with household income of $40,000+ balancing work, home and family". The Dollar Tree concept has proven effective in serving this core customer in communities of all sizes, with remarkably consistent and attractive financial results. Same-store sales have risen in 22 of the past 23 years with store payback periods between two and three years (pre-tax), among the most attractive in retail. Dollar Tree has intentionally shared a meaningful portion of these scale benefits with customers in the form of higher quantity and/or better quality for the customers' dollar. We believe the company should comfortably grow square footage at a 3-5% annual clip over the next 5-10 years, driving solid mid-single-digit profit growth.
Improving Family Dollar
For most of the past decade, Family Dollar's operating performance has lagged that of peers Dollar General and Dollar Tree. Much of that underperformance can be traced to two costly strategic errors. First, in response to burgeoning demand following the '08-09 financial crisis, the company embarked upon an aggressive multi-year store expansion plan by increasing density in existing markets and introducing new Family Dollar stores into middle and upper-middle class suburban markets. The expansion cannibalized its existing store base, raised costs and pressured margins. With same-store sales falling and store productivity declining, Family Dollar made its second mistake–abandoning its everyday low price (EDLP) model in favor of a 'high-low' promotional pricing strategy aimed at reigniting store traffic. Gross margins fell further, leading to unsustainable cost cuts including maintenance deferral and already thin in-store labor. Pressure to sell the company mounted, culminating in activist investor Carl Icahn purchasing a 10% stake in the company and demanding its sale.
Dollar Tree ultimately won the ensuing and well-chronicled battle for Family Dollar. A key question for Dollar Tree investors is whether the problems it inherited at Family Dollar are structural–a combination of a suboptimal real estate footprint, damaged brand and undifferentiated product offering–or the result of a series of strategic missteps that can be gradually undone. Answering this question is nuanced, but we believe Family Dollar should return to historical operating margin levels (roughly 8%) over the next several years under the Dollar Tree leadership team's care. Returning Family Dollar to an EDLP pricing model,
8 | Q1 2017 ANNUAL REPORT
WEITZINVESTMENTS.COM
improving its store merchandise (more private label and $1 price points) and in-stock levels, catching up on deferred maintenance, fixing in-store staffing levels and rebannering underperforming stores should lead to a gradual improvement in profitability. Longer-term, supply chain opportunities could result in Family Dollar closing the margin gap with consumable-heavy peer Dollar General.
Durable Retail?
Retailing is a notoriously difficult business. Creating lasting value requires continual reinvestment, extreme cost consciousness, painful evolution and competitive paranoia. We believe Dollar Tree demonstrates these traits. Discount retail is becoming more competitive with low-margin, hard discounters like Aldi expanding rapidly and Lidl planning a major push into the U.S. over the next five years. Amazon (which we also own in Value Fund and Research Fund) continues to invest significant sums into its already formidable fulfillment network, with an eye toward daily–even hourly–delivery. The combined Dollar Tree is unlikely to be entirely immune to competitive encroachment, but our working thesis is that the company's combination of convenience and low average ticket are underappreciated competitive weapons in serving the low- to middle-income U.S. consumer. In short, we continue to see Dollar Tree as one of the 'disruptors,' with an attractive runway of store growth and self-help opportunities at Family Dollar. We believe Dollar Tree's stock provides long-term investors with a healthy margin of safety in the low $70s. Our base case estimate of intrinsic value falls between $100 and $105 per share.
Included above is a reference to the term "margin of safety". This term refers to purchasing securities at a price that is less than our estimate of intrinsic value. A potential "margin of safety" may limit downside risk and optimize the potential for growth.
As of March 31, 2017: Dollar Tree, Inc. represented 1.6% and 2.0% of the Value and Research Funds' net assets, respectively. Dollar General Corp. represented 1.1% of the Research Fund's net assets. Amazon.com, Inc. represented 1.2% and 2.3% of the Value and Research Funds' net assets, respectively.
David Perkins, CFA®, joined Weitz Investment Management in 2004 as a research analyst and became co-manager of Value Fund in December 2011. Prior to his time with Weitz, Dave was an equity analyst at McCarthy Group Asset Management. Dave has a bachelor's degree in business systems from Taylor University in Upland, Indiana. He has been a CFA® charterholder since 2009.
9 | Q1 2017 ANNUAL REPORT
VALUE FUND
Investment Style: Large-Cap Value
Co-Portfolio Managers: Brad Hinton, CFA & Dave Perkins, CFA
Fiscal Year Contributors
Liberty Broadband's principal asset consists of its interest in Charter Communications. Shares of Charter, and cable companies broadly, have performed well in the wake of the U.S. election. Although much remains to be seen, investors generally believe that regulatory pressures will ease as a result of a presumably more "industry friendly" Federal Communications Commission (FCC) as well as a Justice Department that may look more favorably on further industry consolidation. We have invested in Liberty Broadband because we like the operating strategy at Charter, and while regulatory relief would certainly be a benefit, it's not an explicit part of our investment thesis. Liberty Broadband shares trade at a discount to their underlying Charter investment due to the added complexity of Liberty's involvement. We are confident Liberty Broadband's management will ultimately collapse this discount, thereby making Liberty Broadband a cheaper opportunity to invest in Charter's future.
Liberty SiriusXM is a tracking stock, with its principal asset being Liberty Media's 67% ownership of satellite radio operator SiriusXM. Thanks to the continued strength of new car sales in the U.S., SiriusXM has enjoyed very robust operating results in recent quarters, as 75% of all new cars sold feature a satellite radio built directly into the dashboard. New car buyers are offered a free trial of the service and typically convert to paying subscribers at a healthy rate. Recently, SiriusXM has opened a new channel for customer growth by partnering with used car dealers as well as service providers to offer trial subscriptions. Although we don't anticipate these trials will convert at the same rate as those associated with new car sales, we believe it provides an excellent opportunity to remarket to existing car radios as well as lessen the company's reliance on the cyclical new car market. Shares of Liberty SiriusXM mirrored most of SiriusXM stock price gain of the prior twelve months but still trades at a discount to our intrinsic value of standalone SiriusXM.
Berkshire Hathaway is a conglomerate holding company owning subsidiaries engaged in a number of business activities. Shares benefited from optimism that a combination of higher interest rates, lower taxes and increased domestic activity would increase earnings at Berkshire's insurance and industrial businesses. We believe Berkshire will compound wealth for its shareholders for the foreseeable future.
Quarterly Contributors
Liberty Broadband's principal asset consists of its interest in Charter Communications. In late January, rumors broke that Verizon Communications had made an informal acquisition offer to Charter Communications, sending both Charter and Liberty Broadband shares higher. We acknowledge that such a combination makes strategic sense for Verizon as it searches for an efficient means to deploy 5G wireless technology (which will require very dense, wired networks). However, we suspect shareholders can reap greater value from Charter continuing to integrate its Time Warner Cable and Bright House Networks acquisitions on a stand-alone basis. That said, we believe management will pursue the right course (stand-alone or M&A) that will maximize long-term shareholder value.
Liberty Global is the largest international cable company, with operations in 14 countries providing video, broadband Internet, fixed-line telephone and mobile services to its customers. Liberty Global's shares were strong in the first calendar quarter and made up some of the ground that had been lost during the prior year. The company's quarterly results were solid, but shares have likely been driven upward as speculation of deals in the media industry has heated up of late, including revived speculation of a potential Vodafone transaction. We view Liberty Global as a standalone provider of broadband and Pay-TV services as an attractive opportunity, and although a potential acquisition by Vodafone may create value for shareholders, our investment thesis is not dependent on such an event.
Allergan is a global specialty pharmaceutical company focusing on the development, manufacturing, marketing and distribution of brand name, biosimilar and over-the-counter pharmaceutical products. Allergan's stock rebounded as the company reported stronger-than-expected fourth quarter results following a string of disappointing quarters. The company's initial outlook for 2017 came in ahead of our forecasts, with strong growth across six of its seven therapeutic areas expected to result in high single-digit revenue growth and high teens adjusted cash earnings per share growth. Allergan closed its $2.9 billion acquisition of LifeCell in February and also announced an agreement to acquire body sculpting device manufacturer ZELTIQ Aesthetics for $2.5 billion. If ZELTIQ shareholders approve the merger, Allergan will add two durable assets to its aesthetics portfolio that together should generate roughly $1.0 billion in annual sales with attractive organic growth profiles. We continue to believe Allergan shares have attractive upside potential from current prices.
New Holdings
Dollar Tree
Fiscal Year Detractors
QVC Group is a tracking stock issued by Liberty Interactive which includes subsidiaries QVC, zulily and its interest in HSN. QVC Group operates an American television network and also operates televised and online shopping experiences in other countries. In the third calendar quarter of 2016, shares of QVC Group fell after management indicated that its QVC U.S. business had experienced a significant sales headwind. QVC's U.S. business, which had not seen a decline since the Great Recession, saw sales fall nearly 6% in the third quarter and 7% in the fourth quarter, as several categories simultaneously slowed. Importantly, we don't view these issues as a sign of the QVC model suddenly being broken, and management has indicated sales results have begun to stabilize. QVC's customer retention and loyalty remain strong, as does viewership of their network. Furthermore, the international businesses appear unaffected by the current U.S.-centric slowdown. Although the decline in QVC shares has been disappointing, management has taken advantage by accelerating their share repurchase to foster per share value growth.
Endo International is a specialty healthcare company engaged in developing, manufacturing, marketing and distributing branded pharmaceutical and generic products and medical devices. Endo experienced significantly worse-than-anticipated erosion at Qualitest, its legacy generic drug platform. The competitive environment changed quickly, and we were slow to recognize it. After conversations with both management and a couple of the larger drug buying consortiums, we could not gain comfort in the durability of Endo's now lower earnings base. The company's balance sheet and potential legal obligations (liabilities relating to the company's legacy vaginal mesh products) left less room for error given growth challenges on the branded side of Endo's business. Considering the erosion in our investment thesis, questions about management's ability to identify and navigate risk, and a growing list of unknowns surrounding the business, we elected to close our position in the second calendar quarter of 2016 and refocus our capital in more attractive opportunities.
Allergan is a global specialty pharmaceutical company focusing on the development, manufacturing, marketing and distribution of brand name, biosimilar and over-the-counter pharmaceutical products. Allergan shares finished 2016 on a higher note, following an otherwise challenging year. While revenues and earnings were shy of expectations and drug price regulation dominated headlines throughout much of the past year, the health of Allergan's core underlying growth drivers gave us confidence to continue buying shares at increasingly attractive discounts during the fourth calendar quarter. Encouragingly, recent operating results have come in ahead of internal forecasts, and the company's initial outlook for 2017 exceeded our expectations. Growth across Allergan's therapeutic segment looks healthy, with the global aesthetics franchise demonstrating notable strength. Headwinds from legislative and regulatory developments continue to bear monitoring, but from today's vantage point, we believe any impact to long-term business value should be manageable. We continue to believe Allergan shares have attractive upside potential from current prices.
Quarterly Detractors
Range Resources is an independent producer of natural gas and natural gas liquids (NGLs) based in Fort Worth, Texas, with operations in the Marcellus shale and emerging Terryville field. Range Resources stock weakened during the first quarter as mild winter weather once again put downward pressure on natural gas prices. The company's higher-than-projected 2017 drilling budget and 20% 2018 production growth target likely also raised fears that Range's balance sheet could once again deteriorate in the event of a prolonged downturn in gas prices. March supply/demand was kinder than January and February, however, leaving natural gas storage levels in better shape entering injection season than a year ago (approximately 20% lower). Longer-term demand fundamentals for gas remain attractive, and improving oil prices together with international transport capacity have provided a spark for natural gas liquids prices that should benefit Range's cash flow. We believe Range shares are undervalued, assuming mid-cycle natural gas prices of $2.75 or higher.
TransDigm Group is a designer, producer and supplier of engineered aircraft components for use on commercial and military aircraft. The prospect of rising interest rates and accusations of rigged/fake bids from a critical short report pressured TransDigm's stock during January. The company's levered balance sheet, while married with historically consistent cash flows, increases the company's sensitivity to potential declines in profitability. In his first several weeks in office, President Trump targeted the cost of specific programs at several of TransDigm's larger peers. While it remains to be seen what, if any, lasting impact this scrutiny will have on growth and cash flow, with TransDigm's shares close to our estimate of intrinsic value, we elected to close our position in the stock with a nice gain.
United Parcel Service (UPS) is a package delivery company and a provider of supply chain management solutions. Over the past several years, the growth of e-commerce has created challenges for UPS during its peak holiday shipping season. While the market can not quite decide whether the onslaught of less profitable residential delivery volume is beneficial, UPS has announced plans to significantly accelerate capital spending in anticipation of even more residential delivery volume. Investors' lack of faith in management's intended path led to this most recent sell off. We believe the company's efforts toward a more streamlined holiday shipping experience will bear fruit in time, and we expect the company's stock price will eventually reflect this stepped-up commitment to its customers.
Eliminated Holdings
Motorola Solutions and TransDigm Group
Please visit the Fund's commentary section on our website for additional information.
10 | Q1 2017 ANNUAL REPORT
WEITZINVESTMENTS.COM
Returns
| | | | Annualized | | | | | | | |
| | | | | | | | | | | | | Since Invest- | | | | | | | | | | | | |
| | | | Since | | | | | | | | ment Style | | | | | | | | | | | | |
| | | | Inception | | | | | | | | Inception | | | | | | | | | | | | |
| | | | (5/9/1986) | 20-year | | 10-year | | (6/30/08) | | 5-year | | 3-year | | 1-year | | Quarter |
| WVALX - Investor Class | | | 10.18 | % | | 8.90 | % | | 4.00 | % | | 8.41 | % | | 9.30 | % | | 3.62 | % | | 9.81 | % | | 6.43 | % |
| WVAIX - Institutional Class | | | 10.20 | | | 8.93 | | | 4.06 | | | 8.48 | | | 9.42 | | | 3.81 | | | 10.06 | | | 6.47 | |
| S&P 500 | | | 10.18 | | | 7.86 | | | 7.51 | | | 9.61 | | | 13.30 | | | 10.37 | | | 17.17 | | | 6.07 | |
| Russell 1000 | | | 10.20 | | | 8.09 | | | 7.58 | | | 9.63 | | | 13.26 | | | 9.99 | | | 17.43 | | | 6.03 | |
| Russell 1000 Value | | | 10.30 | * | | 8.37 | | | 5.93 | | | 8.77 | | | 13.13 | | | 8.67 | | | 19.22 | | | 3.27 | |
Growth of $10,000
This chart depicts the change in the value of a $10,000 investment in the Value Fund – Investor Class for the period since inception (5/9/86) through March 31, 2017, as compared with the growth of the Standard & Poor's 500, Russell 1000 and Russell 1000 Value Indices during the same period. Index performance is hypothetical and is shown for illustrative purposes only.
* Since 5/31/1986
Capitalization
Top 10 Stock Holdings
| | % of Net Assets |
| Liberty Broadband Corp. - Series C | 7.5 | |
| Berkshire Hathaway Inc. - Class B | 7.2 | |
| Liberty Global Group - Class C | 5.8 | |
| Allergan plc | 5.4 | |
| Twenty-First Century Fox, Inc. - Class A | 4.0 | |
| Alphabet, Inc. - Class C | 3.9 | |
| Mastercard Inc. - Class A | 3.8 | |
| Laboratory Corp. of America Holdings | 3.7 | |
| QVC Group - Series A | 3.4 | |
| Oracle Corp. | 3.4 | |
| | 48.1 | |
Top Performers
| | | | | | Average | | | | |
| | | | Return | | | Weight | | | Contribution | |
| Liberty Broadband Corp. - Series C | | | 16.6 | % | | 7.2 | % | | 1.11 | % |
| Liberty Global Group - Class C | | | 18.0 | | | 5.6 | | | 0.91 | |
| Allergan plc | | | 14.1 | | | 5.3 | | | 0.75 | |
| Twenty-First Century Fox, Inc. - Class A | | | 16.2 | | | 4.0 | | | 0.69 | |
| Oracle Corp. | | | 16.5 | | | 3.1 | | | 0.48 | |
Industry Breakdown
| | % of Net Assets |
| Consumer Discretionary | 30.2 | |
| Information Technology | 15.5 | |
| Financials | 12.4 | |
| Health Care | 11.3 | |
| Materials | 5.0 | |
| Energy | 3.4 | |
| Consumer Staples | 2.6 | |
| Industrials | 1.9 | |
| Cash Equivalents/Other | 17.7 | |
| | 100.0 | |
Bottom Performers
| | | | | | | Average | | | | |
| | | | Return | | | Weight | | | Contribution | |
| Range Resources Corp. | | | (15.2 | )% | | 1.2 | % | | (0.20 | )% |
| TransDigm Group, Inc. | | | (11.6 | ) | | 0.4 | | | (0.17 | ) |
| United Parcel Service, Inc. - Class B | | | (5.7 | ) | | 1.9 | | | (0.11 | ) |
| Halliburton Co. | | | (8.7 | ) | | 0.8 | | | (0.07 | ) |
| QVC Group - Series A | | | 0.2 | | | 3.3 | | | 0.00 | |
Contributions to Fund performance are based on actual daily holdings. Securities may have been bought or sold during the quarter. Source: FactSet Portfolio Analytics Return shown is the actual quarterly return of the security or combination of share classes.
Returns assume reinvestment of dividends and redemption at the end of each period, and reflect the deduction of annual operating expenses which as stated in its most recent prospectus are 1.23% and 1.08% (gross) of the Fund's Investor and Institutional Class net assets, respectively. Total returns shown include fee waivers and expense reimbursements, if any; total returns would have been lower had there been no waivers and/or reimbursements. Past performance does not guarantee future results. The investment return and the principal value of an investment in this Fund will fluctuate so that an investor's shares, when redeemed, may be worth more or less than the original cost. Current performance may be higher or lower than the performance data quoted. Performance data current to the most recent month-end may be obtained at www.weitzinvestments.com/funds_and_performance/fund_ performance.fs.
See page 6 for additional performance disclosures. See page 74 for a description of all indices.
Performance information does not reflect the deduction of taxes that a shareholder would pay on Fund distributions or the redemption of Fund shares.
11 | Q1 2017 ANNUAL REPORT
PARTNERS VALUE FUND
Investment Style: Multi-Cap Value
Co-Portfolio Managers: Wally Weitz, CFA & Brad Hinton, CFA
Liberty Broadband's principal asset consists of its interest in Charter Communications. Shares of Charter, and cable companies broadly, have performed well in the wake of the U.S. election. Although much remains to be seen, investors generally believe that regulatory pressures will ease as a result of a presumably more "industry friendly" Federal Communications Commission (FCC) as well as a Justice Department that may look more favorably on further industry consolidation. We have invested in Liberty Broadband because we like the operating strategy at Charter, and while regulatory relief would certainly be a benefit, it's not an explicit part of our investment thesis. Liberty Broadband shares trade at a discount to their underlying Charter investment due to the added complexity of Liberty's involvement. We are confident Liberty Broadband's management will ultimately collapse this discount, thereby making Liberty Broadband a cheaper opportunity to invest in Charter's future.
Berkshire Hathaway is a conglomerate holding company owning subsidiaries engaged in a number of business activities. Shares benefited from optimism that a combination of higher interest rates, lower taxes and increased domestic activity would increase earnings at Berkshire's insurance and industrial businesses. We believe Berkshire will compound wealth for its shareholders for the foreseeable future.
ILG, Inc. is a provider of non-traditional lodging, encompassing a portfolio of leisure businesses, from exchange and vacation rental to vacation ownership. A year ago, the stock price was suffering under the combined weight of both a general market swoon and a share overhang from ILG's imminent merger with Starwood's timeshare business. That merger ultimately put over half (70+ million shares) of this small-cap company's stock in the hands of large-cap hotel investors. One year later, the market has marched steadily higher, and the bulk of those shares have likely found homes in the portfolios of more appropriate investors. As such, the stock price has rebounded and reclaimed much of what it had lost in the year prior. We continue to like the prospects and valuation of the newly combined entity.
Liberty Broadband's principal asset consists of its interest in Charter Communications. In late January, rumors broke that Verizon Communications had made an informal acquisition offer to Charter Communications, sending both Charter and Liberty Broadband shares higher. We acknowledge that such a combination makes strategic sense for Verizon as it searches for an efficient means to deploy 5G wireless technology (which will require very dense, wired networks). However, we suspect shareholders can reap greater value from Charter continuing to integrate its Time Warner Cable and Bright House Networks acquisitions on a stand-alone basis. That said, we believe management will pursue the right course (stand-alone or M&A) that will maximize long-term shareholder value.
Liberty Global is the largest international cable company, with operations in 14 countries providing video, broadband Internet, fixed-line telephone and mobile services to its customers. Liberty Global's shares were strong in the first calendar quarter and made up some of the ground that had been lost during the prior year. The company's quarterly results were solid, but shares have likely been driven upward as speculation of deals in the media industry has heated up of late, including revived speculation of a potential Vodafone transaction. We view Liberty Global as a standalone provider of broadband and Pay-TV services as an attractive opportunity, and although a potential acquisition by Vodafone may create value for shareholders, our investment thesis is not dependent on such an event.
Allergan is a global specialty pharmaceutical company focusing on the development, manufacturing, marketing and distribution of brand name, biosimilar and over-the-counter pharmaceutical products. Allergan's stock rebounded as the company reported stronger-than-expected fourth quarter results following a string of disappointing quarters. The company's initial outlook for 2017 came in ahead of our forecasts, with strong growth across six of its seven therapeutic areas expected to result in high single-digit revenue growth and high teens adjusted cash earnings per share growth. Allergan closed its $2.9 billion acquisition of LifeCell in February and also announced an agreement to acquire body sculpting device manufacturer ZELTIQ Aesthetics for $2.5 billion. If ZELTIQ shareholders approve the merger, Allergan will add two durable assets to its aesthetics portfolio that together should generate roughly $1.0 billion in annual sales with attractive organic growth profiles. We continue to believe Allergan shares have attractive upside potential from current prices.
No new equity holdings were added in the first quarter 2017.
QVC Group is a tracking stock issued by Liberty Interactive which includes subsidiaries QVC, zulily and its interest in HSN. QVC Group operates an American television network and also operates televised and online shopping experiences in other countries. In the third calendar quarter of 2016, shares of QVC Group fell after management indicated that its QVC U.S. business had experienced a significant sales headwind. QVC's U.S. business, which had not seen a decline since the Great Recession, saw sales fall nearly 6% in the third quarter and 7% in the fourth quarter, as several categories simultaneously slowed. Importantly, we don't view these issues as a sign of the QVC model suddenly being broken, and management has indicated sales results have begun to stabilize. QVC's customer retention and loyalty remain strong, as does viewership of their network. Furthermore, the international businesses appear unaffected by the current U.S.-centric slowdown. Although the decline in QVC shares has been disappointing, management has taken advantage by accelerating their share repurchase to foster per share value growth.
Fossil Group is the fourth-largest producer of watches and the largest licenser of watches and jewelry globally. Fossil continues to experience the same headwinds from the previous year: weak foot traffic as consumers shift to e-commerce, revenue headwinds from a strong U.S. dollar, and a difficult wholesale channel environment that has been exacerbated by inventory de-stocking. Despite growth in Fossil Group's owned brands, Skagen and Fossil, weakness in the licensed brand portfolio, in particular Michael Kors, has weighed on watch sales. During the fourth calendar quarter earnings release, management guided 2017 earnings well below consensus expectations. In addition, management notified the market of another year of elevated investments in wearables and omni-channel initiatives as well as restructuring charges as Fossil reduces their store footprint. Fossil's wearable technology launches in fourth quarter were successful, but 2017 will be the first year the segment will be material to results as management expands SKU's (distinct types of items for sale) and extends to additional licensed brands.
Endo International is a specialty healthcare company engaged in developing, manufacturing, marketing and distributing branded pharmaceutical and generic products and medical devices. Endo experienced significantly worse-than-anticipated erosion at Qualitest, its legacy generic drug platform. The competitive environment changed quickly, and we were slow to recognize it. After conversations with both management and a couple of the larger drug buying consortiums, we could not gain comfort in the durability of Endo's now lower earnings base. The company's balance sheet and potential legal obligations (liabilities relating to the company's legacy vaginal mesh products) left less room for error given growth challenges on the branded side of Endo's business. Considering the erosion in our investment thesis, questions about management's ability to identify and navigate risk, and a growing list of unknowns surrounding the business, we elected to close our position in the second calendar quarter of 2016 and refocus our capital in more attractive opportunities.
Fossil Group - Please refer to the Fiscal Year synopsis.
Range Resources is an independent producer of natural gas and natural gas liquids (NGLs) based in Fort Worth, Texas, with operations in the Marcellus shale and emerging Terryville field. Range Resources stock weakened during the first quarter as mild winter weather once again put downward pressure on natural gas prices. The company's higher-than-projected 2017 drilling budget and 20% 2018 production growth target likely also raised fears that Range's balance sheet could once again deteriorate in the event of a prolonged downturn in gas prices. March supply/demand was kinder than January and February, however, leaving natural gas storage levels in better shape entering injection season than a year ago (approximately 20% lower). Longer-term demand fundamentals for gas remain attractive, and improving oil prices together with international transport capacity have provided a spark for natural gas liquids prices that should benefit Range's cash flow. We believe Range shares are undervalued, assuming mid-cycle natural gas prices of $2.75 or higher.
TransDigm Group is a designer, producer and supplier of engineered aircraft components for use on commercial and military aircraft. The prospect of rising interest rates and accusations of rigged/fake bids from a critical short report pressured TransDigm's stock during January. The company's levered balance sheet, while married with historically consistent cash flows, increases the company's sensitivity to potential declines in profitability. In his first several weeks in office, President Trump targeted the cost of specific programs at several of TransDigm's larger peers. While it remains to be seen what, if any, lasting impact this scrutiny will have on growth and cash flow, with TransDigm's shares close to our estimate of intrinsic value, we elected to close our position in the stock with a nice gain.
Avon Products, Fossil Group and TransDigm Group
Please visit the Fund's commentary section on our website for additional information.
12 | Q1 2017 ANNUAL REPORT
WEITZINVESTMENTS.COM
Returns
| | | | Annualized | | | | | | |
| | | | Since | | | | | | | | | | | | | | | | | | |
| | | | Inception | | | | | | | | | | | | | | | | | | |
| | | | (6/1/1983) | | 20-year | | 10-year | | 5-year | | 3-year | | 1-year | | Quarter |
| WPVLX - Investor Class | | | 11.94 | % | | 9.54 | % | | 5.12 | % | | 9.09 | % | | 2.66 | % | | 11.06 | % | | 6.37 | % |
| WPVIX - Institutional Class | | | 11.96 | | | 9.57 | | | 5.18 | | | 9.22 | | | 2.86 | | | 11.39 | | | 6.48 | |
| S&P 500 | | | 10.91 | | | 7.86 | | | 7.51 | | | 13.30 | | | 10.37 | | | 17.17 | | | 6.07 | |
| Russell 3000 | | | 10.70 | | | 8.11 | | | 7.54 | | | 13.18 | | | 9.76 | | | 18.07 | | | 5.74 | |
| Russell 3000 Value | | | 11.22 | | | 8.44 | | | 5.94 | | | 13.08 | | | 8.58 | | | 19.97 | | | 2.99 | |
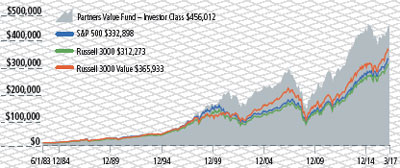
Growth of $10,000
This chart depicts the change in the value of a $10,000 investment in the Partners Value Fund - Investor Class for the period since inception (6/1/83) through March 31, 2017, as compared with the growth of the Standard & Poor's 500, Russell 3000 and Russell 3000 Value Indices during the same period. Index performance is hypothetical and is shown for illustrative purposes only.
Capitalization
Top 10 Stock Holdings
| | % of Net Assets |
| Liberty Broadband Corp. - Series A & C | 8.3 | |
| Liberty Global Group - Class C | 7.4 | |
| Berkshire Hathaway Inc. - Class B | 7.1 | |
| Allergan plc | 5.2 | |
| Twenty-First Century Fox, Inc. - Class A | 4.4 | |
| Laboratory Corp. of America Holdings | 3.9 | |
| Visa Inc. - Class A | 3.5 | |
| Colfax Corp. | 3.2 | |
| QVC Group - Series A | 3.1 | |
| Redwood Trust, Inc. | 3.0 | |
| | 49.1 | |
Top Performers
| | | | | | | Average | | | | |
| | | | Return | | | Weight | | | Contribution | |
| Liberty Broadband Corp. - Series A & C | | | 17.0 | % | | 7.9 | % | | 1.23 | % |
| Liberty Global Group - Class C | | | 18.0 | | | 7.1 | | | 1.15 | |
| Allergan plc | | | 14.1 | | | 5.0 | | | 0.65 | |
| Twenty-First Century Fox, Inc. - Class A | | | 16.2 | | | 4.1 | | | 0.64 | |
| Liberty SiriusXM Group - Series A & C | | | 13.5 | | | 3.2 | | | 0.44 | |
Industry Breakdown
| | % of Net Assets |
| Consumer Discretionary | 32.6 | |
| Financials | 16.3 | |
| Information Technology | 15.5 | |
| Health Care | 9.1 | |
| Industrials | 5.2 | |
| Energy | 2.9 | |
| Cash Equivalents/Other | 18.4 | |
| | 100.0 | |
Bottom Performers
| | | | | | | Average | | | | |
| | | | Return | | | Weight | | | Contribution | |
| Fossil Group, Inc. | | | (32.5 | )% | | 1.0 | % | | (0.47 | )% |
| Range Resources Corp. | | | (15.2 | ) | | 1.8 | | | (0.27 | ) |
| TransDigm Group, Inc. | | | (11.6 | ) | | 0.5 | | | (0.22 | ) |
| Avon Products, Inc. | | | (12.7 | ) | | 0.8 | | | (0.17 | ) |
| QVC Group - Series A | | | 0.2 | | | 3.0 | | | 0.00 | |
Contributions to Fund performance are based on actual daily holdings. Securities may have been bought or sold during the quarter. Source: FactSet Portfolio Analytics Return shown is the actual quarterly return of the security or combination of share classes.
Returns assume reinvestment of dividends and redemption at the end of each period, and reflect the deduction of annual operating expenses which as stated in its most recent prospectus are 1.26% and 1.07% (gross) of the Fund's Investor and Institutional Class net assets, respectively. Total returns shown include fee waivers and expense reimbursements, if any; total returns would have been lower had there been no waivers and/or reimbursements. Past performance does not guarantee future results. The investment return and the principal value of an investment in this Fund will fluctuate so that an investor's shares, when redeemed, may be worth more or less than the original cost. Current performance may be higher or lower than the performance data quoted. Performance data current to the most recent month-end may be obtained at www.weitzinvestments.com/funds_and_performance/fund_ performance.fs.
See page 6 for additional performance disclosures. See page 74 for a description of all indices.
Performance information does not reflect the deduction of taxes that a shareholder would pay on Fund distributions or the redemption of Fund shares.
13 | Q1 2017 ANNUAL REPORT
PARTNERS III OPPORTUNITY FUND
Investment Style: Multi-Cap Alternative
Portfolio Manager: Wally Weitz, CFA
Fiscal Year Contributors
Liberty Broadband's principal asset consists of its interest in Charter Communications. Shares of Charter, and cable companies broadly, have performed well in the wake of the U.S. election. Although much remains to be seen, investors generally believe that regulatory pressures will ease as a result of a presumably more "industry friendly" Federal Communications Commission (FCC) as well as a Justice Department that may look more favorably on further industry consolidation. We have invested in Liberty Broadband because we like the operating strategy at Charter, and while regulatory relief would certainly be a benefit, it's not an explicit part of our investment thesis. Liberty Broadband shares trade at a discount to their underlying Charter investment due to the added complexity of Liberty's involvement. We are confident Liberty Broadband's management will ultimately collapse this discount, thereby making Liberty Broadband a cheaper opportunity to invest in Charter's future.
Liberty SiriusXM is a tracking stock, with its principal asset being Liberty Media's 67% ownership of satellite radio operator SiriusXM. Thanks to the continued strength of new car sales in the U.S., SiriusXM has enjoyed very robust operating results in recent quarters, as 75% of all new cars sold feature a satellite radio built directly into the dashboard. New car buyers are offered a free trial of the service and typically convert to paying subscribers at a healthy rate. Recently, SiriusXM has opened a new channel for customer growth by partnering with used car dealers as well as service providers to offer trial subscriptions. Although we don't anticipate these trials will convert at the same rate as those associated with new car sales, we believe it provides an excellent opportunity to remarket to existing car radios as well as lessen the company's reliance on the cyclical new car market. Shares of Liberty SiriusXM mirrored most of SiriusXM stock price gain of the prior twelve months but still trades at a discount to our intrinsic value of standalone SiriusXM.
Berkshire Hathaway is a conglomerate holding company owning subsidiaries engaged in a number of business activities. Shares benefited from optimism that a combination of higher interest rates, lower taxes and increased domestic activity would increase earnings at Berkshire's insurance and industrial businesses. We believe Berkshire will compound wealth for its shareholders for the foreseeable future.
Quarterly Contributors
Liberty Broadband's principal asset consists of its interest in Charter Communications. In late January, rumors broke that Verizon Communications had made an informal acquisition offer to Charter Communications, sending both Charter and Liberty Broadband shares higher. We acknowledge that such a combination makes strategic sense for Verizon as it searches for an efficient means to deploy 5G wireless technology (which will require very dense, wired networks). However, we suspect shareholders can reap greater value from Charter continuing to integrate its Time Warner Cable and Bright House Networks acquisitions on a stand-alone basis. That said, we believe management will pursue the right course (stand-alone or M&A) that will maximize long-term shareholder value.
Liberty Global is the largest international cable company, with operations in 14 countries providing video, broadband Internet, fixed-line telephone and mobile services to its customers. Liberty Global's shares were strong in the first calendar quarter and made up some of the ground that had been lost during the prior year. The company's quarterly results were solid, but shares have likely been driven upward as speculation of deals in the media industry has heated up of late, including revived speculation of a potential Vodafone transaction. We view Liberty Global as a standalone provider of broadband and Pay-TV services as an attractive opportunity, and although a potential acquisition by Vodafone may create value for shareholders, our investment thesis is not dependent on such an event.
Allergan is a global specialty pharmaceutical company focusing on the development, manufacturing, marketing and distribution of brand name, biosimilar and over-the-counter pharmaceutical products. Allergan's stock rebounded as the company reported stronger-than-expected fourth quarter results following a string of disappointing quarters. The company's initial outlook for 2017 came in ahead of our forecasts, with strong growth across six of its seven therapeutic areas expected to result in high single-digit revenue growth and high teens adjusted cash earnings per share growth. Allergan closed its $2.9 billion acquisition of LifeCell in February and also announced an agreement to acquire body sculpting device manufacturer ZELTIQ Aesthetics for $2.5 billion. If ZELTIQ shareholders approve the merger, Allergan will add two durable assets to its aesthetics portfolio that together should generate roughly $1.0 billion in annual sales with attractive organic growth profiles. We continue to believe Allergan shares have attractive upside potential from current prices.
New Holdings
No new equity holdings were added in the first quarter 2017.
Fiscal Year Detractors
LiLAC Group is a tracking stock distributed by Liberty Global with respect to its businesses in Latin America and the Caribbean. LiLAC's stock has struggled throughout the last year as management revealed additional unanticipated headaches with the May 2016 acquisition of Cable & Wireless Communications. After meeting with management, we believe the company understands the nature of the problem and is set to grow from this reset base. We anticipate that in the coming quarters, LiLAC will demonstrate the benefits they saw in this acquisition, beginning with identifying operating synergies for investors. Management further demonstrated their confidence in their revised outlook by announcing a $300 million stock repurchase authorization.
Wesco Aircraft Holdings is the world's leading distributor and provider of supply chain services to the global aerospace industry. During the past year, the company has continued its transition to a "One Wesco" culture, which includes an implementation of continuous improvement initiatives. In addition, the company has won several new contracts. These new contracts have required funding of upfront inventory and preparation expenses, temporarily depressing free cash flow. We believe Wesco is making significant progress in transforming its business, which we expect to soon be reflected in reported results.
SPDR S&P 500 ETF Trust, PowerShares QQQ Trust and iShares Russell 2000 ETF Partners III Opportunity Fund has the broadest toolkit of our equity funds. The Fund invests in companies of all sizes and typically maintains short positions. Effective shorts include small- and large-cap stock ETFs. Broad market short positions in a rising market environment caused a detraction in performance. The average effective short position for the fiscal year was approximately -33%. As of March 31, 2017, the Fund had an effective short position of -33%, an effective long position of 90% resulting in an effective net position of 57%. Our positioning reflects our belief that, while we like the companies we own and believe they will outperform the market in the long-run, the broad market is fully valued to overvalued.
Quarterly Detractors
SPDR S&P 500 ETF Trust, PowerShares QQQ Trust and iShares Russell 2000 ETF - Please refer to the Fiscal Year synopsis.
Wesco Aircraft Holdings - Please refer to the Fiscal Year synopsis.
TransDigm Group is a designer, producer and supplier of engineered aircraft components for use on commercial and military aircraft. The prospect of rising interest rates and accusations of rigged/fake bids from a critical short report pressured TransDigm's stock during January. The company's levered balance sheet, while married with historically consistent cash flows, increases the company's sensitivity to potential declines in profitability. In his first several weeks in office, President Trump targeted the cost of specific programs at several of TransDigm's larger peers. While it remains to be seen what, if any, lasting impact this scrutiny will have on growth and cash flow, with TransDigm's shares close to our estimate of intrinsic value, we elected to close our position in the stock with a nice gain.
Eliminated Holdings
TransDigm Group
Please visit the Fund's commentary section on our website for additional information.
14 | Q1 2017 ANNUAL REPORT
WEITZINVESTMENTS.COM
Returns
| | | | Annualized | | | | | | |
| | | | Since | | | | | | | | | | | | | | | | | | |
| | | | Inception | | | | | | | | | | | | | | | | | | |
| | | | (6/1/1983) | | 20-year | | 10-year | | 5-year | | 3-year | | 1-year | | Quarter |
| WPOIX - Investor Class | | | 12.48 | % | | 10.51 | % | | 6.25 | % | | 8.19 | % | | 1.90 | % | | 8.94 | % | | 5.14 | % |
| WPOPX - Institutional Class | | | 12.54 | | | 10.62 | | | 6.46 | | | 8.57 | | | 2.33 | | | 9.52 | | | 5.24 | |
| S&P 500 | | | 10.91 | | | 7.86 | | | 7.51 | | | 13.30 | | | 10.37 | | | 17.17 | | | 6.07 | |
| Russell 3000 | | | 10.70 | | | 8.11 | | | 7.54 | | | 13.18 | | | 9.76 | | | 18.07 | | | 5.74 | |
| Russell 3000 Value | | | 11.22 | | | 8.44 | | | 5.94 | | | 13.08 | | | 8.58 | | | 19.97 | | | 2.99 | |
Growth of $10,000
This chart depicts the change in the value of a $10,000 investment in the Partners III Opportunity Fund - Institutional Class for the period since inception (6/1/83) through March 31, 2017, as compared with the growth of the Standard & Poor's 500, Russell 3000 and Russell 3000 Value Indices during the same period. Index performance is hypothetical and is shown for illustrative purposes only.
Capitalization
Top 10 Stock Holdings
| | | |
| | % of Net Assets |
| Liberty Broadband Corp. - Series A & C | 9.8 | |
| Berkshire Hathaway Inc. - Class B | 9.7 | |
| Liberty Global Group - Class C | 8.6 | |
| Mastercard Inc. - Class A | 4.9 | |
| Colfax Corp. | 4.6 | |
| Allergan plc | 4.5 | |
| Liberty SiriusXM Group - Series A & C | 4.5 | |
| Redwood Trust, Inc. | 4.1 | |
| Liberty Ventures Group - Series A | 3.9 | |
| Laboratory Corp. of America Holdings | 3.5 | |
| | 58.1 | |
Top Performers
| | | | | | | Average | | | | |
| | | | Return | | | Weight | | | Contribution | |
| Liberty Broadband Corp. - Series A & C | | | 17.0 | % | | 9.4 | % | | 1.45 | % |
| Liberty Global Group - Class C | | | 18.0 | | | 8.4 | | | 1.37 | |
| Allergan plc | | | 14.1 | | | 4.8 | | | 0.70 | |
| Liberty Ventures Group - Series A | | | 20.6 | | | 3.7 | | | 0.69 | |
| Liberty SiriusXM Group - Series A & C | | | 13.5 | | | 4.4 | | | 0.58 | |
Industry Breakdown
| | % of Net Assets |
| Consumer Discretionary | 40.8 | |
| Information Technology | 17.4 | |
| Financials | 15.8 | |
| Health Care | 8.0 | |
| Industrials | 7.9 | |
| Securities Sold Short | (32.7 | ) |
| Short Proceeds/Other | 42.8 | |
| | 100.0 | |
Bottom Performers
| | | | | | | Average | | | | |
| | | | Return | | | Weight | | | Contribution | |
| PowerShares QQQ Trust, Series 1 (short) | | | 12.0 | % | | (9.3 | )% | | (1.08 | )% |
| SPDR S&P 500 ETF Trust (short) | | | 5.9 | | | (16.8 | ) | | (0.98 | ) |
| Wesco Aircraft Holdings, Inc. | | | (23.7 | ) | | 3.6 | | | (0.90 | ) |
| TransDigm Group, Inc. | | | (11.6 | ) | | 0.7 | | | (0.26 | ) |
| iShares Russell 2000 Fund (short) | | | 2.2 | | | (5.9 | ) | | (0.14 | ) |
Contributions to Fund performance are based on actual daily holdings. Securities may have been bought or sold during the quarter. Source: FactSet Portfolio Analytics Return shown is the actual quarterly return of the security or combination of share classes.
Returns assume reinvestment of dividends and redemption at the end of each period, and reflect the deduction of annual operating expenses which as stated in its most recent prospectus are 2.33% and 1.95% of the Fund's Investor and Institutional Class net assets, respectively. Total returns shown include fee waivers and expense reimbursements, if any; total returns would have been lower had there been no waivers and/or reimbursements. Past performance does not guarantee future results. The investment return and the principal value of an investment in this Fund will fluctuate so that an investor's shares, when redeemed, may be worth more or less than the original cost. Current performance may be higher or lower than the performance data quoted. Performance data current to the most recent month-end may be obtained at www.weitzinvestments.com/funds_and_performance/fund_performance.fs.
See page 6 for additional performance disclosures. See page 74 for a description of all indices.
Performance information does not reflect the deduction of taxes that a shareholder would pay on Fund distributions or the redemption of Fund shares.
15 | Q1 2017 ANNUAL REPORT
RESEARCH FUND
Investment Style: Multi-Cap Value
Co-Portfolio Managers: Nathan Ritz, CFA; Jon Baker, CFA;
Dan Walker, CFA; & Barton Hooper, CFA
Fiscal Year Contributors
Liberty Broadband's principal asset consists of its interest in Charter Communications. Shares of Charter, and cable companies broadly, have performed well in the wake of the U.S. election. Although much remains to be seen, investors generally believe that regulatory pressures will ease as a result of a presumably more "industry friendly" Federal Communications Commission (FCC) as well as a Justice Department that may look more favorably on further industry consolidation. We have invested in Liberty Broadband because we like the operating strategy at Charter, and while regulatory relief would certainly be a benefit, it's not an explicit part of our investment thesis. Liberty Broadband shares trade at a discount to their underlying Charter investment due to the added complexity of Liberty's involvement. We are confident Liberty Broadband's management will ultimately collapse this discount, thereby making Liberty Broadband a cheaper opportunity to invest in Charter's future.
Range Resources is an independent producer of natural gas and natural gas liquids (NGLs) based in Fort Worth, Texas, with operations in the Marcellus shale and emerging Terryville field. Following a strong rebound in natural gas prices during the spring of 2016, we pared our position in Range as the stock approached our $47 intrinsic value estimate. Even as healthy summer demand drove natural gas prices higher, investors began shifting their focus to the possibility of a supply overhang as oil-related drilling activity resumed. Range shares cooled off as a result. The Fund eliminated its position as part of Research Fund's manager transition in December.
Colfax Corp. is a leading manufacturer of pumps, gas handling products and welding equipment. Shares rose through the year at the prospect of a bottoming in many of Colfax's end markets, which include oil & gas, power generation and mining. This potential bottoming provides us confidence that sales growth may return in the near future. In addition, the use of the Colfax Business System, a management philosophy and a set of tools based on the concept of continuous improvement to drive new product development and cut costs, has improved the margin outlook for the business. Shares rose significantly after the U.S. presidential election on hopes that the new administration would spur domestic industrial activity.
Quarterly Contributors
Liberty Broadband's principal asset consists of its interest in Charter Communications. In late January, rumors broke that Verizon Communications had made an informal acquisition offer to Charter Communications, sending both Charter and Liberty Broadband shares higher. We acknowledge that such a combination makes strategic sense for Verizon as it searches for an efficient means to deploy 5G wireless technology (which will require very dense, wired networks). However, we suspect shareholders can reap greater value from Charter continuing to integrate its Time Warner Cable and Bright House Networks acquisitions on a stand-alone basis. That said, we believe management will pursue the right course (stand-alone or M&A) that will maximize long-term shareholder value.
Visa is the world's largest electronic payment network. The company recently closed on its acquisition of Visa Europe, allowing it to provide a fully integrated network to clients, which should result in increased market share and lower costs. We believe Visa will compound nicely as worldwide payment volumes grow, developing countries switch from cash to cards, and the company uses its technology and network to participate in all forms of electronic payments.
Allergan is a global specialty pharmaceutical company focusing on the development, manufacturing, marketing and distribution of brand name, biosimilar and over-the-counter pharmaceutical products. Allergan's stock rebounded as the company reported stronger-than-expected fourth quarter results following a string of disappointing quarters. The company's initial outlook for 2017 came in ahead of our forecasts, with strong growth across six of its seven therapeutic areas expected to result in high single-digit revenue growth and high teens adjusted cash earnings per share growth. Allergan closed its $2.9 billion acquisition of LifeCell in February and also announced an agreement to acquire body sculpting device manufacturer ZELTIQ Aesthetics for $2.5 billion. If ZELTIQ shareholders approve the merger, Allergan will add two durable assets to its aesthetics portfolio that together should generate roughly $1.0 billion in annual sales with attractive organic growth profiles. We continue to believe Allergan shares have attractive upside potential from current prices.
New Holdings
Dollar Tree and Donnelley Financial Solutions
Fiscal Year Detractors
Fossil Group is the fourth-largest producer of watches and the largest licenser of watches and jewelry globally. Fossil continues to experience the same headwinds from the previous year: weak foot traffic as consumers shift to e-commerce, revenue headwinds from a strong U.S. dollar, and a difficult wholesale channel environment that has been exacerbated by inventory de-stocking. Despite growth in Fossil Group's owned brands, Skagen and Fossil, weakness in the licensed brand portfolio, in particular Michael Kors, has weighed on watch sales. During the fourth calendar quarter earnings release, management guided 2017 earnings well below consensus expectations. In addition, management notified the market of another year of elevated investments in wearables and omni-channel initiatives as well as restructuring charges as Fossil reduces their store footprint. Fossil's wearable technology launches in fourth quarter were successful, but 2017 will be the first year the segment will be material to results as management expands SKUs (distinct types of items for sale) and extends to additional licensed brands. We expect Fossil's investments in brand building, omni-channel and store footprint rationalization to bear fruit in 2017.
Allergan is a global specialty pharmaceutical company focusing on the development, manufacturing, marketing and distribution of brand name, biosimilar and over-the-counter pharmaceutical products. Allergan shares finished 2016 on a higher note, following an otherwise challenging year. While revenues and earnings were shy of expectations and drug price regulation dominated headlines throughout much of the past year, the health of Allergan's core underlying growth drivers gave us confidence to continue buying shares at increasingly attractive discounts during the fourth calendar quarter. Encouragingly, recent operating results have come in ahead of internal forecasts, and the company's initial outlook for 2017 exceeded our expectations. Growth across Allergan's therapeutic segment looks healthy, with the global aesthetics franchise demonstrating notable strength. Headwinds from legislative and regulatory developments continue to bear monitoring, but from today's vantage point, we believe any impact to long-term business value should be manageable. We continue to believe Allergan shares have attractive upside potential from current prices.
Zoe's Kitchen is a small, growing restaurant concept serving "better for you" Mediterranean cuisine. While 2016 was a weak year for many restaurants, Zoe's fared better than most, though they were not immune. Worries around weakening U.S. consumer spending and the lack of near-term earnings continue to depress the stock price. We believe this is temporary and think the next several years of growth can produce outsized, though likely volatile, returns. We continue to add to our position on share price declines.
Quarterly Detractors
Fossil Group - Please refer to the Fiscal Year synopsis.
Donnelley Financial Solutions is a financial compliance company recently spun out of RR Donnelley. Primarily a printing company, RR Donnelley split itself into three public companies to ascribe better value to its individual parts, as the printing industry is facing secular decline. While 40% of Donnelley Financial's revenue is still print related, the remainder is software and services, which not only have better margins than print but are also growing organically. We believe the market has misvalued Donnelley Financial due to lack of transparency around the cost structure and the compliance services segment's sensitivity to capital markets transactions. Generally, when a company is spun-off, there is inevitable noise in its income statement as it seeks to recreate the services that its parent previously provided. The result is a host of duplicative costs, which can temporarily mask earnings power. More recently, Donnelley Financial's quarterly results and guidance disappointed investors, as capital market activity was down 15% affecting an otherwise high margin segment. While the recent results are disappointing, we believe a recovery in the capital market is forthcoming and will allow Donnelley Financial to demonstrate more normalized earnings power, aggressively pay down debt, and continue to invest in compliance technology solutions, which are in high demand.
Zoe's Kitchen - Please refer to the Fiscal Year synopsis.
Eliminated Holdings
Chipotle Mexican Grill, Compagnie Financiere Richemont, MasterCard and Range Resources
Please visit the Fund's commentary section on our website for additional information.
16 | Q1 2017 ANNUAL REPORT
WEITZINVESTMENTS.COM
Returns
| | | | Annualized | | | | | | |
| | | | Since Inception | | | | | | | | | | |
| | | | (4/1/2005) | | 10-year | | 5-year | | 3-year | | 1-year | | Quarter |
| WRESX | | | 7.41 | % | | 6.45 | % | | 8.03 | % | | 4.24 | % | | 10.62 | % | | 5.15 | % |
| S&P 500 | | | 8.20 | | | 7.51 | | | 13.30 | | | 10.37 | | | 17.17 | | | 6.07 | |
| Russell 3000 | | | 8.39 | | | 7.54 | | | 13.18 | | | 9.76 | | | 18.07 | | | 5.74 | |
| Russell 3000 Value | | | 7.43 | | | 5.94 | | | 13.08 | | | 8.58 | | | 19.97 | | | 2.99 | |
Growth of $10,000
This chart depicts the change in the value of a $10,000 investment in the Research Fund for the period since inception (4/1/05) through March 31, 2017, as compared with the growth of the Standard & Poor's 500, Russell 3000 and Russell 3000 Value Indices during the same period. Index performance is hypothetical and is shown for illustrative purposes only.
Capitalization
Top 10 Stock Holdings
| | % of Net Assets |
| Visa Inc. - Class A | 6.2 | |
| Liberty Broadband Corp. - Series C | 5.2 | |
| Laboratory Corp. of America Holdings | 4.5 | |
| Oracle Corp. | 4.5 | |
| Praxair, Inc. | 4.2 | |
| Guidewire Software, Inc. | 4.1 | |
| Berkshire Hathaway Inc. - Class B | 3.7 | |
| American Tower Corp. | 3.5 | |
| Allergan plc | 3.2 | |
| National CineMedia, Inc. | 2.9 | |
| | 42.0 | |
Top Performers
| | | | | | | Average | | | | |
| | | | Return | | | Weight | | | Contribution | |
| Liberty Broadband Corp. - Series C | | | 16.6 | % | | 5.3 | % | | 0.82 | % |
| Visa Inc. - Class A | | | 14.1 | | | 6.1 | | | 0.80 | |
| Allergan plc | | | 14.1 | | | 4.1 | | | 0.62 | |
| Oracle Corp. | | | 16.5 | | | 3.8 | | | 0.60 | |
| Laboratory Corp. of America Holdings | | | 11.8 | | | 4.5 | | | 0.51 | |
Industry Breakdown
| | % of Net Assets |
| Information Technology | 24.6 | |
| Consumer Discretionary | 23.7 | |
| Health Care | 9.7 | |
| Materials | 9.2 | |
| Financials | 8.5 | |
| Consumer Staples | 4.1 | |
| Real Estate | 3.5 | |
| Industrials | 2.6 | |
| Cash Equivalents/Other | 14.1 | |
| | 100.0 | |
Bottom Performers
| | | | | | | Average | | | | |
| | | | Return | | | Weight | | | Contribution | |
| Fossil Group, Inc. | | | (32.5 | )% | | 2.2 | % | | (0.95 | )% |
| Donnelley Financial Solutions, Inc. | | | (16.1 | ) | | 1.9 | | | (0.63 | ) |
| Zoe's Kitchen, Inc. | | | (22.9 | ) | | 2.4 | | | (0.55 | ) |
| National CineMedia, Inc. | | | (12.7 | ) | | 2.3 | | | (0.25 | ) |
| Compass Minerals International, Inc. | | | (12.6 | ) | | 1.4 | | | (0.20 | ) |
Contributions to Fund performance are based on actual daily holdings. Securities may have been bought or sold during the quarter. Source: FactSet Portfolio Analytics Return shown is the actual quarterly return of the security or combination of share classes.
Returns assume reinvestment of dividends and redemption at the end of each period, and, starting January 1, 2011, reflect the deduction of the Fund's annual operating expenses which as stated in its most recent prospectus are 1.64% (gross) of the Fund's net assets. For periods of time prior to January 1, 2011, the performance numbers reflect the deduction of annual pro forma operating expenses of 1.50%. Total returns shown include fee waivers and expense reimbursements, if any; total returns would have been lower had there been no waivers and/or reimbursements. Past performance does not guarantee future results. The investment return and the principal value of an investment in this Fund will fluctuate so that an investor's shares, when redeemed, may be worth more or less than the original cost. Current performance may be higher or lower than the performance data quoted. Performance data current to the most recent month-end may be obtained at www.weitzinvestments.com/funds_and_performance/fund_performance.fs.
See page 6 for additional performance disclosures. See page 74 for a description of all indices.
Performance information does not reflect the deduction of taxes that a shareholder would pay on Fund distributions or the redemption of Fund shares.
17 | Q1 2017 ANNUAL REPORT
HICKORY FUND
Investment Style: Small- to Mid-Cap Value
Co-Portfolio Managers: Wally Weitz, CFA & Drew Weitz
Fiscal Year Contributors
Liberty Broadband's principal asset consists of its interest in Charter Communications. Shares of Charter, and cable companies broadly, have performed well in the wake of the U.S. election. Although much remains to be seen, investors generally believe that regulatory pressures will ease as a result of a presumably more "industry friendly" Federal Communications Commission (FCC) as well as a Justice Department that may look more favorably on further industry consolidation. We have invested in Liberty Broadband because we like the operating strategy at Charter, and while regulatory relief would certainly be a benefit, it's not an explicit part of our investment thesis. Liberty Broadband shares trade at a discount to their underlying Charter investment due to the added complexity of Liberty's involvement. We are confident Liberty Broadband's management will ultimately collapse this discount, thereby making Liberty Broadband a cheaper opportunity to invest in Charter's future.
Formula One, which began in 1950, is an iconic global motorsports business. The 2017 FIA Formula One World Championship spans 20 races in 20 countries across five continents. In January, Liberty Media closed on its 100% acquisition of the Formula One racing series. Upon closing, the Liberty Media tracking stock was renamed Liberty Formula One Group. Investors are enthusiastic about the highly regarded executive and newly appointed chairman, Chase Carey. Furthermore, the potential to grow Formula One under Liberty Media's guidance–greater sponsorship prospects, the potential for new races and venues to grow awareness of the sport, and new opportunities to bring Formula One content to digital platforms excite investors.
ILG, Inc. is a provider of non-traditional lodging, encompassing a portfolio of leisure businesses, from exchange and vacation rental to vacation ownership. A year ago, the stock price was suffering under the combined weight of both a general market swoon and a share overhang from ILG's imminent merger with Starwood's timeshare business. That merger ultimately put over half (70+ million shares) of this small-cap company's stock in the hands of large-cap hotel investors. One year later, the market has marched steadily higher, and the bulk of those shares have likely found homes in the portfolios of more appropriate investors. As such, the stock price has rebounded and reclaimed much of what it had lost in the year prior. We continue to like the prospects and valuation of the newly combined entity.
Quarterly Contributors
Liberty Broadband's principal asset consists of its interest in Charter Communications. In late January, rumors broke that Verizon Communications had made an informal acquisition offer to Charter Communications, sending both Charter and Liberty Broadband shares higher. We acknowledge that such a combination makes strategic sense for Verizon as it searches for an efficient means to deploy 5G wireless technology (which will require very dense, wired networks). However, we suspect shareholders can reap greater value from Charter continuing to integrate its Time Warner Cable and Bright House Networks acquisitions on a stand-alone basis. That said, we believe management will pursue the right course (stand-alone or M&A) that will maximize long-term shareholder value.
Liberty Global is the largest international cable company, with operations in 14 countries providing video, broadband Internet, fixed-line telephone and mobile services to its customers. Liberty Global's shares were strong in the first calendar quarter and made up some of the ground that had been lost during the prior year. The company's quarterly results were solid, but shares have likely been driven upward as speculation of deals in the media industry has heated up of late, including revived speculation of a potential Vodafone transaction. We view Liberty Global as a standalone provider of broadband and Pay-TV services as an attractive opportunity, and although a potential acquisition by Vodafone may create value for shareholders, our investment thesis is not dependent on such an event.
Murphy USA is an independent retailer of motor fuel products and convenience merchandise. As a high-volume, low-cost seller of gasoline, Murphy's earnings are extremely sensitive to fuel margins. Murphy's stock price increased in the first calendar quarter largely due to falling gasoline prices (good for margins). In late 2016, the stock became a target for short sellers. This temporarily depressed the stock price as they perceived Murphy USA as a beneficiary of ethanol blending credits, a regulation the Trump administration had targeted for revision. In the first quarter of 2017, management gave additional clarity about how these regulations are a net neutral for their business, easing many investors' concerns. In addition, management issued strong earnings guidance, the company aggressively bought back stock and two insiders purchased large amounts of Murphy stock on the open market, providing confidence that the company could navigate both the fuel and regulatory environments.
New Holdings
Compass Minerals
Fiscal Year Detractors
QVC Group is a tracking stock issued by Liberty Interactive which includes subsidiaries QVC, zulily and its interest in HSN. QVC Group operates an American television network and also operates televised and online shopping experiences in other countries. In the third calendar quarter of 2016, shares of QVC Group fell after management indicated that its QVC U.S. business had experienced a significant sales headwind. QVC's U.S. business, which had not seen a decline since the Great Recession, saw sales fall nearly 6% in the third quarter and 7% in the fourth quarter, as several categories simultaneously slowed. Importantly, we don't view these issues as a sign of the QVC model suddenly being broken, and management has indicated sales results have begun to stabilize. QVC's customer retention and loyalty remain strong, as does viewership of their network. Furthermore, the international businesses appear unaffected by the current U.S.-centric slowdown. Although the decline in QVC shares has been disappointing, management has taken advantage by accelerating their share repurchase to foster per share value growth.
Fossil Group is the fourth-largest producer of watches and the largest licenser of watches and jewelry globally. Fossil continues to experience the same headwinds from the previous year: weak foot traffic as consumers shift to e-commerce, revenue headwinds from a strong U.S. dollar, and a difficult wholesale channel environment that has been exacerbated by inventory de-stocking. Despite growth in Fossil Group's owned brands, Skagen and Fossil, weakness in the licensed brand portfolio, in particular Michael Kors, has weighed on watch sales. During the fourth calendar quarter earnings release, management guided 2017 earnings well below consensus expectations. In addition, management notified the market of another year of elevated investments in wearables and omni-channel initiatives as well as restructuring charges as Fossil reduces their store footprint. Fossil's wearable technology launches in fourth quarter were successful, but 2017 will be the first year the segment will be material to results as management expands SKUs (distinct types of items for sale) and extends to additional licensed brands. We expect Fossil's investments in brand building, omni-channel and store footprint rationalization to bear fruit in 2017.
Wesco Aircraft Holdings is the world's leading distributor and provider of supply chain services to the global aerospace industry. During the past year, the company has continued its transition to a "One Wesco" culture, which includes an implementation of continuous improvement initiatives. In addition, the company has won several new contracts. These new contracts have required funding of upfront inventory and preparation expenses, temporarily depressing free cash flow. We believe Wesco is making significant progress in transforming its business, which we expect to soon be reflected in reported results.
Quarterly Detractors
Wesco Aircraft Holdings - Please refer to the Fiscal Year synopsis.
Fossil Group - Please refer to the Fiscal Year synopsis.
National CineMedia produces the "FirstLook" pre-show, a collection of advertising and entertainment content shown in movie theaters prior to show time. The operating business (NCM LLC) is jointly owned by public shareholders (ticker: NCMI) and the founding three theater circuits: AMC, Regal Entertainment and Cinemark. During the first calendar quarter, AMC reached an agreement with the Department of Justice over its proposed acquisition of Carmike (a partial owner and client of theater advertising competitor Screenvision). The most significant of these conditions requires AMC to reduce its stake in NCM from 39% to fewer than 5% over a period of 24 months; the goal being to encourage continued competition in theater advertising services between the two competitors. The sale of these shares has put pressure on the stock price and represents a significant volume for the buyers to absorb. Nevertheless, we continue to believe NCM's unique position and network creates an opportunity for advertisers to reach their audiences. During the quarter we took advantage of the price decline and added to our position.
Eliminated Holdings
TransDigm Group
Please visit the Fund's commentary section on our website for additional information.
18 | Q1 2017 ANNUAL REPORT
WEITZINVESTMENTS.COM
Returns
| | | | Annualized | | | | | | |
| | | | | | | | | | | | | Since | | | | | | | | | | | | |
| | | | Since | | | | | | Investment | | | | | | | | | | | | |
| | | | Inception | | | | | | | | Style Inception | | | | | | | | | | | | |
| | | | (4/1/1993) | | 20-year | | 10-year | | (6/30/08) | | 5-year | | 3-year | | 1-year | | Quarter |
| WEHIX | | | 9.85 | % | | 8.40 | % | | 4.95 | % | | 9.73 | % | | 8.39 | % | | 3.21 | % | | 11.60 | % | | 4.24 | % |
| Russell 2500 | | | 10.47 | | | 9.85 | | | 7.71 | | | 10.17 | | | 12.60 | | | 7.43 | | | 21.53 | | | 3.76 | |
| Russell 2500 Value | | | 11.01 | | | 10.31 | | | 6.79 | | | 10.20 | | | 12.92 | | | 7.55 | | | 23.13 | | | 1.62 | |
| S&P 500 | | | 9.28 | | | 7.86 | | | 7.51 | | | 9.61 | | | 10.30 | | | 10.37 | | | 17.17 | | | 6.07 | |
Growth of $10,000
This chart depicts the change in the value of a $10,000 investment in the Hickory Fund for the period since inception (4/1/93) through March 31, 2017, as compared with the growth of the Russell 2500, Russell 2500 Value and Standard & Poor's 500 Indices during the same period. Index performance is hypothetical and is shown for illustrative purposes only.
Capitalization
Top 10 Stock Holdings
| | % of Net Assets |
| Liberty Broadband Corp. - Series A & C | 8.2 | |
| Laboratory Corp. of America Holdings | 5.0 | |
| Liberty Global Group - Class C | 4.6 | |
| Liberty SiriusXM Group - Series A & C | 4.4 | |
| Redwood Trust, Inc. | 4.3 | |
| ILG, Inc. | 4.0 | |
| QVC Group - Series A | 3.9 | |
| Murphy USA Inc. | 3.8 | |
| Colfax Corp. | 3.7 | |
| Wesco Aircraft Holdings, Inc. | 3.2 | |
| | 45.1 | |
Top Performers
| | | | | | | Average | | | | |
| | | | Return | | | Weight | | | Contribution | |
| Liberty Broadband Corp. - Series A & C | | | 17.0 | % | | 7.7 | % | | 1.16 | % |
| Liberty Global Group - Class C | | | 18.0 | | | 4.4 | | | 0.70 | |
| Murphy USA Inc. | | | 19.4 | | | 3.3 | | | 0.62 | |
| ILG, Inc. | | | 16.3 | | | 3.5 | | | 0.57 | |
| Laboratory Corp. of America Holdings | | | 11.8 | | | 4.7 | | | 0.52 | |
Industry Breakdown
| | % of Net Assets |
| Consumer Discretionary | 44.6 | |
| Industrials | 9.9 | |
| Financials | 7.1 | |
| Information Technology | 6.1 | |
| Health Care | 5.0 | |
| Real Estate | 2.9 | |
| Telecommunication Services | 2.6 | |
| Energy | 0.8 | |
| Materials | 0.5 | |
| Cash Equivalents/Other | 20.5 | |
| | 100.0 | |
Bottom Performers
| | | | | | | Average | | | | |
| | | | Return | | | Weight | | | Contribution | |
| Wesco Aircraft Holdings, Inc. | | | (23.7 | )% | | 3.4 | % | | (0.90 | )% |
| Fossil Group, Inc. | | | (32.5 | ) | | 1.3 | | | (0.61 | ) |
| National CineMedia, Inc. | | | (12.7 | ) | | 3.0 | | | (0.38 | ) |
| XO Group, Inc. | | | (11.5 | ) | | 2.1 | | | (0.25 | ) |
| TransDigm Group, Inc. | | | (11.6 | ) | | 0.6 | | | (0.22 | ) |
Contributions to Fund performance are based on actual daily holdings. Securities may have been bought or sold during the quarter. Source: FactSet Portfolio Analytics Return shown is the actual quarterly return of the security or combination of share classes.
Returns assume reinvestment of dividends and redemption at the end of each period, and reflect the deduction of the Fund's annual operating expenses which as stated in its most recent prospectus are 1.24% of the Fund's net assets. Total returns shown include fee waivers and expense reimbursements, if any; total returns would have been lower had there been no waivers and/ or reimbursements. Past performance does not guarantee future results. The investment return and the principal value of an investment in this Fund will fluctuate so that an investor's shares, when redeemed, may be worth more or less than the original cost. Current performance may be higher or lower than the performance data quoted. Performance data current to the most recent month-end may be obtained at www.weitzinvestments.com/funds_and_ performance/fund_performance.fs.
See page 6 for additional performance disclosures. See page 74 for a description of all indices.
Performance information does not reflect the deduction of taxes that a shareholder would pay on Fund distributions or the redemption of Fund shares.
19 | Q1 2017 ANNUAL REPORT
BALANCED FUND
Investment Style: Moderate Allocation
Portfolio Manager: Brad Hinton, CFA
Fiscal Year Contributors
Range Resources is an independent producer of natural gas and natural gas liquids (NGLs) based in Fort Worth, Texas, with operations in the Marcellus shale and emerging Terryville field. Following a strong rebound in natural gas prices during the spring of 2016, the Fund closed its position in Range during the second calendar quarter as the stock approached our $47 intrinsic value estimate.
Laboratory Corp. of America (LabCorp) operates as a diversified global life sciences company through two segments: LabCorp Diagnostics and Covance Drug Development. Following a choppy 2016 third quarter, LabCorp's fourth quarter operating results resumed a more normal course. Test volumes rebounded at LabCorp Diagnostics, as did new clinical trial bookings at Covance. The company closed the year on a high note, with sales increasing 11% and cash earnings per share up 12% versus the prior year. Underlying clinical lab trends remain stable and the pace of clinical research outsourcing continues to be healthy. Anticipated cuts in Medicare reimbursement for lab tests and a gradual shift by payers toward value-based payment models are creating new, long hoped-for opportunities for LabCorp's low cost lab network. LabCorp announced the acquisition of two valuable hospital-based labs during the first quarter and continues to see a steady flow of attractive potential 'tuck-in' lab acquisition opportunities. The company's combination of durable organic growth and significant reinvestment runway remains appealing to us as long-term investors.
Texas Instruments is the market leader in the sale of analog and embedded semiconductors. Shares rose on optimism that the available market for the company's products will continue to expand as industrial and automotive markets include more electronic content in their products. The company's long-term strategy of moving incremental business to its low-cost 300 millimeter wafer manufacturing process also continues to expand the long-term margin horizon for the company. Furthermore, Texas Instruments has continued to benefit from investor recognition of the company's execution, disciplined capital allocation (returning all excess cash to shareowners) and the potential that the market for analog semiconductors is becoming slightly less cyclical, as the industry has matured and consolidated.
Quarterly Contributors
Allergan is a global specialty pharmaceutical company focusing on the development, manufacturing, marketing and distribution of brand name, biosimilar and over-the-counter pharmaceutical products. Allergan's stock rebounded as the company reported stronger-than-expected fourth quarter results following a string of disappointing quarters. The company's initial outlook for 2017 came in ahead of our forecasts, with strong growth across six of its seven therapeutic areas expected to result in high single-digit revenue growth and high teens adjusted cash earnings per share growth. Allergan closed its $2.9 billion acquisition of LifeCell in February and also announced an agreement to acquire body sculpting device manufacturer ZELTIQ Aesthetics for $2.5 billion. If ZELTIQ shareholders approve the merger, Allergan will add two durable assets to its aesthetics portfolio that together should generate roughly $1.0 billion in annual sales with attractive organic growth profiles. We continue to believe Allergan shares have attractive upside potential from current prices.
Laboratory Corp. of America (LabCorp) - Please refer to the Fiscal Year synopsis.
New Holdings
Guidewire Software
Fiscal Year Detractors
QVC Group is a tracking stock issued by Liberty Interactive which includes subsidiaries QVC, zulily and its interest in HSN. QVC Group operates an American television network and also operates televised and online shopping experiences in other countries. In the third calendar quarter of 2016, shares of QVC Group fell after management indicated that its QVC U.S. business had experienced a significant sales headwind. QVC's U.S. business, which had not seen a decline since the Great Recession, saw sales fall nearly 6% in the third quarter and 7% in the fourth quarter, as several categories simultaneously slowed. Importantly, we don't view these issues as a sign of the QVC model suddenly being broken, and management has indicated sales results have begun to stabilize. QVC's customer retention and loyalty remain strong, as does viewership of their network. Furthermore, the international businesses appear unaffected by the current U.S.-centric slowdown. Although the decline in QVC shares has been disappointing, management has taken advantage by accelerating their share repurchase to foster per share value growth.
Anheuser-Busch InBev is the clear-cut leading global beer company after its recent acquisition of SABMiller plc. The stock briefly traded above $130 last fall due to high expectations for the combined company's prospects and strong investor demand for stable, cash-generative consumer staples companies. Anheuser-Busch InBev's stock declined later in the year due in part to temporary challenges in its Brazilian business. At $110, we think the company trades at a moderate discount to value for a world-class business, with a roadmap to significantly higher earnings in three years.
Allergan is a global specialty pharmaceutical company focusing on the development, manufacturing, marketing and distribution of brand name, biosimilar and over-the-counter pharmaceutical products. Allergan shares finished 2016 on a higher note, following an otherwise challenging year. While revenues and earnings were shy of expectations and drug price regulation dominated headlines throughout much of the past year, the health of Allergan's core underlying growth drivers gave us confidence to continue buying shares at increasingly attractive discounts during the fourth calendar quarter. Encouragingly, recent operating results have come in ahead of internal forecasts, and the company's initial outlook for 2017 exceeded our expectations. Growth across Allergan's therapeutic segment looks healthy, with the global aesthetics franchise demonstrating notable strength. Headwinds from legislative and regulatory developments continue to bear monitoring, but from today's vantage point, we believe any impact to long-term business value should be manageable. We continue to believe Allergan shares have attractive upside potential from current prices.
Quarterly Detractors
Compass Minerals produces and sells salt, specialty plant nutrition and chemical products around the world. Despite a strong fourth quarter, Compass stock was a weak performer due to concern around the lack of snow in their geographic footprint. Though the company guided to 12% volume growth in salt in 2017 as municipalities restocked, prices still remain under pressure, as a lot of volume was contracted in the summer months when inventories were high. The news was similarly mixed at their sulfate of potash (SOP) operation. While prices seem to be stabilizing and volume growth was exceptional, cost improvements have been slow to materialize. As a result, much of the inventory they are selling now was produced under their higher legacy cost structure. We believe the salt business will recover as soon as we have a "normal" winter and recent capital investments lower their costs even more. In addition, SOP prices are stabilizing and once Compass adjusts its cost structure to the current reality, the business will return to earning historic returns on capital.
United Parcel Service (UPS) is a package delivery company and a provider of supply chain management solutions. Over the past several years, the growth of e-commerce has created challenges for UPS during its peak holiday shipping season. While the market can not quite decide whether the onslaught of less profitable residential delivery volume is beneficial, UPS has announced plans to significantly accelerate capital spending in anticipation of even more residential delivery volume. Investors' lack of faith in management's intended path led to this most recent sell off. We believe the company's efforts toward a more streamlined holiday shipping experience will bear fruit in time, and we expect the company's stock price will eventually reflect this stepped-up commitment to its customers.
Eliminated Holdings
Discovery Communications and Twenty-First Century Fox
Please visit the Fund's commentary section on our website for additional information.
20 | Q1 2017 ANNUAL REPORT
WEITZINVESTMENTS.COM
Returns
| | | | Annualized | | | | | | |
| | | | Since | | | | | | | | | | | | | | | |
| | | | Inception | | | | | | | | | | | | | | | |
| | | | (10/1/2003) | | 10-year | | 5-year | | 3-year | | 1-year | | Quarter |
| WBALX | | | 5.36 | % | | 4.11 | % | | 5.75 | % | | 3.04 | % | | 6.32 | % | | 3.89 | % |
| Blended | | | 6.94 | | | 6.30 | | | 8.74 | | | 7.10 | | | 10.25 | | | 3.94 | |
| S&P 500 | | | 8.83 | | | 7.51 | | | 13.30 | | | 10.37 | | | 17.17 | | | 6.07 | |
| Intermediate | | | | | | | | | | | | | | | | | | | |
| U.S. Govt/Credit | | | 3.55 | | | 3.76 | | | 1.88 | | | 2.01 | | | 0.42 | | | 0.78 | |
Growth of $10,000
This chart depicts the change in the value of a $10,000 investment in the Balanced Fund for the period since inception (10/1/03) through March 31, 2017, as compared with the growth of the Blended, Standard & Poor's 500 and Bloomberg Barclays Intermediate U.S. Government/Credit Indices during the same period. Index performance is hypothetical and is shown for illustrative purposes only.
Capitalization (Common Stocks)
Top 10 Stock Holdings
| | % of Net Assets |
| Laboratory Corp. of America Holdings | 3.4 | |
| Berkshire Hathaway Inc. - Class B | 3.2 | |
| Allergan plc | 2.9 | |
| Visa Inc. - Class A | 2.6 | |
| Oracle Corp. | 2.1 | |
| Liberty Broadband Corp. - Series C | 2.0 | |
| Praxair, Inc. | 2.0 | |
| Monsanto Co. | 1.9 | |
| Liberty Global Group - Class C | 1.8 | |
| Comcast Corp. - Class A | 1.7 | |
| | 23.6 | |
Top Stock Performers
| | | | | | | Average | | | | |
| | | | Return | | | Weight | | | Contribution | |
| Allergan plc | | | 14.1 | % | | 2.9 | % | | 0.38 | % |
| Laboratory Corp. of America Holdings | | | 11.8 | | | 3.3 | | | 0.37 | |
| Visa Inc. - Class A | | | 14.1 | | | 2.6 | | | 0.34 | |
| Liberty Broadband Corp. - Series C | | | 16.6 | | | 2.0 | | | 0.31 | |
| Oracle Corp. | | | 16.5 | | | 2.0 | | | 0.30 | |
Industry Breakdown
| | % of Net Assets |
| Information Technology | 14.0 | |
| Consumer Discretionary | 8.3 | |
| Health Care | 7.9 | |
| Financials | 7.1 | |
| Materials | 4.8 | |
| Consumer Staples | 3.2 | |
| Industrials | 1.0 | |
| Total Common Stocks | 46.3 | |
| Cash Equivalents/Other | 25.4 | |
| U.S. Treasury Notes | 16.1 | |
| Corporate Bonds | 10.2 | |
| Mortgage-Backed Securities | 2.0 | |
| Total Bonds & Cash Equivalents | 53.7 | |
| | 100.0 | |
Bottom Stock Performers
| | | | | | | Average | | | | |
| | | | Return | | | Weight | | | Contribution | |
| Compass Minerals International, Inc. | | | (12.6 | )% | | 1.0 | % | | (0.13 | )% |
| United Parcel Service, Inc. - Class B | | | (5.7 | ) | | 1.0 | | | (0.06 | ) |
| QVC Group - Series A | | | 0.2 | | | 1.5 | | | 0.00 | |
| FLIR Systems, Inc. | | | 0.7 | | | 1.5 | | | 0.01 | |
| Discovery Communications, Inc. - Class C | | | 1.9 | | | 0.4 | | | 0.03 | |
Contributions to Fund performance are based on actual daily holdings. Securities may have been bought or sold during the quarter. Source: FactSet Portfolio Analytics Return shown is the actual quarterly return of the security or combination of share classes.
Returns assume reinvestment of dividends and redemption at the end of each period, and reflect the deduction of the Fund's annual operating expenses which as stated in its most recent prospectus are 1.11% of the Fund's net assets. Total returns shown include fee waivers and expense reimbursements, if any; total returns would have been lower had there been no waivers and/or reimbursements. Past performance does not guarantee future results The investment return and the principal value of an investment in this Fund will fluctuate so that an investor's shares, when redeemed, may be worth more or less than the original cost. Current performance may be higher or lower than the performance data quoted. Performance data current to the most recent month-end may be obtained at www.weitzinvestments.com/funds_and_ performance/fund_performance.fs.
See page 6 for additional performance disclosures. See page 74 for a description of all indices.
Performance information does not reflect the deduction of taxes that a shareholder would pay on Fund distributions or the redemption of Fund shares.
21 | Q1 2017 ANNUAL REPORT
CORE PLUS INCOME FUND
Investment Style: Intermediate-Term Bond
Co-Portfolio Managers: Tom Carney, CFA & Nolan Anderson
Core Plus Income Fund's Institutional Class returned +1.04% for the first calendar quarter compared to a +0.82% return for the Bloomberg Barclays U.S. Aggregate Bond Index (Bloomberg Barclays U.S. Agg), our primary benchmark. For the year ended March 31, 2017, Core Plus Income Fund's Institutional Class returned +4.61% compared to a +0.44% return for the primary benchmark.
Fiscal 2017 Review
The post-election optimism heading into 2017 carried through most of the year's first quarter. However, the Trump administration's inability to repeal and replace the Affordable Care Act proved to be the biggest market event of the year so far, as investors questioned whether this indicated an inability to pass legislation in DC. If tax reform meets the same fate as the healthcare bill, some optimism may prove unfounded, and markets may return to pre-election valuations. As the table below details, longer-term bond yields ended the quarter very near where they began.
| | | | | | | U.S. Treasury Yields | | | | |
| | | | 2-Year | | 3-Year | | 5-Year | | 10-Year |
| 3/31/2017 | | | 1.26 | % | | 1.49 | % | | 1.92 | % | | 2.39 | % |
| 12/31/2016 | | | 1.19 | % | | 1.45 | % | | 1.93 | % | | 2.45 | % |
| 3/31/2016 | | | 0.73 | % | | 0.86 | % | | 1.21 | % | | 1.77 | % |
| Fiscal year low | | | 0.55 | % | | 0.65 | % | | 0.94 | % | | 1.36 | % |
During the past fiscal year (March 31, 2016, to March 31, 2017), U.S. Treasury bond yields moved higher as the economy continued to exhibit slow but steady strength and the Federal Reserve twice raised short-term interest rates.
Rising "risk-free" (Treasury) interest rates were a headwind for investor returns in the past year, as bond prices and changes in interest rates are inversely related. But declining credit spreads (the incremental return above U.S. Treasury bonds investors demand for owning corporate debt) were a key storyline for the year ended March 31, 2017. Corporate bonds and other credit sensitive securities outperformed Treasury bonds in the past year as credit spreads narrowed, particularly for non-investment grade or high-yield bonds. A broad measure of corporate bond spreads compiled by Merrill Lynch declined to 124 basis points as of March 31, down 46 basis points year over year. The repricing of credit risk in the high-yield market was even more pronounced, with spreads decreasing by more than 300 basis points (a full 3 percent). The recovery of commodity prices, credit friendly (i.e., deleveraging) actions by companies and an increased appetite by investors for credit risk are some of the causes for the strength in corporate bonds in the past year.
Portfolio Positioning
The table below shows the change in allocation to various sectors for the most recent quarter and compared to a year ago. We believe this summary provides a view over time of how we have allocated capital.
Since our goal is to invest in sectors that we believe offer the best risk-adjusted returns, our allocations may change significantly over time.
| | % | % | % |
| | Portfolio | Portfolio | Portfolio |
| Sector | 3/31/2017 | 12/31/16 | 3/31/2016 |
| U.S. Treasury | 42.4 | 26.8 | 27.5 |
| Corporate | 28.7 | 34.4 | 43.2 |
| Asset-Backed (ABS) | 14.0 | 19.7 | 10.8 |
| Cash & Equivalents | 5.4 | 6.6 | 3.5 |
| Commercial Mortgage-Backed (CMBS) | 3.5 | 3.8 | 3.9 |
| Corporate Convertible Bonds | 2.1 | 2.8 | 2.9 |
| Municipal | 1.4 | 1.9 | 2.2 |
| Non-Agency Residential Mortgage-Backed | | | |
| (RMBS) | 1.3 | 1.8 | 2.6 |
| Common Stock | 0.8 | 1.6 | 2.6 |
| Agency Mortgage-Backed (MBS) | 0.4 | 0.6 | 0.8 |
| Total | 100.0 | 100.0 | 100.0 |
| High Yield* | 6.9 | 9.4 | 20.6 |
| * High Yield exposure (as of 3/31/2017) consists of investments in the Corporate, Corporate Convertible, Asset-Backed and Non-Agency Mortgage-Backed sectors. |
As the Fund experienced inflows during the quarter, we significantly increased our U.S. Treasury position, followed by modest allocations to corporate credit, ABS and CMBS. With credit spreads near multi-year lows, we are comfortable operating with a lower risk profile today. As of March 31, 2017 our high yield exposure was approximately 7.0%, down from 9.4% at December 31, 2016 and 21% as of March 31, 2016 (our maximum threshold is 25%). In addition, the Fund has minimal exposure to both RMBS and MBS, as we believe the risk/return profiles continue to be unattractive.
Overall portfolio metrics, as measured by average effective maturity and average effective duration, changed moderately compared to the prior quarter. The average effective maturity of our Fund increased to 5.4 from 4.0 years, and the average effective duration increased to 4.3 years from 3.6 years. The Fund remains materially underweight duration relative to our benchmark and the majority of our intermediate-term bond fund peers. We expect the Fund's overall interest rate exposure will remain defensive relative to its benchmark until U.S. Treasury bonds provide sufficient protection against the risk of inflation or longer-term credit spreads provide satisfactory risk-adjusted returns to warrant extending duration.
Fiscal Year Contributors
Security and sector selection were key drivers of outperformance in the past year. Primary contributors included:
| | • | Investments in energy-related corporate debt (both investment-grade and high-yield). Primary contributors included the bonds issued by Antero Resources, DCP Midstream LLC, Energy Transfer Partners LP, Range Resources, Rose Rock Midstream LP, and SemGroup. |
| | | |
| | • | Investment-grade corporate bond investments in REITS and diversified financial services companies. Primary contributors included the bonds issued by Equity Commonwealth, Markel Corporation and Vornado Realty. |
| | | |
| | • | Common stock (up 37.1%) and corporate convertible bond investments issued by Redwood Trust. |
22 | Q1 2017 ANNUAL REPORT
WEITZINVESTMENTS.COM
Fiscal Year Detractors
| | • | U.S. Treasury bonds. As yields generally rose, prices declined during the year. Longer maturity bonds (particularly those greater than 5 years) experienced the largest price declines. The Fund's Treasury holdings have an average maturity of approximately 7 years. |
First Quarter Investment Activity
Portfolio investment remained active during the quarter. Asset allocation was weighted toward U.S. Treasuries, along with modest new investments in corporate credit and securitized products. In corporate bonds, we purchased Calumet Specialty Products, Dominion Resources, DR Horton, Donnelley Financial, JP Morgan, NXPI and Valmont Industries. In securitized products, we added to our subprime automobile ABS issued by Exeter Finance, added to our consumer loan positions in Marlette Funding and SoFi, and participated in a CMBS securitization backed by a repeat sponsor Varde/First City.
While areas of opportunity remain, particularly in shorter duration corporate credit and securitized products, we believe the current state of the credit markets is more advantageous for lenders than borrowers. For example, in the ABS market, we are witnessing robust investor demand across a variety of collateral types. In many cases the riskiest classes of securities, which offer the least investor protections and have the highest risk of loss, are garnering the most attention and are experiencing significant spread compression. Similar market conditions occurred in the summer of 2014, and our patience was rewarded as market conditions inevitably changed.
Fund Strategy
Our investment approach consists primarily of investing in a portfolio of mostly high quality bonds with an overall portfolio average maturity of less than 10 years and minimum duration of at least 3 ½ years where we believe we can capture most of the "coupon" returns of long-term bonds with less interest-rate risk. The Fund has a broad investment mandate. In addition to widely held benchmark securities such as U.S. treasuries, agency MBS and investment grade corporate bonds, the Fund may invest in high yield and convertible bonds, preferred and convertible preferred stock, as well as RMBS, CMBS, and other ABS securities (e.g., credit card, auto, aircraft, container) and non-rated securities. 25% of Fund assets may be invested in non-investment grade bonds. In addition, equity-oriented securities could comprise as much as 20% of Fund assets (currently approximately 1% of Fund assets). We have and will continue to flex these options when the opportunity arises.
We believe our flexible mandate will benefit shareholders over the long term as we seek out potentially mispriced securities due to market inefficiencies such as forced selling that occurs when a company is downgraded to below investment grade. We select assets for our portfolio one security at a time based on our view of opportunities in the marketplace and are willing to be concentrated in our best ideas. Our corporate bond research is geared to bottom-up analysis of individual companies. The credit work we do on companies and industries is supplemented by our firm-wide equity due diligence. Our securitized products research is focused on a thorough review and analysis of the underlying collateral, deal structure and sponsorship.
Our portfolio will often be constructed with a shorter average life (i.e. duration) than the Barclays U.S. Agg. We chose this benchmark to highlight that we could periodically invest in longer term bonds when conditions warrant. The effect over time of our portfolio construction (typically shorter average life) may lead to a penalty when interest rates fall but a boost to relative performance when rates rise.
Overall, we strive to be adequately compensated for the risks assumed in order to maximize our investment (or reinvestment) yield and avoid making interest rate "bets."
23 | Q1 2017 ANNUAL REPORT
CORE PLUS INCOME FUND (CONTINUED)
Returns
| | | | Annualized | | | | | | |
| | | | Since Inception | | | | | | |
| | | | (7/31/2014) | | 1-year | | Quarter |
| WCPNX - Investor Class | | | 3.41 | % | | 4.41 | % | | 0.99 | % |
| WCPBX - Institutional Class | | | 3.61 | | | 4.61 | | | 1.04 | |
| U.S. Aggregate Bond | | | 2.34 | | | 0.44 | | | 0.82 | |
Growth of $10,000
This chart depicts the change in the value of a $10,000 investment in the Core Plus Income Fund – Institutional Class for the period since inception (7/31/14) through March 31, 2017, as compared with the growth of the U.S. Aggregate Bond Index during the same period. Index performance is hypothetical and is shown for illustrative purposes only.
Credit Quality(a)(d)
| Underlying Securities | % of Portfolio | |
| U.S. Treasury | 42.3 | |
| U.S. Government Agency Mortgage | | |
Related Securities(b) | 0.4 | |
| Aaa/AAA | 4.8 | |
| Aa/AA | 3.8 | |
| A/A | 14.5 | |
| Baa/BBB | 21.4 | |
| Ba/BB | 1.5 | |
| B/B | 2.9 | |
| Caa/CCC | 0.3 | |
| Non-Rated | 2.2 | |
| Common Stocks | 0.8 | |
| Cash Equivalents | 5.1 | |
| | 100.0 | |
Financial Attributes
| Portfolio Summary | |
Average Maturity(d) | 5.6 years |
Average Effective Maturity(d) | 5.4 years |
Average Duration(d) | 4.3 years |
Average Effective Duration(d) | 4.3 years |
Average Coupon(d) | 2.8% |
| 30-Day SEC Yield - Investor Class | 1.94% |
| 30-Day SEC Yield - Institutional Class | 2.14% |
Asset Allocation(c)
Maturity Distribution
| Maturity Type | % of Portfolio | |
| Cash Equivalents | 5.1 | |
| Less than 1 Year | 18.4 | |
| 1 - 3 Years | 23.4 | |
| 3 - 5 Years | 16.2 | |
| 5 - 7 Years | 12.9 | |
| 7 - 10 Years | 18.3 | |
| 10 Years or more | 4.9 | |
| Common Stocks | 0.8 | |
| | 100.0 | |
(a) | The Fund receives credit quality ratings on underlying securities of the Fund when available from Moody's, Fitch, Kroll and others. The Fund will use one rating for an underlying security if that is all that is provided. Ratings and portfolio credit quality may change over time. The Fund itself has not been rated by an independent rating agency. |
(b) | Mortgage related securities issued and guaranteed by government-sponsored entities such as Fannie Mae and Freddie Mac are generally not rated by ratings agencies. Securities which are not rated do not necessarily indicate low quality. Fannie Mae's and Freddie Mac's senior long-term debt are currently rated Aaa and AAA by Moody's and Fitch, respectively. |
(c) | Percent of net assets |
(d) | Source: Bloomberg Analytics |
Returns assume reinvestment of dividends and redemption at the end of each period, and reflect the deduction of annual operating expenses which as stated in its most recent prospectus are 2.36% (gross) and 1.38% (gross) of the Fund's Investor and Institutional Class net assets, respectively. Total returns shown include fee waivers and expense reimbursements, if any; total returns would have been lower had there been no waivers and/or reimbursements. Past performance does not guarantee future results. The investment return and the principal value of an investment in this Fund will fluctuate so that an investor's shares, when redeemed, may be worth more or less than the original cost. Current performance may be higher or lower than the performance data quoted. Performance data current to the most recent month-end may be obtained at www.weitzinvestments.com/funds_and_performance/fund_performance.fs.
See page 6 for additional performance disclosures. See page 74 for a description of all indices.
Performance information does not reflect the deduction of taxes that a shareholder would pay on Fund distributions or the redemption of Fund shares.
24 | Q1 2017 ANNUAL REPORT
WEITZINVESTMENTS.COM
SHORT DURATION INCOME FUND
Investment Style: Short-Term Bond
Portfolio Manager: Tom Carney, CFA
The Short Duration Income Fund's Institutional Class returned +0.62% in the first calendar quarter compared to a +0.41% return for the Bloomberg Barclays 1-3 U.S. Aggregate Index (Bloomberg Barclays U.S. Agg 1-3), our Fund's primary benchmark. For the year ended March 31, 2017, the Short Duration Income Fund's Institutional Class returned +2.38% compared to a +0.74% return for the benchmark.
Fiscal 2017 Review
The post-election optimism heading into 2017 carried through most of the year's first quarter. However, the Trump administration's inability to repeal and replace the Affordable Care Act proved to be the biggest market event of the year so far, as investors questioned whether this indicated an inability to pass legislation in DC. If tax reform meets the same fate as the healthcare bill, some optimism may prove unfounded, and markets may return to pre-election valuations. As the table below details, longer-term bond yields ended the quarter very near where they began.
| | | | | | | U.S. Treasury Yields | | | |
| | | | 2-Year | | | 3-Year | | | 5-Year | | | 10-Year | |
| 3/31/2017 | | | 1.26 | % | | 1.49 | % | | 1.92 | % | | 2.39 | % |
| 12/31/2016 | | | 1.19 | % | | 1.45 | % | | 1.93 | % | | 2.45 | % |
| 3/31/2016 | | | 0.73 | % | | 0.86 | % | | 1.21 | % | | 1.77 | % |
| Fiscal year low | | | 0.55 | % | | 0.65 | % | | 0.94 | % | | 1.36 | % |
During the past fiscal year (March 31, 2016, to March 31, 2017), U.S. Treasury bond yields moved higher as the economy continued to exhibit slow but steady strength and the Federal Reserve twice raised short-term interest rates.
Rising "risk-free" (Treasury) interest rates were a headwind for investor returns in the past year, as bond prices and changes in interest rates are inversely related. But declining credit spreads (the incremental return above U.S. Treasury bonds investors demand for owning corporate debt) were a key storyline for the year ended March 31, 2017. Corporate bonds and other credit sensitive securities outperformed Treasury bonds in the past year as credit spreads narrowed, particularly for non-investment grade or high-yield bonds. A broad measure of corporate bond spreads compiled by Merrill Lynch declined to 124 basis points as of March 31, down 46 basis points year over year. The repricing of credit risk in the high-yield market was even more pronounced, with spreads decreasing by more than 300 basis points (a full 3 percent). The recovery of commodity prices, credit friendly (i.e., deleveraging) actions by companies and an increased appetite by investors for credit risk are some of the causes for the strength in corporate bonds in the past year.
Portfolio Positioning
The table below shows the change in allocation to various sectors from the most recent quarter and compared to a year ago. We believe this summary provides a view over time of how we have allocated capital.
Since our goal is to invest in sectors that we believe offer the best risk-adjusted returns, our allocations may change significantly over time.
| | % | % | % | |
| | Portfolio | Portfolio | Portfolio | |
| Sector | 3/31/2017 | 12/31/16 | 3/31/2016 | |
| Corporate | 43.5 | 42.7 | 40.2 | |
| U.S. Treasury | 24.7 | 22.8 | 18.9 | |
| Agency Mortgage-Backed (MBS) | 14.7 | 15.9 | 18.7 | |
| Asset-Backed (ABS) | 5.7 | 6.4 | 4.7 | |
| Corporate Convertible bonds | 4.0 | 4.0 | 3.5 | |
| Non-Agency Residential Mortgage-Backed | | | | |
| (RMBS) | 3.1 | 3.4 | 5.1 | |
| Cash & Equivalents | 2.0 | 3.0 | 3.3 | |
| Common Stock | 1.1 | 1.0 | 2.3 | |
| Commercial Mortgage-Backed (CMBS) | 0.8 | 0.3 | 2.8 | |
| Municipal | 0.4 | 0.5 | 0.5 | |
| Total | 100.0 | 100.0 | 100.0 | |
| High Yield* | 9.8 | 10.1 | 13.1 | |
| * High Yield exposure (as of 3/31/2017) consists of investments in the Corporate, Corporate Convertible, Asset-Backed and Non-Agency Mortgage-Backed sectors. |
Over the past year, agency MBS and RMBS securities holdings continued to decline, driven by prepayments and amortization of principal. While agency MBS have held a prominent position in Fund allocations over the years, we believe the risk/return profile continues to be particularly unattractive. Therefore, we have allowed this portion of the portfolio to run off/shrink over the last few years. Incremental capital has been principally directed toward corporate bonds and ABS where we believe the return profiles have been more satisfactory relative to the risks of ownership.
As of March 31, our high-yield exposure was approximately 10%, unchanged from December 31 (our maximum threshold is 15%). Our high-yield exposure continues to be concentrated in primarily higher-quality, shorter-term bonds that we believe have attractive risk/reward profiles. To highlight our preference for higher-quality credits in the current market environment, the vast majority of our non-convertible high yield corporate bond exposure is allocated to BB or split-rated companies (those rated investment grade by one agency and non-investment grade by at least one other) that we believe have strong asset and liquidity positions.
Overall portfolio metrics, as measured by average maturity and average effective duration, changed modestly compared to a year ago. The average effective maturity declined to 2.2 years from 2.3 years, and the average effective duration declined to 2.0 years from 2.1 years. These measures provide a guide to the Fund's interest rate sensitivity. A lower average effective maturity and shorter average effective duration reduce the Fund's price sensitivity to changes in interest rates (either up or down).
Fiscal Year Contributors
Security and sector selection were key drivers of the Fund's outperformance in the past year. Primary contributors included:
| | | |
| | •
| Investments in energy-related corporate debt (both investment-grade and high-yield). Primary contributors included the bonds issued by Boardwalk Pipelines LP, Energy Transfer Partners LP, Range Resources, Superior Energy Services Inc., Williams Partners LP., and Rose Rock Midstream LP. |
| | | |
| | • | RMBS, CMBS and Auto ABS. These segments of the Fund continued to perform at or above expectations with respect to credit performance and average life progression, while providing steady income and minimal price volatility during the quarter and fiscal year. Key contributors in these segments included the CMBS bonds issued by Oaktree Real Estate; RMBS issued by Sequoia Mortgage Trust; and auto ABS bonds issued by AmeriCredit Automobile Receivables Trust and Drive Time Auto Owners Trust. |
| | | |
| | • | Common stock (up 37.1%) and corporate convertible bond investments issued by Redwood Trust. |
| | | |
| | • | Investment-grade corporate bonds in insurance companies, banks and diversified financial services companies. Primary contributors included the bonds issued by JP Morgan, American Express and Markel Corporation. |
Fiscal Year Detractors
| | | |
| | • | Select U.S. Treasury bonds. As yields generally rose, prices declined during the year. Longer maturity bonds (particularly those greater than 5 years) experienced the largest price declines. The Fund's Treasury holdings primarily consist of shorter-term securities with an average maturity of slightly over two years. |
| | | |
| | • | Despite broadly declining credit spreads, rising U.S. Treasury rates more than offset the benefits of spread compression for select corporate bond investments. Detractors were concentrated in investment-grade bonds maturing longer than three years, including 6-year bonds issued by Boston Properties, 4-year bonds issued by U.S. Bank, and 4- and 5-year bonds issued by Wells Fargo. |
25 | Q1 2017 ANNUAL REPORT
SHORT DURATION INCOME FUND (CONTINUED)
First Quarter Investment Activity
Portfolio investment remained active during the quarter. Asset allocation was heavily weighted toward corporate bonds, particularly investment-grade bonds maturity in less than 3 years. Examples of purchases include Berkshire Hathaway Finance Corp., Goldman Sachs, Dominion Resources, Verizon and U.S. Bank.
Our investments may be wide-ranging, but our analysis is the same. We strive to own only those investments we believe compensate us for the incremental credit risk we assume. Our overall goal is to invest in a portfolio of bonds of varying maturities that we believe represents attractive risk-adjusted returns, taking into consideration the general level of interest rates and the credit quality of each investment. Noteworthy is our Fund's maturity distribution and defensive positioning with respect to interest rates: nearly 70% of the Fund's net assets mature in less than three years, with approximately 26% maturing in less than one year.
Fund Strategy
Our approach consists primarily of investing in a portfolio of mostly high-quality, short- to intermediate-term bonds with an overall portfolio average duration of 1 to 3 ½ years, where we believe we can capture most of the "coupon" returns of long-term bonds with less interest rate risk. We do not and will not try to mimic any particular index as we construct our portfolio. We select assets for our portfolio one security at a time based on our view of opportunities in the marketplace. Our fixed income research certainly doesn't rely on but often benefits from the work our equity teammates conduct on companies and industries in the course of their due diligence.
We may invest in fixed income-related investments that are not considered "investment grade" but have favorable risk/reward characteristics (such as high-yield and convertible bonds, preferred and convertible preferred stock). A small percentage of Fund assets may also be invested in high-dividend-paying common stocks, such as longtime Fund holding Redwood Trust. These types of investments have generally enhanced our long-term returns.
Overall, we strive to be adequately compensated for the risks assumed in order to maximize investment (or reinvestment) yield and avoid making interest rate "bets," particularly ones that depend on interest rates going down.
26 | Q1 2017 ANNUAL REPORT
WEITZINVESTMENTS.COM
Returns
| | | | Annualized | | | | | | |
| | | | Since Inception | | | | | | | | | | | | | | | | | | |
| | | | (12/23/1988) | | 20-year | | 10-year | | 5-year | | 3-year | | 1-year | | Quarter |
| WSHNX - Investor Class | | | 5.21 | % | | 4.41 | % | | 3.37 | % | | 1.65 | % | | 1.46 | % | | 2.15 | % | | 0.57 | % |
| WEFIX - Institutional Class | | | 5.26 | | | 4.47 | | | 3.50 | | | 1.86 | | | 1.70 | | | 2.38 | | | 0.62 | |
| Bloomberg Barclays | | | | | | | | | | | | | | | | | | | | | | |
| U.S. Aggregate 1-3 Year | | | — | | | 3.73 | | | 2.42 | | | 0.95 | | | 0.98 | | | 0.74 | | | 0.41 | |
| U.S. Government/Credit | | | | | | | | | | | | | | | | | | | | | | |
| Intermediate | | | 5.86 | * | | 4.87 | | | 3.76 | | | 1.88 | | | 2.01 | | | 0.42 | | | 0.78 | |
| 1-5 Year | | | 5.26 | * | | 4.20 | | | 2.95 | | | 1.30 | | | 1.38 | | | 0.53 | | | 0.57 | |
| CPI + 1% | | | 3.55 | * | | 3.15 | | | 2.75 | | | 2.24 | | | 2.06 | | | 3.41 | | | 1.23 | |
Growth of $10,000
This chart depicts the change in the value of a $10,000 investment in the Short Duration Income Fund – Institutional Class for the period March 31, 2007 through March 31, 2017, as compared with the growth of the U.S. Aggregate 1-3 Year, Intermediate U.S. Government/Credit and CPI + 1% Indices during the same period. Index performance is hypothetical and is shown for illustrative purposes only.
Credit Quality(a)(d)
| Underlying Securities | % of Portfolio | |
| U.S. Treasury | 24.8 | |
| U.S. Government Agency Mortgage | | |
Related Securities(b) | 14.7 | |
| Aaa/AAA | 5.5 | |
| Aa/AA | 2.5 | |
| A/A | 14.1 | |
| Baa/BBB | 26.1 | |
| Ba/BB | 3.6 | |
| B/B | 1.7 | |
| Non-Rated | 4.5 | |
| Common Stocks | 1.1 | |
| Cash Equivalents | 1.4 | |
| | 100.0 | |
Financial Attributes
| Portfolio Summary | |
Average Maturity(d) | 2.4 years |
Average Effective Maturity(d) | 2.2 years |
Average Duration(d) | 2.0 years |
Average Effective Duration(d) | 2.0 years |
Average Coupon(d) | 2.9% |
| 30-Day SEC Yield - Investor Class | 1.60% |
| 30-Day SEC Yield - Institutional Class | 1.80% |
Maturity Distribution(d)
| Maturity Type | % of Portfolio | |
| Cash Equivalents | 1.5 | |
| Less than 1 Year | 25.7 | |
| 1 - 3 Years | 43.8 | |
| 3 - 5 Years | 22.8 | |
| 5 - 7 Years | 4.1 | |
| 7 - 10 Years | 1.0 | |
| Common Stocks | 1.1 | |
| | 100.0 | |
Asset Allocation(c) | | |
(a) | The Fund receives credit quality ratings on underlying securities of the Fund when available from Moody's, Fitch, Kroll and others. The Fund will use one rating for an underlying security if that is all that is provided. Ratings and portfolio credit quality may change over time. The Fund itself has not been rated by an independent rating agency. |
(b) | Mortgage related securities issued and guaranteed by government-sponsored entities such as Fannie Mae and Freddie Mac are generally not rated by ratings agencies. Securities which are not rated do not necessarily indicate low quality. Fannie Mae's and Freddie Mac's senior long-term debt are currently rated Aaa and AAA by Moody's and Fitch, respectively. |
(c) | Percent of net assets |
(d) | Source: Bloomberg Analytics |
Returns assume reinvestment of dividends and redemption at the end of each period, and reflect the deduction of annual operating expenses which as stated in its most recent prospectus are 0.92% (gross) and 0.63% of the Fund's Investor and Institutional Class net assets, respectively. Total returns shown include fee waivers and expense reimbursements, if any; total returns would have been lower had there been no waivers and/or reimbursements. Past performance does not guarantee future results. The investment return and the principal value of an investment in this Fund will fluctuate so that an investor's shares, when redeemed, may be worth more or less than the original cost. Current performance may be higher or lower than the performance data quoted. Performance data current to the most recent month-end may be obtained at www.weitzinvestments.com/funds_and_performance/fund_ performance.fs.
See page 6 for additional performance disclosures. See page 74 for a description of all indices.
Performance information does not reflect the deduction of taxes that a shareholder would pay on Fund distributions or the redemption of Fund shares.
27 | Q1 2017 ANNUAL REPORT
ULTRA SHORT GOVERNMENT FUND
Investment Style: Ultra-Short-Term Bond
Portfolio Manager: Tom Carney, CFA
The Ultra Short Government Fund returned +0.13% in the first calendar quarter compared to a +0.13% return for the Bank of America Merrill Lynch U.S. 6-Month Treasury Bill Index (BofA Merrill 6-Month Treasury), our Fund's primary benchmark.
Overview
Ultra Short Government Fund's first quarter in its new form (no longer a money market fund under Rule 2a-7 of the Investment Company Act of 1940) went well. While the Fund no longer seeks to maintain a stable net asset value, we ended our first full quarter with no change in the Fund's per share net asset value. This was achieved despite the Federal Reserve's decision to raise short-term interest rates in the quarter for the third time in the past 8+ years. Additionally, the Fund's 30-day yield increased from 0.25% at year end to 0.67% at March 31, as we fully implemented the Fund's new investment mandate. The net effect has been an increase in monthly income distributions to investors.
We believe the Fund's principal investment strategies and objectives will continue to meet our long-term goals of providing current income, protecting principal and providing liquidity. Under normal conditions, the Fund will invest at least 80% of its net assets in obligations issued or guaranteed by the U.S. government and its government-related entities. The balance of Fund assets may be invested in U.S. investment-grade debt securities. We consider investment grade to mean rated at least BBB- by one or more recognized credit ratings firms. Additionally, the Fund will maintain an average effective duration of one year or less. Duration is a measure of how sensitive the Fund's portfolio may be to changes in interest rates. All else equal, a lower duration portfolio of bonds is less sensitive to changes in interest rates than a portfolio of bonds with a higher duration.
Despite the changes made to the Fund, the Federal Reserve's monetary policy decisions (e.g., changes in short-term interest rates) will continue to affect all investments within our opportunity set. As a result, our yield and return will invariably follow the path dictated by the Federal Reserve's monetary policy, as we frequently reinvest holdings that mature in a short period of time. As of March 31, 85% of our portfolio was invested in U.S. Treasury bills and U.S. Treasury notes, 13% was invested in investment grade corporate bonds, with the balance in high-quality Wells Fargo money market funds. The average effective duration of our portfolio at March 31 was 0.4 years, up from 0.3 at year end. As mentioned above, we will continue to focus on high credit quality, preservation of capital and maintaining liquidity for our investors.
Growth of $10,000
This chart depicts the change in the value of a $10,000 investment in the Ultra Short Government Fund for the period March 31, 2007 through March 31, 2017, as compared with the growth of the 6-Month Treasury Index during the same period. Index performance is hypothetical and is shown for illustrative purposes only.
Returns
| | | | Annualized | | | |
| | | | 10-Year | | | 5-Year | | | 1-Year | |
| SAFEX | | | 0.63 | | | 0.07 | | | 0.25 | |
| 6-Month Treasury | | | 1.05 | | | 0.30 | | | 0.58 | |
Sector Breakdown
| | % of Net Assets | |
| Corporate Bonds | 12.6 | |
| U.S. Treasury | 84.6 | |
| Money Markets/Other | 2.8 | |
| | 100.0 | |
Returns assume reinvestment of dividends and redemption at the end of each period, and reflect the deduction of the Fund's annual operating expenses which as stated in its most recent prospectus are 0.60% (gross) of the Fund's net assets. Total returns shown include fee waivers and expense reimbursements, if any; total returns would have been lower had there been no waivers and/or reimbursements. Past performance does not guarantee future results. The investment return and the principal value of an investment in this Fund will fluctuate so that an investor's shares, when redeemed, may be worth more or less than the original cost. Current performance may be higher or lower than the performance data quoted. Performance data current to the most recent month-end may be obtained at www.weitzinvestments.com/funds_and_performance/fund_performance.fs.
The Fund's past performance is not necessarily an indication of how the Fund will perform in the future. Effective December 16, 2016, the Fund revised its principal investment strategies and policies to permit the Fund to invest in a diversified portfolio of short-term debt securities and to have a fluctuating net asset value. Prior to December 16, 2016, the Fund operated as a "government money market fund" as defined under Rule 2a-7 of the Investment Company Act of 1940 and maintained a stable net asset value of $1.00 per share. The Fund's past performance reflects the Fund's prior principal investment strategies and policies.
See page 6 for additional performance disclosures. See page 74 for a description of all indices.
Performance information does not reflect the deduction of taxes that a shareholder would pay on Fund distributions or the redemption of Fund shares.
28 | Q1 2017 ANNUAL REPORT
NEBRASKA TAX-FREE INCOME FUND
Investment Style: Municipal-State Bond
Portfolio Manager: Tom Carney, CFA
Nebraska Tax-Free Income Fund returned +0.78% in the first calendar quarter compared to a +1.90% return for the Barclays 5-Year Municipal Bond Index, our primary benchmark. For the fiscal year ended March 31, 2017, the Nebraska Tax-Free Income Fund's total return was -0.54%, compared to a +0.35% return for the benchmark. Our decision to maintain the Fund's shorter average life and duration metrics compared to its primary benchmark is the principal reason for the underperformance.
Fiscal 2017 Review
The post-election optimism heading into 2017 carried through most of the year's first quarter. However, the Trump administration's inability to repeal and replace the Affordable Care Act proved to be the biggest market event of the year so far, as investors questioned whether this indicated an inability to pass legislation in DC. If tax reform meets the same fate as the healthcare bill, some optimism may prove unfounded, and markets may return to pre-election valuations. As the table below details, longer-term bond yields ended the quarter very near where they began.
| | | | | | | U.S. Treasury Yields | | | |
| | | | 2-Year | | | 3-Year | | | 5-Year | | | 10-Year | |
| 3/31/2017 | | | 1.26 | % | | 1.49 | % | | 1.92 | % | | 2.39 | % |
| 12/31/2016 | | | 1.19 | % | | 1.45 | % | | 1.93 | % | | 2.45 | % |
| 3/31/2016 | | | 0.73 | % | | 0.86 | % | | 1.21 | % | | 1.77 | % |
| Fiscal year low | | | 0.55 | % | | 0.65 | % | | 0.94 | % | | 1.36 | % |
During the past fiscal year (March 31, 2016, to March 31, 2017), U.S. Treasury bond yields moved higher as the economy continued to exhibit slow but steady strength and the Federal Reserve twice raised short-term interest rates.
Rising "risk-free" (Treasury) interest rates were a headwind for investor returns in the past year, as bond prices and changes in interest rates are inversely related. Municipal bonds outperformed their taxable government counterparts as the yield relationship between tax-free municipal bonds and taxable alternatives declined. High-quality 5-year municipal bonds, for example, ended the current fiscal year (March 31) with a yield representing approximately 82% of U.S. Treasuries, down from 95% a year ago. The net effect is that municipal bond yields generally rose in the past year–but by less than their taxable government counterparts.
With municipal bond yields as a percentage of U.S. Treasury yields declining in the past year, the marketplace is currently pricing municipals below the average of the past 15 years. Therefore, the relative value of municipal bonds versus Treasuries has declined. Coupled with the still abnormally low overall interest rate environment, this leaves the municipal marketplace with little absolute value as well, albeit slightly more than was present a year ago, given the modest increase in interest rates.
Our Fund's results in the past year were disappointing despite our defensive positioning. Income returns were offset by (unrealized) price declines due to rising interest rates.
Investment activity in the past year was reasonably active as we took advantage of improved reinvestment opportunities from the increase in the overall interest rate environment. Over the past year, nearly $19 million new investments (more than 30% of Fund assets) were made. A byproduct of these efforts was a meaningful (50%) improvement in the Fund's 'yield to worst' (i.e., the Fund's yield to the earliest call date of its portfolio holdings).
An example from this year's first quarter includes a $1 million investment in the 11-year bonds for Douglas County Nebraska School District #1 (Omaha Public Schools). The bonds are secured by unlimited property taxes by the largest and most economically diverse school district in the state of Nebraska. The district covers 134 square miles and serves over 16% of Nebraska's public school students, with a total enrollment of approximately 51,000 students. The bonds represent the type of investment we have added in the past year. Namely, very high credit quality and offering returns/yield at the time of purchase that have, in many cases, exceeded the comparable U.S. Treasury yield. For example, the yield to maturity and yield to call (or 'yield to worst') at purchase of the 11-year Douglas County School District tax-free municipal bonds were approximately 3.1% and 2.4%, respectively. The yield to maturity was greater than 120% of fully taxable U.S. Treasury alternative/ comparable, while the yield to call was slightly more than 100% of U.S. Treasury bonds of comparable term.
Turning to portfolio metrics, over the past year the average effective duration of our Fund increased to 3.0 years from 2.7 years, and the average effective maturity of our bonds increased to 3.4 years from 2.9 years. Overall asset quality of our portfolio remains high, with approximately 84% rated A or better by a number of nationally recognized statistical rating organizations, credit rating agencies recognized by the U.S. Securities and Exchange Commission.
Please see the following page for additional details regarding the breakdown of our investment holdings by state, sector and rating. Our investments may be wide-ranging, but our analysis is the same. We strive to own only those investments we believe compensate us for the incremental credit risk we assume. Our overall goal is to invest in a portfolio of bonds of varying maturities that we believe represents attractive risk-adjusted returns, taking into consideration the general level of interest rates and the credit quality of each investment.
We expect to continue to position the Fund defensively relative to interest rate exposure while we patiently seek out areas of opportunity. We will invest one security at a time, relying on a fundamental, research-based investment approach, and we are well positioned to take advantage of any market weakness.
The Fund seeks income that is exempt from federal and Nebraska personal income taxes, but income from the Fund may be subject to federal alternative minimum tax and capital gains taxes.
29 | Q1 2017 ANNUAL REPORT
NEBRASKA TAX-FREE INCOME FUND (CONTINUED)
Returns
| | | | Annualized | | | | | | |
| | | | Since Inception | | | | | | | | | | | | | | | | | | |
| | | | (10/01/1985) | | 20-year | | 10-year | | 5-year | | 3-year | | 1-year | | Quarter |
| WNTFX | | | 4.69 | % | | 3.58 | % | | 2.47 | % | | 1.03 | % | | 0.93 | % | | (0.54 | )% | | 0.78 | % |
| 5-Year Municipal Bond | | | — | | | 4.32 | | | 3.84 | | | 2.06 | | | 2.03 | | | 0.35 | | | 1.90 | |
Growth of $10,000
This chart depicts the change in the value of a $10,000 investment in the Nebraska Tax-Free Income Fund for the period March 31, 2007 through March 31, 2017, as compared with the growth of the 5-Year Municipal Bond Index during the same period. Index performance is hypothetical and is shown for illustrative purposes only.
State Breakdown
| | % of Net Assets | |
| | | |
| Nebraska | 89.0 | |
| Florida | 1.7 | |
| Iowa | 1.3 | |
| Texas | 0.7 | |
| Illinois | 0.6 | |
| Cash Equivalents/Other | 6.7 | |
| | 100.0 | |
Financial Attributes
| Portfolio Summary | |
Average Maturity(c) | 4.6 years |
Average Effective Maturity(c) | 3.4 years |
Average Duration(c) | 2.8 years |
Average Effective Duration(c) | 3.0 years |
Average Coupon(c) | 3.7% |
| 30-Day SEC Yield | 0.96% |
| Municipals exempt from federal | |
| and Nebraska income taxes | 89.0% |
| Municipals subject to alternative | |
| minimum tax | 2.0% |
Maturity Distribution(c)
| Maturity Type | % of Portfolio | |
| Cash Equivalents | 5.9 | |
| Less than 1 Year | 25.7 | |
| 1 - 3 Years | 29.2 | |
| 3 - 5 Years | 14.2 | |
| 5 - 7 Years | 9.5 | |
| 7 - 10 Years | 13.6 | |
| 10 Years or more | 1.9 | |
| | 100.0 | |
Asset Allocation(b) | | |
Credit Quality(a)(c)
| Underlying Securities | % of Portfolio | |
| Aaa/AAA | 0.8 | |
| Aa/AA | 53.9 | |
| A/A | 30.0 | |
| Baa/BBB | 1.3 | |
| Non-Rated | 8.1 | |
| Cash Equivalents | 5.9 | |
| | 100.0 | |
Sector Breakdown
| | % of Net Assets | |
| Power | 22.5 | |
| Higher Education | 10.0 | |
| Hospital | 7.7 | |
| General | 6.6 | |
| Lease | 4.3 | |
| Water/Sewer | 4.1 | |
| Airport/Transportation | 3.4 | |
| Housing | 0.9 | |
| Total Revenue | 59.5 | |
| School District | 7.3 | |
| City/Subdivision | 3.8 | |
| County | 2.8 | |
| Natural Resource District | 2.8 | |
| Total General Obligation | 16.7 | |
| Escrow/Pre-Refunded | 17.1 | |
| Cash Equivalents/Other | 6.7 | |
| | 100.0 | |
(a) | The Fund receives credit quality ratings on underlying securities of the Fund when available from Moody's, Fitch and others. The Fund will use one rating for an underlying security if that is all that is provided. Ratings and portfolio credit quality may change over time. The Fund itself has not been rated by an independent rating agency. |
(b) | Percent of net assets. |
(c) | Source: Bloomberg Analytics |
Returns assume reinvestment of dividends and redemption at the end of each period, and reflect the deduction of the Fund's annual operating expenses which as stated in its most recent prospectus are 0.78% of the Fund's net assets. Total returns shown include fee waivers and expense reimbursements, if any; total returns would have been lower had there been no waivers and/or reimbursements. Past performance does not guarantee future results. The investment return and the principal value of an investment in this Fund will fluctuate so that an investor's shares, when redeemed, may be worth more or less than the original cost. Current performance may be higher or lower than the performance data quoted. Performance data current to the most recent month-end may be obtained at www.weitzinvestments.com/funds_and_ performance/fund_performance.fs.
See page 6 for additional performance disclosures. See page 74 for a description of all indices.
Performance information does not reflect the deduction of taxes that a shareholder would pay on Fund distributions or the redemption of Fund shares.
30 | Q1 2017 ANNUAL REPORT
WEITZINVESTMENTS.COM
Schedule of Investments
March 31, 2017
| Common Stocks – 82.3% | | | | | | | | | |
| | | % of Net | | | | | | | |
| Consumer Discretionary | | Assets | | | Shares | | | $ Value | |
| Cable & Satellite | | | 18.0 | | | | | | | |
| Liberty Broadband Corp. - Series C* | | | | | | | 725,000 | | | | 62,640,000 | |
Liberty Global Group - Class C* (c) | | | | | | | 1,370,000 | | | | 48,004,800 | |
| Comcast Corp. - Class A | | | | | | | 550,000 | | | | 20,674,500 | |
| Liberty SiriusXM Group - Series C* | | | | | | | 460,000 | | | | 17,838,800 | |
| | | | | | | | | | | | | |
| Internet & Direct Marketing Retail | | | 4.6 | | | | | | | | | |
| QVC Group - Series A* | | | | | | | 1,415,000 | | | | 28,328,300 | |
| Amazon.com, Inc.* | | | | | | | 11,500 | | | | 10,195,210 | |
| | | | | | | | | | | | | |
| Movies & Entertainment | | | 4.0 | | | | | | | | | |
| Twenty-First Century Fox, Inc. - Class A | | | | | | | 1,030,000 | | | | 33,361,700 | |
| | | | | | | | | | | | | |
| Broadcasting | | | 2.0 | | | | | | | | | |
| Discovery Communications, Inc. - Class C* | | | | | | | 595,000 | | | | 16,844,450 | |
| | | | | | | | | | | | | |
| Multiline Retail | | | 1.6 | | | | | | | | | |
| Dollar Tree, Inc.* | | | | | | | 170,000 | | | | 13,338,200 | |
| | | | 30.2 | | | | | | | | 251,225,960 | |
| Information Technology | | | | | | | | | | | | |
| | | | | | | | | | | | | |
| IT Services | | | 8.2 | | | | | | | | | |
| Mastercard Inc. - Class A | | | | | | | 278,000 | | | | 31,266,660 | |
| Visa Inc. - Class A | | | | | | | 215,000 | | | | 19,107,050 | |
Accenture plc - Class A(c) | | | | | | | 150,000 | | | | 17,982,000 | |
| | | | | | | | | | | | | |
| Internet Software & Services | | | 3.9 | | | | | | | | | |
| Alphabet, Inc. - Class C* | | | | | | | 38,563 | | | | 31,990,322 | |
| | | | | | | | | | | | | |
| Software | | | 3.4 | | | | | | | | | |
| Oracle Corp. | | | | | | | 635,000 | | | | 28,327,350 | |
| | | | 15.5 | | | | | | | | 128,673,382 | |
| Financials | | | | | | | | | | | | |
| | | | | | | | | | | | | |
| Diversified Financial Services | | | 7.2 | | | | | | | | | |
| Berkshire Hathaway Inc. - Class B* | | | | | | | 360,000 | | | | 60,004,800 | |
| | | | | | | | | | | | | |
| Insurance Brokers | | | 3.2 | | | | | | | | | |
Aon plc - Class A(c) | | | | | | | 224,000 | | | | 26,586,560 | |
| | | | | | | | | | | | | |
| Diversified Banks | | | 2.0 | | | | | | | | | |
| Wells Fargo & Co. | | | | | | | 295,000 | | | | 16,419,700 | |
| | | | 12.4 | | | | | | | | 103,011,060 | |
| Health Care | | | | | | | | | | | | |
| | | | | | | | | | | | | |
| Pharmaceuticals | | | 5.4 | | | | | | | | | |
Allergan plc(c) | | | | | | | 186,000 | | | | 44,439,120 | |
| | | | | | | | | | | | | |
| Health Care Services | | | 3.7 | | | | | | | | | |
| Laboratory Corp. of America Holdings* | | | | | | | 215,000 | | | | 30,846,050 | |
| | | | | | | | | | | | | |
| Life Sciences Tools & Services | | | 2.2 | | | | | | | | | |
| Thermo Fisher Scientific Inc. | | | | | | | 118,000 | | | | 18,124,800 | |
| | | | 11.3 | | | | | | | | 93,409,970 | |
| Materials | | | | | | | | | | | | |
| | | | | | | | | | | | | |
| Industrial Gases | | | 2.6 | | | | | | | | | |
| Praxair, Inc. | | | | | | | 180,000 | | | | 21,348,000 | |
| | | | | | | | | | | | | |
| Fertilizers & Agricultural Chemicals | | | 2.4 | | | | | | | | | |
| Monsanto Co. | | | | | | | 175,000 | | | | 19,810,000 | |
| | | | 5.0 | | | | | | | | 41,158,000 | |
| | | | | | | | | | | | | |
| | | | | | | $ Principal | | | | | |
| | | % of Net | | | Amount | | | | | |
| Energy | | Assets | | | or Shares | | | $ Value | |
| Oil & Gas Exploration & Production | | | 2.7 | | | | | | | | | |
| Pioneer Natural Resources Co. | | | | | | | 68,000 | | | | 12,663,640 | |
| Range Resources Corp. | | | | | | | 325,000 | | | | 9,457,500 | |
| | | | | | | | | | | | | |
| Oil & Gas Equipment & Services | | | 0.7 | | | | | | | | | |
| Halliburton Co. | | | | | | | 125,000 | | | | 6,151,250 | |
| | | | 3.4 | | | | | | | | 28,272,390 | |
| Consumer Staples | | | | | | | | | | | | |
| | | | | | | | | | | | | |
| Beverages | | | 1.6 | | | | | | | | | |
Diageo plc - Sponsored ADR(c) | | | | | | | 115,000 | | | | 13,291,700 | |
| | | | | | | | | | | | | |
| Food & Staples Retailing | | | 1.0 | | | | | | | | | |
| CVS Health Corp. | | | | | | | 110,000 | | | | 8,635,000 | |
| | | | 2.6 | | | | | | | | 21,926,700 | |
| Industrials | | | | | | | | | | | | |
| | | | | | | | | | | | | |
| Air Freight & Logistics | | | 1.9 | | | | | | | | | |
| United Parcel Service, Inc. - Class B | | | | | | | 145,000 | | | | 15,558,500 | |
| Total Common Stocks (Cost $426,289,170) | | | | | | | | 683,235,962 | |
| | | | | | | | | | | | | |
| Cash Equivalents – 17.8% | | | | | | | | | | | | |
| | | | | | | | | | | | | |
| U.S. Treasury Bills, 0.46% to 0.87%, | | | | | | | | | | | | |
4/20/17 to 9/14/17(a) | | | | | | | 142,000,000 | | | | 141,836,044 | |
| | | | | | | | | | | | | |
| Wells Fargo Advantage Government Money | | | | | | | | | |
Market Fund - Select Class 0.63%(b) | | | | | | | 6,149,691 | | | | 6,149,691 | |
| Total Cash Equivalents (Cost $147,998,147) | | | | | | | | 147,985,735 | |
| Total Investments in Securities (Cost $574,287,317) | | | | | | | | 831,221,697 | |
| Other Liabilities in Excess of Other Assets - (0.1%) | | | | | | | | (930,149 | ) |
| Net Assets - 100% | | | | | | | | | | | 830,291,548 | |
| Net Asset Value Per Share - Investor Class | | | | | | | | 42.20 | |
| Net Asset Value Per Share - Institutional Class | | | | | | | | 42.44 | |
| * | Non-income producing |
(a) | Interest rates presented represent the yield to maturity at the date of purchase. |
(b) | Rate presented represents the annualized 7-day yield at March 31, 2017. |
(c) | Foreign domiciled entity. |
The accompanying notes form an integral part of these financial statements.
31 | Q1 2017 ANNUAL REPORT
PARTNERS VALUE FUND
Schedule of Investments
March 31, 2017
| Common Stocks – 81.6% | | | | | | | | | |
| | | % of Net | | | | | | | |
| Consumer Discretionary | | Assets | | | Shares | | | $ Value | |
| Cable & Satellite | | | 19.9 | | | | | | | |
| Liberty Broadband Corp.* | | | | | | | | | | |
| Series A | | | | | | | 165,000 | | | | 14,039,850 | |
| Series C | | | | | | | 550,000 | | | | 47,520,000 | |
Liberty Global Group - Class C* (c) | | | | | | | 1,550,000 | | | | 54,312,000 | |
| Liberty SiriusXM Group* | | | | | | | | | | | | |
| Series A | | | | | | | 120,000 | | | | 4,670,400 | |
| Series C | | | | | | | 450,000 | | | | 17,451,000 | |
LiLAC Group - Class C* (c) | | | | | | | 375,000 | | | | 8,640,000 | |
| | | | | | | | | | | | | |
| Movies & Entertainment | | | 4.4 | | | | | | | | | |
| Twenty-First Century Fox, Inc. - Class A | | | | | | | 1,000,000 | | | | 32,390,000 | |
| | | | | | | | | | | | | |
| Internet & Direct Marketing Retail | | | 3.1 | | | | | | | | | |
| QVC Group - Series A* | | | | | | | 1,150,000 | | | | 23,023,000 | |
| | | | | | | | | | | | | |
| Broadcasting | | | 2.7 | | | | | | | | | |
| Discovery Communications, Inc. - Class C* | | | | | | | 700,000 | | | | 19,817,000 | |
| | | | | | | | | | | | | |
| Hotels, Restaurants & Leisure | | | 2.5 | | | | | | | | | |
| ILG, Inc. | | | | | | | 900,000 | | | | 18,864,000 | |
| | | | 32.6 | | | | | | | | 240,727,250 | |
| Financials | | | | | | | | | | | | |
| | | | | | | | | | | | | |
| Diversified Financial Services | | | 7.1 | | | | | | | | | |
| Berkshire Hathaway Inc. - Class B* | | | | | | | 315,000 | | | | 52,504,200 | |
| | | | | | | | | | | | | |
| Insurance Brokers | | | 4.2 | | | | | | | | | |
Aon plc - Class A(c) | | | | | | | 160,000 | | | | 18,990,400 | |
Willis Towers Watson plc(c) | | | | | | | 90,000 | | | | 11,780,100 | |
| | | | | | | | | | | | | |
| Mortgage REITs | | | 3.0 | | | | | | | | | |
| Redwood Trust, Inc. | | | | | | | 1,350,000 | | | | 22,423,500 | |
| | | | | | | | | | | | | |
| Diversified Banks | | | 2.0 | | | | | | | | | |
| Wells Fargo & Co. | | | | | | | 265,000 | | | | 14,749,900 | |
| | | | 16.3 | | | | | | | | 120,448,100 | |
| Information Technology | | | | | | | | | | | | |
| | | | | | | | | | | | | |
| IT Services | | | 5.5 | | | | | | | | | |
| Visa Inc. - Class A | | | | | | | 295,000 | | | | 26,216,650 | |
| Mastercard, Inc. - Class A | | | | | | | 130,000 | | | | 14,621,100 | |
| | | | | | | | | | | | | |
| Internet Software & Services | | | 2.9 | | | | | | | | | |
| Alphabet, Inc. - Class C* | | | | | | | 26,000 | | | | 21,568,560 | |
| | | | | | | | | | | | | |
| Software | | | 2.6 | | | | | | | | | |
| Oracle Corp. | | | | | | | 425,000 | | | | 18,959,250 | |
| | | | | | | | | | | | | |
| Electronic Equipment, | | | | | | | | | | | | |
| Instruments & Components | | | 2.3 | | | | | | | | | |
| FLIR Systems, Inc. | | | | | | | 475,000 | | | | 17,233,000 | |
| | | | | | | | | | | | | |
| Semiconductors & | | | | | | | | | | | | |
| Semiconductor Equipment | | | 2.2 | | | | | | | | | |
| Texas Instruments, Inc. | | | | | | | 200,000 | | | | 16,112,000 | |
| | | | 15.5 | | | | | | | | 114,710,560 | |
| | | | | | | | | | | | |
| | | | | | | $ Principal | | | | | |
| | | % of Net | | | Amount | | | | | |
| Health Care | | Assets | | | or Shares | | | $ Value | |
| Pharmaceuticals | | | 5.2 | | | | | | | | | |
Allergan plc(c) | | | | | | | 160,000 | | | | 38,227,200 | |
| | | | | | | | | | | | | |
| Health Care Services | | | 3.9 | | | | | | | | | |
| Laboratory Corp. of America Holdings* | | | | | | | 200,000 | | | | 28,694,000 | |
| | | | 9.1 | | | | | | | | 66,921,200 | |
| Industrials | | | | | | | | | | | | |
| | | | | | | | | | | | | |
| Machinery | | | 5.2 | | | | | | | | | |
| Colfax Corp.* | | | | | | | 600,000 | | | | 23,556,000 | |
| Allison Transmission Holdings, Inc. | | | | | | | 400,000 | | | | 14,424,000 | |
| | | | 5.2 | | | | | | | | 37,980,000 | |
| Energy | | | | | | | | | | | | |
| | | | | | | | | | | | | |
| Oil & Gas Exploration & Production | | | 2.9 | | | | | | | | | |
| Range Resources Corp. | | | | | | | 375,000 | | | | 10,912,500 | |
| Pioneer Natural Resources Co. | | | | | | | 57,500 | | | | 10,708,225 | |
| | | | 2.9 | | | | | | | | 21,620,725 | |
| | | | | | | | | | | | | |
| Total Common Stocks (Cost $370,468,501) | | | | | | | | 602,407,835 | |
| | | | | | | | | | | | | |
| Cash Equivalents – 17.8% | | | | | | | | | | | | |
| | | | | | | | | | | | | |
| U.S. Treasury Bills, 0.51% to 0.87%, | | | | | | | | | | | | |
4/20/17 to 9/14/17(a) | | | | | | | 124,000,000 | | | | 123,853,948 | |
| | | | | | | | | | | | | |
| Wells Fargo Advantage Government Money | | | | | | | | | |
Market Fund - Select Class 0.63%(b) | | | | | | | 7,898,298 | | | | 7,898,298 | |
| Total Cash Equivalents (Cost $131,758,307) | | | | | | | | 131,752,246 | |
| Total Investments in Securities (Cost $502,226,808) | | | | | | | | 734,160,081 | |
| Other Assets Less Other Liabilities - 0.6% | | | | | | | | | | | 4,563,579 | |
| Net Assets - 100% | | | | | | | | | | | 738,723,660 | |
| Net Asset Value Per Share - Investor Class | | | | | | | | 30.72 | |
| Net Asset Value Per Share - Institutional Class | | | | | | | | 30.91 | |
| * | Non-income producing |
(a) | Interest rates presented represent the yield to maturity at the date of purchase. |
(b) | Rate presented represents the annualized 7-day yield at March 31, 2017. |
(c) | Foreign domiciled entity. |
The accompanying notes form an integral part of these financial statements.
32 | Q1 2017 ANNUAL REPORT
WEITZINVESTMENTS.COM
PARTNERS III OPPORTUNITY FUND
Schedule of Investments
March 31, 2017
| Common Stocks – 89.9% | | | | | | | | | |
| | | % of Net | | | | | | | |
| Consumer Discretionary | | Assets | | | Shares | | | $ Value | |
| Cable & Satellite | | | 24.6 | | | | | | | |
Liberty Broadband Corp.* (c) | | | | | | | | | | |
| Series A | | | | | | | 135,000 | | | | 11,487,150 | |
| Series C | | | | | | | 650,000 | | | | 56,160,000 | |
Liberty Global Group - Class C* (c) (d) | | | | | | | 1,700,000 | | | | 59,568,000 | |
Liberty SiriusXM Group* (c) | | | | | | | | | | | | |
| Series A | | | | | | | 200,000 | | | | 7,784,000 | |
| Series C | | | | | | | 600,000 | | | | 23,268,000 | |
LiLAC Group - Class C* (c) (d) | | | | | | | 500,000 | | | | 11,520,000 | |
| | | | | | | | | | | | | |
| Internet & Direct Marketing Retail | | | 7.5 | | | | | | | | | |
Liberty Ventures Group - Series A* (c) | | | | | | | 600,000 | | | | 26,688,000 | |
QVC Group - Series A* (c) | | | | | | | 800,000 | | | | 16,016,000 | |
Liberty Expedia Holdings, Inc. - Series A* (c) | | | | | | | 200,000 | | | | 9,096,000 | |
| | | | | | | | | | | | | |
| Movies & Entertainment | | | 4.1 | | | | | | | | | |
| Twenty-First Century Fox, Inc. | | | | | | | | | | | | |
| Class A | | | | | | | 400,000 | | | | 12,956,000 | |
| Class B | | | | | | | 150,000 | | | | 4,767,000 | |
Liberty Formula One Group* (c) | | | | | | | | | | | | |
| Series A | | | | | | | 50,000 | | | | 1,635,000 | |
| Series C | | | | | | | 150,000 | | | | 5,122,500 | |
Liberty Braves Group* (c) | | | | | | | | | | | | |
| Series A | | | | | | | 20,000 | | | | 478,800 | |
| Series C | | | | | | | 140,000 | | | | 3,311,000 | |
| | | | | | | | | | | | | |
| Hotels, Restaurants & Leisure | | | 2.1 | | | | | | | | | |
| ILG, Inc. | | | | | | | 700,000 | | | | 14,672,000 | |
| | | | | | | | | | | | | |
| Broadcasting | | | 2.1 | | | | | | | | | |
| Discovery Communications, Inc. - Class C* | | | | | | | 500,000 | | | | 14,155,000 | |
| | | | | | | | | | | | | |
| Advertising | | | 0.4 | | | | | | | | | |
| National CineMedia, Inc. | | | | | | | 200,000 | | | | 2,526,000 | |
| | | | 40.8 | | | | | | | | 281,210,450 | |
| Information Technology | | | | | | | | | | | | |
| | | | | | | | | | | | | |
| IT Services | | | 7.7 | | | | | | | | | |
Mastercard Inc. - Class A(c) | | | | | | | 300,000 | | | | 33,741,000 | |
| Visa Inc. - Class A | | | | | | | 215,000 | | | | 19,107,050 | |
| | | | | | | | | | | | | |
| Internet Software & Services | | | 4.7 | | | | | | | | | |
Alphabet, Inc. - Class C* (c) | | | | | | | 27,000 | | | | 22,398,120 | |
| XO Group, Inc.* | | | | | | | 420,000 | | | | 7,228,200 | |
CommerceHub, Inc.* (c) | | | | | | | | | | | | |
| Series A | | | | | | | 67,000 | | | | 1,037,160 | |
| Series C | | | | | | | 134,000 | | | | 2,081,020 | |
| | | | | | | | | | | | | |
| Semiconductors & | | | | | | | | | | | | |
| Semiconductor Equipment | | | 3.5 | | | | | | | | | |
Texas Instruments, Inc.(c) | | | | | | | 300,000 | | | | 24,168,000 | |
| | | | | | | | | | | | | |
| Application Software | | | 1.5 | | | | | | | | | |
Intelligent Systems Corp.* # † | | | | | | | 2,270,000 | | | | 10,407,950 | |
| | | | 17.4 | | | | | | | | 120,168,500 | |
| Financials | | | | | | | | | | | | |
| | | | | | | | | | | | | |
| Diversified Financial Services | | | 9.7 | | | | | | | | | |
Berkshire Hathaway Inc. - Class B* (c) | | | | | | | 400,000 | | | | 66,672,000 | |
| | | | | | | | | | | | | |
| Mortgage REITs | | | 4.1 | | | | | | | | | |
Redwood Trust, Inc.(c) | | | | | | | 1,700,000 | | | | 28,237,000 | |
| | | | | | | | | | | | | |
| Diversified Banks | | | 2.0 | | | | | | | | | |
Wells Fargo & Co.(c) | | | | | | | 250,000 | | | | 13,915,000 | |
| | | | 15.8 | | | | | | | | 108,824,000 | |
| | | | | | | | | | | | | |
| | | | | | | $ Principal | | | | | |
| | | % of Net | | | Amount | | | | | |
| Health Care | | Assets | | | or Shares | | | $ Value | |
| | | | | | | | | | | | | |
| Pharmaceuticals | | | 4.5 | | | | | | | | | |
Allergan plc(d) | | | | | | | 130,000 | | | | 31,059,600 | |
| | | | | | | | | | | | | |
| Health Care Services | | | 3.5 | | | | | | | | | |
Laboratory Corp. of America Holdings* (c) | | | | | | | 170,000 | | | | 24,389,900 | |
| | | | 8.0 | | | | | | | | 55,449,500 | |
| Industrials | | | | | | | | | | | | |
| | | | | | | | | | | | | |
| Machinery | | | 4.6 | | | | | | | | | |
Colfax Corp.* (c) | | | | | | | 800,000 | | | | 31,408,000 | |
| | | | | | | | | | | | | |
| Aerospace & Defense | | | 3.3 | | | | | | | | | |
| Wesco Aircraft Holdings, Inc.* | | | | | | | 2,000,000 | | | | 22,800,000 | |
| | | | 7.9 | | | | | | | | 54,208,000 | |
| Total Common Stocks (Cost $361,648,597) | | | | | | | | 619,860,450 | |
| | | | | | | | | | | | | |
| Cash Equivalents – 9.7% | | | | | | | | | | | | |
| | | | | | | | | | | | | |
| U.S. Treasury Bills, 0.53% to 0.87%, | | | | | | | | | | | | |
5/25/17 to 9/14/17(a) | | | | | | | 63,000,000 | | | | 62,884,682 | |
| | | | | | | | | | | | | |
| Wells Fargo Advantage Government Money | | | | | | | | | |
Market Fund - Select Class 0.63%(b) | | | | | | | 3,991,480 | | | | 3,991,480 | |
| Total Cash Equivalents (Cost $66,881,580) | | | | | | | | 66,876,162 | |
| Total Investments in Securities (Cost $428,530,177) | | | | | | | | 686,736,612 | |
Due From Broker(c) - 33.4% | | | | | | | | | | | 230,162,412 | |
| Securities Sold Short - (32.7%) | | | | | | | | | | | (225,304,000 | ) |
| Other Liabilities in Excess of Other Assets - (0.3%) | | | | | | | | (1,868,773 | ) |
| Net Assets - 100% | | | | | | | | | | | 689,726,251 | |
| Net Asset Value Per Share - Investor Class | | | | | | | | 14.74 | |
| Net Asset Value Per Share - Institutional Class | | | | | | | | 15.07 | |
| | | | | | | | | | |
| Securities Sold Short – (32.7%) | | | | | | | | | |
| iShares Russell 2000 Fund | | | | | | | 300,000 | | | | (41,244,000 | ) |
| PowerShares QQQ Trust, Series 1 | | | | | | | 500,000 | | | | (66,190,000 | ) |
| SPDR S&P 500 ETF Trust | | | | | | | 500,000 | | | | (117,870,000 | ) |
| Total Securities Sold Short (proceeds $194,115,686) | | | | | | | | (225,304,000 | ) |
| * | Non-income producing |
| † | Controlled affiliate |
| # | Illiquid and/or restricted security. |
(a) | Interest rates presented represent the yield to maturity at the date of purchase. |
(b) | Rate presented represents the annualized 7-day yield at March 31, 2017. |
(c) | Fully or partially pledged as collateral on securities sold short. |
(d) | Foreign domiciled entity. |
The accompanying notes form an integral part of these financial statements.
33 | Q1 2017 ANNUAL REPORT
RESEARCH FUND
Schedule of Investments
March 31, 2017
| Common Stocks – 85.9% | | | | | | | | | |
| | | % of Net | | | | | | | |
| Information Technology | | Assets | | | Shares | | | $ Value | |
| Software | | | 12.9 | | | | | | | |
| Oracle Corp. | | | | | | | 31,230 | | | | 1,393,170 | |
| Guidewire Software, Inc.* | | | | | | | 22,645 | | | | 1,275,593 | |
| ACI Worldwide, Inc.* | | | | | | | 32,000 | | | | 684,480 | |
| salesforce.com, inc.* | | | | | | | 8,000 | | | | 659,920 | |
| | | | | | | | | | | | | |
| IT Services | | | 8.3 | | | | | | | | | |
| Visa Inc. - Class A | | | | | | | 21,767 | | | | 1,934,433 | |
| Fidelity National Information Services, Inc. | | | | | | | 8,000 | | | | 636,960 | |
| | | | | | | | | | | | | |
| Internet Software & Services | | | 2.4 | | | | | | | | | |
| XO Group, Inc.* | | | | | | | 42,429 | | | | 730,203 | |
| | | | | | | | | | | | | |
| Technology Hardware, | | | | | | | | | | | | |
| Storage & Peripherals | | | 1.0 | | | | | | | | | |
| Apple Inc. | | | | | | | 2,160 | | | | 310,306 | |
| | | | 24.6 | | | | | | | | 7,625,065 | |
| Consumer Discretionary | | | | | | | | | | | | |
| | | | | | | | | | | | | |
| Cable & Satellite | | | 6.6 | | | | | | | | | |
| Liberty Broadband Corp. - Series C* | | | | | | | 18,848 | | | | 1,628,467 | |
Liberty Global Group - Class C* (b) | | | | | | | 12,000 | | | | 420,480 | |
| | | | | | | | | | | | | |
| Hotels, Restaurants & Leisure | | | 4.3 | | | | | | | | | |
| Zoe's Kitchen, Inc.* | | | | | | | 43,408 | | | | 803,048 | |
| ILG, Inc. | | | | | | | 25,956 | | | | 544,038 | |
| | | | | | | | | | | | | |
| Multiline Retail | | | 3.1 | | | | | | | | | |
| Dollar Tree, Inc.* | | | | | | | 8,000 | | | | 627,680 | |
| Dollar General Corp. | | | | | | | 4,973 | | | | 346,767 | |
| | | | | | | | | | | | | |
| Advertising | | | 2.9 | | | | | | | | | |
| National CineMedia, Inc. | | | | | | | 70,402 | | | | 889,177 | |
| | | | | | | | | | | | | |
| Textiles, Apparel & Luxury Goods | | | 2.7 | | | | | | | | | |
| Fossil Group, Inc.* | | | | | | | 24,953 | | | | 435,430 | |
The Swatch Group AG - Unsponsored ADR(b) | | | | | | 22,344 | | | | 398,617 | |
| | | | | | | | | | | | | |
| Internet & Direct Marketing Retail | | | 2.3 | | | | | | | | | |
| Amazon.com, Inc.* | | | | | | | 800 | | | | 709,232 | |
| | | | | | | | | | | | | |
| Specialty Retail | | | 1.8 | | | | | | | | | |
| Murphy USA Inc.* | | | | | | | 7,614 | | | | 559,020 | |
| | | | 23.7 | | | | | | | | 7,361,956 | |
| Health Care | | | | | | | | | | | | |
| | | | | | | | | | | | | |
| Health Care Services | | | 4.5 | | | | | | | | | |
| Laboratory Corp. of America Holdings* | | | | | | | 9,799 | | | | 1,405,863 | |
| | | | | | | | | | | | | |
| Pharmaceuticals | | | 3.2 | | | | | | | | | |
Allergan plc(b) | | | | | | | 4,163 | | | | 994,624 | |
| | | | | | | | | | | | | |
| Life Sciences Tools & Services | | | 2.0 | | | | | | | | | |
| Thermo Fisher Scientific Inc. | | | | | | | 4,000 | | | | 614,400 | |
| | | | 9.7 | | | | | | | | 3,014,887 | |
| | | | | | | | | | | | | |
| | | % of Net | | | | | | | | | |
| Materials | | Assets | | | Shares | | | $ Value | |
| Industrial Gases | | | 4.2 | | | | | | | | | |
| Praxair, Inc. | | | | | | | 11,011 | | | | 1,305,905 | |
| | | | | | | | | | | | | |
| Metals & Mining | | | 2.3 | | | | | | | | | |
| Compass Minerals International, Inc. | | | | | | | 10,248 | | | | 695,327 | |
| | | | | | | | | | | | | |
| Construction Materials | | | 1.5 | | | | | | | | | |
| Summit Materials, Inc. - Class A* | | | | | | | 18,722 | | | | 462,621 | |
| | | | | | | | | | | | | |
| Fertilizers & Agricultural Chemicals | | | 1.2 | | | | | | | | | |
| Monsanto Co. | | | | | | | 3,329 | | | | 376,843 | |
| | | | 9.2 | | | | | | | | 2,840,696 | |
| Financials | | | | | | | | | | | | |
| | | | | | | | | | | | | |
| Diversified Financial Services | | | 3.7 | | | | | �� | | | | |
| Berkshire Hathaway Inc. - Class B* | | | | | | | 6,837 | | | | 1,139,591 | |
| | | | | | | | | | | | | |
| Financial Exchanges & Data | | | 2.8 | | | | | | | | | |
| Donnelley Financial Solutions, Inc.* | | | | | | | 44,100 | | | | 850,689 | |
| | | | | | | | | | | | | |
| Insurance Brokers | | | 2.0 | | | | | | | | | |
Willis Towers Watson plc(b) | | | | | | | 2,451 | | | | 320,811 | |
Aon plc - Class A(b) | | | | | | | 2,670 | | | | 316,902 | |
| | | | 8.5 | | | | | | | | 2,627,993 | |
| Consumer Staples | | | | | | | | | | | | |
| | | | | | | | | | | | | |
| Food & Staples Retailing | | | 2.2 | | | | | | | | | |
| CVS Health Corp. | | | | | | | 8,832 | | | | 693,312 | |
| | | | | | | | | | | | | |
| Personal Products | | | 1.9 | | | | | | | | | |
| Avon Products, Inc.* | | | | | | | 131,000 | | | | 576,400 | |
| | | | 4.1 | | | | | | | | 1,269,712 | |
| Real Estate | | | | | | | | | | | | |
| | | | | | | | | | | | | |
| Equity REITs | | | 3.5 | | | | | | | | | |
| American Tower Corp. | | | | | | | 8,828 | | | | 1,072,955 | |
| | | | | | | | | | | | | |
| Industrials | | | | | | | | | | | | |
| | | | | | | | | | | | | |
| Machinery | | | 1.5 | | | | | | | | | |
| Colfax Corp.* | | | | | | | 12,000 | | | | 471,120 | |
| | | | | | | | | | | | | |
| Electrical Equipment | | | 1.1 | | | | | | | | | |
| Thermon Group Holdings, Inc.* | | | | | | | 16,868 | | | | 351,529 | |
| | | | 2.6 | | | | | | | | 822,649 | |
| Total Common Stocks (Cost $24,261,834) | | | | | | | | 26,635,913 | |
| | | | | | | | | | | | | |
| Cash Equivalents – 14.2% | | | | | | | | | | | | |
| | | | | | | | | | | | | |
| Wells Fargo Advantage Government Money | | | | | | | | | |
Market Fund - Select Class 0.63%(a) | | | | | | | 4,413,054 | | | | 4,413,054 | |
| Total Cash Equivalents (Cost $4,413,054) | | | | | | | | 4,413,054 | |
| Total Investments in Securities (Cost $28,674,888) | | | | | | | | 31,048,967 | |
| Other Liabilities in Excess of Other Assets - (0.1%) | | | | | | | | (19,549 | ) |
| Net Assets - 100% | | | | | | | | | | | 31,029,418 | |
| Net Asset Value Per Share | | | | | | | | | | | 10.83 | |
| * | Non-income producing |
(a) | Rate presented represents the annualized 7-day yield at March 31, 2017. |
(b) | Foreign domiciled entity. |
The accompanying notes form an integral part of these financial statements.
34 | Q1 2017 ANNUAL REPORT
WEITZINVESTMENTS.COM
HICKORY FUND
Schedule of Investments
March 31, 2017
| Common Stocks – 79.5% | | | | | | | | | |
| | | % of Net | | | | | | | |
| Consumer Discretionary | | Assets | | | Shares | | | $ Value | |
| Cable & Satellite | | | 18.3 | | | | | | | |
| Liberty Broadband Corp.* | | | | | | | | | | |
| Series A | | | | | | | 50,000 | | | | 4,254,500 | |
| Series C | | | | | | | 210,000 | | | | 18,144,000 | |
Liberty Global Group - Class C* (c) | | | | | | | 360,000 | | | | 12,614,400 | |
| Liberty SiriusXM Group* | | | | | | | | | | | | |
| Series A | | | | | | | 90,000 | | | | 3,502,800 | |
| Series C | | | | | | | 220,000 | | | | 8,531,600 | |
LiLAC Group - Class C* (c) | | | | | | | 129,916 | | | | 2,993,265 | |
| | | | | | | | | | | | | |
| Internet & Direct Marketing Retail | | | 8.3 | | | | | | | | | |
| QVC Group - Series A* | | | | | | | 525,000 | | | | 10,510,500 | |
| Liberty Ventures Group - Series A* | | | | | | | 162,000 | | | | 7,205,760 | |
| Liberty Expedia Holdings, Inc. - Series A* | | | | | | | 108,000 | | | | 4,911,840 | |
| | | | | | | | | | | | | |
| Movies & Entertainment | | | 6.2 | | | | | | | | | |
| Liberty Formula One Group* | | | | | | | | | | | | |
| Series A | | | | | | | 27,500 | | | | 899,250 | |
| Series C | | | | | | | 200,000 | | | | 6,830,000 | |
Lions Gate Entertainment Corp.* (c) | | | | | | | | | | | | |
| Class A | | | | | | | 125,000 | | | | 3,320,000 | |
| Class B | | | | | | | 150,000 | | | | 3,657,000 | |
| Liberty Braves Group* | | | | | | | | | | | | |
| Series A | | | | | | | 11,000 | | | | 263,340 | |
| Series C | | | | | | | 75,000 | | | | 1,773,750 | |
| | | | | | | | | | | | | |
| Hotels, Restaurants & Leisure | | | 4.0 | | | | | | | | | |
| ILG, Inc. | | | | | | | 525,000 | | | | 11,004,000 | |
| | | | | | | | | | | | | |
| Specialty Retail | | | 3.8 | | | | | | | | | |
| Murphy USA Inc.* | | | | | | | 140,000 | | | | 10,278,800 | |
| | | | | | | | | | | | | |
| Advertising | | | 3.1 | | | | | | | | | |
| National CineMedia, Inc. | | | | | | | 669,293 | | | | 8,453,171 | |
| | | | | | | | | | | | | |
| Textiles, Apparel & Luxury Goods | | | 0.9 | | | | | | | | | |
| Fossil Group, Inc.* | | | | | | | 135,000 | | | | 2,355,750 | |
| | | | 44.6 | | | | | | | | 121,503,726 | |
| Industrials | | | | | | | | | | | | |
| | | | | | | | | | | | | |
| Machinery | | | 6.7 | | | | | | | | | |
| Colfax Corp.* | | | | | | | 255,000 | | | | 10,011,300 | |
| Allison Transmission Holdings, Inc. | | | | | | | 230,000 | | | | 8,293,800 | |
| | | | | | | | | | | | | |
| Aerospace & Defense | | | 3.2 | | | | | | | | | |
| Wesco Aircraft Holdings, Inc.* | | | | | | | 775,000 | | | | 8,835,000 | |
| | | | 9.9 | | | | | | | | 27,140,100 | |
| Financials | | | | | | | | | | | | |
| | | | | | | | | | | | | |
| Mortgage REITs | | | 4.3 | | | | | | | | | |
| Redwood Trust, Inc. | | | | | | | 700,000 | | | | 11,627,000 | |
| | | | | | | | | | | | | |
| Insurance Brokers | | | 2.8 | | | | | | | | | |
Willis Towers Watson plc(c) | | | | | | | 59,000 | | | | 7,722,510 | |
| | | | 7.1 | | | | | | | | 19,349,510 | |
| | | | | | $ Principal | | | | |
| | | % of Net | | | Amount | | | | |
| Information Technology | | Assets | | | or Shares | | | $ Value | |
| | | | | | | | | | |
| Electronic Equipment, | | | | | | | | | |
| Instruments & Components | | | 2.5 | | | | | | | |
| FLIR Systems, Inc. | | | | | | | 190,000 | | | | 6,893,200 | |
| | | | | | | | | | | | | |
| Internet Software & Services | | | 2.5 | | | | | | | | | |
| XO Group, Inc.* | | | | | | | 322,917 | | | | 5,557,401 | |
| CommerceHub, Inc.* | | | | | | | | | | | | |
| Series A | | | | | | | 27,000 | | | | 417,960 | |
| Series C | | | | | | | 54,000 | | | | 838,620 | |
| | | | | | | | | | | | | |
| Software | | | 1.1 | | | | | | | | | |
| ACI Worldwide, Inc.* | | | | | | | 135,000 | | | | 2,887,650 | |
| | | | 6.1 | | | | | | | | 16,594,831 | |
| Health Care | | | | | | | | | | | | |
| | | | | | | | | | | | | |
| Health Care Services | | | 5.0 | | | | | | | | | |
| Laboratory Corp. of America Holdings* | | | | | | | 95,000 | | | | 13,629,650 | |
| | | | | | | | | | | | | |
| Real Estate | | | | | | | | | | | | |
| | | | | | | | | | | | | |
| Equity REITs | | | 2.9 | | | | | | | | | |
| Equity Commonwealth* | | | | | | | 250,000 | | | | 7,805,000 | |
| | | | | | | | | | | | | |
| Telecommunication Services | | | | | | | | | | | | |
| | | | | | | | | | | | | |
| Diversified Telecommunication Services | | | 2.6 | | | | | | | | | |
| LICT Corp.* # | | | | | | | 1,005 | | | | 6,984,750 | |
| | | | | | | | | | | | | |
| Energy | | | | | | | | | | | | |
| | | | | | | | | | | | | |
| Oil & Gas Exploration & Production | | | 0.8 | | | | | | | | | |
| Range Resources Corp. | | | | | | | 80,000 | | | | 2,328,000 | |
| | | | | | | | | | | | | |
| Materials | | | | | | | | | | | | |
| | | | | | | | | | | | | |
| Metals & Mining | | | 0.5 | | | | | | | | | |
| Compass Minerals International, Inc. | | | | | | | 20,000 | | | | 1,357,000 | |
| Total Common Stocks (Cost $121,099,318) | | | | | | | | | | | 216,692,567 | |
| | | | | | | | | | | | | |
| Cash Equivalents – 20.7% | | | | | | | | | | | | |
| | | | | | | | | | | | | |
| U.S. Treasury Bills, 0.46% to 0.87%, | | | | | | | | | | | | |
4/20/17 to 9/14/17(a) | | | | | | | 53,000,000 | | | | 52,937,530 | |
| | | | | | | | | | | | | |
| Wells Fargo Advantage Government Money | | | | | | | | | | | | |
Market Fund - Select Class 0.63(b) | | | | | | | 3,382,586 | | | | 3,382,586 | |
| Total Cash Equivalents (Cost $56,323,881) | | | | | | | | | | | 56,320,116 | |
| Total Investments in Securities (Cost $177,423,199) | | | | | | | | 273,012,683 | |
| Other Liabilities in Excess of Other Assets - (0.2%) | | | | | | | | (513,509 | ) |
| Net Assets - 100% | | | | | | | | | | | 272,499,174 | |
| Net Asset Value Per Share | | | | | | | | | | | 53.11 | |
| * | Non-income producing |
| # | Illiquid and/or restricted security. |
(a) | Interest rates presented represent the yield to maturity at the date of purchase. |
(b) | Rate presented represents the annualized 7-day yield at March 31, 2017. |
(c) | Foreign domiciled entity. |
The accompanying notes form an integral part of these financial statements.
35 | Q1 2017 ANNUAL REPORT
BALANCED FUND
Schedule of Investments
March 31, 2017
| Common Stocks – 46.3% | | | | | | | | | |
| | | % of Net | | | | | | | |
| Information Technology | | Assets | | | Shares | | | $ Value | |
| IT Services | | | 5.9 | | | | | | | |
| Visa Inc. - Class A | | | | | | | 35,000 | | | | 3,110,450 | |
| Mastercard Inc. - Class A | | | | | | | 18,000 | | | | 2,024,460 | |
Accenture plc - Class A(e) | | | | | | | 15,000 | | | | 1,798,200 | |
| | | | | | | | | | | | | |
| Software | | | 3.3 | | | | | | | | | |
| Oracle Corp. | | | | | | | 55,000 | | | | 2,453,550 | |
| Guidewire Software, Inc.* | | | | | | | 25,000 | | | | 1,408,250 | |
| | | | | | | | | | | | | |
| Semiconductors & | | | | | | | | | | | | |
| Semiconductor Equipment | | | 1.7 | | | | | | | | | |
| Texas Instruments, Inc. | | | | | | | 25,000 | | | | 2,014,000 | |
| | | | | | | | | | | | | |
| Internet Software & Services | | | 1.6 | | | | | | | | | |
| Alphabet, Inc. - Class C* | | | | | | | 2,300 | | | | 1,907,988 | |
| | | | | | | | | | | | | |
| Electronic Equipment, | | | | | | | | | | | | |
| Instruments & Components | | | 1.5 | | | | | | | | | |
| FLIR Systems, Inc. | | | | | | | 50,000 | | | | 1,814,000 | |
| | | | 14.0 | | | | | | | | 16,530,898 | |
| Consumer Discretionary | | | | | | | | | | | | |
| | | | | | | | | | | | | |
| Cable & Satellite | | | 5.5 | | | | | | | | | |
| Liberty Broadband Corp. - Series C* | | | | | | | 28,000 | | | | 2,419,200 | |
Liberty Global Group - Class C* (e) | | | | | | | 60,000 | | | | 2,102,400 | |
| Comcast Corp. - Class A | | | | | | | 55,000 | | | | 2,067,450 | |
| | | | | | | | | | | | | |
| Internet & Direct Marketing Retail | | | 1.5 | | | | | | | | | �� |
| QVC Group - Series A* | | | | | | | 90,000 | | | | 1,801,800 | |
| | | | | | | | | | | | | |
| Specialty Retail | | | 1.3 | | | | | | | | | |
| Murphy USA Inc.* | | | | | | | 20,000 | | | | 1,468,400 | |
| | | | 8.3 | | | | | | | | 9,859,250 | |
| Health Care | | | | | | | | | | | | |
| | | | | | | | | | | | | |
| Health Care Services | | | 3.4 | | | | | | | | | |
| Laboratory Corp. of America Holdings* | | | | | | | 28,000 | | | | 4,017,160 | |
| | | | | | | | | | | | | |
| Pharmaceuticals | | | 2.9 | | | | | | | | | |
Allergan plc(e) | | | | | | | 14,500 | | | | 3,464,340 | |
| | | | | | | | | | | | | |
| Life Sciences Tools & Services | | | 1.6 | | | | | | | | | |
| Thermo Fisher Scientific Inc. | | | | | | | 12,000 | | | | 1,843,200 | |
| | | | 7.9 | | | | | | | | 9,324,700 | |
| Financials | | | | | | | | | | | | |
| | | | | | | | | | | | | |
| Diversified Financial Services | | | 3.2 | | | | | | | | | |
| Berkshire Hathaway Inc. - Class B* | | | | | | | 22,500 | | | | 3,750,300 | |
| | | | | | | | | | | | | |
| Insurance Brokers | | | 2.4 | | | | | | | | | |
Aon plc - Class A(e) | | | | | | | 13,500 | | | | 1,602,315 | |
Willis Towers Watson plc(e) | | | | | | | 9,437 | | | | 1,235,209 | |
| | | | | | | | | | | | | |
| Mortgage REITs | | | 1.5 | | | | | | | | | |
| Redwood Trust, Inc. | | | | | | | 110,000 | | | | 1,827,100 | |
| | | | 7.1 | | | | | | | | 8,414,924 | |
| | | | | | | | | | | | | |
| | | | | | | $ Principal | | | | | |
| | | % of Net | | | Amount | | | | | |
| Materials | | Assets | | | or Shares | | | $ Value | |
| | | | | | | | | | | | | |
| Industrial Gases | | | 2.0 | | | | | | | | | |
| Praxair, Inc. | | | | | | | 20,000 | | | | 2,372,000 | |
| | | | | | | | | | | | | |
| Fertilizers & Agricultural Chemicals | | | 1.9 | | | | | | | | | |
| Monsanto Co. | | | | | | | 20,000 | | | | 2,264,000 | |
| | | | | | | | | | | | | |
| Metals & Mining | | | 0.9 | | | | | | | | | |
| Compass Minerals International, Inc. | | | | | | | 16,000 | | | | 1,085,600 | |
| | | | 4.8 | | | | | | | | 5,721,600 | |
| Consumer Staples | | | | | | | | | | | | |
| | | | | | | | | | | | | |
| Beverages | | | 3.2 | | | | | | | | | |
Anheuser-Busch InBev SA/NV - Sponsored ADR(e) | | | | 17,000 | | | | 1,865,920 | |
Diageo plc - Sponsored ADR(e) | | | | | | | 16,000 | | | | 1,849,280 | |
| | | | 3.2 | | | | | | | | 3,715,200 | |
| Industrials | | | | | | | | | | | | |
| | | | | | | | | | | | | |
| Air Freight & Logistics | | | 1.0 | | | | | | | | | |
| United Parcel Service, Inc. - Class B | | | | | | | 10,500 | | | | 1,126,650 | |
| Total Common Stocks (Cost $39,598,935) | | | | | | | | 54,693,222 | |
| | | | | | | | | | | | | |
| Corporate Bonds – 9.3% | | | | | | | | | | | | |
| | | | | | | | | | | | | |
| American Express Credit Corp. 1.125% 6/05/17 | | | | 500,000 | | | | 500,032 | |
| Anheuser-Busch InBev Finance Inc. 1.9% 2/01/19 | | | | 500,000 | | | | 500,948 | |
| Apple Inc. 1.55% 2/08/19 | | | | | | | 1,000,000 | | | | 1,002,078 | |
| Bank of America Corp. | | | | | | | | | | | | |
| 1.7% 8/25/17 | | | | | | | 500,000 | | | | 500,824 | |
| 2.25% 4/21/20 | | | | | | | 500,000 | | | | 499,040 | |
| Berkshire Hathaway Inc. (Finance Corp.) | | | | | | | | | | | | |
| 1.45% 3/07/18 | | | | | | | 100,000 | | | | 100,064 | |
| 2.0% 8/15/18 | | | | | | | 500,000 | | | | 503,797 | |
| 1.7% 3/15/19 | | | | | | | 100,000 | | | | 100,202 | |
| 4.25% 1/15/21 | | | | | | | 300,000 | | | | 322,631 | |
| Equity Commonwealth (HRPT Properties Trust) | | | | | | | | | |
| 6.65% 1/15/18 | | | | | | | 250,000 | | | | 253,328 | |
| Goldman Sachs Group, Inc. | | | | | | | | | | | | |
| 2.9% 7/19/18 | | | | | | | 500,000 | | | | 506,635 | |
| 2.6% 12/27/20 | | | | | | | 500,000 | | | | 500,405 | |
| JPMorgan Chase & Co. 1.65622% 3/09/21 Floating Rate | | | | 750,000 | | | | 747,253 | |
| Markel Corp. | | | | | | | | | | | | |
| 7.125% 9/30/19 | | | | | | | 1,014,000 | | | | 1,133,885 | |
| 4.9% 7/01/22 | | | | | | | 400,000 | | | | 436,258 | |
| U.S. Bancorp 2.35% 1/29/21 | | | | | | | 1,000,000 | | | | 1,003,823 | |
| Wells Fargo & Co. | | | | | | | | | | | | |
| 1.15% 6/02/17 | | | | | | | 500,000 | | | | 499,885 | |
| 1.4% 9/08/17 | | | | | | | 500,000 | | | | 499,780 | |
| 4.6% 4/01/21 | | | | | | | 1,250,000 | | | | 1,344,576 | |
| Total Corporate Bonds (Cost $10,943,191) | | | | | | | | 10,955,444 | |
The accompanying notes form an integral part of these financial statements.
36 | Q1 2017 ANNUAL REPORT
WEITZINVESTMENTS.COM
| Corporate Convertible Bonds – 0.9% | | | | | | |
| | | $ Principal | | | | |
| | | Amount | | | $ Value | |
| Redwood Trust, Inc. 5.625% 11/15/19 (Cost $997,188) | | | 1,000,000 | | | | 1,031,250 | |
| | | | | | | | | |
Mortgage-Backed Securities – 2.0%(c) | | | | | | | | |
| | | | | | | | | |
| Federal Home Loan Mortgage Corporation | | | | | | | | |
| | | | | | | | | |
| Collateralized Mortgage Obligations | | | | | | | | |
| 3649 CL BW — 4.0% 2025 (2.8 years) | | | 99,138 | | | | 105,027 | |
| | | | | | | | | |
| Pass-Through Securities | | | | | | | | |
| J14649 — 3.5% 2026 (3.2 years) | | | 138,893 | | | | 144,907 | |
| E02948 — 3.5% 2026 (3.2 years) | | | 233,596 | | | | 244,232 | |
| J16663 — 3.5% 2026 (3.3 years) | | | 140,448 | | | | 146,549 | |
| | | | | | | | 640,715 | |
| Federal National Mortgage Association | | | | | | | | |
| | | | | | | | | |
| Collateralized Mortgage Obligations | | | | | | | | |
| 2002-91 CL QG — 5.0% 2018 (0.4 years) | | | 11,851 | | | | 12,064 | |
| 2003-9 CL DB — 5.0% 2018 (0.4 years) | | | 15,393 | | | | 15,538 | |
| | | | | | | | | |
| Pass-Through Securities | | | | | | | | |
| MA0464 — 3.5% 2020 (1.3 years) | | | 112,578 | | | | 117,156 | |
| AR8198 — 2.5% 2023 (2.4 years) | | | 211,585 | | | | 214,745 | |
| MA1502 — 2.5% 2023 (2.4 years) | | | 180,803 | | | | 183,494 | |
| 995755 — 4.5% 2024 (2.5 years) | | | 23,182 | | | | 24,459 | |
| AB1769 — 3.0% 2025 (3.2 years) | | | 128,558 | | | | 132,265 | |
| AB3902 — 3.0% 2026 (3.6 years) | | | 230,878 | | | | 237,628 | |
| AK3264 — 3.0% 2027 (3.6 years) | | | 180,894 | | | | 186,184 | |
| | | | | | | | 1,123,533 | |
| Government National Mortgage Association | | | | | | | | |
| | | | | | | | | |
| Pass-Through Securities | | | | | | | | |
| G2 5255 — 3.0% 2026 (3.6 years) | | | 233,076 | | | | 240,610 | |
| | | | | | | | | |
| Non-Government Agency | | | | | | | | |
| | | | | | | | | |
| Collateralized Mortgage Obligations | | | | | | | | |
| J.P. Morgan Mortgage Trust (JPMMT) | | | | | | | | |
2014-5 CL A1 — 3.0% 2029 (3.3 years)(d) | | | 311,552 | | | | 314,960 | |
| Sequoia Mortgage Trust (SEMT) | | | | | | | | |
| 2012-1 CL 1A1 — 2.865% 2042 (0.9 years) | | | 50,638 | | | | 51,206 | |
| | | | | | | | 366,166 | |
| Total Mortgage-Backed Securities (Cost $2,309,315) | | | | | | | 2,371,024 | |
| | | | | | | | | |
| U.S. Treasury Notes – 16.1% | | $ Principal | | | | | |
| | | Amount | | | | | |
| | | or Shares | | | $ Value | |
| U.S. Treasury Notes | | | | | | | | |
| 0.625% 5/31/17 | | | 2,000,000 | | | | 1,999,822 | |
| 0.625% 8/31/17 | | | 2,000,000 | | | | 1,998,124 | |
| 0.625% 11/30/17 | | | 3,000,000 | | | | 2,993,145 | |
| 0.75% 2/28/18 | | | 2,000,000 | | | | 1,994,532 | |
| 1.0% 5/31/18 | | | 2,000,000 | | | | 1,997,422 | |
| 1.5% 8/31/18 | | | 2,000,000 | | | | 2,009,258 | |
| 1.25% 11/30/18 | | | 2,000,000 | | | | 2,001,562 | |
| 2.0% 11/30/20 | | | 2,000,000 | | | | 2,020,782 | |
| 1.875% 11/30/21 | | | 2,000,000 | | | | 1,997,890 | |
| Total U.S. Treasury Notes (Cost $18,987,194) | | | | | | | 19,012,537 | |
| | | | | | | | | |
| Cash Equivalents – 25.4% | | | | | | | | |
| | | | | | | | | |
| U.S. Treasury Bills, 0.51% to 0.87%, | | | | | | | | |
4/20/17 to 9/14/17(a) | | | 28,000,000 | | | | 27,959,256 | |
| | | | | | | | | |
| Wells Fargo Advantage Government Money | | | | | | | | |
Market Fund - Select Class 0.63%(b) | | | 2,115,223 | | | | 2,115,223 | |
| Total Cash Equivalents (Cost $30,074,996) | | | | | | | 30,074,479 | |
| Total Investments in Securities (Cost $102,910,819) | | | | | | | 118,137,956 | |
| Other Assets Less Other Liabilities — 0.0% | | | | | | | 50,934 | |
| Net Assets - 100% | | | | | | | 118,188,890 | |
| Net Asset Value Per Share | | | | | | | 13.63 | |
| * | Non-income producing |
(a) | Interest rates presented represent the yield to maturity at the date of purchase. |
(b) | Rate presented represents the annualized 7-day yield at March 31, 2017. |
(c) | Number of years indicated represents estimated average life. |
(d) | Security is exempt from registration under Rule 144A of the Securities Act of 1933. This security may be resold in transactions that are exempt from registration, normally to qualified institutional buyers. |
(e) | Foreign domiciled entity. |
The accompanying notes form an integral part of these financial statements.
37 | Q1 2017 ANNUAL REPORT
CORE PLUS INCOME FUND
Schedule of Investments
March 31, 2017
| Corporate Bonds – 28.7% | | | | | | |
| | | $ Principal | | | | |
| | | Amount | | | $ Value | |
| | | | | | | |
| American Express Credit Corp. 2.25% 8/15/19 | | | 150,000 | | | | 151,235 | |
| Anheuser-Busch InBev Finance Inc. 3.3% 2/01/23 | | | 200,000 | | | | 203,824 | |
| Berkshire Hathaway Inc. | | | | | | | | |
| 2.1% 8/14/19 | | | 250,000 | | | | 252,534 | |
| Finance Corp. | | | | | | | | |
| 4.25% 1/15/21 | | | 500,000 | | | | 537,718 | |
| 3.0% 5/15/22 | | | 200,000 | | | | 205,276 | |
| Boardwalk Pipelines LLC 5.75% 9/15/19 | | | 170,000 | | | | 182,559 | |
| Boston Properties LP 3.125% 9/01/23 | | | 555,000 | | | | 551,557 | |
Calumet Specialty Products Partners, LP 11.5% 1/15/21(c) | | | 130,000 | | | | 150,800 | |
| CONSOL Energy, Inc. 5.875% 4/15/22 | | | 92,000 | | | | 91,425 | |
| D.R. Horton, Inc. 3.625% 2/15/18 | | | 200,000 | | | | 201,964 | |
| Dominion Resources, Inc. 2.962% 7/01/19 | | | 100,000 | | | | 101,476 | |
Donnelley Financial Solutions, Inc. 8.25% 10/15/24(c) | | | 108,000 | | | | 111,780 | |
| Energy Transfer Partners LP (Regency Energy Partners) | | | | | | | | |
| 6.5% 7/15/21 | | | 500,000 | | | | 516,585 | |
| Equity Commonwealth | | | | | | | | |
| 6.65% 1/15/18 (HRPT Properties Trust) | | | 85,000 | | | | 86,131 | |
| 5.875% 9/15/20 | | | 719,000 | | | | 772,327 | |
| Express Scripts Holding Co. 7.25% 6/15/19 | | | 250,000 | | | | 276,898 | |
| FLIR Systems, Inc. 3.125% 6/15/21 | | | 400,000 | | | | 402,600 | |
| Goldman Sachs Group, Inc. 2.239% 4/30/18 Floating Rate | | | 137,000 | | | | 138,234 | |
| JPMorgan Chase & Co. | | | | | | | | |
| 4.25% 10/15/20 | | | 200,000 | | | | 212,174 | |
| 1.65622% 3/09/21 Floating Rate | | | 150,000 | | | | 149,451 | |
| Markel Corp. | | | | | | | | |
| 7.125% 9/30/19 | | | 125,000 | | | | 139,779 | |
| 4.9% 7/01/22 | | | 250,000 | | | | 272,661 | |
| 3.625% 3/30/23 | | | 150,000 | | | | 153,727 | |
| MPLX LP 4.875% 6/01/25 | | | 190,000 | | | | 199,347 | |
| NGL Energy Partners LP 5.125% 7/15/19 | | | 320,000 | | | | 322,400 | |
NXP BV (NXP Funding LLC) 4.625% 6/01/23(c) (d) | | | 100,000 | | | | 106,125 | |
Range Resources Corp. 5.0% 8/15/22(c) | | | 301,000 | | | | 299,495 | |
Sprint Spectrum Co. LLC 3.36% 3/20/23(c) (e) | | | 250,000 | | | | 250,000 | |
| TC PipeLines LP | | | | | | | | |
| 4.65% 6/15/21 | | | 160,000 | | | | 168,618 | |
| 4.375% 3/13/25 | | | 45,000 | | | | 45,659 | |
| Valmont Industries, Inc. 6.625% 4/20/20 | | | 272,000 | | | | 302,320 | |
| Vornado Realty LP 2.5% 6/30/19 | | | 530,000 | | | | 533,277 | |
| Wells Fargo & Co. | | | | | | | | |
| 4.6% 4/01/21 | | | 400,000 | | | | 430,264 | |
| 2.1% 7/26/21 | | | 200,000 | | | | 196,005 | |
| Total Corporate Bonds (Cost $8,608,186) | | | | | | | 8,716,225 | |
| | | | | | | | | |
| Corporate Convertible Bonds – 2.1% | | | | | | | | |
| | | | | | | | | |
| Redwood Trust, Inc. | | | | | | | | |
| 4.625% 4/15/18 | | | 475,000 | | | | 477,969 | |
| 5.625% 11/15/19 | | | 150,000 | | | | 154,687 | |
| Total Corporate Convertible Bonds (Cost $624,760) | | | | | | | 632,656 | |
| | | | | | | | | |
Asset-Backed Securities – 14.0% (b)
| | | $ Principal | | | | |
| | | Amount | | | $ Value | |
| Credit Acceptance Auto Loan Trust (CAALT) | | | | | | |
2014-1A CL B — 2.29% 2022 (0.0 years)(c) | | | 193,951 | | | | 194,009 | |
| DT Auto Owner Trust (DTAOT) | | | | | | | | |
2016-1A CL A — 2.0% 2019 (0.1 years)(c) | | | 30,562 | | | | 30,582 | |
2016-2A CL A — 1.73% 2019 (0.3 years)(c) | | | 46,820 | | | | 46,837 | |
2015-3A CL B — 2.46% 2019 (0.3 years)(c) | | | 80,000 | | | | 80,257 | |
2014-3A CL C — 3.04% 2020 (0.3 years)(c) | | | 103,856 | | | | 104,398 | |
2016-1A CL C — 3.54% 2021 (1.1 years)(c) | | | 215,000 | | | | 217,480 | |
| Exeter Automobile Receivables Trust (EART) | | | | | | | | |
2016-3A CL A — 1.84% 2020 (0.7 years)(c) | | | 151,734 | | | | 151,512 | |
2016-3A CL B — 2.84% 2021 (1.9 years)(c) | | | 110,000 | | | | 110,026 | |
| Flagship Credit Auto Trust (FCAT) | | | | | | | | |
2014-2 CL C — 3.95% 2020 (1.8 years)(c) | | | 260,000 | | | | 262,344 | |
| Ford Credit Auto Owner Trust (FORDO) | | | | | | | | |
| 2013-A CL D — 1.86% 2019 (0.0 years) | | | 175,000 | | | | 175,027 | |
| Honor Automobile Trust Securitization (HATS) | | | | | | | | |
2016-1A CL A — 2.94% 2019 (0.7 years)(c) | | | 194,695 | | | | 195,403 | |
| Marlette Funding Trust (MFT) | | | | | | | | |
2016-1A CL A — 3.06% 2023 (0.6 years)(c) | | | 236,485 | | | | 237,289 | |
2017-1A CL A — 2.827% 2024 (0.9 years)(c) | | | 375,000 | | | | 375,653 | |
| OneMain Direct Auto Receivables Trust (ODART) | | | | | | | | |
2016-1A CL A — 2.04% 2021 (0.6 years)(c) | | | 186,256 | | | | 186,620 | |
2016-1A CL B — 2.76% 2021 (1.5 years)(c) | | | 250,000 | | | | 250,627 | |
2016-1A CL C — 4.58% 2021 (1.8 years)(c) | | | 350,000 | | | | 356,678 | |
| Prestige Auto Receivables Trust (PART) | | | | | | | | |
2014-1A CL A3 — 1.52% 2020 (0.2 years)(c) | | | 70,638 | | | | 70,639 | |
2016-1A CL A2 — 1.78% 2019 (0.4 years)(c) | | | 103,012 | | | | 103,148 | |
| Santander Drive Auto Receivables Trust (SDART) | | | | | | | | |
| 2014-1 CL D — 2.91% 2020 (1.1 years) | | | 388,000 | | | | 392,193 | |
| 2014-5 CL D — 3.21% 2021 (1.7 years) | | | 80,000 | | | | 81,181 | |
| SoFi Consumer Loan Program LLC (SCLP) | | | | | | | | |
2016-2 CL A — 3.09% 2025 (1.5 years)(c) | | | 304,262 | | | | 304,875 | |
2017-1 CL A — 3.28% 2026 (1.8 years)(c) | | | 93,868 | | | | 94,446 | |
2016-3 CL A — 3.05% 2025 (1.8 years)(c) | | | 172,966 | | | | 173,292 | |
| Westlake Automobile Receivables Trust (WLAKE) | | | | | | | | |
2016-3A CL A1 — 0.95% 2017 (0.0 years)(c) | | | 61,674 | | | | 61,665 | |
| Total Asset-Backed Securities (Cost $4,234,993) | | | | | | | 4,256,181 | |
| | | | | | | | | |
Commercial Mortgage-Backed Securities – 3.5%(b) | | | | | | | | |
| | | | | | | | | |
| FORT CRE LLC (FCRE) | | | | | | | | |
| 2016-1A CL A2 — 2.97722% 2036 Floating Rate | | | | | | | | |
(1.3 years)(c) | | | 200,000 | | | | 202,266 | |
| Resource Capital Corp. LTD (RSO) | | | | | | | | |
| 2014-CRE2 CL A — 1.99278% 2032 Floating Rate | | | | | | | | |
(0.0 years)(c) | | | 124,797 | | | | 124,768 | |
| Rialto Real Estate Fund II LP (RIAL) | | | | | | | | |
2015-LT7 CL A — 3.0% 2032 (0.1 years)(c) | | | 10,779 | | | | 10,781 | |
| VSD LLC (VSD) | | | | | | | | |
2017-PLT1 CL A — 3.6% 2043 (1.2 years)(c) | | | 381,039 | | | | 380,267 | |
| Wells Fargo Commercial Mortgage Trust (WFCM) | | | | | | | | |
| 2014-TISH CL WTS1 — 3.163% 2027 Floating Rate | | | | | | | | |
(0.9 years)(c) | | | 352,000 | | | | 358,941 | |
| Total Commercial Mortgage-Backed Securities (Cost $1,058,364) | | | | 1,077,023 | |
The accompanying notes form an integral part of these financial statements.
38 | Q1 2017 ANNUAL REPORT
WEITZINVESTMENTS.COM
| | | | | | | |
Mortgage-Backed Securities – 1.7%(b) | | $ Principal | | | | |
| | | Amount | | | $ Value | |
| Federal National Mortgage Association | | | | | | |
| | | | | | | |
| Pass-Through Securities | | | | | | |
| 932836 — 3.0% 2025 (3.3 years) | | | 113,415 | | | | 116,666 | |
| | | | | | | | | |
| Non-Government Agency | | | | | | | | |
| | | | | | | | | |
| Collateralized Mortgage Obligations | | | | | | | | |
| J.P. Morgan Mortgage Trust (JPMMT) | | | | | | | | |
2016-3 CL 2A1 — 3.0% 2046 (5.6 years)(c) | | | 371,730 | | | | 374,634 | |
| Sunset Mortgage Loan Co. (SMLC) | | | | | | | | |
2014-NPL2 CL A — 3.721% 2044 (0.3 years)(c) | | | 21,287 | | | | 21,284 | |
| | | | | | | | 395,918 | |
| Total Mortgage-Backed Securities (Cost $518,124) | | | | | | | 512,584 | |
| | | | | | | | | |
| Taxable Municipal Bonds – 1.4% | | | | | | | | |
| | | | | | | | | |
| Alderwood Water and Wastewater District, Washington, Water | | | | | |
| & Sewer Revenue, Series B, 5.15% 12/01/25 (Cost $428,062) | | | 400,000 | | | | 422,936 | |
| | | | | | | | | |
| U.S. Treasury – 42.4% | | | | | | | | |
| | | | | | | | | |
| U.S. Treasury Inflation Indexed Bonds | | | | | | | | |
| 0.125% 7/15/26 | | | 303,870 | | | | 296,635 | |
| | | | | | | | | |
| U.S. Treasury Notes/Bonds | | | | | | | | |
| 0.625% 5/31/17 | | | 2,500,000 | | | | 2,499,777 | |
| 2.0% 11/15/21 | | | 300,000 | | | | 301,424 | |
| 2.0% 2/15/22 | | | 1,160,000 | | | | 1,165,052 | |
| 1.75% 2/28/22 | | | 200,000 | | | | 198,262 | |
| 2.0% 2/15/23 | | | 1,075,000 | | | | 1,069,646 | |
| 2.75% 11/15/23 | | | 810,000 | | | | 838,777 | |
| 2.5% 5/15/24 | | | 1,000,000 | | | | 1,018,105 | |
| 2.0% 2/15/25 | | | 470,000 | | | | 459,709 | |
| 1.625% 5/15/26 | | | 760,000 | | | | 713,020 | |
| 1.5% 8/15/26 | | | 350,000 | | | | 323,873 | |
| 2.0% 11/15/26 | | | 1,650,000 | | | | 1,594,184 | |
| 2.25% 2/15/27 | | | 925,000 | | | | 913,311 | |
| 2.5% 2/15/45 | | | 895,000 | | | | 804,416 | |
| 2.5% 5/15/46 | | | 750,000 | | | | 671,719 | |
| | | | | | | | 12,571,275 | |
| Total U.S. Treasury (Cost $12,966,584) | | | | | | | 12,867,910 | |
| Common Stocks – 0.8% | | | | | | |
| | | Shares | | | $ Value | |
| Equity Commonwealth* | | | 4,000 | | | | 124,880 | |
| Redwood Trust, Inc. | | | 7,350 | | | | 122,084 | |
| Total Common Stocks (Cost $183,184) | | | | | | | 246,964 | |
| | | | | | | | | |
| Cash Equivalents – 18.1% | | | | | | | | |
| | | | | | | | | |
| Wells Fargo Advantage Government Money | | | | | | | | |
Market Fund - Select Class 0.63%(a) | | | 5,500,253 | | | | 5,500,253 | |
| Total Cash Equivalents (Cost $5,500,253) | | | | | | | 5,500,253 | |
| Total Investments in Securities (Cost $34,122,510) | | | | | | | 34,232,732 | |
| Other Liabilities in Excess of Other Assets - (12.7%) | | | | | | | (3,856,911 | ) |
| Net Assets - 100% | | | | | | | 30,375,821 | |
| Net Asset Value Per Share - Investor Class | | | | | | | 10.23 | |
| Net Asset Value Per Share - Institutional Class | | | | | | | 10.23 | |
| * | Non-income producing |
(a) | Rate presented represents the annualized 7-day yield at March 31, 2017. |
(b) | Number of years indicated represents estimated average life. |
(c) | Security is exempt from registration under Rule 144A of the Securities Act of 1933. This security may be resold in transactions that are exempt from registration, normally to qualified institutional buyers. |
(d) | Foreign domiciled entity. |
(e) | Annual sinking fund. |
The accompanying notes form an integral part of these financial statements.
39 | Q1 2017 ANNUAL REPORT
SHORT DURATION INCOME FUND
Schedule of Investments
March 31, 2017
| Corporate Bonds – 43.5% | | | | | | |
| | | $ Principal | | | | |
| | | Amount | | | $ Value | |
ACI Worldwide, Inc. 6.375% 8/15/20(c) | | | 250,000 | | | | 256,875 | |
| American Express Bank FSB 6.0% 9/13/17 | | | 8,475,000 | | | | 8,643,890 | |
| American Express Co. 8.125% 5/20/19 | | | 1,000,000 | | | | 1,126,315 | |
| American Express Credit Corp. | | | | | | | | |
| 1.125% 6/05/17 | | | 1,500,000 | | | | 1,500,096 | |
| 2.25% 8/15/19 | | | 11,042,000 | | | | 11,132,887 | |
| American Realty Capital Properties Operating Partnership LP | | | | | |
| 3.0% 2/06/19 | | | 1,870,000 | | | | 1,878,323 | |
| Anheuser-Busch InBev Finance Inc. | | | | | | | | |
| 2.2% 8/01/18 | | | 5,000,000 | | | | 5,034,025 | |
| 1.9% 2/01/19 | | | 13,000,000 | | | | 13,024,661 | |
| 3.3% 2/01/23 | | | 4,800,000 | | | | 4,891,771 | |
| Apple Inc. 1.55% 2/08/19 | | | 1,000,000 | | | | 1,002,078 | |
| AT&T Inc. 2.375% 11/27/18 | | | 5,368,000 | | | | 5,407,374 | |
| Bank of America Corp. | | | | | | | | |
| 1.7% 8/25/17 | | | 7,187,000 | | | | 7,198,844 | |
| 5.75% 12/01/17 | | | 3,945,000 | | | | 4,049,700 | |
| 2.25% 4/21/20 | | | 10,000,000 | | | | 9,980,800 | |
| Berkshire Hathaway Inc. | | | | | | | | |
| 2.1% 8/14/19 | | | 2,750,000 | | | | 2,777,874 | |
| Finance Corp. | | | | | | | | |
| 1.6% 5/15/17 | | | 10,000,000 | | | | 10,002,290 | |
| 1.45% 3/07/18 | | | 900,000 | | | | 900,573 | |
| 5.4% 5/15/18 | | | 5,000,000 | | | | 5,222,350 | |
| 2.0% 8/15/18 | | | 2,500,000 | | | | 2,518,985 | |
| 1.7% 3/15/19 | | | 900,000 | | | | 901,814 | |
| 1.33789% 1/10/20 Floating Rate | | | 7,000,000 | | | | 7,046,956 | |
| 2.9% 10/15/20 | | | 3,000,000 | | | | 3,100,563 | |
| 4.25% 1/15/21 | | | 4,200,000 | | | | 4,516,831 | |
| Boardwalk Pipelines LLC 5.75% 9/15/19 | | | 11,008,000 | | | | 11,821,227 | |
| Boston Properties LP | | | | | | | | |
| 5.875% 10/15/19 | | | 11,440,000 | | | | 12,387,392 | |
| 3.125% 9/01/23 | | | 9,560,000 | | | | 9,500,690 | |
Calumet Specialty Products Partners LP 11.5% 1/15/21(c) | | | 450,000 | | | | 522,000 | |
| Comcast Corp. 5.15% 3/01/20 | | | 3,000,000 | | | | 3,269,235 | |
| D.R. Horton, Inc. 3.625% 2/15/18 | | | 1,920,000 | | | | 1,938,854 | |
| DCP Midstream Operating LP 2.5% 12/01/17 | | | 13,250,000 | | | | 13,250,000 | |
| Dell Inc. (Diamond 1 and 2 Finance Corp.) | | | | | | | | |
3.48% 6/01/19(c) | | | 5,000,000 | | | | 5,126,215 | |
Diageo Capital plc 4.85% 5/15/18(d) | | | 3,941,000 | | | | 4,076,732 | |
| Dominion Resources, Inc. 2.962% 7/01/19 | | | 5,900,000 | | | | 5,987,060 | |
| eBay, Inc. 2.2% 8/01/19 | | | 3,000,000 | | | | 3,011,616 | |
| Energy Transfer Partners LP (Regency Energy Partners) | | | | | | | | |
| 6.5% 7/15/21 | | | 19,374,000 | | | | 20,016,655 | |
| Equity Commonwealth | | | | | | | | |
| 6.65% 1/15/18 (HRPT Properties Trust) | | | 2,990,000 | | | | 3,029,803 | |
| 5.875% 9/15/20 | | | 8,000,000 | | | | 8,593,344 | |
| Expedia, Inc. 7.456% 8/15/18 | | | 10,000,000 | | | | 10,711,890 | |
| Express Scripts Holding Co. | | | | | | | | |
| 2.25% 6/15/19 | | | 8,955,000 | | | | 8,965,137 | |
| 7.25% 6/15/19 | | | 5,217,000 | | | | 5,778,307 | |
| Fifth Third Bank 1.625% 9/27/19 | | | 2,000,000 | | | | 1,976,256 | |
| FLIR Systems, Inc. 3.125% 6/15/21 | | | 2,600,000 | | | | 2,616,903 | |
| Ford Motor Credit Co. LLC | | | | | | | | |
| 2.145% 1/09/18 | | | 2,000,000 | | | | 2,005,460 | |
| 2.943% 1/08/19 | | | 2,000,000 | | | | 2,028,186 | |
| 2.021% 5/03/19 | | | 10,000,000 | | | | 9,957,100 | |
| 1.897% 8/12/19 | | | 1,000,000 | | | | 991,036 | |
| | | | | | | | |
| | | $ Principal | | | | | |
| | | Amount | | | $ Value | |
| Goldman Sachs Group, Inc. | | | | | | | | |
| 6.25% 9/01/17 | | | 2,085,000 | | | | 2,125,332 | |
| 5.95% 1/18/18 | | | 4,000,000 | | | | 4,131,488 | |
| 2.239% 4/30/18 Floating Rate | | | 6,600,000 | | | | 6,659,466 | |
| 2.9% 7/19/18 | | | 2,500,000 | | | | 2,533,175 | |
| 1.91956% 12/13/19 Floating Rate | | | 6,250,000 | | | | 6,297,638 | |
| 2.20122% 4/23/20 Floating Rate | | | 5,479,000 | | | | 5,558,193 | |
| 2.6% 12/27/20 | | | 1,500,000 | | | | 1,501,215 | |
| Intel Corp. 1.35% 12/15/17 | | | 1,000,000 | | | | 1,000,748 | |
| JPMorgan Chase & Co. | | | | | | | | |
| 6.3% 4/23/19 | | | 2,500,000 | | | | 2,716,428 | |
| 1.65622% 3/09/21 Floating Rate | | | 1,850,000 | | | | 1,843,223 | |
| JPMorgan Chase Bank, N.A. | | | | | | | | |
| 6.0% 7/05/17 | | | 5,000,000 | | | | 5,059,505 | |
| 1.74622% 9/23/19 Floating Rate | | | 12,000,000 | | | | 12,069,732 | |
| Kinder Morgan, Inc. 2.0% 12/01/17 | | | 9,065,000 | | | | 9,073,077 | |
| Markel Corp. | | | | | | | | |
| 7.125% 9/30/19 | | | 11,859,000 | | | | 13,261,090 | |
| 5.35% 6/01/21 | | | 10,000,000 | | | | 10,961,570 | |
| 4.9% 7/01/22 | | | 3,850,000 | | | | 4,198,979 | |
| McDonald's Corp. 5.35% 3/01/18 | | | 4,075,000 | | | | 4,215,706 | |
| McKesson Corp. 1.4% 3/15/18 | | | 8,815,000 | | | | 8,795,995 | |
| MetLife Global Funding I | | | | | | | | |
1.3% 4/10/17(c) | | | 1,000,000 | | | | 1,000,020 | |
1.875% 6/22/18(c) | | | 1,000,000 | | | | 1,001,720 | |
1.75% 12/19/18(c) | | | 1,000,000 | | | | 998,940 | |
| NGL Energy Partners LP 5.125% 7/15/19 | | | 2,200,000 | | | | 2,216,500 | |
| Omnicom Group, Inc. 6.25% 7/15/19 | | | 6,181,000 | | | | 6,748,614 | |
Penske Truck Leasing 3.75% 5/11/17(c) | | | 5,000,000 | | | | 5,011,495 | |
Range Resources Corp. 5.0% 8/15/22(c) | | | 11,876,000 | | | | 11,816,620 | |
| Republic Services, Inc. (Allied Waste) 3.8% 5/15/18 | | | 5,000,000 | | | | 5,110,555 | |
Sprint Spectrum Co. LLC 3.36% 3/20/23(c) (e) | | | 4,750,000 | | | | 4,750,000 | |
| Superior Energy Services, Inc. (SESI, LLC) 6.375% 5/01/19 | | | 4,900,000 | | | | 4,912,250 | |
TechnipFMC plc 2.0% 10/01/17(c) (d) | | | 2,000,000 | | | | 1,999,550 | |
| U.S. Bancorp 2.35% 1/29/21 | | | 14,000,000 | | | | 14,053,522 | |
| U.S. Bank, N.A. 1.36344% 1/24/20 Floating Rate | | | 7,000,000 | | | | 7,007,623 | |
| Valmont Industries, Inc. 6.625% 4/20/20 | | | 900,000 | | | | 1,000,322 | |
| Verizon Communications, Inc. | | | | | | | | |
| 3.65% 9/14/18 | | | 10,000,000 | | | | 10,274,600 | |
| 1.50622% 6/09/17 Floating Rate | | | 10,000,000 | | | | 10,004,600 | |
| Vornado Realty LP 2.5% 6/30/19 | | | 13,390,000 | | | | 13,472,804 | |
| Walt Disney Co. 0.875% 7/12/19 | | | 1,000,000 | | | | 982,876 | |
| Washington Post Co. 7.25% 2/01/19 | | | 8,500,000 | | | | 9,243,750 | |
| Wells Fargo & Co. | | | | | | | | |
| 1.15% 6/02/17 | | | 1,500,000 | | | | 1,499,655 | |
| 1.40122% 6/15/17 (Wachovia Bank) Floating Rate | | | 5,000,000 | | | | 5,002,020 | |
| 1.4% 9/08/17 | | | 7,144,000 | | | | 7,140,864 | |
| 4.6% 4/01/21 | | | 5,745,000 | | | | 6,179,672 | |
| 2.1% 7/26/21 | | | 10,100,000 | | | | 9,898,232 | |
| 3.5% 3/08/22 | | | 7,900,000 | | | | 8,189,037 | |
| Wells Fargo Bank, N.A. 2.15% 12/06/19 | | | 10,000,000 | | | | 10,037,570 | |
| Total Corporate Bonds (Cost $515,258,609) | | | | | | | 521,232,944 | |
| | | | | | | | | |
| Corporate Convertible Bonds – 4.0% | | | | | | | | |
| | | | | | | | | |
| Redwood Trust, Inc. | | | | | | | | |
| 4.625% 4/15/18 | | | 32,350,000 | | | | 32,552,188 | |
| 5.625% 11/15/19 | | | 14,850,000 | | | | 15,314,062 | |
| Total Corporate Convertible Bonds (Cost $47,155,897) | | | | 47,866,250 | |
The accompanying notes form an integral part of these financial statements.
40 | Q1 2017 ANNUAL REPORT
WEITZINVESTMENTS.COM
Asset-Backed Securities – 5.7%(b) | | | | | | |
| | | $ Principal | | | | |
| | | Amount | | | $ Value | |
| AmeriCredit Automobile Receivables Trust (AMCAR) | | | | | | |
| 2013-5 CL D — 2.86% 2019 (1.1 years) | | | 4,055,000 | | | | 4,101,981 | |
| Cabela's Master Credit Card Trust (CABMT) | | | | | | | | |
| 2012-2A CL A2 — 1.39222% 2020 Floating Rate | | | | | | | | |
(0.2 years)(c) | | | 6,000,000 | | | | 6,003,287 | |
| CarMax Auto Owner Trust (CARMX) | | | | | | | | |
| 2017-1 CL A1 — 0.85% 2018 (0.2 years) | | | 5,135,096 | | | | 5,135,183 | |
| CPS Auto Receivables Trust (CPS) | | | | | | | | |
2013-A CL A — 1.31% 2020 (0.8 years)(c) | | | 623,031 | | | | 621,727 | |
| DT Auto Owner Trust (DTAOT) | | | | | | | | |
2016-1A CL A — 2.0% 2019 (0.1 years)(c) | | | 1,039,096 | | | | 1,039,784 | |
2016-2A CL A — 1.73% 2019 (0.3 years)(c) | | | 1,513,861 | | | | 1,514,397 | |
| Exeter Automobile Receivables Trust (EART) | | | | | | | | |
2016-3A CL A — 1.84% 2020 (0.7 years)(c) | | | 5,158,959 | | | | 5,151,408 | |
| First Investors Auto Owner Trust (FIAOT) | | | | | | | | |
2016-1A CL A1 — 1.92% 2020 (0.5 years)(c) | | | 2,445,914 | | | | 2,449,629 | |
| Flagship Credit Auto Trust (FCAT) | | | | | | | | |
2014-2 CL A — 1.43% 2019 (0.3 years)(c) | | | 802,367 | | | | 802,592 | |
| Honor Automobile Trust Securitization (HATS) | | | | | | | | |
2016-1A CL A — 2.94% 2019 (0.7 years)(c) | | | 2,336,338 | | | | 2,344,836 | |
| Marlette Funding Trust (MFT) | | | | | | | | |
2017-1A CL A — 2.827% 2024 (0.9 years)(c) | | | 5,625,000 | | | | 5,634,795 | |
| OneMain Direct Auto Receivables Trust (ODART) | | | | | | | | |
2016-1A CL A — 2.04% 2021 (0.6 years)(c) | | | 2,793,846 | | | | 2,799,306 | |
2016-1A CL C — 4.58% 2021 (1.8 years)(c) | | | 9,650,000 | | | | 9,834,118 | |
| Prestige Auto Receivables Trust (PART) | | | | | | | | |
2016-1A CL A2 — 1.78% 2019 (0.4 years)(c) | | | 3,862,944 | | | | 3,868,041 | |
| Santander Drive Auto Receivables Trust (SDART) | | | | | | | | |
| 2016-3 CL A1 — 0.8% 2017 (0.0 years) | | | 678,734 | | | | 678,628 | |
| 2016-3 CL A2 — 1.34% 2019 (0.5 years) | | | 5,000,000 | | | | 4,996,083 | |
| 2014-1 CL D — 2.91% 2020 (1.1 years) | | | 2,345,000 | | | | 2,370,343 | |
| SoFi Consumer Loan Program LLC (SCLP) | | | | | | | | |
2016-2 CL A — 3.09% 2025 (1.5 years)(c) | | | 3,499,013 | | | | 3,506,061 | |
2017-1 CL A — 3.28% 2026 (1.8 years)(c) | | | 1,314,157 | | | | 1,322,240 | |
2016-3 CL A — 3.05% 2025 (1.8 years)(c) | | | 1,556,696 | | | | 1,559,632 | |
| Westlake Automobile Receivables Trust (WLAKE) | | | | | | | | |
2016-3A CL A1 — 0.95% 2017 (0.0 years)(c) | | | 2,251,110 | | | | 2,250,763 | |
| Total Asset-Backed Securities (Cost $67,758,985) | | | | | | | 67,984,834 | |
| | | | | | | | | |
Commercial Mortgage-Backed Securities – 0.8%(b) | | | | | |
| | | | | | | | | |
| FORT CRE LLC (FCRE) | | | | | | | | |
| 2016-1A CL A1 — 2.47722% 2036 Floating Rate | | | | | | | | |
(0.6 years)(c) | | | 2,532,904 | | | | 2,551,280 | |
| Rialto Real Estate Fund II, LP (RIAL) | | | | | | | | |
2015-LT7 CL A — 3.0% 2032 (0.1 years)(c) | | | 438,332 | | | | 438,436 | |
| VSD LLC (VSD) | | | | | | | | |
2017-PLT1 CL A — 3.6% 2043 (1.2 years)(c) | | | 6,287,137 | | | | 6,274,411 | |
| Total Commercial Mortgage-Backed Securities (Cost $9,258,372) | | | | 9,264,127 | |
| | | | | | | | | |
Mortgage-Backed Securities – 17.8%(b) | | | | | | | | |
| | | | | | | | | |
| Federal Home Loan Mortgage Corporation | | | | | | | | |
| | | | | | | | | |
| Collateralized Mortgage Obligations | | | | | | | | |
| 3815 CL AD — 4.0% 2025 (0.7 years) | | | 227,192 | | | | 230,580 | |
| 3844 CL AG — 4.0% 2025 (0.9 years) | | | 887,305 | | | | 903,107 | |
| 4281 CL AG — 2.5% 2028 (2.7 years) | | | 1,935,593 | | | | 1,949,966 | |
| 3649 CL BW — 4.0% 2025 (2.8 years) | | | 2,547,855 | | | | 2,699,198 | |
| 2952 CL PA — 5.0% 2035 (2.9 years) | | | 670,851 | | | | 713,927 | |
| 3620 CL PA — 4.5% 2039 (3.6 years) | | | 1,659,251 | | | | 1,767,947 | |
| | | $ Principal | | | | |
| | | Amount | | | $ Value | |
| 3842 CL PH — 4.0% 2041 (4.3 years) | | | 1,679,885 | | | | 1,776,633 | |
| 3003 CL LD — 5.0% 2034 (4.4 years) | | | 1,642,286 | | | | 1,792,629 | |
| 4107 CL LA — 2.5% 2031 (6.6 years) | | | 6,957,685 | | | | 6,704,824 | |
| 4107 CL LW — 1.75% 2027 (8.9 years) | | | 3,920,569 | | | | 3,573,070 | |
| | | | | | | | 22,111,881 | |
| Pass-Through Securities | | | | | | | | |
| EO1386 — 5.0% 2018 (0.5 years) | | | 8,232 | | | | 8,476 | |
| G18190 — 5.5% 2022 (1.9 years) | | | 30,530 | | | | 32,371 | |
| G13300 — 4.5% 2023 (2.2 years) | | | 178,565 | | | | 190,290 | |
| G18296 — 4.5% 2024 (2.4 years) | | | 448,910 | | | | 475,064 | |
| G18306 — 4.5% 2024 (2.5 years) | | | 945,333 | | | | 1,006,803 | |
| G13517 — 4.0% 2024 (2.5 years) | | | 621,580 | | | | 653,566 | |
| G18308 — 4.0% 2024 (2.6 years) | | | 961,460 | | | | 1,012,937 | |
| J13949 — 3.5% 2025 (3.1 years) | | | 5,133,840 | | | | 5,390,378 | |
| J14649 — 3.5% 2026 (3.2 years) | | | 3,829,483 | | | | 3,995,288 | |
| E02948 — 3.5% 2026 (3.2 years) | | | 9,110,278 | | | | 9,525,077 | |
| E02804 — 3.0% 2025 (3.3 years) | | | 3,334,175 | | | | 3,425,188 | |
| J16663 — 3.5% 2026 (3.3 years) | | | 8,433,559 | | | | 8,799,903 | |
| E03033 — 3.0% 2027 (3.6 years) | | | 4,813,895 | | | | 4,943,313 | |
| E03048 — 3.0% 2027 (3.6 years) | | | 9,254,731 | | | | 9,503,538 | |
| G01818 — 5.0% 2035 (4.6 years) | | | 1,979,700 | | | | 2,164,450 | |
| | | | | | | | 51,126,642 | |
| Structured Agency Credit Risk Debt Notes | | | | | | | | |
| 2013-DN1 CL M1 — 4.38167% 2023 Floating Rate | | | | | | | | |
| (1.0 years) | | | 1,414,596 | | | | 1,434,896 | |
| | | | | | | | 74,673,419 | |
| Federal National Mortgage Association | | | | | | | | |
| | | | | | | | | |
| Collateralized Mortgage Obligations | | | | | | | | |
| 2003-9 CL DB — 5.0% 2018 (0.4 years) | | | 30,786 | | | | 31,075 | |
| 2011-19 CL KA — 4.0% 2025 (0.4 years) | | | 408,920 | | | | 411,465 | |
| 2010-145 CL PA — 4.0% 2024 (1.9 years) | | | 845,538 | | | | 874,284 | |
| 2010-54 CL WA — 3.75% 2025 (2.3 years) | | | 1,204,430 | | | | 1,245,590 | |
| | | | | | | | 2,562,414 | |
| Pass-Through Securities | | | | | | | | |
| 256982 — 6.0% 2017 (0.3 years) | | | 11,891 | | | | 11,961 | |
| 251787 — 6.5% 2018 (0.6 years) | | | 1,280 | | | | 1,423 | |
| 357414 — 4.0% 2018 (0.6 years) | | | 86,350 | | | | 89,304 | |
| 254907 — 5.0% 2018 (0.7 years) | | | 39,299 | | | | 40,439 | |
| MA0464 — 3.5% 2020 (1.3 years) | | | 1,775,274 | | | | 1,847,464 | |
| 357985 — 4.5% 2020 (1.4 years) | | | 69,442 | | | | 71,910 | |
| 888595 — 5.0% 2022 (1.7 years) | | | 164,913 | | | | 174,067 | |
| 888439 — 5.5% 2022 (1.8 years) | | | 156,076 | | | | 165,720 | |
| AD0629 — 5.0% 2024 (2.0 years) | | | 577,370 | | | | 617,205 | |
| 995960 — 5.0% 2023 (2.0 years) | | | 507,726 | | | | 543,253 | |
| AL0471 — 5.5% 2025 (2.1 years) | | | 2,442,340 | | | | 2,599,726 | |
| 995693 — 4.5% 2024 (2.2 years) | | | 939,399 | | | | 993,009 | |
| AR8198 — 2.5% 2023 (2.4 years) | | | 6,198,426 | | | | 6,290,992 | |
| AE0031 — 5.0% 2025 (2.4 years) | | | 908,058 | | | | 970,721 | |
| MA1502 — 2.5% 2023 (2.4 years) | | | 5,243,291 | | | | 5,321,344 | |
| 995692 — 4.5% 2024 (2.4 years) | | | 771,717 | | | | 815,626 | |
| 995755 — 4.5% 2024 (2.5 years) | | | 1,135,918 | | | | 1,198,514 | |
| 890112 — 4.0% 2024 (2.5 years) | | | 625,434 | | | | 658,353 | |
| 930667 — 4.5% 2024 (2.5 years) | | | 737,328 | | | | 779,908 | |
| AA4315 — 4.0% 2024 (2.5 years) | | | 1,263,196 | | | | 1,329,962 | |
| MA0043 — 4.0% 2024 (2.6 years) | | | 505,010 | | | | 531,725 | |
| AA5510 — 4.0% 2024 (2.6 years) | | | 292,166 | | | | 307,565 | |
| 931739 — 4.0% 2024 (2.7 years) | | | 322,883 | | | | 340,059 | |
| 310139 — 3.5% 2025 (2.7 years) | | | 6,302,618 | | | | 6,568,171 | |
| AD7073 — 4.0% 2025 (2.9 years) | | | 1,009,997 | | | | 1,058,022 | |
| AH3429 — 3.5% 2026 (3.1 years) | | | 16,866,407 | | | | 17,645,447 | |
| AB1769 — 3.0% 2025 (3.2 years) | | | 2,956,825 | | | | 3,042,088 | |
| AB2251 — 3.0% 2026 (3.3 years) | | | 3,605,308 | | | | 3,708,885 | |
| AB3902 — 3.0% 2026 (3.6 years) | | | 2,358,474 | | | | 2,427,426 | |
| AK3264 — 3.0% 2027 (3.6 years) | | | 5,897,142 | | | | 6,069,593 | |
The accompanying notes form an integral part of these financial statements.
41 | Q1 2017 ANNUAL REPORT
SHORT DURATION INCOME FUND (CONTINUED)
| | | $ Principal | | | | |
| | | Amount | | | $ Value | |
| AB4482 — 3.0% 2027 (3.7 years) | | | 5,532,314 | | | | 5,694,688 | |
| AL1366 — 2.5% 2027 (3.7 years) | | | 4,115,620 | | | | 4,165,538 | |
| 555531 — 5.5% 2033 (4.2 years) | | | 3,840,646 | | | | 4,302,969 | |
| MA0587 — 4.0% 2030 (4.4 years) | | | 5,625,556 | | | | 5,955,692 | |
| 995112 — 5.5% 2036 (4.5 years) | | | 1,688,176 | | | | 1,890,984 | |
| 725232 — 5.0% 2034 (4.5 years) | | | 342,569 | | | | 375,755 | |
| | | | | | | | 88,605,508 | |
| | | | | | | | 91,167,922 | |
| Government National Mortgage Association | | | | | | | | |
| | | | | | | | | |
| Pass-Through Securities | | | | | | | | |
| G2 5255 — 3.0% 2026 (3.6 years) | | | 10,555,029 | | | | 10,896,222 | |
| | | | | | | | | |
| Non-Government Agency | | | | | | | | |
| | | | | | | | | |
| Collateralized Mortgage Obligations | | | | | | | | |
| Bayview Opportunity Master Fund IIa Trust (BOMFT) | | | | | | | | |
2014-18NPL CL A — 3.2282% 2034 (1.0 years)(c) | | | 3,230,306 | | | | 3,232,676 | |
| Citigroup Mortgage Loan Trust, Inc. (CMLTI) | | | | | | | | |
2014-A CL A — 4.0% 2035 (2.8 years)(c) | | | 2,175,066 | | | | 2,269,984 | |
| J.P. Morgan Mortgage Trust (JPMMT) | | | | | | | | |
2014-2 CL 2A2 — 3.5% 2029 (3.2 years)(c) | | | 4,637,222 | | | | 4,720,474 | |
2014-5 CL A1 — 3.0% 2029 (3.3 years)(c) | | | 9,035,012 | | | | 9,133,837 | |
2016-3 CL 2A1 — 3.0% 2046 (5.6 years)(c) | | | 3,574,180 | | | | 3,602,105 | |
| Sequoia Mortgage Trust (SEMT) | | | | | | | | |
| 2012-1 CL 1A1 — 2.865% 2042 (0.9 years) | | | 1,569,768 | | | | 1,587,389 | |
| 2013-4 CL A3 — 1.55% 2043 (3.3 years) | | | 7,985,022 | | | | 7,799,127 | |
| 2012-4 CL A1 — 3.5% 2042 (6.1 years) | | | 4,139,595 | | | | 4,184,679 | |
| Sunset Mortgage Loan Co. (SMLC) | | | | | | | | |
2014-NPL2 CL A — 3.721% 2044 (0.3 years)(c) | | | 289,215 | | | | 289,178 | |
| Washington Mutual, Inc. (WAMU) | | | | | | | | |
| 2003-S7 CL A1 — 4.5% 2018 (0.1 years) | | | 14,460 | | | | 14,538 | |
| | | | | | | | 36,833,987 | |
| Total Mortgage-Backed Securities (Cost $208,025,126) | | | | 213,571,550 | |
| | | | | | | | | |
| Taxable Municipal Bonds – 0.4% | | | | | | | | |
| | | | | | | | | |
| Iowa State University Revenue 5.8% 7/01/22 | | | 1,335,000 | | | | 1,409,707 | |
| Kansas Development Finance Authority Revenue, | | | | | | | | |
| Series 2015H | | | | | | | | |
| 2.258% 4/15/19 | | | 1,000,000 | | | | 1,008,320 | |
| 2.608% 4/15/20 | | | 500,000 | | | | 509,175 | |
| 2.927% 4/15/21 | | | 750,000 | | | | 765,607 | |
| Omaha, Nebraska Public Facilities Corp., | | | | | | | | |
| Lease Revenue, Series B, Refunding | | | | | | | | |
| 4.588% 6/01/17 | | | 815,000 | | | | 819,059 | |
| 4.788% 6/01/18 | | | 1,000,000 | | | | 1,035,690 | |
| Total Taxable Municipal Bonds (Cost $5,400,000) | | | | | | | 5,547,558 | |
| U.S. Treasury – 24.7% | | | | | | |
| | | $ Principal | | | | |
| | | | Amount | | | | |
| | | | or Shares | | | $ Value | |
| U.S. Treasury Inflation Indexed Bonds | | | | | | |
| 0.125% 7/15/26 | | | | 5,064,500 | | | | 4,943,914 | |
| | | | | | | | | |
| U.S. Treasury Notes | | | | | | | | |
| 0.75% 6/30/17 | | | | 20,000,000 | | | | 19,995,800 | |
| 1.0% 12/15/17 | | | | 25,000,000 | | | | 25,001,950 | |
| 0.75% 12/31/17 | | | | 30,000,000 | | | | 29,941,410 | |
| 0.875% 1/31/18 | | | | 20,000,000 | | | | 19,973,520 | |
| 0.75% 2/28/18 | | | | 15,000,000 | | | | 14,958,990 | |
| 1.375% 6/30/18 | | | | 25,000,000 | | | | 25,075,200 | |
| 0.75% 9/30/18 | | | | 20,000,000 | | | | 19,875,000 | |
| 1.25% 1/31/19 | | | | 15,000,000 | | | | 15,006,450 | |
| 0.875% 5/15/19 | | | | 25,000,000 | | | | 24,783,200 | |
| 1.625% 6/30/19 | | | | 10,000,000 | | | | 10,066,600 | |
| 1.375% 1/31/20 | | | | 15,000,000 | | | | 14,961,915 | |
| 1.375% 8/31/20 | | | | 10,000,000 | | | | 9,908,790 | |
| 2.125% 8/31/20 | | | | 15,000,000 | | | | 15,238,470 | |
| 2.0% 11/30/20 | | | | 20,000,000 | | | | 20,207,820 | |
| 1.125% 7/31/21 | | | | 15,000,000 | | | | 14,549,700 | |
| 2.0% 7/31/22 | | | | 12,000,000 | | | | 11,996,256 | |
| | | | | | | | | 291,541,071 | |
| Total U.S. Treasury (Cost $296,413,513) | | | | | | | 296,484,985 | |
| | | | | | | | | | |
| Common Stocks – 1.1% | | | | | | | | |
| | | | | | | | | | |
| Redwood Trust, Inc. (Cost $8,263,786) | | | 795,000 | | | | 13,204,950 | |
| | | | | | | | | | |
| Cash Equivalents – 2.6% | | | | | | | | |
| | | | | | | | | | |
| Wells Fargo Advantage Government Money | | | | | | | | |
Market Fund - Select Class 0.63%(a) | | | 30,762,215 | | | | 30,762,215 | |
| Total Cash Equivalents (Cost $30,762,215) | | | | | | | 30,762,215 | |
| Total Investments in Securities (Cost $1,188,296,503) | | | | | | | 1,205,919,413 | |
| Options Written - 0.0% | | | | | | | (185,000 | ) |
| Other Liabilities in Excess of Other Assets - (0.6%) | | | | | | | (7,644,992 | ) |
| Net Assets - 100% | | | | | | | | 1,198,089,421 | |
| Net Asset Value Per Share - Investor Class | | | | | | | 12.27 | |
| Net Asset Value Per Share - Institutional Class | | | | | | | 12.29 | |
| Options Written* – (0.0%) | | |
| | Expiration | Shares | |
| | date / | subject | |
| | Strike price | to option | |
| Covered Call Options | | |
| Redwood Trust, Inc. | July 2017 / $15 | 100,000 | (185,000) |
| (premiums received $114,997) | | |
| * | Non-income producing |
(a) | Rate presented represents the annualized 7-day yield at March 31, 2017. |
(b) | Number of years indicated represents estimated average life. |
(c) | Security is exempt from registration under Rule 144A of the Securities Act of 1933. This security may be resold in transactions that are exempt from registration, normally to qualified institutional buyers. |
(d) | Foreign domiciled entity. |
(e) | Annual sinking fund. |
The accompanying notes form an integral part of these financial statements.
42 | Q1 2017 ANNUAL REPORT
WEITZINVESTMENTS.COM
ULTRA SHORT GOVERNMENT FUND
Schedule of Investments
March 31, 2017
| Corporate Bonds – 12.6% | | $ Principal | | | | |
| | | Amount | | | | |
| | | or Shares | | | $ Value | |
| Bank of America Corp. 1.7% 8/25/17 | | | 5,000,000 | | | | 5,008,240 | |
| Intel Corp. 1.35% 12/15/17 | | | 2,000,000 | | | | 2,001,496 | |
MetLife Global Funding I 1.3% 4/10/17(b) | | | 1,240,000 | | | | 1,240,025 | |
| Verizon Communications, Inc. 1.50622% 6/09/17 | | | | | | | | |
| Floating Rate | | | 2,018,000 | | | | 2,018,928 | |
| Wells Fargo & Co. 1.15% 6/02/17 | | | 2,065,000 | | | | 2,064,525 | |
| Total Corporate Bonds (Cost $12,331,009) | | | | | | | 12,333,214 | |
| | | | | | | | | |
| U.S. Treasury – 84.6% | | | | | | | | |
| | | | | | | | | |
| U.S. Treasury Bills† | | | | | | | | |
| 0.50% 4/06/17 | | | 15,000,000 | | | | 14,999,310 | |
| 0.62% 5/04/17 | | | 15,000,000 | | | | 14,991,150 | |
| 0.53% 5/25/17 | | | 15,000,000 | | | | 14,984,580 | |
| | | | | | | | | |
| U.S. Treasury Notes | | | | | | | | |
| 0.75% 12/31/17 | | | 20,000,000 | | | | 19,960,940 | |
| 0.875% 1/31/18 | | | 10,000,000 | | | | 9,986,760 | |
| 1.0% 3/15/18 | | | 8,000,000 | | | | 7,994,840 | |
| Total U.S. Treasury (Cost $82,955,583) | | | | | | | 82,917,580 | |
| | | | | | | | | |
| Money Market Funds – 2.7% | | | | | | | | |
| | | | | | | | | |
| Wells Fargo Advantage Money Market Funds | | | | | | | | |
Government - Select Class 0.63%(a) | | | 2,659,179 | | | | 2,659,179 | |
100% Treasury - Service Class 0.20%(a) | | | 52,556 | | | | 52,556 | |
| Total Money Market Funds (Cost $2,711,735) | | | | | | | 2,711,735 | |
| Total Investments in Securities (Cost $97,998,327) | | | | | | | 97,962,529 | |
| Other Assets Less Other Liabilities — 0.1% | | | | | | | 66,566 | |
| Net Assets - 100% | | | | | | | 98,029,095 | |
| Net Asset Value Per Share | | | | | | | 10.00 | |
| † | Interest rates presented represent the yield to maturity at the date of purchase. |
(a) | Rate presented represents the annualized 7-day yield at March 31, 2017. |
(b) | Security is exempt from registration under Rule 144A of the Securities Act of 1933. This security may be resold in transactions that are exempt from registration, normally to qualified institutional buyers. |
The accompanying notes form an integral part of these financial statements.
43 | Q1 2017 ANNUAL REPORT
NEBRASKA TAX-FREE INCOME FUND
Schedule of Investments
March 31, 2017
| Municipal Bonds – 93.3% | | | | | | | | | |
| | | % of Net | | | $ Principal | | | | |
| | | Assets | | | Amount | | | $ Value | |
| Florida | | | 1.7 | | | | | | | |
| Miami, Dade County, Aviation Revenue, | | | | | | | | | | |
| Series 2010A, 4.25%, 10/01/18 | | | | | | | 1,000,000 | | | | 1,045,630 | |
| | | | | | | | | | | | | |
| Illinois | | | 0.6 | | | | | | | | | |
| Cook, Kane, Lake and McHenry Counties and State of Illinois, | | | | | | | | | |
| General Obligation, Community College District No. 512, | | | | | | | | | |
| Series 2009A, 5.0%, 12/01/23 | | | | | | | 100,000 | | | | 106,158 | |
| Illinois Finance Authority, Revenue, Northwestern Memorial | | | | | | | | | |
| Hospital, Series 2009A, 5.0%, 8/15/17 | | | | | | | 245,000 | | | | 248,700 | |
| | | | | | | | | | | | 354,858 | |
| Iowa | | | 1.3 | | | | | | | | | |
| Cedar Rapids Community School District, Infrastructure Sales, | | | | | | | | | |
| Services and Use Tax Revenue, Series 2011, 4.0%, 7/01/20, | | | | | | | | | |
| Pre-Refunded 7/01/17 @ 100 | | | | | | | 600,000 | | | | 604,566 | |
| Iowa Finance Authority, Hospital Revenue, Bond Anticipation | | | | | | | | | |
| Notes, Shenandoah Medical Center Project, Series 2015, | | | | | | | | | |
| 1.75%, 6/01/18 | | | | | | | 250,000 | | | | 249,713 | |
| | | | | | | | | | | | 854,279 | |
| Nebraska | | | 89.0 | | | | | | | | | |
| Adams County, Hospital Authority #1, Revenue, Mary | | | | | | | | | |
| Lanning Memorial Hospital Project, Radian Insured, | | | | | | | | | |
| Escrowed to Maturity, 4.4%, 12/15/17 | | | | | | | 250,000 | | | | 256,130 | |
| Blair, Water System Revenue, Series 2016, AMT, | | | | | | | | | |
| 2.2%, 12/15/22 | | | | | | | 175,000 | | | | 167,984 | |
| 2.45%, 12/15/23 | | | | | | | 125,000 | | | | 119,096 | |
| 2.65%, 12/15/24 | | | | | | | 100,000 | | | | 93,790 | |
| 2.85%, 12/15/25 | | | | | | | 100,000 | | | | 94,154 | |
| 3.0%, 12/15/26 | | | | | | | 100,000 | | | | 93,637 | |
| 3.1%, 12/15/27 | | | | | | | 100,000 | | | | 93,138 | |
| 3.2%, 12/15/28 | | | | | | | 100,000 | | | | 92,671 | |
| 3.35%, 12/15/29 | | | | | | | 100,000 | | | | 92,256 | |
| 3.5%, 12/15/30 | | | | | | | 100,000 | | | | 91,878 | |
| Buffalo County, General Obligation, Kearney Public Schools | | | | | | | | | |
| District 0007 | | | | | | | | | | | | |
| Series 2012, 1.4%, 12/15/18 | | | | | | | 280,000 | | | | 280,070 | |
| Series 2016 | | | | | | | | | | | | |
| 2.0%, 12/15/18 | | | | | | | 305,000 | | | | 309,801 | |
| 3.0%, 12/15/24 | | | | | | | 250,000 | | | | 264,262 | |
| Chadron, Sales Tax and General Obligation, Aquatic Center, | | | | | | | | | |
| Series 2016, 1.6%, 7/15/22 | | | | | | | 400,000 | | | | 388,164 | |
| Columbus, Combined Revenue, Refunding, Series 2016, | | | | | | | | | |
| 4.0%, 12/15/26 | | | | | | | 100,000 | | | | 110,391 | |
| 4.0%, 12/15/27 | | | | | | | 100,000 | | | | 109,589 | |
| Cornhusker Public Power District, Electric System Revenue, | | | | | | | | | |
| Refunding, Series 2014, 2.25%, 7/01/22 | | | | | | | 260,000 | | | | 262,423 | |
| Dawson Public Power District, Electric System Revenue, | | | | | | | | | |
| Series 2016A | | | | | | | | | | | | |
| Refunding, 2.0%, 6/15/26 | | | | | | | 170,000 | | | | 155,546 | |
| Refunding, 2.1%, 6/15/27 | | | | | | | 105,000 | | | | 95,528 | |
| Series 2016B | | | | | | | | | | | | |
| 2.5%, 6/15/28 | | | | | | | 135,000 | | | | 127,015 | |
| 3.0%, 6/15/29 | | | | | | | 245,000 | | | | 244,000 | |
| 3.0%, 6/15/30 | | | | | | | 355,000 | | | | 349,654 | |
| Douglas County, Educational Facility Revenue, Refunding, | | | | | | | | | |
| Creighton University Project, Series 2010A, 5.6%, 7/01/25 | | | | 400,000 | | | | 448,408 | |
| Douglas County, General Obligation, | | | | | | | | | | | | |
| Omaha Public School District 0001, Series 2015, | | | | | | | | | |
| 5.0%, 12/15/28 | | | | | | | 1,000,000 | | | | 1,190,150 | |
| Refunding, Elkhorn Public School District 0010, | | | | | | | | | |
| Series 2016B | | | | | | | | | | | | |
| 3.0%, 6/15/18 | | | | | | | 200,000 | | | | 204,784 | |
| 3.0%, 12/15/18 | | | | | | | 100,000 | | | | 103,248 | |
| Westside Community School District 0066, Series 2015, | | | | | | | | | |
| 2.5%, 12/01/22 | | | | | | | 250,000 | | | | 260,052 | |
| Douglas County, Hospital Authority #1, Revenue, Refunding, | | | | | | | | | |
| Alegent Health - Immanuel, AMBAC Insured, 5.125%, 9/01/17 | | | | 55,000 | | | | 55,056 | |
| | | $ Principal | | | | |
| | | Amount | | | $ Value | |
| Douglas County, Hospital Authority #2, Revenue, | | | | | | |
| Boys Town Project, Series 2008, 4.75%, 9/01/28 | | | 500,000 | | | | 521,015 | |
| Madonna Rehabilitation Hospital Project, Series 2014, | | | | | | | | |
| 5.0%, 5/15/26 | | | 500,000 | | | | 555,140 | |
| Refunding, Children's Hospital Obligated Group, Series 2008B | | | | | |
| 5.25%, 8/15/20 | | | 1,000,000 | | | | 1,015,160 | |
| 5.5%, 8/15/21 | | | 815,000 | | | | 828,203 | |
5.5%, 8/15/21, Pre-Refunded 8/15/17 @ 100(c) | | | 615,000 | | | | 625,283 | |
| Douglas County, Hospital Authority #3, Revenue, Refunding, | | | | | |
| Nebraska Methodist Health System | | | | | | | | |
Series 2008, 5.5%, 11/01/18, Escrowed to Maturity(b) | | | 215,000 | | | | 225,621 | |
| Series 2015 | | | | | | | | |
| 4.0%, 11/01/18 | | | 250,000 | | | | 259,712 | |
| 4.0%, 11/01/19 | | | 110,000 | | | | 115,657 | |
| 5.0%, 11/01/20 | | | 100,000 | | | | 110,001 | |
| 5.0%, 11/01/21 | | | 100,000 | | | | 111,883 | |
| 5.0%, 11/01/22 | | | 250,000 | | | | 283,150 | |
| Fremont, Combined Utility Revenue, Series 2014B, | | | | | | | | |
| 3.0%, 7/15/21 | | | 370,000 | | | | 389,133 | |
| Hamilton County, General Obligation, Hampton Public School | | | | | |
| District 0091, Series 2016, 1.0%, 12/15/19 | | | 300,000 | | | | 294,681 | |
| Hastings, Combined Utility Revenue, Refunding, Series 2012, | | | | | |
| 2.0%, 10/15/17 | | | 430,000 | | | | 432,644 | |
| Lancaster County, General Obligation, Norris School | | | | | | | | |
| District 0160, Series 2012, 2.75%, 12/15/28 | | | 500,000 | | | | 500,115 | |
| Lancaster County, Hospital Authority #1, Revenue, Refunding | | | | | |
| Bryan LGH Medical Center Project, Series 2008A, | | | | | | | | |
| 5.0%, 6/01/17 | | | 500,000 | | | | 503,170 | |
| Lincoln-Lancaster County, Public Building Commission, | | | | | | | | |
| Lease Revenue, | | | | | | | | |
| Refunding, Series 2015, 3.0%, 12/01/19 | | | 750,000 | | | | 783,367 | |
| Series 2016, 3.0%, 12/01/25 | | | 500,000 | | | | 526,115 | |
| Lincoln, Airport Authority, Revenue, 2014 Series C | | | | | | | | |
| 2.0%, 7/01/17 | | | 185,000 | | | | 185,572 | |
| 2.0%, 7/01/18 | | | 185,000 | | | | 187,294 | |
| 2.0%, 7/01/19 | | | 190,000 | | | | 191,915 | |
| 2.0%, 7/01/21 | | | 195,000 | | | | 195,560 | |
| Lincoln, Educational Facilities, Revenue, Refunding, | | | | | | | | |
| Nebraska Wesleyan University Project, Series 2012 | | | | | | | | |
| 2.25%, 4/01/19 | | | 645,000 | | | | 654,062 | |
| 2.5%, 4/01/21 | | | 925,000 | | | | 943,713 | |
| Lincoln, Electric System Revenue, Refunding, | | | | | | | | |
| Series 2012 | | | | | | | | |
| 5.0%, 9/01/21 | | | 1,000,000 | | | | 1,147,280 | |
| 5.0%, 9/01/28 | | | 1,000,000 | | | | 1,155,740 | |
| Series 2016, 3.0%, 9/01/28 | | | 500,000 | | | | 511,205 | |
| Lincoln, General Obligation, Highway Allocation Fund, | | | | | | | | |
| Refunding, Series 2016 | | | | | | | | |
| 5.0%, 5/15/22 | | | 100,000 | | | | 116,407 | |
| 5.0%, 5/15/23 | | | 135,000 | | | | 159,805 | |
| Lincoln, Parking Revenue, Refunding, Series 2011, | | | | | | | | |
| 3.25%, 8/15/18 | | | 440,000 | | | | 451,774 | |
| Lincoln, Sanitary Sewer Revenue, Refunding, Series 2012, | | | | | | | | |
| 1.5%, 6/15/17 | | | 440,000 | | | | 440,629 | |
| Lincoln, General Obligation, West Haymarket Joint Public Agency, | | | | | |
| Series 2011, 5.0%, 12/15/26 | | | 300,000 | | | | 345,486 | |
| Loup River Public Power District, Electric System Revenue, | | | | | | | | |
| Refunding, Series 2016 | | | | | | | | |
| 5.0%, 12/01/18 | | | 500,000 | | | | 532,070 | |
| 5.0%, 12/01/19 | | | 500,000 | | | | 548,405 | |
| Municipal Energy Agency of Nebraska, Power Supply | | | | | | | | |
| System Revenue, Refunding | | | | | | | | |
| 2009 Series A, BHAC Insured, | | | | | | | | |
| 5.0%, 4/01/20, Pre-Refunded 4/01/19 @ 100 | | | 500,000 | | | | 538,360 | |
| 2012 Series A, 5.0%, 4/01/18 | | | 100,000 | | | | 103,855 | |
| 2013 Series A, 4.0%, 4/01/17 | | | 250,000 | | | | 250,000 | |
| 2016 Series A | | | | | | | | |
| 5.0%, 4/01/21 | | | 250,000 | | | | 282,512 | |
| 5.0%, 4/01/27 | | | 350,000 | | | | 413,455 | |
The accompanying notes form an integral part of these financial statements.
44 | Q1 2017 ANNUAL REPORT
WEITZINVESTMENTS.COM
| $ Principal | | | | |
| | | Amount | | | $ Value | |
| Nebraska, Certificates of Participation, | | | | | | |
| Series 2015C | | | | | | |
| 1.15%, 9/15/18 | | | 460,000 | | | | 459,669 | |
| 1.45%, 9/15/19 | | | 360,000 | | | | 360,410 | |
| 1.7%, 9/15/20 | | | 200,000 | | | | 200,454 | |
| Series 2016A, 2.0%, 2/15/19 | | | 750,000 | | | | 760,867 | |
| Series 2017A, 1.0%, 3/15/18 | | | 350,000 | | | | 349,744 | |
| Nebraska Cooperative Republican Platte Enhancement | | | | | | | | |
| Project, River Flow Enhancement Revenue, Refunding, | | | | | | | | |
| Series 2015, 3.0%, 12/15/17 | | | 440,000 | | | | 446,195 | |
| Nebraska Investment Financial Authority, Revenue, Drinking | | | | | | | | |
| Water State Revolving Fund, Series 2010A, 4.0%, 7/01/25, | | | | | | | | |
| Pre-Refunded 7/01/17 @ 100 | | | 750,000 | | | | 755,617 | |
| Nebraska Investment Financial Authority, | | | | | | | | |
| Homeownership Revenue, 2011 Series A, 2.4%, 9/01/17 | | | 285,000 | | | | 285,735 | |
| Single Family Housing Revenue, 2016 Series C, | | | | | | | | |
| 1.85%, 3/01/23 | | | 100,000 | | | | 98,782 | |
| Nebraska Public Power District, Revenue | | | | | | | | |
| 2007 Series B, 5.0% | | | | | | | | |
| 1/01/20 | | | 300,000 | | | | 302,997 | |
| 1/01/20, Pre-Refunded 7/01/17 @ 100 | | | 95,000 | | | | 95,949 | |
| 1/01/21 | | | 1,340,000 | | | | 1,353,387 | |
| 1/01/21, Pre-Refunded 7/01/17 @ 100 | | | 410,000 | | | | 414,096 | |
| 2008 Series B, 5.0%, 1/01/19, Pre-Refunded | | | | | | | | |
| 1/01/18 @ 100 | | | 250,000 | | | | 257,660 | |
| 2012 Series A | | | | | | | | |
| 4.0%, 1/01/21 | | | 500,000 | | | | 545,655 | |
| 5.0%, 1/01/21 | | | 500,000 | | | | 563,775 | |
| 2012 Series B, 3.0%, 1/01/24 | | | 1,000,000 | | | | 1,037,410 | |
| 2012 Series C, 5.0% | | | | | | | | |
| 1/01/19, Pre-Refunded 1/01/18 @ 100 | | | 500,000 | | | | 515,320 | |
| 1/01/25, Pre-Refunded 1/01/18 @ 100 | | | 750,000 | | | | 772,980 | |
| 2015 Series A-2, 5.0%, 1/01/24 | | | 250,000 | | | | 283,500 | |
| 2016 Series C, 4.0%, 1/01/19 | | | 880,000 | | | | 923,982 | |
| Nebraska State Colleges, Facilities Corp., Deferred | | | | | | | | |
| Maintenance Revenue, Refunding, Series 2016, | | | | | | | | |
| 4.0%, 7/15/28 | | | 750,000 | | | | 820,493 | |
| Nebraska State Colleges, Student Fees and Facilities Revenue, | | | | | | | | |
| Refunding, Wayne State College Project, Series 2016B, | | | | | | | | |
| 1.0%, 7/01/18 | | | 145,000 | | | | 144,107 | |
| Wayne State College Project, Series 2016, | | | | | | | | |
| 2.0%, 7/01/17 | | | 115,000 | | | | 115,286 | |
| 3.0%, 7/01/18 | | | 200,000 | | | | 204,462 | |
| 3.0%, 7/01/19 | | | 120,000 | | | | 123,973 | |
| North Platte, Sewer System Revenue, Refunding, Series 2015, | | | | | | | | |
| 3.0%, 6/15/24 | | | 250,000 | | | | 254,483 | |
| Omaha-Douglas County, General Obligation, Public Building | | | | | | | | |
| Commission, Series 2014, 5.0%, 5/01/26 | | | 725,000 | | | | 834,598 | |
| Omaha, General Obligation, | | | | | | | | |
| Refunding, Series 2008 | | | | | | | | |
| 5.0%, 6/01/20 | | | 255,000 | | | | 266,674 | |
| 5.0%, 6/01/20, Pre-Refunded 6/01/18 @ 100 | | | 95,000 | | | | 99,354 | |
| 5.25%, 10/15/19, Pre-Refunded 10/15/18 @ 100 | | | 250,000 | | | | 266,068 | |
| Various Purpose and Refunding, Series 2016A | | | | | | | | |
| 4.0%, 4/15/22 | | | 815,000 | | | | 903,713 | |
| 4.0%, 4/15/23 | | | 185,000 | | | | 206,469 | |
| Omaha, Public Facilities Corp., Lease Revenue | | | | | | | | |
| Omaha Baseball Stadium Project | | | | | | | | |
| Refunding, Series 2016A, 4.0%. 6/01/28 | | | 1,335,000 | | | | 1,464,682 | |
| Series 2009 | | | | | | | | |
| 4.125%, 6/01/25, Pre-Refunded 6/01/19 @ 100 | | | 250,000 | | | | 266,008 | |
| 5.0%, 6/01/23, Pre-Refunded 6/01/19 @ 100 | | | 770,000 | | | | 833,610 | |
| Series 2010, 4.125%, 6/01/29 | | | 650,000 | | | | 687,518 | |
| Omaha Public Power District | | | | | | | | |
| Electric System Revenue | | | | | | | | |
| 2012 Series A, 5.0%, 2/01/24, | | | | | | | | |
| Pre-Refunded 2/01/22 @ 100 | | | 2,000,000 | | | | 2,313,320 | |
| 2015 Series B, 5.0%, 2/01/18 | | | 1,500,000 | | | | 1,551,000 | |
| Separate Electric System Revenue | | | | | | | | |
| 2015 Series A, 5.0%, 2/01/19 | | | 500,000 | | | | 533,760 | |
| Omaha, Sanitary Sewerage System Revenue, | | | | | | | | |
| Refunding, Series 2016, 5.0%, 4/01/26 | | | 250,000 | | | | 302,950 | |
| Series 2014 | | | | | | | | |
| 5.0%, 11/15/17 | | | 500,000 | | | | 512,460 | |
| 5.0%, 11/15/22 | | | 200,000 | | | | 234,242 | |
| | | $ Principal | | | | |
| % of Net | Amount | | | | |
| Assets | or Shares | | | $ Value | |
| Papillion-La Vista, General Obligation, Sarpy County | | | | | | |
| School District #27, | | | | | | |
| Refunding, Series 2017A | | | | | | |
| 2.05%, 12/01/24 | | | 150,000 | | | | 149,276 | |
| 2.2%, 12/01/25 | | | 150,000 | | | | 149,285 | |
| 2.3%, 12/01/26 | | | 275,000 | | | | 272,569 | |
| Series 2009, 5.0%, 12/01/28 | | | 500,000 | | | | 532,335 | |
| Papio-Missouri River Natural Resources District, General | | | | | | | | |
| Obligation, Flood Protection and Water Quality Enhancement | | | | | |
| Series 2013 | | | | | | | | |
| 3.0%, 12/15/17 | | | 385,000 | | | | 390,663 | |
| 3.0%, 12/15/18 | | | 500,000 | | | | 506,285 | |
| Series 2013B, 5.0%, 12/15/19 | | | 400,000 | | | | 420,468 | |
| Series 2015 | | | | | | | | |
| 2.0%, 12/15/20 | | | 100,000 | | | | 101,396 | |
| 2.25%, 12/15/21 | | | 100,000 | | | | 101,608 | |
| 4.0%, 12/15/24 | | | 100,000 | | | | 107,120 | |
| 4.0%, 12/15/25 | | | 100,000 | | | | 106,991 | |
| Perennial Public Power District, Electric System Revenue, | | | | | | | | |
| Refunding, Series 2016A, 0.95%, 1/01/18 | | | 125,000 | | | | 124,761 | |
| Public Power Generation Agency, Revenue, Whelan Energy | | | | | | | | |
| Center Unit 2, 2015 Series A, 5.0%, 1/01/18 | | | 250,000 | | | | 257,190 | |
| Sarpy County, Certificates of Participation, | | | | | | | | |
| Series 2016, 1.75%, 6/15/26 | | | 500,000 | | | | 453,085 | |
| Sarpy County, Recovery Zone Facility Certificates of | | | | | | | | |
| Participation, Series 2010 | | | | | | | | |
| 2.35%, 12/15/18 | | | 155,000 | | | | 158,164 | |
| 2.6%, 12/15/19 | | | 135,000 | | | | 138,833 | |
| University of Nebraska, Facilities Corp., | | | | | | | | |
| Lease Rental Revenue, NCTA Education Center/Student | | | | | | | | |
| Housing Project, Series 2011, 3.75% 6/15/19 | | | 285,000 | | | | 300,946 | |
| Revenue, Refunding, Health Center and College of | | | | | | | | |
| Nursing Projects, Series 2016, 5.0%, 7/15/29 | | | 380,000 | | | | 450,604 | |
| Revenue, UNMC Global Center Project, Series 2017, | | | | | | | | |
| 5.0%, 12/15/18 | | | 1,000,000 | | | | 1,065,800 | |
| University of Nebraska, University Revenue, | | | | | | | | |
| Lincoln Student Fees and Facilities, Series 2015A | | | | | | | | |
| 2.0%, 7/01/18 | | | 400,000 | | | | 404,960 | |
| 2.0%, 7/01/19 | | | 600,000 | | | | 610,302 | |
| Omaha Health & Recreation Project | | | | | | | | |
| 4.05%, 5/15/19, Pre-Refunded 5/15/18 @ 100 | | | 390,000 | | | | 403,373 | |
| 5.0%, 5/15/33, Pre-Refunded 5/15/18 @ 100 | | | 700,000 | | | | 731,332 | |
| Omaha Student Facilities Project, Series 2007 | | | | | | | | |
| 5.0%, 5/15/27, Pre-Refunded 5/15/17 @ 100 | | | 800,000 | | | | 803,720 | |
| | | | | | | | 56,052,504 | |
| Texas | 0.7 | | | | | | | |
| Austin, Airport System Revenue, Series 2017B, AMT, | | | | | | | | |
| 5.0%, 11/15/26 | | | 250,000 | | | | 294,903 | |
| Harris County, Tax and Subordinate Lien Revenue, | | | | | | | | |
| Refunding, Series 2009C, 5.0%, 8/15/23 | | | 110,000 | | | | 119,838 | |
| | | | | | | | 414,741 | |
| Total Municipal Bonds (Cost $58,430,979) | | | | | | | 58,722,012 | |
| | | | | | | | | |
| Cash Equivalents – 6.8% | | | | | | | | |
| | | | | | | | | |
| Wells Fargo Advantage Government Money Market | | | | | | | | |
Fund - Select Class 0.63%(a) | | | 4,284,346 | | | | 4,284,346 | |
| Total Cash Equivalents (Cost $4,284,346) | | | | | | | 4,284,346 | |
| Total Investments in Securities (Cost $62,715,325) | | | | | | | 63,006,358 | |
| Other Liabilities in Excess of Other Assets - (0.1%) | | | | | | | (33,541 | ) |
| Net Assets - 100% | | | | | | | 62,972,817 | |
| Net Asset Value Per Share | | | | | | | 9.90 | |
(a) | Rate presented represents the annualized 7-day yield at March 31, 2017. |
(b) | Annual sinking fund. |
(c) | Security designated to cover an unsettled bond purchase. |
The accompanying notes form an integral part of these financial statements.
45 | Q1 2017 ANNUAL REPORT
STATEMENTS OF ASSETS AND LIABILITIES
March 31, 2017
| | | | | | | | | | | | | | | | | | | | | | | | Short | | | | | | Nebraska | |
| (In U.S. dollars, | | | | | Partners | | | Partners III | | | | | | | | | | | | Core Plus | | | Duration | | | Ultra Short | | | Tax-Free | |
| except share data) | | Value | | | Value | | | Opportunity | | | Research | | | Hickory | | | Balanced | | | Income | | | Income | | | Government | | | Income | |
| Assets: | | | | | | | | | | | | | | | | | | | | | | | | | | | | | | |
| Investments in securities at value: | | | | | | | | | | | | | | | | | | | | | | | | | | | | | | |
Unaffiliated issuers(a) | | | 831,221,697 | | | | 734,160,081 | | | | 676,328,662 | | | | 31,048,967 | | | | 273,012,683 | | | | 118,137,956 | | | | 34,232,732 | | | | 1,205,919,413 | | | | 97,962,529 | | | | 63,006,358 | |
Controlled affiliates(a) | | | — | | | | — | | | | 10,407,950 | | | | — | | | | — | | | | — | | | | — | | | | — | | | | — | | | | — | |
| | | | 831,221,697 | | | | 734,160,081 | | | | 686,736,612 | | | | 31,048,967 | | | | 273,012,683 | | | | 118,137,956 | | | | 34,232,732 | | | | 1,205,919,413 | | | | 97,962,529 | | | | 63,006,358 | |
| Accrued interest and dividends receivable | | | 346,093 | | | | 234,653 | | | | 103,202 | | | | 4,032 | | | | 33,176 | | | | 175,614 | | | | 174,497 | | | | 6,244,086 | | | | 90,894 | | | | 590,550 | |
| Due from broker | | | — | | | | — | | | | 230,162,412 | | | | — | | | | — | | | | — | | | | — | | | | — | | | | — | | | | — | |
| Receivable for securities sold | | | — | | | | 5,156,940 | | | | 240,982 | | | | — | | | | — | | | | — | | | | — | | | | — | | | | — | | | | — | |
| Receivable for fund shares sold | | | 35,611 | | | | 133,653 | | | | 525,018 | | | | — | | | | 67,266 | | | | 144,697 | | | | — | | | | 780,110 | | | | — | | | | — | |
| Total assets | | | 831,603,401 | | | | 739,685,327 | | | | 917,768,226 | | | | 31,052,999 | | | | 273,113,125 | | | | 118,458,267 | | | | 34,407,229 | | | | 1,212,943,609 | | | | 98,053,423 | | | | 63,596,908 | |
| Liabilities: | | | | | | | | | | | | | | | | | | | | | | | | | | | | | | | | | | | | | | | | |
| Dividends payable on securities sold short | | | — | | | | — | | | | 653,634 | | | | — | | | | — | | | | — | | | | — | | | | — | | | | — | | | | — | |
| Due to adviser | | | 917,695 | | | | 786,679 | | | | 748,037 | | | | 23,581 | | | | 318,358 | | | | 118,514 | | | | 9,220 | | | | 504,161 | | | | 17,188 | | | | 49,091 | |
Options written, at value(b) | | | — | | | | — | | | | — | | | | — | | | | — | | | | — | | | | — | | | | 185,000 | | | | — | | | | — | |
| Payable for securities purchased | | | — | | | | — | | | | — | | | | — | | | | — | | | | — | | | | 3,947,188 | | | | 13,069,133 | | | | — | | | | 575,000 | |
| Payable for fund shares redeemed | | | 394,158 | | | | 174,988 | | | | 1,336,304 | | | | — | | | | 295,593 | | | | 150,863 | | | | 75,000 | | | | 1,095,894 | | | | 525 | | | | — | |
Securities sold short(c) | | | — | | | | — | | | | 225,304,000 | | | | — | | | | — | | | | — | | | | — | | | | — | | | | — | | | | — | |
| Other | | | — | | | | — | | | | — | | | | — | | | | — | | | | — | | | | — | | | | — | | | | 6,615 | | | | — | |
| Total liabilities | | | 1,311,853 | | | | 961,667 | | | | 228,041,975 | | | | 23,581 | | | | 613,951 | | | | 269,377 | | | | 4,031,408 | | | | 14,854,188 | | | | 24,328 | | | | 624,091 | |
| Net assets | | | 830,291,548 | | | | 738,723,660 | | | | 689,726,251 | | | | 31,029,418 | | | | 272,499,174 | | | | 118,188,890 | | | | 30,375,821 | | | | 1,198,089,421 | | | | 98,029,095 | | | | 62,972,817 | |
| Composition of net assets: | | | | | | | | | | | | | | | | | | | | | | | | | | | | | | | | | | | | | | | | |
| Paid-in capital | | | 542,058,023 | | | | 512,218,047 | | | | 443,550,160 | | | | 28,554,910 | | | | 176,215,730 | | | | 101,686,276 | | | | 30,173,302 | | | | 1,185,117,185 | | | | 98,065,062 | | | | 62,718,696 | |
| Accumulated undistributed net investment income (loss) | | | (1,208,394 | ) | | | (907,781 | ) | | | (2,542,368 | ) | | | — | | | | — | | | | — | | | | 1,644 | | | | — | | | | — | | | | 2,348 | |
| Accumulated net realized gain (loss) | | | 32,507,539 | | | | (4,519,879 | ) | | | 21,700,338 | | | | 100,429 | | | | 693,960 | | | | 1,275,477 | | | | 90,653 | | | | (4,580,671 | ) | | | (169 | ) | | | (39,260 | ) |
| Net unrealized appreciation (depreciation) of investments | | | 256,934,380 | | | | 231,933,273 | | | | 227,018,121 | | | | 2,374,079 | | | | 95,589,484 | | | | 15,227,137 | | | | 110,222 | | | | 17,552,907 | | | | (35,798 | ) | | | 291,033 | |
| Net assets | | | 830,291,548 | | | | 738,723,660 | | | | 689,726,251 | | | | 31,029,418 | | | | 272,499,174 | | | | 118,188,890 | | | | 30,375,821 | | | | 1,198,089,421 | | | | 98,029,095 | | | | 62,972,817 | |
Net assets(d): | | | | | | | | | | | | | | | | | | | | | | | | | | | | | | | | | | | | | | | | |
| Investor Class | | | 638,992,783 | | | | 429,226,244 | | | | 28,560,878 | | | | 31,029,418 | | | | 272,499,174 | | | | 118,188,890 | | | | 6,522,137 | | | | 94,817,242 | | | | | | | | 62,972,817 | |
| Institutional Class | | | 191,298,765 | | | | 309,497,416 | | | | 661,165,373 | | | | | | | | | | | | | | | | 23,853,684 | | | | 1,103,272,179 | | | | 98,029,095 | | | | | |
Shares outstanding(d) (e): | | | | | | | | | | | | | | | | | | | | | | | | | | | | | | | | | | | | | | | | |
| Investor Class | | | 15,142,094 | | | | 13,970,911 | | | | 1,937,270 | | | | 2,864,794 | | | | 5,130,422 | | | | 8,673,146 | | | | 637,585 | | | | 7,726,850 | | | | | | | | 6,361,995 | |
| Institutional Class | | | 4,507,307 | | | | 10,014,067 | | | | 43,875,505 | | | | | | | | | | | | | | | | 2,331,675 | | | | 89,757,004 | | | | 9,806,386 | | | | | |
Net asset value, offering and redemption price(d): | | | | | | | | | | | | | | | | | | | | | | | | | | | | | | | | | | | | | | | | |
| Investor Class | | | 42.20 | | | | 30.72 | | | | 14.74 | | | | 10.83 | | | | 53.11 | | | | 13.63 | | | | 10.23 | | | | 12.27 | | | | | | | | 9.90 | |
| Institutional Class | | | 42.44 | | | | 30.91 | | | | 15.07 | | | | | | | | | | | | | | | | 10.23 | | | | 12.29 | | | | 10.00 | | | | | |
| | | | | | | | | | | | | | | | | | | | | | | | | | | | | | | | | | | | | | | | | |
(a) Cost of investments in securities: | | | | | | | | | | | | | | | | | | | | | | | | | | | | | | | | | | | | | | | | |
| Unaffiliated issuers | | | 574,287,317 | | | | 502,226,808 | | | | 425,630,798 | | | | 28,674,888 | | | | 177,423,199 | | | | 102,910,819 | | | | 34,122,510 | | | | 1,188,296,503 | | | | 97,998,327 | | | | 62,715,325 | |
| Controlled affiliates | | | — | | | | — | | | | 2,899,379 | | | | — | | | | — | | | | — | | | | — | | | | — | | | | — | | | | — | |
| | | | 574,287,317 | | | | 502,226,808 | | | | 428,530,177 | | | | 28,674,888 | | | | 177,423,199 | | | | 102,910,819 | | | | 34,122,510 | | | | 1,188,296,503 | | | | 97,998,327 | | | | 62,715,325 | |
(b) Premiums from options written | | | — | | | | — | | | | — | | | | — | | | | — | | | | — | | | | — | | | | 114,997 | | | | — | | | | — | |
(c) Proceeds from short sales | | | — | | | | — | | | | 194,115,686 | | | | — | | | | — | | | | — | | | | — | | | | — | | | | — | | | | — | |
(d) Funds with a single share class are shown with the Investor Class. except for the Ultra Short Government Fund which has been designated Institutional Class
(e) Indefinite number of no par value shares authorized
The accompanying notes form an integral part of these financial statements.
46 | Q1 2017 ANNUAL REPORT
STATEMENTS OF OPERATIONS
Year ended March 31, 2017
| | | | | | | | | | | | | | | | | | | | | | | | Short | | | | | | Nebraska | |
| | | | | | Partners | | | Partners III | | | | | | | | | | | | Core Plus | | | Duration | | | Ultra Short | | | Tax-Free | |
| (In U.S. dollars) | | Value | | | Value | | | Opportunity | | | Research | | | Hickory | | | Balanced | | | Income | | | Income | | | Government | | | Income | |
| Investment income: | | | | | | | | | | | | | | | | | | | | | | | | | | | | | | |
| Dividends: | | | | | | | | | | | | | | | | | | | | | | | | | | | | | | |
Unaffiliated issuers(a) | | | 6,345,390 | | | | 6,530,431 | | | | 5,743,045 | | | | 124,848 | | | | 2,058,440 | | | | 632,011 | | | | 11,736 | | | | 911,033 | | | — | | | — | |
| Interest | | | 613,776 | | | | 535,470 | | | | 198,026 | | | | 19,689 | | | | 243,663 | | | | 749,265 | | | | 666,492 | | | | 31,394,345 | | | | 411,903 | | | | 1,564,899 | |
| Total investment income | | | 6,959,166 | | | | 7,065,901 | | | | 5,941,071 | | | | 144,537 | | | | 2,302,103 | | | | 1,381,276 | | | | 678,228 | | | | 32,305,378 | | | | 411,903 | | | | 1,564,899 | |
| Expenses: | | | | | | | | | | | | | | | | | | | | | | | | | | | | | | | | | | | | | | | | |
| Investment advisory fees | | | 7,810,424 | | | | 6,999,938 | | | | 6,851,650 | | | | 283,392 | | | | 2,858,764 | | | | 917,008 | | | | 89,069 | | | | 4,871,553 | | | | 384,534 | | | | 255,994 | |
| Administrative fees and expenses | | | 656,454 | | | | 611,266 | | | | 516,998 | | | | 78,492 | | | | 463,565 | | | | 230,502 | | | | 94,393 | | | | 875,297 | | | | 180,658 | | | | 171,767 | |
| Shareholder servicing fees: | | | | | | | | | | | | | | | | | | | | | | | | | | | | | | | | | | | | | | | | |
| Investor Class | | | 1,335,275 | | | | 1,094,251 | | | | 86,172 | | | | — | | | | — | | | | — | | | | 10,000 | | | | 256,988 | | | | — | | | | — | |
| Institutional Class | | | 36,996 | | | | 87,950 | | | | 298,432 | | | | — | | | | — | | | | — | | | | 13,696 | | | | 1,184,060 | | | | 2,973 | | | | — | |
| Custodian fees | | | 17,563 | | | | 16,252 | | | | 14,606 | | | | 3,037 | | | | 7,487 | | | | 5,172 | | | | 2,397 | | | | 20,767 | | | | 3,463 | | | | 2,531 | |
| Dividends on securities sold short | | | — | | | | — | | | | 3,764,692 | | | | — | | | | — | | | | — | | | | — | | | | — | | | | — | | | | — | |
| Interest | | | — | | | | — | | | | 550,705 | | | | — | | | | — | | | | — | | | | — | | | | — | | | | — | | | | — | |
| Professional fees | | | 96,160 | | | | 87,047 | | | | 81,159 | | | | 22,008 | | | | 42,798 | | | | 28,928 | | | | 20,298 | | | | 123,723 | | | | 27,983 | | | | 25,023 | |
| Registration fees | | | 50,943 | | | | 48,009 | | | | 51,462 | | | | 20,267 | | | | 25,111 | | | | 21,878 | | | | 27,837 | | | | 70,291 | | | | 23,785 | | | | 7,436 | |
| Sub-transfer agent fees | | | 224,461 | | | | 141,324 | | | | 107,305 | | | | 25,361 | | | | 96,371 | | | | 36,767 | | | | 42,303 | | | | 131,294 | | | | 34,975 | | | | 25,585 | |
| Trustees fees | | | 86,557 | | | | 77,509 | | | | 67,630 | | | | 2,715 | | | | 28,410 | | | | 11,215 | | | | 2,147 | | | | 119,999 | | | | 10,121 | | | | 6,334 | |
| Other | | | 155,899 | | | | 116,359 | | | | 80,330 | | | | 7,578 | | | | 45,569 | | | | 17,878 | | | | 8,078 | | | | 204,313 | | | | 19,540 | | | | 10,743 | |
| | | | 10,470,732 | | | | 9,279,905 | | | | 12,471,141 | | | | 442,850 | | | | 3,568,075 | | | | 1,269,348 | | | | 310,218 | | | | 7,858,285 | | | | 688,032 | | | | 505,413 | |
| Less expenses waived/reimbursed by investment adviser | | | (318,811 | ) | | | (392,123 | ) | | | — | | | | (187,797 | ) | | | — | | | | — | | | | (171,061 | ) | | | (582,640 | ) | | | (538,275 | ) | | | — | |
| Net expenses | | | 10,151,921 | | | | 8,887,782 | | | | 12,471,141 | | | | 255,053 | | | | 3,568,075 | | | | 1,269,348 | | | | 139,157 | | | | 7,275,645 | | | | 149,757 | | | | 505,413 | |
| Net investment income (loss) | | | (3,192,755 | ) | | | (1,821,881 | ) | | | (6,530,070 | ) | | | (110,516 | ) | | | (1,265,972 | ) | | | 111,928 | | | | 539,071 | | | | 25,029,733 | | | | 262,146 | | | | 1,059,486 | |
| Realized and unrealized gain (loss) on investments: | | | | | | | | | | | | | | | | | | | | | | | | | | | | | | | | | | | | | | | | |
| Net realized gain (loss): | | | | | | | | | | | | | | | | | | | | | | | | | | | | | | | | | | | | | | | | |
| Unaffiliated issuers | | | 32,591,851 | | | | (2,079,364 | ) | | | 26,269,999 | | | | 613,608 | | | | 2,344,197 | | | | 3,837,636 | | | | 394,851 | | | | (996,408 | ) | | | (153 | ) | | | 8,962 | |
| Options written | | | — | | | | — | | | | 217,495 | | | | — | | | | — | | | | — | | | | — | | | | — | | | | — | | | | — | |
| Securities sold short | | | — | | | | — | | | | (4,595,322 | ) | | | — | | | | — | | | | — | | | | — | | | | — | | | | — | | | | — | |
| Net realized gain (loss) | | | 32,591,851 | | | | (2,079,364 | ) | | | 21,892,172 | | | | 613,608 | | | | 2,344,197 | | | | 3,837,636 | | | | 394,851 | | | | (996,408 | ) | | | (153 | ) | | | 8,962 | |
| Net unrealized appreciation (depreciation): | | | | | | | | | | | | | | | | | | | | | | | | | | | | | | | | | | | | | | | | |
| Unaffiliated issuers | | | 50,374,828 | | | | 84,694,558 | | | | 75,299,811 | | | | 2,418,599 | | | | 29,836,129 | | | | 3,050,576 | | | | 10,103 | | | | 4,464,201 | | | | (35,798 | ) | | | (1,403,882 | ) |
| Controlled affiliates | | | — | | | | — | | | | 2,462,950 | | | | — | | | | — | | | | — | | | | — | | | | — | | | | — | | | | — | |
| Options written | | | — | | | | — | | | | (123,115 | ) | | | — | | | | — | | | | — | | | | — | | | | (70,003 | ) | | | — | | | | — | |
| Securities sold short | | | — | | | | — | | | | (30,920,909 | ) | | | — | | | | — | | | | — | | | | — | | | | — | | | | — | | | | — | |
| Net unrealized appreciation (depreciation) | | | 50,374,828 | | | | 84,694,558 | | | | 46,718,737 | | | | 2,418,599 | | | | 29,836,129 | | | | 3,050,576 | | | | 10,103 | | | | 4,394,198 | | | | (35,798 | ) | | | (1,403,882 | ) |
| Net realized and unrealized gain (loss) on investments | | | 82,966,679 | | | | 82,615,194 | | | | 68,610,909 | | | | 3,032,207 | | | | 32,180,326 | | | | 6,888,212 | | | | 404,954 | | | | 3,397,790 | | | | (35,951 | ) | | | (1,394,920 | ) |
| Net increase (decrease) in net assets resulting from operations | | | 79,773,924 | | | | 80,793,313 | | | | 62,080,839 | | | | 2,921,691 | | | | 30,914,354 | | | | 7,000,140 | | | | 944,025 | | | | 28,427,523 | | | | 226,195 | | | | (335,434 | ) |
| | | | | | | | | | | | | | | | | | | | | | | | | | | | | | | | | | | | | | | | | |
(a) Foreign taxes withheld | | | — | | | | — | | | | 2,025 | | | | 4,035 | | | | 2,363 | | | | 8,897 | | | | — | | | | — | | | | — | | | | — | |
The accompanying notes form an integral part of these financial statements.
47 | Q1 2017 ANNUAL REPORT
STATEMENTS OF CHANGES IN NET ASSETS
| | | | | | Value | | | Partners Value | | | Partners III Opportunity | | | Research | |
| | | | | | | | | | | | | | | | | | | | | | | | | |
| | | Year ended March 31, | | | Year ended March 31, | | | Year ended March 31, | | | Year ended March 31, | |
| (In U.S. dollars) | | 2017 | | | 2016 | | | 2017 | | | 2016 | | | 2017 | | | 2016 | | | 2017 | | | 2016 | |
| Increase (decrease) in net assets: | | | | | | | | | | | | | | | | | | | | | | |
| From operations: | | | | | | | | | | | | | | | | | | | | | | | | |
| Net investment income (loss) | | | (3,192,755 | ) | | | (5,668,768 | ) | | | (1,821,881 | ) | | | (3,630,661 | ) | | | (6,530,070 | ) | | | (11,360,249 | ) | | | (110,516 | ) | | | (91,351 | ) |
| Net realized gain (loss) | | | 32,591,851 | | | | 45,923,282 | | | | (2,079,364 | ) | | | 65,111,036 | | | | 21,892,172 | | | | 38,357,747 | | | | 613,608 | | | | 572,511 | |
| Net unrealized appreciation (depreciation) | | | 50,374,828 | | | | (127,672,982 | ) | | | 84,694,558 | | | | (175,242,703 | ) | | | 46,718,737 | | | | (125,288,197 | ) | | | 2,418,599 | | | | (2,749,979 | ) |
| Net increase (decrease) in net assets resulting from operations | | | 79,773,924 | | | | (87,418,468 | ) | | | 80,793,313 | | | | (113,762,328 | ) | | | 62,080,839 | | | | (98,290,699 | ) | | | 2,921,691 | | | | (2,268,819 | ) |
| Distributions to shareholders from: | | | | | | | | | | | | | | | | | | | | | | | | | | | | | | | | |
Net investment income(a): | | | | | | | | | | | | | | | | | | | | | | | | | | | | | | | | |
| Investor Class | | | — | | | | — | | | | — | | | | — | | | | — | | | | — | | | | — | | | | — | |
| Institutional Class | | | — | | | | — | | | | — | | | | — | | | | — | | | | — | | | | | | | | | |
Net realized gains(a): | | | | | | | | | | | | | | | | | | | | | | | | | | | | | | | | |
| Investor Class | | | — | | | | (96,114,658 | ) | | | — | | | | (76,768,038 | ) | | | (450,948 | ) | | | (6,965,155 | ) | | | — | | | | (3,079,814 | ) |
| Institutional Class | | | — | | | | (22,272,270 | ) | | | — | | | | (36,641,643 | ) | | | (9,034,420 | ) | | | (100,503,708 | ) | | | — | | | | | |
Return of capital(a): | | | | | | | | | | | | | | | | | | | | | | | | | | | | | | | | |
| Investor Class | | | — | | | | — | | | | — | | | | — | | | | — | | | | — | | | | — | | | | — | |
| Institutional Class | | | — | | | | — | | | | — | | | | — | | | | — | | | | — | | | | | | | | | |
| Total distributions | | | — | | | | (118,386,928 | ) | | | — | | | | (113,409,681 | ) | | | (9,485,368 | ) | | | (107,468,863 | ) | | | — | | | | (3,079,814 | ) |
Fund share transactions(a): | | | | | | | | | | | | | | | | | | | | | | | | | | | | | | | | |
| Investor Class | | | (160,901,195 | ) | | | (35,765,020 | ) | | | (150,687,609 | ) | | | (101,270,168 | ) | | | (8,964,256 | ) | | | (19,153,273 | ) | | | 4,814,605 | | | | 3,034,598 | |
| Institutional Class | | | (18,977,598 | ) | | | 31,067,130 | | | | (20,025,386 | ) | | | 49,259,471 | | | | (66,385,487 | ) | | | (145,917,548 | ) | | | | | | | | |
| Net increase (decrease) from fund share transactions | | | (179,878,793 | ) | | | (4,697,890 | ) | | | (170,712,995 | ) | | | (52,010,697 | ) | | | (75,349,743 | ) | | | (165,070,821 | ) | | | 4,814,605 | | | | 3,034,598 | |
| Total increase (decrease) in net assets | | | (100,104,869 | ) | | | (210,503,286 | ) | | | (89,919,682 | ) | | | (279,182,706 | ) | | | (22,754,272 | ) | | | (370,830,383 | ) | | | 7,736,296 | | | | (2,314,035 | ) |
| Net assets: | | | | | | | | | | | | | | | | | | | | | | | | | | | | | | | | |
| Beginning of period | | | 930,396,417 | | | | 1,140,899,703 | | | | 828,643,342 | | | | 1,107,826,048 | | | | 712,480,523 | | | | 1,083,310,906 | | | | 23,293,122 | | | | 25,607,157 | |
| End of period | | | 830,291,548 | | | | 930,396,417 | | | | 738,723,660 | | | | 828,643,342 | | | | 689,726,251 | | | | 712,480,523 | | | | 31,029,418 | | | | 23,293,122 | |
| Undistributed net investment income (loss) | | | (1,208,394 | ) | | | (874,185 | ) | | | (907,781 | ) | | | (498,954 | ) | | | (2,542,368 | ) | | | (1,151,588 | ) | | | — | | | | — | |
(a) Funds with a single share class are shown with the Investor Class, except for the Ultra Short Government Fund which has been designated Institutional Class
The accompanying notes form an integral part of these financial statements.
48 | Q1 2017 ANNUAL REPORT
| | | | | | | | | | | | | | | | | | | | | Short Duration | | | | | | Ultra Short | | | | | | Nebraska | |
| | | | | | Hickory | | | | | | Balanced | | | Core Plus Income | | | | | | Income | | | | | | Government | | | Tax-Free Income | |
| | | | | | | | | | | | | | | | | | | | | | | | | | | | | | | | | | | | | |
| | | Year ended March 31, | | | Year ended March 31, | | | Year ended March 31, | | | Year ended March 31, | | | Year ended March 31, | | | Year ended March 31, | |
| | | 2017 | | | 2016 | | | 2017 | | | 2016 | | | 2017 | | | 2016 | | | 2017 | | | 2016 | | | 2017 | | | 2016 | | | 2017 | | | 2016 | |
| | | | | | | | | | | | | | | | | | | | | | | | | | | | | | | | | | | | | |
| | | | | | | | | | | | | | | | | | | | | | | | | | | | | | | | | | | | | |
| | | | (1,265,972 | ) | | | (1,821,440 | ) | | | 111,928 | | | | 132,760 | | | | 539,071 | | | | 448,471 | | | | 25,029,733 | | | | 26,437,556 | | | | 262,146 | | | | 34,044 | | | | 1,059,486 | | | | 1,218,149 | |
| | | | 2,344,197 | | | | 14,571,440 | | | | 3,837,636 | | | | 2,532,944 | | | | 394,851 | | | | 13,160 | | | | (996,408 | ) | | | 2,192,903 | | | | (153 | ) | | | 2,803 | | | | 8,962 | | | | (47,460 | ) |
| | | | | | | | | | | | | | | | | | | | | | | | | | | | | | | | | | | | | | | | | | | | | | | | | |
| | | | 29,836,129 | | | | (54,136,676 | ) | | | 3,050,576 | | | | (3,651,050 | ) | | | 10,103 | | | | (75,908 | ) | | | 4,394,198 | | | | (18,344,976 | ) | | | (35,798 | ) | | | — | | | | (1,403,882 | ) | | | (413,154 | ) |
| | | | | | | | | | | | | | | | | | | | | | | | | | | | | | | | | | | | | | | | | | | | | | | | | |
| | | | | | | | | | | | | | | | | | | | | | | | | | | | | | | | | | | | | | | | | | | | | | | | | |
| | | | 30,914,354 | | | | (41,386,676 | ) | | | 7,000,140 | | | | (985,346 | ) | | | 944,025 | | | | 385,723 | | | | 28,427,523 | | | | 10,285,483 | | | | 226,195 | | | | 36,847 | | | | (335,434 | ) | | | 757,535 | |
| | | | | | | | | | | | | | | | | | | | | | | | | | | | | | | | | | | | | | | | | | | | | | | | | |
| | | | | | | | | | | | | | | | | | | | | | | | | | | | | | | | | | | | | | | | | | | | | | | | | |
| | | | — | | | | — | | | | (292,979 | ) | | | — | | | | (129,058 | ) | | | (100,913 | ) | | | (1,676,679 | ) | | | (1,922,796 | ) | | | | | | | | | | | (1,059,081 | ) | | | (1,254,130 | ) |
| | | | | | | | | | | | | | | | | | | | (411,467 | ) | | | (350,624 | ) | | | (23,730,853 | ) | | | (25,323,122 | ) | | | (262,146 | ) | | | (34,044 | ) | | | | | | | | |
| | | | | | | | | | | | | | | | | | | | | | | | | | | | | | | | | | | | | | | | | | | | | | | | | |
| | | | — | | | | (48,187,197 | ) | | | (3,344,298 | ) | | | (5,916,094 | ) | | | (75,492 | ) | | | (7,599 | ) | | | (254,793 | ) | | | (359,372 | ) | | | | | | | | | | | — | | | | — | |
| | | | | | | | | | | | | | | | | | | | (211,290 | ) | | | (24,826 | ) | | | (3,237,153 | ) | | | (4,183,664 | ) | | | — | | | | (1,937 | ) | | | | | | | | |
| | | | | | | | | | | | | | | | | | | | | | | | | | | | | | | | | | | | | | | | | | | | | | | | | |
| | | | — | | | | — | | | | — | | | | — | | | | — | | | | — | | | | (14,356 | ) | | | — | | | | | | | | | | | | — | | | | — | |
| | | | | | | | | | | | | | | | | | | | — | | | | — | | | | (203,189 | ) | | | — | | | | — | | | | — | | | | | | | | | |
| | | | | | | | | | | | | | | | | | | | | | | | | | | | | | | | | | | | | | | | | | | | | | | | | |
| | | | — | | | | (48,187,197 | ) | | | (3,637,277 | ) | | | (5,916,094 | ) | | | (827,307 | ) | | | (483,962 | ) | | | (29,117,023 | ) | | | (31,788,954 | ) | | | (262,146 | ) | | | (35,981 | ) | | | (1,059,081 | ) | | | (1,254,130 | ) |
| | | | | | | | | | | | | | | | | | | | | | | | | | | | | | | | | | | | | | | | | | | | | | | | | |
| | | | (56,584,907 | ) | | | (57,423,156 | ) | | | 3,338,417 | | | | (7,188,984 | ) | | | 1,699,413 | | | | 881,537 | | | | (6,057,739 | ) | | | (11,077,521 | ) | | | | | | | | | | | 233,593 | | | | (5,371,199 | ) |
| | | | | | | | | | | | | | | | | | | | 8,642,485 | | | | 3,379,933 | | | | (51,164,900 | ) | | | (116,650,272 | ) | | | (8,623,636 | ) | | | (1,765,423 | ) | | | | | | | | |
| | | | | | | | | | | | | | | | | | | | | | | | | | | | | | | | | | | | | | | | | | | | | | | | | |
| | | | | | | | | | | | | | | | | | | | | | | | | | | | | | | | | | | | | | | | | | | | | | | | | |
| | | | (56,584,907 | ) | | | (57,423,156 | ) | | | 3,338,417 | | | | (7,188,984 | ) | | | 10,341,898 | | | | 4,261,470 | | | | (57,222,639 | ) | | | (127,727,793 | ) | | | (8,623,636 | ) | | | (1,765,423 | ) | | | 233,593 | | | | (5,371,199 | ) |
| | | | | | | | | | | | | | | | | | | | | | | | | | | | | | | | | | | | | | | | | | | | | | | | | |
| | | | (25,670,553 | ) | | | (146,997,029 | ) | | | 6,701,280 | | | | (14,090,424 | ) | | | 10,458,616 | | | | 4,163,231 | | | | (57,912,139 | ) | | | (149,231,264 | ) | | | (8,659,587 | ) | | | (1,764,557 | ) | | | (1,160,922 | ) | | | (5,867,794 | ) |
| | | | 298,169,727 | | | | 445,166,756 | | | | 111,487,610 | | | | 125,578,034 | | | | 19,917,205 | | | | 15,753,974 | | | | 1,256,001,560 | | | | 1,405,232,824 | | | | 106,688,682 | | | | 108,453,239 | | | | 64,133,739 | | | | 70,001,533 | |
| | | | | | | | | | | | | | | | | | | | | | | | | | | | | | | | | | | | | | | | | | | | | | | | | |
| | | | 272,499,174 | | | | 298,169,727 | | | | 118,188,890 | | | | 111,487,610 | | | | 30,375,821 | | | | 19,917,205 | | | | 1,198,089,421 | | | | 1,256,001,560 | | | | 98,029,095 | | | | 106,688,682 | | | | 62,972,817 | | | | 64,133,739 | |
| | | | | | | | | | | | | | | | | | | | | | | | | | | | | | | | | | | | | | | | | | | | | | | | | |
| | | | — | | | | (63,796 | ) | | | — | | | | 141,277 | | | | 1,644 | | | | 1,265 | | | | — | | | | 6,108 | | | | — | | | | — | | | | 2,348 | | | | 1,943 | |
The accompanying notes form an integral part of these financial statements.
49 | Q1 2017 ANNUAL REPORT
STATEMENT OF CASH FLOWS
| Partners III Opportunity | |
| | | | | | |
| (In U.S. dollars) | Year ended March 31, 2017 | | | | |
| | | | | | |
| Increase (decrease) in cash: | | | | |
| | | | | |
| Cash flows from operating activities: | | | | |
| Net increase in net assets from operations | | | 62,080,839 | |
| Adjustments to reconcile net increase in net assets from operations to net cash provided by operating activities: | | | | |
| Purchases of investment securities | | | (92,758,334 | ) |
| Proceeds from sale of investment securities | | | 210,492,681 | |
| Proceeds from securities sold short | | | 25,146,353 | |
| Short positions covered | | | (51,649,184 | ) |
| Purchase of short-term investment securities, net | | | (1,739,855 | ) |
| Net unrealized appreciation on investments, options and short sales | | | (46,718,737 | ) |
| Net realized gain on investments, options and short sales | | | (21,892,172 | ) |
| Increase in accrued interest and dividends receivable | | | (23,434 | ) |
| Increase in due from broker | | | (447,476 | ) |
| Decrease in receivable for securities sold | | | 1,875,200 | |
| Increase in receivable for fund shares sold | | | (263,639 | ) |
| Decrease in dividends payable on securities sold short | | | (233,487 | ) |
| Decrease in due to adviser | | | (23,332 | ) |
| Increase in payable for fund shares redeemed | | | 993,846 | |
| Decrease in other liabilities | | | (4,158 | ) |
| Net cash provided by operating activities | | | 84,835,111 | |
| | | | | |
| Cash flows from financing activities: | | | | |
| Proceeds from sales of fund shares | | | 34,238,191 | |
| Payments for redemptions of fund shares | | | (118,600,775 | ) |
| Cash distributions to shareholders | | | (472,527 | ) |
| Net cash used in financing activities | | | (84,835,111 | ) |
| | | | | |
| Net increase (decrease) in cash | | | — | |
| Cash: | | | | |
| Balance, beginning of period | | | — | |
| | | | | |
| Balance, end of period | | | — | |
| Supplemental disclosure of cash flow information: | | | | |
| Cash payments for interest | | | 554,863 | |
| | | | | |
| Noncash financing activities: | | | | |
| Reinvestment of shareholder distributions | | | 9,012,841 | |
The accompanying notes form an integral part of these financial statements.
50 | Q1 2017 ANNUAL REPORT
This page intentionally left blank
51 | Q1 2017 ANNUAL REPORT
FINANCIAL HIGHLIGHTS
The following financial information provides selected data, in U.S. dollars, for a share outstanding throughout the periods indicated.
| | | | | | Income (loss) from Investment Operations | | | Distributions | |
| | | | | | | | | Net gain (loss) | | | | | | Dividends | | | | | | | |
| | | | | | | | | on securities | | | Total from | | | from net | | | Distributions | | | | |
| Years ended March 31, | | Net asset value, | | | Net investment | | | (realized | | | investment | | | investment | | | from | | | Total | |
| unless otherwise noted | | beginning of period | | | income (loss) | | | and unrealized) | | | operations | | | income | | realized gains | | | distributions | |
| Value - Investor Class | | | | | | | | | | | | | | | | | | | | | |
| 2017 | | | 38.43 | | | | (0.16 | )(a) | | | 3.93 | | | | 3.77 | | | — | | | — | | | — | |
| 2016 | | | 46.93 | | | | (0.25 | )(a) | | | (3.27 | ) | | | (3.52 | ) | | — | | | | (4.98 | ) | | | (4.98 | ) |
| 2015 | | | 46.20 | | | | (0.24 | )(a) | | | 4.76 | | | | 4.52 | | | — | | | | (3.79 | ) | | | (3.79 | ) |
| 2014 | | | 38.61 | | | | (0.17 | ) | | | 7.76 | | | | 7.59 | | | — | | | | — | | | | — | |
| 2013 | | | 32.98 | | | | (0.02 | ) | | | 5.68 | | | | 5.66 | | | | (0.03 | ) | | | — | | | | (0.03 | ) |
| | | | | | | | | | | | | | | | | | | | | | | | | | | | | |
| Value - Institutional Class | | | | | | | | | | | | | | | | | | | | | | | | | | |
| 2017 | | | 38.56 | | | | (0.08 | )(a) | | | 3.96 | | | | 3.88 | | | | — | | | | — | | | | — | |
| 2016 | | | 46.99 | | | | (0.17 | )(a) | | | (3.28 | ) | | | (3.45 | ) | | | — | | | | (4.98 | ) | | | (4.98 | ) |
Eight months ended 3/31/2015(b) | | | 44.80 | | | | (0.26 | )(a) | | | 4.50 | | | | 4.24 | | | | — | | | | (2.05 | ) | | | (2.05 | ) |
| | | | | | | | | | | | | | | | | | | | | | | | | | | | | |
| Partners Value - Investor Class | | | | | | | | | | | | | | | | | | | | | | | | | | |
| 2017 | | | 27.66 | | | | (0.09 | )(a) | | | 3.15 | | | | 3.06 | | | | — | | | | — | | | | — | |
| 2016 | | | 35.05 | | | | (0.14 | )(a) | | | (3.47 | ) | | | (3.61 | ) | | | — | | | | (3.78 | ) | | | (3.78 | ) |
| 2015 | | | 33.20 | | | | (0.14 | )(a) | | | 3.09 | | | | 2.95 | | | | — | | | | (1.10 | ) | | | (1.10 | ) |
| 2014 | | | 27.75 | | | | (0.14 | ) | | | 5.59 | | | | 5.45 | | | | — | | | | — | | | | — | |
| 2013 | | | 23.25 | | | | (0.06 | ) | | | 4.56 | | | | 4.50 | | | | — | | | | — | | | | — | |
| | | | | | | | | | | | | | | | | | | | | | | | | | | | | |
| Partners Value - Institutional Class | | | | | | | | | | | | | | | | | | | | | | | | | | |
| 2017 | | | 27.75 | | | | (0.02 | )(a) | | | 3.18 | | | | 3.16 | | | | — | | | | — | | | | — | |
| 2016 | | | 35.09 | | | | (0.08 | )(a) | | | (3.48 | ) | | | (3.56 | ) | | | — | | | | (3.78 | ) | | | (3.78 | ) |
Eight months ended 3/31/2015(b) | | | 33.22 | | | | (0.11 | )(a) | | | 2.91 | | | | 2.80 | | | | — | | | | (0.93 | ) | | | (0.93 | ) |
| | | | | | | | | | | | | | | | | | | | | | | | | | | | | |
| Partners III Opportunity - Investor Class | | | | | | | | | | | | | | | | | | | | | | | | | |
| 2017 | | | 13.73 | | | | (0.20 | )(a) | | | 1.40 | | | | 1.20 | | | | — | | | | (0.19 | ) | | | (0.19 | ) |
| 2016 | | | 17.12 | | | | (0.25 | )(a) | | | (1.30 | ) | | | (1.55 | ) | | | — | | | | (1.84 | ) | | | (1.84 | ) |
| 2015 | | | 16.43 | | | | (0.22 | )(a) | | | 1.41 | | | | 1.19 | | | | — | | | | (0.50 | ) | | | (0.50 | ) |
| 2014 | | | 14.26 | | | | (0.17 | )(a) | | | 2.71 | | | | 2.54 | | | | — | | | | (0.37 | ) | | | (0.37 | ) |
| 2013 | | | 12.90 | | | | (0.12 | )(a) | | | 2.40 | | | | 2.28 | | | | — | | | | (0.92 | ) | | | (0.92 | ) |
| | | | | | | | | | | | | | | | | | | | | | | | | | | | | |
| Partners III Opportunity - Institutional Class | | | | | | | | | | | | | | | | | | | | | | | | | |
| 2017 | | | 13.96 | | | | (0.13 | )(a) | | | 1.43 | | | | 1.30 | | | | — | | | | (0.19 | ) | | | (0.19 | ) |
| 2016 | | | 17.31 | | | | (0.19 | )(a) | | | (1.32 | ) | | | (1.51 | ) | | | — | | | | (1.84 | ) | | | (1.84 | ) |
| 2015 | | | 16.55 | | | | (0.17 | )(a) | | | 1.43 | | | | 1.26 | | | | — | | | | (0.50 | ) | | | (0.50 | ) |
| 2014 | | | 14.33 | | | | (0.12 | )(a) | | | 2.71 | | | | 2.59 | | | | — | | | | (0.37 | ) | | | (0.37 | ) |
| 2013 | | | 12.93 | | | | (0.08 | )(a) | | | 2.40 | | | | 2.32 | | | | — | | | | (0.92 | ) | | | (0.92 | ) |
| | | | | | | | | | | | | | | | | | | | | | | | | | | | | |
| Research | | | | | | | | | | | | | | | | | | | | | | | | | | | | |
| 2017 | | | 9.79 | | | | (0.04 | ) | | | 1.08 | | | | 1.04 | | | | — | | | | — | | | | — | |
| 2016 | | | 12.21 | | | | (0.04 | ) | | | (0.95 | ) | | | (0.99 | ) | | | — | | | | (1.43 | ) | | | (1.43 | ) |
| 2015 | | | 12.76 | | | | (0.02 | ) | | | 1.46 | | | | 1.44 | | | | — | | | | (1.99 | ) | | | (1.99 | ) |
| 2014 | | | 10.83 | | | | (0.03 | ) | | | 2.35 | | | | 2.32 | | | | — | # | | | (0.39 | ) | | | (0.39 | ) |
| 2013 | | | 11.07 | | | | 0.01 | | | | 0.65 | | | | 0.66 | | | | (0.01 | ) | | | (0.89 | ) | | | (0.90 | ) |
| * | Annualized |
| † | Not Annualized |
| # | Amount less than $0.01 |
(a) | Based on average daily shares outstanding |
(b) | Initial offering of shares on July 31, 2014 |
(c) | Included in the expense ratio is 0.08%, 0.27%, 0.24%, 0.11% and 0.14% related to interest expense and 0.54, 0.50%, 0.29%, 0.16% and 0.28% related to dividend expense on securities sold short for the periods ended March 31, 2017, 2016, 2015, 2014 and 2013, respectively. |
(d) | Included in the expense ratio is 0.08%, 0.27%, 0.24%, 0.12% and 0.14% related to interest expense and 0.55, 0.51%, 0.29%, 0.15% and 0.27% related to dividend expense on securities sold short for the periods ended March 31, 2017, 2016, 2015, 2014 and 2013, respectively |
The accompanying notes form an integral part of these financial statements.
52 | Q1 2017 ANNUAL REPORT
| | | | | | | | | | | | Ratios/Supplemental Data | | | | | | | |
| | | | | | | | | | | | Ratio of expenses | | | | | | | |
| | | | | | | | | | | | to average net assets | | | | | | | |
| | | | | | | | | | | | | | | | | | Ratio of net | | | | |
| | | | | | | | | | | | | | | | | | investment income | | | Portfolio | |
| | | Net asset value, | | | | | | Net assets, end of | | | Prior to fee | | | Net of fee | | | (loss) to average | | | turnover | |
| | | end of period | | | Total Return (%) | | | period ($000) | | | waivers (%) | | | waivers (%) | | | net assets (%) | | | rate (%) | |
| | | | | | | | | | | | | | | | | | | | | | |
| | | | 42.20 | | | | 9.81 | | | | 638,993 | | | | 1.24 | | | | 1.22 | | | | (0.42 | ) | | | 24 | |
| | | | 38.43 | | | | (8.05 | ) | | | 738,086 | | | | 1.23 | | | | 1.18 | | | | (0.59 | ) | | | 47 | |
| | | | 46.93 | | | | 10.19 | | | | 940,646 | | | | 1.20 | | | | 1.18 | | | | (0.54 | ) | | | 36 | |
| | | | 46.20 | | | | 19.66 | | | | 1,167,282 | | | | 1.18 | | | | 1.18 | | | | (0.41 | ) | | | 19 | |
| | | | 38.61 | | | | 17.20 | | | | 1,013,552 | | | | 1.20 | | | | 1.20 | | | | (0.07 | ) | | | 20 | |
| | | | | | | | | | | | | | | | | | | | | | | | | | | | | |
| | | | | | | | | | | | | | | | | | | | | | | | | | | | | |
| | | | 42.44 | | | | 10.06 | | | | 191,299 | | | | 1.10 | | | | 0.99 | | | | (0.19 | ) | | | 24 | |
| | | | 38.56 | | | | (7.88 | ) | | | 192,310 | | | | 1.08 | | | | 0.99 | | | | (0.39 | ) | | | 47 | |
| | | | 46.99 | | | | 9.57 | † | | | 200,254 | | | | 1.08 | * | | | 0.99 | * | | | (0.87 | )* | | | 36 | |
| | | | | | | | | | | | | | | | | | | | | | | | | | | | | |
| | | | | | | | | | | | | | | | | | | | | | | | | | | | | |
| | | | 30.72 | | | | 11.06 | | | | 429,226 | | | | 1.27 | | | | 1.24 | | | | (0.33 | ) | | | 16 | |
| | | | 27.66 | | | | (10.61 | ) | | | 531,353 | | | | 1.26 | | | | 1.18 | | | | (0.45 | ) | | | 31 | |
| | | | 35.05 | | | | 8.99 | | | | 789,853 | | | | 1.22 | | | | 1.18 | | | | (0.42 | ) | | | 26 | |
| | | | 33.20 | | | | 19.64 | | | | 1,074,499 | | | | 1.18 | | | | 1.18 | | | | (0.46 | ) | | | 19 | |
| | | | 27.75 | | | | 19.35 | | | | 844,213 | | | | 1.19 | | | | 1.19 | | | | (0.25 | ) | | | 24 | |
| | | | | | | | | | | | | | | | | | | | | | | | | | | | | |
| | | | | | | | | | | | | | | | | | | | | | | | | | | | | |
| | | | 30.91 | | | | 11.39 | | | | 309,497 | | | | 1.07 | | | | 0.99 | | | | (0.08 | ) | | | 16 | |
| | | | 27.75 | | | | (10.45 | ) | | | 297,290 | | | | 1.07 | | | | 0.99 | | | | (0.25 | ) | | | 31 | |
| | | | 35.09 | | | | 8.51 | † | | | 317,973 | | | | 1.05 | * | | | 0.99 | * | | | (0.49 | )* | | | 26 | |
| | | | | | | | | | | | | | | | | | | | | | | | | | | | | |
| | | | | | | | | | | | | | | | | | | | | | | | | | | | | |
| | | | 14.74 | | | | 8.94 | | | | 28,561 | | | | 2.29 | (c) | | | 2.29 | (c) | | | (1.43 | ) | | | 23 | |
| | | | 13.73 | | | | (9.56 | ) | | | 35,461 | | | | 2.33 | (c) | | | 2.33 | (c) | | | (1.63 | ) | | | 46 | |
| | | | 17.12 | | | | 7.38 | | | | 68,490 | | | | 2.06 | (c) | | | 2.01 | (c) | | | (1.33 | ) | | | 45 | |
| | | | 16.43 | | | | 17.94 | | | | 78,586 | | | | 1.84 | (c) | | | 1.68 | (c) | | | (1.10 | ) | | | 20 | |
| | | | 14.26 | | | | 18.81 | | | | 19,702 | | | | 2.25 | (c) | | | 1.85 | (c) | | | (0.93 | ) | | | 32 | |
| | | | | | | | | | | | | | | | | | | | | | | | | | | | | |
| | | | | | | | | | | | | | | | | | | | | | | | | | | | | |
| | | | 15.07 | | | | 9.52 | | | | 661,165 | | | | 1.80 | (d) | | | 1.80 | (d) | | | (0.93 | ) | | | 23 | |
| | | | 13.96 | | | | (9.20 | ) | | | 677,019 | | | | 1.95 | (d) | | | 1.95 | (d) | | | (1.26 | ) | | | 46 | |
| | | | 17.31 | | | | 7.76 | | | | 1,014,821 | | | | 1.69 | (d) | | | 1.69 | (d) | | | (1.00 | ) | | | 45 | |
| | | | 16.55 | | | | 18.20 | | | | 1,163,661 | | | | 1.43 | (d) | | | 1.43 | (d) | | | (0.78 | ) | | | 20 | |
| | | | 14.33 | | | | 19.08 | | | | 664,770 | | | | 1.59 | (d) | | | 1.59 | (d) | | | (0.61 | ) | | | 32 | |
| | | | | | | | | | | | | | | | | | | | | | | | | | | | | |
| | | | | | | | | | | | | | | | | | | | | | | | | | | | | |
| | | | 10.83 | | | | 10.62 | | | | 31,029 | | | | 1.56 | | | | 0.90 | | | | (0.39 | ) | | | 95 | |
| | | | 9.79 | | | | (8.77 | ) | | | 23,293 | | | | 1.62 | | | | 0.90 | | | | (0.39 | ) | | | 73 | |
| | | | 12.21 | | | | 12.22 | | | | 25,607 | | | | 1.59 | | | | 0.90 | | | | (0.21 | ) | | | 76 | |
| | | | 12.76 | | | | 21.40 | | | | 24,258 | | | | 1.58 | | | | 0.90 | | | | (0.28 | ) | | | 58 | |
| | | | 10.83 | | | | 7.02 | | | | 19,119 | | | | 1.70 | | | | 0.90 | | | | 0.10 | | | | 97 | |
The accompanying notes form an integral part of these financial statements.
53 | Q1 2017 ANNUAL REPORT
FINANCIAL HIGHLIGHTS (CONTINUED)
The following financial information provides selected data, in U.S. dollars, for a share outstanding throughout the periods indicated.
| | | | | | Income (loss) from Investment Operations | | | Distributions | |
| | | | | | | | | Net gain (loss) | | | | | | Dividends | | | | | | | |
| | | | | | | | | on securities | | | Total from | | | from net | | | Distributions | | | | |
| Years ended March 31, | | Net asset value, | | | Net investment | | | (realized and | | | investment | | | investment | | | from | | | Total | |
| unless otherwise noted | | beginning of period | | | income (loss) | | | unrealized) | | | operations | | | income | | | realized gains | | | distributions | |
| Hickory | | | | | | | | | | | | | | | | | | | | | |
| 2017 | | | 47.59 | | | | (0.25 | ) | | | 5.77 | | | | 5.52 | | | — | | | — | | | — | |
| 2016 | | | 59.51 | | | | (0.30 | ) | | | (4.79 | ) | | | (5.09 | ) | | — | | | | (6.83 | ) | | | (6.83 | ) |
| 2015 | | | 57.87 | | | | (0.35 | ) | | | 5.00 | | | | 4.65 | | | | — | | | | (3.01 | ) | | | (3.01 | ) |
| 2014 | | | 50.22 | | | | (0.34 | ) | | | 7.99 | | | | 7.65 | | | | — | | | | — | | | | — | |
| 2013 | | | 42.53 | | | | (0.25 | ) | | | 7.94 | | | | 7.69 | | | | — | | | | — | | | | — | |
| | | | | | | | | | | | | | | | | | | | | | | | | | | | | |
| Balanced | | | | | | | | | | | | | | | | | | | | | | | | | | | | |
| 2017 | | | 13.24 | | | | 0.01 | | | | 0.80 | | | | 0.81 | | | | (0.03 | ) | | | (0.39 | ) | | | (0.42 | ) |
| 2016 | | | 14.07 | | | | 0.02 | | | | (0.13 | ) | | | (0.11 | ) | | | — | | | | (0.72 | ) | | | (0.72 | ) |
| 2015 | | | 14.22 | | | | (0.02 | ) | | | 0.54 | | | | 0.52 | | | | — | | | | (0.67 | ) | | | (0.67 | ) |
| 2014 | | | 13.58 | | | | (0.03 | ) | | | 1.34 | | | | 1.31 | | | | — | # | | | (0.67 | ) | | | (0.67 | ) |
| 2013 | | | 12.39 | | | | 0.04 | | | | 1.20 | | | | 1.24 | | | | (0.05 | ) | | | — | | | | (0.05 | ) |
| | | | | | | | | | | | | | | | | | | | | | | | | | | | | |
| Core Plus Income - Investor Class | | | | | | | | | | | | | | | | | | | | | | | | | | |
| 2017 | | | 10.15 | | | | 0.23 | (a) | | | 0.21 | | | | 0.44 | | | | (0.23 | ) | | | (0.13 | ) | | | (0.36 | ) |
| 2016 | | | 10.21 | | | | 0.22 | (a) | | | (0.04 | ) | | | 0.18 | | | | (0.22 | ) | | | (0.02 | ) | | | (0.24 | ) |
Eight months ended 3/31/2015(b) | | | 10.00 | | | | 0.09 | (a) | | | 0.20 | | | | 0.29 | | | | (0.08 | ) | | | — | | | | (0.08 | ) |
| | | | | | | | | | | | | | | | | | | | | | | | | | | | | |
| Core Plus Income - Institutional Class | | | | | | | | | | | | | | | | | | | | | | | | | |
| 2017 | | | 10.15 | | | | 0.25 | (a) | | | 0.21 | | | | 0.46 | | | | (0.25 | ) | | | (0.13 | ) | | | (0.38 | ) |
| 2016 | | | 10.20 | | | | 0.25 | (a) | | | (0.04 | ) | | | 0.21 | | | | (0.24 | ) | | | (0.02 | ) | | | (0.26 | ) |
Eight months ended 3/31/2015(b) | | | 10.00 | | | | 0.10 | (a) | | | 0.20 | | | | 0.30 | | | | (0.10 | ) | | | — | | | | (0.10 | ) |
| | | | | | | | | | | | | | | | | | | | | | | | | | | | | |
| Short Duration Income - Investor Class | | | | | | | | | | | | | | | | | | | | | | | | | |
| 2017 | | | 12.28 | | | | 0.23 | (a) | | | 0.04 | | | | 0.27 | | | | (0.24 | )(e) | | | (0.04 | ) | | | (0.28 | ) |
| 2016 | | | 12.48 | | | | 0.22 | (a) | | | (0.15 | ) | | | 0.07 | | | | (0.23 | ) | | | (0.04 | ) | | | (0.27 | ) |
| 2015 | | | 12.49 | | | | 0.19 | (a) | | | 0.02 | | | | 0.21 | | | | (0.21 | ) | | | (0.01 | ) | | | (0.22 | ) |
| 2014 | | | 12.67 | | | | 0.19 | (a) | | | (0.15 | ) | | | 0.04 | | | | (0.22 | ) | | | — | | | | (0.22 | ) |
| 2013 | | | 12.47 | | | | 0.17 | (a) | | | 0.26 | | | | 0.43 | | | | (0.23 | ) | | | — | # | | | (0.23 | ) |
| | | | | | | | | | | | | | | | | | | | | | | | | | | | | |
| Short Duration Income - Institutional Class | | | | | | | | | | | | | | | | | | | | | | | | | |
| 2017 | | | 12.30 | | | | 0.26 | (a) | | | 0.04 | | | | 0.30 | | | | (0.27 | )(e) | | | (0.04 | ) | | | (0.31 | ) |
| 2016 | | | 12.50 | | | | 0.25 | (a) | | | (0.15 | ) | | | 0.10 | | | | (0.26 | ) | | | (0.04 | ) | | | (0.30 | ) |
| 2015 | | | 12.51 | | | | 0.22 | (a) | | | 0.02 | | | | 0.24 | | | | (0.24 | ) | | | (0.01 | ) | | | (0.25 | ) |
| 2014 | | | 12.68 | | | | 0.22 | (a) | | | (0.15 | ) | | | 0.07 | | | | (0.24 | ) | | | — | | | | (0.24 | ) |
| 2013 | | | 12.48 | | | | 0.19 | (a) | | | 0.26 | | | | 0.45 | | | | (0.25 | ) | | | — | # | | | (0.25 | ) |
| | | | | | | | | | | | | | | | | | | | | | | | | | | | | |
Ultra Short Government(c) | | | | | | | | | | | | | | | | | | | | | | | | | | |
| 2017 | | | 10.00 | | | | 0.03 | | | | — | # | | | 0.03 | | | | (0.03 | ) | | | — | | | | (0.03 | ) |
| 2016 | | | 10.00 | | | | — | # | | | — | # | | | — | # | | | — | # | | | — | # | | | — | # |
| 2015 | | | 10.00 | | | | — | # | | | — | # | | | — | # | | | — | # | | | — | # | | | — | # |
| 2014 | | | 10.00 | | | | — | # | | | — | # | | | — | # | | | — | # | | | — | # | | | — | # |
| 2013 | | | 10.00 | | | | — | # | | | — | # | | | — | # | | | — | # | | | — | # | | | — | # |
| | | | | | | | | | | | | | | | | | | | | | | | | | | | | |
| Nebraska Tax-Free Income | | | | | | | | | | | | | | | | | | | | | | | | | | |
| 2017 | | | 10.12 | | | | 0.17 | | | | (0.22 | ) | | | (0.05 | ) | | | (0.17 | ) | | | — | | | | (0.17 | ) |
| 2016 | | | 10.19 | | | | 0.18 | | | | (0.06 | ) | | | 0.12 | | | | (0.19 | ) | | | — | | | | (0.19 | ) |
| 2015 | | | 10.19 | | | | 0.22 | | | | — | # | | | 0.22 | | | | (0.22 | ) | | | — | | | | (0.22 | ) |
| 2014 | | | 10.44 | | | | 0.23 | | | | (0.20 | ) | | | 0.03 | | | | (0.23 | ) | | | (0.05 | ) | | | (0.28 | ) |
| 2013 | | | 10.44 | | | | 0.21 | | | | 0.01 | | | | 0.22 | | | | (0.21 | ) | | | (0.01 | ) | | | (0.22 | ) |
| * | Annualized |
| † | Not Annualized |
| # | Amount less than $0.01 |
(a) | Based on average daily shares outstanding |
(b) | Initial offering of shares on July 31, 2014 |
(c) | Prior to December 16, 2016, this Fund was known as the Government Money Market Fund. All per share amounts, for all periods, have been adjusted to reflect a 1-for-10 reverse split, which was effective December 16, 2016. In addition, on December 16, 2016, the Fund changed from a constant $1.00 net asset value per share money market fund to an ultra short government fund (that is not a money market fund). |
(d) | Because calculations of portfolio turnover exclude securities whose maturity or expiration date was one year or less when the Fund acquired the securities, the Fund has no portfolio turnover information to report for this period. |
(e) | Includes a return of capital distribution of less than $0.01. |
The accompanying notes form an integral part of these financial statements.
54 | Q1 2017 ANNUAL REPORT
| | | | | | | | | | | | Ratios/Supplemental Data | | | | | | | |
| | | | | | | | | | | | Ratio of expenses | | | | | | | |
| | | | | | | | | | | | to average net assets | | | | | | | |
| | | | | | | | | | | | | | | | | | Ratio of net | | | | |
| | | | | | | | | | | | | | | | | | investment income | | | Portfolio | |
| | | Net asset value, | | | | | | Net assets, end of | | | Prior to fee | | | Net of fee | | | (loss) to average | | | turnover | |
| | | end of period | | | Total Return (%) | | | period ($000) | | | waivers (%) | | | waivers (%) | | | net assets (%) | | | rate (%) | |
| | | | | | | | | | | | | | | | | | | | | | |
| | | | 53.11 | | | | 11.60 | | | | 272,499 | | | | 1.25 | | | | 1.25 | | | | (0.44 | ) | | | 7 | |
| | | | 47.59 | | | | (9.04 | ) | | | 298,170 | | | | 1.24 | | | | 1.24 | | | | (0.50 | ) | | | 27 | |
| | | | 59.51 | | | | 8.31 | | | | 445,167 | | | | 1.23 | | | | 1.23 | | | | (0.54 | ) | | | 26 | |
| | | | 57.87 | | | | 15.23 | | | | 517,640 | | | | 1.22 | | | | 1.22 | | | | (0.62 | ) | | | 30 | |
| | | | 50.22 | | | | 18.08 | | | | 432,086 | | | | 1.26 | | | | 1.26 | | | | (0.62 | ) | | | 32 | |
| | | | | | | | | | | | | | | | | | | | | | | | | | | | | |
| | | | | | | | | | | | | | | | | | | | | | | | | | | | | |
| | | | 13.63 | | | | 6.32 | | | | 118,189 | | | | 1.11 | | | | 1.11 | | | | 0.10 | | | | 26 | |
| | | | 13.24 | | | | (0.80 | ) | | | 111,488 | | | | 1.11 | | | | 1.11 | | | | 0.12 | | | | 35 | |
| | | | 14.07 | | | | 3.73 | | | | 125,578 | | | | 1.09 | | | | 1.09 | | | | (0.12 | ) | | | 37 | |
| | | | 14.22 | | | | 9.86 | | | | 126,904 | | | | 1.10 | | | | 1.10 | | | | (0.20 | ) | | | 36 | |
| | | | 13.58 | | | | 10.02 | | | | 98,105 | | | | 1.12 | | | | 1.12 | | | | 0.30 | | | | 47 | |
| | | | | | | | | | | | | | | | | | | | | | | | | | | | | |
| | | | | | | | | | | | | | | | | | | | | | | | | | | | | |
| | | | 10.23 | | | | 4.41 | | | | 6,522 | | | | 1.90 | | | | 0.77 | | | | 2.26 | | | | 54 | |
| | | | 10.15 | | | | 1.78 | | | | 4,809 | | | | 2.35 | | | | 0.85 | | | | 2.20 | | | | 26 | |
| | | | 10.21 | | | | 2.90 | † | | | 3,950 | | | | 3.17 | * | | | 0.85 | * | | | 1.39 | * | | | 8 | † |
| | | | | | | | | | | | | | | | | | | | | | | | | | | | | |
| | | | | | | | | | | | | | | | | | | | | | | | | | | | | |
| | | | 10.23 | | | | 4.61 | | | | 23,854 | | | | 1.22 | | | | 0.57 | | | | 2.47 | | | | 54 | |
| | | | 10.15 | | | | 2.06 | | | | 15,108 | | | | 1.37 | | | | 0.65 | | | | 2.39 | | | | 26 | |
| | | | 10.20 | | | | 2.96 | † | | | 11,804 | | | | 2.54 | * | | | 0.65 | * | | | 1.56 | * | | | 8 | † |
| | | | | | | | | | | | | | | | | | | | | | | | | | | | | |
| | | | | | | | | | | | | | | | | | | | | | | | | | | | | |
| | | | 12.27 | | | | 2.15 | | | | 94,817 | | | | 0.93 | | | | 0.80 | | | | 1.85 | | | | 38 | |
| | | | 12.28 | | | | 0.58 | | | | 100,948 | | | | 0.91 | | | | 0.85 | | | | 1.77 | | | | 23 | |
| | | | 12.48 | | | | 1.64 | | | | 113,709 | | | | 0.89 | | | | 0.84 | | | | 1.51 | | | | 30 | |
| | | | 12.49 | | | | 0.35 | | | | 111,675 | | | | 0.91 | | | | 0.81 | | | | 1.55 | | | | 36 | |
| | | | 12.67 | | | | 3.46 | | | | 78,418 | | | | 0.97 | | | | 0.82 | | | | 1.36 | | | | 37 | |
| | | | | | | | | | | | | | | | | | | | | | | | | | | | | |
| | | | | | | | | | | | | | | | | | | | | | | | | | | | | |
| | | | 12.29 | | | | 2.38 | | | | 1,103,272 | | | | 0.62 | | | | 0.58 | | | | 2.07 | | | | 38 | |
| | | | 12.30 | | | | 0.83 | | | | 1,155,054 | | | | 0.62 | | | | 0.62 | | | | 2.00 | | | | 23 | |
| | | | 12.50 | | | | 1.88 | | | | 1,291,524 | | | | 0.61 | | | | 0.61 | | | | 1.73 | | | | 30 | |
| | | | 12.51 | | | | 0.56 | | | | 1,427,037 | | | | 0.61 | | | | 0.61 | | | | 1.73 | | | | 36 | |
| | | | 12.68 | | | | 3.69 | | | | 1,424,860 | | | | 0.62 | | | | 0.62 | | | | 1.55 | | | | 37 | |
| | | | | | | | | | | | | | | | | | | | | | | | | | | | | |
| | | | | | | | | | | | | | | | | | | | | | | | | | | | | |
| | | | 10.00 | | | | 0.25 | | | | 98,029 | | | | 0.66 | | | | 0.14 | | | | 0.25 | | | | — | |
| | | | 10.00 | | | | 0.03 | | | | 106,689 | | | | 0.70 | | | | 0.05 | | | | 0.03 | | | | (d) |
| | | | 10.00 | | | | 0.01 | | | | 108,453 | | | | 0.67 | | | | 0.01 | | | | 0.01 | | | | (d) |
| | | | 10.00 | | | | 0.01 | | | | 124,158 | | | | 0.67 | | | | 0.03 | | | | 0.01 | | | | (d) |
| | | | 10.00 | | | | 0.03 | | | | 107,918 | | | | 0.70 | | | | 0.04 | | | | 0.03 | | | | (d) |
| | | | | | | | | | | | | | | | | | | | | | | | | | | | | |
| | | | | | | | | | | | | | | | | | | | | | | | | | | | | |
| | | | 9.90 | | | | (0.54 | ) | | | 62,973 | | | | 0.79 | | | | 0.79 | | | | 1.66 | | | | 29 | |
| | | | 10.12 | | | | 1.20 | | | | 64,134 | | | | 0.78 | | | | 0.78 | | | | 1.82 | | | | 13 | |
| | | | 10.19 | | | | 2.14 | | | | 70,002 | | | | 0.75 | | | | 0.75 | | | | 2.14 | | | | 12 | |
| | | | 10.19 | | | | 0.33 | | | | 70,268 | | | | 0.73 | | | | 0.73 | | | | 2.11 | | | | 2 | |
| | | | 10.44 | | | | 2.02 | | | | 103,764 | | | | 0.70 | | | | 0.70 | | | | 1.97 | | | | 14 | |
The accompanying notes form an integral part of these financial statements.
55 | Q1 2017 ANNUAL REPORT
NOTES TO FINANCIAL STATEMENTS
March 31, 2017
(1) Organization
The Weitz Funds (the "Trust") is registered under the Investment Company Act of 1940 as an open-end management investment company issuing shares in series, each series representing a distinct portfolio with its own investment objectives and policies. At March 31, 2017, the Trust had ten series in operation: Value Fund, Partners Value Fund, Partners III Opportunity Fund, Research Fund, Hickory Fund, Balanced Fund, Core Plus Income Fund, Short Duration Income Fund (formerly known as the Short-Intermediate Income Fund), Ultra Short Government Fund and Nebraska Tax-Free Income Fund (individually, a "Fund", collectively, the "Funds").
Currently, the Value, Partners Value, Partners III Opportunity, Core Plus Income and Short Duration Income Funds each offer two classes of shares: Institutional Class and Investor Class shares. Each class of shares has identical rights and privileges, except with respect to certain class specific expenses such as administration and shareholder servicing fees, voting rights on matters affecting a single class of shares and exchange privileges. Income, realized and unrealized gains and losses, and expenses of the Funds not directly attributable to a specific class of shares are allocated to the two classes on the basis of daily net assets of each class. Fees and expenses relating to a specific class are charged directly to that share class. All other Funds offer one class of shares.
The investment objective of the Value, Partners Value, Partners III Opportunity, Research and Hickory Funds (the "Weitz Equity Funds") is capital appreciation.
The investment objectives of the Balanced Fund are long-term capital appreciation and capital preservation.
The investment objectives of the Core Plus Income Fund are current income and capital preservation.
The investment objective of the Short Duration Income Fund is current income consistent with the preservation of capital.
Effective December 16, 2016, the Government Money Market Fund's name was changed to the Ultra Short Government Fund and the Fund ceased operating as a "money market fund" pursuant to Rule 2a-7 of the Investment Company Act of 1940. While the Ultra Short Government Fund's investment strategy changed, its investment objective remained the same, which is current income consistent with the preservation of capital and maintenance of liquidity.
The investment objective of the Nebraska Tax-Free Income Fund is to provide a high level of current income that is exempt from both federal and Nebraska personal income taxes.
Investment strategies and risk factors of each Fund are discussed in the Funds' Prospectus.
(2) Significant Accounting Policies
The following accounting policies are in accordance with accounting principles generally accepted in the United States.
(a) Valuation of Investments
Investments are carried at value determined using the following valuation methods:
| ● | Securities traded on a national or regional securities exchange are valued at the last sales price; if there were no sales on that day, securities are valued at the mean between the latest available and representative bid and ask prices; securities listed on the NASDAQ exchange are valued using the NASDAQ Official Closing Price ("NOCP"). Generally, the NOCP will be the last sales price unless the reported trade for the security is outside the range of the bid/ask price. In such cases, the NOCP will be normalized to the nearer of the bid or ask price. |
| | |
| ● | Short sales traded on a national or regional securities exchange are valued at the last sales price; if there were no sales on that day, short sales are valued at the mean between the latest available and representative bid and ask prices. |
| | |
| ● | Securities not listed on an exchange are valued at the mean between the latest available and representative bid and ask prices, if available. |
| | |
| ● | The value of certain debt securities for which market quotations are not readily available may be based upon current market prices of securities that are comparable in coupon, rating and maturity or an appropriate matrix utilizing similar factors. |
| | |
| ● | The value of a traded option is the last sales price at which such option is traded or, in the absence of a sale on or about the close of the exchange, the mean of the closing bid and ask prices. |
| | |
| ● | Money market funds are valued at the quoted net asset value. |
| | |
| ● | The value of securities for which market quotations are not readily available or are deemed unreliable, including restricted and not readily marketable securities, is determined in good faith in accordance with procedures approved by the Trust's Board of Trustees. Such valuation procedures and methods for valuing securities may include, but are not limited to: multiple of earnings, multiple of book value, discount from value of a similar freely-traded security, purchase price, private transaction in the security or related securities, the nature and duration of restrictions on disposition of the security and a combination of these and other factors. |
| | |
| ● | Investment securities held by the Government Money Market Fund were carried at amortized cost, which approximates market value. Pursuant to Rule 2a-7 of the Investment Company Act of 1940, amortized cost, as defined, is a method of valuing securities at acquisition cost, adjusted for amortization of premium or accretion of discount. |
The Trust has established a Pricing Committee, composed of officers and employees of Weitz Investment Management, Inc., to supervise the daily valuation process. The Board of Trustees has also established a Valuation Committee, composed of the independent Trustees, to oversee the Pricing Committee and the valuation process. The Pricing Committee provides oversight of the approved procedures, evaluates the effectiveness of the pricing policies and reports to the Valuation Committee of the Board of Trustees. When determining the reliability of third party pricing information, the Pricing Committee, among other things, monitors the daily change in prices and reviews transactions among market participants.
(b) Option Transactions
The Funds, except for the Ultra Short Government Fund, may purchase put or call options. When a Fund purchases an option, an amount equal to the premium paid is recorded as an asset and is subsequently marked-to-market daily. Premiums paid for purchasing options that expire unexercised are recognized on the expiration date as realized losses. If an option is exercised, the premium paid is subtracted from the proceeds of the sale or added to the cost of the purchase to determine whether a Fund has realized a gain or loss on the related investment transaction. When a Fund enters into a closing transaction, a Fund realizes a gain or loss depending upon whether the amount from the closing transaction is greater or less than the premium paid.
The Funds, except for the Ultra Short Government Fund, may write put or call options. When a Fund writes an option, an amount equal to the premium received is recorded as a liability and is subsequently marked-to-market daily. Premiums received for writing options that expire unexercised are recognized on the expiration date as realized gains. If an option is exercised, the premium received is subtracted from the cost of the purchase or added to the proceeds of the sale to determine whether a Fund has realized a gain or loss on the related investment transaction. When a Fund enters into a closing transaction, a Fund realizes a gain or loss depending upon whether the amount from the closing transaction is greater or less than the premium received.
56 | Q1 2017 ANNUAL REPORT
The Funds attempt to limit market risk and enhance their income by writing (selling) covered call options. The risk in writing a covered call option is that a Fund gives up the opportunity of profit if the market price of the financial instrument increases. A Fund also has the additional risk of not being able to enter into a closing transaction if a liquid secondary market does not exist. The risk in writing a put option is that a Fund is obligated to purchase the financial instrument underlying the option at prices which may be significantly different than the current market price.
(c) Securities Sold Short
The Funds, except for the Ultra Short Government Fund, may engage in selling securities short, which obligates a Fund to replace a security borrowed by purchasing the same security at the current market value. A Fund incurs a loss if the price of the security increases between the date of the short sale and the date on which the Fund replaces the borrowed security. A Fund realizes a gain if the price of the security declines between those dates.
(d) Federal Income Taxes
It is the policy of each Fund to comply with all sections of the Internal Revenue Code applicable to regulated investment companies and to distribute all of its taxable income to shareholders; therefore, no provision for income or excise taxes is required.
Net investment income and net realized gains may differ for financial statement and tax purposes. The character of distributions made during the year from net investment income or net realized gains may differ from their ultimate characterization for Federal income tax purposes. Also, due to the timing of dividend distributions, the fiscal year in which amounts are distributed may differ from the year that the income or realized gains were recorded by the Funds.
The Funds have reviewed their tax positions taken on federal income tax returns, for each of the three open tax years and as of March 31, 2017, and have determined that no provisions for income taxes are required in the Funds' financial statements.
The following permanent diffeerences between net asset components for financial reporting and tax purposes were reclassified at the end of the fiscal year (in U.S. dollars):
| | | | | | | Partners | | Partners III | | | | | | | | | | | | Core Plus | | Short Duration | |
| | | | Value | | | Value | | Opportunity | | | Research | | | Hickory | | | Balanced | | | Income | | | Income | |
| Paid-in capital | | | (2,858,546 | ) | | (1,413,054 | ) | | (5,139,290 | ) | | — | | | — | | | — | | | — | | | — | |
| Accumulated undistributed net investment income | | | 2,858,546 | | | 1,413,054 | | | 5,139,290 | | | 110,516 | | | 1,329,768 | | | 39,774 | | | 1,833 | | | 371,691 | |
| Accumulated net realized gain (loss) | | | — | | | — | | | — | | | (110,516 | ) | | (1,329,768 | ) | | (39,774 | ) | | (1,833 | ) | | (371,691 | ) |
The differences are primarily due to net operating losses, principal paydown adjustments and distribution re-designations. These reclassifications have no impact on the net asset value of the Funds.
(e) Securities Transactions
Securities transactions are accounted for on the date the securities are purchased or sold (trade date). Realized gains or losses are determined by specifically identifying the security sold.
Income dividends less foreign tax withholding (if any), dividends on short positions and distributions to shareholders are recorded on the ex-dividend date. Interest, including amortization of discount or premium, is accrued as earned.
(f) Dividend Policy
The Funds declare and distribute income dividends and capital gains distributions as may be required to qualify as a regulated investment company under the Internal Revenue Code.
Generally, the Core Plus Income, Short Duration Income and Nebraska Tax-Free Income Funds pay income dividends on a quarterly basis. The Ultra Short Government Fund declares dividends daily and pays dividends monthly. All dividends and distributions are reinvested automatically, unless the shareholder elects otherwise.
(g) Other
Expenses that are directly related to a Fund are charged directly to that Fund. Other operating expenses of the Trust are prorated to each Fund on the basis of relative net assets or another appropriate basis. Income, realized and unrealized gains and losses and expenses (other than class specific expenses) are allocated to each class of shares based on its relative net assets, except that each class separately bears expenses related specifically to that class, such as transfer agent fees and registration fees.
(h) Use of Estimates
The preparation of financial statements in conformity with accounting principles generally accepted in the United States requires management to make estimates and assumptions that affect the reported amounts of assets and liabilities and disclosure of contingent assets and liabilities at the date of the financial statements and the reported amounts of increase and decrease in net assets from operations during the period. Actual results could differ from those estimates.
(3) Fund Share Transactions
| | | Year ended March 31, 2017 | | Year ended March 31, 2016 | |
| | | | Shares | | | $ Amount | | | Shares | | | $ Amount | |
| Value - Investor Class | | | | | | | | | | | | | |
| Sales | | | 291,928 | | | 11,556,078 | | | 638,000 | | | 26,869,406 | |
| Redemptions | | | (4,355,399 | ) | | (172,457,273 | ) | | (3,695,435 | ) | | (155,173,028 | ) |
| Reinvestment of distributions | | | — | | | — | | | 2,217,973 | | | 92,538,602 | |
| Net increase (decrease) | | | (4,063,471 | ) | | (160,901,195 | ) | | (839,462 | ) | | (35,765,020 | ) |
57 | Q1 2017 ANNUAL REPORT
| | | Year ended March 31, 2017 | | Year ended March 31, 2016 | |
| | | | Shares | | | $ Amount | | | Shares | | | $ Amount | |
| Value - Institutional Class | | | | | | | | | | | | | |
| Sales | | | 511,911 | | | 20,334,221 | | | 508,269 | | | 21,918,589 | |
| Redemptions | | | (991,618 | ) | | (39,311,819 | ) | | (294,560 | ) | | (12,195,895 | ) |
| Reinvestment of distributions | | | — | | | — | | | 511,237 | | | 21,344,436 | |
| Net increase (decrease) | | | (479,707 | ) | | (18,977,598 | ) | | 724,946 | | | 31,067,130 | |
| | | | | | | | | | | | | | |
| | | | | | | | | | | | | | |
| Partners Value - Investor Class | | | | | | | | | | | | | |
| Sales | | | 517,644 | | | 14,678,569 | | | 1,216,876 | | | 37,229,570 | |
| Redemptions | | | (5,759,984 | ) | | (165,366,178 | ) | | (7,018,414 | ) | | (211,651,681 | ) |
| Reinvestment of distributions | | | — | | | — | | | 2,478,836 | | | 73,151,943 | |
| Net increase (decrease) | | | (5,242,340 | ) | | (150,687,609 | ) | | (3,322,702 | ) | | (101,270,168 | ) |
| | | | | | | | | | | | | | |
| | | | | | | | | | | | | | |
| Partners Value - Institutional Class | | | | | | | | | | | | | |
| Sales | | | 764,351 | | | 22,103,089 | | | 1,408,442 | | | 42,031,989 | |
| Redemptions | | | (1,462,950 | ) | | (42,128,475 | ) | | (831,059 | ) | | (24,266,381 | ) |
| Reinvestment of distributions | | | — | | | — | | | 1,074,600 | | | 31,493,863 | |
| Net increase (decrease) | | | (698,599 | ) | | (20,025,386 | ) | | 1,651,983 | | | 49,259,471 | |
| | | | | | | | | | | | | | |
| | | | | | | | | | | | | | |
| Partners III Opportunity - Investor Class | | | | | | | | | | | | | |
| Sales | | | 254,763 | | | 3,612,738 | | | 787,638 | | | 11,832,353 | |
| Redemptions | | | (934,863 | ) | | (13,019,132 | ) | | (2,660,062 | ) | | (37,766,982 | ) |
| Reinvestment of distributions | | | 33,751 | | | 442,138 | | | 454,392 | | | 6,781,356 | |
| Net increase (decrease) | | | (646,349 | ) | | (8,964,256 | ) | | (1,418,032 | ) | | (19,153,273 | ) |
| | | | | | | | | | | | | | |
| | | | | | | | | | | | | | |
| Partners III Opportunity - Institutional Class | | | | | | | | | | | | | |
| Sales | | | 2,163,035 | | | 30,625,453 | | | 4,944,586 | | | 73,695,720 | |
| Redemptions | | | (7,441,377 | ) | | (105,581,643 | ) | | (21,424,637 | ) | | (315,779,946 | ) |
| Reinvestment of distributions | | | 642,482 | | | 8,570,703 | | | 6,359,601 | | | 96,166,678 | |
| Net increase (decrease) | | | (4,635,860 | ) | | (66,385,487 | ) | | (10,120,450 | ) | | (145,917,548 | ) |
| | | | | | | | | | | | | | |
| | | | | | | | | | | | | | |
| Research | | | | | | | | | | | | | |
| Sales | | | 548,496 | | | 5,456,203 | | | 79,345 | | | 819,186 | |
| Redemptions | | | (61,774 | ) | | (641,598 | ) | | (86,008 | ) | | (857,483 | ) |
| Reinvestment of distributions | | | — | | | — | | | 288,209 | | | 3,072,895 | |
| Net increase (decrease) | | | 486,722 | | | 4,814,605 | | | 281,546 | | | 3,034,598 | |
| | | | | | | | | | | | | | |
| | | | | | | | | | | | | | |
| Hickory | | | | | | | | | | | | | |
| Sales | | | 345,905 | | | 17,104,540 | | | 396,695 | | | 20,673,746 | |
| Redemptions | | | (1,480,422 | ) | | (73,689,447 | ) | | (2,521,703 | ) | | (124,823,500 | ) |
| Reinvestment of distributions | | | — | | | — | | | 909,598 | | | 46,726,598 | |
| Net increase (decrease) | | | (1,134,517 | ) | | (56,584,907 | ) | | (1,215,410 | ) | | (57,423,156 | ) |
| | | | | | | | | | | | | | |
| | | | | | | | | | | | | | |
| Balanced | | | | | | | | | | | | | |
| Sales | | | 519,358 | | | 6,983,613 | | | 491,175 | | | 6,519,277 | |
| Redemptions | | | (541,433 | ) | | (7,240,890 | ) | | (1,430,350 | ) | | (19,557,267 | ) |
| Reinvestment of distributions | | | 273,687 | | | 3,595,694 | | | 437,254 | | | 5,849,006 | |
| Net increase (decrease) | | | 251,612 | | | 3,338,417 | | | (501,921 | ) | | (7,188,984 | ) |
| | | | | | | | | | | | | | |
| | | | | | | | | | | | | | |
| Core Plus Income - Investor Class | | | | | | | | | | | | | |
| Sales | | | 215,852 | | | 2,237,465 | | | 103,418 | | | 1,049,187 | |
| Redemptions | | | (71,653 | ) | | (740,518 | ) | | (27,627 | ) | | (276,162 | ) |
| Reinvestment of distributions | | | 19,715 | | | 202,466 | | | 10,824 | | | 108,512 | |
| Net increase (decrease) | | | 163,914 | | | 1,699,413 | | | 86,615 | | | 881,537 | |
| | | | | | | | | | | | | | |
| | | | | | | | | | | | | | |
| Core Plus Income - Institutional Class | | | | | | | | | | | | | |
| Sales | | | 942,669 | | | 9,672,988 | | | 381,505 | | | 3,887,905 | |
| Redemptions | | | (159,680 | ) | | (1,653,260 | ) | | (87,637 | ) | | (883,422 | ) |
| Reinvestment of distributions | | | 60,581 | | | 622,757 | | | 37,456 | | | 375,450 | |
| Net increase (decrease) | | | 843,570 | | | 8,642,485 | | | 331,324 | | | 3,379,933 | |
58 | Q1 2017 ANNUAL REPORT
| | | Year ended March 31, 2017 | | Year ended March 31, 2016 | |
| | | | Shares | | | $ Amount | | | Shares | | | $ Amount | |
| Short Duration Income - Investor Class | | | | | | | | | | | | | |
| Sales | | | 2,822,978 | | | 34,888,898 | | | 2,127,886 | | | 26,223,023 | |
| Redemptions | | | (3,471,878 | ) | | (42,885,336 | ) | | (3,208,886 | ) | | (39,575,247 | ) |
| Reinvestment of distributions | | | 157,370 | | | 1,938,699 | | | 185,365 | | | 2,274,703 | |
| Net increase (decrease) | | | (491,530 | ) | | (6,057,739 | ) | | (895,635 | ) | | (11,077,521 | ) |
| | | | | | | | | | | | | | |
| | | | | | | | | | | | | | |
| Short Duration Income - Institutional Class | | | | | | | | | | | | | |
| Sales | | | 17,806,912 | | | 220,538,916 | | | 18,650,517 | | | 230,471,447 | |
| Redemptions | | | (24,062,586 | ) | | (298,094,938 | ) | | (30,419,689 | ) | | (375,584,635 | ) |
| Reinvestment of distributions | | | 2,138,070 | | | 26,391,122 | | | 2,315,263 | | | 28,462,916 | |
| Net increase (decrease) | | | (4,117,604 | ) | | (51,164,900 | ) | | (9,453,909 | ) | | (116,650,272 | ) |
| | | | | | | | | | | | | | |
| | | | | | | | | | | | | | |
| Ultra Short Government | | | | | | | | | | | | | |
| Sales | | | 34,767,394 | | | 43,614,815 | | | 61,508,489 | | | 61,508,489 | |
| Redemptions | | | (36,558,503 | ) | | (52,456,235 | ) | | (63,306,051 | ) | | (63,306,051 | ) |
| 1-for-10 reverse split | | | (95,199,960 | ) | | — | | | — | | | — | |
| Reinvestment of distributions | | | 108,757 | | | 217,784 | | | 32,139 | | | 32,139 | |
| Net increase (decrease) | | | (96,882,312 | ) | | (8,623,636 | ) | | (1,765,423 | ) | | (1,765,423 | ) |
| | | | | | | | | | | | | | |
| | | | | | | | | | | | | | |
| Nebraska Tax-Free Income | | | | | | | | | | | | | |
| Sales | | | 636,946 | | | 6,414,061 | | | 663,014 | | | 6,729,520 | |
| Redemptions | | | (717,977 | ) | | (7,214,586 | ) | | (1,304,161 | ) | | (13,238,682 | ) |
| Reinvestment of distributions | | | 103,506 | | | 1,034,118 | | | 112,526 | | | 1,137,963 | |
| Net increase (decrease) | | | 22,475 | | | 233,593 | | | (528,621 | ) | | (5,371,199 | ) |
4) Related Party Transactions
Each Fund has retained Weitz Investment Management, Inc. (the "Adviser") as its investment adviser. In addition, the Trust has an agreement with Weitz Securities, Inc. (the "Distributor"), a company under common control with the Adviser, to act as distributor for shares of the Trust. Certain officers of the Trust are also officers and directors of the Adviser and the Distributor.
Under the terms of management and investment advisory agreements, the Adviser is paid a monthly fee based on average daily net assets. The annual investment advisory fee schedule for each of the Weitz Equity Funds is as follows:
| Value and Partners Value Funds: | | | | | | | | | | |
| | | | Greater Than | | | Less Than or Equal To | | | Rate | |
| | | $ | 0 | | $ | 1,000,000,000 | | | 0.90 | % |
| | | | 1,000,000,000 | | | 2,000,000,000 | | | 0.85 | % |
| | | | 2,000,000,000 | | | 3,000,000,000 | | | 0.80 | % |
| | | | 3,000,000,000 | | | 5,000,000,000 | | | 0.75 | % |
| | | | 5,000,000,000 | | | | | | 0.70 | % |
| Partners III Opportunity Fund: | | | | | | | | | | |
| | | | Greater Than | | | Less Than or Equal To | | | Rate | |
| | | $ | 0 | | $ | 1,000,000,000 | | | 1.00 | % |
| | | | 1,000,000,000 | | | 2,000,000,000 | | | 0.95 | % |
| | | | 2,000,000,000 | | | 3,000,000,000 | | | 0.90 | % |
| | | | 3,000,000,000 | | | 5,000,000,000 | | | 0.85 | % |
| | | | 5,000,000,000 | | | | | | 0.80 | % |
| Research and Hickory Funds: | | | | | | | | | | |
| | | | Greater Than | | | Less Than or Equal To | | | Rate | |
| | | $ | 0 | | $ | 2,500,000,000 | | | 1.00 | % |
| | | | 2,500,000,000 | | | 5,000,000,000 | | | 0.90 | % |
| | | | 5,000,000,000 | | | | | | 0.80 | % |
The Balanced Fund pays the Adviser, on a monthly basis, an annual advisory fee equal to 0.80% of the Fund's average daily net assets.
The Core Plus Income, Short Duration Income and Nebraska Tax-Free Income Funds each pay the Adviser, on a monthly basis, an annual advisory fee equal to 0.40% of the respective Fund's average daily net assets.
The Ultra Short Government Fund pays the Adviser, on a monthly basis, an annual advisory fee equal to 0.30% of the Fund's average daily net assets (effective December 16, 2016). Prior to December 16, 2016, the Ultra Short Government Fund paid an annual advisory fee equal to 0.40%.
The Adviser also provides administrative services, including shareholder administrative services, to each Fund pursuant to agreements which provide that the Funds will pay the Adviser a monthly fee based on the average daily net assets of each respective Fund and/or a fee per account, plus third party expenses directly related to providing such services.
The Adviser has agreed in writing to reimburse the Research (through July 31, 2017) and Ultra Short Government (through July 31, 2018) Funds or to pay directly a portion of the Funds' expenses to the extent that total expenses (excluding taxes, interest, brokerage costs, acquired fund fees and expenses and extraordinary expenses) exceed 0.90% and 0.20%, respectively, of each Fund's average daily net assets. In addition, for the year ended March 31, 2017, the Adviser voluntarily reimbursed expenses to limit the expenses of the Ultra Short Government Fund to 0.14% of the Fund's average daily net assets. The expenses reimbursed by the Adviser for the Research and Ultra Short Government Funds for the year ended March 31, 2017, were $187,797 and $538,275, respectively.
Through July 31, 2017, the Adviser has agreed in writing to reimburse the Value and Partners Value Funds or to pay directly a portion of each Fund's expenses to the extent that each Class' total annual fund operating expenses (excluding taxes, interest, brokerage costs, acquired fund fees and expenses and extraordinary expenses) exceed 1.30% and 0.99% of the Investor and Institutional Class shares' average daily net assets, respectively.
Through July 31, 2018, the Adviser has agreed in writing to reimburse the Core Plus Income Fund or to pay directly a portion of the Fund's expenses to the extent that each Class' total annual fund operating expenses (excluding taxes, interest, brokerage costs, acquired fund fees and expenses and extraordinary expenses) exceed 0.60% and 0.40% of the Investor and Institutional Class shares' average daily net assets, respectively.
Through July 31, 2018, the Adviser has agreed in writing to reimburse the Short Duration Income Fund or to pay directly a portion of the Fund's expenses to the extent that each Class' total annual fund operating expenses (excluding taxes, interest, brokerage costs, acquired fund fees
59 | Q1 2017 ANNUAL REPORT
and expenses and extraordinary expenses) exceed 0.68% and 0.48% of the Investor and Institutional Class shares' average daily net assets, respectively.
The expenses reimbursed by the Adviser for the Value, Partners Value, Core Plus Income and Short Duration Income Funds for the year ended March 31, 2017, were $119,933; $145,492; $63,335 and $111,862 for the Investor Class shares and $198,878; $246,631; $107,726 and $470,778 for the Institutional Class shares, respectively.
As of March 31, 2017, the controlling shareholder of the Adviser held shares totaling approximately 29%, 74%, 19%, 37%, 46%, 11% and 63% of the Partners III Opportunity, Research, Hickory, Balanced, Core Plus Income, Ultra Short Government and Nebraska Tax-Free Income Funds, respectively.
(5) Distributions to Shareholders and Distributable Earnings
The tax character of distributions paid by the Funds are summarized as follows (in U.S. dollars):
| | | | | | | | | | |
| | | Year ended March 31, | | Year ended March 31, | | Year ended March 31, | | Year ended March 31, | |
| Distributions paid from: | | | 2017 | | | 2016 | | | 2017 | | | 2016 | | | 2017 | | | 2016 | | | 2017 | | | 2016 | |
| | | Value | | Partners Value | | Partners III Opportunity | | Research | |
| Ordinary income | | | — | | | — | | | — | | | — | | | — | | | — | | | — | | | 293,463 | |
| Long-term capital gains | | | — | | | 118,386,928 | | | — | | | 113,409,681 | | | 9,485,368 | | | 107,468,863 | | | — | | | 2,786,351 | |
| Total distributions | | | — | | | 118,386,928 | | | — | | | 113,409,681 | | | 9,485,368 | | | 107,468,863 | | | — | | | 3,079,814 | |
| | | | | | | | | | | | | | | | | | | | | | | | | | |
| | | Hickory | | Balanced | | Core Plus Income | | Short Duration Income | |
| Ordinary income | | | — | | | — | | | 1,222,313 | | | — | | | 757,672 | | | 477,959 | | | 27,843,194 | | | 27,585,680 | |
| Long-term capital gains | | | — | | | 48,187,197 | | | 2,414,964 | | | 5,916,094 | | | 69,635 | | | 6,003 | | | 1,056,284 | | | 4,203,274 | |
| Return of capital | | | — | | | — | | | — | | | — | | | — | | | — | | | 217,545 | | | — | |
| Total distributions | | | — | | | 48,187,197 | | | 3,637,277 | | | 5,916,094 | | | 827,307 | | | 483,962 | | | 29,117,023 | | | 31,788,954 | |
| | | Ultra Short Government | | Nebraska Tax-Free Income | |
| Ordinary income | | | 262,146 | | | 35,981 | | | 12,551 | | | 13,270 | |
| Tax exempt income | | | — | | | — | | | 1,046,530 | | | 1,240,860 | |
| Total distributions | | | 262,146 | | | 35,981 | | | 1,059,081 | | | 1,254,130 | |
As of March 31, 2017, the components of distributable earnings on a tax basis were as follows (in U.S. dollars):
| | | | | | | | | | | | | | | | | |
| | | | | | | | | | Partners III | | | | | | | |
| | | | Value | | | Partners Value | | | Opportunity | | | Research | | | Hickory | |
| Undistributed ordinary income | | | — | | | — | | | — | | | 101,143 | | | 154,489 | |
| Qualified late year ordinary loss deferral | | | (1,208,394 | ) | | (907,781 | ) | | (2,542,368 | ) | | — | | | — | |
| Undistributed long-term gains | | | 32,507,539 | | | — | | | 22,316,202 | | | — | | | 539,471 | |
| Capital loss carryforwards | | | — | | | (3,026,723 | ) | | — | | | — | | | — | |
| Post October capital loss deferral | | | — | | | (1,493,156 | ) | | — | | | — | | | — | |
| Net unrealized appreciation (depreciation) | | | 256,934,380 | | | 231,933,273 | | | 226,402,257 | | | 2,373,365 | | | 95,589,484 | |
| | | | 288,233,525 | | | 226,505,613 | | | 246,176,091 | | | 2,474,508 | | | 96,283,444 | |
| | | | | | | | Short Duration | | | Ultra Short | Nebraska Tax-Free | |
| | | | Balanced | Core Plus Income | | | Income | | | Government | | | Income | |
| Undistributed ordinary income | | | 220,788 | | | 10,490 | | | — | | | 6,615 | | | — | |
| Undistributed tax exempt income | | | — | | | — | | | — | | | — | | | 2,348 | |
| Undistributed long-term gains | | | 1,054,689 | | | 81,807 | | | — | | | — | | | — | |
| Capital loss carryforwards | | | — | | | — | | | — | | | (16 | ) | | (39,260 | ) |
| Post October capital loss deferral | | | — | | | — | | | (4,580,671 | ) | | (153 | ) | | — | |
| Net unrealized appreciation (depreciation) | | | 15,227,137 | | | 110,222 | | | 17,552,907 | | | (35,798 | ) | | 291,033 | |
| | | | 16,502,614 | | | 202,519 | | | 12,972,236 | | | (29,352 | ) | | 254,121 | |
The Value, Partners Value and Partners III Opportunity Funds elected to defer ordinary losses arising after December 31, 2016. Such losses are treated for tax purposes as arising on April 1, 2017.
The Partners Value, Short Duration Income and Ultra Short Government Funds elected to defer realized capital losses arising after October 31, 2016. Such losses are treated for tax purposes as arising on April 1, 2017.
Capital loss carryforwards represent tax basis capital losses that may be carried over to offset future realized capital gains, if any. To the extent that carryforwards are used, no capital gains distributions will be made. The character of the carryforwards are as follows (in U.S. dollars):
| | | | | | | Ultra Short | | Nebraska Tax-Free | |
| | | | Partners Value | | | Government | | | Income | |
| Short term (no expiration) | | | (3,026,723 | ) | | (16 | ) | | — | |
| Long term (no expiration) | | | — | | | — | | | (39,260 | ) |
60 | Q1 2017 ANNUAL REPORT
At March 31, 2017, the cost of investments for Federal income tax purposes is summarized as follows (in U.S. dollars):
| | | | | | | | | | | | | | | | | | | | | | | | | Short | | | | | | Nebraska | |
| | | | | | | Partners | | | Partners III | | | | | | | | | | | | Core Plus | | | Duration | | | Ultra Short | | | Tax-Free | |
| | | | Value | | | Value | | | Opportunity | | | Research | | | Hickory | | | Balanced | | | Income | | | Income | | | Government | | | Income | |
| Tax Cost | | | 574,287,317 | | | 502,226,808 | | | 429,146,041 | | | 28,675,603 | | | 177,423,199 | | | 102,910,819 | | | 34,122,510 | | | 1,188,296,503 | | | 97,998,327 | | | 62,715,325 | |
At March 31, 2017, the aggregate gross unrealized appreciation and depreciation of investments, based on cost for Federal income tax purposes, are summarized as follows (in U.S. dollars):
| | | | | | | | | | | | | | | | | | | | | | | | | Short | | | | | | Nebraska | |
| | | | | | | Partners | | | Partners III | | | | | | | | | | | Core Plus | | | Duration | | | Ultra Short | | | Tax-Free | |
| | | | Value | | | Value | | | Opportunity | | | Research | | | Hickory | | | Balanced | | | Income | | | Income | | | Government | | | Income | |
| Appreciation | | | 257,485,957 | | | 235,454,766 | | | 264,664,063 | | | 3,488,901 | | | 100,927,240 | | | 15,498,843 | | | 272,890 | | | 20,858,667 | | | 4,020 | | | 720,065 | |
| Depreciation | | | (551,577 | ) | | (3,521,493 | ) | | (7,073,492 | ) | | (1,115,537 | ) | | (5,337,756 | ) | | (271,706 | ) | | (162,668 | ) | | (3,235,757 | ) | | (39,818 | ) | | (429,032 | ) |
| Net | | | 256,934,380 | | | 231,933,273 | | | 257,590,571 | | | 2,373,364 | | | 95,589,484 | | | 15,227,137 | | | 110,222 | | | 17,622,910 | | | (35,798 | ) | | 291,033 | |
(6) Securities Transactions
Purchases and proceeds from maturities or sales of investment securities of the Funds for the year ended March 31, 2017, excluding short-term securities and U.S. government obligations, are summarized as follows (in U.S. dollars):
| | | | | | | | | | | | | | | | | | | | | | | | | Short | | | | | | Nebraska | |
| | | | | | | Partners | | | Partners III | | | | | | | | | | | | Core Plus | | | Duration | | | Ultra Short | | | Tax-Free | |
| | | | Value | | | Value | | | Opportunity | | | Research | | | Hickory | | | Balanced | | | Income | | | Income | | | Government | | | Income | |
| Purchases | | | 166,840,702 | | | 99,889,758 | | | 144,407,518 | | | 27,758,623 | | | 16,763,275 | | | 20,595,038 | | | 10,450,971 | | | 298,565,145 | | | — | | | 17,344,826 | |
| Proceeds | | | 325,688,346 | | | 259,666,652 | | | 235,044,914 | | | 21,515,947 | | | 70,784,439 | | | 27,136,374 | | | 8,951,139 | | | 392,201,833 | | | — | | | 18,405,000 | |
(a) Illiquid and Restricted Securities
The Funds own certain securities that have a limited trading market and/or certain restrictions on trading and therefore may be illiquid and/or restricted. Such securities have been valued at fair value in accordance with the procedures described in Note (2)(a). Because of the inherent uncertainty of valuation, these values may differ from the values that would have been used had a ready market for these securities existed and these differences could be material. Illiquid and/or restricted securities owned at March 31, 2017, include the following:
| | | | Acquisition | | | Partners III | | | | |
| | | | Date | | | Opportunity | | | Hickory | |
| Intelligent Systems Corp. | | | 12/03/91 | | $ | 2,899,379 | | $ | — | |
| LICT Corp. | | | 9/09/96 | | | — | | | 2,228,509 | |
| Total cost of illiquid and/or restricted securities | | | | | | 2,899,379 | | | 2,228,509 | |
| Value at March 31, 2017 | | | | | | 10,407,950 | | | 6,984,750 | |
| Percent of net assets at March 31, 2017 | | | | | | 1.5 | % | | 2.6 | % |
(b) Options Written
Transactions relating to options written for the year ended March 31, 2017, are summarized as follows:
| | | | | | |
| | | Partners III Opportunity | | Short Duration Income | |
| | | Number of Contracts | | | $ Premiums | | Number of Contracts | | | $ Premiums | |
| Options outstanding, beginning of period | | | 1,250 | | | 464,365 | | | — | | | — | |
| Options written | | | 3,300 | | | 986,129 | | | 1,000 | | | 114,997 | |
| Options exercised | | | (3,550 | ) | | (1,232,999 | ) | | — | | | — | |
| Options expired | | | (1,000 | ) | | (217,495 | ) | | — | | | — | |
| Options outstanding, end of period | | | — | | | — | | | 1,000 | | | 114,997 | |
The locations in the Statements of Assets and Liabilities as of March 31, 2017, of the Funds' derivative positions, none of which are designated as hedging instruments are as follows (in U.S. dollars):
| | | | | | | | | | | | | | |
| | | | | | | | | | | Average | | Gross | |
| | | | | | | Fair Value of | | Month-End | | Notional | |
| | | | | | | | | Liability | | Notional | | Amount | |
| Fund | | Type of Derivative | | Location | | Asset Derivatives | | Derivatives | | Amount | | Outstanding | |
Partners III Opportunity | | Call options written | | Options written, at value | | — | | — | | 3,070,833 | | — | |
Short Duration Income | | Call options written | | Options written, at value | | — | | (185,000) | | 375,000 | | 1,500,000 | |
61 | Q1 2017 ANNUAL REPORT
Transactions in derivative instruments during the year ended March 31, 2017, are recorded in the following locations in the Statements of Operations (in U.S. dollars):
| | | | | | | | | | | | |
| | | | | | | | | | | Change in | |
| | | | | | | Realized | | | | Unrealized | |
| Fund | | Type of Derivative | | Location | | Gain (Loss) | | Location | | Gain (Loss) | |
Partners III
Opportunity | | Call options written | | Net realized gain (loss) -
options written | | 217,495 | | Net unrealized appreciation
(depreciation) - options written | | (123,115) | |
| | | | | | | | | | | | |
Short Duration
Income | | Call options written | | Net realized gain (loss) -
options written | | — | | Net unrealized appreciation
(depreciation) - options written | | (70,003) | |
(7) Affiliated Issuers
Affiliated issuers, as defined under the Investment Company Act of 1940, are those in which a Fund's holdings of an issuer represent 5% or more of the outstanding voting securities of the issuer. A summary of each Fund's holdings in the securities of such issuers is set forth below:
| | | | | | | | | | | | | | | | |
| | | Number of | | | | | | Number of Shares | | | | | | | |
| | | Shares Held | | Gross | | Gross | | Held | | Value | | Dividend | | Realized | |
| | March 31, 2016 | | Additions | | Reductions | March 31, 2017 | March 31, 2017 | | Income | | Gains/(Losses | ) |
| Partners III Opportunity: | | | | | | | | | | | | | | | | | | | | | | |
| Intelligent Systems Corp.† | | | 2,270,000 | | | — | | | — | | | 2,270,000 | | $ | 10,407,950 | | $ | — | | $ | — | |
† Controlled affiliate in which the Fund owns 25% or more of the outstanding voting securities.
(8) Contingencies
Each Fund indemnifies the Trust's officers and trustees for certain liabilities that might arise from their performance of their duties to each of the Funds. Additionally, in the normal course of business the Funds enter into contracts that contain a variety of representations and warranties and which provide general indemnifications. The Funds' maximum exposure under these arrangements is unknown, as this would involve future claims that may be made against the Funds that have not yet occurred. However, based on experience, the Funds expect the risk of loss to be remote.
(9) Financial Instruments With Off-Balance Sheet Risks
Option contracts written and securities sold short result in off-balance sheet risk as the Fund's ultimate obligation to satisfy the terms of the contract or the sale of securities sold short may exceed the amount recognized in the Statements of Assets and Liabilities.
The Funds are required to maintain collateral in a segregated account to provide adequate margin as determined by the broker.
(10) Margin Borrowing Agreement
The Partners III Opportunity Fund has a margin account with its prime broker, Bank of America Merrill Lynch, under which the Fund may borrow against the value of its securities, subject to regulatory limitations. Interest accrues at the federal funds rate plus 0.625% (1.535% at March 31, 2017). Interest is accrued daily and paid monthly. The Partners III Opportunity Fund held a cash balance of $230,162,412, with the broker at March 31, 2017.
The Partners III Opportunity Fund is exposed to credit risk from its prime broker who effects transactions and extends credit pursuant to a prime brokerage agreement. The Adviser attempts to minimize the credit risk by monitoring credit exposure and the creditworthiness of the prime broker.
(11) Concentration of Credit Risk
Approximately 89% of the Nebraska Tax-Free Income Fund's net assets are in obligations of political subdivisions of the State of Nebraska, which are subject to the credit risk associated with the non-performance of such issuers.
(12) Fair Value Measurements
Various inputs are used in determining the value of the Fund's investments. These inputs are used in determining the value of the Funds' investments and are summarized in the following fair value hierarchy:
| ● | Level 1 – quoted prices in active markets for identical securities; |
| ● | Level 2 – other significant observable inputs (including quoted prices for similar securities); |
| ● | Level 3 – significant unobservable inputs (including the Funds' own assumptions in determining the fair value of investments). |
The inputs or methodology used for valuing securities are not an indication of the risk associated with investing in those securities.
A description of the valuation techniques applied to the Funds' major categories of assets and liabilities measured at fair value on a recurring basis follows.
| ● | Equity securities. Securities traded on a national securities exchange (or reported on the NASDAQ national market) are stated at the last reported sales price on the day of valuation. To the extent these securities are actively traded and valuation adjustments are not applied, they are categorized in Level 1 of the fair value hierarchy. Preferred stock and other equities traded on inactive markets or valued by reference to similar instruments are categorized in Level 2. |
| | |
| ● | Corporate and Municipal bonds. The fair values of corporate and municipal bonds are estimated using various techniques, which may consider recently executed transactions in securities of the issuer or comparable issuers, market price quotations (where observable), bond spreads and fundamental data relating to the issuer. Although most corporate and municipal bonds are categorized in Level 2 of the fair value hierarchy, in instances where lower relative weight is placed on transaction prices, quotations, or similar observable inputs, they are categorized in Level 3. |
| | |
| ● | Asset-backed securities. The fair values of asset-backed securities (including non-government agency mortgage- backed securities and interest-only securities) are generally estimated based on models that consider the estimated cash flows of each tranche of the entity, a benchmark yield and an estimated tranche specific spread to the benchmark yield based on the unique attributes of the tranche. Certain securities are valued principally using dealer quotations. To the extent the inputs are observable and timely, the values would be categorized in Level 2 of the fair value hierarchy; otherwise they would be categorized as Level 3. |
62 | Q1 2017 ANNUAL REPORT
| ● | U.S. Government securities. U.S. Government securities are normally valued using a model that incorporates market observable data such as reported sales of similar securities, broker quotes, yields, bids, offers and reference data. Certain securities are valued principally using dealer quotations. U.S. Government securities are categorized in Level 1 or Level 2 of the fair value hierarchy depending on the inputs used and market activity levels for specific securities. |
| | |
| ● | U.S. agency securities. U.S. agency securities are comprised of two main categories consisting of agency issued debt and mortgage-backed securities. Agency issued debt securities are generally valued in a manner similar to U.S. Government securities. Mortgage-backed securities include collateralized mortgage obligations, to-be-announced (TBA) securities and mortgage pass-through certificates. Mortgage-backed securities are generally valued using dealer quotations. Depending on market activity levels and whether quotations or other data are used, these securities are typically categorized in Level 2 of the fair value hierarchy. |
| | |
| ● | Restricted and/or illiquid securities. Restricted and/or illiquid securities for which quotations are not readily available are valued in accordance with procedures approved by the Trust's Board of Trustees. Restricted securities issued by publicly traded companies are generally valued at a discount to similar publicly traded securities. Restricted or illiquid securities issued by nonpublic entities may be valued by reference to comparable public entities or fundamental data relating to the issuer or both. Depending on the relative significance of valuation inputs, these instruments may be classified in either Level 2 or Level 3 of the fair value hierarchy. |
| | |
| ● | Derivative instruments. Listed derivatives, such as the Funds' equity option contracts, that are valued based on closing prices from the exchange or the mean of the closing bid and ask prices are generally categorized in Level 2 of the fair value hierarchy. The following is a summary of inputs used, in U.S. dollars, as of March 31, 2017, in valuing the Funds' assets and liabilities carried at fair value. The Schedule of Investments for each Fund provides a detailed breakdown of each category. |
| | |
| Value | |
| | | | Level 1 | | | Level 2 | | | Level 3 | | | Total | |
| Assets: | | | | | | | | | | | | | |
| Investments in Securities: | | | | | | | | | | | | | |
| Common Stocks | | | 683,235,962 | | | — | | | — | | | 683,235,962 | |
| Cash Equivalents | | | 147,985,735 | | | — | | | — | | | 147,985,735 | |
| | | | | | | | | | | | | | |
| Total | | | | | | | | | | | | | |
| Investments in | | | | | | | | | | | | | |
| Securities | | | 831,221,697 | | | — | | | — | | | 831,221,697 | |
| | | | | | | | | | | | | | |
| Partners Value | |
| | | | Level 1 | | | Level 2 | | | Level 3 | | | Total | |
| Assets: | | | | | | | | | | | | | |
| Investments in Securities: | | | | | | | | | | | | | |
| Common Stocks | | | 602,407,835 | | | — | | | — | | | 602,407,835 | |
| Cash Equivalents | | | 131,752,246 | | | — | | | — | | | 131,752,246 | |
| Total | | | | | | | | | | | | | |
| Investments in | | | | | | | | | | | | | |
| Securities | | | 734,160,081 | | | — | | | — | | | 734,160,081 | |
| | | | | | | | | | | | | | |
| Partners III Opportunity | |
| | | | Level 1 | | | Level 2 | | | Level 3 | | | Total | |
| Assets: | | | | | | | | | | | | | |
| Investments in Securities: | | | | | | | | | | | | | |
| Common Stocks | | | | | | | | | | | | | |
| Information | | | | | | | | | | | | | |
| Technology | | | 109,760,550 | | | 10,407,950 | | | — | | | 120,168,500 | |
| Other | | | 499,691,950 | | | — | | | — | | | 499,691,950 | |
| Cash Equivalents | | | 66,876,162 | | | — | | | — | | | 66,876,162 | |
| Total | | | | | | | | | | | | | |
| Investments in | | | | | | | | | | | | | |
| Securities | | | 676,328,662 | | | 10,407,950 | | | — | | | 686,736,612 | |
| Liabilities: | | | | | | | | | | | | | |
| Securities Sold | | | | | | | | | | | | | |
| Short | | | (225,304,000 | ) | | — | | | — | | | (225,304,000 | ) |
| | | | | | | | | | | | | | |
| Research | |
| | | | Level 1 | | | Level 2 | | | Level 3 | | | Total | |
| Assets: | | | | | | | | | | | | | |
| Investments in Securities: | | | | | | | | | | | | | |
| Common Stocks | | | 26,635,913 | | | — | | | — | | | 26,635,913 | |
| Cash Equivalents | | | 4,413,054 | | | — | | | — | | | 4,413,054 | |
| Total | | | | | | | | | | | | | |
| Investments in | | | | | | | | | | | | | |
| Securities | | | 31,048,967 | | | — | | | — | | | 31,048,967 | |
| | | | | | | | | | | | | | |
| Hickory | |
| | | | Level 1 | | | Level 2 | | | Level 3 | | | Total | |
| Assets: | | | | | | | | | | | | | |
| Investments in Securities: | | | | | | | | | | | | | |
| Common Stocks | | | | | | | | | | | | | |
| Telecommunication | | | | | | | | | | | | | |
| Services | | | — | | | 6,984,750 | | | — | | | 6,984,750 | |
| Other | | | 209,707,817 | | | — | | | — | | | 209,707,817 | |
| Cash Equivalents | | | 56,320,116 | | | — | | | — | | | 56,320,116 | |
| Total | | | | | | | | | | | | | |
| Investments in | | | | | | | | | | | | | |
| Securities | | | 266,027,933 | | | 6,984,750 | | | — | | | 273,012,683 | |
63 | Q1 2017 ANNUAL REPORT
| | | | | | | | | | | | | | |
| Balanced | |
| | | | Level 1 | | | Level 2 | | | Level 3 | | | Total | |
| Assets: | | | | | | | | | | | | | |
| Investments in Securities: | | | | | | | | | | | | | |
| Common Stocks | | | 54,693,222 | | | — | | | — | | | 54,693,222 | |
| Corporate Bonds | | | — | | | 10,955,444 | | | — | | | 10,955,444 | |
| Corporate | | | | | | | | | | | | | |
| Convertible | | | | | | | | | | | | | |
| Bonds | | | — | | | 1,031,250 | | | — | | | 1,031,250 | |
| | | | | | | | | | | | | | |
| Mortgage- | | | | | | | | | | | | | |
| Backed Securities | | | | | | | | | | | | | |
| | | | — | | | 2,371,024 | | | — | | | 2,371,024 | |
| | | | | | | | | | | | | | |
| U.S. Treasury | | | | | | | | | | | | | |
| Notes | | | — | | | 19,012,537 | | | — | | | 19,012,537 | |
| Cash Equivalents | | | 30,074,479 | | | — | | | — | | | 30,074,479 | |
| Total | | | | | | | | | | | | | |
| Investments in | | | | | | | | | | | | | |
| Securities | | | 84,767,701 | | | 33,370,255 | | | — | | | 118,137,956 | |
| | | | | | | | | | | | | | |
| | | | | | | | | | | | | | |
| Core Plus Income | |
| | | | Level 1 | | | Level 2 | | | Level 3 | | | Total | |
| Assets: | | | | | | | | | | | | | |
| Investments in Securities: | | | | | | | | | | | | | |
| Corporate Bonds | | | — | | | 8,716,225 | | | — | | | 8,716,225 | |
| Corporate | | | | | | | | | | | | | |
| Convertible | | | | | | | | | | | | | |
| Bonds | | | — | | | 632,656 | | | — | | | 632,656 | |
| Asset-Backed | | | | | | | | | | | | | |
| Securities | | | — | | | 4,256,181 | | | — | | | 4,256,181 | |
| Commercial | | | | | | | | | | | | | |
| Mortgage- | | | | | | | | | | | | | |
| Backed Securities | | | — | | | 1,077,023 | | | — | | | 1,077,023 | |
| Mortgage- | | | | | | | | | | | | | |
| Backed Securities | | | — | | | 512,584 | | | — | | | 512,584 | |
| Taxable | | | | | | | | | | | | | |
| Municipal Bonds | | | — | | | 422,936 | | | — | | | 422,936 | |
| U.S. Treasury | | | — | | | 12,867,910 | | | — | | | 12,867,910 | |
| Common Stocks | | | 246,964 | | | — | | | — | | | 246,964 | |
| Cash Equivalents | | | 5,500,253 | | | — | | | — | | | 5,500,253 | |
| Total | | | | | | | | | | | | | |
| Investments in | | | | | | | | | | | | | |
| Securities | | | 5,747,217 | | | 28,485,515 | | | — | | | 34,232,732 | |
| | | | | | | | | | | | | | |
| Short Duration Income | |
| | | | Level 1 | | | Level 2 | | | Level 3 | | | Total | |
| Assets: | | | | | | | | | | | | | |
| Investments in Securities: | | | | | | | | | | | | | |
| Corporate Bonds | | | — | | | 521,232,944 | | | — | | | 521,232,944 | |
| Corporate | | | | | | | | | | | | | |
| Convertible | | | | | | | | | | | | | |
| Bonds | | | — | | | 47,866,250 | | | — | | | 47,866,250 | |
| Asset-Backed | | | | | | | | | | | | | |
| Securities | | | — | | | 67,984,834 | | | — | | | 67,984,834 | |
| Commercial | | | | | | | | | | | | | |
| Mortgage- | | | | | | | | | | | | | |
| Backed Securities | | | — | | | 9,264,127 | | | — | | | 9,264,127 | |
| Mortgage- | | | | | | | | | | | | | |
| Backed Securities | | | — | | | 213,571,550 | | | — | | | 213,571,550 | |
| Taxable | | | | | | | | | | | | | |
| Municipal Bonds | | | — | | | 5,547,558 | | | — | | | 5,547,558 | |
| U.S. Treasury | | | — | | | 296,484,985 | | | — | | | 296,484,985 | |
| Common Stocks | | | 13,204,950 | | | — | | | — | | | 13,204,950 | |
| Cash Equivalents | | | 30,762,215 | | | — | | | — | | | 30,762,215 | |
| Total | | | | | | | | | | | | | |
| Investments in | | | | | | | | | | | | | |
| Securities | | | 43,967,165 | | | 1,161,952,248 | | | — | | | 1,205,919,413 | |
| Liabilities: | | | | | | | | | | | | | |
| Options Written | | | — | | | (185,000 | ) | | — | | | (185,000 | ) |
| | | | | | | | | | | | | | |
| | | | | | | | | | | | | | |
| Ultra Short Government | |
| | | | Level 1 | | | Level 2 | | | Level 3 | | | Total | |
| Assets: | | | | | | | | | | | | | |
| Investments in Securities: | | | | | | | | | | | | | |
| Corporate Bonds | | | — | | | 12,333,214 | | | — | | | 12,333,214 | |
| U.S. Treasury | | | 44,975,040 | | | 37,942,540 | | | — | | | 82,917,580 | |
| Money Market | | | | | | | | | | | | | |
| Funds | | | 2,711,735 | | | — | | | — | | | 2,711,735 | |
| Total | | | | | | | | | | | | | |
| Investments in | | | | | | | | | | | | | |
| Securities | | | 47,686,775 | | | 50,275,754 | | | — | | | 97,962,529 | |
| | | | | | | | | | | | | | |
| | | | | | | | | | | | | | |
| Nebraska Tax-Free Income | |
| | | | Level 1 | | | Level 2 | | | Level 3 | | | Total | |
| Assets: | | | | | | | | | | | | | |
| Investments in Securities: | | | | | | | | | | | | | |
| Municipal Bonds | | | — | | | 58,722,012 | | | — | | | 58,722,012 | |
| Cash Equivalents | | | 4,284,346 | | | — | | | — | | | 4,284,346 | |
| Total | | | | | | | | | | | | | |
| Investments in | | | | | | | | | | | | | |
| Securities | | | 4,284,346 | | | 58,722,012 | | | — | | | 63,006,358 | |
64 | Q1 2017 ANNUAL REPORT
For transfers between the levels within the fair value hierarchy, the Funds have adopted a policy of recognizing the transfers as of the date of the underlying event which caused the transfer. During the year ended March 31, 2017, there were no transfers between Level 1, Level 2 and Level 3.
During the year ended March 31, 2017, there were no assets in which significant unobservable inputs (Level 3) were used.
(13) Subsequent Events
Management has recommended to the Trust's Board of Trustees that the Research Fund cease operations and be liquidated. The Board is expected to consider and vote on this proposal at its meeting on May 25, 2017. If this proposal is approved by the Trustees, the Research Fund is expected to be liquidated in July 2017. In anticipation of its termination, the Fund is currently closed to new investments.
Management has evaluated the impact of all subsequent events on the Funds through the date the financial statements were issued and has determined that there were no additional subsequent events requiring recognition or disclosure in the financial statements.
65 | Q1 2017 ANNUAL REPORT
REPORT OF INDEPENDENT REGISTERED PUBLIC ACCOUNTING FIRM
The Board of Trustees and Shareholders of the Weitz Funds
We have audited the accompanying statements of assets and liabilities of the Weitz Funds, comprising the Value Fund, Partners Value Fund, Partners III Opportunity Fund, Research Fund, Hickory Fund, Balanced Fund, Core Plus Income Fund, Short Duration Income Fund (formerly known as the Short-Intermediate Income Fund), Ultra Short Government Fund (formerly known as the Government Money Market Fund), and Nebraska Tax-Free Income Fund (collectively referred to as the "Funds"), including the schedules of investments, as of March 31, 2017, and the related statements of operations (and statement of cash flows for Partners III Opportunity Fund) for the year then ended, the statements of changes in net assets for each of the two years in the period then ended and the financial highlights for each of the periods indicated therein. These financial statements and financial highlights are the responsibility of the Funds' management. Our responsibility is to express an opinion on these financial statements and financial highlights based on our audits.
We conducted our audits in accordance with standards of the Public Company Accounting Oversight Board (United States). Those standards require that we plan and perform the audits to obtain reasonable assurance about whether the financial statements and financial highlights are free of material misstatement. We were not engaged to perform an audit of the Funds' internal control over financial reporting. Our audits included consideration of internal control over financial reporting as a basis for designing audit procedures that are appropriate in the circumstances, but not for the purpose of expressing an opinion on the effectiveness of the Funds' internal control over financial reporting. Accordingly, we express no such opinion. An audit also includes examining, on a test basis, evidence supporting the amounts and disclosures in the financial statements and financial highlights, assessing the accounting principles used and significant estimates made by management, and evaluating the overall financial statement presentation. Our procedures included confirmation of securities owned as of March 31, 2017, by correspondence with the custodian and brokers or by other appropriate auditing procedures where replies from brokers were not received. We believe that our audits provide a reasonable basis for our opinion.
In our opinion, the financial statements and financial highlights referred to above present fairly, in all material respects, the financial position of each of the Weitz Funds referred to above at March 31, 2017, the results of their operations (and cash flows for Partners III Opportunity Fund) for the year then ended, the changes in their net assets for each of the two years in the period then ended and the financial highlights for the periods indicated therein, in conformity with U.S. generally accepted accounting principles.
Cincinnati, Ohio
May 10, 2017
66 | Q1 2017 ANNUAL REPORT
This page intentionally left blank
67 | Q1 2017 ANNUAL REPORT
ACTUAL AND HYPOTHETICAL EXPENSES FOR COMPARISON PURPOSES
Example
As a shareholder of one or more of the Funds, you incur two types of costs: (1) transaction costs, including any transaction fees that you may be charged if you purchase or redeem your Fund shares through certain financial institutions; and (2) ongoing costs, including management fees and other Fund expenses. This Example is intended to help you understand your ongoing costs (in dollars) of investing in the Funds and to compare these costs with the ongoing costs of investing in other mutual funds. The Example is based on an investment of $1,000 invested at the beginning of the period and held for the entire period from October 1, 2016 through March 31, 2017.
Actual Expenses
The first line for each Fund in the table below provides information about actual account values and actual expenses. You may use the information in this line, together with the amount you invested, to estimate the expenses that you paid over the period. Simply divide your account value by $1,000 (for example, an account value of $8,600 divided by $1,000 = 8.6), then multiply the result by the number in the first line under the heading entitled "Expenses Paid from 10/01/16 – 3/31/17" to estimate the expenses you paid on your account during this period.
Hypothetical Example for Comparison Purposes
The second line for each Fund in the table below provides information about hypothetical account values and hypothetical expenses based on the actual expense ratio of each Fund and an assumed rate of return of 5% per year before expenses, which is not the actual return of the Fund. The hypothetical account values and expenses may not be used to estimate the actual ending account balance or expenses you paid for the period. You may use this information to compare the ongoing costs of investing in a specific Weitz Fund to other funds. To do so, compare this 5% hypothetical example with the 5% hypothetical examples that appear in the shareholder reports of the other funds.
Please note that the expenses shown in the table are meant to highlight your ongoing costs only and do not reflect any transactional costs charged by certain financial institutions. Therefore, the second line of the table is useful in comparing ongoing costs only, and will not help you determine the relative total costs of owning different funds. In addition, if you incurred transactional fees, your costs would have been higher. Actual and hypothetical expenses for each Fund are provided in this table.
| | | | | | | Beginning Account | | | Ending Account | | | Annualized | | | Expenses Paid from | |
| | | | | | | Value 10/01/16 | | | Value 3/31/17 | | | Expense Ratio | | | 10/01/16-3/31/17(1) | |
| Value - Investor Class | | | Actual | | $ | 1,000.00 | | $ | 1,077.08 | | | 1.22 | % | $ | 6.32 | |
| | | Hypothetical(2) | | | 1,000.00 | | | 1,018.90 | | | 1.22 | | | 6.14 | |
| | | | Actual | | | 1,000.00 | | | 1,078.25 | | | 0.99 | | | 5.13 | |
| Value - Institutional Class | | | Hypothetical(2) | | | 1,000.00 | | | 1,020.05 | | | 0.99 | | | 4.99 | |
| | | Actual | | | 1,000.00 | | | 1,081.69 | | | 1.24 | | | 6.44 | |
| Partners Value - Investor Class | | | Hypothetical(2) | | | 1,000.00 | | | 1,018.80 | | | 1.24 | | | 6.24 | |
| | | Actual | | | 1,000.00 | | | 1,083.42 | | | 0.99 | | | 5.14 | |
| Partners Value - Institutional Class | | | Hypothetical(2) | | | 1,000.00 | | | 1,020.05 | | | 0.99 | | | 4.99 | |
| | | Actual | | | 1,000.00 | | | 1,065.03 | | | 2.29 | | | 11.79 | |
| Partners III Opportunity - Investor Class | | | Hypothetical(2) | | | 1,000.00 | | | 1,013.55 | | | 2.29 | | | 11.50 | |
Partners III Opportunity -
Institutional Class | | | Actual | | | 1,000.00 | | | 1,068.04 | | | 1.80 | | | 9.28 | |
| | | Hypothetical(2) | | | 1,000.00 | | | 1,016.00 | | | 1.80 | | | 9.05 | |
| Research | | | Actual | | | 1,000.00 | | | 1,072.28 | | | 0.90 | | | 4.65 | |
| | | Hypothetical(2) | | | 1,000.00 | | | 1,020.50 | | | 0.90 | | | 4.53 | |
| Hickory | | | Actual | | | 1,000.00 | | | 1,057.55 | | | 1.25 | | | 6.41 | |
| | | Hypothetical(2) | | | 1,000.00 | | | 1,018.75 | | | 1.25 | | | 6.29 | |
| Balanced | | | Actual | | | 1,000.00 | | | 1,038.26 | | | 1.11 | | | 5.64 | |
| | | Hypothetical(2) | | | 1,000.00 | | | 1,019.45 | | | 1.11 | | | 5.59 | |
| Core Plus Income - Investor Class | | | Actual | | | 1,000.00 | | | 996.16 | | | 0.77 | | | 3.83 | |
| | | Hypothetical(2) | | | 1,000.00 | | | 1,021.15 | | | 0.77 | | | 3.88 | |
| Core Plus Income - Institutional Class | | | Actual | | | 1,000.00 | | | 997.12 | | | 0.57 | | | 2.84 | |
| | | Hypothetical(2) | | | 1,000.00 | | | 1,022.15 | | | 0.57 | | | 2.87 | |
Short Duration Income -
Investor Class | | | Actual | | | 1,000.00 | | | 1,000.25 | | | 0.80 | | | 3.99 | |
| | | Hypothetical(2) | | | 1,000.00 | | | 1,021.00 | | | 0.80 | | | 4.03 | |
Short Duration Income -
Institutional Class | | | Actual | | | 1,000.00 | | | 1,001.30 | | | 0.58 | | | 2.89 | |
| | | Hypothetical(2) | | | 1,000.00 | | | 1,022.10 | | | 0.58 | | | 2.92 | |
| Ultra Short Government | | | Actual | | | 1,000.00 | | | 1,001.76 | | | 0.14 | | | 0.70 | |
| | | Hypothetical(2) | | | 1,000.00 | | | 1,024.30 | | | 0.14 | | | 0.71 | |
| Nebraska Tax-Free Income | | | Actual | | | 1,000.00 | | | 991.88 | | | 0.79 | | | 3.92 | |
| | | Hypothetical(2) | | | 1,000.00 | | | 1,021.05 | | | 0.79 | | | 3.98 | |
(1) | Expenses are equal to the annualized expense ratio for the Fund, multiplied by the average account value over the period, multiplied by the number of days in the most recent fiscal half year (182/365). |
| | |
(2) | Assumes 5% total return before expenses. |
68 | Q1 2017 ANNUAL REPORT
OTHER INFORMATION
Proxy Voting Policy
A description of the Funds' proxy voting policies and procedures is available without charge, upon request by (i) calling 800-304-9745, (ii) on the Funds' website at weitzinvestments.com; and (iii) on the SEC's website at sec.gov.
Information on how each of the Funds voted proxies relating to portfolio securities during each twelve month period ended June 30 is available: (i) on the Funds' website at weitzinvestments.com and (ii) on the SEC's website at sec.gov.
Form N-Q
The Funds file complete schedules of their portfolio holdings with the Securities and Exchange Commission for the first and third quarters of each fiscal year on Form N-Q. The Funds' Form N-Q is available on the SEC's website at sec.gov and may be reviewed and copied at the SEC's Public Reference Room in Washington DC. Information on the operation of the Public Reference Room may be obtained by calling 800 SEC-0330. A list of the Funds' quarter-end holdings is available on the Funds' website at weitzinvestments.com within 15 days after the end of each quarter and remains available on the website until the list is updated in the subsequent quarter.
Tax Information
Of the distributions paid during the fiscal year, the amounts that may be considered qualified dividend income and for corporate shareholders, the amounts that may qualify for the corporate dividends received deduction, are summarized as follows (in U.S. dollars):
| | | | | | | Core Plus | |
| | | | Balanced | | | Income | |
| Qualified dividend income | | | 963,702 | | | 187 | |
| Corporate dividends received deduction | | | 963,702 | | | 187 | |
The information and distributions reported herein may differ from the information and distributions reported to shareholders for the calendar year ended December 31, 2016, which was reported in conjunction with your 2016 Form 1099-DIV.
69 | Q1 2017 ANNUAL REPORT
INFORMATION ABOUT THE TRUSTEES AND OFFICERS
The individuals listed below serve as Trustees or Officers of the Trust. Each Trustee of the Weitz Funds serves until a successor is elected and qualified or until resignation. Each Officer of the Weitz Funds is elected annually by the Trustees.
The address of all Officers and Trustees is 1125 South 103rd Street, Suite 200, Omaha, Nebraska 68124.
Interested Trustees* Wallace R. Weitz (Age: 67) Position(s) Held with Trust: President; Portfolio Manager; Trustee Length of Service (Beginning Date): 1986 Principal Occupation(s) During Past 5 Years: President, Weitz Funds; Chairman of the Board and Co-Chief Investment Officer, President (1983 to 2014), Weitz Investment Management, Inc. Number of Portfolios Overseen in Fund Complex: 10 Other Directorships During Past 5 Years: Cable One, Inc. (2015 to Present) Thomas R. Pansing (Age: 71) Position(s) Held with Trust: Trustee Length of Service (Beginning Date): 1986 Principal Occupation(s) During Past 5 Years: Partner, Pansing Hogan Ernst & Bachman LLP, a law firm Number of Portfolios Overseen in Fund Complex: 10 Other Directorships During Past 5 Years: N/A | Roland J. Santoni (Age: 75) Position(s) Held with Trust: Trustee Length of Service (Beginning Date): 2004 Principal Occupation(s) During Past 5 Years: Managing Director (2010 to Present), Gary and Mary West Foundation Number of Portfolios Overseen in Fund Complex: 10 Other Directorships During Past 5 Years: N/A Delmer L. Toebben (Age: 86) Position(s) Held with Trust: Trustee Length of Service (Beginning Date): 1996 Principal Occupation(s) During Past 5 Years: Retired Number of Portfolios Overseen in Fund Complex: 10 Other Directorships During Past 5 Years: N/A Justin B. Wender (Age: 47) Position(s) Held with Trust: Trustee Length of Service (Beginning Date): 2009 Principal Occupation(s) During Past 5 Years: Managing Partner, Stella Point Capital, LP, a private equity firm (2010 to Present) Number of Portfolios Overseen in Fund Complex: 10 Other Directorships During Past 5 Years: N/A Independent Trustees Lorraine Chang (Age: 66) Position(s) Held with Trust: Trustee; Chair, Board of Trustees Length of Service (Beginning Date): 1997 Principal Occupation(s) During Past 5 Years: Independent Management Consultant Number of Portfolios Overseen in Fund Complex: 10 Other Directorships During Past 5 Years: N/A John W. Hancock (Age: 69) Position(s) Held with Trust: Trustee Length of Service (Beginning Date): 1986 Principal Occupation(s) During Past 5 Years: CPA, Hancock & Dana, PC, an accounting firm Number of Portfolios Overseen in Fund Complex: 10 Other Directorships During Past 5 Years: N/A |
| * | Mr. Weitz is a Director and Officer of Weitz Investment Management, Inc., investment adviser to the Weitz Funds, and as such is considered an "interested person" of the Trust, as that term is defined in the Investment Company Act of 1940 (an "Interested Trustee"). Mr. Pansing performs certain legal services for the investment adviser and the Weitz Funds and, therefore, is also classified as an "Interested Trustee." |
70 | Q1 2017 ANNUAL REPORT
Officers
Thomas D. Carney (Age: 53)
Position(s) Held with Trust: Vice President
Length of Service (Beginning Date): 2015
Principal Occupation(s) During Past 5 Years: Vice President, Weitz Funds (2015 to Present); Portfolio Manager, Weitz Investment Management, Inc. (1996 to Present)
John R. Detisch (Age: 52)
Position(s) Held with Trust: Vice President, General Counsel, Secretary and Chief Compliance Officer
Length of Service (Beginning Date): 2011
Principal Occupation(s) During Past 5 Years: Vice President, General Counsel, Secretary and Chief Compliance Officer, Weitz Funds; Vice President, General Counsel, Assistant Secretary and Chief Compliance Officer, Weitz Investment Management, Inc.
Bradley P. Hinton (Age: 49)
Position(s) Held with Trust: Vice President
Length of Service (Beginning Date): 2006
Principal Occupation(s) During Past 5 Years: Vice President, Weitz Funds; Co-Chief Investment Officer (2017 to Present), Director of Research (2004 to 2017), Vice President and Portfolio Manager, Weitz Investment Management, Inc.
Jo Ann Quinif (Age: 41)
Position(s) Held with Trust: Vice President
Length of Service (Beginning Date): 2015
Principal Occupation(s) During Past 5 Years: Vice President, Weitz Funds (2015 to Present); Vice President (2015 to Present) and Director of Marketing and Client Services (2008 to Present), Weitz Investment Management, Inc.
Kenneth R. Stoll (Age: 55)
Position(s) Held with Trust: Vice President and Chief Financial Officer
Length of Service (Beginning Date): 2004
Principal Occupation(s) During Past 5 Years: Vice President and Chief Financial Officer, Weitz Funds; President and Chief Financial Officer (2015 to Present), Vice President and Chief Operating Officer (2004 to 2014), Weitz Investment Management, Inc.
The Statement of Additional Information for the Weitz Funds, which can be obtained without charge by calling 800-304-9745, includes additional information about the Trustees and Officers of the Weitz Funds.
71 | Q1 2017 ANNUAL REPORT
This page intentionally left blank
72 | Q1 2017 ANNUAL REPORT
This page intentionally left blank
73 | Q1 2017 ANNUAL REPORT
INDEX DESCRIPTIONS
Russell 1000® | The Russell 1000 Index measures the performance of the large-cap segment of the U.S. equity universe. It is a subset of the Russell 3000 Index and includes approximately 1,000 of the largest securities based on a combination of their market cap and current index membership. |
| | |
Russell 1000® Value | The Russell 1000 Value Index measures the performance of the large-cap value segment of the U.S. equity universe. It includes those Russell 1000 companies with lower price-to-book ratios and lower expected growth values. |
| | |
Russell 3000® | The Russell 3000 Index measures the performance of the largest 3,000 U.S. companies representing approximately 98% of the investable U.S. equity market. |
| | |
Russell 3000® Value | The Russell 3000 Value Index measures the performance of the broad value segment of the U.S. equity value universe. It includes those Russell 3000 companies with lower price-to-book ratios and lower forecasted growth values. |
| | |
Russell 2500TM | The Russell 2500 Index measures the performance of the small to mid-cap segment of the U.S. equity universe, commonly referred to as "SMID" cap. The Russell 2500 Index is a subset of the Russell 3000 Index. It includes approximately 2,500 of the smallest securities based on a combination of their market cap and current index membership. |
| | |
Russell 2500TM Value | The Russell 2500 Value Index measures the performance of the small to mid-cap value segment of the U.S. equity universe. It includes those Russell 2500 companies that are considered more value oriented relative to the overall market as defined by Russell. |
| | |
S&P 500® | The S&P 500 is an unmanaged index consisting of 500 companies generally representative of the market for the stocks of large-size U.S. companies. |
| | |
| Blended | The Blended Index blends the S&P 500 with the Bloomberg Barclays Intermediate U.S. Government/Credit Index by weighting their total returns at 60% and 40%, respectively. The portfolio is rebalanced monthly. |
| | |
| Bloomberg Barclays U.S. Aggregate Bond | The Bloomberg Barclays U.S. Aggregate Bond Index is a broad-based benchmark that measures the investment grade, U.S. dollar-denominated, fixed-rate taxable bond market. The index includes Treasuries, government-related and corporate securities, MBS (agency fixed-rate and hybrid ARM pass-throughs), ABS and CMBS (agency and non-agency). |
| | |
| Bloomberg Barclays U.S. Aggregate 1-3 Year | The Bloomberg Barclays U.S. Aggregate 1-3 Year Index is generally representative of the market for investment grade, U.S. dollar denominated, fixed-rate taxable bonds with maturities from one to three years. |
| | |
| Bloomberg Barclays Intermediate U.S. Government/Credit | The Bloomberg Barclays Intermediate U.S. Government/Credit Index ("BIGC") is the non-securitized portion of the U.S. Aggregate Index and includes Treasuries, government-related issues and corporates with maturities from one to ten years. |
| | |
| CPI + 1% | The CPI + 1% is created by adding 1% to the annual percentage change in the Consumer Price Index ("CPI") as determined by the U.S. Department of Labor Statistics. There can be no guarantee that the CPI will reflect the exact level of inflation at any time. |
| | |
| Bank of America Merrill Lynch 6-Month Treasury Bill | The Bank of America Merrill Lynch 6-Month Treasury Bill Index is an unmanaged index that is generally representative of the market for U.S. Treasury Bills. |
| | |
| Bloomberg Barclays 5-Year Municipal Bond | The Bloomberg Barclays 5-Year Municipal Bond Index is a capitalization weighted bond index created by Bloomberg Barclays intended to be representative of major municipal bonds of all quality ratings with an average maturity of approximately five years. |
74 | Q1 2017 ANNUAL REPORT
Board of Trustees Lorraine Chang
John W. Hancock
Thomas R. Pansing, Jr.
Roland J. Santoni
Delmer L. Toebben
Wallace R. Weitz
Justin B. Wender Investment Adviser Weitz Investment Management, Inc.
1125 South 103rd Street, Suite 200
Omaha, NE 68124-1071
(800) 304-9745 Custodian Wells Fargo Bank, N.A. Officers Wallace R. Weitz, President
Thomas D. Carney, Vice President
John R. Detisch, Vice President, General Counsel,
Secretary & Chief Compliance Officer
Bradley P. Hinton, Vice President
Jo Ann Quinif, Vice President
Kenneth R. Stoll, Vice President & Chief
Financial Officer | Distributor Weitz Securities, Inc. Transfer Agent and Dividend
Paying Agent Weitz Investment Management, Inc. Sub-Transfer Agent Boston Financial Data Services, Inc. NASDAQ symbols: Value Fund Investor Class - WVALX
Institutional Class - WVAIX
Partners Value Fund
Investor Class - WPVLX
Institutional Class - WPVIX
Partners III Opportunity Fund
Investor Class - WPOIX
Institutional Class - WPOPX
Research Fund - WRESX
Hickory Fund - WEHIX
Balanced Fund - WBALX
Core Plus Income Fund
Investor Class - WCPNX
Institutional Class - WCPBX
Short Duration Income Fund
Investor Class - WSHNX
Institutional Class - WEFIX
Ultra Short Government Fund - SAFEX
Nebraska Tax-Free Income Fund - WNTFX |
Help us conserve resources by receiving your report electronically.
Visit us online at weitzinvestments.com.
Simply log in to your account and select "Electronic Delivery."
An investor should consider carefully the investment objectives, risks, and charges and expenses of the Funds before investing. The Funds' Prospectus contains this and other information about the Funds. The Prospectus should be read carefully before investing.
5/12/17
75 | Q1 2017 ANNUAL REPORT